Embed Size (px)
Citation preview
Vodafone Group Plc Annual Report 2018
Ready?The future is exciting.
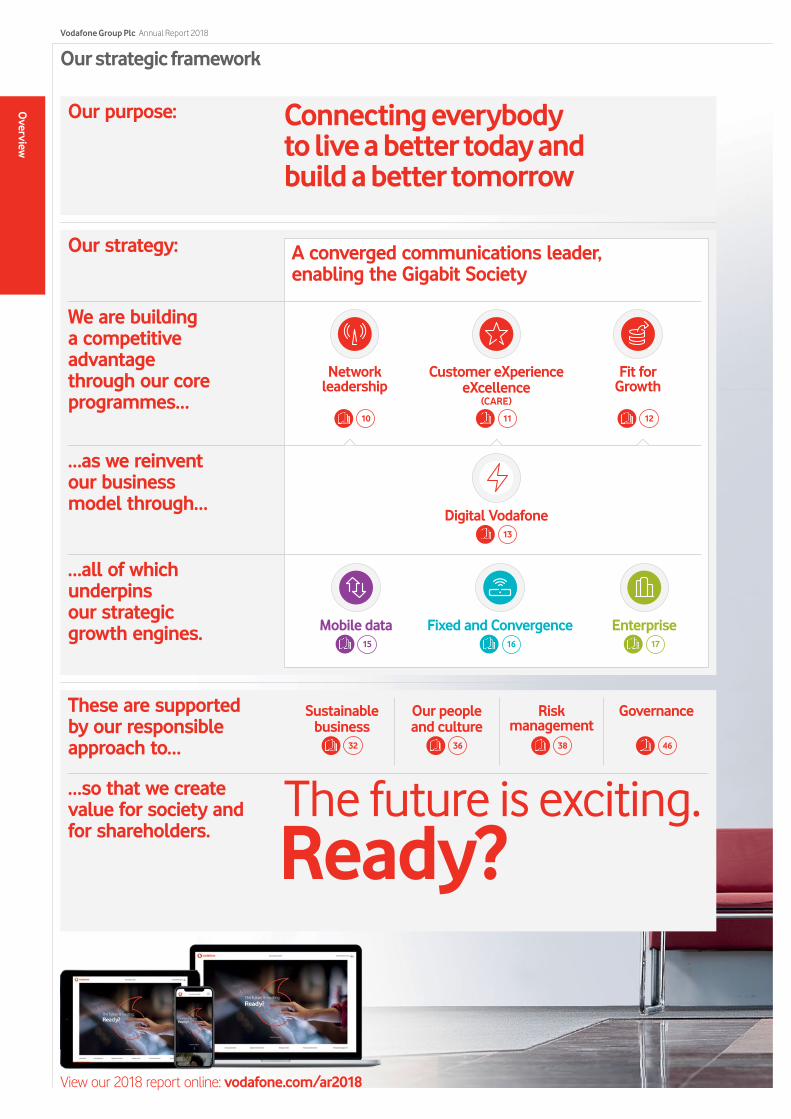
Fixed and Convergence
Connecting everybody to live a better today and build a better tomorrow
These are supported by our responsible approach to…
…all of which underpins our strategic growth engines.
A converged communications leader, enabling the Gigabit Society
Sustainable business
32
Our people and culture
36
Risk management
38
Governance
46
We are building a competitive advantage through our core programmes…
…as we reinvent our business model through…
…so that we create value for society and for shareholders. Ready?
The future is exciting.
Our purpose:
Our strategy:
Mobile data15 16
Enterprise17
Digital Vodafone13
Network leadership
10
Customer eXperience eXcellence
(CARE)
11
Fit for Growth
12
Our strategic framework
View our 2018 report online: vodafone.com/ar2018
Overview
Vodafone Group Plc Annual Report 2018
In this year’s report
Overview00 Our strategic framework
02 Highlights
03 Chairman’s statement
Strategic Report04 Our business at a glance
06 Industry trends
08 Our business model
10 Our core programmes
14 Chief Executive’s strategic review
15 Our growth engines
18 Chief Financial Officer’s review
20 Key performance indicators
22 Our financial performance
30 Financial position and resources
32 Sustainable business
36 Our people and culture
38 Risk management
Governance46 Chairman’s governance statement
48 Board of Directors
50 Executive Committee
52 Leadership structure
54 Board activities
56 Board effectiveness
58 Engaging with our stakeholders
60 Board evaluation
62 Nominations and Governance Committee
64 Audit and Risk Committee
70 Remuneration Committee
88 Our US listing requirements
89 Directors’ report
Financials90 Reporting our financial performance
91 Directors’ statement of responsibility
93 Audit report on the consolidated and parent company financial statements
102 Consolidated financial statements and notes
178 Other unaudited financial information
183 Company financial statements and notes
Other information191 Shareholder information
198 History and development
199 Regulation
207 Alternative performance measures
221 Forward-looking statements
222 Definition of terms
225 Selected financial data
This document is the Group’s UK Annual Report and is not the Group’s Annual Report on Form 20-F that will be filed separately with the US SEC at a later date.
All amounts marked with an “*” represent organic growth which presents performance on a comparable basis, both in terms of merger and acquisition activity and movements in foreign exchange rates. Organic growth is an alternative performance measure. See “Alternative performance measures” on page 207 for further details and reconciliations to the respective closest equivalent GAAP measure.
Vodafone Group Plc Annual Report 2018 01O
verviewStrategic R
eportG
overnanceFinancials
Other inform
ation
Highlights
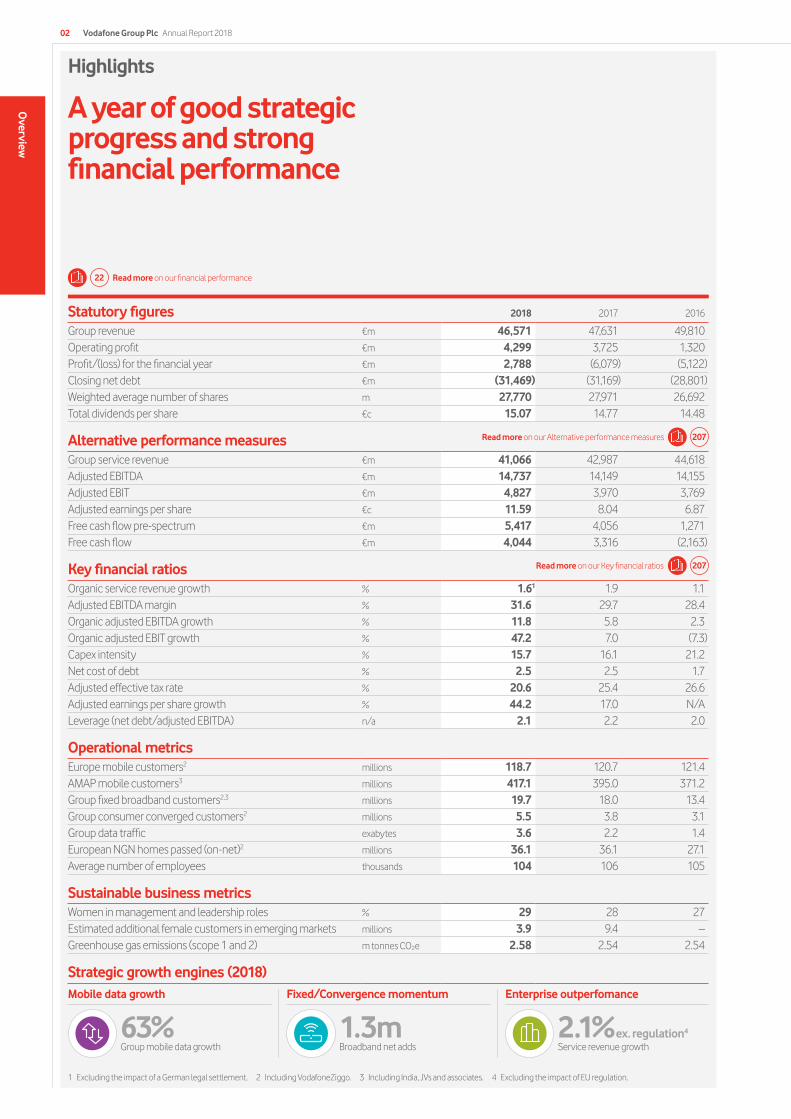
A year of good strategic progress and strong financial performance
Statutory figures 2018 2017 2016
Group revenue €m 46,571 47,631 49,810 Operating profit €m 4,299 3,725 1,320 Profit/(loss) for the financial year €m 2,788 (6,079) (5,122)Closing net debt €m (31,469) (31,169) (28,801)Weighted average number of shares m 27,770 27,971 26,692Total dividends per share €c 15.07 14.77 14.48
Alternative performance measures Group service revenue €m 41,066 42,987 44,618 Adjusted EBITDA €m 14,737 14,149 14,155 Adjusted EBIT €m 4,827 3,970 3,769 Adjusted earnings per share €c 11.59 8.04 6.87 Free cash flow pre-spectrum €m 5,417 4,056 1,271 Free cash flow €m 4,044 3,316 (2,163)
Key financial ratios Organic service revenue growth % 1.61 1.9 1.1Adjusted EBITDA margin % 31.6 29.7 28.4Organic adjusted EBITDA growth % 11.8 5.8 2.3Organic adjusted EBIT growth % 47.2 7.0 (7.3)Capex intensity % 15.7 16.1 21.2Net cost of debt % 2.5 2.5 1.7Adjusted effective tax rate % 20.6 25.4 26.6Adjusted earnings per share growth % 44.2 17.0 N/ALeverage (net debt/adjusted EBITDA) n/a 2.1 2.2 2.0
Operational metricsEurope mobile customers2 millions 118.7 120.7 121.4AMAP mobile customers3 millions 417.1 395.0 371.2Group fixed broadband customers2,3 millions 19.7 18.0 13.4Group consumer converged customers2 millions 5.5 3.8 3.1Group data traffic exabytes 3.6 2.2 1.4European NGN homes passed (on-net)2 millions 36.1 36.1 27.1Average number of employees thousands 104 106 105
Sustainable business metricsWomen in management and leadership roles % 29 28 27Estimated additional female customers in emerging markets millions 3.9 9.4 –Greenhouse gas emissions (scope 1 and 2) m tonnes CO2e 2.58 2.54 2.54
Strategic growth engines (2018)
22 Read more on our financial performance
Mobile data growth
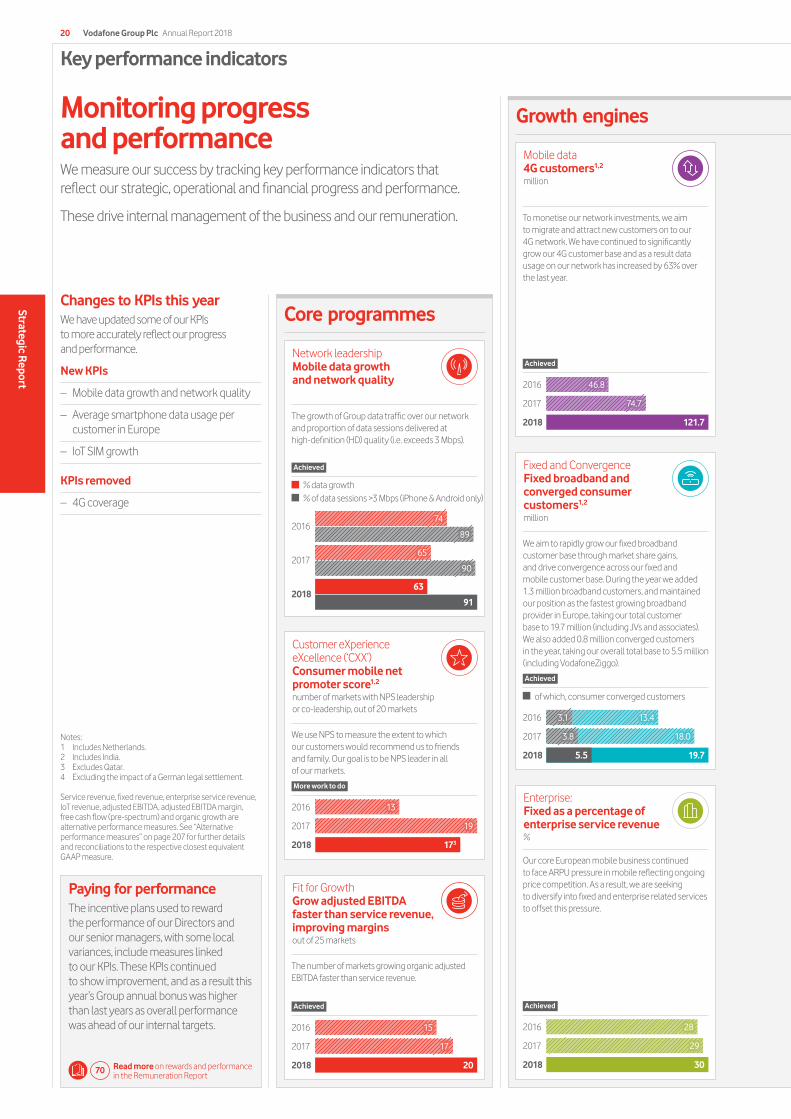
63% Group mobile data growth
Fixed/Convergence momentum
1.3mBroadband net adds
Enterprise outperfomance
2.1% ex. regulation4
Service revenue growth
1 Excluding the impact of a German legal settlement. 2 Including VodafoneZiggo. 3 Including India, JVs and associates. 4 Excluding the impact of EU regulation.
207Read more on our Alternative performance measures
207Read more on our Key financial ratios
Vodafone Group Plc Annual Report 201802
Overview
Chairman’s statement
Significant strategic progressWe have made further progress this year on our ambition to be a converged communications leader in all of our European markets, a mobile data leader in Africa and India, and an Enterprise leader internationally. These strategically strong positions will enhance our ability to achieve our purpose as a Group – which is to connect everybody to live a better today and build a better tomorrow.
A key development was the announcement in May 2018 of our intention to acquire Liberty Global’s cable assets in Germany, the Czech Republic, Hungary and Romania for €18.4 billion, which will transform Vodafone into Europe’s leading next generation infrastructure owner and a truly converged challenger to dominant incumbents. Please see Vittorio Colao’s CEO review on pages 14 to 17 for more insight into this transaction. In addition, we made good progress in securing approvals for the merger of Vodafone India with Idea Cellular, which is expected to close in June 2018.
A strong financial performanceIn addition to these strategic achievements, the Group enjoyed a strong financial performance. Our organic service revenue growth remained modest at a little below 2%, but our sustained focus on cost efficiencies through the “Fit for Growth” programme contributed to organic adjusted EBITDA growth of 12% (8% on an underlying basis)1, with broad-based improvements across most of our markets. This in turn drove a 47% rise in organic adjusted EBIT and 44% growth in adjusted earnings per share.
Progress in Netherlands, challenges in IndiaIn order to strengthen our assets strategically amid highly competitive markets, in recent years we have announced joint ventures in the Netherlands (‘VodafoneZiggo’) and India (‘Vodafone-Idea’). Despite a 4% local currency revenue decline in the year, VodafoneZiggo’s financial performance is expected to stabilise during the year ahead, supported by the success of its convergence strategy and significant cost and capex synergies.
Vodafone India experienced a 19% organic service revenue decline during the year, reflecting intense competitive and regulatory pressures. Nick Read will outline in his CFO review the steps which we are taking to strengthen the combined company’s future financial position, ensuring that we can compete effectively going forwards in a consolidated market.
The future is exciting – for our customers and for VodafoneVodafone’s ultrafast and widely available fixed and mobile networks are enabling a range of exciting new technologies, which contribute to society and create an exciting future for our customers, employees and shareholders. Our new global brand campaign, “The future is exciting. Ready?”, which launched last autumn, communicated that Vodafone will support our customers every step of the way, helping them to make the most of new and exciting innovations.
We have ambitious sustainable business goalsOur sustainable business strategy, which we outline on pages 32 to 35, lies at the heart of our development, as we are convinced that the long-term success of our business is closely tied to the success of the communities in which we operate. Vodafone’s digital networks and services act as a catalyst not only for economic growth, but also for equality and empowerment. We focus our efforts where we believe we can make the greatest impact, and we now have long-term external and internal ambitions in place to deliver our strategy.
Key highlights include our commitment to reduce our greenhouse gas emissions by 40% and purchase 100% of electricity we use from renewable sources. We also intend to support 10 million young people by 2022 through our future digital jobs programme, “What will you be?”, which will help to address the dual challenges of youth unemployment and a growing digital skills gap.
Returns are improvingWe have previously highlighted the need for the Group to improve the returns that we are achieving on the substantial organic and inorganic investments that we have made in recent years. In part, this relies upon a better balancing of competition and investment considerations by European regulators and governments, particularly as we approach spectrum auctions for 5G. However, we also remain focused on making improvements under existing industry conditions.
This has been a challenging year for the Telecoms sector in Europe and particularly in India. While we underperformed the FTSE 100 we outperformed our peers, in some cases materially so, as a result of the progress we are making. The Board’s confidence in our outlook is demonstrated by a further 2% increase in our dividend per share to 15.07 eurocents for the year.
CEO succession: our thanks to VittorioIn May 2018, we announced the succession plan for the Group Chief Executive role. From 1 October, Vittorio Colao will be succeeded by Nick Read, our current Group CFO, with Margherita Della Valle (our Deputy CFO) succeeding Nick Read and joining the Board after the AGM in July.
On behalf of the Board, I would like to express our gratitude to Vittorio for an outstanding tenure. He has been an exemplary leader and strategic visionary who has overseen a dramatic transformation of Vodafone into a global pacesetter in converged communications, ready for the Gigabit future. Vittorio will leave as his legacy a company of great integrity with strong inclusive values that is exceptionally well-positioned for the decade ahead. I would also like to recognise from a governance perspective the great way in which Vittorio has worked together with the Board in an atmosphere of openness, transparency and trust.
Nick has been the co-architect of the Group’s strategy together with Vittorio, combining extensive international operational and commercial leadership with world-class financial acumen. I am confident Vodafone will benefit greatly from his experience, insight and wisdom in his new role as Group Chief Executive. Margherita has a strong track record in financial leadership at the highest levels, and I am delighted to welcome her to the Board. I would also add that the appointment of Nick and Margherita serves as a testament to the strength and depth of the Vodafone senior leadership team that Vittorio has assembled and led over the last decade.
Gerard KleisterleeChairman1 Excluding the net impact of EU regulation, UK handset
financing, and settlements.
Vodafone Group Plc Annual Report 2018 03O
verviewStrategic R
eportG
overnanceFinancials
Other inform
ation
The future is exciting – for our customers and for Vodafone
Our business at a glance
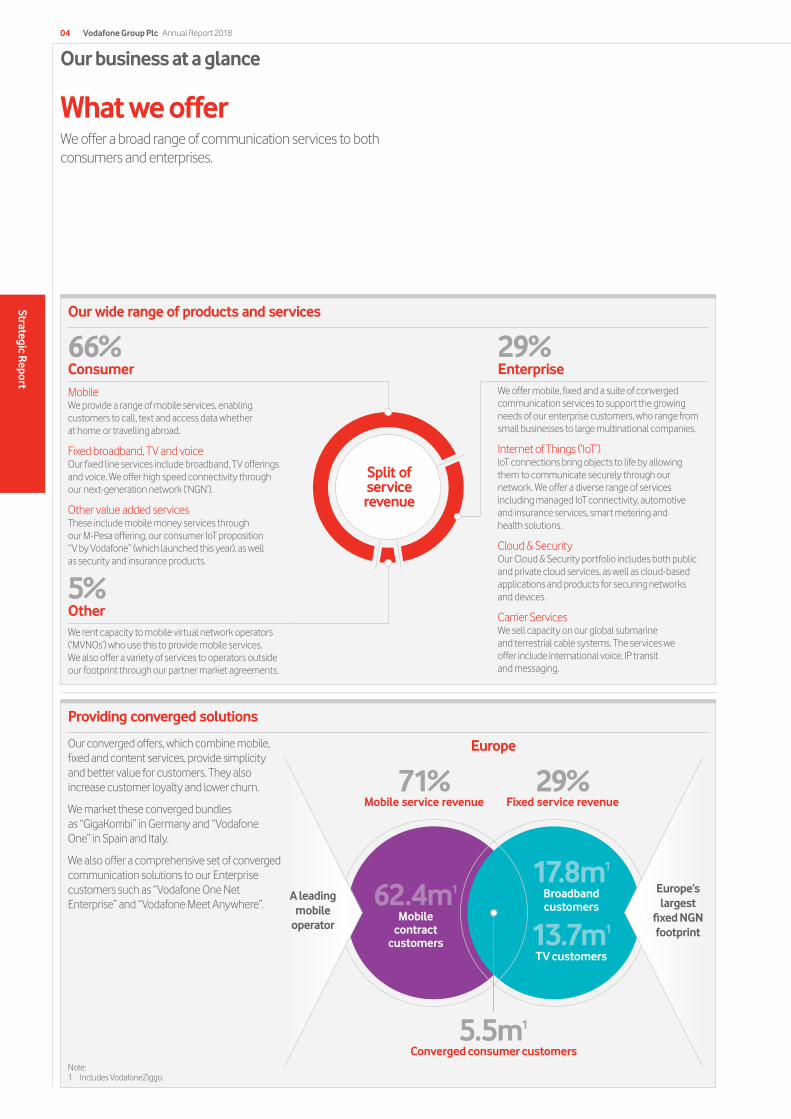
Providing converged solutions
Our converged offers, which combine mobile, fixed and content services, provide simplicity and better value for customers. They also increase customer loyalty and lower churn.
We market these converged bundles as “GigaKombi” in Germany and “Vodafone One” in Spain and Italy.
We also offer a comprehensive set of converged communication solutions to our Enterprise customers such as “Vodafone One Net Enterprise” and “Vodafone Meet Anywhere”.
Our wide range of products and services
What we offer We offer a broad range of communication services to both consumers and enterprises.
66%ConsumerMobileWe provide a range of mobile services, enabling customers to call, text and access data whether at home or travelling abroad.
Fixed broadband, TV and voiceOur fixed line services include broadband, TV offerings and voice. We offer high speed connectivity through our next-generation network (‘NGN’).
Other value added servicesThese include mobile money services through our M-Pesa offering, our consumer IoT proposition “V by Vodafone” (which launched this year), as well as security and insurance products.
29%EnterpriseWe offer mobile, fixed and a suite of converged communication services to support the growing needs of our enterprise customers, who range from small businesses to large multinational companies.
Internet of Things (‘IoT’)IoT connections bring objects to life by allowing them to communicate securely through our network. We offer a diverse range of services including managed IoT connectivity, automotive and insurance services, smart metering and health solutions.
Cloud & Security Our Cloud & Security portfolio includes both public and private cloud services, as well as cloud-based applications and products for securing networks and devices.
Carrier ServicesWe sell capacity on our global submarine and terrestrial cable systems. The services we offer include international voice, IP transit and messaging.
5%OtherWe rent capacity to mobile virtual network operators (‘MVNOs’) who use this to provide mobile services. We also offer a variety of services to operators outside our footprint through our partner market agreements.
71%Mobile service revenue
29%Fixed service revenue
17.8m1
Broadband customers
13.7m1
TV customers
62.4m1
Mobile contract
customers
Europe’s largest
fixed NGN footprint
A leading mobile
operator
Europe
5.5m1
Converged consumer customersNote:1 Includes VodafoneZiggo.
Vodafone Group Plc Annual Report 201804
Strategic Report
Split of service revenue
€0.7bn (includes partner markets and common functions)4
AMAP
23%Europe
75%
Other
2%
Group service revenues
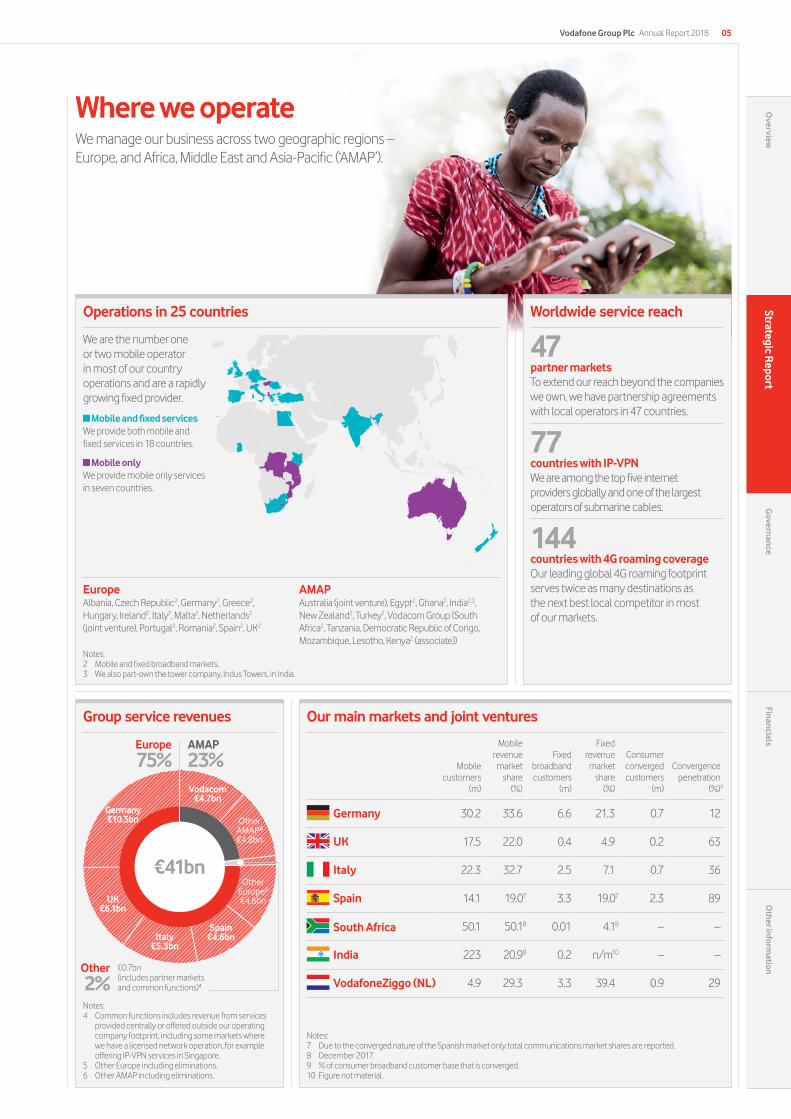
Where we operate We manage our business across two geographic regions – Europe, and Africa, Middle East and Asia-Pacific (‘AMAP’).
EuropeAlbania, Czech Republic2, Germany2, Greece2, Hungary, Ireland2, Italy2, Malta2, Netherlands2
(joint venture), Portugal2, Romania2, Spain2, UK2
AMAPAustralia (joint venture), Egypt2, Ghana2, India2,3, New Zealand2, Turkey2, Vodacom Group (South Africa2, Tanzania, Democratic Republic of Congo, Mozambique, Lesotho, Kenya2 (associate))
Mobile customers
(m)
Mobile revenue market
share (%)
Fixed broadband customers
(m)
Fixed revenue market
share (%)
Consumer converged customers
(m)
Convergence penetration
(%)9
Germany 30.2 33.6 6.6 21.3 0.7 12
UK 17.5 22.0 0.4 4.9 0.2 63
Italy 22.3 32.7 2.5 7.1 0.7 36
Spain 14.1 19.07 3.3 19.07 2.3 89
South Africa 50.1 50.18 0.01 4.18 – –
India 223 20.98 0.2 n/m10 – –
VodafoneZiggo (NL) 4.9 29.3 3.3 39.4 0.9 29
Notes:4 Common functions includes revenue from services
provided centrally or offered outside our operating company footprint, including some markets where we have a licensed network operation, for example offering IP-VPN services in Singapore.
5 Other Europe including eliminations.6 Other AMAP including eliminations.
Notes:7 Due to the converged nature of the Spanish market only total communications market shares are reported.8 December 2017.9 % of consumer broadband customer base that is converged.10 Figure not material.
We are the number one or two mobile operator in most of our country operations and are a rapidly growing fixed provider.
Mobile and fixed services We provide both mobile and fixed services in 18 countries.
Mobile only We provide mobile only services in seven countries.
Notes:2 Mobile and fixed broadband markets.3 We also part-own the tower company, Indus Towers, in India.
Worldwide service reach
47partner markets To extend our reach beyond the companies we own, we have partnership agreements with local operators in 47 countries.
77countries with IP-VPN We are among the top five internet providers globally and one of the largest operators of submarine cables.
144countries with 4G roaming coverage Our leading global 4G roaming footprint serves twice as many destinations as the next best local competitor in most of our markets.
Operations in 25 countries
Our main markets and joint ventures
Vodafone Group Plc Annual Report 2018 05O
verviewStrategic R
eportG
overnanceFinancials
Other inform
ation
Vodacom €4.7bn
Germany €10.3bn
UK €6.1bn
Italy €5.3bn
Spain €4.6bn
Other Europe5 €4.6bn
Other AMAP6 €4.8bn
€41bn
Industry trends
We operate in a rapidly changing industry where innovation and scale are keyRising global smartphone penetration, ubiquitous superfast internet access, increasingly converged solutions and remarkable new technologies are rapidly transforming the way that we live and work, while simultaneously creating a range of new commercial, regulatory and societal challenges.
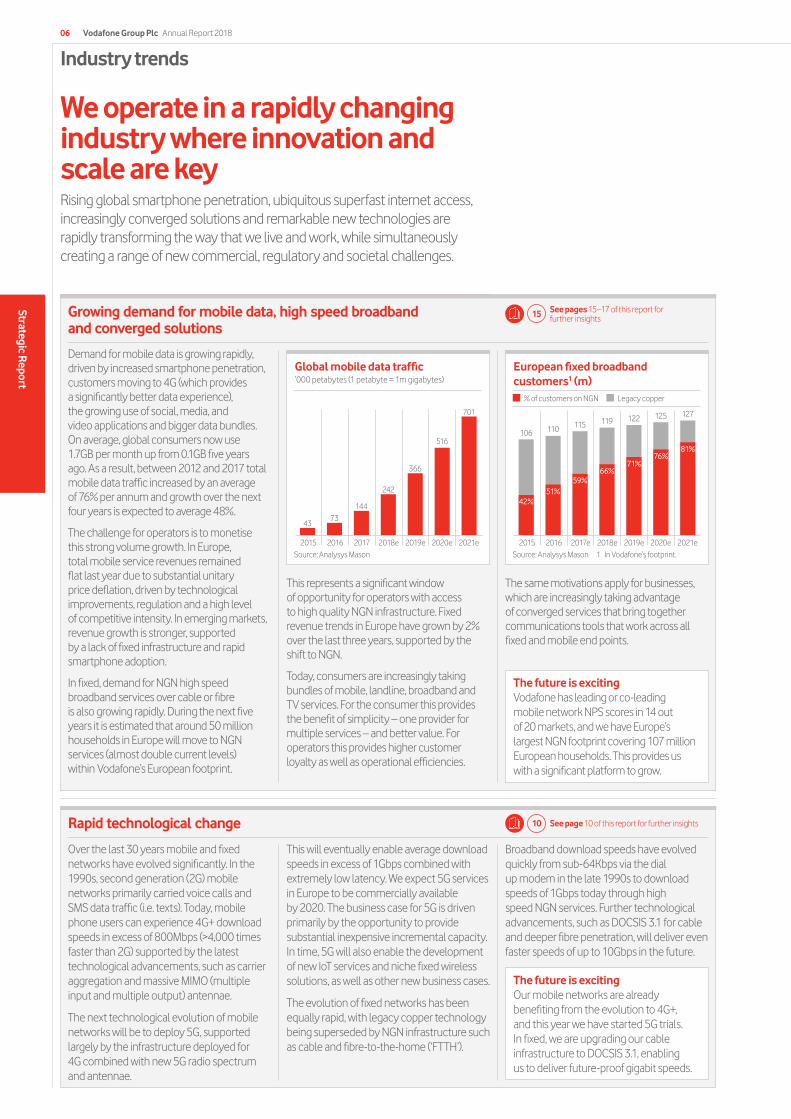
Growing demand for mobile data, high speed broadband and converged solutions
Demand for mobile data is growing rapidly, driven by increased smartphone penetration, customers moving to 4G (which provides a significantly better data experience), the growing use of social, media, and video applications and bigger data bundles. On average, global consumers now use 1.7GB per month up from 0.1GB five years ago. As a result, between 2012 and 2017 total mobile data traffic increased by an average of 76% per annum and growth over the next four years is expected to average 48%.
The challenge for operators is to monetise this strong volume growth. In Europe, total mobile service revenues remained flat last year due to substantial unitary price deflation, driven by technological improvements, regulation and a high level of competitive intensity. In emerging markets, revenue growth is stronger, supported by a lack of fixed infrastructure and rapid smartphone adoption.
In fixed, demand for NGN high speed broadband services over cable or fibre is also growing rapidly. During the next five years it is estimated that around 50 million households in Europe will move to NGN services (almost double current levels) within Vodafone’s European footprint.
This represents a significant window of opportunity for operators with access to high quality NGN infrastructure. Fixed revenue trends in Europe have grown by 2% over the last three years, supported by the shift to NGN.
Today, consumers are increasingly taking bundles of mobile, landline, broadband and TV services. For the consumer this provides the benefit of simplicity – one provider for multiple services – and better value. For operators this provides higher customer loyalty as well as operational efficiencies.
The same motivations apply for businesses, which are increasingly taking advantage of converged services that bring together communications tools that work across all fixed and mobile end points.
Rapid technological change
Over the last 30 years mobile and fixed networks have evolved significantly. In the 1990s, second generation (2G) mobile networks primarily carried voice calls and SMS data traffic (i.e. texts). Today, mobile phone users can experience 4G+ download speeds in excess of 800Mbps (>4,000 times faster than 2G) supported by the latest technological advancements, such as carrier aggregation and massive MIMO (multiple input and multiple output) antennae.
The next technological evolution of mobile networks will be to deploy 5G, supported largely by the infrastructure deployed for 4G combined with new 5G radio spectrum and antennae.
This will eventually enable average download speeds in excess of 1Gbps combined with extremely low latency. We expect 5G services in Europe to be commercially available by 2020. The business case for 5G is driven primarily by the opportunity to provide substantial inexpensive incremental capacity. In time, 5G will also enable the development of new IoT services and niche fixed wireless solutions, as well as other new business cases.
The evolution of fixed networks has been equally rapid, with legacy copper technology being superseded by NGN infrastructure such as cable and fibre-to-the-home (‘FTTH’).
Broadband download speeds have evolved quickly from sub-64Kbps via the dial up modem in the late 1990s to download speeds of 1Gbps today through high speed NGN services. Further technological advancements, such as DOCSIS 3.1 for cable and deeper fibre penetration, will deliver even faster speeds of up to 10Gbps in the future.
10 See page 10 of this report for further insights
15 See pages 15–17 of this report for further insights
The future is excitingOur mobile networks are already benefiting from the evolution to 4G+, and this year we have started 5G trials. In fixed, we are upgrading our cable infrastructure to DOCSIS 3.1, enabling us to deliver future-proof gigabit speeds.
The future is excitingVodafone has leading or co-leading mobile network NPS scores in 14 out of 20 markets, and we have Europe’s largest NGN footprint covering 107 million European households. This provides us with a significant platform to grow.
European fixed broadband customers1 (m)
% of customers on NGN Legacy copper
42%
106
51%
110
59%
115
66%
119
71%
122
76%
125
81%
127
Source: Analysys Mason 1 In Vodafone’s footprint.2015 2016 2017e 2018e 2019e 2020e 2021e
Global mobile data traffic’000 petabytes (1 petabyte = 1m gigabytes)
4373
144
242
366
516
701
Source: Analysys Mason2015 2016 2017 2018e 2019e 2020e 2021e
Vodafone Group Plc Annual Report 201806
Strategic Report
Digital transformation opportunity
The world is undergoing a rapid digital transformation. New technologies including smartphones, cloud computing, artificial intelligence and robotic process automation are enabling companies to connect with customers directly, proactively offering personalised solutions, while simplifying and automating operational processes and improving the efficiency of all commercial and technological decisions.
Digitalisation is a key operational theme for the telecoms industry, which has a significant proportion of costs that can be automated, while also having unrivalled insight into customer usage trends.
By using advanced digital technologies operators will be able to enhance their customers’ experience, generate incremental revenue opportunities, and reduce costs.
The cost cutting opportunity alone for European telecoms has been estimated to be as much as €60 billion1.
Speed of execution will be key in order for operators to further differentiate their services and retain the benefits from digitalisation.
Highly competitive markets
The telecommunication industry is highly competitive, with many alternative providers giving customers a wide choice of suppliers.
In each of the countries in which we operate, there are typically three or four mobile network operators (MNOs), such as Vodafone, who own their own network infrastructure, as well as several resellers that “wholesale” network services from MNOs. In addition, there are an increasing number of over-the-top (‘OTT’) operators that provide internet-based apps for content and communication services.
In fixed, there is usually one national incumbent (typically the former state owned operator), who is generally required to offer wholesale access to its network at regulated prices to resellers, while most markets will also have one or two cable or satellite operators.
In some markets, the uncompetitive wholesale access terms offered by incumbents and the slow pace of NGN infrastructure rollout has seen the emergence of alternative fibre builders, who are looking to capitalise on the growing customer demand for gigabit speeds by offering attractive wholesale access and terms to resellers.
Changing customer and societal expectations
Today, communication networks underpin every aspect of society. Consumers have access to content and information of a breadth and depth that was inconceivable even a decade ago. This is bringing about a revolution in the way millions of people across the world share, learn and access education, healthcare and financial services, among others.
Few industry sectors can claim a closer alignment between their commercial objectives and the achievement of meaningful gains for society. There are, however, areas within the communications industry that can be a source of public concern, including customer privacy, tax and digital human rights.
Our industry needs to continue to make sure these concerns are addressed in an ethical, responsible and transparent manner.
1 Goldman Sachs
13 See page 13 of this report for further insights
32 See page 32 of this report for further insights
The future is excitingThe “Digital Vodafone” programme was launched across the Group this year. This will enable us to deliver a leading digital customer experience; leverage the latest data analytics techniques; and automate and simplify our operations, underpinned by new agile ways of working.
The future is excitingThanks to our substantial investments, we offer market leading network quality and customer service levels positioning us well for the future.
The future is excitingOur sustainable business strategy aligns our commercial objectives with a clear social purpose to create long term value and meet customer expectations.
Regulatory intervention
The remit of regulators is extensive, including wholesale charges between operators, spectrum allocation, and obligations in relation to consumer rights. Regulators are also responsible for topics relating to data protection and cyber security. The decision to regulate or not has material consequences.
Regulators are tasked with protecting consumers and incentivising investment.
Historically the balance has been tilted towards consumers. In the first half of calendar 2018, the European Commission is expected to complete the overhaul of its existing telecoms rules – the European Electronic Communications Code. The Commission’s original proposals struck a balance between investment incentives in networks and competition.
199 See page 199 of this report for further insights
The future is excitingOnly 6.8% of our European service revenues now come from regulated roaming and termination fees; the code if finalised according to the original proposals is supportive of Vodafone’s position as Europe’s fastest growing fixed challenger.
Vodafone Group Plc Annual Report 2018 07O
verviewStrategic R
eportG
overnanceFinancials
Other inform
ation
Differentiated assets and
leading scale
Sustained reinvestment
Improving cash flow
Delivering value for society
and improving returns for our shareholders
Our business model
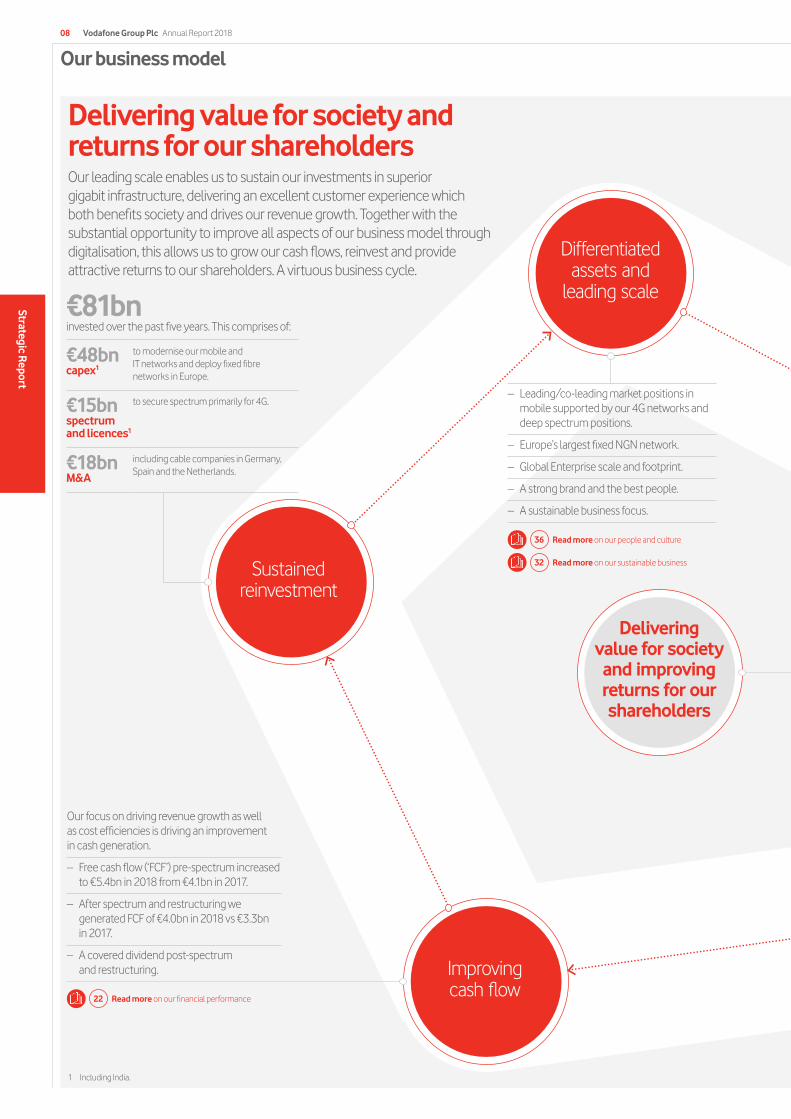
– Leading/co-leading market positions in mobile supported by our 4G networks and deep spectrum positions.
– Europe’s largest fixed NGN network.
– Global Enterprise scale and footprint.
– A strong brand and the best people.
– A sustainable business focus.
Our focus on driving revenue growth as well as cost efficiencies is driving an improvement in cash generation.
– Free cash flow (‘FCF’) pre-spectrum increased to €5.4bn in 2018 from €4.1bn in 2017.
– After spectrum and restructuring we generated FCF of €4.0bn in 2018 vs €3.3bn in 2017.
– A covered dividend post-spectrum and restructuring.
22 Read more on our financial performance
32 Read more on our sustainable business
36 Read more on our people and culture
€81bn invested over the past five years. This comprises of:
€48bncapex1
to modernise our mobile and IT networks and deploy fixed fibre networks in Europe.
€15bnspectrum and licences1
to secure spectrum primarily for 4G.
€18bn M&A
including cable companies in Germany, Spain and the Netherlands.
Delivering value for society and returns for our shareholdersOur leading scale enables us to sustain our investments in superior gigabit infrastructure, delivering an excellent customer experience which both benefits society and drives our revenue growth. Together with the substantial opportunity to improve all aspects of our business model through digitalisation, this allows us to grow our cash flows, reinvest and provide attractive returns to our shareholders. A virtuous business cycle.
Vodafone Group Plc Annual Report 201808
Strategic Report
1 Including India.
Growing revenue streams
Digital transformation
opportunity
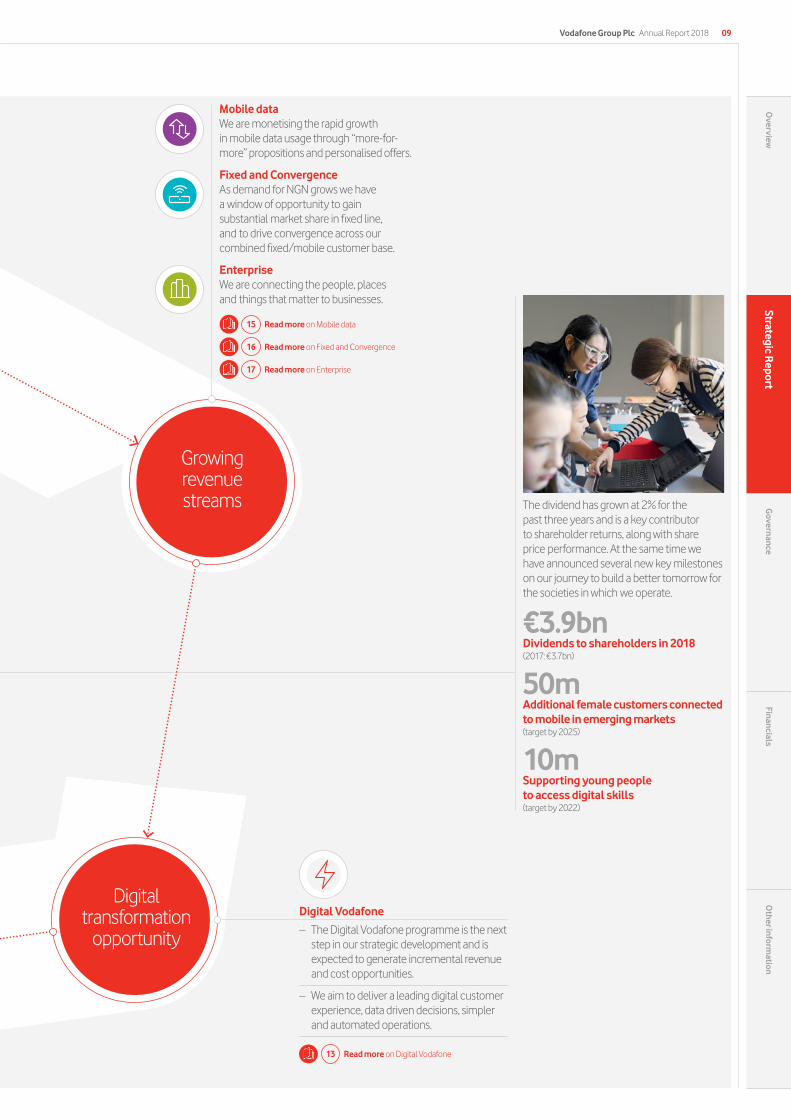
The dividend has grown at 2% for the past three years and is a key contributor to shareholder returns, along with share price performance. At the same time we have announced several new key milestones on our journey to build a better tomorrow for the societies in which we operate.
€3.9bnDividends to shareholders in 2018 (2017: €3.7bn)
50mAdditional female customers connected to mobile in emerging markets(target by 2025)
10mSupporting young people to access digital skills(target by 2022)
Mobile dataWe are monetising the rapid growth in mobile data usage through “more-for-more” propositions and personalised offers.
Fixed and ConvergenceAs demand for NGN grows we have a window of opportunity to gain substantial market share in fixed line, and to drive convergence across our combined fixed/mobile customer base.
EnterpriseWe are connecting the people, places and things that matter to businesses.
16 Read more on Fixed and Convergence
15 Read more on Mobile data
17 Read more on Enterprise
Digital Vodafone
– The Digital Vodafone programme is the next step in our strategic development and is expected to generate incremental revenue and cost opportunities.
– We aim to deliver a leading digital customer experience, data driven decisions, simpler and automated operations.
13 Read more on Digital Vodafone
Vodafone Group Plc Annual Report 2018 09O
verviewStrategic R
eportG
overnanceFinancials
Other inform
ation
Radio site evolution
Our core programmes
We are building a competitive advantage through our core strategic programmes
Network leadership Our sustained investment in network quality has enabled us to establish differentiated and market leading network positions
We continue to invest in our network and IT infrastructure to further expand coverage, improve reliability, and enhance data speeds. As a result, we now have leading or co-leading mobile network NPS scores in 14 out of 20 markets, including India.
This strong and differentiated network position enables us to provide our customers with an excellent user experience, with 92% of all data sessions in Europe now at high definition video standard and a dropped call rate for voice of just 0.34%. In fixed line, we have created Europe’s largest NGN footprint covering 107 million households (including VodafoneZiggo), of which 36 million are owned cable or fibre and 7 million are through strategic partnerships with attractive wholesale rates. As a result we are able to market NGN services to 65% of our European footprint.
In order to maintain our leadership position we will continue to enhance our network and deploy new market leading technologies.
Non-massive MIMO Massive MIMO
Evolving our 4G network to be 5G readyWe are continuing to evolve our 4G network towards delivering gigabit data speeds, increased network capacity, improved response (latency) times, and new service capabilities. These network enhancements are being delivered through a range of advanced technological solutions. As an example, we are now rolling out massive MIMO (multiple input and multiple output) antennas in our markets. These antennae fundamentally change the way in which we transmit radio signals. Rather than the signal being transmitted everywhere, massive MIMO provides multiple beams of signal and each beam is assigned to a unique user or group. It therefore delivers a better and more reliable user experience, creates less interference, and has the benefit of increasing the site capacity by improving spectrum efficiency. This evolution of 4G combined with new 5G radio spectrum and antennae will provide the underlying network infrastructure for 5G.
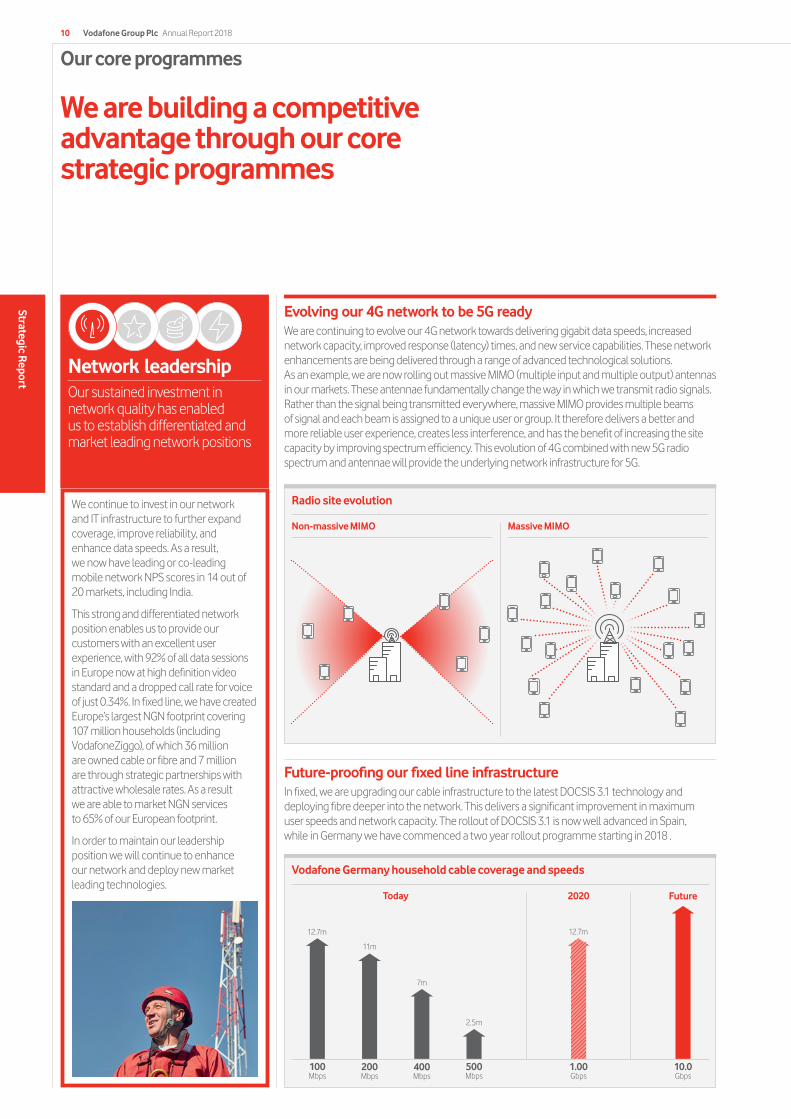
Future-proofing our fixed line infrastructureIn fixed, we are upgrading our cable infrastructure to the latest DOCSIS 3.1 technology and deploying fibre deeper into the network. This delivers a significant improvement in maximum user speeds and network capacity. The rollout of DOCSIS 3.1 is now well advanced in Spain, while in Germany we have commenced a two year rollout programme starting in 2018 .
100 Mbps
200 Mbps
400 Mbps
500 Mbps
1.00 Gbps
10.0 Gbps
2020 Future
12.7m
11m
7m
2.5m
12.7m
Today
Vodafone Germany household cable coverage and speeds
Vodafone Group Plc Annual Report 201810
Strategic Report
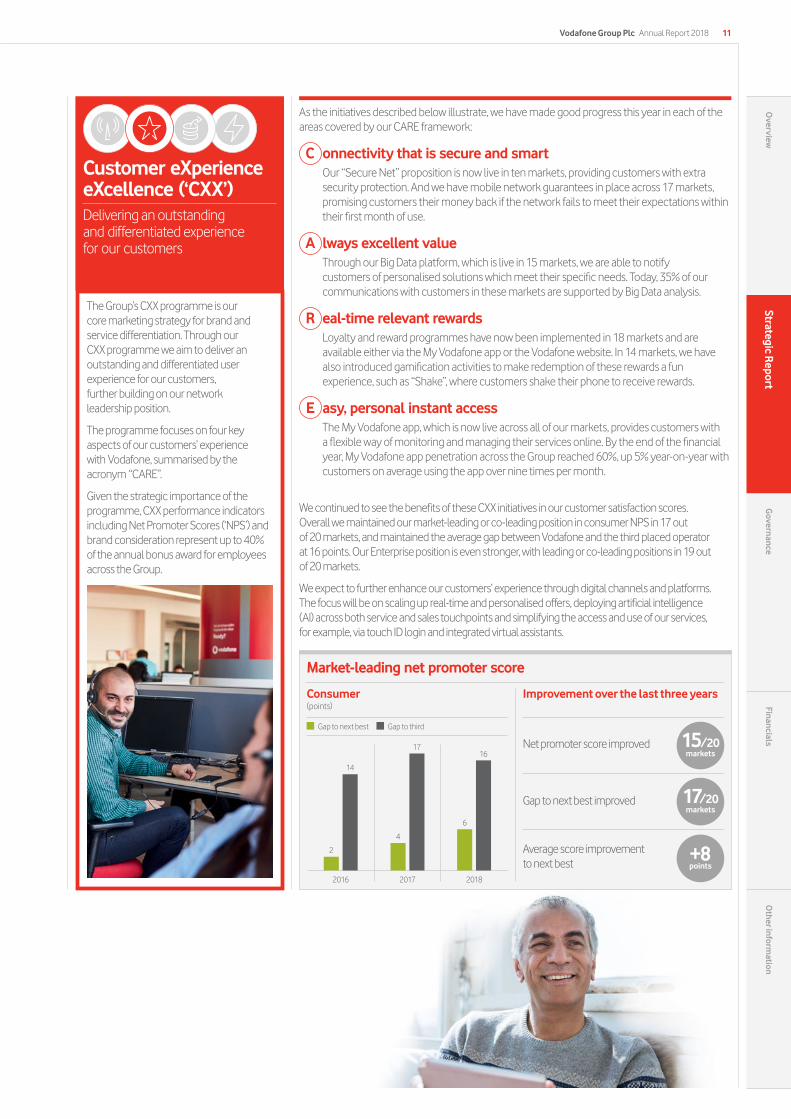
Customer eXperience eXcellence (‘CXX’)Delivering an outstanding and differentiated experience for our customers
The Group’s CXX programme is our core marketing strategy for brand and service differentiation. Through our CXX programme we aim to deliver an outstanding and differentiated user experience for our customers, further building on our network leadership position.
The programme focuses on four key aspects of our customers’ experience with Vodafone, summarised by the acronym “CARE”.
Given the strategic importance of the programme, CXX performance indicators including Net Promoter Scores (‘NPS’) and brand consideration represent up to 40% of the annual bonus award for employees across the Group.
Consumer(points)
Improvement over the last three years
2016 2017 2018
2
4
6
14
1716
Gap to next best Gap to third
Market-leading net promoter score
As the initiatives described below illustrate, we have made good progress this year in each of the areas covered by our CARE framework:
C onnectivity that is secure and smart Our “Secure Net” proposition is now live in ten markets, providing customers with extra security protection. And we have mobile network guarantees in place across 17 markets, promising customers their money back if the network fails to meet their expectations within their first month of use.
A lways excellent valueThrough our Big Data platform, which is live in 15 markets, we are able to notify customers of personalised solutions which meet their specific needs. Today, 35% of our communications with customers in these markets are supported by Big Data analysis.
R eal-time relevant rewardsLoyalty and reward programmes have now been implemented in 18 markets and are available either via the My Vodafone app or the Vodafone website. In 14 markets, we have also introduced gamification activities to make redemption of these rewards a fun experience, such as “Shake”, where customers shake their phone to receive rewards.
E asy, personal instant accessThe My Vodafone app, which is now live across all of our markets, provides customers with a flexible way of monitoring and managing their services online. By the end of the financial year, My Vodafone app penetration across the Group reached 60%, up 5% year-on-year with customers on average using the app over nine times per month.
We continued to see the benefits of these CXX initiatives in our customer satisfaction scores. Overall we maintained our market-leading or co-leading position in consumer NPS in 17 out of 20 markets, and maintained the average gap between Vodafone and the third placed operator at 16 points. Our Enterprise position is even stronger, with leading or co-leading positions in 19 out of 20 markets.
We expect to further enhance our customers’ experience through digital channels and platforms. The focus will be on scaling up real-time and personalised offers, deploying artificial intelligence (AI) across both service and sales touchpoints and simplifying the access and use of our services, for example, via touch ID login and integrated virtual assistants.
Net promoter score improved
Gap to next best improved
Average score improvement to next best
15/20markets
17/20markets
+8points
Vodafone Group Plc Annual Report 2018 11O
verviewStrategic R
eportG
overnanceFinancials
Other inform
ation
Our core programmes (continued)
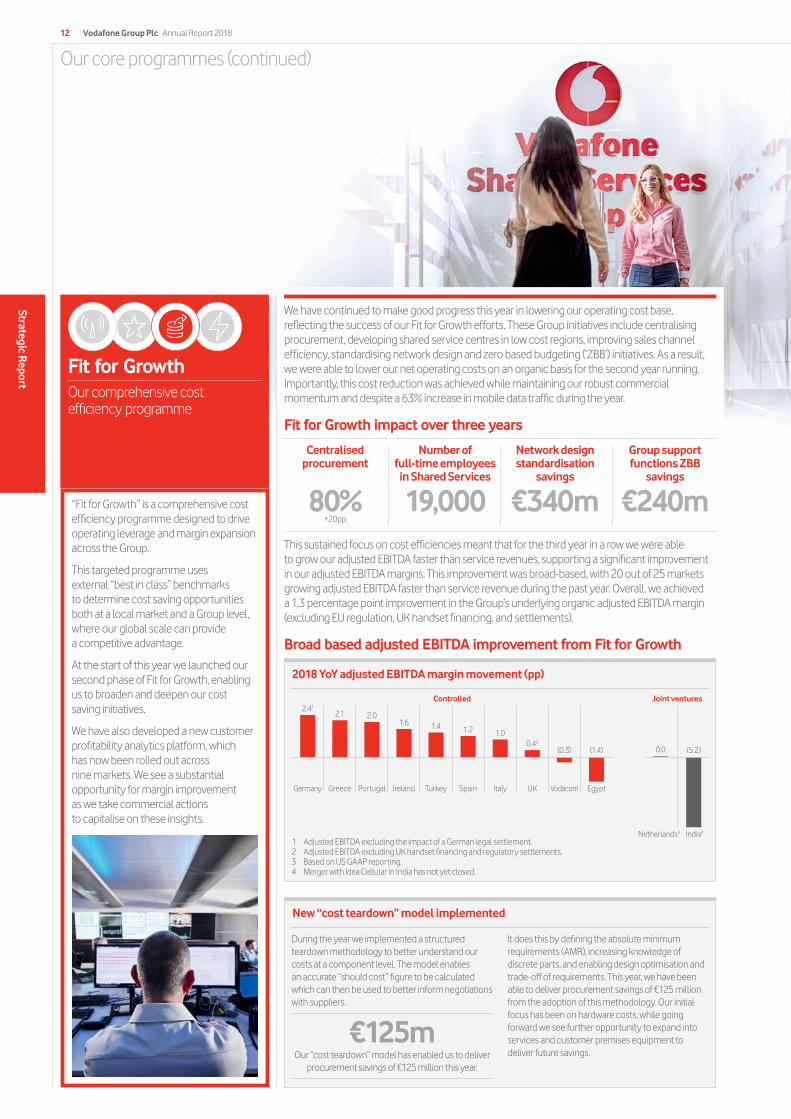
Fit for Growth Our comprehensive cost efficiency programme
“Fit for Growth” is a comprehensive cost efficiency programme designed to drive operating leverage and margin expansion across the Group.
This targeted programme uses external “best in class” benchmarks to determine cost saving opportunities both at a local market and a Group level, where our global scale can provide a competitive advantage.
At the start of this year we launched our second phase of Fit for Growth, enabling us to broaden and deepen our cost saving initiatives.
We have also developed a new customer profitability analytics platform, which has now been rolled out across nine markets. We see a substantial opportunity for margin improvement as we take commercial actions to capitalise on these insights.
New “cost teardown” model implemented
During the year we implemented a structured teardown methodology to better understand our costs at a component level. The model enables an accurate “should cost” figure to be calculated which can then be used to better inform negotiations with suppliers.
It does this by defining the absolute minimum requirements (AMR), increasing knowledge of discrete parts, and enabling design optimisation and trade-off of requirements. This year, we have been able to deliver procurement savings of €125 million from the adoption of this methodology. Our initial focus has been on hardware costs, while going forward we see further opportunity to expand into services and customer premises equipment to deliver future savings.
We have continued to make good progress this year in lowering our operating cost base, reflecting the success of our Fit for Growth efforts. These Group initiatives include centralising procurement, developing shared service centres in low cost regions, improving sales channel efficiency, standardising network design and zero based budgeting (‘ZBB’) initiatives. As a result, we were able to lower our net operating costs on an organic basis for the second year running. Importantly, this cost reduction was achieved while maintaining our robust commercial momentum and despite a 63% increase in mobile data traffic during the year.
Fit for Growth impact over three years
This sustained focus on cost efficiencies meant that for the third year in a row we were able to grow our adjusted EBITDA faster than service revenues, supporting a significant improvement in our adjusted EBITDA margins. This improvement was broad-based, with 20 out of 25 markets growing adjusted EBITDA faster than service revenue during the past year. Overall, we achieved a 1.3 percentage point improvement in the Group’s underlying organic adjusted EBITDA margin (excluding EU regulation, UK handset financing, and settlements).
Broad based adjusted EBITDA improvement from Fit for Growth
Centralised procurement
80%+20pp
Number of full-time employees
in Shared Services
19,000
Network design standardisation
savings
€340m
Group support functions ZBB
savings
€240m
€125mOur “cost teardown” model has enabled us to deliver
procurement savings of €125 million this year.
Vodafone Group Plc Annual Report 201812
Strategic Report
2018 YoY adjusted EBITDA margin movement (pp)
1 Adjusted EBITDA excluding the impact of a German legal settlement.2 Adjusted EBITDA excluding UK handset financing and regulatory settlements.3 Based on US GAAP reporting.4 Merger with Idea Cellular in India has not yet closed.
Germany Greece Portugal Ireland Turkey Spain Italy UK Vodacom Egypt
India4
2.41Controlled Joint ventures
2.1 2.01.6 1.4 1.2 1.0
0.42
(0.3) (1.4) 0.0 (5.2)
Netherlands3
Digital customer management We intend to increase the use of data analytics to provide predictive, proactive and personalised offers to our customers, optimising the efficiency of our marketing spend, enhancing ARPU and improving our direct channel mix. The My Vodafone app and our digital marketing channels will, over time, become our main customer acquisition and management platform.
We will also be able to meet any customer request through automated, digital support – for example, by using chatbots and digital agents that utilise rapidly developing artificial intelligence technologies, developed and shared on a Group-wide basis.
Digital technology management We will rapidly install new “middleware” on top of our legacy IT systems. This “Digital eXperience Layer” will accelerate the deployment of new digital capabilities, de-coupling them from the longer and financially costly upgrade cycles for our legacy billing and other systems. In addition, real-time data analytics will enable even smarter network planning and deployment, as well as more precise ROI-based investment decisions.
Together with the ongoing effort to migrate 65% of our IT applications to the cloud, we aim to achieve significant capex and opex efficiencies, allowing us to re-invest based on customers’ actual and predicted profitability.
Digital operations We see substantial scope for digitalisation to accelerate the simplification and automation of standard processes, in both operational and support areas. These include IT and network operations, customer management back office functions and all other administrative activities. We have already established an automation unit and we have made good progress with over 200 bots active in our Shared Service Centres.
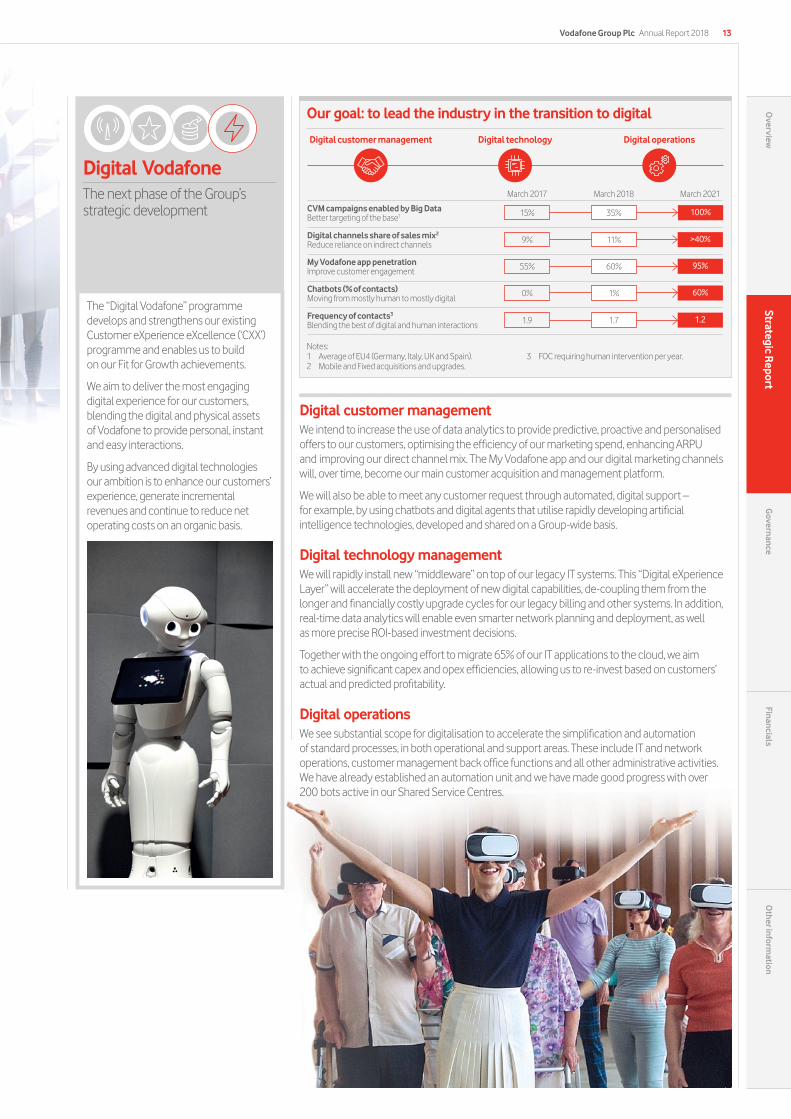
Digital Vodafone The next phase of the Group’s strategic development
The “Digital Vodafone” programme develops and strengthens our existing Customer eXperience eXcellence (‘CXX’) programme and enables us to build on our Fit for Growth achievements.
We aim to deliver the most engaging digital experience for our customers, blending the digital and physical assets of Vodafone to provide personal, instant and easy interactions.
By using advanced digital technologies our ambition is to enhance our customers’ experience, generate incremental revenues and continue to reduce net operating costs on an organic basis.
Vodafone Group Plc Annual Report 2018 13O
verviewStrategic R
eportG
overnanceFinancials
Other inform
ation
Our goal: to lead the industry in the transition to digital
Notes: 1 Average of EU4 (Germany, Italy, UK and Spain). 2 Mobile and Fixed acquisitions and upgrades.
3 FOC requiring human intervention per year.
Digital customer management Digital technology Digital operations
March 2017 March 2018 March 2021
CVM campaigns enabled by Big DataBetter targeting of the base1 15% 100%35%
Digital channels share of sales mix2
Reduce reliance on indirect channels 9% >40%11%
My Vodafone app penetrationImprove customer engagement 55% 95%60%
Chatbots (% of contacts)Moving from mostly human to mostly digital 0% 60%1%
Frequency of contacts3
Blending the best of digital and human interactions 1.9 1.21.7
Chief Executive’s strategic review
Building a digital leader in data communications
Review of the yearThis has been a year of robust commercial momentum and significant strategic progress, with a strong financial performance that exceeded our initial expectations for profitability and cash generation. Our customers enjoyed our best ever mobile network performance, and together with improvements in customer service and in the stability of our modernised IT and billing platforms, particularly in the UK, this contributed to our highest ever net promoter scores (‘NPS’) at year-end.
As I describe in more detail overleaf, our three “growth engines” performed well. Mobile data growth remains strong, up 63% year on year, and our “more-for-more” propositions helped to offset regulatory headwinds. We remained Europe’s fastest growing and leading challenger in broadband, adding 1.1 million households during the year, and also added 0.8 million converged customers, typically increasing ARPU and reducing churn. Meanwhile, our Enterprise business continued to outperform our peers thanks to the success of our world-leading IoT division, despite an overall declining market environment. We achieved all of this while lowering our net operating costs on an organic basis for the second year in a row, thanks to our Fit for Growth initiatives.
Network leadership: preparing for 5GThe substantial investments we made during Project Spring, supported by sustained ongoing capital expenditure, have allowed us to maintain our network leadership and co-leadership positions in mobile. In several markets – notably in Germany and Italy – the gap in performance between ourselves and the value players continued to widen, supporting a premium price differential.
We are optimistic about the long-term potential of 4.5G and 5G services, and we intend to invest in the upcoming 5G spectrum auctions over the next two years in order to maintain and optimise our spectrum position across all technologies.
We expect to deepen our 4.5G coverage and then launch 5G services in 2020, once handsets are widely available, as this will become the lowest cost option to add incremental capacity. We expect 5G investments to be funded from within our existing levels of capital expenditure.
Acquiring Liberty Global’s cable assets in Germany, Central and Eastern EuropeIn May 2018, we announced our intention to acquire Unitymedia in Germany, as well as the UPC cable assets in Central and Eastern Europe (‘CEE’), from Liberty Global for a total enterprise value of €18.4 billion. This transaction transforms Vodafone into Europe’s leading next generation infrastructure owner with 54 million on-net homes, out of a total NGN footprint of 114 million. In Germany we will become a converged national challenger, and in our predominately mobile-only markets in CEE we will significantly accelerate our convergence strategy. In total we will acquire gigabit capable networks passing 17.4 million marketable homes, including 11.0 million in Germany, with an attractive organic growth outlook given a speed advantage versus local incumbents and relatively low broadband penetration. In-market consolidation across the four countries is expected to create synergies with an NPV of over €7.5 billion, with run-rate cost and capex savings of €535 million by the fifth year post completion (before integration costs). The transaction is subject to regulatory approvals and is expected to close around the middle of calendar 2019.
Creating a new market leader in IndiaI am pleased with the progress we are making in securing regulatory approvals for the merger of Vodafone India with Idea Cellular, which is expected to close by the end of June, and we recently announced the appointment of a combined management team. Separately, in April 2018 we also announced the merger of Indus Towers with Bharti Infratel, creating India’s leading listed tower company in which we will own a significant liquid stake.
Customer eXperience eXcellence (‘CXX’) and Digital VodafoneOur efforts to deliver an outstanding customer experience, capitalising on our leading network quality, contributed to further gains in NPS across most of our markets during the year. In 17 out of 20 markets we now have a leading or co-leading consumer NPS score. Even more importantly, the NPS gap between ourselves and the third placed competitor (typically the value-players) is now 16 points.
During the year we decided to initiate a new strategic programme, “Digital Vodafone”, which will leverage on our earlier work with the CXX programme. We aim to transform our business model by delivering the most engaging digital experience for our customers; using advanced data analytics to improve all commercial and technology investment decisions; and automating key aspects of our operations. Our ambition is to generate incremental revenues and to further reduce net operating costs on an organic basis.
The programme is already being implemented across our largest operating businesses, where we are merging commercial and technology teams to achieve better and more efficient product and service development, at a lower cost than in the traditional “siloed” functional model. We are also insourcing critical digital skills, in order to reduce reliance on external developers and adopt more agile working processes, and we have strengthened our internal digital marketing platforms and units, to achieve a better return on our media investments.
This transformational programme will be the most important source of differentiation and efficiency gains for Vodafone in the coming years.
Chief Executive successionIt has been a privilege to spend 20 years of my life working at Vodafone, the last ten of which as Group CEO. The company has evolved from a collection of assets – mostly consumer mobile – and minorities, to a strong mobile and fixed infrastructure owner, with co-controlled JVs and a strong Enterprise business. I am highly confident that Nick Read and Margherita Della Valle, whom I have worked with extensively throughout this time, are the right choices to lead the company through this exciting next phase of convergence and digital transformation.
Vittorio ColaoChief Executive
Vodafone Group Plc Annual Report 201814
Strategic Report
Vodafone Group Plc Annual Report 2018 15O
verviewStrategic R
eportG
overnanceFinancials
Other inform
ation
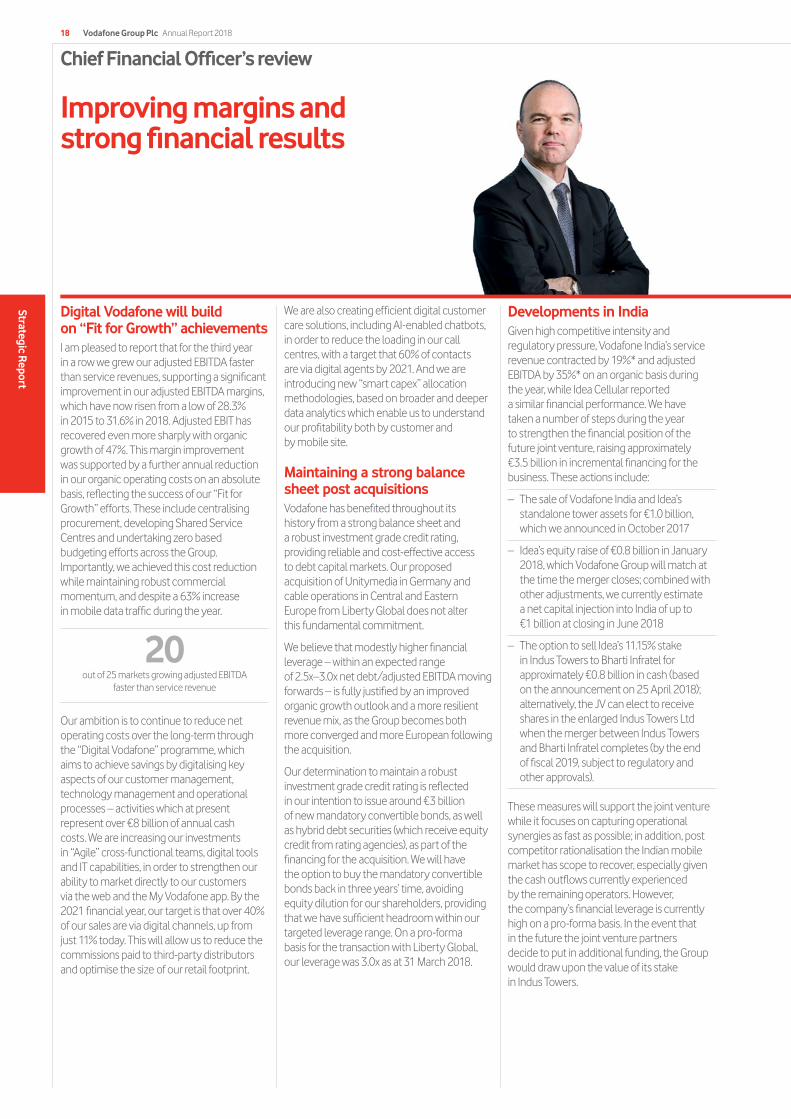
In November, we launched our new “V by Vodafone” consumer Internet of Things (IoT) business.
This enables customers to connect both Vodafone branded and third party electronics products to Vodafone’s leading international IoT network. These products can be easily managed using the “V by Vodafone” smartphone app, providing customers with a single overview of all IoT-enabled products registered to their account.
Customers pay a low-cost fixed monthly subscription for each “V-Sim”; initial products include the V-Auto, V-Camera, V-Pet, V-Bag and V-Home connected devices.
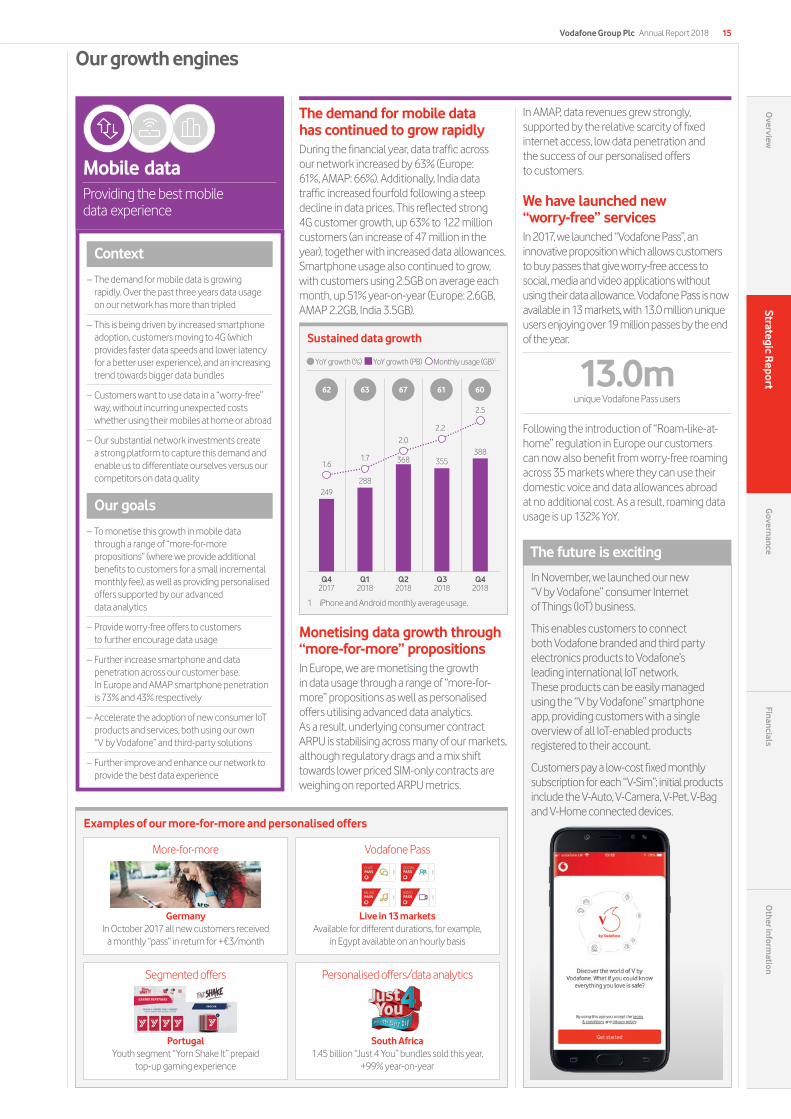
The demand for mobile data has continued to grow rapidlyDuring the financial year, data traffic across our network increased by 63% (Europe: 61%, AMAP: 66%). Additionally, India data traffic increased fourfold following a steep decline in data prices. This reflected strong 4G customer growth, up 63% to 122 million customers (an increase of 47 million in the year), together with increased data allowances. Smartphone usage also continued to grow, with customers using 2.5GB on average each month, up 51% year-on-year (Europe: 2.6GB, AMAP 2.2GB, India 3.5GB).
Monetising data growth through “more-for-more” propositionsIn Europe, we are monetising the growth in data usage through a range of “more-for-more” propositions as well as personalised offers utilising advanced data analytics. As a result, underlying consumer contract ARPU is stabilising across many of our markets, although regulatory drags and a mix shift towards lower priced SIM-only contracts are weighing on reported ARPU metrics.
13.0munique Vodafone Pass users
Mobile dataProviding the best mobile data experience
Context
– The demand for mobile data is growing rapidly. Over the past three years data usage on our network has more than tripled
– This is being driven by increased smartphone adoption, customers moving to 4G (which provides faster data speeds and lower latency for a better user experience), and an increasing trend towards bigger data bundles
– Customers want to use data in a “worry-free” way, without incurring unexpected costs whether using their mobiles at home or abroad
– Our substantial network investments create a strong platform to capture this demand and enable us to differentiate ourselves versus our competitors on data quality
Our goals
– To monetise this growth in mobile data through a range of “more-for-more propositions” (where we provide additional benefits to customers for a small incremental monthly fee), as well as providing personalised offers supported by our advanced data analytics
– Provide worry-free offers to customers to further encourage data usage
– Further increase smartphone and data penetration across our customer base. In Europe and AMAP smartphone penetration is 73% and 43% respectively
– Accelerate the adoption of new consumer IoT products and services, both using our own “V by Vodafone” and third-party solutions
– Further improve and enhance our network to provide the best data experience
Our growth engines
The future is exciting
In AMAP, data revenues grew strongly, supported by the relative scarcity of fixed internet access, low data penetration and the success of our personalised offers to customers.
We have launched new “worry-free” servicesIn 2017, we launched “Vodafone Pass”, an innovative proposition which allows customers to buy passes that give worry-free access to social, media and video applications without using their data allowance. Vodafone Pass is now available in 13 markets, with 13.0 million unique users enjoying over 19 million passes by the end of the year.
Following the introduction of “Roam-like-at-home” regulation in Europe our customers can now also benefit from worry-free roaming across 35 markets where they can use their domestic voice and data allowances abroad at no additional cost. As a result, roaming data usage is up 132% YoY.
Sustained data growth
Q4 2017
Q1 2018
Q2 2018
Q3 2018
Q4 2018
249288
368 355388
1.61.7
2.0
2.2
2.5
62 63 67 61 60
YoY growth (%) YoY growth (PB) Monthly usage (GB)1
1 iPhone and Android monthly average usage.
Examples of our more-for-more and personalised offers
Germany In October 2017 all new customers received
a monthly “pass” in return for +€3/month
Live in 13 markets Available for different durations, for example,
in Egypt available on an hourly basis
Portugal Youth segment “Yorn Shake It” prepaid
top-up gaming experience
South Africa 1.45 billion “Just 4 You” bundles sold this year,
+99% year-on-year
More-for-more
Segmented offers
Vodafone Pass
Personalised offers/data analytics
Vodafone Group Plc Annual Report 201816
Strategic Report
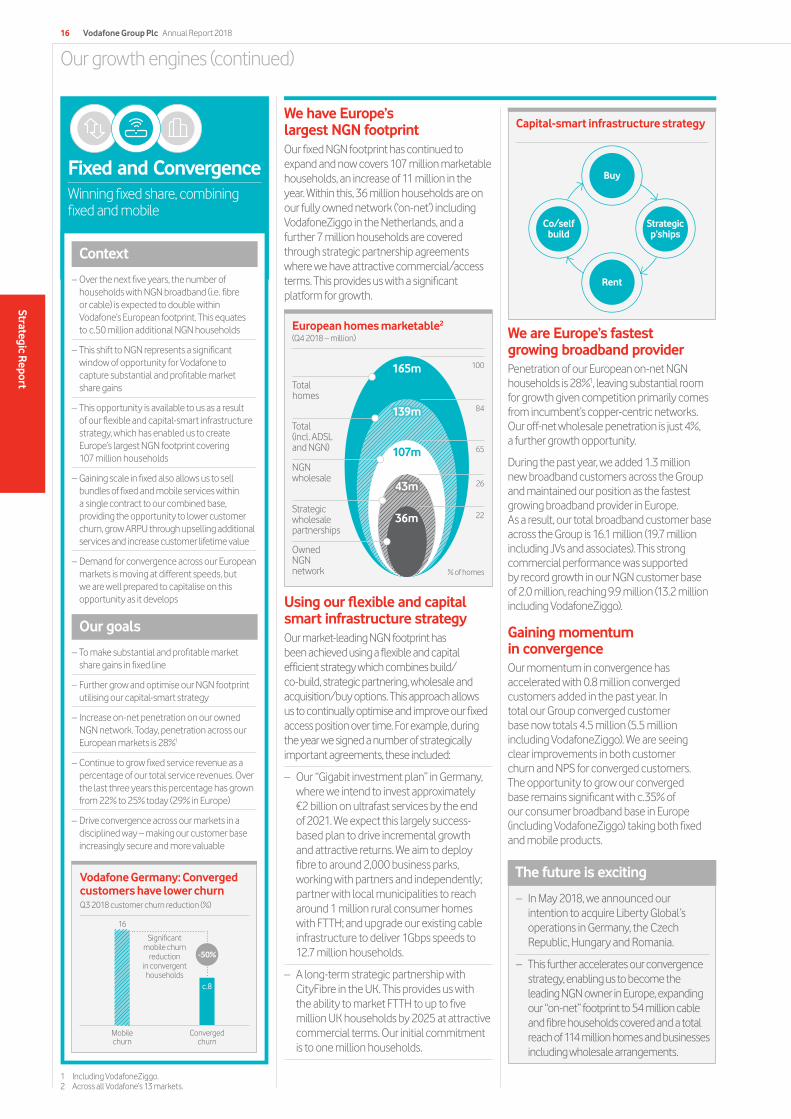
We have Europe’s largest NGN footprintOur fixed NGN footprint has continued to expand and now covers 107 million marketable households, an increase of 11 million in the year. Within this, 36 million households are on our fully owned network (‘on-net’) including VodafoneZiggo in the Netherlands, and a further 7 million households are covered through strategic partnership agreements where we have attractive commercial/access terms. This provides us with a significant platform for growth.
Using our flexible and capital smart infrastructure strategyOur market-leading NGN footprint has been achieved using a flexible and capital efficient strategy which combines build/co-build, strategic partnering, wholesale and acquisition/buy options. This approach allows us to continually optimise and improve our fixed access position over time. For example, during the year we signed a number of strategically important agreements, these included:
– Our “Gigabit investment plan” in Germany, where we intend to invest approximately €2 billion on ultrafast services by the end of 2021. We expect this largely success-based plan to drive incremental growth and attractive returns. We aim to deploy fibre to around 2,000 business parks, working with partners and independently; partner with local municipalities to reach around 1 million rural consumer homes with FTTH; and upgrade our existing cable infrastructure to deliver 1Gbps speeds to 12.7 million households.
– A long-term strategic partnership with CityFibre in the UK. This provides us with the ability to market FTTH to up to five million UK households by 2025 at attractive commercial terms. Our initial commitment is to one million households.
We are Europe’s fastest growing broadband providerPenetration of our European on-net NGN households is 28%1, leaving substantial room for growth given competition primarily comes from incumbent’s copper-centric networks. Our off-net wholesale penetration is just 4%, a further growth opportunity.
During the past year, we added 1.3 million new broadband customers across the Group and maintained our position as the fastest growing broadband provider in Europe. As a result, our total broadband customer base across the Group is 16.1 million (19.7 million including JVs and associates). This strong commercial performance was supported by record growth in our NGN customer base of 2.0 million, reaching 9.9 million (13.2 million including VodafoneZiggo).
Gaining momentum in convergenceOur momentum in convergence has accelerated with 0.8 million converged customers added in the past year. In total our Group converged customer base now totals 4.5 million (5.5 million including VodafoneZiggo). We are seeing clear improvements in both customer churn and NPS for converged customers. The opportunity to grow our converged base remains significant with c.35% of our consumer broadband base in Europe (including VodafoneZiggo) taking both fixed and mobile products.
Fixed and ConvergenceWinning fixed share, combining fixed and mobile
Context
– Over the next five years, the number of households with NGN broadband (i.e. fibre or cable) is expected to double within Vodafone’s European footprint. This equates to c.50 million additional NGN households
– This shift to NGN represents a significant window of opportunity for Vodafone to capture substantial and profitable market share gains
– This opportunity is available to us as a result of our flexible and capital-smart infrastructure strategy, which has enabled us to create Europe’s largest NGN footprint covering 107 million households
– Gaining scale in fixed also allows us to sell bundles of fixed and mobile services within a single contract to our combined base, providing the opportunity to lower customer churn, grow ARPU through upselling additional services and increase customer lifetime value
– Demand for convergence across our European markets is moving at different speeds, but we are well prepared to capitalise on this opportunity as it develops
Our goals
– To make substantial and profitable market share gains in fixed line
– Further grow and optimise our NGN footprint utilising our capital-smart strategy
– Increase on-net penetration on our owned NGN network. Today, penetration across our European markets is 28%1
– Continue to grow fixed service revenue as a percentage of our total service revenues. Over the last three years this percentage has grown from 22% to 25% today (29% in Europe)
– Drive convergence across our markets in a disciplined way – making our customer base increasingly secure and more valuable
European homes marketable2
(Q4 2018 – million)
100
84
65
26
22
Total homes
Total (incl. ADSL and NGN)
NGN wholesale
Strategic wholesale partnerships
Owned NGN network
165m
139m
107m
43m
36m
% of homes
Our growth engines (continued)
Capital-smart infrastructure strategy
Co/self build
Rent
Buy
Strategic p’ships
– In May 2018, we announced our intention to acquire Liberty Global’s operations in Germany, the Czech Republic, Hungary and Romania.
– This further accelerates our convergence strategy, enabling us to become the leading NGN owner in Europe, expanding our “on-net” footprint to 54 million cable and fibre households covered and a total reach of 114 million homes and businesses including wholesale arrangements.
The future is excitingVodafone Germany: Converged customers have lower churnQ3 2018 customer churn reduction (%)
1 Including VodafoneZiggo.2 Across all Vodafone’s 13 markets.
Mobile churn
16
Converged churn
Significant mobile churn
reduction in convergent households
-50%
c.8
We are also highly focused on our cost base and have implemented a multi-year margin improvement programme. This includes retiring expensive-to-run networks and services and migrating legacy customers to more profitable solutions. Through our own digital transformation programmes, we are also driving operational efficiencies by using Artificial Intelligence, machine learning and greater use of digital self-service tools.
ChallengesConsistent with the industry, we continue to experience downward pressure on mobile prices and ARPU, driven by aggressive competition and the consumerisation of Enterprise services, such as the Bring Your Own Device (‘BYOD’) trend. We are also reaching high smartphone penetration levels, and near ubiquitous availability of Wi-Fi that enables OTT operators to offer substitute services. For example, using WhatsApp to call when abroad instead of roaming on our network.
To off-set these challenges, we continue to develop value added services such as “Device Lifecycle Management” and new tariffs that monetise data.
Our Enterprise businessEnterprise is a key part of our business, representing 29% of Group service revenue. During the year, we continued to grow enterprise service revenue by 0.9%*, led by the success of our world-leading IoT platform, despite headwinds from roaming regulation in Europe. Excluding the impact of regulation, we grew service revenue by 2.1%* in the year.
Vodafone Group Plc Annual Report 2018 17O
verviewStrategic R
eportG
overnanceFinancials
Other inform
ation
EnterpriseConnecting the people, places and things that matter to businesses
What differentiates usWe have a unique global footprint that spans 25 countries where we own networks and have partner agreements in 47 countries. As a result, we have a cost advantage compared to nationally based competitors who are forced to wholesale at a higher cost in order to provide services outside of their home footprint. We are also able to provide global service level agreements (‘SLAs’) to multinational customers as we own all of our infrastructure.
Being a challenger in fixed line, we are not held back by either legacy infrastructure or the loss of fixed voice revenues and continue to gain market share. Additionally, the upcoming technology shift to Software Defined Networking enhances the opportunity for us to provide new fixed services.
Our business also continues to benefit from greater exposure to fast growing emerging markets, such as South Africa, Turkey and Egypt, which make up 17% of Enterprise service revenues.
Finally, we have a market-leading platform in the rapidly growing Internet of Things (‘IoT’) segment. This provides us with the benefits of owner economics, and the ability to control the platform’s development and deployment as customer demands evolve. We also provide not just connectivity but truly “end-to-end” IoT services. This year, we grew our IoT service revenue by 14%*, adding more than a million SIMs per month and scaled our services businesses in key verticals including automotive and financial services. In total, we now have 68 million SIMs on our network.
This differentiation is reflected in our market-leading NPS scores, where we are the leader or co-leader in 19 out of 20 countries.
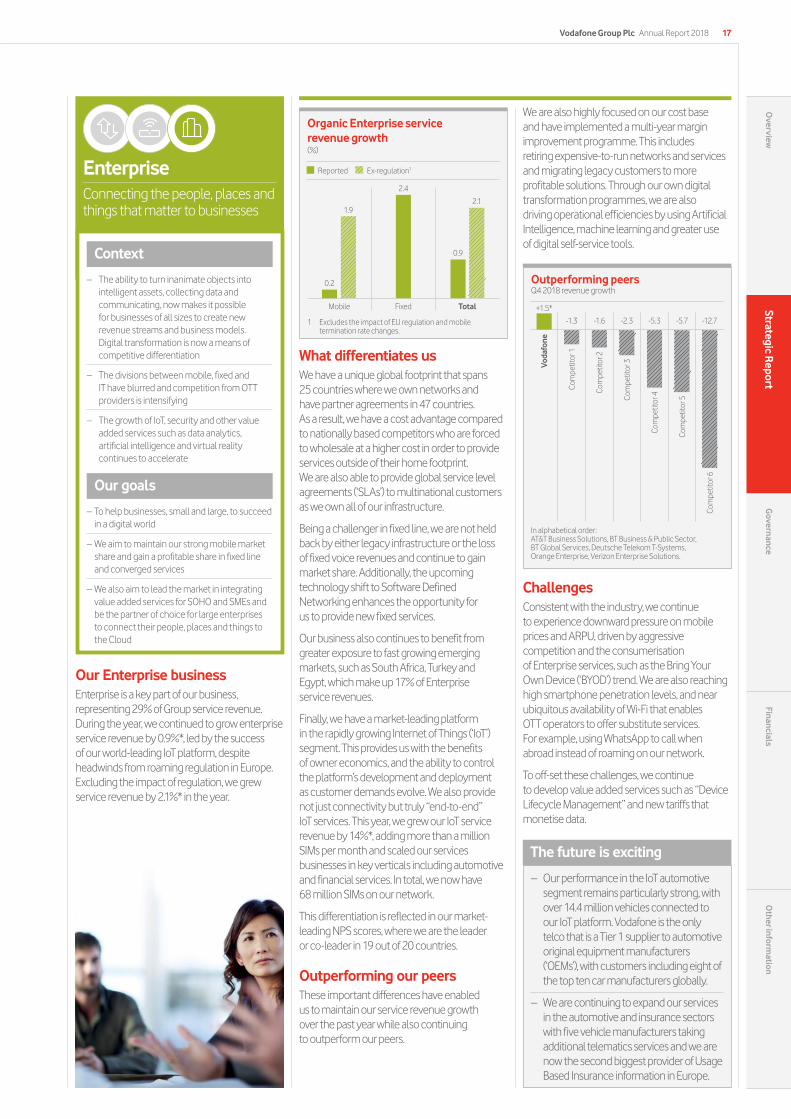
Outperforming our peersThese important differences have enabled us to maintain our service revenue growth over the past year while also continuing to outperform our peers.
Context
– The ability to turn inanimate objects into intelligent assets, collecting data and communicating, now makes it possible for businesses of all sizes to create new revenue streams and business models. Digital transformation is now a means of competitive differentiation
– The divisions between mobile, fixed and IT have blurred and competition from OTT providers is intensifying
– The growth of IoT, security and other value added services such as data analytics, artificial intelligence and virtual reality continues to accelerate
Our goals
– To help businesses, small and large, to succeed in a digital world
– We aim to maintain our strong mobile market share and gain a profitable share in fixed line and converged services
– We also aim to lead the market in integrating value added services for SOHO and SMEs and be the partner of choice for large enterprises to connect their people, places and things to the Cloud
Outperforming peersQ4 2018 revenue growth
Voda
fone
Com
petit
or 1
Com
petit
or 2
Com
petit
or 3
Com
petit
or 4
Com
petit
or 5
Com
petit
or 6
+1.5*
-1.3 -1.6 -2.3 -5.3 -5.7 -12.7
In alphabetical order: AT&T Business Solutions, BT Business & Public Sector, BT Global Services, Deutsche Telekom T-Systems, Orange Enterprise, Verizon Enterprise Solutions.
– Our performance in the IoT automotive segment remains particularly strong, with over 14.4 million vehicles connected to our IoT platform. Vodafone is the only telco that is a Tier 1 supplier to automotive original equipment manufacturers (‘OEMs’), with customers including eight of the top ten car manufacturers globally.
– We are continuing to expand our services in the automotive and insurance sectors with five vehicle manufacturers taking additional telematics services and we are now the second biggest provider of Usage Based Insurance information in Europe.
The future is exciting
Organic Enterprise service revenue growth(%)
Mobile Fixed Total
0.2
2.4
0.9
2.1
Reported Ex-regulation1
1 Excludes the impact of EU regulation and mobile termination rate changes.
1.9
Chief Financial Officer’s review
Improving margins and strong financial results
Digital Vodafone will build on “Fit for Growth” achievementsI am pleased to report that for the third year in a row we grew our adjusted EBITDA faster than service revenues, supporting a significant improvement in our adjusted EBITDA margins, which have now risen from a low of 28.3% in 2015 to 31.6% in 2018. Adjusted EBIT has recovered even more sharply with organic growth of 47%. This margin improvement was supported by a further annual reduction in our organic operating costs on an absolute basis, reflecting the success of our “Fit for Growth” efforts. These include centralising procurement, developing Shared Service Centres and undertaking zero based budgeting efforts across the Group. Importantly, we achieved this cost reduction while maintaining robust commercial momentum, and despite a 63% increase in mobile data traffic during the year.
Our ambition is to continue to reduce net operating costs over the long-term through the “Digital Vodafone” programme, which aims to achieve savings by digitalising key aspects of our customer management, technology management and operational processes – activities which at present represent over €8 billion of annual cash costs. We are increasing our investments in “Agile” cross-functional teams, digital tools and IT capabilities, in order to strengthen our ability to market directly to our customers via the web and the My Vodafone app. By the 2021 financial year, our target is that over 40% of our sales are via digital channels, up from just 11% today. This will allow us to reduce the commissions paid to third-party distributors and optimise the size of our retail footprint.
We are also creating efficient digital customer care solutions, including AI-enabled chatbots, in order to reduce the loading in our call centres, with a target that 60% of contacts are via digital agents by 2021. And we are introducing new “smart capex” allocation methodologies, based on broader and deeper data analytics which enable us to understand our profitability both by customer and by mobile site.
Maintaining a strong balance sheet post acquisitionsVodafone has benefited throughout its history from a strong balance sheet and a robust investment grade credit rating, providing reliable and cost-effective access to debt capital markets. Our proposed acquisition of Unitymedia in Germany and cable operations in Central and Eastern Europe from Liberty Global does not alter this fundamental commitment.
We believe that modestly higher financial leverage – within an expected range of 2.5x–3.0x net debt/adjusted EBITDA moving forwards – is fully justified by an improved organic growth outlook and a more resilient revenue mix, as the Group becomes both more converged and more European following the acquisition.
Our determination to maintain a robust investment grade credit rating is reflected in our intention to issue around €3 billion of new mandatory convertible bonds, as well as hybrid debt securities (which receive equity credit from rating agencies), as part of the financing for the acquisition. We will have the option to buy the mandatory convertible bonds back in three years’ time, avoiding equity dilution for our shareholders, providing that we have sufficient headroom within our targeted leverage range. On a pro-forma basis for the transaction with Liberty Global, our leverage was 3.0x as at 31 March 2018.
Developments in IndiaGiven high competitive intensity and regulatory pressure, Vodafone India’s service revenue contracted by 19%* and adjusted EBITDA by 35%* on an organic basis during the year, while Idea Cellular reported a similar financial performance. We have taken a number of steps during the year to strengthen the financial position of the future joint venture, raising approximately €3.5 billion in incremental financing for the business. These actions include:
– The sale of Vodafone India and Idea’s standalone tower assets for €1.0 billion, which we announced in October 2017
– Idea’s equity raise of €0.8 billion in January 2018, which Vodafone Group will match at the time the merger closes; combined with other adjustments, we currently estimate a net capital injection into India of up to €1 billion at closing in June 2018
– The option to sell Idea’s 11.15% stake in Indus Towers to Bharti Infratel for approximately €0.8 billion in cash (based on the announcement on 25 April 2018); alternatively, the JV can elect to receive shares in the enlarged Indus Towers Ltd when the merger between Indus Towers and Bharti Infratel completes (by the end of fiscal 2019, subject to regulatory and other approvals).
These measures will support the joint venture while it focuses on capturing operational synergies as fast as possible; in addition, post competitor rationalisation the Indian mobile market has scope to recover, especially given the cash outflows currently experienced by the remaining operators. However, the company’s financial leverage is currently high on a pro-forma basis. In the event that in the future the joint venture partners decide to put in additional funding, the Group would draw upon the value of its stake in Indus Towers.
20out of 25 markets growing adjusted EBITDA
faster than service revenue
Vodafone Group Plc Annual Report 201818
Strategic Report
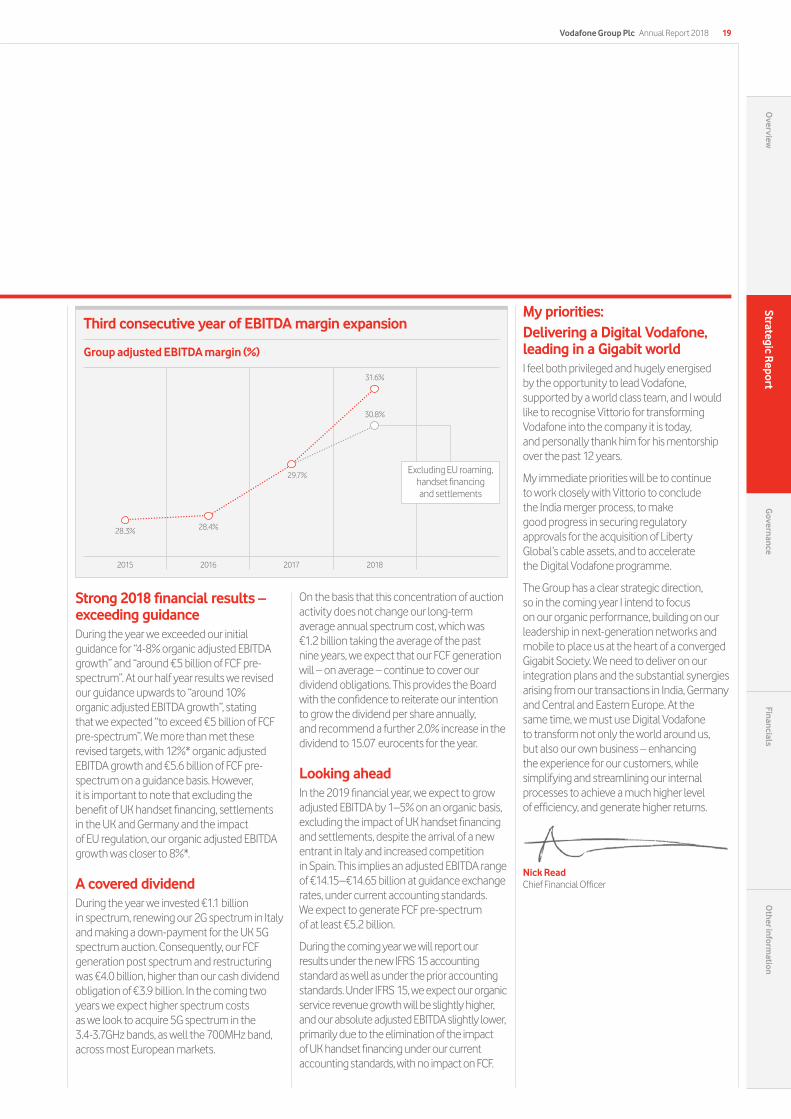
Strong 2018 financial results – exceeding guidanceDuring the year we exceeded our initial guidance for “4-8% organic adjusted EBITDA growth” and “around €5 billion of FCF pre-spectrum”. At our half year results we revised our guidance upwards to “around 10% organic adjusted EBITDA growth”, stating that we expected “to exceed €5 billion of FCF pre-spectrum”. We more than met these revised targets, with 12%* organic adjusted EBITDA growth and €5.6 billion of FCF pre-spectrum on a guidance basis. However, it is important to note that excluding the benefit of UK handset financing, settlements in the UK and Germany and the impact of EU regulation, our organic adjusted EBITDA growth was closer to 8%*.
A covered dividendDuring the year we invested €1.1 billion in spectrum, renewing our 2G spectrum in Italy and making a down-payment for the UK 5G spectrum auction. Consequently, our FCF generation post spectrum and restructuring was €4.0 billion, higher than our cash dividend obligation of €3.9 billion. In the coming two years we expect higher spectrum costs as we look to acquire 5G spectrum in the 3.4-3.7GHz bands, as well the 700MHz band, across most European markets.
On the basis that this concentration of auction activity does not change our long-term average annual spectrum cost, which was €1.2 billion taking the average of the past nine years, we expect that our FCF generation will – on average – continue to cover our dividend obligations. This provides the Board with the confidence to reiterate our intention to grow the dividend per share annually, and recommend a further 2.0% increase in the dividend to 15.07 eurocents for the year.
Looking aheadIn the 2019 financial year, we expect to grow adjusted EBITDA by 1–5% on an organic basis, excluding the impact of UK handset financing and settlements, despite the arrival of a new entrant in Italy and increased competition in Spain. This implies an adjusted EBITDA range of €14.15–€14.65 billion at guidance exchange rates, under current accounting standards. We expect to generate FCF pre-spectrum of at least €5.2 billion.
During the coming year we will report our results under the new IFRS 15 accounting standard as well as under the prior accounting standards. Under IFRS 15, we expect our organic service revenue growth will be slightly higher, and our absolute adjusted EBITDA slightly lower, primarily due to the elimination of the impact of UK handset financing under our current accounting standards, with no impact on FCF.
My priorities: Delivering a Digital Vodafone, leading in a Gigabit worldI feel both privileged and hugely energised by the opportunity to lead Vodafone, supported by a world class team, and I would like to recognise Vittorio for transforming Vodafone into the company it is today, and personally thank him for his mentorship over the past 12 years.
My immediate priorities will be to continue to work closely with Vittorio to conclude the India merger process, to make good progress in securing regulatory approvals for the acquisition of Liberty Global’s cable assets, and to accelerate the Digital Vodafone programme.
The Group has a clear strategic direction, so in the coming year I intend to focus on our organic performance, building on our leadership in next-generation networks and mobile to place us at the heart of a converged Gigabit Society. We need to deliver on our integration plans and the substantial synergies arising from our transactions in India, Germany and Central and Eastern Europe. At the same time, we must use Digital Vodafone to transform not only the world around us, but also our own business – enhancing the experience for our customers, while simplifying and streamlining our internal processes to achieve a much higher level of efficiency, and generate higher returns.
Nick ReadChief Financial Officer
Vodafone Group Plc Annual Report 2018 19O
verviewStrategic R
eportG
overnanceFinancials
Other inform
ation
Third consecutive year of EBITDA margin expansion
Group adjusted EBITDA margin (%)
2015 2016 2017 2018
31.6%
30.8%
29.7%
28.4%28.3%
Excluding EU roaming, handset financing and settlements
Growth engines
Core programmes
Notes:1 Includes Netherlands.2 Includes India.3 Excludes Qatar.4 Excluding the impact of a German legal settlement.
Service revenue, fixed revenue, enterprise service revenue, IoT revenue, adjusted EBITDA, adjusted EBITDA margin, free cash flow (pre-spectrum) and organic growth are alternative performance measures. See “Alternative performance measures” on page 207 for further details and reconciliations to the respective closest equivalent GAAP measure.
Fit for Growth Grow adjusted EBITDA faster than service revenue, improving margins out of 25 markets
Customer eXperience eXcellence (‘CXX’) Consumer mobile net promoter score1,2
number of markets with NPS leadership or co-leadership, out of 20 markets
Network leadership Mobile data growth and network quality
Key performance indicators
Monitoring progress and performanceWe measure our success by tracking key performance indicators that reflect our strategic, operational and financial progress and performance.
These drive internal management of the business and our remuneration.
Changes to KPIs this yearWe have updated some of our KPIs to more accurately reflect our progress and performance.
New KPIs
– Mobile data growth and network quality
– Average smartphone data usage per customer in Europe
– IoT SIM growth
KPIs removed
– 4G coverage
Paying for performanceThe incentive plans used to reward the performance of our Directors and our senior managers, with some local variances, include measures linked to our KPIs. These KPIs continued to show improvement, and as a result this year’s Group annual bonus was higher than last years as overall performance was ahead of our internal targets.
We use NPS to measure the extent to which our customers would recommend us to friends and family. Our goal is to be NPS leader in all of our markets.
2018 173
2017 19
2016 13
More work to do
The number of markets growing organic adjusted EBITDA faster than service revenue.
2018 20
2017 17
2016 15
Achieved
Mobile data 4G customers1,2
million
To monetise our network investments, we aim to migrate and attract new customers on to our 4G network. We have continued to significantly grow our 4G customer base and as a result data usage on our network has increased by 63% over the last year.
2018 121.7
2017 74.7
2016 46.8
Achieved
Enterprise: Fixed as a percentage of enterprise service revenue%
Our core European mobile business continued to face ARPU pressure in mobile reflecting ongoing price competition. As a result, we are seeking to diversify into fixed and enterprise related services to offset this pressure.
2018 30
2017 29
2016 28
Achieved
The growth of Group data traffic over our network and proportion of data sessions delivered at high-definition (HD) quality (i.e. exceeds 3 Mbps).
Achieved
201863
91
201765
90
201674
89
% data growth % of data sessions >3 Mbps (iPhone & Android only)
Fixed and Convergence Fixed broadband and converged consumer customers1,2
million
We aim to rapidly grow our fixed broadband customer base through market share gains, and drive convergence across our fixed and mobile customer base. During the year we added 1.3 million broadband customers, and maintained our position as the fastest growing broadband provider in Europe, taking our total customer base to 19.7 million (including JVs and associates). We also added 0.8 million converged customers in the year, taking our overall total base to 5.5 million (including VodafoneZiggo).
2018
2017 18.0
2016 13.4
of which, consumer converged customers
Achieved
19.75.5
3.8
3.1
Vodafone Group Plc Annual Report 201820
Strategic Report
70 Read more on rewards and performance in the Remuneration Report
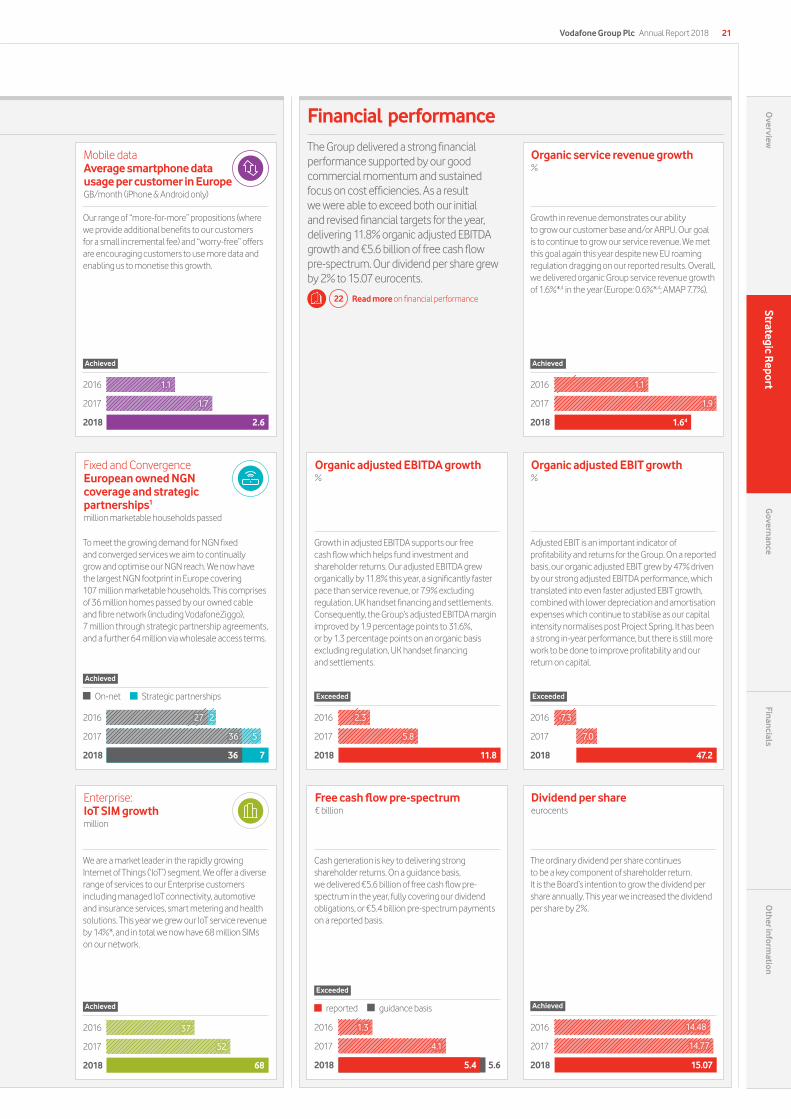
Growth engines Financial performanceThe Group delivered a strong financial performance supported by our good commercial momentum and sustained focus on cost efficiencies. As a result we were able to exceed both our initial and revised financial targets for the year, delivering 11.8% organic adjusted EBITDA growth and €5.6 billion of free cash flow pre-spectrum. Our dividend per share grew by 2% to 15.07 eurocents.
22 Read more on financial performance
Mobile data Average smartphone data usage per customer in EuropeGB/month (iPhone & Android only)
Our range of “more-for-more” propositions (where we provide additional benefits to our customers for a small incremental fee) and “worry-free” offers are encouraging customers to use more data and enabling us to monetise this growth.
2018 2.6
2017
2016 1.1
Achieved
Enterprise: IoT SIM growthmillion
We are a market leader in the rapidly growing Internet of Things (‘IoT’) segment. We offer a diverse range of services to our Enterprise customers including managed IoT connectivity, automotive and insurance services, smart metering and health solutions. This year we grew our IoT service revenue by 14%*, and in total we now have 68 million SIMs on our network.
2018
2017 52
2016 37
Achieved
Organic service revenue growth%
Growth in revenue demonstrates our ability to grow our customer base and/or ARPU. Our goal is to continue to grow our service revenue. We met this goal again this year despite new EU roaming regulation dragging on our reported results. Overall, we delivered organic Group service revenue growth of 1.6%*,4 in the year (Europe: 0.6%*,4; AMAP 7.7%).
2018 1.64
2017 1.9
2016 1.1
Achieved
Organic adjusted EBITDA growth%
Growth in adjusted EBITDA supports our free cash flow which helps fund investment and shareholder returns. Our adjusted EBITDA grew organically by 11.8% this year, a significantly faster pace than service revenue, or 7.9% excluding regulation, UK handset financing and settlements. Consequently, the Group’s adjusted EBITDA margin improved by 1.9 percentage points to 31.6%, or by 1.3 percentage points on an organic basis excluding regulation, UK handset financing and settlements.
2018 11.8
2017 5.8
2016 2.3
Exceeded
Organic adjusted EBIT growth%
Adjusted EBIT is an important indicator of profitability and returns for the Group. On a reported basis, our organic adjusted EBIT grew by 47% driven by our strong adjusted EBITDA performance, which translated into even faster adjusted EBIT growth, combined with lower depreciation and amortisation expenses which continue to stabilise as our capital intensity normalises post Project Spring. It has been a strong in-year performance, but there is still more work to be done to improve profitability and our return on capital.
2018 47.2
2017 7.0
2016 -7.3
Exceeded
Free cash flow pre-spectrum€ billion
Cash generation is key to delivering strong shareholder returns. On a guidance basis, we delivered €5.6 billion of free cash flow pre-spectrum in the year, fully covering our dividend obligations, or €5.4 billion pre-spectrum payments on a reported basis.
2018 5.4 5.6
2017 4.1
2016 1.3
reported guidance basis
Exceeded
Dividend per shareeurocents
The ordinary dividend per share continues to be a key component of shareholder return. It is the Board’s intention to grow the dividend per share annually. This year we increased the dividend per share by 2%.
2018 15.07
2017 14.77
2016 14.48
Achieved
Fixed and Convergence European owned NGN coverage and strategic partnerships1
million marketable households passed
To meet the growing demand for NGN fixed and converged services we aim to continually grow and optimise our NGN reach. We now have the largest NGN footprint in Europe covering 107 million marketable households. This comprises of 36 million homes passed by our owned cable and fibre network (including VodafoneZiggo), 7 million through strategic partnership agreements, and a further 64 million via wholesale access terms.
2018 7
2017 5
2016 2
On-net Strategic partnerships
Achieved
36
36
27
1.7
68
Vodafone Group Plc Annual Report 2018 21O
verviewStrategic R
eportG
overnanceFinancials
Other inform
ation
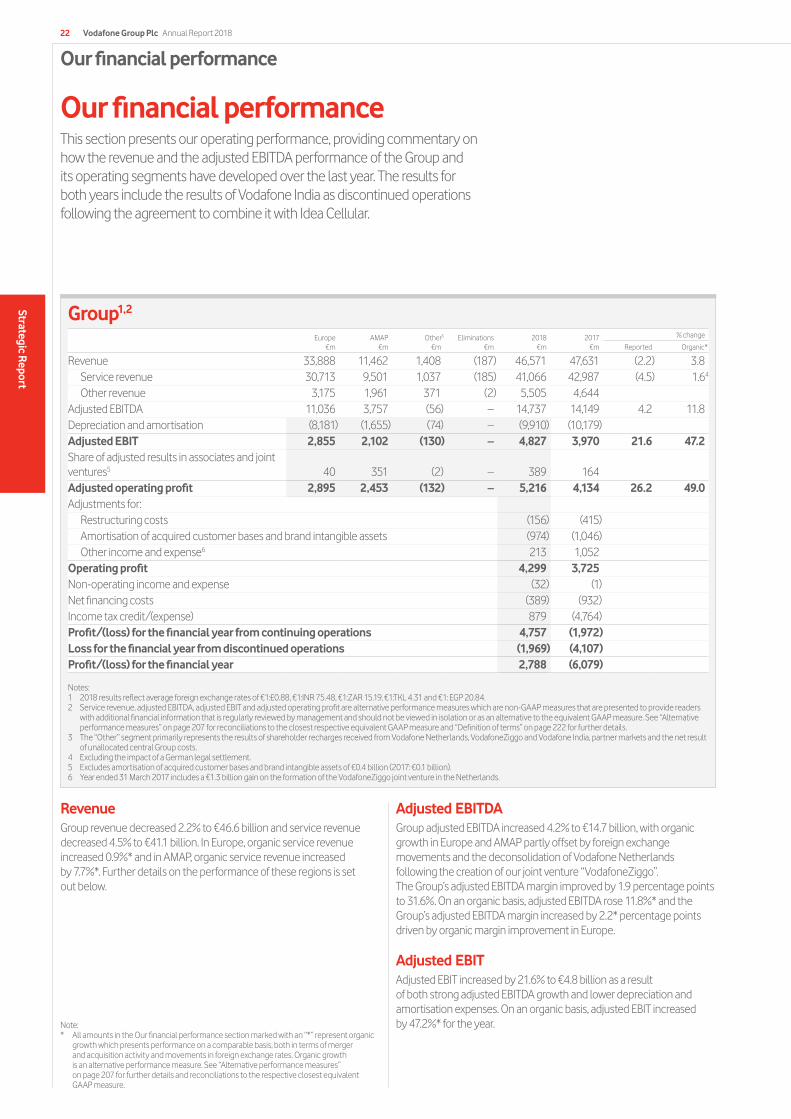
Our financial performance
Group1,2
Europe€m
AMAP€m
Other3
€mEliminations
€m2018
€m2017
€m
% change
Reported Organic*
Revenue 33,888 11,462 1,408 (187) 46,571 47,631 (2.2) 3.8 Service revenue 30,713 9,501 1,037 (185) 41,066 42,987 (4.5) 1.64 Other revenue 3,175 1,961 371 (2) 5,505 4,644
Adjusted EBITDA 11,036 3,757 (56) – 14,737 14,149 4.2 11.8 Depreciation and amortisation (8,181) (1,655) (74) – (9,910) (10,179)Adjusted EBIT 2,855 2,102 (130) – 4,827 3,970 21.6 47.2 Share of adjusted results in associates and joint ventures5 40 351 (2) – 389 164Adjusted operating profit 2,895 2,453 (132) – 5,216 4,134 26.2 49.0 Adjustments for:
Restructuring costs (156) (415)Amortisation of acquired customer bases and brand intangible assets (974) (1,046)Other income and expense6 213 1,052
Operating profit 4,299 3,725 Non-operating income and expense (32) (1) Net financing costs (389) (932) Income tax credit/(expense) 879 (4,764) Profit/(loss) for the financial year from continuing operations 4,757 (1,972) Loss for the financial year from discontinued operations (1,969) (4,107) Profit/(loss) for the financial year 2,788 (6,079)
Notes:1 2018 results reflect average foreign exchange rates of €1:£0.88, €1:INR 75.48, €1:ZAR 15.19, €1:TKL 4.31 and €1: EGP 20.84.2 Service revenue, adjusted EBITDA, adjusted EBIT and adjusted operating profit are alternative performance measures which are non-GAAP measures that are presented to provide readers
with additional financial information that is regularly reviewed by management and should not be viewed in isolation or as an alternative to the equivalent GAAP measure. See “Alternative performance measures” on page 207 for reconciliations to the closest respective equivalent GAAP measure and “Definition of terms” on page 222 for further details.
3 The “Other” segment primarily represents the results of shareholder recharges received from Vodafone Netherlands, VodafoneZiggo and Vodafone India, partner markets and the net result of unallocated central Group costs.
4 Excluding the impact of a German legal settlement.5 Excludes amortisation of acquired customer bases and brand intangible assets of €0.4 billion (2017: €0.1 billion).6 Year ended 31 March 2017 includes a €1.3 billion gain on the formation of the VodafoneZiggo joint venture in the Netherlands.
Our financial performanceThis section presents our operating performance, providing commentary on how the revenue and the adjusted EBITDA performance of the Group and its operating segments have developed over the last year. The results for both years include the results of Vodafone India as discontinued operations following the agreement to combine it with Idea Cellular.
RevenueGroup revenue decreased 2.2% to €46.6 billion and service revenue decreased 4.5% to €41.1 billion. In Europe, organic service revenue increased 0.9%* and in AMAP, organic service revenue increased by 7.7%*. Further details on the performance of these regions is set out below.
Adjusted EBITDAGroup adjusted EBITDA increased 4.2% to €14.7 billion, with organic growth in Europe and AMAP partly offset by foreign exchange movements and the deconsolidation of Vodafone Netherlands following the creation of our joint venture “VodafoneZiggo”. The Group’s adjusted EBITDA margin improved by 1.9 percentage points to 31.6%. On an organic basis, adjusted EBITDA rose 11.8%* and the Group’s adjusted EBITDA margin increased by 2.2* percentage points driven by organic margin improvement in Europe.
Adjusted EBITAdjusted EBIT increased by 21.6% to €4.8 billion as a result of both strong adjusted EBITDA growth and lower depreciation and amortisation expenses. On an organic basis, adjusted EBIT increased by 47.2%* for the year. Note:
* All amounts in the Our financial performance section marked with an “*” represent organic growth which presents performance on a comparable basis, both in terms of merger and acquisition activity and movements in foreign exchange rates. Organic growth is an alternative performance measure. See “Alternative performance measures” on page 207 for further details and reconciliations to the respective closest equivalent GAAP measure.
Vodafone Group Plc Annual Report 201822
Strategic Report
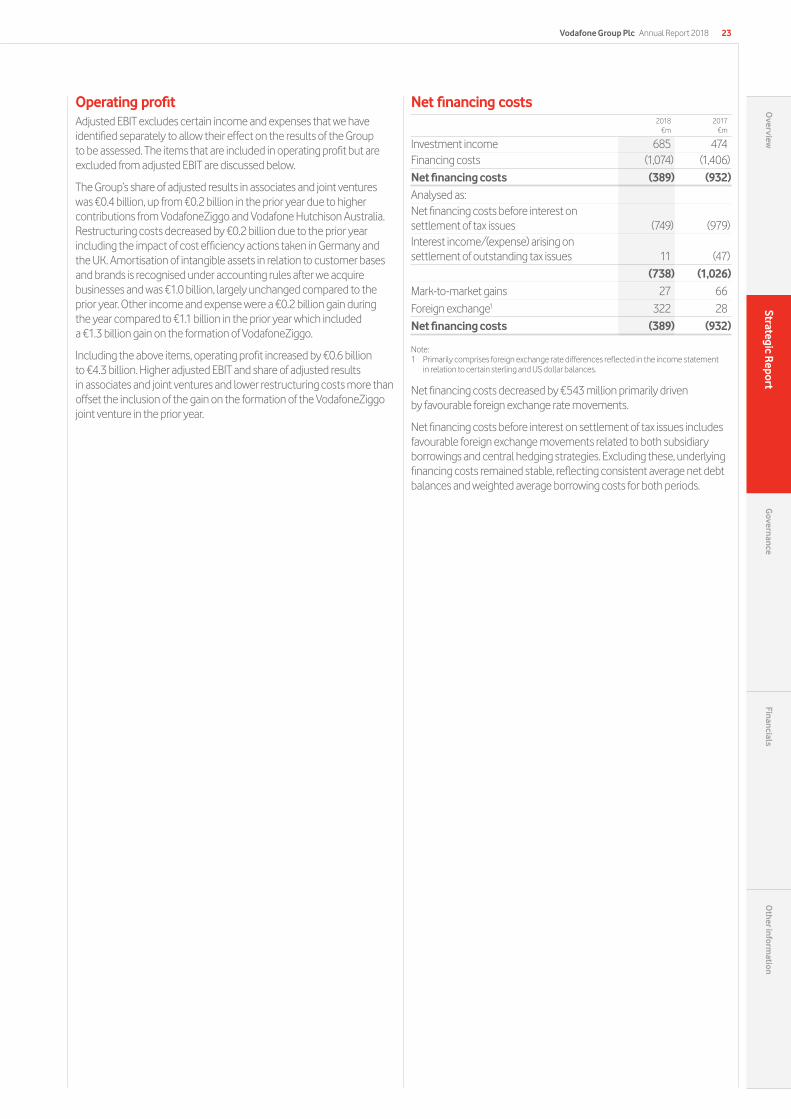
Operating profitAdjusted EBIT excludes certain income and expenses that we have identified separately to allow their effect on the results of the Group to be assessed. The items that are included in operating profit but are excluded from adjusted EBIT are discussed below.
The Group’s share of adjusted results in associates and joint ventures was €0.4 billion, up from €0.2 billion in the prior year due to higher contributions from VodafoneZiggo and Vodafone Hutchison Australia. Restructuring costs decreased by €0.2 billion due to the prior year including the impact of cost efficiency actions taken in Germany and the UK. Amortisation of intangible assets in relation to customer bases and brands is recognised under accounting rules after we acquire businesses and was €1.0 billion, largely unchanged compared to the prior year. Other income and expense were a €0.2 billion gain during the year compared to €1.1 billion in the prior year which included a €1.3 billion gain on the formation of VodafoneZiggo.
Including the above items, operating profit increased by €0.6 billion to €4.3 billion. Higher adjusted EBIT and share of adjusted results in associates and joint ventures and lower restructuring costs more than offset the inclusion of the gain on the formation of the VodafoneZiggo joint venture in the prior year.
Net financing costs
2018
€m 2017
€m
Investment income 685 474 Financing costs (1,074) (1,406)Net financing costs (389) (932)Analysed as:Net financing costs before interest on settlement of tax issues (749) (979)Interest income/(expense) arising on settlement of outstanding tax issues 11 (47)
(738) (1,026)Mark-to-market gains 27 66Foreign exchange1 322 28Net financing costs (389) (932)
Note:1 Primarily comprises foreign exchange rate differences reflected in the income statement
in relation to certain sterling and US dollar balances.
Net financing costs decreased by €543 million primarily driven by favourable foreign exchange rate movements.
Net financing costs before interest on settlement of tax issues includes favourable foreign exchange movements related to both subsidiary borrowings and central hedging strategies. Excluding these, underlying financing costs remained stable, reflecting consistent average net debt balances and weighted average borrowing costs for both periods.
Vodafone Group Plc Annual Report 2018 23O
verviewStrategic R
eportG
overnanceFinancials
Other inform
ation
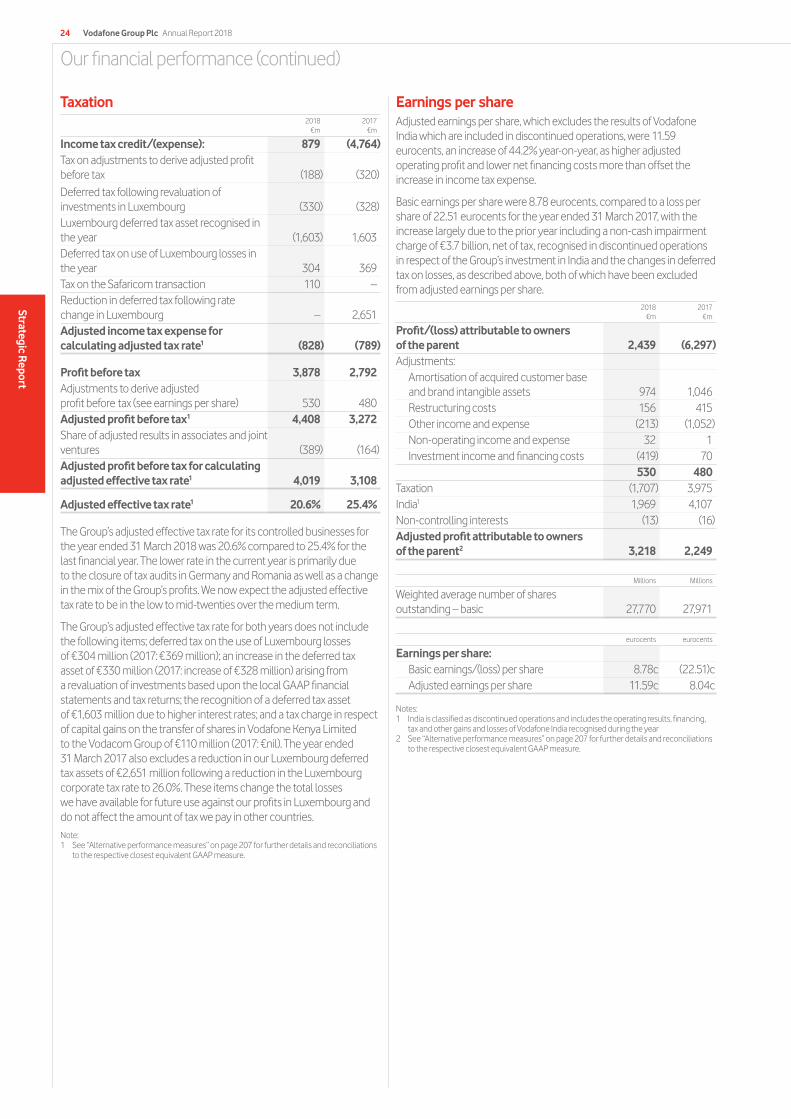
Our financial performance (continued)
Taxation
2018
€m2017
€m
Income tax credit/(expense): 879 (4,764) Tax on adjustments to derive adjusted profit before tax (188) (320) Deferred tax following revaluation of investments in Luxembourg (330) (328) Luxembourg deferred tax asset recognised in the year (1,603) 1,603 Deferred tax on use of Luxembourg losses in the year 304 369 Tax on the Safaricom transaction 110 –Reduction in deferred tax following rate change in Luxembourg – 2,651Adjusted income tax expense for calculating adjusted tax rate1 (828) (789)
Profit before tax 3,878 2,792 Adjustments to derive adjusted profit before tax (see earnings per share) 530 480 Adjusted profit before tax1 4,408 3,272 Share of adjusted results in associates and joint ventures (389) (164)Adjusted profit before tax for calculating adjusted effective tax rate1 4,019 3,108
Adjusted effective tax rate1 20.6% 25.4%
The Group’s adjusted effective tax rate for its controlled businesses for the year ended 31 March 2018 was 20.6% compared to 25.4% for the last financial year. The lower rate in the current year is primarily due to the closure of tax audits in Germany and Romania as well as a change in the mix of the Group’s profits. We now expect the adjusted effective tax rate to be in the low to mid-twenties over the medium term.
The Group’s adjusted effective tax rate for both years does not include the following items; deferred tax on the use of Luxembourg losses of €304 million (2017: €369 million); an increase in the deferred tax asset of €330 million (2017: increase of €328 million) arising from a revaluation of investments based upon the local GAAP financial statements and tax returns; the recognition of a deferred tax asset of €1,603 million due to higher interest rates; and a tax charge in respect of capital gains on the transfer of shares in Vodafone Kenya Limited to the Vodacom Group of €110 million (2017: €nil). The year ended 31 March 2017 also excludes a reduction in our Luxembourg deferred tax assets of €2,651 million following a reduction in the Luxembourg corporate tax rate to 26.0%. These items change the total losses we have available for future use against our profits in Luxembourg and do not affect the amount of tax we pay in other countries.Note:1 See “Alternative performance measures” on page 207 for further details and reconciliations
to the respective closest equivalent GAAP measure.
Earnings per shareAdjusted earnings per share, which excludes the results of Vodafone India which are included in discontinued operations, were 11.59 eurocents, an increase of 44.2% year-on-year, as higher adjusted operating profit and lower net financing costs more than offset the increase in income tax expense.
Basic earnings per share were 8.78 eurocents, compared to a loss per share of 22.51 eurocents for the year ended 31 March 2017, with the increase largely due to the prior year including a non-cash impairment charge of €3.7 billion, net of tax, recognised in discontinued operations in respect of the Group’s investment in India and the changes in deferred tax on losses, as described above, both of which have been excluded from adjusted earnings per share.
2018
€m2017
€m
Profit/(loss) attributable to owners of the parent 2,439 (6,297)Adjustments:
Amortisation of acquired customer base and brand intangible assets 974 1,046 Restructuring costs 156 415 Other income and expense (213) (1,052)Non-operating income and expense 32 1 Investment income and financing costs (419) 70
530 480 Taxation (1,707) 3,975 India1 1,969 4,107 Non-controlling interests (13) (16)Adjusted profit attributable to owners of the parent2 3,218 2,249
Millions Millions
Weighted average number of shares outstanding – basic 27,770 27,971
eurocents eurocents
Earnings per share:Basic earnings/(loss) per share 8.78c (22.51)cAdjusted earnings per share 11.59c 8.04c
Notes:1 India is classified as discontinued operations and includes the operating results, financing,
tax and other gains and losses of Vodafone India recognised during the year 2 See “Alternative performance measures” on page 207 for further details and reconciliations
to the respective closest equivalent GAAP measure.
Vodafone Group Plc Annual Report 201824
Strategic Report
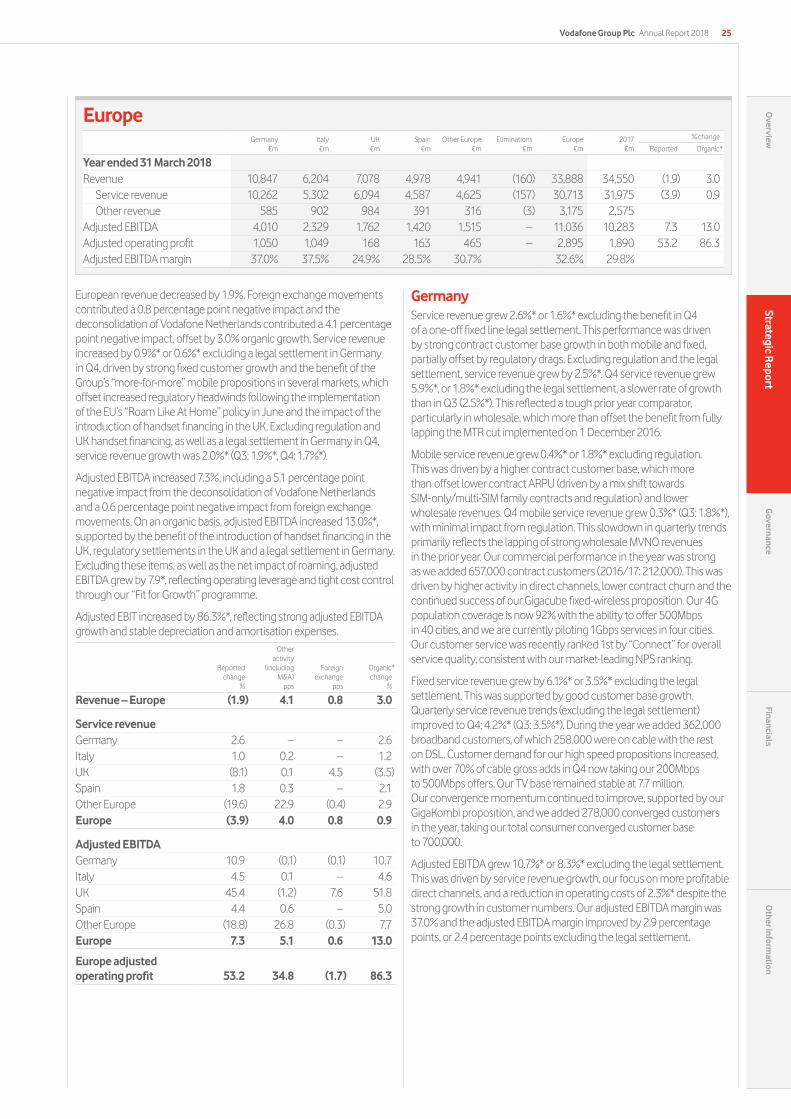
EuropeGermany
€mItaly€m
UK€m
Spain€m
Other Europe€m
Eliminations€m
Europe€m
2017€m
% change
Reported Organic*
Year ended 31 March 2018Revenue 10,847 6,204 7,078 4,978 4,941 (160) 33,888 34,550 (1.9) 3.0
Service revenue 10,262 5,302 6,094 4,587 4,625 (157) 30,713 31,975 (3.9) 0.9 Other revenue 585 902 984 391 316 (3) 3,175 2,575
Adjusted EBITDA 4,010 2,329 1,762 1,420 1,515 – 11,036 10,283 7.3 13.0 Adjusted operating profit 1,050 1,049 168 163 465 – 2,895 1,890 53.2 86.3 Adjusted EBITDA margin 37.0% 37.5% 24.9% 28.5% 30.7% 32.6% 29.8%
European revenue decreased by 1.9%. Foreign exchange movements contributed a 0.8 percentage point negative impact and the deconsolidation of Vodafone Netherlands contributed a 4.1 percentage point negative impact, offset by 3.0% organic growth. Service revenue increased by 0.9%* or 0.6%* excluding a legal settlement in Germany in Q4, driven by strong fixed customer growth and the benefit of the Group’s “more-for-more” mobile propositions in several markets, which offset increased regulatory headwinds following the implementation of the EU’s “Roam Like At Home” policy in June and the impact of the introduction of handset financing in the UK. Excluding regulation and UK handset financing, as well as a legal settlement in Germany in Q4, service revenue growth was 2.0%* (Q3: 1.9%*, Q4: 1.7%*).
Adjusted EBITDA increased 7.3%, including a 5.1 percentage point negative impact from the deconsolidation of Vodafone Netherlands and a 0.6 percentage point negative impact from foreign exchange movements. On an organic basis, adjusted EBITDA increased 13.0%*, supported by the benefit of the introduction of handset financing in the UK, regulatory settlements in the UK and a legal settlement in Germany. Excluding these items, as well as the net impact of roaming, adjusted EBITDA grew by 7.9*, reflecting operating leverage and tight cost control through our “Fit for Growth” programme.
Adjusted EBIT increased by 86.3%*, reflecting strong adjusted EBITDA growth and stable depreciation and amortisation expenses.
Reported change
%
Other activity
(including M&A)
pps
Foreign exchange
pps
Organic*change
%
Revenue – Europe (1.9) 4.1 0.8 3.0
Service revenueGermany 2.6 – – 2.6 Italy 1.0 0.2 – 1.2 UK (8.1) 0.1 4.5 (3.5)Spain 1.8 0.3 – 2.1 Other Europe (19.6) 22.9 (0.4) 2.9 Europe (3.9) 4.0 0.8 0.9
Adjusted EBITDAGermany 10.9 (0.1) (0.1) 10.7 Italy 4.5 0.1 – 4.6 UK 45.4 (1.2) 7.6 51.8 Spain 4.4 0.6 – 5.0 Other Europe (18.8) 26.8 (0.3) 7.7 Europe 7.3 5.1 0.6 13.0
Europe adjusted operating profit 53.2 34.8 (1.7) 86.3
GermanyService revenue grew 2.6%* or 1.6%* excluding the benefit in Q4 of a one-off fixed line legal settlement. This performance was driven by strong contract customer base growth in both mobile and fixed, partially offset by regulatory drags. Excluding regulation and the legal settlement, service revenue grew by 2.5%*. Q4 service revenue grew 5.9%*, or 1.8%* excluding the legal settlement, a slower rate of growth than in Q3 (2.5%*). This reflected a tough prior year comparator, particularly in wholesale, which more than offset the benefit from fully lapping the MTR cut implemented on 1 December 2016.
Mobile service revenue grew 0.4%* or 1.8%* excluding regulation. This was driven by a higher contract customer base, which more than offset lower contract ARPU (driven by a mix shift towards SIM-only/multi-SIM family contracts and regulation) and lower wholesale revenues. Q4 mobile service revenue grew 0.3%* (Q3: 1.8%*), with minimal impact from regulation. This slowdown in quarterly trends primarily reflects the lapping of strong wholesale MVNO revenues in the prior year. Our commercial performance in the year was strong as we added 657,000 contract customers (2016/17: 212,000). This was driven by higher activity in direct channels, lower contract churn and the continued success of our Gigacube fixed-wireless proposition. Our 4G population coverage is now 92% with the ability to offer 500Mbps in 40 cities, and we are currently piloting 1Gbps services in four cities. Our customer service was recently ranked 1st by “Connect” for overall service quality, consistent with our market-leading NPS ranking.
Fixed service revenue grew by 6.1%* or 3.5%* excluding the legal settlement. This was supported by good customer base growth. Quarterly service revenue trends (excluding the legal settlement) improved to Q4: 4.2%* (Q3: 3.5%*). During the year we added 362,000 broadband customers, of which 258,000 were on cable with the rest on DSL. Customer demand for our high speed propositions increased, with over 70% of cable gross adds in Q4 now taking our 200Mbps to 500Mbps offers. Our TV base remained stable at 7.7 million. Our convergence momentum continued to improve, supported by our GigaKombi proposition, and we added 278,000 converged customers in the year, taking our total consumer converged customer base to 700,000.
Adjusted EBITDA grew 10.7%* or 8.3%* excluding the legal settlement. This was driven by service revenue growth, our focus on more profitable direct channels, and a reduction in operating costs of 2.3%* despite the strong growth in customer numbers. Our adjusted EBITDA margin was 37.0% and the adjusted EBITDA margin improved by 2.9 percentage points, or 2.4 percentage points excluding the legal settlement.
Vodafone Group Plc Annual Report 2018 25O
verviewStrategic R
eportG
overnanceFinancials
Other inform
ation
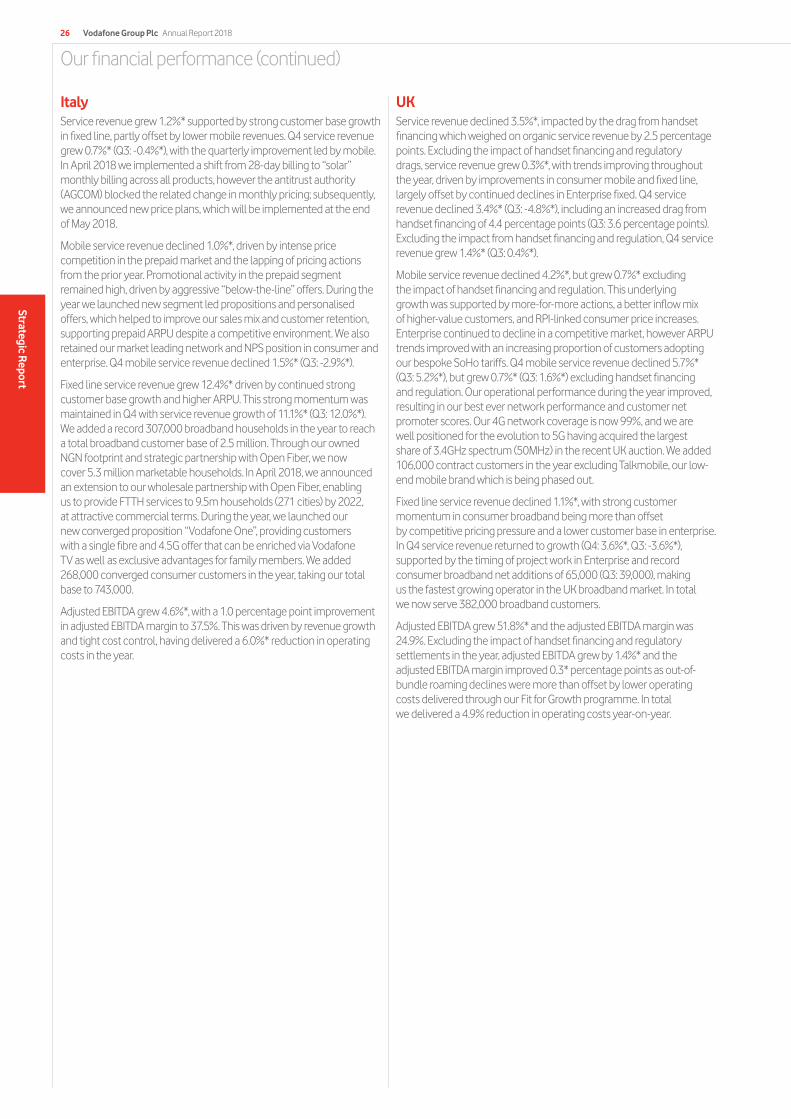
Our financial performance (continued)
ItalyService revenue grew 1.2%* supported by strong customer base growth in fixed line, partly offset by lower mobile revenues. Q4 service revenue grew 0.7%* (Q3: -0.4%*), with the quarterly improvement led by mobile. In April 2018 we implemented a shift from 28-day billing to “solar” monthly billing across all products, however the antitrust authority (AGCOM) blocked the related change in monthly pricing; subsequently, we announced new price plans, which will be implemented at the end of May 2018.
Mobile service revenue declined 1.0%*, driven by intense price competition in the prepaid market and the lapping of pricing actions from the prior year. Promotional activity in the prepaid segment remained high, driven by aggressive “below-the-line” offers. During the year we launched new segment led propositions and personalised offers, which helped to improve our sales mix and customer retention, supporting prepaid ARPU despite a competitive environment. We also retained our market leading network and NPS position in consumer and enterprise. Q4 mobile service revenue declined 1.5%* (Q3: -2.9%*).
Fixed line service revenue grew 12.4%* driven by continued strong customer base growth and higher ARPU. This strong momentum was maintained in Q4 with service revenue growth of 11.1%* (Q3: 12.0%*). We added a record 307,000 broadband households in the year to reach a total broadband customer base of 2.5 million. Through our owned NGN footprint and strategic partnership with Open Fiber, we now cover 5.3 million marketable households. In April 2018, we announced an extension to our wholesale partnership with Open Fiber, enabling us to provide FTTH services to 9.5m households (271 cities) by 2022, at attractive commercial terms. During the year, we launched our new converged proposition “Vodafone One”, providing customers with a single fibre and 4.5G offer that can be enriched via Vodafone TV as well as exclusive advantages for family members. We added 268,000 converged consumer customers in the year, taking our total base to 743,000.
Adjusted EBITDA grew 4.6%*, with a 1.0 percentage point improvement in adjusted EBITDA margin to 37.5%. This was driven by revenue growth and tight cost control, having delivered a 6.0%* reduction in operating costs in the year.
UKService revenue declined 3.5%*, impacted by the drag from handset financing which weighed on organic service revenue by 2.5 percentage points. Excluding the impact of handset financing and regulatory drags, service revenue grew 0.3%*, with trends improving throughout the year, driven by improvements in consumer mobile and fixed line, largely offset by continued declines in Enterprise fixed. Q4 service revenue declined 3.4%* (Q3: -4.8%*), including an increased drag from handset financing of 4.4 percentage points (Q3: 3.6 percentage points). Excluding the impact from handset financing and regulation, Q4 service revenue grew 1.4%* (Q3: 0.4%*).
Mobile service revenue declined 4.2%*, but grew 0.7%* excluding the impact of handset financing and regulation. This underlying growth was supported by more-for-more actions, a better inflow mix of higher-value customers, and RPI-linked consumer price increases. Enterprise continued to decline in a competitive market, however ARPU trends improved with an increasing proportion of customers adopting our bespoke SoHo tariffs. Q4 mobile service revenue declined 5.7%* (Q3: 5.2%*), but grew 0.7%* (Q3: 1.6%*) excluding handset financing and regulation. Our operational performance during the year improved, resulting in our best ever network performance and customer net promoter scores. Our 4G network coverage is now 99%, and we are well positioned for the evolution to 5G having acquired the largest share of 3.4GHz spectrum (50MHz) in the recent UK auction. We added 106,000 contract customers in the year excluding Talkmobile, our low-end mobile brand which is being phased out.
Fixed line service revenue declined 1.1%*, with strong customer momentum in consumer broadband being more than offset by competitive pricing pressure and a lower customer base in enterprise. In Q4 service revenue returned to growth (Q4: 3.6%*, Q3: -3.6%*), supported by the timing of project work in Enterprise and record consumer broadband net additions of 65,000 (Q3: 39,000), making us the fastest growing operator in the UK broadband market. In total we now serve 382,000 broadband customers.
Adjusted EBITDA grew 51.8%* and the adjusted EBITDA margin was 24.9%. Excluding the impact of handset financing and regulatory settlements in the year, adjusted EBITDA grew by 1.4%* and the adjusted EBITDA margin improved 0.3* percentage points as out-of-bundle roaming declines were more than offset by lower operating costs delivered through our Fit for Growth programme. In total we delivered a 4.9% reduction in operating costs year-on-year.
Vodafone Group Plc Annual Report 201826
Strategic Report
SpainService revenue grew by 2.1%*. This was driven by a higher customer base in both mobile and fixed and our more-for-more tariff refresh at the start of the year, partly offset by increased promotional activity, particularly in the value segment. In Q4 promotional activity moderated but the market remained highly competitive driven by value players offering aggressive prices and handset subsidies. Interconnect revenues also fell following an MTR cut on 1 February. As a result, Q4 service revenue grew 1.0%* (Q3: 2.0%*).
We continued to grow our customer base adding 164,000 mobile contract customers, 109,000 fixed broadband households and 51,000 TV households in the year, however high competitive intensity in Q4 led to an increase in churn and a decline in our broadband and TV base. Vodafone One, our fully integrated fixed, mobile and TV service, reached 2.5 million households by the end of the year, up 154,000 year-on-year. Consumer converged revenues grew by 13.7%* and now represent 59% of total consumer revenue.
We maintained our market leading NPS position in consumer, and further improved our market leading network position during the year. This was reflected in the latest independent network tests by P3 which showed we had extended our overall lead across both voice and data. Our 4G coverage is now 96%. In fixed, including our commercial wholesale agreement with Telefónica, our NGN footprint now covers 20.5 million households (of which 10.3 million are on-net). We continued to deploy DOCSIS 3.1 in our cable footprint, enabling us to deliver broadband speeds of up to 1Gbps to 7.9 million households by the end of the year. We expect to complete the DOCSIS 3.1 rollout in the first half of fiscal 2018/19.
Adjusted EBITDA grew 5.0%*, and the adjusted EBITDA margin improved by 1.2 percentage points to 28.5%. This improvement was driven by service revenue growth and lower commercial and operating costs; these more than offset higher content, roaming and wholesale access costs. Operating costs were 2.5%* lower year-on-year, reflecting the impact of our Fit for Growth programme.
Other EuropeService revenue grew 2.9%* with all of the larger markets growing during the year (excluding the impact of an MTR cut in Ireland). Quarterly service revenue trends were broadly stable at 3.3%* in Q4 (Q3: 2.9%*). Adjusted organic EBITDA grew 7.7%* in the year, and adjusted EBITDA margin grew 0.3 percentage points to 30.7% reflecting continued strong cost control.
In Ireland service revenue declined 0.2%*, but grew 1.3%* excluding the impact of regulation, supported by fixed customer growth. Portugal service revenue grew 4.6%* driven by a return to growth in mobile, and continued strong customer growth in fixed. In Greece, service revenue grew by 3.7%*, driven by ARPU growth in consumer mobile and strong fixed customer base growth. In January, we announced the acquisition of fixed and mobile telecommunications provider CYTA Hellas for a total enterprise value of €118 million. This acquisition provides further scale and momentum to our fixed line and convergence strategy in Greece. The transaction is subject to regulatory approval and is expected to close in the first half of 2019 financial year.
VodafoneZiggoThe results of VodafoneZiggo (in which Vodafone owns a 50% stake), are reported here on a US GAAP basis, broadly consistent with Vodafone’s accounting policies.
Total revenue declined by 3.8%, or by 2.2% excluding the impact of regulation. This reflected intense price competition in mobile, particularly in the SoHo segment, partially offset by growth in fixed line driven by higher RGUs and ARPU. In Q4 revenues declined 2.9% (Q3: 3.7%) or 1.5% (Q3: -1.9%) excluding regulation. Within this mobile declined 12.5% (Q3: -12.4%) and fixed grew 1.3% (Q3: 0.6%). Excluding the drags from regulation, a mix-shift towards SIM-only sales and convergence discounts, mobile revenue was stable.
We gained good commercial momentum during the year, supported by our new converged offers. We added 924,000 converged customers, equivalent to 28% of our fixed customer base, with these households using a total of 1.3 million mobile SIMs, including 62% of Vodafone-branded consumer contract customers. This strong take up of our converged products is contributing to a higher customer NPS and a significant reduction in churn across both mobile and fixed. In Q4 we recorded mobile contract net additions of 35,000 (Q3: 14,000), excluding the impact of discontinued non-revenue generating secondary SIMs as part of the migration of former Ziggo mobile subscribers to Vodafone. In fixed broadband we maintained our good momentum, adding 12,000 customers (Q3: 26,000).
Adjusted EBITDA declined 3.8%, as lower revenues were partly offset by lower equipment expenses as a result of new consumer credit regulations which increased the proportion of SIM-only sales during the year. In Q4, adjusted EBITDA was down 0.6% year-on-year despite lower revenues, reflecting lower interconnect and roaming costs, lower equipment expenses, and operating cost savings from integration activities. We have continued to make good progress on integrating the business, and remain on track to deliver total annualised cost synergies of at least €210 million by 2021. Net third party debt and capital lease obligations was €10.1 billion at year-end, equivalent to 5.4x annualised adjusted EBITDA (last two quarters annualised).
During 2018 financial year, Vodafone received €220 million in dividends from the joint venture, €55 million in interest payments on the shareholder loan and €100 million of principal repayments on the shareholder loan, which reduced to €900 million. For calendar year 2018, VodafoneZiggo expects stabilising adjusted EBITDA, supporting total cash returns of €600–800 million to its parents. As a result, we expect to receive total cash returns (including dividends, interest payments and shareholder loan repayments) of €300–400 million during the 2018 calendar year from the joint venture.
Vodafone Group Plc Annual Report 2018 27O
verviewStrategic R
eportG
overnanceFinancials
Other inform
ation
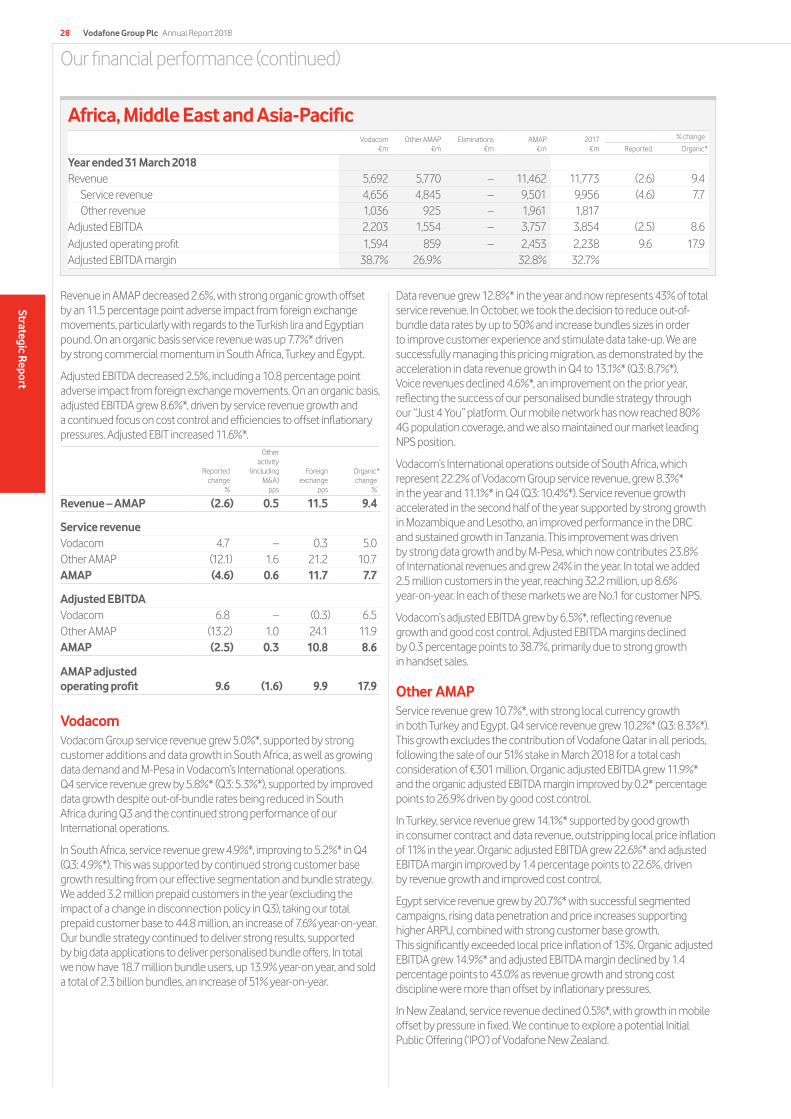
Our financial performance (continued)
Revenue in AMAP decreased 2.6%, with strong organic growth offset by an 11.5 percentage point adverse impact from foreign exchange movements, particularly with regards to the Turkish lira and Egyptian pound. On an organic basis service revenue was up 7.7%* driven by strong commercial momentum in South Africa, Turkey and Egypt.
Adjusted EBITDA decreased 2.5%, including a 10.8 percentage point adverse impact from foreign exchange movements. On an organic basis, adjusted EBITDA grew 8.6%*, driven by service revenue growth and a continued focus on cost control and efficiencies to offset inflationary pressures. Adjusted EBIT increased 11.6%*.
Reported change
%
Other activity
(including M&A)
pps
Foreign exchange
pps
Organic*change
%
Revenue – AMAP (2.6) 0.5 11.5 9.4
Service revenueVodacom 4.7 – 0.3 5.0 Other AMAP (12.1) 1.6 21.2 10.7 AMAP (4.6) 0.6 11.7 7.7
Adjusted EBITDAVodacom 6.8 – (0.3) 6.5 Other AMAP (13.2) 1.0 24.1 11.9 AMAP (2.5) 0.3 10.8 8.6
AMAP adjusted operating profit 9.6 (1.6) 9.9 17.9
VodacomVodacom Group service revenue grew 5.0%*, supported by strong customer additions and data growth in South Africa, as well as growing data demand and M-Pesa in Vodacom’s International operations. Q4 service revenue grew by 5.8%* (Q3: 5.3%*), supported by improved data growth despite out-of-bundle rates being reduced in South Africa during Q3 and the continued strong performance of our International operations.
In South Africa, service revenue grew 4.9%*, improving to 5.2%* in Q4 (Q3: 4.9%*). This was supported by continued strong customer base growth resulting from our effective segmentation and bundle strategy. We added 3.2 million prepaid customers in the year (excluding the impact of a change in disconnection policy in Q3), taking our total prepaid customer base to 44.8 million, an increase of 7.6% year-on-year. Our bundle strategy continued to deliver strong results, supported by big data applications to deliver personalised bundle offers. In total we now have 18.7 million bundle users, up 13.9% year-on year, and sold a total of 2.3 billion bundles, an increase of 51% year-on-year.
Data revenue grew 12.8%* in the year and now represents 43% of total service revenue. In October, we took the decision to reduce out-of-bundle data rates by up to 50% and increase bundles sizes in order to improve customer experience and stimulate data take-up. We are successfully managing this pricing migration, as demonstrated by the acceleration in data revenue growth in Q4 to 13.1%* (Q3: 8.7%*). Voice revenues declined 4.6%*, an improvement on the prior year, reflecting the success of our personalised bundle strategy through our “Just 4 You” platform. Our mobile network has now reached 80% 4G population coverage, and we also maintained our market leading NPS position.
Vodacom’s International operations outside of South Africa, which represent 22.2% of Vodacom Group service revenue, grew 8.3%* in the year and 11.1%* in Q4 (Q3: 10.4%*). Service revenue growth accelerated in the second half of the year supported by strong growth in Mozambique and Lesotho, an improved performance in the DRC and sustained growth in Tanzania. This improvement was driven by strong data growth and by M-Pesa, which now contributes 23.8% of International revenues and grew 24% in the year. In total we added 2.5 million customers in the year, reaching 32.2 million, up 8.6% year-on-year. In each of these markets we are No.1 for customer NPS.
Vodacom’s adjusted EBITDA grew by 6.5%*, reflecting revenue growth and good cost control. Adjusted EBITDA margins declined by 0.3 percentage points to 38.7%, primarily due to strong growth in handset sales.
Other AMAPService revenue grew 10.7%*, with strong local currency growth in both Turkey and Egypt. Q4 service revenue grew 10.2%* (Q3: 8.3%*). This growth excludes the contribution of Vodafone Qatar in all periods, following the sale of our 51% stake in March 2018 for a total cash consideration of €301 million. Organic adjusted EBITDA grew 11.9%* and the organic adjusted EBITDA margin improved by 0.2* percentage points to 26.9% driven by good cost control.
In Turkey, service revenue grew 14.1%* supported by good growth in consumer contract and data revenue, outstripping local price inflation of 11% in the year. Organic adjusted EBITDA grew 22.6%* and adjusted EBITDA margin improved by 1.4 percentage points to 22.6%, driven by revenue growth and improved cost control.
Egypt service revenue grew by 20.7%* with successful segmented campaigns, rising data penetration and price increases supporting higher ARPU, combined with strong customer base growth. This significantly exceeded local price inflation of 13%. Organic adjusted EBITDA grew 14.9%* and adjusted EBITDA margin declined by 1.4 percentage points to 43.0% as revenue growth and strong cost discipline were more than offset by inflationary pressures.
In New Zealand, service revenue declined 0.5%*, with growth in mobile offset by pressure in fixed. We continue to explore a potential Initial Public Offering (‘IPO’) of Vodafone New Zealand.
Africa, Middle East and Asia-PacificVodacom
€mOther AMAP
€mEliminations
€mAMAP
€m2017
€m
% change
Reported Organic*
Year ended 31 March 2018Revenue 5,692 5,770 – 11,462 11,773 (2.6) 9.4
Service revenue 4,656 4,845 – 9,501 9,956 (4.6) 7.7 Other revenue 1,036 925 – 1,961 1,817
Adjusted EBITDA 2,203 1,554 – 3,757 3,854 (2.5) 8.6 Adjusted operating profit 1,594 859 – 2,453 2,238 9.6 17.9 Adjusted EBITDA margin 38.7% 26.9% 32.8% 32.7%
Vodafone Group Plc Annual Report 201828
Strategic Report
Associates and joint venturesVodafone Hutchison Australia (‘VHA’) continued to perform well in a competitive environment, with local currency service revenue growth of 0.8% during year. This was driven by growth in our mobile contract customer base. Local currency adjusted EBITDA excluding changes in pricing structure for new mobile phone plans grew 1.9%, supported by revenue growth and strong commercial cost discipline.
Our stake in Indus Towers Limited (‘Indus Towers’), the Indian towers company in which Vodafone owned a 42% interest during the year, achieved local currency revenue growth of 6.8% and adjusted EBITDA growth of 4.7%. In total, Indus Towers paid dividends of €138 million to the Group during the year.
On 25 April 2018, Vodafone, Bharti Airtel Limited (‘Bharti Airtel’) and Idea announced the merger of Indus Towers into Bharti Infratel Limited (‘Bharti Infratel’), creating a combined company that will own the respective businesses of Bharti Infratel and Indus Towers. Bharti Airtel and Vodafone will jointly control the combined company, in accordance with the terms of a new shareholders’ agreement. Vodafone will be issued with 783.1 million new shares in the combined company, in exchange for its shareholding in Indus Towers. On the basis that (a) Providence decides to sell 3.35% of its 4.85% shareholding in Indus Towers for cash and (b) Idea Group decides to sell its full 11.15% shareholding in Indus Towers for cash, these shares would be equivalent to a 29.4% shareholding in the combined company. The final number of shares issued to Vodafone will be subject to closing adjustments, including but not limited to movements in net debt and working capital for Bharti Infratel and Indus Towers. The transaction is conditional on regulatory and other approvals and is expected to close before the end of the financial year ending 31 March 2019.
India1
On 20 March 2017, Vodafone announced an agreement to combine its subsidiary, Vodafone India (excluding its 42% stake in Indus Towers), with Idea Cellular. The combined company will be jointly controlled by Vodafone and the Aditya Birla Group. Vodafone India has been classified as discontinued operations for Group reporting purposes. From an operational perspective, the Group remains highly focused on the management of the business and committed to its success, both prior to the completion of the merger and thereafter. The results of Vodafone India are detailed below.
2018€m
2017€m
% change
Reported Organic*
Revenue 4,670 5,853 (20.2) (18.5)Service revenue 4,643 5,834 (20.4) (18.7)Other revenue 27 19
Direct costs (1,165) (1,583)Customer costs (282) (313)Operating expenses (2,193) (2,361)Adjusted EBITDA 1,030 1,596 (35.5) (34.5)Depreciation and amortisation (40) (1,116)Adjusted operating profit 990 480 106.3 110.7 Adjustments for:
Impairment loss2 – (4,515)Other income and expense3 416 –Other (107) (136)
Operating profit/(loss) 1,299 (4,171)Adjusted EBITDA margin 22.1% 27.3%
Notes:1 The results of Vodafone India are classified as discontinued operations in accordance
with IFRS.2 2017 includes a gross impairment charge of €4.5 billion (€3.7 billion net of tax) recorded
in respect of the Group’s investment in India. In addition, in 2018 we recorded a non-cash re-measurement charge of €3.2 billion (€2.2 billion net of tax) in respect of Vodafone India’s fair value less costs of disposal, as set out in note 7 “Discontinued operations, assets and liabilities held for sale” for further details.
3 Includes the profit on disposal of Vodafone India’s standalone tower business to ATC Telecom during the year ended 31 March 2018 (2017: €nil).
Service revenue declined 18.7%* as a result of intense price competition following the arrival of the new entrant. During the second half of the year the market leader increased the competitiveness of its tariffs, triggering further price reductions by the new entrant in the fourth quarter. This was further exacerbated by cuts to both domestic and international MTR rates in the second half of the year. Excluding the impact of regulation, service revenue declined 14.0%*. In Q4 service revenue declined by 21.2%* (Q3: -23.1%*), or by 9.4%* ex-regulation (Q3: -14.2%*). On a sequential basis, local currency service revenues excluding regulation declined 3.8% quarter-on-quarter.
Adjusted EBITDA declined 34.5%*, with a 5.2 percentage point deterioration in adjusted EBITDA margin to 22.1%. This reflected lower revenues, partially offset by significant cost actions and a provision release in the fourth quarter following positive legal judgements. These cost initiatives included active network site sharing, the renegotiation of tower maintenance contracts and the closure of sites with low utilisation.
During the year we continued to invest in network quality in our leadership circles, with a capital expenditure/sales ratio of 20.4%. We added 48,500 sites in the year, supporting our leading network-NPS scores. As a result of this investment we were able to carry 4.5x more data traffic than last year.
Net debt in India was €7.7 billion at the end of the period, down from €8.7 billion at the end of the prior financial year due to the positive translation impact of closing foreign exchange rates on the debt balance of €1.2 billion and proceeds from the sale of Vodafone India’s standalone towers to American Tower Corporation of €0.5 billion, partially offset by negative free cash flow of €0.2 billion and accrued interest expense of €0.3 billion.
Following the completion of Idea’s equity raising in February 2018, under the terms of the merger agreement the Group intends to inject up to €1 billion of incremental equity into India, net of the proceeds of the sale of a stake in the joint venture to the Aditya Birla Group, prior to completion. In the event that the joint venture partners decide to put in additional funding in the future, the Group would draw upon the value of its stake in Indus Towers.
We are making good progress in securing the necessary regulatory approvals for the merger of Vodafone India and Idea Cellular. The merger is expected to complete in June 2018.
Vodafone Group Plc Annual Report 2018 29O
verviewStrategic R
eportG
overnanceFinancials
Other inform
ation
Financial position and resources
Consolidated statement of financial position The consolidated statement of financial position is set out on page 103. Details on the major movements of both our assets and liabilities in the year are set out below:
AssetsGoodwill and other intangible assets Goodwill and other intangible assets decreased by €2.9 billion to €43.3 billion. The decrease primarily arose as a result of €0.7 billion of spectrum additions, principally in Italy, plus €2.3 billion of software additions, offset by €4.4 billion of amortisation, €0.9 billion of disposals arising from the sale of the Group’s interest in Vodafone Qatar and €0.6 billion of unfavourable foreign exchange movements.
Property, plant and equipmentProperty, plant and equipment decreased by €1.9 billion to €28.3 billion, principally due to €5.1 billion of additions driven by continued investment in the Group’s networks, offset by €6.0 billion of depreciation charges, €0.6 billion of unfavourable foreign exchange and €0.4 billion of disposals from the sale of the Group’s interest in Vodafone Qatar.
Other non-current assets Other non-current assets increased by €0.6 billion to €36.1 billion, mainly due to a €1.9 billion increase in deferred tax assets in Luxembourg from higher interest rates and a revaluation of investments based upon the local GAAP financial statements and tax returns. This was offset by a €0.5 billion decrease in trade and other receivables as well as €0.6 billion and €0.3 billion reductions in investments in associates and joint ventures and other investments respectively.
Current assetsCurrent assets decreased by €1.4 billion to €24.1 billion, which includes a €4.2 billion decrease in cash and cash equivalents offset by a €2.7 billion increase in other investments.
Assets and liabilities held for saleAssets and liabilities held for sale of €13.8 billion (2017: €17.2 billion) and €11.0 billion (2017: €11.8 billion) respectively, relate to our operations in India following the agreement to combine with Idea Cellular.
Total equity and liabilitiesTotal equityTotal equity decreased by €5.1 billion to €68.6 billion largely due to €4.3 billion of dividends paid to equity shareholders and non-controlling interests and the repurchase of treasury shares for €1.7 billion partially offset by the total comprehensive income for the year of €0.4 billion.
Non-current liabilitiesNon-current liabilities decreased by €0.6 billion to €38.0 billion primarily due to a €1.6 billion decrease in long-term borrowings which is partially offset by a €1.1 billion increase in trade and other payables.
Current liabilitiesCurrent liabilities decreased by €2.6 billion to €28.0 billion mainly due to a €1.7 billion decrease in short-term borrowings. Trade payables at 31 March 2018 were equivalent to 48 days (2017: 48 days) outstanding, calculated by reference to the amount owed to suppliers as a proportion of the amounts invoiced by suppliers during the year. It is our policy to agree terms of transactions, including payment terms, with suppliers and it is our normal practice that payment is made accordingly.
Share buybacksOn 25 August 2017, Vodafone announced the commencement of a new irrevocable and non-discretionary share buyback programme (the ‘Programme’). The sole purpose of the Programme was to reduce the issued share capital of Vodafone and thereby avoid any change in Vodafone’s issued share capital as a result of the maturing of the first tranche of the mandatory convertible bond (‘MCB’) in August 2017.
In order to satisfy the first tranche of the MCB, 729.1 million shares were reissued from treasury shares on 25 August 2017 at a conversion price of £1.9751. This reflected the conversion price at issue (£2.1730) adjusted for the pound sterling equivalent of aggregate dividends paid in August 2016, February 2017 and August 2017.
Date of share purchase
Number of shares
purchased 000s
Average price paid per share
inclusive of transaction costs
Pence
Total number of shares purchased
under publicly announced
share buyback programme
000s
Maximum number of shares
that may yet be purchased under
the programme 000s
August 2017 9,562 221.77 9,562 719,515 September 2017 252,851 212.07 262,413 466,664 October 2017 320,849 215.15 583,262 145,815 November 2017 145,815 221.25 729,077 – Total 729,077 215.39 729,077 –
DividendsDividends will continue to be declared in euros and paid in euros, pounds sterling and US dollars, aligning the Group’s shareholder returns with the primary currency in which we generate free cash flow. The foreign exchange rate at which future dividends declared in euros will be converted into pounds sterling and US dollars will be calculated based on the average exchange rate over the five business days during the week prior to the payment of the dividend.
The Board is recommending a final dividend per share of 10.23 eurocents, representing a 2.0% increase over the prior financial year’s final dividend per share. The ex-dividend date for the final dividend is 7 June 2018 for ordinary shareholders, the record date is 8 June 2018 and the dividend is payable on 3 August 2018. Dividend payments on ordinary shares will be paid directly into a nominated bank or building society account.
Contractual obligations and commitmentsA summary of our principal contractual financial obligations and commitments at 31 March 2018 is set out below, and excludes the Group’s intention to inject up to €1 billion of incremental equity into India under the terms of the merger agreement (see note 28 “Commitments”) and commitments arising from the Group’s announcement on 9 May 2018 that it had agreed to acquire Liberty Global’s operations in Germany, the Czech Republic, Hungary and Romania (see note 31 “Subsequent events”).
Payments due by period €m
Contractual obligations and commitments1 Total < 1 year 1–3 years 3–5 years >5 years
Borrowings2 52,551 11,316 7,541 8,537 25,157Operating lease commitments3 9,694 2,686 2,788 1,620 2,600Capital commitments3,4 2,706 1,973 391 278 64Purchase commitments5 8,652 4,753 2,016 841 1,042Total 73,603 20,728 12,736 11,276 28,863
Notes:1 This table includes commitments in respect of options over interests in Group businesses
held by non-controlling shareholders (see “Potential cash outflows from option agreements and similar arrangements” on page 148) and obligations to pay dividends to non-controlling shareholders (see “Dividends from associates and to non-controlling shareholders” on page 148). The table excludes current and deferred tax liabilities and obligations under post employment benefit schemes, details of which are provided in notes 6 “Taxation” and 25 “Post employment benefits” respectively. The table also excludes the contractual obligations of associates and joint ventures.
2 See note 20 “Borrowings”.3 See note 28 “Commitments”.4 Primarily related to spectrum and network infrastructure.5 Primarily related to device purchase obligations.
Vodafone Group Plc Annual Report 201830
Strategic Report
Liquidity and capital resourcesOur liquidity and working capital may be affected by a material decrease in cash flow due to a number of factors as outlined in “Identifying and managing our risks” on pages 38 to 45.
In addition to the commentary on the Group’s consolidated statement of cash flows below, further disclosure in relation to the Group’s objectives, policies and processes for managing its capital, its financial risk management objectives, details of its financial instruments and hedging activities and its exposures to credit risk and liquidity risk can be found in “Borrowings”, “Liquidity and capital resources” and “Capital and financial risk management” in notes 20, 21 and 22 respectively to the consolidated financial statements.
Cash flowsA reconciliation of cash generated by operations to free cash flow, a non-GAAP measure used by management, is shown on page 208. A reconciliation of adjusted EBITDA to the respective closest equivalent GAAP measure, operating profit, is provided in note 2 “Segmental analysis” to the consolidated financial statements.
The reconciliation to net debt is shown below.2018
€m2017
€m
Adjusted EBITDA 14,737 14,149 Capital additions1 (7,321) (7,675)Working capital (584) (984)Disposal of property, plant and equipment 41 43 Other 128 94 Operating free cash flow2 7,001 5,627 Taxation (1,010) (761)Dividends received from associates and investments 489 433 Dividends paid to non-controlling shareholders in subsidiaries (310) (413)Interest received and paid (753) (830)Free cash flow (pre-spectrum)2 5,417 4,056 Licence and spectrum payments (1,123) (474)Restructuring payments (250) (266)Free cash flow2 4,044 3,316 Acquisitions and disposals 1,405 460 Equity dividends paid (3,920) (3,714)Share buybacks3 (1,626) – Foreign exchange 622 (1,372)Other4 (825) (1,058)Net debt increase (300) (2,368)Opening net debt (31,169) (28,801)Closing net debt (31,469) (31,169)
Notes:1 Capital additions include the purchase of property, plant and equipment and intangible
assets, other than licence and spectrum, during the year.2 Operating free cash flow, free cash flow (pre-spectrum) and free cash flow are alternative
performance measures which are non-GAAP measures that are presented to provide readers with additional financial information that is regularly reviewed by management and should not be viewed in isolation or as an alternative to the equivalent GAAP measure. In addition, free cash flow has been redefined to include restructuring and licence and spectrum payments to ensure greater comparability with similarly titled measures and disclosures by other companies. See “Alternative performance measures” on page 207 for reconciliations to the closest respective equivalent GAAP measure and “Definition of terms” on page 222 for further details.
3 Share buybacks are shown net of €140 million of receipts from the option structure entered into in February 2016, when the mandatory convertible bond was issued. The options structure was intended to ensure that the total cash outflow to execute the programme was broadly equivalent to the £1.44 billion raised on issuing the first tranche.
4 Other cash flows for the year ended 31 March 2018 include €nil (2017: €2,366 million) received from the repayment of US$2.5 billion of loan notes issued by Verizon Communications Inc. and €nil (2017: €3,571 million) from a capital injection into Vodafone India.
This year’s report contains the Strategic Report on pages 4 to 45, which includes an analysis of our performance and position, a review of the business during the year, and outlines the principal risks and uncertainties we face. The Strategic Report was approved by the Board and signed on its behalf by the Chief Executive and Chief Financial Officer.
Vittorio ColaoChief Executive
15 May 2018
Nick ReadChief Financial Officer
15 May 2018
Operating free cash flowOperating free cash flow increased by €1.4 billion mainly due to higher adjusted EBITDA, lower capital additions and lower working capital cash outflows, which were predominately related to the final payments for Project Spring in the prior year.
Free cash flowFree cash flow (pre-spectrum) was €5.4 billion, an increase of €1.4 billion, largely driven by the increase in operating free cash flow (see above).
Licence and spectrum paymentsLicence and spectrum payments include amounts relating to the purchase of spectrum in Italy of €0.6 billion, UK of €0.3 billion and Germany of €0.1 billion (2017: €0.1 billion in Germany and €0.3 billion in Egypt).
Licence and spectrum additions, which exclude working capital cash movements and represent licences acquired during the year, were €0.7 billion including €0.6 billion in Italy and €0.1 billion in Greece.
Acquisitions and disposalsAcquisitions and disposals include €1.0 billion of proceeds from the placing of Vodacom shares following the transfer of the Group’s interests in Safaricom to Vodacom and €0.2 billion from the Tanzanian initial public offering.
Foreign exchange A foreign exchange gain of €0.6 billion was recognised on net debt as a result of the translation impact of closing foreign exchange rates, mainly due to movements in the US dollar and sterling against the euro.
Net debtClosing net debt at 31 March 2018 was €31.5 billion (2017: €31.2 billion) and excludes €7.7 billion (2017: €8.7 billion) of net debt for Vodafone India, which is instead included in assets and liabilities held for sale on the consolidated statement of financial position; the remaining £1.4 billion mandatory convertible bond issued in February 2016 (see note 21 “Liquidity and capital resources”), which will be settled in equity shares; US$2.5 billion of loan notes receivable from Verizon Communications Inc. and €0.9 billion of shareholder loans receivable from VodafoneZiggo (see note 13 “Other investments”).
Closing net debt also continues to include liabilities of €1.8 billion (2017: €1.8 billion) relating to minority holdings in KDG and certain bonds which are reported at an amount €1.65 billion (2017: €2.0 billion) higher than their euro-equivalent cash redemption value as a result of hedge accounting under IFRS. In addition, where bonds are issued in currencies other than euros, the Group has entered into foreign currency swaps to fix the euro cash outflows on redemption. The impact of these swaps are not reflected in gross debt and would increase the euro equivalent redemption value of the bonds by €0.6 billion (2017: reduction €0.9 billion). See note 21 “Liquidity and capital resources” for further details.
Vodafone Group Plc Annual Report 2018 31O
verviewStrategic R
eportG
overnanceFinancials
Other inform
ation
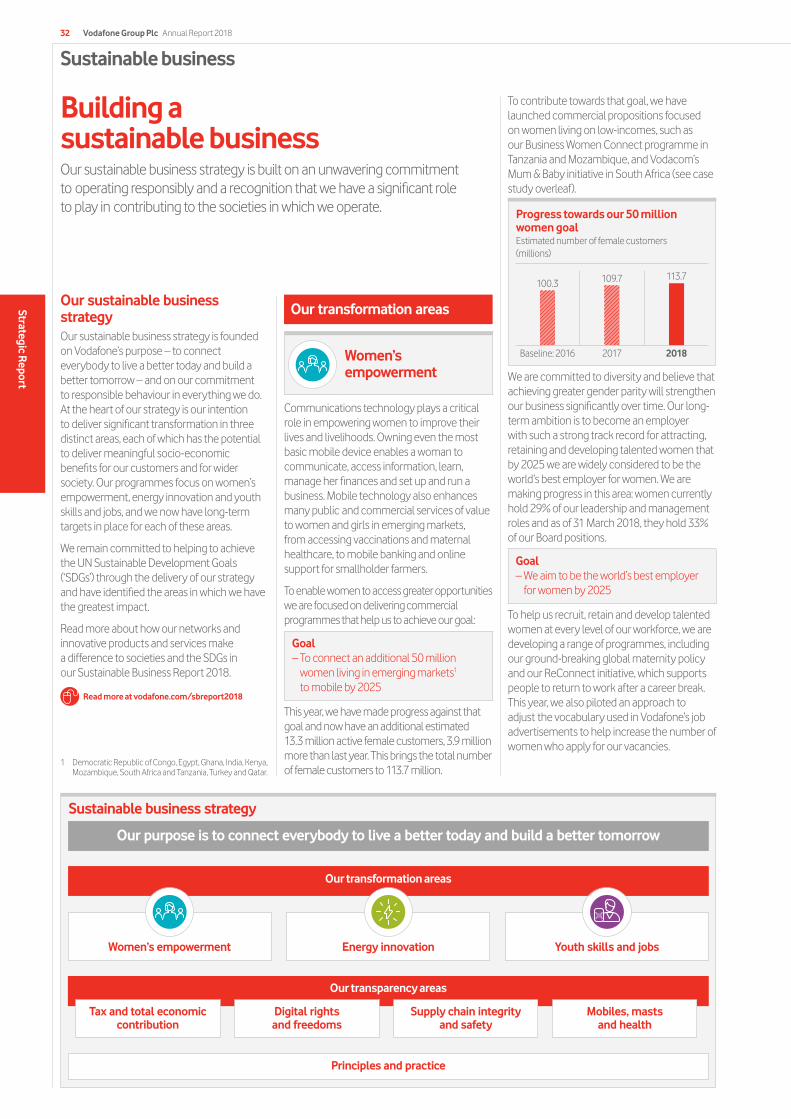
Sustainable business strategy
Our transparency areas
Sustainable business
Our sustainable business strategyOur sustainable business strategy is founded on Vodafone’s purpose – to connect everybody to live a better today and build a better tomorrow – and on our commitment to responsible behaviour in everything we do. At the heart of our strategy is our intention to deliver significant transformation in three distinct areas, each of which has the potential to deliver meaningful socio-economic benefits for our customers and for wider society. Our programmes focus on women’s empowerment, energy innovation and youth skills and jobs, and we now have long-term targets in place for each of these areas.
We remain committed to helping to achieve the UN Sustainable Development Goals (‘SDGs’) through the delivery of our strategy and have identified the areas in which we have the greatest impact.
Read more about how our networks and innovative products and services make a difference to societies and the SDGs in our Sustainable Business Report 2018.
Read more at vodafone.com/sbreport2018
Our purpose is to connect everybody to live a better today and build a better tomorrow
Tax and total economic contribution
Supply chain integrity and safety
Mobiles, masts and health
Digital rights and freedoms
Principles and practice
Our transformation areas
Building a sustainable businessOur sustainable business strategy is built on an unwavering commitment to operating responsibly and a recognition that we have a significant role to play in contributing to the societies in which we operate.
To contribute towards that goal, we have launched commercial propositions focused on women living on low-incomes, such as our Business Women Connect programme in Tanzania and Mozambique, and Vodacom’s Mum & Baby initiative in South Africa (see case study overleaf).
We are committed to diversity and believe that achieving greater gender parity will strengthen our business significantly over time. Our long-term ambition is to become an employer with such a strong track record for attracting, retaining and developing talented women that by 2025 we are widely considered to be the world’s best employer for women. We are making progress in this area: women currently hold 29% of our leadership and management roles and as of 31 March 2018, they hold 33% of our Board positions.
Goal– We aim to be the world’s best employer
for women by 2025
To help us recruit, retain and develop talented women at every level of our workforce, we are developing a range of programmes, including our ground-breaking global maternity policy and our ReConnect initiative, which supports people to return to work after a career break. This year, we also piloted an approach to adjust the vocabulary used in Vodafone’s job advertisements to help increase the number of women who apply for our vacancies.
1 Democratic Republic of Congo, Egypt, Ghana, India, Kenya, Mozambique, South Africa and Tanzania, Turkey and Qatar.
Progress towards our 50 million women goalEstimated number of female customers (millions)
Baseline: 2016 2017 2018
100.3 109.7 113.7
Our transformation areas
Women’s empowerment
Communications technology plays a critical role in empowering women to improve their lives and livelihoods. Owning even the most basic mobile device enables a woman to communicate, access information, learn, manage her finances and set up and run a business. Mobile technology also enhances many public and commercial services of value to women and girls in emerging markets, from accessing vaccinations and maternal healthcare, to mobile banking and online support for smallholder farmers.
To enable women to access greater opportunities we are focused on delivering commercial programmes that help us to achieve our goal:
Goal– To connect an additional 50 million
women living in emerging markets1 to mobile by 2025
This year, we have made progress against that goal and now have an additional estimated 13.3 million active female customers, 3.9 million more than last year. This brings the total number of female customers to 113.7 million.
Vodafone Group Plc Annual Report 201832
Strategic Report
Youth skills and jobsWomen’s empowerment Energy innovation
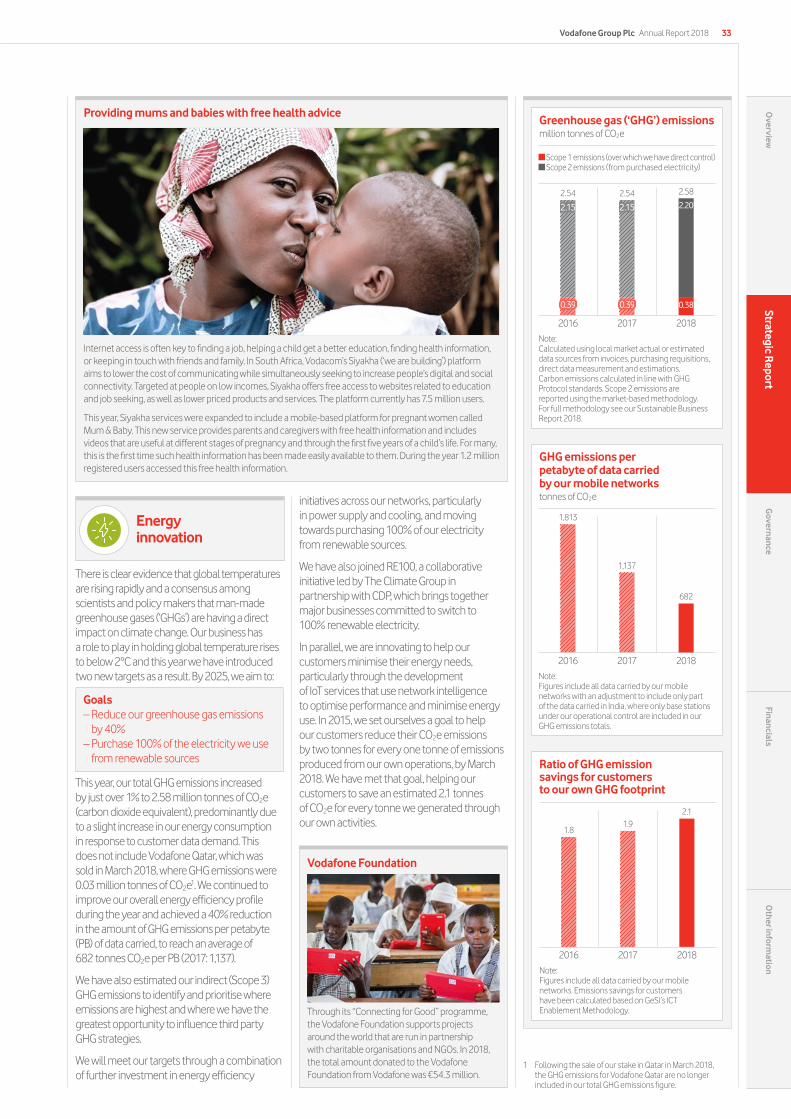
Energy innovation
There is clear evidence that global temperatures are rising rapidly and a consensus among scientists and policy makers that man-made greenhouse gases (‘GHGs’) are having a direct impact on climate change. Our business has a role to play in holding global temperature rises to below 2°C and this year we have introduced two new targets as a result. By 2025, we aim to:
Goals– Reduce our greenhouse gas emissions
by 40%– Purchase 100% of the electricity we use
from renewable sources
This year, our total GHG emissions increased by just over 1% to 2.58 million tonnes of CO2e (carbon dioxide equivalent), predominantly due to a slight increase in our energy consumption in response to customer data demand. This does not include Vodafone Qatar, which was sold in March 2018, where GHG emissions were 0.03 million tonnes of CO2e1. We continued to improve our overall energy efficiency profile during the year and achieved a 40% reduction in the amount of GHG emissions per petabyte (PB) of data carried, to reach an average of 682 tonnes CO2e per PB (2017: 1,137).
We have also estimated our indirect (Scope 3) GHG emissions to identify and prioritise where emissions are highest and where we have the greatest opportunity to influence third party GHG strategies.
We will meet our targets through a combination of further investment in energy efficiency
initiatives across our networks, particularly in power supply and cooling, and moving towards purchasing 100% of our electricity from renewable sources.
We have also joined RE100, a collaborative initiative led by The Climate Group in partnership with CDP, which brings together major businesses committed to switch to 100% renewable electricity.
In parallel, we are innovating to help our customers minimise their energy needs, particularly through the development of IoT services that use network intelligence to optimise performance and minimise energy use. In 2015, we set ourselves a goal to help our customers reduce their CO2e emissions by two tonnes for every one tonne of emissions produced from our own operations, by March 2018. We have met that goal, helping our customers to save an estimated 2.1 tonnes of CO2e for every tonne we generated through our own activities.
Providing mums and babies with free health advice
Internet access is often key to finding a job, helping a child get a better education, finding health information, or keeping in touch with friends and family. In South Africa, Vodacom’s Siyakha (‘we are building’) platform aims to lower the cost of communicating while simultaneously seeking to increase people’s digital and social connectivity. Targeted at people on low incomes, Siyakha offers free access to websites related to education and job seeking, as well as lower priced products and services. The platform currently has 7.5 million users.
This year, Siyakha services were expanded to include a mobile-based platform for pregnant women called Mum & Baby. This new service provides parents and caregivers with free health information and includes videos that are useful at different stages of pregnancy and through the first five years of a child’s life. For many, this is the first time such health information has been made easily available to them. During the year 1.2 million registered users accessed this free health information.
Greenhouse gas (‘GHG’) emissionsmillion tonnes of CO2e
Note:Calculated using local market actual or estimated data sources from invoices, purchasing requisitions, direct data measurement and estimations. Carbon emissions calculated in line with GHG Protocol standards. Scope 2 emissions are reported using the market-based methodology. For full methodology see our Sustainable Business Report 2018.
2016 2017 2018
Vodafone Foundation
Through its “Connecting for Good” programme, the Vodafone Foundation supports projects around the world that are run in partnership with charitable organisations and NGOs. In 2018, the total amount donated to the Vodafone Foundation from Vodafone was €54.3 million.
Scope 1 emissions (over which we have direct control) Scope 2 emissions (from purchased electricity)
1 Following the sale of our stake in Qatar in March 2018, the GHG emissions for Vodafone Qatar are no longer included in our total GHG emissions figure.
Vodafone Group Plc Annual Report 2018 33O
verviewStrategic R
eportG
overnanceFinancials
Other inform
ation
GHG emissions per petabyte of data carried by our mobile networks tonnes of CO2e
2016 2017 2018
Note: Figures include all data carried by our mobile networks with an adjustment to include only part of the data carried in India, where only base stations under our operational control are included in our GHG emissions totals.
1,813
1,137
682
Ratio of GHG emission savings for customers to our own GHG footprint
2016 2017 2018
Note: Figures include all data carried by our mobile networks. Emissions savings for customers have been calculated based on GeSI’s ICT Enablement Methodology.
1.81.9
2.1
2.58
2.20
0.38
2.542.54
2.15 2.15
0.39 0.39
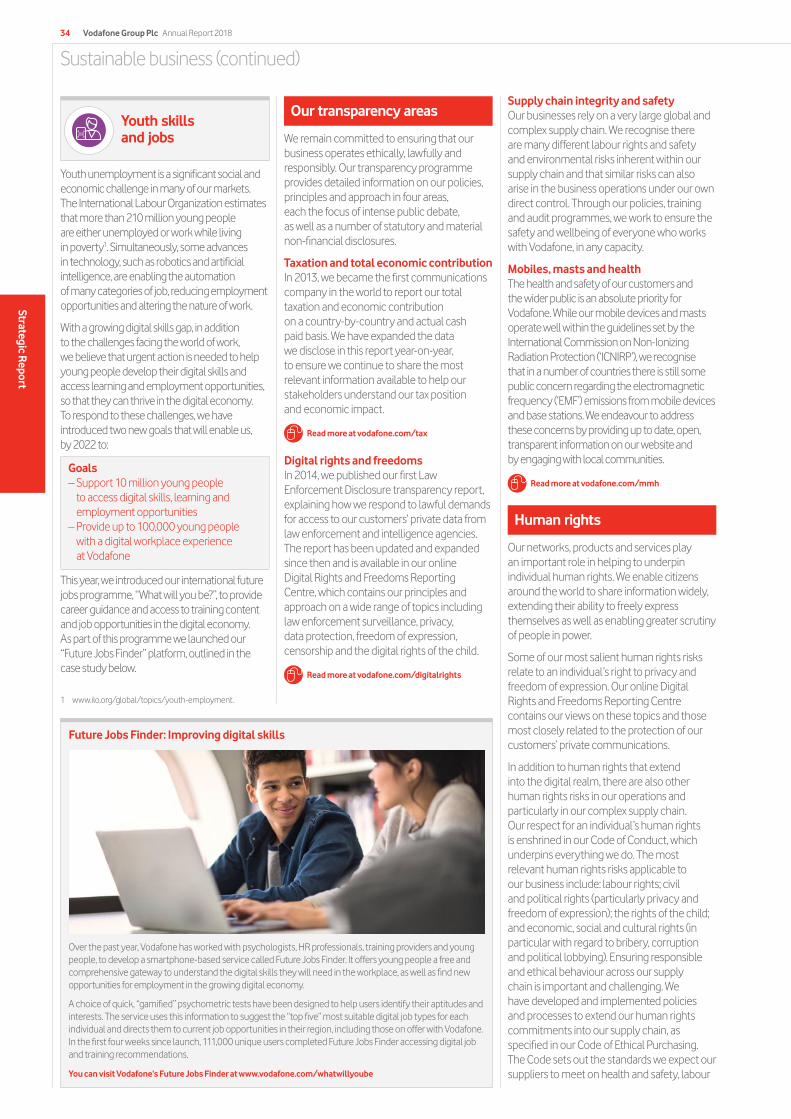
Sustainable business (continued)
Youth skills and jobs
Youth unemployment is a significant social and economic challenge in many of our markets. The International Labour Organization estimates that more than 210 million young people are either unemployed or work while living in poverty1. Simultaneously, some advances in technology, such as robotics and artificial intelligence, are enabling the automation of many categories of job, reducing employment opportunities and altering the nature of work.
With a growing digital skills gap, in addition to the challenges facing the world of work, we believe that urgent action is needed to help young people develop their digital skills and access learning and employment opportunities, so that they can thrive in the digital economy. To respond to these challenges, we have introduced two new goals that will enable us, by 2022 to:
Goals– Support 10 million young people
to access digital skills, learning and employment opportunities
– Provide up to 100,000 young people with a digital workplace experience at Vodafone
This year, we introduced our international future jobs programme, “What will you be?”, to provide career guidance and access to training content and job opportunities in the digital economy. As part of this programme we launched our “Future Jobs Finder” platform, outlined in the case study below.
Our transparency areas
We remain committed to ensuring that our business operates ethically, lawfully and responsibly. Our transparency programme provides detailed information on our policies, principles and approach in four areas, each the focus of intense public debate, as well as a number of statutory and material non-financial disclosures.
Taxation and total economic contributionIn 2013, we became the first communications company in the world to report our total taxation and economic contribution on a country-by-country and actual cash paid basis. We have expanded the data we disclose in this report year-on-year, to ensure we continue to share the most relevant information available to help our stakeholders understand our tax position and economic impact.
Read more at vodafone.com/tax
Digital rights and freedomsIn 2014, we published our first Law Enforcement Disclosure transparency report, explaining how we respond to lawful demands for access to our customers’ private data from law enforcement and intelligence agencies. The report has been updated and expanded since then and is available in our online Digital Rights and Freedoms Reporting Centre, which contains our principles and approach on a wide range of topics including law enforcement surveillance, privacy, data protection, freedom of expression, censorship and the digital rights of the child.
Read more at vodafone.com/digitalrights
Future Jobs Finder: Improving digital skills
Over the past year, Vodafone has worked with psychologists, HR professionals, training providers and young people, to develop a smartphone-based service called Future Jobs Finder. It offers young people a free and comprehensive gateway to understand the digital skills they will need in the workplace, as well as find new opportunities for employment in the growing digital economy.
A choice of quick, “gamified” psychometric tests have been designed to help users identify their aptitudes and interests. The service uses this information to suggest the “top five” most suitable digital job types for each individual and directs them to current job opportunities in their region, including those on offer with Vodafone. In the first four weeks since launch, 111,000 unique users completed Future Jobs Finder accessing digital job and training recommendations.
You can visit Vodafone’s Future Jobs Finder at www.vodafone.com/whatwillyoube
Supply chain integrity and safetyOur businesses rely on a very large global and complex supply chain. We recognise there are many different labour rights and safety and environmental risks inherent within our supply chain and that similar risks can also arise in the business operations under our own direct control. Through our policies, training and audit programmes, we work to ensure the safety and wellbeing of everyone who works with Vodafone, in any capacity.
Mobiles, masts and healthThe health and safety of our customers and the wider public is an absolute priority for Vodafone. While our mobile devices and masts operate well within the guidelines set by the International Commission on Non-Ionizing Radiation Protection (‘ICNIRP’), we recognise that in a number of countries there is still some public concern regarding the electromagnetic frequency (‘EMF’) emissions from mobile devices and base stations. We endeavour to address these concerns by providing up to date, open, transparent information on our website and by engaging with local communities.
Read more at vodafone.com/mmh
Human rights
Our networks, products and services play an important role in helping to underpin individual human rights. We enable citizens around the world to share information widely, extending their ability to freely express themselves as well as enabling greater scrutiny of people in power.
Some of our most salient human rights risks relate to an individual’s right to privacy and freedom of expression. Our online Digital Rights and Freedoms Reporting Centre contains our views on these topics and those most closely related to the protection of our customers’ private communications.
In addition to human rights that extend into the digital realm, there are also other human rights risks in our operations and particularly in our complex supply chain. Our respect for an individual’s human rights is enshrined in our Code of Conduct, which underpins everything we do. The most relevant human rights risks applicable to our business include: labour rights; civil and political rights (particularly privacy and freedom of expression); the rights of the child; and economic, social and cultural rights (in particular with regard to bribery, corruption and political lobbying). Ensuring responsible and ethical behaviour across our supply chain is important and challenging. We have developed and implemented policies and processes to extend our human rights commitments into our supply chain, as specified in our Code of Ethical Purchasing. The Code sets out the standards we expect our suppliers to meet on health and safety, labour
Vodafone Group Plc Annual Report 201834
Strategic Report
1 www.ilo.org/global/topics/youth-employment.
(including child or forced labour) rights, ethics and environmental protection.
Our commitment to human rights is overseen by our Group Executive Committee. In each of the countries in which we operate, the chief executive responsible for our operating company oversees human rights matters, with governance support from the relevant local market professionals.
Over the past year, we have undertaken significant work and introduced robust measures in order to prepare for the European General Data Protection Regulation, which became effective on 25 May 2018.
Read more at vodafone.com/digitalrights
Anti-bribery and corruption
Vodafone does not tolerate bribery and corruption in any form – we would rather walk away from a business opportunity than engage in any act of corruption. Our anti-bribery and corruption policy is summarised in our Code of Conduct, which is mandatory for everyone working for Vodafone. It states that employees or others working on our behalf must never offer or accept any kind of bribe. Our policy is consistent with the UK Bribery Act and the US Foreign Corrupt Practices Act and any breaches can lead to dismissal or termination of contract.
The policy provides guidance about what constitutes a bribe and prohibits the giving or receiving of any excessive or improper gifts and hospitality. It also makes clear that where our policy differs in degree from an equivalent local law, the more stringent of the two must be followed. Training in our Code of Conduct is incorporated into our standard induction processes and all employees complete refresher training every two years.
Our Group Chief Executive and Group Executive Committee oversee and spearhead our efforts to prevent bribery and corruption. They are supported by our country chief executives, who are responsible for ensuring our anti-bribery and corruption programme is implemented effectively in their local market.
The implementation of the policy is monitored regularly in all local markets by our anti-bribery specialist teams, and also as part of the annual Group Policy Compliance Review assurance process, which assesses key anti-bribery controls. Visits to local markets on a rotating basis enable us to formally review the implementation of the anti-bribery programme. This year, reviews conducted in Ghana and Greece found good implementation of key controls, however some areas for improvement in relation to supplier management and monitoring were identified and are now being addressed.
All Vodafone employees are encouraged to report any suspected breaches of our Code of Conduct as soon as possible using our “Speak Up” process. Senior executives review every Speak Up report and the programme is reviewed by the Group Risk and Compliance Committee. In our latest Global People Survey, 86% of respondents said they would use Speak Up to report unethical behaviour.
Ensuring compliance in our supply chain
On-site audits provide detailed insights into how a supplier’s policies translate into action in the workplace. These involve an examination of written policies and procedures, inspections of site facilities, and discussions with factory management and employees. We work through the Joint Audit Cooperation (‘JAC’) initiative to share audits with peer companies with whom we share a number of suppliers. Between January and December 2017, there were 81 shared on-site audits, of which 75 were within Vodafone’s supply chain. In parallel, we conduct our own on-site assessments for specific suppliers that we have identified as high risk but that are not covered by the shared assessments. This year, we conducted 17 such on-site assessments.
Detecting excessive working hours and ensuring ethical working conditions are an important part of our supplier assessments but are often hard to assess. Increasingly we seek feedback directly from our suppliers’ employees to help us and our suppliers to identify areas for improvement. We use Laborlink, which is a simple mobile phone-based independent worker survey, to gather confidential and unbiased feedback directly from employees. This enables employees to reply anonymously to pre-recorded questions in their local language at any time and from any location. During 2018, more than 2,500 suppliers’ employees in ten supplier factories responded to Laborlink surveys directly to tell us about their working conditions.
Read more at vodafone.com/sbreport2018
Engaging employees to raise awareness of bribery risk
Every Vodafone employee has an obligation to help us address the risk of bribery and corruption. To ensure they understand how they can each play a part, we run a high-profile communications programme, Doing What’s Right. This uses a range of materials to highlight some of the most common compliance challenges facing employees and focuses in particular on bribery-related risks, as well as gifts and hospitality.
This year, we launched an updated version of our e-learning training programme which included a specific module on anti-bribery. To date, over 80,000 employees around the world have completed the e-learning training module. In addition, for higher-risk employees who work in areas such as procurement, network operations, Enterprise sales and government relations, tailored face-to-face training programmes are rolled out to cover relevant scenarios for those employees.
Vodafone Group Plc Annual Report 2018 35O
verviewStrategic R
eportG
overnanceFinancials
Other inform
ation
Find out moreOur Sustainable Business Report 2018 provides more detail on our progress against our sustainable business strategy.
Read more at vodafone.com/sbreport2018
We have also published a Slavery and Human Trafficking Statement, our first UK Gender Pay Gap Report and a Conflict Minerals Report, in line with our statutory reporting requirements.
Read our latest reports at vodafone.com/sbreporting
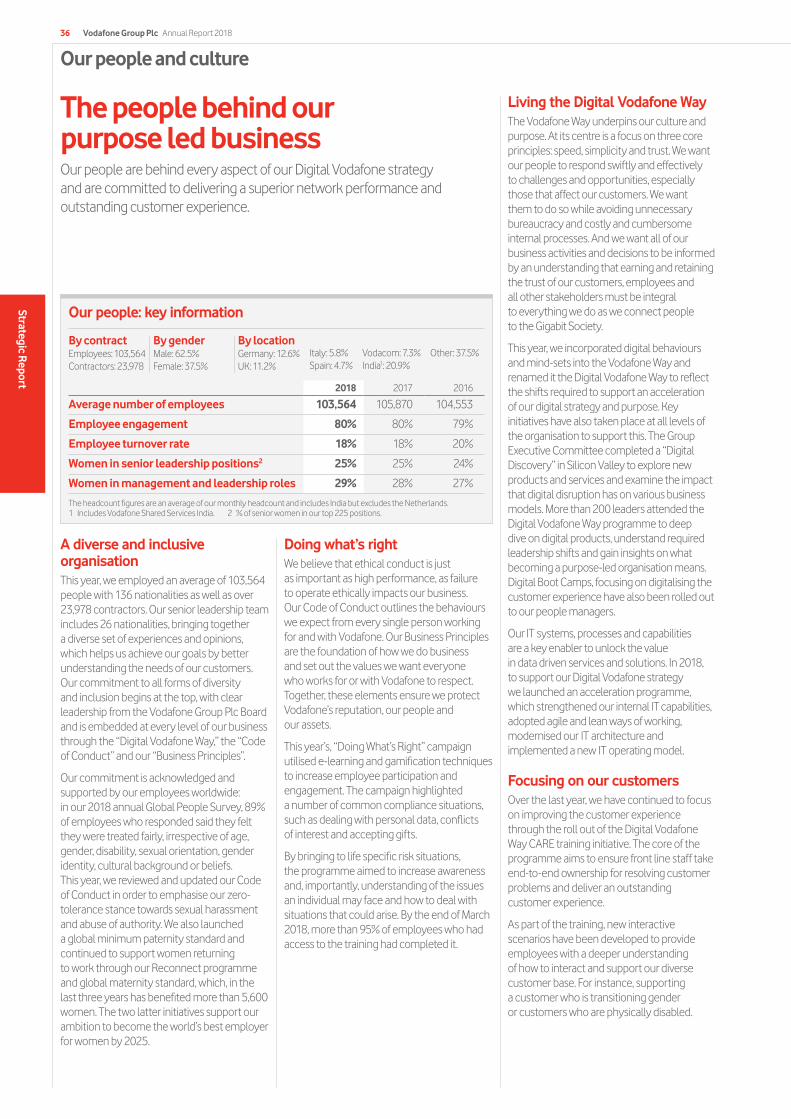
Living the Digital Vodafone WayThe Vodafone Way underpins our culture and purpose. At its centre is a focus on three core principles: speed, simplicity and trust. We want our people to respond swiftly and effectively to challenges and opportunities, especially those that affect our customers. We want them to do so while avoiding unnecessary bureaucracy and costly and cumbersome internal processes. And we want all of our business activities and decisions to be informed by an understanding that earning and retaining the trust of our customers, employees and all other stakeholders must be integral to everything we do as we connect people to the Gigabit Society.
This year, we incorporated digital behaviours and mind-sets into the Vodafone Way and renamed it the Digital Vodafone Way to reflect the shifts required to support an acceleration of our digital strategy and purpose. Key initiatives have also taken place at all levels of the organisation to support this. The Group Executive Committee completed a “Digital Discovery” in Silicon Valley to explore new products and services and examine the impact that digital disruption has on various business models. More than 200 leaders attended the Digital Vodafone Way programme to deep dive on digital products, understand required leadership shifts and gain insights on what becoming a purpose-led organisation means. Digital Boot Camps, focusing on digitalising the customer experience have also been rolled out to our people managers.
Our IT systems, processes and capabilities are a key enabler to unlock the value in data driven services and solutions. In 2018, to support our Digital Vodafone strategy we launched an acceleration programme, which strengthened our internal IT capabilities, adopted agile and lean ways of working, modernised our IT architecture and implemented a new IT operating model.
Focusing on our customersOver the last year, we have continued to focus on improving the customer experience through the roll out of the Digital Vodafone Way CARE training initiative. The core of the programme aims to ensure front line staff take end-to-end ownership for resolving customer problems and deliver an outstanding customer experience.
As part of the training, new interactive scenarios have been developed to provide employees with a deeper understanding of how to interact and support our diverse customer base. For instance, supporting a customer who is transitioning gender or customers who are physically disabled.
Our people and culture
The people behind our purpose led businessOur people are behind every aspect of our Digital Vodafone strategy and are committed to delivering a superior network performance and outstanding customer experience.
A diverse and inclusive organisationThis year, we employed an average of 103,564 people with 136 nationalities as well as over 23,978 contractors. Our senior leadership team includes 26 nationalities, bringing together a diverse set of experiences and opinions, which helps us achieve our goals by better understanding the needs of our customers. Our commitment to all forms of diversity and inclusion begins at the top, with clear leadership from the Vodafone Group Plc Board and is embedded at every level of our business through the “Digital Vodafone Way,” the “Code of Conduct” and our “Business Principles”.
Our commitment is acknowledged and supported by our employees worldwide: in our 2018 annual Global People Survey, 89% of employees who responded said they felt they were treated fairly, irrespective of age, gender, disability, sexual orientation, gender identity, cultural background or beliefs. This year, we reviewed and updated our Code of Conduct in order to emphasise our zero-tolerance stance towards sexual harassment and abuse of authority. We also launched a global minimum paternity standard and continued to support women returning to work through our Reconnect programme and global maternity standard, which, in the last three years has benefited more than 5,600 women. The two latter initiatives support our ambition to become the world’s best employer for women by 2025.
Doing what’s rightWe believe that ethical conduct is just as important as high performance, as failure to operate ethically impacts our business. Our Code of Conduct outlines the behaviours we expect from every single person working for and with Vodafone. Our Business Principles are the foundation of how we do business and set out the values we want everyone who works for or with Vodafone to respect. Together, these elements ensure we protect Vodafone’s reputation, our people and our assets.
This year’s, “Doing What’s Right” campaign utilised e-learning and gamification techniques to increase employee participation and engagement. The campaign highlighted a number of common compliance situations, such as dealing with personal data, conflicts of interest and accepting gifts.
By bringing to life specific risk situations, the programme aimed to increase awareness and, importantly, understanding of the issues an individual may face and how to deal with situations that could arise. By the end of March 2018, more than 95% of employees who had access to the training had completed it.
Our people: key information
2018 2017 2016
Average number of employees 103,564 105,870 104,553
Employee engagement 80% 80% 79%
Employee turnover rate 18% 18% 20%
Women in senior leadership positions2 25% 25% 24%
Women in management and leadership roles 29% 28% 27%
The headcount figures are an average of our monthly headcount and includes India but excludes the Netherlands.1 Includes Vodafone Shared Services India. 2 % of senior women in our top 225 positions.
By contractEmployees: 103,564 Contractors: 23,978
By genderMale: 62.5% Female: 37.5%
By locationGermany: 12.6% UK: 11.2%
Italy: 5.8% Spain: 4.7%
Vodacom: 7.3% India1: 20.9%
Other: 37.5%
Vodafone Group Plc Annual Report 201836
Strategic Report
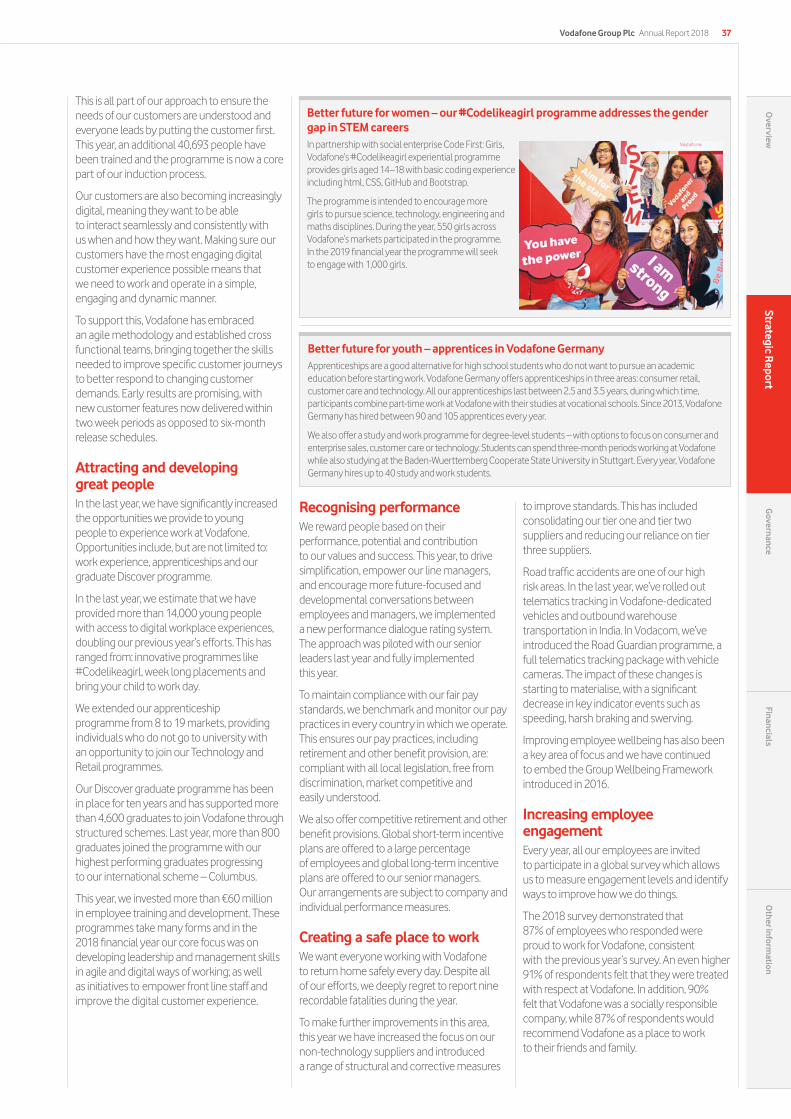
Recognising performanceWe reward people based on their performance, potential and contribution to our values and success. This year, to drive simplification, empower our line managers, and encourage more future-focused and developmental conversations between employees and managers, we implemented a new performance dialogue rating system. The approach was piloted with our senior leaders last year and fully implemented this year.
To maintain compliance with our fair pay standards, we benchmark and monitor our pay practices in every country in which we operate. This ensures our pay practices, including retirement and other benefit provision, are: compliant with all local legislation, free from discrimination, market competitive and easily understood.
We also offer competitive retirement and other benefit provisions. Global short-term incentive plans are offered to a large percentage of employees and global long-term incentive plans are offered to our senior managers. Our arrangements are subject to company and individual performance measures.
Creating a safe place to workWe want everyone working with Vodafone to return home safely every day. Despite all of our efforts, we deeply regret to report nine recordable fatalities during the year.
To make further improvements in this area, this year we have increased the focus on our non-technology suppliers and introduced a range of structural and corrective measures
to improve standards. This has included consolidating our tier one and tier two suppliers and reducing our reliance on tier three suppliers.
Road traffic accidents are one of our high risk areas. In the last year, we’ve rolled out telematics tracking in Vodafone-dedicated vehicles and outbound warehouse transportation in India. In Vodacom, we’ve introduced the Road Guardian programme, a full telematics tracking package with vehicle cameras. The impact of these changes is starting to materialise, with a significant decrease in key indicator events such as speeding, harsh braking and swerving.
Improving employee wellbeing has also been a key area of focus and we have continued to embed the Group Wellbeing Framework introduced in 2016.
Increasing employee engagementEvery year, all our employees are invited to participate in a global survey which allows us to measure engagement levels and identify ways to improve how we do things.
The 2018 survey demonstrated that 87% of employees who responded were proud to work for Vodafone, consistent with the previous year’s survey. An even higher 91% of respondents felt that they were treated with respect at Vodafone. In addition, 90% felt that Vodafone was a socially responsible company, while 87% of respondents would recommend Vodafone as a place to work to their friends and family.
This is all part of our approach to ensure the needs of our customers are understood and everyone leads by putting the customer first. This year, an additional 40,693 people have been trained and the programme is now a core part of our induction process.
Our customers are also becoming increasingly digital, meaning they want to be able to interact seamlessly and consistently with us when and how they want. Making sure our customers have the most engaging digital customer experience possible means that we need to work and operate in a simple, engaging and dynamic manner.
To support this, Vodafone has embraced an agile methodology and established cross functional teams, bringing together the skills needed to improve specific customer journeys to better respond to changing customer demands. Early results are promising, with new customer features now delivered within two week periods as opposed to six-month release schedules.
Attracting and developing great peopleIn the last year, we have significantly increased the opportunities we provide to young people to experience work at Vodafone. Opportunities include, but are not limited to: work experience, apprenticeships and our graduate Discover programme.
In the last year, we estimate that we have provided more than 14,000 young people with access to digital workplace experiences, doubling our previous year’s efforts. This has ranged from: innovative programmes like #Codelikeagirl, week long placements and bring your child to work day.
We extended our apprenticeship programme from 8 to 19 markets, providing individuals who do not go to university with an opportunity to join our Technology and Retail programmes.
Our Discover graduate programme has been in place for ten years and has supported more than 4,600 graduates to join Vodafone through structured schemes. Last year, more than 800 graduates joined the programme with our highest performing graduates progressing to our international scheme – Columbus.
This year, we invested more than €60 million in employee training and development. These programmes take many forms and in the 2018 financial year our core focus was on developing leadership and management skills in agile and digital ways of working; as well as initiatives to empower front line staff and improve the digital customer experience.
Better future for women – our #Codelikeagirl programme addresses the gender gap in STEM careers In partnership with social enterprise Code First: Girls, Vodafone’s #Codelikeagirl experiential programme provides girls aged 14–18 with basic coding experience including html, CSS, GitHub and Bootstrap.
The programme is intended to encourage more girls to pursue science, technology, engineering and maths disciplines. During the year, 550 girls across Vodafone’s markets participated in the programme. In the 2019 financial year the programme will seek to engage with 1,000 girls.
Better future for youth – apprentices in Vodafone GermanyApprenticeships are a good alternative for high school students who do not want to pursue an academic education before starting work. Vodafone Germany offers apprenticeships in three areas: consumer retail, customer care and technology. All our apprenticeships last between 2.5 and 3.5 years, during which time, participants combine part-time work at Vodafone with their studies at vocational schools. Since 2013, Vodafone Germany has hired between 90 and 105 apprentices every year.
We also offer a study and work programme for degree-level students – with options to focus on consumer and enterprise sales, customer care or technology. Students can spend three-month periods working at Vodafone while also studying at the Baden-Wuerttemberg Cooperate State University in Stuttgart. Every year, Vodafone Germany hires up to 40 study and work students.
Vodafone Group Plc Annual Report 2018 37O
verviewStrategic R
eportG
overnanceFinancials
Other inform
ation
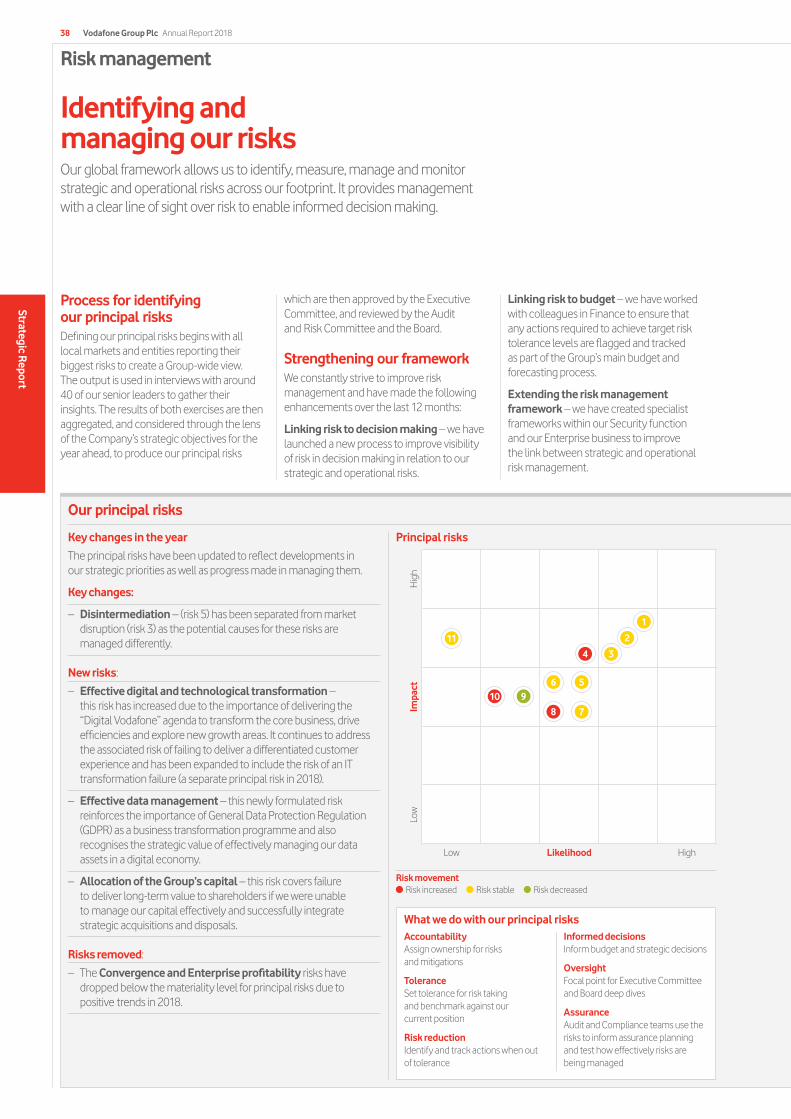
Our principal risks
Key changes in the year
The principal risks have been updated to reflect developments in our strategic priorities as well as progress made in managing them.
Key changes:
– Disintermediation – (risk 5) has been separated from market disruption (risk 3) as the potential causes for these risks are managed differently.
New risks:
– Effective digital and technological transformation – this risk has increased due to the importance of delivering the “Digital Vodafone” agenda to transform the core business, drive efficiencies and explore new growth areas. It continues to address the associated risk of failing to deliver a differentiated customer experience and has been expanded to include the risk of an IT transformation failure (a separate principal risk in 2018).
– Effective data management – this newly formulated risk reinforces the importance of General Data Protection Regulation (GDPR) as a business transformation programme and also recognises the strategic value of effectively managing our data assets in a digital economy.
– Allocation of the Group’s capital – this risk covers failure to deliver long-term value to shareholders if we were unable to manage our capital effectively and successfully integrate strategic acquisitions and disposals.
Risks removed:
– The Convergence and Enterprise profitability risks have dropped below the materiality level for principal risks due to positive trends in 2018.
Risk management
Identifying and managing our risksOur global framework allows us to identify, measure, manage and monitor strategic and operational risks across our footprint. It provides management with a clear line of sight over risk to enable informed decision making.
Process for identifying our principal risksDefining our principal risks begins with all local markets and entities reporting their biggest risks to create a Group-wide view. The output is used in interviews with around 40 of our senior leaders to gather their insights. The results of both exercises are then aggregated, and considered through the lens of the Company’s strategic objectives for the year ahead, to produce our principal risks
which are then approved by the Executive Committee, and reviewed by the Audit and Risk Committee and the Board.
Strengthening our frameworkWe constantly strive to improve risk management and have made the following enhancements over the last 12 months:
Linking risk to decision making – we have launched a new process to improve visibility of risk in decision making in relation to our strategic and operational risks.
Linking risk to budget – we have worked with colleagues in Finance to ensure that any actions required to achieve target risk tolerance levels are flagged and tracked as part of the Group’s main budget and forecasting process.
Extending the risk management framework – we have created specialist frameworks within our Security function and our Enterprise business to improve the link between strategic and operational risk management.
What we do with our principal risksAccountability Assign ownership for risks and mitigations
Tolerance Set tolerance for risk taking and benchmark against our current position
Risk reduction Identify and track actions when out of tolerance
Informed decisions Inform budget and strategic decisions
Oversight Focal point for Executive Committee and Board deep dives
Assurance Audit and Compliance teams use the risks to inform assurance planning and test how effectively risks are being managed
Risk movement Risk increased Risk stable Risk decreased
Low Likelihood High
Low
Impa
ctH
igh
Principal risks
Vodafone Group Plc Annual Report 201838
Strategic Report
7
5
4 3
6
8
910
11 2
1
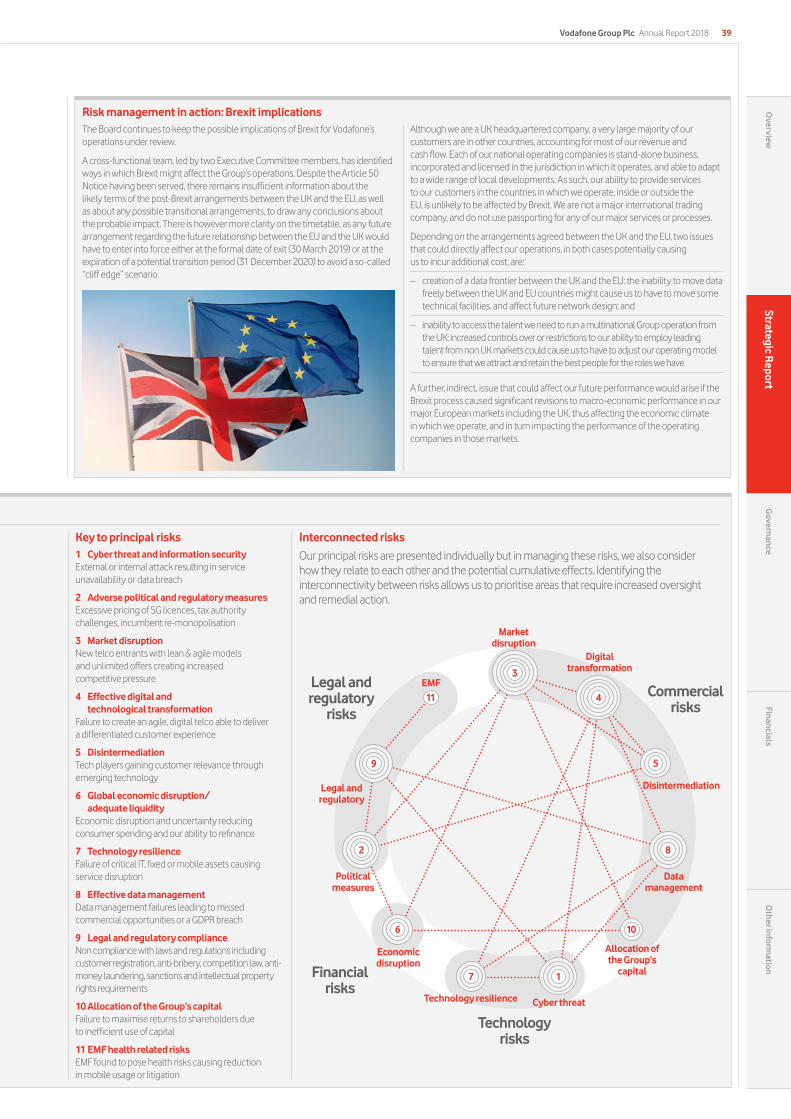
Legal and regulatory
risks
Financial risks
Technology risks
Interconnected risks
Our principal risks are presented individually but in managing these risks, we also consider how they relate to each other and the potential cumulative effects. Identifying the interconnectivity between risks allows us to prioritise areas that require increased oversight and remedial action.
Vodafone Group Plc Annual Report 2018 39O
verviewStrategic R
eportG
overnanceFinancials
Other inform
ation
Key to principal risks1 Cyber threat and information securityExternal or internal attack resulting in service unavailability or data breach
2 Adverse political and regulatory measuresExcessive pricing of 5G licences, tax authority challenges, incumbent re-monopolisation
3 Market disruptionNew telco entrants with lean & agile models and unlimited offers creating increased competitive pressure
4 Effective digital and technological transformation
Failure to create an agile, digital telco able to deliver a differentiated customer experience
5 DisintermediationTech players gaining customer relevance through emerging technology
6 Global economic disruption/adequate liquidity
Economic disruption and uncertainty reducing consumer spending and our ability to refinance
7 Technology resilienceFailure of critical IT, fixed or mobile assets causing service disruption
8 Effective data managementData management failures leading to missed commercial opportunities or a GDPR breach
9 Legal and regulatory complianceNon compliance with laws and regulations including customer registration, anti-bribery, competition law, anti-money laundering, sanctions and intellectual property rights requirements
10 Allocation of the Group’s capitalFailure to maximise returns to shareholders due to inefficient use of capital
11 EMF health related risksEMF found to pose health risks causing reduction in mobile usage or litigation
Risk management in action: Brexit implicationsThe Board continues to keep the possible implications of Brexit for Vodafone’s operations under review.
A cross-functional team, led by two Executive Committee members, has identified ways in which Brexit might affect the Group’s operations. Despite the Article 50 Notice having been served, there remains insufficient information about the likely terms of the post-Brexit arrangements between the UK and the EU, as well as about any possible transitional arrangements, to draw any conclusions about the probable impact. There is however more clarity on the timetable, as any future arrangement regarding the future relationship between the EU and the UK would have to enter into force either at the formal date of exit (30 March 2019) or at the expiration of a potential transition period (31 December 2020) to avoid a so-called “cliff edge” scenario.
Although we are a UK headquartered company, a very large majority of our customers are in other countries, accounting for most of our revenue and cash flow. Each of our national operating companies is stand-alone business, incorporated and licensed in the jurisdiction in which it operates, and able to adapt to a wide range of local developments. As such, our ability to provide services to our customers in the countries in which we operate, inside or outside the EU, is unlikely to be affected by Brexit. We are not a major international trading company, and do not use passporting for any of our major services or processes.
Depending on the arrangements agreed between the UK and the EU, two issues that could directly affect our operations, in both cases potentially causing us to incur additional cost, are:
– creation of a data frontier between the UK and the EU: the inability to move data freely between the UK and EU countries might cause us to have to move some technical facilities, and affect future network design; and
– inability to access the talent we need to run a multinational Group operation from the UK: increased controls over or restrictions to our ability to employ leading talent from non UK markets could cause us to have to adjust our operating model to ensure that we attract and retain the best people for the roles we have.
A further, indirect, issue that could affect our future performance would arise if the Brexit process caused significant revisions to macro-economic performance in our major European markets including the UK, thus affecting the economic climate in which we operate, and in turn impacting the performance of the operating companies in those markets.
1010
2
9
11EMF
Legal and regulatory
Political measures
Economic disruption
Technology resilience Cyber threat
Allocation of the Group’s
capital
Data management
Disintermediation
Market disruption
Digital transformation3
4
5
8
17
6
Commercial risks
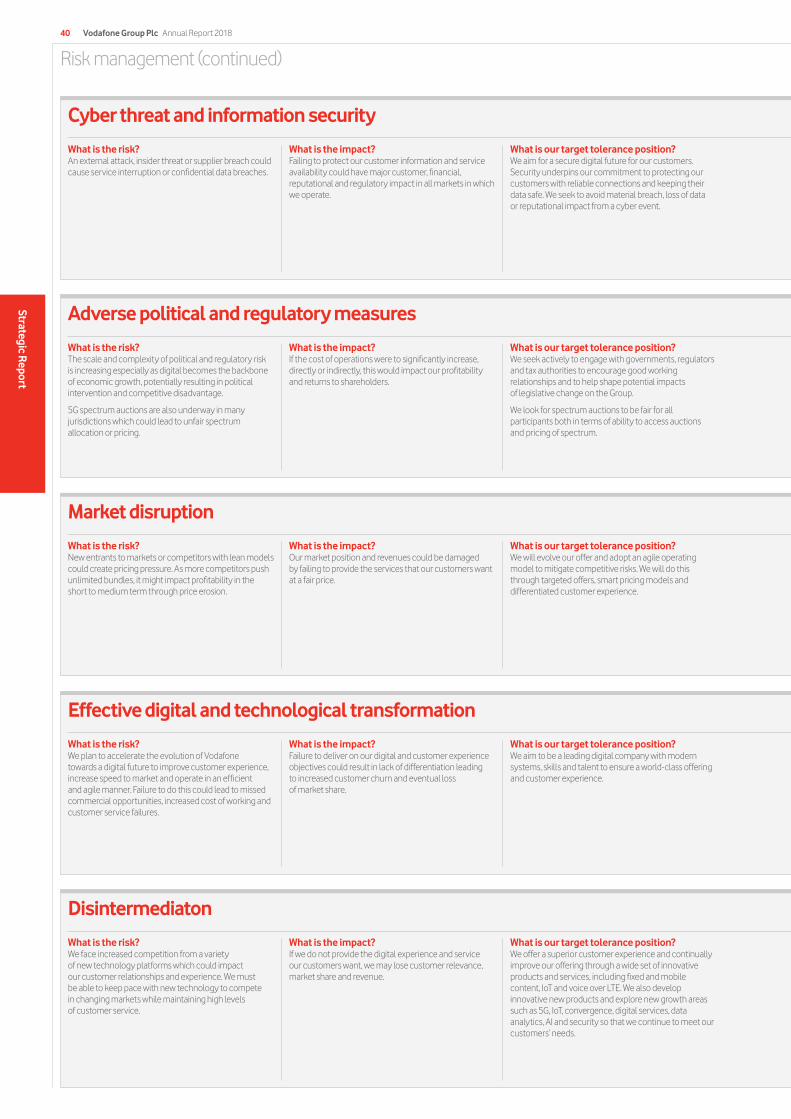
Risk management (continued)
What is the risk?An external attack, insider threat or supplier breach could cause service interruption or confidential data breaches.
What is the impact?Failing to protect our customer information and service availability could have major customer, financial, reputational and regulatory impact in all markets in which we operate.
What is our target tolerance position?We aim for a secure digital future for our customers. Security underpins our commitment to protecting our customers with reliable connections and keeping their data safe. We seek to avoid material breach, loss of data or reputational impact from a cyber event.
What is the risk?New entrants to markets or competitors with lean models could create pricing pressure. As more competitors push unlimited bundles, it might impact profitability in the short to medium term through price erosion.
What is the impact?Our market position and revenues could be damaged by failing to provide the services that our customers want at a fair price.
What is our target tolerance position?We will evolve our offer and adopt an agile operating model to mitigate competitive risks. We will do this through targeted offers, smart pricing models and differentiated customer experience.
What is the risk?The scale and complexity of political and regulatory risk is increasing especially as digital becomes the backbone of economic growth, potentially resulting in political intervention and competitive disadvantage.
5G spectrum auctions are also underway in many jurisdictions which could lead to unfair spectrum allocation or pricing.
What is the impact?If the cost of operations were to significantly increase, directly or indirectly, this would impact our profitability and returns to shareholders.
What is our target tolerance position?We seek actively to engage with governments, regulators and tax authorities to encourage good working relationships and to help shape potential impacts of legislative change on the Group.
We look for spectrum auctions to be fair for all participants both in terms of ability to access auctions and pricing of spectrum.
Cyber threat and information security
Market disruption
Adverse political and regulatory measures
What is the risk? We plan to accelerate the evolution of Vodafone towards a digital future to improve customer experience, increase speed to market and operate in an efficient and agile manner. Failure to do this could lead to missed commercial opportunities, increased cost of working and customer service failures.
What is the impact?Failure to deliver on our digital and customer experience objectives could result in lack of differentiation leading to increased customer churn and eventual loss of market share.
What is our target tolerance position?We aim to be a leading digital company with modern systems, skills and talent to ensure a world-class offering and customer experience.
Effective digital and technological transformation
What is the risk?We face increased competition from a variety of new technology platforms which could impact our customer relationships and experience. We must be able to keep pace with new technology to compete in changing markets while maintaining high levels of customer service.
What is the impact?If we do not provide the digital experience and service our customers want, we may lose customer relevance, market share and revenue.
What is our target tolerance position?We offer a superior customer experience and continually improve our offering through a wide set of innovative products and services, including fixed and mobile content, IoT and voice over LTE. We also develop innovative new products and explore new growth areas such as 5G, IoT, convergence, digital services, data analytics, AI and security so that we continue to meet our customers’ needs.
Disintermediaton
Vodafone Group Plc Annual Report 201840
Strategic Report
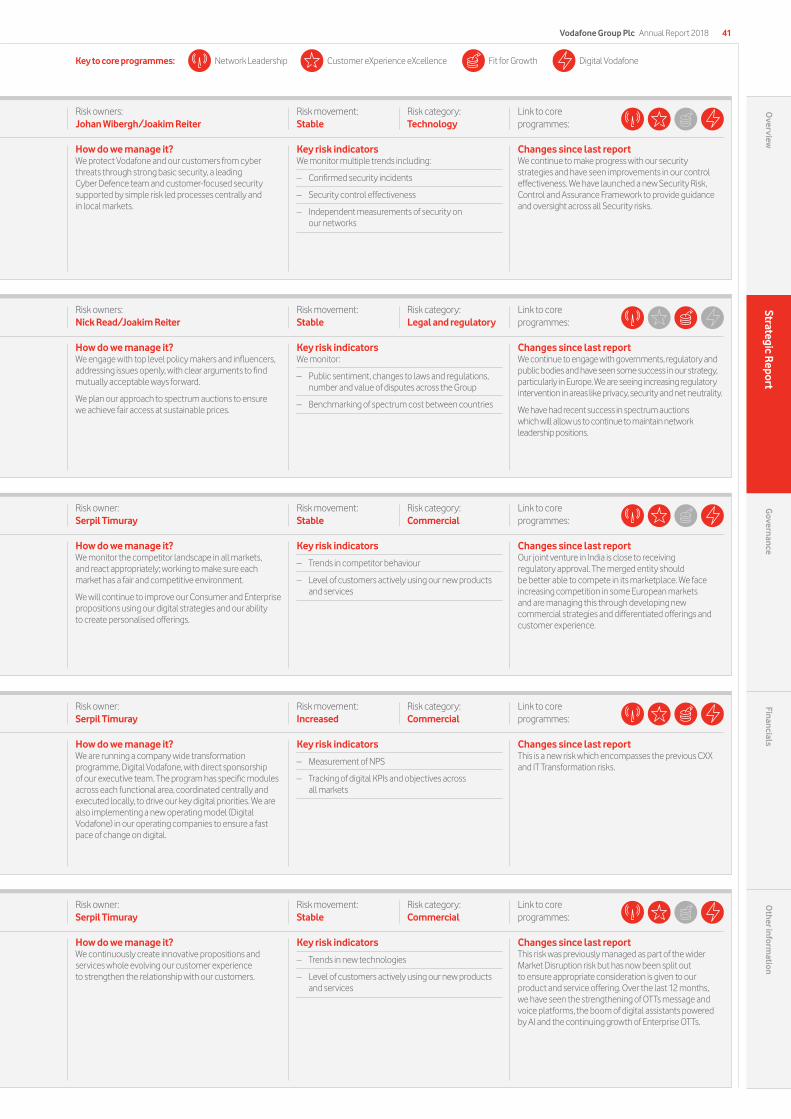
How do we manage it?We protect Vodafone and our customers from cyber threats through strong basic security, a leading Cyber Defence team and customer-focused security supported by simple risk led processes centrally and in local markets.
Key risk indicatorsWe monitor multiple trends including:
– Confirmed security incidents
– Security control effectiveness
– Independent measurements of security on our networks
Changes since last reportWe continue to make progress with our security strategies and have seen improvements in our control effectiveness. We have launched a new Security Risk, Control and Assurance Framework to provide guidance and oversight across all Security risks.
How do we manage it?We monitor the competitor landscape in all markets, and react appropriately; working to make sure each market has a fair and competitive environment.
We will continue to improve our Consumer and Enterprise propositions using our digital strategies and our ability to create personalised offerings.
Key risk indicators
– Trends in competitor behaviour
– Level of customers actively using our new products and services
Changes since last reportOur joint venture in India is close to receiving regulatory approval. The merged entity should be better able to compete in its marketplace. We face increasing competition in some European markets and are managing this through developing new commercial strategies and differentiated offerings and customer experience.
How do we manage it?We engage with top level policy makers and influencers, addressing issues openly, with clear arguments to find mutually acceptable ways forward.
We plan our approach to spectrum auctions to ensure we achieve fair access at sustainable prices.
Key risk indicatorsWe monitor:
– Public sentiment, changes to laws and regulations, number and value of disputes across the Group
– Benchmarking of spectrum cost between countries
Changes since last reportWe continue to engage with governments, regulatory and public bodies and have seen some success in our strategy, particularly in Europe. We are seeing increasing regulatory intervention in areas like privacy, security and net neutrality.
We have had recent success in spectrum auctions which will allow us to continue to maintain network leadership positions.
Risk owners: Johan Wibergh/Joakim Reiter
Risk movement: Stable
Risk category: Technology
Link to core programmes:
Risk owner: Serpil Timuray
Risk movement: Stable
Risk category: Commercial
Link to core programmes:
Risk owners: Nick Read/Joakim Reiter
Risk movement: Stable
Risk category: Legal and regulatory
Link to core programmes:
How do we manage it?We are running a company wide transformation programme, Digital Vodafone, with direct sponsorship of our executive team. The program has specific modules across each functional area, coordinated centrally and executed locally, to drive our key digital priorities. We are also implementing a new operating model (Digital Vodafone) in our operating companies to ensure a fast pace of change on digital.
Key risk indicators
– Measurement of NPS
– Tracking of digital KPIs and objectives across all markets
Changes since last reportThis is a new risk which encompasses the previous CXX and IT Transformation risks.
Risk owner: Serpil Timuray
Risk movement: Increased
Risk category: Commercial
Link to core programmes:
How do we manage it?We continuously create innovative propositions and services whole evolving our customer experience to strengthen the relationship with our customers.
Key risk indicators
– Trends in new technologies
– Level of customers actively using our new products and services
Changes since last reportThis risk was previously managed as part of the wider Market Disruption risk but has now been split out to ensure appropriate consideration is given to our product and service offering. Over the last 12 months, we have seen the strengthening of OTTs message and voice platforms, the boom of digital assistants powered by AI and the continuing growth of Enterprise OTTs.
Risk owner: Serpil Timuray
Risk movement: Stable
Risk category: Commercial
Link to core programmes:
Vodafone Group Plc Annual Report 2018 41O
verviewStrategic R
eportG
overnanceFinancials
Other inform
ation
Customer eXperience eXcellenceNetwork Leadership Fit for Growth Digital VodafoneKey to core programmes:
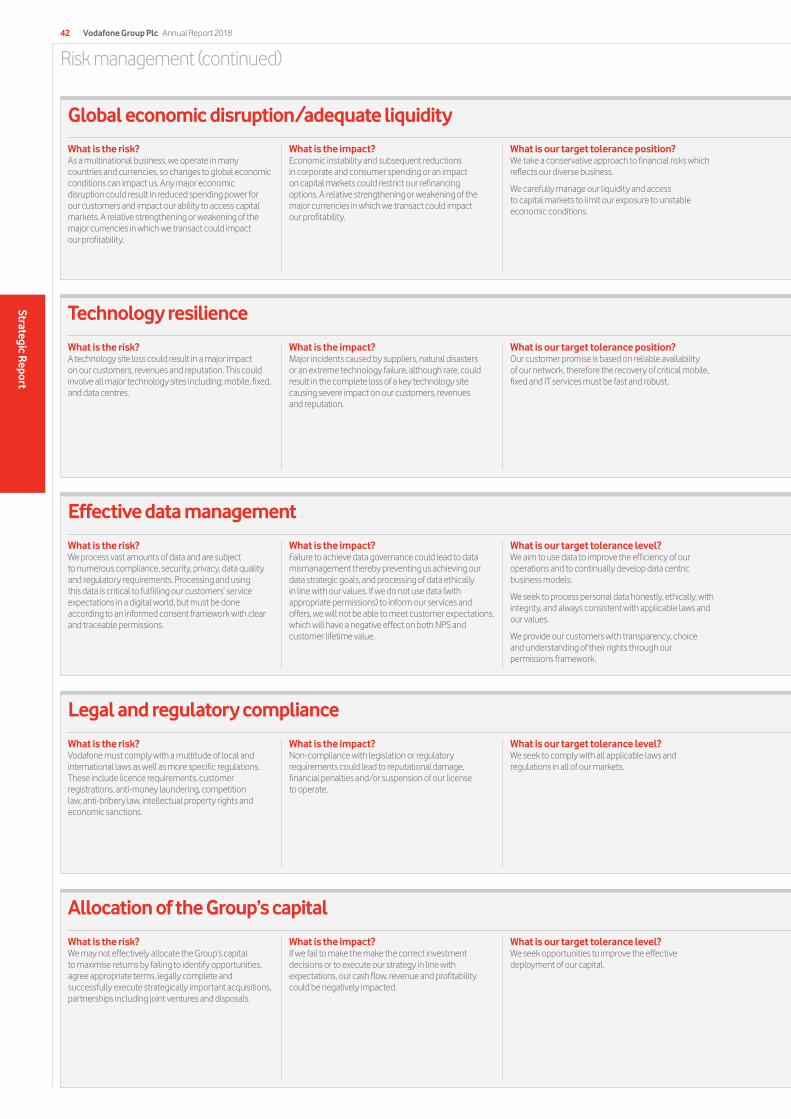
Risk management (continued)
What is the risk?As a multinational business, we operate in many countries and currencies, so changes to global economic conditions can impact us. Any major economic disruption could result in reduced spending power for our customers and impact our ability to access capital markets. A relative strengthening or weakening of the major currencies in which we transact could impact our profitability.
What is the impact?Economic instability and subsequent reductions in corporate and consumer spending or an impact on capital markets could restrict our refinancing options. A relative strengthening or weakening of the major currencies in which we transact could impact our profitability.
What is our target tolerance position?We take a conservative approach to financial risks which reflects our diverse business.
We carefully manage our liquidity and access to capital markets to limit our exposure to unstable economic conditions.
Global economic disruption/adequate liquidity
What is the risk?A technology site loss could result in a major impact on our customers, revenues and reputation. This could involve all major technology sites including: mobile, fixed, and data centres.
What is the impact?Major incidents caused by suppliers, natural disasters or an extreme technology failure, although rare, could result in the complete loss of a key technology site causing severe impact on our customers, revenues and reputation.
What is our target tolerance position?Our customer promise is based on reliable availability of our network, therefore the recovery of critical mobile, fixed and IT services must be fast and robust.
Technology resilience
What is the risk?We process vast amounts of data and are subject to numerous compliance, security, privacy, data quality and regulatory requirements. Processing and using this data is critical to fulfilling our customers’ service expectations in a digital world, but must be done according to an informed consent framework with clear and traceable permissions.
What is the impact?Failure to achieve data governance could lead to data mismanagement thereby preventing us achieving our data strategic goals, and processing of data ethically in line with our values. If we do not use data (with appropriate permissions) to inform our services and offers, we will not be able to meet customer expectations, which will have a negative effect on both NPS and customer lifetime value.
What is our target tolerance level?We aim to use data to improve the efficiency of our operations and to continually develop data centric business models.
We seek to process personal data honestly, ethically, with integrity, and always consistent with applicable laws and our values.
We provide our customers with transparency, choice and understanding of their rights through our permissions framework.
Effective data management
What is the risk?Vodafone must comply with a multitude of local and international laws as well as more specific regulations. These include licence requirements, customer registrations, anti-money laundering, competition law, anti-bribery law, intellectual property rights and economic sanctions.
What is the impact?Non-compliance with legislation or regulatory requirements could lead to reputational damage, financial penalties and/or suspension of our license to operate.
What is our target tolerance level?We seek to comply with all applicable laws and regulations in all of our markets.
Legal and regulatory compliance
What is the risk?We may not effectively allocate the Group’s capital to maximise returns by failing to identify opportunities, agree appropriate terms, legally complete and successfully execute strategically important acquisitions, partnerships including joint ventures and disposals.
What is the impact?If we fail to make the make the correct investment decisions or to execute our strategy in line with expectations, our cash flow, revenue and profitability could be negatively impacted.
What is our target tolerance level?We seek opportunities to improve the effective deployment of our capital.
Allocation of the Group’s capital
Vodafone Group Plc Annual Report 201842
Strategic Report
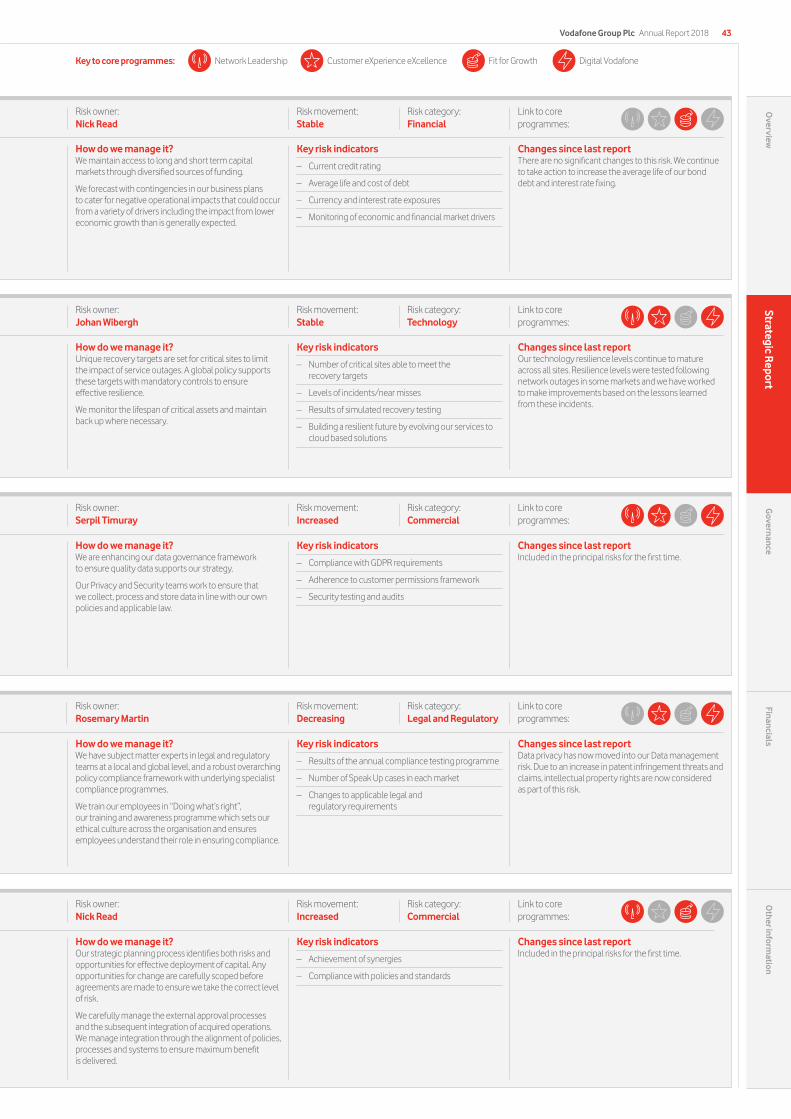
How do we manage it?We maintain access to long and short term capital markets through diversified sources of funding.
We forecast with contingencies in our business plans to cater for negative operational impacts that could occur from a variety of drivers including the impact from lower economic growth than is generally expected.
Key risk indicators
– Current credit rating
– Average life and cost of debt
– Currency and interest rate exposures
– Monitoring of economic and financial market drivers
Changes since last reportThere are no significant changes to this risk. We continue to take action to increase the average life of our bond debt and interest rate fixing.
Risk owner: Nick Read
Risk movement: Stable
Risk category: Financial
Link to core programmes:
How do we manage it?Unique recovery targets are set for critical sites to limit the impact of service outages. A global policy supports these targets with mandatory controls to ensure effective resilience.
We monitor the lifespan of critical assets and maintain back up where necessary.
Key risk indicators
– Number of critical sites able to meet the recovery targets
– Levels of incidents/near misses
– Results of simulated recovery testing
– Building a resilient future by evolving our services to cloud based solutions
Changes since last reportOur technology resilience levels continue to mature across all sites. Resilience levels were tested following network outages in some markets and we have worked to make improvements based on the lessons learned from these incidents.
Risk owner: Johan Wibergh
Risk movement: Stable
Risk category: Technology
Link to core programmes:
How do we manage it?We are enhancing our data governance framework to ensure quality data supports our strategy.
Our Privacy and Security teams work to ensure that we collect, process and store data in line with our own policies and applicable law.
Key risk indicators
– Compliance with GDPR requirements
– Adherence to customer permissions framework
– Security testing and audits
Changes since last reportIncluded in the principal risks for the first time.
Risk owner: Serpil Timuray
Risk movement: Increased
Risk category: Commercial
Link to core programmes:
How do we manage it?We have subject matter experts in legal and regulatory teams at a local and global level, and a robust overarching policy compliance framework with underlying specialist compliance programmes.
We train our employees in “Doing what’s right”, our training and awareness programme which sets our ethical culture across the organisation and ensures employees understand their role in ensuring compliance.
Key risk indicators
– Results of the annual compliance testing programme
– Number of Speak Up cases in each market
– Changes to applicable legal and regulatory requirements
Changes since last reportData privacy has now moved into our Data management risk. Due to an increase in patent infringement threats and claims, intellectual property rights are now considered as part of this risk.
Risk owner: Rosemary Martin
Risk movement: Decreasing
Risk category: Legal and Regulatory
Link to core programmes:
How do we manage it?Our strategic planning process identifies both risks and opportunities for effective deployment of capital. Any opportunities for change are carefully scoped before agreements are made to ensure we take the correct level of risk.
We carefully manage the external approval processes and the subsequent integration of acquired operations. We manage integration through the alignment of policies, processes and systems to ensure maximum benefit is delivered.
Key risk indicators
– Achievement of synergies
– Compliance with policies and standards
Changes since last reportIncluded in the principal risks for the first time.
Risk owner: Nick Read
Risk movement: Increased
Risk category: Commercial
Link to core programmes:
Vodafone Group Plc Annual Report 2018 43O
verviewStrategic R
eportG
overnanceFinancials
Other inform
ation
Customer eXperience eXcellenceNetwork Leadership Fit for Growth Digital VodafoneKey to core programmes:
Risk management (continued)
Electro-magnetic fields related health risks
What is the risk?Electromagnetic signals emitted by mobile devices and base stations may be found to pose health risks, with potential impacts including: changes to national legislation, a reduction in mobile phone usage or litigation.
What is the impact?This is an unlikely risk; however, it would have a major impact on services used by our customers in all our markets – particularly in countries that have a greater concern for environmental and health related risks.
What is our target tolerance position?Vodafone does not want to expose anyone to levels of EMF above those mandated by regulators.
We comply with national standards, where existing, and with our own EMF policy, based on international science guidelines. Our vision is to lead within the industry in responding to public concern about mobiles, masts and health.
Long-Term Viability Statement
The UK Corporate Governance Code (the ‘Code’)The Code requires the Directors to assess the prospects of the Group over a period significantly longer than 12 months and whether they have a reasonable expectation that the Company will be able to continue in operation and meet its liabilities as they fall due over the period of their assessment.
The review periodThe Board has concluded that the most relevant time period for this assessment continues to be three years, as the period in which the principal risks (particularly those of an operational nature) are expected to develop, in what is a fairly dynamic industry sector with the potential impact from digital transformation a fast evolving risk. This time horizon is also supported by the business planning and forecasting cycle.
The Vodafone methodologyThe Board carried out an assessment of the principal risks facing the Group that would threaten its business model, future performance, solvency or liquidity. The assessment starts with the available headroom as of 31 March 2018 and follows a three-stage approach to stress test it (as shown in the diagram).
Key assumptionsThe plans and projections prepared as part of this forecasting cycle include the Group’s cash flows, committed and required funding and other key financial ratios. They were drawn up on the basis that debt refinance will be available in all plausible market conditions and that there will be no material changes to the business structure over the review period. The Group has also taken into account the liquidity implications of merger and acquisition activity not yet completed. As of 31 March 2018, the Group had sources of liquidity (comprised mainly of cash and cash equivalents, and available facilities) of €18.9bn, excluding cash in the held for sale Indian subsidiary.
Viability statementHaving considered the principal risks facing the Group and their inherent uncertainty, as well as the likely effectiveness of the planned mitigating actions, the Directors deem that the process of stress-testing the Group’s prospects is reasonable and appropriate. The cash and facilities available to the Group as of 31 March 2018, along with options available to reduce cash outgoings, provide sufficient headroom, which remained positive in all scenarios tested. Therefore, the Directors confirm that they have a reasonable expectation that the Group remains in operation and is able to meet its liabilities as they fall due up to 31 March 2021.
Vodafone Group Plc Annual Report 201844
Strategic Report
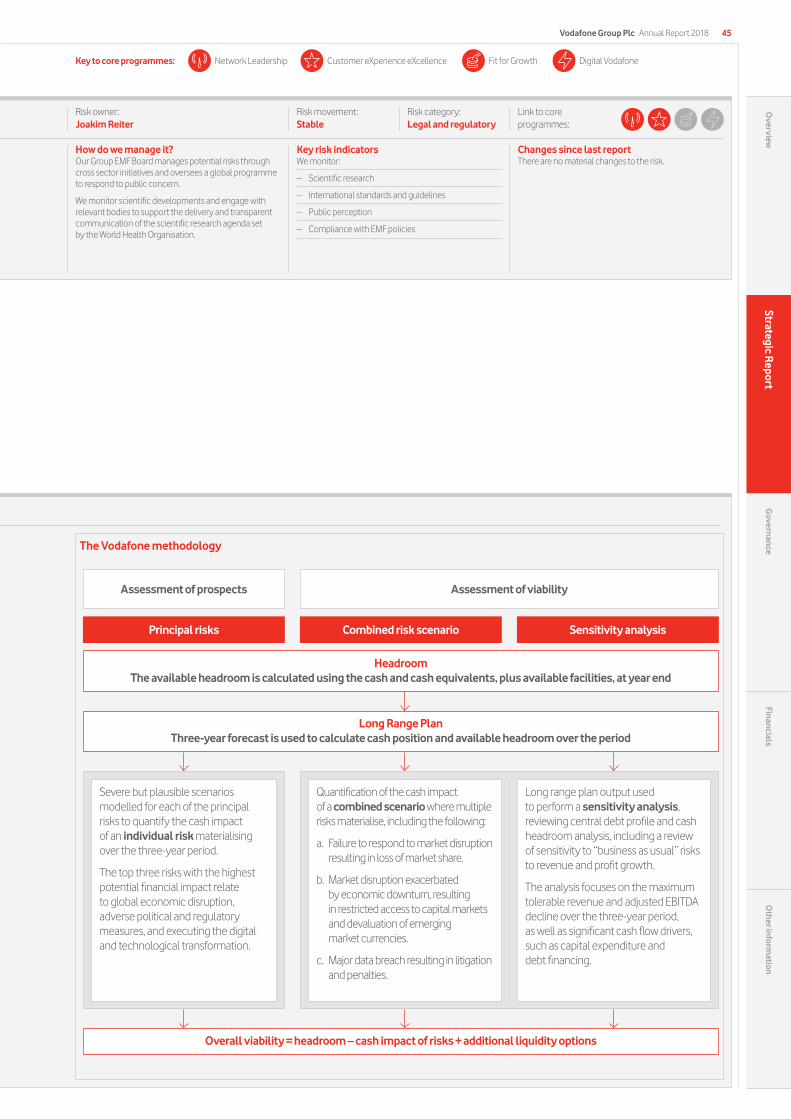
Risk owner: Joakim Reiter
Risk movement: Stable
Risk category: Legal and regulatory
Link to core programmes:
How do we manage it?Our Group EMF Board manages potential risks through cross sector initiatives and oversees a global programme to respond to public concern.
We monitor scientific developments and engage with relevant bodies to support the delivery and transparent communication of the scientific research agenda set by the World Health Organisation.
Key risk indicatorsWe monitor:
– Scientific research
– International standards and guidelines
– Public perception
– Compliance with EMF policies
Changes since last reportThere are no material changes to the risk.
Vodafone Group Plc Annual Report 2018 45O
verviewStrategic R
eportG
overnanceFinancials
Other inform
ation
Customer eXperience eXcellenceNetwork Leadership Digital VodafoneFit for GrowthKey to core programmes:
The Vodafone methodology
Long Range Plan Three-year forecast is used to calculate cash position and available headroom over the period
Headroom The available headroom is calculated using the cash and cash equivalents, plus available facilities, at year end
Principal risks
Assessment of prospects
Combined risk scenario
Assessment of viability
Sensitivity analysis
Severe but plausible scenarios modelled for each of the principal risks to quantify the cash impact of an individual risk materialising over the three-year period.
The top three risks with the highest potential financial impact relate to global economic disruption, adverse political and regulatory measures, and executing the digital and technological transformation.
Quantification of the cash impact of a combined scenario where multiple risks materialise, including the following:
a. Failure to respond to market disruption resulting in loss of market share.
b. Market disruption exacerbated by economic downturn, resulting in restricted access to capital markets and devaluation of emerging market currencies.
c. Major data breach resulting in litigation and penalties.
Long range plan output used to perform a sensitivity analysis, reviewing central debt profile and cash headroom analysis, including a review of sensitivity to “business as usual” risks to revenue and profit growth.
The analysis focuses on the maximum tolerable revenue and adjusted EBITDA decline over the three-year period, as well as significant cash flow drivers, such as capital expenditure and debt financing.
Overall viability = headroom – cash impact of risks + additional liquidity options


