Embed Size (px)
Citation preview
THIRD QUARTERNine months ended 31st December, 2020
HAYLEYS PLCInterim Report

STATEMENT OF PROFIT OR LOSS
Consolidated
Audited Unaudited Unaudited Unaudited Unaudited
year ended 9 months to 9 months to 3 months to 3 months to
31.03.20 31.12.20 31.12.19 Change 31.12.20 31.12.19 Change
Rs.'000 Notes Rs.'000 Rs.'000 % Rs.'000 Rs.'000 %
210,307,003 Revenue 4 171,895,488 160,629,112 7 64,999,923 55,253,570 18
(158,324,525) Cost of sales (126,947,309) (120,896,109) 5 (47,745,570) (40,546,505) 18
(1,829,082) Direct interest cost (1,414,219) (1,390,739) 2 (454,011) (473,518) (4)
50,153,396 Gross profit 43,533,960 38,342,264 14 16,800,342 14,233,547 18
1,672,923 Other income 911,287 1,216,029 (25) 372,130 365,953 2
(10,687,848) Distribution expenses (8,832,979) (8,029,105) 10 (3,109,827) (3,191,505) (3)
(24,247,578) Administrative expenses (18,224,282) (18,903,568) (4) (6,581,687) (6,124,056) 7
(418,013) Other expenses (108,546) (312,978) (65) (32,276) (69,241) (53)
16,472,880 Results from operating activities 17,279,440 12,312,642 40 7,448,682 5,214,698 43
2,038,444 Finance income 1,931,977 1,199,720 61 689,498 297,854 >100
(13,047,348) Finance cost (7,790,796) (9,616,681) (19) (2,154,662) (3,009,427) (28)
(11,008,904) Net finance cost (5,858,819) (8,416,961) (30) (1,465,164) (2,711,573) (46)
86,882 Change in fair value of investment properties - - - - - -
264,061 Share of profit of equity accounted investees (net of tax) 285,244 240,692 19 82,295 21,257 >100
(310,867) Value added tax on financial services (191,130) (249,622) (23) (74,552) (97,750) (24)
5,504,052 Profit before tax for the period 5 11,514,735 3,886,751 >100 5,991,261 2,426,632 >100
(2,609,260) Tax expense (3,311,460) (1,677,029) 97 (1,611,209) (857,772) 88
2,894,792 Profit for the period 8,203,275 2,209,722 >100 4,380,052 1,568,860 >100
Profit for the period attributable to:
372,432 Owners of the parent 4,087,543 138,396 >100 2,721,252 678,497 >100
2,522,360 Non-controlling interest 4,115,732 2,071,326 99 1,658,800 890,363 86 2,894,792 Profit for the period 8,203,275 2,209,722 >100 4,380,052 1,568,860 >100
Earnings / per share
4.97 Basic (Rs.) 54.50 1.85 36.28 9.05
4.97 Diluted (Rs.) 54.50 1.85 36.28 9.05
The Notes on pages 11 to 13 form an integral part of these Financial Statements. Figures in brackets indicate deductions.
Consolidated Consolidated
HAYLEYS PLC | Page 1

STATEMENT OF PROFIT OR LOSS
Company
Audited Unaudited Unaudited Unaudited Unaudited
year ended 9 months to 9 months to 3 months to 3 months to
31.03.20 31.12.20 31.12.19 Change 31.12.20 31.12.19 Change
Rs.'000 Notes Rs.'000 Rs.'000 % Rs.'000 Rs.'000 %
400,102 Revenue 5 297,443 302,033 (2) 105,070 97,545 8
(173,195) Cost of sales (275,333) (130,772) >100 (92,270) (41,553) >100
226,907 Gross profit 22,110 171,261 (87) 12,800 55,992 (77)
1,021,949 Group dividend 2,006,302 586,606 >100 1,122,011 288,720 >100
15,705 Other income 127 15,697 (99) 43 15,697 (100)
13,952 Administrative expenses 88,127 (65,351) >100 96,623 (15,556) >100
1,278,513 Results from operating activities 2,116,666 708,213 >100 1,231,477 344,853 >100
31,841 Finance income 17,469 24,290 (28) 7,629 3,363 127
(3,092,129) Finance cost (2,056,435) (2,338,850) (12) (563,447) (780,006) (28)
(3,060,288) Net finance cost (2,038,966) (2,314,560) (12) (555,818) (776,643) (28)
5,550 Change in fair value of investment properties - - - - - -
(1,776,225) Profit/Loss before tax for the period 5 77,700 (1,606,347) >100 675,659 (431,790) >100
(8,959) Tax expense (17,616) (8,464) >100 (17,616) - >100
(1,785,184) Profit/Loss for the period 60,084 (1,614,811) >100 658,043 (431,790) >100
The Notes on pages 11 to 13 form an integral part of these Financial Statements. Figures in brackets indicate deductions.
Company Company
HAYLEYS PLC | Page 2
STATEMENT OF COMPREHENSIVE INCOME
Consolidated
Audited Unaudited Unaudited Unaudited Unaudited
year ended 9 months to 9 months to 3 months to 3 months to
31.03.20 31.12.20 31.12.19 Change 31.12.20 31.12.19 Change
Rs.'000 Rs.'000 Rs.'000 % Rs.'000 Rs.'000 %
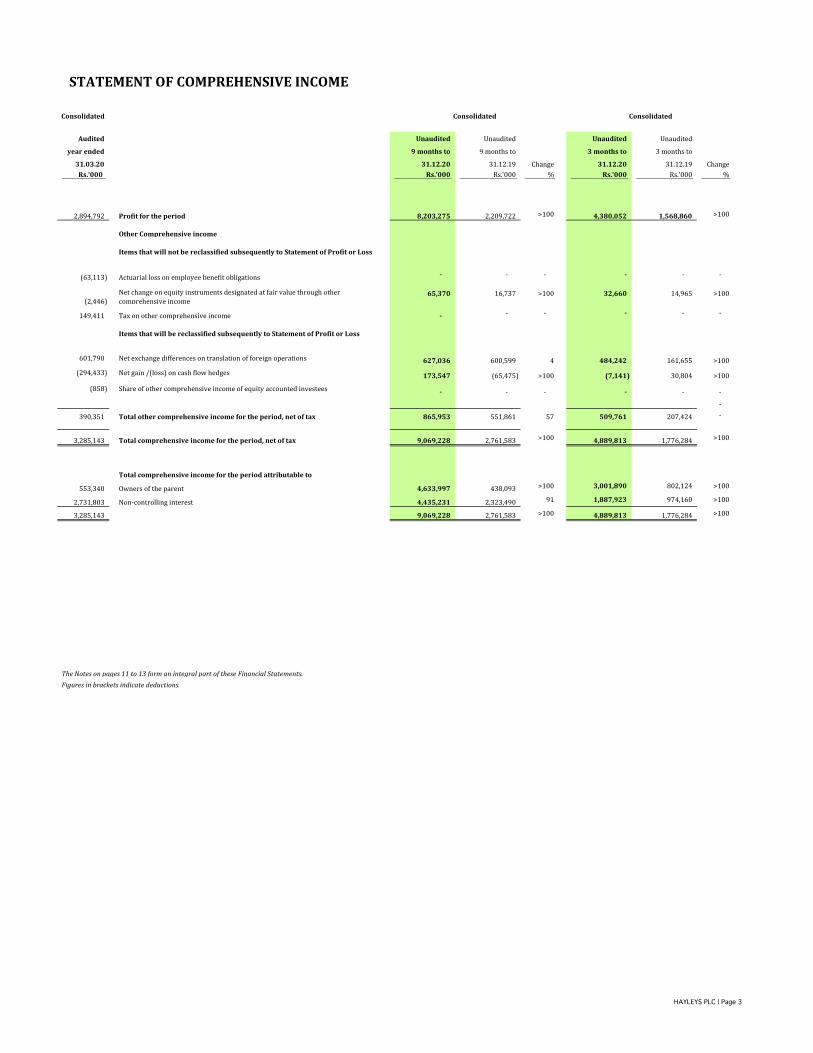
2,894,792 Profit for the period 8,203,275 2,209,722 >100 4,380,052 1,568,860 >100
Other Comprehensive income
Items that will not be reclassified subsequently to Statement of Profit or Loss
(63,113) Actuarial loss on employee benefit obligations - - - - - -
(2,446)
Net change on equity instruments designated at fair value through other
comprehensive income65,370 16,737 >100 32,660 14,965 >100
149,411 Tax on other comprehensive income - - - - - -
Items that will be reclassified subsequently to Statement of Profit or Loss
601,790 Net exchange differences on translation of foreign operations 627,036 600,599 4 484,242 161,655 >100
(294,433) Net gain /(loss) on cash flow hedges 173,547 (65,475) >100 (7,141) 30,804 >100
(858) Share of other comprehensive income of equity accounted investees - - - - - -
-
390,351 Total other comprehensive income for the period, net of tax 865,953 551,861 57 509,761 207,424 -
3,285,143 Total comprehensive income for the period, net of tax 9,069,228 2,761,583 >100 4,889,813 1,776,284 >100
Total comprehensive income for the period attributable to
553,340 Owners of the parent 4,633,997 438,093 >100 3,001,890 802,124 >100
2,731,803 Non-controlling interest 4,435,231 2,323,490 91 1,887,923 974,160 >100
3,285,143 9,069,228 2,761,583 >100 4,889,813 1,776,284 >100
The Notes on pages 11 to 13 form an integral part of these Financial Statements.
Figures in brackets indicate deductions.
Consolidated Consolidated
HAYLEYS PLC | Page 3

STATEMENT OF COMPREHENSIVE INCOME
Company
Audited Unaudited Unaudited Unaudited Unaudited
year ended 9 months to 9 months to 3 months to 3 months to
31.03.20 31.12.20 31.12.19 Change 31.12.20 31.12.19 Change
Rs.'000 Rs.'000 Rs.'000 % Rs.'000 Rs.'000 %
(1,785,184) Profit/(Loss) for the period 60,084 (1,614,811) >100 658,043 (431,790) >100
Other Comprehensive income
Items that will not be reclassified subsequently to Statement of Profit or Loss
(24,857) Actuarial loss on employee benefit obligations - - - - - -
-
Net change on equity instruments designated at fair value through other
comprehensive income- - - - - -
1,879 Tax on other comprehensive income - - - - - -
Items that will be reclassified subsequently to Statement of Profit or Loss
- Net exchange differences on translation of foreign operations - - - - - -
- Net gain /(loss) on cash flow hedges - - - - - -
- Share of other comprehensive income of equity accounted investees - - - - - -
-
(22,978) Total other comprehensive income for the period, net of tax - - - - - -
(1,808,162) Total comprehensive income for the period, net of tax 60,084 (1,614,811) >100 658,043 (431,790) >100
The Notes on pages 11 to 13 form an integral part of these Financial Statements.
Figures in brackets indicate deductions.
Company Company
HAYLEYS PLC | Page 4

STATEMENT OF FINANCIAL POSITION
Consolidated Company
Audited Audited Unaudited Unaudited Unaudited Unaudited
as at as at as at as at as at as at
31.03.20 31.03.20 31.12.20 31.12.19 31.12.20 31.12.19
Rs.'000 Rs.'000 Notes Rs.'000 Rs.'000 Rs.'000 Rs.'000
ASSETS
Non - current assets
88,485,496 178,930 Property, plant & equipment 87,819,061 88,283,414 143,633 217,727
9,613,729 - Right-of- use assets 8,873,845 5,718,930 271,287 -
2,719,260 75,900 Investment Properties 2,720,161 2,006,528 75,900 70,350
505,240 - Biological assets 517,082 462,454 - -
13,293,849 35,229 Intangible assets 13,179,712 14,123,198 55,273 -
- 39,144,873 Investments in subsidiaries - - 39,166,286 38,978,023
2,113,980 1,504,863 Investments in equity accounted investees 2,286,439 2,178,968 1,504,863 1,504,863
252,027 77,597 Other non-current financial assets 292,740 272,483 70,923 79,823
11,333,929 - Non - current trade and other receivables 11,705,766 11,438,957 - -
1,119,034 - Other non-current assets 990,942 2,371,126 - -
1,241,800 71,215 Deferred tax assets 2,142,187 1,077,852 71,215 -
130,678,344 41,088,607 Total non-current assets 130,527,935 127,933,910 41,359,380 40,850,786
Current assets
42,225,729 1,775 Inventories 39,682,007 37,647,887 1,817 1,756
- 3,187,550 Amounts due from subsidiaries - - 2,717,028 2,735,985
150,137 40,239 Amounts due from equity accounted investees 227,361 106,620 69,340 31,045
59,115,893 44,177 Trade and other receivables 63,839,709 60,397,381 58,287 69,282
2,318,473 8,613 Other current assets 2,546,238 2,819,915 60,367 48,327
1,497,885 62,917 Income tax recoverable 1,252,620 1,358,572 46,387 71,798
412,536 5,110 Other current financial assets 287,752 345,513 8,242 7,482
3,495,891 - Short-term deposits 6,663,970 3,372,465 238,328 -
8,411,179 313,293 Cash in hand and at bank 15,317,412 8,183,396 211,752 63,252
3,021 - Assets classified as held for sale 7 3,022 3,021 - -
117,630,744 3,663,674 Total current assets 129,820,091 114,234,770 3,411,548 3,028,927
248,309,088 44,752,281 Total assets 260,348,026 242,168,680 44,770,928 43,879,713
EQUITY AND LIABILITIES
1,575,000 1,575,000 Stated capital 6 1,575,000 1,575,000 1,575,000 1,575,000
676,104 13,226 Capital reserves 675,934 661,113 13,226 13,226
23,644,932 - Other components of equity 24,187,626 23,400,360 - -
13,808,523 14,309,726 Revenue reserves 17,757,298 13,588,877 14,144,810 14,503,077
39,704,559 15,897,952 Total equity attributable to equity holders of the company 44,195,858 39,225,350 15,733,036 16,091,303
23,151,943 - Non- controlling interest 25,987,918 23,351,027 - -
62,856,502 15,897,952 Total Equity 70,183,776 62,576,377 15,733,036 16,091,303
Non - current liabilities
52,239,814 17,969,123 Interest bearing borrowings 54,888,862 51,492,758 20,339,330 18,493,642
787,993 - Grants 829,928 794,368 - -
5,120,949 - Deferred tax liabilities 5,983,089 5,123,567 - -
1,394,611 - Security deposits 1,365,342 1,359,173 - -
1,730,000 - Other Non-current Liabilities 1,791,434 1,555,961 - -
1,979,089 - Other non-current financial liabilities 1,782,206 1,335,898 - -
9,240,100 952,633 Employee benefit obligations 9,875,197 9,098,320 1,051,847 933,231
72,492,556 18,921,756 Total non-current liabilities 76,516,058 70,760,045 21,391,177 19,426,873
Current liabilities
32,019,839 474,980 Trade and other payables 45,189,535 32,753,665 535,562 651,151
3,447,003 6,248 Other current liabilities 4,417,041 2,790,321 15,598 18,380
5,035,956 - Other current financial liabilities 7,641,461 5,162,833 - 10,798
- 69,312 Amounts due to subsidiaries - - 267,751 60,938
3,152 3,152 Amounts due to equity accounted investees 19,162 3,664 3,152 3,152
383,218 - Deferred Revenue 498,323 447,815 - -
754,952 - Income tax payable 1,795,308 562,177 - -
26,774,764 3,847,776 Current portion of long term interest bearing borrowings 20,587,890 25,446,999 4,997,424 3,599,027
44,540,814 5,531,105 Short-term interest bearing borrowings 33,499,140 41,664,452 1,827,228 4,018,091
332 - Liabilities directly associated with assets classified as held for sale 7 332 332 - -
112,960,030 9,932,573 Total current liabilities 113,648,192 108,832,258 7,646,715 8,361,537
185,452,586 28,854,329 Total liabilities 190,164,250 179,592,303 29,037,892 27,788,410
248,309,088 44,752,281 Total equity and liabilities 260,348,026 242,168,680 44,770,928 43,879,713
The Financial Statements have been prepared in compliance with the requirements of the Companies Act no 7 of 2007 .
sgd.
Choliya De Silva
Group Chief Financial Officer
The Directors are responsible for the preparation and presentation of these Financial Statements.
Signed for and on behalf of the Board
sgd. sgd.
Mohan Pandithage Sarath Ganegoda
Chairman & Chief Executive Director
The Notes on pages 11 to 13 form an integral part of these Financial Statements.
Figures in brackets indicate deductions.
Consolidated Company
The Financial Position as at 31st December 2020, and Statement of Profit or Loss , Statement of Comprehensive Income, Changes in Equity and Cash Flow for the nine months then ended are drawn up from the unaudited Financial Statements of the Company, its Subsidiaries and Equity Accounted Investees and they provide the information required by the Colombo Stock Exchange.
12th February 2021
HAYLEYS PLC | Page 5
STATEMENT OF CHANGES IN EQUITY
For the period ended 31st December
Consolidated Stated Reserve Other Revaluation Fair value reserve Cashflow Foreign currency General Timber Bearer Biological Retained Shareholders' Non-controlling Total
capital on scrip capital reserve of financial assets hedge translation reserve reserve reserve earnings Funds interest Equity
issue reserve at FVOCI reserve reserve
Rs. '000 Rs.'000 Rs.'000 Rs.'000 Rs.'000 Rs.'000 Rs.'000 Rs.'000 Rs.'000 Rs.'000 Rs.'000 Rs.'000 Rs.'000 Rs.'000
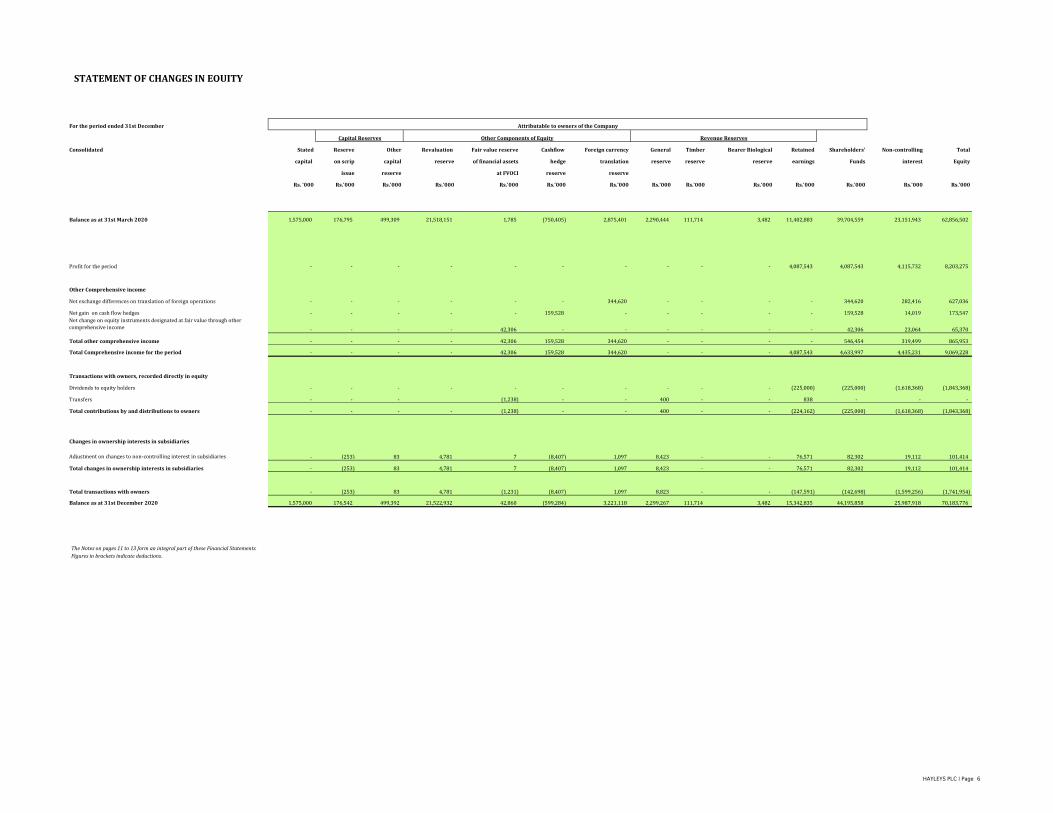
Balance as at 31st March 2020 1,575,000 176,795 499,309 21,518,151 1,785 (750,405) 2,875,401 2,290,444 111,714 3,482 11,402,883 39,704,559 23,151,943 62,856,502
Profit for the period - - - - - - - - - - 4,087,543 4,087,543 4,115,732 8,203,275
Other Comprehensive income
Net exchange differences on translation of foreign operations - - - - - - 344,620 - - - - 344,620 282,416 627,036
Net gain on cash flow hedges - - - - - 159,528 - - - - - 159,528 14,019 173,547
Net change on equity instruments designated at fair value through other
comprehensive income - - - - 42,306 - - - - - - 42,306 23,064 65,370
Total other comprehensive income - - - - 42,306 159,528 344,620 - - - - 546,454 319,499 865,953
Total Comprehensive income for the period - - - - 42,306 159,528 344,620 - - - 4,087,543 4,633,997 4,435,231 9,069,228
Transactions with owners, recorded directly in equity
Dividends to equity holders - - - - - - - - - - (225,000) (225,000) (1,618,368) (1,843,368)
Transfers - - - (1,238) - - 400 - - 838 - - -
Total contributions by and distributions to owners - - - - (1,238) - - 400 - - (224,162) (225,000) (1,618,368) (1,843,368)
Changes in ownership interests in subsidiaries
Adjustment on changes to non-controlling interest in subsidiaries - (253) 83 4,781 7 (8,407) 1,097 8,423 - - 76,571 82,302 19,112 101,414
Total changes in ownership interests in subsidiaries - (253) 83 4,781 7 (8,407) 1,097 8,423 - - 76,571 82,302 19,112 101,414
Total transactions with owners - (253) 83 4,781 (1,231) (8,407) 1,097 8,823 - - (147,591) (142,698) (1,599,256) (1,741,954)
Balance as at 31st December 2020 1,575,000 176,542 499,392 21,522,932 42,860 (599,284) 3,221,118 2,299,267 111,714 3,482 15,342,835 44,195,858 25,987,918 70,183,776
The Notes on pages 11 to 13 form an integral part of these Financial Statements. (8,572) 10,456,969 2,864 1,784,802 11,880 29,329 6,646
Figures in brackets indicate deductions.
Attributable to owners of the Company
Capital Reserves Other Components of Equity Revenue Reserves
HAYLEYS PLC | Page 6

STATEMENT OF CHANGES IN EQUITY
For the period ended 31st December
Consolidated Stated Reserve Other Revaluation Fair value reserve Cashflow Foreign currency General Timber Bearer Biological Retained Shareholders' Non-controlling Total
capital on scrip capital reserve of financial assets hedge translation reserve reserve reserve earnings Funds interest Equity
issue reserve at FVOCI reserve reserve
Rs. '000 Rs.'000 Rs.'000 Rs.'000 Rs.'000 Rs.'000 Rs.'000 Rs.'000 Rs.'000 Rs.'000 Rs.'000 Rs.'000 Rs.'000 Rs.'000
Balance as at 31st March 2019 - Restated 1,575,000 161,499 474,540 21,088,371 3,554 (480,373) 2,460,568 2,244,906 102,166 8,992 11,808,987 39,448,210 21,528,570 60,976,780
Profit for the period - - - - - - - - - - 138,396 138,396 2,071,326 2,209,722
Other Comprehensive income
Net exchange differences on translation of foreign operations - - - - - - 347,757 - - - - 347,757 252,842 600,599
Net loss on cash flow hedges - - - - - (57,915) - - - - - (57,915) (7,560) (65,475)
Net change on equity instruments designated at fair value through other
comprehensive income- - - - 9,855 - - - - - - 9,855 6,882 16,737
Total other comprehensive income - - - - 9,855 (57,915) 347,757 - - - - 299,697 252,164 551,861
Total Comprehensive income for the period - - - - 9,855 (57,915) 347,757 - - - 138,396 438,093 2,323,490 2,761,583
- -
Transactions with owners, recorded directly in equity
Dividends to equity holders - - - - - - - - - - (375,000) (375,000) (922,972) (1,297,972)
Transfers - - 6,375 - - - - - - - (6,375) - - -
Total contributions by and distributions to owners - - 6,375 - - - - - - - (381,375) (375,000) (922,972) (1,297,972)
Changes in ownership interests in subsidiaries
Adjustment on changes to non-controlling interest in subsidiaries - 17,694 1,005 2,872 38 24,457 1,176 (60) 23 - (333,159) (285,954) 421,939 135,985
Total changes in ownership interests in subsidiaries - 17,694 1,005 2,872 38 24,457 1,176 (60) 23 - (333,159) (285,954) 421,939 135,985
Total transactions with owners - 17,694 7,380 2,872 38 24,457 1,176 (60) 23 - (714,534) (660,954) (501,033) (1,161,987)
Balance as at 31st December 2019 1,575,000 179,193 481,920 21,091,243 13,447 (513,831) 2,809,501 2,244,846 102,189 8,992 11,232,850 39,225,350 23,351,027 62,576,377
1,575,000 577,326 490,492 10,636,028 1,819 939,050 2,233,358 72,860 2,346 14,567,260 15,817,529 46,913,069
The Notes on pages 11 to 13 form an integral part of these Financial Statements. (8,572) 10,455,215 11,628 1,870,451 11,488 29,329 6,646
Figures in brackets indicate deductions.
Attributable to owners of the Company
Capital Reserves Other Components of Equity Revenue Reserves
HAYLEYS PLC | Page 7

STATEMENT OF CHANGES IN EQUITY
For the period ended 31st December
Capital
Reserve
Other Component
of Equity
CompanyStated Other Revaluation General Retained Total
capital capital reserve reserve earnings Equity
reserve
Rs. '000 Rs.'000 Rs.'000 Rs.'000 Rs.'000 Rs.'000
Balance as at 31st March 2020 1,575,000 13,226 - 382,087 13,927,639 15,897,952
Profit for the period - - - - 60,084 60,084
Other Comprehensive income
Total other comprehensive income - - - - - -
Total Comprehensive income for the period - - - - 60,084 60,084
Transactions with owners, recorded directly in equity
Dividends to equity holders - - - - (225,000) (225,000)
Total contributions by and distributions to owners - - - - (225,000) (225,000)
Total transactions with owners - - - - (225,000) (225,000)
Balance as at 31st December 2020 1,575,000 13,226 - 382,087 13,762,723 15,733,036
Balance as at 31st March 2019 1,575,000 13,226 - 382,087 16,110,801 18,081,114
Loss for the period - - - - (1,614,811) (1,614,811)
Other Comprehensive income
Total other comprehensive income - - - - - -
Total Comprehensive income for the period - - - - (1,614,811) (1,614,811)
Transactions with owners, recorded directly in equity
Dividends to equity holders - - - - (375,000) (375,000)
Total contributions by and distributions to owners - - - - (375,000) (375,000)
Total transactions with owners - - - - (375,000) (375,000)
Balance as at 31st December 2019 1,575,000 13,226 - 382,087 14,120,990 16,091,303
The Notes on pages 11 to 13 form an integral part of these Financial Statements.
Figures in brackets indicate deductions.
Revenue Reserves
HAYLEYS PLC | Page 8

STATEMENT OF CASH FLOWS
Consolidated Company
Audited Audited Unaudited Unaudited Unaudited Unaudited
year ended year ended 9 months to 9 months to 9 months to 9 months to
31.03.20 31.03.20 31.12.20 31.12.19 31.12.20 31.12.19
Rs.'000 Rs.'000 Rs.'000 Rs.'000 Rs.'000 Rs.'000
Cash flows from operating activities
22,834,854 951,466 Cash generated from operations (Note A) 35,657,852 17,955,028 2,908,400 1,071,582
(810,401) (87,704) Employee benefit paid (636,896) (577,067) (14,734) (52,439)
(3,176,145) (98,327) Income tax paid (2,064,086) (2,600,691) (1,085) (37,377)
18,848,308 765,435 Net cash inflow from operating activities 32,956,870 14,777,270 2,892,581 981,766
Cash flows from investing activities
(8,290,039) (57,572) Purchase and construction of property, plant & equipment (3,244,082) (5,191,978) (32,598) (45,461)
(677,903) - Investments in other non- current assets - (677,903) - -
(4,483,323) (64) Investments in other current financial assets (802,130) (389,963) -
183 - Development of biological assets (11,843) (12,528) - -
38,095 - Grants received - capital 67,546 38,155 - -
(13,600) - Improvements to investment property (901) - - -
488,555 62 Proceeds from disposal of property, plant & equipment/ investment property 132,696 411,048 255 53
5,340 - Proceeds from disposal of intangible assets 92,908 3,627 - -
4,281,574 - Proceeds from disposal of current financial assets 969,426 278,478 -
51,900 - Proceeds from disposal of assets held for sale - 51,900 - -
(236,905) - On acquisition of right to generate hydro power/ ERP system (127,380) (102,589) - -
- Proceeds from buy back of shares of non current financial assets 12,048 - -
- (669,443) Long term investments in group companies and others (2,842) (4,735) (21,413) (667,594)
543,634 21,955 Interest received 344,659 331,207 14,065 17,315
109,246 - Net movement in deferred revenue 115,105 173,843 - -
116,632 - Dividends received from equity accounted investees 112,497 29,133 - -
4,094 456 Dividends received from non-group companies 2,959 4,032 261 370
(8,062,517) (704,606) Net cash used in investing activities (2,339,334) (5,058,273) (39,430) (695,317)
10,785,791 60,829 Net cash inflow before financing 30,617,536 9,718,997 2,853,151 286,449
Cash flows from financing activities
(1,987,712) - Payment on lease (780,114) (10,697) - -
(10,997,452) (3,054,139) Interest paid (including interest capitalized) (6,378,610) (9,058,048) (2,009,487) (2,305,699)
(359,353) - Dividend paid to non-controlling interest (1,618,368) (922,972) - -
52,136,197 10,500,000 Proceeds from interest-bearing borrowings 31,102,762 35,746,739 11,200,000 8,500,000
(46,168,149) (7,010,338) Repayment of interest-bearing borrowings (34,082,981) (30,672,284) (7,975,000) (4,721,125)
- (2,000) Long term loan facility fee - - (3,000) (2,000)
1,013,921 - Net movement in financial liabilities 2,408,622 648,100 - -
6,177 - Net movement in security deposits (29,269) (29,261) - -
(1,533,999) - Acquisition of non-controlling interest 101,408 - - -
- (15,244) Debenture issue fee - - - (15,544)
(375,000) (375,000) Dividends paid to equity holders of parent (225,000) (375,000) (225,000) (375,000)
(8,265,370) 43,279 Net cash inflow / (outflow) from financing activities (9,501,550) (4,673,423) 987,513 1,080,632
2,520,421 104,108 Net increase / (decrease) in cash and cash equivalents 21,115,986 5,045,574 3,840,664 1,367,081
(35,153,050) (5,321,920) Cash and cash equivalents at beginning of the year/period (32,632,629) (35,153,050) (5,217,812) (5,321,920)
(32,632,629) (5,217,812) Cash and cash equivalents at end of the year/period (Note B) (11,516,643) (30,107,476) (1,377,148) (3,954,839)
(0.01) (0.45) - 0.31 - -
Net cash flows related to discontinued operation, shown in Note 7, discontinued operation
The Notes on pages 11 to 13 form an integral part of these Financial Statements.
Figures in brackets indicate deductions.
Consolidated Company
HAYLEYS PLC | Page 9

STATEMENT OF CASH FLOWS
Consolidated Company
Audited Audited Unaudited Unaudited Unaudited Unauditedyear ended year ended 9 months to 9 months to 9 months to 9 months to
31.03.20 31.03.20 31.12.20 31.12.19 31.12.20 31.12.19Rs.'000 Rs.'000 Rs.'000 Rs.'000 Rs.'000 Rs.'000
A. Cash generated from operations
5,504,052 (1,776,225) Profit before tax 11,514,735 3,886,751 77,700 (1,606,347)
Adjustments for:
11,008,904 3,060,288 Net finance costs 5,858,819 8,416,961 2,038,966 2,314,560
(264,061) - Share of profits from equity accounted investees (285,244) (240,692) - -
5,159,375 70,583 Depreciation on property, plant & equipment / right of use assets 3,998,960 3,882,250 86,919 46,227
79,870 - Impairment of property, plant & equipment 8,000 - 8,678 8,678
1,442,333 Depreciation on right of use assets 1,113,442 - - -
110,462 - Write off of property, plant & equipment - - - -
(86,882) (5,550) Change in fair value of investment properties - - - -
14,944 - Change in fair value of agricultural produce on bearer biological assets - - - -
(39,650) - Change in fair value of biological assets - - - -
(56,545) (62) (Gain)/loss on the disposal of property, plant & equipment (52,852) (95,394) (127) (53)
- (15,643) (Gain)/loss on deemed disposal of subsidiary - - - -
- - Scrip Dividend - - - (15,643)
193,974 - Amortisation of intangible assets 149,020 154,240 - -
711,428 - Net (gain)/loss on translation of foreign currency 1,257,231 716,459 - -
940,203 - Impairment of trade & other receivables - - - -
361,581 - Provision for unrealised profit and write-down of inventories - - - -
(173,310) - Impairment/ amortisation of other non -current assets - 53,797 - -
1,484,181 132,416 Provision for post employee benefit obligations 1,253,255 1,161,741 113,948 102,607
(27,952) - Grants amortised (25,611) (21,637) - -
26,362,907 1,465,807 24,789,755 17,914,476 2,326,084 850,029
(4,248,022) (534,997) (Increase)/decrease in trade and other receivables and other current assets (5,892,817) (5,474,289) 378,611 18,037
(2,859,741) (867) (Increase)/decrease in inventories 2,543,723 2,094,627 (41) (848)
3,579,710 21,523 Increase/(decrease) in trade and other payables 14,217,191 3,420,214 203,746 204,364
22,834,854 951,466 35,657,852 17,955,028 2,908,400 1,071,582
B. Analysis of cash and cash equivalents
8,412,294 313,293 Cash in hand and at bank 15,318,527 8,184,511 211,752 63,252
3,495,891 - Short - term deposits 6,663,970 3,372,465 238,328 -
11,908,185 313,293 21,982,497 11,556,976 450,080 63,252
(44,540,814) (5,531,105) Short-term interest bearing borrowings (33,499,140) (41,664,452) (1,827,228) (4,018,091)
(32,632,629) (5,217,812) Cash and cash equivalents (11,516,643) (30,107,476) (1,377,148) (3,954,839)
* Includes discontinued operations.
The Notes on pages 11 to 13 form an integral part of these Financial Statements. Figures in brackets indicate deductions.
Consolidated Company
*
HAYLEYS PLC | Page 10

NOTES TO THE FINANCIAL STATEMENTS
1
2
3
4 INDUSTRY SEGMENT REVENUE
Consolidated
Total Intra-group
Audited Unaudited Unaudited
year ended 9 months to 9 months to
31.03.20 31.12.20 31.12.19
Rs.'000 Rs.'000 Rs.'000 Rs.'000 Rs.'000
6,216,160 Eco Solutions 6,073,301 1,018,164 5,055,137 4,944,619
17,870,232 Hand Protection 21,039,018 2,659 21,036,359 13,394,195
22,822,743 Purification Products 18,827,040 - 18,827,040 17,580,785
12,099,878 Textiles 10,905,979 8,696 10,897,283 9,863,887
4,644,728 Construction Materials 3,893,104 107,574 3,785,530 3,632,945
13,631,015 Agriculture 14,135,046 353,827 13,781,219 9,926,455
12,643,867 Plantations 11,521,331 15,200 11,506,131 9,788,638
43,894,412 Transportation & Logistics 25,638,214 34,070 25,604,144 31,740,753
61,564,533 Consumer & Retail 53,453,369 - 53,453,369 48,417,967
4,414,328 Industry Inputs 3,049,311 288,116 2,761,195 3,687,111
1,600,072 Power & Energy 1,100,008 18,610 1,081,398 1,370,731
4,481,442 Leisure 885,281 39,050 846,231 3,203,329
4,423,593 Others 4,249,233 988,781 3,260,452 3,077,697
210,307,003 174,770,235 2,874,747 171,895,488 160,629,112
210,307,003 171,895,488 160,629,112
The Interim Condensed Financial Statements have been prepared in compliance with Sri Lanka Accounting Standard LKAS 34- Interim Financial
Reporting. These Interim Condensed Financial Statements should be read in conjunction with the Annual Financial Statements for the year ended 31st
March 2020.
The Interim Condensed Financial Statements have been prepared on a historical cost basis, except for, land ,biological assets and financial
instruments.
These Statements also provide information required by the Colombo Stock Exchange.
There has not been a significant change in the nature of the contingent liabilities, which were disclosed in the Annual Report for the year ended 31st
March 2020.
No circumstances have arisen since the Statement of Financial Position date, which would require adjustments to the Interim Financial statements
except for following,
The ordinary shares of the company will be subdivided by splitting each issued ordinary share into 10 ordinary shares from 10th February 2021.
Consequently the total number of existing issued Ordinary Shares will be increased from 75,000,000 to 750,000,000 without changing the Stated
Capital of the Company which will remain at Rs.1,575,000,000/-
External
Consolidated
HAYLEYS PLC | Page 11

NOTES TO THE FINANCIAL STATEMENTS
0 -64,999,923 -55,253,570
5 INDUSTRY SEGMENT RESULTS
Consolidated
Audited Unaudited Unaudited
year ended 9 months to 9 months to
31.03.20 31.12.20 31.12.19
Rs.'000 Rs.'000 Rs.'000
435,086 Eco Solutions 321,239 435,943
1,090,832 Hand Protection 4,093,361 900,773
2,501,619 Purification Products 3,562,804 1,846,573
445,181 Textiles 735,878 588,819
460,589 Construction Materials 689,439 352,936
1,546,504 Agriculture 1,543,163 1,062,359
406,592 Plantations 1,049,548 260,532
3,969,708 Transportation & Logistics 2,062,884 2,659,900
4,331,818 Consumer & Retail 3,647,472 3,290,253
307,732 Industry Inputs 269,860 232,797
938,149 Power & Energy 651,232 879,985
(352,310) Leisure (1,407,594) (437,513)
1,629,143 Others 2,375,457 977,381
17,710,642 Segment results 19,594,743 13,050,737
(1,237,763) Non - segment income/(expenses) (2,315,303) (738,095)
16,472,880 Operating profit 17,279,440 12,312,642
(11,008,904) Net finance cost (5,858,819) (8,416,961)
86,882 Change in fair value of investment properties - -
264,061 Share of profits from equity accounted investees 285,244 240,692
(310,867) Value added tax on financial services (191,130) (249,622)
5,504,052 Profit before tax 11,514,735 3,886,751 5,504,052 11,514,735 3,886,751
(0) - (0)
Consolidated
HAYLEYS PLC | Page 12

NOTES TO THE FINANCIAL STATEMENTS
6 STATED CAPITAL
Company
Audited Unaudited Unaudited
as at as at as at
31.03.20 31.12.20 31.12.19
Rs.'000 Rs.'000 Rs.'000
Issued and fully paid
1,575,000 75,000,000 (75,000,000 - 31.12.2020) Ordinary Shares 1,575,000 1,575,000
7 ASSETS AND LIABILITIES OF DISCONTINUED OPERATIONS
Consolidated
Audited Unaudited Unaudited
as at as at as at
31.03.20 31.12.20 31.12.19
Rs.'000 Rs.'000 Rs.'000
Assets classified as held for sale
1,906 Trade and Other Receivables 1,906 1,906
1,115 Cash in Hand and at Bank 1,115 1,115
3,021 Total assets 3,021 3,021
Liabilities directly associated with assets classified as held for sale
332 Trade and other payables 332 332
332 Total equity and liabilities 332 332
Consolidated
Company
HAYLEYS PLC | Page 13
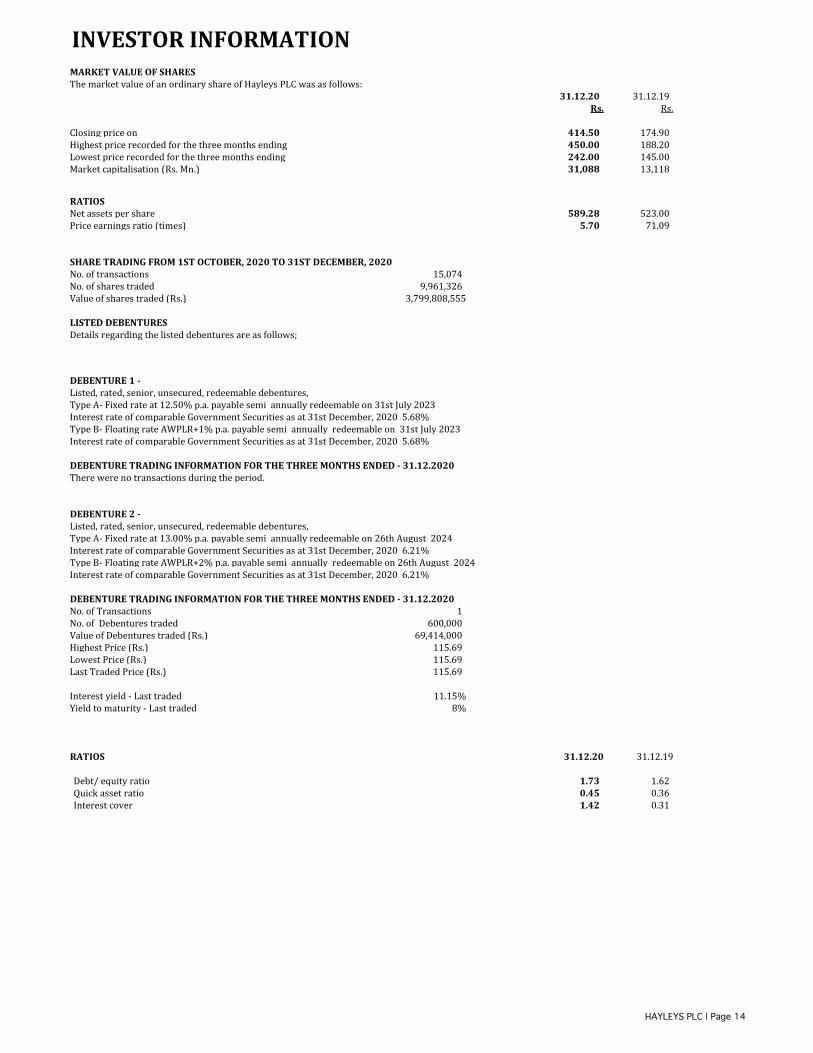
INVESTOR INFORMATIONMARKET VALUE OF SHARESThe market value of an ordinary share of Hayleys PLC was as follows:
31.12.20 31.12.19Rs. Rs.
Closing price on 414.50 174.90 Highest price recorded for the three months ending 450.00 188.20 Lowest price recorded for the three months ending 242.00 145.00 Market capitalisation (Rs. Mn.) 31,088 13,118
RATIOSNet assets per share 589.28 523.00 Price earnings ratio (times) 5.70 71.09
SHARE TRADING FROM 1ST OCTOBER, 2020 TO 31ST DECEMBER, 2020No. of transactions 15,074 No. of shares traded 9,961,326 Value of shares traded (Rs.) 3,799,808,555
LISTED DEBENTURESDetails regarding the listed debentures are as follows;
DEBENTURE 1 -Listed, rated, senior, unsecured, redeemable debentures, Type A- Fixed rate at 12.50% p.a. payable semi annually redeemable on 31st July 2023 Interest rate of comparable Government Securities as at 31st December, 2020 5.68%Type B- Floating rate AWPLR+1% p.a. payable semi annually redeemable on 31st July 2023Interest rate of comparable Government Securities as at 31st December, 2020 5.68%
DEBENTURE TRADING INFORMATION FOR THE THREE MONTHS ENDED - 31.12.2020There were no transactions during the period.
DEBENTURE 2 -Listed, rated, senior, unsecured, redeemable debentures, Type A- Fixed rate at 13.00% p.a. payable semi annually redeemable on 26th August 2024Interest rate of comparable Government Securities as at 31st December, 2020 6.21%Type B- Floating rate AWPLR+2% p.a. payable semi annually redeemable on 26th August 2024Interest rate of comparable Government Securities as at 31st December, 2020 6.21%
DEBENTURE TRADING INFORMATION FOR THE THREE MONTHS ENDED - 31.12.2020No. of Transactions 1 No. of Debentures traded 600,000 Value of Debentures traded (Rs.) 69,414,000 Highest Price (Rs.) 115.69 Lowest Price (Rs.) 115.69 Last Traded Price (Rs.) 115.69
Interest yield - Last traded 11.15%Yield to maturity - Last traded 8%
RATIOS 31.12.20 31.12.19
Debt/ equity ratio 1.73 1.62 Quick asset ratio 0.45 0.36 Interest cover 1.42 0.31
HAYLEYS PLC | Page 14

INVESTOR INFORMATION
FIRST TWENTY SHAREHOLDERS AS AT 31ST DECEMBER, 2020
No.of Shares %
1 Mr.K.D.D.Perera 38,259,697 51.01
2 Trustees of the D.S.Jayasundera Trust 8,698,017 11.60
3 Finco Holdings (Pvt) Ltd 2,340,830 3.12
4 Employees Provident Fund 1,388,803 1.85
5 Hayleys Group Services(Private) Ltd No.02 A/C 1,117,090 1.49
6 Sri Lanka Insurance Corporation Ltd-Life Fund 797,418 1.06
7 Mrs.R.N.Ponnambalam 600,145 0.80
8 Mr.N.K.A.D.De Silva 570,166 0.76
9 Mrs.R.M.Spittel 564,697 0.75
10 Mr.R.H.S.Phillips 520,727 0.69
11 Mrs.A.M.L.Johnpulle & Mr.B.J.M.Johnpulle 505,209 0.67 12 Seylan Bank PLC/W.D.N.H Perera 500,000 0.67
13 Mrs.Y.M.Spittel 465,561 0.62
14 Mrs.S.D. Wickramasinghe 449,298 0.60
15 Mrs.P.M Godamunne 443,447 0.59
16 Mrs.A.K Wikramanayake 438,449 0.58
17 J.B. Cocoshell (Pvt) Ltd 373,122 0.50
18 Mrs. V. Saraswathi & Mr. S. Vasudevan 355,519 0.47
19 Mr.A.C Wikramanayake 319,432 0.43
20 Mr.S.Rameshan 316,982 0.42
Total 59,024,609 78.70
There were no non voting shares as at 31st December, 2020.
PUBLIC HOLDING
Percentage of public holding as at 31st December, 2020 37.09%
Total number of Shareholders representing the Public Holding 6,974
Float- adjusted market capitalization (Rs.) 11,530,353,750
The Company complies with option 1 of the Listing Rules 7.13.1 (a) which no minimum Public Holding.
DIRECTORS’ SHAREHOLDINGS AS AT 31ST DECEMBER, 2020
Name of the Director No.of Shares
Mr. A M Pandithage 125,357
Mr.K.D.D.Perera 38,261,363 *
Mr S C Ganegoda 25,000
Mr H S R Kariyawasan 9,427
Mr L R V Waidyaratne 37,930
Ms. J. Dharmasena 21,095
* Inclusive of indirect holding through other companies in which he owns controlling interest.
Name of the Shareholder
Directors' holdings of ordinary shares in the Company were as follows
HAYLEYS PLC | Page 15
CORPORATE INFORMATION
NAME OF COMPANY AUDIT COMMITTEE
Hayleys PLC M Y A Perera - Chairman
Dr H Cabral, PC
M H Jamaldeen
K D G Gunaratne (appointed w.e.f 17. 06. 2020 )
COMPANY NUMBER REMUNERATION COMMITTEE
PQ 22 Dr H Cabral, PC – Chairman
K D D Perera
STOCK EXCHANGE LISTING M H Jamaldeen
M Y A Perera
REGISTERED OFFICE NOMINATION COMMITTEE
Hayley Building, A M Pandithage – Chairman
P.O. Box 70, 400, Deans Road, K D D Perera
Colombo 10, Sri Lanka Dr H Cabral, PC
Telephone: (94-11)2627000
Facsimile: (94-11)2699299
Website: http://www.hayleys.com RELATED PARTY TRANSACTION REVIEW COMMITTEE
Dr H Cabral, PC - Chairman
DIRECTORS S C GanegodaA M Pandithage – Chairman & Chief Executive M Y A Perera
K D D Perera - Co-Chairman (Non - Executive)
S C Ganegoda SECRETARIES
H S R Kariyawasan Hayleys Group Services (Private) Limited
Dr. H Cabral, PC 400, Deans Road, Colombo 10, Sri Lanka
L R V Waidyaratne Telephone: (94-11)2627650
M H Jamaldeen Facsimile: (94-11)2627645
M Y A Perera E-mail: [email protected]
Ms. J Dharmasena Please direct any queries about the
R J Karunarajah administration of shareholdings to the Company Secretaries
K D G Gunaratne
Ms. A A K Amarasinghe (Alternate to K D D Perera)
INVESTOR RELATIONS
GROUP MANAGEMENT COMMITTEE Please contact Strategic Business Development Unit
A M Pandithage – Chairman & Chief Executive Telephone: (94-11)2627662
S C Ganegoda E-mail: [email protected]
H S R Kariyawasan
L R V Waidyaratne
Ms. J Dharmasena
W G R Rajadurai
E R P Goonethileke
Ms. D Talpahewa
C De Silva
N R Ranatunge
D W P N Dediwela
H Prematillake
Ng Soon Huat
M Wijewardene
R J Karunarajah
(A public limited company, incorporated in Sri Lanka in
1952)
The ordinary shares of the Company are listed with the
Colombo Stock Exchange of Sri Lanka
HAYLEYS PLC | Page 16


