Embed Size (px)
Citation preview

Creating Value since 1928
C T HOLDINGS PLCAnnual Report 2021 2022
CONTENTS
Our Business at a Glance 01
Milestones 02
Profile of Businesses 04
Financial Highlights 06
Operational Spotlight 07
Overview
Stewardship
Financial Reports
Supplementary
Chairman’s Message 08
Management Discussion and Analysis 10
Profile of Directors 14
Corporate Governance 17
Risk Assessment 20
Report of the Remuneration Committee 22
Report of the Nominations Committee 23
Report of the Related Party Transactions Review Committee 24
Annual Report of the Board of Directors of the Company 28
Report of the Audit Committee 31
Statement of Directors’ Responsibility 33
Independent Auditors’ Report 34
Statement of Profit or Loss and Other Comprehensive Income 40
Statement of Financial Position 41
Statement of Changes in Equity 42
Statement of Cash Flows 44
Notes to the Financial Statements 46
Five Year Review – Group 134
Group Directory 135
Information of Shareholders 139
Notice of Annual General Meeting 143
Form of Proxy 147
Corporate Information Inner Back Cover

01 C T HOLDINGS PLCAnnual Report 2021 2022
OUR BUSINESS AT A GLANCE
C T Holdings PLC then known as Ceylon Theatres Limited was incorporated in 1928 with its primary focus on the entertainment industry. The Company owned and operated a string of cinemas in various parts of the country including such well known destinations such as Regal Colombo, Empire and Majestic cinemas.
The Company also set up the first film production and processing facilities in the country with the establishment of Ceylon Studios Ltd in 1956, thus paving the way for the development of the local film production expertise.
Despite the Company’s first production “Asokamala” being unsuccessful, the Company persevered to subsequently produce hit films such as “Golu Hadawatha”, “Akkara Paha”, “Sakman Maluwa” etc. The hit film “Nidhanaya” was adjudged the best Sri Lankan film produced in the past 50 years.
Anticipating the effects of the changes within the film industry in the 1970s and 80s, the Company began to diversify into other areas of business, notably, consolidating its interest in Millers Limited and through it, Cargills (Ceylon) Ltd. (now Cargills (Ceylon) PLC). Millers Ltd was subsequently merged with C T Holdings PLC.
The Company also diversified into Financial Services and Real Estate. The subsidiary Cargills shed the Department Store concept to introduce and expand the Supermarket concept to Sri Lanka. This change was to be the most significant change to the Group and the backbone of future growth. Cargills also expanded into Food Processing, Restaurants, Dairy, Agri Business and Confectionery. A fully fledged Commercial Bank under the name ‘Cargills Bank’ was also set up by the Group. All this while also staying true to its roots in cinema business by developing cinemas with digital sounds, 3D viewing and upgrading facilities for patrons.
C T Holdings is now a diversified Group with an interest in Retail and Wholesale Distribution, FMCG, Restaurants, Real Estate, Entertainment, and Banking & Financial Services.

02C T HOLDINGS PLCAnnual Report 2021 2022
MILESTONES
Ceylon Theatres Limited established, focusing primarily on the entertainment industry by
Sir Chittampalam A. Gardiner.
Completed the Majestic City
shopping and entertainment mall
through CT Land Development PLC.
KFC franchise awarded to
Cargills.
Name of Ceylon Theatres PLC
changed to C T Holdings PLC
Cargills commissioned its new state-of-the art meat processing facility.
Cargills acquired the Walls Ice
Cream plant and CPC/Best foods
production facility of jams, cordials
and sauces.
Cargills acquired controlling interest in Kotmale Holdings PLC. Cargills also acquired Diana Biscuits Manufacturers (Private) Limited (subsequently re-named Cargills Quality Confectioneries (Pvt) Ltd).
Acquired Millers and Cargills and ventured into retail and distribution under the leadership of Mr. Albert A Page.
1981
Entered the Ceramic / Tiles, Plantation and Packaging sectors.
1999
2006
1991
2010
Cargills entered the brewery sector.
Ceylon Theatres added three new
screens to the Majestic Cineplex
including Sri Lanka’s first ever
3D cinema.
20121996
2002
Entered the financial services sector through C T Smith Stockbrokers (Member, Colombo Stock Exchange) – now re named as C T CLSA Securities (Private) Limited.
Cargills diversified into food processing with the acquisition of the Goldi processed meat plant – now known as Cargills Quality Foods Ltd.
1992
C T Properties Limited completed its flagship ‘Empire’ residential development project.
2009
2011
Ceylon Theatres merged with its
subsidiary Millers PLC to create an
investment holding Company.
Cinema exhibition operation
transferred to a wholly owned
subsidiary, Ceylon Theatres (Private)
Limited.
2008
1928

03 C T HOLDINGS PLCAnnual Report 2021 2022
Group received license to set up
and operate a Commercial Bank.
Cargills Square Mall opened in Jaffna.
Exited the Ceramic / Tiles, Plantation
and Packaging sectors.
Cargills commenced its
175th year of operations
Cargills opened the 400th Cargills Food
City supermarket in Wattala in early
2020
Launched the Kotmale Cheese
processing plant in Hatton
Cargills launched Cargills Online web portal for
online ordering and delivery
Opened Cargills Square Mall, Dematagoda
Cargills commissioned the expanded
dairy facility.Cargills Square mall Gampaha opened with a
supermarket, KFC and two cinema
screens.
Regal Cinema in Nuwara Eliya fully refurbished and re-opened.
Cargills set up the TGI Fridays Franchise Restaurant in Colombo, Fort.
2013
2017
C T Holdings completed 90
years of operations
Cargills opened Cargills Food Hall,
bringing Sri Lanka’s first gourmet supermarket
experience at the Colombo City
Centre Shopping Mall
2019
2014 2020
2021
Cargills Bank began expansion of its network by opening 11 branches.
2016
2018
Retail sector comprising the supermarkets spun off into a separate Company with new direct equity injection into the Company. Two new cinema screens set up by Ceylon Theatres at Arcade Independence Square, the Group’s Regal cinema was refurbished. Cargills exited the brewery sector.
2015

04C T HOLDINGS PLCAnnual Report 2021 2022
PROFILE OF BUSINESSES
Retail and Wholesale DistributionThe retail sector of the Group functions under Cargills Foods Company (Pvt) Ltd. The modern trade arm covers all districts of the island through Cargills Food City and Food City Express store formats. This sector maintains a backward integration model with local fruit and vegetable collection centres in every district of the island.
Millers Limited the marketing and distribution arm holds the agency rights for leading international food brands reaching 30,000 groceries islandwide. The Company is also the distributor for the Group’s own brands.
Food & Beverage Manufacturing & DistributionThe Group’s FMCG brands are some of the widest consumed household brands in the Country which include, ‘Magic’ and ‘Kotmale’ dairy products, ‘Kist’ range of jams, cordials, nectars, juices, culinary & confectionery, and ‘Cargills Finest’, ‘Goldi’ and ‘Sams’ and ‘Island’s Finest’ Convenience Foods. The sector operates some of the most modern facilities with many ISO International Standard certifications among them such as ISO 9001: 2000 Quality Management System certification, ISO 22000: 2005 Food Safety Management System certification and ISO 14001: 2004 Environment Management System certification.
Real EstateC T Land Development is a long established name in the Real Estate and Property sector. The Company owns and operates ‘Majestic City’ shopping and entertainment mall. The Group also owns and operates the Cargills Square Malls in Jaffna, Gampaha and Dematagoda. Property development operations under C T Properties previously completed the ‘Empire’ luxury apartment complex in Colombo 2 and C T Gardens Township project in Piliyandala.

05 C T HOLDINGS PLCAnnual Report 2021 2022
RestaurantsThe restaurants’ sector comprises the world renowned ‘KFC’ and ‘TGI Fridays’ franchises held by the Group.
Banking and Financial ServicesCargills Bank was promoted and launched by the Group. Capital Market operations of the Group are carried out under C T CLSA Holdings Ltd, which covers stockbroking, advisory services and capital market solutions.
EntertainmentThe Group has been associated with the national cinema industry for over 90 years with the making of the first national production and thereon producing landmark motion pictures that have won international acclaim. Ceylon Theatres (Private) Limited operates Thirteen cinema screens in Six locations.

06C T HOLDINGS PLCAnnual Report 2021 2022
FINANCIAL HIGHLIGHTS
Retail
FMCG
Restaurant
Real Estate
Entertainment
17.42%
79.25%
3.03 %
0.28%0.02%
Revenue Composition 2021
Retail
FMCG
Restaurant
Real Estate
Entertainment
18.92%
76.65%
4.29%
0.08%0.06%
Revenue Composition 2022
Group CompanyIn thousands of rupees 2022 2021 Change % 2022 2021 Change %
OperationsRevenue 136,872,756 112,940,971 21.19 - - - Results from operating activities 8,668,900 7,179,102 20.75 963,416 750,403 28.39 Profit before taxation 5,468,375 4,311,617 26.83 925,342 749,094 23.53 Profit for the year 4,170,305 3,321,269 25.56 925,342 740,248 25.00 Profit attributable to owners of the Parent 2,838,029 2,061,487 37.67 925,342 740,248 25.00
Per Share DataEarnings Per Share (Rs.) 14.09 10.24 37.60 4.59 3.68 24.85 Dividends Per Share (Rs.) 4.55 4.35 4.60 4.55 4.35 4.60 Dividend Cover (Times) 3.10 2.35 31.55 1.01 0.84 20.21
Shareholders’ InterestStated Capital 6,489,758 6,489,758 6,489,758 6,489,758 Total equity attributable to equity holders of the parent 23,787,323 23,359,195 7,694,856 7,668,843 Return on equity attributable to equity holders of the parent (%) 11.93 8.83 12.03 9.65 Total equity attributable to equity holders of the parent per Share (Rs.) 118.11 115.98 38.21 38.08
LeverageNet Finance Costs (3,372,811) (2,598,434) (40,674) 7,569 Interest Cover (Times) 2.62 2.66 23.75 - Borrowings (including overdrafts) 40,861,602 37,738,776 826,399 456 Borrowing as a Percentage of total equity attributable to equity holders of the parent (%) 171.78 161.56 10.74 0.01
Note: Earnings, dividends and shareholders’ funds per share have been calculated based on the number of issued shares presently in issue.
Composition of group revenue

07 C T HOLDINGS PLCAnnual Report 2021 2022
OPERATIONAL SPOTLIGHT
Revenue
Rs.136.87BnTotal Assets
Rs.104.65Bn
Profit for the year
Rs.4.17BnDividend Per Share
Rs.4.55Earnings Per Share
Rs.14.09Total Equity
Rs.33.34Bn
4.5(Rs. Bn)
0
1.5
2.0
0.5
2.5
3.0
4.0
3.5
Profit for the year - Group
2018
2019
2020
2021
2022
2018
2019
2020
2021
2022
3.0(Rs. Bn)
0
1.0
1.5
2.0
2.5
0.5
Profit for the Year Attributable to Equity Holders of the Parent - Group
50
30
40
10
20
(Rs. Bn)
0
Borrowings - Group
2018
2019
2020
2021
2022
2018
2019
2020
2021
2022
140(Rs. Bn)
0
40
20
80
60
120
100
Revenue - Group
6(Rs.)
0
2
1
4
3
5
Dividends per share - Group
2018
2019
2020
2021
2022
16(Rs.)
0
4
2
8
6
10
12
14
Earnings Per Share - Group
2018
2019
2020
2021
2022

08C T HOLDINGS PLCAnnual Report 2021 2022
CHAIRMAN’S MESSAGE
“CT Holdings will continue to make investments on a selective basis, to support the upliftment of our partners and reduce costs for the consumer.”
It gives me great pleasure to share with you the Annual Report and Financial Statements of CT Holdings for the year ended 31st March 2022.
Present economic climateThe year under review saw the delta and omicron variants of Covid-19 spread across the world, taking a significant human and economic toll. The pandemic, however, is now nearing its end, with a large part of the global population achieving immunity. As the health crisis comes to an end, the world is getting ready for a marked slowdown in economic activity due to the aftereffects of the pandemic and the conflict in Ukraine. Meanwhile, Central banks across the world have started monetary tightening measures as inflationary pressure continues to rise amidst supply chain bottlenecks and rising commodity prices.
Amidst these global challenges, Sri Lanka faces its own set of problems with a severe shortage of foreign currency leading to power interruptions and shortages of essential food, fuel, and cooking gas. The Sri Lankan economy rebounded with 3.7% growth in 2021 after 3.6% contraction in 2020. However, these gains are likely to be short-lived as a slowdown is expected in 2022 given the current situation. Year-over-year inflation which was 12% at the end of 2021 has increased sharply to 45% as of May 2022, highlighting the rapid increase in the cost of living.
Our response Your Company remains conscious of the impact of price increases on consumers, especially on essential food products. The Group is focused on improving
productivity and reducing wastage, to ensure that the burden of rising costs is minimized for the consumer. As a leading distributor and processor of food in the country, our core objective remains to provide affordable nutrition to consumers. During the reporting period, there were many obstacles which made this objective challenging, including rising cost of raw materials and packaging material, rising fuel and distribution costs, and other operational challenges such as power interruptions which impacted the entire island. Nevertheless, our teams worked proactively to ensure continuous availability of products for the consumer while supply chain teams were committed to support our partners, including farmers and suppliers. The Management took all necessary steps to secure employment and well-being of team members across the Group.
As a leading buyer of agricultural produce and fresh milk, the Company continued to provide a steady market for our suppliers. During the reporting period, our purchases generated direct revenue of Rs. 11.2 Bn to the agriculture and dairy farming communities across Sri Lanka.
Way forwardThe Group remains confident that Sri Lanka will overcome its current economic crisis. We are encouraged by steps taken to engage with the IMF and believe that the newly introduced tax rates are the need of the hour to stabilize the government’s fiscal position. CT Holdings will continue to make investments on a selective basis, to support the upliftment of our partners and reduce costs for the consumer.

09 C T HOLDINGS PLCAnnual Report 2021 2022
Developing local raw material suppliers and agricultural producers are a key element in ensuring long-term food security of the country and the Group will continue to make investments to achieve these objectives. Despite the uncertain economic environment, the Group’s capital investments for the reporting period amounted to Rs 7.75 Bn, reaffirming our confidence in Sri Lanka’s recovery as well the Group’s commitment to uplifting communities across Sri Lanka and serving our customers.
Financial performanceDespite a very challenging operating environment, the Group’s businesses delivered strong results during the reporting period. The Group posted a Revenue of Rs. 136.9 Bn (21% growth), a Gross Profit of Rs. 15.6 Bn (24% growth) and a Profit after tax of Rs. 4.2 Bn (26% growth). The Retail & Wholesale distribution segment and FMCG segment combined contributed to 95% of Group Revenue. Earnings per share (EPS) recorded a 38% increase from Rs. 10.24 to Rs. 14.09. Net Financing Costs increased 30% from the previous year, mainly on account of an exchange loss of Rs. 516 Mn on trade payables. Group performance was driven by the Retail, FMCG, and Restaurant sectors while the Entertainment and Real Estate sectors faced another difficult year. The Financial Services sector recorded improved performance across all key indicators.
DividendsThe Group declared an Interim Dividend of Rs. 1.55 per share for the reporting period, which is higher than the Rs. 1.45
declared during the previous financial year. The Directors are pleased to propose a Final Dividend of Rs. 3.0 per share for the reporting period, which is also higher compared to the Rs. 2.9 Final Dividend during the previous financial year.
DirectorateMr. Sunil Mendis, who has been associated with the Group since the year 2006, retired at the 2021 AGM after indicating that he would not be seeking reelection. Mr. Mendis devoted his efforts exclusively towards developing businesses of the Group and we wish to extend our sincere appreciation of all his contributions to the company and its subsidiaries. Mr. R Selvaskandan, who was Independent Non-Executive Director, resigned from the Board with effect from 31 December 2021. His advice and contribution to decision making, drawing from his wealth of experience, was always welcomed and appreciated. All other retiring directors will be seeking reelection at the company's upcoming Annual General Meeting.
Acknowledgement We are most grateful for the efforts of our Groups Management and team for their hard work and dedication in the face of many challenges during the year. The enormous contribution of our team gives me the confidence to state that the Group is in a good place at present and can withstand any grave adversities and prevail for the betterment of all its stakeholders. I wish to extend my sincere thanks to my fellow Directors for all support and advice given during this year. We as the Board wish to place on record our sincere appreciation to
our customers, bankers, suppliers and principals. We appreciate very much your support during the year. I also wish to thank the shareholders of CT Holdings for the confidence placed in the Company and Group.
(Signed)Louis Page 06 July 2022

10C T HOLDINGS PLCAnnual Report 2021 2022
MANAGEMENT DISCUSSION AND ANALYSIS
Sri Lanka’s economy grew by 3.6% during the year 2021, aided by growth in all three sectors –Agriculture recorded a 2.0% expansion, Industry grew 5.3%, and Services grew 3.0%. The 1st and 2nd Quarters of the financial year were impacted by lockdowns as the delta variant spread rapidly across the country. The 2nd Quarter was the most challenging, coinciding with extended periods of lockdown in August and September. Consumers resumed daily activities with confidence towards the 3rd Quarter as the vaccination drive implemented by the Government got into full force. Consumer spending rebounded after September and continued to be strong till the end of the financial year, despite increasing inflationary pressure and an uncertain economic environment.
Retail and Wholesale DistributionThe Retail sector which is the largest component of the Group by turnover delivered strong results in growth and profitability as consumer spending and footfall recovered despite periodic slowdowns during the lockdowns. During the year under review, 30 new stores were added along with a new dark-store to facilitate the growing popularity of the e-commerce operation. Considering the current environment, the Group will carefully evaluate its outlet expansion plan for the coming year but will continue ahead with the rollout of outlets already in the pipeline. The sharp depreciation of the Sri Lankan Rupee and import restrictions had some impact on the operations of the Wholesale distribution business. However, the business has carefully navigated the current operating climate and has
increased its focus on distributing local brands.
2018
2019
2020
2021
2022
150(Rs' Bn)
0
100
50
Segmental Revenue - Retail & wholesale Distribution
FMCGThe Dairy sector, which is the largest within FMCG, recorded another strong year despite multiple challenges. The Group’s focus on value addition, product innovation, and quality have established our brands as leading national brands across the island. Farmgate prices of fresh milk have trended upwards during the year as demand for fresh milk has increased and an increasing number of collectors compete for a limited supply of milk in the country. Nonetheless, strong relationships built over the last two decades have ensured a loyal farmer base who continue to work with us despite short-term volatilities in the market.
Convenience foods, confectionery, beverages, and the culinary range also recorded a strong year, with double-digit volume growth in all categories. Both modern and general trade channels performed well, with sales to
institutions such as Hotels, Restaurants and catering establishments also seeing a recovery. Within the beverage category, we saw a strong uptick in both take-home and on-the-go products. It is noteworthy to mention that the KIST RIDE energy drink launched in the previous year becoming one of the top performing SKUs with strong acceptance from consumers – especially the youth. The confectionery range recorded consistent growth during the year, with the Group’s focus on value added confectionery proving to be successful. Within the convenience food category, we saw the breaded range launched under the Sam’s brand during the previous financial year, grow in popularity among consumers. As availability of raw materials has become a challenge from time to time, the Group is looking to strengthen its partnerships with local breeders and livestock companies to secure continuous supplies.
Raw material availability has been a continuous challenge for all manufacturing businesses due to low agricultural production because of the fertilizer crisis, import restrictions, and the foreign exchange shortages in the market. Though rising raw material and packaging costs have added margin pressure, the Group has been able to mitigate the impact through selective price revisions, forward buying of raw materials, and operational efficiencies.

11 C T HOLDINGS PLCAnnual Report 2021 2022
2018
2019
2020
2021
2022
30(Rs' Bn)
0
10
5
20
25
15
Segmental Revenue - FMCG
RestaurantsThe restaurant business which consists of the KFC operation and TGI Fridays recorded a strong recovery in volumes, after pandemic-related lockdowns led to a decline in revenue in the previous year. The number of restaurants increased, with 14 new outlets added during the year taking the total number to 57 (56 KFC and TGI Friday) as of 31 March 2022. The dine-in channel recorded an impressive recovery as pandemic related concerns subsided, with customers returning to the restaurants. Selective price revisions to the menu were undertaken during the year to mitigate the impact of rising raw material costs. Consumption continued to remain strong despite price increases, with the performance of new outlets exceeding expectations. The TGI Fridays restaurant located at the One Galle Face Mall also recorded a recovery with consumer confidence to dine in picking up during the year.
2018
2019
2020
2021
2022
6(Rs' Bn)
0
2
1
3
4
5
Segmental Revenue - Restaurants
Real EstateThe Group owns several properties in strategic locations of the island and has continued to look at ways to unlock the value of such properties by developing. The real estate sector was restructured during the year to facilitate further expansion with a focused management team to oversee operations. Accordingly, certain investment properties and properties designated for development were brought under The Empire Investments Company (Pvt) Ltd, which would be the apex company for the Group’s property development initiatives going forward. The Group recently constructed three Cargills Square Mini Malls and two further Mini Malls are under construction. Plans are also underway to develop the Group’s Regal Cinema Properties in Kandy and Negombo on the same concept.
Refurbishment of the Majestic City shopping and entertainment mall, one of the largest and most popular Malls in Colombo operated under CT
Land Development will continue, with a view to position it as the leading entertainment hub of the Colombo South.
2018
2019
2020
2021
2022
600(Rs' Mn)
0
200
100
300
400
500
Segmental Revenue - Real Estate
EntertainmentThis sector is operated under Ceylon Theaters (Private) Limited, a wholly owned subsidiary engaged in movie exhibition. This sector was the worst affected during the year due to state-imposed closures and restricted attendances. The unavailability of good quality content for exhibition also adversely impacted this sector. Despite the setbacks, Ceylon Theatres continues to be committed to the movie and cinema industry and looks forward to improved performances in the upcoming year. One location, with two screens, was closed during the year due to poor performance. At the reporting date, Ceylon Theatres operated 13 screens across six locations. Further, in keeping with the Group ethos of not limiting its presence to the Colombo district, the Group is drawing plans to add further cinemas in outstation

12C T HOLDINGS PLCAnnual Report 2021 2022
Management Discussion and Analysis
locations. Revenues of the sector were up to Rs. 71 Mn from Rs. 18 Mn in the previous year. Under the present circumstances, the Entertainment sector is working towards curtailing operating costs as a means of sustaining operations.
2018
2019
2020
2021
2022
400(Rs' Mn)
0
200
100
300
Segmental Revenue - Entertainment
Banking & Financial Services The Banking and Financial Services Sector is accounted as an Equity Accounted Investee (Associate). The Bank was able to achieve growth across all key indicators despite the challenging operating environment and emerged stronger than in the previous year. Significant loan growth and the reduction of NPLs have brought us closer to breakeven despite the low interest rate environment exerting pressure on net interest margins. On account of the recent challenges facing the domestic economy, the time frames for the listing and the long-term capital requirements have been extended by the Central Bank. This sector also includes C T CLSA Holdings Limited which is a leading capital market service
provider in Sri Lanka covering Stock Broking, Investment banking, Capital market solutions and asset management services.
Group Financial ReviewThe Group posted a Revenue of Rs. 136.9 Bn (21% growth), a Gross Profit of Rs. 15.6 Bn (24% growth) and a Profit after tax of Rs. 4.2 Bn (26% growth) for the reporting period. The Retail & Wholesale distribution segment and FMCG segment combined contributed to 95% of Group Revenue. Earnings per share (EPS) recorded a 38% increase from Rs. 10.24 to Rs. 14.09. Net Financing Costs increased 30% from the previous year, mainly on account of an exchange loss of Rs. 516 Mn on trade payables.
The Group increased its long-term borrowings during the year and secured credit facilities to benefit from the low interest rates that prevailed during most parts of the financial year. Long-term borrowings increased to Rs. 27.1 Bn while short-term borrowings declined to Rs 13.8 Bn. Collectively, the Group’s total borrowings stood at Rs. 40.9 Bn at the end of the reporting period compared to Rs. 37.8 Bn in the previous year. The Group’s investments during the year amounted to Rs. 7.75 Bn compared to Rs. 6.46 Bn in the previous financial year. The investments have been funded through internally generated funds and borrowings. At the company level there were no investments in PPE during the reporting period.
2018
2019
2020
2021
2022
150(Rs' Bn)
0
100
50
Revenue - Group
2018
2019
2020
2021
2022
5(Rs' Bn)
0
2
1
4
3
Profit for the Year

13 C T HOLDINGS PLCAnnual Report 2021 2022
business which operates the Regal cinemas and the Majestic cinema.
Sustainability & GovernanceOur responsibility to the planet and our surroundings is factored in every business decision of the Group. As a leading player in the agriculture and food processing sectors, we have taken pioneering initiatives to move towards sustainable agriculture, cleaner energy consumption, and eco-friendly packaging and waste management. We have introduced measures to recycle waste (plastic, solid waste, and wastewater), and substitute non-renewable energy sources with solar power. The Group currently has over 5Mwh of solar power generating capacity installed across its retail outlets and processing facilities. The introduction of modern agricultural practices such as precision farming and encouraging more farmers to shift towards GAP certified processes have had a positive impact on the environment, with improved soil health, minimized agricultural residue in crops and waterways, reduced water consumption, while ensuring quality produce. Our restaurants business has eliminated 90% of its plastic consumption over the years. The retail chain continues to encourage consumers to shift away from polythene bags and towards eco-friendly bags while back-end systems are increasingly digitized to reduce paper use.
The Group places the highest value on ethical business practices and conduct with a zero-tolerance policy towards corruption and bribery in all its transactions, and strives to nurture a culture of transparency, honesty and accountability.
Human CapitalThe health and safety of our team was of paramount importance and the Management set up special quarantine and COVID care centers for team members during the reporting period. In January 2022, the Group’s subsidiary Cargills (Ceylon) PLC launched its digital learning & development platform, to enable greater access to training courses which were previously provided through classroom-based sessions. Given the Group’s diverse geographic distribution, the online learning platform will enable team members to connect with each other virtually, learn from each other, and access training material via the phone or computer. The total number of team members in the Group as at the end of the reporting period amounted to 9,542. We are an equal opportunity employer and tolerates no discrimination on the basis of gender, disability, race, religion, marital status, etc. and ensures every team member is valued and respected. The gender composition of the team was 51:49 (male: female) and almost 60% of the team belongs to the 18-30 age group.
Social and Relationship CapitalThe Group continued to develop and strengthen its relationships with local fruit, vegetable and dairy farmers and other small and medium primary producers across the country. The agriculture modernization project which promotes higher yielding, socially and ecologically responsible farming methods was expanded to include more farmers. The ‘Sarubima’ fund established by Cargills in 2008 has evolved to support farmers with credit insurance against crop failures, in addition to funding educational scholarships for farmer children and investing in rural community development projects. With focused efforts to source locally and build food production in Sri Lanka, the Group has been able to support the economy by bridging nutritional gaps which would otherwise be met with imported products. The Group has also made investments towards bringing affordable entertainment to customers across Sri Lanka through the entertainment
2018
2019
2020
2021
2022
50(Rs' Bn)
0
20
10
40
30
Borrowings - Group
2018
2019
2020
2021
2022
8.0(Rs' Bn)
0
4.0
2.0
6.0
Group additions to PPE

14C T HOLDINGS PLCAnnual Report 2021 2022
PROFILE OF DIRECTORS
Anthony PageChairman Emeritus
Mr. Anthony A. Page counts over 45 years of management experience in a diverse array of businesses. He is a Fellow Member of the Institute of Chartered Accountants of Sri Lanka and a Fellow Member of the Institute of Certified Management Accountants of Sri Lanka.
He served on the Board of the Colombo Stock Exchange and several public listed and non-listed Companies. Mr. Page also served as a Council Member of the Employers Federation of Ceylon.
Board of Directors
Louis Page Chairman, Non-Executive Director
Mr. Louis R Page is a Fellow Member of the Institute of Chartered Accountants of Sri Lanka and a Fellow Member of the Chartered Institute of Management Accountants (UK). He is also the Chairman of subsidiary company Cargills (Ceylon) PLC. He has held a number of Board and Senior Management positions at the highest level in overseas public companies and public institutions.
Ranjit PageDeputy Chairman/Managing Director, Executive Director
Mr. V. Ranjit Page possesses over 39 years of management experience with expertise in food retailing, food service, and manufacturing, having introduced the concept of super marketing to the Sri Lankan masses. He is the Deputy Chairman / CEO of Cargills (Ceylon) PLC and the Chairman of Cargills Bank Ltd. He also serves on the boards of several other C T Holdings Group companies.
J B L De SilvaIndependent Non-Executive Director
Mr. J. B. L. De Silva, a lawyer by profession, has substantial experience in the rubber trade. He is a past Chairman of the Colombo Rubber Traders’ Association and is a director of other listed and non-listed companies.

15 C T HOLDINGS PLCAnnual Report 2021 2022
Priya EdirisingheIndependent Non-Executive Director
Mr. A. T. Priya Edirisinghe is a Fellow Member of the Institute of Chartered Accountants of Sri Lanka, Fellow Member of the Chartered Institute of Management Accountants (UK) and holds a Diploma in Commercial Arbitration. He was the Senior Partner of Bakertilly Edirisinghe & Co., Chartered Accountants and currently serves as Consultant/Advisor. He is the Managing Director of PE Management Consultants (Pvt) Ltd. He counts over 50 years’ experience in both public practice and in the private sector. He serves on the boards of a number of other listed and non-listed companies where in some companies he also serves as Chairman/Member of the Audit Committee, Related Party Transactions Review Committee, and Member of the Remuneration Committee.
Mr. Edirisinghe is the Chairman of the Company’s Audit Committee and Related Party Transactions Review Committee and a member of the company’s Remuneration Committee.
Cecilia Page MuttukumaruNon-Executive Director
Ms. Cecilia Page Muttukumaru is a Director of CT CLSA Holdings Limited, and the Chairman of CT CLSA Securities (Private) Limited, CT CLSA Capital (Private) Limited and Comtrust Asset Management (Private) Limited. She is a Fellow Member of the Institute of Chartered Accountants of Sri Lanka and a Fellow Member of the Chartered Institute of Management Accountants (U.K.).
Aravinda PageNon-Executive Director
Dr. A. Aravinda Page, MA (Cantab), M.B.B. Chir, MRCS (UK), is a specialty registrar in cardiothoracic surgery and is currently attached to Papworth Hospital NHS Foundation Trust, Cambridge, UK.
Joseph PageNon-Executive Director
Mr. Joseph C. Page is the Deputy Chairman/Managing Director of C T Land Development PLC. He is also a Director of Cargills (Ceylon) PLC, Ceylon Theatres (Pvt.) Ltd. and C T Properties Limited. Prior to joining C T Land Development PLC, he was the Executive Director of Millers Limited. He has over 35 years of management experience in the private sector.
Asite TalwatteIndependent Non-Executive Director
Mr. A. D. B. Talwatte is a fellow member of the Institute of Chartered Accountants of Sri Lanka (ICASL) and the Chartered Institute of Management Accountants of the U.K. He also holds a Post-Graduate Diploma in Business and Financial Administration awarded by the ICASL and the University of Wageningen, Holland and has a MBA from the University of Sri Jayawardenapura, Sri Lanka. Mr. Talwatte has also participated in a Kellogg Executive Programme at the Kellogg Graduate School of Management, Northwestern University, Evanston, Illinois.
Mr. Talwatte worked at Ernst & Young in Assurance, Business Risk and Advisory Services for 37 years, including 10 years as Country Managing Partner. He has worked with Ernst & Young in Cleveland, Ohio and also served on Ernst & Young’s Far-East Area Executive Committee, the Area Advisory Council and the ASEAN Leadership Committee.
Mr. Talwatte was President of the CA Sri Lanka for a two-year period in 2002/2003 and the CIMA in 1995/96. He also served as the Chairman of the Statutory Accounting Standards Committee and the Auditing Standards Committee, the Urgent Issues Task Force and the Examinations Committee of the ICASL.
Mr. Talwatte has been closely associated with the development of Corporate Governance in Sri Lanka being actively involved with the Code of Audit Committees in 2002 and the Code of Corporate Governance in 2003. He co-
Board of Directors

16C T HOLDINGS PLCAnnual Report 2021 2022
Profile of Directors
chaired the Committees to structure the revised Codes of Corporate Governance of 2008, 2012 and 2017 and the Listing Rules of 2008. He chaired the International Integrated Reporting Council of Sri Lanka (IIRSL) on behalf of CA Sri Lanka from 2018 to 2021. He currently chairs the Corporate Governance Committee of CA Sri Lanka.
Mr. Talwatte serves as an Independent Non-Executive Director on the boards of several listed companies.
Imtiaz Abdul WahidNon-Executive Director
Mr. M. Imtiaz Abdul Wahid is an Associate Member of the Institute of Chartered Accountants of Sri Lanka and a Fellow Member of the Chartered Institute of Management Accountants (UK). He has been involved in the operations of the subsidiary company Cargills (Ceylon) PLC in an executive capacity at different intervals progressively at higher levels (appointed Director 1997 and Deputy Managing Director in 2001) spanning a period of over 30 years, leaving the services of the company for employment abroad on two occasions in between whereby he also gained valuable exposure holding a number of senior management positions in overseas companies. He was appointed Managing Director/ Deputy CEO of Cargills (Ceylon) PLC in May 2010.
Sanjay NilesExecutive Director
Mr. Sanjay C. Niles is an Associate Member of the Institute of Chartered Accountants of Sri Lanka and the Chartered Institute of Management Accountants, UK. He is also a Director of CT Land Development PLC, Executive Director of Ceylon Theatres (Pvt) Ltd., and a Director of other companies within the CT Holdings Group.

17 C T HOLDINGS PLCAnnual Report 2021 2022
CORPORATE GOVERNANCE
Section 7.10 of the Listing Rules of the Colombo Stock Exchange – “Corporate Governance” sets out the Corporate Governance requirements of listed companies. The Directors hereby confirm that the Company is in compliance with the said section of the Listing Rules as at 31st March 2022.
Corporate Governance within the Group is handled at two levels(a) Subsidiary Company level – each of the listed subsidiaries has Corporate Governance Procedures that are compliant with the
requirements of Listing Rules. Subsidiaries that are private companies follow the Corporate Governance procedures adopted for the listed company immediately above in the group structure.
(b) At the Parent Company level – the details of the Parent Company’s compliance with the Listing Rules are set out in the table below.
The overall Policy Framework for the Group is formulated by the Group’s Executive Committee, which is then presented to the Board of Directors of the Parent Company and subsidiaries for approval and adoption. The Policy Framework is periodically reviewed and updated as required.
Principle Compliance Status
Remarks
1. Non-Executive Directors
The Board shall include at least two Non-Executive Directors; or one third of the total number of Directors whichever is higher.
Complied The Board of Directors consists of Ten Directors of whom Eight are Non-Executive Directors.
2. Independent Directors
Two or 1/3rd of Non-Executive Directors appointed to the Board of Directors, whichever is higher shall be ‘independent’.
Complied Three Directors out of the Eight Non-Executive Directors are Independent (See 3 below).
The Board shall require each Non-Executive Director to submit a declaration annually of his/her independence or non-independence in the prescribed format.
Complied All Non- Executive Directors submitsigned declarations of Independence / Non-Independence annually.
3. Disclosures relating to Directors
The Board shall make a determination annually as to the independence or non-independence of each Non-Executive Director and set out in the annual report the names of Directors determined to be ‘independent’.
Complied Messrs. J B L De Silva, Priya Edirisinghe, and A D B Talwatte are deemed to be independent Directors as stated below.

18C T HOLDINGS PLCAnnual Report 2021 2022
Principle Compliance Status
Remarks
In the event a Director does not qualify as ‘independent’ but if the Board, taking account of all the circumstances, is of the opinion that the Director is nevertheless ‘independent’, the Board shall specify the criteria not met and the basis for its determination in the annual report.
Complied Messrs. J B L De Silva and Priya Edirisinghe have served in the Company’s Board for a continuous period exceeding nine (09) years. Further Messrs. Priya Edirisinghe and A D B Talwatte also serve as Directors of other Group Companies of C T Holdings PLC. Nevertheless, the Board of Directors of the Company, having considered their credentials and integrity have resolved that Messrs. J B L De Silva, Priya Edirisinghe, and A D B Talwatte be deemed Independent Directors of the Company.
The Board shall publish in its annual report a brief résumé of each Director on its Board.
Complied Disclosed in the Annual Report.
Upon appointment of a new Director to its Board, the Company shall forthwith provide to the Exchange a brief résumé of such Director for dissemination to the public.
N / A No new Directors were appointed to the Board of the Company during the year.
5. Remuneration Committee
A listed company shall have a remuneration committee comprising a minimum of two independent Non-Executive Directors or exclusively by Non-Executive Directors a majority of whom shall be independent, whichever shall be higher. One Non-Executive Director shall be appointed as Chairman of the Committee by the Board
Complied The Remuneration Committee consisted of two Independent Directors and one Non-Executive Director. The Chairman of the Remuneration Committee is a Non-Executive Director.
The Remuneration Committee shall recommend to the Board of Directors, the remuneration payable to the Executive Directors and Chief Executive Officer.
Complied The functions of the Remuneration Committee are disclosed in the Report of the Remuneration Committee.
The annual report should set out the names of Directors comprising the Remuneration Committee, contain a statement of the remuneration policy and set out the aggregate remuneration paid to Executive and Non- Executive Directors.
Complied The names of the members of the remuneration Committee are disclosed in the Annual Report under Corporate Information. Details of the Directors’ emoluments are disclosed in Notes to the financial statements. The Remuneration Policy is stated in the Report of the Remuneration Committee.
Corporate Governance

19 C T HOLDINGS PLCAnnual Report 2021 2022
Principle Compliance Status
Remarks
6. Audit Committee
A listed company shall have an Audit Committee comprising a minimum of two Independent Non-Executive Directors or exclusively by Non-Executive Directors a majority of whom shall be independent whichever shall be higher. One Non-Executive Director shall be appointed Chairman of the committee by the Board
Complied The Audit Committee consists of three Independent Directors. The Chairman of the Audit Committee is an Independent Non-Executive Director.
Unless otherwise determined by the Audit Committee the Chief Executive Officer and the Chief Financial Officer of the listed company shall attend audit committee meetings.
Complied The Deputy Chairman/Managing Director and Executive Director are invited to attend the Audit Committee meetings as required.
The Chairman or one member of the committee should be a Member of a recognised professional accounting body.
Complied The Chairman and a member are Fellow Members of the Institute of Chartered Accountants of Sri Lanka and Chartered Institute of Management Accountants, UK.
Functions of the Audit Committee Complied Disclosed in the Report of the AuditCommittee.
The annual report should set out the names of Directors comprising the Audit Committee.
Complied The names of the members of the Audit Committee are disclosed in the Annual Report under Corporate Information.
The committee shall make a determination of the independence of the auditors and shall disclose the basis for such determination in the annual report.
Complied Disclosed in the Report of the AuditCommittee.
The annual report shall contain a report by the Audit Committee, setting out the manner of compliance, during the period to which the annual report relates.
Complied Disclosed in the Report of the AuditCommittee

20C T HOLDINGS PLCAnnual Report 2021 2022
RISK ASSESSMENT
Risks are internal or external events that can negatively impact the realization of short-term objectives or the implementation of long-term strategies. They can also emerge from missed or poorly exploited opportunities. The risk management process encompasses anticipating, identifying, managing, and mitigating internal and external risks and opportunities to ensure both short and long-term economic, environmental and social sustainability of the C T Holdings (CTH) Group.
CTH risk portfolio is distributed among subsidiary companies and varies with the nature of each business, geographical dispersion and operation of each sector and company. The Board of Directors of CTH is entrusted with the task of assessing and regulating the risk profile of each operating sector along the lines of the strategic objectives of the Parent Company. For certain key areas, the Group has set up separate monitoring and reporting structures dedicated to monitoring and reporting on internal and external risks. Such structures, where appropriate, have direct reporting responsibilities to independent committees as well.
Consistent risk monitoringThe management teams of the respective sectors are responsible for overseeing the implementation and effectiveness of risk management in their particular sector. They ensure that the risk management system as a whole is operational and that the standards and processes remain current. The significant internal and external risks faced by CTH along with the mitigating factors are described below.
1. Business riskThe business risks constantly change in nature and complexity in the operating environment of the Group. The Group’s businesses are subject to a variety of risks, including laws and regulations, market conditions and competitive landscape, which require constant monitoring and evaluation by the management. CTH as the Holding Company carefully evaluates all risks pertaining to high value investments of the Group both in existing operating sectors and new areas (if any).
2. Reputational riskFailure to protect the Group’s reputation could lead to a loss of trust and confidence among stakeholders. We recognise the commercial imperative to safeguard the interests of all our stakeholders. We therefore endeavor to engage with them to take into account their views in developing long term strategies.
3. Funding & liquidityThe Group’s subsidiaries and associates finance their operations through a combination of retained earnings, and long term and short term banking facilities. Effective management of cash flow is a key component of maintaining strong funding and liquidity positions. Adequate funding arrangements are available to meet investments and contingencies that may occur in the ordinary course of business. Further, the strong relationships maintained with Banks enable companies within the Group to raise funds at competitive rates as and when required.
4. Credit riskCredit risk is the risk due to uncertainty in the counterparty’s ability to meet its financial obligations. The Group’s Credit risk primarily arises from deposits with banks as well as credit exposure to customers including outstanding receivables. Strict credit control procedures are adopted in order to assess the credit quality of present and potential customers with further mitigating measures undertaken to reduce risk. The utilisation of credit limits is regularly monitored.
5. Interest rate riskExcept in the case of investment of surplus funds, the Group’s income and operating cash inflows are substantially independent of changes in market interest rates. The Group’s interest rate risk arises from long and short term borrowings at variable rates linked to market conditions. Such arrangements, while being advantageous at present exposes the Group to interest rate fluctuations. The Group monitors its interest rate exposure on a dynamic basis.
6. Exchange rate riskExposure to Exchange Rate risk is minimal. Revenue streams are also largely independent of Exchange Rate fluctuations except in the case of commodity imports.
7. Product safetyThe safety and quality of our products is of paramount importance to the Group as well as being essential for maintaining customer trust and confidence. A breach in confidence could adversely affect the size of our customer base and financial results. We have

21 C T HOLDINGS PLCAnnual Report 2021 2022
detailed and established procedures for ensuring product integrity and quality at all times. There are strict product safety processes in place. We work in partnership with suppliers to ensure mutual understanding of the standards required. We also monitor developments in areas such as health, safety and nutrition in order to respond appropriately to changing customer trends and new legislation.
8. Health and safety risksProvision of adequate safety to our staff and customers is of the utmost importance to us. Injury or loss of life cannot be measured in financial terms. We operate stringent health and safety processes in line with best practice in our outlets, manufacturing facilities and offices, which also ensure that safety practices are inculcated in all employees. Such procedures are monitored regularly.
9. Regulatory and political environment
As a Group predominantly operating within Sri Lanka our business is affected by the regulatory and political framework within the country. The effect of such an environment outside Sri Lanka could affect the Company to the extent that it affects the entire local economy. We consider these uncertainties in the local and overseas economies when developing strategies and reviewing performance. We remain vigilant to future changes. As part of our day to day operations we engage with governmental and non-governmental organisations to ensure the views of our customers and employees are represented and try to anticipate and contribute to important changes in public policy whenever possible.
10. Legal issuesFull provision is made for all legal liabilities that are expected to result in any material loss to the Company. All contingent liabilities have been disclosed in the financial statements.
11. Retirement benefit obligations The retirement benefit obligations are computed based on actuarial assumptions. The management takes all required steps to ensure that such assumptions are accurate and corresponds to past results and current trends. However, any significant discrepancies between actuarial assumptions and actual conditions may have some impact on future results. The management considers the possibility of such impact as very low.
12. Risk of natural disastersNatural disasters such as earthquakes, storms, and floods, as well as accidents, acts of terror, infection and other factors beyond the control of the Group could adversely affect the Group’s business operation. Insurance covers are obtained against all identified risks and natural disasters affecting the assets of the Group and operational matters.
13. CompetitionMost sectors of the Group face very competitive business environments. The management regularly reviews the competitor environment in order to develop appropriate counter strategies. Due to the widespread nature of operations, Group’s sales are not dependent on a single or small group of customers.
14. Information systems and cyber security
The Group is heavily reliant on computerised operational and financial systems to ensure efficiency of operations and financial reporting. These systems and the associated controls are regularly monitored and reviewed. Measures have been put in place to protect the Group against factors such as natural disasters, accidents, data losses, computer viruses and unauthorised access. An IT disaster recovery plan is also in place.
15. Commodity price riskThe Group’s FMCG sector is more exposed to the volatility in the commodity prices. Prices may also be adversely affected by environmental factors such as drought & floods. Long term relationships built with suppliers and forward contracts help in minimising the effects of this risk factor to some extent.
16. Supply chainRaw material, semi processed food and finished goods for re-sale are sourced from third-party suppliers, contract manufacturers and primary producers exposes the group to market volatility and availability.
17. Covid 19 The Company and subsidiaries developed effective strategies to minimize, as far as possible, the adverse effects arising from the Covid 19 pandemic. Details of the effect of the pandemic on the Group and steps taken to counter the same are disclosed in Notes to the Financial Statements.

22C T HOLDINGS PLCAnnual Report 2021 2022
REPORT OF THE REMUNERATION COMMITTEE
The Remuneration Committee of C T Holdings PLC is appointed by the Board of Directors of the Company and reports directly to the Board.
Remuneration PolicyAs is well known, Human Resources in Companies are a vital cog in the wheel to successfully carry out its business activities in a fair and equitable manner in the interest of its shareholders, employees, and other stakeholders and in all instances, within the laws of the country to enhance / add shareholder value for the benefit of its respective stakeholders. Executive Directors and Senior Management are pivotal drivers and there is a need to ensure that such employees are adequately and fairly compensated in line with market conditions applicable to the respective sectors.
FrameworkThe policy framework for the functioning of the Remuneration Committee of the Company and its subsidiaries is set out in the Group Policies adopted across the Group. In addition to the Remuneration Committee of the Holding Company, some listed subsidiaries have their own Remuneration Committees. The Chairman and one other member (or two members as appropriate) of the Remuneration Committee of the Parent Company shall be members of each of such separate remuneration committees. In the event a subsidiary company does not have a separate remuneration committee, the remuneration committee of the immediate holding company will function as the remuneration committee for that subsidiary company as well.
CompositionThe Composition of the Remuneration Committees is in accordance with the rules on Corporate Governance of the Securities & Exchange Commission of Sri Lanka, the Colombo Stock Exchange and the respective company’s Articles.
The composition of the Remuneration Committee of CT Holdings PLC is as follows:
Name Non-Executive Directors
Louis Page, Chairman
Non-Executive
Priya Edirisinghe Independent
J B L De Silva Independent
The Executive Director of CT Holdings PLC functions as the Secretary to the Committee.
Scope • The Remuneration Committee shall recommend the remuneration payable to
• Chief Executive Officer and / or equivalent position
• Executive Directors, and, • Senior Management/Executives,
to the board of the company which will make the final determination upon consideration of such recommendations.
• Detailed procedures are set out in the Group Policies in respect of all revisions in remuneration payable.
• The Remuneration Committee shall also recommend the variable incentives/or bonuses within the parameters set out in the Group policies.
• The Board of the respective Company may decide that the Remuneration Committee should include the review of emoluments of other levels of employees as well. The procedure for such revision of emoluments are also specified in the Group policies.
• Once in three years, the company shall commission an independent party to study & report on the emoluments of the CEO, Executive Directors, and senior management / executives, and may include other levels also in the review as applicable to the relevant sectors. The said Report will be discussed by the Committee for guidance in making the required assessments.
MeetingsThe Remuneration Committee shall meet on a needs basis and meets at least once a year.
(Signed)Louis PageChairman - Remuneration Committee
06 July 2022

23 C T HOLDINGS PLCAnnual Report 2021 2022
REPORT OF THE NOMINATIONS COMMITTEE
The Nominations Committee of C T Holdings PLC is appointed by the Board of Directors of the Company and reports directly to the Board.
Policy FrameworkThe policy framework for the functioning of the Nominations Committee of the Company and its subsidiaries is set out in the Group Policies adopted across the Group. C T Holdings PLC and subsidiaries are subject to the Nominations Committee of C T Holdings PLC. Nominations to the Boards of all Group Companies shall be reviewed and approved by this Committee prior to appointment.
CompositionThe Nominations Committee of CT Holdings comprise the Chairman, the Deputy Chairman / Managing Director, and the Chairman of the Executive Committee of the company.
The composition of the Nominations Committee during the year continued to be as follows:
Name Description of Directorship
Louis Page, Chairman Non-Executive, Chairman of C T Holdings PLC
Priya Edirisinghe Independent, Chairman Executive Committee
Ranjit Page Executive, Deputy Chairman/MD of C T Holdings PLC
The Composition of the Nominations Committee satisfies the criteria as specified in the standards of Corporate Governance for listed Companies.
ScopeThe scope of the Nominations Committee would be to review all appointments to the Board of Group companies and recommend to the respective Board of Directors of the relevant company for appointment.
No new appointments were made to the Board of Directors of CT Holdings PLC during the year. However, Directors’ appointments were recommended to be made in subsidiary and sub-subsidiary companies, based on which such appointments were formally approved by the Boards of the respective companies.
MeetingsThe Nominations Committee shall meet once each year or as required.
(Signed)Louis PageChairman - Nominations Committee
06 July 2022

24C T HOLDINGS PLCAnnual Report 2021 2022
REPORT OF THE RELATED PARTY TRANSACTIONS REVIEW COMMITTEEThe Related Party Transactions Review (RPTR) Committee of C T Holdings PLC is appointed by the Board of Directors of the Company. The RPTR Committee functions within the overall governance process established by the Board of Directors of the Company and assists the Board in effectively discharging its responsibilities. The Committee reports directly to the Board.
FrameworkThe policy framework for the functioning of the RPTR Committee of the Company and its subsidiaries is set out in the Group Policies adopted centrally for the entire Group. However, the holding company and all listed subsidiaries have separate RPTR Committees. The Chairman and one other member (or two members as appropriate) of the RPTR Committee of the parent company shall be members of each of such separate RPTR Committees. In the case of non-listed subsidiary companies, the RPTR committee of the immediate holding company functions as the RPTR committee for the subsidiary companies as well.
CompositionThe Composition of the RPTR Committees must be in accordance with the code of best practices on related party transactions (RPT code) of the Securities & Exchange Commission of Sri Lanka (SEC), the listing rules of the Colombo Stock Exchange and the respective company’s Articles, as appropriate.
The composition of the RPTR Committee of CT Holdings PLC is as follows:
Name Non-Executive Directors
Priya Edirisinghe, FCA, FCMA (UK) - Chairman Independent
A D B Talwatte, FCA, FCMA (UK), MBA Independent
J B L De Silva Independent
The Composition of the members of the RPTR Committee satisfies the criteria as specified in the RPT code of SEC and the listing rules of the Colombo Stock Exchange. The Deputy Chairman / Managing Director and Executive Director attend RPTR Committee meetings as and when requested by the Committee. The Company Secretary functions as the Secretary to the Committee.
ScopeThe Functions of the RPTR Committee, as set out in the Group Policies, include the following – • Developing and recommending for adoption by the Board of Directors of the Company and its listed subsidiaries, a related party transactions policy consistent with that proposed by the RPT Code of the SEC.
• Reviewing and updating the control procedures in place to ensure that all recurrent and non-recurrent related party transactions are identified, adequately captured and reported in a timely manner in accordance with the applicable rules.
• Establishing procedures to ensure that related party transactions that are captured within the system are reviewed in a systematic manner and certified by key management personnel with appropriate level of authority.
• Reviewing all related party transactions as reported by the management for compliance with the RPT code.
• Ensuring that appropriate disclosures are made as applicable to the CSE (where immediate market disclosures are required) and the Annual Report.
As per the applicable procedures of the Group the RPTR Committee has obtained: • Quarterly declarations of related party transactions from Directors & Senior Management of all Group companies on recurrent & non-recurrent transactions undertaken by them or by their close family members.
• Quarterly declarations of Directors & Senior Management of all Group companies who have a Significant Shareholding/ownership in a Company or partnership or proprietorship which is outside the Group companies and/or of the Subsidiaries and Associate Companies of Group companies.

25 C T HOLDINGS PLCAnnual Report 2021 2022
• Quarterly declarations of Group Financial Officer or equivalent Position in Group companies on Recurrent and/or Non-Recurrent transactions within the Group Companies.
Likewise, procedures are also in place for the assessment of the need to obtain shareholder approval for specified transactions and to inform the SEC/CSE on the applicable Non-Recurrent transactions.
Related Party TransactionsCompanies within the Group regularly engage in transactions with other companies within the Group. The RPTR Committee receives and reviews details of all related party transactions from the Chief Financial Officers of individual companies and disposes of the same in accordance with the mandate set out above.
With regard to non-recurrent transactions, if any, the Committee is empowered to seek independent expert advice on valuation or any other related matter that the committee deems to be significant.
MeetingsIn terms of the listing rules of the Colombo Stock Exchange, the RPTR Committees should meet at least four times a year. Unless otherwise determined by the RPTR Committee the Chief Executive Officer and the Chief Financial Officer of the listed company shall attend RPTR committee meetings.
The RPTR Committee of C T Holdings PLC met four times during the year, once per calendar quarter.
Details of the participation of the members of the RPTR committee at such meeting is set out below.
Name Meetings Held Meetings Attended
Priya Edirisinghe 4 4
A D B Talwatte 4 4
Sunil Mendis * (up to 1 July 2021) 4 1
J B L De Silva 4 4
* Mr. Sunil Mendis (Independent, Non-Executive Director) who had attained 76 years of age retired at the conclusion of the AGM 2021 held on 01 July 2021, as per Section 210 (2) (b) of the Companies Act No. 07 of 2007, as he did not wish to be re-elected.
ConclusionBased on its work, the Related Party Transactions Review Committee confirms that there were no non-recurrent transactions with related parties during the year, except as set out below:
The Board of Directors of C T Holdings PLC and Cargills (Ceylon) PLC resolved to form a Real Estate subsidiary company by transferring all properties of the Group designated for development and other unlisted Real Estate / Property Development subsidiaries of the Group under the Real Estate subsidiary and participate in the equity of the said subsidiary in proportion to the value of the properties / equity holdings transferred plus stamp duty and direct taxes borne by C T Holdings PLC and Cargills (Ceylon) PLC and an equity injection of Rs.550Mn by C T Holdings PLC. An announcement to this effect was made to the Colombo Stock Exchange on 26 October 2021.
The Related Party Transactions Review Committee of C T Holdings PLC reviewed the transaction/s and is of the view that the transactions are on normal commercial terms and are not prejudicial to the interests of the Entity and its minority shareholders and the Related Party Transactions Review Committee obtained an opinion from an independent valuer prior to forming its view on the transaction/s.

26C T HOLDINGS PLCAnnual Report 2021 2022
Report of the Related Party Transactions Review Committee
It also noted that in respect of recurrent transactions, the transactions have been carried out in the ordinary course of business at “arm’s length” basis as required by the Para 23 of LAKAS 24, “Related Party Disclosures”. There were no changes to terms or practices followed over the previous year and general terms and conditions applicable to such transactions with Related Parties are similar to those entered into with non-related parties taking into account, if any, due consideration of factors such as volume, cost and any other special benefits which form part and parcel of such transactions. The observations of the Committee have been communicated to the Board of Directors, and the Board in turn has made a declaration to the effect that the Company has complied with the requirements of the Rules pertaining to Related Party Transactions as contained in Section 9 of the listing rules of the Colombo Stock Exchange.
The details of the recurrent transactions entered into with Related Parties are disclosed in notes to the Financial Statements.
Priya EdirisingheChairman - RPTR Committee
06 July 2022
Financial ReportsReport of the Related Party Transactions Review Committee 24
Annual Report of the Board of Directors of the Company 28
Report of the Audit Committee 31
Statement of Directors’ Responsibility 33
Independent Auditors’ Report 34
Statement of Profit or Loss and Other Comprehensive Income 40
Statement of Financial Position 41
Statement of Changes in Equity 42
Statement of Cash Flows 44

28C T HOLDINGS PLCAnnual Report 2021 2022
The Directors are pleased to present the Annual Report of C T Holdings PLC for the Year ended 31st March 2022.
ActivitiesThe Group’s Principal activities and important events during the year are discussed in detail in the Chairman’s Statement and Review of Operations set out on pages 08 to 09 and 10 to 13 respectively. There were no significant changes to the business activities of the Group during the year.
Risk managementThe overall approach to risk management within the Company and Group is set out in pages 20 to 21.
Financial statementsThe Audited Financial Statements of the Company & Group for the year ended 31st March 2022 set out on pages 40 to 133 form an integral part of this annual report.
Auditors’ reportThe Independent Auditors’ Report is set out on pages 34 to 39.
Accounting policiesThe accounting policies adopted in the preparation of the financial statements are given on notes 46 to 64.
Ratios and market price informationKey ratios and market price information pertaining to the equity of the Group are set out on page 134 along with the trend for the past four years. Company and subsidiaries have not raised any capital through listed debt instruments during the year.
Property, plant & equipmentThe movement of property, plant and equipment during the year is given in note 13 to the financial statements. The Group’s outlay on property, plant and equipment during the year amounted to Rs. 7.57Bn (2021 – Rs. 6.28Bn). The capital outlay on property, plant and equipment during the year at the Company level amounted to Rs. Nil (2021 – Rs. 147,000). The Directors are of the opinion that the carrying amount of properties stated in note 13 to the financial statements reasonably reflects their fair values.
Extents, locations, valuations of the Group’s property holdings and investment properties are disclosed in note 13 and 16 to the financial statements.
Stated capitalThe stated capital of the Company at the balance sheet date amounted to Rs. 6,489,758,332 (2021 - Rs. 6,489,758,332) comprising 201,406,978 ordinary (voting) shares (2021 – 201,406,978).
Details of the Employees’ Share option Scheme of the subsidiary Cargills (Ceylon) PLC are given in note 27.4 to the Financial Statements. Except for this, neither the Company nor any other subsidiaries have any share ownership or stock option schemes at present.
ShareholdersThere were 1,427 registered shareholders as at 31st March 2022 (2021 – 1,531 shareholders). An analysis
of shareholders according to size and holdings, public holdings and the names of the twenty largest shareholders of the Company at the reporting date are given on Pages 139 to 141.
DirectorateAll Directors of the Company have been Directors throughout the year under review, except for Mr. Sunil Mendis who retired as of 1 July 2021, and Mr. Raj Selvaskandan who resigned at the end of December 2021. Details of Directors of group companies as at the reporting date are given on pages 135 to 138 of this report. Brief profiles of the Directors of the Company are given on pages 14 to 16, including their executive/non-executive status and determination of independence, as appropriate.
ANNUAL REPORT OF THE BOARD OF DIRECTORS OF THE COMPANY

29 C T HOLDINGS PLCAnnual Report 2021 2022
Details of attendanceThe details of the Directors’ attendance at meetings (some connecting electronically when unable to be physically present) are given below.
Name Board Meetings AGM
Held Attended Held Attended
Louis Page 4 4 1 1
Ranjit Page 4 4 1 1
J B L De Silva 4 3 1 1
Priya Edirisinghe 4 4 1 1
Sunil Mendis 1 0 1 1
Cecilia Page Muttukumaru 4 4 1 1
S C Niles 4 4 1 1
Dr. A Aravinda Page 4 3 1 1
Joseph Page 4 4 1 1
R. Selvaskandan 3 2 1 1
A D B Talwatte 4 4 1 1
Imtiaz Abdul Wahid 4 4 1 1
Directors’ remunerationThe remuneration of the Directors is given in Note 8.1 to the financial statements.
Directors’ Interests Register and Directors’ interest in contracts or proposed contractsThe Company maintains a Directors’ Interests Register in terms of the Companies Act No. 07 of 2007. The Directors have made necessary declarations of their interests in contracts and proposed contracts in terms of Sections 192 (1) and 192 (2) of the Companies Act, as at date. These interests are entered in the Interests Register which is deemed to form part and parcel of this Annual Report and available for inspection upon request.
The particulars of the Directors’ Interests in Contracts with the Company are given in Related Party disclosures to the Financial Statements on page 120 and form an integral part of this Annual Report.
Related Party TransactionsRelated party transactions are disclosed in Note 31 to the financial statements. The Directors hereby confirm that to the best of their knowledge and information available to them, the Company has complied with the requirements of the rules relating to the related party transactions as contained in Section 9 of the listing Rules of the Colombo Stock Exchange.

30C T HOLDINGS PLCAnnual Report 2021 2022
Directors’ shareholdingsThe Directors’ shareholdings in the Company as at the reporting date were as follows:
Name As at31-Mar-2022
As at31-Mar-2021
Louis Page 11,000 11,000
Ranjit Page 17,235,454 16,788,809
J B L De Silva 234 234
Priya Edirisinghe - -
Sunil Mendis - -
Cecilia Page Muttukumaru 1,646,731 1,460,266
S C Niles 56,485 56,485
Dr. A Aravinda Page 636,114 636,114
Joseph Page 7,069,172 7,069,172
R. Selvaskandan - -
A D B Talwatte - -
Imtiaz Abdul Wahid - -
26,655,190 26,022,080
Events after the reporting periodEvents occurring after the reporting date of the Company are given in Note 35 to the financial statements.
Corporate governanceThe corporate governance practices within the Group are set out in pages 17 to 19 and the report of the Audit Committee is set out on page 31 and 32.
DividendsThe Company paid an interim dividend of Rs. 1.55 per share in December 2021 for the year ended 31st March 2022 (2021 – Rs 1.45).
The Directors propose a final dividend of Rs. 3.00 (2021 – Rs.2.90) per share payable on or before 19 August 2022, subject to approval of the shareholders at the Annual General Meeting.
AuditorsThe remuneration paid to the Auditors is given in Note 8.3 to the financial statements. As far as the Directors are aware, the Auditors do not have any relationship (other than that of an auditor) with the Company.
M/s. KPMG, Chartered Accountants are deemed re-appointed in terms of Section 158 of the Companies Act No.7 of 2007, as Auditors of the Company. A resolution authorising the Directors to determine their remuneration will be submitted at the Annual General Meeting.
By Order of the Board
Ranjit PageDeputy Chairman / Managing Director
Priya EdirisingheDirector
S L W DissanayakeCompany Secretary
06 July 2022
Annual Report of the Board of Directors of the Company

31 C T HOLDINGS PLCAnnual Report 2021 2022
REPORT OF THE AUDIT COMMITTEE
The Audit Committee of C T Holdings PLC is appointed by the Board of Directors of the Company. The Audit Committee functions within the overall governance process established by the Board of Directors of the Company and assists the Board in effectively discharging its responsibilities. The Committee reports directly to the Board.
Policy FrameworkThe policy framework for the functioning of the Audit Committee of the Company and its subsidiaries is set out in the Group Policies adopted across the Group. In addition to the Audit Committee of the holding company, all listed subsidiaries and significant non-listed subsidiaries have separate Audit Committees. The Chairman and one other member (or two members as appropriate) of the Audit Committee of the parent company are members of each of such separate Audit Committees. In the event a non-listed subsidiary company does not have a separate audit committee, the audit committee of the immediate holding company will function as the audit committee for that subsidiary company as well.
CompositionThe Composition of the Audit Committees is in accordance with the rules on Corporate Governance of the Securities & Exchange Commission of Sri Lanka, the Colombo Stock Exchange, and the respective company’s Articles.
The composition of the Audit Committee of CT Holdings PLC is as follows:
Name Non-Executive Directors
Priya Edirisinghe, FCA, FCMA (UK) Chairman Independent
A D B Talwatte, FCA, FCMA (UK), MBA Independent
J B L De Silva Independent
The Chairman of the Audit Committee is a Fellow member of the Institute of Chartered Accountants of Sri Lanka. The Deputy Chairman / Managing Director and Executive Director of the Company attend Audit Committee meetings as and when requested by the Committee. The Company Secretary functions as the Secretary to the Committee.
ScopeThe Functions of the Audit Committee, as set out in the Group Policies, include thefollowing – • Oversight of the preparation, presentation, and adequacy of disclosures in the financial statements of the listed company, in accordance with Sri Lanka Accounting Standards.
• Oversight of the Company’s compliance with financial reporting requirements, information requirements of the Companies Act and other relevant financial
reporting related regulations and requirements.
• Oversight over the processes to ensure that the Company’s internal controls and risk management, are adequate, to meet the requirements of the Sri Lanka Auditing Standards.
• Assessment of the independence and performance of the Company’s external auditors.
• To make recommendations to the Board pertaining to appointment, re-appointment, and removal of external auditors and to approve the remuneration and terms of engagement of the external auditors.
The Audit Committee obtains written assurance from the Executive Director (who also functions as the Chief Financial Officer), and the Company Secretary, when considering the quarterly and annual financial statements for recommendation to the Board.
MeetingsIn terms of the Group Policy, the Audit Committees should meet at least four times a year of which the Company Auditors will attend at least one of such meetings. Unless otherwise determined by the audit committee the chief executive officer and the chief financial officer of the listed company shall attend audit committee meetings.
The Audit Committee of CT Holdings PLC met four times during the year, once per calendar quarter, one of which was with the participation of the Company’s auditors.

32C T HOLDINGS PLCAnnual Report 2021 2022
Details of the participation of the members of the audit committee at such meetings is set out below.
Name Meetings Held Meetings Attended
Priya Edirisinghe 4 4
A D B Talwatte 4 4
Sunil Mendis * (up to 1 July 2021) 1 1
J B L De Silva 4 3
* Mr. Sunil Mendis (Independent, Non-Executive Director) who had attained 76 years of age retired at the conclusion of the AGM 2021 held on 01 July 2021, as per Section 210 (2) (b) of the Companies Act No. 07 of 2007, as he did not wish to be re-elected.
Financial StatementsFour quarterly financial statements as well as the annual financial statements were circulated, reviewed and recommended to the Board for approval during the year. Conformity of such financial statements with the applicable Accounting Standards, Company Law and other Statutes including Corporate Governance Rules and consistency of the presentation of such financial statements with the previous quarter / year as the case may be were also confirmed. Departures, if any, are appropriately disclosed.
ConclusionBased on its work, the Audit Committee is of the opinion that the control procedures and environment within the Group provide reasonable assurance regarding the monitoring of the operations, accuracy of the financial statements, safeguarding of the assets of the Company, and risk profiling and initiatives taken towards mitigating same.
Audit and Auditors’ IndependenceThe Audit Committee assessed the independence and performance of the Company’s external auditors and made recommendations to the Board pertaining to their re-appointment. The Audit Committee also reviewed the audit fees for the Company and approved the remuneration and terms of engagement of the external auditors and made recommendations to the Board. When doing so, the Audit Committee reviewed the type and quantum of non-audit services (if any) provided by the external auditors to the Company to ensure that their independence as Auditors has not been impaired.
The Audit Committee obtains a statement from Messrs. KPMG confirming independence as required by Section 163 (3) of the Companies Act No. 07 of 2007 on the audit of the Statement of Financial Position and the related Statements of Income, Changes in Equity, and Cash Flows of the Company and the Group.
The Audit Committee has recommended to the Board of Directors that M/s. KPMG be reappointed as Auditors of the Company for the year ending 31st March 2023.
Priya EdirisingheChairman - Audit Committee
06 July 2022
Report of the Audit Committee

33 C T HOLDINGS PLCAnnual Report 2021 2022
STATEMENT OF DIRECTORS’ RESPONSIBILITY
Maintenance of Accounting RecordsUnder the provisions of the Companies Act No. 07 of 2007 (‘the Act’), every company is required to maintain accounting records that correctly record and explain the Company’s transactions, and will at any time enable the financial position of the Company to be determined with reasonable accuracy, enable the Directors to prepare financial statements in accordance with the Act and also enable the financial statements of the Company to be readily and properly audited.
Preparation of Financial Statements of the Company and GroupThe Act places the responsibility on the Board of Directors to ensure that financial statements are prepared within the prescribed time period in conformity with the Act. Such financial statements of a Company shall give a true and fair view of the state of affairs of the Company as at the reporting date and the profit or loss or income and expenditure, as the case may be, of the Company for the accounting period ending on that reporting date.
Further, the Act also requires that a Company with one or more subsidiaries at the reporting date also prepare financial statements in relation to the Group including every subsidiary, which give a true and fair view of the state of affairs of the Company and its subsidiaries as at the reporting date and the profit or loss or income and expenditure, as the case may be, of the Company and its subsidiaries for the accounting period ending on that reporting date.
DividendsIn the event of any distribution of dividends the Board of Directors is required to satisfy themselves that the Company will, immediately after the relevant distribution is made, satisfy the solvency test, provided that such a certificate is obtained from the auditors.
Annual ReportThe Board of Directors is required to prepare an Annual Report on the affairs of the Company during the accounting period ending on the reporting date in the prescribed format and circulate the same to every shareholder of the Company within the time frame prescribed in the Act.
Independent auditThe Act required the Company to appoint an Auditor to audit the financial statements of the Company / Group for the reporting period. Accordingly, M/s KPMG currently function as the Auditors of the Company. Their responsibility with regard to the financial statements as auditors of the Company are set out in the Independent Auditors’ Report set out on pages 34 to 39.
ManagementThe Directors are responsible for the proper management of the resources of the Company. The internal control system has been designed and implemented to obtain reasonable but not absolute assurance that the Company is protected from undue risks, frauds, and other irregularities.
ComplianceConsidering the present financial position of the Group and the forecasts
for the foreseeable future, the Directors have adopted the going concern basis for the preparation of these financial statements.
The Directors confirm that:(a) The Company is in compliance
with the requirements of the Act as aforementioned.
(b) These financial statements have been prepared in accordance with the requirements of the Companies Act No. 7 of 2007 and applicable Sri Lanka Accounting Standards, which have been consistently applied and supported by reasonable and prudent judgments and estimates.
(c) The Company obtained the required certificate of solvency for the dividends declared during the year.
(d) All statutory payments have been made up to date.
(e) Other than as disclosed in the Financial Statements, no material issues have arisen pertaining to employees and industrial relations of the Company that requires disclosure or any adjustment to the Financial Statements.
The Directors are satisfied that the control procedures within the Company operated effectively during the year.
By order of the Board
S L W DissanayakeCompany Secretary
06 July 2022

34C T HOLDINGS PLCAnnual Report 2021 2022
INDEPENDENT AUDITORS’ REPORT
TO THE SHAREHOLDERS OF CT HOLDINGS PLC
Report on the Audit of the Financial Statements
Opinion
We have audited the financial statements of CT Holdings PLC (“the Company”) and the consolidated financial statements of the Company and its subsidiaries (“the Group”), which comprise the statement of financial position as at 31 March 2022, and the statement of profit or loss and other comprehensive income, statement of changes in equity and statement of cash flows for the year then ended, and notes to the financial statements, including a summary of significant accounting policies and other explanatory information as set out on pages 40 to 133 of the Annual Report.
In our opinion, the accompanying financial statements of the Company and the Group give a true and fair view of the financial position of the Company and the Group as at 31 March 2022, and of their financial performance and cash flows for the year then ended in accordance with Sri Lanka Accounting Standards.
Basis for Opinion
We conducted our audit in accordance with Sri Lanka Auditing Standards (SLAuSs). Our responsibilities under those standards are further described in the Auditor’s Responsibilities for the Audit of the Financial Statements section of our report. We are independent of the Group in accordance with the Code of Ethics issued by CA Sri Lanka (Code of Ethics), and we have fulfilled our other ethical responsibilities in accordance with the Code of Ethics. We believe that the audit evidence we have obtained is sufficient and appropriate to provide a basis for our opinion.
Key Audit Matters
Key audit matters are those matters that, in our professional judgment, were of most significance in our audit of the Company financial statements and the consolidated financial statements of the current period. These matters were addressed in the context of our audit of the Company financial statements and the consolidated financial statements as a whole, and in forming our opinion thereon, and we do not provide a separate opinion on these matters.
KPMG Tel +94 - 11 542 6426(Chartered Accountants) Fax +94 - 11 244 587232A, Sir Mohamed Macan Markar Mawatha, +94 - 11 244 6058P. 0. Box 186, Internet www.kpmg.com/lk Colombo 00300, Sri Lanka.
KPMG, a Sri Lankan partnership and a member firm of the KPMG global organization of independent member firms affiliated with KPMG International Limited, a private English company limited by guarantee.
C. P. Jayatilake FCA Ms. S. Joseph FCA S. T. D. L. Perera FCA Ms. B.K.D.T.N. Rodrigo FCA Ms. C.T.K.N. Perera ACA
T. J. S. Rajakarier FCA Ms. S.M.B. Jayasekara FCAG. A. U. Karunaratne FCA R. H. Rajan FCA A.M.R.P. Alahakoon ACA
P. Y. S. Perera FCA W. J. C. Perera FCA W. K. D. C. Abeyrathne FCA R.M.D.B. Rajapakse FCAM.N.M. Shameel FCA Ms. P.M.K. Sumanasekara FCA
Principals: S.R.I. Perera FCMA(UK), LLB, Attorney-at-Law, H.S. Goonewardene ACA,W. A. A. Weerasekara CFA, ACMA, MRICS

35 C T HOLDINGS PLCAnnual Report 2021 2022
01. Revenue Recognition – Group
Refer note 6 to the financial statements
Risk Description Our Response
The Group has recognised revenue in the amount of Rs.136,872 Mn.
As at the reporting date 31 March 2022, revenue from the sale of goods from the Food Retailing,Food and Beverage Manufacturing & Distribution segments continued to be the main revenue stream for the Group amounting to Rs. 130,815 Mn which is 96% of Group revenue.
Based on the Group’s business model, there are many different types of revenues, arising from different types of transactions and events with customers.
We identified revenue recognition as a key audit matter because of its significance to the consolidated financial statements.
Our audit procedures included: » Obtaining an understanding of and assessing the design, implementation and operating effectiveness of management’s key internal controls in relation to revenue recognition from sales transactions.
» Testing the design, implementation, and operating effectiveness of relevant general IT controls, automated controls including testing the completeness and accuracy of key reports used in the operation of a control that addresses process risk points related to accounts with a risk of material misstatement.
» Comparing revenue transactions recorded during the current year for the manufacturing segment, on a sample basis, with invoices, sales contracts, underlying goods delivery and acceptance notes, where appropriate, to assess whether the related revenue was recognised in accordance with the Group’s revenue recognition accounting policies.
» Performing a revenue mapping between the front-end system and general ledger for restaurants and retail segments and mapping total inventories issued to corresponding invoices for the manufacturing segment to assess whether the sales were completely and accurately accounted in the general ledger.
» Comparing, on a sample basis, specific revenue transactions recorded before and after the financial year end date with the underlying goods delivery notes and/or invoices to assess whether the related revenue had been recognised in the correct financial period.

36C T HOLDINGS PLCAnnual Report 2021 2022
Independent Auditors’ Report
02.Valuation of Investment Property - Group and Company
Refer note 16 to financial statements
Risk Description Our Response
The Group and the Company have recognised investment property carries at fair value amounting to Rs. 9,579 Mn and Rs. 710 Mn respectively.
Management’s assessment of fair value of investment properties is based on valuations performed by a qualified independent property valuer in accordance with recognised industry standards.
Estimating the fair value is a complex process which involves a significant degree of judgement and estimates in respect of price per perch of the land, capitalization rates, value per square feet, fair market rental and diversity of locations and nature of the land and buildings and investment properties.
We identified this as a key audit matter because of the significance of the value of these properties to the Financial Statements and significant judgement/estimation involves in the valuation.
Our audit procedures included: » Assessing the objectivity, independence, competence and qualifications of the external valuer.
» Assessing the key assumptions applied and conclusions made in deriving the fair value of the properties and comparing the fair value of properties with evidence of current market values. In addition, assessing the valuation methodologies with reference to recognised industry standards.
» Assessing the key inputs used in the valuation by the independent external valuer against our expectations based on our experience, externally published market comparable and our knowledge of property market, consultation with internal valuation specialist.
» Assessing the adequacy of the disclosures in the financial statements, including the description and appropriateness of the inherent degree of subjectivity and key assumptions in the estimates.

37 C T HOLDINGS PLCAnnual Report 2021 2022
03.Carrying value of inventories – Group
Refer Note 21 to the financial statements
Risk Description Our Response
The Group has recognized Inventory in the amount of Rs. 14,809 Mn.
The Group holds a significant level of inventory across a broad and diversified product range, over many locations. At 31 March 2022 14.2% of total assets of the Group consisted of inventory.
Due to the change in consumer demands judgment is exercised with regard to categorisation of stock as obsolete and/or slow moving to be considered for provision/write offs; estimates are then involved in arriving at provisions against cost in respect of slow moving and obsolete inventories located in 14 locations of the subsidiaries and many outlets to arrive at valuation based on lower of cost and net realisable value.
Given the level of judgments, estimates, number of items and locations involved this is considered to be a key audit matter.
Our audit procedures included: » Obtaining an understanding of and assessing the design, implementation and operating effectiveness of key internal controls relating to inventory counts across the Group’s sites and purchasing and issuing of inventories.
» Comparing, on a sample basis, the purchase prices and quantities of inventories recorded by the Group with supplier invoices, goods delivery notes and goods receipt notes.
» Evaluation of the inventory costing methodology and valuation policy established by management, including compliance with the applicable financial reporting standard.
» Comparing, on a sample basis, the selling price of the finished goods subsequent to the reporting date to their carrying values of these inventories as at the financial year end.
» Considering the principles of accounting for the inventory write offs and also carrying out a comparison of inventory levels, to sales data to corroborate whether slow moving and obsolete inventories had been appropriately identified and adequately provided for.
» Attending stock counts as at the year end at sample locations of supermarkets, outlets and warehouses. In addition, assessing the effectiveness of the physical count controls in operation at each count location to identify damaged stocks, expired stocks and stock shortages that are written off in a timely manner and evaluating the results of the other cycle counts performed by the management and third parties throughout the period to assess the level of count variances that are also adjusted periodically.
Other Information
Management is responsible for the other information. The other information comprises the information included in the annual report, but does not include the financial statements and our auditor’s report thereon.
Our opinion on the financial statements does not cover the other information and we do not express any form of assurance conclusion thereon.
In connection with our audit of the financial statements, our responsibility is to read the other information and, in doing so, consider whether the other information is materially inconsistent with the financial statements or our knowledge obtained in the audit or otherwise appears to be materially misstated. If, based on the work we have performed, we conclude that there is a material misstatement of this other information, we are required to report that fact. We have nothing to report in this regard.

38C T HOLDINGS PLCAnnual Report 2021 2022
Independent Auditors’ Report
Responsibilities of Management and Those Charged with Governance for the Financial Statements
Management is responsible for the preparation of financial statements that give a true and fair view in accordance with Sri Lanka Accounting Standards, and for such internal control as management determines is necessary to enable the preparation of financial statements that are free from material misstatement, whether due to fraud or error.
In preparing the financial statements, management is responsible for assessing the Group’s ability to continue as a going concern, disclosing, as applicable, matters related to going concern and using the going concern basis of accounting unless management either intends to liquidate the Group or to cease operations, or has no realistic alternative but to do so.
Those charged with governance are responsible for overseeing the Company’s and the Group’s financial reporting process.
Auditor’s Responsibilities for the Audit of the Financial Statements
Our objectives are to obtain reasonable assurance about whether the financial statements as a whole are free from material misstatement, whether due to fraud or error, and to issue an auditor’s report that includes our opinion. Reasonable assurance is a high level of assurance, but is not a guarantee that an audit conducted in accordance with SLAuSs will always detect a material misstatement when it exists. Misstatements can arise from fraud or error and are considered material if, individually or in the aggregate, they could reasonably be expected to influence the economic decisions of users taken on the basis of these financial statements.
As part of an audit in accordance with SLAuSs, we exercise professional judgment and maintain professional skepticism throughout the audit. We also:
» Identify and assess the risks of material misstatement of the financial statements, whether due to fraud or error, design and perform audit procedures responsive to those risks, and obtain audit evidence that is sufficient and appropriate to provide a basis for our opinion. The risk of not detecting a material misstatement resulting from fraud is higher than for one resulting from error, as fraud may involve collusion, forgery, intentional omissions, misrepresentations, or the override of internal control.
» Obtain an understanding of internal control relevant to the audit in order to design audit procedures that are appropriate in the circumstances, but not for the purpose of expressing an opinion on the effectiveness of the Company and the Group’s internal control.
» Evaluate the appropriateness of accounting policies used and the reasonableness of accounting estimates and related disclosures made by management.
» Conclude on the appropriateness of management’s use of the going concern basis of accounting and, based on the audit evidence obtained, whether a material uncertainty exists related to events or conditions that may cast significant doubt on the Group’s ability to continue as a going concern. If we conclude that a material uncertainty exists, we are required to draw attention in our auditor’s report to the related disclosures in the financial statements or, if such disclosures are inadequate, to modify our opinion. Our conclusions are based on the audit evidence obtained up to the date of our auditor’s report. However, future events or conditions may cause the Group to cease to continue as a going concern.
» Evaluate the overall presentation, structure and content of the financial statements, including the disclosures, and whether the financial statements represent the underlying transactions and events in a manner that achieves fair presentation.
» Obtain sufficient appropriate audit evidence regarding the financial information of the entities or business activities within the Group to express an opinion on the consolidated financial statements. We are responsible for the direction, supervision and performance of the group audit. We remain solely responsible for our audit opinion.

39 C T HOLDINGS PLCAnnual Report 2021 2022
We communicate with those charged with governance regarding, among other matters, the planned scope and timing of the audit and significant audit findings, including any significant deficiencies in internal control that we identify during our audit.
We also provide those charged with governance with a statement that we have complied with ethical requirements in accordance with the Code of Ethics regarding independence, and to communicate with them all relationships and other matters that may reasonably be thought to bear on our independence, and where applicable, related safeguards.
From the matters communicated with those charged with governance, we determine those matters that were of most significance in the audit of the financial statements of the current period and are therefore the key audit matters. We describe these matters in our auditor’s report unless law or regulation precludes public disclosure about the matter or when, in extremely rare circumstances, we determine that a matter should not be communicated in our report because the adverse consequences of doing so would reasonably be expected to outweigh the public interest benefits of such communication.
Report on Other Legal and Regulatory Requirements
As required by section 163 (2) of the Companies Act No. 07 of 2007, we have obtained all the information and explanations that were required for the audit and, as far as appears from our examination, proper accounting records have been kept by the Company.
CA Sri Lanka membership number of the engagement partner responsible for signing this independent auditor’s report is 2599.
CHARTERED ACCOUNTANTS Colombo, Sri Lanka
06 July 2022

40C T HOLDINGS PLCAnnual Report 2021 2022
STATEMENT OF PROFIT OR LOSS AND OTHER COMPREHENSIVE INCOME
Group CompanyFor the year ended 31 March 2022 2021 2022 2021
Note Rs. '000 Rs. '000 Rs. '000 Rs. '000
Revenue 6 136,872,756 112,940,971 - - Cost of sales (121,271,134) (100,326,804) - - Gross profit 15,601,622 12,614,167 - - Other income 7 2,196,883 2,098,333 1,137,007 991,208 Distribution expenses (3,891,166) (3,038,654) - - Administrative expenses (4,421,260) (3,800,579) (122,411) (101,285)Other expenses (817,179) (694,165) (51,180) (139,520)Results from operating activities 8 8,668,900 7,179,102 963,416 750,403 Finance income 227,360 213,448 3,546 8,329Finance costs (3,600,171) (2,811,882) (44,220) (760)Net finance income / (costs) 9 (3,372,811) (2,598,434) (40,674) 7,569 Changes in fair value of investment property 16 263,160 98,478 2,600 (8,878)Share of loss of equity accounted investees, net of tax 19.2 (90,874) (367,529) - - Profit before tax 5,468,375 4,311,617 925,342 749,094 Income tax expense 10.1 (1,298,070) (990,348) - (8,846)Profit for the year 4,170,305 3,321,269 925,342 740,248
Other comprehensive income (OCI)Items that will not be reclassified to profit or loss Revaluation of land and buildings 13.1 - 2,859,801 - - Actuarial gain/(loss) on employee benefit liability 27 167,470 (84,024) (10) 1,123 Share of other comprehensive income in equity accounted investee, net of tax 19.2 (69,394) 22,709 - - Net change in fair value of FVOCI financial assets (82) 18,037 (7,393) 12,344 Profit from sale of investments 4,709 330,198 4,709 330,198 Tax on other comprehensive income 10.2 (39,810) (323,461) - - Other comprehensive income for the year, net of tax 62,893 2,823,260 (2,694) 343,665 Total comprehensive income for the year 4,233,198 6,144,529 922,648 1,083,913
Profit attributable to:Equity holders of the parent 2,838,029 2,061,487 925,342 740,248 Non-controlling interest 1,332,276 1,259,782 - -
4,170,305 3,321,269 925,342 740,248
Total comprehensive income attributable to:Equity holders of the parent 2,856,615 4,383,251 922,648 1,083,913 Non-controlling interest 1,376,583 1,761,278 - -
4,233,198 6,144,529 922,648 1,083,913
Earnings per share (Rs.) 11 14.09 10.24 4.59 3.68
Figures in brackets indicates deductions.The notes on pages 46 to 133 form an integral part of these Financial Statements.

41 C T HOLDINGS PLCAnnual Report 2021 2022
STATEMENT OF FINANCIAL POSITION Group Company
As at 31 March 2022 2021 2022 2021 Note Rs. '000 Rs. '000 Rs. '000 Rs. '000
ASSETSNon-current assetsProperty, plant and equipment 13 41,767,767 37,827,979 2,033 2,126 Right of use of assets 14.1 16,889,657 14,423,813 117 137 Prepayment on leasehold land and building 15 200,912 200,912 - - Investment property 16 9,579,553 9,176,410 709,700 1,611,865 Intangible assets 17 1,641,799 1,594,962 688,467 688,467 Investments in subsidiaries 18 - - 1,604,677 1,942,686 Investment in equity accounted investees 19 5,655,456 5,846,685 5,605,950 2,906,169 Other financial assets 20 1,692,801 527,685 65,163 482,425 Deferred tax assets 10.5 8,598 10,756 - - Total non-current assets 77,436,543 69,609,202 8,676,107 7,633,875
Current assetsInventories 21 14,809,637 11,779,617 - - Trade and other receivables 22 7,834,561 6,591,744 75,843 48,480 Other financial assets 1,016,556 1,018,661 - 63,865 Cash and cash equivalents 23 3,554,218 3,155,193 8,944 144,766 Total current assets 27,214,972 22,545,215 84,787 257,111 Total assets 104,651,515 92,154,417 8,760,894 7,890,986
EQUITYStated capital 24 6,489,758 6,489,758 6,489,758 6,489,758 Reserves 25 3,136,528 3,191,265 45,747 53,140 Retained earnings 14,161,037 13,678,172 1,159,351 1,125,945 Total equity attributable to equity holders of the parent 23,787,323 23,359,195 7,694,856 7,668,843 Non-controlling interest 9,555,690 7,954,517 - - Total equity 33,343,013 31,313,712 7,694,856 7,668,843
LIABILITIESNon - current liabilitiesInterest bearing loans and borrowings 26 27,101,528 18,369,804 800,780 189 Deferred tax liabilities 10.5 911,084 1,068,399 - - Employee benefits 27 1,638,653 1,624,204 36,893 34,596 Capital grants 28 15,975 27,454 - - Trade and other payables 29 181,187 169,679 - - Total non-current liabilities 29,848,427 21,259,540 837,673 34,785
Current liabilitiesTrade and other payables 29 23,334,471 16,319,750 35,510 18,087 Current tax liabilities 4,198,294 3,723,439 - - Dividend payable 167,236 169,004 167,236 169,004 Interest bearing loans and borrowings 26 13,760,074 19,368,972 25,619 267 Total current liabilities 41,460,075 39,581,165 228,365 187,358 Total liabilities 71,308,502 60,840,705 1,066,038 222,143 Total equity and liabilities 104,651,515 92,154,417 8,760,894 7,890,986
Figures in brackets indicates deductions.The notes on pages 46 to 133 form an integral part of these Financial Statements.
I certify that these Financial Statements have been prepared in accordance with the requirements of the Companies Act No 7 of 2007.
S C NilesExecutive Director
The Board of Directors is responsible for the preparation and presentation of these Financial statements. The Financial Statements have been approved by the Board of Directors on 06 July 2022, in Colombo.
Priya Edirisinghe Ranjit PageDirector Deputy Chairman / Managing Director

42C T HOLDINGS PLCAnnual Report 2021 2022
STATEMENT OF CHANGES IN EQUITY
Group <------------- Attributable to the owners of the parent -----------> Stated capital
Rs. '000
Revaluationreserve
Rs. '000
Fair valuereserve
Rs. '000
Retained earnings
Rs. '000
Totalreserve
Rs. '000
Non- controlling
interestRs. '000
Total
Rs. '000
Balance as at 1 April 2020 6,489,758 1,767,962 32,667 12,899,459 21,189,846 5,317,420 26,507,266
Total comprehensive income for the yearProfit for the year - - - 2,061,487 2,061,487 1,259,782 3,321,269
Other comprehensive incomeRevaluation of property plant and equipment, net of tax - 1,757,493 - - 1,757,493 758,963 2,516,456 Net change in fair value of investments at FVOCI financial assets, net of tax - - 16,995 - 16,995 1,042 18,037 Re-measurements of defined benefit plan, net of tax - - - (44,795) (44,795) (19,345) (64,140)Share of other comprehensive income of associates - - - 22,709 22,709 - 22,709 Profit from sale of investments - - - 330,198 330,198 - 330,198 Total other comprehensive income for the year - 1,757,493 16,995 308,112 2,082,600 740,660 2,823,260 Total comprehensive income for the year - 1,757,493 16,995 2,369,599 4,144,087 2,000,442 6,144,529
Transactions directly recorded in equityDividends paid - - - (855,980) (855,980) (415,238) (1,271,218)Exercise of share options - (281) 8 6,991 6,718 10,569 17,287 Equity settled share based payment - - - 92,921 92,921 (62,271) 30,650 Put options written on non-controlling interest - - - (90,436) (90,436) (38,998) (129,434)Write back of unclaimed dividends - - - 6,150 6,150 8,482 14,632 Exercise of put option - (383,579) - (750,532) (1,134,111) 1,134,111 - Total contributions by & distributions to owners - (383,860) 8 (1,590,886) (1,974,738) 636,655 (1,338,083)Balance as at 31st March 2021 6,489,758 3,141,595 49,670 13,678,172 23,359,195 7,954,517 31,313,712
Balance as at 1 April 2021 6,489,758 3,141,595 49,670 13,678,172 23,359,195 7,954,517 31,313,712
Total comprehensive income for the yearProfit for the year - - - 2,838,029 2,838,029 1,332,276 4,170,305
Other comprehensive incomeNet change in fair value of investments at FVOCI financial assets, net of tax - - (2,189) - (2,189) 2,107 (82)Re-measurements of defined benefit plan, net of tax - - - 85,460 85,460 42,200 127,660 Share of other comprehensive income of associates - - - (69,394) (69,394) - (69,394)Profit from sale of investments - - - 4,709 4,709 - 4,709 Total other comprehensive income for the year - - (2,189) 20,775 18,586 44,307 62,893 Total comprehensive income for the year - - (2,189) 2,858,804 2,856,615 1,376,583 4,233,198
Transactions directly recorded in equityExercise of share options - (2,903) 15 27,150 24,262 42,928 67,190 Acquisition of non controlling interest in subsidiary (Note18.3.2) - 38,083 (202) (895,885) (858,004) (63,997) (922,001)Change in ownership interest in relation to common control transactions - (82,756) - (700,128) (782,884) 782,884 - Write back of unclaimed dividends - - - 5,425 5,425 - 5,425 Transfer from revaluation reserve due to disposal of revalued assets - (4,785) - 3,389 (1,396) 1,396 - Equity settled share based payment - - - 80,371 80,371 (80,371) - Dividends paid - - - (896,261) (896,261) (458,250) (1,354,511)Total contributions by & distributions to owners - (52,361) (187) (2,375,939) (2,428,487) 224,590 (2,203,897)Balance as at 31st March 2022 6,489,758 3,089,234 47,294 14,161,037 23,787,323 9,555,690 33,343,013

43 C T HOLDINGS PLCAnnual Report 2021 2022
Company Stated Fair value Retained Total capital reserve earnings Equity
Rs. '000 Rs. '000 Rs. '000 Rs. '000
Balance as at 1 April 2020 6,489,758 40,796 910,356 7,440,910
Total comprehensive income for the yearProfit for the year - - 740,248 740,248
Other comprehensive income Net change in fair value of FVOCI financial assets - 12,344 - 12,344 Defined benefit plan actuarial gain - - 1,123 1,123 Profit on disposal of investments - 330,198 330,198 Total other comprehensive income for the year - 12,344 331,321 343,665 Total comprehensive income for the year - 12,344 1,071,569 1,083,913
Transactions directly recorded in equity,Dividends paid - 2019/20 (final) & 2020/21 (interim) - - (855,980) (855,980)Total contributions by & distributions to owners - - (855,980) (855,980)Balance as at 31 March 2021 6,489,758 53,140 1,125,945 7,668,843
Balance as at 1 April 2021 6,489,758 53,140 1,125,945 7,668,843
Total comprehensive income for the yearProfit for the year - - 925,342 925,342
Other comprehensive income Net change in fair value of FVOCI financial assets - (7,393) - (7,393)Defined benefit plan actuarial loss - - (10) (10)Profit on disposal of investments - - 4,709 4,709 Change in ownership interest in relation to common control transactions - - (374) (374)Total other comprehensive income for the year - (7,393) 4,325 (3,068)Total comprehensive income for the year - (7,393) 929,667 922,274
Transactions directly recorded in equity,Dividends paid - 2020/21 (final) & 2021/22 (interim) - - (896,261) (896,261)Total contributions by & distributions to owners - - (896,261) (896,261)Balance as at 31 March 2022 6,489,758 45,747 1,159,351 7,694,856

44C T HOLDINGS PLCAnnual Report 2021 2022
STATEMENT OF CASH FLOWS
Group Company For the year ended 31 March Note 2022 2021 2022 2021
Rs. '000 Rs. '000 Rs. '000 Rs. '000
Profit before tax 5,468,375 4,311,617 925,342 749,094
Adjustments for:Depreciation of property, plant & equipment 13 3,538,664 3,019,288 93 89 Amortisation of right of use assets 14.1 1,739,535 1,438,593 20 20 Negative lease payments 14.2 (164,538) (123,565) - - Amortisation of intangible assets 17 105,311 75,469 - - Interest income 9 (227,360) (192,232) (3,546) (8,329)Profit on sale of property, plant & equipment 7 (4,278) (67,423) - - Dividend income 7 (732) (9,107) (1,136,347) (991,353)Finance costs 9 3,600,171 2,811,882 44,220 760 Share of loss of equity accounted investees 19.2 90,874 367,529 - - Reversal / (charge) for impairment of trade and other receivables 22 25,686 33,898 - - Amortisation of deferred income 28 (11,479) (11,483) - - Provision for slow moving and obsolete inventories 21 16,924 29,482 - - Change in fair value of investment properties 16 (263,160) (98,478) (2,600) 8,878Provision for obligation on defined benefit plan 27 248,896 281,624 2,287 4,591 Equity-settled share-based payment transactions - 47,937 - - Gain on disposal of ROU asset and liability 492 - - - Impairment losses on investments in subsidiaries 18 - - 51,147 139,520 Impairment losses on property plant & equipment 13 2,350 2,778 - - Cash generated from/ (used in) operating activities before working capital change 14,165,731 11,917,809 (119,384) (96,730)
Changes in;Inventories (3,046,944) (1,269,856) - - Trade and other receivables (1,268,503) 919,589 (27,363) 430 Trade and other payables 6,522,261 (1,392,643) 17,431 (6,345)Cash generated from / (used in) operating activities 16,372,545 10,174,899 (129,316) (102,645)Interest paid (1,322,666) (1,282,316) (44,206) (716)Income tax paid (1,119,241) (1,005,569) - (8,846)Defined benefit plan payments 27 (67,682) (58,214) - - Net cash from / (used in) operating activities 13,862,956 7,828,800 (173,522) (112,207)

45 C T HOLDINGS PLCAnnual Report 2021 2022
Group Company For the year ended 31 March Note 2022 2021 2022 2021
Rs. '000 Rs. '000 Rs. '000 Rs. '000
Cash flows from investing activitiesProceeds from sale of property, plant and equipment 27,598 73,250 - - Interest received 227,360 188,161 3,546 8,329 Dividends received 732 9,107 1,136,347 991,353 Proceeds from sale of investment property - - 904,765 - Acquisition of property, plant and equipment 13 (7,571,922) (6,282,249) - (147)Improvements to investment property 16 (25,495) (92,666) - - Acquisition of non controlling interest in subsidiaries 18.3.2 (922,001) - (922,001) - Acquisition of associates 19 - - (2,699,781) - Proceed from disposal of subsidiaries - - 1,208,488 -Acquisition of intangible assets 17 (152,148) (80,400) - - Net change in other investments (1,161,347) 6,820 478,437 94,454 Net cash from / (used in) investing activities (9,577,223) (6,177,977) 109,801 1,093,989
Cash flows from financing activitiesNet movement in Bank Loans 26 991,596 4,436,594 802,083 - Lease payments 14.2 (2,573,937) (2,243,078) - - Finance lease obtained during the period 26 6,567 2,486 - - Share issued to non controlling interest 67,190 - - - Dividends paid to owners (898,029) (855,980) (898,029) (857,484)Payment of finance lease liabilities 26 (2,277) (10,716) - - Dividends paid to non controlling interest (452,825) (415,238) - - Net cash from / (used in) financing activities (2,861,715) 914,068 (95,946) (857,484)
Net increase / (decrease) in cash and cash equivalents 1,424,018 2,564,891 (159,667) 124,298 Cash and cash equivalents at 1st April 360,486 (2,204,405) 144,499 20,201 Cash and cash equivalents at 31st March (Note 23) 1,784,504 360,486 (15,168) 144,499
Figures in brackets indicates deductions.The notes on pages 46 to 133 form an integral part of these Financial Statements.

46C T HOLDINGS PLCAnnual Report 2021 2022
NOTES TO THE FINANCIAL STATEMENTS
1. Presentation of the financial statements
1.1 Description of the reporting entity and business
C T Holdings PLC (the ‘Company’) is a company incorporated in Sri Lanka and listed on the Colombo Stock Exchange. The address of the Company’s registered office is No. 8, Sir Chittampalam A Gardiner Mawatha, Colombo 2.
The consolidated financial statements of the Group as at and for the year ended 31 March 2022 comprise the Company and its subsidiaries (together referred to as the ‘Group’ and individually as ‘Group entities’) and the Group’s interest in equity accounted investees. The financial statements of all companies within the Group are prepared for a common financial year which ends on 31 March 2022, except as mentioned in Note 19.5. The principle activities of the Group are described in Note 2.1 to the financial statements.
1.2 Statement of compliance
The financial statements which comprise the Statement of Financial Position, Statement of Profit or Loss and Other Comprehensive Income, Statement of Changes in Equity, Statement of Cash Flows and Notes thereto have been prepared in accordance with Sri Lanka Accounting Standards (LKAS / SLFRSs), and the requirements of the Companies Act No. 07 of 2007. The Board of Directors of the Company is responsible for the preparation and presentation of these financial statements. The financial statements were authorised for issue by the Board of Directors on 06 July 2022.
1.3 Functional and presentation currency
These financial statements are presented in Sri Lankan Rupees, which is the Group’s functional currency. All financial information presented in Sri Lankan Rupees has been rounded to the nearest thousands, except when otherwise indicated.
1.4 Key accounting judgements and estimates
In preparing these financial statements, management has made judgements, estimates and assumptions that affect the application of the Group’s accounting policies and the reported amounts of assets, liabilities, income and expenses. Actual results may differ from these estimates. Estimates and underlying assumptions are reviewed on an on-going basis. Revisions to accounting estimates are recognised in the period in which the estimates arerevised and in any future periods affected.
1.4.1 Impact due to Covid-19 and economic uncertainties
The Group’s management has made an assessment of its ability to continue as a going concern and is satisfied that it has the resources to continue in business for a foreseeable future. The management has also assessed the existing and anticipated effects of COVID-19 and economic uncertainties on the Group and the appropriateness of the use of the going concern basis. Furthermore, management is not aware of any material uncertainties that may cast significant doubt upon the Group’s ability to continue as a going concern.
Therefore, the Financial Statements continue to be prepared on the going concern basis.
1.4.2 JudgementsInformation about critical judgments in applying accounting policies that have the most significant effect on the amounts recognised in the financial statements is included in the following notes: » Note 3.5 - Revenue Recognition: whether revenue from made-to-order products is recognised over time or at a point in time;
» Note 14 - Lease Term: whether the Group is reasonably certain to exercise extension options; and
» Note 19 Equity-accounted investees: whether the Group has significant influence over an investee; and
» Note 34.1 - Deferred Tax Liabilities: Determination of whether lands should be considered as a capital asset or an investment asset.

47 C T HOLDINGS PLCAnnual Report 2021 2022
1.4.3 Assumptions and estimation uncertainties
Information about assumptions and estimation uncertainties at 31 March 2022 that have a significant risk of resulting in a material adjustment to the carrying amounts of assets and liabilities in the next financial year is included in the following notes:
Note 27 Measurement of defined benefit obligations: key actuarial assumptions
Note 13 and Note 16
Determination of fair value of investment property and property plant and equipment: key valuation assumptions
Note 17 Impairment test of intangible assets and goodwill: keyassumptions underlyingrecoverable amounts;
Note 34 Recognition and measurement of provisions and contingencies: key assumptions about the likelihood andmagnitude of an outflowof resources
1.5 Materiality and Aggregation
Each material class of similar items is presented separately in the financial statements. Items of a dissimilar nature or function are presented separately unless they are immaterial as permitted by the Sri Lanka Accounting Standard – LKAS 1 Presentation of Financial Statements.
1.6 Comparative Information
Comparative information has been reclassified to conform to the current year’s presentation, where necessary. Except when a standard permits or requires otherwise, comparative information is disclosed in respect of the previous period. Where the presentation or classification of items in the financial statements are amended, comparative amounts are reclassified unless it is impracticable.
1.7 Events after the reporting period
All material events after the reporting date have been considered and where appropriate, adjustments or disclosures have been made in respective notes to the financial statements.
1.8 Basis of measurement
The financial statements of the Group have been prepared on the historical cost basis except for the following material items in the statement of financial position:
Items Measurement bases
Freehold land and building Fair value
Financial instruments at fair value through profit or loss Fair value
Equity securities at fair Value through other comprehensive income (FVOCI)
Fair value
Debt investments at FVTPL Fair value
Investment property Fair value
Defined benefit obligations Present value
Share based payment arrangements Fair value
1.9 Going Concern
The Management of the C T Holdings PLC has made an assessment of the Group’s ability to continue as a going concern and is satisfied that the group has the resources to continue in business for a foreseeable future. Furthermore, management is not aware of any material uncertainties that may cast significant doubt upon the Group’s ability to continue as a going concern. Therefore, the financial statements continue to be prepared on the going concern basis.
1.10 Measurement of fair value
A number of the Group’s accounting policies and disclosures require the measurement of fair values, for both financial and non-financial assets andliabilities.

48
Notes to the Financial Statements
C T HOLDINGS PLCAnnual Report 2021 2022
The Group has an established control framework with respect to the measurement of fair values.
Significant valuation issues are reported to the Group’s audit committee.
When measuring the fair value of an asset or a liability, the Group uses observable market data as far as possible. Fair values are categorised into different levels in a fair value hierarchy based on the inputs used in the valuation techniques as follows.
Level 1 Quoted prices (unadjusted) in active markets for identical assets or liabilities.
Level 2 Inputs other than quoted prices included in Level 1 that are observable for the asset or liability, either directly (i.e. as prices) or indirectly (i.e. derived from prices).
Level 3 Inputs for the asset or liability that are not based on observable market data (unobservable inputs).
If the inputs used to measure the fair value of an asset or a liability fall into different levels of the fair value hierarchy, then the fair value measurement is categorised in its entirety in the same level of the fair value hierarchy as the lowest level input that is significant to the entire measurement.
The Group recognises transfers between levels of the fair value hierarchy at the end of the reporting period during which the change has occurred.
‘Fair value’ is the price that would be received to sell an asset or paid to transfer a liability in an orderly transaction between market participants at the measurement date in the principal or, in its absence, the most advantageous market to which the Group has access at that date. The fair value of a liability reflects its nonperformance risk.
A number of Group’s accounting policies and disclosures require the measurement of fair values, for both financial and non-financial assets and liabilities. The Group measures the fair value of an instrument using the quoted price in an active market for that instrument. A market is regarded as active if transactions for the asset or liability take place with sufficient frequency and volume to provide pricing information on an ongoing basis. If there is no quoted price in an active market, then the Group uses valuation techniques that maximise the use of relevant observable inputs and minimise the use of unobservable inputs. The chosen valuation technique incorporates all of the factors that market participants would take into account in pricing a transaction. If an asset or a liability measured at fair value has a bid price and an ask price, then the Group measures assets and long positionsat a bid price and liabilities and short positions at an ask price.
The best evidence of the fair value of a financial instrument on initial recognition is normally the transaction price – i.e. the fair value of the consideration given or received. If the Group determines that the fair value on initial recognition differs
from the transaction price and the fair value is evidenced neither by a quoted price in an active market for an identical asset or liability nor based on a valuation technique for which any unobservable inputs are judged to be insignificant in relation to the measurement, then the financial instrument is initially measured at fair value, adjusted to defer the difference between the fair value on initial recognition and the transaction price. Subsequently, that difference is recognised in profit or loss on an appropriate basis over the life of the instrument but no later than when the valuation is wholly supported by observable market data or the transaction is closed out.
Further information about the assumptions made in measuring fair values is included in the following notes:
Reference Item
Note 16 Investment property
Note 30 Financial instruments
Note 18 Investment in subsidiaries
Note 13 Freehold land and building
Note 27.4 Share based payment arrangements
2. Operating segments
2.1 Basis for segmentation
The Group has the following six strategic divisions, which are its reportable segments. These divisions offer different products and services, and are managed

49 C T HOLDINGS PLCAnnual Report 2021 2022
separately because they require different technology and marketing strategies.
The following summary describes the operations of each reportable segment.
Reportable Segment Operation
Retail and Wholesale Distribution
Operation of a chain of supermarkets and convenient stores. Local distributor for world renown brands of food and beverages.
FMCG Manufacturer / distributor of dairy, agrifoods, convenience foods and confectionery.
Restaurants Franchisee / Operator for ‘Kentucky Fried Chicken’ (KFC) and‘TGI Fridays’ Restaurants in Sri Lanka.
Real Estate Owner / operator of the ‘Majestic City’ and ‘Cargills Square’ shopping and entertainment malls. Development and sale / rental of residential condominiums and commercial development.
Entertainment Import, distribution and exhibition of cinematic content.
Financial Services Commercial Banking, stock brokering, capital market solutions and fund management (Associates).
The Group’s chief executive officer reviews the internal management reports of each division at least quarterly. Segment results that are reported to the Group’s chief operating officer include items directly attributable to a segment as well as those that can be allocated on a reasonable basis. Unallocated items comprise mainly corporate assets, head office expenses, and tax assets and liabilities. Inter segment transfers are based on fair market prices.
Segment results, assets and liabilities include items directly attributable to a segment as well as those that can be allocated on a reasonable basis. Segment capital expenditure is the
3. Significant accounting policies
The Group has consistently applied the accounting policies to all periodspresented in these Financial Statements.
3.1 Basis of Consolidation
The Financial Statements comprise of Financial Statements of the Company, its subsidiaries and its equity accounted investees for the year ended 31 March 2022. Financial Statements of the Company's subsidiaries and associates are prepared for the same reporting year using consistent accounting policies.
3.1.1 Business Combination and Goodwill
The Group accounts for business combinations using the acquisition method when the acquired set of activities and assets meets the definition of a business and control is transferred to the Group. In determining whether a particular set of activities and assets is a business, the Group assesses whether the set of assets and activities acquired includes, at a minimum, an input and substantive process and whether the acquired set has the ability to produce outputs.
The Group has an option to apply a 'concentration test' that permits a simplified assessment of whether an acquired set of activities and assets is not a business. The optional concentration test is met if substantially all of the fair value of the gross assets acquired is concentrated in a single identifiable asset or group of similar identifiable assets.
total cost incurred during the period to acquire property, plant and equipment, and intangible assets other than goodwill.
2.2 Changes in Significant Accounting Policies
There were no changes in accounting policies for the year ended 31st March 2022.
Further a number of other new standards were effective from 1 April 2021 but they do not have a material effect on the Group's Financial Statements.
The Group has consistently applied the accounting policies to all periods presented in these Financial Statements.

50
Notes to the Financial Statements
C T HOLDINGS PLCAnnual Report 2021 2022
Goodwill acquired in a business combination is initially measured at cost, being the excess of the cost of the business combination over the Group's interest in the net amount of the identifiable assets, liabilities and contingent liabilities acquired.Following initial recognition, goodwill is measured at cost less any accumulated impairment losses.
Goodwill is reviewed for impairment annually, or more frequently, if events or changes in circumstances indicatethat the carrying value may be impaired. For the purpose of impairment testing,goodwill acquired in a business combination, from the acquisition date is, allocated to each of the Group's Cash - generating Units (CGUs) or group of CGUs, which are expected to benefit from the synergies of the combination, irrespective of whether other assets or liabilities of the acquiree are assigned to those units.
Where goodwill forms part of a CGU (or group of CGUs) and part of the operation within that unit is disposed of, the goodwill associated with the operation disposed of is included in the carrying amount of the operation whendetermining the gain or loss on disposal of the operation. Goodwill disposed of in this circumstance is measured based on the relative values of the operation disposed of and the portion of theCGU retained.
3.2.2 SubsidiariesSubsidiaries are entities controlled by the Group. The Group controls an entity when it is exposed to, or has right to, variable returns from its involvement with the entity and has the ability to
affect those returns through its power over the entity. The financial statements of subsidiaries are included in the consolidated financial statements from the date on which control commences until the date on which control ceases.
The Company re-assesses whether or not it controls an investee if facts and circumstances indicate that there are changes to one or more of the three elements of control listed above. Total comprehensive income of subsidiary is attached to the owners of the Company and to the non-controlling interest,even this result in the non-controlling interest having a deficit balance. When necessary, adjustments are made to the financial statements of subsidiaries to bring their accounting policies into line with the Group’s accounting policies.
3.2.3 Loss of controlWhen the Group loses control over a subsidiary it de-recognises the assets and liabilities of the subsidiary, any related non-controlling interests and the other components of equity. Any resulting gain or loss is recognised in profit or loss. Any interest retained inthe former subsidiary is measured at fair value when control is lost. Subsequently that retained interest is accounted for as equity accounted investee or as a FVOCI financial asset depending on the level of influence retained.
3.2.4 Non-controlling interestsNon-controlling-interests are measured at their proportionate share of the acquiree’s identifiable net assets at the date of acquisition.
Changes in the Group’s interest in a subsidiary that do not result in a
loss of control are accounted for as transactions with owners in theircapacity as owners. Adjustments to non-controlling interests are based on a proportionate amount of the net assets of the subsidiary. No adjustments are made to goodwill and no gain or loss is recognised in profit or loss.
3.2.5 Interest in equity accounted investees
The Group’s interests in equity accounted investees comprise interests in associates. Associates are those entities in which the Group has significant influence, but not control or joint control, over the financial andoperating policies. Significant influence is presumed to exist when the Group holds between 20% and 50% of the voting power of another entity.Significant influence is the power to participate in the financial and operating policy decisions of the investee, but is not control or joint control over those policies. The considerations made in determining significant influence or joint control is similar to those necessary to determine control over subsidiaries.
Investments in associates are accounted for under the equity method. They are initially recognised at cost which includes transaction costs.Subsequent to initial recognition, the consolidated financial statements include the Group’s share of the profit or loss and other comprehensive income of equity accounted investees, after adjustments to align the accounting policies with those of the Group, from the date that significant influence commences until the date that significant influence ceases.

51 C T HOLDINGS PLCAnnual Report 2021 2022
When the Group’s share of losses exceed its interest in an equity accounted investee, the carrying amount of the investment, including any long term interests that form part thereof, is reduced to zero, and the recognition of further losses is discontinued except to the extent that the Group has an obligation or has made payments on behalf of the investee.
3.2.6 Transactions eliminated on consolidation
Intra-group balances and transactions, and any unrealised income and expenses arising from intra-group transactions, are eliminated. Unrealised gains arising from transactions with equity accounted investees are eliminated against the investmentto the extent of the Group’s interest in the investee. Unrealised losses are eliminated in the same way asunrealised gains, but only to the extent that there is no evidence of impairment
3.2.7 Common Control TransactionsAll common control transactions are accounted using book value accounting in both consolidated and separate financial statements. This is on the basis that the entities are part of a larger economic group, and that the figures from that larger group are the relevant ones. Accordingly, » The net assets of the combining entities are consolidated using the existing book values.
» No amount is recognised as goodwill which arises as a result of difference between the consideration and net assets acquired.
» In applying book value accounting, no entries are recognized in Profit or Loss; instead, the result of the transaction is recognized in equity as arising from a transaction with shareholders.
3.3 Foreign Currency Transactions and balances
All foreign currency transactions are translated into the functional currency of the Group which is Sri Lankan Rupees (Rs.) at the spot exchange rates at the dates of the transactions.
Monetary assets and liabilities denominated in foreign currencies at the reporting date are retranslated to the functional currency at the spot exchange rate at the reporting date. The foreign currency gain or loss on monetary items is the difference between amortised cost in the functional currency at the beginning of the year adjusted for effective interest and payments during the year and the amortised cost in foreign currency translated at the spot exchange rate at the reporting date.
Non-monetary assets and liabilities denominated in foreign currencies are translated into functional currency at spot exchange rate at the reporting date. Non-monetary assets and liabilities that are measured at fair value in a foreign currency are translated into functional currency at the spot exchange rate when the fair value was determined. Non-monetary items that are measured based on historical cost in a foreign currency are translated at the spot exchange rate at the date of
transaction. Foreign currency differences are generally recognised in profit or loss and presented within finance cost.
If there is a long term lack of exchangeability due to the non-availability of foreign currencies in the market at an indicative exchange rate and foreign currency is not available for immediate delivery at the rate published by other legal exchange mechanisms, the entity shall use either the official rate or estimated rates, maximizing the use of observable data, considering the facts and circumstances prevalent at that point in time.
3.4 Revenue from contracts with customers
Revenue from contracts with customers is recognised when control of the goods or services are transferred to the customer at an amount that reflects the consideration to which the Group expects to be entitled in exchange for those goods or services. Revenue is recognised upon satisfaction of performance obligation. The revenue recognition occurs at a point in time when control of the asset is transferred to the customer, generally on delivery of the goods. Group determines at contract inception whether it satisfies the performance obligation over time or at a point in time. For each performance obligation satisfied overtime, the Group recognises the revenue over time by measuring the progress towards complete satisfaction of that performance obligation.

52
Notes to the Financial Statements
C T HOLDINGS PLCAnnual Report 2021 2022
3.4.1 Performance obligations and revenue recognition policies
Type of product / service
Nature and timing of satisfaction of performance obligations, including significant payment terms
Revenue recognition under SLFRS 15
Retail and Wholesale Distribution/ FMCG
The Group operates a chain of retail stores selling consumer goods and the Group manufactures and sells a range of food products.In the case of retail, payment of the transaction price is due immediately when the customer purchases the goods and takes delivery in store. In the case of Wholesale Distribution, when the products have been delivered to the specific location, the risks of obsolescence and loss have been transferred to the customer, and either the customer has accepted the products in accordance with the sales contract.
Revenue is recognised when the goods are delivered and have been accepted by customers at their premises. For contracts that permit the customer to return an item, revenue is recognised to the extent that it is highly probable that a significant reversal in the amount of cumulative revenue recognised will not occur.
Customer loyalty programme
The Group operates a loyalty programme where retail customers accumulate points for purchases made which entitle them to discount on future purchases. A contract liability for the award points is reocgnised at the time of the sale.
Revenue is recognised when the points are redeemed or when they expire after the initial sale. A liability is recognised until the points are redeemed or expire.
Restaurants The Group operates chains of restaurants for KFC and TGIF brands operates through franchise arrangements.
Revenue from restaurant and shop sales (food and beverages) is recognized upon rendering of service. Sales are net of discounts.
Real Estate - Rental income from operating leases
The Group develops and operates commercial shopping malls to be rented out to third parties as well as to be used by own.
Rental income from operating leases is recognised on a straight-line basis over the lease term. When the Group provides incentives to its tenants, the cost of the incentives is recognised over the lease term, on a straight- line basis, as a reduction of rental income.
Real Estate- Revenue from service and property management charges
The Group provides services to the tenants of the commercial shopping malls operated agreed upon the tenants agreements or othewise.
Revenue from service and property management charges is recognised in the accounting period. In the case of fixed price contracts, the customer pays the fixed amount based on a payment schedule. If the services rendered exceed the payment, a contract asset is recognised. If the payments exceed the services rendered, a contract liability is recognised.

53 C T HOLDINGS PLCAnnual Report 2021 2022
3.4.2 Finance and Other income
a. Financing components of Retail and Wholesale DistributionThe Group does not expect to have any contracts where the period between the transfer of the promised goods or services to the customer and payment by the customer exceeds one year. As a consequence, the Group does not adjust any of the transaction prices for the time value of money.
b. CommissionsWhen the Group is acting as an agent, the commission rather than gross income is recorded as revenue.
c. Dividend incomeDividends are received from financial assets measured at fair value through profit or loss (FVTPL) and at fair value through other comprehensive income (FVOCI). Dividends are recognised as other income in profit or loss when the right to receive payment is established. This applies even if they are paid out of pre-acquisition profits, unless the dividend clearly represents a recovery of part of the cost of an investment. In this case, the dividend is recognised in OCI if it relates to an investment measured at FVOCI.
d. Interest incomeInterest income from financial assets at FVTPL is included in the net fair value gains / (losses) on these assets. Interest income on financial assets at amortised cost and financial assets at FVOCI calculated using the effective interest method is recognised in the statement of profit or loss as part of other income.
Other income also includes rental income from investment properties (Refer Note 7). Gains and losses on disposal of an item of property, plant & equipment and investments are accounted in profit or loss by comparing the net sales proceeds with the carrying amounts of property, plant & equipment and investments concerned and are recognised net within “other income” in profit or loss. Whenre-valued assets are sold, the amounts included in the revaluation surplus reserve are transferred to retained earnings. Other income is recognized on an accrual basis.
3.5 Employee benefits
3.5.1 Short-term employee benefitsShort-term employee benefits are expensed as the related service is provided. A liability is recognisedfor the amount expected to be paid if the Group has a present legal or constructive obligation to pay this amount as a result of past service provided by the employee, and the obligation can be estimated reliably.
3.5.2 Share-based payment arrangement
The grant-date fair value of equity settled share-based payment arrangements granted to employees is generally recognised as an expense, with a corresponding increase in equity, over the vesting period of the awards. The amount recognised as an expense is adjusted to reflect the number of awards for which the related service and non-market performance conditions are expected to be met, such that the amount ultimately recognised is based on the number of awards that meet
the related service and non- market performance conditions at the vesting date. For share-based payment awards with non-vesting conditions, the grant-date fair value of the share- based payment is measured to reflect such conditions and there is no true-up for differences between expected and actual outcomes.
Where a parent grants rights to its equity instruments to employees of its subsidiary, and the arrangement is accounted for as equity-settled in the consolidated financial statements, the subsidiary should in its own separate financial statements measure the services received from its employees in accordance with the requirements of SLFRS 2 applicable to equity-settledshare-based payment transactions and corresponding increase recognised in equity as a capital contribution from the parent.
3.5.3 Defined contribution plansDefined contribution plan is a post employment benefit plan under which an entity pays fixed contributions into a separate entity and will have no legal or constructive obligation to pay any further amounts. Obligations for contributions to Employees Provident Fund and Employees Trust Fund covering all employees are recognised as an expense in profit or loss, as incurred.
Types of contribution plans which are being contributed for by the Group;
(a) Employee Provident Fund (EPF) - The Group and employees contribute 12% and 8% respectively of the salary to EPF.

54
Notes to the Financial Statements
C T HOLDINGS PLCAnnual Report 2021 2022
(b) Employees Trust Fund - All employees of the Group are members of the Employees’ Trust Fund (ETF). The Group contributes 3% of the salary of each employee to ETF.
3.5.4 Defined benefit plansDefined Benefit Plan is a post employment benefit plan other than Defined Contribution Plan. These plans create an obligation on the entity to provide agreed benefits to current and past employees and effectively places actuarial and investment risk on the entity. The liability recognised in the statement of financial position in respect of Defined Benefit Plan is the present value of the defined benefit obligation at the reporting date. The defined benefit obligation is calculated annually by independent actuaries, using projected unit credit method, as recommended by LKAS 19-Employee Benefit. The present value of the defined benefit obligation is determined by discounting the estimated future cash outflows using interest rates that apply to the currency in which the benefits will be paid, and that have terms to maturity approximating to the terms of the related liability.
The assumptions based on which the results of the actuarial valuation were determined are included in the 27.3 to the Financial Statements.
This liability is not externally funded and the item is grouped under non-current liabilities in the statement of financial position. However, under the Payment of Gratuity Act No. 12 of 1983 the liability to an employee arises only on
completion of five years of continued service. The Group recognizes all actuarial-gains and losses arising from defined benefit plans in other comprehensive Income and expenses related to defined benefit plans in staff expenses in profit or loss.
When the benefits of a plan are changed or when a plan is curtailed, resulting change in benefit that relates to past service or the gain or loss on curtailment is recognized immediately in profit or loss. The Group recognizes gains and losses on the settlement of a defined benefit plan when the settlement occurs.
3.5.5 Termination benefitsTermination benefits are expensed at the earlier of when the Group can no longer withdraw the offer of those benefits and when the Group recognises costs for a restructuring. If benefits are not expected to be settled wholly within 12 months of the reporting date, then they are discounted.
3.6 Grants
Grants are recognised initially as deferred income at fair value when there is reasonable assurance that they will be received and the Group will comply with the conditions associated with the grant, and are then recognised in profit or loss as other income on a systematic basis over the useful life of the asset.Grants that compensate the Group for expenses incurred are recognised in profit or loss as other income on asystematic basis in the periods in which the expenses are recognised.
3.7 Finance income and Finance costs
The Group’s finance income and finance costs would include:3.7.1 interest income;
3.7.2 interest expense;
3.7.3 the net gain or loss on the disposal of investments in debt securities measured at FVOCI;
3.7.4 the net gain or loss on financial assets at fair value through profit or loss;
3.7.5 the foreign currency gain or loss on financial assets and financial liabilities;
3.7.6 impairment losses (and reversals) on investments in debt securities carried at amortised cost or FVOCI (other than trade receivables);
3.7.7 the gain on the re- measurement to fair value of any pre-existing interest in an acquiree in a business combination;
3.7.8 the reclassification of net gains previously recognised in other comprehensive income.
3.8 Income Tax Expense
Income tax expense comprises current and deferred tax. Current tax and deferred tax is recognised in profit or loss except to the extent that it relates to a business combination, or items recognised directly in equity or in other comprehensive income.
The Group has determined that interest and penalties related to income taxes, including uncertain tax treatments,

55 C T HOLDINGS PLCAnnual Report 2021 2022
do not meet the definition of income taxes, and therefore accounted for them under LKAS 37 Provisions, Contingent Liabilities and Contingent Assets.
3.8.1 Current taxCurrent tax comprises the expected tax payable or receivable on the taxable income or loss for the year and any adjustment to the tax payable or receivable in respect of previous years.The amount of current tax payable or receivable is the best estimate of the tax amount expected to be paid or received that reflects uncertainty related to income taxes, if any. It is measured using tax rates enacted or substantively enacted at the reporting date. Current tax also includes any tax arising from dividends.
Current tax payable also includes any tax arising from dividends. Current tax assets and liabilities are offset only if certain criteria are met.
3.8.2 IFRIC Interpretation 23 - Uncertainty over Income Tax Treatment
IFRIC - 23 interpretation addresses the accounting for income taxes when tax treatments involve uncertainty that affects the application of LKAS 12 Income Taxes. It clarifies that an entity must consider the probability that the tax authorities will accept a treatment retained in its income tax filings, assuming that they have full knowledge of all relevant information when making their examination.
The Group applies significant judgement in identifying uncertainties over income tax treatments. The Group assessed
whether the Interpretation had an impact on its financial statements. The Group is of the view that it is probable that its tax treatments will be accepted by the taxation authorities hence the Interpretation did not have an impact on the financial statements of the Group.
The Group reviewed its income tax treatments and concluded that no additional provisions are required as disclosed in Note 34.
3.8.3 Deferred taxDeferred tax is recognised in respect of temporary differences between the carrying amounts of assets and liabilities for financial reporting purposes and the amounts used for taxation purposes.
Deferred tax is not recognised for: » temporary differences on the initial recognition of assets or liabilities in a transaction that is not a business combination and that affects neither accounting nor taxable profit or loss;
» temporary differences related to investments in subsidiaries, associates and jointly controlled entities to the extent that the Group is able to control the timing of the reversal of the temporary differences and it is probable that they will not reverse in the foreseeable future; and
» taxable temporary differences arising on the initial recognition of goodwill.
Deferred tax assets are recognised for unused tax losses, tax credits and deductible temporary differences to the extent that it is probable that future taxable profits will be available against which they can be utilised. Future
taxable profits are determined based on business plans for individual subsidiaries in the Group and the reversal of temporary differences. Deferred tax is not recognized for the undistributed profits of subsidiaries as the parent company has control over the dividend policy of its subsidiaries and distribution of those profits. Deferred tax assets are reviewed at each reporting date and are reduced to the extent that it is no longer probable that the related tax benefit will be realised; such reductions are reversed when the probability of future taxable profits improves.
Un-recognised deferred tax assets are reassessed at each reporting date and recognised to the extent that it has become probable that future taxable profits will be available against which they can be used.
Deferred tax is measured at the tax rates that are expected to be applied to temporary differences when they reverse, using tax rates enacted or substantively enacted at the reporting date.
Temporary differences in relation to a right-of-use asset and lease liability are regarded as a net package (ROU asset and lease liability) for the purpose of recognizing deferred tax.
The measurement of deferred tax reflects the tax consequences that would follow the manner in which the Group expects, at the reporting date, to recover or settle the carrying amount of its assets and liabilities. For this purpose, the carrying amount of investment property that is measured at

56
Notes to the Financial Statements
C T HOLDINGS PLCAnnual Report 2021 2022
fair value is presumed to be recovered through sale.
Deferred tax assets and liabilities are offset if there is a legally enforceable right to offset current tax liabilities and assets, and they relate to taxes levied by the same tax authority on the same taxable entity, or on different tax entities, but they intend to settle current tax liabilities and assets on a net basis or their tax assets and liabilities will be realized simultaneously.
3.9 Dividend distribution
Dividend distribution to the Company’s shareholders is recognized as a liability in the Group’s financial statements inthe period in which the dividends areproposed by directors or approved by the Company’s shareholders, as the case may be.
3.10 Inventories
Inventories are measured at the lower of cost and net realisable value. The cost of inventories is based on the first-in first- out principle, and includes expenditure incurred in acquiring the inventories, production or conversion costs, and other costs incurred in bringing them to their existing location and condition. In the case of manufactured inventories and work in progress, cost includes an appropriate share of production overheads based on normal operating capacity. Net realisable value is the estimated selling price in the ordinary course of business, less the estimated costs of completion and estimated costs necessary to make the sale.
The cost of each category of inventory of the Group is determined on the
following basis: » Raw & packing materials - Actual cost on a First In First Out - (FIFO) basis
» Finished goods and work-in-progress - Directly attributable manufacturing cost
» Merchandising goods - Actual cost on a First In First Out - (FIFO) basis
» Other inventories - Actual cost
Property inventoryThe Group’s property inventories arise where there is a change in use of investment properties evidenced by the commencement of development with a view to sale, and the properties are reclassified as inventories at their deemed cost, which is the fair value at the date of re-classification. They are subsequently carried at the lower of cost and net realisable value. Net realisable value is the estimated selling price in the ordinary course of business less costs to complete redevelopment and selling expenses.
3.11 Property, plant and equipment
i. Recognition and measurementItems of property, plant and equipment are measured at cost less accumulated depreciation and any accumulated impairment losses. Land is stated at its fair value. The Group revalues its Land every 3 years. Cost includes expenditure that is directly attributable to the acquisition of the asset. The cost of self-constructed assets includes the following: » the cost of materials and direct labour;
» any other costs directly attributable to bringing the assets to a working condition for their intended use; and
» capitalised borrowing costs.
Purchased software that is integral to the functionality of the relatedequipment is capitalised as part of that equipment. If significant parts of an item of property, plant and equipment have different useful lives, then they are accounted for as separate items (major components) of property, plant andequipment. Any gain or loss on disposal of an item of property, plant and equipment (calculated as the difference between the net proceeds from disposal and the carrying amount of the item) is recognised in profit or loss.
ii. Subsequent expenditureSubsequent expenditure is capitalised only when it is probable that the future economic benefits associated with the expenditure will flow to the Group. On-going repairs and maintenance are expensed as incurred.
iii. DepreciationItems of property, plant and equipment are depreciated from the date they are available for use or, in respect of selfconstructed assets, from the date that the asset is completed and ready for use. Depreciation is calculated to write off the cost of items of property, plant and equipment less their estimated residual values using the straight-line basis over their estimated useful lives. Depreciation is generally recognised in profit or loss, unless the amount is included in the carrying amount of another asset. Leased assets are depreciated over the shorter of the lease term and their useful lives unless it is reasonably certain that the Group will obtain ownership by the end of the lease term. Land is not depreciated.

57 C T HOLDINGS PLCAnnual Report 2021 2022
Description No. of years
Freehold buildings 50
Improvements to leasehold buildings 4 to10 years or period of lease whichever is lower
Plant & machinery 5 to 10
Motor vehicles 4 to 5
Furniture & fittings 5
Depreciation methods, useful lives and residual values are reviewed at each reporting date and adjusted if appropriate. Fully depreciated property, plant and equipment are retained in the financial statements until such time when they are no longer in use.
iv. Constructions in progressAll direct and indirect costs that are related to the construction of fixed assets and incurred before the assets are ready for their intended use are capitalised as construction in progress. Construction in progress is stated in the statement of financial position at cost less impairment losses. Construction in progress is transferred to fixed assets when it is ready for its intended use. No depreciation is provided against construction in progress.
v. Reclassification to investment propertyWhen the use of a property changes from owner-occupied to investment property, the property is re-measured to fair value and re-classified as investment property. Any gain arising on this re-measurement is recognised in profit or loss to the extent that it reverses a previous impairment loss on the specific property, with any remaining gain recognised in other comprehensive income and presented in the revaluation reserve in equity. Any loss is recognized immediately in profit or loss.
3.12 Intangible assets and goodwill
i. Recognition and measurement
Asset Measurement basis
Goodwill Goodwill arising on the acquisition of subsidiaries is measured at cost less accumulated impairment losses. In respect of acquisitions prior to 1 April 2011, goodwill is included on the basis of its deemed cost, which represents the amount recorded under previous GAAP (SLAS) In respect of equity accounted investees, the carrying amount of goodwill is included in the carrying amount of the investment, and any impairment loss is allocated to the carrying amount of the equity accounted investee as a whole.
Other intangible assets
Other intangible assets, including computer software, patents, trademarks and licenses, which are acquired by the Group and have finite useful lives are measured at cost less accumulated amortisation and any accumulated impairment losses.
ii. Subsequent expenditureSubsequent expenditure is capitalised only when it increases the future economic benefits embodied in the specific asset to which it relates. All other expenditure, including expenditure on internally generated goodwill and brands, is recognised in profit or loss as incurred.
iii. AmortisationAmortisation is calculated to write off the cost of intangible assets less their estimated residual values using the straight-line method over their estimated useful lives, and is generally recognized in profit or loss. Goodwill is not amortised.
The estimated useful lives for current and comparative periods are as follows:
Description No. of years
Trademarks and licenses
10 years
Computer software 4 years
3.13 Investment property
Investment property is property held either to earn rental income or for capital appreciation or for both, but not for salein the ordinary course of business or usein the production or supply of goods or services or for administrative purposes.
Investment property is initially measured at cost and subsequently at fair value with any change therein recognised in profit or loss. Cost includes expenditure that is directly attributable to the acquisition of the investment property. The cost of self-constructed investment property includes the cost of materials and direct labour, any other

58
Notes to the Financial Statements
C T HOLDINGS PLCAnnual Report 2021 2022
costs directly attributable to bringing the investment property to a working condition for their intended use and capitalised borrowing costs.
Any gain or loss on disposal of an investment property (calculated as the difference between the net proceeds from disposal and the carrying amount of the item) is recognised in profit or loss. When investment property that was previously classified as property, plant and equipment is sold, any related amount included in the revaluation reserve is transferred to retained earnings. When the use of a property changes such that it is re-classified as property, plant and equipment, its fair value at the date of re-classification becomes its cost for subsequent accounting.
3.14 Assets held for sale
Non-current assets, or disposal groups comprising assets and liabilities, are classified as held-for-sale or held-for distribution if it is highly probable that they will be recovered primarily through sale or distribution rather than through continuing use. Immediately before classification as held-for-sale or held-for- distribution, the assets, or components of a disposal group, are re-measured in accordance with the Group’s other accounting policies. Thereafter, generally the assets, or disposal group, are measured at the lower of their carrying amount and fair value less costs to sell.
Any impairment loss on a disposal group is allocated first to goodwill, and then to the remaining assets and liabilities on a pro-rata basis, except that no loss is allocated to inventories, financial assets, deferred tax assets, employee
benefit assets, investment property or biological assets, which continue to be measured in accordance with the Group’s other accounting policies. Impairment losses on initial classification as held-for-sale or held-for-distribution and subsequent gains and losses on re-measurement are recognised in profit or loss. Gains are not recognised in excess of any cumulative impairment loss. Once classified as held-for-sale or held-for-distribution, intangible assets and property, plant and equipment are no longer amortised or depreciated, and any equity-accounted investee is no longer equity accounted.
3.15 Cash and cash equivalents
Cash and cash equivalents include cash in hand, cash at bank and call deposits with maturities of three months or less from the acquisition date that are subject to an insignificant risk of changes in their fair value.
3.16 Financial instruments
3.16.1 Recognition and initial measurement
Trade receivables and debt securities issued are initially recognised when they are originated. All other financial assets and financial liabilities are initially recognised when the Group becomes a party to the contractual provisions of the instrument. A financial asset (unless it is a trade receivable without a significant financing component) or financial liability is initially measured at fair value plus, for an item not at fair value through profit or loss (FVTPL), transaction costs that are directly attributable to its acquisition or issue. A trade receivable without a significant financing component is initially measured at the transaction price.
3.16.2 Classification and subsequent measurement
i. Financial assetsOn initial recognition, a financial asset is classified as measured at: amortised cost; Financial assets at fair value through other comprehensive income (FVOCI) – debt investment; Financial assets at fair value through other comprehensive income (FVOCI) – equity investment; or Financial assets at fair value through profit or loss (FVTPL).
Financial assets are not reclassified subsequent to their initial recognition unless the Group changes its business model for managing financial assets, in which case all affected financial assets are reclassified on the first day of the first reporting period following the change in the business model.
A financial asset is measured at amortised cost if it meets both of the following conditions and is not designated as at FVTPL:
» it is held within a business model whose objective is to hold assets to collect contractual cash flows; and
» its contractual terms give rise on specified dates to cash flows that are solely payments of principal and interest on the principal amount outstanding.
The Group's financial assets classified under amortised cost includes trade and other receivable, amounts due from related companies and cash and cash equivalents.
A debt investment is measured at FVOCI if it meets both of the following

59 C T HOLDINGS PLCAnnual Report 2021 2022
conditions and is not designated as at FVTPL: » it is held within a business model whose objective is achieved by both collecting contractual cash flows and selling financial assets; and
» its contractual terms give rise on specified dates to cash flows that are solely payments of principal and interest on the principal amount outstanding.
On initial recognition of an equity investment that is not held for trading, the Group may irrevocably elect to present subsequent changes in the investment’s fair value in OCI. This election is made on an investment-by investment basis.
All financial assets not classified as measured at amortised cost or FVOCI as described above are measured at FVTPL. This includes all derivative financial assets. On initial recognition, the Group may irrevocably designate a financial asset that otherwise meets the requirements to be measured at amortised cost or at FVOCI as at FVTPL if doing so eliminates or significantly reduces an accounting mismatch that would otherwise arise.
ii. Financial assets – Business model assessment:The Group makes an assessment of the objective of the business model in which a financial asset is held at a portfolio level because this best reflects the way the business is managed, and information is provided to management.
The information considered includes: » the stated policies and objectives for the portfolio and the operation of those policies in practice. These include whether management’s strategy focuses on earning contractual interest income, maintaining a particular interest rate profile, matching the duration of the financial assets to the duration of any related liabilities or expected cash outflows or realising cash flows through the sale of the assets;
» how the performance of the portfolio is evaluated and reported to the Group’s management;
» the risks that affect the performance of the business model (and the financial assets held within that business model) and how those risks are managed;
» how managers of the business are compensated – e.g. whether compensation is based on the fair value of the assets managed or the contractual cash flows collected; and
» the frequency, volume and timing of sales of financial assets in prior periods, the reasons for such sales and expectations about future sales activity.
Transfers of financial assets to third parties in transactions that do not qualify for de-recognition are not considered sales for this purpose, consistent with the Group’s continuing recognition of the assets. Financial assets that are held for trading or are managed and whose performance is evaluated on a fair value basis are measured at FVTPL.
iii. Financial assets – Assessment whether contractual cash flows are solely payments of principal and interest:For the purposes of this assessment, ‘principal’ is defined as the fair value of the financial asset on initial recognition. ‘Interest’ is defined as consideration for the time value of money and for the credit risk associated with the principal amount outstanding during a particular period of time and for other basic lending risks and costs (e.g. liquidity risk and administrative costs), as well as a profit margin.
In assessing whether the contractual cash flows are solely payments of principal and interest, the Group considers the contractual terms of the instrument. This includes assessing whether the financial asset contains a contractual term that could change the timing or amount of contractual cash flows such that it would not meet this condition. In making this assessment, the Group considers: » contingent events that would change the amount or timing of cash flows;
» terms that may adjust the contractual coupon rate, including variable-rate features;
» prepayment and extension features; and
» terms that limit the Group’s claim to cash flows from specified assets (e.g. nonrecourse features).
A prepayment feature is consistent with the solely payments of principal and interest criterion if the prepayment

60
Notes to the Financial Statements
C T HOLDINGS PLCAnnual Report 2021 2022
amount substantially represents unpaid amounts of principal and interest on the principal amount outstanding, which may include reasonable additional compensation for early termination of the contract. Additionally, for a financial asset acquired at a discount or premium to its contractual par amount, a feature that permits or requires prepayment at an amount that substantially represents the contractual par amount plus accrued (but unpaid) contractual interest (which may also include reasonable additional compensation for early termination) is treated as consistent with this criterion if the fair value of the prepayment feature is insignificant at initial recognition.
iv. Financial assets – Subsequent measurement and gains and losses:
Financial assets at FVTPL
These assets are subsequently measured at fair value. Net gains and losses, including any interest or dividend income, are recognised in profit or loss.
Financial assets at amortised cost
These assets are subsequently measured at amortised cost using the effective interest method. The amortised cost is reduced by impairment losses. Interest income, foreign exchange gains and losses and impairment are recognised in profit or loss. Any gain or loss on derecognition is recognised in profit or loss.
Debt investments at FVOCI
These assets are subsequently measured at fair value. Interest income calculated using the effective interest method, foreign exchange gains and losses and impairment are recognised in profit or loss. Other net gains and losses are recognised in OCI. On derecognition, gains and losses accumulated in OCI are reclassified to profit or loss.
Equity investments at FVOCI
These assets are subsequently measured at fair value. Dividends are recognised as income in profit or loss unless the dividend clearly represents a recovery of part of the cost of the investment. Other net gains and losses are recognised in OCI and are never reclassified to profit or loss.
v. Financial Liabilities - Classification, Subsequent Measurement and Gains and LossesFinancial liabilities are classified as measured at amortised cost or FVTPL. A financial liability is classified as at FVTPL if it is classified as held-for-trading, it is a derivative or it is designated as such on initial recognition. Financial liabilities at FVTPL are measured at fair value and net gains and losses, including any interest expense, are recognised in profit or loss. Other financial liabilities are subsequently measured at amortised cost using the effective interest method. Interest expense and foreign exchange gains and losses are recognised in profit or loss. Any gain or loss on derecognition is also recognised in profit or loss.
Financial liabilities measured at amortised cost include interest bearing loans and borrowings, trade and other payables and amounts due to related companies.
3.16.3 Derivative financial instruments
Derivatives are initially recognised at fair value; any directly attributable transaction costs are recognised in profit or loss as incurred. Subsequent to initial recognition, derivatives are measured at fair value, and changes therein are generally recognised in profit or loss.
i. Financial liability on put options written over non-controlling interestThe financial liability is recognised at the present value of the redemption amount and accreted through finance charges in the profit or loss over the contract period
up to the final redemption amount. Any adjustments to the redemption amount are recognised in equity in accordance with SLFRS 9 - Financial Instruments.
The initial redemption liability is a reduction of parent’s equity if the risks and rewards of ownership remain with the non-controlling interest or a reduction of non-controlling interest equity if the risks and rewards of ownership transfer to the parent. If the present value of the redemption amount exceeds the carrying value of the non-controlling interest, any excess is recorded against parent’s equity. If the contract is exercised, any noncontrolling interest equity is allocated to parent equity. No adjustments are made to goodwill upon settlement of the contract. The redemption liability is offset by the cash payment. If the contract lapses un-exercised where the risks and rewards of ownership have transferred to the parent, a non-controlling interest equity is reinstated. In substance, the parent has sold

61 C T HOLDINGS PLCAnnual Report 2021 2022
those shares back to the noncontrolling interest and it is a transaction with a non-controlling interest. The non-controlling interest equity amount is reinstated at an amount equal to its share of the carrying values of the subsidiary’s net assets at the date of lapse plus the goodwill from the subsidiary’s initial acquisition. Any difference between the redemption liability and the non-controlling interest equity adjustment is recognised against the parent’s equity. No adjustments are made to goodwill. If the contract lapses unexercised where the risks and rewards of ownership remain with the non- controlling interest, then no adjustment is made to the carrying value of the non- controlling interest and theredemption
liability is de-recognised against the parent’s equity.
3.16.4 De-recognitioni. Financial assetsThe Group de-recognises a financial asset when the contractual rights to the cash flows from the financial asset expire, or it transfers the rights to receive the contractual cash flows in a transaction in which substantially all of the risks and rewards of ownership of the financial asset are transferred or in which the Group neither transfers nor retains substantially all of the risks and rewards of ownership and it does not retain control of the financial asset.
The Group enters into transactions whereby it transfers assets recognised in its statement of financial position, but retains either all or substantially all of the risks and rewards of the transferred
assets. In these cases, the transferred assets are not de-recognised.
ii. Financial liabilitiesThe Group de-recognises a financial liability when its contractual obligations are discharged or cancelled, or expire. The Group also de-recognises a financial liability when its terms are modified and the cash flows of the modified liability are substantially different, in which case a new financial liability based on the modified terms is recognised at fair value.
On de-recognition of a financial liability, the difference between the carrying amount extinguished and the consideration paid (including any non-cash assets transferred or liabilities assumed) is recognised in profit or loss.
iii. OffsettingFinancial assets and financial liabilities are offset and the net amount presented in the statement of financial position when, and only when, the Group currently has a legally enforceable right to set off the amounts and it intends either to settle them on a net basis or to realise the asset and settle the liability simultaneously.
3.17 Impairment
3.17.1 Non-derivative financial assetsThe Group assesses on a forward looking basis the expected credit losses associated with its debt instruments carried at amortised cost and FVOCI. The impairment methodology applied depends on whether there has been a significant increase in credit risk.
For trade receivables, the Group applies the simplified approach permitted by SLFRS 9, which requires expected lifetime losses to be recognised from initial recognition of the receivables. The Group has established a provision matrix that is based on its historical credit loss experience, adjusted for forward-looking factors specific to the debtors and the economic environment.
At each reporting date the Group assesses whether there is objective evidence that financial assets not carried at fair value through profit or loss are impaired. If there is objective evidence (such as significant financial difficulty of the obligor, breach of contract, or it becomes probable that the debtor will enter bankruptcy), the asset is tested for impairment.
The amount of the loss is measured as the difference between the asset’s carrying amount and the present value of estimated future cash flows (excluding future expected credit losses that have not been incurred) discounted at the financial asset’s original effective interest rate (that is, the effective interest rate computed at initial recognition). An impairment loss is calculated as the difference between an asset’s carrying amount and the present value of the estimated future cash flows discounted at the asset’s original effective interest rate. Losses are recognised in profit or loss and reflected in a provision account.
In relation to trade receivables, a provision for impairment is made when there is objective evidence (such as the

62
Notes to the Financial Statements
C T HOLDINGS PLCAnnual Report 2021 2022
probability of insolvency or significant financial difficulties of the debtor) that the Group will not be able to collect all of the amounts due under the original terms of the invoice. Impaired debts are derecognised when they are assessed as uncollectible.
If in a subsequent period the amount of the impairment loss decreases and the decrease can be related objectively to an event occurring after the impairment was recognised, the previously recognised impairment loss is reversed, to the extent that the carrying value of the asset does not exceed its amortised cost at the reversal date. Any subsequent reversal of an impairment loss is recognised in profit or loss.
3.17.2 Non-financial assetsAt each reporting date, the Group reviews the carrying amounts of its non- financial assets (other than biological assets, investment property, inventories and deferred tax assets) to determine whether there is any indication of impairment. If any such indication exists, then the asset’s recoverable amount is estimated. Goodwill is tested annually for impairment. For impairment testing, assets are grouped together into the smallest group of assets that generates cash inflows from continuing use that are largely independent of the cash inflows of other assets or CGUs. Goodwill arising from a business combination is allocated to CGUs or groups of CGUs that are expected to benefit from the synergies of the combination. The recoverable amount of an asset or CGU is the greater of its value in use and its fair value less costs to sell. Value in use is based on the estimated future cash flows, discounted
to their present value using a pre-tax discount rate that reflects current market assessments of the time value of money and the risks specific to the asset or CGU. An impairment loss is recognised if the carrying amount of an asset or CGU exceeds its recoverable amount. Impairment losses are recognised in profit or loss. They are allocated first to reduce the carrying amount of any goodwill allocated to the CGU, and then to reduce the carrying amounts of the other assets in the CGU on a pro rata basis. An impairment loss in respect of goodwill is not reversed. For other assets, an impairment loss is reversed only to the extent that the asset’s carrying amount does not exceed the carrying amount that would have been determined, net of depreciation or amortisation, if no impairment loss had been recognised.
3.17.3 Credit-impaired financial assetsAt each reporting date, the Group assesses whether financial assets carried at amortised cost and debt securities at FVOCI are credit-impaired. A financial asset is “credit impaired” when one or more events that have a detrimental impact on the estimated future cash flows of the financial asset have occurred.
Evidence that a financial asset is credit-impaired includes the following observable data:
» significant financial difficulty of the borrower or issuer;
» a breach of contract such as a default or being more than 90 days past due;
» the restructuring of a loan or advance by the Group on terms that the Group would not consider otherwise; or
» it is probable that the borrower will enter bankruptcy or other financial reorganisation.
3.18 Stated capital - Ordinary shares
Ordinary shares are classified as equity. Incremental costs directly attributable to the issue of ordinary shares are recognised as a deduction from equity, net of any tax effects.
3.19 Capital Grant
Government GrantsGovernment grants, including non- monetary grants at fair value, are recognised when there is reasonable assurance that the conditions attached to them will be complied by the Group and the grants will be received. Grants related to assets, including nonmonetary grants at fair value, are presented in the Statement of Financial Position as deferred income and recognised in the profit or loss on a systematic and rational basis over the useful life of the asset. Grants related to income are presented as a credit in the profit or loss, under the heading ‘other income’ against the incurrence of related expenditure.
3.20 Provisions
A provision is recognised if, as a result of a past event, the Group has a present legal or constructive obligation that can be estimated reliably, and it is probable that an outflow of economic benefits will be required to settle the obligation. Provisions are determined

63 C T HOLDINGS PLCAnnual Report 2021 2022
by discounting the expected future cash flows at a pre-tax rate that reflects current market assessments of the time value of money and the risks specific to the liability.
3.21 Leases
At inception of a contract, the Group assesses whether a contract is, or contains, a lease. A contract is, or contains, a lease if the contract conveys the right to control the use of an identified asset for a period of time in exchange for consideration. To assess whether a contract conveys the right to control the use of an identified asset, the Group uses the definition of a lease in SLFRS 16. This policy is applied to contracts entered into, on or after 1 April 2019.
3.21.2 As a LesseeAt commencement or on modification of a contract that contains a lease component, the Group allocates the consideration in the contract to each lease component on the basis of its relative stand-alone prices. However, for the leases of property the Group has elected not to separate non-lease components and account for the lease and non-lease components as a single lease component.
The Group recognises a right-of-use asset and a lease liability at the lease commencement date. The right-of-use asset is initially measured at cost, which comprises the initial amount of the lease liability adjusted for any lease payments made at or before the commencement date, plus any initial direct costs incurred and an estimate of costs to dismantle and remove the underlying asset or to restore the underlying asset or the site
on which it is located, less any lease incentives received.
The right-of-use asset is subsequently depreciated using the straight-line method from the commencement date to the end of the lease term, unless the lease transfers ownership of the underlying asset to the Group by the end of the lease term or the cost of the right- of-use asset reflects that the Group will exercise a purchase option. In that case the right-of-use asset will be depreciated over the useful life of the underlying asset, which is determined on the same basis as those of property and equipment. In addition, the right-of-use asset is periodically reduced by impairment losses, if any, and adjusted for certain remeasurements of the lease liability.
The lease liability is initially measured at the present value of the lease payments that are not paid at the commencement date, discounted using the interest rate implicit in the lease or, if that rate cannot be readily determined, the Company’s incremental borrowing rate. Generally, the Group entities uses its incremental borrowing rate as the discount rate.
The Group entities determines its incremental borrowing rate by obtaining interest rates from various external financing sources and makes certain adjustments to reflect the terms of the lease and type of the asset leased.
Lease payments included in the measurement of the lease liability comprise the following: » fixed payments, including in- substance fixed payments;
» variable lease payments that depend on an index or a rate, initially measured using the index or rate as at the commencement date;
» amounts expected to be payable under a residual value guarantee; and
» the exercise price under a purchase option that the Group is reasonably certain to exercise, lease payments in an optional renewal period if the Group is reasonably certain to exercise an extension option, and penalties early termination of a lease unless the Group is reasonably certain not to terminate early.
The lease liability is measured at amortised cost using the effective interest method. It is remeasured when there is a change in future lease payments arising from a change in an index or rate, if there is a change in the Group’s estimate of the amount expected to be payable under a residual value guarantee, if the Group changes its assessment of whether it will exercise a purchase, extension or termination option or if there is a revised in-substance fixed lease payment.
When the lease liability is remeasured in this way, a corresponding adjustment is made to the carrying amount of the right-of-use asset, or is recorded in profit or loss if the carrying amount of the right-of-use asset has been reduced to zero.
The Group presents right-of-use assets that do not meet the definition of investment property in “Right-of-use” assets and lease liabilites in interest bearing loans and borrowings in the statement of Financial Position.

64
Notes to the Financial Statements
C T HOLDINGS PLCAnnual Report 2021 2022
Short term leases and leases of low- value assetsThe Group has elected not to recognise right-of-use assets and lease liabilities for leases of low-value assets and short- term leases. The Group recognises the lease payments associated with these leases as an expense on a straight-line basis over the lease term.
3.21.2 As a LessorAt inception or on modification of a contract that contains a lease component, the Group allocates the consideration in the contract to each lease component on the basis of their relative stand-alone prices.
When the Group acts as a lessor, it determines at lease inception whether each lease is a finance lease or an operating lease.
To classify each lease, the Group makes an overall assessment of whether the lease transfers substantially all of the risk and rewards incidental to ownership of the underlying asset. If this is the case, then the lease is a finance lease; if not then it is an operating lease. As part of this assessment, the Group considers certain indicators such as whether the lease is for the major part of the economic useful life of the asset.
When the Group is an intermediate lessor, it accounts for its interest in the head lease and the sub-lease separately. It assesses the lease
classification of sub-lease with reference to the right-of-use asset arising from the head lease, not with reference to the underlying asset. If a head lease is a short-term lease to which the Group applies the exemption described above, then it classifies sub-lease as an operating lease.
The Group recognises lease payments received under operating leases as rental income on a straight-line basis over the lease term as part of ‘other income’.
3.22 Contingent Liabilities
Contingent Liabilities are possible obligations whose existence will be confirmed only by uncertain futureevents or present obligations wherethe transfer of economic benefit is not probable or cannot be readily measured as defined in the Sri Lanka Accounting Standard - LKAS 37 on ‘Provisions, Contingent Liabilities and Contingent Assets’. Contingent liabilities are not recognised in the Statement of Financial Position but are disclosed unless its occurrence is remote.
3.23 Operating profit
Operating profit is the result generated from the continuing principal revenue producing activities of the Group as well as other income and expenses related to operating activities. Operating profit excludes net finance costs, share of profit of equity accounted investees and income taxes.
4. Standards issued but not effective as at the reporting date
A number of new standards are effective for annual periods beginning after 1 April 2022 and earlier application is permitted; however, the Group has not early adopted the new or amended standards in preparing these Financial Statements.
» Onerous contracts - Cost of fulfilling a contract (Amendments to LKAS 37)
» Deferred Tax related to Assets and Liabilities arising from a Single Transaction (Amendments to IAS 12)
» Reference to Conceptual Framework (Amendments to SLFRS 3)
» Property, plant and equipment: Proceeds before Intended Use (Amendments to LKAS 16)
» Classification of liabilities as current or non-current (Amendments to LKAS 1)
» Annual Improvements to SLFRS standards 2018-2020.
» Definition of Accounting Estimates (Amendments to LKAS 8)
» Disclosure of Accounting Policies (Amendments to LKAS 1)

65 C T HOLDINGS PLCAnnual Report 2021 2022
6. Revenue
In thousands of rupees Group Company For the year ended 31st March 2022 2021 2022 2021
The following is an analysis of the Group’s revenueSales of goods 136,690,708 112,607,061 - - Rendering of services 71,321 18,092 - - Investment property rentals 110,727 315,818 - -
136,872,756 112,940,971 - -
7. Other income
In thousands of rupees Group Company For the year ended 31st March 2022 2021 2022 2021
Dividend income 732 9,107 1,136,347 991,353 Rental income 207,121 208,436 660 (145)Gain on disposal of property, plant and equipment 4,278 67,423 - - Income from services 9,607 - - Merchandising income 1,678,761 1,638,795 - - Amortisation of deferred income 11,481 11,483 - - Sundry income 281,776 160,910 - - Change in fair value of short term investments 3,127 2,179 - -
2,196,883 2,098,333 1,137,007 991,208

66
Notes to the Financial Statements
C T HOLDINGS PLCAnnual Report 2021 2022
8. Results from operating activities
8.1 Expenses by nature
In thousands of rupees Group Company For the year ended 31st March 2022 2021 2022 2021
The following items have been included in results from operating activities:Employee costs (Note 8.2) 9,074,293 7,656,524 62,511 52,273 Depreciation of property, plant and equipment (Note 13) 3,538,664 3,019,288 93 89 Amortisation of intangible assets (Note 17.1) 105,311 75,469 - - Directors’ emoluments 524,911 539,308 27,947 30,027 Auditor's remuneration (Note 8.3) 17,393 15,800 1,076 964 Impairment loss on investments in subsidiaries (Note 18.1) - - 51,147 139,520 Impairment of trade and other receivables (Note 22.3) 25,686 33,898 - - Impairment of inventories 16,924 29,482 - - Depreciation of right of use assets (Note 14.1) 1,739,535 1,438,593 20 20 Foreign exchange gain/(loss) (Note 09) (515,901) 21,216 - -
8.2 Employee costs
Salaries, wages and other related expenses 8,106,365 6,707,874 53,915 41,957 Equity-settled share-based payments - 30,059 - - Defined benefit plan cost - retirement benefit obligation (Note 27.1 a) 248,896 281,624 2,287 4,591 Defined contribution plan costs - EPF & ETF 719,032 636,967 6,309 5,725
9,074,293 7,656,524 62,511 52,273
8.3 Auditor's remuneration
Audit and audit related expenses 14,545 13,589 770 700 Non-audit services 2,848 2,211 306 264
17,393 15,800 1,076 964

67 C T HOLDINGS PLCAnnual Report 2021 2022
9. Net finance income / costs
In thousands of rupees Group Company For the year ended 31st March 2022 2021 2022 2021
Finance incomeInterest income 227,360 192,232 3,546 8,329 Foreign exchange gain - 21,216 - -
227,360 213,448 3,546 8,329
Finance costsInterest on bank and other loans and security deposits (1,290,134) (1,164,416) (41,033) (224)Interest on overdraft facilities (84,172) (117,900) (3,172) (520)Interest on lease Liabilities (Note 14.3) (1,709,964) (1,529,566) (15) (16)Foreign exchange loss (515,901) - - -
(3,600,171) (2,811,882) (44,220) (760)Net finance income / (costs) recognised in profit or loss (3,372,811) (2,598,434) (40,674) 7,569
10. Income tax expense
10.1 Amounts recognised in profit or loss
In thousands of rupees Group Company
For the year ended 31st March Note 2022 2021 2022 2021
Current tax expenses
Current tax on profits for the year 10.4.1 1,553,764 1,320,179 - -
Irrecoverable ESC/WHT 401 11,529 - -
Dividend tax 261,872 226,613 - 8,846
Current tax on profits in respect of prior years (323,000) (4,702) - -
1,493,037 1,553,619 - 8,846
Deferred tax expenses
Deferred tax on profits for the year 10.5 (194,967) (563,271) - -
(194,967) (563,271) - -
Total income tax expense recognised in profit or loss 1,298,070 990,348 - 8,846
10.2 Amounts recognised in other comprehensive income
Re-measurement of obligation on defined benefit plan (39,810) 19,884 - -
Fair value gain - (343,345) - - Total income tax expense recognised in other comprehensive income (39,810) (323,461) - -

68
Notes to the Financial Statements
C T HOLDINGS PLCAnnual Report 2021 2022
10.3 Tax rates applicable for group companiesThe tax liability of companies are computed at the standard rate of 14%, 18%, 24% (2021 - 14%, 18%, 24%)
10.4 Reconciliation of effective taxReconciliation between current tax expense and profit before taxation is given below:In thousands of rupees Group Company For the year ended 31st March 2022 2021 2022 2021
Profit before taxation 5,468,375 4,311,617 925,342 749,094 Aggregate disallowed expenses 8,571,539 7,866,723 53,740 243,503 Aggregate allowable expenses (6,404,623) (5,168,009) (2,651) (51)Aggregate other income (421,721) (478,373) (981,584) (1,000,231)Exempt profit (33,971) (67,572) - - Adjusted business profit 7,179,599 6,464,386 (5,153) (7,685)Tax losses incurred 319,755 20,597 5,153 7,685 Taxable income from other sources 166,421 87,073 - - Adjusted profit (a) 7,665,775 6,572,056 - -
Tax lossesTax losses brought forward 2,562,671 2,564,740 373,762 366,077 Tax losses added 319,755 20,526 5,153 7,685 Tax losses utilised (b) (159,402) (14,982) - - Adjustments related to prior years - - - - Adjustment on finalisation of liability (197,784) (7,613) (62,136) - Tax losses carried forward 2,525,240 2,562,671 316,779 373,762
Taxable income (a+b) 7,506,373 6,557,074 - - Income tax @ 24% (2021- @ 24%) 810,378 559,150 - - Income tax @ 18% (2021 @ 18%) 743,362 761,029 - - Income tax @ 14% (2021 @ 14%) 24 - - - Current tax charge 1,553,764 1,320,179 - -
10.5 Deferred tax (assets) / liabilities
Group Company 2022 2021 2022 2021
As at 1 April 1,057,643 1,297,453 - - Charge / (reversal) and impact of change in tax rate regognised in profit or loss (194,967) (563,271) - - Charge / (reversal) and impact of change in tax rate recognised in other comprehensive income 39,810 323,461 - - As at 31 March 902,486 1,057,643 - -
The Group's deferred tax charge recognised in P&L and OCI for the year ended 31 March 2021 includes benefit from change in tax rate as mentioned in Note 10.3 which amounts to Rs. 296 Mn.

69 C T HOLDINGS PLCAnnual Report 2021 2022
10.5.1 Movement in deferred tax (assets) / liabilities
Movement in net balance Recognised in Classified as In thousands of rupees As at Profit or other As at Deferred Deferred
1st Apr-20 loss Comprehensive 31st Mar-21 tax liabilities tax assets Income
For the year ended 31st March 2021Accelerated tax depreciation [refer note 10.5.1(i)] 2,492,891 (487,665) 343,345 2,348,571 2,348,571 - Fair value gains 188,807 (42,585) - 146,222 146,222 - Retirement benefit obligations (369,979) 4,878 (19,884) (384,985) (19,884) (365,101)Tax losses [refer note 10.5.2(ii)] (227,899) (1,390) - (229,289) - (229,289)Provisions & other (287,500) 8,786 - (278,714) - (278,714)ROU assets and lease liabilities (498,867) (45,295) - (544,162) - (544,162)Tax assets / (liabilities) before set-off 1,297,453 (563,271) 323,461 1,057,643 2,474,909 (1,417,266)
Set-off of tax - - - - (1,406,510) 1,406,510 Net tax assets / (liabilities) 1,297,453 (563,271) 323,461 1,057,643 1,068,399 (10,756)
Movement in net balance Recognised in Classifed as In thousands of rupees As at Profit or other As at Deferred Deferred
1st Apr-21 loss Comprehensive 31st Mar-22 tax liabilities tax assets Income
For the year ended 31st March 2022Accelerated tax depreciation [refer note 10.5.1(i)] 2,348,571 (68,448) - 2,280,123 2,280,123 - Fair value gains 146,222 49,796 - 196,018 196,018 - Retirement benefit obligations (384,985) (42,615) 39,810 (387,790) - (387,790)Tax losses [refer note 10.5.2(ii)] (229,289) (25,609) - (254,898) - (254,898)Provisions & other (278,714) 66,736 - (211,978) - (211,978)ROU assets and lease liabilities (544,162) (174,827) - (718,989) - (718,989)Tax assets / (liabilities) before set-off 1,057,643 (194,967) 39,810 902,486 2,476,141 (1,573,655)
Set-off of tax - - - - (1,565,057) 1,565,057Net tax assets / (liabilities) 1,057,643 (194,967) 39,810 902,486 911,084 (8,598)
(i) Accelerated tax depreciation on property, plant and equipment.(ii) Tax losses are available for deduction against future taxable income.
10.5.2 Deferred income tax assets and liabilities during the year were calculated after setting off balances within the same tax jurisdiction.
10.5.3 Deferred tax has been computed taking into consideration the tax rates effective from 1 January 2020 which is 14%, 18% and 24% for all standard rate companies. Deferred taxation is provided for all Group companies except those companies with tax losses available for carry forward exceeding taxable temporary differences and companies which are exempt from income tax.

70
Notes to the Financial Statements
C T HOLDINGS PLCAnnual Report 2021 2022
10.5.4 Un-accounted deferred tax assetsA deferred tax asset is recognised only to the extent that it is probable that taxable profit will be available in the foreseeable future, against which such deductible temporary timing differences could be utilised. The deferred tax effect on undistributed reserves of subsidiaries has not been recognised where the parent can control the timing of the reversal of these temporary differences.
The break down of the tax effect of un-accounted deferred tax assets is given below;In thousands of rupees Group Company For the year ended 31st March 2022 2021 2022 2021
Deductible temporary differencesTax losses 323,521 642,429 76,027 211,673
323,521 642,429 76,027 211,673
11. Earnings per share
11.1 Basic earnings per share
Earnings per share is calculated by dividing the profit attributable to equity holders of the Company by weighted average number of ordinary shares outstanding during the year.
In rupees Group Company For the year ended 31st March 2022 2021 2022 2021
Basic earning per share 14.09 10.24 4.59 3.68
In thousands of rupeesProfit for the year attributable to owners of the Company 2,838,029 2,061,487 925,342 740,248
In thousands of numbersWeighted-average number of ordinary sharesIssued ordinary shares as at at 31st March 201,407 201,407 201,407 201,407
11.2 Diluted earnings per share
Diluted earnings per share computation is the same as in the Note 11.1.
12. Dividend per share
For the year ended 31st March 2022 For the year ended 31st March 2021 Date of payment Dividend per
shareRs.
Dividend(in thousands of
rupees)
Date of payment Dividend pershare
Rs.
Dividend(in thousands of
rupees)
Interim 20-Dec-21 1.55 312,181 7-Jan-21 1.45 292,040 Final (proposed) 19-Aug-22 3.00 604,221 22-Jul-21 2.90 584,080
- 4.55 916,402 - 4.35 876,120

71 C T HOLDINGS PLCAnnual Report 2021 2022
13. Property, plant and equipment
13.1 Reconciliation of carrying amount
Group Freehold Freehold Improvements Plant & Motor Furniture & Capital work TotalIn thousands of rupees land buildings to leasehold
buildings machinery vehicles fittings in progress
Cost / ValuationAs at 1st April 2020 11,908,467 2,531,243 11,343,042 22,250,648 1,706,647 84,459 3,512,156 53,336,662 Additions 858 773,341 1,332,545 2,558,634 400,393 11,049 7,704,100 12,780,920 Revaluations 2,106,121 753,680 - - - - - 2,859,801 Transfers - - - - - - (6,498,671) (6,498,671)Disposals - - (8,826) (15,897) (133,918) - - (158,641)Impairment - - (2,778) - - - - (2,778)Transfer to investment property (232,806) - - - - - (566,551) (799,357)Transfer- Acc. Dep- Revaluation - (1,064,654) - - - - - (1,064,654)As at 31st March 2021 13,782,640 2,993,610 12,663,983 24,793,385 1,973,122 95,508 4,151,034 60,453,282
As at 1st April 2021 13,782,640 2,993,610 12,663,983 24,793,385 1,973,122 95,508 4,151,034 60,453,282 Additions 83,624 265,338 1,745,845 2,188,926 424,177 539 6,566,644 11,275,093Transfers - - - - - - (3,656,483) (3,656,483)Transfer to investment property - - - - - - (114,488) (114,488)Disposals (5,478) - (47,720) (15,283) (32,542) - - (101,023)Impairment - - (2,024) (5) - (321) - (2,350)As at 31st March 2022 13,860,786 3,258,948 14,360,084 26,967,023 2,364,757 95,726 6,946,707 67,854,031
Accumulated depreciation and impairment lossesAs at 1st April 2020 - 1,021,226 5,186,554 13,341,943 1,225,733 48,027 - 20,823,483 Charge for the year - 142,941 726,149 1,916,559 224,581 9,058 - 3,019,288 Disposals - - (5,187) (13,709) (133,918) - - (152,814)Transfer to AHS - (1,064,654) - - - - - (1,064,654)As at 31st March 2021 - 99,513 5,907,516 15,244,793 1,316,396 57,085 - 22,625,303
As at 1st April 2021 - 99,513 5,907,516 15,244,793 1,316,396 57,085 - 22,625,303 Charge for the year - 200,204 872,988 2,169,363 285,770 10,339 - 3,538,664 Disposals - - (31,127) (14,099) (32,477) - - (77,703)As at 31st March 2022 - 299,717 6,749,377 17,400,057 1,569,689 67,424 - 26,086,264
Carrying ValueAs at 31st March 2021 13,782,640 2,894,097 6,756,467 9,548,592 656,726 38,423 4,151,034 37,827,979 As at 31st March 2022 13,860,786 2,959,231 7,610,707 9,566,966 795,068 28,302 6,946,707 41,767,767

72
Notes to the Financial Statements
C T HOLDINGS PLCAnnual Report 2021 2022
Company Improvements Plant & Motor Furniture & Total
to leasehold machinery vehicles fittings
In thousands of rupees buildings
Cost / revaluation
As at 1 April 2020 4,854 2,417 41,024 108 48,403
Additions - 148 - - 148
As at 31 March 2021 4,854 2,565 41,024 108 48,551
As at 1 April 2021 4,854 2,565 41,024 108 48,551
Additions - - - - -
As at 31 March 2022 4,854 2,565 41,024 108 48,551
Accumulated depreciation and impairment losses
As at 1 April 2020 2,880 2,414 41,024 18 46,336
Charge for the year 72 2 - 15 89
As at 31 March 2021 2,952 2,416 41,024 33 46,425
As at 1 April 2021 2,952 2,416 41,024 33 46,425
Charge for the year 74 2 - 17 93
As at 31 March 2022 3,026 2,418 41,024 50 46,518
Carrying value
As at 31 st March 2021 1,902 149 - 75 2,126
As at 31 st March 2022 1,828 147 - 58 2,033

73 C T HOLDINGS PLCAnnual Report 2021 2022
13.2 Details of land and building as at 31st March 2021
Location Valuation technique
Land extent Building area
(Sq. ft.)
No. ofbuildings
In thousands of rupees
Value
Company:- C T Holdings PLC
Kandy Technique (1) 170 Perches 9,650 4 609,615
Negombo Technique (1) 91 Perches 17,500 1 295,150
Bandarawela Technique (2) 2.8 Acres 30,600 4 552,000
Nuwara Eliya Technique (1) 60 Perches 6,500 3 155,100
Company:- Cargills (Ceylon) PLC
Colombo 01 Technique (2) 141 Perches 124,215 1 3,095,500
Colombo 02 Technique (1) 81.5 Perches 20,970 2 923,375
Canal Row, Colombo 01 Technique (2) 15 Perches 12,300 1 400,291
Dematagoda Technique (2) 84 Perches 71,956 1 350,989
Company:- Cargills Foods Company (Private) Limited
Kandy Technique (2) 88 Perches 25,174 1 1,426,400
Maharagama Technique (2) 145 Perches 15,827 1 683,700
Nuwara Eliya Technique (2) 57 Perches 9,617 1 307,100
Mattakuliya (111) Technique (2) 330 Perches 80,967 2 848,000
Kohuwala Technique (2) 29 Perches 6,225 1 173,000
Mattakuliya (141) Technique (2) 288 Perches 44,469 4 589,800
Gampaha Technique (2) 82.6 Perches 39,565 1 423,776
Moratuwa Technique (2) 78.6 Perches 7,475 1 385,765
Ingiriya (A,C,D,B1) Technique (1) 26 Acres 1,300 1 248,858
Park Road Technique (2) - 4,610 1 64,800
Negombo Technique (1) 28.8 Acres - - 760,750
Company:- Cargills Quality Foods Limited
Mattakuliya Technique (1) 1.3 Acres 17,881 1 474,078
Ja - Ela Technique (1) 5.1 Acres 41,833 1 486,515
Ja - Ela Technique (1) 4 Acres 7,600 1 169,700
Company:- Cargills Agrifoods Limited
Katana Technique (1) 11.3 Acres 76,059 1 594,240
Company:- Millers Limited
Kelaniya Technique (2) 1.5 Acres 55,770 2 495,000
Company:- C P C (Lanka) Limited
Katoolaya Estate, Thawalantenne Technique (1) 4 Acres 19,961 1 67,000

74
Notes to the Financial Statements
C T HOLDINGS PLCAnnual Report 2021 2022
Location Valuation technique
Land extent Building area
(Sq. ft.)
No. ofbuildings
In thousands of rupees
Value
Company:- Kotmale Dairy Products (Private) Limited
Mulleriyawa Technique (1) 1.7 Acres 35,528 3 328,717
Bogahawatta Technique (1) 1 Acres 33,221 6 485,750
Kuduoya Estate, Ruwanpura, Hatton Technique (1) 17.4 Acres 14,569 4 104,422
Company:- Cargills Quality Dairies (Private) Limited
Mirigama, Baduragoda Technique (1) 100.2 Perches - - 20,040
Mirigama, Baduragoda Technique (1) 38.51 Perches - - 13,100
Company:- The Empire Investments Company (Private) Limited
Bandarawela Technique (1) 85 Perches 6,345 1 603,461
Katubedda Technique (1) 1.15 Acres 3,500 1 540,745
Total 16,676,737
13.3 Measurement of fair values of freehold land - Group
(a) Valuation processThe Group’s freehold lands are stated at their revalued amounts, being the fair value at the date of revaluation less any subsequent accumulated impairment losses. The Group has revalued all of its freehold land in the reporting period ending 31st March 2021. The value measurements were carried out in conformity with the requirements of the Sri Lanka Accounting Standards by Mr. Tissa Weeratne, Chartered Valuation Surveyor, UK & Fellow, Institute of Valuers of Sri Lanka, with appropriate qualifications and recent experience in the valuation of properties in the relevant locations. Mr. T Weeratne is not related to the Group. The surplus arising on such valuations have been transferred to revaluation reserves.
(b) Valuation techniques usedValuation technique (1) : - Market Comparable ApproachThe bare lands are valued using the market comparable approach. Under the market comparable approach, a property’s fair value is estimated based on comparable transactions. The valuer used the comparable method of valuation involving analysing data obtained from local selling prices for the entire portfolio, by property type. The market comparable approach is based upon the principle of substitution under which a potential buyer will not pay more for the property than it will cost to buy a comparable substitute property. The unit of comparison applied by the Group is the price per perch.
Valuation techniques (2) : - Income Capitalisation MethodThe commercial property (shopping malls & theatres) are valued using the income capitalisation method where a property’s fair value is estimated based on the normalised net operating income generated by the property, which is divided by the capitalisation (discount) rate. The difference between gross and net rental income includes expense at rates estimated by the valuer.
(c) Fair value hierarchyThe fair value measurement for all the lands are categorised as a Level 3 fair value based on the inputs to the valuation technique used. A significant increase in the market value per perch, capitalisation rate and market rent used in arriving at fair value would

75 C T HOLDINGS PLCAnnual Report 2021 2022
result in a significant increase in fair value, and vice versa. There has been no change to the valuation technique during the year.
Level 1 - Quoted prices in active marketsLevel 2 - Significant observable inputsLevel 3 - Significant unobservable inputs
(d) Information about fair value measurements using significant unobservable inputs (Level 3)Property valuations are inherently subjective as they are made on the basis of assumptions made by the valuer which may not prove to be accurate. For these reasons we have classified the land valuations as Level 3 as defined by SLFRS 13.
(e) The following table shows the valuation techniques used by Group in measuring level 3 fair values and the significant unobservable inputs used.
Valuation technique Significant unobservable inputs Sensitivity of the input to the fair value
Market comparable method - This method considers the selling price of a similar property within a reasonably recent period of time in determining the fair value of property being revalued. This involves evaluation of recent active market prices of similar assets, making appropriate adjustments for difference in size, nature and location of the property.
Market price per perch. The valuer has used a range of prices for respective landsbased on adjusted fair value taking into account other valuation considerations. Market price per perch ranges between Rs. 5,000 - Rs. 16,100,000 per perch.
The estimated fair value would increase / (decrease) if: » Cost per square foot was higher / (lower); or
» Market value per perch was higher / (lower)
Income method :- The net income generated by the property is used in conjunction with certain factors is used to calculate its fair value.
Contractual rentals agreed Occupancy rates 100% Capitalization rates 5%-7% Repairs and insurance 22%-25% Valuer has used market price per perch for excess land in existing location using a range of prices for similar lands based on adjusted fair value taking into account other valuation consideration ranges between Rs. 2,000,000 - Rs. 18,000,000 per perch
Estimated fair value will increase / (decrease) if market interest rate increase / (decrease)
13.4 If land were stated at the historical cost basis, the carrying amounts would have been as follows:
In thousands of rupees GroupAs at 31st March 2022 2021
Freehold land 6,896,770 6,813,146

76
Notes to the Financial Statements
C T HOLDINGS PLCAnnual Report 2021 2022
13.5 Leased assets capitalised in property, plant and equipment
In thousands of rupees Group CompanyAs at 31st March 2022 2021 2022 2021
Improvements to leasehold buildingsCapitalised 14,360,084 12,663,983 4,854 4,854 Accumulated Amortisation (6,749,377) (5,907,516) (3,026) (2,952)Carrying value 7,610,707 6,756,467 1,828 1,902
13.6 Security
The details of assets mortgaged for banking facilities obtained have been given in the Note 26.3 to the financial statements, If any.
13.7 Details on classes of assets
(a) Land & buildings consist of freehold land, road ways & buildings.(b) Improvements to leasehold buildings include the cost of civil work incurred in setting up new outlets on leasehold premises.(c) Furniture & fittings consist of tools, implements, furniture & fittings, office & other equipment.(d) Capital work in progress consists of expenditure incurred on projects where operations had not commenced as at the
reporting date.
13.8 Other information
Property, plant and equipment of the Group and the Company included:In millions of rupees Group Company As at 31st March 2022 2021 2022 2021
Fully depreciated assets 7,467 6,459 41 41
Depreciation amounting to Rs. 2,794 Mn (2021 - Rs. 2,405 Mn) and Rs. 745 Mn (2021 - Rs. 614 Mn) has been charged respectively to the cost of sales and, administration and other expenses of the Group.
13.9 Impairment
The Management has assessed the potential impairment loss of property, plant and equipment as at 31 March 2022. Based on the assessment, the Group does not foresee any indications of impairment as at the reporting date due to the COVID-19 pandemic and economic uncertainties, and functions under the business continuity plan as per the Group’s risk management strategy, allowing operations to function through alternate working arrangements, whilst strictly adhering to and supporting government directives.

77 C T HOLDINGS PLCAnnual Report 2021 2022
14. Leases
Information about leases for which a Group is lessee is presented below :
14.1 Right of use assets
In thousands of rupees Group Company As at 31 March 2022 2021 2022 2021
Balance as at 1 April 14,423,813 10,157,100 137 157 Additions 4,392,228 5,740,661 - - Recognition of ROU asset on modification of payment 482 - - - Termination of Lease (187,331) (35,355) - - Depreciation (1,739,535) (1,438,593) (20) (20)Balance as at 31 March 16,889,657 14,423,813 117 137
14.2 Lease liabilities
In thousands of rupees Group Company As at 31 March 2022 2021 2022 2021
Balance as at 1 April 16,607,619 11,773,068 189 173 Recognition of lease liability on initial application of SLFRS 16 - 180,357 - - Adjusted balance as at 1 st April 16,607,619 11,953,425 189 173 Additions 4,366,801 5,529,839 - - Recognition of lease liability on modification of payment 482 - - - Interest expense 1,709,964 1,529,566 15 16 Payments (2,573,937) (2,243,078) - - Termination of Lease (186,839) (38,568) - - Negative lease payments due to rent concessions (164,538) (123,565) - - Balance as at 31 March 19,759,552 16,607,619 204 189
Lease Liabilities included in the statement of financial position as at 31 MarchCurrent (Note 26) 1,139,857 1,123,546 18 - Non-current (Note 26) 18,619,695 15,484,073 186 189
19,759,552 16,607,619 204 189
Maturity analysis - contractual undiscounted cash flowsLess than one year 3,012,742 2,668,417 30 30 one to five years 11,659,203 10,326,266 122 152 More than five years 24,864,576 20,789,346 - - Total undiscounted liabilities as at 31 March 39,536,521 33,784,029 152 182
* Lease liabilities is presented under Note 26.

78
Notes to the Financial Statements
C T HOLDINGS PLCAnnual Report 2021 2022
14.3 Amounts Recognised in Profit or Loss
In thousands of rupees Group Company As at 31 March 2022 2021 2022 2021
Depreciation of right-of-use assets 1,739,535 1,438,593 20 20 Interest expense on lease liabilities 1,709,964 1,529,566 15 16 Negative lease payments due to rent concessions (164,538) (123,565) - - Income from sub - leasing right of use assets presented in 'other income' (23,270) (24,324) - -
3,261,691 2,820,270 35 36
14.4 Amounts Recognised in Statement of Cash Flows
Total cash outflow for leases, net of concessions (2,573,937) (2,243,078) - - (2,573,937) (2,243,078) - -
Impairment: The Group does not foresee any indications of impairment of right of use assets due to the COVID-19 pandemic since as Group is operating under the business continuity plan as per the Group risk management strategy, to the extent possible, whilst strictly adhering to and supporting government directives.
15. Prepayment on leasehold land and building
15.1 Reconciliation of carrying amount
In thousands of rupees Group Company As at 31 March 2022 2021 2022 2021
Cost As at 1 April 200,912 200,912 - - Additions - - - - As at 31 March 200,912 200,912 - -
Accumulated amortisationAs at 1 April - - - - charge for the year - - - - As at 31 March - - - -
200,912 200,912 - -
Carrying value Current portion - - - - Non - current portion 200,912 200,912 - -
200,912 200,912 - -

79 C T HOLDINGS PLCAnnual Report 2021 2022
15.1 Reconciliation of carrying amount (Contd.)
Property Leaseperiod
AmountRs.’000
Cargills Foods Company (Pvt) LimitedKolonnawa land 99 years 200,912
The prepayment relates to amounts paid in advance for lease contracts that are not finalized as of 31 March 2022.
16. Investment Property
16.1 Reconciliation of carrying amount
In thousands of rupees Group Company As at 31 March 2022 2021 2022 2021
As at 1 April 9,176,410 8,185,909 1,611,865 1,620,743 Improvements during the year 25,495 92,666 - - Transfer from Property, plant & equipment 114,488 799,357 - - Disposals - - (904,765) - Change in fair value 263,160 98,478 2,600 (8,878)As at 31 March 9,579,553 9,176,410 709,700 1,611,865
Investment property comprises both commercial properties leased to third parties as well as land held for capital appreciation. Changes in fair values are recognised as gains in profit or gains/ losses. All gains /losses are unrealised.
16.2 Measurement of fair values(a) Valuation processThe valuations of investment property for the reporting period were performed by Mr. Tissa Weeratne, Chartered Valuation Surveyor, UK & Fellow, Institute of Valuers of Sri Lanka, an accredited independent valuer with a recognised and relevant professional qualification and with recent experience in the locations and categories of the investment property being valued. The valuation models applied are in accordance with those recommended by the International Valuation Standards Committee and are consistent with the principles in SLFRS 13. For all investment properties, their current use equates to the highest and best use and changes in Level 2 and 3 fair values are reviewed annually at each reporting date.
(b) Valuation techniques usedValuation technique (1): - Market comparable approachThe bare lands are valued using the market comparable approach. Under the market comparable approach, a property’s fair value is estimated based on comparable transactions. The valuer used the comparable method of valuation involving analysing data obtained from local selling prices for the entire portfolio, by property type. The market comparable approach is based upon the principle of substitution under which a potential buyer will not pay more for the property than it will cost to buy a comparable substitute property. The unit of comparison applied by the Group is the price per perch.
Valuation techniques (2): - Income capitalisation methodThe commercial property (shopping malls & theatres) are valued using the income capitalisation method where a property’s fair value is estimated based on the normalised net operating income generated by the property, which is divided by the

80
Notes to the Financial Statements
C T HOLDINGS PLCAnnual Report 2021 2022
capitalisation (discount) rate. The difference between gross and net rental income includes expense at rates estimated by the valuer.
(c) Fair value hierarchyThe fair value measurement for all the investment properties are categorised as a Level 3 fair value based on the inputs to the valuation technique used. A significant increase in the market value per perch, capitalisation rate and market rent used in arriving at fair value would result in a significant increase in fair value, and vice versa. There has been no change to the valuation technique during the year.
Level 1 - Quoted prices in active marketsLevel 2 - Significant observable inputsLevel 3 - Significant unobservable inputs
(d) Information about fair value measurements using significant unobservable inputs (Level 3)Property valuations are inherently subjective as they are made on the basis of assumptions made by the valuer which may not prove to be accurate. For these reasons we have classified the investment property valuations as Level 3 as defined by SLFRS 13.
Group
Description of the property Valuation Land extent Building No. of In thousands of rupees
technique area buildings Fair value Change in fair value
(Sq. ft.) 2022 2021 2022 2021
Company:- Cargills (Ceylon) PLC
Land - Colombo 02 Technique (1) 78.17 Perches 5,146 1 744,230 724,687 19,543 19,350
Commercial property - Jaffna Technique (2) Leasehold 99,164 1 200,703 195,400 4,849 (2,184)
Company:- Millers Limited
Bare land - Nittambuwa Technique (1) 112 Perches - - 151,750 143,800 7,950 8,850
Company:- The Empire Investment Company (Private) Limited
Dematagoda Technique (2) 84.32 Perches 71,956 1 826,280 768,802 32,437 (38,727)
Company:- C T Land Development PLC
Commercial property - Colombo 04
Technique (1) 257.25 Perches 277,514 1 4,246,658 3,967,626 164,544 39,804
Company:- C T Real Estate (Private) Limited
Bare land Piliyandala Technique (1) 114 Perches - - 102,600 102,600 - -
Commercial property - Piliyandala
Technique (2) 154.9 Perches 21,278 2 131,832 128,995 2,837 8,561
Company:- C T Properties Lakeside (Private) Limited
Bare land - Boralesgamuwa Technique (1) 43 Acres 11,400 1 1,200,000 1,200,000 - -
Company:- C T Properties G S (Private) Limited
Bare land - Kotahena Technique (1) 199.8 Perches - - 1,528,500 1,518,500 10,000 20,000
Company:- Frederick North Hotel Company (Private) Limited
Bare land - Boralasgamuwa Technique (2) 2.5 Acres 23,168 4 447,000 426,000 21,000 42,824
Total 9,579,553 9,176,410 263,160 98,478

81 C T HOLDINGS PLCAnnual Report 2021 2022
Company
Description of the property Valuation Land extent Building No. of In thousands of rupees
technique area (Sq. ft.)
buildings Fair value Change in fair value
2022 2021 2022 2021
Land - Kandy Technique (1) 170 Perches 9,650 4 - 609,615 - 17,865
Land - Negombo Technique (1) 91.0 Perches 17,500 1 - 295,150 - 17,850
Commercial property - Bandarawela
Technique (2) 2.8 Acres 30,600 4 552,000 552,000 - (47,240)
Land - Nuwara Eliya Technique (1) 60 Perches 6,500 3 157,700 155,100 2,600 2,647
Total 709,700 1,611,865 2,600 (8,878)
(e) The following table shows the valuation techniques used by Group in measuring level 3 fair values and the significant unobservable inputs used.
Valuation technique Significant unobservable inputs Sensitivity of the input to the fair value
Market comparable method - This method considers the selling price of a similar property within a reasonably recent period of time in determining the fair value of property being revalued. This involves evaluation of recent active market prices of similar assets, making appropriate adjustments for difference in size, nature and location of the property
Construction cost per square foot Rs. 4,400 - Rs. 12,700 Market price per perch. The valuer has used a range of prices for respective lands based on adjusted fair value taking into account other valuation considerations Rs. 250,000 - Rs.18,000,000 per perch.
The estimated fair value wouldincrease/(decrease) if: » cost per square foot was higher / (lower);
or
» market value per perch was higher / (lower)
Income method - The net income generated by the property is used in conjunction with certain factors is used to calculate its fair value.
Contractual rates 70%-95%Capitalization rates 5.4%-7.5%Repairs and insurance 25%-30%Contractual rental Rs. 15,000 - Rs. 9,000,000 per month.
The estimated fair value wouldincrease / (decrease) if: » contractual rentals were higher / (lower);
» occupancy rates were higher/(lower);
» capitalization rate was (higher)/lower;
» repair and insurance was(higher) / lower; or
» market value per perch was higher / (lower)
(f) Income and expenseDuring the year ended 31st March 2022 Rs. 258.6 Mn (2021: 318.0 Mn) rental and ancillary income from investment properties was recognised in the Group profit or loss. Direct operating expenses, including repairs and maintenance, arising from investment property that generated rental income amounted to Rs. 200.03 Mn (2021: Rs. 143.04 Mn). The Group did not incur any direct operating expenses arising from investment properties that did not generate rental income (2021: Nil).

82
Notes to the Financial Statements
C T HOLDINGS PLCAnnual Report 2021 2022
(g) Restrictions and obligationsAs at 31st March 2022, there were no restrictions on the realisability of investment property or the remittance of income and proceeds of disposal (2021: Rs. nil) except for the restriction mentioned as note (i) below. There are no obligations to construct or develop the Group’s residential or development land investment property or has no obligation to complete any construction of any property as at the reporting date.
(i.) Restrictions on realisability of bare land located at BoralesgamuwaSri Lanka Land Reclamation and Development Corporation (SLRDC) has issued an acquisition notice for this land under the Weras Reservoir Project on 29th March 2013. Due to impracticability of estimating the compensation to be received from SLRDC or fair value of the land as at 31st March 2022, the said land is stated at its previous revalued amount in the Financial Statements.
17. Intangible assets
17.1 Reconciliation of carrying amount
Group CompanyIn thousands of rupees Goodwill Trademarks Computer
SoftwareTotal Goodwill Total
Cost As at 1 April 2020 1,323,227 297,226 551,472 2,171,925 688,467 688,467 Additions - - 80,400 80,400 - - As at 31 March 2021 1,323,227 297,226 631,872 2,252,325 688,467 688,467
As at 1 April 2021 1,323,227 297,226 631,872 2,252,325 688,467 688,467 Additions - 5,505 146,643 152,148 - - As at 31 March 2022 1,323,227 302,731 778,515 2,404,473 688,467 688,467
Accumulated amortisation/ impairment lossesAs at 1 April 2020 71,746 169,604 340,544 581,894 - - Charged during the year - 23,142 52,327 75,469 - - As at 31 March 2021 71,746 192,746 392,871 657,363 - -
As at 1 April 2021 71,746 192,746 392,871 657,363 - - Charged during the year - 23,142 82,169 105,311 - - As at 31 March 2022 71,746 215,888 475,040 762,674 - -
Net carrying value As at 31 March 2021 1,251,481 104,480 239,001 1,594,962 688,467 688,467 As at 31 March 2022 1,251,481 86,843 303,475 1,641,799 688,467 688,467

83 C T HOLDINGS PLCAnnual Report 2021 2022
17.2 Impairment loss and subsequent reversal of goodwill
(a) Consolidation goodwillGoodwill on acquisition as at the reporting date has been tested for impairment. For the purposes of impairment testing, goodwill has been allocated to the Group’s CGUs (operating divisions) as follows.
In thousands of rupees Group CompanyAs at 31 March 2022 2021 2022 2021
FMCG 634,760 634,760 - - Corporate 688,467 688,467 688,467 688,467
1,323,227 1,323,227 688,467 688,467
There has been no permanent impairment of intangible assets that require a provision during the year. Recoverable value of goodwill has been estimated based on the expected future cash flows. When testing for impairment for goodwill, the recoverable amount is determined on the basis of value-in-use calculations. These calculations use cash flow projections based on financial budgets which are approved by management and are discounted at an appropriate pre-tax discount rate equivalent to the average treasury bond rate.
The key assumptions used are given below; » Business Growth - long term average growth for each division. The weighted average growth rate used is consistent with the forecast included in industry reports.
» Margin - past performance and budgeted expectations.
» Discount rate - risk free adjusted for the specific risk relating to the industry.
Five years of cash flows were included in the discounted cash flow model. A long-term nominal growth rate range into perpetuity has been determined as 2%-3%- based on management’s internal assessment.
Budgeted EBITDA was based on expectations of future outcomes taking into account past experience, adjusted for anticipated revenue growth. Revenue growth was projected taking into account the average growth levels experienced over the past five years and the estimated sales volume and price growth for the next five years.
The discount rate was based on the weighted average cost of capital (WACC) for the Sector, determined by considering the cost of equity and cost of debt proportionately weighted which ranges between 10%-17.5%.
A reasonably possible change in any of the key assumptions on which the management has based its determination of the CGU’s recoverable amount would not cause the CGU’s carrying amount to exceed its recoverable amount.
(b) Company - Merger goodwillThe Company goodwill relates to the property assets and investments acquired through the merger of Millers PLC with C T Holdings PLC (previously Ceylon Theatres PLC) in the financial year 2007/08. At the reporting date, the market value of the said quoted investments and property assets exceed the book value and the recognized goodwill. Therefore, no impairment was deemed to be necessary to the carrying value of goodwill stated in the Financial Statements.

84
Notes to the Financial Statements
C T HOLDINGS PLCAnnual Report 2021 2022
18. Investments in subsidiaries
18.1 Reconciliation of carrying amount
In thousands of rupees Group Company As at 31 March 2022 2021 2022 2021
Cost As at 1 April - - 2,789,958 2,789,958 Additions - - 922,001 - Disposals - - (1,831,850) - As at 31 March - - 1,880,109 2,789,958
Less : Provision for impairment As at 1 April - - (847,272) (707,752)Impairment recognised - - (51,147) (139,520)Disposals - - 622,987 - As at 31 March - - (275,432) (847,272)
Net carrying amount - - 1,604,677 1,942,686
Impairment of Investments
Ceylon Theatres (Pvt) LimitedThe Investment in Ceylon Theatres (Pvt) Limited was fully impaired as at 31st March 2022 due to continuous losses made by the entity led by adverse economic conditions in the Entertainment Industry. The impairment loss recognized for the year 2021/22 was 51.15 Mn.
18.2 Breakdown of the cost by investment
Name of the investee Principal activity
Group CompanyOwnership interest and voting power
%
Total cost of investment (In thousands of rupees)
Ownership interest and voting power
%
Total cost of investment (In thousands of rupees)
As at 31st March 2022 2021 2022 2021 2022 2021 2022 2021QuotedCargills (Ceylon) PLC R & WD 71.18% 69.84% 1,090,764 168,763 71.18% 69.84% 1,090,764 168,763 C T Land Development PLC Real estate 67.86% 67.86% 513,913 513,913 67.86% 67.86% 513,913 513,913 Kotmale Holdings PLC FMCG 70.83% 69.50% 1,964,833 1,964,833 - - - -
3,569,510 2,647,509 1,604,677 682,676 Un-quotedC T Properties Limited Real estate 84.60% 91.95% 2,488,925 2,488,925 73.61% 73.61% - 1,831,850 Ceylon Theatres (Private) Limited Entertainment 85.54% 85.54% 300,432 300,432 55.00% 55.00% 275,432 275,432 Cargills Quality Foods Limited FMCG 71.18% 69.84% 1,193,453 1,193,453 - - - - Cargills Agrifoods Limited FMCG 71.18% 69.84% 45,630 45,630 - - - - C P C Lanka Limited FMCG 71.18% 69.84% 14,200 14,200 - - - -

85 C T HOLDINGS PLCAnnual Report 2021 2022
Name of the investee Principal activity
Group CompanyOwnership interest and voting power
%
Total cost of investment (In thousands of rupees)
Ownership interest and voting power
%
Total cost of investment (In thousands of rupees)
As at 31st March 2022 2021 2022 2021 2022 2021 2022 2021Cargills Quality Diaries (Private) Limited FMCG 71.18% 69.84% 75,000 75,000 - - - - Cargills Distributors (Private) Limited FMCG 71.18% 69.84% 50,261 50,261 - - - - Cargills Food Processors (Private) Limited Restaurants 71.18% 69.84% 221,500 221,500 - - - - Cargills Food Services (Private) Limited Restaurants 71.18% 69.84% 213,500 213,500 - - - - Millers Limited R & WD 71.18% 69.84% 300,000 300,000 - - - - Cargills Foods Company (Private) Limited R & WD 71.18% 69.84% 1,167,947 1,167,947 - - - - Cargills Quality Confectioneries (Private) Limited FMCG 71.18% 69.84% 1,535,547 1,535,547 - - - - Dawson Office Complex (Private) Limited Real estate 71.18% 69.84% 101 101 - - - - Cargills Frozen Products (Pvt) Limited FMCG 71.18% 69.84% 50,250 50,250 - - - - Cargills Agro Development Company (Pvt) Ltd FMCG 71.18% 69.84% 160,019 160,019 - - - - C T Property Management Company (Private) Limited Real estate 84.60% 91.95% - - - - - - C T Real Estate (Private) Limited Real estate 84.60% 91.95% - - - - - - C T Properties Lakeside (Private) Limited Real estate 84.60% 91.95% - - - - - - C T Properties GS (Pvt) Ltd Real estate 84.60% 91.95% 615,446 615,446 - - - - Kotmale Products Limited FMCG 70.83% 69.50% 185,400 185,400 - - - - Kotmale Milk Foods Limited FMCG 70.83% 69.50% - - - - - - Kotmale Dairy Products (Private) Limited FMCG 70.83% 69.50% 13,030 13,030 - - - - Kotmale Milk Products Limited FMCG 70.83% 69.50% - - - - - - Frederick North Hotel Company Limited Real estate 84.60% 69.84% 311,000 311,000 - - - - The Empire Investments Company (Private) Limited Real estate 84.60% 69.84% 5,680,594 776,000 - - - -Cargills Enterprise Solutions (Private) Limited(Stated Capital Rs.10) FMCG 71.18% 69.84% - - - - - -
14,622,235 9,717,641 275,432 2,107,282 18,191,745 12,365,150 1,880,109 2,789,958

86
Notes to the Financial Statements
C T HOLDINGS PLCAnnual Report 2021 2022
18.2.1 Composition of the GroupInformation about the composition of the Group at the end of the reporting period is as follows:
Number of wholly-owned subsidiaries
Number of non wholly owned subsidiaries
In thousands of rupees 2022 2021 2022 2021
Retail & wholesale distribution - - 2 2 Real estate - - 9 9 FMCG - - 14 14 Restaurants - - 2 2 Entertainment - - 1 1 Intermediay Investment Company - - 1 1
- - 29 29
18.3 Non-controlling interest
18.3.1 Details of non-wholly owned subsidiaries that have material non-controlling interests(a) Summarised financial informationThe summarised financial information below represents amounts before intra-group eliminations.
In thousands of rupees Cargills (Ceylon) PLC C T Land Development PLC
As at 31st March 2022 2021 2022 2021
AssetsCurrent assets 27,178,089 23,123,652 193,081 206,396 Non-current assets 71,265,687 59,468,926 4,819,600 4,755,874 Total assets 98,443,776 82,592,578 5,012,681 4,962,270
LiabilitiesCurrent liabilities 41,001,806 38,945,230 109,295 262,642 Non-current liabilities 28,320,455 20,686,625 909,608 695,535 Equity 29,121,515 22,960,723 3,993,778 4,004,093 Total equity and liabilities 98,443,776 82,592,578 5,012,681 4,962,270
Equity attributable to:Owners of the Company 25,495,243 22,953,849 2,710,178 2,128,841 Non-controlling interests 3,626,272 6,874 1,283,600 1,875,252
29,121,515 22,960,723 3,993,778 4,004,093

87 C T HOLDINGS PLCAnnual Report 2021 2022
In thousands of rupees Cargills (Ceylon) PLC C T Land Development PLC
For the year ended 31 March 2022 2021 2022 2021
Revenue (Including other income) 138,858,982 114,649,861 330,550 392,861 Expenses (134,320,262) (111,166,222) (347,514) (265,123)Profit for the year 4,538,720 3,483,639 (16,964) 127,738 Other comprehensive income / (loss) 75,587 2,477,636 6,649 (4,395)Total comprehensive income 4,614,307 5,961,275 (10,315) 123,343
Profit for the year attributable to:Owners of the Company 3,230,661 2,434,019 (11,512) 86,734 Non-controlling interests 1,308,059 1,049,620 (5,452) 41,004 Profit for the year 4,538,720 3,483,639 (16,964) 127,738
Other comprehensive income attributable to :Owners of the Company 53,803 1,731,124 4,512 (2,984)Non-controlling interests 21,784 746,512 2,137 (1,411)Other comprehensive income / (loss) 75,587 2,477,636 6,649 (4,395)
Total comprehensive income attributable to:Owners of the Company 3,284,464 4,165,143 (7,000) 83,750 Non-controlling interests 1,329,843 1,796,132 (3,315) 39,593 Total comprehensive income for the year 4,614,307 5,961,275 (10,315) 123,343
Dividends paid to non-controlling interests 466,741 395,304 - 19,561
Details of net cash inflows / (outflows)Net cash inflow from operating activities 14,166,421 11,630,537 39,865 64,322 Net cash outflow from investing activities (11,437,225) (10,010,054) 7,680 124,464 Net cash inflow / (outflow) from financing activities (1,212,727) 752,879 (3,600) (65,113)Net cash inflow / (outflow) 1,516,469 2,373,362 43,945 123,673 Proportion of ownership interest and voting power held by non-controlling-interest 28.82% 30.16% 32.14% 32.14%
18.3.2 Acquisition of Non-controlling interestDuring the Year the Group acquired an additional 1.4% interest in Cargills (Ceylon) PLC, increasing its ownership from 69.8% to 71.2%. The carrying amount of Cargills (Ceylon) PLC’s net assets in the Group’s consolidated financial statements on the date of the acquisition was 23 Bn.
Carrying Amount of NCI Aquired 63,997Consideration paid to NCI 922,001A decrease in equity attributable to owners of the Company (858,004)

88
Notes to the Financial Statements
C T HOLDINGS PLCAnnual Report 2021 2022
The decrease in equity attributable to owners of the Company comprised:
- an decrease in the retained earnings of 895.8 million ; and- an increase in the revaluation reserve of 38 million ; and- an decrease in the fair Value reserve of 202 thousand ; and
18.4 Common control transactions
C T Holdings PLC (hereinafter referred to as CTH) and subsidiaries presently have operations primarily in the following sectors
» Retail & Wholesale Distribution
» FMCG
» Restaurants
» Real Estate
» Entertainment
Significant growth and expansion in these sectors has necessitated a reorganisation of the sectors and their sub-sectors into separate growth driven units employing focused management and prudent resource allocation. Accordingly the following common control transactions have taken place during the year 31st March 2022 based on the board approval dated 25th October 2021;
18.4.1 Cargills Ceylon PLC purchased C T Land Development PLC investment in C T Properties Limited for Rs. 75 Mn and thereafter disposed its total investment in Associate (C T Properties Limited) to The Empire Investments Company (Private) Limited under a common control transaction amounting to Rs. 434 Mn (Group - Rs. 429 Mn) resulting in a gain of Rs. 12mn (Group Rs. 5 Mn)
18.4.2 The Empire Investments Company (Private) Limited acquired C T Properties Limited shares from Cargills Ceylon PLC and C T Holdings PLC.
18.4.3 The Empire Investments Company (Private) Limited issued new additional shares amounting to Rs. 4,905 Mn which was invested by Cargills Ceylon PLC and C T Holdings PLC amounting to Rs. 2,205 Mn and Rs. 2,700 Mn resulting in Cargills Ceylon PLC shareholding in The Empire Investments Company (Private) Limited falling to 53.43% from 100% which did not result in a loss of control.
18.4.4 Cargills Ceylon PLC disposed its investment in Subsidiary (Frederick North Hotel Company Limited) to The Empire Investments Company (Private) Limited for Rs. 428 Mn resulting in a gain of Rs. 117 Mn.
18.4.5 As a result of Common control transactions, Total investment in subsidiaries and associates amounted to Rs. 1,491.29 Mn at the Company level.

89 C T HOLDINGS PLCAnnual Report 2021 2022
19. Investments in equity accounted investees
19.1 Breakdown of investments in equity accounted investees
Name of the investee
As at 31st MarchIn thousands of rupees
Principalactivity
Group Company
Ownership interest and voting power
%
Total cost of investment (in thousands of rupees)
Ownership interest and voting power
%
Total cost of investment (in thousands of rupees)
2022 2021 2022 2021 2022 2021 2022 2021
C T CLSA Holdings Limited
Financial Services 25.81% 25.81% 184,424 159,314 25.81% 25.81% 33,342 33,342
Cinema Entertainments (Private) Limited Entertainment 30.92% 30.92% 7,521 7,823 16.67% 16.67% 1,375 1,375
Cargills Bank Limited Banking 53.17% 53.17% 5,463,511 5,679,548 25.29% 25.29% 2,871,452 2,871,452
The Empire Investments Company (Private) Limited Real estate - - - - 46.57% - 2,699,781 -
5,655,456 5,846,685 5,605,950 2,906,169
19.2 Summarised financial information as included in their own financial statements of equity accounted investees.
For the year ended 31st MarchIn thousands of rupees.
C T CLSA Holdings Limited
Cinema Entertainments (Private) Limited
Cargills Bank Limited Total
2022 2021 2022 2021 2022 2021 2022 2021
Profit / (loss) and other comprehensive income
Revenue 710,541 408,318 2,153 1,070 2,312,198 1,939,758 3,024,892 2,349,146
Other income 36,980 40,045 81 1,060 146,309 73,180 183,370 114,285
Total expenses (527,608) (327,432) (3,210) (12,512) (2,735,634) (2,756,885) (3,266,452) (3,096,829)
Profit / (loss) for the year 219,913 120,931 (976) (10,382) (277,127) (743,947) (58,190) (633,398)
Other comprehensive income / (loss) for the year (2,699) (6,328) - - (129,211) 45,784 (131,910) 39,456
Total comprehensive income / (loss) for the year 217,214 114,603 (976) (10,382) (406,338) (698,163) (190,100) (593,942)
Transactions with owners
Dividend paid (119,780) (96,154) - - - - (119,780) (96,154)
Balance sheet
Total assets 1,986,712 1,699,326 44,867 37,051 55,767,061 46,532,534 57,798,640 48,268,911
Total liabilities (1,272,255) (1,082,067) (20,541) (11,750) (46,442,200) (36,798,232) (47,734,996) (37,892,049)
Net assets 714,457 617,259 24,326 25,301 9,324,861 9,734,302 10,063,644 10,376,862
Percentage of ownership interest as at 31st March 25.81% 25.81% 30.92% 30.92% 53.17% 53.17%

90
Notes to the Financial Statements
C T HOLDINGS PLCAnnual Report 2021 2022
For the year ended 31st MarchIn thousands of rupees.
C T CLSA Holdings Limited
Cinema Entertainments (Private) Limited
Cargills Bank Limited Total
2022 2021 2022 2021 2022 2021 2022 2021
Reconciliation of carrying amount of interests in associates
Group’s of share of net assets of associates 184,424 159,314 7,521 7,823 4,957,713 5,173,750 5,149,658 5,340,887
Goodwill - - - - 505,798 505,798 505,798 505,798
Carrying amount of investment in associates 184,424 159,314 7,521 7,823 5,463,511 5,679,548 5,655,456 5,846,685
Share of profit / (loss) 56,767 31,212 (302) (3,210) (147,339) (395,531) (90,874) (367,529)
Share of other comprehensive income
Items that will not be re-classified subsequently to profit or loss: - - - - - - -
Items that may be re-classified subsequently to profit or loss: (697) (1,633) - - (68,697) 24,342 (69,394) 22,709
Share of other comprehensive income (697) (1,633) - - (68,697) 24,342 (69,394) 22,709
19.3 The summarised financial information presented above represents amounts shown in the associate’s Financial Statements prepared in accordance with Sri Lanka Financial Reporting Standards (SLFRS). All of the above associates are accounted for using the equity method in these consolidated Financial Statements.
19.4 None of the Group equity accounted investees are publicly listed entities and consequentially do not have published price quotations.
19.5 The financial year end date of Cargills Bank Limited is 31st December due to the industry requirement and Financial Statements for the year ended 31st December 2021 have been used for the purposes of applying the equity method. Further, there are no significant transactions between the dates of the financial statements of the said companies and 31st March 2022 which require any adjustments.
19.6 Restriction on voting power
Cargills Bank LimitedThe Group’s voting rights in Cargills Bank Ltd is below 50% as per the investment conditions imposed by the regulator. As such the Group does not have controlling power over the investee and accordingly the investment in Cargills Bank Limited is equity accounted.

91 C T HOLDINGS PLCAnnual Report 2021 2022
20. Other financial assets
In thousands of rupees Group Company As at 31 March 2022 2021 2022 2021
Non CurrentEquity Investments (Note 20.1) 192,801 527,685 65,163 482,425 Debt investments at Fair Value Through Profit or Loss (Note 20.2 ) 1,500,000 - - -
1,692,801 527,685 65,163 482,425
CurrentOther non-equity investments (Note 20.3) 1,016,556 1,018,661 - 63,865
1,016,556 1,018,661 - 63,865
20.1 Equity Investments - “Non-current”Group Company
Shares / Units Carrying Value Shares / Units Carrying Value(Numbers) (In thousands of Rs.) (Numbers) (In thousands of Rs.)2022 2021 2022 2021 2022 2021 2022 2021
Investments in quoted companiesCeylon Printers PLC 118,830 118,830 6,179 6,179 118,830 118,830 6,179 6,179 Office Equipment PLC 163,700 163,700 8,905 8,905 163,700 163,700 8,905 8,905 Paragon (Ceylon) PLC 213,060 213,060 8,949 8,948 213,060 213,060 8,949 8,948 Overseas Realty (Ceylon) PLC 4,500 4,500 70 69 4,500 4,500 70 69 Lanka IOC PLC 525,000 525,000 16,170 11,978 325,000 325,000 10,010 6,175 The HDFC Bank of Sri Lanka 70,000 70,000 2,184 2,338 70,000 70,000 2,184 2,338 Lanka Walltiles PLC - 25,776 - 24,294 - 25,776 - 24,294 Sierra Cables PLC 49,600 49,600 337 1,049 - - - - Aitken Spence PLC 267,500 267,500 19,714 12,049 - - - -
62,508 75,809 36,297 56,908
Investments in un-quoted companiesLanka Film Distributors Company (Private) Limited 100 100 100 100 100 100 100 100
Other investmentsComtrust Gilt Edged Fund (Unit trust) 10,580,268 42,721,486 130,193 451,776 2,621,116 40,519,339 28,766 425,417
192,801 527,685 65,163 482,425
20.1.1 The Group’s shareholdings in the ordinary share capital of Office Equipment PLC, Ceylon Printers PLC and Paragon(Ceylon) PLC range between 19.64% to 21.30%. However, these companies have not been treated as equity accounted investees since the Group exercises no significant influence in the operations of the companies concerned.

92
Notes to the Financial Statements
C T HOLDINGS PLCAnnual Report 2021 2022
20.1.2 The Share Price of the Company’s Investment in Comtrust Gilt Edged Fund (Unit Trust) as at 31st March 2022 is Rs. 10.97 (2021-Rs.10.50)
The Share of the Group’s Investment in Comtrust Gilt Edged Fund (Unit Trust) is as Follows;CT Holdings PLC – Rs.10.97 (2021-Rs.10.50)CT Land Development PLC - Rs.12.74 (2021-Rs. 11.97)
20.1.3 The Group designated the above equity investments as equity investments at FVOCI because these equity investments represent investments that the Group intends to hold for the long term.
The market value of quoted equity investments of Group as at 31 March 2022, as quoted by the Colombo Stock Exchange amounted to Rs. 62.5 Mn. (2021 - Rs. 75.8 Mn.)
During the year the investment in Lanka Walltiles PLC was disposed with a gain on disposal amounting to 4.7 Mn being recognised in Other Comprehensive Income.
Dividend Income recognised on quoted equity investments is as follows:In thousands of rupees Group Companyas at 31st March 2022 2021 2022 2021
Quoted equity investmentsLanka IOC PLC 446 394 276 244The HDFC Bank of Sri Lanka 18 - 18 -Lanka Walltiles PLC - 8,375 - 8,375Sierra Cables PLC - 4 - -Aitken Spence PLC 268 334 - -
732 9,107 294 8,619
20.2 Debt investments measured at Fair Value Through Profit or Loss (FVTPL) - “Non current”
In thousands of rupees Group Company As at 31 March 2022 2021 2022 2021
Debt investments measured at Fair Value Through Profit or Loss (FVTPL) 1,500,000 - - - 1,500,000 - - -
The Subsidiary Cargills (Ceylon) PLC Invested in Fifteen Million (15,000,000) Basel III Additional Tier 1 Compliant Rated Unlisted Unsecured Subordinated Perpetual Convertible Debentures issued by Cargills Bank Limited, with a conversion at the option of the debenture holder and Non-Viability Conversion upon the occurrence of a trigger event at the par value of Sri Lankan Rupees One Hundred (LKR 100/-). The interest rate is based on the Weighted Average Twelve-Month Net Treasury Bill Rate + 2% p.a. The debenture holder has the right to convert the debenture to ordinary shares of the Bank during the conversion period.
The interest is cumulative and will be paid only if the Bank has distributable profits. The Bank has discretion at all times to cancel the interest payments. However the agreement does not stipulate interest, on interest deferred/cancelled and therefore as the investment does not meet the SPPI criteria, it has been classified as FVTPL.

93 C T HOLDINGS PLCAnnual Report 2021 2022
20.3 Other Non Equity Investments - Current
In thousands of rupees Group Company As at 31 March 2022 2021 2022 2021
Call deposits / fixed deposit 1,016,556 1,018,661 - 63,865 1,016,556 1,018,661 - 63,865
21. Inventories
In thousands of rupees Group Company As at 31st March 2022 2021 2022 2021
Raw material and consumables 2,908,081 1,798,132 - - Work-in-progress 42,756 46,304 - - Finished goods 11,585,999 9,919,211 - - Goods in transit 276,692 53,381 - - Food and beverages - restaurant operations 127,236 76,792 - -
14,940,764 11,893,820 - - Provision for obsolete and slow moving items (131,127) (114,203) - -
14,809,637 11,779,617 - -
21.1 Movement in the provision for obolete and slow moving items
In thousands of rupees Group CompanyAs at 31st March 2022 2021 2022 2021
As at 1st April 114,203 84,721 - -Provisions recognised 16,924 29,482 - -As at 31st March 131,127 114,203 - -
22. Trade and other receivables
In thousands of rupees Group Company As at 31st March 2022 2021 2022 2021
Trade receivables (other than from related companies) 3,997,784 3,287,580 3 2 Amounts due form related companies (Note 31.3) 277,213 303,831 28,257 21,722 Current tax assets 451,015 572,811 3,366 (657)Advances and other receivables 919,756 642,081 44,217 27,413 Loans given to employees (Note 22.1) 139,600 114,974 - - Prepayments and accrued income 2,341,468 1,937,056 - -
8,126,836 6,858,333 75,843 48,480 Provision for impaired / doubtful debts (Note 22.3) (292,275) (266,589) - -
7,834,561 6,591,744 75,843 48,480

94
Notes to the Financial Statements
C T HOLDINGS PLCAnnual Report 2021 2022
22.1 Loans given to employees
In thousands of rupees Group Company As at 31st March 2022 2021 2022 2021
As at 1st April 114,974 103,758 - - Loans granted during the year 44,956 26,846 - - Recoveries (20,330) (15,630) - - As at 31st March 139,600 114,974 - -
22.2 Credit and market risks, and impairment losses
Information about the Group’s exposure to credit, and impairment losses for trade and other receivables, excluding construction contracts in progress, is included in Note 30.5.
22.3 Movement in the provision for impaired / doubtful debts
In thousands of rupees Group Company As at 31st March 2022 2021 2022 2021
As at 1st April 266,589 232,691 - - Impairment losses recognised 25,686 33,898 - - As at 31st March 292,275 266,589 - -
23. Cash and cash equivalents
In thousands of rupees Group Company As at 31st March 2022 2021 2022 2021
Cash and bank balances 3,197,700 2,701,810 269 23,590 Short term deposits with banks (Note 23.1) 356,518 453,383 8,675 121,176 Cash and cash equivalents 3,554,218 3,155,193 8,944 144,766 Bank overdraft (Note 26) (1,769,714) (2,794,707) (24,112) (267)Cash and cash equivalents in the statement of cash flows 1,784,504 360,486 (15,168) 144,499
23.1 Short term deposits with bank
In thousands of rupees Group Company As at 31st March 2022 2021 2022 2021
As at 31st MarchFixed & other deposits 356,518 453,383 8,675 121,176
356,518 453,383 8,675 121,176

95 C T HOLDINGS PLCAnnual Report 2021 2022
24. Stated capital
Group Company As at 31st March 2022 2021 2022 2021
Issued and fully paid shares (In thousand rupees)Issued ordinary shares as at 1st April 6,489,758 6,489,758 6,489,758 6,489,758 Issued for the year - - - - Issued ordinary shares as at 31st March 6,489,758 6,489,758 6,489,758 6,489,758
No. of shares in issue (In thousands)Issued ordinary shares as at 1st April 201,407 201,407 201,407 201,407 Issued during the year - - - - Issued ordinary shares as at 31st March 201,407 201,407 201,407 201,407
Fully paid ordinary shares carry one vote per share and carry a right to dividends. All ordinary shares rank equally with regard to the Company’s residual assets.
25. Reserves
In thousands of rupees Group Company As at 31st March 2022 2021 2022 2021
Revaluation reserve (Note 25.1) 3,089,234 3,141,595 - - Fair value reserve (Note 25.2) 47,294 49,670 45,747 53,140
3,136,528 3,191,265 45,747 53,140
25.1 Revaluation reserve
The revaluation reserve arises on the revaluation of land as described in Note 13.2 and is reflected net of the amounts capitalised through a share issue. Distributions from the properties revaluation reserve can be made where they are in accordance with the requirements of the Company’s articles and any other statutes.
25.2 Fair value reserve
The fair value reserve represents the cumulative net change in the fair value of equity securities designated at Fair Value through Other Comprehensive Income (FVOCI); and the cumulative net change in fair value of debt securities at FVOCI until the assets are derecognised or reclassified. This amount is reduced by the amount of loss allowance.

96
Notes to the Financial Statements
C T HOLDINGS PLCAnnual Report 2021 2022
26. Interest bearing loans and borrowings
In thousands of rupees Group Company As at 31st March 2022 2021 2022 2021
Non-current liabilitiesLoans from banks 8,477,543 2,885,731 800,594 - Finance lease liabilities (Note 26.1) 4,290 - - - Lease liabilities (Note 14.2) 18,619,695 15,484,073 186 189
27,101,528 18,369,804 800,780 189
Current liabilitiesLoans from banks 10,846,897 15,447,113 1,489 - Finance lease liabilities (Note 26.1) 3,606 3,606 - - Bank overdraft 1,769,714 2,794,707 24,112 267 Lease liabilities (Note 14.2) 1,139,857 1,123,546 18 -
13,760,074 19,368,972 25,619 267
26.1 Finance lease liabilities
In thousands of rupees Group Company As at 31st March 2022 2021 2022 2021
As at 1st April 3,606 11,836 - - Obtained during the year 6,567 2,486 - - Repayments during the year (2,277) (10,716) - - As at 31st March 7,896 3,606 - - Finance charges allocated to future periods - - - - Net liability 7,896 3,606 - -
Current portion of finance lease liabilities 3,606 3,606 - - Non-current portion of finance lease liabilities 4,290 - - - Net liability 7,896 3,606 - -

97 C T HOLDINGS PLCAnnual Report 2021 2022
26.2 Information about the Group’s exposure to risks is covered in Note 30.4.
26.3 Terms and repayment schedule Terms and conditions of outstanding loans are as follows :-
Institution and facility Principal amount
Amount Outstanding
Repayment terms & interest rate Security offered
Rs. ‘000 Rs. ‘000
Cargills (Ceylon) PLC
Bank overdrafts
Commercial Bank of Ceylon PLC
200,000 53,071 On demand, based on monthly AWPLR+1.0%
Corporate guarantee from C T Holdings PLC
Deutsche Bank 45,000 42,593 On demand, based on the prevailing market rates
Clean basis
MCB Bank Limited 500,000 - On demand, based on monthly AWPLR
Clean basis
Nations Trust Bank PLC 200,000 - On demand, based on weekly AWPLR+1.0%
Clean basis
Sampath Bank PLC 100,000 - On demand, based on monthly AWPLR+1.0%
Clean basis
95,664
Short term loans
Bank of Ceylon 1,500,000 - 1-12 months, based on the prevailing market rates
Clean basis
Commercial Bank of Ceylon PLC
1,500,000 - 1-12 months, based on the prevailing market rates
Corporate guarantee for Rs.50 Mn. from C T Holdings PLC
Hatton National Bank PLC 250,000 - 1-4 months, based on Money Market Rates (AWPLR weekly review)
Clean basis
Nations Trust Bank PLC 2,800,000 1,205,000 1-3 months, based on the prevailing market rates
Clean basis
Sampath Bank PLC 1,800,000 - 1-6 months, based on the prevailing market rates
Clean basis
1,205,000
Long term loans
Commercial Bank of Ceylon PLC
800,000 519,451 Interest to be serviced monthly and capital to be repaid in 3 bi-annual installments
Clean basis

98
Notes to the Financial Statements
C T HOLDINGS PLCAnnual Report 2021 2022
Institution and facility Principal amount
Amount Outstanding
Repayment terms & interest rate Security offered
Rs. ‘000 Rs. ‘000
Cargills (Ceylon) PLC (Contd.)
Hatton National Bank PLC 7,000,000 5,822,697 Interest to be serviced monthly and capital to be repaid in 20 quarterly installments of 400.0 Mn. No grace period for Capital repayment
Clean basis
6,342,148
7,642,812
Cargills Foods Company (Private) Limited
Bank overdrafts
Bank of Ceylon 115,000 - On demand, based on monthly AWPLR+0.5%
Clean basis
Cargills Bank Limited - 432,695 On demand, based on the prevailing market rates
Fully secured against cash
Commercial Bank of Ceylon PLC
200,000 165,474 On demand, based on monthly AWPLR+1.0%
Corporate guarantee from Cargills (Ceylon) PLC
Deutsche Bank 500,000 397,425 On demand, based on the prevailing market rates
Clean basis
Standard Chartered Bank 10,000 16 On demand, based on the prevailing market rates
Clean basis
995,610
Short term loans
Bank of Ceylon 500,000 - 1-12 months, based on the prevailing market rates
Clean basis
Commercial Bank of Ceylon PLC
2,800,000 2,505,000 1-12 months, based on the prevailing market rates
Corporate guarantee of Rs.250.0 Mn. from Cargills (Ceylon) PLC
Deutsche Bank 700,000 700,000 1-3 months, based on the prevailing market rates
Clean basis
Hatton National Bank PLC 3,000,000 - 1-4 months, based on Money Market Rates (AWPLR weekly review)
Clean basis
Standard Chartered Bank 2,590,000 500,000 1-4 months, based on the prevailing market rates
Clean basis
Union Bank PLC 300,000 - 1-4 months, based on monthly AWPLR+1.00%
Clean basis
3,705,000
26.3 Terms and repayment schedule Terms and conditions of outstanding loans are as follows :- (Contd.)

99 C T HOLDINGS PLCAnnual Report 2021 2022
Institution and facility Principal amount
Amount Outstanding
Repayment terms & interest rate Security offered
Rs. ‘000 Rs. ‘000
Cargills Foods Company (Private) Limited (Contd.)
Long term loans
Commercial Bank of Ceylon PLC
3,000,000 2,336,131 Interest to be serviced monthly and capital to be repaid in 3 bi-annual installments
Clean basis
Hatton National Bank PLC 1,000,000 852,701 Interest to be serviced monthly and capital to be repaid in 20 quarterly installments of 50.0 Mn. No grace period for capital repayment
Clean basis
Standard Chartered Bank 1,250,000 1,041,865 Interest to be serviced quarterly and capital to be repaid in 12 quarterly installments
Clean basis
4,230,697
8,931,307
Cargills Agrifoods Limited
Bank overdraft
Commercial Bank of Ceylon PLC
150,000 4,724 On demand, based on monthly AWPLR+1.0%
Corporate guarantee for Rs.155 Mn. from Cargills (Ceylon) PLC
4,724
Cargills Food Processors (Private) Limited
Bank overdrafts
Cargills Bank Limited - 65,173 On demand, based on the prevailing market rates
Fully secured against cash
Commercial Bank of Ceylon PLC
100,000 1,187 On demand, based on monthly AWPLR +1.0%
Corporate guarantee for Rs.50 Mn. from Cargills (Ceylon) PLC
Deutsche Bank 100,000 29,752 On demand, based on the prevailing market rates
Clean basis
96,112
Short term loan
Commercial Bank of Ceylon PLC
250,000 - 1-12 months, based on the prevailing market rates
Corporate guarantee from Cargills (Ceylon) PLC
-
96,112
26.3 Terms and repayment schedule Terms and conditions of outstanding loans are as follows :- (Contd.)

100
Notes to the Financial Statements
C T HOLDINGS PLCAnnual Report 2021 2022
Institution and facility Principal amount
Amount Outstanding
Repayment terms & interest rate Security offered
Rs. ‘000 Rs. ‘000
Cargills Food Services (Private) Limited
Bank overdrafts
Commercial Bank of Ceylon PLC
- 6,446 On demand, based on the prevailing market rates
Clean basis
Deutsche Bank 5,000 - On demand, based on the prevailing market rates
Clean basis
6,446
Long term loan
Hatton National Bank PLC 11,700 2,925 To be repaid over a period of 02 years in 24 equal monthly installments
Clean basis
2,925
9,371
Cargills Quality Confectionaries (Private) Limited
Bank Overdrafts
Cargills Bank Limited - 9,985 On demand, based on the prevailing market rates
Fully secured against cash
Commercial Bank of Ceylon PLC
50,000 21,464 On demand, based on monthly AWPLR +1.0%
Corporate guarantee for Rs.150 Mn. from Cargills (Ceylon) PLC
31,449
Cargills Quality Confectionaries (Private) Limited (Contd.)
Short term loans
Commercial Bank of Ceylon PLC
50,000 50,000 1-12 months, based on the prevailing market rates
Clean basis
Hatton National Bank PLC 200,000 - 1-4 months, based on Money Market Rates (AWPLR weekly review)
Corporate guarantee for Rs. 200 Mn. from Cargills (Ceylon) PLC
50,000
81,449
26.3 Terms and repayment schedule Terms and conditions of outstanding loans are as follows :- (Contd.)

101 C T HOLDINGS PLCAnnual Report 2021 2022
Institution and facility Principal amount
Amount Outstanding
Repayment terms & interest rate Security offered
Rs. ‘000 Rs. ‘000
Cargills Quality Dairies (Private) Limited
Bank overdrafts
Commercial Bank of Ceylon PLC
50,000 - On demand, based on monthly AWPLR +1.0%
Corporate guarantee for Rs.70 Mn. from Cargills (Ceylon) PLC
Deutsche Bank 100,000 98,292 On demand, based on the prevailing market rates
Clean basis
98,292
Short term loans
Commercial Bank of Ceylon PLC
1,450,000 380,000 1-12 months, based on the prevailing market rates
Clean basis
Hatton National Bank PLC 2,500,000 - 1-4 months, based on Money Market Rates (AWPLR weekly review)
Clean basis
Standard Chartered Bank 1,150,000 630,000 1-12 months, based on the prevailing market rates
Clean basis
1,010,000
Long term loan
Hatton National Bank PLC 1,000,000 853,252 Interest to be serviced monthly and capital to be repaid in 20 quarterly installments of 50.0 Mn. No grace period for Capital repayment
Clean basis
853,252
1,961,544
Cargills Quality Foods Limited
Bank overdrafts
Commercial Bank of Ceylon PLC
50,000 - On demand, based on monthly AWPLR +1.0%
Corporate guarantee for Rs. 125 Mn. from Cargills (Ceylon) PLC
Deutsche Bank 350,000 347,928 On demand, based on the prevailing market rates
Clean basis
347,928
26.3 Terms and repayment schedule Terms and conditions of outstanding loans are as follows :- (Contd.)

102
Notes to the Financial Statements
C T HOLDINGS PLCAnnual Report 2021 2022
Institution and facility Principal amount
Amount Outstanding
Repayment terms & interest rate Security offered
Rs. ‘000 Rs. ‘000
Cargills Quality Foods Limited (Contd.)
Short term loans
Commercial Bank of Ceylon PLC
100,000 70,000 1-12 months, based on the prevailing market rates
Corporate guarantee from Cargills (Ceylon) PLC
Hatton National Bank PLC 1,000,000 - 1-4 months, based on Money Market Rates (AWPLR weekly review)
Clean basis
Standard Chartered Bank 750,000 70,000 1-12 months, based on the prevailing market rates
Clean basis
140,000
487,928
Millers Limited
Bank overdrafts
Commercial Bank of Ceylon PLC
50,000 - On demand, based on monthly AWPLR +1.0%
Corporate Guarantee from Cargills (Ceylon) PLC
Cargills Bank Limited - 2,430 On demand, based on the prevailing market rates
Fully secured against cash
Deutsche Bank 200,000 23,395 On demand, based on the prevailing market rates
Clean basis
25,825
Millers Limited (Contd.)
Short term loans
Commercial Bank of Ceylon PLC
150,000 - 1-12 months, based on the prevailing market rates
Corporate Guarantee for Rs. 215 Mn. from Cargills (Ceylon) PLC
Hatton National Bank PLC 200,000 - 1-4 months, based on Money Market Rates (AWPLR weekly review)
Corporate Guarantee for Rs. 335 Mn. from Cargills (Ceylon) PLC
Standard Chartered Bank 250,000 - 1-3 months, based on the prevailing market rates
Corporate Guarantee for Rs. 250 Mn. from Cargills (Ceylon) PLC
-
25,825
26.3 Terms and repayment schedule Terms and conditions of outstanding loans are as follows :- (Contd.)

103 C T HOLDINGS PLCAnnual Report 2021 2022
Institution and facility Principal amount
Amount Outstanding
Repayment terms & interest rate Security offered
Rs. ‘000 Rs. ‘000
Cargills Agro Development Company (Private) Limited
Short term loan
Hatton National Bank PLC 100,000 76,000 1-6 months, based on weekly AWPLR+0.5%
Clean basis
76,000
Long term loan
Hatton National Bank PLC 9,529 3,561 To be repaid over a period of 02 years in 23 equal monthly installments
Clean basis
3,561
79,561
Kotmale Dairy Products (Private) Limited
Bank overdraft
Bank of Ceylon 10,000 - On demand, based on the prevailing market rates
Corporate guarantee from Kotmale Holdings PLC. Mortgage over stocks and book debtors
-
Import Loan facility / Series of Loan on Import
Bank of Ceylon 40,000 - Based on the prevailing market rates Corporate guarantee from Kotmale Holdings PLC. Mortgage over stocks and book debtors
Kotmale Dairy Products (Private) Limited (Contd.)
Short term loans
Hatton National Bank PLC 1,000,000 - 1-4 months, based on Money Market Rates (AWPLR weekly review)
Clean basis
Commercial Bank of Ceylon PLC
685,000 685,000 1-12 months, based on the prevailing market rates
Letter of Comfort obtained from Cargills Quality Dairies (Private) Limited
685,000
685,000
26.3 Terms and repayment schedule Terms and conditions of outstanding loans are as follows :- (Contd.)

104
Notes to the Financial Statements
C T HOLDINGS PLCAnnual Report 2021 2022
Institution and facility Principal amount
Amount Outstanding
Repayment terms & interest rate Security offered
Rs. ‘000 Rs. ‘000
Kotmale Milk Products Limited
Bank overdraft
Pan Asia Bank Corporation Limited
5,000 - On demand, based on the prevailing market rates
Corporate guarantee from Kotmale Holdings PLC
-
Import Loan facility
Pan Asia Bank Corporation Limited
20,000 - Based on the prevailing market rates Corporate guarantee from Kotmale Holdings PLC
-
Ceylon Theatres (Pvt) Ltd
Bank overdraft
Commercial Bank of Ceylon PLC
62,000 32,559 Payable on demand (AWPLR + 1.0%)
Coporate Guarantees of Rs 25 Mn each from CT Holdings PLC and CT Land Development PLC
32,559
Short term loans
Commercial Bank of Ceylon PLC
52,000 19,331 59 equal monthly Installments of Rs 833,400.00 and final installment of Rs 829,400.00 (AWPLR + 2%)
Coporate Guarantee for Rs.50Mn. from CT Holdings PLC
Commercial Bank of Ceylon PLC
10,000 1,333 Covid 19 refinance- 4%. Capital repayments from March 21 (03 mnt grace period from Dec 21)
Coporate Guarantee for Rs.25Mn. from CT Land Development PLC
20,664
53,223
CT Land Development PLC
Bank overdraft
Commercial Bank of Ceylon PLC
- 10,993 Payable on demand (AWPLR + 1.0%)
Negative pledge over the property at Majestic City , No.10, Station Road, Colombo 4.
10,993
26.3 Terms and repayment schedule Terms and conditions of outstanding loans are as follows :- (Contd.)

105 C T HOLDINGS PLCAnnual Report 2021 2022
Institution and facility Principal amount
Amount Outstanding
Repayment terms & interest rate Security offered
Rs. ‘000 Rs. ‘000
CT Land Development PLC (Contd.)
Long term loans
Commercial Bank of Ceylon PLC
14,500 1,812 23 equal Monthly Instalments of Rs 604,200/- each and a final installement of Rs 603,400/- (4.0% Interest Per Annum)
General Terms and conditions of Term Loans
Commercial Bank of Ceylon PLC
160,000 157,038 53 equal Monthly installements of Rs. 2,962,000/- each and a final installement of Rs. 3,014,000/- (8.25% Interest Per Annum)
General Terms and conditions of Term Loans
Commercial Bank of Ceylon PLC
40,000 39,260 53 equal Monthly installements of Rs. 740,000/- each and a final installement of Rs. 780,000/- (8% Interest Per Annum)
General Terms and conditions of Term Loans
198,110
209,103
C T Holdings PLC
Bank overdraft
Cargills Bank Limited - 24,112 Payable on demand. Based on the prevailing market rates
No Security Provided
24,112
Long term loan
Hatton National Bank PLC 1,000,000 802,083 To be repaid 20 equal quarterly installment of Rs 50 Mn each. Interest to be serviced monthly.
Clean basis
802,083
826,195
Total
Bank overdraft 1,769,714
Short term and long term loans
19,324,440
21,094,154

106
Notes to the Financial Statements
C T HOLDINGS PLCAnnual Report 2021 2022
27. Employee benefits
27.1 Reconciliation of carrying amount
In thousands of rupees Group Company As at 31st March 2022 2021 2022 2021
Balance as at 1st April 1,624,204 1,316,770 34,596 31,128 Transfer 705 - - - Current service cost 131,632 143,539 1,501 1,477 Interest cost 129,320 138,085 2,352 3,114 Past service cost (12,056) - (1,566) - Benefits paid (67,682) (58,214) - - Actuarial (gain)/ loss (167,470) 84,024 10 (1,123)Balance as at 31st March 1,638,653 1,624,204 36,893 34,596
(a) Amounts recognised in profit or lossCurrent service cost 131,632 143,539 1,501 1,477 Interest cost 129,320 138,085 2,352 3,114 Past service cost (12,056) - (1,566) -
248,896 281,624 2,287 4,591
During 2021/22, the pension arrangements were adjusted to reflect new legal requirements in that country regarding the retirement age. As a result of the plan amendment, the Group & Company’s defined benefit obligation decreased by Rs. 12.056 Mn and Rs. 1.566 Mn respectively. A corresponding past service credit was recognized in profit or loss during 2021/22.
27.2 Actuaries
The Group engaged the actuaries, Messrs. Actuarial and Management Consultants (Private) Limited to carry out the actuarial valuation of different companies within the Group.
27.3 Actuarial assumptions & sensitivity analysis
(a) Actuarial assumptionsThe following were the principal actuarial assumptions at the reporting date:
In thousands of rupees Group Company As at 31st March 2022 2021 2022 2021
Discount rate 15% 8% 15% 6.8%Future salary growth rate 12.5% - 14% 5% -10% 14% 7.5%Staff turover rate 1%-20% 1%-15% 20% 11%
In addition to the above, demographic assumptions such as mortality, withdrawal and disability, and retirement age were considered for the actuarial valuation. “A 67/07 mortality table” issued by the Institute of Actuaries, London was used to estimate the gratuity liability of all Group companies.

107 C T HOLDINGS PLCAnnual Report 2021 2022
(b) Sensitivity analysisReasonably possible changes at the reporting date to one of the relevant actuarial assumptions, holding other assumptions constant, would have affected the defined benefit obligation by the amounts shown below.
In thousands of rupees Group Company As at 31st March 2022 2021 2022 2021
IncreaseDiscount rate (1% movement) (51,207) (71,803) (1,537) (428)Future salary growth (1% movement) 61,276 83,265 1,511 323
DecreaseDiscount rate (1% movement) 55,356 79,442 1,623 438Future salary growth (1% movement) (57,598) (76,659) (1,459) (323)
As at 31st March 2022, the weighted average duration of the defined benefit obligation for the Company was 4.85 years.
27.4 Share-based payment arrangements of subsidiaries
(a) Description of share based payment arrangementsAn Employee Share Option Scheme (ESOS) proposed by the Directors of the subsidiary Cargills (Ceylon) PLC (CCP) for the benefit of it’s employees and those of its subsidiaries (‘’Group’’) was approved by the shareholders of CCP at an Extra Ordinary General Meeting held on 29th June 2017.
Under the terms of the ESOS, which are in compliance with the Listing Rules of the Colombo Stock Exchange, a maximum number of Seven million six hundred seventy nine thousand nine hundred and ninety seven (7,679,997) ordinary voting shares could be issued which is equivalent to 3.0% of the issued capital of CCP. The share options would be granted in three tranches which would constitute :
a) First tranche – 3,839,999 options constituting 1.50% of the issued shares of the Company at an exercise price of Rs. 184.98 b) Second tranche – 1,919,999 options constituting 0.75% of the issued shares of the Company at an exercise price of Rs.
172.33; andc) Third tranche – 1,919,999 options constituting 0.75% of the issued shares of the Company at an exercise price of Rs.
211.40;
Each of the aforesaid tranches are subdivided in to sub tranches with different vesting periods and exercise periods. Share options would be issued to employees who are eligible for the award of the share options for a consideration that is equivalent to the volume weighted average price during the period of thirty (30) market days immediately prior to the respective grant dates for each tranche.

108
Notes to the Financial Statements
C T HOLDINGS PLCAnnual Report 2021 2022
The key terms and conditions related to the grants under these tranches are as follows; all options are to be settled by the physical delivery of shares.
Type of Tranche
Number of options
Vesting Condition Vesting Period
Vesting Date Exercise Period Exercise Duration
Tranche 1
Sub Tranche 1 1,280,000 Remaining in employment up until the vesting date.
3 Months September 30,2017
October 1,2017 to March 31, 2019
1 Year & 6 Months
Sub Tranche 2 1,280,000 9 Months March 31, 2018 April 1,2018 to March 31, 2020
2 Years
Sub Tranche 3 1,279,999 1 Year & 9 Months
March 31, 2019 April 1,2019 to March 31, 2021
2 Years
Tranche 2
Sub Tranche 1 640,000 Remaining in employment up until the vesting date. And meeting the performance related conditions relating to FY 2018/19.
1 Year & 4 Months
July 31, 2019 August 1,2019 to March 31, 2020
8 Months
Sub Tranche 2 640,000 2 Years March 31, 2020 April 1,2020 to March 31, 2021
1 Year
Sub Tranche 3 639,999 3 Years March 31, 2021 April 1,2021 to March 31, 2022
1 Year
Tranche 3
Sub Tranche 1 640,000 Remaining in employment up until the vesting date. And meeting the performance related conditions relating to FY 2019/20.
1 Year & 4 Months
July 31, 2020 August 1,2020 to March 31, 2021
8 Months
Sub Tranche 2 640,000 2 Years March 31, 2021 April 1,2021 to March 31, 2022
1 Year
Sub Tranche 3 639,999 3 Years March 31, 2022 April 1,2022 to March 31, 2023
1 Year
Total Share Options
7,679,997
The cost of Share Based Payments accounted in the Group’s Financial Statements for the year amounted to Rs. Nil. (2021 - Rs. 30.65 Mn)
Grant DateAs per “SLFRS 2 - Share-based Payments” the entity should recognise the value/cost of the share options granted to employees through the ESOS scheme based on the Grant Date of the share options. The date of obtaining the shareholder approval for ESOS is recognised as the Grant date for all 3 tranches of the ESOS scheme which is 29th June 2017.

109 C T HOLDINGS PLCAnnual Report 2021 2022
27.4.1 Measurement of Fair ValuesAs required by SLFRS 2 on “Share-based Payment”, the fair value of the ESOS was estimated at the grant date using the Binomial Valuation Model taking into consideration various terms and conditions upon which the share options are granted.
The inputs used in measurement of fair value at the grant date of ESOS were as follows:Tranches
Description of the valuation input Tranche 1 Tranche 2 Tranche 3
Expected dividend yield rate (%) 1.5 1.5 1.5Risk free rate (%) 10.73 10.73 10.73Probability of share price increase (%) 80 80 80Probability of share price decrease (%) 20 20 20Size of annual increase of share price (%) 18 18 18Size of annual reduction in share price (%) 10 10 10Exercise price (Rs.) 184.98 172.33 211.4
The probability of price movements of the Company share price has been arrived at by taking into consideration share price movements of Company during the last five year period.
27.4.2 Reconciliation of Outstanding Share OptionsThe number and weighted-average exercise prices of share options under the ESOS scheme was as follows :
In thousands of options Number of *WAEP 2022 Number of *WAEP 2021options 2022 (Rs.) options 2021 (Rs.)
Outstanding as at 1 April 1,920 198.38 4,480 192.69 Forfeited during the year (1,280) 191.87 (2,103) 189.17 Exercised during the year - - (457) 184.98 Granted during the year - - - - Outstanding as at 31 March 640 211.40 1,920 198.38 Exercisable as at 31 March - - - -
*WAEP - Weighted Average Exercise Price
Pursuant to the Employee Share Option Scheme of the Company approved by the Shareholders on 29th June 2017, 456,688 options were exercised by employees during the period 1st April 2020 to 31st March 2021 and in respect of which 363,231 shares have been issued during the period.
Exercise period of the first tranche of the ESOS concluded on 31st March 2021 and no further options were issued in respect to Tranches 2 and 3 due to the qualification criteria not being met. Accordingly, there are no exercisable options at the reporting date.

110
Notes to the Financial Statements
C T HOLDINGS PLCAnnual Report 2021 2022
28. Capital Grants
28.1 Reconciliation of carrying amount - Government grants
In thousands of rupees Group As at 31st March 2022 2021
GrossAs at 1st April 116,907 116,907 Received during the year - - As at 31st March 116,907 116,907
Accumulated amortisationAs at 1st April 89,453 77,970 Amortised during the year 11,479 11,483 As at 31st March 100,932 89,453
Net carrying valueAs at 31st March 15,975 27,454
28.2 Grants received
Granted By Purpose of the grant
Basis of amortisation Short term and long term loans
Amount received
Balance as at
1-Apr-21
Amortised during the
year
Balance as at
31-Mar-22
United States Agency for International Development (USAID) and Connecting Regional Economies (USAID/CORE)
Kilinochchi project
Based on the corresponding expenditure being incurred
92,002 21,034 (9,075) 11,959
Dehiattakandiya project
Based on depreciation applicable corresponding to the plant & machinery acquired from the grant.
24,905 6,420 (2,404) 4,016
116,907 27,454 (11,479) 15,975

111 C T HOLDINGS PLCAnnual Report 2021 2022
29. Trade and other payables
In thousands of rupees Group Company As at 31st March 2022 2021 2022 2021
Current Trade creditors (other than from related companies) 15,926,120 11,480,197 - - Amounts due to related companies (Note 31.3) 2,928 4,281 18,868 7,036 Accruals, other accounts payable & provisions 7,405,423 4,835,272 16,642 11,051
23,334,471 16,319,750 35,510 18,087
Non currentSecurity deposits (Note 29.1) 181,187 169,679 - -
181,187 169,679 - -
29.1 Security deposits
This represents deposits which are repayable at the termination of tenancy agreements.

112
Notes to the Financial Statements
C T HOLDINGS PLCAnnual Report 2021 2022
30. Financial instruments – Fair values and risk management
30.1 Accounting classifications and fair values
The following table shows the carrying amounts and fair values of financial assets and financial liabilities. It does not include fair value information for financial assets and financial liabilities not measured at fair value if the carrying amount is a reasonable approximation of fair value.
In thousands of rupees Note Fianancial assets at amortised cost
FVTPLequity instruments
FVOCI equityinstruments
FVTPL debtinstruments
As at 31st March 2022 2021 2022 2021 2022 2021 2022 2021
GroupFinancial AssetsFinancial assets measured at fair value- Other financial assets - Equity 20.1 - - 130,193 451,776 62,508 75,809 - - - Other financial assets - Debt 20.2 - - - - - - 1,500,000 -
Financial assets not measured at fair value- Trade receivables & amount due from related companies 22 4,274,997 3,591,411 - - - - - Other financial assets 20.1 &
20.3 1,016,556 1,018,661 - - 100 100- Other receivables 22 1,059,356 757,055 - - - - - Cash and cash equivalents 23 3,554,218 3,155,193 - - - - Total financial assets 9,905,127 8,522,320 130,193 451,776 62,608 75,909 1,500,000 -
Financial liabilitiesFinancial liabilities not measured at fair value
Financial liabilities at Amortised cost
- Interest bearing loans and borrowings 26 40,861,602 37,738,777 - Security deposits 29 181,187 169,679 - Trade creditors & amount due to related companies 29 15,929,048 11,484,478 Total financial liabilities 56,971,837 49,392,934

113 C T HOLDINGS PLCAnnual Report 2021 2022
30.1 Accounting classifications and fair values (Contd.)
In thousands of rupees Note Fianancial assets at amortised cost
FVTPL equity instruments FVOCI equity instruments
As at 31st March 2022 2021 2022 2021 2022 2021
CompanyFinancial AssetsFinancial assets measured at fair value- Other financial assets 20.1 - - 28,766 425,417 36,297 63,865
Financial assets not measured at fair value- Trade receivables & amount due from related companies 22 28,260 21,724 - - - - - Other financial assets 20.1 &
20.3 - 63,865 - - 100 100- Other receivables 22 44,217 27,413 - - - - - Cash and cash equivalents 23 8,944 144,766 - - - - Total financial assets 81,421 257,768 28,766 425,417 36,397 63,965
Financial liabilitiesFinancial liabilities not measured at fair value Financial liabilities at
Amortised cost
- Interest bearing loans and borrowings 26 826,399 456 - Trade creditors & amount due to related companies 29 18,868 7,036 Total financial liabilities 845,267 7,492

114
Notes to the Financial Statements
C T HOLDINGS PLCAnnual Report 2021 2022
30.2 Fair Value Hierarchy
The table below analyses financial instruments carried at fair value, by valuation method.
The different levels have been defined as follows:Level 1: Quoted prices (unadjusted) in active markets for identical assets or liabilities Level 2: Input other than quoted prices included within Level 1 that are observable for the asset or liability, either directly (i.e. as
prices) or indirectly (i.e. derived from prices)Level 3: Quoted price (unadjusted) in active markets for identical assets or liabilities
In thousands of rupees Level 1 Level 2 Level 3 Total
As at 31 March 2022 2021 2022 2021 2022 2021 2022 2021
Rs. '000 Rs. '000 Rs. '000 Rs. '000 Rs. '000 Rs. '000 Rs. '000 Rs. '000
GroupFreehold land and buildings 13 - - - - 16,820,017 16,676,737 16,820,017 16,676,737 Investment property 16 - - - - 9,579,553 9,176,410 9,579,553 9,176,410 Other financial assets - Equity 20.1 62,508 75,809 130,193 451,776 100 100 192,801 527,685 Other financial assets - Debt 20.2 - - 1,500,000 - - - 1,500,000 -
In thousands of rupees Level 1 Level 2 Level 3 Total
As at 31 March 2022 2021 2022 2021 2022 2021 2022 2021
Rs. '000 Rs. '000 Rs. '000 Rs. '000 Rs. '000 Rs. '000 Rs. '000 Rs. '000
CompanyFreehold land and buildings - - - - - - - - Investment property 16 - - - - 709,700 1,611,865 709,700 1,611,865 Other Investments 20.1 36,297 56,908 28,766 425,417 100 100 65,163 482,425

115 C T HOLDINGS PLCAnnual Report 2021 2022
30.2.1 Assets and Liabilities Measured at Fair Value - RecurringThe following table shows the valuation techniques used by both Group in measuring level 3 fair values and the significant unobservable inputs used.
Asset and liabilities
Valuation technique Significant unobservable inputs Sensitivity of the input to the fair value
Property, plant and equipment - Freehold land and building
Market comparable method - This method considers the selling price of a similar property within a reasonably recent period of time in determining the fair value of property being revalued. This involves evaluation of recent active market prices of similar assets, making appropriate adjustments for difference in size, nature and location of the property.
Market value per perch of land/Price per square foot. The value has used a range of prices for respective lands based on adjusted fair value taking into account other valuation considerations - Rs. 800,000 - Rs. 18,000,000 per perch
Estimated fair value will increase (decrease) if ; Price per perch/ sq ft increases (decreases)
Income method:- The net income generated by the property is used in conjunction with certain factors is used to calculate its fair value.
Cash flows from property discounted at an appropriate rate Contractual rental Rs. 50,000 - Rs. 9,000,000 per month. Capitalization rates 5% - 8% Repairs and insurance 25% - 30%.
Estimated fair value will increase (decrease) if ; market interest rate increases (decreases)
Investment property - Freehold land and building
Market comparable method :- This method considers the selling price of a similar property within a reasonably recent period of time in determining the fair value of property being revalued. This involves evaluation of recent active market prices of similar assets, making appropriate adjustments for difference in size, nature and location of the property.
Construction cost per square foot Rs. 4,400 - Rs. 12,700. Market price per perch. The valuer has used a range of prices for respective lands based on adjusted fair value taking into account other valuation considerations - Rs. 250,000 - Rs. 18,000,000 per perch
The estimated fair value would increase/ (decrease) if
Cost per square foot was higher/(lower)
Market value per perch was higher/(lower)
Income method:- The net income generated by the property is used in conjunction with certain factors is used to calculate its fair value.
Contractual rentals agreed
Occupancy rates 70%-95%
Capitalization rates 5.4%-7.5%
Repairs and insurance 25% - 30%
Contractual rental Rs. 15,000 - Rs. 9,000,000 per month.
The estimated fair value would increase/ (decrease) if
Contractual rentals were higher/(lower)
Occupancy rates were higher/(lower)
Capitalization rate was (higher)/lower
Repair and insurance was (higher)/lower
Market value per perch was higher/(lower)

116
Notes to the Financial Statements
C T HOLDINGS PLCAnnual Report 2021 2022
30.3 Capital management
The Group manages its capital to ensure that entities in the Group will be able to continue as going concern while maximising the return to stakeholders through the optimisation of the debt and equity balance. The Group’s overall strategy remains unchanged from 2017.
The capital structure of the Group consists of below: In thousands of rupees Group CompanyAs at 31st March Note 2022 2021 2022 2021
Debt (long and short term borrowings, excluding derivatives)Interest bearing loans and borrowings 26 40,861,602 37,738,776 826,399 456 Net debt 40,861,602 37,738,776 826,399 456
Equity (all capital and reserves of the Group that are managed as capital)Stated capital 24 6,489,758 6,489,758 6,489,758 6,489,758 Reserves 25 3,136,528 3,191,265 45,747 53,140 Retained earnings 14,161,037 13,678,172 1,159,351 1,125,945 Non-controlling interest 9,555,690 7,954,517 - - Total equity 33,343,013 31,313,712 7,694,856 7,668,843 Total debt and equity 74,204,615 69,052,488 8,521,255 7,669,299
The Group is not subject to any externally imposed capital requirements.
30.4 Financial risk management
The Group has exposure to the following risks arising from financial instruments: » credit risk
» liquidity risk and
» market risk
Risk management frameworkThe Board of Directors has overall responsibility for the establishment and oversight of the Group’s risk management framework. The Group’s risk management processes are established to identify and analyse the risks faced by the Group, to set appropriate risk limits and controls and to monitor risks and adherence to limits. Risk management systems are reviewed regularly to reflect changes in market conditions and the Group’s activities.
The Audit Committee oversees how management monitors compliance with the Group’s risk management processes/ guidelines and procedures and reviews the adequacy of the risk management framework in relation to the risks. The Audit Committee is assisted in its oversight role by Risk Management team and Internal Audit, who undertakes both regular and ad hoc reviews of risk management controls and procedures, the results of which are reported to the Audit Committee.

117 C T HOLDINGS PLCAnnual Report 2021 2022
30.5 Credit risk
Credit risk is the risk of financial loss to the Group if a customer or counter party to a financial instrument fails to meet its contractual obligation, and arise principally from the Group’s receivables from customers.
Group implemented several initiatives such as periodic review of the creditworthiness of its counterparties, Financial Statements reviews, and industry information. Further, economic environment was scrutinised in response to Covid-19 pandemic limiting exposure to counterparties who were severely affected.
Carrying amount of financial assets represents the maximum credit exposure.
The maximum exposure to credit risk at the reporting date was as follows:In thousands of rupees Group CompanyAs at 31st March Note 2022 2021 2022 2021
Trade receivables 22 4,274,997 3,591,411 28,260 21,724Other receivables 22 1,059,356 757,055 44,217 27,413Other financial assets 20.3 1,016,556 1,018,661 - 63,865Cash and cash equivalents 23 3,554,218 3,155,193 8,944 144,766
9,905,127 8,522,320 81,421 257,768
30.5.1 Trade receivablesTrade receivables net provisions for impairments were at the ageing set out below.Neither past due nor impaired 28,257 21,722 28,257 21,7221 - 30 days 2,690,971 2,162,652 3 231 - 60 days 556,277 1,024,002 - -61 - 90 days 234,803 210,807 - -More than 90 days 764,689 172,228 - -
4,274,997 3,591,411 28,260 21,724
Based on historic payment behaviour and extensive analysis of customer credit risk, including underlying customers’ credit ratings, if available, the management believes that the unimpaired amounts that are past due by more than 30 days are still collectible in full.
Impairment and risk exposureIndividual receivables which are known to be uncollectible are written off by reducing the carrying amount directly. The other receivables are assessed collectively to determine whether there is objective evidence that an impairment has been incurred but not yet been identified. For these receivables the estimated impairment losses are recognised in a separate provision for impairment.
The movement in the provision for impairment in respect of trade and other receivables during the year is given in Note 22.3.
30.5.2 Cash and cash equivalentsThe Group held cash and cash equivalents of Rs. 3.55 Bn at 31st March 2022 (2021: Rs. 3.15 Bn). The cash and cash equivalents are held with bank and financial institution counter-parties, with high credit ratings which are rated AA-(lka) to BBB-(lka), based on Fitch Ratings.

118
Notes to the Financial Statements
C T HOLDINGS PLCAnnual Report 2021 2022
30.5.3 Corporate guaranteesThe Group’s policy is to provide financial guarantees only to subsidiaries. As at 31st March 2022, the Company had issued guarantees to certain banks in respect of credit facilities granted to subsidiaries (refer Notes 34.1 & 34.2)
30.6 Liquidity risk
Exposure to liquidity risk - Contractual maturities of financial liabilities at the reporting date.
Liquidity risk is the risk that the Group will encounter difficulty in meeting the obligations associated with its financial liabilities that are settled by delivering cash or another financial asset. The Group’s approach to managing liquidity is to ensure, as far as possible, that it will always have sufficient liquidity to meet its liabilities when due, under both normal and stressed conditions, without incurring unacceptable losses or risking damage to the Group’s reputation. The Group holds cash and undrawn committed facilities to enable the Group to manage its liquidity risk.
The Group monitors its risk to shortage of funds by considering maturity of both the Group’s financial investment and financial assets and other projected cash flow from operations.
The Group's objective is to maintain balance between continuity of funding and flexibility through the use of multiple sources of funding including bank loans and overdrafts over a wider spread of maturity periods. In liquidity risk management, the Group uses a mixed approach where it combines elements of cash flow matching approach and the liquid assets approach. The business units attempt to match cash outflows in each time bucket against a combination of contractual cash inflows that can be generated through the sale of assets, repurchase agreement or secured borrowings.
Contractual cash flowsIn thousands of rupees Note Carrying Contractual Within Between 1-5 More than 5 Total
value maturity 1 year years years
GroupAs at 31st March 2021Bank overdrafts 26 2,794,707 2,794,707 2,794,707 - - 2,794,707Loans from Banks 26 18,332,844 18,332,844 15,447,113 2,885,731 - 18,332,844Trade and other payables 29 16,319,750 16,319,750 16,319,750 - - 16,319,750Finance lease liabilities 26.1 3,606 3,858 3,606 - - 3,606Lease liabilities 14.2 16,607,619 33,784,029 2,668,417 10,326,266 20,789,346 33,784,029
54,058,526 71,235,188 37,233,593 13,211,997 20,789,346 71,234,936
As at 31st March 2022Bank overdrafts 26 1,769,714 1,769,714 1,769,714 - - 1,769,714Loans from Banks 26 19,324,440 19,324,440 10,846,897 8,477,543 - 19,324,440Trade and other payables 29 23,334,471 23,334,471 23,334,471 - - 23,334,471Finance lease liabilities 26.1 7,896 7,896 3,606 4,290 - 7,896Lease liabilities 14.2 19,759,552 39,536,521 3,012,742 11,659,203 24,864,576 39,536,521
64,196,073 83,973,042 38,967,430 20,141,036 24,864,576 83,973,042
Contractual cash flows of the Company are not material, and are therefore not disclosed seperately
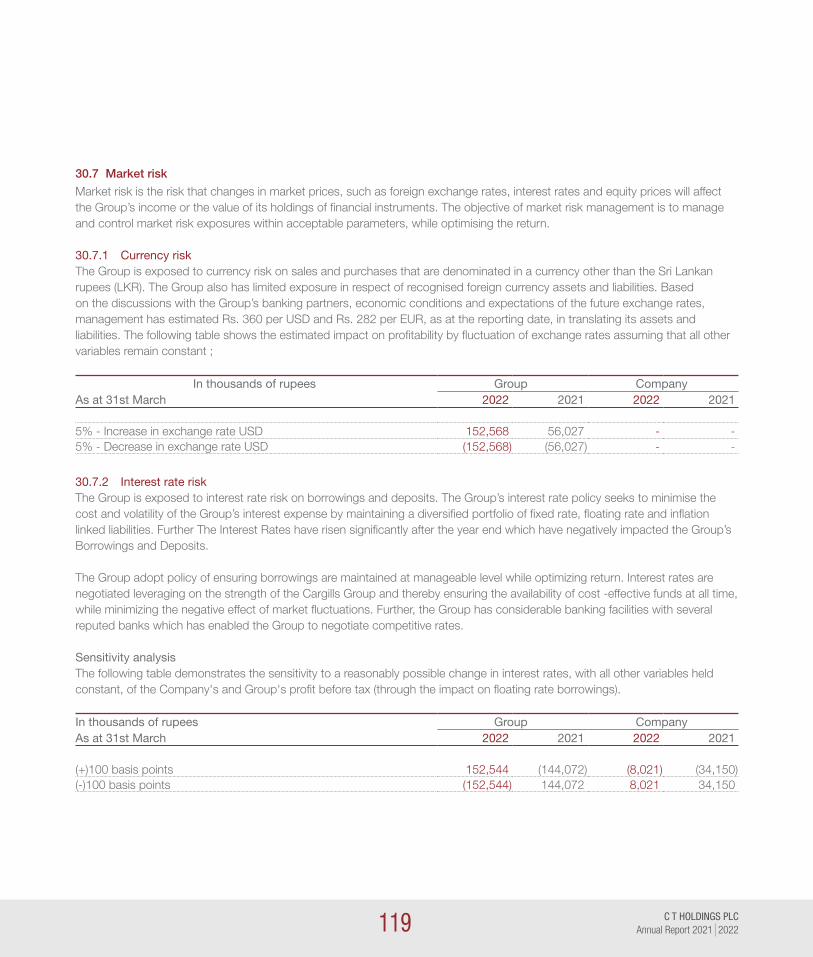
119 C T HOLDINGS PLCAnnual Report 2021 2022
30.7 Market risk
Market risk is the risk that changes in market prices, such as foreign exchange rates, interest rates and equity prices will affect the Group’s income or the value of its holdings of financial instruments. The objective of market risk management is to manage and control market risk exposures within acceptable parameters, while optimising the return.
30.7.1 Currency riskThe Group is exposed to currency risk on sales and purchases that are denominated in a currency other than the Sri Lankan rupees (LKR). The Group also has limited exposure in respect of recognised foreign currency assets and liabilities. Based on the discussions with the Group’s banking partners, economic conditions and expectations of the future exchange rates, management has estimated Rs. 360 per USD and Rs. 282 per EUR, as at the reporting date, in translating its assets and liabilities. The following table shows the estimated impact on profitability by fluctuation of exchange rates assuming that all other variables remain constant ;
In thousands of rupees Group CompanyAs at 31st March 2022 2021 2022 2021
5% - Increase in exchange rate USD 152,568 56,027 - -5% - Decrease in exchange rate USD (152,568) (56,027) - -
30.7.2 Interest rate riskThe Group is exposed to interest rate risk on borrowings and deposits. The Group’s interest rate policy seeks to minimise the cost and volatility of the Group’s interest expense by maintaining a diversified portfolio of fixed rate, floating rate and inflation linked liabilities. Further The Interest Rates have risen significantly after the year end which have negatively impacted the Group’s Borrowings and Deposits.
The Group adopt policy of ensuring borrowings are maintained at manageable level while optimizing return. Interest rates are negotiated leveraging on the strength of the Cargills Group and thereby ensuring the availability of cost -effective funds at all time, while minimizing the negative effect of market fluctuations. Further, the Group has considerable banking facilities with several reputed banks which has enabled the Group to negotiate competitive rates.
Sensitivity analysisThe following table demonstrates the sensitivity to a reasonably possible change in interest rates, with all other variables held constant, of the Company's and Group's profit before tax (through the impact on floating rate borrowings).
In thousands of rupees Group CompanyAs at 31st March 2022 2021 2022 2021
(+)100 basis points 152,544 (144,072) (8,021) (34,150)(-)100 basis points (152,544) 144,072 8,021 34,150
120
Notes to the Financial Statements
C T HOLDINGS PLCAnnual Report 2021 2022
30.7.3 Market Price RiskListed equity securities are susceptible to market price risk arising from uncertainties of future values of the investment securities. The Group manages the equity price risk through diversification and placing limits on individual and total equity portfolio investments. The Group’s equity risk management policies are;
» Equity investment decisions are based on fundamentals rather than on speculation; and
» Decisions are based on in depth macroeconomic and industry analysis as well as research reports on company performance. Market price risk exposure is not material to the Group.
31. Related parties
31.1 Transactions with key management personnel
According to the LKAS 24 - “Related Party Disclosures”, Key Management Personnel are those having authority and responsibility for planning, directing and controlling the activities of the entity. Accordingly, the Board of Directors (including Executive & Non-Executive Directors) of the Company have been classified as Key Management Personnel of the entity.
(a) Mrs. R Page, wife of Mr. Ranjit Page , is a Director of the Double Yummm (Private) Limited with which Cargills Foods Company (Private) Limited had regular transactions in the ordinary course of business and the amount outstanding as at 31st March 2022 was Rs. 16.20 Mn (2021 - Rs. 13.72 Mn). Purchases for re-sale in the ordinary course of business for the year amounted to Rs. 158.42 Mn (2021 - Rs. 123.71 Mn) and rental income earned for the year is Nil (2021 - Nil).
(b) Short term employment benefits paid to key management personnel have been disclosed in the Note 8.1 to these financial statements. There are no post employment benefits paid during the year.
(c) No unsecured loans to Directors have been granted during the year.
Close Family Members (CFM) of a KMP are those family members who may be expected to influence, or be influenced by, that individual in their dealings with the entity. They may include;
(a) the individual's domestic partner and children;
(b) children of the individual's domestic partner; and
(c) dependents of the individual or the individual's domestic partner
CFM are related parties to the entity. There were no transactions with CFM during the year.
31.2 Other related party transactions
Transactions that are carried out in the ordinary course of business between the Company and other Group companies as well as between Group companies who are defined as related parties in Sri Lanka Accounting Standards (LKAS - 24 ‘Related party Disclosures’) are disclosed below.

121 C T HOLDINGS PLCAnnual Report 2021 2022
a.) Transactions between the Company and the other Group companies
Related Company Common Directors Transaction 2022 2021
C T Properties Limited Ranjit Page Recovery of Expenditure (1,796) (2,061)
R. Selvaskandan
Louis Page Settlement 1,798 3,800
Joseph Page
Ms. Cecilia Muttukumaru
S C Niles
Ceylon Theatres (Private) Limited Louis Page Rent Income 532 -
R. Selvaskandan Settlement 118,514 3,570
Joseph Page
Ms. Cecilia page Muttukumaru Recovery of Expenditure (112,514) -
S C Niles
M I Abdul Wahid
Millers Limited M I Abdul Wahid Rent Income - -
Settlement - -
Cargills (Ceylon) PLC L R Page Recovery of Expenditure (11,832) 655
Ranjit Page
M I Abdul Wahid
Priya Edirisinghe
Joseph Page

122
Notes to the Financial Statements
C T HOLDINGS PLCAnnual Report 2021 2022
b) Transactions between Group companies
In thousands of rupees Balanceas at
1-Apr-21
Net AmountReceived/
(Paid)
Balanceas at
31-Mar-22
Purchase / Sale of
Goods
Receipt / Rendering
of Services
Interest Received /
Paid
Dividend Received /
PaidSubsidiaryCargills (Ceylon) PLC (1,313,613) (758,664) (2,072,277) Cargills Foods Company (Private) Limited 895,310 1,027,372 1,922,682 Cargills Quality Foods Limited 3,671 (286,586) (282,915) Cargills Quality Diaries (Private) Limited (378,627) (472,642) (851,269) The Empire Investments Company (Private) Limited
173,891 850,332 1,024,223 - - -
Kotmale Holdings PLC 695 (675) 20 - - -
Kotmale Products Limited (77,438) (108,790) (186,228) - - -
Kotmale Milk Foods Limited - - - - - - - Kotmale Dairy Products (Private) Limited 13,713 35,615 49,328 Kotmale Milk Products Limited - - - - - - - Cargills Quality Confectioneries (Private) Limited (51,150) (142,723) (193,873) - -
Cargills Agrifoods Limited (148,821) (99,430) (248,251) C P C (Lanka) Limited (35,205) (63,206) (98,411) Cargills Food Processors (Private) Limited (2,364) 21,836 19,472 Cargills Food Services (Private) Limited (381) 403 22 -
Millers Limited (101,471) (63,907) (165,378) Dawson Office Complex (Private) Limited - - - - - - - Cargills Agro Development Company (Private) Limited
18 755 773 - - -
C T Land Development PLC (18,037) 8,500 (9,537) - -
Ceylon Theatres (Private) Limited 18,554 79,078 97,632 - -
C T Properties Limited 947,170 36,508 983,678 - - -
C T Property Management Company (Private) Limited
- - - - - - -
C T Real Estate (Private) Limited - - - - - - - C T Properties Lakeside (Private) Limited - - - - - - - C T Properties G S (Private) Limited - - - - - - - Fredrick North Hotel Company Limited - - - - - - - Cargills Enterprise Solutions (Private) Limited 3,200 4,800 8,000 - - -
Equity accounted investeesC T CLSA Holdings Limited - - - - - - - Cinema Entertainments (Private) Limited 2,819 569 3,388 - - -
Cargills Bank Limited 72,981 (34,543) 38,438 - - -

123 C T HOLDINGS PLCAnnual Report 2021 2022
31.3 Related party balances
In thousands of rupees Group CompanyAs at 31st March 2022 2021 2022 2021
(a) Amount due from subsidiary companiesCeylon Theatres (Private) Limited - - 23,081 16,549 C T Properties Limited - - 1,768 1,765
- - 24,849 18,314
(b) Amount due from other related companiesUnited Hotels Co. Limited 466 66 - - Cargills Bank Limited 38,438 72,981 - - Ceylon Hotels Corporation PLC 379 257 - - Galle Face Hotel Company Limited 494 480 - - Kandy Hotels Company (1938) PLC 434 85 - - Cinema Entertainments (Private) Limited 3,482 3,483 3,408 3,408 Cargills Foundation 233,520 226,479 - -
277,213 303,831 3,408 3,408 Total amounts due from related companies 277,213 303,831 28,257 21,722
(c) Amounts due to subsidiary companiesCargills (Ceylon) PLC - - 18,868 7,036
- - 18,868 7,036 (d) Amount due to other related companiesUnidil Packaging Ltd 2,834 4,281 - - Cinema Entertainments (Private) Limited 94 - - -
2,928 4,281 - - Total amounts due to related companies 2,928 4,281 18,868 7,036
31.4 Parent Company and ultimate controlling entity
Odeon Holdings (Ceylon) (Private) Limited holds 42.09% (2021 – 42.09%) of the ordinary share capital of the Company.
32. Operating segments
The Group has six reportable segments, as described in Note 2.1, which are the Group’s strategic business units. The strategic business units offer different products and services, and are managed separately because they require different management strategies. For each of the strategic business units, the Group’s chief decision maker reviews internal management reports at least on a quarterly basis.
32.1 Geographical information
The Group does not distinguish its turnover into significant geographical segments.

124
Notes to the Financial Statements
C T HOLDINGS PLCAnnual Report 2021 2022
32.2 The accounting policies of the reportable segments are the same as the Group’s accounting policies described in Note 2.1. Segment profit represents the profit before tax earned by each segment without allocation of corporate net income and Directors’ salaries, share of profit of associates, other gains and losses. This is the measure reported to the chief operating decision maker for the purposes of resource allocation and assessment of segment performance.
For the purposes of monitoring segment performance and allocating resources between segments:
(a) All assets are allocated to reportable segments other than interests in associates and assets used by the head office. Goodwill is allocated to reportable segments as described in Note 17.2. Assets used jointly by reportable segments are allocated on the basis of the revenues earned by individual reportable segments.
(b) All liabilities are allocated to reportable segments other than liabilities of the head office, if there are any.
In thousands of rupees Retail & Wholesale Distribution FMCG RestaurantsFor the Year ended 31-Mar
202231-Mar
202131-Mar
202231-Mar
202131-Mar
202231-Mar
2021RevenueGross revenue 105,958,154 89,589,107 34,864,766 27,470,785 5,875,972 3,422,733 Eliminations of inter segment revenue (1,040,986) (84,336) (8,967,198) (7,791,228) - - Corporate and other unallocated revenueExternal revenue 104,917,168 89,504,771 25,897,568 19,679,557 5,875,972 3,422,733
Segment resultResults from operating activities 3,805,308 2,629,699 4,107,764 3,980,840 977,184 448,625 Corporate and other unallocated operating profitTotal results from operating activities
Reportable Segment Profit after tax 804,625 657,025 3,401,139 2,887,451 666,653 226,655 Corporate and other unallocated operating profit
Reportable Segment Profit after attributable to owners of the parentReportable Segment Profit after attributable to owners of the parent
572,699 458,866 2,419,354 2,016,596 474,496 158,296
Corporate and other unallocated operating profitNet Finance Costs (2,695,070) (1,799,026) (106,009) (362,775) (85,863) (107,944)

125 C T HOLDINGS PLCAnnual Report 2021 2022
In thousands of rupees Real Estate Entertainment GroupFor the Year ended 31-Mar
202231-Mar
202131-Mar
202231-Mar
202131-Mar
202231-Mar
2021RevenueGross revenue 146,783 347,468 71,321 18,092 146,916,996 120,848,185 Eliminations of inter segment revenue (36,056) (31,650) - - (10,044,240) (7,907,214)Coporate and other unallocated revenue - -External revenue 110,727 315,818 71,321 18,092 136,872,756 112,940,971
Segment resultResults from operating activities (216,663) 55,990 (86,664) 123,999 8,586,929 7,239,153 Corporate and other unallocated operating profit 81,971 (60,051)Total results from operating activities 8,668,900 7,179,102
Reportable Segment Profit after tax (40,602) 152,835 (128,752) (155,423) 4,703,063 3,768,543 Corporate and other unallocated operating profit (532,758) (447,274)
4,170,305 3,321,269
Reportable Segment Profit after attributable to owners of the parentReportable Segment Profit after attributable to owners of the parent
(28,694) 103,744 (110,133) (132,949) 3,327,722 2,604,553
Corporate and other unallocated operating profit (489,693) (543,066)2,838,029 2,061,487
Net Finance Costs (20,294) (61,515) (42,088) (31,424) (2,949,324) (2,362,684)Corporate and other unallocated (423,487) (235,750)
(3,372,811) (2,598,434)

126
Notes to the Financial Statements
C T HOLDINGS PLCAnnual Report 2021 2022
In thousands of rupees Retail & Wholesale Distribution FMCG RestaurantsAs at 31-Mar
202231-Mar
202131-Mar
202231-Mar
202131-Mar
202231-Mar
2021Non current assetsProperty, plant & equipment 21,628,965 18,895,656 8,538,466 8,332,717 1,410,292 1,052,652 Right of use asset 15,044,695 12,136,959 83,339 796,542 2,308,361 1,236,080 Investment properties 151,750 143,800 98,182 21,989 - - Intangible assets and goodwill 169,602 164,029 724,057 723,861 93,134 111,395 Other investments - - 135 118 134 84 Deferred tax assets - - 11,969 13,036 2,101 3,192 Total segment non-current assets 36,995,012 31,340,444 9,456,148 9,888,263 3,814,022 2,403,403 Prepayment on leasehold land and building 200,912 200,912 - - - -
37,195,924 31,541,356 9,456,148 9,888,263 3,814,022 2,403,403
Current assetsInventories 10,664,662 9,292,815 4,001,420 2,405,479 130,061 79,011 Trade and other receivables 3,691,463 3,152,995 2,742,290 2,202,782 177,268 194,040 Other financial assets 904,695 856,021 92,453 88,827 - - Cash and cash equivalents 1,137,542 1,047,565 1,304,801 1,427,502 921,829 368,645 Total segment current assets 16,398,362 14,349,396 8,140,964 6,124,590 1,229,158 641,696
Total segment assets 53,594,286 45,890,752 17,597,112 16,012,853 5,043,180 3,045,099 Investments in equity accounted investeesCorporate and other unallocated assetsTotal assets
Segment liabilitiesNon-current liabilitiesBorrowings 18,159,176 15,713,686 904,962 721,628 2,111,739 1,249,722 Employee benefits 828,149 829,173 125,431 119,800 - - Capital Grants - - 15,975 27,456 - Trade and other payables - - 119,800 - - - Deferred tax liabilities (163,399) 48,563 427,102 438,542 (15,731) (950)Total segment non-current liabilities 18,823,926 16,591,422 1,593,270 1,307,426 2,096,008 1,248,772
Current liabilitiesTrade and other payables 17,878,769 12,592,150 3,533,153 2,379,279 1,088,762 535,415 Current tax liabilities 978,876 780,659 2,378,036 2,324,382 583,669 412,681 Borrowings 7,572,808 10,080,346 2,478,866 4,355,700 298,562 323,551 Total segment current liabilities 26,430,453 23,453,155 8,390,055 9,059,361 1,970,993 1,271,647
Total segment liabilities 45,254,379 40,044,577 9,983,325 10,366,787 4,067,001 2,520,419 Corporate and other unallocated liabilitiesTotal liabilities

127 C T HOLDINGS PLCAnnual Report 2021 2022
In thousands of rupees Real Estate Entertainment GroupAs at 31-Mar
202231-Mar
202131-Mar
202231-Mar
202131-Mar
202231-Mar
2021Non-current assetsProperty, plant & equipment 3,157,543 1,423,245 230,340 335,409 34,965,606 30,039,679 Right of use asset 42,884 45,666 261,537 311,340 17,740,816 14,526,587 Investment properties 8,482,870 6,438,220 - - 8,732,802 6,604,009 Intangible assets and goodwill 7,977 4,385 - - 994,770 1,003,670 Other investments 101,427 102,571 - - 101,696 102,773 Deferred tax assets - - - - 14,070 16,228 Total segment non-current assets 11,792,701 8,014,087 491,877 646,749 62,549,760 52,292,946
Prepayment on leasehold land and building - - - - 200,912 200,912
11,792,701 8,014,087 491,877 646,749 62,750,672 52,493,858
Current assetsInventories - - 5,068 1,567 14,801,211 11,778,872 Trade and other receivables 629,996 302,918 19,669 29,845 7,260,686 5,882,580 Other financial assets 19,408 9,948 - - 1,016,556 954,796 Cash and cash equivalents 106,507 14,987 1,091 4,309 3,471,770 2,863,008Total segment current assets 755,911 327,853 25,828 35,721 26,550,223 21,479,256
Total segment assets 12,548,612 8,341,940 517,705 682,470 89,300,895 73,973,114 Investment in equity accounted investees 5,655,456 5,846,685 Corporate and other unallocated assets 9,695,164 12,334,618 Total assets 104,651,515 92,154,417
Segment liabilitiesNon-current liabilitiesBorrowings 202,482 51,744 271,107 312,612 21,649,466 18,049,392 Employee benefits 52,102 58,066 1,105 2,536 1,006,787 1,009,575 Capital Grants - - - - 15,975 27,456 Trade and other payables 244,747 169,679 - - 364,547 169,679 Deferred tax liabilities 441,685 399,515 - - 689,657 885,670 Total segment non-current liabilities 941,016 679,004 272,212 315,148 23,726,432 20,141,772
Current liabilitiesTrade and other payables 1,015,382 1,010,625 52,734 149,798 23,568,800 16,667,267 Current tax liabilities 22,163 18,728 - 837 3,962,744 3,537,287 Borrowings 172,369 388,163 93,982 127,910 10,616,587 15,275,670 Total segment current liabilities 1,209,914 1,417,516 146,716 278,545 38,148,131 35,480,224
Total segment liabilities 2,150,930 2,096,520 418,928 593,693 61,874,563 55,621,996 Corporate and other unallocated liabilities 9,433,939 5,218,709 Total liabilities 71,308,502 60,840,705

128
Notes to the Financial Statements
C T HOLDINGS PLCAnnual Report 2021 2022
33. Commitments
The capital expenditure commitments of the Company and Group approved by the Directors were as follows:
33.1 Capital commitments
In thousands of rupees Group CompanyAs at 31st March 2022 2021 2022 2021
(a) Subsidiary company Cargills (Ceylon) PLCApproved and contracted 3,047,782 2,157,569 - -
33.2 Financial commitments
In thousands of rupees Group CompanyAs at 31st March 2022 2021 2022 2021
(a) Settlement of letter of credits and import bills 495,341 2,018,360 - -495,341 2,018,360 - -
34. Contingent liabilities
34.1 IFRIC 23 - Uncertainty over Income Tax Treatments
34.1.1 Deferred tax on Freehold LandThe Inland Revenue Act No. 24 of 2017 and new tax rates including capital gains taxes were effective from 1 April 2018. Accordingly, the income tax charge for the year ended 31 March 2022 has been computed at rates applicable to the year of assessment 2021/22. The provision for deferred tax as at 31 March 2022 has been calculated at 10% on capital gains arising from revalued Land applicable post 1 April 2018.
The uncertain tax treatment relates to the interpretation of the new law relating to freehold land for tax purposes, where the Group had to exercise judgement to determine the provision required for deferred taxes on capital gains applicable to freehold land.
Having sought independent professional legal advice, the Group is of the view that the freehold land used in the business falls under the category of “Investment Assets” and that it is likely that the taxation authorities would accept the Group’s tax treatment and accordingly, deferred tax has been provided on the related gain on revaluation post 1 April 2018.
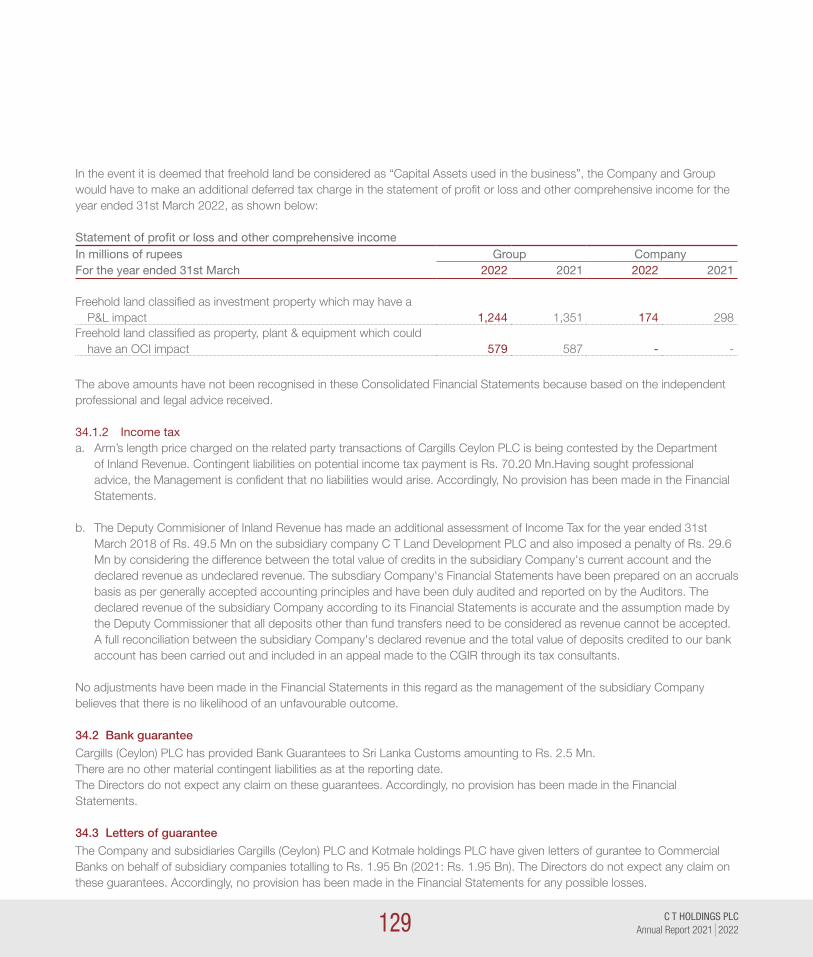
129 C T HOLDINGS PLCAnnual Report 2021 2022
In the event it is deemed that freehold land be considered as “Capital Assets used in the business”, the Company and Group would have to make an additional deferred tax charge in the statement of profit or loss and other comprehensive income for the year ended 31st March 2022, as shown below:
Statement of profit or loss and other comprehensive incomeIn millions of rupees Group CompanyFor the year ended 31st March 2022 2021 2022 2021
Freehold land classified as investment property which may have a P&L impact 1,244 1,351 174 298Freehold land classified as property, plant & equipment which could have an OCI impact 579 587 - -
The above amounts have not been recognised in these Consolidated Financial Statements because based on the independent professional and legal advice received.
34.1.2 Income taxa. Arm’s length price charged on the related party transactions of Cargills Ceylon PLC is being contested by the Department
of Inland Revenue. Contingent liabilities on potential income tax payment is Rs. 70.20 Mn.Having sought professional advice, the Management is confident that no liabilities would arise. Accordingly, No provision has been made in the Financial Statements.
b. The Deputy Commisioner of Inland Revenue has made an additional assessment of Income Tax for the year ended 31st March 2018 of Rs. 49.5 Mn on the subsidiary company C T Land Development PLC and also imposed a penalty of Rs. 29.6 Mn by considering the difference between the total value of credits in the subsidiary Company's current account and the declared revenue as undeclared revenue. The subsdiary Company's Financial Statements have been prepared on an accruals basis as per generally accepted accounting principles and have been duly audited and reported on by the Auditors. The declared revenue of the subsidiary Company according to its Financial Statements is accurate and the assumption made by the Deputy Commissioner that all deposits other than fund transfers need to be considered as revenue cannot be accepted. A full reconciliation between the subsidiary Company's declared revenue and the total value of deposits credited to our bank account has been carried out and included in an appeal made to the CGIR through its tax consultants.
No adjustments have been made in the Financial Statements in this regard as the management of the subsidiary Company believes that there is no likelihood of an unfavourable outcome.
34.2 Bank guarantee
Cargills (Ceylon) PLC has provided Bank Guarantees to Sri Lanka Customs amounting to Rs. 2.5 Mn.There are no other material contingent liabilities as at the reporting date.The Directors do not expect any claim on these guarantees. Accordingly, no provision has been made in the Financial Statements.
34.3 Letters of guarantee
The Company and subsidiaries Cargills (Ceylon) PLC and Kotmale holdings PLC have given letters of gurantee to Commercial Banks on behalf of subsidiary companies totalling to Rs. 1.95 Bn (2021: Rs. 1.95 Bn). The Directors do not expect any claim on these guarantees. Accordingly, no provision has been made in the Financial Statements for any possible losses.

130
Notes to the Financial Statements
C T HOLDINGS PLCAnnual Report 2021 2022
35 Events after the reporting period
(a) Surcharge TaxSurcharge Tax Act No. 14 of 2022 was enacted on 8th April 2022 and is applicable to the Group as the collective taxable income of companies belonging to the Group,calculated in accordance with the provisions of the Inland Revenue Act No. 24 of 2017, exceeds Rs. 2,000 Mn, for the year of assessment 2020/21. The liability is computed at the rate of 25% on the taxable income of the individual Group companies, net of dividends from Subsidiaries.
As the Act was certified by the Speaker of Parliament after the financial reporting date, no liability has been recognised in financial year 2021/22 on account of the one-off Surcharge Tax as the law had not been enacted as at 31st March 2022.
Total Surcharge Tax liability of Rs. 1,081.19 Mn will be recognized in the Financial Statements of financial year 2022/23 for the Group as an adjustment to the 1st April 2021 retained earnings in the Statement of Changes in Equity as per the Statement of Alternative Treatment (SoAT) issued by The Institute of Chartered Accountants of Sri Lanka.
On 20th April 2022, the Group paid Rs. 540.59 Mn on account of the first instalment of the Surcharge Tax liability with the balance payable on 20th July 2022.
(b) Changes to tax lawsAccording to the Gazette No 2282/26 enacted on 31st May 2022, Value Added Tax (VAT) charged based on the Value Added Tax Act No 14 of 2002 as amended by Act No 6 of 2005, has been increased from 8% to 12% effective from 1st June 2022.
(c) Economic UncertaintySri Lankan economy showed signs of recovery from the impact of COVID-19 pandemic during the year ended 31 March 2022. However, from late March 2022, the Sri Lankan economy presented a negative outlook mainly due to insufficient foreign reserves/liquidity and the global price increases of fuel. The situation was aggravated when the credit rating of the country was downgraded to “Restricted Default (RD)” by Fitch Ratings in May 2022, following the expiry of the 30-day grace period on coupon payments that were due on 18 April 2022 on two international sovereign bonds.
The macro level issues on reserves and the free floating of the USD caused a sharp depreciation of the rupee along with an adjustment to the Standing Lending Facility Rate by 700 basis points in April, resulted in a steep increase in costs of imports and other products. The inflationary pressures could further intensify in the period ahead, driven by the build-up of aggregate demand, fuel shortages, domestic supply disruptions, and the elevated prices of commodities globally, which could also have an impact on the Group’s businesses.
The Management has considered the consequences of the current economic & political uncertainty in the country and based on its strategic plans has determined that it is not expected to have a significant impact on the Group’s operations in the foreseeable future.

131 C T HOLDINGS PLCAnnual Report 2021 2022
(d) Proposed DividendsThe Company and following subsidiaries have declared the following final dividends out of the profits for the year ended 31st March 2022
(a) Company – final dividend of Rs. 3.00 per share (on 201,406,978 shares now in issue)(b) Subsidiary, Cargills (Ceylon) PLC – final dividend of Rs. 5.00 per share (on 257,677,731 shares now in issue)
The above final dividends are to be submitted for approval by the shareholders at the respective Annual General Meetings of the companies concerned. As required by the Section 56 (2) of the Companies Act No. 7 of 2007, the Boards of Directors of the respective companies have confirmed that the Companies concerned satisfy the ‘Solvency test’. In accordance with LKAS 10 - “Events after the reporting period”, the proposed dividends have not been recognised as a liability in the Financial Statements.
Other than the above mentioned events no material events have occurred since the reporting date which require adjustments to or disclosure in the Financial Statements.
36. Going Concern
C T Properties LimitedThe Group recorded accumulated losses of Rs.1,629,377,716/- as at 31st March 2022 (2021: Rs. 1,599,121,794/-). This indicates the existence of a material uncertainty which may cast significant doubt about the Company’s ability to continue as a going concern. Note 16.2(g) indicates a potential restriction on the realisability of a land owned by the subsidiary. However, the net realisable values of the property assets and investments exceed the value at which such assets are stated in the statement of financial position. Further, the related party dues would not be demanded for repayment in a manner that would affect the Company’s ability to function as a going concern due to the investments and borrowings for the same operations. Having taken into consideration the financial position and future prospects, the Directors have a reasonable expectation that the Company has adequate resources to continue to be in operation in the foreseeable future. Accordingly, the Directors have adopted a Going Concern method of accounting of the subsidiary concerned as at the reporting date.
C T Real Estate ( Pvt) LimitedThe Company had accumulated losses as at the reporting date of Rs. 85,354,685 (2021: Rs. 85,838,477) and Company's total liabilities exceeded its total assets by Rs. 84,106,329 (2021: Rs. 84,590,121) . These factors indicate the existence of a material uncertainty which may cast significant doubt about the Company's ability to continue as a going concern. In order to mitigate this going concern, it was resolved at the Extra Ordinary General Meeting of the Board of Directors of C T Properties Limited held on 4 August 2017 that, Group companies will not claim any borrowings or liabilities that would adversely affect the financial position of the Company. However, the financial statements of the Company have been prepared on a going concern basis without making adjustments that may be required to reclassify assets and liabilities, if the Company is unable to continue as a going concern. The validity of the above going concern assumption is based on the financial support of its ultimate parent company, C T Holdings PLC.

132
Notes to the Financial Statements
C T HOLDINGS PLCAnnual Report 2021 2022
C T Properties G S ( Pvt) LimitedThe Company's accumulated losses amounts to Rs. 312,625,413 as at 31 March 2022 (2021: Rs. 320,295,625) and company's total current liabilities exceeds current assets by Rs. 691,470,713 (2021 : Rs. 690,140,925). These factors indicate an existence of a material uncertainty which may cast significant doubt about the Company's ability to continue as a going concern. In order to mitigate this going concern, it was resolved at the Extra Ordinary General Meeting of the Board of Directors of C T Properties Limited held on 4 August 2017 that in respect of the property situated at Kotahena, carried at value of Rs. 1,528,500,000, the Company would look to dispose the property at a price higher than the carrying value due to the piling work already done at the site. Therefore, the financial statements of the Company have been prepared on a going concern basis without making adjustments that may be required to reclassify assets and liabilities, if the Company is unable to continue as a going concern.
The validity of the above going concern assumption is based on the financial support of its ultimate parent Company C T Holdings PLC.
C T Property Management Company ( Pvt) LimitedThe Company had accumulated losses as at the reporting date of Rs. 2,361,005 (2021: Rs. 2,235,244) and Company's total liabilities exceeded its total assets by Rs. 2,360,985 (2021: Rs. 2,235,224). These factors indicate the existence of a material uncertainty which may cast significant doubt about the Company's ability to continue as a going concern.
In order to mitigate this going concern, it was resolved at the Extra Ordinary General Meeting of the Board of Directors of C T Properties Limited held on 4 August 2017 that the Group companies will not claim any borrowings or liabilities that would adversely affect the financial position of the Company.
However, the financial statements of the Company have been prepared on a going concern basis without making adjustments that may be required to reclassify assets and liabilities, if the Company is unable to continue as a going concern. The validity of the above going concern assumption is based on the financial support of its ultimate parent company, C T Holdings PLC. Further, the Company does not have any source of revenue for the year and has terminated all employees.
Ceylon Theatres (Pvt) LtdThe Company had net current asset deficiency of Rs. 198,339,455 as at 31 March 2022 (2021 : Rs. 242,823,818) and has recognized current year losses of Rs. 152,327,779 (2021 : 161,514,269). Notwithstanding this, the financial statements have been prepared on a going concern basis. The Company is fairly confident that it can secure amendments to the covenants and to the terms of its current bank borrowings. At this time, the Company is attempting to secure various options from its lenders to amend the terms of its credit facilities.The continuation of the Company’s activities depends on the resumption of its operations

133 C T HOLDINGS PLCAnnual Report 2021 2022
within a reasonable time and restore, and then maintain, its profitability. These financial statements do not reflect adjustments that would be necessary if the going concern assumption were not appropriate. This is because management believes that the aforementioned measures it has taken or intends to take will mitigate the effect of the conditions and events that cast doubt on the appropriateness of this assumption.
37. Assessment of going concern
The Financial Statements of C T Holdings PLC for the year ended 31 March 2022, have been prepared on the basis that the Company is a going concern.
Based on the prevailing information, the management has considered the consequences of the uncertainty faced by the country and, whilst these challenges would have a bearing on the inflation, consumer demand and supply chain, Company has adapted strategies to mitigate its impact and does not contemplate a significant doubt upon the entity’s ability to continue as a going concern.
38. Comparative information
Comparative Information is re-classified wherever necessary to conform to the current year’s presentation in order to provide a better presentation.
39. Directors’ responsibility statement
Board of Directors is responsible for the preparation and fair presentation of these Financial Statements in accordance with Sri Lanka Accounting Standards.
The Board of Directors acknowledges their responsibility for Financial Statements as set out in the Annual Report of the Board of Director’s, Statement of Directors’ Responsibility, and the certification on the Statement of Financial Position.

134C T HOLDINGS PLCAnnual Report 2021 2022
FIVE YEAR REVIEW – GROUP
As at / for the year ended 31st March 2022 2021 2020 2019 2018In thousands of rupees
Financial ResultsRevenue 136,872,756 112,940,971 107,817,065 95,547,360 92,134,483 Results from operations 8,668,900 7,179,102 7,170,944 5,233,973 6,802,234 Net finance costs (3,372,811) (2,598,434) (2,680,731) (1,425,141) (1,319,208)Profit before taxation 5,468,375 4,311,617 4,254,692 3,888,474 5,791,257 Tax expenses (1,298,070) (990,348) (1,532,815) (1,504,237) (2,051,792)Profit after tax for the year from discontinued operations - - - - - Profit for the year 4,170,305 3,321,269 2,721,877 2,384,237 3,739,465
Attributable to -Owners of the parent 2,838,029 2,061,487 1,404,986 1,642,617 2,597,342 Non-controlling Interest 1,332,276 1,259,782 1,316,891 741,620 1,142,123
4,170,305 3,321,269 2,721,877 2,384,237 3,739,465
Financial PositionStated capital 6,489,758 6,489,758 6,489,758 6,489,758 6,489,758 Reserves 17,297,565 16,869,437 14,700,088 14,958,595 14,167,708 Total equity attributable to equity holders of the parent 23,787,323 23,359,195 21,189,846 21,448,353 20,657,466 Non-controlling interest 9,555,690 7,954,517 5,317,420 4,765,746 4,239,636 Total equity 33,343,013 31,313,712 26,507,266 26,214,099 24,897,102
BorrowingsNon-current borrowings 13,760,074 19,368,972 19,112,192 16,935,443 14,719,710 Non-current payables 181,187 169,679 169,608 3,456,493 3,089,325
13,941,261 19,538,651 19,281,800 20,391,936 17,809,035
Net AssetsCurrent assets 27,214,972 22,545,215 21,196,782 21,026,746 18,717,656 Current liabilities (41,460,075) (39,581,165) (40,077,347) (34,569,514) (30,865,988)Net current liabilities (14,245,103) (17,035,950) (18,880,565) (13,542,768) (12,148,332)Non-current liabilities (29,848,427) (21,259,540) (13,784,294) (6,555,370) (5,973,075)Non-current assets 77,436,543 69,609,202 59,172,125 46,312,237 43,018,509 Total net assets 33,343,013 31,313,712 26,507,266 26,214,099 24,897,102
Ratios & StatisticsGrowth in revenue (%) 21.19 4.75 12.84 3.70 8.35 Earnings per share (Rs.) 14.09 10.24 6.98 8.16 12.90 Growth in earnings (%) 37.67 46.73 (14.47) (36.76) 48.60 Shareholders’ funds per share (Rs.) 118.11 115.98 104.71 106.49 102.57 Growth in shareholders’ funds (%) 1.83 10.76 (1.67) 3.83 9.91 Return on shareholders’ funds (%) 11.93 8.83 6.66 7.66 12.58 Non-current assets to shareholders’ funds (%) 325.54 297.99 280.58 215.92 208.25 Current ratio (times) 0.66 0.57 0.53 0.61 0.61 Debt equity ratio (times) 0.42 0.62 1.14 0.78 0.72 Dividend per share (Rs.) 4.55 4.35 4.60 5.50 5.50 Dividend cover (times) 3.10 2.35 1.52 1.48 2.35 Market price per share (Rs.) 151.50 170.00 160.00 162.90 175.00 Price earnings ratio (times) 10.75 16.60 22.94 19.97 13.57 Net asset value per share 165.55 155.47 131.61 130.15 123.62
NoteAll per share details have been calculated, for all periods, based on the number of shares in issue as at 31st March 2022.

135 C T HOLDINGS PLCAnnual Report 2021 2022
GROUP DIRECTORY
Parent companyC T Holdings PLCAddress: No 8, Sir Chittampalam A Gardiner Mawatha, Colombo 02.
Phone: +94112431243
Fax: +94112447956
Email: [email protected]
Chairman Emeritus: Mr. Anthony A Page
Directors: Louis Page (Chairman), Ranjit Page, Priya Edirisinghe, J B L De Silva, Cecilia Page Muttukumaru, Dr. A Aravinda Page, Joseph Page, A D B Talwatte, Imtiaz Abdul Wahid, S C Niles
Retail and Wholesale DistributionCargills (Ceylon) PLCAddress: 40, York Street, Colombo 01.
Phone: +94112427777
Fax: +94112338704
Email: [email protected]
Directors: Louis Page (Chairman), Ranjit Page, Imtiaz Abdul Wahid, Priya Edirisinghe, Sanjeev Gardiner, Y Kanagasabai, Joseph Page, Errol Perera, Asoka Pieris, Ms. Indira Malwatte, Asite Talwatte, Dilantha Jayawardhana (w. e. f. 01 July 2021)
Cargills Foods Company (Private) LimitedAddress: 40, York Street, Colombo 01
Phone: +94112427777
Fax: +94112338704
Directors: Ranjit Page (Chairman), Imtiaz Abdul Wahid, Asoka Pieris, Priya Edirisinghe, Y Kanagasabai,
Millers LimitedAddress: 40 York Street, Colombo 1
Phone: +94112427777
Fax: +94112338704
Directors: Imtiaz Abdul Wahid, D G O Dias, Dilantha Jayawardhana
FMCGCargills Quality Foods LimitedAddress: 40, York Street, Colombo 01.
Phone: +94112427777
Fax: +94112338704
Directors: Ranjit Page (Chairman), Imtiaz Abdul Wahid, S L W Dissanayake, Dilantha Jayawardhana, Mahinda Ganepola
Cargills Distributors (Private) LimitedAddress: 40, York Street, Colombo 01.
Phone: +94112427777
Fax: +94112338704
Directors: Imtiaz Abdul Wahid, Dilantha Jayawardhana
Cargills Quality Dairies (Private) LimitedAddress: 40, York Street, Colombo 01.
Phone: +94112427777
Fax: +94112338704
Directors: Imtiaz Abdul Wahid, D G O Dias, S L W Dissanayake, Dilantha Jayawardhana, Saranga Wijesundara
Cargills Agrifoods LimitedAddress: 40, York Street, Colombo 01.
Phone: +94112427777
Fax: +94112338704
Directors: Imtiaz Abdul Wahid, Dilantha Jayawardhana , Buddhisha Herath
CPC (Lanka) LimitedAddress: 40, York Street, Colombo 01.
Phone: +94112427777
Fax: +94112338704
Directors: Imtiaz Abdul Wahid, Dilantha Jayawardhana

136C T HOLDINGS PLCAnnual Report 2021 2022
Group Directory
Ceylon Agro Development Company (Private) LimitedAddress: 40, York Street, Colombo 01.
Phone: +94112427777
Fax: +94112338704
Directors: Imtiaz Abdul Wahid, Haridas Fernando, Keerthi Gunasekara, Talaal Maruzook, Saranga Wijesundara
Kotmale Holdings PLCAddress: 40, York Street, Colombo 01.
Phone: +94112427777
Fax: +94112338704
Directors: Ranjit Page (Chairman), Imtiaz Abdul Wahid, Priya Edirisinghe, Joseph Page, Asite Talwatte, Saranga Wijesundara
Kotmale Products LimitedAddress: 40, York Street, Colombo 01.
Phone: +94112427777
Fax: +94112338704
Directors: Imtiaz Abdul Wahid, S L W Dissanayake
Kotmale Milk Foods LimitedAddress: 40, York Street, Colombo 01.
Phone: +94112427777
Fax: +94112338704
Directors: Imtiaz Abdul Wahid, S L W Dissanayake
Kotmale Dairy Products (Private) LimitedAddress: 40, York Street, Colombo 01.
Phone: +94112427777
Fax: +94112338704
Directors: Imtiaz Abdul Wahid, S L W Dissanayake
Kotmale Milk Products LimitedAddress: 40, York Street, Colombo 01.
Phone: +94112427777
Fax: +94112338704
Directors: Imtiaz Abdul Wahid, S L W Dissanayake
Cargills Frozen Products (Pvt) LimitedAddress: 40, York Street, Colombo 01.
Phone: +94112427777
Fax: +94112338704
Directors: Imtiaz Abdul Wahid, D G O Dias, S L W
Dissanayake, Dilantha Jayawardhana
Cargills Quality Confectionaries (Private) LimitedAddress: 40, York Street, Colombo 01.
Phone: +94112427777
Fax: +94112338704
Directors: Imtiaz Abdul Wahid, Dilantha Jayawardhana, Buddhisha Herath
Cargills Enterprise Solutions (Private) LimitedAddress: 40, York Street, Colombo 01.
Phone: +94112427777
Fax: +94112338704
Directors: V R Page (Chairman), Rohan Muttiah, S C Niles, Imtiaz Abdul Wahid
RestaurantsCargills Food Processors (Private) LimitedAddress: 40, York Street, Colombo 01.
Phone: +94112427777
Fax: +94112338704
Directors: Imtiaz Abdul Wahid, Dilantha Jayawardhana
Cargills Foods Services (Private) LimitedAddress: 40, York Street, Colombo 01.
Phone: +94112427777
Fax: +94112338704
Directors: Imtiaz Abdul Wahid, Dilantha Jayawardhana

137 C T HOLDINGS PLCAnnual Report 2021 2022
Real EstateC T Land Development PLCAddress: 4th Floor, Majestic City, 10 Station Road, Colombo 04.
Phone: +94112508673-4
Fax: +94112592427
Email: [email protected]
Directors: Louis Page (Chairman from 27 December 2021), R Selvaskandan (Chairman up to 27 December 2021), Joseph Page, Mrs. M G Perera (up to 30 September 2021), Priya Edirisinghe, Sunil Mendis (up to 2 July 2021), S C Niles, Ranjit Page, Dr. T Senthilverl, Priyan Edirisinghe (from 1 October 2021), Suren Madanayake (from 1 October 2021), Joel Selvanayagam (from 23 February 2022).
C T Properties LimitedAddress: 28th Floor, West Tower, World Trade Centre, Colombo 01.
Phone: +94112005700
Fax: +9411233672
Email: [email protected]
Directors: Ranjit Page (Chairman), R Selvaskandan (Chairman up to 30 December 2021), Joseph Page (up to 13 January 2022), S C Niles, Louis Page, Errol Perera (up to 7 January 2022), Jayantha Perera (up to 9 January 2022).
C T Property Management Company (Private) LimitedAddress: 28th Floor, West Tower, World Trade Centre, Colombo 01.
Phone: +94112005700
Fax: +94112336727
Directors: R Selvaskandan (Chairman up to 30 December 2021), Joseph Page (up to 13 January 2022), S C Niles, Louis Page, Errol Perera (up to 7 January 2022), Jayantha Perera (up to 9 January 2022).
C T Real Estate (Private) LimitedAddress: 28th Floor, West Tower, World Trade Centre, Colombo 01.
Phone: +94112005700
Fax: +94112336727
Directors: R Selvaskandan (Chairman up to 30 December 2021), Joseph Page (up to 13 January 2022), Cecilia Page Muttukumaru (up to 7 January 2022), S C Niles, Louis Page, Errol Perera (up to 7 January 2022), Jayantha Perera (up to 9 January 2022).
C T Properties Lakeside (Private) LimitedAddress: 28th Floor, West Tower, World Trade Centre, Colombo 01.
Phone: +94112005700
Fax: +94112336727
Directors: R Selvaskandan (Chairman up to 30 December 2021), Joseph Page (up to 13 January 2022), Cecilia Page Muttukumaru (up to 7 January 2022), S C Niles, Louis Page, Errol Perera (up to 7 January 2022), Jayantha Perera (up to 9 January 2022).
C T Properties G S (Private) LtdAddress: 28th Floor, West Tower, World Trade Centre, Colombo 01.
Phone: +117468500
Fax: +117468502
Directors: Louis Page (alternate - R Selvaskandan up to 30 December 2021), Ranjit Page (alternate - S C Niles)
Dawson Office Complex (Private) LimitedAddress: 40 York Street, Colombo 01.
Phone: +94112427777
Fax: +94112338704
Director: Imtiaz Abdul Wahid, Dilantha Jayawardhana
Frederick North Hotel Company (Private) LimitedAddress: 40 York Street, Colombo 01.
Phone: +94112427777
Fax: +94112338704
Directors: Imtiaz Abdul Wahid, S C Niles
The Empire Investment Company (Private) LimitedAddress: 40 York Street, Colombo 01.
Phone: +94112427777
Fax: +94112338704
Directors: Ranjit Page, S C Niles, Anthony A. Page

138C T HOLDINGS PLCAnnual Report 2021 2022
Group Directory
EntertainmentCeylon Theatres (Private) LimitedAddress: No 8, Sir Chittampalam A Gardiner Mawatha, P O Box 2042, Colombo 02.
Phone: +94112431243,
+94112555565
Fax: +94112447956
Directors: Louis Page (Chairman), Joseph Page, Ranjit Page (from 18 March 2022), Cecilia Page Muttukumaru (up to 7 January 2022), S C Niles, Errol Perera, Mrs. M G Perera (up to 12 September 2021), Imtiaz Abdul Wahid, Amali David (from 18 March 2022).
Banking & Financial ServicesCargills Bank LimitedAddress: 696 Galle Road, Colombo 04.
Phone: +94117640000
Fax: +94112055575
Email: [email protected],
Directors: Ranjit Page (Chairman), Senarath Bandara, Prabhu Mathavan, Faizal Salieh, Richard Ebell, Ruvini Fernando, Marianne Page, Yudhishtran Kanagasabai, Buwaneka Perera
C T CLSA Holdings LimitedAddress: 4-15, Majestic City, 10 Station Road, Colombo 04.
Phone: +94112552290
Fax: +94112552289
Directors: Priya Edirisinghe (Chairman), Cecilia Page Muttukumaru, Ranjit Page, Edward Park, Zakir Mohamedally
C T CLSA Securities (Private) LimitedAddress: 4-14, Majestic City, 10 Station Road, Colombo 04.
Phone: +94112552290
Fax: +94112552289
Email: [email protected]
Directors: Cecilia Page Muttukumaru (Chairperson), Priya Edirisinghe, Kanishka Hewage (up to 24 September 2021), Edward Park, Sundarajee Sivashanth (from 26 October 2021).
C T CLSA Capital (Private) LimitedAddress: 4-15 A, Majestic City, 10 Station Road, Colombo 04.
Phone: +94112584843,
+94112503523
Fax: +94112580181
Email: [email protected]
Directors: Cecilia Page Muttukumaru (Chairperson), S C Niles, Edward Park, Zakir Mohamedally
C T CLSA Asset Management (Private) Limited (former name: Comtrust Asset Management (Pvt) Ltd.)Address: 4-07, Majestic City, 10 Station Road, Colombo 04.
Phone: +94112506347,
+94112506204
Fax: +94112506347
Email: [email protected]
Directors: Cecilia Page Muttukumaru (Chairperson), Joseph Page, Edward Park, Zakir Mohamedally

139 C T HOLDINGS PLCAnnual Report 2021 2022
INFORMATION OF SHAREHOLDERS
1. Distribution of Shareholders
Size of Shareholdings 31 Mach 2022 31 Mach 2021
Shareholders Holding Shareholders Holding
Numbers % Numbers % Numbers % Numbers %
1 - 1,000 Shares 700 49.05 125,045 0.06 760 49.64 143,598 0.07
1,001 - 10,000 Shares 410 28.74 1,613,718 0.80 443 28.94 1,722,031 0.86
10,001 - 100,000 Shares 250 17.52 7,355,396 3.65 260 16.98 7,819,679 3.88
100,001 - 1,000,000 Shares 51 3.57 17,555,288 8.72 51 3.33 16,001,337 7.94
Over 1,000,000 Shares 16 1.12 174,757,531 86.77 17 1.11 175,720,333 87.25
Total 1,427 100.00 201,406,978 100.00 1,531 100.00 201,406,978 100.00
2. Analysis of Shareholders
Size of Shareholdings 31 Mach 2022 31 Mach 2021
Shareholders Holding Shareholders Holding
Numbers % Numbers % Numbers % Numbers %
Institutions 117 8.20 117,599,884 58.39 123 8.03 118,372,470 58.77
Individuals 1,310 91.80 83,807,094 41.61 1,408 91.97 83,034,508 41.23
Total 1,427 100.00 201,406,978 100.00 1,531 100.00 201,406,978 100.00
Size of Shareholdings 31 Mach 2022 31 Mach 2021
Shareholders Holding Shareholders Holding
Numbers % Numbers % Numbers % Numbers %
Residents 1,300 91.10 176,062,075 87.42 1,398 91.31 176,292,331 87.53
Non residents 127 8.90 25,344,903 12.58 133 8.69 25,114,647 12.47
Total 1,427 100.00 201,406,978 100.00 1,531 100.00 201,406,978 100.00

140C T HOLDINGS PLCAnnual Report 2021 2022
Information of Shareholders
3. Major Shareholders
The holdings of the top 20 shareholders
Name of Shareholder 31 Mach 2022 31 Mach 2021
Number of Shares
% Number of Shares
%
Odeon Holdings (Ceylon) (Pvt) Ltd 84,781,323 42.09 84,781,323 42.09
Mr.Anthony A. Page 17,501,287 8.69 17,501,287 8.69
Mr.Ranjit Page 17,235,454 8.56 16,788,809 8.34
Ms. M.M.Page 11,043,098 5.48 10,899,173 5.41
Sir Chittampalam A Gardiner Trust 10,120,004 5.02 10,120,004 5.02
Employees Provident Fund 7,686,987 3.82 7,686,987 3.82
Mr. Joseph Page 7,069,172 3.51 7,069,172 3.51
Mrs. T. Selvaratnam 5,667,250 2.81 5,667,250 2.81
Mrs. Tanya Selvaratnam 2,821,500 1.40 2,821,500 1.40
Mr. T. Selvaratnam 2,821,500 1.40 2,821,500 1.40
Mrs.Cecillia Page Muttukumaru 1,646,731 0.82 1,460,266 0.73
Citibank New York S/A Norges Bank Account 2 1,477,015 0.73 1,526,018 0.76
Mr. A.I. Dominic Antoine Indrajit 1,429,940 0.71 - -
Mrs. P.R .Page 1,276,747 0.63 1,002,884 0.50
Mrs. A.M.Basnayake 1,125,448 0.56 1,078,473 0.54
SSBT- Sunsuper Pty. Ltd. As Trustee for Sunsuper Superannuation Fund 1,054,075 0.52 927,107 0.46
SSBT- Retail Employees Superannuation Trust 960,100 0.48 1,487,829 0.74
Nothern Trust Company S/A Hosking Global Fund PLC 958,629 0.48 1,384,808 0.69
The Gale Face Hotel Co. Ltd 915,503 0.45 915,503 0.45
Citibank Hong Kong S/A Hostplus Pooled Superannuation Trust 820,996 0.41 820,996 0.41
Melstacorp PLC - - 1,623,050 0.81
178,412,759 88.58 178,383,939 88.57
Others 22,994,219 11.42 23,023,039 11.43
Total 201,406,978 100.00 201,406,978 100.00

141 C T HOLDINGS PLCAnnual Report 2021 2022
4. Share Valuation
The market value of ordinary shares of the Company on 31st March 2022 was Rs. 151.50 (2021 - Rs. 170.00). The highest and lowest values recorded during the year ended 31st March 2022 were Rs. 190.00 (2021 - Rs 198.00) and Rs. 150.00 (2021 - Rs. 136.00) respectIvely.
5. Public Shareholding
Description 2022 2021
Shareholders (No's) 1,414 1,517
Shareholding (%) 35.19% 35.56%
Float adjusted market capitalisation (Rs.'000) 10,738,402 12,176,585
The Company complies with the minimum public holding requirement of the main board as per option 1 of Section 7.13.1 (a) of the CSE Listing Rules.

142C T HOLDINGS PLCAnnual Report 2021 2022
NOTES

143 C T HOLDINGS PLCAnnual Report 2021 2022
NOTICE OF ANNUAL GENERAL MEETING
Notice is hereby given that the Ninety First Annual General Meeting (AGM) of C T Holdings PLC will be held at the Board Room of the Company’s Corporate Office at Level 28, West Tower, World Trade Centre, Echelon Square, Colombo 01 to be convened through an ‘online virtual’ platform by using ‘audio visual’ tools on Friday 29 July 2022 at 10.00 a.m. and the business to be brought before the meeting will be:
To Read the Notice convening the Meeting, and1) To receive and consider the Annual Report of the Directors and the financial
statements for the year ended 31st March 2022 with the report of the Auditors thereon.
2) To declare a dividend as recommended by the Directors.3) To re-elect Directors a. Dr. A. Aravinda Page, and b. Mr. A. D. B. Talwatte, who retire by rotation, and c. Mr. L. R. Page, d. Mr. J B L De Silva, e. Mr. A T P Edirisinghe, f. Ms. Cecilia Page Muttukumaru, who retire in terms of Section 210 2 (a) & (b)
of the Companies Act No. 07 of 2007 having surpassed seventy years of age and offer themselves for re-election in terms of Section 211 (1) and (2) of the Companies Act No, 07 of 2007.
Ordinary Resolution (i)“Resolved that Mr. L. R. Page, a retiring Director, who has attained the age of Seventy-two years be and is hereby reappointed a Director of the Company and it is hereby declared that the age limit of Seventy years referred to in Section 210 of the Companies Act No. 07 of 2007 shall not apply to the appointment of the said Director”, and
Ordinary Resolution (ii)“Resolved that Mr. J B L De Silva, a retiring Director, who has attained the age of Seventy-five years be and is hereby reappointed a Director of the Company and it is hereby declared that the age limit of Seventy years referred to in Section 210 of the Companies Act No. 07 of 2007 shall not apply to the appointment of the said Director”, and
Ordinary Resolution (iii)“Resolved that Mr. A T P Edirisinghe, a retiring Director, who has attained the age of Seventy-six years be and is hereby reappointed a Director of the Company and it is hereby declared that the age limit of Seventy years referred to in Section 210 of the Companies Act No. 07 of 2007 shall not apply to the appointment of the said Director”, and
Ordinary Resolution (iv)“Resolved that Ms. Cecilia Page Muttukumaru, a retiring Director, who has attained Seventy years of age be and is hereby reappointed a Director of the Company and it is hereby declared that the age limit of Seventy years referred to in Section 210 of the Companies Act No. 07 of 2007 shall not apply to the appointment of the said
Director”, and4) To authorise the Directors to
determine contributions to charities.5) To authorise the Directors to
determine the remuneration of the Auditors, Messrs. KPMG, who are deemed re-appointed as auditors at the Annual General Meeting of the Company in terms of Section 158 of the Companies Act No. 7 of 2007.
The Annual Report and Financial Statements of C T Holdings PLC for the year ended 31 March 2022 is available on:The Colombo Stock Exchange website – https://www.cse.lk/home/company-info/CTH.N0000/financial
Taking into consideration the waiver of the CSE Listing Rule 7.5 (b)(i) in relation to providing hard copies of the Annual Report for the financial year ended 31 March 2022, the members are advised to refer to the website noted above, as a printed copy of the Annual Report will not be provided on request due to the limited availability of paper in the market.
For clarification on how to download and / or access the Annual Report and Financial Statements, please contact the undersigned on +94 77 772 6582 during normal office hours (8.30 a.m. to 5.00 p.m.).
By order of the BoardC T Holdings PLC
(Signed)S L W DissanayakeCompany Secretary
Colombo06 July 2022

144C T HOLDINGS PLCAnnual Report 2021 2022
Notes:(i) A member is entitled to appoint a proxy to attend and vote at the meeting in his or her stead and the proxy need not be a
member of the Company. A Form of Proxy is enclosed for this purpose.
(ii) The Board of Directors, having taken note of the health and safety guidelines issued by the Health Authorities in view of the covid-19 pandemic and the Colombo Stock Exchange issuing guidelines to the listed entities to hold Shareholder Meetings virtually, has decided to hold the Annual General Meeting (AGM) through an online/digital platform in conformity with the applicable regulatory provisions.
(iii) Shareholders who wish to participate in the Annual General Meeting through the online platform are kindly requested to complete and forward the “Registration of Shareholder details form” with e-signature or scan of the signed document to the email address [email protected] with the email subject title “ CTH AGM 2022” or post it to the registered address mentioned below to be received not less than 48 hours before the date of the meeting.
Shareholders are requested to provide their email address legibly in the space provided in order to forward the weblink if they wish to participate at the meeting through the online platform.
(iv) The Deputy Chairman, certain members of the Board and key essential officials for the administration of formalities to conduct the meeting, will be physically present at the Company’s Corporate Office.
(v) Voting on the items listed in the Agenda will be registered by using an online platform and the procedure to be followed when voting will be explained to the shareholders prior to the commencement of the meeting.
(vi) Shareholders who wish to appoint a member of the Directors as his/her proxy to represent them at the AGM may do so by completing the Form of Proxy accordingly. In such event the email address of the proxy holder will not be required.
(vii) Shareholders may send their questions/comments on the items listed in the Agenda of the Notice convening the AGM by email to [email protected] to be received not less than 48 hours before the date of the meeting.
(viii) The duly completed instrument appointing the proxy should be deposited at the Registered Office of the Company or a scanned copy of the same should be emailed to [email protected] to be received not less than 48 hours before the date of the meeting.
(ix) Only registered shareholders and registered proxy holders will be permitted to log-in and participate in the AGM virtually.
(x) The Company intends to proceed to hold the AGM as planned on 29 July 2022 irrespective of whether it is declared a public holiday since the aforesaid measures will enable full participation at the meeting.
(xi) In the event the Company is required to take any further action in relation to the Meeting in the best interests of the shareholders in the context of any communications, guidelines, directives or orders issued by the Government of Sri Lanka, Notice of such action shall be given by way of additional announcement/s made to the Colombo Stock Exchange.
Notice of Annual General Meeting

145 C T HOLDINGS PLCAnnual Report 2021 2022
NOTES

146C T HOLDINGS PLCAnnual Report 2021 2022

147 C T HOLDINGS PLCAnnual Report 2021 2022
FORM OF PROXY
I/We ..............................................................................................................................................................................................
bearing NIC No. .................................................................................. of ......................................................................................
.......................................................................................................................................................................................... being a
*member/members of C T HOLDINGS PLC (the Company) hereby appoint
(1) *Mr./Mrs/Miss ...........................................................................................................................................................................
bearing NIC No. of ...................................................................................................................................................................
(e-mail address ........................................................................................................................................................................)
whom failing *Mr./Mrs/Miss ....................................................................................................................................................
bearing NIC No. of....................................................................................................................................................................
(e-mail address .............................................................................................................................................).or failing him/her
(2) The Chairman of the Meeting as my/our proxy to vote as indicated for me/us and on my / our behalf at the Ninety First Annual General Meeting of the Company to be held online on 29 July 2022 and at any adjournment thereof.
No. Resolution For Against
1. To adopt the Financial Statements for the year ended 31st March 2022
2. To declare a dividend as recommended by the Directors
3a. To re-elect Dr. A. Aravinda Page as a Director
3b. To re-elect Mr. A. D. B. Talwatte as a Director
3c. To re-elect Mr. L. R. Page as a Director
3d. To re-elect Mr. J B L De Silva as a Director
3e. To re-elect Mr. A T P Edirisinghe as a Director
3f. To re-elect Ms. Cecilia Page Muttukumaru as a Director
4. To authorise the Directors to determine contribution to charities
5. To authorise the Directors to determine the remuneration of the Auditors, Messrs. KPMG, who are deemed re-appointed as Auditors at the Annual General Meeting.
Signed on this .................................................................. day of ........................................ 2022
................................................................ ............................................................Signature of member(s) Witnesses:
Note:(a) *Strike out whichever is not desired(b) Instructions as to completion of the Form of Proxy are set out in the reverse hereof(c) A Proxy holder need not be a Member of the Company(d) Please indicate with an “X” in the cage provided how your Proxy holder should vote. If no indication is given, or if there is, in
the view of the Proxy holder, any doubt (by reason of the manner in which the instructions contained in the Proxy have been completed) as to the way in which the Proxy holder should vote, the Proxy holder in his/her discretion may vote as he/she thinks fit

148C T HOLDINGS PLCAnnual Report 2021 2022
Instructions for Completion of The Proxy Form
1. To be valid, the completed Form of Proxy should be deposited at the Registered Office of the Company at No. 8, Sir Chittampalam A Gardiner Mawatha, Colombo 2, or electronic document with e-signature or scan of the signed document emailed to ‘[email protected]’, with the subject title ‘CTH-AGM 2022’ not less than 48 hours before the time appointed for holding the meeting.
2. In perfecting the Form of Proxy, please ensure that all details are legible. If you wish to appoint a person other than the Chairman as your proxy, please fill in your full name and address, the name, address and email address of the proxy holder and sign in the space provided and fill in the date of signature.
3. The instrument appointing a Proxy shall, in the case of an individual, be signed by the appointer or by his Attorney and in the case of a Corporation must be executed under its Common Seal or in such other manner prescribed by its Articles of Association or other constitutional documents.
4. If the Proxy Form is signed by an Attorney, the relevant Power of Attorney or a notarially certified copy thereof, should also accompany the completed Form of Proxy, if it has not already been registered with the Company.
5. In the case of joint holders, only one need sign. The votes of the senior holder who tenders a vote will alone be counted.
6. In the case of non-resident Shareholders, the stamping will be attended to upon the return of the completed Form of Proxy to Sri Lanka.

CORPORATE INFORMATION
Name of CompanyC T Holdings PLC
Registration NoPQ 210
Legal FormQuoted Public Company with limited liability incorporated in Sri Lanka on 29th September 1928 and re-registered under the Companies Act No. 7 of 2007.
Chairman EmeritusAnthony A Page
Board of DirectorsLouis Page (Chairman)Ranjit Page (Deputy Chairman /Managing Director)J B L De SilvaPriya EdirisingheSunil Mendis (retired 1 July 2021)Cecilia Page MuttukumaruDr. A Aravinda PageJoseph PageR Selvaskandan (resigned 31 Dec 2021)A D B TalwatteImtiaz Abdul WahidS C Niles (Executive Director)
Company SecretarySarath Dissanayake
Registered OfficeNo 8, Sir Chittampalam A Gardiner Mawatha, Colombo 2, Sri LankaTelephone: +94 11 2431243Email: [email protected]: +94 11 2447956Postal Address: PO Box 327, Colombo
Exchange ListingColombo Stock Exchange
Executive CommitteePriya Edirisinghe (Chairman)Ranjit PageJoseph PageImtiaz Abdul WahidA D B Talwatte
Audit CommitteePriya Edirisinghe (Chairman)J B L De SilvaA D B Talwatte
Remuneration CommitteeLouis Page (Chairman)J B L De SilvaPriya Edirisinghe
Nominations CommitteeLouis Page (Chairman)Priya EdirisingheRanjit Page
Related Party Transactions Review CommitteePriya Edirisinghe (Chairman)J B L De SilvaA D B Talwatte
AuditorsKPMG, Chartered Accountants
Tax ConsultantsPricewaterhouseCoopers, Chartered Accountants
BankersCargills Bank LtdCommercial Bank of Ceylon PLCHatton National Bank PLCNations Trust Bank PLCSampath Bank PLCStandard Chartered Bank

Creating Value since 1928
C T Holdings PLCNo 08, Sir Chittampalam A Gardiner Mawatha, Colombo 02.


