Embed Size (px)
Citation preview

WEATHERFORD INTERNATIONAL PLC
FIRST QUARTER 2018
APRIL 24
2018
©2018 Weatherford International plc. All rights reserved.
DISCLAIMER
2
This presentation contains forward-looking statements concerning, among other things, Weatherford’s prospects for its operations and expectations regarding future financial results which are subject to certain risks, uncertainties and assumptions. These risks and uncertainties, which are more fully described in Weatherford International plc’s reports and registration statements filed with the SEC, include but are not limited to the impact of oil and natural gas prices and worldwide economic conditions on drilling activity, the outcome of pending litigation, our ability to maintain robust internal controls over financial reporting, the demand for and pricing of Weatherford’s products and services, domestic and international economic and regulatory conditions, changes in tax and other laws affecting our business, results of our tax planning efforts, our ability to realize costs savings and business enhancements from our transformation efforts, cost cutting measures, reductions in force and facility closures and sales, effects of extreme weather conditions and global political instability. Should one or more of these risks or uncertainties materialize, or should the assumptions prove incorrect, actual results may vary materially from those currently anticipated.
This presentation includes non-GAAP financial measures which provide users of our financial information with additional meaningful comparisons between current results and results of prior periods as well as comparisons with peer companies. The non-GAAP amounts should not be considered as substitutes for operating income, provision for income taxes, net income or other data prepared and reported in accordance with GAAP, but should be viewed in addition to the Company’s reported results prepared in accordance with GAAP. Any non-GAAP measures included herein will be accompanied by a reconciliation to the nearest corresponding GAAP measures in the appendix to this presentation and on our website at https://www.weatherford.com/en/investor-relations/financial-information/non-gaap-financials/.
©2018 Weatherford International plc. All rights reserved.
FINANCIAL OVERVIEW
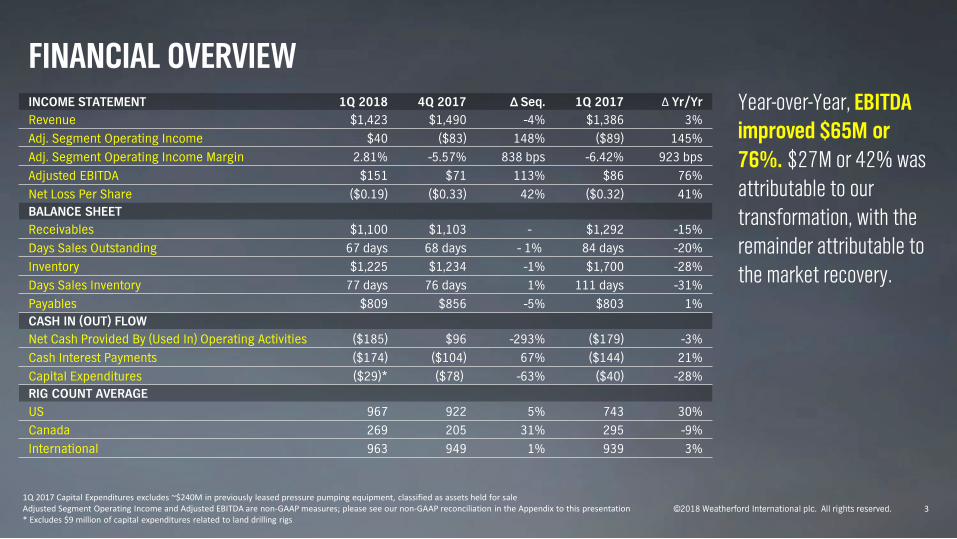
3 1Q 2017 Capital Expenditures excludes ~$240M in previously leased pressure pumping equipment, classified as assets held for sale Adjusted Segment Operating Income and Adjusted EBITDA are non-GAAP measures; please see our non-GAAP reconciliation in the Appendix to this presentation * Excludes $9 million of capital expenditures related to land drilling rigs
Year-over-Year, EBITDA improved $65M or 76%. $27M or 42% was attributable to our transformation, with the remainder attributable to the market recovery.
INCOME STATEMENT 1Q 2018 4Q 2017 Δ Seq. 1Q 2017 Δ Yr/Yr Revenue $1,423 $1,490 -4% $1,386 3% Adj. Segment Operating Income $40 ($83) 148% ($89) 145% Adj. Segment Operating Income Margin 2.81% -5.57% 838 bps -6.42% 923 bps Adjusted EBITDA $151 $71 113% $86 76% Net Loss Per Share ($0.19) ($0.33) 42% ($0.32) 41% BALANCE SHEET Receivables $1,100 $1,103 - $1,292 -15% Days Sales Outstanding 67 days 68 days - 1% 84 days -20% Inventory $1,225 $1,234 -1% $1,700 -28% Days Sales Inventory 77 days 76 days 1% 111 days -31% Payables $809 $856 -5% $803 1% CASH IN (OUT) FLOW Net Cash Provided By (Used In) Operating Activities ($185) $96 -293% ($179) -3% Cash Interest Payments ($174) ($104) 67% ($144) 21% Capital Expenditures ($29)* ($78) -63% ($40) -28% RIG COUNT AVERAGE US 967 922 5% 743 30% Canada 269 205 31% 295 -9% International 963 949 1% 939 3%
©2018 Weatherford International plc. All rights reserved.
1Q 2018 REVENUE MIX
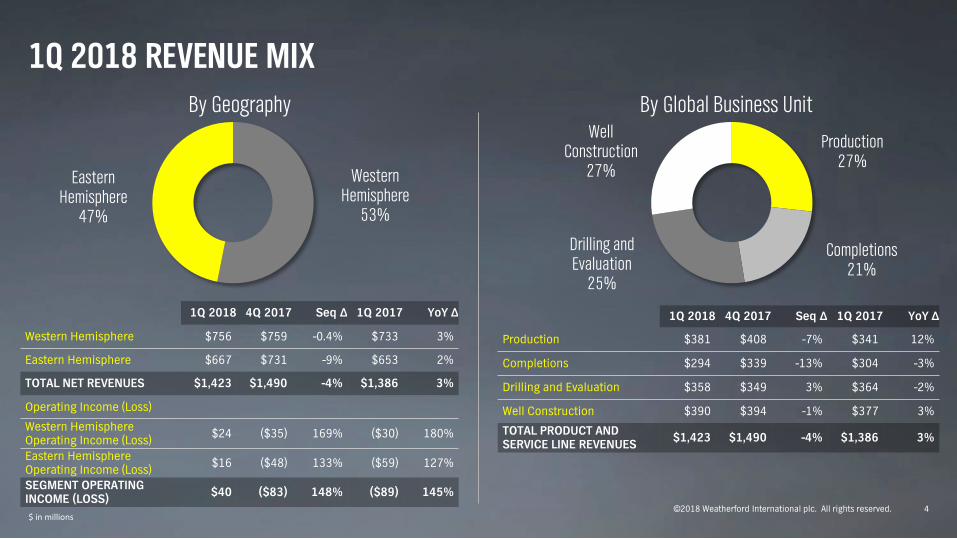
4 $ in millions
Western Hemisphere
53%
Eastern Hemisphere
47%
By Geography
Production 27%
Completions 21%
Drilling and Evaluation
25%
Well Construction
27%
By Global Business Unit
1Q 2018 4Q 2017 Seq Δ 1Q 2017 YoY Δ
Western Hemisphere $756 $759 -0.4% $733 3%
Eastern Hemisphere $667 $731 -9% $653 2%
TOTAL NET REVENUES $1,423 $1,490 -4% $1,386 3%
Operating Income (Loss)
Western Hemisphere Operating Income (Loss) $24 ($35) 169% ($30) 180%
Eastern Hemisphere Operating Income (Loss) $16 ($48) 133% ($59) 127%
SEGMENT OPERATING INCOME (LOSS) $40 ($83) 148% ($89) 145%
1Q 2018 4Q 2017 Seq Δ 1Q 2017 YoY Δ
Production $381 $408 -7% $341 12%
Completions $294 $339 -13% $304 -3%
Drilling and Evaluation $358 $349 3% $364 -2%
Well Construction $390 $394 -1% $377 3%
TOTAL PRODUCT AND SERVICE LINE REVENUES $1,423 $1,490 -4% $1,386 3%
©2018 Weatherford International plc. All rights reserved.
1Q 2018 HEMISPHERE REVENUE BY BUSINESS UNIT
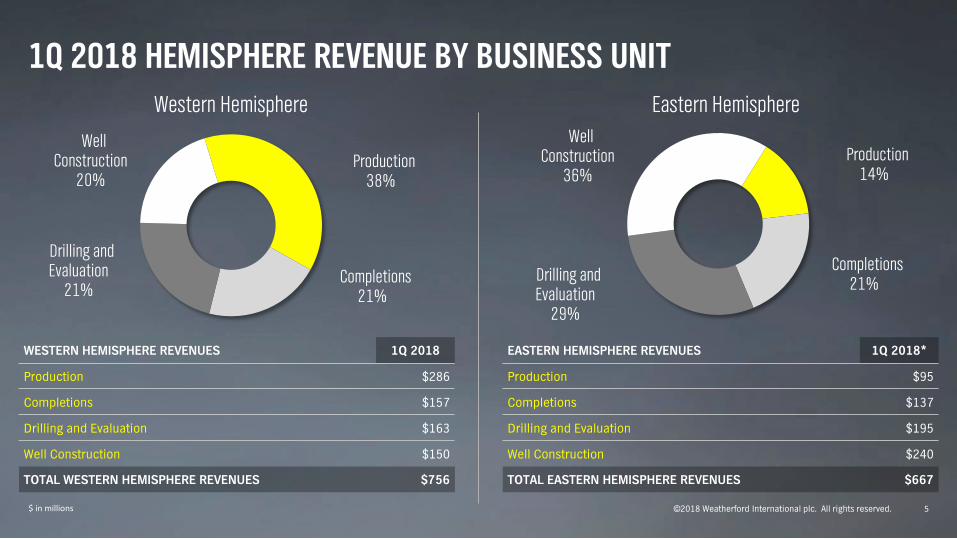
5 $ in millions
Western Hemisphere Eastern Hemisphere
WESTERN HEMISPHERE REVENUES 1Q 2018
Production $286
Completions $157
Drilling and Evaluation $163
Well Construction $150
TOTAL WESTERN HEMISPHERE REVENUES $756
EASTERN HEMISPHERE REVENUES 1Q 2018*
Production $95
Completions $137
Drilling and Evaluation $195
Well Construction $240
TOTAL EASTERN HEMISPHERE REVENUES $667
Production 14%
Completions 21% Drilling and
Evaluation 29%
Well Construction
36% Production
38%
Completions 21%
Drilling and Evaluation
21%
Well Construction
20%
©2018 Weatherford International plc. All rights reserved.
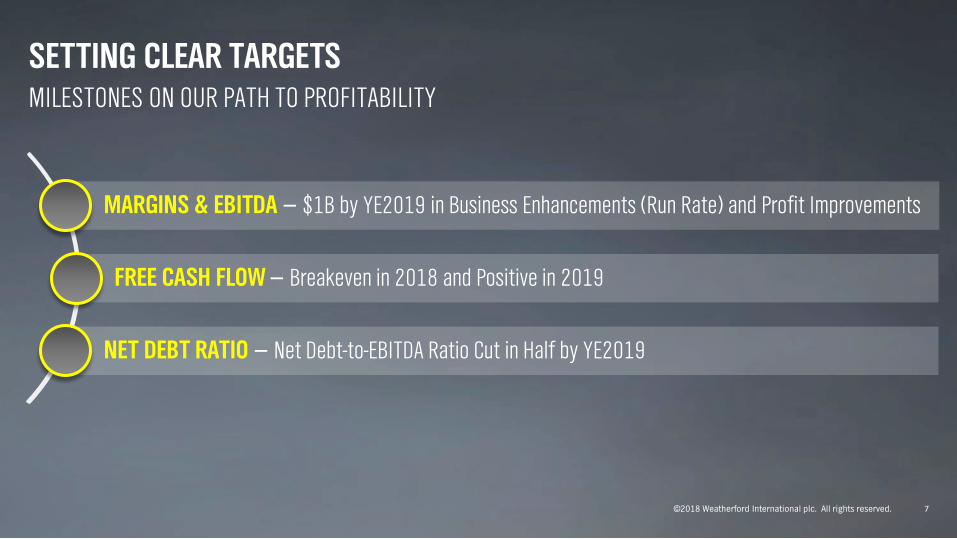
SETTING CLEAR TARGETS MILESTONES ON OUR PATH TO PROFITABILITY
7
MARGINS & EBITDA ‒ $1B by YE2019 in Business Enhancements (Run Rate) and Profit Improvements
FREE CASH FLOW ‒ Breakeven in 2018 and Positive in 2019
NET DEBT RATIO ‒ Net Debt-to-EBITDA Ratio Cut in Half by YE2019
©2018 Weatherford International plc. All rights reserved.
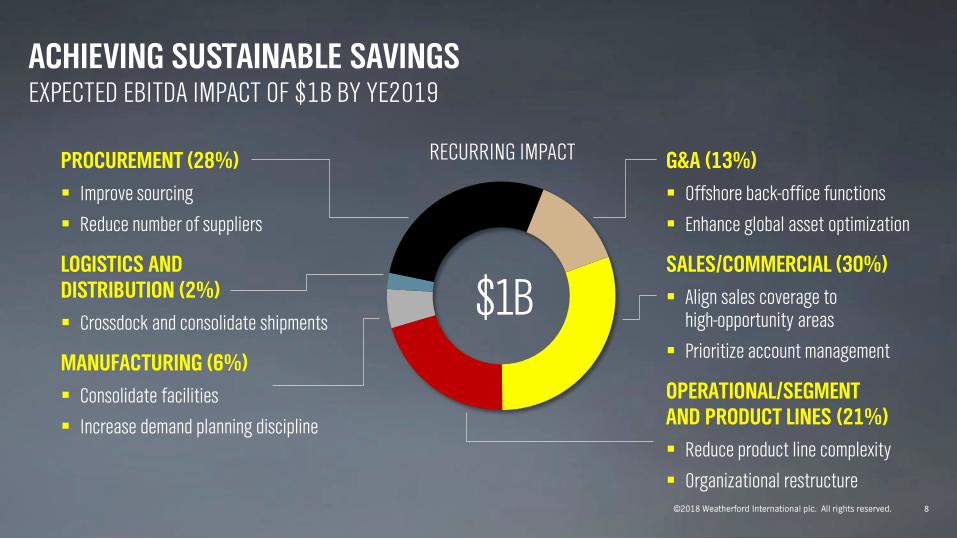
ACHIEVING SUSTAINABLE SAVINGS EXPECTED EBITDA IMPACT OF $1B BY YE2019
8
$1B
PROCUREMENT (28%) Improve sourcing
Reduce number of suppliers
LOGISTICS AND DISTRIBUTION (2%) Crossdock and consolidate shipments
MANUFACTURING (6%) Consolidate facilities
Increase demand planning discipline
G&A (13%) Offshore back-office functions
Enhance global asset optimization
SALES/COMMERCIAL (30%) Align sales coverage to
high-opportunity areas
Prioritize account management
OPERATIONAL/SEGMENT AND PRODUCT LINES (21%) Reduce product line complexity
Organizational restructure
RECURRING IMPACT
©2018 Weatherford International plc. All rights reserved.
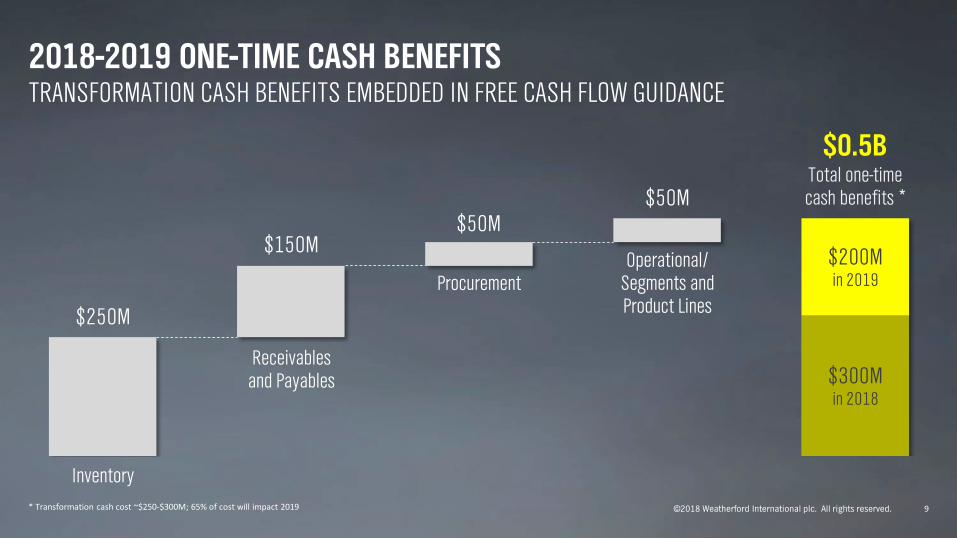
2018-2019 ONE-TIME CASH BENEFITS TRANSFORMATION CASH BENEFITS EMBEDDED IN FREE CASH FLOW GUIDANCE
9
$150M
$250M
$50M
$0.5B Total one-time cash benefits * $50M
Receivables and Payables
Inventory
Procurement Operational/
Segments and Product Lines
$300M in 2018
$200M in 2019
* Transformation cash cost ~$250-$300M; 65% of cost will impact 2019
©2018 Weatherford International plc. All rights reserved.
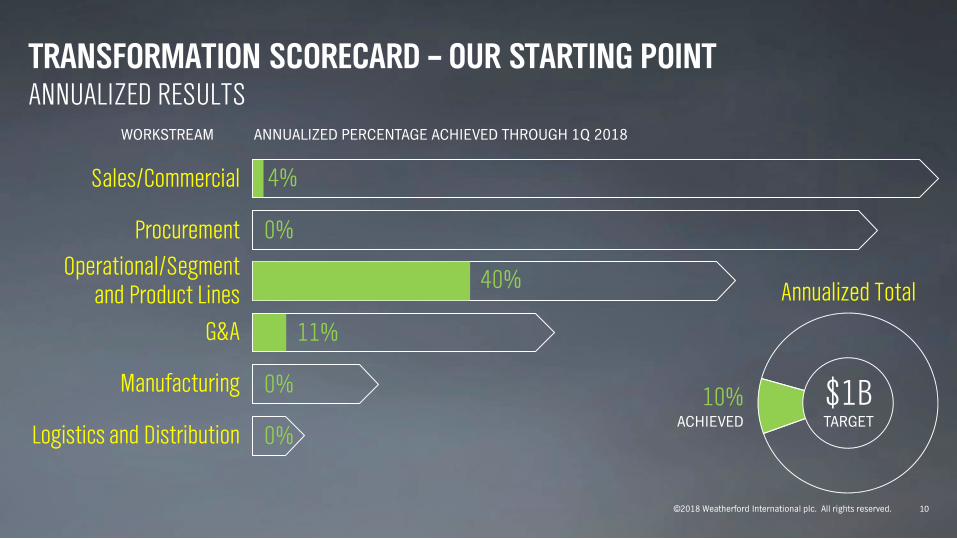
TRANSFORMATION SCORECARD – OUR STARTING POINT ANNUALIZED RESULTS
10
Procurement
Sales/Commercial
Operational/Segment and Product Lines
G&A
Manufacturing
Logistics and Distribution
WORKSTREAM ANNUALIZED PERCENTAGE ACHIEVED THROUGH 1Q 2018
Annualized Total
10% ACHIEVED
$1B TARGET
4%
0%
11%
40%
0%
0%
©2018 Weatherford International plc. All rights reserved.
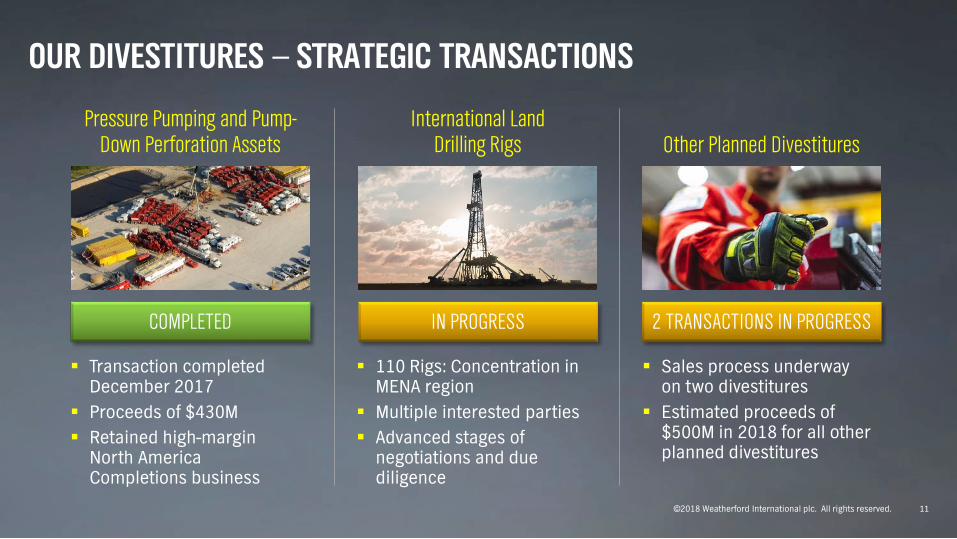
OUR DIVESTITURES — STRATEGIC TRANSACTIONS
11
Transaction completed December 2017
Proceeds of $430M Retained high-margin
North America Completions business
Pressure Pumping and Pump-Down Perforation Assets
Sales process underway on two divestitures
Estimated proceeds of $500M in 2018 for all other planned divestitures
COMPLETED 2 TRANSACTIONS IN PROGRESS
International Land Drilling Rigs Other Planned Divestitures
110 Rigs: Concentration in MENA region
Multiple interested parties Advanced stages of
negotiations and due diligence
IN PROGRESS
©2018 Weatherford International plc. All rights reserved.
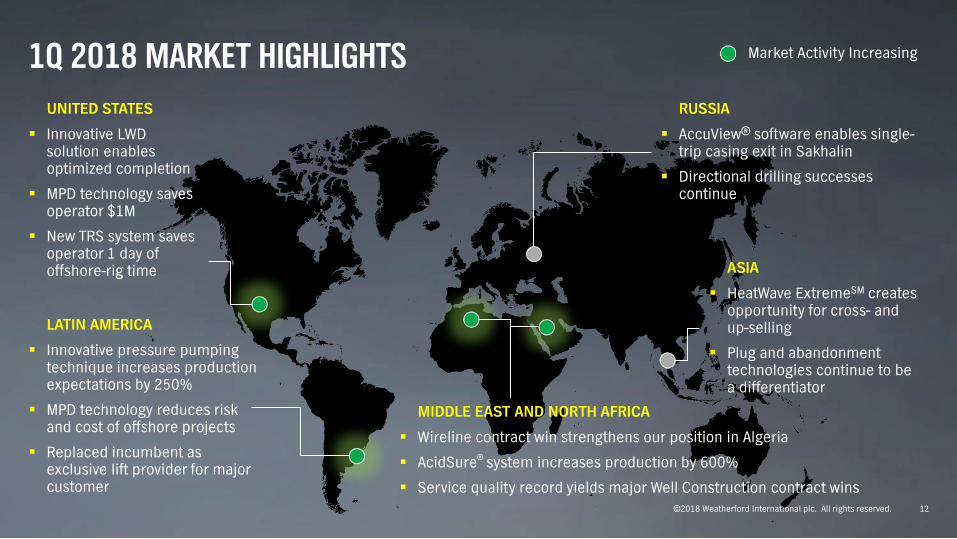
1Q 2018 MARKET HIGHLIGHTS
12
UNITED STATES
Innovative LWD solution enables optimized completion
MPD technology saves operator $1M
New TRS system saves operator 1 day of offshore-rig time
LATIN AMERICA
Innovative pressure pumping technique increases production expectations by 250%
MPD technology reduces risk and cost of offshore projects
Replaced incumbent as exclusive lift provider for major customer
RUSSIA
AccuView® software enables single-trip casing exit in Sakhalin
Directional drilling successes continue
ASIA
HeatWave ExtremeSM creates opportunity for cross- and up-selling
Plug and abandonment technologies continue to be a differentiator
MIDDLE EAST AND NORTH AFRICA
Wireline contract win strengthens our position in Algeria
AcidSure® system increases production by 600%
Service quality record yields major Well Construction contract wins
Market Activity Increasing
©2018 Weatherford International plc. All rights reserved.
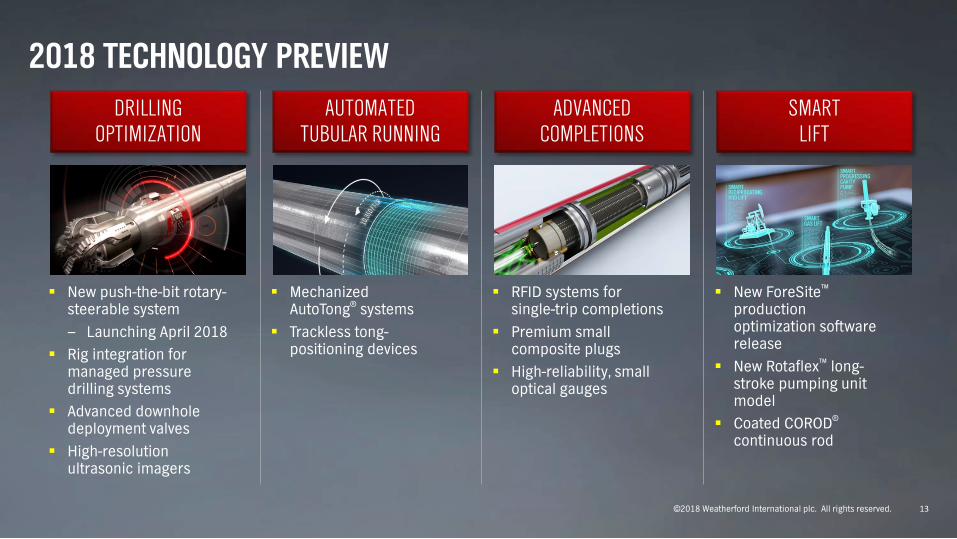
2018 TECHNOLOGY PREVIEW
13
DRILLING OPTIMIZATION
AUTOMATED TUBULAR RUNNING
ADVANCED COMPLETIONS
SMART LIFT
New push-the-bit rotary-steerable system ‒ Launching April 2018
Rig integration for managed pressure drilling systems
Advanced downhole deployment valves
High-resolution ultrasonic imagers
Mechanized AutoTong® systems
Trackless tong-positioning devices
RFID systems for single-trip completions
Premium small composite plugs
High-reliability, small optical gauges
New ForeSite™ production optimization software release
New Rotaflex™ long-stroke pumping unit model
Coated COROD®
continuous rod
©2018 Weatherford International plc. All rights reserved.
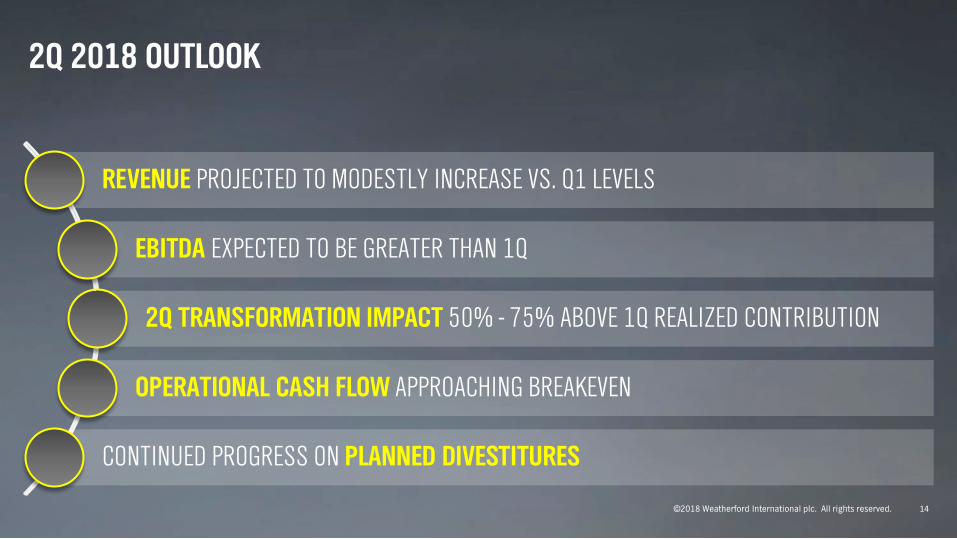
2Q 2018 OUTLOOK
14
REVENUE PROJECTED TO MODESTLY INCREASE VS. Q1 LEVELS
EBITDA EXPECTED TO BE GREATER THAN 1Q
2Q TRANSFORMATION IMPACT 50% - 75% ABOVE 1Q REALIZED CONTRIBUTION
OPERATIONAL CASH FLOW APPROACHING BREAKEVEN
CONTINUED PROGRESS ON PLANNED DIVESTITURES

APPENDIX
©2018 Weatherford International plc. All rights reserved.
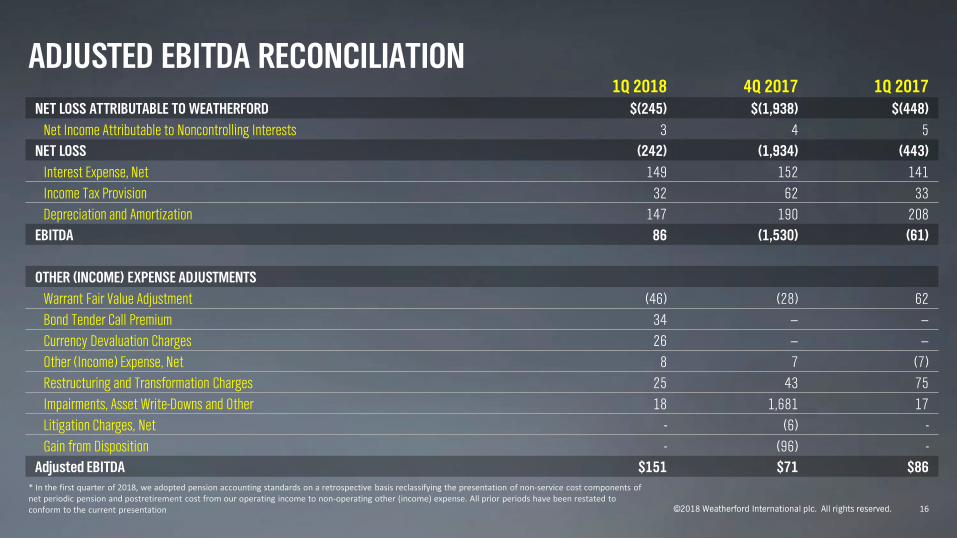
ADJUSTED EBITDA RECONCILIATION
16
1Q 2018 4Q 2017 1Q 2017 NET LOSS ATTRIBUTABLE TO WEATHERFORD $(245) $(1,938) $(448) Net Income Attributable to Noncontrolling Interests 3 4 5 NET LOSS (242) (1,934) (443) Interest Expense, Net 149 152 141 Income Tax Provision 32 62 33 Depreciation and Amortization 147 190 208 EBITDA 86 (1,530) (61)
OTHER (INCOME) EXPENSE ADJUSTMENTS Warrant Fair Value Adjustment (46) (28) 62 Bond Tender Call Premium 34 − − Currency Devaluation Charges 26 − − Other (Income) Expense, Net 8 7 (7) Restructuring and Transformation Charges 25 43 75 Impairments, Asset Write-Downs and Other 18 1,681 17 Litigation Charges, Net - (6) - Gain from Disposition - (96) - Adjusted EBITDA $151 $71 $86
* In the first quarter of 2018, we adopted pension accounting standards on a retrospective basis reclassifying the presentation of non-service cost components of net periodic pension and postretirement cost from our operating income to non-operating other (income) expense. All prior periods have been restated to conform to the current presentation
©2018 Weatherford International plc. All rights reserved.
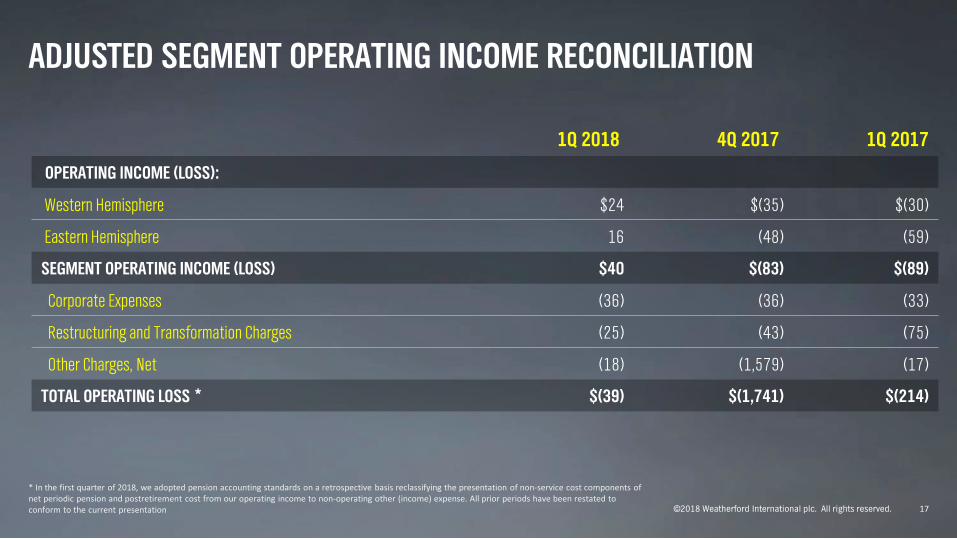
ADJUSTED SEGMENT OPERATING INCOME RECONCILIATION
17
* In the first quarter of 2018, we adopted pension accounting standards on a retrospective basis reclassifying the presentation of non-service cost components of net periodic pension and postretirement cost from our operating income to non-operating other (income) expense. All prior periods have been restated to conform to the current presentation
1Q 2018 4Q 2017 1Q 2017
OPERATING INCOME (LOSS):
Western Hemisphere $24 $(35) $(30)
Eastern Hemisphere 16 (48) (59)
SEGMENT OPERATING INCOME (LOSS) $40 $(83) $(89)
Corporate Expenses (36) (36) (33)
Restructuring and Transformation Charges (25) (43) (75)
Other Charges, Net (18) (1,579) (17)
TOTAL OPERATING LOSS * $(39) $(1,741) $(214)

FOR FURTHER COMPANY INFORMATION WE INVITE YOU TO VISIT
Weatherford.com
WeatherfordAnnualReport.com
Linkedin.com/Company/Weatherford
Facebook.com/Weatherford
YouTube.com/Weatherford
@WeatherfordCorp
@WeatherfordCorp


