Embed Size (px)
Citation preview
MULBERRY PLC — PRELIMINARY RESULTS FOR THE 52 WEEKS ENDED 28 MARCH 2020
2
PRELIMINARY RESULTS FOR THE 52 WEEKS ENDED 28 MARCH 2020
Contents
Highlights
Current Trading
Our Progress to Date 2018-2020
COVID-19
FINANCIAL REVIEW
Revenue
International Revenue
Digital Revenue
Group Income Statement
Group Balance sheet
Group Cash Flow
Capital Expenditure
3
4
6
7
9
10
11
12
13
14
15
16
17
18
19
21
22
23
STRATEGY OVERVIEW
Strategy — Our 4 Strategic Pillars
Strategic Pillar 1 — Omni-channel Distribution
Strategic Pillar 2 — International Development
Strategic Pillar 3 — Constant Innovation
Strategic Pillar 4 — Sustainable Lifecycle
3
PRELIMINARY RESULTS FOR THE 52 WEEKS ENDED 28 MARCH 2020
Highlights
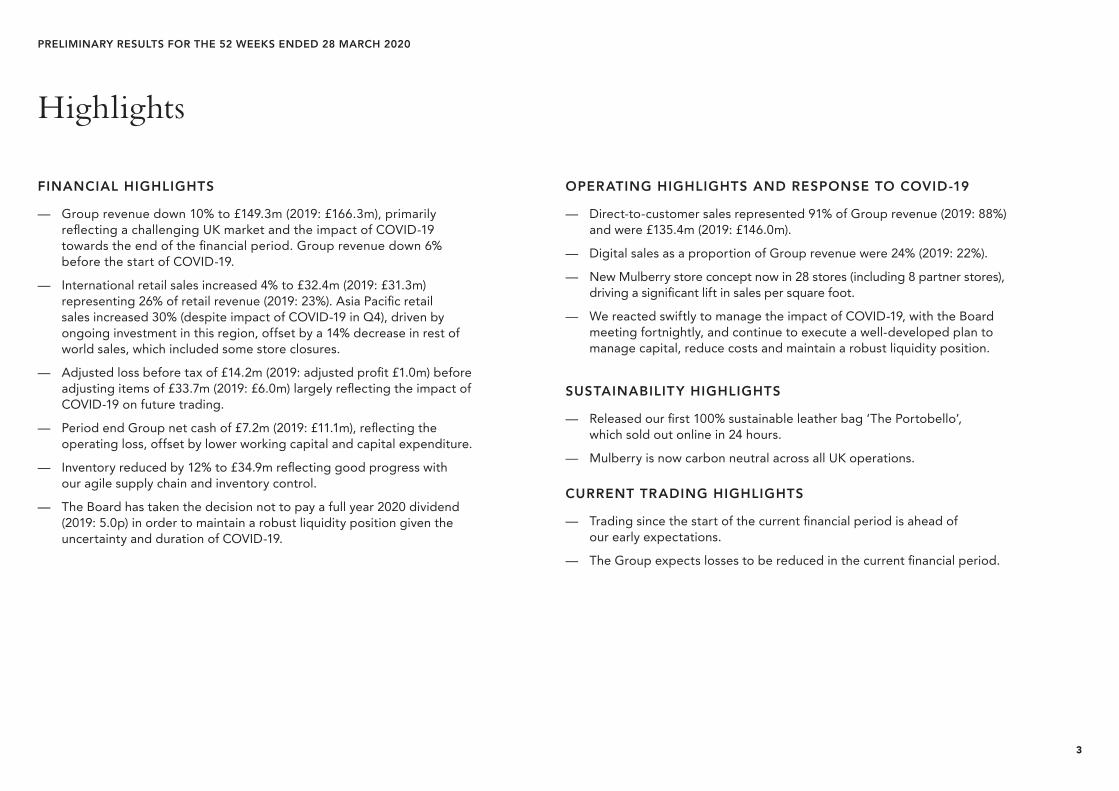
FINANCIAL HIGHLIGHTS
— Group revenue down 10% to £149.3m (2019: £166.3m), primarily reflecting a challenging UK market and the impact of COVID-19 towards the end of the financial period. Group revenue down 6% before the start of COVID-19.
— International retail sales increased 4% to £32.4m (2019: £31.3m) representing 26% of retail revenue (2019: 23%). Asia Pacific retail sales increased 30% (despite impact of COVID-19 in Q4), driven by ongoing investment in this region, offset by a 14% decrease in rest of world sales, which included some store closures.
— Adjusted loss before tax of £14.2m (2019: adjusted profit £1.0m) before adjusting items of £33.7m (2019: £6.0m) largely reflecting the impact of COVID-19 on future trading.
— Period end Group net cash of £7.2m (2019: £11.1m), reflecting the operating loss, offset by lower working capital and capital expenditure.
— Inventory reduced by 12% to £34.9m reflecting good progress with our agile supply chain and inventory control.
— The Board has taken the decision not to pay a full year 2020 dividend (2019: 5.0p) in order to maintain a robust liquidity position given the uncertainty and duration of COVID-19.
OPERATING HIGHLIGHTS AND RESPONSE TO COVID-19
— Direct-to-customer sales represented 91% of Group revenue (2019: 88%) and were £135.4m (2019: £146.0m).
— Digital sales as a proportion of Group revenue were 24% (2019: 22%).
— New Mulberry store concept now in 28 stores (including 8 partner stores), driving a significant lift in sales per square foot.
— We reacted swiftly to manage the impact of COVID-19, with the Board meeting fortnightly, and continue to execute a well-developed plan to manage capital, reduce costs and maintain a robust liquidity position.
SUSTAINABILITY HIGHLIGHTS
— Released our first 100% sustainable leather bag ‘The Portobello’, which sold out online in 24 hours.
— Mulberry is now carbon neutral across all UK operations.
CURRENT TRADING HIGHLIGHTS
— Trading since the start of the current financial period is ahead of our early expectations.
— The Group expects losses to be reduced in the current financial period.
4
PRELIMINARY RESULTS FOR THE 52 WEEKS ENDED 28 MARCH 2020
Current Trading
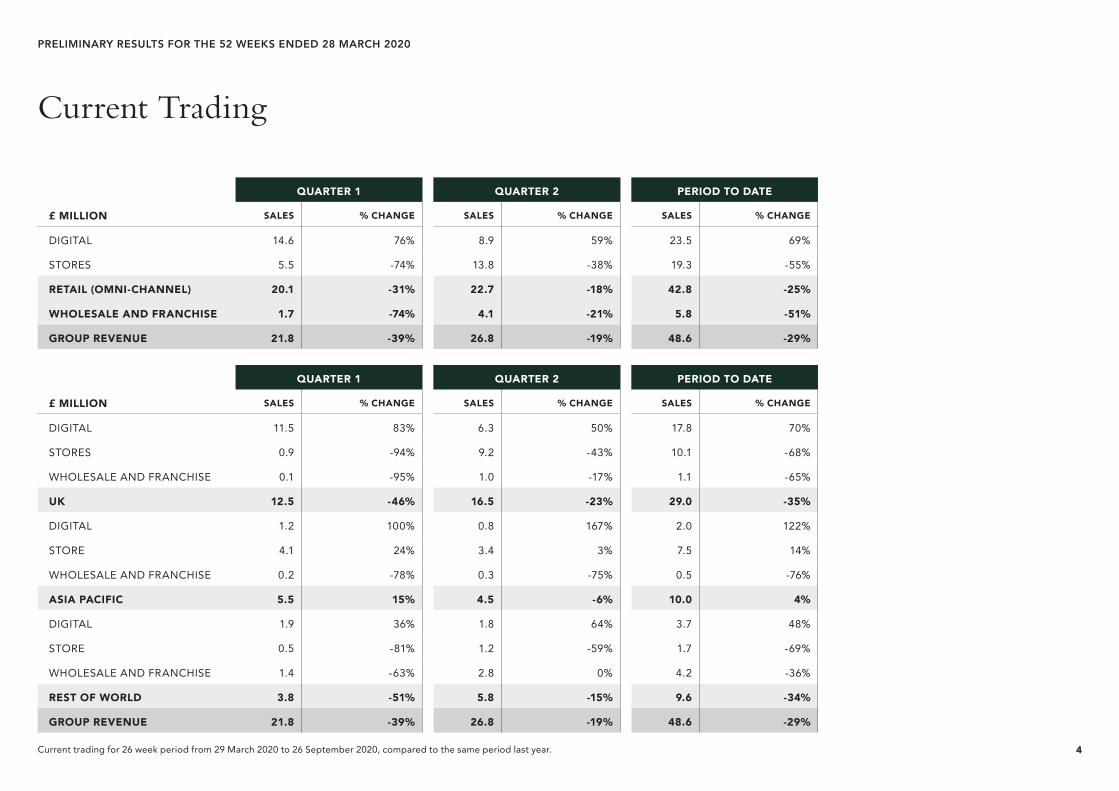
QUARTER 1 QUARTER 2 PERIOD TO DATE
£ MILLION SALES % CHANGE SALES % CHANGE SALES % CHANGE
DIGITAL 14.6 76% 8.9 59% 23.5 69%
STORES 5.5 -74% 13.8 -38% 19.3 -55%
RETAIL (OMNI-CHANNEL) 20.1 -31% 22.7 -18% 42.8 -25%
WHOLESALE AND FRANCHISE 1.7 -74% 4.1 -21% 5.8 -51%
GROUP REVENUE 21.8 -39% 26.8 -19% 48.6 -29%
QUARTER 1 QUARTER 2 PERIOD TO DATE
£ MILLION SALES % CHANGE SALES % CHANGE SALES % CHANGE
DIGITAL 11.5 83% 6.3 50% 17.8 70%
STORES 0.9 -94% 9.2 -43% 10.1 -68%
WHOLESALE AND FRANCHISE 0.1 -95% 1.0 -17% 1.1 -65%
UK 12.5 -46% 16.5 -23% 29.0 -35%
DIGITAL 1.2 100% 0.8 167% 2.0 122%
STORE 4.1 24% 3.4 3% 7.5 14%
WHOLESALE AND FRANCHISE 0.2 -78% 0.3 -75% 0.5 -76%
ASIA PACIFIC 5.5 15% 4.5 -6% 10.0 4%
DIGITAL 1.9 36% 1.8 64% 3.7 48%
STORE 0.5 -81% 1.2 -59% 1.7 -69%
WHOLESALE AND FRANCHISE 1.4 -63% 2.8 0% 4.2 -36%
REST OF WORLD 3.8 -51% 5.8 -15% 9.6 -34%
GROUP REVENUE 21.8 -39% 26.8 -19% 48.6 -29%
Current trading for 26 week period from 29 March 2020 to 26 September 2020, compared to the same period last year.
5
PRELIMINARY RESULTS FOR THE 52 WEEKS ENDED 28 MARCH 2020
Current Trading
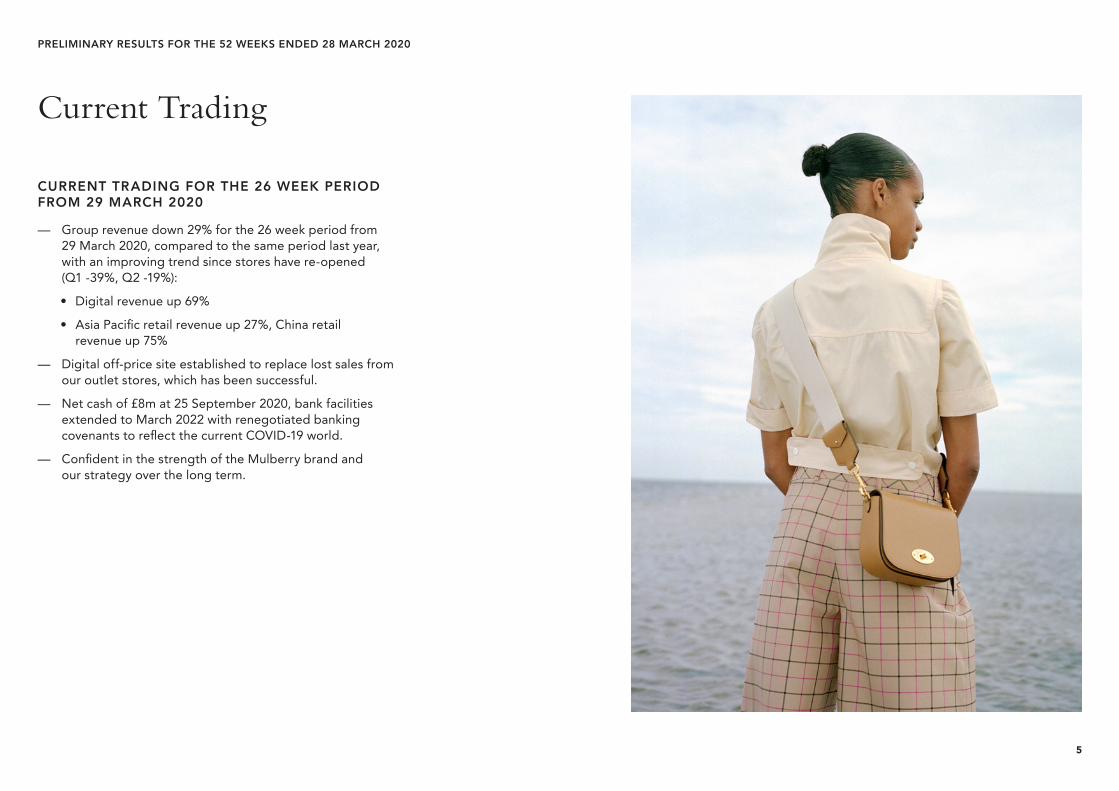
CURRENT TRADING FOR THE 26 WEEK PERIOD FROM 29 MARCH 2020
— Group revenue down 29% for the 26 week period from 29 March 2020, compared to the same period last year, with an improving trend since stores have re-opened (Q1 -39%, Q2 -19%):
• Digital revenue up 69%
• Asia Pacific retail revenue up 27%, China retail revenue up 75%
— Digital off-price site established to replace lost sales from our outlet stores, which has been successful.
— Net cash of £8m at 25 September 2020, bank facilities extended to March 2022 with renegotiated banking covenants to reflect the current COVID-19 world.
— Confident in the strength of the Mulberry brand and our strategy over the long term.
6
PRELIMINARY RESULTS FOR THE 52 WEEKS ENDED 28 MARCH 2020
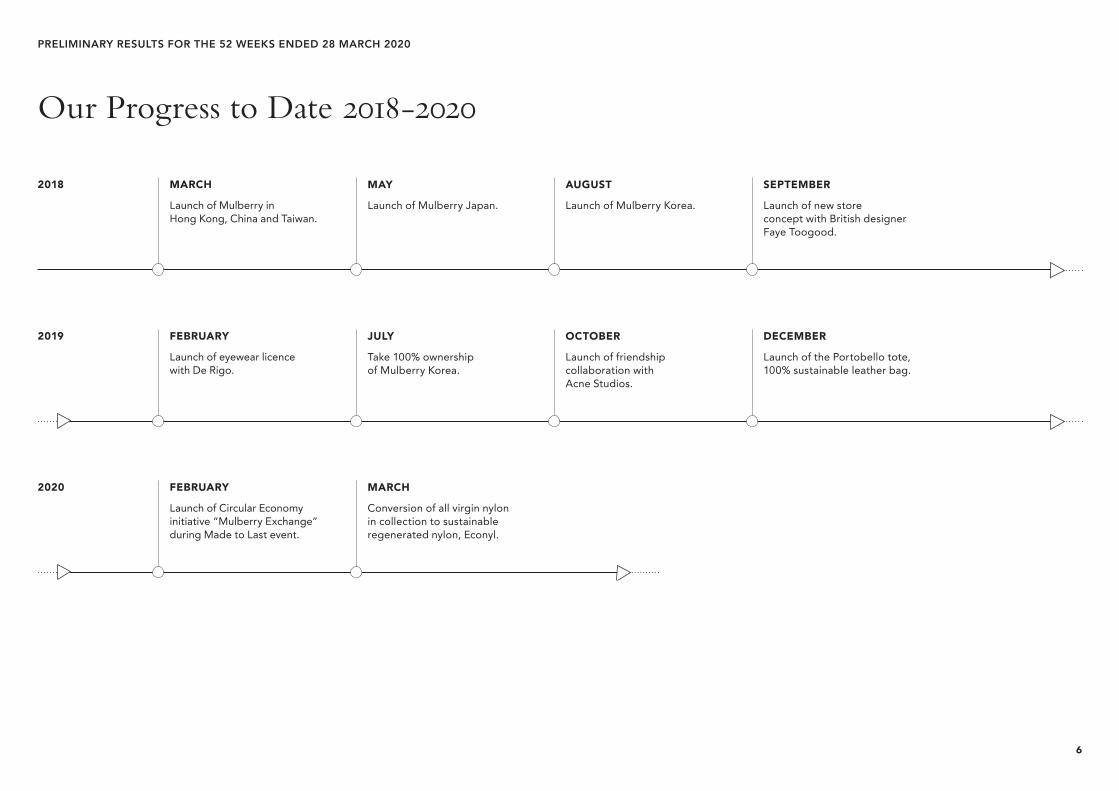
Our Progress to Date 2018-2020
MARCH
Launch of Mulberry in Hong Kong, China and Taiwan.
FEBRUARY
Launch of eyewear licence with De Rigo.
FEBRUARY
Launch of Circular Economy initiative “Mulberry Exchange” during Made to Last event.
2018
2019
2020
MAY
Launch of Mulberry Japan.
JULY
Take 100% ownership of Mulberry Korea.
MARCH
Conversion of all virgin nylon in collection to sustainable regenerated nylon, Econyl.
AUGUST
Launch of Mulberry Korea.
SEPTEMBER
Launch of new store concept with British designer Faye Toogood.
OCTOBER
Launch of friendship collaboration with Acne Studios.
DECEMBER
Launch of the Portobello tote, 100% sustainable leather bag.
7
PRELIMINARY RESULTS FOR THE 52 WEEKS ENDED 28 MARCH 2020
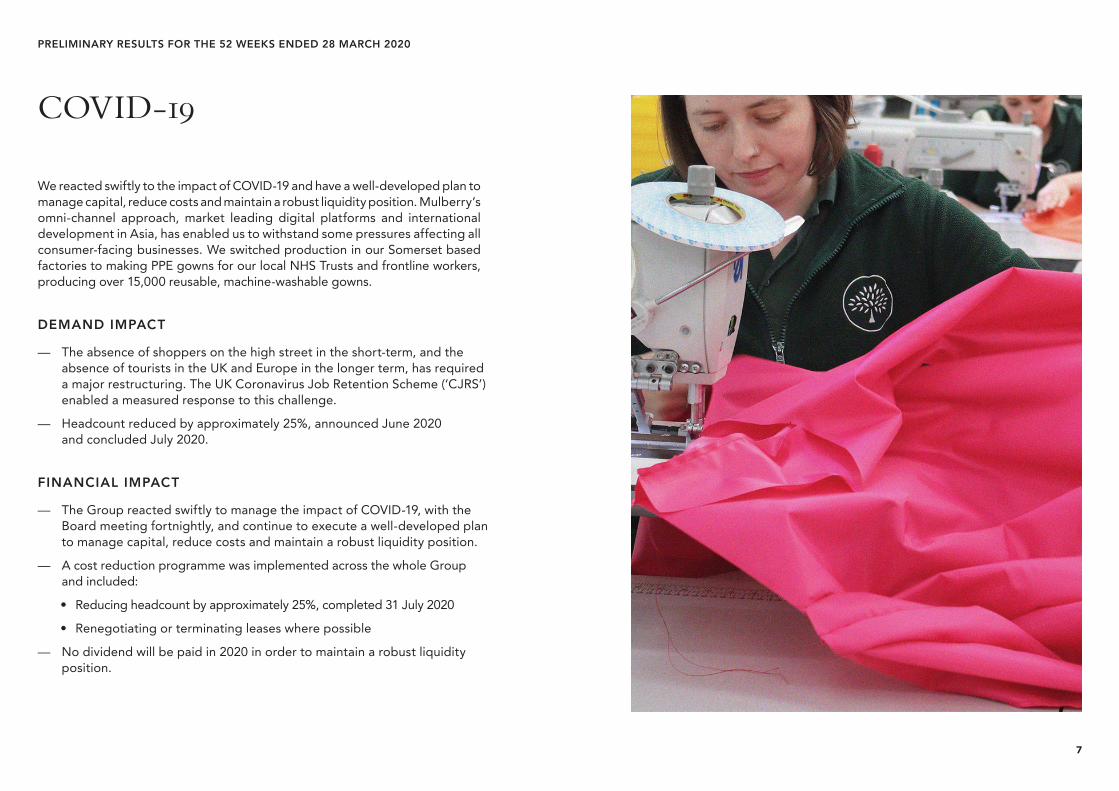
COVID-19
We reacted swiftly to the impact of COVID-19 and have a well-developed plan to manage capital, reduce costs and maintain a robust liquidity position. Mulberry’s omni-channel approach, market leading digital platforms and international development in Asia, has enabled us to withstand some pressures affecting all consumer-facing businesses. We switched production in our Somerset based factories to making PPE gowns for our local NHS Trusts and frontline workers, producing over 15,000 reusable, machine-washable gowns.
DEMAND IMPACT
— The absence of shoppers on the high street in the short-term, and the absence of tourists in the UK and Europe in the longer term, has required a major restructuring. The UK Coronavirus Job Retention Scheme (‘CJRS’) enabled a measured response to this challenge.
— Headcount reduced by approximately 25%, announced June 2020 and concluded July 2020.
FINANCIAL IMPACT
— The Group reacted swiftly to manage the impact of COVID-19, with the Board meeting fortnightly, and continue to execute a well-developed plan to manage capital, reduce costs and maintain a robust liquidity position.
— A cost reduction programme was implemented across the whole Group and included:
• Reducing headcount by approximately 25%, completed 31 July 2020
• Renegotiating or terminating leases where possible
— No dividend will be paid in 2020 in order to maintain a robust liquidity position.
8
PRELIMINARY RESULTS FOR THE 52 WEEKS ENDED 28 MARCH 2020
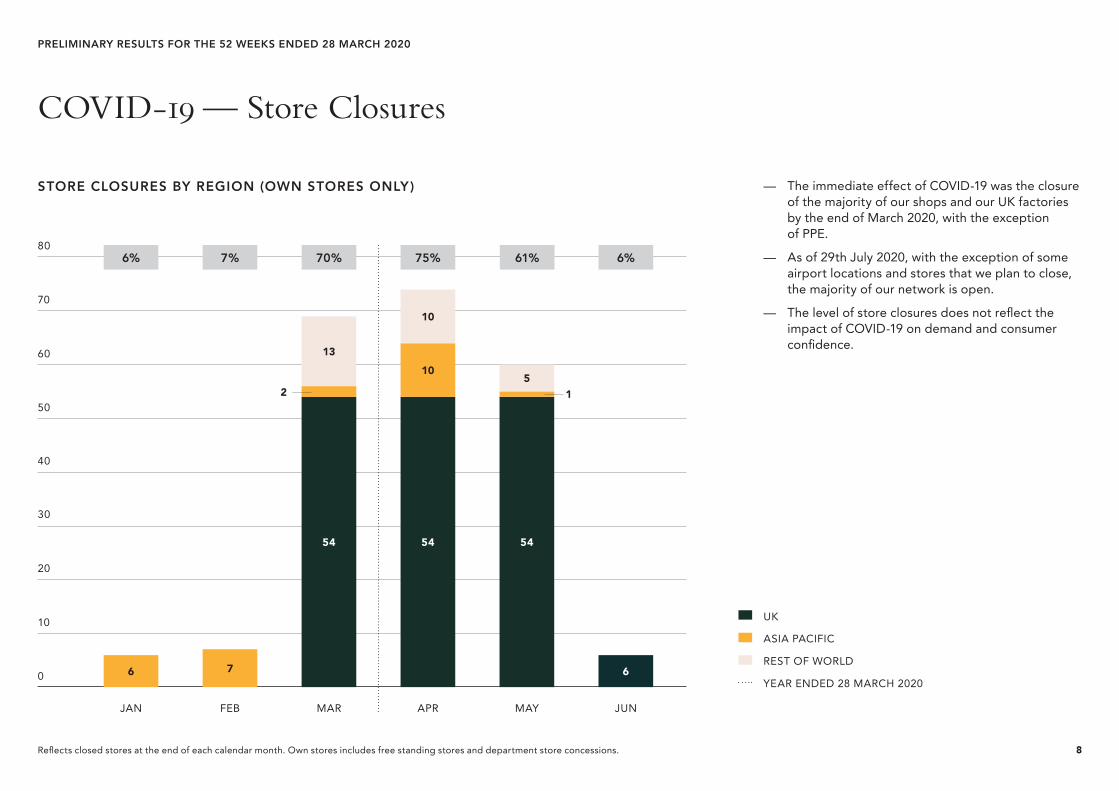
COVID-19 — Store Closures
6 670
JAN FEB MAR APR MAY JUN
10
20
30
40
50
60
70
80
STORE CLOSURES BY REGION (OWN STORES ONLY)
7% 70% 75%6% 6%61%
UK
REST OF WORLD
YEAR ENDED 28 MARCH 2020
ASIA PACIFIC
— The immediate effect of COVID-19 was the closure of the majority of our shops and our UK factories by the end of March 2020, with the exception of PPE.
— As of 29th July 2020, with the exception of some airport locations and stores that we plan to close, the majority of our network is open.
— The level of store closures does not reflect the impact of COVID-19 on demand and consumer confidence.
54
13
2 1
54
10
10
54
5
Reflects closed stores at the end of each calendar month. Own stores includes free standing stores and department store concessions.

Financial Review
10
PRELIMINARY RESULTS FOR THE 52 WEEKS ENDED 28 MARCH 2020
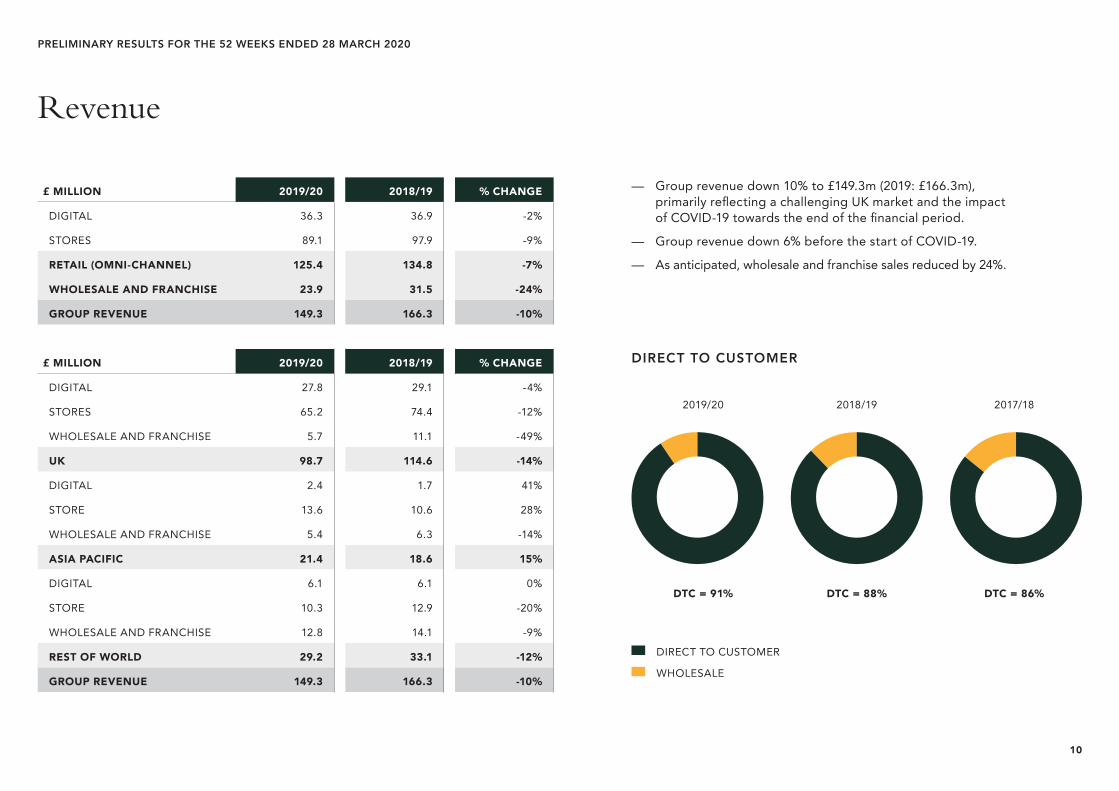
— Group revenue down 10% to £149.3m (2019: £166.3m), primarily reflecting a challenging UK market and the impact of COVID-19 towards the end of the financial period.
— Group revenue down 6% before the start of COVID-19.
— As anticipated, wholesale and franchise sales reduced by 24%.
Revenue
£ MILLION 2019/20 2018/19 % CHANGE
DIGITAL 36.3 36.9 -2%
STORES 89.1 97.9 -9%
RETAIL (OMNI-CHANNEL) 125.4 134.8 -7%
WHOLESALE AND FRANCHISE 23.9 31.5 -24%
GROUP REVENUE 149.3 166.3 -10%
£ MILLION 2019/20 2018/19 % CHANGE
DIGITAL 27.8 29.1 -4%
STORES 65.2 74.4 -12%
WHOLESALE AND FRANCHISE 5.7 11.1 -49%
UK 98.7 114.6 -14%
DIGITAL 2.4 1.7 41%
STORE 13.6 10.6 28%
WHOLESALE AND FRANCHISE 5.4 6.3 -14%
ASIA PACIFIC 21.4 18.6 15%
DIGITAL 6.1 6.1 0%
STORE 10.3 12.9 -20%
WHOLESALE AND FRANCHISE 12.8 14.1 -9%
REST OF WORLD 29.2 33.1 -12%
GROUP REVENUE 149.3 166.3 -10%
2019/20 2018/19 2017/18
DTC = 91% DTC = 88% DTC = 86%
DIRECT TO CUSTOMER
WHOLESALE
DIRECT TO CUSTOMER
11
PRELIMINARY RESULTS FOR THE 52 WEEKS ENDED 28 MARCH 2020
UK
REST OF WORLD
ASIA PACIFIC
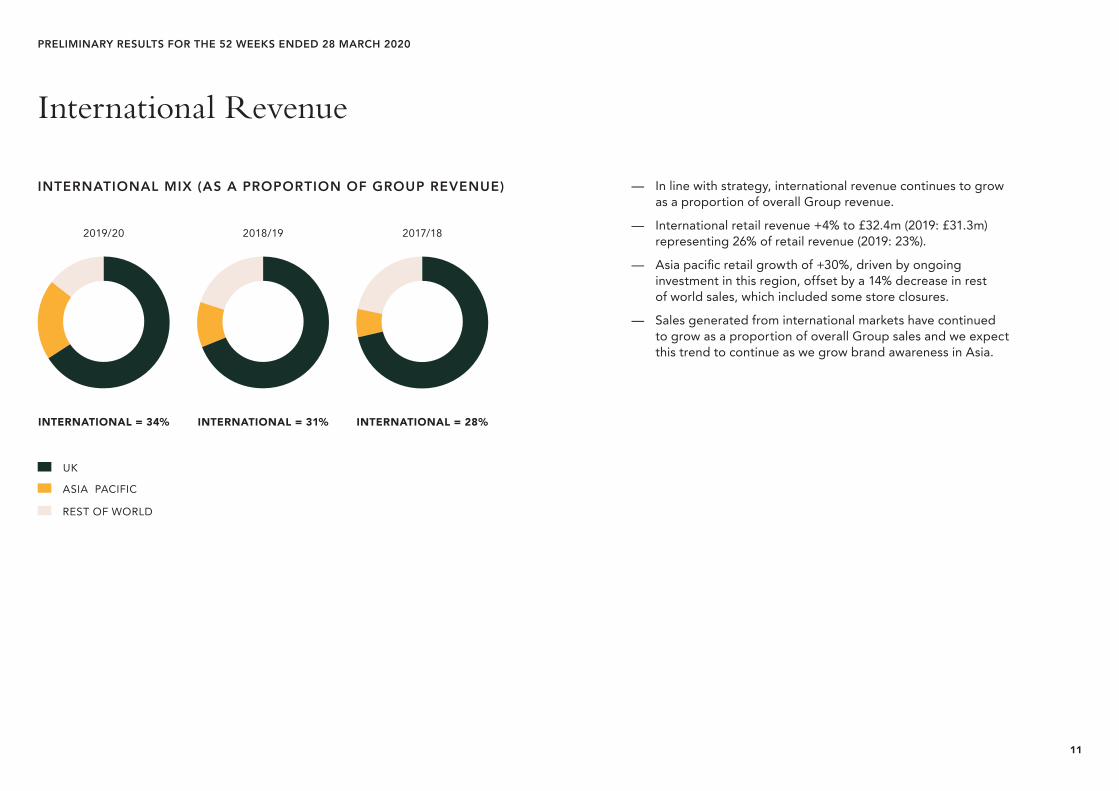
— In line with strategy, international revenue continues to grow as a proportion of overall Group revenue.
— International retail revenue +4% to £32.4m (2019: £31.3m) representing 26% of retail revenue (2019: 23%).
— Asia pacific retail growth of +30%, driven by ongoing investment in this region, offset by a 14% decrease in rest of world sales, which included some store closures.
— Sales generated from international markets have continued to grow as a proportion of overall Group sales and we expect this trend to continue as we grow brand awareness in Asia.
INTERNATIONAL MIX (AS A PROPORTION OF GROUP REVENUE)
INTERNATIONAL = 34% INTERNATIONAL = 31% INTERNATIONAL = 28%
2019/20 2018/19 2017/18
International Revenue
12
PRELIMINARY RESULTS FOR THE 52 WEEKS ENDED 28 MARCH 2020
Digital Revenue
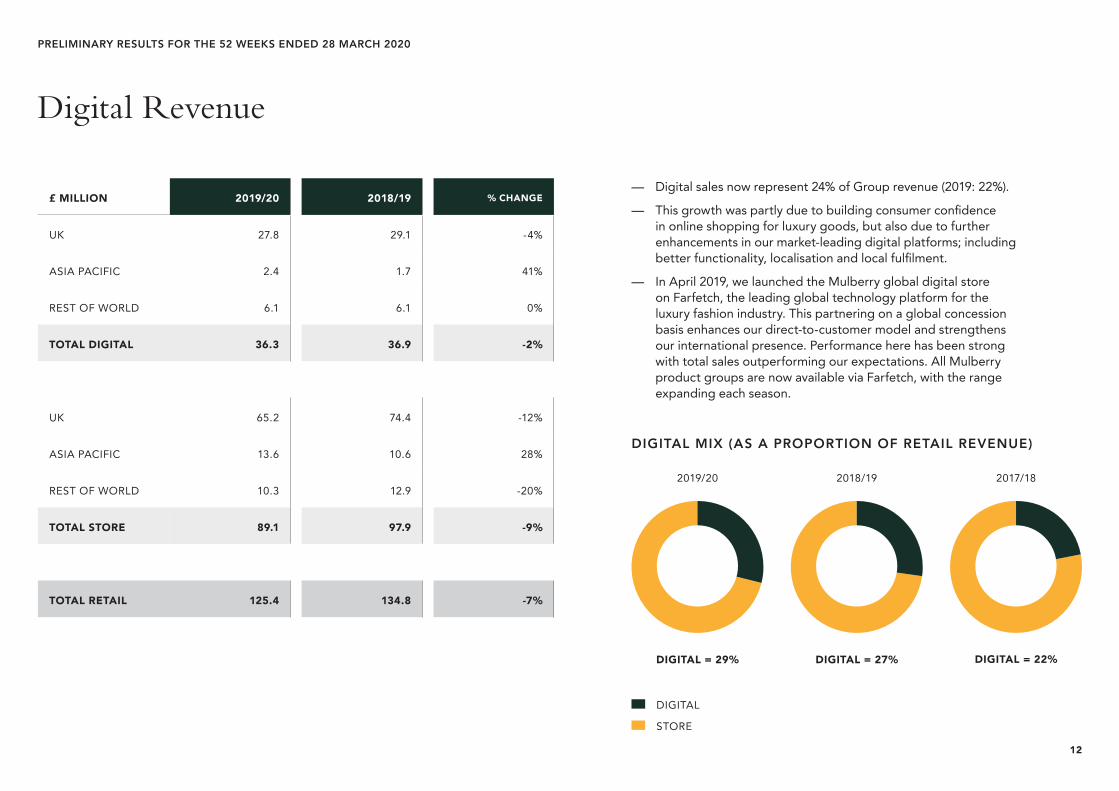
— Digital sales now represent 24% of Group revenue (2019: 22%).
— This growth was partly due to building consumer confidence in online shopping for luxury goods, but also due to further enhancements in our market-leading digital platforms; including better functionality, localisation and local fulfilment.
— In April 2019, we launched the Mulberry global digital store on Farfetch, the leading global technology platform for the luxury fashion industry. This partnering on a global concession basis enhances our direct-to-customer model and strengthens our international presence. Performance here has been strong with total sales outperforming our expectations. All Mulberry product groups are now available via Farfetch, with the range expanding each season.
£ MILLION 2019/20 2018/19 % CHANGE
UK 27.8 29.1 -4%
ASIA PACIFIC 2.4 1.7 41%
REST OF WORLD 6.1 6.1 0%
TOTAL DIGITAL 36.3 36.9 -2%
UK 65.2 74.4 -12%
ASIA PACIFIC 13.6 10.6 28%
REST OF WORLD 10.3 12.9 -20%
TOTAL STORE 89.1 97.9 -9%
TOTAL RETAIL 125.4 134.8 -7%
2019/20 2018/19 2017/18
DIGITAL = 29% DIGITAL = 27% DIGITAL = 22%
DIGITAL
STORE
DIGITAL MIX (AS A PROPORTION OF RETAIL REVENUE)
13
PRELIMINARY RESULTS FOR THE 52 WEEKS ENDED 28 MARCH 2020
Group Income Statement
52 WEEKS ENDED 28 MARCH 2020 53 WEEKS ENDED 30 MARCH 2019
£ MILLION UNDERLYING ADJUSTING ITEMS REPORTED UNDERLYING ADJUSTING
ITEMS REPORTED
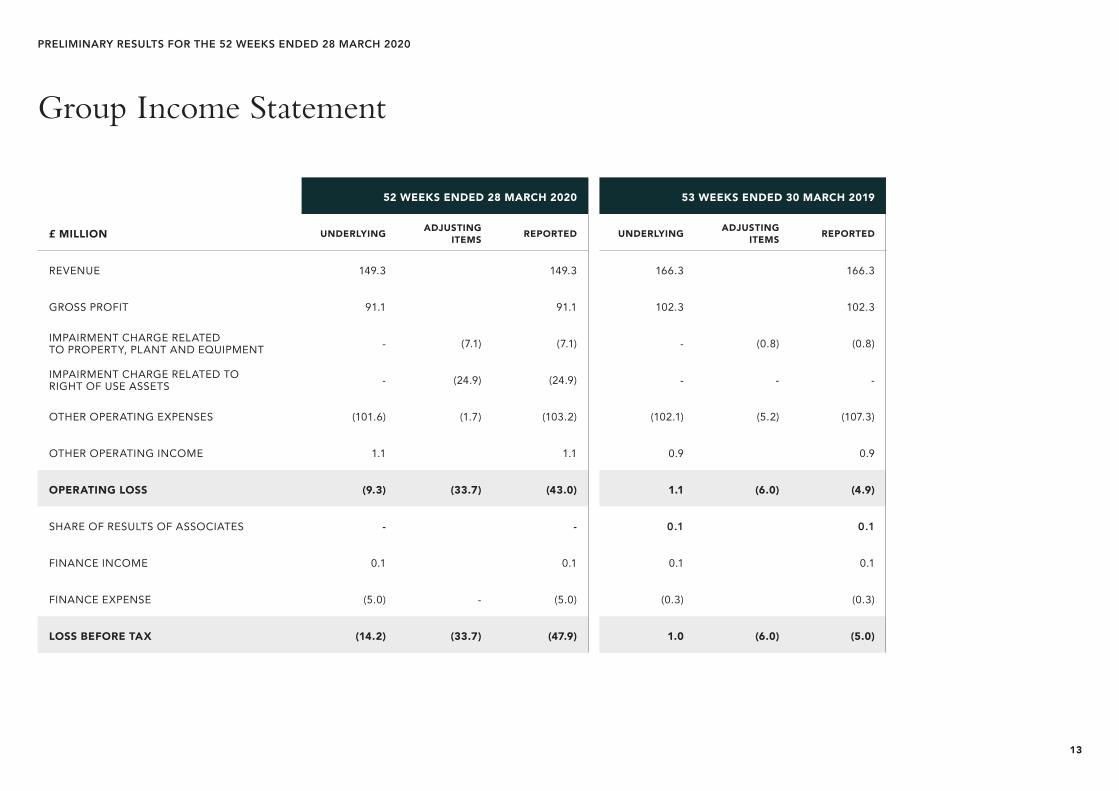
REVENUE 149.3 149.3 166.3 166.3
GROSS PROFIT 91.1 91.1 102.3 102.3
IMPAIRMENT CHARGE RELATED TO PROPERTY, PLANT AND EQUIPMENT - (7.1) (7.1) - (0.8) (0.8)
IMPAIRMENT CHARGE RELATED TO RIGHT OF USE ASSETS - (24.9) (24.9) - - -
OTHER OPERATING EXPENSES (101.6) (1.7) (103.2) (102.1) (5.2) (107.3)
OTHER OPERATING INCOME 1.1 1.1 0.9 0.9
OPERATING LOSS (9.3) (33.7) (43.0) 1.1 (6.0) (4.9)
SHARE OF RESULTS OF ASSOCIATES - - 0.1 0.1
FINANCE INCOME 0.1 0.1 0.1 0.1
FINANCE EXPENSE (5.0) - (5.0) (0.3) (0.3)
LOSS BEFORE TAX (14.2) (33.7) (47.9) 1.0 (6.0) (5.0)
14
PRELIMINARY RESULTS FOR THE 52 WEEKS ENDED 28 MARCH 2020
Group Balance Sheet
£ MILLION 28 MARCH 2020 30 MARCH 2019
NON-CURRENT ASSETS 33.3 41.6
RIGHT OF USE ASSETS 45.9 -
INVENTORIES 34.9 39.7
TRADE AND OTHER RECEIVABLES 11.1 13.7
NET CASH 7.2 11.1
CURRENT TAX 0.4 1.8
CURRENT LIABILITIES (24.6) (25.4)
LEASE LIABILITIES (92.1) -
NON-CURRENT LIABILITIES (2.6) (1.8)
NET ASSETS 13.5 80.7
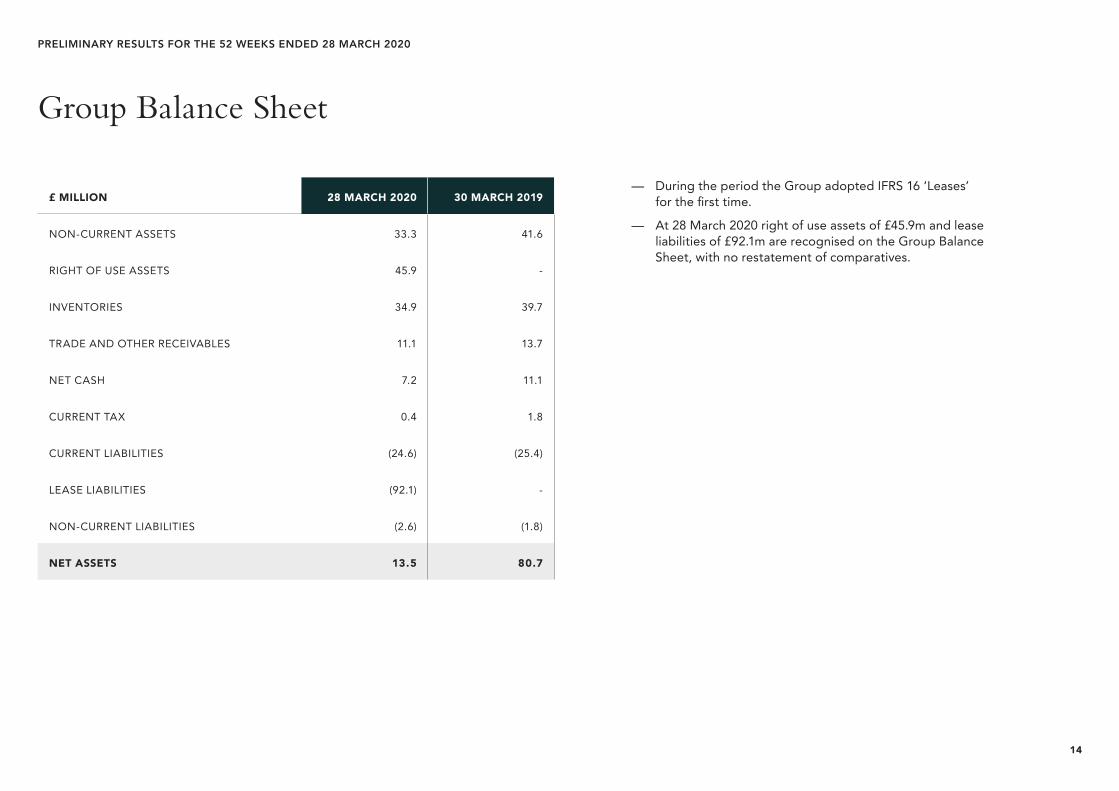
— During the period the Group adopted IFRS 16 ‘Leases’ for the first time.
— At 28 March 2020 right of use assets of £45.9m and lease liabilities of £92.1m are recognised on the Group Balance Sheet, with no restatement of comparatives.
15
PRELIMINARY RESULTS FOR THE 52 WEEKS ENDED 28 MARCH 2020
Group Cash Flow
£ MILLION 52 WEEKS ENDED 28 MARCH 2020
53 WEEKS ENDED 30 MARCH 2019
OPERATING LOSS FOR THE PERIOD -43.0 -5.0
ADJUSTMENTS FOR:
DEPRECIATION AND AMORTISATION 56.3 8.3
WORKING CAPITAL 8.4 2.6
CASH GENERATED FROM OPERATIONS 21.7 5.9
TAX 1.8 -1.7
INTEREST RECEIVED -4.9 -0.1
DIVIDENDS PAID -3.0 -3.0
CAPEX NET OF PROCEEDS -6.8 -11.6
PAYMENT OF LEASE LIABILITIES -14.3 –
OTHER 0.9 -2.6
NET DECREASE IN CASH AND CASH EQUIVALENTS -4.6 -13.1
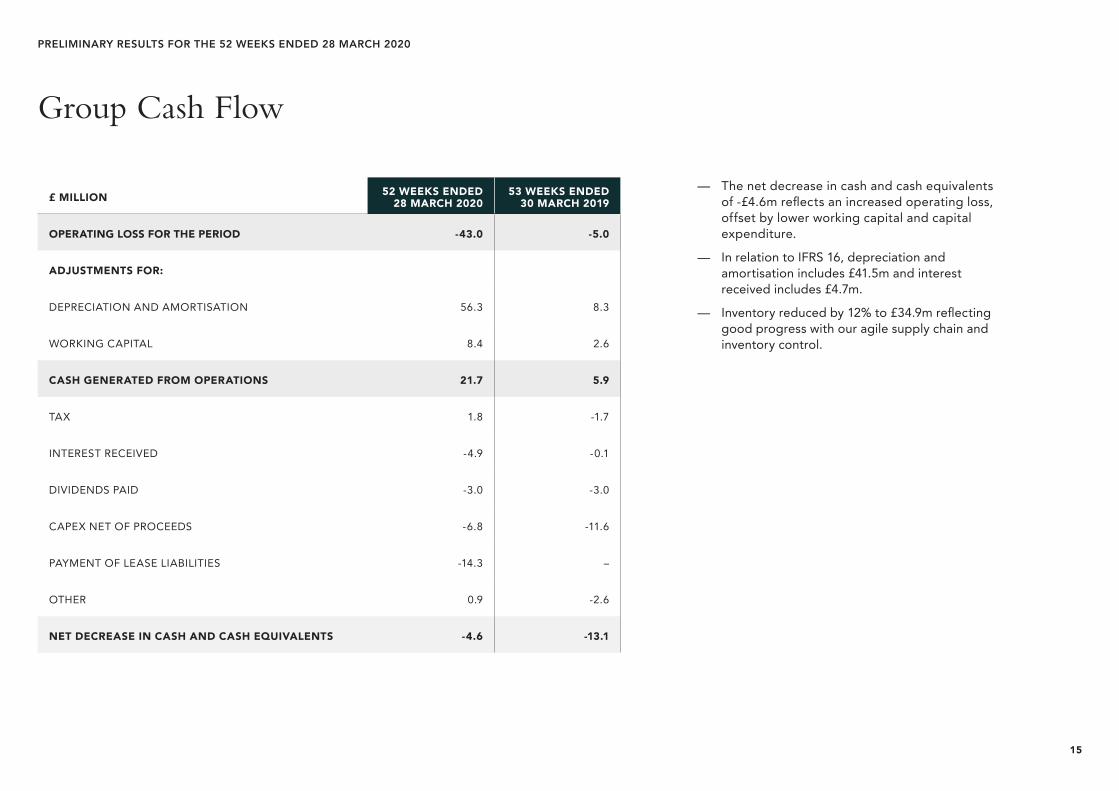
— The net decrease in cash and cash equivalents of -£4.6m reflects an increased operating loss, offset by lower working capital and capital expenditure.
— In relation to IFRS 16, depreciation and amortisation includes £41.5m and interest received includes £4.7m.
— Inventory reduced by 12% to £34.9m reflecting good progress with our agile supply chain and inventory control.
16
PRELIMINARY RESULTS FOR THE 52 WEEKS ENDED 28 MARCH 2020
Capital Expenditure
STORE + DIGITAL
OTHER
PROJECTED
FACTORIES
SYSTEMS DEVELOPMENT
2019/202020/21(PROJECTED)
2018/19 2017/18
14
0
2
4
6
8
10
12
4.0
1.8
1.6
0.5
8.9
2.2
0.5
3.0
1.0
0.7
0.7
0.3
£ MILLION
0.3
£6.4 £11.9 £5.4£1.8
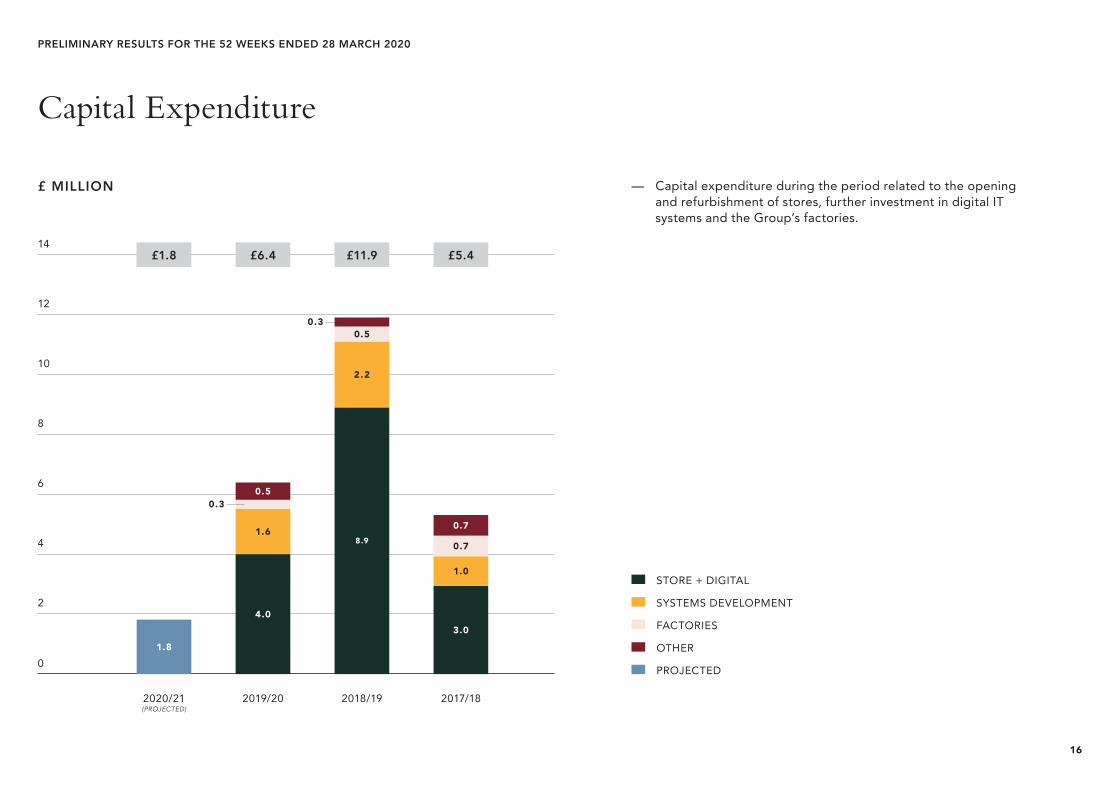
— Capital expenditure during the period related to the opening and refurbishment of stores, further investment in digital IT systems and the Group’s factories.
Strategy Overview
18
PRELIMINARY RESULTS FOR THE 52 WEEKS ENDED 28 MARCH 2020
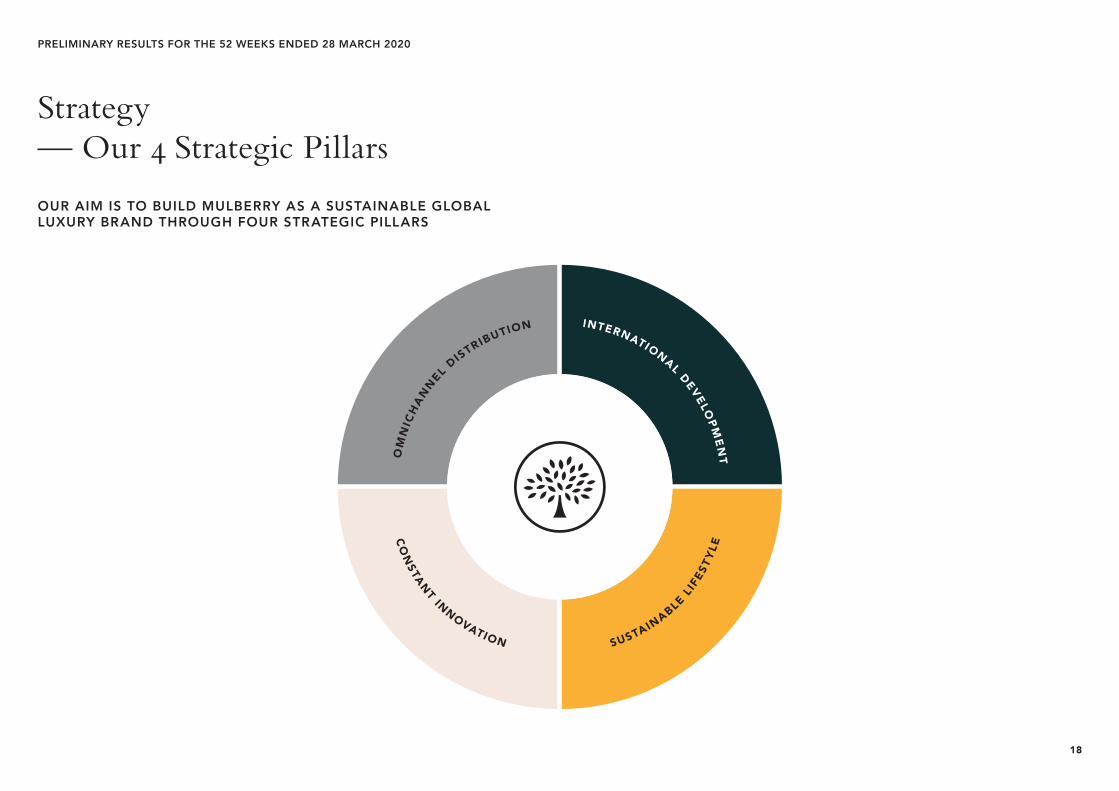
OUR AIM IS TO BUILD MULBERRY AS A SUSTAINABLE GLOBAL LUXURY BRAND THROUGH FOUR STRATEGIC PILLARS
Strategy — Our 4 Strategic Pillars
INTERNATIONAL DEVELOPM
EN
T
CO
NSTAN
T INNOVATION
OM
NIC
HA
NN
EL DISTRIBUTION
SUSTAINABLE L
IFES
TYLE
19
PRELIMINARY RESULTS FOR THE 52 WEEKS ENDED 28 MARCH 2020
Strategic Pillar 1 — Omni-channel Distribution
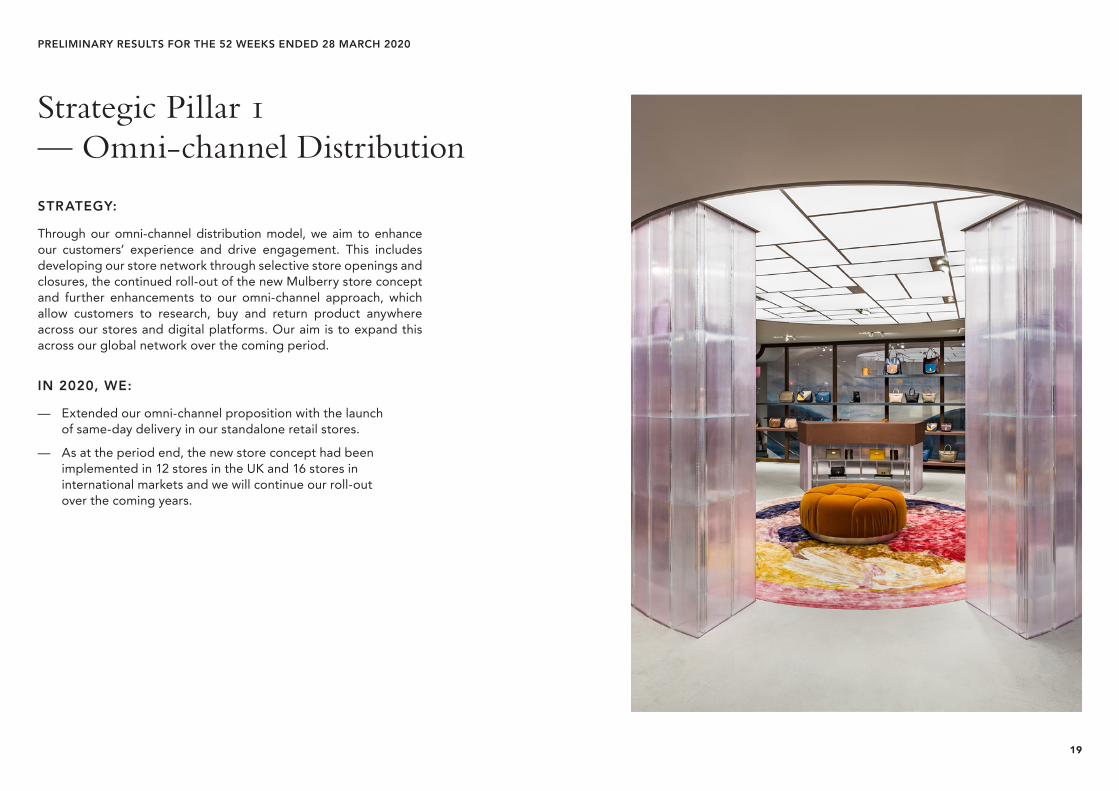
STRATEGY:
Through our omni-channel distribution model, we aim to enhance our customers’ experience and drive engagement. This includes developing our store network through selective store openings and closures, the continued roll-out of the new Mulberry store concept and further enhancements to our omni-channel approach, which allow customers to research, buy and return product anywhere across our stores and digital platforms. Our aim is to expand this across our global network over the coming period.
IN 2020, WE:
— Extended our omni-channel proposition with the launch of same-day delivery in our standalone retail stores.
— As at the period end, the new store concept had been implemented in 12 stores in the UK and 16 stores in international markets and we will continue our roll-out over the coming years.
20
PRELIMINARY RESULTS FOR THE 52 WEEKS ENDED 28 MARCH 2020
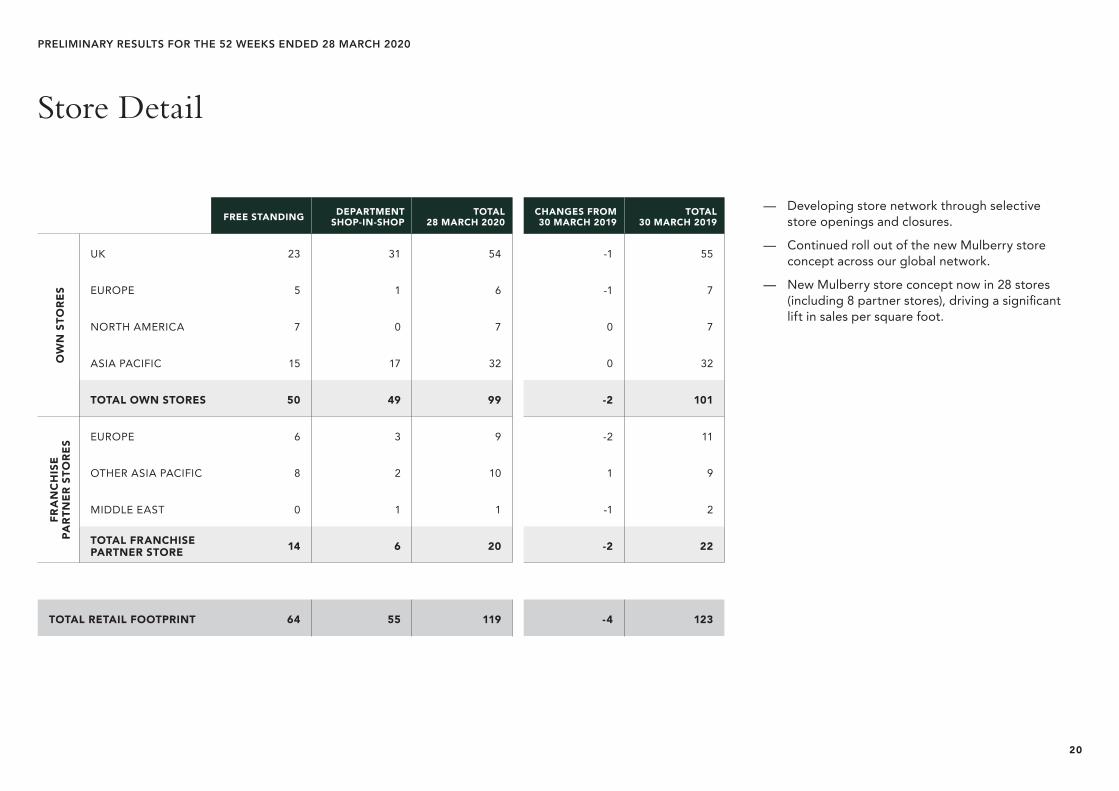
— Developing store network through selective store openings and closures.
— Continued roll out of the new Mulberry store concept across our global network.
— New Mulberry store concept now in 28 stores (including 8 partner stores), driving a significant lift in sales per square foot.
Store Detail
FREE STANDING DEPARTMENT SHOP-IN-SHOP
TOTAL 28 MARCH 2020
CHANGES FROM 30 MARCH 2019
TOTAL 30 MARCH 2019
OW
N S
TORE
S
UK 23 31 54 -1 55
EUROPE 5 1 6 -1 7
NORTH AMERICA 7 0 7 0 7
ASIA PACIFIC 15 17 32 0 32
TOTAL OWN STORES 50 49 99 -2 101
FRA
NC
HIS
EPA
RTN
ER S
TORE
S EUROPE 6 3 9 -2 11
OTHER ASIA PACIFIC 8 2 10 1 9
MIDDLE EAST 0 1 1 -1 2
TOTAL FRANCHISE PARTNER STORE 14 6 20 -2 22
TOTAL RETAIL FOOTPRINT 64 55 119 -4 123
21
PRELIMINARY RESULTS FOR THE 52 WEEKS ENDED 28 MARCH 2020
Strategic Pillar 2 — International Development
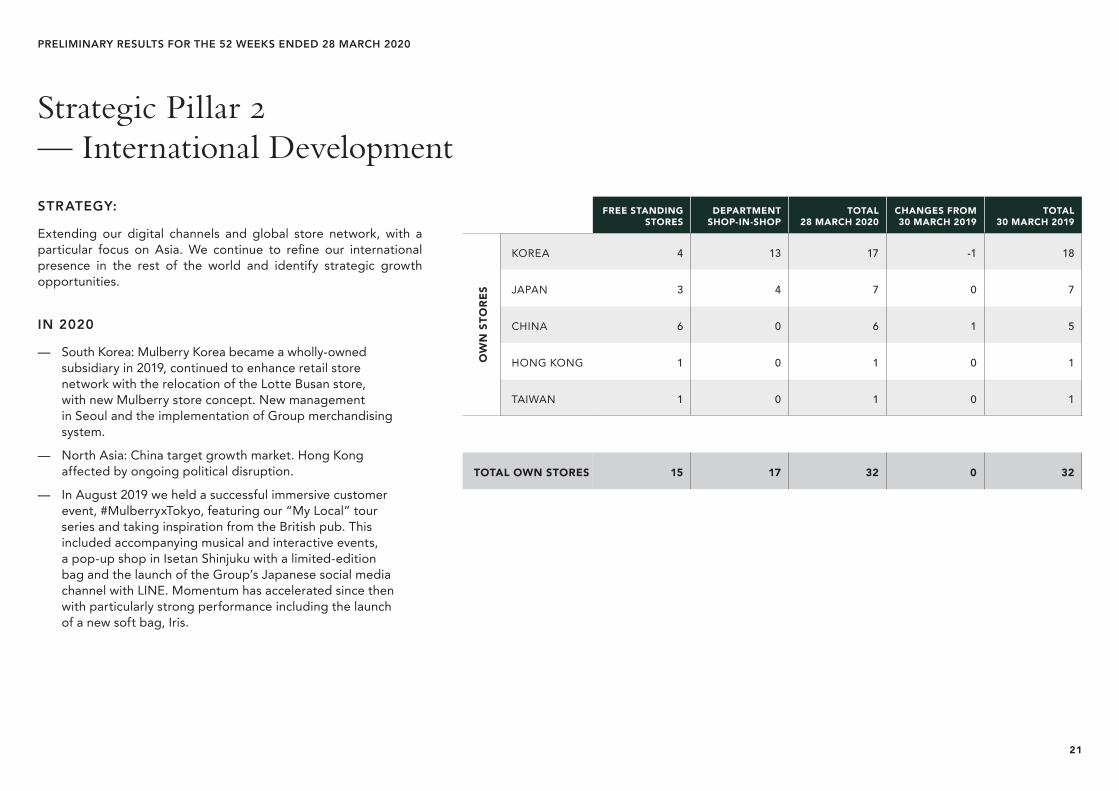
STRATEGY:
Extending our digital channels and global store network, with a particular focus on Asia. We continue to refine our international presence in the rest of the world and identify strategic growth opportunities.
IN 2020
— South Korea: Mulberry Korea became a wholly-owned subsidiary in 2019, continued to enhance retail store network with the relocation of the Lotte Busan store, with new Mulberry store concept. New management in Seoul and the implementation of Group merchandising system.
— North Asia: China target growth market. Hong Kong affected by ongoing political disruption.
— In August 2019 we held a successful immersive customer event, #MulberryxTokyo, featuring our “My Local” tour series and taking inspiration from the British pub. This included accompanying musical and interactive events, a pop-up shop in Isetan Shinjuku with a limited-edition bag and the launch of the Group’s Japanese social media channel with LINE. Momentum has accelerated since then with particularly strong performance including the launch of a new soft bag, Iris.
FREE STANDING STORES
DEPARTMENT SHOP-IN-SHOP
TOTAL 28 MARCH 2020
CHANGES FROM 30 MARCH 2019
TOTAL 30 MARCH 2019
OW
N S
TORE
S
KOREA 4 13 17 -1 18
JAPAN 3 4 7 0 7
CHINA 6 0 6 1 5
HONG KONG 1 0 1 0 1
TAIWAN 1 0 1 0 1
TOTAL OWN STORES 15 17 32 0 32
22
PRELIMINARY RESULTS FOR THE 52 WEEKS ENDED 28 MARCH 2020
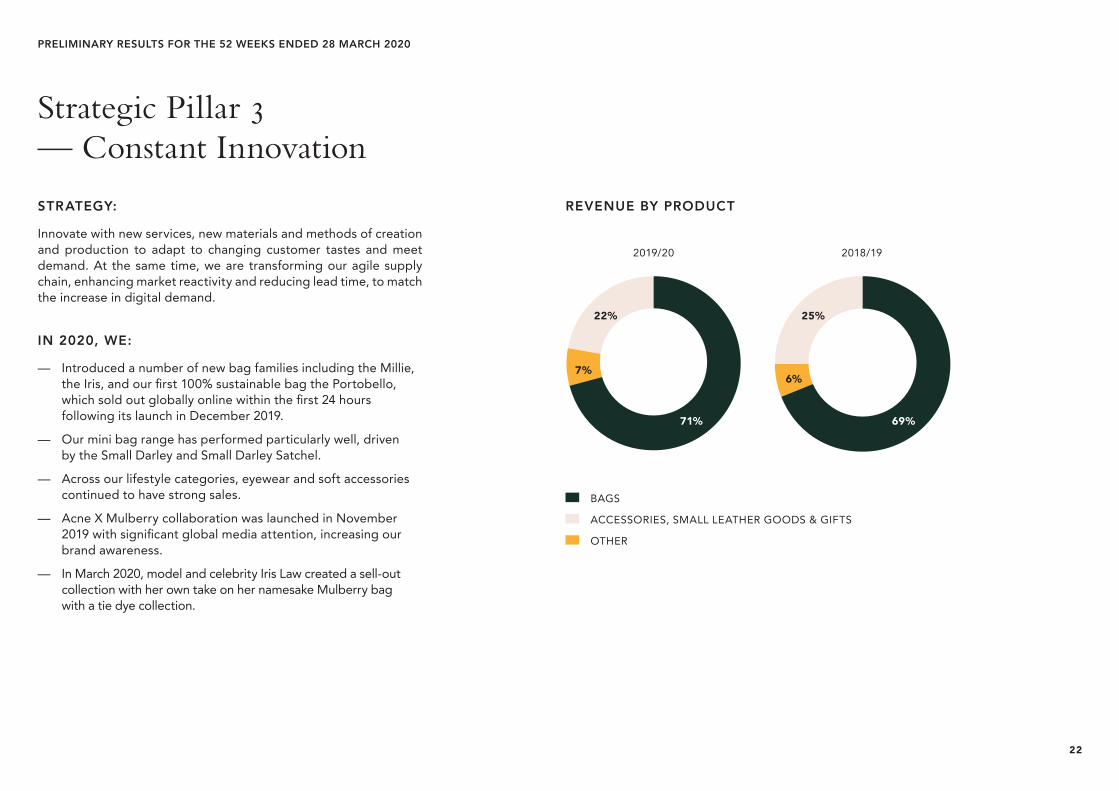
Strategic Pillar 3 — Constant Innovation
STRATEGY:
Innovate with new services, new materials and methods of creation and production to adapt to changing customer tastes and meet demand. At the same time, we are transforming our agile supply chain, enhancing market reactivity and reducing lead time, to match the increase in digital demand.
IN 2020, WE:
— Introduced a number of new bag families including the Millie, the Iris, and our first 100% sustainable bag the Portobello, which sold out globally online within the first 24 hours following its launch in December 2019.
— Our mini bag range has performed particularly well, driven by the Small Darley and Small Darley Satchel.
— Across our lifestyle categories, eyewear and soft accessories continued to have strong sales.
— Acne X Mulberry collaboration was launched in November 2019 with significant global media attention, increasing our brand awareness.
— In March 2020, model and celebrity Iris Law created a sell-out collection with her own take on her namesake Mulberry bag with a tie dye collection.
REVENUE BY PRODUCT
BAGS
ACCESSORIES, SMALL LEATHER GOODS & GIFTS
OTHER
2019/20 2018/19
22% 25%
7%6%
71% 69%
23
PRELIMINARY RESULTS FOR THE 52 WEEKS ENDED 28 MARCH 2020
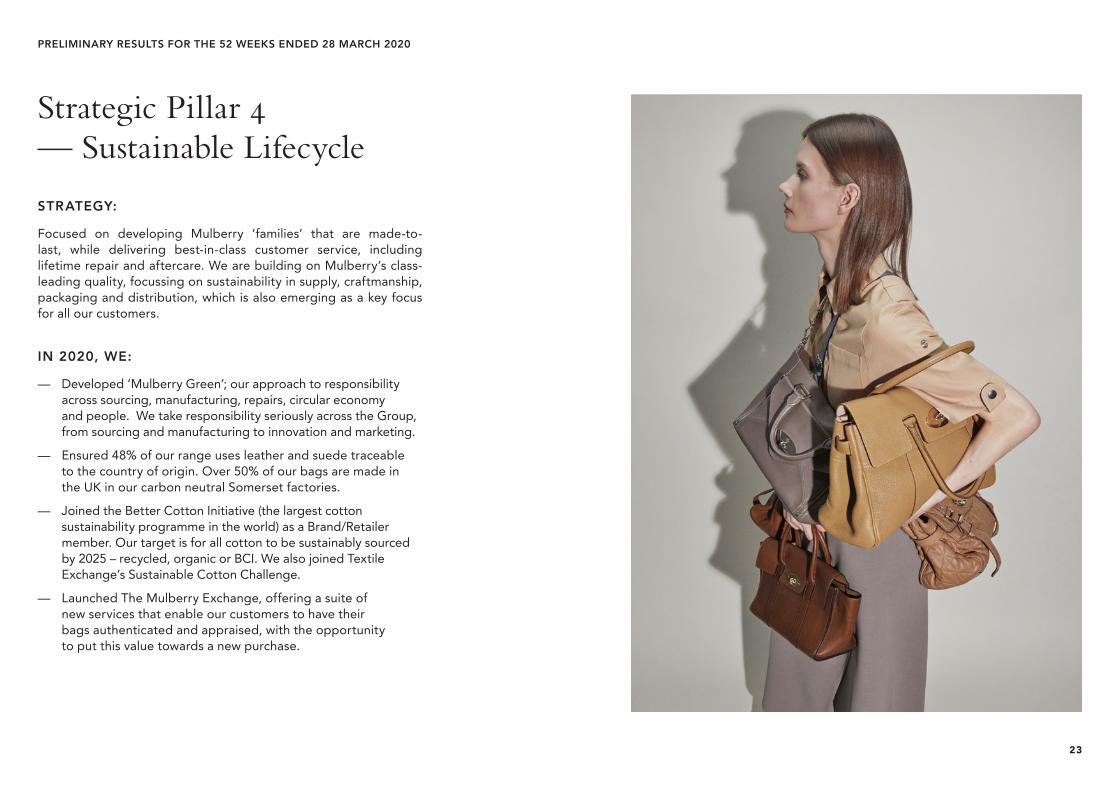
Strategic Pillar 4 — Sustainable Lifecycle
STRATEGY:
Focused on developing Mulberry ‘families’ that are made-to-last, while delivering best-in-class customer service, including lifetime repair and aftercare. We are building on Mulberry’s class-leading quality, focussing on sustainability in supply, craftmanship, packaging and distribution, which is also emerging as a key focus for all our customers.
IN 2020, WE:
— Developed ‘Mulberry Green’; our approach to responsibility across sourcing, manufacturing, repairs, circular economy and people. We take responsibility seriously across the Group, from sourcing and manufacturing to innovation and marketing.
— Ensured 48% of our range uses leather and suede traceable to the country of origin. Over 50% of our bags are made in the UK in our carbon neutral Somerset factories.
— Joined the Better Cotton Initiative (the largest cotton sustainability programme in the world) as a Brand/Retailer member. Our target is for all cotton to be sustainably sourced by 2025 – recycled, organic or BCI. We also joined Textile Exchange’s Sustainable Cotton Challenge.
— Launched The Mulberry Exchange, offering a suite of new services that enable our customers to have their bags authenticated and appraised, with the opportunity to put this value towards a new purchase.
24
PRELIMINARY RESULTS FOR THE 52 WEEKS ENDED 28 MARCH 2020
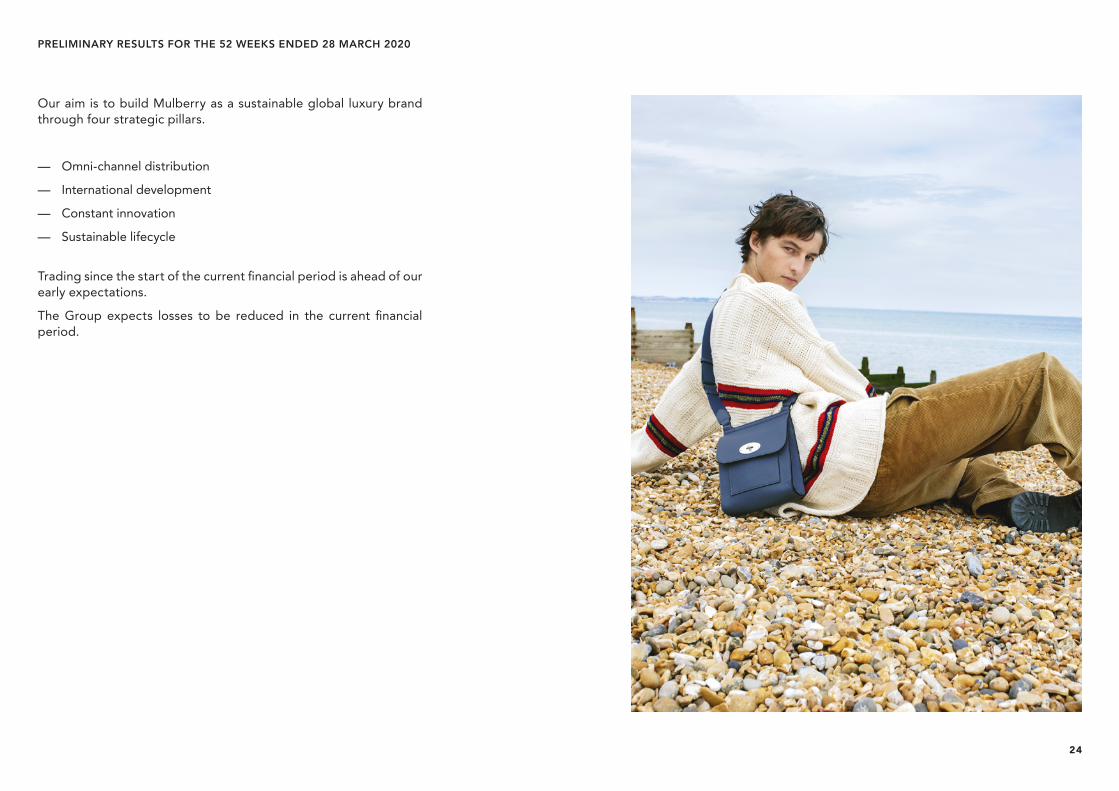
Our aim is to build Mulberry as a sustainable global luxury brand through four strategic pillars.
— Omni-channel distribution
— International development
— Constant innovation
— Sustainable lifecycle
Trading since the start of the current financial period is ahead of our early expectations.
The Group expects losses to be reduced in the current financial period.