Embed Size (px)
Citation preview
HSBC ETFs PLC Interim Report and Unaudited Financial Statements For the period from 1 January 2015 to 30 June 2015
Contents
HSBC ETFs PLC >1<
Management and Administration ................................................................................................. 3
General Information .............................................................................................................................. 4
Investment Managers’ Report ........................................................................................................ 10
Schedules of Investments
HSBC FTSE 100 UCITS ETF ........................................................................................................................... 21
HSBC EURO STOXX 50 UCITS ETF .............................................................................................................. 25
HSBC MSCI JAPAN UCITS ETF ...................................................................................................................... 29
HSBC FTSE 250 UCITS ETF ........................................................................................................................... 37
HSBC S&P 500 UCITS ETF ............................................................................................................................. 45
HSBC MSCI EUROPE UCITS ETF .................................................................................................................. 58
HSBC MSCI USA UCITS ETF .......................................................................................................................... 74
HSBC MSCI BRAZIL UCITS ETF ..................................................................................................................... 89
HSBC MSCI PACIFIC ex JAPAN UCITS ETF .................................................................................................. 92
HSBC MSCI EM FAR EAST UCITS ETF ......................................................................................................... 98
HSBC MSCI TURKEY UCITS ETF ................................................................................................................... 111
HSBC MSCI WORLD UCITS ETF .................................................................................................................... 113
HSBC S&P BRIC 40 UCITS ETF ..................................................................................................................... 141
HSBC MSCI CHINA UCITS ETF ..................................................................................................................... 144
HSBC MSCI SOUTH AFRICA UCITS ETF ...................................................................................................... 149
HSBC MSCI CANADA UCITS ETF ................................................................................................................. 151
HSBC MSCI MEXICO CAPPED UCITS ETF .................................................................................................. 155
HSBC MSCI EM LATIN AMERICA UCITS ETF .............................................................................................. 157
HSBC MSCI INDONESIA UCITS ETF ............................................................................................................. 162
HSBC MSCI MALAYSIA UCITS ETF .............................................................................................................. 164
HSBC MSCI TAIWAN UCITS ETF .................................................................................................................. 166
HSBC MSCI KOREA UCITS ETF ..................................................................................................................... 169
HSBC FTSE EPRA/NAREIT DEVELOPED UCITS ETF ................................................................................. 172
HSBC MSCI RUSSIA CAPPED UCITS ETF ................................................................................................... 182
HSBC MSCI EMERGING MARKETS UCITS ETF .......................................................................................... 184
HSBC MSCI AC FAR EAST ex JAPAN UCITS ETF ....................................................................................... 207
HSBC ESI WORLDWIDE EQUITY UCITS ETF .............................................................................................. 221
HSBC WORLDWIDE EQUITY UCITS ETF ..................................................................................................... 293
Balance Sheet .......................................................................................................................................... 341
Income Statement .................................................................................................................................. 357
Statement of Changes in Net Assets Attributable to Holders of Redeemable Participating Shares .......................................................................................... 372
Cash Flow Statement ......................................................................................................................... 387
Notes to the Financial Statements ............................................................................................... 402
Contents (continued)
>2< HSBC ETFs PLC
Schedules of Changes in Investments
HSBC FTSE 100 UCITS ETF ........................................................................................................................... 432
HSBC EURO STOXX 50 UCITS ETF ............................................................................................................... 433
HSBC MSCI JAPAN UCITS ETF ...................................................................................................................... 434
HSBC FTSE 250 UCITS ETF ........................................................................................................................... 435
HSBC S&P 500 UCITS ETF ............................................................................................................................. 436
HSBC MSCI EUROPE UCITS ETF .................................................................................................................. 437
HSBC MSCI USA UCITS ETF ......................................................................................................................... 438
HSBC MSCI BRAZIL UCITS ETF ..................................................................................................................... 439
HSBC MSCI PACIFIC ex JAPAN UCITS ETF .................................................................................................. 440
HSBC MSCI EM FAR EAST UCITS ETF ......................................................................................................... 441
HSBC MSCI TURKEY UCITS ETF ................................................................................................................... 442
HSBC MSCI WORLD UCITS ETF .................................................................................................................... 443
HSBC S&P BRIC 40 UCITS ETF ...................................................................................................................... 444
HSBC MSCI CHINA UCITS ETF ...................................................................................................................... 445
HSBC MSCI SOUTH AFRICA UCITS ETF ....................................................................................................... 446
HSBC MSCI CANADA UCITS ETF .................................................................................................................. 447
HSBC MSCI MEXICO CAPPED UCITS ETF ................................................................................................... 448
HSBC MSCI EM LATIN AMERICA UCITS ETF ............................................................................................... 449
HSBC MSCI INDONESIA UCITS ETF .............................................................................................................. 450
HSBC MSCI MALAYSIA UCITS ETF ............................................................................................................... 451
HSBC MSCI TAIWAN UCITS ETF ................................................................................................................... 452
HSBC MSCI KOREA UCITS ETF ..................................................................................................................... 453
HSBC FTSE EPRA/NAREIT DEVELOPED UCITS ETF ................................................................................. 454
HSBC MSCI RUSSIA CAPPED UCITS ETF ................................................................................................... 455
HSBC MSCI EMERGING MARKETS UCITS ETF .......................................................................................... 456
HSBC MSCI AC FAR EAST ex JAPAN UCITS ETF ....................................................................................... 457
HSBC ESI WORLDWIDE EQUITY UCITS ETF .............................................................................................. 458
HSBC WORLDWIDE EQUITY UCITS ETF ..................................................................................................... 459
Management and Administration
HSBC ETFs PLC >3<
Directors Paying Agent – Austria Eimear Cowhey* (Irish) (Chairperson) Erste Bank der Oesterreichischen Sparkassen AG Peter Blessing* (Irish) Graben 21, 1010 Wien Melissa McDonald** (British) Österreich *Independent Non-Executive Directors and members of the Audit Committee.
Company Secretary
**Non-Executive Director Goodbody Secretarial Limited 25/28 North Wall Quay Custodian IFSC HSBC Institutional Trust Services (Ireland) Limited Dublin 1 1 Grand Canal Square Ireland Grand Canal Harbour Dublin 2 Registered Office Ireland 25/28 North Wall Quay IFSC Registrar and Transfer Agent (Secondary Market)
Dublin 1 Ireland
Computershare Investor Services (Ireland) Limited Heron House Administrator Corrig Road HSBC Securities Services (Ireland) Limited Sandyford Industrial Estate 1 Grand Canal Square Dublin 18 Grand Canal Harbour Ireland Dublin 2 Legal Advisers (As to Irish Law) Registrar and Transfer Agent Matheson (Primary Market) 70 Sir John Rogerson’s Quay HSBC Securities Services (Ireland) Limited Dublin 2 1 Grand Canal Square Ireland Grand Canal Harbour Dublin 2 Promoter, Distributor, UK Representative Ireland and Investment Manager HSBC Global Asset Management (UK) Limited Independent Auditors 8 Canada Square PricewaterhouseCoopers London E14 5HQ Chartered Accountants and Statutory Audit Firm United Kingdom One Spencer Dock North Wall Quay Swiss Representative Dublin 1 HSBC Global Asset Management Ireland (Switzerland) Limited Bederstrasse 49 Sponsor CH-8002 Zurich J&E Davy Switzerland Davy House 49 Dawson Street Paying Agent – Germany Dublin 2 HSBC Trinkaus & Burkhardt AG Ireland Königsallee 21/23 40212 Düsseldorf Paying Agent – Sweden Germany Skandinaviska Enskilda Banken AB through its entity Custody Services Paying Agent – Switzerland SEB Merchant Banking Custody Services HSBC Private Bank (Suisse) SA Global Funds Quai des Bergues 9 - 17 RB6 P.O. Box 2888 Rissneleden 110 CH - 1211 Geneva, 1 SE-106 40 Stockholm Switzerland Sweden Paying Agent – France CACEIS Bank 1/3 Place Valhubert 75013 Paris France
General Information
>4< HSBC ETFs PLC
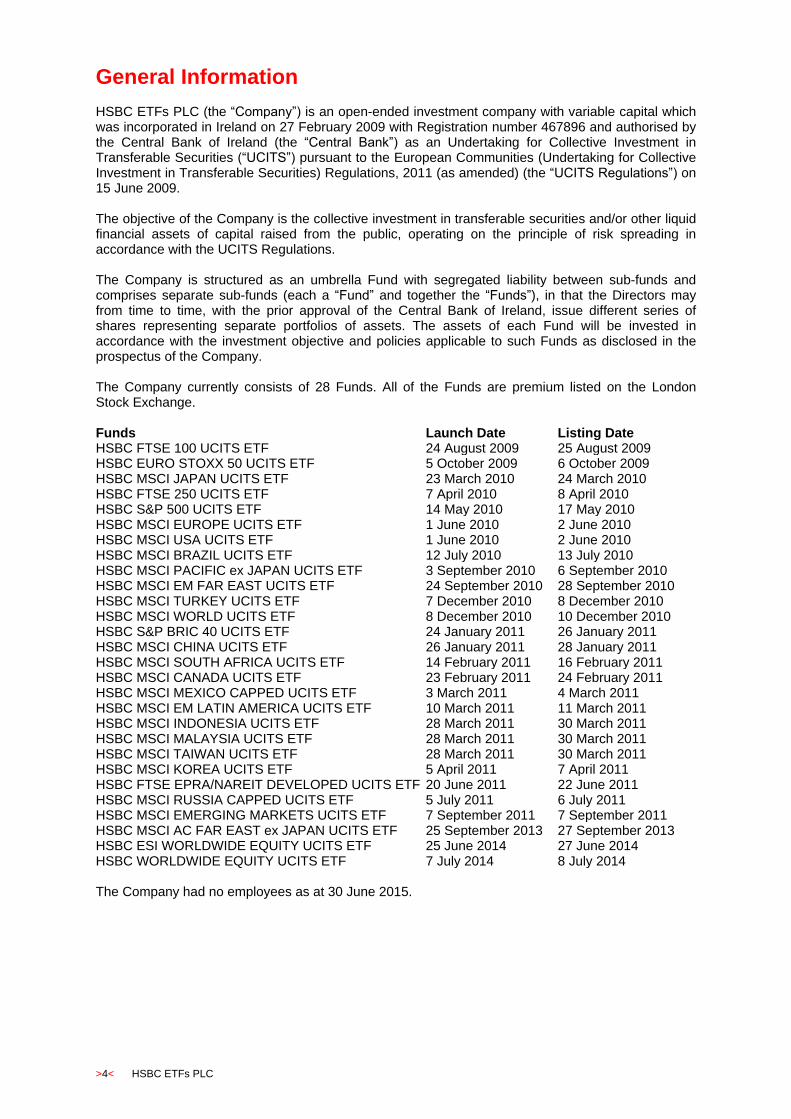
HSBC ETFs PLC (the “Company”) is an open-ended investment company with variable capital which was incorporated in Ireland on 27 February 2009 with Registration number 467896 and authorised by the Central Bank of Ireland (the “Central Bank”) as an Undertaking for Collective Investment in Transferable Securities (“UCITS”) pursuant to the European Communities (Undertaking for Collective Investment in Transferable Securities) Regulations, 2011 (as amended) (the “UCITS Regulations”) on 15 June 2009. The objective of the Company is the collective investment in transferable securities and/or other liquid financial assets of capital raised from the public, operating on the principle of risk spreading in accordance with the UCITS Regulations. The Company is structured as an umbrella Fund with segregated liability between sub-funds and comprises separate sub-funds (each a “Fund” and together the “Funds”), in that the Directors may from time to time, with the prior approval of the Central Bank of Ireland, issue different series of shares representing separate portfolios of assets. The assets of each Fund will be invested in accordance with the investment objective and policies applicable to such Funds as disclosed in the prospectus of the Company. The Company currently consists of 28 Funds. All of the Funds are premium listed on the London Stock Exchange. Funds Launch Date Listing Date HSBC FTSE 100 UCITS ETF 24 August 2009 25 August 2009 HSBC EURO STOXX 50 UCITS ETF 5 October 2009 6 October 2009 HSBC MSCI JAPAN UCITS ETF 23 March 2010 24 March 2010 HSBC FTSE 250 UCITS ETF 7 April 2010 8 April 2010 HSBC S&P 500 UCITS ETF 14 May 2010 17 May 2010 HSBC MSCI EUROPE UCITS ETF 1 June 2010 2 June 2010 HSBC MSCI USA UCITS ETF 1 June 2010 2 June 2010 HSBC MSCI BRAZIL UCITS ETF 12 July 2010 13 July 2010 HSBC MSCI PACIFIC ex JAPAN UCITS ETF 3 September 2010 6 September 2010 HSBC MSCI EM FAR EAST UCITS ETF 24 September 2010 28 September 2010 HSBC MSCI TURKEY UCITS ETF 7 December 2010 8 December 2010 HSBC MSCI WORLD UCITS ETF 8 December 2010 10 December 2010 HSBC S&P BRIC 40 UCITS ETF 24 January 2011 26 January 2011 HSBC MSCI CHINA UCITS ETF 26 January 2011 28 January 2011 HSBC MSCI SOUTH AFRICA UCITS ETF 14 February 2011 16 February 2011 HSBC MSCI CANADA UCITS ETF 23 February 2011 24 February 2011 HSBC MSCI MEXICO CAPPED UCITS ETF 3 March 2011 4 March 2011 HSBC MSCI EM LATIN AMERICA UCITS ETF 10 March 2011 11 March 2011 HSBC MSCI INDONESIA UCITS ETF 28 March 2011 30 March 2011 HSBC MSCI MALAYSIA UCITS ETF 28 March 2011 30 March 2011 HSBC MSCI TAIWAN UCITS ETF 28 March 2011 30 March 2011 HSBC MSCI KOREA UCITS ETF 5 April 2011 7 April 2011 HSBC FTSE EPRA/NAREIT DEVELOPED UCITS ETF 20 June 2011 22 June 2011 HSBC MSCI RUSSIA CAPPED UCITS ETF 5 July 2011 6 July 2011 HSBC MSCI EMERGING MARKETS UCITS ETF 7 September 2011 7 September 2011 HSBC MSCI AC FAR EAST ex JAPAN UCITS ETF 25 September 2013 27 September 2013 HSBC ESI WORLDWIDE EQUITY UCITS ETF 25 June 2014 27 June 2014 HSBC WORLDWIDE EQUITY UCITS ETF 7 July 2014 8 July 2014 The Company had no employees as at 30 June 2015.

General Information (continued)
HSBC ETFs PLC >5<
Stock Exchange Listing The details of the various stock exchange listings for each of the Funds are listed below. Funds Primary Listing Secondary Listing HSBC FTSE 100 UCITS ETF London Stock Exchange NYSE Euronext – Paris,
Deutsche Börse and SIX Swiss HSBC EURO STOXX 50 UCITS ETF London Stock Exchange NYSE Euronext – Paris,
Deutsche Börse and SIX Swiss HSBC MSCI JAPAN UCITS ETF London Stock Exchange NYSE Euronext – Paris,
Deutsche Börse and SIX Swiss
HSBC FTSE 250 UCITS ETF London Stock Exchange None
HSBC S&P 500 UCITS ETF London Stock Exchange NYSE Euronext – Paris, Deutsche Börse and SIX Swiss
HSBC MSCI EUROPE UCITS ETF London Stock Exchange NYSE Euronext – Paris, Deutsche Börse and SIX Swiss
HSBC MSCI USA UCITS ETF London Stock Exchange NYSE Euronext – Paris, Deutsche Börse and SIX Swiss
HSBC MSCI BRAZIL UCITS ETF London Stock Exchange NYSE Euronext – Paris, Deutsche Börse and SIX Swiss
HSBC MSCI PACIFIC ex JAPAN UCITS ETF London Stock Exchange NYSE Euronext – Paris, Deutsche Börse and SIX Swiss
HSBC MSCI EM FAR EAST UCITS ETF London Stock Exchange NYSE Euronext – Paris, Deutsche Börse and SIX Swiss
HSBC MSCI TURKEY UCITS ETF London Stock Exchange NYSE Euronext – Paris, SIX Swiss and Deutsche Börse
HSBC MSCI WORLD UCITS ETF London Stock Exchange NYSE Euronext – Paris, SIX Swiss and Deutsche Börse
HSBC S&P BRIC 40 UCITS ETF London Stock Exchange NYSE Euronext – Paris, SIX Swiss and Deutsche Börse
HSBC MSCI CHINA UCITS ETF London Stock Exchange NYSE Euronext – Paris, SIX Swiss and Deutsche Börse
HSBC MSCI SOUTH AFRICA UCITS ETF London Stock Exchange NYSE Euronext – Paris, SIX Swiss and Deutsche Börse
HSBC MSCI CANADA UCITS ETF London Stock Exchange NYSE Euronext – Paris, SIX Swiss and Deutsche Börse
HSBC MSCI MEXICO CAPPED UCITS ETF London Stock Exchange SIX Swiss and Deutsche Börse HSBC MSCI EM LATIN AMERICA UCITS ETF London Stock Exchange NYSE Euronext – Paris, SIX
Swiss and Deutsche Börse HSBC MSCI INDONESIA UCITS ETF London Stock Exchange SIX Swiss and Deutsche Börse HSBC MSCI MALAYSIA UCITS ETF London Stock Exchange SIX Swiss and Deutsche Börse HSBC MSCI TAIWAN UCITS ETF London Stock Exchange SIX Swiss and Deutsche Börse HSBC MSCI KOREA UCITS ETF London Stock Exchange SIX Swiss and Deutsche Börse HSBC FTSE EPRA/NAREIT DEVELOPED UCITS ETF
London Stock Exchange Deutsche Börse
HSBC MSCI RUSSIA CAPPED UCITS ETF London Stock Exchange SIX Swiss and Deutsche Börse HSBC MSCI EMERGING MARKETS UCITS ETF
London Stock Exchange SIX Swiss and Deutsche Börse
HSBC MSCI AC FAR EAST ex JAPAN UCITS ETF
London Stock Exchange SIX Swiss and Deutsche Börse
HSBC ESI WORLDWIDE EQUITY UCITS ETF London Stock Exchange None HSBC WORLDWIDE EQUITY UCITS ETF London Stock Exchange None
General Information (continued)
>6< HSBC ETFs PLC
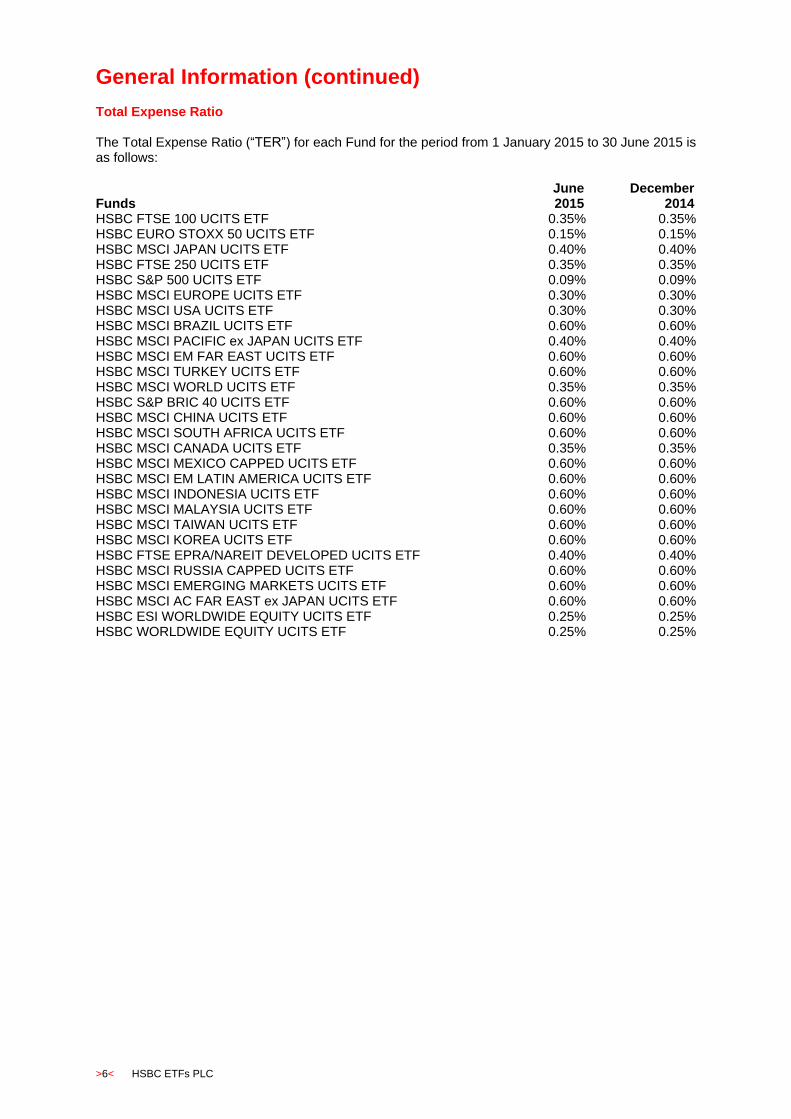
Total Expense Ratio The Total Expense Ratio (“TER”) for each Fund for the period from 1 January 2015 to 30 June 2015 is as follows:
Funds June 2015
December 2014
HSBC FTSE 100 UCITS ETF 0.35% 0.35% HSBC EURO STOXX 50 UCITS ETF 0.15% 0.15% HSBC MSCI JAPAN UCITS ETF 0.40% 0.40% HSBC FTSE 250 UCITS ETF 0.35% 0.35% HSBC S&P 500 UCITS ETF 0.09% 0.09% HSBC MSCI EUROPE UCITS ETF 0.30% 0.30% HSBC MSCI USA UCITS ETF 0.30% 0.30% HSBC MSCI BRAZIL UCITS ETF 0.60% 0.60% HSBC MSCI PACIFIC ex JAPAN UCITS ETF 0.40% 0.40% HSBC MSCI EM FAR EAST UCITS ETF 0.60% 0.60% HSBC MSCI TURKEY UCITS ETF 0.60% 0.60% HSBC MSCI WORLD UCITS ETF 0.35% 0.35% HSBC S&P BRIC 40 UCITS ETF 0.60% 0.60% HSBC MSCI CHINA UCITS ETF 0.60% 0.60% HSBC MSCI SOUTH AFRICA UCITS ETF 0.60% 0.60% HSBC MSCI CANADA UCITS ETF 0.35% 0.35% HSBC MSCI MEXICO CAPPED UCITS ETF 0.60% 0.60% HSBC MSCI EM LATIN AMERICA UCITS ETF 0.60% 0.60% HSBC MSCI INDONESIA UCITS ETF 0.60% 0.60% HSBC MSCI MALAYSIA UCITS ETF 0.60% 0.60% HSBC MSCI TAIWAN UCITS ETF 0.60% 0.60% HSBC MSCI KOREA UCITS ETF 0.60% 0.60% HSBC FTSE EPRA/NAREIT DEVELOPED UCITS ETF 0.40% 0.40% HSBC MSCI RUSSIA CAPPED UCITS ETF 0.60% 0.60% HSBC MSCI EMERGING MARKETS UCITS ETF 0.60% 0.60% HSBC MSCI AC FAR EAST ex JAPAN UCITS ETF 0.60% 0.60% HSBC ESI WORLDWIDE EQUITY UCITS ETF 0.25% 0.25% HSBC WORLDWIDE EQUITY UCITS ETF 0.25% 0.25%
General Information (continued)
HSBC ETFs PLC >7<
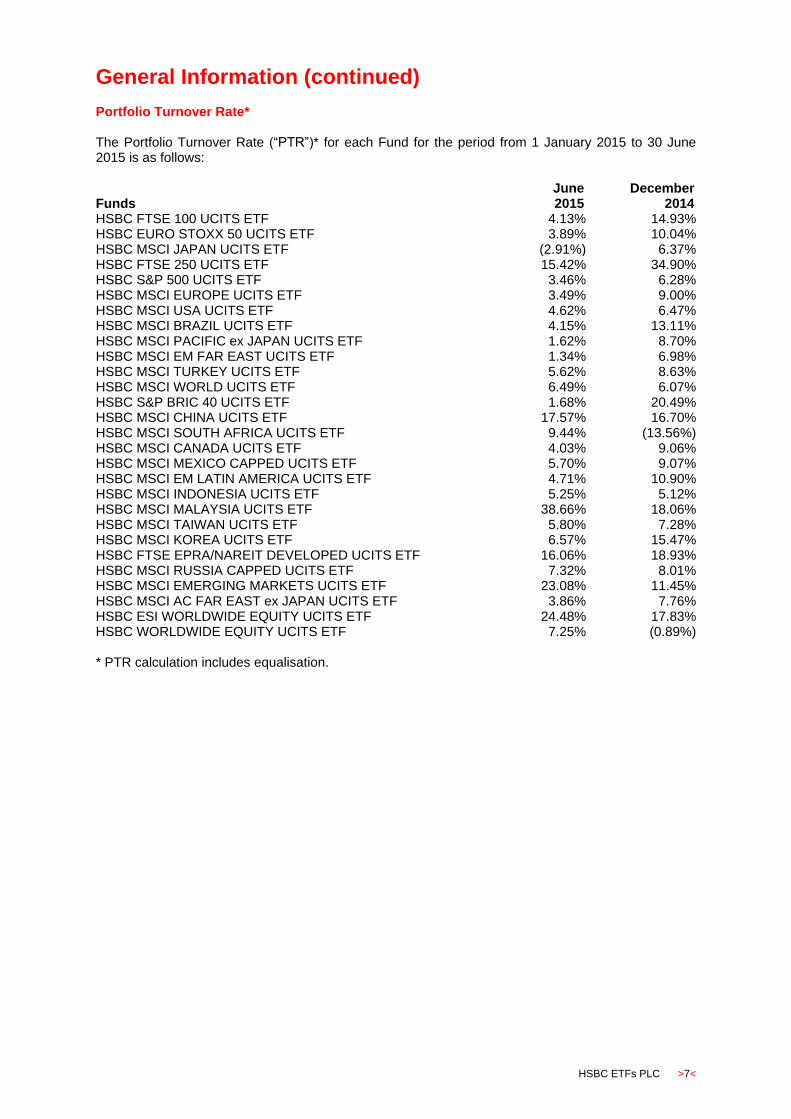
Portfolio Turnover Rate* The Portfolio Turnover Rate (“PTR”)* for each Fund for the period from 1 January 2015 to 30 June 2015 is as follows:
Funds June 2015
December 2014
HSBC FTSE 100 UCITS ETF 4.13% 14.93% HSBC EURO STOXX 50 UCITS ETF 3.89% 10.04% HSBC MSCI JAPAN UCITS ETF (2.91%) 6.37% HSBC FTSE 250 UCITS ETF 15.42% 34.90% HSBC S&P 500 UCITS ETF 3.46% 6.28% HSBC MSCI EUROPE UCITS ETF 3.49% 9.00% HSBC MSCI USA UCITS ETF 4.62% 6.47% HSBC MSCI BRAZIL UCITS ETF 4.15% 13.11% HSBC MSCI PACIFIC ex JAPAN UCITS ETF 1.62% 8.70% HSBC MSCI EM FAR EAST UCITS ETF 1.34% 6.98% HSBC MSCI TURKEY UCITS ETF 5.62% 8.63% HSBC MSCI WORLD UCITS ETF 6.49% 6.07% HSBC S&P BRIC 40 UCITS ETF 1.68% 20.49% HSBC MSCI CHINA UCITS ETF 17.57% 16.70% HSBC MSCI SOUTH AFRICA UCITS ETF 9.44% (13.56%) HSBC MSCI CANADA UCITS ETF 4.03% 9.06% HSBC MSCI MEXICO CAPPED UCITS ETF 5.70% 9.07% HSBC MSCI EM LATIN AMERICA UCITS ETF 4.71% 10.90% HSBC MSCI INDONESIA UCITS ETF 5.25% 5.12% HSBC MSCI MALAYSIA UCITS ETF 38.66% 18.06% HSBC MSCI TAIWAN UCITS ETF 5.80% 7.28% HSBC MSCI KOREA UCITS ETF 6.57% 15.47% HSBC FTSE EPRA/NAREIT DEVELOPED UCITS ETF 16.06% 18.93% HSBC MSCI RUSSIA CAPPED UCITS ETF 7.32% 8.01% HSBC MSCI EMERGING MARKETS UCITS ETF 23.08% 11.45% HSBC MSCI AC FAR EAST ex JAPAN UCITS ETF 3.86% 7.76% HSBC ESI WORLDWIDE EQUITY UCITS ETF 24.48% 17.83% HSBC WORLDWIDE EQUITY UCITS ETF 7.25% (0.89%) * PTR calculation includes equalisation.
General Information (continued)
>8< HSBC ETFs PLC
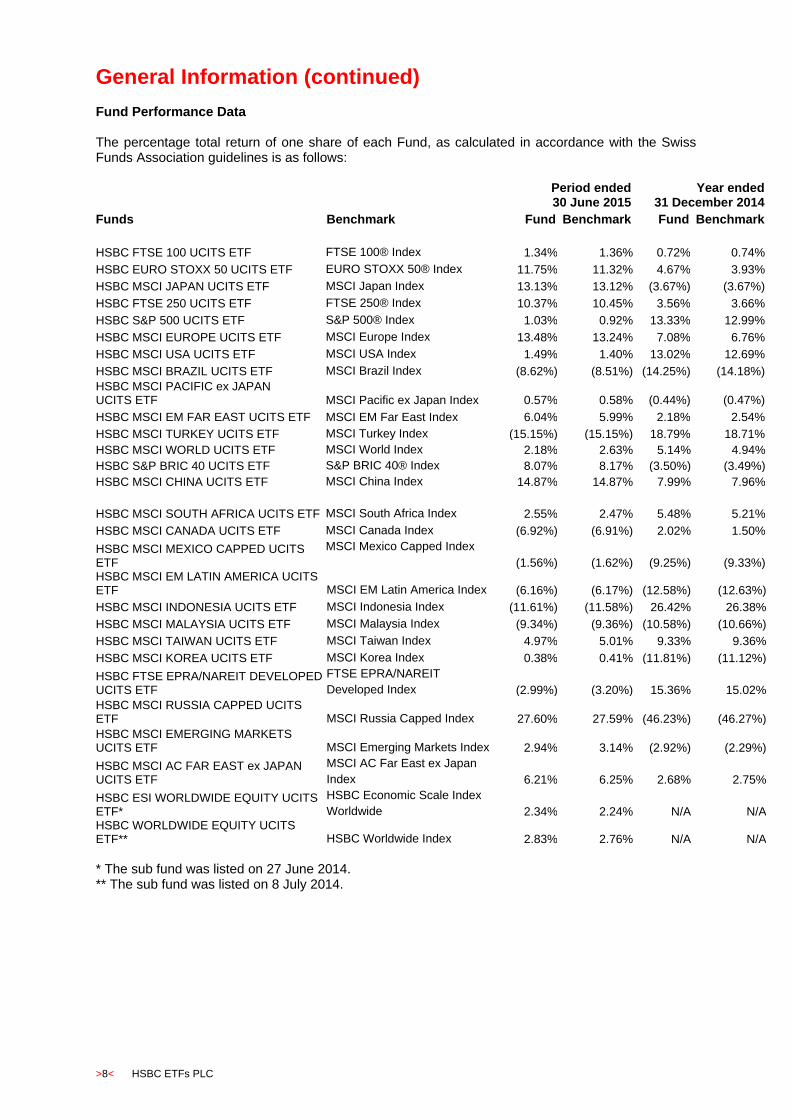
Fund Performance Data The percentage total return of one share of each Fund, as calculated in accordance with the Swiss Funds Association guidelines is as follows:
Period ended 30 June 2015
Year ended 31 December 2014
Funds Benchmark Fund Benchmark Fund Benchmark
HSBC FTSE 100 UCITS ETF FTSE 100® Index 1.34% 1.36% 0.72% 0.74%
HSBC EURO STOXX 50 UCITS ETF EURO STOXX 50® Index 11.75% 11.32% 4.67% 3.93%
HSBC MSCI JAPAN UCITS ETF MSCI Japan Index 13.13% 13.12% (3.67%) (3.67%)
HSBC FTSE 250 UCITS ETF FTSE 250® Index 10.37% 10.45% 3.56% 3.66%
HSBC S&P 500 UCITS ETF S&P 500® Index 1.03% 0.92% 13.33% 12.99%
HSBC MSCI EUROPE UCITS ETF MSCI Europe Index 13.48% 13.24% 7.08% 6.76%
HSBC MSCI USA UCITS ETF MSCI USA Index 1.49% 1.40% 13.02% 12.69%
HSBC MSCI BRAZIL UCITS ETF MSCI Brazil Index (8.62%) (8.51%) (14.25%) (14.18%)
HSBC MSCI PACIFIC ex JAPAN UCITS ETF MSCI Pacific ex Japan Index 0.57% 0.58% (0.44%) (0.47%)
HSBC MSCI EM FAR EAST UCITS ETF MSCI EM Far East Index 6.04% 5.99% 2.18% 2.54%
HSBC MSCI TURKEY UCITS ETF MSCI Turkey Index (15.15%) (15.15%) 18.79% 18.71%
HSBC MSCI WORLD UCITS ETF MSCI World Index 2.18% 2.63% 5.14% 4.94%
HSBC S&P BRIC 40 UCITS ETF S&P BRIC 40® Index 8.07% 8.17% (3.50%) (3.49%)
HSBC MSCI CHINA UCITS ETF MSCI China Index 14.87% 14.87% 7.99% 7.96%
HSBC MSCI SOUTH AFRICA UCITS ETF
MSCI South Africa Index 2.55% 2.47% 5.48% 5.21%
HSBC MSCI CANADA UCITS ETF MSCI Canada Index (6.92%) (6.91%) 2.02% 1.50%
HSBC MSCI MEXICO CAPPED UCITS ETF
MSCI Mexico Capped Index
(1.56%) (1.62%) (9.25%) (9.33%) HSBC MSCI EM LATIN AMERICA UCITS ETF MSCI EM Latin America Index (6.16%) (6.17%) (12.58%) (12.63%)
HSBC MSCI INDONESIA UCITS ETF MSCI Indonesia Index (11.61%) (11.58%) 26.42% 26.38%
HSBC MSCI MALAYSIA UCITS ETF MSCI Malaysia Index (9.34%) (9.36%) (10.58%) (10.66%)
HSBC MSCI TAIWAN UCITS ETF MSCI Taiwan Index 4.97% 5.01% 9.33% 9.36%
HSBC MSCI KOREA UCITS ETF MSCI Korea Index 0.38% 0.41% (11.81%) (11.12%)
HSBC FTSE EPRA/NAREIT DEVELOPED UCITS ETF
FTSE EPRA/NAREIT
Developed Index (2.99%) (3.20%) 15.36% 15.02%
HSBC MSCI RUSSIA CAPPED UCITS ETF MSCI Russia Capped Index 27.60% 27.59% (46.23%) (46.27%)
HSBC MSCI EMERGING MARKETS UCITS ETF MSCI Emerging Markets Index 2.94% 3.14% (2.92%) (2.29%)
HSBC MSCI AC FAR EAST ex JAPAN UCITS ETF
MSCI AC Far East ex Japan
Index 6.21% 6.25% 2.68% 2.75%
HSBC ESI WORLDWIDE EQUITY UCITS ETF*
HSBC Economic Scale Index
Worldwide 2.34% 2.24% N/A N/A HSBC WORLDWIDE EQUITY UCITS ETF** HSBC Worldwide Index 2.83% 2.76% N/A N/A
* The sub fund was listed on 27 June 2014. ** The sub fund was listed on 8 July 2014.
General Information (continued)
HSBC ETFs PLC >9<
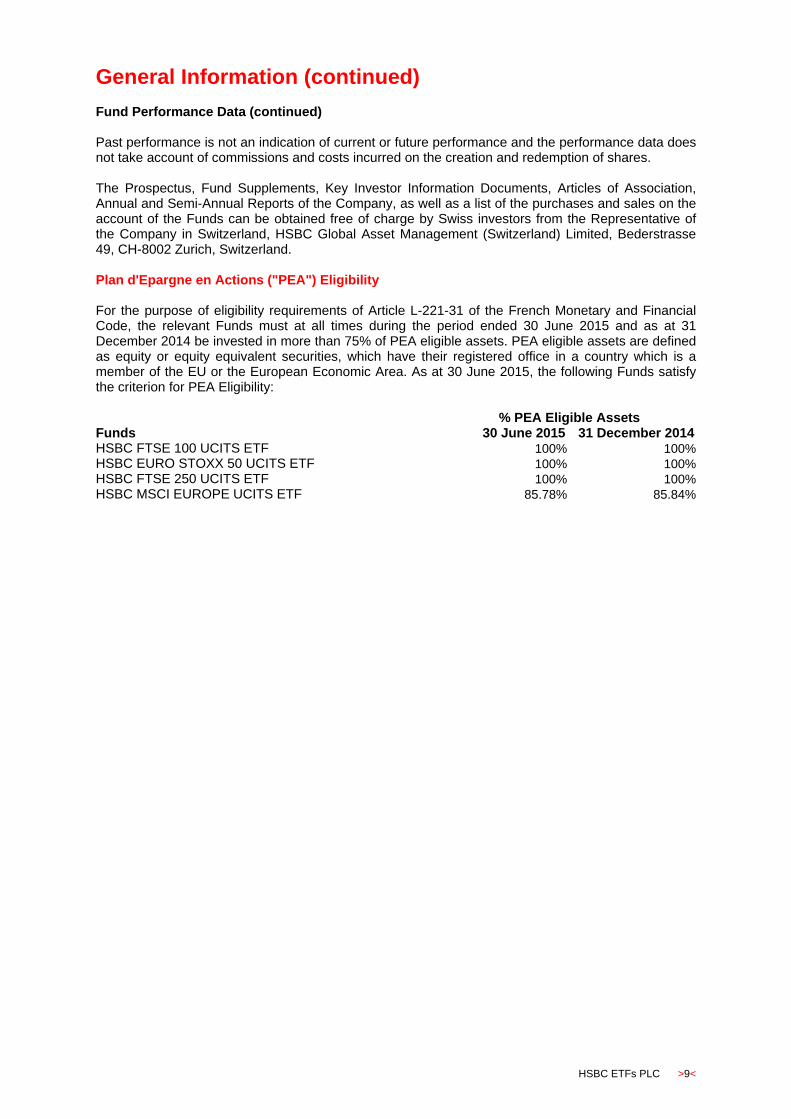
Fund Performance Data (continued) Past performance is not an indication of current or future performance and the performance data does not take account of commissions and costs incurred on the creation and redemption of shares. The Prospectus, Fund Supplements, Key Investor Information Documents, Articles of Association, Annual and Semi-Annual Reports of the Company, as well as a list of the purchases and sales on the account of the Funds can be obtained free of charge by Swiss investors from the Representative of the Company in Switzerland, HSBC Global Asset Management (Switzerland) Limited, Bederstrasse 49, CH-8002 Zurich, Switzerland. Plan d'Epargne en Actions ("PEA") Eligibility For the purpose of eligibility requirements of Article L-221-31 of the French Monetary and Financial Code, the relevant Funds must at all times during the period ended 30 June 2015 and as at 31 December 2014 be invested in more than 75% of PEA eligible assets. PEA eligible assets are defined as equity or equity equivalent securities, which have their registered office in a country which is a member of the EU or the European Economic Area. As at 30 June 2015, the following Funds satisfy the criterion for PEA Eligibility: % PEA Eligible Assets Funds 30 June 2015 31 December 2014 HSBC FTSE 100 UCITS ETF 100% 100%
HSBC EURO STOXX 50 UCITS ETF 100% 100%
HSBC FTSE 250 UCITS ETF 100% 100%
HSBC MSCI EUROPE UCITS ETF 85.78% 85.84%
Investment Manager’s Report
>10< HSBC ETFs PLC
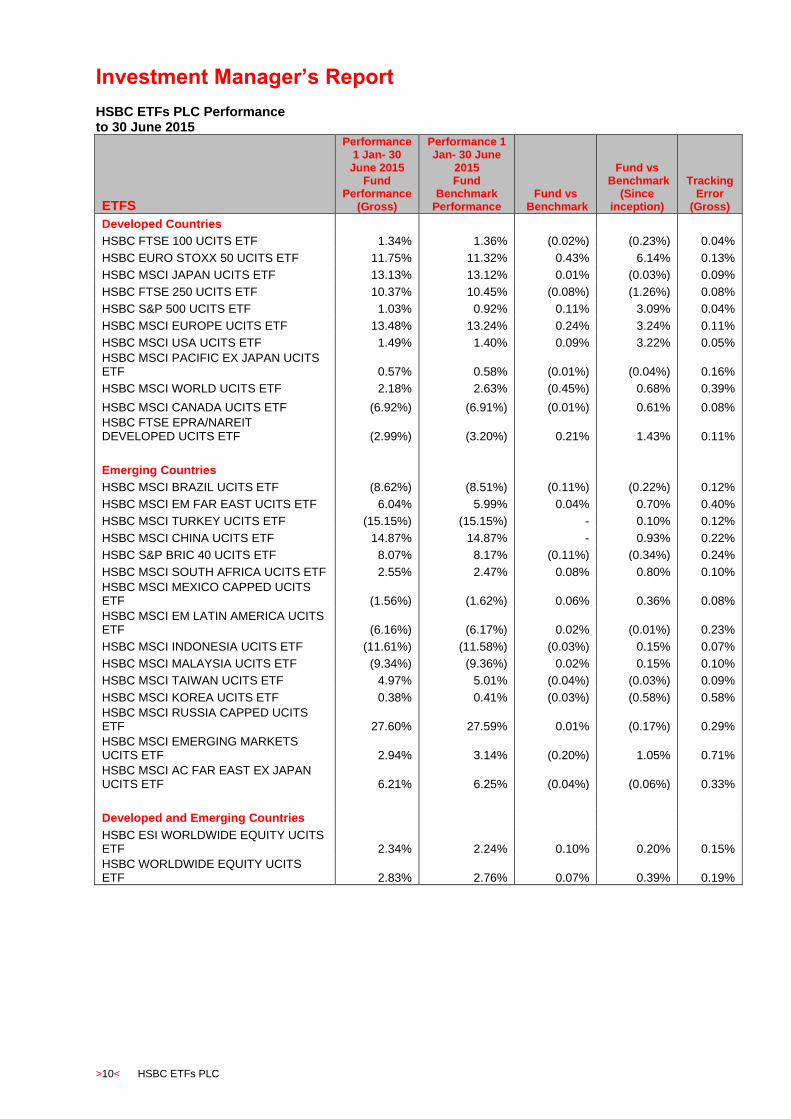
HSBC ETFs PLC Performance to 30 June 2015
ETFS
Performance 1 Jan- 30 June 2015
Fund Performance
(Gross)
Performance 1 Jan- 30 June
2015 Fund
Benchmark Performance
Fund vs Benchmark
Fund vs Benchmark
(Since inception)
Tracking Error
(Gross)
Developed Countries
HSBC FTSE 100 UCITS ETF 1.34% 1.36% (0.02%) (0.23%) 0.04%
HSBC EURO STOXX 50 UCITS ETF 11.75% 11.32% 0.43% 6.14% 0.13%
HSBC MSCI JAPAN UCITS ETF 13.13% 13.12% 0.01% (0.03%) 0.09%
HSBC FTSE 250 UCITS ETF 10.37% 10.45% (0.08%) (1.26%) 0.08%
HSBC S&P 500 UCITS ETF 1.03% 0.92% 0.11% 3.09% 0.04%
HSBC MSCI EUROPE UCITS ETF 13.48% 13.24% 0.24% 3.24% 0.11%
HSBC MSCI USA UCITS ETF 1.49% 1.40% 0.09% 3.22% 0.05%
HSBC MSCI PACIFIC EX JAPAN UCITS ETF 0.57% 0.58% (0.01%) (0.04%) 0.16%
HSBC MSCI WORLD UCITS ETF 2.18% 2.63% (0.45%) 0.68% 0.39%
HSBC MSCI CANADA UCITS ETF (6.92%) (6.91%) (0.01%) 0.61% 0.08%
HSBC FTSE EPRA/NAREIT DEVELOPED UCITS ETF (2.99%) (3.20%) 0.21% 1.43% 0.11%
Emerging Countries
HSBC MSCI BRAZIL UCITS ETF (8.62%) (8.51%) (0.11%) (0.22%) 0.12%
HSBC MSCI EM FAR EAST UCITS ETF 6.04% 5.99% 0.04% 0.70% 0.40%
HSBC MSCI TURKEY UCITS ETF (15.15%) (15.15%) - 0.10% 0.12%
HSBC MSCI CHINA UCITS ETF 14.87% 14.87% - 0.93% 0.22%
HSBC S&P BRIC 40 UCITS ETF 8.07% 8.17% (0.11%) (0.34%) 0.24%
HSBC MSCI SOUTH AFRICA UCITS ETF 2.55% 2.47% 0.08% 0.80% 0.10%
HSBC MSCI MEXICO CAPPED UCITS ETF (1.56%) (1.62%) 0.06% 0.36% 0.08%
HSBC MSCI EM LATIN AMERICA UCITS ETF (6.16%) (6.17%) 0.02% (0.01%) 0.23%
HSBC MSCI INDONESIA UCITS ETF (11.61%) (11.58%) (0.03%) 0.15% 0.07%
HSBC MSCI MALAYSIA UCITS ETF (9.34%) (9.36%) 0.02% 0.15% 0.10%
HSBC MSCI TAIWAN UCITS ETF 4.97% 5.01% (0.04%) (0.03%) 0.09%
HSBC MSCI KOREA UCITS ETF 0.38% 0.41% (0.03%) (0.58%) 0.58%
HSBC MSCI RUSSIA CAPPED UCITS ETF 27.60% 27.59% 0.01% (0.17%) 0.29%
HSBC MSCI EMERGING MARKETS UCITS ETF 2.94% 3.14% (0.20%) 1.05% 0.71%
HSBC MSCI AC FAR EAST EX JAPAN UCITS ETF 6.21% 6.25% (0.04%) (0.06%) 0.33%
Developed and Emerging Countries
HSBC ESI WORLDWIDE EQUITY UCITS ETF 2.34% 2.24% 0.10%
0.20% 0.15%
HSBC WORLDWIDE EQUITY UCITS ETF 2.83% 2.76% 0.07% 0.39% 0.19%
Investment Manager’s Report (continued)
HSBC ETFs PLC >11<
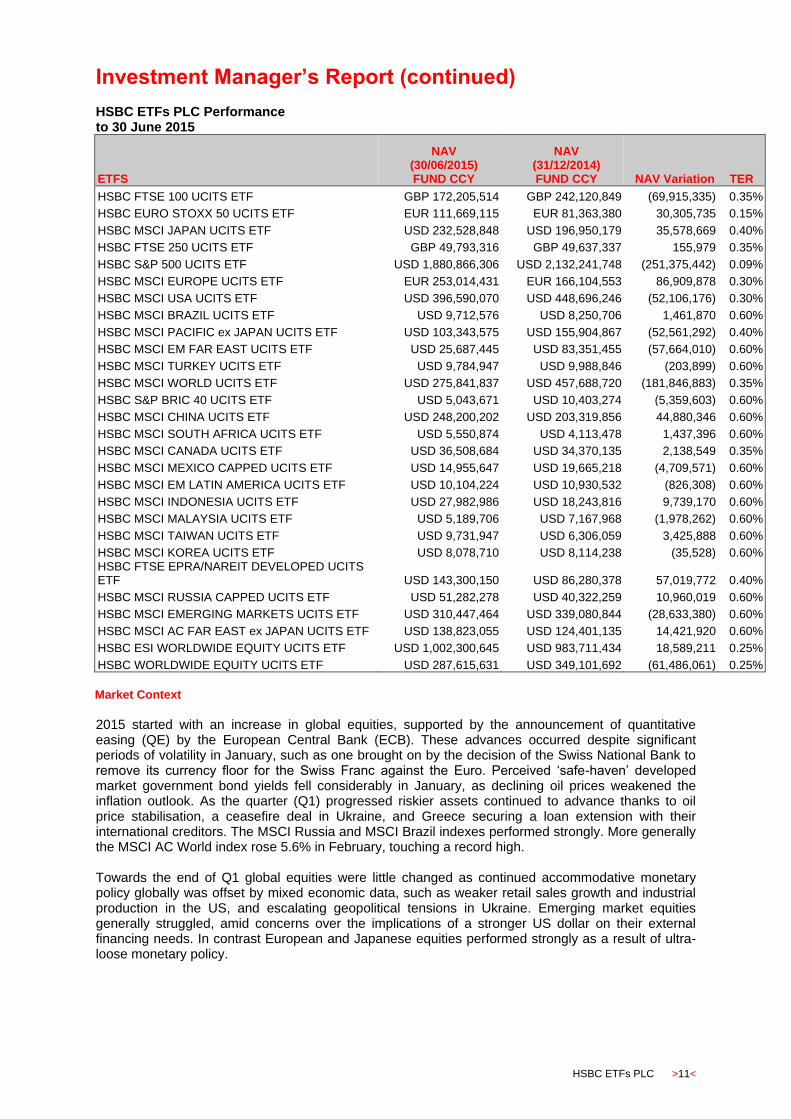
HSBC ETFs PLC Performance to 30 June 2015
ETFS
NAV (30/06/2015) FUND CCY
NAV (31/12/2014) FUND CCY NAV Variation TER
HSBC FTSE 100 UCITS ETF GBP 172,205,514 GBP 242,120,849 (69,915,335) 0.35%
HSBC EURO STOXX 50 UCITS ETF EUR 111,669,115 EUR 81,363,380 30,305,735 0.15%
HSBC MSCI JAPAN UCITS ETF USD 232,528,848 USD 196,950,179 35,578,669 0.40%
HSBC FTSE 250 UCITS ETF GBP 49,793,316 GBP 49,637,337 155,979 0.35%
HSBC S&P 500 UCITS ETF USD 1,880,866,306 USD 2,132,241,748 (251,375,442) 0.09%
HSBC MSCI EUROPE UCITS ETF EUR 253,014,431 EUR 166,104,553 86,909,878 0.30%
HSBC MSCI USA UCITS ETF USD 396,590,070 USD 448,696,246 (52,106,176) 0.30%
HSBC MSCI BRAZIL UCITS ETF USD 9,712,576 USD 8,250,706 1,461,870 0.60%
HSBC MSCI PACIFIC ex JAPAN UCITS ETF USD 103,343,575 USD 155,904,867 (52,561,292) 0.40%
HSBC MSCI EM FAR EAST UCITS ETF USD 25,687,445 USD 83,351,455 (57,664,010) 0.60%
HSBC MSCI TURKEY UCITS ETF USD 9,784,947 USD 9,988,846 (203,899) 0.60%
HSBC MSCI WORLD UCITS ETF USD 275,841,837 USD 457,688,720 (181,846,883) 0.35%
HSBC S&P BRIC 40 UCITS ETF USD 5,043,671 USD 10,403,274 (5,359,603) 0.60%
HSBC MSCI CHINA UCITS ETF USD 248,200,202 USD 203,319,856 44,880,346 0.60%
HSBC MSCI SOUTH AFRICA UCITS ETF USD 5,550,874 USD 4,113,478 1,437,396 0.60%
HSBC MSCI CANADA UCITS ETF USD 36,508,684 USD 34,370,135 2,138,549 0.35%
HSBC MSCI MEXICO CAPPED UCITS ETF USD 14,955,647 USD 19,665,218 (4,709,571) 0.60%
HSBC MSCI EM LATIN AMERICA UCITS ETF USD 10,104,224 USD 10,930,532 (826,308) 0.60%
HSBC MSCI INDONESIA UCITS ETF USD 27,982,986 USD 18,243,816 9,739,170 0.60%
HSBC MSCI MALAYSIA UCITS ETF USD 5,189,706 USD 7,167,968 (1,978,262) 0.60%
HSBC MSCI TAIWAN UCITS ETF USD 9,731,947 USD 6,306,059 3,425,888 0.60%
HSBC MSCI KOREA UCITS ETF USD 8,078,710 USD 8,114,238 (35,528) 0.60% HSBC FTSE EPRA/NAREIT DEVELOPED UCITS ETF USD 143,300,150 USD 86,280,378
57,019,772 0.40%
HSBC MSCI RUSSIA CAPPED UCITS ETF USD 51,282,278 USD 40,322,259 10,960,019 0.60%
HSBC MSCI EMERGING MARKETS UCITS ETF USD 310,447,464 USD 339,080,844 (28,633,380) 0.60%
HSBC MSCI AC FAR EAST ex JAPAN UCITS ETF USD 138,823,055 USD 124,401,135 14,421,920 0.60%
HSBC ESI WORLDWIDE EQUITY UCITS ETF USD 1,002,300,645 USD 983,711,434 18,589,211 0.25%
HSBC WORLDWIDE EQUITY UCITS ETF USD 287,615,631 USD 349,101,692 (61,486,061) 0.25%
Market Context
2015 started with an increase in global equities, supported by the announcement of quantitative easing (QE) by the European Central Bank (ECB). These advances occurred despite significant periods of volatility in January, such as one brought on by the decision of the Swiss National Bank to remove its currency floor for the Swiss Franc against the Euro. Perceived ‘safe-haven’ developed market government bond yields fell considerably in January, as declining oil prices weakened the inflation outlook. As the quarter (Q1) progressed riskier assets continued to advance thanks to oil price stabilisation, a ceasefire deal in Ukraine, and Greece securing a loan extension with their international creditors. The MSCI Russia and MSCI Brazil indexes performed strongly. More generally the MSCI AC World index rose 5.6% in February, touching a record high. Towards the end of Q1 global equities were little changed as continued accommodative monetary policy globally was offset by mixed economic data, such as weaker retail sales growth and industrial production in the US, and escalating geopolitical tensions in Ukraine. Emerging market equities generally struggled, amid concerns over the implications of a stronger US dollar on their external financing needs. In contrast European and Japanese equities performed strongly as a result of ultra-loose monetary policy.
Investment Manager’s Report (continued)
>12< HSBC ETFs PLC
Market Context (continued)
In the second quarter of 2015, global equities again advanced, benefiting still from ample global liquidity which helped shrug off re-emerging Greek repayment fears and slowing growth momentum in the US and China. Whilst the MSCI AC World index touched fresh highs in April, more notable was the MSCI China index, up 19% on rumours of further monetary easing in China. Brazilian and Russian stocks also made significant gains in local currency terms. In May, developed market equities registered modest positive gains led by the US and Japan. However EM equities sold off as US dollar strength re-emerged due to comments from various Fed policymakers including Janet Yellen suggesting rate rises were likely this year, thus raising tightening expectations. In Europe France, Italy and Spain all surprised with encouraging first quarter economic growth figures. However Eurozone equities were volatile and slightly down overall as concerns remained over ongoing negotiations with Greece and with time now running short for a resolution. This situation carried on into June with global equity markets joining Eurozone equities in declining as a result of Grexit fears and Chinese stock market instability. Overall the MSCI AC World index fell 2.5% in June. Within emerging markets in June Chinese stocks significantly underperformed, with the Shanghai Composite Index falling by over 7%, amid concerns over excessive valuations in some sectors and curbs on margin financing. In contrast Brazilian and Russian stocks outperformed the MSCI Emerging Market index. It was noted in the Annual Report and Accounts for the year ended 31st December 2014 that the Report and Accounts had a slightly different return calculation methodology to that of the Key Investor Information Documents (“KIIDs”) and there were some small differences in investment returns, mainly on the index, between the two sets of documents. This was largely as a result of the treatment of dividend reinvestment and the index publication period. The return calculation methodology of the KIIDs was adjusted during the first half of 2015 and brought in line with that of the Report and Accounts, which was reflected in the latest KIIDs that were re-published on the 10th of June 2015.
Investment Manager’s Report (continued)
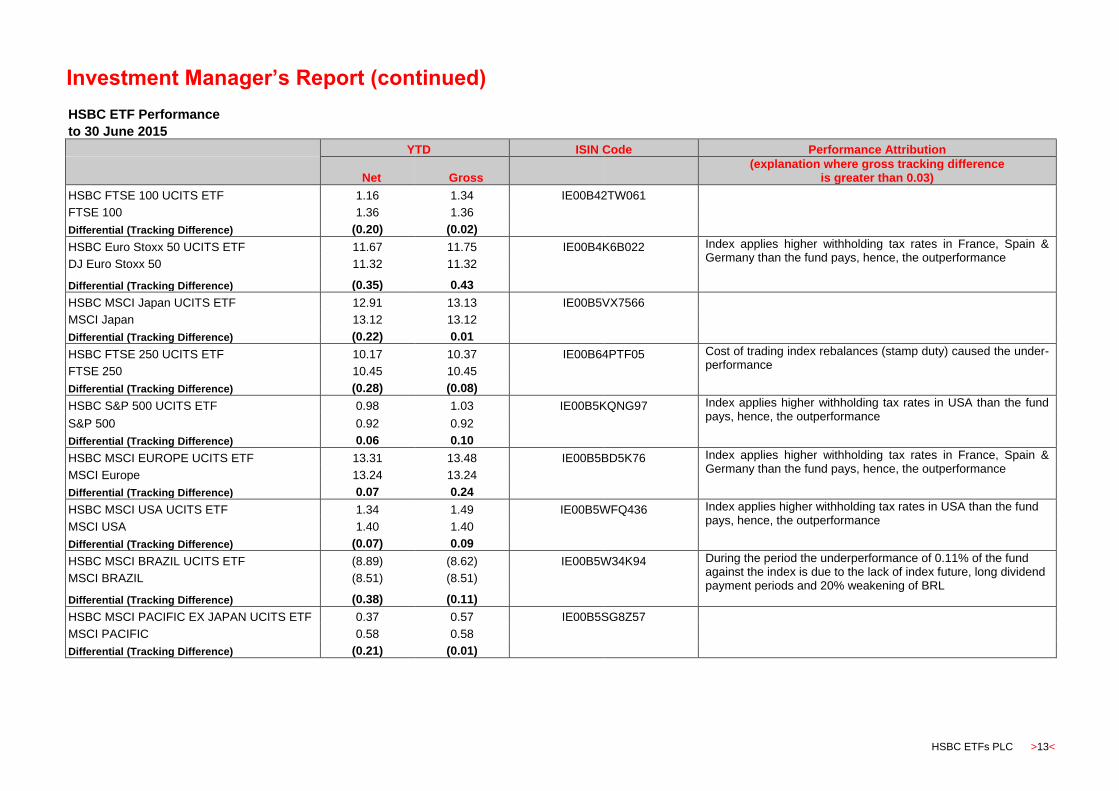
HSBC ETFs PLC >13<
HSBC ETF Performance
to 30 June 2015
YTD ISIN Code Performance Attribution
Net Gross (explanation where gross tracking difference
is greater than 0.03)
HSBC FTSE 100 UCITS ETF 1.16 1.34 IE00B42TW061
FTSE 100 1.36 1.36
Differential (Tracking Difference) (0.20) (0.02)
HSBC Euro Stoxx 50 UCITS ETF 11.67 11.75 IE00B4K6B022 Index applies higher withholding tax rates in France, Spain & Germany than the fund pays, hence, the outperformance
DJ Euro Stoxx 50 11.32 11.32
Differential (Tracking Difference) (0.35) 0.43
HSBC MSCI Japan UCITS ETF 12.91 13.13 IE00B5VX7566
MSCI Japan 13.12 13.12
Differential (Tracking Difference) (0.22) 0.01
HSBC FTSE 250 UCITS ETF 10.17 10.37 IE00B64PTF05 Cost of trading index rebalances (stamp duty) caused the under-performance
FTSE 250 10.45 10.45
Differential (Tracking Difference) (0.28) (0.08)
HSBC S&P 500 UCITS ETF 0.98 1.03 IE00B5KQNG97 Index applies higher withholding tax rates in USA than the fund pays, hence, the outperformance
S&P 500 0.92 0.92
Differential (Tracking Difference) 0.06 0.10
HSBC MSCI EUROPE UCITS ETF 13.31 13.48 IE00B5BD5K76 Index applies higher withholding tax rates in France, Spain & Germany than the fund pays, hence, the outperformance
MSCI Europe 13.24 13.24
Differential (Tracking Difference) 0.07 0.24
HSBC MSCI USA UCITS ETF 1.34 1.49 IE00B5WFQ436 Index applies higher withholding tax rates in USA than the fund pays, hence, the outperformance
MSCI USA 1.40 1.40
Differential (Tracking Difference) (0.07) 0.09
HSBC MSCI BRAZIL UCITS ETF (8.89) (8.62) IE00B5W34K94 During the period the underperformance of 0.11% of the fund against the index is due to the lack of index future, long dividend payment periods and 20% weakening of BRL
MSCI BRAZIL (8.51) (8.51)
Differential (Tracking Difference) (0.38) (0.11)
HSBC MSCI PACIFIC EX JAPAN UCITS ETF 0.37 0.57 IE00B5SG8Z57
MSCI PACIFIC 0.58 0.58
Differential (Tracking Difference) (0.21) (0.01)
Investment Manager’s Report (continued)
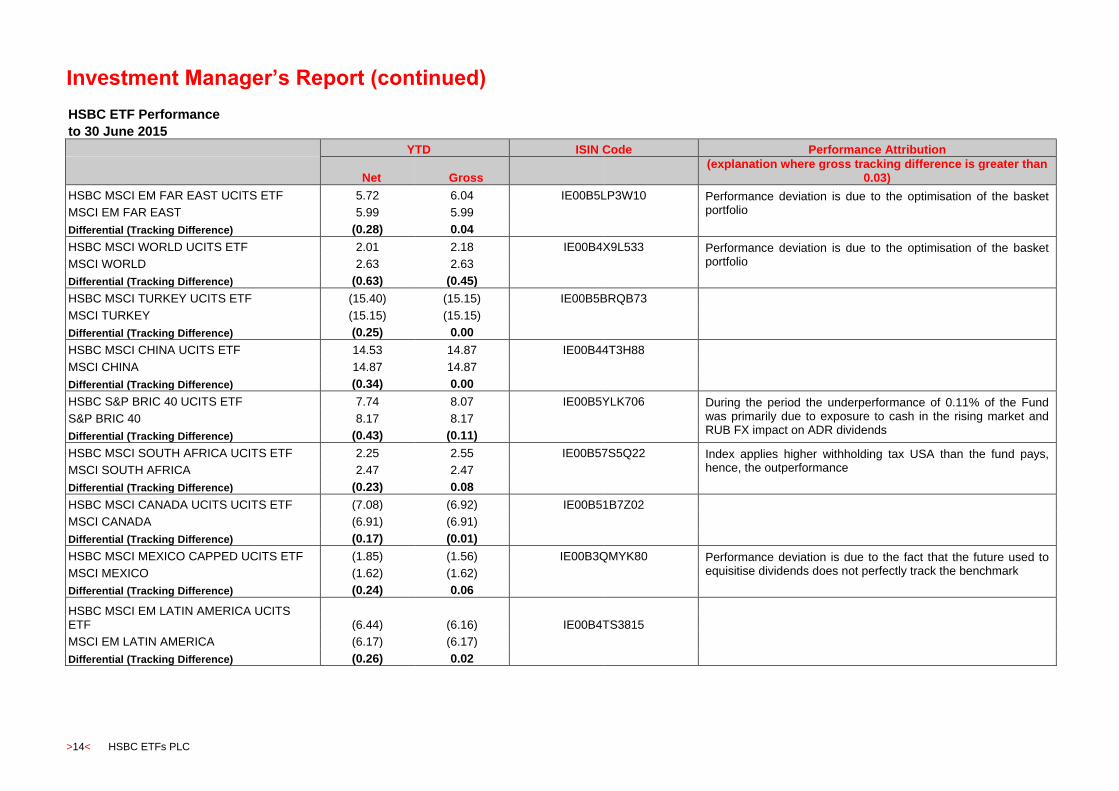
>14< HSBC ETFs PLC
HSBC ETF Performance
to 30 June 2015
YTD ISIN Code Performance Attribution
Net Gross (explanation where gross tracking difference is greater than
0.03)
HSBC MSCI EM FAR EAST UCITS ETF 5.72 6.04 IE00B5LP3W10 Performance deviation is due to the optimisation of the basket portfolio
MSCI EM FAR EAST 5.99 5.99
Differential (Tracking Difference) (0.28) 0.04
HSBC MSCI WORLD UCITS ETF 2.01 2.18 IE00B4X9L533 Performance deviation is due to the optimisation of the basket portfolio
MSCI WORLD 2.63 2.63
Differential (Tracking Difference) (0.63) (0.45)
HSBC MSCI TURKEY UCITS ETF (15.40) (15.15) IE00B5BRQB73
MSCI TURKEY (15.15) (15.15)
Differential (Tracking Difference) (0.25) 0.00
HSBC MSCI CHINA UCITS ETF 14.53 14.87 IE00B44T3H88
MSCI CHINA 14.87 14.87
Differential (Tracking Difference) (0.34) 0.00
HSBC S&P BRIC 40 UCITS ETF 7.74 8.07 IE00B5YLK706 During the period the underperformance of 0.11% of the Fund was primarily due to exposure to cash in the rising market and RUB FX impact on ADR dividends
S&P BRIC 40 8.17 8.17
Differential (Tracking Difference) (0.43) (0.11)
HSBC MSCI SOUTH AFRICA UCITS ETF 2.25 2.55 IE00B57S5Q22 Index applies higher withholding tax USA than the fund pays, hence, the outperformance
MSCI SOUTH AFRICA 2.47 2.47
Differential (Tracking Difference) (0.23) 0.08
HSBC MSCI CANADA UCITS UCITS ETF (7.08) (6.92) IE00B51B7Z02
MSCI CANADA (6.91) (6.91)
Differential (Tracking Difference) (0.17) (0.01)
HSBC MSCI MEXICO CAPPED UCITS ETF (1.85) (1.56) IE00B3QMYK80 Performance deviation is due to the fact that the future used to equisitise dividends does not perfectly track the benchmark
MSCI MEXICO (1.62) (1.62)
Differential (Tracking Difference) (0.24) 0.06
HSBC MSCI EM LATIN AMERICA UCITS ETF (6.44) (6.16)
IE00B4TS3815
MSCI EM LATIN AMERICA (6.17) (6.17)
Differential (Tracking Difference) (0.26) 0.02

Investment Manager’s Report (continued)
HSBC ETFs PLC >15<
HSBC ETF Performance
to 30 June 2015
YTD ISIN Code Performance Attribution
Net Gross (explanation where gross tracking difference is greater than
0.03)
HSBC MSCI INDONESIA UCITS ETF (11.87) (11.61) IE00B46G8275
MSCI INDONESIA (11.58) (11.58)
Differential (Tracking Difference) (0.30) (0.03)
HSBC MSCI MALAYSIA UCITS ETF (9.61) (9.34) IE00B3X3R831
MSCI MALAYSIA (9.36) (9.36)
Differential (Tracking Difference) (0.25) 0.02
HSBC MSCI TAIWAN UCITS ETF 4.66 4.97 IE00B3S1J086 Fund's exposure to cash in rising market caused the
MSCI TAIWAN 5.01 5.01 small negative performance effect
Differential (Tracking Difference) (0.35) (0.04)
HSBC MSCI KOREA UCITS ETF 0.08 0.38 IE00B3Z0X395 Fund's exposure to cash in rising market caused the small negative performance effect
MSCI KOREA 0.41 0.41
Differential (Tracking Difference) (0.33) (0.03)
HSBC FTSE EPRA NAREIT DEVELOPED UCITS ETF (3.19) (2.99) IE00B5L01S80
Index applies higher withholding tax rates for USA, France, Germany and Spain than the fund pays, hence, the outperformance FTSE EPRA NAREIT DEVELOPED (3.20) (3.20)
Differential (Tracking Difference) 0.02 0.21
HSBC MSCI RUSSIA CAPPED UCITS ETF 27.22 27.60 IE00B5LJZQ16
MSCI RUSSIA CAPPED 27.59 27.59
Differential (Tracking Difference) (0.37) 0.01
HSBC MSCI EMERGING MARKETS UCITS ETF 2.63 2.94 IE00B5SSQT16
Performance deviation is due to the optimisation of the basket portfolio MSCI EMERGING MARKETS 3.14 3.14
Differential (Tracking Difference) (0.51) (0.20)
Investment Manager’s Report (continued)
>16< HSBC ETFs PLC
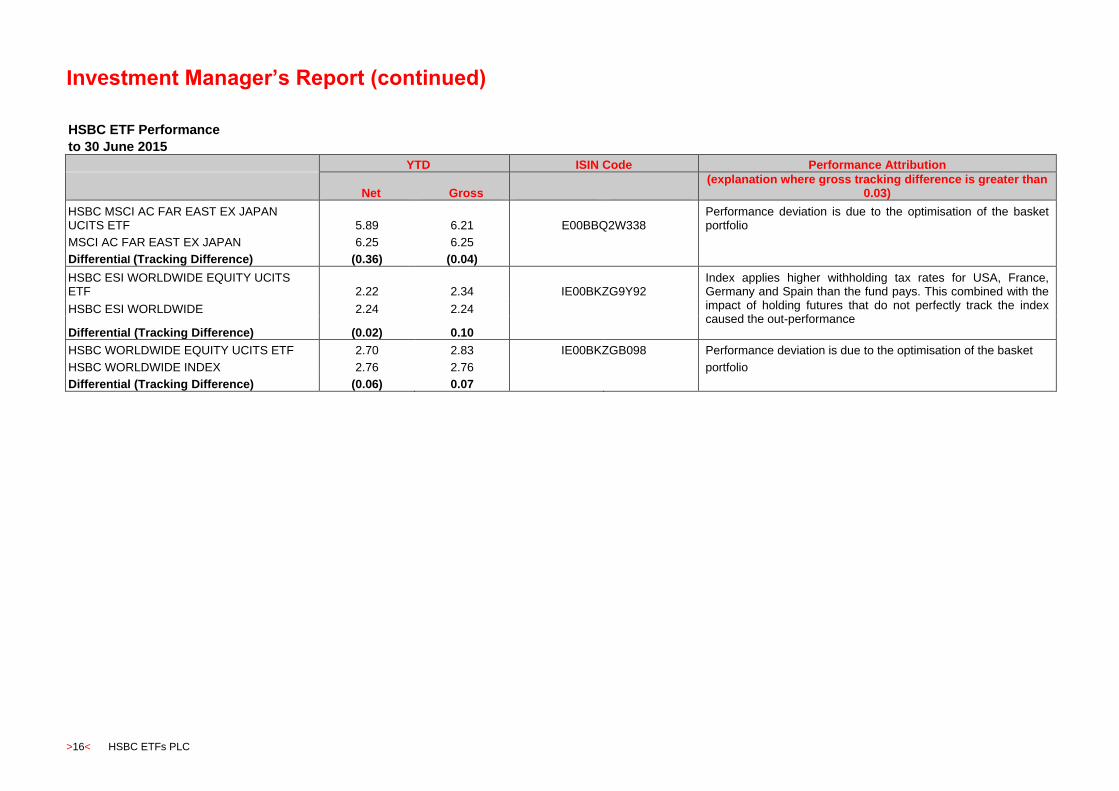
HSBC ETF Performance
to 30 June 2015
YTD ISIN Code Performance Attribution
Net Gross (explanation where gross tracking difference is greater than
0.03)
HSBC MSCI AC FAR EAST EX JAPAN UCITS ETF 5.89 6.21 E00BBQ2W338
Performance deviation is due to the optimisation of the basket portfolio MSCI AC FAR EAST EX JAPAN 6.25 6.25
Differential (Tracking Difference) (0.36) (0.04)
HSBC ESI WORLDWIDE EQUITY UCITS ETF 2.22 2.34 IE00BKZG9Y92
Index applies higher withholding tax rates for USA, France, Germany and Spain than the fund pays. This combined with the impact of holding futures that do not perfectly track the index caused the out-performance
HSBC ESI WORLDWIDE 2.24 2.24
Differential (Tracking Difference) (0.02) 0.10
HSBC WORLDWIDE EQUITY UCITS ETF 2.70 2.83 IE00BKZGB098 Performance deviation is due to the optimisation of the basket
HSBC WORLDWIDE INDEX 2.76 2.76 portfolio
Differential (Tracking Difference) (0.06) 0.07
Investment Manager’s Report (continued)
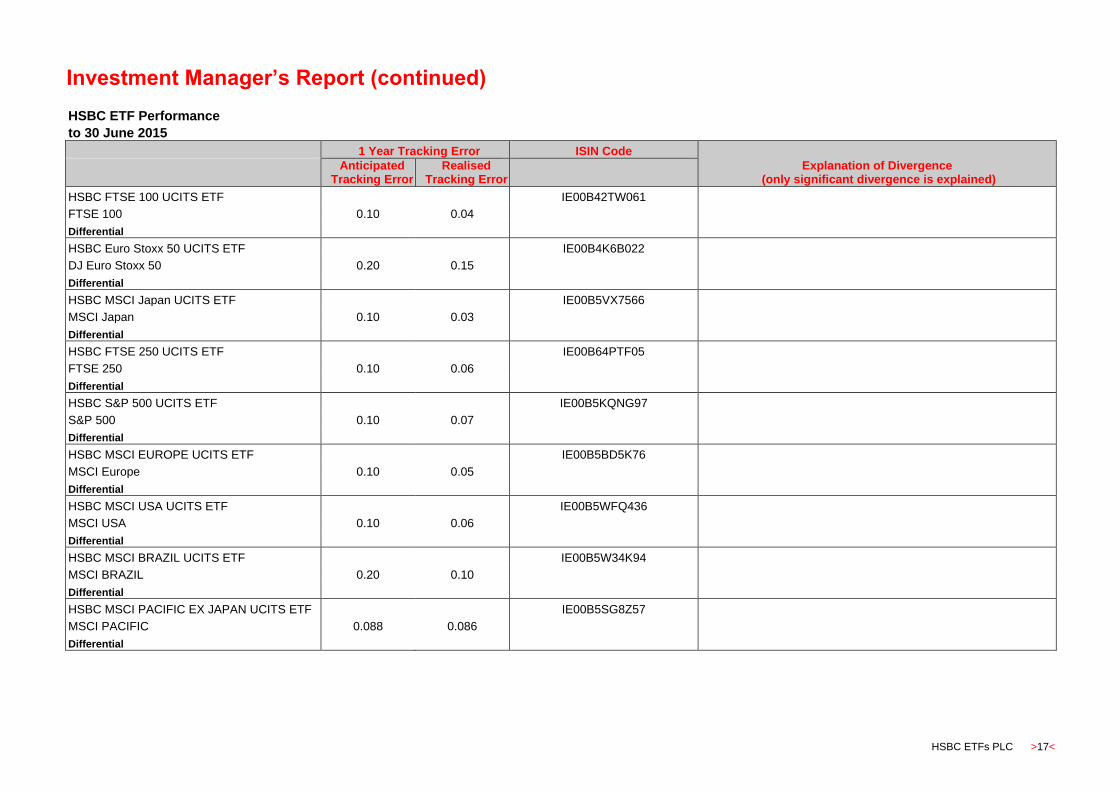
HSBC ETFs PLC >17<
HSBC ETF Performance
to 30 June 2015
1 Year Tracking Error ISIN Code
Explanation of Divergence (only significant divergence is explained)
Anticipated Tracking Error
Realised Tracking Error
HSBC FTSE 100 UCITS ETF IE00B42TW061
FTSE 100 0.10 0.04
Differential
HSBC Euro Stoxx 50 UCITS ETF IE00B4K6B022
DJ Euro Stoxx 50 0.20 0.15
Differential
HSBC MSCI Japan UCITS ETF IE00B5VX7566
MSCI Japan 0.10 0.03
Differential
HSBC FTSE 250 UCITS ETF IE00B64PTF05
FTSE 250 0.10 0.06
Differential
HSBC S&P 500 UCITS ETF IE00B5KQNG97
S&P 500 0.10 0.07
Differential
HSBC MSCI EUROPE UCITS ETF IE00B5BD5K76
MSCI Europe 0.10 0.05
Differential
HSBC MSCI USA UCITS ETF IE00B5WFQ436
MSCI USA 0.10 0.06
Differential
HSBC MSCI BRAZIL UCITS ETF IE00B5W34K94
MSCI BRAZIL 0.20 0.10
Differential
HSBC MSCI PACIFIC EX JAPAN UCITS ETF IE00B5SG8Z57
MSCI PACIFIC 0.088 0.086
Differential

Investment Manager’s Report (continued)
>18< HSBC ETFs PLC
HSBC ETF Performance
to 30 June 2015
1 Year Tracking Error ISIN Code
Explanation of Divergence (only significant divergence is explained)
Anticipated Tracking Error
Realised Tracking Error
HSBC MSCI EM FAR EAST UCITS ETF IE00B5LP3W10
MSCI EM FAR EAST 0.40 0.38
Differential
HSBC MSCI WORLD UCITS ETF IE00B4X9L533
MSCI WORLD 0.40 0.30
Differential
HSBC MSCI TURKEY UCITS ETF IE00B5BRQB73
MSCI TURKEY 0.10 0.04
Differential
HSBC MSCI CHINA UCITS ETF IE00B44T3H88
MSCI CHINA 0.40 0.11
Differential
HSBC S&P BRIC 40 UCITS ETF IE00B5YLK706
S&P BRIC 40 0.20 0.14
Differential
HSBC MSCI SOUTH AFRICA UCITS ETF IE00B57S5Q22
MSCI SOUTH AFRICA 0.10 0.10
Differential
HSBC MSCI CANADA UCITS ETF IE00B51B7Z02
MSCI CANADA 0.10 0.04
Differential
HSBC MSCI MEXICO CAPPED UCITS ETF IE00B3QMYK80
MSCI MEXICO 0.10 0.08
Differential
HSBC MSCI EM LATIN AMERICA UCITS ETF IE00B4TS3815
MSCI EM LATIN AMERICA 0.200 0.081
Differential
Investment Manager’s Report (continued)
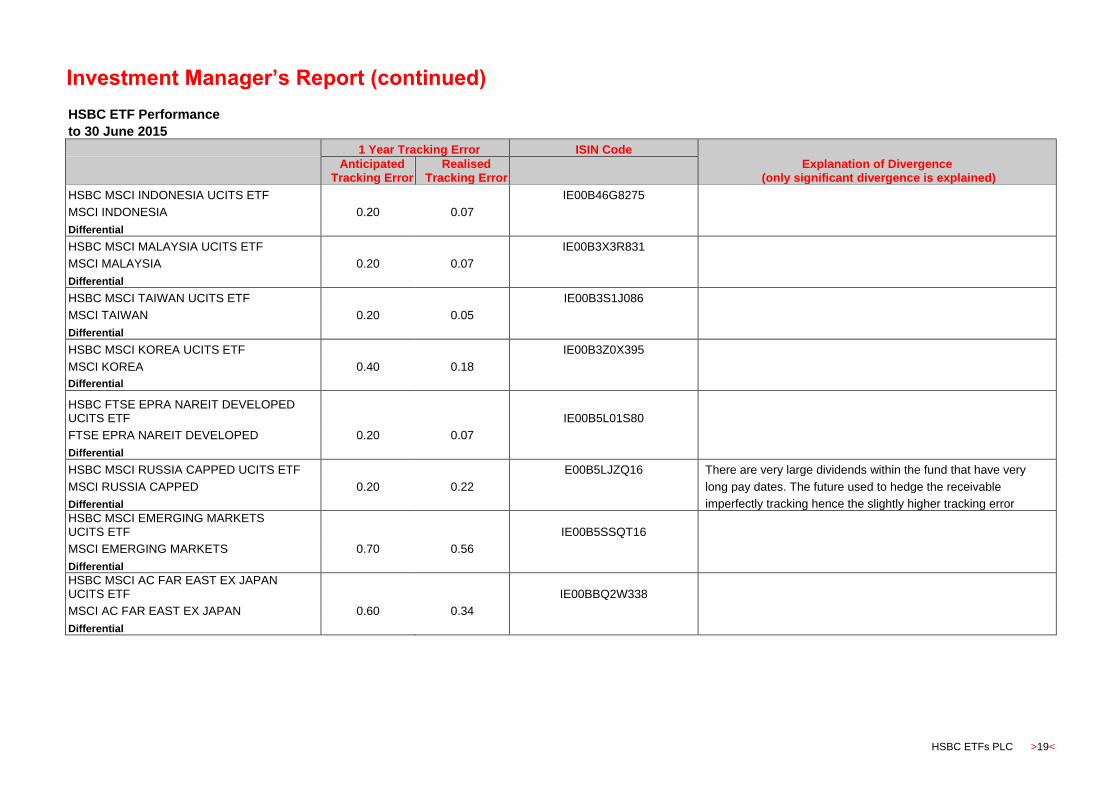
HSBC ETFs PLC >19<
HSBC ETF Performance
to 30 June 2015
1 Year Tracking Error ISIN Code
Explanation of Divergence (only significant divergence is explained)
Anticipated Tracking Error
Realised Tracking Error
HSBC MSCI INDONESIA UCITS ETF IE00B46G8275
MSCI INDONESIA 0.20 0.07
Differential
HSBC MSCI MALAYSIA UCITS ETF IE00B3X3R831
MSCI MALAYSIA 0.20 0.07
Differential
HSBC MSCI TAIWAN UCITS ETF IE00B3S1J086
MSCI TAIWAN 0.20 0.05
Differential
HSBC MSCI KOREA UCITS ETF IE00B3Z0X395
MSCI KOREA 0.40 0.18
Differential
HSBC FTSE EPRA NAREIT DEVELOPED UCITS ETF IE00B5L01S80
FTSE EPRA NAREIT DEVELOPED 0.20 0.07
Differential
HSBC MSCI RUSSIA CAPPED UCITS ETF E00B5LJZQ16 There are very large dividends within the fund that have very
MSCI RUSSIA CAPPED 0.20 0.22 long pay dates. The future used to hedge the receivable
Differential imperfectly tracking hence the slightly higher tracking error
HSBC MSCI EMERGING MARKETS UCITS ETF IE00B5SSQT16
MSCI EMERGING MARKETS 0.70 0.56
Differential
HSBC MSCI AC FAR EAST EX JAPAN UCITS ETF IE00BBQ2W338
MSCI AC FAR EAST EX JAPAN 0.60 0.34
Differential
Investment Manager’s Report (continued)
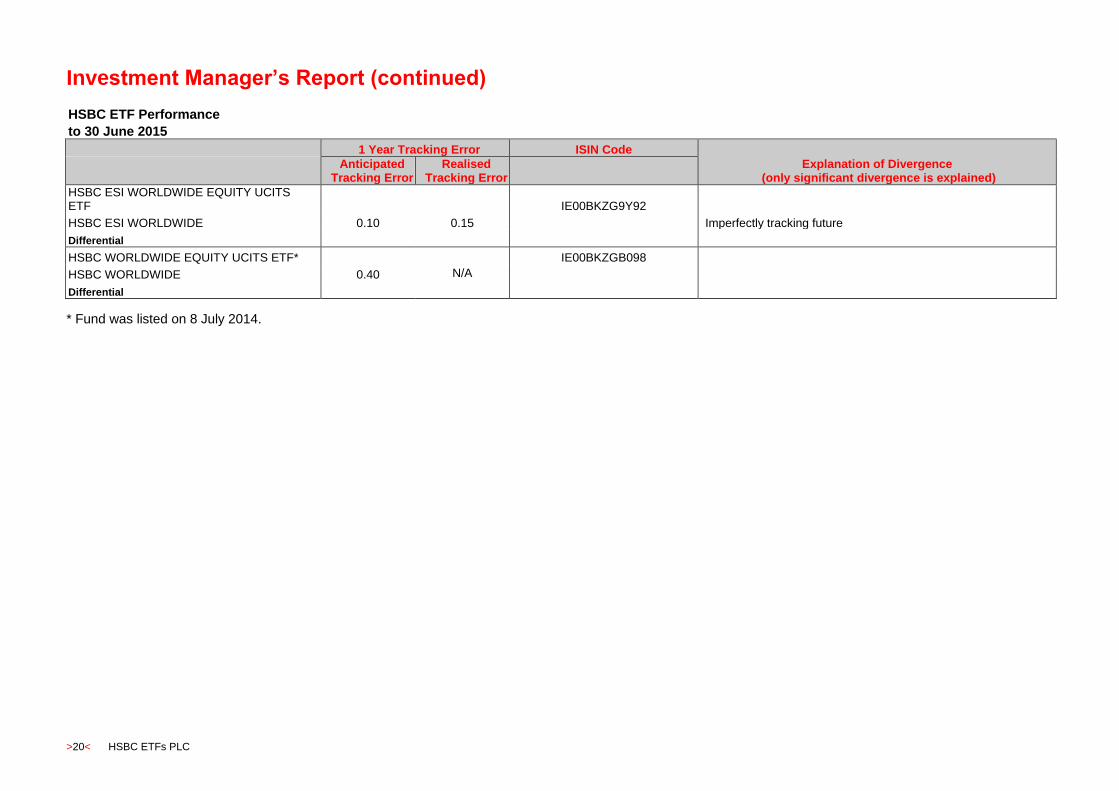
>20< HSBC ETFs PLC
HSBC ETF Performance
to 30 June 2015
1 Year Tracking Error ISIN Code
Explanation of Divergence (only significant divergence is explained)
Anticipated Tracking Error
Realised Tracking Error
HSBC ESI WORLDWIDE EQUITY UCITS ETF IE00BKZG9Y92
HSBC ESI WORLDWIDE 0.10 0.15 Imperfectly tracking future
Differential
HSBC WORLDWIDE EQUITY UCITS ETF*
N/A
IE00BKZGB098
HSBC WORLDWIDE 0.40
Differential
* Fund was listed on 8 July 2014.
Schedules of Investments
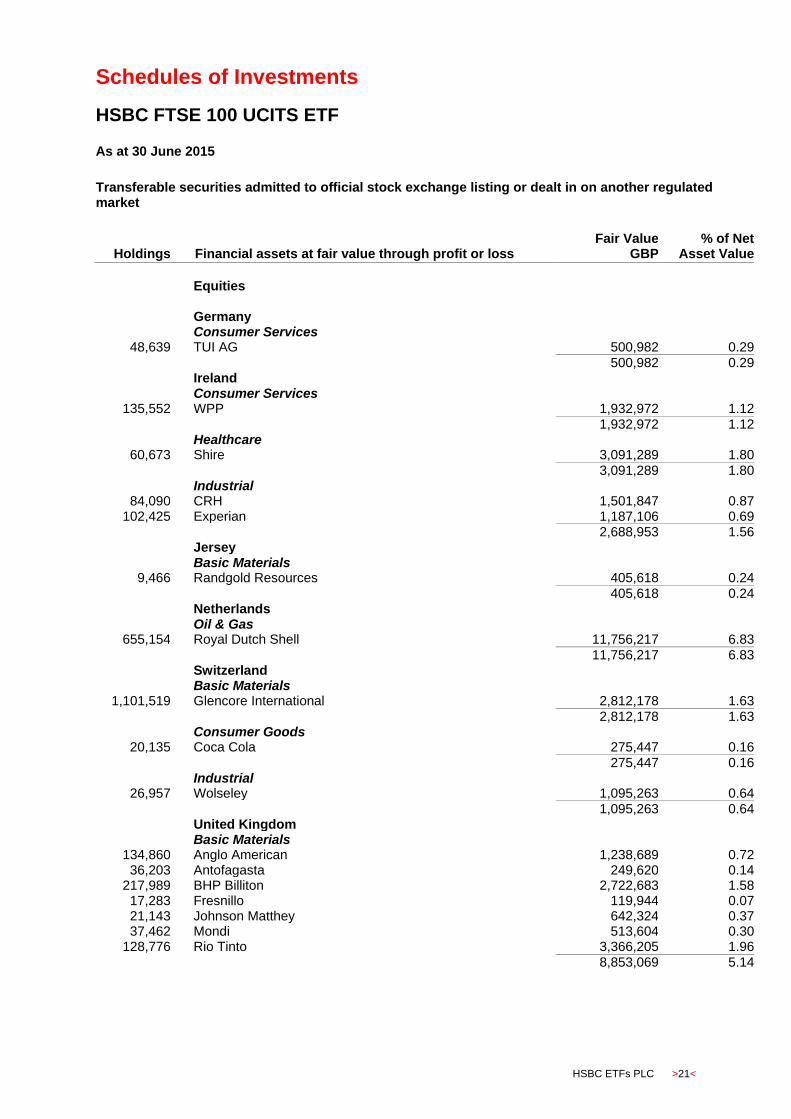
HSBC FTSE 100 UCITS ETF
HSBC ETFs PLC >21<
As at 30 June 2015
Transferable securities admitted to official stock exchange listing or dealt in on another regulated market
Holdings Financial assets at fair value through profit or loss
Fair Value GBP
% of Net Asset Value
Equities Germany Consumer Services
48,639 TUI AG 500,982 0.29
500,982 0.29 Ireland Consumer Services
135,552 WPP 1,932,972 1.12
1,932,972 1.12 Healthcare
60,673 Shire 3,091,289 1.80
3,091,289 1.80 Industrial
84,090 CRH 1,501,847 0.87 102,425 Experian 1,187,106 0.69
2,688,953 1.56 Jersey Basic Materials
9,466 Randgold Resources 405,618 0.24
405,618 0.24 Netherlands Oil & Gas
655,154 Royal Dutch Shell 11,756,217 6.83
11,756,217 6.83 Switzerland Basic Materials
1,101,519 Glencore International 2,812,178 1.63
2,812,178 1.63 Consumer Goods
20,135 Coca Cola 275,447 0.16
275,447 0.16 Industrial
26,957 Wolseley 1,095,263 0.64
1,095,263 0.64 United Kingdom Basic Materials
134,860 Anglo American 1,238,689 0.72 36,203 Antofagasta 249,620 0.14
217,989 BHP Billiton 2,722,683 1.58 17,283 Fresnillo 119,944 0.07 21,143 Johnson Matthey 642,324 0.37 37,462 Mondi 513,604 0.30
128,776 Rio Tinto 3,366,205 1.96
8,853,069 5.14
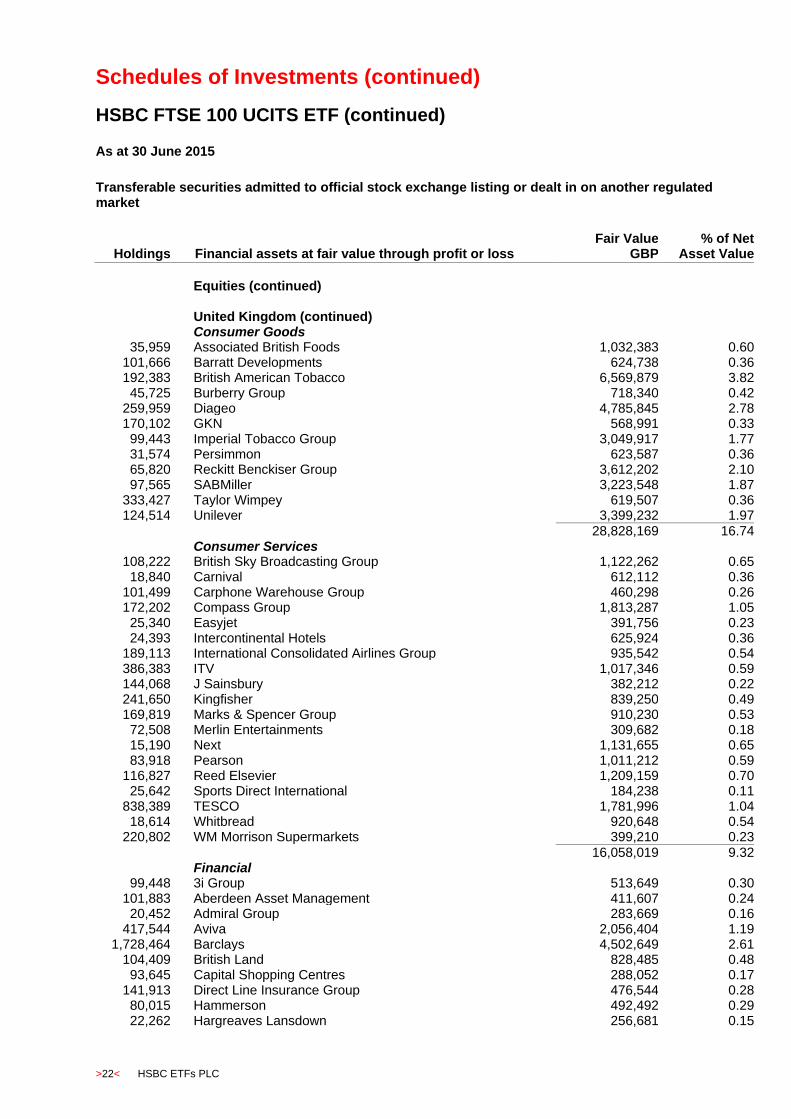
Schedules of Investments (continued)
HSBC FTSE 100 UCITS ETF (continued)
>22< HSBC ETFs PLC
As at 30 June 2015
Transferable securities admitted to official stock exchange listing or dealt in on another regulated market
Holdings Financial assets at fair value through profit or loss
Fair Value GBP
% of Net Asset Value
Equities (continued) United Kingdom (continued) Consumer Goods
35,959 Associated British Foods 1,032,383 0.60 101,666 Barratt Developments 624,738 0.36 192,383 British American Tobacco 6,569,879 3.82 45,725 Burberry Group 718,340 0.42
259,959 Diageo 4,785,845 2.78 170,102 GKN 568,991 0.33 99,443 Imperial Tobacco Group 3,049,917 1.77 31,574 Persimmon 623,587 0.36 65,820 Reckitt Benckiser Group 3,612,202 2.10 97,565 SABMiller 3,223,548 1.87
333,427 Taylor Wimpey 619,507 0.36 124,514 Unilever 3,399,232 1.97
28,828,169 16.74 Consumer Services
108,222 British Sky Broadcasting Group 1,122,262 0.65 18,840 Carnival 612,112 0.36
101,499 Carphone Warehouse Group 460,298 0.26 172,202 Compass Group 1,813,287 1.05 25,340 Easyjet 391,756 0.23 24,393 Intercontinental Hotels 625,924 0.36
189,113 International Consolidated Airlines Group 935,542 0.54 386,383 ITV 1,017,346 0.59 144,068 J Sainsbury 382,212 0.22 241,650 Kingfisher 839,250 0.49 169,819 Marks & Spencer Group 910,230 0.53 72,508 Merlin Entertainments 309,682 0.18 15,190 Next 1,131,655 0.65 83,918 Pearson 1,011,212 0.59
116,827 Reed Elsevier 1,209,159 0.70 25,642 Sports Direct International 184,238 0.11
838,389 TESCO 1,781,996 1.04 18,614 Whitbread 920,648 0.54
220,802 WM Morrison Supermarkets 399,210 0.23
16,058,019 9.32 Financial
99,448 3i Group 513,649 0.30 101,883 Aberdeen Asset Management 411,607 0.24 20,452 Admiral Group 283,669 0.16
417,544 Aviva 2,056,404 1.19 1,728,464 Barclays 4,502,649 2.61
104,409 British Land 828,485 0.48 93,645 Capital Shopping Centres 288,052 0.17
141,913 Direct Line Insurance Group 476,544 0.28 80,015 Hammerson 492,492 0.29 22,262 Hargreaves Lansdown 256,681 0.15

Schedules of Investments (continued)
HSBC FTSE 100 UCITS ETF (continued)
HSBC ETFs PLC >23<
As at 30 June 2015
Transferable securities admitted to official stock exchange listing or dealt in on another regulated market
Holdings Financial assets at fair value through profit or loss
Fair Value GBP
% of Net Asset Value
Equities (continued) United Kingdom (continued) Financial (continued)
2,014,250 HSBC Holdings* 11,483,239 6.67 81,191 Land Securities Group 977,540 0.57
612,851 Legal & General Group 1,525,386 0.89 5,945,541 Lloyds Banking Group 5,067,979 2.94
32,212 London Stock Exchange Group 763,424 0.45 504,405 Old Mutual 1,016,376 0.59 263,355 Prudential 4,035,915 2.35 225,839 Royal Bank of Scotland 793,824 0.46 103,616 RSA Insurance Group 411,563 0.24 11,537 Schroders 366,415 0.21 52,328 St James's Place 474,092 0.27
215,470 Standard Chartered 2,195,639 1.27 201,870 Standard Life 896,303 0.52
40,117,927 23.30 Healthcare
130,240 AstraZeneca 5,234,346 3.04 501,791 GlaxoSmithKline 6,636,186 3.85 13,725 Hikma Pharmaceuticals 265,304 0.15 92,552 Smith & Nephew 994,009 0.58
13,129,845 7.62 Industrial
51,942 Ashtead Group 570,843 0.33 51,840 Babcock International 559,872 0.33
326,440 BAE Systems 1,472,897 0.86 34,271 Bunzl 595,630 0.35 68,319 Capita 845,789 0.49
158,291 G4S 425,170 0.25 16,400 Intertek Group 401,800 0.23 82,182 Meggitt 383,297 0.22
32,014,791 Rolls-Royce Holdings 1,661,265 0.96 79,476 Royal Mail 408,904 0.24 39,996 Smiths Group 451,555 0.26 25,480 Travis Perkins 537,628 0.31 21,672 Weir Group 367,774 0.21
8,682,424 5.04 Oil & Gas
351,254 BG Group 3,721,536 2.16 1,882,287 BP 7,908,429 4.59
11,629,965 6.75 Technology
145,686 ARM Holdings 1,510,764 0.88 111,157 Sage Group 569,680 0.33
2,080,444 1.21
* Investment in a related party.

Schedules of Investments (continued)
HSBC FTSE 100 UCITS ETF (continued)
>24< HSBC ETFs PLC
As at 30 June 2015
Transferable securities admitted to official stock exchange listing or dealt in on another regulated market
Holdings Financial assets at fair value through profit or loss
Fair Value GBP
% of Net Asset Value
Equities (continued) United Kingdom (continued) Telecommunications (continued)
863,793 BT Group 3,888,796 2.26 46,227 Inmarsat 423,208 0.25
2,741,936 Vodafone Group 6,302,340 3.66
10,614,344 6.17 Utilities
512,977 Centrica 1,353,233 0.78 389,315 National Grid 3,181,482 1.85 24,578 Severn Trent 511,468 0.30
101,913 SSE 1,565,384 0.91 70,369 United Utilities Group 627,692 0.36
7,239,259 4.20 Total equities* 171,792,384 99.76
Total financial assets at fair value through profit or loss 171,792,384 99.76 Financial liabilities at fair value through profit or loss Futures
7 LIFFE FTSE 100 Index Future Sep 15** (12,860) (0.01)
Total Futures*** (12,860) (0.01)
Total financial liabilities at fair value through profit or loss (12,860) (0.01)
Other net assets 425,990 0.25
Net assets attributable to holders of redeemable participating shares 172,205,514 100.00
** HSBC Bank Plc is the counterparty to the future contract.
Analysis of Total Assets Fair Value
GBP % of Total
Assets * Transferable securities admitted to an official stock exchange listing or dealt in on another regulated market 171,792,384 86.08 *** Financial derivative instruments dealt in on a regulated market (12,860) (0.01) All equity positions and futures held by the Fund at 30 June 2015 and at 31 December 2014 are classified as Level 1. See Note 6(d) for further details.
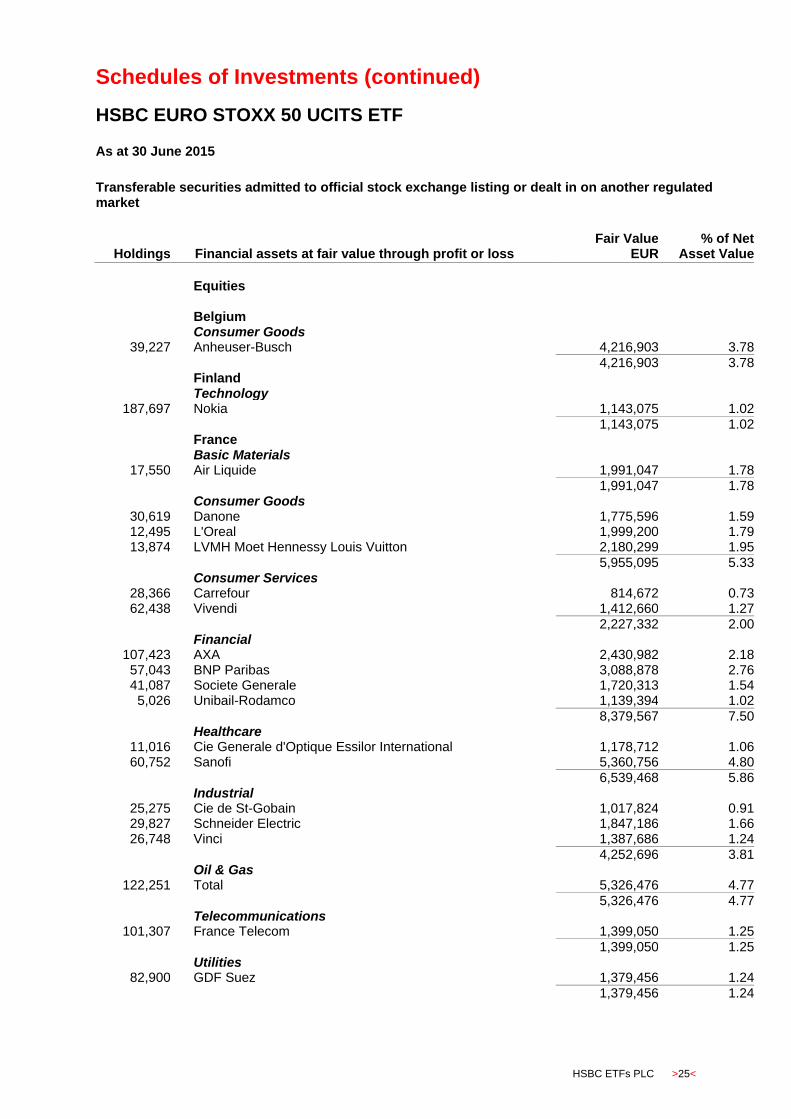
Schedules of Investments (continued)
HSBC EURO STOXX 50 UCITS ETF
HSBC ETFs PLC >25<
As at 30 June 2015
Transferable securities admitted to official stock exchange listing or dealt in on another regulated market
Holdings Financial assets at fair value through profit or loss
Fair Value EUR
% of Net Asset Value
Equities Belgium Consumer Goods
39,227 Anheuser-Busch 4,216,903 3.78
4,216,903 3.78 Finland Technology
187,697 Nokia 1,143,075 1.02
1,143,075 1.02 France Basic Materials
17,550 Air Liquide 1,991,047 1.78 1,991,047 1.78 Consumer Goods
30,619 Danone 1,775,596 1.59 12,495 L'Oreal 1,999,200 1.79 13,874 LVMH Moet Hennessy Louis Vuitton 2,180,299 1.95
5,955,095 5.33 Consumer Services
28,366 Carrefour 814,672 0.73 62,438 Vivendi 1,412,660 1.27
2,227,332 2.00 Financial
107,423 AXA 2,430,982 2.18 57,043 BNP Paribas 3,088,878 2.76 41,087 Societe Generale 1,720,313 1.54
5,026 Unibail-Rodamco 1,139,394 1.02
8,379,567 7.50 Healthcare
11,016 Cie Generale d'Optique Essilor International 1,178,712 1.06 60,752 Sanofi 5,360,756 4.80
6,539,468 5.86 Industrial
25,275 Cie de St-Gobain 1,017,824 0.91 29,827 Schneider Electric 1,847,186 1.66 26,748 Vinci 1,387,686 1.24
4,252,696 3.81 Oil & Gas
122,251 Total 5,326,476 4.77
5,326,476 4.77 Telecommunications
101,307 France Telecom 1,399,050 1.25
1,399,050 1.25 Utilities
82,900 GDF Suez 1,379,456 1.24
1,379,456 1.24

Schedules of Investments (continued)
HSBC EURO STOXX 50 UCITS ETF (continued)
>26< HSBC ETFs PLC
As at 30 June 2015
Transferable securities admitted to official stock exchange listing or dealt in on another regulated market
Holdings Financial assets at fair value through profit or loss
Fair Value EUR
% of Net Asset Value
Equities (continued) Germany Basic Materials
46,868 BASF 3,694,136 3.31 42,198 Bayer 5,297,959 4.74
8,992,095 8.05 Consumer Goods
16,372 Bayerische Motoren Werke 1,607,403 1.44 50,857 Daimler 4,151,965 3.72
8,036 Volkswagen 1,671,488 1.49
7,430,856 6.65 Financial
23,320 Allianz 3,257,804 2.92 66,278 Deutsche Bank 1,786,192 1.60
7,491 Muenchener Rueckversicherungs 1,191,069 1.06
6,235,065 5.58 Industrial
48,851 Deutsche Post 1,280,140 1.15 39,601 Siemens 3,577,950 3.20
4,858,090 4.35 Technology
48,401 SAP 3,029,903 2.71
3,029,903 2.71 Telecommunications
158,075 Deutsche Telekom 2,442,259 2.19 2,442,259 2.19 Utilities
102,107 E.ON 1,220,179 1.09 24,634 RWE 475,067 0.43
1,695,246 1.52 Italy Financial
68,918 Assicurazioni Generali 1,113,715 1.00 732,749 Intesa Sanpaolo 2,382,900 2.13 284,906 UniCredit 1,716,559 1.54
5,213,174 4.67 Oil & Gas
137,675 ENI 2,191,786 1.96
2,191,786 1.96 Utilities
357,476 Enel 1,452,782 1.30 1,452,782 1.30 Netherlands Consumer Goods
47,702 Koninklijke Philips Electronics 1,088,559 0.97 79,695 Unilever 2,977,007 2.67
4,065,566 3.64

Schedules of Investments (continued)
HSBC EURO STOXX 50 UCITS ETF (continued)
HSBC ETFs PLC >27<
As at 30 June 2015
Transferable securities admitted to official stock exchange listing or dealt in on another regulated market
Holdings Financial assets at fair value through profit or loss
Fair Value EUR
% of Net Asset Value
Equities (continued) Netherlands (continued) Financial
197,342 ING Groep 2,922,635 2.62
2,922,635 2.62 Industrial
29,764 European Aeronautic Defence and Space 1,732,265 1.55
1,732,265 1.55 Technology
19,151 ASML Holding 1,775,298 1.59
1,775,298 1.59 Spain Consumer Services
53,627 Inditex 1,563,495 1.40
1,563,495 1.40 Financial
321,743 Banco Bilbao Vizcaya Argentaria 2,828,764 2.53 730,550 Banco Santander 4,576,165 4.10
7,404,929 6.63 Oil & Gas
51,481 Repsol 810,826 0.73
810,826 0.73 Telecommunications
221,228 Telefonica 2,820,657 2.53
2,820,657 2.53 Utilities
288,516 Iberdrola 1,743,214 1.56
1,743,214 1.56 Total equities* 111,190,306 99.57 Total financial assets at fair value through profit or loss 111,190,306 99.57
Financial liabilities at fair value through profit or loss Futures
13 EUX Euro Stoxx 50 Sep 15** (9,370) (0.01)
Total futures*** (9,370) (0.01)
Total financial liabilities at fair value through profit or loss (9,370) (0.01)
Other net assets 488,179 0.44
Net assets attributable to holders of redeemable participating shares 111,669,115 100.00
** HSBC Bank Plc is the counterparty to the future contract.

Schedules of Investments (continued)
HSBC EURO STOXX 50 UCITS ETF (continued)
>28< HSBC ETFs PLC
Analysis of Total Assets Fair Value
EUR % of Total
Assets * Transferable securities admitted to an official stock exchange listing or dealt in on another regulated market 111,190,306 93.47 *** Financial derivative instruments dealt in on a regulated market (9,370) (0.01) All equity positions and futures held by the Fund at 30 June 2015 and at 31 December 2014 are classified as Level 1. See Note 6(d) for further details.

Schedules of Investments (continued)
HSBC MSCI JAPAN UCITS ETF
HSBC ETFs PLC >29<
As at 30 June 2015
Transferable securities admitted to official stock exchange listing or dealt in on another regulated market
Holdings Financial assets at fair value through profit or loss
Fair Value USD
% of Net Asset Value
Equities Basic Materials
12,251 Air Water 224,366 0.10 97,622 Asahi Kasei 802,181 0.34 22,500 Daicel 289,053 0.12
8,108 Hitachi Chemical 146,304 0.06 16,767 Hitachi Metals 257,743 0.11 38,013 JFE Holdings 843,888 0.37 14,672 JSR 259,471 0.11 21,790 Kaneka 159,376 0.07 18,033 Kansai Paint 279,562 0.12
237,198 Kobe Steel 399,320 0.17 26,812 Kuraray 328,015 0.14
3,721 Maruichi Steel Tube 92,443 0.04 104,771 Mitsubishi Chemical Holdings 659,715 0.28 30,373 Mitsubishi Gas Chemical 170,276 0.07 64,202 Mitsui Chemicals 238,728 0.10 11,196 Nippon Paint 316,121 0.14
586,414 Nippon Steel 1,521,087 0.65 12,721 Nitto Denko 1,045,832 0.45 62,117 OJI Holdings 270,063 0.12 31,691 Shin-Etsu Chemical 1,968,046 0.85
115,444 Sumitomo Chemical 694,372 0.30 38,101 Sumitomo Metal Mining 580,241 0.25 12,049 Taiyo Nippon Sanso 145,831 0.06 73,087 Teijin 283,711 0.13
113,551 Toray Industries 960,913 0.41 16,371 Toyota Tsusho 439,494 0.19
13,376,152 5.75 Consumer Goods
2,085 ABC-Mart 127,624 0.05 14,761 Aisin Seiki 628,487 0.27 43,774 Ajinomoto 948,529 0.41 29,867 Asahi Group Holdings 950,086 0.41 12,449 Asics 321,996 0.14 13,819 Bandai Namco Holdings 267,424 0.11 50,130 Bridgestone 1,854,808 0.80
5,716 Calbee 241,038 0.10 15,576 Casio Computer 307,536 0.13 20,566 Citizen Holdings 143,533 0.06 14,957 Daihatsu Motor 213,052 0.09 45,872 Daiwa House Industry 1,069,528 0.46 37,537 Denso 1,870,025 0.80 45,328 Fuji Heavy Industries 1,669,911 0.72
125,640 Honda Motor 4,067,526 1.75 11,345 Iida Group Holdings 180,793 0.08 84,773 Japan Tobacco 3,020,902 1.30 15,978 JTEKT 302,676 0.13

Schedules of Investments (continued)
HSBC MSCI JAPAN UCITS ETF
>30< HSBC ETFs PLC
As at 30 June 2015
Transferable securities admitted to official stock exchange listing or dealt in on another regulated market
Holdings
Financial assets at fair value through profit or loss Fair Value
USD % of Net
Asset Value Equities (continued) Consumer Goods (continued)
38,841 Kao 1,807,067 0.78 11,514 Kikkoman 359,915 0.15 63,354 Kirin Holdings 872,920 0.38
8,054 Koito Manufacturing 314,288 0.14 7,189 Konami 133,716 0.06
35,667 Konica Minolta Holdings 416,526 0.18 9,261 Makita 502,538 0.22
41,607 Mazda Motor 815,377 0.35 4,753 MEIJI Holdings 613,716 0.26
49,512 Mitsubishi Motors 421,620 0.18 13,918 NGK Spark Plug 386,153 0.17 12,541 NHK Spring 138,257 0.06 26,625 Nikon 308,103 0.13
8,203 Nintendo 1,372,250 0.59 13,457 Nippon Meat Packers 307,268 0.13
191,948 Nissan Motor 2,000,030 0.86 16,657 Nisshin Seifun Group 221,612 0.10
4,979 Nissin Food Products 218,504 0.09 7,473 NOK 232,071 0.10
170,437 Panasonic 2,342,090 1.01 2,858 Rinnai 225,389 0.10 3,856 Sanrio 104,778 0.04
14,500 Sega Sammy Holdings 189,597 0.08 32,091 Sekisui Chemical 394,171 0.17 45,844 Sekisui House 728,319 0.31
111,492 Sharp 135,760 0.06 6,094 Shimano 831,690 0.36
28,015 Shiseido 636,013 0.27 90,116 Sony 2,549,230 1.10 11,105 Stanley Electric 231,602 0.10 58,328 Sumitomo Electric Industries 904,247 0.39 13,433 Sumitomo Rubber Industries 208,249 0.09 10,821 Suntory Beverage And Food 431,107 0.19 28,142 Suzuki Motor 950,984 0.41
6,958 Toyo Suisan Kaisha 253,892 0.11 5,111 Toyoda Gosei 123,342 0.05
12,555 Toyota Industries 716,168 0.31 211,271 Toyota Motor 14,163,004 6.09 28,911 Unicharm 687,423 0.30
6,845 Yakult Honsha 406,119 0.17 13,109 Yamaha 264,612 0.11 20,289 Yamaha Motor 443,866 0.19
8,705 Yamazaki Baking 145,054 0.06 8,074 Yokohama Rubber 162,186 0.07
57,856,297 24.88 Consumer Services
50,550 Aeon 717,776 0.31

Schedules of Investments (continued)
HSBC MSCI JAPAN UCITS ETF
HSBC ETFs PLC >31<
As at 30 June 2015
Transferable securities admitted to official stock exchange listing or dealt in on another regulated market
Holdings
Financial assets at fair value through profit or loss Fair Value
USD % of Net
Asset Value Equities (continued) Consumer Services (continued)
91,121 All Nippon Airways 247,303 0.11 5,207 Benesse Holdings 130,638 0.06
11,113 Central Japan Railway 2,007,542 0.86 43,336 Dai Nippon Printing 447,827 0.19 16,670 Dentsu 863,709 0.37
9,176 Don Quijote 390,691 0.17 25,821 East Japan Railway 2,323,289 1.00
4,600 FamilyMart 211,646 0.09 4,087 Fast Retailing 1,855,708 0.80
18,142 Hakuhodo DY Holdings 194,371 0.08 88,438 Hankyu 522,541 0.22 27,392 Isetan Mitsukoshi Holdings 489,794 0.21 18,779 J Front Retailing 353,588 0.15
9,286 Japan Airlines 324,041 0.13 11,110 Kakaku 160,887 0.07 39,442 Keihan Electric Railway 229,822 0.10 36,478 Keikyu 275,452 0.12 45,014 Keio 322,251 0.14 21,467 Keisei Electric Railway 255,432 0.11
140,955 Kintetsu 480,352 0.21 5,074 Lawson 347,486 0.15
18,687 Marui Group 252,591 0.11 5,224 McDonald's Holdings 110,359 0.05
67,311 Nagoya Railroad 251,938 0.11 5,732 Nitori Holdings 467,498 0.20
48,445 Odakyu Electric Railway 452,520 0.19 15,413 Oriental Land 984,371 0.42
7,337 Park24 125,736 0.05 61,440 Rakuten 992,911 0.43
3,815 Sankyo 135,153 0.06 9,273 Seibu Holdings 214,916 0.09
58,168 Seven & I Holdings 2,500,418 1.08 1,723 Shimamura 181,079 0.08
15,163 So-Net 305,082 0.13 21,733 Takashimaya 197,145 0.08 79,514 Tobu Railway 341,800 0.15
8,905 Toho 221,597 0.10 86,581 Tokyu 580,202 0.25 17,135 USS 309,470 0.13 12,691 West Japan Railway 812,602 0.35 52,139 Yamada Denki 208,786 0.09
22,798,320 9.80 Financial
31,386 Acom 120,553 0.05 8,033 Aeon Financial Service 223,203 0.09 8,904 Aeon Mall 166,925 0.07
90,316 Aozora Bank 340,996 0.15

Schedules of Investments (continued)
HSBC MSCI JAPAN UCITS ETF
>32< HSBC ETFs PLC
As at 30 June 2015
Transferable securities admitted to official stock exchange listing or dealt in on another regulated market
Holdings
Financial assets at fair value through profit or loss Fair Value
USD % of Net
Asset Value Equities (continued) Financial (continued)
26,685 Bank of Kyoto 307,489 0.13 86,982 Bank of Yokohama 533,557 0.23 53,979 Chiba Bank 411,575 0.18 12,593 Chugoku Bank 198,726 0.09 11,600 Credit Saison 248,751 0.11 83,089 Dai-ichi Life Insurance 1,634,076 0.70
128,298 Daiwa Securities Group 961,671 0.41 60,217 Fukuoka Financial Group 312,490 0.13 29,032 Gunma Bank 214,481 0.09 31,370 Hachijuni Bank 236,880 0.10 39,279 Hiroshima Bank 234,971 0.10 95,114 Hokuhoku Financial Group 224,639 0.10 22,848 Hulic 202,778 0.09 18,986 Iyo Bank 233,359 0.10 21,158 Japan Exchange Group 687,313 0.30
61 Japan Prime Realty Investment 189,683 0.08 97 Japan Real Estate Investment 440,747 0.19
189 Japan Retail Fund Investment 378,263 0.16 47,241 Joyo Bank 264,841 0.11 96,605 Mitsubishi Estate 2,081,470 0.90
982,749 Mitsubishi UFJ Financial Group 7,065,930 3.04 38,524 Mitsubishi UFJ Lease & Finance 210,935 0.09 72,710 Mitsui Fudosan 2,036,343 0.88
1,793,217 Mizuho Financial Group 3,883,484 1.67 39,179 MS&AD Insurance Group Holdings 1,220,852 0.53
108 Nippon Building Fund 473,076 0.20 114 Nippon Prologis REIT 209,991 0.09
25,607 NKSJ Holdings 939,924 0.40 280,344 Nomura Holding 1,902,944 0.82
9,732 Nomura Real Estate Holdings 204,399 0.09 9,042 NTT Urban Development 90,003 0.04
102,184 ORIX 1,520,672 0.65 170,577 Resona Holdings 931,890 0.40 16,441 SBI Holdings 226,531 0.09 46,767 Seven Bank 216,703 0.09
137,774 Shinsei Bank 278,104 0.12 41,409 Shizuoka Bank 432,821 0.19 13,662 Sony Financial Holdings 239,600 0.10 98,079 Sumitomo Mitsui Financial Group 4,375,542 1.88
256,578 Sumitomo Mitsui Trust Holdings 1,175,480 0.51 27,649 Sumitomo Realty & Development 970,138 0.42 14,061 Suruga Bank 301,869 0.13 44,641 T&D Holdings 665,794 0.29 53,412 Tokio Marine Holdings 2,223,518 0.96 16,008 Tokyo Tatemono 222,397 0.10 39,510 Tokyu Fudosan Holdings 304,805 0.13
204 United Urban Investment Corporation 288,583 0.12

Schedules of Investments (continued)
HSBC MSCI JAPAN UCITS ETF
HSBC ETFs PLC >33<
As at 30 June 2015
Transferable securities admitted to official stock exchange listing or dealt in on another regulated market
Holdings
Financial assets at fair value through profit or loss Fair Value
USD % of Net
Asset Value Equities (continued) Financial (continued)
15,280 Yamaguchi Financial Group 190,430 0.08
43,652,195 18.77 Healthcare
13,784 Alfresa Holdings 214,705 0.09 165,734 Astellas Pharma 2,364,146 1.02 17,303 Chugai Pharmaceutical 597,436 0.26 49,347 Daiichi Sankyo 913,019 0.39 12,384 Dainippon Sumitomo Pharma 136,526 0.06 19,494 Eisai 1,308,893 0.56
4,464 Hisamitsu Pharmaceutical 173,467 0.08 18,101 Kyowa Hakko Kirin 236,830 0.10 10,564 Medipal Holdings 172,405 0.07
4,354 Miraca Holdings 217,762 0.09 17,474 Mitsubishi Tanabe Pharma 262,042 0.11 19,806 Olympus 684,668 0.30
6,358 ONO Pharmaceutical 694,696 0.30 30,148 Otsuka Holdings 961,735 0.41 28,911 Santen Pharmaceutical 409,453 0.18 23,025 Shionogi 892,850 0.39
6,031 Suzuken 193,205 0.08 11,302 Sysmex Corporation 674,250 0.29
2,471 Taisho Pharmaceutical Holdings 167,002 0.07 60,870 Takeda Pharmaceutical 2,940,404 1.27 23,428 Terumo 562,318 0.24
14,777,812 6.36 Industrial
26,723 Amada 282,594 0.12 73,164 Asahi Glass 439,468 0.19 12,268 Chiyoda 108,679 0.05 18,071 Daikin Industries 1,300,923 0.56
5,611 Daito Trust Construction 581,437 0.25 15,690 Fanuc 3,215,831 1.38 43,569 Fuji Electric 187,643 0.08 11,009 Hamamatsu Photonics 324,786 0.14 20,120 Hino Motors 248,941 0.11
2,313 Hirose Electric 331,360 0.14 373,141 Hitachi 2,460,264 1.06
8,453 Hitachi Construction Machinery 148,108 0.06 32,870 Hoya 1,318,131 0.57
9,437 Ibiden 159,642 0.07 107,801 IHI 502,158 0.22 46,143 Isuzu Motors 606,177 0.26
121,746 ITOCHU 1,608,820 0.69 3,255 Japan Airport Terminal 177,427 0.08
28,213 Japan Display 106,290 0.05 16,128 JGC 304,727 0.13 65,825 Kajima 309,315 0.13

Schedules of Investments (continued)
HSBC MSCI JAPAN UCITS ETF
>34< HSBC ETFs PLC
As at 30 June 2015
Transferable securities admitted to official stock exchange listing or dealt in on another regulated market
Holdings
Financial assets at fair value through profit or loss Fair Value
USD % of Net
Asset Value Equities (continued) Industrial (continued)
18,217 Kamigumi 171,205 0.07 109,899 Kawasaki Heavy Industries 512,829 0.22
3,520 Keyence 1,900,308 0.82 72,038 Komatsu 1,446,471 0.62 86,715 Kubota 1,375,861 0.59
8,266 Kurita Water Industries 192,793 0.08 24,736 Kyocera 1,286,276 0.55 20,708 LIXIL Group 411,232 0.18
3,768 Mabuchi Motor 238,339 0.10 127,624 Marubeni 732,483 0.32 24,610 Minebea 406,463 0.18
106,569 Mitsubishi 2,344,492 1.01 149,187 Mitsubishi Electric 1,928,769 0.83 234,399 Mitsubishi Heavy Industries 1,426,527 0.61
9,583 Mitsubishi Logistics 125,930 0.05 86,969 Mitsubishi Materials 334,045 0.14
131,755 Mitsui & Co 1,790,076 0.77 88,316 Mitsui Osk Lines 282,923 0.12 15,651 Murata Manufacturing 2,732,034 1.17
9,390 Nabtesco 235,585 0.10 20,393 NGK Insulators 525,803 0.23 16,829 Nidec 1,260,473 0.54 31,127 Nippon Electric Glass 157,715 0.07 65,494 Nippon Express 322,211 0.14
126,222 Nippon Yusen 351,748 0.15 36,237 NSK 559,998 0.24 50,530 Obayashi 368,760 0.16 15,079 Omron 655,582 0.28 11,009 Recruit Holdings 336,033 0.14 16,215 Secom 1,052,819 0.45 19,394 Shimadzu 263,574 0.11 46,022 Shimizu 387,764 0.17
4,171 SMC 1,256,601 0.54 87,159 Sumitomo 1,014,297 0.44 43,429 Sumitomo Heavy Industries 253,408 0.11 91,510 Taiheiyo Cement 267,728 0.12 79,362 Taisei 455,943 0.20
9,479 TDK 725,847 0.31 9,284 THK 200,756 0.09
40,426 Toppan Printing 338,301 0.15 310,783 Toshiba 1,069,257 0.46 22,121 Toto 398,798 0.17 12,813 Toyo Seikan Group Holding 205,444 0.09 26,967 Yamato Holdings 522,194 0.22 17,757 Yaskawa Electric 227,540 0.10 17,597 Yokogawa Electric 226,353 0.10
48,002,309 20.65

Schedules of Investments (continued)
HSBC MSCI JAPAN UCITS ETF
HSBC ETFs PLC >35<
As at 30 June 2015
Transferable securities admitted to official stock exchange listing or dealt in on another regulated market
Holdings
Financial assets at fair value through profit or loss Fair Value
USD % of Net
Asset Value Equities (continued) Oil & Gas
6,869 Idemitsu Kosan 134,893 0.06 73,252 Inpex 833,001 0.36
173,685 JX Holdings 749,728 0.32 14,663 Showa Shell Sekiyu 128,218 0.05 22,187 TonenGeneral Sekiyu 206,521 0.09
2,052,361 0.88 Technology
11,535 Advantest 120,096 0.05 18,356 Brother Industries 260,118 0.11 82,231 Canon 2,676,296 1.15
3,638 Colopl 73,524 0.03 35,695 FUJIFILM Holdings 1,275,790 0.55
144,023 Fujitsu 805,535 0.35 31,526 Gungho Online Entertainment 122,636 0.05
5,307 Hitachi High-Technologies 149,411 0.07 3,734 Itochu Techno-Solutions 93,072 0.04 3,206 Mixi 159,298 0.07
201,432 NEC 610,724 0.26 10,305 Nexon Company 141,819 0.06
8,796 Nomura Research Institute 344,321 0.15 9,727 NTT Data 425,281 0.18 2,987 Oracle 124,982 0.05 4,027 Otsuka 188,244 0.08
54,538 Ricoh 566,038 0.25 7,502 Rohm 503,342 0.22
21,559 Seiko Epson 382,500 0.17 13,270 Tokyo Electron 840,131 0.36
8,188 Trend Micro 280,372 0.12 110,248 Yahoo Japan 445,082 0.19
10,588,612 4.56 Telecommunications
1,472 Hikari Tsushin 99,364 0.04 134,983 KDDI 3,258,610 1.40 57,850 Nippon Telegraph & Telephone 2,096,007 0.90
117,942 NTT DoCoMo 2,259,274 0.97 74,024 Softbank 4,361,043 1.88
12,074,298 5.19 Utilities
49,654 Chubu Electric Power 740,357 0.32 23,099 Chugoku Electric Power 337,146 0.14 11,178 Electric Power Development 395,087 0.17 13,213 Hokuriku Electric Power 196,956 0.08 54,258 Kansai Electric Power 601,044 0.26 33,338 Kyushu Electric Power 386,875 0.17
144,504 Osaka Gas 570,741 0.25 14,018 Shikoku Electric Power 209,986 0.09 32,149 Toho Gas 190,480 0.08
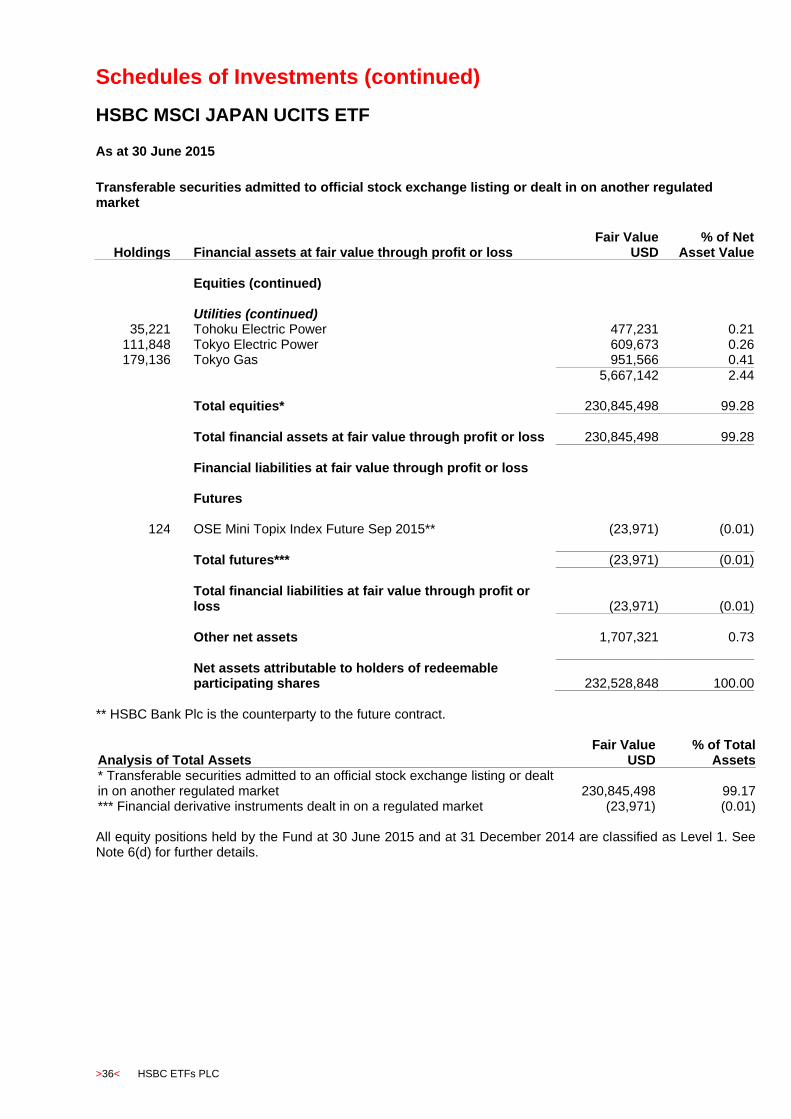
Schedules of Investments (continued)
HSBC MSCI JAPAN UCITS ETF
>36< HSBC ETFs PLC
As at 30 June 2015
Transferable securities admitted to official stock exchange listing or dealt in on another regulated market
Holdings
Financial assets at fair value through profit or loss Fair Value
USD % of Net
Asset Value Equities (continued) Utilities (continued)
35,221 Tohoku Electric Power 477,231 0.21 111,848 Tokyo Electric Power 609,673 0.26 179,136 Tokyo Gas 951,566 0.41
5,667,142 2.44
Total equities* 230,845,498 99.28
Total financial assets at fair value through profit or loss 230,845,498 99.28
Financial liabilities at fair value through profit or loss Futures
124 OSE Mini Topix Index Future Sep 2015** (23,971) (0.01)
Total futures*** (23,971) (0.01)
Total financial liabilities at fair value through profit or loss (23,971) (0.01)
Other net assets 1,707,321 0.73
Net assets attributable to holders of redeemable participating shares 232,528,848 100.00
** HSBC Bank Plc is the counterparty to the future contract.
Analysis of Total Assets Fair Value
USD % of Total
Assets * Transferable securities admitted to an official stock exchange listing or dealt in on another regulated market 230,845,498 99.17 *** Financial derivative instruments dealt in on a regulated market (23,971) (0.01) All equity positions held by the Fund at 30 June 2015 and at 31 December 2014 are classified as Level 1. See Note 6(d) for further details.
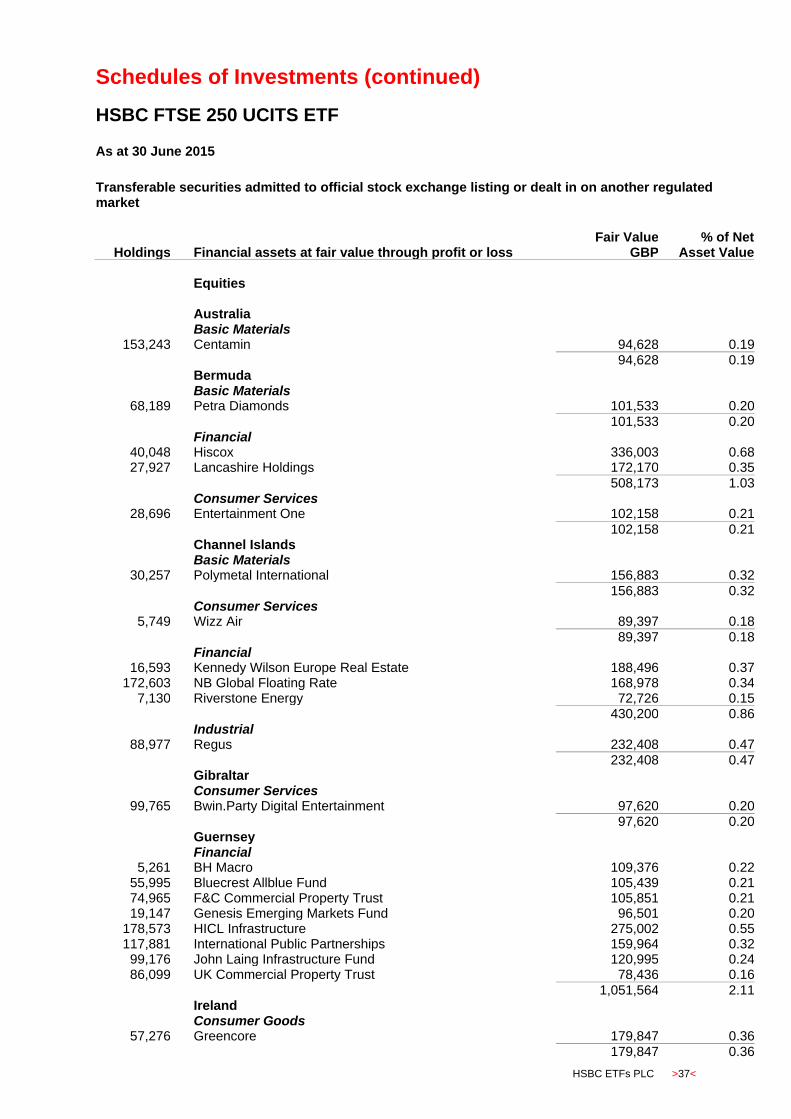
Schedules of Investments (continued)
HSBC FTSE 250 UCITS ETF
HSBC ETFs PLC >37<
As at 30 June 2015
Transferable securities admitted to official stock exchange listing or dealt in on another regulated market
Holdings
Financial assets at fair value through profit or loss Fair Value
GBP % of Net
Asset Value Equities Australia Basic Materials
153,243 Centamin 94,628 0.19
94,628 0.19 Bermuda Basic Materials
68,189 Petra Diamonds 101,533 0.20
101,533 0.20 Financial
40,048 Hiscox 336,003 0.68 27,927 Lancashire Holdings 172,170 0.35
508,173 1.03 Consumer Services
28,696 Entertainment One 102,158 0.21
102,158 0.21 Channel Islands Basic Materials
30,257 Polymetal International 156,883 0.32
156,883 0.32 Consumer Services
5,749 Wizz Air 89,397 0.18
89,397 0.18 Financial
16,593 Kennedy Wilson Europe Real Estate 188,496 0.37 172,603 NB Global Floating Rate 168,978 0.34
7,130 Riverstone Energy 72,726 0.15 430,200 0.86 Industrial
88,977 Regus 232,408 0.47
232,408 0.47 Gibraltar Consumer Services
99,765 Bwin.Party Digital Entertainment 97,620 0.20 97,620 0.20 Guernsey Financial
5,261 BH Macro 109,376 0.22 55,995 Bluecrest Allblue Fund 105,439 0.21 74,965 F&C Commercial Property Trust 105,851 0.21 19,147 Genesis Emerging Markets Fund 96,501 0.20
178,573 HICL Infrastructure 275,002 0.55 117,881 International Public Partnerships 159,964 0.32 99,176 John Laing Infrastructure Fund 120,995 0.24 86,099 UK Commercial Property Trust 78,436 0.16
1,051,564 2.11 Ireland Consumer Goods
57,276 Greencore 179,847 0.36 179,847 0.36

Schedules of Investments (continued)
HSBC FTSE 250 UCITS ETF (continued)
>38< HSBC ETFs PLC
As at 30 June 2015
Transferable securities admitted to official stock exchange listing or dealt in on another regulated market
Holdings
Financial assets at fair value through profit or loss Fair Value
GBP % of Net
Asset Value Equities (continued) Ireland (continued) Consumer Services
34,391 United Drug 168,310 0.34 168,310 0.34 Financial
73,050 Beazley 216,081 0.43
216,081 0.43 Industrial
12,437 DCC 621,850 1.25 30,166 Grafton Group 234,088 0.47
855,938 1.72 Isle of Man Technology
26,789 Playtech 219,268 0.44
219,268 0.44 Jersey Financial
83,774 3i Infrastructure 140,741 0.28 31,662 Phoenix Group Holdings 259,628 0.52
400,369 0.80 Luxembourg Consumer Services
78,948 B&M European Value Retail 270,713 0.54 270,713 0.54 United Kingdom Basic Materials
21,391 African Barrick Gold 64,579 0.13 19,005 Croda International 523,017 1.05 64,615 Elementis 165,802 0.33 67,496 Evraz Group 83,155 0.17 36,812 Kazakhmys 74,876 0.15 82,306 Lonmin 92,100 0.18 38,207 Synthomer 119,053 0.24 14,859 Vedanta Resources 77,267 0.16 11,335 Victrex 218,766 0.44
1,418,615 2.85 Consumer Goods
12,055 A.G.BARR 74,138 0.15 17,225 Bellway 408,577 0.82 17,747 Berkeley Group Holdings 593,815 1.19 18,977 Bovis Homes Group 211,214 0.42 33,547 Britvic 240,700 0.48
6,946 Cranswick 110,858 0.22 34,383 Crest Nicholson Holdings 193,061 0.39 19,367 Dairy Crest Group 103,129 0.21 15,775 Jimmy Choo 24,735 0.05 51,457 Pets At Home Group 153,702 0.31
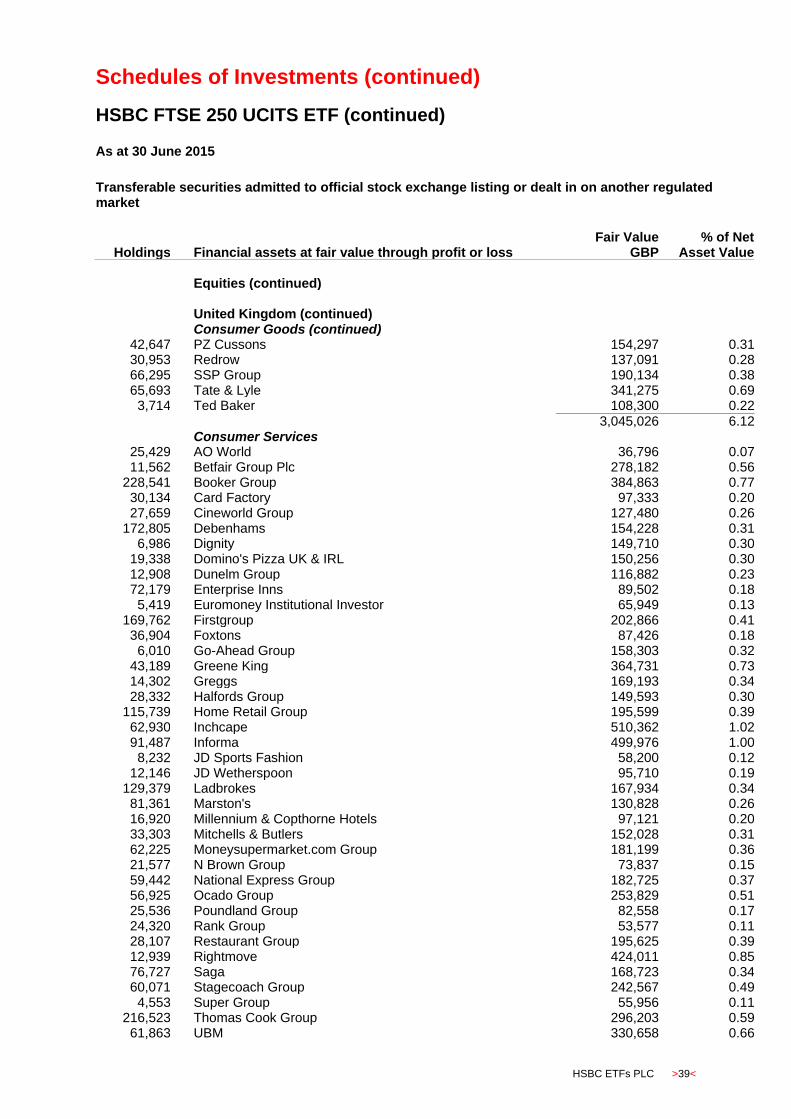
Schedules of Investments (continued)
HSBC FTSE 250 UCITS ETF (continued)
HSBC ETFs PLC >39<
As at 30 June 2015
Transferable securities admitted to official stock exchange listing or dealt in on another regulated market
Holdings
Financial assets at fair value through profit or loss Fair Value
GBP % of Net
Asset Value Equities (continued) United Kingdom (continued) Consumer Goods (continued)
42,647 PZ Cussons 154,297 0.31 30,953 Redrow 137,091 0.28 66,295 SSP Group 190,134 0.38 65,693 Tate & Lyle 341,275 0.69
3,714 Ted Baker 108,300 0.22
3,045,026 6.12 Consumer Services
25,429 AO World 36,796 0.07 11,562 Betfair Group Plc 278,182 0.56
228,541 Booker Group 384,863 0.77 30,134 Card Factory 97,333 0.20 27,659 Cineworld Group 127,480 0.26
172,805 Debenhams 154,228 0.31 6,986 Dignity 149,710 0.30
19,338 Domino's Pizza UK & IRL 150,256 0.30 12,908 Dunelm Group 116,882 0.23 72,179 Enterprise Inns 89,502 0.18
5,419 Euromoney Institutional Investor 65,949 0.13 169,762 Firstgroup 202,866 0.41 36,904 Foxtons 87,426 0.18
6,010 Go-Ahead Group 158,303 0.32 43,189 Greene King 364,731 0.73 14,302 Greggs 169,193 0.34 28,332 Halfords Group 149,593 0.30
115,739 Home Retail Group 195,599 0.39 62,930 Inchcape 510,362 1.02 91,487 Informa 499,976 1.00
8,232 JD Sports Fashion 58,200 0.12 12,146 JD Wetherspoon 95,710 0.19
129,379 Ladbrokes 167,934 0.34 81,361 Marston's 130,828 0.26 16,920 Millennium & Copthorne Hotels 97,121 0.20 33,303 Mitchells & Butlers 152,028 0.31 62,225 Moneysupermarket.com Group 181,199 0.36 21,577 N Brown Group 73,837 0.15 59,442 National Express Group 182,725 0.37 56,925 Ocado Group 253,829 0.51 25,536 Poundland Group 82,558 0.17 24,320 Rank Group 53,577 0.11 28,107 Restaurant Group 195,625 0.39 12,939 Rightmove 424,011 0.85 76,727 Saga 168,723 0.34 60,071 Stagecoach Group 242,567 0.49
4,553 Super Group 55,956 0.11 216,523 Thomas Cook Group 296,203 0.59 61,863 UBM 330,658 0.66
Schedules of Investments (continued)
HSBC FTSE 250 UCITS ETF (continued)
>40< HSBC ETFs PLC
As at 30 June 2015
Transferable securities admitted to official stock exchange listing or dealt in on another regulated market
Holdings
Financial assets at fair value through profit or loss Fair Value
GBP % of Net
Asset Value Equities (continued) United Kingdom (continued) Consumer Services (continued)
15,989 WH Smith 244,312 0.49 124,354 William Hill 501,271 1.01
7,978,102 16.02 Financial
85,425 AA 316,670 0.64 13,553 Aberforth Smaller Companies Trust 161,416 0.32 78,224 Alliance Trust 379,230 0.76 16,088 Allied Minds 87,358 0.18 70,511 Amlin 335,914 0.67 54,969 Ashmore Group 158,970 0.32
4,827 Bank of Georgia Holding 94,127 0.19 15,836 Bankers Investment Trust 100,875 0.20 20,231 Big Yellow Group REIT 128,973 0.26 37,645 Brewin Dolphin Holdings 109,886 0.22 19,703 British Empire Securities and General Trust 98,614 0.20
4,638 Caledonia Investments 112,472 0.23 102,434 Capital & Counties Properties 445,793 0.89 42,698 City of London Investment Trust 167,590 0.34 21,012 Close Brothers Group 321,063 0.64
2,331 CLS Holdings 43,357 0.09 21,597 Countrywide 122,671 0.25
692 Daejan Holdings 40,828 0.08 14,041 Derwent London REIT 477,675 0.96 27,660 Edinburgh Investment Trust 184,354 0.37
5,018 Electra Private Equity 159,322 0.32 34,299 Esure Group 87,119 0.17 81,057 Fidelity China Special Situations 123,369 0.25 59,290 Fidelity European Values 103,639 0.21 15,800 Finsbury Growth & Income 91,008 0.18 79,660 Foreign & Colonial Investment Trust 344,928 0.69 58,372 Grainger 133,497 0.27 48,486 Great Portland Estates 376,251 0.76 97,270 Hansteen Holdings 112,347 0.23
148,735 Henderson Group 388,198 0.78 75,597 ICAP 400,286 0.80 51,211 IG Group Holdings 382,290 0.77 53,579 Intermediate Capital Group 294,417 0.59 33,073 International Personal Finance 151,144 0.30 71,729 Investec 410,290 0.82 75,620 IP Group 156,155 0.31 17,238 Jardine Lloyd Thompson Group 179,965 0.36 19,657 John Laing Group Plc 42,361 0.09 39,595 JP Morgan American Invest Trust 107,065 0.22 18,319 JPMorgan Emerging Markets Investment Trust 107,532 0.22 58,719 Jupiter Fund Management 261,711 0.53 33,447 Just Retirement Group 57,997 0.12
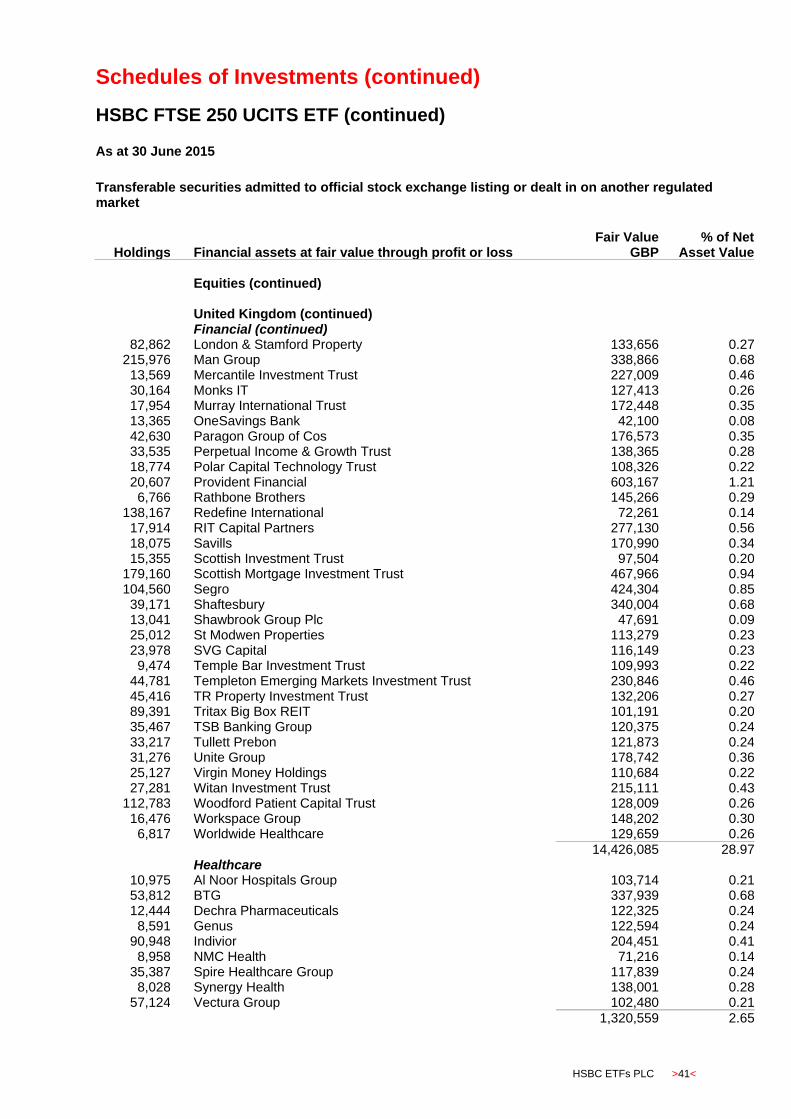
Schedules of Investments (continued)
HSBC FTSE 250 UCITS ETF (continued)
HSBC ETFs PLC >41<
As at 30 June 2015
Transferable securities admitted to official stock exchange listing or dealt in on another regulated market
Holdings
Financial assets at fair value through profit or loss Fair Value
GBP % of Net
Asset Value Equities (continued) United Kingdom (continued) Financial (continued)
82,862 London & Stamford Property 133,656 0.27 215,976 Man Group 338,866 0.68 13,569 Mercantile Investment Trust 227,009 0.46 30,164 Monks IT 127,413 0.26 17,954 Murray International Trust 172,448 0.35 13,365 OneSavings Bank 42,100 0.08 42,630 Paragon Group of Cos 176,573 0.35 33,535 Perpetual Income & Growth Trust 138,365 0.28 18,774 Polar Capital Technology Trust 108,326 0.22 20,607 Provident Financial 603,167 1.21
6,766 Rathbone Brothers 145,266 0.29 138,167 Redefine International 72,261 0.14 17,914 RIT Capital Partners 277,130 0.56 18,075 Savills 170,990 0.34 15,355 Scottish Investment Trust 97,504 0.20
179,160 Scottish Mortgage Investment Trust 467,966 0.94 104,560 Segro 424,304 0.85 39,171 Shaftesbury 340,004 0.68 13,041 Shawbrook Group Plc 47,691 0.09 25,012 St Modwen Properties 113,279 0.23 23,978 SVG Capital 116,149 0.23
9,474 Temple Bar Investment Trust 109,993 0.22 44,781 Templeton Emerging Markets Investment Trust 230,846 0.46 45,416 TR Property Investment Trust 132,206 0.27 89,391 Tritax Big Box REIT 101,191 0.20 35,467 TSB Banking Group 120,375 0.24 33,217 Tullett Prebon 121,873 0.24 31,276 Unite Group 178,742 0.36 25,127 Virgin Money Holdings 110,684 0.22 27,281 Witan Investment Trust 215,111 0.43
112,783 Woodford Patient Capital Trust 128,009 0.26 16,476 Workspace Group 148,202 0.30
6,817 Worldwide Healthcare 129,659 0.26
14,426,085 28.97 Healthcare
10,975 Al Noor Hospitals Group 103,714 0.21 53,812 BTG 337,939 0.68 12,444 Dechra Pharmaceuticals 122,325 0.24
8,591 Genus 122,594 0.24 90,948 Indivior 204,451 0.41
8,958 NMC Health 71,216 0.14 35,387 Spire Healthcare Group 117,839 0.24
8,028 Synergy Health 138,001 0.28 57,124 Vectura Group 102,480 0.21
1,320,559 2.65
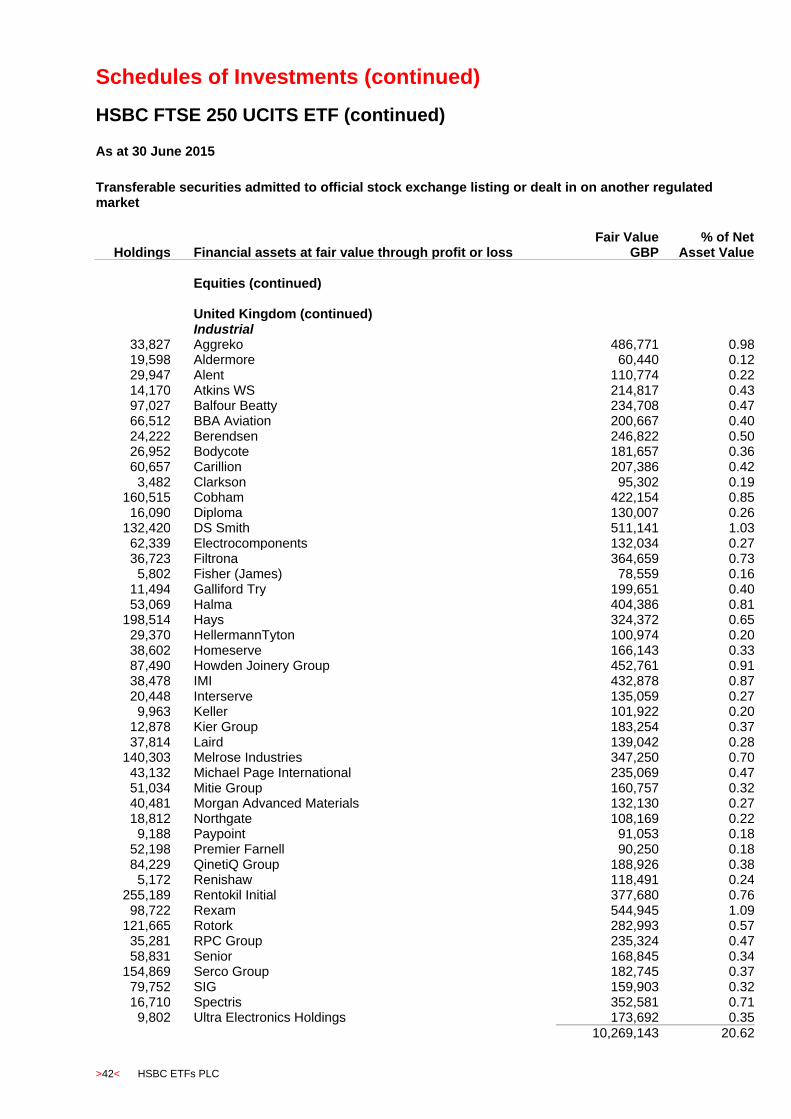
Schedules of Investments (continued)
HSBC FTSE 250 UCITS ETF (continued)
>42< HSBC ETFs PLC
As at 30 June 2015
Transferable securities admitted to official stock exchange listing or dealt in on another regulated market
Holdings
Financial assets at fair value through profit or loss Fair Value
GBP % of Net
Asset Value Equities (continued) United Kingdom (continued) Industrial
33,827 Aggreko 486,771 0.98 19,598 Aldermore 60,440 0.12 29,947 Alent 110,774 0.22 14,170 Atkins WS 214,817 0.43 97,027 Balfour Beatty 234,708 0.47 66,512 BBA Aviation 200,667 0.40 24,222 Berendsen 246,822 0.50 26,952 Bodycote 181,657 0.36 60,657 Carillion 207,386 0.42
3,482 Clarkson 95,302 0.19 160,515 Cobham 422,154 0.85 16,090 Diploma 130,007 0.26
132,420 DS Smith 511,141 1.03 62,339 Electrocomponents 132,034 0.27 36,723 Filtrona 364,659 0.73
5,802 Fisher (James) 78,559 0.16 11,494 Galliford Try 199,651 0.40 53,069 Halma 404,386 0.81
198,514 Hays 324,372 0.65 29,370 HellermannTyton 100,974 0.20 38,602 Homeserve 166,143 0.33 87,490 Howden Joinery Group 452,761 0.91 38,478 IMI 432,878 0.87 20,448 Interserve 135,059 0.27
9,963 Keller 101,922 0.20 12,878 Kier Group 183,254 0.37 37,814 Laird 139,042 0.28
140,303 Melrose Industries 347,250 0.70 43,132 Michael Page International 235,069 0.47 51,034 Mitie Group 160,757 0.32 40,481 Morgan Advanced Materials 132,130 0.27 18,812 Northgate 108,169 0.22
9,188 Paypoint 91,053 0.18 52,198 Premier Farnell 90,250 0.18 84,229 QinetiQ Group 188,926 0.38
5,172 Renishaw 118,491 0.24 255,189 Rentokil Initial 377,680 0.76 98,722 Rexam 544,945 1.09
121,665 Rotork 282,993 0.57 35,281 RPC Group 235,324 0.47 58,831 Senior 168,845 0.34
154,869 Serco Group 182,745 0.37 79,752 SIG 159,903 0.32 16,710 Spectris 352,581 0.71
9,802 Ultra Electronics Holdings 173,692 0.35
10,269,143 20.62
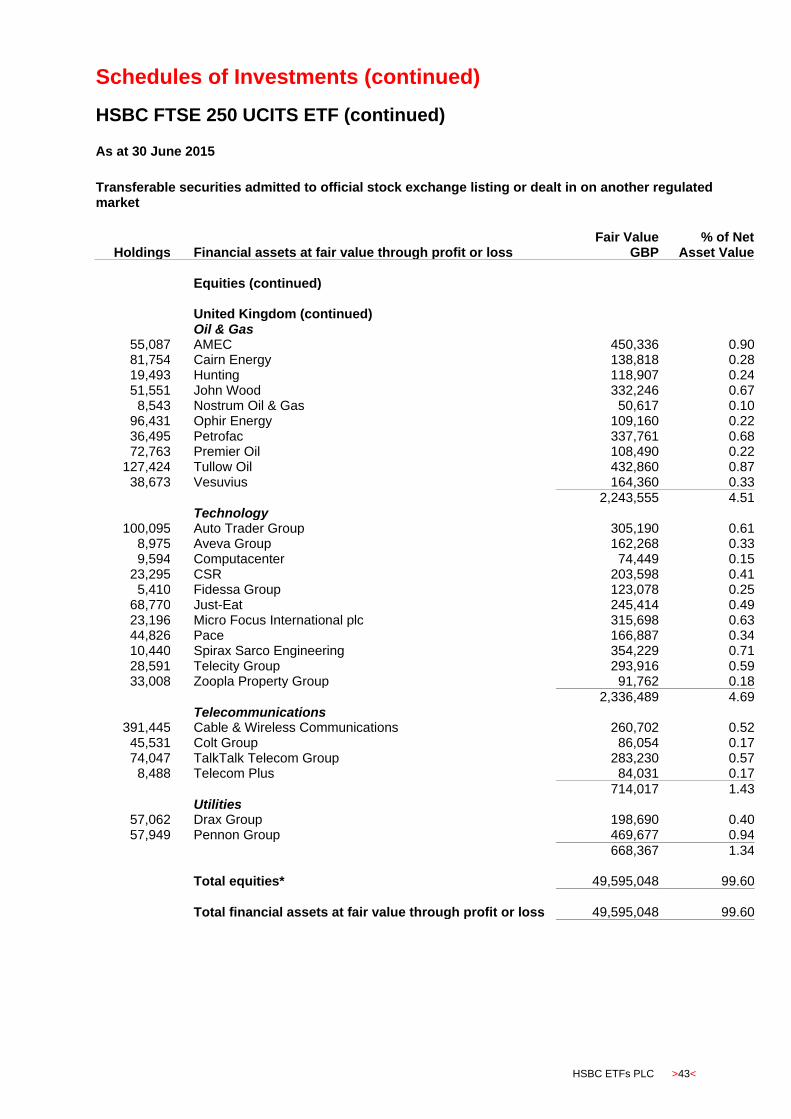
Schedules of Investments (continued)
HSBC FTSE 250 UCITS ETF (continued)
HSBC ETFs PLC >43<
As at 30 June 2015
Transferable securities admitted to official stock exchange listing or dealt in on another regulated market
Holdings
Financial assets at fair value through profit or loss Fair Value
GBP % of Net
Asset Value Equities (continued) United Kingdom (continued) Oil & Gas
55,087 AMEC 450,336 0.90 81,754 Cairn Energy 138,818 0.28 19,493 Hunting 118,907 0.24 51,551 John Wood 332,246 0.67
8,543 Nostrum Oil & Gas 50,617 0.10 96,431 Ophir Energy 109,160 0.22 36,495 Petrofac 337,761 0.68 72,763 Premier Oil 108,490 0.22
127,424 Tullow Oil 432,860 0.87 38,673 Vesuvius 164,360 0.33
2,243,555 4.51 Technology
100,095 Auto Trader Group 305,190 0.61 8,975 Aveva Group 162,268 0.33 9,594 Computacenter 74,449 0.15
23,295 CSR 203,598 0.41 5,410 Fidessa Group 123,078 0.25
68,770 Just-Eat 245,414 0.49 23,196 Micro Focus International plc 315,698 0.63 44,826 Pace 166,887 0.34 10,440 Spirax Sarco Engineering 354,229 0.71 28,591 Telecity Group 293,916 0.59 33,008 Zoopla Property Group 91,762 0.18
2,336,489 4.69 Telecommunications
391,445 Cable & Wireless Communications 260,702 0.52 45,531 Colt Group 86,054 0.17 74,047 TalkTalk Telecom Group 283,230 0.57
8,488 Telecom Plus 84,031 0.17
714,017 1.43 Utilities
57,062 Drax Group 198,690 0.40 57,949 Pennon Group 469,677 0.94
668,367 1.34 Total equities* 49,595,048 99.60
Total financial assets at fair value through profit or loss 49,595,048 99.60
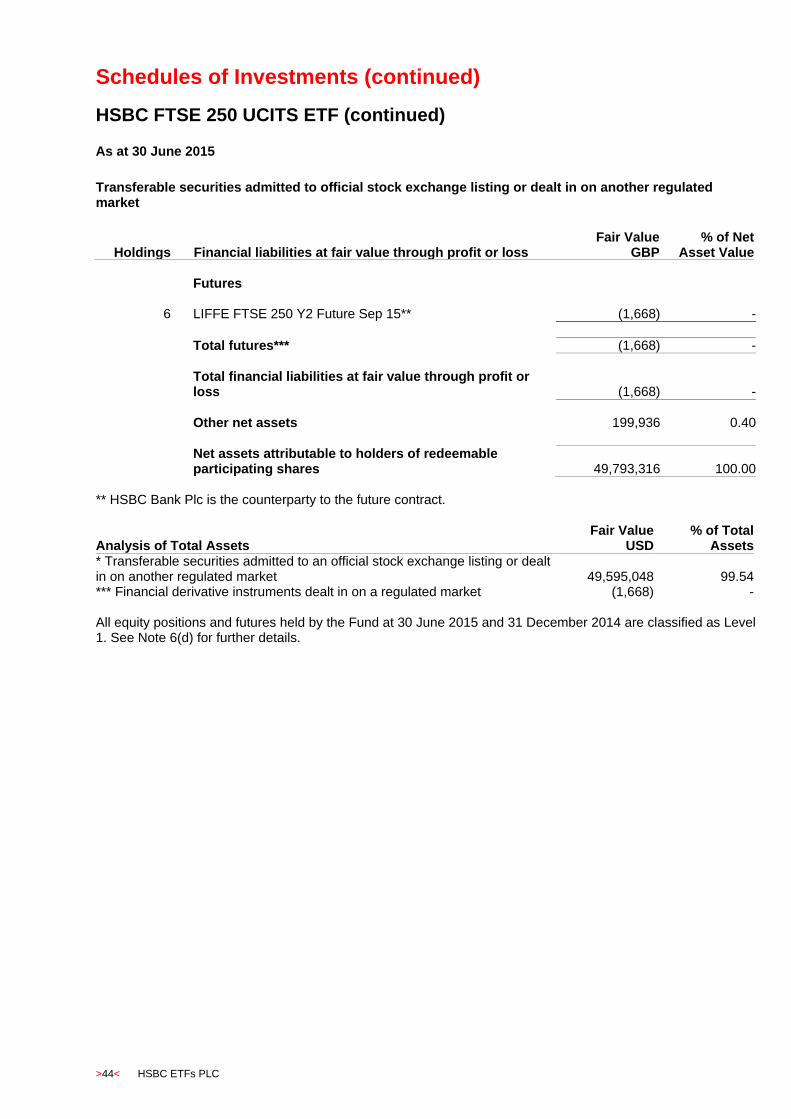
Schedules of Investments (continued)
HSBC FTSE 250 UCITS ETF (continued)
>44< HSBC ETFs PLC
As at 30 June 2015
Transferable securities admitted to official stock exchange listing or dealt in on another regulated market
Holdings
Financial liabilities at fair value through profit or loss Fair Value
GBP % of Net
Asset Value Futures
6 LIFFE FTSE 250 Y2 Future Sep 15** (1,668) -
Total futures*** (1,668) -
Total financial liabilities at fair value through profit or loss (1,668) -
Other net assets 199,936 0.40
Net assets attributable to holders of redeemable participating shares 49,793,316 100.00
** HSBC Bank Plc is the counterparty to the future contract.
Analysis of Total Assets Fair Value
USD % of Total
Assets * Transferable securities admitted to an official stock exchange listing or dealt in on another regulated market 49,595,048 99.54 *** Financial derivative instruments dealt in on a regulated market (1,668) - All equity positions and futures held by the Fund at 30 June 2015 and 31 December 2014 are classified as Level 1. See Note 6(d) for further details.

Schedules of Investments (continued)
HSBC S&P 500 UCITS ETF
HSBC ETFs PLC >45<
As at 30 June 2015
Transferable securities admitted to official stock exchange listing or dealt in on another regulated market
Holdings
Financial assets at fair value through profit or loss Fair Value
USD % of Net
Asset Value
Equities Ireland Financial
31,368 XL Group 1,166,890 0.06
1,166,890 0.06 Healthcare
11,914 Mallinckrodt 1,402,516 0.07 14,963 Perrigo 2,765,611 0.15
4,168,127 0.22 Industrial
63,939 Accenture 6,188,016 0.33 9,800 Allegion Public Limited Company 589,372 0.03
26,817 Ingersoll-Rand 1,808,002 0.10 8,585,390 0.46 Netherlands Basic Materials
40,327 Lyondell Basell Industries 4,174,651 0.22
4,174,651 0.22 Consumer Services
37,804 Nielsen Holdings 1,692,485 0.09
1,692,485 0.09 Switzerland Financial
33,325 ACE 3,388,486 0.18
3,388,486 0.18 Industrial
41,544 TE Connectivity 2,671,280 0.14 42,592 Tyco International 1,638,940 0.09
4,310,220 0.23 Oil & Gas
34,776 Transocean 560,589 0.03
560,589 0.03 United Kingdom Oil & Gas
23,842 Ensco 530,961 0.03 25,835 Noble Corporation 397,601 0.02
928,562 0.05 United States Basic Materials
19,654 Air Products & Chemicals 2,689,257 0.14 6,821 Airgas 721,525 0.04
124,453 Alcoa 1,387,651 0.07 10,853 Allegheny Technologies 327,761 0.02
9,534 Avery Dennison 581,002 0.03 24,075 CF Industries Holdings 1,547,541 0.08 23,435 CONSOL Energy 509,477 0.03
110,804 Dow Chemical 5,669,841 0.30 92,372 DuPont 5,907,189 0.31

Schedules of Investments (continued)
HSBC S&P 500 UCITS ETF (continued)
>46< HSBC ETFs PLC
As at 30 June 2015 Transferable securities admitted to official stock exchange listing or dealt in on another regulated market
Holdings
Financial assets at fair value through profit or loss Fair Value
USD % of Net
Asset Value
Equities (continued)
United States (continued) Basic Materials (continued)
15,293 Eastman Chemical 1,251,273 0.07 27,477 Ecolab 3,106,824 0.16 13,553 FMC 712,210 0.04
105,655 Freeport-McMoRan Copper & Gold 1,967,296 0.10 8,265 International Flavors & Fragrances 903,282 0.05
43,155 International Paper 2,053,747 0.11 31,663 Mosaic 1,483,412 0.08 54,104 Newmont Mining 1,263,869 0.07 32,463 Nucor 1,430,644 0.08 27,697 PPG Industries 3,177,400 0.17 29,405 Praxair 3,515,368 0.19 12,135 Sigma Aldrich 1,691,012 0.09
41,897,581 2.23 Consumer Goods
201,184 Altria Group 9,839,909 0.52 63,464 Archer-Daniels-Midland 3,060,234 0.16 23,055 BorgWarner 1,310,446 0.07 15,967 Brown-Forman 1,599,574 0.09 18,188 Campbell Soup 866,658 0.05 13,348 Clorox 1,388,459 0.07 27,904 Coach 965,757 0.05
401,317 Coca-Cola 15,743,666 0.84 22,091 Coca-Cola Enterprises 959,633 0.05 86,817 Colgate-Palmolive 5,678,700 0.30 43,475 ConAgra Foods 1,900,727 0.10 17,332 Constellation Brands 2,010,859 0.11 29,563 Delphi Automotive 2,515,516 0.13 33,774 DR Horton 924,057 0.05 19,654 Dr Pepper Snapple Group 1,432,777 0.08 31,794 Electronic Arts 2,114,301 0.11 22,916 Estee Lauder Cos 1,985,901 0.11
406,691 Ford Motor 6,104,432 0.32 4,395 Fossil 304,837 0.02
12,332 Garmin 541,745 0.03 60,982 General Mills 3,397,917 0.18
137,551 General Motors 4,584,575 0.24 15,554 Genuine Parts 1,392,550 0.07 27,987 Goodyear Tire & Rubber 843,808 0.04 40,814 Hanesbrands 1,359,922 0.07 21,531 Harley-Davidson 1,213,272 0.06
7,279 Harman International Industries 865,764 0.05 11,681 Hasbro 873,622 0.05 15,108 Hershey 1,342,044 0.07 13,859 Hormel Foods 781,232 0.04
9,916 JM Smucker 1,074,994 0.06 66,925 Johnson Controls 3,314,795 0.18
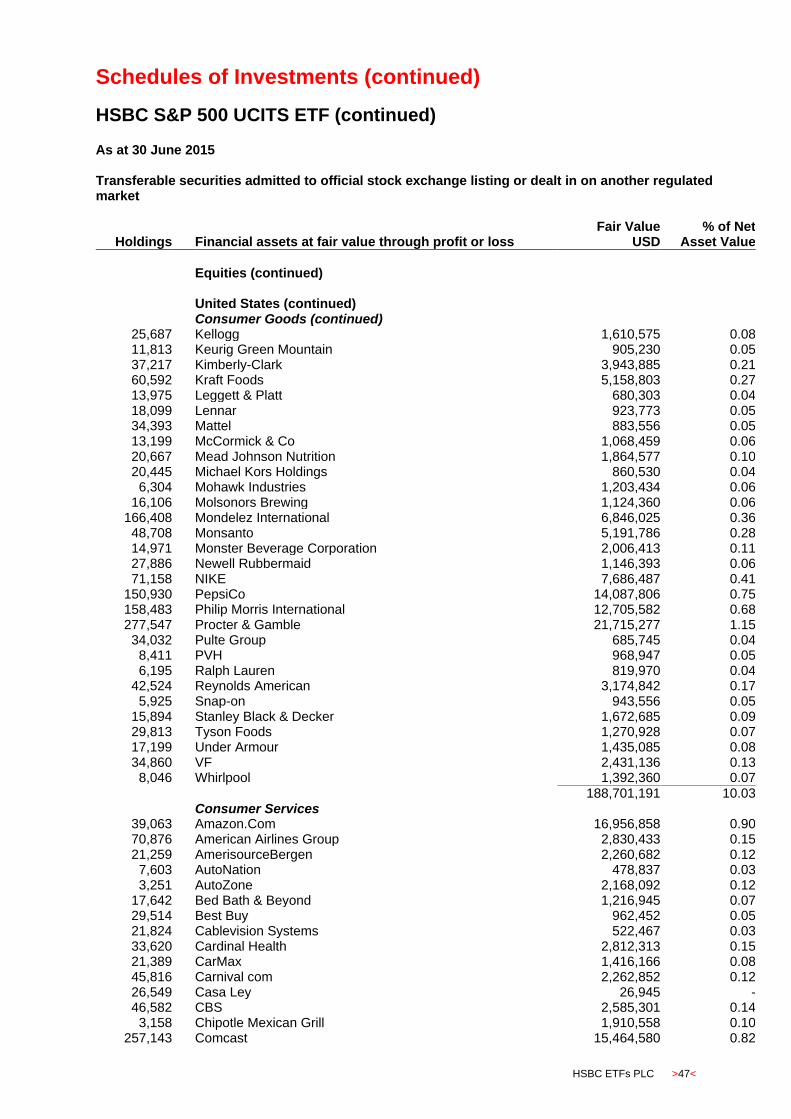
Schedules of Investments (continued)
HSBC S&P 500 UCITS ETF (continued)
HSBC ETFs PLC >47<
As at 30 June 2015 Transferable securities admitted to official stock exchange listing or dealt in on another regulated market
Holdings
Financial assets at fair value through profit or loss Fair Value
USD % of Net
Asset Value
Equities (continued) United States (continued) Consumer Goods (continued)
25,687 Kellogg 1,610,575 0.08 11,813 Keurig Green Mountain 905,230 0.05 37,217 Kimberly-Clark 3,943,885 0.21 60,592 Kraft Foods 5,158,803 0.27 13,975 Leggett & Platt 680,303 0.04 18,099 Lennar 923,773 0.05 34,393 Mattel 883,556 0.05 13,199 McCormick & Co 1,068,459 0.06 20,667 Mead Johnson Nutrition 1,864,577 0.10 20,445 Michael Kors Holdings 860,530 0.04
6,304 Mohawk Industries 1,203,434 0.06 16,106 Molsonors Brewing 1,124,360 0.06
166,408 Mondelez International 6,846,025 0.36 48,708 Monsanto 5,191,786 0.28 14,971 Monster Beverage Corporation 2,006,413 0.11 27,886 Newell Rubbermaid 1,146,393 0.06 71,158 NIKE 7,686,487 0.41
150,930 PepsiCo 14,087,806 0.75 158,483 Philip Morris International 12,705,582 0.68 277,547 Procter & Gamble 21,715,277 1.15 34,032 Pulte Group 685,745 0.04
8,411 PVH 968,947 0.05 6,195 Ralph Lauren 819,970 0.04
42,524 Reynolds American 3,174,842 0.17 5,925 Snap-on 943,556 0.05
15,894 Stanley Black & Decker 1,672,685 0.09 29,813 Tyson Foods 1,270,928 0.07 17,199 Under Armour 1,435,085 0.08 34,860 VF 2,431,136 0.13
8,046 Whirlpool 1,392,360 0.07
188,701,191 10.03 Consumer Services
39,063 Amazon.Com 16,956,858 0.90 70,876 American Airlines Group 2,830,433 0.15 21,259 AmerisourceBergen 2,260,682 0.12
7,603 AutoNation 478,837 0.03 3,251 AutoZone 2,168,092 0.12
17,642 Bed Bath & Beyond 1,216,945 0.07 29,514 Best Buy 962,452 0.05 21,824 Cablevision Systems 522,467 0.03 33,620 Cardinal Health 2,812,313 0.15 21,389 CarMax 1,416,166 0.08 45,816 Carnival com 2,262,852 0.12 26,549 Casa Ley 26,945 - 46,582 CBS 2,585,301 0.14
3,158 Chipotle Mexican Grill 1,910,558 0.10 257,143 Comcast 15,464,580 0.82
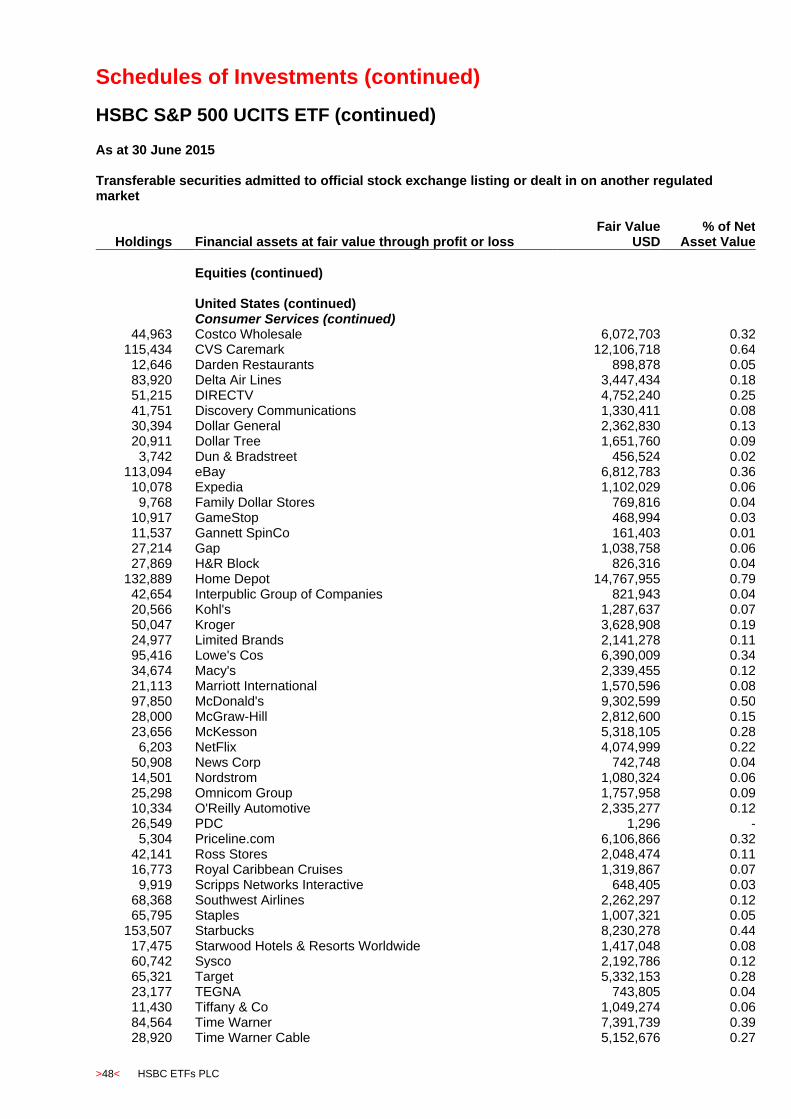
Schedules of Investments (continued)
HSBC S&P 500 UCITS ETF (continued)
>48< HSBC ETFs PLC
As at 30 June 2015 Transferable securities admitted to official stock exchange listing or dealt in on another regulated market
Holdings
Financial assets at fair value through profit or loss Fair Value
USD % of Net
Asset Value
Equities (continued) United States (continued) Consumer Services (continued)
44,963 Costco Wholesale 6,072,703 0.32 115,434 CVS Caremark 12,106,718 0.64 12,646 Darden Restaurants 898,878 0.05 83,920 Delta Air Lines 3,447,434 0.18 51,215 DIRECTV 4,752,240 0.25 41,751 Discovery Communications 1,330,411 0.08 30,394 Dollar General 2,362,830 0.13 20,911 Dollar Tree 1,651,760 0.09
3,742 Dun & Bradstreet 456,524 0.02 113,094 eBay 6,812,783 0.36 10,078 Expedia 1,102,029 0.06
9,768 Family Dollar Stores 769,816 0.04 10,917 GameStop 468,994 0.03 11,537 Gannett SpinCo 161,403 0.01 27,214 Gap 1,038,758 0.06 27,869 H&R Block 826,316 0.04
132,889 Home Depot 14,767,955 0.79 42,654 Interpublic Group of Companies 821,943 0.04 20,566 Kohl's 1,287,637 0.07 50,047 Kroger 3,628,908 0.19 24,977 Limited Brands 2,141,278 0.11 95,416 Lowe's Cos 6,390,009 0.34 34,674 Macy's 2,339,455 0.12 21,113 Marriott International 1,570,596 0.08 97,850 McDonald's 9,302,599 0.50 28,000 McGraw-Hill 2,812,600 0.15 23,656 McKesson 5,318,105 0.28
6,203 NetFlix 4,074,999 0.22 50,908 News Corp 742,748 0.04 14,501 Nordstrom 1,080,324 0.06 25,298 Omnicom Group 1,757,958 0.09 10,334 O'Reilly Automotive 2,335,277 0.12 26,549 PDC 1,296 -
5,304 Priceline.com 6,106,866 0.32 42,141 Ross Stores 2,048,474 0.11 16,773 Royal Caribbean Cruises 1,319,867 0.07
9,919 Scripps Networks Interactive 648,405 0.03 68,368 Southwest Airlines 2,262,297 0.12 65,795 Staples 1,007,321 0.05
153,507 Starbucks 8,230,278 0.44 17,475 Starwood Hotels & Resorts Worldwide 1,417,048 0.08 60,742 Sysco 2,192,786 0.12 65,321 Target 5,332,153 0.28 23,177 TEGNA 743,805 0.04 11,430 Tiffany & Co 1,049,274 0.06 84,564 Time Warner 7,391,739 0.39 28,920 Time Warner Cable 5,152,676 0.27
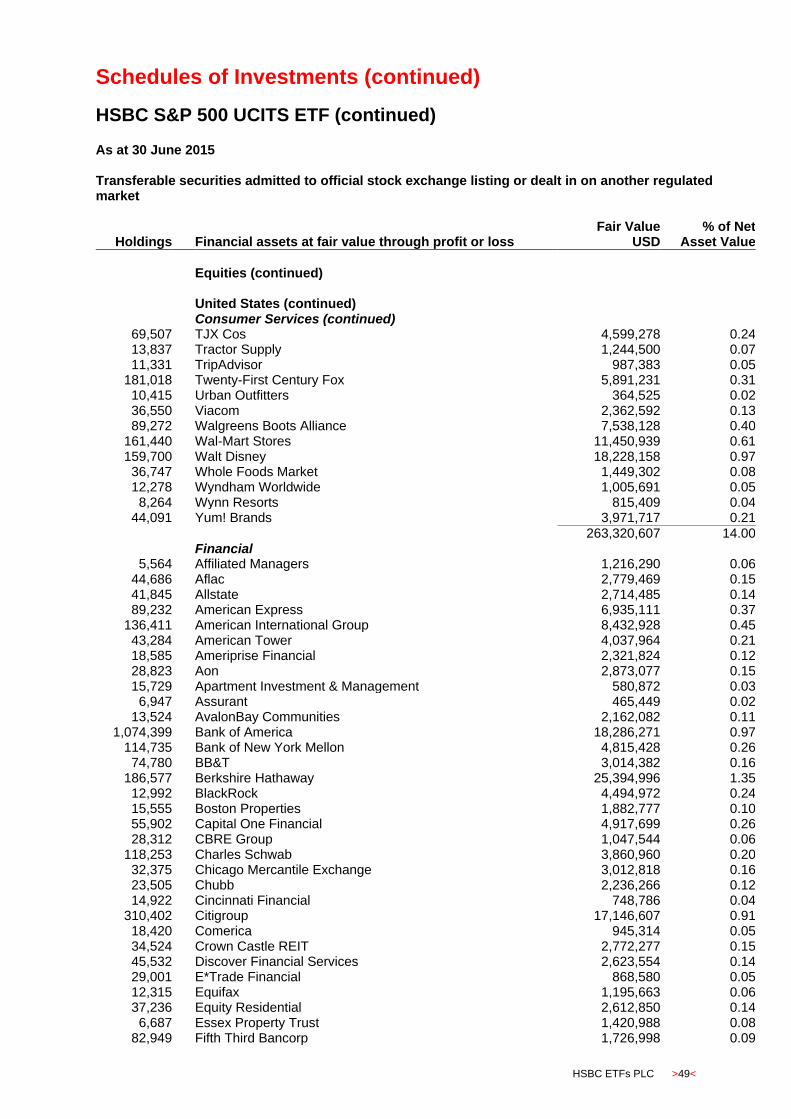
Schedules of Investments (continued)
HSBC S&P 500 UCITS ETF (continued)
HSBC ETFs PLC >49<
As at 30 June 2015 Transferable securities admitted to official stock exchange listing or dealt in on another regulated market
Holdings
Financial assets at fair value through profit or loss Fair Value
USD % of Net
Asset Value
Equities (continued) United States (continued) Consumer Services (continued)
69,507 TJX Cos 4,599,278 0.24 13,837 Tractor Supply 1,244,500 0.07 11,331 TripAdvisor 987,383 0.05
181,018 Twenty-First Century Fox 5,891,231 0.31 10,415 Urban Outfitters 364,525 0.02 36,550 Viacom 2,362,592 0.13 89,272 Walgreens Boots Alliance 7,538,128 0.40
161,440 Wal-Mart Stores 11,450,939 0.61 159,700 Walt Disney 18,228,158 0.97 36,747 Whole Foods Market 1,449,302 0.08 12,278 Wyndham Worldwide 1,005,691 0.05
8,264 Wynn Resorts 815,409 0.04 44,091 Yum! Brands 3,971,717 0.21
263,320,607 14.00 Financial
5,564 Affiliated Managers 1,216,290 0.06 44,686 Aflac 2,779,469 0.15 41,845 Allstate 2,714,485 0.14 89,232 American Express 6,935,111 0.37
136,411 American International Group 8,432,928 0.45 43,284 American Tower 4,037,964 0.21 18,585 Ameriprise Financial 2,321,824 0.12 28,823 Aon 2,873,077 0.15 15,729 Apartment Investment & Management 580,872 0.03
6,947 Assurant 465,449 0.02 13,524 AvalonBay Communities 2,162,082 0.11
1,074,399 Bank of America 18,286,271 0.97 114,735 Bank of New York Mellon 4,815,428 0.26 74,780 BB&T 3,014,382 0.16
186,577 Berkshire Hathaway 25,394,996 1.35 12,992 BlackRock 4,494,972 0.24 15,555 Boston Properties 1,882,777 0.10 55,902 Capital One Financial 4,917,699 0.26 28,312 CBRE Group 1,047,544 0.06
118,253 Charles Schwab 3,860,960 0.20 32,375 Chicago Mercantile Exchange 3,012,818 0.16 23,505 Chubb 2,236,266 0.12 14,922 Cincinnati Financial 748,786 0.04
310,402 Citigroup 17,146,607 0.91 18,420 Comerica 945,314 0.05 34,524 Crown Castle REIT 2,772,277 0.15 45,532 Discover Financial Services 2,623,554 0.14 29,001 E*Trade Financial 868,580 0.05 12,315 Equifax 1,195,663 0.06 37,236 Equity Residential 2,612,850 0.14
6,687 Essex Property Trust 1,420,988 0.08 82,949 Fifth Third Bancorp 1,726,998 0.09
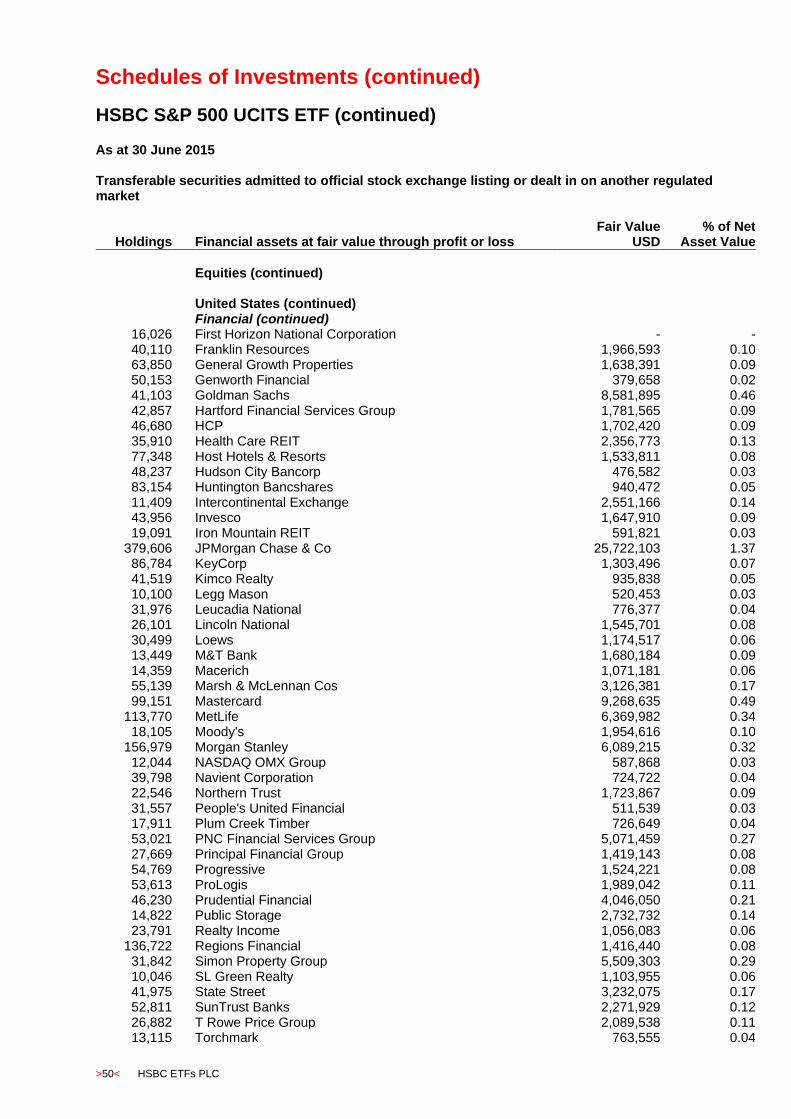
Schedules of Investments (continued)
HSBC S&P 500 UCITS ETF (continued)
>50< HSBC ETFs PLC
As at 30 June 2015 Transferable securities admitted to official stock exchange listing or dealt in on another regulated market
Holdings
Financial assets at fair value through profit or loss Fair Value
USD % of Net
Asset Value
Equities (continued) United States (continued) Financial (continued)
16,026 First Horizon National Corporation - - 40,110 Franklin Resources 1,966,593 0.10 63,850 General Growth Properties 1,638,391 0.09 50,153 Genworth Financial 379,658 0.02 41,103 Goldman Sachs 8,581,895 0.46 42,857 Hartford Financial Services Group 1,781,565 0.09 46,680 HCP 1,702,420 0.09 35,910 Health Care REIT 2,356,773 0.13 77,348 Host Hotels & Resorts 1,533,811 0.08 48,237 Hudson City Bancorp 476,582 0.03 83,154 Huntington Bancshares 940,472 0.05 11,409 Intercontinental Exchange 2,551,166 0.14 43,956 Invesco 1,647,910 0.09 19,091 Iron Mountain REIT 591,821 0.03
379,606 JPMorgan Chase & Co 25,722,103 1.37 86,784 KeyCorp 1,303,496 0.07 41,519 Kimco Realty 935,838 0.05 10,100 Legg Mason 520,453 0.03 31,976 Leucadia National 776,377 0.04 26,101 Lincoln National 1,545,701 0.08 30,499 Loews 1,174,517 0.06 13,449 M&T Bank 1,680,184 0.09 14,359 Macerich 1,071,181 0.06 55,139 Marsh & McLennan Cos 3,126,381 0.17 99,151 Mastercard 9,268,635 0.49
113,770 MetLife 6,369,982 0.34 18,105 Moody's 1,954,616 0.10
156,979 Morgan Stanley 6,089,215 0.32 12,044 NASDAQ OMX Group 587,868 0.03 39,798 Navient Corporation 724,722 0.04 22,546 Northern Trust 1,723,867 0.09 31,557 People's United Financial 511,539 0.03 17,911 Plum Creek Timber 726,649 0.04 53,021 PNC Financial Services Group 5,071,459 0.27 27,669 Principal Financial Group 1,419,143 0.08 54,769 Progressive 1,524,221 0.08 53,613 ProLogis 1,989,042 0.11 46,230 Prudential Financial 4,046,050 0.21 14,822 Public Storage 2,732,732 0.14 23,791 Realty Income 1,056,083 0.06
136,722 Regions Financial 1,416,440 0.08 31,842 Simon Property Group 5,509,303 0.29 10,046 SL Green Realty 1,103,955 0.06 41,975 State Street 3,232,075 0.17 52,811 SunTrust Banks 2,271,929 0.12 26,882 T Rowe Price Group 2,089,538 0.11 13,115 Torchmark 763,555 0.04

Schedules of Investments (continued)
HSBC S&P 500 UCITS ETF (continued)
HSBC ETFs PLC >51<
As at 30 June 2015 Transferable securities admitted to official stock exchange listing or dealt in on another regulated market
Holdings
Financial assets at fair value through profit or loss Fair Value
USD % of Net
Asset Value
Equities (continued) United States (continued) Financial (continued)
32,728 Travelers Cos 3,163,489 0.17 25,911 Unum Group 926,318 0.05
181,361 US Bancorp 7,871,067 0.42 33,674 Ventas 2,090,819 0.11
197,759 Visa 13,279,517 0.71 17,794 Vornado Realty Trust 1,689,184 0.09
479,370 Wells Fargo & Co 26,959,769 1.43 52,821 Western Union 1,073,851 0.06 53,470 Weyerhaeuser 1,684,305 0.09 20,658 Zions Bancorporation 655,582 0.03
325,127,088 17.28 Healthcare
152,304 Abbott Laboratories 7,475,080 0.40 175,808 Abbvie 11,812,540 0.63 35,872 Aetna 4,572,245 0.24 22,907 Alexion Pharmaceuticals 4,140,898 0.22 40,149 Allergan 12,183,616 0.65 77,783 Amgen 11,941,246 0.63 27,165 Anthem Inc 4,458,863 0.24
7,607 Bard 1,298,515 0.07 55,678 Baxter International 3,893,563 0.21 21,419 Becton Dickinson and Co 3,034,001 0.16 24,064 Biogen Idec 9,720,412 0.52
137,157 Boston Scientific 2,427,679 0.13 170,539 Bristol-Myers Squibb 11,347,665 0.60 81,143 Celgene 9,391,085 0.50 26,318 Cigna 4,263,516 0.23 17,504 DaVita 1,391,043 0.07 14,499 DENTSPLY International 747,423 0.04 10,957 Edwards Lifesciences 1,560,606 0.08 99,906 Eli Lilly & Co 8,341,152 0.44 20,744 Endo International 1,652,260 0.09 74,608 Express Scripts 6,635,636 0.35
150,346 Gilead Sciences 17,602,510 0.94 29,672 HCA Holdings 2,691,844 0.14
8,643 Henry Schein 1,228,343 0.07 17,446 Hospira 1,547,635 0.08 15,227 Humana 2,912,621 0.16
3,769 Intuitive Surgical 1,826,081 0.10 283,692 Johnson & Johnson 27,648,622 1.47 10,181 Laboratory of America Holdings 1,234,141 0.07
145,790 Medtronic 10,803,039 0.57 288,967 Merck & Co 16,450,891 0.87 42,110 Mylan 2,857,585 0.15
8,780 Patterson Cos 427,147 0.02 629,948 Pfizer 21,122,156 1.12 14,822 Quest Diagnostics 1,074,891 0.06

Schedules of Investments (continued)
HSBC S&P 500 UCITS ETF (continued)
>52< HSBC ETFs PLC
As at 30 June 2015 Transferable securities admitted to official stock exchange listing or dealt in on another regulated market
Holdings
Financial assets at fair value through profit or loss Fair Value
USD % of Net
Asset Value
Equities (continued) United States (continued) Healthcare (continued)
7,713 Regeneron Pharms 3,934,633 0.21 28,646 St Jude Medical 2,093,163 0.11 30,420 Stryker 2,907,239 0.16 10,046 Tenet Healthcare 581,462 0.03 40,722 Thermo Fisher Scientific 5,284,087 0.28 97,385 UnitedHealth Group 11,880,970 0.63
9,311 Universal Health 1,323,093 0.07 10,160 Varian Medical Systems 856,793 0.05 24,936 Vertex Pharmaceuticals 3,079,097 0.16
8,476 Waters 1,088,149 0.06 17,434 Zimmer Holdings 1,904,316 0.10 51,018 Zoetis 2,460,088 0.13
269,109,640 14.31 Industrial
64,897 3M 10,013,607 0.53 17,789 ADT Corporation 597,177 0.03 33,865 Agilent Technologies 1,306,512 0.07
6,397 Alliance Data Systems 1,867,540 0.10 24,877 AMETEK 1,362,762 0.07 31,534 Amphenol 1,828,026 0.10 48,033 Automatic Data Processing 3,853,688 0.20 14,080 Ball 987,712 0.05 65,794 Boeing 9,126,944 0.49 61,686 Caterpillar 5,232,206 0.28 15,068 CH Robinson Worldwide 940,092 0.05
9,847 Cintas 832,958 0.04 100,860 CSX 3,293,079 0.18 17,147 Cummins 2,249,515 0.12 62,998 Danaher 5,391,999 0.29 34,158 Deere & Co 3,315,034 0.18 16,596 Dover 1,164,707 0.06 47,787 Eaton 3,225,145 0.17 68,368 Emerson Electric 3,789,638 0.20 19,861 Expeditors International of Washington 915,691 0.05 27,613 Fastenal 1,164,716 0.06 26,882 FedEx 4,580,693 0.24 29,034 Fidelity National Information Services 1,794,301 0.10 24,299 Fiserv 2,012,686 0.11 14,480 FLIR Systems 446,274 0.02 13,973 Flowserve 735,818 0.04 15,053 Fluor 797,959 0.04 32,093 General Dynamics 4,547,257 0.24
1,030,802 General Electric 27,388,409 1.46 6,103 Grainger 1,444,275 0.08
79,772 Honeywell International 8,134,351 0.43 34,608 Illinois Tool Works 3,176,668 0.17 12,846 Jacobs Engineering Group 521,804 0.03
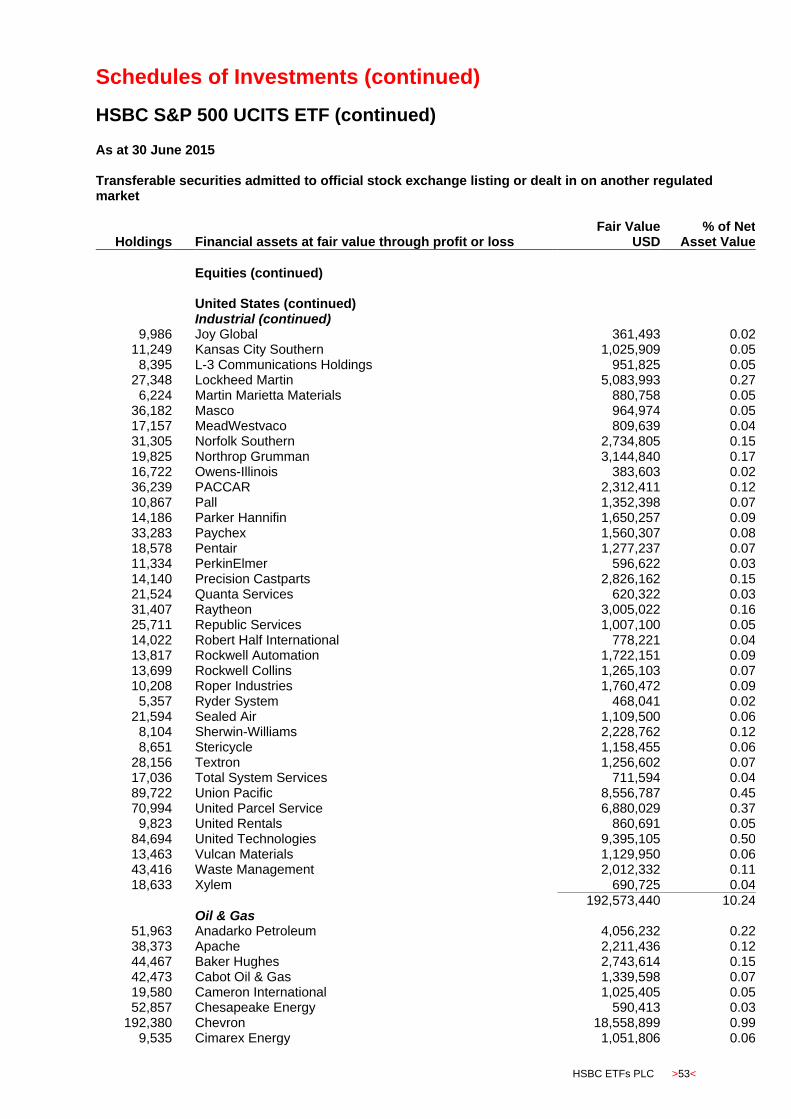
Schedules of Investments (continued)
HSBC S&P 500 UCITS ETF (continued)
HSBC ETFs PLC >53<
As at 30 June 2015 Transferable securities admitted to official stock exchange listing or dealt in on another regulated market
Holdings
Financial assets at fair value through profit or loss Fair Value
USD % of Net
Asset Value
Equities (continued) United States (continued) Industrial (continued)
9,986 Joy Global 361,493 0.02 11,249 Kansas City Southern 1,025,909 0.05
8,395 L-3 Communications Holdings 951,825 0.05 27,348 Lockheed Martin 5,083,993 0.27
6,224 Martin Marietta Materials 880,758 0.05 36,182 Masco 964,974 0.05 17,157 MeadWestvaco 809,639 0.04 31,305 Norfolk Southern 2,734,805 0.15 19,825 Northrop Grumman 3,144,840 0.17 16,722 Owens-Illinois 383,603 0.02 36,239 PACCAR 2,312,411 0.12 10,867 Pall 1,352,398 0.07 14,186 Parker Hannifin 1,650,257 0.09 33,283 Paychex 1,560,307 0.08 18,578 Pentair 1,277,237 0.07 11,334 PerkinElmer 596,622 0.03 14,140 Precision Castparts 2,826,162 0.15 21,524 Quanta Services 620,322 0.03 31,407 Raytheon 3,005,022 0.16 25,711 Republic Services 1,007,100 0.05 14,022 Robert Half International 778,221 0.04 13,817 Rockwell Automation 1,722,151 0.09 13,699 Rockwell Collins 1,265,103 0.07 10,208 Roper Industries 1,760,472 0.09
5,357 Ryder System 468,041 0.02 21,594 Sealed Air 1,109,500 0.06
8,104 Sherwin-Williams 2,228,762 0.12 8,651 Stericycle 1,158,455 0.06
28,156 Textron 1,256,602 0.07 17,036 Total System Services 711,594 0.04 89,722 Union Pacific 8,556,787 0.45 70,994 United Parcel Service 6,880,029 0.37
9,823 United Rentals 860,691 0.05 84,694 United Technologies 9,395,105 0.50 13,463 Vulcan Materials 1,129,950 0.06 43,416 Waste Management 2,012,332 0.11 18,633 Xylem 690,725 0.04
192,573,440 10.24 Oil & Gas
51,963 Anadarko Petroleum 4,056,232 0.22 38,373 Apache 2,211,436 0.12 44,467 Baker Hughes 2,743,614 0.15 42,473 Cabot Oil & Gas 1,339,598 0.07 19,580 Cameron International 1,025,405 0.05 52,857 Chesapeake Energy 590,413 0.03
192,380 Chevron 18,558,899 0.99 9,535 Cimarex Energy 1,051,806 0.06
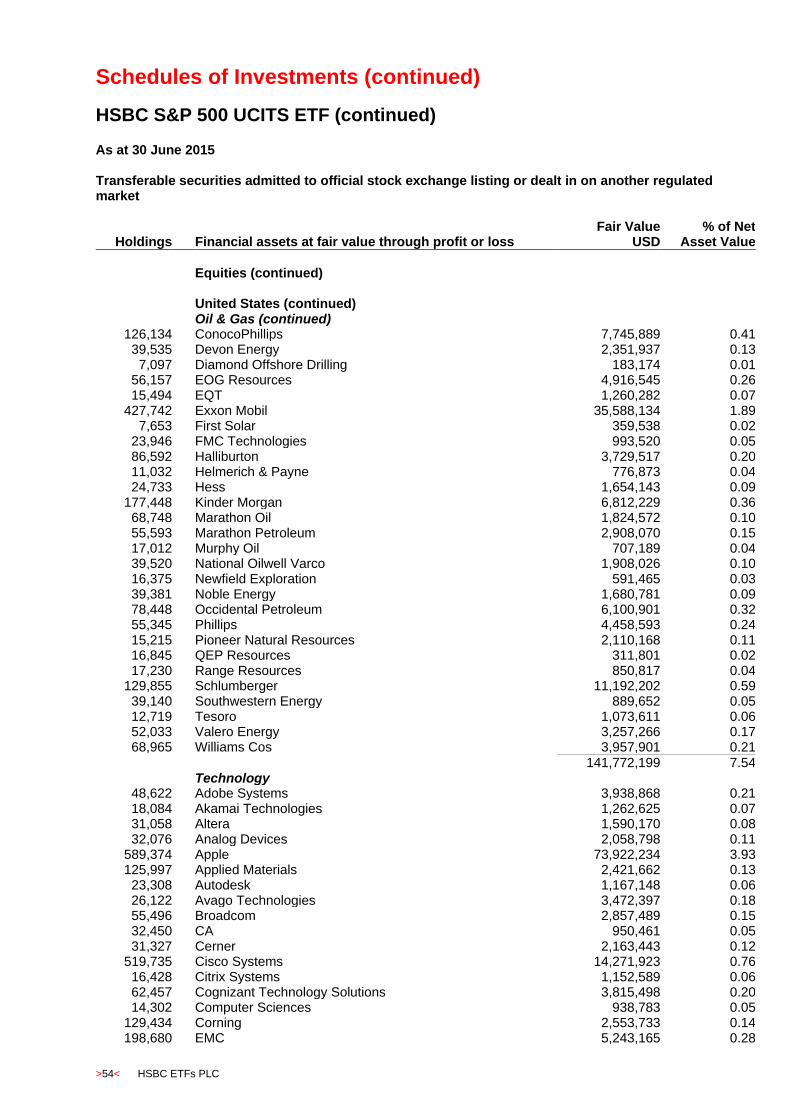
Schedules of Investments (continued)
HSBC S&P 500 UCITS ETF (continued)
>54< HSBC ETFs PLC
As at 30 June 2015 Transferable securities admitted to official stock exchange listing or dealt in on another regulated market
Holdings
Financial assets at fair value through profit or loss Fair Value
USD % of Net
Asset Value
Equities (continued) United States (continued) Oil & Gas (continued)
126,134 ConocoPhillips 7,745,889 0.41 39,535 Devon Energy 2,351,937 0.13
7,097 Diamond Offshore Drilling 183,174 0.01 56,157 EOG Resources 4,916,545 0.26 15,494 EQT 1,260,282 0.07
427,742 Exxon Mobil 35,588,134 1.89 7,653 First Solar 359,538 0.02
23,946 FMC Technologies 993,520 0.05 86,592 Halliburton 3,729,517 0.20 11,032 Helmerich & Payne 776,873 0.04 24,733 Hess 1,654,143 0.09
177,448 Kinder Morgan 6,812,229 0.36 68,748 Marathon Oil 1,824,572 0.10 55,593 Marathon Petroleum 2,908,070 0.15 17,012 Murphy Oil 707,189 0.04 39,520 National Oilwell Varco 1,908,026 0.10 16,375 Newfield Exploration 591,465 0.03 39,381 Noble Energy 1,680,781 0.09 78,448 Occidental Petroleum 6,100,901 0.32 55,345 Phillips 4,458,593 0.24 15,215 Pioneer Natural Resources 2,110,168 0.11 16,845 QEP Resources 311,801 0.02 17,230 Range Resources 850,817 0.04
129,855 Schlumberger 11,192,202 0.59 39,140 Southwestern Energy 889,652 0.05 12,719 Tesoro 1,073,611 0.06 52,033 Valero Energy 3,257,266 0.17 68,965 Williams Cos 3,957,901 0.21
141,772,199 7.54 Technology
48,622 Adobe Systems 3,938,868 0.21 18,084 Akamai Technologies 1,262,625 0.07 31,058 Altera 1,590,170 0.08 32,076 Analog Devices 2,058,798 0.11
589,374 Apple 73,922,234 3.93 125,997 Applied Materials 2,421,662 0.13 23,308 Autodesk 1,167,148 0.06 26,122 Avago Technologies 3,472,397 0.18 55,496 Broadcom 2,857,489 0.15 32,450 CA 950,461 0.05 31,327 Cerner 2,163,443 0.12
519,735 Cisco Systems 14,271,923 0.76 16,428 Citrix Systems 1,152,589 0.06 62,457 Cognizant Technology Solutions 3,815,498 0.20 14,302 Computer Sciences 938,783 0.05
129,434 Corning 2,553,733 0.14 198,680 EMC 5,243,165 0.28
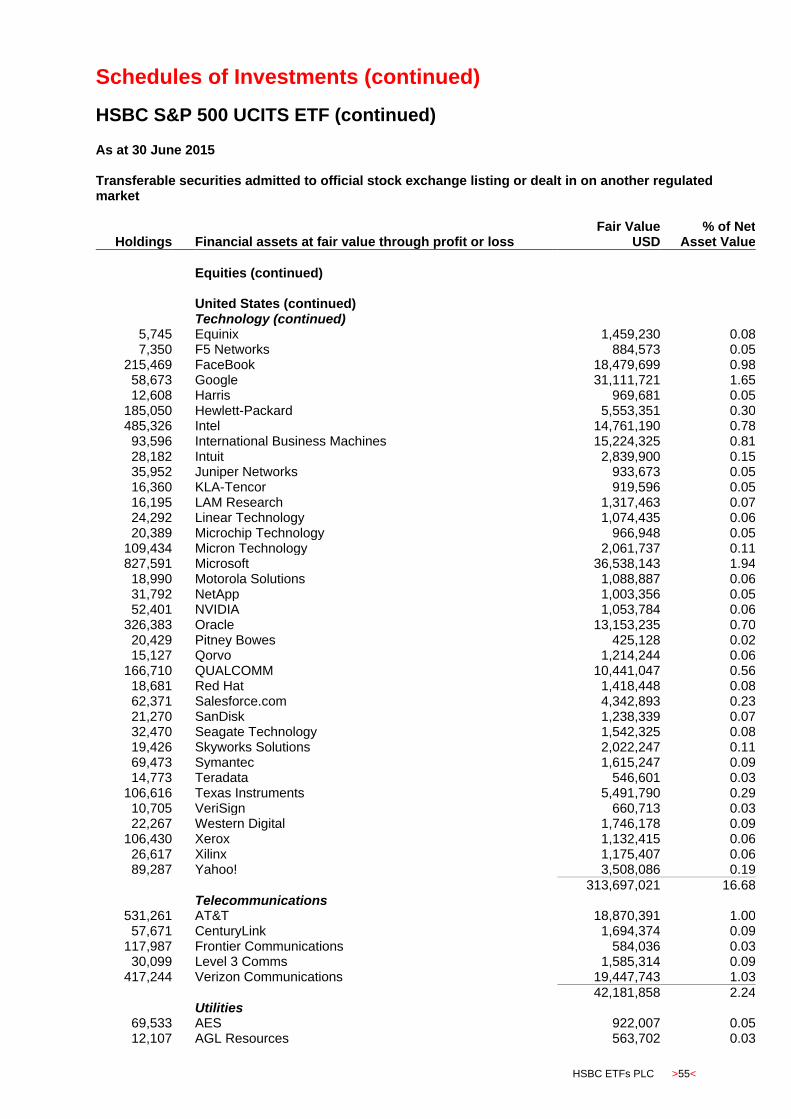
Schedules of Investments (continued)
HSBC S&P 500 UCITS ETF (continued)
HSBC ETFs PLC >55<
As at 30 June 2015 Transferable securities admitted to official stock exchange listing or dealt in on another regulated market
Holdings
Financial assets at fair value through profit or loss Fair Value
USD % of Net
Asset Value
Equities (continued) United States (continued) Technology (continued)
5,745 Equinix 1,459,230 0.08 7,350 F5 Networks 884,573 0.05
215,469 FaceBook 18,479,699 0.98 58,673 Google 31,111,721 1.65 12,608 Harris 969,681 0.05
185,050 Hewlett-Packard 5,553,351 0.30 485,326 Intel 14,761,190 0.78 93,596 International Business Machines 15,224,325 0.81 28,182 Intuit 2,839,900 0.15 35,952 Juniper Networks 933,673 0.05 16,360 KLA-Tencor 919,596 0.05 16,195 LAM Research 1,317,463 0.07 24,292 Linear Technology 1,074,435 0.06 20,389 Microchip Technology 966,948 0.05
109,434 Micron Technology 2,061,737 0.11 827,591 Microsoft 36,538,143 1.94 18,990 Motorola Solutions 1,088,887 0.06 31,792 NetApp 1,003,356 0.05 52,401 NVIDIA 1,053,784 0.06
326,383 Oracle 13,153,235 0.70 20,429 Pitney Bowes 425,128 0.02 15,127 Qorvo 1,214,244 0.06
166,710 QUALCOMM 10,441,047 0.56 18,681 Red Hat 1,418,448 0.08 62,371 Salesforce.com 4,342,893 0.23 21,270 SanDisk 1,238,339 0.07 32,470 Seagate Technology 1,542,325 0.08 19,426 Skyworks Solutions 2,022,247 0.11 69,473 Symantec 1,615,247 0.09 14,773 Teradata 546,601 0.03
106,616 Texas Instruments 5,491,790 0.29 10,705 VeriSign 660,713 0.03 22,267 Western Digital 1,746,178 0.09
106,430 Xerox 1,132,415 0.06 26,617 Xilinx 1,175,407 0.06 89,287 Yahoo! 3,508,086 0.19
313,697,021 16.68 Telecommunications
531,261 AT&T 18,870,391 1.00 57,671 CenturyLink 1,694,374 0.09
117,987 Frontier Communications 584,036 0.03 30,099 Level 3 Comms 1,585,314 0.09
417,244 Verizon Communications 19,447,743 1.03
42,181,858 2.24 Utilities
69,533 AES 922,007 0.05 12,107 AGL Resources 563,702 0.03
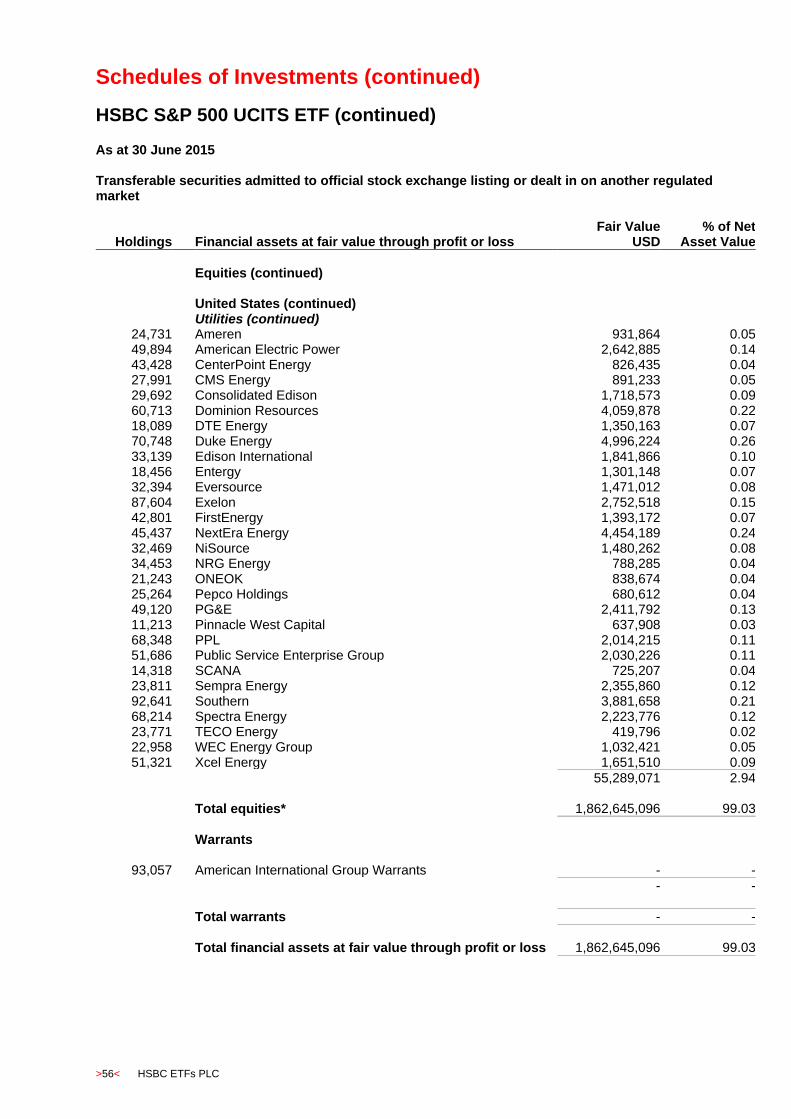
Schedules of Investments (continued)
HSBC S&P 500 UCITS ETF (continued)
>56< HSBC ETFs PLC
As at 30 June 2015 Transferable securities admitted to official stock exchange listing or dealt in on another regulated market
Holdings
Financial assets at fair value through profit or loss Fair Value
USD % of Net
Asset Value
Equities (continued) United States (continued) Utilities (continued)
24,731 Ameren 931,864 0.05 49,894 American Electric Power 2,642,885 0.14 43,428 CenterPoint Energy 826,435 0.04 27,991 CMS Energy 891,233 0.05 29,692 Consolidated Edison 1,718,573 0.09 60,713 Dominion Resources 4,059,878 0.22 18,089 DTE Energy 1,350,163 0.07 70,748 Duke Energy 4,996,224 0.26 33,139 Edison International 1,841,866 0.10 18,456 Entergy 1,301,148 0.07 32,394 Eversource 1,471,012 0.08 87,604 Exelon 2,752,518 0.15 42,801 FirstEnergy 1,393,172 0.07 45,437 NextEra Energy 4,454,189 0.24 32,469 NiSource 1,480,262 0.08 34,453 NRG Energy 788,285 0.04 21,243 ONEOK 838,674 0.04 25,264 Pepco Holdings 680,612 0.04 49,120 PG&E 2,411,792 0.13 11,213 Pinnacle West Capital 637,908 0.03 68,348 PPL 2,014,215 0.11 51,686 Public Service Enterprise Group 2,030,226 0.11 14,318 SCANA 725,207 0.04 23,811 Sempra Energy 2,355,860 0.12 92,641 Southern 3,881,658 0.21 68,214 Spectra Energy 2,223,776 0.12 23,771 TECO Energy 419,796 0.02 22,958 WEC Energy Group 1,032,421 0.05 51,321 Xcel Energy 1,651,510 0.09
55,289,071 2.94 Total equities* 1,862,645,096 99.03
Warrants
93,057 American International Group Warrants - - - -
Total warrants - -
Total financial assets at fair value through profit or loss 1,862,645,096 99.03

Schedules of Investments (continued)
HSBC S&P 500 UCITS ETF (continued)
HSBC ETFs PLC >57<
As at 30 June 2015 Transferable securities admitted to official stock exchange listing or dealt in on another regulated market
Holdings
Financial liabilities at fair value through profit or loss Fair Value
USD % of Net
Asset Value
Futures
164 CME S&P 500 E-Mini Index Future Sep 15** (249,748) (0.01)
Total futures*** (249,748) (0.01)
Total financial liabilities at fair value through profit or loss (249,748) (0.01)
Other net assets 18,470,958 0.98
Net assets attributable to holders of redeemable participating shares 1,880,866,306 100.00
** HSBC Bank Plc is the counterparty to the future contract.
Analysis of Total Assets Fair Value
USD % of Total
Assets * Transferable securities admitted to an official stock exchange listing or dealt in on another regulated market 1,862,645,096 98.54 *** Financial derivative instruments dealt in on a regulated market (249,748) (0.01) All equity positions and futures held by the Fund at 30 June 2015 and at 31 December 2014 are classified as Level 1. See Note 6(d) for further details.
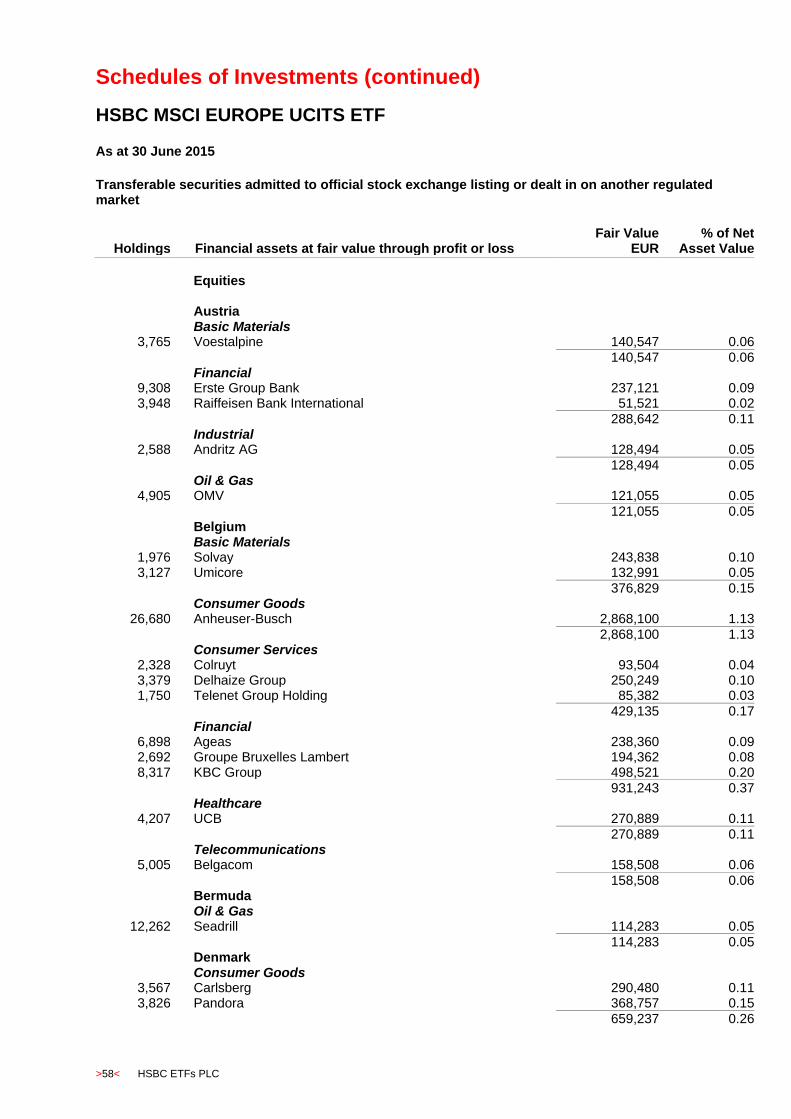
Schedules of Investments (continued)
HSBC MSCI EUROPE UCITS ETF
>58< HSBC ETFs PLC
As at 30 June 2015
Transferable securities admitted to official stock exchange listing or dealt in on another regulated market
Holdings
Financial assets at fair value through profit or loss Fair Value
EUR % of Net
Asset Value
Equities Austria
Basic Materials 3,765 Voestalpine 140,547 0.06
140,547 0.06 Financial
9,308 Erste Group Bank 237,121 0.09 3,948 Raiffeisen Bank International 51,521 0.02
288,642 0.11 Industrial
2,588 Andritz AG 128,494 0.05
128,494 0.05 Oil & Gas
4,905 OMV 121,055 0.05
121,055 0.05 Belgium Basic Materials
1,976 Solvay 243,838 0.10 3,127 Umicore 132,991 0.05
376,829 0.15 Consumer Goods
26,680 Anheuser-Busch 2,868,100 1.13
2,868,100 1.13 Consumer Services
2,328 Colruyt 93,504 0.04 3,379 Delhaize Group 250,249 0.10 1,750 Telenet Group Holding 85,382 0.03
429,135 0.17 Financial
6,898 Ageas 238,360 0.09 2,692 Groupe Bruxelles Lambert 194,362 0.08 8,317 KBC Group 498,521 0.20
931,243 0.37 Healthcare
4,207 UCB 270,889 0.11
270,889 0.11 Telecommunications
5,005 Belgacom 158,508 0.06
158,508 0.06 Bermuda Oil & Gas
12,262 Seadrill 114,283 0.05
114,283 0.05 Denmark Consumer Goods
3,567 Carlsberg 290,480 0.11 3,826 Pandora 368,757 0.15
659,237 0.26
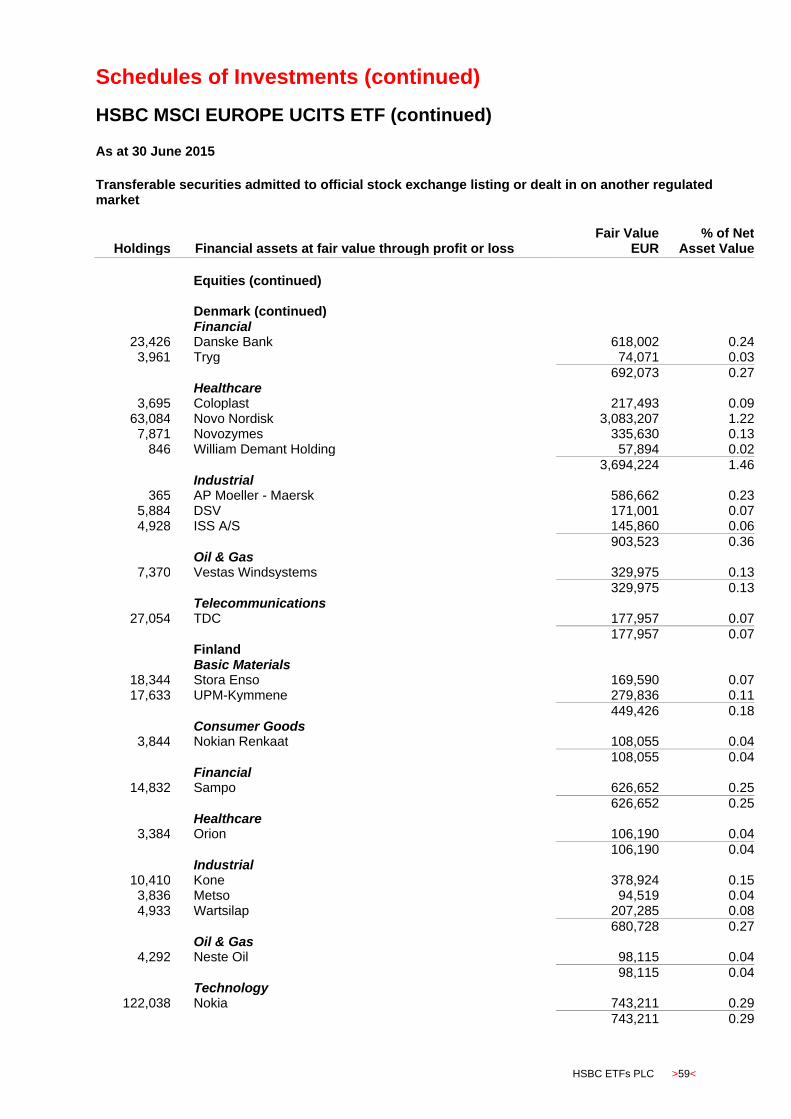
Schedules of Investments (continued)
HSBC MSCI EUROPE UCITS ETF (continued)
HSBC ETFs PLC >59<
As at 30 June 2015
Transferable securities admitted to official stock exchange listing or dealt in on another regulated market
Holdings
Financial assets at fair value through profit or loss Fair Value
EUR % of Net
Asset Value
Equities (continued) Denmark (continued)
Financial 23,426 Danske Bank 618,002 0.24
3,961 Tryg 74,071 0.03
692,073 0.27 Healthcare
3,695 Coloplast 217,493 0.09 63,084 Novo Nordisk 3,083,207 1.22
7,871 Novozymes 335,630 0.13 846 William Demant Holding 57,894 0.02
3,694,224 1.46 Industrial
365 AP Moeller - Maersk 586,662 0.23 5,884 DSV 171,001 0.07 4,928 ISS A/S 145,860 0.06
903,523 0.36 Oil & Gas
7,370 Vestas Windsystems 329,975 0.13 329,975 0.13 Telecommunications
27,054 TDC 177,957 0.07
177,957 0.07 Finland Basic Materials
18,344 Stora Enso 169,590 0.07 17,633 UPM-Kymmene 279,836 0.11
449,426 0.18 Consumer Goods
3,844 Nokian Renkaat 108,055 0.04
108,055 0.04 Financial
14,832 Sampo 626,652 0.25
626,652 0.25 Healthcare
3,384 Orion 106,190 0.04
106,190 0.04 Industrial
10,410 Kone 378,924 0.15 3,836 Metso 94,519 0.04 4,933 Wartsilap 207,285 0.08
680,728 0.27 Oil & Gas
4,292 Neste Oil 98,115 0.04
98,115 0.04 Technology
122,038 Nokia 743,211 0.29
743,211 0.29
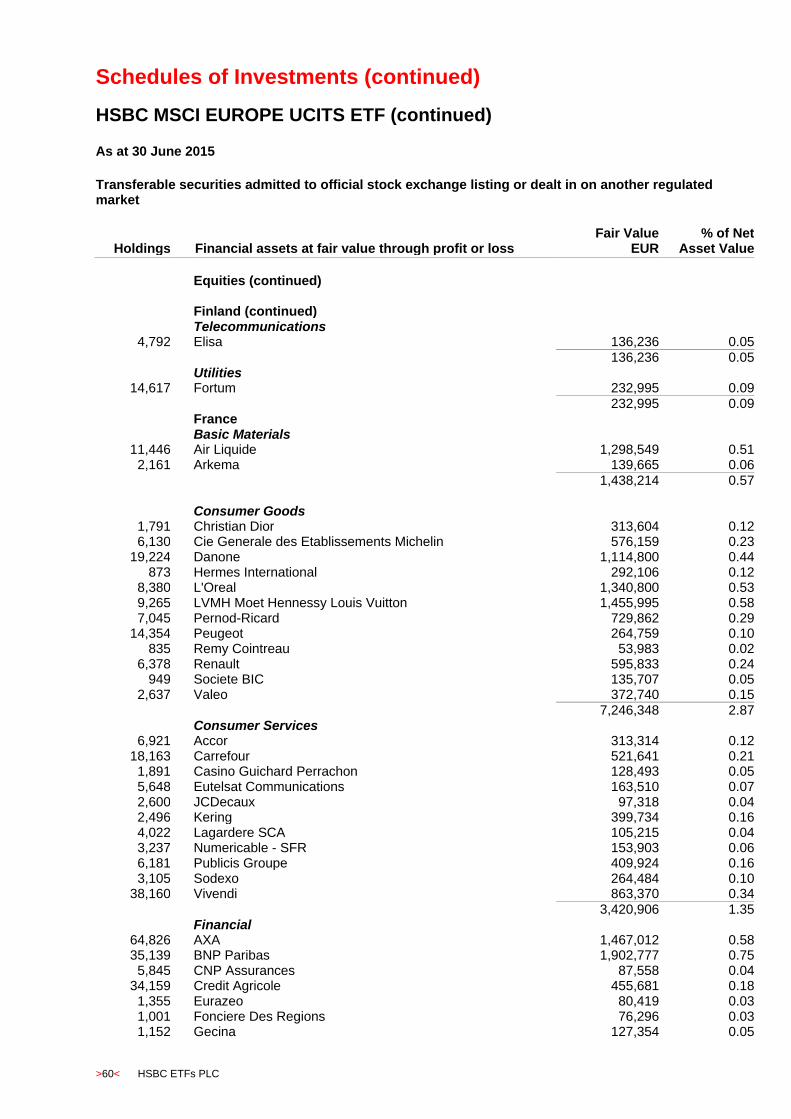
Schedules of Investments (continued)
HSBC MSCI EUROPE UCITS ETF (continued)
>60< HSBC ETFs PLC
As at 30 June 2015
Transferable securities admitted to official stock exchange listing or dealt in on another regulated market
Holdings
Financial assets at fair value through profit or loss Fair Value
EUR % of Net
Asset Value
Equities (continued) Finland (continued)
Telecommunications 4,792 Elisa 136,236 0.05
136,236 0.05 Utilities
14,617 Fortum 232,995 0.09
232,995 0.09 France Basic Materials
11,446 Air Liquide 1,298,549 0.51 2,161 Arkema 139,665 0.06
1,438,214 0.57 Consumer Goods
1,791 Christian Dior 313,604 0.12 6,130 Cie Generale des Etablissements Michelin 576,159 0.23
19,224 Danone 1,114,800 0.44 873 Hermes International 292,106 0.12
8,380 L'Oreal 1,340,800 0.53 9,265 LVMH Moet Hennessy Louis Vuitton 1,455,995 0.58 7,045 Pernod-Ricard 729,862 0.29
14,354 Peugeot 264,759 0.10 835 Remy Cointreau 53,983 0.02
6,378 Renault 595,833 0.24 949 Societe BIC 135,707 0.05
2,637 Valeo 372,740 0.15
7,246,348 2.87 Consumer Services
6,921 Accor 313,314 0.12 18,163 Carrefour 521,641 0.21
1,891 Casino Guichard Perrachon 128,493 0.05 5,648 Eutelsat Communications 163,510 0.07 2,600 JCDecaux 97,318 0.04 2,496 Kering 399,734 0.16 4,022 Lagardere SCA 105,215 0.04 3,237 Numericable - SFR 153,903 0.06 6,181 Publicis Groupe 409,924 0.16 3,105 Sodexo 264,484 0.10
38,160 Vivendi 863,370 0.34
3,420,906 1.35 Financial
64,826 AXA 1,467,012 0.58 35,139 BNP Paribas 1,902,777 0.75
5,845 CNP Assurances 87,558 0.04 34,159 Credit Agricole 455,681 0.18
1,355 Eurazeo 80,419 0.03 1,001 Fonciere Des Regions 76,296 0.03 1,152 Gecina 127,354 0.05

Schedules of Investments (continued)
HSBC MSCI EUROPE UCITS ETF (continued)
HSBC ETFs PLC >61<
As at 30 June 2015
Transferable securities admitted to official stock exchange listing or dealt in on another regulated market
Holdings
Financial assets at fair value through profit or loss Fair Value
EUR % of Net
Asset Value
Equities (continued) France (continued)
Financial (continued) 1,104 ICADE 70,722 0.03 5,674 Klepierre 223,868 0.09
30,887 Natixis Banques Populai 199,375 0.08 5,122 SCOR 162,086 0.06
24,045 Societe Generale 1,006,764 0.40 3,236 Unibail-Rodamco 733,601 0.29
951 Wendel 104,562 0.04
6,698,075 2.65 Healthcare
6,805 Cie Generale d'Optique Essilor International 728,135 0.29 39,398 Sanofi 3,476,479 1.37
4,204,614 1.66 Industrial
979 Aeroports de Paris 99,222 0.04 7,192 Alstom 183,036 0.07
28,533 Bollore 136,245 0.05 6,691 Bouygues 224,383 0.09 8,736 Bureau Veritas 180,486 0.07
15,847 Cie de St-Gobain 638,159 0.25 6,769 Edenred 150,035 0.06
15,577 Groupe Eurotunnel 202,345 0.08 1,173 Imerys 80,468 0.03 6,147 Lafarge 364,148 0.14 8,707 Legrand 438,484 0.17 9,688 Rexel 140,088 0.06 9,686 Safran 588,812 0.23
18,424 Schneider Electric 1,140,998 0.45 3,431 Thales 185,823 0.08 3,693 Vallourec 67,656 0.03
15,677 Vinci 813,323 0.32 6,692 Zodiac Aerospace 195,406 0.08
5,829,117 2.30 Oil & Gas
3,413 Technip 189,490 0.08 71,020 Total 3,094,341 1.22
3,283,831 1.30 Technology
92,956 Alcatel 303,780 0.12 2,858 AtoS 191,429 0.07 5,156 Cap Gemini 409,232 0.16 4,190 Dassault Systemes 273,272 0.11
864 Iliad 171,806 0.07 1,349,519 0.53 Telecommunications
61,522 France Telecom 849,619 0.34
849,619 0.34
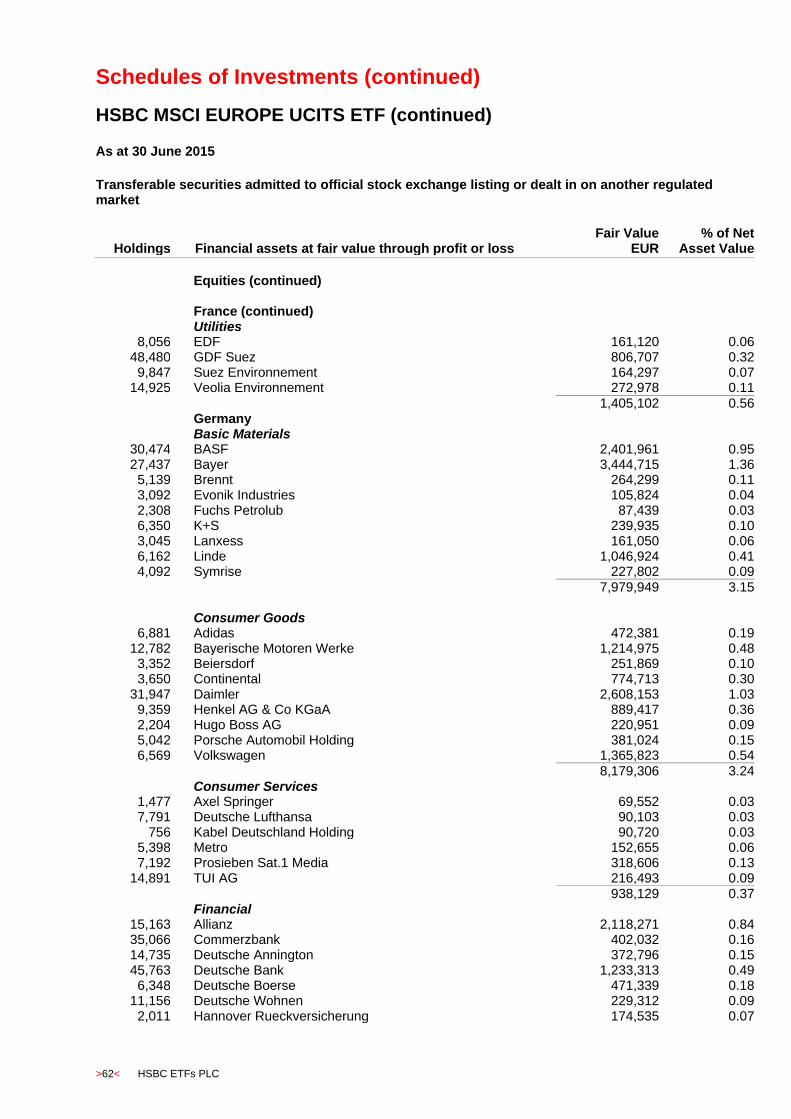
Schedules of Investments (continued)
HSBC MSCI EUROPE UCITS ETF (continued)
>62< HSBC ETFs PLC
As at 30 June 2015
Transferable securities admitted to official stock exchange listing or dealt in on another regulated market
Holdings
Financial assets at fair value through profit or loss Fair Value
EUR % of Net
Asset Value
Equities (continued)
France (continued) Utilities
8,056 EDF 161,120 0.06 48,480 GDF Suez 806,707 0.32
9,847 Suez Environnement 164,297 0.07 14,925 Veolia Environnement 272,978 0.11
1,405,102 0.56 Germany Basic Materials
30,474 BASF 2,401,961 0.95 27,437 Bayer 3,444,715 1.36
5,139 Brennt 264,299 0.11 3,092 Evonik Industries 105,824 0.04 2,308 Fuchs Petrolub 87,439 0.03 6,350 K+S 239,935 0.10 3,045 Lanxess 161,050 0.06 6,162 Linde 1,046,924 0.41 4,092 Symrise 227,802 0.09
7,979,949 3.15 Consumer Goods
6,881 Adidas 472,381 0.19 12,782 Bayerische Motoren Werke 1,214,975 0.48
3,352 Beiersdorf 251,869 0.10 3,650 Continental 774,713 0.30
31,947 Daimler 2,608,153 1.03 9,359 Henkel AG & Co KGaA 889,417 0.36 2,204 Hugo Boss AG 220,951 0.09 5,042 Porsche Automobil Holding 381,024 0.15 6,569 Volkswagen 1,365,823 0.54
8,179,306 3.24 Consumer Services
1,477 Axel Springer 69,552 0.03 7,791 Deutsche Lufthansa 90,103 0.03
756 Kabel Deutschland Holding 90,720 0.03 5,398 Metro 152,655 0.06 7,192 Prosieben Sat.1 Media 318,606 0.13
14,891 TUI AG 216,493 0.09 938,129 0.37 Financial
15,163 Allianz 2,118,271 0.84 35,066 Commerzbank 402,032 0.16 14,735 Deutsche Annington 372,796 0.15 45,763 Deutsche Bank 1,233,313 0.49
6,348 Deutsche Boerse 471,339 0.18 11,156 Deutsche Wohnen 229,312 0.09
2,011 Hannover Rueckversicherung 174,535 0.07
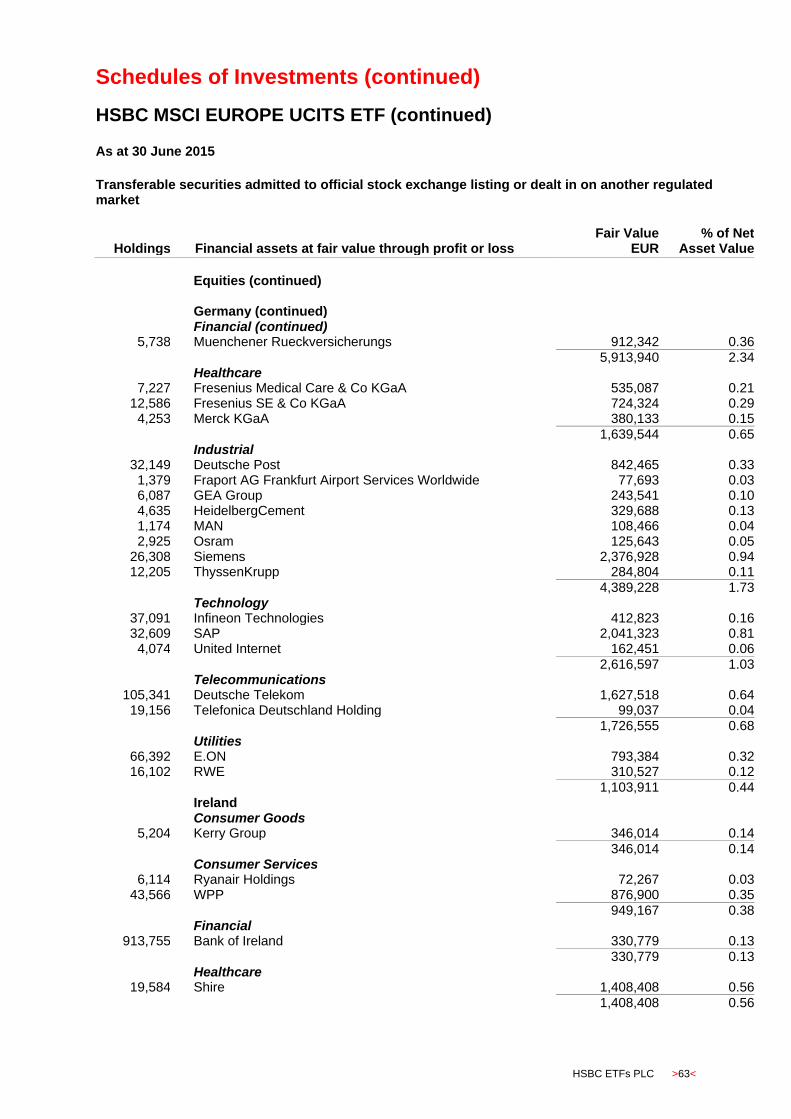
Schedules of Investments (continued)
HSBC MSCI EUROPE UCITS ETF (continued)
HSBC ETFs PLC >63<
As at 30 June 2015
Transferable securities admitted to official stock exchange listing or dealt in on another regulated market
Holdings
Financial assets at fair value through profit or loss Fair Value
EUR % of Net
Asset Value
Equities (continued)
Germany (continued) Financial (continued)
5,738 Muenchener Rueckversicherungs 912,342 0.36
5,913,940 2.34 Healthcare
7,227 Fresenius Medical Care & Co KGaA 535,087 0.21 12,586 Fresenius SE & Co KGaA 724,324 0.29
4,253 Merck KGaA 380,133 0.15
1,639,544 0.65 Industrial
32,149 Deutsche Post 842,465 0.33 1,379 Fraport AG Frankfurt Airport Services Worldwide 77,693 0.03 6,087 GEA Group 243,541 0.10 4,635 HeidelbergCement 329,688 0.13 1,174 MAN 108,466 0.04 2,925 Osram 125,643 0.05
26,308 Siemens 2,376,928 0.94 12,205 ThyssenKrupp 284,804 0.11
4,389,228 1.73 Technology
37,091 Infineon Technologies 412,823 0.16 32,609 SAP 2,041,323 0.81
4,074 United Internet 162,451 0.06
2,616,597 1.03 Telecommunications
105,341 Deutsche Telekom 1,627,518 0.64 19,156 Telefonica Deutschland Holding 99,037 0.04
1,726,555 0.68 Utilities
66,392 E.ON 793,384 0.32 16,102 RWE 310,527 0.12
1,103,911 0.44 Ireland Consumer Goods
5,204 Kerry Group 346,014 0.14
346,014 0.14 Consumer Services
6,114 Ryanair Holdings 72,267 0.03 43,566 WPP 876,900 0.35
949,167 0.38 Financial
913,755 Bank of Ireland 330,779 0.13
330,779 0.13 Healthcare
19,584 Shire 1,408,408 0.56
1,408,408 0.56
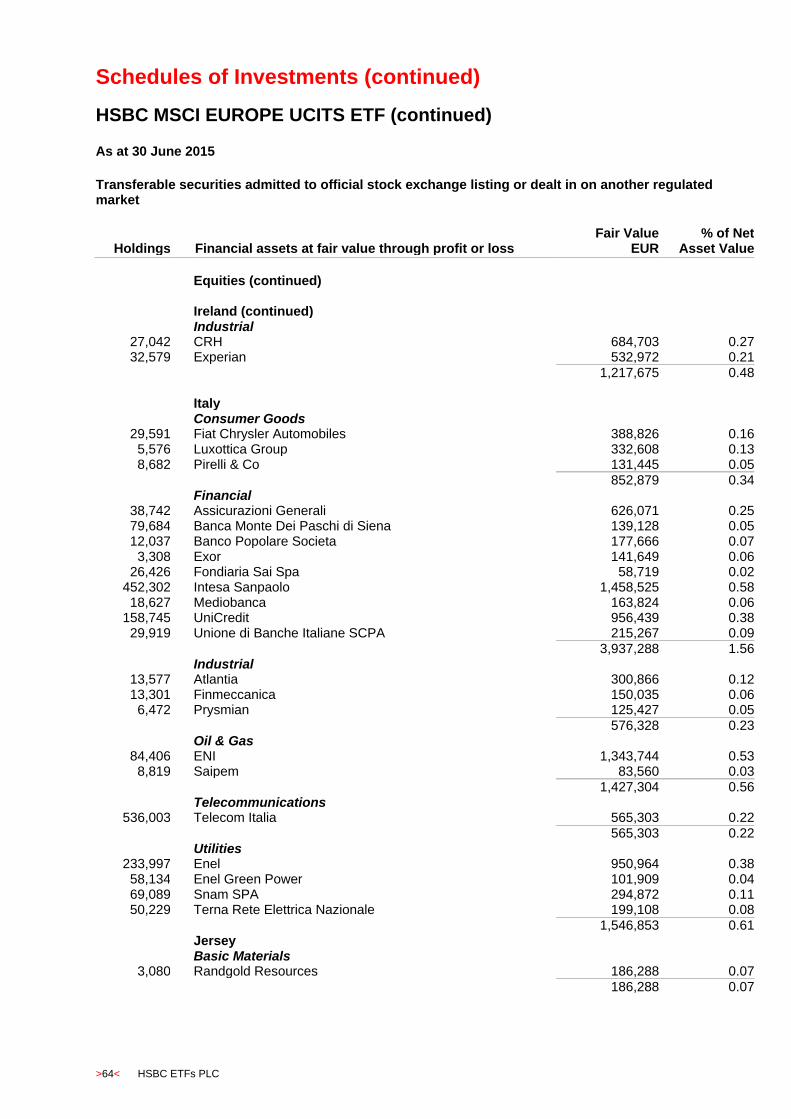
Schedules of Investments (continued)
HSBC MSCI EUROPE UCITS ETF (continued)
>64< HSBC ETFs PLC
As at 30 June 2015
Transferable securities admitted to official stock exchange listing or dealt in on another regulated market
Holdings
Financial assets at fair value through profit or loss Fair Value
EUR % of Net
Asset Value
Equities (continued)
Ireland (continued) Industrial
27,042 CRH 684,703 0.27 32,579 Experian 532,972 0.21
1,217,675 0.48 Italy
Consumer Goods 29,591 Fiat Chrysler Automobiles 388,826 0.16
5,576 Luxottica Group 332,608 0.13 8,682 Pirelli & Co 131,445 0.05
852,879 0.34 Financial
38,742 Assicurazioni Generali 626,071 0.25 79,684 Banca Monte Dei Paschi di Siena 139,128 0.05 12,037 Banco Popolare Societa 177,666 0.07
3,308 Exor 141,649 0.06 26,426 Fondiaria Sai Spa 58,719 0.02
452,302 Intesa Sanpaolo 1,458,525 0.58 18,627 Mediobanca 163,824 0.06
158,745 UniCredit 956,439 0.38 29,919 Unione di Banche Italiane SCPA 215,267 0.09
3,937,288 1.56 Industrial
13,577 Atlantia 300,866 0.12 13,301 Finmeccanica 150,035 0.06
6,472 Prysmian 125,427 0.05
576,328 0.23 Oil & Gas
84,406 ENI 1,343,744 0.53 8,819 Saipem 83,560 0.03
1,427,304 0.56 Telecommunications
536,003 Telecom Italia 565,303 0.22
565,303 0.22 Utilities
233,997 Enel 950,964 0.38 58,134 Enel Green Power 101,909 0.04 69,089 Snam SPA 294,872 0.11 50,229 Terna Rete Elettrica Nazionale 199,108 0.08
1,546,853 0.61 Jersey Basic Materials
3,080 Randgold Resources 186,288 0.07
186,288 0.07
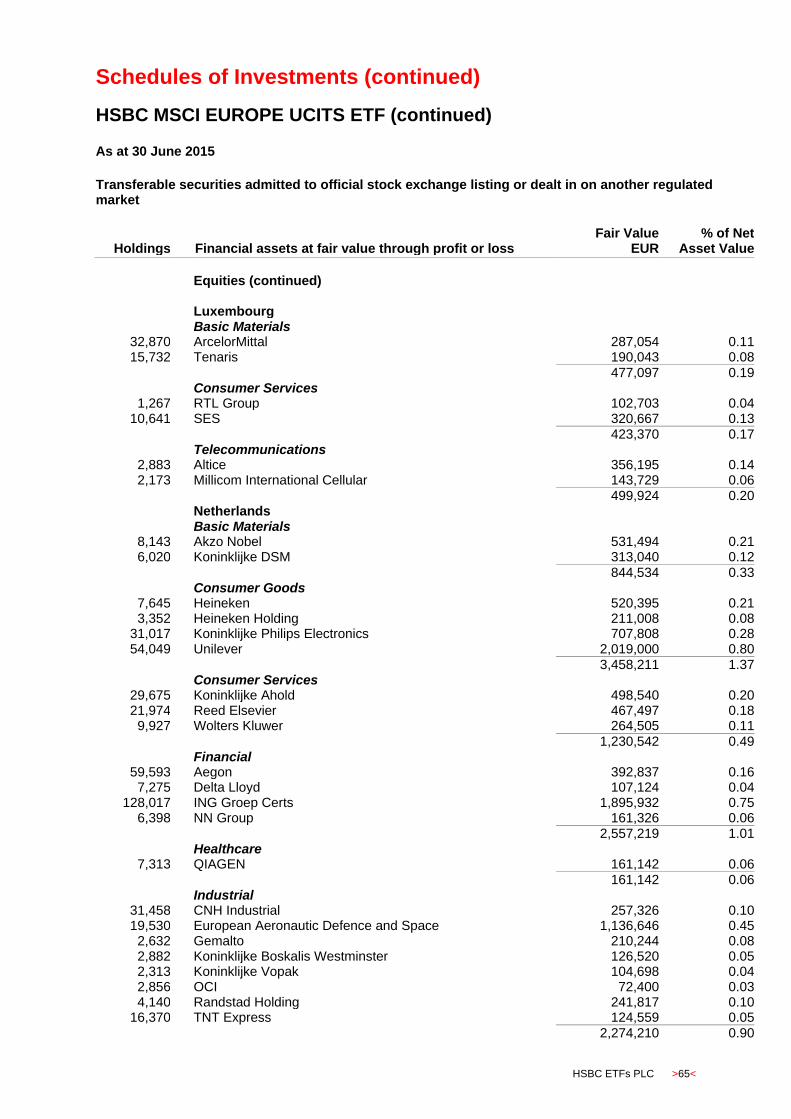
Schedules of Investments (continued)
HSBC MSCI EUROPE UCITS ETF (continued)
HSBC ETFs PLC >65<
As at 30 June 2015
Transferable securities admitted to official stock exchange listing or dealt in on another regulated market
Holdings
Financial assets at fair value through profit or loss Fair Value
EUR % of Net
Asset Value
Equities (continued)
Luxembourg Basic Materials
32,870 ArcelorMittal 287,054 0.11 15,732 Tenaris 190,043 0.08
477,097 0.19 Consumer Services
1,267 RTL Group 102,703 0.04 10,641 SES 320,667 0.13
423,370 0.17 Telecommunications
2,883 Altice 356,195 0.14 2,173 Millicom International Cellular 143,729 0.06
499,924 0.20 Netherlands Basic Materials
8,143 Akzo Nobel 531,494 0.21 6,020 Koninklijke DSM 313,040 0.12
844,534 0.33 Consumer Goods
7,645 Heineken 520,395 0.21 3,352 Heineken Holding 211,008 0.08
31,017 Koninklijke Philips Electronics 707,808 0.28 54,049 Unilever 2,019,000 0.80
3,458,211 1.37 Consumer Services
29,675 Koninklijke Ahold 498,540 0.20 21,974 Reed Elsevier 467,497 0.18
9,927 Wolters Kluwer 264,505 0.11
1,230,542 0.49 Financial
59,593 Aegon 392,837 0.16 7,275 Delta Lloyd 107,124 0.04
128,017 ING Groep Certs 1,895,932 0.75 6,398 NN Group 161,326 0.06
2,557,219 1.01 Healthcare
7,313 QIAGEN 161,142 0.06 161,142 0.06 Industrial
31,458 CNH Industrial 257,326 0.10 19,530 European Aeronautic Defence and Space 1,136,646 0.45
2,632 Gemalto 210,244 0.08 2,882 Koninklijke Boskalis Westminster 126,520 0.05 2,313 Koninklijke Vopak 104,698 0.04 2,856 OCI 72,400 0.03 4,140 Randstad Holding 241,817 0.10
16,370 TNT Express 124,559 0.05
2,274,210 0.90

Schedules of Investments (continued)
HSBC MSCI EUROPE UCITS ETF (continued)
>66< HSBC ETFs PLC
As at 30 June 2015
Transferable securities admitted to official stock exchange listing or dealt in on another regulated market
Holdings
Financial assets at fair value through profit or loss Fair Value
EUR % of Net
Asset Value
Equities (continued)
Netherlands (continued) Oil & Gas
210,190 Royal Dutch Shell 5,323,699 2.10
5,323,699 2.10 Technology
11,632 ASML Holding 1,078,286 0.43
1,078,286 0.43 Telecommunications
105,347 Koninklijke KPN 361,340 0.14
361,340 0.14 Norway
Basic Materials 44,803 Norsk Hydro 168,919 0.07
5,900 Yara International 274,877 0.11 443,796 0.18 Financial
32,425 DNB 483,824 0.19 6,801 Gjensidige Forsikring 98,066 0.04
581,890 0.23 Industrial
27,163 Orkla 191,189 0.08 191,189 0.08 Oil & Gas
37,029 Statoil 591,807 0.23 591,807 0.23 Telecommunications
24,885 Telenor 487,709 0.19
487,709 0.19 Portugal Consumer Services
8,552 Jeronimo Martins 98,348 0.04 98,348 0.04 Financial
48,824 Banco Espirito Santo - - 1,258,696 BCP R 98,178 0.04
98,178 0.04 Oil & Gas
12,845 Galp Energia 135,129 0.05
135,129 0.05 Utilities
77,147 EDP - Energias de Portugal 262,686 0.10 262,686 0.10 Spain Consumer Goods
20,330 Distribuidora Internacional de Alimentacion 139,261 0.06
139,261 0.06
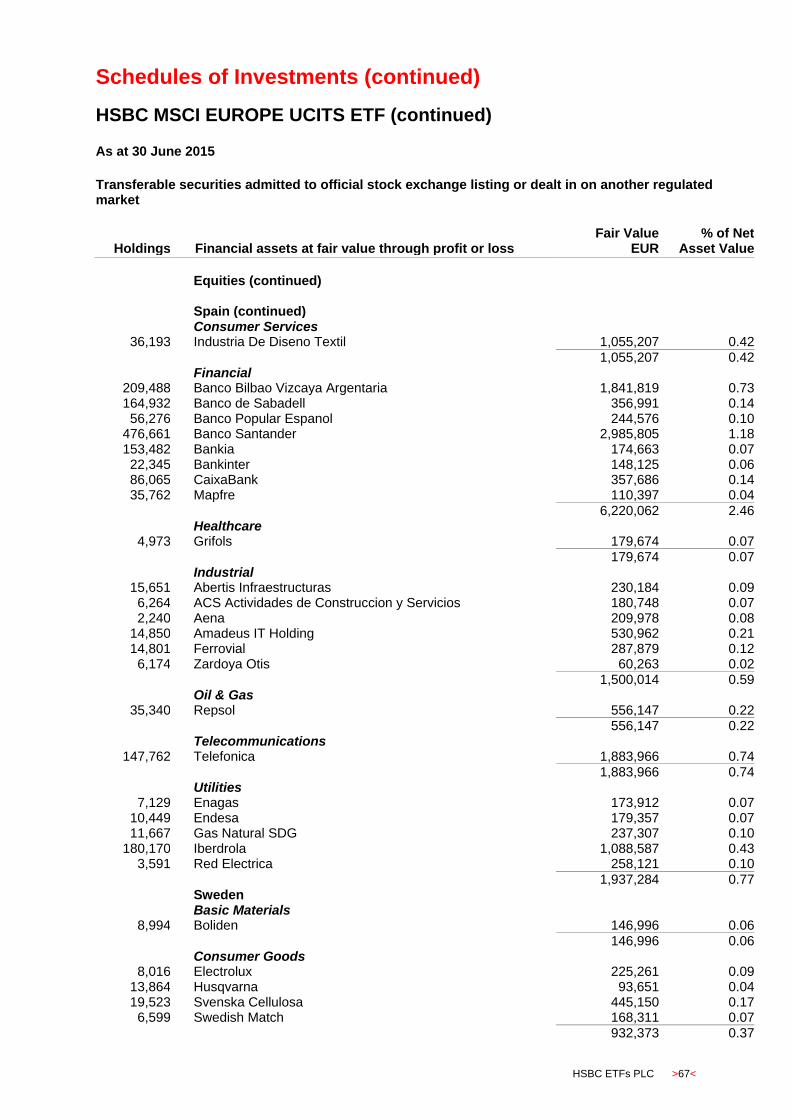
Schedules of Investments (continued)
HSBC MSCI EUROPE UCITS ETF (continued)
HSBC ETFs PLC >67<
As at 30 June 2015
Transferable securities admitted to official stock exchange listing or dealt in on another regulated market
Holdings
Financial assets at fair value through profit or loss Fair Value
EUR % of Net
Asset Value
Equities (continued)
Spain (continued) Consumer Services
36,193 Industria De Diseno Textil 1,055,207 0.42
1,055,207 0.42 Financial
209,488 Banco Bilbao Vizcaya Argentaria 1,841,819 0.73 164,932 Banco de Sabadell 356,991 0.14 56,276 Banco Popular Espanol 244,576 0.10
476,661 Banco Santander 2,985,805 1.18 153,482 Bankia 174,663 0.07 22,345 Bankinter 148,125 0.06 86,065 CaixaBank 357,686 0.14 35,762 Mapfre 110,397 0.04
6,220,062 2.46 Healthcare
4,973 Grifols 179,674 0.07
179,674 0.07 Industrial
15,651 Abertis Infraestructuras 230,184 0.09 6,264 ACS Actividades de Construccion y Servicios 180,748 0.07 2,240 Aena 209,978 0.08
14,850 Amadeus IT Holding 530,962 0.21 14,801 Ferrovial 287,879 0.12
6,174 Zardoya Otis 60,263 0.02 1,500,014 0.59 Oil & Gas
35,340 Repsol 556,147 0.22 556,147 0.22 Telecommunications
147,762 Telefonica 1,883,966 0.74
1,883,966 0.74 Utilities
7,129 Enagas 173,912 0.07 10,449 Endesa 179,357 0.07 11,667 Gas Natural SDG 237,307 0.10
180,170 Iberdrola 1,088,587 0.43 3,591 Red Electrica 258,121 0.10
1,937,284 0.77 Sweden Basic Materials
8,994 Boliden 146,996 0.06
146,996 0.06 Consumer Goods
8,016 Electrolux 225,261 0.09 13,864 Husqvarna 93,651 0.04 19,523 Svenska Cellulosa 445,150 0.17
6,599 Swedish Match 168,311 0.07
932,373 0.37
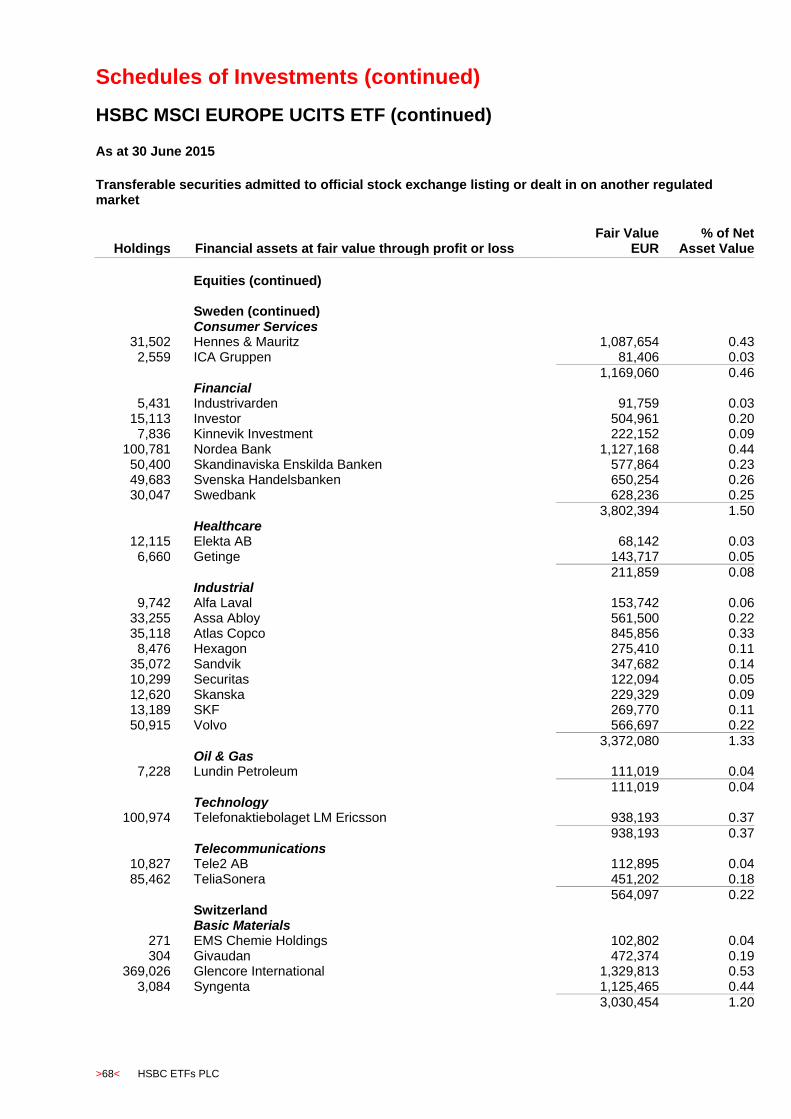
Schedules of Investments (continued)
HSBC MSCI EUROPE UCITS ETF (continued)
>68< HSBC ETFs PLC
As at 30 June 2015
Transferable securities admitted to official stock exchange listing or dealt in on another regulated market
Holdings
Financial assets at fair value through profit or loss Fair Value
EUR % of Net
Asset Value
Equities (continued)
Sweden (continued) Consumer Services
31,502 Hennes & Mauritz 1,087,654 0.43 2,559 ICA Gruppen 81,406 0.03
1,169,060 0.46 Financial
5,431 Industrivarden 91,759 0.03 15,113 Investor 504,961 0.20
7,836 Kinnevik Investment 222,152 0.09 100,781 Nordea Bank 1,127,168 0.44 50,400 Skandinaviska Enskilda Banken 577,864 0.23 49,683 Svenska Handelsbanken 650,254 0.26 30,047 Swedbank 628,236 0.25
3,802,394 1.50 Healthcare
12,115 Elekta AB 68,142 0.03 6,660 Getinge 143,717 0.05
211,859 0.08 Industrial
9,742 Alfa Laval 153,742 0.06 33,255 Assa Abloy 561,500 0.22 35,118 Atlas Copco 845,856 0.33
8,476 Hexagon 275,410 0.11 35,072 Sandvik 347,682 0.14 10,299 Securitas 122,094 0.05 12,620 Skanska 229,329 0.09 13,189 SKF 269,770 0.11 50,915 Volvo 566,697 0.22
3,372,080 1.33 Oil & Gas
7,228 Lundin Petroleum 111,019 0.04
111,019 0.04 Technology
100,974 Telefonaktiebolaget LM Ericsson 938,193 0.37
938,193 0.37 Telecommunications
10,827 Tele2 AB 112,895 0.04 85,462 TeliaSonera 451,202 0.18
564,097 0.22 Switzerland Basic Materials
271 EMS Chemie Holdings 102,802 0.04 304 Givaudan 472,374 0.19
369,026 Glencore International 1,329,813 0.53 3,084 Syngenta 1,125,465 0.44
3,030,454 1.20
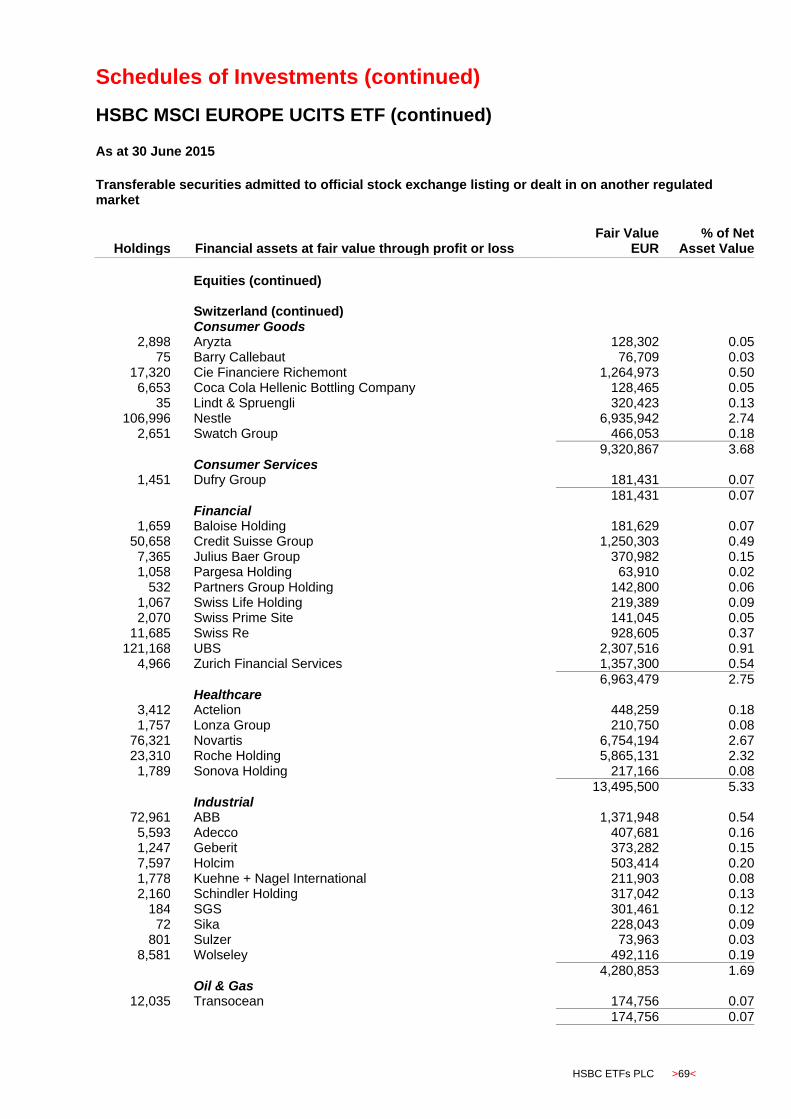
Schedules of Investments (continued)
HSBC MSCI EUROPE UCITS ETF (continued)
HSBC ETFs PLC >69<
As at 30 June 2015
Transferable securities admitted to official stock exchange listing or dealt in on another regulated market
Holdings
Financial assets at fair value through profit or loss Fair Value
EUR % of Net
Asset Value
Equities (continued) Switzerland (continued)
Consumer Goods 2,898 Aryzta 128,302 0.05
75 Barry Callebaut 76,709 0.03 17,320 Cie Financiere Richemont 1,264,973 0.50
6,653 Coca Cola Hellenic Bottling Company 128,465 0.05 35 Lindt & Spruengli 320,423 0.13
106,996 Nestle 6,935,942 2.74 2,651 Swatch Group 466,053 0.18
9,320,867 3.68 Consumer Services
1,451 Dufry Group 181,431 0.07
181,431 0.07 Financial
1,659 Baloise Holding 181,629 0.07 50,658 Credit Suisse Group 1,250,303 0.49
7,365 Julius Baer Group 370,982 0.15 1,058 Pargesa Holding 63,910 0.02
532 Partners Group Holding 142,800 0.06 1,067 Swiss Life Holding 219,389 0.09 2,070 Swiss Prime Site 141,045 0.05
11,685 Swiss Re 928,605 0.37 121,168 UBS 2,307,516 0.91
4,966 Zurich Financial Services 1,357,300 0.54
6,963,479 2.75 Healthcare
3,412 Actelion 448,259 0.18 1,757 Lonza Group 210,750 0.08
76,321 Novartis 6,754,194 2.67 23,310 Roche Holding 5,865,131 2.32
1,789 Sonova Holding 217,166 0.08
13,495,500 5.33 Industrial
72,961 ABB 1,371,948 0.54 5,593 Adecco 407,681 0.16 1,247 Geberit 373,282 0.15 7,597 Holcim 503,414 0.20 1,778 Kuehne + Nagel International 211,903 0.08 2,160 Schindler Holding 317,042 0.13
184 SGS 301,461 0.12 72 Sika 228,043 0.09
801 Sulzer 73,963 0.03 8,581 Wolseley 492,116 0.19
4,280,853 1.69 Oil & Gas
12,035 Transocean 174,756 0.07
174,756 0.07
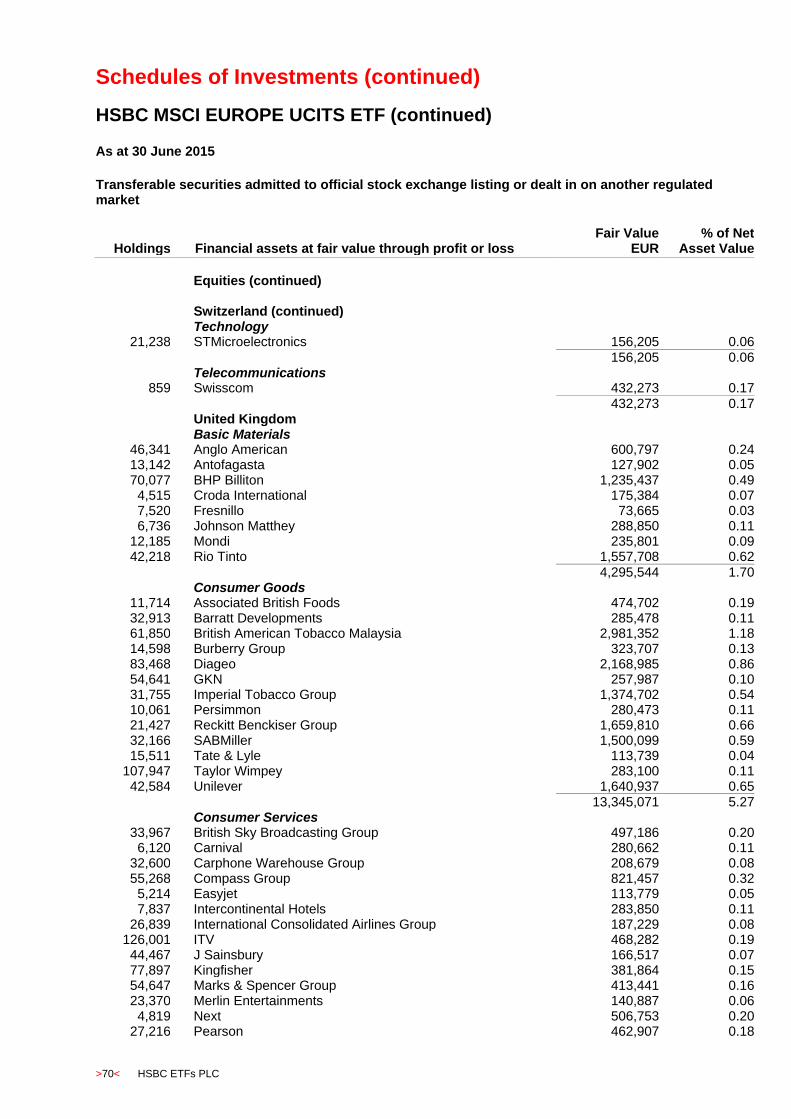
Schedules of Investments (continued)
HSBC MSCI EUROPE UCITS ETF (continued)
>70< HSBC ETFs PLC
As at 30 June 2015
Transferable securities admitted to official stock exchange listing or dealt in on another regulated market
Holdings
Financial assets at fair value through profit or loss Fair Value
EUR % of Net
Asset Value
Equities (continued) Switzerland (continued)
Technology 21,238 STMicroelectronics 156,205 0.06
156,205 0.06 Telecommunications
859 Swisscom 432,273 0.17
432,273 0.17 United Kingdom Basic Materials
46,341 Anglo American 600,797 0.24 13,142 Antofagasta 127,902 0.05 70,077 BHP Billiton 1,235,437 0.49
4,515 Croda International 175,384 0.07 7,520 Fresnillo 73,665 0.03 6,736 Johnson Matthey 288,850 0.11
12,185 Mondi 235,801 0.09 42,218 Rio Tinto 1,557,708 0.62
4,295,544 1.70 Consumer Goods
11,714 Associated British Foods 474,702 0.19 32,913 Barratt Developments 285,478 0.11 61,850 British American Tobacco Malaysia 2,981,352 1.18 14,598 Burberry Group 323,707 0.13 83,468 Diageo 2,168,985 0.86 54,641 GKN 257,987 0.10 31,755 Imperial Tobacco Group 1,374,702 0.54 10,061 Persimmon 280,473 0.11 21,427 Reckitt Benckiser Group 1,659,810 0.66 32,166 SABMiller 1,500,099 0.59 15,511 Tate & Lyle 113,739 0.04
107,947 Taylor Wimpey 283,100 0.11 42,584 Unilever 1,640,937 0.65
13,345,071 5.27 Consumer Services
33,967 British Sky Broadcasting Group 497,186 0.20 6,120 Carnival 280,662 0.11
32,600 Carphone Warehouse Group 208,679 0.08 55,268 Compass Group 821,457 0.32
5,214 Easyjet 113,779 0.05 7,837 Intercontinental Hotels 283,850 0.11
26,839 International Consolidated Airlines Group 187,229 0.08 126,001 ITV 468,282 0.19 44,467 J Sainsbury 166,517 0.07 77,897 Kingfisher 381,864 0.15 54,647 Marks & Spencer Group 413,441 0.16 23,370 Merlin Entertainments 140,887 0.06
4,819 Next 506,753 0.20 27,216 Pearson 462,907 0.18
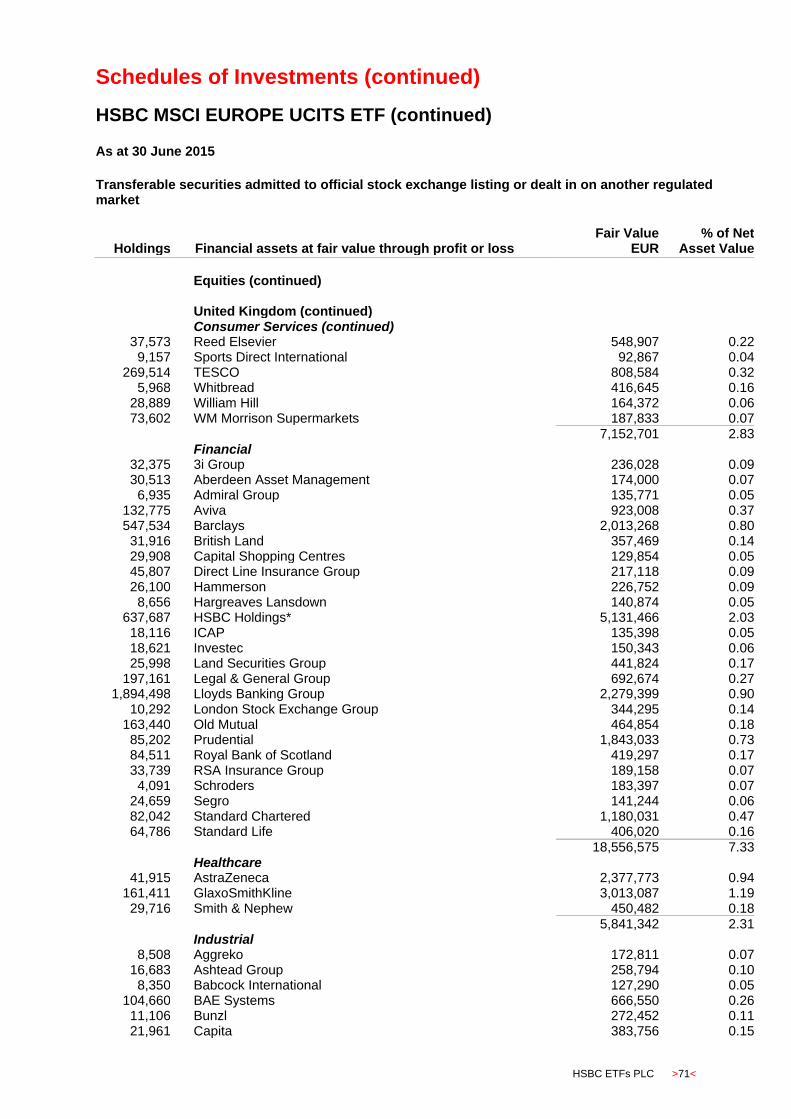
Schedules of Investments (continued)
HSBC MSCI EUROPE UCITS ETF (continued)
HSBC ETFs PLC >71<
As at 30 June 2015
Transferable securities admitted to official stock exchange listing or dealt in on another regulated market
Holdings
Financial assets at fair value through profit or loss Fair Value
EUR % of Net
Asset Value
Equities (continued)
United Kingdom (continued) Consumer Services (continued)
37,573 Reed Elsevier 548,907 0.22 9,157 Sports Direct International 92,867 0.04
269,514 TESCO 808,584 0.32 5,968 Whitbread 416,645 0.16
28,889 William Hill 164,372 0.06 73,602 WM Morrison Supermarkets 187,833 0.07
7,152,701 2.83 Financial
32,375 3i Group 236,028 0.09 30,513 Aberdeen Asset Management 174,000 0.07
6,935 Admiral Group 135,771 0.05 132,775 Aviva 923,008 0.37 547,534 Barclays 2,013,268 0.80 31,916 British Land 357,469 0.14 29,908 Capital Shopping Centres 129,854 0.05 45,807 Direct Line Insurance Group 217,118 0.09 26,100 Hammerson 226,752 0.09
8,656 Hargreaves Lansdown 140,874 0.05 637,687 HSBC Holdings* 5,131,466 2.03 18,116 ICAP 135,398 0.05 18,621 Investec 150,343 0.06 25,998 Land Securities Group 441,824 0.17
197,161 Legal & General Group 692,674 0.27 1,894,498 Lloyds Banking Group 2,279,399 0.90
10,292 London Stock Exchange Group 344,295 0.14 163,440 Old Mutual 464,854 0.18 85,202 Prudential 1,843,033 0.73 84,511 Royal Bank of Scotland 419,297 0.17 33,739 RSA Insurance Group 189,158 0.07
4,091 Schroders 183,397 0.07 24,659 Segro 141,244 0.06 82,042 Standard Chartered 1,180,031 0.47 64,786 Standard Life 406,020 0.16
18,556,575 7.33 Healthcare
41,915 AstraZeneca 2,377,773 0.94 161,411 GlaxoSmithKline 3,013,087 1.19 29,716 Smith & Nephew 450,482 0.18
5,841,342 2.31 Industrial
8,508 Aggreko 172,811 0.07 16,683 Ashtead Group 258,794 0.10
8,350 Babcock International 127,290 0.05 104,660 BAE Systems 666,550 0.26 11,106 Bunzl 272,452 0.11 21,961 Capita 383,756 0.15
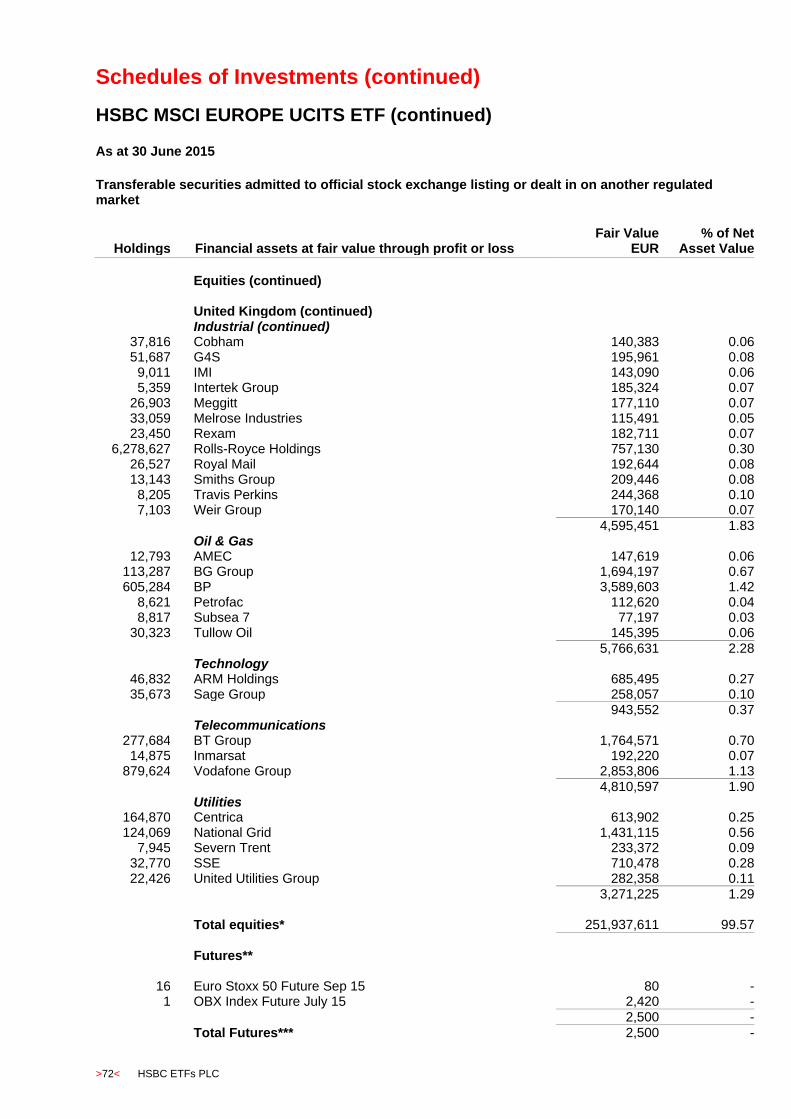
Schedules of Investments (continued)
HSBC MSCI EUROPE UCITS ETF (continued)
>72< HSBC ETFs PLC
As at 30 June 2015
Transferable securities admitted to official stock exchange listing or dealt in on another regulated market
Holdings
Financial assets at fair value through profit or loss Fair Value
EUR % of Net
Asset Value
Equities (continued)
United Kingdom (continued) Industrial (continued)
37,816 Cobham 140,383 0.06 51,687 G4S 195,961 0.08
9,011 IMI 143,090 0.06 5,359 Intertek Group 185,324 0.07
26,903 Meggitt 177,110 0.07 33,059 Melrose Industries 115,491 0.05 23,450 Rexam 182,711 0.07
6,278,627 Rolls-Royce Holdings 757,130 0.30 26,527 Royal Mail 192,644 0.08 13,143 Smiths Group 209,446 0.08
8,205 Travis Perkins 244,368 0.10 7,103 Weir Group 170,140 0.07
4,595,451 1.83 Oil & Gas
12,793 AMEC 147,619 0.06 113,287 BG Group 1,694,197 0.67 605,284 BP 3,589,603 1.42
8,621 Petrofac 112,620 0.04 8,817 Subsea 7 77,197 0.03
30,323 Tullow Oil 145,395 0.06
5,766,631 2.28 Technology
46,832 ARM Holdings 685,495 0.27 35,673 Sage Group 258,057 0.10
943,552 0.37 Telecommunications
277,684 BT Group 1,764,571 0.70 14,875 Inmarsat 192,220 0.07
879,624 Vodafone Group 2,853,806 1.13
4,810,597 1.90 Utilities
164,870 Centrica 613,902 0.25 124,069 National Grid 1,431,115 0.56
7,945 Severn Trent 233,372 0.09 32,770 SSE 710,478 0.28 22,426 United Utilities Group 282,358 0.11
3,271,225 1.29 Total equities* 251,937,611 99.57
Futures**
16 Euro Stoxx 50 Future Sep 15 80 - 1 OBX Index Future July 15 2,420 -
2,500 -
Total Futures*** 2,500 -
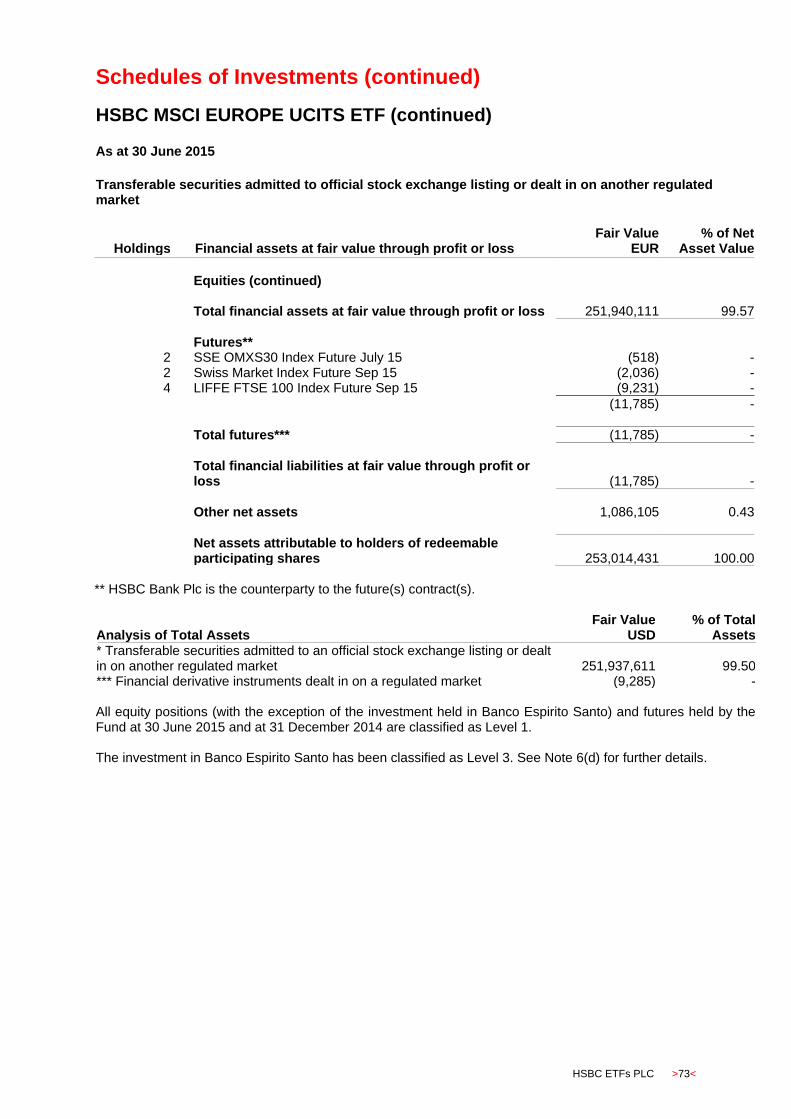
Schedules of Investments (continued)
HSBC MSCI EUROPE UCITS ETF (continued)
HSBC ETFs PLC >73<
As at 30 June 2015
Transferable securities admitted to official stock exchange listing or dealt in on another regulated market
Holdings
Financial assets at fair value through profit or loss Fair Value
EUR % of Net
Asset Value
Equities (continued)
Total financial assets at fair value through profit or loss 251,940,111 99.57
Futures**
2 SSE OMXS30 Index Future July 15 (518) - 2 Swiss Market Index Future Sep 15 (2,036) - 4 LIFFE FTSE 100 Index Future Sep 15 (9,231) -
(11,785) -
Total futures*** (11,785) -
Total financial liabilities at fair value through profit or loss (11,785) -
Other net assets 1,086,105 0.43
Net assets attributable to holders of redeemable participating shares 253,014,431 100.00 ** HSBC Bank Plc is the counterparty to the future(s) contract(s).
Analysis of Total Assets Fair Value
USD % of Total
Assets * Transferable securities admitted to an official stock exchange listing or dealt in on another regulated market 251,937,611 99.50 *** Financial derivative instruments dealt in on a regulated market (9,285) - All equity positions (with the exception of the investment held in Banco Espirito Santo) and futures held by the Fund at 30 June 2015 and at 31 December 2014 are classified as Level 1. The investment in Banco Espirito Santo has been classified as Level 3. See Note 6(d) for further details.
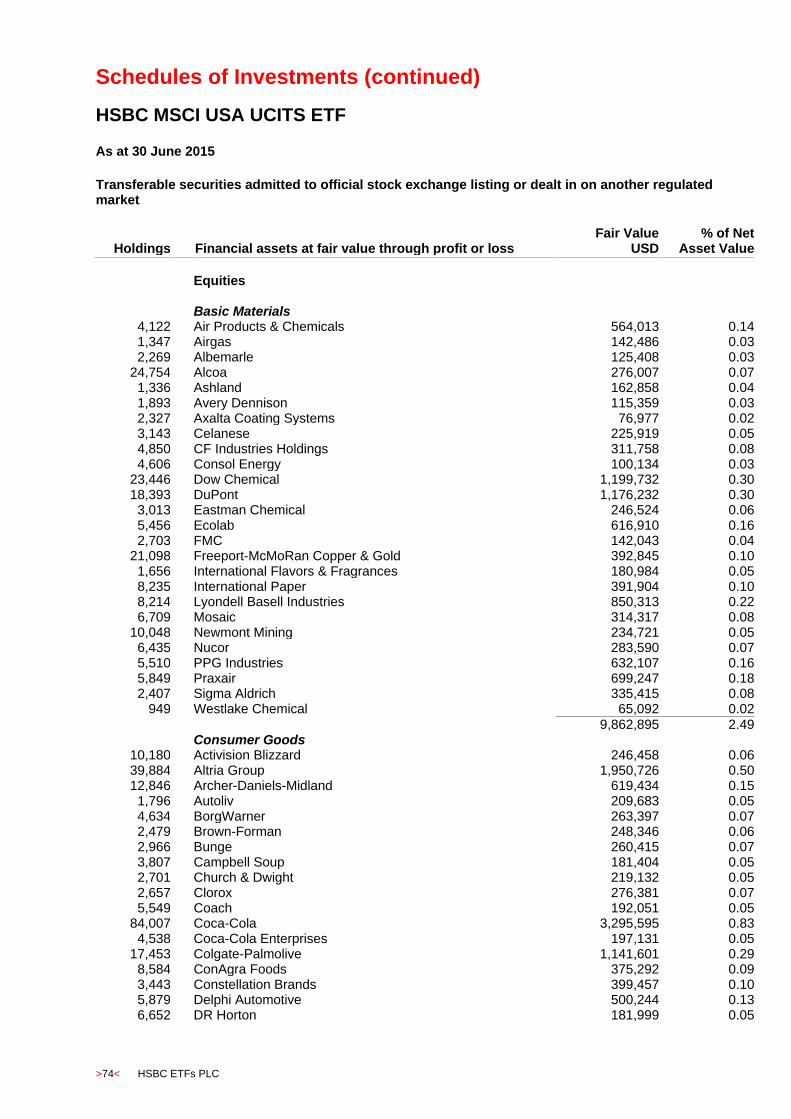
Schedules of Investments (continued)
HSBC MSCI USA UCITS ETF
>74< HSBC ETFs PLC
As at 30 June 2015
Transferable securities admitted to official stock exchange listing or dealt in on another regulated market
Holdings
Financial assets at fair value through profit or loss Fair Value
USD % of Net
Asset Value
Equities Basic Materials
4,122 Air Products & Chemicals 564,013 0.14 1,347 Airgas 142,486 0.03 2,269 Albemarle 125,408 0.03
24,754 Alcoa 276,007 0.07 1,336 Ashland 162,858 0.04 1,893 Avery Dennison 115,359 0.03 2,327 Axalta Coating Systems 76,977 0.02 3,143 Celanese 225,919 0.05 4,850 CF Industries Holdings 311,758 0.08 4,606 Consol Energy 100,134 0.03
23,446 Dow Chemical 1,199,732 0.30 18,393 DuPont 1,176,232 0.30
3,013 Eastman Chemical 246,524 0.06 5,456 Ecolab 616,910 0.16 2,703 FMC 142,043 0.04
21,098 Freeport-McMoRan Copper & Gold 392,845 0.10 1,656 International Flavors & Fragrances 180,984 0.05 8,235 International Paper 391,904 0.10 8,214 Lyondell Basell Industries 850,313 0.22 6,709 Mosaic 314,317 0.08
10,048 Newmont Mining 234,721 0.05 6,435 Nucor 283,590 0.07 5,510 PPG Industries 632,107 0.16 5,849 Praxair 699,247 0.18 2,407 Sigma Aldrich 335,415 0.08
949 Westlake Chemical 65,092 0.02
9,862,895 2.49 Consumer Goods
10,180 Activision Blizzard 246,458 0.06 39,884 Altria Group 1,950,726 0.50 12,846 Archer-Daniels-Midland 619,434 0.15
1,796 Autoliv 209,683 0.05 4,634 BorgWarner 263,397 0.07 2,479 Brown-Forman 248,346 0.06 2,966 Bunge 260,415 0.07 3,807 Campbell Soup 181,404 0.05 2,701 Church & Dwight 219,132 0.05 2,657 Clorox 276,381 0.07 5,549 Coach 192,051 0.05
84,007 Coca-Cola 3,295,595 0.83 4,538 Coca-Cola Enterprises 197,131 0.05
17,453 Colgate-Palmolive 1,141,601 0.29 8,584 ConAgra Foods 375,292 0.09 3,443 Constellation Brands 399,457 0.10 5,879 Delphi Automotive 500,244 0.13 6,652 DR Horton 181,999 0.05

Schedules of Investments (continued)
HSBC MSCI USA UCITS ETF (continued)
HSBC ETFs PLC >75<
As at 30 June 2015
Transferable securities admitted to official stock exchange listing or dealt in on another regulated market
Holdings
Financial assets at fair value through profit or loss Fair Value
USD % of Net
Asset Value
Equities (continued) Consumer Goods (continued)
3,940 Dr Pepper Snapple Group 287,226 0.07 6,296 Electronic Arts 418,684 0.11 1,258 Energizer Holdings 165,490 0.04 4,702 Estee Lauder Cos 407,475 0.10
74,749 Ford Motor 1,121,982 0.28 2,372 Garmin 104,202 0.03
12,257 General Mills 682,960 0.17 29,353 General Motors 978,335 0.25
3,133 Genuine Parts 280,497 0.08 5,463 Goodyear Tire & Rubber 164,709 0.04 8,077 Hanesbrands 269,126 0.07 4,284 Harley-Davidson 241,403 0.06 1,390 Harman International Industries 165,327 0.04 2,295 Hasbro 171,643 0.04 3,095 Hershey 274,929 0.07 2,929 Hormel Foods 165,108 0.04 3,703 Jarden 191,630 0.05 2,057 JM Smucker 222,999 0.06
13,312 Johnson Controls 659,343 0.17 5,405 Kellogg 338,894 0.09 2,472 Keurig Green Mountain 189,429 0.05 7,402 Kimberly-Clark 784,390 0.20
11,908 Kraft Foods 1,013,847 0.26 1,563 Lear Corporation 175,462 0.04 2,773 Leggett & Platt 134,990 0.03 3,520 Lennar 179,661 0.04 6,049 LKQ 182,952 0.05 2,216 Lululemon Athletica 144,705 0.04 6,828 Mattel 175,411 0.05 2,377 McCormick & Co 192,418 0.05 4,113 Mead Johnson Nutrition 371,075 0.09 4,168 Michael Kors Holdings 175,431 0.04 1,257 Mohawk Industries 239,961 0.06 3,103 Molsonors Brewing 216,620 0.05
33,406 Mondelez International 1,374,323 0.35 9,832 Monsanto 1,047,993 0.26 2,927 Monster Beverage 392,277 0.09 5,531 Newell Rubbermaid 227,379 0.06
13,890 NIKE 1,500,398 0.38 30,022 PepsiCo 2,802,253 0.71 31,329 Philip Morris International 2,511,646 0.63
1,270 Polaris Industries 188,100 0.05 54,693 Procter & Gamble 4,279,180 1.08
6,839 Pulte Group 137,806 0.03 1,673 PVH 192,730 0.05 1,221 Ralph Lauren 161,612 0.04 8,706 Reynolds American 649,990 0.16
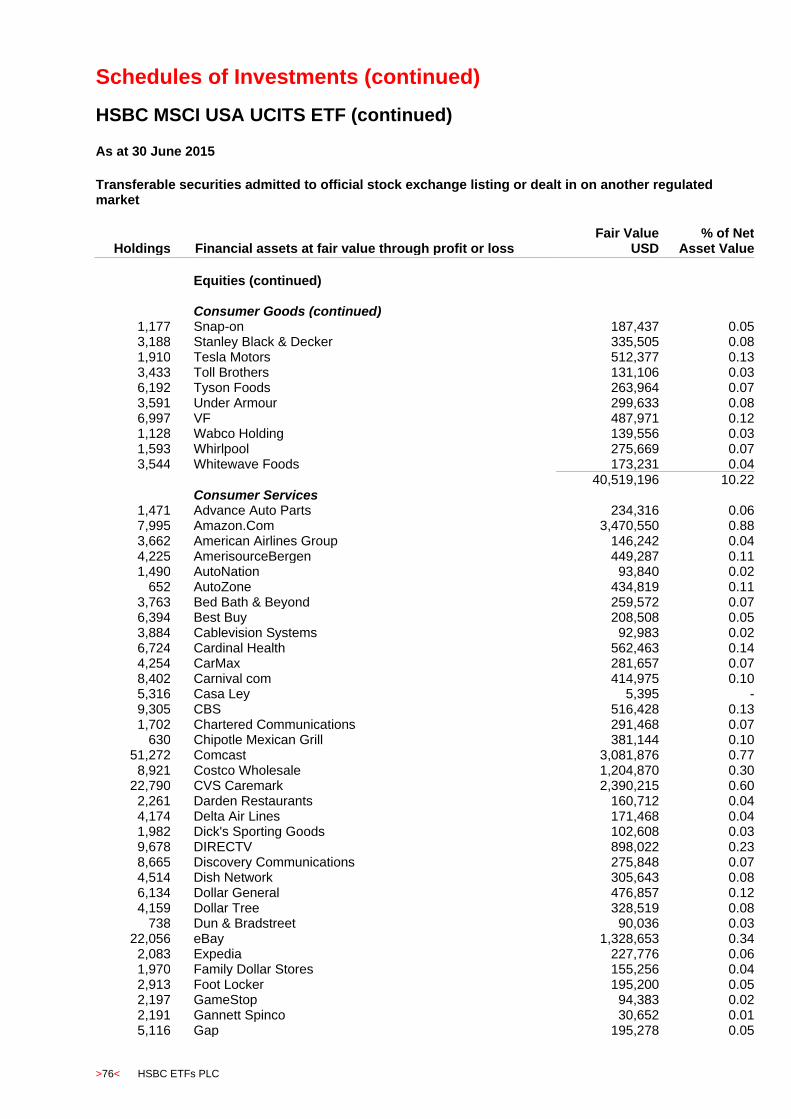
Schedules of Investments (continued)
HSBC MSCI USA UCITS ETF (continued)
>76< HSBC ETFs PLC
As at 30 June 2015
Transferable securities admitted to official stock exchange listing or dealt in on another regulated market
Holdings
Financial assets at fair value through profit or loss Fair Value
USD % of Net
Asset Value
Equities (continued) Consumer Goods (continued)
1,177 Snap-on 187,437 0.05 3,188 Stanley Black & Decker 335,505 0.08 1,910 Tesla Motors 512,377 0.13 3,433 Toll Brothers 131,106 0.03 6,192 Tyson Foods 263,964 0.07 3,591 Under Armour 299,633 0.08 6,997 VF 487,971 0.12 1,128 Wabco Holding 139,556 0.03 1,593 Whirlpool 275,669 0.07 3,544 Whitewave Foods 173,231 0.04
40,519,196 10.22 Consumer Services
1,471 Advance Auto Parts 234,316 0.06 7,995 Amazon.Com 3,470,550 0.88 3,662 American Airlines Group 146,242 0.04 4,225 AmerisourceBergen 449,287 0.11 1,490 AutoNation 93,840 0.02
652 AutoZone 434,819 0.11 3,763 Bed Bath & Beyond 259,572 0.07 6,394 Best Buy 208,508 0.05 3,884 Cablevision Systems 92,983 0.02 6,724 Cardinal Health 562,463 0.14 4,254 CarMax 281,657 0.07 8,402 Carnival com 414,975 0.10 5,316 Casa Ley 5,395 - 9,305 CBS 516,428 0.13 1,702 Chartered Communications 291,468 0.07
630 Chipotle Mexican Grill 381,144 0.10 51,272 Comcast 3,081,876 0.77
8,921 Costco Wholesale 1,204,870 0.30 22,790 CVS Caremark 2,390,215 0.60
2,261 Darden Restaurants 160,712 0.04 4,174 Delta Air Lines 171,468 0.04 1,982 Dick's Sporting Goods 102,608 0.03 9,678 DIRECTV 898,022 0.23 8,665 Discovery Communications 275,848 0.07 4,514 Dish Network 305,643 0.08 6,134 Dollar General 476,857 0.12 4,159 Dollar Tree 328,519 0.08
738 Dun & Bradstreet 90,036 0.03 22,056 eBay 1,328,653 0.34
2,083 Expedia 227,776 0.06 1,970 Family Dollar Stores 155,256 0.04 2,913 Foot Locker 195,200 0.05 2,197 GameStop 94,383 0.02 2,191 Gannett Spinco 30,652 0.01 5,116 Gap 195,278 0.05

Schedules of Investments (continued)
HSBC MSCI USA UCITS ETF (continued)
HSBC ETFs PLC >77<
As at 30 June 2015
Transferable securities admitted to official stock exchange listing or dealt in on another regulated market
Holdings
Financial assets at fair value through profit or loss Fair Value
USD % of Net
Asset Value
Equities (continued) Consumer Services (continued)
5,468 H&R Block 162,126 0.04 7,881 Hertz Global Holdings 142,804 0.04
10,018 Hilton Worldwide Holdings 275,996 0.07 26,690 Home Depot 2,966,059 0.75
1,382 IHS 177,767 0.04 8,385 Interpublic Group of Companies 161,579 0.04 4,092 Kohl's 256,200 0.06 9,428 Kroger 683,624 0.17 8,143 Las Vegas Sands 428,078 0.11
17,720 Liberty Global 914,525 0.23 9,150 Liberty Interactive 253,913 0.06 1,911 Liberty Media Corp - Liberty Capital 68,872 0.02 4,189 Liberty Media Corporation 150,385 0.04 5,049 Limited Brands 432,851 0.11
19,704 Lowe's Cos 1,319,577 0.33 6,898 Macy's 465,408 0.12 4,481 Marriott International 333,342 0.08
19,465 McDonald's 1,850,538 0.47 5,510 McGraw-Hill 553,480 0.14 4,709 McKesson 1,058,630 0.27 7,941 MGM Resorts International 144,923 0.04 1,158 NetFlix 760,737 0.19 7,733 News Corp 112,824 0.03 7,117 Nielsen Holdings 318,628 0.08 2,859 Nordstrom 212,996 0.05 2,019 Omnicare 190,291 0.05 5,075 Omnicom Group 352,662 0.09 2,058 O'Reilly Automotive 465,067 0.12 5,316 PDC 259 - 1,052 Priceline.com 1,211,241 0.30
20,014 Rite Aid 167,117 0.04 8,384 Ross Stores 407,546 0.10 3,558 Royal Caribbean Cruises 279,979 0.07 1,606 Scripps Networks Interactive 104,984 0.03 1,550 Signet Jewelers 198,772 0.05
50,193 Sirius XM Holdings 187,220 0.05 3,459 Southwest Airlines 114,458 0.03
13,018 Staples 199,306 0.05 30,367 Starbucks 1,628,127 0.41
3,477 Starwood Hotels & Resorts Worldwide 281,950 0.07 11,935 Sysco 430,854 0.11 12,289 Target 1,003,151 0.25
4,383 TEGNA 140,563 0.03 2,626 Tiffany & Co 241,067 0.06
16,821 Time Warner 1,470,324 0.37 5,691 Time Warner Cable 1,013,965 0.26
13,826 TJX Cos 914,866 0.24

Schedules of Investments (continued)
HSBC MSCI USA UCITS ETF (continued)
>78< HSBC ETFs PLC
As at 30 June 2015
Transferable securities admitted to official stock exchange listing or dealt in on another regulated market
Holdings
Financial assets at fair value through profit or loss Fair Value
USD % of Net
Asset Value
Equities (continued) Consumer Services (continued)
2,798 Tractor Supply 251,652 0.06 2,376 TripAdvisor 207,045 0.05
35,786 Twenty First Century Fox 1,161,764 0.29 1,220 Ulta Salon Cosmetic 188,429 0.05 1,837 United Continental Holdings 97,379 0.02 2,171 Urban Outfitters 75,985 0.02 7,193 Viacom 464,956 0.12
17,708 Walgreens Boots Alliance 1,495,264 0.38 32,711 Wal-Mart Stores 2,320,191 0.59 32,704 Walt Disney 3,732,835 0.94
7,331 Whole Foods Market 289,135 0.07 2,441 Wyndham Worldwide 199,942 0.05 1,645 Wynn Resorts 162,312 0.04 8,772 Yum! Brands 790,182 0.20
56,204,221 14.17 Financial
6,630 ACE 674,138 0.17 1,124 Affiliated Managers 245,706 0.06 8,889 Aflac 552,896 0.14
336 Alleghany 157,503 0.04 8,515 Allstate 552,368 0.14 8,780 Ally Financial 196,935 0.05 7,207 American Capital Agency 132,393 0.03
18,577 American Express 1,443,804 0.36 27,796 American International Group 1,718,349 0.43 17,963 American Realty Capital 146,039 0.04
8,527 American Tower 795,484 0.20 3,697 Ameriprise Financial 461,866 0.12
19,200 Annaly Capital Management 176,448 0.04 5,676 AON 565,784 0.14 2,557 Arch Capital Group 171,217 0.04 1,444 Assurant 96,748 0.02 2,676 AvalonBay Communities 427,812 0.11 1,969 Axis Capital Holdings 105,086 0.03
213,049 Bank of America 3,626,094 0.91 22,560 Bank of New York Mellon 946,843 0.24 14,621 BB&T 589,373 0.15 23,394 Berkshire Hathaway 3,184,157 0.80
2,512 BlackRock 869,102 0.22 3,081 Boston Properties 372,924 0.09 1,697 Camden Property Trust 126,053 0.03
11,172 Capital One Financial 982,801 0.25 6,075 CBRE Group 224,775 0.06
23,771 Charles Schwab 776,123 0.20 6,492 Chicago Mercantile Exchange 604,146 0.15 4,675 Chubb 444,780 0.11 3,117 Cincinnati Financial 156,411 0.04
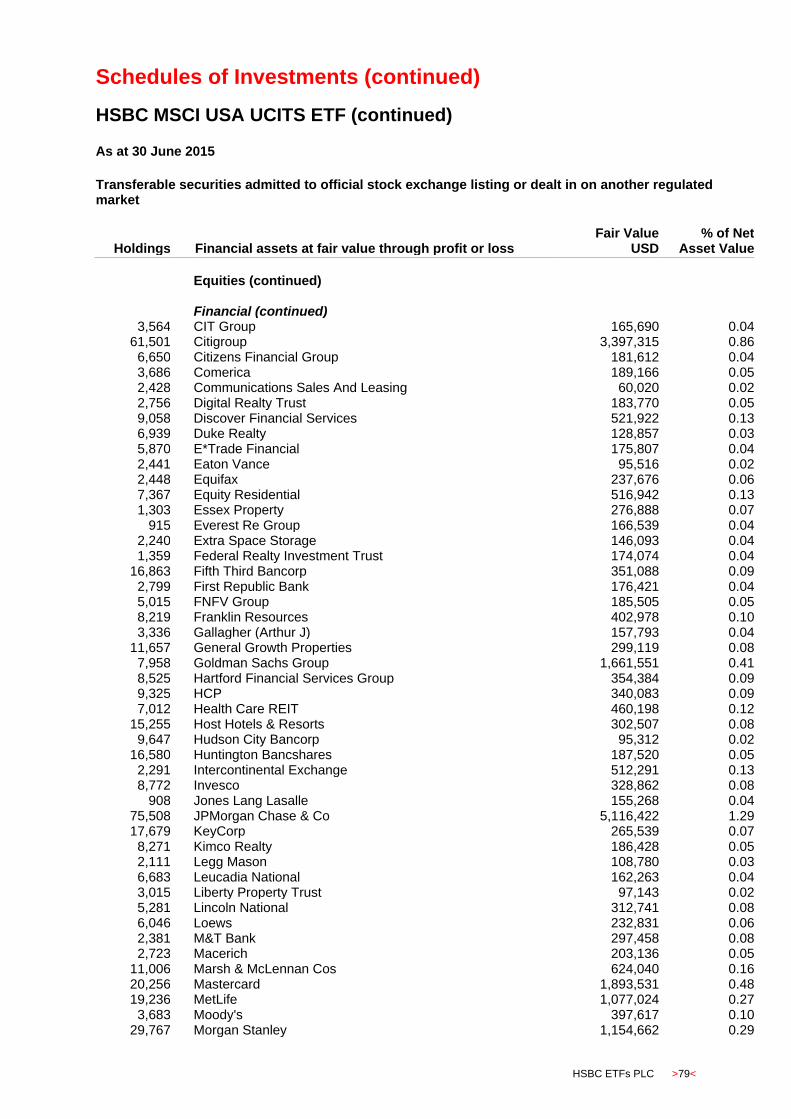
Schedules of Investments (continued)
HSBC MSCI USA UCITS ETF (continued)
HSBC ETFs PLC >79<
As at 30 June 2015
Transferable securities admitted to official stock exchange listing or dealt in on another regulated market
Holdings
Financial assets at fair value through profit or loss Fair Value
USD % of Net
Asset Value
Equities (continued) Financial (continued)
3,564 CIT Group 165,690 0.04 61,501 Citigroup 3,397,315 0.86
6,650 Citizens Financial Group 181,612 0.04 3,686 Comerica 189,166 0.05 2,428 Communications Sales And Leasing 60,020 0.02 2,756 Digital Realty Trust 183,770 0.05 9,058 Discover Financial Services 521,922 0.13 6,939 Duke Realty 128,857 0.03 5,870 E*Trade Financial 175,807 0.04 2,441 Eaton Vance 95,516 0.02 2,448 Equifax 237,676 0.06 7,367 Equity Residential 516,942 0.13 1,303 Essex Property 276,888 0.07
915 Everest Re Group 166,539 0.04 2,240 Extra Space Storage 146,093 0.04 1,359 Federal Realty Investment Trust 174,074 0.04
16,863 Fifth Third Bancorp 351,088 0.09 2,799 First Republic Bank 176,421 0.04 5,015 FNFV Group 185,505 0.05 8,219 Franklin Resources 402,978 0.10 3,336 Gallagher (Arthur J) 157,793 0.04
11,657 General Growth Properties 299,119 0.08 7,958 Goldman Sachs Group 1,661,551 0.41 8,525 Hartford Financial Services Group 354,384 0.09 9,325 HCP 340,083 0.09 7,012 Health Care REIT 460,198 0.12
15,255 Host Hotels & Resorts 302,507 0.08 9,647 Hudson City Bancorp 95,312 0.02
16,580 Huntington Bancshares 187,520 0.05 2,291 Intercontinental Exchange 512,291 0.13 8,772 Invesco 328,862 0.08
908 Jones Lang Lasalle 155,268 0.04 75,508 JPMorgan Chase & Co 5,116,422 1.29 17,679 KeyCorp 265,539 0.07
8,271 Kimco Realty 186,428 0.05 2,111 Legg Mason 108,780 0.03 6,683 Leucadia National 162,263 0.04 3,015 Liberty Property Trust 97,143 0.02 5,281 Lincoln National 312,741 0.08 6,046 Loews 232,831 0.06 2,381 M&T Bank 297,458 0.08 2,723 Macerich 203,136 0.05
11,006 Marsh & McLennan Cos 624,040 0.16 20,256 Mastercard 1,893,531 0.48 19,236 MetLife 1,077,024 0.27
3,683 Moody's 397,617 0.10 29,767 Morgan Stanley 1,154,662 0.29

Schedules of Investments (continued)
HSBC MSCI USA UCITS ETF (continued)
>80< HSBC ETFs PLC
As at 30 June 2015
Transferable securities admitted to official stock exchange listing or dealt in on another regulated market
Holdings
Financial assets at fair value through profit or loss Fair Value
USD % of Net
Asset Value
Equities (continued) Financial (continued)
2,359 NASDAQ OMX Group 115,143 0.03 8,131 Navient Corporation 148,066 0.04 8,898 New York Community Bancorp 163,545 0.04 4,523 Northern Trust 345,829 0.09
960 PartnerRe 123,360 0.03 6,271 People's United Financial 101,653 0.03 3,564 Plum Creek Timber 144,591 0.04
10,546 PNC Financial Services Group 1,008,725 0.26 5,953 Principal Financial Group 305,329 0.08
11,927 Progressive 331,928 0.08 10,372 ProLogis 384,801 0.10
9,262 Prudential Financial 810,610 0.21 2,985 Public Storage 550,344 0.14 2,545 Raymond James Financial 151,631 0.04 2,946 Realogy Holdings 137,637 0.03 4,453 Realty Income 197,669 0.05 1,832 Regency Centers 108,051 0.03
27,197 Regions Financial 281,761 0.07 927 RenaissanceRe Holdings 94,100 0.02
2,969 SEI Investments 145,570 0.04 6,367 Simon Property Group 1,101,618 0.28 1,998 SL Green Realty 219,560 0.06 8,350 State Street 642,950 0.16
10,587 SunTrust Banks 455,453 0.11 3,380 Synchrony Financial 111,303 0.02 5,281 T Rowe Price Group 410,492 0.11 5,597 TD Ameritrade Holding 206,082 0.05 2,642 Torchmark 153,817 0.04 6,508 Travelers Cos 629,063 0.16 5,241 UDR 167,869 0.04 5,147 Unum Group 184,005 0.05
36,074 US Bancorp 1,565,612 0.39 6,700 Ventas 416,003 0.10
39,773 Visa 2,670,757 0.67 3,399 Vornado Realty Trust 322,667 0.08 4,635 Voya Financial 215,388 0.05
99,130 Wells Fargo & Co 5,575,071 1.41 10,705 Western Union 217,633 0.05 10,665 Weyerhaeuser 335,948 0.08
3,243 Willis Group Holdings 152,097 0.04 2,038 WR Berkley 105,833 0.03 6,178 XL Group 229,822 0.06
995 Zillow 86,306 0.02
68,068,232 17.16 Healthcare
30,571 Abbott Laboratories 1,500,425 0.38 34,900 Abbvie 2,344,931 0.59

Schedules of Investments (continued)
HSBC MSCI USA UCITS ETF (continued)
HSBC ETFs PLC >81<
As at 30 June 2015
Transferable securities admitted to official stock exchange listing or dealt in on another regulated market
Holdings
Financial assets at fair value through profit or loss Fair Value
USD % of Net
Asset Value
Equities (continued) Healthcare (continued)
7,136 Aetna 909,555 0.23 4,540 Alexion Pharmaceuticals 820,696 0.21 2,972 Alkermes 191,218 0.05 7,626 Allergan 2,314,186 0.58 1,531 Alnylam Pharmaceuticals 183,521 0.05
15,369 Amgen 2,359,449 0.59 5,403 Anthem 886,848 0.22 1,515 Bard 258,611 0.07
10,945 Baxter International 765,384 0.19 4,253 Becton Dickinson 602,437 0.15 4,751 Biogen Idec 1,919,119 0.48 3,223 Biomarin Pharmaceutical 440,842 0.11
26,796 Boston Scientific 474,289 0.12 33,677 Bristol-Myers Squibb 2,240,867 0.57 16,212 Celgene 1,876,296 0.47
2,286 Centene 183,794 0.05 5,234 Cigna 847,908 0.21
982 Cooper Companies 174,767 0.04 3,471 DaVita 275,840 0.07 2,890 DENTSPLY International 148,980 0.04 2,143 Edwards Lifesciences 305,227 0.08
20,253 Eli Lilly & Co 1,690,923 0.43 4,084 Endo International 325,291 0.08 3,729 Envision Healthcare 147,221 0.04
14,722 Express Scripts 1,309,375 0.33 30,164 Gilead Sciences 3,531,601 0.89
6,814 HCA Holdings 618,166 0.16 1,711 Henry Schein 243,167 0.06 4,819 Hologic 183,411 0.05 3,437 Hospira 304,896 0.08 3,030 Humana 579,578 0.15 2,886 Illumina 630,187 0.16 3,131 Incyte Genomics 326,282 0.08
731 Intuitive Surgical 354,170 0.09 2,400 ISIS Pharmaceuticals 138,120 0.03 1,225 Jazz Pharmaceuticals 215,686 0.05
56,313 Johnson & Johnson 5,488,265 1.38 2,031 Laboratory Corporation of America Holdings 246,198 0.06 2,357 Mallinckrodt 277,466 0.07 1,554 Medivation 177,467 0.04
28,758 Medtronic 2,130,968 0.54 57,481 Merck & Co 3,272,393 0.83
8,418 Mylan 571,245 0.14 1,729 Patterson Cos 84,116 0.02 2,856 Perrigo Co Ltd 527,874 0.13
124,126 Pfizer 4,161,945 1.05 582 Puma Biotechnology 67,949 0.01
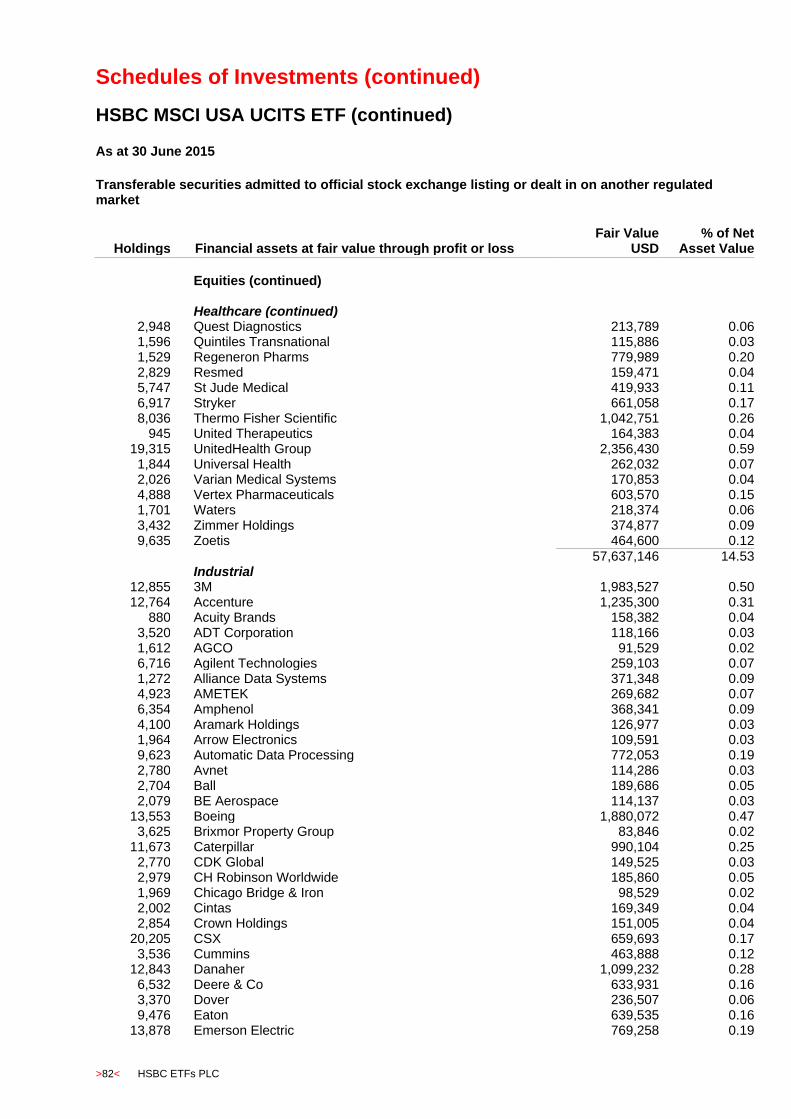
Schedules of Investments (continued)
HSBC MSCI USA UCITS ETF (continued)
>82< HSBC ETFs PLC
As at 30 June 2015
Transferable securities admitted to official stock exchange listing or dealt in on another regulated market
Holdings
Financial assets at fair value through profit or loss Fair Value
USD % of Net
Asset Value
Equities (continued) Healthcare (continued)
2,948 Quest Diagnostics 213,789 0.06 1,596 Quintiles Transnational 115,886 0.03 1,529 Regeneron Pharms 779,989 0.20 2,829 Resmed 159,471 0.04 5,747 St Jude Medical 419,933 0.11 6,917 Stryker 661,058 0.17 8,036 Thermo Fisher Scientific 1,042,751 0.26
945 United Therapeutics 164,383 0.04 19,315 UnitedHealth Group 2,356,430 0.59
1,844 Universal Health 262,032 0.07 2,026 Varian Medical Systems 170,853 0.04 4,888 Vertex Pharmaceuticals 603,570 0.15 1,701 Waters 218,374 0.06 3,432 Zimmer Holdings 374,877 0.09 9,635 Zoetis 464,600 0.12
57,637,146 14.53 Industrial
12,855 3M 1,983,527 0.50 12,764 Accenture 1,235,300 0.31
880 Acuity Brands 158,382 0.04 3,520 ADT Corporation 118,166 0.03 1,612 AGCO 91,529 0.02 6,716 Agilent Technologies 259,103 0.07 1,272 Alliance Data Systems 371,348 0.09 4,923 AMETEK 269,682 0.07 6,354 Amphenol 368,341 0.09 4,100 Aramark Holdings 126,977 0.03 1,964 Arrow Electronics 109,591 0.03 9,623 Automatic Data Processing 772,053 0.19 2,780 Avnet 114,286 0.03 2,704 Ball 189,686 0.05 2,079 BE Aerospace 114,137 0.03
13,553 Boeing 1,880,072 0.47 3,625 Brixmor Property Group 83,846 0.02
11,673 Caterpillar 990,104 0.25 2,770 CDK Global 149,525 0.03 2,979 CH Robinson Worldwide 185,860 0.05 1,969 Chicago Bridge & Iron 98,529 0.02 2,002 Cintas 169,349 0.04 2,854 Crown Holdings 151,005 0.04
20,205 CSX 659,693 0.17 3,536 Cummins 463,888 0.12
12,843 Danaher 1,099,232 0.28 6,532 Deere & Co 633,931 0.16 3,370 Dover 236,507 0.06 9,476 Eaton 639,535 0.16
13,878 Emerson Electric 769,258 0.19
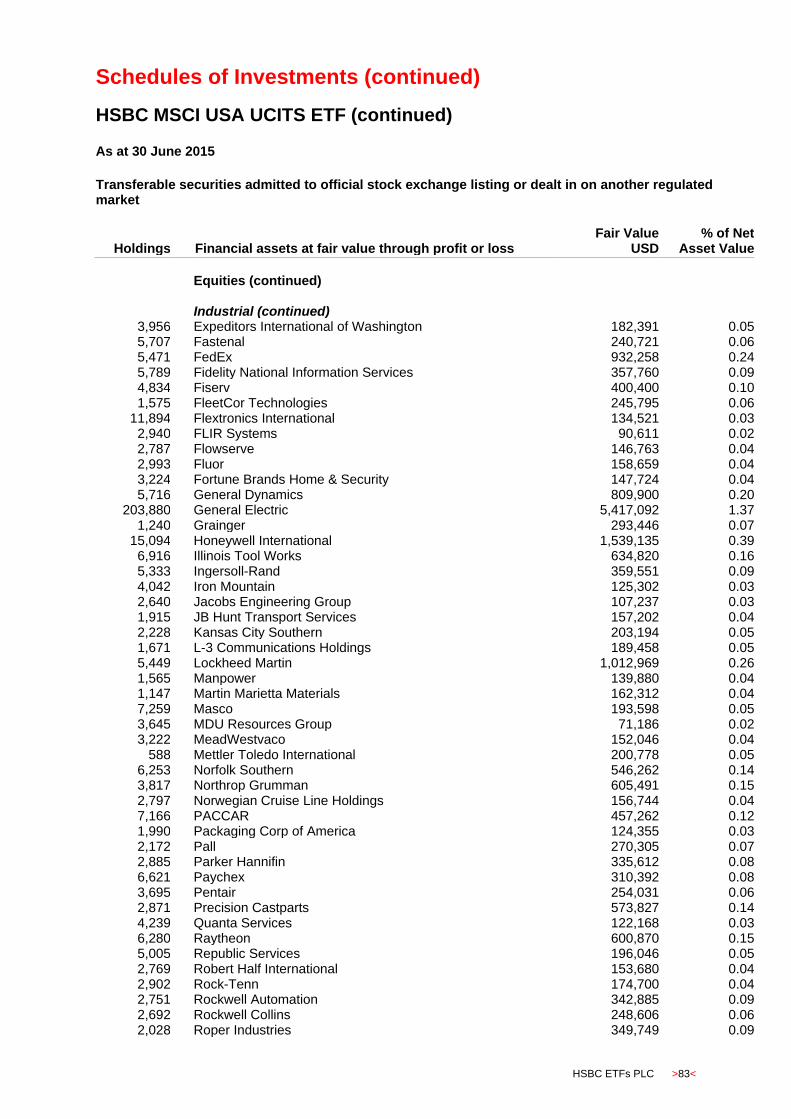
Schedules of Investments (continued)
HSBC MSCI USA UCITS ETF (continued)
HSBC ETFs PLC >83<
As at 30 June 2015
Transferable securities admitted to official stock exchange listing or dealt in on another regulated market
Holdings
Financial assets at fair value through profit or loss Fair Value
USD % of Net
Asset Value
Equities (continued) Industrial (continued)
3,956 Expeditors International of Washington 182,391 0.05 5,707 Fastenal 240,721 0.06 5,471 FedEx 932,258 0.24 5,789 Fidelity National Information Services 357,760 0.09 4,834 Fiserv 400,400 0.10 1,575 FleetCor Technologies 245,795 0.06
11,894 Flextronics International 134,521 0.03 2,940 FLIR Systems 90,611 0.02 2,787 Flowserve 146,763 0.04 2,993 Fluor 158,659 0.04 3,224 Fortune Brands Home & Security 147,724 0.04 5,716 General Dynamics 809,900 0.20
203,880 General Electric 5,417,092 1.37 1,240 Grainger 293,446 0.07
15,094 Honeywell International 1,539,135 0.39 6,916 Illinois Tool Works 634,820 0.16 5,333 Ingersoll-Rand 359,551 0.09 4,042 Iron Mountain 125,302 0.03 2,640 Jacobs Engineering Group 107,237 0.03 1,915 JB Hunt Transport Services 157,202 0.04 2,228 Kansas City Southern 203,194 0.05 1,671 L-3 Communications Holdings 189,458 0.05 5,449 Lockheed Martin 1,012,969 0.26 1,565 Manpower 139,880 0.04 1,147 Martin Marietta Materials 162,312 0.04 7,259 Masco 193,598 0.05 3,645 MDU Resources Group 71,186 0.02 3,222 MeadWestvaco 152,046 0.04
588 Mettler Toledo International 200,778 0.05 6,253 Norfolk Southern 546,262 0.14 3,817 Northrop Grumman 605,491 0.15 2,797 Norwegian Cruise Line Holdings 156,744 0.04 7,166 PACCAR 457,262 0.12 1,990 Packaging Corp of America 124,355 0.03 2,172 Pall 270,305 0.07 2,885 Parker Hannifin 335,612 0.08 6,621 Paychex 310,392 0.08 3,695 Pentair 254,031 0.06 2,871 Precision Castparts 573,827 0.14 4,239 Quanta Services 122,168 0.03 6,280 Raytheon 600,870 0.15 5,005 Republic Services 196,046 0.05 2,769 Robert Half International 153,680 0.04 2,902 Rock-Tenn 174,700 0.04 2,751 Rockwell Automation 342,885 0.09 2,692 Rockwell Collins 248,606 0.06 2,028 Roper Industries 349,749 0.09
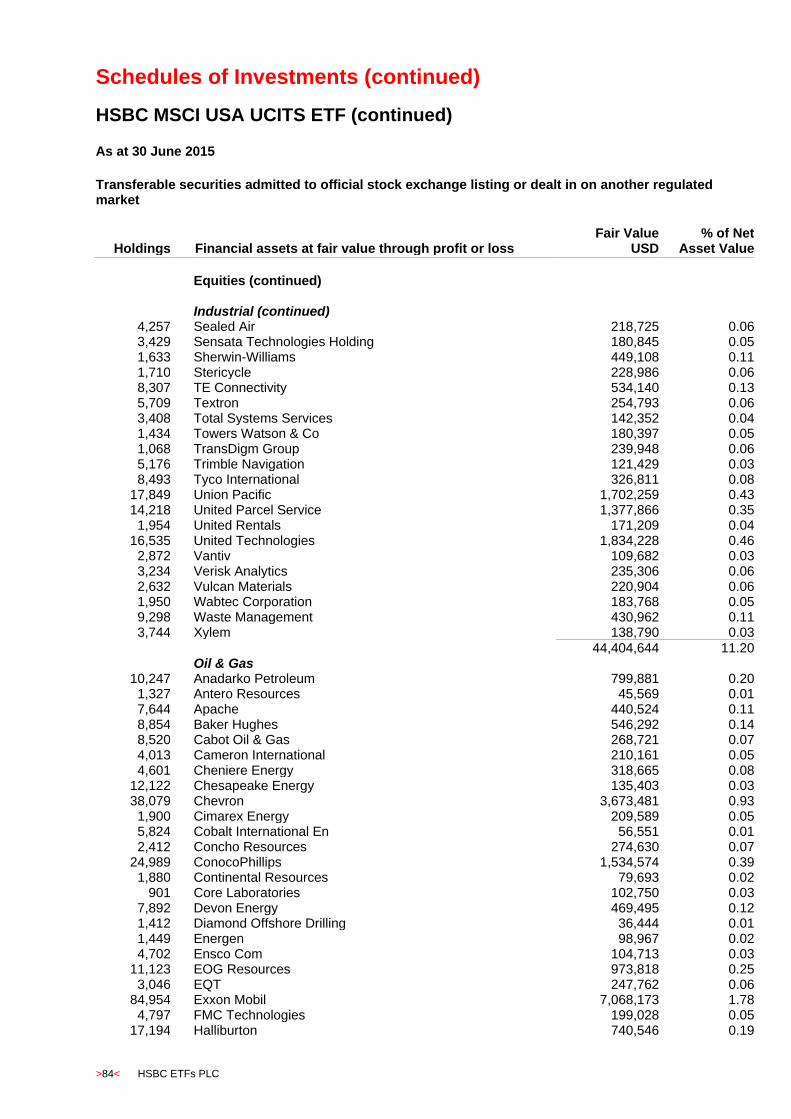
Schedules of Investments (continued)
HSBC MSCI USA UCITS ETF (continued)
>84< HSBC ETFs PLC
As at 30 June 2015
Transferable securities admitted to official stock exchange listing or dealt in on another regulated market
Holdings
Financial assets at fair value through profit or loss Fair Value
USD % of Net
Asset Value
Equities (continued) Industrial (continued)
4,257 Sealed Air 218,725 0.06 3,429 Sensata Technologies Holding 180,845 0.05 1,633 Sherwin-Williams 449,108 0.11 1,710 Stericycle 228,986 0.06 8,307 TE Connectivity 534,140 0.13 5,709 Textron 254,793 0.06 3,408 Total Systems Services 142,352 0.04 1,434 Towers Watson & Co 180,397 0.05 1,068 TransDigm Group 239,948 0.06 5,176 Trimble Navigation 121,429 0.03 8,493 Tyco International 326,811 0.08
17,849 Union Pacific 1,702,259 0.43 14,218 United Parcel Service 1,377,866 0.35
1,954 United Rentals 171,209 0.04 16,535 United Technologies 1,834,228 0.46
2,872 Vantiv 109,682 0.03 3,234 Verisk Analytics 235,306 0.06 2,632 Vulcan Materials 220,904 0.06 1,950 Wabtec Corporation 183,768 0.05 9,298 Waste Management 430,962 0.11 3,744 Xylem 138,790 0.03
44,404,644 11.20 Oil & Gas
10,247 Anadarko Petroleum 799,881 0.20 1,327 Antero Resources 45,569 0.01 7,644 Apache 440,524 0.11 8,854 Baker Hughes 546,292 0.14 8,520 Cabot Oil & Gas 268,721 0.07 4,013 Cameron International 210,161 0.05 4,601 Cheniere Energy 318,665 0.08
12,122 Chesapeake Energy 135,403 0.03 38,079 Chevron 3,673,481 0.93
1,900 Cimarex Energy 209,589 0.05 5,824 Cobalt International En 56,551 0.01 2,412 Concho Resources 274,630 0.07
24,989 ConocoPhillips 1,534,574 0.39 1,880 Continental Resources 79,693 0.02
901 Core Laboratories 102,750 0.03 7,892 Devon Energy 469,495 0.12 1,412 Diamond Offshore Drilling 36,444 0.01 1,449 Energen 98,967 0.02 4,702 Ensco Com 104,713 0.03
11,123 EOG Resources 973,818 0.25 3,046 EQT 247,762 0.06
84,954 Exxon Mobil 7,068,173 1.78 4,797 FMC Technologies 199,028 0.05
17,194 Halliburton 740,546 0.19
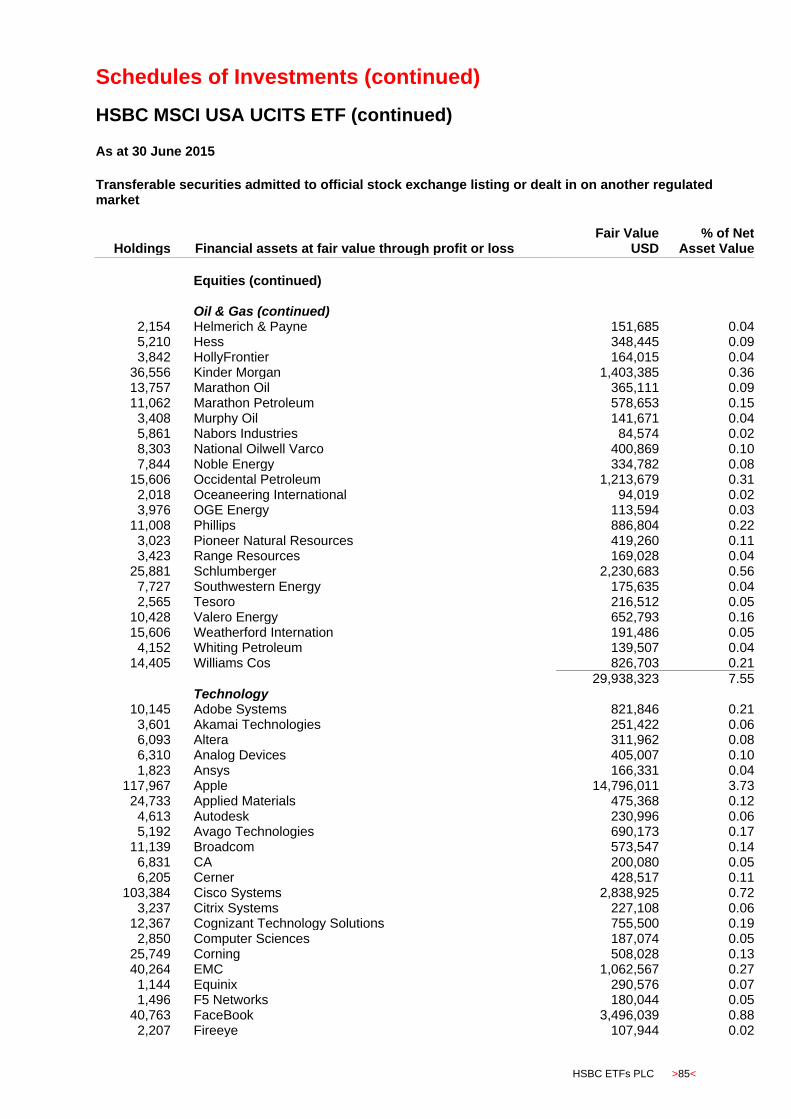
Schedules of Investments (continued)
HSBC MSCI USA UCITS ETF (continued)
HSBC ETFs PLC >85<
As at 30 June 2015
Transferable securities admitted to official stock exchange listing or dealt in on another regulated market
Holdings
Financial assets at fair value through profit or loss Fair Value
USD % of Net
Asset Value
Equities (continued) Oil & Gas (continued)
2,154 Helmerich & Payne 151,685 0.04 5,210 Hess 348,445 0.09 3,842 HollyFrontier 164,015 0.04
36,556 Kinder Morgan 1,403,385 0.36 13,757 Marathon Oil 365,111 0.09 11,062 Marathon Petroleum 578,653 0.15
3,408 Murphy Oil 141,671 0.04 5,861 Nabors Industries 84,574 0.02 8,303 National Oilwell Varco 400,869 0.10 7,844 Noble Energy 334,782 0.08
15,606 Occidental Petroleum 1,213,679 0.31 2,018 Oceaneering International 94,019 0.02 3,976 OGE Energy 113,594 0.03
11,008 Phillips 886,804 0.22 3,023 Pioneer Natural Resources 419,260 0.11 3,423 Range Resources 169,028 0.04
25,881 Schlumberger 2,230,683 0.56 7,727 Southwestern Energy 175,635 0.04 2,565 Tesoro 216,512 0.05
10,428 Valero Energy 652,793 0.16 15,606 Weatherford Internation 191,486 0.05
4,152 Whiting Petroleum 139,507 0.04 14,405 Williams Cos 826,703 0.21
29,938,323 7.55 Technology
10,145 Adobe Systems 821,846 0.21 3,601 Akamai Technologies 251,422 0.06 6,093 Altera 311,962 0.08 6,310 Analog Devices 405,007 0.10 1,823 Ansys 166,331 0.04
117,967 Apple 14,796,011 3.73 24,733 Applied Materials 475,368 0.12
4,613 Autodesk 230,996 0.06 5,192 Avago Technologies 690,173 0.17
11,139 Broadcom 573,547 0.14 6,831 CA 200,080 0.05 6,205 Cerner 428,517 0.11
103,384 Cisco Systems 2,838,925 0.72 3,237 Citrix Systems 227,108 0.06
12,367 Cognizant Technology Solutions 755,500 0.19 2,850 Computer Sciences 187,074 0.05
25,749 Corning 508,028 0.13 40,264 EMC 1,062,567 0.27
1,144 Equinix 290,576 0.07 1,496 F5 Networks 180,044 0.05
40,763 FaceBook 3,496,039 0.88 2,207 Fireeye 107,944 0.02
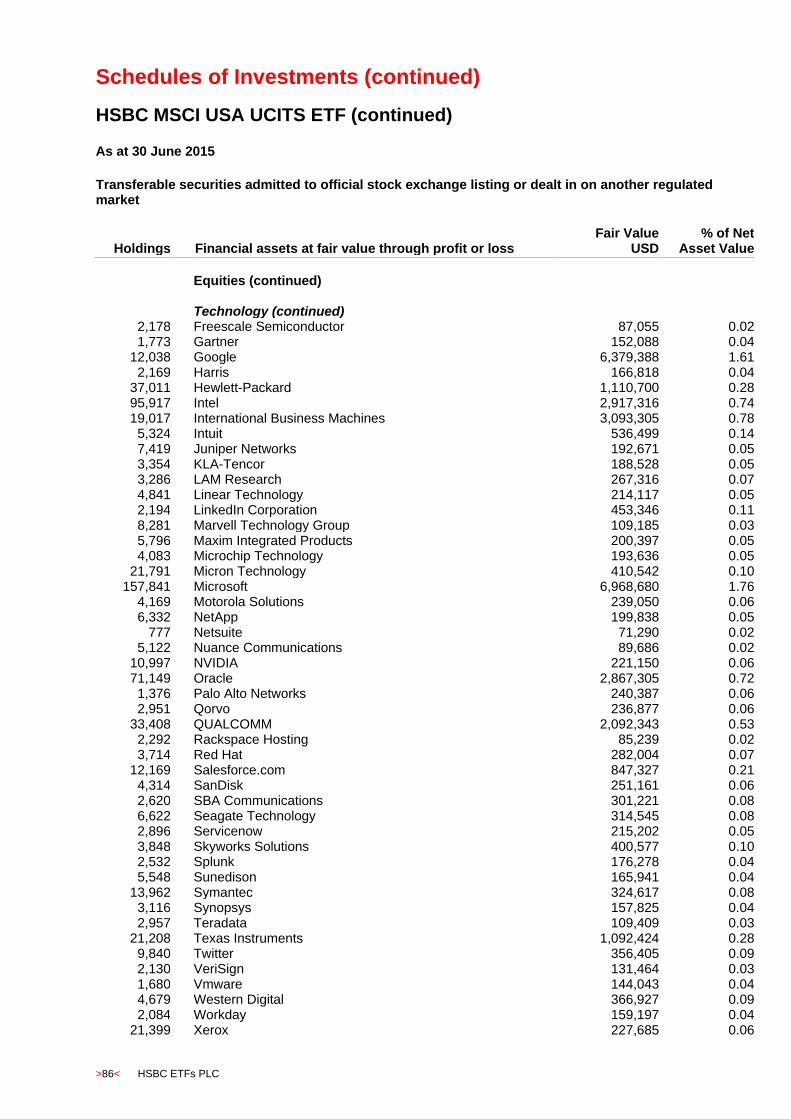
Schedules of Investments (continued)
HSBC MSCI USA UCITS ETF (continued)
>86< HSBC ETFs PLC
As at 30 June 2015
Transferable securities admitted to official stock exchange listing or dealt in on another regulated market
Holdings
Financial assets at fair value through profit or loss Fair Value
USD % of Net
Asset Value
Equities (continued) Technology (continued)
2,178 Freescale Semiconductor 87,055 0.02 1,773 Gartner 152,088 0.04
12,038 Google 6,379,388 1.61 2,169 Harris 166,818 0.04
37,011 Hewlett-Packard 1,110,700 0.28 95,917 Intel 2,917,316 0.74 19,017 International Business Machines 3,093,305 0.78
5,324 Intuit 536,499 0.14 7,419 Juniper Networks 192,671 0.05 3,354 KLA-Tencor 188,528 0.05 3,286 LAM Research 267,316 0.07 4,841 Linear Technology 214,117 0.05 2,194 LinkedIn Corporation 453,346 0.11 8,281 Marvell Technology Group 109,185 0.03 5,796 Maxim Integrated Products 200,397 0.05 4,083 Microchip Technology 193,636 0.05
21,791 Micron Technology 410,542 0.10 157,841 Microsoft 6,968,680 1.76
4,169 Motorola Solutions 239,050 0.06 6,332 NetApp 199,838 0.05
777 Netsuite 71,290 0.02 5,122 Nuance Communications 89,686 0.02
10,997 NVIDIA 221,150 0.06 71,149 Oracle 2,867,305 0.72
1,376 Palo Alto Networks 240,387 0.06 2,951 Qorvo 236,877 0.06
33,408 QUALCOMM 2,092,343 0.53 2,292 Rackspace Hosting 85,239 0.02 3,714 Red Hat 282,004 0.07
12,169 Salesforce.com 847,327 0.21 4,314 SanDisk 251,161 0.06 2,620 SBA Communications 301,221 0.08 6,622 Seagate Technology 314,545 0.08 2,896 Servicenow 215,202 0.05 3,848 Skyworks Solutions 400,577 0.10 2,532 Splunk 176,278 0.04 5,548 Sunedison 165,941 0.04
13,962 Symantec 324,617 0.08 3,116 Synopsys 157,825 0.04 2,957 Teradata 109,409 0.03
21,208 Texas Instruments 1,092,424 0.28 9,840 Twitter 356,405 0.09 2,130 VeriSign 131,464 0.03 1,680 Vmware 144,043 0.04 4,679 Western Digital 366,927 0.09 2,084 Workday 159,197 0.04
21,399 Xerox 227,685 0.06
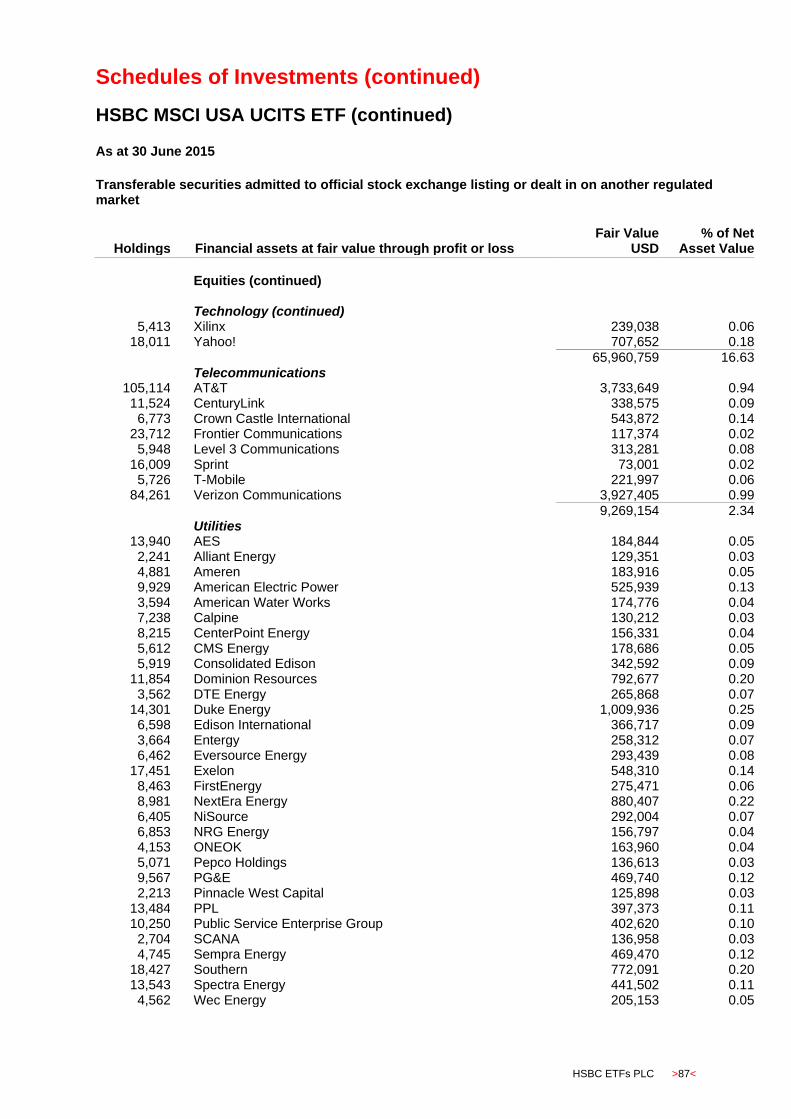
Schedules of Investments (continued)
HSBC MSCI USA UCITS ETF (continued)
HSBC ETFs PLC >87<
As at 30 June 2015
Transferable securities admitted to official stock exchange listing or dealt in on another regulated market
Holdings
Financial assets at fair value through profit or loss Fair Value
USD % of Net
Asset Value
Equities (continued) Technology (continued)
5,413 Xilinx 239,038 0.06 18,011 Yahoo! 707,652 0.18
65,960,759 16.63 Telecommunications
105,114 AT&T 3,733,649 0.94 11,524 CenturyLink 338,575 0.09
6,773 Crown Castle International 543,872 0.14 23,712 Frontier Communications 117,374 0.02
5,948 Level 3 Communications 313,281 0.08 16,009 Sprint 73,001 0.02
5,726 T-Mobile 221,997 0.06 84,261 Verizon Communications 3,927,405 0.99
9,269,154 2.34 Utilities
13,940 AES 184,844 0.05 2,241 Alliant Energy 129,351 0.03 4,881 Ameren 183,916 0.05 9,929 American Electric Power 525,939 0.13 3,594 American Water Works 174,776 0.04 7,238 Calpine 130,212 0.03 8,215 CenterPoint Energy 156,331 0.04 5,612 CMS Energy 178,686 0.05 5,919 Consolidated Edison 342,592 0.09
11,854 Dominion Resources 792,677 0.20 3,562 DTE Energy 265,868 0.07
14,301 Duke Energy 1,009,936 0.25 6,598 Edison International 366,717 0.09 3,664 Entergy 258,312 0.07 6,462 Eversource Energy 293,439 0.08
17,451 Exelon 548,310 0.14 8,463 FirstEnergy 275,471 0.06 8,981 NextEra Energy 880,407 0.22 6,405 NiSource 292,004 0.07 6,853 NRG Energy 156,797 0.04 4,153 ONEOK 163,960 0.04 5,071 Pepco Holdings 136,613 0.03 9,567 PG&E 469,740 0.12 2,213 Pinnacle West Capital 125,898 0.03
13,484 PPL 397,373 0.11 10,250 Public Service Enterprise Group 402,620 0.10
2,704 SCANA 136,958 0.03 4,745 Sempra Energy 469,470 0.12
18,427 Southern 772,091 0.20 13,543 Spectra Energy 441,502 0.11
4,562 Wec Energy 205,153 0.05
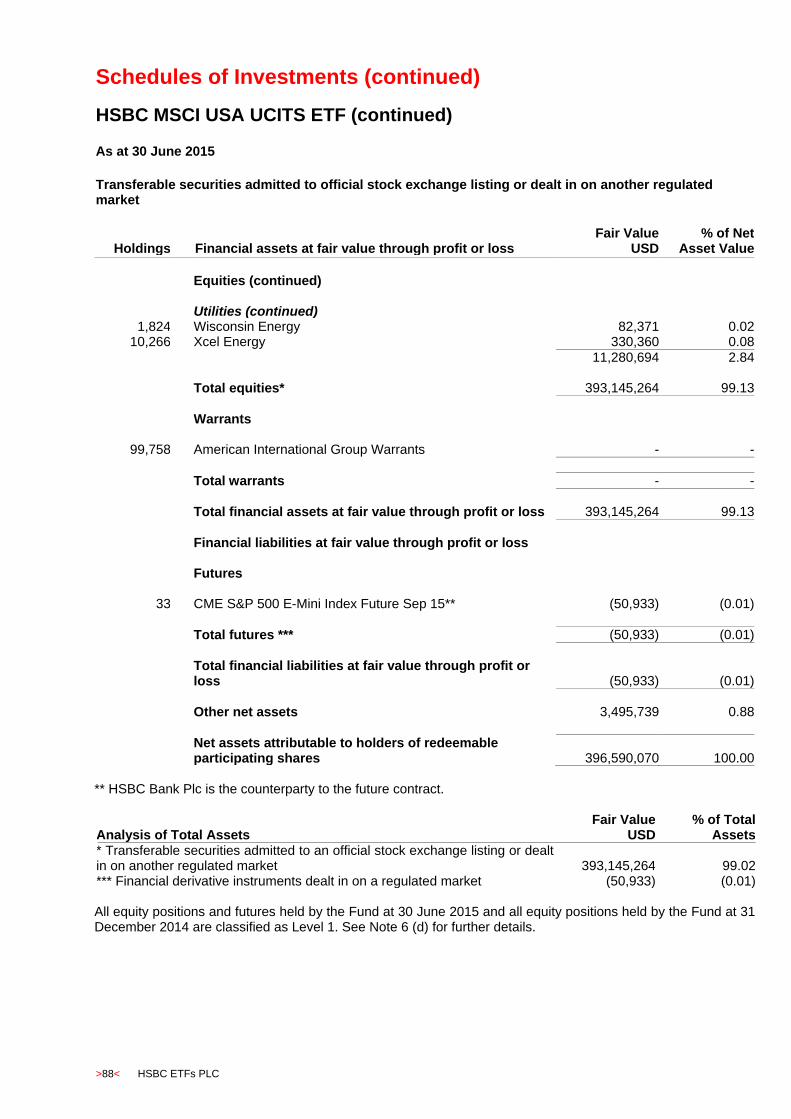
Schedules of Investments (continued)
HSBC MSCI USA UCITS ETF (continued)
>88< HSBC ETFs PLC
As at 30 June 2015
Transferable securities admitted to official stock exchange listing or dealt in on another regulated market
Holdings
Financial assets at fair value through profit or loss Fair Value
USD % of Net
Asset Value
Equities (continued) Utilities (continued)
1,824 Wisconsin Energy 82,371 0.02 10,266 Xcel Energy 330,360 0.08
11,280,694 2.84 Total equities* 393,145,264 99.13
Warrants
99,758 American International Group Warrants - -
Total warrants - -
Total financial assets at fair value through profit or loss 393,145,264 99.13
Financial liabilities at fair value through profit or loss Futures
33 CME S&P 500 E-Mini Index Future Sep 15** (50,933) (0.01)
Total futures *** (50,933) (0.01)
Total financial liabilities at fair value through profit or loss (50,933) (0.01)
Other net assets 3,495,739 0.88
Net assets attributable to holders of redeemable participating shares 396,590,070 100.00
** HSBC Bank Plc is the counterparty to the future contract.
Analysis of Total Assets Fair Value
USD % of Total
Assets * Transferable securities admitted to an official stock exchange listing or dealt in on another regulated market 393,145,264 99.02 *** Financial derivative instruments dealt in on a regulated market (50,933) (0.01) All equity positions and futures held by the Fund at 30 June 2015 and all equity positions held by the Fund at 31 December 2014 are classified as Level 1. See Note 6 (d) for further details.
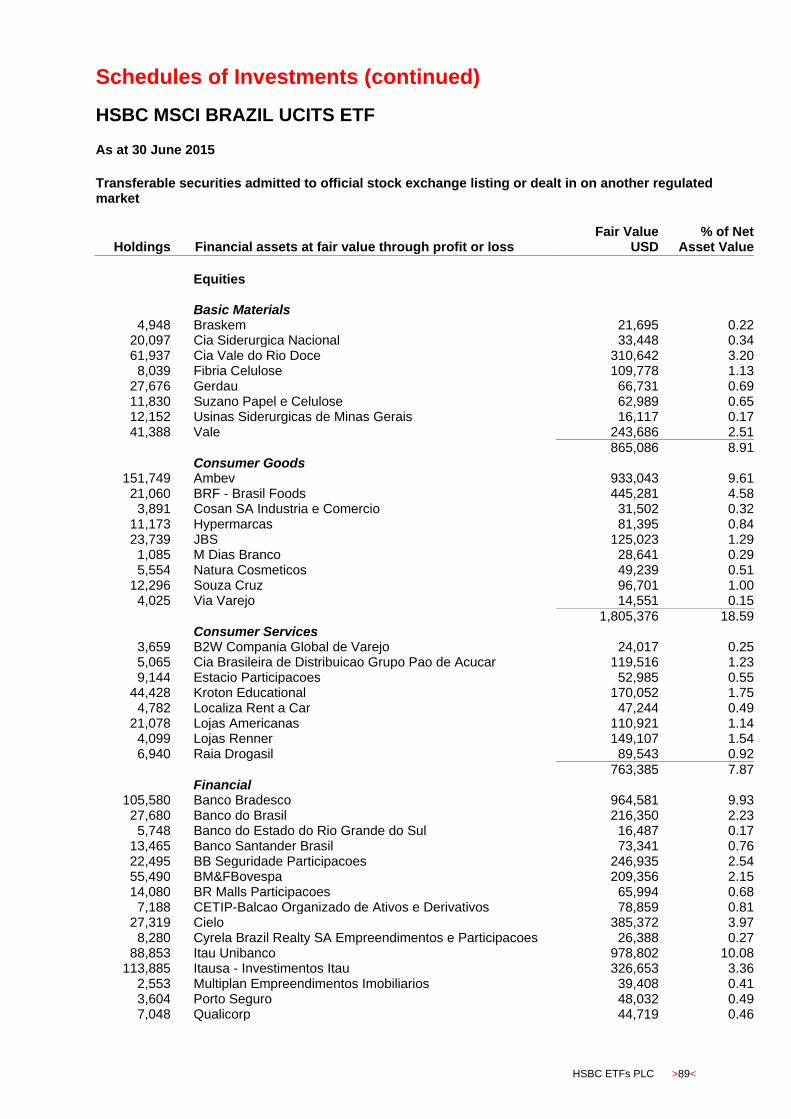
Schedules of Investments (continued)
HSBC MSCI BRAZIL UCITS ETF
HSBC ETFs PLC >89<
As at 30 June 2015
Transferable securities admitted to official stock exchange listing or dealt in on another regulated market
Holdings
Financial assets at fair value through profit or loss Fair Value
USD % of Net
Asset Value
Equities Basic Materials
4,948 Braskem 21,695 0.22 20,097 Cia Siderurgica Nacional 33,448 0.34 61,937 Cia Vale do Rio Doce 310,642 3.20
8,039 Fibria Celulose 109,778 1.13 27,676 Gerdau 66,731 0.69 11,830 Suzano Papel e Celulose 62,989 0.65 12,152 Usinas Siderurgicas de Minas Gerais 16,117 0.17 41,388 Vale 243,686 2.51
865,086 8.91 Consumer Goods
151,749 Ambev 933,043 9.61 21,060 BRF - Brasil Foods 445,281 4.58
3,891 Cosan SA Industria e Comercio 31,502 0.32 11,173 Hypermarcas 81,395 0.84 23,739 JBS 125,023 1.29
1,085 M Dias Branco 28,641 0.29 5,554 Natura Cosmeticos 49,239 0.51
12,296 Souza Cruz 96,701 1.00 4,025 Via Varejo 14,551 0.15
1,805,376 18.59 Consumer Services
3,659 B2W Compania Global de Varejo 24,017 0.25 5,065 Cia Brasileira de Distribuicao Grupo Pao de Acucar 119,516 1.23 9,144 Estacio Participacoes 52,985 0.55
44,428 Kroton Educational 170,052 1.75 4,782 Localiza Rent a Car 47,244 0.49
21,078 Lojas Americanas 110,921 1.14 4,099 Lojas Renner 149,107 1.54 6,940 Raia Drogasil 89,543 0.92
763,385 7.87 Financial
105,580 Banco Bradesco 964,581 9.93 27,680 Banco do Brasil 216,350 2.23
5,748 Banco do Estado do Rio Grande do Sul 16,487 0.17 13,465 Banco Santander Brasil 73,341 0.76 22,495 BB Seguridade Participacoes 246,935 2.54 55,490 BM&FBovespa 209,356 2.15 14,080 BR Malls Participacoes 65,994 0.68
7,188 CETIP-Balcao Organizado de Ativos e Derivativos 78,859 0.81 27,319 Cielo 385,372 3.97
8,280 Cyrela Brazil Realty SA Empreendimentos e Participacoes 26,388 0.27 88,853 Itau Unibanco 978,802 10.08
113,885 Itausa - Investimentos Itau 326,653 3.36 2,553 Multiplan Empreendimentos Imobiliarios 39,408 0.41 3,604 Porto Seguro 48,032 0.49 7,048 Qualicorp 44,719 0.46

Schedules of Investments (continued)
HSBC MSCI BRAZIL UCITS ETF (continued)
>90< HSBC ETFs PLC
As at 30 June 2015
Transferable securities admitted to official stock exchange listing or dealt in on another regulated market
Holdings
Financial assets at fair value through profit or loss Fair Value
USD % of Net
Asset Value
Equities (continued) Financial (continued)
5,554 Sul America 27,123 0.28 3,748,400 38.59 Healthcare
8,519 Odontoprev 29,563 0.30 29,563 0.30 Industrial
28,418 CCR 136,400 1.40 9,545 Duratex 22,308 0.23 7,122 EcoRodovias Infraestrutura e Logistica 17,768 0.18
21,437 Embraer 163,276 1.68 17,772 Klabin 109,216 1.13 18,196 Weg 111,587 1.15
560,555 5.77 Oil & Gas
126,093 Petrobras 515,916 5.31 95,719 Petroleo Brasileiro 432,313 4.45
948,229 9.76 Technology
3,905 Totvs 49,026 0.50
49,026 0.50 Telecommunications
11,060 Oi 20,828 0.21 11,017 Telefonica Brasil 154,488 1.59 27,289 Tim Participacoes 89,956 0.93
265,272 2.73 Utilities
3,200 AES Tiete 18,027 0.19 7,194 Centrais Eletricas Brasileiras 19,615 0.20
24,271 Cia Energetica de Minas Gerais 92,665 0.95 6,041 Cia Energetica de Sao Paulo 38,136 0.39 3,268 CIA Paranaense De Energia 36,768 0.38 6,406 CPFL Energia 39,697 0.41 7,591 EDP - Energias do Brasil 28,127 0.29
11,005 Sabesp 58,454 0.60 5,258 Tractebel Energia 57,871 0.60 3,059 Transmissora Alianca de Energia Eletrica 20,266 0.21
11,625 Ultrapar Participacoes 245,867 2.53
655,493 6.75 Total equities 9,690,385 99.77
Total financial assets at fair value through profit or loss 9,690,385 99.77 Other net assets 22,191 0.23
Net assets attributable to holders of redeemable participating shares 9,712,576 100.00
Schedules of Investments (continued)
HSBC MSCI BRAZIL UCITS ETF (continued)
HSBC ETFs PLC >91<
All financial assets held by the Fund at 30 June 2015 are transferable securities that have been admitted to an official stock exchange listing or are dealt in on another market. All equity positions and futures held by the Fund at 30 June 2015 and at 31 December 2014 are classified as Level 1. See Note 6(d) for further details.
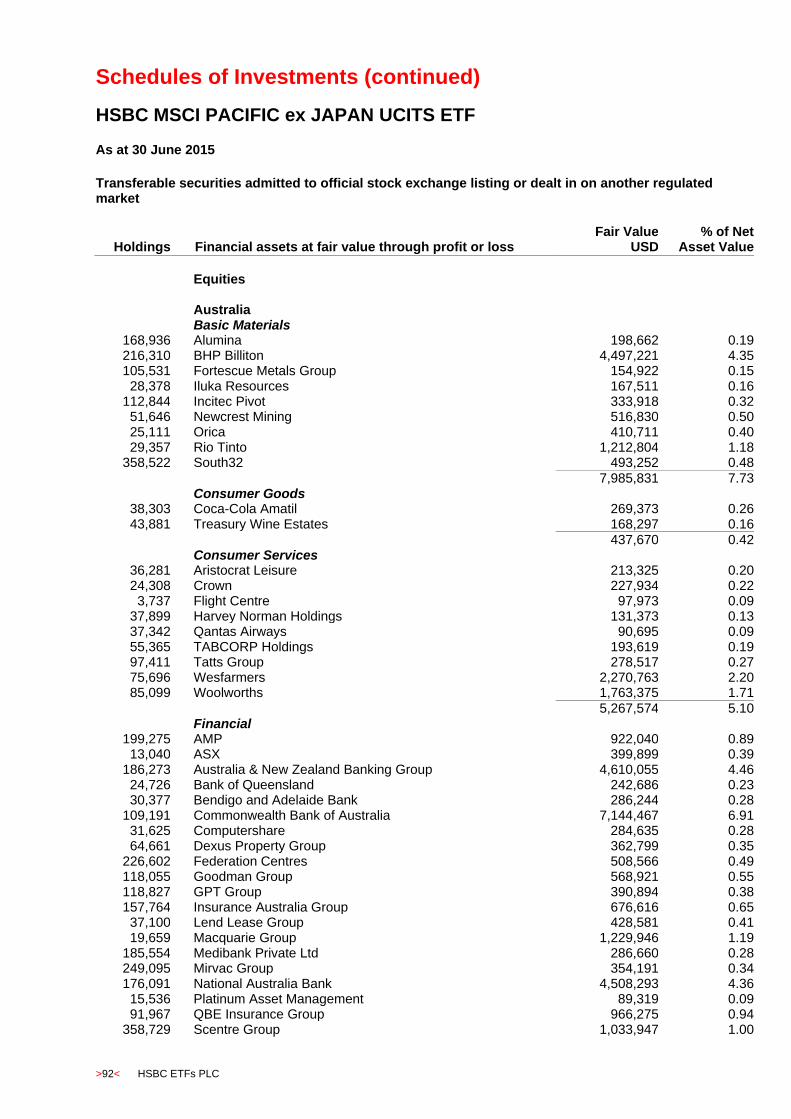
Schedules of Investments (continued)
HSBC MSCI PACIFIC ex JAPAN UCITS ETF
>92< HSBC ETFs PLC
As at 30 June 2015
Transferable securities admitted to official stock exchange listing or dealt in on another regulated market
Holdings
Financial assets at fair value through profit or loss Fair Value
USD % of Net
Asset Value
Equities Australia Basic Materials
168,936 Alumina 198,662 0.19 216,310 BHP Billiton 4,497,221 4.35 105,531 Fortescue Metals Group 154,922 0.15 28,378 Iluka Resources 167,511 0.16
112,844 Incitec Pivot 333,918 0.32 51,646 Newcrest Mining 516,830 0.50 25,111 Orica 410,711 0.40 29,357 Rio Tinto 1,212,804 1.18
358,522 South32 493,252 0.48
7,985,831 7.73 Consumer Goods
38,303 Coca-Cola Amatil 269,373 0.26 43,881 Treasury Wine Estates 168,297 0.16
437,670 0.42 Consumer Services
36,281 Aristocrat Leisure 213,325 0.20 24,308 Crown 227,934 0.22
3,737 Flight Centre 97,973 0.09 37,899 Harvey Norman Holdings 131,373 0.13 37,342 Qantas Airways 90,695 0.09 55,365 TABCORP Holdings 193,619 0.19 97,411 Tatts Group 278,517 0.27 75,696 Wesfarmers 2,270,763 2.20 85,099 Woolworths 1,763,375 1.71
5,267,574 5.10 Financial
199,275 AMP 922,040 0.89 13,040 ASX 399,899 0.39
186,273 Australia & New Zealand Banking Group 4,610,055 4.46 24,726 Bank of Queensland 242,686 0.23 30,377 Bendigo and Adelaide Bank 286,244 0.28
109,191 Commonwealth Bank of Australia 7,144,467 6.91 31,625 Computershare 284,635 0.28 64,661 Dexus Property Group 362,799 0.35
226,602 Federation Centres 508,566 0.49 118,055 Goodman Group 568,921 0.55 118,827 GPT Group 390,894 0.38 157,764 Insurance Australia Group 676,616 0.65 37,100 Lend Lease Group 428,581 0.41 19,659 Macquarie Group 1,229,946 1.19
185,554 Medibank Private Ltd 286,660 0.28 249,095 Mirvac Group 354,191 0.34 176,091 National Australia Bank 4,508,293 4.36 15,536 Platinum Asset Management 89,319 0.09 91,967 QBE Insurance Group 966,275 0.94
358,729 Scentre Group 1,033,947 1.00
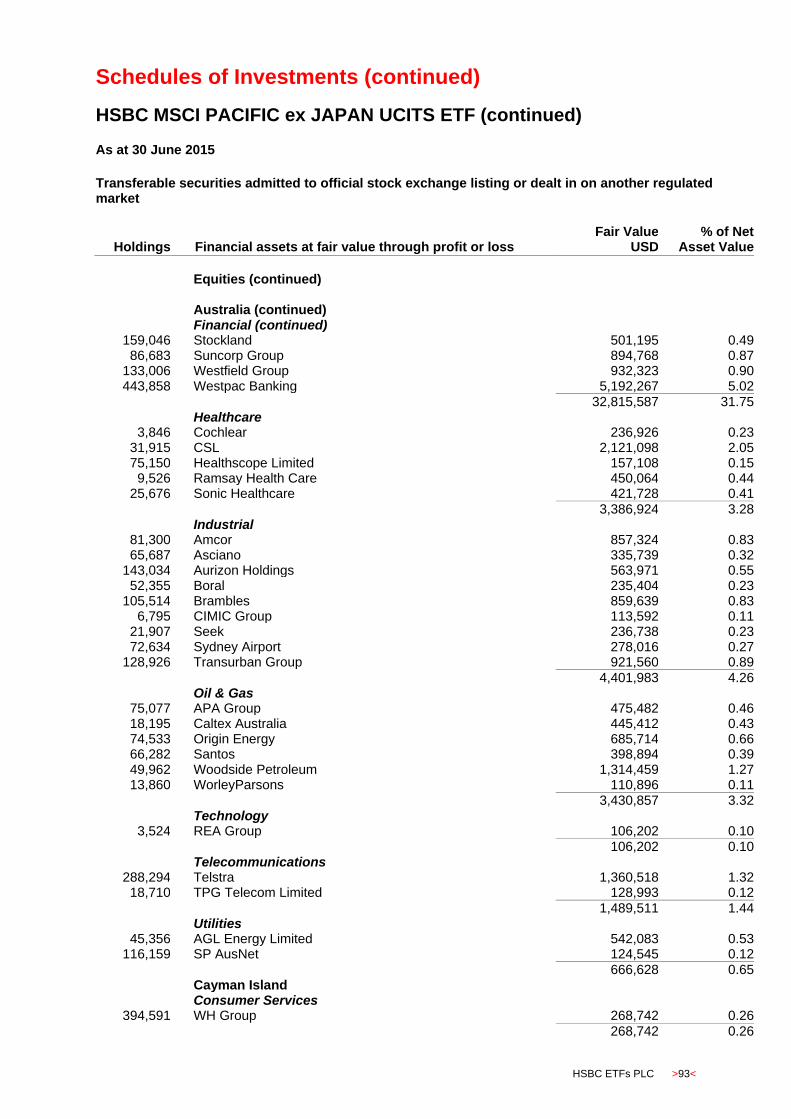
Schedules of Investments (continued)
HSBC MSCI PACIFIC ex JAPAN UCITS ETF (continued)
HSBC ETFs PLC >93<
As at 30 June 2015
Transferable securities admitted to official stock exchange listing or dealt in on another regulated market
Holdings
Financial assets at fair value through profit or loss Fair Value
USD % of Net
Asset Value
Equities (continued) Australia (continued) Financial (continued)
159,046 Stockland 501,195 0.49 86,683 Suncorp Group 894,768 0.87
133,006 Westfield Group 932,323 0.90 443,858 Westpac Banking 5,192,267 5.02
32,815,587 31.75 Healthcare
3,846 Cochlear 236,926 0.23 31,915 CSL 2,121,098 2.05 75,150 Healthscope Limited 157,108 0.15
9,526 Ramsay Health Care 450,064 0.44 25,676 Sonic Healthcare 421,728 0.41
3,386,924 3.28 Industrial
81,300 Amcor 857,324 0.83 65,687 Asciano 335,739 0.32
143,034 Aurizon Holdings 563,971 0.55 52,355 Boral 235,404 0.23
105,514 Brambles 859,639 0.83 6,795 CIMIC Group 113,592 0.11
21,907 Seek 236,738 0.23 72,634 Sydney Airport 278,016 0.27
128,926 Transurban Group 921,560 0.89
4,401,983 4.26 Oil & Gas
75,077 APA Group 475,482 0.46 18,195 Caltex Australia 445,412 0.43 74,533 Origin Energy 685,714 0.66 66,282 Santos 398,894 0.39 49,962 Woodside Petroleum 1,314,459 1.27 13,860 WorleyParsons 110,896 0.11
3,430,857 3.32 Technology
3,524 REA Group 106,202 0.10 106,202 0.10 Telecommunications
288,294 Telstra 1,360,518 1.32 18,710 TPG Telecom Limited 128,993 0.12
1,489,511 1.44 Utilities
45,356 AGL Energy Limited 542,083 0.53 116,159 SP AusNet 124,545 0.12
666,628 0.65 Cayman Island Consumer Services
394,591 WH Group 268,742 0.26
268,742 0.26

Schedules of Investments (continued)
HSBC MSCI PACIFIC ex JAPAN UCITS ETF (continued)
>94< HSBC ETFs PLC
As at 30 June 2015
Transferable securities admitted to official stock exchange listing or dealt in on another regulated market
Holdings
Financial assets at fair value through profit or loss Fair Value
USD % of Net
Asset Value
Equities (continued) Hong Kong Consumer Goods
158,259 First Pacific 133,506 0.13 394,293 Li & Fung 312,788 0.30 91,862 Techtronic Industries 300,971 0.29 49,533 Yue Yuen Industrial Holdings 165,801 0.16
913,066 0.88 Consumer Services
78,936 Cathay Pacific Airways 194,068 0.19 157,249 Galaxy Entertainment Group 626,761 0.61 64,183 MGM China Holdings 104,977 0.10 98,106 MTR 456,834 0.44 84,383 Shangri-La Asia 117,771 0.11
132,142 SJM Holdings 143,178 0.14
1,643,589 1.59 Financial
811,319 AIA Group 5,311,083 5.14 79,231 Bank of East Asia 346,458 0.34
249,316 BOC Hong Kong Holdings 1,038,743 1.01 181,801 Cheung Kong Property Holdings 1,507,866 1.46 181,747 CK Hutchison Holdings 2,670,216 2.58 151,100 Hang Lung Properties 449,253 0.43 51,521 Hang Seng Bank 1,006,821 0.97 77,825 Henderson Land Development 532,549 0.52 74,764 Hong Kong Exchanges and Clearing 2,638,542 2.55 43,121 Hysan Development 186,889 0.18 43,908 Kerry Properties 172,176 0.17
153,082 Link REIT 896,469 0.87 359,349 New World Development 470,013 0.45 204,187 Sino Land 341,341 0.33 114,546 Sun Hung Kai Properties 1,855,774 1.80 78,261 Swire Properties 249,848 0.24 61,575 Wheelock & Co 314,525 0.30
19,988,566 19.34 Industrial
42,419 Cheung Kong Infrastructure Holdings 329,391 0.32 318,879 Noble Group 179,984 0.18 100,113 NWS Holdings 144,890 0.14 39,639 Swire Pacific 498,265 0.48 91,855 Wharf Holdings 611,375 0.59
128,333 Yangzijiang Shipbuilding Holdings 134,862 0.13
1,898,767 1.84 Technology
16,081 ASM Pacific Technology 159,305 0.15 159,305 0.15

Schedules of Investments (continued)
HSBC MSCI PACIFIC ex JAPAN UCITS ETF (continued)
HSBC ETFs PLC >95<
As at 30 June 2015
Transferable securities admitted to official stock exchange listing or dealt in on another regulated market
Holdings
Financial assets at fair value through profit or loss Fair Value
USD % of Net
Asset Value
Equities (continued) Hong Kong (continued) Telecommunications
179,047 HKT Trust 210,629 0.20 276,694 PCCW 165,248 0.16
375,877 0.36 Utilities
127,667 CLP Holdings 1,085,224 1.05 467,444 Hong Kong & China Gas 980,405 0.95 93,463 Power Assets Holdings 852,343 0.82
2,917,972 2.82 Ireland Industrial
30,263 James Hardie Industries 402,866 0.39
402,866 0.39 Macau Consumer Services
163,043 Sands China 548,906 0.53 104,251 Wynn Macau 174,008 0.17
722,914 0.70 New Zealand Healthcare
25,086 Ryman Healthcare 134,368 0.13
134,368 0.13 Industrial
64,345 Auckland International Airport 214,754 0.21 46,013 Fletcher Building 252,683 0.24
467,437 0.45 Telecommunications
123,616 Spark New Zealand 233,666 0.23
233,666 0.23 Utilities
24,522 Contact Energy 83,087 0.08 85,388 Meridian Energy 124,735 0.12 47,614 Mighty River Power 89,842 0.09
297,664 0.29 Singapore Consumer Goods
477,037 Golden Agri-Resources 145,254 0.14 128,492 Wilmar International 312,999 0.30
458,253 0.44 Consumer Services
27,648 City Developments 200,815 0.19 144,163 ComfortDelGro 335,113 0.33 409,507 Genting Singapore PLC 272,194 0.26
7,935 Jardine Cycle & Carriage 179,747 0.17 36,111 Singapore Airlines 287,762 0.28
107,794 Singapore Press Holdings 326,624 0.32
1,602,255 1.55

Schedules of Investments (continued)
HSBC MSCI PACIFIC ex JAPAN UCITS ETF (continued)
>96< HSBC ETFs PLC
As at 30 June 2015
Transferable securities admitted to official stock exchange listing or dealt in on another regulated market
Holdings
Financial assets at fair value through profit or loss Fair Value
USD % of Net
Asset Value
Equities (continued)
Singapore (continued) Financial
136,687 Ascendas Real Estate Investment Trust 249,722 0.24 138,334 CapitaCommercial 160,268 0.16 172,711 CapitaLand 448,933 0.43 162,073 CapitaMall Trust 258,787 0.25 116,921 DBS Group Holdings 1,796,580 1.74 211,939 Global Logistic Properties 398,222 0.39 378,739 Hutchison Port Holdings Trust 238,606 0.23 201,765 Oversea-Chinese Banking 1,525,412 1.48 54,127 Singapore Exchange 314,753 0.30
158,718 Suntec Real Estate Investment Trust 203,333 0.20 87,028 United Overseas Bank 1,491,078 1.44 31,834 UOL Group 163,603 0.16
7,249,297 7.02 Industrial
97,977 Keppel 598,122 0.58 65,627 SembCorp Industries 189,595 0.18 56,478 SembCorp Marine 119,122 0.12
104,328 Singapore Technologies Engineering 255,687 0.25
1,162,526 1.13 Telecommunications
537,100 Singapore Telecommunications 1,679,310 1.63 40,407 StarHub 118,535 0.11
1,797,845 1.74 Total equities* 102,683,742 99.36
Total financial assets at fair value through profit or loss 102,683,742 99.36
Financial liabilities at fair value through profit or loss Futures**
2 HKG H-Shares China Enterprises Idx Fut Jul 2015 (7,739) (0.01) 4 SFE SPI 200 Future September 2015 (7,013) - 1 SGX MSCI Singapore Index ETS Future Jul 2015 (431) -
(15,183) (0.01)
Total futures*** (15,183) (0.01)
Total financial liabilities at fair value through profit or loss (15,183) (0.01)
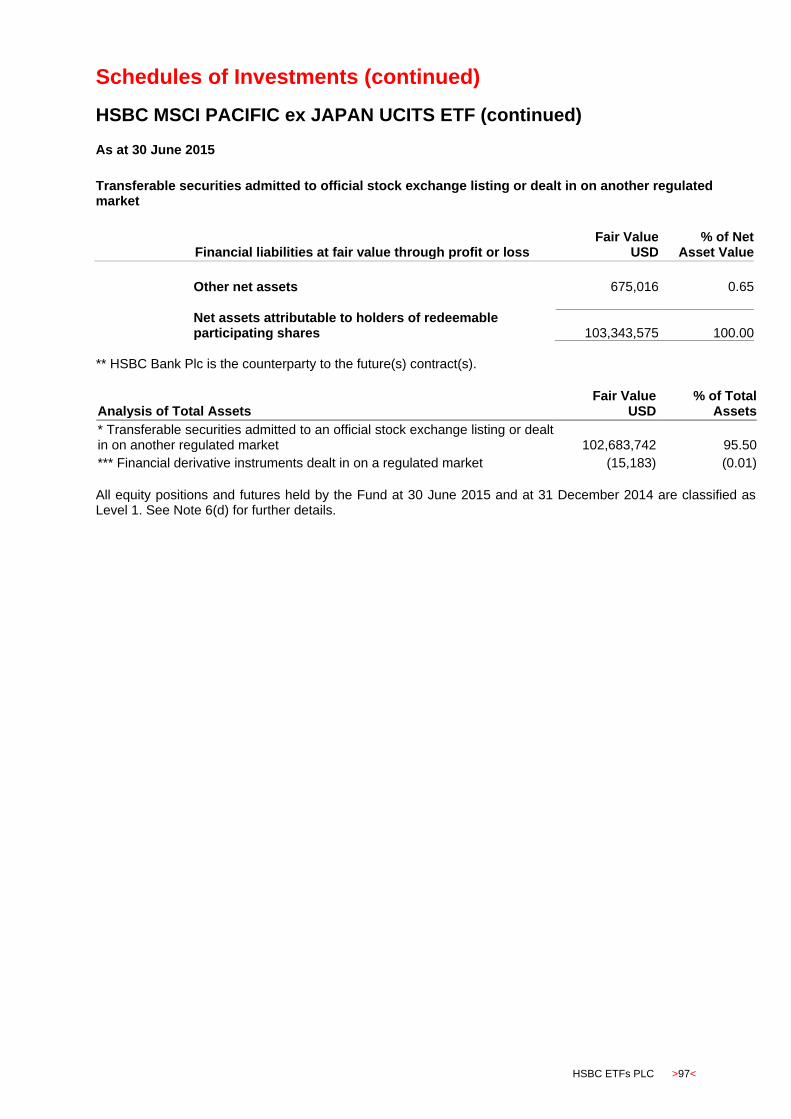
Schedules of Investments (continued)
HSBC MSCI PACIFIC ex JAPAN UCITS ETF (continued)
HSBC ETFs PLC >97<
As at 30 June 2015
Transferable securities admitted to official stock exchange listing or dealt in on another regulated market
Financial liabilities at fair value through profit or loss Fair Value
USD % of Net
Asset Value
Other net assets 675,016 0.65
Net assets attributable to holders of redeemable participating shares 103,343,575 100.00 ** HSBC Bank Plc is the counterparty to the future(s) contract(s).
Analysis of Total Assets Fair Value
USD % of Total
Assets
* Transferable securities admitted to an official stock exchange listing or dealt in on another regulated market 102,683,742 95.50
*** Financial derivative instruments dealt in on a regulated market (15,183) (0.01)
All equity positions and futures held by the Fund at 30 June 2015 and at 31 December 2014 are classified as Level 1. See Note 6(d) for further details.
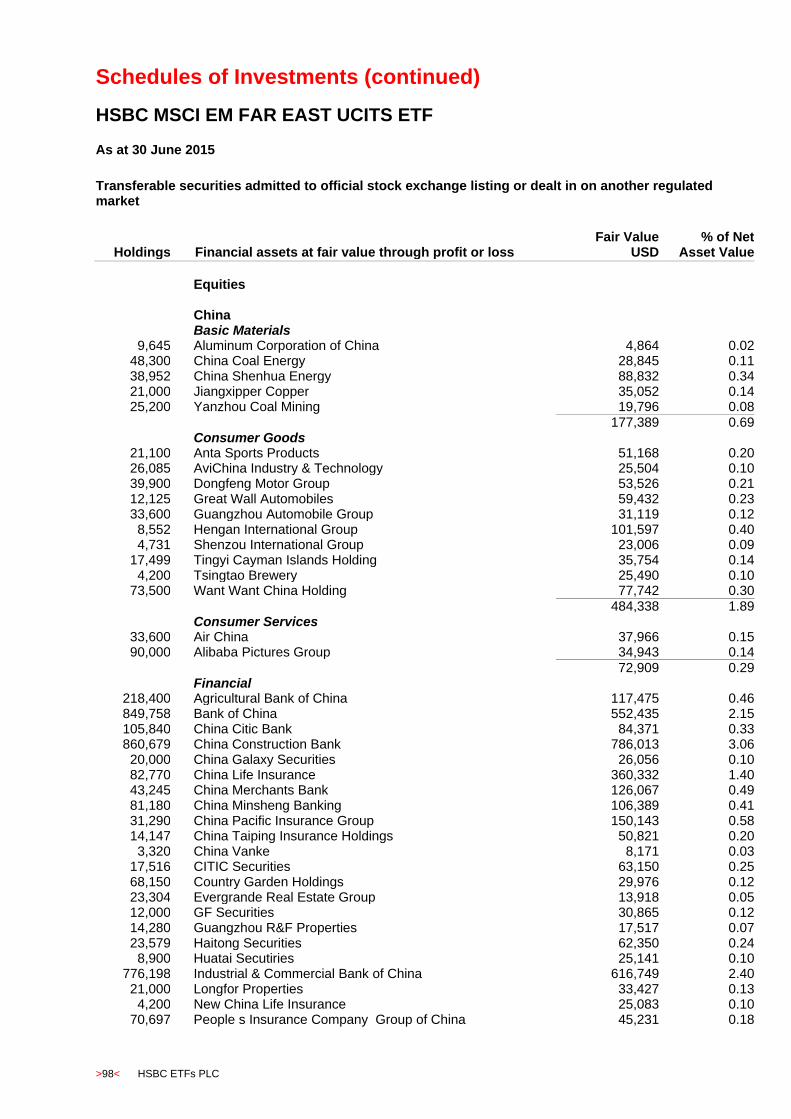
Schedules of Investments (continued)
HSBC MSCI EM FAR EAST UCITS ETF
>98< HSBC ETFs PLC
As at 30 June 2015
Transferable securities admitted to official stock exchange listing or dealt in on another regulated market
Holdings
Financial assets at fair value through profit or loss Fair Value
USD % of Net
Asset Value
Equities
China Basic Materials
9,645 Aluminum Corporation of China 4,864 0.02 48,300 China Coal Energy 28,845 0.11 38,952 China Shenhua Energy 88,832 0.34 21,000 Jiangxipper Copper 35,052 0.14 25,200 Yanzhou Coal Mining 19,796 0.08
177,389 0.69 Consumer Goods
21,100 Anta Sports Products 51,168 0.20 26,085 AviChina Industry & Technology 25,504 0.10 39,900 Dongfeng Motor Group 53,526 0.21 12,125 Great Wall Automobiles 59,432 0.23 33,600 Guangzhou Automobile Group 31,119 0.12
8,552 Hengan International Group 101,597 0.40 4,731 Shenzou International Group 23,006 0.09
17,499 Tingyi Cayman Islands Holding 35,754 0.14 4,200 Tsingtao Brewery 25,490 0.10
73,500 Want Want China Holding 77,742 0.30
484,338 1.89 Consumer Services
33,600 Air China 37,966 0.15 90,000 Alibaba Pictures Group 34,943 0.14
72,909 0.29 Financial
218,400 Agricultural Bank of China 117,475 0.46 849,758 Bank of China 552,435 2.15 105,840 China Citic Bank 84,371 0.33 860,679 China Construction Bank 786,013 3.06 20,000 China Galaxy Securities 26,056 0.10 82,770 China Life Insurance 360,332 1.40 43,245 China Merchants Bank 126,067 0.49 81,180 China Minsheng Banking 106,389 0.41 31,290 China Pacific Insurance Group 150,143 0.58 14,147 China Taiping Insurance Holdings 50,821 0.20
3,320 China Vanke 8,171 0.03 17,516 CITIC Securities 63,150 0.25 68,150 Country Garden Holdings 29,976 0.12 23,304 Evergrande Real Estate Group 13,918 0.05 12,000 GF Securities 30,865 0.12 14,280 Guangzhou R&F Properties 17,517 0.07 23,579 Haitong Securities 62,350 0.24
8,900 Huatai Secutiries 25,141 0.10 776,198 Industrial & Commercial Bank of China 616,749 2.40 21,000 Longfor Properties 33,427 0.13
4,200 New China Life Insurance 25,083 0.10 70,697 People s Insurance Company Group of China 45,231 0.18
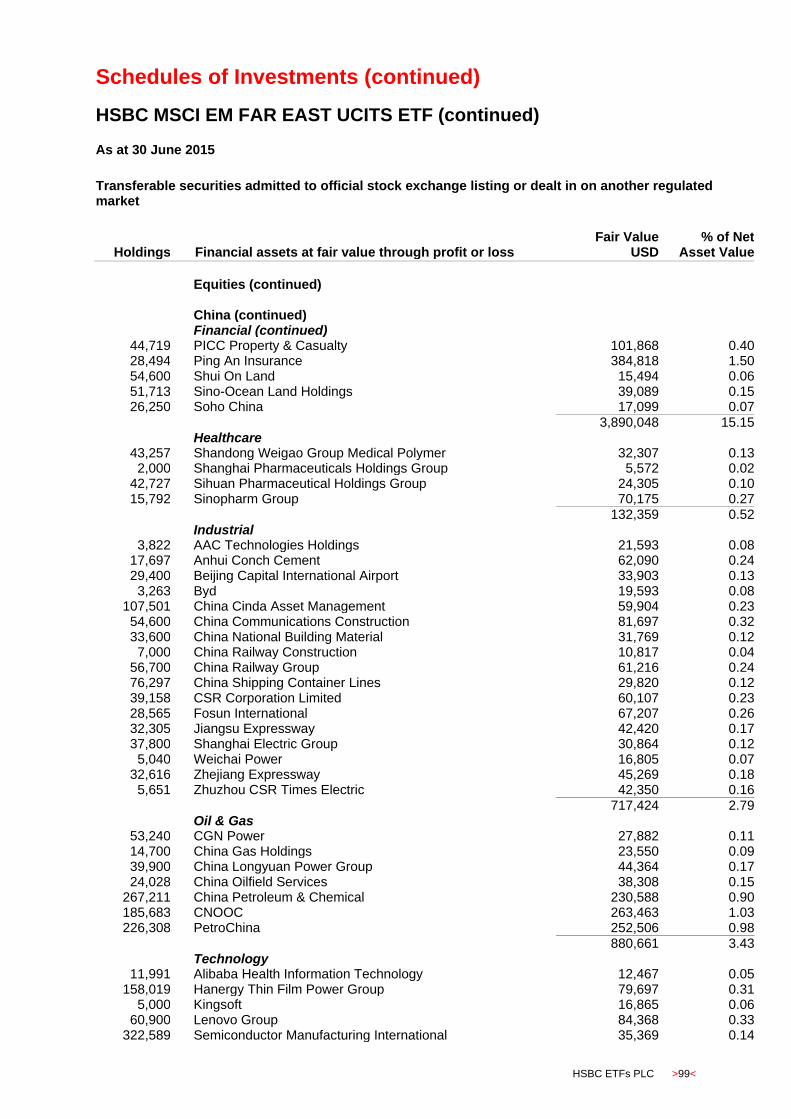
Schedules of Investments (continued)
HSBC MSCI EM FAR EAST UCITS ETF (continued)
HSBC ETFs PLC >99<
As at 30 June 2015
Transferable securities admitted to official stock exchange listing or dealt in on another regulated market
Holdings
Financial assets at fair value through profit or loss Fair Value
USD % of Net
Asset Value
Equities (continued)
China (continued) Financial (continued)
44,719 PICC Property & Casualty 101,868 0.40 28,494 Ping An Insurance 384,818 1.50 54,600 Shui On Land 15,494 0.06 51,713 Sino-Ocean Land Holdings 39,089 0.15 26,250 Soho China 17,099 0.07
3,890,048 15.15 Healthcare
43,257 Shandong Weigao Group Medical Polymer 32,307 0.13 2,000 Shanghai Pharmaceuticals Holdings Group 5,572 0.02
42,727 Sihuan Pharmaceutical Holdings Group 24,305 0.10 15,792 Sinopharm Group 70,175 0.27
132,359 0.52 Industrial
3,822 AAC Technologies Holdings 21,593 0.08 17,697 Anhui Conch Cement 62,090 0.24 29,400 Beijing Capital International Airport 33,903 0.13
3,263 Byd 19,593 0.08 107,501 China Cinda Asset Management 59,904 0.23 54,600 China Communications Construction 81,697 0.32 33,600 China National Building Material 31,769 0.12
7,000 China Railway Construction 10,817 0.04 56,700 China Railway Group 61,216 0.24 76,297 China Shipping Container Lines 29,820 0.12 39,158 CSR Corporation Limited 60,107 0.23 28,565 Fosun International 67,207 0.26 32,305 Jiangsu Expressway 42,420 0.17 37,800 Shanghai Electric Group 30,864 0.12
5,040 Weichai Power 16,805 0.07 32,616 Zhejiang Expressway 45,269 0.18
5,651 Zhuzhou CSR Times Electric 42,350 0.16
717,424 2.79 Oil & Gas
53,240 CGN Power 27,882 0.11 14,700 China Gas Holdings 23,550 0.09 39,900 China Longyuan Power Group 44,364 0.17 24,028 China Oilfield Services 38,308 0.15
267,211 China Petroleum & Chemical 230,588 0.90 185,683 CNOOC 263,463 1.03 226,308 PetroChina 252,506 0.98
880,661 3.43 Technology
11,991 Alibaba Health Information Technology 12,467 0.05 158,019 Hanergy Thin Film Power Group 79,697 0.31
5,000 Kingsoft 16,865 0.06 60,900 Lenovo Group 84,368 0.33
322,589 Semiconductor Manufacturing International 35,369 0.14
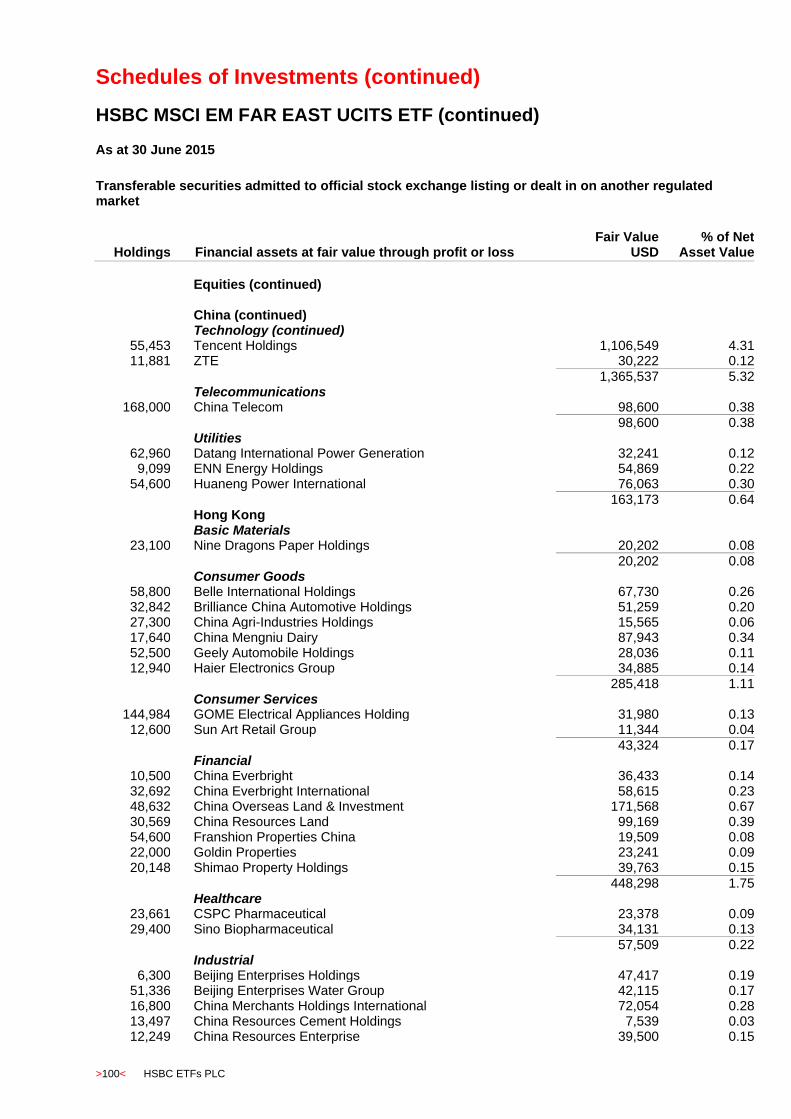
Schedules of Investments (continued)
HSBC MSCI EM FAR EAST UCITS ETF (continued)
>100< HSBC ETFs PLC
As at 30 June 2015
Transferable securities admitted to official stock exchange listing or dealt in on another regulated market
Holdings
Financial assets at fair value through profit or loss Fair Value
USD % of Net
Asset Value
Equities (continued)
China (continued) Technology (continued)
55,453 Tencent Holdings 1,106,549 4.31 11,881 ZTE 30,222 0.12
1,365,537 5.32 Telecommunications
168,000 China Telecom 98,600 0.38 98,600 0.38 Utilities
62,960 Datang International Power Generation 32,241 0.12 9,099 ENN Energy Holdings 54,869 0.22
54,600 Huaneng Power International 76,063 0.30
163,173 0.64 Hong Kong Basic Materials
23,100 Nine Dragons Paper Holdings 20,202 0.08
20,202 0.08 Consumer Goods
58,800 Belle International Holdings 67,730 0.26 32,842 Brilliance China Automotive Holdings 51,259 0.20 27,300 China Agri-Industries Holdings 15,565 0.06 17,640 China Mengniu Dairy 87,943 0.34 52,500 Geely Automobile Holdings 28,036 0.11 12,940 Haier Electronics Group 34,885 0.14
285,418 1.11 Consumer Services
144,984 GOME Electrical Appliances Holding 31,980 0.13 12,600 Sun Art Retail Group 11,344 0.04
43,324 0.17 Financial
10,500 China Everbright 36,433 0.14 32,692 China Everbright International 58,615 0.23 48,632 China Overseas Land & Investment 171,568 0.67 30,569 China Resources Land 99,169 0.39 54,600 Franshion Properties China 19,509 0.08 22,000 Goldin Properties 23,241 0.09 20,148 Shimao Property Holdings 39,763 0.15
448,298 1.75 Healthcare
23,661 CSPC Pharmaceutical 23,378 0.09 29,400 Sino Biopharmaceutical 34,131 0.13
57,509 0.22 Industrial
6,300 Beijing Enterprises Holdings 47,417 0.19 51,336 Beijing Enterprises Water Group 42,115 0.17 16,800 China Merchants Holdings International 72,054 0.28 13,497 China Resources Cement Holdings 7,539 0.03 12,249 China Resources Enterprise 39,500 0.15

Schedules of Investments (continued)
HSBC MSCI EM FAR EAST UCITS ETF (continued)
HSBC ETFs PLC >101<
As at 30 June 2015
Transferable securities admitted to official stock exchange listing or dealt in on another regulated market
Holdings
Financial assets at fair value through profit or loss Fair Value
USD % of Net
Asset Value
Equities (continued)
Hong Kong (continued) Industrial (continued)
20,334 China State Construction International Holdings 36,615 0.14 18,900 Citic Pacific 33,887 0.13
9,746 COSCO Pacific 13,225 0.05 8,400 Shanghai Industrial Holdings 28,496 0.11
320,848 1.25 Oil & Gas
33,600 Kunlun Energy 34,196 0.13
34,196 0.13 Telecommunications
66,238 China Mobile 847,995 3.30 56,533 China Unicom Hong Kong 88,964 0.35
936,959 3.65 Utilities
2,846 China Resources Gas Group 8,444 0.03 25,200 China Resources Power Holdings 70,374 0.27 78,668 GCL-Poly Energy Holdings 18,164 0.07 37,800 Guangdong Investment 52,951 0.21
149,933 0.58 Indonesia Basic Materials
140,700 Adaro Energy 8,021 0.03 6,476 Tambang Batubara Bukit Asam 4,080 0.02
12,101 0.05 Consumer Goods
4,682 Astra Agro Lestari 8,059 0.03 236,440 Astra International 125,469 0.49 81,119 Charoen Pokphand Indonesia 16,732 0.07
6,906 Gudang Garam 23,361 0.09 56,700 Indofood Sukses Makmur 27,962 0.11 16,800 Unilever Indonesia 49,773 0.19
251,356 0.98 Consumer Services
105,000 Global Mediacom 9,214 0.03 22,036 Matahari Department Store 27,354 0.11
36,568 0.14 Financial
120,473 Bank Central Asia 121,986 0.47 40,156 Bank Danamon Indonesia 12,951 0.05
111,941 Bank Mandiri 84,381 0.33 64,098 Bank Negara Indonesia Persero 25,481 0.10
134,729 Bank Rakyat Indonesia Persero 104,590 0.41 20,092 Bumi Serpong Damai 2,517 0.01
347,787 PT Lippo Karawaci 30,781 0.12
382,687 1.49
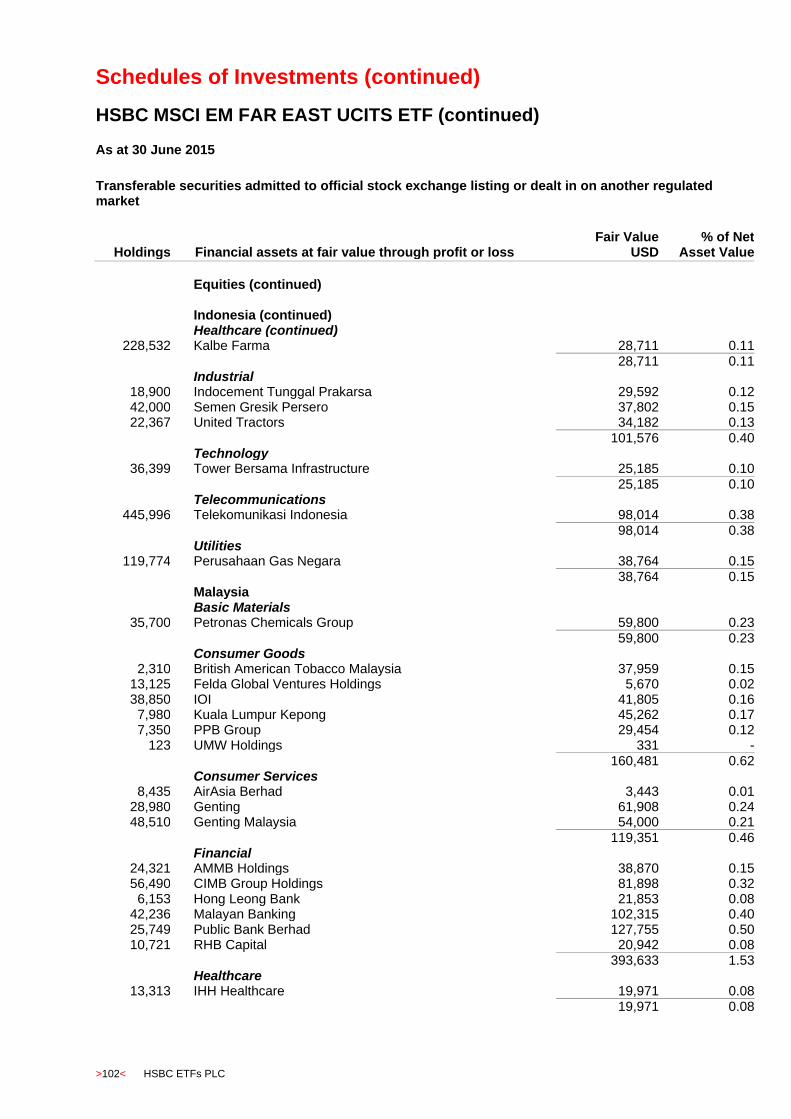
Schedules of Investments (continued)
HSBC MSCI EM FAR EAST UCITS ETF (continued)
>102< HSBC ETFs PLC
As at 30 June 2015
Transferable securities admitted to official stock exchange listing or dealt in on another regulated market
Holdings
Financial assets at fair value through profit or loss Fair Value
USD % of Net
Asset Value
Equities (continued)
Indonesia (continued) Healthcare (continued)
228,532 Kalbe Farma 28,711 0.11
28,711 0.11 Industrial
18,900 Indocement Tunggal Prakarsa 29,592 0.12 42,000 Semen Gresik Persero 37,802 0.15 22,367 United Tractors 34,182 0.13
101,576 0.40 Technology
36,399 Tower Bersama Infrastructure 25,185 0.10
25,185 0.10 Telecommunications
445,996 Telekomunikasi Indonesia 98,014 0.38
98,014 0.38 Utilities
119,774 Perusahaan Gas Negara 38,764 0.15 38,764 0.15 Malaysia Basic Materials
35,700 Petronas Chemicals Group 59,800 0.23
59,800 0.23 Consumer Goods
2,310 British American Tobacco Malaysia 37,959 0.15 13,125 Felda Global Ventures Holdings 5,670 0.02 38,850 IOI 41,805 0.16
7,980 Kuala Lumpur Kepong 45,262 0.17 7,350 PPB Group 29,454 0.12
123 UMW Holdings 331 -
160,481 0.62 Consumer Services
8,435 AirAsia Berhad 3,443 0.01 28,980 Genting 61,908 0.24 48,510 Genting Malaysia 54,000 0.21
119,351 0.46 Financial
24,321 AMMB Holdings 38,870 0.15 56,490 CIMB Group Holdings 81,898 0.32
6,153 Hong Leong Bank 21,853 0.08 42,236 Malayan Banking 102,315 0.40 25,749 Public Bank Berhad 127,755 0.50 10,721 RHB Capital 20,942 0.08
393,633 1.53 Healthcare
13,313 IHH Healthcare 19,971 0.08 19,971 0.08
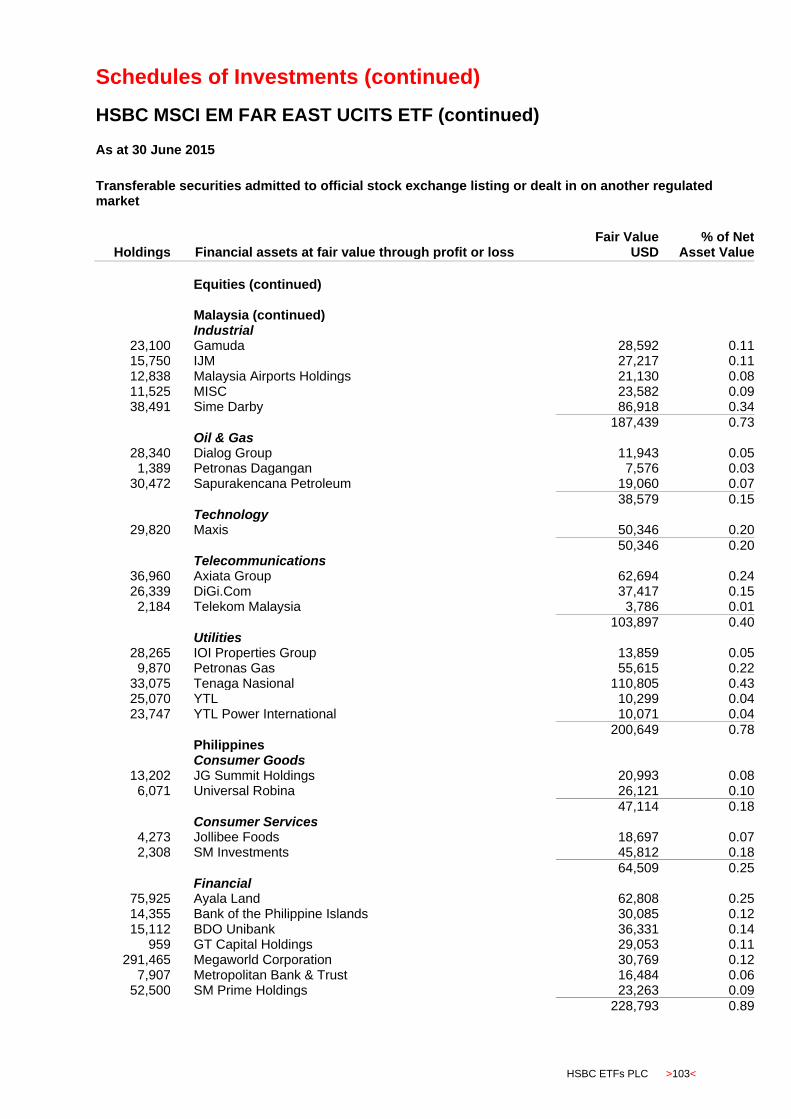
Schedules of Investments (continued)
HSBC MSCI EM FAR EAST UCITS ETF (continued)
HSBC ETFs PLC >103<
As at 30 June 2015
Transferable securities admitted to official stock exchange listing or dealt in on another regulated market
Holdings
Financial assets at fair value through profit or loss Fair Value
USD % of Net
Asset Value
Equities (continued)
Malaysia (continued) Industrial
23,100 Gamuda 28,592 0.11 15,750 IJM 27,217 0.11 12,838 Malaysia Airports Holdings 21,130 0.08 11,525 MISC 23,582 0.09 38,491 Sime Darby 86,918 0.34
187,439 0.73 Oil & Gas
28,340 Dialog Group 11,943 0.05 1,389 Petronas Dagangan 7,576 0.03
30,472 Sapurakencana Petroleum 19,060 0.07
38,579 0.15 Technology
29,820 Maxis 50,346 0.20
50,346 0.20 Telecommunications
36,960 Axiata Group 62,694 0.24 26,339 DiGi.Com 37,417 0.15
2,184 Telekom Malaysia 3,786 0.01
103,897 0.40 Utilities
28,265 IOI Properties Group 13,859 0.05 9,870 Petronas Gas 55,615 0.22
33,075 Tenaga Nasional 110,805 0.43 25,070 YTL 10,299 0.04 23,747 YTL Power International 10,071 0.04
200,649 0.78 Philippines Consumer Goods
13,202 JG Summit Holdings 20,993 0.08 6,071 Universal Robina 26,121 0.10
47,114 0.18 Consumer Services
4,273 Jollibee Foods 18,697 0.07 2,308 SM Investments 45,812 0.18
64,509 0.25 Financial
75,925 Ayala Land 62,808 0.25 14,355 Bank of the Philippine Islands 30,085 0.12 15,112 BDO Unibank 36,331 0.14
959 GT Capital Holdings 29,053 0.11 291,465 Megaworld Corporation 30,769 0.12
7,907 Metropolitan Bank & Trust 16,484 0.06 52,500 SM Prime Holdings 23,263 0.09
228,793 0.89

Schedules of Investments (continued)
HSBC MSCI EM FAR EAST UCITS ETF (continued)
>104< HSBC ETFs PLC
As at 30 June 2015
Transferable securities admitted to official stock exchange listing or dealt in on another regulated market
Holdings
Financial assets at fair value through profit or loss Fair Value
USD % of Net
Asset Value
Equities (continued)
Philippines (continued) Industrial
28,367 Aboitiz Equity Ventures 36,520 0.14 51,198 Alliance Global Group 24,640 0.10
1,509 Ayala 26,438 0.10 4,200 International Container Terminal 10,265 0.04
97,863 0.38 Telecommunications
1,162 Philippine Long Distance Telephone 72,416 0.28
72,416 0.28 Utilities
14,906 Aboitiz Power 15,041 0.06 140,910 Energy Development 23,376 0.09 158,710 Metro Pacific 16,649 0.06
55,066 0.21 South Korea Basic Materials
1,176 Hanwha Chemical 19,715 0.08 185 Honam Petrochemical 47,931 0.19 678 Hyundai Steel 41,150 0.16 111 Korea Zinc 54,234 0.21
97 Kumho Petro Chemical 6,157 0.02 566 LG Chemical 141,316 0.55 197 OCI 15,895 0.06 768 Pohang Iron Steel 154,226 0.60
480,624 1.87 Consumer Goods
380 Amorepacific 142,400 0.56 160 Amorepacific Group 26,823 0.11 137 CJ 36,355 0.14
46 CJ CheilJedang 18,186 0.07 880 Coway 72,107 0.28 667 Hankook Tire 25,115 0.10
38,000 Huaneng Renewables 15,342 0.06 838 Hyundai Mobis 159,269 0.62
2,407 Hyundai Motor 273,734 1.06 3,087 Kia Motors 125,367 0.49 1,151 KT & G 97,925 0.38 1,335 LG Electronics 56,490 0.22
105 LG Household & Healthcare 72,859 0.28 174 N C Soft 30,964 0.12
33 Orion 31,005 0.12
1,183,941 4.61 Consumer Services
1,065 Cheil Communications 16,518 0.06 265 E-Mart 54,879 0.21 214 Hotel Shilla 21,391 0.08 197 Hyundai Department Store 25,962 0.10
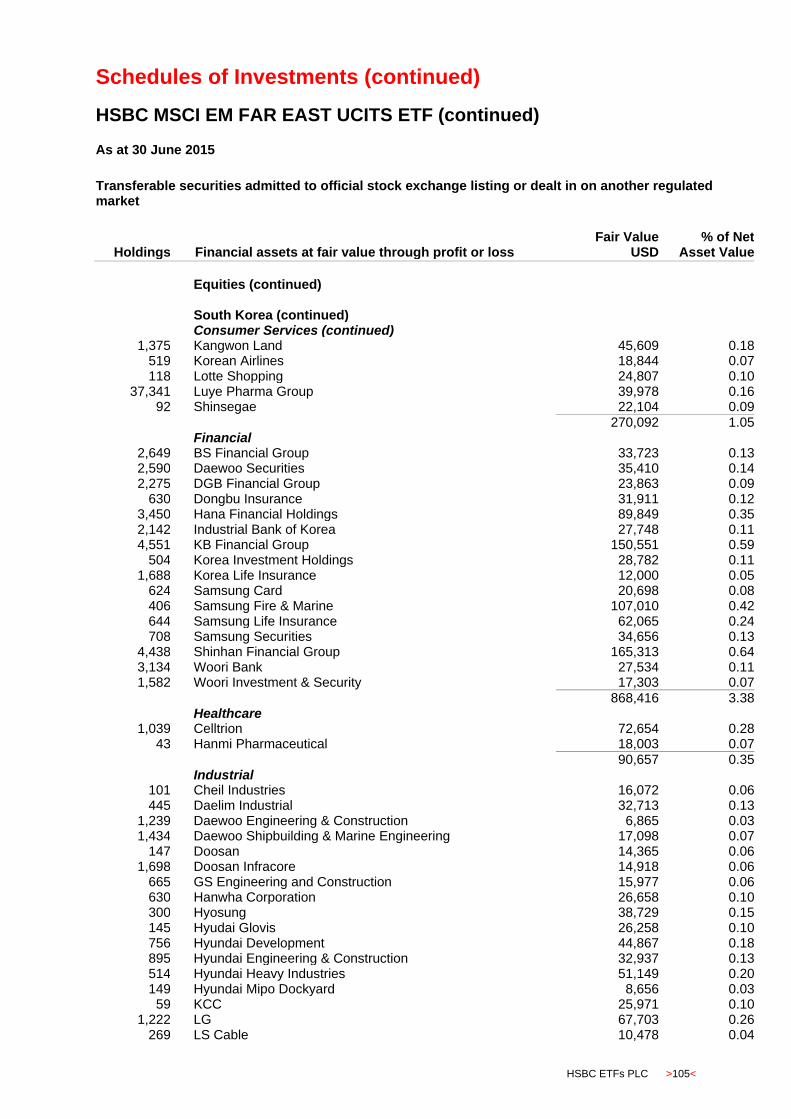
Schedules of Investments (continued)
HSBC MSCI EM FAR EAST UCITS ETF (continued)
HSBC ETFs PLC >105<
As at 30 June 2015
Transferable securities admitted to official stock exchange listing or dealt in on another regulated market
Holdings
Financial assets at fair value through profit or loss Fair Value
USD % of Net
Asset Value
Equities (continued)
South Korea (continued) Consumer Services (continued)
1,375 Kangwon Land 45,609 0.18 519 Korean Airlines 18,844 0.07 118 Lotte Shopping 24,807 0.10
37,341 Luye Pharma Group 39,978 0.16 92 Shinsegae 22,104 0.09
270,092 1.05 Financial
2,649 BS Financial Group 33,723 0.13 2,590 Daewoo Securities 35,410 0.14 2,275 DGB Financial Group 23,863 0.09
630 Dongbu Insurance 31,911 0.12 3,450 Hana Financial Holdings 89,849 0.35 2,142 Industrial Bank of Korea 27,748 0.11 4,551 KB Financial Group 150,551 0.59
504 Korea Investment Holdings 28,782 0.11 1,688 Korea Life Insurance 12,000 0.05
624 Samsung Card 20,698 0.08 406 Samsung Fire & Marine 107,010 0.42 644 Samsung Life Insurance 62,065 0.24 708 Samsung Securities 34,656 0.13
4,438 Shinhan Financial Group 165,313 0.64 3,134 Woori Bank 27,534 0.11 1,582 Woori Investment & Security 17,303 0.07
868,416 3.38 Healthcare
1,039 Celltrion 72,654 0.28 43 Hanmi Pharmaceutical 18,003 0.07
90,657 0.35 Industrial
101 Cheil Industries 16,072 0.06 445 Daelim Industrial 32,713 0.13
1,239 Daewoo Engineering & Construction 6,865 0.03 1,434 Daewoo Shipbuilding & Marine Engineering 17,098 0.07
147 Doosan 14,365 0.06 1,698 Doosan Infracore 14,918 0.06
665 GS Engineering and Construction 15,977 0.06 630 Hanwha Corporation 26,658 0.10 300 Hyosung 38,729 0.15 145 Hyudai Glovis 26,258 0.10 756 Hyundai Development 44,867 0.18 895 Hyundai Engineering & Construction 32,937 0.13 514 Hyundai Heavy Industries 51,149 0.20 149 Hyundai Mipo Dockyard 8,656 0.03
59 KCC 25,971 0.10 1,222 LG 67,703 0.26
269 LS Cable 10,478 0.04
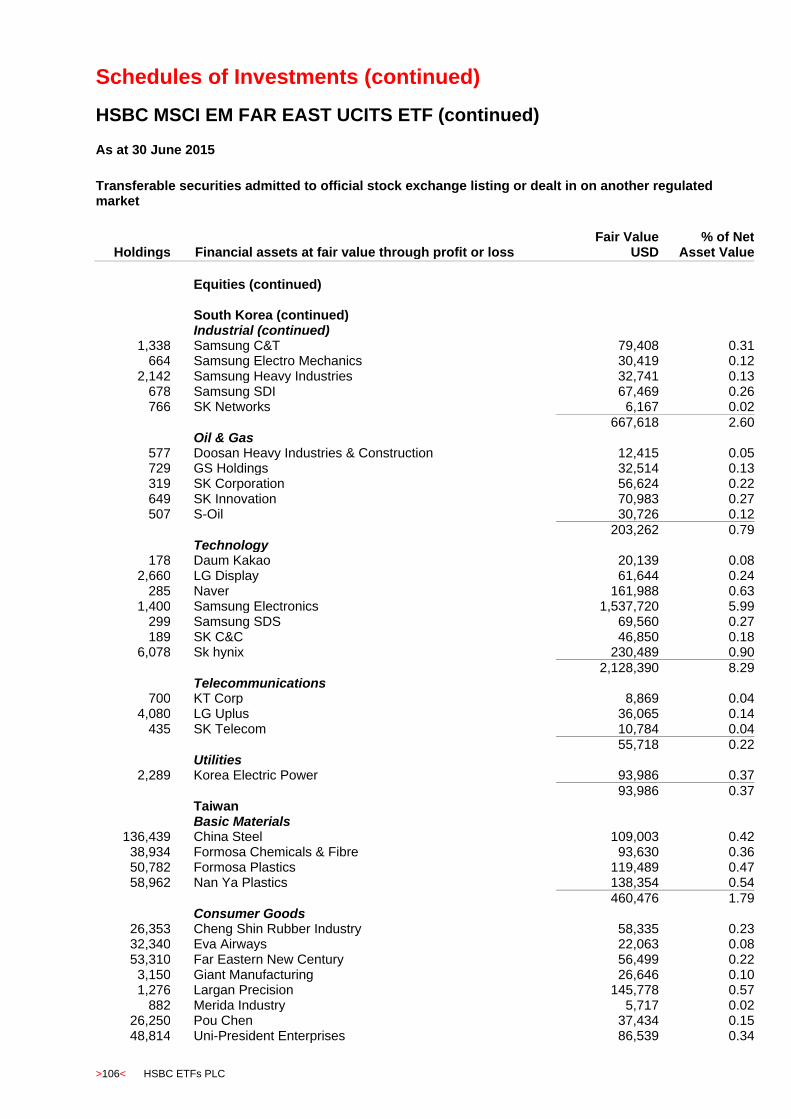
Schedules of Investments (continued)
HSBC MSCI EM FAR EAST UCITS ETF (continued)
>106< HSBC ETFs PLC
As at 30 June 2015
Transferable securities admitted to official stock exchange listing or dealt in on another regulated market
Holdings
Financial assets at fair value through profit or loss Fair Value
USD % of Net
Asset Value
Equities (continued)
South Korea (continued) Industrial (continued)
1,338 Samsung C&T 79,408 0.31 664 Samsung Electro Mechanics 30,419 0.12
2,142 Samsung Heavy Industries 32,741 0.13 678 Samsung SDI 67,469 0.26 766 SK Networks 6,167 0.02
667,618 2.60 Oil & Gas
577 Doosan Heavy Industries & Construction 12,415 0.05 729 GS Holdings 32,514 0.13 319 SK Corporation 56,624 0.22 649 SK Innovation 70,983 0.27 507 S-Oil 30,726 0.12
203,262 0.79 Technology
178 Daum Kakao 20,139 0.08 2,660 LG Display 61,644 0.24
285 Naver 161,988 0.63 1,400 Samsung Electronics 1,537,720 5.99
299 Samsung SDS 69,560 0.27 189 SK C&C 46,850 0.18
6,078 Sk hynix 230,489 0.90
2,128,390 8.29 Telecommunications
700 KT Corp 8,869 0.04 4,080 LG Uplus 36,065 0.14
435 SK Telecom 10,784 0.04 55,718 0.22 Utilities
2,289 Korea Electric Power 93,986 0.37
93,986 0.37 Taiwan Basic Materials
136,439 China Steel 109,003 0.42 38,934 Formosa Chemicals & Fibre 93,630 0.36 50,782 Formosa Plastics 119,489 0.47 58,962 Nan Ya Plastics 138,354 0.54
460,476 1.79 Consumer Goods
26,353 Cheng Shin Rubber Industry 58,335 0.23 32,340 Eva Airways 22,063 0.08 53,310 Far Eastern New Century 56,499 0.22
3,150 Giant Manufacturing 26,646 0.10 1,276 Largan Precision 145,778 0.57
882 Merida Industry 5,717 0.02 26,250 Pou Chen 37,434 0.15 48,814 Uni-President Enterprises 86,539 0.34
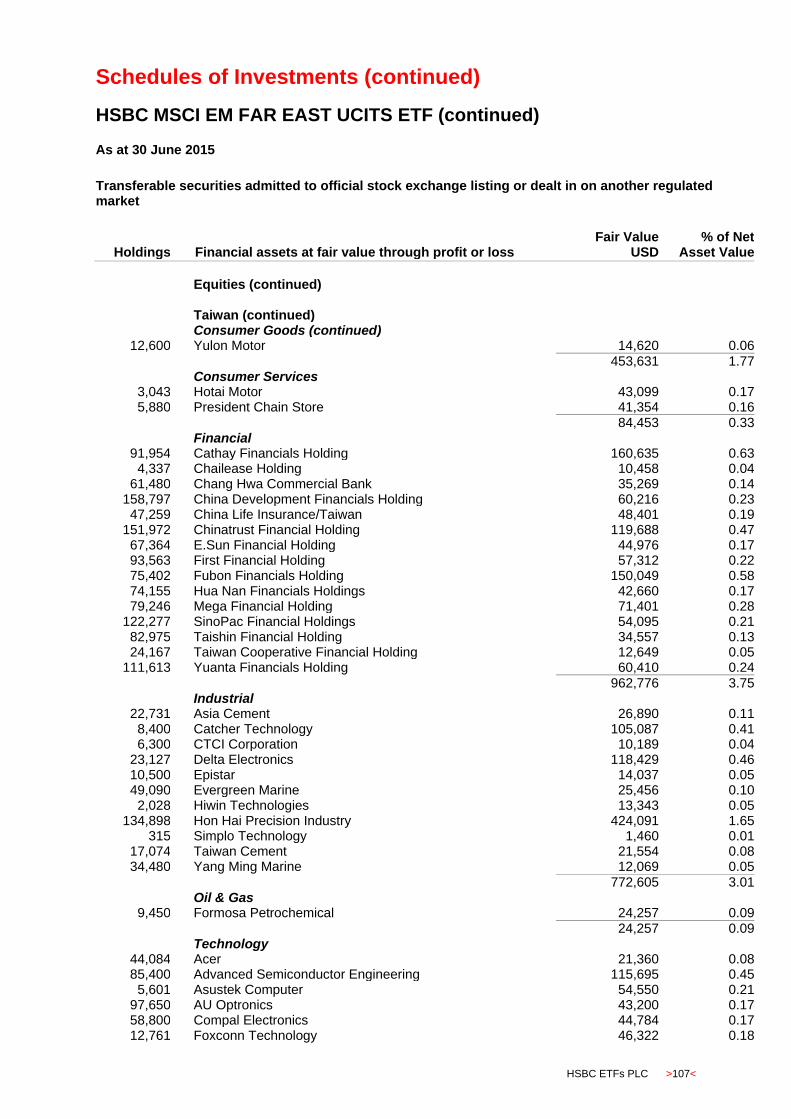
Schedules of Investments (continued)
HSBC MSCI EM FAR EAST UCITS ETF (continued)
HSBC ETFs PLC >107<
As at 30 June 2015
Transferable securities admitted to official stock exchange listing or dealt in on another regulated market
Holdings
Financial assets at fair value through profit or loss Fair Value
USD % of Net
Asset Value
Equities (continued)
Taiwan (continued) Consumer Goods (continued)
12,600 Yulon Motor 14,620 0.06
453,631 1.77 Consumer Services
3,043 Hotai Motor 43,099 0.17 5,880 President Chain Store 41,354 0.16
84,453 0.33 Financial
91,954 Cathay Financials Holding 160,635 0.63 4,337 Chailease Holding 10,458 0.04
61,480 Chang Hwa Commercial Bank 35,269 0.14 158,797 China Development Financials Holding 60,216 0.23 47,259 China Life Insurance/Taiwan 48,401 0.19
151,972 Chinatrust Financial Holding 119,688 0.47 67,364 E.Sun Financial Holding 44,976 0.17 93,563 First Financial Holding 57,312 0.22 75,402 Fubon Financials Holding 150,049 0.58 74,155 Hua Nan Financials Holdings 42,660 0.17 79,246 Mega Financial Holding 71,401 0.28
122,277 SinoPac Financial Holdings 54,095 0.21 82,975 Taishin Financial Holding 34,557 0.13 24,167 Taiwan Cooperative Financial Holding 12,649 0.05
111,613 Yuanta Financials Holding 60,410 0.24
962,776 3.75 Industrial
22,731 Asia Cement 26,890 0.11 8,400 Catcher Technology 105,087 0.41 6,300 CTCI Corporation 10,189 0.04
23,127 Delta Electronics 118,429 0.46 10,500 Epistar 14,037 0.05 49,090 Evergreen Marine 25,456 0.10
2,028 Hiwin Technologies 13,343 0.05 134,898 Hon Hai Precision Industry 424,091 1.65
315 Simplo Technology 1,460 0.01 17,074 Taiwan Cement 21,554 0.08 34,480 Yang Ming Marine 12,069 0.05
772,605 3.01 Oil & Gas
9,450 Formosa Petrochemical 24,257 0.09 24,257 0.09 Technology
44,084 Acer 21,360 0.08 85,400 Advanced Semiconductor Engineering 115,695 0.45
5,601 Asustek Computer 54,550 0.21 97,650 AU Optronics 43,200 0.17 58,800 Compal Electronics 44,784 0.17 12,761 Foxconn Technology 46,322 0.18
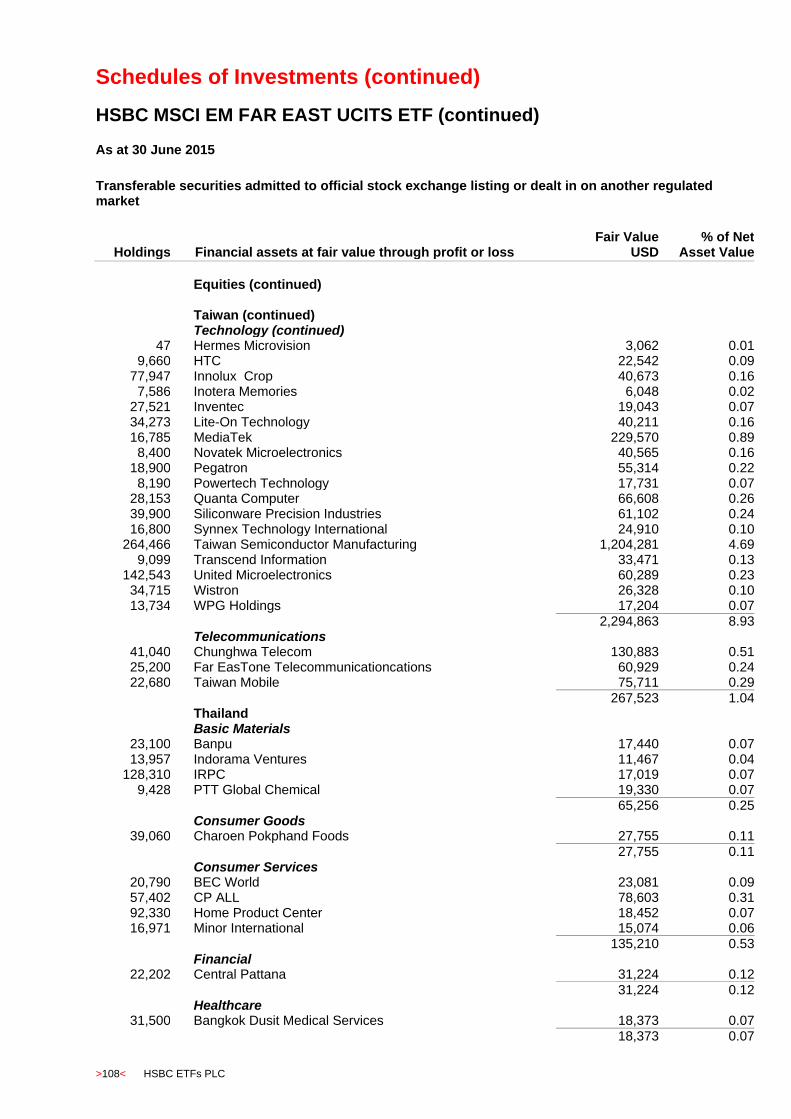
Schedules of Investments (continued)
HSBC MSCI EM FAR EAST UCITS ETF (continued)
>108< HSBC ETFs PLC
As at 30 June 2015
Transferable securities admitted to official stock exchange listing or dealt in on another regulated market
Holdings
Financial assets at fair value through profit or loss Fair Value
USD % of Net
Asset Value
Equities (continued)
Taiwan (continued) Technology (continued)
47 Hermes Microvision 3,062 0.01 9,660 HTC 22,542 0.09
77,947 Innolux Crop 40,673 0.16 7,586 Inotera Memories 6,048 0.02
27,521 Inventec 19,043 0.07 34,273 Lite-On Technology 40,211 0.16 16,785 MediaTek 229,570 0.89
8,400 Novatek Microelectronics 40,565 0.16 18,900 Pegatron 55,314 0.22
8,190 Powertech Technology 17,731 0.07 28,153 Quanta Computer 66,608 0.26 39,900 Siliconware Precision Industries 61,102 0.24 16,800 Synnex Technology International 24,910 0.10
264,466 Taiwan Semiconductor Manufacturing 1,204,281 4.69 9,099 Transcend Information 33,471 0.13
142,543 United Microelectronics 60,289 0.23 34,715 Wistron 26,328 0.10 13,734 WPG Holdings 17,204 0.07
2,294,863 8.93 Telecommunications
41,040 Chunghwa Telecom 130,883 0.51 25,200 Far EasTone Telecommunicationcations 60,929 0.24 22,680 Taiwan Mobile 75,711 0.29
267,523 1.04 Thailand Basic Materials
23,100 Banpu 17,440 0.07 13,957 Indorama Ventures 11,467 0.04
128,310 IRPC 17,019 0.07 9,428 PTT Global Chemical 19,330 0.07
65,256 0.25 Consumer Goods
39,060 Charoen Pokphand Foods 27,755 0.11
27,755 0.11 Consumer Services
20,790 BEC World 23,081 0.09 57,402 CP ALL 78,603 0.31 92,330 Home Product Center 18,452 0.07 16,971 Minor International 15,074 0.06
135,210 0.53 Financial
22,202 Central Pattana 31,224 0.12
31,224 0.12 Healthcare
31,500 Bangkok Dusit Medical Services 18,373 0.07
18,373 0.07
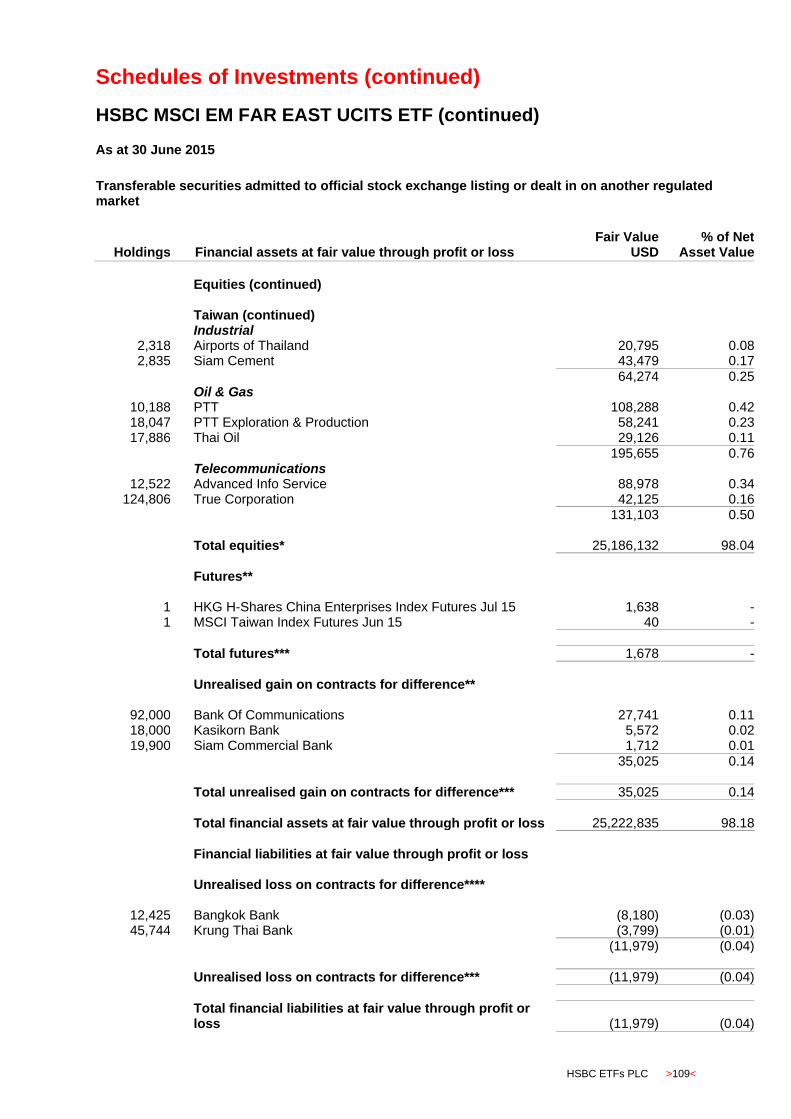
Schedules of Investments (continued)
HSBC MSCI EM FAR EAST UCITS ETF (continued)
HSBC ETFs PLC >109<
As at 30 June 2015
Transferable securities admitted to official stock exchange listing or dealt in on another regulated market
Holdings
Financial assets at fair value through profit or loss Fair Value
USD % of Net
Asset Value
Equities (continued)
Taiwan (continued) Industrial
2,318 Airports of Thailand 20,795 0.08 2,835 Siam Cement 43,479 0.17
64,274 0.25 Oil & Gas
10,188 PTT 108,288 0.42 18,047 PTT Exploration & Production 58,241 0.23 17,886 Thai Oil 29,126 0.11
195,655 0.76 Telecommunications
12,522 Advanced Info Service 88,978 0.34 124,806 True Corporation 42,125 0.16
131,103 0.50 Total equities* 25,186,132 98.04
Futures**
1 HKG H-Shares China Enterprises Index Futures Jul 15 1,638 - 1 MSCI Taiwan Index Futures Jun 15 40 -
Total futures*** 1,678 -
Unrealised gain on contracts for difference**
92,000 Bank Of Communications 27,741 0.11 18,000 Kasikorn Bank 5,572 0.02 19,900 Siam Commercial Bank 1,712 0.01
35,025 0.14
Total unrealised gain on contracts for difference*** 35,025 0.14
Total financial assets at fair value through profit or loss 25,222,835 98.18 Financial liabilities at fair value through profit or loss Unrealised loss on contracts for difference****
12,425 Bangkok Bank (8,180) (0.03) 45,744 Krung Thai Bank (3,799) (0.01)
(11,979) (0.04)
Unrealised loss on contracts for difference*** (11,979) (0.04)
Total financial liabilities at fair value through profit or loss (11,979) (0.04)

Schedules of Investments (continued)
HSBC MSCI EM FAR EAST UCITS ETF (continued)
>110< HSBC ETFs PLC
As at 30 June 2015
Transferable securities admitted to official stock exchange listing or dealt in on another regulated market
Financial assets at fair value through profit or loss Fair Value
USD % of Net
Asset Value
Other net assets 476,589 1.86
Net assets attributable to holders of redeemable participating shares 25,687,445 100.00
** HSBC Bank Plc is the counterparty to the future contract. **** Barclays Capital is the counterparty to the contract(s) for difference.
Analysis of Total Assets Fair Value
USD % of Total
Assets
* Transferable securities admitted to an official stock exchange listing or dealt in on another regulated market 25,186,132
*** Financial derivative instruments dealt in on a regulated market (10,301)
With the exception of the Contracts for Differences, all other equity positions and futures held by the Fund at 30 June 2015 and 31 December 2014 have been classified as Level 1. The Contracts for Differences have been classified as Level 2. See Note 6(d) for further details.
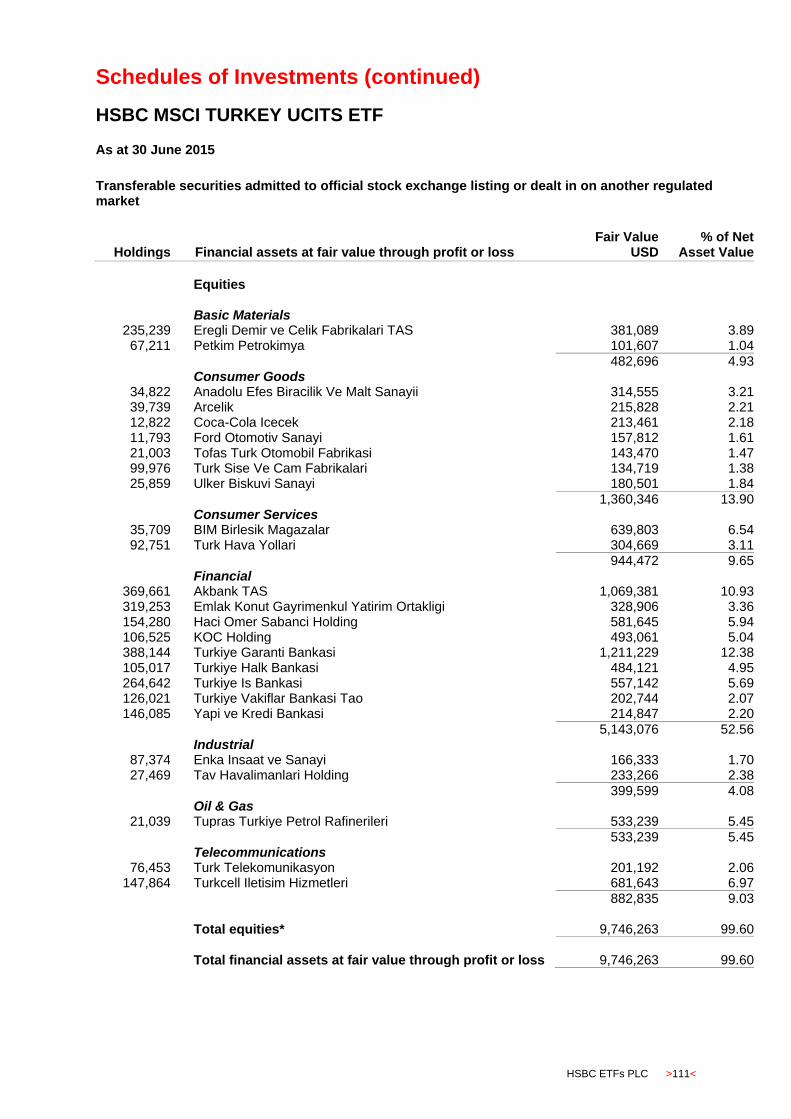
Schedules of Investments (continued)
HSBC MSCI TURKEY UCITS ETF
HSBC ETFs PLC >111<
As at 30 June 2015
Transferable securities admitted to official stock exchange listing or dealt in on another regulated market
Holdings
Financial assets at fair value through profit or loss Fair Value
USD % of Net
Asset Value
Equities Basic Materials
235,239 Eregli Demir ve Celik Fabrikalari TAS 381,089 3.89 67,211 Petkim Petrokimya 101,607 1.04
482,696 4.93 Consumer Goods
34,822 Anadolu Efes Biracilik Ve Malt Sanayii 314,555 3.21 39,739 Arcelik 215,828 2.21 12,822 Coca-Cola Icecek 213,461 2.18 11,793 Ford Otomotiv Sanayi 157,812 1.61 21,003 Tofas Turk Otomobil Fabrikasi 143,470 1.47 99,976 Turk Sise Ve Cam Fabrikalari 134,719 1.38 25,859 Ulker Biskuvi Sanayi 180,501 1.84
1,360,346 13.90 Consumer Services
35,709 BIM Birlesik Magazalar 639,803 6.54 92,751 Turk Hava Yollari 304,669 3.11
944,472 9.65 Financial
369,661 Akbank TAS 1,069,381 10.93 319,253 Emlak Konut Gayrimenkul Yatirim Ortakligi 328,906 3.36 154,280 Haci Omer Sabanci Holding 581,645 5.94 106,525 KOC Holding 493,061 5.04 388,144 Turkiye Garanti Bankasi 1,211,229 12.38 105,017 Turkiye Halk Bankasi 484,121 4.95 264,642 Turkiye Is Bankasi 557,142 5.69 126,021 Turkiye Vakiflar Bankasi Tao 202,744 2.07 146,085 Yapi ve Kredi Bankasi 214,847 2.20
5,143,076 52.56 Industrial
87,374 Enka Insaat ve Sanayi 166,333 1.70 27,469 Tav Havalimanlari Holding 233,266 2.38
399,599 4.08 Oil & Gas
21,039 Tupras Turkiye Petrol Rafinerileri 533,239 5.45
533,239 5.45 Telecommunications
76,453 Turk Telekomunikasyon 201,192 2.06 147,864 Turkcell Iletisim Hizmetleri 681,643 6.97
882,835 9.03 Total equities* 9,746,263 99.60
Total financial assets at fair value through profit or loss 9,746,263 99.60

Schedules of Investments (continued)
HSBC MSCI TURKEY UCITS ETF (continued)
>112< HSBC ETFs PLC
As at 30 June 2015
Transferable securities admitted to official stock exchange listing or dealt in on another regulated market
Holdings
Financial liabilities at fair value through profit or loss Fair Value
USD % of Net
Asset Value
Futures
11 IST BIST 30 Futures Aug 15** (883) (0.01)
Total futures*** (883) (0.01)
Total financial liabilities at fair value through profit or loss (883) (0.01)
Other net assets 39,567 0.41
Net assets attributable to holders of redeemable participating shares 9,784,947 100.00
** HSBC Bank Plc is the counterparty to the future contract.
Analysis of Total Assets Fair Value
USD % of Total
Assets
* Transferable securities admitted to an official stock exchange listing or dealt in on another regulated market 9,746,263
*** Financial derivative instruments dealt in on a regulated market (883)
All equity positions and futures held by the Fund at 30 June 2015 and at 31 December 2014 are classified as Level 1. See Note 6(d) for further details.
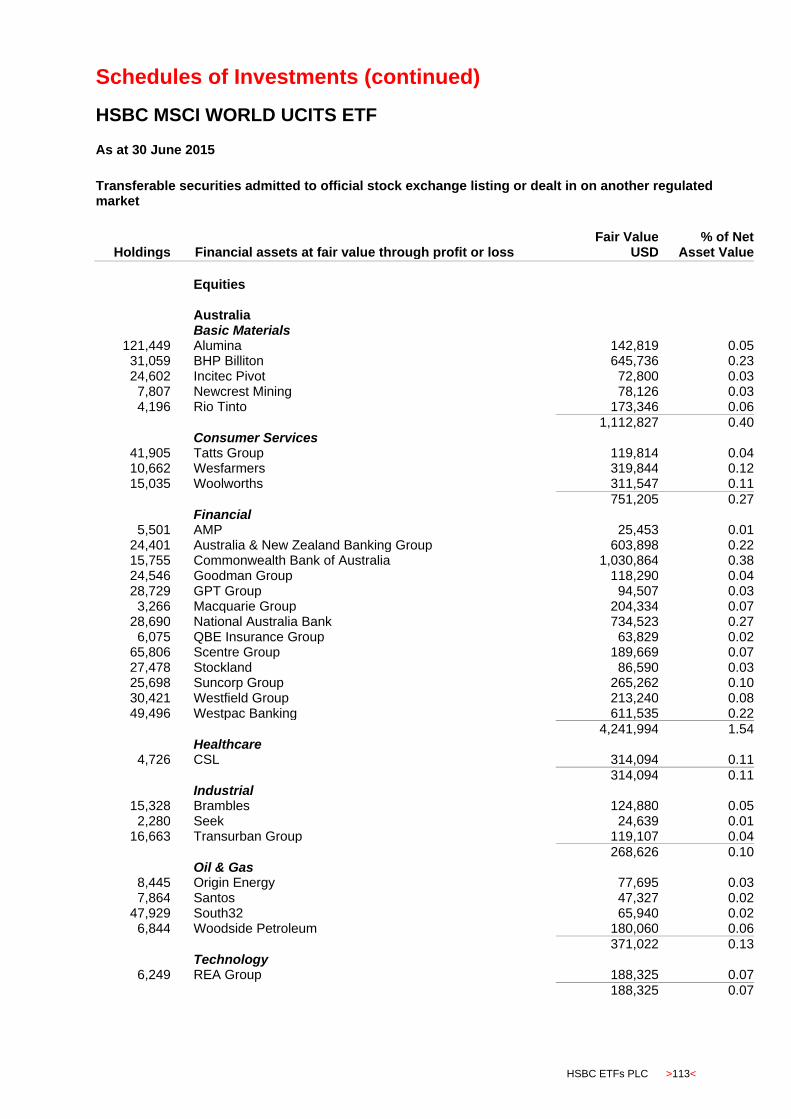
Schedules of Investments (continued)
HSBC MSCI WORLD UCITS ETF
HSBC ETFs PLC >113<
As at 30 June 2015
Transferable securities admitted to official stock exchange listing or dealt in on another regulated market
Holdings Financial assets at fair value through profit or loss
Fair Value USD
% of Net Asset Value
Equities Australia Basic Materials
121,449 Alumina 142,819 0.05 31,059 BHP Billiton 645,736 0.23 24,602 Incitec Pivot 72,800 0.03
7,807 Newcrest Mining 78,126 0.03 4,196 Rio Tinto 173,346 0.06
1,112,827 0.40 Consumer Services
41,905 Tatts Group 119,814 0.04 10,662 Wesfarmers 319,844 0.12 15,035 Woolworths 311,547 0.11
751,205 0.27 Financial
5,501 AMP 25,453 0.01 24,401 Australia & New Zealand Banking Group 603,898 0.22 15,755 Commonwealth Bank of Australia 1,030,864 0.38 24,546 Goodman Group 118,290 0.04 28,729 GPT Group 94,507 0.03
3,266 Macquarie Group 204,334 0.07 28,690 National Australia Bank 734,523 0.27
6,075 QBE Insurance Group 63,829 0.02 65,806 Scentre Group 189,669 0.07 27,478 Stockland 86,590 0.03 25,698 Suncorp Group 265,262 0.10 30,421 Westfield Group 213,240 0.08 49,496 Westpac Banking 611,535 0.22
4,241,994 1.54 Healthcare
4,726 CSL 314,094 0.11
314,094 0.11 Industrial
15,328 Brambles 124,880 0.05 2,280 Seek 24,639 0.01
16,663 Transurban Group 119,107 0.04
268,626 0.10 Oil & Gas
8,445 Origin Energy 77,695 0.03 7,864 Santos 47,327 0.02
47,929 South32 65,940 0.02 6,844 Woodside Petroleum 180,060 0.06
371,022 0.13 Technology
6,249 REA Group 188,325 0.07 188,325 0.07
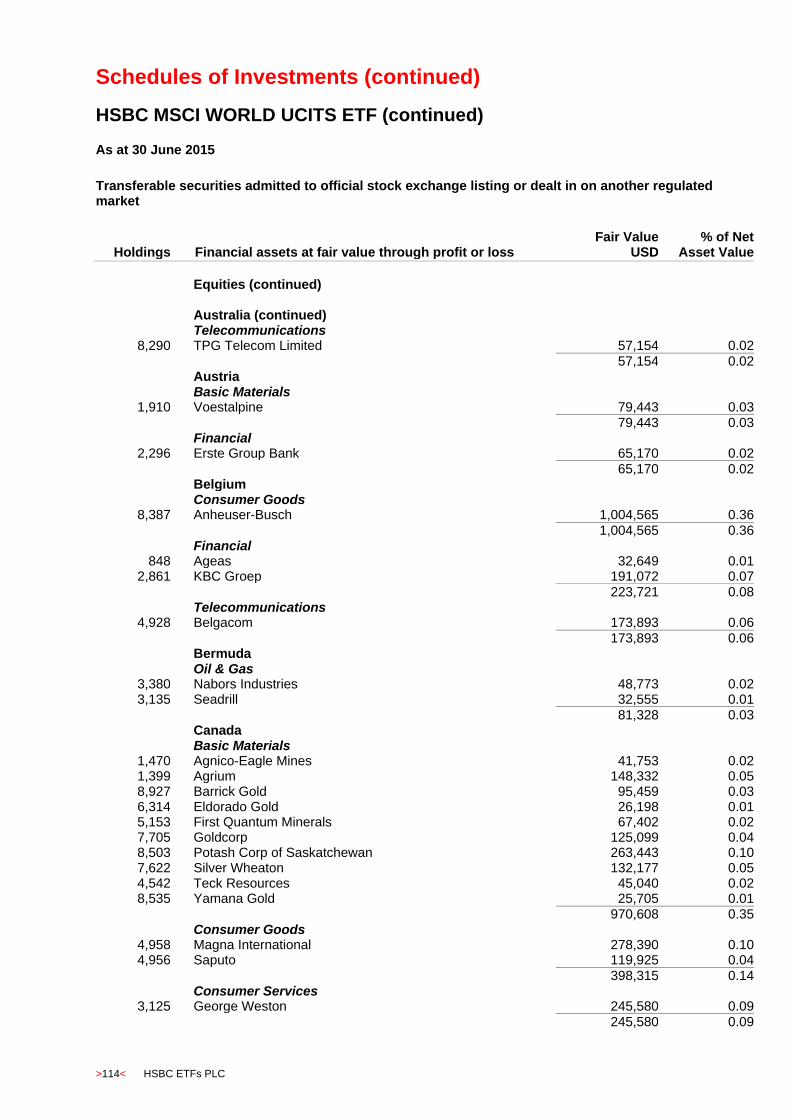
Schedules of Investments (continued)
HSBC MSCI WORLD UCITS ETF (continued)
>114< HSBC ETFs PLC
As at 30 June 2015
Transferable securities admitted to official stock exchange listing or dealt in on another regulated market
Holdings Financial assets at fair value through profit or loss
Fair Value USD
% of Net Asset Value
Equities (continued) Australia (continued) Telecommunications
8,290 TPG Telecom Limited 57,154 0.02
57,154 0.02 Austria Basic Materials
1,910 Voestalpine 79,443 0.03 79,443 0.03 Financial
2,296 Erste Group Bank 65,170 0.02
65,170 0.02 Belgium Consumer Goods
8,387 Anheuser-Busch 1,004,565 0.36
1,004,565 0.36 Financial
848 Ageas 32,649 0.01 2,861 KBC Groep 191,072 0.07
223,721 0.08 Telecommunications
4,928 Belgacom 173,893 0.06
173,893 0.06 Bermuda Oil & Gas
3,380 Nabors Industries 48,773 0.02 3,135 Seadrill 32,555 0.01
81,328 0.03 Canada Basic Materials
1,470 Agnico-Eagle Mines 41,753 0.02 1,399 Agrium 148,332 0.05 8,927 Barrick Gold 95,459 0.03 6,314 Eldorado Gold 26,198 0.01 5,153 First Quantum Minerals 67,402 0.02 7,705 Goldcorp 125,099 0.04 8,503 Potash Corp of Saskatchewan 263,443 0.10 7,622 Silver Wheaton 132,177 0.05 4,542 Teck Resources 45,040 0.02 8,535 Yamana Gold 25,705 0.01
970,608 0.35 Consumer Goods
4,958 Magna International 278,390 0.10 4,956 Saputo 119,925 0.04
398,315 0.14 Consumer Services
3,125 George Weston 245,580 0.09
245,580 0.09
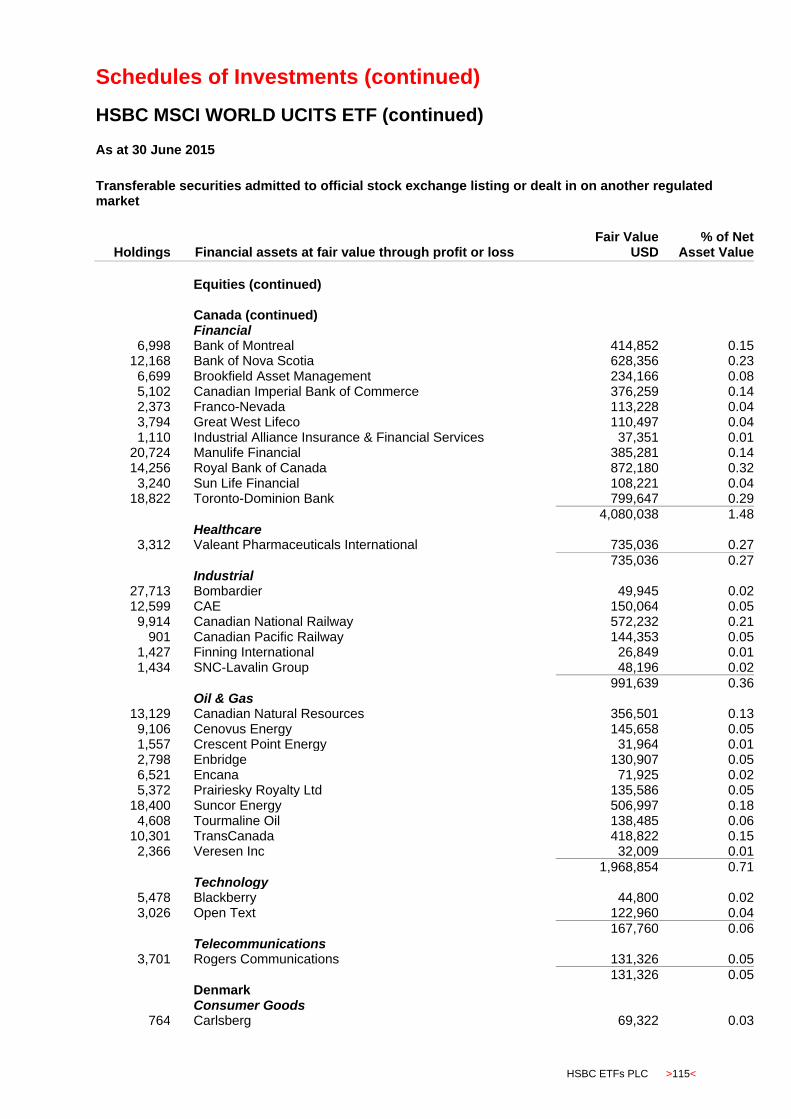
Schedules of Investments (continued)
HSBC MSCI WORLD UCITS ETF (continued)
HSBC ETFs PLC >115<
As at 30 June 2015
Transferable securities admitted to official stock exchange listing or dealt in on another regulated market
Holdings Financial assets at fair value through profit or loss
Fair Value USD
% of Net Asset Value
Equities (continued) Canada (continued) Financial
6,998 Bank of Montreal 414,852 0.15 12,168 Bank of Nova Scotia 628,356 0.23
6,699 Brookfield Asset Management 234,166 0.08 5,102 Canadian Imperial Bank of Commerce 376,259 0.14 2,373 Franco-Nevada 113,228 0.04 3,794 Great West Lifeco 110,497 0.04 1,110 Industrial Alliance Insurance & Financial Services 37,351 0.01
20,724 Manulife Financial 385,281 0.14 14,256 Royal Bank of Canada 872,180 0.32
3,240 Sun Life Financial 108,221 0.04 18,822 Toronto-Dominion Bank 799,647 0.29
4,080,038 1.48 Healthcare
3,312 Valeant Pharmaceuticals International 735,036 0.27
735,036 0.27 Industrial
27,713 Bombardier 49,945 0.02 12,599 CAE 150,064 0.05
9,914 Canadian National Railway 572,232 0.21 901 Canadian Pacific Railway 144,353 0.05
1,427 Finning International 26,849 0.01 1,434 SNC-Lavalin Group 48,196 0.02
991,639 0.36 Oil & Gas
13,129 Canadian Natural Resources 356,501 0.13 9,106 Cenovus Energy 145,658 0.05 1,557 Crescent Point Energy 31,964 0.01 2,798 Enbridge 130,907 0.05 6,521 Encana 71,925 0.02 5,372 Prairiesky Royalty Ltd 135,586 0.05
18,400 Suncor Energy 506,997 0.18 4,608 Tourmaline Oil 138,485 0.06
10,301 TransCanada 418,822 0.15 2,366 Veresen Inc 32,009 0.01
1,968,854 0.71 Technology
5,478 Blackberry 44,800 0.02 3,026 Open Text 122,960 0.04
167,760 0.06 Telecommunications
3,701 Rogers Communications 131,326 0.05
131,326 0.05 Denmark Consumer Goods
764 Carlsberg 69,322 0.03
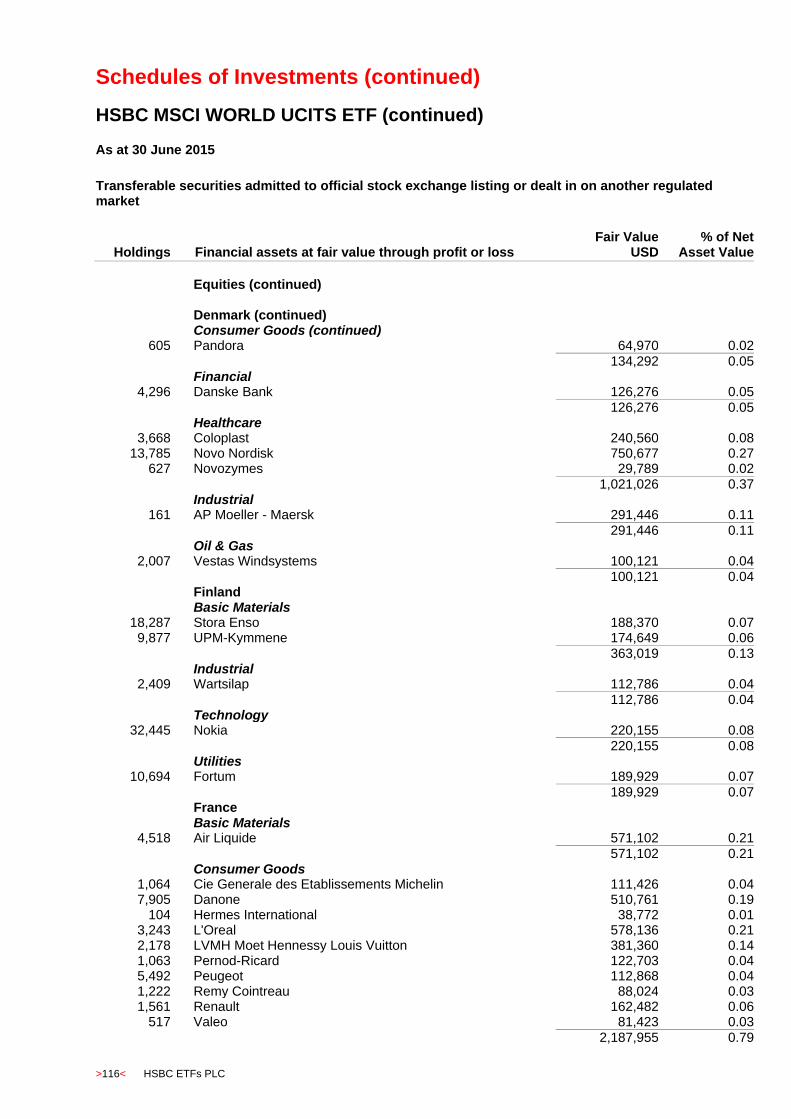
Schedules of Investments (continued)
HSBC MSCI WORLD UCITS ETF (continued)
>116< HSBC ETFs PLC
As at 30 June 2015
Transferable securities admitted to official stock exchange listing or dealt in on another regulated market
Holdings Financial assets at fair value through profit or loss
Fair Value USD
% of Net Asset Value
Equities (continued) Denmark (continued) Consumer Goods (continued)
605 Pandora 64,970 0.02
134,292 0.05 Financial
4,296 Danske Bank 126,276 0.05
126,276 0.05 Healthcare
3,668 Coloplast 240,560 0.08 13,785 Novo Nordisk 750,677 0.27
627 Novozymes 29,789 0.02
1,021,026 0.37 Industrial
161 AP Moeller - Maersk 291,446 0.11
291,446 0.11 Oil & Gas
2,007 Vestas Windsystems 100,121 0.04 100,121 0.04 Finland Basic Materials
18,287 Stora Enso 188,370 0.07 9,877 UPM-Kymmene 174,649 0.06
363,019 0.13 Industrial
2,409 Wartsilap 112,786 0.04
112,786 0.04 Technology
32,445 Nokia 220,155 0.08
220,155 0.08 Utilities
10,694 Fortum 189,929 0.07
189,929 0.07 France Basic Materials
4,518 Air Liquide 571,102 0.21
571,102 0.21 Consumer Goods
1,064 Cie Generale des Etablissements Michelin 111,426 0.04 7,905 Danone 510,761 0.19
104 Hermes International 38,772 0.01 3,243 L'Oreal 578,136 0.21 2,178 LVMH Moet Hennessy Louis Vuitton 381,360 0.14 1,063 Pernod-Ricard 122,703 0.04 5,492 Peugeot 112,868 0.04 1,222 Remy Cointreau 88,024 0.03 1,561 Renault 162,482 0.06
517 Valeo 81,423 0.03
2,187,955 0.79

Schedules of Investments (continued)
HSBC MSCI WORLD UCITS ETF (continued)
HSBC ETFs PLC >117<
As at 30 June 2015
Transferable securities admitted to official stock exchange listing or dealt in on another regulated market
Holdings Financial assets at fair value through profit or loss
Fair Value USD
% of Net Asset Value
Equities (continued) France (continued) Consumer Services
7,390 Carrefour 236,479 0.09 1,204 Eutelsat Communications 38,836 0.02
478 Kering 85,294 0.03 2,223 Numericable 117,763 0.04 1,582 Publicis Groupe 116,900 0.04
12,465 Vivendi 314,227 0.11
909,499 0.33 Financial
16,959 AXA 427,610 0.16 8,950 BNP Paribas 539,989 0.20 9,545 Credit Agricole 141,871 0.05
742 Gecina 91,396 0.03 16,707 Natixis Banques Populai 120,159 0.04
7,265 Societe Generale 338,924 0.12 424 Unibail-Rodamco 107,098 0.04
1,767,047 0.64 Healthcare
10,570 Sanofi 1,039,211 0.38
1,039,211 0.38 Industrial
2,842 Cie de St-Gobain 127,517 0.06 17,697 Groupe Eurotunnel 256,137 0.09
3,048 Lafarge 201,184 0.07 2,623 Safran 177,662 0.06 6,919 Schneider Electric 477,428 0.17 1,186 Vallourec 24,209 0.01 1,293 Vinci 74,741 0.03
1,338,878 0.49 Oil & Gas
20,100 Total 975,768 0.36
975,768 0.36 Technology
28,594 Alcatel 104,117 0.04 833 Cap Gemini 73,666 0.03 512 Iliad 113,438 0.04
291,221 0.11 Telecommunications
20,943 France Telecom 322,252 0.12
322,252 0.12 Utilities
4,767 EDF 106,228 0.04 9,351 GDF Suez 173,370 0.06
11,004 Veolia Environnement 224,247 0.08
503,845 0.18

Schedules of Investments (continued)
HSBC MSCI WORLD UCITS ETF (continued)
>118< HSBC ETFs PLC
As at 30 June 2015
Transferable securities admitted to official stock exchange listing or dealt in on another regulated market
Holdings Financial assets at fair value through profit or loss
Fair Value USD
% of Net Asset Value
Equities (continued) Germany Basic Materials
9,595 BASF 842,645 0.31 8,295 Bayer 1,160,369 0.42 4,704 Fuchs Petrolub 198,563 0.07 1,218 K+S 51,278 0.02 1,063 Lanxess 62,643 0.02 1,988 Linde 376,334 0.14
2,691,832 0.98 Consumer Goods
1,222 Adidas 93,471 0.03 3,970 Bayerische Motoren Werke 434,287 0.16 8,470 Daimler 770,459 0.28 1,365 Hugo Boss 152,469 0.05 1,667 Porsche Automobil Holding 140,362 0.05 1,611 Volkswagen 373,355 0.14
1,964,403 0.71 Consumer Services
614 Kabel Deutschland Holdi 82,094 0.03 82,094 0.03 Financial
4,863 Allianz 756,944 0.28 5,324 Commerzbank 68,010 0.02
10,850 Deutsche Bank 325,800 0.12 1,610 Deutsche Boerse 133,194 0.05
12,572 Deutsche Wohnen 287,929 0.10 1,294 Hannover Rueckversicherung 125,132 0.05 2,498 Muenchener Rueckversicherungs 442,540 0.16
2,139,549 0.78 Industrial
5,991 Deutsche Post 174,923 0.06 2,001 HeidelbergCement 158,585 0.06 1,145 Osram 54,800 0.02 5,465 Siemens 550,150 0.20 2,447 ThyssenKrupp 63,622 0.02
1,002,080 0.36 Technology
12,853 Infineon Technologies 159,391 0.05 8,434 SAP 588,262 0.22
676 United Internet 30,034 0.01
777,687 0.28 Telecommunications
23,848 Deutsche Telekom 410,529 0.15
410,529 0.15 Utilities
9,700 E.ON 129,152 0.05 5,597 RWE 120,265 0.04
249,417 0.09

Schedules of Investments (continued)
HSBC MSCI WORLD UCITS ETF (continued)
HSBC ETFs PLC >119<
As at 30 June 2015
Transferable securities admitted to official stock exchange listing or dealt in on another regulated market
Holdings Financial assets at fair value through profit or loss
Fair Value USD
% of Net Asset Value
Equities (continued) Hong Kong Consumer Goods
67,599 Li & Fung 53,625 0.02 10,474 Yue Yuen Industrial Holdings 35,059 0.01
88,684 0.03 Consumer Services
7,276 Galaxy Entertainment Group 29,001 0.01 36,327 SJM Holdings 39,361 0.01
68,362 0.02 Financial
78,784 AIA Group 515,738 0.19 45,423 Cheung Kong Property Holdings Ltd 376,740 0.14 36,723 CK Hutchison Holdings Limited 539,532 0.19 56,872 Hang Lung Properties 169,093 0.06 10,287 Hong Kong Exchanges and Clearing 363,045 0.13 18,754 Kerry Properties 73,540 0.03 48,417 Link REIT 283,537 0.10 96,000 New World Development 125,564 0.05 52,313 Sino Land 87,452 0.03 22,510 Sun Hung Kai Properties 364,687 0.13
2,898,928 1.05 Industrial
10,902 Cheung Kong Infrastructure Holdings 84,656 0.03 65,131 Noble Group 36,762 0.01 38,971 NWS Holdings 56,401 0.02
7,515 Swire Pacific 94,464 0.04 16,868 Wharf Holdings 112,271 0.04
384,554 0.14 Technology
3,595 ASM Pacific Technology 35,614 0.01
35,614 0.01 Telecommunications
237,007 PCCW 141,546 0.05
141,546 0.05 Ireland Consumer Goods
2,743 Kerry Group 203,210 0.07
203,210 0.07 Consumer Services
9,372 WPP 210,183 0.08
210,183 0.08 Financial
158,991 Bank of Ireland 64,127 0.02 1,006 XL Group 37,423 0.02
101,550 0.04 Healthcare
1,574 Alkermes 101,271 0.04 2,213 Allergan 671,557 0.24

Schedules of Investments (continued)
HSBC MSCI WORLD UCITS ETF (continued)
>120< HSBC ETFs PLC
As at 30 June 2015
Transferable securities admitted to official stock exchange listing or dealt in on another regulated market
Holdings Financial assets at fair value through profit or loss
Fair Value USD
% of Net Asset Value
Equities (continued) Ireland (continued) Healthcare (continued)
2,760 Endo International 219,834 0.08 1,294 Jazz Pharmaceuticals 227,835 0.08 3,839 Shire 307,616 0.11
1,528,113 0.55 Industrial
3,919 Accenture 379,281 0.14 5,034 CRH 142,017 0.05 8,148 Experian 148,518 0.06 2,178 Ingersoll-Rand 146,841 0.05
816,657 0.30 Israel Basic Materials
92 Israel Corporation 32,460 0.01
32,460 0.01 Financial
22,829 Bank Leumi Le Israel 96,583 0.04 3,097 Mizrahi Tefahot Bank 38,429 0.01
135,012 0.05 Healthcare
5,084 Teva Pharmaceutical Industries 300,803 0.11
300,803 0.11 Telecommunications
1,728 Nice Systems 109,935 0.04
109,935 0.04 Italy Consumer Goods
14,476 Fiat Chrysler Automobiles 211,937 0.08 1,400 Luxottica Group 93,047 0.03
304,984 0.11 Financial
6,311 Assicurazioni Generali 113,633 0.04 30,820 Banca Monte dei Paschi di Siena 59,957 0.02
4,256 Banco Popolare Societa 69,992 0.03 47,910 Intesa Sanpaolo 173,596 0.06
5,243 Mediobanca 51,378 0.02 45,929 UniCredit 308,324 0.11
776,880 0.28 Industrial
8,895 Prysmian 192,071 0.07
192,071 0.07 Oil & Gas
18,682 ENI 331,382 0.12
331,382 0.12 Telecommunications
158,127 Telecom Italia 200,499 0.07
200,499 0.07
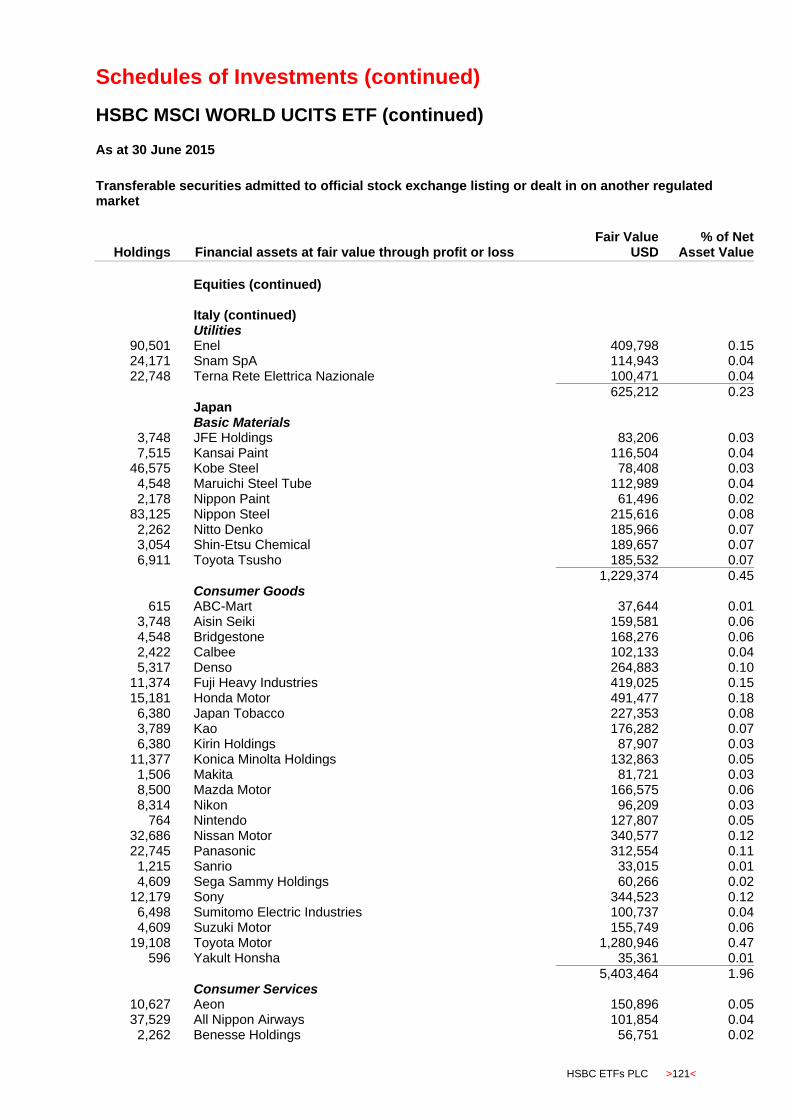
Schedules of Investments (continued)
HSBC MSCI WORLD UCITS ETF (continued)
HSBC ETFs PLC >121<
As at 30 June 2015
Transferable securities admitted to official stock exchange listing or dealt in on another regulated market
Holdings Financial assets at fair value through profit or loss
Fair Value USD
% of Net Asset Value
Equities (continued) Italy (continued) Utilities
90,501 Enel 409,798 0.15 24,171 Snam SpA 114,943 0.04 22,748 Terna Rete Elettrica Nazionale 100,471 0.04
625,212 0.23 Japan Basic Materials
3,748 JFE Holdings 83,206 0.03 7,515 Kansai Paint 116,504 0.04
46,575 Kobe Steel 78,408 0.03 4,548 Maruichi Steel Tube 112,989 0.04 2,178 Nippon Paint 61,496 0.02
83,125 Nippon Steel 215,616 0.08 2,262 Nitto Denko 185,966 0.07 3,054 Shin-Etsu Chemical 189,657 0.07 6,911 Toyota Tsusho 185,532 0.07
1,229,374 0.45 Consumer Goods
615 ABC-Mart 37,644 0.01 3,748 Aisin Seiki 159,581 0.06 4,548 Bridgestone 168,276 0.06 2,422 Calbee 102,133 0.04 5,317 Denso 264,883 0.10
11,374 Fuji Heavy Industries 419,025 0.15 15,181 Honda Motor 491,477 0.18
6,380 Japan Tobacco 227,353 0.08 3,789 Kao 176,282 0.07 6,380 Kirin Holdings 87,907 0.03
11,377 Konica Minolta Holdings 132,863 0.05 1,506 Makita 81,721 0.03 8,500 Mazda Motor 166,575 0.06 8,314 Nikon 96,209 0.03
764 Nintendo 127,807 0.05 32,686 Nissan Motor 340,577 0.12 22,745 Panasonic 312,554 0.11
1,215 Sanrio 33,015 0.01 4,609 Sega Sammy Holdings 60,266 0.02
12,179 Sony 344,523 0.12 6,498 Sumitomo Electric Industries 100,737 0.04 4,609 Suzuki Motor 155,749 0.06
19,108 Toyota Motor 1,280,946 0.47 596 Yakult Honsha 35,361 0.01
5,403,464 1.96 Consumer Services
10,627 Aeon 150,896 0.05 37,529 All Nippon Airways 101,854 0.04
2,262 Benesse Holdings 56,751 0.02

Schedules of Investments (continued)
HSBC MSCI WORLD UCITS ETF (continued)
>122< HSBC ETFs PLC
As at 30 June 2015
Transferable securities admitted to official stock exchange listing or dealt in on another regulated market
Holdings Financial assets at fair value through profit or loss
Fair Value USD
% of Net Asset Value
Equities (continued) Japan (continued) Consumer Services (continued)
19,777 Dai Nippon Printing 204,372 0.08 996 Don Quijote 42,407 0.02
5,328 East Japan Railway 479,396 0.17 4,541 Kakaku 65,759 0.02
40,079 Keihan Electric Railway 233,534 0.08 10,438 Keikyu 78,819 0.03 42,483 Kintetsu 144,775 0.05
5,953 McDonald's Holdings 125,759 0.05 2,135 Nitori Holdings 174,129 0.06 4,967 Oriental Land 317,224 0.12 2,347 Rakuten 37,929 0.01 8,801 Seven & I Holdings 378,321 0.14
11,857 So-Net 238,564 0.09 14,215 USS 256,733 0.09
3,087,222 1.12 Financial
8,616 Dai-ichi Life Insurance 169,447 0.06 30,593 Daiwa Securities Group 229,313 0.08 19,005 Hachijuni Bank 143,510 0.05 11,680 Iyo Bank 143,560 0.05
3,686 Japan Exchange Group 119,739 0.04 17 Japan Prime Realty Investment 52,862 0.02 71 Japan Retail Fund Investment 142,099 0.05
15,006 Mitsubishi Estate 323,322 0.12 100,607 Mitsubishi UFJ Financial Group 723,361 0.26
7,515 Mitsui Fudosan 210,468 0.08 185,820 Mizuho Financial Group 402,421 0.15
3,789 MS&AD Insurance Group Holdings 118,069 0.04 20 Nippon Building Fund 87,607 0.03 24 Nippon Prologis REIT 44,209 0.02
9,506 NKSJ Holdings 348,925 0.13 27,823 Nomura Holding 188,859 0.07
9,880 ORIX 147,031 0.05 17,302 Resona Holdings 94,524 0.03
7,207 SBI Holdings 99,301 0.04 12,179 Sumitomo Mitsui Financial Group 543,335 0.20
7,515 Sumitomo Realty & Development 263,684 0.10 7,940 T&D Holdings 118,420 0.04 4,548 Tokio Marine Holdings 189,331 0.07 1,990 Tokyo Tatemono 27,647 0.01
4,931,044 1.79 Healthcare
20,471 Astellas Pharma 292,013 0.11 2,859 Eisai 191,963 0.07 3,748 Olympus 129,564 0.05
339 ONO Pharmaceutical 37,040 0.01
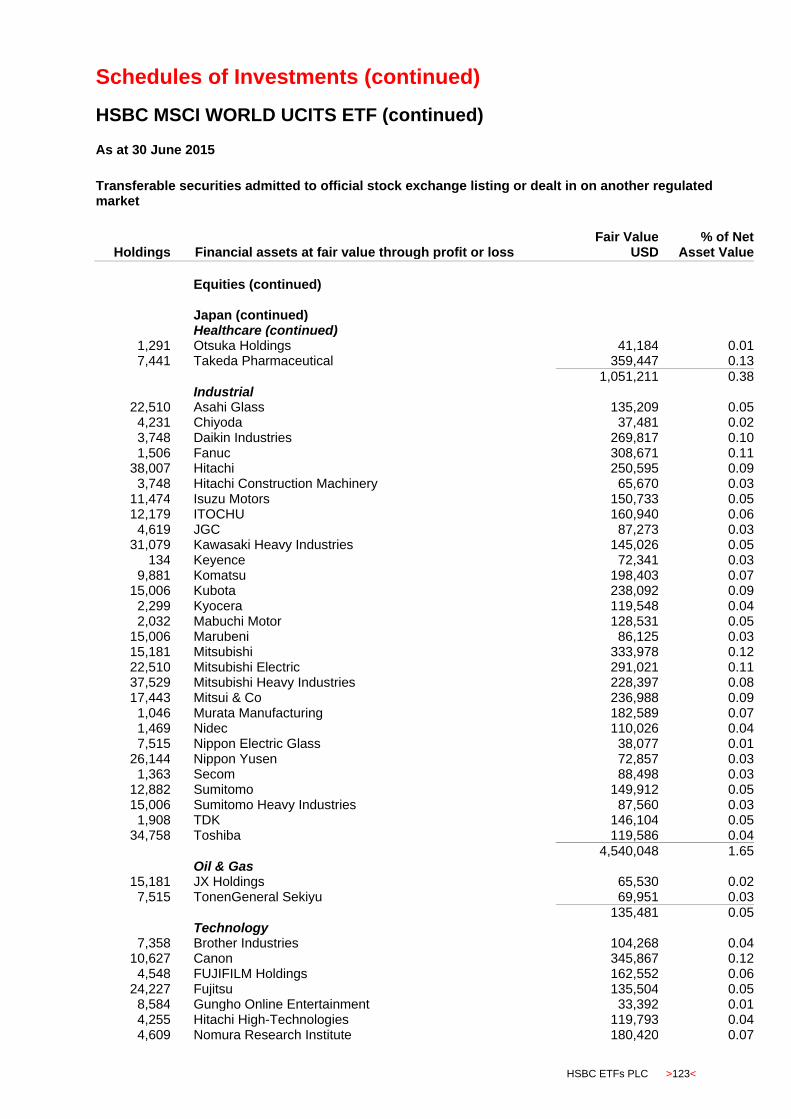
Schedules of Investments (continued)
HSBC MSCI WORLD UCITS ETF (continued)
HSBC ETFs PLC >123<
As at 30 June 2015
Transferable securities admitted to official stock exchange listing or dealt in on another regulated market
Holdings Financial assets at fair value through profit or loss
Fair Value USD
% of Net Asset Value
Equities (continued) Japan (continued) Healthcare (continued)
1,291 Otsuka Holdings 41,184 0.01 7,441 Takeda Pharmaceutical 359,447 0.13
1,051,211 0.38 Industrial
22,510 Asahi Glass 135,209 0.05 4,231 Chiyoda 37,481 0.02 3,748 Daikin Industries 269,817 0.10 1,506 Fanuc 308,671 0.11
38,007 Hitachi 250,595 0.09 3,748 Hitachi Construction Machinery 65,670 0.03
11,474 Isuzu Motors 150,733 0.05 12,179 ITOCHU 160,940 0.06
4,619 JGC 87,273 0.03 31,079 Kawasaki Heavy Industries 145,026 0.05
134 Keyence 72,341 0.03 9,881 Komatsu 198,403 0.07
15,006 Kubota 238,092 0.09 2,299 Kyocera 119,548 0.04 2,032 Mabuchi Motor 128,531 0.05
15,006 Marubeni 86,125 0.03 15,181 Mitsubishi 333,978 0.12 22,510 Mitsubishi Electric 291,021 0.11 37,529 Mitsubishi Heavy Industries 228,397 0.08 17,443 Mitsui & Co 236,988 0.09
1,046 Murata Manufacturing 182,589 0.07 1,469 Nidec 110,026 0.04 7,515 Nippon Electric Glass 38,077 0.01
26,144 Nippon Yusen 72,857 0.03 1,363 Secom 88,498 0.03
12,882 Sumitomo 149,912 0.05 15,006 Sumitomo Heavy Industries 87,560 0.03
1,908 TDK 146,104 0.05 34,758 Toshiba 119,586 0.04
4,540,048 1.65 Oil & Gas
15,181 JX Holdings 65,530 0.02 7,515 TonenGeneral Sekiyu 69,951 0.03
135,481 0.05 Technology
7,358 Brother Industries 104,268 0.04 10,627 Canon 345,867 0.12
4,548 FUJIFILM Holdings 162,552 0.06 24,227 Fujitsu 135,504 0.05
8,584 Gungho Online Entertainment 33,392 0.01 4,255 Hitachi High-Technologies 119,793 0.04 4,609 Nomura Research Institute 180,420 0.07
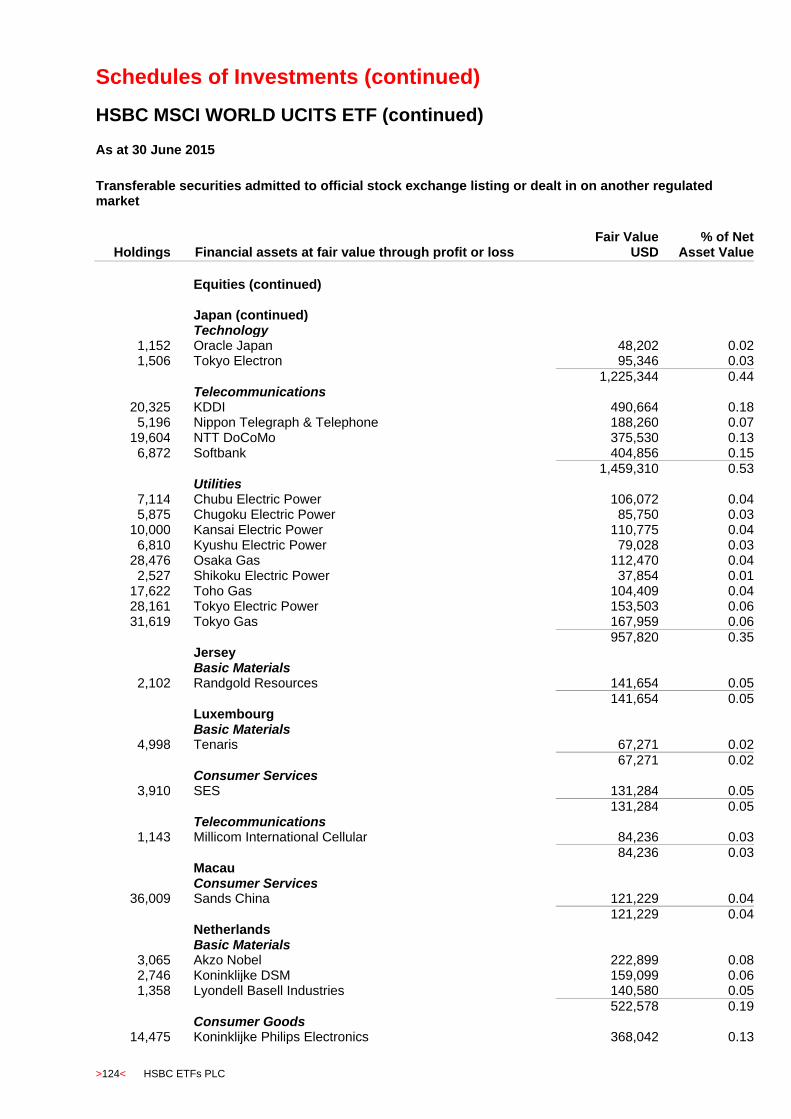
Schedules of Investments (continued)
HSBC MSCI WORLD UCITS ETF (continued)
>124< HSBC ETFs PLC
As at 30 June 2015
Transferable securities admitted to official stock exchange listing or dealt in on another regulated market
Holdings Financial assets at fair value through profit or loss
Fair Value USD
% of Net Asset Value
Equities (continued) Japan (continued) Technology
1,152 Oracle Japan 48,202 0.02 1,506 Tokyo Electron 95,346 0.03
1,225,344 0.44 Telecommunications
20,325 KDDI 490,664 0.18 5,196 Nippon Telegraph & Telephone 188,260 0.07
19,604 NTT DoCoMo 375,530 0.13 6,872 Softbank 404,856 0.15
1,459,310 0.53 Utilities
7,114 Chubu Electric Power 106,072 0.04 5,875 Chugoku Electric Power 85,750 0.03
10,000 Kansai Electric Power 110,775 0.04 6,810 Kyushu Electric Power 79,028 0.03
28,476 Osaka Gas 112,470 0.04 2,527 Shikoku Electric Power 37,854 0.01
17,622 Toho Gas 104,409 0.04 28,161 Tokyo Electric Power 153,503 0.06 31,619 Tokyo Gas 167,959 0.06
957,820 0.35 Jersey Basic Materials
2,102 Randgold Resources 141,654 0.05 141,654 0.05 Luxembourg Basic Materials
4,998 Tenaris 67,271 0.02
67,271 0.02 Consumer Services
3,910 SES 131,284 0.05 131,284 0.05 Telecommunications
1,143 Millicom International Cellular 84,236 0.03 84,236 0.03 Macau Consumer Services
36,009 Sands China 121,229 0.04
121,229 0.04 Netherlands Basic Materials
3,065 Akzo Nobel 222,899 0.08 2,746 Koninklijke DSM 159,099 0.06 1,358 Lyondell Basell Industries 140,580 0.05
522,578 0.19 Consumer Goods
14,475 Koninklijke Philips Electronics 368,042 0.13

Schedules of Investments (continued)
HSBC MSCI WORLD UCITS ETF (continued)
HSBC ETFs PLC >125<
As at 30 June 2015
Transferable securities admitted to official stock exchange listing or dealt in on another regulated market
Holdings Financial assets at fair value through profit or loss
Fair Value USD
% of Net Asset Value
Equities (continued) Netherlands (continued) Consumer Goods (continued)
13,691 Unilever 569,832 0.21
937,874 0.34 Consumer Services
11,680 Koninklijke Ahold 218,633 0.08
218,633 0.08 Financial
11,228 Aegon 82,467 0.03 2,489 Delta Lloyd 40,836 0.01
38,275 ING Groep 631,587 0.23
754,890 0.27 Healthcare
4,751 QIAGEN 116,644 0.04
116,644 0.04 Industrial
12,571 CNH Industrial 114,574 0.04 2,602 European Aeronautic Defence and Space 168,730 0.06 1,591 Gemalto 141,603 0.05 3,445 Koninklijke Vopak 173,746 0.06 2,100 Randstad Holding 136,669 0.05
11,892 TNT Express 100,820 0.04
836,142 0.30 Oil & Gas
41,096 Royal Dutch Shell 1,159,587 0.42
1,159,587 0.42 Technology
831 ASML Holding 85,831 0.03
85,831 0.03 Telecommunications
19,076 Koninklijke KPN 72,903 0.03
72,903 0.03 New Zealand Healthcare
7,021 Ryman Healthcare 37,607 0.01
37,607 0.01 Utilities
7,444 Contact Energy 25,222 0.01 35,122 Meridian Energy 51,306 0.02 36,742 Mighty River Power 69,328 0.02
145,856 0.05 Norway Basic Materials
6,380 Norsk Hydro 26,801 0.01 1,842 Yara International 95,618 0.03
122,419 0.04 Financial
2,350 DNB 39,070 0.02
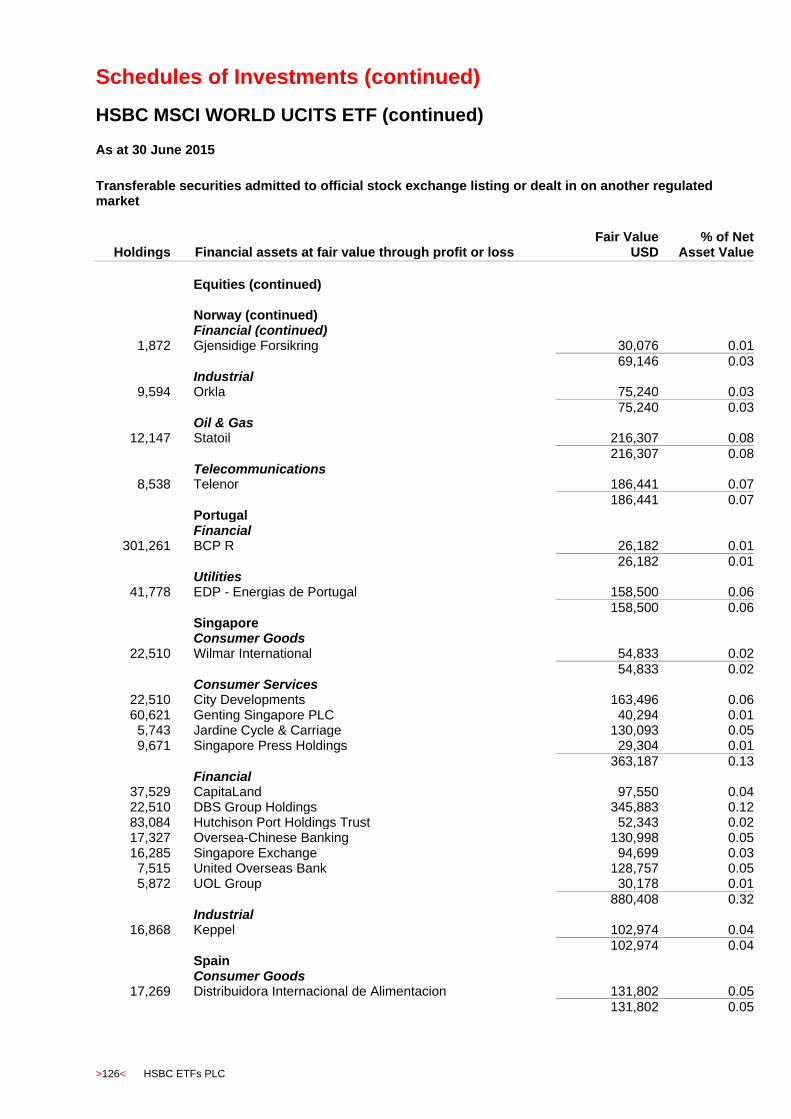
Schedules of Investments (continued)
HSBC MSCI WORLD UCITS ETF (continued)
>126< HSBC ETFs PLC
As at 30 June 2015
Transferable securities admitted to official stock exchange listing or dealt in on another regulated market
Holdings Financial assets at fair value through profit or loss
Fair Value USD
% of Net Asset Value
Equities (continued) Norway (continued) Financial (continued)
1,872 Gjensidige Forsikring 30,076 0.01
69,146 0.03 Industrial
9,594 Orkla 75,240 0.03
75,240 0.03 Oil & Gas
12,147 Statoil 216,307 0.08
216,307 0.08 Telecommunications
8,538 Telenor 186,441 0.07
186,441 0.07 Portugal Financial
301,261 BCP R 26,182 0.01
26,182 0.01 Utilities
41,778 EDP - Energias de Portugal 158,500 0.06
158,500 0.06 Singapore Consumer Goods
22,510 Wilmar International 54,833 0.02
54,833 0.02 Consumer Services
22,510 City Developments 163,496 0.06 60,621 Genting Singapore PLC 40,294 0.01
5,743 Jardine Cycle & Carriage 130,093 0.05 9,671 Singapore Press Holdings 29,304 0.01
363,187 0.13 Financial
37,529 CapitaLand 97,550 0.04 22,510 DBS Group Holdings 345,883 0.12 83,084 Hutchison Port Holdings Trust 52,343 0.02 17,327 Oversea-Chinese Banking 130,998 0.05 16,285 Singapore Exchange 94,699 0.03
7,515 United Overseas Bank 128,757 0.05 5,872 UOL Group 30,178 0.01
880,408 0.32 Industrial
16,868 Keppel 102,974 0.04
102,974 0.04 Spain Consumer Goods
17,269 Distribuidora Internacional de Alimentacion 131,802 0.05
131,802 0.05
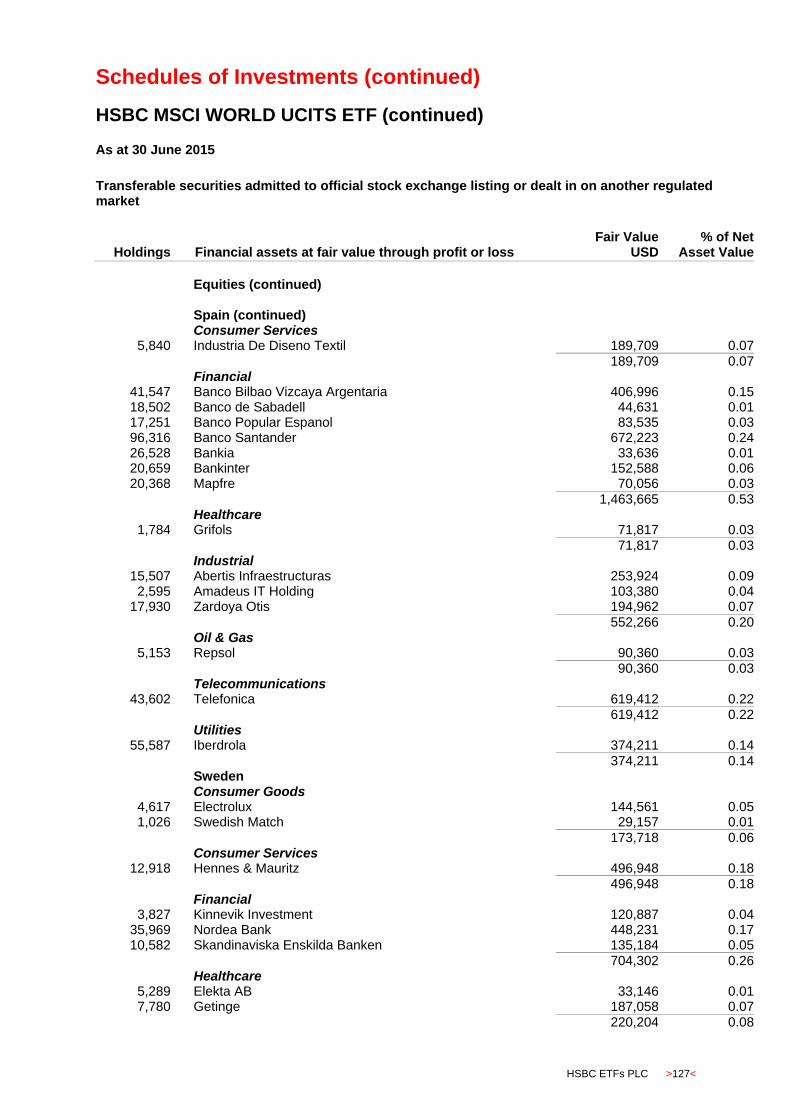
Schedules of Investments (continued)
HSBC MSCI WORLD UCITS ETF (continued)
HSBC ETFs PLC >127<
As at 30 June 2015
Transferable securities admitted to official stock exchange listing or dealt in on another regulated market
Holdings Financial assets at fair value through profit or loss
Fair Value USD
% of Net Asset Value
Equities (continued) Spain (continued) Consumer Services
5,840 Industria De Diseno Textil 189,709 0.07
189,709 0.07 Financial
41,547 Banco Bilbao Vizcaya Argentaria 406,996 0.15 18,502 Banco de Sabadell 44,631 0.01 17,251 Banco Popular Espanol 83,535 0.03 96,316 Banco Santander 672,223 0.24 26,528 Bankia 33,636 0.01 20,659 Bankinter 152,588 0.06 20,368 Mapfre 70,056 0.03
1,463,665 0.53 Healthcare
1,784 Grifols 71,817 0.03
71,817 0.03 Industrial
15,507 Abertis Infraestructuras 253,924 0.09 2,595 Amadeus IT Holding 103,380 0.04
17,930 Zardoya Otis 194,962 0.07
552,266 0.20 Oil & Gas
5,153 Repsol 90,360 0.03 90,360 0.03 Telecommunications
43,602 Telefonica 619,412 0.22 619,412 0.22 Utilities
55,587 Iberdrola 374,211 0.14
374,211 0.14 Sweden Consumer Goods
4,617 Electrolux 144,561 0.05 1,026 Swedish Match 29,157 0.01
173,718 0.06 Consumer Services
12,918 Hennes & Mauritz 496,948 0.18
496,948 0.18 Financial
3,827 Kinnevik Investment 120,887 0.04 35,969 Nordea Bank 448,231 0.17 10,582 Skandinaviska Enskilda Banken 135,184 0.05
704,302 0.26 Healthcare
5,289 Elekta AB 33,146 0.01 7,780 Getinge 187,058 0.07
220,204 0.08
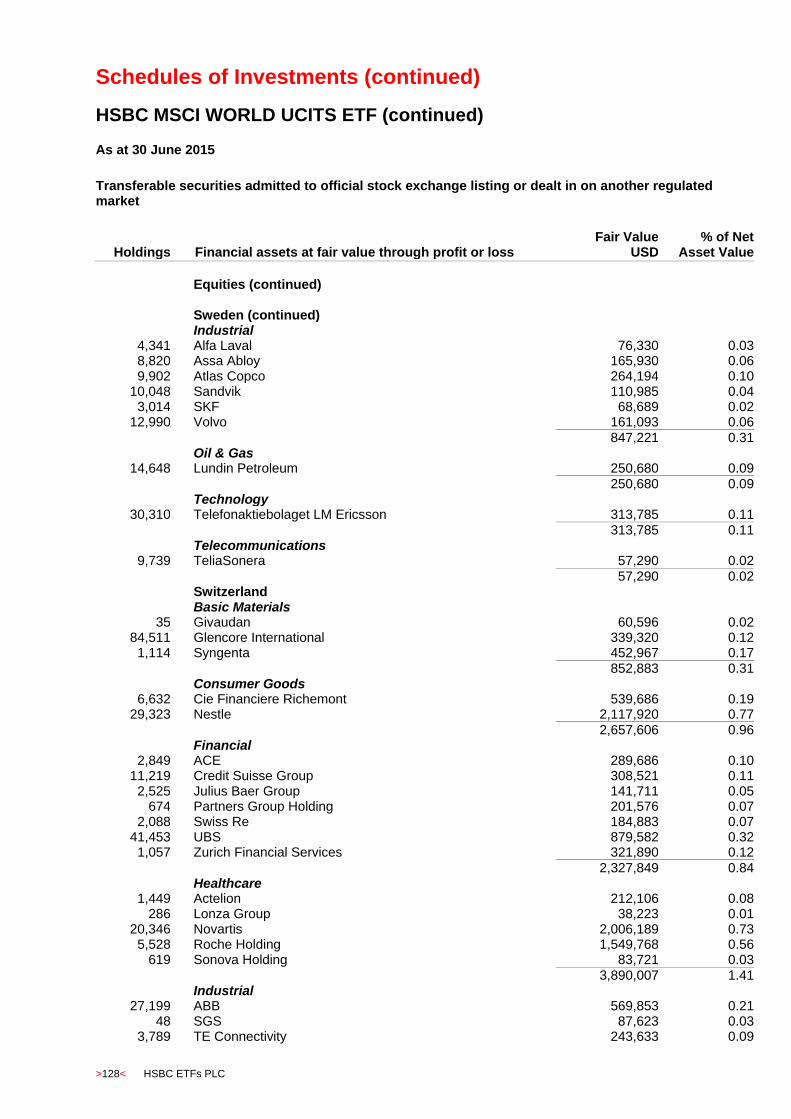
Schedules of Investments (continued)
HSBC MSCI WORLD UCITS ETF (continued)
>128< HSBC ETFs PLC
As at 30 June 2015
Transferable securities admitted to official stock exchange listing or dealt in on another regulated market
Holdings Financial assets at fair value through profit or loss
Fair Value USD
% of Net Asset Value
Equities (continued) Sweden (continued) Industrial
4,341 Alfa Laval 76,330 0.03 8,820 Assa Abloy 165,930 0.06 9,902 Atlas Copco 264,194 0.10
10,048 Sandvik 110,985 0.04 3,014 SKF 68,689 0.02
12,990 Volvo 161,093 0.06
847,221 0.31 Oil & Gas
14,648 Lundin Petroleum 250,680 0.09
250,680 0.09 Technology
30,310 Telefonaktiebolaget LM Ericsson 313,785 0.11
313,785 0.11 Telecommunications
9,739 TeliaSonera 57,290 0.02
57,290 0.02 Switzerland Basic Materials
35 Givaudan 60,596 0.02 84,511 Glencore International 339,320 0.12
1,114 Syngenta 452,967 0.17 852,883 0.31 Consumer Goods
6,632 Cie Financiere Richemont 539,686 0.19 29,323 Nestle 2,117,920 0.77
2,657,606 0.96 Financial
2,849 ACE 289,686 0.10 11,219 Credit Suisse Group 308,521 0.11
2,525 Julius Baer Group 141,711 0.05 674 Partners Group Holding 201,576 0.07
2,088 Swiss Re 184,883 0.07 41,453 UBS 879,582 0.32
1,057 Zurich Financial Services 321,890 0.12
2,327,849 0.84 Healthcare
1,449 Actelion 212,106 0.08 286 Lonza Group 38,223 0.01
20,346 Novartis 2,006,189 0.73 5,528 Roche Holding 1,549,768 0.56
619 Sonova Holding 83,721 0.03
3,890,007 1.41 Industrial
27,199 ABB 569,853 0.21 48 SGS 87,623 0.03
3,789 TE Connectivity 243,633 0.09
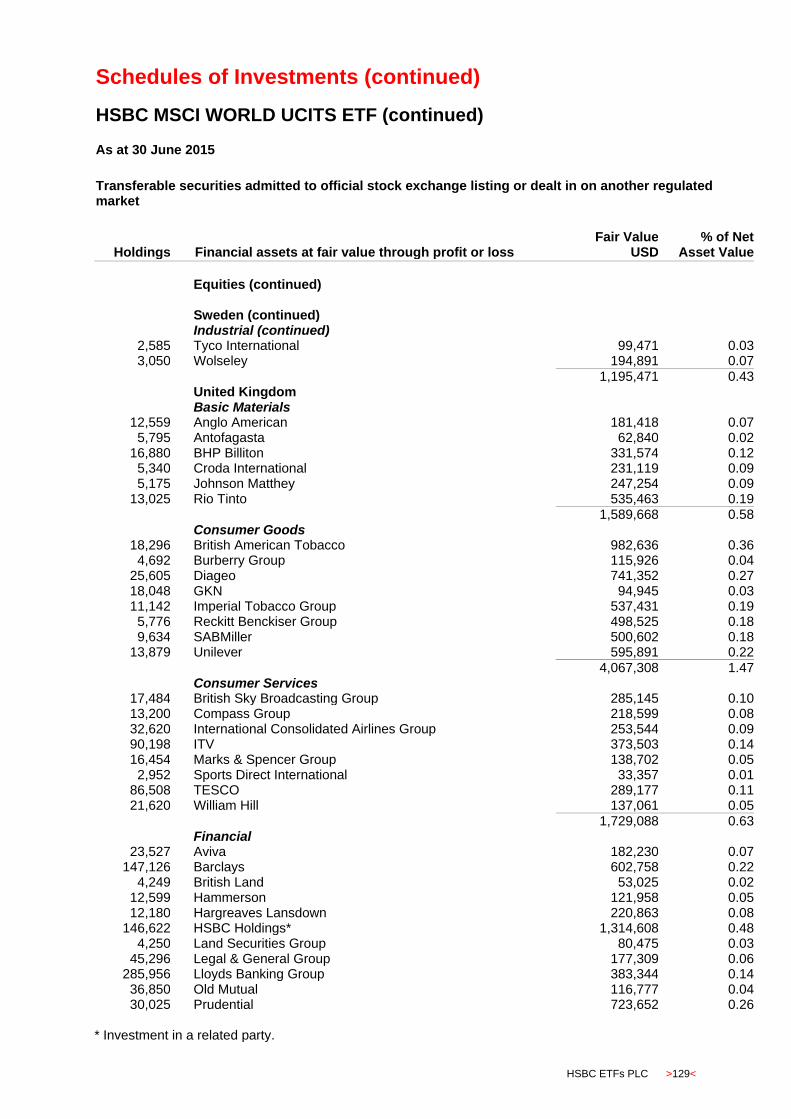
Schedules of Investments (continued)
HSBC MSCI WORLD UCITS ETF (continued)
HSBC ETFs PLC >129<
As at 30 June 2015
Transferable securities admitted to official stock exchange listing or dealt in on another regulated market
Holdings Financial assets at fair value through profit or loss
Fair Value USD
% of Net Asset Value
Equities (continued) Sweden (continued) Industrial (continued)
2,585 Tyco International 99,471 0.03 3,050 Wolseley 194,891 0.07
1,195,471 0.43 United Kingdom Basic Materials
12,559 Anglo American 181,418 0.07 5,795 Antofagasta 62,840 0.02
16,880 BHP Billiton 331,574 0.12 5,340 Croda International 231,119 0.09 5,175 Johnson Matthey 247,254 0.09
13,025 Rio Tinto 535,463 0.19 1,589,668 0.58 Consumer Goods
18,296 British American Tobacco 982,636 0.36 4,692 Burberry Group 115,926 0.04
25,605 Diageo 741,352 0.27 18,048 GKN 94,945 0.03 11,142 Imperial Tobacco Group 537,431 0.19
5,776 Reckitt Benckiser Group 498,525 0.18 9,634 SABMiller 500,602 0.18
13,879 Unilever 595,891 0.22
4,067,308 1.47 Consumer Services
17,484 British Sky Broadcasting Group 285,145 0.10 13,200 Compass Group 218,599 0.08 32,620 International Consolidated Airlines Group 253,544 0.09 90,198 ITV 373,503 0.14 16,454 Marks & Spencer Group 138,702 0.05
2,952 Sports Direct International 33,357 0.01 86,508 TESCO 289,177 0.11 21,620 William Hill 137,061 0.05
1,729,088 0.63 Financial
23,527 Aviva 182,230 0.07 147,126 Barclays 602,758 0.22
4,249 British Land 53,025 0.02 12,599 Hammerson 121,958 0.05 12,180 Hargreaves Lansdown 220,863 0.08
146,622 HSBC Holdings* 1,314,608 0.48 4,250 Land Securities Group 80,475 0.03
45,296 Legal & General Group 177,309 0.06 285,956 Lloyds Banking Group 383,344 0.14 36,850 Old Mutual 116,777 0.04 30,025 Prudential 723,652 0.26
* Investment in a related party.
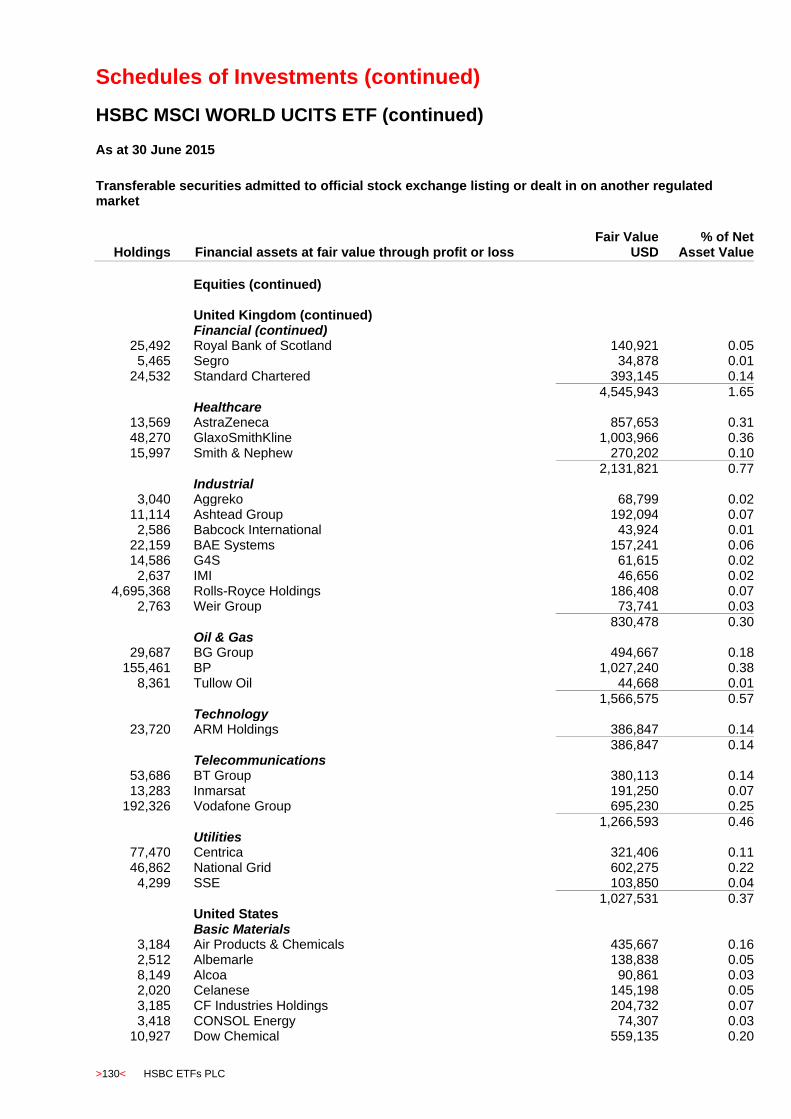
Schedules of Investments (continued)
HSBC MSCI WORLD UCITS ETF (continued)
>130< HSBC ETFs PLC
As at 30 June 2015
Transferable securities admitted to official stock exchange listing or dealt in on another regulated market
Holdings Financial assets at fair value through profit or loss
Fair Value USD
% of Net Asset Value
Equities (continued) United Kingdom (continued) Financial (continued)
25,492 Royal Bank of Scotland 140,921 0.05 5,465 Segro 34,878 0.01
24,532 Standard Chartered 393,145 0.14
4,545,943 1.65 Healthcare
13,569 AstraZeneca 857,653 0.31 48,270 GlaxoSmithKline 1,003,966 0.36 15,997 Smith & Nephew 270,202 0.10
2,131,821 0.77 Industrial
3,040 Aggreko 68,799 0.02 11,114 Ashtead Group 192,094 0.07
2,586 Babcock International 43,924 0.01 22,159 BAE Systems 157,241 0.06 14,586 G4S 61,615 0.02
2,637 IMI 46,656 0.02 4,695,368 Rolls-Royce Holdings 186,408 0.07
2,763 Weir Group 73,741 0.03
830,478 0.30 Oil & Gas
29,687 BG Group 494,667 0.18 155,461 BP 1,027,240 0.38
8,361 Tullow Oil 44,668 0.01 1,566,575 0.57 Technology
23,720 ARM Holdings 386,847 0.14
386,847 0.14 Telecommunications
53,686 BT Group 380,113 0.14 13,283 Inmarsat 191,250 0.07
192,326 Vodafone Group 695,230 0.25
1,266,593 0.46 Utilities
77,470 Centrica 321,406 0.11 46,862 National Grid 602,275 0.22
4,299 SSE 103,850 0.04 1,027,531 0.37 United States Basic Materials
3,184 Air Products & Chemicals 435,667 0.16 2,512 Albemarle 138,838 0.05 8,149 Alcoa 90,861 0.03 2,020 Celanese 145,198 0.05 3,185 CF Industries Holdings 204,732 0.07 3,418 CONSOL Energy 74,307 0.03
10,927 Dow Chemical 559,135 0.20

Schedules of Investments (continued)
HSBC MSCI WORLD UCITS ETF (continued)
HSBC ETFs PLC >131<
As at 30 June 2015
Transferable securities admitted to official stock exchange listing or dealt in on another regulated market
Holdings Financial assets at fair value through profit or loss
Fair Value USD
% of Net Asset Value
Equities (continued) United States (continued) Basic Materials (continued)
10,304 DuPont 658,941 0.24 268 Ecolab 30,303 0.01
8,065 Freeport-McMoRan Copper & Gold 150,170 0.05 1,664 International Flavors & Fragrances 181,859 0.07 3,045 International Paper 144,912 0.05 2,341 Newmont Mining 54,686 0.02 2,601 Nucor 114,626 0.04
330 PPG Industries 37,858 0.02 4,089 Praxair 488,840 0.18
3,510,933 1.27 Consumer Goods
20,239 Altria Group 989,889 0.36 4,299 Archer-Daniels-Midland 207,298 0.08 2,602 Coach 90,055 0.03
37,634 Coca-Cola 1,476,382 0.53 10,631 Colgate-Palmolive 695,374 0.25
1,970 DR Horton 53,899 0.02 2,176 Energizer Holdings 286,253 0.10
26,103 Ford Motor 391,806 0.14 5,212 Garmin 228,963 0.08 5,563 General Mills 309,970 0.11 4,653 General Motors 155,084 0.06
10,472 Hanesbrands 348,927 0.13 2,409 Harley-Davidson 135,747 0.05 7,260 Johnson Controls 359,588 0.13
369 Keurig Green Mountain 28,276 0.01 5,112 Kimberly-Clark 541,719 0.20 6,178 Kraft Foods 525,995 0.19 1,463 Lennar 74,672 0.03 1,895 Michael Kors Holdings 79,761 0.03
18,520 Mondelez International 761,913 0.28 4,642 Monsanto 494,791 0.18
453 Monster Beverage 60,711 0.02 7,930 NIKE 856,599 0.31
14,514 PepsiCo 1,354,737 0.49 15,351 Philip Morris International 1,230,690 0.45 24,760 Procter & Gamble 1,937,222 0.70
1,239 Tesla Motors 332,374 0.12 5,719 Tyson Foods 243,801 0.09 1,944 Under Armour 162,207 0.06
758 Wabco Holding 93,780 0.03 1,148 Whirlpool 198,661 0.07
14,707,144 5.33 Consumer Services
3,169 Amazon.Com 1,375,631 0.50 1,736 Bed Bath & Beyond 119,749 0.04

Schedules of Investments (continued)
HSBC MSCI WORLD UCITS ETF (continued)
>132< HSBC ETFs PLC
As at 30 June 2015
Transferable securities admitted to official stock exchange listing or dealt in on another regulated market
Holdings Financial assets at fair value through profit or loss
Fair Value USD
% of Net Asset Value
Equities (continued) United States (continued) Consumer Services (continued)
3,826 Carnival com 188,966 0.07 6,729 CBS 373,460 0.14
391 Chipotle Mexican Grill 236,551 0.09 24,250 Comcast 1,457,798 0.52
4,048 Costco Wholesale 546,723 0.20 11,568 CVS Caremark 1,213,252 0.44
4,433 Darden Restaurants 315,098 0.11 5,875 DIRECTV 545,141 0.20 4,529 Dollar Tree 357,746 0.13
654 Dun & Bradstreet 79,788 0.03 12,413 eBay 747,759 0.27
1,469 Expedia 160,635 0.06 1,842 Family Dollar Stores 145,168 0.05 5,491 Gap 209,591 0.08 2,426 Hilton Worldwide Holdings 66,836 0.02
11,993 Home Depot 1,332,782 0.48 1,752 Kohl's 109,693 0.04
712 Kroger 51,627 0.02 3,081 Las Vegas Sands 161,968 0.06
11,910 Liberty Global 613,410 0.22 7,276 Liberty Interactive 201,909 0.07 3,674 Liberty Media Corporation 131,897 0.05 4,475 Limited Brands 383,642 0.14
11,113 Lowe's Cos 744,238 0.27 4,324 Macy's 291,740 0.11
10,252 McDonald's 974,658 0.35 2,232 McGraw-Hill 224,204 0.08 2,885 McKesson 648,577 0.24 2,208 MGM Resorts International 40,296 0.01
379 NetFlix 248,980 0.09 4,599 News Corp 67,099 0.02 1,913 Nordstrom 142,519 0.05 1,909 O'Reilly Automotive 431,396 0.16
407 Priceline.com 468,608 0.17 2,233 Royal Caribbean Cruises 175,715 0.06
46,876 Sirius XM Holdings 174,847 0.06 3,504 Staples 53,646 0.02
16,919 Starbucks 907,112 0.33 1,894 Starwood Hotels & Resorts Worldwide 153,584 0.06 7,489 Target 611,327 0.22 2,552 Thomson Reuters 97,219 0.04 9,594 Time Warner 838,612 0.30 2,178 Time Warner Cable 388,054 0.14 5,242 TJX Cos 346,863 0.13
17,568 Twenty-First Century Fox 571,751 0.21 2,071 Urban Outfitters 72,485 0.03

Schedules of Investments (continued)
HSBC MSCI WORLD UCITS ETF (continued)
HSBC ETFs PLC >133<
As at 30 June 2015
Transferable securities admitted to official stock exchange listing or dealt in on another regulated market
Holdings Financial assets at fair value through profit or loss
Fair Value USD
% of Net Asset Value
Equities (continued) United States (continued) Consumer Services (continued)
2,000 Viacom 129,280 0.05 9,949 Walgreens Boots Alliance 840,094 0.31
10,505 Wal-Mart Stores 745,120 0.27 15,328 Walt Disney 1,749,538 0.63
3,717 Whole Foods Market 146,598 0.05 778 Wynn Resorts 76,765 0.03
1,985 Yum! Brands 178,809 0.06
23,666,554 8.58 Financial
136 Affiliated Managers 29,730 0.01 5,153 Aflac 320,517 0.12 6,594 Allstate 427,753 0.16 2,560 Ally Financial 57,421 0.02
10,370 American Express 805,956 0.29 7,578 American International Group 468,472 0.17 2,602 American Tower 242,741 0.09 2,280 Ameriprise Financial 284,840 0.10
709 AvalonBay Communities 113,348 0.04 86,657 Bank of America 1,474,902 0.53 13,453 Bank of New York Mellon 564,622 0.20
7,261 BB&T 292,691 0.11 7,945 Berkshire Hathaway 1,081,394 0.39
796 BlackRock 275,400 0.10 2,916 Camden Property Trust 216,600 0.08 3,259 Capital One Financial 286,694 0.10 4,002 CBRE Group 148,074 0.05 2,052 Charles Schwab 66,998 0.02 3,097 Chicago Mercantile Exchange 288,207 0.10 1,347 Chubb 128,154 0.05 1,894 CIT Group 88,052 0.03
22,688 Citigroup 1,253,285 0.45 1,116 Comerica 57,273 0.02 1,894 Crown Castle REIT 152,088 0.06 4,228 Discover Financial Services 243,617 0.09 6,976 Duke Realty 129,544 0.05 5,435 Eaton Vance 212,672 0.08 2,089 Equity Residential 146,585 0.05 2,135 Federal Realty Investment Trust 273,472 0.10 6,694 Fifth Third Bancorp 139,369 0.05 3,132 Franklin Resources 153,562 0.06 4,366 Goldman Sachs 911,577 0.33 4,428 Hartford Financial Services Group 184,072 0.07 2,374 HCP 86,580 0.03 7,510 Host Hotels & Resorts 148,923 0.05 1,229 Intercontinental Exchange 274,817 0.10 6,588 Invesco 246,984 0.09
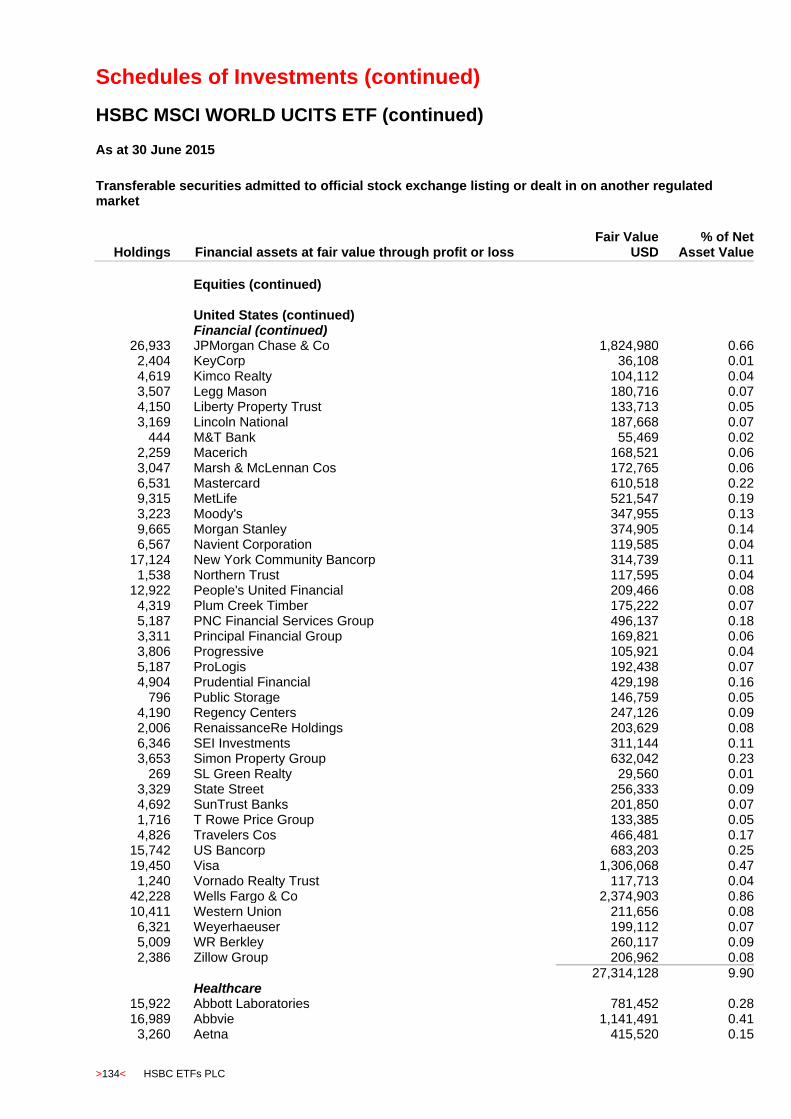
Schedules of Investments (continued)
HSBC MSCI WORLD UCITS ETF (continued)
>134< HSBC ETFs PLC
As at 30 June 2015
Transferable securities admitted to official stock exchange listing or dealt in on another regulated market
Holdings Financial assets at fair value through profit or loss
Fair Value USD
% of Net Asset Value
Equities (continued) United States (continued) Financial (continued)
26,933 JPMorgan Chase & Co 1,824,980 0.66 2,404 KeyCorp 36,108 0.01 4,619 Kimco Realty 104,112 0.04 3,507 Legg Mason 180,716 0.07 4,150 Liberty Property Trust 133,713 0.05 3,169 Lincoln National 187,668 0.07
444 M&T Bank 55,469 0.02 2,259 Macerich 168,521 0.06 3,047 Marsh & McLennan Cos 172,765 0.06 6,531 Mastercard 610,518 0.22 9,315 MetLife 521,547 0.19 3,223 Moody's 347,955 0.13 9,665 Morgan Stanley 374,905 0.14 6,567 Navient Corporation 119,585 0.04
17,124 New York Community Bancorp 314,739 0.11 1,538 Northern Trust 117,595 0.04
12,922 People's United Financial 209,466 0.08 4,319 Plum Creek Timber 175,222 0.07 5,187 PNC Financial Services Group 496,137 0.18 3,311 Principal Financial Group 169,821 0.06 3,806 Progressive 105,921 0.04 5,187 ProLogis 192,438 0.07 4,904 Prudential Financial 429,198 0.16
796 Public Storage 146,759 0.05 4,190 Regency Centers 247,126 0.09 2,006 RenaissanceRe Holdings 203,629 0.08 6,346 SEI Investments 311,144 0.11 3,653 Simon Property Group 632,042 0.23
269 SL Green Realty 29,560 0.01 3,329 State Street 256,333 0.09 4,692 SunTrust Banks 201,850 0.07 1,716 T Rowe Price Group 133,385 0.05 4,826 Travelers Cos 466,481 0.17
15,742 US Bancorp 683,203 0.25 19,450 Visa 1,306,068 0.47
1,240 Vornado Realty Trust 117,713 0.04 42,228 Wells Fargo & Co 2,374,903 0.86 10,411 Western Union 211,656 0.08
6,321 Weyerhaeuser 199,112 0.07 5,009 WR Berkley 260,117 0.09 2,386 Zillow Group 206,962 0.08
27,314,128 9.90 Healthcare
15,922 Abbott Laboratories 781,452 0.28 16,989 Abbvie 1,141,491 0.41
3,260 Aetna 415,520 0.15
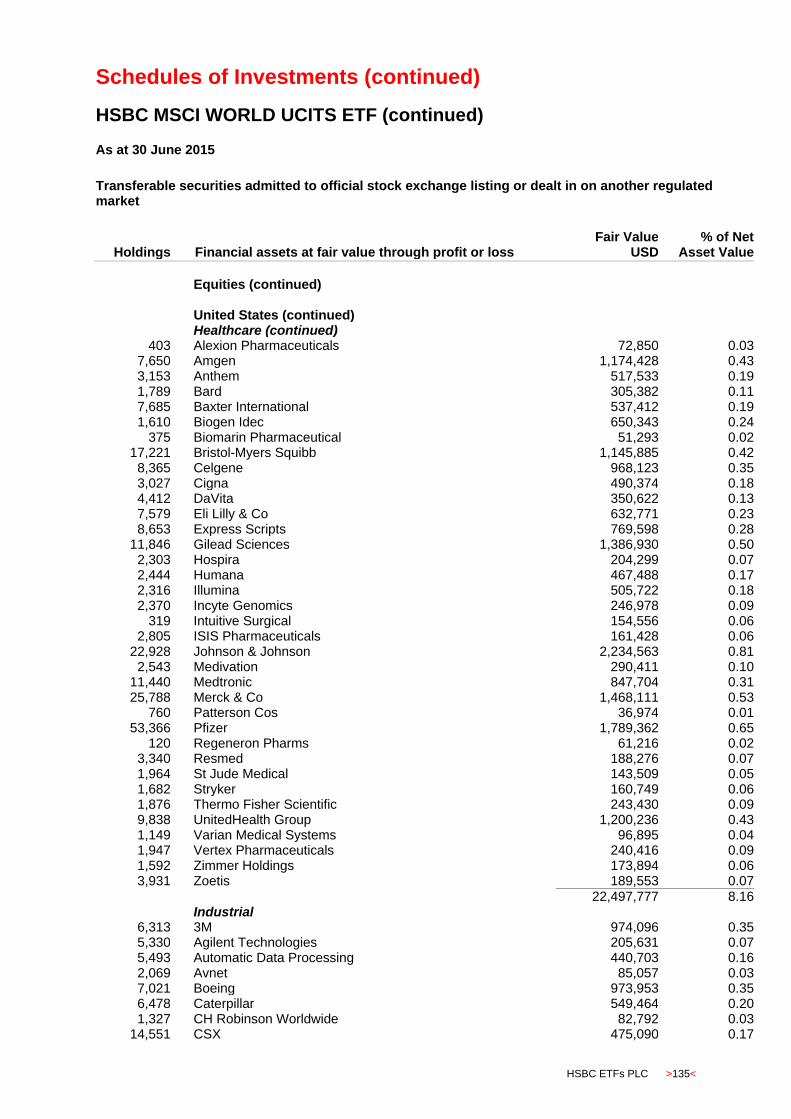
Schedules of Investments (continued)
HSBC MSCI WORLD UCITS ETF (continued)
HSBC ETFs PLC >135<
As at 30 June 2015
Transferable securities admitted to official stock exchange listing or dealt in on another regulated market
Holdings Financial assets at fair value through profit or loss
Fair Value USD
% of Net Asset Value
Equities (continued) United States (continued) Healthcare (continued)
403 Alexion Pharmaceuticals 72,850 0.03 7,650 Amgen 1,174,428 0.43 3,153 Anthem 517,533 0.19 1,789 Bard 305,382 0.11 7,685 Baxter International 537,412 0.19 1,610 Biogen Idec 650,343 0.24
375 Biomarin Pharmaceutical 51,293 0.02 17,221 Bristol-Myers Squibb 1,145,885 0.42
8,365 Celgene 968,123 0.35 3,027 Cigna 490,374 0.18 4,412 DaVita 350,622 0.13 7,579 Eli Lilly & Co 632,771 0.23 8,653 Express Scripts 769,598 0.28
11,846 Gilead Sciences 1,386,930 0.50 2,303 Hospira 204,299 0.07 2,444 Humana 467,488 0.17 2,316 Illumina 505,722 0.18 2,370 Incyte Genomics 246,978 0.09
319 Intuitive Surgical 154,556 0.06 2,805 ISIS Pharmaceuticals 161,428 0.06
22,928 Johnson & Johnson 2,234,563 0.81 2,543 Medivation 290,411 0.10
11,440 Medtronic 847,704 0.31 25,788 Merck & Co 1,468,111 0.53
760 Patterson Cos 36,974 0.01 53,366 Pfizer 1,789,362 0.65
120 Regeneron Pharms 61,216 0.02 3,340 Resmed 188,276 0.07 1,964 St Jude Medical 143,509 0.05 1,682 Stryker 160,749 0.06 1,876 Thermo Fisher Scientific 243,430 0.09 9,838 UnitedHealth Group 1,200,236 0.43 1,149 Varian Medical Systems 96,895 0.04 1,947 Vertex Pharmaceuticals 240,416 0.09 1,592 Zimmer Holdings 173,894 0.06 3,931 Zoetis 189,553 0.07
22,497,777 8.16 Industrial
6,313 3M 974,096 0.35 5,330 Agilent Technologies 205,631 0.07 5,493 Automatic Data Processing 440,703 0.16 2,069 Avnet 85,057 0.03 7,021 Boeing 973,953 0.35 6,478 Caterpillar 549,464 0.20 1,327 CH Robinson Worldwide 82,792 0.03
14,551 CSX 475,090 0.17
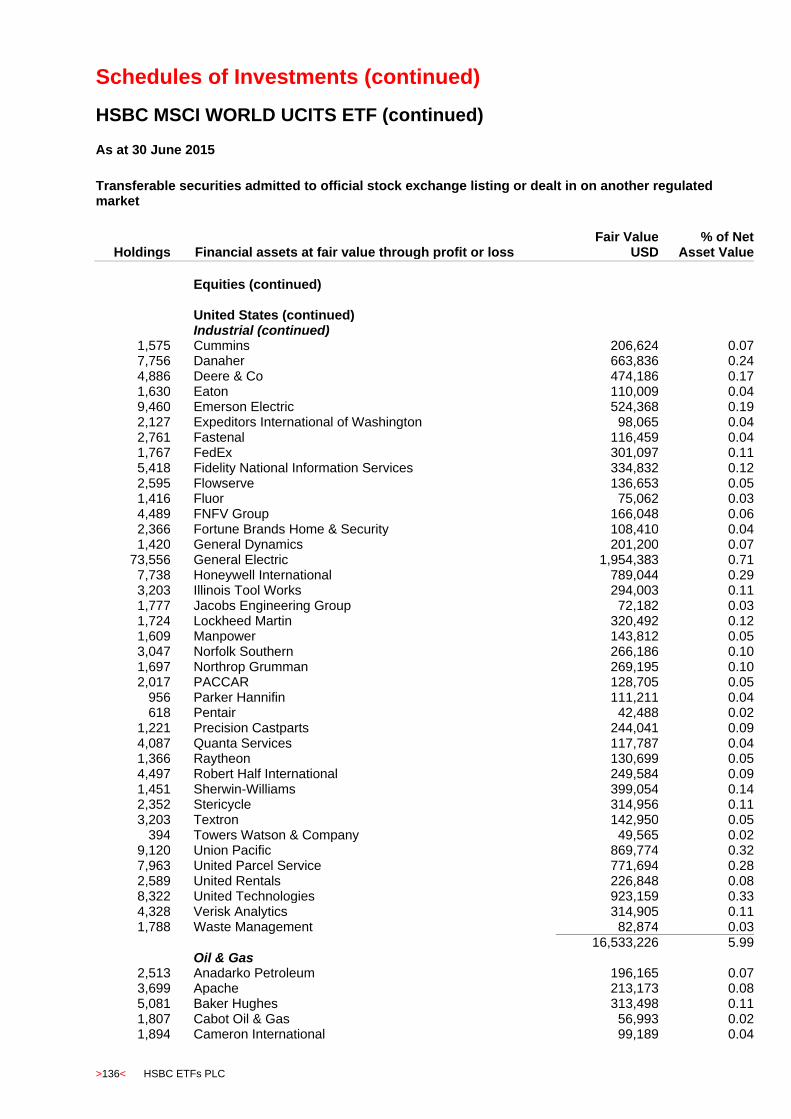
Schedules of Investments (continued)
HSBC MSCI WORLD UCITS ETF (continued)
>136< HSBC ETFs PLC
As at 30 June 2015
Transferable securities admitted to official stock exchange listing or dealt in on another regulated market
Holdings Financial assets at fair value through profit or loss
Fair Value USD
% of Net Asset Value
Equities (continued) United States (continued) Industrial (continued)
1,575 Cummins 206,624 0.07 7,756 Danaher 663,836 0.24 4,886 Deere & Co 474,186 0.17 1,630 Eaton 110,009 0.04 9,460 Emerson Electric 524,368 0.19 2,127 Expeditors International of Washington 98,065 0.04 2,761 Fastenal 116,459 0.04 1,767 FedEx 301,097 0.11 5,418 Fidelity National Information Services 334,832 0.12 2,595 Flowserve 136,653 0.05 1,416 Fluor 75,062 0.03 4,489 FNFV Group 166,048 0.06 2,366 Fortune Brands Home & Security 108,410 0.04 1,420 General Dynamics 201,200 0.07
73,556 General Electric 1,954,383 0.71 7,738 Honeywell International 789,044 0.29 3,203 Illinois Tool Works 294,003 0.11 1,777 Jacobs Engineering Group 72,182 0.03 1,724 Lockheed Martin 320,492 0.12 1,609 Manpower 143,812 0.05 3,047 Norfolk Southern 266,186 0.10 1,697 Northrop Grumman 269,195 0.10 2,017 PACCAR 128,705 0.05
956 Parker Hannifin 111,211 0.04 618 Pentair 42,488 0.02
1,221 Precision Castparts 244,041 0.09 4,087 Quanta Services 117,787 0.04 1,366 Raytheon 130,699 0.05 4,497 Robert Half International 249,584 0.09 1,451 Sherwin-Williams 399,054 0.14 2,352 Stericycle 314,956 0.11 3,203 Textron 142,950 0.05
394 Towers Watson & Company 49,565 0.02 9,120 Union Pacific 869,774 0.32 7,963 United Parcel Service 771,694 0.28 2,589 United Rentals 226,848 0.08 8,322 United Technologies 923,159 0.33 4,328 Verisk Analytics 314,905 0.11 1,788 Waste Management 82,874 0.03
16,533,226 5.99 Oil & Gas
2,513 Anadarko Petroleum 196,165 0.07 3,699 Apache 213,173 0.08 5,081 Baker Hughes 313,498 0.11 1,807 Cabot Oil & Gas 56,993 0.02 1,894 Cameron International 99,189 0.04

Schedules of Investments (continued)
HSBC MSCI WORLD UCITS ETF (continued)
HSBC ETFs PLC >137<
As at 30 June 2015
Transferable securities admitted to official stock exchange listing or dealt in on another regulated market
Holdings Financial assets at fair value through profit or loss
Fair Value USD
% of Net Asset Value
Equities (continued) United States (continued) Oil & Gas (continued)
2,988 Cheniere Energy 206,949 0.07 5,029 Chesapeake Energy 56,174 0.02
14,409 Chevron 1,390,036 0.50 922 Cimarex Energy 101,706 0.04
5,112 Cobalt International En 49,638 0.02 11,988 ConocoPhillips 736,183 0.27
5,430 Devon Energy 323,031 0.12 2,504 Energen 171,023 0.06 4,744 EOG Resources 415,337 0.15
31,834 Exxon Mobil 2,648,589 0.96 2,229 FMC Technologies 92,481 0.03 9,808 Halliburton 422,431 0.15 1,646 Helmerich & Payne 115,911 0.04 2,195 Hess 146,802 0.05 9,400 Kinder Morgan 360,866 0.13 6,058 Marathon Oil 160,779 0.06 4,924 Marathon Petroleum 257,574 0.09 4,763 National Oilwell Varco 229,958 0.08 3,011 Noble Energy 128,509 0.05 6,943 Occidental Petroleum 539,957 0.20 4,053 Oceaneering International 188,829 0.07 7,512 OGE Energy 214,618 0.08 6,553 Phillips 527,910 0.19 1,382 Pioneer Natural Resources 191,670 0.07
518 Range Resources 25,579 0.01 12,815 Schlumberger 1,104,525 0.40
2,390 Southwestern Energy 54,325 0.02 555 Tesoro 46,848 0.02
6,587 Valero Energy 412,346 0.15 6,694 Weatherford Internation 82,135 0.03 4,620 Williams Cos 265,142 0.10
12,546,879 4.55 Technology
3,833 Adobe Systems 310,511 0.11 2,125 Altera 108,800 0.04 2,318 Analog Devices 148,781 0.06
46,293 Apple 5,806,300 2.10 7,100 Applied Materials 136,462 0.05 2,993 Autodesk 149,874 0.06
251 Avago Technologies 33,365 0.01 3,310 Broadcom 170,432 0.06
49,509 Cisco Systems 1,359,517 0.49 1,327 Citrix Systems 93,102 0.03 4,151 Cognizant Technology Solutions 253,585 0.09
15,849 Corning 312,701 0.11 16,379 EMC 432,242 0.16

Schedules of Investments (continued)
HSBC MSCI WORLD UCITS ETF (continued)
>138< HSBC ETFs PLC
As at 30 June 2015
Transferable securities admitted to official stock exchange listing or dealt in on another regulated market
Holdings Financial assets at fair value through profit or loss
Fair Value USD
% of Net Asset Value
Equities (continued) United States (continued) Technology (continued)
920 F5 Networks 110,722 0.04 14,300 FaceBook 1,226,440 0.44
3,647 Fireeye 178,375 0.06 4,418 Google 2,342,716 0.85 1,982 Harris 152,436 0.06
21,440 Hewlett-Packard 643,414 0.23 46,042 Intel 1,400,367 0.51
9,069 International Business Machines 1,475,164 0.53 1,999 Intuit 201,439 0.07 4,723 Juniper Networks 122,656 0.05 3,196 KLA-Tencor 179,647 0.07
472 LinkedIn Corporation 97,529 0.04 3,895 Marvell Technology Group 51,356 0.02 3,380 Maxim Integrated Products 116,864 0.04 4,425 Micron Technology 83,367 0.03
60,916 Microsoft 2,689,441 0.97 3,240 NetApp 102,254 0.04 2,496 Netsuite 229,008 0.08 5,385 NVIDIA 108,292 0.04
34,180 Oracle 1,377,454 0.50 1,645 Palo Alto Networks 287,382 0.10
15,187 QUALCOMM 951,162 0.34 1,641 Rackspace Hosting 61,029 0.02 1,680 Red Hat 127,562 0.05 4,890 Salesforce.com 340,491 0.12 2,283 SanDisk 132,916 0.05 1,711 SBA Communications 196,714 0.07 6,249 Seagate Technology 296,828 0.11 2,431 Servicenow 180,648 0.07
10,693 Symantec 248,612 0.09 1,912 Teradata 70,744 0.03
12,465 Texas Instruments 642,072 0.23 3,598 Twitter 130,320 0.05 1,316 VeriSign 81,224 0.03 2,834 Western Digital 222,242 0.08
976 Workday Incorporation 74,557 0.03 12,104 Xerox 128,787 0.05 12,434 Yahoo! 488,532 0.18
26,866,435 9.74 Telecommunications
43,751 AT&T 1,554,036 0.57 7,352 Sprint 33,525 0.01
38,164 Verizon Communications 1,778,824 0.64
3,366,385 1.22 Utilities
1,734 Alliant Energy 100,086 0.04
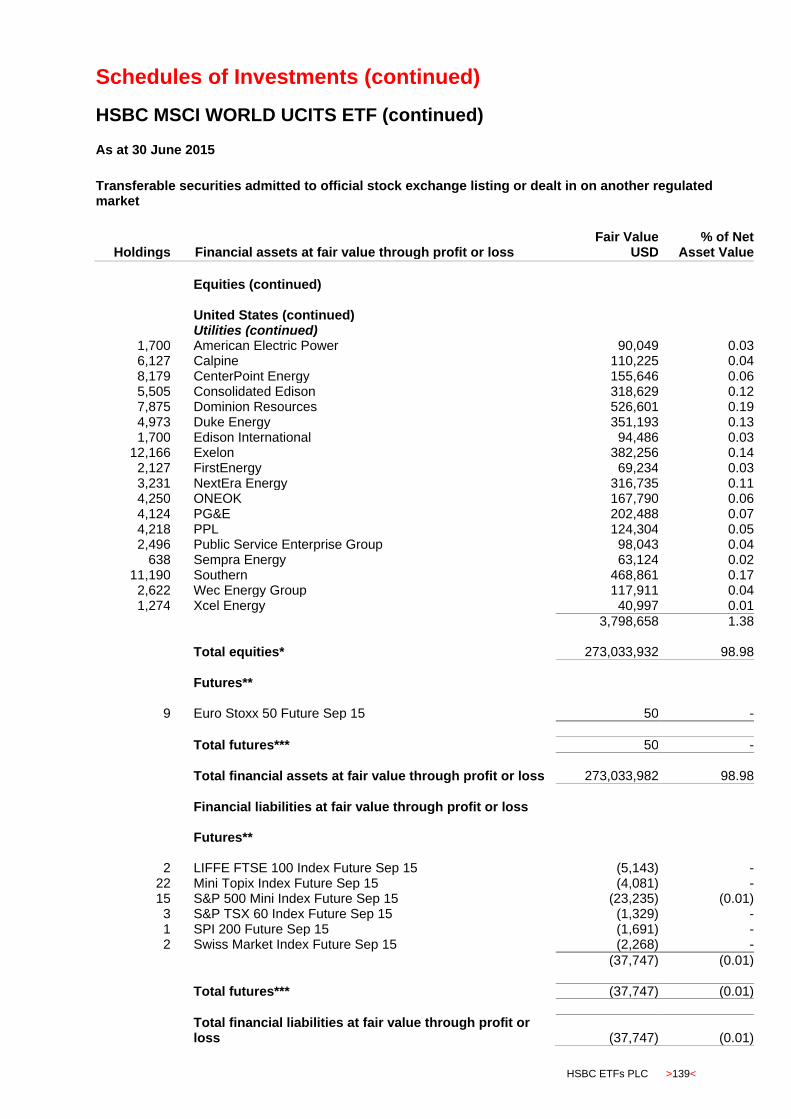
Schedules of Investments (continued)
HSBC MSCI WORLD UCITS ETF (continued)
HSBC ETFs PLC >139<
As at 30 June 2015
Transferable securities admitted to official stock exchange listing or dealt in on another regulated market
Holdings Financial assets at fair value through profit or loss
Fair Value USD
% of Net Asset Value
Equities (continued) United States (continued) Utilities (continued)
1,700 American Electric Power 90,049 0.03 6,127 Calpine 110,225 0.04 8,179 CenterPoint Energy 155,646 0.06 5,505 Consolidated Edison 318,629 0.12 7,875 Dominion Resources 526,601 0.19 4,973 Duke Energy 351,193 0.13 1,700 Edison International 94,486 0.03
12,166 Exelon 382,256 0.14 2,127 FirstEnergy 69,234 0.03 3,231 NextEra Energy 316,735 0.11 4,250 ONEOK 167,790 0.06 4,124 PG&E 202,488 0.07 4,218 PPL 124,304 0.05 2,496 Public Service Enterprise Group 98,043 0.04
638 Sempra Energy 63,124 0.02 11,190 Southern 468,861 0.17
2,622 Wec Energy Group 117,911 0.04 1,274 Xcel Energy 40,997 0.01
3,798,658 1.38 Total equities* 273,033,932 98.98
Futures**
9 Euro Stoxx 50 Future Sep 15 50 -
Total futures*** 50 - Total financial assets at fair value through profit or loss 273,033,982 98.98
Financial liabilities at fair value through profit or loss Futures**
2 LIFFE FTSE 100 Index Future Sep 15 (5,143) - 22 Mini Topix Index Future Sep 15 (4,081) - 15 S&P 500 Mini Index Future Sep 15 (23,235) (0.01) 3 S&P TSX 60 Index Future Sep 15 (1,329) - 1 SPI 200 Future Sep 15 (1,691) - 2 Swiss Market Index Future Sep 15 (2,268) -
(37,747) (0.01)
Total futures*** (37,747) (0.01)
Total financial liabilities at fair value through profit or loss (37,747) (0.01)
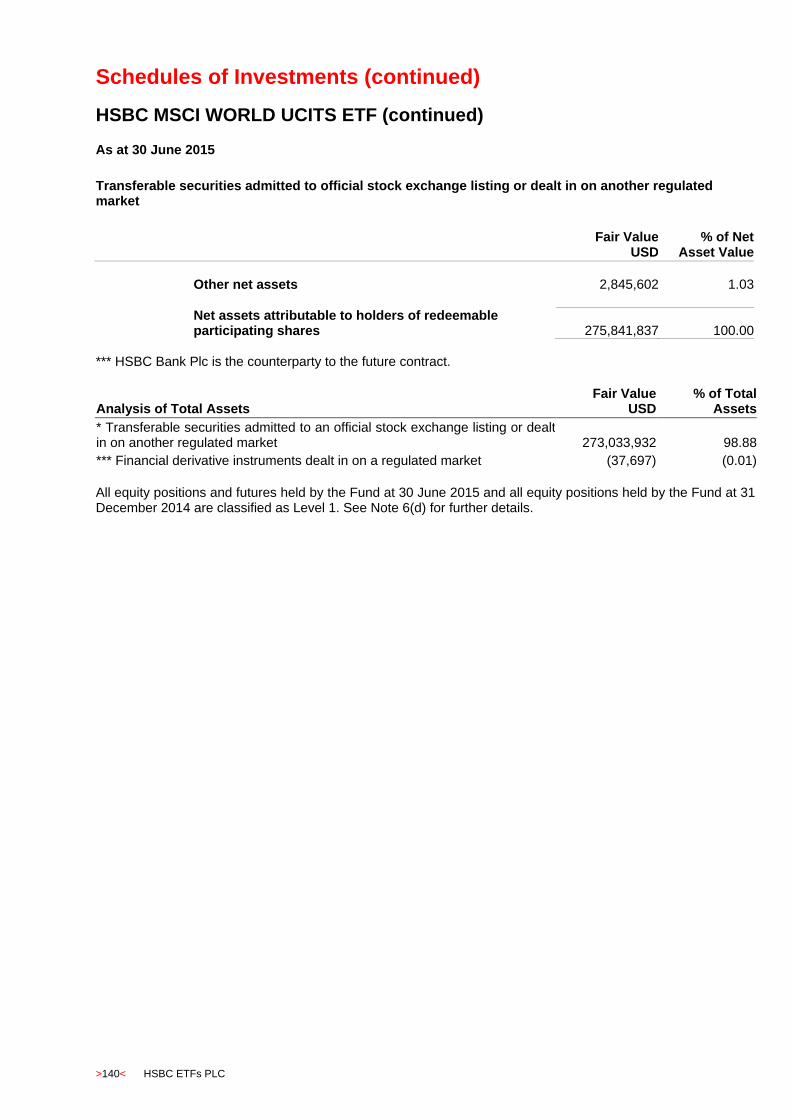
Schedules of Investments (continued)
HSBC MSCI WORLD UCITS ETF (continued)
>140< HSBC ETFs PLC
As at 30 June 2015
Transferable securities admitted to official stock exchange listing or dealt in on another regulated market
Fair Value
USD % of Net
Asset Value
Other net assets 2,845,602 1.03
Net assets attributable to holders of redeemable participating shares 275,841,837 100.00
*** HSBC Bank Plc is the counterparty to the future contract.
Analysis of Total Assets Fair Value
USD % of Total
Assets
* Transferable securities admitted to an official stock exchange listing or dealt in on another regulated market 273,033,932 98.88
*** Financial derivative instruments dealt in on a regulated market (37,697) (0.01)
All equity positions and futures held by the Fund at 30 June 2015 and all equity positions held by the Fund at 31 December 2014 are classified as Level 1. See Note 6(d) for further details.

Schedules of Investments (continued)
HSBC S&P BRIC 40 UCITS ETF
HSBC ETFs PLC >141<
As at 30 June 2015
Transferable securities admitted to official stock exchange listing or dealt in on another regulated market
Holdings
Financial assets at fair value through profit or loss Fair Value
USD % of Net
Asset Value
Equities Brazil Basic Materials
7,409 Vale 43,639 0.87
43,639 0.87 Consumer Goods
22,811 Ambev 139,147 2.76 3,320 BRF - Brasil Foods 69,421 1.38
208,568 4.14 Financial
12,622 Banco Bradesco 115,618 2.29 13,822 Itau Unibanco Holding 151,351 3.00
266,969 5.29 Oil & Gas
7,452 Petroleo Brasileiro 67,441 1.34
67,441 1.34 Utilities
2,173 Ultrapar Participacoes 45,676 0.91 45,676 0.91 China Basic Materials
17,015 China Shenhua Energy 38,803 0.77
38,803 0.77 Consumer Goods
3,923 Hengan International Group 46,605 0.92 34,353 Want Want China Holding 36,336 0.72
82,941 1.64 Consumer Services
1,849 Alibaba Group Holding 152,117 3.02
152,117 3.02 Financial
119,757 Agricultural Bank of China 64,416 1.28 343,289 Bank of China 223,175 4.42 103,417 Bank Of Communications 107,785 2.14 409,231 China Construction Bank 373,729 7.41 37,253 China Life Insurance 162,177 3.22 22,984 China Merchants Bank 67,002 1.33
408,453 Industrial & Commercial Bank of China 324,548 6.43 9,871 Ping An Insurance 133,310 2.64
1,456,142 28.87 Oil & Gas
127,563 China Petroleum & Chemical 110,079 2.18 80,363 CNOOC 114,026 2.26
105,492 PetroChina 117,704 2.33
341,809 6.77 Technology
1,368 Baidu 272,342 5.40 31,700 Lenovo Group 43,916 0.87

Schedules of Investments (continued)
HSBC S&P BRIC 40 UCITS ETF (continued)
>142< HSBC ETFs PLC
As at 30 June 2015
Transferable securities admitted to official stock exchange listing or dealt in on another regulated market
Holdings
Financial assets at fair value through profit or loss Fair Value
USD % of Net
Asset Value
Equities (continued) China (continued) Technology (continued)
26,731 Tencent Holdings 533,410 10.58
849,668 16.85 Telecommunications
69,488 China Telecom 40,783 0.81
40,783 0.81 Hong Kong Financial
20,052 China Overseas Land & Investment 70,741 1.40
70,741 1.40 Industrial
27,429 Citic Pacific 49,179 0.98
49,179 0.98 Telecommunications
27,561 China Mobile 352,842 7.00
352,842 7.00 India Financial
1,975 HDFC Bank 119,547 2.37 7,043 ICICI Bank 73,388 1.45
192,935 3.82 Industrial
952 Tata Motors 32,815 0.65 32,815 0.65 Oil & Gas
2,131 Reliance Industries 66,381 1.32 66,381 1.32 Technology
9,642 Infosys 152,826 3.03
152,826 3.03 Russia Basic Materials
2,456 JSC MMC Norilsk Nickel 41,433 0.82 41,433 0.82 Consumer Services
1,444 Magnit 80,373 1.59 80,373 1.59 Financial
13,509 Sberbank of Russia 70,517 1.40
70,517 1.40 Oil & Gas
2,594 Lukoil 114,149 2.26 29,630 OAO Gazprom 152,594 3.02
1,218 Tatneft 38,952 0.77
305,695 6.05
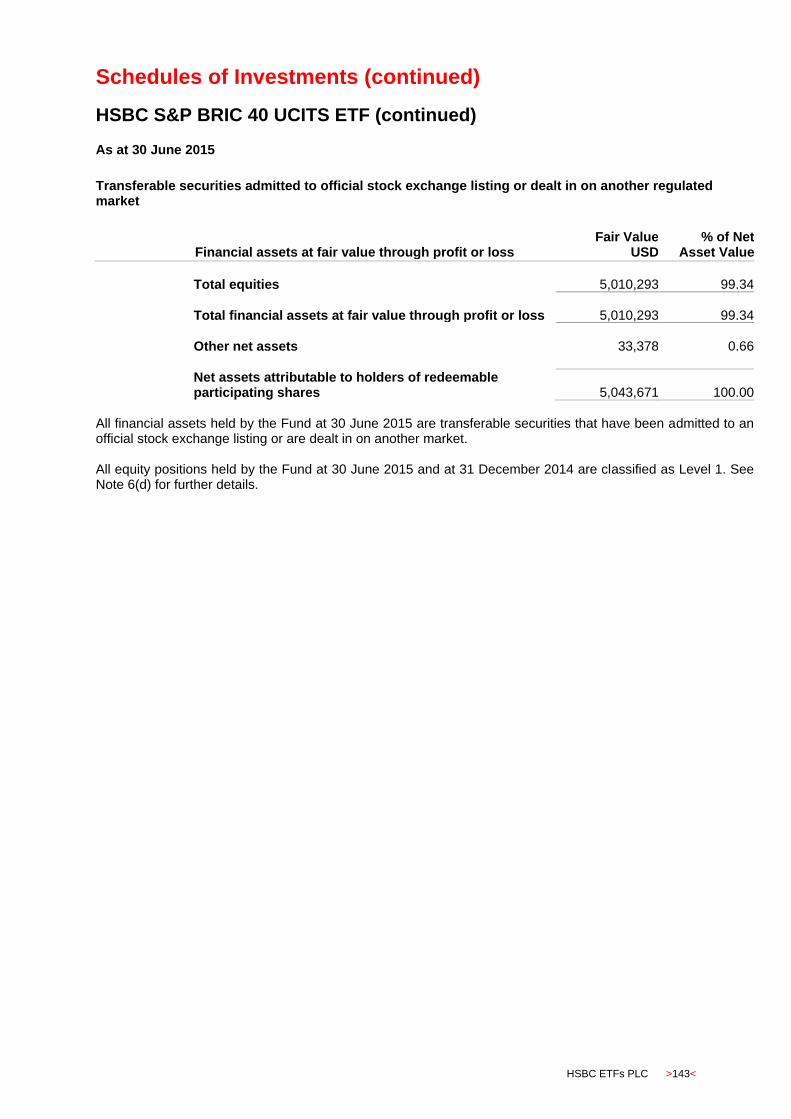
Schedules of Investments (continued)
HSBC S&P BRIC 40 UCITS ETF (continued)
HSBC ETFs PLC >143<
As at 30 June 2015
Transferable securities admitted to official stock exchange listing or dealt in on another regulated market
Financial assets at fair value through profit or loss Fair Value
USD % of Net
Asset Value
Total equities 5,010,293 99.34
Total financial assets at fair value through profit or loss 5,010,293 99.34
Other net assets 33,378 0.66
Net assets attributable to holders of redeemable participating shares 5,043,671 100.00
All financial assets held by the Fund at 30 June 2015 are transferable securities that have been admitted to an official stock exchange listing or are dealt in on another market. All equity positions held by the Fund at 30 June 2015 and at 31 December 2014 are classified as Level 1. See Note 6(d) for further details.
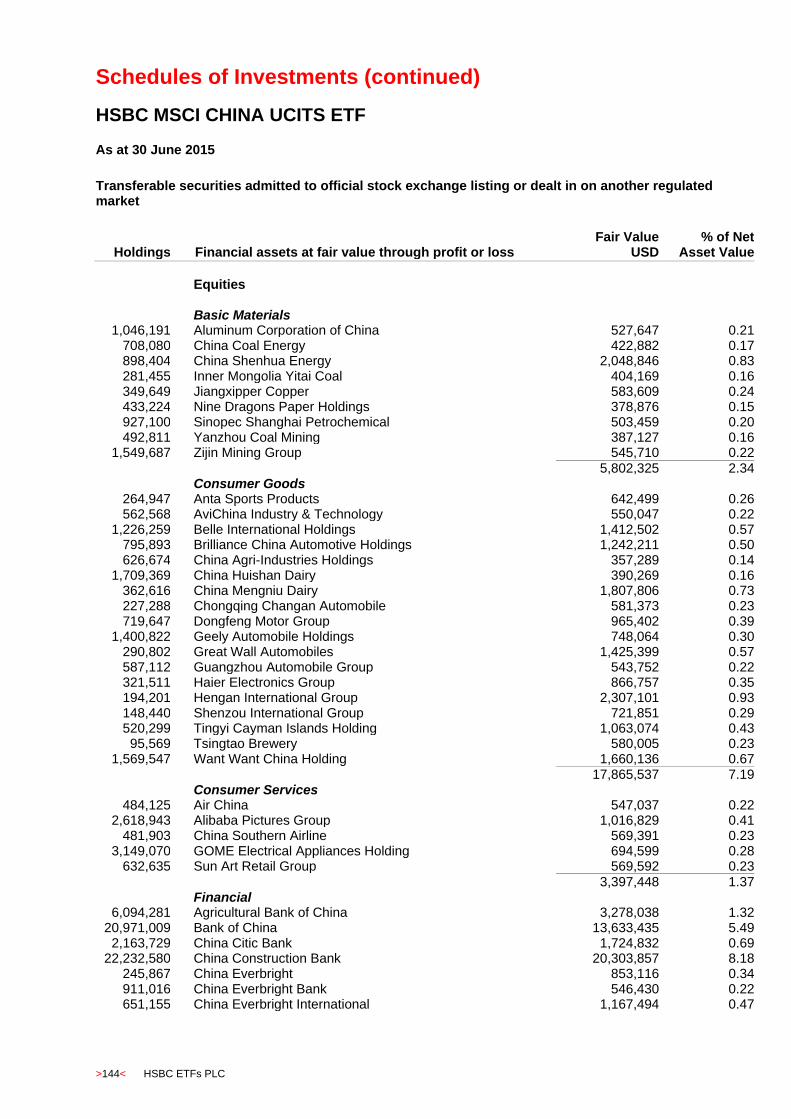
Schedules of Investments (continued)
HSBC MSCI CHINA UCITS ETF
>144< HSBC ETFs PLC
As at 30 June 2015
Transferable securities admitted to official stock exchange listing or dealt in on another regulated market
Holdings
Financial assets at fair value through profit or loss Fair Value
USD % of Net
Asset Value
Equities
Basic Materials 1,046,191 Aluminum Corporation of China 527,647 0.21
708,080 China Coal Energy 422,882 0.17 898,404 China Shenhua Energy 2,048,846 0.83 281,455 Inner Mongolia Yitai Coal 404,169 0.16 349,649 Jiangxipper Copper 583,609 0.24 433,224 Nine Dragons Paper Holdings 378,876 0.15 927,100 Sinopec Shanghai Petrochemical 503,459 0.20 492,811 Yanzhou Coal Mining 387,127 0.16
1,549,687 Zijin Mining Group 545,710 0.22
5,802,325 2.34 Consumer Goods
264,947 Anta Sports Products 642,499 0.26 562,568 AviChina Industry & Technology 550,047 0.22
1,226,259 Belle International Holdings 1,412,502 0.57 795,893 Brilliance China Automotive Holdings 1,242,211 0.50 626,674 China Agri-Industries Holdings 357,289 0.14
1,709,369 China Huishan Dairy 390,269 0.16 362,616 China Mengniu Dairy 1,807,806 0.73 227,288 Chongqing Changan Automobile 581,373 0.23 719,647 Dongfeng Motor Group 965,402 0.39
1,400,822 Geely Automobile Holdings 748,064 0.30 290,802 Great Wall Automobiles 1,425,399 0.57 587,112 Guangzhou Automobile Group 543,752 0.22 321,511 Haier Electronics Group 866,757 0.35 194,201 Hengan International Group 2,307,101 0.93 148,440 Shenzou International Group 721,851 0.29 520,299 Tingyi Cayman Islands Holding 1,063,074 0.43 95,569 Tsingtao Brewery 580,005 0.23
1,569,547 Want Want China Holding 1,660,136 0.67 17,865,537 7.19 Consumer Services
484,125 Air China 547,037 0.22 2,618,943 Alibaba Pictures Group 1,016,829 0.41
481,903 China Southern Airline 569,391 0.23 3,149,070 GOME Electrical Appliances Holding 694,599 0.28
632,635 Sun Art Retail Group 569,592 0.23
3,397,448 1.37 Financial
6,094,281 Agricultural Bank of China 3,278,038 1.32 20,971,009 Bank of China 13,633,435 5.49
2,163,729 China Citic Bank 1,724,832 0.69 22,232,580 China Construction Bank 20,303,857 8.18
245,867 China Everbright 853,116 0.34 911,016 China Everbright Bank 546,430 0.22 651,155 China Everbright International 1,167,494 0.47
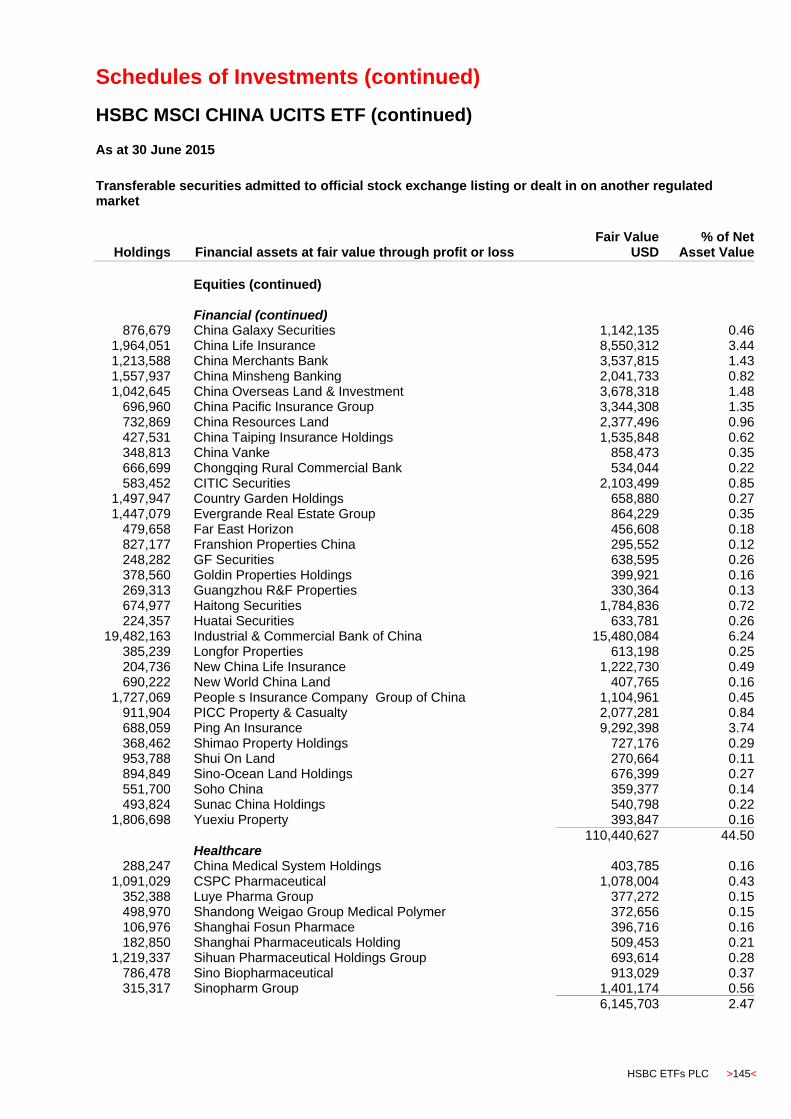
Schedules of Investments (continued)
HSBC MSCI CHINA UCITS ETF (continued)
HSBC ETFs PLC >145<
As at 30 June 2015
Transferable securities admitted to official stock exchange listing or dealt in on another regulated market
Holdings
Financial assets at fair value through profit or loss Fair Value
USD % of Net
Asset Value
Equities (continued)
Financial (continued) 876,679 China Galaxy Securities 1,142,135 0.46
1,964,051 China Life Insurance 8,550,312 3.44 1,213,588 China Merchants Bank 3,537,815 1.43 1,557,937 China Minsheng Banking 2,041,733 0.82 1,042,645 China Overseas Land & Investment 3,678,318 1.48
696,960 China Pacific Insurance Group 3,344,308 1.35 732,869 China Resources Land 2,377,496 0.96 427,531 China Taiping Insurance Holdings 1,535,848 0.62 348,813 China Vanke 858,473 0.35 666,699 Chongqing Rural Commercial Bank 534,044 0.22 583,452 CITIC Securities 2,103,499 0.85
1,497,947 Country Garden Holdings 658,880 0.27 1,447,079 Evergrande Real Estate Group 864,229 0.35
479,658 Far East Horizon 456,608 0.18 827,177 Franshion Properties China 295,552 0.12 248,282 GF Securities 638,595 0.26 378,560 Goldin Properties Holdings 399,921 0.16 269,313 Guangzhou R&F Properties 330,364 0.13 674,977 Haitong Securities 1,784,836 0.72 224,357 Huatai Securities 633,781 0.26
19,482,163 Industrial & Commercial Bank of China 15,480,084 6.24 385,239 Longfor Properties 613,198 0.25 204,736 New China Life Insurance 1,222,730 0.49 690,222 New World China Land 407,765 0.16
1,727,069 People s Insurance Company Group of China 1,104,961 0.45 911,904 PICC Property & Casualty 2,077,281 0.84 688,059 Ping An Insurance 9,292,398 3.74 368,462 Shimao Property Holdings 727,176 0.29 953,788 Shui On Land 270,664 0.11 894,849 Sino-Ocean Land Holdings 676,399 0.27 551,700 Soho China 359,377 0.14 493,824 Sunac China Holdings 540,798 0.22
1,806,698 Yuexiu Property 393,847 0.16
110,440,627 44.50 Healthcare
288,247 China Medical System Holdings 403,785 0.16 1,091,029 CSPC Pharmaceutical 1,078,004 0.43
352,388 Luye Pharma Group 377,272 0.15 498,970 Shandong Weigao Group Medical Polymer 372,656 0.15 106,976 Shanghai Fosun Pharmace 396,716 0.16 182,850 Shanghai Pharmaceuticals Holding 509,453 0.21
1,219,337 Sihuan Pharmaceutical Holdings Group 693,614 0.28 786,478 Sino Biopharmaceutical 913,029 0.37 315,317 Sinopharm Group 1,401,174 0.56
6,145,703 2.47
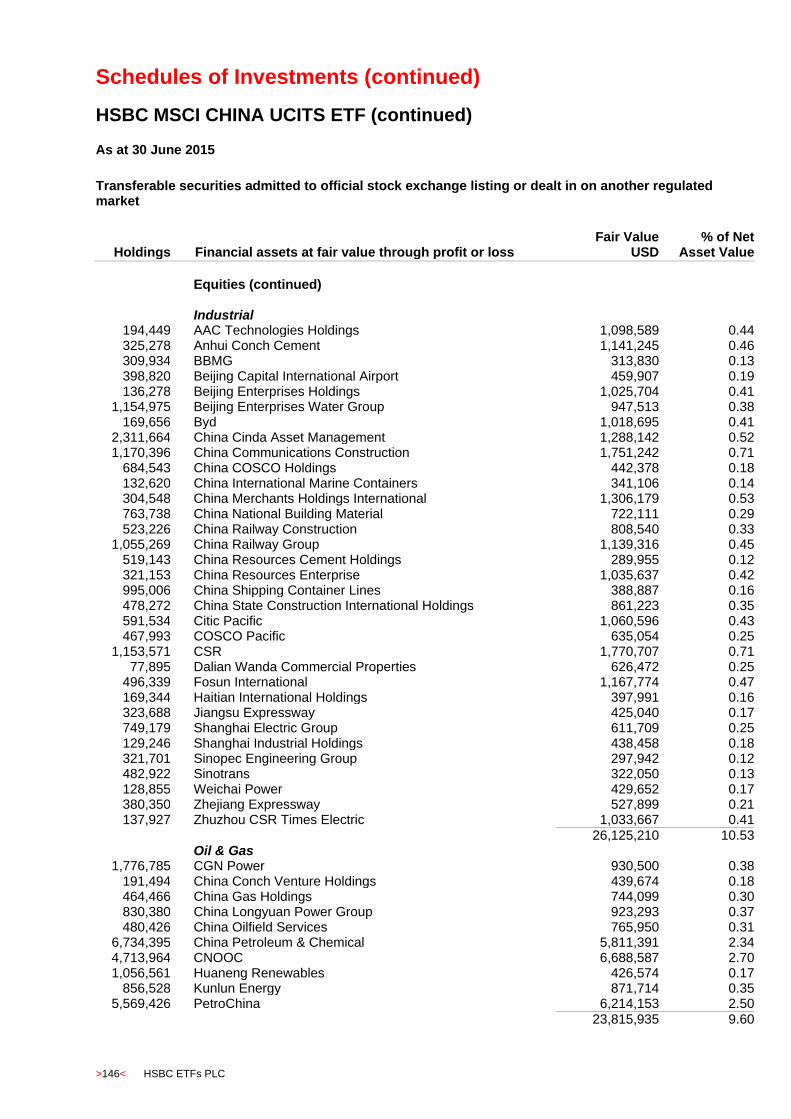
Schedules of Investments (continued)
HSBC MSCI CHINA UCITS ETF (continued)
>146< HSBC ETFs PLC
As at 30 June 2015
Transferable securities admitted to official stock exchange listing or dealt in on another regulated market
Holdings
Financial assets at fair value through profit or loss Fair Value
USD % of Net
Asset Value
Equities (continued)
Industrial 194,449 AAC Technologies Holdings 1,098,589 0.44 325,278 Anhui Conch Cement 1,141,245 0.46 309,934 BBMG 313,830 0.13 398,820 Beijing Capital International Airport 459,907 0.19 136,278 Beijing Enterprises Holdings 1,025,704 0.41
1,154,975 Beijing Enterprises Water Group 947,513 0.38 169,656 Byd 1,018,695 0.41
2,311,664 China Cinda Asset Management 1,288,142 0.52 1,170,396 China Communications Construction 1,751,242 0.71
684,543 China COSCO Holdings 442,378 0.18 132,620 China International Marine Containers 341,106 0.14 304,548 China Merchants Holdings International 1,306,179 0.53 763,738 China National Building Material 722,111 0.29 523,226 China Railway Construction 808,540 0.33
1,055,269 China Railway Group 1,139,316 0.45 519,143 China Resources Cement Holdings 289,955 0.12 321,153 China Resources Enterprise 1,035,637 0.42 995,006 China Shipping Container Lines 388,887 0.16 478,272 China State Construction International Holdings 861,223 0.35 591,534 Citic Pacific 1,060,596 0.43 467,993 COSCO Pacific 635,054 0.25
1,153,571 CSR 1,770,707 0.71 77,895 Dalian Wanda Commercial Properties 626,472 0.25
496,339 Fosun International 1,167,774 0.47 169,344 Haitian International Holdings 397,991 0.16 323,688 Jiangsu Expressway 425,040 0.17 749,179 Shanghai Electric Group 611,709 0.25 129,246 Shanghai Industrial Holdings 438,458 0.18 321,701 Sinopec Engineering Group 297,942 0.12 482,922 Sinotrans 322,050 0.13 128,855 Weichai Power 429,652 0.17 380,350 Zhejiang Expressway 527,899 0.21 137,927 Zhuzhou CSR Times Electric 1,033,667 0.41
26,125,210 10.53 Oil & Gas
1,776,785 CGN Power 930,500 0.38 191,494 China Conch Venture Holdings 439,674 0.18 464,466 China Gas Holdings 744,099 0.30 830,380 China Longyuan Power Group 923,293 0.37 480,426 China Oilfield Services 765,950 0.31
6,734,395 China Petroleum & Chemical 5,811,391 2.34 4,713,964 CNOOC 6,688,587 2.70 1,056,561 Huaneng Renewables 426,574 0.17
856,528 Kunlun Energy 871,714 0.35 5,569,426 PetroChina 6,214,153 2.50
23,815,935 9.60

Schedules of Investments (continued)
HSBC MSCI CHINA UCITS ETF (continued)
HSBC ETFs PLC >147<
As at 30 June 2015
Transferable securities admitted to official stock exchange listing or dealt in on another regulated market
Holdings
Financial assets at fair value through profit or loss Fair Value
USD % of Net
Asset Value
Equities (continued)
Technology 650,372 Alibaba Health Information Technology 676,164 0.27 634,359 China Communications Services 320,757 0.13
4,032,192 Hanergy Thin Film Power Group 2,033,637 0.82 223,586 Kingsoft 754,174 0.30
1,761,922 Lenovo Group 2,440,880 0.98 6,989,890 Semiconductor Manufacturing International 766,381 0.31 1,362,479 Tencent Holdings 27,187,893 10.95
200,410 ZTE 509,779 0.21
34,689,665 13.97 Telecommunications
1,622,816 China Mobile 20,775,679 8.37 3,668,448 China Telecom 2,153,026 0.87 1,582,577 China Unicom Hong Kong 2,490,463 1.00
25,419,168 10.24 Utilities
845,188 China Power International Development 644,313 0.26 235,981 China Resources Gas Group 700,100 0.28 507,305 China Resources Power Holdings 1,416,715 0.57 744,338 Datang International Power Generation 381,168 0.16 200,103 ENN Energy Holdings 1,206,676 0.49
2,876,125 GCL-Poly Energy Holdings 664,074 0.27 746,658 Guangdong Investment 1,045,941 0.42 432,743 Huadian Power International 479,489 0.19 931,945 Huaneng Power International 1,298,283 0.52
7,836,759 3.16
Total equities* 261,538,377 105.37
Unrealised gain on contracts for difference
2,318,408 Bank Of Communications** 518,249 0.21
Total unrealised gain on contracts for difference*** 518,249 0.21
Total financial assets at fair value through profit or loss 262,056,626 105.58
Financial liabilities at fair value through profit or loss Futures
17 H-Shares Index Future Jul 15**** (15,390) (0.01)
Total Futures*** (15,390) (0.01) Total financial liabilities at fair value through profit or loss (15,390) (0.01)
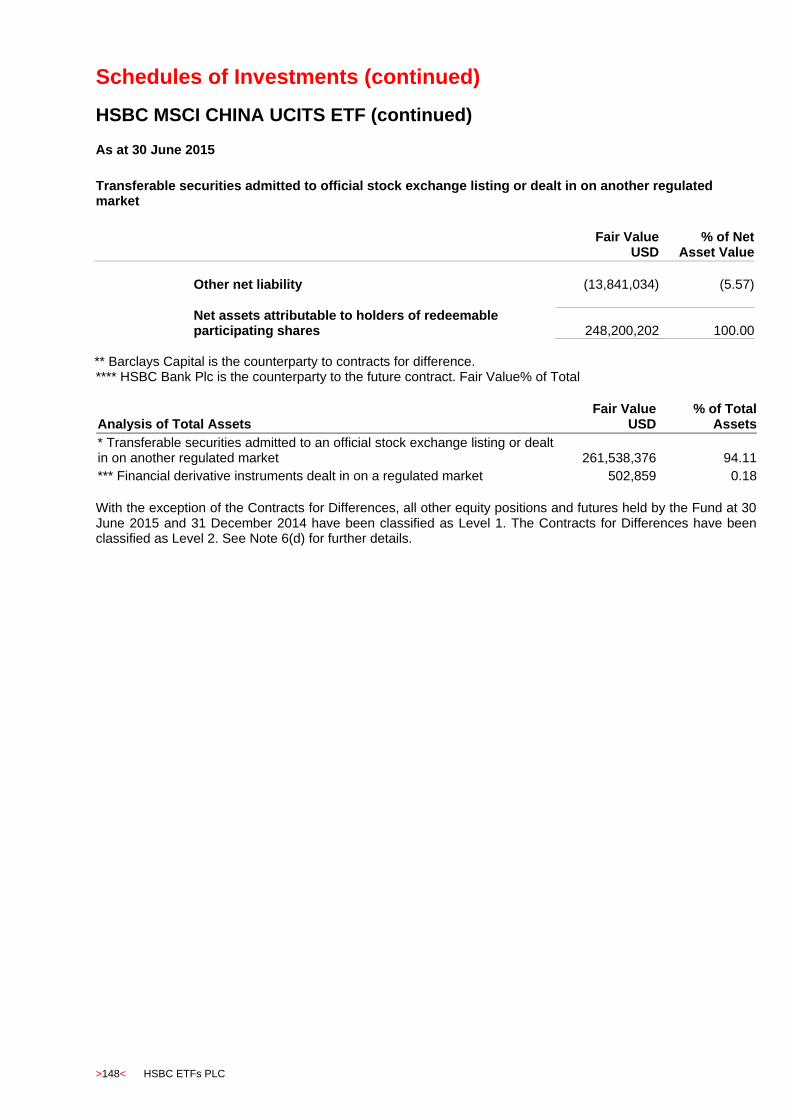
Schedules of Investments (continued)
HSBC MSCI CHINA UCITS ETF (continued)
>148< HSBC ETFs PLC
As at 30 June 2015
Transferable securities admitted to official stock exchange listing or dealt in on another regulated market
Fair Value
USD % of Net
Asset Value
Other net liability (13,841,034) (5.57)
Net assets attributable to holders of redeemable participating shares 248,200,202 100.00
** Barclays Capital is the counterparty to contracts for difference. **** HSBC Bank Plc is the counterparty to the future contract. Fair Value% of Total
Analysis of Total Assets Fair Value
USD % of Total
Assets
* Transferable securities admitted to an official stock exchange listing or dealt in on another regulated market 261,538,376 94.11
*** Financial derivative instruments dealt in on a regulated market 502,859 0.18
With the exception of the Contracts for Differences, all other equity positions and futures held by the Fund at 30 June 2015 and 31 December 2014 have been classified as Level 1. The Contracts for Differences have been classified as Level 2. See Note 6(d) for further details.

Schedules of Investments (continued)
HSBC MSCI SOUTH AFRICA UCITS ETF
HSBC ETFs PLC >149<
As at 30 June 2015
Transferable securities admitted to official stock exchange listing or dealt in on another regulated market
Holdings
Financial assets at fair value through profit or loss Fair Value
USD % of Net
Asset Value
Equities South Africa Basic Materials
1,907 African Rainbow Minerals 12,998 0.23 946 Anglo American Platinum 21,372 0.39
7,087 AngloGold Ashanti 64,023 1.15 2,512 Exxaro Resources 17,989 0.32
13,645 Gold Fields 43,798 0.79 9,425 Impala Platinum Holdings 42,164 0.76 1,130 Kumba Iron Ore 14,054 0.25 2,075 Mondi 45,636 0.82 9,496 Sappi 33,759 0.61
295,793 5.32 Consumer Goods
40,371 Steinhoff International Holdings 256,074 4.61 2,863 Tiger Brands 66,868 1.21
322,942 5.82 Consumer Services
3,516 Foschini Group 46,058 0.83 1,904 Massmart Holdings 23,451 0.42 4,218 Mr Price Group 87,051 1.57 6,966 Naspers 1,087,563 19.59 4,273 Pick n Pay Stores 20,242 0.36 8,038 Shoprite Holdings 114,897 2.07 2,886 Spar Group 45,096 0.81 7,503 Truworths International 52,976 0.96 6,440 Tsogo Sun Holdings 12,930 0.23
16,927 Woolworths Holdings 137,505 2.48
1,627,769 29.32 Financial
26,272 African Bank - - 5,947 Barclays Africa Group 89,653 1.62 5,888 Brait 59,813 1.08
608 Capitec Bank Holdings 24,292 0.44 3,988 Coronation Fund Manager 27,077 0.49 6,245 Discovery Holdings 65,070 1.17
59,028 FirstRand 259,304 4.67 40,067 Growthpoint Properties 87,345 1.57
4,266 Hyprop Investments 42,527 0.77 4,260 Investec 38,449 0.69 2,008 Liberty Holdings 24,016 0.43
19,285 MMI Holdings 47,904 0.86 3,445 Nedbank Group 68,629 1.24 1,546 PSG Group 26,105 0.47
62,761 Redefine Properties 52,793 0.95 4,928 Resilent Property 39,159 0.71
12,379 RMB Holdings 67,771 1.22 11,725 RMI Holdings 41,026 0.74
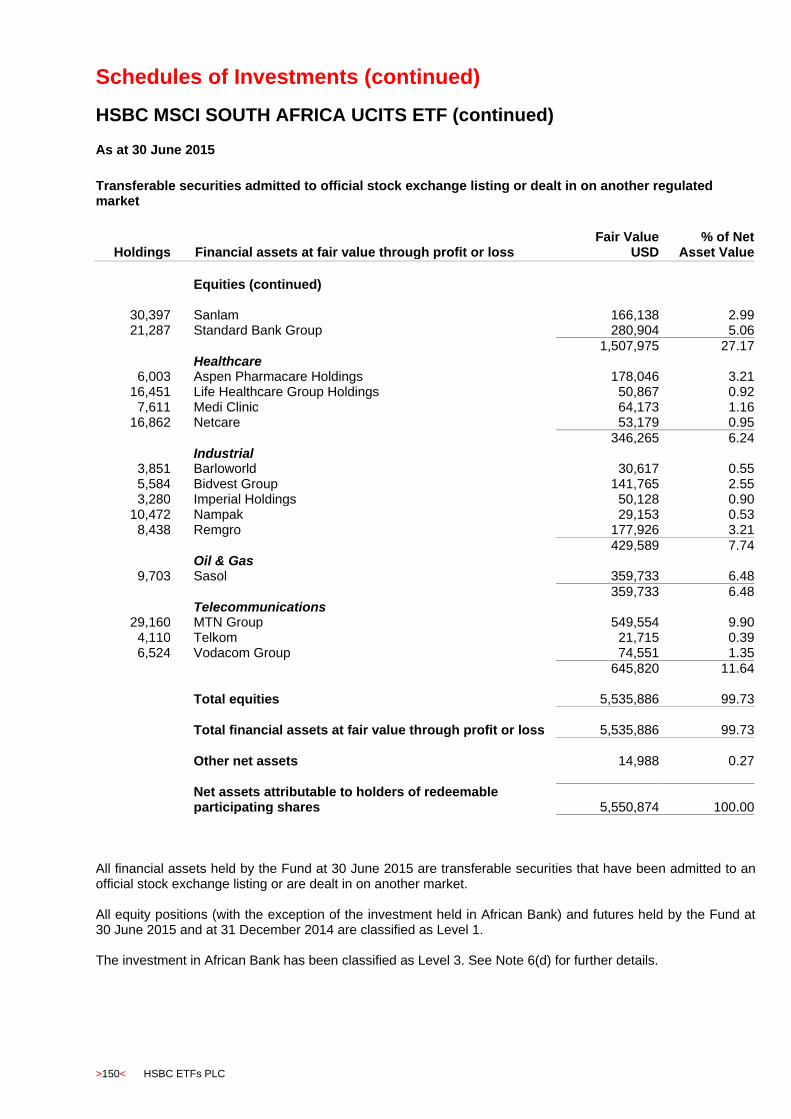
Schedules of Investments (continued)
HSBC MSCI SOUTH AFRICA UCITS ETF (continued)
>150< HSBC ETFs PLC
As at 30 June 2015
Transferable securities admitted to official stock exchange listing or dealt in on another regulated market
Holdings
Financial assets at fair value through profit or loss Fair Value
USD % of Net
Asset Value
Equities (continued)
30,397 Sanlam 166,138 2.99 21,287 Standard Bank Group 280,904 5.06
1,507,975 27.17 Healthcare
6,003 Aspen Pharmacare Holdings 178,046 3.21 16,451 Life Healthcare Group Holdings 50,867 0.92
7,611 Medi Clinic 64,173 1.16 16,862 Netcare 53,179 0.95
346,265 6.24 Industrial
3,851 Barloworld 30,617 0.55 5,584 Bidvest Group 141,765 2.55 3,280 Imperial Holdings 50,128 0.90
10,472 Nampak 29,153 0.53 8,438 Remgro 177,926 3.21
429,589 7.74 Oil & Gas
9,703 Sasol 359,733 6.48
359,733 6.48 Telecommunications
29,160 MTN Group 549,554 9.90 4,110 Telkom 21,715 0.39 6,524 Vodacom Group 74,551 1.35
645,820 11.64 Total equities 5,535,886 99.73 Total financial assets at fair value through profit or loss 5,535,886 99.73
Other net assets 14,988 0.27
Net assets attributable to holders of redeemable participating shares 5,550,874 100.00
All financial assets held by the Fund at 30 June 2015 are transferable securities that have been admitted to an official stock exchange listing or are dealt in on another market. All equity positions (with the exception of the investment held in African Bank) and futures held by the Fund at 30 June 2015 and at 31 December 2014 are classified as Level 1. The investment in African Bank has been classified as Level 3. See Note 6(d) for further details.

Schedules of Investments (continued)
HSBC MSCI CANADA UCITS ETF
HSBC ETFs PLC >151<
As at 30 June 2015
Transferable securities admitted to official stock exchange listing or dealt in on another regulated market
Holdings
Financial assets at fair value through profit or loss Fair Value
USD % of Net
Asset Value
Equities Basic Materials
6,425 Agnico-Eagle Mines 182,491 0.50 4,080 Agrium 432,592 1.19
34,809 Barrick Gold 372,222 1.02 11,799 Cameco 168,888 0.46 21,349 Eldorado Gold 88,580 0.24 20,561 First Quantum Minerals 268,942 0.74 24,321 Goldcorp 394,879 1.08 34,134 Kinross Gold 79,563 0.22
2,743 Methanex 153,184 0.42 24,838 Potash Corp of Saskatchewan 769,541 2.11 12,062 Silver Wheaton 209,173 0.57 16,893 Teck Resources 167,516 0.46 30,062 Turquoise Hill Resource 114,377 0.31
2,066 West fraser Timber 113,572 0.31 28,019 Yamana Gold 84,386 0.23
3,599,906 9.86 Consumer Goods
6,867 Gildan Activewear 228,212 0.62 12,260 Magna International 688,394 1.89
7,573 Saputo 183,252 0.50
1,099,858 3.01 Consumer Services
12,485 Alimentation Couche-Tard 534,321 1.46 2,211 Canadian Tire 236,570 0.65 3,696 Dollarama 224,108 0.61 1,645 Empire 115,912 0.32 1,528 George Weston 120,079 0.33 2,469 Jean Coutu Group 45,881 0.13 6,767 Loblaw 341,914 0.94 7,544 Metro 202,551 0.56 6,040 Restaurant Brands International 231,595 0.63
11,893 Shaw Communications 259,113 0.71 10,755 Thomson Reuters 409,714 1.12
2,721,758 7.46 Financial
19,332 Bank of Montreal 1,146,030 3.14 36,308 Bank of Nova Scotia 1,874,946 5.13 25,410 Brookfield Asset Management 888,215 2.43 11,863 Canadian Imperial Bank of Commerce 874,866 2.40
7,171 CI Financial 192,996 0.53 611 Fairfax Financial Holdings 301,416 0.83
3,300 First Capital Realty 47,262 0.13 4,654 Franco-Nevada 222,066 0.61 8,934 Great West Lifeco 260,195 0.71 4,006 H&R Real Estate Investment Trust 72,005 0.20 3,005 IGM Financial 95,750 0.26 2,995 Industrial Alliance Insurance & Financial Services 100,781 0.28
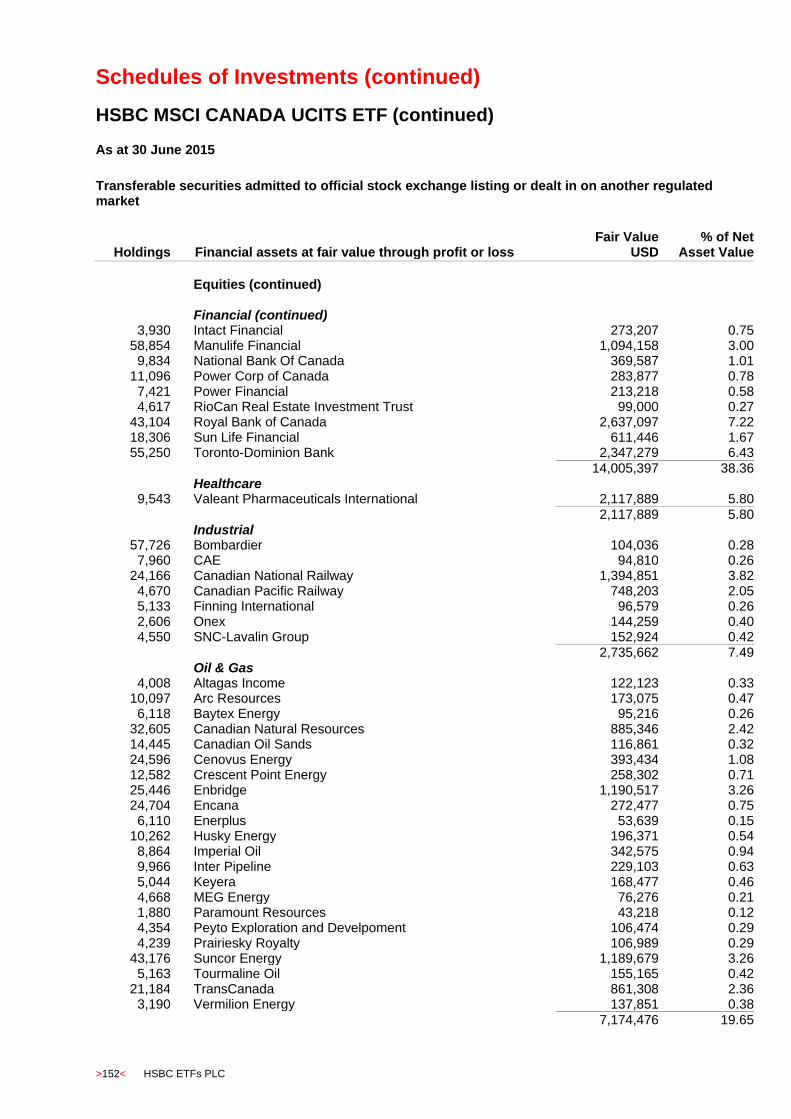
Schedules of Investments (continued)
HSBC MSCI CANADA UCITS ETF (continued)
>152< HSBC ETFs PLC
As at 30 June 2015
Transferable securities admitted to official stock exchange listing or dealt in on another regulated market
Holdings
Financial assets at fair value through profit or loss Fair Value
USD % of Net
Asset Value
Equities (continued) Financial (continued)
3,930 Intact Financial 273,207 0.75 58,854 Manulife Financial 1,094,158 3.00
9,834 National Bank Of Canada 369,587 1.01 11,096 Power Corp of Canada 283,877 0.78
7,421 Power Financial 213,218 0.58 4,617 RioCan Real Estate Investment Trust 99,000 0.27
43,104 Royal Bank of Canada 2,637,097 7.22 18,306 Sun Life Financial 611,446 1.67 55,250 Toronto-Dominion Bank 2,347,279 6.43
14,005,397 38.36 Healthcare
9,543 Valeant Pharmaceuticals International 2,117,889 5.80 2,117,889 5.80 Industrial
57,726 Bombardier 104,036 0.28 7,960 CAE 94,810 0.26
24,166 Canadian National Railway 1,394,851 3.82 4,670 Canadian Pacific Railway 748,203 2.05 5,133 Finning International 96,579 0.26 2,606 Onex 144,259 0.40 4,550 SNC-Lavalin Group 152,924 0.42
2,735,662 7.49 Oil & Gas
4,008 Altagas Income 122,123 0.33 10,097 Arc Resources 173,075 0.47
6,118 Baytex Energy 95,216 0.26 32,605 Canadian Natural Resources 885,346 2.42 14,445 Canadian Oil Sands 116,861 0.32 24,596 Cenovus Energy 393,434 1.08 12,582 Crescent Point Energy 258,302 0.71 25,446 Enbridge 1,190,517 3.26 24,704 Encana 272,477 0.75
6,110 Enerplus 53,639 0.15 10,262 Husky Energy 196,371 0.54
8,864 Imperial Oil 342,575 0.94 9,966 Inter Pipeline 229,103 0.63 5,044 Keyera 168,477 0.46 4,668 MEG Energy 76,276 0.21 1,880 Paramount Resources 43,218 0.12 4,354 Peyto Exploration and Develpoment 106,474 0.29 4,239 Prairiesky Royalty 106,989 0.29
43,176 Suncor Energy 1,189,679 3.26 5,163 Tourmaline Oil 155,165 0.42
21,184 TransCanada 861,308 2.36 3,190 Vermilion Energy 137,851 0.38
7,174,476 19.65

Schedules of Investments (continued)
HSBC MSCI CANADA UCITS ETF (continued)
HSBC ETFs PLC >153<
As at 30 June 2015
Transferable securities admitted to official stock exchange listing or dealt in on another regulated market
Holdings
Financial assets at fair value through profit or loss Fair Value
USD % of Net
Asset Value
Equities (continued) Technology
14,970 Blackberry 122,427 0.34 6,199 Catamaran Corp 379,006 1.04 6,713 CGI 262,670 0.72 1,072 Constellation Software 226,493 0.62 3,640 Open Text 147,909 0.40 8,645 Veresen Inc 116,956 0.32
1,255,461 3.44 Telecommunications
4,298 BCE 182,668 0.50 10,818 Rogers Communications 383,866 1.05
6,013 Telus 207,249 0.57
773,783 2.12 Utilities
2,269 Atco Ltd 71,771 0.20 3,647 Canadian Utilities 105,076 0.29 8,250 Fortis 231,815 0.64
10,097 Pembina Pipeline 326,498 0.89 8,204 TransAlta 63,611 0.17
798,771 2.19 Total equities* 36,282,961 99.38
Total financial assets at fair value through profit or loss 36,282,961 99.38
Financial liabilities at fair value through profit or loss Futures
6 S&P TSX 60 Index Future Sep 15** (2,447) (0.01)
Total futures*** (2,447) (0.01)
Total financial liabilities at fair value through profit or loss (2,447) (0.01)
Other net assets 228,170 0.63
Net assets attributable to holders of redeemable participating shares 36,508,684 100.00
** HSBC Bank Plc is the counterparty to the future contract.

Schedules of Investments (continued)
HSBC MSCI CANADA UCITS ETF (continued)
>154< HSBC ETFs PLC
Analysis of Total Assets Fair Value
USD % of Total
Assets
* Transferable securities admitted to an official stock exchange listing or dealt in on another regulated market 36,282,961 99.25
*** Financial derivative instruments dealt in on a regulated market (2,447) (0.01)
All equity positions and futures held by the Fund at 30 June 2015 and all equity positions held by the Fund as at 31 December 2014 are classified as Level 1. See Note 6(d) for further details.

Schedules of Investments (continued)
HSBC MSCI MEXICO CAPPED UCITS ETF
HSBC ETFs PLC >155<
As at 30 June 2015
Transferable securities admitted to official stock exchange listing or dealt in on another regulated market
Holdings Financial assets at fair value through profit or loss
Fair Value USD
% of Net Asset Value
Equities Basic Materials
314,378 Grupo Mexico 949,306 6.35 11,465 Industrias Penoles 187,020 1.25 86,534 Mexichem 250,326 1.67
1,386,652 9.27 Consumer Goods
33,197 Arca Continental 188,934 1.27 40,984 Coca-Cola Femsa 325,925 2.18
151,393 Fomento Economico Mexicano 1,350,516 9.03 16,049 Gruma 206,583 1.38
135,662 Grupo Bimbo 351,548 2.35 50,982 Grupo Lala 106,541 0.71
126,219 Kimberly-Clark de Mexico 272,860 1.82 2,802,907 18.74 Consumer Services
37,764 Controladora Commercial Mexicana 118,919 0.80 15,459 El Puerto De Liverpool 178,860 1.19 27,804 Grupo Comercial Chedraui 79,085 0.53
201,517 Grupo Televisa 1,568,274 10.49 432,806 Walmart de Mexico 1,054,524 7.05
2,999,662 20.06 Financial
189,773 Fibra Uno Administration 451,252 3.02 88,293 Gentera 156,659 1.05
150,581 Grupo Fin Santander 278,693 1.86 205,733 Grupo Financiero Banorte 1,130,763 7.56 192,308 Grupo Financiero Inbursa 436,566 2.92
2,453,933 16.41 Industrial
232,733 Alfa 445,423 2.98 1,052,859 Cemex 966,926 6.47
17,125 Grupo Aeroportuario 243,615 1.63 25,544 Grupo Aeroportuario del Pacifico 175,366 1.17 47,177 Grupo Carso 196,939 1.32 64,240 OHL Mexico 84,094 0.56 20,363 Promotora y Operadora de Infraestructura 218,520 1.46
2,330,883 15.59 Telecommunications
2,699,968 America Movil 2,883,976 19.28
2,883,976 19.28 Total equities* 14,858,013 99.35
Futures
3 MDX Mexico Bolsa Index Future Sep 15** 1,138 -
Total Futures*** 1,138 -
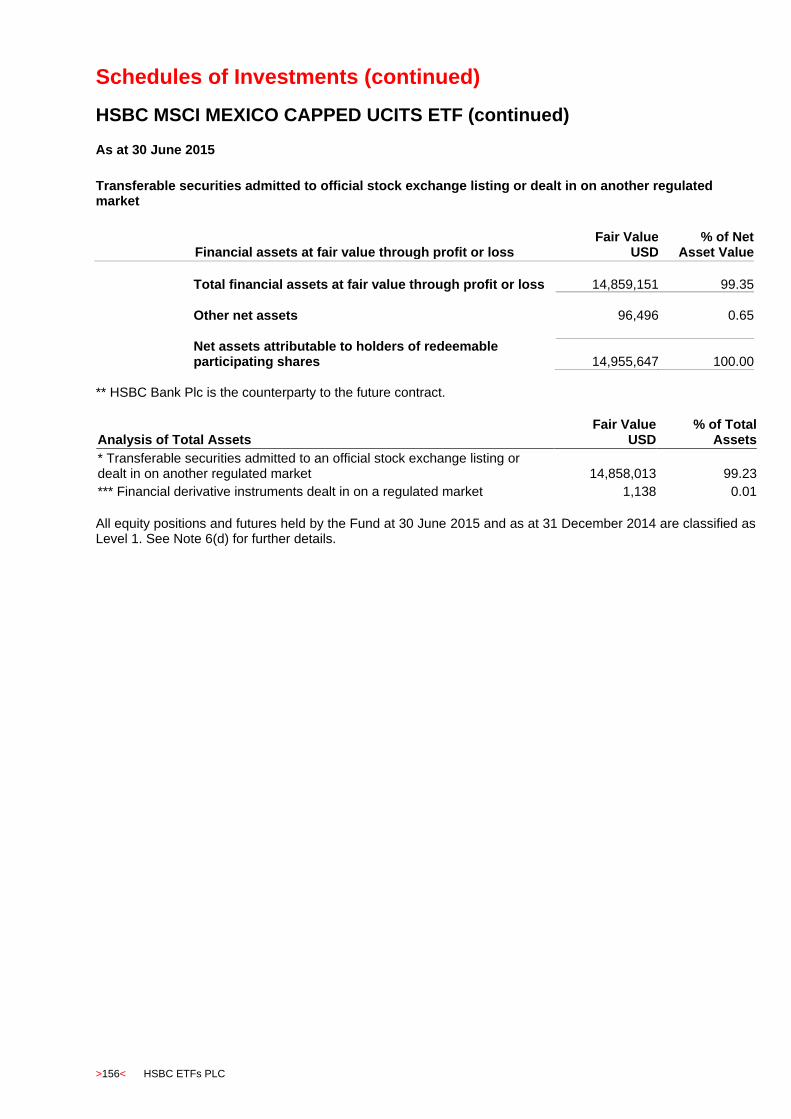
Schedules of Investments (continued)
HSBC MSCI MEXICO CAPPED UCITS ETF (continued)
>156< HSBC ETFs PLC
As at 30 June 2015
Transferable securities admitted to official stock exchange listing or dealt in on another regulated market
Financial assets at fair value through profit or loss
Fair Value USD
% of Net Asset Value
Total financial assets at fair value through profit or loss 14,859,151 99.35
Other net assets 96,496 0.65
Net assets attributable to holders of redeemable participating shares 14,955,647 100.00
** HSBC Bank Plc is the counterparty to the future contract.
Analysis of Total Assets Fair Value
USD % of Total
Assets
* Transferable securities admitted to an official stock exchange listing or dealt in on another regulated market 14,858,013 99.23
*** Financial derivative instruments dealt in on a regulated market 1,138 0.01
All equity positions and futures held by the Fund at 30 June 2015 and as at 31 December 2014 are classified as Level 1. See Note 6(d) for further details.
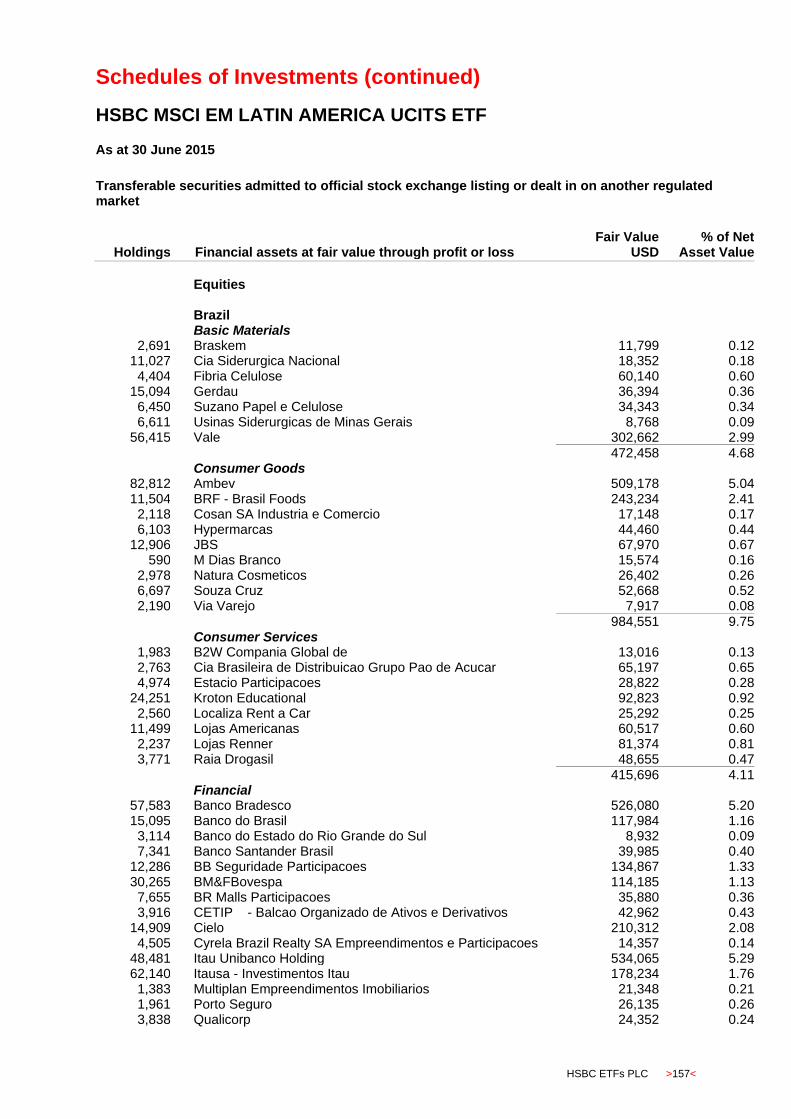
Schedules of Investments (continued)
HSBC MSCI EM LATIN AMERICA UCITS ETF
HSBC ETFs PLC >157<
As at 30 June 2015
Transferable securities admitted to official stock exchange listing or dealt in on another regulated market
Holdings
Financial assets at fair value through profit or loss Fair Value
USD % of Net
Asset Value
Equities Brazil Basic Materials
2,691 Braskem 11,799 0.12 11,027 Cia Siderurgica Nacional 18,352 0.18
4,404 Fibria Celulose 60,140 0.60 15,094 Gerdau 36,394 0.36
6,450 Suzano Papel e Celulose 34,343 0.34 6,611 Usinas Siderurgicas de Minas Gerais 8,768 0.09
56,415 Vale 302,662 2.99
472,458 4.68 Consumer Goods
82,812 Ambev 509,178 5.04 11,504 BRF - Brasil Foods 243,234 2.41
2,118 Cosan SA Industria e Comercio 17,148 0.17 6,103 Hypermarcas 44,460 0.44
12,906 JBS 67,970 0.67 590 M Dias Branco 15,574 0.16
2,978 Natura Cosmeticos 26,402 0.26 6,697 Souza Cruz 52,668 0.52 2,190 Via Varejo 7,917 0.08
984,551 9.75 Consumer Services
1,983 B2W Compania Global de 13,016 0.13 2,763 Cia Brasileira de Distribuicao Grupo Pao de Acucar 65,197 0.65 4,974 Estacio Participacoes 28,822 0.28
24,251 Kroton Educational 92,823 0.92 2,560 Localiza Rent a Car 25,292 0.25
11,499 Lojas Americanas 60,517 0.60 2,237 Lojas Renner 81,374 0.81 3,771 Raia Drogasil 48,655 0.47
415,696 4.11 Financial
57,583 Banco Bradesco 526,080 5.20 15,095 Banco do Brasil 117,984 1.16
3,114 Banco do Estado do Rio Grande do Sul 8,932 0.09 7,341 Banco Santander Brasil 39,985 0.40
12,286 BB Seguridade Participacoes 134,867 1.33 30,265 BM&FBovespa 114,185 1.13
7,655 BR Malls Participacoes 35,880 0.36 3,916 CETIP - Balcao Organizado de Ativos e Derivativos 42,962 0.43
14,909 Cielo 210,312 2.08 4,505 Cyrela Brazil Realty SA Empreendimentos e Participacoes 14,357 0.14
48,481 Itau Unibanco Holding 534,065 5.29 62,140 Itausa - Investimentos Itau 178,234 1.76
1,383 Multiplan Empreendimentos Imobiliarios 21,348 0.21 1,961 Porto Seguro 26,135 0.26 3,838 Qualicorp 24,352 0.24
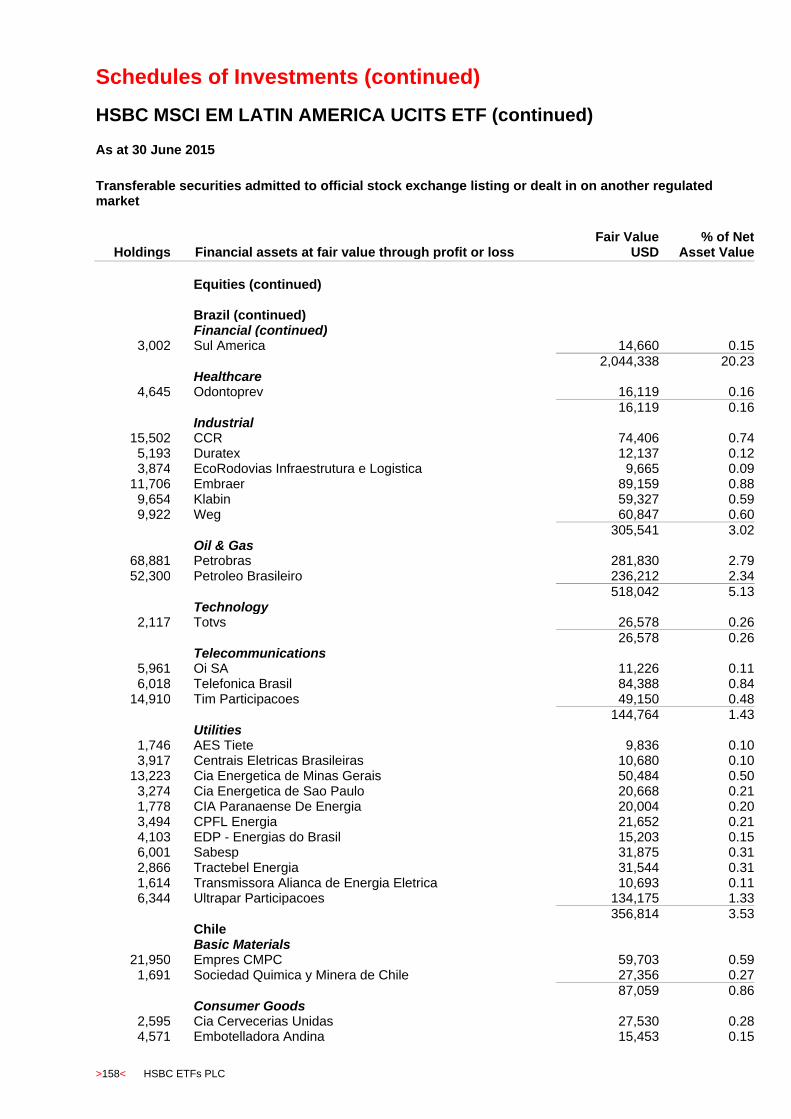
Schedules of Investments (continued)
HSBC MSCI EM LATIN AMERICA UCITS ETF (continued)
>158< HSBC ETFs PLC
As at 30 June 2015
Transferable securities admitted to official stock exchange listing or dealt in on another regulated market
Holdings
Financial assets at fair value through profit or loss Fair Value
USD % of Net
Asset Value
Equities (continued) Brazil (continued) Financial (continued)
3,002 Sul America 14,660 0.15
2,044,338 20.23 Healthcare
4,645 Odontoprev 16,119 0.16
16,119 0.16 Industrial
15,502 CCR 74,406 0.74 5,193 Duratex 12,137 0.12 3,874 EcoRodovias Infraestrutura e Logistica 9,665 0.09
11,706 Embraer 89,159 0.88 9,654 Klabin 59,327 0.59 9,922 Weg 60,847 0.60
305,541 3.02 Oil & Gas
68,881 Petrobras 281,830 2.79 52,300 Petroleo Brasileiro 236,212 2.34
518,042 5.13 Technology
2,117 Totvs 26,578 0.26
26,578 0.26 Telecommunications
5,961 Oi SA 11,226 0.11 6,018 Telefonica Brasil 84,388 0.84
14,910 Tim Participacoes 49,150 0.48 144,764 1.43 Utilities
1,746 AES Tiete 9,836 0.10 3,917 Centrais Eletricas Brasileiras 10,680 0.10
13,223 Cia Energetica de Minas Gerais 50,484 0.50 3,274 Cia Energetica de Sao Paulo 20,668 0.21 1,778 CIA Paranaense De Energia 20,004 0.20 3,494 CPFL Energia 21,652 0.21 4,103 EDP - Energias do Brasil 15,203 0.15 6,001 Sabesp 31,875 0.31 2,866 Tractebel Energia 31,544 0.31 1,614 Transmissora Alianca de Energia Eletrica 10,693 0.11 6,344 Ultrapar Participacoes 134,175 1.33
356,814 3.53 Chile Basic Materials
21,950 Empres CMPC 59,703 0.59 1,691 Sociedad Quimica y Minera de Chile 27,356 0.27
87,059 0.86 Consumer Goods
2,595 Cia Cervecerias Unidas 27,530 0.28 4,571 Embotelladora Andina 15,453 0.15
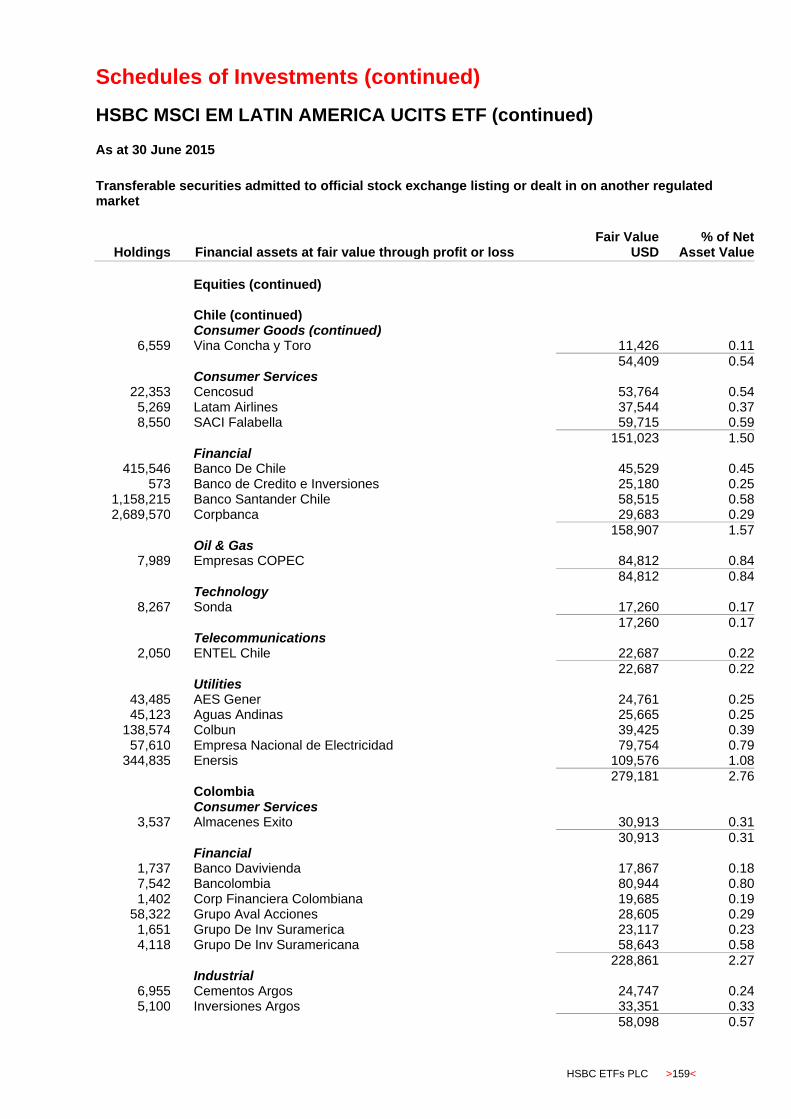
Schedules of Investments (continued)
HSBC MSCI EM LATIN AMERICA UCITS ETF (continued)
HSBC ETFs PLC >159<
As at 30 June 2015
Transferable securities admitted to official stock exchange listing or dealt in on another regulated market
Holdings
Financial assets at fair value through profit or loss Fair Value
USD % of Net
Asset Value
Equities (continued) Chile (continued) Consumer Goods (continued)
6,559 Vina Concha y Toro 11,426 0.11
54,409 0.54 Consumer Services
22,353 Cencosud 53,764 0.54 5,269 Latam Airlines 37,544 0.37 8,550 SACI Falabella 59,715 0.59
151,023 1.50 Financial
415,546 Banco De Chile 45,529 0.45 573 Banco de Credito e Inversiones 25,180 0.25
1,158,215 Banco Santander Chile 58,515 0.58 2,689,570 Corpbanca 29,683 0.29
158,907 1.57 Oil & Gas
7,989 Empresas COPEC 84,812 0.84
84,812 0.84 Technology
8,267 Sonda 17,260 0.17 17,260 0.17 Telecommunications
2,050 ENTEL Chile 22,687 0.22
22,687 0.22 Utilities
43,485 AES Gener 24,761 0.25 45,123 Aguas Andinas 25,665 0.25
138,574 Colbun 39,425 0.39 57,610 Empresa Nacional de Electricidad 79,754 0.79
344,835 Enersis 109,576 1.08
279,181 2.76 Colombia Consumer Services
3,537 Almacenes Exito 30,913 0.31
30,913 0.31 Financial
1,737 Banco Davivienda 17,867 0.18 7,542 Bancolombia 80,944 0.80 1,402 Corp Financiera Colombiana 19,685 0.19
58,322 Grupo Aval Acciones 28,605 0.29 1,651 Grupo De Inv Suramerica 23,117 0.23 4,118 Grupo De Inv Suramericana 58,643 0.58
228,861 2.27 Industrial
6,955 Cementos Argos 24,747 0.24 5,100 Inversiones Argos 33,351 0.33
58,098 0.57
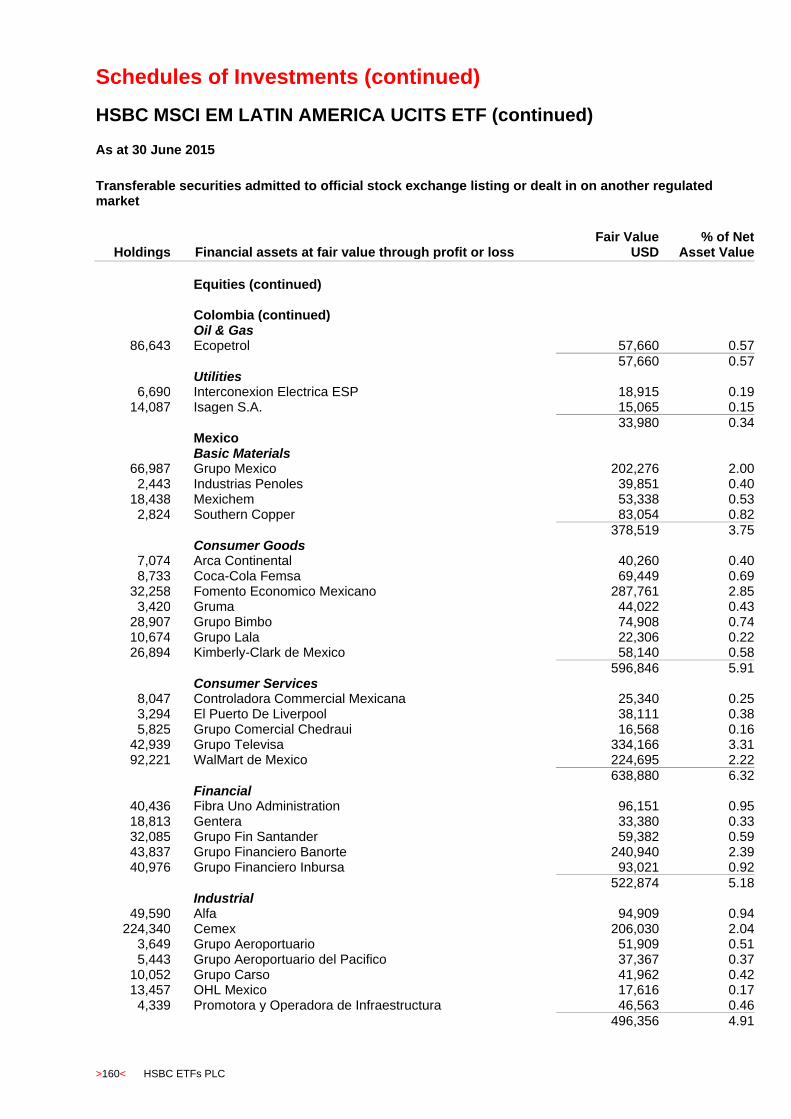
Schedules of Investments (continued)
HSBC MSCI EM LATIN AMERICA UCITS ETF (continued)
>160< HSBC ETFs PLC
As at 30 June 2015
Transferable securities admitted to official stock exchange listing or dealt in on another regulated market
Holdings
Financial assets at fair value through profit or loss Fair Value
USD % of Net
Asset Value
Equities (continued) Colombia (continued) Oil & Gas
86,643 Ecopetrol 57,660 0.57
57,660 0.57 Utilities
6,690 Interconexion Electrica ESP 18,915 0.19 14,087 Isagen S.A. 15,065 0.15
33,980 0.34 Mexico Basic Materials
66,987 Grupo Mexico 202,276 2.00 2,443 Industrias Penoles 39,851 0.40
18,438 Mexichem 53,338 0.53 2,824 Southern Copper 83,054 0.82
378,519 3.75 Consumer Goods
7,074 Arca Continental 40,260 0.40 8,733 Coca-Cola Femsa 69,449 0.69
32,258 Fomento Economico Mexicano 287,761 2.85 3,420 Gruma 44,022 0.43
28,907 Grupo Bimbo 74,908 0.74 10,674 Grupo Lala 22,306 0.22 26,894 Kimberly-Clark de Mexico 58,140 0.58
596,846 5.91 Consumer Services
8,047 Controladora Commercial Mexicana 25,340 0.25 3,294 El Puerto De Liverpool 38,111 0.38 5,825 Grupo Comercial Chedraui 16,568 0.16
42,939 Grupo Televisa 334,166 3.31 92,221 WalMart de Mexico 224,695 2.22
638,880 6.32 Financial
40,436 Fibra Uno Administration 96,151 0.95 18,813 Gentera 33,380 0.33 32,085 Grupo Fin Santander 59,382 0.59 43,837 Grupo Financiero Banorte 240,940 2.39 40,976 Grupo Financiero Inbursa 93,021 0.92
522,874 5.18 Industrial
49,590 Alfa 94,909 0.94 224,340 Cemex 206,030 2.04
3,649 Grupo Aeroportuario 51,909 0.51 5,443 Grupo Aeroportuario del Pacifico 37,367 0.37
10,052 Grupo Carso 41,962 0.42 13,457 OHL Mexico 17,616 0.17
4,339 Promotora y Operadora de Infraestructura 46,563 0.46
496,356 4.91
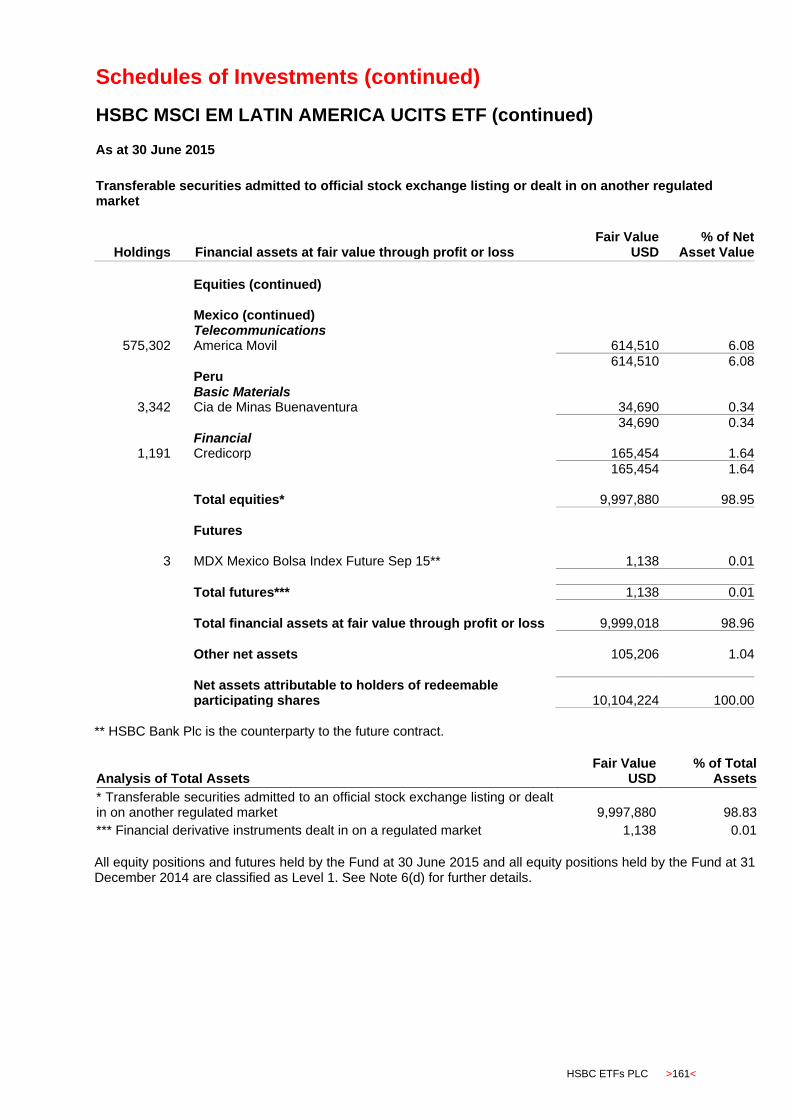
Schedules of Investments (continued)
HSBC MSCI EM LATIN AMERICA UCITS ETF (continued)
HSBC ETFs PLC >161<
As at 30 June 2015
Transferable securities admitted to official stock exchange listing or dealt in on another regulated market
Holdings
Financial assets at fair value through profit or loss Fair Value
USD % of Net
Asset Value
Equities (continued) Mexico (continued) Telecommunications
575,302 America Movil 614,510 6.08
614,510 6.08 Peru Basic Materials
3,342 Cia de Minas Buenaventura 34,690 0.34 34,690 0.34 Financial
1,191 Credicorp 165,454 1.64
165,454 1.64 Total equities* 9,997,880 98.95
Futures
3 MDX Mexico Bolsa Index Future Sep 15** 1,138 0.01
Total futures*** 1,138 0.01
Total financial assets at fair value through profit or loss 9,999,018 98.96
Other net assets 105,206 1.04
Net assets attributable to holders of redeemable participating shares 10,104,224 100.00
** HSBC Bank Plc is the counterparty to the future contract.
Analysis of Total Assets Fair Value
USD % of Total
Assets
* Transferable securities admitted to an official stock exchange listing or dealt in on another regulated market 9,997,880 98.83
*** Financial derivative instruments dealt in on a regulated market 1,138 0.01
All equity positions and futures held by the Fund at 30 June 2015 and all equity positions held by the Fund at 31 December 2014 are classified as Level 1. See Note 6(d) for further details.
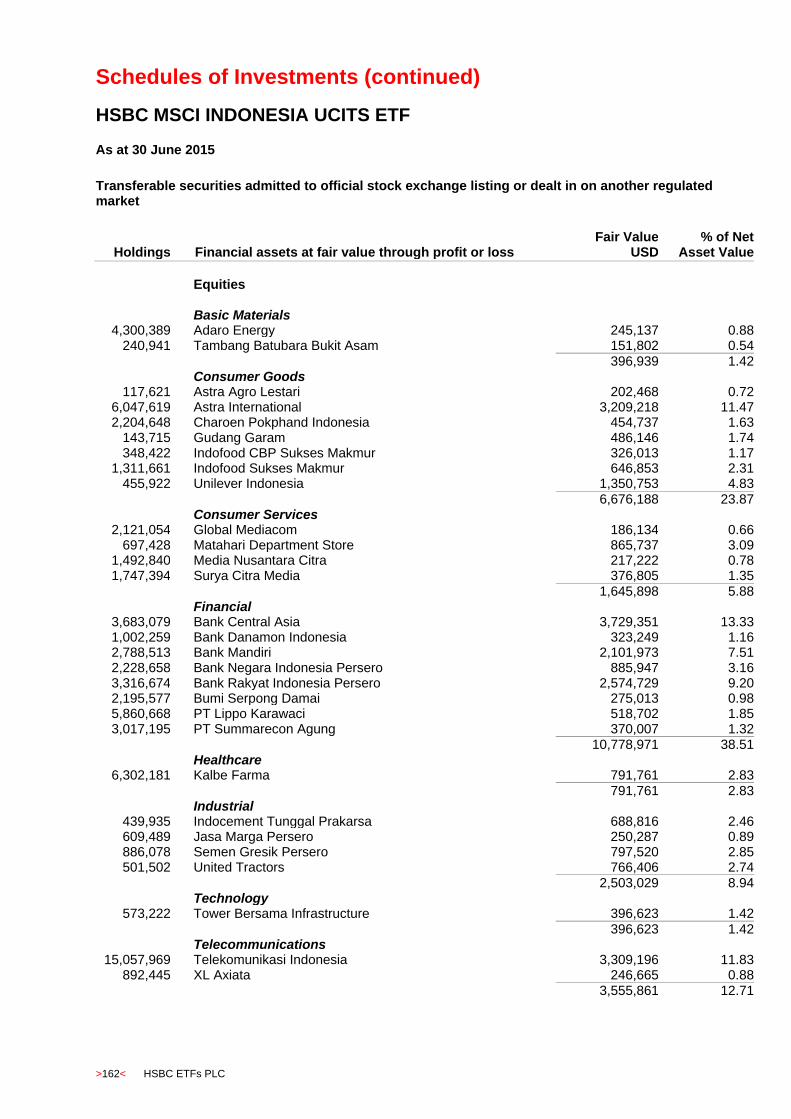
Schedules of Investments (continued)
HSBC MSCI INDONESIA UCITS ETF
>162< HSBC ETFs PLC
As at 30 June 2015
Transferable securities admitted to official stock exchange listing or dealt in on another regulated market
Holdings
Financial assets at fair value through profit or loss Fair Value
USD % of Net
Asset Value
Equities Basic Materials
4,300,389 Adaro Energy 245,137 0.88 240,941 Tambang Batubara Bukit Asam 151,802 0.54
396,939 1.42 Consumer Goods
117,621 Astra Agro Lestari 202,468 0.72 6,047,619 Astra International 3,209,218 11.47 2,204,648 Charoen Pokphand Indonesia 454,737 1.63
143,715 Gudang Garam 486,146 1.74 348,422 Indofood CBP Sukses Makmur 326,013 1.17
1,311,661 Indofood Sukses Makmur 646,853 2.31 455,922 Unilever Indonesia 1,350,753 4.83
6,676,188 23.87 Consumer Services
2,121,054 Global Mediacom 186,134 0.66 697,428 Matahari Department Store 865,737 3.09
1,492,840 Media Nusantara Citra 217,222 0.78 1,747,394 Surya Citra Media 376,805 1.35
1,645,898 5.88 Financial
3,683,079 Bank Central Asia 3,729,351 13.33 1,002,259 Bank Danamon Indonesia 323,249 1.16 2,788,513 Bank Mandiri 2,101,973 7.51 2,228,658 Bank Negara Indonesia Persero 885,947 3.16 3,316,674 Bank Rakyat Indonesia Persero 2,574,729 9.20 2,195,577 Bumi Serpong Damai 275,013 0.98 5,860,668 PT Lippo Karawaci 518,702 1.85 3,017,195 PT Summarecon Agung 370,007 1.32
10,778,971 38.51 Healthcare
6,302,181 Kalbe Farma 791,761 2.83
791,761 2.83 Industrial
439,935 Indocement Tunggal Prakarsa 688,816 2.46 609,489 Jasa Marga Persero 250,287 0.89 886,078 Semen Gresik Persero 797,520 2.85 501,502 United Tractors 766,406 2.74
2,503,029 8.94 Technology
573,222 Tower Bersama Infrastructure 396,623 1.42
396,623 1.42 Telecommunications
15,057,969 Telekomunikasi Indonesia 3,309,196 11.83 892,445 XL Axiata 246,665 0.88
3,555,861 12.71

Schedules of Investments (continued)
HSBC MSCI INDONESIA UCITS ETF (continued)
HSBC ETFs PLC >163<
As at 30 June 2015
Transferable securities admitted to official stock exchange listing or dealt in on another regulated market
Holdings
Financial assets at fair value through profit or loss Fair Value
USD % of Net
Asset Value
Equities (continued)
Utilities 3,259,177 Perusahaan Gas Negara 1,054,817 3.77
1,054,817 3.77 Total equities* 27,800,087 99.35
Total financial assets at fair value through profit or loss 27,800,087 99.35
Financial liabilities at fair value through profit or loss Futures
15 SGX MSCI Indonesia Index July 15** (3,300) (0.01)
Total futures*** (3,300) (0.01)
Total financial liabilities at fair value through profit or loss (3,300) (0.01)
Other net assets 186,199 0.66
Net assets attributable to holders of redeemable participating shares 27,982,986 100.00
** HSBC Bank Plc is the counterparty to the future contract.
Analysis of Total Assets Fair Value
USD % of Total
Assets
* Transferable securities admitted to an official stock exchange listing or dealt in on another regulated market 27,800,087 99.20
*** Financial derivative instruments dealt in on a regulated market (3,300) (0.01)
All equity positions held by the Fund at 30 June 2015 and all equity positions and futures at 31 December 2014 are classified as Level 1. See Note 6(d) for further details.

Schedules of Investments (continued)
HSBC MSCI MALAYSIA UCITS ETF
>164< HSBC ETFs PLC
As at 30 June 2015
Transferable securities admitted to official stock exchange listing or dealt in on another regulated market
Holdings
Financial assets at fair value through profit or loss Fair Value
USD % of Net
Asset Value
Equities Basic Materials
114,584 Petronas Chemicals Group 191,935 3.70
191,935 3.70 Consumer Goods
5,258 British American Tobacco Malaysia 86,402 1.66 52,430 Felda Global Ventures Holdings 22,651 0.44
9,480 Genting Plantations 24,900 0.48 118,928 IOI 127,974 2.47 17,474 Kuala Lumpur Kepong 99,110 1.91 19,406 PPB Group 77,768 1.50 23,863 UMW Holdings 64,132 1.23
502,937 9.69 Consumer Services
51,423 AirAsia 20,989 0.40 63,861 Astro Malaysia Holdings 52,131 1.01 27,737 Berjaya Sports Toto 24,113 0.46 91,906 Genting 196,333 3.78
121,501 Genting Malaysia 135,252 2.61
428,818 8.26 Financial
44,347 Alliance Financial Group 51,599 1.00 80,177 AMMB Holdings 128,139 2.47
206,835 CIMB Group Holdings 299,864 5.78 23,079 Hong Leong Bank 81,966 1.58
8,561 Hong Leong Financial Group 34,398 0.66 190,688 Malayan Banking 461,937 8.90 103,264 Public Bank 512,352 9.87 20,919 RHB Capital 40,862 0.79
1,611,117 31.05 Healthcare
100,407 IHH Healthcare 150,624 2.90
150,624 2.90 Industrial
67,285 Gamuda 83,282 1.61 61,864 IJM 106,905 2.06 15,647 Lafarge Malayan Cement 35,084 0.67 33,681 Malaysia Airports Holdings 55,436 1.07 45,668 MISC 93,442 1.80
127,089 Sime Darby 286,986 5.53 41,864 Westports Holdings 46,935 0.90
708,070 13.64 Oil & Gas
96,026 Bumi Armada 29,014 0.56 152,326 Dialog Group 64,193 1.24 10,098 Petronas Dagangan 55,080 1.06
134,869 Sapurakencana Petroleum 84,360 1.62
232,647 4.48
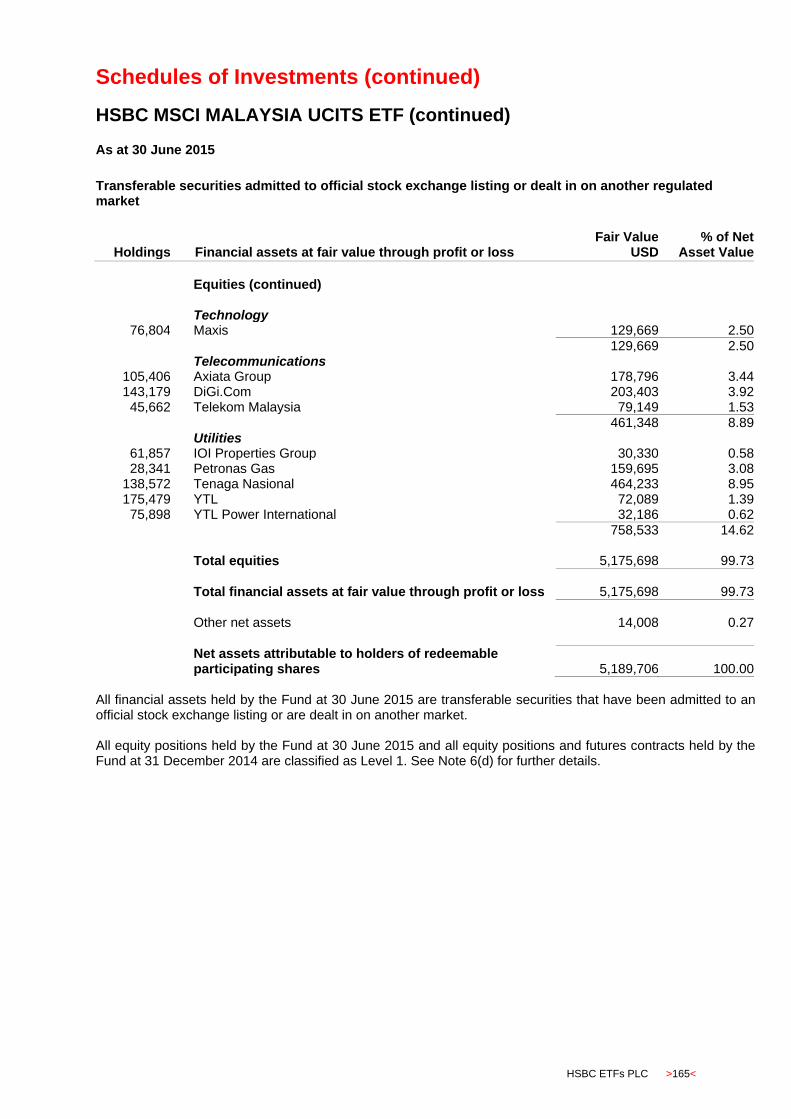
Schedules of Investments (continued)
HSBC MSCI MALAYSIA UCITS ETF (continued)
HSBC ETFs PLC >165<
As at 30 June 2015
Transferable securities admitted to official stock exchange listing or dealt in on another regulated market
Holdings
Financial assets at fair value through profit or loss Fair Value
USD % of Net
Asset Value
Equities (continued) Technology
76,804 Maxis 129,669 2.50
129,669 2.50 Telecommunications
105,406 Axiata Group 178,796 3.44 143,179 DiGi.Com 203,403 3.92 45,662 Telekom Malaysia 79,149 1.53
461,348 8.89 Utilities
61,857 IOI Properties Group 30,330 0.58 28,341 Petronas Gas 159,695 3.08
138,572 Tenaga Nasional 464,233 8.95 175,479 YTL 72,089 1.39 75,898 YTL Power International 32,186 0.62
758,533 14.62 Total equities 5,175,698 99.73
Total financial assets at fair value through profit or loss 5,175,698 99.73
Other net assets 14,008 0.27
Net assets attributable to holders of redeemable participating shares 5,189,706 100.00 All financial assets held by the Fund at 30 June 2015 are transferable securities that have been admitted to an official stock exchange listing or are dealt in on another market. All equity positions held by the Fund at 30 June 2015 and all equity positions and futures contracts held by the Fund at 31 December 2014 are classified as Level 1. See Note 6(d) for further details.
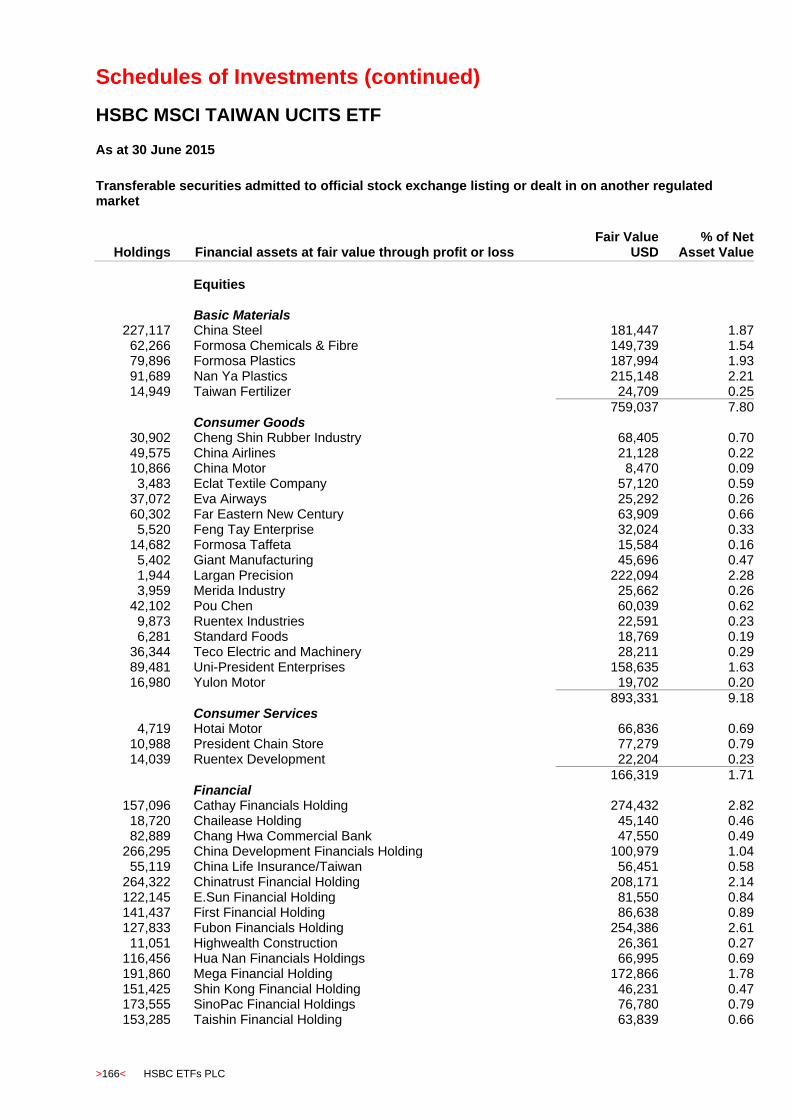
Schedules of Investments (continued)
HSBC MSCI TAIWAN UCITS ETF
>166< HSBC ETFs PLC
As at 30 June 2015
Transferable securities admitted to official stock exchange listing or dealt in on another regulated market
Holdings
Financial assets at fair value through profit or loss Fair Value
USD % of Net
Asset Value
Equities Basic Materials
227,117 China Steel 181,447 1.87 62,266 Formosa Chemicals & Fibre 149,739 1.54 79,896 Formosa Plastics 187,994 1.93 91,689 Nan Ya Plastics 215,148 2.21 14,949 Taiwan Fertilizer 24,709 0.25
759,037 7.80 Consumer Goods
30,902 Cheng Shin Rubber Industry 68,405 0.70 49,575 China Airlines 21,128 0.22 10,866 China Motor 8,470 0.09
3,483 Eclat Textile Company 57,120 0.59 37,072 Eva Airways 25,292 0.26 60,302 Far Eastern New Century 63,909 0.66
5,520 Feng Tay Enterprise 32,024 0.33 14,682 Formosa Taffeta 15,584 0.16
5,402 Giant Manufacturing 45,696 0.47 1,944 Largan Precision 222,094 2.28 3,959 Merida Industry 25,662 0.26
42,102 Pou Chen 60,039 0.62 9,873 Ruentex Industries 22,591 0.23 6,281 Standard Foods 18,769 0.19
36,344 Teco Electric and Machinery 28,211 0.29 89,481 Uni-President Enterprises 158,635 1.63 16,980 Yulon Motor 19,702 0.20
893,331 9.18 Consumer Services
4,719 Hotai Motor 66,836 0.69 10,988 President Chain Store 77,279 0.79 14,039 Ruentex Development 22,204 0.23
166,319 1.71 Financial
157,096 Cathay Financials Holding 274,432 2.82 18,720 Chailease Holding 45,140 0.46 82,889 Chang Hwa Commercial Bank 47,550 0.49
266,295 China Development Financials Holding 100,979 1.04 55,119 China Life Insurance/Taiwan 56,451 0.58
264,322 Chinatrust Financial Holding 208,171 2.14 122,145 E.Sun Financial Holding 81,550 0.84 141,437 First Financial Holding 86,638 0.89 127,833 Fubon Financials Holding 254,386 2.61 11,051 Highwealth Construction 26,361 0.27
116,456 Hua Nan Financials Holdings 66,995 0.69 191,860 Mega Financial Holding 172,866 1.78 151,425 Shin Kong Financial Holding 46,231 0.47 173,555 SinoPac Financial Holdings 76,780 0.79 153,285 Taishin Financial Holding 63,839 0.66
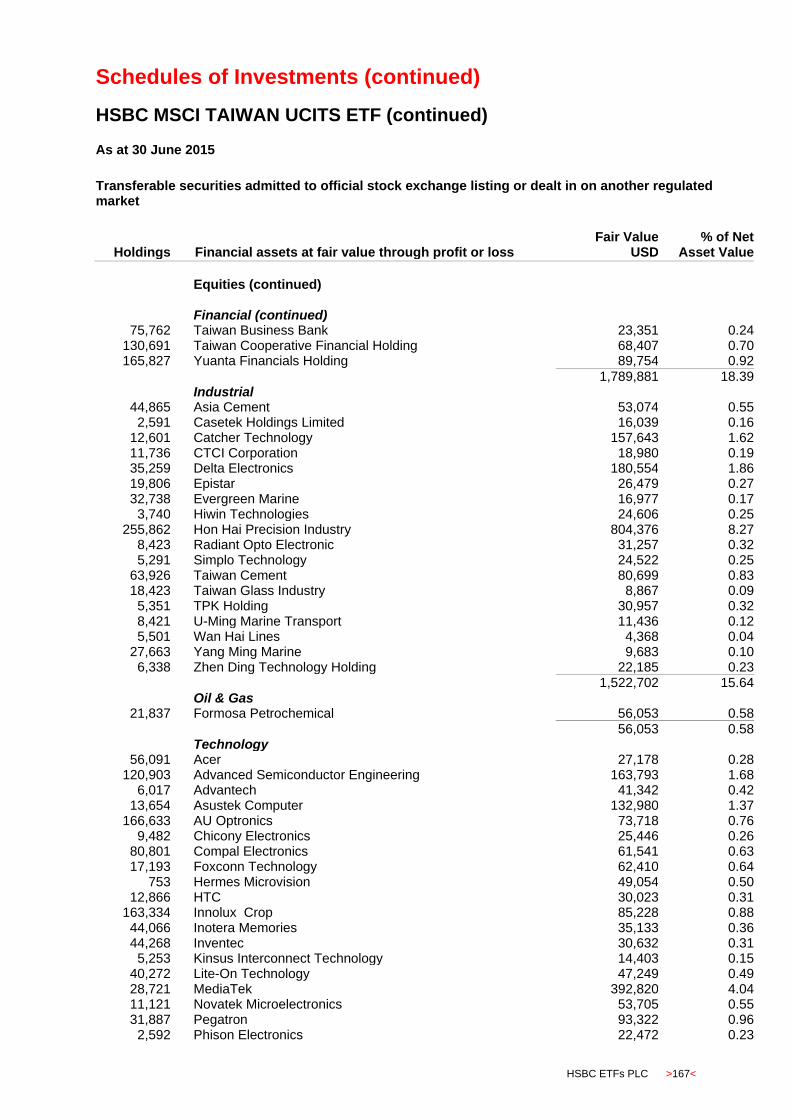
Schedules of Investments (continued)
HSBC MSCI TAIWAN UCITS ETF (continued)
HSBC ETFs PLC >167<
As at 30 June 2015
Transferable securities admitted to official stock exchange listing or dealt in on another regulated market
Holdings
Financial assets at fair value through profit or loss Fair Value
USD % of Net
Asset Value
Equities (continued) Financial (continued)
75,762 Taiwan Business Bank 23,351 0.24 130,691 Taiwan Cooperative Financial Holding 68,407 0.70 165,827 Yuanta Financials Holding 89,754 0.92
1,789,881 18.39 Industrial
44,865 Asia Cement 53,074 0.55 2,591 Casetek Holdings Limited 16,039 0.16
12,601 Catcher Technology 157,643 1.62 11,736 CTCI Corporation 18,980 0.19 35,259 Delta Electronics 180,554 1.86 19,806 Epistar 26,479 0.27 32,738 Evergreen Marine 16,977 0.17
3,740 Hiwin Technologies 24,606 0.25 255,862 Hon Hai Precision Industry 804,376 8.27
8,423 Radiant Opto Electronic 31,257 0.32 5,291 Simplo Technology 24,522 0.25
63,926 Taiwan Cement 80,699 0.83 18,423 Taiwan Glass Industry 8,867 0.09
5,351 TPK Holding 30,957 0.32 8,421 U-Ming Marine Transport 11,436 0.12 5,501 Wan Hai Lines 4,368 0.04
27,663 Yang Ming Marine 9,683 0.10 6,338 Zhen Ding Technology Holding 22,185 0.23
1,522,702 15.64 Oil & Gas
21,837 Formosa Petrochemical 56,053 0.58
56,053 0.58 Technology
56,091 Acer 27,178 0.28 120,903 Advanced Semiconductor Engineering 163,793 1.68
6,017 Advantech 41,342 0.42 13,654 Asustek Computer 132,980 1.37
166,633 AU Optronics 73,718 0.76 9,482 Chicony Electronics 25,446 0.26
80,801 Compal Electronics 61,541 0.63 17,193 Foxconn Technology 62,410 0.64
753 Hermes Microvision 49,054 0.50 12,866 HTC 30,023 0.31
163,334 Innolux Crop 85,228 0.88 44,066 Inotera Memories 35,133 0.36 44,268 Inventec 30,632 0.31
5,253 Kinsus Interconnect Technology 14,403 0.15 40,272 Lite-On Technology 47,249 0.49 28,721 MediaTek 392,820 4.04 11,121 Novatek Microelectronics 53,705 0.55 31,887 Pegatron 93,322 0.96
2,592 Phison Electronics 22,472 0.23
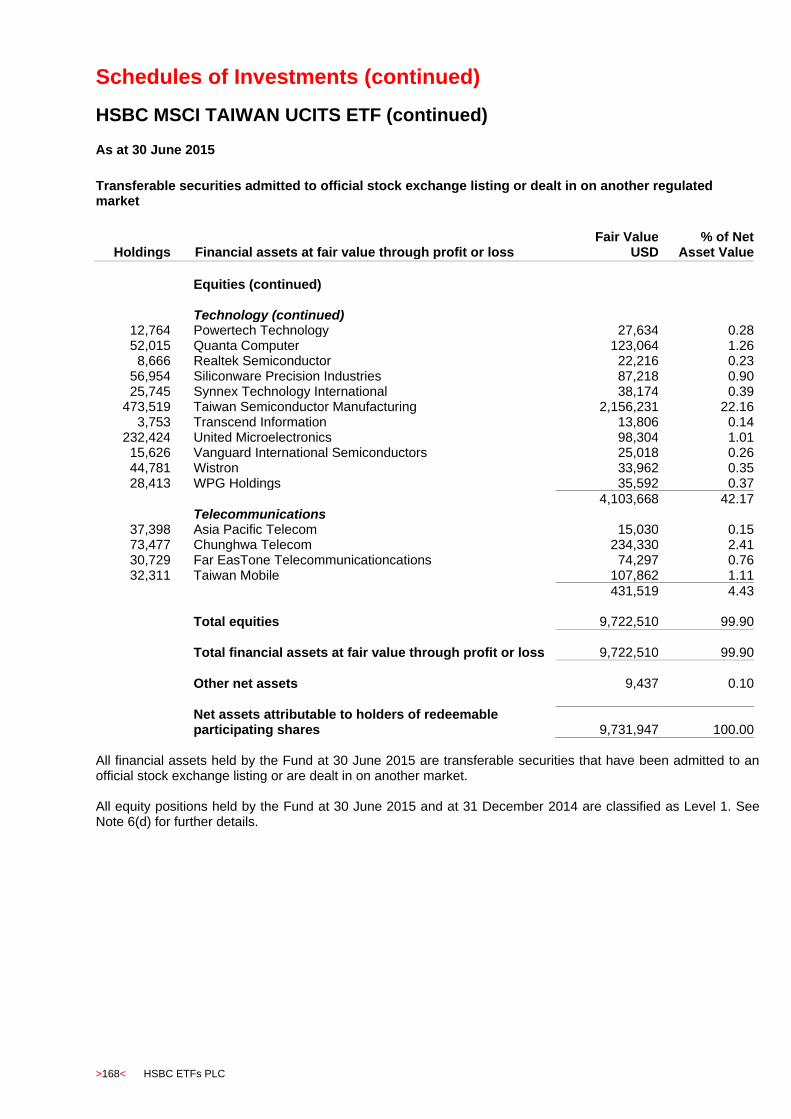
Schedules of Investments (continued)
HSBC MSCI TAIWAN UCITS ETF (continued)
>168< HSBC ETFs PLC
As at 30 June 2015
Transferable securities admitted to official stock exchange listing or dealt in on another regulated market
Holdings
Financial assets at fair value through profit or loss Fair Value
USD % of Net
Asset Value
Equities (continued) Technology (continued)
12,764 Powertech Technology 27,634 0.28 52,015 Quanta Computer 123,064 1.26
8,666 Realtek Semiconductor 22,216 0.23 56,954 Siliconware Precision Industries 87,218 0.90 25,745 Synnex Technology International 38,174 0.39
473,519 Taiwan Semiconductor Manufacturing 2,156,231 22.16 3,753 Transcend Information 13,806 0.14
232,424 United Microelectronics 98,304 1.01 15,626 Vanguard International Semiconductors 25,018 0.26 44,781 Wistron 33,962 0.35 28,413 WPG Holdings 35,592 0.37
4,103,668 42.17 Telecommunications
37,398 Asia Pacific Telecom 15,030 0.15 73,477 Chunghwa Telecom 234,330 2.41 30,729 Far EasTone Telecommunicationcations 74,297 0.76 32,311 Taiwan Mobile 107,862 1.11
431,519 4.43 Total equities 9,722,510 99.90
Total financial assets at fair value through profit or loss 9,722,510 99.90
Other net assets 9,437 0.10
Net assets attributable to holders of redeemable participating shares 9,731,947 100.00
All financial assets held by the Fund at 30 June 2015 are transferable securities that have been admitted to an official stock exchange listing or are dealt in on another market. All equity positions held by the Fund at 30 June 2015 and at 31 December 2014 are classified as Level 1. See Note 6(d) for further details.

Schedules of Investments (continued)
HSBC MSCI KOREA UCITS ETF
HSBC ETFs PLC >169<
As at 30 June 2015
Transferable securities admitted to official stock exchange listing or dealt in on another regulated market
Holdings
Financial assets at fair value through profit or loss Fair Value
USD % of Net
Asset Value
Equities Basic Materials
1,490 Hanwha Chemical 24,979 0.31 217 Honam Petrochemical 56,222 0.70
1,127 Hyundai Steel 68,401 0.85 120 Korea Zinc 58,631 0.72 194 Kumho Petro Chemical 12,314 0.15 760 LG Chemical 181,072 2.24 240 OCI 19,364 0.24 982 Pohang Iron Steel 197,201 2.44
618,184 7.65 Consumer Goods
972 Amorepacific 258,798 3.21 205 CJ 54,400 0.67 111 CJ CheilJedang 43,884 0.54 760 Coway 62,274 0.77 539 Halla Visteon Climate Control 18,628 0.23
1,047 Hankook Tire 39,423 0.49 133 Hanssem 33,505 0.41 960 Hyundai Mobis 182,455 2.26
3,268 Hyundai Motor 366,672 4.54 3,711 Kia Motors 150,709 1.87 1,547 KT & G 131,615 1.63 1,498 LG Electronics 63,387 0.78
132 LG Household & Healthcare 91,593 1.13 10 Lotte Confectionery 17,428 0.22
216 N C Soft 38,438 0.48 50 Orion 46,977 0.58
1,600,186 19.81 Consumer Services
1,160 Cheil Communications 17,991 0.22 294 E-Mart 60,885 0.76 470 Hotel Shilla 46,981 0.58 214 Hyundai Department Store 28,202 0.35
1,657 Kangwon Land 54,963 0.68 497 Korean Airlines 18,045 0.22 155 Lotte Shopping 32,586 0.41 642 Paradise 13,842 0.17
98 Shinsegae 23,546 0.29
297,041 3.68 Financial
3,070 BS Financial Group 39,082 0.48 2,531 Daewoo Securities 34,603 0.43 2,334 DGB Financial Group 24,481 0.30
598 Dongbu Insurance 30,290 0.37 4,083 Hana Financial Holdings 106,335 1.32
881 Hyundai Marine & Fire Insurance 23,300 0.29 3,923 Industrial Bank of Korea 50,820 0.63
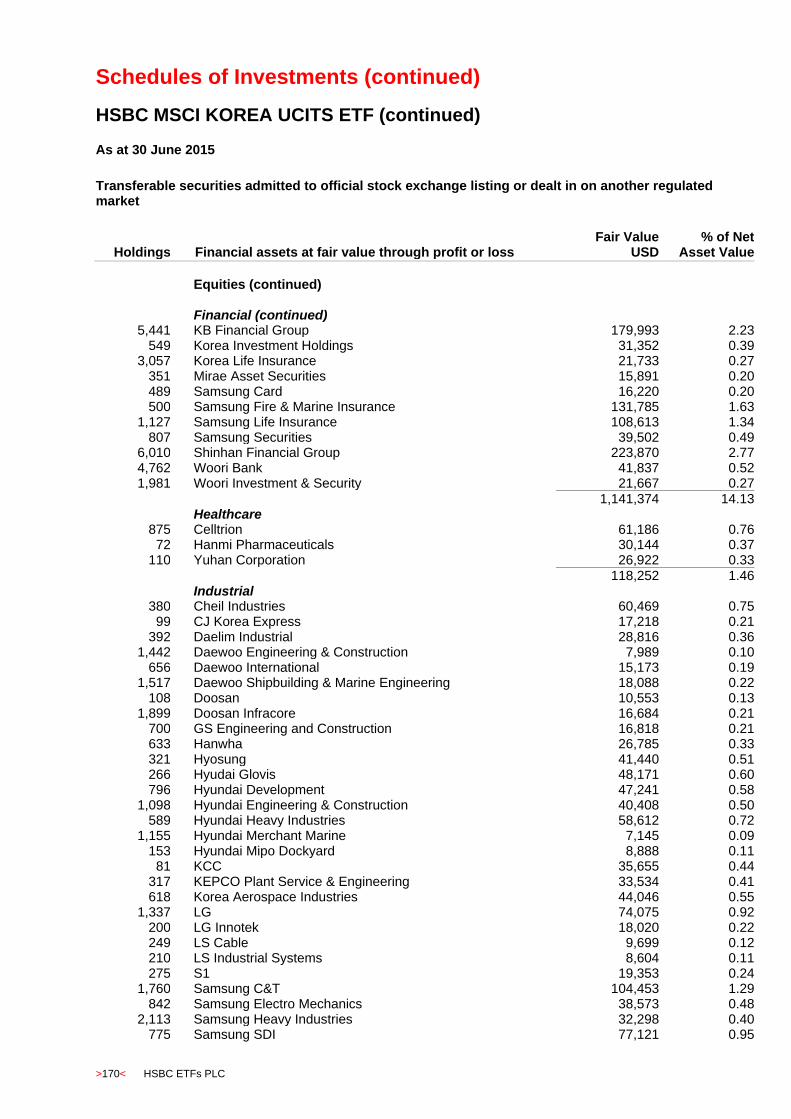
Schedules of Investments (continued)
HSBC MSCI KOREA UCITS ETF (continued)
>170< HSBC ETFs PLC
As at 30 June 2015
Transferable securities admitted to official stock exchange listing or dealt in on another regulated market
Holdings
Financial assets at fair value through profit or loss Fair Value
USD % of Net
Asset Value
Equities (continued)
Financial (continued) 5,441 KB Financial Group 179,993 2.23
549 Korea Investment Holdings 31,352 0.39 3,057 Korea Life Insurance 21,733 0.27
351 Mirae Asset Securities 15,891 0.20 489 Samsung Card 16,220 0.20 500 Samsung Fire & Marine Insurance 131,785 1.63
1,127 Samsung Life Insurance 108,613 1.34 807 Samsung Securities 39,502 0.49
6,010 Shinhan Financial Group 223,870 2.77 4,762 Woori Bank 41,837 0.52 1,981 Woori Investment & Security 21,667 0.27
1,141,374 14.13 Healthcare
875 Celltrion 61,186 0.76 72 Hanmi Pharmaceuticals 30,144 0.37
110 Yuhan Corporation 26,922 0.33
118,252 1.46 Industrial
380 Cheil Industries 60,469 0.75 99 CJ Korea Express 17,218 0.21
392 Daelim Industrial 28,816 0.36 1,442 Daewoo Engineering & Construction 7,989 0.10
656 Daewoo International 15,173 0.19 1,517 Daewoo Shipbuilding & Marine Engineering 18,088 0.22
108 Doosan 10,553 0.13 1,899 Doosan Infracore 16,684 0.21
700 GS Engineering and Construction 16,818 0.21 633 Hanwha 26,785 0.33 321 Hyosung 41,440 0.51 266 Hyudai Glovis 48,171 0.60 796 Hyundai Development 47,241 0.58
1,098 Hyundai Engineering & Construction 40,408 0.50 589 Hyundai Heavy Industries 58,612 0.72
1,155 Hyundai Merchant Marine 7,145 0.09 153 Hyundai Mipo Dockyard 8,888 0.11
81 KCC 35,655 0.44 317 KEPCO Plant Service & Engineering 33,534 0.41 618 Korea Aerospace Industries 44,046 0.55
1,337 LG 74,075 0.92 200 LG Innotek 18,020 0.22 249 LS Cable 9,699 0.12 210 LS Industrial Systems 8,604 0.11 275 S1 19,353 0.24
1,760 Samsung C&T 104,453 1.29 842 Samsung Electro Mechanics 38,573 0.48
2,113 Samsung Heavy Industries 32,298 0.40 775 Samsung SDI 77,121 0.95

Schedules of Investments (continued)
HSBC MSCI KOREA UCITS ETF (continued)
HSBC ETFs PLC >171<
As at 30 June 2015
Transferable securities admitted to official stock exchange listing or dealt in on another regulated market
Holdings
Financial assets at fair value through profit or loss Fair Value
USD % of Net
Asset Value
Equities (continued)
Industrial (continued) 1,577 SK Networks 12,696 0.16
978,625 12.11 Oil & Gas
673 Doosan Heavy Industries & Construction 14,480 0.18 720 GS Holdings 32,113 0.40 298 SK Corporation 52,897 0.66 912 SK Innovation 99,748 1.23 641 S-Oil 38,847 0.48
238,085 2.95 Technology
368 Daum Kakao 41,635 0.52 3,275 LG Display 75,896 0.94
395 Naver 224,510 2.78 1,845 Samsung Electronics 2,026,075 25.07
436 Samsung SDS 101,432 1.26 282 SK C&C 69,903 0.86
8,202 Sk hynix 311,035 3.85
2,850,486 35.28 Telecommunications
900 KT Corporation 11,403 0.14 3,013 LG Uplus 26,633 0.33 1,230 SK Telecom 30,492 0.38
68,528 0.85 Utilities
3,616 Korea Electric Power 148,472 1.84 402 Korea Gas 15,569 0.19
164,041 2.03 Total equities 8,074,802 99.95
Total financial assets at fair value through profit or loss 8,074,802 99.95
Other net assets 3,908 0.05
Net assets attributable to holders of redeemable participating shares 8,078,710 100.00
All financial assets held by the Fund at 30 June 2015 are transferable securities that have been admitted to an official stock exchange listing or are dealt in on another market. All equity positions held by the Fund at 30 June 2015 and at 31 December 2014 are classified as Level 1. See Note 6(d) for further details.

Schedules of Investments (continued)
HSBC FTSE EPRA/NAREIT DEVELOPED UCITS ETF
>172< HSBC ETFs PLC
As at 30 June 2015
Transferable securities admitted to official stock exchange listing or dealt in on another regulated market
Holdings
Financial assets at fair value through profit or loss Fair Value
USD % of Net
Asset Value
Equities Australia Financial
5,992 Buwog-Bauen Und Wohnen Gesellschaft 116,368 0.08 56,002 BWP Trust 131,712 0.09 36,380 Charter Hall Retail 118,557 0.08
170,106 Cromwell Property Group 134,012 0.09 110,175 Dexus Property Group 618,168 0.43 376,842 Federation Centres 845,751 0.59 201,057 Goodman Group 968,918 0.68 202,729 GPT Group 666,899 0.47 64,822 Investa Office Fund 189,324 0.13
420,277 Mirvac Group 597,596 0.42 591,365 Scentre Group 1,704,462 1.19 78,243 Shopping Centres Australasia 128,093 0.09
270,593 Stockland 852,709 0.60 223,599 Westfield Group 1,567,347 1.09
8,639,916 6.03 Austria Financial
8,390 CA Immobilien Anlagen 146,298 0.10 7,225 Conwert Immobilien Iest 91,530 0.07
237,828 0.17 Belgium Financial
1,474 Aedifica 82,609 0.06 1,931 Befimmo Sicafi 118,011 0.08 2,314 Cofinimmo 239,030 0.17 1,588 Intervest Offices & Warehouses 37,838 0.02
231 Leasiest Real Estate 20,560 0.01 1,584 Warehouses De Pauw 122,289 0.09
253 Wereldhave Belgium 26,052 0.02
646,389 0.45 Canada Financial
8,868 Allied Properties Real Estate Investment Trust 251,738 0.18 15,835 Artis Real Estate Investment Trust 173,894 0.12
4,555 Boardwalk Real Estate Investment Trust 206,616 0.14 12,715 Calloway Real Estate Investment Trust 294,539 0.21 13,550 Canadian Apartment Properties 299,555 0.21
8,272 Canadian Real Estate Investment Trust 281,266 0.20 19,793 Chartwell Retirement Residences 182,005 0.13 18,997 Cominar Real Estate Investment Trust 269,788 0.19
9,111 Crombie Real Estate Investment Trust 91,004 0.06 11,164 Dream Global Real Estate Investment Trust 88,797 0.06 12,400 Dream Office Real Estate Investment 243,739 0.17 10,335 First Capital Realty 148,015 0.10

Schedules of Investments (continued)
HSBC FTSE EPRA/NAREIT DEVELOPED UCITS ETF (continued)
HSBC ETFs PLC >173<
As at 30 June 2015
Transferable securities admitted to official stock exchange listing or dealt in on another regulated market
Holdings
Financial assets at fair value through profit or loss Fair Value
USD % of Net
Asset Value
Equities (continued) Canada (continued) Financial (continued)
5,382 Granite Real Estate Investment Trust 185,198 0.13 31,416 H&R Real Estate Investment Trust 564,680 0.39 10,959 InnVest REIT 45,207 0.03
6,080 Killam Properties 49,626 0.03 4,063 Morguard Real Estate Investment Trust 53,633 0.04 3,768 Northern Property Real Estate Investment Trust 67,546 0.05
22,340 Pure Industrial Real Estate Trust 84,282 0.06 36,389 RioCan Real Estate Investment Trust 780,274 0.54
4,361,402 3.04 Healthcare
10,320 Extendicare 62,576 0.04 62,576 0.04 Finland Financial
61,582 Citycon 80,296 0.06 28,379 Sponda 104,662 0.07 11,214 Technopolis 45,231 0.03
230,189 0.16 France Financial
683 Affine 12,762 0.01 831 ANF Immobilier 20,250 0.01
4,106 Fonciere Des Regions 348,699 0.24 3,929 Gecina 483,954 0.34 4,052 ICADE 289,214 0.20
20,276 Klepierre 891,348 0.62 4,881 Mercialys 108,850 0.08
11,393 Unibail-Rodamco 2,877,748 2.01
5,032,825 3.51 Germany Financial
1,994 Adler Real Estate 28,571 0.02 9,477 Alstria Office 122,012 0.09
52,022 Deutsche Annington 1,466,462 1.02 5,261 Deutsche Euroshop 230,896 0.16
38,647 Deutsche Wohnen 885,108 0.62 4,009 DIC Asset 35,735 0.02
11,332 Hamborner REIT 55,397 0.04 6,548 LEG Immobilien 454,673 0.32 7,748 Prime Office 36,776 0.02
13,165 TAG Immobilien 154,019 0.11 5,891 TLG Immobilien 95,207 0.07
3,564,856 2.49
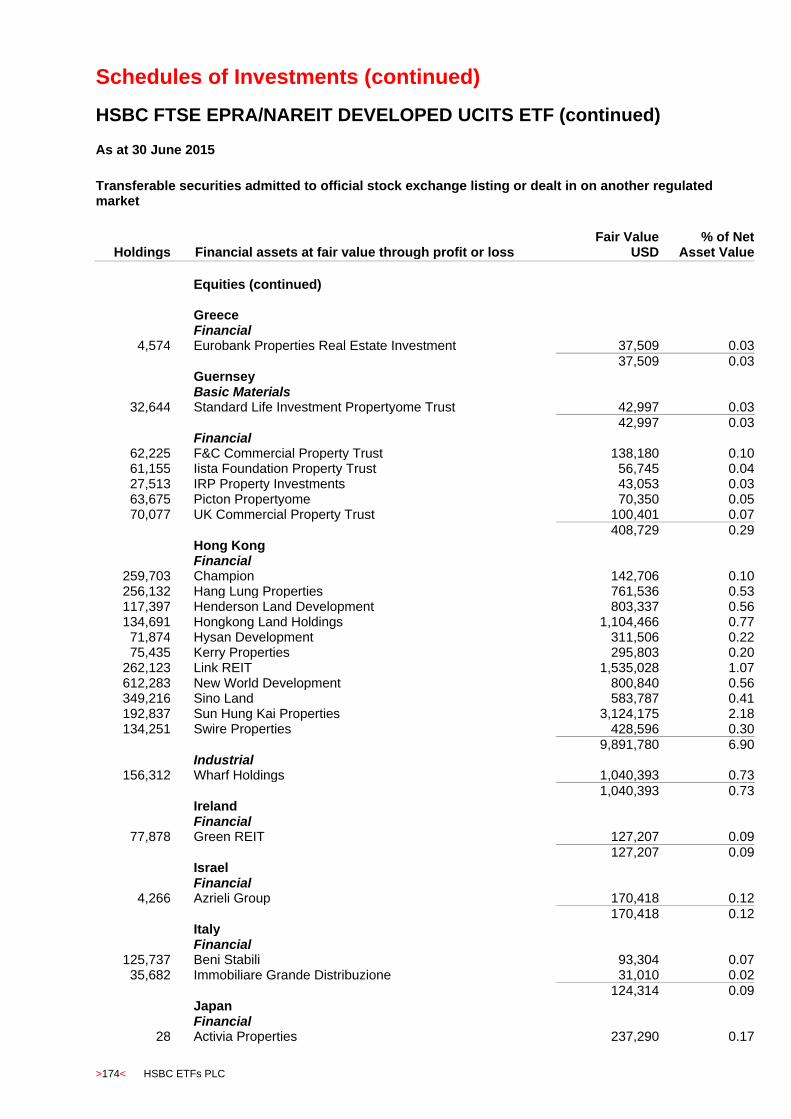
Schedules of Investments (continued)
HSBC FTSE EPRA/NAREIT DEVELOPED UCITS ETF (continued)
>174< HSBC ETFs PLC
As at 30 June 2015
Transferable securities admitted to official stock exchange listing or dealt in on another regulated market
Holdings
Financial assets at fair value through profit or loss Fair Value
USD % of Net
Asset Value
Equities (continued)
Greece Financial
4,574 Eurobank Properties Real Estate Investment 37,509 0.03
37,509 0.03 Guernsey Basic Materials
32,644 Standard Life Investment Propertyome Trust 42,997 0.03 42,997 0.03 Financial
62,225 F&C Commercial Property Trust 138,180 0.10 61,155 Iista Foundation Property Trust 56,745 0.04 27,513 IRP Property Investments 43,053 0.03 63,675 Picton Propertyome 70,350 0.05 70,077 UK Commercial Property Trust 100,401 0.07
408,729 0.29 Hong Kong Financial
259,703 Champion 142,706 0.10 256,132 Hang Lung Properties 761,536 0.53 117,397 Henderson Land Development 803,337 0.56 134,691 Hongkong Land Holdings 1,104,466 0.77 71,874 Hysan Development 311,506 0.22 75,435 Kerry Properties 295,803 0.20
262,123 Link REIT 1,535,028 1.07 612,283 New World Development 800,840 0.56 349,216 Sino Land 583,787 0.41 192,837 Sun Hung Kai Properties 3,124,175 2.18 134,251 Swire Properties 428,596 0.30
9,891,780 6.90 Industrial
156,312 Wharf Holdings 1,040,393 0.73
1,040,393 0.73 Ireland Financial
77,878 Green REIT 127,207 0.09
127,207 0.09 Israel Financial
4,266 Azrieli Group 170,418 0.12
170,418 0.12 Italy Financial
125,737 Beni Stabili 93,304 0.07 35,682 Immobiliare Grande Distribuzione 31,010 0.02
124,314 0.09 Japan Financial
28 Activia Properties 237,290 0.17
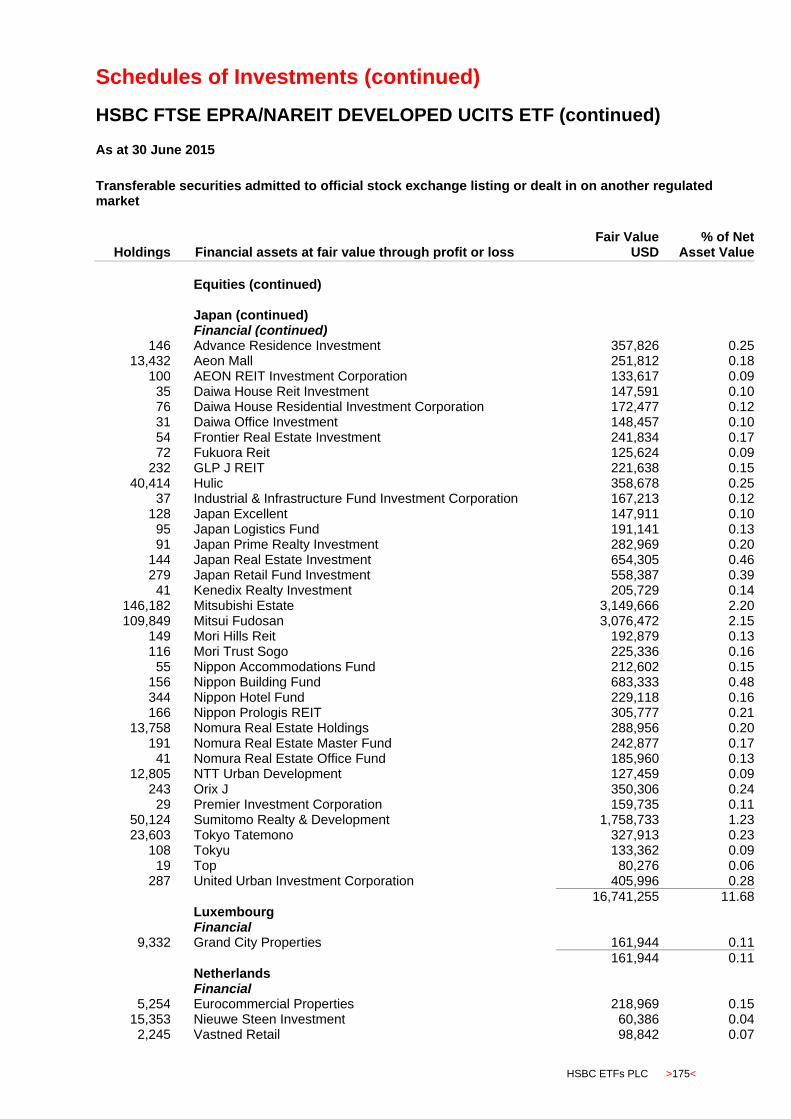
Schedules of Investments (continued)
HSBC FTSE EPRA/NAREIT DEVELOPED UCITS ETF (continued)
HSBC ETFs PLC >175<
As at 30 June 2015
Transferable securities admitted to official stock exchange listing or dealt in on another regulated market
Holdings
Financial assets at fair value through profit or loss Fair Value
USD % of Net
Asset Value
Equities (continued)
Japan (continued) Financial (continued)
146 Advance Residence Investment 357,826 0.25 13,432 Aeon Mall 251,812 0.18
100 AEON REIT Investment Corporation 133,617 0.09 35 Daiwa House Reit Investment 147,591 0.10 76 Daiwa House Residential Investment Corporation 172,477 0.12 31 Daiwa Office Investment 148,457 0.10 54 Frontier Real Estate Investment 241,834 0.17 72 Fukuora Reit 125,624 0.09
232 GLP J REIT 221,638 0.15 40,414 Hulic 358,678 0.25
37 Industrial & Infrastructure Fund Investment Corporation 167,213 0.12 128 Japan Excellent 147,911 0.10
95 Japan Logistics Fund 191,141 0.13 91 Japan Prime Realty Investment 282,969 0.20
144 Japan Real Estate Investment 654,305 0.46 279 Japan Retail Fund Investment 558,387 0.39
41 Kenedix Realty Investment 205,729 0.14 146,182 Mitsubishi Estate 3,149,666 2.20 109,849 Mitsui Fudosan 3,076,472 2.15
149 Mori Hills Reit 192,879 0.13 116 Mori Trust Sogo 225,336 0.16
55 Nippon Accommodations Fund 212,602 0.15 156 Nippon Building Fund 683,333 0.48 344 Nippon Hotel Fund 229,118 0.16 166 Nippon Prologis REIT 305,777 0.21
13,758 Nomura Real Estate Holdings 288,956 0.20 191 Nomura Real Estate Master Fund 242,877 0.17
41 Nomura Real Estate Office Fund 185,960 0.13 12,805 NTT Urban Development 127,459 0.09
243 Orix J 350,306 0.24 29 Premier Investment Corporation 159,735 0.11
50,124 Sumitomo Realty & Development 1,758,733 1.23 23,603 Tokyo Tatemono 327,913 0.23
108 Tokyu 133,362 0.09 19 Top 80,276 0.06
287 United Urban Investment Corporation 405,996 0.28 16,741,255 11.68 Luxembourg Financial
9,332 Grand City Properties 161,944 0.11
161,944 0.11 Netherlands Financial
5,254 Eurocommercial Properties 218,969 0.15 15,353 Nieuwe Steen Investment 60,386 0.04
2,245 Vastned Retail 98,842 0.07
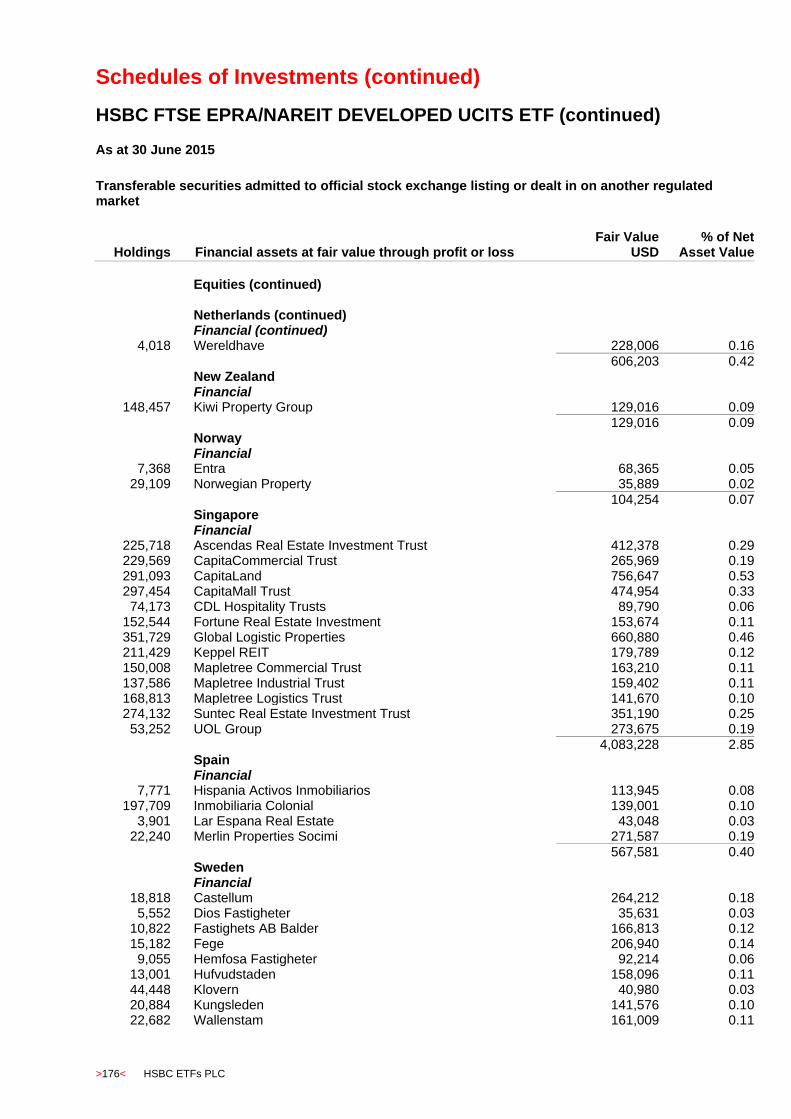
Schedules of Investments (continued)
HSBC FTSE EPRA/NAREIT DEVELOPED UCITS ETF (continued)
>176< HSBC ETFs PLC
As at 30 June 2015
Transferable securities admitted to official stock exchange listing or dealt in on another regulated market
Holdings
Financial assets at fair value through profit or loss Fair Value
USD % of Net
Asset Value
Equities (continued)
Netherlands (continued) Financial (continued)
4,018 Wereldhave 228,006 0.16
606,203 0.42 New Zealand Financial
148,457 Kiwi Property Group 129,016 0.09 129,016 0.09 Norway Financial
7,368 Entra 68,365 0.05 29,109 Norwegian Property 35,889 0.02
104,254 0.07 Singapore Financial
225,718 Ascendas Real Estate Investment Trust 412,378 0.29 229,569 CapitaCommercial Trust 265,969 0.19 291,093 CapitaLand 756,647 0.53 297,454 CapitaMall Trust 474,954 0.33 74,173 CDL Hospitality Trusts 89,790 0.06
152,544 Fortune Real Estate Investment 153,674 0.11 351,729 Global Logistic Properties 660,880 0.46 211,429 Keppel REIT 179,789 0.12 150,008 Mapletree Commercial Trust 163,210 0.11 137,586 Mapletree Industrial Trust 159,402 0.11 168,813 Mapletree Logistics Trust 141,670 0.10 274,132 Suntec Real Estate Investment Trust 351,190 0.25 53,252 UOL Group 273,675 0.19
4,083,228 2.85 Spain Financial
7,771 Hispania Activos Inmobiliarios 113,945 0.08 197,709 Inmobiliaria Colonial 139,001 0.10
3,901 Lar Espana Real Estate 43,048 0.03 22,240 Merlin Properties Socimi 271,587 0.19
567,581 0.40 Sweden Financial
18,818 Castellum 264,212 0.18 5,552 Dios Fastigheter 35,631 0.03
10,822 Fastighets AB Balder 166,813 0.12 15,182 Fege 206,940 0.14
9,055 Hemfosa Fastigheter 92,214 0.06 13,001 Hufvudstaden 158,096 0.11 44,448 Klovern 40,980 0.03 20,884 Kungsleden 141,576 0.10 22,682 Wallenstam 161,009 0.11
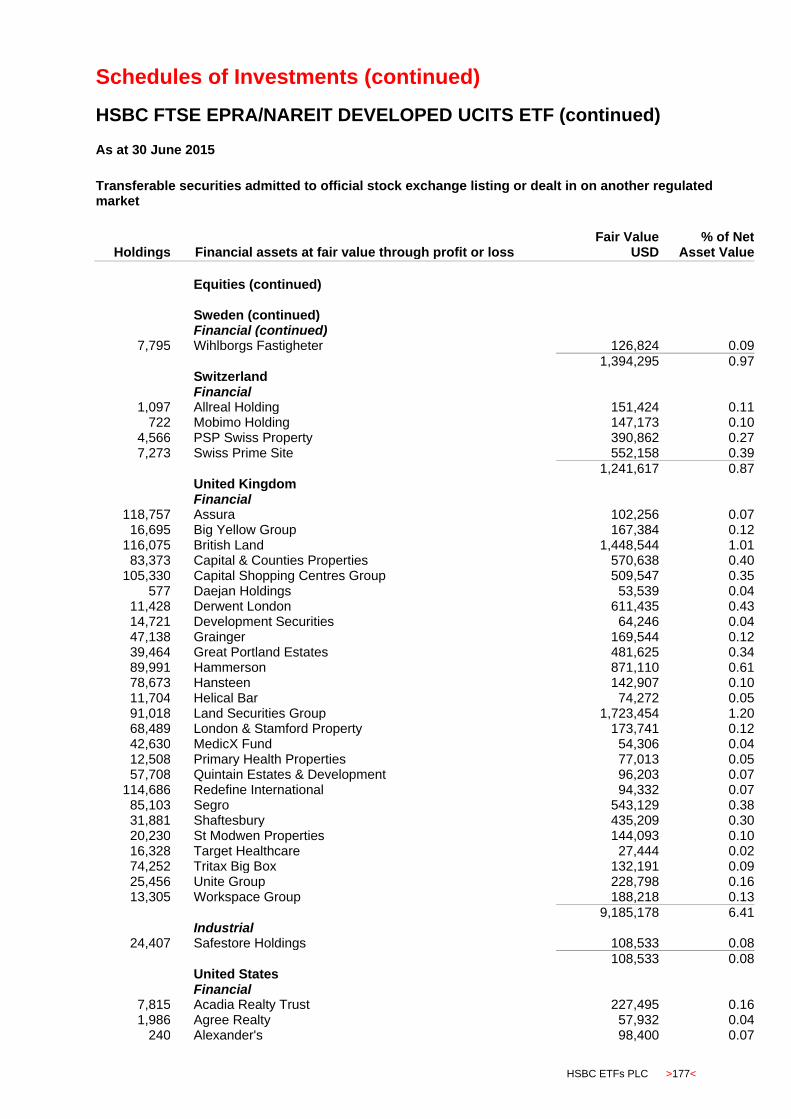
Schedules of Investments (continued)
HSBC FTSE EPRA/NAREIT DEVELOPED UCITS ETF (continued)
HSBC ETFs PLC >177<
As at 30 June 2015
Transferable securities admitted to official stock exchange listing or dealt in on another regulated market
Holdings
Financial assets at fair value through profit or loss Fair Value
USD % of Net
Asset Value
Equities (continued)
Sweden (continued) Financial (continued)
7,795 Wihlborgs Fastigheter 126,824 0.09
1,394,295 0.97 Switzerland Financial
1,097 Allreal Holding 151,424 0.11 722 Mobimo Holding 147,173 0.10
4,566 PSP Swiss Property 390,862 0.27 7,273 Swiss Prime Site 552,158 0.39
1,241,617 0.87 United Kingdom Financial
118,757 Assura 102,256 0.07 16,695 Big Yellow Group 167,384 0.12
116,075 British Land 1,448,544 1.01 83,373 Capital & Counties Properties 570,638 0.40
105,330 Capital Shopping Centres Group 509,547 0.35 577 Daejan Holdings 53,539 0.04
11,428 Derwent London 611,435 0.43 14,721 Development Securities 64,246 0.04 47,138 Grainger 169,544 0.12 39,464 Great Portland Estates 481,625 0.34 89,991 Hammerson 871,110 0.61 78,673 Hansteen 142,907 0.10 11,704 Helical Bar 74,272 0.05 91,018 Land Securities Group 1,723,454 1.20 68,489 London & Stamford Property 173,741 0.12 42,630 MedicX Fund 54,306 0.04 12,508 Primary Health Properties 77,013 0.05 57,708 Quintain Estates & Development 96,203 0.07
114,686 Redefine International 94,332 0.07 85,103 Segro 543,129 0.38 31,881 Shaftesbury 435,209 0.30 20,230 St Modwen Properties 144,093 0.10 16,328 Target Healthcare 27,444 0.02 74,252 Tritax Big Box 132,191 0.09 25,456 Unite Group 228,798 0.16 13,305 Workspace Group 188,218 0.13
9,185,178 6.41 Industrial
24,407 Safestore Holdings 108,533 0.08
108,533 0.08 United States Financial
7,815 Acadia Realty Trust 227,495 0.16 1,986 Agree Realty 57,932 0.04
240 Alexander's 98,400 0.07
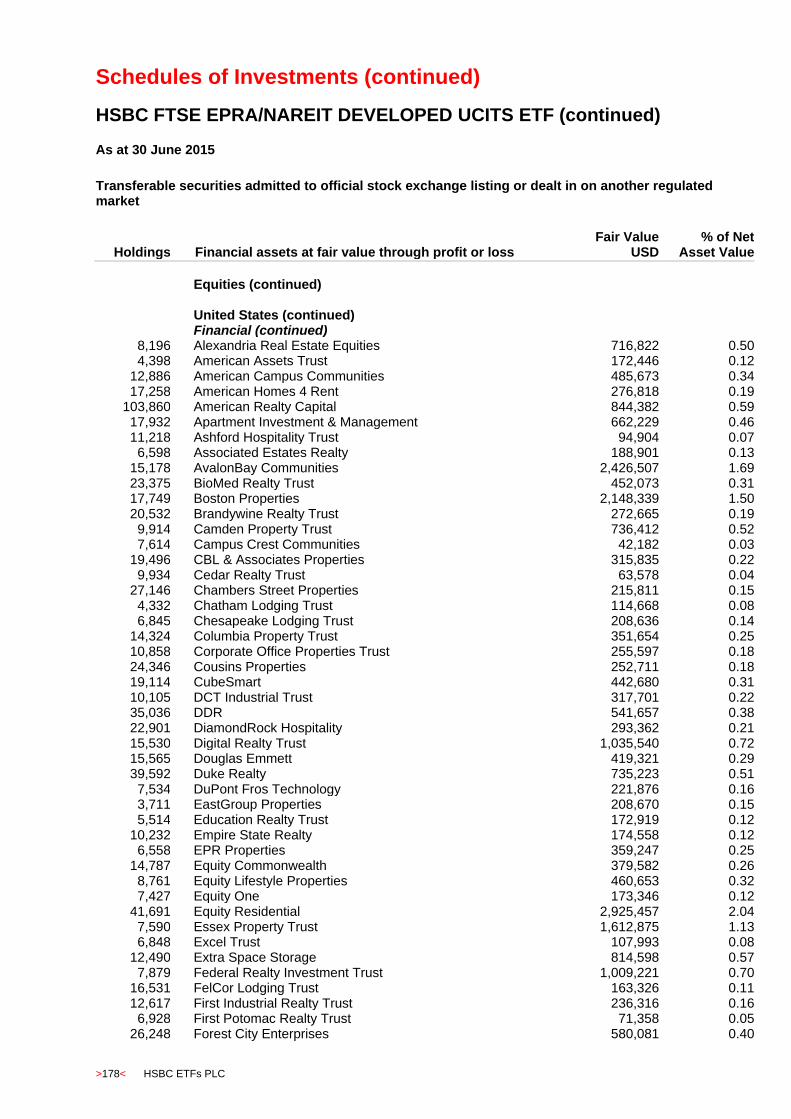
Schedules of Investments (continued)
HSBC FTSE EPRA/NAREIT DEVELOPED UCITS ETF (continued)
>178< HSBC ETFs PLC
As at 30 June 2015
Transferable securities admitted to official stock exchange listing or dealt in on another regulated market
Holdings
Financial assets at fair value through profit or loss Fair Value
USD % of Net
Asset Value
Equities (continued)
United States (continued) Financial (continued)
8,196 Alexandria Real Estate Equities 716,822 0.50 4,398 American Assets Trust 172,446 0.12
12,886 American Campus Communities 485,673 0.34 17,258 American Homes 4 Rent 276,818 0.19
103,860 American Realty Capital 844,382 0.59 17,932 Apartment Investment & Management 662,229 0.46 11,218 Ashford Hospitality Trust 94,904 0.07
6,598 Associated Estates Realty 188,901 0.13 15,178 AvalonBay Communities 2,426,507 1.69 23,375 BioMed Realty Trust 452,073 0.31 17,749 Boston Properties 2,148,339 1.50 20,532 Brandywine Realty Trust 272,665 0.19
9,914 Camden Property Trust 736,412 0.52 7,614 Campus Crest Communities 42,182 0.03
19,496 CBL & Associates Properties 315,835 0.22 9,934 Cedar Realty Trust 63,578 0.04
27,146 Chambers Street Properties 215,811 0.15 4,332 Chatham Lodging Trust 114,668 0.08 6,845 Chesapeake Lodging Trust 208,636 0.14
14,324 Columbia Property Trust 351,654 0.25 10,858 Corporate Office Properties Trust 255,597 0.18 24,346 Cousins Properties 252,711 0.18 19,114 CubeSmart 442,680 0.31 10,105 DCT Industrial Trust 317,701 0.22 35,036 DDR 541,657 0.38 22,901 DiamondRock Hospitality 293,362 0.21 15,530 Digital Realty Trust 1,035,540 0.72 15,565 Douglas Emmett 419,321 0.29 39,592 Duke Realty 735,223 0.51
7,534 DuPont Fros Technology 221,876 0.16 3,711 EastGroup Properties 208,670 0.15 5,514 Education Realty Trust 172,919 0.12
10,232 Empire State Realty 174,558 0.12 6,558 EPR Properties 359,247 0.25
14,787 Equity Commonwealth 379,582 0.26 8,761 Equity Lifestyle Properties 460,653 0.32 7,427 Equity One 173,346 0.12
41,691 Equity Residential 2,925,457 2.04 7,590 Essex Property Trust 1,612,875 1.13 6,848 Excel Trust 107,993 0.08
12,490 Extra Space Storage 814,598 0.57 7,879 Federal Realty Investment Trust 1,009,221 0.70
16,531 FelCor Lodging Trust 163,326 0.11 12,617 First Industrial Realty Trust 236,316 0.16
6,928 First Potomac Realty Trust 71,358 0.05 26,248 Forest City Enterprises 580,081 0.40

Schedules of Investments (continued)
HSBC FTSE EPRA/NAREIT DEVELOPED UCITS ETF (continued)
HSBC ETFs PLC >179<
As at 30 June 2015
Transferable securities admitted to official stock exchange listing or dealt in on another regulated market
Holdings
Financial assets at fair value through profit or loss Fair Value
USD % of Net
Asset Value
Equities (continued)
United States (continued) Financial (continued)
10,398 Franklin Street Properties 117,601 0.08 10,103 Gaming And Leisure Properties 370,376 0.26 57,797 General Growth Properties 1,483,071 1.03
2,954 Getty Realty 48,327 0.03 8,241 Government Propertiesome Trust 152,870 0.11 6,375 Gramercy Property Trust 148,984 0.10
52,994 HCP 1,932,691 1.35 40,566 Health Care REIT 2,662,347 1.86 11,438 Healthcare Realty Trust 266,048 0.19 14,490 Healthcare Trust of America 347,036 0.24
4,786 Hersha Hospitality Trust 122,713 0.09 10,792 Highwoods Properties 431,140 0.30
6,671 Home Properties 487,317 0.34 17,167 Hospitality Properties Trust 494,753 0.35 87,480 Host Hotels & Resorts 1,734,728 1.21
8,330 Hudson Pacific Properties 236,322 0.16 10,087 Inland Real Estate 95,020 0.07 14,183 Investors Real Estate Trust 101,267 0.07 10,137 Kilroy Realty 680,700 0.48 47,167 Kimco Realty 1,063,144 0.74
9,422 Kite Realty Group Trust 230,556 0.16 12,944 LaSalle Hotel Properties 458,994 0.32 27,143 Lexington Realty Trust 230,173 0.16 17,151 Liberty Property Trust 552,605 0.39
4,075 LTC Properties 169,520 0.12 18,123 Macerich 1,351,976 0.94 10,211 Mack-Cali Realty 188,189 0.13 23,842 Medical Properties Trust 312,569 0.22
8,635 Mid-America Apartment Communities 628,714 0.44 3,966 National Health Investors 247,082 0.17
15,307 National Retail Properties 535,898 0.37 7,314 New Senior Investment Group 97,788 0.07
18,753 New York Real Estate Investment Trust 186,592 0.13 18,491 Omega Healthcare Investors 634,796 0.44 16,534 Paramount Group 283,724 0.20
9,180 Parkway Properties 160,099 0.11 8,326 Pebblebrook Hotel Trust 357,019 0.25 7,671 Pennsylvania Real Estate Investment Trust 163,699 0.11 8,068 Physicians Realty Trust 123,925 0.08
17,704 Piedmont Office Realty Trust 311,413 0.22 6,219 Post Properties 338,127 0.24
60,631 ProLogis 2,249,410 1.57 2,317 PS Business Parks 167,172 0.12
16,778 Public Storage 3,093,360 2.16 3,413 QTS Realty Trust 124,404 0.09 9,017 Ramco-Gershenson Properties Trust 147,157 0.10
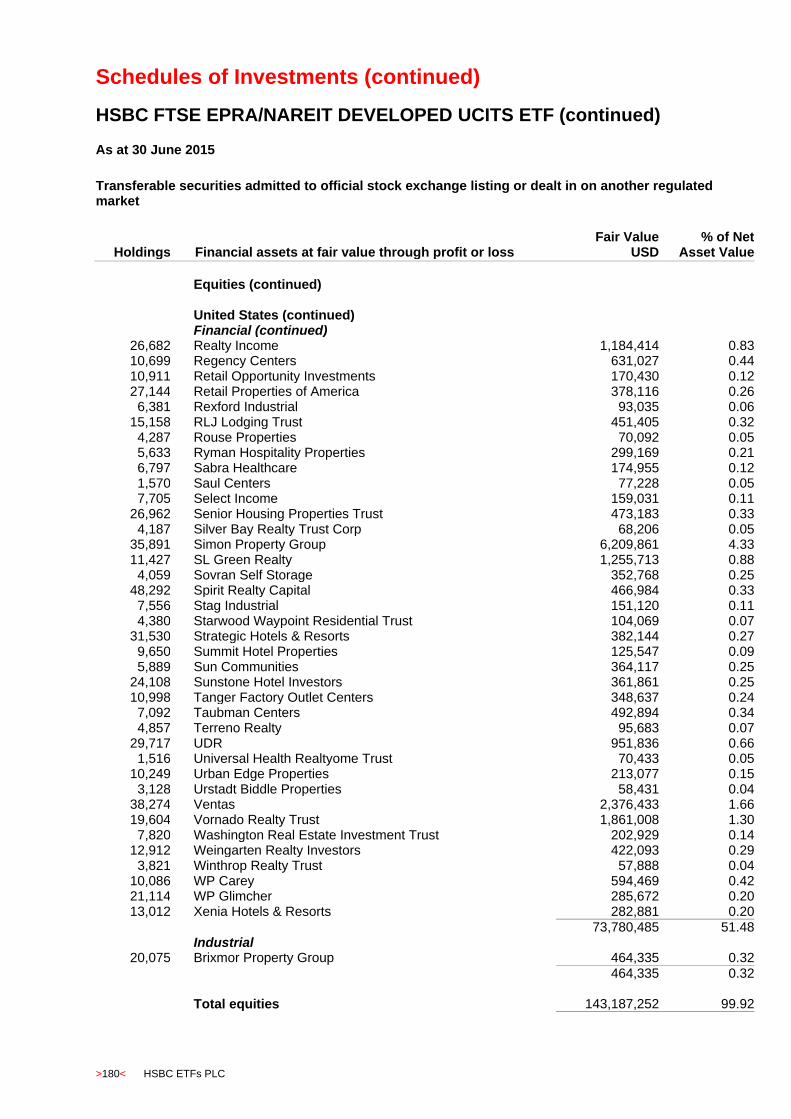
Schedules of Investments (continued)
HSBC FTSE EPRA/NAREIT DEVELOPED UCITS ETF (continued)
>180< HSBC ETFs PLC
As at 30 June 2015
Transferable securities admitted to official stock exchange listing or dealt in on another regulated market
Holdings
Financial assets at fair value through profit or loss Fair Value
USD % of Net
Asset Value
Equities (continued)
United States (continued) Financial (continued)
26,682 Realty Income 1,184,414 0.83 10,699 Regency Centers 631,027 0.44 10,911 Retail Opportunity Investments 170,430 0.12 27,144 Retail Properties of America 378,116 0.26
6,381 Rexford Industrial 93,035 0.06 15,158 RLJ Lodging Trust 451,405 0.32
4,287 Rouse Properties 70,092 0.05 5,633 Ryman Hospitality Properties 299,169 0.21 6,797 Sabra Healthcare 174,955 0.12 1,570 Saul Centers 77,228 0.05 7,705 Select Income 159,031 0.11
26,962 Senior Housing Properties Trust 473,183 0.33 4,187 Silver Bay Realty Trust Corp 68,206 0.05
35,891 Simon Property Group 6,209,861 4.33 11,427 SL Green Realty 1,255,713 0.88
4,059 Sovran Self Storage 352,768 0.25 48,292 Spirit Realty Capital 466,984 0.33
7,556 Stag Industrial 151,120 0.11 4,380 Starwood Waypoint Residential Trust 104,069 0.07
31,530 Strategic Hotels & Resorts 382,144 0.27 9,650 Summit Hotel Properties 125,547 0.09 5,889 Sun Communities 364,117 0.25
24,108 Sunstone Hotel Investors 361,861 0.25 10,998 Tanger Factory Outlet Centers 348,637 0.24
7,092 Taubman Centers 492,894 0.34 4,857 Terreno Realty 95,683 0.07
29,717 UDR 951,836 0.66 1,516 Universal Health Realtyome Trust 70,433 0.05
10,249 Urban Edge Properties 213,077 0.15 3,128 Urstadt Biddle Properties 58,431 0.04
38,274 Ventas 2,376,433 1.66 19,604 Vornado Realty Trust 1,861,008 1.30
7,820 Washington Real Estate Investment Trust 202,929 0.14 12,912 Weingarten Realty Investors 422,093 0.29
3,821 Winthrop Realty Trust 57,888 0.04 10,086 WP Carey 594,469 0.42 21,114 WP Glimcher 285,672 0.20 13,012 Xenia Hotels & Resorts 282,881 0.20
73,780,485 51.48 Industrial
20,075 Brixmor Property Group 464,335 0.32
464,335 0.32 Total equities 143,187,252 99.92

Schedules of Investments (continued)
HSBC FTSE EPRA/NAREIT DEVELOPED UCITS ETF (continued)
HSBC ETFs PLC >181<
As at 30 June 2015 Transferable securities admitted to official stock exchange listing or dealt in on another regulated market
Financial assets at fair value through profit or loss
Fair Value USD
% of Net Asset Value
Total financial assets at fair value through profit or loss 143,187,252 99.92 Other net assets 112,898 0.08
Net assets attributable to holders of redeemable participating shares 143,300,150 100.00
All financial assets held by the Fund at 30 June 2015 are transferable securities that have been admitted to an official stock exchange listing or are dealt in on another market. All equity positions held by the Fund at 30 June 2015 and at 31 December 2014 are classified as Level 1. See Note 6(d) for further details.

Schedules of Investments (continued)
HSBC MSCI RUSSIA CAPPED UCITS ETF
>182< HSBC ETFs PLC
As at 30 June 2015
Transferable securities admitted to official stock exchange listing or dealt in on another regulated market
Holdings
Financial assets at fair value through profit or loss Fair Value
USD % of Net
Asset Value
Equities Basic Materials
619,107 ALROSA 700,282 1.37 18,624 MMC Norilsk Nickel 3,170,582 6.18 70,420 Severstal 743,573 1.45
246,805 Uralkali 646,748 1.26
5,261,185 10.26 Consumer Services
87,438 Magnit 4,866,799 9.49 4,866,799 9.49 Financial
383,089 Moscow Exchange 477,874 0.93 3,629,246 Sberbank of Russia 4,696,565 9.16
1,743,163,993 VTB Bank 2,471,377 4.82
7,645,816 14.91 Oil & Gas
3,980,043 Gazprom 10,403,207 20.28 171,598 Lukoil 7,594,184 14.81 30,628 NovaTek 3,117,930 6.08
391,994 Rosneft Oil 1,631,933 3.18 4,733,312 Surgutneftegas 3,183,222 6.21
476,172 Tatneft 2,510,986 4.90 523 Transneft 1,227,830 2.39
29,669,292 57.85 Telecommunications
31,271 Megafon 434,667 0.85 173,705 Mobile Telesystems OJSC 1,698,835 3.31 269,251 Rostelecom 435,084 0.85 56,784 Sistema 502,538 0.98
3,071,124 5.99 Utilities
38,962,876 Rushydro 383,231 0.75
383,231 0.75 Total equities* 50,897,447 99.25
Total financial assets at fair value through profit or loss 50,897,447 99.25
Financial liabilities at fair value through profit or loss Futures
35 EUX RDX USD Index Future Sep 15** (10,275) (0.02)
Total futures*** (10,275) (0.02)
Total financial liabilities at fair value through profit or loss (10,275) (0.02)
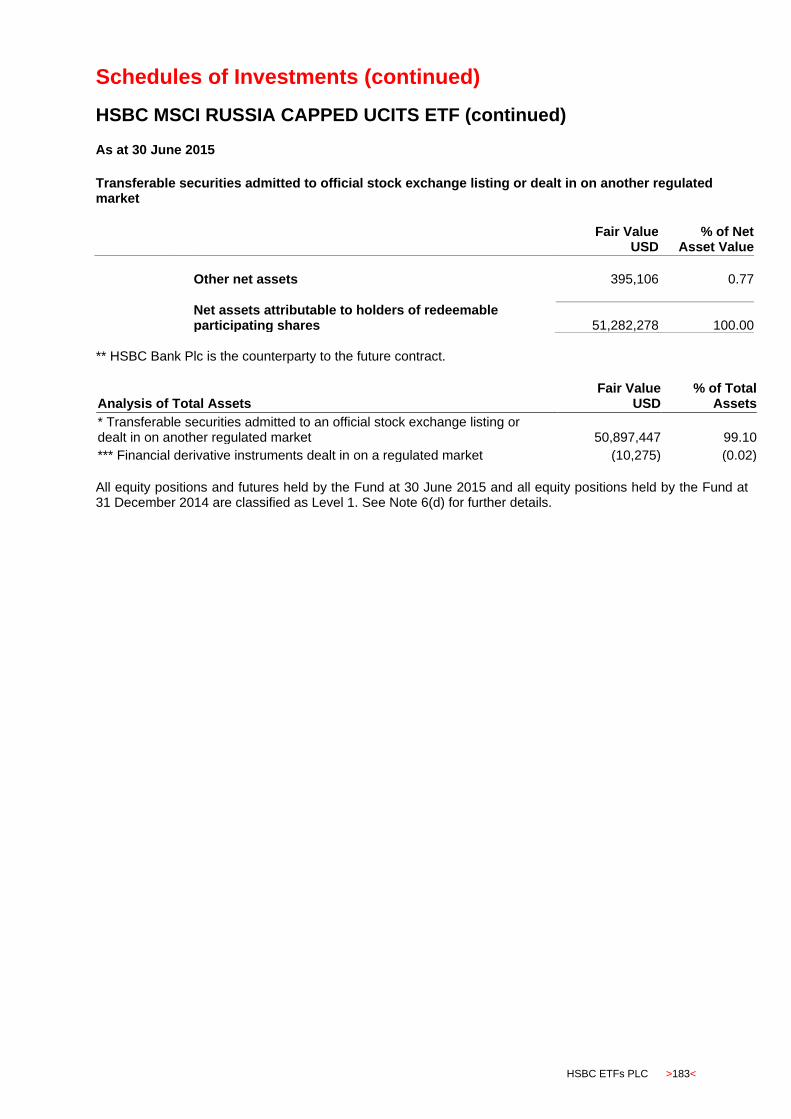
Schedules of Investments (continued)
HSBC MSCI RUSSIA CAPPED UCITS ETF (continued)
HSBC ETFs PLC >183<
As at 30 June 2015
Transferable securities admitted to official stock exchange listing or dealt in on another regulated market
Fair Value
USD % of Net
Asset Value
Other net assets 395,106 0.77
Net assets attributable to holders of redeemable participating shares 51,282,278 100.00
** HSBC Bank Plc is the counterparty to the future contract.
Analysis of Total Assets Fair Value
USD % of Total
Assets
* Transferable securities admitted to an official stock exchange listing or dealt in on another regulated market 50,897,447 99.10
*** Financial derivative instruments dealt in on a regulated market (10,275) (0.02)
All equity positions and futures held by the Fund at 30 June 2015 and all equity positions held by the Fund at 31 December 2014 are classified as Level 1. See Note 6(d) for further details.

Schedules of Investments (continued)
HSBC MSCI EMERGING MARKETS UCITS ETF
>184< HSBC ETFs PLC
As at 30 June 2015
Transferable securities admitted to official stock exchange listing or dealt in on another regulated market
Holdings
Financial assets at fair value through profit or loss Fair Value
USD % of Net
Asset Value
Equities Brazil Basic Materials
9,084 Braskem 39,829 0.01 64,424 Cia Siderurgica Nacional 107,221 0.03 21,271 Fibria Celulose 290,470 0.09 75,812 Gerdau 182,794 0.06 29,022 Suzano Papel e Celulose 154,527 0.05 71,037 Usinas Siderurgicas de Minas Gerais 94,216 0.03
244,691 Vale 1,319,510 0.43 2,188,567 0.70 Consumer Goods
375,765 Ambev 2,310,427 0.74 46,869 BRF - Brasil Foods 990,972 0.32
8,470 Cosan SA Industria e Comercio 68,575 0.02 25,382 Hypermarcas 184,907 0.06 57,205 JBS 301,273 0.10 17,980 Natura Cosmeticos 159,403 0.05 34,605 Souza Cruz 272,148 0.09
4,287,705 1.38 Consumer Services
11,030 B2W Compania Global de Varejo 72,399 0.02 8,461 Cia Brasileira de Distribuicao Grupo Pao de Acucar 199,650 0.07
27,678 Estacio Participacoes 160,380 0.05 106,122 Kroton Educational 406,191 0.13 11,608 Localiza Rent a Car 114,683 0.04 44,488 Lojas Americanas 248,333 0.08 11,786 Lojas Renner 428,734 0.14 16,886 Raia Drogasil 217,870 0.07
1,848,240 0.60 Financial
256,794 Banco Bradesco 2,348,149 0.76 64,413 Banco do Brasil 503,460 0.16 29,740 Banco Santander Brasil 161,988 0.05 52,166 BB Seguridade Participacoes 572,644 0.18
150,846 BM&FBovespa 569,120 0.18 31,031 BR Malls Participacoes 145,445 0.05 24,714 CETIP - Balcao Organizado de Ativos e Derivativos 271,135 0.09 67,478 Cielo 951,869 0.31 35,172 Cyrela Brazil Realty SA Empreendimentos e Participacoes 112,092 0.04
220,083 Itau Unibanco 2,424,427 0.78 266,757 Itausa - Investimentos Itau 765,132 0.25
6,687 Multiplan Empreendimentos Imobiliarios 103,220 0.03 21,497 Qualicorp 136,398 0.04
9,065,079 2.92 Healthcare
60,957 Odontoprev 211,536 0.07
211,536 0.07

Schedules of Investments (continued)
HSBC MSCI EMERGING MARKETS UCITS ETF (continued)
HSBC ETFs PLC >185<
As at 30 June 2015 Transferable securities admitted to official stock exchange listing or dealt in on another regulated market
Holdings
Financial assets at fair value through profit or loss Fair Value
USD % of Net
Asset Value
Equities (continued) Brazil (continued) Industrial
83,416 CCR 400,377 0.13 30,558 EcoRodovias Infraestrutura e Logistica 76,238 0.02 56,291 Embraer 428,742 0.14 35,758 Klabin 219,746 0.07 39,418 Weg 241,731 0.08
1,366,834 0.44 Oil & Gas
328,462 Petrobras 1,343,920 0.43 203,338 Petroleo Brasileiro 918,372 0.30
2,262,292 0.73 Technology
9,757 Totvs 122,496 0.04 122,496 0.04 Telecommunications
21,691 Telefonica Brasil 304,166 0.10 65,627 Tim Participacoes 216,334 0.07
520,500 0.17 Utilities
61,105 Cia Energetica de Minas Gerais 233,294 0.08 8,484 Cia Energetica de Sao Paulo 53,558 0.02
26,817 CPFL Energia 166,182 0.05 29,628 Sabesp 157,373 0.05 16,035 Tractebel Energia 176,486 0.06 30,051 Ultrapar Participacoes 635,575 0.20
1,422,468 0.46 Chile Basic Materials
48,526 Empres CMPC 131,989 0.04 7,472 Sociedad Quimica y Minera de Chile 120,878 0.04
252,867 0.08 Consumer Goods
28,664 Cia Cervecerias Unidas 304,089 0.09 46,922 Vina Concha y Toro 81,741 0.03
385,830 0.12 Consumer Services
57,631 Cencosud 138,614 0.05 26,614 Latam Airlines 189,635 0.06 35,710 SACI Falabella 249,405 0.08
577,654 0.19 Financial
6,837 Banco de Credito e Inversiones 300,450 0.10 7,524,774 Banco Santander Chile 380,163 0.12
680,613 0.22 Oil & Gas
26,021 Empresas COPEC 276,241 0.09
276,241 0.09

Schedules of Investments (continued)
HSBC MSCI EMERGING MARKETS UCITS ETF (continued)
>186< HSBC ETFs PLC
As at 30 June 2015 Transferable securities admitted to official stock exchange listing or dealt in on another regulated market
Holdings
Financial assets at fair value through profit or loss Fair Value
USD % of Net
Asset Value
Equities (continued) Chile (continued) Telecommunications
10,327 ENTEL Chile 114,286 0.04
114,286 0.04 Utilities
621,980 AES Gener 354,167 0.11 610,960 Colbun 173,822 0.06 319,170 Empresa Nacional de Electricidad 441,851 0.15
1,692,768 Enersis 537,902 0.17
1,507,742 0.49 China Basic Materials
353,490 Aluminum Corporation of China 178,283 0.06 444,595 China Coal Energy 265,522 0.09 301,089 China Shenhua Energy 686,645 0.22 93,056 Inner Mongolia Yitai Coal 133,628 0.04
223,505 Jiangxi Copper 373,059 0.12 243,673 Yanzhou Coal Mining 191,417 0.06
1,828,554 0.59 Consumer Goods
87,257 Anta Sports Products 211,599 0.07 86,355 AviChina Industry & Technology 84,433 0.03
264,538 Dongfeng Motor Group 354,876 0.11 91,483 Great Wall Automobiles 448,414 0.14
205,877 Guangzhou Automobile Group 190,672 0.06 74,248 Hengan International Group 882,063 0.28 50,047 Shenzou International Group 243,374 0.08 99,002 Tingyi Cayman Islands Holding 202,281 0.07
583,744 Want Want China Holding 617,436 0.20 3,235,148 1.04 Consumer Services
108,118 Air China 122,168 0.04 843,925 Alibaba Pictures 327,662 0.10 70,872 China Southern Airline 83,739 0.03
533,569 0.17 Financial
2,124,761 Agricultural Bank of China 1,142,882 0.37 6,528,431 Bank of China 4,244,190 1.37
816,903 China Citic Bank 651,200 0.21 6,372,836 China Construction Bank 5,819,979 1.87
246,040 China Galaxy Securities 320,540 0.10 554,227 China Life Insurance 2,412,775 0.78 398,411 China Merchants Bank 1,161,436 0.37 539,796 China Minsheng Banking 707,422 0.23 207,798 China Pacific Insurance Group 997,102 0.32 92,912 China Taiping Insurance Holdings 333,774 0.11
106,127 China Vanke 261,192 0.08 160,643 CITIC Securities 579,161 0.19
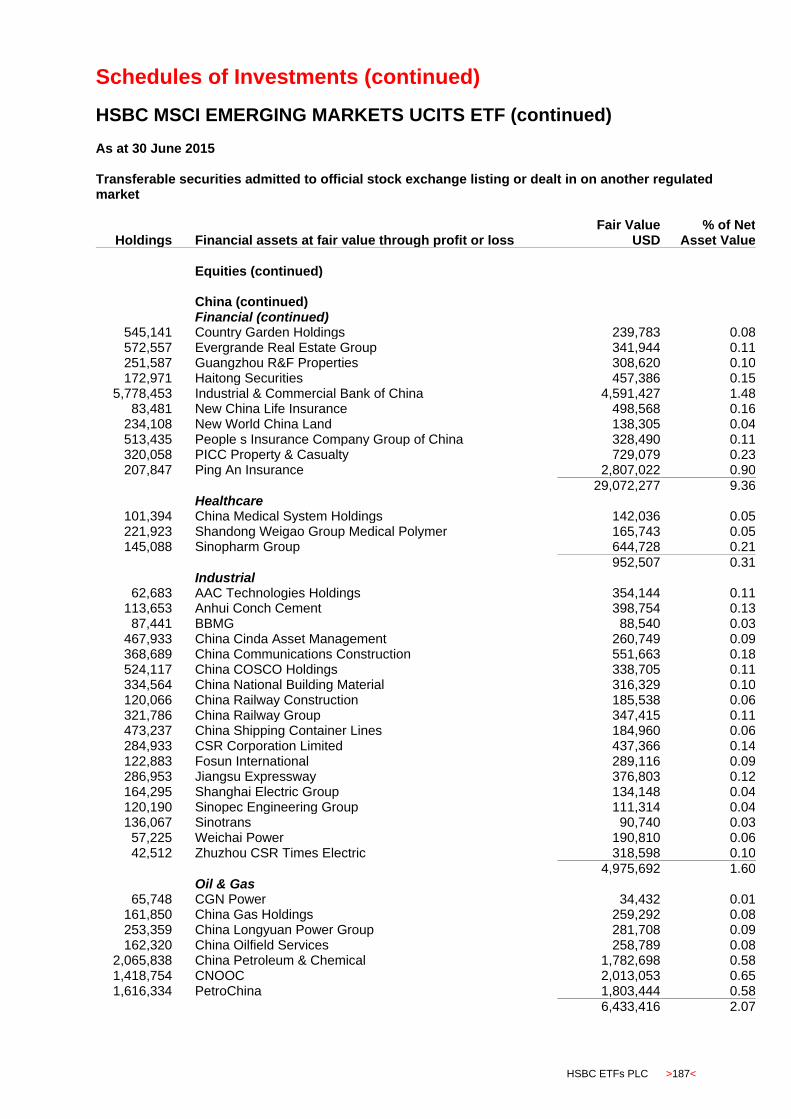
Schedules of Investments (continued)
HSBC MSCI EMERGING MARKETS UCITS ETF (continued)
HSBC ETFs PLC >187<
As at 30 June 2015 Transferable securities admitted to official stock exchange listing or dealt in on another regulated market
Holdings
Financial assets at fair value through profit or loss Fair Value
USD % of Net
Asset Value
Equities (continued) China (continued) Financial (continued)
545,141 Country Garden Holdings 239,783 0.08 572,557 Evergrande Real Estate Group 341,944 0.11 251,587 Guangzhou R&F Properties 308,620 0.10 172,971 Haitong Securities 457,386 0.15
5,778,453 Industrial & Commercial Bank of China 4,591,427 1.48 83,481 New China Life Insurance 498,568 0.16
234,108 New World China Land 138,305 0.04 513,435 People s Insurance Company Group of China 328,490 0.11 320,058 PICC Property & Casualty 729,079 0.23 207,847 Ping An Insurance 2,807,022 0.90
29,072,277 9.36 Healthcare
101,394 China Medical System Holdings 142,036 0.05 221,923 Shandong Weigao Group Medical Polymer 165,743 0.05 145,088 Sinopharm Group 644,728 0.21
952,507 0.31 Industrial
62,683 AAC Technologies Holdings 354,144 0.11 113,653 Anhui Conch Cement 398,754 0.13 87,441 BBMG 88,540 0.03
467,933 China Cinda Asset Management 260,749 0.09 368,689 China Communications Construction 551,663 0.18 524,117 China COSCO Holdings 338,705 0.11 334,564 China National Building Material 316,329 0.10 120,066 China Railway Construction 185,538 0.06 321,786 China Railway Group 347,415 0.11 473,237 China Shipping Container Lines 184,960 0.06 284,933 CSR Corporation Limited 437,366 0.14 122,883 Fosun International 289,116 0.09 286,953 Jiangsu Expressway 376,803 0.12 164,295 Shanghai Electric Group 134,148 0.04 120,190 Sinopec Engineering Group 111,314 0.04 136,067 Sinotrans 90,740 0.03 57,225 Weichai Power 190,810 0.06 42,512 Zhuzhou CSR Times Electric 318,598 0.10
4,975,692 1.60 Oil & Gas
65,748 CGN Power 34,432 0.01 161,850 China Gas Holdings 259,292 0.08 253,359 China Longyuan Power Group 281,708 0.09 162,320 China Oilfield Services 258,789 0.08
2,065,838 China Petroleum & Chemical 1,782,698 0.58 1,418,754 CNOOC 2,013,053 0.65 1,616,334 PetroChina 1,803,444 0.58
6,433,416 2.07
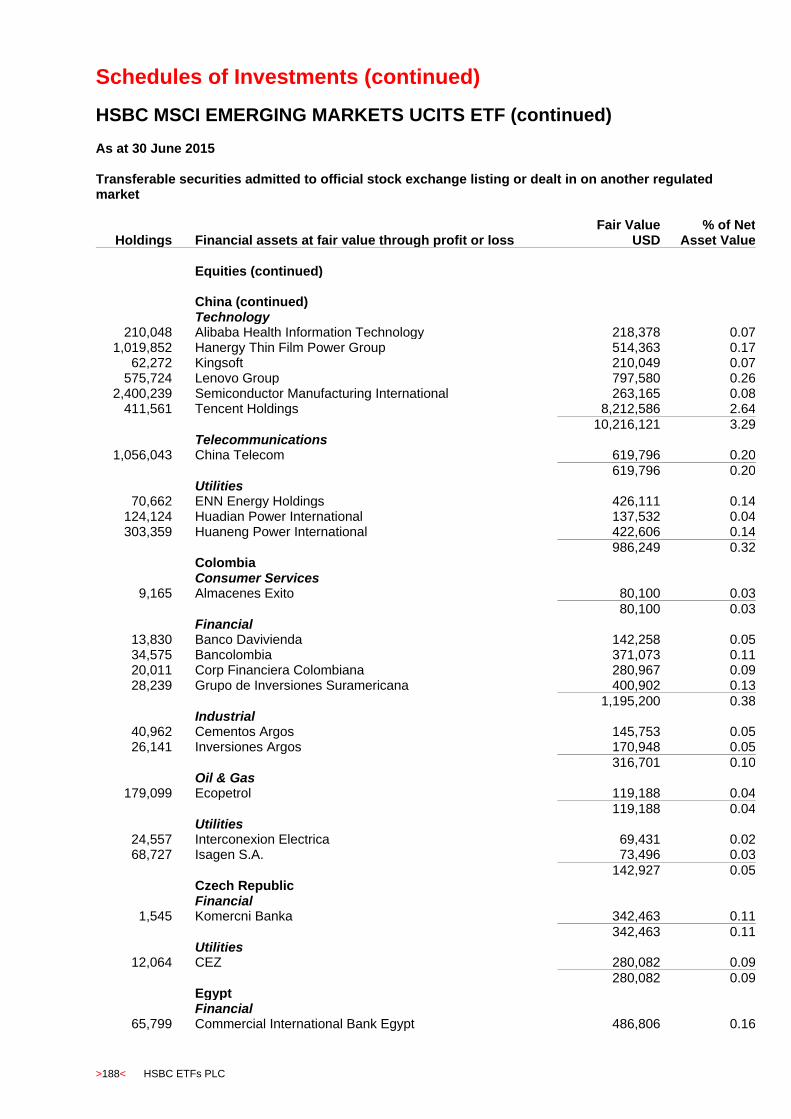
Schedules of Investments (continued)
HSBC MSCI EMERGING MARKETS UCITS ETF (continued)
>188< HSBC ETFs PLC
As at 30 June 2015 Transferable securities admitted to official stock exchange listing or dealt in on another regulated market
Holdings
Financial assets at fair value through profit or loss Fair Value
USD % of Net
Asset Value
Equities (continued) China (continued) Technology
210,048 Alibaba Health Information Technology 218,378 0.07 1,019,852 Hanergy Thin Film Power Group 514,363 0.17
62,272 Kingsoft 210,049 0.07 575,724 Lenovo Group 797,580 0.26
2,400,239 Semiconductor Manufacturing International 263,165 0.08 411,561 Tencent Holdings 8,212,586 2.64
10,216,121 3.29 Telecommunications
1,056,043 China Telecom 619,796 0.20 619,796 0.20 Utilities
70,662 ENN Energy Holdings 426,111 0.14 124,124 Huadian Power International 137,532 0.04 303,359 Huaneng Power International 422,606 0.14
986,249 0.32 Colombia Consumer Services
9,165 Almacenes Exito 80,100 0.03
80,100 0.03 Financial
13,830 Banco Davivienda 142,258 0.05 34,575 Bancolombia 371,073 0.11 20,011 Corp Financiera Colombiana 280,967 0.09 28,239 Grupo de Inversiones Suramericana 400,902 0.13
1,195,200 0.38 Industrial
40,962 Cementos Argos 145,753 0.05 26,141 Inversiones Argos 170,948 0.05
316,701 0.10 Oil & Gas
179,099 Ecopetrol 119,188 0.04
119,188 0.04 Utilities
24,557 Interconexion Electrica 69,431 0.02 68,727 Isagen S.A. 73,496 0.03
142,927 0.05 Czech Republic Financial
1,545 Komercni Banka 342,463 0.11
342,463 0.11 Utilities
12,064 CEZ 280,082 0.09
280,082 0.09 Egypt Financial
65,799 Commercial International Bank Egypt 486,806 0.16
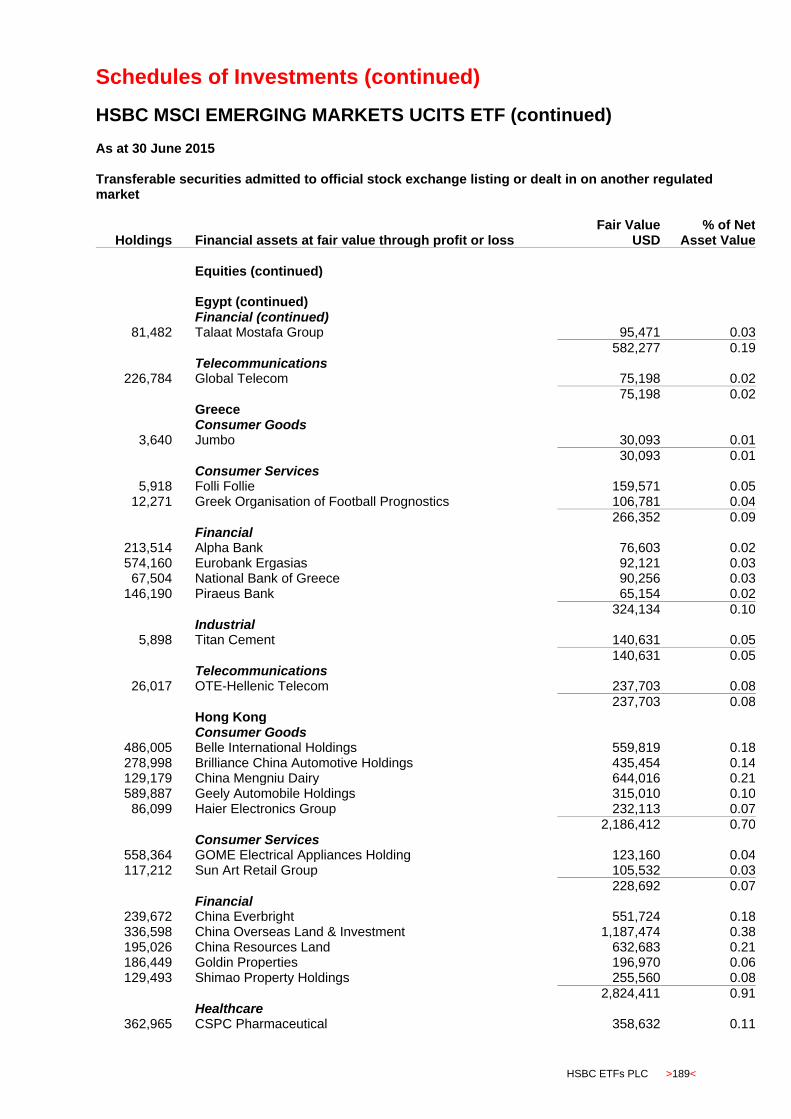
Schedules of Investments (continued)
HSBC MSCI EMERGING MARKETS UCITS ETF (continued)
HSBC ETFs PLC >189<
As at 30 June 2015 Transferable securities admitted to official stock exchange listing or dealt in on another regulated market
Holdings
Financial assets at fair value through profit or loss Fair Value
USD % of Net
Asset Value
Equities (continued) Egypt (continued) Financial (continued)
81,482 Talaat Mostafa Group 95,471 0.03
582,277 0.19 Telecommunications
226,784 Global Telecom 75,198 0.02
75,198 0.02 Greece Consumer Goods
3,640 Jumbo 30,093 0.01
30,093 0.01 Consumer Services
5,918 Folli Follie 159,571 0.05 12,271 Greek Organisation of Football Prognostics 106,781 0.04
266,352 0.09 Financial
213,514 Alpha Bank 76,603 0.02 574,160 Eurobank Ergasias 92,121 0.03 67,504 National Bank of Greece 90,256 0.03
146,190 Piraeus Bank 65,154 0.02
324,134 0.10 Industrial
5,898 Titan Cement 140,631 0.05
140,631 0.05 Telecommunications
26,017 OTE-Hellenic Telecom 237,703 0.08
237,703 0.08 Hong Kong Consumer Goods
486,005 Belle International Holdings 559,819 0.18 278,998 Brilliance China Automotive Holdings 435,454 0.14 129,179 China Mengniu Dairy 644,016 0.21 589,887 Geely Automobile Holdings 315,010 0.10 86,099 Haier Electronics Group 232,113 0.07
2,186,412 0.70 Consumer Services
558,364 GOME Electrical Appliances Holding 123,160 0.04 117,212 Sun Art Retail Group 105,532 0.03
228,692 0.07 Financial
239,672 China Everbright 551,724 0.18 336,598 China Overseas Land & Investment 1,187,474 0.38 195,026 China Resources Land 632,683 0.21 186,449 Goldin Properties 196,970 0.06 129,493 Shimao Property Holdings 255,560 0.08
2,824,411 0.91 Healthcare
362,965 CSPC Pharmaceutical 358,632 0.11
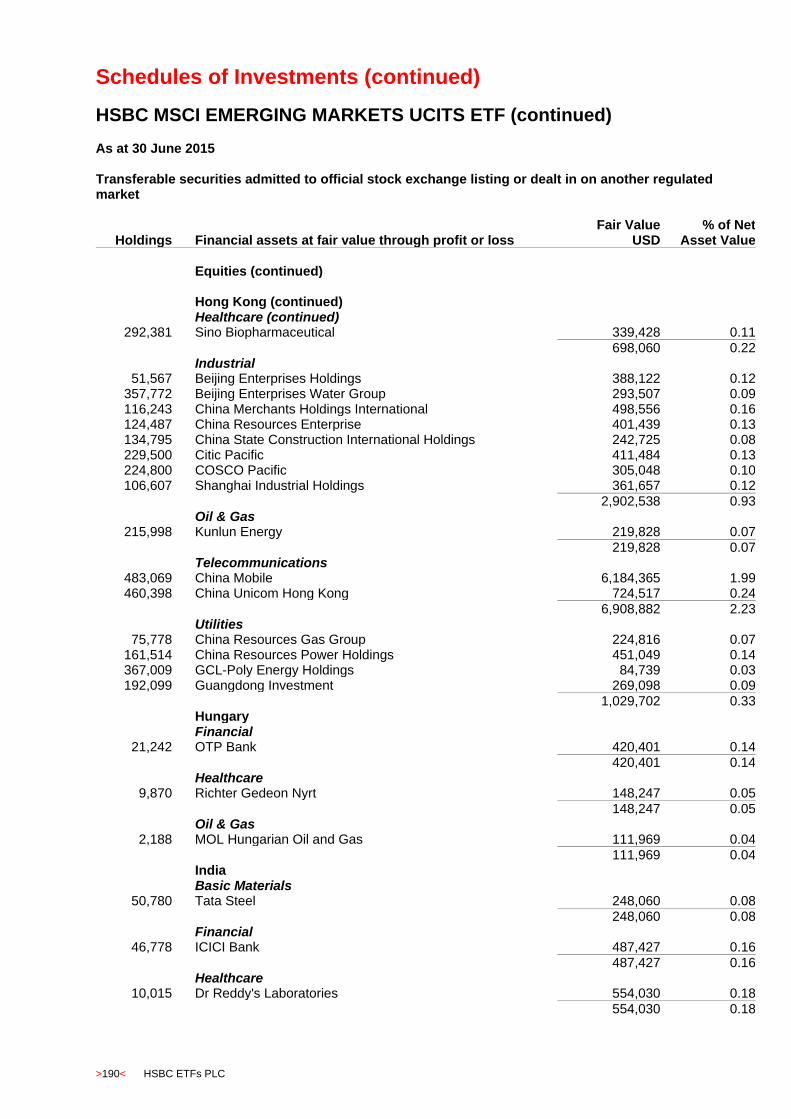
Schedules of Investments (continued)
HSBC MSCI EMERGING MARKETS UCITS ETF (continued)
>190< HSBC ETFs PLC
As at 30 June 2015 Transferable securities admitted to official stock exchange listing or dealt in on another regulated market
Holdings
Financial assets at fair value through profit or loss Fair Value
USD % of Net
Asset Value
Equities (continued) Hong Kong (continued) Healthcare (continued)
292,381 Sino Biopharmaceutical 339,428 0.11
698,060 0.22 Industrial
51,567 Beijing Enterprises Holdings 388,122 0.12 357,772 Beijing Enterprises Water Group 293,507 0.09 116,243 China Merchants Holdings International 498,556 0.16 124,487 China Resources Enterprise 401,439 0.13 134,795 China State Construction International Holdings 242,725 0.08 229,500 Citic Pacific 411,484 0.13 224,800 COSCO Pacific 305,048 0.10 106,607 Shanghai Industrial Holdings 361,657 0.12
2,902,538 0.93 Oil & Gas
215,998 Kunlun Energy 219,828 0.07
219,828 0.07 Telecommunications
483,069 China Mobile 6,184,365 1.99 460,398 China Unicom Hong Kong 724,517 0.24
6,908,882 2.23 Utilities
75,778 China Resources Gas Group 224,816 0.07 161,514 China Resources Power Holdings 451,049 0.14 367,009 GCL-Poly Energy Holdings 84,739 0.03 192,099 Guangdong Investment 269,098 0.09
1,029,702 0.33 Hungary Financial
21,242 OTP Bank 420,401 0.14 420,401 0.14 Healthcare
9,870 Richter Gedeon Nyrt 148,247 0.05
148,247 0.05 Oil & Gas
2,188 MOL Hungarian Oil and Gas 111,969 0.04
111,969 0.04 India Basic Materials
50,780 Tata Steel 248,060 0.08 248,060 0.08 Financial
46,778 ICICI Bank 487,427 0.16
487,427 0.16 Healthcare
10,015 Dr Reddy's Laboratories 554,030 0.18
554,030 0.18
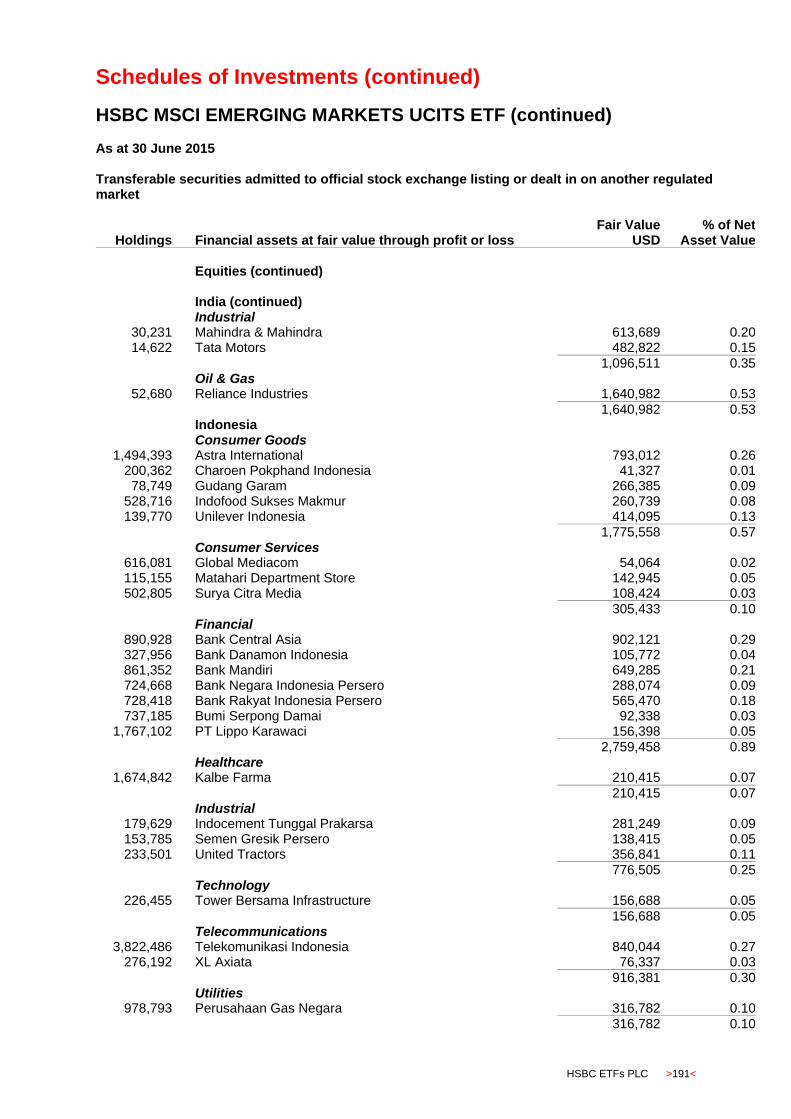
Schedules of Investments (continued)
HSBC MSCI EMERGING MARKETS UCITS ETF (continued)
HSBC ETFs PLC >191<
As at 30 June 2015 Transferable securities admitted to official stock exchange listing or dealt in on another regulated market
Holdings
Financial assets at fair value through profit or loss Fair Value
USD % of Net
Asset Value
Equities (continued) India (continued) Industrial
30,231 Mahindra & Mahindra 613,689 0.20 14,622 Tata Motors 482,822 0.15
1,096,511 0.35 Oil & Gas
52,680 Reliance Industries 1,640,982 0.53
1,640,982 0.53 Indonesia Consumer Goods
1,494,393 Astra International 793,012 0.26 200,362 Charoen Pokphand Indonesia 41,327 0.01 78,749 Gudang Garam 266,385 0.09
528,716 Indofood Sukses Makmur 260,739 0.08 139,770 Unilever Indonesia 414,095 0.13
1,775,558 0.57 Consumer Services
616,081 Global Mediacom 54,064 0.02 115,155 Matahari Department Store 142,945 0.05 502,805 Surya Citra Media 108,424 0.03
305,433 0.10 Financial
890,928 Bank Central Asia 902,121 0.29 327,956 Bank Danamon Indonesia 105,772 0.04 861,352 Bank Mandiri 649,285 0.21 724,668 Bank Negara Indonesia Persero 288,074 0.09 728,418 Bank Rakyat Indonesia Persero 565,470 0.18 737,185 Bumi Serpong Damai 92,338 0.03
1,767,102 PT Lippo Karawaci 156,398 0.05
2,759,458 0.89 Healthcare
1,674,842 Kalbe Farma 210,415 0.07
210,415 0.07 Industrial
179,629 Indocement Tunggal Prakarsa 281,249 0.09 153,785 Semen Gresik Persero 138,415 0.05 233,501 United Tractors 356,841 0.11
776,505 0.25 Technology
226,455 Tower Bersama Infrastructure 156,688 0.05
156,688 0.05 Telecommunications
3,822,486 Telekomunikasi Indonesia 840,044 0.27 276,192 XL Axiata 76,337 0.03
916,381 0.30 Utilities
978,793 Perusahaan Gas Negara 316,782 0.10
316,782 0.10
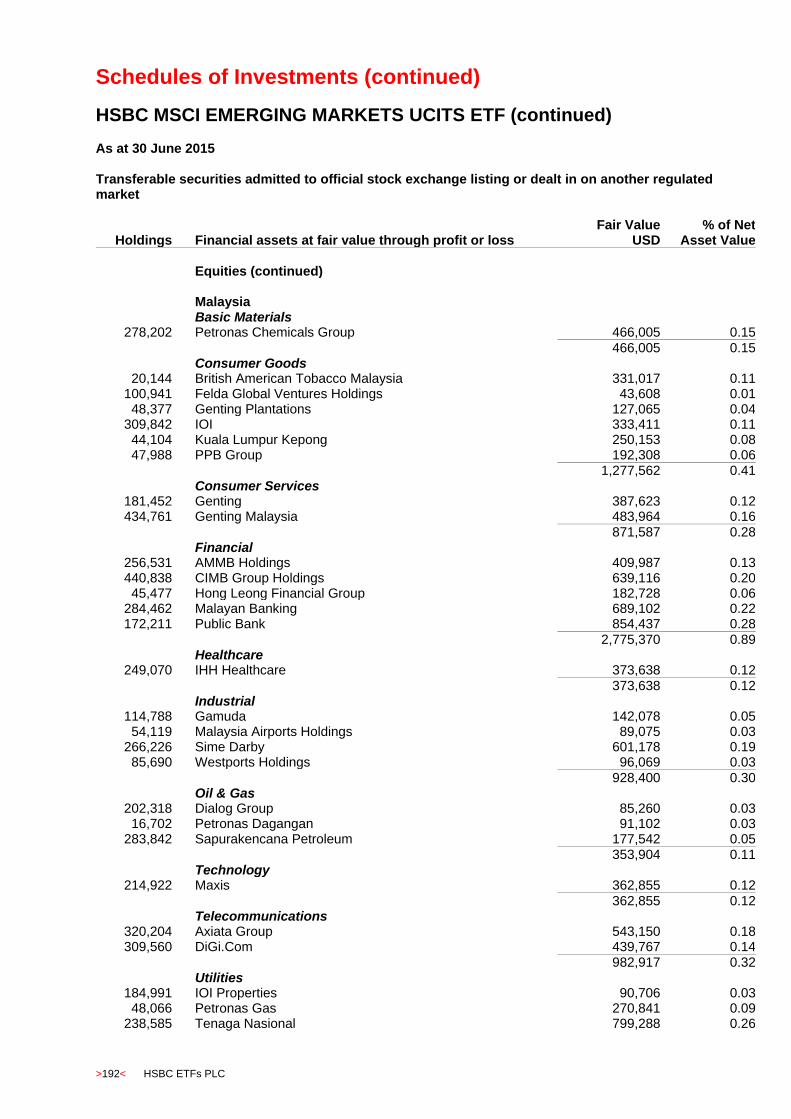
Schedules of Investments (continued)
HSBC MSCI EMERGING MARKETS UCITS ETF (continued)
>192< HSBC ETFs PLC
As at 30 June 2015 Transferable securities admitted to official stock exchange listing or dealt in on another regulated market
Holdings
Financial assets at fair value through profit or loss Fair Value
USD % of Net
Asset Value
Equities (continued) Malaysia Basic Materials
278,202 Petronas Chemicals Group 466,005 0.15
466,005 0.15 Consumer Goods
20,144 British American Tobacco Malaysia 331,017 0.11 100,941 Felda Global Ventures Holdings 43,608 0.01 48,377 Genting Plantations 127,065 0.04
309,842 IOI 333,411 0.11 44,104 Kuala Lumpur Kepong 250,153 0.08 47,988 PPB Group 192,308 0.06
1,277,562 0.41 Consumer Services
181,452 Genting 387,623 0.12 434,761 Genting Malaysia 483,964 0.16
871,587 0.28 Financial
256,531 AMMB Holdings 409,987 0.13 440,838 CIMB Group Holdings 639,116 0.20 45,477 Hong Leong Financial Group 182,728 0.06
284,462 Malayan Banking 689,102 0.22 172,211 Public Bank 854,437 0.28
2,775,370 0.89 Healthcare
249,070 IHH Healthcare 373,638 0.12
373,638 0.12 Industrial
114,788 Gamuda 142,078 0.05 54,119 Malaysia Airports Holdings 89,075 0.03
266,226 Sime Darby 601,178 0.19 85,690 Westports Holdings 96,069 0.03
928,400 0.30 Oil & Gas
202,318 Dialog Group 85,260 0.03 16,702 Petronas Dagangan 91,102 0.03
283,842 Sapurakencana Petroleum 177,542 0.05 353,904 0.11 Technology
214,922 Maxis 362,855 0.12
362,855 0.12 Telecommunications
320,204 Axiata Group 543,150 0.18 309,560 DiGi.Com 439,767 0.14
982,917 0.32 Utilities
184,991 IOI Properties 90,706 0.03 48,066 Petronas Gas 270,841 0.09
238,585 Tenaga Nasional 799,288 0.26
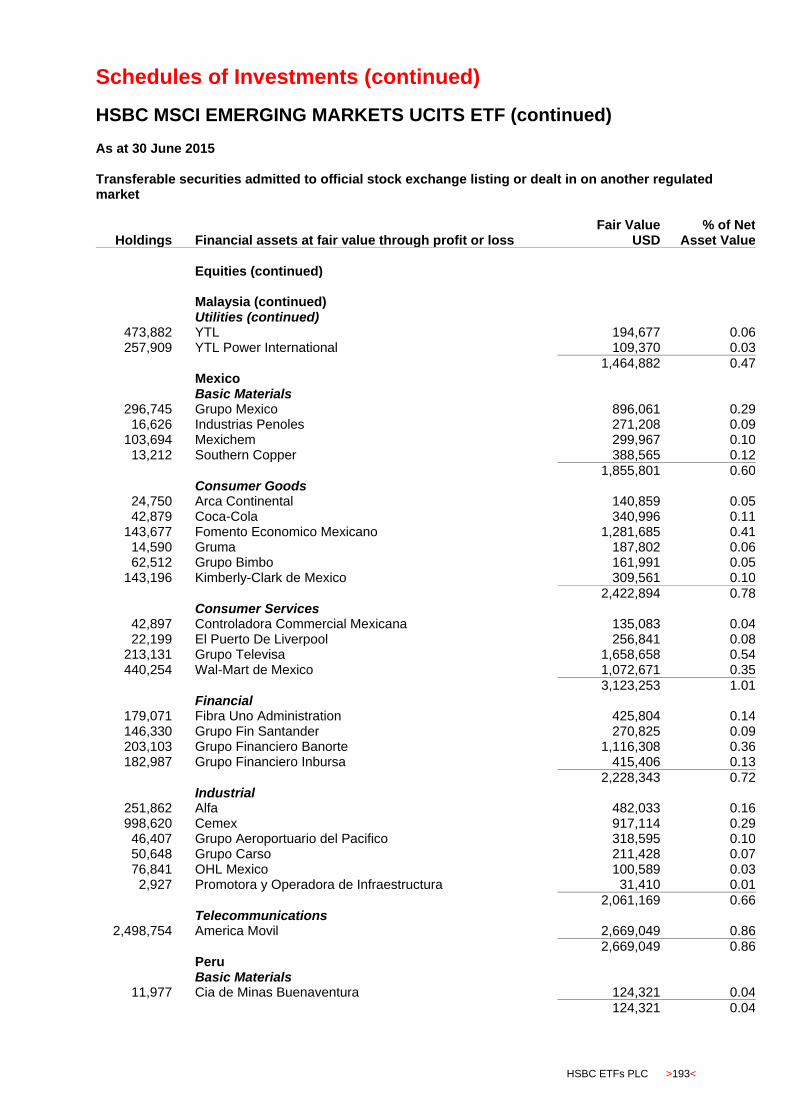
Schedules of Investments (continued)
HSBC MSCI EMERGING MARKETS UCITS ETF (continued)
HSBC ETFs PLC >193<
As at 30 June 2015 Transferable securities admitted to official stock exchange listing or dealt in on another regulated market
Holdings
Financial assets at fair value through profit or loss Fair Value
USD % of Net
Asset Value
Equities (continued) Malaysia (continued) Utilities (continued)
473,882 YTL 194,677 0.06 257,909 YTL Power International 109,370 0.03
1,464,882 0.47 Mexico Basic Materials
296,745 Grupo Mexico 896,061 0.29 16,626 Industrias Penoles 271,208 0.09
103,694 Mexichem 299,967 0.10 13,212 Southern Copper 388,565 0.12
1,855,801 0.60 Consumer Goods
24,750 Arca Continental 140,859 0.05 42,879 Coca-Cola 340,996 0.11
143,677 Fomento Economico Mexicano 1,281,685 0.41 14,590 Gruma 187,802 0.06 62,512 Grupo Bimbo 161,991 0.05
143,196 Kimberly-Clark de Mexico 309,561 0.10
2,422,894 0.78 Consumer Services
42,897 Controladora Commercial Mexicana 135,083 0.04 22,199 El Puerto De Liverpool 256,841 0.08
213,131 Grupo Televisa 1,658,658 0.54 440,254 Wal-Mart de Mexico 1,072,671 0.35
3,123,253 1.01 Financial
179,071 Fibra Uno Administration 425,804 0.14 146,330 Grupo Fin Santander 270,825 0.09 203,103 Grupo Financiero Banorte 1,116,308 0.36 182,987 Grupo Financiero Inbursa 415,406 0.13
2,228,343 0.72 Industrial
251,862 Alfa 482,033 0.16 998,620 Cemex 917,114 0.29 46,407 Grupo Aeroportuario del Pacifico 318,595 0.10 50,648 Grupo Carso 211,428 0.07 76,841 OHL Mexico 100,589 0.03
2,927 Promotora y Operadora de Infraestructura 31,410 0.01
2,061,169 0.66 Telecommunications
2,498,754 America Movil 2,669,049 0.86 2,669,049 0.86 Peru Basic Materials
11,977 Cia de Minas Buenaventura 124,321 0.04
124,321 0.04
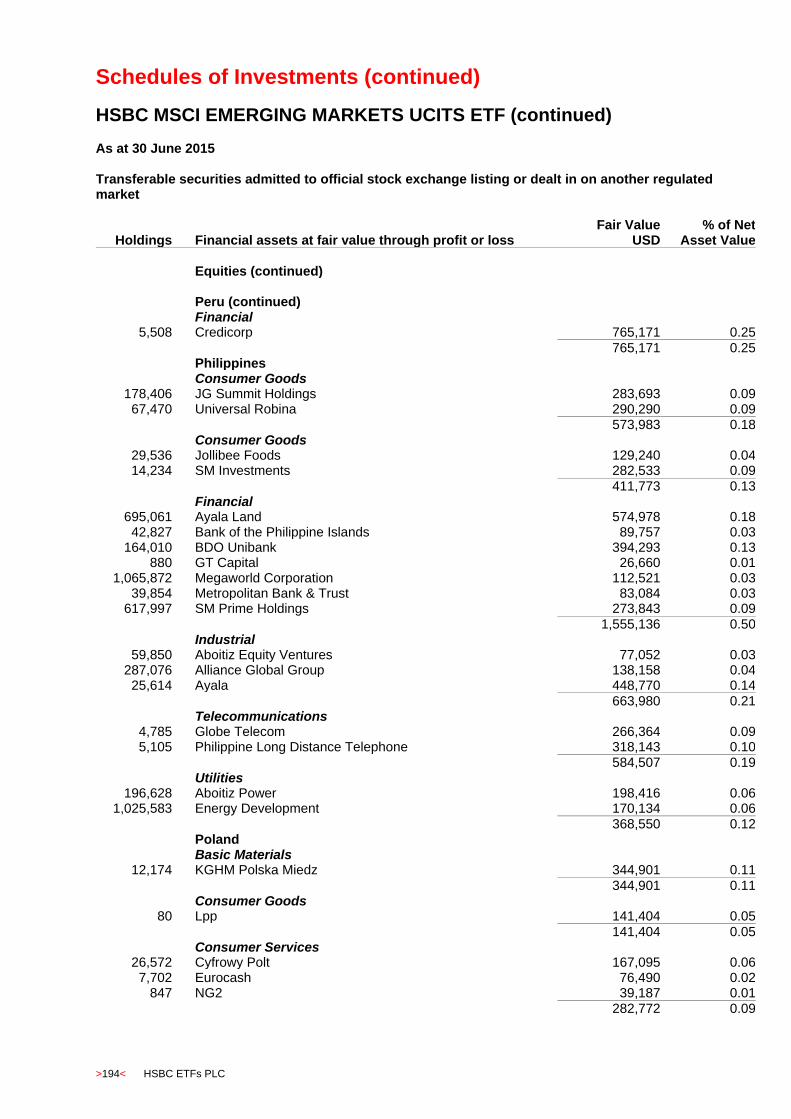
Schedules of Investments (continued)
HSBC MSCI EMERGING MARKETS UCITS ETF (continued)
>194< HSBC ETFs PLC
As at 30 June 2015 Transferable securities admitted to official stock exchange listing or dealt in on another regulated market
Holdings
Financial assets at fair value through profit or loss Fair Value
USD % of Net
Asset Value
Equities (continued) Peru (continued) Financial
5,508 Credicorp 765,171 0.25
765,171 0.25 Philippines Consumer Goods
178,406 JG Summit Holdings 283,693 0.09 67,470 Universal Robina 290,290 0.09
573,983 0.18 Consumer Goods
29,536 Jollibee Foods 129,240 0.04 14,234 SM Investments 282,533 0.09
411,773 0.13 Financial
695,061 Ayala Land 574,978 0.18 42,827 Bank of the Philippine Islands 89,757 0.03
164,010 BDO Unibank 394,293 0.13 880 GT Capital 26,660 0.01
1,065,872 Megaworld Corporation 112,521 0.03 39,854 Metropolitan Bank & Trust 83,084 0.03
617,997 SM Prime Holdings 273,843 0.09
1,555,136 0.50 Industrial
59,850 Aboitiz Equity Ventures 77,052 0.03 287,076 Alliance Global Group 138,158 0.04 25,614 Ayala 448,770 0.14
663,980 0.21 Telecommunications
4,785 Globe Telecom 266,364 0.09 5,105 Philippine Long Distance Telephone 318,143 0.10
584,507 0.19 Utilities
196,628 Aboitiz Power 198,416 0.06 1,025,583 Energy Development 170,134 0.06
368,550 0.12 Poland Basic Materials
12,174 KGHM Polska Miedz 344,901 0.11
344,901 0.11 Consumer Goods
80 Lpp 141,404 0.05
141,404 0.05 Consumer Services
26,572 Cyfrowy Polt 167,095 0.06 7,702 Eurocash 76,490 0.02
847 NG2 39,187 0.01 282,772 0.09
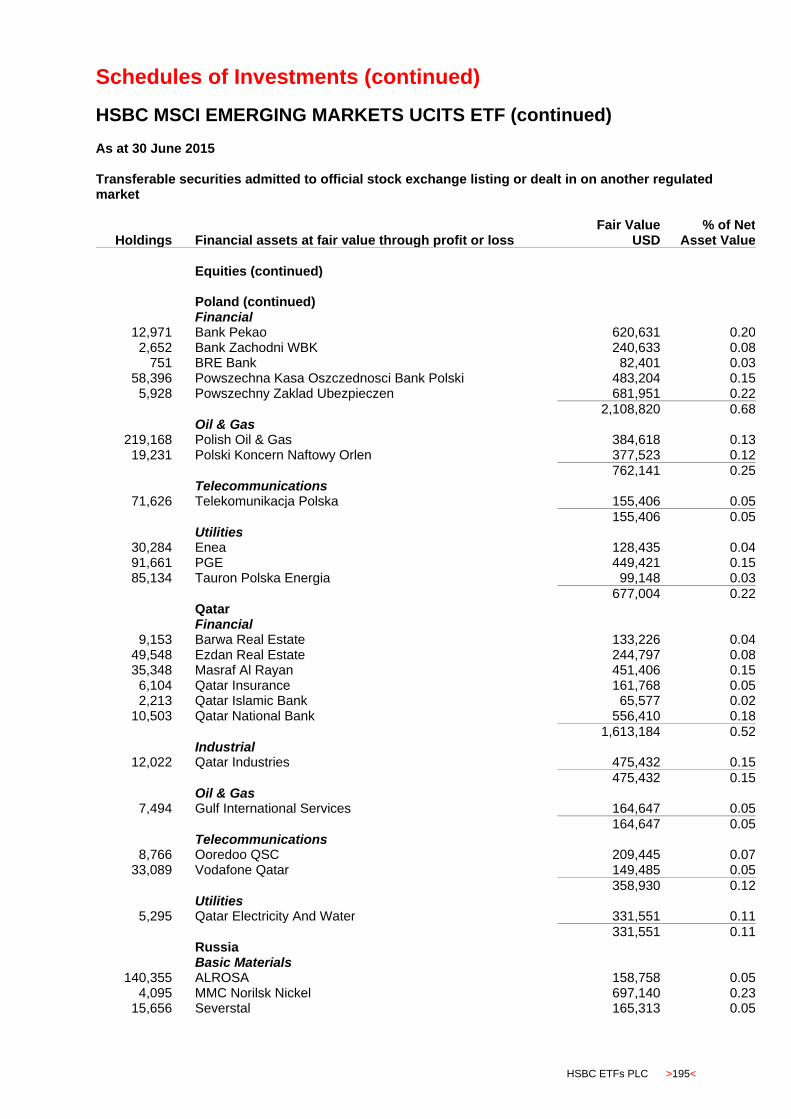
Schedules of Investments (continued)
HSBC MSCI EMERGING MARKETS UCITS ETF (continued)
HSBC ETFs PLC >195<
As at 30 June 2015 Transferable securities admitted to official stock exchange listing or dealt in on another regulated market
Holdings
Financial assets at fair value through profit or loss Fair Value
USD % of Net
Asset Value
Equities (continued) Poland (continued) Financial
12,971 Bank Pekao 620,631 0.20 2,652 Bank Zachodni WBK 240,633 0.08
751 BRE Bank 82,401 0.03 58,396 Powszechna Kasa Oszczednosci Bank Polski 483,204 0.15
5,928 Powszechny Zaklad Ubezpieczen 681,951 0.22
2,108,820 0.68 Oil & Gas
219,168 Polish Oil & Gas 384,618 0.13 19,231 Polski Koncern Naftowy Orlen 377,523 0.12
762,141 0.25 Telecommunications
71,626 Telekomunikacja Polska 155,406 0.05 155,406 0.05 Utilities
30,284 Enea 128,435 0.04 91,661 PGE 449,421 0.15 85,134 Tauron Polska Energia 99,148 0.03
677,004 0.22 Qatar Financial
9,153 Barwa Real Estate 133,226 0.04 49,548 Ezdan Real Estate 244,797 0.08 35,348 Masraf Al Rayan 451,406 0.15
6,104 Qatar Insurance 161,768 0.05 2,213 Qatar Islamic Bank 65,577 0.02
10,503 Qatar National Bank 556,410 0.18
1,613,184 0.52 Industrial
12,022 Qatar Industries 475,432 0.15
475,432 0.15 Oil & Gas
7,494 Gulf International Services 164,647 0.05
164,647 0.05 Telecommunications
8,766 Ooredoo QSC 209,445 0.07 33,089 Vodafone Qatar 149,485 0.05
358,930 0.12 Utilities
5,295 Qatar Electricity And Water 331,551 0.11
331,551 0.11 Russia Basic Materials
140,355 ALROSA 158,758 0.05 4,095 MMC Norilsk Nickel 697,140 0.23
15,656 Severstal 165,313 0.05

Schedules of Investments (continued)
HSBC MSCI EMERGING MARKETS UCITS ETF (continued)
>196< HSBC ETFs PLC
As at 30 June 2015 Transferable securities admitted to official stock exchange listing or dealt in on another regulated market
Holdings
Financial assets at fair value through profit or loss Fair Value
USD % of Net
Asset Value
Equities (continued) Russia (continued) Basic Materials (continued)
95,349 Uralkaliy 249,861 0.08
1,271,072 0.41 Consumer Services
21,292 Magnit 1,185,113 0.38
1,185,113 0.38 Financial
104,358 Moscow Exchange 130,178 0.04 881,279 Sberbank of Russia 1,140,453 0.37
405,812,676 VTB Bank 575,342 0.18
1,845,973 0.59 Oil & Gas
874,155 Gazprom 2,284,904 0.74 40,565 Lukoil 1,795,231 0.58
7,597 NovaTek 773,375 0.25 39,371 Rosneft Oil 163,908 0.05
1,085,522 Surgutneftegas 729,142 0.24 143,418 Tatneft 756,283 0.24
138 Transneft 323,978 0.10
6,826,821 2.20 Telecommunications
15,420 AFK Sistema 136,467 0.04 43,779 Mobile Telesystems 428,159 0.14 72,391 Rostelecom 116,977 0.04
681,603 0.22 South Africa Basic Materials
11,341 African Rainbow Minerals 77,299 0.02 6,585 Anglo American Platinum 148,770 0.05
30,378 AngloGold Ashanti 274,429 0.09 14,185 Exxaro Resources 101,581 0.03 53,218 Gold Fields 170,820 0.06 54,301 Impala Platinum Holdings 242,923 0.08 40,512 Sappi 144,021 0.04
1,159,843 0.37 Consumer Goods
173,334 Steinhoff International Holdings 1,099,461 0.35 17,545 Tiger Brands 409,782 0.14
1,509,243 0.49 Consumer Services
21,825 Foschini Group 285,899 0.09 17,035 Mr Price Group 351,570 0.11 31,119 Naspers 4,858,438 1.56 30,057 Pick n Pay Stores 142,389 0.05 33,825 Shoprite Holdings 483,503 0.16 10,400 Spar Group 162,507 0.05 33,943 Truworths International 239,659 0.08

Schedules of Investments (continued)
HSBC MSCI EMERGING MARKETS UCITS ETF (continued)
HSBC ETFs PLC >197<
As at 30 June 2015 Transferable securities admitted to official stock exchange listing or dealt in on another regulated market
Holdings
Financial assets at fair value through profit or loss Fair Value
USD % of Net
Asset Value
Equities (continued) South Africa (continued) Consumer Services (continued)
74,997 Woolworths Holdings 609,232 0.20
7,133,197 2.30 Financial
114,330 African Bank 0 - 21,077 Barclays Africa Group 317,742 0.10 50,320 Discovery Holdings 524,312 0.17
272,827 FirstRand 1,198,503 0.39 222,816 Growthpoint Properties 485,733 0.16 24,478 MMI Holdings 60,803 0.02 25,207 Nedbank Group 502,157 0.16
8,166 PSG Group 137,886 0.04 433,081 Redefine Properties 364,298 0.12 97,142 RMB Holdings 531,819 0.17
153,268 Sanlam 837,700 0.27 102,149 Standard Bank Group 1,347,960 0.43
6,308,913 2.03 Healthcare
24,118 Aspen Pharmacare Holdings 715,329 0.23 62,014 Life Healthcare Group Holdings 191,748 0.06 26,105 Medi Clinic 220,106 0.07 85,717 Netcare 270,334 0.09
1,397,517 0.45 Industrial
28,258 Bidvest Group 717,407 0.23 17,097 Imperial Holdings 261,292 0.08 39,131 Nampak 108,936 0.04 40,849 Remgro 861,353 0.28
1,948,988 0.63 Oil & Gas
44,025 Sasol 1,632,201 0.53
1,632,201 0.53 Telecommunications
140,590 MTN Group 2,649,582 0.85 17,795 Telkom 94,020 0.03 26,322 Vodacom Group 300,786 0.10
3,044,388 0.98 South Korea Basic Materials
10,930 Hanwha Chemical 183,236 0.06 1,008 Honam Petrochemical 261,161 0.08 6,488 Hyundai Steel 393,776 0.13
850 Korea Zinc 415,303 0.13 1,127 Kumho Petro Chemical 71,533 0.02 4,044 LG Chem 1,009,686 0.32 1,427 OCI 115,137 0.04
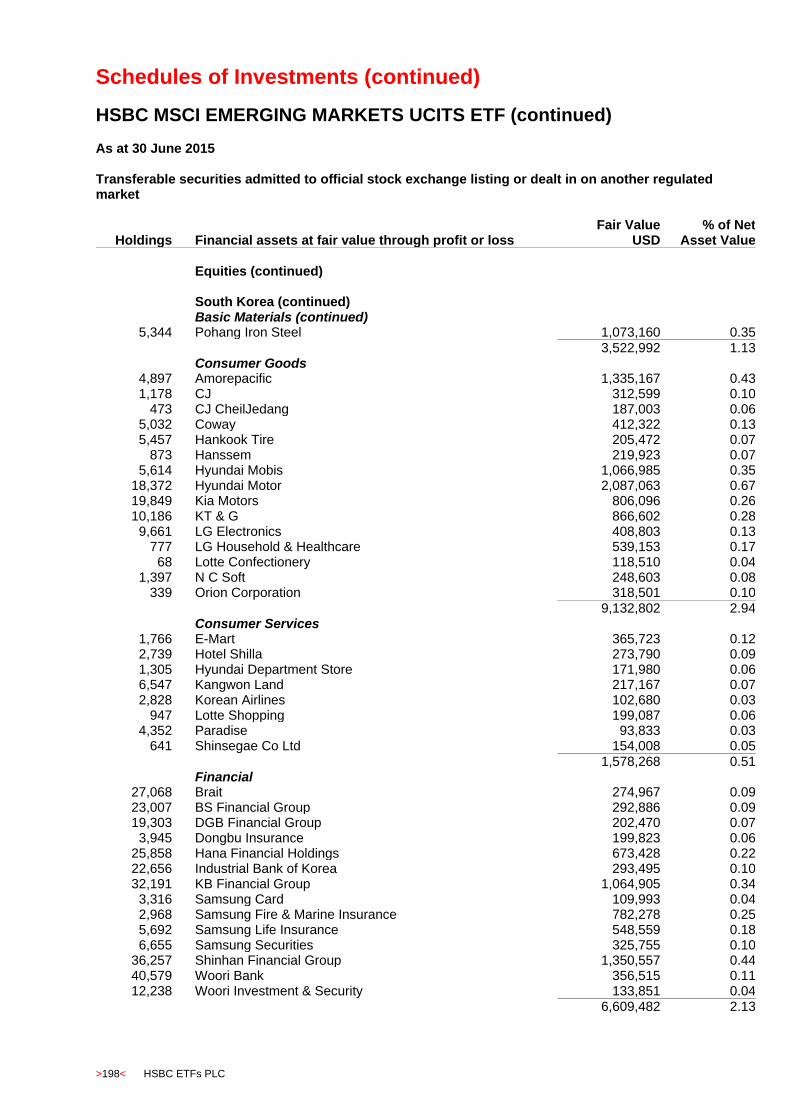
Schedules of Investments (continued)
HSBC MSCI EMERGING MARKETS UCITS ETF (continued)
>198< HSBC ETFs PLC
As at 30 June 2015 Transferable securities admitted to official stock exchange listing or dealt in on another regulated market
Holdings
Financial assets at fair value through profit or loss Fair Value
USD % of Net
Asset Value
Equities (continued) South Korea (continued) Basic Materials (continued)
5,344 Pohang Iron Steel 1,073,160 0.35
3,522,992 1.13 Consumer Goods
4,897 Amorepacific 1,335,167 0.43 1,178 CJ 312,599 0.10
473 CJ CheilJedang 187,003 0.06 5,032 Coway 412,322 0.13 5,457 Hankook Tire 205,472 0.07
873 Hanssem 219,923 0.07 5,614 Hyundai Mobis 1,066,985 0.35
18,372 Hyundai Motor 2,087,063 0.67 19,849 Kia Motors 806,096 0.26 10,186 KT & G 866,602 0.28
9,661 LG Electronics 408,803 0.13 777 LG Household & Healthcare 539,153 0.17
68 Lotte Confectionery 118,510 0.04 1,397 N C Soft 248,603 0.08
339 Orion Corporation 318,501 0.10
9,132,802 2.94 Consumer Services
1,766 E-Mart 365,723 0.12 2,739 Hotel Shilla 273,790 0.09 1,305 Hyundai Department Store 171,980 0.06 6,547 Kangwon Land 217,167 0.07 2,828 Korean Airlines 102,680 0.03
947 Lotte Shopping 199,087 0.06 4,352 Paradise 93,833 0.03
641 Shinsegae Co Ltd 154,008 0.05
1,578,268 0.51 Financial
27,068 Brait 274,967 0.09 23,007 BS Financial Group 292,886 0.09 19,303 DGB Financial Group 202,470 0.07
3,945 Dongbu Insurance 199,823 0.06 25,858 Hana Financial Holdings 673,428 0.22 22,656 Industrial Bank of Korea 293,495 0.10 32,191 KB Financial Group 1,064,905 0.34
3,316 Samsung Card 109,993 0.04 2,968 Samsung Fire & Marine Insurance 782,278 0.25 5,692 Samsung Life Insurance 548,559 0.18 6,655 Samsung Securities 325,755 0.10
36,257 Shinhan Financial Group 1,350,557 0.44 40,579 Woori Bank 356,515 0.11 12,238 Woori Investment & Security 133,851 0.04
6,609,482 2.13

Schedules of Investments (continued)
HSBC MSCI EMERGING MARKETS UCITS ETF (continued)
HSBC ETFs PLC >199<
As at 30 June 2015 Transferable securities admitted to official stock exchange listing or dealt in on another regulated market
Holdings
Financial assets at fair value through profit or loss Fair Value
USD % of Net
Asset Value
Equities (continued) South Korea (continued) Healthcare
5,459 Celltrion 381,731 0.12 882 Yuhan Corporation 215,864 0.07
597,595 0.19 Industrial
340 Cheil Industries 54,104 0.02 550 CJ Korea Express 95,656 0.03
3,239 Daelim Industrial 238,108 0.08 4,312 Daewoo International 99,735 0.03 9,841 Daewoo Shipbuilding & Marine Engineering 117,339 0.04
12,195 Doosan Infracore 107,142 0.03 7,297 GS Engineering and Construction 175,319 0.06 1,569 Hyudai Glovis 284,135 0.09 4,770 Hyundai Development 283,091 0.09 7,161 Hyundai Engineering & Construction 263,534 0.08 3,550 Hyundai Heavy Industries 353,266 0.11
491 KCC 216,129 0.07 8,793 LG 487,164 0.16 1,214 LG Innotek 109,379 0.04
13,321 Samsung C&T 790,578 0.25 5,298 Samsung Electro Mechanics 242,707 0.08
15,005 Samsung Heavy Industries 229,356 0.07 4,650 Samsung SDI 462,728 0.15
4,609,470 1.48 Oil & Gas
5,354 Doosan Heavy Industries & Construction 115,197 0.04 5,802 GS Holdings 258,774 0.08 2,423 SK Corporation 430,099 0.14 3,978 SK Innovation 435,085 0.14 3,496 S-Oil 211,869 0.07
1,451,024 0.47 Technology
2,162 Daum Kakao 244,605 0.08 13,685 LG Display 317,143 0.10
2,108 Naver 1,198,146 0.38 10,388 Samsung Electronics 11,406,077 3.68
2,161 Samsung SDS 502,738 0.16 1,586 SK C&C 393,141 0.13
45,804 Sk hynix 1,736,975 0.56
15,798,825 5.09 Telecommunications
18,880 LG Uplus 166,889 0.05 657 SK Telecom 147,250 0.05
314,139 0.10 Utilities
19,821 Korea Electric Power 813,844 0.26 813,844 0.26
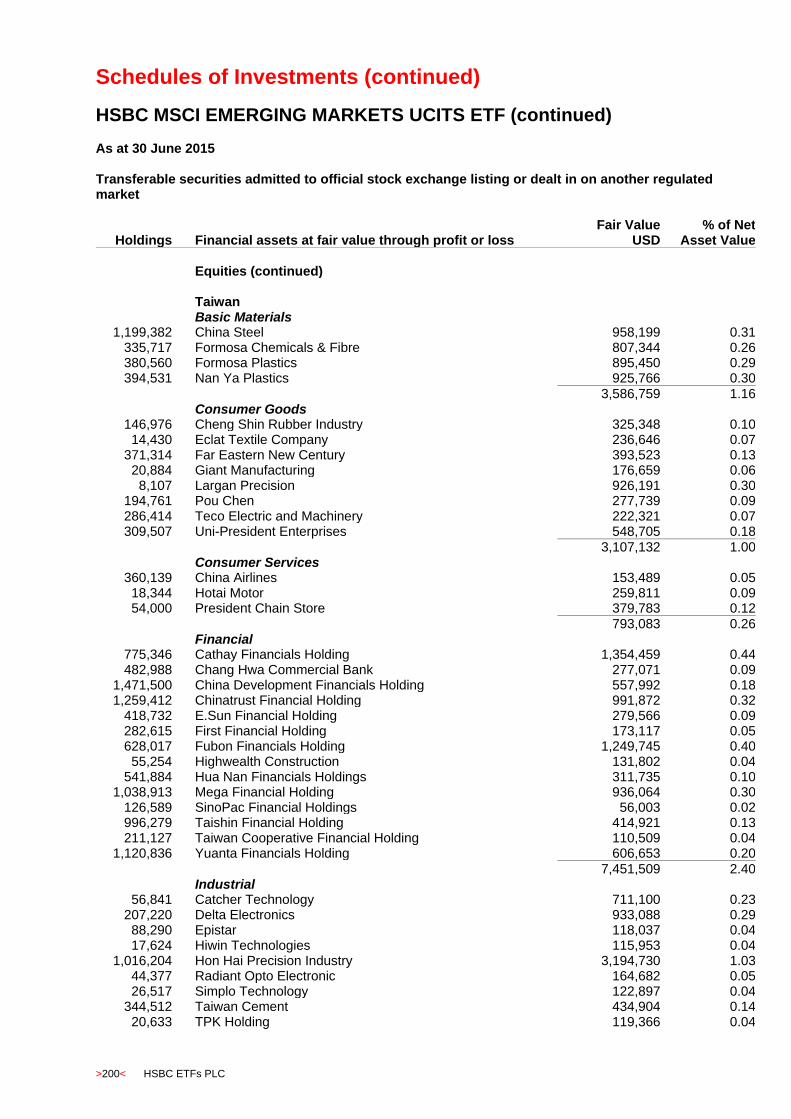
Schedules of Investments (continued)
HSBC MSCI EMERGING MARKETS UCITS ETF (continued)
>200< HSBC ETFs PLC
As at 30 June 2015 Transferable securities admitted to official stock exchange listing or dealt in on another regulated market
Holdings
Financial assets at fair value through profit or loss Fair Value
USD % of Net
Asset Value
Equities (continued) Taiwan Basic Materials
1,199,382 China Steel 958,199 0.31 335,717 Formosa Chemicals & Fibre 807,344 0.26 380,560 Formosa Plastics 895,450 0.29 394,531 Nan Ya Plastics 925,766 0.30
3,586,759 1.16 Consumer Goods
146,976 Cheng Shin Rubber Industry 325,348 0.10 14,430 Eclat Textile Company 236,646 0.07
371,314 Far Eastern New Century 393,523 0.13 20,884 Giant Manufacturing 176,659 0.06
8,107 Largan Precision 926,191 0.30 194,761 Pou Chen 277,739 0.09 286,414 Teco Electric and Machinery 222,321 0.07 309,507 Uni-President Enterprises 548,705 0.18
3,107,132 1.00 Consumer Services
360,139 China Airlines 153,489 0.05 18,344 Hotai Motor 259,811 0.09 54,000 President Chain Store 379,783 0.12
793,083 0.26 Financial
775,346 Cathay Financials Holding 1,354,459 0.44 482,988 Chang Hwa Commercial Bank 277,071 0.09
1,471,500 China Development Financials Holding 557,992 0.18 1,259,412 Chinatrust Financial Holding 991,872 0.32
418,732 E.Sun Financial Holding 279,566 0.09 282,615 First Financial Holding 173,117 0.05 628,017 Fubon Financials Holding 1,249,745 0.40 55,254 Highwealth Construction 131,802 0.04
541,884 Hua Nan Financials Holdings 311,735 0.10 1,038,913 Mega Financial Holding 936,064 0.30
126,589 SinoPac Financial Holdings 56,003 0.02 996,279 Taishin Financial Holding 414,921 0.13 211,127 Taiwan Cooperative Financial Holding 110,509 0.04
1,120,836 Yuanta Financials Holding 606,653 0.20
7,451,509 2.40 Industrial
56,841 Catcher Technology 711,100 0.23 207,220 Delta Electronics 933,088 0.29 88,290 Epistar 118,037 0.04 17,624 Hiwin Technologies 115,953 0.04
1,016,204 Hon Hai Precision Industry 3,194,730 1.03 44,377 Radiant Opto Electronic 164,682 0.05 26,517 Simplo Technology 122,897 0.04
344,512 Taiwan Cement 434,904 0.14 20,633 TPK Holding 119,366 0.04

Schedules of Investments (continued)
HSBC MSCI EMERGING MARKETS UCITS ETF (continued)
HSBC ETFs PLC >201<
As at 30 June 2015 Transferable securities admitted to official stock exchange listing or dealt in on another regulated market
Holdings
Financial assets at fair value through profit or loss Fair Value
USD % of Net
Asset Value
Equities (continued) Taiwan (continued) Industrial (continued)
175,495 U-Ming Marine Transport 238,320 0.08
6,153,077 1.98 Oil & Gas
72,634 Formosa Petrochemical 186,443 0.06
186,443 0.06 Technology
420,334 Acer 203,665 0.07 536,110 Advanced Semiconductor Engineering 726,293 0.23 25,621 Advantech 176,041 0.06 53,040 Asustek Computer 516,570 0.16
695,468 AU Optronics 307,674 0.10 45,631 Chicony Electronics 122,454 0.04
404,563 Compal Electronics 308,131 0.10 3,391 Hermes Microvision 220,905 0.07
62,480 HTC 145,799 0.05 640,186 Innolux Crop 334,052 0.11 188,035 Inotera Memories 149,919 0.05 204,166 Inventec 141,274 0.05 111,768 MediaTek 1,528,662 0.49 79,150 Novatek Microelectronics 382,225 0.12
127,157 Pegatron 372,143 0.12 253,822 Quanta Computer 600,528 0.19 272,044 Siliconware Precision Industries 416,603 0.14 150,352 Synnex Technology International 222,937 0.07
1,916,990 Taiwan Semiconductor Manufacturing 8,729,265 2.81 1,148,300 United Microelectronics 485,677 0.16
68,242 Vanguard International Semiconductors 109,260 0.03
16,200,077 5.22 Telecommunications
347,408 Chunghwa Telecom 1,107,940 0.35 164,184 Far EasTone Telecommunicationcations 396,964 0.13 74,562 Taiwan Mobile 248,907 0.08
1,753,811 0.56 Thailand Basic Materials
128,428 Banpu 96,961 0.03 154,364 Indorama Ventures 126,826 0.04 671,087 IRPC 89,013 0.03
312,800 0.10 Consumer Goods
309,605 Charoen Pokphand Foods 219,997 0.07
219,997 0.07 Consumer Services
149,907 BEC World 166,438 0.05 428,367 CP ALL 586,578 0.19 338,109 Home Product Centre 67,571 0.02

Schedules of Investments (continued)
HSBC MSCI EMERGING MARKETS UCITS ETF (continued)
>202< HSBC ETFs PLC
As at 30 June 2015 Transferable securities admitted to official stock exchange listing or dealt in on another regulated market
Holdings
Financial assets at fair value through profit or loss Fair Value
USD % of Net
Asset Value
Equities (continued) Thailand (continued) Consumer Services (continued)
278,578 Minor International 247,438 0.08
1,068,025 0.34 Financial
135,449 Central Pattana 190,488 0.06
190,488 0.06 Healthcare
49,436 Bumrungrad Hospital Public 273,705 0.09
273,705 0.09 Industrial
43,535 Airports of Thailand 390,552 0.12 36,365 Siam Cement 557,714 0.18
948,266 0.30 Oil & Gas
72,369 PTT 769,211 0.25 103,698 PTT Exploration & Production 334,653 0.11
1,103,864 0.36 Telecommunications
79,525 Advanced Info Service 565,084 0.18 663,112 True Corporation 223,815 0.07
788,899 0.25 Utilities
87,719 Energy Absolute 61,032 0.02
61,032 0.02 Turkey Basic Materials
6,520 Eregli Demir ve Celik Fabrikalari TAS 10,562 - 10,562 - Consumer Goods
20,318 Anadolu Efes Biracilik 183,537 0.06 57,655 Arcelik 313,132 0.10
7,681 Coca-Cola Icecek 127,873 0.04 73,519 Turk Sise Ve Cam Fabrikalari 99,068 0.03
723,610 0.23 Consumer Services
23,121 BIM Birlesik Magazalar 414,262 0.13 69,491 Turk Hava Yollari 228,265 0.07
642,527 0.20 Financial
142,323 Akbank TAS 411,723 0.13 176,174 Emlak Konut Gayrimenkul Yatirim Ortakligi 181,501 0.06 52,758 Haci Omer Sabanci Holding 198,901 0.06 40,896 KOC Holding 189,291 0.06
197,977 Turkiye Garanti Bankasi 617,801 0.20 62,195 Turkiye Halk Bankasi 286,715 0.09
154,853 Turkiye Is Bankasi 326,006 0.11
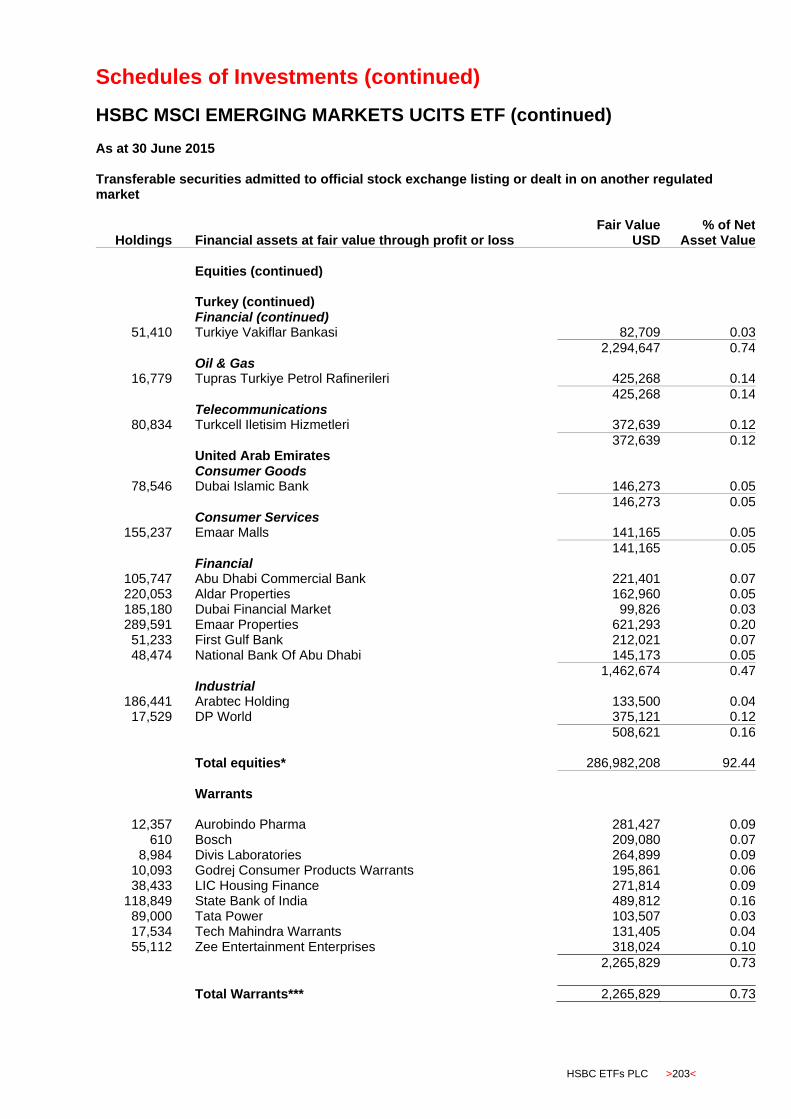
Schedules of Investments (continued)
HSBC MSCI EMERGING MARKETS UCITS ETF (continued)
HSBC ETFs PLC >203<
As at 30 June 2015 Transferable securities admitted to official stock exchange listing or dealt in on another regulated market
Holdings
Financial assets at fair value through profit or loss Fair Value
USD % of Net
Asset Value
Equities (continued) Turkey (continued) Financial (continued)
51,410 Turkiye Vakiflar Bankasi 82,709 0.03
2,294,647 0.74 Oil & Gas
16,779 Tupras Turkiye Petrol Rafinerileri 425,268 0.14
425,268 0.14 Telecommunications
80,834 Turkcell Iletisim Hizmetleri 372,639 0.12
372,639 0.12 United Arab Emirates Consumer Goods
78,546 Dubai Islamic Bank 146,273 0.05
146,273 0.05 Consumer Services
155,237 Emaar Malls 141,165 0.05
141,165 0.05 Financial
105,747 Abu Dhabi Commercial Bank 221,401 0.07 220,053 Aldar Properties 162,960 0.05 185,180 Dubai Financial Market 99,826 0.03 289,591 Emaar Properties 621,293 0.20 51,233 First Gulf Bank 212,021 0.07 48,474 National Bank Of Abu Dhabi 145,173 0.05
1,462,674 0.47 Industrial
186,441 Arabtec Holding 133,500 0.04 17,529 DP World 375,121 0.12
508,621 0.16 Total equities* 286,982,208 92.44 Warrants
12,357 Aurobindo Pharma 281,427 0.09 610 Bosch 209,080 0.07
8,984 Divis Laboratories 264,899 0.09 10,093 Godrej Consumer Products Warrants 195,861 0.06 38,433 LIC Housing Finance 271,814 0.09
118,849 State Bank of India 489,812 0.16 89,000 Tata Power 103,507 0.03 17,534 Tech Mahindra Warrants 131,405 0.04 55,112 Zee Entertainment Enterprises 318,024 0.10
2,265,829 0.73
Total Warrants*** 2,265,829 0.73

Schedules of Investments (continued)
HSBC MSCI EMERGING MARKETS UCITS ETF (continued)
>204< HSBC ETFs PLC
As at 30 June 2015 Transferable securities admitted to official stock exchange listing or dealt in on another regulated market
Holdings
Financial assets at fair value through profit or loss Fair Value
USD % of Net
Asset Value
LEPOs** India Basic Materials
54,763 Ambuja Cements LEPO 12/11/2019 197,475 0.06 44,853 Coal India LEPO 02/11/2020 296,357 0.10 97,282 Hindalco Industries LEPO 12/11/2019 170,749 0.05 37,381 Jindal Steel & Power LEPO 25/11/2019 50,248 0.02
2,568 Ultratech Cement LEPO 21/11/2023 120,574 0.04 15,309 UPL LEPO 18/06/2024 128,609 0.04
964,012 0.31 Consumer Goods
4,125 Bajaj Auto Limited LEPO 12/11/2019 164,467 0.05 891 Eicher Motors Ltd LEPO 22/11/2023 273,732 0.09
7,853 Hero Honda Motors LEPO 29/07/2019 310,832 0.10 57,753 Hindustan Unilever LEPO 11/04/2018 830,402 0.27
184,847 ITC LEPO 18/02/2018 913,717 0.31 17,956 Motherson Sumi Systems LEPO 22/11/2023 146,086 0.04
1,864 Nestle India LEPO 19/11/2018 185,719 0.06 4,310 United Spirits LEPO 22/10/2018 228,568 0.07
3,053,523 0.99 Financial
119,219 Housing Development Finance Corp Ltd LEPO 20/02/2018 2,424,306 0.78 12,631 Shriram Transport Finance LEPO 21/11/2023 169,084 0.06
2,593,390 0.84 Healthcare
6,868 Apollo Hospitals Enterprise LEPO 31/07/2023 141,761 0.05 14,471 Cipla LEPO 26/03/2020 139,683 0.04 15,806 Lupin LEPO 21/11/2023 467,586 0.15
8,577 Piramal Healthcare LEPO 12/05/2020 124,851 0.04 65,948 Sun Pharmaceuticals LEPO 24/10/2018 904,688 0.29
1,778,569 0.57 Industrial
17,846 Adani Enterprises LEPO 12/05/20 25,431 0.01 36,649 Asian Paints (India) LEPO 17/05/2021 434,206 0.14
7,053 Bharat Forge LEPO 18/06/2024 117,624 0.04 52,292 Bharat Heavy Electricals LEPO 07/01/2019 203,327 0.06 26,615 Larsen & Toubro LEPO 12/11/2018 744,243 0.24 33,460 Mahindra & Mahindra LEPO 16/05/2016 147,107 0.05 45,004 Mundra Port LEPO 19/08/2019 217,342 0.07
7,727 Siemens LEPO 21/11/2023 163,479 0.05
2,052,759 0.66
India Oil & Gas
11,311 Bharat Petroleum LEPO 12/11/2019 156,009 0.05 30,500 Gail India LEPO 12/11/2019 187,627 0.06 79,226 Oil & Natural Gas LEPO 12/11/2019 384,729 0.12 98,438 Sesa Sterlite LEPO 21/11/2023 268,893 0.09
997,258 0.32
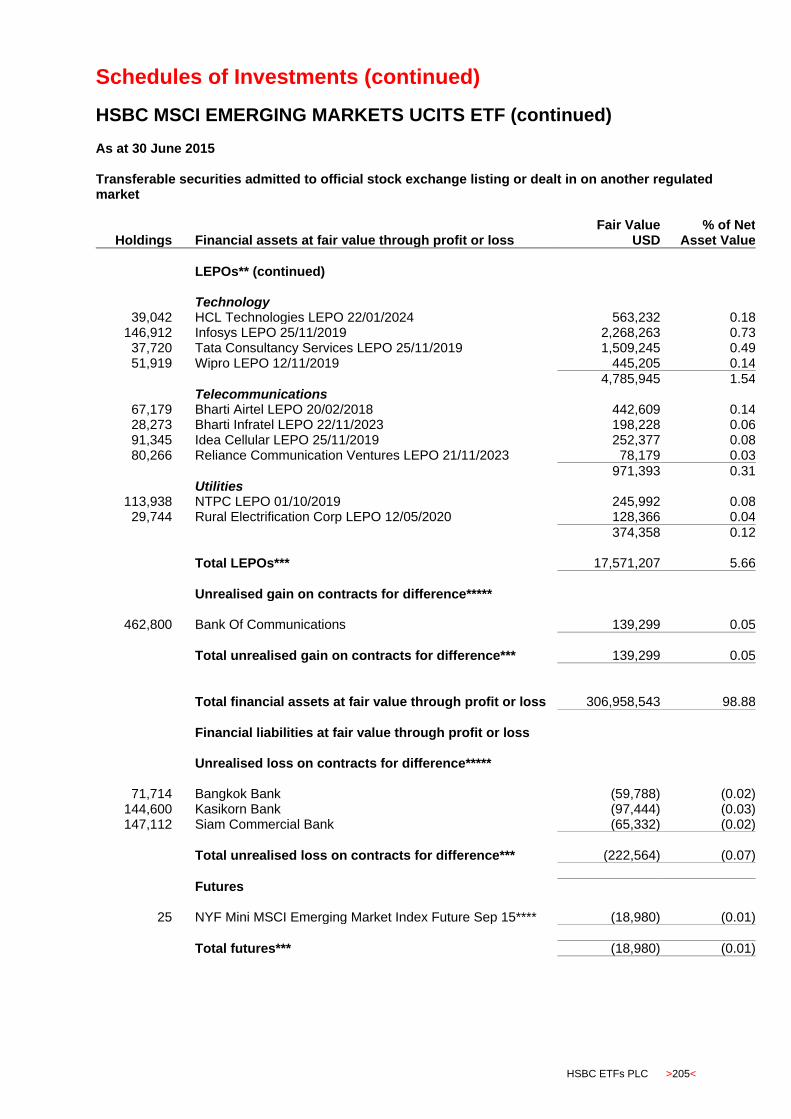
Schedules of Investments (continued)
HSBC MSCI EMERGING MARKETS UCITS ETF (continued)
HSBC ETFs PLC >205<
As at 30 June 2015 Transferable securities admitted to official stock exchange listing or dealt in on another regulated market
Holdings
Financial assets at fair value through profit or loss Fair Value
USD % of Net
Asset Value
LEPOs** (continued) Technology
39,042 HCL Technologies LEPO 22/01/2024 563,232 0.18 146,912 Infosys LEPO 25/11/2019 2,268,263 0.73 37,720 Tata Consultancy Services LEPO 25/11/2019 1,509,245 0.49 51,919 Wipro LEPO 12/11/2019 445,205 0.14
4,785,945 1.54 Telecommunications
67,179 Bharti Airtel LEPO 20/02/2018 442,609 0.14 28,273 Bharti Infratel LEPO 22/11/2023 198,228 0.06 91,345 Idea Cellular LEPO 25/11/2019 252,377 0.08 80,266 Reliance Communication Ventures LEPO 21/11/2023 78,179 0.03
971,393 0.31 Utilities
113,938 NTPC LEPO 01/10/2019 245,992 0.08 29,744 Rural Electrification Corp LEPO 12/05/2020 128,366 0.04
374,358 0.12 Total LEPOs*** 17,571,207 5.66 Unrealised gain on contracts for difference*****
462,800 Bank Of Communications 139,299 0.05
Total unrealised gain on contracts for difference*** 139,299 0.05
Total financial assets at fair value through profit or loss 306,958,543 98.88
Financial liabilities at fair value through profit or loss Unrealised loss on contracts for difference*****
71,714 Bangkok Bank (59,788) (0.02) 144,600 Kasikorn Bank (97,444) (0.03) 147,112 Siam Commercial Bank (65,332) (0.02)
Total unrealised loss on contracts for difference*** (222,564) (0.07)
Futures
25 NYF Mini MSCI Emerging Market Index Future Sep 15**** (18,980) (0.01)
Total futures*** (18,980) (0.01)
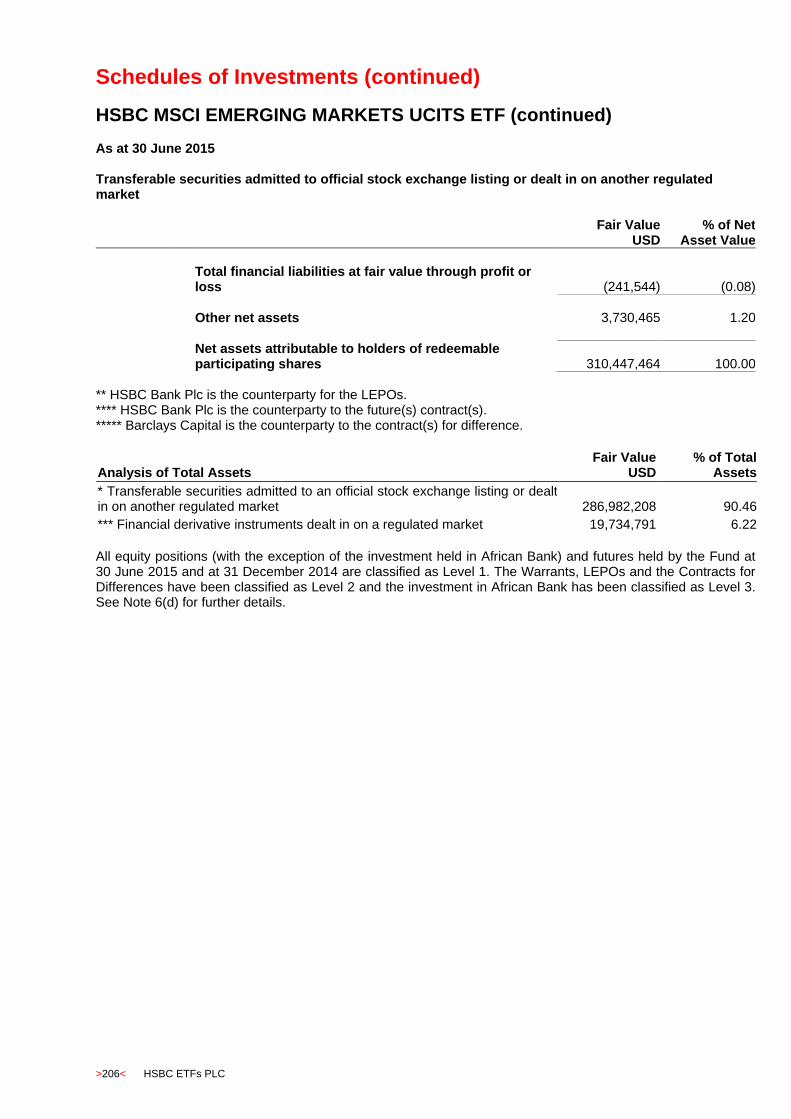
Schedules of Investments (continued)
HSBC MSCI EMERGING MARKETS UCITS ETF (continued)
>206< HSBC ETFs PLC
As at 30 June 2015 Transferable securities admitted to official stock exchange listing or dealt in on another regulated market
Fair Value
USD % of Net
Asset Value
Total financial liabilities at fair value through profit or loss (241,544) (0.08)
Other net assets 3,730,465 1.20
Net assets attributable to holders of redeemable participating shares 310,447,464 100.00
** HSBC Bank Plc is the counterparty for the LEPOs. **** HSBC Bank Plc is the counterparty to the future(s) contract(s). ***** Barclays Capital is the counterparty to the contract(s) for difference.
Analysis of Total Assets Fair Value
USD % of Total
Assets
* Transferable securities admitted to an official stock exchange listing or dealt in on another regulated market 286,982,208 90.46
*** Financial derivative instruments dealt in on a regulated market 19,734,791 6.22
All equity positions (with the exception of the investment held in African Bank) and futures held by the Fund at 30 June 2015 and at 31 December 2014 are classified as Level 1. The Warrants, LEPOs and the Contracts for Differences have been classified as Level 2 and the investment in African Bank has been classified as Level 3. See Note 6(d) for further details.
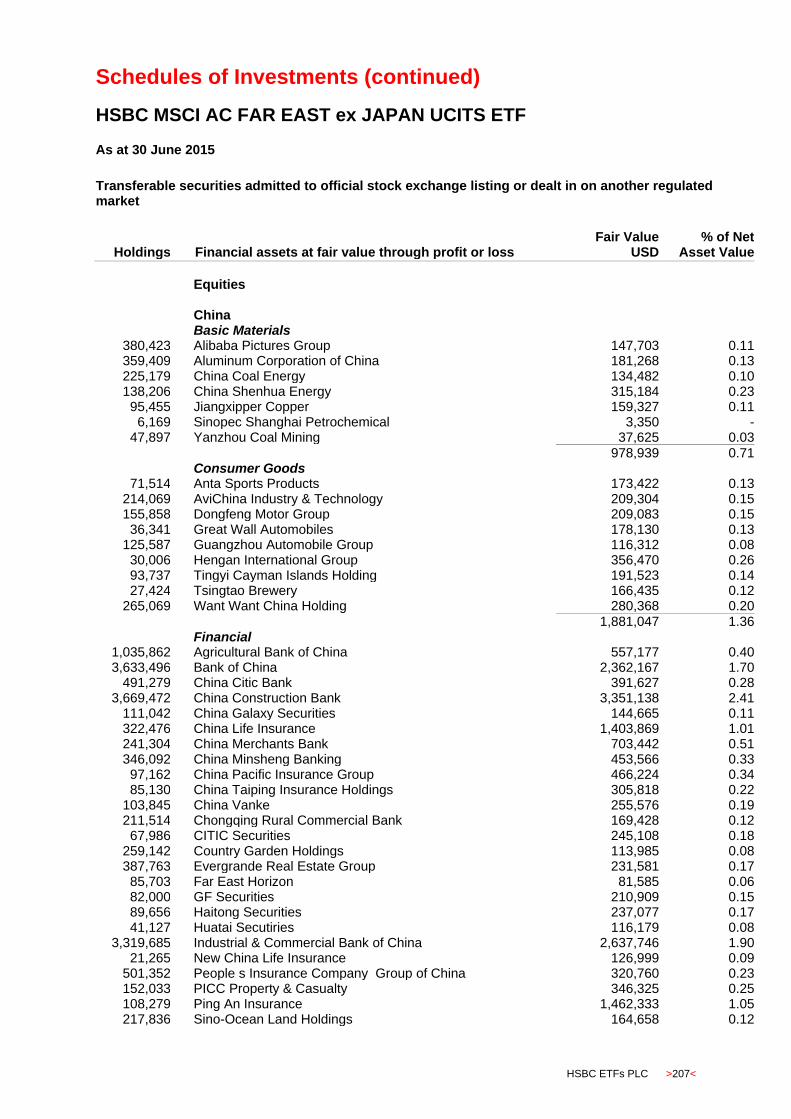
Schedules of Investments (continued)
HSBC MSCI AC FAR EAST ex JAPAN UCITS ETF
HSBC ETFs PLC >207<
As at 30 June 2015
Transferable securities admitted to official stock exchange listing or dealt in on another regulated market
Holdings
Financial assets at fair value through profit or loss Fair Value
USD % of Net
Asset Value
Equities China Basic Materials
380,423 Alibaba Pictures Group 147,703 0.11 359,409 Aluminum Corporation of China 181,268 0.13 225,179 China Coal Energy 134,482 0.10 138,206 China Shenhua Energy 315,184 0.23 95,455 Jiangxipper Copper 159,327 0.11
6,169 Sinopec Shanghai Petrochemical 3,350 - 47,897 Yanzhou Coal Mining 37,625 0.03
978,939 0.71 Consumer Goods
71,514 Anta Sports Products 173,422 0.13 214,069 AviChina Industry & Technology 209,304 0.15 155,858 Dongfeng Motor Group 209,083 0.15 36,341 Great Wall Automobiles 178,130 0.13
125,587 Guangzhou Automobile Group 116,312 0.08 30,006 Hengan International Group 356,470 0.26 93,737 Tingyi Cayman Islands Holding 191,523 0.14 27,424 Tsingtao Brewery 166,435 0.12
265,069 Want Want China Holding 280,368 0.20
1,881,047 1.36 Financial
1,035,862 Agricultural Bank of China 557,177 0.40 3,633,496 Bank of China 2,362,167 1.70
491,279 China Citic Bank 391,627 0.28 3,669,472 China Construction Bank 3,351,138 2.41
111,042 China Galaxy Securities 144,665 0.11 322,476 China Life Insurance 1,403,869 1.01 241,304 China Merchants Bank 703,442 0.51 346,092 China Minsheng Banking 453,566 0.33 97,162 China Pacific Insurance Group 466,224 0.34 85,130 China Taiping Insurance Holdings 305,818 0.22
103,845 China Vanke 255,576 0.19 211,514 Chongqing Rural Commercial Bank 169,428 0.12 67,986 CITIC Securities 245,108 0.18
259,142 Country Garden Holdings 113,985 0.08 387,763 Evergrande Real Estate Group 231,581 0.17 85,703 Far East Horizon 81,585 0.06 82,000 GF Securities 210,909 0.15 89,656 Haitong Securities 237,077 0.17 41,127 Huatai Secutiries 116,179 0.08
3,319,685 Industrial & Commercial Bank of China 2,637,746 1.90 21,265 New China Life Insurance 126,999 0.09
501,352 People s Insurance Company Group of China 320,760 0.23 152,033 PICC Property & Casualty 346,325 0.25 108,279 Ping An Insurance 1,462,333 1.05 217,836 Sino-Ocean Land Holdings 164,658 0.12

Schedules of Investments (continued)
HSBC MSCI AC FAR EAST ex JAPAN UCITS ETF (continued)
>208< HSBC ETFs PLC
As at 30 June 2015
Transferable securities admitted to official stock exchange listing or dealt in on another regulated market
Holdings
Financial assets at fair value through profit or loss Fair Value
USD % of Net
Asset Value
Equities (continued) China (continued) Financial (continued)
153,556 Soho China 100,026 0.07 530,320 Yuexiu Property 115,606 0.08
17,075,574 12.30 Healthcare
104,326 Shandong Weigao Group Medical Polymer 77,916 0.06 514 Shanghai Fosun Pharmace 1,906 -
221,076 Sihuan Pharmaceutical Holdings Group 125,758 0.09 46,635 Sinopharm Group 207,232 0.15
412,812 0.30 Industrial
38,508 AAC Technologies Holdings 217,561 0.16 59,592 Anhui Conch Cement 209,080 0.15 43,443 Byd 260,852 0.19
503,915 China Cinda Asset Management 280,799 0.20 282,624 China Communications Construction 422,885 0.31 266,974 China COSCO Holdings 172,529 0.12 167,349 China National Building Material 158,228 0.11 12,338 China Railway Construction 19,066 0.01
185,480 China Railway Group 200,253 0.14 452,485 China Shipping Container Lines 176,849 0.13 169,169 CSR Corporation Limited 259,671 0.19 21,592 Fosun International 50,801 0.04
155,893 Jiangsu Expressway 204,706 0.15 6,169 Shanghai Electric Group 5,037 -
158,657 Zhejiang Expressway 220,205 0.16 28,699 Zhuzhou CSR Times Electric 215,079 0.15
3,073,601 2.21 Oil & Gas
448,776 CGN Power 235,023 0.17 101,974 China Gas Holdings 163,368 0.12 161,802 China Longyuan Power Group 179,906 0.13 85,841 China Oilfield Services 136,858 0.10
1,237,670 China Petroleum & Chemical 1,068,037 0.77 841,646 CNOOC 1,194,201 0.86
1,046,578 PetroChina 1,167,732 0.84
4,145,125 2.99 Technology
167,297 Alibaba Health Information Technology 173,931 0.13 563,281 Hanergy Thin Film Power Group 284,091 0.20 23,512 Kingsoft 79,308 0.06
298,686 Lenovo Group 413,785 0.29 234,854 Tencent Holdings 4,686,447 3.38 62,169 ZTE 158,138 0.11
5,795,700 4.17

Schedules of Investments (continued)
HSBC MSCI AC FAR EAST ex JAPAN UCITS ETF (continued)
HSBC ETFs PLC >209<
As at 30 June 2015
Transferable securities admitted to official stock exchange listing or dealt in on another regulated market
Holdings
Financial assets at fair value through profit or loss Fair Value
USD % of Net
Asset Value
Equities (continued) China (continued) Telecommunications
710,652 China Telecom 417,084 0.30
417,084 0.30 Utilities
306,588 Datang International Power Generation 157,001 0.11 40,905 ENN Energy Holdings 246,668 0.18
252,357 Huaneng Power International 351,556 0.25
755,225 0.54 Hong Kong Basic Materials
100,825 Nine Dragons Paper Holdings 88,177 0.06
88,177 0.06 Consumer Goods
230,330 Belle International Holdings 265,312 0.19 148,124 Brilliance China Automotive Holdings 231,189 0.17 805,093 China Huishan Dairy 183,812 0.13 87,967 China Mengniu Dairy 438,556 0.32
228,159 Geely Automobile Holdings 121,841 0.09 71,713 Haier Electronics Group 193,330 0.14
286,497 Li & Fung 227,274 0.16 43,108 Techtronic Industries 141,237 0.10
1,802,551 1.30 Consumer Services
122,526 Galaxy Entertainment Group 488,362 0.35 620,671 GOME Electrical Appliances Holding 136,903 0.10 93,266 MTR 434,296 0.32
8,745 Shangri-La Asia 12,205 0.01 94,793 SJM Holdings 102,710 0.07 91,461 Sun Art Retail Group 82,347 0.06
208,388 WH Group 141,926 0.10
1,398,749 1.01 Financial
568,879 AIA Group 3,724,014 2.68 43,957 Bank of East Asia 192,213 0.14
148,760 BOC Hong Kong Holdings 619,789 0.45 120,575 Cheung Kong Property Holdings 1,000,055 0.72 78,722 China Everbright 273,152 0.20
119,126 China Everbright International 213,588 0.15 216,123 China Overseas Land & Investment 762,454 0.55 110,683 China Resources Land 359,066 0.26 120,575 CK Hutchison Holdings 1,771,481 1.28 92,535 Goldin Properties 97,756 0.07
112,504 Hang Lung Properties 334,499 0.24 34,955 Hang Seng Bank 683,089 0.49 45,823 Henderson Land Development 313,563 0.22 53,351 Hong Kong Exchanges and Clearing 1,882,843 1.36 47,897 Hysan Development 207,588 0.15

Schedules of Investments (continued)
HSBC MSCI AC FAR EAST ex JAPAN UCITS ETF (continued)
>210< HSBC ETFs PLC
As at 30 June 2015
Transferable securities admitted to official stock exchange listing or dealt in on another regulated market
Holdings
Financial assets at fair value through profit or loss Fair Value
USD % of Net
Asset Value
Equities (continued) Hong Kong (continued) Financial (continued)
39,269 Kerry Properties 153,985 0.11 87,710 Link REIT 513,642 0.37
308,400 New World Development 403,374 0.29 71,684 Shimao Property Holdings 141,471 0.10
206,004 Sino Land 344,379 0.25 75,435 Sun Hung Kai Properties 1,222,132 0.88 51,384 Swire Properties 164,043 0.12 42,877 Wheelock & Co 219,016 0.16
15,597,192 11.24 Healthcare
2,056 China Medical System Holdings 2,880 - 150,635 CSPC Pharmaceutical 148,837 0.11 183,014 Luye Pharma Group Ltd 195,938 0.14 181,736 Sino Biopharmaceutical 210,979 0.15
558,634 0.40 Industrial
33,788 Beijing Enterprises Holdings 254,307 0.18 24,286 Beijing Enterprises Water Group 19,924 0.01 27,146 Cheung Kong Infrastructure Holdings 210,794 0.15 68,148 China Merchants Holdings International 292,281 0.21 67,826 China Resources Enterprise 218,721 0.16
111,950 China State Construction International Holdings 201,588 0.15 50,723 Citic Pacific 90,944 0.07
315,773 Noble Group 178,231 0.13 33,642 Swire Pacific 422,882 0.30 73,510 Wharf Holdings 489,273 0.35
115,782 Yangzijiang Shipbuilding Holdings 121,672 0.09
2,500,617 1.80 Oil & Gas
154,383 Kunlun Energy 157,120 0.11
157,120 0.11 Technology
14,776 ASM Pacific Technology 146,377 0.11
146,377 0.11 Telecommunications
284,329 China Mobile 3,640,048 2.62 189,167 China Unicom Hong Kong 297,688 0.21 147,300 HKT Trust 173,282 0.13 311,948 PCCW 186,302 0.14
4,297,320 3.10 Utilities
23,175 China Resources Gas Group 68,755 0.05 95,634 China Resources Power Holdings 267,070 0.19 92,210 CLP Holdings 783,825 0.57
856,323 GCL-Poly Energy Holdings 197,718 0.14 22,751 Guangdong Investment 31,870 0.03
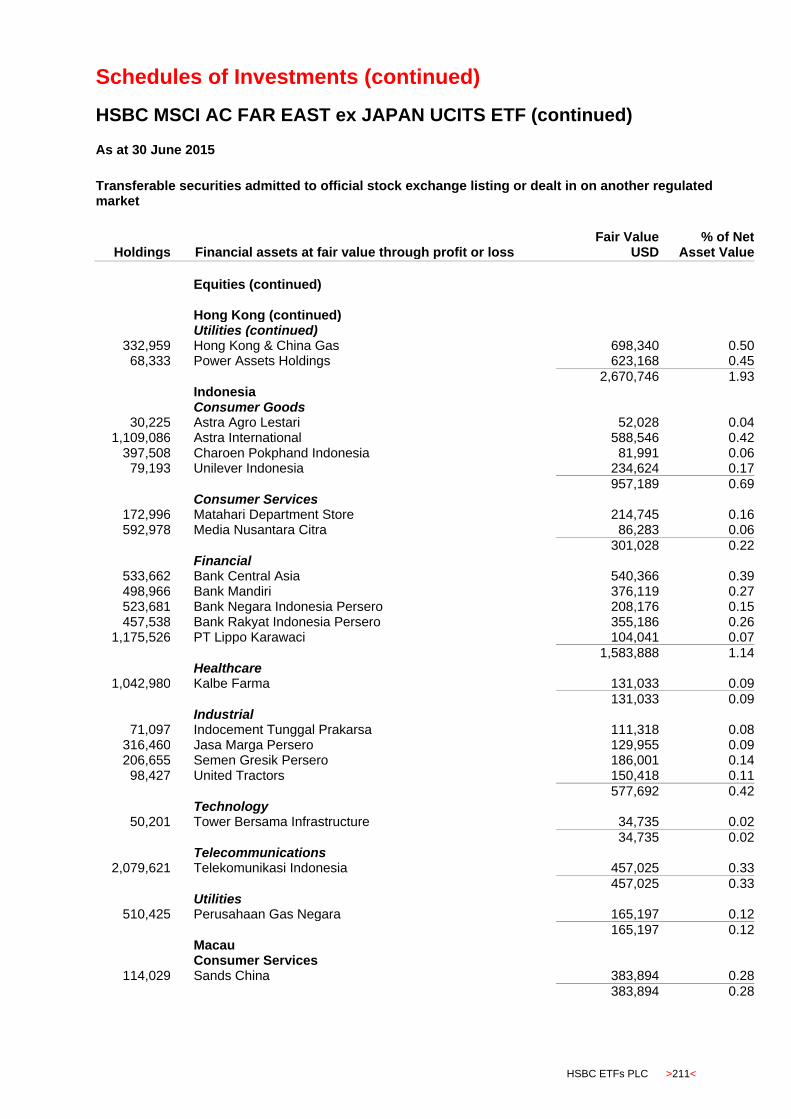
Schedules of Investments (continued)
HSBC MSCI AC FAR EAST ex JAPAN UCITS ETF (continued)
HSBC ETFs PLC >211<
As at 30 June 2015
Transferable securities admitted to official stock exchange listing or dealt in on another regulated market
Holdings
Financial assets at fair value through profit or loss Fair Value
USD % of Net
Asset Value
Equities (continued) Hong Kong (continued) Utilities (continued)
332,959 Hong Kong & China Gas 698,340 0.50 68,333 Power Assets Holdings 623,168 0.45
2,670,746 1.93 Indonesia Consumer Goods
30,225 Astra Agro Lestari 52,028 0.04 1,109,086 Astra International 588,546 0.42
397,508 Charoen Pokphand Indonesia 81,991 0.06 79,193 Unilever Indonesia 234,624 0.17
957,189 0.69 Consumer Services
172,996 Matahari Department Store 214,745 0.16 592,978 Media Nusantara Citra 86,283 0.06
301,028 0.22 Financial
533,662 Bank Central Asia 540,366 0.39 498,966 Bank Mandiri 376,119 0.27 523,681 Bank Negara Indonesia Persero 208,176 0.15 457,538 Bank Rakyat Indonesia Persero 355,186 0.26
1,175,526 PT Lippo Karawaci 104,041 0.07
1,583,888 1.14 Healthcare
1,042,980 Kalbe Farma 131,033 0.09
131,033 0.09 Industrial
71,097 Indocement Tunggal Prakarsa 111,318 0.08 316,460 Jasa Marga Persero 129,955 0.09 206,655 Semen Gresik Persero 186,001 0.14 98,427 United Tractors 150,418 0.11
577,692 0.42 Technology
50,201 Tower Bersama Infrastructure 34,735 0.02
34,735 0.02 Telecommunications
2,079,621 Telekomunikasi Indonesia 457,025 0.33
457,025 0.33 Utilities
510,425 Perusahaan Gas Negara 165,197 0.12
165,197 0.12 Macau Consumer Services
114,029 Sands China 383,894 0.28
383,894 0.28
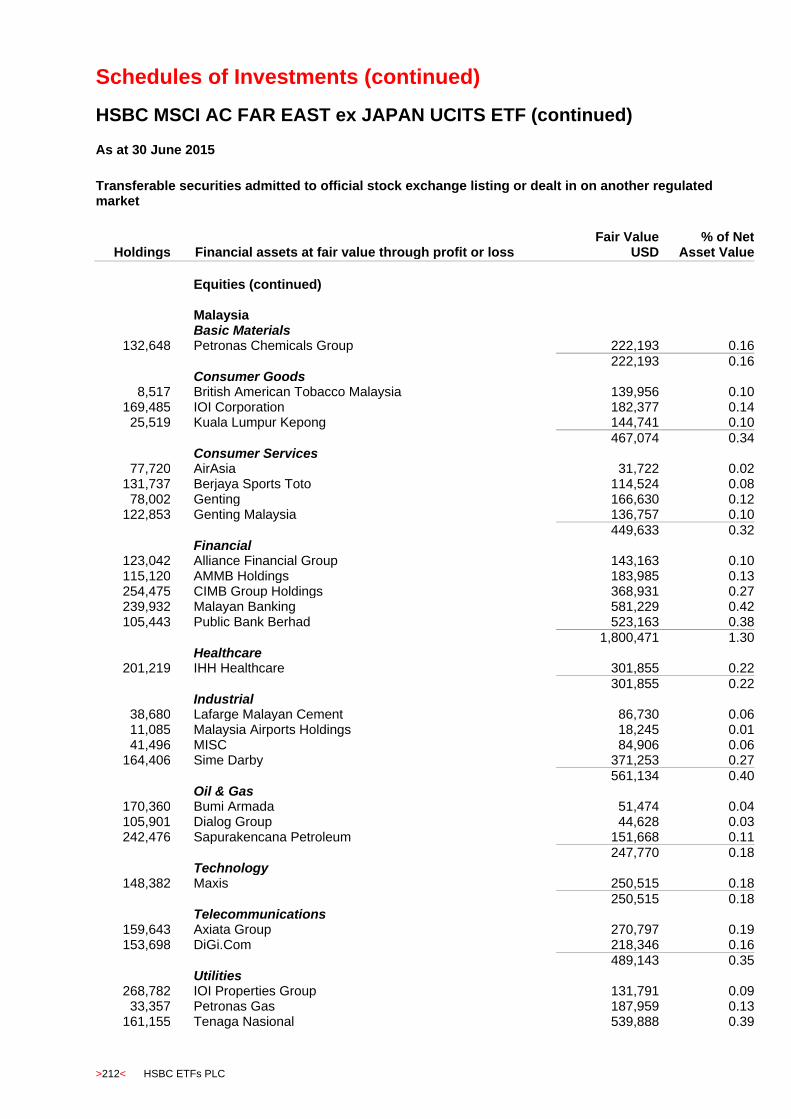
Schedules of Investments (continued)
HSBC MSCI AC FAR EAST ex JAPAN UCITS ETF (continued)
>212< HSBC ETFs PLC
As at 30 June 2015
Transferable securities admitted to official stock exchange listing or dealt in on another regulated market
Holdings
Financial assets at fair value through profit or loss Fair Value
USD % of Net
Asset Value
Equities (continued) Malaysia Basic Materials
132,648 Petronas Chemicals Group 222,193 0.16
222,193 0.16 Consumer Goods
8,517 British American Tobacco Malaysia 139,956 0.10 169,485 IOI Corporation 182,377 0.14 25,519 Kuala Lumpur Kepong 144,741 0.10
467,074 0.34 Consumer Services
77,720 AirAsia 31,722 0.02 131,737 Berjaya Sports Toto 114,524 0.08 78,002 Genting 166,630 0.12
122,853 Genting Malaysia 136,757 0.10
449,633 0.32 Financial
123,042 Alliance Financial Group 143,163 0.10 115,120 AMMB Holdings 183,985 0.13 254,475 CIMB Group Holdings 368,931 0.27 239,932 Malayan Banking 581,229 0.42 105,443 Public Bank Berhad 523,163 0.38
1,800,471 1.30 Healthcare
201,219 IHH Healthcare 301,855 0.22
301,855 0.22 Industrial
38,680 Lafarge Malayan Cement 86,730 0.06 11,085 Malaysia Airports Holdings 18,245 0.01 41,496 MISC 84,906 0.06
164,406 Sime Darby 371,253 0.27
561,134 0.40 Oil & Gas
170,360 Bumi Armada 51,474 0.04 105,901 Dialog Group 44,628 0.03 242,476 Sapurakencana Petroleum 151,668 0.11
247,770 0.18 Technology
148,382 Maxis 250,515 0.18
250,515 0.18 Telecommunications
159,643 Axiata Group 270,797 0.19 153,698 DiGi.Com 218,346 0.16
489,143 0.35 Utilities
268,782 IOI Properties Group 131,791 0.09 33,357 Petronas Gas 187,959 0.13
161,155 Tenaga Nasional 539,888 0.39
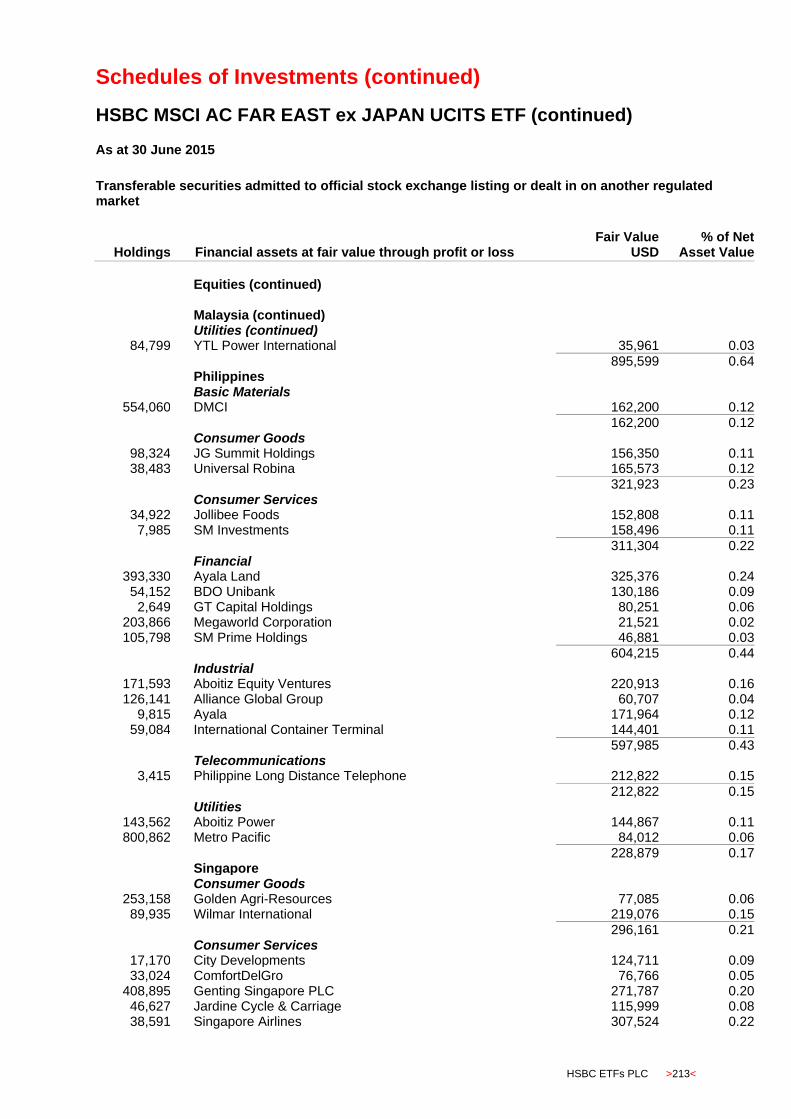
Schedules of Investments (continued)
HSBC MSCI AC FAR EAST ex JAPAN UCITS ETF (continued)
HSBC ETFs PLC >213<
As at 30 June 2015
Transferable securities admitted to official stock exchange listing or dealt in on another regulated market
Holdings
Financial assets at fair value through profit or loss Fair Value
USD % of Net
Asset Value
Equities (continued) Malaysia (continued) Utilities (continued)
84,799 YTL Power International 35,961 0.03
895,599 0.64 Philippines Basic Materials
554,060 DMCI 162,200 0.12 162,200 0.12 Consumer Goods
98,324 JG Summit Holdings 156,350 0.11 38,483 Universal Robina 165,573 0.12
321,923 0.23 Consumer Services
34,922 Jollibee Foods 152,808 0.11 7,985 SM Investments 158,496 0.11
311,304 0.22 Financial
393,330 Ayala Land 325,376 0.24 54,152 BDO Unibank 130,186 0.09
2,649 GT Capital Holdings 80,251 0.06 203,866 Megaworld Corporation 21,521 0.02 105,798 SM Prime Holdings 46,881 0.03
604,215 0.44 Industrial
171,593 Aboitiz Equity Ventures 220,913 0.16 126,141 Alliance Global Group 60,707 0.04
9,815 Ayala 171,964 0.12 59,084 International Container Terminal 144,401 0.11
597,985 0.43 Telecommunications
3,415 Philippine Long Distance Telephone 212,822 0.15
212,822 0.15 Utilities
143,562 Aboitiz Power 144,867 0.11 800,862 Metro Pacific 84,012 0.06
228,879 0.17 Singapore Consumer Goods
253,158 Golden Agri-Resources 77,085 0.06 89,935 Wilmar International 219,076 0.15
296,161 0.21 Consumer Services
17,170 City Developments 124,711 0.09 33,024 ComfortDelGro 76,766 0.05
408,895 Genting Singapore PLC 271,787 0.20 46,627 Jardine Cycle & Carriage 115,999 0.08 38,591 Singapore Airlines 307,524 0.22

Schedules of Investments (continued)
HSBC MSCI AC FAR EAST ex JAPAN UCITS ETF (continued)
>214< HSBC ETFs PLC
As at 30 June 2015
Transferable securities admitted to official stock exchange listing or dealt in on another regulated market
Holdings
Financial assets at fair value through profit or loss Fair Value
USD % of Net
Asset Value
Equities (continued) Singapore (continued) Consumer Services (continued)
35,878 Singapore Press Holdings 108,713 0.08
1,005,500 0.72 Financial
78,562 Ascendas Real Estate Investment Trust 143,530 0.10 191,212 CapitaCommercial 221,530 0.16 110,599 CapitaLand 287,484 0.21 100,375 CapitaMall Trust 160,272 0.11 80,659 DBS Group Holdings 1,239,387 0.89
138,215 Global Logistic Properties 259,698 0.19 78,989 Hutchison Port Holdings Trust 49,763 0.04
128,027 Oversea-Chinese Banking 967,928 0.70 57,532 Singapore Exchange 334,553 0.24 20,754 Suntec Real Estate Investment Trust 26,588 0.02 61,605 United Overseas Bank 1,055,497 0.76
4,746,230 3.42 Industrial
72,709 Keppel 443,868 0.32 70,311 SembCorp Industries 203,126 0.15 56,466 SembCorp Marine 119,097 0.09 65,061 Singapore Technologies Engineering 159,451 0.11
925,542 0.67 Telecommunications
382,893 Singapore Telecommunications 1,197,163 0.86 1,197,163 0.86 South Korea Basic Materials
6,502 Hanwha Chemical 109,003 0.08 959 Honam Petrochemical 248,466 0.18
3,438 Hyundai Steel 208,663 0.15 426 Korea Zinc 208,140 0.15 722 Kumho Petro Chemical 45,827 0.03
2,294 LG Chem 572,754 0.41 980 OCI Company 79,071 0.06
3,261 Pohang Iron Steel 654,860 0.47
2,126,784 1.53 Consumer Goods
2,529 Amorepacific 751,801 0.54 846 CJ 224,498 0.16
9 CJ CheilJedang 3,558 - 4,025 Coway 329,809 0.24 1,703 Halla Visteon Climate 58,856 0.04 3,755 Hankook Tire 141,387 0.10
15 Hanssem 3,779 - 3,309 Hyundai Mobis 628,901 0.45
10,162 Hyundai Motor 1,155,592 0.84 877 Hyundai Wia 80,982 0.06
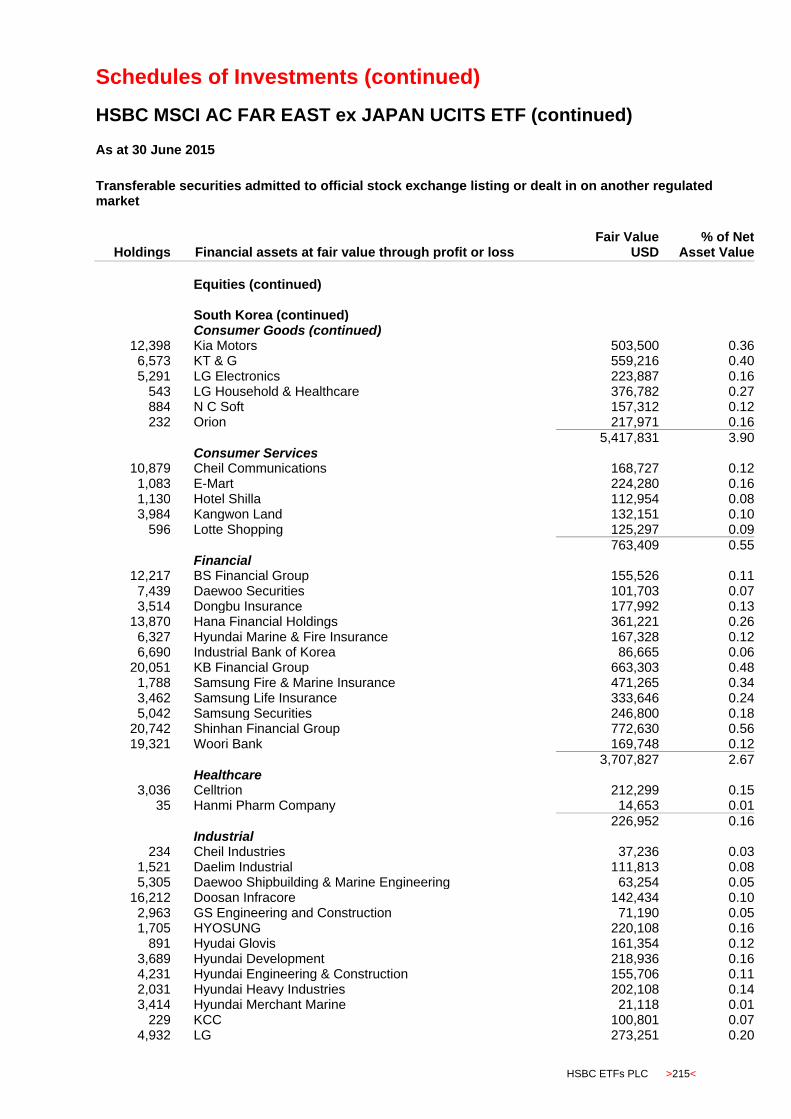
Schedules of Investments (continued)
HSBC MSCI AC FAR EAST ex JAPAN UCITS ETF (continued)
HSBC ETFs PLC >215<
As at 30 June 2015
Transferable securities admitted to official stock exchange listing or dealt in on another regulated market
Holdings
Financial assets at fair value through profit or loss Fair Value
USD % of Net
Asset Value
Equities (continued) South Korea (continued) Consumer Goods (continued)
12,398 Kia Motors 503,500 0.36 6,573 KT & G 559,216 0.40 5,291 LG Electronics 223,887 0.16
543 LG Household & Healthcare 376,782 0.27 884 N C Soft 157,312 0.12 232 Orion 217,971 0.16
5,417,831 3.90 Consumer Services
10,879 Cheil Communications 168,727 0.12 1,083 E-Mart 224,280 0.16 1,130 Hotel Shilla 112,954 0.08 3,984 Kangwon Land 132,151 0.10
596 Lotte Shopping 125,297 0.09
763,409 0.55 Financial
12,217 BS Financial Group 155,526 0.11 7,439 Daewoo Securities 101,703 0.07 3,514 Dongbu Insurance 177,992 0.13
13,870 Hana Financial Holdings 361,221 0.26 6,327 Hyundai Marine & Fire Insurance 167,328 0.12 6,690 Industrial Bank of Korea 86,665 0.06
20,051 KB Financial Group 663,303 0.48 1,788 Samsung Fire & Marine Insurance 471,265 0.34 3,462 Samsung Life Insurance 333,646 0.24 5,042 Samsung Securities 246,800 0.18
20,742 Shinhan Financial Group 772,630 0.56 19,321 Woori Bank 169,748 0.12
3,707,827 2.67 Healthcare
3,036 Celltrion 212,299 0.15 35 Hanmi Pharm Company 14,653 0.01
226,952 0.16 Industrial
234 Cheil Industries 37,236 0.03 1,521 Daelim Industrial 111,813 0.08 5,305 Daewoo Shipbuilding & Marine Engineering 63,254 0.05
16,212 Doosan Infracore 142,434 0.10 2,963 GS Engineering and Construction 71,190 0.05 1,705 HYOSUNG 220,108 0.16
891 Hyudai Glovis 161,354 0.12 3,689 Hyundai Development 218,936 0.16 4,231 Hyundai Engineering & Construction 155,706 0.11 2,031 Hyundai Heavy Industries 202,108 0.14 3,414 Hyundai Merchant Marine 21,118 0.01
229 KCC 100,801 0.07 4,932 LG 273,251 0.20
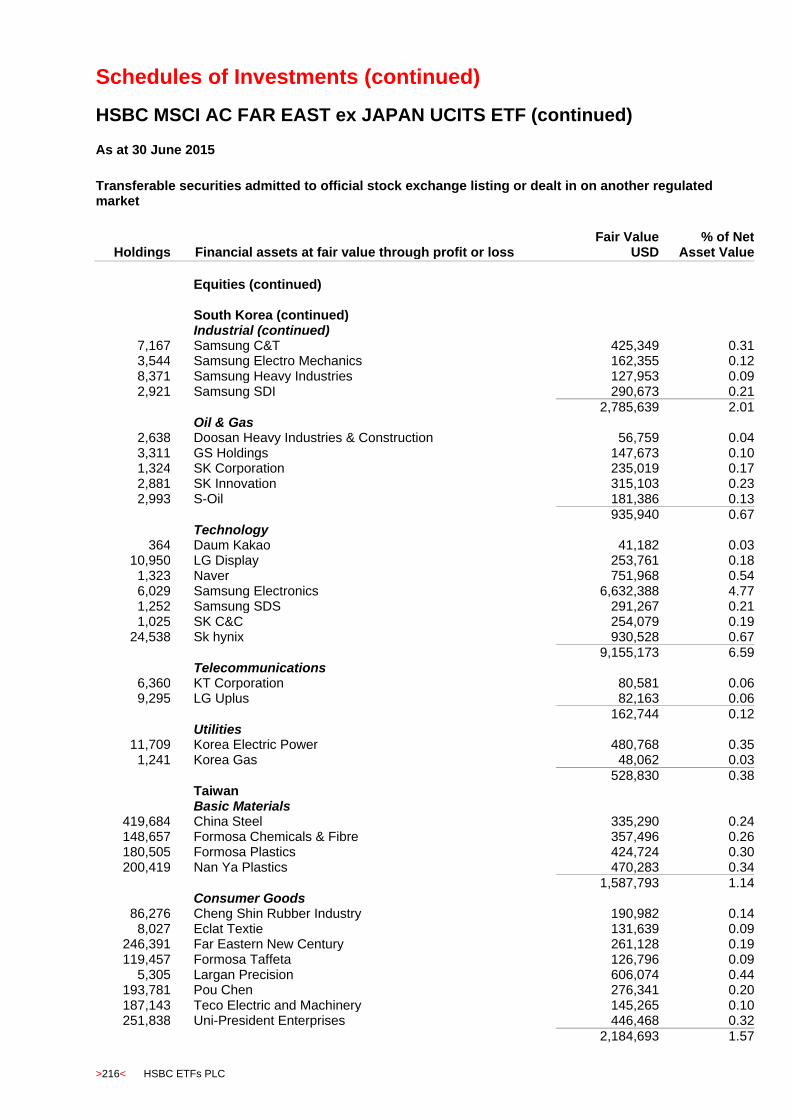
Schedules of Investments (continued)
HSBC MSCI AC FAR EAST ex JAPAN UCITS ETF (continued)
>216< HSBC ETFs PLC
As at 30 June 2015
Transferable securities admitted to official stock exchange listing or dealt in on another regulated market
Holdings
Financial assets at fair value through profit or loss Fair Value
USD % of Net
Asset Value
Equities (continued) South Korea (continued) Industrial (continued)
7,167 Samsung C&T 425,349 0.31 3,544 Samsung Electro Mechanics 162,355 0.12 8,371 Samsung Heavy Industries 127,953 0.09 2,921 Samsung SDI 290,673 0.21
2,785,639 2.01 Oil & Gas
2,638 Doosan Heavy Industries & Construction 56,759 0.04 3,311 GS Holdings 147,673 0.10 1,324 SK Corporation 235,019 0.17 2,881 SK Innovation 315,103 0.23 2,993 S-Oil 181,386 0.13
935,940 0.67 Technology
364 Daum Kakao 41,182 0.03 10,950 LG Display 253,761 0.18
1,323 Naver 751,968 0.54 6,029 Samsung Electronics 6,632,388 4.77 1,252 Samsung SDS 291,267 0.21 1,025 SK C&C 254,079 0.19
24,538 Sk hynix 930,528 0.67 9,155,173 6.59 Telecommunications
6,360 KT Corporation 80,581 0.06 9,295 LG Uplus 82,163 0.06
162,744 0.12 Utilities
11,709 Korea Electric Power 480,768 0.35 1,241 Korea Gas 48,062 0.03
528,830 0.38 Taiwan Basic Materials
419,684 China Steel 335,290 0.24 148,657 Formosa Chemicals & Fibre 357,496 0.26 180,505 Formosa Plastics 424,724 0.30 200,419 Nan Ya Plastics 470,283 0.34
1,587,793 1.14 Consumer Goods
86,276 Cheng Shin Rubber Industry 190,982 0.14 8,027 Eclat Textie 131,639 0.09
246,391 Far Eastern New Century 261,128 0.19 119,457 Formosa Taffeta 126,796 0.09
5,305 Largan Precision 606,074 0.44 193,781 Pou Chen 276,341 0.20 187,143 Teco Electric and Machinery 145,265 0.10 251,838 Uni-President Enterprises 446,468 0.32
2,184,693 1.57

Schedules of Investments (continued)
HSBC MSCI AC FAR EAST ex JAPAN UCITS ETF (continued)
HSBC ETFs PLC >217<
As at 30 June 2015
Transferable securities admitted to official stock exchange listing or dealt in on another regulated market
Holdings
Financial assets at fair value through profit or loss Fair Value
USD % of Net
Asset Value
Equities (continued) Taiwan (continued) Consumer Services
14,600 Hotai Motor 206,784 0.15 25,666 President Chain Store 180,509 0.13
387,293 0.28 Financial
373,504 Cathay Financials Holding 652,477 0.47 82,584 Chang Hwa Commercial Bank 47,375 0.03
833,524 China Development Financials Holding 316,072 0.23 740,491 Chinatrust Financial Holding 583,187 0.42 201,897 E.Sun Financial Holding 134,796 0.10 346,527 First Financial Holding 212,266 0.15 322,524 Fubon Financials Holding 641,818 0.46 84,851 Highwealth Construction 202,403 0.15
149,017 Hua Nan Financials Holdings 85,727 0.06 413,542 Mega Financial Holding 372,603 0.27 334,422 Shin Kong Financial Holding 102,100 0.07 449,081 SinoPac Financial Holdings 198,673 0.14 465,931 Taishin Financial Holding 194,047 0.14 274,691 Taiwan Business Bank 84,665 0.06 96,888 Taiwan Cooperative Financial Holding 50,713 0.04
580,911 Yuanta Financials Holding 314,418 0.23
4,193,340 3.02 Industrial
198,076 Asia Cement 234,318 0.17 38,495 Catcher Technology 481,585 0.35 85,663 CTCI Corporation 138,540 0.10 75,657 Delta Electronics 387,425 0.28 50,438 Epistar 67,432 0.05
8,202 Hiwin Technologies 53,963 0.04 572,320 Hon Hai Precision Industry 1,799,253 1.29 19,772 Radiant Opto Electronic 73,373 0.05
215,019 Taiwan Cement 271,435 0.20 33,181 Taiwan Glass Industry 15,970 0.01 90,257 U-Ming Marine Transport 122,568 0.09
3,645,862 2.63 Technology
152,793 Acer 74,033 0.05 346,419 Advanced Semiconductor Engineering 469,310 0.34 37,303 Asustek Computer 363,304 0.26
430,038 AU Optronics 190,248 0.14 61,360 Chicony Electronics 164,663 0.12
270,762 Compal Electronics 206,223 0.15 32,051 Foxconn Technology 116,343 0.08
1,274 Hermes Microvision 82,994 0.06 33,181 HTC 77,429 0.06
339,630 Innolux Crop 177,220 0.13 114,619 Lite-On Technology 134,476 0.10
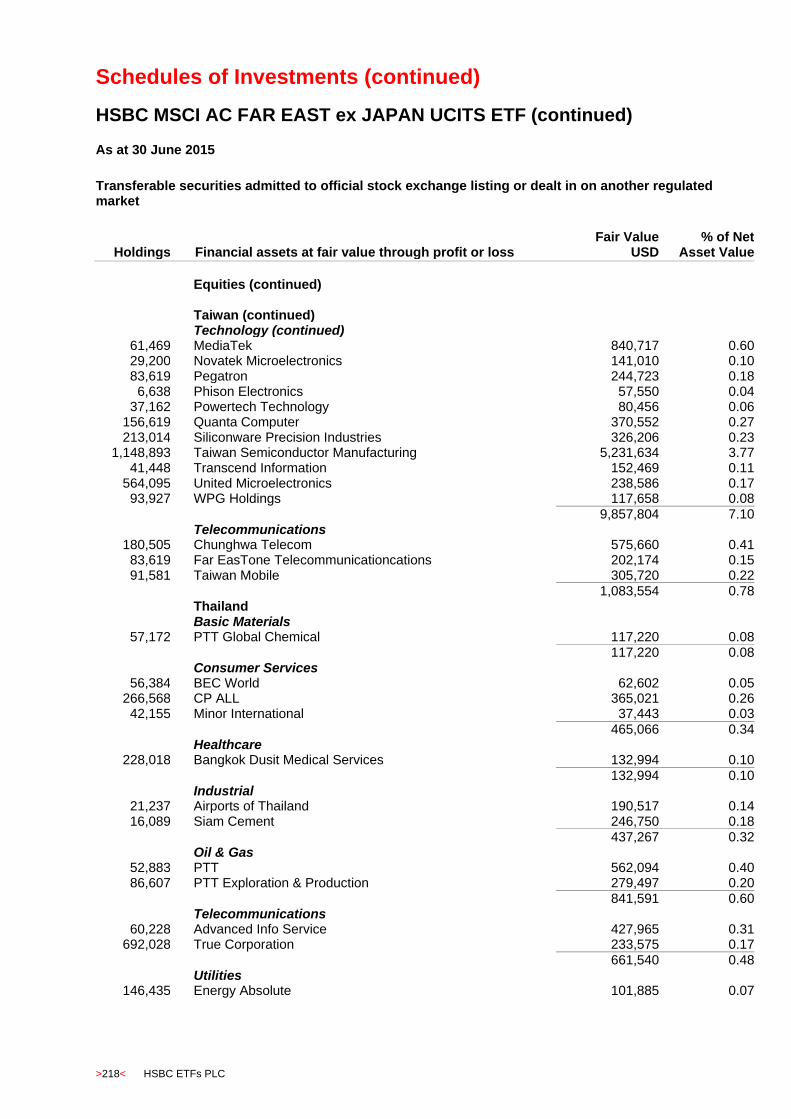
Schedules of Investments (continued)
HSBC MSCI AC FAR EAST ex JAPAN UCITS ETF (continued)
>218< HSBC ETFs PLC
As at 30 June 2015
Transferable securities admitted to official stock exchange listing or dealt in on another regulated market
Holdings
Financial assets at fair value through profit or loss Fair Value
USD % of Net
Asset Value
Equities (continued) Taiwan (continued) Technology (continued)
61,469 MediaTek 840,717 0.60 29,200 Novatek Microelectronics 141,010 0.10 83,619 Pegatron 244,723 0.18
6,638 Phison Electronics 57,550 0.04 37,162 Powertech Technology 80,456 0.06
156,619 Quanta Computer 370,552 0.27 213,014 Siliconware Precision Industries 326,206 0.23
1,148,893 Taiwan Semiconductor Manufacturing 5,231,634 3.77 41,448 Transcend Information 152,469 0.11
564,095 United Microelectronics 238,586 0.17 93,927 WPG Holdings 117,658 0.08
9,857,804 7.10 Telecommunications
180,505 Chunghwa Telecom 575,660 0.41 83,619 Far EasTone Telecommunicationcations 202,174 0.15 91,581 Taiwan Mobile 305,720 0.22
1,083,554 0.78 Thailand Basic Materials
57,172 PTT Global Chemical 117,220 0.08 117,220 0.08 Consumer Services
56,384 BEC World 62,602 0.05 266,568 CP ALL 365,021 0.26 42,155 Minor International 37,443 0.03
465,066 0.34 Healthcare
228,018 Bangkok Dusit Medical Services 132,994 0.10
132,994 0.10 Industrial
21,237 Airports of Thailand 190,517 0.14 16,089 Siam Cement 246,750 0.18
437,267 0.32 Oil & Gas
52,883 PTT 562,094 0.40 86,607 PTT Exploration & Production 279,497 0.20
841,591 0.60 Telecommunications
60,228 Advanced Info Service 427,965 0.31 692,028 True Corporation 233,575 0.17
661,540 0.48 Utilities
146,435 Energy Absolute 101,885 0.07
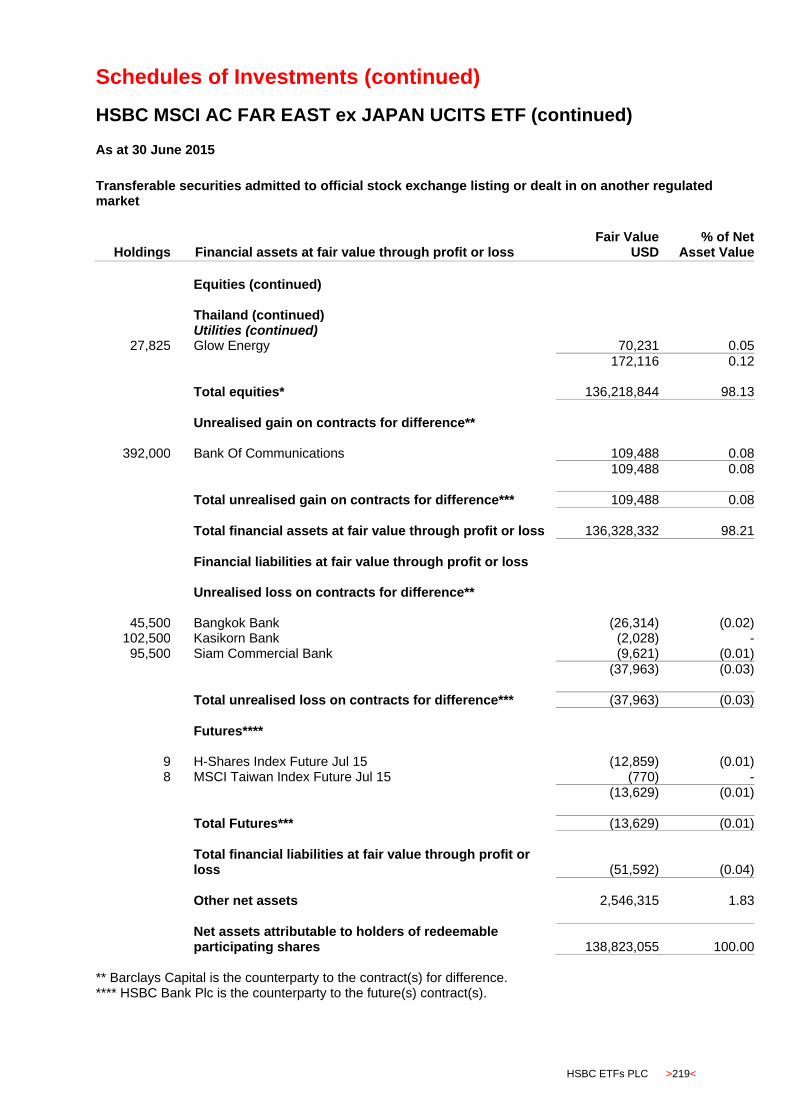
Schedules of Investments (continued)
HSBC MSCI AC FAR EAST ex JAPAN UCITS ETF (continued)
HSBC ETFs PLC >219<
As at 30 June 2015
Transferable securities admitted to official stock exchange listing or dealt in on another regulated market
Holdings
Financial assets at fair value through profit or loss Fair Value
USD % of Net
Asset Value
Equities (continued) Thailand (continued) Utilities (continued)
27,825 Glow Energy 70,231 0.05
172,116 0.12 Total equities* 136,218,844 98.13
Unrealised gain on contracts for difference**
392,000 Bank Of Communications 109,488 0.08
109,488 0.08
Total unrealised gain on contracts for difference*** 109,488 0.08
Total financial assets at fair value through profit or loss 136,328,332 98.21
Financial liabilities at fair value through profit or loss Unrealised loss on contracts for difference**
45,500 Bangkok Bank (26,314) (0.02) 102,500 Kasikorn Bank (2,028) - 95,500 Siam Commercial Bank (9,621) (0.01)
(37,963) (0.03)
Total unrealised loss on contracts for difference*** (37,963) (0.03)
Futures****
9 H-Shares Index Future Jul 15 (12,859) (0.01) 8 MSCI Taiwan Index Future Jul 15 (770) -
(13,629) (0.01)
Total Futures*** (13,629) (0.01)
Total financial liabilities at fair value through profit or loss (51,592) (0.04)
Other net assets 2,546,315 1.83
Net assets attributable to holders of redeemable participating shares 138,823,055 100.00
** Barclays Capital is the counterparty to the contract(s) for difference. **** HSBC Bank Plc is the counterparty to the future(s) contract(s).
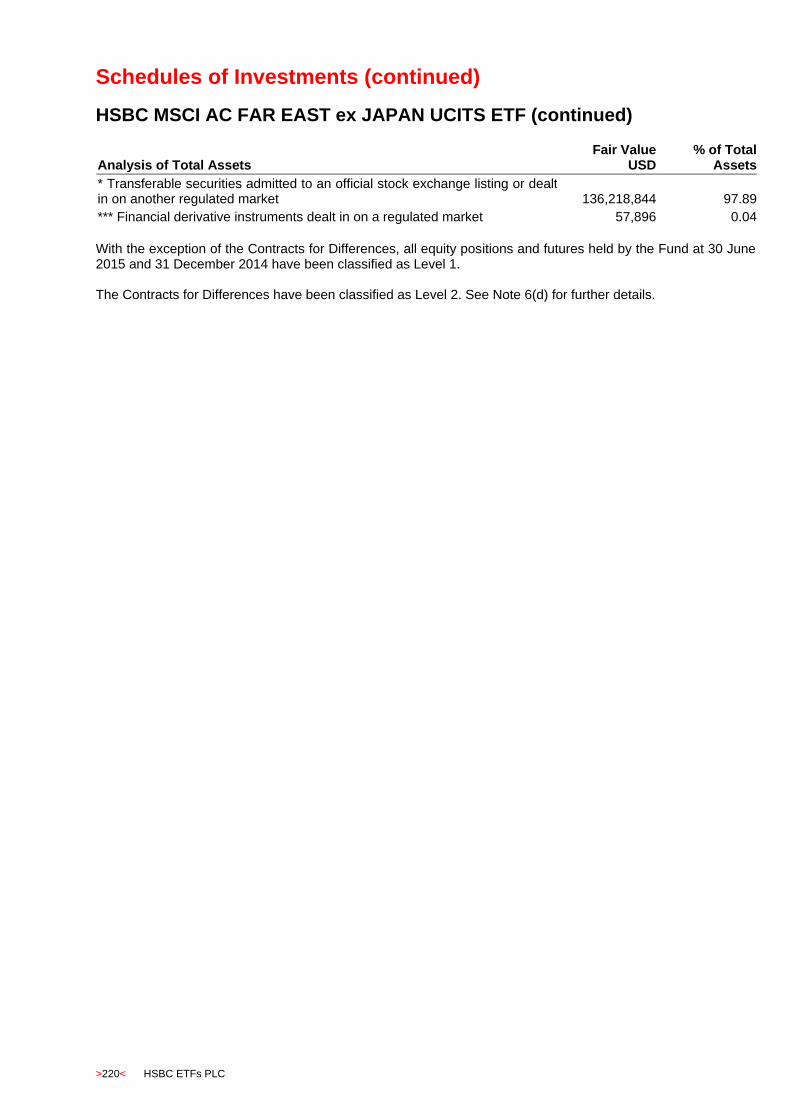
Schedules of Investments (continued)
HSBC MSCI AC FAR EAST ex JAPAN UCITS ETF (continued)
>220< HSBC ETFs PLC
Analysis of Total Assets Fair Value
USD % of Total
Assets
* Transferable securities admitted to an official stock exchange listing or dealt in on another regulated market 136,218,844 97.89
*** Financial derivative instruments dealt in on a regulated market 57,896 0.04
With the exception of the Contracts for Differences, all equity positions and futures held by the Fund at 30 June 2015 and 31 December 2014 have been classified as Level 1. The Contracts for Differences have been classified as Level 2. See Note 6(d) for further details.
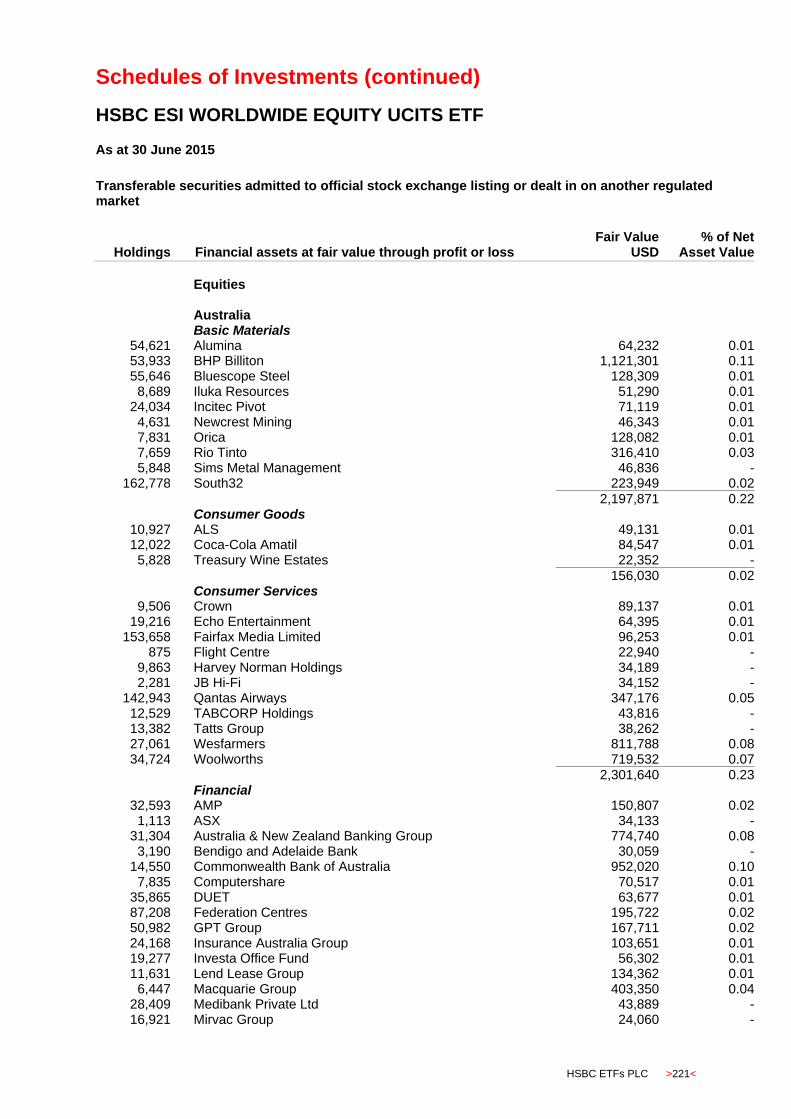
Schedules of Investments (continued)
HSBC ESI WORLDWIDE EQUITY UCITS ETF
HSBC ETFs PLC >221<
As at 30 June 2015
Transferable securities admitted to official stock exchange listing or dealt in on another regulated market
Holdings
Financial assets at fair value through profit or loss Fair Value
USD % of Net
Asset Value
Equities Australia Basic Materials
54,621 Alumina 64,232 0.01 53,933 BHP Billiton 1,121,301 0.11 55,646 Bluescope Steel 128,309 0.01
8,689 Iluka Resources 51,290 0.01 24,034 Incitec Pivot 71,119 0.01
4,631 Newcrest Mining 46,343 0.01 7,831 Orica 128,082 0.01 7,659 Rio Tinto 316,410 0.03 5,848 Sims Metal Management 46,836 -
162,778 South32 223,949 0.02
2,197,871 0.22 Consumer Goods
10,927 ALS 49,131 0.01 12,022 Coca-Cola Amatil 84,547 0.01
5,828 Treasury Wine Estates 22,352 -
156,030 0.02 Consumer Services
9,506 Crown 89,137 0.01 19,216 Echo Entertainment 64,395 0.01
153,658 Fairfax Media Limited 96,253 0.01 875 Flight Centre 22,940 -
9,863 Harvey Norman Holdings 34,189 - 2,281 JB Hi-Fi 34,152 -
142,943 Qantas Airways 347,176 0.05 12,529 TABCORP Holdings 43,816 - 13,382 Tatts Group 38,262 - 27,061 Wesfarmers 811,788 0.08 34,724 Woolworths 719,532 0.07
2,301,640 0.23 Financial
32,593 AMP 150,807 0.02 1,113 ASX 34,133 -
31,304 Australia & New Zealand Banking Group 774,740 0.08 3,190 Bendigo and Adelaide Bank 30,059 -
14,550 Commonwealth Bank of Australia 952,020 0.10 7,835 Computershare 70,517 0.01
35,865 DUET 63,677 0.01 87,208 Federation Centres 195,722 0.02 50,982 GPT Group 167,711 0.02 24,168 Insurance Australia Group 103,651 0.01 19,277 Investa Office Fund 56,302 0.01 11,631 Lend Lease Group 134,362 0.01
6,447 Macquarie Group 403,350 0.04 28,409 Medibank Private Ltd 43,889 - 16,921 Mirvac Group 24,060 -
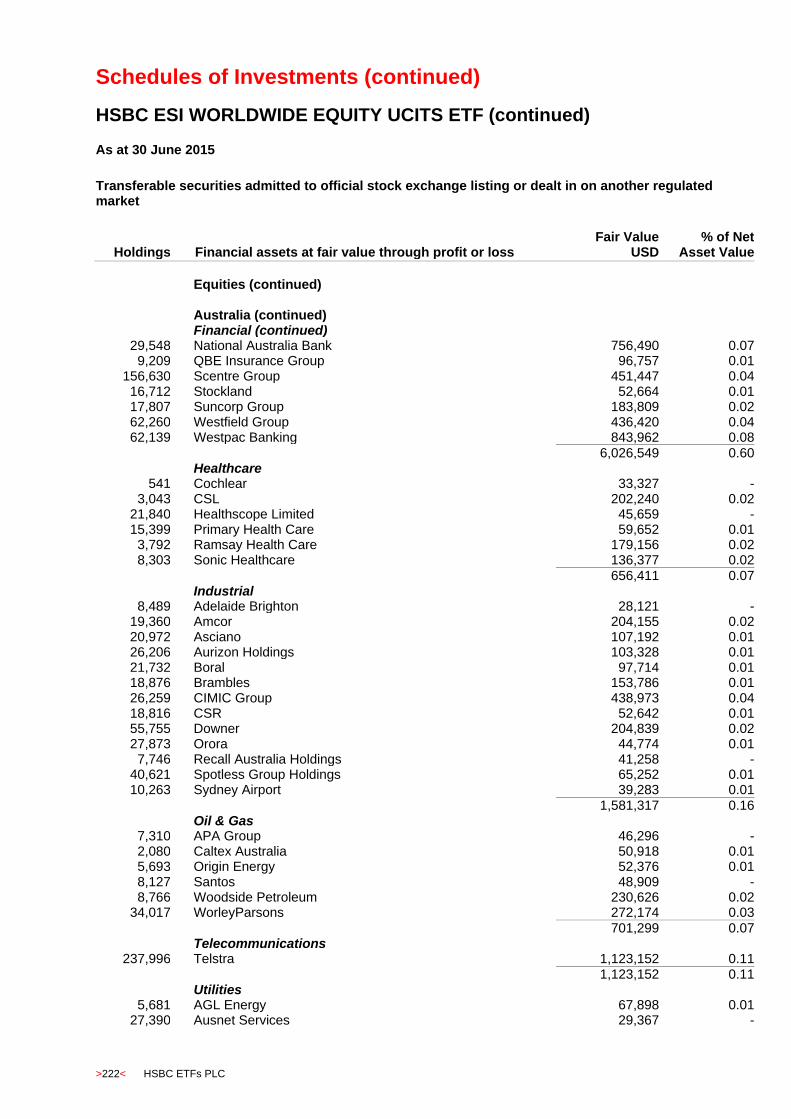
Schedules of Investments (continued)
HSBC ESI WORLDWIDE EQUITY UCITS ETF (continued)
>222< HSBC ETFs PLC
As at 30 June 2015
Transferable securities admitted to official stock exchange listing or dealt in on another regulated market
Holdings
Financial assets at fair value through profit or loss Fair Value
USD % of Net
Asset Value
Equities (continued) Australia (continued)
Financial (continued) 29,548 National Australia Bank 756,490 0.07
9,209 QBE Insurance Group 96,757 0.01 156,630 Scentre Group 451,447 0.04 16,712 Stockland 52,664 0.01 17,807 Suncorp Group 183,809 0.02 62,260 Westfield Group 436,420 0.04 62,139 Westpac Banking 843,962 0.08
6,026,549 0.60 Healthcare
541 Cochlear 33,327 - 3,043 CSL 202,240 0.02
21,840 Healthscope Limited 45,659 - 15,399 Primary Health Care 59,652 0.01
3,792 Ramsay Health Care 179,156 0.02 8,303 Sonic Healthcare 136,377 0.02
656,411 0.07 Industrial
8,489 Adelaide Brighton 28,121 - 19,360 Amcor 204,155 0.02 20,972 Asciano 107,192 0.01 26,206 Aurizon Holdings 103,328 0.01 21,732 Boral 97,714 0.01 18,876 Brambles 153,786 0.01 26,259 CIMIC Group 438,973 0.04 18,816 CSR 52,642 0.01 55,755 Downer 204,839 0.02 27,873 Orora 44,774 0.01
7,746 Recall Australia Holdings 41,258 - 40,621 Spotless Group Holdings 65,252 0.01 10,263 Sydney Airport 39,283 0.01
1,581,317 0.16 Oil & Gas
7,310 APA Group 46,296 - 2,080 Caltex Australia 50,918 0.01 5,693 Origin Energy 52,376 0.01 8,127 Santos 48,909 - 8,766 Woodside Petroleum 230,626 0.02
34,017 WorleyParsons 272,174 0.03
701,299 0.07 Telecommunications
237,996 Telstra 1,123,152 0.11 1,123,152 0.11
Utilities 5,681 AGL Energy 67,898 0.01
27,390 Ausnet Services 29,367 -
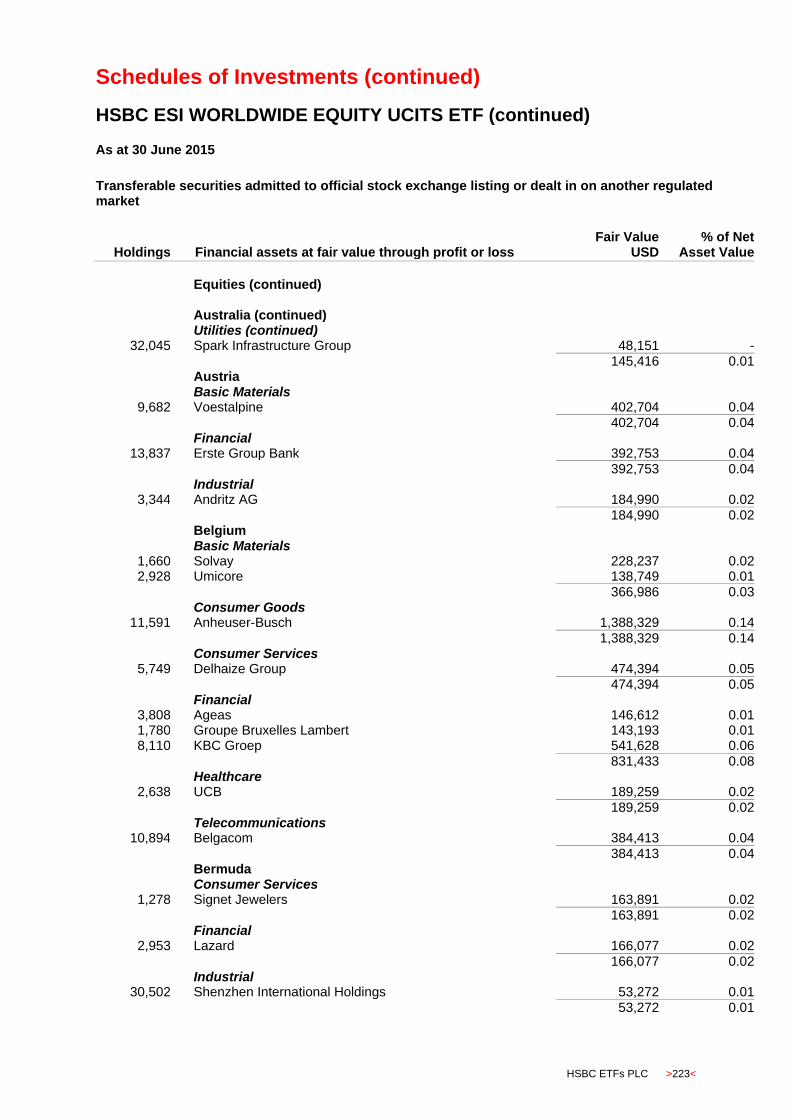
Schedules of Investments (continued)
HSBC ESI WORLDWIDE EQUITY UCITS ETF (continued)
HSBC ETFs PLC >223<
As at 30 June 2015
Transferable securities admitted to official stock exchange listing or dealt in on another regulated market
Holdings
Financial assets at fair value through profit or loss Fair Value
USD % of Net
Asset Value
Equities (continued) Australia (continued) Utilities (continued)
32,045 Spark Infrastructure Group 48,151 -
145,416 0.01 Austria Basic Materials
9,682 Voestalpine 402,704 0.04 402,704 0.04 Financial
13,837 Erste Group Bank 392,753 0.04
392,753 0.04 Industrial
3,344 Andritz AG 184,990 0.02
184,990 0.02 Belgium Basic Materials
1,660 Solvay 228,237 0.02 2,928 Umicore 138,749 0.01
366,986 0.03 Consumer Goods
11,591 Anheuser-Busch 1,388,329 0.14
1,388,329 0.14 Consumer Services
5,749 Delhaize Group 474,394 0.05 474,394 0.05 Financial
3,808 Ageas 146,612 0.01 1,780 Groupe Bruxelles Lambert 143,193 0.01 8,110 KBC Groep 541,628 0.06
831,433 0.08 Healthcare
2,638 UCB 189,259 0.02
189,259 0.02 Telecommunications
10,894 Belgacom 384,413 0.04
384,413 0.04 Bermuda Consumer Services
1,278 Signet Jewelers 163,891 0.02
163,891 0.02 Financial
2,953 Lazard 166,077 0.02
166,077 0.02 Industrial
30,502 Shenzhen International Holdings 53,272 0.01
53,272 0.01
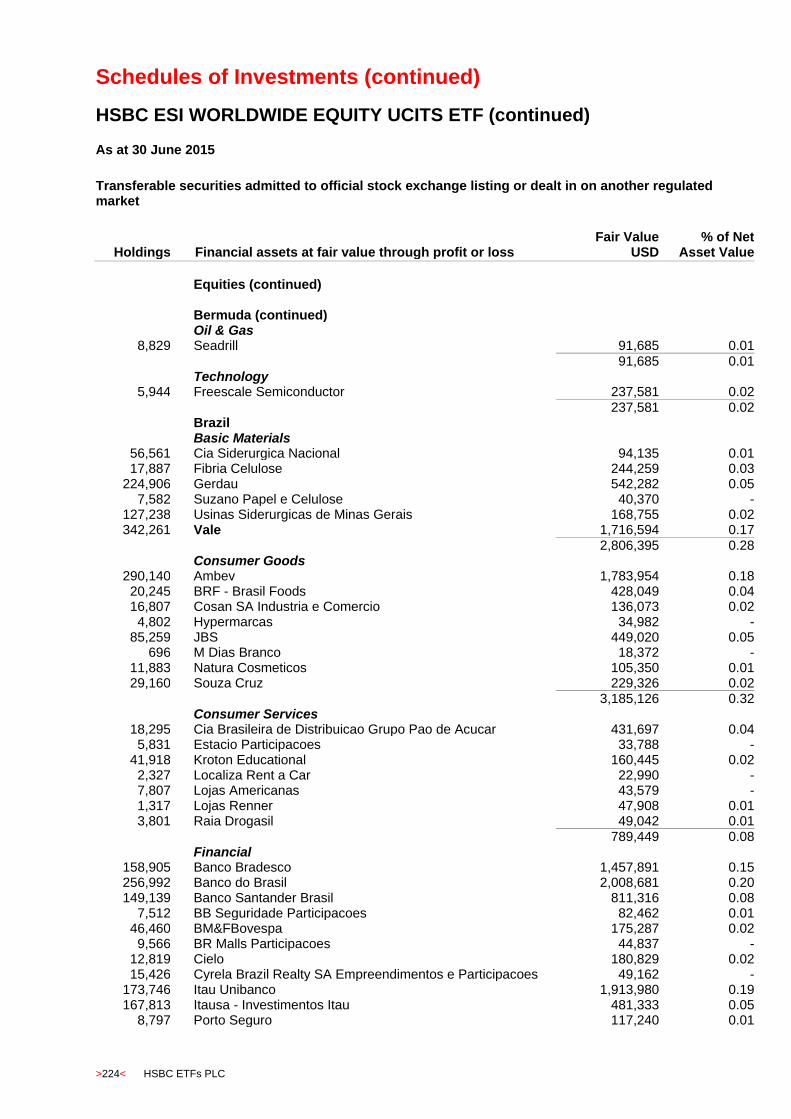
Schedules of Investments (continued)
HSBC ESI WORLDWIDE EQUITY UCITS ETF (continued)
>224< HSBC ETFs PLC
As at 30 June 2015
Transferable securities admitted to official stock exchange listing or dealt in on another regulated market
Holdings
Financial assets at fair value through profit or loss Fair Value
USD % of Net
Asset Value
Equities (continued)
Bermuda (continued) Oil & Gas
8,829 Seadrill 91,685 0.01
91,685 0.01 Technology
5,944 Freescale Semiconductor 237,581 0.02
237,581 0.02 Brazil Basic Materials
56,561 Cia Siderurgica Nacional 94,135 0.01 17,887 Fibria Celulose 244,259 0.03
224,906 Gerdau 542,282 0.05 7,582 Suzano Papel e Celulose 40,370 -
127,238 Usinas Siderurgicas de Minas Gerais 168,755 0.02 342,261 Vale 1,716,594 0.17
2,806,395 0.28 Consumer Goods
290,140 Ambev 1,783,954 0.18 20,245 BRF - Brasil Foods 428,049 0.04 16,807 Cosan SA Industria e Comercio 136,073 0.02
4,802 Hypermarcas 34,982 - 85,259 JBS 449,020 0.05
696 M Dias Branco 18,372 - 11,883 Natura Cosmeticos 105,350 0.01 29,160 Souza Cruz 229,326 0.02
3,185,126 0.32 Consumer Services
18,295 Cia Brasileira de Distribuicao Grupo Pao de Acucar 431,697 0.04 5,831 Estacio Participacoes 33,788 -
41,918 Kroton Educational 160,445 0.02 2,327 Localiza Rent a Car 22,990 - 7,807 Lojas Americanas 43,579 - 1,317 Lojas Renner 47,908 0.01 3,801 Raia Drogasil 49,042 0.01
789,449 0.08 Financial
158,905 Banco Bradesco 1,457,891 0.15 256,992 Banco do Brasil 2,008,681 0.20 149,139 Banco Santander Brasil 811,316 0.08
7,512 BB Seguridade Participacoes 82,462 0.01 46,460 BM&FBovespa 175,287 0.02
9,566 BR Malls Participacoes 44,837 - 12,819 Cielo 180,829 0.02 15,426 Cyrela Brazil Realty SA Empreendimentos e Participacoes 49,162 -
173,746 Itau Unibanco 1,913,980 0.19 167,813 Itausa - Investimentos Itau 481,333 0.05
8,797 Porto Seguro 117,240 0.01
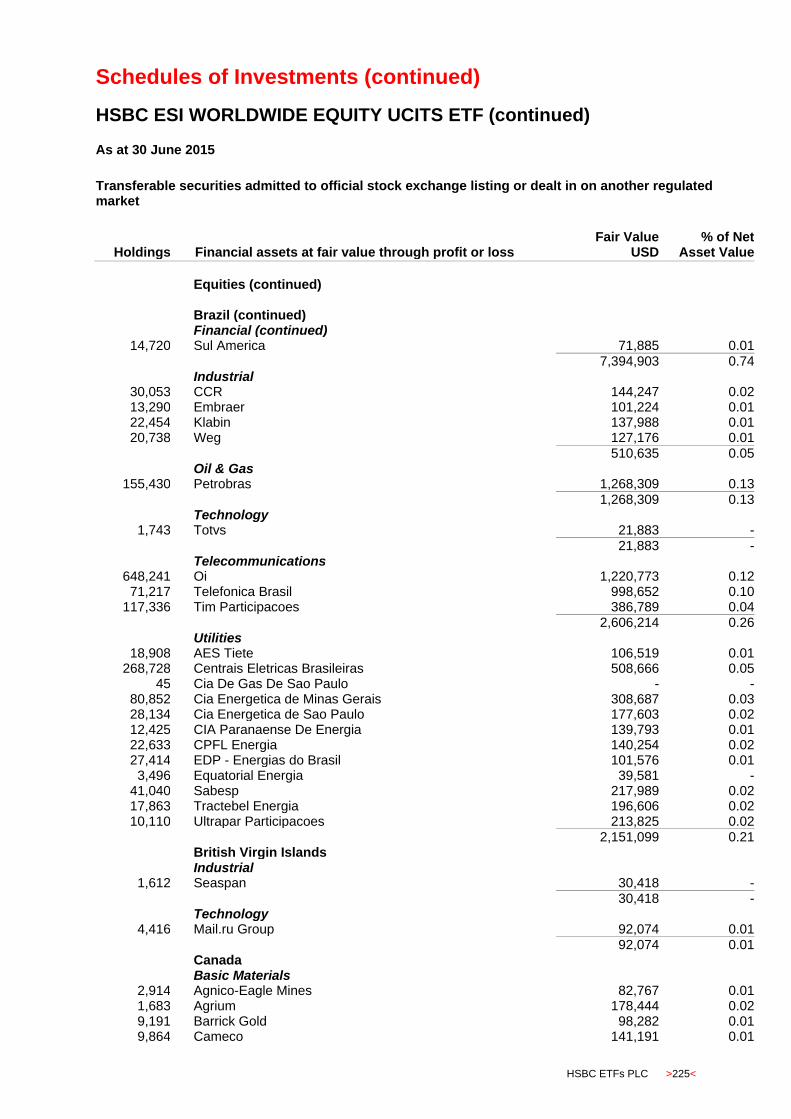
Schedules of Investments (continued)
HSBC ESI WORLDWIDE EQUITY UCITS ETF (continued)
HSBC ETFs PLC >225<
As at 30 June 2015
Transferable securities admitted to official stock exchange listing or dealt in on another regulated market
Holdings
Financial assets at fair value through profit or loss Fair Value
USD % of Net
Asset Value
Equities (continued)
Brazil (continued) Financial (continued)
14,720 Sul America 71,885 0.01
7,394,903 0.74 Industrial
30,053 CCR 144,247 0.02 13,290 Embraer 101,224 0.01 22,454 Klabin 137,988 0.01 20,738 Weg 127,176 0.01
510,635 0.05 Oil & Gas
155,430 Petrobras 1,268,309 0.13
1,268,309 0.13 Technology
1,743 Totvs 21,883 -
21,883 - Telecommunications
648,241 Oi 1,220,773 0.12 71,217 Telefonica Brasil 998,652 0.10
117,336 Tim Participacoes 386,789 0.04 2,606,214 0.26 Utilities
18,908 AES Tiete 106,519 0.01 268,728 Centrais Eletricas Brasileiras 508,666 0.05
45 Cia De Gas De Sao Paulo - - 80,852 Cia Energetica de Minas Gerais 308,687 0.03 28,134 Cia Energetica de Sao Paulo 177,603 0.02 12,425 CIA Paranaense De Energia 139,793 0.01 22,633 CPFL Energia 140,254 0.02 27,414 EDP - Energias do Brasil 101,576 0.01
3,496 Equatorial Energia 39,581 - 41,040 Sabesp 217,989 0.02 17,863 Tractebel Energia 196,606 0.02 10,110 Ultrapar Participacoes 213,825 0.02
2,151,099 0.21 British Virgin Islands Industrial
1,612 Seaspan 30,418 - 30,418 - Technology
4,416 Mail.ru Group 92,074 0.01
92,074 0.01 Canada Basic Materials
2,914 Agnico-Eagle Mines 82,767 0.01 1,683 Agrium 178,444 0.02 9,191 Barrick Gold 98,282 0.01 9,864 Cameco 141,191 0.01
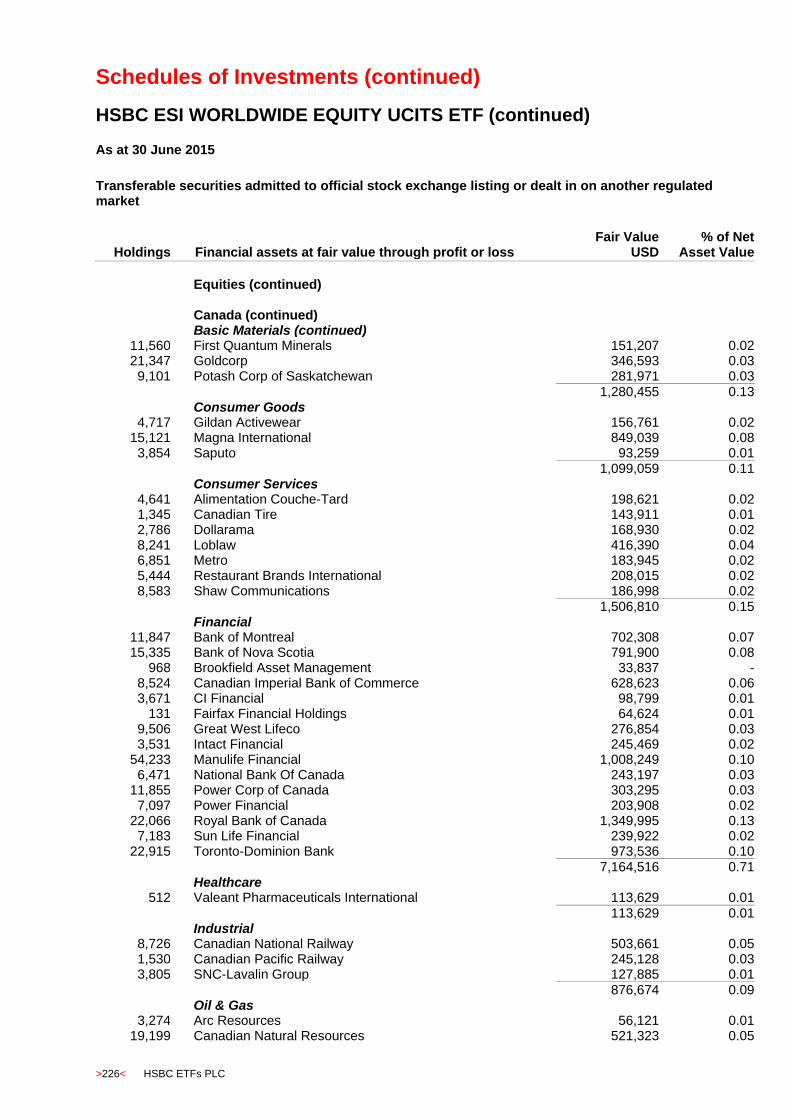
Schedules of Investments (continued)
HSBC ESI WORLDWIDE EQUITY UCITS ETF (continued)
>226< HSBC ETFs PLC
As at 30 June 2015
Transferable securities admitted to official stock exchange listing or dealt in on another regulated market
Holdings
Financial assets at fair value through profit or loss Fair Value
USD % of Net
Asset Value
Equities (continued)
Canada (continued) Basic Materials (continued)
11,560 First Quantum Minerals 151,207 0.02 21,347 Goldcorp 346,593 0.03
9,101 Potash Corp of Saskatchewan 281,971 0.03
1,280,455 0.13 Consumer Goods
4,717 Gildan Activewear 156,761 0.02 15,121 Magna International 849,039 0.08
3,854 Saputo 93,259 0.01 1,099,059 0.11 Consumer Services
4,641 Alimentation Couche-Tard 198,621 0.02 1,345 Canadian Tire 143,911 0.01 2,786 Dollarama 168,930 0.02 8,241 Loblaw 416,390 0.04 6,851 Metro 183,945 0.02 5,444 Restaurant Brands International 208,015 0.02 8,583 Shaw Communications 186,998 0.02
1,506,810 0.15 Financial
11,847 Bank of Montreal 702,308 0.07 15,335 Bank of Nova Scotia 791,900 0.08
968 Brookfield Asset Management 33,837 - 8,524 Canadian Imperial Bank of Commerce 628,623 0.06 3,671 CI Financial 98,799 0.01
131 Fairfax Financial Holdings 64,624 0.01 9,506 Great West Lifeco 276,854 0.03 3,531 Intact Financial 245,469 0.02
54,233 Manulife Financial 1,008,249 0.10 6,471 National Bank Of Canada 243,197 0.03
11,855 Power Corp of Canada 303,295 0.03 7,097 Power Financial 203,908 0.02
22,066 Royal Bank of Canada 1,349,995 0.13 7,183 Sun Life Financial 239,922 0.02
22,915 Toronto-Dominion Bank 973,536 0.10
7,164,516 0.71 Healthcare
512 Valeant Pharmaceuticals International 113,629 0.01
113,629 0.01 Industrial
8,726 Canadian National Railway 503,661 0.05 1,530 Canadian Pacific Railway 245,128 0.03 3,805 SNC-Lavalin Group 127,885 0.01
876,674 0.09 Oil & Gas
3,274 Arc Resources 56,121 0.01 19,199 Canadian Natural Resources 521,323 0.05
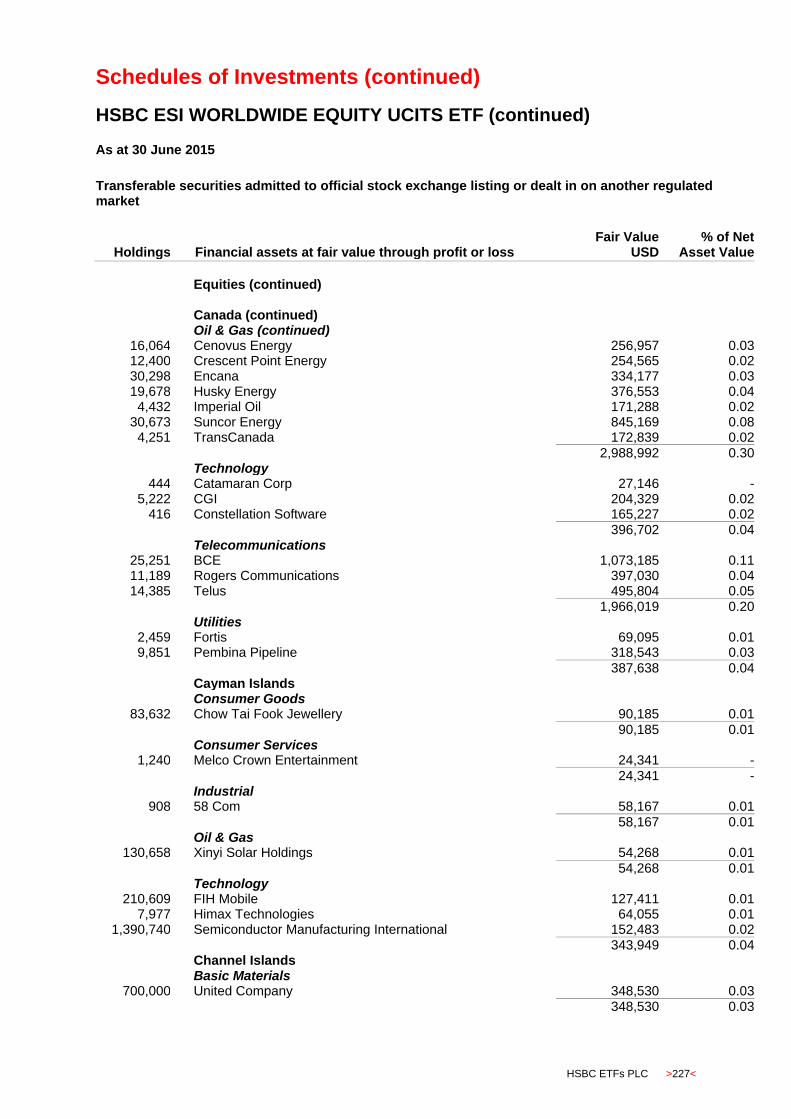
Schedules of Investments (continued)
HSBC ESI WORLDWIDE EQUITY UCITS ETF (continued)
HSBC ETFs PLC >227<
As at 30 June 2015
Transferable securities admitted to official stock exchange listing or dealt in on another regulated market
Holdings
Financial assets at fair value through profit or loss Fair Value
USD % of Net
Asset Value
Equities (continued)
Canada (continued) Oil & Gas (continued)
16,064 Cenovus Energy 256,957 0.03 12,400 Crescent Point Energy 254,565 0.02 30,298 Encana 334,177 0.03 19,678 Husky Energy 376,553 0.04
4,432 Imperial Oil 171,288 0.02 30,673 Suncor Energy 845,169 0.08
4,251 TransCanada 172,839 0.02
2,988,992 0.30 Technology
444 Catamaran Corp 27,146 - 5,222 CGI 204,329 0.02
416 Constellation Software 165,227 0.02
396,702 0.04 Telecommunications
25,251 BCE 1,073,185 0.11 11,189 Rogers Communications 397,030 0.04 14,385 Telus 495,804 0.05
1,966,019 0.20 Utilities
2,459 Fortis 69,095 0.01 9,851 Pembina Pipeline 318,543 0.03
387,638 0.04 Cayman Islands Consumer Goods
83,632 Chow Tai Fook Jewellery 90,185 0.01
90,185 0.01 Consumer Services
1,240 Melco Crown Entertainment 24,341 -
24,341 - Industrial
908 58 Com 58,167 0.01
58,167 0.01 Oil & Gas
130,658 Xinyi Solar Holdings 54,268 0.01
54,268 0.01 Technology
210,609 FIH Mobile 127,411 0.01 7,977 Himax Technologies 64,055 0.01
1,390,740 Semiconductor Manufacturing International 152,483 0.02
343,949 0.04 Channel Islands Basic Materials
700,000 United Company 348,530 0.03 348,530 0.03
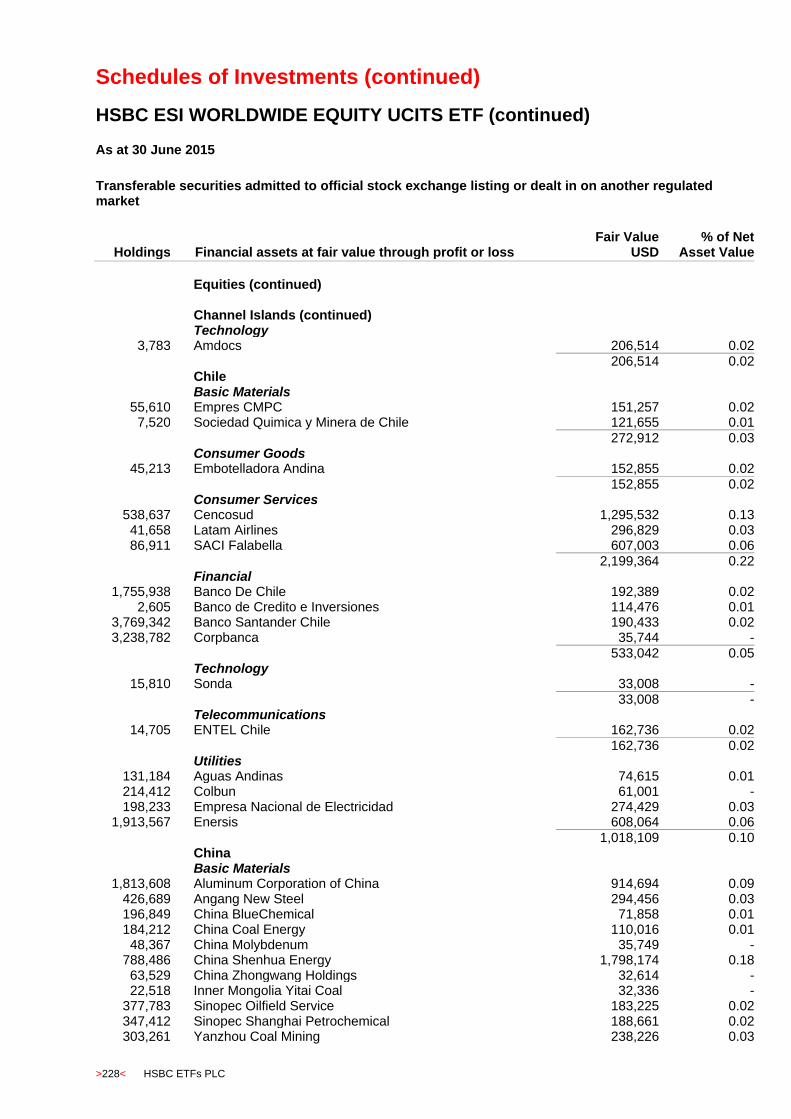
Schedules of Investments (continued)
HSBC ESI WORLDWIDE EQUITY UCITS ETF (continued)
>228< HSBC ETFs PLC
As at 30 June 2015
Transferable securities admitted to official stock exchange listing or dealt in on another regulated market
Holdings
Financial assets at fair value through profit or loss Fair Value
USD % of Net
Asset Value
Equities (continued)
Channel Islands (continued) Technology
3,783 Amdocs 206,514 0.02
206,514 0.02 Chile Basic Materials
55,610 Empres CMPC 151,257 0.02 7,520 Sociedad Quimica y Minera de Chile 121,655 0.01
272,912 0.03 Consumer Goods
45,213 Embotelladora Andina 152,855 0.02
152,855 0.02 Consumer Services
538,637 Cencosud 1,295,532 0.13 41,658 Latam Airlines 296,829 0.03 86,911 SACI Falabella 607,003 0.06
2,199,364 0.22 Financial
1,755,938 Banco De Chile 192,389 0.02 2,605 Banco de Credito e Inversiones 114,476 0.01
3,769,342 Banco Santander Chile 190,433 0.02 3,238,782 Corpbanca 35,744 -
533,042 0.05 Technology
15,810 Sonda 33,008 -
33,008 - Telecommunications
14,705 ENTEL Chile 162,736 0.02
162,736 0.02 Utilities
131,184 Aguas Andinas 74,615 0.01 214,412 Colbun 61,001 - 198,233 Empresa Nacional de Electricidad 274,429 0.03
1,913,567 Enersis 608,064 0.06
1,018,109 0.10 China Basic Materials
1,813,608 Aluminum Corporation of China 914,694 0.09 426,689 Angang New Steel 294,456 0.03 196,849 China BlueChemical 71,858 0.01 184,212 China Coal Energy 110,016 0.01 48,367 China Molybdenum 35,749 -
788,486 China Shenhua Energy 1,798,174 0.18 63,529 China Zhongwang Holdings 32,614 - 22,518 Inner Mongolia Yitai Coal 32,336 -
377,783 Sinopec Oilfield Service 183,225 0.02 347,412 Sinopec Shanghai Petrochemical 188,661 0.02 303,261 Yanzhou Coal Mining 238,226 0.03
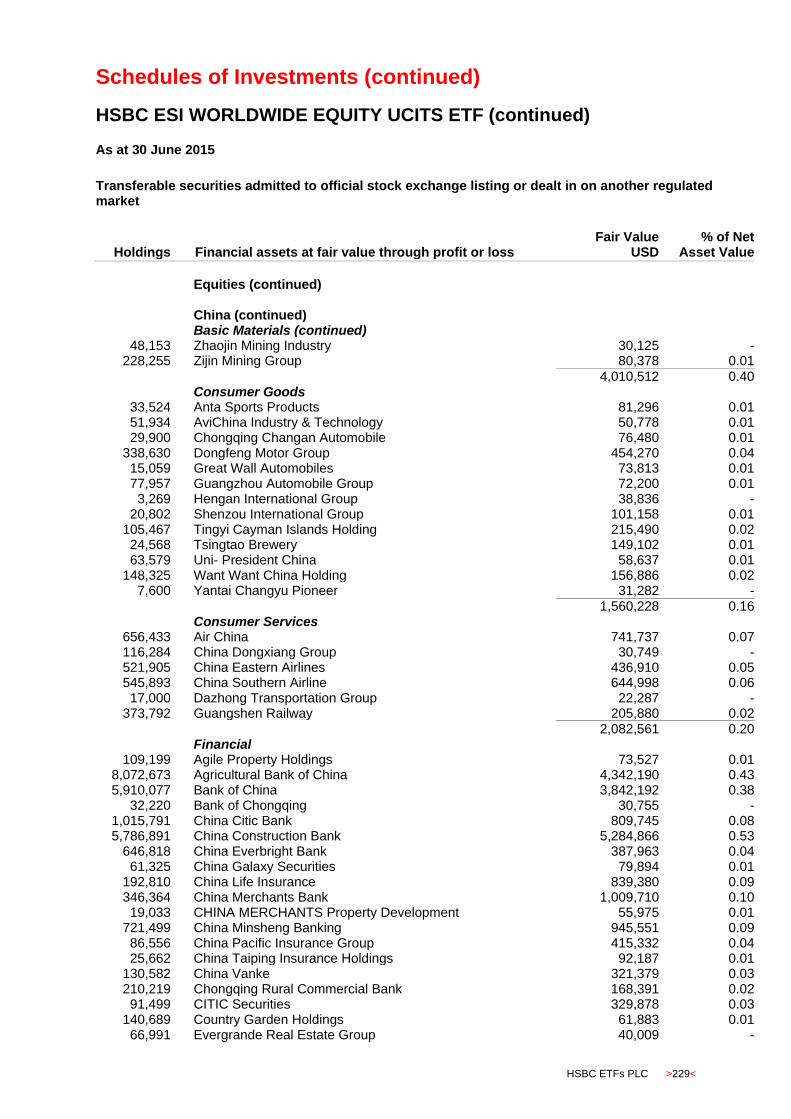
Schedules of Investments (continued)
HSBC ESI WORLDWIDE EQUITY UCITS ETF (continued)
HSBC ETFs PLC >229<
As at 30 June 2015
Transferable securities admitted to official stock exchange listing or dealt in on another regulated market
Holdings
Financial assets at fair value through profit or loss Fair Value
USD % of Net
Asset Value
Equities (continued)
China (continued) Basic Materials (continued)
48,153 Zhaojin Mining Industry 30,125 - 228,255 Zijin Mining Group 80,378 0.01
4,010,512 0.40 Consumer Goods
33,524 Anta Sports Products 81,296 0.01 51,934 AviChina Industry & Technology 50,778 0.01 29,900 Chongqing Changan Automobile 76,480 0.01
338,630 Dongfeng Motor Group 454,270 0.04 15,059 Great Wall Automobiles 73,813 0.01 77,957 Guangzhou Automobile Group 72,200 0.01
3,269 Hengan International Group 38,836 - 20,802 Shenzou International Group 101,158 0.01
105,467 Tingyi Cayman Islands Holding 215,490 0.02 24,568 Tsingtao Brewery 149,102 0.01 63,579 Uni- President China 58,637 0.01
148,325 Want Want China Holding 156,886 0.02 7,600 Yantai Changyu Pioneer 31,282 -
1,560,228 0.16 Consumer Services
656,433 Air China 741,737 0.07 116,284 China Dongxiang Group 30,749 - 521,905 China Eastern Airlines 436,910 0.05 545,893 China Southern Airline 644,998 0.06 17,000 Dazhong Transportation Group 22,287 -
373,792 Guangshen Railway 205,880 0.02
2,082,561 0.20 Financial
109,199 Agile Property Holdings 73,527 0.01 8,072,673 Agricultural Bank of China 4,342,190 0.43 5,910,077 Bank of China 3,842,192 0.38
32,220 Bank of Chongqing 30,755 - 1,015,791 China Citic Bank 809,745 0.08 5,786,891 China Construction Bank 5,284,866 0.53
646,818 China Everbright Bank 387,963 0.04 61,325 China Galaxy Securities 79,894 0.01
192,810 China Life Insurance 839,380 0.09 346,364 China Merchants Bank 1,009,710 0.10 19,033 CHINA MERCHANTS Property Development 55,975 0.01
721,499 China Minsheng Banking 945,551 0.09 86,556 China Pacific Insurance Group 415,332 0.04 25,662 China Taiping Insurance Holdings 92,187 0.01
130,582 China Vanke 321,379 0.03 210,219 Chongqing Rural Commercial Bank 168,391 0.02 91,499 CITIC Securities 329,878 0.03
140,689 Country Garden Holdings 61,883 0.01 66,991 Evergrande Real Estate Group 40,009 -

Schedules of Investments (continued)
HSBC ESI WORLDWIDE EQUITY UCITS ETF (continued)
>230< HSBC ETFs PLC
As at 30 June 2015
Transferable securities admitted to official stock exchange listing or dealt in on another regulated market
Holdings
Financial assets at fair value through profit or loss Fair Value
USD % of Net
Asset Value
Equities (continued)
China (continued) Financial (continued)
32,357 Far East Horizon 30,802 - 87,858 Greentown China 112,195 0.01 50,577 Guangzhou R&F Properties 62,042 0.01 42,656 Haitong Securities 112,795 0.01
8,130,889 Industrial & Commercial Bank of China 6,460,620 0.65 20,420 New China Life Insurance 121,953 0.01
794,523 People s Insurance Company Group of China 508,327 0.05 192,924 PICC Property & Casualty 439,473 0.05 57,603 Ping An Insurance 777,942 0.08
378,134 Renhe Commercial Holdings 31,216 - 51,776 Sino-Ocean Land Holdings 39,136 -
190,358 Soho China 123,999 0.01 44,754 Sunac China Holdings 49,011 0.01
28,000,318 2.80 Healthcare
11,406 Guangzhou Pharmaceutical 42,078 - 32,067 Shanghai Pharmaceuticals Holding 89,344 0.01 17,574 Sinopharm Group 78,094 0.01
209,516 0.02 Industrial
6,014 AAC Technologies 33,978 - 60,364 Anhui Conch Cement 211,789 0.02 57,578 BBMG 58,302 0.01 59,160 Beijing Capital International Airport 68,221 0.01 23,193 Byd 139,262 0.01 41,284 China Machinery Engineering 44,519 0.01
155,512 China Cinda Asset Management 86,657 0.01 172,932 China Communications Construction 258,755 0.03 318,798 China COSCO Holdings 206,020 0.02
9,975 China Intl Marine Containers 25,656 - 52,877 China National Building Material 49,995 0.01
226,484 China Railway Construction 349,985 0.03 310,233 China Railway Group 334,941 0.03 227,751 China Shipping Container Lines 89,014 0.01 34,400 CSG Holding 43,929 -
190,737 CSR Corporation Limited 292,777 0.03 31,696 Dongfang Electrical Machinery 59,119 0.01
5,980 Guangzhou Shipyard 22,022 - 14,286 Haitian International Holdings 33,575 -
101,877 Jiangsu Expressway 133,776 0.01 919,224 Metallurgical Corporation 399,583 0.04 271,751 Shanghai Electric Group 221,886 0.02 13,900 Shanghai Mechanical And Electrical 42,673 0.01 35,200 Shanghai Zhenhua Port Machinery 27,843 -
210,124 Sinopec Engineering Group 194,606 0.02 103,920 Sinotrans 69,302 0.01
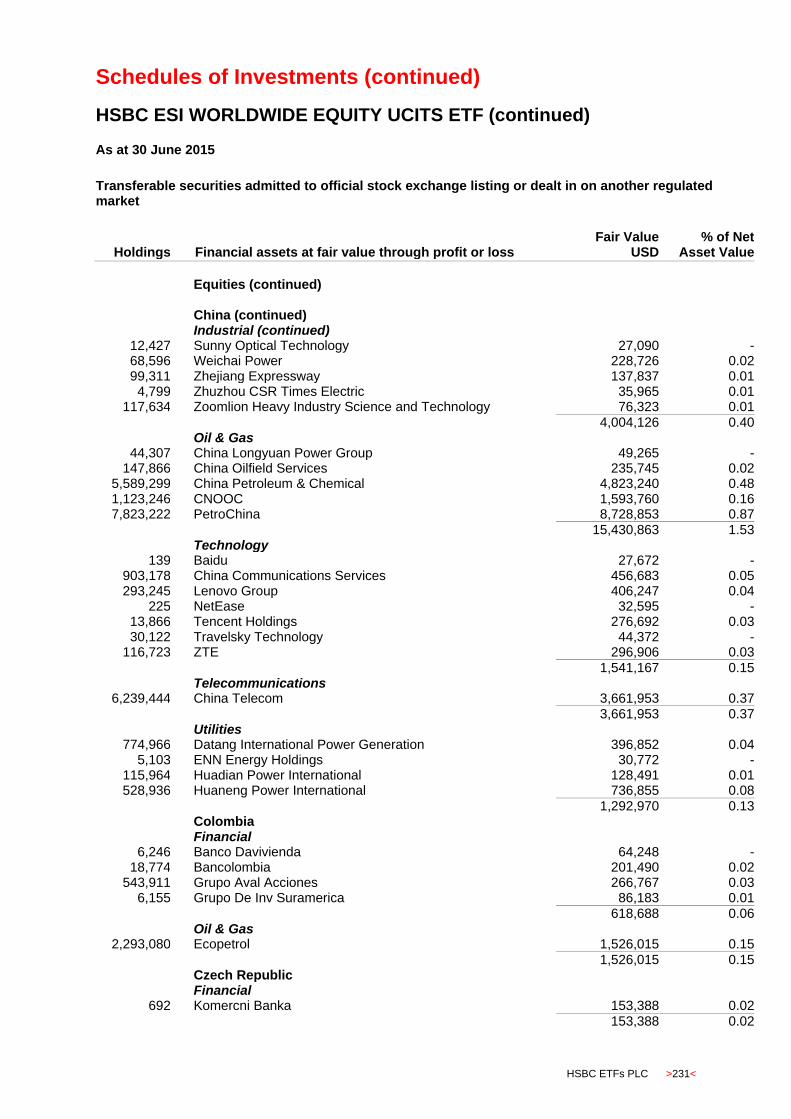
Schedules of Investments (continued)
HSBC ESI WORLDWIDE EQUITY UCITS ETF (continued)
HSBC ETFs PLC >231<
As at 30 June 2015
Transferable securities admitted to official stock exchange listing or dealt in on another regulated market
Holdings
Financial assets at fair value through profit or loss Fair Value
USD % of Net
Asset Value
Equities (continued)
China (continued) Industrial (continued)
12,427 Sunny Optical Technology 27,090 - 68,596 Weichai Power 228,726 0.02 99,311 Zhejiang Expressway 137,837 0.01
4,799 Zhuzhou CSR Times Electric 35,965 0.01 117,634 Zoomlion Heavy Industry Science and Technology 76,323 0.01
4,004,126 0.40 Oil & Gas
44,307 China Longyuan Power Group 49,265 - 147,866 China Oilfield Services 235,745 0.02
5,589,299 China Petroleum & Chemical 4,823,240 0.48 1,123,246 CNOOC 1,593,760 0.16 7,823,222 PetroChina 8,728,853 0.87
15,430,863 1.53 Technology
139 Baidu 27,672 - 903,178 China Communications Services 456,683 0.05 293,245 Lenovo Group 406,247 0.04
225 NetEase 32,595 - 13,866 Tencent Holdings 276,692 0.03 30,122 Travelsky Technology 44,372 -
116,723 ZTE 296,906 0.03
1,541,167 0.15 Telecommunications
6,239,444 China Telecom 3,661,953 0.37
3,661,953 0.37 Utilities
774,966 Datang International Power Generation 396,852 0.04 5,103 ENN Energy Holdings 30,772 -
115,964 Huadian Power International 128,491 0.01 528,936 Huaneng Power International 736,855 0.08
1,292,970 0.13 Colombia Financial
6,246 Banco Davivienda 64,248 - 18,774 Bancolombia 201,490 0.02
543,911 Grupo Aval Acciones 266,767 0.03 6,155 Grupo De Inv Suramerica 86,183 0.01
618,688 0.06 Oil & Gas
2,293,080 Ecopetrol 1,526,015 0.15
1,526,015 0.15 Czech Republic Financial
692 Komercni Banka 153,388 0.02
153,388 0.02
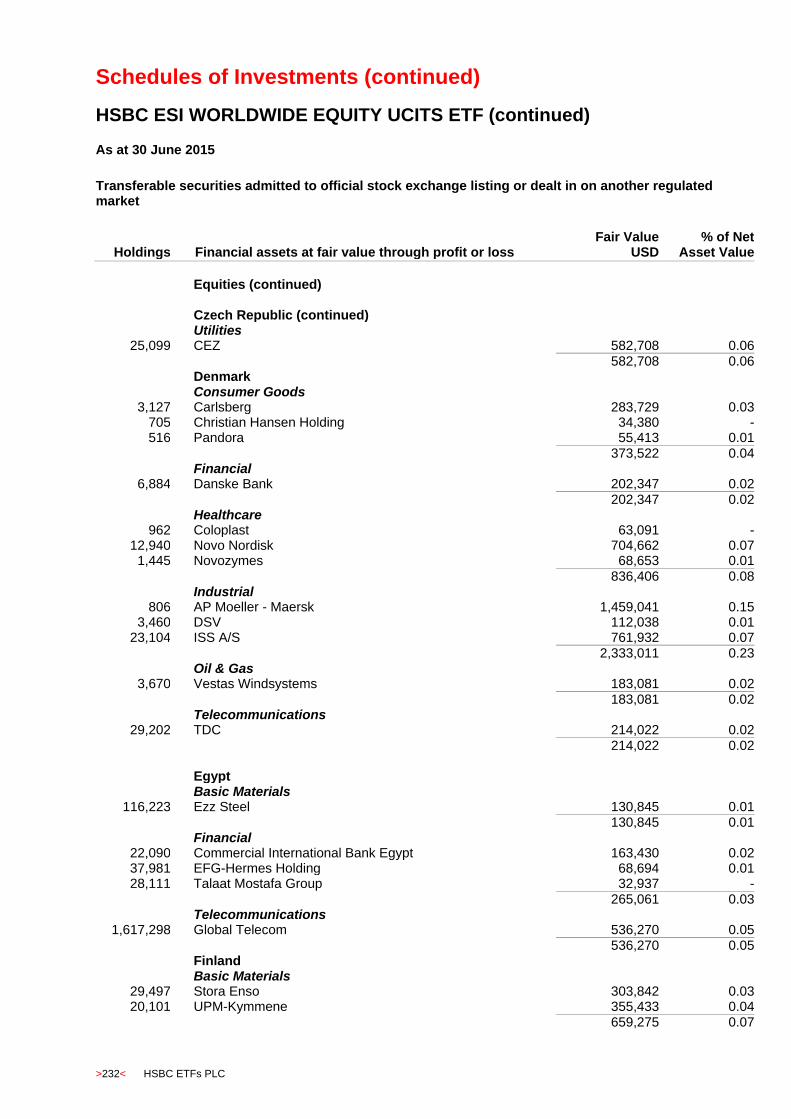
Schedules of Investments (continued)
HSBC ESI WORLDWIDE EQUITY UCITS ETF (continued)
>232< HSBC ETFs PLC
As at 30 June 2015
Transferable securities admitted to official stock exchange listing or dealt in on another regulated market
Holdings
Financial assets at fair value through profit or loss Fair Value
USD % of Net
Asset Value
Equities (continued)
Czech Republic (continued) Utilities
25,099 CEZ 582,708 0.06
582,708 0.06 Denmark Consumer Goods
3,127 Carlsberg 283,729 0.03 705 Christian Hansen Holding 34,380 - 516 Pandora 55,413 0.01
373,522 0.04 Financial
6,884 Danske Bank 202,347 0.02
202,347 0.02 Healthcare
962 Coloplast 63,091 - 12,940 Novo Nordisk 704,662 0.07
1,445 Novozymes 68,653 0.01
836,406 0.08 Industrial
806 AP Moeller - Maersk 1,459,041 0.15 3,460 DSV 112,038 0.01
23,104 ISS A/S 761,932 0.07
2,333,011 0.23 Oil & Gas
3,670 Vestas Windsystems 183,081 0.02
183,081 0.02 Telecommunications
29,202 TDC 214,022 0.02
214,022 0.02 Egypt Basic Materials
116,223 Ezz Steel 130,845 0.01 130,845 0.01 Financial
22,090 Commercial International Bank Egypt 163,430 0.02 37,981 EFG-Hermes Holding 68,694 0.01 28,111 Talaat Mostafa Group 32,937 -
265,061 0.03 Telecommunications
1,617,298 Global Telecom 536,270 0.05
536,270 0.05 Finland Basic Materials
29,497 Stora Enso 303,842 0.03 20,101 UPM-Kymmene 355,433 0.04
659,275 0.07

Schedules of Investments (continued)
HSBC ESI WORLDWIDE EQUITY UCITS ETF (continued)
HSBC ETFs PLC >233<
As at 30 June 2015
Transferable securities admitted to official stock exchange listing or dealt in on another regulated market
Holdings
Financial assets at fair value through profit or loss Fair Value
USD % of Net
Asset Value
Equities (continued)
Finland (continued) Financial
3,735 Sampo 175,825 0.02
175,825 0.02 Healthcare
1,674 Orion 58,529 0.01
58,529 0.01 Industrial
7,985 Kone 323,847 0.03 4,198 Wartsilap 196,544 0.02
520,391 0.05 Technology
132,012 Nokia 895,764 0.09
895,764 0.09 Telecommunications
2,735 Elisa 86,636 0.01
86,636 0.01 Utilities
14,927 Fortum 265,109 0.03
265,109 0.03 France Basic Materials
5,171 Air Liquide 653,645 0.07 1,436 Arkema 103,407 0.01
757,052 0.08 Consumer Goods
5,172 Christian Dior 1,009,039 0.10 5,794 Cie Generale des Etablissements Michelin 606,769 0.06 6,807 Danone 439,817 0.05
538 Hermes International 200,573 0.02 6,293 L'Oreal 1,121,866 0.11 6,071 LVMH Moet Hennessy Louis Vuitton 1,063,011 0.11 2,780 Pernod-Ricard 320,898 0.03
73,937 Peugeot 1,519,510 0.15 11,130 Renault 1,158,506 0.12
691 Societe BIC 110,097 0.01 2,103 Valeo 331,206 0.03
7,881,292 0.79 Consumer Services
5,757 Accor 290,382 0.03 44,268 Carrefour 1,416,568 0.14
8,995 Casino Guichard Perrachon 681,010 0.07 2,472 Eutelsat Communications 79,737 0.01 2,293 Kering 409,161 0.04 1,096 Numericable - SFR 58,060 - 7,894 Publicis Groupe 583,317 0.06
10,387 Sodexo 985,805 0.10
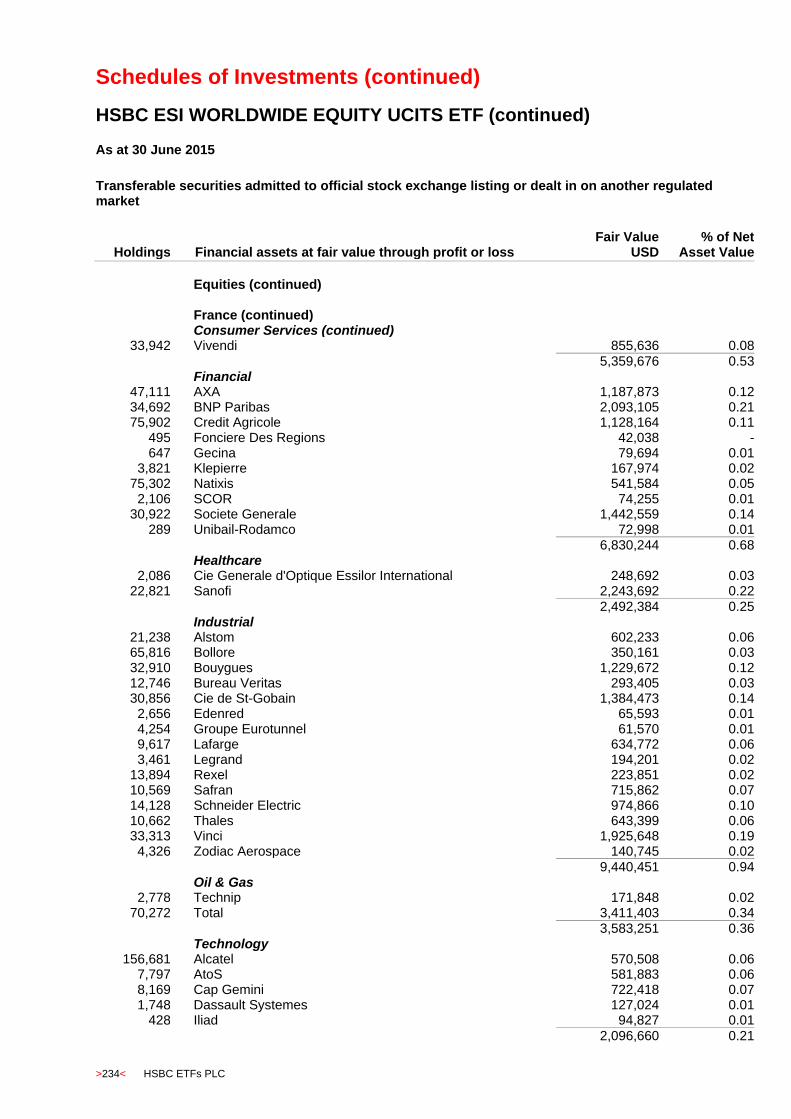
Schedules of Investments (continued)
HSBC ESI WORLDWIDE EQUITY UCITS ETF (continued)
>234< HSBC ETFs PLC
As at 30 June 2015
Transferable securities admitted to official stock exchange listing or dealt in on another regulated market
Holdings
Financial assets at fair value through profit or loss Fair Value
USD % of Net
Asset Value
Equities (continued)
France (continued) Consumer Services (continued)
33,942 Vivendi 855,636 0.08
5,359,676 0.53 Financial
47,111 AXA 1,187,873 0.12 34,692 BNP Paribas 2,093,105 0.21 75,902 Credit Agricole 1,128,164 0.11
495 Fonciere Des Regions 42,038 - 647 Gecina 79,694 0.01
3,821 Klepierre 167,974 0.02 75,302 Natixis 541,584 0.05
2,106 SCOR 74,255 0.01 30,922 Societe Generale 1,442,559 0.14
289 Unibail-Rodamco 72,998 0.01
6,830,244 0.68 Healthcare
2,086 Cie Generale d'Optique Essilor International 248,692 0.03 22,821 Sanofi 2,243,692 0.22
2,492,384 0.25 Industrial
21,238 Alstom 602,233 0.06 65,816 Bollore 350,161 0.03 32,910 Bouygues 1,229,672 0.12 12,746 Bureau Veritas 293,405 0.03 30,856 Cie de St-Gobain 1,384,473 0.14
2,656 Edenred 65,593 0.01 4,254 Groupe Eurotunnel 61,570 0.01 9,617 Lafarge 634,772 0.06 3,461 Legrand 194,201 0.02
13,894 Rexel 223,851 0.02 10,569 Safran 715,862 0.07 14,128 Schneider Electric 974,866 0.10 10,662 Thales 643,399 0.06 33,313 Vinci 1,925,648 0.19
4,326 Zodiac Aerospace 140,745 0.02
9,440,451 0.94 Oil & Gas
2,778 Technip 171,848 0.02 70,272 Total 3,411,403 0.34
3,583,251 0.36 Technology
156,681 Alcatel 570,508 0.06 7,797 AtoS 581,883 0.06 8,169 Cap Gemini 722,418 0.07 1,748 Dassault Systemes 127,024 0.01
428 Iliad 94,827 0.01
2,096,660 0.21
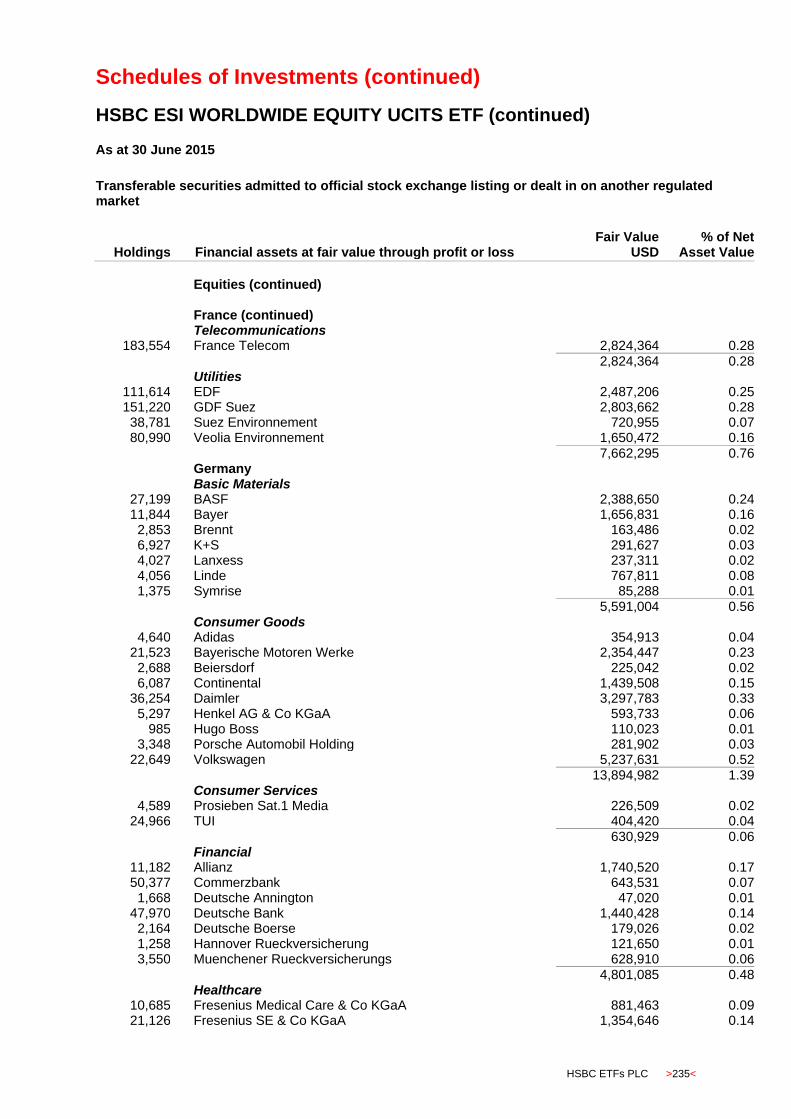
Schedules of Investments (continued)
HSBC ESI WORLDWIDE EQUITY UCITS ETF (continued)
HSBC ETFs PLC >235<
As at 30 June 2015
Transferable securities admitted to official stock exchange listing or dealt in on another regulated market
Holdings
Financial assets at fair value through profit or loss Fair Value
USD % of Net
Asset Value
Equities (continued)
France (continued) Telecommunications
183,554 France Telecom 2,824,364 0.28
2,824,364 0.28 Utilities
111,614 EDF 2,487,206 0.25 151,220 GDF Suez 2,803,662 0.28 38,781 Suez Environnement 720,955 0.07 80,990 Veolia Environnement 1,650,472 0.16
7,662,295 0.76 Germany
Basic Materials 27,199 BASF 2,388,650 0.24 11,844 Bayer 1,656,831 0.16
2,853 Brennt 163,486 0.02 6,927 K+S 291,627 0.03 4,027 Lanxess 237,311 0.02 4,056 Linde 767,811 0.08 1,375 Symrise 85,288 0.01
5,591,004 0.56 Consumer Goods
4,640 Adidas 354,913 0.04 21,523 Bayerische Motoren Werke 2,354,447 0.23
2,688 Beiersdorf 225,042 0.02 6,087 Continental 1,439,508 0.15
36,254 Daimler 3,297,783 0.33 5,297 Henkel AG & Co KGaA 593,733 0.06
985 Hugo Boss 110,023 0.01 3,348 Porsche Automobil Holding 281,902 0.03
22,649 Volkswagen 5,237,631 0.52
13,894,982 1.39 Consumer Services
4,589 Prosieben Sat.1 Media 226,509 0.02 24,966 TUI 404,420 0.04
630,929 0.06 Financial
11,182 Allianz 1,740,520 0.17 50,377 Commerzbank 643,531 0.07
1,668 Deutsche Annington 47,020 0.01 47,970 Deutsche Bank 1,440,428 0.14
2,164 Deutsche Boerse 179,026 0.02 1,258 Hannover Rueckversicherung 121,650 0.01 3,550 Muenchener Rueckversicherungs 628,910 0.06
4,801,085 0.48 Healthcare
10,685 Fresenius Medical Care & Co KGaA 881,463 0.09 21,126 Fresenius SE & Co KGaA 1,354,646 0.14
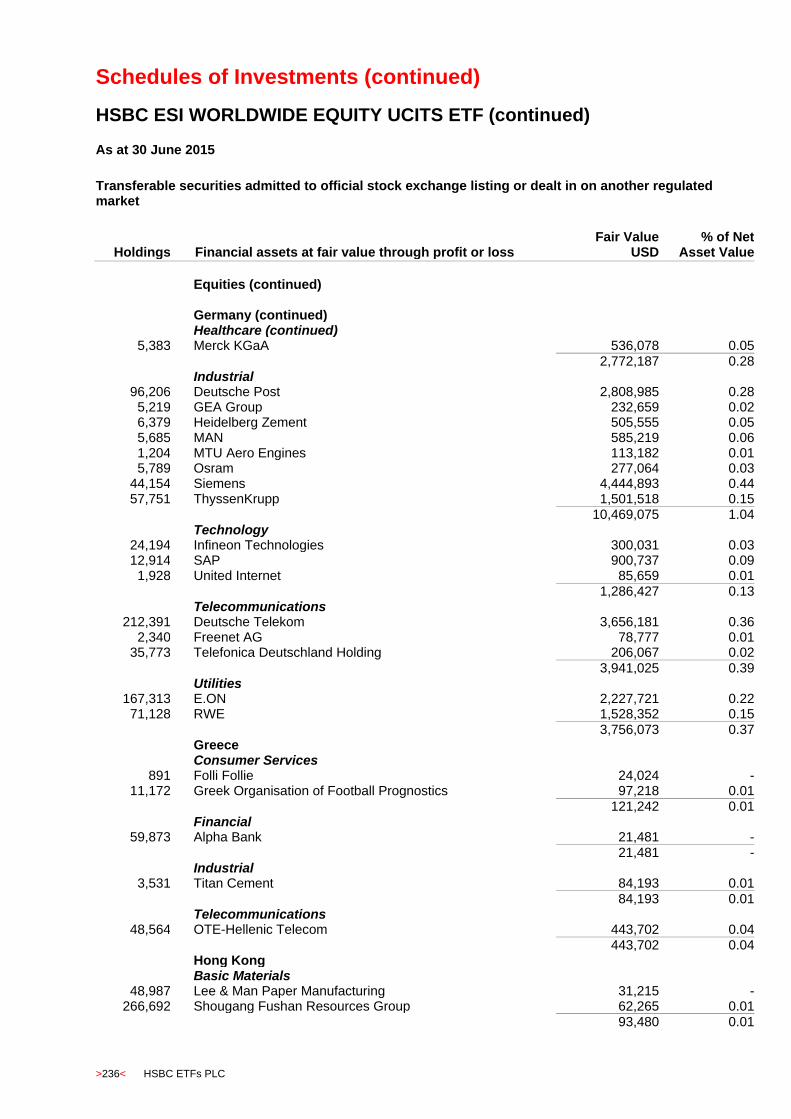
Schedules of Investments (continued)
HSBC ESI WORLDWIDE EQUITY UCITS ETF (continued)
>236< HSBC ETFs PLC
As at 30 June 2015
Transferable securities admitted to official stock exchange listing or dealt in on another regulated market
Holdings
Financial assets at fair value through profit or loss Fair Value
USD % of Net
Asset Value
Equities (continued)
Germany (continued) Healthcare (continued)
5,383 Merck KGaA 536,078 0.05
2,772,187 0.28 Industrial
96,206 Deutsche Post 2,808,985 0.28 5,219 GEA Group 232,659 0.02 6,379 Heidelberg Zement 505,555 0.05 5,685 MAN 585,219 0.06 1,204 MTU Aero Engines 113,182 0.01 5,789 Osram 277,064 0.03
44,154 Siemens 4,444,893 0.44 57,751 ThyssenKrupp 1,501,518 0.15
10,469,075 1.04 Technology
24,194 Infineon Technologies 300,031 0.03 12,914 SAP 900,737 0.09
1,928 United Internet 85,659 0.01
1,286,427 0.13 Telecommunications
212,391 Deutsche Telekom 3,656,181 0.36 2,340 Freenet AG 78,777 0.01
35,773 Telefonica Deutschland Holding 206,067 0.02
3,941,025 0.39 Utilities
167,313 E.ON 2,227,721 0.22 71,128 RWE 1,528,352 0.15
3,756,073 0.37 Greece Consumer Services
891 Folli Follie 24,024 - 11,172 Greek Organisation of Football Prognostics 97,218 0.01
121,242 0.01 Financial
59,873 Alpha Bank 21,481 - 21,481 - Industrial
3,531 Titan Cement 84,193 0.01
84,193 0.01 Telecommunications
48,564 OTE-Hellenic Telecom 443,702 0.04
443,702 0.04 Hong Kong Basic Materials
48,987 Lee & Man Paper Manufacturing 31,215 - 266,692 Shougang Fushan Resources Group 62,265 0.01
93,480 0.01
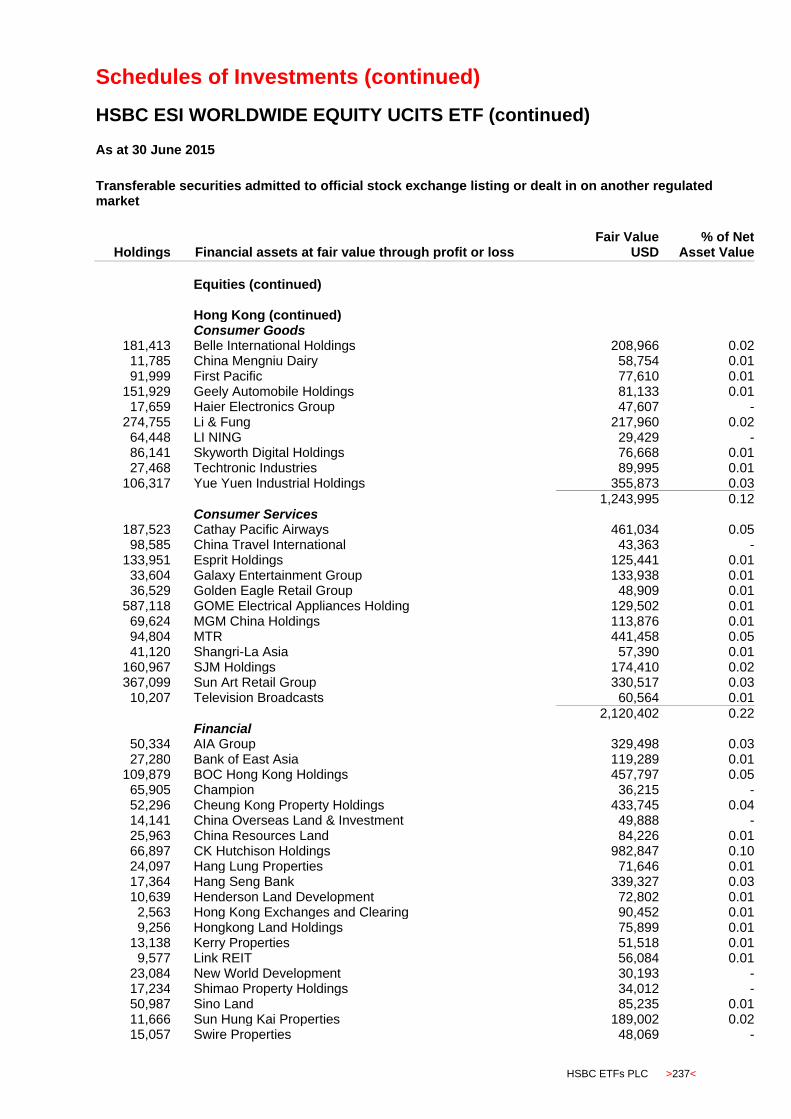
Schedules of Investments (continued)
HSBC ESI WORLDWIDE EQUITY UCITS ETF (continued)
HSBC ETFs PLC >237<
As at 30 June 2015
Transferable securities admitted to official stock exchange listing or dealt in on another regulated market
Holdings
Financial assets at fair value through profit or loss Fair Value
USD % of Net
Asset Value
Equities (continued)
Hong Kong (continued) Consumer Goods
181,413 Belle International Holdings 208,966 0.02 11,785 China Mengniu Dairy 58,754 0.01 91,999 First Pacific 77,610 0.01
151,929 Geely Automobile Holdings 81,133 0.01 17,659 Haier Electronics Group 47,607 -
274,755 Li & Fung 217,960 0.02 64,448 LI NING 29,429 - 86,141 Skyworth Digital Holdings 76,668 0.01 27,468 Techtronic Industries 89,995 0.01
106,317 Yue Yuen Industrial Holdings 355,873 0.03
1,243,995 0.12 Consumer Services
187,523 Cathay Pacific Airways 461,034 0.05 98,585 China Travel International 43,363 -
133,951 Esprit Holdings 125,441 0.01 33,604 Galaxy Entertainment Group 133,938 0.01 36,529 Golden Eagle Retail Group 48,909 0.01
587,118 GOME Electrical Appliances Holding 129,502 0.01 69,624 MGM China Holdings 113,876 0.01 94,804 MTR 441,458 0.05 41,120 Shangri-La Asia 57,390 0.01
160,967 SJM Holdings 174,410 0.02 367,099 Sun Art Retail Group 330,517 0.03 10,207 Television Broadcasts 60,564 0.01
2,120,402 0.22 Financial
50,334 AIA Group 329,498 0.03 27,280 Bank of East Asia 119,289 0.01
109,879 BOC Hong Kong Holdings 457,797 0.05 65,905 Champion 36,215 - 52,296 Cheung Kong Property Holdings 433,745 0.04 14,141 China Overseas Land & Investment 49,888 - 25,963 China Resources Land 84,226 0.01 66,897 CK Hutchison Holdings 982,847 0.10 24,097 Hang Lung Properties 71,646 0.01 17,364 Hang Seng Bank 339,327 0.03 10,639 Henderson Land Development 72,802 0.01
2,563 Hong Kong Exchanges and Clearing 90,452 0.01 9,256 Hongkong Land Holdings 75,899 0.01
13,138 Kerry Properties 51,518 0.01 9,577 Link REIT 56,084 0.01
23,084 New World Development 30,193 - 17,234 Shimao Property Holdings 34,012 - 50,987 Sino Land 85,235 0.01 11,666 Sun Hung Kai Properties 189,002 0.02 15,057 Swire Properties 48,069 -
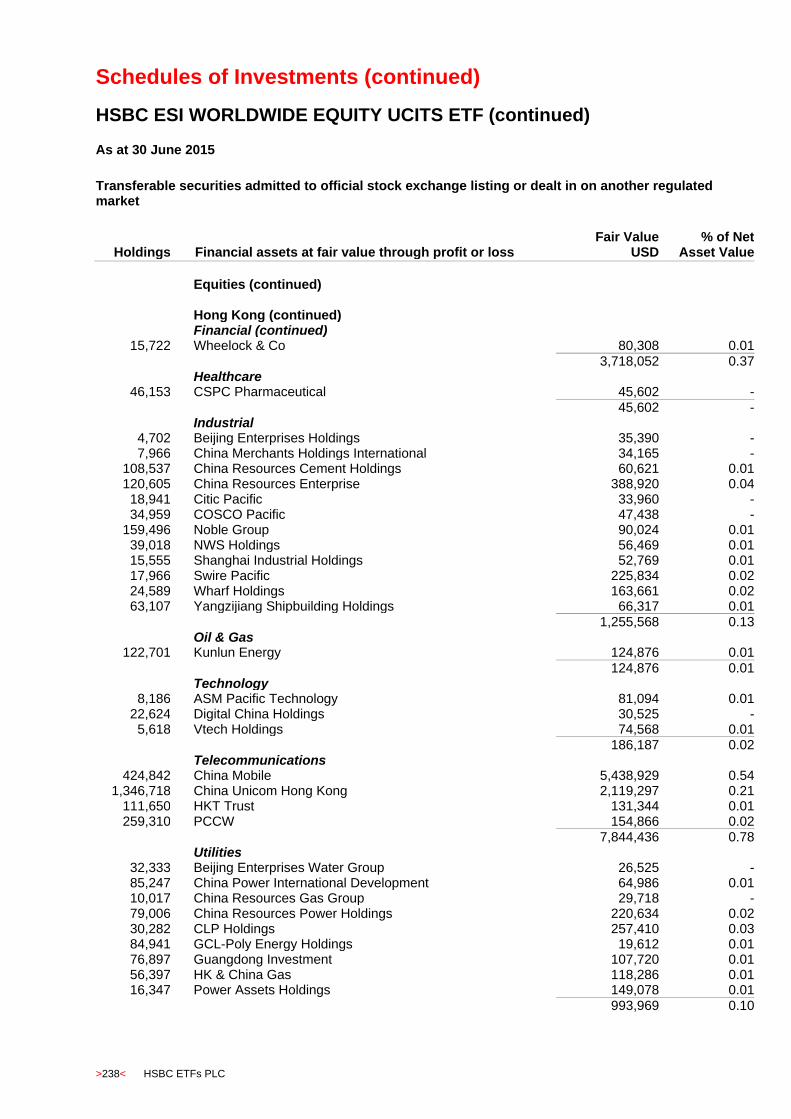
Schedules of Investments (continued)
HSBC ESI WORLDWIDE EQUITY UCITS ETF (continued)
>238< HSBC ETFs PLC
As at 30 June 2015
Transferable securities admitted to official stock exchange listing or dealt in on another regulated market
Holdings
Financial assets at fair value through profit or loss Fair Value
USD % of Net
Asset Value
Equities (continued)
Hong Kong (continued) Financial (continued)
15,722 Wheelock & Co 80,308 0.01
3,718,052 0.37 Healthcare
46,153 CSPC Pharmaceutical 45,602 -
45,602 - Industrial
4,702 Beijing Enterprises Holdings 35,390 - 7,966 China Merchants Holdings International 34,165 -
108,537 China Resources Cement Holdings 60,621 0.01 120,605 China Resources Enterprise 388,920 0.04 18,941 Citic Pacific 33,960 - 34,959 COSCO Pacific 47,438 -
159,496 Noble Group 90,024 0.01 39,018 NWS Holdings 56,469 0.01 15,555 Shanghai Industrial Holdings 52,769 0.01 17,966 Swire Pacific 225,834 0.02 24,589 Wharf Holdings 163,661 0.02 63,107 Yangzijiang Shipbuilding Holdings 66,317 0.01
1,255,568 0.13 Oil & Gas
122,701 Kunlun Energy 124,876 0.01
124,876 0.01 Technology
8,186 ASM Pacific Technology 81,094 0.01 22,624 Digital China Holdings 30,525 -
5,618 Vtech Holdings 74,568 0.01
186,187 0.02 Telecommunications
424,842 China Mobile 5,438,929 0.54 1,346,718 China Unicom Hong Kong 2,119,297 0.21
111,650 HKT Trust 131,344 0.01 259,310 PCCW 154,866 0.02
7,844,436 0.78 Utilities
32,333 Beijing Enterprises Water Group 26,525 - 85,247 China Power International Development 64,986 0.01 10,017 China Resources Gas Group 29,718 - 79,006 China Resources Power Holdings 220,634 0.02 30,282 CLP Holdings 257,410 0.03 84,941 GCL-Poly Energy Holdings 19,612 0.01 76,897 Guangdong Investment 107,720 0.01 56,397 HK & China Gas 118,286 0.01 16,347 Power Assets Holdings 149,078 0.01
993,969 0.10

Schedules of Investments (continued)
HSBC ESI WORLDWIDE EQUITY UCITS ETF (continued)
HSBC ETFs PLC >239<
As at 30 June 2015
Transferable securities admitted to official stock exchange listing or dealt in on another regulated market
Holdings
Financial assets at fair value through profit or loss Fair Value
USD % of Net
Asset Value
Equities (continued)
Hungary Financial
10,985 OTP Bank 217,405 0.02
217,405 0.02 Healthcare
2,857 Richter Gedeon 42,912 -
42,912 - Oil & Gas
12,580 MOL Hungarian Oil and Gas 643,768 0.06
643,768 0.06 India Basic Materials
354,152 Tata Steel 1,730,033 0.17
1,730,033 0.17 Financial
8,416 HDFC Bank 509,421 0.05 76,478 ICICI Bank 796,901 0.08
1,306,322 0.13 Healthcare
1,206 Dr Reddy's Laboratories 66,716 0.01
66,716 0.01 Industrial
18,813 Mahindra & Mahindra 381,904 0.04 35,071 Tata Motors 1,208,897 0.12
1,590,801 0.16 Oil & Gas
41,545 Reliance Industries 1,294,127 0.13 1,294,127 0.13 Indonesia Basic Materials
2,774,384 Adaro Energy 158,150 0.02
158,150 0.02 Consumer Goods
1,040,690 Astra International 552,251 0.05 110,770 Charoen Pokphand Indonesia 22,848 - 55,805 Gudang Garam 188,772 0.02 59,569 Indofood CBP Sukses Makmur 55,738 0.01
198,085 Indofood Sukses Makmur 97,687 0.01 71,623 Unilever Indonesia 212,196 0.02
1,129,492 0.11 Consumer Services
40,089 Matahari Department Store 49,764 - 317,380 Media Nusantara Citra 46,182 - 211,622 Surya Citra Media 45,634 -
141,580 - Financial
363,631 Bank Central Asia 368,199 0.04 591,360 Bank Mandiri 445,766 0.04
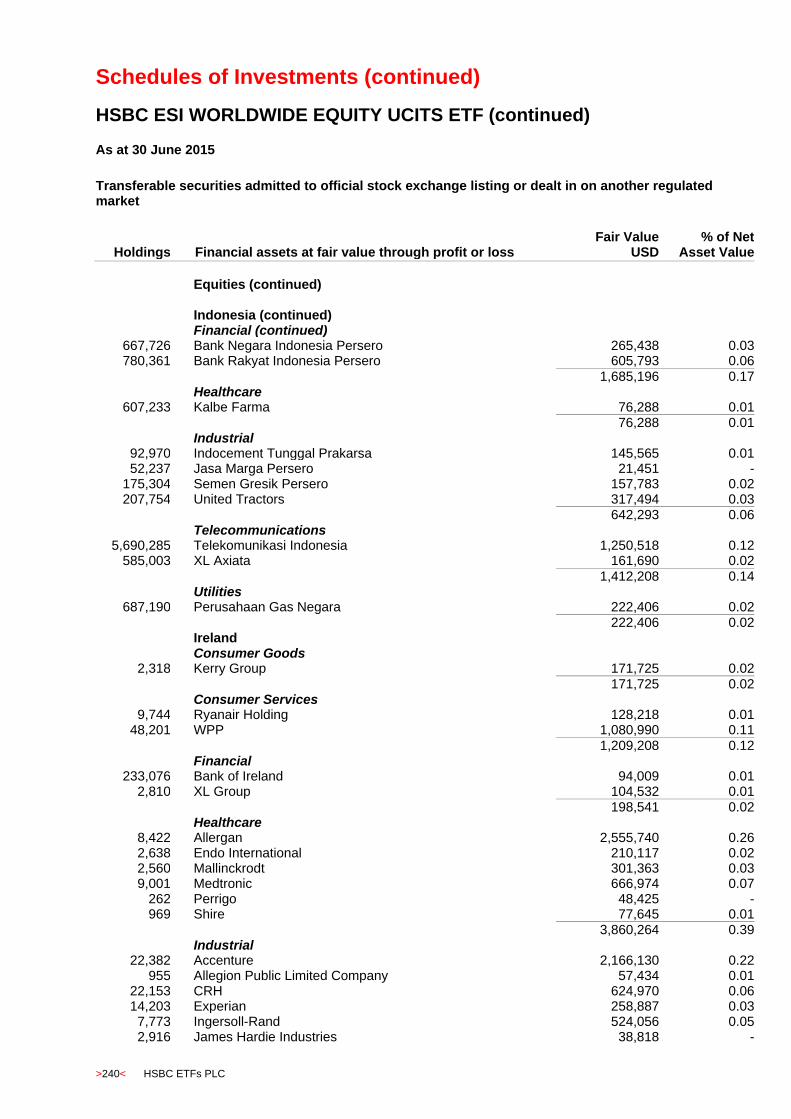
Schedules of Investments (continued)
HSBC ESI WORLDWIDE EQUITY UCITS ETF (continued)
>240< HSBC ETFs PLC
As at 30 June 2015
Transferable securities admitted to official stock exchange listing or dealt in on another regulated market
Holdings
Financial assets at fair value through profit or loss Fair Value
USD % of Net
Asset Value
Equities (continued)
Indonesia (continued) Financial (continued)
667,726 Bank Negara Indonesia Persero 265,438 0.03 780,361 Bank Rakyat Indonesia Persero 605,793 0.06
1,685,196 0.17 Healthcare
607,233 Kalbe Farma 76,288 0.01 76,288 0.01 Industrial
92,970 Indocement Tunggal Prakarsa 145,565 0.01 52,237 Jasa Marga Persero 21,451 -
175,304 Semen Gresik Persero 157,783 0.02 207,754 United Tractors 317,494 0.03
642,293 0.06 Telecommunications
5,690,285 Telekomunikasi Indonesia 1,250,518 0.12 585,003 XL Axiata 161,690 0.02
1,412,208 0.14 Utilities
687,190 Perusahaan Gas Negara 222,406 0.02 222,406 0.02 Ireland Consumer Goods
2,318 Kerry Group 171,725 0.02
171,725 0.02 Consumer Services
9,744 Ryanair Holding 128,218 0.01 48,201 WPP 1,080,990 0.11
1,209,208 0.12 Financial
233,076 Bank of Ireland 94,009 0.01 2,810 XL Group 104,532 0.01
198,541 0.02 Healthcare
8,422 Allergan 2,555,740 0.26 2,638 Endo International 210,117 0.02 2,560 Mallinckrodt 301,363 0.03 9,001 Medtronic 666,974 0.07
262 Perrigo 48,425 - 969 Shire 77,645 0.01
3,860,264 0.39 Industrial
22,382 Accenture 2,166,130 0.22 955 Allegion Public Limited Company 57,434 0.01
22,153 CRH 624,970 0.06 14,203 Experian 258,887 0.03
7,773 Ingersoll-Rand 524,056 0.05 2,916 James Hardie Industries 38,818 -
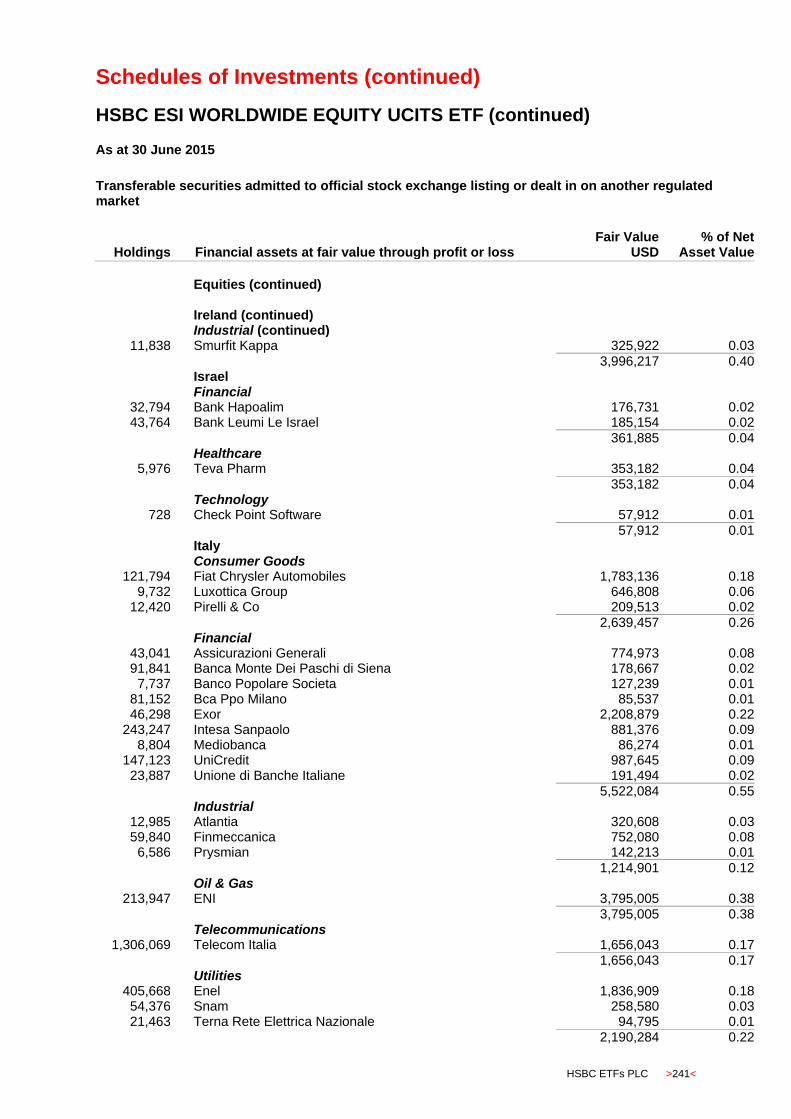
Schedules of Investments (continued)
HSBC ESI WORLDWIDE EQUITY UCITS ETF (continued)
HSBC ETFs PLC >241<
As at 30 June 2015
Transferable securities admitted to official stock exchange listing or dealt in on another regulated market
Holdings
Financial assets at fair value through profit or loss Fair Value
USD % of Net
Asset Value
Equities (continued)
Ireland (continued) Industrial (continued)
11,838 Smurfit Kappa 325,922 0.03
3,996,217 0.40 Israel Financial
32,794 Bank Hapoalim 176,731 0.02 43,764 Bank Leumi Le Israel 185,154 0.02
361,885 0.04 Healthcare
5,976 Teva Pharm 353,182 0.04
353,182 0.04 Technology
728 Check Point Software 57,912 0.01
57,912 0.01 Italy Consumer Goods
121,794 Fiat Chrysler Automobiles 1,783,136 0.18 9,732 Luxottica Group 646,808 0.06
12,420 Pirelli & Co 209,513 0.02 2,639,457 0.26 Financial
43,041 Assicurazioni Generali 774,973 0.08 91,841 Banca Monte Dei Paschi di Siena 178,667 0.02
7,737 Banco Popolare Societa 127,239 0.01 81,152 Bca Ppo Milano 85,537 0.01 46,298 Exor 2,208,879 0.22
243,247 Intesa Sanpaolo 881,376 0.09 8,804 Mediobanca 86,274 0.01
147,123 UniCredit 987,645 0.09 23,887 Unione di Banche Italiane 191,494 0.02
5,522,084 0.55 Industrial
12,985 Atlantia 320,608 0.03 59,840 Finmeccanica 752,080 0.08
6,586 Prysmian 142,213 0.01
1,214,901 0.12 Oil & Gas
213,947 ENI 3,795,005 0.38
3,795,005 0.38 Telecommunications
1,306,069 Telecom Italia 1,656,043 0.17 1,656,043 0.17 Utilities
405,668 Enel 1,836,909 0.18 54,376 Snam 258,580 0.03 21,463 Terna Rete Elettrica Nazionale 94,795 0.01
2,190,284 0.22
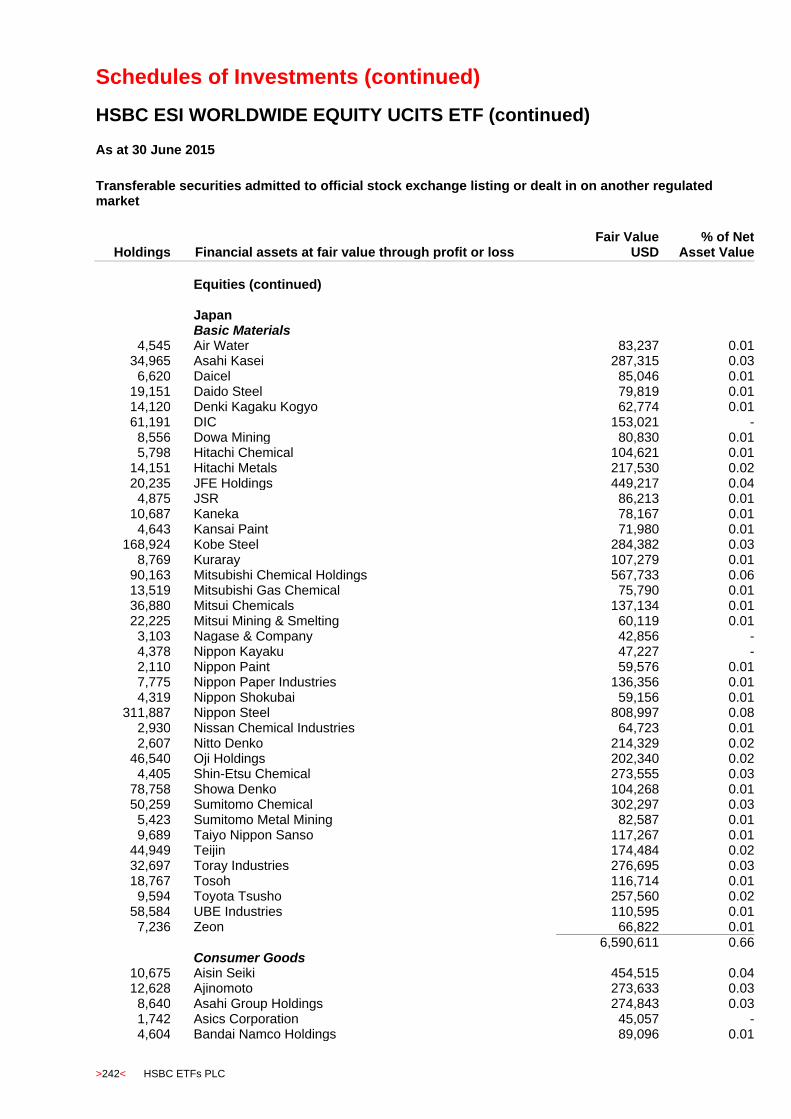
Schedules of Investments (continued)
HSBC ESI WORLDWIDE EQUITY UCITS ETF (continued)
>242< HSBC ETFs PLC
As at 30 June 2015
Transferable securities admitted to official stock exchange listing or dealt in on another regulated market
Holdings
Financial assets at fair value through profit or loss Fair Value
USD % of Net
Asset Value
Equities (continued)
Japan Basic Materials
4,545 Air Water 83,237 0.01 34,965 Asahi Kasei 287,315 0.03
6,620 Daicel 85,046 0.01 19,151 Daido Steel 79,819 0.01 14,120 Denki Kagaku Kogyo 62,774 0.01 61,191 DIC 153,021 -
8,556 Dowa Mining 80,830 0.01 5,798 Hitachi Chemical 104,621 0.01
14,151 Hitachi Metals 217,530 0.02 20,235 JFE Holdings 449,217 0.04
4,875 JSR 86,213 0.01 10,687 Kaneka 78,167 0.01
4,643 Kansai Paint 71,980 0.01 168,924 Kobe Steel 284,382 0.03
8,769 Kuraray 107,279 0.01 90,163 Mitsubishi Chemical Holdings 567,733 0.06 13,519 Mitsubishi Gas Chemical 75,790 0.01 36,880 Mitsui Chemicals 137,134 0.01 22,225 Mitsui Mining & Smelting 60,119 0.01
3,103 Nagase & Company 42,856 - 4,378 Nippon Kayaku 47,227 - 2,110 Nippon Paint 59,576 0.01 7,775 Nippon Paper Industries 136,356 0.01 4,319 Nippon Shokubai 59,156 0.01
311,887 Nippon Steel 808,997 0.08 2,930 Nissan Chemical Industries 64,723 0.01 2,607 Nitto Denko 214,329 0.02
46,540 Oji Holdings 202,340 0.02 4,405 Shin-Etsu Chemical 273,555 0.03
78,758 Showa Denko 104,268 0.01 50,259 Sumitomo Chemical 302,297 0.03
5,423 Sumitomo Metal Mining 82,587 0.01 9,689 Taiyo Nippon Sanso 117,267 0.01
44,949 Teijin 174,484 0.02 32,697 Toray Industries 276,695 0.03 18,767 Tosoh 116,714 0.01
9,594 Toyota Tsusho 257,560 0.02 58,584 UBE Industries 110,595 0.01
7,236 Zeon 66,822 0.01 6,590,611 0.66 Consumer Goods
10,675 Aisin Seiki 454,515 0.04 12,628 Ajinomoto 273,633 0.03
8,640 Asahi Group Holdings 274,843 0.03 1,742 Asics Corporation 45,057 - 4,604 Bandai Namco Holdings 89,096 0.01

Schedules of Investments (continued)
HSBC ESI WORLDWIDE EQUITY UCITS ETF (continued)
HSBC ETFs PLC >243<
As at 30 June 2015
Transferable securities admitted to official stock exchange listing or dealt in on another regulated market
Holdings
Financial assets at fair value through profit or loss Fair Value
USD % of Net
Asset Value
Equities (continued)
Japan (continued) Consumer Goods (continued)
23,533 Bridgestone 870,720 0.09 1,082 Calbee 45,627 - 4,494 Casio Computer 88,731 0.01
13,880 Citizen Holdings 96,870 0.01 24,294 Daihatsu Motor 346,050 0.03 13,056 Daiwa House Industry 304,407 0.03 16,023 Denso 798,236 0.08
959 Ezaki Glico 47,650 - 5,692 Fuji Heavy Industries 209,697 0.02
19,053 GS Yuasa 74,895 0.01 60,982 Honda Motor 1,974,259 0.20
2,545 House Foods 48,419 - 6,387 Iida Group Holdings 101,783 0.01 3,371 ITO 70,745 0.01
27,151 Japan Tobacco 967,531 0.10 10,822 JTEKT 205,005 0.02
8,270 Kao 384,760 0.04 3,443 Kewpie 72,931 0.01 2,541 Kikkoman 79,429 0.01
34,300 Kirin Holdings 472,601 0.05 2,501 Koito Manufacturing 97,596 0.01 3,764 Konami 70,011 0.01
20,904 Konica Minolta Holdings 244,121 0.02 864 Kose 71,032 0.01
6,699 Lion 53,706 - 2,284 Makita 123,939 0.01
10,912 Mazda Motor 213,844 0.02 1,215 Meiji Holdings 156,883 0.02
24,946 Mitsubishi Motors 212,428 0.02 2,398 NGK Spark Plug 66,532 0.01 8,404 NHK Spring 92,649 0.01
10,830 Nichirei 74,787 0.01 779 Nifco 33,805 -
14,547 Nikon 168,337 0.02 1,040 Nintendo 173,978 0.02 7,478 Nippon Meat Packers 170,748 0.02
143,024 Nissan Motor 1,490,259 0.15 4,691 Nisshin Seifun 62,411 0.01 9,682 Nisshinbo Industries 108,321 0.01 1,842 Nissin Food Products 80,836 0.01 6,398 NOK 198,688 0.02
204,184 Panasonic 2,805,830 0.28 783 Rinnai 61,749 0.01
17,183 Sapporo Breweries 63,893 0.01 6,793 Sega Sammy Holdings 88,823 0.01
17,167 Sekisui Chemical 210,861 0.02
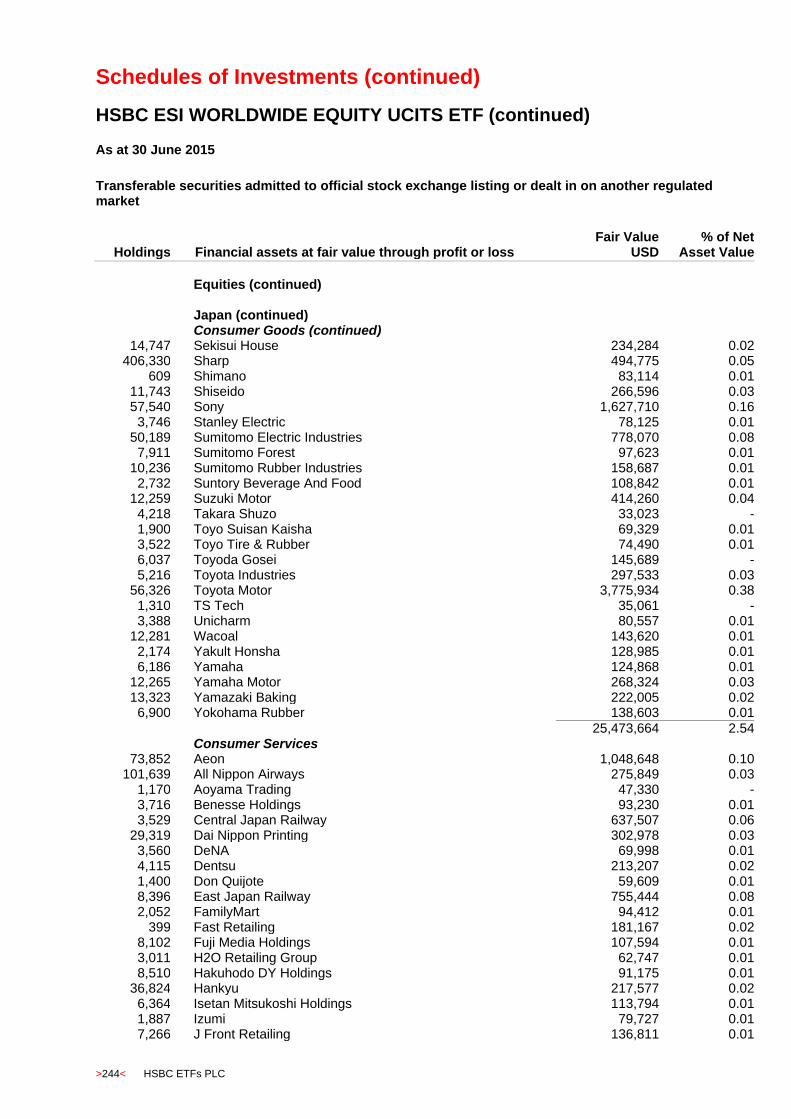
Schedules of Investments (continued)
HSBC ESI WORLDWIDE EQUITY UCITS ETF (continued)
>244< HSBC ETFs PLC
As at 30 June 2015
Transferable securities admitted to official stock exchange listing or dealt in on another regulated market
Holdings
Financial assets at fair value through profit or loss Fair Value
USD % of Net
Asset Value
Equities (continued)
Japan (continued) Consumer Goods (continued)
14,747 Sekisui House 234,284 0.02 406,330 Sharp 494,775 0.05
609 Shimano 83,114 0.01 11,743 Shiseido 266,596 0.03 57,540 Sony 1,627,710 0.16
3,746 Stanley Electric 78,125 0.01 50,189 Sumitomo Electric Industries 778,070 0.08
7,911 Sumitomo Forest 97,623 0.01 10,236 Sumitomo Rubber Industries 158,687 0.01
2,732 Suntory Beverage And Food 108,842 0.01 12,259 Suzuki Motor 414,260 0.04
4,218 Takara Shuzo 33,023 - 1,900 Toyo Suisan Kaisha 69,329 0.01 3,522 Toyo Tire & Rubber 74,490 0.01 6,037 Toyoda Gosei 145,689 - 5,216 Toyota Industries 297,533 0.03
56,326 Toyota Motor 3,775,934 0.38 1,310 TS Tech 35,061 - 3,388 Unicharm 80,557 0.01
12,281 Wacoal 143,620 0.01 2,174 Yakult Honsha 128,985 0.01 6,186 Yamaha 124,868 0.01
12,265 Yamaha Motor 268,324 0.03 13,323 Yamazaki Baking 222,005 0.02
6,900 Yokohama Rubber 138,603 0.01
25,473,664 2.54 Consumer Services
73,852 Aeon 1,048,648 0.10 101,639 All Nippon Airways 275,849 0.03
1,170 Aoyama Trading 47,330 - 3,716 Benesse Holdings 93,230 0.01 3,529 Central Japan Railway 637,507 0.06
29,319 Dai Nippon Printing 302,978 0.03 3,560 DeNA 69,998 0.01 4,115 Dentsu 213,207 0.02 1,400 Don Quijote 59,609 0.01 8,396 East Japan Railway 755,444 0.08 2,052 FamilyMart 94,412 0.01
399 Fast Retailing 181,167 0.02 8,102 Fuji Media Holdings 107,594 0.01 3,011 H2O Retailing Group 62,747 0.01 8,510 Hakuhodo DY Holdings 91,175 0.01
36,824 Hankyu 217,577 0.02 6,364 Isetan Mitsukoshi Holdings 113,794 0.01 1,887 Izumi 79,727 0.01 7,266 J Front Retailing 136,811 0.01

Schedules of Investments (continued)
HSBC ESI WORLDWIDE EQUITY UCITS ETF (continued)
HSBC ETFs PLC >245<
As at 30 June 2015
Transferable securities admitted to official stock exchange listing or dealt in on another regulated market
Holdings
Financial assets at fair value through profit or loss Fair Value
USD % of Net
Asset Value
Equities (continued)
Japan (continued) Consumer Services (continued)
8,347 Japan Airlines 291,274 0.03 10,763 Keihan Electric Railway 62,714 0.01
9,773 Keikyu 73,798 0.01 12,075 Keio 86,444 0.01
6,671 Keisei Electric Railway 79,377 0.01 50,077 Kintetsu 170,654 0.02
2,295 K's Holdings 82,711 0.01 2,047 Lawson 140,186 0.01 2,830 Marui 38,253 - 1,385 Matsumotokiyoshi 63,950 0.01
44,218 Nagoya Railroad 165,504 0.02 15,451 Nankai Electric Railway 69,448 0.01
3,642 Nippon Television Holdings 64,438 0.01 20,566 Nishi-Nippon Railroad 94,456 0.01
1,178 Nitori Holdings 96,077 0.01 17,147 Odakyu Electric Railway 160,169 0.02
2,300 Oriental Land 146,892 0.01 1,530 Park24 26,220 - 7,154 Rakuten 115,613 0.01
232 Ryohin Keikaku 45,010 - 1,216 Sankyo 43,079 - 3,178 Seibu Holdings 73,655 0.01
17,403 Seven & I Holdings 748,088 0.07 707 Shimamura 74,302 0.01
13,086 Sotetsu Holdings 68,229 0.01 1,548 Start Today 43,329 -
652 Sugi Holdings 33,302 - 829 Sundrug 49,388 -
10,977 Takashimaya 99,575 0.01 31,238 Tobu Railway 134,280 0.01
2,358 Toho 58,678 0.01 5,996 Tokyo Broadcasting Systems 82,861 0.01
31,196 Tokyu 209,053 0.02 663 Tsuruha Holdings 51,636 -
2,691 USS 48,601 - 6,359 West Japan Railway 407,165 0.04
42,311 Yamada Denki 169,431 0.02
9,056,644 0.90 Financial
9,475 Acom 36,393 - 7 Activia Properties 59,323 0.01
19 Advance Residence Investment 46,566 - 2,953 Aeon Financial Service 82,051 0.01 1,180 Aeon Mall 22,122 -
14,232 Aozora Bank 53,734 0.01 6,030 Bank of Kyoto 69,483 0.01

Schedules of Investments (continued)
HSBC ESI WORLDWIDE EQUITY UCITS ETF (continued)
>246< HSBC ETFs PLC
As at 30 June 2015
Transferable securities admitted to official stock exchange listing or dealt in on another regulated market
Holdings
Financial assets at fair value through profit or loss Fair Value
USD % of Net
Asset Value
Equities (continued)
Japan (continued) Financial (continued)
20,484 Bank of Yokohama 125,651 0.01 12,232 Chiba Bank 93,266 0.01
4,001 Chugoku Bank 63,138 0.01 3,371 Credit Saison 72,288 0.01
32,411 Dai-ichi Life Insurance 637,413 0.06 22 Daiwa House Residential Investment Corporation 49,928 -
30,675 Daiwa Securities Group 229,928 0.02 15 Frontier Real Estate Investment 67,176 0.01
15,730 Fukuoka Financial Group 81,629 0.01 65 GLP J REIT 62,097 0.01
7,461 Gunma Bank 55,120 0.01 9,819 Hachijuni Bank 74,145 0.01 9,863 Hiroshima Bank 59,001 0.01
32,881 Hokuhoku Financial Group 77,658 0.01 8 Industrial & Infrastructure Fund Investment Corporation 36,154 -
4,682 Iyo Bank 57,547 0.01 35 Japan Excellent 40,445 - 20 Japan Logistics Fund 40,240 -
12,106 Joyo Bank 67,868 0.01 6,832 Keiyo Bank 35,956 -
12 Kenedix Realty Investment 60,213 0.01 6,035 Leopalace21 37,039 - 8,611 Mitsubishi Estate 185,534 0.02
213,605 Mitsubishi UFJ Financial Group 1,535,812 0.15 7,868 Mitsubishi UFJ Lease & Finance 43,081 - 5,829 Mitsui Fudosan 163,249 0.02
342,004 Mizuho Financial Group 740,662 0.07 44 Mori Hills Reit 56,957 0.01 30 Mori Trust Sogo 58,276 0.01
13,162 MS&AD Insurance Group Holdings 410,139 0.04 13 Nippon Accommodations Fund 50,251 0.01 67 Nippon Hotel Fund 44,625 - 46 Nippon Prologis REIT 84,733 0.01
22,124 Nishi-Nippon Bank 63,824 0.01 10,588 NKSJ Holdings 388,641 0.04 93,596 Nomura Holding 635,319 0.06
5,478 Nomura Real Estate Holdings 115,053 0.01 40 Nomura Real Estate Master Fund 50,864 0.01
21,698 North Pacific Bank 96,995 0.01 5,090 Okasan Securities Group 35,815 -
14,891 ORIX 221,603 0.02 103,430 Resona Holdings 565,055 0.06
3,214 San-in Godo Bank 31,020 - 2,020 SBI Holdings 27,832 - 6,921 Seven Bank 32,070 - 9,404 Seventy Seven Bank 57,408 0.01

Schedules of Investments (continued)
HSBC ESI WORLDWIDE EQUITY UCITS ETF (continued)
HSBC ETFs PLC >247<
As at 30 June 2015
Transferable securities admitted to official stock exchange listing or dealt in on another regulated market
Holdings
Financial assets at fair value through profit or loss Fair Value
USD % of Net
Asset Value
Equities (continued)
Japan (continued) Financial (continued)
6,304 Shiga Bank 34,002 - 21,947 Shinsei Bank 44,301 -
8,554 Shizuoka Bank 89,409 0.01 6,664 Sony Financial Holdings 116,871 0.01
24,159 Sumitomo Mitsui Financial Group 1,077,792 0.11 70,283 Sumitomo Mitsui Trust Holdings 321,993 0.03
920 Sumitomo Realty & Development 32,281 - 1,985 Suruga Bank 42,615 -
15,747 T&D Holdings 234,857 0.02 4,064 Tokai Tokyo Securities 29,592 -
10,965 Tokio Marine Holdings 456,468 0.05 6,560 Tokyo Tatemono 91,137 0.01
11,604 Tokyu Fudosan Holdings 89,521 0.01 73 United Urban Investment Corporation 103,267 0.01
5,341 Yamaguchi Financial Group 66,563 0.01
11,019,059 1.10 Healthcare
6,263 Alfresa Holdings 97,555 0.01 23,159 Astellas Pharma 330,356 0.03
3,491 Chugai Pharmaceutical 120,537 0.01 16,017 Daiichi Sankyo 296,347 0.03
8,006 Dainippon Sumitomo Pharma 88,261 0.01 3,765 Eisai 252,795 0.03 1,201 Hisamitsu Pharmaceutical 46,670 0.01 1,284 Kaken Pharmaceutical 44,858 -
455 Kobayashi Pharmaceutical 30,937 - 8,669 Kyowa Hakko Kirin 113,424 0.01 7,916 Medipal Holdings 129,189 0.01
977 Miraca Holdings 48,864 0.01 8,057 Mitsubishi Tanabe Pharma 120,824 0.01 1,500 Nihon Kohden 37,143 - 1,205 Nippon Shinyaku 36,928 - 7,950 Olympus 274,821 0.03
534 ONO Pharmaceutical 58,347 0.01 9,596 Otsuka Holdings 306,117 0.03 2,967 Rohto Pharmaceutical 49,028 - 2,500 Santen Pharmaceutical 35,406 - 3,596 Shionogi 139,444 0.02 3,444 Suzuken 110,330 0.01
907 Sysmex Corporation 54,109 0.01 1,496 Taisho Pharmaceutical Holdings 101,107 0.01 9,238 Takeda Pharmaceutical 446,254 0.05 4,698 Terumo 112,761 0.01 3,514 Toho Holdings 80,954 0.01 1,647 Topcon 39,706 -
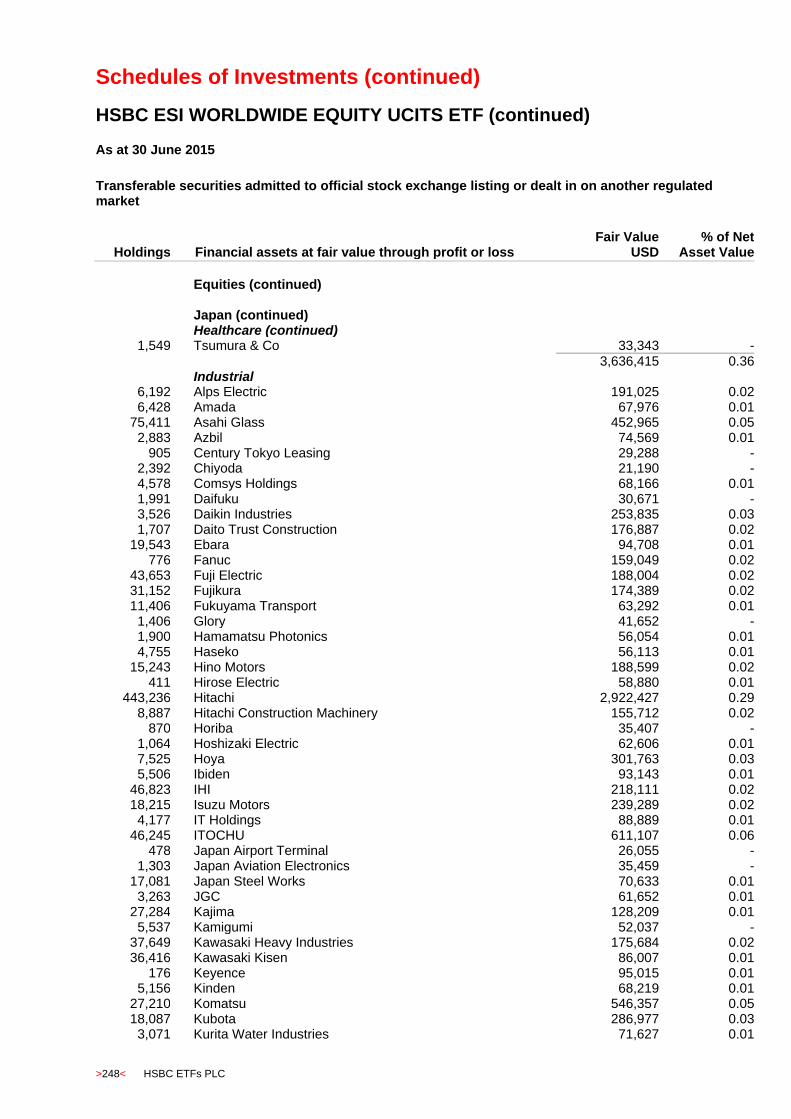
Schedules of Investments (continued)
HSBC ESI WORLDWIDE EQUITY UCITS ETF (continued)
>248< HSBC ETFs PLC
As at 30 June 2015
Transferable securities admitted to official stock exchange listing or dealt in on another regulated market
Holdings
Financial assets at fair value through profit or loss Fair Value
USD % of Net
Asset Value
Equities (continued)
Japan (continued) Healthcare (continued)
1,549 Tsumura & Co 33,343 -
3,636,415 0.36 Industrial
6,192 Alps Electric 191,025 0.02 6,428 Amada 67,976 0.01
75,411 Asahi Glass 452,965 0.05 2,883 Azbil 74,569 0.01
905 Century Tokyo Leasing 29,288 - 2,392 Chiyoda 21,190 - 4,578 Comsys Holdings 68,166 0.01 1,991 Daifuku 30,671 - 3,526 Daikin Industries 253,835 0.03 1,707 Daito Trust Construction 176,887 0.02
19,543 Ebara 94,708 0.01 776 Fanuc 159,049 0.02
43,653 Fuji Electric 188,004 0.02 31,152 Fujikura 174,389 0.02 11,406 Fukuyama Transport 63,292 0.01
1,406 Glory 41,652 - 1,900 Hamamatsu Photonics 56,054 0.01 4,755 Haseko 56,113 0.01
15,243 Hino Motors 188,599 0.02 411 Hirose Electric 58,880 0.01
443,236 Hitachi 2,922,427 0.29 8,887 Hitachi Construction Machinery 155,712 0.02
870 Horiba 35,407 - 1,064 Hoshizaki Electric 62,606 0.01 7,525 Hoya 301,763 0.03 5,506 Ibiden 93,143 0.01
46,823 IHI 218,111 0.02 18,215 Isuzu Motors 239,289 0.02
4,177 IT Holdings 88,889 0.01 46,245 ITOCHU 611,107 0.06
478 Japan Airport Terminal 26,055 - 1,303 Japan Aviation Electronics 35,459 -
17,081 Japan Steel Works 70,633 0.01 3,263 JGC 61,652 0.01
27,284 Kajima 128,209 0.01 5,537 Kamigumi 52,037 -
37,649 Kawasaki Heavy Industries 175,684 0.02 36,416 Kawasaki Kisen 86,007 0.01
176 Keyence 95,015 0.01 5,156 Kinden 68,219 0.01
27,210 Komatsu 546,357 0.05 18,087 Kubota 286,977 0.03
3,071 Kurita Water Industries 71,627 0.01
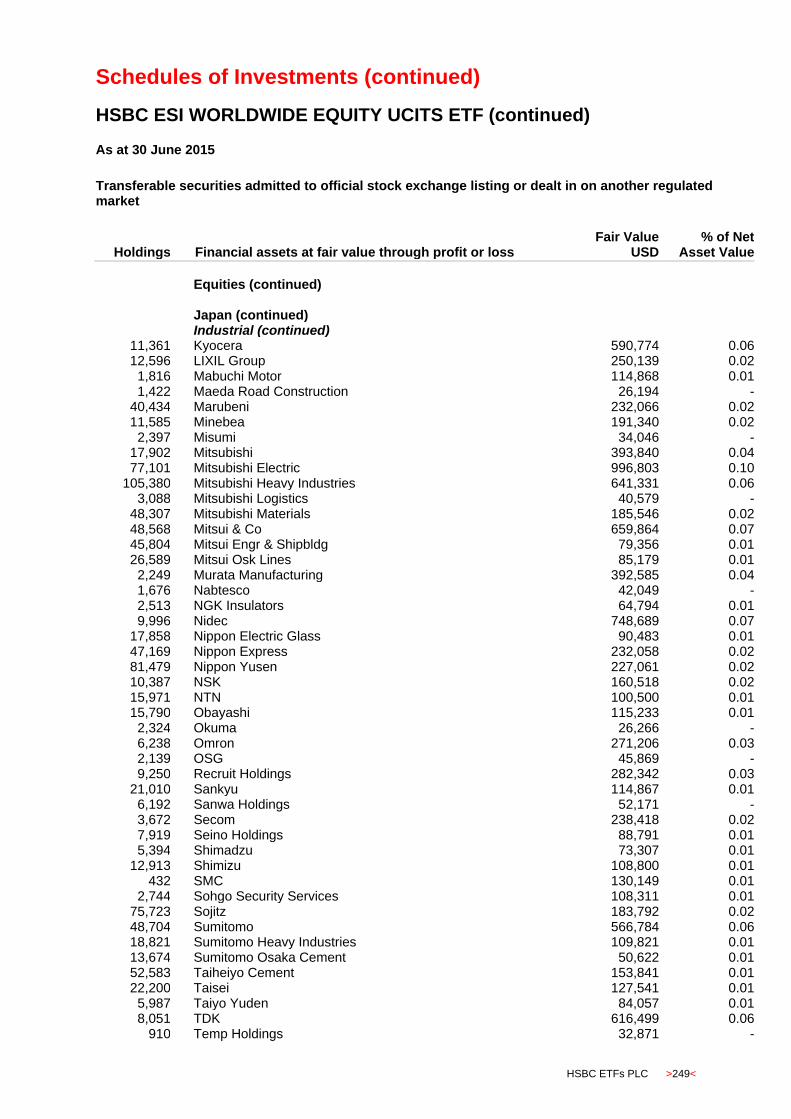
Schedules of Investments (continued)
HSBC ESI WORLDWIDE EQUITY UCITS ETF (continued)
HSBC ETFs PLC >249<
As at 30 June 2015
Transferable securities admitted to official stock exchange listing or dealt in on another regulated market
Holdings
Financial assets at fair value through profit or loss Fair Value
USD % of Net
Asset Value
Equities (continued)
Japan (continued) Industrial (continued)
11,361 Kyocera 590,774 0.06 12,596 LIXIL Group 250,139 0.02
1,816 Mabuchi Motor 114,868 0.01 1,422 Maeda Road Construction 26,194 -
40,434 Marubeni 232,066 0.02 11,585 Minebea 191,340 0.02
2,397 Misumi 34,046 - 17,902 Mitsubishi 393,840 0.04 77,101 Mitsubishi Electric 996,803 0.10
105,380 Mitsubishi Heavy Industries 641,331 0.06 3,088 Mitsubishi Logistics 40,579 -
48,307 Mitsubishi Materials 185,546 0.02 48,568 Mitsui & Co 659,864 0.07 45,804 Mitsui Engr & Shipbldg 79,356 0.01 26,589 Mitsui Osk Lines 85,179 0.01
2,249 Murata Manufacturing 392,585 0.04 1,676 Nabtesco 42,049 - 2,513 NGK Insulators 64,794 0.01 9,996 Nidec 748,689 0.07
17,858 Nippon Electric Glass 90,483 0.01 47,169 Nippon Express 232,058 0.02 81,479 Nippon Yusen 227,061 0.02 10,387 NSK 160,518 0.02 15,971 NTN 100,500 0.01 15,790 Obayashi 115,233 0.01
2,324 Okuma 26,266 - 6,238 Omron 271,206 0.03 2,139 OSG 45,869 - 9,250 Recruit Holdings 282,342 0.03
21,010 Sankyu 114,867 0.01 6,192 Sanwa Holdings 52,171 - 3,672 Secom 238,418 0.02 7,919 Seino Holdings 88,791 0.01 5,394 Shimadzu 73,307 0.01
12,913 Shimizu 108,800 0.01 432 SMC 130,149 0.01
2,744 Sohgo Security Services 108,311 0.01 75,723 Sojitz 183,792 0.02 48,704 Sumitomo 566,784 0.06 18,821 Sumitomo Heavy Industries 109,821 0.01 13,674 Sumitomo Osaka Cement 50,622 0.01 52,583 Taiheiyo Cement 153,841 0.01 22,200 Taisei 127,541 0.01
5,987 Taiyo Yuden 84,057 0.01 8,051 TDK 616,499 0.06
910 Temp Holdings 32,871 -
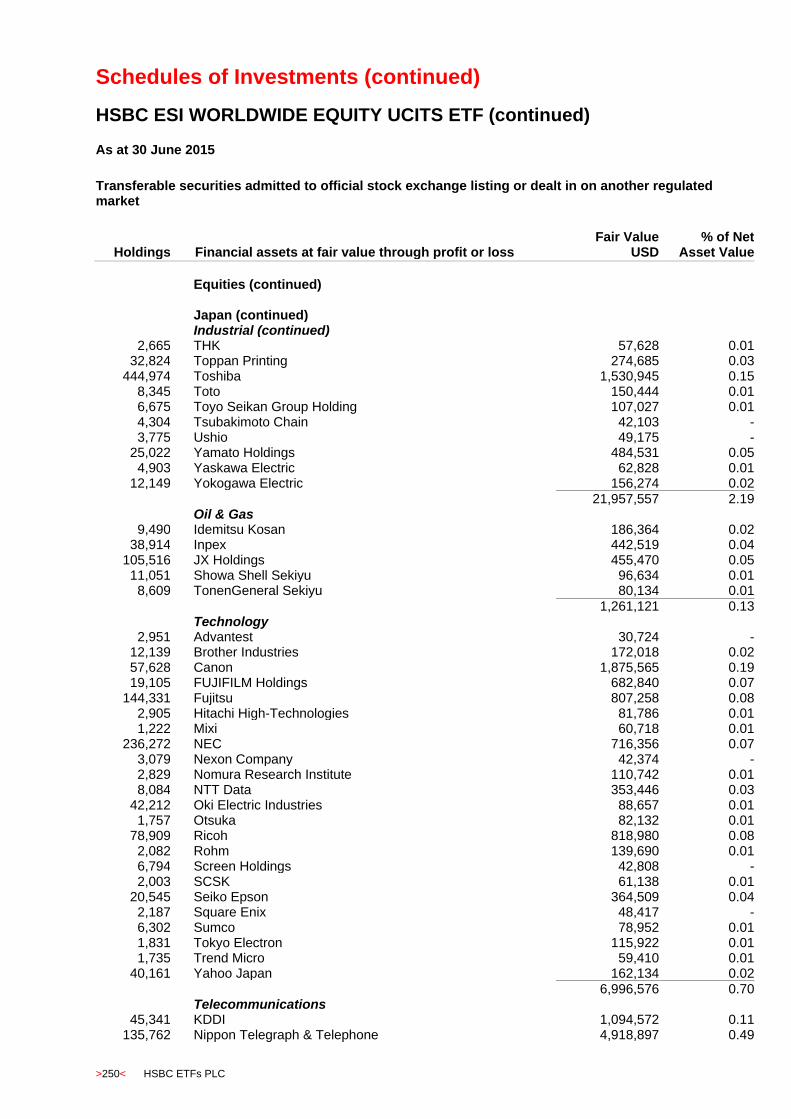
Schedules of Investments (continued)
HSBC ESI WORLDWIDE EQUITY UCITS ETF (continued)
>250< HSBC ETFs PLC
As at 30 June 2015
Transferable securities admitted to official stock exchange listing or dealt in on another regulated market
Holdings
Financial assets at fair value through profit or loss Fair Value
USD % of Net
Asset Value
Equities (continued)
Japan (continued) Industrial (continued)
2,665 THK 57,628 0.01 32,824 Toppan Printing 274,685 0.03
444,974 Toshiba 1,530,945 0.15 8,345 Toto 150,444 0.01 6,675 Toyo Seikan Group Holding 107,027 0.01 4,304 Tsubakimoto Chain 42,103 - 3,775 Ushio 49,175 -
25,022 Yamato Holdings 484,531 0.05 4,903 Yaskawa Electric 62,828 0.01
12,149 Yokogawa Electric 156,274 0.02
21,957,557 2.19 Oil & Gas
9,490 Idemitsu Kosan 186,364 0.02 38,914 Inpex 442,519 0.04
105,516 JX Holdings 455,470 0.05 11,051 Showa Shell Sekiyu 96,634 0.01
8,609 TonenGeneral Sekiyu 80,134 0.01
1,261,121 0.13 Technology
2,951 Advantest 30,724 - 12,139 Brother Industries 172,018 0.02 57,628 Canon 1,875,565 0.19 19,105 FUJIFILM Holdings 682,840 0.07
144,331 Fujitsu 807,258 0.08 2,905 Hitachi High-Technologies 81,786 0.01 1,222 Mixi 60,718 0.01
236,272 NEC 716,356 0.07 3,079 Nexon Company 42,374 - 2,829 Nomura Research Institute 110,742 0.01 8,084 NTT Data 353,446 0.03
42,212 Oki Electric Industries 88,657 0.01 1,757 Otsuka 82,132 0.01
78,909 Ricoh 818,980 0.08 2,082 Rohm 139,690 0.01 6,794 Screen Holdings 42,808 - 2,003 SCSK 61,138 0.01
20,545 Seiko Epson 364,509 0.04 2,187 Square Enix 48,417 - 6,302 Sumco 78,952 0.01 1,831 Tokyo Electron 115,922 0.01 1,735 Trend Micro 59,410 0.01
40,161 Yahoo Japan 162,134 0.02
6,996,576 0.70 Telecommunications
45,341 KDDI 1,094,572 0.11 135,762 Nippon Telegraph & Telephone 4,918,897 0.49
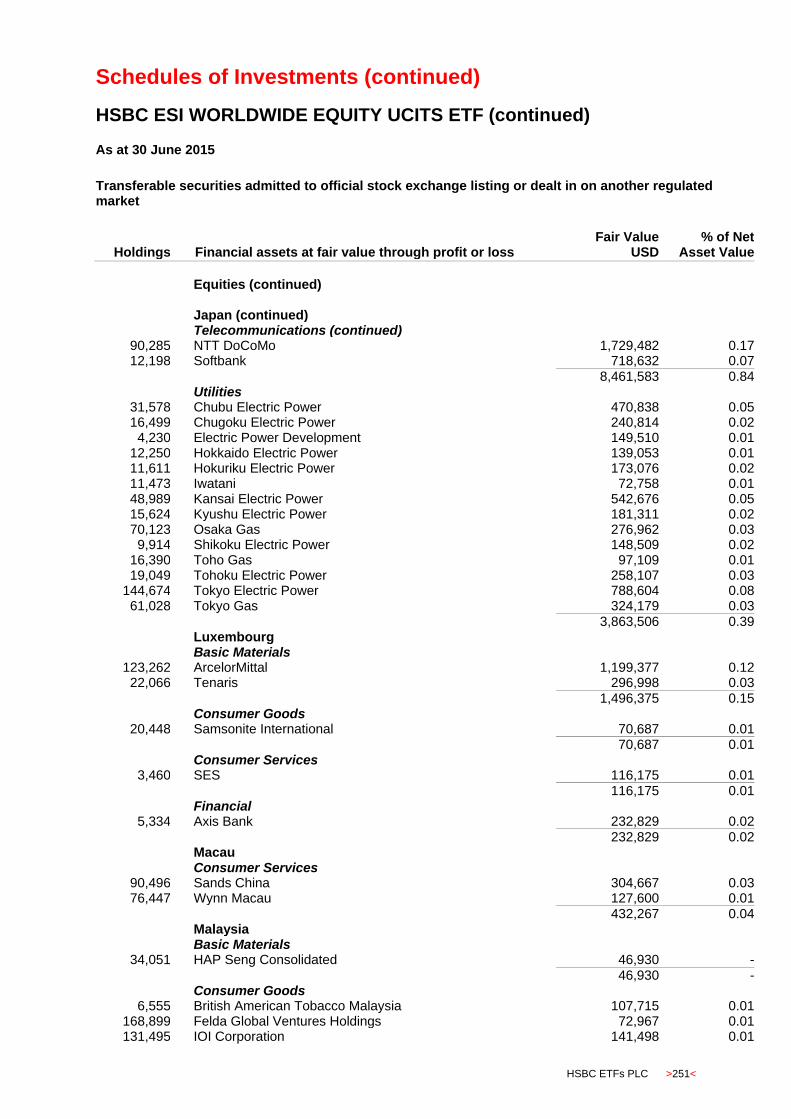
Schedules of Investments (continued)
HSBC ESI WORLDWIDE EQUITY UCITS ETF (continued)
HSBC ETFs PLC >251<
As at 30 June 2015
Transferable securities admitted to official stock exchange listing or dealt in on another regulated market
Holdings
Financial assets at fair value through profit or loss Fair Value
USD % of Net
Asset Value
Equities (continued)
Japan (continued) Telecommunications (continued)
90,285 NTT DoCoMo 1,729,482 0.17 12,198 Softbank 718,632 0.07
8,461,583 0.84 Utilities
31,578 Chubu Electric Power 470,838 0.05 16,499 Chugoku Electric Power 240,814 0.02
4,230 Electric Power Development 149,510 0.01 12,250 Hokkaido Electric Power 139,053 0.01 11,611 Hokuriku Electric Power 173,076 0.02 11,473 Iwatani 72,758 0.01 48,989 Kansai Electric Power 542,676 0.05 15,624 Kyushu Electric Power 181,311 0.02 70,123 Osaka Gas 276,962 0.03
9,914 Shikoku Electric Power 148,509 0.02 16,390 Toho Gas 97,109 0.01 19,049 Tohoku Electric Power 258,107 0.03
144,674 Tokyo Electric Power 788,604 0.08 61,028 Tokyo Gas 324,179 0.03
3,863,506 0.39 Luxembourg Basic Materials
123,262 ArcelorMittal 1,199,377 0.12 22,066 Tenaris 296,998 0.03
1,496,375 0.15 Consumer Goods
20,448 Samsonite International 70,687 0.01 70,687 0.01 Consumer Services
3,460 SES 116,175 0.01
116,175 0.01 Financial
5,334 Axis Bank 232,829 0.02
232,829 0.02 Macau Consumer Services
90,496 Sands China 304,667 0.03 76,447 Wynn Macau 127,600 0.01
432,267 0.04 Malaysia Basic Materials
34,051 HAP Seng Consolidated 46,930 -
46,930 - Consumer Goods
6,555 British American Tobacco Malaysia 107,715 0.01 168,899 Felda Global Ventures Holdings 72,967 0.01 131,495 IOI Corporation 141,498 0.01
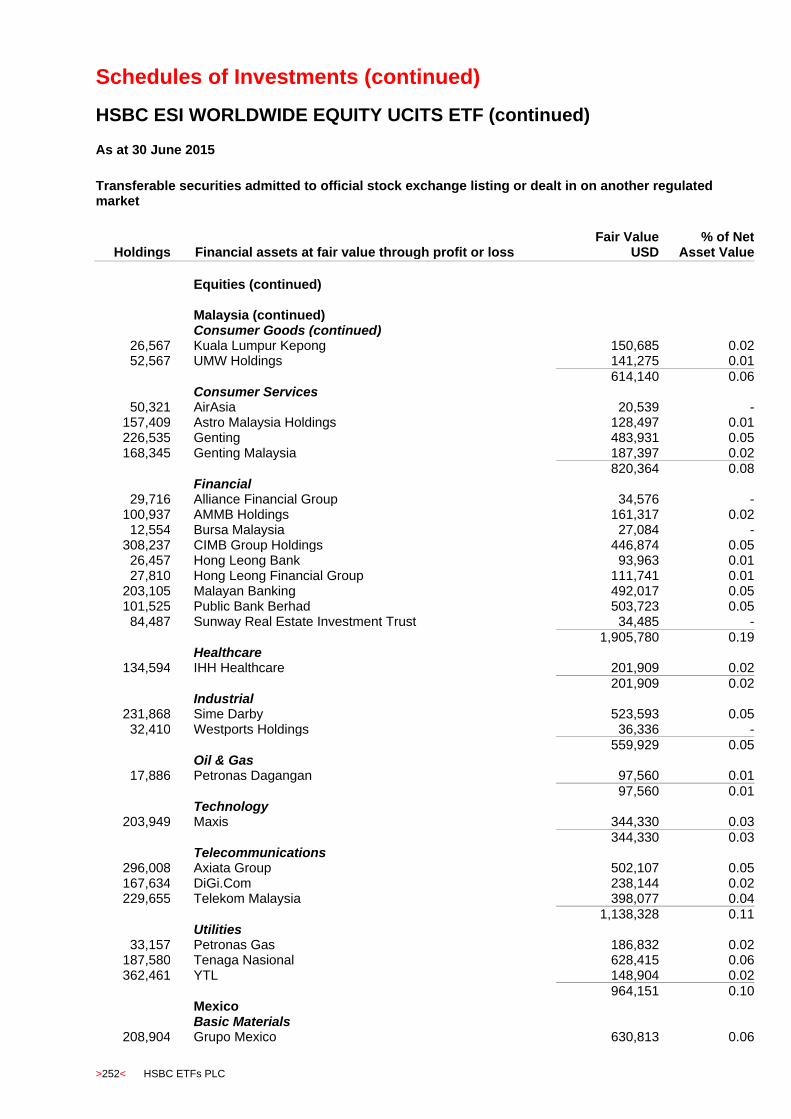
Schedules of Investments (continued)
HSBC ESI WORLDWIDE EQUITY UCITS ETF (continued)
>252< HSBC ETFs PLC
As at 30 June 2015
Transferable securities admitted to official stock exchange listing or dealt in on another regulated market
Holdings
Financial assets at fair value through profit or loss Fair Value
USD % of Net
Asset Value
Equities (continued)
Malaysia (continued) Consumer Goods (continued)
26,567 Kuala Lumpur Kepong 150,685 0.02 52,567 UMW Holdings 141,275 0.01
614,140 0.06 Consumer Services
50,321 AirAsia 20,539 - 157,409 Astro Malaysia Holdings 128,497 0.01 226,535 Genting 483,931 0.05 168,345 Genting Malaysia 187,397 0.02
820,364 0.08 Financial
29,716 Alliance Financial Group 34,576 - 100,937 AMMB Holdings 161,317 0.02 12,554 Bursa Malaysia 27,084 -
308,237 CIMB Group Holdings 446,874 0.05 26,457 Hong Leong Bank 93,963 0.01 27,810 Hong Leong Financial Group 111,741 0.01
203,105 Malayan Banking 492,017 0.05 101,525 Public Bank Berhad 503,723 0.05 84,487 Sunway Real Estate Investment Trust 34,485 -
1,905,780 0.19 Healthcare
134,594 IHH Healthcare 201,909 0.02
201,909 0.02 Industrial
231,868 Sime Darby 523,593 0.05 32,410 Westports Holdings 36,336 -
559,929 0.05 Oil & Gas
17,886 Petronas Dagangan 97,560 0.01
97,560 0.01 Technology
203,949 Maxis 344,330 0.03
344,330 0.03 Telecommunications
296,008 Axiata Group 502,107 0.05 167,634 DiGi.Com 238,144 0.02 229,655 Telekom Malaysia 398,077 0.04
1,138,328 0.11 Utilities
33,157 Petronas Gas 186,832 0.02 187,580 Tenaga Nasional 628,415 0.06 362,461 YTL 148,904 0.02
964,151 0.10 Mexico Basic Materials
208,904 Grupo Mexico 630,813 0.06

Schedules of Investments (continued)
HSBC ESI WORLDWIDE EQUITY UCITS ETF (continued)
HSBC ETFs PLC >253<
As at 30 June 2015
Transferable securities admitted to official stock exchange listing or dealt in on another regulated market
Holdings
Financial assets at fair value through profit or loss Fair Value
USD % of Net
Asset Value
Equities (continued)
Mexico (continued) Basic Materials (continued)
13,211 Industrias Penoles 215,501 0.02 31,121 Mexichem 90,027 0.01 10,746 Southern Copper 316,040 0.03
1,252,381 0.12 Consumer Goods
29,774 Arca Continental 169,452 0.02 23,317 Coca-Cola Femsa 185,429 0.02 37,691 Fomento Economico Mexicano 336,226 0.04 13,125 Gruma 168,945 0.02
163,872 Grupo Bimbo 424,650 0.04 50,662 Grupo Lala sab De 105,872 0.01
9,125 Industrias Bachoco 41,378 - 57,987 Kimberly-Clark de Mexico 125,356 0.01
1,557,308 0.16 Consumer Services
38,515 Controladora Commercial Mexicana 121,284 0.01 15,707 El Puerto De Liverpool 181,729 0.01
8,139 Grupo Elektra 181,841 0.02 36,729 Grupo Televisa 285,838 0.03
237,331 Wal-Mart de Mexico 578,253 0.06 1,348,945 0.13 Financial
92,197 Fibra Uno Administration 219,231 0.02 16,203 Gentera 28,749 -
167,372 Grupo Fin Santander 309,769 0.03 31,990 Grupo Financiero Banorte 175,826 0.02 14,143 Macquarie Mexico Real Estate 19,560 - 17,723 TF Administradora Industrial 34,778 0.01
787,913 0.08 Industrial
95,295 Alfa 182,383 0.02 411,402 Cemex 377,824 0.04
5,643 Grupo Aeroportuario del Pacifico 38,741 -
598,948 0.06 Telecommunications
2,400,959 America Movil 2,564,589 0.26
2,564,589 0.26 Utilities
6,604 Infraestructura Energetica Nova 32,762 - 32,762 - Netherlands Basic Materials
7,562 Akzo Nobel 549,938 0.06 5,373 Koninklijke DSM 311,303 0.03 5,107 Lyondell Basell Industries 528,677 0.05
1,389,918 0.14
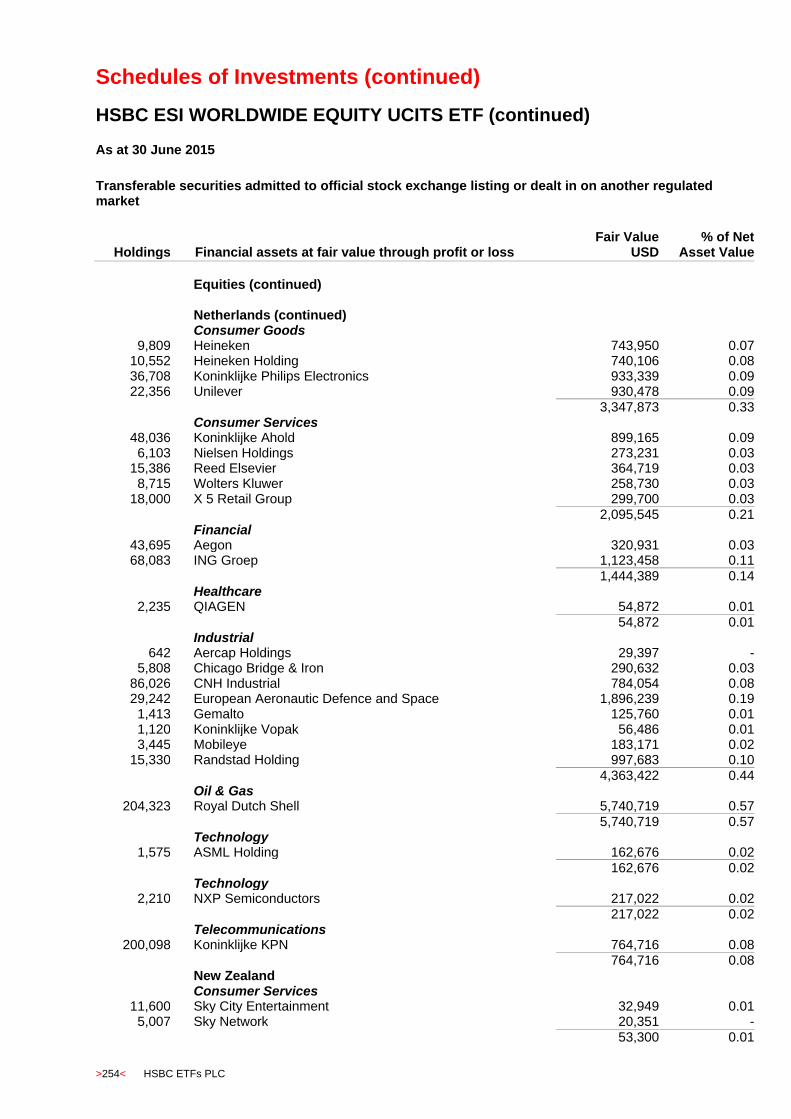
Schedules of Investments (continued)
HSBC ESI WORLDWIDE EQUITY UCITS ETF (continued)
>254< HSBC ETFs PLC
As at 30 June 2015
Transferable securities admitted to official stock exchange listing or dealt in on another regulated market
Holdings
Financial assets at fair value through profit or loss Fair Value
USD % of Net
Asset Value
Equities (continued)
Netherlands (continued) Consumer Goods
9,809 Heineken 743,950 0.07 10,552 Heineken Holding 740,106 0.08 36,708 Koninklijke Philips Electronics 933,339 0.09 22,356 Unilever 930,478 0.09
3,347,873 0.33 Consumer Services
48,036 Koninklijke Ahold 899,165 0.09 6,103 Nielsen Holdings 273,231 0.03
15,386 Reed Elsevier 364,719 0.03 8,715 Wolters Kluwer 258,730 0.03
18,000 X 5 Retail Group 299,700 0.03 2,095,545 0.21 Financial
43,695 Aegon 320,931 0.03 68,083 ING Groep 1,123,458 0.11
1,444,389 0.14 Healthcare
2,235 QIAGEN 54,872 0.01
54,872 0.01 Industrial
642 Aercap Holdings 29,397 - 5,808 Chicago Bridge & Iron 290,632 0.03
86,026 CNH Industrial 784,054 0.08 29,242 European Aeronautic Defence and Space 1,896,239 0.19
1,413 Gemalto 125,760 0.01 1,120 Koninklijke Vopak 56,486 0.01 3,445 Mobileye 183,171 0.02
15,330 Randstad Holding 997,683 0.10
4,363,422 0.44 Oil & Gas
204,323 Royal Dutch Shell 5,740,719 0.57
5,740,719 0.57 Technology
1,575 ASML Holding 162,676 0.02
162,676 0.02 Technology
2,210 NXP Semiconductors 217,022 0.02
217,022 0.02 Telecommunications
200,098 Koninklijke KPN 764,716 0.08 764,716 0.08 New Zealand Consumer Services
11,600 Sky City Entertainment 32,949 0.01 5,007 Sky Network 20,351 -
53,300 0.01
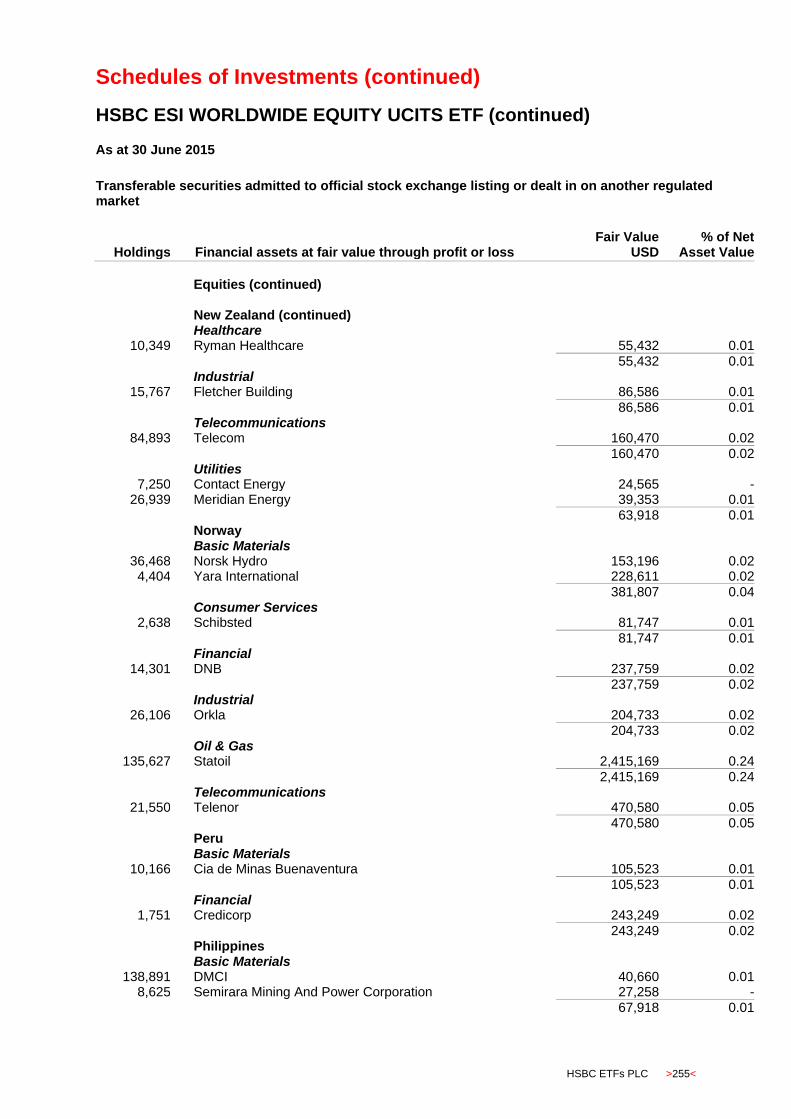
Schedules of Investments (continued)
HSBC ESI WORLDWIDE EQUITY UCITS ETF (continued)
HSBC ETFs PLC >255<
As at 30 June 2015
Transferable securities admitted to official stock exchange listing or dealt in on another regulated market
Holdings
Financial assets at fair value through profit or loss Fair Value
USD % of Net
Asset Value
Equities (continued)
New Zealand (continued) Healthcare
10,349 Ryman Healthcare 55,432 0.01
55,432 0.01 Industrial
15,767 Fletcher Building 86,586 0.01
86,586 0.01 Telecommunications
84,893 Telecom 160,470 0.02
160,470 0.02 Utilities
7,250 Contact Energy 24,565 - 26,939 Meridian Energy 39,353 0.01
63,918 0.01 Norway Basic Materials
36,468 Norsk Hydro 153,196 0.02 4,404 Yara International 228,611 0.02
381,807 0.04 Consumer Services
2,638 Schibsted 81,747 0.01
81,747 0.01 Financial
14,301 DNB 237,759 0.02 237,759 0.02 Industrial
26,106 Orkla 204,733 0.02 204,733 0.02 Oil & Gas
135,627 Statoil 2,415,169 0.24
2,415,169 0.24 Telecommunications
21,550 Telenor 470,580 0.05
470,580 0.05 Peru Basic Materials
10,166 Cia de Minas Buenaventura 105,523 0.01 105,523 0.01 Financial
1,751 Credicorp 243,249 0.02
243,249 0.02 Philippines Basic Materials
138,891 DMCI 40,660 0.01 8,625 Semirara Mining And Power Corporation 27,258 -
67,918 0.01

Schedules of Investments (continued)
HSBC ESI WORLDWIDE EQUITY UCITS ETF (continued)
>256< HSBC ETFs PLC
As at 30 June 2015
Transferable securities admitted to official stock exchange listing or dealt in on another regulated market
Holdings
Financial assets at fair value through profit or loss Fair Value
USD % of Net
Asset Value
Equities (continued)
Philippines (continued) Consumer Goods
22,052 Universal Robina 94,879 0.01
94,879 0.01 Consumer Services
24,506 Jollibee Foods 107,231 0.01
107,231 0.01 Financial
42,571 BDO Unibank 102,344 0.01 54,851 Robinsons Land 35,643 -
137,987 0.01 Industrial
7,734 Ayala 135,503 0.01
135,503 0.01 Telecommunications
3,763 Globe Telecom 209,473 0.02 10,234 Philippine Long Distance Telephone 637,781 0.06
847,254 0.08 Utilities
78,593 Aboitiz Power 79,307 0.01 200,222 Energy Development 33,215 - 31,419 Manila Electric 202,910 0.02
315,432 0.03 Poland Basic Materials
17,710 KGHM Polska Miedz 501,742 0.05 3,081 Lubelski Wegiel Bogdanka 42,476 -
544,218 0.05 Consumer Goods
11 Lpp 19,443 - 19,443 - Consumer Services
4,971 Cyfrowy Polt 31,260 - 2,292 Eurocash 22,762 - 1,799 TVN 9,175 -
63,197 - Financial
3,457 Bank Handlowy W Warszawie 91,883 0.01 11,195 Bank Millennium 19,497 -
5,435 Bank Pekao 260,052 0.03 1,561 Bank Zachodni WBK 141,639 0.01
596 BRE Bank 65,394 0.01 37,307 Powszechna Kasa Oszczednosci Bank Polski 308,701 0.03
2,171 Powszechny Zaklad Ubezpieczen 249,749 0.02
1,136,915 0.11 Industrial
5,871 PKP Cargo 129,225 0.01
129,225 0.01
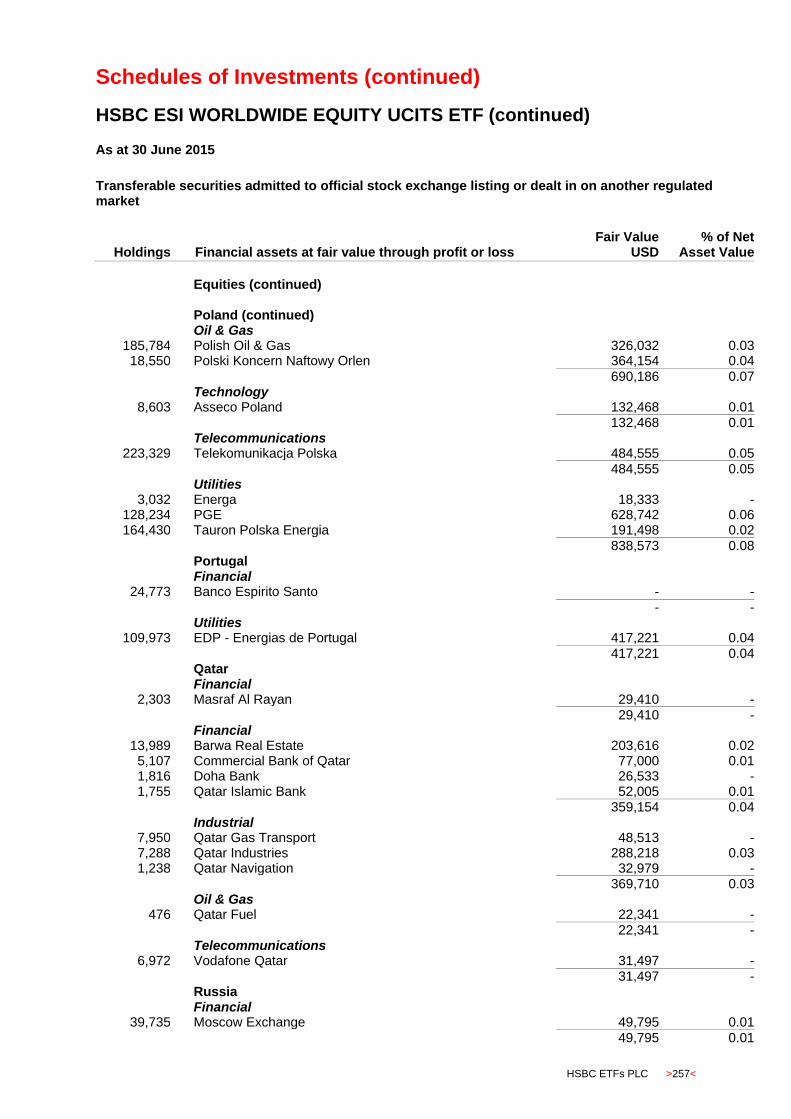
Schedules of Investments (continued)
HSBC ESI WORLDWIDE EQUITY UCITS ETF (continued)
HSBC ETFs PLC >257<
As at 30 June 2015
Transferable securities admitted to official stock exchange listing or dealt in on another regulated market
Holdings
Financial assets at fair value through profit or loss Fair Value
USD % of Net
Asset Value
Equities (continued)
Poland (continued) Oil & Gas
185,784 Polish Oil & Gas 326,032 0.03 18,550 Polski Koncern Naftowy Orlen 364,154 0.04
690,186 0.07 Technology
8,603 Asseco Poland 132,468 0.01 132,468 0.01 Telecommunications
223,329 Telekomunikacja Polska 484,555 0.05
484,555 0.05 Utilities
3,032 Energa 18,333 - 128,234 PGE 628,742 0.06 164,430 Tauron Polska Energia 191,498 0.02
838,573 0.08 Portugal
Financial 24,773 Banco Espirito Santo - -
- - Utilities
109,973 EDP - Energias de Portugal 417,221 0.04
417,221 0.04 Qatar Financial
2,303 Masraf Al Rayan 29,410 -
29,410 - Financial
13,989 Barwa Real Estate 203,616 0.02 5,107 Commercial Bank of Qatar 77,000 0.01 1,816 Doha Bank 26,533 - 1,755 Qatar Islamic Bank 52,005 0.01
359,154 0.04 Industrial
7,950 Qatar Gas Transport 48,513 - 7,288 Qatar Industries 288,218 0.03 1,238 Qatar Navigation 32,979 -
369,710 0.03 Oil & Gas
476 Qatar Fuel 22,341 -
22,341 - Telecommunications
6,972 Vodafone Qatar 31,497 - 31,497 - Russia Financial
39,735 Moscow Exchange 49,795 0.01
49,795 0.01
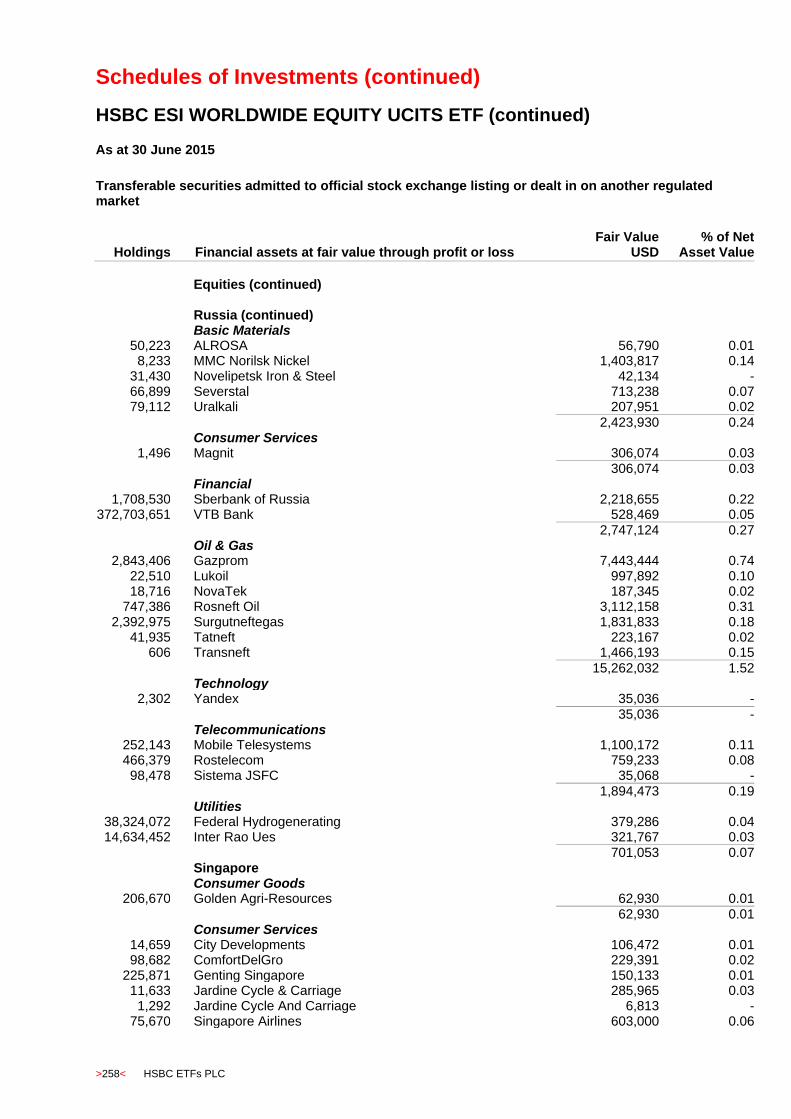
Schedules of Investments (continued)
HSBC ESI WORLDWIDE EQUITY UCITS ETF (continued)
>258< HSBC ETFs PLC
As at 30 June 2015
Transferable securities admitted to official stock exchange listing or dealt in on another regulated market
Holdings
Financial assets at fair value through profit or loss Fair Value
USD % of Net
Asset Value
Equities (continued)
Russia (continued) Basic Materials
50,223 ALROSA 56,790 0.01 8,233 MMC Norilsk Nickel 1,403,817 0.14
31,430 Novelipetsk Iron & Steel 42,134 - 66,899 Severstal 713,238 0.07 79,112 Uralkali 207,951 0.02
2,423,930 0.24 Consumer Services
1,496 Magnit 306,074 0.03 306,074 0.03 Financial
1,708,530 Sberbank of Russia 2,218,655 0.22 372,703,651 VTB Bank 528,469 0.05
2,747,124 0.27 Oil & Gas
2,843,406 Gazprom 7,443,444 0.74 22,510 Lukoil 997,892 0.10 18,716 NovaTek 187,345 0.02
747,386 Rosneft Oil 3,112,158 0.31 2,392,975 Surgutneftegas 1,831,833 0.18
41,935 Tatneft 223,167 0.02 606 Transneft 1,466,193 0.15
15,262,032 1.52 Technology
2,302 Yandex 35,036 -
35,036 - Telecommunications
252,143 Mobile Telesystems 1,100,172 0.11 466,379 Rostelecom 759,233 0.08 98,478 Sistema JSFC 35,068 -
1,894,473 0.19 Utilities
38,324,072 Federal Hydrogenerating 379,286 0.04 14,634,452 Inter Rao Ues 321,767 0.03
701,053 0.07 Singapore Consumer Goods
206,670 Golden Agri-Resources 62,930 0.01
62,930 0.01 Consumer Services
14,659 City Developments 106,472 0.01 98,682 ComfortDelGro 229,391 0.02
225,871 Genting Singapore 150,133 0.01 11,633 Jardine Cycle & Carriage 285,965 0.03
1,292 Jardine Cycle And Carriage 6,813 - 75,670 Singapore Airlines 603,000 0.06
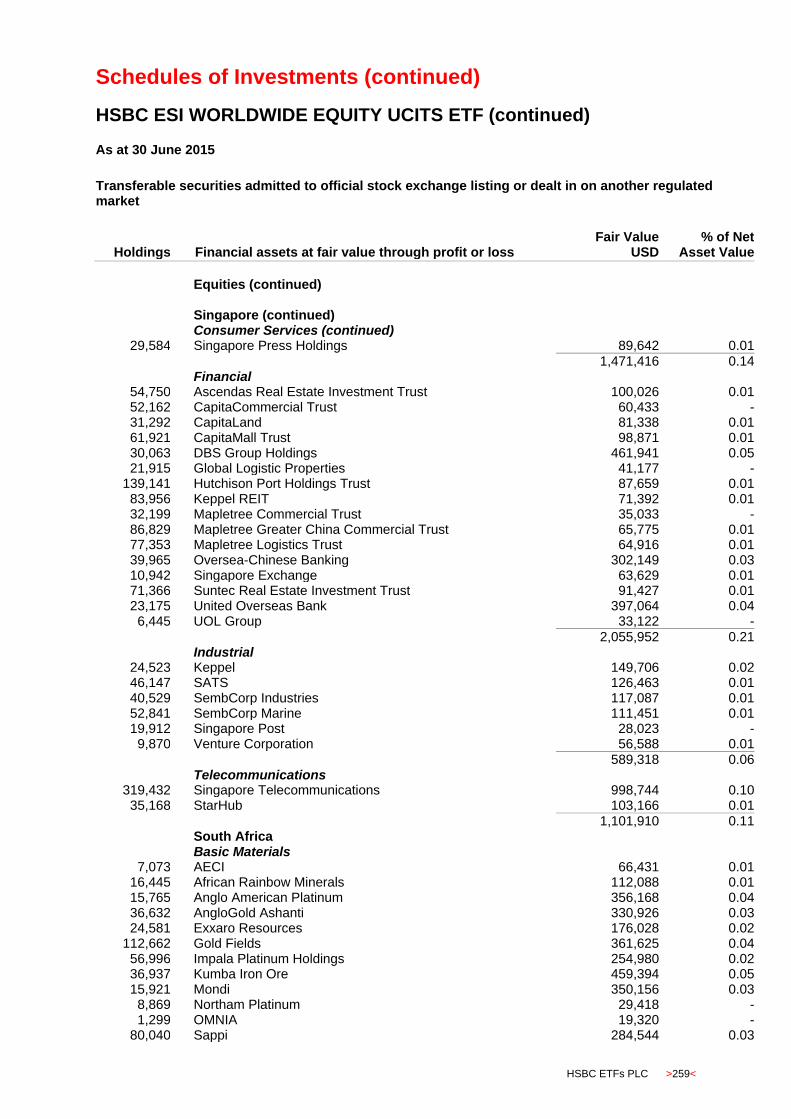
Schedules of Investments (continued)
HSBC ESI WORLDWIDE EQUITY UCITS ETF (continued)
HSBC ETFs PLC >259<
As at 30 June 2015
Transferable securities admitted to official stock exchange listing or dealt in on another regulated market
Holdings
Financial assets at fair value through profit or loss Fair Value
USD % of Net
Asset Value
Equities (continued)
Singapore (continued) Consumer Services (continued)
29,584 Singapore Press Holdings 89,642 0.01
1,471,416 0.14 Financial
54,750 Ascendas Real Estate Investment Trust 100,026 0.01 52,162 CapitaCommercial Trust 60,433 - 31,292 CapitaLand 81,338 0.01 61,921 CapitaMall Trust 98,871 0.01 30,063 DBS Group Holdings 461,941 0.05 21,915 Global Logistic Properties 41,177 -
139,141 Hutchison Port Holdings Trust 87,659 0.01 83,956 Keppel REIT 71,392 0.01 32,199 Mapletree Commercial Trust 35,033 - 86,829 Mapletree Greater China Commercial Trust 65,775 0.01 77,353 Mapletree Logistics Trust 64,916 0.01 39,965 Oversea-Chinese Banking 302,149 0.03 10,942 Singapore Exchange 63,629 0.01 71,366 Suntec Real Estate Investment Trust 91,427 0.01 23,175 United Overseas Bank 397,064 0.04
6,445 UOL Group 33,122 -
2,055,952 0.21 Industrial
24,523 Keppel 149,706 0.02 46,147 SATS 126,463 0.01 40,529 SembCorp Industries 117,087 0.01 52,841 SembCorp Marine 111,451 0.01 19,912 Singapore Post 28,023 -
9,870 Venture Corporation 56,588 0.01
589,318 0.06 Telecommunications
319,432 Singapore Telecommunications 998,744 0.10 35,168 StarHub 103,166 0.01
1,101,910 0.11 South Africa Basic Materials
7,073 AECI 66,431 0.01 16,445 African Rainbow Minerals 112,088 0.01 15,765 Anglo American Platinum 356,168 0.04 36,632 AngloGold Ashanti 330,926 0.03 24,581 Exxaro Resources 176,028 0.02
112,662 Gold Fields 361,625 0.04 56,996 Impala Platinum Holdings 254,980 0.02 36,937 Kumba Iron Ore 459,394 0.05 15,921 Mondi 350,156 0.03
8,869 Northam Platinum 29,418 - 1,299 OMNIA 19,320 -
80,040 Sappi 284,544 0.03
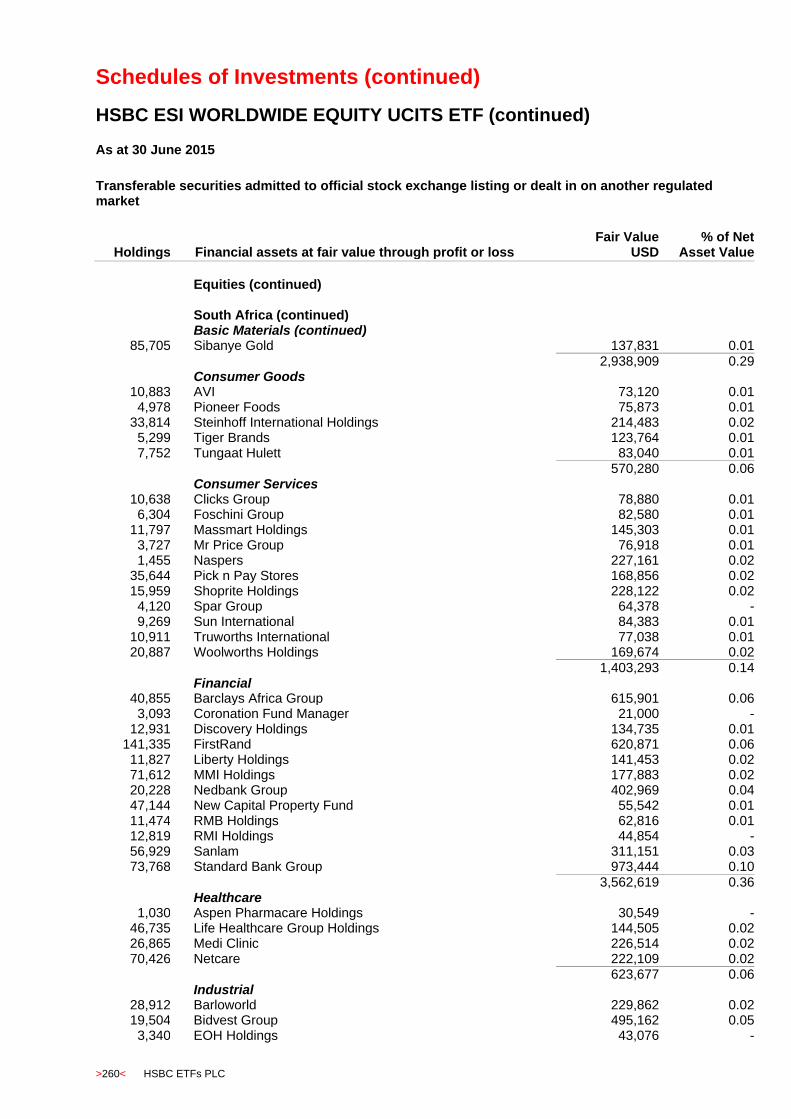
Schedules of Investments (continued)
HSBC ESI WORLDWIDE EQUITY UCITS ETF (continued)
>260< HSBC ETFs PLC
As at 30 June 2015
Transferable securities admitted to official stock exchange listing or dealt in on another regulated market
Holdings
Financial assets at fair value through profit or loss Fair Value
USD % of Net
Asset Value
Equities (continued)
South Africa (continued) Basic Materials (continued)
85,705 Sibanye Gold 137,831 0.01
2,938,909 0.29 Consumer Goods
10,883 AVI 73,120 0.01 4,978 Pioneer Foods 75,873 0.01
33,814 Steinhoff International Holdings 214,483 0.02 5,299 Tiger Brands 123,764 0.01 7,752 Tungaat Hulett 83,040 0.01
570,280 0.06 Consumer Services
10,638 Clicks Group 78,880 0.01 6,304 Foschini Group 82,580 0.01
11,797 Massmart Holdings 145,303 0.01 3,727 Mr Price Group 76,918 0.01 1,455 Naspers 227,161 0.02
35,644 Pick n Pay Stores 168,856 0.02 15,959 Shoprite Holdings 228,122 0.02
4,120 Spar Group 64,378 - 9,269 Sun International 84,383 0.01
10,911 Truworths International 77,038 0.01 20,887 Woolworths Holdings 169,674 0.02
1,403,293 0.14 Financial
40,855 Barclays Africa Group 615,901 0.06 3,093 Coronation Fund Manager 21,000 -
12,931 Discovery Holdings 134,735 0.01 141,335 FirstRand 620,871 0.06 11,827 Liberty Holdings 141,453 0.02 71,612 MMI Holdings 177,883 0.02 20,228 Nedbank Group 402,969 0.04 47,144 New Capital Property Fund 55,542 0.01 11,474 RMB Holdings 62,816 0.01 12,819 RMI Holdings 44,854 - 56,929 Sanlam 311,151 0.03 73,768 Standard Bank Group 973,444 0.10
3,562,619 0.36 Healthcare
1,030 Aspen Pharmacare Holdings 30,549 - 46,735 Life Healthcare Group Holdings 144,505 0.02 26,865 Medi Clinic 226,514 0.02 70,426 Netcare 222,109 0.02
623,677 0.06 Industrial
28,912 Barloworld 229,862 0.02 19,504 Bidvest Group 495,162 0.05
3,340 EOH Holdings 43,076 -
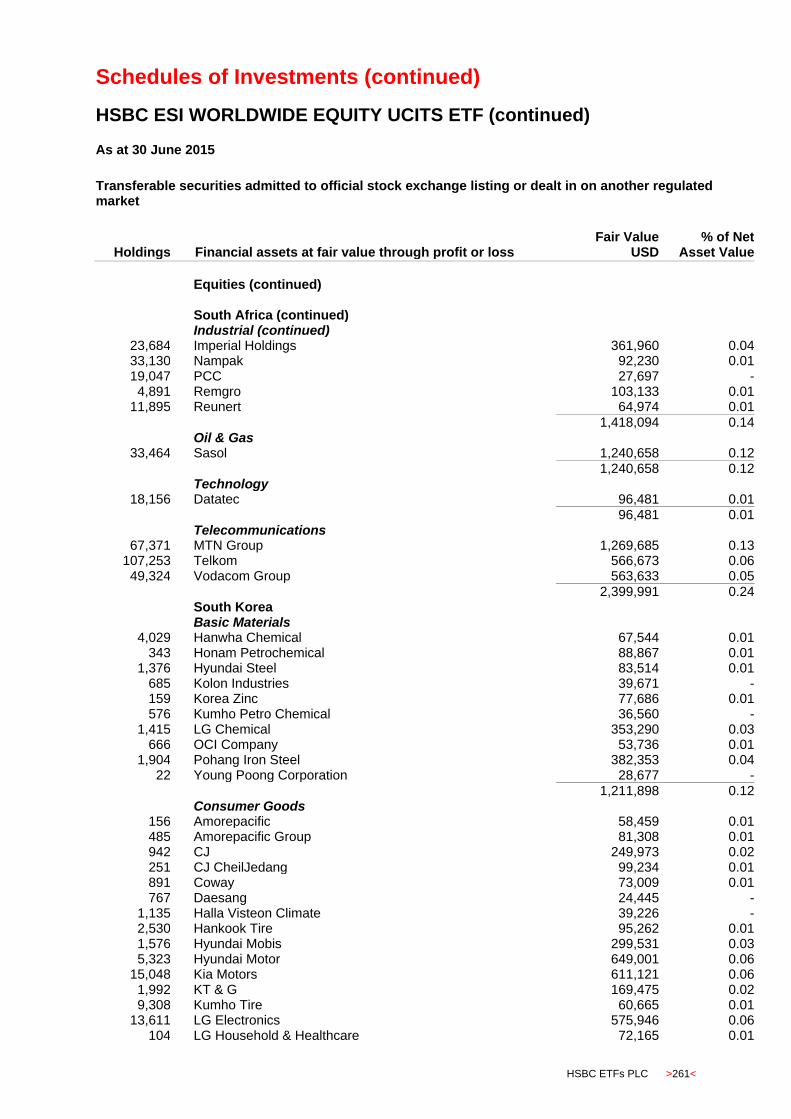
Schedules of Investments (continued)
HSBC ESI WORLDWIDE EQUITY UCITS ETF (continued)
HSBC ETFs PLC >261<
As at 30 June 2015
Transferable securities admitted to official stock exchange listing or dealt in on another regulated market
Holdings
Financial assets at fair value through profit or loss Fair Value
USD % of Net
Asset Value
Equities (continued)
South Africa (continued) Industrial (continued)
23,684 Imperial Holdings 361,960 0.04 33,130 Nampak 92,230 0.01 19,047 PCC 27,697 -
4,891 Remgro 103,133 0.01 11,895 Reunert 64,974 0.01
1,418,094 0.14 Oil & Gas
33,464 Sasol 1,240,658 0.12 1,240,658 0.12 Technology
18,156 Datatec 96,481 0.01 96,481 0.01 Telecommunications
67,371 MTN Group 1,269,685 0.13 107,253 Telkom 566,673 0.06 49,324 Vodacom Group 563,633 0.05
2,399,991 0.24 South Korea Basic Materials
4,029 Hanwha Chemical 67,544 0.01 343 Honam Petrochemical 88,867 0.01
1,376 Hyundai Steel 83,514 0.01 685 Kolon Industries 39,671 - 159 Korea Zinc 77,686 0.01 576 Kumho Petro Chemical 36,560 -
1,415 LG Chemical 353,290 0.03 666 OCI Company 53,736 0.01
1,904 Pohang Iron Steel 382,353 0.04 22 Young Poong Corporation 28,677 -
1,211,898 0.12 Consumer Goods
156 Amorepacific 58,459 0.01 485 Amorepacific Group 81,308 0.01 942 CJ 249,973 0.02 251 CJ CheilJedang 99,234 0.01 891 Coway 73,009 0.01 767 Daesang 24,445 -
1,135 Halla Visteon Climate 39,226 - 2,530 Hankook Tire 95,262 0.01 1,576 Hyundai Mobis 299,531 0.03 5,323 Hyundai Motor 649,001 0.06
15,048 Kia Motors 611,121 0.06 1,992 KT & G 169,475 0.02 9,308 Kumho Tire 60,665 0.01
13,611 LG Electronics 575,946 0.06 104 LG Household & Healthcare 72,165 0.01
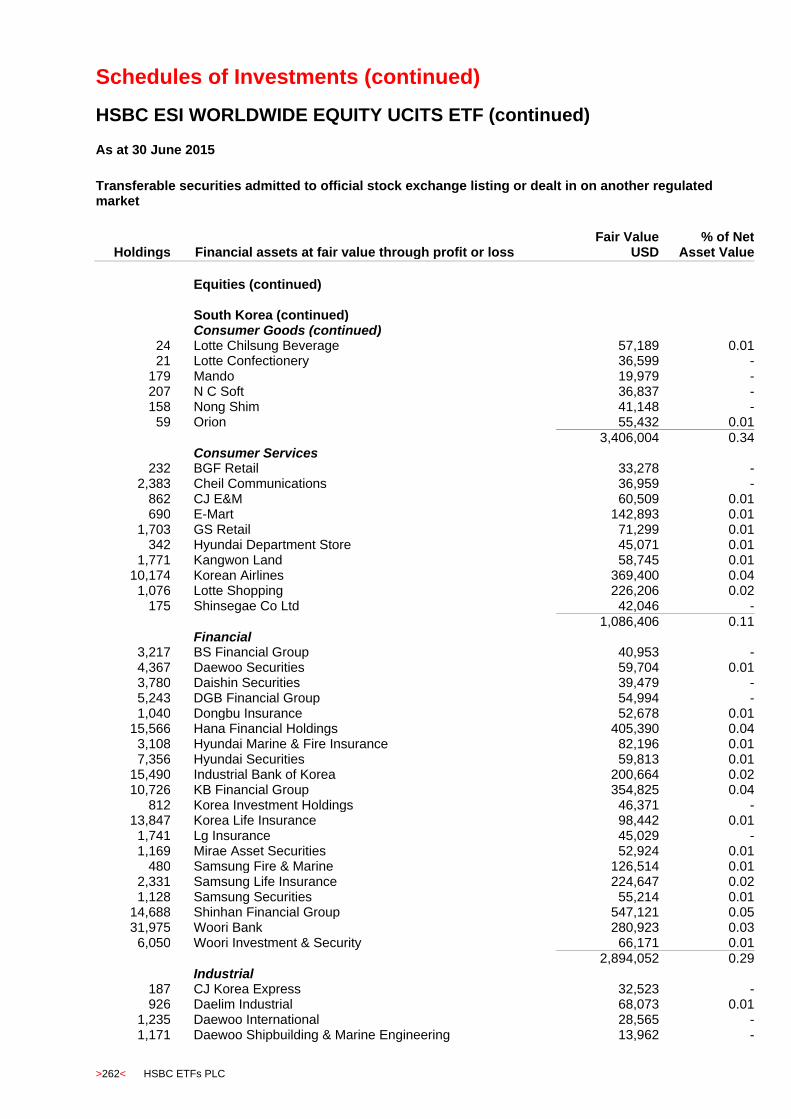
Schedules of Investments (continued)
HSBC ESI WORLDWIDE EQUITY UCITS ETF (continued)
>262< HSBC ETFs PLC
As at 30 June 2015
Transferable securities admitted to official stock exchange listing or dealt in on another regulated market
Holdings
Financial assets at fair value through profit or loss Fair Value
USD % of Net
Asset Value
Equities (continued)
South Korea (continued) Consumer Goods (continued)
24 Lotte Chilsung Beverage 57,189 0.01 21 Lotte Confectionery 36,599 -
179 Mando 19,979 - 207 N C Soft 36,837 - 158 Nong Shim 41,148 -
59 Orion 55,432 0.01
3,406,004 0.34 Consumer Services
232 BGF Retail 33,278 - 2,383 Cheil Communications 36,959 -
862 CJ E&M 60,509 0.01 690 E-Mart 142,893 0.01
1,703 GS Retail 71,299 0.01 342 Hyundai Department Store 45,071 0.01
1,771 Kangwon Land 58,745 0.01 10,174 Korean Airlines 369,400 0.04
1,076 Lotte Shopping 226,206 0.02 175 Shinsegae Co Ltd 42,046 -
1,086,406 0.11 Financial
3,217 BS Financial Group 40,953 - 4,367 Daewoo Securities 59,704 0.01 3,780 Daishin Securities 39,479 - 5,243 DGB Financial Group 54,994 - 1,040 Dongbu Insurance 52,678 0.01
15,566 Hana Financial Holdings 405,390 0.04 3,108 Hyundai Marine & Fire Insurance 82,196 0.01 7,356 Hyundai Securities 59,813 0.01
15,490 Industrial Bank of Korea 200,664 0.02 10,726 KB Financial Group 354,825 0.04
812 Korea Investment Holdings 46,371 - 13,847 Korea Life Insurance 98,442 0.01
1,741 Lg Insurance 45,029 - 1,169 Mirae Asset Securities 52,924 0.01
480 Samsung Fire & Marine 126,514 0.01 2,331 Samsung Life Insurance 224,647 0.02 1,128 Samsung Securities 55,214 0.01
14,688 Shinhan Financial Group 547,121 0.05 31,975 Woori Bank 280,923 0.03
6,050 Woori Investment & Security 66,171 0.01 2,894,052 0.29 Industrial
187 CJ Korea Express 32,523 - 926 Daelim Industrial 68,073 0.01
1,235 Daewoo International 28,565 - 1,171 Daewoo Shipbuilding & Marine Engineering 13,962 -

Schedules of Investments (continued)
HSBC ESI WORLDWIDE EQUITY UCITS ETF (continued)
HSBC ETFs PLC >263<
As at 30 June 2015
Transferable securities admitted to official stock exchange listing or dealt in on another regulated market
Holdings
Financial assets at fair value through profit or loss Fair Value
USD % of Net
Asset Value
Equities (continued)
South Korea (continued) Industrial (continued)
8,243 Doosan Infracore 72,420 0.01 1,244 GS Engineering and Construction 29,889 - 1,873 Hanjin Kal 46,009 0.01
16,257 Hanjin Shipping 83,657 0.01 722 HYOSUNG 93,207 0.01 107 Hyudai Glovis 19,377 -
1,077 Hyundai Development 63,918 0.01 2,209 Hyundai Engineering & Construction 81,294 0.01 1,897 Hyundai Heavy Industries 188,773 0.02
14,655 Hyundai Merchant Marine 90,654 0.01 195 KCC 85,835 0.01 675 KEPCO Plant Service & Engineering 71,406 0.01
2,532 LG 140,282 0.01 360 LG Hausys Limited 48,088 - 785 LG Innotek 70,727 0.01 755 LG International 26,330 -
1,631 LS Cable 63,532 - 8,929 Macquarie Korea 64,439 0.01
635 S1 44,688 - 2,340 Samsung C&T 138,875 0.01 4,373 Samsung Electro Mechanics 200,332 0.02 3,565 Samsung Engineering 100,994 0.01
10,524 Samsung Heavy Industries 160,863 0.02 1,962 Samsung SDI 195,241 0.02 6,862 SK Networks 55,243 0.01
2,379,196 0.24 Oil & Gas
10,180 Doosan Heavy Industries & Construction 219,033 0.02 914 GS Holdings 40,765 -
4,511 SK Corporation 800,733 0.08 2,186 SK Innovation 239,089 0.03 1,441 S-Oil 87,329 0.01
1,386,949 0.14 Technology
778 Gemvax And Kael 28,597 - 28,549 LG Display 661,609 0.07
194 Naver 110,266 0.01 3,014 Samsung Electronics 3,426,198 0.34
488 Samsung SDS 113,529 0.01 743 SK C&C 184,176 0.02
14,091 Sk hynix 534,358 0.05
5,058,733 0.50 Telecommunications
30,670 KT 782,251 0.08 20,038 LG Uplus 177,126 0.02
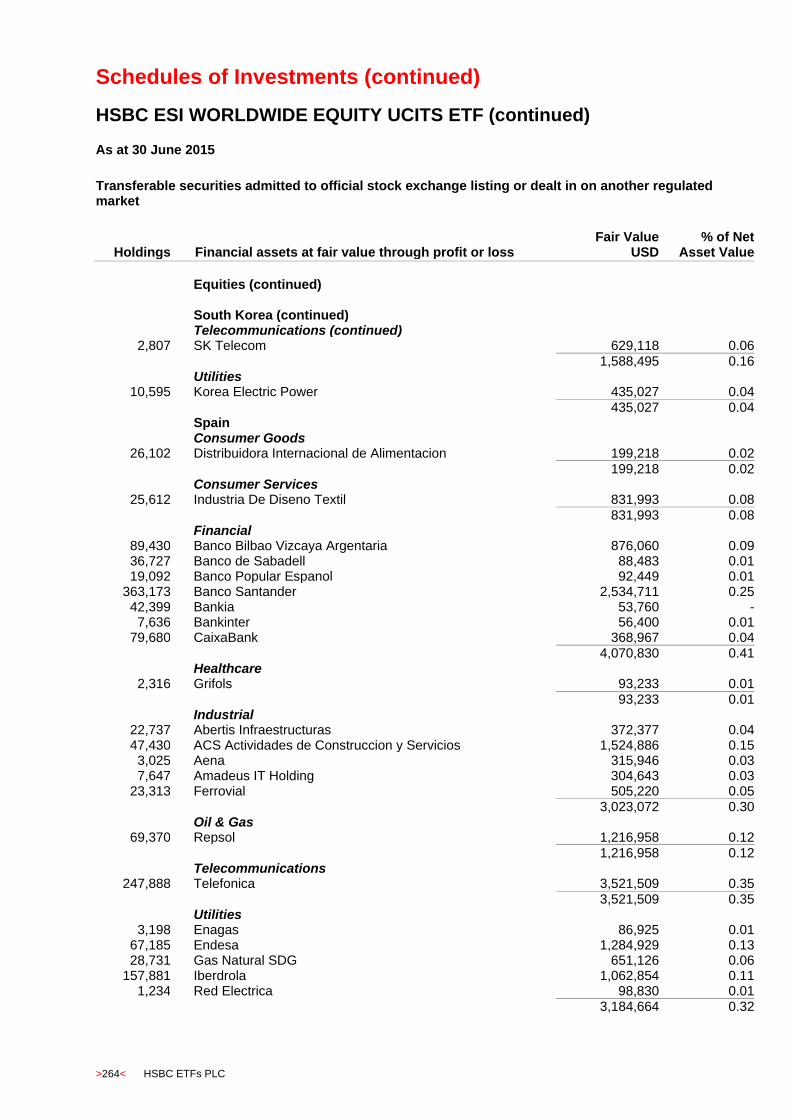
Schedules of Investments (continued)
HSBC ESI WORLDWIDE EQUITY UCITS ETF (continued)
>264< HSBC ETFs PLC
As at 30 June 2015
Transferable securities admitted to official stock exchange listing or dealt in on another regulated market
Holdings
Financial assets at fair value through profit or loss Fair Value
USD % of Net
Asset Value
Equities (continued)
South Korea (continued) Telecommunications (continued)
2,807 SK Telecom 629,118 0.06
1,588,495 0.16 Utilities
10,595 Korea Electric Power 435,027 0.04
435,027 0.04 Spain Consumer Goods
26,102 Distribuidora Internacional de Alimentacion 199,218 0.02
199,218 0.02 Consumer Services
25,612 Industria De Diseno Textil 831,993 0.08
831,993 0.08 Financial
89,430 Banco Bilbao Vizcaya Argentaria 876,060 0.09 36,727 Banco de Sabadell 88,483 0.01 19,092 Banco Popular Espanol 92,449 0.01
363,173 Banco Santander 2,534,711 0.25 42,399 Bankia 53,760 -
7,636 Bankinter 56,400 0.01 79,680 CaixaBank 368,967 0.04
4,070,830 0.41 Healthcare
2,316 Grifols 93,233 0.01
93,233 0.01 Industrial
22,737 Abertis Infraestructuras 372,377 0.04 47,430 ACS Actividades de Construccion y Servicios 1,524,886 0.15
3,025 Aena 315,946 0.03 7,647 Amadeus IT Holding 304,643 0.03
23,313 Ferrovial 505,220 0.05
3,023,072 0.30 Oil & Gas
69,370 Repsol 1,216,958 0.12
1,216,958 0.12 Telecommunications
247,888 Telefonica 3,521,509 0.35
3,521,509 0.35 Utilities
3,198 Enagas 86,925 0.01 67,185 Endesa 1,284,929 0.13 28,731 Gas Natural SDG 651,126 0.06
157,881 Iberdrola 1,062,854 0.11 1,234 Red Electrica 98,830 0.01
3,184,664 0.32
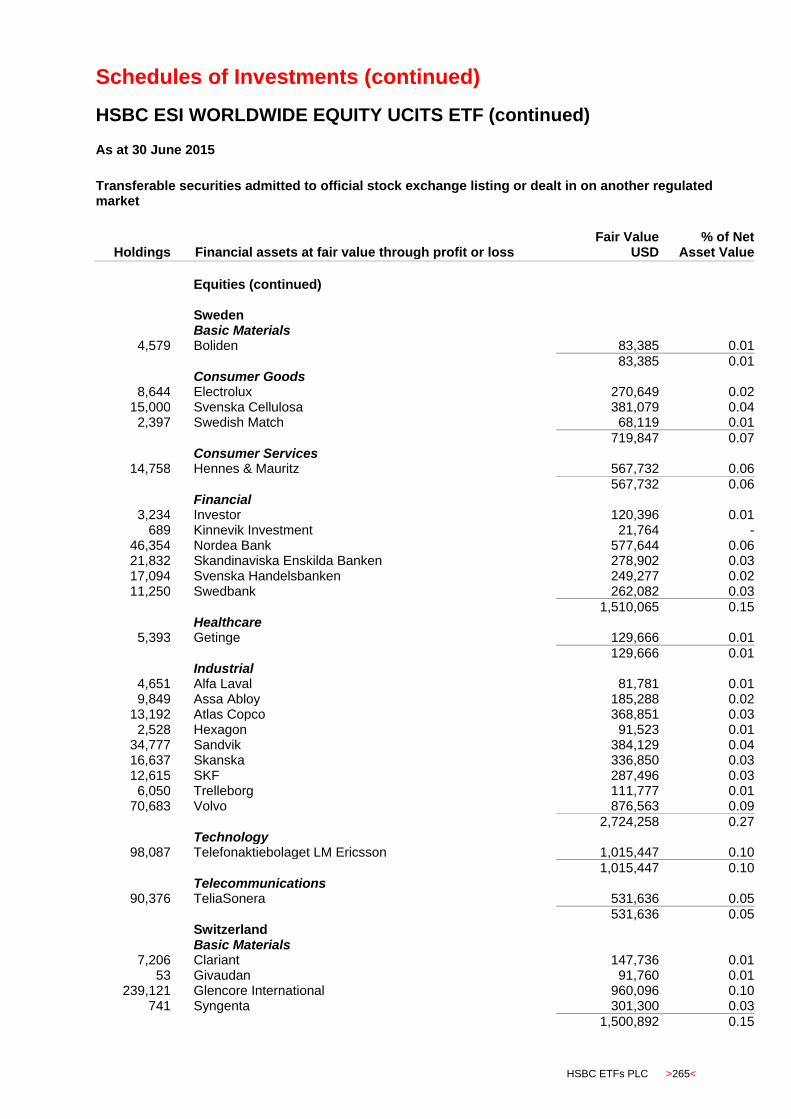
Schedules of Investments (continued)
HSBC ESI WORLDWIDE EQUITY UCITS ETF (continued)
HSBC ETFs PLC >265<
As at 30 June 2015
Transferable securities admitted to official stock exchange listing or dealt in on another regulated market
Holdings
Financial assets at fair value through profit or loss Fair Value
USD % of Net
Asset Value
Equities (continued)
Sweden Basic Materials
4,579 Boliden 83,385 0.01
83,385 0.01 Consumer Goods
8,644 Electrolux 270,649 0.02 15,000 Svenska Cellulosa 381,079 0.04
2,397 Swedish Match 68,119 0.01
719,847 0.07 Consumer Services
14,758 Hennes & Mauritz 567,732 0.06
567,732 0.06 Financial
3,234 Investor 120,396 0.01 689 Kinnevik Investment 21,764 -
46,354 Nordea Bank 577,644 0.06 21,832 Skandinaviska Enskilda Banken 278,902 0.03 17,094 Svenska Handelsbanken 249,277 0.02 11,250 Swedbank 262,082 0.03
1,510,065 0.15 Healthcare
5,393 Getinge 129,666 0.01
129,666 0.01 Industrial
4,651 Alfa Laval 81,781 0.01 9,849 Assa Abloy 185,288 0.02
13,192 Atlas Copco 368,851 0.03 2,528 Hexagon 91,523 0.01
34,777 Sandvik 384,129 0.04 16,637 Skanska 336,850 0.03 12,615 SKF 287,496 0.03
6,050 Trelleborg 111,777 0.01 70,683 Volvo 876,563 0.09
2,724,258 0.27 Technology
98,087 Telefonaktiebolaget LM Ericsson 1,015,447 0.10
1,015,447 0.10 Telecommunications
90,376 TeliaSonera 531,636 0.05
531,636 0.05 Switzerland Basic Materials
7,206 Clariant 147,736 0.01 53 Givaudan 91,760 0.01
239,121 Glencore International 960,096 0.10 741 Syngenta 301,300 0.03
1,500,892 0.15

Schedules of Investments (continued)
HSBC ESI WORLDWIDE EQUITY UCITS ETF (continued)
>266< HSBC ETFs PLC
As at 30 June 2015
Transferable securities admitted to official stock exchange listing or dealt in on another regulated market
Holdings
Financial assets at fair value through profit or loss Fair Value
USD % of Net
Asset Value
Equities (continued)
Switzerland (continued) Consumer Goods
1,129 Aryzta 55,692 0.01 3,326 Cie Financiere Richemont 270,657 0.03
10,483 Coca-Cola Hellenic Bottling 225,537 0.02 14 Lindt & Spruengli 74,063 0.01
37,620 Nestle 2,717,190 0.27 593 Swatch Group 231,032 0.02
3,574,171 0.36 Consumer Services
74 Galenica Holding 77,243 0.01
77,243 0.01 Financial
3,032 ACE 308,294 0.03 850 Baloise Holding 103,686 0.01
42,528 Credit Suisse Group 1,169,514 0.12 1,833 Julius Baer Group 102,874 0.01
87 Partners Group Holding 26,019 - 382 Swiss Life Holding 87,514 0.01
3,243 Swiss Re 287,152 0.03 61,908 UBS Group 1,313,612 0.13
2,403 Zurich Financial Services 731,789 0.07 4,130,454 0.41 Healthcare
383 Actelion 56,064 0.01 723 Lonza Group 96,627 0.01
16,768 Novartis 1,653,385 0.16 7,260 Roche Holding 2,035,333 0.20
531 Sonova Holding 71,819 0.01
3,913,228 0.39 Industrial
49,573 ABB 1,038,617 0.10 3,185 Adecco 258,672 0.03
210 Geberit 70,041 0.01 6,570 Holcim 485,078 0.05 2,369 Kuehne + Nagel International 314,582 0.03 1,822 Schindler Holding 297,704 0.03
135 SGS 246,439 0.02 33 Sika 116,456 0.01
8,956 TE Connectivity 575,871 0.06 22,907 Tyco International 881,461 0.09
6,774 Wolseley 432,851 0.04
4,717,772 0.47 Oil & Gas
19,584 Transocean 316,848 0.03
316,848 0.03
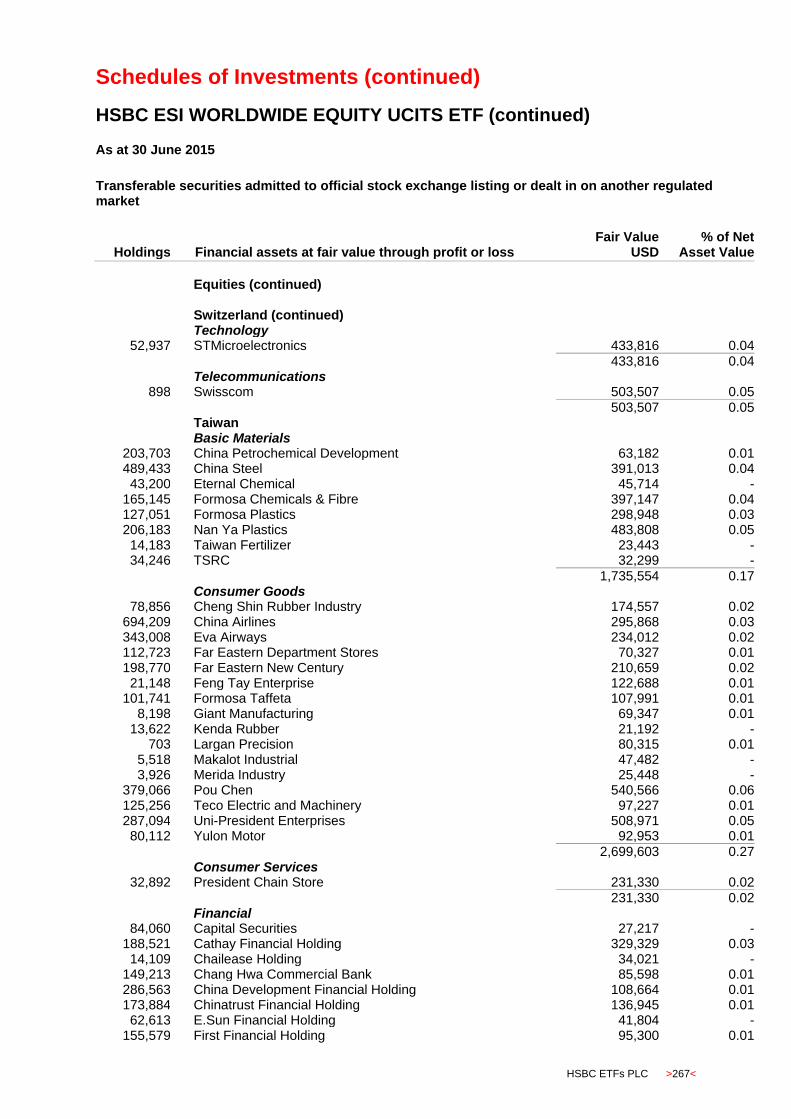
Schedules of Investments (continued)
HSBC ESI WORLDWIDE EQUITY UCITS ETF (continued)
HSBC ETFs PLC >267<
As at 30 June 2015
Transferable securities admitted to official stock exchange listing or dealt in on another regulated market
Holdings
Financial assets at fair value through profit or loss Fair Value
USD % of Net
Asset Value
Equities (continued)
Switzerland (continued) Technology
52,937 STMicroelectronics 433,816 0.04
433,816 0.04 Telecommunications
898 Swisscom 503,507 0.05
503,507 0.05 Taiwan Basic Materials
203,703 China Petrochemical Development 63,182 0.01 489,433 China Steel 391,013 0.04 43,200 Eternal Chemical 45,714 -
165,145 Formosa Chemicals & Fibre 397,147 0.04 127,051 Formosa Plastics 298,948 0.03 206,183 Nan Ya Plastics 483,808 0.05 14,183 Taiwan Fertilizer 23,443 - 34,246 TSRC 32,299 -
1,735,554 0.17 Consumer Goods
78,856 Cheng Shin Rubber Industry 174,557 0.02 694,209 China Airlines 295,868 0.03 343,008 Eva Airways 234,012 0.02 112,723 Far Eastern Department Stores 70,327 0.01 198,770 Far Eastern New Century 210,659 0.02 21,148 Feng Tay Enterprise 122,688 0.01
101,741 Formosa Taffeta 107,991 0.01 8,198 Giant Manufacturing 69,347 0.01
13,622 Kenda Rubber 21,192 - 703 Largan Precision 80,315 0.01
5,518 Makalot Industrial 47,482 - 3,926 Merida Industry 25,448 -
379,066 Pou Chen 540,566 0.06 125,256 Teco Electric and Machinery 97,227 0.01 287,094 Uni-President Enterprises 508,971 0.05 80,112 Yulon Motor 92,953 0.01
2,699,603 0.27 Consumer Services
32,892 President Chain Store 231,330 0.02
231,330 0.02 Financial
84,060 Capital Securities 27,217 - 188,521 Cathay Financial Holding 329,329 0.03 14,109 Chailease Holding 34,021 -
149,213 Chang Hwa Commercial Bank 85,598 0.01 286,563 China Development Financial Holding 108,664 0.01 173,884 Chinatrust Financial Holding 136,945 0.01 62,613 E.Sun Financial Holding 41,804 -
155,579 First Financial Holding 95,300 0.01

Schedules of Investments (continued)
HSBC ESI WORLDWIDE EQUITY UCITS ETF (continued)
>268< HSBC ETFs PLC
As at 30 June 2015
Transferable securities admitted to official stock exchange listing or dealt in on another regulated market
Holdings
Financial assets at fair value through profit or loss Fair Value
USD % of Net
Asset Value
Equities (continued)
Taiwan (continued) Financial (continued)
131,100 Fubon Financial Holding 260,887 0.03 181,401 Hua Nan Financial Holdings 104,357 0.01 154,275 Mega Financial Holding 139,002 0.02 348,161 Shin Kong Financial Holding 106,295 0.01 184,498 SinoPac Financial Holdings 81,622 0.01 384,540 Taishin Financial Holding 160,150 0.02 95,634 Taiwan Business Bank 29,476 -
182,034 Taiwan Cooperative Financial Holding 95,281 0.01 312,850 Yuanta Financial Holding 169,330 0.02
2,005,278 0.2 Industrial
102,404 Asia Cement 121,141 0.01 4,195 Casetek Holdings 25,969 -
12,540 Catcher Technology 156,880 0.02 75,654 Cheung Uei Precision Industry 130,689 0.01 45,158 CTCI Corporation 73,033 0.01 62,250 Delta Electronics 318,770 0.03 47,516 Epistar 63,525 0.01 50,637 Evergreen Marine 26,258 - 25,411 Everlight Electronics 48,756 0.01
2,623 Hiwin Technologies 17,257 - 774,355 Hon Hai Precision Industry 2,434,408 0.24 20,208 Radiant Opto Electronic 74,991 0.01
6,697 Simplo Technology 31,038 - 167,695 Taiwan Cement 211,694 0.02
7,960 TPK Holding 46,050 0.01 57,899 Tripod Technology 103,208 0.01 23,644 U-Ming Marine Transport 32,108 -
330,798 Unimicron Technology 169,931 0.02 130,360 Walsin Lihwa 32,490 - 55,660 Wan Hai Lines 44,197 -
331,274 Wintek 19,648 - 58,217 Yageo Corporation 91,322 0.01
222,297 Yang Ming Marine 77,811 0.01 13,959 Yungtay Engineering 26,828 - 20,516 Zhen Ding Technology Holding 71,812 0.01
4,449,814 0.44 Oil & Gas
192,084 Formosa Petrochemical 493,058 0.05
493,058 0.05 Technology
331,666 Acer 160,703 0.02 399,151 Advanced Semiconductor Engineering 540,748 0.06 11,730 Advantech 80,596 0.01 33,381 Asustek Computer 325,106 0.03
1,783,787 AU Optronics 789,146 0.08
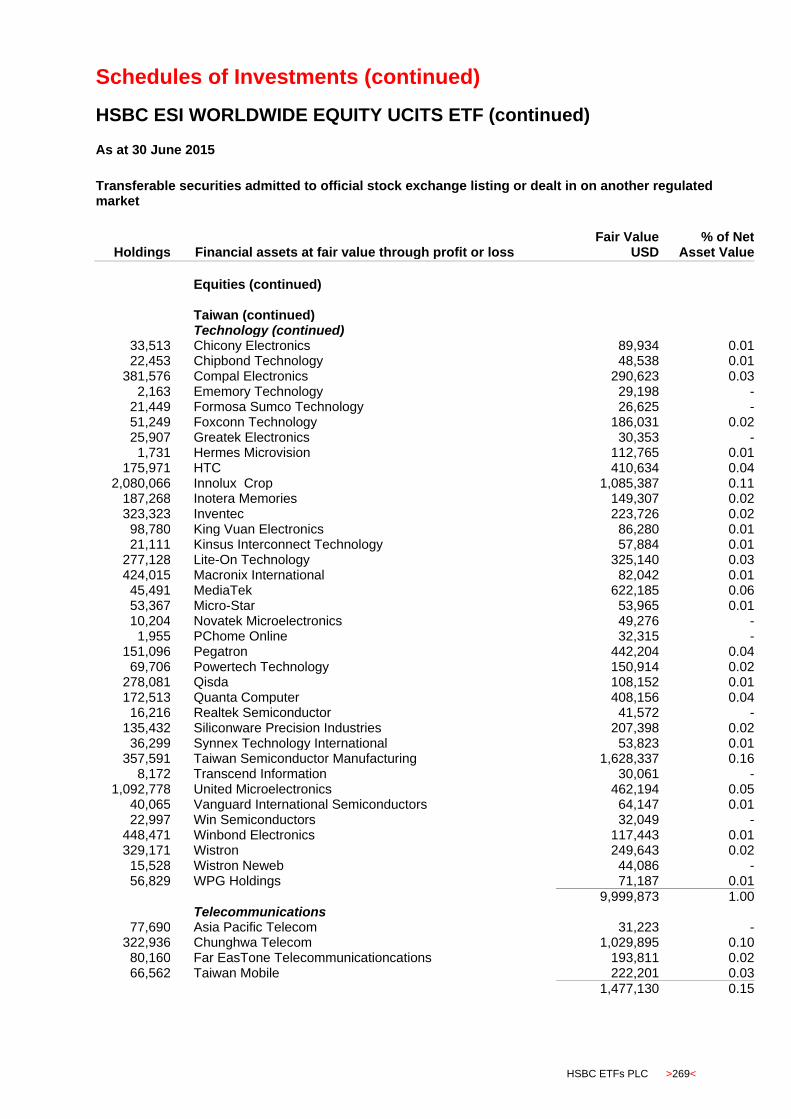
Schedules of Investments (continued)
HSBC ESI WORLDWIDE EQUITY UCITS ETF (continued)
HSBC ETFs PLC >269<
As at 30 June 2015
Transferable securities admitted to official stock exchange listing or dealt in on another regulated market
Holdings
Financial assets at fair value through profit or loss Fair Value
USD % of Net
Asset Value
Equities (continued)
Taiwan (continued) Technology (continued)
33,513 Chicony Electronics 89,934 0.01 22,453 Chipbond Technology 48,538 0.01
381,576 Compal Electronics 290,623 0.03 2,163 Ememory Technology 29,198 -
21,449 Formosa Sumco Technology 26,625 - 51,249 Foxconn Technology 186,031 0.02 25,907 Greatek Electronics 30,353 -
1,731 Hermes Microvision 112,765 0.01 175,971 HTC 410,634 0.04
2,080,066 Innolux Crop 1,085,387 0.11 187,268 Inotera Memories 149,307 0.02 323,323 Inventec 223,726 0.02 98,780 King Vuan Electronics 86,280 0.01 21,111 Kinsus Interconnect Technology 57,884 0.01
277,128 Lite-On Technology 325,140 0.03 424,015 Macronix International 82,042 0.01 45,491 MediaTek 622,185 0.06 53,367 Micro-Star 53,965 0.01 10,204 Novatek Microelectronics 49,276 -
1,955 PChome Online 32,315 - 151,096 Pegatron 442,204 0.04 69,706 Powertech Technology 150,914 0.02
278,081 Qisda 108,152 0.01 172,513 Quanta Computer 408,156 0.04 16,216 Realtek Semiconductor 41,572 -
135,432 Siliconware Precision Industries 207,398 0.02 36,299 Synnex Technology International 53,823 0.01
357,591 Taiwan Semiconductor Manufacturing 1,628,337 0.16 8,172 Transcend Information 30,061 -
1,092,778 United Microelectronics 462,194 0.05 40,065 Vanguard International Semiconductors 64,147 0.01 22,997 Win Semiconductors 32,049 -
448,471 Winbond Electronics 117,443 0.01 329,171 Wistron 249,643 0.02 15,528 Wistron Neweb 44,086 - 56,829 WPG Holdings 71,187 0.01
9,999,873 1.00 Telecommunications
77,690 Asia Pacific Telecom 31,223 - 322,936 Chunghwa Telecom 1,029,895 0.10 80,160 Far EasTone Telecommunicationcations 193,811 0.02 66,562 Taiwan Mobile 222,201 0.03
1,477,130 0.15

Schedules of Investments (continued)
HSBC ESI WORLDWIDE EQUITY UCITS ETF (continued)
>270< HSBC ETFs PLC
As at 30 June 2015
Transferable securities admitted to official stock exchange listing or dealt in on another regulated market
Holdings
Financial assets at fair value through profit or loss Fair Value
USD % of Net
Asset Value
Equities (continued)
Thailand Basic Materials
376,698 Banpu 284,401 0.03 54,200 Indorama Ventures 44,531 -
504,081 IRPC 66,861 0.01 154,294 PTT Global Chemical 316,349 0.03
712,142 0.07 Consumer Goods
354,294 Charoen Pokphand Foods 251,752 0.02 120,976 Thai Union Frozen Products 78,083 0.01
329,835 0.03 Consumer Services
74,878 BEC World 83,135 0.01 38,930 Central Plaza Hotel 42,935 -
100,627 CP ALL 137,792 0.01 139,828 Home Product Center 27,945 - 28,817 Major Cineplex Group 28,795 - 68,813 Minor International 61,121 0.01
1,425,869 Thai Airways International 553,031 0.06 934,754 0.09 Financial
38,303 Central Pattana 53,867 0.01
53,867 0.01 Healthcare
208,518 Bangkok Dusit Medical Services 121,621 0.01
121,621 0.01 Industrial
20,170 Airports of Thailand 180,945 0.02 46,368 Bangkok Expressway 54,227 0.01 31,738 Delta Electronics 85,041 0.01 38,066 Hana Microelectronics 45,645 -
316,131 Italian-Thai Development 74,878 0.01 32,060 Siam Cement 493,589 0.05 48,532 Sino Thai Engr & Contruction 33,480 -
409,744 TPI Polene 37,365 -
1,005,170 0.10 Oil & Gas
124,235 PTT 1,320,495 0.13 206,615 PTT Exploration & Production 666,786 0.07 67,790 Thai Oil 110,389 0.01
2,097,670 0.21 Technology
235,118 Jasmine International 36,894 - 47,300 Samart Corporation 39,562 - 66,599 Shin Corporation 153,801 0.02 26,619 Thaicom 27,584 -
257,841 0.02

Schedules of Investments (continued)
HSBC ESI WORLDWIDE EQUITY UCITS ETF (continued)
HSBC ETFs PLC >271<
As at 30 June 2015
Transferable securities admitted to official stock exchange listing or dealt in on another regulated market
Holdings
Financial assets at fair value through profit or loss Fair Value
USD % of Net
Asset Value
Equities (continued)
Thailand (continued) Telecommunications
81,946 Advanced Info Service 582,287 0.06 124,112 Total Access Communications 305,912 0.03 615,896 True Corporation 207,879 0.02
1,096,078 0.11 Utilities
8,104 Electricity Generating 36,830 - 111,111 Energy Absolute 77,308 0.01
114,138 0.01 Turkey Basic Materials
176,408 Eregli Demir ve Celik Fabrikalari TAS 285,782 0.03 285,782 0.03 Consumer Goods
19,807 Anadolu Efes Biracilik 178,921 0.02 18,142 Arcelik 98,532 0.01
4,831 Coca-Cola Icecek 80,427 0.01 5,917 Ford Otomotiv Sanayi 79,180 0.01
12,605 Tofas Turk Otomobil Fabrikasi 86,103 0.01 52,897 Turk Sise Ve Cam Fabrikalari 71,280 0.01
4,701 Ulker Biskuvi Sanayi 32,814 -
627,257 0.07 Consumer Services
5,980 BIM Birlesik Magazalar 107,144 0.01 158,351 Turk Hava Yollari 520,153 0.05
627,297 0.06 Financial
95,575 Akbank 276,486 0.03 39,906 Emlak Konut Gayrimenkul Yatirim Ortakligi 41,112 - 93,509 Haci Omer Sabanci Holding 352,535 0.04 90,889 KOC Holding 420,688 0.04
115,630 Turkiye Garanti Bankasi 360,831 0.04 47,856 Turkiye Halk Bankasi 220,613 0.02
222,652 Turkiye Is Bankasi 468,741 0.05 116,077 Turkiye Vakiflar Bankasi 186,746 0.02 158,843 Yapi ve Kredi Bankasi 233,610 0.02
2,561,362 0.26 Industrial
69,728 Enka Insaat 132,741 0.01 18,171 Tav Havalimanlari 154,308 0.02
1,067 Turk Traktor Ve Ziraat 27,481 -
314,530 0.03 Oil & Gas
3,932 Tupras Turkiye Petrol Rafinerileri 99,658 0.01
99,658 0.01
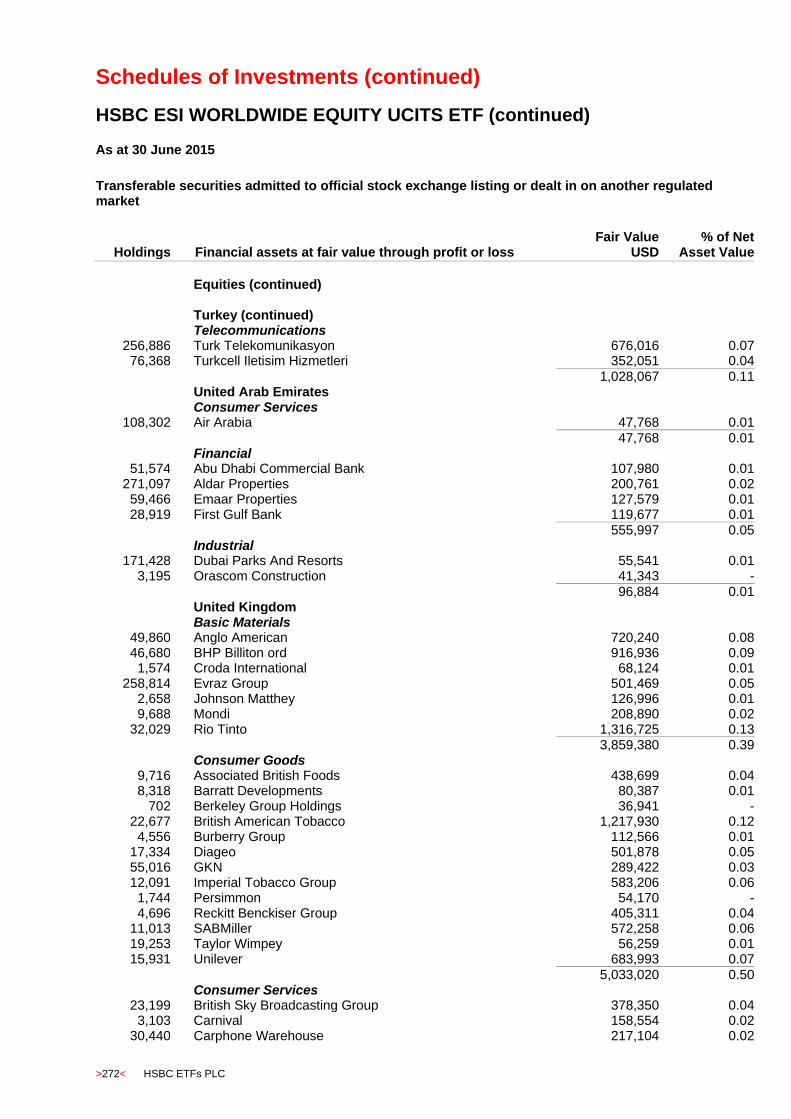
Schedules of Investments (continued)
HSBC ESI WORLDWIDE EQUITY UCITS ETF (continued)
>272< HSBC ETFs PLC
As at 30 June 2015
Transferable securities admitted to official stock exchange listing or dealt in on another regulated market
Holdings
Financial assets at fair value through profit or loss Fair Value
USD % of Net
Asset Value
Equities (continued)
Turkey (continued) Telecommunications
256,886 Turk Telekomunikasyon 676,016 0.07 76,368 Turkcell Iletisim Hizmetleri 352,051 0.04
1,028,067 0.11 United Arab Emirates Consumer Services
108,302 Air Arabia 47,768 0.01
47,768 0.01 Financial
51,574 Abu Dhabi Commercial Bank 107,980 0.01 271,097 Aldar Properties 200,761 0.02 59,466 Emaar Properties 127,579 0.01 28,919 First Gulf Bank 119,677 0.01
555,997 0.05 Industrial
171,428 Dubai Parks And Resorts 55,541 0.01 3,195 Orascom Construction 41,343 -
96,884 0.01 United Kingdom Basic Materials
49,860 Anglo American 720,240 0.08 46,680 BHP Billiton ord 916,936 0.09
1,574 Croda International 68,124 0.01 258,814 Evraz Group 501,469 0.05
2,658 Johnson Matthey 126,996 0.01 9,688 Mondi 208,890 0.02
32,029 Rio Tinto 1,316,725 0.13
3,859,380 0.39 Consumer Goods
9,716 Associated British Foods 438,699 0.04 8,318 Barratt Developments 80,387 0.01
702 Berkeley Group Holdings 36,941 - 22,677 British American Tobacco 1,217,930 0.12
4,556 Burberry Group 112,566 0.01 17,334 Diageo 501,878 0.05 55,016 GKN 289,422 0.03 12,091 Imperial Tobacco Group 583,206 0.06
1,744 Persimmon 54,170 - 4,696 Reckitt Benckiser Group 405,311 0.04
11,013 SABMiller 572,258 0.06 19,253 Taylor Wimpey 56,259 0.01 15,931 Unilever 683,993 0.07
5,033,020 0.50 Consumer Services
23,199 British Sky Broadcasting Group 378,350 0.04 3,103 Carnival 158,554 0.02
30,440 Carphone Warehouse 217,104 0.02
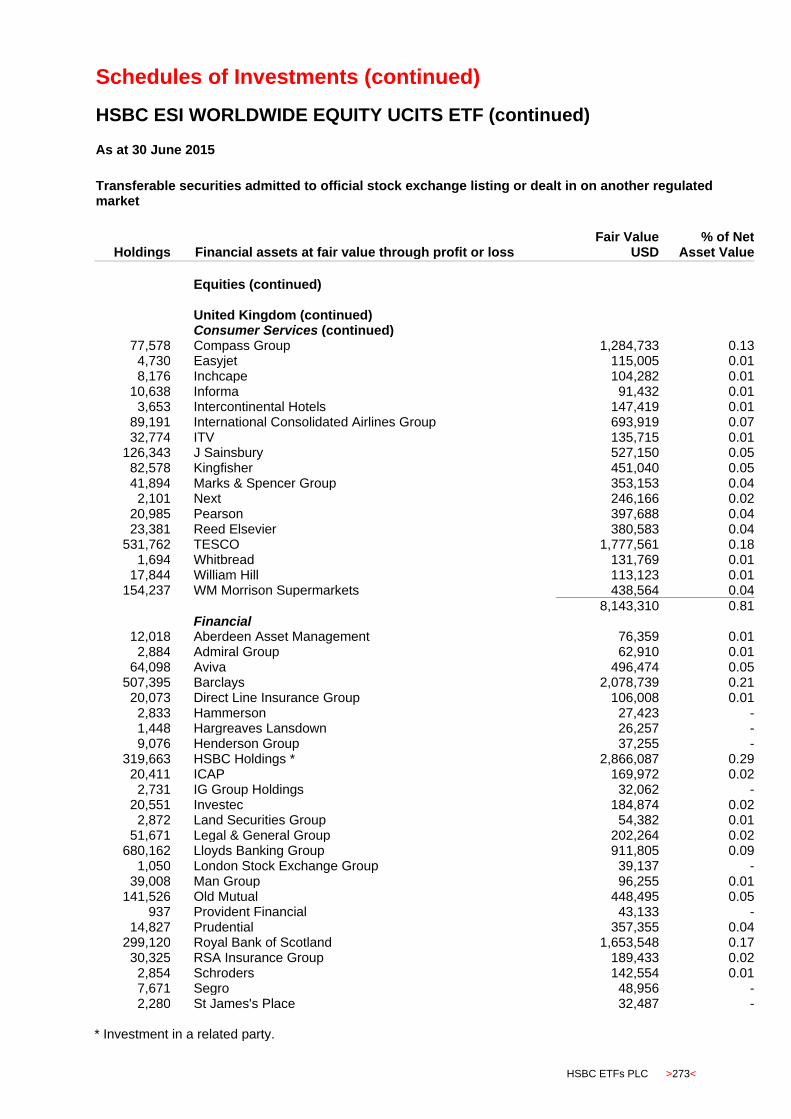
Schedules of Investments (continued)
HSBC ESI WORLDWIDE EQUITY UCITS ETF (continued)
HSBC ETFs PLC >273<
As at 30 June 2015
Transferable securities admitted to official stock exchange listing or dealt in on another regulated market
Holdings
Financial assets at fair value through profit or loss Fair Value
USD % of Net
Asset Value
Equities (continued)
United Kingdom (continued) Consumer Services (continued)
77,578 Compass Group 1,284,733 0.13 4,730 Easyjet 115,005 0.01 8,176 Inchcape 104,282 0.01
10,638 Informa 91,432 0.01 3,653 Intercontinental Hotels 147,419 0.01
89,191 International Consolidated Airlines Group 693,919 0.07 32,774 ITV 135,715 0.01
126,343 J Sainsbury 527,150 0.05 82,578 Kingfisher 451,040 0.05 41,894 Marks & Spencer Group 353,153 0.04
2,101 Next 246,166 0.02 20,985 Pearson 397,688 0.04 23,381 Reed Elsevier 380,583 0.04
531,762 TESCO 1,777,561 0.18 1,694 Whitbread 131,769 0.01
17,844 William Hill 113,123 0.01 154,237 WM Morrison Supermarkets 438,564 0.04
8,143,310 0.81 Financial
12,018 Aberdeen Asset Management 76,359 0.01 2,884 Admiral Group 62,910 0.01
64,098 Aviva 496,474 0.05 507,395 Barclays 2,078,739 0.21 20,073 Direct Line Insurance Group 106,008 0.01
2,833 Hammerson 27,423 - 1,448 Hargreaves Lansdown 26,257 - 9,076 Henderson Group 37,255 -
319,663 HSBC Holdings * 2,866,087 0.29 20,411 ICAP 169,972 0.02
2,731 IG Group Holdings 32,062 - 20,551 Investec 184,874 0.02
2,872 Land Securities Group 54,382 0.01 51,671 Legal & General Group 202,264 0.02
680,162 Lloyds Banking Group 911,805 0.09 1,050 London Stock Exchange Group 39,137 -
39,008 Man Group 96,255 0.01 141,526 Old Mutual 448,495 0.05
937 Provident Financial 43,133 - 14,827 Prudential 357,355 0.04
299,120 Royal Bank of Scotland 1,653,548 0.17 30,325 RSA Insurance Group 189,433 0.02
2,854 Schroders 142,554 0.01 7,671 Segro 48,956 - 2,280 St James's Place 32,487 -
* Investment in a related party.

Schedules of Investments (continued)
HSBC ESI WORLDWIDE EQUITY UCITS ETF (continued)
>274< HSBC ETFs PLC
As at 30 June 2015
Transferable securities admitted to official stock exchange listing or dealt in on another regulated market
Holdings
Financial assets at fair value through profit or loss Fair Value
USD % of Net
Asset Value
Equities (continued)
United Kingdom (continued) Financial (continued)
51,371 Standard Chartered 823,262 0.08 30,771 Standard Life 214,867 0.02
11,422,353 1.14 Healthcare
24,841 AstraZeneca 1,570,121 0.16 98,503 GlaxoSmithKline 2,048,760 0.20
1,361 Hikma Pharmaceuticals 41,375 - 10,612 Smith & Nephew 179,245 0.02
3,839,501 0.38 Industrial
4,396 Aggreko 99,487 0.01 19,605 Ashtead Group 338,852 0.03 10,397 Babcock International 176,595 0.02
149,254 BAE Systems 1,059,110 0.11 3,996 Bunzl 109,225 0.01
14,985 Capita 291,758 0.03 26,134 Cobham 108,095 0.01 13,240 DS Smith 80,375 0.01
198,650 G4S 839,152 0.08 3,342 Halma 40,050 - 6,211 Howden Joinery Group 50,550 0.01 7,596 IMI 134,395 0.01 4,319 Intertek Group 166,416 0.02
17,807 Meggitt 130,616 0.01 23,420 Rexam 203,316 0.02
9,932,130 Rolls-Royce Holdings 540,698 0.06 111,943 Royal Mail 905,792 0.09 10,871 Smiths Group 193,023 0.02
2,911 Spectris 96,599 0.01 3,665 Travis Perkins 121,619 0.01 3,179 Weir Group 84,843 0.01
5,770,566 0.58 Oil & Gas
18,320 AMEC 235,537 0.02 21,408 BG Group 356,716 0.04
502,450 BP 3,320,039 0.33 3,491 Ensco 77,745 0.01
14,828 Tullow Oil 79,218 0.01
4,069,255 0.41 Technology
4,021 ARM Holdings 65,578 0.01 19,553 Sage Group 157,599 0.01
223,177 0.02 Telecommunications
205,709 BT Group 1,456,481 0.15
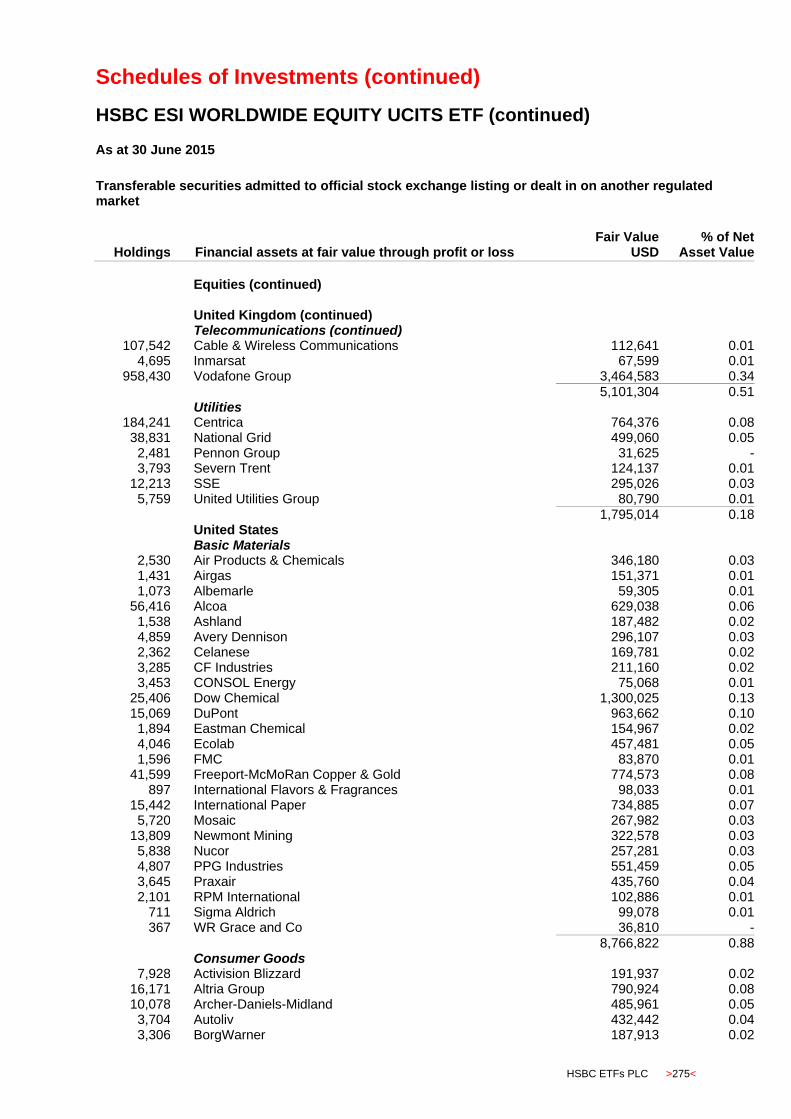
Schedules of Investments (continued)
HSBC ESI WORLDWIDE EQUITY UCITS ETF (continued)
HSBC ETFs PLC >275<
As at 30 June 2015
Transferable securities admitted to official stock exchange listing or dealt in on another regulated market
Holdings
Financial assets at fair value through profit or loss Fair Value
USD % of Net
Asset Value
Equities (continued)
United Kingdom (continued) Telecommunications (continued)
107,542 Cable & Wireless Communications 112,641 0.01 4,695 Inmarsat 67,599 0.01
958,430 Vodafone Group 3,464,583 0.34
5,101,304 0.51 Utilities
184,241 Centrica 764,376 0.08 38,831 National Grid 499,060 0.05
2,481 Pennon Group 31,625 - 3,793 Severn Trent 124,137 0.01
12,213 SSE 295,026 0.03 5,759 United Utilities Group 80,790 0.01
1,795,014 0.18 United States Basic Materials
2,530 Air Products & Chemicals 346,180 0.03 1,431 Airgas 151,371 0.01 1,073 Albemarle 59,305 0.01
56,416 Alcoa 629,038 0.06 1,538 Ashland 187,482 0.02 4,859 Avery Dennison 296,107 0.03 2,362 Celanese 169,781 0.02 3,285 CF Industries 211,160 0.02 3,453 CONSOL Energy 75,068 0.01
25,406 Dow Chemical 1,300,025 0.13 15,069 DuPont 963,662 0.10
1,894 Eastman Chemical 154,967 0.02 4,046 Ecolab 457,481 0.05 1,596 FMC 83,870 0.01
41,599 Freeport-McMoRan Copper & Gold 774,573 0.08 897 International Flavors & Fragrances 98,033 0.01
15,442 International Paper 734,885 0.07 5,720 Mosaic 267,982 0.03
13,809 Newmont Mining 322,578 0.03 5,838 Nucor 257,281 0.03 4,807 PPG Industries 551,459 0.05 3,645 Praxair 435,760 0.04 2,101 RPM International 102,886 0.01
711 Sigma Aldrich 99,078 0.01 367 WR Grace and Co 36,810 -
8,766,822 0.88 Consumer Goods
7,928 Activision Blizzard 191,937 0.02 16,171 Altria Group 790,924 0.08 10,078 Archer-Daniels-Midland 485,961 0.05
3,704 Autoliv 432,442 0.04 3,306 BorgWarner 187,913 0.02

Schedules of Investments (continued)
HSBC ESI WORLDWIDE EQUITY UCITS ETF (continued)
>276< HSBC ETFs PLC
As at 30 June 2015
Transferable securities admitted to official stock exchange listing or dealt in on another regulated market
Holdings
Financial assets at fair value through profit or loss Fair Value
USD % of Net
Asset Value
Equities (continued)
United States (continued) Consumer Goods (continued)
1,315 Brown-Forman 131,737 0.01 4,889 Bunge 429,254 0.04 6,283 Campbell Soup 299,385 0.03 1,073 Church & Dwight 87,052 0.01 1,993 Clorox 207,312 0.02 7,306 Coach 252,861 0.03
40,615 Coca-Cola 1,593,326 0.16 4,204 Coca-Cola Enterprises 182,622 0.02
10,997 Colgate-Palmolive 719,314 0.07 9,017 ConAgra Foods 394,223 0.04
713 Constellation Brands 82,722 0.01 12,032 Delphi Automotive 1,023,803 0.10
1,716 DR Horton 46,950 - 3,980 Dr Pepper Snapple Group 290,142 0.03 1,695 Electronic Arts 112,717 0.01 1,440 Energizer Holdings 189,432 0.02 5,200 Estee Lauder Cos 450,632 0.04
134,868 Ford Motor 2,024,369 0.20 3,366 Garmin 147,868 0.01
10,910 General Mills 607,905 0.06 46,250 General Motors 1,541,512 0.15
2,900 Genuine Parts 259,637 0.03 18,474 Goodyear Tire & Rubber 556,991 0.06
538 Hain Celestial Group 35,433 - 14,404 Hanesbrands 479,941 0.05
3,806 Harley-Davidson 214,468 0.02 1,097 Harman International Industries 130,477 0.01 1,868 Hasbro 139,708 0.01 2,744 Hershey 243,749 0.02 4,005 Hormel Foods 225,762 0.02 1,555 Ingredion 124,105 0.01 4,149 Jarden 214,711 0.02 1,161 JM Smucker 125,864 0.01
28,323 Johnson Controls 1,402,838 0.14 6,569 Kellogg 411,876 0.04
875 Keurig Green Mountain 67,051 0.01 8,077 Kimberly-Clark 855,920 0.09 3,863 Kraft Foods 328,896 0.03 8,392 Lear Corporation 942,086 0.10 4,100 Leggett & Platt 199,588 0.02 3,872 LKQ 117,109 0.01
12,509 Mattel 321,356 0.03 1,873 McCormick & Co 151,619 0.02 1,198 Mead Johnson Nutrition 108,084 0.01 1,007 Michael Kors Holdings 42,385 -
291 Middleby Corporation 32,659 -
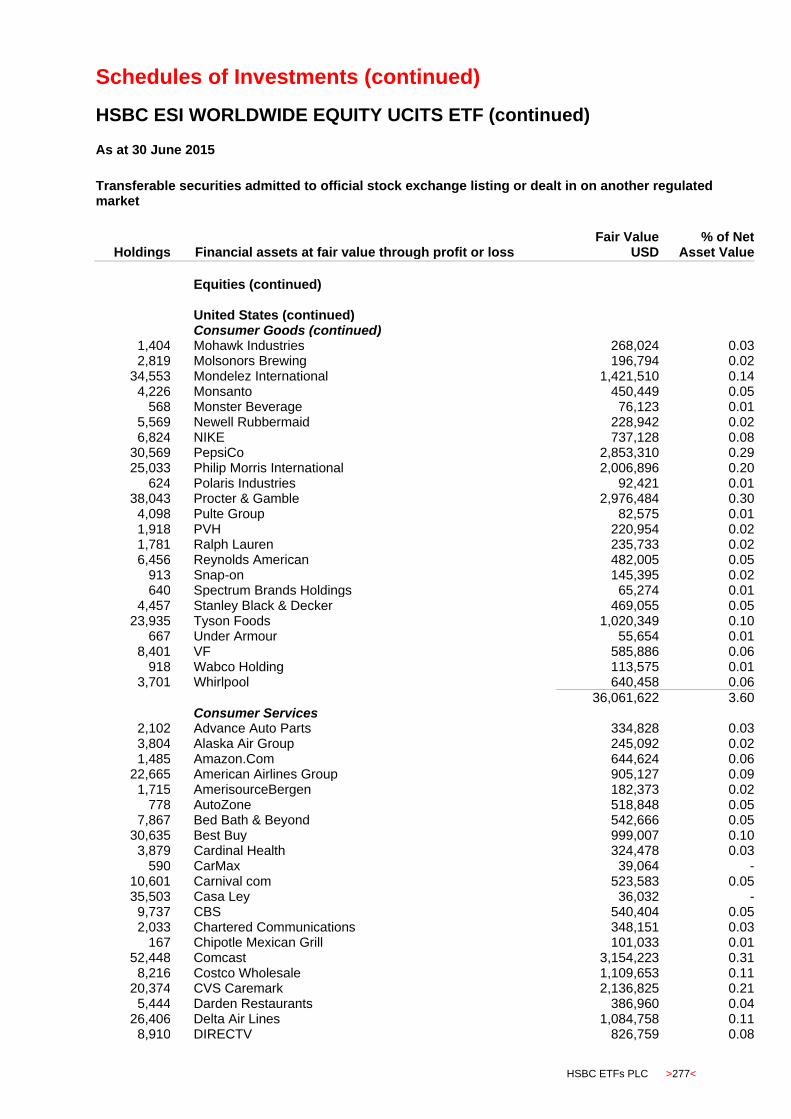
Schedules of Investments (continued)
HSBC ESI WORLDWIDE EQUITY UCITS ETF (continued)
HSBC ETFs PLC >277<
As at 30 June 2015
Transferable securities admitted to official stock exchange listing or dealt in on another regulated market
Holdings
Financial assets at fair value through profit or loss Fair Value
USD % of Net
Asset Value
Equities (continued)
United States (continued) Consumer Goods (continued)
1,404 Mohawk Industries 268,024 0.03 2,819 Molsonors Brewing 196,794 0.02
34,553 Mondelez International 1,421,510 0.14 4,226 Monsanto 450,449 0.05
568 Monster Beverage 76,123 0.01 5,569 Newell Rubbermaid 228,942 0.02 6,824 NIKE 737,128 0.08
30,569 PepsiCo 2,853,310 0.29 25,033 Philip Morris International 2,006,896 0.20
624 Polaris Industries 92,421 0.01 38,043 Procter & Gamble 2,976,484 0.30
4,098 Pulte Group 82,575 0.01 1,918 PVH 220,954 0.02 1,781 Ralph Lauren 235,733 0.02 6,456 Reynolds American 482,005 0.05
913 Snap-on 145,395 0.02 640 Spectrum Brands Holdings 65,274 0.01
4,457 Stanley Black & Decker 469,055 0.05 23,935 Tyson Foods 1,020,349 0.10
667 Under Armour 55,654 0.01 8,401 VF 585,886 0.06
918 Wabco Holding 113,575 0.01 3,701 Whirlpool 640,458 0.06
36,061,622 3.60 Consumer Services
2,102 Advance Auto Parts 334,828 0.03 3,804 Alaska Air Group 245,092 0.02 1,485 Amazon.Com 644,624 0.06
22,665 American Airlines Group 905,127 0.09 1,715 AmerisourceBergen 182,373 0.02
778 AutoZone 518,848 0.05 7,867 Bed Bath & Beyond 542,666 0.05
30,635 Best Buy 999,007 0.10 3,879 Cardinal Health 324,478 0.03
590 CarMax 39,064 - 10,601 Carnival com 523,583 0.05 35,503 Casa Ley 36,032 -
9,737 CBS 540,404 0.05 2,033 Chartered Communications 348,151 0.03
167 Chipotle Mexican Grill 101,033 0.01 52,448 Comcast 3,154,223 0.31
8,216 Costco Wholesale 1,109,653 0.11 20,374 CVS Caremark 2,136,825 0.21
5,444 Darden Restaurants 386,960 0.04 26,406 Delta Air Lines 1,084,758 0.11
8,910 DIRECTV 826,759 0.08
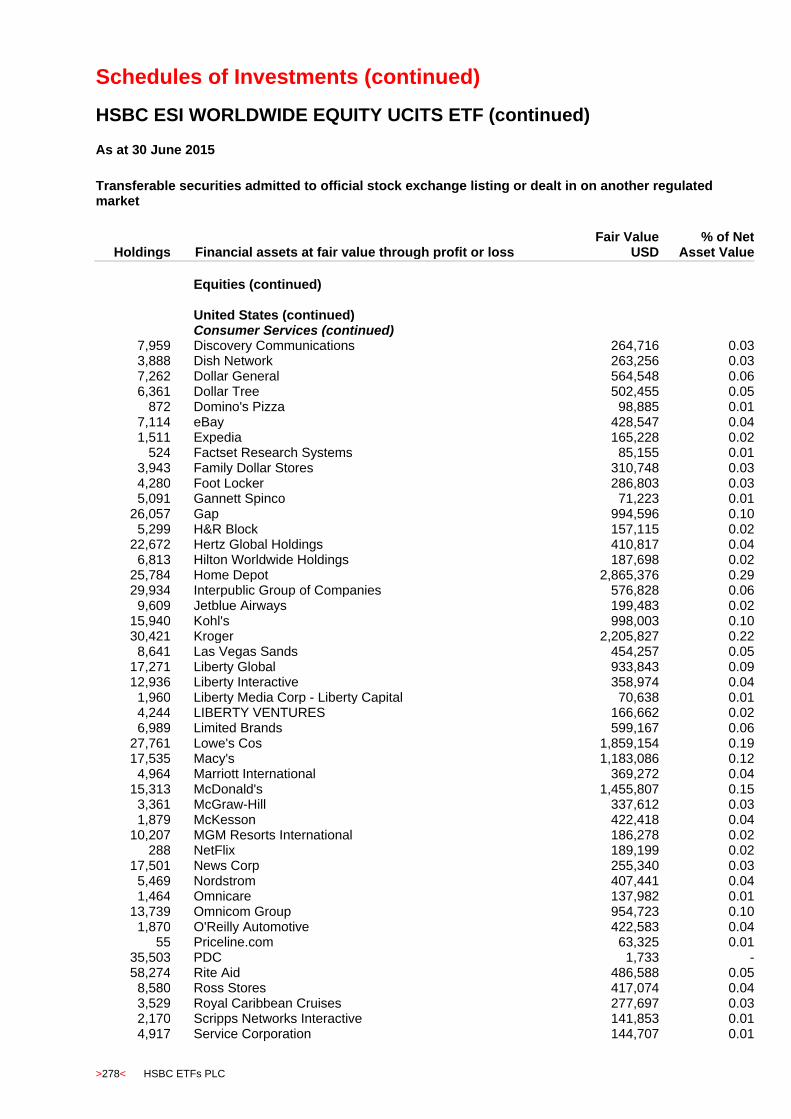
Schedules of Investments (continued)
HSBC ESI WORLDWIDE EQUITY UCITS ETF (continued)
>278< HSBC ETFs PLC
As at 30 June 2015
Transferable securities admitted to official stock exchange listing or dealt in on another regulated market
Holdings
Financial assets at fair value through profit or loss Fair Value
USD % of Net
Asset Value
Equities (continued)
United States (continued) Consumer Services (continued)
7,959 Discovery Communications 264,716 0.03 3,888 Dish Network 263,256 0.03 7,262 Dollar General 564,548 0.06 6,361 Dollar Tree 502,455 0.05
872 Domino's Pizza 98,885 0.01 7,114 eBay 428,547 0.04 1,511 Expedia 165,228 0.02
524 Factset Research Systems 85,155 0.01 3,943 Family Dollar Stores 310,748 0.03 4,280 Foot Locker 286,803 0.03 5,091 Gannett Spinco 71,223 0.01
26,057 Gap 994,596 0.10 5,299 H&R Block 157,115 0.02
22,672 Hertz Global Holdings 410,817 0.04 6,813 Hilton Worldwide Holdings 187,698 0.02
25,784 Home Depot 2,865,376 0.29 29,934 Interpublic Group of Companies 576,828 0.06
9,609 Jetblue Airways 199,483 0.02 15,940 Kohl's 998,003 0.10 30,421 Kroger 2,205,827 0.22
8,641 Las Vegas Sands 454,257 0.05 17,271 Liberty Global 933,843 0.09 12,936 Liberty Interactive 358,974 0.04
1,960 Liberty Media Corp - Liberty Capital 70,638 0.01 4,244 LIBERTY VENTURES 166,662 0.02 6,989 Limited Brands 599,167 0.06
27,761 Lowe's Cos 1,859,154 0.19 17,535 Macy's 1,183,086 0.12
4,964 Marriott International 369,272 0.04 15,313 McDonald's 1,455,807 0.15
3,361 McGraw-Hill 337,612 0.03 1,879 McKesson 422,418 0.04
10,207 MGM Resorts International 186,278 0.02 288 NetFlix 189,199 0.02
17,501 News Corp 255,340 0.03 5,469 Nordstrom 407,441 0.04 1,464 Omnicare 137,982 0.01
13,739 Omnicom Group 954,723 0.10 1,870 O'Reilly Automotive 422,583 0.04
55 Priceline.com 63,325 0.01 35,503 PDC 1,733 - 58,274 Rite Aid 486,588 0.05
8,580 Ross Stores 417,074 0.04 3,529 Royal Caribbean Cruises 277,697 0.03 2,170 Scripps Networks Interactive 141,853 0.01 4,917 Service Corporation 144,707 0.01

Schedules of Investments (continued)
HSBC ESI WORLDWIDE EQUITY UCITS ETF (continued)
HSBC ETFs PLC >279<
As at 30 June 2015
Transferable securities admitted to official stock exchange listing or dealt in on another regulated market
Holdings
Financial assets at fair value through profit or loss Fair Value
USD % of Net
Asset Value
Equities (continued)
United States (continued) Consumer Services (continued)
24,278 Sirius XM Holdings 90,557 0.01 21,424 Southwest Airlines 708,920 0.07 38,525 Staples 589,818 0.06
9,542 Starbucks 511,594 0.05 5,383 Starwood Hotels & Resorts Worldwide 436,507 0.04
12,562 Sysco 453,488 0.04 32,389 Target 2,643,914 0.26 10,182 TEGNA corporation 326,537 0.03 20,158 Thomson Reuters 767,924 0.08
1,021 Tiffany & Co 93,728 0.01 10,734 Time Warner 938,259 0.09
6,529 Time Warner Cable 1,163,272 0.12 18,445 TJX Cos 1,220,506 0.12
1,910 Tractor Supply 171,785 0.02 27,221 Twenty-First Century Fox 885,907 0.09
786 Ulta Salon Cosmetic 121,398 0.01 21,895 United Continental Holdings 1,160,654 0.12
6,713 Viacom 433,928 0.04 19,908 Walgreens Boots Alliance 1,681,032 0.17
194,461 Wal-Mart Stores 13,793,119 1.38 24,275 Walt Disney 2,770,749 0.28 10,909 Whole Foods Market 430,251 0.04
2,255 Williams Sonoma 185,519 0.02 2,063 Wyndham Worldwide 168,980 0.02 1,462 Wynn Resorts 144,256 0.01 6,037 Yum! Brands 543,813 0.05
71,355,623 7.12 Financial
535 Affiliated Managers 116,951 0.01 5,569 Aflac 346,392 0.03
89 Alleghany 41,720 - 8,309 Allstate 539,005 0.05 9,083 American Capital Agency 166,855 0.02
16,548 American Express 1,286,111 0.13 17,661 American International Group 1,091,803 0.11 26,802 American Realty Capital 217,900 0.02
299 American Tower 27,894 - 2,496 Ameriprise Financial 311,825 0.03
53,858 Annaly Capital Management 494,955 0.05 8,869 Aon 884,062 0.09 2,486 Apartment Investment & Management 91,808 0.01
840 Arch Capital Group 56,246 0.01 530 AvalonBay Communities 84,731 0.01
243,336 Bank of America 4,141,579 0.41 20,127 Bank of New York Mellon 844,730 0.08 10,271 BB&T 414,024 0.04
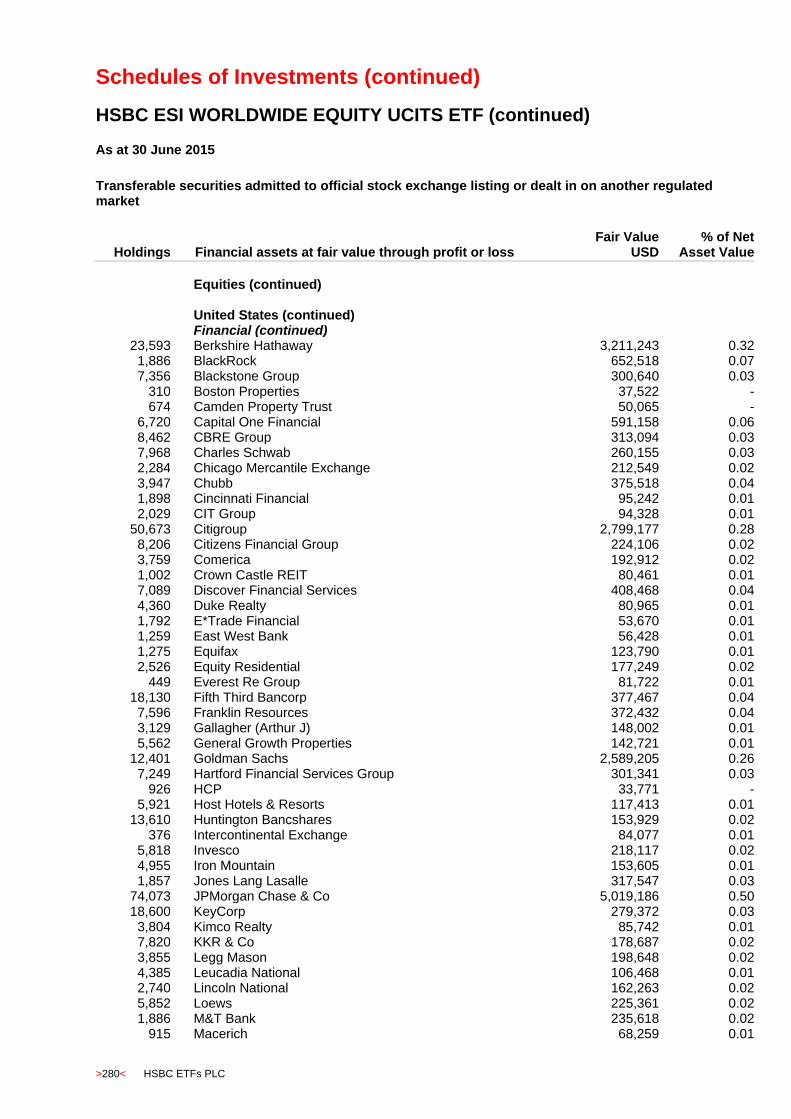
Schedules of Investments (continued)
HSBC ESI WORLDWIDE EQUITY UCITS ETF (continued)
>280< HSBC ETFs PLC
As at 30 June 2015
Transferable securities admitted to official stock exchange listing or dealt in on another regulated market
Holdings
Financial assets at fair value through profit or loss Fair Value
USD % of Net
Asset Value
Equities (continued)
United States (continued) Financial (continued)
23,593 Berkshire Hathaway 3,211,243 0.32 1,886 BlackRock 652,518 0.07 7,356 Blackstone Group 300,640 0.03
310 Boston Properties 37,522 - 674 Camden Property Trust 50,065 -
6,720 Capital One Financial 591,158 0.06 8,462 CBRE Group 313,094 0.03 7,968 Charles Schwab 260,155 0.03 2,284 Chicago Mercantile Exchange 212,549 0.02 3,947 Chubb 375,518 0.04 1,898 Cincinnati Financial 95,242 0.01 2,029 CIT Group 94,328 0.01
50,673 Citigroup 2,799,177 0.28 8,206 Citizens Financial Group 224,106 0.02 3,759 Comerica 192,912 0.02 1,002 Crown Castle REIT 80,461 0.01 7,089 Discover Financial Services 408,468 0.04 4,360 Duke Realty 80,965 0.01 1,792 E*Trade Financial 53,670 0.01 1,259 East West Bank 56,428 0.01 1,275 Equifax 123,790 0.01 2,526 Equity Residential 177,249 0.02
449 Everest Re Group 81,722 0.01 18,130 Fifth Third Bancorp 377,467 0.04
7,596 Franklin Resources 372,432 0.04 3,129 Gallagher (Arthur J) 148,002 0.01 5,562 General Growth Properties 142,721 0.01
12,401 Goldman Sachs 2,589,205 0.26 7,249 Hartford Financial Services Group 301,341 0.03
926 HCP 33,771 - 5,921 Host Hotels & Resorts 117,413 0.01
13,610 Huntington Bancshares 153,929 0.02 376 Intercontinental Exchange 84,077 0.01
5,818 Invesco 218,117 0.02 4,955 Iron Mountain 153,605 0.01 1,857 Jones Lang Lasalle 317,547 0.03
74,073 JPMorgan Chase & Co 5,019,186 0.50 18,600 KeyCorp 279,372 0.03
3,804 Kimco Realty 85,742 0.01 7,820 KKR & Co 178,687 0.02 3,855 Legg Mason 198,648 0.02 4,385 Leucadia National 106,468 0.01 2,740 Lincoln National 162,263 0.02 5,852 Loews 225,361 0.02 1,886 M&T Bank 235,618 0.02
915 Macerich 68,259 0.01
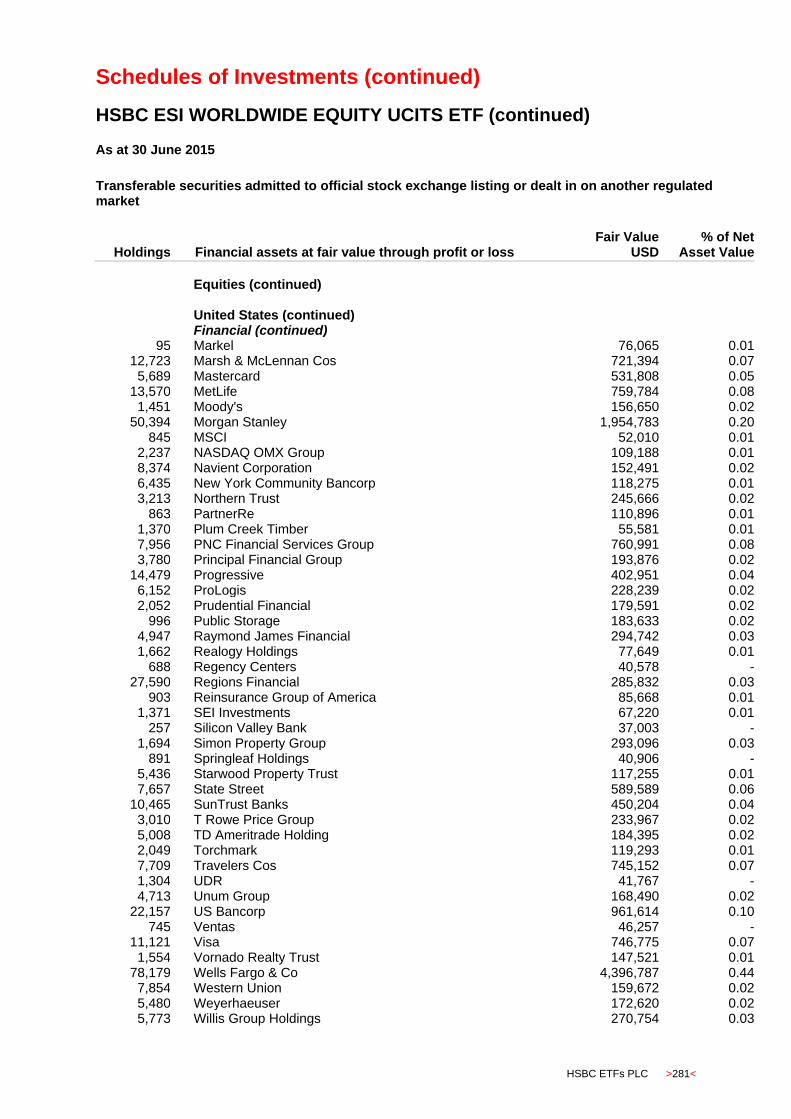
Schedules of Investments (continued)
HSBC ESI WORLDWIDE EQUITY UCITS ETF (continued)
HSBC ETFs PLC >281<
As at 30 June 2015
Transferable securities admitted to official stock exchange listing or dealt in on another regulated market
Holdings
Financial assets at fair value through profit or loss Fair Value
USD % of Net
Asset Value
Equities (continued)
United States (continued) Financial (continued)
95 Markel 76,065 0.01 12,723 Marsh & McLennan Cos 721,394 0.07
5,689 Mastercard 531,808 0.05 13,570 MetLife 759,784 0.08
1,451 Moody's 156,650 0.02 50,394 Morgan Stanley 1,954,783 0.20
845 MSCI 52,010 0.01 2,237 NASDAQ OMX Group 109,188 0.01 8,374 Navient Corporation 152,491 0.02 6,435 New York Community Bancorp 118,275 0.01 3,213 Northern Trust 245,666 0.02
863 PartnerRe 110,896 0.01 1,370 Plum Creek Timber 55,581 0.01 7,956 PNC Financial Services Group 760,991 0.08 3,780 Principal Financial Group 193,876 0.02
14,479 Progressive 402,951 0.04 6,152 ProLogis 228,239 0.02 2,052 Prudential Financial 179,591 0.02
996 Public Storage 183,633 0.02 4,947 Raymond James Financial 294,742 0.03 1,662 Realogy Holdings 77,649 0.01
688 Regency Centers 40,578 - 27,590 Regions Financial 285,832 0.03
903 Reinsurance Group of America 85,668 0.01 1,371 SEI Investments 67,220 0.01
257 Silicon Valley Bank 37,003 - 1,694 Simon Property Group 293,096 0.03
891 Springleaf Holdings 40,906 - 5,436 Starwood Property Trust 117,255 0.01 7,657 State Street 589,589 0.06
10,465 SunTrust Banks 450,204 0.04 3,010 T Rowe Price Group 233,967 0.02 5,008 TD Ameritrade Holding 184,395 0.02 2,049 Torchmark 119,293 0.01 7,709 Travelers Cos 745,152 0.07 1,304 UDR 41,767 - 4,713 Unum Group 168,490 0.02
22,157 US Bancorp 961,614 0.10 745 Ventas 46,257 -
11,121 Visa 746,775 0.07 1,554 Vornado Realty Trust 147,521 0.01
78,179 Wells Fargo & Co 4,396,787 0.44 7,854 Western Union 159,672 0.02 5,480 Weyerhaeuser 172,620 0.02 5,773 Willis Group Holdings 270,754 0.03
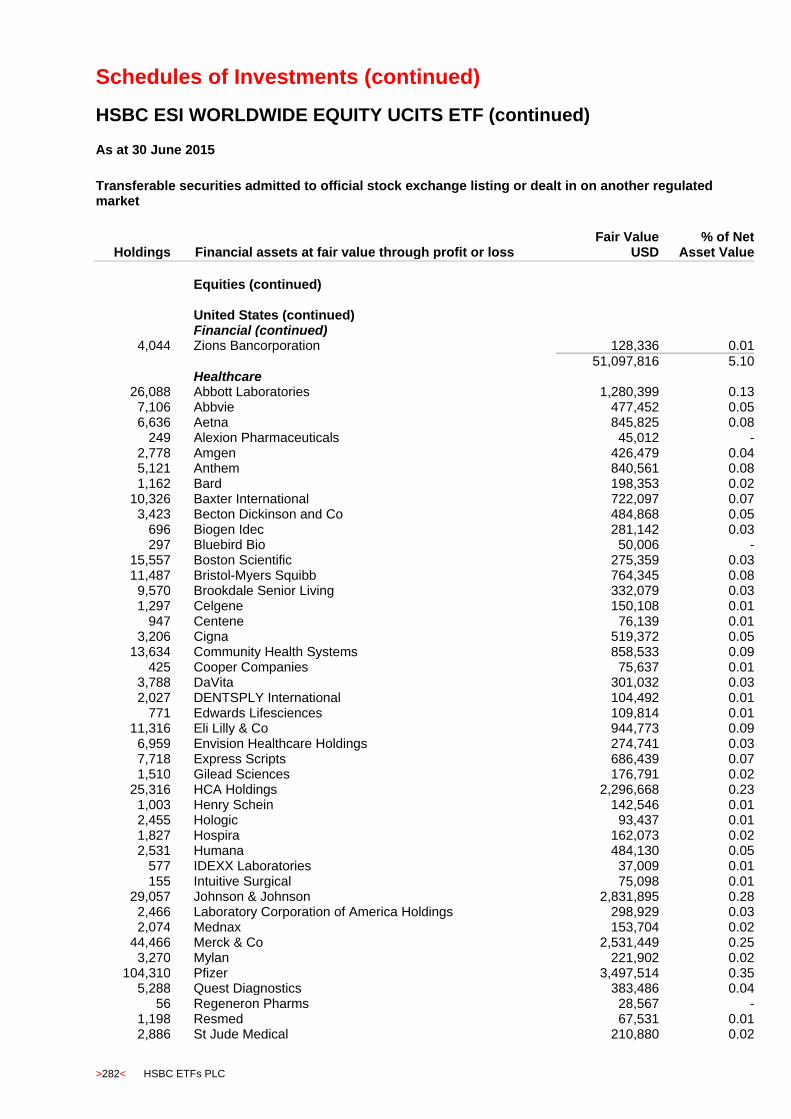
Schedules of Investments (continued)
HSBC ESI WORLDWIDE EQUITY UCITS ETF (continued)
>282< HSBC ETFs PLC
As at 30 June 2015
Transferable securities admitted to official stock exchange listing or dealt in on another regulated market
Holdings
Financial assets at fair value through profit or loss Fair Value
USD % of Net
Asset Value
Equities (continued)
United States (continued) Financial (continued)
4,044 Zions Bancorporation 128,336 0.01
51,097,816 5.10 Healthcare
26,088 Abbott Laboratories 1,280,399 0.13 7,106 Abbvie 477,452 0.05 6,636 Aetna 845,825 0.08
249 Alexion Pharmaceuticals 45,012 - 2,778 Amgen 426,479 0.04 5,121 Anthem 840,561 0.08 1,162 Bard 198,353 0.02
10,326 Baxter International 722,097 0.07 3,423 Becton Dickinson and Co 484,868 0.05
696 Biogen Idec 281,142 0.03 297 Bluebird Bio 50,006 -
15,557 Boston Scientific 275,359 0.03 11,487 Bristol-Myers Squibb 764,345 0.08
9,570 Brookdale Senior Living 332,079 0.03 1,297 Celgene 150,108 0.01
947 Centene 76,139 0.01 3,206 Cigna 519,372 0.05
13,634 Community Health Systems 858,533 0.09 425 Cooper Companies 75,637 0.01
3,788 DaVita 301,032 0.03 2,027 DENTSPLY International 104,492 0.01
771 Edwards Lifesciences 109,814 0.01 11,316 Eli Lilly & Co 944,773 0.09
6,959 Envision Healthcare Holdings 274,741 0.03 7,718 Express Scripts 686,439 0.07 1,510 Gilead Sciences 176,791 0.02
25,316 HCA Holdings 2,296,668 0.23 1,003 Henry Schein 142,546 0.01 2,455 Hologic 93,437 0.01 1,827 Hospira 162,073 0.02 2,531 Humana 484,130 0.05
577 IDEXX Laboratories 37,009 0.01 155 Intuitive Surgical 75,098 0.01
29,057 Johnson & Johnson 2,831,895 0.28 2,466 Laboratory Corporation of America Holdings 298,929 0.03 2,074 Mednax 153,704 0.02
44,466 Merck & Co 2,531,449 0.25 3,270 Mylan 221,902 0.02
104,310 Pfizer 3,497,514 0.35 5,288 Quest Diagnostics 383,486 0.04
56 Regeneron Pharms 28,567 - 1,198 Resmed 67,531 0.01 2,886 St Jude Medical 210,880 0.02
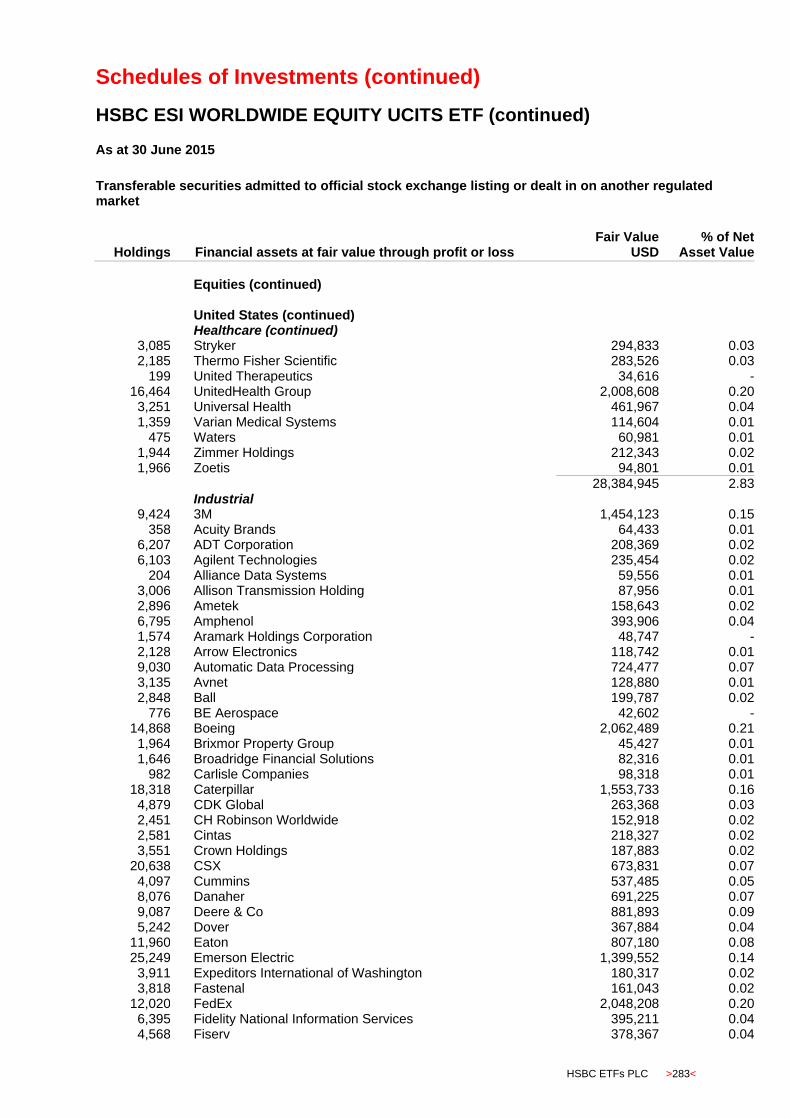
Schedules of Investments (continued)
HSBC ESI WORLDWIDE EQUITY UCITS ETF (continued)
HSBC ETFs PLC >283<
As at 30 June 2015
Transferable securities admitted to official stock exchange listing or dealt in on another regulated market
Holdings
Financial assets at fair value through profit or loss Fair Value
USD % of Net
Asset Value
Equities (continued)
United States (continued) Healthcare (continued)
3,085 Stryker 294,833 0.03 2,185 Thermo Fisher Scientific 283,526 0.03
199 United Therapeutics 34,616 - 16,464 UnitedHealth Group 2,008,608 0.20
3,251 Universal Health 461,967 0.04 1,359 Varian Medical Systems 114,604 0.01
475 Waters 60,981 0.01 1,944 Zimmer Holdings 212,343 0.02 1,966 Zoetis 94,801 0.01
28,384,945 2.83 Industrial
9,424 3M 1,454,123 0.15 358 Acuity Brands 64,433 0.01
6,207 ADT Corporation 208,369 0.02 6,103 Agilent Technologies 235,454 0.02
204 Alliance Data Systems 59,556 0.01 3,006 Allison Transmission Holding 87,956 0.01 2,896 Ametek 158,643 0.02 6,795 Amphenol 393,906 0.04 1,574 Aramark Holdings Corporation 48,747 - 2,128 Arrow Electronics 118,742 0.01 9,030 Automatic Data Processing 724,477 0.07 3,135 Avnet 128,880 0.01 2,848 Ball 199,787 0.02
776 BE Aerospace 42,602 - 14,868 Boeing 2,062,489 0.21
1,964 Brixmor Property Group 45,427 0.01 1,646 Broadridge Financial Solutions 82,316 0.01
982 Carlisle Companies 98,318 0.01 18,318 Caterpillar 1,553,733 0.16
4,879 CDK Global 263,368 0.03 2,451 CH Robinson Worldwide 152,918 0.02 2,581 Cintas 218,327 0.02 3,551 Crown Holdings 187,883 0.02
20,638 CSX 673,831 0.07 4,097 Cummins 537,485 0.05 8,076 Danaher 691,225 0.07 9,087 Deere & Co 881,893 0.09 5,242 Dover 367,884 0.04
11,960 Eaton 807,180 0.08 25,249 Emerson Electric 1,399,552 0.14
3,911 Expeditors International of Washington 180,317 0.02 3,818 Fastenal 161,043 0.02
12,020 FedEx 2,048,208 0.20 6,395 Fidelity National Information Services 395,211 0.04 4,568 Fiserv 378,367 0.04
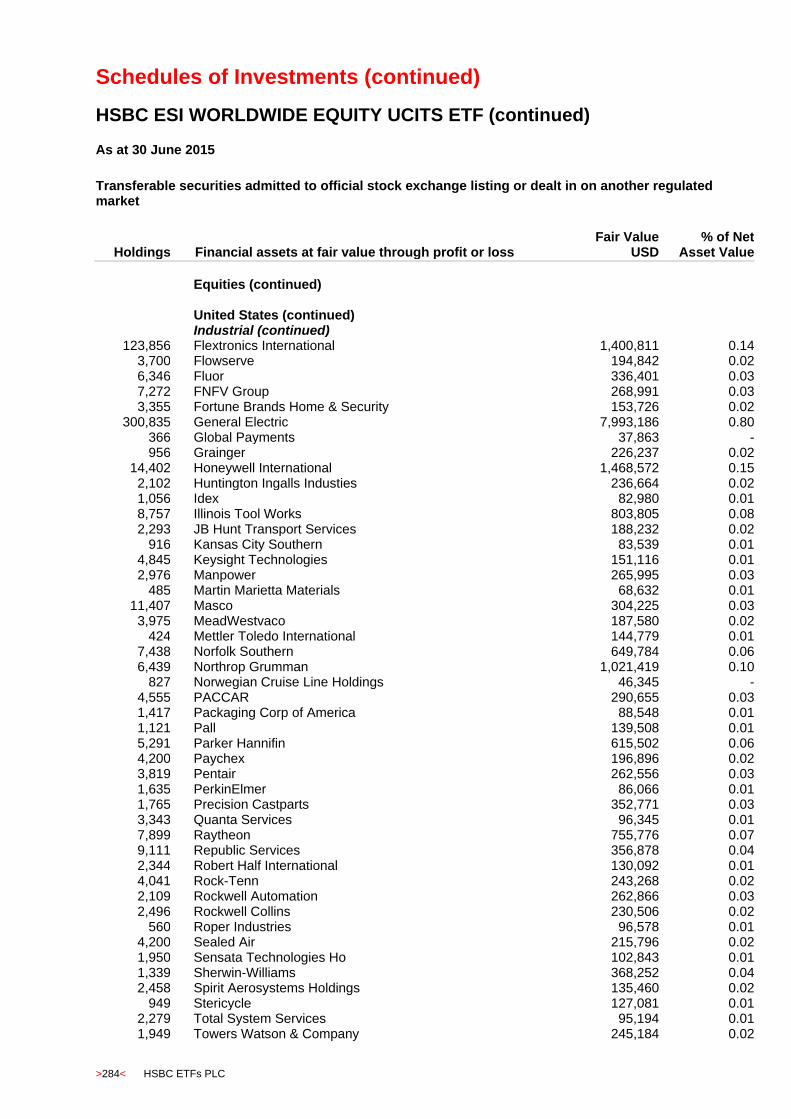
Schedules of Investments (continued)
HSBC ESI WORLDWIDE EQUITY UCITS ETF (continued)
>284< HSBC ETFs PLC
As at 30 June 2015
Transferable securities admitted to official stock exchange listing or dealt in on another regulated market
Holdings
Financial assets at fair value through profit or loss Fair Value
USD % of Net
Asset Value
Equities (continued)
United States (continued) Industrial (continued)
123,856 Flextronics International 1,400,811 0.14 3,700 Flowserve 194,842 0.02 6,346 Fluor 336,401 0.03 7,272 FNFV Group 268,991 0.03 3,355 Fortune Brands Home & Security 153,726 0.02
300,835 General Electric 7,993,186 0.80 366 Global Payments 37,863 - 956 Grainger 226,237 0.02
14,402 Honeywell International 1,468,572 0.15 2,102 Huntington Ingalls Industies 236,664 0.02 1,056 Idex 82,980 0.01 8,757 Illinois Tool Works 803,805 0.08 2,293 JB Hunt Transport Services 188,232 0.02
916 Kansas City Southern 83,539 0.01 4,845 Keysight Technologies 151,116 0.01 2,976 Manpower 265,995 0.03
485 Martin Marietta Materials 68,632 0.01 11,407 Masco 304,225 0.03
3,975 MeadWestvaco 187,580 0.02 424 Mettler Toledo International 144,779 0.01
7,438 Norfolk Southern 649,784 0.06 6,439 Northrop Grumman 1,021,419 0.10
827 Norwegian Cruise Line Holdings 46,345 - 4,555 PACCAR 290,655 0.03 1,417 Packaging Corp of America 88,548 0.01 1,121 Pall 139,508 0.01 5,291 Parker Hannifin 615,502 0.06 4,200 Paychex 196,896 0.02 3,819 Pentair 262,556 0.03 1,635 PerkinElmer 86,066 0.01 1,765 Precision Castparts 352,771 0.03 3,343 Quanta Services 96,345 0.01 7,899 Raytheon 755,776 0.07 9,111 Republic Services 356,878 0.04 2,344 Robert Half International 130,092 0.01 4,041 Rock-Tenn 243,268 0.02 2,109 Rockwell Automation 262,866 0.03 2,496 Rockwell Collins 230,506 0.02
560 Roper Industries 96,578 0.01 4,200 Sealed Air 215,796 0.02 1,950 Sensata Technologies Ho 102,843 0.01 1,339 Sherwin-Williams 368,252 0.04 2,458 Spirit Aerosystems Holdings 135,460 0.02
949 Stericycle 127,081 0.01 2,279 Total System Services 95,194 0.01 1,949 Towers Watson & Company 245,184 0.02

Schedules of Investments (continued)
HSBC ESI WORLDWIDE EQUITY UCITS ETF (continued)
HSBC ETFs PLC >285<
As at 30 June 2015
Transferable securities admitted to official stock exchange listing or dealt in on another regulated market
Holdings
Financial assets at fair value through profit or loss Fair Value
USD % of Net
Asset Value
Equities (continued)
United States (continued) Industrial (continued)
165 TransDigm Group 37,071 - 2,514 Trimble Navigation 58,978 0.01
12,976 Union Pacific 1,237,521 0.12 41,705 United Parcel Service 4,041,632 0.40
1,488 United Rentals 130,379 0.01 18,836 United Technologies 2,089,477 0.21
1,573 Valspar 128,703 0.01 676 Vantiv 25,816 -
1,691 Verisk Analytics 123,037 0.01 2,493 Vulcan Materials 209,237 0.02 1,130 Wabtec Corporation 106,491 0.01 1,581 Waste Connections 74,497 0.01
10,415 Waste Management 482,735 0.05 3,021 Xylem 111,988 0.01
47,780,557 4.77 Oil & Gas
6,784 Anadarko Petroleum 529,559 0.05 15,895 Apache 916,029 0.09 11,285 Baker Hughes 696,285 0.07
2,071 Cabot Oil & Gas 65,319 0.01 5,859 Cameron International 306,836 0.03
35,981 Chesapeake Energy 401,908 0.04 48,516 Chevron 4,680,339 0.47
769 Cimarex Energy 84,828 0.01 237 Concho Resources 26,985 -
46,025 ConocoPhillips 2,826,395 0.28 7,353 Devon Energy 437,430 0.04 1,999 Dresser-Rand Group 170,275 0.02 6,431 Enbridge Energy Partners 214,345 0.02
12,544 Energy Transfer Partners 654,797 0.07 4,048 Enterprise Products Partners 120,995 0.01 4,415 EOG Resources 386,533 0.04
290 EQT 23,589 - 99,114 Exxon Mobil 8,246,285 0.82
4,060 FMC Technologies 168,449 0.02 20,420 Halliburton 879,489 0.09
2,425 Helmerich & Payne 170,769 0.02 9,221 Hess 616,700 0.06 3,757 HollyFrontier 160,386 0.02
58,754 Kinder Morgan 2,255,566 0.23 530 Magellan Midstream Partners 38,891 -
31,375 Marathon Oil 832,693 0.08 13,063 Marathon Petroleum 683,326 0.07
7,241 Murphy Oil 301,008 0.03 12,588 National Oilwell Varco 607,749 0.06
3,411 Newfield Exploration 123,205 0.01
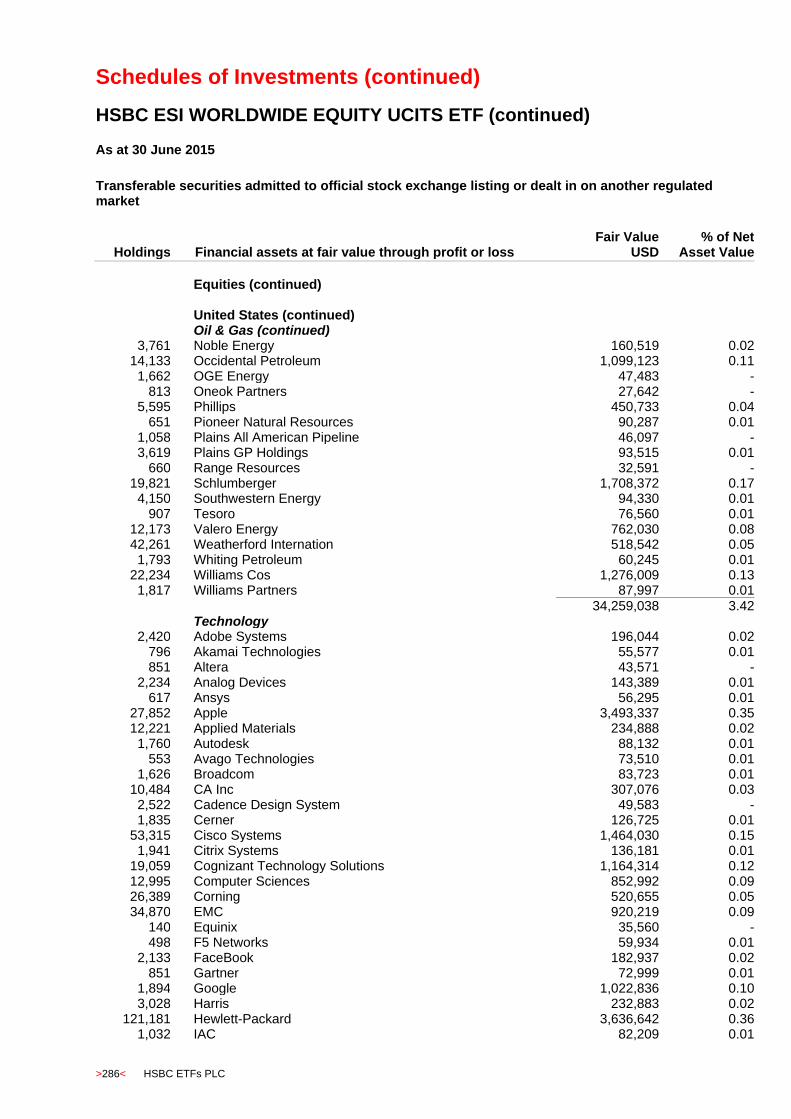
Schedules of Investments (continued)
HSBC ESI WORLDWIDE EQUITY UCITS ETF (continued)
>286< HSBC ETFs PLC
As at 30 June 2015
Transferable securities admitted to official stock exchange listing or dealt in on another regulated market
Holdings
Financial assets at fair value through profit or loss Fair Value
USD % of Net
Asset Value
Equities (continued)
United States (continued) Oil & Gas (continued)
3,761 Noble Energy 160,519 0.02 14,133 Occidental Petroleum 1,099,123 0.11
1,662 OGE Energy 47,483 - 813 Oneok Partners 27,642 -
5,595 Phillips 450,733 0.04 651 Pioneer Natural Resources 90,287 0.01
1,058 Plains All American Pipeline 46,097 - 3,619 Plains GP Holdings 93,515 0.01
660 Range Resources 32,591 - 19,821 Schlumberger 1,708,372 0.17
4,150 Southwestern Energy 94,330 0.01 907 Tesoro 76,560 0.01
12,173 Valero Energy 762,030 0.08 42,261 Weatherford Internation 518,542 0.05
1,793 Whiting Petroleum 60,245 0.01 22,234 Williams Cos 1,276,009 0.13
1,817 Williams Partners 87,997 0.01
34,259,038 3.42 Technology
2,420 Adobe Systems 196,044 0.02 796 Akamai Technologies 55,577 0.01 851 Altera 43,571 -
2,234 Analog Devices 143,389 0.01 617 Ansys 56,295 0.01
27,852 Apple 3,493,337 0.35 12,221 Applied Materials 234,888 0.02
1,760 Autodesk 88,132 0.01 553 Avago Technologies 73,510 0.01
1,626 Broadcom 83,723 0.01 10,484 CA Inc 307,076 0.03
2,522 Cadence Design System 49,583 - 1,835 Cerner 126,725 0.01
53,315 Cisco Systems 1,464,030 0.15 1,941 Citrix Systems 136,181 0.01
19,059 Cognizant Technology Solutions 1,164,314 0.12 12,995 Computer Sciences 852,992 0.09 26,389 Corning 520,655 0.05 34,870 EMC 920,219 0.09
140 Equinix 35,560 - 498 F5 Networks 59,934 0.01
2,133 FaceBook 182,937 0.02 851 Gartner 72,999 0.01
1,894 Google 1,022,836 0.10 3,028 Harris 232,883 0.02
121,181 Hewlett-Packard 3,636,642 0.36 1,032 IAC 82,209 0.01
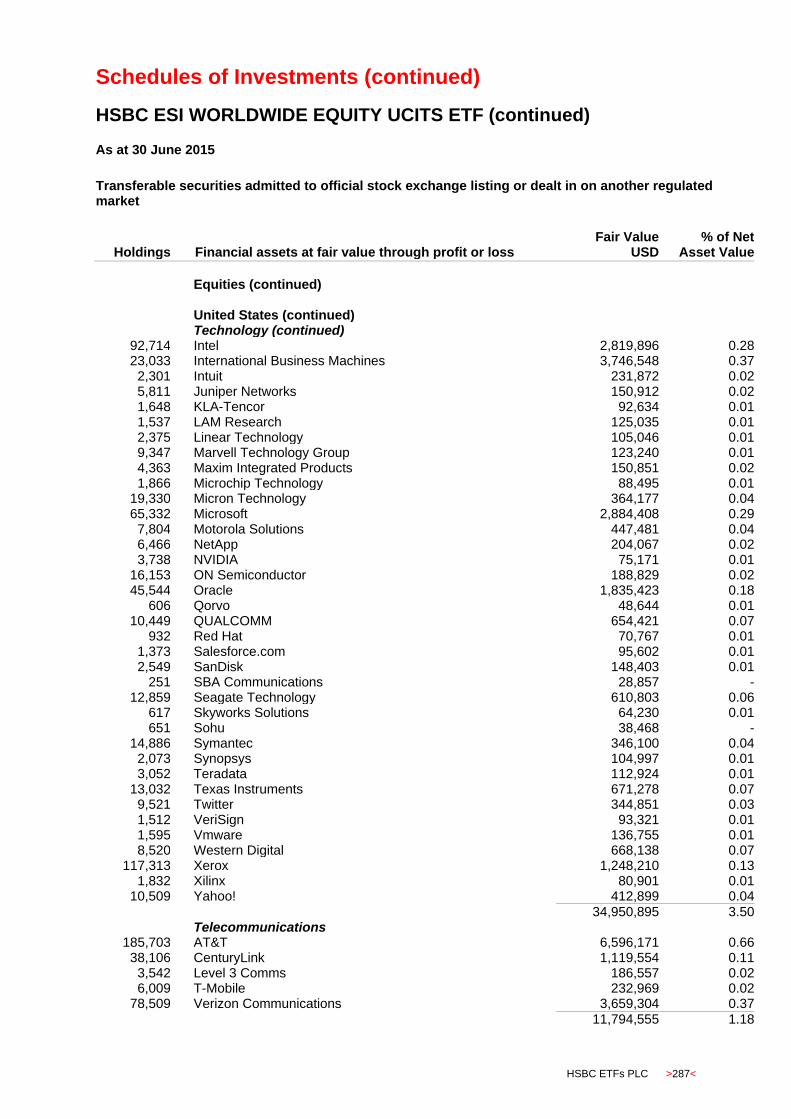
Schedules of Investments (continued)
HSBC ESI WORLDWIDE EQUITY UCITS ETF (continued)
HSBC ETFs PLC >287<
As at 30 June 2015
Transferable securities admitted to official stock exchange listing or dealt in on another regulated market
Holdings
Financial assets at fair value through profit or loss Fair Value
USD % of Net
Asset Value
Equities (continued)
United States (continued) Technology (continued)
92,714 Intel 2,819,896 0.28 23,033 International Business Machines 3,746,548 0.37
2,301 Intuit 231,872 0.02 5,811 Juniper Networks 150,912 0.02 1,648 KLA-Tencor 92,634 0.01 1,537 LAM Research 125,035 0.01 2,375 Linear Technology 105,046 0.01 9,347 Marvell Technology Group 123,240 0.01 4,363 Maxim Integrated Products 150,851 0.02 1,866 Microchip Technology 88,495 0.01
19,330 Micron Technology 364,177 0.04 65,332 Microsoft 2,884,408 0.29
7,804 Motorola Solutions 447,481 0.04 6,466 NetApp 204,067 0.02 3,738 NVIDIA 75,171 0.01
16,153 ON Semiconductor 188,829 0.02 45,544 Oracle 1,835,423 0.18
606 Qorvo 48,644 0.01 10,449 QUALCOMM 654,421 0.07
932 Red Hat 70,767 0.01 1,373 Salesforce.com 95,602 0.01 2,549 SanDisk 148,403 0.01
251 SBA Communications 28,857 - 12,859 Seagate Technology 610,803 0.06
617 Skyworks Solutions 64,230 0.01 651 Sohu 38,468 -
14,886 Symantec 346,100 0.04 2,073 Synopsys 104,997 0.01 3,052 Teradata 112,924 0.01
13,032 Texas Instruments 671,278 0.07 9,521 Twitter 344,851 0.03 1,512 VeriSign 93,321 0.01 1,595 Vmware 136,755 0.01 8,520 Western Digital 668,138 0.07
117,313 Xerox 1,248,210 0.13 1,832 Xilinx 80,901 0.01
10,509 Yahoo! 412,899 0.04
34,950,895 3.50 Telecommunications
185,703 AT&T 6,596,171 0.66 38,106 CenturyLink 1,119,554 0.11
3,542 Level 3 Comms 186,557 0.02 6,009 T-Mobile 232,969 0.02
78,509 Verizon Communications 3,659,304 0.37
11,794,555 1.18
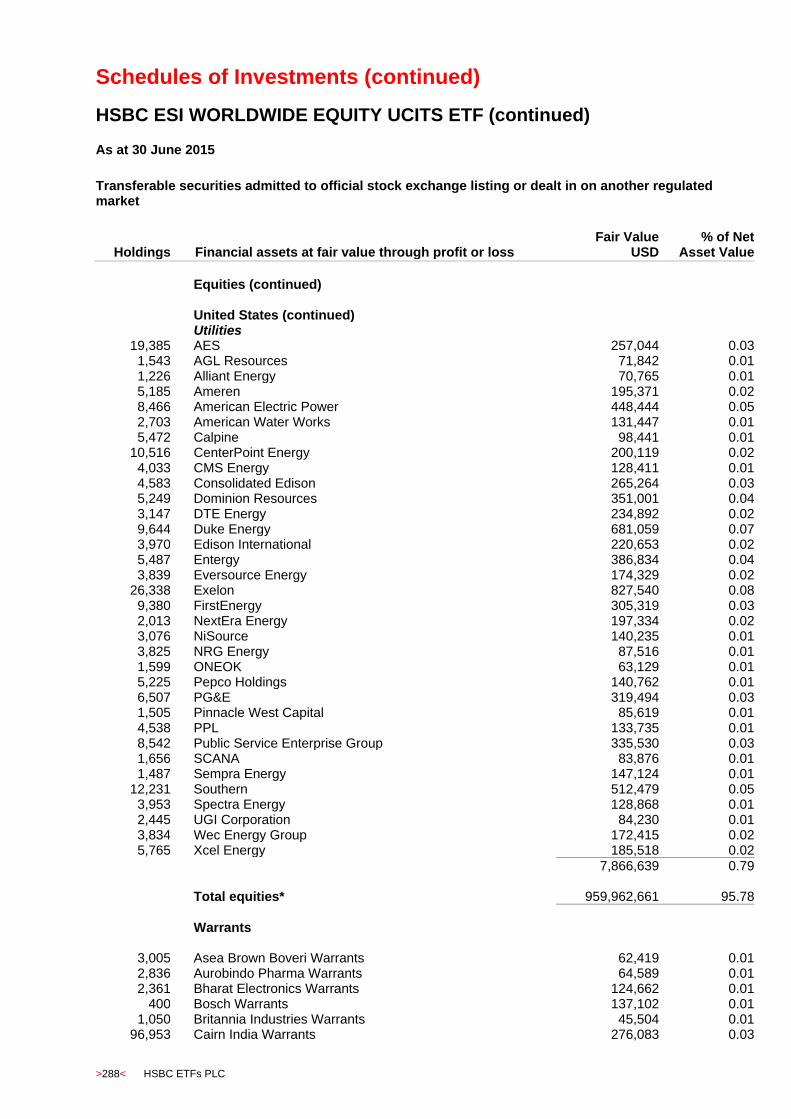
Schedules of Investments (continued)
HSBC ESI WORLDWIDE EQUITY UCITS ETF (continued)
>288< HSBC ETFs PLC
As at 30 June 2015
Transferable securities admitted to official stock exchange listing or dealt in on another regulated market
Holdings
Financial assets at fair value through profit or loss Fair Value
USD % of Net
Asset Value
Equities (continued)
United States (continued) Utilities
19,385 AES 257,044 0.03 1,543 AGL Resources 71,842 0.01 1,226 Alliant Energy 70,765 0.01 5,185 Ameren 195,371 0.02 8,466 American Electric Power 448,444 0.05 2,703 American Water Works 131,447 0.01 5,472 Calpine 98,441 0.01
10,516 CenterPoint Energy 200,119 0.02 4,033 CMS Energy 128,411 0.01 4,583 Consolidated Edison 265,264 0.03 5,249 Dominion Resources 351,001 0.04 3,147 DTE Energy 234,892 0.02 9,644 Duke Energy 681,059 0.07 3,970 Edison International 220,653 0.02 5,487 Entergy 386,834 0.04 3,839 Eversource Energy 174,329 0.02
26,338 Exelon 827,540 0.08 9,380 FirstEnergy 305,319 0.03 2,013 NextEra Energy 197,334 0.02 3,076 NiSource 140,235 0.01 3,825 NRG Energy 87,516 0.01 1,599 ONEOK 63,129 0.01 5,225 Pepco Holdings 140,762 0.01 6,507 PG&E 319,494 0.03 1,505 Pinnacle West Capital 85,619 0.01 4,538 PPL 133,735 0.01 8,542 Public Service Enterprise Group 335,530 0.03 1,656 SCANA 83,876 0.01 1,487 Sempra Energy 147,124 0.01
12,231 Southern 512,479 0.05 3,953 Spectra Energy 128,868 0.01 2,445 UGI Corporation 84,230 0.01 3,834 Wec Energy Group 172,415 0.02 5,765 Xcel Energy 185,518 0.02
7,866,639 0.79 Total equities* 959,962,661 95.78
Warrants
3,005 Asea Brown Boveri Warrants 62,419 0.01 2,836 Aurobindo Pharma Warrants 64,589 0.01 2,361 Bharat Electronics Warrants 124,662 0.01
400 Bosch Warrants 137,102 0.01 1,050 Britannia Industries Warrants 45,504 0.01
96,953 Cairn India Warrants 276,083 0.03
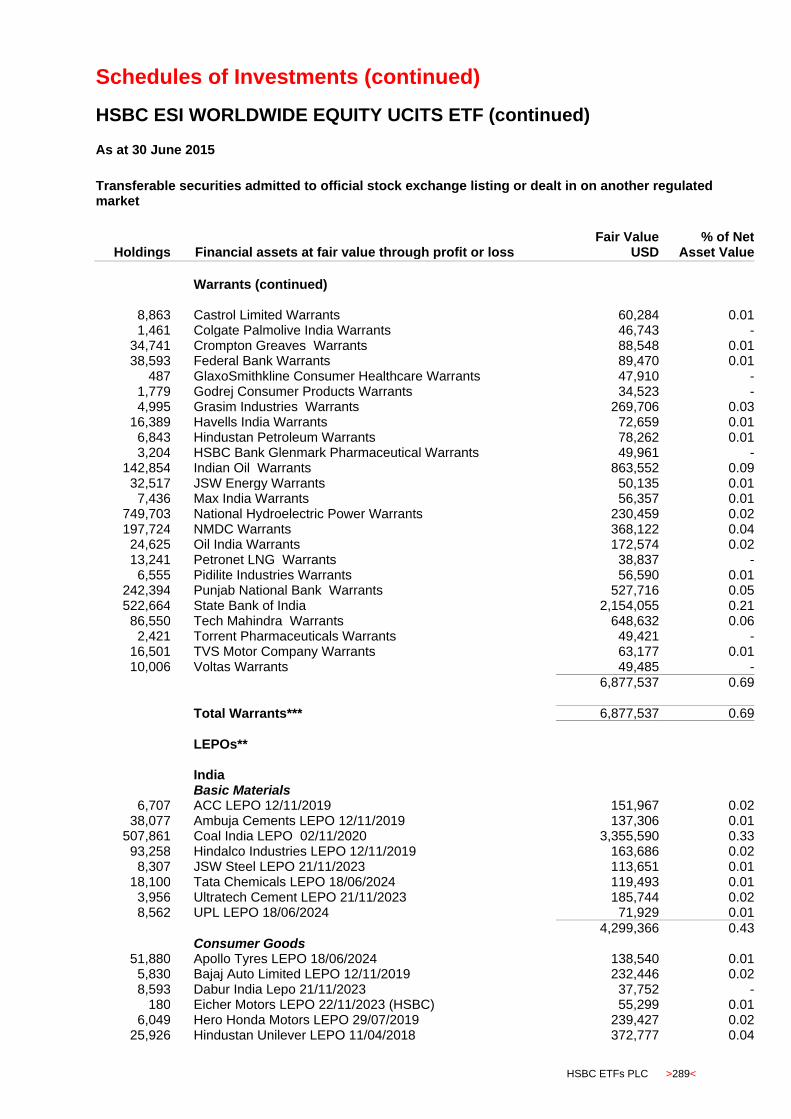
Schedules of Investments (continued)
HSBC ESI WORLDWIDE EQUITY UCITS ETF (continued)
HSBC ETFs PLC >289<
As at 30 June 2015
Transferable securities admitted to official stock exchange listing or dealt in on another regulated market
Holdings
Financial assets at fair value through profit or loss Fair Value
USD % of Net
Asset Value
Warrants (continued)
8,863 Castrol Limited Warrants 60,284 0.01 1,461 Colgate Palmolive India Warrants 46,743 -
34,741 Crompton Greaves Warrants 88,548 0.01 38,593 Federal Bank Warrants 89,470 0.01
487 GlaxoSmithkline Consumer Healthcare Warrants 47,910 - 1,779 Godrej Consumer Products Warrants 34,523 - 4,995 Grasim Industries Warrants 269,706 0.03
16,389 Havells India Warrants 72,659 0.01 6,843 Hindustan Petroleum Warrants 78,262 0.01 3,204 HSBC Bank Glenmark Pharmaceutical Warrants 49,961 -
142,854 Indian Oil Warrants 863,552 0.09 32,517 JSW Energy Warrants 50,135 0.01
7,436 Max India Warrants 56,357 0.01 749,703 National Hydroelectric Power Warrants 230,459 0.02 197,724 NMDC Warrants 368,122 0.04 24,625 Oil India Warrants 172,574 0.02 13,241 Petronet LNG Warrants 38,837 -
6,555 Pidilite Industries Warrants 56,590 0.01 242,394 Punjab National Bank Warrants 527,716 0.05 522,664 State Bank of India 2,154,055 0.21 86,550 Tech Mahindra Warrants 648,632 0.06
2,421 Torrent Pharmaceuticals Warrants 49,421 - 16,501 TVS Motor Company Warrants 63,177 0.01 10,006 Voltas Warrants 49,485 -
6,877,537 0.69
Total Warrants*** 6,877,537 0.69
LEPOs** India Basic Materials
6,707 ACC LEPO 12/11/2019 151,967 0.02 38,077 Ambuja Cements LEPO 12/11/2019 137,306 0.01
507,861 Coal India LEPO 02/11/2020 3,355,590 0.33 93,258 Hindalco Industries LEPO 12/11/2019 163,686 0.02
8,307 JSW Steel LEPO 21/11/2023 113,651 0.01 18,100 Tata Chemicals LEPO 18/06/2024 119,493 0.01
3,956 Ultratech Cement LEPO 21/11/2023 185,744 0.02 8,562 UPL LEPO 18/06/2024 71,929 0.01
4,299,366 0.43 Consumer Goods
51,880 Apollo Tyres LEPO 18/06/2024 138,540 0.01 5,830 Bajaj Auto Limited LEPO 12/11/2019 232,446 0.02 8,593 Dabur India Lepo 21/11/2023 37,752 -
180 Eicher Motors LEPO 22/11/2023 (HSBC) 55,299 0.01 6,049 Hero Honda Motors LEPO 29/07/2019 239,427 0.02
25,926 Hindustan Unilever LEPO 11/04/2018 372,777 0.04

Schedules of Investments (continued)
HSBC ESI WORLDWIDE EQUITY UCITS ETF (continued)
>290< HSBC ETFs PLC
As at 30 June 2015
Transferable securities admitted to official stock exchange listing or dealt in on another regulated market
Holdings
Financial assets at fair value through profit or loss Fair Value
USD % of Net
Asset Value
LEPOs**(continued) India (continued) Consumer Goods (continued)
4,359 HSBC Maruti Suzuki India LEPO 14/01/2019 275,081 0.03 136,200 ITC LEPO 18/02/2018 673,250 0.07 34,828 Motherson Sumi Systems LEPO 22/11/2023 (HSBC) 283,354 0.03
100 MRF LEPO 22/11/2023 (HSBC) 53,691 0.01 1,403 Nestle India LEPO 19/11/2018 139,787 0.01
2,501,404 0.25 Financial
119,693 Bank of Baroda LEPO 21/11/2023 270,626 0.03 119,890 DLF LEPO 29/10/2018 219,830 0.02 13,120 Housing Development Finance LEPO 20/02/2018 266,794 0.02
5,282 Indiabulls Housing LEPO 18/06/2024 51,569 0.01 22,851 Infrastructure Development Finance LEPO 20/08/2019 52,939 0.01
7,573 Kotak Mahindra Bank LEPO 25/11/2019 164,610 0.01 34,467 Power Financial LEPO 21/11/2023 138,399 0.01
6,773 Shriram Transport Finance LEPO 21/11/2023 90,666 0.01 4,275 Yes Bank Lepo 18/06/2024 56,583 0.01
1,312,016 0.13 Healthcare
1,689 Apollo Hospitals Enterprise LEPO 31/07/2023 34,862 - 2,122 Cadila Healthcare LEPO 18/06/2024 59,799 0.01
13,480 Cipla LEPO 26/03/2020 130,117 0.01 4,142 IPCA Laboratories LEPO 18/06/2024 46,104 -
10,154 Sun Pharmaceuticals LEPO 24/10/2018 139,295 0.01
410,177 0.03 Industrial
91,202 Ashok Leyland LEPO 18/06/2024 103,788 0.01 10,476 Asian Paints (India) LEPO 17/05/2021 124,117 0.01
3,910 Bharat Forge LEPO 18/06/2024 65,207 0.01 177,013 Bharat Heavy Electricals LEPO 07/01/2019 688,280 0.07
2,065 Container Corporation LEPO 22/11/2023 (HSBC) 54,348 0.01 4,315 Cummins India LEPO 18/06/2024 60,679 0.01 2,603 Larsen & Toubro LEPO 12/11/2018 72,788 0.01 7,016 Siemens LEPO 21/11/2023 148,436 0.01 8,378 Titan Industries LEPO 07/07/2020 48,135 -
1,365,778 0.14 Oil & Gas
34,339 Bharat Petroleum LEPO 12/11/2019 473,628 0.05 24,213 Gail India LEPO 12/11/2019 148,951 0.01
490,611 Oil & Natural Gas LEPO 12/11/2019 2,382,456 0.24 168,976 Sesa Sterlite LEPO 21/11/2023 461,575 0.05
3,466,610 0.35 Technology
66,092 HCL Technologies LEPO 22/01/2024 953,463 0.10 118,421 Infosys LEPO 25/11/2019 1,828,373 0.18
5,710 Mindtree LEPO 18/06/2024 114,084 0.01 2,196 Oracle Financial Services LEPO 22/11/2023 (HSBC) 130,203 0.01

Schedules of Investments (continued)
HSBC ESI WORLDWIDE EQUITY UCITS ETF (continued)
HSBC ETFs PLC >291<
As at 30 June 2015
Transferable securities admitted to official stock exchange listing or dealt in on another regulated market
Holdings
Financial assets at fair value through profit or loss Fair Value
USD % of Net
Asset Value
LEPOs**(continued) India (continued) Technology (continued)
61,587 Tata Consultancy Services LEPO 25/11/2019 2,464,207 0.25 182,575 Wipro LEPO 12/11/2019 1,565,581 0.15
7,055,911 0.70 Telecommunications
5,087 Aditya Birla Nuvo LEPO 21/11/2018 142,553 0.01 151,485 Bharti Airtel LEPO 20/02/2018 998,059 0.10 25,000 Bharti Infratel LEPO 22/11/2023 (HSBC) 175,280 0.02
112,411 Idea Cellular LEPO 25/11/2019 310,580 0.03 9,969 Zee Entertainment Enterprises LEPO 21/11/23 57,526 0.01
1,683,998 0.17 Utilities
196,564 NTPC LEPO 01/10/2019 424,382 0.04 37,286 Rural Electrification LEPO 12/05/2020 160,915 0.02
585,297 0.06
Total LEPOs*** 22,680,557 2.26
Futures
38 Euro Stoxx 50 Future Sep 15**** 212 -
212 - Total futures*** 212 -
Unrealised gain on contracts for difference*****
925,671 Bank of Communications 292,129 0.03
292,129 0.03 Total unrealised gain on contracts for difference*** 292,129 0.03
Total financial assets at fair value through profit or loss 989,813,096 98.76
Financial liabilities at fair value through profit or loss Futures****
27 CME S&P 500 E-Mini Index Future Sep 15 (41,040) (0.01) 7 LIFFE FTSE 100 Index Future Sep 15 (18,000) - 3 MSE S&P TSX 60 Index Future Sep 15 (1,329) -
39 NYF Mini MSCI Emerging Market index Future Sep 15 (16,575) - 67 OSE Mini Topix Index Future Sep 15 (12,429) - 3 SFE SPI 200 Future Sep 15 (5,073) -
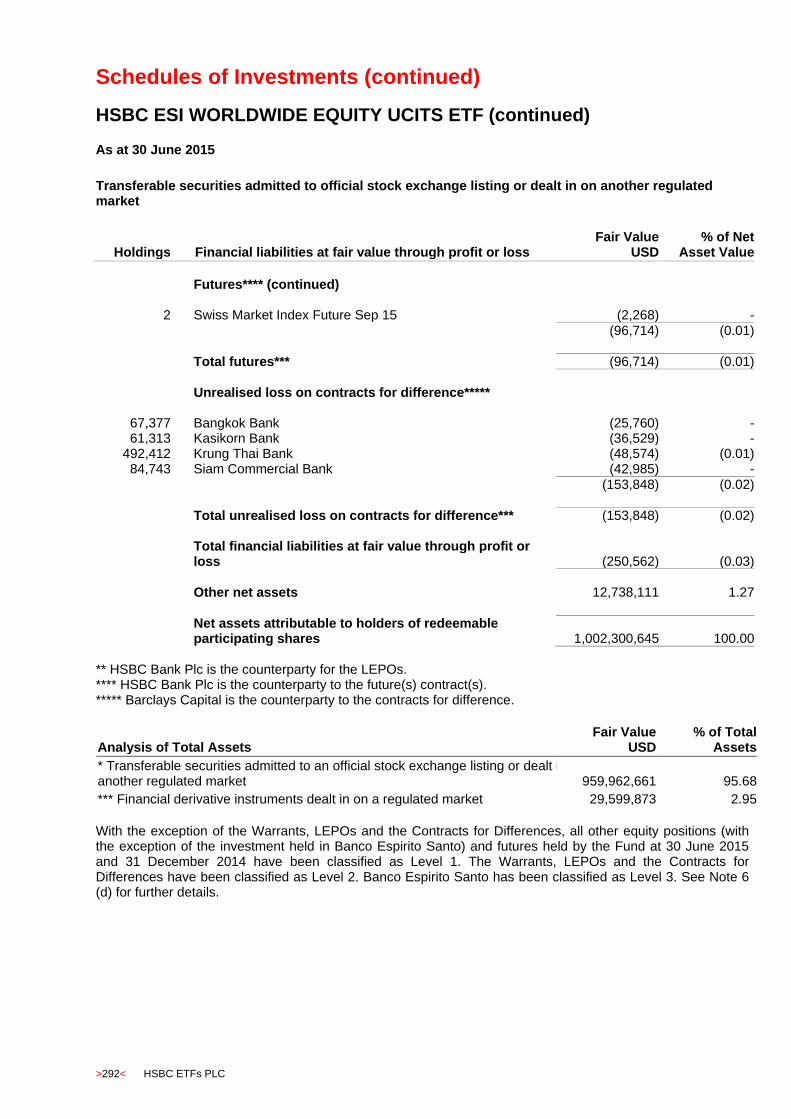
Schedules of Investments (continued)
HSBC ESI WORLDWIDE EQUITY UCITS ETF (continued)
>292< HSBC ETFs PLC
As at 30 June 2015
Transferable securities admitted to official stock exchange listing or dealt in on another regulated market
Holdings
Financial liabilities at fair value through profit or loss Fair Value
USD % of Net
Asset Value
Futures**** (continued)
2 Swiss Market Index Future Sep 15 (2,268) - (96,714) (0.01)
Total futures*** (96,714) (0.01)
Unrealised loss on contracts for difference*****
67,377 Bangkok Bank (25,760) - 61,313 Kasikorn Bank (36,529) -
492,412 Krung Thai Bank (48,574) (0.01) 84,743 Siam Commercial Bank (42,985) -
(153,848) (0.02)
Total unrealised loss on contracts for difference*** (153,848) (0.02) Total financial liabilities at fair value through profit or loss (250,562) (0.03)
Other net assets 12,738,111 1.27
Net assets attributable to holders of redeemable participating shares 1,002,300,645 100.00
** HSBC Bank Plc is the counterparty for the LEPOs. **** HSBC Bank Plc is the counterparty to the future(s) contract(s). ***** Barclays Capital is the counterparty to the contracts for difference.
Analysis of Total Assets Fair Value
USD % of Total
Assets
* Transferable securities admitted to an official stock exchange listing or dealt in on another regulated market 959,962,661 95.68
*** Financial derivative instruments dealt in on a regulated market 29,599,873 2.95
With the exception of the Warrants, LEPOs and the Contracts for Differences, all other equity positions (with the exception of the investment held in Banco Espirito Santo) and futures held by the Fund at 30 June 2015 and 31 December 2014 have been classified as Level 1. The Warrants, LEPOs and the Contracts for Differences have been classified as Level 2. Banco Espirito Santo has been classified as Level 3. See Note 6 (d) for further details.

Schedules of Investments (continued)
HSBC WORLDWIDE EQUITY UCITS ETF
HSBC ETFs PLC >293<
As at 30 June 2015
Transferable securities admitted to official stock exchange listing or dealt in on another regulated market
Holdings
Financial assets at fair value through profit or loss Fair Value
USD % of Net
Asset Value
Equities Australia Basic Materials
27,233 BHP Billiton 566,191 0.20 24,089 Fortescue Metals Group 35,363 0.01 27,748 Incitec Pivot 82,109 0.03
6,844 Newcrest Mining 68,489 0.02 5,280 Orica 86,359 0.03 3,282 Rio Tinto 135,587 0.05
43,816 South32 60,282 0.02
1,034,380 0.36 Consumer Services
6,418 Crown 60,181 0.02 30,208 Tatts Group 86,370 0.03
9,267 Wesfarmers 277,996 0.10 10,282 Woolworths 213,058 0.07
637,605 0.22 Financial
31,591 AMP 146,171 0.05 4,429 ASX 135,825 0.05
22,602 Australia & New Zealand Banking Group 559,375 0.19 7,155 Bank of Queensland 70,227 0.02
12,948 Commonwealth Bank of Australia 847,199 0.30 16,145 Dexus Property Group 90,586 0.03 45,396 Federation Centres 101,883 0.04 22,938 Goodman Group 110,541 0.04 30,186 Insurance Australia Group 129,461 0.05
8,559 Lend Lease Group 98,874 0.03 65,017 Mirvac Group 92,448 0.03 21,101 National Australia Bank 540,229 0.19 11,028 QBE Insurance Group 115,869 0.04 23,198 Scentre Group 66,862 0.02 13,920 Suncorp Group 143,686 0.05 19,862 Westfield Group 139,225 0.05 51,884 Westpac Banking 641,040 0.22
4,029,501 1.40 Healthcare
4,491 CSL 298,476 0.11 1,903 Ramsay Health Care 89,909 0.03 5,773 Sonic Healthcare 94,821 0.03
483,206 0.17 Industrial
10,696 Amcor 112,791 0.04 21,695 Aurizon Holdings 85,542 0.03 13,090 Brambles 106,646 0.04
4,486 CIMIC Group 74,993 0.02 4,577 Seek 49,462 0.02
22,392 Sydney Airport 85,708 0.03
515,142 0.18
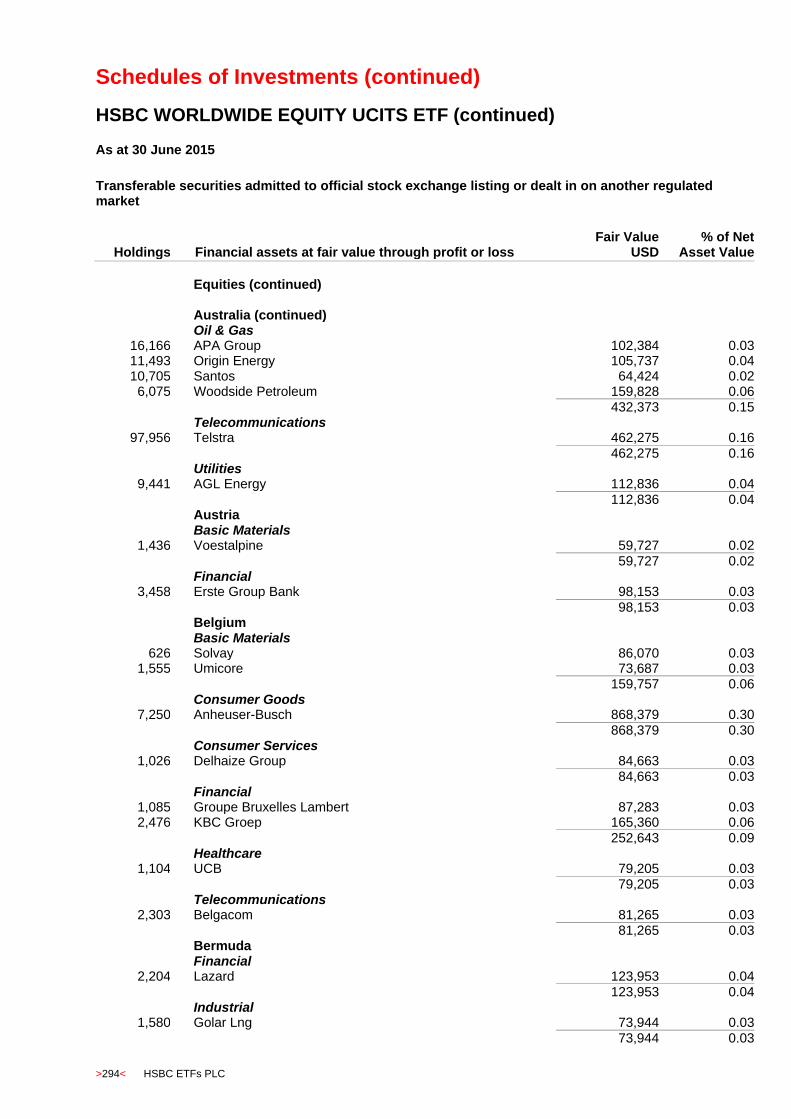
Schedules of Investments (continued)
HSBC WORLDWIDE EQUITY UCITS ETF (continued)
>294< HSBC ETFs PLC
As at 30 June 2015
Transferable securities admitted to official stock exchange listing or dealt in on another regulated market
Holdings
Financial assets at fair value through profit or loss Fair Value
USD % of Net
Asset Value
Equities (continued) Australia (continued)
Oil & Gas 16,166 APA Group 102,384 0.03 11,493 Origin Energy 105,737 0.04 10,705 Santos 64,424 0.02
6,075 Woodside Petroleum 159,828 0.06
432,373 0.15 Telecommunications
97,956 Telstra 462,275 0.16
462,275 0.16 Utilities
9,441 AGL Energy 112,836 0.04
112,836 0.04 Austria Basic Materials
1,436 Voestalpine 59,727 0.02
59,727 0.02 Financial
3,458 Erste Group Bank 98,153 0.03
98,153 0.03 Belgium Basic Materials
626 Solvay 86,070 0.03 1,555 Umicore 73,687 0.03
159,757 0.06 Consumer Goods
7,250 Anheuser-Busch 868,379 0.30
868,379 0.30 Consumer Services
1,026 Delhaize Group 84,663 0.03 84,663 0.03 Financial
1,085 Groupe Bruxelles Lambert 87,283 0.03 2,476 KBC Groep 165,360 0.06
252,643 0.09 Healthcare
1,104 UCB 79,205 0.03
79,205 0.03 Telecommunications
2,303 Belgacom 81,265 0.03 81,265 0.03 Bermuda Financial
2,204 Lazard 123,953 0.04
123,953 0.04 Industrial
1,580 Golar Lng 73,944 0.03
73,944 0.03
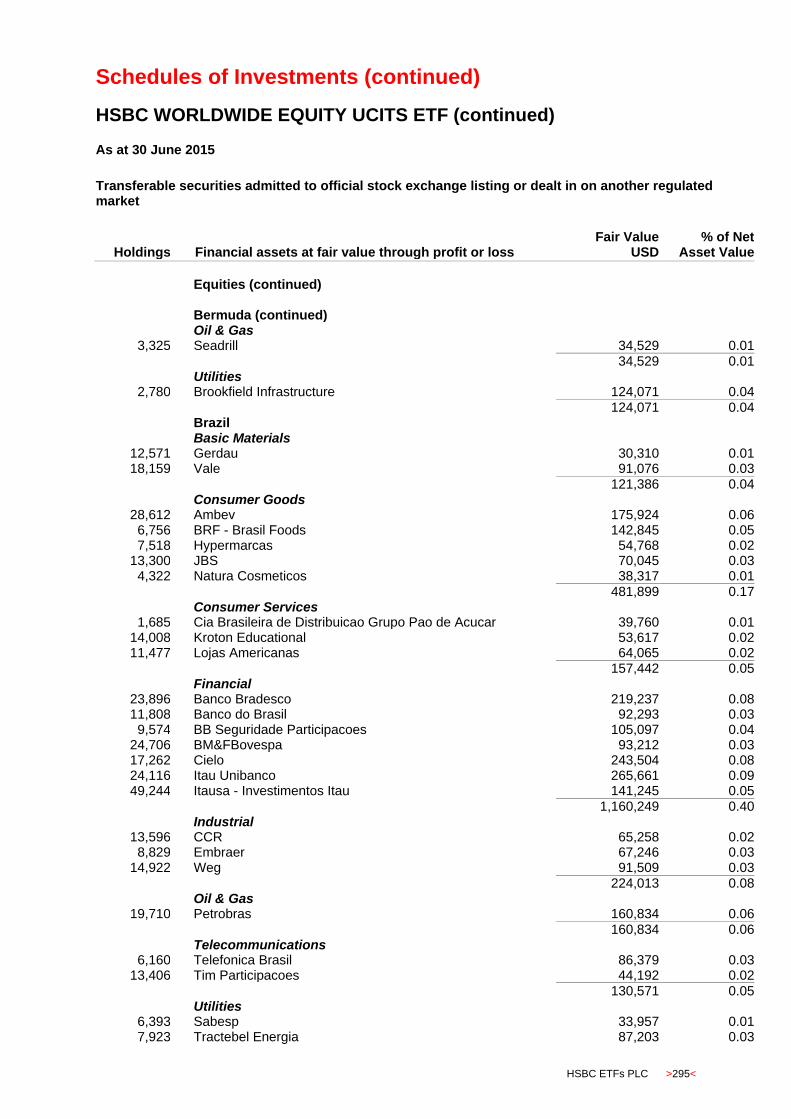
Schedules of Investments (continued)
HSBC WORLDWIDE EQUITY UCITS ETF (continued)
HSBC ETFs PLC >295<
As at 30 June 2015
Transferable securities admitted to official stock exchange listing or dealt in on another regulated market
Holdings
Financial assets at fair value through profit or loss Fair Value
USD % of Net
Asset Value
Equities (continued)
Bermuda (continued) Oil & Gas
3,325 Seadrill 34,529 0.01
34,529 0.01 Utilities
2,780 Brookfield Infrastructure 124,071 0.04
124,071 0.04 Brazil Basic Materials
12,571 Gerdau 30,310 0.01 18,159 Vale 91,076 0.03
121,386 0.04 Consumer Goods
28,612 Ambev 175,924 0.06 6,756 BRF - Brasil Foods 142,845 0.05 7,518 Hypermarcas 54,768 0.02
13,300 JBS 70,045 0.03 4,322 Natura Cosmeticos 38,317 0.01
481,899 0.17 Consumer Services
1,685 Cia Brasileira de Distribuicao Grupo Pao de Acucar 39,760 0.01 14,008 Kroton Educational 53,617 0.02 11,477 Lojas Americanas 64,065 0.02
157,442 0.05 Financial
23,896 Banco Bradesco 219,237 0.08 11,808 Banco do Brasil 92,293 0.03
9,574 BB Seguridade Participacoes 105,097 0.04 24,706 BM&FBovespa 93,212 0.03 17,262 Cielo 243,504 0.08 24,116 Itau Unibanco 265,661 0.09 49,244 Itausa - Investimentos Itau 141,245 0.05
1,160,249 0.40 Industrial
13,596 CCR 65,258 0.02 8,829 Embraer 67,246 0.03
14,922 Weg 91,509 0.03
224,013 0.08 Oil & Gas
19,710 Petrobras 160,834 0.06
160,834 0.06 Telecommunications
6,160 Telefonica Brasil 86,379 0.03 13,406 Tim Participacoes 44,192 0.02
130,571 0.05 Utilities
6,393 Sabesp 33,957 0.01 7,923 Tractebel Energia 87,203 0.03

Schedules of Investments (continued)
HSBC WORLDWIDE EQUITY UCITS ETF (continued)
>296< HSBC ETFs PLC
As at 30 June 2015
Transferable securities admitted to official stock exchange listing or dealt in on another regulated market
Holdings
Financial assets at fair value through profit or loss Fair Value
USD % of Net
Asset Value
Equities (continued)
Brazil (continued) Utilities (continued)
4,470 Ultrapar Participacoes 94,540 0.03
215,700 0.07 British Virgin Islands Technology
1,458 Mail.ru Group 30,399 0.01 30,399 0.01 Canada Basic Materials
1,865 Agnico-Eagle Mines 52,972 0.02 1,404 Agrium 148,863 0.05 9,946 Barrick Gold 106,355 0.04 4,668 Cameco 66,817 0.02 5,712 First Quantum Minerals 74,714 0.03 6,833 Goldcorp 110,941 0.04 7,383 Potash Corp of Saskatchewan 228,743 0.08 3,684 Silver Wheaton 63,886 0.02
853,291 0.30 Consumer Goods
3,978 Magna International 223,363 0.08 3,592 Saputo 86,920 0.03
310,283 0.11 Consumer Services
3,919 Alimentation Couche-Tard 167,722 0.06 1,012 Canadian Tire 108,281 0.04 1,518 Loblaw 76,699 0.02
352,702 0.12 Financial
4,513 Bank of Montreal 267,538 0.09 9,029 Bank of Nova Scotia 466,258 0.16 8,122 Brookfield Asset Management 283,907 0.10 2,144 Canadian Imperial Bank of Commerce 158,115 0.05 1,279 Franco-Nevada 61,028 0.02 3,925 Great West Lifeco 114,312 0.04
16,087 Manulife Financial 299,074 0.10 2,403 National Bank Of Canada 90,311 0.03 4,387 Power Corporation of Canada 112,236 0.04 2,920 Power Financial 83,896 0.03 4,849 RioCan Real Estate Investment Trust 103,975 0.04
10,676 Royal Bank of Canada 653,156 0.23 5,574 Sun Life Financial 186,180 0.07
14,008 Toronto-Dominion Bank 595,125 0.21
3,475,111 1.21 Healthcare
2,480 Valeant Pharmaceuticals International 550,389 0.19
550,389 0.19

Schedules of Investments (continued)
HSBC WORLDWIDE EQUITY UCITS ETF (continued)
HSBC ETFs PLC >297<
As at 30 June 2015
Transferable securities admitted to official stock exchange listing or dealt in on another regulated market
Holdings
Financial assets at fair value through profit or loss Fair Value
USD % of Net
Asset Value
Equities (continued)
Canada (continued) Industrial
6,635 Canadian National Railway 382,969 0.13 1,535 Canadian Pacific Railway 245,930 0.09
628,899 0.22 Oil & Gas
8,924 Canadian Natural Resources 242,319 0.08 6,351 Cenovus Energy 101,590 0.04 3,831 Crescent Point Energy 78,648 0.03 6,839 Enbridge 319,970 0.11 6,754 Encana 74,495 0.03 3,633 Husky Energy 69,520 0.02 2,770 Imperial Oil 107,055 0.04 3,820 Inter Pipeline 87,816 0.03 2,282 Keyera 76,222 0.03
11,652 Suncor Energy 321,061 0.11 5,872 TransCanada 238,746 0.08
1,717,442 0.60 Technology
1,349 Catamaran Corp 82,477 0.03 2,334 CGI 91,326 0.03
204 Constellation Software 81,025 0.03 254,828 0.09 Telecommunications
6,318 BCE 268,519 0.09 3,572 Rogers Communications 126,749 0.04 5,303 Telus 182,777 0.07
578,045 0.20 Utilities
3,228 Fortis 90,703 0.03 3,302 Pembina Pipeline 106,774 0.04
197,477 0.07 Cayman Islands Consumer Services
3,759 Melco Crown Entertainment 73,789 0.02 7,264 Vipshop Holdings 161,624 0.06
235,413 0.08 Channel Islands Technology
1,874 Amdocs 102,302 0.04
102,302 0.04 Chile Consumer Services
22,074 Cencosud 53,092 0.02 4,896 Latam Airlines 34,886 0.01
10,114 SACI Falabella 70,638 0.03
158,616 0.06
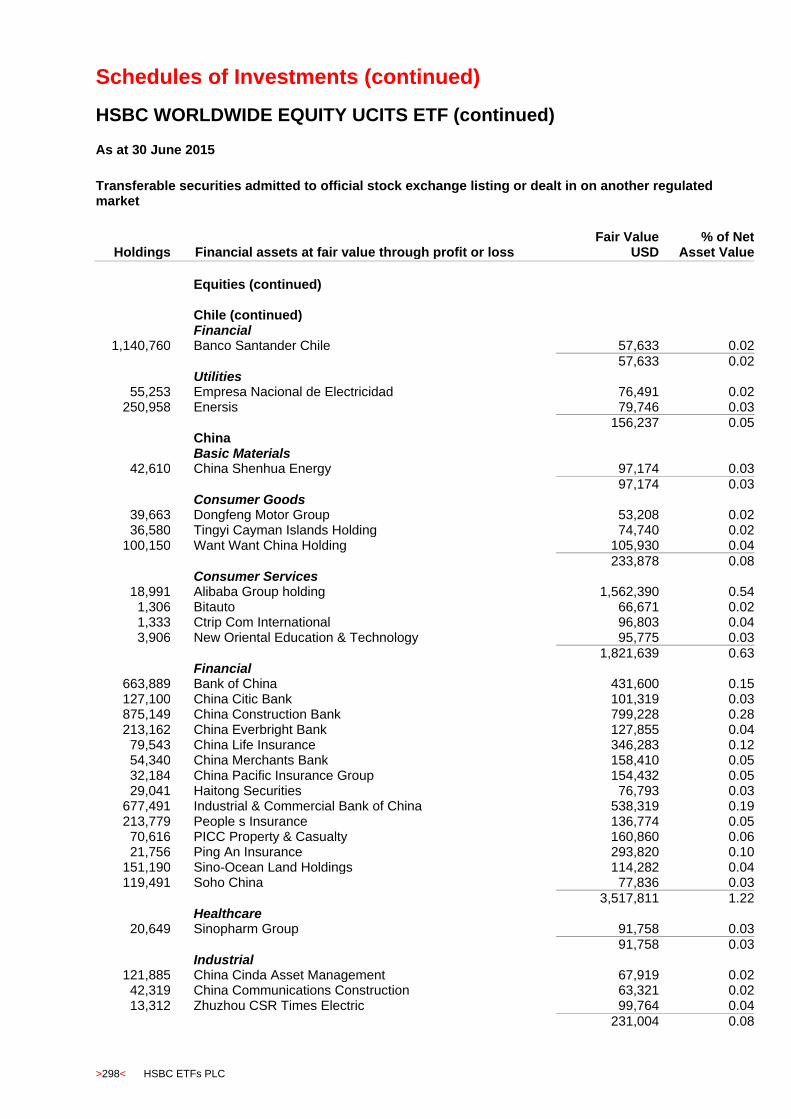
Schedules of Investments (continued)
HSBC WORLDWIDE EQUITY UCITS ETF (continued)
>298< HSBC ETFs PLC
As at 30 June 2015
Transferable securities admitted to official stock exchange listing or dealt in on another regulated market
Holdings
Financial assets at fair value through profit or loss Fair Value
USD % of Net
Asset Value
Equities (continued)
Chile (continued) Financial
1,140,760 Banco Santander Chile 57,633 0.02
57,633 0.02 Utilities
55,253 Empresa Nacional de Electricidad 76,491 0.02 250,958 Enersis 79,746 0.03
156,237 0.05 China Basic Materials
42,610 China Shenhua Energy 97,174 0.03
97,174 0.03 Consumer Goods
39,663 Dongfeng Motor Group 53,208 0.02 36,580 Tingyi Cayman Islands Holding 74,740 0.02
100,150 Want Want China Holding 105,930 0.04
233,878 0.08 Consumer Services
18,991 Alibaba Group holding 1,562,390 0.54 1,306 Bitauto 66,671 0.02 1,333 Ctrip Com International 96,803 0.04 3,906 New Oriental Education & Technology 95,775 0.03
1,821,639 0.63 Financial
663,889 Bank of China 431,600 0.15 127,100 China Citic Bank 101,319 0.03 875,149 China Construction Bank 799,228 0.28 213,162 China Everbright Bank 127,855 0.04 79,543 China Life Insurance 346,283 0.12 54,340 China Merchants Bank 158,410 0.05 32,184 China Pacific Insurance Group 154,432 0.05 29,041 Haitong Securities 76,793 0.03
677,491 Industrial & Commercial Bank of China 538,319 0.19 213,779 People s Insurance 136,774 0.05 70,616 PICC Property & Casualty 160,860 0.06 21,756 Ping An Insurance 293,820 0.10
151,190 Sino-Ocean Land Holdings 114,282 0.04 119,491 Soho China 77,836 0.03
3,517,811 1.22 Healthcare
20,649 Sinopharm Group 91,758 0.03 91,758 0.03 Industrial
121,885 China Cinda Asset Management 67,919 0.02 42,319 China Communications Construction 63,321 0.02 13,312 Zhuzhou CSR Times Electric 99,764 0.04
231,004 0.08
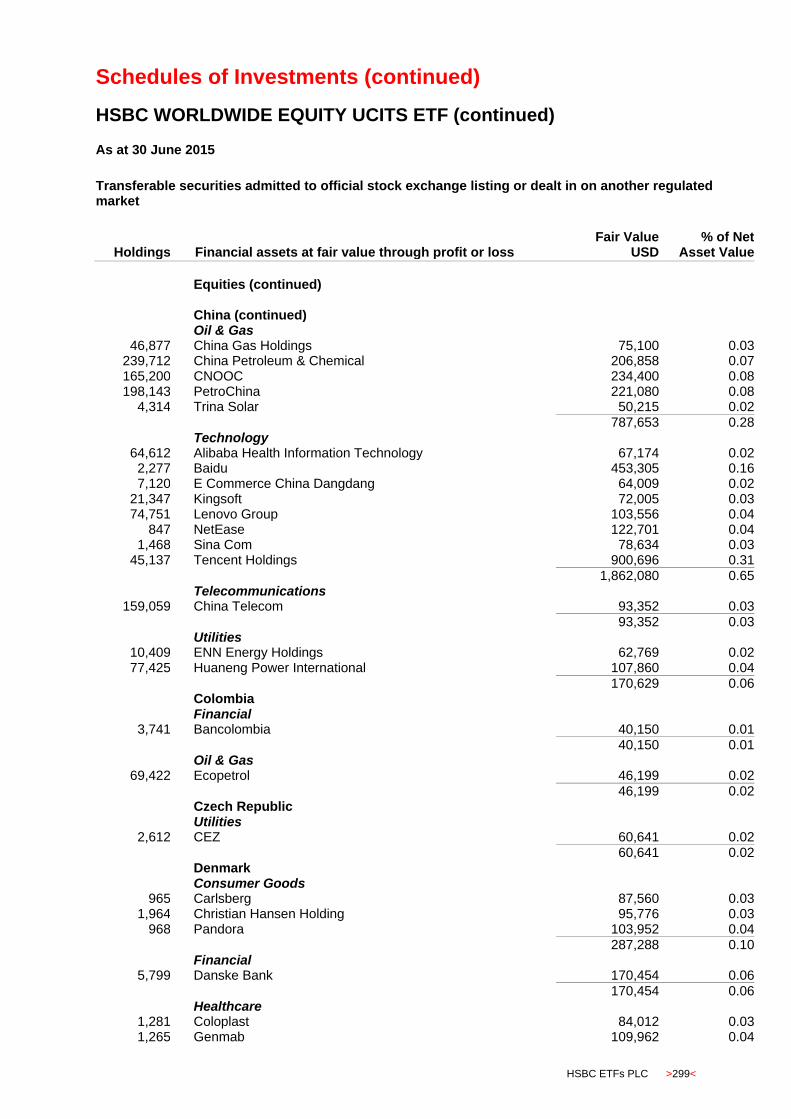
Schedules of Investments (continued)
HSBC WORLDWIDE EQUITY UCITS ETF (continued)
HSBC ETFs PLC >299<
As at 30 June 2015
Transferable securities admitted to official stock exchange listing or dealt in on another regulated market
Holdings
Financial assets at fair value through profit or loss Fair Value
USD % of Net
Asset Value
Equities (continued)
China (continued) Oil & Gas
46,877 China Gas Holdings 75,100 0.03 239,712 China Petroleum & Chemical 206,858 0.07 165,200 CNOOC 234,400 0.08 198,143 PetroChina 221,080 0.08
4,314 Trina Solar 50,215 0.02
787,653 0.28 Technology
64,612 Alibaba Health Information Technology 67,174 0.02 2,277 Baidu 453,305 0.16 7,120 E Commerce China Dangdang 64,009 0.02
21,347 Kingsoft 72,005 0.03 74,751 Lenovo Group 103,556 0.04
847 NetEase 122,701 0.04 1,468 Sina Com 78,634 0.03
45,137 Tencent Holdings 900,696 0.31
1,862,080 0.65 Telecommunications
159,059 China Telecom 93,352 0.03
93,352 0.03 Utilities
10,409 ENN Energy Holdings 62,769 0.02 77,425 Huaneng Power International 107,860 0.04
170,629 0.06 Colombia Financial
3,741 Bancolombia 40,150 0.01
40,150 0.01 Oil & Gas
69,422 Ecopetrol 46,199 0.02
46,199 0.02 Czech Republic Utilities
2,612 CEZ 60,641 0.02 60,641 0.02 Denmark Consumer Goods
965 Carlsberg 87,560 0.03 1,964 Christian Hansen Holding 95,776 0.03
968 Pandora 103,952 0.04
287,288 0.10 Financial
5,799 Danske Bank 170,454 0.06
170,454 0.06 Healthcare
1,281 Coloplast 84,012 0.03 1,265 Genmab 109,962 0.04

Schedules of Investments (continued)
HSBC WORLDWIDE EQUITY UCITS ETF (continued)
>300< HSBC ETFs PLC
As at 30 June 2015
Transferable securities admitted to official stock exchange listing or dealt in on another regulated market
Holdings
Financial assets at fair value through profit or loss Fair Value
USD % of Net
Asset Value
Equities (continued)
Denmark (continued) Healthcare (continued)
12,981 Novo Nordisk 706,895 0.25 1,998 Novozymes 94,927 0.03
995,796 0.35 Industrial
55 AP Moeller - Maersk 99,563 0.04 1,828 DSV 59,192 0.02
158,755 0.06 Oil & Gas
2,396 Vestas Windsystems 119,526 0.04
119,526 0.04 Telecommunications
5,155 TDC 37,781 0.01
37,781 0.01 Egypt Financial
12,966 Commercial International Bank Egypt 95,927 0.03
95,927 0.03 Industrial
1,285 Orascom Construction 16,628 0.01
16,628 0.01 Finland Basic Materials
7,507 Stora Enso 77,328 0.03 5,903 UPM-Kymmene 104,379 0.04
181,707 0.07 Financial
3,585 Sampo 168,764 0.06
168,764 0.06 Industrial
2,261 Wartsilap 105,857 0.04
105,857 0.04 Technology
33,171 Nokia 225,081 0.08
225,081 0.08 Utilities
4,627 Fortum 82,177 0.03
82,177 0.03 France Basic Materials
2,611 Air Liquide 330,046 0.12 967 Arkema 69,634 0.02
399,680 0.14 Consumer Goods
652 Christian Dior 127,203 0.04 1,743 Cie Generale des Etablissements Michelin 182,533 0.06 5,394 Danone 348,520 0.12

Schedules of Investments (continued)
HSBC WORLDWIDE EQUITY UCITS ETF (continued)
HSBC ETFs PLC >301<
As at 30 June 2015
Transferable securities admitted to official stock exchange listing or dealt in on another regulated market
Holdings
Financial assets at fair value through profit or loss Fair Value
USD % of Net
Asset Value
Equities (continued)
France (continued) Consumer Goods (continued)
160 Hermes International 59,650 0.02 1,806 L'Oreal 321,959 0.11 1,748 LVMH Moet Hennessy Louis Vuitton 306,069 0.11 1,838 Pernod-Ricard 212,162 0.08 6,354 Peugeot 130,584 0.05 2,237 Renault 232,846 0.08
799 Valeo 125,836 0.04
2,047,362 0.71 Consumer Services
1,913 Accor 96,491 0.03 6,142 Carrefour 196,543 0.07
683 Casino Guichard Perrachon 51,710 0.02 704 Kering 125,621 0.05 634 Numericable - SFR 33,586 0.01
1,567 Publicis Groupe 115,792 0.04 648 Sodexo 61,500 0.02
11,559 Vivendi 291,388 0.10
972,631 0.34 Financial
21,457 AXA 541,024 0.19 8,509 BNP Paribas 513,381 0.18
13,659 Credit Agricole 203,020 0.07 1,841 Klepierre 80,932 0.03
12,884 Natixis Banques Populai 92,664 0.03 5,050 Societe Generale 235,590 0.08
958 Unibail-Rodamco 241,980 0.08
1,908,591 0.66 Healthcare
1,979 Cie Generale d'Optique Essilor International 235,935 0.08 11,049 Sanofi 1,086,305 0.38
1,322,240 0.46 Industrial
2,884 Alstom 81,780 0.03 14,325 Bollore 76,214 0.03
4,214 Cie de St-Gobain 189,077 0.06 2,497 Edenred 61,667 0.02 7,462 Groupe Eurotunnel 108,001 0.04 2,138 Lafarge 141,119 0.05 2,495 Legrand 139,997 0.05 2,434 Safran 164,860 0.06 3,801 Schneider Electric 262,278 0.09 1,556 Thales 93,897 0.03 5,336 Vinci 308,446 0.11 3,500 Zodiac Aerospace 113,871 0.04
1,741,207 0.61
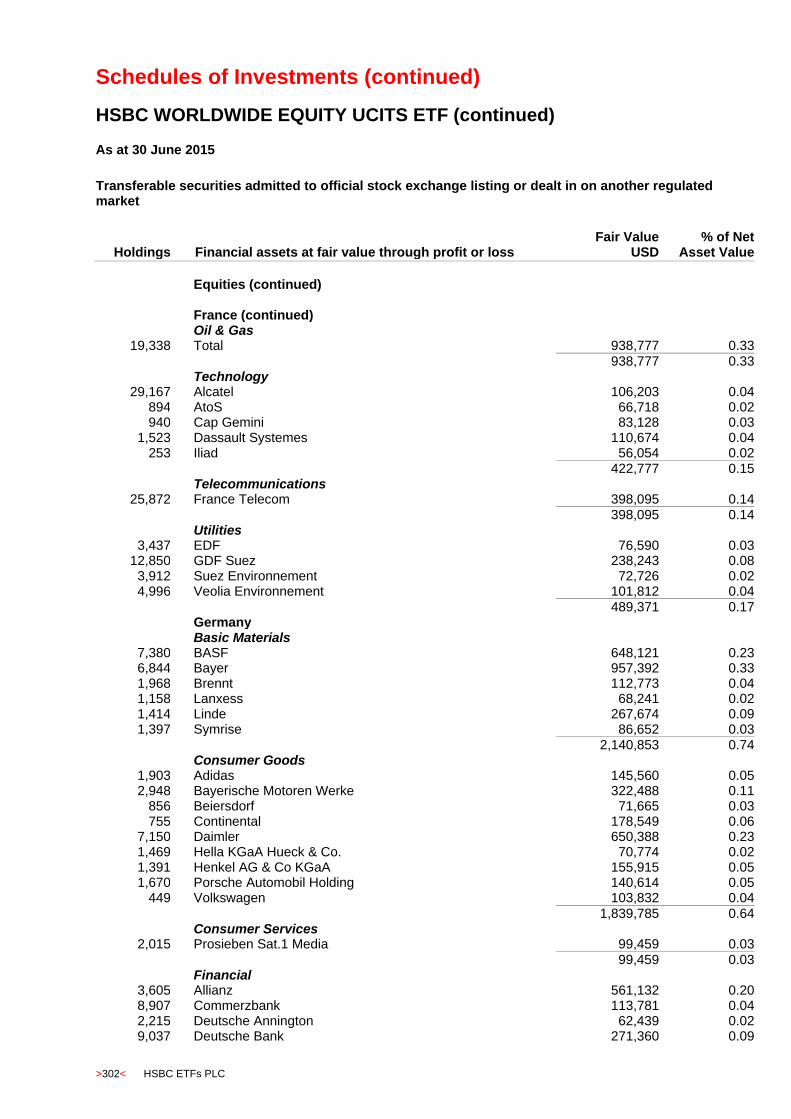
Schedules of Investments (continued)
HSBC WORLDWIDE EQUITY UCITS ETF (continued)
>302< HSBC ETFs PLC
As at 30 June 2015
Transferable securities admitted to official stock exchange listing or dealt in on another regulated market
Holdings
Financial assets at fair value through profit or loss Fair Value
USD % of Net
Asset Value
Equities (continued)
France (continued) Oil & Gas
19,338 Total 938,777 0.33
938,777 0.33 Technology
29,167 Alcatel 106,203 0.04 894 AtoS 66,718 0.02 940 Cap Gemini 83,128 0.03
1,523 Dassault Systemes 110,674 0.04 253 Iliad 56,054 0.02
422,777 0.15 Telecommunications
25,872 France Telecom 398,095 0.14 398,095 0.14 Utilities
3,437 EDF 76,590 0.03 12,850 GDF Suez 238,243 0.08
3,912 Suez Environnement 72,726 0.02 4,996 Veolia Environnement 101,812 0.04
489,371 0.17 Germany Basic Materials
7,380 BASF 648,121 0.23 6,844 Bayer 957,392 0.33 1,968 Brennt 112,773 0.04 1,158 Lanxess 68,241 0.02 1,414 Linde 267,674 0.09 1,397 Symrise 86,652 0.03
2,140,853 0.74 Consumer Goods
1,903 Adidas 145,560 0.05 2,948 Bayerische Motoren Werke 322,488 0.11
856 Beiersdorf 71,665 0.03 755 Continental 178,549 0.06
7,150 Daimler 650,388 0.23 1,469 Hella KGaA Hueck & Co. 70,774 0.02 1,391 Henkel AG & Co KGaA 155,915 0.05 1,670 Porsche Automobil Holding 140,614 0.05
449 Volkswagen 103,832 0.04
1,839,785 0.64 Consumer Services
2,015 Prosieben Sat.1 Media 99,459 0.03
99,459 0.03 Financial
3,605 Allianz 561,132 0.20 8,907 Commerzbank 113,781 0.04 2,215 Deutsche Annington 62,439 0.02 9,037 Deutsche Bank 271,360 0.09
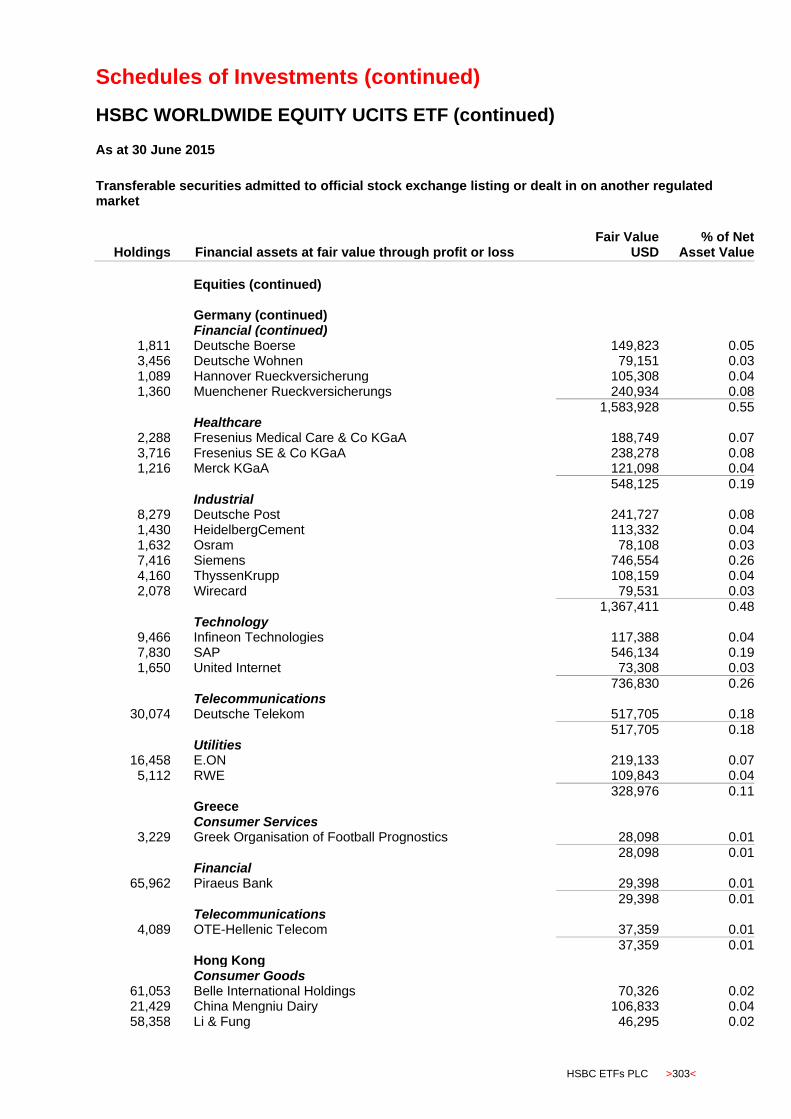
Schedules of Investments (continued)
HSBC WORLDWIDE EQUITY UCITS ETF (continued)
HSBC ETFs PLC >303<
As at 30 June 2015
Transferable securities admitted to official stock exchange listing or dealt in on another regulated market
Holdings
Financial assets at fair value through profit or loss Fair Value
USD % of Net
Asset Value
Equities (continued)
Germany (continued) Financial (continued)
1,811 Deutsche Boerse 149,823 0.05 3,456 Deutsche Wohnen 79,151 0.03 1,089 Hannover Rueckversicherung 105,308 0.04 1,360 Muenchener Rueckversicherungs 240,934 0.08
1,583,928 0.55 Healthcare
2,288 Fresenius Medical Care & Co KGaA 188,749 0.07 3,716 Fresenius SE & Co KGaA 238,278 0.08 1,216 Merck KGaA 121,098 0.04
548,125 0.19 Industrial
8,279 Deutsche Post 241,727 0.08 1,430 HeidelbergCement 113,332 0.04 1,632 Osram 78,108 0.03 7,416 Siemens 746,554 0.26 4,160 ThyssenKrupp 108,159 0.04 2,078 Wirecard 79,531 0.03
1,367,411 0.48 Technology
9,466 Infineon Technologies 117,388 0.04 7,830 SAP 546,134 0.19 1,650 United Internet 73,308 0.03
736,830 0.26 Telecommunications
30,074 Deutsche Telekom 517,705 0.18
517,705 0.18 Utilities
16,458 E.ON 219,133 0.07 5,112 RWE 109,843 0.04
328,976 0.11 Greece Consumer Services
3,229 Greek Organisation of Football Prognostics 28,098 0.01 28,098 0.01 Financial
65,962 Piraeus Bank 29,398 0.01
29,398 0.01 Telecommunications
4,089 OTE-Hellenic Telecom 37,359 0.01
37,359 0.01 Hong Kong Consumer Goods
61,053 Belle International Holdings 70,326 0.02 21,429 China Mengniu Dairy 106,833 0.04 58,358 Li & Fung 46,295 0.02
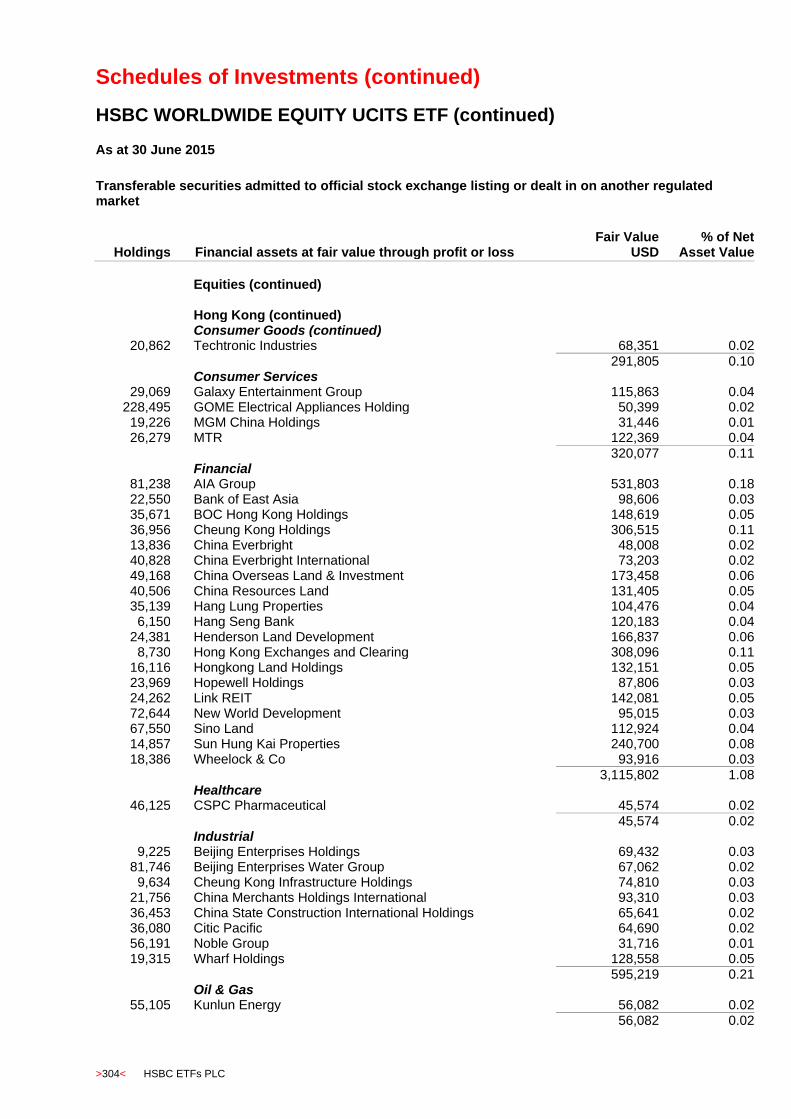
Schedules of Investments (continued)
HSBC WORLDWIDE EQUITY UCITS ETF (continued)
>304< HSBC ETFs PLC
As at 30 June 2015
Transferable securities admitted to official stock exchange listing or dealt in on another regulated market
Holdings
Financial assets at fair value through profit or loss Fair Value
USD % of Net
Asset Value
Equities (continued)
Hong Kong (continued) Consumer Goods (continued)
20,862 Techtronic Industries 68,351 0.02
291,805 0.10 Consumer Services
29,069 Galaxy Entertainment Group 115,863 0.04 228,495 GOME Electrical Appliances Holding 50,399 0.02 19,226 MGM China Holdings 31,446 0.01 26,279 MTR 122,369 0.04
320,077 0.11 Financial
81,238 AIA Group 531,803 0.18 22,550 Bank of East Asia 98,606 0.03 35,671 BOC Hong Kong Holdings 148,619 0.05 36,956 Cheung Kong Holdings 306,515 0.11 13,836 China Everbright 48,008 0.02 40,828 China Everbright International 73,203 0.02 49,168 China Overseas Land & Investment 173,458 0.06 40,506 China Resources Land 131,405 0.05 35,139 Hang Lung Properties 104,476 0.04
6,150 Hang Seng Bank 120,183 0.04 24,381 Henderson Land Development 166,837 0.06
8,730 Hong Kong Exchanges and Clearing 308,096 0.11 16,116 Hongkong Land Holdings 132,151 0.05 23,969 Hopewell Holdings 87,806 0.03 24,262 Link REIT 142,081 0.05 72,644 New World Development 95,015 0.03 67,550 Sino Land 112,924 0.04 14,857 Sun Hung Kai Properties 240,700 0.08 18,386 Wheelock & Co 93,916 0.03
3,115,802 1.08 Healthcare
46,125 CSPC Pharmaceutical 45,574 0.02
45,574 0.02 Industrial
9,225 Beijing Enterprises Holdings 69,432 0.03 81,746 Beijing Enterprises Water Group 67,062 0.02
9,634 Cheung Kong Infrastructure Holdings 74,810 0.03 21,756 China Merchants Holdings International 93,310 0.03 36,453 China State Construction International Holdings 65,641 0.02 36,080 Citic Pacific 64,690 0.02 56,191 Noble Group 31,716 0.01 19,315 Wharf Holdings 128,558 0.05
595,219 0.21 Oil & Gas
55,105 Kunlun Energy 56,082 0.02 56,082 0.02

Schedules of Investments (continued)
HSBC WORLDWIDE EQUITY UCITS ETF (continued)
HSBC ETFs PLC >305<
As at 30 June 2015
Transferable securities admitted to official stock exchange listing or dealt in on another regulated market
Holdings
Financial assets at fair value through profit or loss Fair Value
USD % of Net
Asset Value
Equities (continued)
Hong Kong (continued) Technology
29,259 CK Hutchison Holdings 429,872 0.15
429,872 0.15 Telecommunications
65,410 China Mobile 837,395 0.29 122,080 China Unicom Hong Kong 192,114 0.07
1,029,509 0.36 Utilities
19,446 CLP Holdings 165,299 0.06 151,837 GCL-Poly Energy Holdings 35,058 0.01 72,783 HK & China Gas 152,653 0.05 15,261 Power Assets Holdings 139,174 0.05
492,184 0.17 Hungary Financial
3,407 OTP Bank 67,428 0.02
67,428 0.02 India Financial
3,904 HDFC Bank 236,309 0.08 14,521 ICICI Bank 151,309 0.05
387,618 0.13 Healthcare
1,497 Dr Reddy's Laboratories 82,814 0.03
82,814 0.03 Industrial
1,928 Tata Motors 66,458 0.02
66,458 0.02 Oil & Gas
8,297 Reliance Industries 258,452 0.09
258,452 0.09 Indonesia Consumer Goods
230,592 Astra International 122,366 0.04 21,191 Unilever Indonesia 62,782 0.02
185,148 0.06 Financial
150,419 Bank Central Asia 152,309 0.05 113,908 Bank Mandiri 85,864 0.03 151,475 Bank Rakyat Indonesia Persero 117,590 0.04
355,763 0.12 Healthcare
441,313 Kalbe Farma 55,443 0.02
55,443 0.02 Industrial
30,831 Indocement Tunggal Prakarsa 48,273 0.02 50,664 Semen Gresik Persero 45,600 0.01

Schedules of Investments (continued)
HSBC WORLDWIDE EQUITY UCITS ETF (continued)
>306< HSBC ETFs PLC
As at 30 June 2015
Transferable securities admitted to official stock exchange listing or dealt in on another regulated market
Holdings
Financial assets at fair value through profit or loss Fair Value
USD % of Net
Asset Value
Equities (continued)
Indonesia (continued) Industrial (continued)
32,682 United Tractors 49,945 0.02
143,818 0.05 Telecommunications
569,844 Telekomunikasi Indonesia 125,231 0.04
125,231 0.04 Utilities
145,382 Perusahaan Gas Negara 47,052 0.02
47,052 0.02 Ireland Consumer Goods
1,136 Kerry Group 84,158 0.03
84,158 0.03 Consumer Services
13,149 Ryanair Holdings 173,170 0.06 10,614 WPP 238,037 0.08
411,207 0.14 Financial
205,112 Bank of Ireland 82,730 0.03 3,023 XL Group 112,456 0.04
195,186 0.07 Healthcare
1,154 Endo International 91,916 0.03 573 Jazz Pharmaceuticals 100,888 0.03
1,253 Mallinckrodt 147,503 0.05 1,278 Perrigo Co Ltd 236,213 0.08 4,570 Shire 366,190 0.13
942,710 0.32 Industrial
5,727 Accenture 554,259 0.19 1,359 Allegion Public Limited Company 81,730 0.03 6,447 CRH 181,880 0.06
580 DCC 45,609 0.02 9,190 Experian 167,512 0.06 3,122 Ingersoll-Rand 210,485 0.07 1,151 Smurfit Kappa 31,689 0.01
1,273,164 0.44 Israel Financial
7,927 Bank Hapoalim 42,720 0.01
42,720 0.01 Healthcare
7,489 Teva Pharm 442,600 0.15
442,600 0.15 Technology
1,460 Check Point Software 116,143 0.04
116,143 0.04
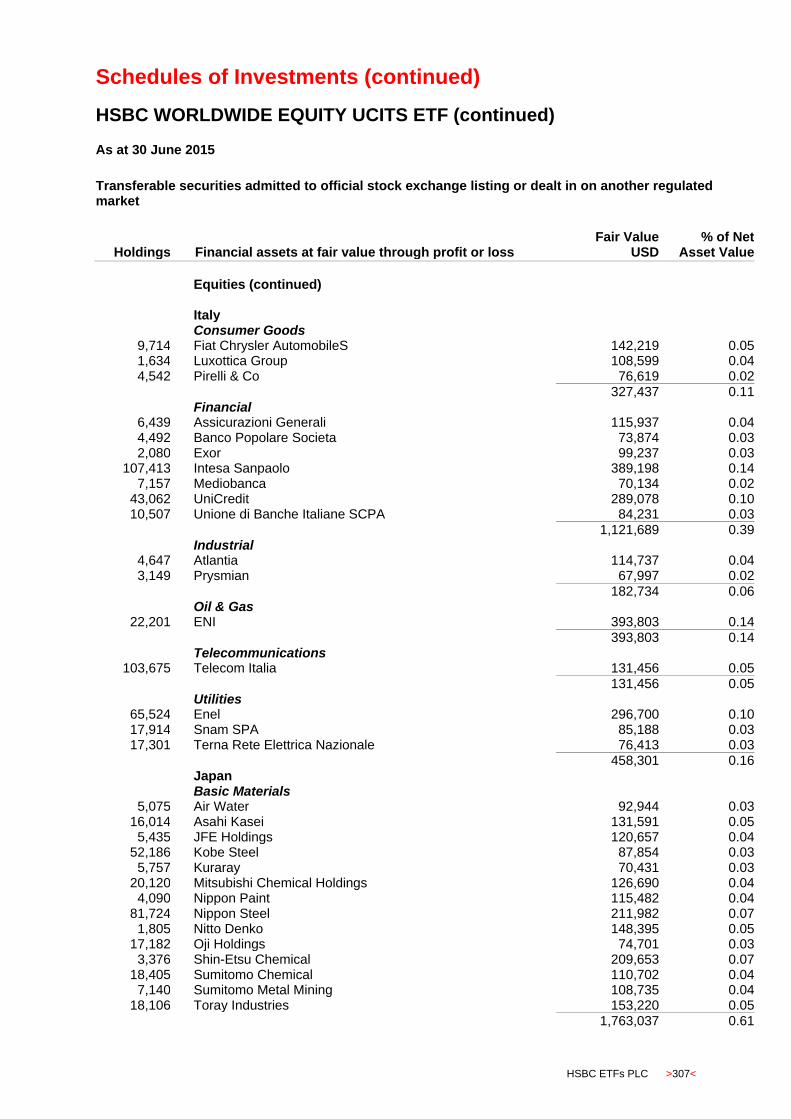
Schedules of Investments (continued)
HSBC WORLDWIDE EQUITY UCITS ETF (continued)
HSBC ETFs PLC >307<
As at 30 June 2015
Transferable securities admitted to official stock exchange listing or dealt in on another regulated market
Holdings
Financial assets at fair value through profit or loss Fair Value
USD % of Net
Asset Value
Equities (continued)
Italy Consumer Goods
9,714 Fiat Chrysler AutomobileS 142,219 0.05 1,634 Luxottica Group 108,599 0.04 4,542 Pirelli & Co 76,619 0.02
327,437 0.11 Financial
6,439 Assicurazioni Generali 115,937 0.04 4,492 Banco Popolare Societa 73,874 0.03 2,080 Exor 99,237 0.03
107,413 Intesa Sanpaolo 389,198 0.14 7,157 Mediobanca 70,134 0.02
43,062 UniCredit 289,078 0.10 10,507 Unione di Banche Italiane SCPA 84,231 0.03
1,121,689 0.39 Industrial
4,647 Atlantia 114,737 0.04 3,149 Prysmian 67,997 0.02
182,734 0.06 Oil & Gas
22,201 ENI 393,803 0.14
393,803 0.14 Telecommunications
103,675 Telecom Italia 131,456 0.05
131,456 0.05 Utilities
65,524 Enel 296,700 0.10 17,914 Snam SPA 85,188 0.03 17,301 Terna Rete Elettrica Nazionale 76,413 0.03
458,301 0.16 Japan Basic Materials
5,075 Air Water 92,944 0.03 16,014 Asahi Kasei 131,591 0.05
5,435 JFE Holdings 120,657 0.04 52,186 Kobe Steel 87,854 0.03
5,757 Kuraray 70,431 0.03 20,120 Mitsubishi Chemical Holdings 126,690 0.04
4,090 Nippon Paint 115,482 0.04 81,724 Nippon Steel 211,982 0.07
1,805 Nitto Denko 148,395 0.05 17,182 Oji Holdings 74,701 0.03
3,376 Shin-Etsu Chemical 209,653 0.07 18,405 Sumitomo Chemical 110,702 0.04
7,140 Sumitomo Metal Mining 108,735 0.04 18,106 Toray Industries 153,220 0.05
1,763,037 0.61
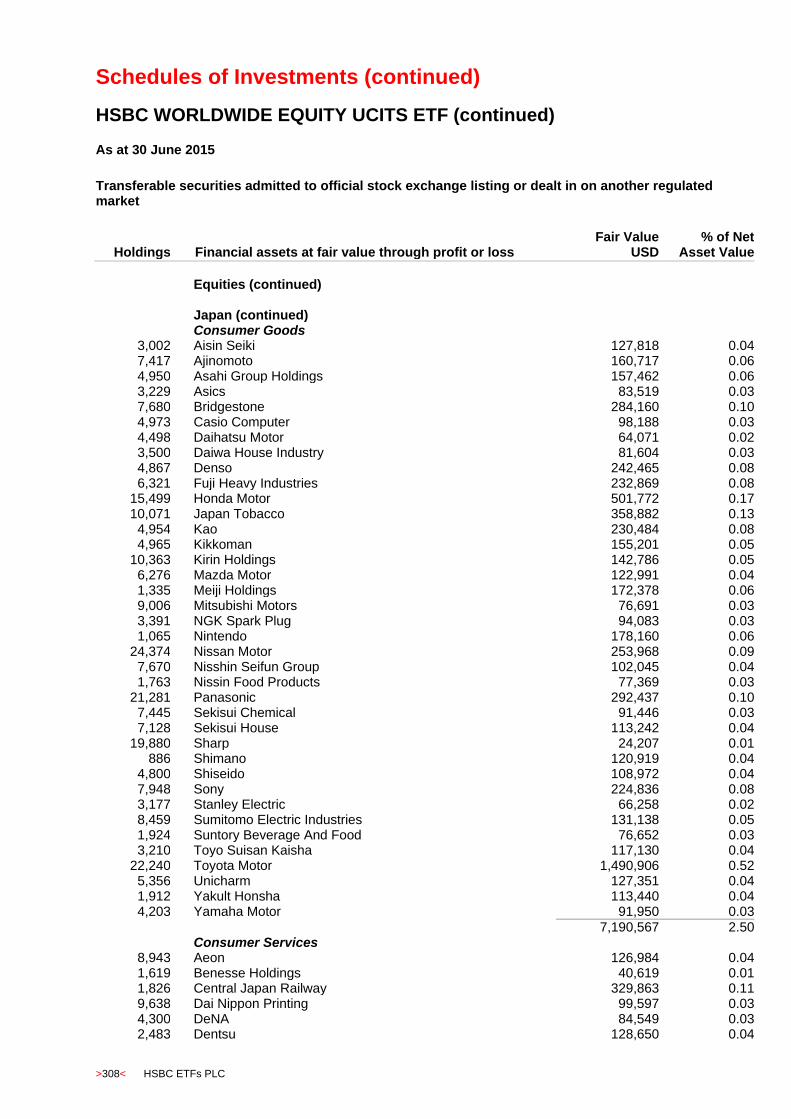
Schedules of Investments (continued)
HSBC WORLDWIDE EQUITY UCITS ETF (continued)
>308< HSBC ETFs PLC
As at 30 June 2015
Transferable securities admitted to official stock exchange listing or dealt in on another regulated market
Holdings
Financial assets at fair value through profit or loss Fair Value
USD % of Net
Asset Value
Equities (continued)
Japan (continued) Consumer Goods
3,002 Aisin Seiki 127,818 0.04 7,417 Ajinomoto 160,717 0.06 4,950 Asahi Group Holdings 157,462 0.06 3,229 Asics 83,519 0.03 7,680 Bridgestone 284,160 0.10 4,973 Casio Computer 98,188 0.03 4,498 Daihatsu Motor 64,071 0.02 3,500 Daiwa House Industry 81,604 0.03 4,867 Denso 242,465 0.08 6,321 Fuji Heavy Industries 232,869 0.08
15,499 Honda Motor 501,772 0.17 10,071 Japan Tobacco 358,882 0.13
4,954 Kao 230,484 0.08 4,965 Kikkoman 155,201 0.05
10,363 Kirin Holdings 142,786 0.05 6,276 Mazda Motor 122,991 0.04 1,335 Meiji Holdings 172,378 0.06 9,006 Mitsubishi Motors 76,691 0.03 3,391 NGK Spark Plug 94,083 0.03 1,065 Nintendo 178,160 0.06
24,374 Nissan Motor 253,968 0.09 7,670 Nisshin Seifun Group 102,045 0.04 1,763 Nissin Food Products 77,369 0.03
21,281 Panasonic 292,437 0.10 7,445 Sekisui Chemical 91,446 0.03 7,128 Sekisui House 113,242 0.04
19,880 Sharp 24,207 0.01 886 Shimano 120,919 0.04
4,800 Shiseido 108,972 0.04 7,948 Sony 224,836 0.08 3,177 Stanley Electric 66,258 0.02 8,459 Sumitomo Electric Industries 131,138 0.05 1,924 Suntory Beverage And Food 76,652 0.03 3,210 Toyo Suisan Kaisha 117,130 0.04
22,240 Toyota Motor 1,490,906 0.52 5,356 Unicharm 127,351 0.04 1,912 Yakult Honsha 113,440 0.04 4,203 Yamaha Motor 91,950 0.03
7,190,567 2.50 Consumer Services
8,943 Aeon 126,984 0.04 1,619 Benesse Holdings 40,619 0.01 1,826 Central Japan Railway 329,863 0.11 9,638 Dai Nippon Printing 99,597 0.03 4,300 DeNA 84,549 0.03 2,483 Dentsu 128,650 0.04
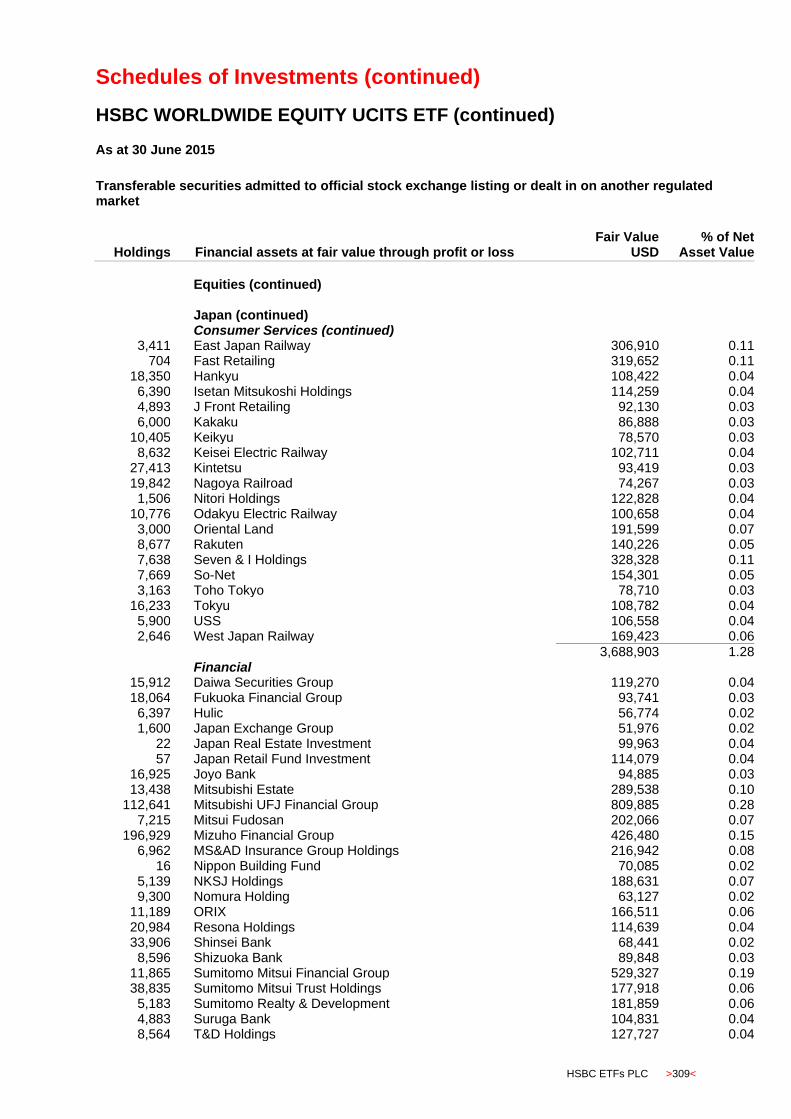
Schedules of Investments (continued)
HSBC WORLDWIDE EQUITY UCITS ETF (continued)
HSBC ETFs PLC >309<
As at 30 June 2015
Transferable securities admitted to official stock exchange listing or dealt in on another regulated market
Holdings
Financial assets at fair value through profit or loss Fair Value
USD % of Net
Asset Value
Equities (continued)
Japan (continued) Consumer Services (continued)
3,411 East Japan Railway 306,910 0.11 704 Fast Retailing 319,652 0.11
18,350 Hankyu 108,422 0.04 6,390 Isetan Mitsukoshi Holdings 114,259 0.04 4,893 J Front Retailing 92,130 0.03 6,000 Kakaku 86,888 0.03
10,405 Keikyu 78,570 0.03 8,632 Keisei Electric Railway 102,711 0.04
27,413 Kintetsu 93,419 0.03 19,842 Nagoya Railroad 74,267 0.03
1,506 Nitori Holdings 122,828 0.04 10,776 Odakyu Electric Railway 100,658 0.04
3,000 Oriental Land 191,599 0.07 8,677 Rakuten 140,226 0.05 7,638 Seven & I Holdings 328,328 0.11 7,669 So-Net 154,301 0.05 3,163 Toho Tokyo 78,710 0.03
16,233 Tokyu 108,782 0.04 5,900 USS 106,558 0.04 2,646 West Japan Railway 169,423 0.06
3,688,903 1.28 Financial
15,912 Daiwa Securities Group 119,270 0.04 18,064 Fukuoka Financial Group 93,741 0.03
6,397 Hulic 56,774 0.02 1,600 Japan Exchange Group 51,976 0.02
22 Japan Real Estate Investment 99,963 0.04 57 Japan Retail Fund Investment 114,079 0.04
16,925 Joyo Bank 94,885 0.03 13,438 Mitsubishi Estate 289,538 0.10
112,641 Mitsubishi UFJ Financial Group 809,885 0.28 7,215 Mitsui Fudosan 202,066 0.07
196,929 Mizuho Financial Group 426,480 0.15 6,962 MS&AD Insurance Group Holdings 216,942 0.08
16 Nippon Building Fund 70,085 0.02 5,139 NKSJ Holdings 188,631 0.07 9,300 Nomura Holding 63,127 0.02
11,189 ORIX 166,511 0.06 20,984 Resona Holdings 114,639 0.04 33,906 Shinsei Bank 68,441 0.02
8,596 Shizuoka Bank 89,848 0.03 11,865 Sumitomo Mitsui Financial Group 529,327 0.19 38,835 Sumitomo Mitsui Trust Holdings 177,918 0.06
5,183 Sumitomo Realty & Development 181,859 0.06 4,883 Suruga Bank 104,831 0.04 8,564 T&D Holdings 127,727 0.04
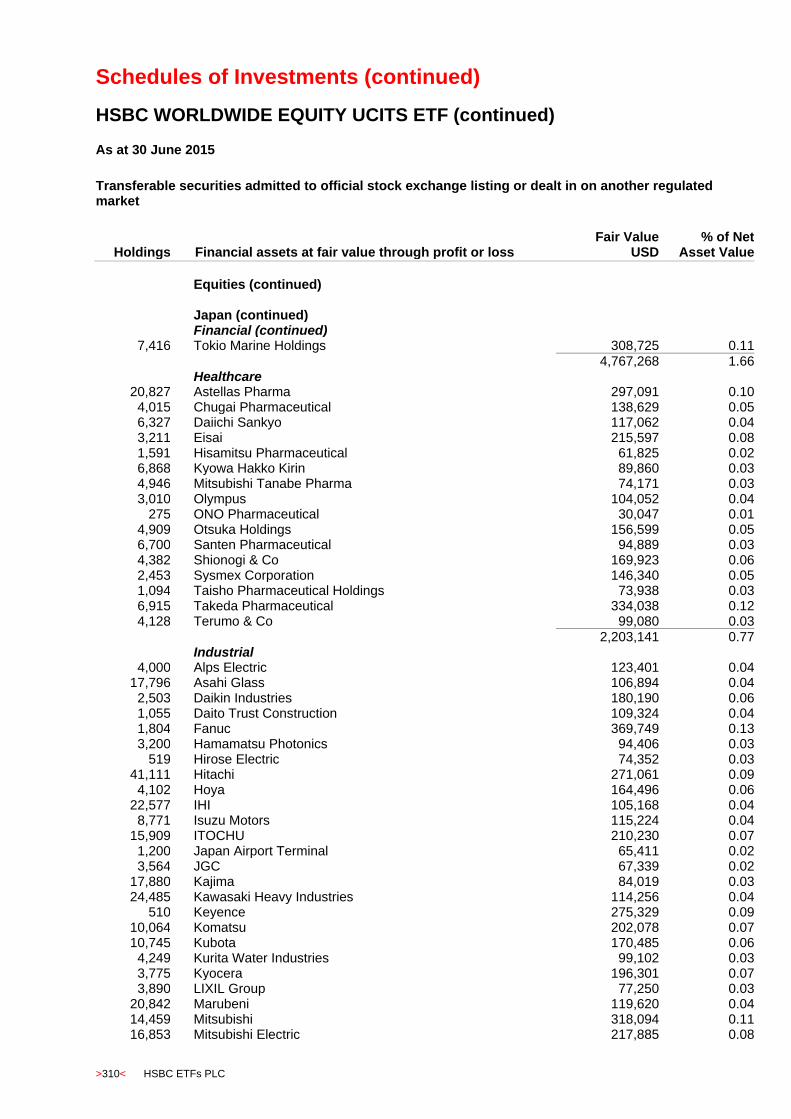
Schedules of Investments (continued)
HSBC WORLDWIDE EQUITY UCITS ETF (continued)
>310< HSBC ETFs PLC
As at 30 June 2015
Transferable securities admitted to official stock exchange listing or dealt in on another regulated market
Holdings
Financial assets at fair value through profit or loss Fair Value
USD % of Net
Asset Value
Equities (continued)
Japan (continued) Financial (continued)
7,416 Tokio Marine Holdings 308,725 0.11
4,767,268 1.66 Healthcare
20,827 Astellas Pharma 297,091 0.10 4,015 Chugai Pharmaceutical 138,629 0.05 6,327 Daiichi Sankyo 117,062 0.04 3,211 Eisai 215,597 0.08 1,591 Hisamitsu Pharmaceutical 61,825 0.02 6,868 Kyowa Hakko Kirin 89,860 0.03 4,946 Mitsubishi Tanabe Pharma 74,171 0.03 3,010 Olympus 104,052 0.04
275 ONO Pharmaceutical 30,047 0.01 4,909 Otsuka Holdings 156,599 0.05 6,700 Santen Pharmaceutical 94,889 0.03 4,382 Shionogi & Co 169,923 0.06 2,453 Sysmex Corporation 146,340 0.05 1,094 Taisho Pharmaceutical Holdings 73,938 0.03 6,915 Takeda Pharmaceutical 334,038 0.12 4,128 Terumo & Co 99,080 0.03
2,203,141 0.77 Industrial
4,000 Alps Electric 123,401 0.04 17,796 Asahi Glass 106,894 0.04
2,503 Daikin Industries 180,190 0.06 1,055 Daito Trust Construction 109,324 0.04 1,804 Fanuc 369,749 0.13 3,200 Hamamatsu Photonics 94,406 0.03
519 Hirose Electric 74,352 0.03 41,111 Hitachi 271,061 0.09
4,102 Hoya 164,496 0.06 22,577 IHI 105,168 0.04
8,771 Isuzu Motors 115,224 0.04 15,909 ITOCHU 210,230 0.07
1,200 Japan Airport Terminal 65,411 0.02 3,564 JGC 67,339 0.02
17,880 Kajima 84,019 0.03 24,485 Kawasaki Heavy Industries 114,256 0.04
510 Keyence 275,329 0.09 10,064 Komatsu 202,078 0.07 10,745 Kubota 170,485 0.06
4,249 Kurita Water Industries 99,102 0.03 3,775 Kyocera 196,301 0.07 3,890 LIXIL Group 77,250 0.03
20,842 Marubeni 119,620 0.04 14,459 Mitsubishi 318,094 0.11 16,853 Mitsubishi Electric 217,885 0.08
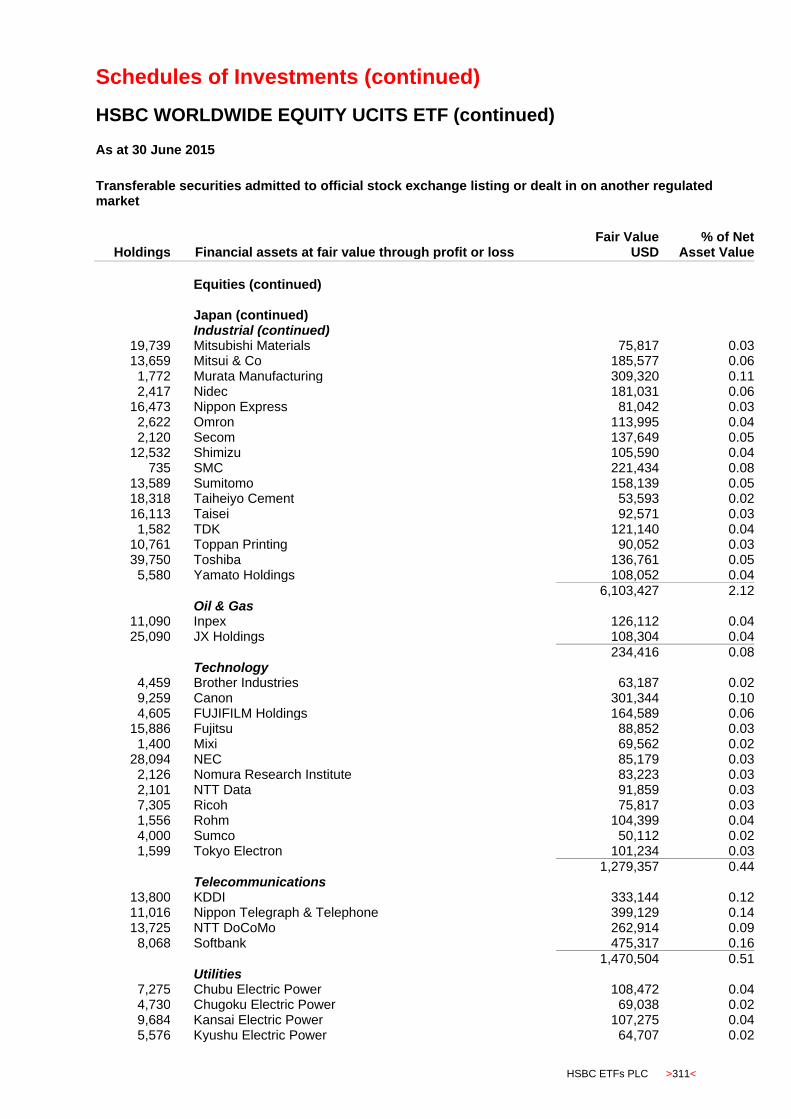
Schedules of Investments (continued)
HSBC WORLDWIDE EQUITY UCITS ETF (continued)
HSBC ETFs PLC >311<
As at 30 June 2015
Transferable securities admitted to official stock exchange listing or dealt in on another regulated market
Holdings
Financial assets at fair value through profit or loss Fair Value
USD % of Net
Asset Value
Equities (continued)
Japan (continued) Industrial (continued)
19,739 Mitsubishi Materials 75,817 0.03 13,659 Mitsui & Co 185,577 0.06
1,772 Murata Manufacturing 309,320 0.11 2,417 Nidec 181,031 0.06
16,473 Nippon Express 81,042 0.03 2,622 Omron 113,995 0.04 2,120 Secom 137,649 0.05
12,532 Shimizu 105,590 0.04 735 SMC 221,434 0.08
13,589 Sumitomo 158,139 0.05 18,318 Taiheiyo Cement 53,593 0.02 16,113 Taisei 92,571 0.03
1,582 TDK 121,140 0.04 10,761 Toppan Printing 90,052 0.03 39,750 Toshiba 136,761 0.05
5,580 Yamato Holdings 108,052 0.04 6,103,427 2.12 Oil & Gas
11,090 Inpex 126,112 0.04 25,090 JX Holdings 108,304 0.04
234,416 0.08 Technology
4,459 Brother Industries 63,187 0.02 9,259 Canon 301,344 0.10 4,605 FUJIFILM Holdings 164,589 0.06
15,886 Fujitsu 88,852 0.03 1,400 Mixi 69,562 0.02
28,094 NEC 85,179 0.03 2,126 Nomura Research Institute 83,223 0.03 2,101 NTT Data 91,859 0.03 7,305 Ricoh 75,817 0.03 1,556 Rohm 104,399 0.04 4,000 Sumco 50,112 0.02 1,599 Tokyo Electron 101,234 0.03
1,279,357 0.44 Telecommunications
13,800 KDDI 333,144 0.12 11,016 Nippon Telegraph & Telephone 399,129 0.14 13,725 NTT DoCoMo 262,914 0.09
8,068 Softbank 475,317 0.16
1,470,504 0.51 Utilities
7,275 Chubu Electric Power 108,472 0.04 4,730 Chugoku Electric Power 69,038 0.02 9,684 Kansai Electric Power 107,275 0.04 5,576 Kyushu Electric Power 64,707 0.02
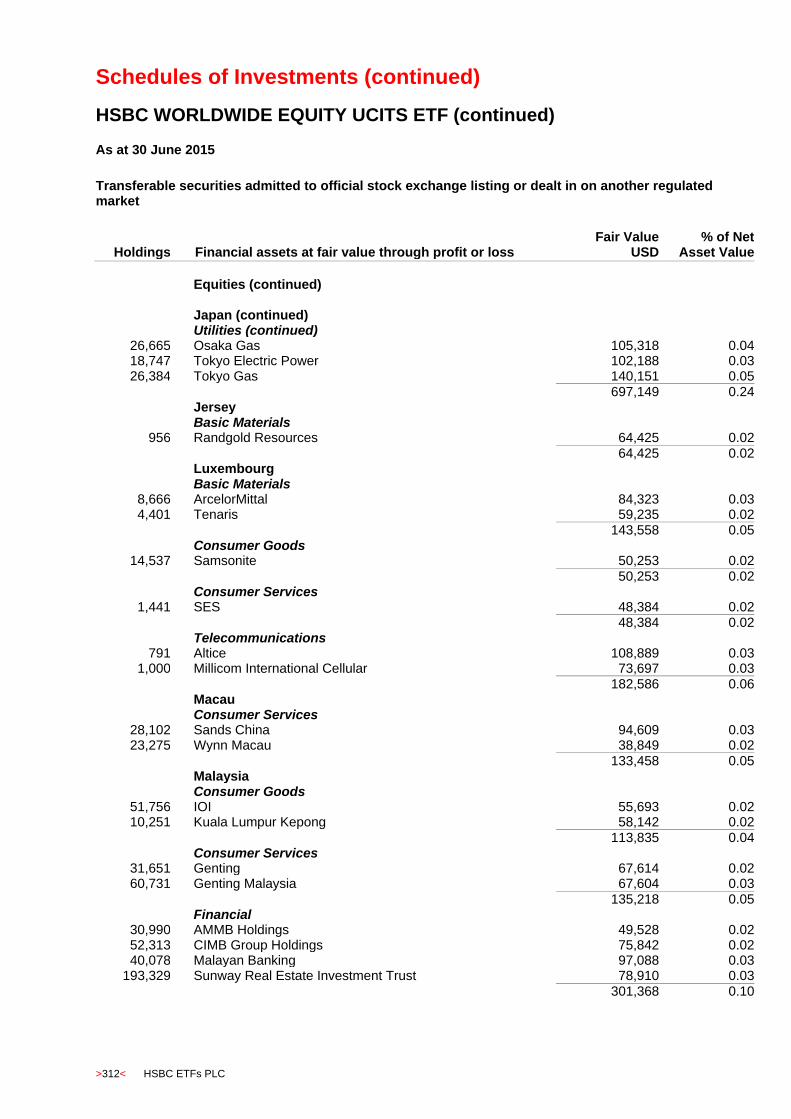
Schedules of Investments (continued)
HSBC WORLDWIDE EQUITY UCITS ETF (continued)
>312< HSBC ETFs PLC
As at 30 June 2015
Transferable securities admitted to official stock exchange listing or dealt in on another regulated market
Holdings
Financial assets at fair value through profit or loss Fair Value
USD % of Net
Asset Value
Equities (continued)
Japan (continued) Utilities (continued)
26,665 Osaka Gas 105,318 0.04 18,747 Tokyo Electric Power 102,188 0.03 26,384 Tokyo Gas 140,151 0.05
697,149 0.24 Jersey Basic Materials
956 Randgold Resources 64,425 0.02
64,425 0.02 Luxembourg Basic Materials
8,666 ArcelorMittal 84,323 0.03 4,401 Tenaris 59,235 0.02
143,558 0.05 Consumer Goods
14,537 Samsonite 50,253 0.02
50,253 0.02 Consumer Services
1,441 SES 48,384 0.02 48,384 0.02 Telecommunications
791 Altice 108,889 0.03 1,000 Millicom International Cellular 73,697 0.03
182,586 0.06 Macau Consumer Services
28,102 Sands China 94,609 0.03 23,275 Wynn Macau 38,849 0.02
133,458 0.05 Malaysia Consumer Goods
51,756 IOI 55,693 0.02 10,251 Kuala Lumpur Kepong 58,142 0.02
113,835 0.04 Consumer Services
31,651 Genting 67,614 0.02 60,731 Genting Malaysia 67,604 0.03
135,218 0.05 Financial
30,990 AMMB Holdings 49,528 0.02 52,313 CIMB Group Holdings 75,842 0.02 40,078 Malayan Banking 97,088 0.03
193,329 Sunway Real Estate Investment Trust 78,910 0.03
301,368 0.10

Schedules of Investments (continued)
HSBC WORLDWIDE EQUITY UCITS ETF (continued)
HSBC ETFs PLC >313<
As at 30 June 2015
Transferable securities admitted to official stock exchange listing or dealt in on another regulated market
Holdings
Financial assets at fair value through profit or loss Fair Value
USD % of Net
Asset Value
Equities (continued)
Malaysia (continued) Healthcare
54,797 Hartalega Holdings 123,595 0.04 50,337 IHH Healthcare 75,512 0.03
199,107 0.07 Industrial
41,526 Cahya Mata Sarawak 56,681 0.02 40,011 IJM 69,142 0.03 15,698 Sime Darby 35,449 0.01
161,272 0.06 Technology
18,117 Maxis 30,587 0.01
30,587 0.01 Telecommunications
16,086 Axiata Group 27,286 0.01 35,809 DiGi.Com 50,871 0.02 26,478 Telekom Malaysia 45,896 0.01
124,053 0.04 Utilities
9,731 Petronas Gas 54,832 0.02 24,406 Tenaga Nasional 81,763 0.03
136,595 0.05 Mexico Basic Materials
49,202 Grupo Mexico 148,572 0.05 18,818 Mexichem 54,437 0.02
1,821 Southern Copper 53,556 0.02
256,565 0.09 Consumer Goods
6,932 Coca-Cola Femsa 55,127 0.02 21,706 Fomento Economico Mexicano 193,631 0.07 33,869 Grupo Bimbo 87,766 0.03
336,524 0.12 Consumer Services
2,972 Casa Ley 3,016 - 66,677 Wal-mart de Mexico SAB 162,457 0.06
165,473 0.06 Financial
27,341 Fibra Uno Administration 65,013 0.02 27,397 Grupo Fin Santander 50,706 0.02 27,827 Grupo Financiero Banorte 152,944 0.05
268,663 0.09 Industrial
31,098 Alfa 59,518 0.02 116,884 Cemex 107,344 0.04
6,851 Grupo Aeroportuario 97,460 0.03 6,079 Promotora y Operadora de Infraestructura 65,235 0.02
329,557 0.11
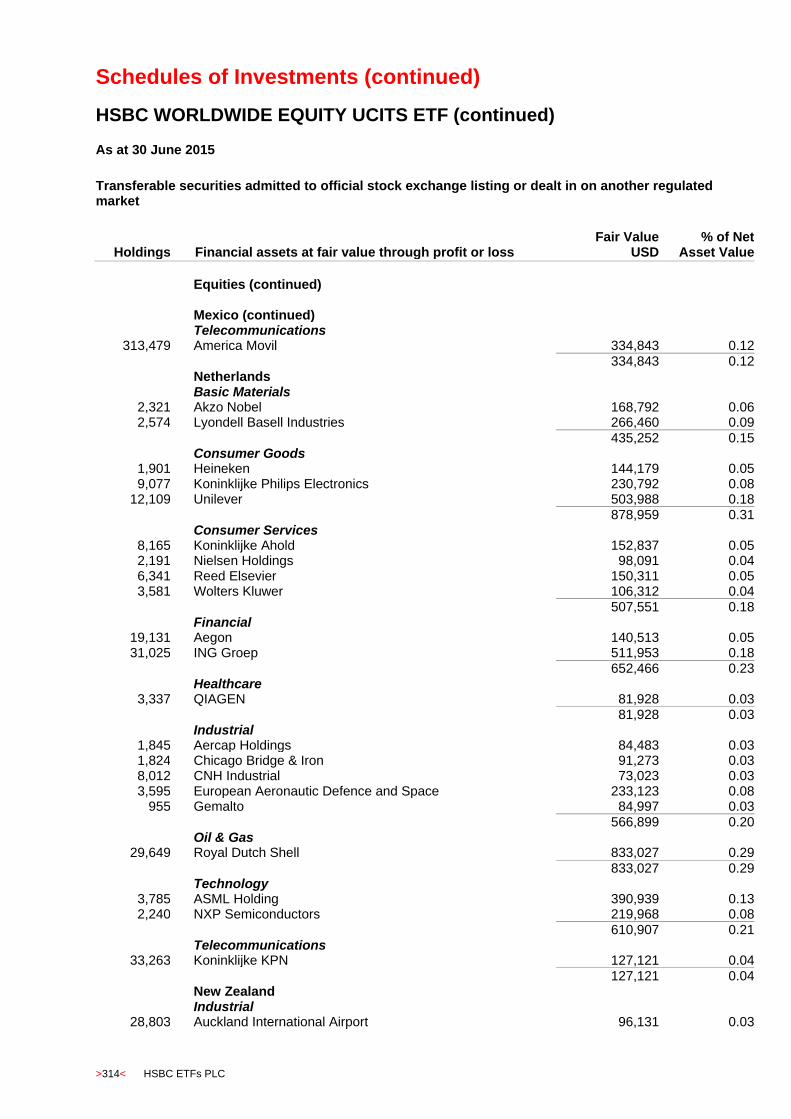
Schedules of Investments (continued)
HSBC WORLDWIDE EQUITY UCITS ETF (continued)
>314< HSBC ETFs PLC
As at 30 June 2015
Transferable securities admitted to official stock exchange listing or dealt in on another regulated market
Holdings
Financial assets at fair value through profit or loss Fair Value
USD % of Net
Asset Value
Equities (continued)
Mexico (continued) Telecommunications
313,479 America Movil 334,843 0.12
334,843 0.12 Netherlands Basic Materials
2,321 Akzo Nobel 168,792 0.06 2,574 Lyondell Basell Industries 266,460 0.09
435,252 0.15 Consumer Goods
1,901 Heineken 144,179 0.05 9,077 Koninklijke Philips Electronics 230,792 0.08
12,109 Unilever 503,988 0.18 878,959 0.31 Consumer Services
8,165 Koninklijke Ahold 152,837 0.05 2,191 Nielsen Holdings 98,091 0.04 6,341 Reed Elsevier 150,311 0.05 3,581 Wolters Kluwer 106,312 0.04
507,551 0.18 Financial
19,131 Aegon 140,513 0.05 31,025 ING Groep 511,953 0.18
652,466 0.23 Healthcare
3,337 QIAGEN 81,928 0.03 81,928 0.03 Industrial
1,845 Aercap Holdings 84,483 0.03 1,824 Chicago Bridge & Iron 91,273 0.03 8,012 CNH Industrial 73,023 0.03 3,595 European Aeronautic Defence and Space 233,123 0.08
955 Gemalto 84,997 0.03
566,899 0.20 Oil & Gas
29,649 Royal Dutch Shell 833,027 0.29
833,027 0.29 Technology
3,785 ASML Holding 390,939 0.13 2,240 NXP Semiconductors 219,968 0.08
610,907 0.21 Telecommunications
33,263 Koninklijke KPN 127,121 0.04
127,121 0.04 New Zealand Industrial
28,803 Auckland International Airport 96,131 0.03

Schedules of Investments (continued)
HSBC WORLDWIDE EQUITY UCITS ETF (continued)
HSBC ETFs PLC >315<
As at 30 June 2015
Transferable securities admitted to official stock exchange listing or dealt in on another regulated market
Holdings
Financial assets at fair value through profit or loss Fair Value
USD % of Net
Asset Value
Equities (continued)
New Zealand (continued) Industrial (continued)
9,455 Fletcher Building 51,923 0.02
148,054 0.05 Oil & Gas
14,388 Oil Search 78,848 0.03
78,848 0.03 Telecommunications
27,455 Telecom 51,897 0.02
51,897 0.02 Norway Basic Materials
11,026 Norsk Hydro 46,318 0.02 1,346 Yara International 69,871 0.02
116,189 0.04 Consumer Services
1,095 Schibsted 33,932 0.01 33,932 0.01 Financial
7,729 DNB 128,498 0.04
128,498 0.04 Industrial
8,665 Orkla 67,954 0.02
67,954 0.02 Oil & Gas
9,383 Statoil 167,087 0.06
167,087 0.06 Telecommunications
7,446 Telenor 162,596 0.06
162,596 0.06 Peru Financial
716 Credicorp 99,467 0.03
99,467 0.03 Philippines Financial
91,699 Ayala Land 75,857 0.03 39,665 BDO Unibank 95,358 0.03
271,018 SM Prime Holdings 120,092 0.04
291,307 0.10 Industrial
105,168 Alliance Global Group 50,613 0.02 4,623 Ayala 80,997 0.03
131,610 0.05 Telecommunications
783 Philippine Long Distance Telephone 48,796 0.02
48,796 0.02
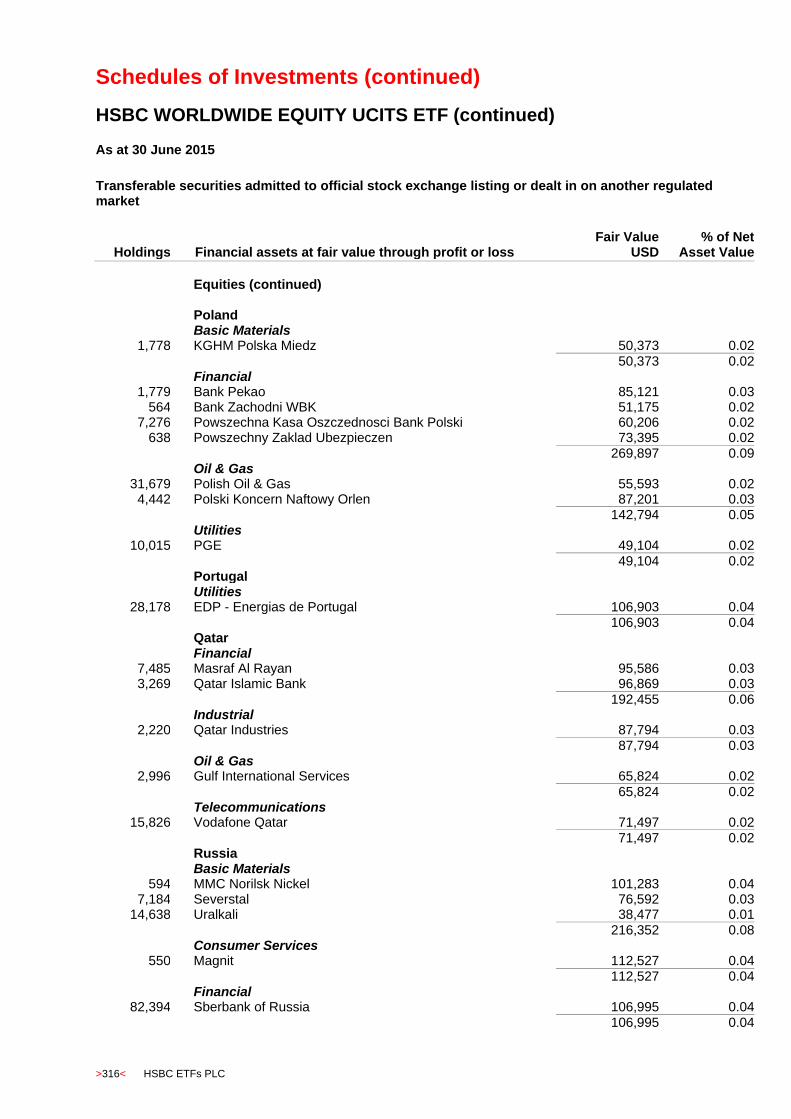
Schedules of Investments (continued)
HSBC WORLDWIDE EQUITY UCITS ETF (continued)
>316< HSBC ETFs PLC
As at 30 June 2015
Transferable securities admitted to official stock exchange listing or dealt in on another regulated market
Holdings
Financial assets at fair value through profit or loss Fair Value
USD % of Net
Asset Value
Equities (continued)
Poland Basic Materials
1,778 KGHM Polska Miedz 50,373 0.02
50,373 0.02 Financial
1,779 Bank Pekao 85,121 0.03 564 Bank Zachodni WBK 51,175 0.02
7,276 Powszechna Kasa Oszczednosci Bank Polski 60,206 0.02 638 Powszechny Zaklad Ubezpieczen 73,395 0.02
269,897 0.09 Oil & Gas
31,679 Polish Oil & Gas 55,593 0.02 4,442 Polski Koncern Naftowy Orlen 87,201 0.03
142,794 0.05 Utilities
10,015 PGE 49,104 0.02
49,104 0.02 Portugal Utilities
28,178 EDP - Energias de Portugal 106,903 0.04 106,903 0.04 Qatar Financial
7,485 Masraf Al Rayan 95,586 0.03 3,269 Qatar Islamic Bank 96,869 0.03
192,455 0.06 Industrial
2,220 Qatar Industries 87,794 0.03
87,794 0.03 Oil & Gas
2,996 Gulf International Services 65,824 0.02
65,824 0.02 Telecommunications
15,826 Vodafone Qatar 71,497 0.02
71,497 0.02 Russia Basic Materials
594 MMC Norilsk Nickel 101,283 0.04 7,184 Severstal 76,592 0.03
14,638 Uralkali 38,477 0.01
216,352 0.08 Consumer Services
550 Magnit 112,527 0.04 112,527 0.04 Financial
82,394 Sberbank of Russia 106,995 0.04 106,995 0.04

Schedules of Investments (continued)
HSBC WORLDWIDE EQUITY UCITS ETF (continued)
HSBC ETFs PLC >317<
As at 30 June 2015
Transferable securities admitted to official stock exchange listing or dealt in on another regulated market
Holdings
Financial assets at fair value through profit or loss Fair Value
USD % of Net
Asset Value
Equities (continued)
Russia (continued) Oil & Gas
82,702 Gazprom 216,497 0.08 6,913 Lukoil 306,460 0.11
11,897 NovaTek 119,088 0.04 16,861 Rosneft Oil 70,210 0.02 82,019 Surgutneftegas 62,786 0.02 17,324 Tatneft 92,194 0.03
25 Transneft 60,486 0.02
927,721 0.32 Technology
2,533 Yandex 38,552 0.01
38,552 0.01 Telecommunications
9,679 Mobile Telesystems 42,233 0.01 44,028 Sistema JSFC 15,678 0.01
57,911 0.02 Singapore Consumer Services
8,907 City Developments 64,694 0.02 42,210 ComfortDelGro 98,119 0.03 86,713 Genting Singapore PLC 57,637 0.02
983 Jardine Cycle & Carriage 22,272 0.01 8,855 Singapore Airlines 70,564 0.03
22,610 Singapore Press Holdings 68,510 0.02 381,796 0.13 Financial
44,677 CapitaLand 116,130 0.04 66,246 CapitaMall Trust 105,777 0.03 14,801 DBS Group Holdings 227,429 0.08 33,091 Oversea-Chinese Banking 250,179 0.09 72,863 Suntec Real Estate Investment Trust 93,345 0.03
7,939 United Overseas Bank 136,021 0.05
928,881 0.32 Industrial
16,855 Keppel 102,895 0.03 18,203 SembCorp Industries 52,588 0.02
155,483 0.05 Telecommunications
74,591 Singapore Telecommunications 233,218 0.08
233,218 0.08 South Africa Basic Materials
1,403 Anglo American Platinum 31,697 0.01 2,005 Kumba Iron Ore 24,937 0.01
56,634 0.02
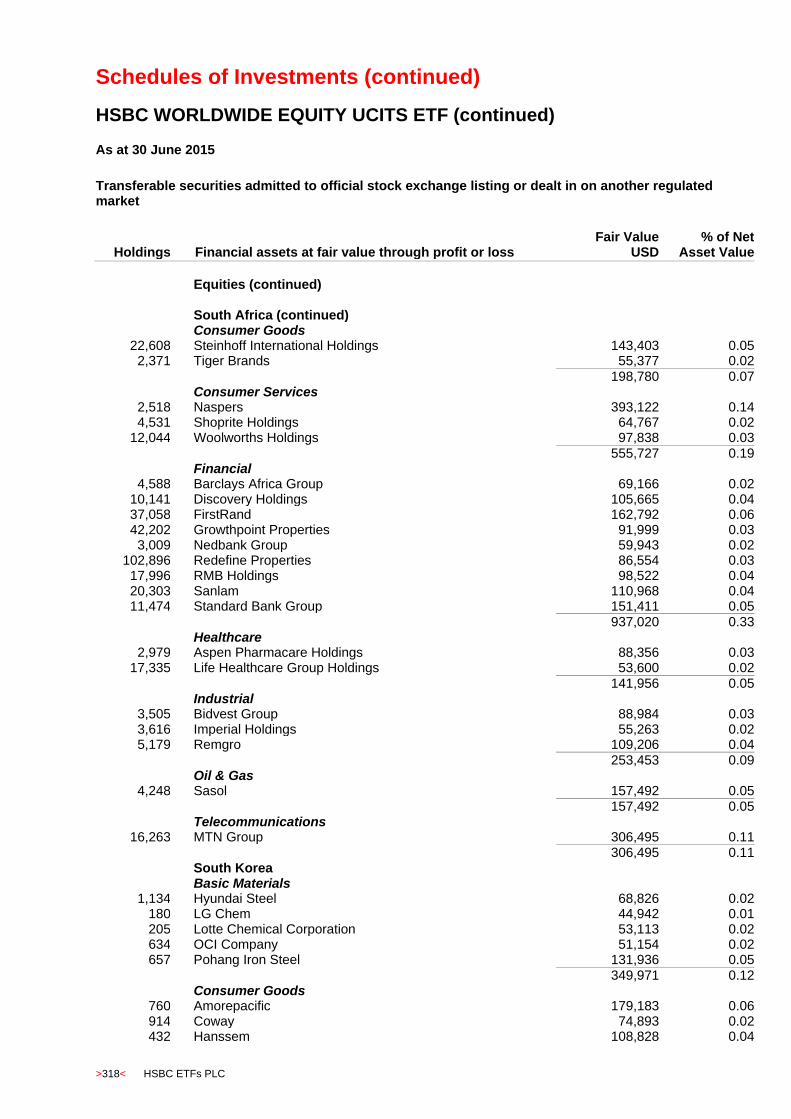
Schedules of Investments (continued)
HSBC WORLDWIDE EQUITY UCITS ETF (continued)
>318< HSBC ETFs PLC
As at 30 June 2015
Transferable securities admitted to official stock exchange listing or dealt in on another regulated market
Holdings
Financial assets at fair value through profit or loss Fair Value
USD % of Net
Asset Value
Equities (continued)
South Africa (continued) Consumer Goods
22,608 Steinhoff International Holdings 143,403 0.05 2,371 Tiger Brands 55,377 0.02
198,780 0.07 Consumer Services
2,518 Naspers 393,122 0.14 4,531 Shoprite Holdings 64,767 0.02
12,044 Woolworths Holdings 97,838 0.03
555,727 0.19 Financial
4,588 Barclays Africa Group 69,166 0.02 10,141 Discovery Holdings 105,665 0.04 37,058 FirstRand 162,792 0.06 42,202 Growthpoint Properties 91,999 0.03
3,009 Nedbank Group 59,943 0.02 102,896 Redefine Properties 86,554 0.03 17,996 RMB Holdings 98,522 0.04 20,303 Sanlam 110,968 0.04 11,474 Standard Bank Group 151,411 0.05
937,020 0.33 Healthcare
2,979 Aspen Pharmacare Holdings 88,356 0.03 17,335 Life Healthcare Group Holdings 53,600 0.02
141,956 0.05 Industrial
3,505 Bidvest Group 88,984 0.03 3,616 Imperial Holdings 55,263 0.02 5,179 Remgro 109,206 0.04
253,453 0.09 Oil & Gas
4,248 Sasol 157,492 0.05 157,492 0.05 Telecommunications
16,263 MTN Group 306,495 0.11 306,495 0.11 South Korea Basic Materials
1,134 Hyundai Steel 68,826 0.02 180 LG Chem 44,942 0.01 205 Lotte Chemical Corporation 53,113 0.02 634 OCI Company 51,154 0.02 657 Pohang Iron Steel 131,936 0.05
349,971 0.12 Consumer Goods
760 Amorepacific 179,183 0.06 914 Coway 74,893 0.02 432 Hanssem 108,828 0.04
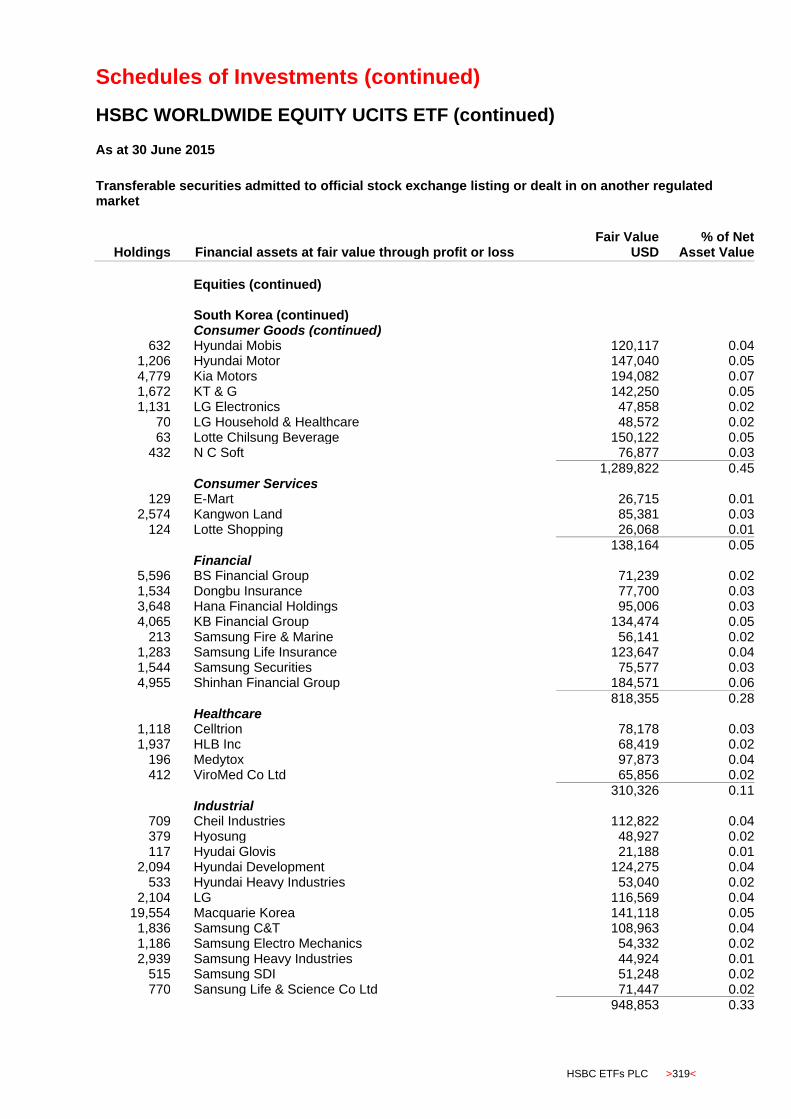
Schedules of Investments (continued)
HSBC WORLDWIDE EQUITY UCITS ETF (continued)
HSBC ETFs PLC >319<
As at 30 June 2015
Transferable securities admitted to official stock exchange listing or dealt in on another regulated market
Holdings
Financial assets at fair value through profit or loss Fair Value
USD % of Net
Asset Value
Equities (continued)
South Korea (continued) Consumer Goods (continued)
632 Hyundai Mobis 120,117 0.04 1,206 Hyundai Motor 147,040 0.05 4,779 Kia Motors 194,082 0.07 1,672 KT & G 142,250 0.05 1,131 LG Electronics 47,858 0.02
70 LG Household & Healthcare 48,572 0.02 63 Lotte Chilsung Beverage 150,122 0.05
432 N C Soft 76,877 0.03
1,289,822 0.45 Consumer Services
129 E-Mart 26,715 0.01 2,574 Kangwon Land 85,381 0.03
124 Lotte Shopping 26,068 0.01
138,164 0.05 Financial
5,596 BS Financial Group 71,239 0.02 1,534 Dongbu Insurance 77,700 0.03 3,648 Hana Financial Holdings 95,006 0.03 4,065 KB Financial Group 134,474 0.05
213 Samsung Fire & Marine 56,141 0.02 1,283 Samsung Life Insurance 123,647 0.04 1,544 Samsung Securities 75,577 0.03 4,955 Shinhan Financial Group 184,571 0.06
818,355 0.28 Healthcare
1,118 Celltrion 78,178 0.03 1,937 HLB Inc 68,419 0.02
196 Medytox 97,873 0.04 412 ViroMed Co Ltd 65,856 0.02
310,326 0.11 Industrial
709 Cheil Industries 112,822 0.04 379 Hyosung 48,927 0.02 117 Hyudai Glovis 21,188 0.01
2,094 Hyundai Development 124,275 0.04 533 Hyundai Heavy Industries 53,040 0.02
2,104 LG 116,569 0.04 19,554 Macquarie Korea 141,118 0.05
1,836 Samsung C&T 108,963 0.04 1,186 Samsung Electro Mechanics 54,332 0.02 2,939 Samsung Heavy Industries 44,924 0.01
515 Samsung SDI 51,248 0.02 770 Sansung Life & Science Co Ltd 71,447 0.02
948,853 0.33

Schedules of Investments (continued)
HSBC WORLDWIDE EQUITY UCITS ETF (continued)
>320< HSBC ETFs PLC
As at 30 June 2015
Transferable securities admitted to official stock exchange listing or dealt in on another regulated market
Holdings
Financial assets at fair value through profit or loss Fair Value
USD % of Net
Asset Value
Equities (continued)
South Korea (continued) Oil & Gas
784 SK Innovation 85,748 0.03
85,748 0.03 Technology
610 Com2uS 59,121 0.02 720 EO Technics 60,610 0.02
2,321 LG Display 53,788 0.02 280 Naver 159,147 0.06 991 Samsung Electronics 1,126,530 0.39 376 Samsung SDS 87,473 0.03 198 SK C&C 49,081 0.02
4,770 Sk hynix 180,888 0.06 7,273 Wonik IPS 92,587 0.03
1,869,225 0.65 Telecommunications
2,644 KT Corporation 67,436 0.02 146 SK Telecom 32,722 0.01
100,158 0.03 Utilities
2,980 Korea Electric Power 122,358 0.04
122,358 0.04 Spain Consumer Goods
8,511 Distribuidora Internacional de Alimentacion 64,958 0.02
64,958 0.02 Consumer Services
10,149 Industria De Diseno Textil 329,685 0.11
329,685 0.11 Financial
53,549 Banco Bilbao Vizcaya Argentaria 524,568 0.18 46,207 Banco de Sabadell 111,398 0.04 15,087 Banco Popular Espanol 73,056 0.03
107,602 Banco Santander 750,992 0.26 66,613 Bankia 84,463 0.03
9,813 Bankinter 72,479 0.02 23,015 CaixaBank 106,574 0.04
1,723,530 0.60 Healthcare
535 Grifols 21,537 0.01
21,537 0.01 Industrial
4,464 Abertis Infraestructuras 73,071 0.02 2,214 ACS Actividades de Construccion y Servicios 71,181 0.02
753 Aena 78,647 0.03 3,366 Amadeus IT Holding 134,095 0.05 5,296 Ferrovial 114,771 0.04
471,765 0.16
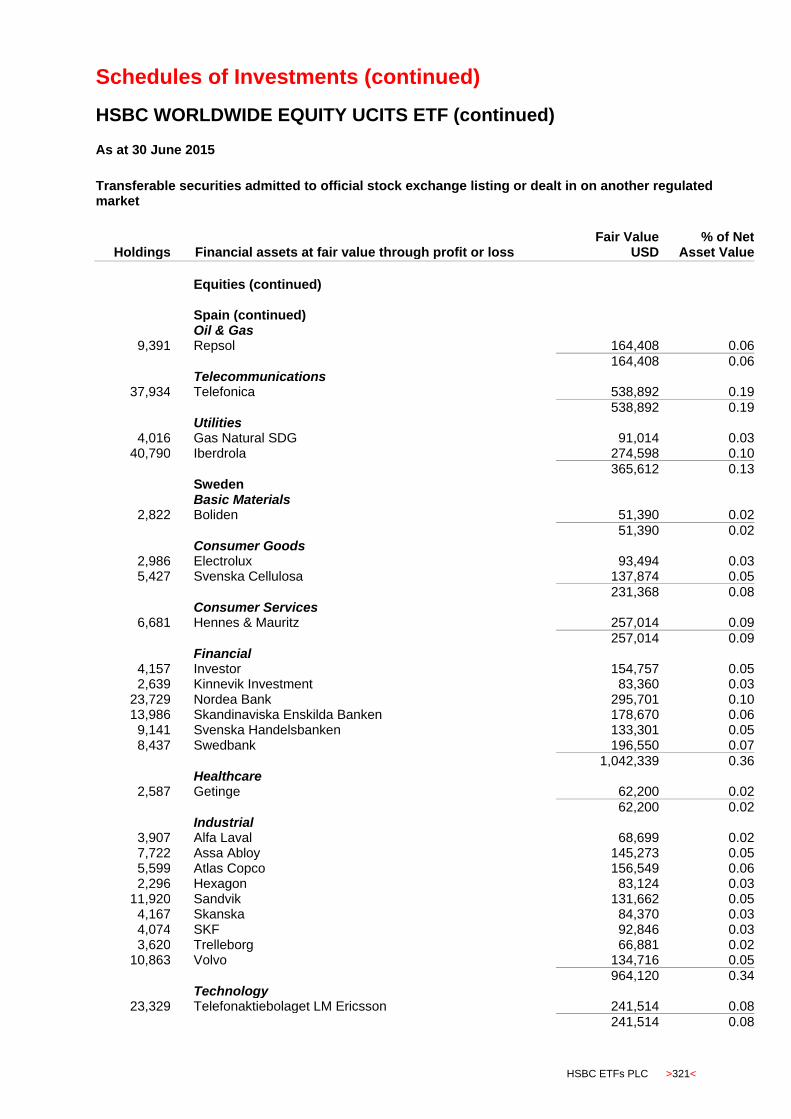
Schedules of Investments (continued)
HSBC WORLDWIDE EQUITY UCITS ETF (continued)
HSBC ETFs PLC >321<
As at 30 June 2015
Transferable securities admitted to official stock exchange listing or dealt in on another regulated market
Holdings
Financial assets at fair value through profit or loss Fair Value
USD % of Net
Asset Value
Equities (continued)
Spain (continued) Oil & Gas
9,391 Repsol 164,408 0.06
164,408 0.06 Telecommunications
37,934 Telefonica 538,892 0.19
538,892 0.19 Utilities
4,016 Gas Natural SDG 91,014 0.03 40,790 Iberdrola 274,598 0.10
365,612 0.13 Sweden Basic Materials
2,822 Boliden 51,390 0.02
51,390 0.02 Consumer Goods
2,986 Electrolux 93,494 0.03 5,427 Svenska Cellulosa 137,874 0.05
231,368 0.08 Consumer Services
6,681 Hennes & Mauritz 257,014 0.09
257,014 0.09 Financial
4,157 Investor 154,757 0.05 2,639 Kinnevik Investment 83,360 0.03
23,729 Nordea Bank 295,701 0.10 13,986 Skandinaviska Enskilda Banken 178,670 0.06
9,141 Svenska Handelsbanken 133,301 0.05 8,437 Swedbank 196,550 0.07
1,042,339 0.36 Healthcare
2,587 Getinge 62,200 0.02
62,200 0.02 Industrial
3,907 Alfa Laval 68,699 0.02 7,722 Assa Abloy 145,273 0.05 5,599 Atlas Copco 156,549 0.06 2,296 Hexagon 83,124 0.03
11,920 Sandvik 131,662 0.05 4,167 Skanska 84,370 0.03 4,074 SKF 92,846 0.03 3,620 Trelleborg 66,881 0.02
10,863 Volvo 134,716 0.05
964,120 0.34 Technology
23,329 Telefonaktiebolaget LM Ericsson 241,514 0.08
241,514 0.08

Schedules of Investments (continued)
HSBC WORLDWIDE EQUITY UCITS ETF (continued)
>322< HSBC ETFs PLC
As at 30 June 2015
Transferable securities admitted to official stock exchange listing or dealt in on another regulated market
Holdings
Financial assets at fair value through profit or loss Fair Value
USD % of Net
Asset Value
Equities (continued)
Sweden (continued) Telecommunications
16,628 TeliaSonera 97,814 0.03
97,814 0.03 Switzerland Basic Materials
3,596 Clariant 73,725 0.02 87 Givaudan 150,624 0.05
63,793 Glencore International 256,136 0.09 823 Syngenta 334,642 0.12
815,127 0.28 Consumer Goods
1,101 Aryzta 54,311 0.02 4,401 Cie Financiere Richemont 358,136 0.12 1,729 Coca Cola Hellenic Bottling Company 37,198 0.01
16 Lindt & Spruengli 84,644 0.03 22,994 Nestle 1,660,794 0.58
282 Swatch Group 109,867 0.04
2,304,950 0.80 Consumer Services
77 Galenica Holding 80,374 0.03
80,374 0.03 Financial
530 ACE 53,890 0.02 842 Baloise Holding 102,711 0.04
14,752 Credit Suisse Group 405,678 0.14 2,299 Julius Baer Group 129,027 0.04
384 Swiss Life Holding 87,972 0.03 2,855 Swiss Re 252,797 0.09
31,193 UBS 661,877 0.23 1,098 Zurich Financial Services 334,376 0.12
2,028,328 0.71 Healthcare
637 Lonza Group 85,133 0.03 19,247 Novartis 1,897,823 0.66
5,027 Roche Holding 1,409,314 0.49 716 Sonova Holding 96,841 0.03
3,489,111 1.21 Industrial
20,137 ABB 421,895 0.15 1,171 Adecco 95,103 0.03
493 Geberit 164,430 0.06 2,327 Holcim 171,808 0.06
768 Kuehne + Nagel International 101,984 0.03 43 SGS 78,496 0.03
3,243 TE Connectivity 208,525 0.07 4,401 Tyco International 169,350 0.06
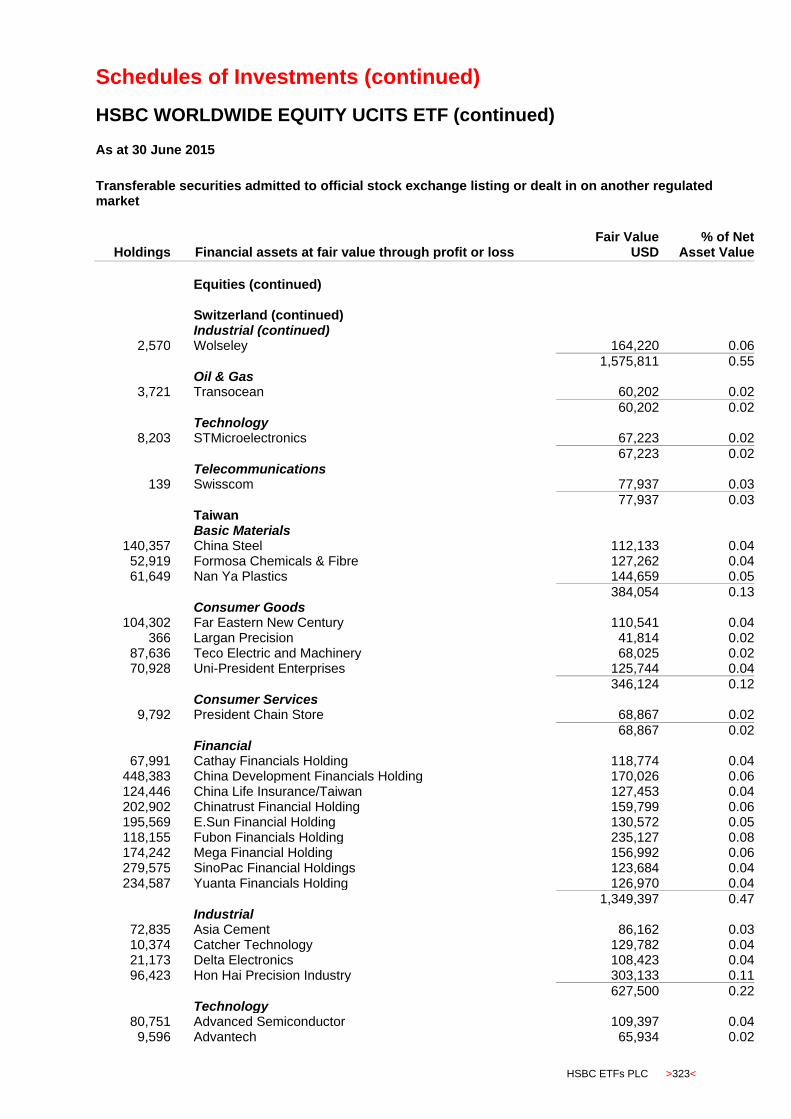
Schedules of Investments (continued)
HSBC WORLDWIDE EQUITY UCITS ETF (continued)
HSBC ETFs PLC >323<
As at 30 June 2015
Transferable securities admitted to official stock exchange listing or dealt in on another regulated market
Holdings
Financial assets at fair value through profit or loss Fair Value
USD % of Net
Asset Value
Equities (continued)
Switzerland (continued) Industrial (continued)
2,570 Wolseley 164,220 0.06
1,575,811 0.55 Oil & Gas
3,721 Transocean 60,202 0.02
60,202 0.02 Technology
8,203 STMicroelectronics 67,223 0.02
67,223 0.02 Telecommunications
139 Swisscom 77,937 0.03
77,937 0.03 Taiwan Basic Materials
140,357 China Steel 112,133 0.04 52,919 Formosa Chemicals & Fibre 127,262 0.04 61,649 Nan Ya Plastics 144,659 0.05
384,054 0.13 Consumer Goods
104,302 Far Eastern New Century 110,541 0.04 366 Largan Precision 41,814 0.02
87,636 Teco Electric and Machinery 68,025 0.02 70,928 Uni-President Enterprises 125,744 0.04
346,124 0.12 Consumer Services
9,792 President Chain Store 68,867 0.02
68,867 0.02 Financial
67,991 Cathay Financials Holding 118,774 0.04 448,383 China Development Financials Holding 170,026 0.06 124,446 China Life Insurance/Taiwan 127,453 0.04 202,902 Chinatrust Financial Holding 159,799 0.06 195,569 E.Sun Financial Holding 130,572 0.05 118,155 Fubon Financials Holding 235,127 0.08 174,242 Mega Financial Holding 156,992 0.06 279,575 SinoPac Financial Holdings 123,684 0.04 234,587 Yuanta Financials Holding 126,970 0.04
1,349,397 0.47 Industrial
72,835 Asia Cement 86,162 0.03 10,374 Catcher Technology 129,782 0.04 21,173 Delta Electronics 108,423 0.04 96,423 Hon Hai Precision Industry 303,133 0.11
627,500 0.22 Technology
80,751 Advanced Semiconductor 109,397 0.04 9,596 Advantech 65,934 0.02
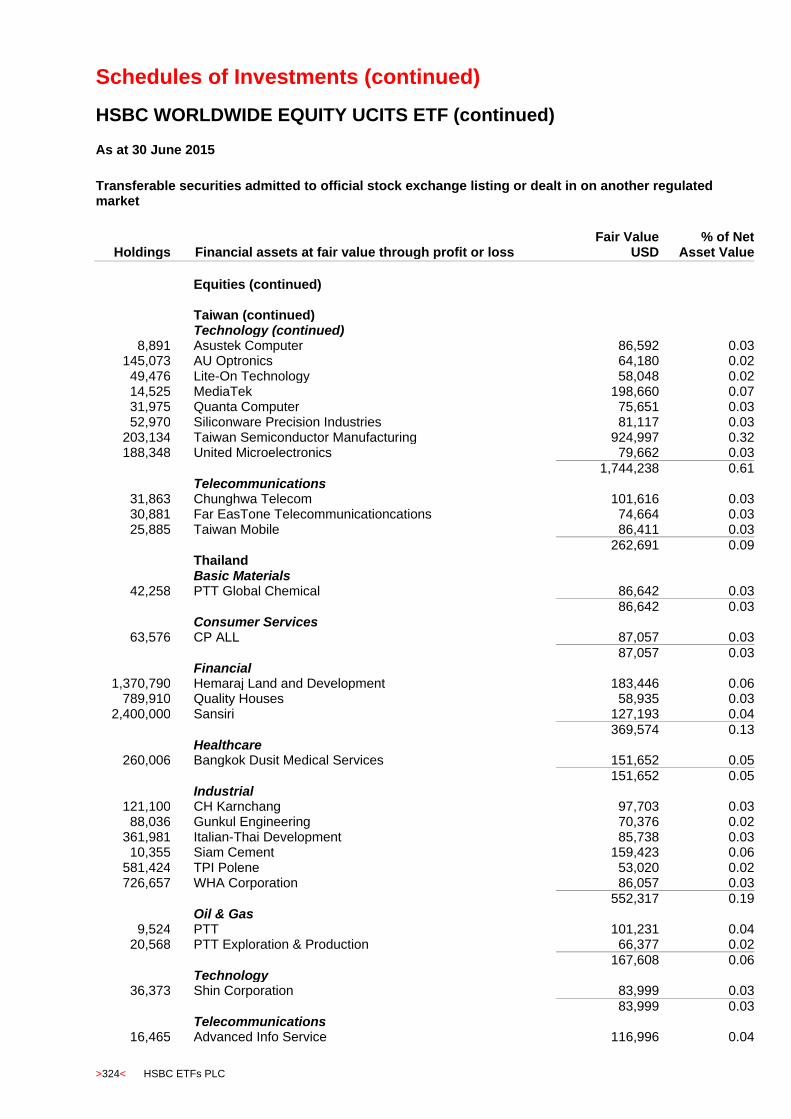
Schedules of Investments (continued)
HSBC WORLDWIDE EQUITY UCITS ETF (continued)
>324< HSBC ETFs PLC
As at 30 June 2015
Transferable securities admitted to official stock exchange listing or dealt in on another regulated market
Holdings
Financial assets at fair value through profit or loss Fair Value
USD % of Net
Asset Value
Equities (continued)
Taiwan (continued) Technology (continued)
8,891 Asustek Computer 86,592 0.03 145,073 AU Optronics 64,180 0.02 49,476 Lite-On Technology 58,048 0.02 14,525 MediaTek 198,660 0.07 31,975 Quanta Computer 75,651 0.03 52,970 Siliconware Precision Industries 81,117 0.03
203,134 Taiwan Semiconductor Manufacturing 924,997 0.32 188,348 United Microelectronics 79,662 0.03
1,744,238 0.61 Telecommunications
31,863 Chunghwa Telecom 101,616 0.03 30,881 Far EasTone Telecommunicationcations 74,664 0.03 25,885 Taiwan Mobile 86,411 0.03
262,691 0.09 Thailand Basic Materials
42,258 PTT Global Chemical 86,642 0.03 86,642 0.03 Consumer Services
63,576 CP ALL 87,057 0.03
87,057 0.03 Financial
1,370,790 Hemaraj Land and Development 183,446 0.06 789,910 Quality Houses 58,935 0.03
2,400,000 Sansiri 127,193 0.04
369,574 0.13 Healthcare
260,006 Bangkok Dusit Medical Services 151,652 0.05
151,652 0.05 Industrial
121,100 CH Karnchang 97,703 0.03 88,036 Gunkul Engineering 70,376 0.02
361,981 Italian-Thai Development 85,738 0.03 10,355 Siam Cement 159,423 0.06
581,424 TPI Polene 53,020 0.02 726,657 WHA Corporation 86,057 0.03
552,317 0.19 Oil & Gas
9,524 PTT 101,231 0.04 20,568 PTT Exploration & Production 66,377 0.02
167,608 0.06 Technology
36,373 Shin Corporation 83,999 0.03
83,999 0.03 Telecommunications
16,465 Advanced Info Service 116,996 0.04
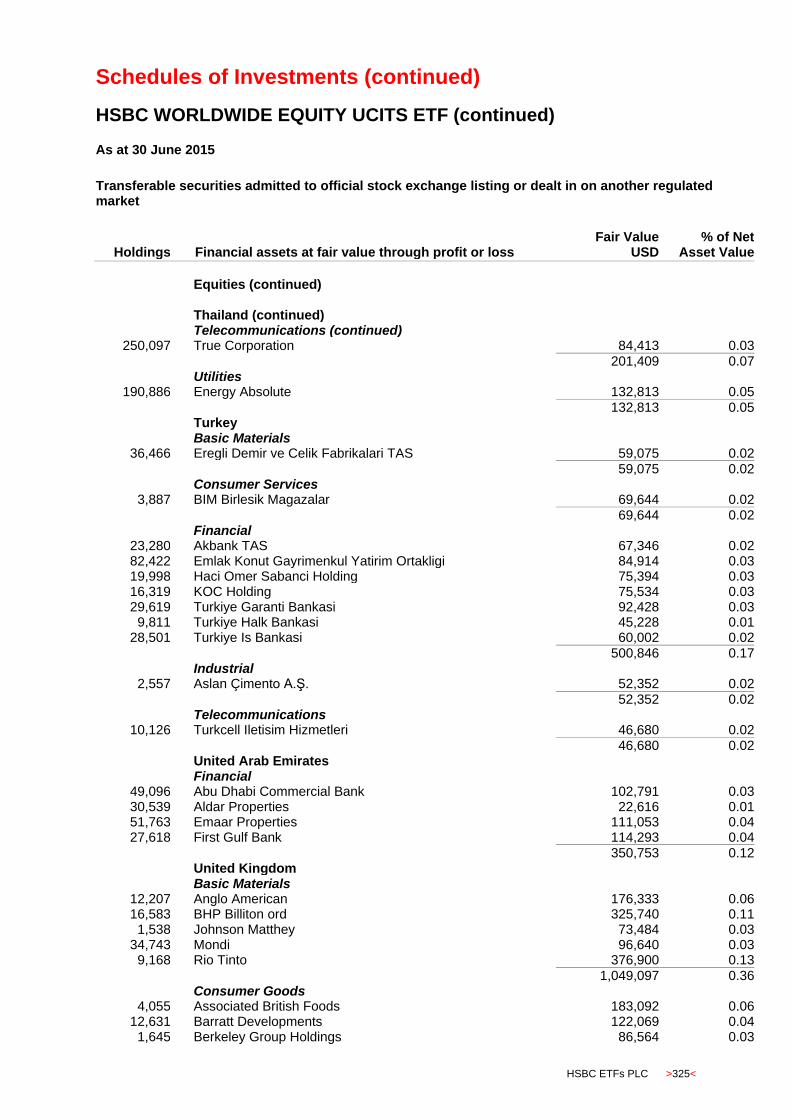
Schedules of Investments (continued)
HSBC WORLDWIDE EQUITY UCITS ETF (continued)
HSBC ETFs PLC >325<
As at 30 June 2015
Transferable securities admitted to official stock exchange listing or dealt in on another regulated market
Holdings
Financial assets at fair value through profit or loss Fair Value
USD % of Net
Asset Value
Equities (continued)
Thailand (continued) Telecommunications (continued)
250,097 True Corporation 84,413 0.03
201,409 0.07 Utilities
190,886 Energy Absolute 132,813 0.05
132,813 0.05 Turkey Basic Materials
36,466 Eregli Demir ve Celik Fabrikalari TAS 59,075 0.02
59,075 0.02 Consumer Services
3,887 BIM Birlesik Magazalar 69,644 0.02
69,644 0.02 Financial
23,280 Akbank TAS 67,346 0.02 82,422 Emlak Konut Gayrimenkul Yatirim Ortakligi 84,914 0.03 19,998 Haci Omer Sabanci Holding 75,394 0.03 16,319 KOC Holding 75,534 0.03 29,619 Turkiye Garanti Bankasi 92,428 0.03
9,811 Turkiye Halk Bankasi 45,228 0.01 28,501 Turkiye Is Bankasi 60,002 0.02
500,846 0.17 Industrial
2,557 Aslan Çimento A.Ş. 52,352 0.02
52,352 0.02 Telecommunications
10,126 Turkcell Iletisim Hizmetleri 46,680 0.02
46,680 0.02 United Arab Emirates Financial
49,096 Abu Dhabi Commercial Bank 102,791 0.03 30,539 Aldar Properties 22,616 0.01 51,763 Emaar Properties 111,053 0.04 27,618 First Gulf Bank 114,293 0.04
350,753 0.12 United Kingdom Basic Materials
12,207 Anglo American 176,333 0.06 16,583 BHP Billiton ord 325,740 0.11
1,538 Johnson Matthey 73,484 0.03 34,743 Mondi 96,640 0.03
9,168 Rio Tinto 376,900 0.13
1,049,097 0.36 Consumer Goods
4,055 Associated British Foods 183,092 0.06 12,631 Barratt Developments 122,069 0.04
1,645 Berkeley Group Holdings 86,564 0.03
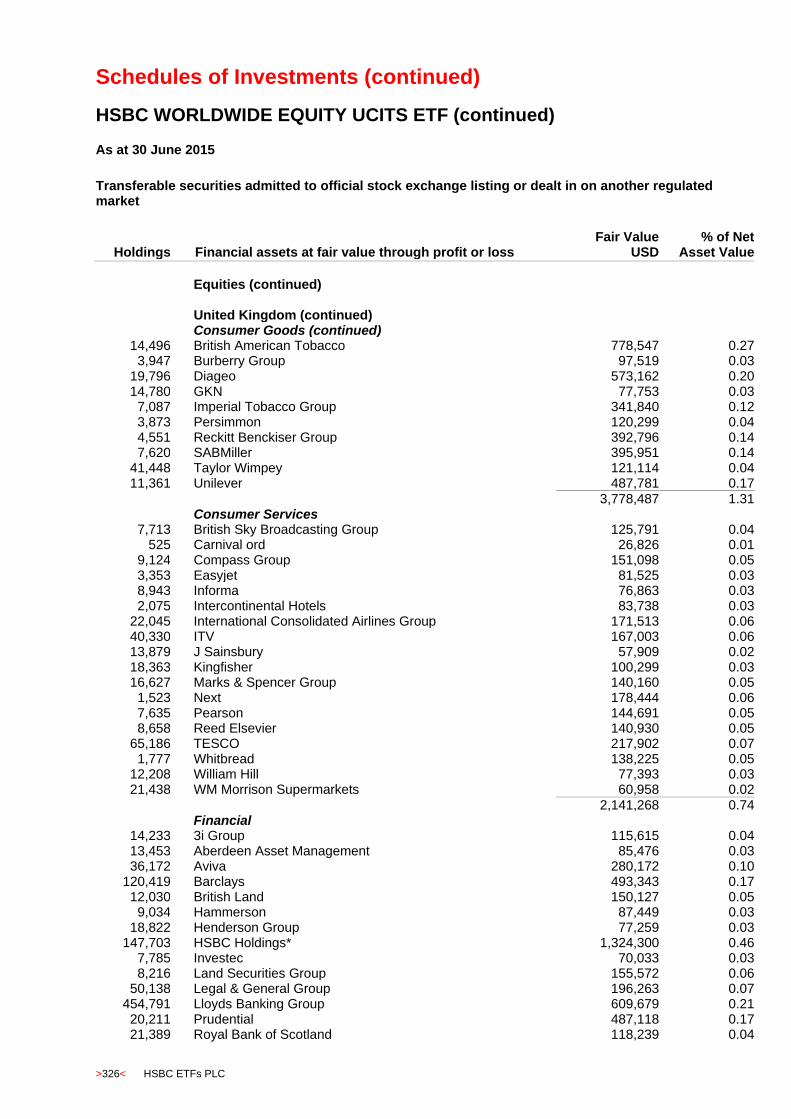
Schedules of Investments (continued)
HSBC WORLDWIDE EQUITY UCITS ETF (continued)
>326< HSBC ETFs PLC
As at 30 June 2015
Transferable securities admitted to official stock exchange listing or dealt in on another regulated market
Holdings
Financial assets at fair value through profit or loss Fair Value
USD % of Net
Asset Value
Equities (continued)
United Kingdom (continued) Consumer Goods (continued)
14,496 British American Tobacco 778,547 0.27 3,947 Burberry Group 97,519 0.03
19,796 Diageo 573,162 0.20 14,780 GKN 77,753 0.03
7,087 Imperial Tobacco Group 341,840 0.12 3,873 Persimmon 120,299 0.04 4,551 Reckitt Benckiser Group 392,796 0.14 7,620 SABMiller 395,951 0.14
41,448 Taylor Wimpey 121,114 0.04 11,361 Unilever 487,781 0.17
3,778,487 1.31 Consumer Services
7,713 British Sky Broadcasting Group 125,791 0.04 525 Carnival ord 26,826 0.01
9,124 Compass Group 151,098 0.05 3,353 Easyjet 81,525 0.03 8,943 Informa 76,863 0.03 2,075 Intercontinental Hotels 83,738 0.03
22,045 International Consolidated Airlines Group 171,513 0.06 40,330 ITV 167,003 0.06 13,879 J Sainsbury 57,909 0.02 18,363 Kingfisher 100,299 0.03 16,627 Marks & Spencer Group 140,160 0.05
1,523 Next 178,444 0.06 7,635 Pearson 144,691 0.05 8,658 Reed Elsevier 140,930 0.05
65,186 TESCO 217,902 0.07 1,777 Whitbread 138,225 0.05
12,208 William Hill 77,393 0.03 21,438 WM Morrison Supermarkets 60,958 0.02
2,141,268 0.74 Financial
14,233 3i Group 115,615 0.04 13,453 Aberdeen Asset Management 85,476 0.03 36,172 Aviva 280,172 0.10
120,419 Barclays 493,343 0.17 12,030 British Land 150,127 0.05
9,034 Hammerson 87,449 0.03 18,822 Henderson Group 77,259 0.03
147,703 HSBC Holdings* 1,324,300 0.46 7,785 Investec 70,033 0.03 8,216 Land Securities Group 155,572 0.06
50,138 Legal & General Group 196,263 0.07 454,791 Lloyds Banking Group 609,679 0.21 20,211 Prudential 487,118 0.17 21,389 Royal Bank of Scotland 118,239 0.04

Schedules of Investments (continued)
HSBC WORLDWIDE EQUITY UCITS ETF (continued)
HSBC ETFs PLC >327<
As at 30 June 2015
Transferable securities admitted to official stock exchange listing or dealt in on another regulated market
Holdings
Financial assets at fair value through profit or loss Fair Value
USD % of Net
Asset Value
Equities (continued)
United Kingdom (continued) Financial (continued)
11,240 RSA Insurance Group 70,214 0.02 1,921 Schroders 95,952 0.03
17,647 Standard Chartered 282,808 0.10 18,200 Standard Life 127,087 0.04
4,826,706 1.68 Healthcare
10,130 AstraZeneca 640,285 0.22 38,621 GlaxoSmithKline 803,277 0.28
8,489 Smith & Nephew 143,386 0.05
1,586,948 0.55 Industrial
2,482 Aggreko 56,171 0.02 5,393 Ashtead Group 93,213 0.03 4,756 Babcock International 80,781 0.03
21,613 BAE Systems 153,366 0.05 3,745 Bunzl 102,364 0.04 5,028 Capita 97,895 0.03
13,893 Cobham 57,464 0.02 12,563 G4S 53,070 0.02
3,012 IMI 53,291 0.02 1,862 Intertek Group 71,745 0.03 9,903 Meggitt 72,639 0.03 6,880 Rexam 59,727 0.02
4,758,476 Rolls Royce 235,119 0.08 7,987 Royal Mail 64,627 0.02 4,295 Smiths Group 76,261 0.03 1,692 Spectris 56,147 0.02 2,911 Travis Perkins 96,599 0.03 2,355 Weir Group 62,852 0.02
1,543,331 0.54 Oil & Gas
3,606 AMEC 46,362 0.02 28,467 BG Group 474,339 0.16
141,725 BP 936,476 0.33 2,724 Ensco 60,663 0.02 7,296 Tullow Oil 38,979 0.01
1,556,819 0.54 Technology
2,335 ARM Holdings 38,081 0.01 2,052 Dialog Semiconductor 110,865 0.04
12,852 Sage Group 103,588 0.04 252,534 0.09 Telecommunications
65,135 BT Group 461,175 0.16 218,932 Vodafone Group 791,407 0.28
1,252,582 0.44
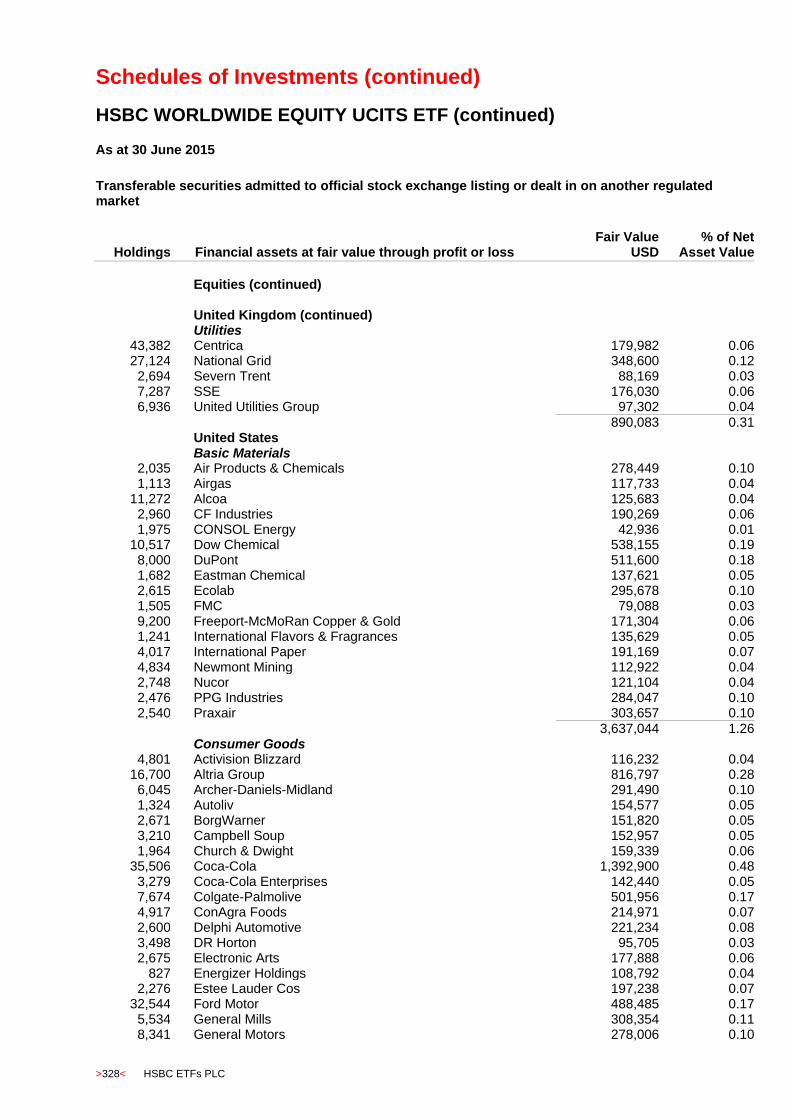
Schedules of Investments (continued)
HSBC WORLDWIDE EQUITY UCITS ETF (continued)
>328< HSBC ETFs PLC
As at 30 June 2015
Transferable securities admitted to official stock exchange listing or dealt in on another regulated market
Holdings
Financial assets at fair value through profit or loss Fair Value
USD % of Net
Asset Value
Equities (continued)
United Kingdom (continued) Utilities
43,382 Centrica 179,982 0.06 27,124 National Grid 348,600 0.12
2,694 Severn Trent 88,169 0.03 7,287 SSE 176,030 0.06 6,936 United Utilities Group 97,302 0.04
890,083 0.31 United States Basic Materials
2,035 Air Products & Chemicals 278,449 0.10 1,113 Airgas 117,733 0.04
11,272 Alcoa 125,683 0.04 2,960 CF Industries 190,269 0.06 1,975 CONSOL Energy 42,936 0.01
10,517 Dow Chemical 538,155 0.19 8,000 DuPont 511,600 0.18 1,682 Eastman Chemical 137,621 0.05 2,615 Ecolab 295,678 0.10 1,505 FMC 79,088 0.03 9,200 Freeport-McMoRan Copper & Gold 171,304 0.06 1,241 International Flavors & Fragrances 135,629 0.05 4,017 International Paper 191,169 0.07 4,834 Newmont Mining 112,922 0.04 2,748 Nucor 121,104 0.04 2,476 PPG Industries 284,047 0.10 2,540 Praxair 303,657 0.10
3,637,044 1.26 Consumer Goods
4,801 Activision Blizzard 116,232 0.04 16,700 Altria Group 816,797 0.28
6,045 Archer-Daniels-Midland 291,490 0.10 1,324 Autoliv 154,577 0.05 2,671 BorgWarner 151,820 0.05 3,210 Campbell Soup 152,957 0.05 1,964 Church & Dwight 159,339 0.06
35,506 Coca-Cola 1,392,900 0.48 3,279 Coca-Cola Enterprises 142,440 0.05 7,674 Colgate-Palmolive 501,956 0.17 4,917 ConAgra Foods 214,971 0.07 2,600 Delphi Automotive 221,234 0.08 3,498 DR Horton 95,705 0.03 2,675 Electronic Arts 177,888 0.06
827 Energizer Holdings 108,792 0.04 2,276 Estee Lauder Cos 197,238 0.07
32,544 Ford Motor 488,485 0.17 5,534 General Mills 308,354 0.11 8,341 General Motors 278,006 0.10
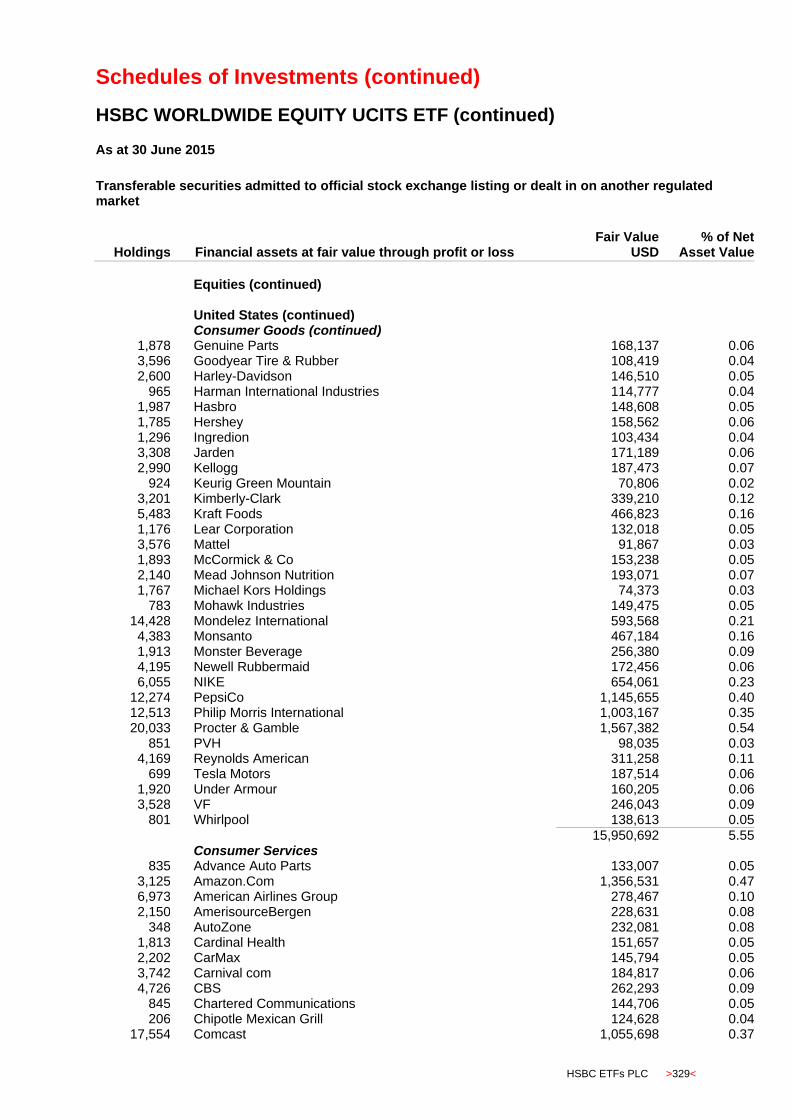
Schedules of Investments (continued)
HSBC WORLDWIDE EQUITY UCITS ETF (continued)
HSBC ETFs PLC >329<
As at 30 June 2015
Transferable securities admitted to official stock exchange listing or dealt in on another regulated market
Holdings
Financial assets at fair value through profit or loss Fair Value
USD % of Net
Asset Value
Equities (continued)
United States (continued) Consumer Goods (continued)
1,878 Genuine Parts 168,137 0.06 3,596 Goodyear Tire & Rubber 108,419 0.04 2,600 Harley-Davidson 146,510 0.05
965 Harman International Industries 114,777 0.04 1,987 Hasbro 148,608 0.05 1,785 Hershey 158,562 0.06 1,296 Ingredion 103,434 0.04 3,308 Jarden 171,189 0.06 2,990 Kellogg 187,473 0.07
924 Keurig Green Mountain 70,806 0.02 3,201 Kimberly-Clark 339,210 0.12 5,483 Kraft Foods 466,823 0.16 1,176 Lear Corporation 132,018 0.05 3,576 Mattel 91,867 0.03 1,893 McCormick & Co 153,238 0.05 2,140 Mead Johnson Nutrition 193,071 0.07 1,767 Michael Kors Holdings 74,373 0.03
783 Mohawk Industries 149,475 0.05 14,428 Mondelez International 593,568 0.21
4,383 Monsanto 467,184 0.16 1,913 Monster Beverage 256,380 0.09 4,195 Newell Rubbermaid 172,456 0.06 6,055 NIKE 654,061 0.23
12,274 PepsiCo 1,145,655 0.40 12,513 Philip Morris International 1,003,167 0.35 20,033 Procter & Gamble 1,567,382 0.54
851 PVH 98,035 0.03 4,169 Reynolds American 311,258 0.11
699 Tesla Motors 187,514 0.06 1,920 Under Armour 160,205 0.06 3,528 VF 246,043 0.09
801 Whirlpool 138,613 0.05
15,950,692 5.55 Consumer Services
835 Advance Auto Parts 133,007 0.05 3,125 Amazon.Com 1,356,531 0.47 6,973 American Airlines Group 278,467 0.10 2,150 AmerisourceBergen 228,631 0.08
348 AutoZone 232,081 0.08 1,813 Cardinal Health 151,657 0.05 2,202 CarMax 145,794 0.05 3,742 Carnival com 184,817 0.06 4,726 CBS 262,293 0.09
845 Chartered Communications 144,706 0.05 206 Chipotle Mexican Grill 124,628 0.04
17,554 Comcast 1,055,698 0.37

Schedules of Investments (continued)
HSBC WORLDWIDE EQUITY UCITS ETF (continued)
>330< HSBC ETFs PLC
As at 30 June 2015
Transferable securities admitted to official stock exchange listing or dealt in on another regulated market
Holdings
Financial assets at fair value through profit or loss Fair Value
USD % of Net
Asset Value
Equities (continued)
United States (continued) Consumer Services (continued)
3,635 Costco Wholesale 490,943 0.17 9,597 CVS Caremark 1,006,533 0.35 2,189 Darden Restaurants 155,594 0.05 8,444 Delta Air Lines 346,880 0.12 3,589 DIRECTV 333,023 0.12 1,442 Discovery Communications 47,961 0.02 2,134 Dish Network 144,493 0.05 3,147 Dollar General 244,648 0.08 2,547 Dollar Tree 201,188 0.07
10,814 eBay 651,435 0.23 1,186 Expedia 129,689 0.05 1,687 Gannett 23,601 0.01 3,444 H&R Block 102,115 0.04 3,491 Hertz Global Holdings 63,257 0.02 4,186 Hilton Worldwide Holdings 115,324 0.04
10,744 Home Depot 1,193,981 0.42 5,840 Interpublic Group of Companies 112,537 0.04 2,276 Kohl's 142,500 0.05 4,625 Kroger 335,359 0.12 4,299 Las Vegas Sands 225,998 0.08 1,795 Liberty Global 97,056 0.03 5,442 Liberty Interactive 151,016 0.05
773 LIBERTY VENTURES 'A' 30,356 0.01 2,670 Limited Brands 228,899 0.08 8,948 Lowe's Cos 599,248 0.21 8,008 McDonald's 761,321 0.26 3,044 McGraw-Hill 305,770 0.11 1,996 McKesson 448,721 0.16 3,507 MGM Resorts International 64,003 0.02
332 NetFlix 218,104 0.08 2,572 Omnicom Group 178,728 0.06 1,174 O'Reilly Automotive 265,301 0.09 2,972 PDC 145 -
470 Priceline.com 541,144 0.19 11,489 Rite Aid 95,933 0.03
4,380 Ross Stores 212,912 0.07 1,515 Scripps Networks Interactive 99,036 0.03
38,811 Sirius XM Holdings 144,765 0.05 6,436 Southwest Airlines 212,967 0.07 8,670 Staples 132,738 0.05
12,916 Starbucks 692,491 0.24 5,535 Sysco 199,814 0.07 5,704 Target 465,618 0.17 3,375 Tegna 108,236 0.04 4,152 Thomson Reuters 158,171 0.05 1,539 Tiffany & Co 141,280 0.05
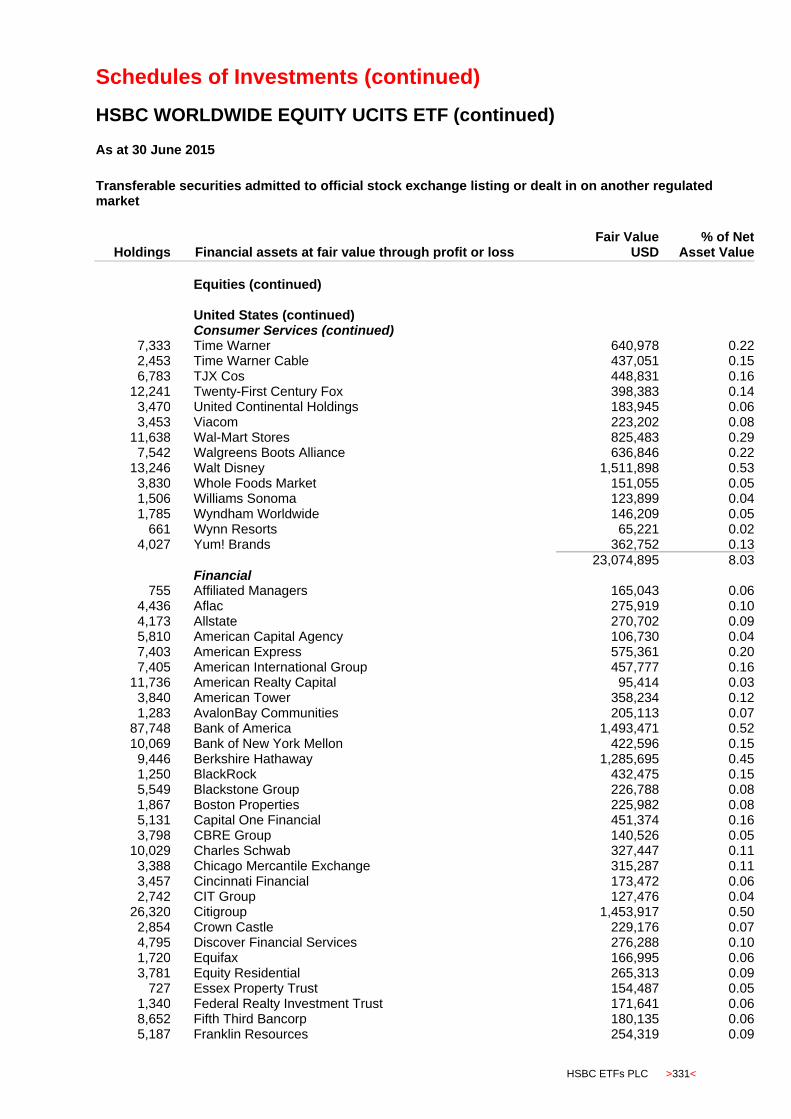
Schedules of Investments (continued)
HSBC WORLDWIDE EQUITY UCITS ETF (continued)
HSBC ETFs PLC >331<
As at 30 June 2015
Transferable securities admitted to official stock exchange listing or dealt in on another regulated market
Holdings
Financial assets at fair value through profit or loss Fair Value
USD % of Net
Asset Value
Equities (continued)
United States (continued) Consumer Services (continued)
7,333 Time Warner 640,978 0.22 2,453 Time Warner Cable 437,051 0.15 6,783 TJX Cos 448,831 0.16
12,241 Twenty-First Century Fox 398,383 0.14 3,470 United Continental Holdings 183,945 0.06 3,453 Viacom 223,202 0.08
11,638 Wal-Mart Stores 825,483 0.29 7,542 Walgreens Boots Alliance 636,846 0.22
13,246 Walt Disney 1,511,898 0.53 3,830 Whole Foods Market 151,055 0.05 1,506 Williams Sonoma 123,899 0.04 1,785 Wyndham Worldwide 146,209 0.05
661 Wynn Resorts 65,221 0.02 4,027 Yum! Brands 362,752 0.13
23,074,895 8.03 Financial
755 Affiliated Managers 165,043 0.06 4,436 Aflac 275,919 0.10 4,173 Allstate 270,702 0.09 5,810 American Capital Agency 106,730 0.04 7,403 American Express 575,361 0.20 7,405 American International Group 457,777 0.16
11,736 American Realty Capital 95,414 0.03 3,840 American Tower 358,234 0.12 1,283 AvalonBay Communities 205,113 0.07
87,748 Bank of America 1,493,471 0.52 10,069 Bank of New York Mellon 422,596 0.15
9,446 Berkshire Hathaway 1,285,695 0.45 1,250 BlackRock 432,475 0.15 5,549 Blackstone Group 226,788 0.08 1,867 Boston Properties 225,982 0.08 5,131 Capital One Financial 451,374 0.16 3,798 CBRE Group 140,526 0.05
10,029 Charles Schwab 327,447 0.11 3,388 Chicago Mercantile Exchange 315,287 0.11 3,457 Cincinnati Financial 173,472 0.06 2,742 CIT Group 127,476 0.04
26,320 Citigroup 1,453,917 0.50 2,854 Crown Castle 229,176 0.07 4,795 Discover Financial Services 276,288 0.10 1,720 Equifax 166,995 0.06 3,781 Equity Residential 265,313 0.09
727 Essex Property Trust 154,487 0.05 1,340 Federal Realty Investment Trust 171,641 0.06 8,652 Fifth Third Bancorp 180,135 0.06 5,187 Franklin Resources 254,319 0.09
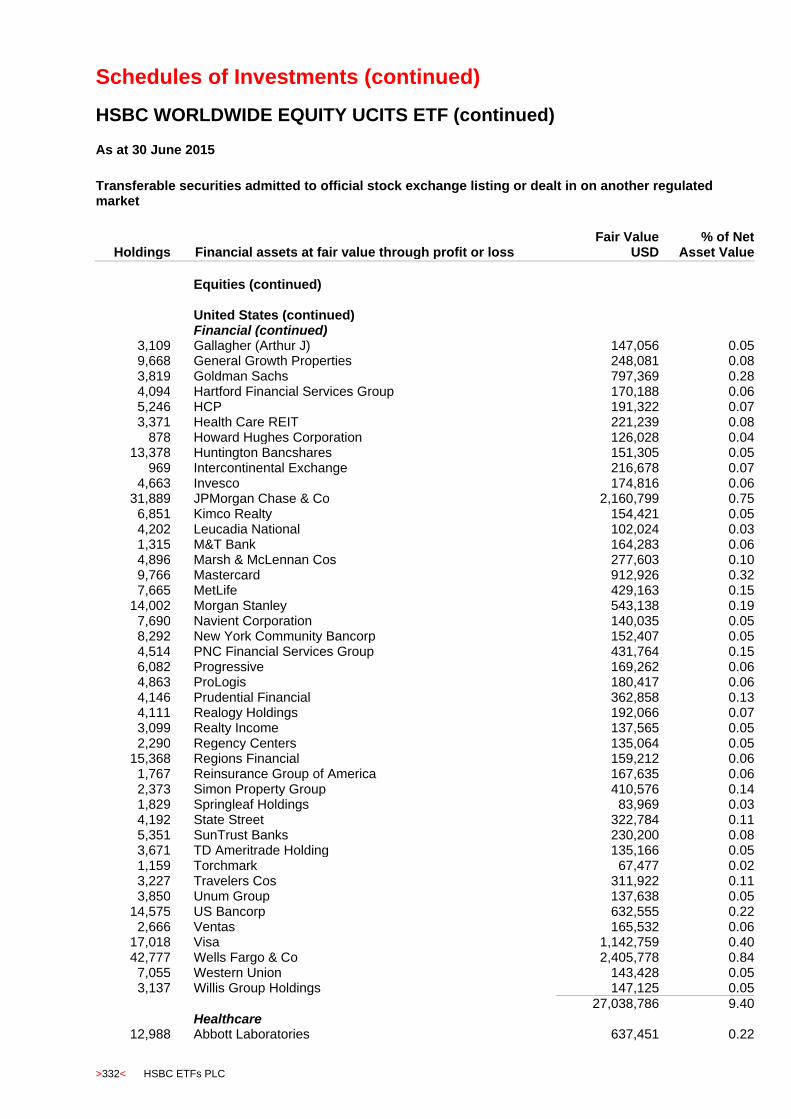
Schedules of Investments (continued)
HSBC WORLDWIDE EQUITY UCITS ETF (continued)
>332< HSBC ETFs PLC
As at 30 June 2015
Transferable securities admitted to official stock exchange listing or dealt in on another regulated market
Holdings
Financial assets at fair value through profit or loss Fair Value
USD % of Net
Asset Value
Equities (continued)
United States (continued) Financial (continued)
3,109 Gallagher (Arthur J) 147,056 0.05 9,668 General Growth Properties 248,081 0.08 3,819 Goldman Sachs 797,369 0.28 4,094 Hartford Financial Services Group 170,188 0.06 5,246 HCP 191,322 0.07 3,371 Health Care REIT 221,239 0.08
878 Howard Hughes Corporation 126,028 0.04 13,378 Huntington Bancshares 151,305 0.05
969 Intercontinental Exchange 216,678 0.07 4,663 Invesco 174,816 0.06
31,889 JPMorgan Chase & Co 2,160,799 0.75 6,851 Kimco Realty 154,421 0.05 4,202 Leucadia National 102,024 0.03 1,315 M&T Bank 164,283 0.06 4,896 Marsh & McLennan Cos 277,603 0.10 9,766 Mastercard 912,926 0.32 7,665 MetLife 429,163 0.15
14,002 Morgan Stanley 543,138 0.19 7,690 Navient Corporation 140,035 0.05 8,292 New York Community Bancorp 152,407 0.05 4,514 PNC Financial Services Group 431,764 0.15 6,082 Progressive 169,262 0.06 4,863 ProLogis 180,417 0.06 4,146 Prudential Financial 362,858 0.13 4,111 Realogy Holdings 192,066 0.07 3,099 Realty Income 137,565 0.05 2,290 Regency Centers 135,064 0.05
15,368 Regions Financial 159,212 0.06 1,767 Reinsurance Group of America 167,635 0.06 2,373 Simon Property Group 410,576 0.14 1,829 Springleaf Holdings 83,969 0.03 4,192 State Street 322,784 0.11 5,351 SunTrust Banks 230,200 0.08 3,671 TD Ameritrade Holding 135,166 0.05 1,159 Torchmark 67,477 0.02 3,227 Travelers Cos 311,922 0.11 3,850 Unum Group 137,638 0.05
14,575 US Bancorp 632,555 0.22 2,666 Ventas 165,532 0.06
17,018 Visa 1,142,759 0.40 42,777 Wells Fargo & Co 2,405,778 0.84
7,055 Western Union 143,428 0.05 3,137 Willis Group Holdings 147,125 0.05
27,038,786 9.40 Healthcare
12,988 Abbott Laboratories 637,451 0.22
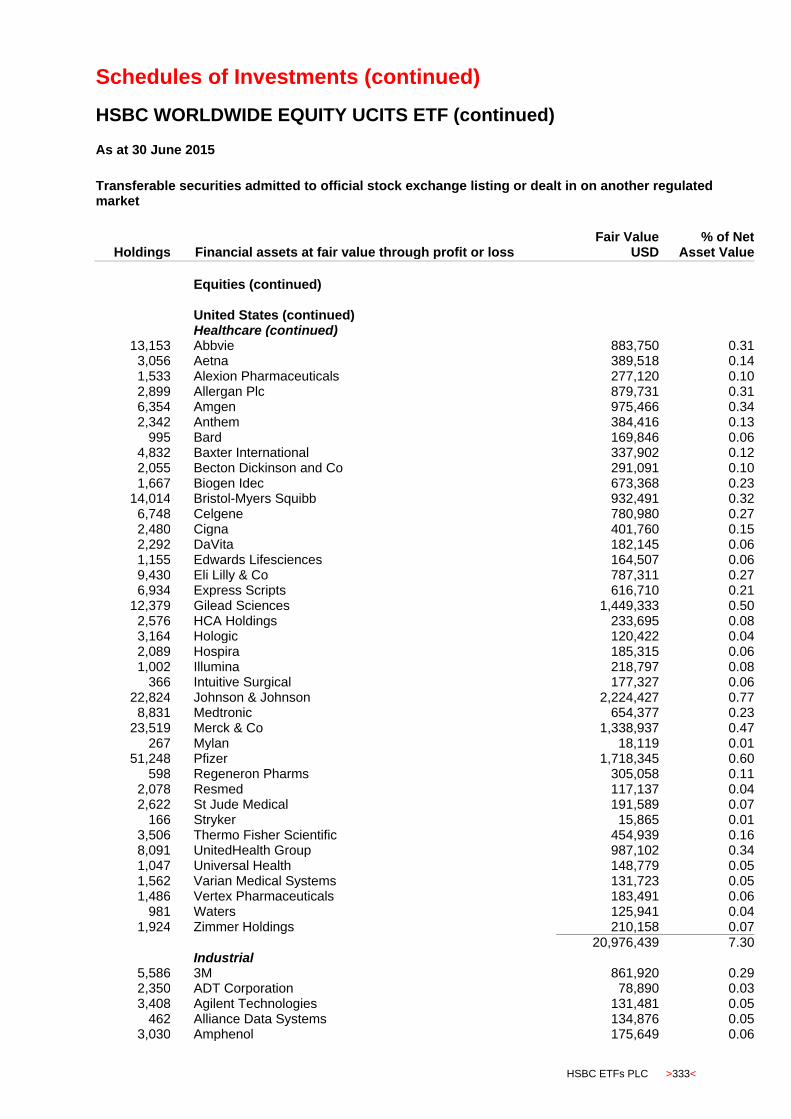
Schedules of Investments (continued)
HSBC WORLDWIDE EQUITY UCITS ETF (continued)
HSBC ETFs PLC >333<
As at 30 June 2015
Transferable securities admitted to official stock exchange listing or dealt in on another regulated market
Holdings
Financial assets at fair value through profit or loss Fair Value
USD % of Net
Asset Value
Equities (continued)
United States (continued) Healthcare (continued)
13,153 Abbvie 883,750 0.31 3,056 Aetna 389,518 0.14 1,533 Alexion Pharmaceuticals 277,120 0.10 2,899 Allergan Plc 879,731 0.31 6,354 Amgen 975,466 0.34 2,342 Anthem 384,416 0.13
995 Bard 169,846 0.06 4,832 Baxter International 337,902 0.12 2,055 Becton Dickinson and Co 291,091 0.10 1,667 Biogen Idec 673,368 0.23
14,014 Bristol-Myers Squibb 932,491 0.32 6,748 Celgene 780,980 0.27 2,480 Cigna 401,760 0.15 2,292 DaVita 182,145 0.06 1,155 Edwards Lifesciences 164,507 0.06 9,430 Eli Lilly & Co 787,311 0.27 6,934 Express Scripts 616,710 0.21
12,379 Gilead Sciences 1,449,333 0.50 2,576 HCA Holdings 233,695 0.08 3,164 Hologic 120,422 0.04 2,089 Hospira 185,315 0.06 1,002 Illumina 218,797 0.08
366 Intuitive Surgical 177,327 0.06 22,824 Johnson & Johnson 2,224,427 0.77
8,831 Medtronic 654,377 0.23 23,519 Merck & Co 1,338,937 0.47
267 Mylan 18,119 0.01 51,248 Pfizer 1,718,345 0.60
598 Regeneron Pharms 305,058 0.11 2,078 Resmed 117,137 0.04 2,622 St Jude Medical 191,589 0.07
166 Stryker 15,865 0.01 3,506 Thermo Fisher Scientific 454,939 0.16 8,091 UnitedHealth Group 987,102 0.34 1,047 Universal Health 148,779 0.05 1,562 Varian Medical Systems 131,723 0.05 1,486 Vertex Pharmaceuticals 183,491 0.06
981 Waters 125,941 0.04 1,924 Zimmer Holdings 210,158 0.07
20,976,439 7.30 Industrial
5,586 3M 861,920 0.29 2,350 ADT Corporation 78,890 0.03 3,408 Agilent Technologies 131,481 0.05
462 Alliance Data Systems 134,876 0.05 3,030 Amphenol 175,649 0.06
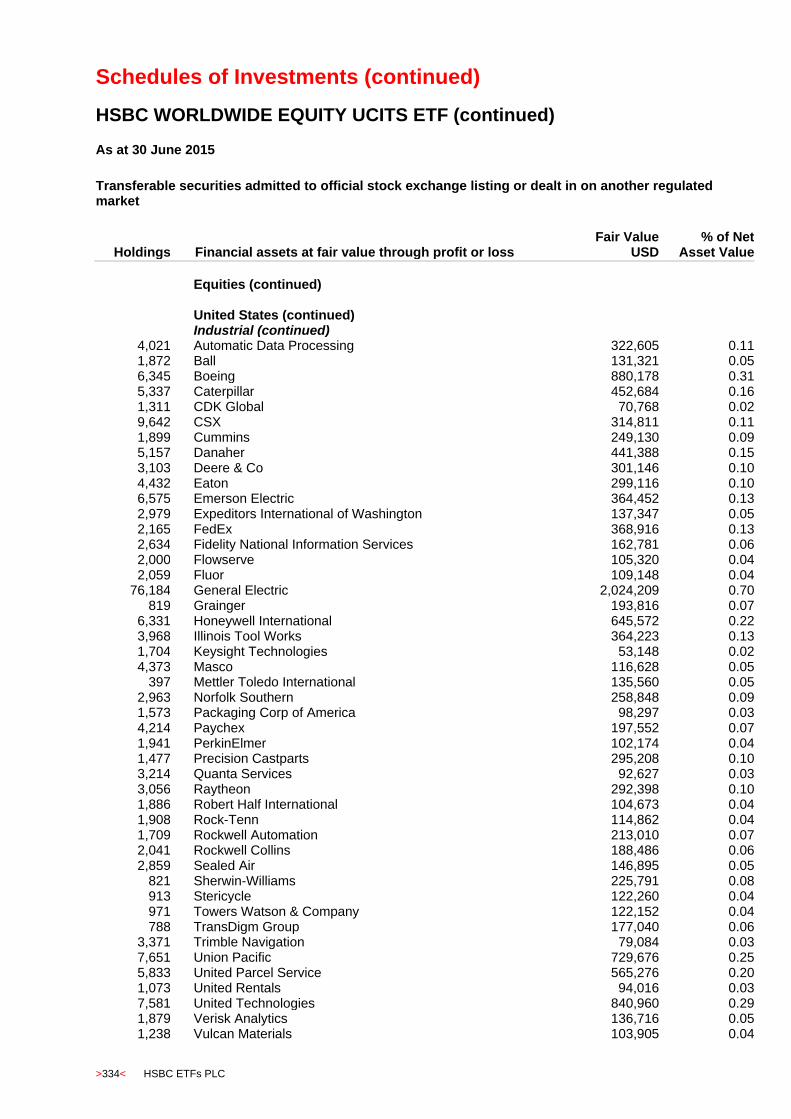
Schedules of Investments (continued)
HSBC WORLDWIDE EQUITY UCITS ETF (continued)
>334< HSBC ETFs PLC
As at 30 June 2015
Transferable securities admitted to official stock exchange listing or dealt in on another regulated market
Holdings
Financial assets at fair value through profit or loss Fair Value
USD % of Net
Asset Value
Equities (continued)
United States (continued) Industrial (continued)
4,021 Automatic Data Processing 322,605 0.11 1,872 Ball 131,321 0.05 6,345 Boeing 880,178 0.31 5,337 Caterpillar 452,684 0.16 1,311 CDK Global 70,768 0.02 9,642 CSX 314,811 0.11 1,899 Cummins 249,130 0.09 5,157 Danaher 441,388 0.15 3,103 Deere & Co 301,146 0.10 4,432 Eaton 299,116 0.10 6,575 Emerson Electric 364,452 0.13 2,979 Expeditors International of Washington 137,347 0.05 2,165 FedEx 368,916 0.13 2,634 Fidelity National Information Services 162,781 0.06 2,000 Flowserve 105,320 0.04 2,059 Fluor 109,148 0.04
76,184 General Electric 2,024,209 0.70 819 Grainger 193,816 0.07
6,331 Honeywell International 645,572 0.22 3,968 Illinois Tool Works 364,223 0.13 1,704 Keysight Technologies 53,148 0.02 4,373 Masco 116,628 0.05
397 Mettler Toledo International 135,560 0.05 2,963 Norfolk Southern 258,848 0.09 1,573 Packaging Corp of America 98,297 0.03 4,214 Paychex 197,552 0.07 1,941 PerkinElmer 102,174 0.04 1,477 Precision Castparts 295,208 0.10 3,214 Quanta Services 92,627 0.03 3,056 Raytheon 292,398 0.10 1,886 Robert Half International 104,673 0.04 1,908 Rock-Tenn 114,862 0.04 1,709 Rockwell Automation 213,010 0.07 2,041 Rockwell Collins 188,486 0.06 2,859 Sealed Air 146,895 0.05
821 Sherwin-Williams 225,791 0.08 913 Stericycle 122,260 0.04 971 Towers Watson & Company 122,152 0.04 788 TransDigm Group 177,040 0.06
3,371 Trimble Navigation 79,084 0.03 7,651 Union Pacific 729,676 0.25 5,833 United Parcel Service 565,276 0.20 1,073 United Rentals 94,016 0.03 7,581 United Technologies 840,960 0.29 1,879 Verisk Analytics 136,716 0.05 1,238 Vulcan Materials 103,905 0.04
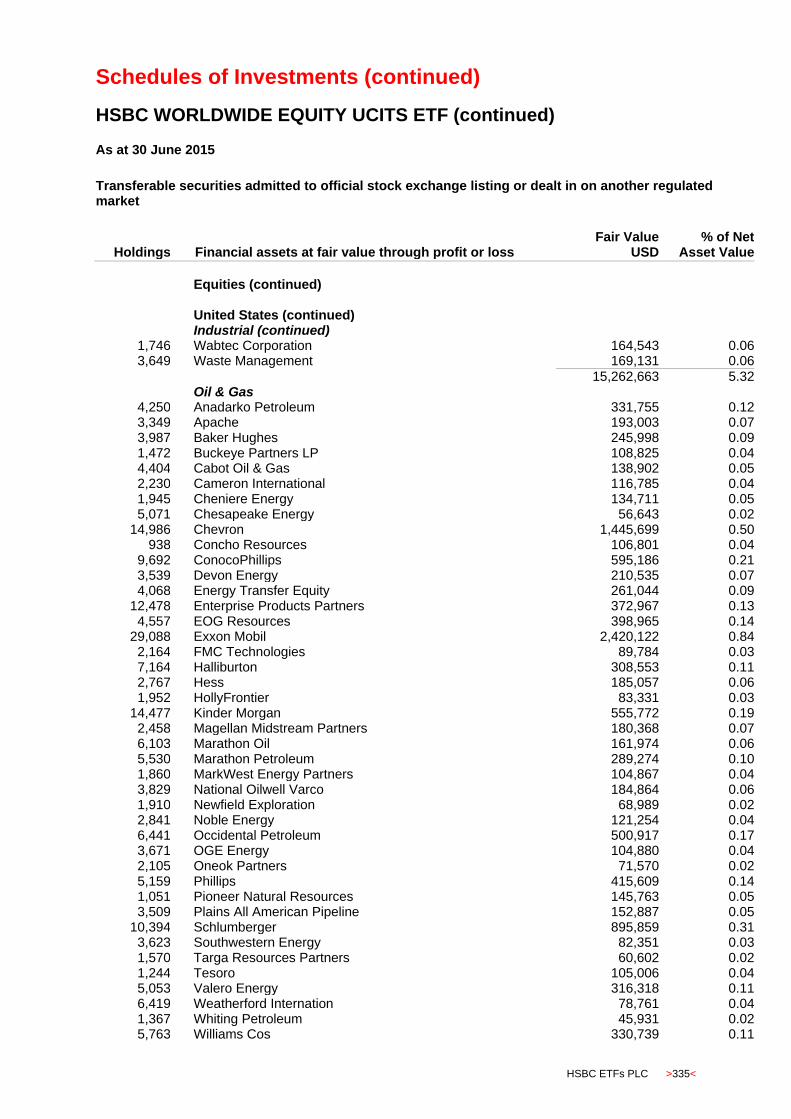
Schedules of Investments (continued)
HSBC WORLDWIDE EQUITY UCITS ETF (continued)
HSBC ETFs PLC >335<
As at 30 June 2015
Transferable securities admitted to official stock exchange listing or dealt in on another regulated market
Holdings
Financial assets at fair value through profit or loss Fair Value
USD % of Net
Asset Value
Equities (continued)
United States (continued) Industrial (continued)
1,746 Wabtec Corporation 164,543 0.06 3,649 Waste Management 169,131 0.06
15,262,663 5.32 Oil & Gas
4,250 Anadarko Petroleum 331,755 0.12 3,349 Apache 193,003 0.07 3,987 Baker Hughes 245,998 0.09 1,472 Buckeye Partners LP 108,825 0.04 4,404 Cabot Oil & Gas 138,902 0.05 2,230 Cameron International 116,785 0.04 1,945 Cheniere Energy 134,711 0.05 5,071 Chesapeake Energy 56,643 0.02
14,986 Chevron 1,445,699 0.50 938 Concho Resources 106,801 0.04
9,692 ConocoPhillips 595,186 0.21 3,539 Devon Energy 210,535 0.07 4,068 Energy Transfer Equity 261,044 0.09
12,478 Enterprise Products Partners 372,967 0.13 4,557 EOG Resources 398,965 0.14
29,088 Exxon Mobil 2,420,122 0.84 2,164 FMC Technologies 89,784 0.03 7,164 Halliburton 308,553 0.11 2,767 Hess 185,057 0.06 1,952 HollyFrontier 83,331 0.03
14,477 Kinder Morgan 555,772 0.19 2,458 Magellan Midstream Partners 180,368 0.07 6,103 Marathon Oil 161,974 0.06 5,530 Marathon Petroleum 289,274 0.10 1,860 MarkWest Energy Partners 104,867 0.04 3,829 National Oilwell Varco 184,864 0.06 1,910 Newfield Exploration 68,989 0.02 2,841 Noble Energy 121,254 0.04 6,441 Occidental Petroleum 500,917 0.17 3,671 OGE Energy 104,880 0.04 2,105 Oneok Partners 71,570 0.02 5,159 Phillips 415,609 0.14 1,051 Pioneer Natural Resources 145,763 0.05 3,509 Plains All American Pipeline 152,887 0.05
10,394 Schlumberger 895,859 0.31 3,623 Southwestern Energy 82,351 0.03 1,570 Targa Resources Partners 60,602 0.02 1,244 Tesoro 105,006 0.04 5,053 Valero Energy 316,318 0.11 6,419 Weatherford Internation 78,761 0.04 1,367 Whiting Petroleum 45,931 0.02 5,763 Williams Cos 330,739 0.11
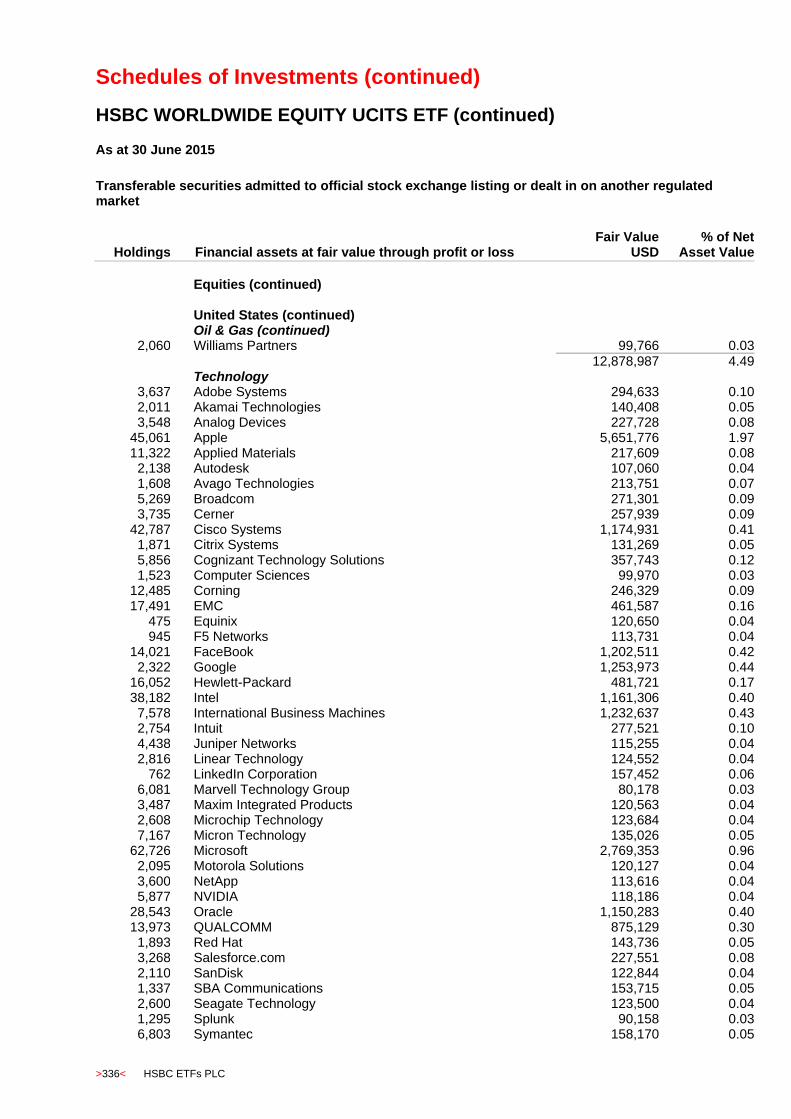
Schedules of Investments (continued)
HSBC WORLDWIDE EQUITY UCITS ETF (continued)
>336< HSBC ETFs PLC
As at 30 June 2015
Transferable securities admitted to official stock exchange listing or dealt in on another regulated market
Holdings
Financial assets at fair value through profit or loss Fair Value
USD % of Net
Asset Value
Equities (continued)
United States (continued) Oil & Gas (continued)
2,060 Williams Partners 99,766 0.03
12,878,987 4.49 Technology
3,637 Adobe Systems 294,633 0.10 2,011 Akamai Technologies 140,408 0.05 3,548 Analog Devices 227,728 0.08
45,061 Apple 5,651,776 1.97 11,322 Applied Materials 217,609 0.08
2,138 Autodesk 107,060 0.04 1,608 Avago Technologies 213,751 0.07 5,269 Broadcom 271,301 0.09 3,735 Cerner 257,939 0.09
42,787 Cisco Systems 1,174,931 0.41 1,871 Citrix Systems 131,269 0.05 5,856 Cognizant Technology Solutions 357,743 0.12 1,523 Computer Sciences 99,970 0.03
12,485 Corning 246,329 0.09 17,491 EMC 461,587 0.16
475 Equinix 120,650 0.04 945 F5 Networks 113,731 0.04
14,021 FaceBook 1,202,511 0.42 2,322 Google 1,253,973 0.44
16,052 Hewlett-Packard 481,721 0.17 38,182 Intel 1,161,306 0.40
7,578 International Business Machines 1,232,637 0.43 2,754 Intuit 277,521 0.10 4,438 Juniper Networks 115,255 0.04 2,816 Linear Technology 124,552 0.04
762 LinkedIn Corporation 157,452 0.06 6,081 Marvell Technology Group 80,178 0.03 3,487 Maxim Integrated Products 120,563 0.04 2,608 Microchip Technology 123,684 0.04 7,167 Micron Technology 135,026 0.05
62,726 Microsoft 2,769,353 0.96 2,095 Motorola Solutions 120,127 0.04 3,600 NetApp 113,616 0.04 5,877 NVIDIA 118,186 0.04
28,543 Oracle 1,150,283 0.40 13,973 QUALCOMM 875,129 0.30
1,893 Red Hat 143,736 0.05 3,268 Salesforce.com 227,551 0.08 2,110 SanDisk 122,844 0.04 1,337 SBA Communications 153,715 0.05 2,600 Seagate Technology 123,500 0.04 1,295 Splunk 90,158 0.03 6,803 Symantec 158,170 0.05

Schedules of Investments (continued)
HSBC WORLDWIDE EQUITY UCITS ETF (continued)
HSBC ETFs PLC >337<
As at 30 June 2015
Transferable securities admitted to official stock exchange listing or dealt in on another regulated market
Holdings
Financial assets at fair value through profit or loss Fair Value
USD % of Net
Asset Value
Equities (continued)
United States (continued) Technology (continued)
2,128 Teradata 78,736 0.03 9,469 Texas Instruments 487,748 0.17 3,130 Twitter 113,369 0.04
915 Vmware 78,452 0.03 2,229 Western Digital 174,798 0.06 1,040 Workday Incorporation 79,446 0.03 3,223 Xilinx 142,328 0.05 7,273 Yahoo! 285,756 0.10
24,161,795 8.40 Telecommunications
40,555 AT&T 1,440,514 0.50 5,419 CenturyLink 159,210 0.06 1,716 Level 3 Comms 90,382 0.03 4,716 T-Mobile 182,839 0.06
31,350 Verizon Communications 1,461,223 0.51
3,334,168 1.16 Utilities
7,766 AES 102,977 0.04 2,469 AGL Resources 114,957 0.04 3,673 Ameren 138,399 0.05 3,077 American Water Works 149,634 0.05 5,340 Dominion Resources 357,086 0.12 2,236 DTE Energy 166,895 0.06 5,988 Duke Energy 422,873 0.15 3,443 Edison International 191,362 0.07 3,816 Eversource 173,286 0.06 8,088 Exelon 254,125 0.09 3,774 NextEra Energy 369,965 0.13 3,746 NiSource 170,780 0.06 4,382 PG&E 215,156 0.08 2,242 Pinnacle West Capital 127,547 0.04 6,139 PPL 180,916 0.06 2,399 Sempra Energy 237,357 0.08 7,742 Southern 324,390 0.11 6,000 Spectra Energy 195,600 0.07 3,437 Wec Energy Group 154,562 0.05
4,047,867 1.41 Total equities* 313,966,536 109.16
Warrants
3,864 Aurobindo Pharma Warrants 88,001 0.03 266 Bosch Limited Warrants 91,173 0.03
2,143 Britannia Industries Warrants 92,871 0.03 11,551 Cairn India Warrants 32,893 0.01
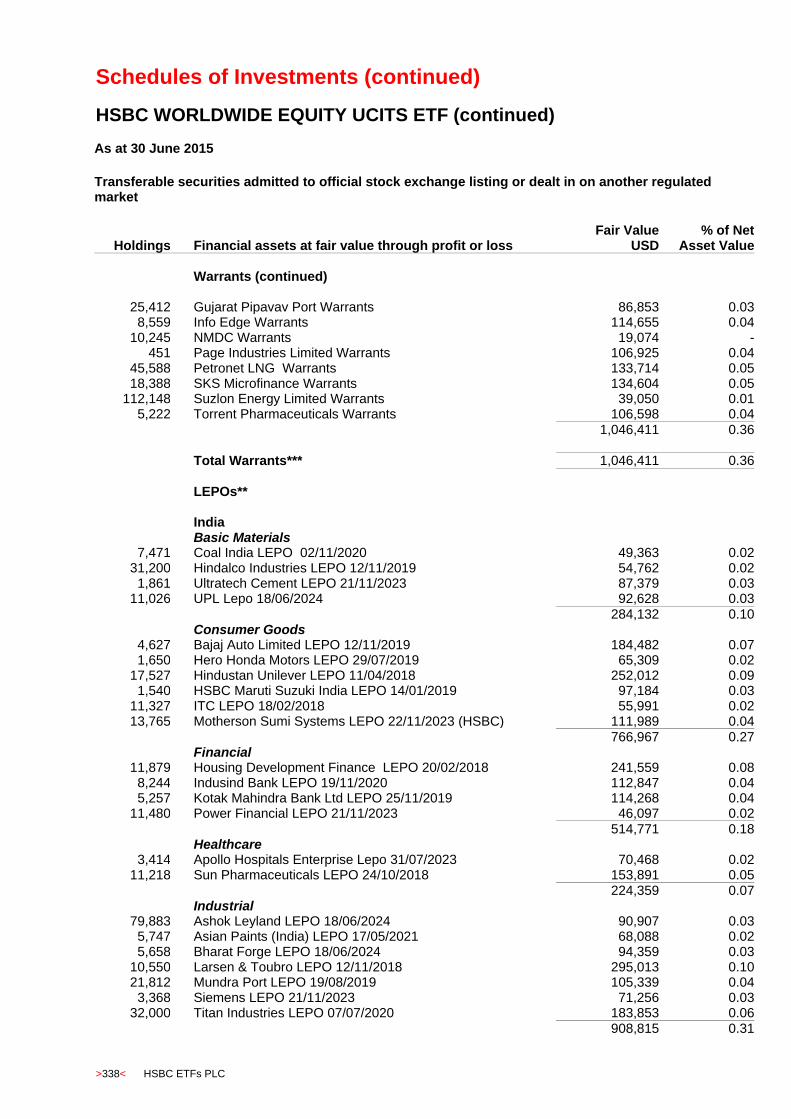
Schedules of Investments (continued)
HSBC WORLDWIDE EQUITY UCITS ETF (continued)
>338< HSBC ETFs PLC
As at 30 June 2015
Transferable securities admitted to official stock exchange listing or dealt in on another regulated market
Holdings Financial assets at fair value through profit or loss Fair Value
USD % of Net
Asset Value Warrants (continued)
25,412 Gujarat Pipavav Port Warrants 86,853 0.03 8,559 Info Edge Warrants 114,655 0.04
10,245 NMDC Warrants 19,074 - 451 Page Industries Limited Warrants 106,925 0.04
45,588 Petronet LNG Warrants 133,714 0.05 18,388 SKS Microfinance Warrants 134,604 0.05
112,148 Suzlon Energy Limited Warrants 39,050 0.01 5,222 Torrent Pharmaceuticals Warrants 106,598 0.04
1,046,411 0.36 Total Warrants*** 1,046,411 0.36
LEPOs** India Basic Materials
7,471 Coal India LEPO 02/11/2020 49,363 0.02 31,200 Hindalco Industries LEPO 12/11/2019 54,762 0.02
1,861 Ultratech Cement LEPO 21/11/2023 87,379 0.03 11,026 UPL Lepo 18/06/2024 92,628 0.03
284,132 0.10 Consumer Goods
4,627 Bajaj Auto Limited LEPO 12/11/2019 184,482 0.07 1,650 Hero Honda Motors LEPO 29/07/2019 65,309 0.02
17,527 Hindustan Unilever LEPO 11/04/2018 252,012 0.09 1,540 HSBC Maruti Suzuki India LEPO 14/01/2019 97,184 0.03
11,327 ITC LEPO 18/02/2018 55,991 0.02 13,765 Motherson Sumi Systems LEPO 22/11/2023 (HSBC) 111,989 0.04
766,967 0.27 Financial
11,879 Housing Development Finance LEPO 20/02/2018 241,559 0.08 8,244 Indusind Bank LEPO 19/11/2020 112,847 0.04 5,257 Kotak Mahindra Bank Ltd LEPO 25/11/2019 114,268 0.04
11,480 Power Financial LEPO 21/11/2023 46,097 0.02
514,771 0.18 Healthcare
3,414 Apollo Hospitals Enterprise Lepo 31/07/2023 70,468 0.02 11,218 Sun Pharmaceuticals LEPO 24/10/2018 153,891 0.05
224,359 0.07 Industrial
79,883 Ashok Leyland LEPO 18/06/2024 90,907 0.03 5,747 Asian Paints (India) LEPO 17/05/2021 68,088 0.02 5,658 Bharat Forge LEPO 18/06/2024 94,359 0.03
10,550 Larsen & Toubro LEPO 12/11/2018 295,013 0.10 21,812 Mundra Port LEPO 19/08/2019 105,339 0.04
3,368 Siemens LEPO 21/11/2023 71,256 0.03 32,000 Titan Industries LEPO 07/07/2020 183,853 0.06
908,815 0.31
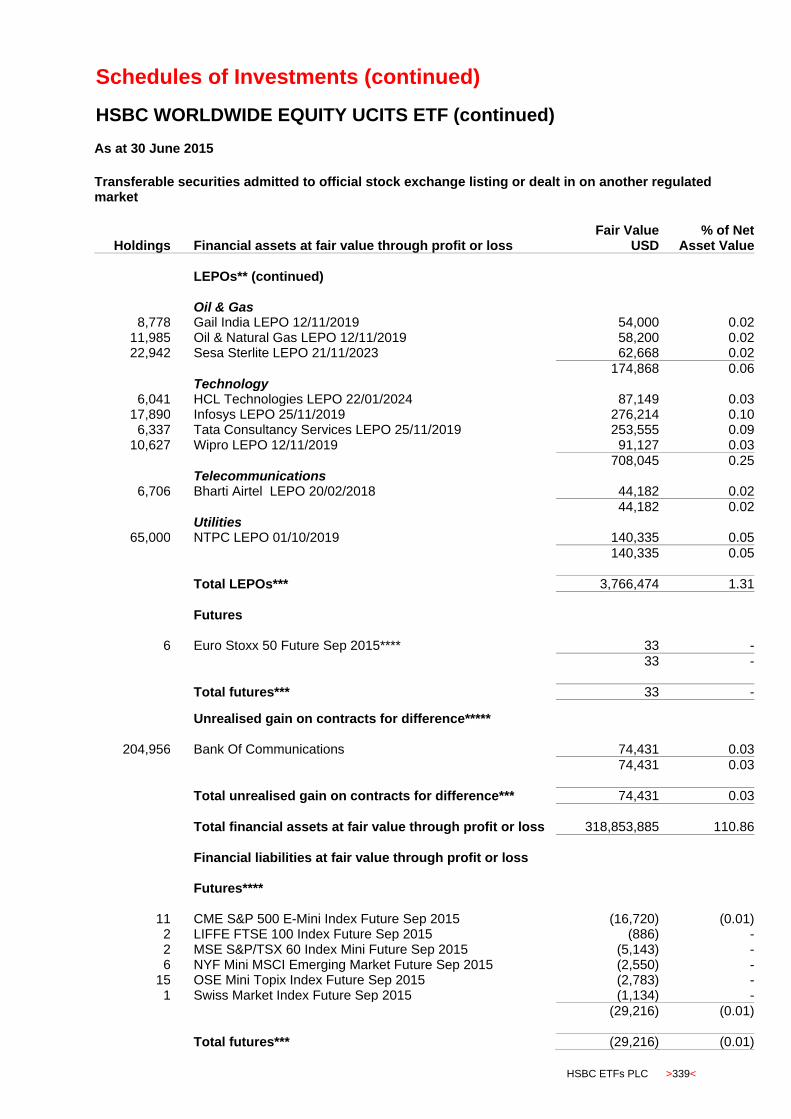
Schedules of Investments (continued)
HSBC WORLDWIDE EQUITY UCITS ETF (continued)
HSBC ETFs PLC >339<
As at 30 June 2015
Transferable securities admitted to official stock exchange listing or dealt in on another regulated market
Holdings Financial assets at fair value through profit or loss Fair Value
USD % of Net
Asset Value LEPOs** (continued) Oil & Gas
8,778 Gail India LEPO 12/11/2019 54,000 0.02 11,985 Oil & Natural Gas LEPO 12/11/2019 58,200 0.02 22,942 Sesa Sterlite LEPO 21/11/2023 62,668 0.02
174,868 0.06 Technology
6,041 HCL Technologies LEPO 22/01/2024 87,149 0.03 17,890 Infosys LEPO 25/11/2019 276,214 0.10
6,337 Tata Consultancy Services LEPO 25/11/2019 253,555 0.09 10,627 Wipro LEPO 12/11/2019 91,127 0.03
708,045 0.25 Telecommunications
6,706 Bharti Airtel LEPO 20/02/2018 44,182 0.02 44,182 0.02 Utilities
65,000 NTPC LEPO 01/10/2019 140,335 0.05
140,335 0.05
Total LEPOs*** 3,766,474 1.31
Futures
6 Euro Stoxx 50 Future Sep 2015**** 33 -
33 -
Total futures*** 33 -
Unrealised gain on contracts for difference*****
204,956 Bank Of Communications 74,431 0.03
74,431 0.03
Total unrealised gain on contracts for difference*** 74,431 0.03
Total financial assets at fair value through profit or loss 318,853,885 110.86 Financial liabilities at fair value through profit or loss Futures****
11 CME S&P 500 E-Mini Index Future Sep 2015 (16,720) (0.01) 2 LIFFE FTSE 100 Index Future Sep 2015 (886) - 2 MSE S&P/TSX 60 Index Mini Future Sep 2015 (5,143) - 6 NYF Mini MSCI Emerging Market Future Sep 2015 (2,550) -
15 OSE Mini Topix Index Future Sep 2015 (2,783) - 1 Swiss Market Index Future Sep 2015 (1,134) -
(29,216) (0.01)
Total futures*** (29,216) (0.01)
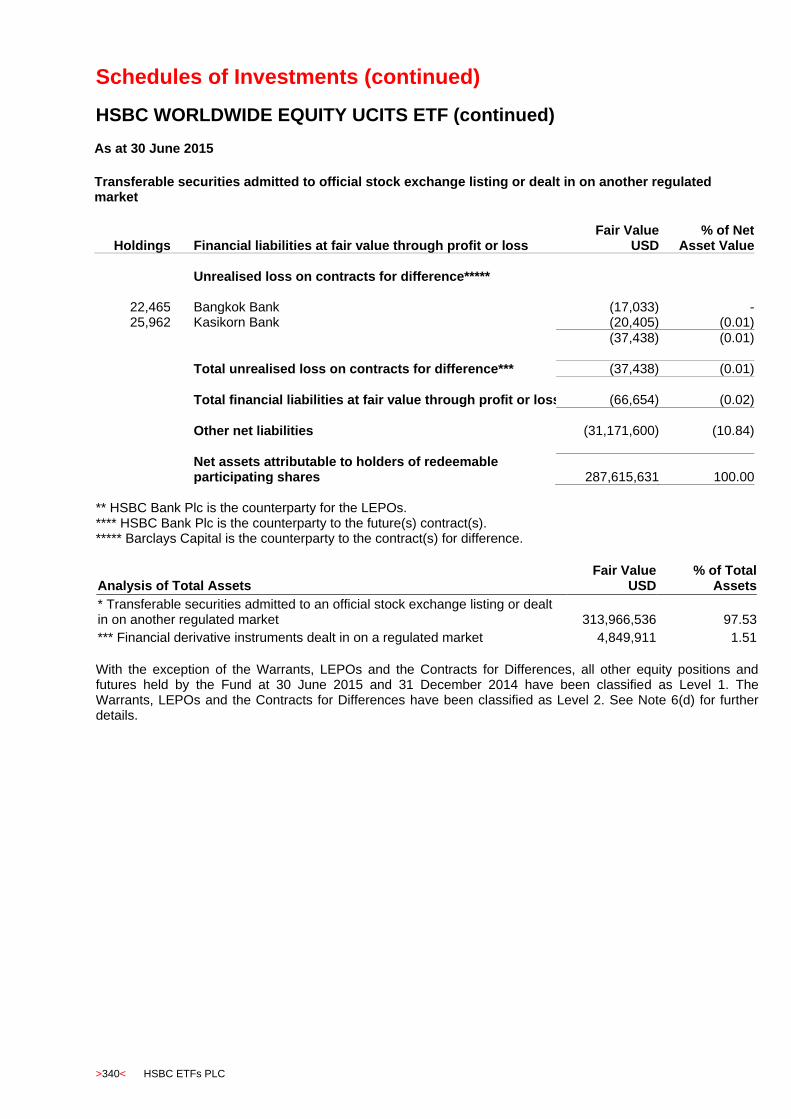
Schedules of Investments (continued)
HSBC WORLDWIDE EQUITY UCITS ETF (continued)
>340< HSBC ETFs PLC
As at 30 June 2015
Transferable securities admitted to official stock exchange listing or dealt in on another regulated market
Holdings Financial liabilities at fair value through profit or loss Fair Value
USD % of Net
Asset Value Unrealised loss on contracts for difference*****
22,465 Bangkok Bank (17,033) - 25,962 Kasikorn Bank (20,405) (0.01)
(37,438) (0.01)
Total unrealised loss on contracts for difference*** (37,438) (0.01)
Total financial liabilities at fair value through profit or loss (66,654) (0.02)
Other net liabilities (31,171,600) (10.84)
Net assets attributable to holders of redeemable participating shares 287,615,631 100.00 ** HSBC Bank Plc is the counterparty for the LEPOs. **** HSBC Bank Plc is the counterparty to the future(s) contract(s). ***** Barclays Capital is the counterparty to the contract(s) for difference.
Analysis of Total Assets Fair Value
USD % of Total
Assets
* Transferable securities admitted to an official stock exchange listing or dealt in on another regulated market 313,966,536 97.53
*** Financial derivative instruments dealt in on a regulated market 4,849,911 1.51
With the exception of the Warrants, LEPOs and the Contracts for Differences, all other equity positions and futures held by the Fund at 30 June 2015 and 31 December 2014 have been classified as Level 1. The Warrants, LEPOs and the Contracts for Differences have been classified as Level 2. See Note 6(d) for further details.
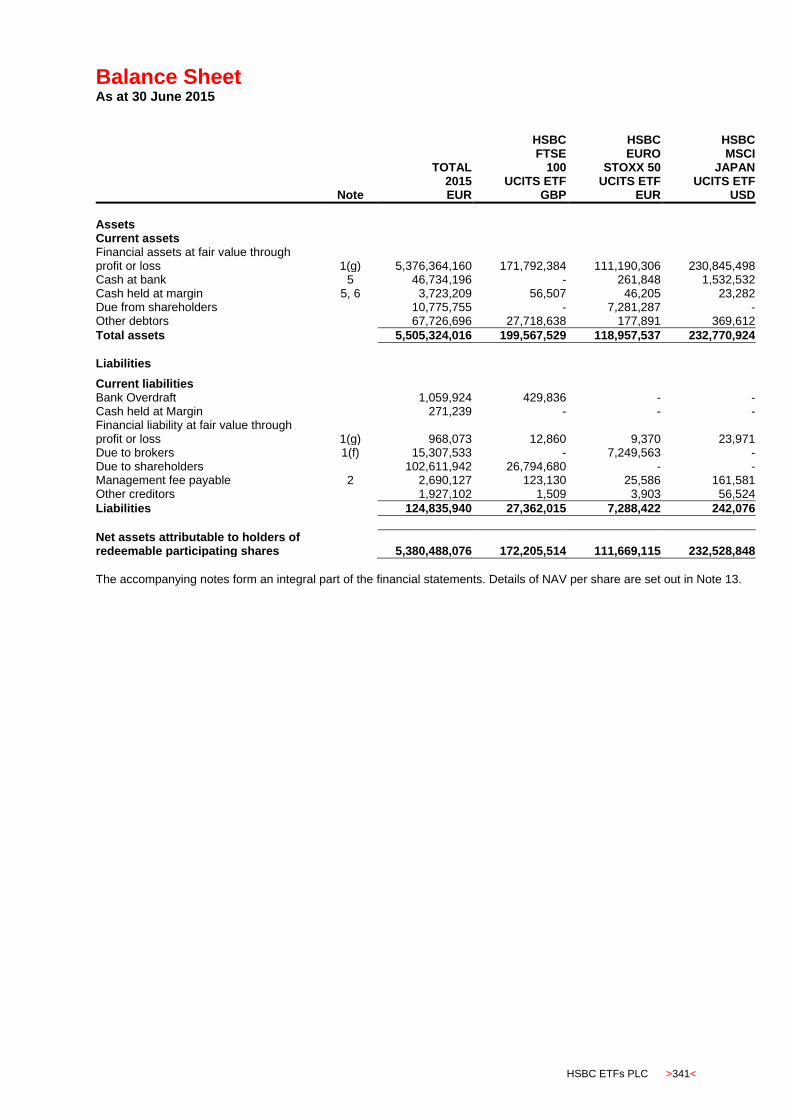
Balance Sheet As at 30 June 2015
HSBC ETFs PLC >341<
Note
TOTAL 2015 EUR
HSBC FTSE
100 UCITS ETF
GBP
HSBC EURO
STOXX 50 UCITS ETF
EUR
HSBC MSCI
JAPAN UCITS ETF
USD
Assets Current assets Financial assets at fair value through profit or loss 1(g) 5,376,364,160 171,792,384 111,190,306 230,845,498 Cash at bank 5 46,734,196 - 261,848 1,532,532 Cash held at margin 5, 6 3,723,209 56,507 46,205 23,282 Due from shareholders 10,775,755 - 7,281,287 - Other debtors 67,726,696 27,718,638 177,891 369,612
Total assets 5,505,324,016 199,567,529 118,957,537 232,770,924
Liabilities
Current liabilities Bank Overdraft 1,059,924 429,836 - - Cash held at Margin 271,239 - - - Financial liability at fair value through profit or loss 1(g) 968,073 12,860 9,370 23,971 Due to brokers 1(f) 15,307,533 - 7,249,563 - Due to shareholders 102,611,942 26,794,680 - - Management fee payable 2 2,690,127 123,130 25,586 161,581 Other creditors 1,927,102 1,509 3,903 56,524
Liabilities 124,835,940 27,362,015 7,288,422 242,076
Net assets attributable to holders of redeemable participating shares 5,380,488,076 172,205,514 111,669,115 232,528,848
The accompanying notes form an integral part of the financial statements. Details of NAV per share are set out in Note 13.
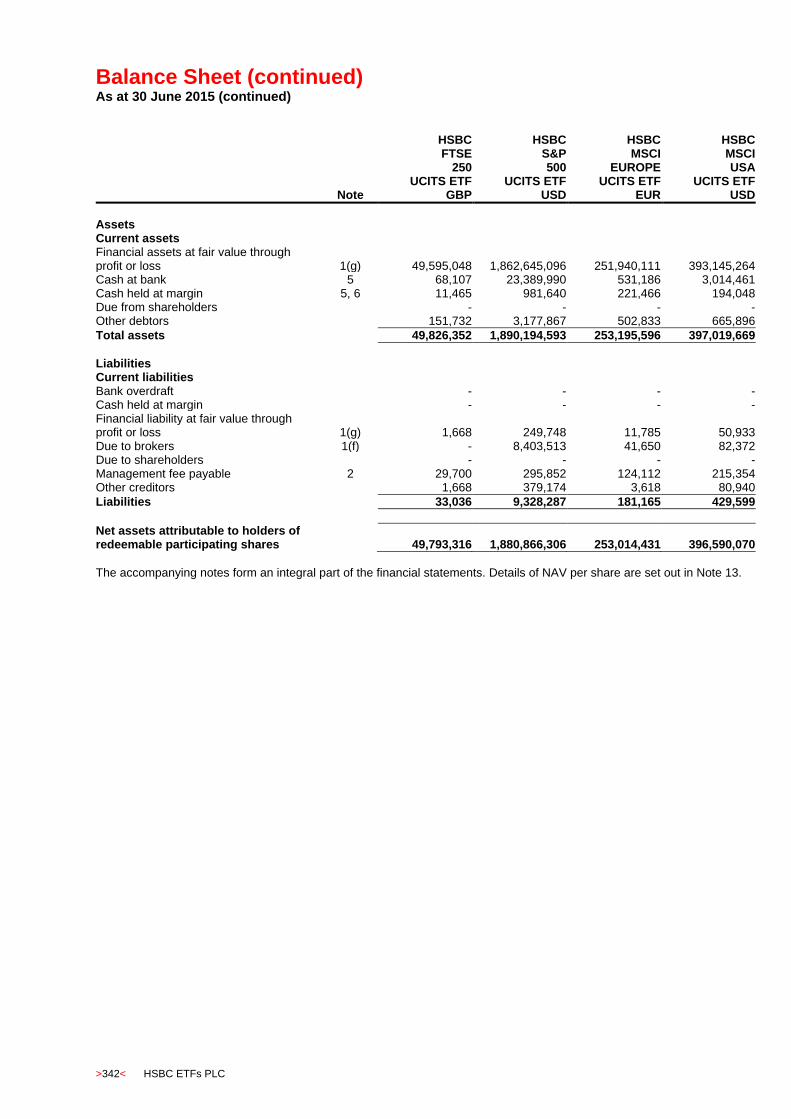
Balance Sheet (continued) As at 30 June 2015 (continued)
>342< HSBC ETFs PLC
Note
HSBC FTSE
250 UCITS ETF
GBP
HSBC S&P 500
UCITS ETF USD
HSBC MSCI
EUROPE UCITS ETF
EUR
HSBC MSCI USA
UCITS ETF USD
Assets Current assets Financial assets at fair value through profit or loss 1(g) 49,595,048 1,862,645,096 251,940,111 393,145,264 Cash at bank 5 68,107 23,389,990 531,186 3,014,461 Cash held at margin 5, 6 11,465 981,640 221,466 194,048 Due from shareholders - - - - Other debtors 151,732 3,177,867 502,833 665,896
Total assets 49,826,352 1,890,194,593 253,195,596 397,019,669
Liabilities Current liabilities Bank overdraft - - - - Cash held at margin - - - - Financial liability at fair value through profit or loss 1(g) 1,668 249,748 11,785 50,933 Due to brokers 1(f) - 8,403,513 41,650 82,372 Due to shareholders - - - - Management fee payable 2 29,700 295,852 124,112 215,354 Other creditors 1,668 379,174 3,618 80,940
Liabilities 33,036 9,328,287 181,165 429,599
Net assets attributable to holders of redeemable participating shares 49,793,316 1,880,866,306 253,014,431 396,590,070
The accompanying notes form an integral part of the financial statements. Details of NAV per share are set out in Note 13.

Balance Sheet (continued) As at 30 June 2015 (continued)
HSBC ETFs PLC >343<
Note
HSBC MSCI
BRAZIL UCITS ETF
USD
HSBC MSCI
PACIFIC ex JAPAN
UCITS ETF USD
HSBC MSCI EM
FAR EAST UCITS ETF
USD
HSBC MSCI
TURKEY UCITS ETF
USD
Assets Current assets Financial assets at fair value through profit or loss 1(g) 9,690,385 102,683,742 25,222,835 9,746,263 Cash at bank 5 - - 92,631 44,728 Cash held at margin 5, 6 - 102,649 174,092 4,661 Due from shareholders - 3,872,559 - - Other debtors 40,426 865,390 252,972 -
Total assets 9,730,811 107,524,340 25,742,530 9,795,652
Liabilities Current liabilities Bank overdraft 5,707 175,892 - - Cash held at margin - - - - Financial liability at fair value through profit or loss 1(g) - 15,183 11,979 883 Due to brokers 1(f) - - - - Due to shareholders - 3,854,238 - - Management fee payable 2 10,094 91,271 6,594 9,822 Other creditors 2,434 44,181 36,512 -
Liabilities 18,235 4,180,765 55,085 10,705
Net assets attributable to holders of redeemable participating shares 9,712,576 103,343,575 25,687,445 9,784,947
The accompanying notes form an integral part of the financial statements. Details of NAV per share are set out in Note 13.
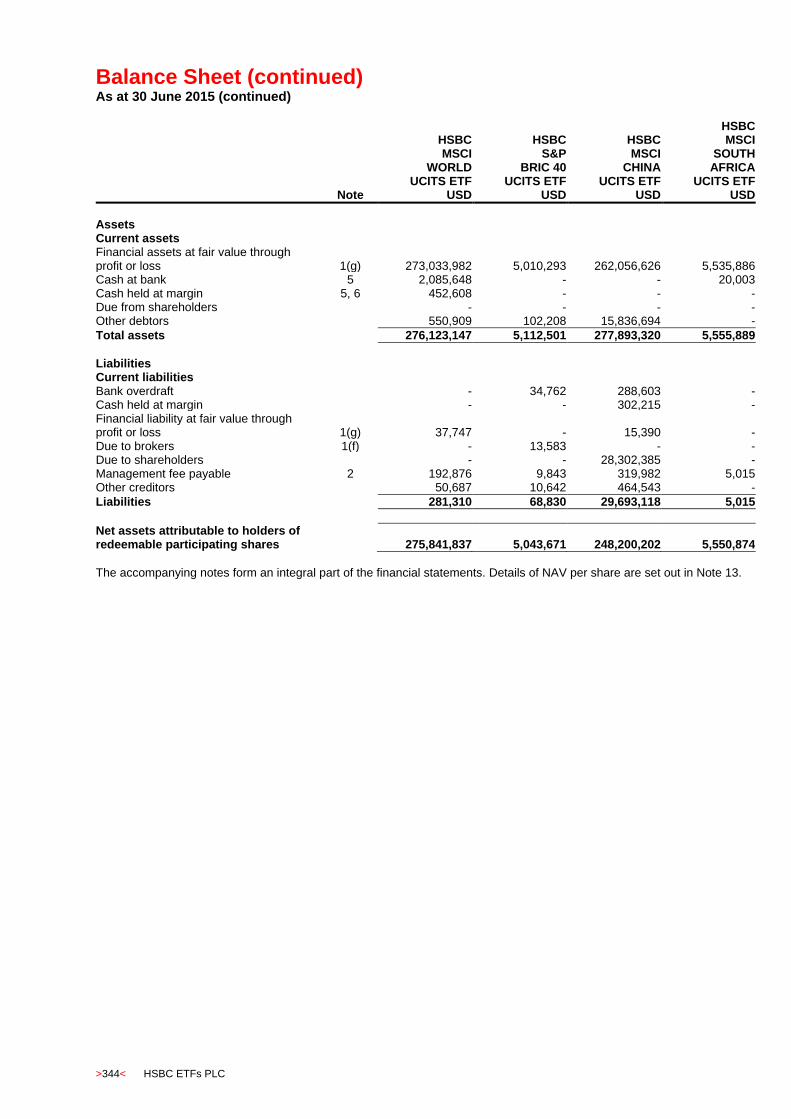
Balance Sheet (continued) As at 30 June 2015 (continued)
>344< HSBC ETFs PLC
Note
HSBC MSCI
WORLD UCITS ETF
USD
HSBC S&P
BRIC 40 UCITS ETF
USD
HSBC MSCI
CHINA UCITS ETF
USD
HSBC MSCI
SOUTH AFRICA
UCITS ETF USD
Assets Current assets Financial assets at fair value through profit or loss 1(g) 273,033,982 5,010,293 262,056,626 5,535,886 Cash at bank 5 2,085,648 - - 20,003 Cash held at margin 5, 6 452,608 - - - Due from shareholders - - - - Other debtors 550,909 102,208 15,836,694 -
Total assets 276,123,147 5,112,501 277,893,320 5,555,889
Liabilities Current liabilities Bank overdraft - 34,762 288,603 - Cash held at margin - - 302,215 - Financial liability at fair value through profit or loss 1(g) 37,747 - 15,390 - Due to brokers 1(f) - 13,583 - - Due to shareholders - - 28,302,385 - Management fee payable 2 192,876 9,843 319,982 5,015 Other creditors 50,687 10,642 464,543 -
Liabilities 281,310 68,830 29,693,118 5,015
Net assets attributable to holders of redeemable participating shares 275,841,837 5,043,671 248,200,202 5,550,874
The accompanying notes form an integral part of the financial statements. Details of NAV per share are set out in Note 13.

Balance Sheet (continued) As at 30 June 2015 (continued)
HSBC ETFs PLC >345<
Note
HSBC MSCI
CANADA UCITS ETF
USD
HSBC MSCI
MEXICO CAPPED
UCITS ETF USD
HSBC MSCI
EM LATIN AMERICA
UCITS ETF USD
HSBC MSCI
INDONESIA UCITS ETF
USD
Assets Current assets Financial assets at fair value through profit or loss 1(g) 36,282,961 14,859,151 9,999,018 27,800,087 Cash at bank 5 165,126 105,001 87,088 166,645 Cash held at margin 5, 6 12,146 5,556 2,439 13,450 Due from shareholders - - - - Other debtors 96,395 2,977 28,104 43,863
Total assets 36,556,628 14,972,685 10,116,649 28,024,045
Liabilities Current liabilities Bank overdraft - - - - Cash held at margins - - - - Financial liability at fair value through profit or loss 1(g) 2,447 - - 3,300 Due to brokers 1(f) - - - - Due to shareholders - - - - Management fee payable 2 21,398 16,739 10,461 28,986 Other creditors 24,099 299 1,964 8,773
Liabilities 47,944 17,038 12,425 41,059
Net assets attributable to holders of redeemable participating shares 36,508,684 14,955,647 10,104,224 27,982,986
The accompanying notes form an integral part of the financial statements. Details of NAV per share are set out in Note 13.
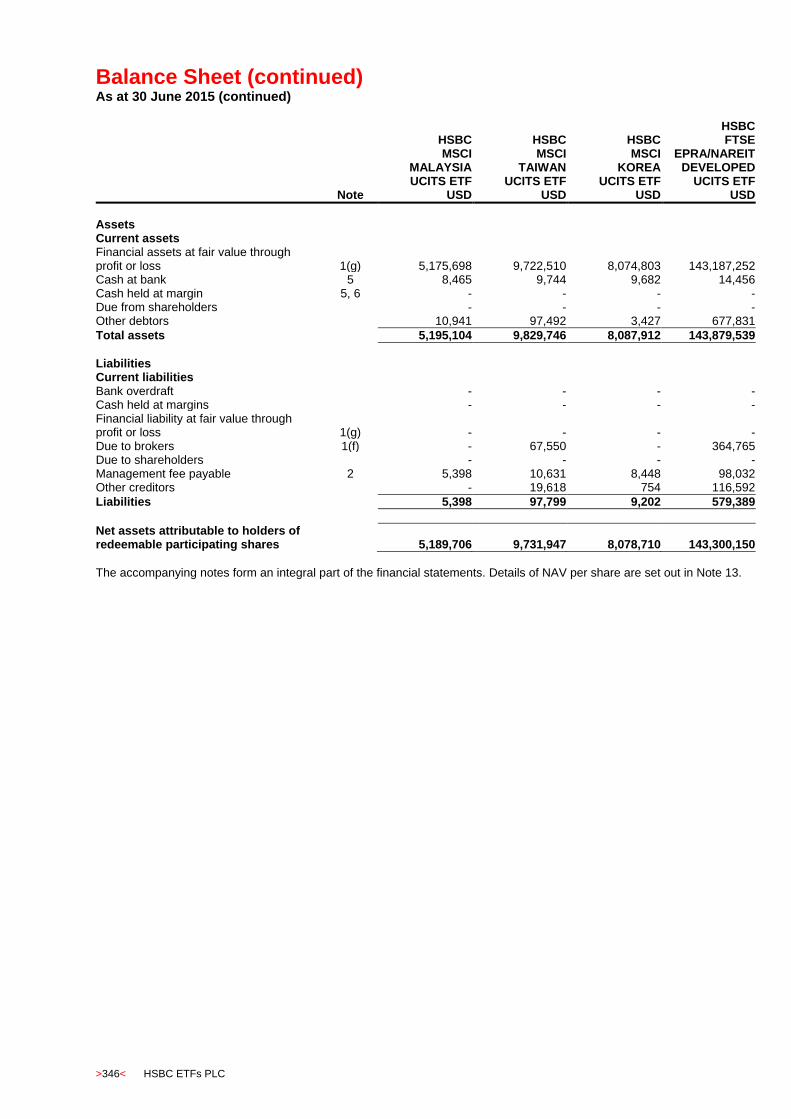
Balance Sheet (continued) As at 30 June 2015 (continued)
>346< HSBC ETFs PLC
Note
HSBC MSCI
MALAYSIA UCITS ETF
USD
HSBC MSCI
TAIWAN UCITS ETF
USD
HSBC MSCI
KOREA UCITS ETF
USD
HSBC FTSE
EPRA/NAREIT DEVELOPED
UCITS ETF USD
Assets Current assets Financial assets at fair value through profit or loss 1(g) 5,175,698 9,722,510 8,074,803 143,187,252 Cash at bank 5 8,465 9,744 9,682 14,456 Cash held at margin 5, 6 - - - - Due from shareholders - - - - Other debtors 10,941 97,492 3,427 677,831
Total assets 5,195,104 9,829,746 8,087,912 143,879,539
Liabilities Current liabilities Bank overdraft - - - - Cash held at margins - - - - Financial liability at fair value through profit or loss 1(g) - - - - Due to brokers 1(f) - 67,550 - 364,765 Due to shareholders - - - - Management fee payable 2 5,398 10,631 8,448 98,032 Other creditors - 19,618 754 116,592
Liabilities 5,398 97,799 9,202 579,389
Net assets attributable to holders of redeemable participating shares 5,189,706 9,731,947 8,078,710 143,300,150
The accompanying notes form an integral part of the financial statements. Details of NAV per share are set out in Note 13.

Balance Sheet (continued) As at 30 June 2015 (continued)
HSBC ETFs PLC >347<
Note
HSBC MSCI
RUSSIA CAPPED
UCITS ETF USD
HSBC MSCI
EMERGING MARKETS UCITS ETF
USD
HSBC MSCI AC
FAR EAST ex JAPAN
UCITS ETF USD
HSBC ESI
WORLDWIDE EQUITY
UCITS ETF USD
Assets Current assets Financial assets at fair value through profit or loss 1(g) 50,897,447 306,958,543 136,328,332 989,813,096 Cash at bank 5 231,698 7,309,650 1,497,944 9,420,360 Cash held at margin 5, 6 87,318 402,711 270,867 584,482 Due from shareholders - - - 20,977 Other debtors 143,688 2,590,719 1,063,384 3,482,383
Total assets 51,360,151 317,261,623 139,160,527 1,003,321,298
Liabilities Current liabilities Bank overdraft - - - - Cash held at margins - - - - Financial liability at fair value through profit or loss 1(g) 10,275 241,544 51,592 250,562 Due to brokers 1(f) - - - - Due to shareholders - 6,005,800 - - Management fee payable 2 53,229 326,743 140,946 417,800 Other creditors 14,369 240,072 144,934 352,291
Liabilities 77,873 6,814,159 337,472 1,020,653
Net assets attributable to holders of redeemable participating shares 51,282,278 310,447,464 138,823,055 1,002,300,645
The accompanying notes form an integral part of the financial statements. Details of NAV per share are set out in Note 13.
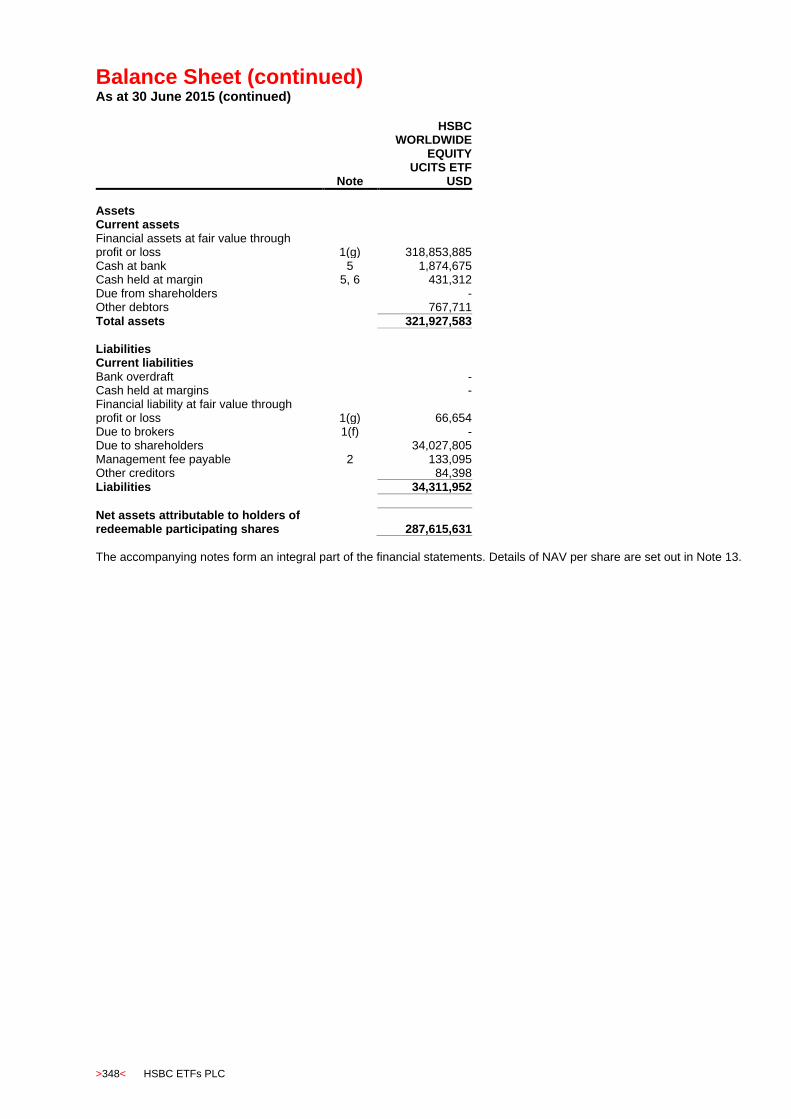
Balance Sheet (continued) As at 30 June 2015 (continued)
>348< HSBC ETFs PLC
Note
HSBC WORLDWIDE
EQUITY UCITS ETF
USD
Assets Current assets Financial assets at fair value through profit or loss 1(g) 318,853,885 Cash at bank 5 1,874,675 Cash held at margin 5, 6 431,312 Due from shareholders - Other debtors 767,711
Total assets 321,927,583
Liabilities Current liabilities Bank overdraft - Cash held at margins - Financial liability at fair value through profit or loss 1(g) 66,654 Due to brokers 1(f) - Due to shareholders 34,027,805 Management fee payable 2 133,095 Other creditors 84,398
Liabilities 34,311,952
Net assets attributable to holders of redeemable participating shares 287,615,631
The accompanying notes form an integral part of the financial statements. Details of NAV per share are set out in Note 13.
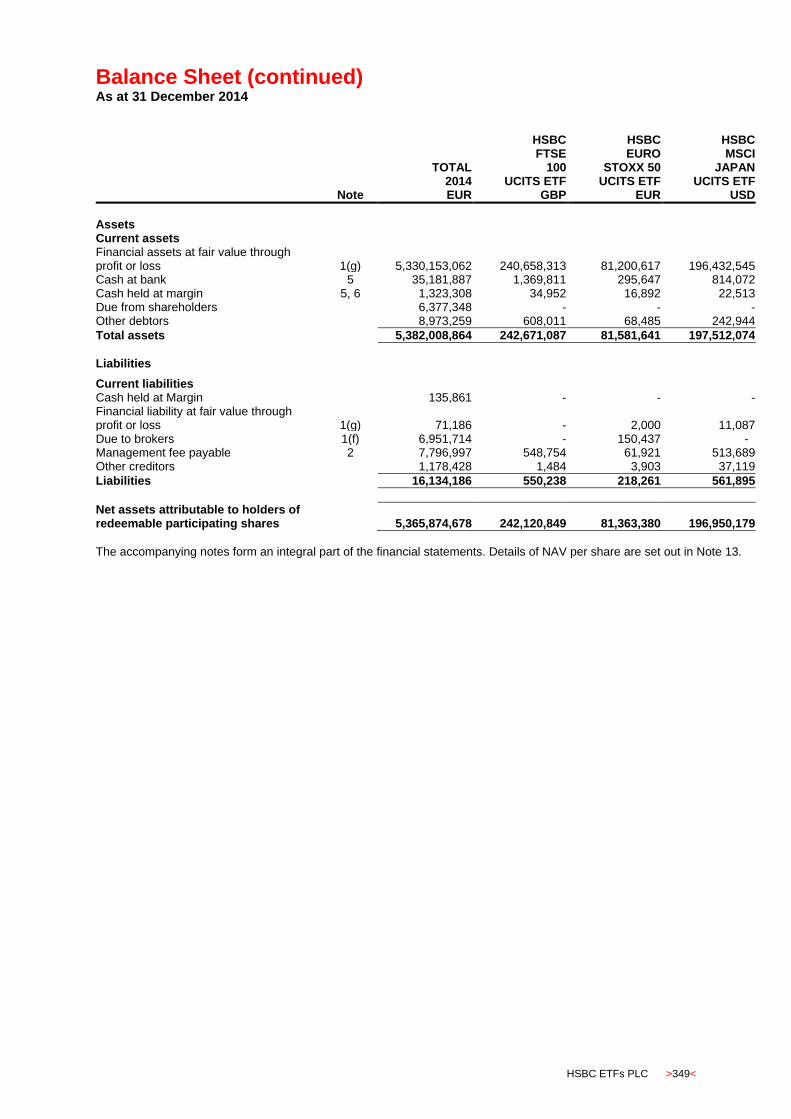
Balance Sheet (continued) As at 31 December 2014
HSBC ETFs PLC >349<
Note
TOTAL 2014 EUR
HSBC FTSE
100 UCITS ETF
GBP
HSBC EURO
STOXX 50 UCITS ETF
EUR
HSBC MSCI
JAPAN UCITS ETF
USD
Assets Current assets Financial assets at fair value through profit or loss 1(g) 5,330,153,062 240,658,313 81,200,617 196,432,545 Cash at bank 5 35,181,887 1,369,811 295,647 814,072 Cash held at margin 5, 6 1,323,308 34,952 16,892 22,513 Due from shareholders 6,377,348 - - - Other debtors 8,973,259 608,011 68,485 242,944
Total assets 5,382,008,864 242,671,087 81,581,641 197,512,074
Liabilities
Current liabilities Cash held at Margin 135,861 - - - Financial liability at fair value through profit or loss 1(g) 71,186 - 2,000 11,087 Due to brokers 1(f) 6,951,714 - 150,437 - Management fee payable 2 7,796,997 548,754 61,921 513,689 Other creditors 1,178,428 1,484 3,903 37,119
Liabilities 16,134,186 550,238 218,261 561,895
Net assets attributable to holders of redeemable participating shares 5,365,874,678 242,120,849 81,363,380 196,950,179
The accompanying notes form an integral part of the financial statements. Details of NAV per share are set out in Note 13.

Balance Sheet (continued) As at 31 December 2014 (continued)
>350< HSBC ETFs PLC
Note
HSBC FTSE
250 UCITS ETF
GBP
HSBC S&P 500
UCITS ETF USD
HSBC MSCI
EUROPE UCITS ETF
EUR
HSBC MSCI USA
UCITS ETF USD
Assets Current assets Financial assets at fair value through profit or loss 1(g) 49,575,606 2,119,151,162 165,871,296 446,720,737 Cash at bank 5 45,075 11,367,478 278,143 2,052,360 Cash held at margin 5, 6 5,567 137,914 70,970 23,531 Due from shareholders - - - 5,003,950 Other debtors 119,225 2,885,268 154,192 638,677
Total assets 49,745,473 2,133,541,822 166,374,601 454,439,255
Liabilities Current liabilities Financial liability at fair value through profit or loss 1(g) - - - - Due to brokers 1(f) - - 26,944 4,979,822 Management fee payable 2 107,403 873,563 240,444 668,541 Other creditors 733 426,511 2,660 94,646
Liabilities 108,136 1,300,074 270,048 5,743,009
Net assets attributable to holders of redeemable participating shares 49,637,337 2,132,241,748 166,104,553 448,696,246
The accompanying notes form an integral part of the financial statements. Details of NAV per share are set out in Note 13.

Balance Sheet (continued) As at 31 December 2014 (continued)
HSBC ETFs PLC >351<
Note
HSBC MSCI
BRAZIL UCITS ETF
USD
HSBC MSCI
PACIFIC ex JAPAN
UCITS ETF USD
HSBC MSCI EM
FAR EAST UCITS ETF
USD
HSBC MSCI
TURKEY UCITS ETF
USD
Assets Current assets Financial assets at fair value through profit or loss 1(g) 8,222,253 155,476,925 81,960,516 9,985,960 Cash at bank 5 47,108 592,490 1,336,552 41,136 Cash held at margin 5, 6 - 69,018 142,827 1,507 Due from shareholders - - - - Other debtors 37,263 211,105 253,734 -
Total assets 8,306,624 156,349,538 83,693,629 10,028,603
Liabilities Current liabilities Financial liability at fair value through profit or loss 1(g) - 419 7,541 - Due to brokers 1(f) - - - - Management fee payable 2 50,463 394,969 282,638 39,757 Other creditors 5,455 49,283 51,995 -
Liabilities 55,918 444,671 342,174 39,757
Net assets attributable to holders of redeemable participating shares 8,250,706 155,904,867 83,351,455 9,988,846
The accompanying notes form an integral part of the financial statements. Details of NAV per share are set out in Note 13.
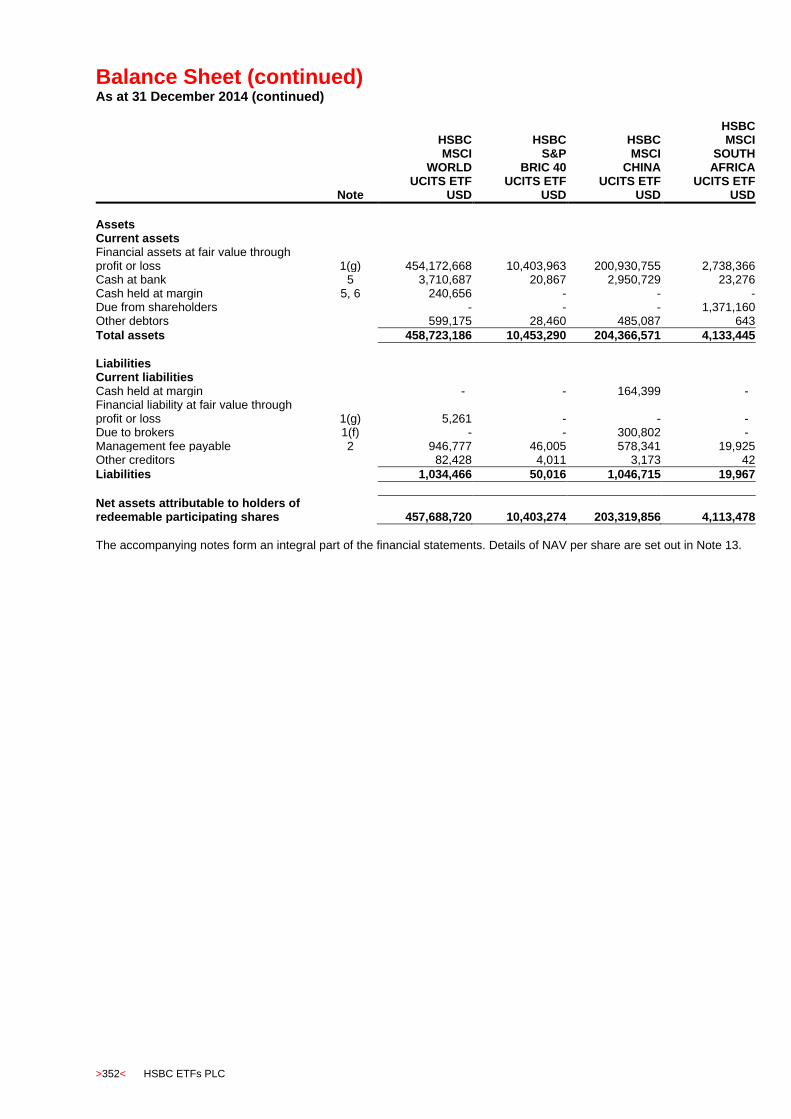
Balance Sheet (continued) As at 31 December 2014 (continued)
>352< HSBC ETFs PLC
Note
HSBC MSCI
WORLD UCITS ETF
USD
HSBC S&P
BRIC 40 UCITS ETF
USD
HSBC MSCI
CHINA UCITS ETF
USD
HSBC MSCI
SOUTH AFRICA
UCITS ETF USD
Assets Current assets Financial assets at fair value through profit or loss 1(g) 454,172,668 10,403,963 200,930,755 2,738,366 Cash at bank 5 3,710,687 20,867 2,950,729 23,276 Cash held at margin 5, 6 240,656 - - - Due from shareholders - - - 1,371,160 Other debtors 599,175 28,460 485,087 643
Total assets 458,723,186 10,453,290 204,366,571 4,133,445
Liabilities Current liabilities Cash held at margin - - 164,399 - Financial liability at fair value through profit or loss 1(g) 5,261 - - - Due to brokers 1(f) - - 300,802 - Management fee payable 2 946,777 46,005 578,341 19,925 Other creditors 82,428 4,011 3,173 42
Liabilities 1,034,466 50,016 1,046,715 19,967
Net assets attributable to holders of redeemable participating shares 457,688,720 10,403,274 203,319,856 4,113,478
The accompanying notes form an integral part of the financial statements. Details of NAV per share are set out in Note 13.

Balance Sheet (continued) As at 31 December 2014 (continued)
HSBC ETFs PLC >353<
Note
HSBC MSCI
CANADA UCITS ETF
USD
HSBC MSCI
MEXICO CAPPED
UCITS ETF USD
HSBC MSCI
EM LATIN AMERICA
UCITS ETF USD
HSBC MSCI
INDONESIA UCITS ETF
USD
Assets Current assets Financial assets at fair value through profit or loss 1(g) 34,078,266 19,565,067 10,887,031 18,148,241 Cash at bank 5 282,224 178,252 83,458 150,663 Cash held at margin 5, 6 10,326 3,981 84 8,006 Due from shareholders - - - - Other debtors 89,241 - 23,332 2,329
Total assets 34,460,057 19,747,300 10,993,905 18,309,239
Liabilities Current liabilities Financial liability at fair value through profit or loss 1(g) - - - 1,060 Due to brokers 1(f) - - - - Management fee payable 2 67,611 82,038 60,220 63,897 Other creditors 22,311 44 3,153 466
Liabilities 89,922 82,082 63,373 65,423
Net assets attributable to holders of redeemable participating shares 34,370,135 19,665,218 10,930,532 18,243,816
The accompanying notes form an integral part of the financial statements. Details of NAV per share are set out in Note 13.

Balance Sheet (continued) As at 31 December 2014 (continued)
>354< HSBC ETFs PLC
Note
HSBC MSCI
MALAYSIA UCITS ETF
USD
HSBC MSCI
TAIWAN UCITS ETF
USD
HSBC MSCI
KOREA UCITS ETF
USD
HSBC FTSE
EPRA/NAREIT DEVELOPED
UCITS ETF USD
Assets Current assets Financial assets at fair value through profit or loss 1(g) 5,814,104 6,307,880 8,094,768 86,132,690 Cash at bank 5 2,697,854 19,657 23,329 85,273 Cash held at margin 5, 6 - - - - Due from shareholders 1,341,801 - - - Other debtors 16,764 - 88,042 395,659
Total assets 9,870,523 6,327,537 8,206,139 86,613,622
Liabilities Current liabilities Financial liability at fair value through profit or loss 1(g) - - - - Due to brokers 1(f) 2,685,743 - 52,220 172,046 Management fee payable 2 16,812 21,243 20,312 88,446 Other creditors - 235 19,369 72,752
Liabilities 2,702,555 21,478 91,901 333,244
Net assets attributable to holders of redeemable participating shares 7,167,968 6,306,059 8,114,238 86,280,378
The accompanying notes form an integral part of the financial statements. Details of NAV per share are set out in Note 13.
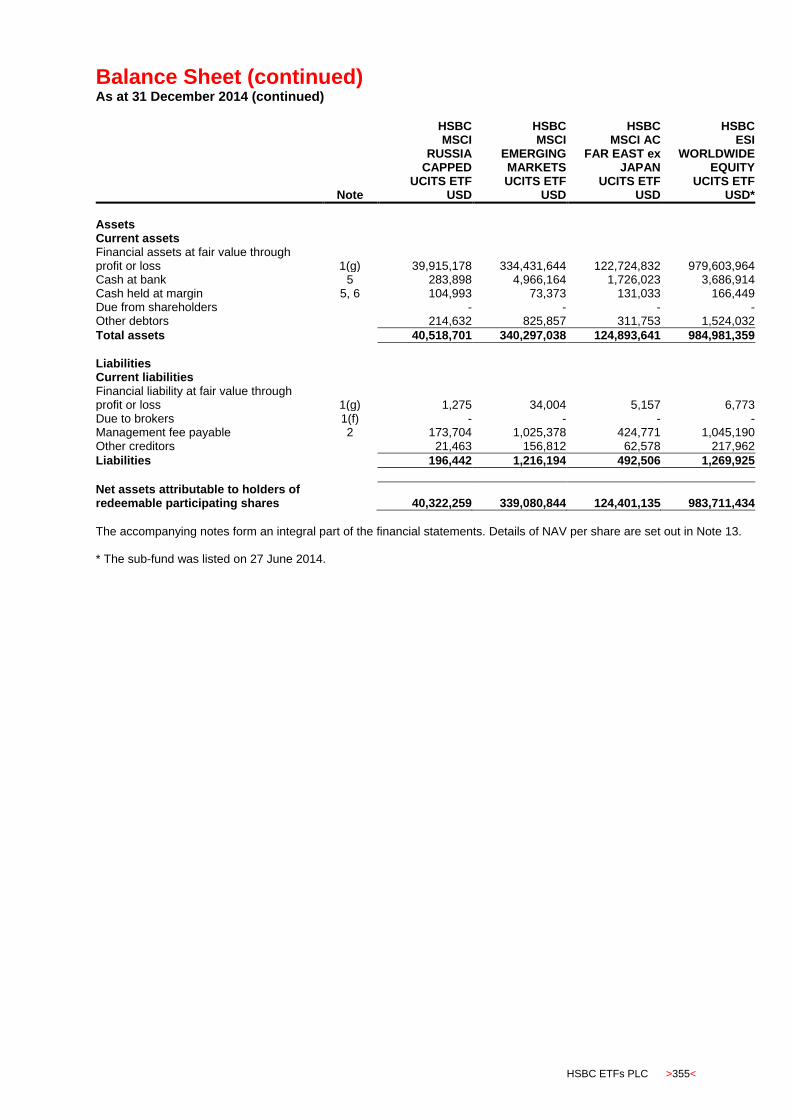
Balance Sheet (continued) As at 31 December 2014 (continued)
HSBC ETFs PLC >355<
Note
HSBC MSCI
RUSSIA CAPPED
UCITS ETF USD
HSBC MSCI
EMERGING MARKETS UCITS ETF
USD
HSBC MSCI AC
FAR EAST ex JAPAN
UCITS ETF USD
HSBC ESI
WORLDWIDE EQUITY
UCITS ETF USD*
Assets Current assets Financial assets at fair value through profit or loss 1(g) 39,915,178 334,431,644 122,724,832 979,603,964 Cash at bank 5 283,898 4,966,164 1,726,023 3,686,914 Cash held at margin 5, 6 104,993 73,373 131,033 166,449 Due from shareholders - - - - Other debtors 214,632 825,857 311,753 1,524,032
Total assets 40,518,701 340,297,038 124,893,641 984,981,359
Liabilities Current liabilities Financial liability at fair value through profit or loss 1(g) 1,275 34,004 5,157 6,773 Due to brokers 1(f) - - - - Management fee payable 2 173,704 1,025,378 424,771 1,045,190 Other creditors 21,463 156,812 62,578 217,962
Liabilities 196,442 1,216,194 492,506 1,269,925
Net assets attributable to holders of redeemable participating shares 40,322,259 339,080,844 124,401,135 983,711,434
The accompanying notes form an integral part of the financial statements. Details of NAV per share are set out in Note 13. * The sub-fund was listed on 27 June 2014.

Balance Sheet (continued) As at 31 December 2014 (continued)
>356< HSBC ETFs PLC
Note
HSBC WORLDWIDE
EQUITY UCITS ETF
USD*
Assets Current assets Financial assets at fair value through profit or loss 1(g) 346,336,540 Cash at bank 5 2,530,909 Cash held at margin 5, 6 295,562 Due from shareholders - Other debtors 580,702
Total assets 349,743,713
Liabilities Current liabilities Financial liability at fair value through profit or loss 1(g) 11,142 Due to brokers 1(f) 6,650 Management fee payable 2 541,478 Other creditors 82,751
Liabilities 642,021
Net assets attributable to holders of redeemable participating shares 349,101,692
The accompanying notes form an integral part of the financial statements. Details of NAV per share are set out in Note 13. * The sub-fund was listed on 8 July 2014.
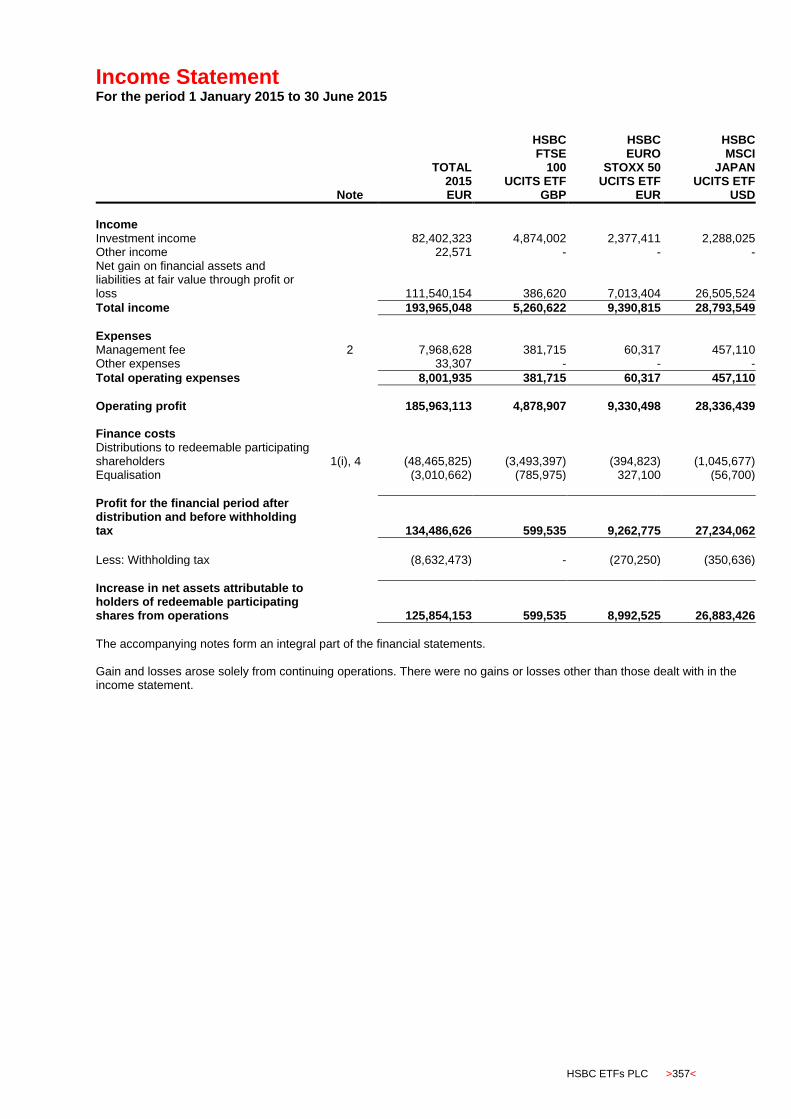
Income Statement For the period 1 January 2015 to 30 June 2015
HSBC ETFs PLC >357<
Note
TOTAL 2015 EUR
HSBC FTSE
100 UCITS ETF
GBP
HSBC EURO
STOXX 50 UCITS ETF
EUR
HSBC MSCI
JAPAN UCITS ETF
USD
Income Investment income 82,402,323 4,874,002 2,377,411 2,288,025 Other income 22,571 - - - Net gain on financial assets and liabilities at fair value through profit or loss 111,540,154 386,620 7,013,404 26,505,524
Total income 193,965,048 5,260,622 9,390,815 28,793,549
Expenses Management fee 2 7,968,628 381,715 60,317 457,110 Other expenses 33,307 - - -
Total operating expenses 8,001,935 381,715 60,317 457,110
Operating profit 185,963,113 4,878,907 9,330,498 28,336,439
Finance costs Distributions to redeemable participating shareholders 1(i), 4 (48,465,825) (3,493,397) (394,823) (1,045,677) Equalisation (3,010,662) (785,975) 327,100 (56,700)
Profit for the financial period after distribution and before withholding tax 134,486,626 599,535 9,262,775 27,234,062
Less: Withholding tax (8,632,473) - (270,250) (350,636)
Increase in net assets attributable to holders of redeemable participating shares from operations 125,854,153 599,535 8,992,525 26,883,426
The accompanying notes form an integral part of the financial statements. Gain and losses arose solely from continuing operations. There were no gains or losses other than those dealt with in the income statement.
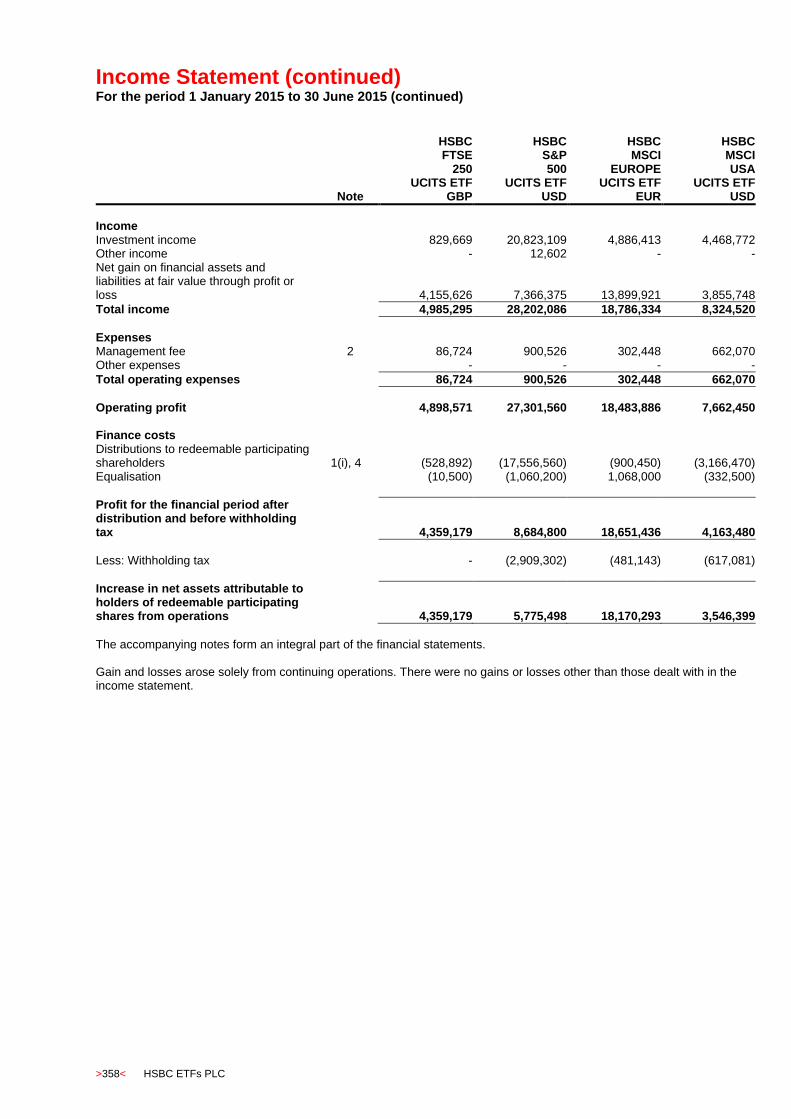
Income Statement (continued) For the period 1 January 2015 to 30 June 2015 (continued)
>358< HSBC ETFs PLC
Note
HSBC FTSE
250 UCITS ETF
GBP
HSBC
S&P 500
UCITS ETF USD
HSBC MSCI
EUROPE UCITS ETF
EUR
HSBC MSCI USA
UCITS ETF USD
Income Investment income 829,669 20,823,109 4,886,413 4,468,772 Other income - 12,602 - - Net gain on financial assets and liabilities at fair value through profit or loss 4,155,626 7,366,375 13,899,921 3,855,748
Total income 4,985,295 28,202,086 18,786,334 8,324,520
Expenses Management fee 2 86,724 900,526 302,448 662,070 Other expenses - - - -
Total operating expenses 86,724 900,526 302,448 662,070
Operating profit 4,898,571 27,301,560 18,483,886 7,662,450
Finance costs Distributions to redeemable participating shareholders 1(i), 4 (528,892) (17,556,560) (900,450) (3,166,470) Equalisation (10,500) (1,060,200) 1,068,000 (332,500)
Profit for the financial period after distribution and before withholding tax 4,359,179 8,684,800 18,651,436 4,163,480
Less: Withholding tax - (2,909,302) (481,143) (617,081)
Increase in net assets attributable to holders of redeemable participating shares from operations 4,359,179 5,775,498 18,170,293 3,546,399
The accompanying notes form an integral part of the financial statements. Gain and losses arose solely from continuing operations. There were no gains or losses other than those dealt with in the income statement.
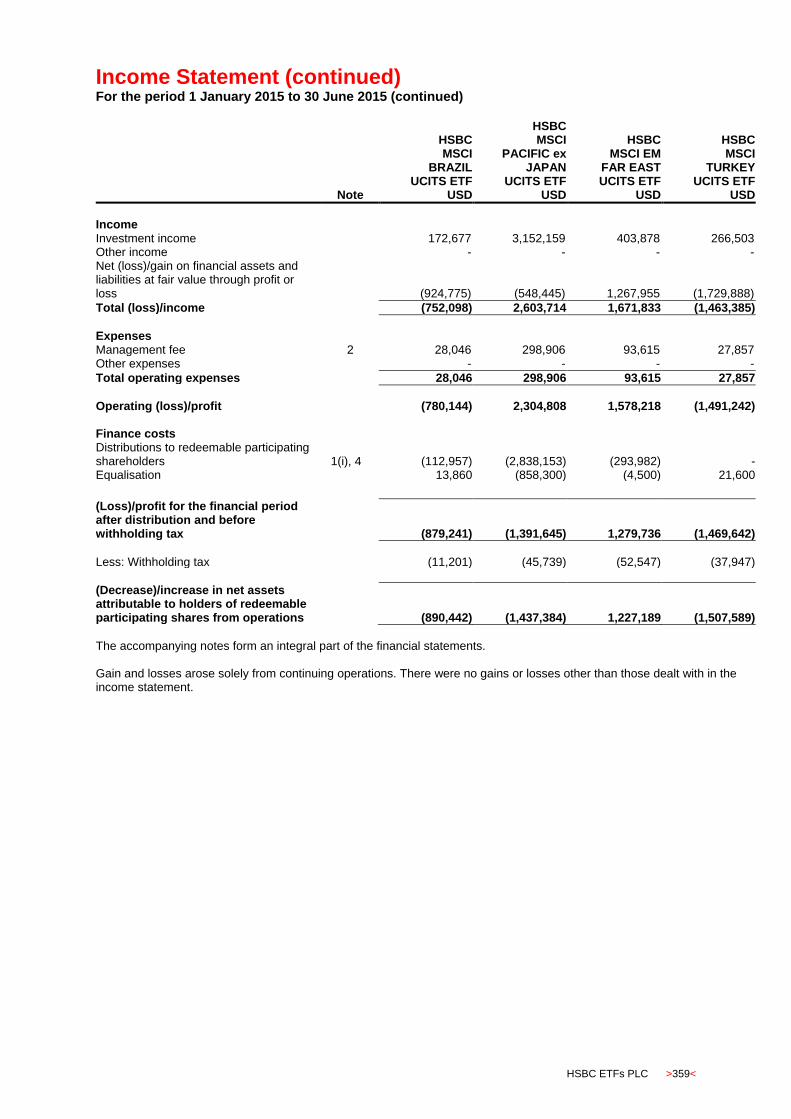
Income Statement (continued) For the period 1 January 2015 to 30 June 2015 (continued)
HSBC ETFs PLC >359<
Note
HSBC MSCI
BRAZIL UCITS ETF
USD
HSBC MSCI
PACIFIC ex JAPAN
UCITS ETF USD
HSBC MSCI EM
FAR EAST UCITS ETF
USD
HSBC MSCI
TURKEY UCITS ETF
USD
Income Investment income 172,677 3,152,159 403,878 266,503 Other income - - - - Net (loss)/gain on financial assets and liabilities at fair value through profit or loss (924,775) (548,445) 1,267,955 (1,729,888)
Total (loss)/income (752,098) 2,603,714 1,671,833 (1,463,385)
Expenses Management fee 2 28,046 298,906 93,615 27,857 Other expenses - - - -
Total operating expenses 28,046 298,906 93,615 27,857
Operating (loss)/profit (780,144) 2,304,808 1,578,218 (1,491,242)
Finance costs Distributions to redeemable participating shareholders 1(i), 4 (112,957) (2,838,153) (293,982) - Equalisation 13,860 (858,300) (4,500) 21,600
(Loss)/profit for the financial period after distribution and before withholding tax (879,241) (1,391,645) 1,279,736 (1,469,642)
Less: Withholding tax (11,201) (45,739) (52,547) (37,947)
(Decrease)/increase in net assets attributable to holders of redeemable participating shares from operations (890,442) (1,437,384) 1,227,189 (1,507,589)
The accompanying notes form an integral part of the financial statements. Gain and losses arose solely from continuing operations. There were no gains or losses other than those dealt with in the income statement.

Income Statement (continued) For the period 1 January 2015 to 30 June 2015 (continued)
>360< HSBC ETFs PLC
Note
HSBC MSCI
WORLD UCITS ETF
USD
HSBC S&P
BRIC 40 UCITS ETF
USD
HSBC MSCI
CHINA UCITS ETF
USD
HSBC MSCI
SOUTH AFRICA
UCITS ETF USD
Income Investment income 5,620,527 134,020 5,767,093 67,938 Other income - - - - Net gain/(loss) on financial assets and liabilities at fair value through profit or loss 8,202,434 687,462 27,720,138 (45,998)
Total income 13,822,961 821,482 33,487,231 21,940
Expenses Management fee 2 678,727 31,827 793,602 14,184
Other expenses - 2,367 9,502 - Total operating expenses 678,727 34,194 803,104 14,184
Operating profit 13,144,234 787,288 32,684,127 7,756
Finance costs Distributions to redeemable participating shareholders 1(i), 4 (3,324,320) (152,260) (1,664,625) (44,025) Equalisation (699,750) (19,500) (616,500) 17,150
Profit/(loss) for the financial period after distribution and before withholding tax 9,120,164 615,528 30,403,002 (19,119)
Less: Withholding tax (673,507) (12,110) (481,872) (6,475)
Increase/(decrease) in net assets attributable to holders of redeemable participating shares from operations 8,446,657 603,418 29,921,130 (25,594)
The accompanying notes form an integral part of the financial statements. Gain and losses arose solely from continuing operations. There were no gains or losses other than those dealt with in the income statement.
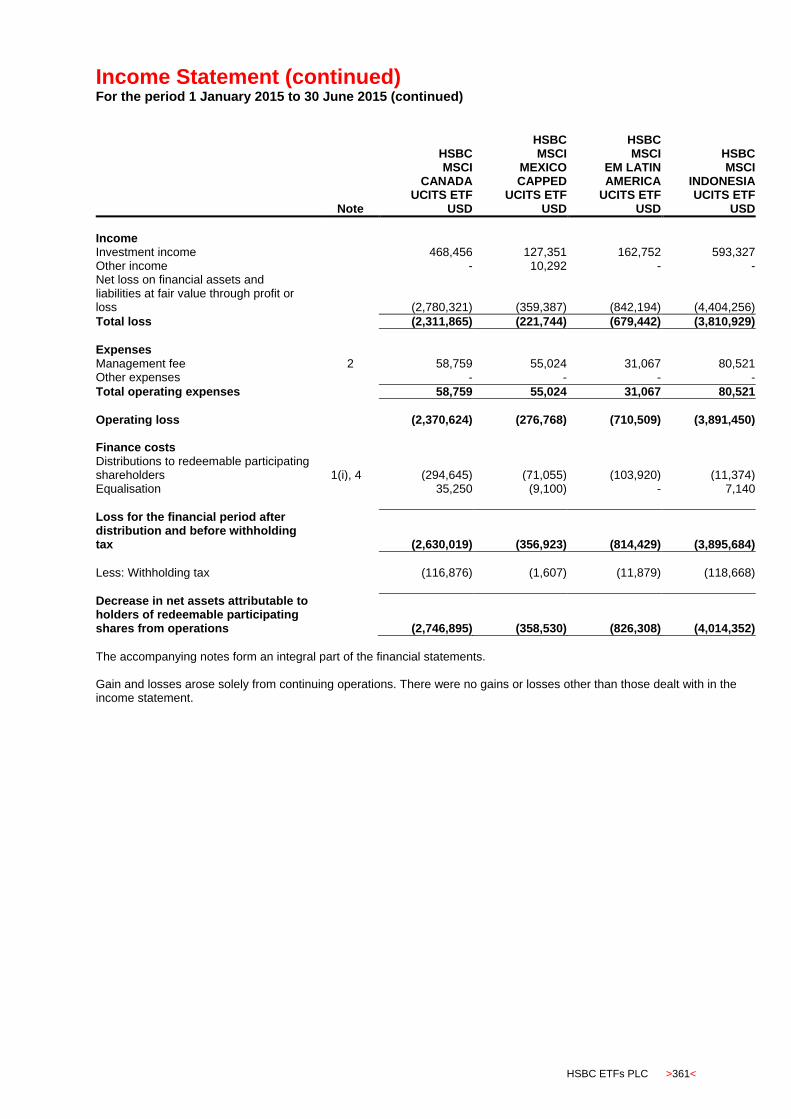
Income Statement (continued) For the period 1 January 2015 to 30 June 2015 (continued)
HSBC ETFs PLC >361<
Note
HSBC MSCI
CANADA UCITS ETF
USD
HSBC MSCI
MEXICO CAPPED
UCITS ETF USD
HSBC MSCI
EM LATIN AMERICA
UCITS ETF USD
HSBC MSCI
INDONESIA UCITS ETF
USD
Income Investment income 468,456 127,351 162,752 593,327 Other income - 10,292 - - Net loss on financial assets and liabilities at fair value through profit or loss (2,780,321) (359,387) (842,194) (4,404,256)
Total loss (2,311,865) (221,744) (679,442) (3,810,929)
Expenses Management fee 2 58,759 55,024 31,067 80,521 Other expenses - - - -
Total operating expenses 58,759 55,024 31,067 80,521
Operating loss (2,370,624) (276,768) (710,509) (3,891,450)
Finance costs Distributions to redeemable participating shareholders 1(i), 4 (294,645) (71,055) (103,920) (11,374) Equalisation 35,250 (9,100) - 7,140
Loss for the financial period after distribution and before withholding tax (2,630,019) (356,923) (814,429) (3,895,684)
Less: Withholding tax (116,876) (1,607) (11,879) (118,668)
Decrease in net assets attributable to holders of redeemable participating shares from operations (2,746,895) (358,530) (826,308) (4,014,352)
The accompanying notes form an integral part of the financial statements. Gain and losses arose solely from continuing operations. There were no gains or losses other than those dealt with in the income statement.
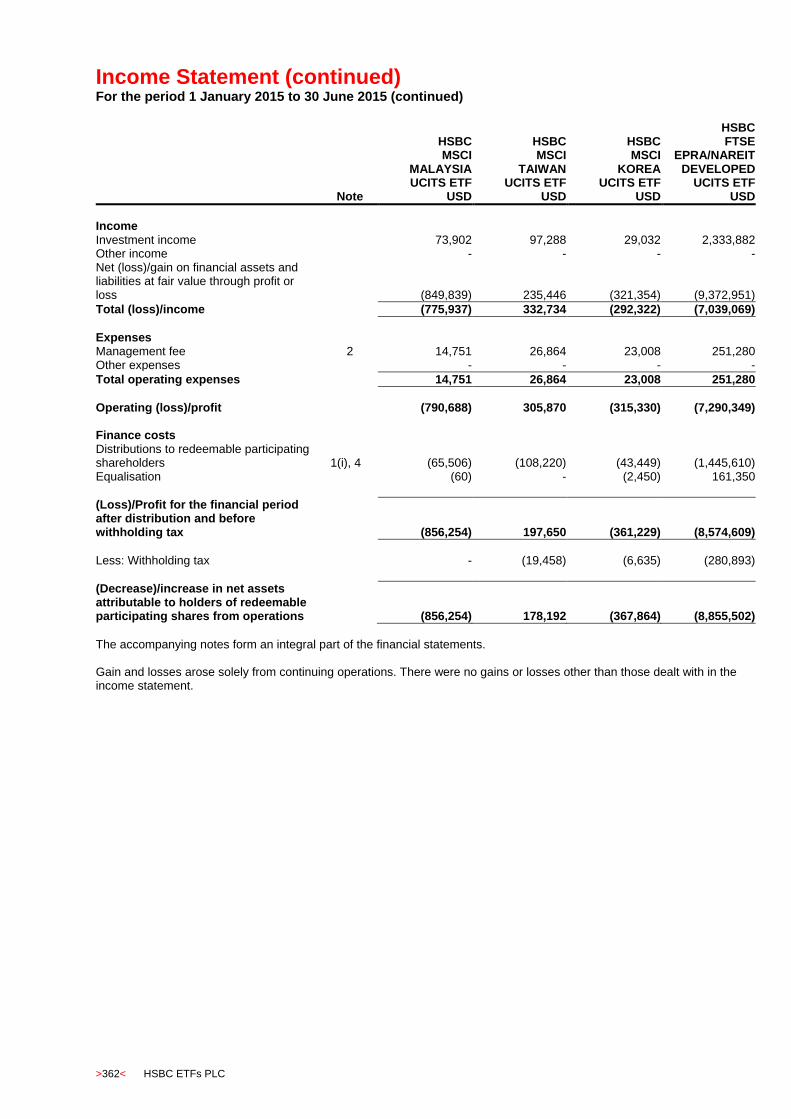
Income Statement (continued) For the period 1 January 2015 to 30 June 2015 (continued)
>362< HSBC ETFs PLC
Note
HSBC MSCI
MALAYSIA UCITS ETF
USD
HSBC MSCI
TAIWAN UCITS ETF
USD
HSBC MSCI
KOREA UCITS ETF
USD
HSBC FTSE
EPRA/NAREIT DEVELOPED
UCITS ETF USD
Income Investment income 73,902 97,288 29,032 2,333,882 Other income - - - - Net (loss)/gain on financial assets and liabilities at fair value through profit or loss (849,839) 235,446 (321,354) (9,372,951)
Total (loss)/income (775,937) 332,734 (292,322) (7,039,069)
Expenses Management fee 2 14,751 26,864 23,008 251,280 Other expenses - - - -
Total operating expenses 14,751 26,864 23,008 251,280
Operating (loss)/profit (790,688) 305,870 (315,330) (7,290,349)
Finance costs Distributions to redeemable participating shareholders 1(i), 4 (65,506) (108,220) (43,449) (1,445,610) Equalisation (60) - (2,450) 161,350
(Loss)/Profit for the financial period after distribution and before withholding tax (856,254) 197,650 (361,229) (8,574,609)
Less: Withholding tax - (19,458) (6,635) (280,893)
(Decrease)/increase in net assets attributable to holders of redeemable participating shares from operations (856,254) 178,192 (367,864) (8,855,502)
The accompanying notes form an integral part of the financial statements. Gain and losses arose solely from continuing operations. There were no gains or losses other than those dealt with in the income statement.
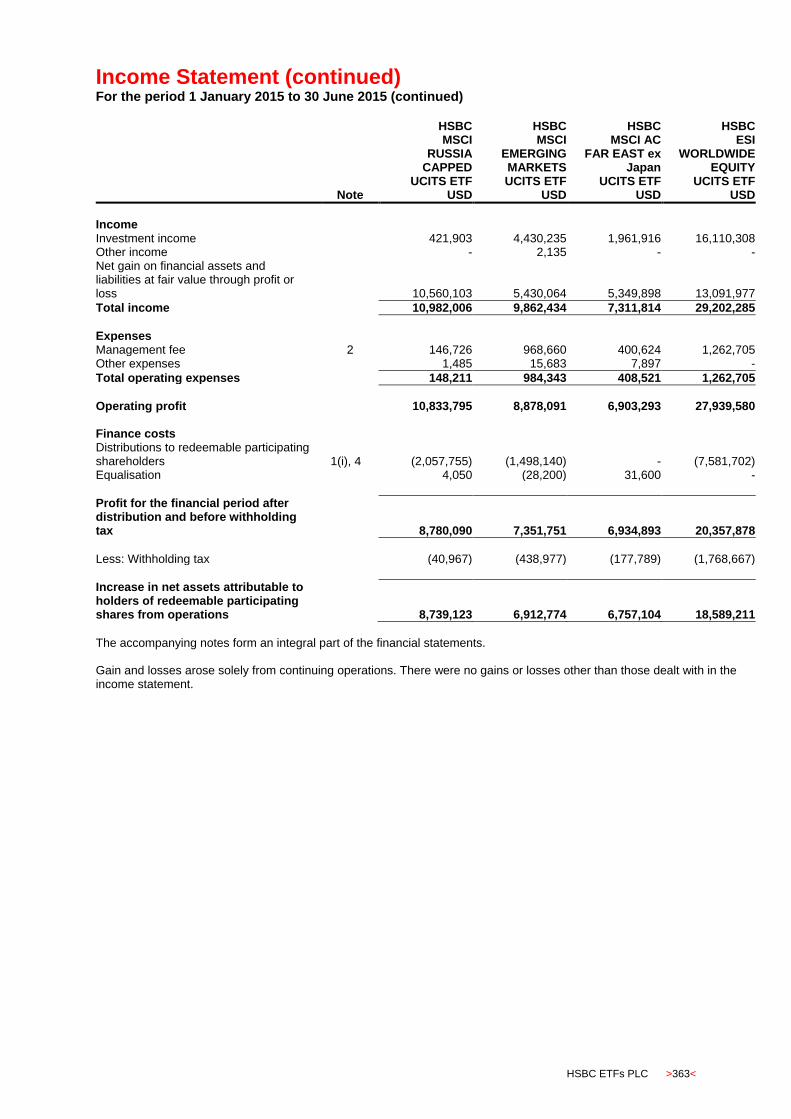
Income Statement (continued) For the period 1 January 2015 to 30 June 2015 (continued)
HSBC ETFs PLC >363<
Note
HSBC MSCI
RUSSIA CAPPED
UCITS ETF USD
HSBC MSCI
EMERGING MARKETS UCITS ETF
USD
HSBC MSCI AC
FAR EAST ex Japan
UCITS ETF USD
HSBC ESI
WORLDWIDE EQUITY
UCITS ETF USD
Income Investment income 421,903 4,430,235 1,961,916 16,110,308 Other income - 2,135 - - Net gain on financial assets and liabilities at fair value through profit or loss 10,560,103 5,430,064 5,349,898 13,091,977
Total income 10,982,006 9,862,434 7,311,814 29,202,285
Expenses Management fee 2 146,726 968,660 400,624 1,262,705 Other expenses 1,485 15,683 7,897 -
Total operating expenses 148,211 984,343 408,521 1,262,705
Operating profit 10,833,795 8,878,091 6,903,293 27,939,580
Finance costs Distributions to redeemable participating shareholders 1(i), 4 (2,057,755) (1,498,140) - (7,581,702) Equalisation 4,050 (28,200) 31,600 -
Profit for the financial period after distribution and before withholding tax 8,780,090 7,351,751 6,934,893 20,357,878
Less: Withholding tax (40,967) (438,977) (177,789) (1,768,667)
Increase in net assets attributable to holders of redeemable participating shares from operations 8,739,123 6,912,774 6,757,104 18,589,211
The accompanying notes form an integral part of the financial statements. Gain and losses arose solely from continuing operations. There were no gains or losses other than those dealt with in the income statement.

Income Statement (continued) For the period 1 January 2015 to 30 June 2015 (continued)
>364< HSBC ETFs PLC
Note
HSBC WORLDWIDE
EQUITY UCITS ETF
USD
Income Investment income 4,631,642 Other income - Net gain on financial assets and liabilities at fair value through profit or loss 5,461,925
Total gain 10,093,567
Expenses Management fee 2 411,950 Other expenses -
Total operating expenses 411,950
Operating profit 9,681,617
Finance costs Distributions to redeemable participating shareholders 1(i), 4 (2,681,648) Equalisation (273,000)
Profit for the financial period after distribution and before withholding tax 6,726,969
Less: Withholding tax (558,355)
Increase in net assets attributable to holders of redeemable participating shares from operations 6,168,614
The accompanying notes form an integral part of the financial statements. Gain and losses arose solely from continuing operations. There were no gains or losses other than those dealt with in the income statement.

Income Statement For the period 1 January 2014 to 30 June 2014
HSBC ETFs PLC >365<
Note
TOTAL 2014 EUR
HSBC FTSE
100 UCITS ETF
GBP
HSBC EURO
STOXX 50 UCITS ETF
EUR
HSBC MSCI
JAPAN UCITS ETF
USD
Income Investment income 40,067,170 5,633,963 1,721,418 2,111,033 Other income 147,980 8,969 - 13,660 Net gain/(loss) on financial assets and liabilities at fair value through profit or loss 124,210,158 (1,076,776) 3,390,883 3,867,852
Total income 164,425,308 4,566,156 5,112,301 5,992,545
Expenses Management fee 2 4,090,304 489,271 58,891 325,389 Other expenses 20,959 - - -
Total operating expenses 4,111,263 489,271 58,891 325,389
Operating profit 160,314,045 4,076,885 5,053,410 5,667,156
Finance costs Distributions to redeemable participating shareholders 1(i), 4 (21,909,220) (4,248,576) (436,581) (576,171) Equalisation 1,582,009 (233,400) (77,700) 196,700
Profit/(loss) for the financial year after distribution and before withholding tax 139,986,834 (405,091) 4,539,129 5,287,685
Less: Withholding tax (3,579,604) - (151,610) (323,200)
Increase/(decrease) in net assets attributable to holders of redeemable participating shares from operations 136,407,230 (405,091) 4,387,519 4,964,485
The accompanying notes form an integral part of the financial statements. Gain and losses arose solely from continuing operations. There were no gains or losses other than those dealt with in the income statement.

Income Statement (continued) For the period 1 January 2014 to 30 June 2014 (continued)
>366< HSBC ETFs PLC
Note
HSBC FTSE
250 UCITS ETF
GBP
HSBC
S&P 500
UCITS ETF USD
HSBC MSCI
EUROPE UCITS ETF
EUR
HSBC MSCI USA
UCITS ETF USD
Income Investment income 920,484 14,325,874 1,683,317 3,214,787 Other income 12,677 - 14,476 - Net (loss)/gain on financial assets and liabilities at fair value through profit or loss (1,080,420) 92,898,053 2,774,075 19,827,716
Total (loss)/income (147,259) 107,223,927 4,471,868 23,042,503
Expenses Management fee 2 106,055 625,266 108,775 474,002 Other expenses - - - -
Total operating expenses 106,055 625,266 108,775 474,002
Operating (loss)/profit (253,314) 106,598,661 4,363,093 22,568,501
Finance costs Distributions to redeemable participating shareholders 1(i), 4 (512,431) (9,951,855) (411,950) (2,075,320) Equalisation 34,750 420,520 596,000 111,500
(Loss)/profit for the financial year after distribution and before withholding tax (730,995) 97,067,326 4,547,143 20,604,681
Less: Withholding tax - (2,011,493) (140,177) (447,523)
(Decrease)/increase in net assets attributable to holders of redeemable participating shares from operations (730,995) 95,055,833 4,406,966 20,157,158
The accompanying notes form an integral part of the financial statements. Gain and losses arose solely from continuing operations. There were no gains or losses other than those dealt with in the income statement.

Income Statement (continued) For the period 1 January 2014 to 30 June 2014 (continued)
HSBC ETFs PLC >367<
Note
HSBC MSCI
BRAZIL UCITS ETF
USD
HSBC MSCI
PACIFIC ex JAPAN
UCITS ETF USD
HSBC MSCI EM
FAR EAST UCITS ETF
USD
HSBC MSCI
TURKEY UCITS ETF
USD
Income Investment income 276,994 3,317,966 922,882 263,851 Other income - 13,046 - - Net gain on financial assets and liabilities at fair value through profit or loss 773,483 7,212,315 2,463,622 2,712,321
Total income 1,050,477 10,543,327 3,386,504 2,976,172
Expenses Management fee 2 29,715 284,766 250,791 34,822 Other expenses - - 1,099 -
Total operating expenses 29,715 284,766 251,890 34,822
Operating profit 1,020,762 10,258,561 3,134,614 2,941,350
Finance costs Distributions to redeemable participating shareholders 1(i), 4 (106,699) (1,892,763) (1,288,143) - Equalisation - 430,800 - (40,800)
Profit for the financial year after distribution and before withholding tax 914,063 8,796,598 1,846,471 2,900,550
Less: Withholding tax (22,571) (77,307) (93,094) (35,825)
Increase in net assets attributable to holders of redeemable participating shares from operations 891,492 8,719,291 1,753,377 2,864,725
The accompanying notes form an integral part of the financial statements. Gain and losses arose solely from continuing operations. There were no gains or losses other than those dealt with in the income statement.

Income Statement (continued) For the period 1 January 2014 to 30 June 2014 (continued)
>368< HSBC ETFs PLC
Note
HSBC MSCI
WORLD UCITS ETF
USD
HSBC S&P
BRIC 40 UCITS ETF
USD
HSBC MSCI
CHINA UCITS ETF
USD
HSBC MSCI
SOUTH AFRICA
UCITS ETF USD
Income Investment income 4,813,168 189,800 3,372,741 54,510 Other income 59,232 - 16,131 - Net gain/(loss) on financial assets and liabilities at fair value through profit or loss 17,333,321 82,710 (3,130,834) (32,610)
Total income 22,205,721 272,510 258,038 21,900
Expenses Management fee 2 551,173 31,126 453,280 11,728 Other expenses - 2,090 7,473 -
Total operating expenses 551,173 33,216 460,753 11,728
Operating profit/(loss) 21,654,548 239,294 (202,715) 10,172
Finance costs Distributions to redeemable participating shareholders 1(i), 4 (2,392,870) (34,224) (580,000) (62,880) Equalisation 429,795 - - 28,050
Profit/(loss) for the financial year after distribution and before withholding tax 19,691,473 205,070 (782,715) (24,658)
Less: Withholding tax (537,797) (18,894) (283,338) (5,253)
Increase/(decrease) in net assets attributable to holders of redeemable participating shares from operations 19,153,676 186,176 (1,066,053) (29,911)
The accompanying notes form an integral part of the financial statements. Gain and losses arose solely from continuing operations. There were no gains or losses other than those dealt with in the income statement.

Income Statement (continued) For the period 1 January 2014 to 30 June 2014 (continued)
HSBC ETFs PLC >369<
Note
HSBC MSCI
CANADA UCITS ETF
USD
HSBC MSCI
MEXICO CAPPED
UCITS ETF USD
HSBC MSCI
EM LATIN AMERICA
UCITS ETF USD
HSBC MSCI
INDONESIA UCITS ETF
USD
Income Investment income 298,315 87,813 321,422 190,362 Other income - - - - Net gain on financial assets and liabilities at fair value through profit or loss 2,494,754 2,613,832 334,782 1,523,202
Total income 2,793,069 2,701,645 656,204 1,713,564
Expenses Management fee 2 34,643 60,630 48,523 27,193 Other expenses - - - -
Total operating expenses 34,643 60,630 48,523 27,193
Operating profit 2,758,426 2,641,015 607,681 1,686,371
Finance costs Distributions to redeemable participating shareholders 1(i), 4 (148,230) (236,200) (187,210) (16,192) Equalisation 158,250 - 39,030 29,430
Profit for the financial year after distribution and before withholding tax 2,768,446 2,404,815 459,501 1,699,609
Less: Withholding tax (74,563) (2,615) (26,500) (38,072)
Increase in net assets attributable to holders of redeemable participating shares from operations 2,693,883 2,402,200 433,001 1,661,537
The accompanying notes form an integral part of the financial statements. Gain and losses arose solely from continuing operations. There were no gains or losses other than those dealt with in the income statement.

Income Statement (continued) For the period 1 January 2014 to 30 June 2014 (continued)
>370< HSBC ETFs PLC
Note
HSBC MSCI
MALAYSIA UCITS ETF
USD
HSBC MSCI
TAIWAN UCITS ETF
USD
HSBC MSCI
KOREA UCITS ETF
USD
HSBC FTSE
EPRA/NAREIT DEVELOPED
UCITS ETF USD
Income Investment income 86,878 17,632 3,081 435,529 Other income - 8,191 - - Net gain on financial assets and liabilities at fair value through profit or loss 3,257 269,754 97,961 2,006,240
Total income 90,135 295,577 101,042 2,441,769
Expenses Management fee 2 18,822 11,041 9,032 40,446 Other expenses - - - -
Total operating expenses 18,822 11,041 9,032 40,446
Operating profit 71,313 284,536 92,010 2,401,323
Finance costs Distributions to redeemable participating shareholders 1(i), 4 (98,355) (81,500) - (271,300) Equalisation (14,640) - - -
(Loss)/Profit for the financial year after distribution and before withholding tax (41,682) 203,036 92,010 2,130,023
Less: Withholding tax - (3,527) (696) (48,868)
(Decrease)/increase in net assets attributable to holders of redeemable participating shares from operations (41,682) 199,509 91,314 2,081,155
The accompanying notes form an integral part of the financial statements. Gain and losses arose solely from continuing operations. There were no gains or losses other than those dealt with in the income statement.
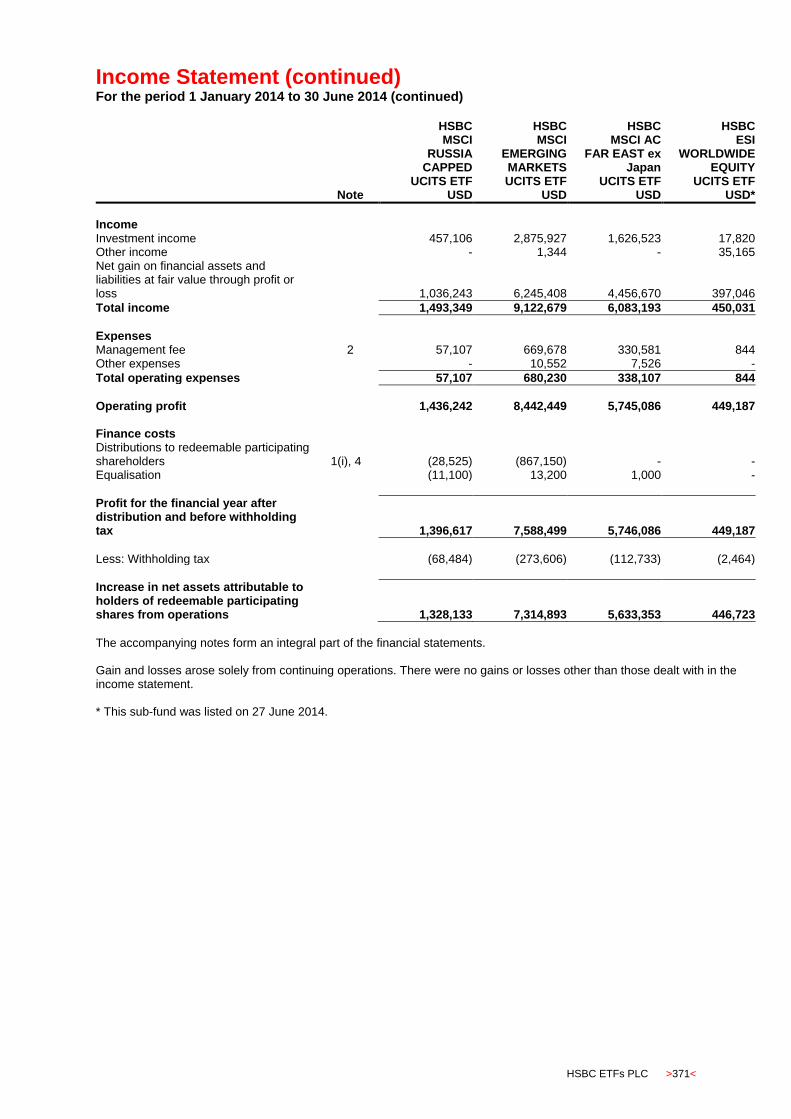
Income Statement (continued) For the period 1 January 2014 to 30 June 2014 (continued)
HSBC ETFs PLC >371<
Note
HSBC MSCI
RUSSIA CAPPED
UCITS ETF USD
HSBC MSCI
EMERGING MARKETS UCITS ETF
USD
HSBC MSCI AC
FAR EAST ex Japan
UCITS ETF USD
HSBC ESI
WORLDWIDE EQUITY
UCITS ETF USD*
Income Investment income 457,106 2,875,927 1,626,523 17,820 Other income - 1,344 - 35,165 Net gain on financial assets and liabilities at fair value through profit or loss 1,036,243 6,245,408 4,456,670 397,046
Total income 1,493,349 9,122,679 6,083,193 450,031
Expenses Management fee 2 57,107 669,678 330,581 844 Other expenses - 10,552 7,526 -
Total operating expenses 57,107 680,230 338,107 844
Operating profit 1,436,242 8,442,449 5,745,086 449,187
Finance costs Distributions to redeemable participating shareholders 1(i), 4 (28,525) (867,150) - - Equalisation (11,100) 13,200 1,000 -
Profit for the financial year after distribution and before withholding tax 1,396,617 7,588,499 5,746,086 449,187
Less: Withholding tax (68,484) (273,606) (112,733) (2,464)
Increase in net assets attributable to holders of redeemable participating shares from operations 1,328,133 7,314,893 5,633,353 446,723
The accompanying notes form an integral part of the financial statements. Gain and losses arose solely from continuing operations. There were no gains or losses other than those dealt with in the income statement. * This sub-fund was listed on 27 June 2014.

Statement of Changes in Net Assets Attributable to Holders of Redeemable Participating Shares For the period 1 January 2015 to 30 June 2015
>372< HSBC ETFs PLC
Note
TOTAL 2015 EUR
HSBC FTSE
100 UCITS ETF
GBP
HSBC EURO
STOXX 50 UCITS ETF
EUR
HSBC MSCI
JAPAN UCITS ETF
USD
Net assets attributable to holders of redeemable participating shares at the start of the period 5,365,874,678 242,120,849 81,363,380 196,950,179
Notional foreign exchange adjustment arising on aggregation 1(b) 443,622,998 - - -
Increase in net assets attributable to holders of redeemable participating shares from operations 125,854,153 599,535 8,992,525 26,883,426
Proceeds from redeemable participating shares issued 466,008,213 - 21,313,210 19,032,615 Redemption of redeemable participating shares (1,020,871,966) (70,514,870) - (10,337,372)
Net assets attributable to holders of redeemable participating shares at the end of the period 5,380,488,076 172,205,514 111,669,115 232,528,848
The accompanying notes form an integral part of the financial statements.
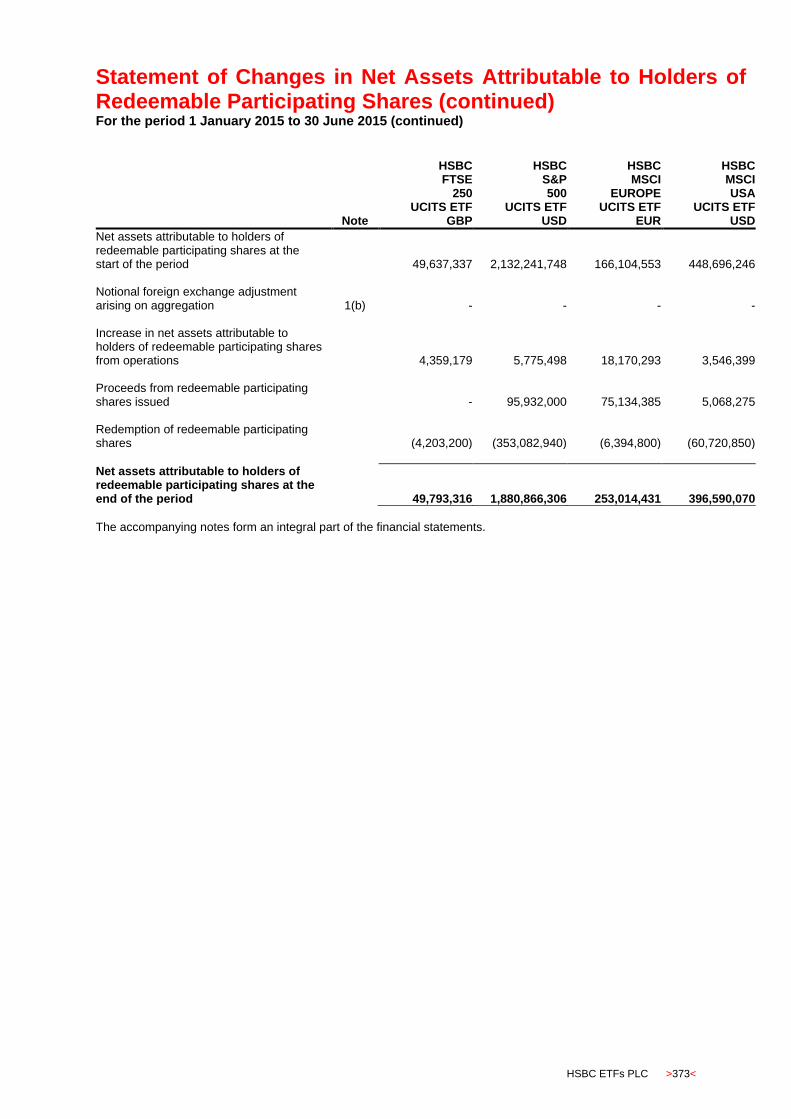
Statement of Changes in Net Assets Attributable to Holders of Redeemable Participating Shares (continued) For the period 1 January 2015 to 30 June 2015 (continued)
HSBC ETFs PLC >373<
Note
HSBC FTSE
250 UCITS ETF
GBP
HSBC S&P 500
UCITS ETF USD
HSBC MSCI
EUROPE UCITS ETF
EUR
HSBC MSCI USA
UCITS ETF USD
Net assets attributable to holders of redeemable participating shares at the start of the period 49,637,337 2,132,241,748 166,104,553 448,696,246
Notional foreign exchange adjustment arising on aggregation 1(b) - - - -
Increase in net assets attributable to holders of redeemable participating shares from operations 4,359,179 5,775,498 18,170,293 3,546,399
Proceeds from redeemable participating shares issued - 95,932,000 75,134,385 5,068,275 Redemption of redeemable participating shares (4,203,200) (353,082,940) (6,394,800) (60,720,850)
Net assets attributable to holders of redeemable participating shares at the end of the period 49,793,316 1,880,866,306 253,014,431 396,590,070
The accompanying notes form an integral part of the financial statements.
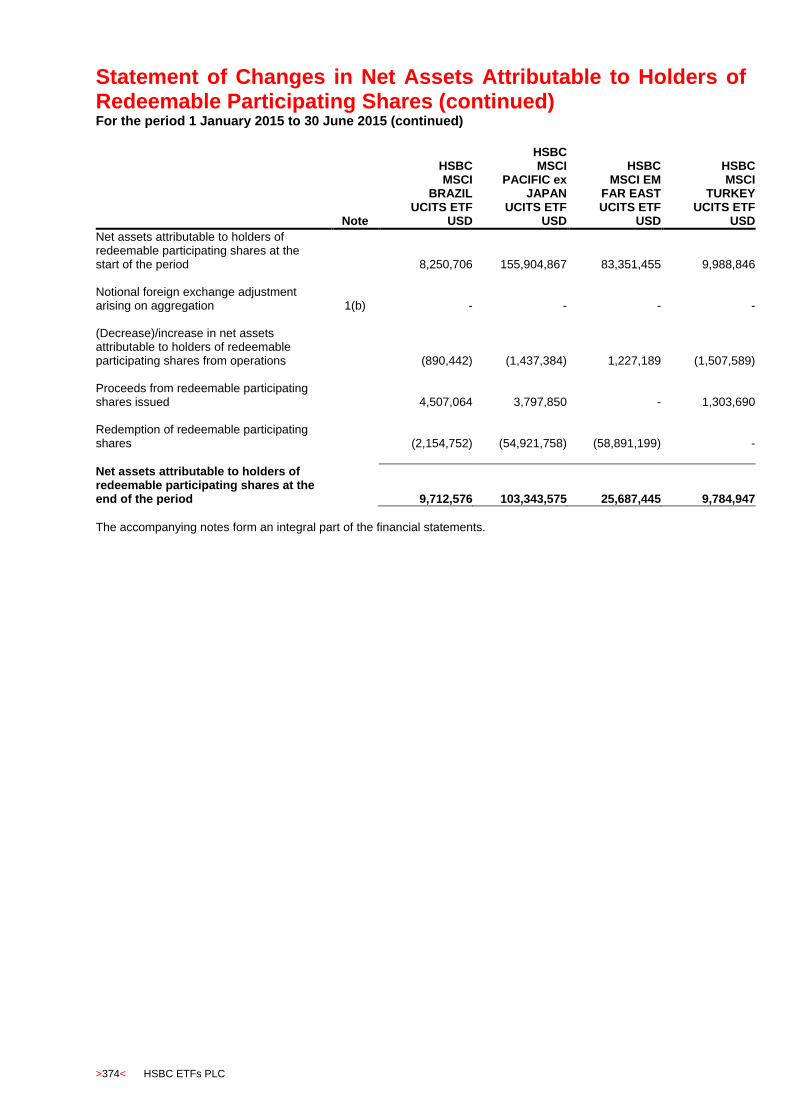
Statement of Changes in Net Assets Attributable to Holders of Redeemable Participating Shares (continued) For the period 1 January 2015 to 30 June 2015 (continued)
>374< HSBC ETFs PLC
Note
HSBC MSCI
BRAZIL UCITS ETF
USD
HSBC MSCI
PACIFIC ex JAPAN
UCITS ETF USD
HSBC MSCI EM
FAR EAST UCITS ETF
USD
HSBC MSCI
TURKEY UCITS ETF
USD
Net assets attributable to holders of redeemable participating shares at the start of the period 8,250,706 155,904,867 83,351,455 9,988,846
Notional foreign exchange adjustment arising on aggregation 1(b) - - - -
(Decrease)/increase in net assets attributable to holders of redeemable participating shares from operations (890,442) (1,437,384) 1,227,189 (1,507,589)
Proceeds from redeemable participating shares issued 4,507,064 3,797,850 - 1,303,690 Redemption of redeemable participating shares (2,154,752) (54,921,758) (58,891,199) -
Net assets attributable to holders of redeemable participating shares at the end of the period 9,712,576 103,343,575 25,687,445 9,784,947
The accompanying notes form an integral part of the financial statements.
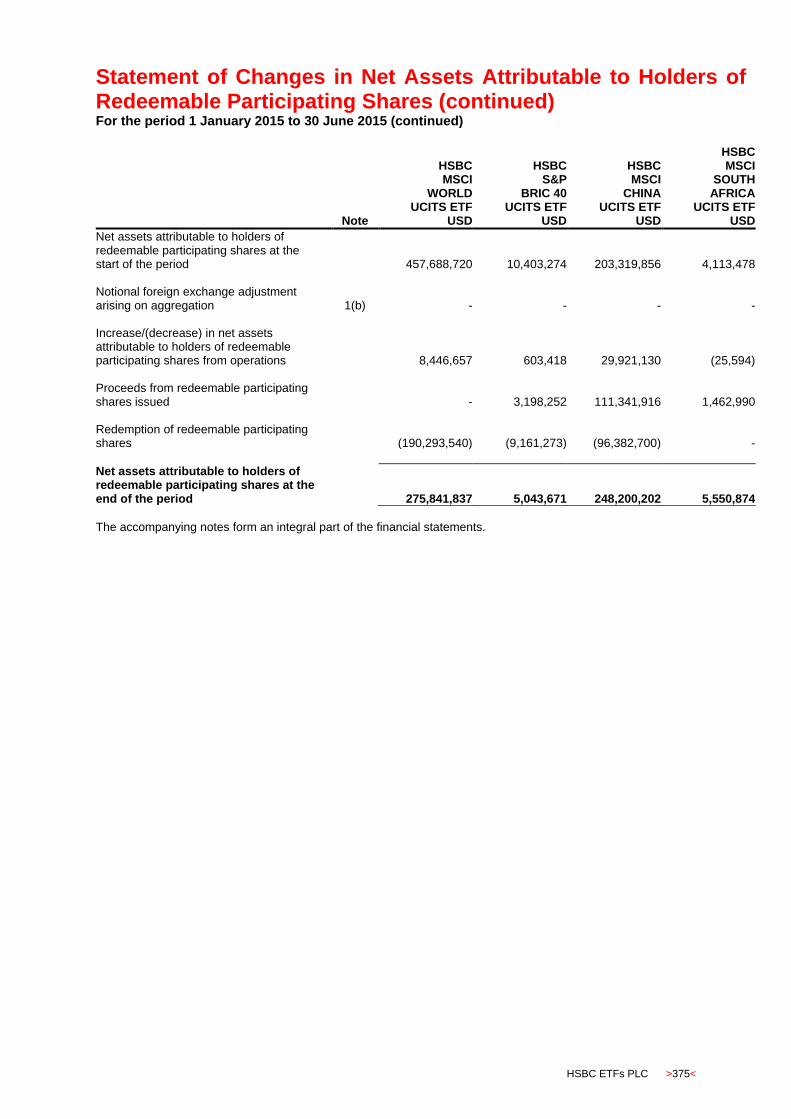
Statement of Changes in Net Assets Attributable to Holders of Redeemable Participating Shares (continued) For the period 1 January 2015 to 30 June 2015 (continued)
HSBC ETFs PLC >375<
Note
HSBC MSCI
WORLD UCITS ETF
USD
HSBC S&P
BRIC 40 UCITS ETF
USD
HSBC MSCI
CHINA UCITS ETF
USD
HSBC MSCI
SOUTH AFRICA
UCITS ETF USD
Net assets attributable to holders of redeemable participating shares at the start of the period 457,688,720 10,403,274 203,319,856 4,113,478
Notional foreign exchange adjustment arising on aggregation 1(b) - - - -
Increase/(decrease) in net assets attributable to holders of redeemable participating shares from operations 8,446,657 603,418 29,921,130 (25,594)
Proceeds from redeemable participating shares issued - 3,198,252 111,341,916 1,462,990 Redemption of redeemable participating shares (190,293,540) (9,161,273) (96,382,700) -
Net assets attributable to holders of redeemable participating shares at the end of the period 275,841,837 5,043,671 248,200,202 5,550,874
The accompanying notes form an integral part of the financial statements.
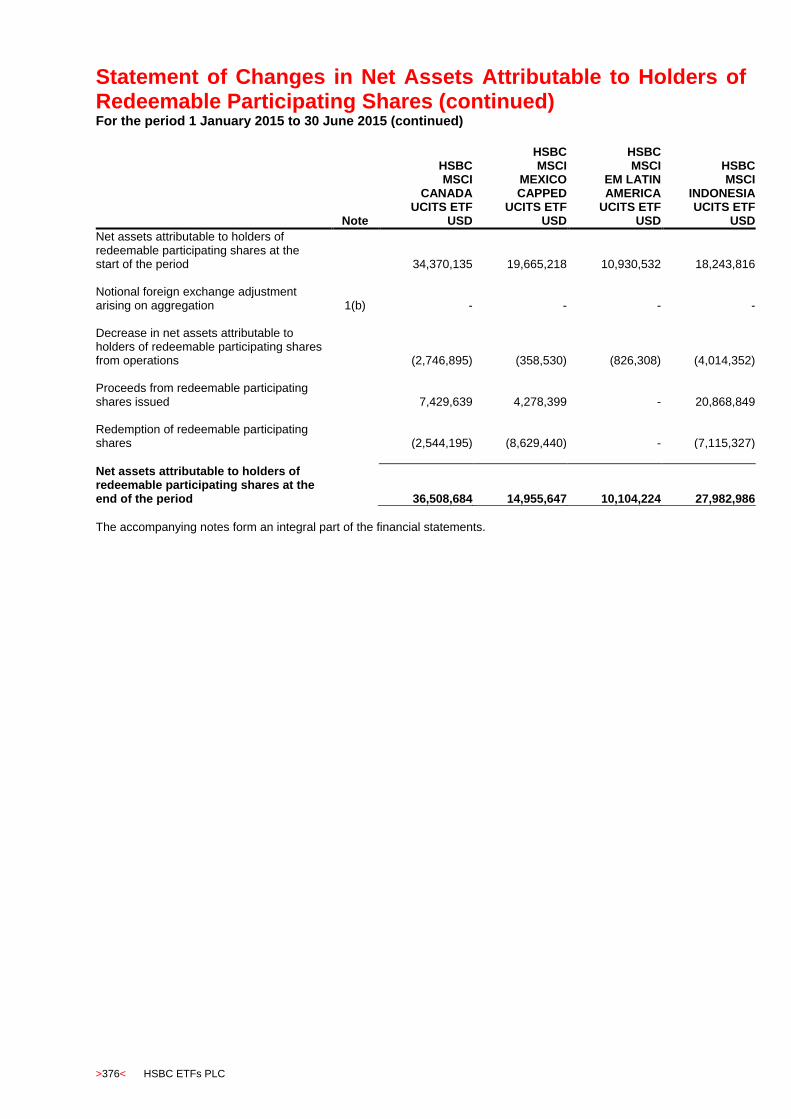
Statement of Changes in Net Assets Attributable to Holders of Redeemable Participating Shares (continued) For the period 1 January 2015 to 30 June 2015 (continued)
>376< HSBC ETFs PLC
Note
HSBC MSCI
CANADA UCITS ETF
USD
HSBC MSCI
MEXICO CAPPED
UCITS ETF USD
HSBC MSCI
EM LATIN AMERICA
UCITS ETF USD
HSBC MSCI
INDONESIA UCITS ETF
USD
Net assets attributable to holders of redeemable participating shares at the start of the period 34,370,135 19,665,218 10,930,532 18,243,816
Notional foreign exchange adjustment arising on aggregation 1(b) - - - -
Decrease in net assets attributable to holders of redeemable participating shares from operations (2,746,895) (358,530) (826,308) (4,014,352)
Proceeds from redeemable participating shares issued 7,429,639 4,278,399 - 20,868,849 Redemption of redeemable participating shares (2,544,195) (8,629,440) - (7,115,327)
Net assets attributable to holders of redeemable participating shares at the end of the period 36,508,684 14,955,647 10,104,224 27,982,986
The accompanying notes form an integral part of the financial statements.

Statement of Changes in Net Assets Attributable to Holders of Redeemable Participating Shares (continued) For the period 1 January 2015 to 30 June 2015 (continued)
HSBC ETFs PLC >377<
Note
HSBC MSCI
MALAYSIA UCITS ETF
USD
HSBC MSCI
TAIWAN UCITS ETF
USD
HSBC MSCI
KOREA UCITS ETF
USD
HSBC FTSE
EPRA/NAREIT DEVELOPED
UCITS ETF USD
Net assets attributable to holders of redeemable participating shares at the start of the period 7,167,968 6,306,059 8,114,238 86,280,378
Notional foreign exchange adjustment arising on aggregation 1(b) - - - -
(Decrease)/increase in net assets attributable to holders of redeemable participating shares from operations (856,254) 178,192 (367,864) (8,855,502)
Proceeds from redeemable participating shares issued 5,273,715 9,750,053 3,024,562 82,330,700 Redemption of redeemable participating shares (6,395,723) (6,502,357) (2,692,226) (16,455,426)
Net assets attributable to holders of redeemable participating shares at the end of the period 5,189,706 9,731,947 8,078,710 143,300,150
The accompanying notes form an integral part of the financial statements.
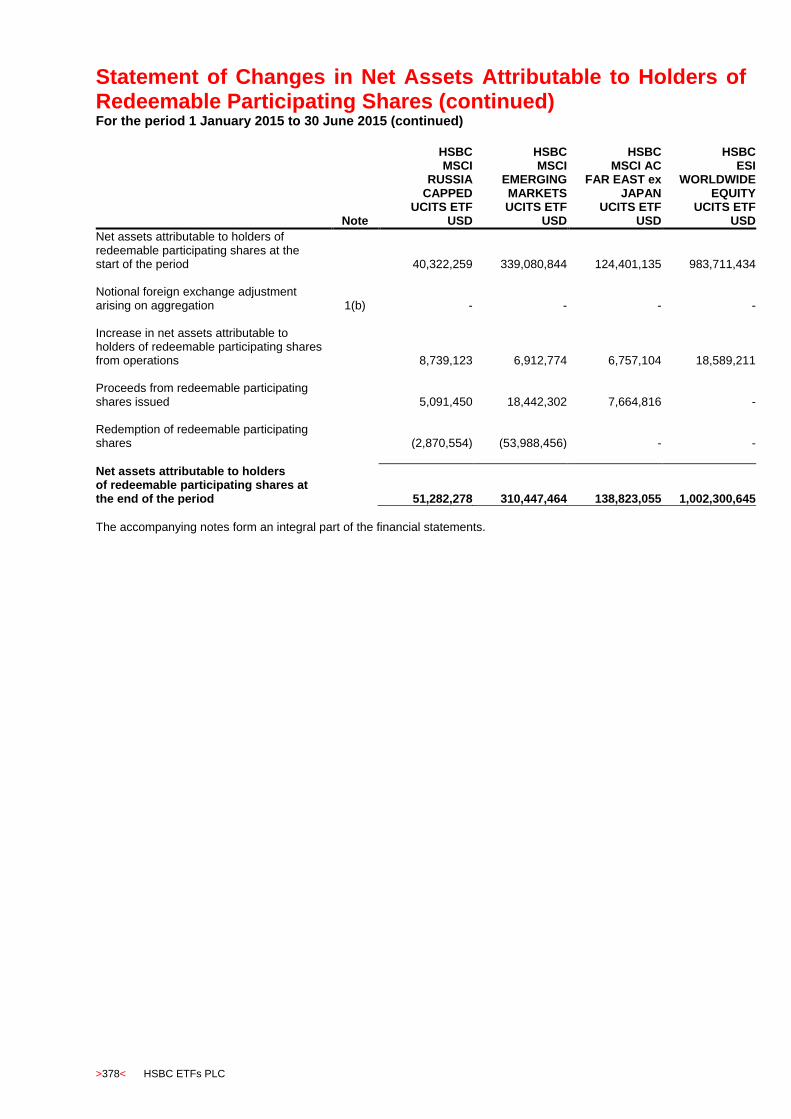
Statement of Changes in Net Assets Attributable to Holders of Redeemable Participating Shares (continued) For the period 1 January 2015 to 30 June 2015 (continued)
>378< HSBC ETFs PLC
Note
HSBC MSCI
RUSSIA CAPPED
UCITS ETF USD
HSBC MSCI
EMERGING MARKETS UCITS ETF
USD
HSBC MSCI AC
FAR EAST ex JAPAN
UCITS ETF USD
HSBC ESI
WORLDWIDE EQUITY
UCITS ETF USD
Net assets attributable to holders of redeemable participating shares at the start of the period 40,322,259 339,080,844 124,401,135 983,711,434
Notional foreign exchange adjustment arising on aggregation 1(b) - - - -
Increase in net assets attributable to holders of redeemable participating shares from operations 8,739,123 6,912,774 6,757,104 18,589,211
Proceeds from redeemable participating shares issued 5,091,450 18,442,302 7,664,816 - Redemption of redeemable participating shares (2,870,554) (53,988,456) - -
Net assets attributable to holders of redeemable participating shares at the end of the period 51,282,278 310,447,464 138,823,055 1,002,300,645
The accompanying notes form an integral part of the financial statements.
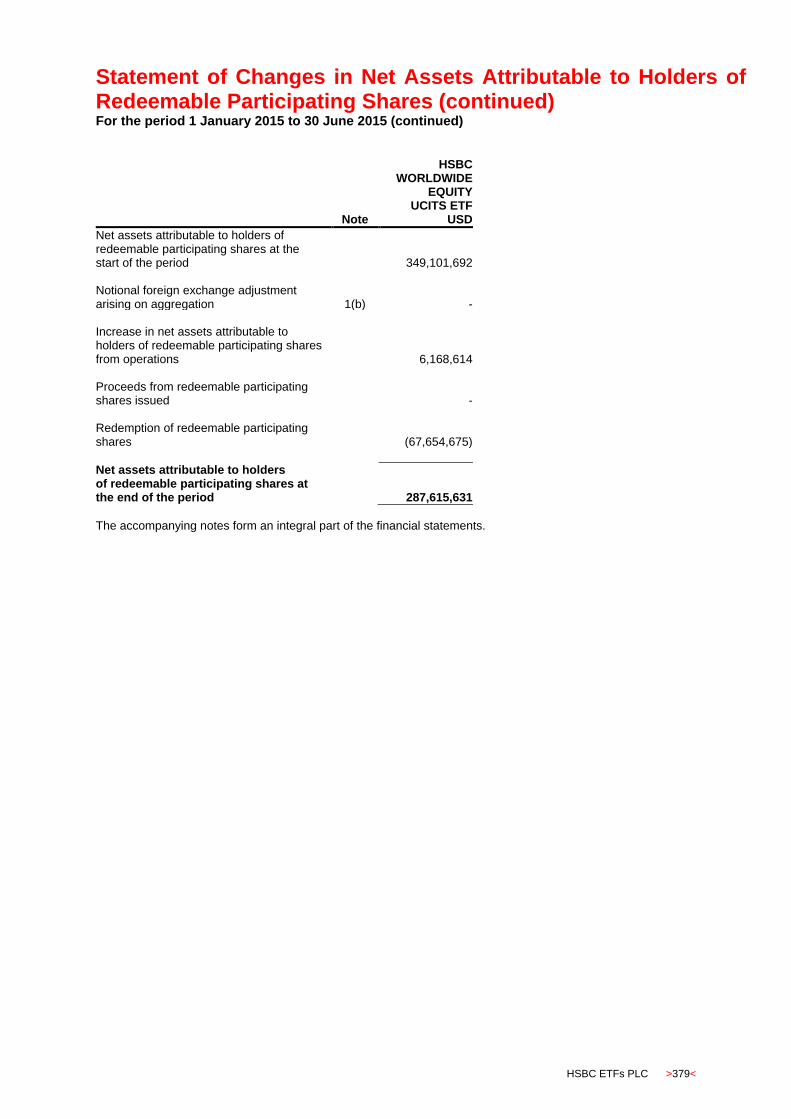
Statement of Changes in Net Assets Attributable to Holders of Redeemable Participating Shares (continued) For the period 1 January 2015 to 30 June 2015 (continued)
HSBC ETFs PLC >379<
Note
HSBC
WORLDWIDE EQUITY
UCITS ETF USD
Net assets attributable to holders of redeemable participating shares at the start of the period 349,101,692
Notional foreign exchange adjustment arising on aggregation 1(b) -
Increase in net assets attributable to holders of redeemable participating shares from operations 6,168,614
Proceeds from redeemable participating shares issued - Redemption of redeemable participating shares (67,654,675)
Net assets attributable to holders of redeemable participating shares at the end of the period 287,615,631
The accompanying notes form an integral part of the financial statements.
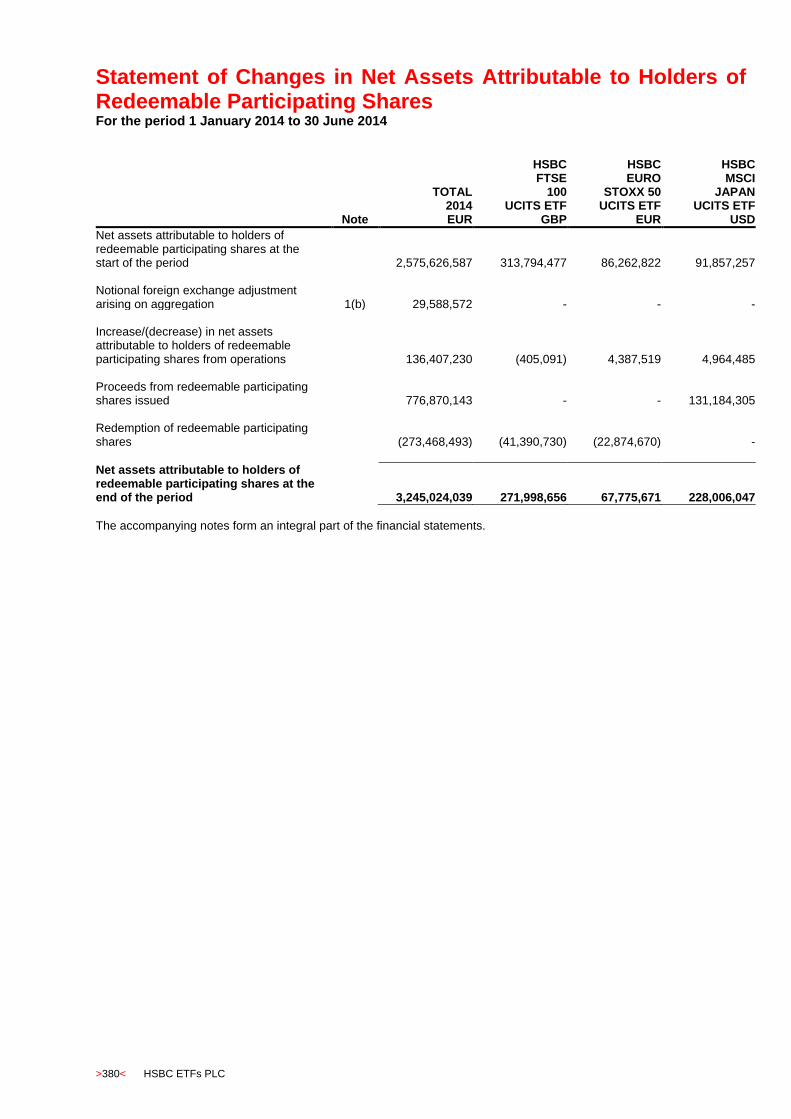
Statement of Changes in Net Assets Attributable to Holders of Redeemable Participating Shares For the period 1 January 2014 to 30 June 2014
>380< HSBC ETFs PLC
Note
TOTAL 2014 EUR
HSBC FTSE
100 UCITS ETF
GBP
HSBC EURO
STOXX 50 UCITS ETF
EUR
HSBC MSCI
JAPAN UCITS ETF
USD
Net assets attributable to holders of redeemable participating shares at the start of the period 2,575,626,587 313,794,477 86,262,822 91,857,257
Notional foreign exchange adjustment arising on aggregation 1(b) 29,588,572 - - -
Increase/(decrease) in net assets attributable to holders of redeemable participating shares from operations 136,407,230 (405,091) 4,387,519 4,964,485
Proceeds from redeemable participating shares issued 776,870,143 - - 131,184,305 Redemption of redeemable participating shares (273,468,493) (41,390,730) (22,874,670) -
Net assets attributable to holders of redeemable participating shares at the end of the period 3,245,024,039 271,998,656 67,775,671 228,006,047
The accompanying notes form an integral part of the financial statements.

Statement of Changes in Net Assets Attributable to Holders of Redeemable Participating Shares (continued) For the period 1 January 2014 to 30 June 2014 (continued)
HSBC ETFs PLC >381<
Note
HSBC FTSE
250 UCITS ETF
GBP
HSBC S&P 500
UCITS ETF USD
HSBC MSCI
EUROPE UCITS ETF
EUR
HSBC MSCI USA
UCITS ETF USD
Net assets attributable to holders of redeemable participating shares at the start of the period 57,271,266 1,200,602,632 62,670,604 296,756,313
Notional foreign exchange adjustment arising on aggregation 1(b) - - - -
(Decrease)/increase in net assets attributable to holders of redeemable participating shares from operations (730,995) 95,055,833 4,406,966 20,157,158
Proceeds from redeemable participating shares issued 7,912,200 407,996,840 41,170,719 35,721,725 Redemption of redeemable participating shares - (165,145,380) - -
Net assets attributable to holders of redeemable participating shares at the end of the period 64,452,471 1,538,509,925 108,248,289 352,635,196
The accompanying notes form an integral part of the financial statements.

Statement of Changes in Net Assets Attributable to Holders of Redeemable Participating Shares (continued) For the period 1 January 2014 to 30 June 2014 (continued)
>382< HSBC ETFs PLC
Note
HSBC MSCI
BRAZIL UCITS ETF
USD
HSBC MSCI
PACIFIC ex JAPAN
UCITS ETF USD
HSBC MSCI EM
FAR EAST UCITS ETF
USD
HSBC MSCI
TURKEY UCITS ETF
USD
Net assets attributable to holders of redeemable participating shares at the start of the period 9,971,262 109,734,637 95,301,835 8,560,825
Notional foreign exchange adjustment arising on aggregation 1(b) - - - -
Increase in net assets attributable to holders of redeemable participating shares from operations 891,492 8,719,291 1,753,377 2,864,725
Proceeds from redeemable participating shares issued - 61,097,910 - 4,970,130 - Redemption of redeemable participating shares - (7,748,250) (11,015,480) (4,472,094)
Net assets attributable to holders of redeemable participating shares at the end of the period 10,862,754 171,803,588 86,039,732 11,923,586
The accompanying notes form an integral part of the financial statements.
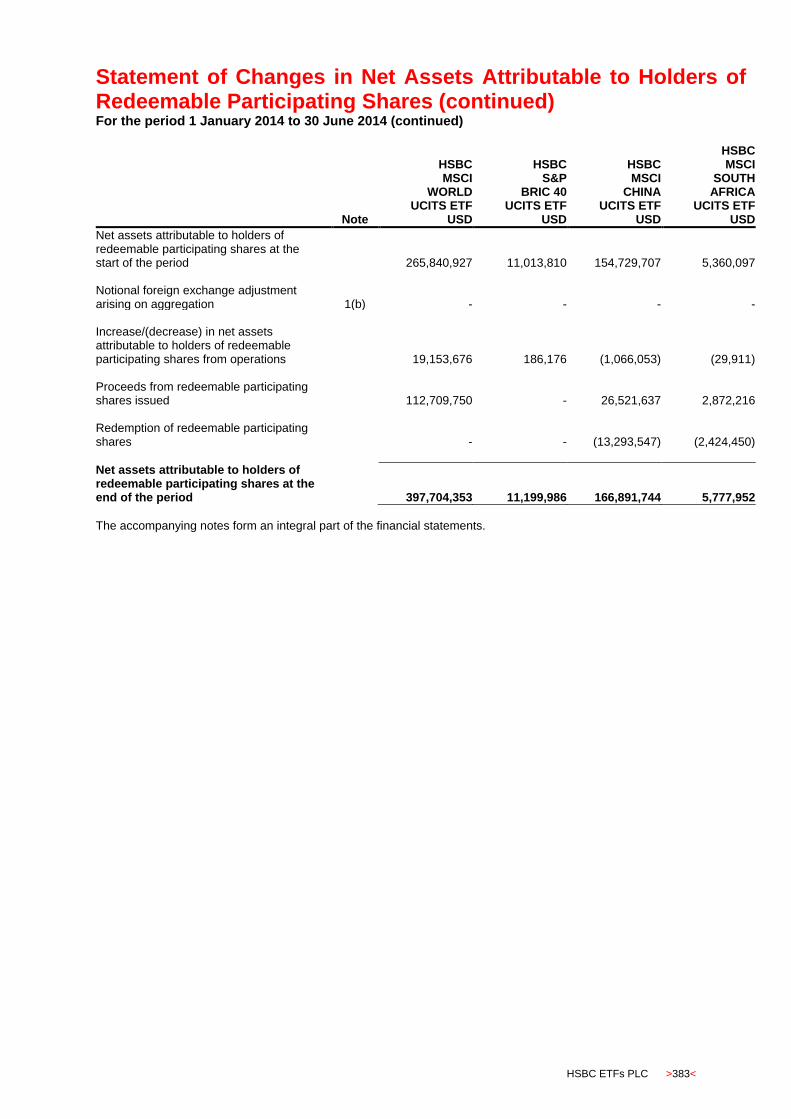
Statement of Changes in Net Assets Attributable to Holders of Redeemable Participating Shares (continued) For the period 1 January 2014 to 30 June 2014 (continued)
HSBC ETFs PLC >383<
Note
HSBC MSCI
WORLD UCITS ETF
USD
HSBC S&P
BRIC 40 UCITS ETF
USD
HSBC MSCI
CHINA UCITS ETF
USD
HSBC MSCI
SOUTH AFRICA
UCITS ETF USD
Net assets attributable to holders of redeemable participating shares at the start of the period 265,840,927 11,013,810 154,729,707 5,360,097
Notional foreign exchange adjustment arising on aggregation 1(b) - - - -
Increase/(decrease) in net assets attributable to holders of redeemable participating shares from operations 19,153,676 186,176 (1,066,053) (29,911)
Proceeds from redeemable participating shares issued 112,709,750 - 26,521,637 2,872,216 Redemption of redeemable participating shares - - (13,293,547) (2,424,450)
Net assets attributable to holders of redeemable participating shares at the end of the period 397,704,353 11,199,986 166,891,744 5,777,952
The accompanying notes form an integral part of the financial statements.
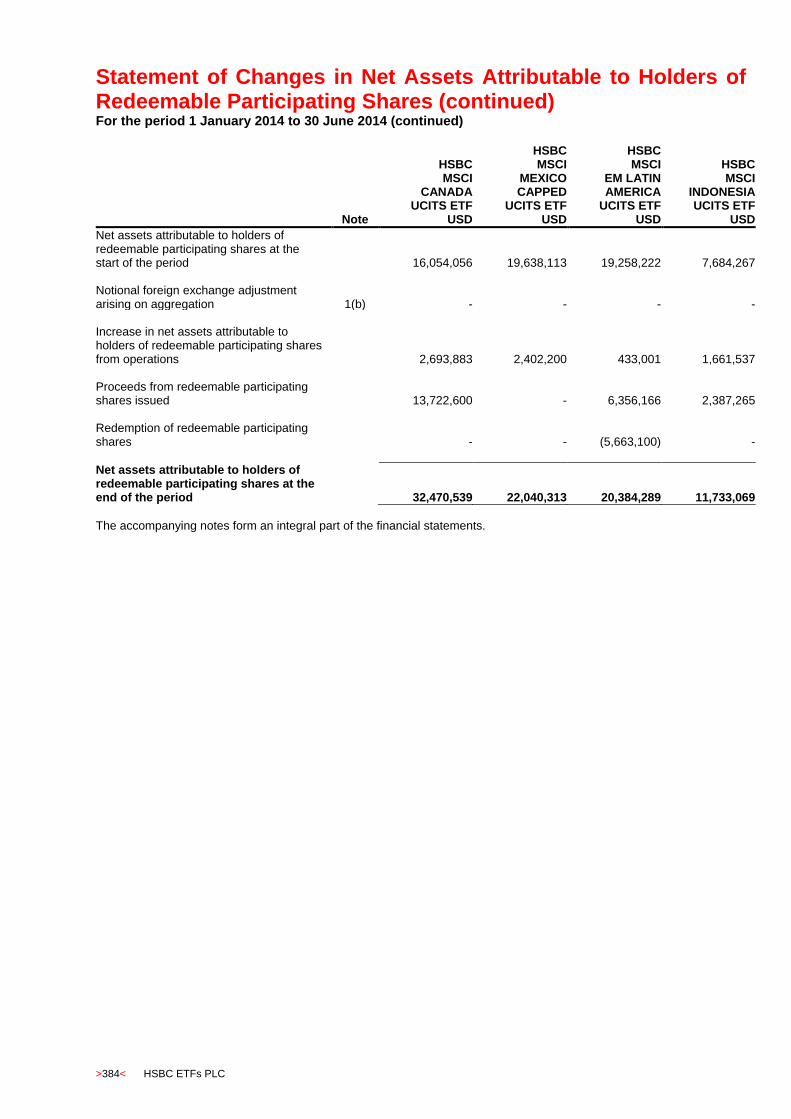
Statement of Changes in Net Assets Attributable to Holders of Redeemable Participating Shares (continued) For the period 1 January 2014 to 30 June 2014 (continued)
>384< HSBC ETFs PLC
Note
HSBC MSCI
CANADA UCITS ETF
USD
HSBC MSCI
MEXICO CAPPED
UCITS ETF USD
HSBC MSCI
EM LATIN AMERICA
UCITS ETF USD
HSBC MSCI
INDONESIA UCITS ETF
USD
Net assets attributable to holders of redeemable participating shares at the start of the period 16,054,056 19,638,113 19,258,222 7,684,267
Notional foreign exchange adjustment arising on aggregation 1(b) - - - -
Increase in net assets attributable to holders of redeemable participating shares from operations 2,693,883 2,402,200 433,001 1,661,537
Proceeds from redeemable participating shares issued 13,722,600 - 6,356,166 2,387,265 Redemption of redeemable participating shares - - (5,663,100) -
Net assets attributable to holders of redeemable participating shares at the end of the period 32,470,539 22,040,313 20,384,289 11,733,069
The accompanying notes form an integral part of the financial statements.

Statement of Changes in Net Assets Attributable to Holders of Redeemable Participating Shares (continued) For the period 1 January 2014 to 30 June 2014 (continued)
HSBC ETFs PLC >385<
Note
HSBC MSCI
MALAYSIA UCITS ETF
USD
HSBC MSCI
TAIWAN UCITS ETF
USD
HSBC MSCI
KOREA UCITS ETF
USD
HSBC FTSE
EPRA/NAREIT DEVELOPED
UCITS ETF USD
Net assets attributable to holders of redeemable participating shares at the start of the period 7,727,234 5,887,506 3,085,574 20,326,608
Notional foreign exchange adjustment arising on aggregation 1(b) - - - -
(Decrease)/increase in net assets attributable to holders of redeemable participating shares from operations (41,682) 199,509 91,314 2,081,155
Proceeds from redeemable participating shares issued 2,977,452 3,153,275 - - Redemption of redeemable participating shares (5,960,766) (2,788,496) - -
Net assets attributable to holders of redeemable participating shares at the end of the period 4,702,238 6,451,794 3,176,888 22,407,763
The accompanying notes form an integral part of the financial statements.

Statement of Changes in Net Assets Attributable to Holders of Redeemable Participating Shares (continued) For the period 1 January 2014 to 30 June 2014 (continued)
>386< HSBC ETFs PLC
Note
HSBC MSCI
RUSSIA CAPPED
UCITS ETF USD
HSBC MSCI
EMERGING MARKETS UCITS ETF
USD
HSBC MSCI AC
FAR EAST ex JAPAN
UCITS ETF USD
HSBC ESI
WORLDWIDE EQUITY
UCITS ETF USD
Net assets attributable to holders of redeemable participating shares at the start of the period 11,741,478 259,944,066 107,327,395 -
Notional foreign exchange adjustment arising on aggregation 1(b) - - - -
Increase in net assets attributable to holders of redeemable participating shares from operations 1,328,133 7,314,893 5,633,353 446,723
Proceeds from redeemable participating shares issued 41,528,386 12,325,618 6,897,927 123,137,236 Redemption of redeemable participating shares (3,724,461) (51,981,417) - -
Net assets attributable to holders of redeemable participating shares at the end of the period 50,873,536 227,603,160 119,858,675 123,583,959
The accompanying notes form an integral part of the financial statements.
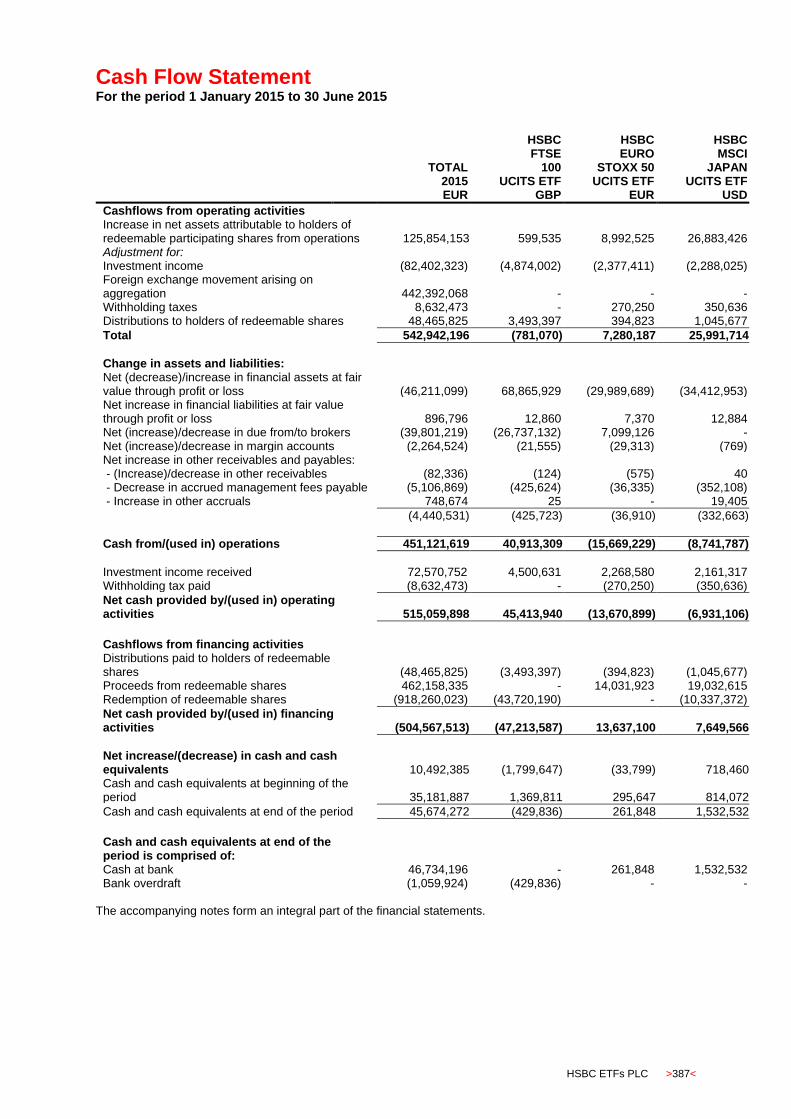
Cash Flow Statement For the period 1 January 2015 to 30 June 2015
HSBC ETFs PLC >387<
TOTAL 2015 EUR
HSBC FTSE
100 UCITS ETF
GBP
HSBC EURO
STOXX 50 UCITS ETF
EUR
HSBC MSCI
JAPAN UCITS ETF
USD
Cashflows from operating activities Increase in net assets attributable to holders of redeemable participating shares from operations 125,854,153 599,535 8,992,525 26,883,426 Adjustment for: Investment income (82,402,323) (4,874,002) (2,377,411) (2,288,025) Foreign exchange movement arising on aggregation
442,392,068 - - -
Withholding taxes 8,632,473 - 270,250 350,636 Distributions to holders of redeemable shares 48,465,825 3,493,397 394,823 1,045,677
Total 542,942,196 (781,070) 7,280,187 25,991,714
Change in assets and liabilities: Net (decrease)/increase in financial assets at fair value through profit or loss (46,211,099) 68,865,929 (29,989,689) (34,412,953) Net increase in financial liabilities at fair value through profit or loss
896,796 12,860 7,370 12,884
Net (increase)/decrease in due from/to brokers (39,801,219) (26,737,132) 7,099,126 - Net (increase)/decrease in margin accounts (2,264,524) (21,555) (29,313) (769) Net increase in other receivables and payables: - (Increase)/decrease in other receivables (82,336) (124) (575) 40 - Decrease in accrued management fees payable (5,106,869) (425,624) (36,335) (352,108) - Increase in other accruals 748,674 25 - 19,405
(4,440,531) (425,723) (36,910) (332,663)
Cash from/(used in) operations 451,121,619 40,913,309 (15,669,229) (8,741,787)
Investment income received 72,570,752 4,500,631 2,268,580 2,161,317 Withholding tax paid (8,632,473) - (270,250) (350,636)
Net cash provided by/(used in) operating activities 515,059,898 45,413,940 (13,670,899) (6,931,106)
Cashflows from financing activities Distributions paid to holders of redeemable shares (48,465,825) (3,493,397) (394,823) (1,045,677) Proceeds from redeemable shares 462,158,335 - 14,031,923 19,032,615 Redemption of redeemable shares (918,260,023) (43,720,190) - (10,337,372)
Net cash provided by/(used in) financing activities (504,567,513) (47,213,587) 13,637,100 7,649,566
Net increase/(decrease) in cash and cash equivalents 10,492,385 (1,799,647) (33,799) 718,460 Cash and cash equivalents at beginning of the period 35,181,887 1,369,811 295,647 814,072
Cash and cash equivalents at end of the period 45,674,272 (429,836) 261,848 1,532,532
Cash and cash equivalents at end of the period is comprised of: Cash at bank 46,734,196 - 261,848 1,532,532 Bank overdraft (1,059,924) (429,836) - -
The accompanying notes form an integral part of the financial statements.

Cash Flow Statement (continued) For the period 1 January 2015 to 30 June 2015 (continued)
>388< HSBC ETFs PLC
HSBC FTSE
250 UCITS ETF
GBP
HSBC S&P 500
UCITS ETF USD
HSBC MSCI
EUROPE UCITS ETF
EUR
HSBC MSCI USA
UCITS ETF USD
Cashflows from operating activities Increase in net assets attributable to holders of redeemable participating shares from operations 4,359,179 5,775,498 18,170,293 3,546,399 Adjustment for: Investment income (829,669) (20,823,109) (4,886,413) (4,468,772) Foreign exchange movement arising on aggregation - - - - Withholding taxes - 2,909,302 481,143 617,081 Distributions to holders of redeemable shares 528,892 17,556,560 900,450 3,166,470
Total 4,058,402 5,418,251 14,665,473 2,861,178
Change in assets and liabilities: Net (increase)/decrease in financial assets at fair value through profit or loss (19,442) 256,506,066 (86,068,815) 53,575,473 Net increase in financial liabilities at fair value through profit or loss 1,668 249,748 11,785 50,933 Net decrease/(increase) in due from/to brokers - 7,839,738 14,706 (5,007,408) Net increase in margin accounts (5,898) (843,726) (150,496) (170,517) Net increase in other receivables and payables: - Increase in other receivables (3,192) - (2,958) - - Decrease in accrued management fees payable (77,703) (577,711) (116,332) (453,187) - Increase/(decrease) in other accruals 935 (47,337) 958 (13,706)
(79,960) (625,048) (118,332) (466,893)
Cash from/(used in) operations 3,954,770 268,545,029 (71,645,679) 50,842,766
Investment income received 800,354 21,094,285 4,540,730 4,551,511 Withholding tax paid - (2,909,302) (481,143) (617,081)
Net cash provided by/(used in) operating activities 4,755,124 286,730,012 (67,586,092) 54,777,196
Cashflows from financing activities Distributions paid to holders of redeemable shares (528,892) (17,556,560) (900,450) (3,166,470) Proceeds from redeemable shares - 95,932,000 75,134,385 10,072,225 Redemption of redeemable shares (4,203,200) (353,082,940) (6,394,800) (60,720,850)
Net cash (used in)/provided by financing activities (4,732,092) (274,707,500) 67,839,135 (53,815,095)
Net increase in cash and cash equivalents 23,032 12,022,512 253,043 962,101 Cash and cash equivalents at beginning of the period 45,075 11,367,478 278,143 2,052,360
Cash and cash equivalents at end of the period 68,107 23,389,990 531,186 3,014,461
Cash and cash equivalents at end of the period is comprised of: Cash at bank 68,107 23,389,990 531,186 3,014,461 Bank overdraft - - - -
The accompanying notes form an integral part of the financial statements.
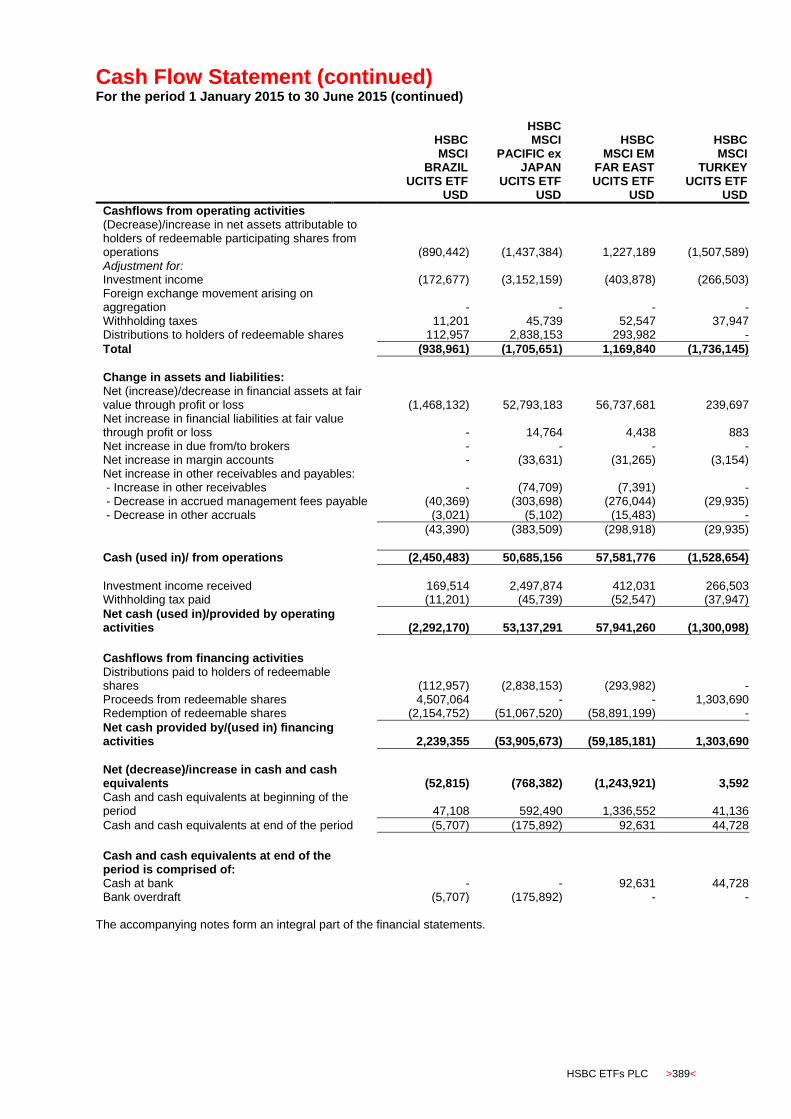
Cash Flow Statement (continued) For the period 1 January 2015 to 30 June 2015 (continued)
HSBC ETFs PLC >389<
HSBC MSCI
BRAZIL UCITS ETF
USD
HSBC MSCI
PACIFIC ex JAPAN
UCITS ETF USD
HSBC MSCI EM
FAR EAST UCITS ETF
USD
HSBC MSCI
TURKEY UCITS ETF
USD
Cashflows from operating activities (Decrease)/increase in net assets attributable to holders of redeemable participating shares from operations (890,442) (1,437,384) 1,227,189 (1,507,589) Adjustment for: Investment income (172,677) (3,152,159) (403,878) (266,503) Foreign exchange movement arising on aggregation - - - - Withholding taxes 11,201 45,739 52,547 37,947 Distributions to holders of redeemable shares 112,957 2,838,153 293,982 -
Total (938,961) (1,705,651) 1,169,840 (1,736,145)
Change in assets and liabilities: Net (increase)/decrease in financial assets at fair value through profit or loss (1,468,132) 52,793,183 56,737,681 239,697 Net increase in financial liabilities at fair value through profit or loss - 14,764 4,438 883 Net increase in due from/to brokers - - - - Net increase in margin accounts - (33,631) (31,265) (3,154) Net increase in other receivables and payables: - Increase in other receivables - (74,709) (7,391) - - Decrease in accrued management fees payable (40,369) (303,698) (276,044) (29,935) - Decrease in other accruals (3,021) (5,102) (15,483) -
(43,390) (383,509) (298,918) (29,935)
Cash (used in)/ from operations (2,450,483) 50,685,156 57,581,776 (1,528,654)
Investment income received 169,514 2,497,874 412,031 266,503 Withholding tax paid (11,201) (45,739) (52,547) (37,947)
Net cash (used in)/provided by operating activities (2,292,170) 53,137,291 57,941,260 (1,300,098)
Cashflows from financing activities Distributions paid to holders of redeemable shares (112,957) (2,838,153) (293,982) - Proceeds from redeemable shares 4,507,064 - - 1,303,690 Redemption of redeemable shares (2,154,752) (51,067,520) (58,891,199) -
Net cash provided by/(used in) financing activities 2,239,355 (53,905,673) (59,185,181) 1,303,690
Net (decrease)/increase in cash and cash equivalents (52,815) (768,382) (1,243,921) 3,592 Cash and cash equivalents at beginning of the period 47,108 592,490 1,336,552 41,136
Cash and cash equivalents at end of the period (5,707) (175,892) 92,631 44,728
Cash and cash equivalents at end of the period is comprised of: Cash at bank - - 92,631 44,728 Bank overdraft (5,707) (175,892) - -
The accompanying notes form an integral part of the financial statements.
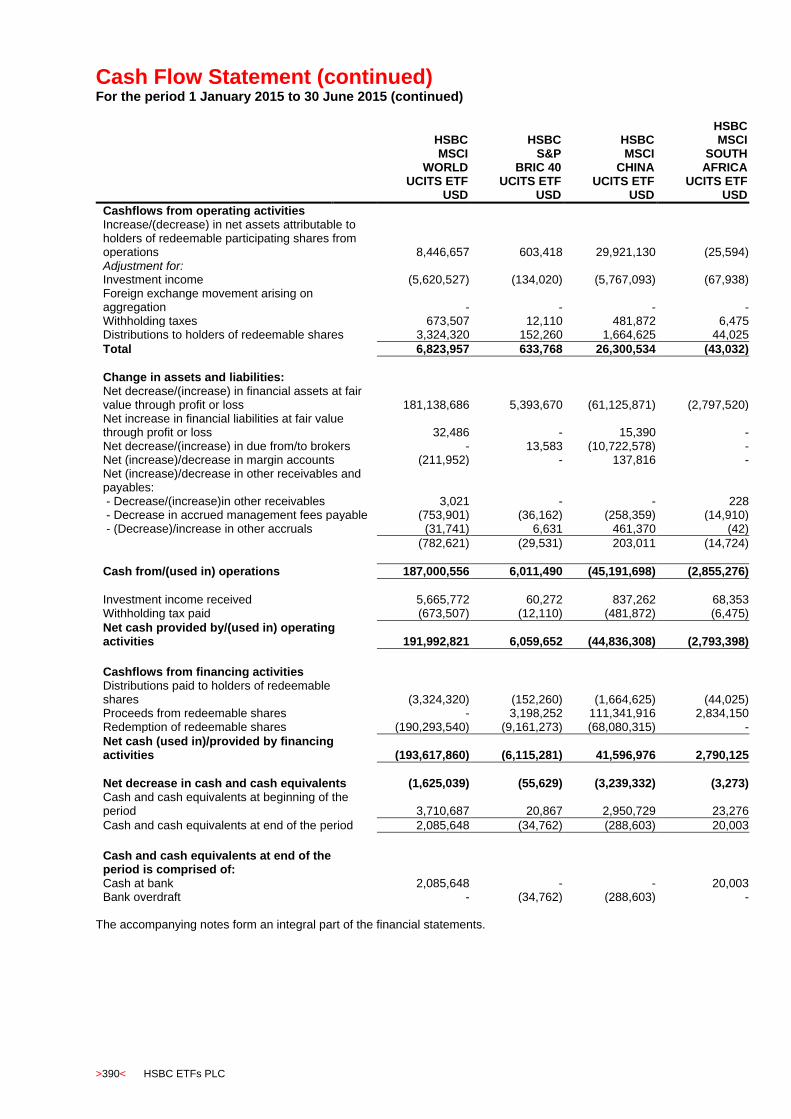
Cash Flow Statement (continued) For the period 1 January 2015 to 30 June 2015 (continued)
>390< HSBC ETFs PLC
HSBC MSCI
WORLD UCITS ETF
USD
HSBC S&P
BRIC 40 UCITS ETF
USD
HSBC MSCI
CHINA UCITS ETF
USD
HSBC MSCI
SOUTH AFRICA
UCITS ETF USD
Cashflows from operating activities Increase/(decrease) in net assets attributable to holders of redeemable participating shares from operations 8,446,657 603,418 29,921,130 (25,594) Adjustment for: Investment income (5,620,527) (134,020) (5,767,093) (67,938) Foreign exchange movement arising on aggregation - - - - Withholding taxes 673,507 12,110 481,872 6,475 Distributions to holders of redeemable shares 3,324,320 152,260 1,664,625 44,025
Total 6,823,957 633,768 26,300,534 (43,032)
Change in assets and liabilities: Net decrease/(increase) in financial assets at fair value through profit or loss 181,138,686 5,393,670 (61,125,871) (2,797,520) Net increase in financial liabilities at fair value through profit or loss 32,486 - 15,390 - Net decrease/(increase) in due from/to brokers - 13,583 (10,722,578) - Net (increase)/decrease in margin accounts (211,952) - 137,816 - Net (increase)/decrease in other receivables and payables: - Decrease/(increase)in other receivables 3,021 - - 228 - Decrease in accrued management fees payable (753,901) (36,162) (258,359) (14,910) - (Decrease)/increase in other accruals (31,741) 6,631 461,370 (42)
(782,621) (29,531) 203,011 (14,724)
Cash from/(used in) operations 187,000,556 6,011,490 (45,191,698) (2,855,276)
Investment income received 5,665,772 60,272 837,262 68,353 Withholding tax paid (673,507) (12,110) (481,872) (6,475)
Net cash provided by/(used in) operating activities 191,992,821 6,059,652 (44,836,308) (2,793,398)
Cashflows from financing activities Distributions paid to holders of redeemable shares (3,324,320) (152,260) (1,664,625) (44,025) Proceeds from redeemable shares - 3,198,252 111,341,916 2,834,150 Redemption of redeemable shares (190,293,540) (9,161,273) (68,080,315) -
Net cash (used in)/provided by financing activities (193,617,860) (6,115,281) 41,596,976 2,790,125
Net decrease in cash and cash equivalents (1,625,039) (55,629) (3,239,332) (3,273) Cash and cash equivalents at beginning of the period 3,710,687 20,867 2,950,729 23,276
Cash and cash equivalents at end of the period 2,085,648 (34,762) (288,603) 20,003
Cash and cash equivalents at end of the period is comprised of: Cash at bank 2,085,648 - - 20,003 Bank overdraft - (34,762) (288,603) -
The accompanying notes form an integral part of the financial statements.
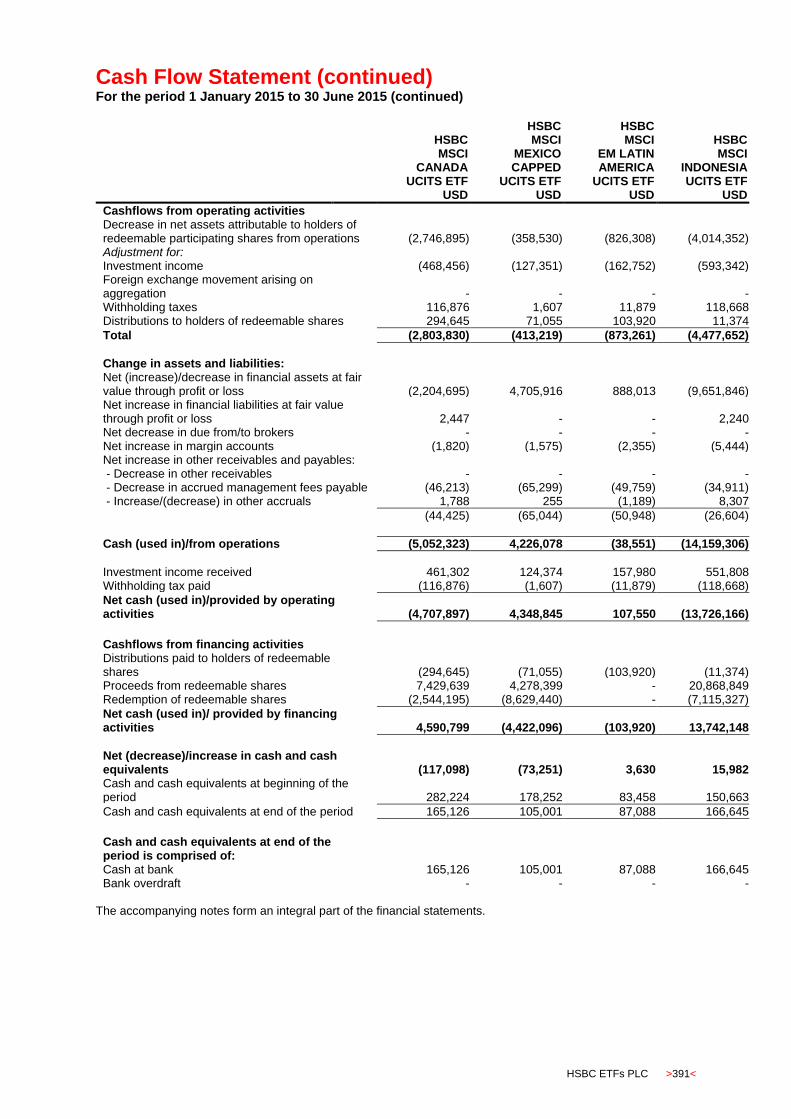
Cash Flow Statement (continued) For the period 1 January 2015 to 30 June 2015 (continued)
HSBC ETFs PLC >391<
HSBC MSCI
CANADA UCITS ETF
USD
HSBC MSCI
MEXICO CAPPED
UCITS ETF USD
HSBC MSCI
EM LATIN AMERICA
UCITS ETF USD
HSBC MSCI
INDONESIA UCITS ETF
USD
Cashflows from operating activities Decrease in net assets attributable to holders of redeemable participating shares from operations (2,746,895) (358,530) (826,308) (4,014,352) Adjustment for: Investment income (468,456) (127,351) (162,752) (593,342) Foreign exchange movement arising on aggregation - - - - Withholding taxes 116,876 1,607 11,879 118,668 Distributions to holders of redeemable shares 294,645 71,055 103,920 11,374
Total (2,803,830) (413,219) (873,261) (4,477,652)
Change in assets and liabilities: Net (increase)/decrease in financial assets at fair value through profit or loss (2,204,695) 4,705,916 888,013 (9,651,846) Net increase in financial liabilities at fair value through profit or loss 2,447 - - 2,240 Net decrease in due from/to brokers - - - - Net increase in margin accounts (1,820) (1,575) (2,355) (5,444) Net increase in other receivables and payables: - Decrease in other receivables - - - - - Decrease in accrued management fees payable (46,213) (65,299) (49,759) (34,911) - Increase/(decrease) in other accruals 1,788 255 (1,189) 8,307
(44,425) (65,044) (50,948) (26,604)
Cash (used in)/from operations (5,052,323) 4,226,078 (38,551) (14,159,306)
Investment income received 461,302 124,374 157,980 551,808 Withholding tax paid (116,876) (1,607) (11,879) (118,668)
Net cash (used in)/provided by operating activities (4,707,897) 4,348,845 107,550 (13,726,166)
Cashflows from financing activities Distributions paid to holders of redeemable shares (294,645) (71,055) (103,920) (11,374) Proceeds from redeemable shares 7,429,639 4,278,399 - 20,868,849 Redemption of redeemable shares (2,544,195) (8,629,440) - (7,115,327)
Net cash (used in)/ provided by financing activities 4,590,799 (4,422,096) (103,920) 13,742,148
Net (decrease)/increase in cash and cash equivalents (117,098) (73,251) 3,630 15,982 Cash and cash equivalents at beginning of the period 282,224 178,252 83,458 150,663
Cash and cash equivalents at end of the period 165,126 105,001 87,088 166,645
Cash and cash equivalents at end of the period is comprised of: Cash at bank 165,126 105,001 87,088 166,645 Bank overdraft - - - -
The accompanying notes form an integral part of the financial statements.
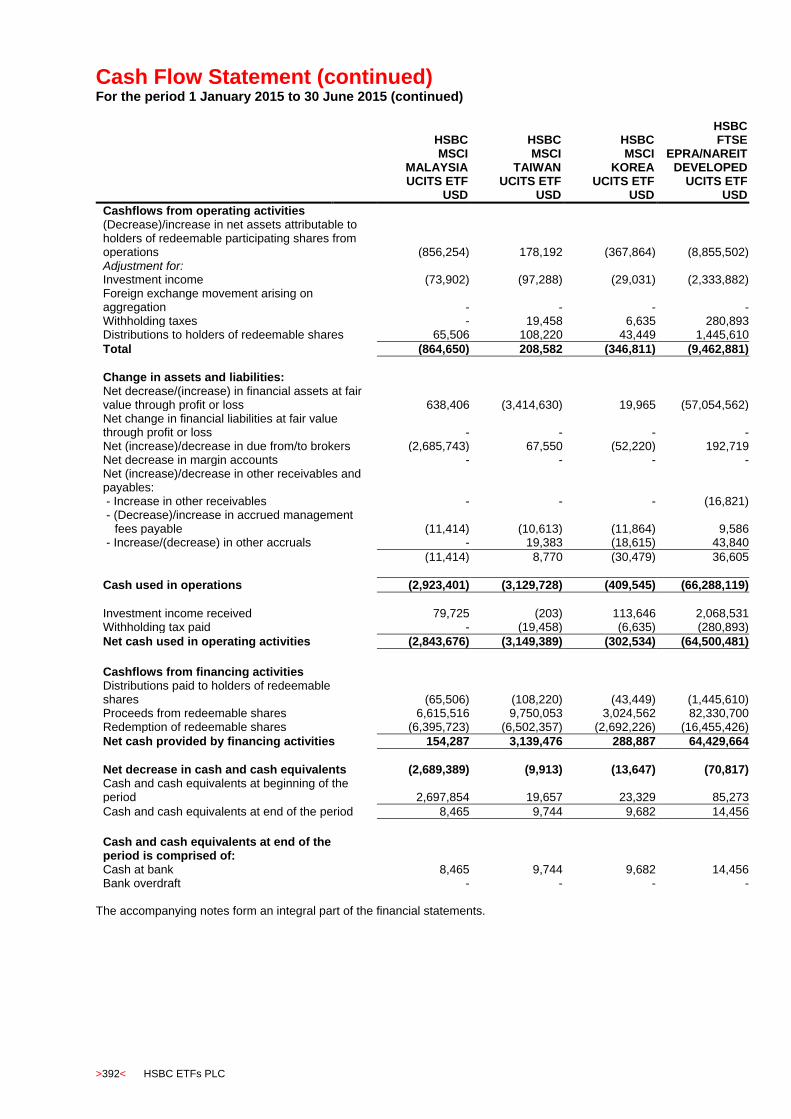
Cash Flow Statement (continued) For the period 1 January 2015 to 30 June 2015 (continued)
>392< HSBC ETFs PLC
HSBC MSCI
MALAYSIA UCITS ETF
USD
HSBC MSCI
TAIWAN UCITS ETF
USD
HSBC MSCI
KOREA UCITS ETF
USD
HSBC FTSE
EPRA/NAREIT DEVELOPED
UCITS ETF USD
Cashflows from operating activities (Decrease)/increase in net assets attributable to holders of redeemable participating shares from operations (856,254) 178,192 (367,864) (8,855,502) Adjustment for: Investment income (73,902) (97,288) (29,031) (2,333,882) Foreign exchange movement arising on aggregation - - - - Withholding taxes - 19,458 6,635 280,893 Distributions to holders of redeemable shares 65,506 108,220 43,449 1,445,610
Total (864,650) 208,582 (346,811) (9,462,881)
Change in assets and liabilities: Net decrease/(increase) in financial assets at fair value through profit or loss 638,406 (3,414,630) 19,965 (57,054,562) Net change in financial liabilities at fair value through profit or loss - - - - Net (increase)/decrease in due from/to brokers (2,685,743) 67,550 (52,220) 192,719 Net decrease in margin accounts - - - - Net (increase)/decrease in other receivables and payables: - Increase in other receivables - - - (16,821) - (Decrease)/increase in accrued management
fees payable (11,414) (10,613) (11,864) 9,586 - Increase/(decrease) in other accruals - 19,383 (18,615) 43,840
(11,414) 8,770 (30,479) 36,605
Cash used in operations (2,923,401) (3,129,728) (409,545) (66,288,119)
Investment income received 79,725 (203) 113,646 2,068,531 Withholding tax paid - (19,458) (6,635) (280,893)
Net cash used in operating activities (2,843,676) (3,149,389) (302,534) (64,500,481)
Cashflows from financing activities Distributions paid to holders of redeemable shares (65,506) (108,220) (43,449) (1,445,610) Proceeds from redeemable shares 6,615,516 9,750,053 3,024,562 82,330,700 Redemption of redeemable shares (6,395,723) (6,502,357) (2,692,226) (16,455,426)
Net cash provided by financing activities 154,287 3,139,476 288,887 64,429,664
Net decrease in cash and cash equivalents (2,689,389) (9,913) (13,647) (70,817) Cash and cash equivalents at beginning of the period 2,697,854 19,657 23,329 85,273
Cash and cash equivalents at end of the period 8,465 9,744 9,682 14,456
Cash and cash equivalents at end of the period is comprised of: Cash at bank 8,465 9,744 9,682 14,456 Bank overdraft - - - -
The accompanying notes form an integral part of the financial statements.

Cash Flow Statement (continued) For the period 1 January 2015 to 30 June 2015 (continued)
HSBC ETFs PLC >393<
HSBC MSCI
RUSSIA CAPPED
UCITS ETF USD
HSBC MSCI
EMERGING MARKETS UCITS ETF
USD
HSBC MSCI AC
FAR EAST ex JAPAN
UCITS ETF USD
HSBC ESI
WORLDWIDE EQUITY
UCITS ETF USD
Cashflows from operating activities Increase in net assets attributable to holders of redeemable participating shares from operations 8,739,123 6,912,774 6,757,104
18,589,211
Adjustment for: Investment income (421,903) (4,430,235) (1,961,916) (16,110,308) Foreign exchange movement arising on aggregation - - - - Withholding taxes 40,967 438,977 177,789 1,768,667 Distributions to holders of redeemable shares 2,057,755 1,498,140 - 7,581,702
Total 10,415,942 4,419,656 4,972,977 11,829,272
Change in assets and liabilities: Net (increase)/decrease in financial assets at fair value through profit or loss (10,982,269) 27,473,101 (13,603,500) (10,209,132) Net increase in financial liabilities at fair value through profit or loss 9,000 207,540 46,435
243,789
Net increase in due from/to brokers - (460,282) - (552) Net decrease/(increase) in margin accounts 17,675 (329,338) (139,834) (418,033) Net increase in other receivables and payables: - Increase in other receivables - - (28,598) (42,758) - Decrease in accrued management fees payable (120,475) (698,634) (283,825) (627,390) - (Decrease)/Increase in other accruals (7,094) 83,260 82,356 134,329
(127,569) (615,374) (230,067) (535,819)
Cash (used in)/from in operations (667,221) 30,695,303 (8,953,989) 909,525
Investment income received 492,847 3,125,654 1,238,883 14,174,290 Withholding tax paid (40,967) (438,977) (177,789) (1,768,667)
Net cash (used in)/provided by operating activities (215,341) 33,381,980 (7,892,895) 13,315,148
Cashflows from financing activities Distributions paid to holders of redeemable shares (2,057,755) (1,498,140) - (7,581,702) Proceeds from redeemable shares 5,091,450 18,442,302 7,664,816 - Redemption of redeemable shares (2,870,554) (47,982,656) - -
Net cash provided by/(used in) financing activities 163,141 (31,038,494) 7,664,816 (7,581,702)
Net (decrease)/increase in cash and cash equivalents (52,200) 2,343,486 (228,079) 5,733,446 Cash and cash equivalents at beginning of the period 283,898 4,966,164 1,726,023 3,686,914
Cash and cash equivalents at end of the period 231,698 7,309,650 1,497,944 9,420,360
Cash and cash equivalents at end of the period is comprised of: Cash at bank 231,698 7,309,650 1,497,944 9,420,360 Bank overdraft - - - -
The accompanying notes form an integral part of the financial statements.
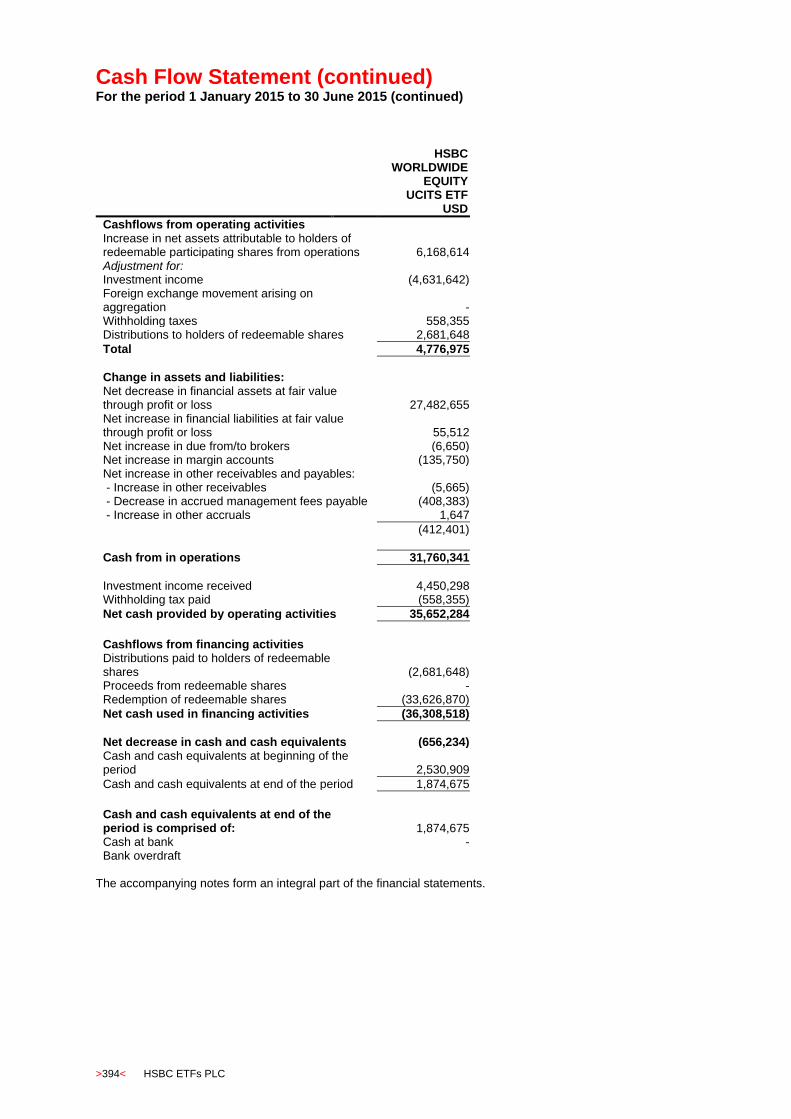
Cash Flow Statement (continued) For the period 1 January 2015 to 30 June 2015 (continued)
>394< HSBC ETFs PLC
HSBC
WORLDWIDE EQUITY
UCITS ETF USD
Cashflows from operating activities Increase in net assets attributable to holders of redeemable participating shares from operations 6,168,614 Adjustment for: Investment income (4,631,642) Foreign exchange movement arising on aggregation - Withholding taxes 558,355 Distributions to holders of redeemable shares 2,681,648
Total 4,776,975
Change in assets and liabilities: Net decrease in financial assets at fair value through profit or loss 27,482,655 Net increase in financial liabilities at fair value through profit or loss 55,512 Net increase in due from/to brokers (6,650) Net increase in margin accounts (135,750) Net increase in other receivables and payables: - Increase in other receivables (5,665) - Decrease in accrued management fees payable (408,383) - Increase in other accruals 1,647
(412,401)
Cash from in operations 31,760,341
Investment income received 4,450,298 Withholding tax paid (558,355)
Net cash provided by operating activities 35,652,284
Cashflows from financing activities Distributions paid to holders of redeemable shares (2,681,648) Proceeds from redeemable shares - Redemption of redeemable shares (33,626,870)
Net cash used in financing activities (36,308,518)
Net decrease in cash and cash equivalents (656,234) Cash and cash equivalents at beginning of the period 2,530,909
Cash and cash equivalents at end of the period 1,874,675
Cash and cash equivalents at end of the period is comprised of: 1,874,675 Cash at bank - Bank overdraft
The accompanying notes form an integral part of the financial statements.

Cash Flow Statement For the period 1 January 2014 to 30 June 2014
HSBC ETFs PLC >395<
TOTAL 2014 EUR
HSBC FTSE
100 UCITS ETF
GBP
HSBC EURO
STOXX 50 UCITS ETF
EUR
HSBC MSCI
JAPAN UCITS ETF
USD
Cashflows from operating activities Increase/(decrease) in net assets attributable to holders of redeemable participating shares from operations 136,407,230 (405,091) 4,387,519 4,964,485 Adjustment for: Investment income (40,067,170) (5,633,963) (1,721,418) (2,111,033) Foreign exchange movement arising on aggregation 29,504,304 - - - Withholding taxes 3,579,604 - 151,610 323,200 Distributions to holders of redeemable shares 21,909,220 4,248,576 436,581 576,171
Total 151,333,188 (1,790,478) 3,254,292 3,752,823
Change in assets and liabilities: Net (increase)/decrease in financial assets at fair value through profit or loss (660,613,878) 41,901,169 18,440,030 (134,970,426) Net (decrease)/ increase in financial liabilities at fair value through profit or loss (321,586) 463 1,960 - Net decrease/(increase) in due from/to brokers 62,589,188 (1,699,637) (42,693) (9,727,219) Net (increase)/decrease in margin accounts 37,171 (10,080) (4,300) 3,478 Net decrease/(increase) in other receivables and payables: - (increase)/decrease in other receivables (98,451) 839 (69,843) (42) - Increase/(decrease) in accrued management
fees payable 2,090,721 221,260 27,637 244,368 - Increase/(decrease) in other accruals 159,226 (90,245) (4,210) 50,129
2,151,496 131,854 (46,416) 294,455
Cash (used in)/from operations (444,824,421) 38,533,291 21,602,873 (140,646,889)
Investment income received 35,399,422 5,333,469 1,711,954 1,783,709 Withholding tax paid (3,579,604) - (151,610) (323,200)
Net cash (used in)/from operating activities (413,004,603) 43,866,760 23,163,217 (139,186,380)
Cashflows from financing activities Distributions paid to holders of redeemable shares (21,909,220) (4,248,576) (436,581) (576,171) Proceeds from redeemable shares 781,713,346 1,704,040 - 131,184,305 Redemption of redeemable shares (273,468,493) (41,390,730) (22,874,670) -
Net cash provided by/(used in) financing activities 486,335,633 (43,935,266) (23,311,251) 130,608,134
Net increase/(decrease) in cash and cash equivalents 73,331,030 (68,506) (148,034) (8,578,246) Cash and cash equivalents at beginning of the period 17,469,857 (25,394) 220,636 9,875,538
Cash and cash equivalents at end of the period 90,800,887 (93,900) 72,602 1,297,292
Cash and cash equivalents at end of the period is comprised of: Cash at bank 91,006,192 - 72,602 1,297,292 Bank overdraft (205,305) (93,900) - -
The accompanying notes form an integral part of the financial statements.

Cash Flow Statement (continued) For the period 1 January 2014 to 30 June 2014 (continued)
>396< HSBC ETFs PLC
HSBC FTSE
250 UCITS ETF
GBP
HSBC S&P 500
UCITS ETF USD
HSBC MSCI
EUROPE UCITS ETF
EUR
HSBC MSCI USA
UCITS ETF USD
Cashflows from operating activities (Decrease)/increase in net assets attributable to holders of redeemable participating shares from operations (730,995) 95,055,833 4,406,966 20,157,158 Adjustment for: Investment income (920,484) (14,325,874) (1,683,317) (3,214,787) Foreign exchange movement arising on aggregation - - - - Withholding taxes - 2,011,493 140,177 447,523 Distributions to holders of redeemable shares 512,431 9,951,855 411,950 2,075,320
Total (1,139,048) 92,693,307 3,275,776 19,465,214
Change in assets and liabilities: Net increase in financial assets at fair value through profit or loss (6,999,505) (333,773,951) (45,582,862) (55,926,291) Net increase in financial liabilities at fair value through profit or loss - - 1,827 - Net (increase)/decrease in due from/to brokers (72,629) (3,702,574) (5,372) 62,965 Net increase in margin accounts (3,450) (248,179) (18,848) (22,326) Net decrease in other receivables and payables: - Increase in other receivables (4,696) - (29,049) - - Increase in accrued management fees payable 57,964 365,747 69,293 271,457 - Decrease in other accruals (13,442) (17,107) (2,613) (7,958)
39,826 348,640 37,631 263,499
Cash used in operations (8,174,806) (244,682,757) (42,291,848) (36,156,939)
Investment income received 863,704 14,408,480 1,554,694 3,262,451 Withholding tax paid - (2,011,493) (140,177) (447,523)
Net cash used in operating activities (7,311,102) (232,285,770) (40,877,331) (33,342,011)
Cashflows from financing activities Distributions paid to holders of redeemable shares (512,431) (9,951,855) (411,950) (2,075,320) Proceeds from redeemable shares 7,912,200 411,714,259 41,170,719 35,721,725 Redemption of redeemable shares - (165,145,380) - -
Net cash provided by financing activities 7,399,769 236,617,024 40,758,769 33,646,405
Net increase/(decrease) in cash and cash equivalents 88,667 4,331,254 (118,562) 304,394 Cash and cash equivalents at beginning of the period (1,932) 3,519,247 178,522 1,198,794
Cash and cash equivalents at end of the period 86,735 7,850,501 59,960 1,503,188
Cash and cash equivalents at end of the period is comprised of: Cash at bank 86,735 7,850,501 59,960 1,503,188 Bank overdraft - - - -
The accompanying notes form an integral part of the financial statements.
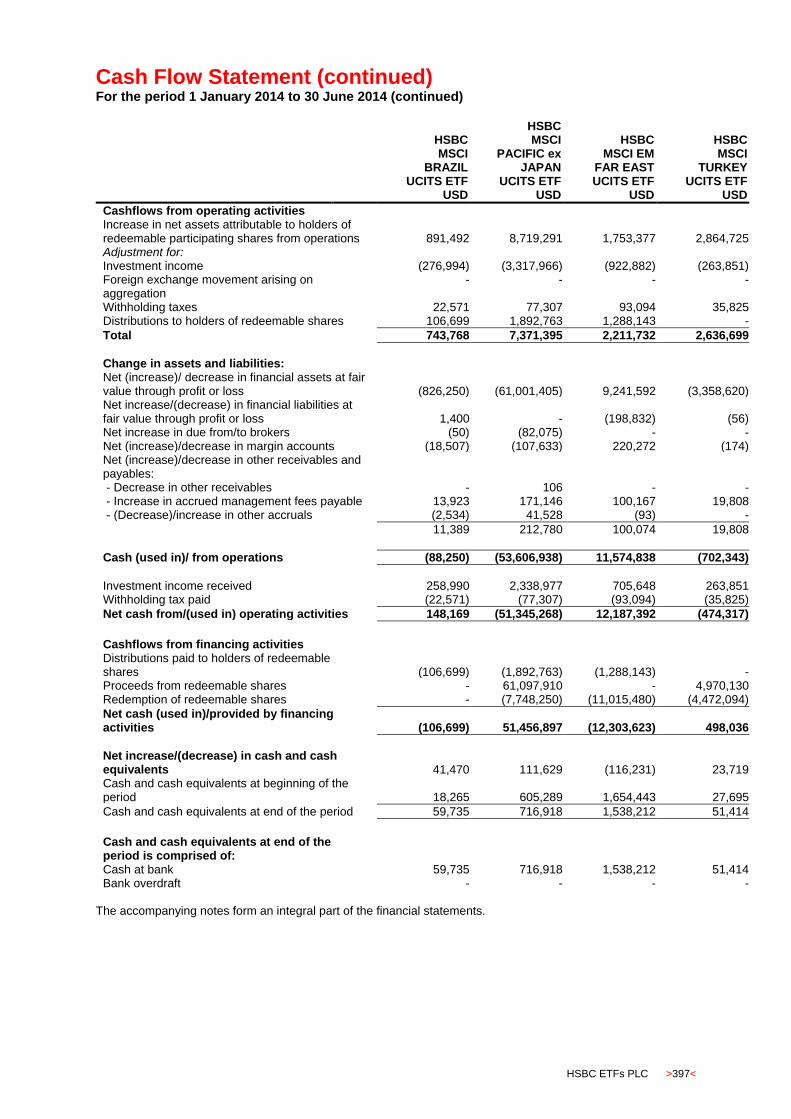
Cash Flow Statement (continued) For the period 1 January 2014 to 30 June 2014 (continued)
HSBC ETFs PLC >397<
HSBC MSCI
BRAZIL UCITS ETF
USD
HSBC MSCI
PACIFIC ex JAPAN
UCITS ETF USD
HSBC MSCI EM
FAR EAST UCITS ETF
USD
HSBC MSCI
TURKEY UCITS ETF
USD
Cashflows from operating activities Increase in net assets attributable to holders of redeemable participating shares from operations 891,492 8,719,291 1,753,377 2,864,725 Adjustment for: Investment income (276,994) (3,317,966) (922,882) (263,851) Foreign exchange movement arising on aggregation
- - - -
Withholding taxes 22,571 77,307 93,094 35,825 Distributions to holders of redeemable shares 106,699 1,892,763 1,288,143 -
Total 743,768 7,371,395 2,211,732 2,636,699
Change in assets and liabilities: Net (increase)/ decrease in financial assets at fair value through profit or loss (826,250) (61,001,405) 9,241,592 (3,358,620) Net increase/(decrease) in financial liabilities at fair value through profit or loss 1,400 - (198,832) (56) Net increase in due from/to brokers (50) (82,075) - - Net (increase)/decrease in margin accounts (18,507) (107,633) 220,272 (174) Net (increase)/decrease in other receivables and payables: - Decrease in other receivables - 106 - - - Increase in accrued management fees payable 13,923 171,146 100,167 19,808 - (Decrease)/increase in other accruals (2,534) 41,528 (93) -
11,389 212,780 100,074 19,808
Cash (used in)/ from operations (88,250) (53,606,938) 11,574,838 (702,343)
Investment income received 258,990 2,338,977 705,648 263,851 Withholding tax paid (22,571) (77,307) (93,094) (35,825)
Net cash from/(used in) operating activities 148,169 (51,345,268) 12,187,392 (474,317)
Cashflows from financing activities Distributions paid to holders of redeemable shares (106,699) (1,892,763) (1,288,143) - Proceeds from redeemable shares - 61,097,910 - 4,970,130 Redemption of redeemable shares - (7,748,250) (11,015,480) (4,472,094)
Net cash (used in)/provided by financing activities (106,699) 51,456,897 (12,303,623) 498,036
Net increase/(decrease) in cash and cash equivalents 41,470 111,629 (116,231) 23,719 Cash and cash equivalents at beginning of the period 18,265 605,289 1,654,443 27,695
Cash and cash equivalents at end of the period 59,735 716,918 1,538,212 51,414
Cash and cash equivalents at end of the period is comprised of: Cash at bank 59,735 716,918 1,538,212 51,414 Bank overdraft - - - -
The accompanying notes form an integral part of the financial statements.
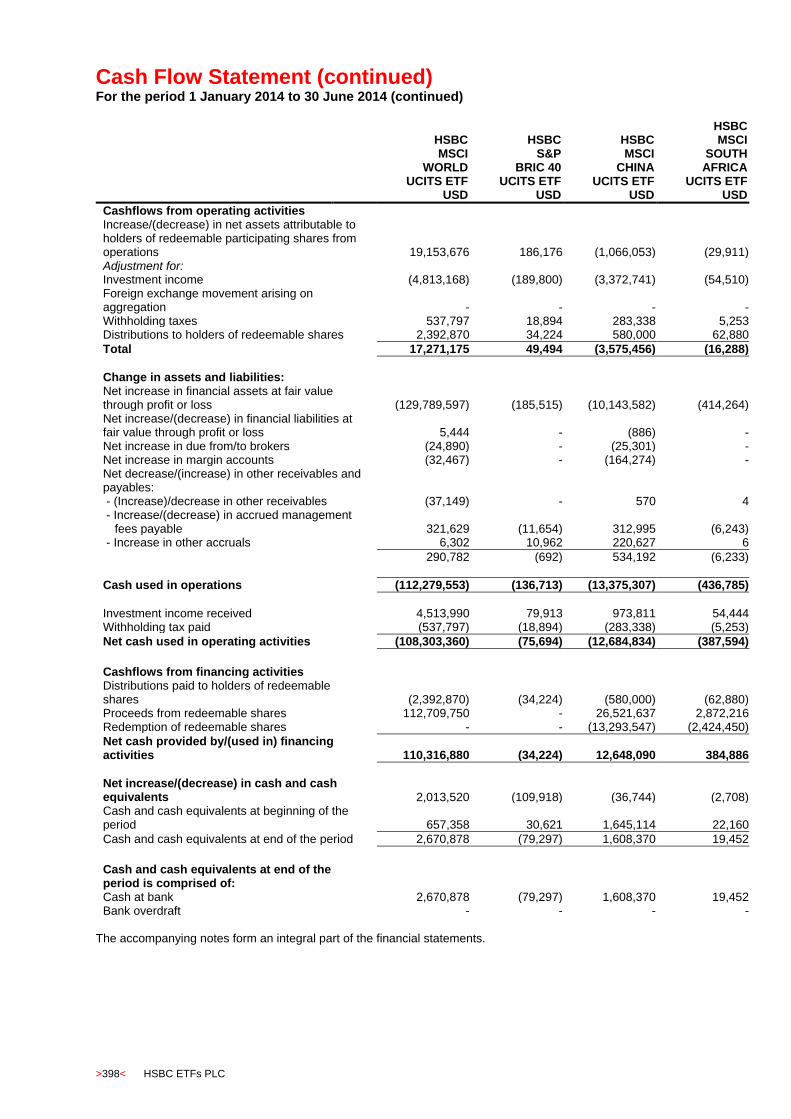
Cash Flow Statement (continued) For the period 1 January 2014 to 30 June 2014 (continued)
>398< HSBC ETFs PLC
HSBC MSCI
WORLD UCITS ETF
USD
HSBC S&P
BRIC 40 UCITS ETF
USD
HSBC MSCI
CHINA UCITS ETF
USD
HSBC MSCI
SOUTH AFRICA
UCITS ETF USD
Cashflows from operating activities Increase/(decrease) in net assets attributable to holders of redeemable participating shares from operations 19,153,676 186,176 (1,066,053) (29,911) Adjustment for: Investment income (4,813,168) (189,800) (3,372,741) (54,510) Foreign exchange movement arising on aggregation - - - - Withholding taxes 537,797 18,894 283,338 5,253 Distributions to holders of redeemable shares 2,392,870 34,224 580,000 62,880
Total 17,271,175 49,494 (3,575,456) (16,288)
Change in assets and liabilities: Net increase in financial assets at fair value through profit or loss (129,789,597) (185,515) (10,143,582) (414,264) Net increase/(decrease) in financial liabilities at fair value through profit or loss 5,444 - (886) - Net increase in due from/to brokers (24,890) - (25,301) - Net increase in margin accounts (32,467) - (164,274) - Net decrease/(increase) in other receivables and payables: - (Increase)/decrease in other receivables (37,149) - 570 4 - Increase/(decrease) in accrued management
fees payable 321,629 (11,654) 312,995 (6,243) - Increase in other accruals 6,302 10,962 220,627 6
290,782 (692) 534,192 (6,233)
Cash used in operations (112,279,553) (136,713) (13,375,307) (436,785)
Investment income received 4,513,990 79,913 973,811 54,444 Withholding tax paid (537,797) (18,894) (283,338) (5,253)
Net cash used in operating activities (108,303,360) (75,694) (12,684,834) (387,594)
Cashflows from financing activities Distributions paid to holders of redeemable shares (2,392,870) (34,224) (580,000) (62,880) Proceeds from redeemable shares 112,709,750 - 26,521,637 2,872,216 Redemption of redeemable shares - - (13,293,547) (2,424,450)
Net cash provided by/(used in) financing activities 110,316,880 (34,224) 12,648,090 384,886
Net increase/(decrease) in cash and cash equivalents 2,013,520 (109,918) (36,744) (2,708) Cash and cash equivalents at beginning of the period 657,358 30,621 1,645,114 22,160
Cash and cash equivalents at end of the period 2,670,878 (79,297) 1,608,370 19,452
Cash and cash equivalents at end of the period is comprised of: Cash at bank 2,670,878 (79,297) 1,608,370 19,452 Bank overdraft - - - -
The accompanying notes form an integral part of the financial statements.

Cash Flow Statement (continued) For the period 1 January 2014 to 30 June 2014 (continued)
HSBC ETFs PLC >399<
HSBC MSCI
CANADA UCITS ETF
USD
HSBC MSCI
MEXICO CAPPED
UCITS ETF USD
HSBC MSCI
EM LATIN AMERICA
UCITS ETF USD
HSBC MSCI
INDONESIA UCITS ETF
USD
Cashflows from operating activities Increase in net assets attributable to holders of redeemable participating shares from operations 2,693,883 2,402,200 433,001 1,661,537 Adjustment for: Investment income (298,315) (87,813) (321,422) (190,362) Foreign exchange movement arising on aggregation - - - - Withholding taxes 74,563 2,615 26,500 38,072 Distributions to holders of redeemable shares 148,230 236,200 187,210 16,192
Total 2,618,361 2,553,202 325,289 1,525,439
Change in assets and liabilities: Net increase in financial assets at fair value through profit or loss (16,484,802) (2,423,167) (1,137,719) (4,003,993) Net increase in financial liabilities at fair value through profit or loss - - - - Net increase in due from/to brokers - - 422 - Net decrease/(increase) in margin accounts (9,961) (876) (31) (7,332) Net decrease in other receivables and payables: - Decrease in other receivables 87,671 - - - - Increase/(decrease) in accrued management
fees payable 1,989 9,929 (20,680) (5,029) - Increase/(decrease) in other accruals 10,994 - (2,441) 4,310
100,654 9,929 (23,121) (719)
Cash (used in)/from operations (13,775,748) 139,088 (835,160) (2,486,605)
Investment income received 254,340 93,094 304,930 168,811 Withholding tax paid (74,563) (2,615) (26,500) (38,072)
Net cash (used in)/from operating activities (13,595,971) 229,567 (556,730) (2,355,866)
Cashflows from financing activities Distributions paid to holders of redeemable shares (148,230) (236,200) (187,210) (16,192) Proceeds from redeemable shares 13,722,600 - 6,356,166 2,387,265 Redemption of redeemable shares - - (5,663,100) -
Net cash provided by/(used in) financing activities 13,574,370 (236,200) 505,856 2,371,073
Net (decrease)/increase in cash and cash equivalents (21,601) (6,633) (50,874) 15,207 Cash and cash equivalents at beginning of the period 33,908 132,866 93,707 36,740
Cash and cash equivalents at end of the period 12,307 126,233 42,833 51,947
Cash and cash equivalents at end of the period is comprised of: Cash at bank 12,307 126,233 42,833 51,947 Bank overdraft - - - -
The accompanying notes form an integral part of the financial statements.

Cash Flow Statement (continued) For the period 1 January 2014 to 30 June 2014 (continued)
>400< HSBC ETFs PLC
HSBC MSCI
MALAYSIA UCITS ETF
USD
HSBC MSCI
TAIWAN UCITS ETF
USD
HSBC MSCI
KOREA UCITS ETF
USD
HSBC FTSE
EPRA/NAREIT DEVELOPED
UCITS ETF USD
Cashflows from operating activities (Decrease)/Increase in net assets attributable to holders of redeemable participating shares from operations (41,682) 199,509 91,314 2,081,155 Adjustment for: Investment income (86,878) (17,632) (3,081) (435,529) Foreign exchange movement arising on aggregation - - - - Withholding taxes - 3,527 696 48,868 Distributions to holders of redeemable shares 98,355 81,500 - 271,300
Total (30,205) 266,904 88,929 1,965,794
Change in assets and liabilities: Net decrease/(increase) in financial assets at fair value through profit or loss 3,010,672 (556,747) (93,903) (2,107,012) Net decrease in financial liabilities at fair value through profit or loss - - - - Net increase in due from/to brokers - - (20,008) (4,907) Net decrease in margin accounts 666 - - - Net decrease/(increase) in other receivables and payables: - Increase in other receivables - (8,191) - (1,138) - Decrease in accrued management fees payable (2,268) (9,006) (1,705) (5,938) - Increase/(decrease) in other accruals - 3,540 (6,144) (614)
(2,268) (13,657) (7,849) (7,690)
Cash from/(used in) operations 2,978,865 (303,500) (32,831) (153,815)
Investment income received 98,701 (71) 31,010 439,899 Withholding tax paid - (3,527) (696) (48,868)
Net cash from/(used in) operating activities 3,077,566 (307,098) (2,517) 237,216
Cashflows from financing activities Distributions paid to holders of redeemable shares (98,355) (81,500) - (271,300) Proceeds from redeemable shares 2,977,452 3,153,275 - - Redemption of redeemable shares (5,960,766) (2,788,496) - -
Net cash (used in)/provided by financing activities (3,081,669) 283,279 - (271,300)
Net (decrease)/increase in cash and cash equivalents (4,103) (23,819) (2,517) (34,084) Cash and cash equivalents at beginning of the period 47,167 22,124 10,621 (5,054)
Cash and cash equivalents at end of the period 43,064 (1,695) 8,104 (39,138)
Cash and cash equivalents at end of the period is comprised of: Cash at bank 43,064 - 8,104 - Bank overdraft - (1,695) - (39,138)
The accompanying notes form an integral part of the financial statements.
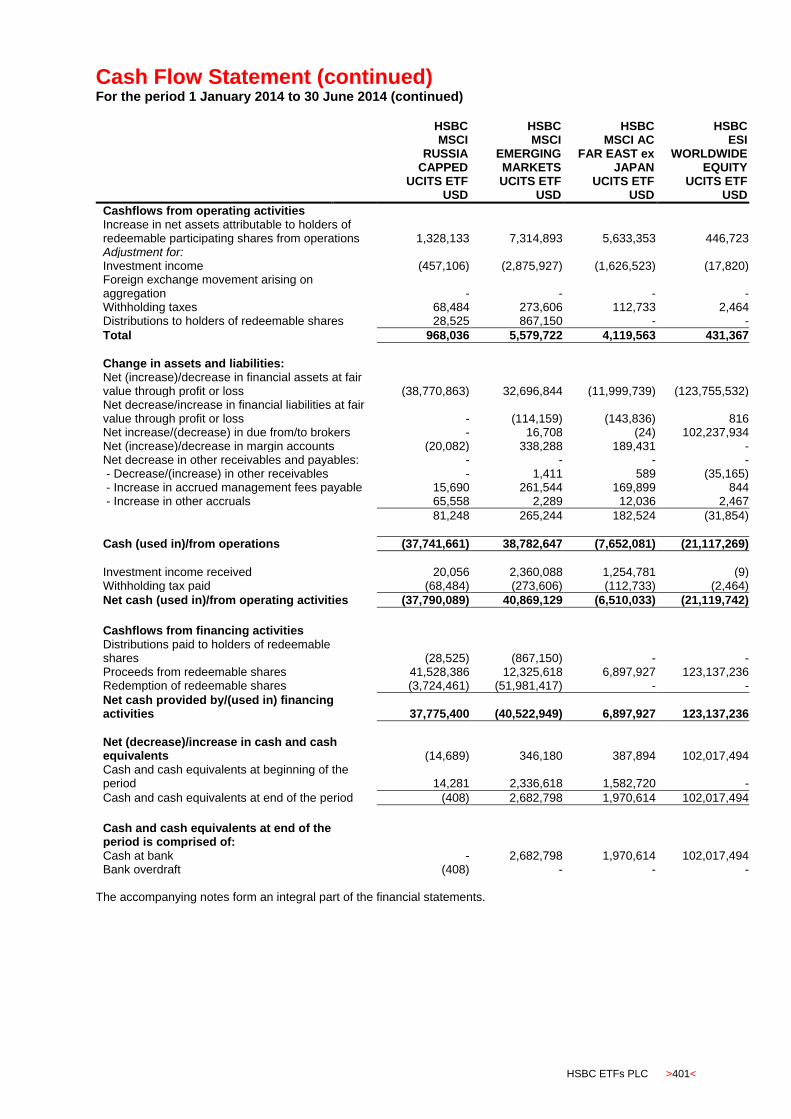
Cash Flow Statement (continued) For the period 1 January 2014 to 30 June 2014 (continued)
HSBC ETFs PLC >401<
HSBC MSCI
RUSSIA CAPPED
UCITS ETF USD
HSBC MSCI
EMERGING MARKETS UCITS ETF
USD
HSBC MSCI AC
FAR EAST ex JAPAN
UCITS ETF USD
HSBC ESI
WORLDWIDE EQUITY
UCITS ETF USD
Cashflows from operating activities Increase in net assets attributable to holders of redeemable participating shares from operations 1,328,133 7,314,893 5,633,353 446,723 Adjustment for: Investment income (457,106) (2,875,927) (1,626,523) (17,820) Foreign exchange movement arising on aggregation - - - - Withholding taxes 68,484 273,606 112,733 2,464 Distributions to holders of redeemable shares 28,525 867,150 - -
Total 968,036 5,579,722 4,119,563 431,367
Change in assets and liabilities: Net (increase)/decrease in financial assets at fair value through profit or loss (38,770,863) 32,696,844 (11,999,739) (123,755,532) Net decrease/increase in financial liabilities at fair value through profit or loss - (114,159) (143,836) 816 Net increase/(decrease) in due from/to brokers - 16,708 (24) 102,237,934 Net (increase)/decrease in margin accounts (20,082) 338,288 189,431 - Net decrease in other receivables and payables: - - - - - Decrease/(increase) in other receivables - 1,411 589 (35,165) - Increase in accrued management fees payable 15,690 261,544 169,899 844 - Increase in other accruals 65,558 2,289 12,036 2,467
81,248 265,244 182,524 (31,854)
Cash (used in)/from operations (37,741,661) 38,782,647 (7,652,081) (21,117,269)
Investment income received 20,056 2,360,088 1,254,781 (9) Withholding tax paid (68,484) (273,606) (112,733) (2,464)
Net cash (used in)/from operating activities (37,790,089) 40,869,129 (6,510,033) (21,119,742)
Cashflows from financing activities Distributions paid to holders of redeemable shares (28,525) (867,150) - - Proceeds from redeemable shares 41,528,386 12,325,618 6,897,927 123,137,236 Redemption of redeemable shares (3,724,461) (51,981,417) - -
Net cash provided by/(used in) financing activities 37,775,400 (40,522,949) 6,897,927 123,137,236
Net (decrease)/increase in cash and cash equivalents (14,689) 346,180 387,894 102,017,494 Cash and cash equivalents at beginning of the period 14,281 2,336,618 1,582,720 -
Cash and cash equivalents at end of the period (408) 2,682,798 1,970,614 102,017,494
Cash and cash equivalents at end of the period is comprised of: Cash at bank - 2,682,798 1,970,614 102,017,494 Bank overdraft (408) - - -
The accompanying notes form an integral part of the financial statements.
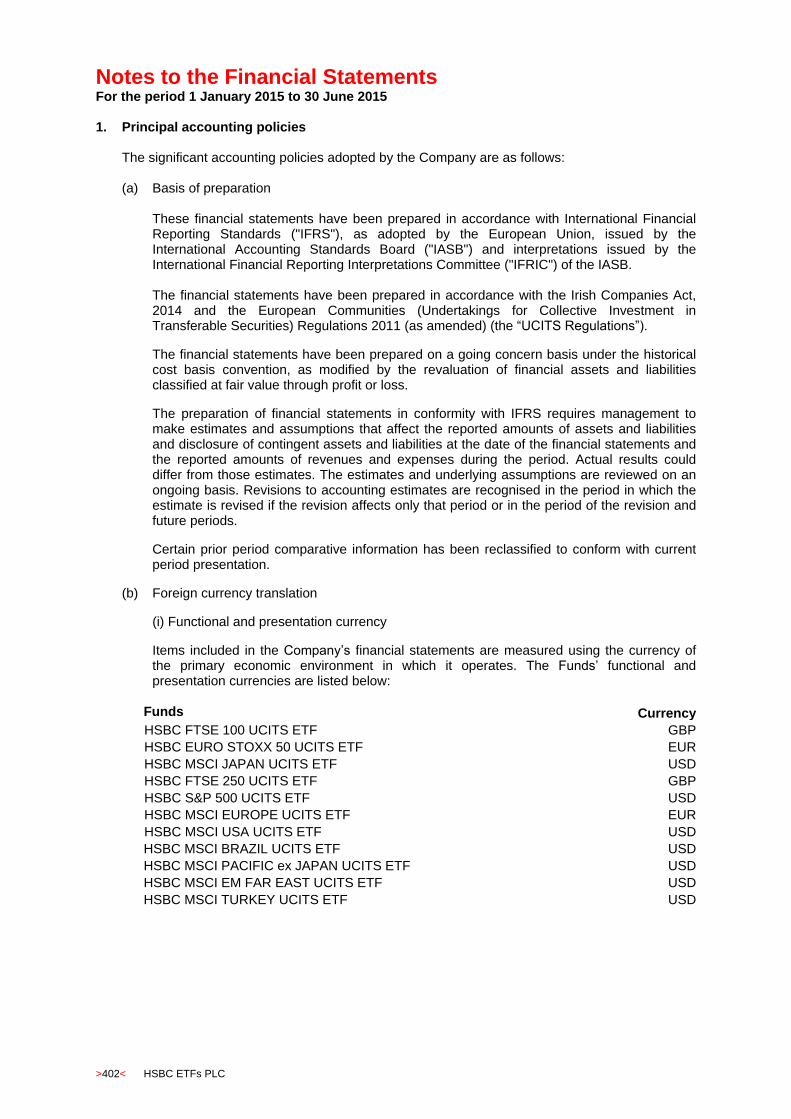
Notes to the Financial Statements For the period 1 January 2015 to 30 June 2015
>402< HSBC ETFs PLC
1. Principal accounting policies
The significant accounting policies adopted by the Company are as follows:
(a) Basis of preparation These financial statements have been prepared in accordance with International Financial Reporting Standards ("IFRS"), as adopted by the European Union, issued by the International Accounting Standards Board ("IASB") and interpretations issued by the International Financial Reporting Interpretations Committee ("IFRIC") of the IASB. The financial statements have been prepared in accordance with the Irish Companies Act, 2014 and the European Communities (Undertakings for Collective Investment in Transferable Securities) Regulations 2011 (as amended) (the “UCITS Regulations”). The financial statements have been prepared on a going concern basis under the historical cost basis convention, as modified by the revaluation of financial assets and liabilities classified at fair value through profit or loss. The preparation of financial statements in conformity with IFRS requires management to make estimates and assumptions that affect the reported amounts of assets and liabilities and disclosure of contingent assets and liabilities at the date of the financial statements and the reported amounts of revenues and expenses during the period. Actual results could differ from those estimates. The estimates and underlying assumptions are reviewed on an ongoing basis. Revisions to accounting estimates are recognised in the period in which the estimate is revised if the revision affects only that period or in the period of the revision and future periods. Certain prior period comparative information has been reclassified to conform with current period presentation.
(b) Foreign currency translation (i) Functional and presentation currency Items included in the Company’s financial statements are measured using the currency of the primary economic environment in which it operates. The Funds’ functional and presentation currencies are listed below:
Funds Currency
HSBC FTSE 100 UCITS ETF GBP
HSBC EURO STOXX 50 UCITS ETF EUR
HSBC MSCI JAPAN UCITS ETF USD
HSBC FTSE 250 UCITS ETF GBP
HSBC S&P 500 UCITS ETF USD
HSBC MSCI EUROPE UCITS ETF EUR
HSBC MSCI USA UCITS ETF USD
HSBC MSCI BRAZIL UCITS ETF USD
HSBC MSCI PACIFIC ex JAPAN UCITS ETF USD
HSBC MSCI EM FAR EAST UCITS ETF USD
HSBC MSCI TURKEY UCITS ETF USD

Notes to the Financial Statements (continued) For the period 1 January 2015 to 30 June 2015 (continued)
HSBC ETFs PLC >403<
1. Principal accounting policies (continued)
(b) Foreign currency translation (continued) (i) Functional and presentation currency (continued)
f Funds Currency
HSBC MSCI WORLD UCITS ETF USD
HSBC S&P BRIC 40 UCITS ETF USD
HSBC MSCI CHINA UCITS ETF USD
HSBC MSCI SOUTH AFRICA UCITS ETF USD
HSBC MSCI CANADA UCITS ETF USD
HSBC MSCI MEXICO CAPPED UCITS ETF USD
HSBC MSCI EM LATIN AMERICA UCITS ETF USD
HSBC MSCI INDONESIA UCITS ETF USD
HSBC MSCI MALAYSIA UCITS ETF USD
HSBC MSCI TAIWAN UCITS ETF USD
HSBC MSCI KOREA UCITS ETF USD
HSBC FTSE EPRA/NAREIT DEVELOPED UCITS ETF USD
HSBC MSCI RUSSIA CAPPED UCITS ETF USD
HSBC MSCI EMERGING MARKETS UCITS ETF USD
HSBC MSCI AC FAR EAST ex JAPAN UCITS ETF USD
HSBC ESI WORLDWIDE EQUITY UCITS ETF USD
HSBC WORLDWIDE EQUITY UCITS ETF USD The overall Company’s functional and presentation currency is Euro. For the purpose of aggregating the financial statements of the Funds, the balance sheet figures for the Funds whose presentation currency is not Euro have been translated to Euro at the exchange rate ruling at period end. The income and expenses in the income statement are translated at the average exchange rate for the period. The resulting adjustment of EUR 443,622,998 (31 December 2014: (EUR 507,797,940)) is due to the movement in exchange rates between 30 June 2015 and 31 December 2014 and also the restatement of the income and expenses in the income statement and amounts paid on subscriptions and redemptions of redeemable preference shares at average rates. This is a notional adjustment which has no effect on the Net Asset Value per share of the individual Funds. (ii) Transactions and balances Monetary assets and liabilities denominated in currencies other than the functional currency are translated to the functional currency at the closing rates of exchange at period end. Transactions during the period are translated at the rate of exchange prevailing on the date of the transaction. Foreign currency transaction gains and losses on financial instruments classified as at fair value through profit or loss and foreign currency differences on other financial instruments are included in the income statement as part of the ‘Net gain or loss on financial assets and liabilities at fair value through profit or loss’.
Notes to the Financial Statements (continued) For the period 1 January 2015 to 30 June 2015 (continued)
>404< HSBC ETFs PLC
1. Principal accounting policies (continued)
(c) Income Interest income is recognised in the income statement for all instruments and deposits using the effective interest method. The income generated by the security lending for the Company is included in other income in the income statement. Dividend income is credited to the income statement on the date on which the relevant securities are listed as “ex-dividend”. Dividend income is shown gross of any non-recoverable withholding taxes, which is disclosed under investment income in the income statement, and net of any tax credits.
(d) Expenses
Expenses are recognised in the income statement on an accrual basis.
(e) Cash and cash equivalents Cash and cash equivalents include cash in hand and other short term deposits with original maturities of three months or less and bank overdrafts. Details of margin cash are disclosed in Note 5.
(f) Due from/to brokers Amounts due from/to brokers represent payables for securities purchased and receivables for securities sold that have been contracted for but not yet delivered by the end of the period.
(g) Financial assets and liabilities at fair value through profit or loss (i) Classification The Company has designated its investments into the financial assets and liabilities at fair value through profit or loss category. This category has two sub-categories: financial assets and liabilities held for trading, and those designated by management at fair value through profit and loss at inception. Financial assets or liabilities held for trading are acquired or incurred principally for the purpose of selling or repurchasing in the short term. All investments in equity investments and derivative contracts have been categorised as held for trading. (ii) Recognition Purchases and sales of financial instruments are accounted for at trade date - the date on which the Company commits to purchase or sell the asset. Realised gains and losses on disposals of financial instruments are calculated using the first-in-first-out (FIFO) method.

Notes to the Financial Statements (continued) For the period 1 January 2015 to 30 June 2015 (continued)
HSBC ETFs PLC >405<
1. Principal accounting policies (continued)
(g) Financial assets and liabilities at fair value through profit or loss (continued) (iii) Measurement Financial instruments categorised at fair value through profit or loss are measured initially at fair value, with transaction costs for such instruments being recognised in the income statement. Gains and losses arising from changes in the fair value of financial assets and liabilities at fair value through profit or loss are included in the income statement in the period in which they arise. (iv) Fair value measurement principles The fair value of financial instruments is based on their quoted market prices at the balance sheet date without any deduction for estimated future selling costs. The Company utilises the last traded market price for both financial assets and financial liabilities where the last traded price falls within the bid-ask spread. If a quoted market price is not available on a recognised stock exchange or from a broker/dealer for non-exchange-traded financial instruments, the fair value of the instrument is estimated using valuation techniques, including use of recent arm’s length market transactions, reference to the current fair value of another instrument that is substantially the same, discounted cash flow techniques, option pricing models or any other valuation technique that provides a reliable estimate of prices obtained in actual market transactions. Where discounted cash flow techniques are used, estimated future cash flows are based on management’s best estimates and the discount rate used is a market rate at the balance sheet date applicable to an instrument with similar terms and conditions. Where other pricing models are used, inputs are based on market data at the balance sheet date. Fair values for unquoted equity investments are estimated, if possible, using applicable price/earnings ratios for similar listed companies adjusted to reflect the specific circumstances of the issuer. As at 30 June 2015 and 31 December 2014, there were no investments valued using discounted cash flow techniques and there were no equity investments held for which a quoted price was not available, except for the investment held in Connaught plc, which was valued at Nil. (v) Derecognition A financial asset is derecognised when the Company no longer has control over the contractual rights that comprise that asset. This occurs when the rights are realised, expire or are surrendered. A financial liability is derecognised when it is extinguished or when the obligation specified in the contract is discharged, cancelled or expired.
Notes to the Financial Statements (continued) For the period 1 January 2015 to 30 June 2015 (continued)
>406< HSBC ETFs PLC
1. Principal accounting policies (continued)
(h) Offsetting of financial assets and liabilities Financial assets and liabilities are offset and the net amount reported in the balance sheet and income statement where there is a legally enforceable right to offset the recognised amounts and there is an intention to settle on a net basis, or realise the assets and settle the liabilities simultaneously.
(i) Distributions to holders of redeemable participating shares Distributions to holders of redeemable participating shares are recorded in the income statement as finance costs when authorised.
(j) Redeemable participating shares Redeemable participating shares are redeemable at the shareholder’s option and are classified as financial liabilities. The redeemable participating shares can be put back to the Funds at any time for cash equal to a proportionate share of the particular Funds’ net asset value. The redeemable participating share is carried at the redemption amount that is payable at the period end date if the shareholder exercised its right to put the share back to the Funds. Equalisation is operated in connection with the issue and redemption of shares. It represents the income element included in the price for the issue and redemption of shares. Equalisation arrangements are intended to ensure that the income per share is not affected by changes in the number of shares in issue during the period. The buying/selling price of each share contains an amount called equalisation this is equivalent to the net income less expenses accrued in the Company at the time of purchase⁄sale. For distributing funds, equalisation attributable to subscriptions in the Funds forms part of the distributions to those shareholders who subscribed to the fund during the distribution period. The equalisation element of the distributions is not reported to shareholders separately from the net income distributed. The equalisation attributable to redemptions from the respective Funds is disclosed in the income statement.
(k) Net asset value In accordance with the provisions of the prospectus of the Company, each asset which is quoted, listed or traded on or under the rules of any Recognised Market shall be valued using the index method of stock valuations which is the last traded price for equity securities or, if the last traded price is unavailable and if bid and offer quotations are made, then the latest available middle market quotation on the relevant Recognised Market at the close of business on such Recognised Market on each Dealing Day for the purpose of determining net asset value per share for subscriptions and redemptions and for various fee calculations. Net assets attributable to holders of redeemable participating shares represent a liability in the balance sheet, carried at the redemption amount that would be payable at the balance sheet date if the shareholder exercised the right to redeem the share to the Company. Consequently, differences arising on the pricing of investments are included in the balance sheet and income statement in order to fair value the liability to shareholders. The cumulative differences are included as “Adjustment from bid prices to pricing basis as set out in the prospectus” on the balance sheet. The movement in the adjustment year on year is included in the income statement.

Notes to the Financial Statements (continued) For the period 1 January 2015 to 30 June 2015 (continued)
HSBC ETFs PLC >407<
1. Principal accounting policies (continued)
(k) Net asset value (continued) All references to Net Asset Value throughout this document refer to Net Asset Attributable to Holders of Redeemable Participating Shares.
(l) Transaction costs Transaction costs are incremental costs, which are separately identifiable and directly attributable to the acquisition, issue or disposal of a financial asset or financial liability. Transaction costs include fees and commissions paid to brokers and counterparties and any capital gains taxes. Transaction costs are expensed as incurred and are recorded in the Income Statement. The transaction costs are included in Net gain/(loss) on financial assets and liabilities at fair value through profit or loss in the Income Statement. Transaction costs incurred during the period by each subfund are detailed in Note 6(e). New standards, amendments and interpretations effective after 1 January 2018 and have
not been early adopted. IFRS 9, ‘Financial instruments’, effective for annual periods beginning on or after 1 January
2018, specifies how an entity should classify and measure financial assets and financial
liabilities, including some hybrid contracts. The standard improves and simplifies the
approach for classification and measurement of financial assets compared with the
requirements of IAS 39. Most of the requirements in IAS 39 for classification and
measurement of financial liabilities were carried forward unchanged. The standard applies a
consistent approach to classifying financial assets and replaces the numerous categories of
financial assets in IAS 39, each of which had its own classification criteria. The standard is
not expected to have a significant impact on the Fund's financial position or performance, as
it is expected that the Funds will continue to classify its financial assets and financial
liabilities (both long and short) as being at fair value through profit or loss held for trading.
2. Fees and expenses (a) Management fee
The Company has a fee structure where, in respect of each of the Funds, all of the fees and expenses (except for transaction costs and taxes or duty charges for portfolio re-balancing, all of which will be paid separately out of the assets of the relevant Funds) are paid as one single fee. This is referred to as the “Total Expense Ratio” or “TER” in the prospectus of the Company and is being disclosed in these financial statements as “Management fee”. This fee also includes any due proportion of expenses of the Company which may be allocated to the Funds from time to time.
The TER is paid to the Investment Manager, and the Investment Manager is then responsible for the payment of all other operational expenses of the Company. This includes, but is not limited to, fees and expenses of the Directors, Investment Manager, Custodian, Administrator, Registrar and Transfer Agent, Auditors, and Company Secretary.
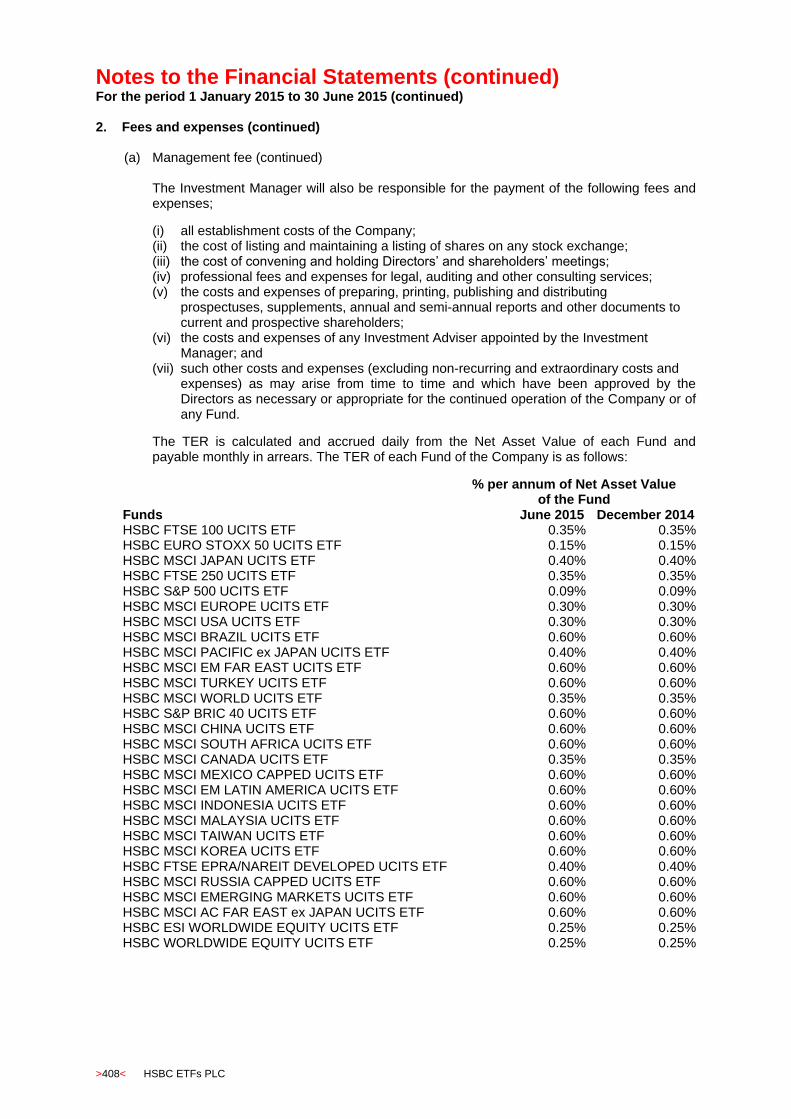
Notes to the Financial Statements (continued) For the period 1 January 2015 to 30 June 2015 (continued)
>408< HSBC ETFs PLC
2. Fees and expenses (continued)
(a) Management fee (continued) The Investment Manager will also be responsible for the payment of the following fees and expenses; (i) all establishment costs of the Company; (ii) the cost of listing and maintaining a listing of shares on any stock exchange; (iii) the cost of convening and holding Directors’ and shareholders’ meetings; (iv) professional fees and expenses for legal, auditing and other consulting services; (v) the costs and expenses of preparing, printing, publishing and distributing
prospectuses, supplements, annual and semi-annual reports and other documents to current and prospective shareholders;
(vi) the costs and expenses of any Investment Adviser appointed by the Investment Manager; and
(vii) such other costs and expenses (excluding non-recurring and extraordinary costs and expenses) as may arise from time to time and which have been approved by the Directors as necessary or appropriate for the continued operation of the Company or of any Fund.
The TER is calculated and accrued daily from the Net Asset Value of each Fund and payable monthly in arrears. The TER of each Fund of the Company is as follows:
% per annum of Net Asset Value
of the Fund Funds June 2015 December 2014 HSBC FTSE 100 UCITS ETF 0.35% 0.35% HSBC EURO STOXX 50 UCITS ETF 0.15% 0.15% HSBC MSCI JAPAN UCITS ETF 0.40% 0.40% HSBC FTSE 250 UCITS ETF 0.35% 0.35% HSBC S&P 500 UCITS ETF 0.09% 0.09% HSBC MSCI EUROPE UCITS ETF 0.30% 0.30% HSBC MSCI USA UCITS ETF 0.30% 0.30% HSBC MSCI BRAZIL UCITS ETF 0.60% 0.60% HSBC MSCI PACIFIC ex JAPAN UCITS ETF 0.40% 0.40% HSBC MSCI EM FAR EAST UCITS ETF 0.60% 0.60% HSBC MSCI TURKEY UCITS ETF 0.60% 0.60% HSBC MSCI WORLD UCITS ETF 0.35% 0.35% HSBC S&P BRIC 40 UCITS ETF 0.60% 0.60% HSBC MSCI CHINA UCITS ETF 0.60% 0.60% HSBC MSCI SOUTH AFRICA UCITS ETF 0.60% 0.60% HSBC MSCI CANADA UCITS ETF 0.35% 0.35% HSBC MSCI MEXICO CAPPED UCITS ETF 0.60% 0.60% HSBC MSCI EM LATIN AMERICA UCITS ETF 0.60% 0.60% HSBC MSCI INDONESIA UCITS ETF 0.60% 0.60% HSBC MSCI MALAYSIA UCITS ETF 0.60% 0.60% HSBC MSCI TAIWAN UCITS ETF 0.60% 0.60% HSBC MSCI KOREA UCITS ETF 0.60% 0.60% HSBC FTSE EPRA/NAREIT DEVELOPED UCITS ETF 0.40% 0.40% HSBC MSCI RUSSIA CAPPED UCITS ETF 0.60% 0.60% HSBC MSCI EMERGING MARKETS UCITS ETF 0.60% 0.60% HSBC MSCI AC FAR EAST ex JAPAN UCITS ETF 0.60% 0.60% HSBC ESI WORLDWIDE EQUITY UCITS ETF 0.25% 0.25% HSBC WORLDWIDE EQUITY UCITS ETF 0.25% 0.25%
Notes to the Financial Statements (continued) For the period 1 January 2015 to 30 June 2015 (continued)
HSBC ETFs PLC >409<
2. Fees and expenses (continued)
(a) Management fee (continued)
If the Fund’s expenses exceed the TER outlined above in relation to operating the funds, the Investment Manager will cover any shortfall from its own assets. There were no excess payments made by the Investment Manager during the period ended 30 June 2015 (31 December 2014: Nil). The TER is not expected to exceed the amounts disclosed above. However, if an increase is required it will require prior approval by shareholders of the relevant Fund, which must be approved by a majority vote at a meeting of shareholders or by written resolution of all shareholders. The management fee for the period amounted to EUR 7,968,628 (December 2014: EUR 10,658,886) of which EUR 2,690,127 (December 2014: EUR 7,796,997) was payable at the period end.
(b) Directors’ fees
Directors’ fees will not exceed the sum of EUR 40,000 per annum per Director without the approval of the Board of Directors (with each Director abstaining on any resolution relating to their own remuneration). The Directors’ fees for the period ended 30 June 2015 amounted to EUR 37,500 (31 December 2014: EUR 75,000). Melissa McDonald has waived her entitlement to receive a Director’s fee.
3. Taxation
Under current law and practice the Company qualifies as an investment undertaking as defined in Section 739B of the Taxes Consolidation Act, 1997, as amended. On that basis, it is not chargeable to Irish tax on its income or gains. However, Irish tax may arise on the occurrence of a “chargeable event”. A chargeable event includes any distribution payments to shareholders or any encashment, redemption, cancellation or transfer of shares and the holding of shares at the end of each eight year period beginning with the acquisition of such shares. No Irish tax will arise on the Company in respect of chargeable events in respect of: a) A shareholder who is neither Irish resident nor ordinarily resident in Ireland for tax purposes,
at the time of the chargeable event, provided appropriate valid declarations in accordance with the provisions of the Taxes Consolidation Act, 1997, as amended, are held by the Company; or the Company has been authorised by the Irish Revenue to make gross payments in the absence of appropriate declarations; and
b) Certain exempted Irish tax resident shareholders who have provided the Company with the
necessary signed statutory declarations; and
c) Any transaction (which might otherwise be a chargeable event) in relation to shares held in a recognised clearing system as designated by order of the Irish Revenue Commissioners (such as CREST) will not constitute a chargeable event. It is the current intention of the Directors that all shares in the Company will be held in CREST or another recognised clearing system.
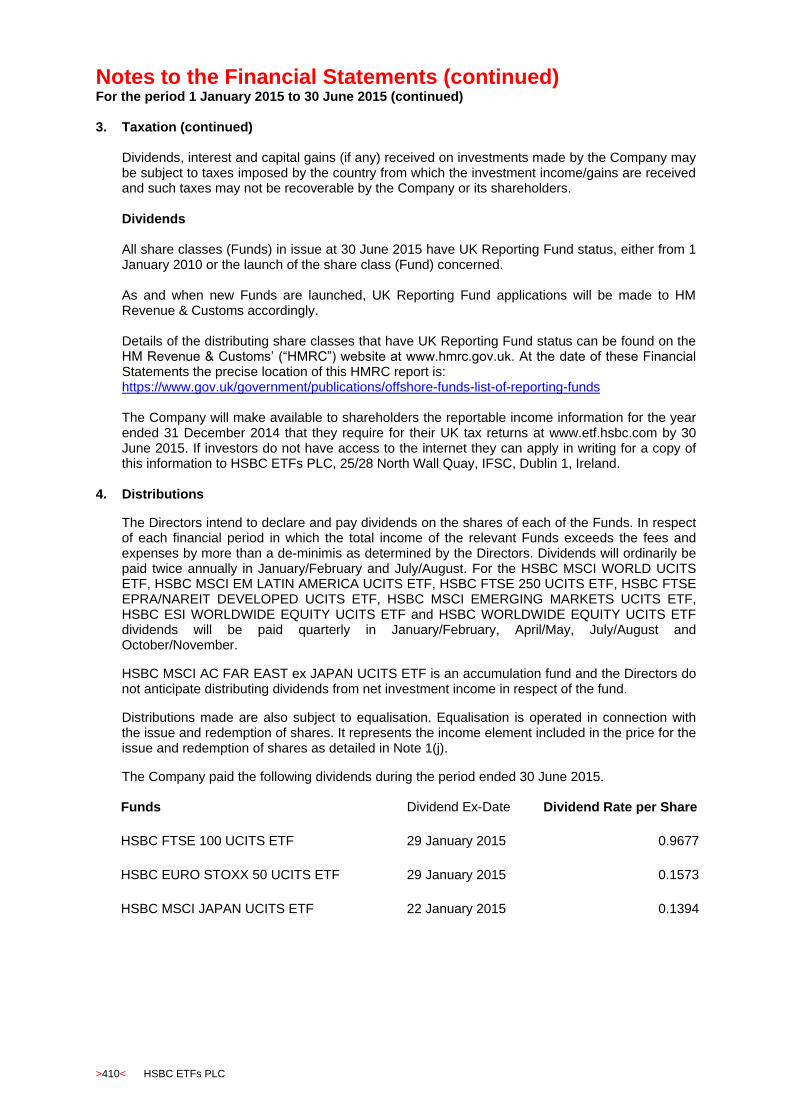
Notes to the Financial Statements (continued) For the period 1 January 2015 to 30 June 2015 (continued)
>410< HSBC ETFs PLC
3. Taxation (continued)
Dividends, interest and capital gains (if any) received on investments made by the Company may be subject to taxes imposed by the country from which the investment income/gains are received and such taxes may not be recoverable by the Company or its shareholders. Dividends All share classes (Funds) in issue at 30 June 2015 have UK Reporting Fund status, either from 1 January 2010 or the launch of the share class (Fund) concerned. As and when new Funds are launched, UK Reporting Fund applications will be made to HM Revenue & Customs accordingly. Details of the distributing share classes that have UK Reporting Fund status can be found on the HM Revenue & Customs’ (“HMRC”) website at www.hmrc.gov.uk. At the date of these Financial Statements the precise location of this HMRC report is: https://www.gov.uk/government/publications/offshore-funds-list-of-reporting-funds The Company will make available to shareholders the reportable income information for the year ended 31 December 2014 that they require for their UK tax returns at www.etf.hsbc.com by 30 June 2015. If investors do not have access to the internet they can apply in writing for a copy of this information to HSBC ETFs PLC, 25/28 North Wall Quay, IFSC, Dublin 1, Ireland.
4. Distributions The Directors intend to declare and pay dividends on the shares of each of the Funds. In respect of each financial period in which the total income of the relevant Funds exceeds the fees and expenses by more than a de-minimis as determined by the Directors. Dividends will ordinarily be paid twice annually in January/February and July/August. For the HSBC MSCI WORLD UCITS ETF, HSBC MSCI EM LATIN AMERICA UCITS ETF, HSBC FTSE 250 UCITS ETF, HSBC FTSE EPRA/NAREIT DEVELOPED UCITS ETF, HSBC MSCI EMERGING MARKETS UCITS ETF, HSBC ESI WORLDWIDE EQUITY UCITS ETF and HSBC WORLDWIDE EQUITY UCITS ETF dividends will be paid quarterly in January/February, April/May, July/August and October/November. HSBC MSCI AC FAR EAST ex JAPAN UCITS ETF is an accumulation fund and the Directors do not anticipate distributing dividends from net investment income in respect of the fund. Distributions made are also subject to equalisation. Equalisation is operated in connection with the issue and redemption of shares. It represents the income element included in the price for the issue and redemption of shares as detailed in Note 1(j). The Company paid the following dividends during the period ended 30 June 2015.
Funds Dividend Ex-Date Dividend Rate per Share
HSBC FTSE 100 UCITS ETF 29 January 2015 0.9677
HSBC EURO STOXX 50 UCITS ETF 29 January 2015 0.1573
HSBC MSCI JAPAN UCITS ETF 22 January 2015 0.1394

Notes to the Financial Statements (continued) For the period 1 January 2015 to 30 June 2015 (continued)
HSBC ETFs PLC >411<
4. Distributions (continued)
Funds Dividend Ex-Date Dividend Rate per Share
HSBC FTSE 250 UCITS ETF 29 January 2015 0.0892
16 April 2015 0.0867
HSBC S&P 500 UCITS ETF 15 January 2015 0.1712
HSBC MSCI EUROPE UCITS ETF 29 January 2015 0.0667
HSBC MSCI USA UCITS ETF 15 January 2015 0.1398
HSBC MSCI BRAZIL UCITS ETF 15 January 2015 0.2527
HSBC MSCI PACIFIC ex JAPAN UCITS ETF 22 January 2015 0.2383
HSBC MSCI EM FAR EAST UCITS ETF 22 January 2015 0.3769
HSBC MSCI WORLD UCITS ETF 15 January 2015 0.0562
16 April 2015 0.0838
HSBC S&P BRIC 40 UCITS ETF 15 January 2015 0.3310
HSBC MSCI CHINA UCITS ETF 22 January 2015 0.0579
HSBC MSCI SOUTH AFRICA UCITS ETF 29 January 2015 0.5870
HSBC MSCI CANADA UCITS ETF 15 January 2015 0.1511
HSBC MSCI MEXICO CAPPED UCITS ETF 15 January 2015 0.1579
HSBC MSCI EM LATIN AMERICA UCITS ETF 15 January 2015 0.1484
16 April 2015 0.1114
HSBC MSCI INDONESIA UCITS ETF 22 January 2015 0.0484
HSBC MSCI MALAYSIA UCITS ETF 22 January 2015 0.6518
HSBC MSCI TAIWAN UCITS ETF 22 January 2015 0.5411
HSBC MSCI KOREA UCITS ETF 22 January 2015 0.2069
HSBC FTSE EPRA/NAREIT DEVELOPED UCITS ETF 29 January 2015 0.1597
16 April 2015 0.1342
HSBC MSCI RUSSIA CAPPED UCITS ETF 29 January 2015 0.3626
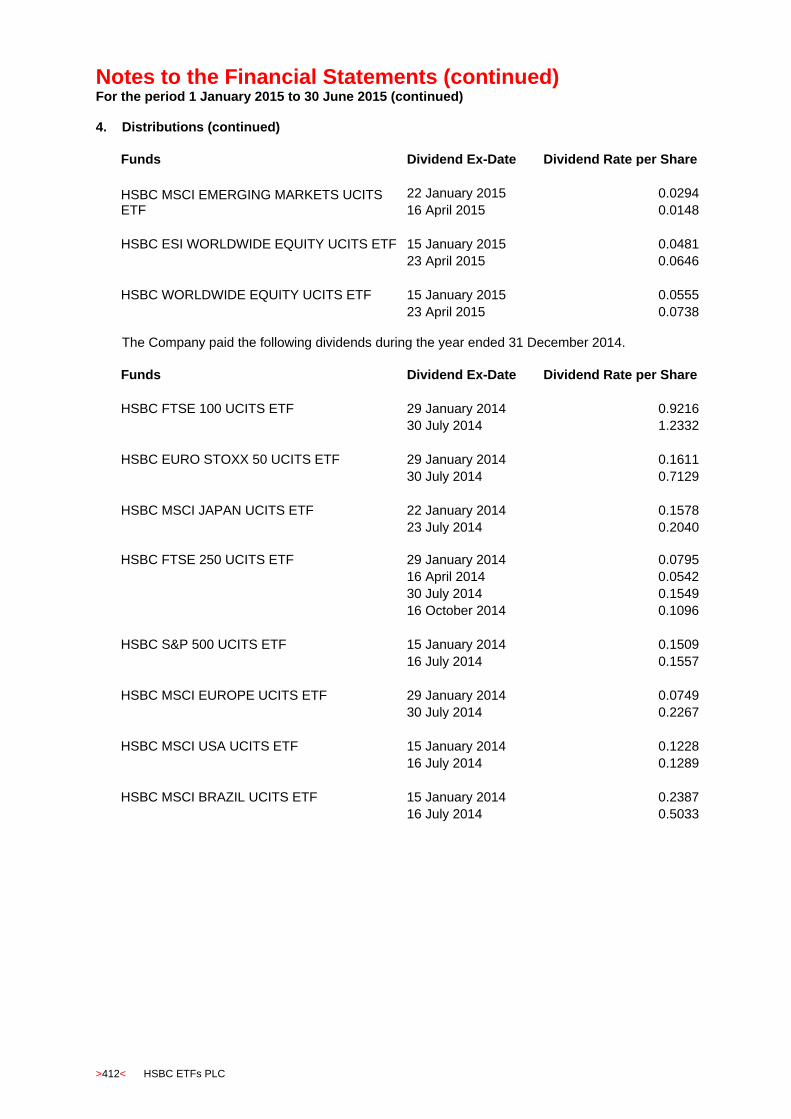
Notes to the Financial Statements (continued) For the period 1 January 2015 to 30 June 2015 (continued)
>412< HSBC ETFs PLC
4. Distributions (continued)
Funds Dividend Ex-Date Dividend Rate per Share
HSBC MSCI EMERGING MARKETS UCITS ETF
22 January 2015 0.0294
16 April 2015 0.0148
HSBC ESI WORLDWIDE EQUITY UCITS ETF 15 January 2015 0.0481
23 April 2015 0.0646
HSBC WORLDWIDE EQUITY UCITS ETF 15 January 2015 0.0555
23 April 2015 0.0738 The Company paid the following dividends during the year ended 31 December 2014.
Funds Dividend Ex-Date Dividend Rate per Share
HSBC FTSE 100 UCITS ETF 29 January 2014 0.9216
30 July 2014 1.2332
HSBC EURO STOXX 50 UCITS ETF 29 January 2014 0.1611
30 July 2014 0.7129
HSBC MSCI JAPAN UCITS ETF 22 January 2014 0.1578
23 July 2014 0.2040
HSBC FTSE 250 UCITS ETF 29 January 2014 0.0795
16 April 2014 0.0542
30 July 2014 0.1549
16 October 2014 0.1096
HSBC S&P 500 UCITS ETF 15 January 2014 0.1509
16 July 2014 0.1557
HSBC MSCI EUROPE UCITS ETF 29 January 2014 0.0749
30 July 2014 0.2267
HSBC MSCI USA UCITS ETF 15 January 2014 0.1228
16 July 2014 0.1289
HSBC MSCI BRAZIL UCITS ETF 15 January 2014 0.2387
16 July 2014 0.5033
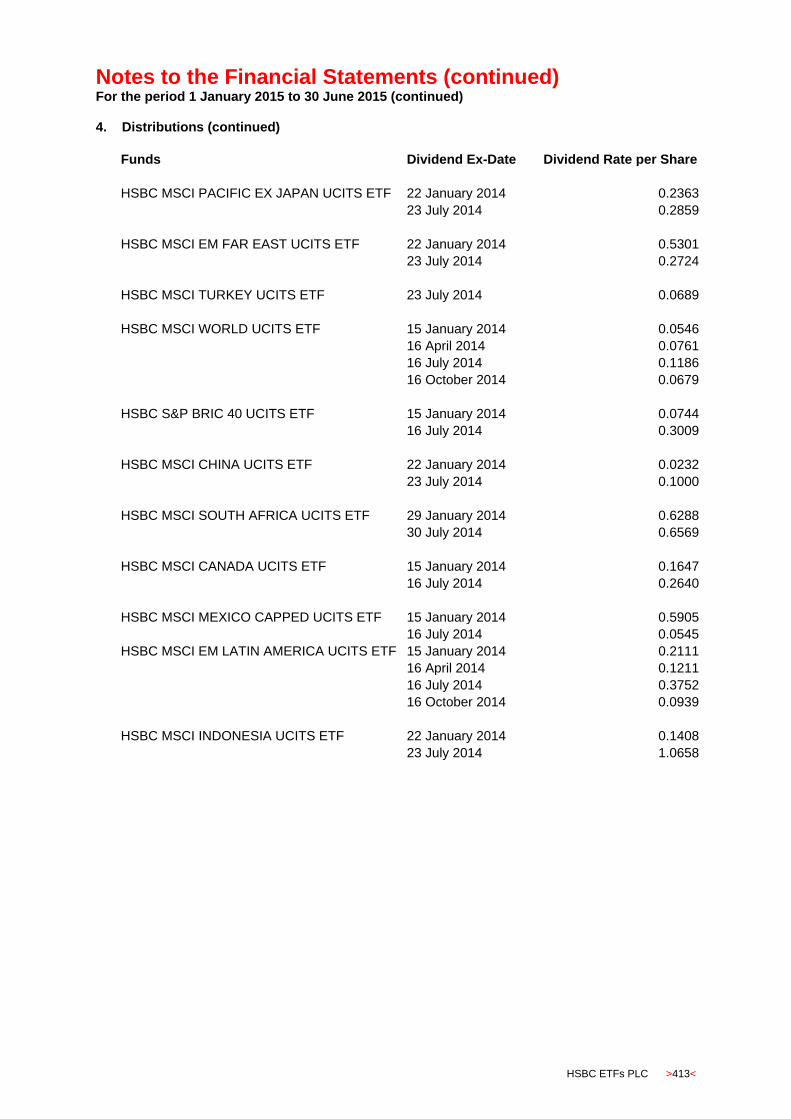
Notes to the Financial Statements (continued) For the period 1 January 2015 to 30 June 2015 (continued)
HSBC ETFs PLC >413<
4. Distributions (continued)
Funds Dividend Ex-Date Dividend Rate per Share
HSBC MSCI PACIFIC EX JAPAN UCITS ETF 22 January 2014 0.2363
23 July 2014 0.2859
HSBC MSCI EM FAR EAST UCITS ETF 22 January 2014 0.5301
23 July 2014 0.2724
HSBC MSCI TURKEY UCITS ETF 23 July 2014 0.0689
HSBC MSCI WORLD UCITS ETF 15 January 2014 0.0546
16 April 2014 0.0761
16 July 2014 0.1186
16 October 2014 0.0679
HSBC S&P BRIC 40 UCITS ETF 15 January 2014 0.0744
16 July 2014 0.3009
HSBC MSCI CHINA UCITS ETF 22 January 2014 0.0232
23 July 2014 0.1000
HSBC MSCI SOUTH AFRICA UCITS ETF 29 January 2014 0.6288
30 July 2014 0.6569
HSBC MSCI CANADA UCITS ETF 15 January 2014 0.1647
16 July 2014 0.2640
HSBC MSCI MEXICO CAPPED UCITS ETF 15 January 2014 0.5905
16 July 2014 0.0545
HSBC MSCI EM LATIN AMERICA UCITS ETF 15 January 2014 0.2111
16 April 2014 0.1211
16 July 2014 0.3752
16 October 2014 0.0939
HSBC MSCI INDONESIA UCITS ETF 22 January 2014 0.1408
23 July 2014 1.0658
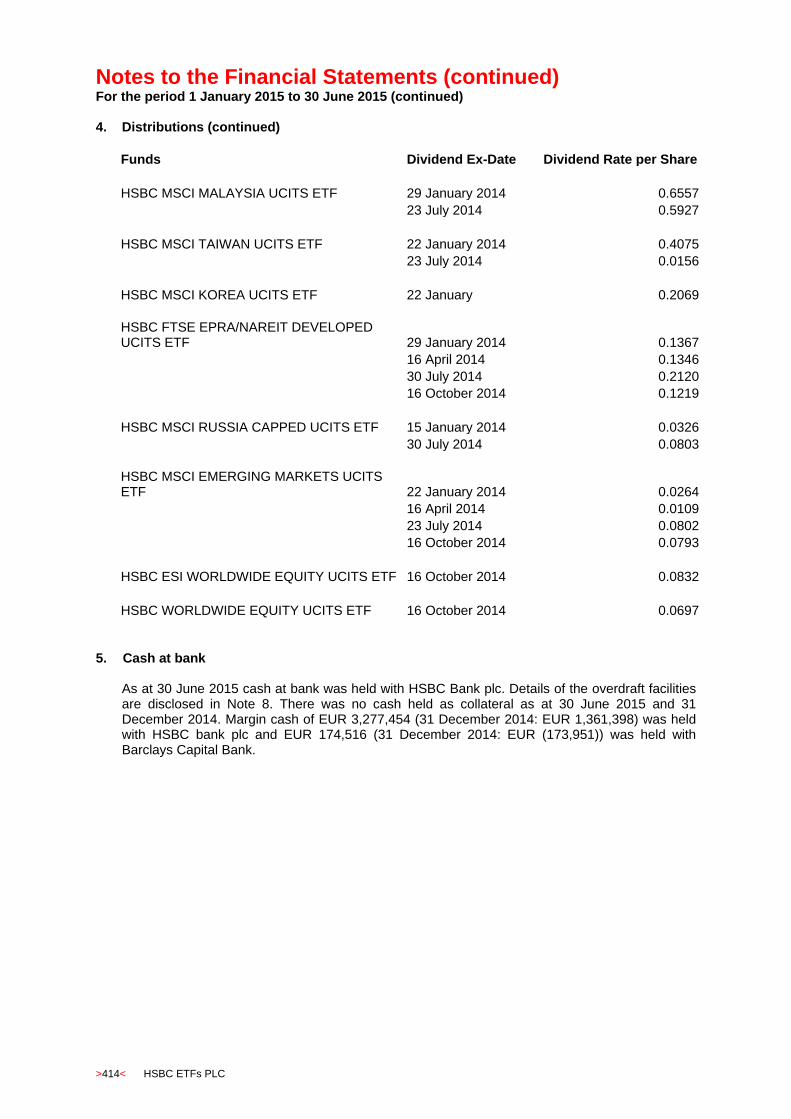
Notes to the Financial Statements (continued) For the period 1 January 2015 to 30 June 2015 (continued)
>414< HSBC ETFs PLC
4. Distributions (continued)
5. Cash at bank
As at 30 June 2015 cash at bank was held with HSBC Bank plc. Details of the overdraft facilities are disclosed in Note 8. There was no cash held as collateral as at 30 June 2015 and 31 December 2014. Margin cash of EUR 3,277,454 (31 December 2014: EUR 1,361,398) was held with HSBC bank plc and EUR 174,516 (31 December 2014: EUR (173,951)) was held with Barclays Capital Bank.
Funds Dividend Ex-Date Dividend Rate per Share
HSBC MSCI MALAYSIA UCITS ETF 29 January 2014 0.6557
23 July 2014 0.5927
HSBC MSCI TAIWAN UCITS ETF 22 January 2014 0.4075
23 July 2014 0.0156
HSBC MSCI KOREA UCITS ETF 22 January 0.2069
HSBC FTSE EPRA/NAREIT DEVELOPED UCITS ETF 29 January 2014 0.1367
16 April 2014 0.1346
30 July 2014 0.2120
16 October 2014 0.1219
HSBC MSCI RUSSIA CAPPED UCITS ETF 15 January 2014 0.0326
30 July 2014 0.0803
HSBC MSCI EMERGING MARKETS UCITS ETF 22 January 2014 0.0264
16 April 2014 0.0109
23 July 2014 0.0802
16 October 2014 0.0793
HSBC ESI WORLDWIDE EQUITY UCITS ETF 16 October 2014 0.0832
HSBC WORLDWIDE EQUITY UCITS ETF 16 October 2014 0.0697
Notes to the Financial Statements (continued) For the period 1 January 2015 to 30 June 2015 (continued)
HSBC ETFs PLC >415<
6. Financial instruments and associated risks
The Company’s investment activities expose it to various types of risk which are associated with the financial instruments and markets in which it invests. The most significant types of financial risk to which the Company is exposed are market risk, credit risk and liquidity risk. Market risk includes other price risk, currency risk and interest rate risk. Each of the Company’s Funds will seek to replicate the performance of a financial index while minimising as far as possible the tracking error between the Funds’ performance and that of the financial index. Each Fund will seek to achieve this objective by holding a portfolio of securities that constitute the respective financial index. The securities in which the Funds invest will be traded or dealt in on a Regulated Market.
The Funds may use financial derivative instruments (“FDIs”) for efficient portfolio management of its assets and for investment purposes. Efficient portfolio management means investment decisions involving transactions that are entered into for one or more of the following specific aims: the reduction of risk; the reduction of cost; or the generation of additional capital or income for the Funds with an appropriate level of risk, taking into account the risk profile of the Funds. In particular, financial derivative instruments may be used for the purpose of minimising tracking error i.e. the risk that the Funds’ return varies from the respective benchmark financial index. Changes to the composition and/or weighting of the securities constituting the financial index which is tracked by each Fund will ordinarily require that Fund to make corresponding adjustments or rebalancings to its investments in order to seek to track the financial index. The Investment Manager will accordingly seek to rebalance the composition and/or weighting of the securities held by a Fund from time to time to the extent practicable and possible to conform to changes in the composition and/or weighting of securities that constitute the respective financial index. Other rebalancing measures may be taken from time to time to seek to maintain the correspondence between the performance of a Fund and the performance of the financial index.
The Company uses the commitment approach to calculate the Funds’ global exposure. The commitment approach is a methodology which aggregates the underlying market or notional values of derivatives to determine the exposure of the fund to derivatives. The Company has delegated to the Investment Manager, the task of monitoring and measuring the overall risk profile of each Fund. The Investment Manager is responsible for the securities selection, implementation of the investment objectives and risk monitoring of each Fund. Risk Management Process The Investment Manager is responsible for the risk management of the Funds on a daily basis. The Investment Manager oversees a Risk Management Policies and Procedures document ("RMP") which sets out the risk procedures to be employed. The Investment Manager Risk Team produces monthly reports from covering risks monitoring and the use of any FDIs. Such items are reported to the Board on a monthly and quarterly basis.

Notes to the Financial Statements (continued) For the period 1 January 2015 to 30 June 2015 (continued)
>416< HSBC ETFs PLC
6. Financial instruments and associated risks (continued) Risk Management Process (continued) A Funds’ investment activities expose it to the various types of risks which are associated with the financial instruments and markets in which it invests. The following summary is not intended to be a comprehensive summary of all risks and investors should refer to the prospectus of the Company and relevant Fund supplement for a more detailed disclosure of the risks inherent in investing in the Funds. (a) Market risk
Market risk is the risk that changes in interest rates, foreign exchange rates or equity and commodity prices will make an instrument less valuable or more onerous. All financial instruments are recognised at fair value, and all changes in market conditions directly affect net income.
(i) Other price risk Other price risk is the risk that the fair values of equities or future cash flows of a financial instrument will fluctuate because of changes in market prices (other than those arising from interest rate risk or currency risk).
The Company’s financial instruments principally comprise equity investments. The Investment Manager attempts to mitigate this risk through the construction of a well-diversified portfolio in accordance to the respective Funds’ investment objective. In accordance with the Company’s policies and procedures, the Investment Manager monitors the Company’s overall other price risk on a daily basis, and the Board of Directors reviews it on a quarterly basis. The investment concentrations within the portfolio for each Fund are disclosed in the Schedule of Investments by investment type.
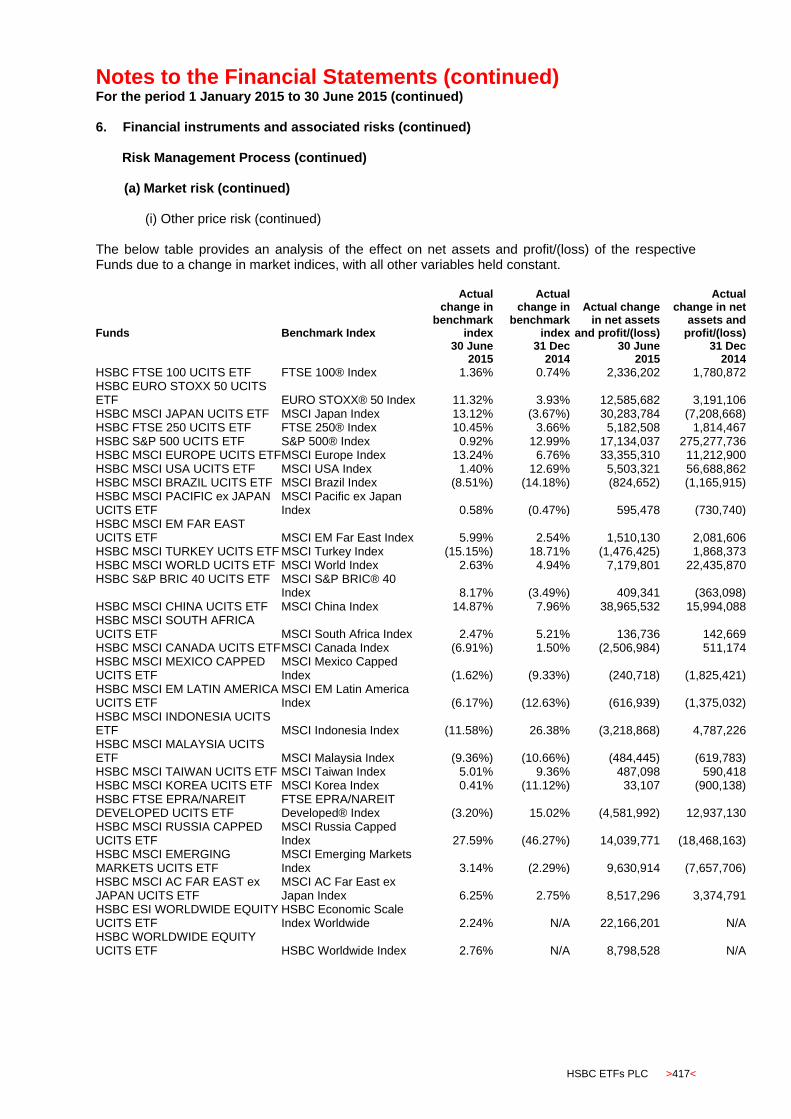
Notes to the Financial Statements (continued) For the period 1 January 2015 to 30 June 2015 (continued)
HSBC ETFs PLC >417<
6. Financial instruments and associated risks (continued)
Risk Management Process (continued)
(a) Market risk (continued) (i) Other price risk (continued)
The below table provides an analysis of the effect on net assets and profit/(loss) of the respective Funds due to a change in market indices, with all other variables held constant.
Funds Benchmark Index
Actual change in
benchmark index
Actual change in
benchmark index
Actual change in net assets
and profit/(loss)
Actual change in net
assets and profit/(loss)
30 June
2015 31 Dec
2014 30 June
2015 31 Dec
2014
HSBC FTSE 100 UCITS ETF FTSE 100® Index 1.36% 0.74% 2,336,202 1,780,872 HSBC EURO STOXX 50 UCITS ETF EURO STOXX® 50 Index 11.32% 3.93% 12,585,682 3,191,106 HSBC MSCI JAPAN UCITS ETF MSCI Japan Index 13.12% (3.67%) 30,283,784 (7,208,668) HSBC FTSE 250 UCITS ETF FTSE 250® Index 10.45% 3.66% 5,182,508 1,814,467 HSBC S&P 500 UCITS ETF S&P 500® Index 0.92% 12.99% 17,134,037 275,277,736 HSBC MSCI EUROPE UCITS ETF MSCI Europe Index 13.24% 6.76% 33,355,310 11,212,900 HSBC MSCI USA UCITS ETF MSCI USA Index 1.40% 12.69% 5,503,321 56,688,862 HSBC MSCI BRAZIL UCITS ETF MSCI Brazil Index (8.51%) (14.18%) (824,652) (1,165,915) HSBC MSCI PACIFIC ex JAPAN UCITS ETF
MSCI Pacific ex Japan Index 0.58% (0.47%)
595,478 (730,740)
HSBC MSCI EM FAR EAST UCITS ETF MSCI EM Far East Index 5.99% 2.54% 1,510,130
2,081,606
HSBC MSCI TURKEY UCITS ETF MSCI Turkey Index (15.15%) 18.71% (1,476,425) 1,868,373 HSBC MSCI WORLD UCITS ETF MSCI World Index 2.63% 4.94% 7,179,801 22,435,870 HSBC S&P BRIC 40 UCITS ETF MSCI S&P BRIC® 40
Index 8.17% (3.49%) 409,341 (363,098) HSBC MSCI CHINA UCITS ETF MSCI China Index 14.87% 7.96% 38,965,532 15,994,088 HSBC MSCI SOUTH AFRICA UCITS ETF MSCI South Africa Index 2.47% 5.21%
136,736
142,669
HSBC MSCI CANADA UCITS ETF MSCI Canada Index (6.91%) 1.50% (2,506,984) 511,174 HSBC MSCI MEXICO CAPPED UCITS ETF
MSCI Mexico Capped Index (1.62%) (9.33%)
(240,718) (1,825,421)
HSBC MSCI EM LATIN AMERICA UCITS ETF
MSCI EM Latin America Index (6.17%) (12.63%)
(616,939) (1,375,032)
HSBC MSCI INDONESIA UCITS ETF MSCI Indonesia Index (11.58%) 26.38%
(3,218,868)
4,787,226
HSBC MSCI MALAYSIA UCITS ETF MSCI Malaysia Index (9.36%) (10.66%)
(484,445) (619,783)
HSBC MSCI TAIWAN UCITS ETF MSCI Taiwan Index 5.01% 9.36% 487,098 590,418 HSBC MSCI KOREA UCITS ETF MSCI Korea Index 0.41% (11.12%) 33,107 (900,138) HSBC FTSE EPRA/NAREIT DEVELOPED UCITS ETF
FTSE EPRA/NAREIT Developed® Index (3.20%) 15.02% (4,581,992)
12,937,130
HSBC MSCI RUSSIA CAPPED UCITS ETF
MSCI Russia Capped Index 27.59% (46.27%) 14,039,771 (18,468,163)
HSBC MSCI EMERGING MARKETS UCITS ETF
MSCI Emerging Markets Index 3.14% (2.29%)
9,630,914 (7,657,706)
HSBC MSCI AC FAR EAST ex JAPAN UCITS ETF
MSCI AC Far East ex Japan Index 6.25% 2.75%
8,517,296
3,374,791
HSBC ESI WORLDWIDE EQUITY UCITS ETF
HSBC Economic Scale Index Worldwide 2.24% N/A
22,166,201 N/A
HSBC WORLDWIDE EQUITY UCITS ETF HSBC Worldwide Index 2.76% N/A
8,798,528 N/A
Notes to the Financial Statements (continued) For the period 1 January 2015 to 30 June 2015 (continued)
>418< HSBC ETFs PLC
6. Financial instruments and associated risks (continued)
Risk Management Process (continued)
(a) Market risk (continued)
(i) Other price risk (continued) The majority of Funds employ an investment strategy of full replication of the respective underlying benchmark index, therefore a Beta of 1 was assumed in the calculation of the above sensitivity analysis. The methodology utilised above is based on historical data and cannot take account of the fact that future market price movement and correlations between markets in conditions of market stress may bear no relation to historical patterns. (ii) Currency risk Currency risk is the risk that the fair value of future cash flows of a financial instrument will fluctuate because of changes in foreign exchange rates. The Company may invest in financial instruments and enter into transactions denominated in currencies other than its functional currency. Consequently, the Company is exposed to risks that the exchange rate of its currency relative to other foreign currencies may change in a manner that has an adverse effect on the value of that portion of the Company’s assets or liabilities denominated in currencies other than the Funds’ respective currency. Monetary items are units of currency held and assets and liabilities to be received or paid in a fixed or determinable number of units of currency. Monetary assets and liabilities included cash and cash equivalents, trade receivables and payables including due to/from brokers, and monies due to/from brokers. All assets and liabilities that do not meet the definition of monetary items are classified as non-monetary. Marketable equity investments are considered non-monetary assets. The currency risk associated with equities is included in other price risk. Once paid in or accumulated, all elements of net assets attributable to holders of redeemable participating shares are non-monetary. As at 30 June 2015 and 31 December 2014 none of the Funds had any significant monetary assets or liabilities that are exposed to currency risk. (iii) Interest rate risk Interest rate risk is the risk that the fair value of future cash flows of a financial instrument will fluctuate because of changes in market interest rates. The majority of the Company’s financial assets and liabilities are non-interest bearing. Interest bearing financial assets and liabilities include cash at bank which matures or reprices in the short-term, no longer than 3 months. As a result, the Company is subject to limited exposure to fair value interest rate risk due to fluctuations in the prevailing levels of market interest rates.

Notes to the Financial Statements (continued) For the period 1 January 2015 to 30 June 2015 (continued)
HSBC ETFs PLC >419<
6. Financial instruments and associated risks (continued)
Risk Management Process (continued)
(b) Credit risk Credit risk is the risk that a counterparty to a financial instrument will fail to discharge an obligation or commitment that it has entered into with the Company. Credit risk is generally higher when a non-exchange traded financial instrument is involved because the counterparty for non-exchange traded financial instruments is not backed by an exchange clearing house. Credit risk associated with investing activities is managed by the Investment Manager as part of the overall investment process. To reduce the Company’s counterparty credit exposures, securities trading is primarily conducted on recognised exchanges and on a delivery-versus-payment basis. The risk of default is considered minimal, as delivery of securities on a settled trade is simultaneous with the Custodian receiving payment. Payment is made on a purchase simultaneous with the securities being received by the Custodian. The trade will fail if either party fails to meet its obligation. The assets of the Company held by the Custodian will be segregated from the assets of either the Custodian or its agents or both. The Company is subject to credit risk to the extent that this institution may be unable to fulfil its obligations either to return the Company’s securities or repay amounts owed. Management does not anticipate any losses as a result of this concentration. All of the cash of the Company held by the Custodian is placed on deposit with an affiliate of the Custodian, HSBC Bank plc with credit rating of AA- (2014: AA-) by Fitch. The Company’s future contracts and LEPO’s are held with HSBC Bank plc. The Company’s CFDs are held with Barclays Capital, currently rated A (2014: A) by Fitch. These institutions are highly rated by prominent credit rating agencies.
The Company will rank as a general creditor in the event of bankruptcy or insolvency of HSBC Bank plc. Cash held by HSBC Bank plc is not held in a segregated client account. HSBC Bank plc complies with the FSA capital requirements in the event of insolvency of HSBC Bank plc. The Company’s credit risk exposure is represented by the carrying amounts of Cash at bank and Cash held at margin as disclosed on the Balance Sheet on pages 343 to 347.
(c) Liquidity risk
Liquidity risk is the risk that an entity will encounter difficulty in meeting obligations associated with financial liabilities. The Company’s constitution provides for the daily creation and cancellation of shares and it is therefore exposed to the liquidity risk of meeting shareholder redemptions at any time. The Company’s equity investments are considered to be readily realisable as they are all traded on organised public markets. The Company has therefore limited exposure to liquidity risk.

Notes to the Financial Statements (continued) For the period 1 January 2015 to 30 June 2015 (continued)
>420< HSBC ETFs PLC
6. Financial instruments and associated risks (continued)
Risk Management Process (continued)
(c) Liquidity risk (continued) The Company has also obtained overdraft facilities in order to manage its short term liquidity requirements. Details of the Company’s overdraft facility are outlined in Note 8. In accordance with the Company’s policies and procedures in place, the Investment Manager monitors the Company’s overall liquidity risk on a daily basis, and the Board of Directors reviews it on a quarterly basis. Substantially all of the Company's financial liabilities included in the Balance Sheet at 30 June 2015 and 31 December 2014 on pages 341 to 356 are payable within one month. The Company's financial instruments include investments in derivative contracts traded over-the counter, which are not traded in an organised public market and which generally may be illiquid. As a result, the Company may not be able to liquidate quickly some of its investments in these instruments at an amount close to its fair value in order to meet its liquidity requirements, or to respond to specific events such as a deterioration in the credit worthiness of any particular issuer.
(d) Fair value of assets and liabilities IFRS 13 requires disclosures of financial instruments measured at fair value to be based on a three-level fair value hierarchy that reflects the significance of the inputs in such fair value measurements. The hierarchy gives the highest priority to unadjusted quoted prices in active markets for identical assets or liabilities (level measurements) and the lowest priority to unobservable inputs (level 3 measurements). The three levels of the fair value hierarchy are as follows:
Level 1 Inputs that reflect unadjusted quoted prices in active markets for identical assets or liabilities that the Company has the ability to access at the measurement date;
Level 2 Inputs other than quoted prices that are observable for the asset
or liability either directly or indirectly, including inputs in markets that are not considered to be active;
Level 3 Inputs that are unobservable.
Inputs are used in applying the various valuation techniques and broadly refer to the assumptions that market participants use to make valuation decisions, including assumptions about risk. Inputs may include price information, volatility statistics, specific and broad credit data, liquidity statistics, and other factors. There were no transfers between Level 1 and 2 during the period. A financial instrument’s level within the fair value hierarchy is based on the lowest level of any input that is significant to the fair value measurement. However, the determination of what constitutes “observable” requires significant judgment by the Directors.
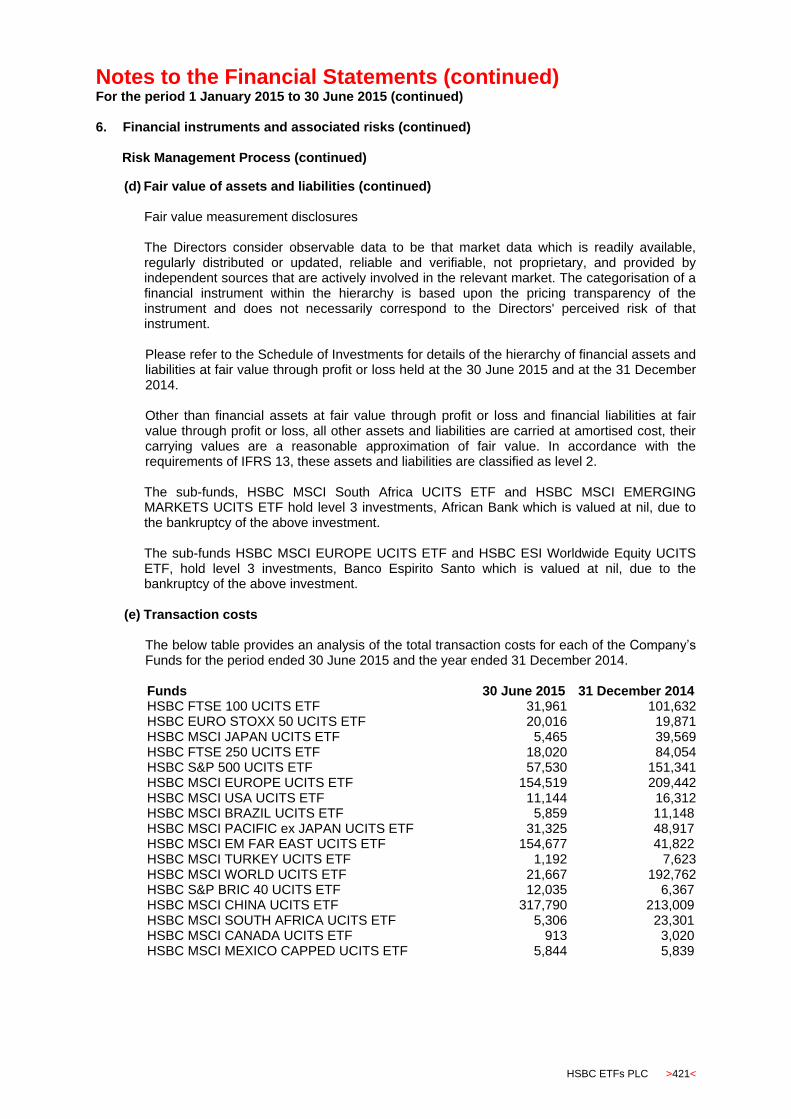
Notes to the Financial Statements (continued) For the period 1 January 2015 to 30 June 2015 (continued)
HSBC ETFs PLC >421<
6. Financial instruments and associated risks (continued)
Risk Management Process (continued)
(d) Fair value of assets and liabilities (continued) Fair value measurement disclosures The Directors consider observable data to be that market data which is readily available, regularly distributed or updated, reliable and verifiable, not proprietary, and provided by independent sources that are actively involved in the relevant market. The categorisation of a financial instrument within the hierarchy is based upon the pricing transparency of the instrument and does not necessarily correspond to the Directors' perceived risk of that instrument. Please refer to the Schedule of Investments for details of the hierarchy of financial assets and liabilities at fair value through profit or loss held at the 30 June 2015 and at the 31 December 2014. Other than financial assets at fair value through profit or loss and financial liabilities at fair value through profit or loss, all other assets and liabilities are carried at amortised cost, their carrying values are a reasonable approximation of fair value. In accordance with the requirements of IFRS 13, these assets and liabilities are classified as level 2. The sub-funds, HSBC MSCI South Africa UCITS ETF and HSBC MSCI EMERGING MARKETS UCITS ETF hold level 3 investments, African Bank which is valued at nil, due to the bankruptcy of the above investment. The sub-funds HSBC MSCI EUROPE UCITS ETF and HSBC ESI Worldwide Equity UCITS ETF, hold level 3 investments, Banco Espirito Santo which is valued at nil, due to the bankruptcy of the above investment.
(e) Transaction costs The below table provides an analysis of the total transaction costs for each of the Company’s Funds for the period ended 30 June 2015 and the year ended 31 December 2014. Funds 30 June 2015 31 December 2014 HSBC FTSE 100 UCITS ETF 31,961 101,632 HSBC EURO STOXX 50 UCITS ETF 20,016 19,871 HSBC MSCI JAPAN UCITS ETF 5,465 39,569 HSBC FTSE 250 UCITS ETF 18,020 84,054 HSBC S&P 500 UCITS ETF 57,530 151,341 HSBC MSCI EUROPE UCITS ETF 154,519 209,442 HSBC MSCI USA UCITS ETF 11,144 16,312 HSBC MSCI BRAZIL UCITS ETF 5,859 11,148 HSBC MSCI PACIFIC ex JAPAN UCITS ETF 31,325 48,917 HSBC MSCI EM FAR EAST UCITS ETF 154,677 41,822 HSBC MSCI TURKEY UCITS ETF 1,192 7,623 HSBC MSCI WORLD UCITS ETF 21,667 192,762 HSBC S&P BRIC 40 UCITS ETF 12,035 6,367 HSBC MSCI CHINA UCITS ETF 317,790 213,009 HSBC MSCI SOUTH AFRICA UCITS ETF 5,306 23,301 HSBC MSCI CANADA UCITS ETF 913 3,020 HSBC MSCI MEXICO CAPPED UCITS ETF 5,844 5,839
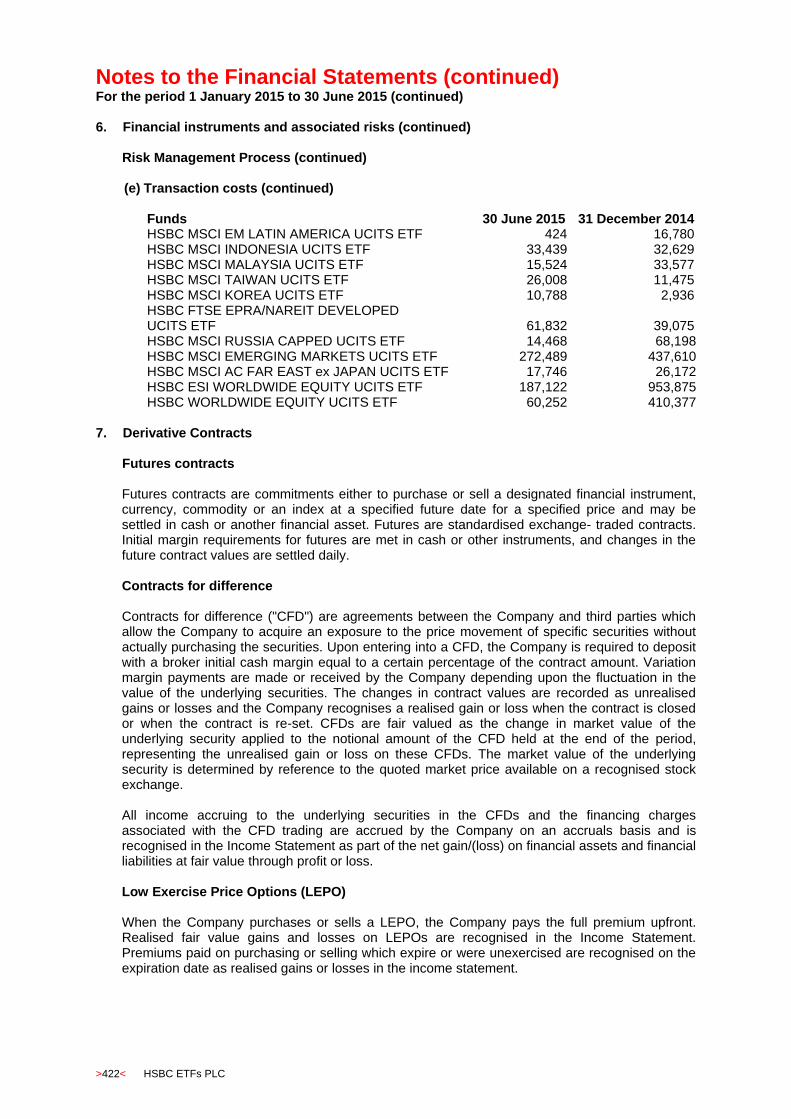
Notes to the Financial Statements (continued) For the period 1 January 2015 to 30 June 2015 (continued)
>422< HSBC ETFs PLC
6. Financial instruments and associated risks (continued)
Risk Management Process (continued)
(e) Transaction costs (continued)
Funds 30 June 2015 31 December 2014 HSBC MSCI EM LATIN AMERICA UCITS ETF 424 16,780 HSBC MSCI INDONESIA UCITS ETF 33,439 32,629 HSBC MSCI MALAYSIA UCITS ETF 15,524 33,577 HSBC MSCI TAIWAN UCITS ETF 26,008 11,475 HSBC MSCI KOREA UCITS ETF 10,788 2,936 HSBC FTSE EPRA/NAREIT DEVELOPED UCITS ETF 61,832 39,075 HSBC MSCI RUSSIA CAPPED UCITS ETF 14,468 68,198 HSBC MSCI EMERGING MARKETS UCITS ETF 272,489 437,610 HSBC MSCI AC FAR EAST ex JAPAN UCITS ETF 17,746 26,172 HSBC ESI WORLDWIDE EQUITY UCITS ETF 187,122 953,875 HSBC WORLDWIDE EQUITY UCITS ETF 60,252 410,377
7. Derivative Contracts
Futures contracts Futures contracts are commitments either to purchase or sell a designated financial instrument, currency, commodity or an index at a specified future date for a specified price and may be settled in cash or another financial asset. Futures are standardised exchange- traded contracts. Initial margin requirements for futures are met in cash or other instruments, and changes in the future contract values are settled daily.
Contracts for difference Contracts for difference ("CFD") are agreements between the Company and third parties which allow the Company to acquire an exposure to the price movement of specific securities without actually purchasing the securities. Upon entering into a CFD, the Company is required to deposit with a broker initial cash margin equal to a certain percentage of the contract amount. Variation margin payments are made or received by the Company depending upon the fluctuation in the value of the underlying securities. The changes in contract values are recorded as unrealised gains or losses and the Company recognises a realised gain or loss when the contract is closed or when the contract is re-set. CFDs are fair valued as the change in market value of the underlying security applied to the notional amount of the CFD held at the end of the period, representing the unrealised gain or loss on these CFDs. The market value of the underlying security is determined by reference to the quoted market price available on a recognised stock exchange. All income accruing to the underlying securities in the CFDs and the financing charges associated with the CFD trading are accrued by the Company on an accruals basis and is recognised in the Income Statement as part of the net gain/(loss) on financial assets and financial liabilities at fair value through profit or loss. Low Exercise Price Options (LEPO) When the Company purchases or sells a LEPO, the Company pays the full premium upfront. Realised fair value gains and losses on LEPOs are recognised in the Income Statement. Premiums paid on purchasing or selling which expire or were unexercised are recognised on the expiration date as realised gains or losses in the income statement.
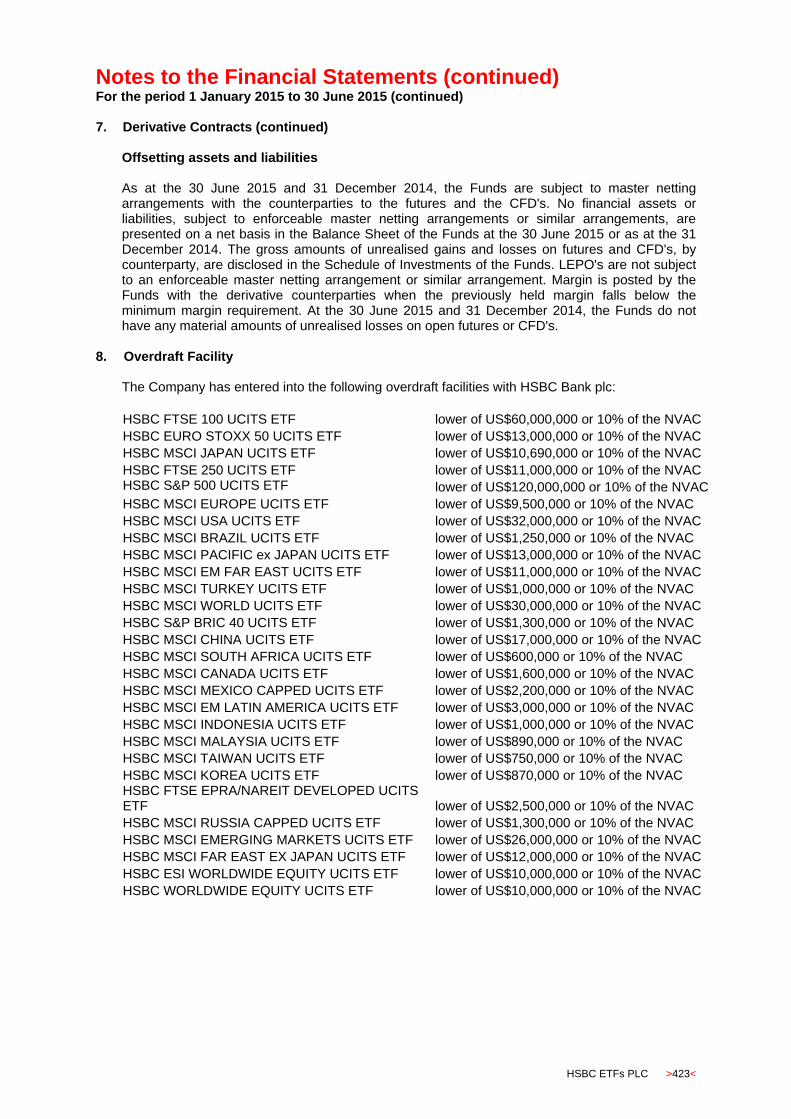
Notes to the Financial Statements (continued) For the period 1 January 2015 to 30 June 2015 (continued)
HSBC ETFs PLC >423<
7. Derivative Contracts (continued)
Offsetting assets and liabilities As at the 30 June 2015 and 31 December 2014, the Funds are subject to master netting arrangements with the counterparties to the futures and the CFD's. No financial assets or liabilities, subject to enforceable master netting arrangements or similar arrangements, are presented on a net basis in the Balance Sheet of the Funds at the 30 June 2015 or as at the 31 December 2014. The gross amounts of unrealised gains and losses on futures and CFD's, by counterparty, are disclosed in the Schedule of Investments of the Funds. LEPO's are not subject to an enforceable master netting arrangement or similar arrangement. Margin is posted by the Funds with the derivative counterparties when the previously held margin falls below the minimum margin requirement. At the 30 June 2015 and 31 December 2014, the Funds do not have any material amounts of unrealised losses on open futures or CFD's.
8. Overdraft Facility
The Company has entered into the following overdraft facilities with HSBC Bank plc:
HSBC FTSE 100 UCITS ETF lower of US$60,000,000 or 10% of the NVAC HSBC EURO STOXX 50 UCITS ETF lower of US$13,000,000 or 10% of the NVAC HSBC MSCI JAPAN UCITS ETF lower of US$10,690,000 or 10% of the NVAC HSBC FTSE 250 UCITS ETF lower of US$11,000,000 or 10% of the NVAC HSBC S&P 500 UCITS ETF lower of US$120,000,000 or 10% of the NVAC HSBC MSCI EUROPE UCITS ETF lower of US$9,500,000 or 10% of the NVAC HSBC MSCI USA UCITS ETF lower of US$32,000,000 or 10% of the NVAC HSBC MSCI BRAZIL UCITS ETF lower of US$1,250,000 or 10% of the NVAC HSBC MSCI PACIFIC ex JAPAN UCITS ETF lower of US$13,000,000 or 10% of the NVAC HSBC MSCI EM FAR EAST UCITS ETF lower of US$11,000,000 or 10% of the NVAC HSBC MSCI TURKEY UCITS ETF lower of US$1,000,000 or 10% of the NVAC HSBC MSCI WORLD UCITS ETF lower of US$30,000,000 or 10% of the NVAC HSBC S&P BRIC 40 UCITS ETF lower of US$1,300,000 or 10% of the NVAC HSBC MSCI CHINA UCITS ETF lower of US$17,000,000 or 10% of the NVAC HSBC MSCI SOUTH AFRICA UCITS ETF lower of US$600,000 or 10% of the NVAC HSBC MSCI CANADA UCITS ETF lower of US$1,600,000 or 10% of the NVAC HSBC MSCI MEXICO CAPPED UCITS ETF lower of US$2,200,000 or 10% of the NVAC HSBC MSCI EM LATIN AMERICA UCITS ETF lower of US$3,000,000 or 10% of the NVAC HSBC MSCI INDONESIA UCITS ETF lower of US$1,000,000 or 10% of the NVAC HSBC MSCI MALAYSIA UCITS ETF lower of US$890,000 or 10% of the NVAC HSBC MSCI TAIWAN UCITS ETF lower of US$750,000 or 10% of the NVAC HSBC MSCI KOREA UCITS ETF lower of US$870,000 or 10% of the NVAC HSBC FTSE EPRA/NAREIT DEVELOPED UCITS ETF lower of US$2,500,000 or 10% of the NVAC HSBC MSCI RUSSIA CAPPED UCITS ETF lower of US$1,300,000 or 10% of the NVAC HSBC MSCI EMERGING MARKETS UCITS ETF lower of US$26,000,000 or 10% of the NVAC HSBC MSCI FAR EAST EX JAPAN UCITS ETF lower of US$12,000,000 or 10% of the NVAC HSBC ESI WORLDWIDE EQUITY UCITS ETF lower of US$10,000,000 or 10% of the NVAC HSBC WORLDWIDE EQUITY UCITS ETF lower of US$10,000,000 or 10% of the NVAC

Notes to the Financial Statements (continued) For the period 1 January 2015 to 30 June 2015 (continued)
>424< HSBC ETFs PLC
8. Overdraft Facility (continued) NVAC represents the net value of assets under custody with the Custodian, HSBC Institutional Trust Services (Ireland) Limited. To the extent that the facility is drawn down, the assets and cash balances held by the Custodian are held as collateral for the overdraft facilities. Interest is charged on the facility at the HSBC Bank plc’s base rate plus 2%, calculated on a per annum basis. An annual fee of EUR 10,000 is payable per Fund.
9. Exchange Rates
The following exchange rates were used to translate assets and liabilities into the functional currency (USD) at 30 June 2015 and 31 December 2014.
30 June 2015 31 December 2014 Australian Dollar 0.76860 0.81835 Brazilian Real 3.10640 2.65820 Canadian Dollar 0.80099 0.86337 Chilean Peso 0.00156 0.00165 Chinese Yuan Renminbi 6.20100 6.20400 Colombian Peso 0.00038 0.00042 Czech Koruna 24.46550 22.90400 Danish Krone 6.69530 6.15375 Egyptian Pound 0.13106 0.13986 Euro 0.89751 0.82641 Hong Kong Dollar 7.75255 7.75485 Hungarian Forint 0.00353 0.00383 Indian Rupee 0.01570 0.01584 Indonesian Rupiah 13,333 12,385 Israeli New Shekel 3.77240 3.89145 Japanese Yen 122.36500 119.89500 Korean Won 1,115.45 1,099.15000 Malaysian Ringgit 3.77300 3.49650 Mexican Peso 0.06373 0.06784 Moroccan Dirham 9.73010 9.06298 New Zealand Dollar 1.47863 1.27943 Norwegian Kroner 7.86750 7.49755 Peruvian Nuevo Sol 3.17760 2.97650 Philippine Peso 45.09000 44.73250 Polish Zloty 3.76090 0.28153 Pound Sterling 1.57270 1.55925 Qatari Riyal 3.64125 - Russian Rouble 0.01795 0.01667 Singapore Dollar 1.34650 1.32510 South African Rand 12.13775 0.08644 Swedish Krona 8.29750 7.82825 Swiss Franc 0.93455 0.99365 Taiwan Dollar 30.85450 31.60200 Thai Baht 33.77550 32.90000 Turkish Lira 2.67900 2.33775 UAE Dirham 3.67295 -

Notes to the Financial Statements (continued) For the period 1 January 2015 to 30 June 2015 (continued)
HSBC ETFs PLC >425<
9. Exchange Rates (continued) The following average exchange rates were used to translate income and expenses into the presentation currency (EUR) at 30 June 2015 and 31 December 2014. 30 June 2015 31December 2014 Pound Sterling 0.72589 0.80186 United States Dollar 1.10888 1.31862 The following Exchange rates were used to translate assets and liabilities into the functional currency (Euro) at 30 June 2015 and 31 December 2014. 30 June 2015 31 December 2014 Danish Krone 7.45990 7.44635 Norwegian Kroner 8.76597 9.07241 Pound Sterling 0.70846 0.77605 Swedish Krona 9.24508 9.47257 Swiss Franc 1.04128 1.20237 United States Dollar 1.11420 1.21005
10. Related party transactions In accordance with the requirements of UCITS Notices, all transactions carried out with the Company by the promoter, manager, trustee, investment adviser and associates/group companies (“connected parties”) must be carried out as if negotiated at arm’s length and be in the best interests of shareholders. The Directors are satisfied that there are arrangements (evidenced by written procedures) in place to ensure that the obligations set out in the UCITS Notices are applied to all transactions with connected parties and transactions with connected parties entered into during the year complied with the obligations set out in the UCITS Notices. The Promoter, Distributor, UK Representative, HSBC Global Asset Management (Switzerland) Limited (Swiss Representative), Germany Paying Agent, Investment Manager, Administrator and Custodian are all wholly owned subsidiaries of HSBC Holdings plc and are therefore considered as related parties to the Company. Fees and charges to these parties are disclosed in Note 2 to the financial statements. The Company receives fees from HSBC Bank Plc in the form of duties and charges, direct dealing cash transaction fees, in-kind transaction fees and conversion transaction fees, where applicable to cover expenses incurred by the Company in processing creations and redemptions. Transaction fees received by the Company during the period from HSBC Bank plc amounted to EUR 1,023,587 (December 2014: EUR 2,740,926) and are included in the Income Statement under Net gain/loss on financial assets and liabilities at fair value through profit or loss.
The Company holds cash margin, cash on deposit and has obtained credit facilities with HSBC Bank plc as detailed in Note 6(b) and Note 8. HSBC Bank plc is considered to be a related party being a subsidiary of HSBC Holdings plc.
The HSBC FTSE 100 UCITS ETF, HSBC MSCI EUROPE UCITS ETF, HSBC MSCI WORLD UCITS ETF, HSBC ESI WORLDWIDE EQUITY UCITS ETF and HSBC WORLDWIDE EQUITY UCITS ETF hold investments in HSBC Holdings plc as disclosed in the Schedules of Investments.
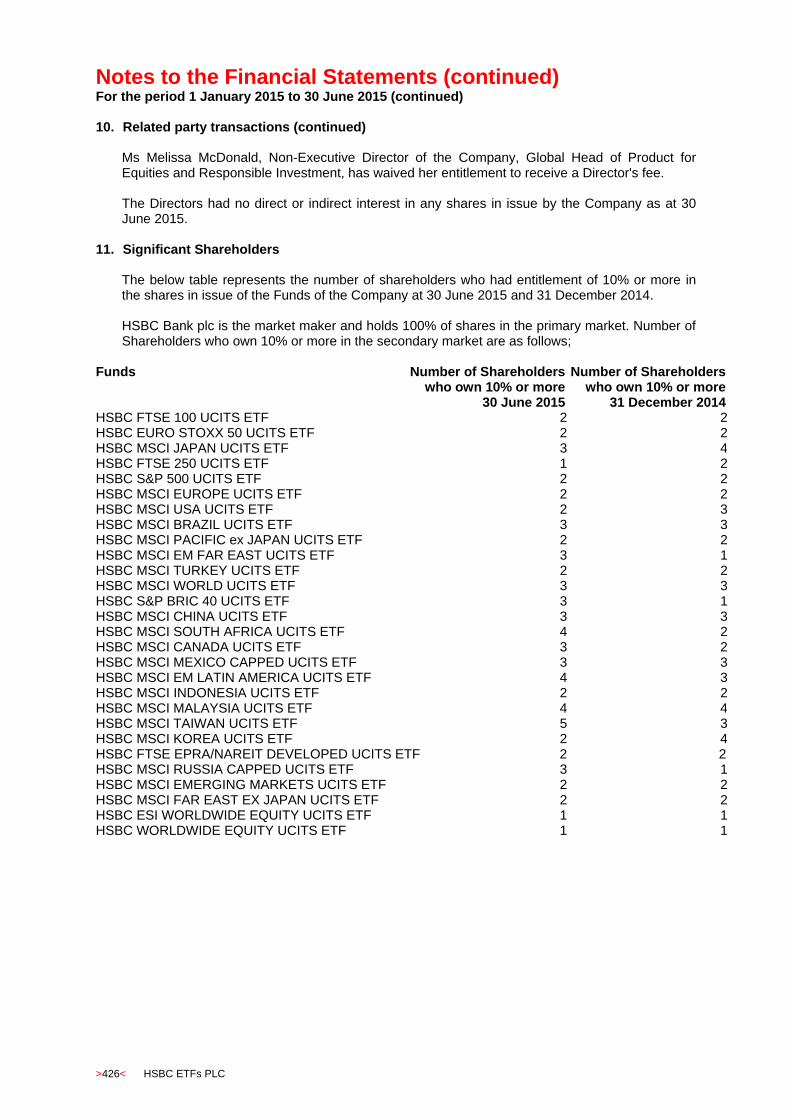
Notes to the Financial Statements (continued) For the period 1 January 2015 to 30 June 2015 (continued)
>426< HSBC ETFs PLC
10. Related party transactions (continued) Ms Melissa McDonald, Non-Executive Director of the Company, Global Head of Product for Equities and Responsible Investment, has waived her entitlement to receive a Director's fee. The Directors had no direct or indirect interest in any shares in issue by the Company as at 30 June 2015.
11. Significant Shareholders
The below table represents the number of shareholders who had entitlement of 10% or more in the shares in issue of the Funds of the Company at 30 June 2015 and 31 December 2014. HSBC Bank plc is the market maker and holds 100% of shares in the primary market. Number of Shareholders who own 10% or more in the secondary market are as follows;
Funds Number of Shareholders who own 10% or more
Number of Shareholders who own 10% or more
30 June 2015 31 December 2014 HSBC FTSE 100 UCITS ETF 2 2 HSBC EURO STOXX 50 UCITS ETF 2 2 HSBC MSCI JAPAN UCITS ETF 3 4 HSBC FTSE 250 UCITS ETF 1 2 HSBC S&P 500 UCITS ETF 2 2 HSBC MSCI EUROPE UCITS ETF 2 2 HSBC MSCI USA UCITS ETF 2 3 HSBC MSCI BRAZIL UCITS ETF 3 3 HSBC MSCI PACIFIC ex JAPAN UCITS ETF 2 2 HSBC MSCI EM FAR EAST UCITS ETF 3 1 HSBC MSCI TURKEY UCITS ETF 2 2 HSBC MSCI WORLD UCITS ETF 3 3 HSBC S&P BRIC 40 UCITS ETF 3 1 HSBC MSCI CHINA UCITS ETF 3 3 HSBC MSCI SOUTH AFRICA UCITS ETF 4 2 HSBC MSCI CANADA UCITS ETF 3 2 HSBC MSCI MEXICO CAPPED UCITS ETF 3 3 HSBC MSCI EM LATIN AMERICA UCITS ETF 4 3 HSBC MSCI INDONESIA UCITS ETF 2 2 HSBC MSCI MALAYSIA UCITS ETF 4 4 HSBC MSCI TAIWAN UCITS ETF 5 3 HSBC MSCI KOREA UCITS ETF 2 4 HSBC FTSE EPRA/NAREIT DEVELOPED UCITS ETF 2 22 HSBC MSCI RUSSIA CAPPED UCITS ETF 3 1 HSBC MSCI EMERGING MARKETS UCITS ETF 2 2 HSBC MSCI FAR EAST EX JAPAN UCITS ETF 2 2 HSBC ESI WORLDWIDE EQUITY UCITS ETF 1 1 HSBC WORLDWIDE EQUITY UCITS ETF 1 1
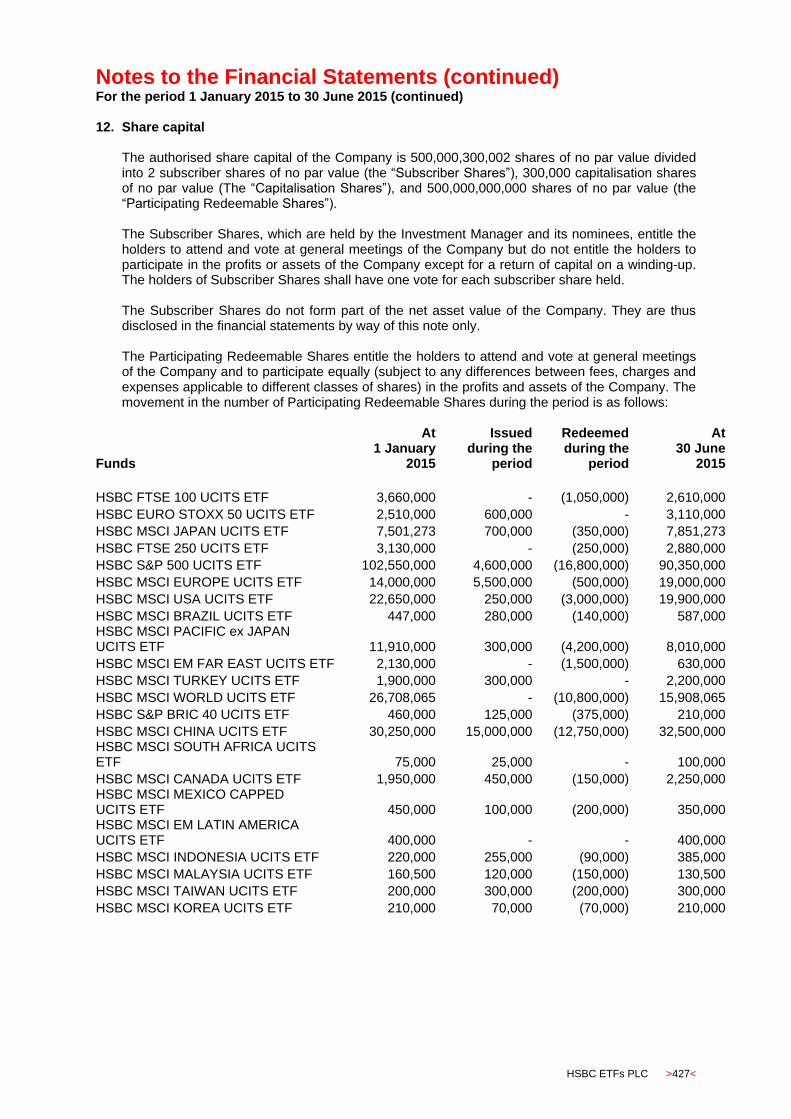
Notes to the Financial Statements (continued) For the period 1 January 2015 to 30 June 2015 (continued)
HSBC ETFs PLC >427<
12. Share capital
The authorised share capital of the Company is 500,000,300,002 shares of no par value divided into 2 subscriber shares of no par value (the “Subscriber Shares”), 300,000 capitalisation shares of no par value (The “Capitalisation Shares”), and 500,000,000,000 shares of no par value (the “Participating Redeemable Shares”). The Subscriber Shares, which are held by the Investment Manager and its nominees, entitle the holders to attend and vote at general meetings of the Company but do not entitle the holders to participate in the profits or assets of the Company except for a return of capital on a winding-up. The holders of Subscriber Shares shall have one vote for each subscriber share held. The Subscriber Shares do not form part of the net asset value of the Company. They are thus disclosed in the financial statements by way of this note only. The Participating Redeemable Shares entitle the holders to attend and vote at general meetings of the Company and to participate equally (subject to any differences between fees, charges and expenses applicable to different classes of shares) in the profits and assets of the Company. The movement in the number of Participating Redeemable Shares during the period is as follows:
Funds
At 1 January
2015
Issued during the
period
Redeemed during the
period
At 30 June
2015
HSBC FTSE 100 UCITS ETF 3,660,000 - (1,050,000) 2,610,000
HSBC EURO STOXX 50 UCITS ETF 2,510,000 600,000 - 3,110,000
HSBC MSCI JAPAN UCITS ETF 7,501,273 700,000 (350,000) 7,851,273
HSBC FTSE 250 UCITS ETF 3,130,000 - (250,000) 2,880,000
HSBC S&P 500 UCITS ETF 102,550,000 4,600,000 (16,800,000) 90,350,000
HSBC MSCI EUROPE UCITS ETF 14,000,000 5,500,000 (500,000) 19,000,000
HSBC MSCI USA UCITS ETF 22,650,000 250,000 (3,000,000) 19,900,000
HSBC MSCI BRAZIL UCITS ETF 447,000 280,000 (140,000) 587,000 HSBC MSCI PACIFIC ex JAPAN UCITS ETF 11,910,000 300,000 (4,200,000) 8,010,000
HSBC MSCI EM FAR EAST UCITS ETF 2,130,000 - (1,500,000) 630,000
HSBC MSCI TURKEY UCITS ETF 1,900,000 300,000 - 2,200,000
HSBC MSCI WORLD UCITS ETF 26,708,065 - (10,800,000) 15,908,065
HSBC S&P BRIC 40 UCITS ETF 460,000 125,000 (375,000) 210,000
HSBC MSCI CHINA UCITS ETF 30,250,000 15,000,000 (12,750,000) 32,500,000 HSBC MSCI SOUTH AFRICA UCITS ETF 75,000 25,000 - 100,000
HSBC MSCI CANADA UCITS ETF 1,950,000 450,000 (150,000) 2,250,000 HSBC MSCI MEXICO CAPPED UCITS ETF 450,000 100,000 (200,000) 350,000 HSBC MSCI EM LATIN AMERICA UCITS ETF 400,000 - - 400,000
HSBC MSCI INDONESIA UCITS ETF 220,000 255,000 (90,000) 385,000
HSBC MSCI MALAYSIA UCITS ETF 160,500 120,000 (150,000) 130,500
HSBC MSCI TAIWAN UCITS ETF 200,000 300,000 (200,000) 300,000
HSBC MSCI KOREA UCITS ETF 210,000 70,000 (70,000) 210,000
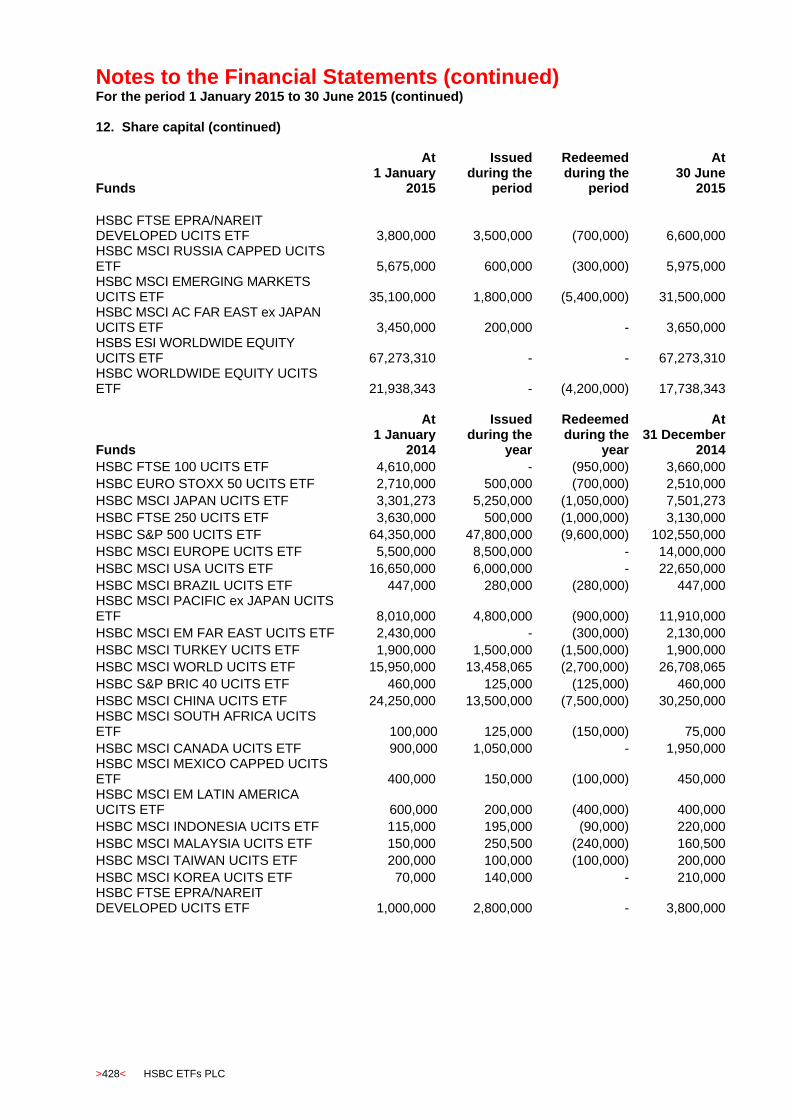
Notes to the Financial Statements (continued) For the period 1 January 2015 to 30 June 2015 (continued)
>428< HSBC ETFs PLC
12. Share capital (continued)
Funds
At 1 January
2015
Issued during the
period
Redeemed during the
period
At 30 June
2015
HSBC FTSE EPRA/NAREIT DEVELOPED UCITS ETF 3,800,000 3,500,000 (700,000) 6,600,000 HSBC MSCI RUSSIA CAPPED UCITS ETF 5,675,000 600,000 (300,000) 5,975,000 HSBC MSCI EMERGING MARKETS UCITS ETF 35,100,000 1,800,000 (5,400,000) 31,500,000 HSBC MSCI AC FAR EAST ex JAPAN UCITS ETF 3,450,000 200,000 - 3,650,000 HSBS ESI WORLDWIDE EQUITY UCITS ETF 67,273,310 - - 67,273,310 HSBC WORLDWIDE EQUITY UCITS ETF 21,938,343 - (4,200,000) 17,738,343
Funds
At 1 January
2014
Issued during the
year
Redeemed during the
year
At 31 December
2014
HSBC FTSE 100 UCITS ETF 4,610,000 - (950,000) 3,660,000
HSBC EURO STOXX 50 UCITS ETF 2,710,000 500,000 (700,000) 2,510,000
HSBC MSCI JAPAN UCITS ETF 3,301,273 5,250,000 (1,050,000) 7,501,273
HSBC FTSE 250 UCITS ETF 3,630,000 500,000 (1,000,000) 3,130,000
HSBC S&P 500 UCITS ETF 64,350,000 47,800,000 (9,600,000) 102,550,000
HSBC MSCI EUROPE UCITS ETF 5,500,000 8,500,000 - 14,000,000
HSBC MSCI USA UCITS ETF 16,650,000 6,000,000 - 22,650,000
HSBC MSCI BRAZIL UCITS ETF 447,000 280,000 (280,000) 447,000 HSBC MSCI PACIFIC ex JAPAN UCITS ETF 8,010,000 4,800,000 (900,000) 11,910,000
HSBC MSCI EM FAR EAST UCITS ETF 2,430,000 - (300,000) 2,130,000
HSBC MSCI TURKEY UCITS ETF 1,900,000 1,500,000 (1,500,000) 1,900,000
HSBC MSCI WORLD UCITS ETF 15,950,000 13,458,065 (2,700,000) 26,708,065
HSBC S&P BRIC 40 UCITS ETF 460,000 125,000 (125,000) 460,000
HSBC MSCI CHINA UCITS ETF 24,250,000 13,500,000 (7,500,000) 30,250,000 HSBC MSCI SOUTH AFRICA UCITS ETF 100,000 125,000 (150,000) 75,000
HSBC MSCI CANADA UCITS ETF 900,000 1,050,000 - 1,950,000 HSBC MSCI MEXICO CAPPED UCITS ETF 400,000 150,000 (100,000) 450,000 HSBC MSCI EM LATIN AMERICA UCITS ETF 600,000 200,000 (400,000) 400,000
HSBC MSCI INDONESIA UCITS ETF 115,000 195,000 (90,000) 220,000
HSBC MSCI MALAYSIA UCITS ETF 150,000 250,500 (240,000) 160,500
HSBC MSCI TAIWAN UCITS ETF 200,000 100,000 (100,000) 200,000
HSBC MSCI KOREA UCITS ETF 70,000 140,000 - 210,000 HSBC FTSE EPRA/NAREIT DEVELOPED UCITS ETF 1,000,000 2,800,000 - 3,800,000

Notes to the Financial Statements (continued) For the period 1 January 2015 to 30 June 2015 (continued)
HSBC ETFs PLC >429<
12. Share capital (continued)
Funds
At 1 January
2014
Issued during the
year
Redeemed during the
year
At 31 December
2014
HSBC MSCI RUSSIA CAPPED UCITS ETF 875,000 5,100,000 (300,000) 5,675,000 HSBC MSCI EMERGING MARKETS UCITS ETF 25,500,000 16,200,000 (6,600,000) 35,100,000 HSBC MSCI AC FAR EAST ex JAPAN UCITS ETF 3,050,000 400,000 - 3,450,000 HSBS ESI WORLDWIDE EQUITY UCITS ETF - 67,273,310 - 67,273,310 HSBC WORLDWIDE EQUITY UCITS ETF - 30,714,841 (8,776,498) 21,938,343 13. Comparative net asset value
Funds NAV
Per Share Total NAV
30 June 2015 30 June 2015
HSBC FTSE 100 UCITS UCITS ETF GBP 65.98 GBP 172,205,514
HSBC EURO STOXX 50 UCITS ETF EUR 35.91 EUR 111,669,115
HSBC MSCI JAPAN UCITS ETF USD 29.62 USD 232,528,848
HSBC FTSE 250 UCITS ETF GBP 17.29 GBP 49,793,316
HSBC S&P 500 UCITS ETF USD 20.82 USD 1,880,866,306
HSBC MSCI EUROPE UCITS ETF EUR 13.32 EUR 253,014,431
HSBC MSCI USA UCITS ETF USD 19.93 USD 396,590,070
HSBC MSCI BRAZIL UCITS ETF USD 16.55 USD 9,712,576
HSBC MSCI PACIFIC ex JAPAN UCITS ETF USD 12.90 USD 103,343,575
HSBC MSCI EM FAR EAST UCITS ETF USD 40.77 USD 25,687,445
HSBC MSCI TURKEY UCITS ETF USD 4.45 USD 9,784,947
HSBC MSCI WORLD UCITS ETF USD 17.34 USD 275,841,837
HSBC S&P BRIC 40 UCITS ETF USD 24.02 USD 5,043,671
HSBC MSCI CHINA UCITS ETF USD 7.63 USD 248,200,202
HSBC MSCI SOUTH AFRICA UCITS ETF USD 55.51 USD 5,550,874
HSBC MSCI CANADA UCITS ETF USD 16.23 USD 36,508,684
HSBC MSCI MEXICO CAPPED UCITS ETF USD 42.73 USD 14,955,647
HSBC MSCI EM LATIN AMERICA UCITS ETF USD 25.26 USD 10,104,224
HSBC MSCI INDONESIA UCITS ETF USD 72.68 USD 27,982,986
HSBC MSCI MALAYSIA UCITS ETF USD 39.77 USD 5,189,706
HSBC MSCI TAIWAN UCITS ETF USD 32.44 USD 9,731,947
HSBC MSCI KOREA UCITS ETF USD 38.47 USD 8,078,710
HSBC FTSE EPRA/NAREIT DEVELOPED UCITS ETF USD 21.71 USD 143,300,150
HSBC MSCI RUSSIA CAPPED UCITS ETF USD 8.58 USD 51,282,278
HSBC MSCI EMERGING MARKETS UCITS ETF USD 9.86 USD 310,447,464
HSBC MSCI AC FAR EAST ex JAPAN UCITS ETF USD 38.03 USD 138,823,055
HSBC ESI WORLDWIDE EQUITY UCITS ETF USD 14.90 USD 1,002,300,645
HSBC WORLDWIDE EQUITY UCITS ETF USD 16.21 USD 287,615,631
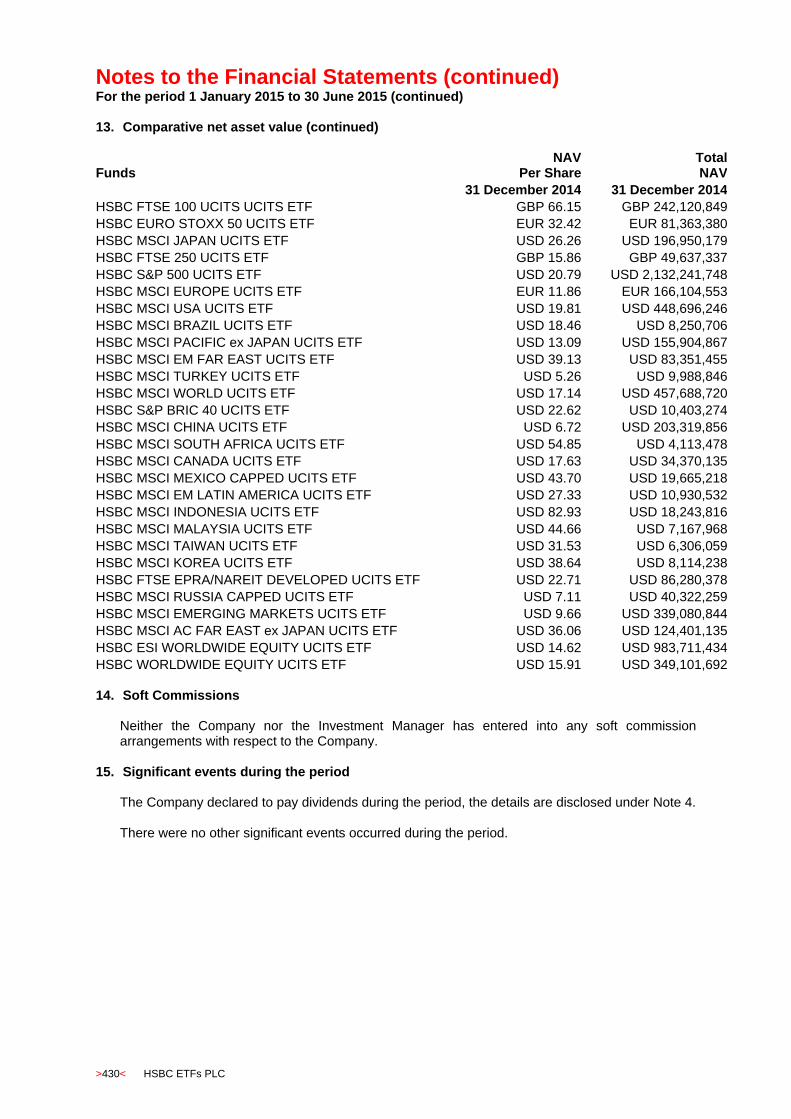
Notes to the Financial Statements (continued) For the period 1 January 2015 to 30 June 2015 (continued)
>430< HSBC ETFs PLC
13. Comparative net asset value (continued)
Funds NAV
Per Share Total NAV
31 December 2014 31 December 2014
HSBC FTSE 100 UCITS UCITS ETF GBP 66.15 GBP 242,120,849
HSBC EURO STOXX 50 UCITS ETF EUR 32.42 EUR 81,363,380
HSBC MSCI JAPAN UCITS ETF USD 26.26 USD 196,950,179
HSBC FTSE 250 UCITS ETF GBP 15.86 GBP 49,637,337
HSBC S&P 500 UCITS ETF USD 20.79 USD 2,132,241,748
HSBC MSCI EUROPE UCITS ETF EUR 11.86 EUR 166,104,553
HSBC MSCI USA UCITS ETF USD 19.81 USD 448,696,246
HSBC MSCI BRAZIL UCITS ETF USD 18.46 USD 8,250,706
HSBC MSCI PACIFIC ex JAPAN UCITS ETF USD 13.09 USD 155,904,867
HSBC MSCI EM FAR EAST UCITS ETF USD 39.13 USD 83,351,455
HSBC MSCI TURKEY UCITS ETF USD 5.26 USD 9,988,846
HSBC MSCI WORLD UCITS ETF USD 17.14 USD 457,688,720
HSBC S&P BRIC 40 UCITS ETF USD 22.62 USD 10,403,274
HSBC MSCI CHINA UCITS ETF USD 6.72 USD 203,319,856
HSBC MSCI SOUTH AFRICA UCITS ETF USD 54.85 USD 4,113,478
HSBC MSCI CANADA UCITS ETF USD 17.63 USD 34,370,135
HSBC MSCI MEXICO CAPPED UCITS ETF USD 43.70 USD 19,665,218
HSBC MSCI EM LATIN AMERICA UCITS ETF USD 27.33 USD 10,930,532
HSBC MSCI INDONESIA UCITS ETF USD 82.93 USD 18,243,816
HSBC MSCI MALAYSIA UCITS ETF USD 44.66 USD 7,167,968
HSBC MSCI TAIWAN UCITS ETF USD 31.53 USD 6,306,059
HSBC MSCI KOREA UCITS ETF USD 38.64 USD 8,114,238
HSBC FTSE EPRA/NAREIT DEVELOPED UCITS ETF USD 22.71 USD 86,280,378
HSBC MSCI RUSSIA CAPPED UCITS ETF USD 7.11 USD 40,322,259
HSBC MSCI EMERGING MARKETS UCITS ETF USD 9.66 USD 339,080,844
HSBC MSCI AC FAR EAST ex JAPAN UCITS ETF USD 36.06 USD 124,401,135
HSBC ESI WORLDWIDE EQUITY UCITS ETF USD 14.62 USD 983,711,434
HSBC WORLDWIDE EQUITY UCITS ETF USD 15.91 USD 349,101,692 14. Soft Commissions
Neither the Company nor the Investment Manager has entered into any soft commission arrangements with respect to the Company.
15. Significant events during the period The Company declared to pay dividends during the period, the details are disclosed under Note 4. There were no other significant events occurred during the period.
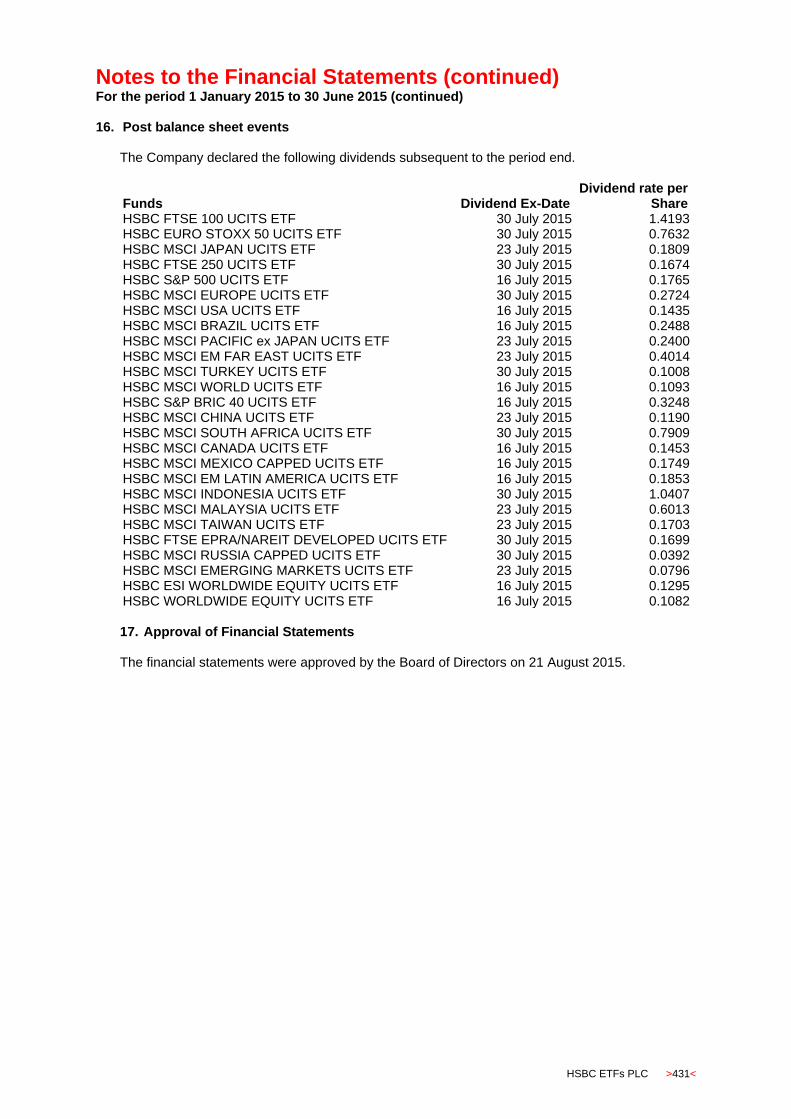
Notes to the Financial Statements (continued) For the period 1 January 2015 to 30 June 2015 (continued)
HSBC ETFs PLC >431<
16. Post balance sheet events The Company declared the following dividends subsequent to the period end.
Funds Dividend Ex-Date Dividend rate per
Share HSBC FTSE 100 UCITS ETF 30 July 2015 1.4193 HSBC EURO STOXX 50 UCITS ETF 30 July 2015 0.7632 HSBC MSCI JAPAN UCITS ETF 23 July 2015 0.1809 HSBC FTSE 250 UCITS ETF 30 July 2015 0.1674 HSBC S&P 500 UCITS ETF 16 July 2015 0.1765 HSBC MSCI EUROPE UCITS ETF 30 July 2015 0.2724 HSBC MSCI USA UCITS ETF 16 July 2015 0.1435 HSBC MSCI BRAZIL UCITS ETF 16 July 2015 0.2488 HSBC MSCI PACIFIC ex JAPAN UCITS ETF 23 July 2015 0.2400 HSBC MSCI EM FAR EAST UCITS ETF 23 July 2015 0.4014 HSBC MSCI TURKEY UCITS ETF 30 July 2015 0.1008 HSBC MSCI WORLD UCITS ETF 16 July 2015 0.1093 HSBC S&P BRIC 40 UCITS ETF 16 July 2015 0.3248 HSBC MSCI CHINA UCITS ETF 23 July 2015 0.1190 HSBC MSCI SOUTH AFRICA UCITS ETF 30 July 2015 0.7909 HSBC MSCI CANADA UCITS ETF 16 July 2015 0.1453 HSBC MSCI MEXICO CAPPED UCITS ETF 16 July 2015 0.1749 HSBC MSCI EM LATIN AMERICA UCITS ETF 16 July 2015 0.1853 HSBC MSCI INDONESIA UCITS ETF 30 July 2015 1.0407 HSBC MSCI MALAYSIA UCITS ETF 23 July 2015 0.6013 HSBC MSCI TAIWAN UCITS ETF 23 July 2015 0.1703 HSBC FTSE EPRA/NAREIT DEVELOPED UCITS ETF 30 July 2015 0.1699 HSBC MSCI RUSSIA CAPPED UCITS ETF 30 July 2015 0.0392 HSBC MSCI EMERGING MARKETS UCITS ETF 23 July 2015 0.0796 HSBC ESI WORLDWIDE EQUITY UCITS ETF 16 July 2015 0.1295 HSBC WORLDWIDE EQUITY UCITS ETF 16 July 2015 0.1082 17. Approval of Financial Statements
The financial statements were approved by the Board of Directors on 21 August 2015.
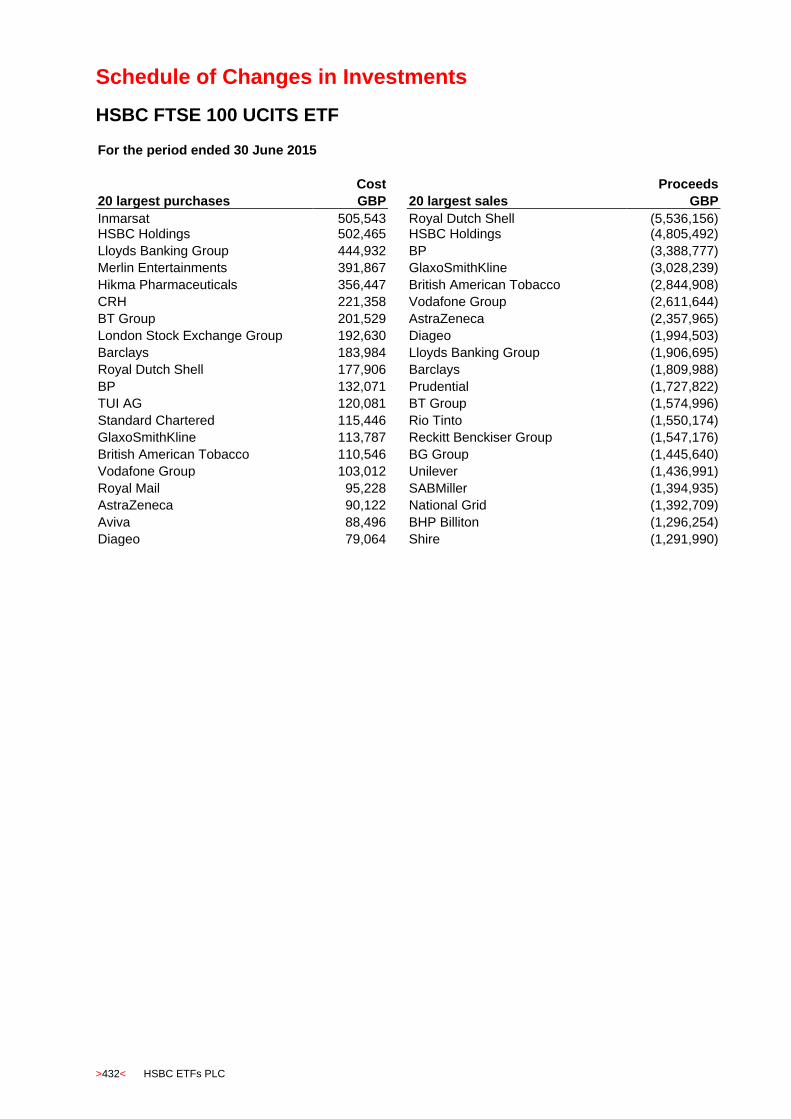
Schedule of Changes in Investments
>432< HSBC ETFs PLC
HSBC FTSE 100 UCITS ETF
For the period ended 30 June 2015
Cost Proceeds
20 largest purchases GBP 20 largest sales GBP
Inmarsat 505,543 Royal Dutch Shell (5,536,156) HSBC Holdings 502,465 HSBC Holdings (4,805,492)
Lloyds Banking Group 444,932 BP (3,388,777)
Merlin Entertainments 391,867 GlaxoSmithKline (3,028,239)
Hikma Pharmaceuticals 356,447 British American Tobacco (2,844,908)
CRH 221,358 Vodafone Group (2,611,644)
BT Group 201,529 AstraZeneca (2,357,965)
London Stock Exchange Group 192,630 Diageo (1,994,503)
Barclays 183,984 Lloyds Banking Group (1,906,695)
Royal Dutch Shell 177,906 Barclays (1,809,988)
BP 132,071 Prudential (1,727,822)
TUI AG 120,081 BT Group (1,574,996)
Standard Chartered 115,446 Rio Tinto (1,550,174)
GlaxoSmithKline 113,787 Reckitt Benckiser Group (1,547,176)
British American Tobacco 110,546 BG Group (1,445,640)
Vodafone Group 103,012 Unilever (1,436,991)
Royal Mail 95,228 SABMiller (1,394,935)
AstraZeneca 90,122 National Grid (1,392,709)
Aviva 88,496 BHP Billiton (1,296,254)
Diageo 79,064 Shire (1,291,990)

Schedule of Changes in Investments (continued)
HSBC ETFs PLC >433<
HSBC EURO STOXX 50 UCITS ETF
For the period ended 30 June 2015
Cost Proceeds
20 largest purchases EUR 20 largest sales EUR
Banco Santander 1,413,715 Banco Santander (170,913)
Total 1,172,103 Carrefour (87,599)
Bayer 1,115,813 BBV Argentaria (62,193)
Sanofi 1,038,481 Vivendi (50,006)
Anheuser-Busch 874,434 Bayer (43,659)
Daimler 866,887 Total (42,763)
BASF 789,667 Repsol (42,399)
Telefonica 776,452 Sanofi (41,020)
Siemens 724,173 Muenchener Ruecker (37,846)
Allianz 694,166 Koninklijke Philips Electronics (34,075)
BNP Paribas 628,599 Daimler (32,990)
SAP 624,139 Anheuser-Busch (32,773)
Unilever 623,462 Nokia (30,957)
BBV Argentaria 615,771 BASF (30,342)
ING Groep Certs 572,334 Siemens (29,672)
Deutsche Telekom 512,088 Allianz (27,275)
AXA 511,601 Unilever (23,454)
Intesa 504,929 SAP (22,958)
ENI 455,872 BNP Paribas (22,462)
LVMH Moet Hennessy Louis Vuitton 454,819 Deutsche Telekom (19,289)
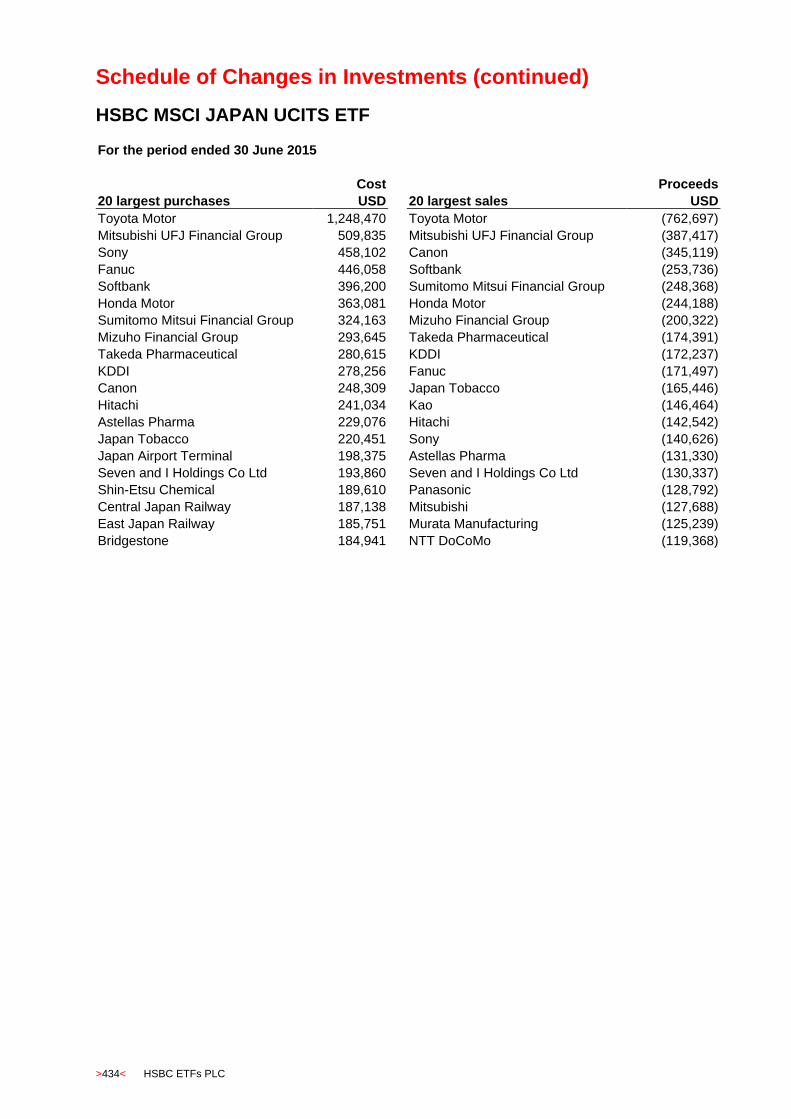
Schedule of Changes in Investments (continued)
>434< HSBC ETFs PLC
HSBC MSCI JAPAN UCITS ETF
For the period ended 30 June 2015
Cost Proceeds
20 largest purchases USD 20 largest sales USD
Toyota Motor 1,248,470 Toyota Motor (762,697)
Mitsubishi UFJ Financial Group 509,835 Mitsubishi UFJ Financial Group (387,417)
Sony 458,102 Canon (345,119)
Fanuc 446,058 Softbank (253,736)
Softbank 396,200 Sumitomo Mitsui Financial Group (248,368)
Honda Motor 363,081 Honda Motor (244,188)
Sumitomo Mitsui Financial Group 324,163 Mizuho Financial Group (200,322)
Mizuho Financial Group 293,645 Takeda Pharmaceutical (174,391)
Takeda Pharmaceutical 280,615 KDDI (172,237)
KDDI 278,256 Fanuc (171,497)
Canon 248,309 Japan Tobacco (165,446)
Hitachi 241,034 Kao (146,464)
Astellas Pharma 229,076 Hitachi (142,542)
Japan Tobacco 220,451 Sony (140,626)
Japan Airport Terminal 198,375 Astellas Pharma (131,330)
Seven and I Holdings Co Ltd 193,860 Seven and I Holdings Co Ltd (130,337)
Shin-Etsu Chemical 189,610 Panasonic (128,792)
Central Japan Railway 187,138 Mitsubishi (127,688)
East Japan Railway 185,751 Murata Manufacturing (125,239)
Bridgestone 184,941 NTT DoCoMo (119,368)
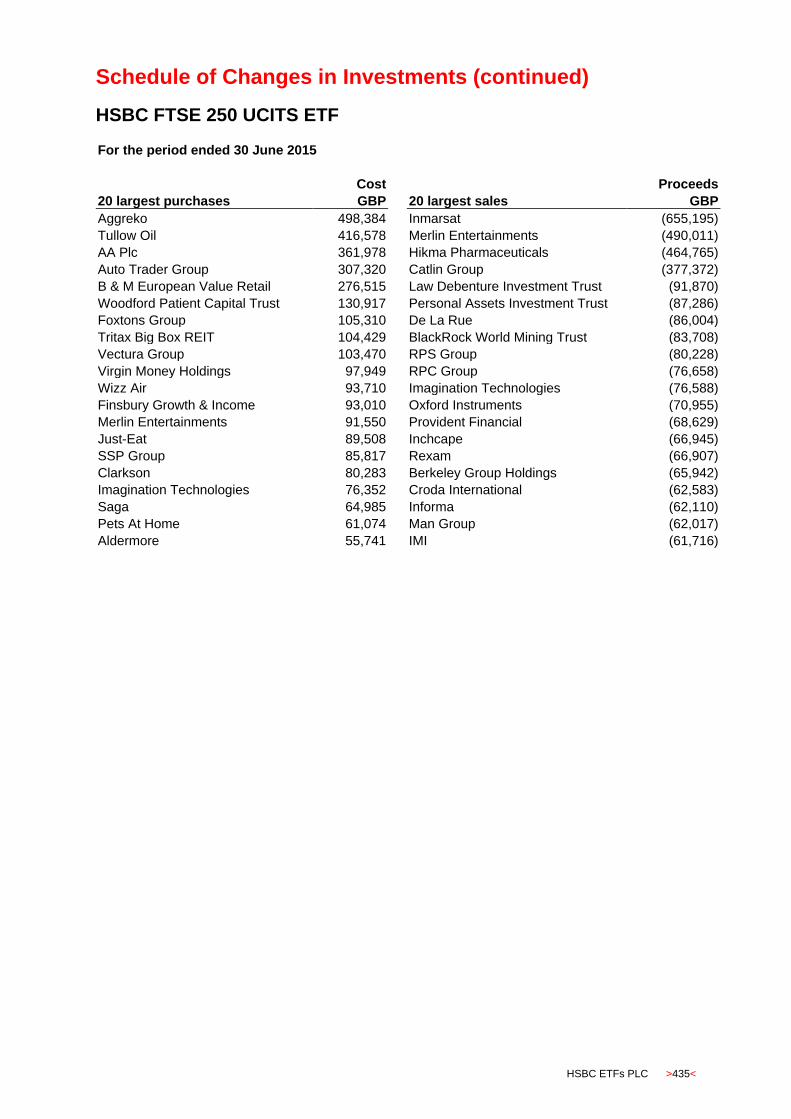
Schedule of Changes in Investments (continued)
HSBC ETFs PLC >435<
HSBC FTSE 250 UCITS ETF
For the period ended 30 June 2015
Cost Proceeds
20 largest purchases GBP 20 largest sales GBP
Aggreko 498,384 Inmarsat (655,195)
Tullow Oil 416,578 Merlin Entertainments (490,011)
AA Plc 361,978 Hikma Pharmaceuticals (464,765)
Auto Trader Group 307,320 Catlin Group (377,372)
B & M European Value Retail 276,515 Law Debenture Investment Trust (91,870)
Woodford Patient Capital Trust 130,917 Personal Assets Investment Trust (87,286)
Foxtons Group 105,310 De La Rue (86,004)
Tritax Big Box REIT 104,429 BlackRock World Mining Trust (83,708)
Vectura Group 103,470 RPS Group (80,228)
Virgin Money Holdings 97,949 RPC Group (76,658)
Wizz Air 93,710 Imagination Technologies (76,588)
Finsbury Growth & Income 93,010 Oxford Instruments (70,955)
Merlin Entertainments 91,550 Provident Financial (68,629)
Just-Eat 89,508 Inchcape (66,945)
SSP Group 85,817 Rexam (66,907)
Clarkson 80,283 Berkeley Group Holdings (65,942)
Imagination Technologies 76,352 Croda International (62,583)
Saga 64,985 Informa (62,110)
Pets At Home 61,074 Man Group (62,017)
Aldermore 55,741 IMI (61,716)
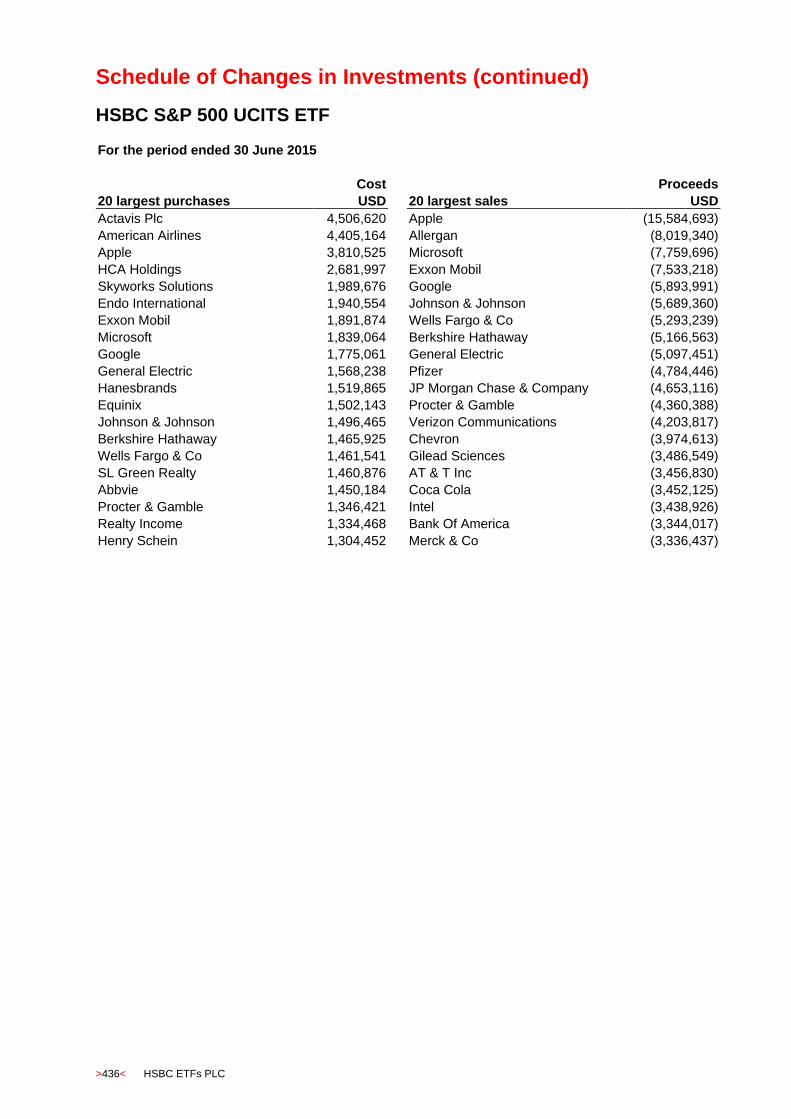
Schedule of Changes in Investments (continued)
>436< HSBC ETFs PLC
HSBC S&P 500 UCITS ETF
For the period ended 30 June 2015
Cost Proceeds
20 largest purchases USD 20 largest sales USD
Actavis Plc 4,506,620 Apple (15,584,693)
American Airlines 4,405,164 Allergan (8,019,340)
Apple 3,810,525 Microsoft (7,759,696)
HCA Holdings 2,681,997 Exxon Mobil (7,533,218)
Skyworks Solutions 1,989,676 Google (5,893,991)
Endo International 1,940,554 Johnson & Johnson (5,689,360)
Exxon Mobil 1,891,874 Wells Fargo & Co (5,293,239)
Microsoft 1,839,064 Berkshire Hathaway (5,166,563)
Google 1,775,061 General Electric (5,097,451)
General Electric 1,568,238 Pfizer (4,784,446)
Hanesbrands 1,519,865 JP Morgan Chase & Company (4,653,116)
Equinix 1,502,143 Procter & Gamble (4,360,388)
Johnson & Johnson 1,496,465 Verizon Communications (4,203,817)
Berkshire Hathaway 1,465,925 Chevron (3,974,613)
Wells Fargo & Co 1,461,541 Gilead Sciences (3,486,549)
SL Green Realty 1,460,876 AT & T Inc (3,456,830)
Abbvie 1,450,184 Coca Cola (3,452,125)
Procter & Gamble 1,346,421 Intel (3,438,926)
Realty Income 1,334,468 Bank Of America (3,344,017)
Henry Schein 1,304,452 Merck & Co (3,336,437)
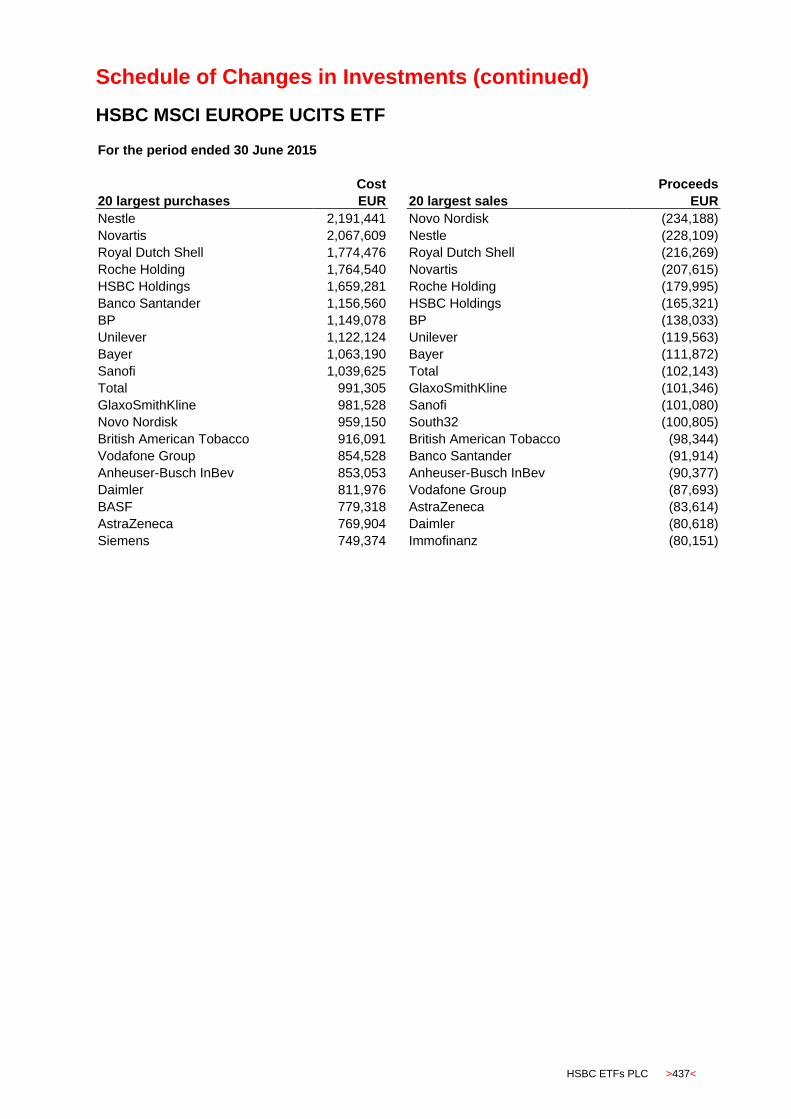
Schedule of Changes in Investments (continued)
HSBC ETFs PLC >437<
HSBC MSCI EUROPE UCITS ETF
For the period ended 30 June 2015
Cost Proceeds
20 largest purchases EUR 20 largest sales EUR
Nestle 2,191,441 Novo Nordisk (234,188)
Novartis 2,067,609 Nestle (228,109)
Royal Dutch Shell 1,774,476 Royal Dutch Shell (216,269)
Roche Holding 1,764,540 Novartis (207,615)
HSBC Holdings 1,659,281 Roche Holding (179,995)
Banco Santander 1,156,560 HSBC Holdings (165,321)
BP 1,149,078 BP (138,033)
Unilever 1,122,124 Unilever (119,563)
Bayer 1,063,190 Bayer (111,872)
Sanofi 1,039,625 Total (102,143)
Total 991,305 GlaxoSmithKline (101,346)
GlaxoSmithKline 981,528 Sanofi (101,080)
Novo Nordisk 959,150 South32 (100,805)
British American Tobacco 916,091 British American Tobacco (98,344)
Vodafone Group 854,528 Banco Santander (91,914)
Anheuser-Busch InBev 853,053 Anheuser-Busch InBev (90,377)
Daimler 811,976 Vodafone Group (87,693)
BASF 779,318 AstraZeneca (83,614)
AstraZeneca 769,904 Daimler (80,618)
Siemens 749,374 Immofinanz (80,151)
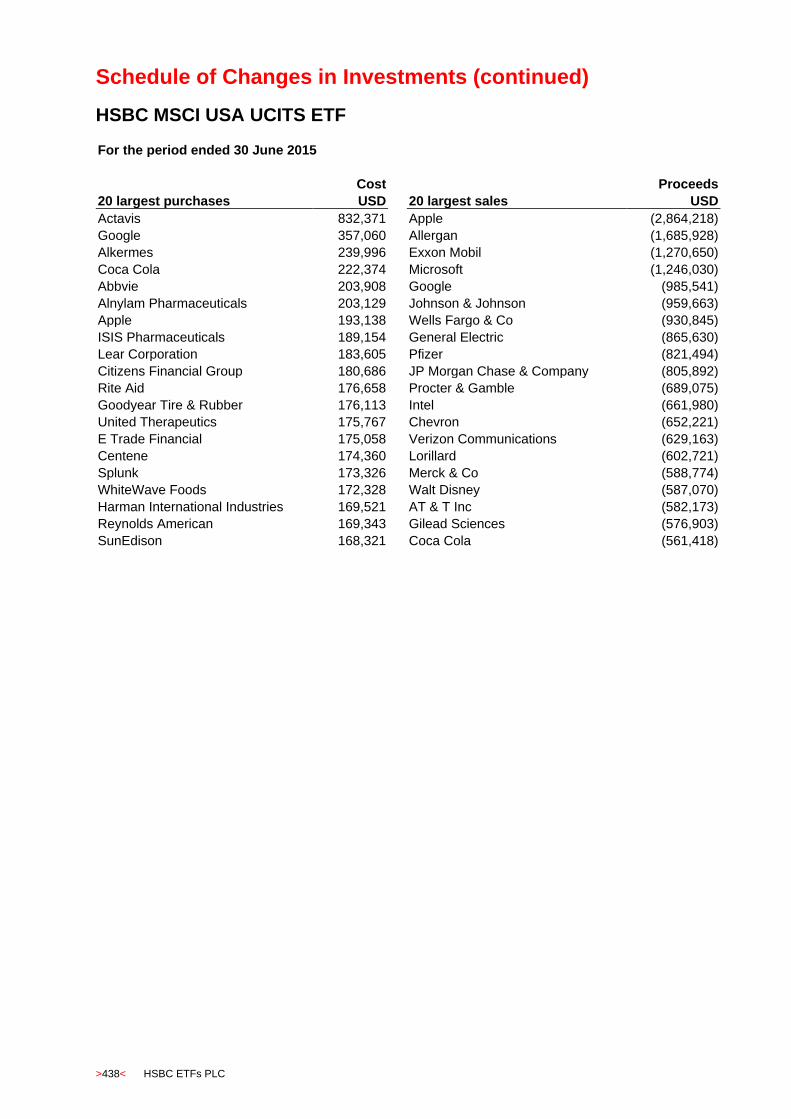
Schedule of Changes in Investments (continued)
>438< HSBC ETFs PLC
HSBC MSCI USA UCITS ETF
For the period ended 30 June 2015
Cost Proceeds
20 largest purchases USD 20 largest sales USD
Actavis 832,371 Apple (2,864,218)
Google 357,060 Allergan (1,685,928)
Alkermes 239,996 Exxon Mobil (1,270,650)
Coca Cola 222,374 Microsoft (1,246,030)
Abbvie 203,908 Google (985,541)
Alnylam Pharmaceuticals 203,129 Johnson & Johnson (959,663)
Apple 193,138 Wells Fargo & Co (930,845)
ISIS Pharmaceuticals 189,154 General Electric (865,630)
Lear Corporation 183,605 Pfizer (821,494)
Citizens Financial Group 180,686 JP Morgan Chase & Company (805,892)
Rite Aid 176,658 Procter & Gamble (689,075)
Goodyear Tire & Rubber 176,113 Intel (661,980)
United Therapeutics 175,767 Chevron (652,221)
E Trade Financial 175,058 Verizon Communications (629,163)
Centene 174,360 Lorillard (602,721)
Splunk 173,326 Merck & Co (588,774)
WhiteWave Foods 172,328 Walt Disney (587,070)
Harman International Industries 169,521 AT & T Inc (582,173)
Reynolds American 169,343 Gilead Sciences (576,903)
SunEdison 168,321 Coca Cola (561,418)
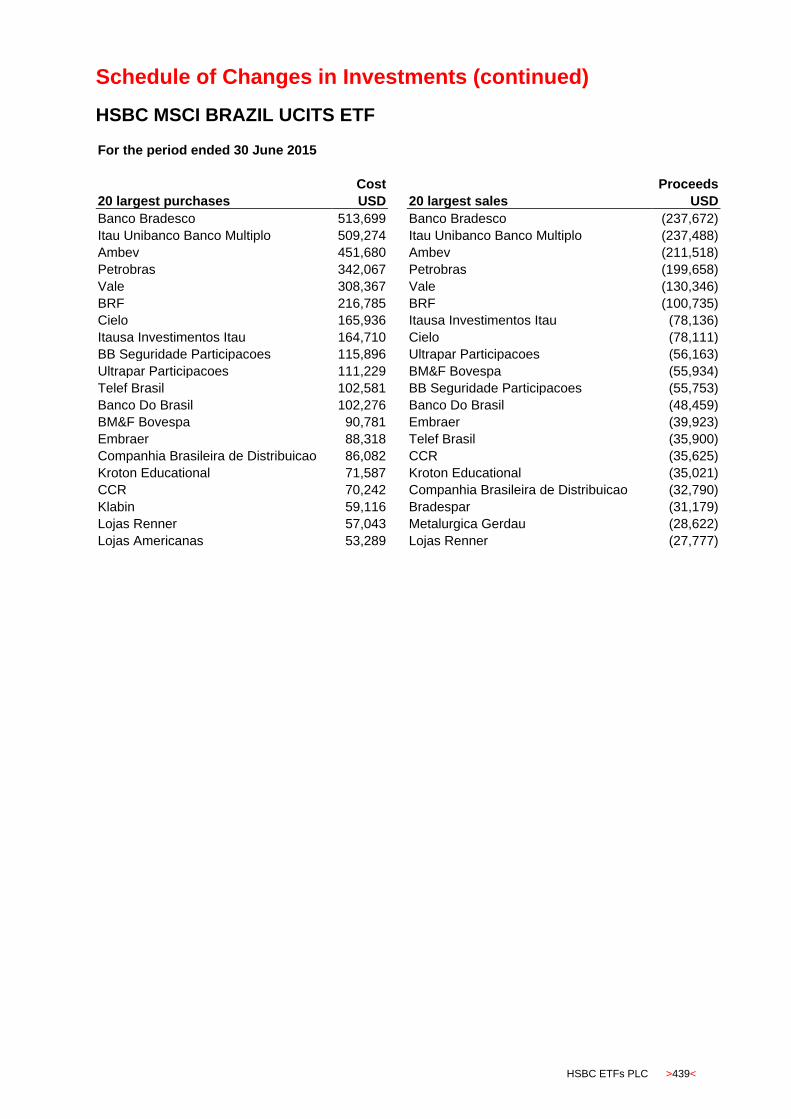
Schedule of Changes in Investments (continued)
HSBC ETFs PLC >439<
HSBC MSCI BRAZIL UCITS ETF
For the period ended 30 June 2015
Cost Proceeds
20 largest purchases USD 20 largest sales USD
Banco Bradesco 513,699 Banco Bradesco (237,672)
Itau Unibanco Banco Multiplo 509,274 Itau Unibanco Banco Multiplo (237,488)
Ambev 451,680 Ambev (211,518)
Petrobras 342,067 Petrobras (199,658)
Vale 308,367 Vale (130,346)
BRF 216,785 BRF (100,735)
Cielo 165,936 Itausa Investimentos Itau (78,136)
Itausa Investimentos Itau 164,710 Cielo (78,111)
BB Seguridade Participacoes 115,896 Ultrapar Participacoes (56,163)
Ultrapar Participacoes 111,229 BM&F Bovespa (55,934)
Telef Brasil 102,581 BB Seguridade Participacoes (55,753)
Banco Do Brasil 102,276 Banco Do Brasil (48,459)
BM&F Bovespa 90,781 Embraer (39,923)
Embraer 88,318 Telef Brasil (35,900)
Companhia Brasileira de Distribuicao 86,082 CCR (35,625)
Kroton Educational 71,587 Kroton Educational (35,021)
CCR 70,242 Companhia Brasileira de Distribuicao (32,790)
Klabin 59,116 Bradespar (31,179)
Lojas Renner 57,043 Metalurgica Gerdau (28,622)
Lojas Americanas 53,289 Lojas Renner (27,777)
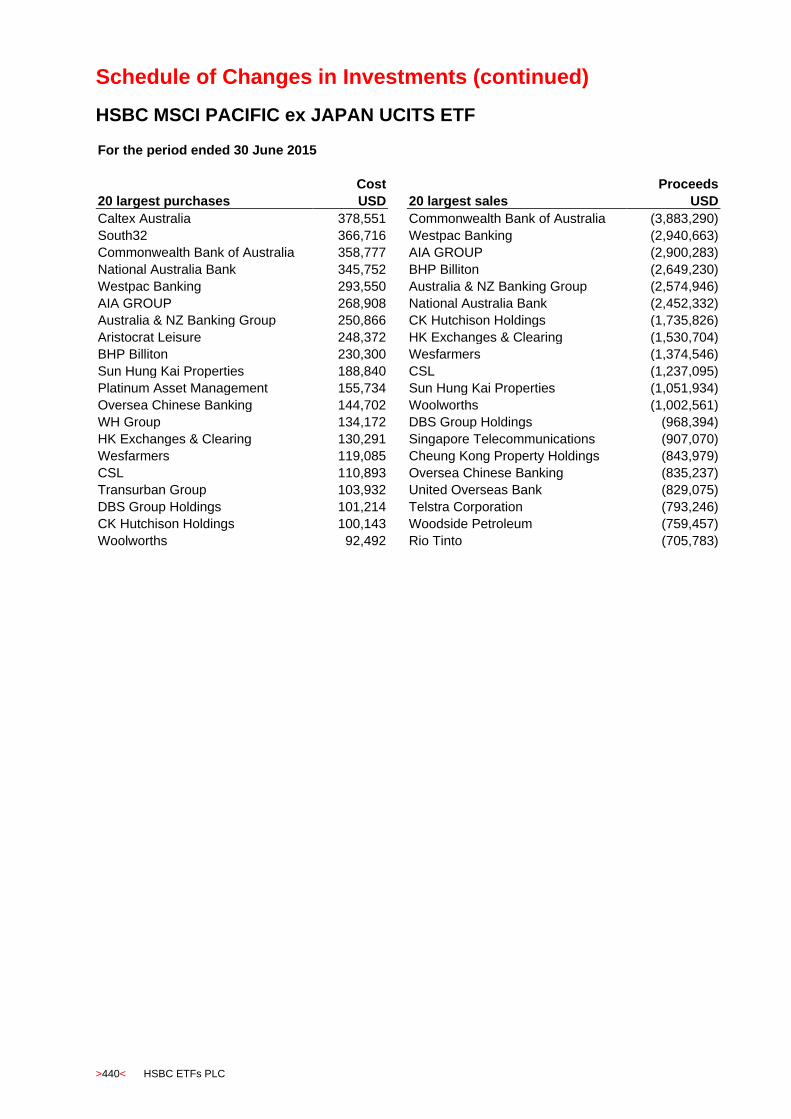
Schedule of Changes in Investments (continued)
>440< HSBC ETFs PLC
HSBC MSCI PACIFIC ex JAPAN UCITS ETF
For the period ended 30 June 2015
Cost Proceeds
20 largest purchases USD 20 largest sales USD
Caltex Australia 378,551 Commonwealth Bank of Australia (3,883,290)
South32 366,716 Westpac Banking (2,940,663)
Commonwealth Bank of Australia 358,777 AIA GROUP (2,900,283)
National Australia Bank 345,752 BHP Billiton (2,649,230)
Westpac Banking 293,550 Australia & NZ Banking Group (2,574,946)
AIA GROUP 268,908 National Australia Bank (2,452,332)
Australia & NZ Banking Group 250,866 CK Hutchison Holdings (1,735,826)
Aristocrat Leisure 248,372 HK Exchanges & Clearing (1,530,704)
BHP Billiton 230,300 Wesfarmers (1,374,546)
Sun Hung Kai Properties 188,840 CSL (1,237,095)
Platinum Asset Management 155,734 Sun Hung Kai Properties (1,051,934)
Oversea Chinese Banking 144,702 Woolworths (1,002,561)
WH Group 134,172 DBS Group Holdings (968,394)
HK Exchanges & Clearing 130,291 Singapore Telecommunications (907,070)
Wesfarmers 119,085 Cheung Kong Property Holdings (843,979)
CSL 110,893 Oversea Chinese Banking (835,237)
Transurban Group 103,932 United Overseas Bank (829,075)
DBS Group Holdings 101,214 Telstra Corporation (793,246)
CK Hutchison Holdings 100,143 Woodside Petroleum (759,457)
Woolworths 92,492 Rio Tinto (705,783)
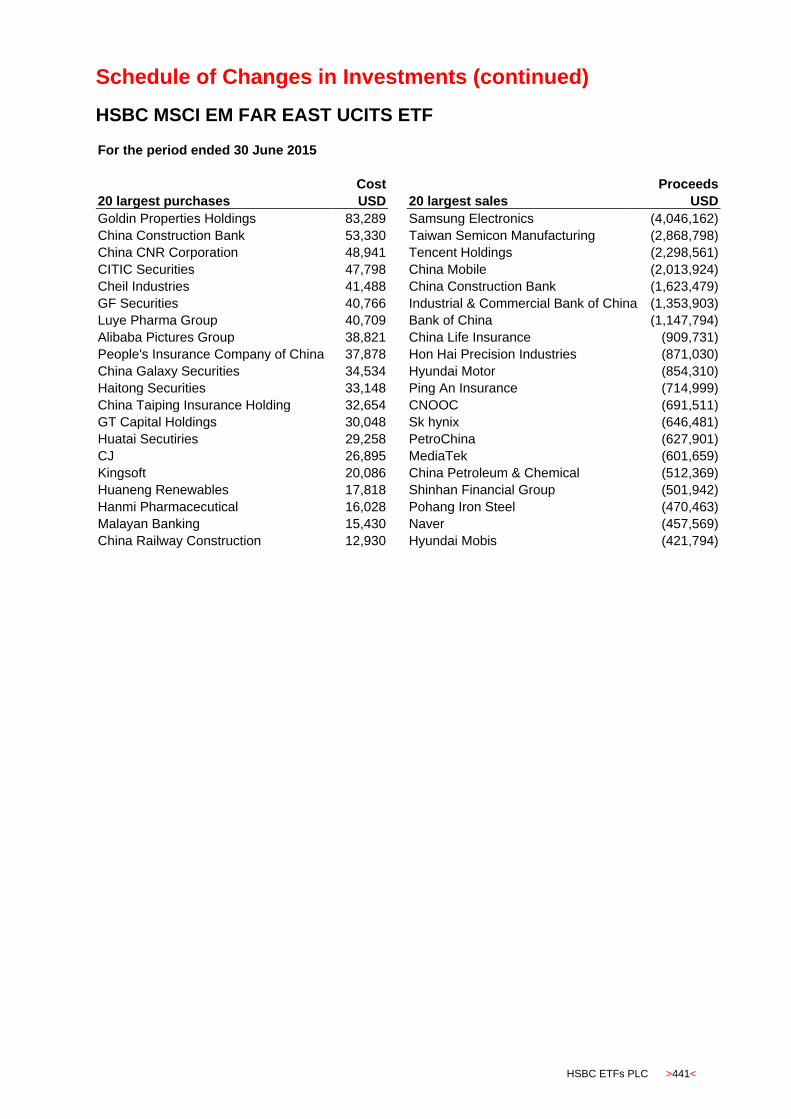
Schedule of Changes in Investments (continued)
HSBC ETFs PLC >441<
HSBC MSCI EM FAR EAST UCITS ETF
For the period ended 30 June 2015
Cost Proceeds
20 largest purchases USD 20 largest sales USD
Goldin Properties Holdings 83,289 Samsung Electronics (4,046,162)
China Construction Bank 53,330 Taiwan Semicon Manufacturing (2,868,798)
China CNR Corporation 48,941 Tencent Holdings (2,298,561)
CITIC Securities 47,798 China Mobile (2,013,924)
Cheil Industries 41,488 China Construction Bank (1,623,479)
GF Securities 40,766 Industrial & Commercial Bank of China (1,353,903)
Luye Pharma Group 40,709 Bank of China (1,147,794)
Alibaba Pictures Group 38,821 China Life Insurance (909,731)
People's Insurance Company of China 37,878 Hon Hai Precision Industries (871,030)
China Galaxy Securities 34,534 Hyundai Motor (854,310)
Haitong Securities 33,148 Ping An Insurance (714,999)
China Taiping Insurance Holding 32,654 CNOOC (691,511)
GT Capital Holdings 30,048 Sk hynix (646,481)
Huatai Secutiries 29,258 PetroChina (627,901)
CJ 26,895 MediaTek (601,659)
Kingsoft 20,086 China Petroleum & Chemical (512,369)
Huaneng Renewables 17,818 Shinhan Financial Group (501,942)
Hanmi Pharmacecutical 16,028 Pohang Iron Steel (470,463)
Malayan Banking 15,430 Naver (457,569)
China Railway Construction 12,930 Hyundai Mobis (421,794)

Schedule of Changes in Investments (continued)
>442< HSBC ETFs PLC
HSBC MSCI TURKEY UCITS ETF
For the period ended 30 June 2015
Cost Proceeds
20 largest purchases USD 20 largest sales USD
Akbank 313,510 Turk Telekomunikasyon (33,118)
Garanti Bankasi 190,690 Garanti Bankasi (22,501)
BIM Birlesik Magazalar 100,157 Turkcell Iletism Hizmetleri (12,733)
Turkcell Iletism Hizmetleri 98,900 BIM Birlesik Magazalar (11,044)
Turkiye IS Bankasi 90,947 Turkiye IS Bankasi (10,786)
Sabanci Holding 85,717 Turkiye Halk Bankasi (9,823)
Turkiye Halk Bankasi 82,588 Sabanci Holding (9,718)
Tupras-Turkiye Petrol Rafine 77,880 KOC Holding (8,271)
KOC Holding 75,614 Tupras-Turkiye Petrol Rafine (7,516)
Eregli Demir Ve Celik Fabrik 61,976 Emlak Konut Gayrimenkul (6,775)
Emlak Konut Gayrimenkul 55,870 Eregli Demir Ve Celik Fabrik (6,541)
Turk Hava Yollari 48,118 Turk Hava Yollari (5,358)
Anadolou Efes Biracilik 45,683 Anadolou Efes Biracilik (4,529)
Tav Havalimanlari 36,104 Yapi Kredi (4,259)
Yapi Kredi 35,528 Turkiye Vakiflar Bankasi (4,110)
Turk Telekomunikasyon 34,826 Coca Cola Icecek (4,006)
Turkiye Vakiflar Bankasi 34,431 Arcelik (3,868)
Coca Cola Icecek 33,268 Tav Havalimanlari (3,651)
Arcelik 33,235 Ulker Biskuvi Sanayi (3,225)
Ulker Biskuvi Sanayi 31,006 Ford Otomotiv Sanayi (2,612)

Schedule of Changes in Investments (continued)
HSBC ETFs PLC >443<
HSBC MSCI WORLD UCITS ETF
For the period ended 30 June 2015
Cost Proceeds
20 largest purchases USD 20 largest sales USD
Verisk Analytics 478,423 Apple (4,915,965)
Federal Realty Investment Trust 466,664 Exxon Mobil (2,751,055)
Medivation 459,614 Microsoft (2,407,409)
Robert Half International 428,102 General Electric (2,107,253)
Regency Centers 423,206 Johnson & Johnson (1,985,769)
Zillow Group Inc 421,779 JP Morgan Chase & Company (1,755,326)
SEI Investments 419,555 Google (1,641,747)
USS 397,921 Wells Fargo & Co (1,598,550)
OGE Energy 375,128 Novartis (1,572,580)
Fuchs Petrolub 372,703 Nestle (1,560,627)
Netsuite 369,059 Toyota Motor (1,460,739)
Palo Alto Networks 358,501 Procter & Gamble (1,443,563)
Eaton Vance 351,963 Royal Dutch Shell (1,434,809)
Croda International 346,852 Walt Disney (1,310,531)
Oceaneering International 340,124 Roche Holding (1,298,810)
Resmed 331,099 Verizon Comms (1,278,670)
Camden Property Trust 327,013 Comcast (1,268,567)
Zardoya Otis 318,877 Pfizer (1,245,325)
International Flavours & Fragrances 311,744 Unilever (1,173,140)
Koninklijke Vopak 310,979 Coca Cola (1,117,682)
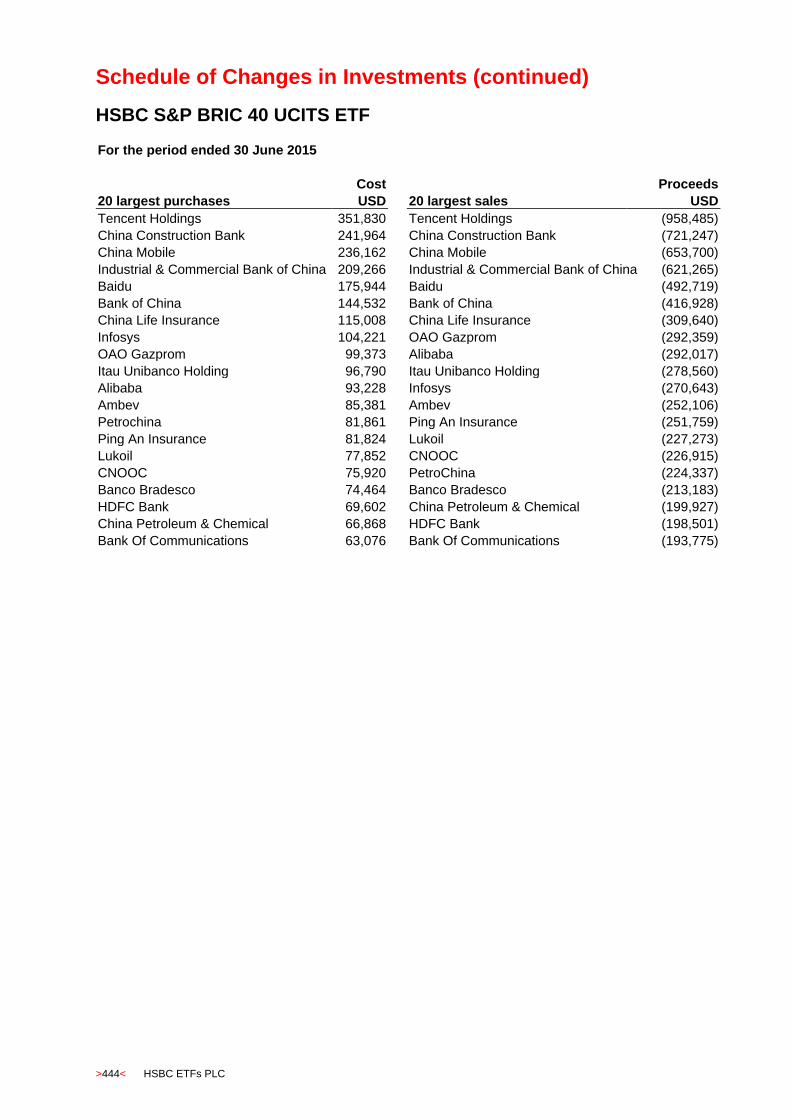
Schedule of Changes in Investments (continued)
>444< HSBC ETFs PLC
HSBC S&P BRIC 40 UCITS ETF
For the period ended 30 June 2015
Cost Proceeds
20 largest purchases USD 20 largest sales USD
Tencent Holdings 351,830 Tencent Holdings (958,485)
China Construction Bank 241,964 China Construction Bank (721,247)
China Mobile 236,162 China Mobile (653,700)
Industrial & Commercial Bank of China 209,266 Industrial & Commercial Bank of China (621,265)
Baidu 175,944 Baidu (492,719)
Bank of China 144,532 Bank of China (416,928)
China Life Insurance 115,008 China Life Insurance (309,640)
Infosys 104,221 OAO Gazprom (292,359)
OAO Gazprom 99,373 Alibaba (292,017)
Itau Unibanco Holding 96,790 Itau Unibanco Holding (278,560)
Alibaba 93,228 Infosys (270,643)
Ambev 85,381 Ambev (252,106)
Petrochina 81,861 Ping An Insurance (251,759)
Ping An Insurance 81,824 Lukoil (227,273)
Lukoil 77,852 CNOOC (226,915)
CNOOC 75,920 PetroChina (224,337)
Banco Bradesco 74,464 Banco Bradesco (213,183)
HDFC Bank 69,602 China Petroleum & Chemical (199,927)
China Petroleum & Chemical 66,868 HDFC Bank (198,501)
Bank Of Communications 63,076 Bank Of Communications (193,775)

Schedule of Changes in Investments (continued)
HSBC ETFs PLC >445<
HSBC MSCI CHINA UCITS ETF
For the period ended 30 June 2015
Cost Proceeds
20 largest purchases USD 20 largest sales USD
Tencent Holdings 11,647,991 Tencent Holdings (11,579,651)
China Construction Bank 10,387,740 China Mobile (9,093,458)
China Mobile 9,864,597 China Construction Bank (7,615,218) Industrial & Commercial Bank of China 6,711,896
Industrial & Commercial Bank of China (6,923,967)
Bank of China 5,699,445 Bank of China (5,892,862)
China Life Insurance 3,966,438 Ping An Insurance (4,037,599)
Ping An Insurance 3,740,926 China Life Insurance (3,824,062)
CNOOC 3,098,110 CNOOC (3,047,866)
Petrochina 2,923,897 Petrochina (2,796,213)
China Petroleum & Chemical 2,509,879 China Petroleum & Chemical (2,504,467)
China OS Land & Investment 1,591,666 China OS Land & Investment (1,795,222)
China Pacific Insurance Group 1,581,957 China Pacific Insurance Group (1,509,684)
Haitong Securities 1,581,860 China Merchants Bank (1,500,045)
CITIC Securities 1,574,242 Agricultural Bank of China (1,230,067)
Agricultural Bank of China 1,426,319 Lenovo Group (1,130,241)
China Merchants Bank 1,401,345 China Unicom (1,099,815)
Goldin Properties Holdings 1,394,774 China Minsheng Banking (1,084,017)
China Resources Land 1,304,258 China Resources Land (1,077,034)
Lenovo Group 1,233,341 China Telecom (1,012,704)
Hanergy Thin Film Power Group 1,233,252 Hengan International Group (998,932)
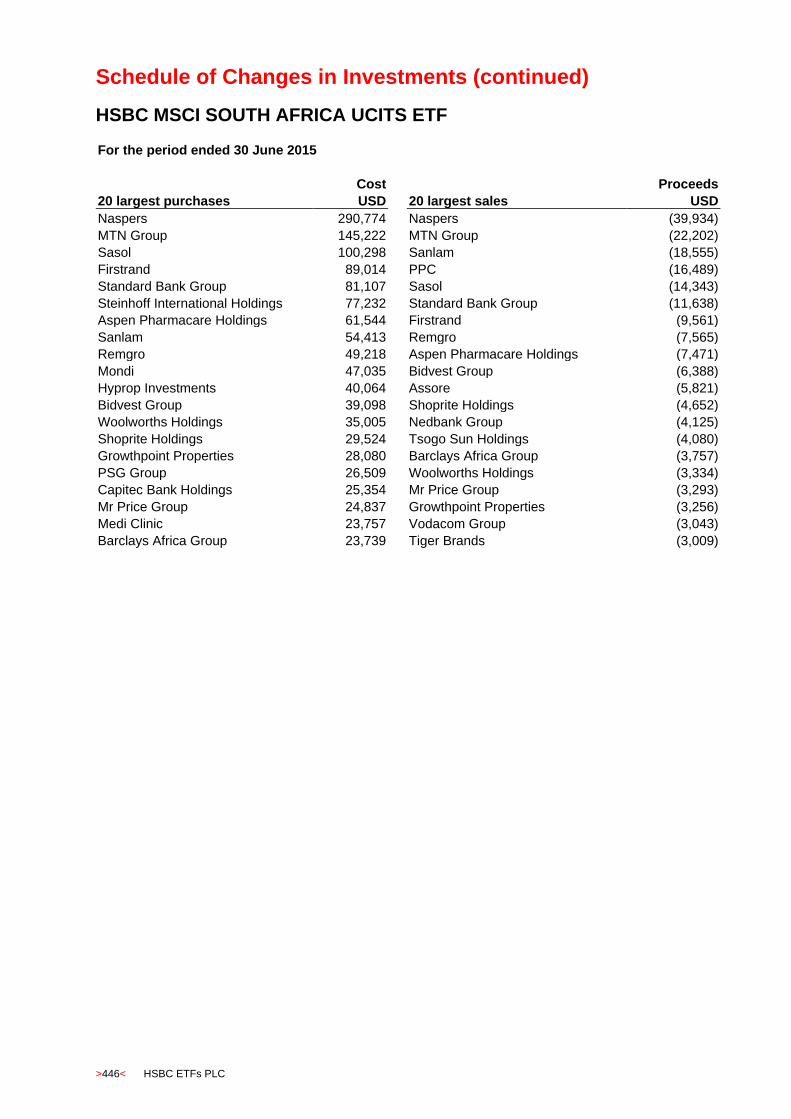
Schedule of Changes in Investments (continued)
>446< HSBC ETFs PLC
HSBC MSCI SOUTH AFRICA UCITS ETF
For the period ended 30 June 2015
Cost Proceeds
20 largest purchases USD 20 largest sales USD
Naspers 290,774 Naspers (39,934)
MTN Group 145,222 MTN Group (22,202)
Sasol 100,298 Sanlam (18,555)
Firstrand 89,014 PPC (16,489)
Standard Bank Group 81,107 Sasol (14,343)
Steinhoff International Holdings 77,232 Standard Bank Group (11,638)
Aspen Pharmacare Holdings 61,544 Firstrand (9,561)
Sanlam 54,413 Remgro (7,565)
Remgro 49,218 Aspen Pharmacare Holdings (7,471)
Mondi 47,035 Bidvest Group (6,388)
Hyprop Investments 40,064 Assore (5,821)
Bidvest Group 39,098 Shoprite Holdings (4,652)
Woolworths Holdings 35,005 Nedbank Group (4,125)
Shoprite Holdings 29,524 Tsogo Sun Holdings (4,080)
Growthpoint Properties 28,080 Barclays Africa Group (3,757)
PSG Group 26,509 Woolworths Holdings (3,334)
Capitec Bank Holdings 25,354 Mr Price Group (3,293)
Mr Price Group 24,837 Growthpoint Properties (3,256)
Medi Clinic 23,757 Vodacom Group (3,043)
Barclays Africa Group 23,739 Tiger Brands (3,009)
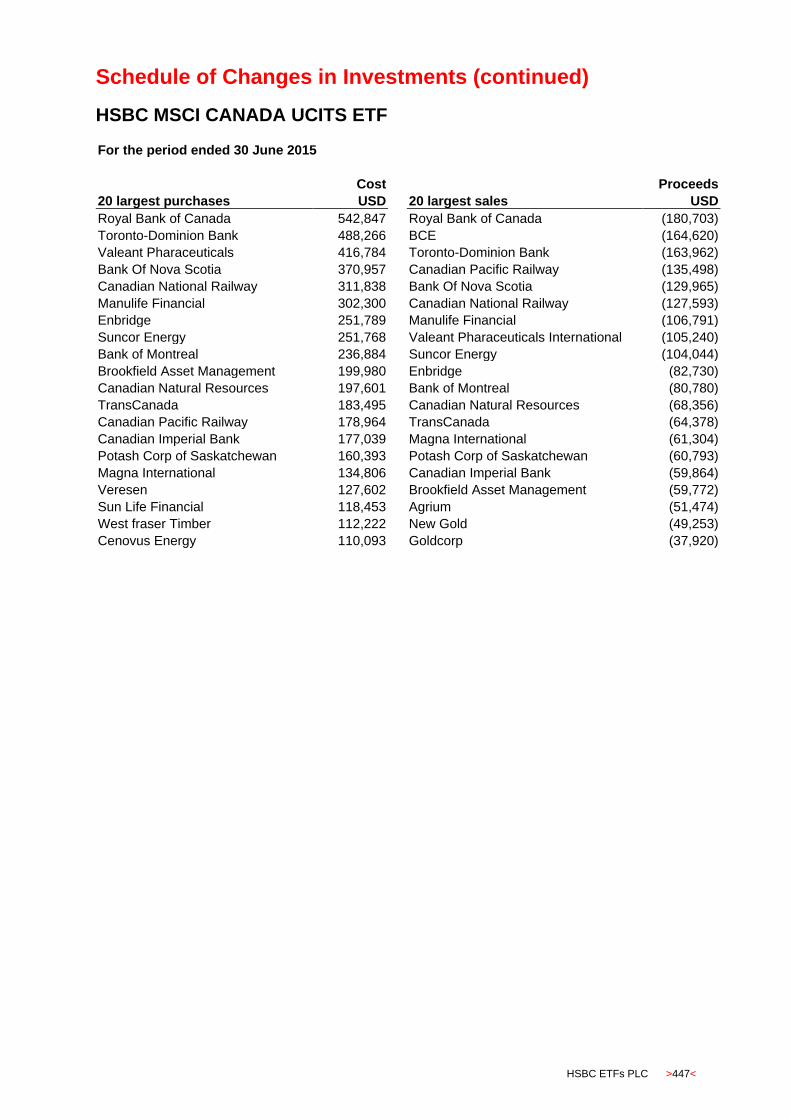
Schedule of Changes in Investments (continued)
HSBC ETFs PLC >447<
HSBC MSCI CANADA UCITS ETF
For the period ended 30 June 2015
Cost Proceeds
20 largest purchases USD 20 largest sales USD
Royal Bank of Canada 542,847 Royal Bank of Canada (180,703)
Toronto-Dominion Bank 488,266 BCE (164,620)
Valeant Pharaceuticals 416,784 Toronto-Dominion Bank (163,962)
Bank Of Nova Scotia 370,957 Canadian Pacific Railway (135,498)
Canadian National Railway 311,838 Bank Of Nova Scotia (129,965)
Manulife Financial 302,300 Canadian National Railway (127,593)
Enbridge 251,789 Manulife Financial (106,791)
Suncor Energy 251,768 Valeant Pharaceuticals International (105,240)
Bank of Montreal 236,884 Suncor Energy (104,044)
Brookfield Asset Management 199,980 Enbridge (82,730)
Canadian Natural Resources 197,601 Bank of Montreal (80,780)
TransCanada 183,495 Canadian Natural Resources (68,356)
Canadian Pacific Railway 178,964 TransCanada (64,378)
Canadian Imperial Bank 177,039 Magna International (61,304)
Potash Corp of Saskatchewan 160,393 Potash Corp of Saskatchewan (60,793)
Magna International 134,806 Canadian Imperial Bank (59,864)
Veresen 127,602 Brookfield Asset Management (59,772)
Sun Life Financial 118,453 Agrium (51,474)
West fraser Timber 112,222 New Gold (49,253)
Cenovus Energy 110,093 Goldcorp (37,920)
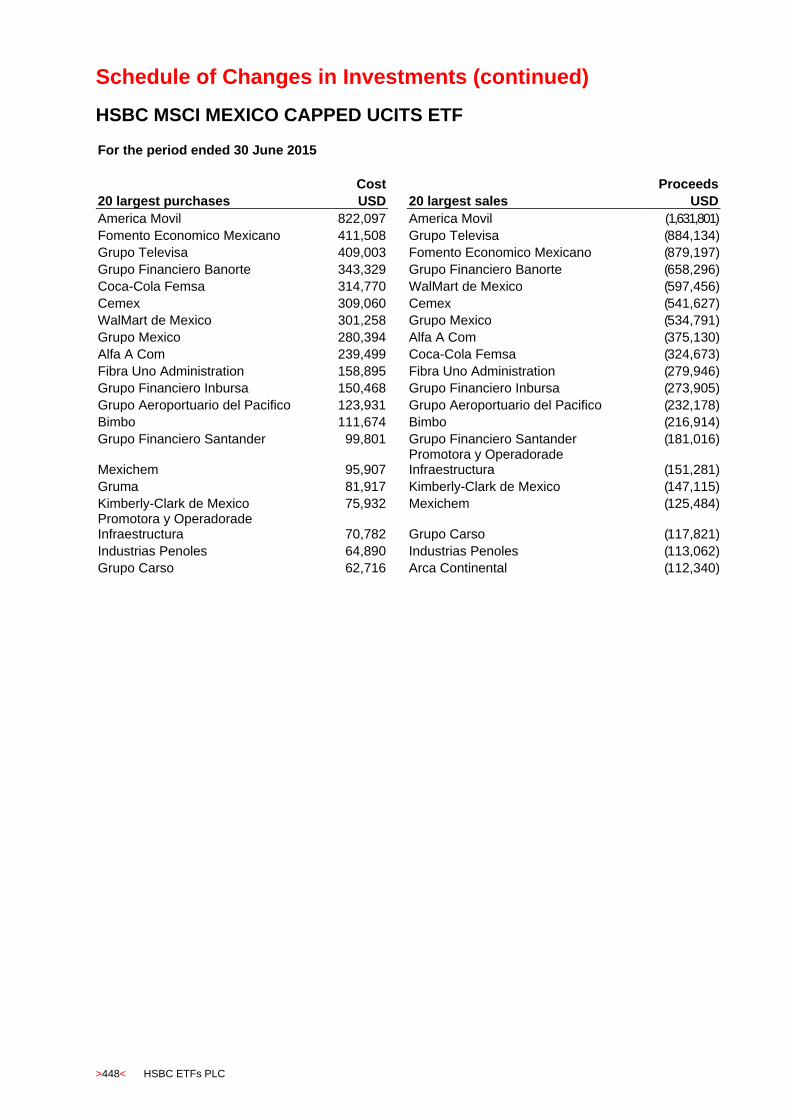
Schedule of Changes in Investments (continued)
>448< HSBC ETFs PLC
HSBC MSCI MEXICO CAPPED UCITS ETF
For the period ended 30 June 2015
Cost Proceeds
20 largest purchases USD 20 largest sales USD
America Movil 822,097 America Movil (1,631,801)
Fomento Economico Mexicano 411,508 Grupo Televisa (884,134)
Grupo Televisa 409,003 Fomento Economico Mexicano (879,197)
Grupo Financiero Banorte 343,329 Grupo Financiero Banorte (658,296)
Coca-Cola Femsa 314,770 WalMart de Mexico (597,456)
Cemex 309,060 Cemex (541,627)
WalMart de Mexico 301,258 Grupo Mexico (534,791)
Grupo Mexico 280,394 Alfa A Com (375,130)
Alfa A Com 239,499 Coca-Cola Femsa (324,673)
Fibra Uno Administration 158,895 Fibra Uno Administration (279,946)
Grupo Financiero Inbursa 150,468 Grupo Financiero Inbursa (273,905)
Grupo Aeroportuario del Pacifico 123,931 Grupo Aeroportuario del Pacifico (232,178)
Bimbo 111,674 Bimbo (216,914)
Grupo Financiero Santander 99,801 Grupo Financiero Santander (181,016)
Mexichem 95,907 Promotora y Operadorade
Infraestructura (151,281)
Gruma 81,917 Kimberly-Clark de Mexico (147,115)
Kimberly-Clark de Mexico 75,932 Mexichem (125,484) Promotora y Operadorade Infraestructura 70,782
Grupo Carso (117,821)
Industrias Penoles 64,890 Industrias Penoles (113,062)
Grupo Carso 62,716 Arca Continental (112,340)
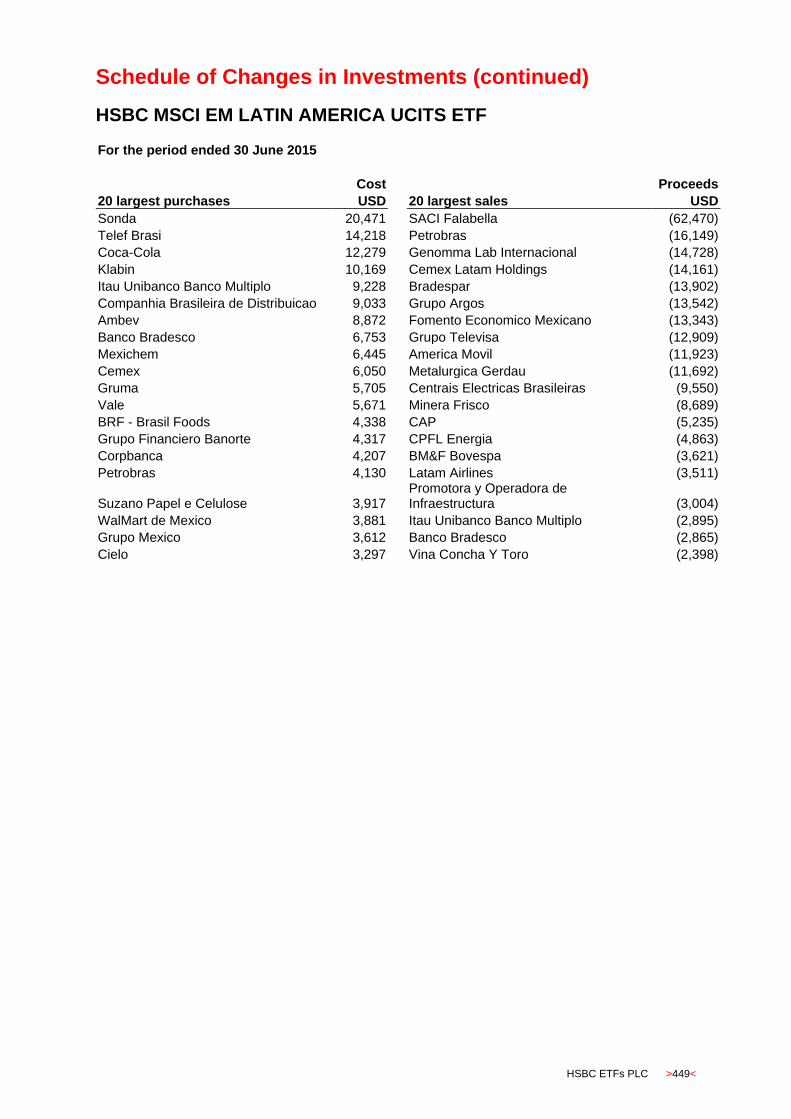
Schedule of Changes in Investments (continued)
HSBC ETFs PLC >449<
HSBC MSCI EM LATIN AMERICA UCITS ETF
For the period ended 30 June 2015
Cost Proceeds
20 largest purchases USD 20 largest sales USD
Sonda 20,471 SACI Falabella (62,470)
Telef Brasi 14,218 Petrobras (16,149)
Coca-Cola 12,279 Genomma Lab Internacional (14,728)
Klabin 10,169 Cemex Latam Holdings (14,161)
Itau Unibanco Banco Multiplo 9,228 Bradespar (13,902)
Companhia Brasileira de Distribuicao 9,033 Grupo Argos (13,542)
Ambev 8,872 Fomento Economico Mexicano (13,343)
Banco Bradesco 6,753 Grupo Televisa (12,909)
Mexichem 6,445 America Movil (11,923)
Cemex 6,050 Metalurgica Gerdau (11,692)
Gruma 5,705 Centrais Electricas Brasileiras (9,550)
Vale 5,671 Minera Frisco (8,689)
BRF - Brasil Foods 4,338 CAP (5,235)
Grupo Financiero Banorte 4,317 CPFL Energia (4,863)
Corpbanca 4,207 BM&F Bovespa (3,621)
Petrobras 4,130 Latam Airlines (3,511)
Suzano Papel e Celulose 3,917 Promotora y Operadora de
Infraestructura (3,004)
WalMart de Mexico 3,881 Itau Unibanco Banco Multiplo (2,895)
Grupo Mexico 3,612 Banco Bradesco (2,865)
Cielo 3,297 Vina Concha Y Toro (2,398)
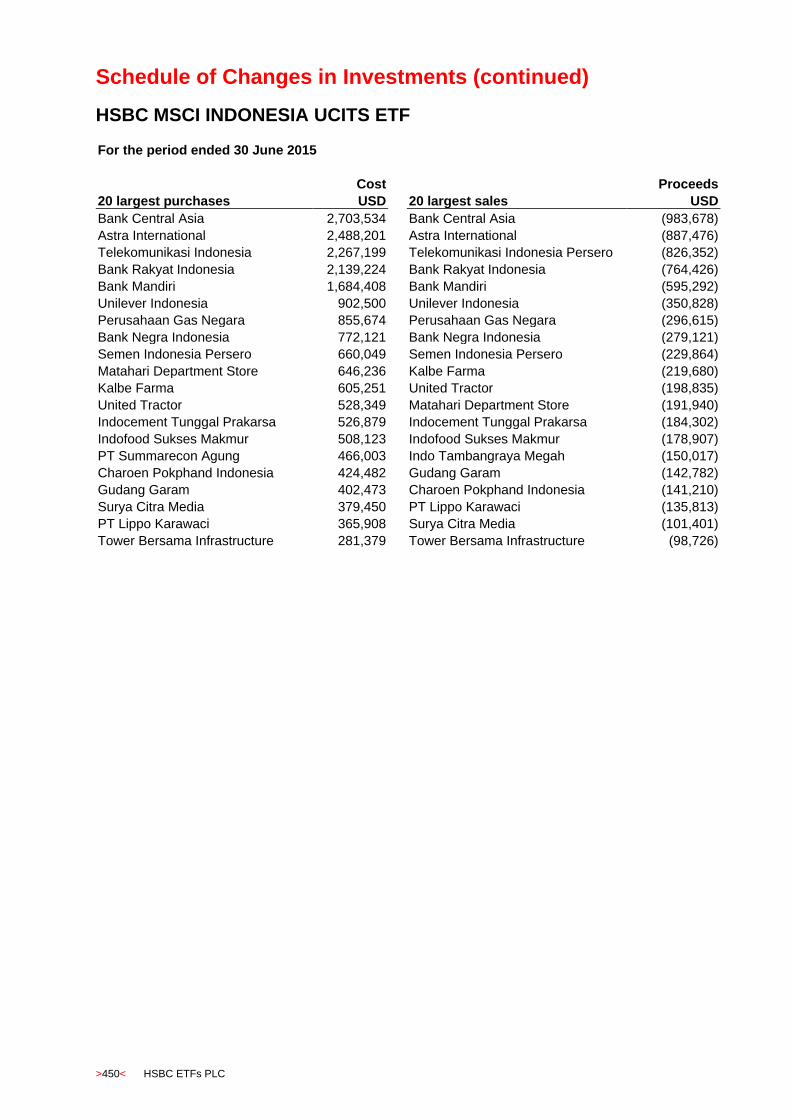
Schedule of Changes in Investments (continued)
>450< HSBC ETFs PLC
HSBC MSCI INDONESIA UCITS ETF
For the period ended 30 June 2015
Cost Proceeds
20 largest purchases USD 20 largest sales USD
Bank Central Asia 2,703,534 Bank Central Asia (983,678)
Astra International 2,488,201 Astra International (887,476)
Telekomunikasi Indonesia 2,267,199 Telekomunikasi Indonesia Persero (826,352)
Bank Rakyat Indonesia 2,139,224 Bank Rakyat Indonesia (764,426)
Bank Mandiri 1,684,408 Bank Mandiri (595,292)
Unilever Indonesia 902,500 Unilever Indonesia (350,828)
Perusahaan Gas Negara 855,674 Perusahaan Gas Negara (296,615)
Bank Negra Indonesia 772,121 Bank Negra Indonesia (279,121)
Semen Indonesia Persero 660,049 Semen Indonesia Persero (229,864)
Matahari Department Store 646,236 Kalbe Farma (219,680)
Kalbe Farma 605,251 United Tractor (198,835)
United Tractor 528,349 Matahari Department Store (191,940)
Indocement Tunggal Prakarsa 526,879 Indocement Tunggal Prakarsa (184,302)
Indofood Sukses Makmur 508,123 Indofood Sukses Makmur (178,907)
PT Summarecon Agung 466,003 Indo Tambangraya Megah (150,017)
Charoen Pokphand Indonesia 424,482 Gudang Garam (142,782)
Gudang Garam 402,473 Charoen Pokphand Indonesia (141,210)
Surya Citra Media 379,450 PT Lippo Karawaci (135,813)
PT Lippo Karawaci 365,908 Surya Citra Media (101,401)
Tower Bersama Infrastructure 281,379 Tower Bersama Infrastructure (98,726)

Schedule of Changes in Investments (continued)
HSBC ETFs PLC >451<
HSBC MSCI MALAYSIA UCITS ETF
For the period ended 30 June 2015
Cost Proceeds
20 largest purchases USD 20 largest sales USD
Tenaga Nasional 562,269 Public Bank (719,986)
Public Bank 543,003 Tenaga Nasional (580,529)
Malayan Banking 454,437 Malayan Banking (569,835)
CIMB Group Holdings Berhad 323,607 Sime Darby (381,173)
Sime Darby 309,283 CIMB Group Holdings Berhad (379,358)
DiGi. Com 238,882 DiGi. Com (270,363)
Genting 214,089 Axiata Group Berhad (246,817)
Axiata Group Berhad 191,647 Genting (246,118)
Petronas Chemical Group 170,878 Petronas Gas (211,336)
Petronas Gas 167,791 Petronas Chemical Group (200,734)
IHH Healthcare 144,919 IOI Corporation Berhad (183,460)
Maxis 142,266 Maxis (177,951)
IOI Corporation Berhad 141,443 IHH Healthcare (172,014)
AMMB Holdings 135,331 AMMB Holdings (171,884)
Genting Malaysia 134,140 Genting Malaysia (166,266)
IJM 121,035 Kuala Lumpur Kepong Berhad (156,468)
Kuala Lumpur Kepong Berhad 114,024 Sapurakencana Petroleum (128,174)
Sapurakencana Petroleum 103,020 Gamuda (127,235)
MISC 98,000 MISC (117,603)
Gamuda 95,669 IJM (114,850)

Schedule of Changes in Investments (continued)
>452< HSBC ETFs PLC
HSBC MSCI TAIWAN UCITS ETF
For the period ended 30 June 2015
Cost Proceeds
20 largest purchases USD 20 largest sales USD
Taiwan Semiconductor Manufacturing 2,240,577
Taiwan Semiconductor Manufacturing (1,507,275)
Hon Hai Precision Industry 778,962 Hon Hai Precision Industry (520,759)
Media Tek 408,151 Media Tek (249,333)
Cathay Financial Holding 258,539 Cathay Financial Holding (187,330)
Fubon Financial Holding 243,597 Fubon Financial Holding (179,401)
Chunghwa Telecom 232,155 Chunghwa Telecom (158,256)
Delta Electronics 215,554 Nan Ya Plastics (146,782)
Nan Ya Plastics 212,368 Largan Precision (144,383)
Formosa Plastics 195,712 Chinatrust Financial Holding (137,771)
Chinatrust Financial Holding 191,760 Delta Electronics (134,737)
Largan Precision 191,164 Formosa Plastics (131,482)
China Steel 186,638 China Steel (126,906) Advanced Semiconductor Engineering 168,588
Mega Financial Holding (115,534)
Mega Financial Holding 163,479 Advanced Semiconductor
Engineering (114,862)
Uni-President Enterprises 151,458 Uni-President Enterprises (106,170)
Formosa Chemical & Fiber 146,823 Formosa Chemical & Fiber (103,226)
Asustek Computer 139,187 Catcher Technology (96,980)
Catcher Technology 138,625 Asustek Computer (91,381)
Quanta Computer 127,055 Quanta Computer (87,207)
Taiwan Mobile 111,609 Taiwan Mobile (75,524)
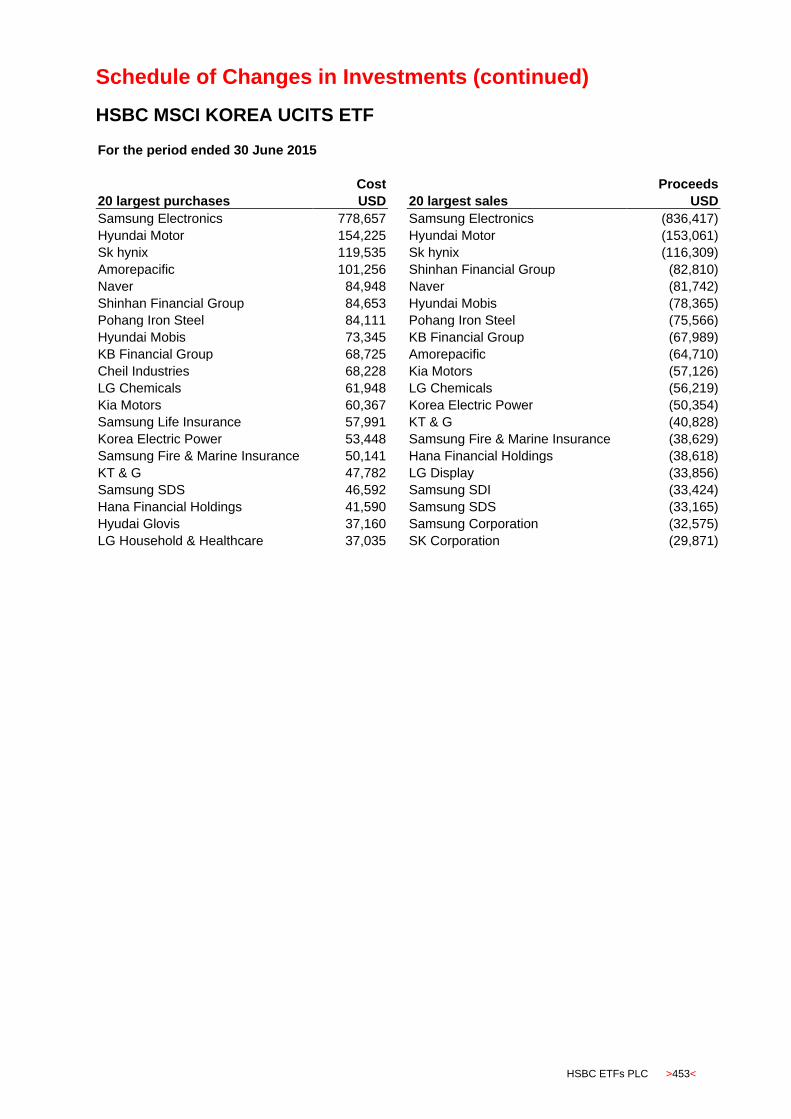
Schedule of Changes in Investments (continued)
HSBC ETFs PLC >453<
HSBC MSCI KOREA UCITS ETF
For the period ended 30 June 2015
Cost Proceeds
20 largest purchases USD 20 largest sales USD
Samsung Electronics 778,657 Samsung Electronics (836,417)
Hyundai Motor 154,225 Hyundai Motor (153,061)
Sk hynix 119,535 Sk hynix (116,309)
Amorepacific 101,256 Shinhan Financial Group (82,810)
Naver 84,948 Naver (81,742)
Shinhan Financial Group 84,653 Hyundai Mobis (78,365)
Pohang Iron Steel 84,111 Pohang Iron Steel (75,566)
Hyundai Mobis 73,345 KB Financial Group (67,989)
KB Financial Group 68,725 Amorepacific (64,710)
Cheil Industries 68,228 Kia Motors (57,126)
LG Chemicals 61,948 LG Chemicals (56,219)
Kia Motors 60,367 Korea Electric Power (50,354)
Samsung Life Insurance 57,991 KT & G (40,828)
Korea Electric Power 53,448 Samsung Fire & Marine Insurance (38,629)
Samsung Fire & Marine Insurance 50,141 Hana Financial Holdings (38,618)
KT & G 47,782 LG Display (33,856)
Samsung SDS 46,592 Samsung SDI (33,424)
Hana Financial Holdings 41,590 Samsung SDS (33,165)
Hyudai Glovis 37,160 Samsung Corporation (32,575)
LG Household & Healthcare 37,035 SK Corporation (29,871)
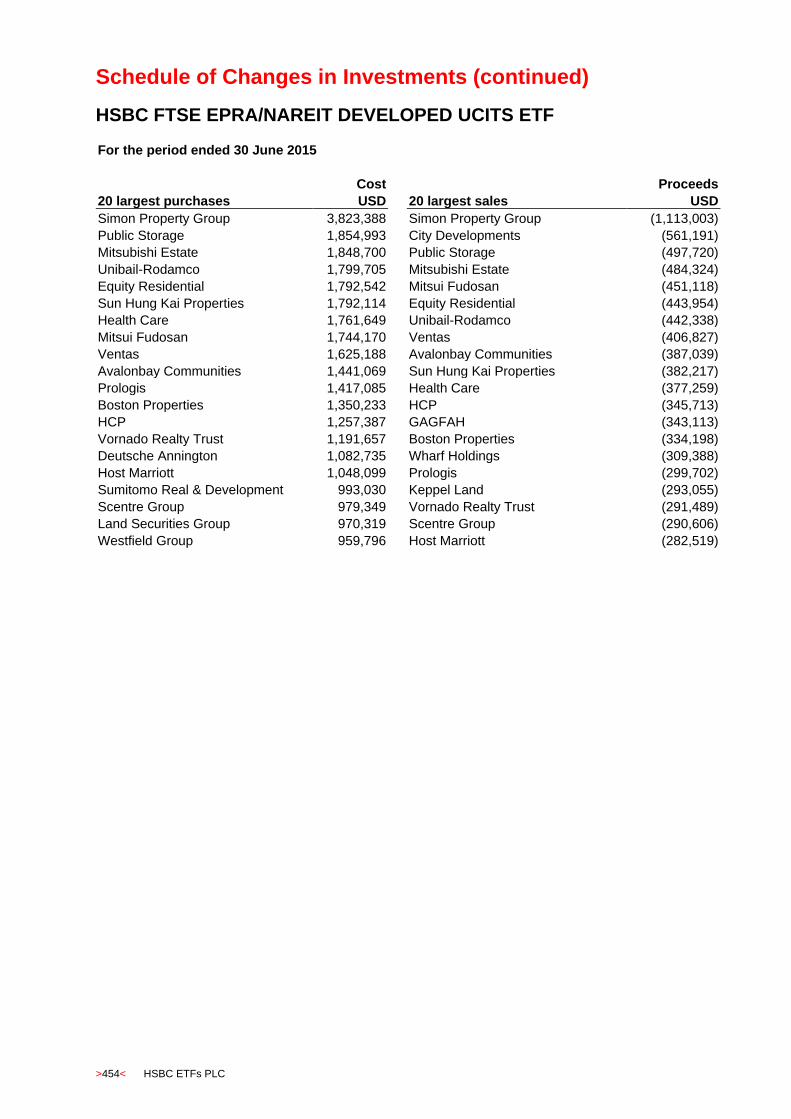
Schedule of Changes in Investments (continued)
>454< HSBC ETFs PLC
HSBC FTSE EPRA/NAREIT DEVELOPED UCITS ETF
For the period ended 30 June 2015
Cost Proceeds
20 largest purchases USD 20 largest sales USD
Simon Property Group 3,823,388 Simon Property Group (1,113,003)
Public Storage 1,854,993 City Developments (561,191)
Mitsubishi Estate 1,848,700 Public Storage (497,720)
Unibail-Rodamco 1,799,705 Mitsubishi Estate (484,324)
Equity Residential 1,792,542 Mitsui Fudosan (451,118)
Sun Hung Kai Properties 1,792,114 Equity Residential (443,954)
Health Care 1,761,649 Unibail-Rodamco (442,338)
Mitsui Fudosan 1,744,170 Ventas (406,827)
Ventas 1,625,188 Avalonbay Communities (387,039)
Avalonbay Communities 1,441,069 Sun Hung Kai Properties (382,217)
Prologis 1,417,085 Health Care (377,259)
Boston Properties 1,350,233 HCP (345,713)
HCP 1,257,387 GAGFAH (343,113)
Vornado Realty Trust 1,191,657 Boston Properties (334,198)
Deutsche Annington 1,082,735 Wharf Holdings (309,388)
Host Marriott 1,048,099 Prologis (299,702)
Sumitomo Real & Development 993,030 Keppel Land (293,055)
Scentre Group 979,349 Vornado Realty Trust (291,489)
Land Securities Group 970,319 Scentre Group (290,606)
Westfield Group 959,796 Host Marriott (282,519)

Schedule of Changes in Investments (continued)
HSBC ETFs PLC >455<
HSBC MSCI RUSSIA CAPPED UCITS ETF
For the period ended 30 June 2015
Cost Proceeds
20 largest purchases USD 20 largest sales USD
Gazprom 1,213,263 Gazprom (964,169)
Lukoil 957,376 Lukoil (756,993)
Sberbank of Russia 568,845 Sberbank of Russia (733,410)
Magnit 529,304 Uralkaliy (622,101)
MMC Norilsk Nickel 391,799 Magnit (376,341)
Surgutneftegaz 358,813 MMC Norilsk Nickel (323,203)
Novatek 328,745 Surgutneftegaz (282,970)
Tatneft 304,298 Novatek (244,330)
VTB Bank 246,747 Tatneft (226,775)
Rosneft Oil 204,905 VTB Bank (189,423)
Mobile Telesystems 202,375 Mobile Telesystems (161,614)
Transneft 141,331 Rosneft Oil (154,792)
Uralkaliy 109,885 Moscow Exchange (144,581)
Severstal 92,689 Transneft (105,474)
ALROSA 85,562 ALROSA (70,978)
Megafon 60,622 Severstal (67,921)
Moscow Exchange 56,203 Megafon (47,506)
Rostelecom 48,015 Rushydro (36,485)
AFK Sistema 47,903 Rostelecom (36,047)
Rushydro 47,049 AFK Sistema (31,589)
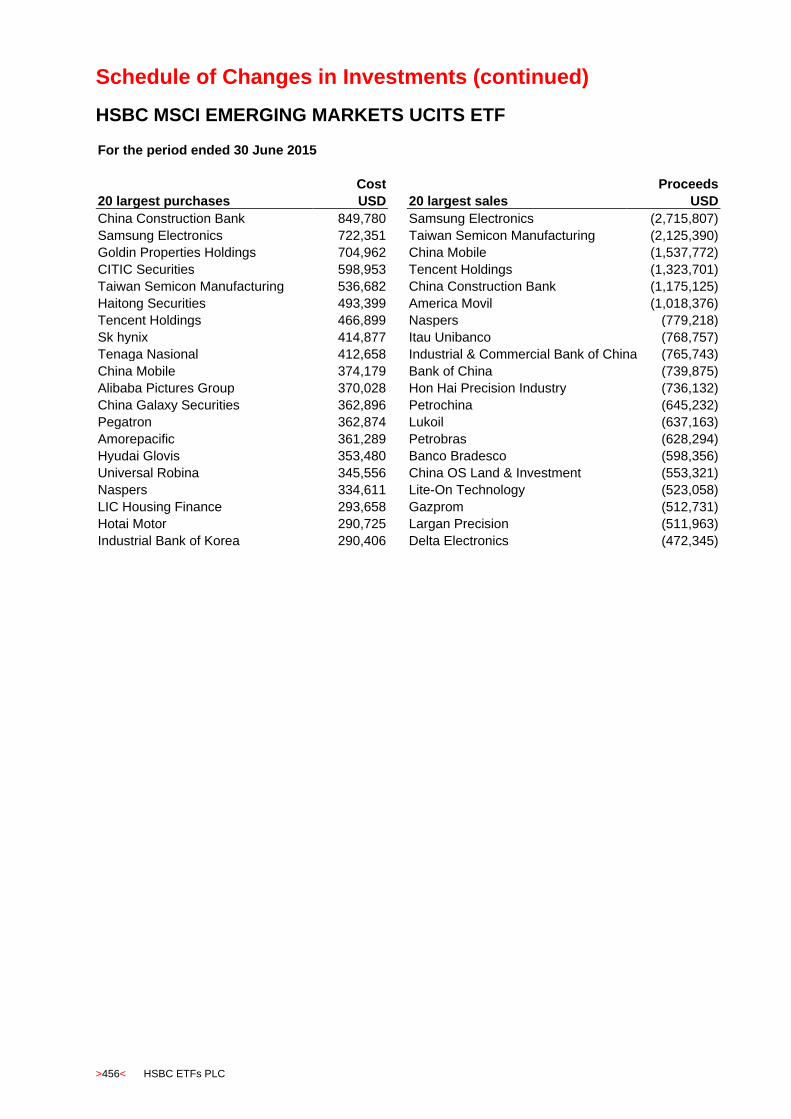
Schedule of Changes in Investments (continued)
>456< HSBC ETFs PLC
HSBC MSCI EMERGING MARKETS UCITS ETF
For the period ended 30 June 2015
Cost Proceeds
20 largest purchases USD 20 largest sales USD
China Construction Bank 849,780 Samsung Electronics (2,715,807)
Samsung Electronics 722,351 Taiwan Semicon Manufacturing (2,125,390)
Goldin Properties Holdings 704,962 China Mobile (1,537,772)
CITIC Securities 598,953 Tencent Holdings (1,323,701)
Taiwan Semicon Manufacturing 536,682 China Construction Bank (1,175,125)
Haitong Securities 493,399 America Movil (1,018,376)
Tencent Holdings 466,899 Naspers (779,218)
Sk hynix 414,877 Itau Unibanco (768,757)
Tenaga Nasional 412,658 Industrial & Commercial Bank of China (765,743)
China Mobile 374,179 Bank of China (739,875)
Alibaba Pictures Group 370,028 Hon Hai Precision Industry (736,132)
China Galaxy Securities 362,896 Petrochina (645,232)
Pegatron 362,874 Lukoil (637,163)
Amorepacific 361,289 Petrobras (628,294)
Hyudai Glovis 353,480 Banco Bradesco (598,356)
Universal Robina 345,556 China OS Land & Investment (553,321)
Naspers 334,611 Lite-On Technology (523,058)
LIC Housing Finance 293,658 Gazprom (512,731)
Hotai Motor 290,725 Largan Precision (511,963)
Industrial Bank of Korea 290,406 Delta Electronics (472,345)
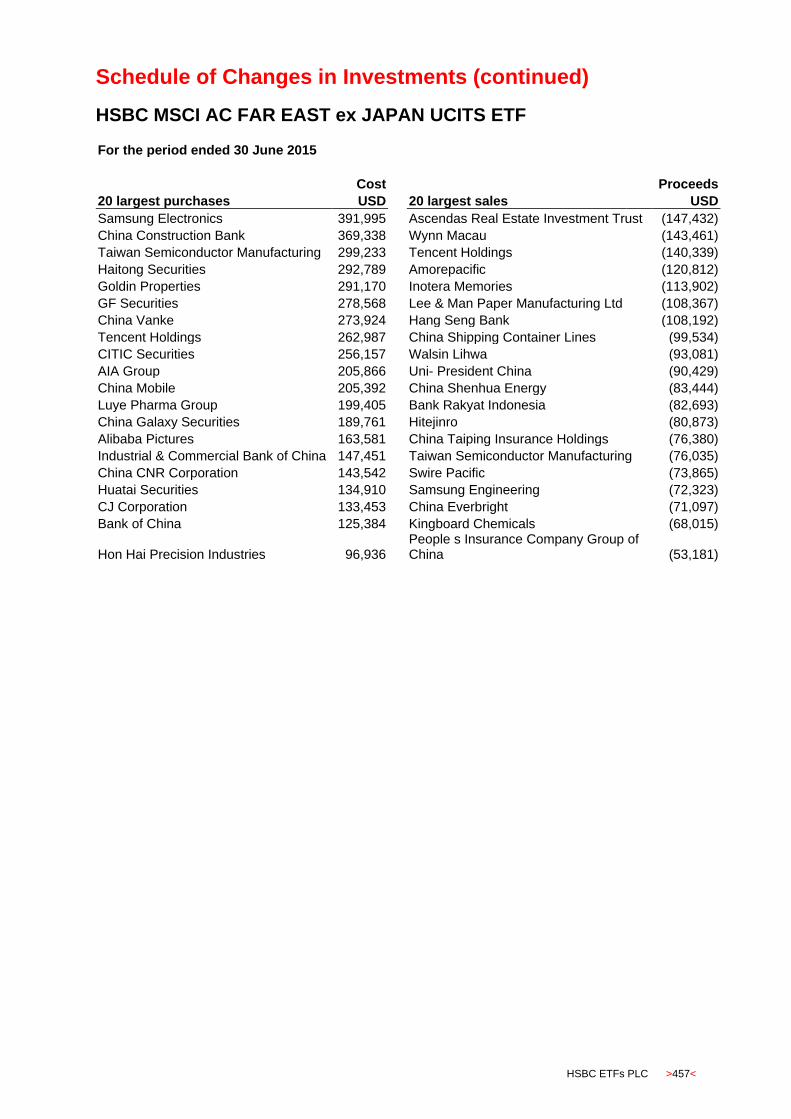
Schedule of Changes in Investments (continued)
HSBC ETFs PLC >457<
HSBC MSCI AC FAR EAST ex JAPAN UCITS ETF
For the period ended 30 June 2015
Cost Proceeds
20 largest purchases USD 20 largest sales USD
Samsung Electronics 391,995 Ascendas Real Estate Investment Trust (147,432)
China Construction Bank 369,338 Wynn Macau (143,461)
Taiwan Semiconductor Manufacturing 299,233 Tencent Holdings (140,339)
Haitong Securities 292,789 Amorepacific (120,812)
Goldin Properties 291,170 Inotera Memories (113,902)
GF Securities 278,568 Lee & Man Paper Manufacturing Ltd (108,367)
China Vanke 273,924 Hang Seng Bank (108,192)
Tencent Holdings 262,987 China Shipping Container Lines (99,534)
CITIC Securities 256,157 Walsin Lihwa (93,081)
AIA Group 205,866 Uni- President China (90,429)
China Mobile 205,392 China Shenhua Energy (83,444)
Luye Pharma Group 199,405 Bank Rakyat Indonesia (82,693)
China Galaxy Securities 189,761 Hitejinro (80,873)
Alibaba Pictures 163,581 China Taiping Insurance Holdings (76,380)
Industrial & Commercial Bank of China 147,451 Taiwan Semiconductor Manufacturing (76,035)
China CNR Corporation 143,542 Swire Pacific (73,865)
Huatai Securities 134,910 Samsung Engineering (72,323)
CJ Corporation 133,453 China Everbright (71,097)
Bank of China 125,384 Kingboard Chemicals (68,015)
Hon Hai Precision Industries 96,936 People s Insurance Company Group of
China (53,181)
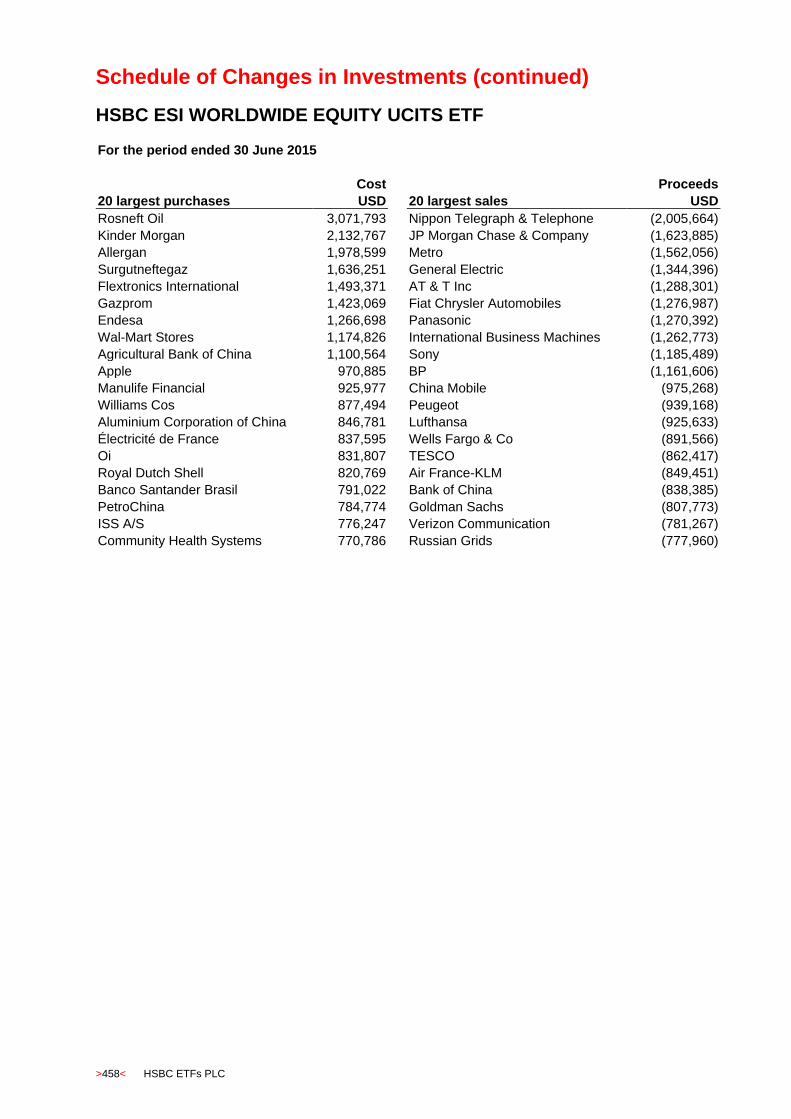
Schedule of Changes in Investments (continued)
>458< HSBC ETFs PLC
HSBC ESI WORLDWIDE EQUITY UCITS ETF
For the period ended 30 June 2015
Cost Proceeds
20 largest purchases USD 20 largest sales USD
Rosneft Oil 3,071,793 Nippon Telegraph & Telephone (2,005,664)
Kinder Morgan 2,132,767 JP Morgan Chase & Company (1,623,885)
Allergan 1,978,599 Metro (1,562,056)
Surgutneftegaz 1,636,251 General Electric (1,344,396)
Flextronics International 1,493,371 AT & T Inc (1,288,301)
Gazprom 1,423,069 Fiat Chrysler Automobiles (1,276,987)
Endesa 1,266,698 Panasonic (1,270,392)
Wal-Mart Stores 1,174,826 International Business Machines (1,262,773)
Agricultural Bank of China 1,100,564 Sony (1,185,489)
Apple 970,885 BP (1,161,606)
Manulife Financial 925,977 China Mobile (975,268)
Williams Cos 877,494 Peugeot (939,168)
Aluminium Corporation of China 846,781 Lufthansa (925,633)
Électricité de France 837,595 Wells Fargo & Co (891,566)
Oi 831,807 TESCO (862,417)
Royal Dutch Shell 820,769 Air France-KLM (849,451)
Banco Santander Brasil 791,022 Bank of China (838,385)
PetroChina 784,774 Goldman Sachs (807,773)
ISS A/S 776,247 Verizon Communication (781,267)
Community Health Systems 770,786 Russian Grids (777,960)

Schedule of Changes in Investments (continued)
HSBC ETFs PLC >459<
HSBC WORLDWIDE EQUITY UCITS ETF
For the period ended 30 June 2015
Cost Proceeds
20 largest purchases USD 20 largest sales USD
Alibaba Group Holding 1,628,695 Apple (1,958,684)
Kia Motors 207,480 Exxon Mobil (1,097,916)
Realogy Holdings 189,112 Microsoft (882,520)
Hemaraj Land and Development 185,488 General Electric (696,918)
Bangkok Dusit Medical Services 146,997 Novartis (637,159)
Petronet LNG Warrants 142,479 Nestle (592,039)
Energy Absolute 139,687 Roche Holding (533,067)
Cielo 130,752 Procter & Gamble (516,640)
Sansiri 130,688 Johnson & Johnson (507,382)
Howard Hughes 129,687 Wells Fargo & Co (500,755)
SKS Microfinance Warrrants 129,662 Wal Mart Stores (491,980)
Hartalega Holdings 126,330 Walt Disney (460,227)
Altagas Income 117,969 Medtronic (429,382)
XL Group 115,961 Verizon Comms (429,255)
Alps Electric 115,815 JP Morgan Chase & Company (425,809)
Dialog Semicon 114,426 International Business Machines (394,735)
Info Edge Warrants 113,596 Oracle (381,831)
Cheil Industries 111,775 HSBC Holdings (363,730)
Genmab 111,668 Pfizer (362,334)
Page Industries Warrants 107,036 Home Depot (348,335)

HSBC Global Asset Management is the asset management specialist of the HSBC Group and operates through HSBC Bank plc and its subsidiaries, and is appointed as the Promotor, Distributor, UK Representative and Investment Manager to HSBC ETFs PLC.
The registered office of HSBC Global Asset Management (UK) Limited is 8 Canada Square, London, E14 5HQ.
© Copyright. HSBC ETFs PLC 2015. All Rights Reserved.


