Embed Size (px)
Citation preview
Geophysical Prospecting, 2003, 51, 551–566
Velocity and attenuation in partially saturated rocks:poroelastic numerical experiments
Hans B. Helle,1∗ Nam H. Pham2† and Jose M. Carcione3
1Norsk Hydro a.s., PO Box 7190, 5020 Bergen, Norway, 2Department of Petroleum Engineering and Applied Geophysics, NorwegianUniversity of Science and Technology, 7491 Trondheim, Norway, and 3Istituto Nazionale di Oceanografia e di Geofisica Sperimentale (OGS),Borgo Grotta Gigante 42C, 34010 Sgonico, Trieste, Italy
Received July 2002, revision accepted June 2003
ABSTRACTWe use a poroelastic modelling algorithm to compute numerical experiments on wavepropagation in a rock sample with partial saturation using realistic fluid distributionpatterns from tomography scans. Frequencies are in the range 10 to 500 kHz. Therock is a homogeneous isotropic sandstone partially filled with gas and water, whichare defined by their characteristic values of viscosity, compressibility and density. Weassume no mixing and that the two different pore-fills occupy different macroscopicregions. The von Karman self-similar correlation function is used, employing differentfractal parameters to model uniform and patchy fluid distributions, respectively, whereeffective saturation is varied in steps from full gas to full water saturation.
Without resorting to additional matrix–fluid interaction mechanisms, we are ableto reproduce the main features of the variation in wave velocity and attenuationwith effective saturation and frequency, as those of published laboratory experiments.Furthermore, the behaviour of the attenuation peaks versus water saturation andfrequency is similar to that of White’s model. The conversion of primary P-waveenergy into dissipating slow waves at the heterogeneities is shown to be the mainmechanism for attenuating the primary wavefield. Fluid/gas patches are shown toaffect attenuation more than equivalent patches in the permeability or solid-grainproperties.
I N T R O D U C T I O N
The primary goals of seismic exploration are the identifica-tion of pore fluids and the mapping of hydrocarbon deposits.In the area of hydrocarbon field reservoir management, recentdevelopments in borehole acoustic measurements and subseageophone arrays make it feasible to conduct high-resolutionsurveys to detect pockets of unswept reserves and to monitorthe progress of enhanced recovery by gas and water injection.Understanding the physics of elastic waves in porous rocks
Paper presented at the 64th EAGE Conference – Geophysical Division,Florence, Italy, May 2002.∗E-mail: [email protected]†Now at: Statoil ASA, 7501 Stjørdal, Norway.
partially filled with gas and liquid is thus important for ex-ploring and exploiting hydrocarbon reservoirs.
Regions of non-uniform patchy saturation occur at gas–oiland gas–water contacts in hydrocarbon reservoirs. Also, dur-ing production, gas may come out of solution and create pock-ets of free gas. When laboratory measurements and sonic logsare used to infer the acoustic properties at seismic frequencies,the frequency dependence of these properties becomes a keyfactor. As demonstrated by White (1975), wave velocity andattenuation are substantially affected by the presence of par-tial (patchy) saturation, depending mainly on the size of thegas pockets (saturation), frequency, permeability and porosityof rocks.
Patchy saturation effects on acoustic properties havebeen observed by Murphy (1984) and Knight and
C© 2003 European Association of Geoscientists & Engineers 551
552 H.B. Helle, N.H. Pham and J.M. Carcione
Nolen-Hoecksema (1990). Cadoret, Marion and Zinszner(1995) have observed the phenomenon in the laboratory in thefrequency range 1–500 kHz. Two different saturation meth-ods result in different fluid distributions and produce twodifferent values of velocity for the same saturation. Imbibi-tion by depressurization produces a very uniform saturation,while drainage by drying produces heterogeneous saturationat high water-saturation levels. In the latter case, the exper-iments show considerably higher velocities, as predicted byWhite’s (1975) theory. The experimental results of Yin, Batzleand Smith (1992) at 2 kHz display consistent peaks in reso-nance attenuation at high water saturation. A strong depen-dence on the saturation history is evident, with the attenuationpeak located at 90% water saturation in the drainage exper-iment, and 98% water saturation for imbibition techniques.Similar features have been reported by Bourbie and Zinszner(1984) at 500 kHz and Cadoret, Mavko and Zinszner (1998)at 1 kHz.
A number of theories have predicted the effects of fluids onattenuation and seismic velocities at full saturation (e.g. Biot1962; O’Connell and Budiansky 1977) while fewer theoriesaddress partial saturation (e.g. White 1975). Although atten-uation still remains poorly understood and underexploited,it is believed by many investigators that in the seismic andsonic frequency range (10 Hz–20 kHz), the dominating mech-anisms of wave attenuation are oscillating flow of the viscouspore fluid and the grain boundary friction (Winkler and Nur1979, 1982). The role of pore fluid in controlling the velocitywas well established in the low-frequency (seismic) limit byGassmann (1951), and for ultrasonic frequencies (0.5 MHzand above) by the experimental studies of Gregory (1976),Domenico (1977) and others. The few published results ob-tained in the sonic frequency band (1–20 kHz), e.g. by Murphy(1984) and Cadoret et al. (1995), are usually in relatively goodagreement with the Gassmann model. For higher frequencies(50 kHz and above), the velocity versus water saturation rela-tionship is more complex and depends strongly on rock typeand porosity (Gregory 1976). Heterogeneity of the rock mate-rial (Lucet and Zinszner 1992) and fluid distribution (Cadoretet al. 1995, 1998) seem to be important factors in explainingthe observed behaviour of elastic waves at sonic and ultrasonicfrequencies.
White’s (1975) model describes wave velocity and attenu-ation as a function of frequency, permeability and porosity,among other parameters. Attenuation and velocity dispersionare caused by fluid flow between the water phase and the gaspockets, which have different pore pressures. The critical fluiddiffusion relaxation scale is proportional to the square root of
the permeability-to-frequency ratio (e.g. Mavko, Mukerji andDvorkin 1998, p. 207). At seismic frequencies, the length scaleis very large, and the pressure is nearly uniform throughout themedium, but as frequency increases, pore pressure differencescan cause an important increase in P-wave velocity. White’smodel considers spherical gas pockets located at the centreof a cubic array saturated with liquid. For simplicity in thecalculations, White considered two concentric spheres, wherethe volume of the outer sphere is the same as the volume ofthe elementary cube. The theory provides an average of thebulk modulus for a single gas pocket, without taking into ac-count the interactions between neighbouring gas pockets. Gist(1994) successfully used White’s model to fit ultrasonic ve-locities obtained from saturations established using drainagetechniques. He used saturation-dependent moduli as input toWhite’s model instead of the dry-rock moduli. The predictedvelocities, considering local fluid flow, are higher than the ve-locities predicted by White’s model. Recently, Johnson (2001)developed a generalization of White’s model for patches ofarbitrary shape. This model has two geometrical parametersbesides the usual parameters of Biot’s theory: the specific sur-face area and the size of the patches. The model was usedby Tserkovnyak and Johnson (2002) to determine the char-acteristic patch size as a function of water saturation fromthe dispersion and attenuation data of Cadoret et al. (1995,1998).
Numerical simulations, based on the full-wave solution ofthe poroelastic equations, can be useful to study the physicsof wave propagation in partially saturated rocks. AlthoughWhite’s (1975) model is an ideal representation of patchy sat-uration, its predictions are qualitatively correct, and serve as areference theoretical framework. However, Biot’s (1962) the-ory provides the only existing treatment of the problem thatdirectly relates acoustic velocity and attenuation to measur-able macroscopic characteristics of a rock. In this sense, it isuseful to compare the results of White’s model with numericalsimulations based on Biot’s theory of poroelasticity as madein a recent study by Carcione, Helle and Pham (2003). Thisanalysis confirms that Biot’s theory shows more dissipationand higher velocities than White’s model due to multiple scat-tering of slow waves and local fluid-flow effects.
In the present investigation, a more realistic situation is con-sidered, where an arbitrary (general) pore-scale fluid distri-bution is modelled. By using computerized tomography (CT)scans, it is possible to visualize the fluid distribution in realrocks (Cadoret et al. 1995). Fractal models, such as the vonKarman autocovariance function, calibrated by the CT scans,are used to model realistic fluid distributions. We introduce
C© 2003 European Association of Geoscientists & Engineers, Geophysical Prospecting, 51, 551–566
Velocity and attenuation for patchy saturation 553
a numerical rock sample with homogeneous rock properties,but with alternately uniform and patchy fluid distributions,based on a fractal model utilizing the CT scans of Cadoret et al.
(1995). Using numerical simulations of poroelastic wave prop-agation in the frequency range 10–500 kHz, we investigate theeffect of varying the fluid distribution patterns and effectivesaturation. By analysing the recorded wave arrivals, we obtainvalues of velocity and attenuation versus effective fluid satu-ration that are consistent with published laboratory measure-ments. Visual inspection of the numerical wavefield revealsthat the attenuation of the primary wave can be explainedby slow-wave conversion at the saturation heterogeneities.For comparison, we substitute the gas pockets with materialinclusions of equivalent seismic contrast, but otherwise thesame homogeneous permeability and porosity, fully saturatedwith water. Finally, we include patches of low-permeabilityrock coinciding with the gas pockets, embedded in a high-permeability water-saturated background. Heterogeneities ingas/fluid distribution are shown to be more effective in atten-uating the primary wavefield than those of equivalent hetero-geneities in rock material and permeability.
We solve the poroelastic equations with an algorithm devel-oped by Carcione and Helle (1999), which uses a 4th-orderRunge–Kutta time-stepping scheme and the staggered Fouriermethod for computing the spatial derivatives. The stiff part ofthe differential equations is solved with a time-splitting tech-nique, which preserves the physics of the quasi-static slowwave at low frequencies.
In general, P-wave and S-wave velocities can be higher inpartially saturated rocks than in dry rocks. As predicted byWhite’s (1975) model, this behaviour depends on frequency,viscosity and permeability. It is therefore important to inves-tigate the sensitivity and properties of wave velocity and at-tenuation versus pore-fluid distribution. This is the basis fordirect hydrocarbon detection and enhanced oil recovery andmonitoring, since techniques such as ‘bright spot’ and AVOanalyses make use of those physical properties. The modellingmethodology used in the present study constitutes a powerfulcomputational tool to investigate the physics of wave propa-gation in porous rocks, and, in some cases, can be used as analternative method to laboratory experiments.
N U M E R I C A L R O C K W I T H F R A C TA LF L U I D / G A S D I S T R I B U T I O N
The numerical rock sample is a homogeneous isotropic Bereasandstone with a porosity of 24.6% and permeability of0.55 darcy (King, Marsden and Dennis 2000), partially filled
Table 1 Material properties of the single constituents
Solid Bulk modulus, Ks 35.0 GPaShear modulus, µs 35.0 GPaDensity, ρs 2650 kg/m3
Matrix Bulk modulus, Km 9.25 GPaShear modulus, µm 9.25 GPaPorosity, φ 0.246Permeability, κ 0.55 DTortuosity, T 2.5
Gas Bulk modulus, Kg 0.01 GPaDensity, ρg 100 kg/m3
Viscosity, ηg 0.02 cP
Water Bulk modulus, Kw 2.4 GPaDensity, ρw 1000 kg/m3
Viscosity, ηw 1.0 cP
Table 2 Properties of the saturated rock
Water-filled Gas-filled
ρ 2244 kg/m3 2023 kg/m3
cP+ (0) 3418 m/s 3268 m/scP+ (∞) 3434 m/s 3275 m/scP− (0) 44 m/s 23 m/scP− (∞) 813 m/s 195 m/sf peak(P+) 27.79 kHz 5.56 kHz
with water and gas. The properties of the rock and pore-fillingfluids are given in Table 1. No mixing is assumed and thetwo different pore-fills occupy different macroscopic regionsof the model. In Table 2, we give the bulk properties of therock, fully saturated with a single fluid, gas or water, respec-tively, where the relaxed (f = 0) and unrelaxed (f = ∞) phasevelocities of the fast compressional wave (cP+ ) and the slowwave (cP− ) are given. Also listed is the central frequency ofthe dominant attenuation peak (f peak) corresponding to theBiot peaks for the rock, fully saturated with gas or water,respectively.
Statistically, seismic heterogeneity is often characterized bythe so-called von Karman self-similar correlation function,commonly cited in turbulence theory and given by
N(r ) = 12m−1�(m)
(rl
)mKm
(rl
), (1)
where r is the lag, l is the correlation length, � is the gammafunction and Km is the modified Bessel function of the second
C© 2003 European Association of Geoscientists & Engineers, Geophysical Prospecting, 51, 551–566
554 H.B. Helle, N.H. Pham and J.M. Carcione
kind. Following Frankel and Clayton (1986), we consider aspecific type of von Karman function where m = 0 and
N(r ) = K0
(rl
). (2)
The corresponding wavenumber-domain correlation functionis
P(kx, kz) = (1 + kr
2l2)−(ν+E/2)
, (3)
where kr = (k2x + k2
z )1/2 is the radial wavenumber, ν (0 < ν <
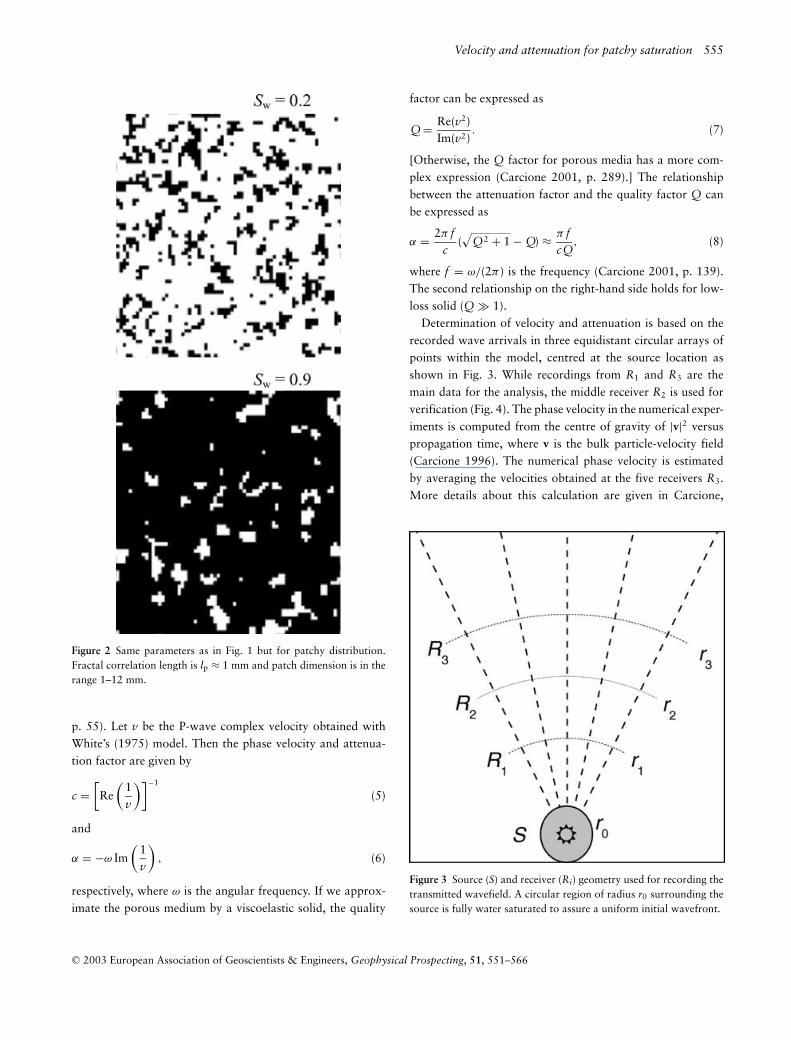
1) is a self-similarity coefficient, is a normalization constant,and E is the space dimension. If ν = 0, the function has purefractal behaviour, and if ν = 0.5, the exponential correlationfunction is obtained. The von Karman correlation functiondescribes self-affine, fractal processes of fractal dimensionD =E + 1 − ν at scales smaller than l. For a 2D model, E = 2 andD thus lies between 2 for very smooth fluctuations and 3 forvery complex fluctuations (Holliger 1997). Here, we setD = 2and vary the fractal correlation parameter l to generate modelswith uniform and patchy fluid distribution, respectively, usingsmall values of l for uniform saturation and larger values forpatchy saturation. For modelling the patchy distribution, weset the correlation length l = lp, expressed by
lp(Sw) = γ1 + γ2 exp (γ3(|Sw − 0.5| + 0.5)) , (4)
to account for the fact that patches are more pronounced athigh and low values of saturation Sw than in the intermediaterange. The factors γ i are estimated from the CT scans, and toestimate the correlation length in the case of uniform distribu-tion l = lu, we simply determine the ratio lu/lp by comparingthe corresponding CT images. For models used in this study,we have determined the following values for the coefficientsof (4): γ 1 = 3 × 10⁻⁴ m, γ 2 = 6 × 10⁻⁸ m, γ 3 = 10 andlu/lp = 0.3.
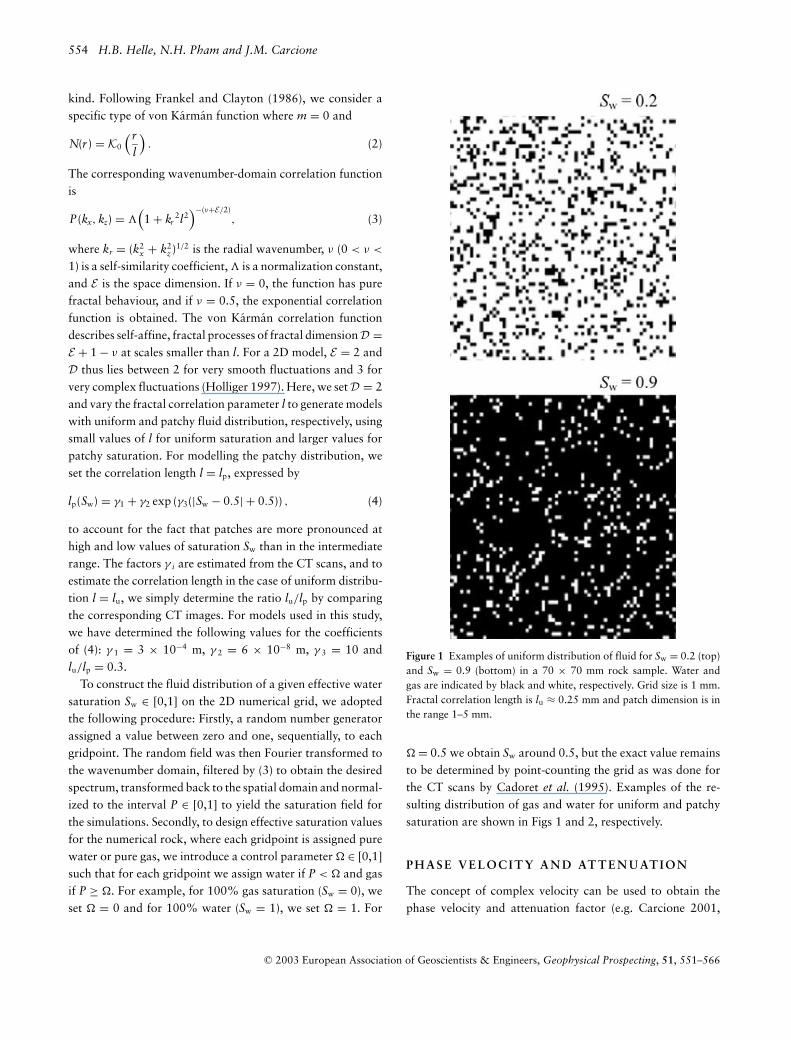
To construct the fluid distribution of a given effective watersaturation Sw ∈ [0,1] on the 2D numerical grid, we adoptedthe following procedure: Firstly, a random number generatorassigned a value between zero and one, sequentially, to eachgridpoint. The random field was then Fourier transformed tothe wavenumber domain, filtered by (3) to obtain the desiredspectrum, transformed back to the spatial domain and normal-ized to the interval P ∈ [0,1] to yield the saturation field forthe simulations. Secondly, to design effective saturation valuesfor the numerical rock, where each gridpoint is assigned purewater or pure gas, we introduce a control parameter � ∈ [0,1]such that for each gridpoint we assign water if P < � and gasif P ≥ �. For example, for 100% gas saturation (Sw = 0), weset � = 0 and for 100% water (Sw = 1), we set � = 1. For
Figure 1 Examples of uniform distribution of fluid for Sw = 0.2 (top)and Sw = 0.9 (bottom) in a 70 × 70 mm rock sample. Water andgas are indicated by black and white, respectively. Grid size is 1 mm.Fractal correlation length is lu ≈ 0.25 mm and patch dimension is inthe range 1–5 mm.
� = 0.5 we obtain Sw around 0.5, but the exact value remainsto be determined by point-counting the grid as was done forthe CT scans by Cadoret et al. (1995). Examples of the re-sulting distribution of gas and water for uniform and patchysaturation are shown in Figs 1 and 2, respectively.
P H A S E V E L O C I T Y A N D AT T E N U AT I O N
The concept of complex velocity can be used to obtain thephase velocity and attenuation factor (e.g. Carcione 2001,
C© 2003 European Association of Geoscientists & Engineers, Geophysical Prospecting, 51, 551–566
Velocity and attenuation for patchy saturation 555
Figure 2 Same parameters as in Fig. 1 but for patchy distribution.Fractal correlation length is lp ≈ 1 mm and patch dimension is in therange 1–12 mm.
p. 55). Let v be the P-wave complex velocity obtained withWhite’s (1975) model. Then the phase velocity and attenua-tion factor are given by
c =[Re
(1v
)]−1
(5)
and
α = −ω Im(
1v
), (6)
respectively, where ω is the angular frequency. If we approx-imate the porous medium by a viscoelastic solid, the quality
factor can be expressed as
Q = Re(v2)Im(v2)
. (7)
[Otherwise, the Q factor for porous media has a more com-plex expression (Carcione 2001, p. 289).] The relationshipbetween the attenuation factor and the quality factor Q canbe expressed as
α = 2π fc
(√
Q2 + 1 − Q) ≈ π fcQ
, (8)
where f = ω/(2π ) is the frequency (Carcione 2001, p. 139).The second relationship on the right-hand side holds for low-loss solid (Q 1).
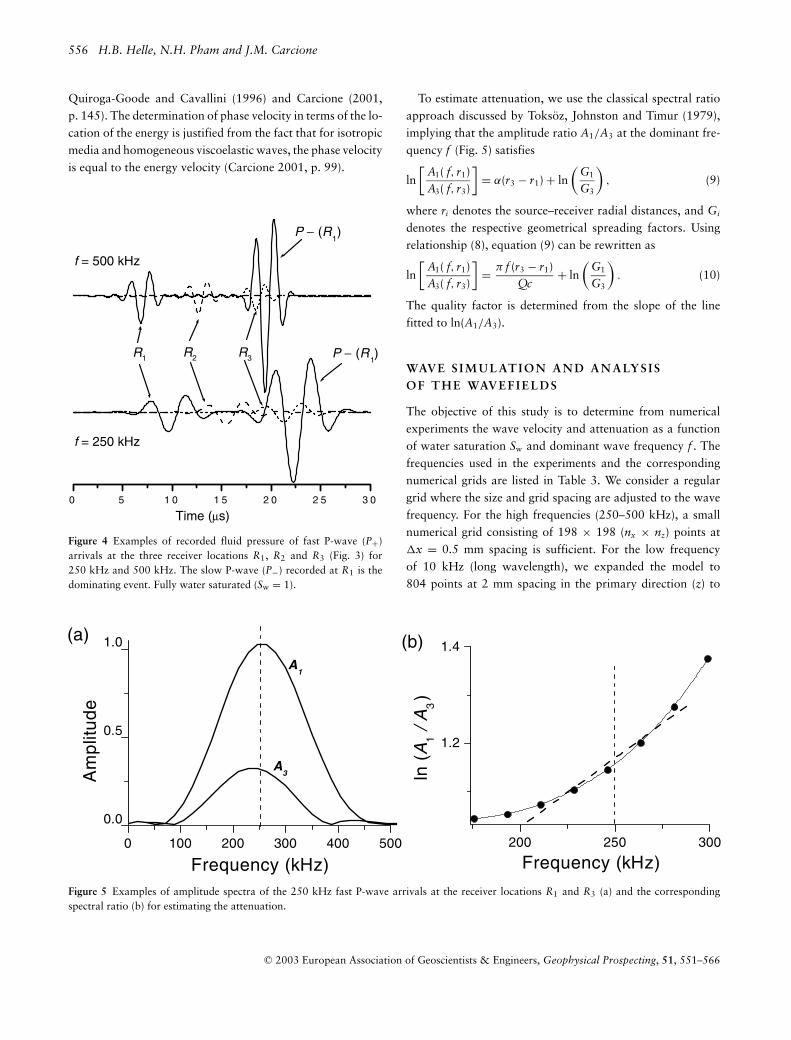
Determination of velocity and attenuation is based on therecorded wave arrivals in three equidistant circular arrays ofpoints within the model, centred at the source location asshown in Fig. 3. While recordings from R1 and R3 are themain data for the analysis, the middle receiver R2 is used forverification (Fig. 4). The phase velocity in the numerical exper-iments is computed from the centre of gravity of |v|2 versuspropagation time, where v is the bulk particle-velocity field(Carcione 1996). The numerical phase velocity is estimatedby averaging the velocities obtained at the five receivers R3.More details about this calculation are given in Carcione,
Figure 3 Source (S) and receiver (Ri) geometry used for recording thetransmitted wavefield. A circular region of radius r0 surrounding thesource is fully water saturated to assure a uniform initial wavefront.
C© 2003 European Association of Geoscientists & Engineers, Geophysical Prospecting, 51, 551–566
556 H.B. Helle, N.H. Pham and J.M. Carcione
Quiroga-Goode and Cavallini (1996) and Carcione (2001,p. 145). The determination of phase velocity in terms of the lo-cation of the energy is justified from the fact that for isotropicmedia and homogeneous viscoelastic waves, the phase velocityis equal to the energy velocity (Carcione 2001, p. 99).
0 5 1 0 1 5 2 0 2 5 3 0
P − (R1 )R1
Time (µs)
R3R2
P − (R1 )
f = 500 kHz
f = 250 kHz
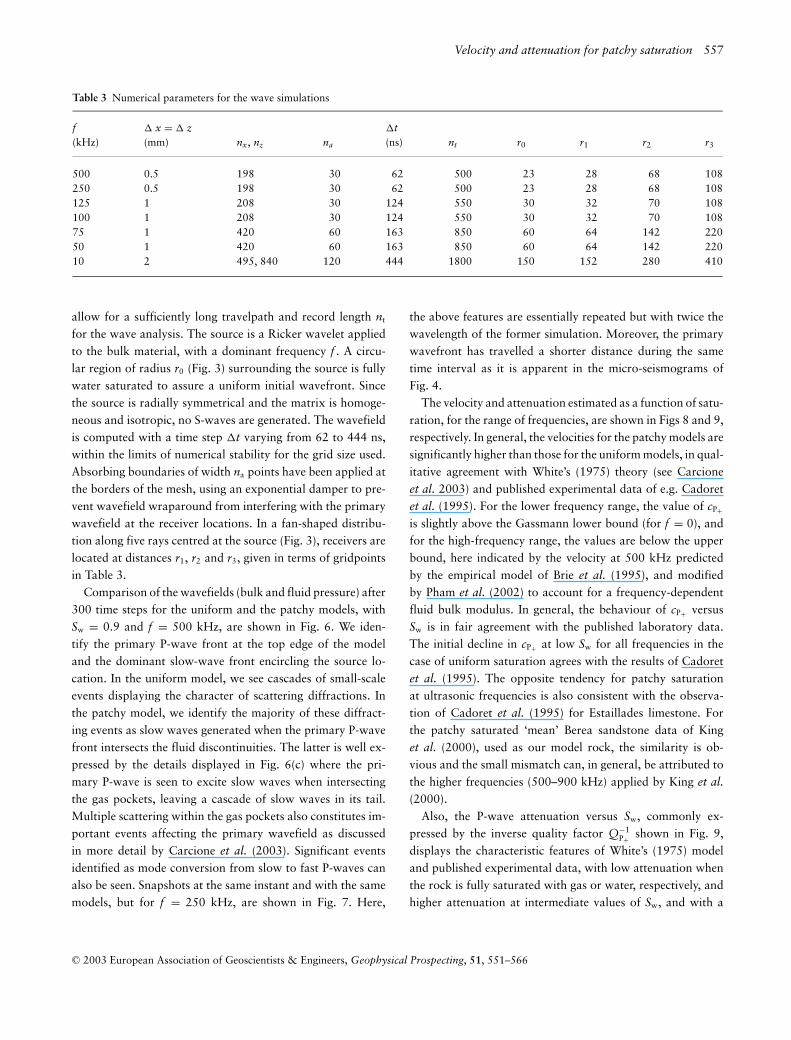
Figure 4 Examples of recorded fluid pressure of fast P-wave (P+)arrivals at the three receiver locations R1, R2 and R3 (Fig. 3) for250 kHz and 500 kHz. The slow P-wave (P−) recorded at R1 is thedominating event. Fully water saturated (Sw = 1).
200 250 300
1.2
1.4(b)
ln (
A1
/ A3 )
Frequency (kHz)0 100 200 300 400 500
0.0
0.5
1.0(a)
A3
A1
Frequency (kHz)
Am
plit
ud
e
Figure 5 Examples of amplitude spectra of the 250 kHz fast P-wave arrivals at the receiver locations R1 and R3 (a) and the correspondingspectral ratio (b) for estimating the attenuation.
To estimate attenuation, we use the classical spectral ratioapproach discussed by Toksoz, Johnston and Timur (1979),implying that the amplitude ratio A1/A3 at the dominant fre-quency f (Fig. 5) satisfies
ln[
A1( f, r1)A3( f, r3)
]= α(r3 − r1) + ln
(G1
G3
), (9)
where ri denotes the source–receiver radial distances, and Gi
denotes the respective geometrical spreading factors. Usingrelationship (8), equation (9) can be rewritten as
ln[
A1( f, r1)A3( f, r3)
]= π f (r3 − r1)
Qc+ ln
(G1
G3
). (10)
The quality factor is determined from the slope of the linefitted to ln(A1/A3).
WAV E S I M U L AT I O N A N D A N A LY S I SO F T H E WAV E F I E L D S
The objective of this study is to determine from numericalexperiments the wave velocity and attenuation as a functionof water saturation Sw and dominant wave frequency f . Thefrequencies used in the experiments and the correspondingnumerical grids are listed in Table 3. We consider a regulargrid where the size and grid spacing are adjusted to the wavefrequency. For the high frequencies (250–500 kHz), a smallnumerical grid consisting of 198 × 198 (nx × nz) points at�x = 0.5 mm spacing is sufficient. For the low frequencyof 10 kHz (long wavelength), we expanded the model to804 points at 2 mm spacing in the primary direction (z) to
C© 2003 European Association of Geoscientists & Engineers, Geophysical Prospecting, 51, 551–566
Velocity and attenuation for patchy saturation 557
Table 3 Numerical parameters for the wave simulations
f � x = � z �t(kHz) (mm) nx, nz na (ns) nt r0 r1 r2 r3
500 0.5 198 30 62 500 23 28 68 108250 0.5 198 30 62 500 23 28 68 108125 1 208 30 124 550 30 32 70 108100 1 208 30 124 550 30 32 70 10875 1 420 60 163 850 60 64 142 22050 1 420 60 163 850 60 64 142 22010 2 495, 840 120 444 1800 150 152 280 410
allow for a sufficiently long travelpath and record length nt
for the wave analysis. The source is a Ricker wavelet appliedto the bulk material, with a dominant frequency f . A circu-lar region of radius r0 (Fig. 3) surrounding the source is fullywater saturated to assure a uniform initial wavefront. Sincethe source is radially symmetrical and the matrix is homoge-neous and isotropic, no S-waves are generated. The wavefieldis computed with a time step �t varying from 62 to 444 ns,within the limits of numerical stability for the grid size used.Absorbing boundaries of width na points have been applied atthe borders of the mesh, using an exponential damper to pre-vent wavefield wraparound from interfering with the primarywavefield at the receiver locations. In a fan-shaped distribu-tion along five rays centred at the source (Fig. 3), receivers arelocated at distances r1, r2 and r3, given in terms of gridpointsin Table 3.
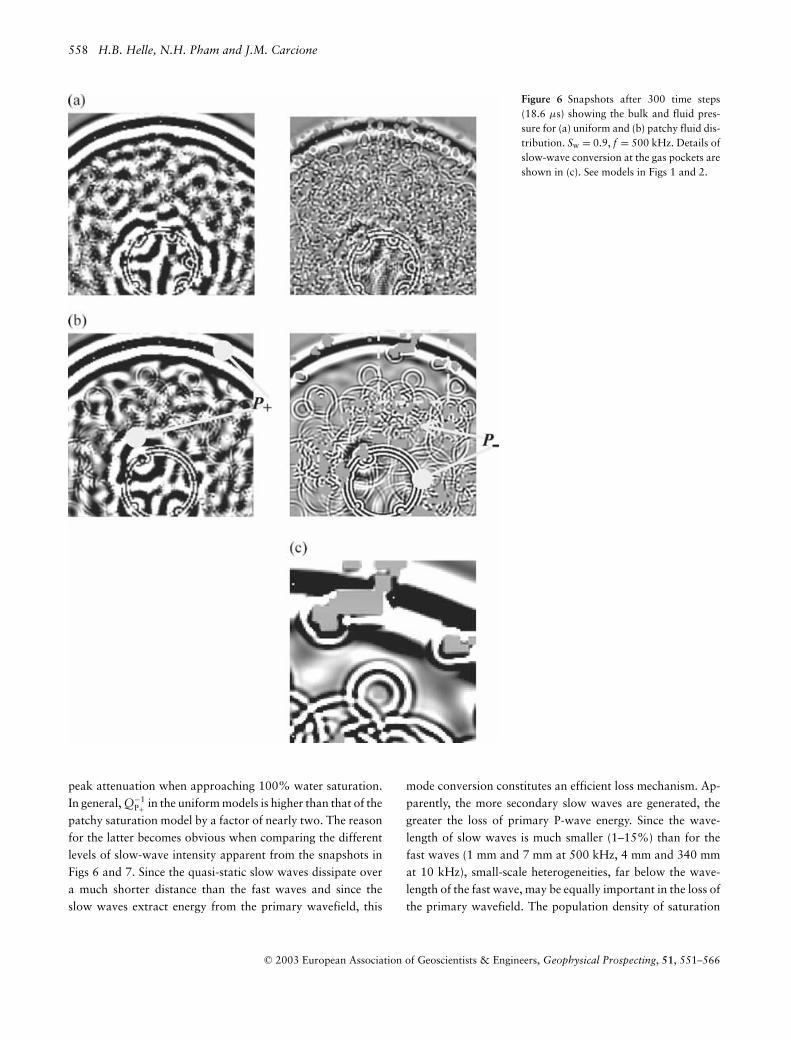
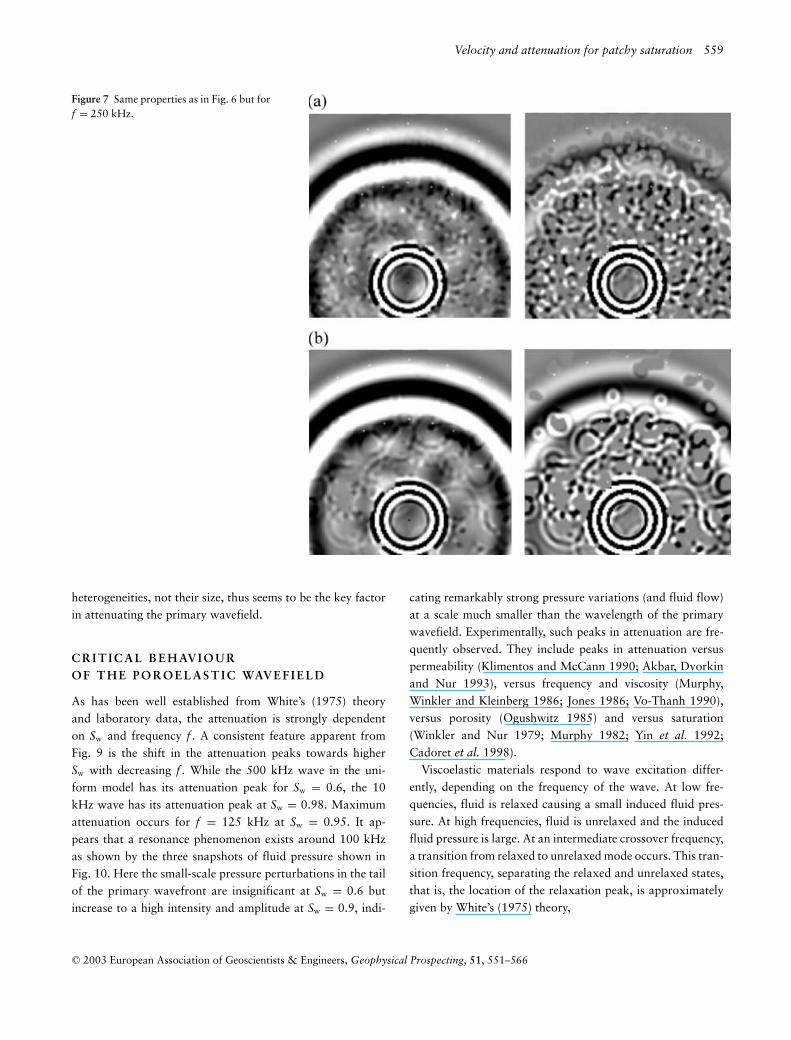
Comparison of the wavefields (bulk and fluid pressure) after300 time steps for the uniform and the patchy models, withSw = 0.9 and f = 500 kHz, are shown in Fig. 6. We iden-tify the primary P-wave front at the top edge of the modeland the dominant slow-wave front encircling the source lo-cation. In the uniform model, we see cascades of small-scaleevents displaying the character of scattering diffractions. Inthe patchy model, we identify the majority of these diffract-ing events as slow waves generated when the primary P-wavefront intersects the fluid discontinuities. The latter is well ex-pressed by the details displayed in Fig. 6(c) where the pri-mary P-wave is seen to excite slow waves when intersectingthe gas pockets, leaving a cascade of slow waves in its tail.Multiple scattering within the gas pockets also constitutes im-portant events affecting the primary wavefield as discussedin more detail by Carcione et al. (2003). Significant eventsidentified as mode conversion from slow to fast P-waves canalso be seen. Snapshots at the same instant and with the samemodels, but for f = 250 kHz, are shown in Fig. 7. Here,
the above features are essentially repeated but with twice thewavelength of the former simulation. Moreover, the primarywavefront has travelled a shorter distance during the sametime interval as it is apparent in the micro-seismograms ofFig. 4.
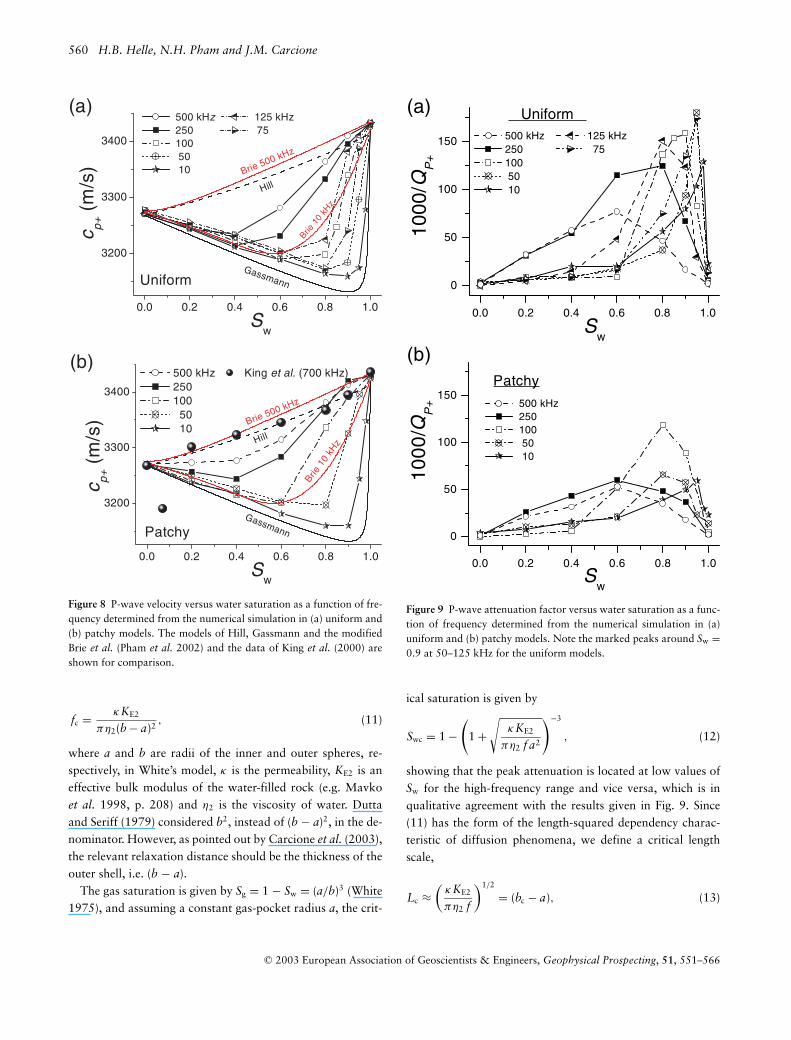
The velocity and attenuation estimated as a function of satu-ration, for the range of frequencies, are shown in Figs 8 and 9,respectively. In general, the velocities for the patchy models aresignificantly higher than those for the uniform models, in qual-itative agreement with White’s (1975) theory (see Carcioneet al. 2003) and published experimental data of e.g. Cadoretet al. (1995). For the lower frequency range, the value of cP+is slightly above the Gassmann lower bound (for f = 0), andfor the high-frequency range, the values are below the upperbound, here indicated by the velocity at 500 kHz predictedby the empirical model of Brie et al. (1995), and modifiedby Pham et al. (2002) to account for a frequency-dependentfluid bulk modulus. In general, the behaviour of cP+ versusSw is in fair agreement with the published laboratory data.The initial decline in cP+ at low Sw for all frequencies in thecase of uniform saturation agrees with the results of Cadoretet al. (1995). The opposite tendency for patchy saturationat ultrasonic frequencies is also consistent with the observa-tion of Cadoret et al. (1995) for Estaillades limestone. Forthe patchy saturated ‘mean’ Berea sandstone data of Kinget al. (2000), used as our model rock, the similarity is ob-vious and the small mismatch can, in general, be attributed tothe higher frequencies (500–900 kHz) applied by King et al.
(2000).Also, the P-wave attenuation versus Sw, commonly ex-
pressed by the inverse quality factor Q−1P+ shown in Fig. 9,
displays the characteristic features of White’s (1975) modeland published experimental data, with low attenuation whenthe rock is fully saturated with gas or water, respectively, andhigher attenuation at intermediate values of Sw, and with a
C© 2003 European Association of Geoscientists & Engineers, Geophysical Prospecting, 51, 551–566
558 H.B. Helle, N.H. Pham and J.M. Carcione
Figure 6 Snapshots after 300 time steps(18.6 µs) showing the bulk and fluid pres-sure for (a) uniform and (b) patchy fluid dis-tribution. Sw = 0.9, f = 500 kHz. Details ofslow-wave conversion at the gas pockets areshown in (c). See models in Figs 1 and 2.
peak attenuation when approaching 100% water saturation.In general, Q−1
P+ in the uniform models is higher than that of thepatchy saturation model by a factor of nearly two. The reasonfor the latter becomes obvious when comparing the differentlevels of slow-wave intensity apparent from the snapshots inFigs 6 and 7. Since the quasi-static slow waves dissipate overa much shorter distance than the fast waves and since theslow waves extract energy from the primary wavefield, this
mode conversion constitutes an efficient loss mechanism. Ap-parently, the more secondary slow waves are generated, thegreater the loss of primary P-wave energy. Since the wave-length of slow waves is much smaller (1–15%) than for thefast waves (1 mm and 7 mm at 500 kHz, 4 mm and 340 mmat 10 kHz), small-scale heterogeneities, far below the wave-length of the fast wave, may be equally important in the loss ofthe primary wavefield. The population density of saturation
C© 2003 European Association of Geoscientists & Engineers, Geophysical Prospecting, 51, 551–566
Velocity and attenuation for patchy saturation 559
Figure 7 Same properties as in Fig. 6 but forf = 250 kHz.
heterogeneities, not their size, thus seems to be the key factorin attenuating the primary wavefield.
C R I T I C A L B E H AV I O U RO F T H E P O R O E L A S T I C WAV E F I E L D
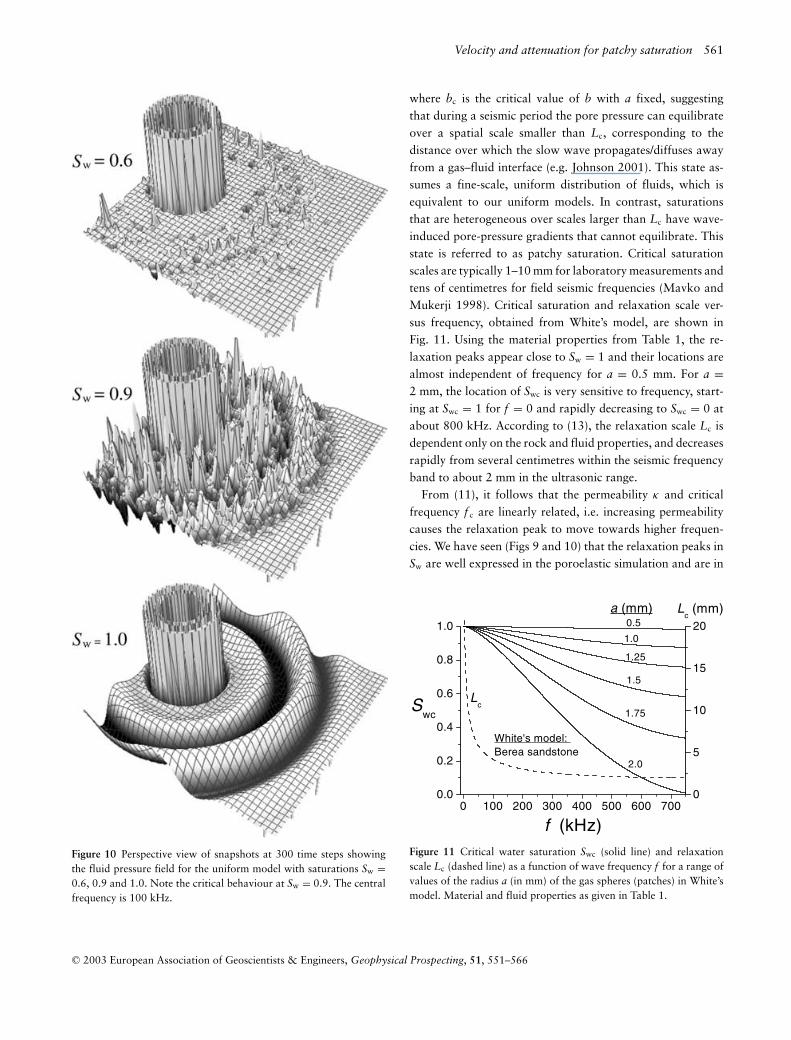
As has been well established from White’s (1975) theoryand laboratory data, the attenuation is strongly dependenton Sw and frequency f . A consistent feature apparent fromFig. 9 is the shift in the attenuation peaks towards higherSw with decreasing f . While the 500 kHz wave in the uni-form model has its attenuation peak for Sw = 0.6, the 10kHz wave has its attenuation peak at Sw = 0.98. Maximumattenuation occurs for f = 125 kHz at Sw = 0.95. It ap-pears that a resonance phenomenon exists around 100 kHzas shown by the three snapshots of fluid pressure shown inFig. 10. Here the small-scale pressure perturbations in the tailof the primary wavefront are insignificant at Sw = 0.6 butincrease to a high intensity and amplitude at Sw = 0.9, indi-
cating remarkably strong pressure variations (and fluid flow)at a scale much smaller than the wavelength of the primarywavefield. Experimentally, such peaks in attenuation are fre-quently observed. They include peaks in attenuation versuspermeability (Klimentos and McCann 1990; Akbar, Dvorkinand Nur 1993), versus frequency and viscosity (Murphy,Winkler and Kleinberg 1986; Jones 1986; Vo-Thanh 1990),versus porosity (Ogushwitz 1985) and versus saturation(Winkler and Nur 1979; Murphy 1982; Yin et al. 1992;Cadoret et al. 1998).
Viscoelastic materials respond to wave excitation differ-ently, depending on the frequency of the wave. At low fre-quencies, fluid is relaxed causing a small induced fluid pres-sure. At high frequencies, fluid is unrelaxed and the inducedfluid pressure is large. At an intermediate crossover frequency,a transition from relaxed to unrelaxed mode occurs. This tran-sition frequency, separating the relaxed and unrelaxed states,that is, the location of the relaxation peak, is approximatelygiven by White’s (1975) theory,
C© 2003 European Association of Geoscientists & Engineers, Geophysical Prospecting, 51, 551–566
560 H.B. Helle, N.H. Pham and J.M. Carcione
0.0 0.2 0.4 0.6 0.8 1.0
3200
3300
3400
Hill
(a)
Gassmann
Brie 1
0 kH
z
500 kHz
Uniform
Sw
c p+ (
m/s
)
500 kHz 125 kHz 250 75 100 50 10
0.0 0.2 0.4 0.6 0.8 1.0
3200
3300
3400
Hill
(b)
Brie 1
0 kH
z
Gassmann
Brie 500 kHz
Patchy
Sw
c p+ (
m/s
)
500 kHz King et al. (700 kHz) 250 100 50 10
Brie
Figure 8 P-wave velocity versus water saturation as a function of fre-quency determined from the numerical simulation in (a) uniform and(b) patchy models. The models of Hill, Gassmann and the modifiedBrie et al. (Pham et al. 2002) and the data of King et al. (2000) areshown for comparison.
fc = κKE2
πη2(b − a)2, (11)
where a and b are radii of the inner and outer spheres, re-spectively, in White’s model, κ is the permeability, KE2 is aneffective bulk modulus of the water-filled rock (e.g. Mavkoet al. 1998, p. 208) and η2 is the viscosity of water. Duttaand Seriff (1979) considered b2, instead of (b − a)2, in the de-nominator. However, as pointed out by Carcione et al. (2003),the relevant relaxation distance should be the thickness of theouter shell, i.e. (b − a).
The gas saturation is given by Sg = 1 − Sw = (a/b)3 (White1975), and assuming a constant gas-pocket radius a, the crit-
0.0 0.2 0.4 0.6 0.8 1.0
0
50
100
150
Uniform
(a)
Sw
1000
/QP
+
500 kHz 125 kHz 250 75 100 50 10
0.0 0.2 0.4 0.6 0.8 1.0
0
50
100
150Patchy
(b)
10
00
/QP
+
Sw
500 kHz 250 100 50 10
Figure 9 P-wave attenuation factor versus water saturation as a func-tion of frequency determined from the numerical simulation in (a)uniform and (b) patchy models. Note the marked peaks around Sw =0.9 at 50–125 kHz for the uniform models.
ical saturation is given by
Swc = 1 −(
1 +√
κKE2
πη2 f a2
)−3
, (12)
showing that the peak attenuation is located at low values ofSw for the high-frequency range and vice versa, which is inqualitative agreement with the results given in Fig. 9. Since(11) has the form of the length-squared dependency charac-teristic of diffusion phenomena, we define a critical lengthscale,
Lc ≈(
κKE2
πη2 f
)1/2
= (bc − a), (13)
C© 2003 European Association of Geoscientists & Engineers, Geophysical Prospecting, 51, 551–566
Velocity and attenuation for patchy saturation 561
Figure 10 Perspective view of snapshots at 300 time steps showingthe fluid pressure field for the uniform model with saturations Sw =0.6, 0.9 and 1.0. Note the critical behaviour at Sw = 0.9. The centralfrequency is 100 kHz.
where bc is the critical value of b with a fixed, suggestingthat during a seismic period the pore pressure can equilibrateover a spatial scale smaller than Lc, corresponding to thedistance over which the slow wave propagates/diffuses awayfrom a gas–fluid interface (e.g. Johnson 2001). This state as-sumes a fine-scale, uniform distribution of fluids, which isequivalent to our uniform models. In contrast, saturationsthat are heterogeneous over scales larger than Lc have wave-induced pore-pressure gradients that cannot equilibrate. Thisstate is referred to as patchy saturation. Critical saturationscales are typically 1–10 mm for laboratory measurements andtens of centimetres for field seismic frequencies (Mavko andMukerji 1998). Critical saturation and relaxation scale ver-sus frequency, obtained from White’s model, are shown inFig. 11. Using the material properties from Table 1, the re-laxation peaks appear close to Sw = 1 and their locations arealmost independent of frequency for a = 0.5 mm. For a =2 mm, the location of Swc is very sensitive to frequency, start-ing at Swc = 1 for f = 0 and rapidly decreasing to Swc = 0 atabout 800 kHz. According to (13), the relaxation scale Lc isdependent only on the rock and fluid properties, and decreasesrapidly from several centimetres within the seismic frequencyband to about 2 mm in the ultrasonic range.
From (11), it follows that the permeability κ and criticalfrequency f c are linearly related, i.e. increasing permeabilitycauses the relaxation peak to move towards higher frequen-cies. We have seen (Figs 9 and 10) that the relaxation peaks inSw are well expressed in the poroelastic simulation and are in
0 100 200 300 400 500 600 7000.0
0.2
0.4
0.6
0.8
1.0 0.5
Lc
White's model: Berea sandstone
2.0
1.75
1.5
1.25
1.0
a (mm)
Swc
f (kHz)
0
5
10
15
20
Lc (mm)
Figure 11 Critical water saturation Swc (solid line) and relaxationscale Lc (dashed line) as a function of wave frequency f for a range ofvalues of the radius a (in mm) of the gas spheres (patches) in White’smodel. Material and fluid properties as given in Table 1.
C© 2003 European Association of Geoscientists & Engineers, Geophysical Prospecting, 51, 551–566
562 H.B. Helle, N.H. Pham and J.M. Carcione
0.0 0.2 0.4 0.6 0.8 1.0
3200
3300
3400
Hill
Ga
ssm
an
n
(a)
White's model: a = 1.5 mm
500
0 m
D
550
100
100
c p+ (
m/s
)
Sw
0 mD 10 100 550
0.0 0.2 0.4 0.6 0.8 1.0
0
50
100
150
(b)
White's model: a = 1.5 mm
0
5 D
550 mD
100
10 mD
Biot: Uniform 100 kHz
Biot: Uniform 100 kHz
0 mD 10 100 550 S
wc
1000
/ QP
+
Sw
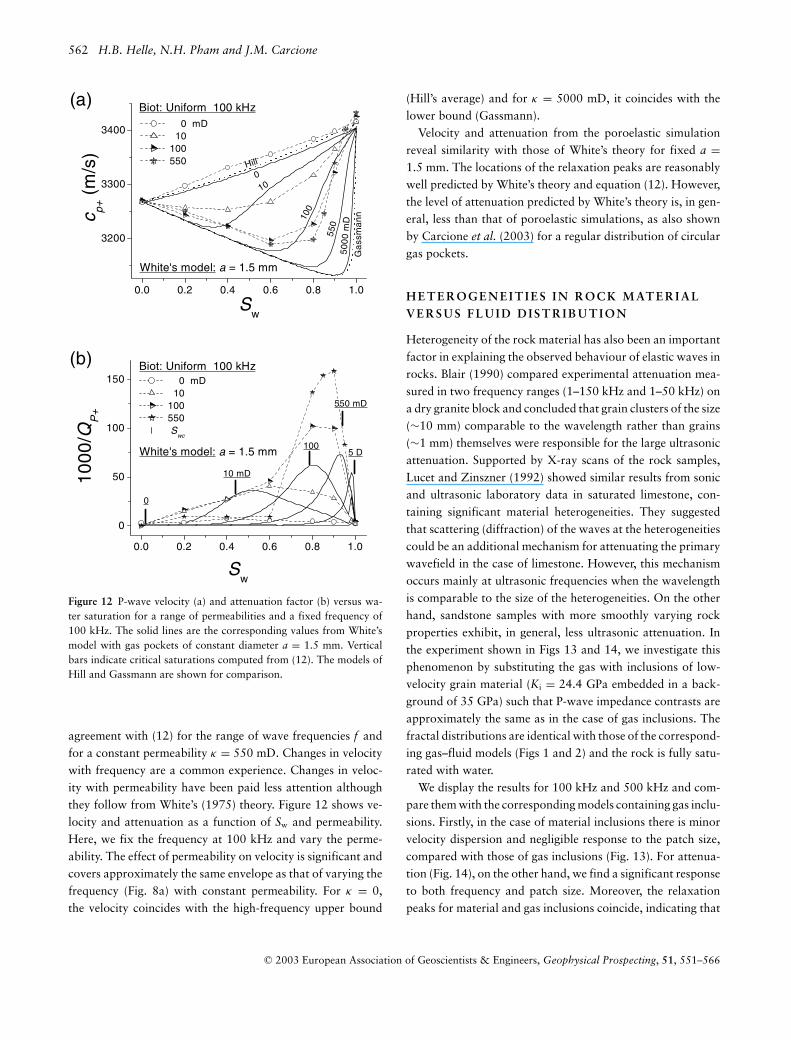
Figure 12 P-wave velocity (a) and attenuation factor (b) versus wa-ter saturation for a range of permeabilities and a fixed frequency of100 kHz. The solid lines are the corresponding values from White’smodel with gas pockets of constant diameter a = 1.5 mm. Verticalbars indicate critical saturations computed from (12). The models ofHill and Gassmann are shown for comparison.
agreement with (12) for the range of wave frequencies f andfor a constant permeability κ = 550 mD. Changes in velocitywith frequency are a common experience. Changes in veloc-ity with permeability have been paid less attention althoughthey follow from White’s (1975) theory. Figure 12 shows ve-locity and attenuation as a function of Sw and permeability.Here, we fix the frequency at 100 kHz and vary the perme-ability. The effect of permeability on velocity is significant andcovers approximately the same envelope as that of varying thefrequency (Fig. 8a) with constant permeability. For κ = 0,the velocity coincides with the high-frequency upper bound
(Hill’s average) and for κ = 5000 mD, it coincides with thelower bound (Gassmann).
Velocity and attenuation from the poroelastic simulationreveal similarity with those of White’s theory for fixed a =1.5 mm. The locations of the relaxation peaks are reasonablywell predicted by White’s theory and equation (12). However,the level of attenuation predicted by White’s theory is, in gen-eral, less than that of poroelastic simulations, as also shownby Carcione et al. (2003) for a regular distribution of circulargas pockets.
H E T E R O G E N E I T I E S I N R O C K M AT E R I A LV E R S U S F L U I D D I S T R I B U T I O N
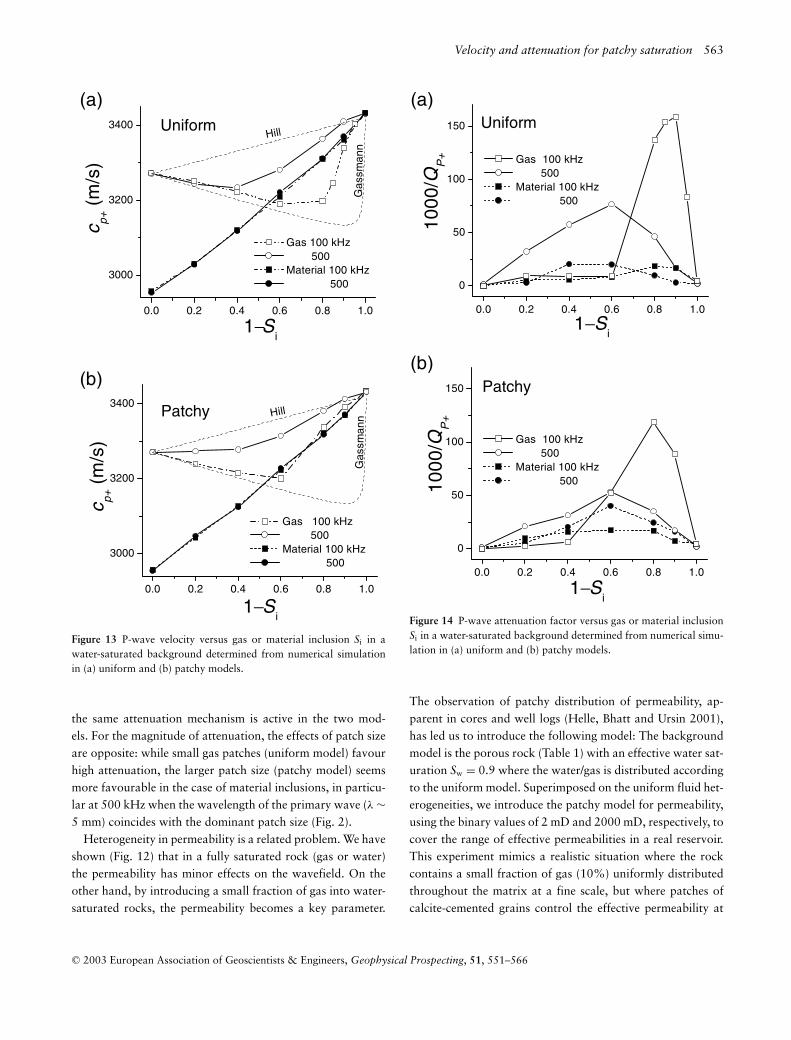
Heterogeneity of the rock material has also been an importantfactor in explaining the observed behaviour of elastic waves inrocks. Blair (1990) compared experimental attenuation mea-sured in two frequency ranges (1–150 kHz and 1–50 kHz) ona dry granite block and concluded that grain clusters of the size(∼10 mm) comparable to the wavelength rather than grains(∼1 mm) themselves were responsible for the large ultrasonicattenuation. Supported by X-ray scans of the rock samples,Lucet and Zinszner (1992) showed similar results from sonicand ultrasonic laboratory data in saturated limestone, con-taining significant material heterogeneities. They suggestedthat scattering (diffraction) of the waves at the heterogeneitiescould be an additional mechanism for attenuating the primarywavefield in the case of limestone. However, this mechanismoccurs mainly at ultrasonic frequencies when the wavelengthis comparable to the size of the heterogeneities. On the otherhand, sandstone samples with more smoothly varying rockproperties exhibit, in general, less ultrasonic attenuation. Inthe experiment shown in Figs 13 and 14, we investigate thisphenomenon by substituting the gas with inclusions of low-velocity grain material (Ki = 24.4 GPa embedded in a back-ground of 35 GPa) such that P-wave impedance contrasts areapproximately the same as in the case of gas inclusions. Thefractal distributions are identical with those of the correspond-ing gas–fluid models (Figs 1 and 2) and the rock is fully satu-rated with water.
We display the results for 100 kHz and 500 kHz and com-pare them with the corresponding models containing gas inclu-sions. Firstly, in the case of material inclusions there is minorvelocity dispersion and negligible response to the patch size,compared with those of gas inclusions (Fig. 13). For attenua-tion (Fig. 14), on the other hand, we find a significant responseto both frequency and patch size. Moreover, the relaxationpeaks for material and gas inclusions coincide, indicating that
C© 2003 European Association of Geoscientists & Engineers, Geophysical Prospecting, 51, 551–566
Velocity and attenuation for patchy saturation 563
0.0 0.2 0.4 0.6 0.8 1.0
3000
3200
3400
(a)
Gas
sman
n
HillUniform
Gas 100 kHz 500 Material 100 kHz 500
c p+ (
m/s
)
1−Si
0.0 0.2 0.4 0.6 0.8 1.0
3000
3200
3400
(b)
Hill
Gas
sman
n
Gas 100 kHz 500 Material 100 kHz 500
Patchy
1−Si
c p+ (
m/s
)
Figure 13 P-wave velocity versus gas or material inclusion Si in awater-saturated background determined from numerical simulationin (a) uniform and (b) patchy models.
the same attenuation mechanism is active in the two mod-els. For the magnitude of attenuation, the effects of patch sizeare opposite: while small gas patches (uniform model) favourhigh attenuation, the larger patch size (patchy model) seemsmore favourable in the case of material inclusions, in particu-lar at 500 kHz when the wavelength of the primary wave (λ ∼5 mm) coincides with the dominant patch size (Fig. 2).
Heterogeneity in permeability is a related problem. We haveshown (Fig. 12) that in a fully saturated rock (gas or water)the permeability has minor effects on the wavefield. On theother hand, by introducing a small fraction of gas into water-saturated rocks, the permeability becomes a key parameter.
0.0 0.2 0.4 0.6 0.8 1.0
0
50
100
150
(a)Uniform
Gas 100 kHz 500 Material 100 kHz 500
1000
/QP
+
1−Si
0.0 0.2 0.4 0.6 0.8 1.0
0
50
100
150
(b)
Gas 100 kHz 500 Material 100 kHz 500
Patchy
1000
/QP
+
1−Si
Figure 14 P-wave attenuation factor versus gas or material inclusionSi in a water-saturated background determined from numerical simu-lation in (a) uniform and (b) patchy models.
The observation of patchy distribution of permeability, ap-parent in cores and well logs (Helle, Bhatt and Ursin 2001),has led us to introduce the following model: The backgroundmodel is the porous rock (Table 1) with an effective water sat-uration Sw = 0.9 where the water/gas is distributed accordingto the uniform model. Superimposed on the uniform fluid het-erogeneities, we introduce the patchy model for permeability,using the binary values of 2 mD and 2000 mD, respectively, tocover the range of effective permeabilities in a real reservoir.This experiment mimics a realistic situation where the rockcontains a small fraction of gas (10%) uniformly distributedthroughout the matrix at a fine scale, but where patches ofcalcite-cemented grains control the effective permeability at
C© 2003 European Association of Geoscientists & Engineers, Geophysical Prospecting, 51, 551–566
564 H.B. Helle, N.H. Pham and J.M. Carcione
0.0 0.2 0.4 0.6 0.8 1.0
0
50
100
150
Sw
= 0.9 (Uniform)
(b)
500 kHz
100
kHz
1000
/QP
+
Scaled permeability
0.0 0.2 0.4 0.6 0.8 1.0
3350
3375
3400
3425(a)
Sw
= 0.9 (Uniform)
500 kHz
100 kHz
c p+ (
m/s
)
Scaled permeability
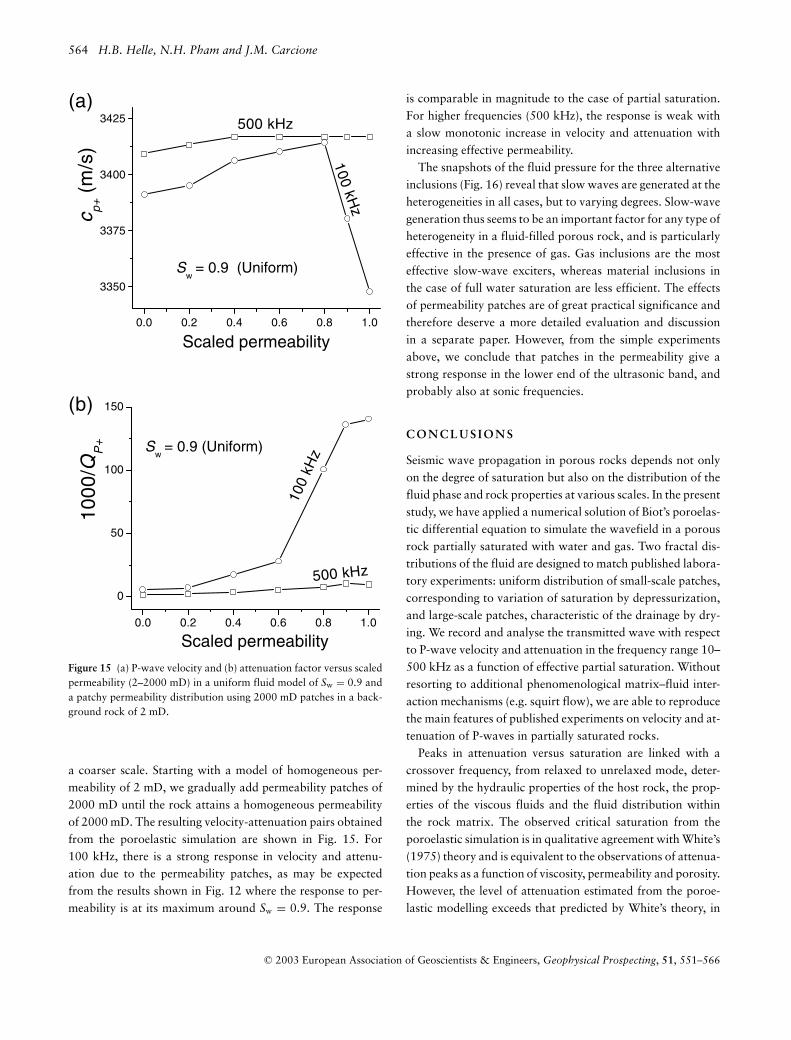
Figure 15 (a) P-wave velocity and (b) attenuation factor versus scaledpermeability (2–2000 mD) in a uniform fluid model of Sw = 0.9 anda patchy permeability distribution using 2000 mD patches in a back-ground rock of 2 mD.
a coarser scale. Starting with a model of homogeneous per-meability of 2 mD, we gradually add permeability patches of2000 mD until the rock attains a homogeneous permeabilityof 2000 mD. The resulting velocity-attenuation pairs obtainedfrom the poroelastic simulation are shown in Fig. 15. For100 kHz, there is a strong response in velocity and attenu-ation due to the permeability patches, as may be expectedfrom the results shown in Fig. 12 where the response to per-meability is at its maximum around Sw = 0.9. The response
is comparable in magnitude to the case of partial saturation.For higher frequencies (500 kHz), the response is weak witha slow monotonic increase in velocity and attenuation withincreasing effective permeability.
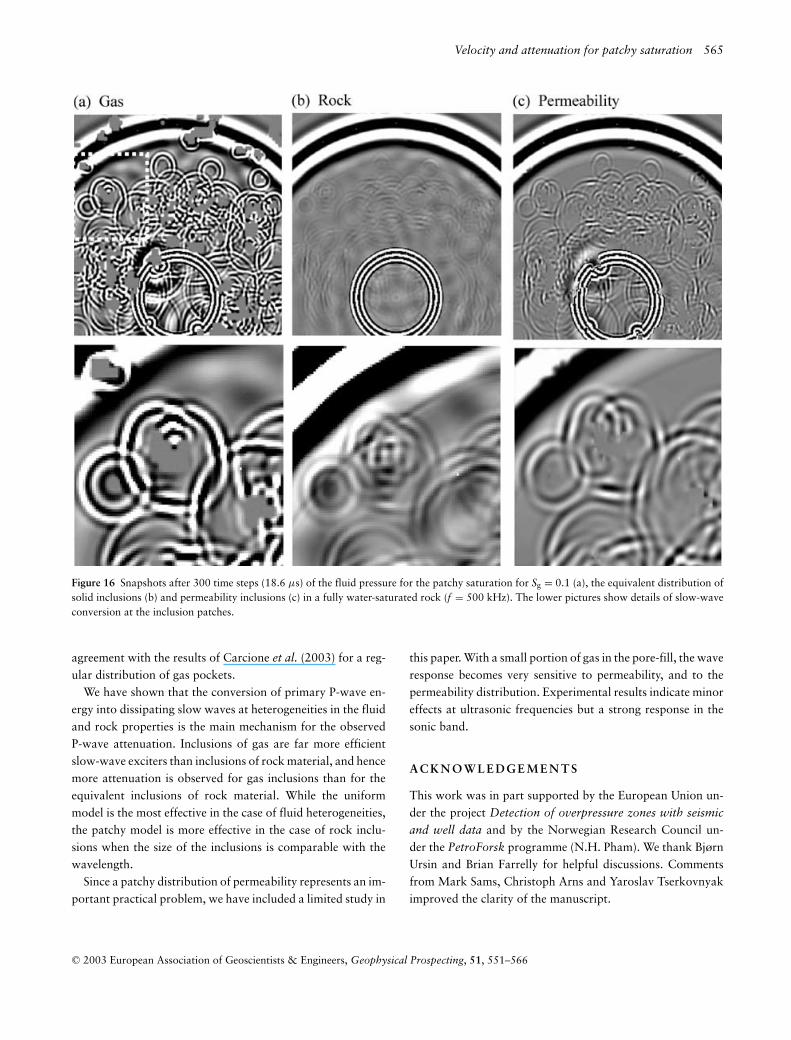
The snapshots of the fluid pressure for the three alternativeinclusions (Fig. 16) reveal that slow waves are generated at theheterogeneities in all cases, but to varying degrees. Slow-wavegeneration thus seems to be an important factor for any type ofheterogeneity in a fluid-filled porous rock, and is particularlyeffective in the presence of gas. Gas inclusions are the mosteffective slow-wave exciters, whereas material inclusions inthe case of full water saturation are less efficient. The effectsof permeability patches are of great practical significance andtherefore deserve a more detailed evaluation and discussionin a separate paper. However, from the simple experimentsabove, we conclude that patches in the permeability give astrong response in the lower end of the ultrasonic band, andprobably also at sonic frequencies.
C O N C L U S I O N S
Seismic wave propagation in porous rocks depends not onlyon the degree of saturation but also on the distribution of thefluid phase and rock properties at various scales. In the presentstudy, we have applied a numerical solution of Biot’s poroelas-tic differential equation to simulate the wavefield in a porousrock partially saturated with water and gas. Two fractal dis-tributions of the fluid are designed to match published labora-tory experiments: uniform distribution of small-scale patches,corresponding to variation of saturation by depressurization,and large-scale patches, characteristic of the drainage by dry-ing. We record and analyse the transmitted wave with respectto P-wave velocity and attenuation in the frequency range 10–500 kHz as a function of effective partial saturation. Withoutresorting to additional phenomenological matrix–fluid inter-action mechanisms (e.g. squirt flow), we are able to reproducethe main features of published experiments on velocity and at-tenuation of P-waves in partially saturated rocks.
Peaks in attenuation versus saturation are linked with acrossover frequency, from relaxed to unrelaxed mode, deter-mined by the hydraulic properties of the host rock, the prop-erties of the viscous fluids and the fluid distribution withinthe rock matrix. The observed critical saturation from theporoelastic simulation is in qualitative agreement with White’s(1975) theory and is equivalent to the observations of attenua-tion peaks as a function of viscosity, permeability and porosity.However, the level of attenuation estimated from the poroe-lastic modelling exceeds that predicted by White’s theory, in
C© 2003 European Association of Geoscientists & Engineers, Geophysical Prospecting, 51, 551–566
Velocity and attenuation for patchy saturation 565
Figure 16 Snapshots after 300 time steps (18.6 µs) of the fluid pressure for the patchy saturation for Sg = 0.1 (a), the equivalent distribution ofsolid inclusions (b) and permeability inclusions (c) in a fully water-saturated rock (f = 500 kHz). The lower pictures show details of slow-waveconversion at the inclusion patches.
agreement with the results of Carcione et al. (2003) for a reg-ular distribution of gas pockets.
We have shown that the conversion of primary P-wave en-ergy into dissipating slow waves at heterogeneities in the fluidand rock properties is the main mechanism for the observedP-wave attenuation. Inclusions of gas are far more efficientslow-wave exciters than inclusions of rock material, and hencemore attenuation is observed for gas inclusions than for theequivalent inclusions of rock material. While the uniformmodel is the most effective in the case of fluid heterogeneities,the patchy model is more effective in the case of rock inclu-sions when the size of the inclusions is comparable with thewavelength.
Since a patchy distribution of permeability represents an im-portant practical problem, we have included a limited study in
this paper. With a small portion of gas in the pore-fill, the waveresponse becomes very sensitive to permeability, and to thepermeability distribution. Experimental results indicate minoreffects at ultrasonic frequencies but a strong response in thesonic band.
A C K N O W L E D G E M E N T S
This work was in part supported by the European Union un-der the project Detection of overpressure zones with seismic
and well data and by the Norwegian Research Council un-der the PetroForsk programme (N.H. Pham). We thank BjørnUrsin and Brian Farrelly for helpful discussions. Commentsfrom Mark Sams, Christoph Arns and Yaroslav Tserkovnyakimproved the clarity of the manuscript.
C© 2003 European Association of Geoscientists & Engineers, Geophysical Prospecting, 51, 551–566
566 H.B. Helle, N.H. Pham and J.M. Carcione
R E F E R E N C E S
Akbar N., Dvorkin J. and Nur A. 1993. Relating P-wave attenuationto permeability. Geophysics 58, 20–29.
Biot M.A. 1962. Mechanics of deformation and acoustic propagationin porous media. Journal of Applied Physics 33, 1482–1498.
Blair D.P. 1990. A direct comparison between vibrational resonanceand pulse transmission data for assessment of seismic attenuationin rock. Geophysics 55, 51–60.
Bourbie T. and Zinszner B. 1984. Saturation methods and attenuationversus saturation relationships in Fontainebleau sandstone. 54thSEG meeting, Atlanta, USA, Expanded Abstracts, 344–347.
Brie A., Pampuri F., Marsala A.F. and Meazza O. 1995. Shear sonicinterpretation in gas-bearing sands. Society of Petroleum Engineers,Annual Technical Conference, Dallas, USA, (Paper # 30595), 701–710.
Cadoret T., Marion D. and Zinszner B. 1995. Influence of frequencyand fluid distribution on elastic wave velocities in partially satu-rated limestones. Journal of Geophysical Research 100(B6), 9789–9803.
Cadoret T., Mavko G. and Zinszner B. 1998. Fluid distribution effecton sonic attenuation in partially saturated limestones. Geophysics63, 154–160.
Carcione J.M. 1996. Wave propagation in anisotropic, saturatedporous medium: plane-wave theory and numerical simulation. Jour-nal of the Acoustical Society of America 99(5), 2655–2666.
Carcione J.M. 2001. Wave Fields in Real Media: Wave Propagation inAnisotropic, Anelastic and Porous Media. Handbook of Geophys-ical Exploration, Vol. 31. Pergamon Press Inc.
Carcione J.M. and Helle H.B. 1999. Numerical simulation of the poro-viscoelastic wave equation on a staggered mesh. Journal of Com-putational Physics 154, 520–527.
Carcione J.M., Helle H.B. and Pham N.H. 2003. White’s modelfor wave propagation in partially saturated rocks: comparisonwith poroelastic numerical experiments. Geophysics 68, 1389–1398.
Carcione J.M., Quiroga-Goode G. and Cavallini F. 1996. Wavefrontsin dissipative anisotropic media: comparison of the plane wave the-ory with numerical simulations. Geophysics 61, 857–861.
Domenico S.N. 1977. Elastic properties of unconsolidated poroussand reservoirs. Geophysics 42, 1339–1368.
Dutta N.C. and Seriff A.J. 1979. On White’s model of attenuation inrocks with partial gas saturation. Geophysics 44, 1806–1812.
Frankel A. and Clayton R.W. 1986. Finite difference simulation ofseismic wave scattering: implications for the propagation of shortperiod seismic waves in the crust and models of crustal heterogene-ity. Journal of Geophysical Research 91, 6465–6489.
Gassmann F. 1951. Uber die elastizitat poroser medien. Vierteljahrss-chrift der Naturforschenden Gesellschaft in Zurich 96, 1–23.
Gist G.A. 1994. Interpreting laboratory velocity measurements in par-tially gas-saturated rocks. Geophysics 59, 1100–1109.
Gregory A.R. 1976. Fluid saturation effects on dynamic elastic prop-erties of sedimentary rocks. Geophysics 41, 895–921.
Helle H.B., Bhatt A. and Ursin B. 2001. Porosity and permeability pre-diction from wireline logs using artificial neural networks: a NorthSea case study. Geophysical Prospecting 49, 431–444.
Holliger K. 1997. Seismic scattering in the upper crystalline crust
based on evidence from sonic logs. Geophysical Journal Interna-tional 128, 65–72.
Johnson D.L. 2001. Theory of frequency dependent acoustics inpatchy-saturated porous media. Journal of the Acoustical Societyof America 110(2), 682–694.
Jones T.D. 1986. Pore fluids and frequency-dependent wave propaga-tion in rocks. Geophysics 51, 1939–1953.
King M.S., Marsden J.M. and Dennis J.W. 2000. Biot dispersion forP- and S-wave velocities in partially and fully saturated sandstones.Geophysical Prospecting 48, 1075–1089.
Klimentos T. and McCann C. 1990. Relationships among compres-sional wave attenuation, porosity, clay content, and permeability insandstones. Geophysics 55, 998–1014.
Knight R. and Nolen-Hoecksema R. 1990. A laboratory study of thedependence of elastic wave velocities on pore scale fluid distribu-tion. Geophysical Research Letters 17, 1529–1532.
Lucet N. and Zinszner B. 1992. Effects of heterogeneities andanisotropy on ultrasonic attenuation in rocks. Geophysics 57,1018–1026.
Mavko G. and Mukerji T. 1998. Bounds on low-frequency seismicvelocities in partially saturated rocks. Geophysics 63, 918–924.
Mavko G., Mukerji T. and Dvorkin J. 1998. The Rock Physics Hand-book: Tools for Seismic Analysis in Porous Media. Cambridge Uni-versity Press.
Murphy W.F. 1982. Effect of partial water saturation on attenua-tion of Massilon sandstone and Vycor porous glass. Journal of theAcoustical Society of America 71, 1458–1468.
Murphy W.F. 1984. Acoustic measures of partial gas saturation in tightsandstones. Journal of Geophysical Research 89, 11549–11559.
Murphy W.F., Winkler K.W. and Kleinberg R.L. 1986. Acoustic re-laxation in sedimentary rocks: dependence on grain contacts andfluid saturation. Geophysics 51, 757–766.
O’Connell R.J. and Budiansky B. 1977. Viscoelastic properties offluid-saturated cracked solids. Journal of Geophysical Research 82,5719–5735.
Ogushwitz P.R. 1985. Application of the Biot theory. II. Suspension.Journal of the Acoustical Society of America 77, 441–452.
Pham N.H., Carcione J.M., Helle H.B. and Ursin B. 2002. Wave ve-locities and attenuation of shaley sandstones as a function of porepressure and partial saturation. Geophysical Prospecting 50, 615–627.
Toksoz M.N., Johnston D.H. and Timur A. 1979. Attenuation of seis-mic waves in dry and saturated rocks: I. Laboratory measurements.Geophysics 44, 681–690.
Tserkovnyak Y. and Johnson D.L. 2002. Can one hear the shape of asaturation patch? Geophysical Research Letters 29, 1–4.
Vo-Thanh D. 1990. Effects of fluid viscosity on shear-waves attenua-tion in saturated sandstones. Geophysics 55, 712–722.
White J.E. 1975. Computed seismic speeds and attenuation in rockswith partial saturation. Geophysics 40, 224–232.
Winkler K.W. and Nur A. 1979. Pore fluids and seismic attenuationin rocks. Geophysical Research Letters 6, 1–4.
Winkler K.W. and Nur A. 1982. Seismic attenuation: effects of porefluids and frictional sliding. Geophysics 47, 1–15.
Yin C.-S., Batzle M.L. and Smith B.J. 1992. Effects of partial liq-uid/gas saturation on extensional wave attenuation in Berea sand-stone. Geophysical Research Letters 19, 1399–1402.
C© 2003 European Association of Geoscientists & Engineers, Geophysical Prospecting, 51, 551–566


