Embed Size (px)
Citation preview
RESEARCH ARTICLE
Attenuation parameter and liver stiffness
measurement using FibroTouch vs Fibroscan
in patients with chronic liver disease
Ying Zhuang Ng1, Lee Lee Lai1,2, Sui Weng Wong1, Siti Yatimah Mohamad1, Kee
Huat Chuah1, Wah Kheong ChanID1*
1 Faculty of Medicine, Department of Medicine, Gastroenterology and Hepatology Unit, University of Malaya,
Kuala Lumpur, Malaysia, 2 Department of Nursing Science, University of Malaya, Kuala Lumpur, Malaysia
Abstract
Background & aim
We studied FibroTouch (FT) and Fibroscan (FS) examination results and their repeatability
when performed by healthcare personnel of different background.
Methods
FT and FS examinations were performed on patients with chronic liver disease by two oper-
ators, a doctor and a nurse, twice on each patient, at two different time points, independent
of each other.
Results
The data for 163 patients with 1304 examinations was analyzed. There was strong correla-
tion between FT and FS for attenuation parameter (Spearman’s rho 0.76, p<0.001) and liver
stiffness measurement (LSM) (Spearman’s rho 0.70, p<0.001). However, FT produced
higher value at lower attenuation parameter and LSM, and lower value at higher attenuation
parameter and LSM. There was substantial agreement when using 15kPa LSM cut-off, but
only moderate agreement when using 10kPa and 20kPa LSM cut-offs and 248dB/m,
268dB/m and 280dB/m attenuation parameter cut-offs. The IQR for attenuation parameter
and IQR/median for LSM were significantly lower for FT compared with FS (4dB/m vs 27dB/
m, p<0.001, and 10 vs 12, p<0.001, respectively). The intra- and inter-observer reliability of
attenuation parameter and LSM using FT and FS were good to excellent with intraclass cor-
relation coefficients 0.89–0.99. FT had shorter examination time (33s vs 47s, p<0.001) and
less invalid measurements (0 vs 2, p<0.001).
Conclusion
Measurements obtained with FT and FS strongly correlated, but significant differences in
their absolute values, consistency, examination time and number of invalid measurements
PLOS ONE
PLOS ONE | https://doi.org/10.1371/journal.pone.0250300 May 3, 2021 1 / 13
a1111111111
a1111111111
a1111111111
a1111111111
a1111111111
OPEN ACCESS
Citation: Ng YZ, Lai LL, Wong SW, Mohamad SY,
Chuah KH, Chan WK (2021) Attenuation parameter
and liver stiffness measurement using FibroTouch
vs Fibroscan in patients with chronic liver disease.
PLoS ONE 16(5): e0250300. https://doi.org/
10.1371/journal.pone.0250300
Editor: Daisuke Tokuhara, Osaka City University
Graduate School of Medicine, JAPAN
Received: October 27, 2020
Accepted: April 1, 2021
Published: May 3, 2021
Peer Review History: PLOS recognizes the
benefits of transparency in the peer review
process; therefore, we enable the publication of
all of the content of peer review and author
responses alongside final, published articles. The
editorial history of this article is available here:
https://doi.org/10.1371/journal.pone.0250300
Copyright: © 2021 Ng et al. This is an open access
article distributed under the terms of the Creative
Commons Attribution License, which permits
unrestricted use, distribution, and reproduction in
any medium, provided the original author and
source are credited.
Data Availability Statement: All relevant data are
within the paper and its Supporting Information
files.
were observed. Either device can be used by healthcare personnel of different backgrounds
when sufficiently trained.
Introduction
Chronic liver disease causes major health burden with increasing morbidity and mortality
worldwide [1]. Early identification of liver fibrosis regardless of aetiology is critical in the man-
agement of chronic liver disease as it is one of the most important predictors of long-term out-
come. The gold standard for staging liver fibrosis remains histopathological examination of a
liver biopsy specimen. However, due to the invasive nature of the liver biopsy procedure,
many non-invasive diagnostic techniques have been developed. Transient elastography is a
useful non-invasive tool for the assessment of liver fibrosis [2]. Fibroscan (FS) is a vibration-
controlled transient elastography device that estimates liver stiffness for the diagnosis of liver
fibrosis; additionally, controlled attenuation parameter (CAP), which is derived from the same
radiofrequency data for liver stiffness measurement, is used for the diagnosis of hepatic steato-
sis [3]. It has been validated in numerous studies, is widely accepted, and has been incorpo-
rated into major guidelines [4–6]. In 2013, FibroTouch (FT), also a vibration-controlled
transient elastography device, was introduced. Similar to FS, liver stiffness measurement
(LSM) and the attenuation parameter (called ultrasound attenuation parameter, UAP)
obtained using FT can be used for the diagnosis of liver fibrosis and hepatic steatosis [7]. The
primary aim of this study was to compare LSM and attenuation parameter obtained using FT
and FS in patients with chronic liver disease of various aetiologies. Our secondary aims were
to determine the intra-observer and inter-observer variability of the two modalities in health-
care personnel of different backgrounds, and to compare the time taken to complete an exami-
nation with FT and FS.
Methods
Study design
This is a cross-sectional study of consecutive adult patients who were scheduled for FS exami-
nation at the University of Malaya Medical Centre, Kuala Lumpur, Malaysia between Septem-
ber 2019 to March 2020. The study conformed to the ethical guidelines of the 1975
Declaration of Helsinki and ethical approval was obtained from the University Malaya Medical
Centre Medical Research Ethics Committee prior to commencement (MECID: 201982–7708).
Adults with chronic liver disease of various aetiologies were included in this study. The exclu-
sion criteria were patients younger than 16 years old, malignancy, ascites, extrahepatic chole-
stasis and pregnancy. All participating subjects provided written informed consent.
Demographic, anthropometric, clinical, and laboratory data were recorded using a standard
protocol. BMI was calculated by dividing weight in kilogram by the square of height in meter.
Subjects with BMI�25 kg per m2 were considered as obese [8]. Waist circumference was mea-
sured at the midpoint between the lowest margin of the least palpable rib and the top of the
iliac crest in the standing position. Central obesity was defined as a waist circumference�90
cm in men and�80 cm in women [9]. Venous blood was drawn after overnight fasting for
fasting blood glucose, liver and lipid profile within 6 months before or after elastography
examination.
PLOS ONE FibroTouch vs Fibroscan
PLOS ONE | https://doi.org/10.1371/journal.pone.0250300 May 3, 2021 2 / 13
Funding: The authors received no specific funding
for this work.
Competing interests: The authors have declared
that no competing interests exist.
Transient elastography
The transient elastography devices used in this study were Fibroscan 502 Touch (Echosens,
France) and FibroTouch FT100 (Wuxi Hisky Medical Technology Co. Ltd, Wuxi, China).
Examinations using both devices were performed by two operators, twice on each patient, at
two different time points, independent of each other. One operator was a doctor (operator 1,
N. Y. Z.), while the other operator was a nurse (operator 2, L. L. L.).
Fibroscan examinations
FS was performed after�2 hours of fasting. Each of the operators have performed�100 exam-
inations prior to commencement of this study. An examination was considered successful if
there were�10 valid measurements and reliable if the interquartile range (IQR)/median for
liver stiffness measurement was�30% or if the liver stiffness measurement was<7.1 kPa
when the IQR/median was >30% [10,11]. An examination was considered unsuccessful if<10
valid measurements were obtained after 30 attempts [12]. The use of Fibroscan probe, M or
XL, was based on computer recommendation. The time taken to complete an examination,
from the time the probe was first placed onto the patient until the examination was completed
or considered unsuccessful, was recorded [12].
FibroTouch examinations
FT was also performed after�2 hours of fasting. Both operators have not performed FT previ-
ously and have received training for the purpose of this study. Following training, each of the
operators have performed�100 examinations prior to commencement of this study. Similar
to FS, an examination was considered successful if there were�10 valid measurements and
reliable if the IQR/median for liver stiffness measurement was�30% or if the liver stiffness
measurement was <7.1 kPa when the IQR/median was >30%. An examination was also con-
sidered unsuccessful if<10 valid measurements were obtained after 30 attempts. The time
taken to complete an examination, from the time the probe was first placed onto the patient
until the examination was completed or considered unsuccessful, was recorded.
Statistical analysis
Data were analysed using a standard statistical software program, SPSS 25.0 (SPSS Inc, Chi-
cago, IL, USA). Continuous variables were expressed as mean ± standard deviation or median
(IQR), where appropriate. Categorical variables were expressed as percentages. Spearman cor-
relation coefficient rho and scatter plot were used to compare LSM and attenuation parameters
obtained using FS and FT whereby | rho |� 0.30 was considered weak correlation, 0.30 < |
rho |< 0.70 moderate correlation, and | rho |� 0.70 strong correlation. The median attenua-
tion parameter, IQR of attenuation parameter, LSM, and IQR/median of LSM, time taken to
complete an examination and number of invalid measurements using the two devices were
compared using Wilcoxon test. Significance was assumed when p<0.05. Bland Altman plot
was used to analyse the agreement between measurements obtained using the two devices. The
agreement in diagnosis of liver fibrosis and hepatic steatosis using LSM and attenuation
parameter obtained using the two devices were analysed with Cohen’s Kappa (K) value
whereby K�0 was considered no agreement, 0.01–0.20 slight agreement, 0.21–0.40 fair agree-
ment, 0.41–0.60 moderate agreement, 0.61–0.80 substantial agreement, 0.81–0.99 almost per-
fect agreement. The LSM and attenuation parameter cut-offs for diagnosis were based on
previously published studies for FS. The cut-offs for attenuation parameter used for the diag-
nosis of steatosis grades >S0, >S1 and>S2 were 248 dB/m, 268 dB/m and 280 dB/m,
PLOS ONE FibroTouch vs Fibroscan
PLOS ONE | https://doi.org/10.1371/journal.pone.0250300 May 3, 2021 3 / 13
respectively [13]. The LSM cut-offs used were <10 kPa, >15 kPa and>20 kPa, indicative of
unlikely compensated advanced chronic liver disease, likely compensated advanced chronic
liver disease and likely clinically significant portal hypertension, respectively [4,14]. In addi-
tion, subgroup analyses were performed: (1) using LSM cut-offs 8 kPa and 11 kPa for the diag-
nosis of significant fibrosis and cirrhosis, respectively, for patients with chronic hepatitis B
[15], and (2) using LSM cut-offs 7 kPa an 10.3 kPa for the diagnosis of significant fibrosis and
cirrhosis, respectively, for patients with NAFLD [16]. Further analyses was performed to look
at the diagnostic accuracy of LSM obtained by FT, using LSM obtained by FS as the reference
standard for the aforementioned diagnostic goals. Diagnostic accuracy was determined based
on area under receiver operating characteristic curve (AUROC), which was interpreted as fol-
lows: 0.90–1.00 = excellent, 0.80–0.90 = good, 0.70–0.80 = fair,< 0.70 = poor. The optimal
cut-off for LSM obtained by FT for a particular diagnostic goal was the LSM value that pro-
vided the highest sum of sensitivity and specificity for that diagnostic goal. The sensitivity,
specificity, positive predictive value, negative predictive value, and accuracy of LSM obtained
by FT for a particular diagnostic goal were determined based on the optimal cut-off for that
diagnostic goal. Intra-observer and inter-observer reliability were analysed using intraclass
correlation coefficient. Intraclass correlation coefficient (ICC) was interpreted as follows:
0.90–1.00 = excellent, 0.80–0.90 = good, 0.70–0.80 = fair, and 0.70 = poor.
Results
A total of 1336 transient elastography (TE) examinations with FT and FS were performed on
167 patients. There were no adverse events from both procedures. One patient was excluded
due to age less than 16 years old. Three patients were excluded from the analysis due to failed
or unreliable TE results. There was failure to obtain 4 sets of reliable LSM in two patients using
FS and in one patient using both FT and FS. The rate of successful and reliable examination
using FT and FS was 99% and 98%, respectively. After exclusion of the aforementioned
patients, 163 patients with 1304 examinations were included for analysis. Only 6 (1%) FS
examinations were performed using the XL probe. The rest of the FS examinations were per-
formed using the M probe. Patients characteristics are summarized in Table 1. The mean age
of the study population was 57 ± 14 years and 52% were males. The mean BMI was 25.7 ± 4.5
kg per m2 and ranged between 15 kg per m2 and 40.4 kg per m2. The waist circumference was
89.6 ± 12.7 cm and ranged between 59.0 cm and 122.5 cm. The prevalence of obesity and cen-
tral obesity was 52% and 62%, respectively. The main aetiology of chronic liver disease was
non-alcoholic fatty liver disease (NAFLD, 48.5%), followed by chronic hepatitis B (46%),
chronic hepatitis C (0.6%) and other aetiologies (4.9%).
Attenuation parameters
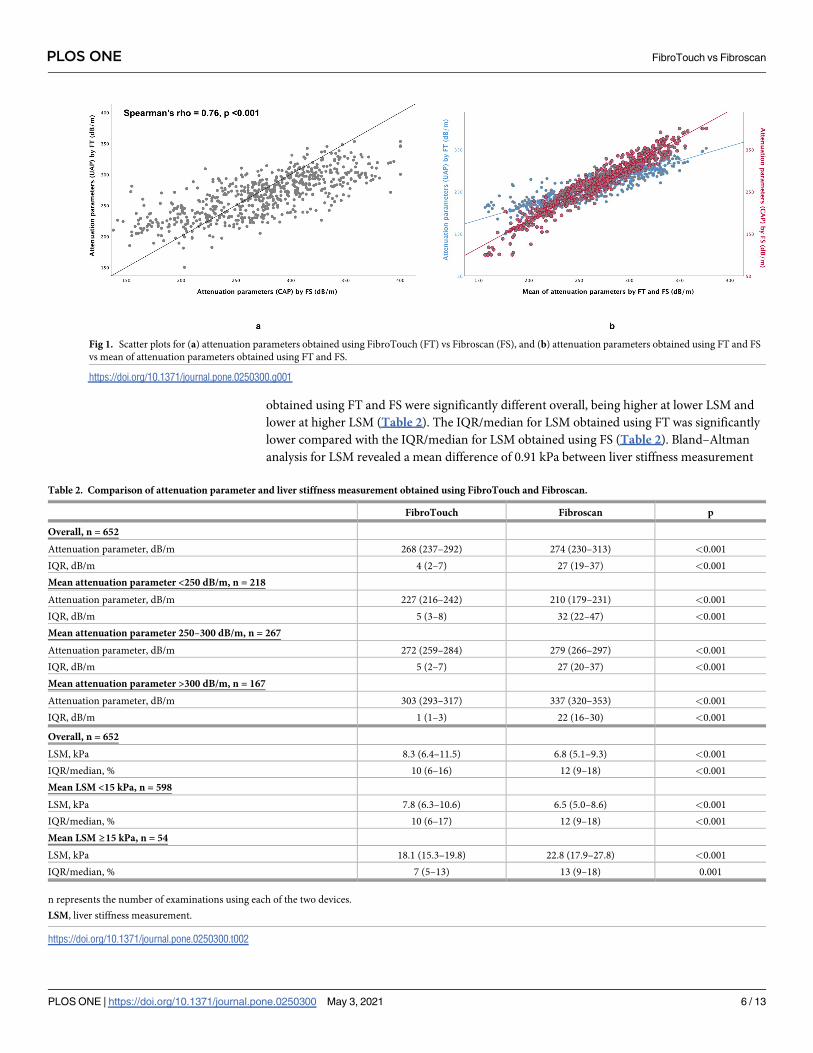
There was a strong correlation between FT and FS for attenuation parameter (Spearman’s
rho = 0.76, p<0.001) (Fig 1A). However, FT tended to produce higher value at lower attenua-
tion parameters but lower value at higher attenuation parameters (Fig 1B). Attenuation
parameter obtained using FT and FS were significantly different overall, FT being higher at
lower attenuation parameter and lower at higher attenuation parameter (Table 2). The IQR
for attenuation parameter obtained using FT was significantly lower compared with the IQR
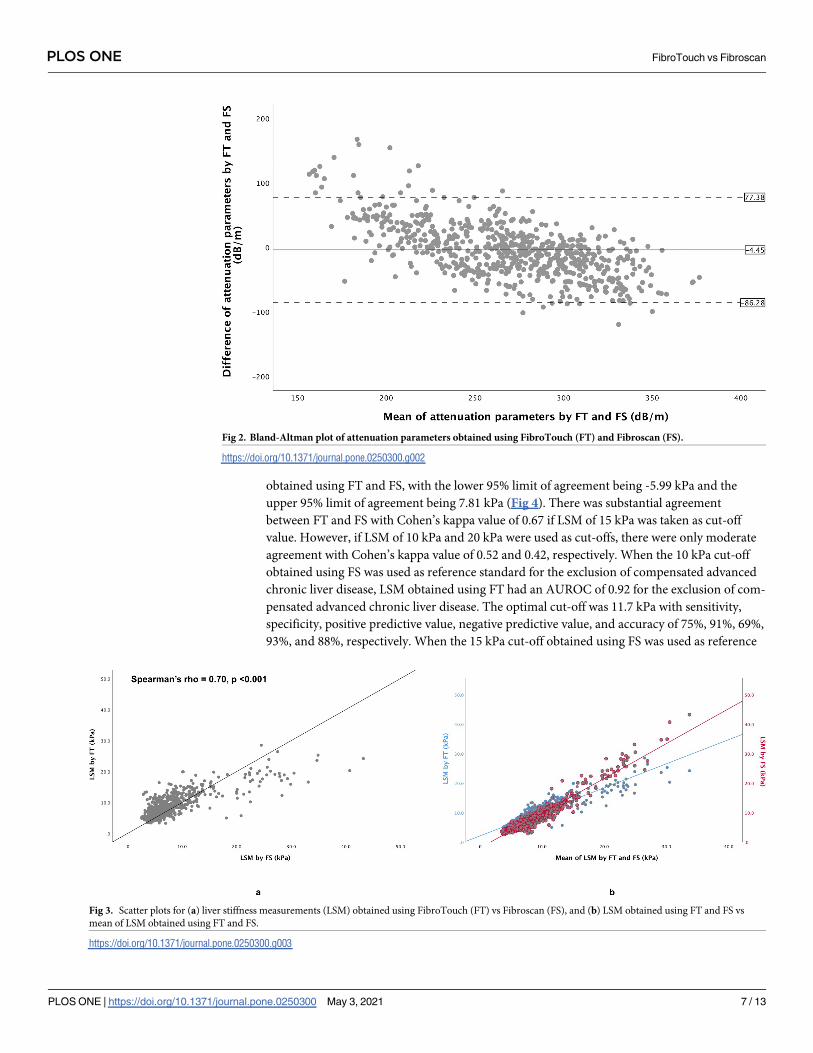
for attenuation parameter obtained using FS (Table 2). Bland–Altman analysis for attenuation
parameters revealed a mean difference of -4.45 dB/m between attenuation parameters
obtained with FT and FS, with the lower 95% limit of agreement being −86.28 dB/m and the
upper 95% limit of agreement being 77.38 dB/m (Fig 2). There was only moderate agreement
PLOS ONE FibroTouch vs Fibroscan
PLOS ONE | https://doi.org/10.1371/journal.pone.0250300 May 3, 2021 4 / 13
between FT and FS with Cohen’s kappa value of 0.57, 0.56 and 0.58 when using attenuation
parameter 248 dB/m, 268 dB/m and 280 dB/m as cut-off, respectively.
There was a strong correlation between operator 1 and 2 for attenuation parameter mea-
sured using FT (Spearman’s rho = 0.85, p<0.001) and FS (Spearman’s rho = 0.83, p<0.001)
(S1A and S1B Fig). The intra-observer reliability of UAP obtained using FT by operator 1 and
2 were excellent with ICC 0.95 (95% CI, 0.93–0.96) and ICC 0.94 (95% CI, 0.92–0.96), respec-
tively. The intra-observer reliability of CAP obtained using FS by operator 1 and 2 were also
excellent with ICC 0.94 (95% CI, 0.92–0.96) and ICC 0.90 (95% CI, 0.86–0.93), respectively.
The inter-observer reliability of UAP using FT was excellent with ICC 0.92 (95% CI, 0.90–
0.93), whereas the inter-observer reliability of CAP obtained using FS was good with ICC 0.89
(95% CI, 0.87–0.91).
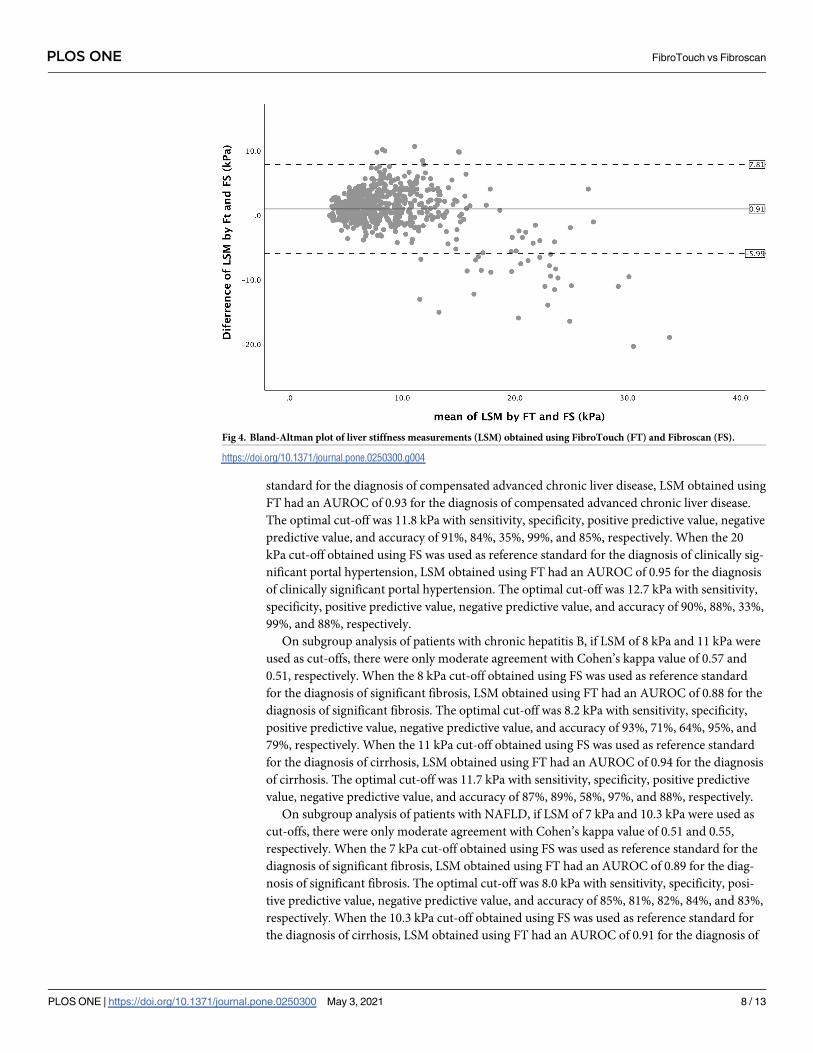
Liver stiffness measurement
There was also a strong correlation between FT and FS for LSM (Spearman’s rho = 0.70, p
<0.001) (Fig 3A). However, FT tended to produce lower value at higher LSM (Fig 3B). LSM
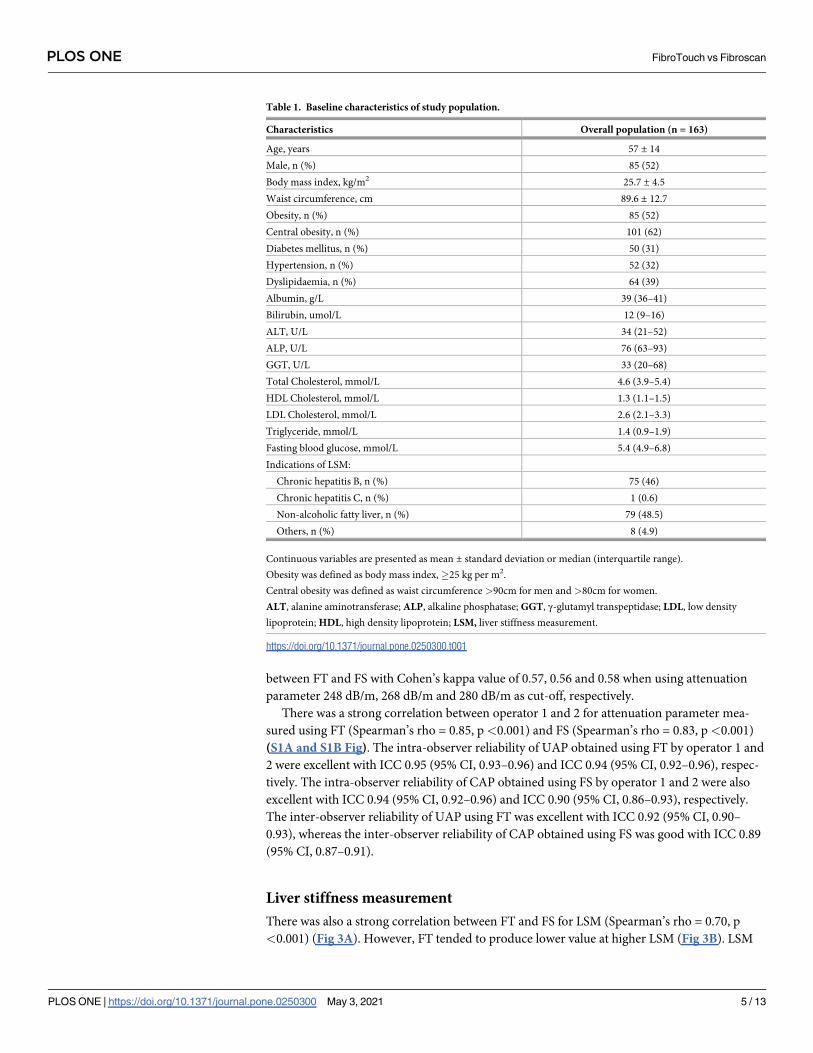
Table 1. Baseline characteristics of study population.
Characteristics Overall population (n = 163)
Age, years 57 ± 14
Male, n (%) 85 (52)
Body mass index, kg/m2 25.7 ± 4.5
Waist circumference, cm 89.6 ± 12.7
Obesity, n (%) 85 (52)
Central obesity, n (%) 101 (62)
Diabetes mellitus, n (%) 50 (31)
Hypertension, n (%) 52 (32)
Dyslipidaemia, n (%) 64 (39)
Albumin, g/L 39 (36–41)
Bilirubin, umol/L 12 (9–16)
ALT, U/L 34 (21–52)
ALP, U/L 76 (63–93)
GGT, U/L 33 (20–68)
Total Cholesterol, mmol/L 4.6 (3.9–5.4)
HDL Cholesterol, mmol/L 1.3 (1.1–1.5)
LDL Cholesterol, mmol/L 2.6 (2.1–3.3)
Triglyceride, mmol/L 1.4 (0.9–1.9)
Fasting blood glucose, mmol/L 5.4 (4.9–6.8)
Indications of LSM:
Chronic hepatitis B, n (%) 75 (46)
Chronic hepatitis C, n (%) 1 (0.6)
Non-alcoholic fatty liver, n (%) 79 (48.5)
Others, n (%) 8 (4.9)
Continuous variables are presented as mean ± standard deviation or median (interquartile range).
Obesity was defined as body mass index,�25 kg per m2.
Central obesity was defined as waist circumference >90cm for men and >80cm for women.
ALT, alanine aminotransferase; ALP, alkaline phosphatase; GGT, γ-glutamyl transpeptidase; LDL, low density
lipoprotein; HDL, high density lipoprotein; LSM, liver stiffness measurement.
https://doi.org/10.1371/journal.pone.0250300.t001
PLOS ONE FibroTouch vs Fibroscan
PLOS ONE | https://doi.org/10.1371/journal.pone.0250300 May 3, 2021 5 / 13
obtained using FT and FS were significantly different overall, being higher at lower LSM and
lower at higher LSM (Table 2). The IQR/median for LSM obtained using FT was significantly
lower compared with the IQR/median for LSM obtained using FS (Table 2). Bland–Altman
analysis for LSM revealed a mean difference of 0.91 kPa between liver stiffness measurement
Fig 1. Scatter plots for (a) attenuation parameters obtained using FibroTouch (FT) vs Fibroscan (FS), and (b) attenuation parameters obtained using FT and FS
vs mean of attenuation parameters obtained using FT and FS.
https://doi.org/10.1371/journal.pone.0250300.g001
Table 2. Comparison of attenuation parameter and liver stiffness measurement obtained using FibroTouch and Fibroscan.
FibroTouch Fibroscan p
Overall, n = 652
Attenuation parameter, dB/m 268 (237–292) 274 (230–313) <0.001
IQR, dB/m 4 (2–7) 27 (19–37) <0.001
Mean attenuation parameter <250 dB/m, n = 218
Attenuation parameter, dB/m 227 (216–242) 210 (179–231) <0.001
IQR, dB/m 5 (3–8) 32 (22–47) <0.001
Mean attenuation parameter 250–300 dB/m, n = 267
Attenuation parameter, dB/m 272 (259–284) 279 (266–297) <0.001
IQR, dB/m 5 (2–7) 27 (20–37) <0.001
Mean attenuation parameter >300 dB/m, n = 167
Attenuation parameter, dB/m 303 (293–317) 337 (320–353) <0.001
IQR, dB/m 1 (1–3) 22 (16–30) <0.001
Overall, n = 652
LSM, kPa 8.3 (6.4–11.5) 6.8 (5.1–9.3) <0.001
IQR/median, % 10 (6–16) 12 (9–18) <0.001
Mean LSM <15 kPa, n = 598
LSM, kPa 7.8 (6.3–10.6) 6.5 (5.0–8.6) <0.001
IQR/median, % 10 (6–17) 12 (9–18) <0.001
Mean LSM ≥15 kPa, n = 54
LSM, kPa 18.1 (15.3–19.8) 22.8 (17.9–27.8) <0.001
IQR/median, % 7 (5–13) 13 (9–18) 0.001
n represents the number of examinations using each of the two devices.
LSM, liver stiffness measurement.
https://doi.org/10.1371/journal.pone.0250300.t002
PLOS ONE FibroTouch vs Fibroscan
PLOS ONE | https://doi.org/10.1371/journal.pone.0250300 May 3, 2021 6 / 13
obtained using FT and FS, with the lower 95% limit of agreement being -5.99 kPa and the
upper 95% limit of agreement being 7.81 kPa (Fig 4). There was substantial agreement
between FT and FS with Cohen’s kappa value of 0.67 if LSM of 15 kPa was taken as cut-off
value. However, if LSM of 10 kPa and 20 kPa were used as cut-offs, there were only moderate
agreement with Cohen’s kappa value of 0.52 and 0.42, respectively. When the 10 kPa cut-off
obtained using FS was used as reference standard for the exclusion of compensated advanced
chronic liver disease, LSM obtained using FT had an AUROC of 0.92 for the exclusion of com-
pensated advanced chronic liver disease. The optimal cut-off was 11.7 kPa with sensitivity,
specificity, positive predictive value, negative predictive value, and accuracy of 75%, 91%, 69%,
93%, and 88%, respectively. When the 15 kPa cut-off obtained using FS was used as reference
Fig 2. Bland-Altman plot of attenuation parameters obtained using FibroTouch (FT) and Fibroscan (FS).
https://doi.org/10.1371/journal.pone.0250300.g002
Fig 3. Scatter plots for (a) liver stiffness measurements (LSM) obtained using FibroTouch (FT) vs Fibroscan (FS), and (b) LSM obtained using FT and FS vs
mean of LSM obtained using FT and FS.
https://doi.org/10.1371/journal.pone.0250300.g003
PLOS ONE FibroTouch vs Fibroscan
PLOS ONE | https://doi.org/10.1371/journal.pone.0250300 May 3, 2021 7 / 13
standard for the diagnosis of compensated advanced chronic liver disease, LSM obtained using
FT had an AUROC of 0.93 for the diagnosis of compensated advanced chronic liver disease.
The optimal cut-off was 11.8 kPa with sensitivity, specificity, positive predictive value, negative
predictive value, and accuracy of 91%, 84%, 35%, 99%, and 85%, respectively. When the 20
kPa cut-off obtained using FS was used as reference standard for the diagnosis of clinically sig-
nificant portal hypertension, LSM obtained using FT had an AUROC of 0.95 for the diagnosis
of clinically significant portal hypertension. The optimal cut-off was 12.7 kPa with sensitivity,
specificity, positive predictive value, negative predictive value, and accuracy of 90%, 88%, 33%,
99%, and 88%, respectively.
On subgroup analysis of patients with chronic hepatitis B, if LSM of 8 kPa and 11 kPa were
used as cut-offs, there were only moderate agreement with Cohen’s kappa value of 0.57 and
0.51, respectively. When the 8 kPa cut-off obtained using FS was used as reference standard
for the diagnosis of significant fibrosis, LSM obtained using FT had an AUROC of 0.88 for the
diagnosis of significant fibrosis. The optimal cut-off was 8.2 kPa with sensitivity, specificity,
positive predictive value, negative predictive value, and accuracy of 93%, 71%, 64%, 95%, and
79%, respectively. When the 11 kPa cut-off obtained using FS was used as reference standard
for the diagnosis of cirrhosis, LSM obtained using FT had an AUROC of 0.94 for the diagnosis
of cirrhosis. The optimal cut-off was 11.7 kPa with sensitivity, specificity, positive predictive
value, negative predictive value, and accuracy of 87%, 89%, 58%, 97%, and 88%, respectively.
On subgroup analysis of patients with NAFLD, if LSM of 7 kPa and 10.3 kPa were used as
cut-offs, there were only moderate agreement with Cohen’s kappa value of 0.51 and 0.55,
respectively. When the 7 kPa cut-off obtained using FS was used as reference standard for the
diagnosis of significant fibrosis, LSM obtained using FT had an AUROC of 0.89 for the diag-
nosis of significant fibrosis. The optimal cut-off was 8.0 kPa with sensitivity, specificity, posi-
tive predictive value, negative predictive value, and accuracy of 85%, 81%, 82%, 84%, and 83%,
respectively. When the 10.3 kPa cut-off obtained using FS was used as reference standard for
the diagnosis of cirrhosis, LSM obtained using FT had an AUROC of 0.91 for the diagnosis of
Fig 4. Bland-Altman plot of liver stiffness measurements (LSM) obtained using FibroTouch (FT) and Fibroscan (FS).
https://doi.org/10.1371/journal.pone.0250300.g004
PLOS ONE FibroTouch vs Fibroscan
PLOS ONE | https://doi.org/10.1371/journal.pone.0250300 May 3, 2021 8 / 13
cirrhosis. The optimal cut-off was 9.8 kPa with sensitivity, specificity, positive predictive value,
negative predictive value, and accuracy of 90%, 80%, 56%, 97%, and 82%, respectively.
There was a strong correlation between operator 1 and 2 for LSM measured using FT
(Spearman’s rho = 0.74, p<0.001) and FS (Spearman’s rho = 0.85, p<0.001) (S2A and S2B
Fig). The intra-observer reliability of LSM using FT by operator 1 and 2 were similar and
excellent with ICC 0.97 (95% CI, 0.96–0.98). The intra-observer reliability of LSM using FS by
operator 1 and 2 were also excellent with ICC 0.99 (95% CI, 0.98–0.99) and ICC 0.96 (95% CI,
0.94–0.97), respectively. The inter-observer reliability of LSM using FT was good with ICC
0.89 (95% CI, 0.86–0.91), whereas the inter-observer reliability of LSM using FS was excellent
with ICC 0.95 (95% CI, 0.94–0.96).
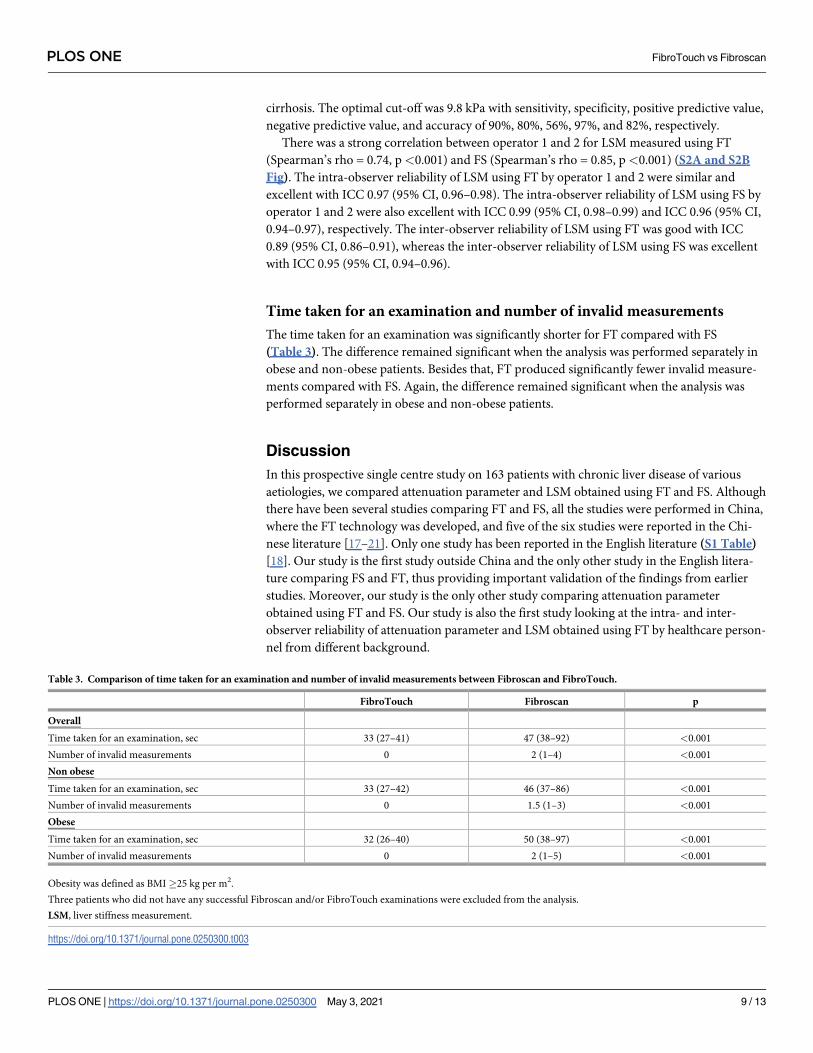
Time taken for an examination and number of invalid measurements
The time taken for an examination was significantly shorter for FT compared with FS
(Table 3). The difference remained significant when the analysis was performed separately in
obese and non-obese patients. Besides that, FT produced significantly fewer invalid measure-
ments compared with FS. Again, the difference remained significant when the analysis was
performed separately in obese and non-obese patients.
Discussion
In this prospective single centre study on 163 patients with chronic liver disease of various
aetiologies, we compared attenuation parameter and LSM obtained using FT and FS. Although
there have been several studies comparing FT and FS, all the studies were performed in China,
where the FT technology was developed, and five of the six studies were reported in the Chi-
nese literature [17–21]. Only one study has been reported in the English literature (S1 Table)
[18]. Our study is the first study outside China and the only other study in the English litera-
ture comparing FS and FT, thus providing important validation of the findings from earlier
studies. Moreover, our study is the only other study comparing attenuation parameter
obtained using FT and FS. Our study is also the first study looking at the intra- and inter-
observer reliability of attenuation parameter and LSM obtained using FT by healthcare person-
nel from different background.
Table 3. Comparison of time taken for an examination and number of invalid measurements between Fibroscan and FibroTouch.
FibroTouch Fibroscan p
Overall
Time taken for an examination, sec 33 (27–41) 47 (38–92) <0.001
Number of invalid measurements 0 2 (1–4) <0.001
Non obese
Time taken for an examination, sec 33 (27–42) 46 (37–86) <0.001
Number of invalid measurements 0 1.5 (1–3) <0.001
Obese
Time taken for an examination, sec 32 (26–40) 50 (38–97) <0.001
Number of invalid measurements 0 2 (1–5) <0.001
Obesity was defined as BMI�25 kg per m2.
Three patients who did not have any successful Fibroscan and/or FibroTouch examinations were excluded from the analysis.
LSM, liver stiffness measurement.
https://doi.org/10.1371/journal.pone.0250300.t003
PLOS ONE FibroTouch vs Fibroscan
PLOS ONE | https://doi.org/10.1371/journal.pone.0250300 May 3, 2021 9 / 13
Our study showed strong correlation between LSM obtained using FT and FS. While this is
consistent with previous studies, we noted that the correlation tended to be higher in studies
including purely or predominantly patients with chronic hepatitis B [17,18,21,22]. Another
study included only patients with primary biliary cholangitis [19]. In the study that included
patients with chronic liver disease of various aetiologies [20], the correlation tended to be
lower. We also found strong correlation between attenuation parameters obtained using FT
and FS. In the only other study comparing attenuation parameter obtained using FT and FS,
the correlation was moderate [20]. We believe the differences in correlation between LSM and
attenuation parameter obtained using FT and FS in the different studies are likely the result of
differences in the performance of the devices in populations with different characteristics. For
example, we observed that the diagnostic performance of attenuation parameter is lower in
studies with a greater proportion of patients who are obese, have NAFLD or have higher
grades of histological hepatic steatosis [23,24]. A subsequent individual patient data meta-anal-
ysis confirmed that attenuation parameter can be affected by body mass index and the pres-
ence of diabetes mellitus and NAFLD [11].
Interestingly, we observed that FT tended to produce higher LSM compared with FS for
lower LSM values and lower LSM compared with FS for higher LSM values. Although there
was substantial agreement between FT and FS when LSM of 15 kPa was taken as cut off, there
was only moderate agreement between FT and FS if LSM of 10 kPa and 20 kPa were taken as
cut off. On the other hand, FT tended to produce higher attenuation parameter compared
with FS for lower attenuation parameter values, and lower attenuation parameter compared
with FS for higher attenuation parameter values. There was only moderate agreement between
FT and FS for diagnosis of the different hepatic steatosis grades. These findings suggest that FT
and FS results may not be interchangeable, although they are strongly correlated and may be
similarly used for evaluation of patients with chronic liver disease. Moreover, FT appeared to
produce more consistent results with significantly lower IQR for attenuation parameter and
IQR/median for LSM compared with FS.
Our study revealed high intra- and inter-observer reliability for attenuation parameter and
LSM obtained using FT when performed by healthcare personnel of different background,
suggesting that FT can be used by healthcare personnel of different background after sufficient
training. We have previously published a study comparing FS by healthcare personnel of dif-
ferent background, which showed a similarly high level of intra- and inter-observer reliability
[12]. In the current study, we also found that FS produced more invalid measurements and
required slightly longer examination time compared with FT. Furthermore, FS has probes of
different sizes and the choice of probe is by automatic probe recommendation tool embedded
in the FS device. The XL probe was introduced to overcome failed and unreliable examinations
using the conventional M probe, especially in obese patients [25]. On the other hand, FT uses
one universal probe for examination. The FT probe is equipped with a build-in liver capsule
detection module that utilizes the characteristics of internal and external sounds signals of the
liver capsule to automatically adjust the depth of examination. In addition to the lower number
of invalid measurements, the use of one universal probe may have also contributed to the
shorter examination time for FT compared with FS.
Despite our best effort, this study has several limitations. Firstly, liver biopsy was not used
as reference standard for the degree of hepatic steatosis and fibrosis in this study. However,
there have been numerous studies on the use of FS for estimation of hepatic steatosis and
fibrosis using liver biopsy as reference standard. Moreover, FS is established and recognized as
a non-invasive tool for these purposes. Therefore, the use of FS as the reference standard for
comparison in this study is acceptable. Nevertheless, further studies on FT using liver biopsy
as reference standard may be needed in view of our findings of only moderate agreement in
PLOS ONE FibroTouch vs Fibroscan
PLOS ONE | https://doi.org/10.1371/journal.pone.0250300 May 3, 2021 10 / 13
FT and FS diagnosis when applying previously established cut-offs for FS. Secondly, when
assessing the inter-observer and intra-observer reliability, the repeat examinations of FT and
FS by both operators were performed on the same day. Ideally, these should have been per-
formed at least several days apart to minimize the operator bias, but this was not feasible for
logistic reasons. The examinations were performed at different times of the day to minimize
operator bias. Thirdly, the results obtained from this study may not be applicable to all aetiolo-
gies of chronic liver disease as the majority of the patients had either NAFLD or chronic hepa-
titis B. Finally, the results of this study may not be applicable to the paediatric population,
especially when children have been shown to have age-dependent increases in liver stiffness
measurement [26,27]. Further studies are needed to investigate the use of FibroTouch in the
paediatric population.
In conclusion, although attenuation parameter and LSM obtained using FT and FS are
strongly correlated, there are some differences in values at both extremes of attenuation
parameter and LSM values with only moderate agreement in FT and FS diagnosis when apply-
ing previously established cut-offs for FS, with the exception of the 15 kPa LSM cut-off, which
showed substantial agreement. The intra- and inter-observer reliability of FT and FS are good
to excellent suggesting that examination using either devices can be performed by healthcare
personnel of different background when they are sufficiently trained. FT does have the advan-
tage of one universal probe with significantly lower invalid measurements and shorter exami-
nation time.
Supporting information
S1 Fig. Scatter plots of attenuation parameters obtained by operator 1 vs operator 2 using (a)
Fibrotouch, and (b) Fibroscan.
(TIF)
S2 Fig. Scatter plots of liver stiffness measurements obtained by operator 1 vs operator 2 using
(a) Fibrotouch, and (b) Fibroscan.
(TIF)
S1 Table. Summary of studies that evaluated the performance of Fibroscan (FS) and Fibro-
Touch (FT).
(DOCX)
S1 File. Complete dataset to replicate all of the figures, tables, statistics, and other values
in this paper.
(SAV)
Acknowledgments
We would like to thank Wellmedic Healthcare Pvt. Ltd. by providing the FibroTouch device
used in this study. The company was not involved in the study design; in the collection, analy-
sis and interpretation of data; in the write up of the report; and in the decision to submit the
paper for publication. An abstract for this work was submitted to The Liver Meeting Digital
Experience 2020, where it was presented as a poster, and the abstract was published in the cor-
responding supplementary issue of Hepatology.
Author Contributions
Conceptualization: Wah Kheong Chan.
PLOS ONE FibroTouch vs Fibroscan
PLOS ONE | https://doi.org/10.1371/journal.pone.0250300 May 3, 2021 11 / 13

Data curation: Ying Zhuang Ng, Lee Lee Lai, Sui Weng Wong, Siti Yatimah Mohamad, Kee
Huat Chuah.
Formal analysis: Ying Zhuang Ng.
Validation: Wah Kheong Chan.
Writing – original draft: Ying Zhuang Ng.
Writing – review & editing: Wah Kheong Chan.
References1. Ratziu V, Harrison SA, Francque S, et al. Elafibranor, an Agonist of the Peroxisome Proliferator-Acti-
vated Receptor-alpha and -delta, Induces Resolution of Nonalcoholic Steatohepatitis Without Fibrosis
Worsening. Gastroenterology. 2016; 150(5):1147–1159 e1145. https://doi.org/10.1053/j.gastro.2016.
01.038 PMID: 26874076
2. Singh S, Muir AJ, Dieterich DT, Falck-Ytter YT. American Gastroenterological Association Institute
Technical Review on the Role of Elastography in Chronic Liver Diseases. Gastroenterology. 2017; 152
(6):1544–1577. https://doi.org/10.1053/j.gastro.2017.03.016 PMID: 28442120
3. Sasso M, Beaugrand M, de Ledinghen V, et al. Controlled attenuation parameter (CAP): a novel
VCTE™ guided ultrasonic attenuation measurement for the evaluation of hepatic steatosis: preliminary
study and validation in a cohort of patients with chronic liver disease from various causes. Ultrasound in
medicine & biology. 2010; 36(11):1825–1835.
4. de Franchis R, Baveno VIF. Expanding consensus in portal hypertension: Report of the Baveno VI Con-
sensus Workshop: Stratifying risk and individualizing care for portal hypertension. Journal of hepatol-
ogy. 2015; 63(3):743–752. https://doi.org/10.1016/j.jhep.2015.05.022 PMID: 26047908
5. Ghany MG, Morgan TR. Hepatitis C Guidance 2019 Update: American Association for the Study of
Liver Diseases-Infectious Diseases Society of America Recommendations for Testing, Managing, and
Treating Hepatitis C Virus Infection. Hepatology (Baltimore, Md). 2020; 71(2):686–721.
6. Wong VW, Chan WK, Chitturi S, et al. Asia-Pacific Working Party on Non-alcoholic Fatty Liver Disease
guidelines 2017-Part 1: Definition, risk factors and assessment. Journal of gastroenterology and hepa-
tology. 2018; 33(1):70–85. https://doi.org/10.1111/jgh.13857 PMID: 28670712
7. Deng H, Wang CL, Lai J, Yu SL, Xie DY, Gao ZL. Noninvasive Diagnosis of Hepatic Steatosis Using Fat
Attenuation Parameter Measured by FibroTouch and a New Algorithm in CHB Patients. Hepatitis
monthly. 2016; 16(9):e40263. https://doi.org/10.5812/hepatmon.40263 PMID: 27822268
8. Anuurad E, Shiwaku K, Nogi A, et al. The new BMI criteria for asians by the regional office for the west-
ern pacific region of WHO are suitable for screening of overweight to prevent metabolic syndrome in
elder Japanese workers. Journal of occupational health. 2003; 45(6):335–343. https://doi.org/10.1539/
joh.45.335 PMID: 14676412
9. Alberti KG, Zimmet P, Shaw J. The metabolic syndrome—a new worldwide definition. Lancet (London,
England). 2005; 366(9491):1059–1062. https://doi.org/10.1016/S0140-6736(05)67402-8 PMID:
16182882
10. Boursier J, Zarski JP, de Ledinghen V, et al. Determination of reliability criteria for liver stiffness evalua-
tion by transient elastography. Hepatology (Baltimore, Md). 2013; 57(3):1182–1191. https://doi.org/10.
1002/hep.25993 PMID: 22899556
11. Chan WK, Nik Mustapha NR, Mahadeva S, Wong VW, Cheng JY, Wong GL. Can the same controlled
attenuation parameter cut-offs be used for M and XL probes for diagnosing hepatic steatosis? Journal
of gastroenterology and hepatology. 2018; 33(10):1787–1794. https://doi.org/10.1111/jgh.14150 PMID:
29603365
12. Leong WL, Lai LL, Nik Mustapha NR, et al. Comparing point shear wave elastography (ElastPQ) and
transient elastography for diagnosis of fibrosis stage in non-alcoholic fatty liver disease. Journal of
gastroenterology and hepatology. 2020; 35(1):135–141. https://doi.org/10.1111/jgh.14782 PMID:
31310032
13. Karlas T, Petroff D, Sasso M, et al. Individual patient data meta-analysis of controlled attenuation
parameter (CAP) technology for assessing steatosis. Journal of hepatology. 2017; 66(5):1022–1030.
https://doi.org/10.1016/j.jhep.2016.12.022 PMID: 28039099
14. Wong VW, Irles M, Wong GL, et al. Unified interpretation of liver stiffness measurement by M and XL
probes in non-alcoholic fatty liver disease. Gut. 2019; 68(11):2057–2064. https://doi.org/10.1136/gutjnl-
2018-317334 PMID: 30658997
PLOS ONE FibroTouch vs Fibroscan
PLOS ONE | https://doi.org/10.1371/journal.pone.0250300 May 3, 2021 12 / 13

15. Sarin SK, Kumar M, Lau GK, et al. Asian-Pacific clinical practice guidelines on the management of hep-
atitis B: a 2015 update. Hepatology international. 2016; 10(1):1–98. https://doi.org/10.1007/s12072-
015-9675-4 PMID: 26563120
16. Wong VW, Vergniol J, Wong GL, et al. Diagnosis of fibrosis and cirrhosis using liver stiffness measure-
ment in nonalcoholic fatty liver disease. Hepatology. 2010; 51(2):454–462. https://doi.org/10.1002/hep.
23312 PMID: 20101745
17. Yuan L, Shao J, Hao M, et al. [Correlation between liver hardness testing results obtained by Fibro-
Touch and FibroScan and liver pathological stage]. Zhonghua gan zang bing za zhi = Zhonghua gan-
zangbing zazhi = Chinese journal of hepatology. 2014; 22(6):425–429. https://doi.org/10.3760/cma.j.
issn.1007-3418.2014.06.006 PMID: 25203705
18. Ou X, Wang X, Wu X, et al. [Comparison of FibroTouch and FibroScan for the assessment of fibrosis in
chronic hepatitis B patients]. Zhonghua gan zang bing za zhi = Zhonghua ganzangbing zazhi = Chinese
journal of hepatology. 2015; 23(2):103–106. https://doi.org/10.3760/cma.j.issn.1007-3418.2015.02.006
PMID: 25880975
19. Zhang YG, Zhao SX, Zhou GD, et al. [Correlation of FibroTouch and FibroScan with the stage of pri-
mary biliary cirrhosis]. Zhonghua gan zang bing za zhi = Zhonghua ganzangbing zazhi = Chinese jour-
nal of hepatology. 2016; 24(12):902–906. https://doi.org/10.3760/cma.j.issn.1007-3418.2016.12.005
PMID: 28073410
20. Zeng J, Sun WL, Chen GY, et al. [Efficiency of FibroScan and FibroTouch in liver stiffness measure-
ment and fat quantification: a comparative analysis]. Zhonghua gan zang bing za zhi = Zhonghua gan-
zangbing zazhi = Chinese journal of hepatology. 2016; 24(9):652–658. https://doi.org/10.3760/cma.j.
issn.1007-3418.2016.09.004 PMID: 27788720
21. Chen GF, Ping J, Gu HT, et al. [Correlation of liver stiffness measured by FibroTouch and FibroScan
with Ishak fibrosis score in patients with chronic hepatitis B]. Zhonghua gan zang bing za zhi = Zhon-
ghua ganzangbing zazhi = Chinese journal of hepatology. 2017; 25(2):145–150. https://doi.org/10.
3760/cma.j.issn.1007-3418.2017.02.013 PMID: 28297803
22. Xu Y, Liu Y, Cao Z, et al. Comparison of FibroTouch and FibroScan for staging fibrosis in chronic liver
disease: Single-center prospective study. Dig Liver Dis. 2019; 51(9):1323–1329. https://doi.org/10.
1016/j.dld.2019.02.009 PMID: 30928419
23. Chan WK, Nik Mustapha NR, Mahadeva S. Controlled attenuation parameter for the detection and
quantification of hepatic steatosis in nonalcoholic fatty liver disease. Journal of gastroenterology and
hepatology. 2014; 29(7):1470–1476. https://doi.org/10.1111/jgh.12557 PMID: 24548002
24. Chan WK, Nik Mustapha NR, Wong GL, Wong VW, Mahadeva S. Controlled attenuation parameter
using the FibroScan® XL probe for quantification of hepatic steatosis for non-alcoholic fatty liver dis-
ease in an Asian population. United European gastroenterology journal. 2017; 5(1):76–85. https://doi.
org/10.1177/2050640616646528 PMID: 28405325
25. de Ledinghen V, Wong VW, Vergniol J, et al. Diagnosis of liver fibrosis and cirrhosis using liver stiffness
measurement: comparison between M and XL probe of FibroScan®. Journal of hepatology. 2012; 56
(4):833–839. https://doi.org/10.1016/j.jhep.2011.10.017 PMID: 22173167
26. Li DK, Khan MR, Wang Z, et al. Normal liver stiffness and influencing factors in healthy children: An indi-
vidual participant data meta-analysis. Liver international: official journal of the International Association
for the Study of the Liver. 2020; 40(11):2602–2611. https://doi.org/10.1111/liv.14658 PMID: 32901449
27. Tokuhara D, Cho Y, Shintaku H. Transient Elastography-Based Liver Stiffness Age-Dependently
Increases in Children. PloS one. 2016; 11(11):e0166683. https://doi.org/10.1371/journal.pone.0166683
PMID: 27861607
PLOS ONE FibroTouch vs Fibroscan
PLOS ONE | https://doi.org/10.1371/journal.pone.0250300 May 3, 2021 13 / 13


