Embed Size (px)
Citation preview

[ APPLICATION NOTEBOOK ]
Amino Acid Analysis Application Notebook
1Amino Acid Analysis Application Notebook
[ CONTENTS ]
[ INTRODUCTION ]
Waters UPLC Amino Acid Analysis Solution ...............................................................................9
UPLC Amino Acid Analysis Solution .............................................................................................. 11
Enhancement of the UPLC Amino Acid Analysis Solution
with Flexible Detector Options ........................................................................................................ 15
Amino Acid Analysis of Proteins, Cell Culture Media,
Foods, and Feeds ................................................................................................................................. 23
Automating Amino Acid Analysis using Robotic
Sample Preparation Instrumentation .......................................................................................... 25
Improving Sample Handling for Amino Acid Analysis...........................................................27
[ HYDROLYSATES ]
Waters AccQ•Tag Method for Hydrolysate
Amino Acid Analysis ............................................................................................................................. 31
Separation of Low Levels of Isoleucine from Leucine
Using the ACQUITY UPLC H-Class Amino Acid System ................................................... 33
Amino Acid Analysis of Pure Protein Hydrolysate with Waters
UPLC Amino Acid Analysis Solution .............................................................................................37
Amino Acid Analysis of Protein Hydrolysates using
UPLC Amino Acid Analysis Solution ............................................................................................ 43
2 Amino Acid Analysis Application Notebook
[ CELL CULTURE ]
Monitoring Cell Culture Media with the Waters
Amino Acid Analysis Solution ..........................................................................................................47
[ FOODS AND FEEDS ]
Improving Food Process Control Using the
UPLC Amino Acid Analysis Solution ............................................................................................ 53
Application of the UPLC Amino Acid Analysis Solution to
the Analysis of Animal Feed Hydrolysates ................................................................................ 59
ACQUITY UPLC for the Rapid Analysis of Amino Acids in Wine .................................... 65
Determination of Amino Acids in Beers Using the UPLC
Amino Acid Analysis Solution ..........................................................................................................73
Complete Amino Acid Analysis of Food and Feeds ...............................................................79
[ OTHER AND REFERENCES ]
A Validated Bioanalytical Method for the Quantification
of Biogenic Amines Using UPLC-MS/MS ................................................................................. 83
References ............................................................................................................................................... 89
[ CONTENTS ]

3Amino Acid Analysis Application Notebook
[ Author Biographies ]
Nancy joined Waters Corporation as a Customer Support Specialist in 1986. Starting out working in the Life Science Marketing Lab focus on protein purification, the analysis of catecholamine’s, amino acids, and peptides, supporting the Pico•Tag® and AccQ•Tag Ultra® methodologies the. Currently, Nancy is a Principal Project Manager for Waters Global Services team where she continues to drive world renowned service through improved customer satisfaction with successful installations, increased efficiency for the field engineers, and reduced costs.
Nancy received her B.S. / B.S. in Medical Technology, and Biology with a minor in Chemistry, from the Salve Regina University. Prior to Waters Nancy was employed at University of Massachusetts Medical Center in the Core Research Facility. She maintained both the spinning cup (Beckman) and gas phase sequencers (ABI), along with conducting amino acid analysis, peptide purification and gel electrophoresis.
NANCY ASTEPHEN
Andrew Aubin is the Manager of the Purification / SFx Systems Marketing Laboratory of Waters Corporation (Milford, MA). He has been actively involved in the development of new LC, SFC, and SFE product solutions for the pharmaceutical, fine chemical and life science markets more than 19 years. Currently, he is responsible for managing a team that provides application support for all of Waters Purification Products.
ANDREW AUBIN
Weibin Chen is a director in the scientific operations (SciOps) of Waters Corporation (Milford, MA). He has been actively involved in the development of new LC-MS-based solutions for biopharmaceutical analysis for more than 16 years. Currently, he is responsible for managing scientific projects that are designed to deliver novel analytical solutions to address the challenges and unmet analytical needs in the biopharmaceutical industry by LC-MS technologies. Weibin has a Ph.D. degree in Analytical Chemistry from Purdue University and published more than 40 peer-reviewed scientific papers/book chapters on biomolecule analysis.
WEIBIN CHEN
Richard Daw is a field technical support specialist at Waters Corporation. He performs demonstrations and provides technical and application support for all separation, MS, Informatics, and consumable product areas, to a wide range of analytical chemistry customers in the South East USA. Richard received an MChem in Chemistry from the University of Exeter in the UK and has a experience in a wide range of lab environments (Petroleum, Earth Science, Toxicology, Pharmaceuticals, Material Science, Tobacco, and Drugs of Abuse) prior to working at Waters.
RICHARD DAW
4 Amino Acid Analysis Application Notebook
Diane joined Waters Corporation as a Senior Applications Chemist in 2001 and spent the next 10 years in various scientific manager and marketing roles within the Consumables Group, including Director of Applications. Her group developed LC, LC-MS, and GC-MS applications for new and existing LC columns and SPE products, covering all markets. In 2011, Diane was named the Director of New Product Portfolio Management. In 2013, Diane moved into the Pharmaceutical Vertical Marketing team as Director of Small Molecule Pharmaceutical Business Development, with focus on DMPK, Natural Products, and QC. In 2016, Diane became Senior Director of Pharmaceutical Market Development, covering Small Molecule Core Pharma, Biopharmaceuticals, DMPK, and Natural Products.
Prior to joining Waters, Diane received her B.S. (Chemistry), with a concentration in Business, from the University of Notre Dame. She was later awarded a Ph.D. (Analytical Chemistry) from Indiana University, under the direction of Professor Ronald Hites.
DIANE M. DIEHL, Ph.D.
A native of Romania, Catalin is a principal chemist at Waters. He develops bioanalysis applications for LCMS quantification of amino acids, peptides and proteins, as well as biopharmaceutical applications for mass spectrometry based characterization of protein therapeutics. Catalin’s biggest career influence was his 7th grade chemistry school teacher. He received a Bachelor degree in chemistry from University of Bucharest and a doctorate in analytical chemistry from Oregon State University. Away from work Catalin enjoys biking, hiking, and ice skating with his daughter.
CATALIN DONEANU
John Gebler has been with Waters for over 16 years focusing on Biopharmaceutical Strategic Business Development. He is responsible to develop Waters biopharmaceutical LC-MS business and strategy worldwide. John works with scientists from the pharmaceutical and biotech industry developing roadmaps for future Waters biopharma products, applications, and methods, while managing high-level technical collaborations with industry and academics. John’s current focus is the characterization and bio-analysis of antibody drug conjugates (ADC’s) and biosimilars. He received his PhD in Chemistry from The University of Utah.
JOHN GEBLER
[ Author Biographies ]

5Amino Acid Analysis Application Notebook
[ Author Biographies ]
Eric Grumbach is the Director, Product Marketing for Chromatography Systems within the Marketing Operations Group at Waters Corporation, Milford, MA. Eric and his team are responsible for the development and implementation of strategic and tactical plans to drive new business for Waters liquid and supercritical chromatography portfolio.
Eric has been at Waters for over 18 years, in various technical and business roles. He began the first 8 years of his career at Waters as an Applications Scientist in the Consumables Group. In 2008, he transitioned into a Global Product Marketing Manger role within Consumables Business Unit, taking on responsibility for a number of technologies including our industry leading ACQUITY® UPLC Columns, as well as leading the commercialization efforts for the 2.5 µm XP Columns. During this time, he authored two technology primers: Beginners Guide to UPLC [UltraPerformance Liquid Chromatography] and Comprehensive Guide to HILIC [Hydrophilic Interaction Chromatography].
In 2012, Eric transitioned into the Separation Technologies division, taking on product management responsibility for the ACQUITY UPLC H-Class System and led the development and commercialization efforts of the ACQUITY Arc® UHPLC System.
ERIC GRUMBACH
Hillary Hewitson is a Business Development Manager within the Pharmaceutical market segment at Waters Corporation, based in Milford, MA. Her focus is Pharmaceutical QC and manufacturing, including process analytical technologies. Previous to this role, she worked in development and application labs, performing a variety of pharmaceutical, protein, peptide, and amino acid separations. She participated in the development and commercialization of analytical standards for benchmarking mass spectrometry and was involved in the evaluations leading to advances with nano-scale column technology. Her first role with Waters was working in the QC lab at the chemistry manufacturing site.
Hillary obtained her Bachelor of Science in Biology from Bridgewater State University (MA) in 1995.
HILLARY HEWITSON
Paula Hong, Ph.D. is a Principal Scientist at Waters Corporation. She received her B.S. in Chemistry from Bucknell University (Lewisburg, PA) and her doctorate in Inorganic Chemistry from The University of Pennsylvania (Philadelphia, PA). She began her career as an applications chemist at Waters Corporation focusing on UHPLC and sub-2-µm technology for the application of biomoelcules. More recently, she also has studied in the impact of instrumentation on numerous applications for both LC and SFC. She has authored journal articles, review articles, as well as white papers.
PAULA HONG, Ph.D.
6 Amino Acid Analysis Application Notebook
Jo-Ann Jablonski is a Principal Scientist in Separations Technology Division at Waters Corporation. Prior to joining Waters, Jo-Ann was a peptide chemist at two biotechnology firms where she synthesized, analyzed, isolated, and characterized peptides for research, process development, and manufacturing. Since joining Waters in 1998, Jo-Ann has provided technical support and training on Waters purification systems, in addition to isolating compounds from pharmaceuticals, natural product extracts, and other chemically diverse mixtures.
JO-ANN JABLONSKI
Iggy received his Ph.D. from The State University of New York in 1997, working under the direction of Professor Nicole S. Sampson, where he studied the relationship between protein structure and function. Iggy then joined Micromass, Inc. supporting various software applications in mass spectrometry. After three years, Iggy moved into the applications laboratory as a Product Specialist supporting high resolution, accurate mass time of flight mass spectrometry for Waters. This role focused on the analysis of peptides, oligomers, proteins, protein complexes and polymers as well as proteomic and metabolomic studies. In 2007, Iggy then took on a new role as Field Marketing Manager in support of Waters’ marketing in the drug metabolism and pharmacokinetics area for the Americas. In 2014, Iggy moved into his current role in mass spectrometry sales.
IGGY KASS
Jeff received his Ph.D. from Northeastern University in 1992, working under the direction of Professor Ira Krull. Jeff joined Waters after graduation, focusing on chiral separations and ion analysis. After a short stint in the pharmaceutical industry, Jeff rejoined Waters in 2000 as Manager of the Applied Technology group in the Chemistry Operations division of Waters. Jeff was named Biopharmaceutical Business Director in 2007, a role in which he developed and implemented a strategy to grow Waters’ business to biopharmaceutical firms. In 2012 Jeff took on a new role managing Waters’ business in the chemical materials area. This area of Waters’ business is focused on petroleum, polymers, chemicals, personal care products, and electronics. In 2014, Jeff took over the newly formed Health Sciences business, a critical growth area for Waters that is focused on the biomarker discovery to diagnostic continuum. In 2016, Jeff was named Vice President of the Consumables Group. In June of 2017, he was appointed to the role of Vice President, Global Marketing.
JEFFREY R. MAZZEO, Ph.D.
[ Author Biographies ]
7Amino Acid Analysis Application Notebook
Dr Robert Plumb is the Director of Metabolic Phenotyping and Stratified Medicine in the Waters Health Sciences Business Operations Division, based in Milford, MA.
Dr Plumb has published over 100 papers on the subject of HPLC-MS and NMR for bioanalysis, metabolomics and metabolite identification. He is a recognized expert in the use of liquid chromatography with mass spectrometry, capillary scale LC, purifications scale LC, and metabonomics, giving many invited papers at international meetings around the world.
After obtaining an honors degree in Chemistry from the University of Hertfordshire in 1992, he started work in at Glaxo Research and Development Drug Metabolism Department. During his time at Glaxo and later GlaxoWellcome he continued his research in liquid chromatography combined with NMR and mass spectrometry for metabolite identification and bioanalysis obtaining his Ph.D. in 1999. Dr Plumb continued his work for GlaxoWellcome with the responsibility of metabolite identification using HPLC/MS/NMR and new analytical technology development. In 2001 he moved to Waters Corporation in Milford, MA, USA where he was responsible for the Life Science Chromatography group and latterly LC-MS applications in the Pharmaceutical Market Development Group before becoming the Director of Metabolic Phenotyping. He is currently a visiting Professor in Analytical Chemistry at Kings College London, visiting Professor at Imperial College in the Dept Surgery and Cancer, and a Fellow of the Royal Society of Chemistry. In 2014 he was awarded Highly Cited Researcher by Thompson Reuters.
Dr. ROBERT PLUMB
Mr. Romano is a Senior Manager for Waters Corporation. His current responsibilities include business development for global Environment and Food & Beverages companies. He has been with Waters for thirty-three years. At Waters he has held positions in customer education, applications laboratory, and marketing manager for environmental, food and beverages and natural products. Prior to Waters, Romano worked for DuPont as a methods development chemist in the analytical department. He has a master’s degree in chemistry from Bridgewater State University, Bridgewater, Massachusetts.
JOSEPH ROMANO
Thomas E. Wheat earned his Ph.D. from the University of Illinois and held research positions at Northwestern University before joining Waters Corporation. At Waters, his work has focused on both bioseparations and small molecule separations, particularly with MS detection. He has developed techniques for purification, notably At-column Dilution, as well as tools for bioseparations, including Auto•Blend™ Plus. He has published and presented papers on analytical biochemistry, capillary electrophoresis, mass spectrometry, and preparative chromatography. Recently, he has focused on synergies in separation systems and novel approaches to multi-dimensional chromatography.
THOMAS WHEAT, Ph.D.
[ Author Biographies ]

8 Amino Acid Analysis Application Notebook
[ NOTES ]
WAT E R S U P L C AM INO AC I D A NA LYSIS SO LU T IO N
Easy method transfer and significant run capacity gains in a high-throughput services labClient: A global biopharmaceutical firm headquartered in the U.S.
BACKGROUNDAn analytical services laboratory supporting the efforts of its process development group performs
LC-based analyses of amino acids from cell culture supernatants on an as-needed basis. The
information gleaned from the analyses is used by the process development group to make
decisions about how to best scale up the production of biopharmaceuticals.
To make the best informed decisions, the process development group must determine which amino
acids are critical for producing the highest quality proteins at the fastest rate. Once these have
been identified, the drug manufacturing process is modified so that cell cycle regulation results
in optimal drug production.
The support lab employs five chemists, one of whom is dedicated to this project. HPLC has been
the industry standard for years for performing the relevant amino acid analysis work. An HPLC
separation typically takes slightly more than one hour to resolve the important compounds
contained in the sample.
Results reported by the support lab are carefully checked for accuracy before being released
by the laboratory. Turnaround time is also key given the number of experiments required to
finetune the production process for a given protein.
CHALLENGEProcess development submits samples to the support lab at the rate of 100 per month, or roughly
five samples per eight-hour day. The support lab must derivatize each sample and then analyze
it on one of the lab’s HPLC instruments. Each HPLC separation takes 60 minutes from injection
to injection.
With other demands on the lab as well, the lab director has had to outsource between 30% to 40%
of the analyses and wait anywhere from two weeks to one month for results, depending on the
number of samples sent out at one time.
T HE SOLUT IONIn an effort to keep the work in-house without hiring additional resources, reduce turnaround times,
and cut costs, the lab director installed a Waters® ACQUITY UltraPerformance LC® (UPLC®) System.
In early 2005, the support lab introduced UPLC into the lab and, with only minor modifications,
transferred its reversed-phase HPLC amino acid analysis method to an ACQUITY UPLC® System
equipped with UV detection and 1.7-μm ACQUITY UPLC Column chemistries.
“ I was totally amazed that
we were able to separate
this set of amino acids
in nine minutes when,
not long ago, it took
several hours.”
Vice President,Process Development
9Waters UPLC Amino Acid Analysis Solution
Waters Corporation 34 Maple Street Milford, MA 01757 U.S.A. T: 1 508 478 2000 F: 1 508 872 1990 www.waters.com
Waters, ACQUITY UPLC, ACQUITY UltraPerformance LC, and UPLC are registered trademarks of Waters Corporation. The Science of What’s Possible is a trademark of Waters Corporation. All other trademarks are the property of their respective owners.
©2008 Waters Corporation. Printed in the U.S.A. February 2008 720001372EN LB-CP
Because UPLC is based on the same fundamental principles as
HPLC, important aspects of the HPLC separation, such as the
elution order of the amino acids and resolution, were the same
in both methods.
BUSINESS BENEFITThe support lab was able to readily transfer an HPLC method to the
UPLC system and obtain a 7X increase in speed without any per-
ceptible loss of resolution. The significant improvement in sample
throughput has increased capacity to the extent that requisite
outsourcing of amino acid analyses has been eliminated.
The laboratory now has the ability to run all the analyses in-house –
with capacity to spare – saving $56,000 in eight months while
allowing the lab to exercise a greater degree of control over the
process of generating test data.
The lab also reduced consumption of the solvent acetonitrile by
10X, which has resulted in a savings of $5,000 since installation
of the ACQUITY UPLC System. In less than eight months, the lab
has recouped its initial capital investment.
The adoption of UPLC has had other added benefits for this laboratory.
Previously, it was not uncommon for an analyst to start an HPLC
run just before leaving the lab for the day, only to arrive the next
morning to find out that the results were unacceptable due to a
needed modification or adjustment to the operating conditions.
Now, due to the speed of UPLC, much more can be accomplished in
an eight-hour day, minimizing the need to conduct overnight runs.
WAT ERS AND UPLCThe Waters UPLC Amino Acid Analysis Solution synergistically
combines unique instrumentation, column chemistries, and software
for data acquisition, processing, and support services. This system
creates a singular solution with superior sensitivity, resolution,
efficiency, and sample throughput.
When coupled with Waters mass spectrometers, UPLC provides a
level of separation, quantification, and characterization previously
unattainable with traditional HPLC methods.
UPLC is currently being employed by companies that rely heavily on
HPLC, thus bringing their laboratories measurable improvements in
analytical sensitivity, resolution, and speed. Ultimately, these firms
are looking for meaningful ways to increase laboratory productivity,
decrease operational costs, facilitate product development, and
increase revenue generation.
10 Waters UPLC Amino Acid Analysis Solution

AM
Q
NH
3
His S
er Arg
Gly
Asp
Glu
Th
r
Ala P
ro
Cy
sLy
s
Ty
rM
et
Val
NV
a
ILe
Leu P
he
Minutes
1.50 2.00 2.50 3.00 3.50 4.00 4.50 5.00 5.50 6.00 6.50 7.00 7.50 8.00
M E T HO D S A N D D IS C U S S IO N
Ultimately, a new amino acid method must provide the right
answer. Increased ruggedness, preferably with reduced labor
and run times, are also desired characteristics of a successful
laboratory system. These needs are met by combining AccQ•Tag
Ultra amino acid analysis chemistries with the proven separation
technology of the ACQUITY UPLC System; together they comprise
the turnkey application solution called the Waters UPLC Amino
Acid Analysis Solution.
UPLC Amino Acid Analysis SolutionThomas E. Wheat, Eric S. Grumbach, and Jeffrey R. Mazzeo Waters Corporation, Milford, MA, USA
IN T RO DU C T IO N
Analysis of amino acids is required in several different areas
of research and is also a fundamental tool in various product
analysis activities. These applications impose different
requirements on the analytical method because the amino acids
play different roles.
Amino acids are the basic constituents of proteins. For that reason,
qualitative and quantitative analysis of the amino acid composition
of hydrolyzed samples of pure proteins or peptides is used to
identify the material and to directly measure its concentration.
Amino acids are also intermediates in a myriad of metabolic
pathways, often not directly involving proteins. The amino
acids are, therefore, measured as elements of physiological
and nutritional studies. This has proven particularly important
in monitoring the growth of cells in cultures, as used in the
production of biopharmaceuticals.
Similar considerations lead to the analysis of foods and feeds to
ensure that nutritional requirements are met. These diverse sample
applications will all benefit from improved amino acid methods.
A comprehensive system-based solution for the analysis of amino
acids has been recently developed. This solution provides better
resolution and sensitivity, all achieved in a shorter analysis time
than with previous methodologies. Its enhanced separation ensures
that the analysis yields accurate and precise qualitative and
quantitative results and that the method is exceptionally rugged.
This application solution is based on the well-understood and
widely-used Waters® AccQ•Tag™ pre-column derivatization
chemistry The derivatives are separated using the Waters
ACQUITY UltraPerformance LC® (UPLC®) System for optimum
resolution and sensitivity. System control, data acquisition,
processing, and flexible reporting are provided within Empower®
Software. The integrated total application solution ensures
successful analyses.
UPLC Amino Acid Analysis Solution.
Figure 1. Separation of 50 pmoles of the amino acid hydrolysate standard with the UPLC Amino Acid Analysis Solution.
11UPLC Amino Acid Analysis Solution
CLASSIC UPLC
Analysis of a hydrolysate standard is shown in Figure 1. The amino
acids are derivatized using AccQ•Fluor™ Ultra Reagent (Part
Number: 186003836) (6-aminoquinolyl-N-hydroxysuccinimidyl
carbamate). Both primary and secondary amino acids react in
a simple batch-wise derivatization, and samples are stable for
several days. No special sample preparation is required, and the
reaction occurs in a largely aqueous solution so it is very tolerant
of buffer salts and other sample components. The excess reagent
naturally hydrolyzes, and the by-product is chromatographically
resolved from the derivatives. No special handling or extraction
is required.
The derivatives are separated on an AccQ•Tag Ultra Column,
2.1 x 100 mm (Part Number: 186003837), a bridged ethyl hybrid
(BEH) C18 1.7 μm particle specifically tested for separation of
the amino acids. Packaged eluents are quality control (QC) tested
with amino acid separations. They are provided as concentrates
requiring only dilution with water before use. The instrument is
the ACQUITY UPLC System with UV detection at 260 nm.
The resolution of the amino acids is 1.6 or greater to ensure
accurate quantitation. Retention time reproducibility is on the
order of hundredths of minutes, much less than a peak width,
to ensure unambiguous identification of the amino acids. The
detection is linear, over more than three orders of magnitude,
to permit quantitative analysis of samples with disparate ratios
of amino acids with an ample margin for samples of different
concentration. The sensitivity of the method gives adequate
signal-to-noise to quantitate at the level of 50 femtomoles
on-column.
The method can be successfully used for a range of applications.
The standard method shown in Figure 1 can also resolve the
derivatives of cysteine commonly used in protein structure
analysis. The products of performic acid oxidation that are part
of assessing the nutritional quality of foods and feeds are also
well-separated.
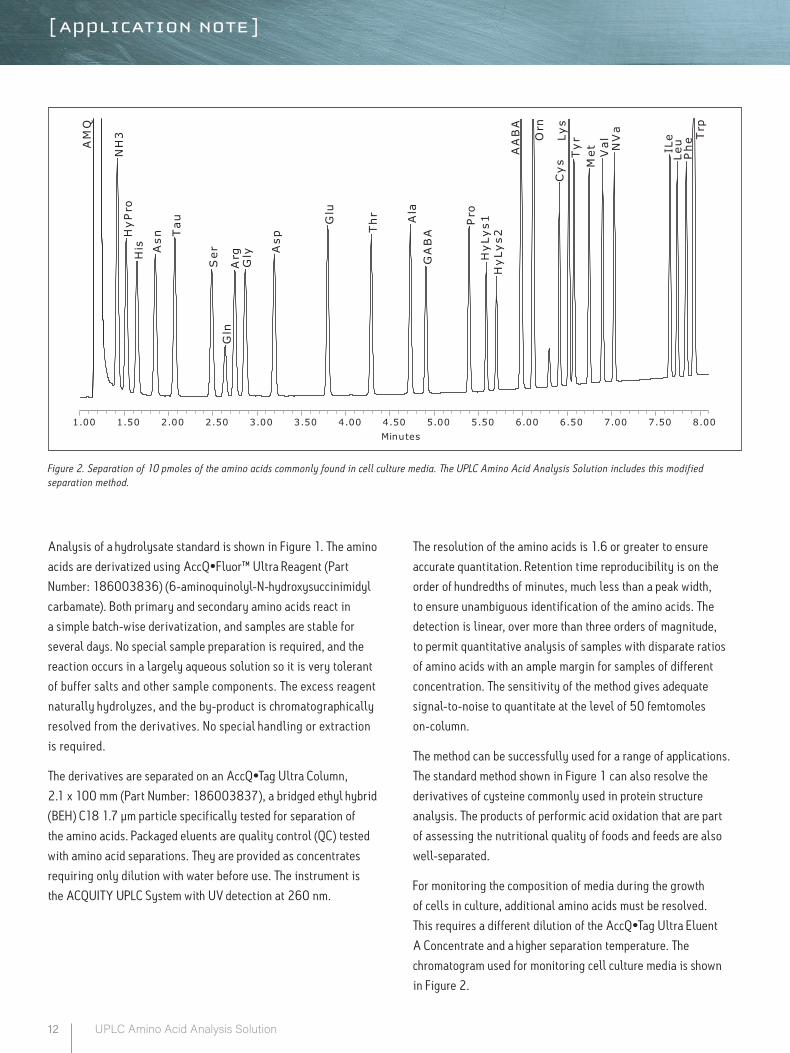
For monitoring the composition of media during the growth
of cells in culture, additional amino acids must be resolved.
This requires a different dilution of the AccQ•Tag Ultra Eluent
A Concentrate and a higher separation temperature. The
chromatogram used for monitoring cell culture media is shown
in Figure 2.
Figure 2. Separation of 10 pmoles of the amino acids commonly found in cell culture media. The UPLC Amino Acid Analysis Solution includes this modified separation method.
AM
Q
NH
3H
yP
roH
is Asn
Tau
Ser
Gln
Arg
Gly A
sp
Glu
Th
r Ala
GA
BA
Pro
Hy
Lys1
Hy
Lys2
AA
BA
Orn
Cy
sLy
sT
yr
Met
Val
NV
a
ILe
Leu
Ph
e Trp
Minutes1.00 1.50 2.00 2.50 3.00 3.50 4.00 4.50 5.00 5.50 6.00 6.50 7.00 7.50 8.00
12 UPLC Amino Acid Analysis Solution
CO N C LU S IO N
These results describe the new Waters UPLC Amino Acid Analysis Solution, an Assured Performance Solution (APS), that come complete
with application-focused chemistries, innovative UltraPerformance LC and MS technologies, methodology, documentation, and support to
deliver the answers you need about amino acids, every time. Successful results are assured through the use of pre-tested derivatization and
separation chemistry and the high resolution provided with the ACQUITY UPLC System.
This integrated analytical approach will give accurate and precise qualitative and quantitative results for a wide range of applications
including protein and peptide hydrolysates, monitoring cell culture media, and measuring the nutritional value of food and feeds.
Waters Corporation 34 Maple Street Milford, MA 01757 U.S.A. T: 1 508 478 2000 F: 1 508 872 1990 www.waters.com
13UPLC Amino Acid Analysis Solution
Waters, The Science of What’s Possible, UltraPerformance LC, Empower, ACQUITY UPLC, and UPLC are registered trademarks of Waters Corporation. AccQ•Tag, and AccQ•Fluor are trademarks of Waters Corporation. All other trademarks are the property of their respective owners.
©2006-2008 Waters Corporation. Produced in the U.S.A. November 2015 720001683EN KP-PDF

14 Amino Acids Application Notebook
[ NOTES ]
15Enhancement of the UPLC Amino Acid Analysis Solution with Flexible Detector Options
CLASSIC UPLC
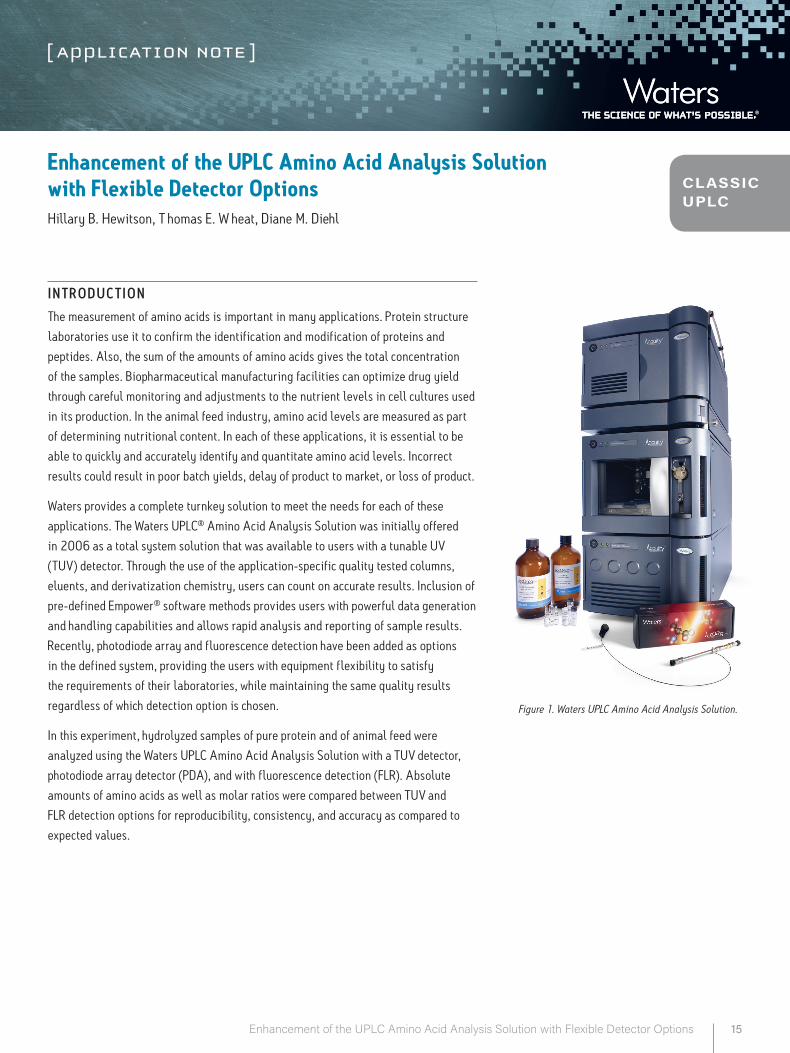
Enhancement of the UPLC Amino Acid Analysis Solution with Flexible Detector OptionsHillary B. Hewitson, T homas E. W heat, Diane M. Diehl
Figure 1. Waters UPLC Amino Acid Analysis Solution.
IN T RO DU C T IO N
The measurement of amino acids is important in many applications. Protein structure
laboratories use it to confirm the identification and modification of proteins and
peptides. Also, the sum of the amounts of amino acids gives the total concentration
of the samples. Biopharmaceutical manufacturing facilities can optimize drug yield
through careful monitoring and adjustments to the nutrient levels in cell cultures used
in its production. In the animal feed industry, amino acid levels are measured as part
of determining nutritional content. In each of these applications, it is essential to be
able to quickly and accurately identify and quantitate amino acid levels. Incorrect
results could result in poor batch yields, delay of product to market, or loss of product.
Waters provides a complete turnkey solution to meet the needs for each of these
applications. The Waters UPLC® Amino Acid Analysis Solution was initially offered
in 2006 as a total system solution that was available to users with a tunable UV
(TUV) detector. Through the use of the application-specific quality tested columns,
eluents, and derivatization chemistry, users can count on accurate results. Inclusion of
pre-defined Empower® software methods provides users with powerful data generation
and handling capabilities and allows rapid analysis and reporting of sample results.
Recently, photodiode array and fluorescence detection have been added as options
in the defined system, providing the users with equipment flexibility to satisfy
the requirements of their laboratories, while maintaining the same quality results
regardless of which detection option is chosen.
In this experiment, hydrolyzed samples of pure protein and of animal feed were
analyzed using the Waters UPLC Amino Acid Analysis Solution with a TUV detector,
photodiode array detector (PDA), and with fluorescence detection (FLR). Absolute
amounts of amino acids as well as molar ratios were compared between TUV and
FLR detection options for reproducibility, consistency, and accuracy as compared to
expected values.

16 Enhancement of the UPLC Amino Acid Analysis Solution with Flexible Detector Options
Samples
Acid-hydrolyzed bovine serum albumin (BSA) and soybean meal samples were
prepared in an independent laboratory as part of a collaborative study. The
samples were supplied at an estimated concentration of 1.0 mg/mL in 0.1 M HCl
sealed under argon in ampoules. Samples were stored at -80 °C until analysis.
Sample Dilution and Derivatization
The supplied samples were diluted with 0.1 M HCl prior to derivatization,
as necessary, to assure accurate pipetting and complete derivatization. The
samples were derivatized in batches, and were stable for up to one week at room
temperature when tightly capped. Conditions, including suggested neutralization,
for pre-column derivatization and analysis are described in detail in the Waters
UPLC Amino Acid Analysis Application System Guide. The following sequential
modified derivatization conditions were used for these samples.
1. 60 μL AccQ•Tag™ Ultra Borate Buffer
2. 10 μL diluted sample
3. 10 μL 0.1 N NaOH
4. 20 μL reconstituted AccQ•Tag Ultra Reagent
Acquisition and Processing Methods
The Waters UPLC Amino Acid Analysis Solution is provided with a CD that
contains all the Empower methods necessary for acquisition and processing of the
samples, as well as reporting of results. Details of the methods can be found in
the Waters UPLC Amino Acid Analysis System Guide.
E X P E R IM E N TA L
LC conditions (Header 2) LC system: Waters ACQUITY UPLC®
System
Column: AccQ•Tag Ultra, 2.1 x 100 mm, 1.7 μm
Column temp: 55 ˚C
Sample temp: 20 ˚C
Flow rate: 700 μL/min
Mobile phase A: 1:20 Dilution of AccQ•Tag Ultra Eluent A
Concentrate (prepared fresh daily)
Mobile phase B: AccQ•Tag Ultra Eluent B
Needle washes: Weak – 95:5 Water: Acetonitrile
Strong – 5:95 Water: Acetonitrile
Gradient: AccQ•Tag Ultra Hydrolysate Method (provided in the UPLC Amino Acid Analysis Solution)
Total run time: 9.5 min
Injection volume: 1 μL, Partial Loop with Needle Overfill (2 μL loop installed)
Detection: UV (TUV), 260nm UV (PDA), 260nm, using 2D mode Fluorescence (FLR), λEx 266 nm, λEm 473 nm
17Enhancement of the UPLC Amino Acid Analysis Solution with Flexible Detector Options
R E SU LT S A N D D IS C U S S IO N
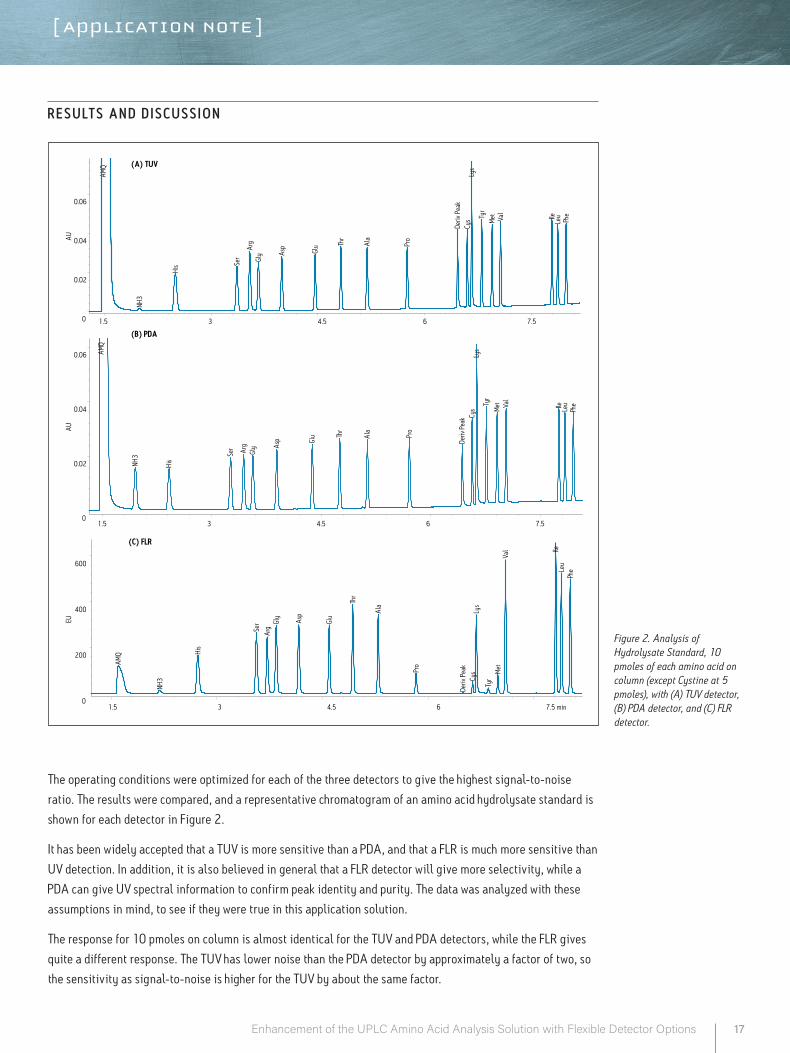
Figure 2. Analysis of Hydrolysate Standard, 10 pmoles of each amino acid on column (except Cystine at 5 pmoles), with (A) TUV detector, (B) PDA detector, and (C) FLR detector.
AMQ
NH3
His
Ser
Arg
Gly
Asp
Glu
Thr
Ala
Pro
Deriv
Pea
kCy
sLy
s
Tyr
Met
Val Ile
Leu
Phe
EU
0
200
400
600
AMQ
NH3
His Se
r
Arg
Gly As
p
Glu Th
r
Ala
Pro
Deriv
Pea
kCy
sLy
sTy
rM
et Val
IleLe
u Phe
AU
0
0.02
0.04
0.06
AMQ
NH3
His
Ser Arg
Gly A
sp Glu Th
r
Ala Pro
Deriv
Pea
k Cys
Lys
Tyr
Met Val
Ile Leu
Phe
AU
0
0.02
0.04
0.06
1.5 3 4.5 6 7.5
(A) TUV
(B) PDA
(C) FLR
1. 35 4. 65 7.5
1. 35 4. 65 7.5 min
The operating conditions were optimized for each of the three detectors to give the highest signal-to-noise
ratio. The results were compared, and a representative chromatogram of an amino acid hydrolysate standard is
shown for each detector in Figure 2.
It has been widely accepted that a TUV is more sensitive than a PDA, and that a FLR is much more sensitive than
UV detection. In addition, it is also believed in general that a FLR detector will give more selectivity, while a
PDA can give UV spectral information to confirm peak identity and purity. The data was analyzed with these
assumptions in mind, to see if they were true in this application solution.
The response for 10 pmoles on column is almost identical for the TUV and PDA detectors, while the FLR gives
quite a different response. The TUV has lower noise than the PDA detector by approximately a factor of two, so
the sensitivity as signal-to-noise is higher for the TUV by about the same factor.
18 Enhancement of the UPLC Amino Acid Analysis Solution with Flexible Detector Options
With the FLR detector, we observe that the derivatives of the
different amino acids have different fluorescence yields, and thus
different sized peaks. The excitation and emission spectra are
identical for all the amino acids. The differences do not seem to
be related to spectral shifts. Tyrosine is the smallest peak in the
fluorescence chromatogram, and, therefore, dictates the limit of
quantitation. The usable range for both the TUV and FLR detectors
in the application is 50 fmoles to 50 pmoles on column.
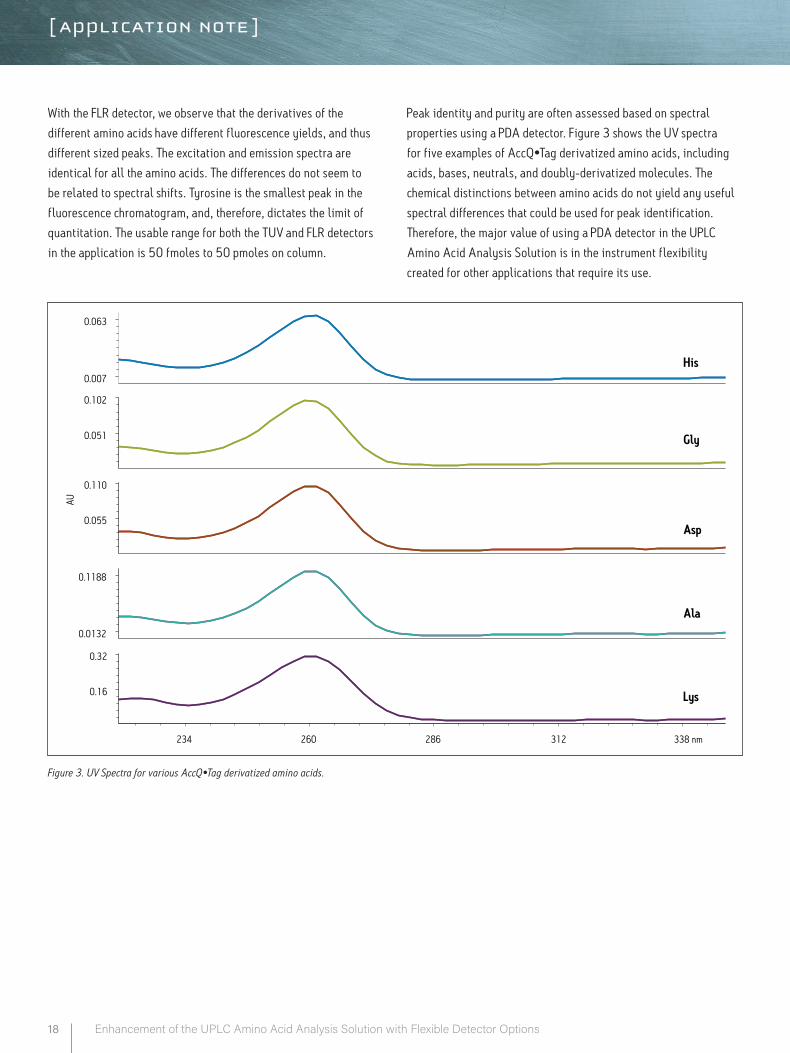
Peak identity and purity are often assessed based on spectral
properties using a PDA detector. Figure 3 shows the UV spectra
for five examples of AccQ•Tag derivatized amino acids, including
acids, bases, neutrals, and doubly-derivatized molecules. The
chemical distinctions between amino acids do not yield any useful
spectral differences that could be used for peak identification.
Therefore, the major value of using a PDA detector in the UPLC
Amino Acid Analysis Solution is in the instrument flexibility
created for other applications that require its use.
0.007
0.063
0.051
0.102
0.055
0.110
0.0132
0.1188
0.16
0.32
234 260 286 312 338 nm
His
Gly
Asp
Ala
Lys
AU
Figure 3. UV Spectra for various AccQ•Tag derivatized amino acids.
19Enhancement of the UPLC Amino Acid Analysis Solution with Flexible Detector Options
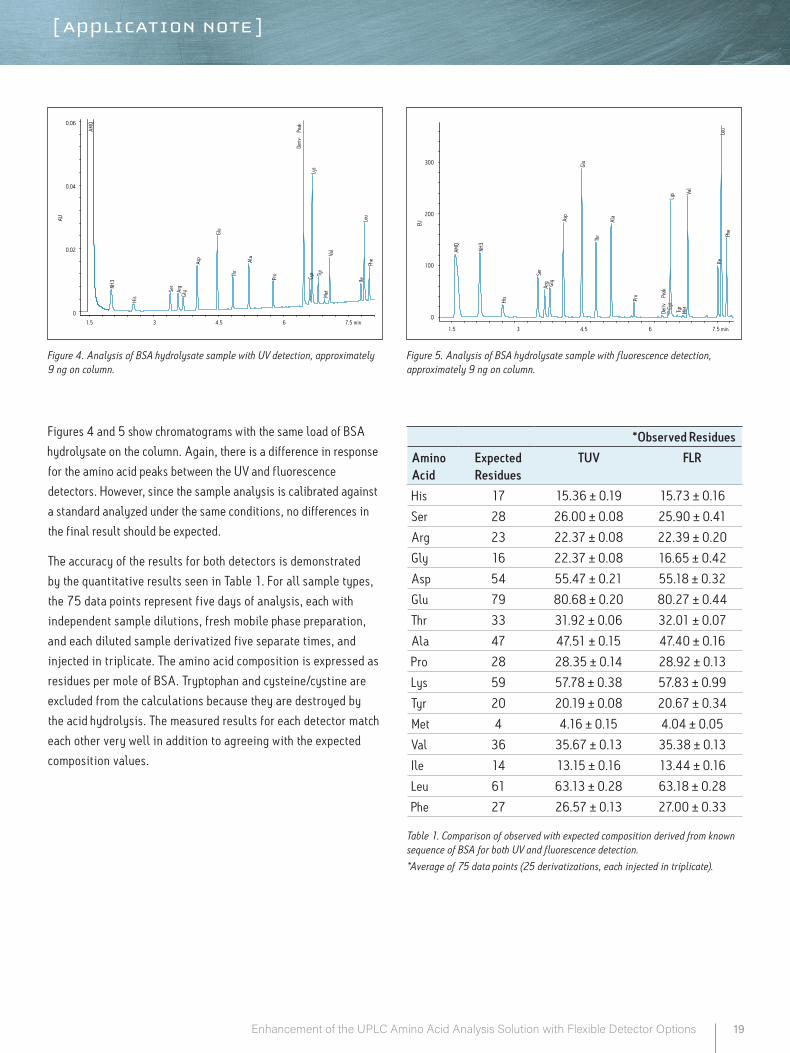
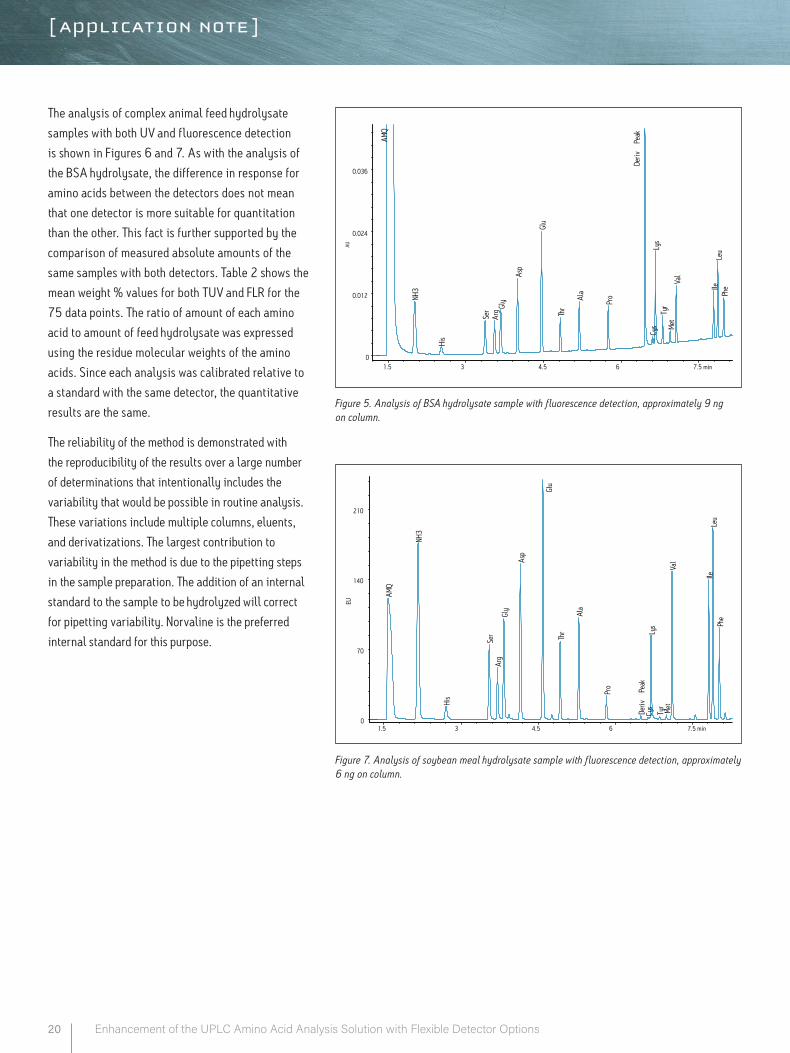
Figures 4 and 5 show chromatograms with the same load of BSA
hydrolysate on the column. Again, there is a difference in response
for the amino acid peaks between the UV and fluorescence
detectors. However, since the sample analysis is calibrated against
a standard analyzed under the same conditions, no differences in
the final result should be expected.
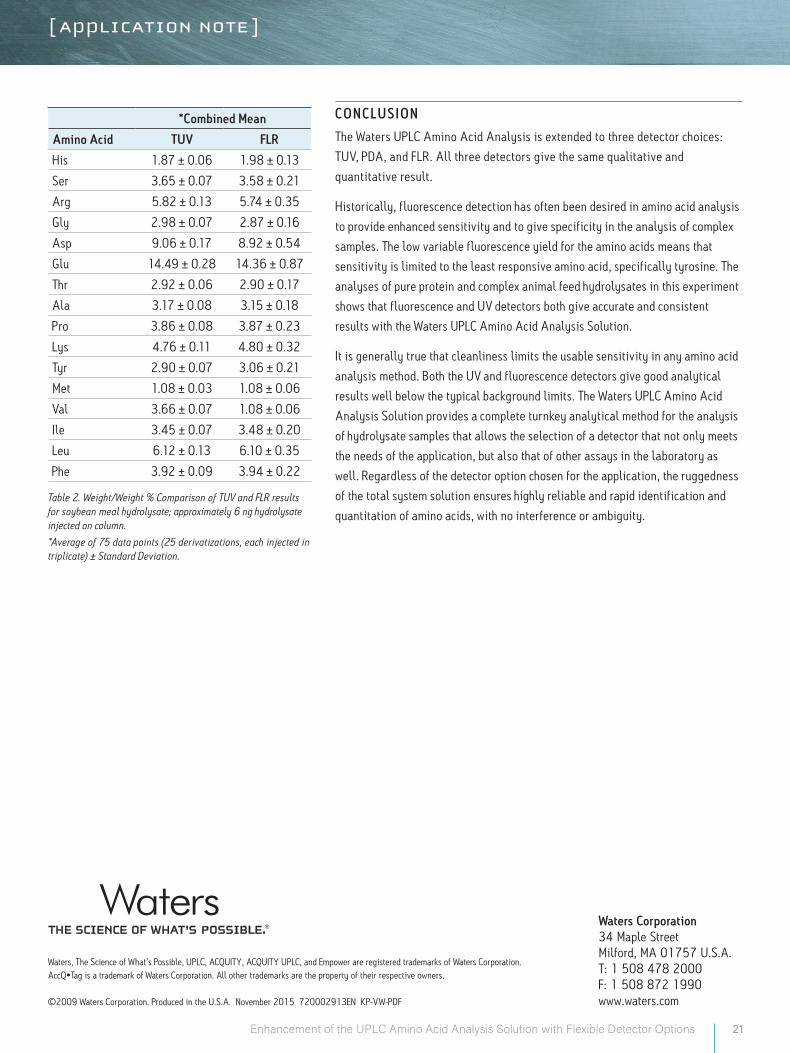
The accuracy of the results for both detectors is demonstrated
by the quantitative results seen in Table 1. For all sample types,
the 75 data points represent five days of analysis, each with
independent sample dilutions, fresh mobile phase preparation,
and each diluted sample derivatized five separate times, and
injected in triplicate. The amino acid composition is expressed as
residues per mole of BSA. Tryptophan and cysteine/cystine are
excluded from the calculations because they are destroyed by
the acid hydrolysis. The measured results for each detector match
each other very well in addition to agreeing with the expected
composition values.
AU
0
0.02
0.04
0.06
1.5 3 4.5 6 7.5 min
NH3
His
Ser
Arg
Gly
Asp
Glu
Thr
Ala
Pro
Deriv
Peak
Cys
Lys
Tyr
Met
Val
IleLe
uPh
e
AMQ
AMQ
NH3
His
Ser
Arg Gly
Asp
Glu
Thr
Ala
Pro
Deriv
Peak
Cys
Lys
Tyr
Met
Val
IleLe
uPh
e
EU
0
100
200
300
1. 35 4. 65 7.5 min
Figure 4. Analysis of BSA hydrolysate sample with UV detection, approximately 9 ng on column.
Figure 5. Analysis of BSA hydrolysate sample with fluorescence detection, approximately 9 ng on column.
Table 1. Comparison of observed with expected composition derived from known sequence of BSA for both UV and fluorescence detection.
*Average of 75 data points (25 derivatizations, each injected in triplicate).
*Observed Residues
Amino Acid
Expected Residues
TUV FLR
His 17 15.36 ± 0.19 15.73 ± 0.16
Ser 28 26.00 ± 0.08 25.90 ± 0.41
Arg 23 22.37 ± 0.08 22.39 ± 0.20
Gly 16 22.37 ± 0.08 16.65 ± 0.42
Asp 54 55.47 ± 0.21 55.18 ± 0.32
Glu 79 80.68 ± 0.20 80.27 ± 0.44
Thr 33 31.92 ± 0.06 32.01 ± 0.07
Ala 47 47.51 ± 0.15 47.40 ± 0.16
Pro 28 28.35 ± 0.14 28.92 ± 0.13
Lys 59 57.78 ± 0.38 57.83 ± 0.99
Tyr 20 20.19 ± 0.08 20.67 ± 0.34
Met 4 4.16 ± 0.15 4.04 ± 0.05
Val 36 35.67 ± 0.13 35.38 ± 0.13
Ile 14 13.15 ± 0.16 13.44 ± 0.16
Leu 61 63.13 ± 0.28 63.18 ± 0.28
Phe 27 26.57 ± 0.13 27.00 ± 0.33
20 Enhancement of the UPLC Amino Acid Analysis Solution with Flexible Detector Options
The analysis of complex animal feed hydrolysate
samples with both UV and fluorescence detection
is shown in Figures 6 and 7. As with the analysis of
the BSA hydrolysate, the difference in response for
amino acids between the detectors does not mean
that one detector is more suitable for quantitation
than the other. This fact is further supported by the
comparison of measured absolute amounts of the
same samples with both detectors. Table 2 shows the
mean weight % values for both TUV and FLR for the
75 data points. The ratio of amount of each amino
acid to amount of feed hydrolysate was expressed
using the residue molecular weights of the amino
acids. Since each analysis was calibrated relative to
a standard with the same detector, the quantitative
results are the same.
The reliability of the method is demonstrated with
the reproducibility of the results over a large number
of determinations that intentionally includes the
variability that would be possible in routine analysis.
These variations include multiple columns, eluents,
and derivatizations. The largest contribution to
variability in the method is due to the pipetting steps
in the sample preparation. The addition of an internal
standard to the sample to be hydrolyzed will correct
for pipetting variability. Norvaline is the preferred
internal standard for this purpose.
AMQ
NH3
His
Ser
Arg Gl
y
Asp
Glu
Thr
Ala
Pro
Deriv
Peak
Cys
Lys
Tyr
Met
Val
IleLe
uPh
e
AU
0
0.012
0.024
0.036
1.5 3 4.5 6 7.5 min
AMQ
NH3
His
Ser
Arg
Gly
Asp
Glu
Thr
Ala
Pro
Deriv
Peak
Cys
Lys
Tyr
Met
Val
IleLe
uPh
e
EU
0
70
140
210
1.5 3 4.5 6 7.5 min
Figure 5. Analysis of BSA hydrolysate sample with fluorescence detection, approximately 9 ng on column.
Figure 7. Analysis of soybean meal hydrolysate sample with fluorescence detection, approximately 6 ng on column.
Waters Corporation 34 Maple Street Milford, MA 01757 U.S.A. T: 1 508 478 2000 F: 1 508 872 1990 www.waters.com
21Enhancement of the UPLC Amino Acid Analysis Solution with Flexible Detector Options
Waters, The Science of What’s Possible, UPLC, ACQUITY, ACQUITY UPLC, and Empower are registered trademarks of Waters Corporation. AccQ•Tag is a trademark of Waters Corporation. All other trademarks are the property of their respective owners.
©2009 Waters Corporation. Produced in the U.S.A. November 2015 720002913EN KP-VW-PDF
CO N C LU S IO N
The Waters UPLC Amino Acid Analysis is extended to three detector choices:
TUV, PDA, and FLR. All three detectors give the same qualitative and
quantitative result.
Historically, fluorescence detection has often been desired in amino acid analysis
to provide enhanced sensitivity and to give specificity in the analysis of complex
samples. The low variable fluorescence yield for the amino acids means that
sensitivity is limited to the least responsive amino acid, specifically tyrosine. The
analyses of pure protein and complex animal feed hydrolysates in this experiment
shows that fluorescence and UV detectors both give accurate and consistent
results with the Waters UPLC Amino Acid Analysis Solution.
It is generally true that cleanliness limits the usable sensitivity in any amino acid
analysis method. Both the UV and fluorescence detectors give good analytical
results well below the typical background limits. The Waters UPLC Amino Acid
Analysis Solution provides a complete turnkey analytical method for the analysis
of hydrolysate samples that allows the selection of a detector that not only meets
the needs of the application, but also that of other assays in the laboratory as
well. Regardless of the detector option chosen for the application, the ruggedness
of the total system solution ensures highly reliable and rapid identification and
quantitation of amino acids, with no interference or ambiguity.Table 2. Weight/Weight % Comparison of TUV and FLR results for soybean meal hydrolysate; approximately 6 ng hydrolysate injected on column.
*Average of 75 data points (25 derivatizations, each injected in triplicate) ± Standard Deviation.
*Combined Mean
Amino Acid TUV FLR
His 1.87 ± 0.06 1.98 ± 0.13
Ser 3.65 ± 0.07 3.58 ± 0.21
Arg 5.82 ± 0.13 5.74 ± 0.35
Gly 2.98 ± 0.07 2.87 ± 0.16
Asp 9.06 ± 0.17 8.92 ± 0.54
Glu 14.49 ± 0.28 14.36 ± 0.87
Thr 2.92 ± 0.06 2.90 ± 0.17
Ala 3.17 ± 0.08 3.15 ± 0.18
Pro 3.86 ± 0.08 3.87 ± 0.23
Lys 4.76 ± 0.11 4.80 ± 0.32
Tyr 2.90 ± 0.07 3.06 ± 0.21
Met 1.08 ± 0.03 1.08 ± 0.06
Val 3.66 ± 0.07 1.08 ± 0.06
Ile 3.45 ± 0.07 3.48 ± 0.20
Leu 6.12 ± 0.13 6.10 ± 0.35
Phe 3.92 ± 0.09 3.94 ± 0.22

22 Amino Acids Application Notebook
[ NOTES ]
TO DOWNLOAD A COPY OF THIS POSTER, VISIT WWW.WATERS.COM/POSTERS ©2012 Waters Corporation
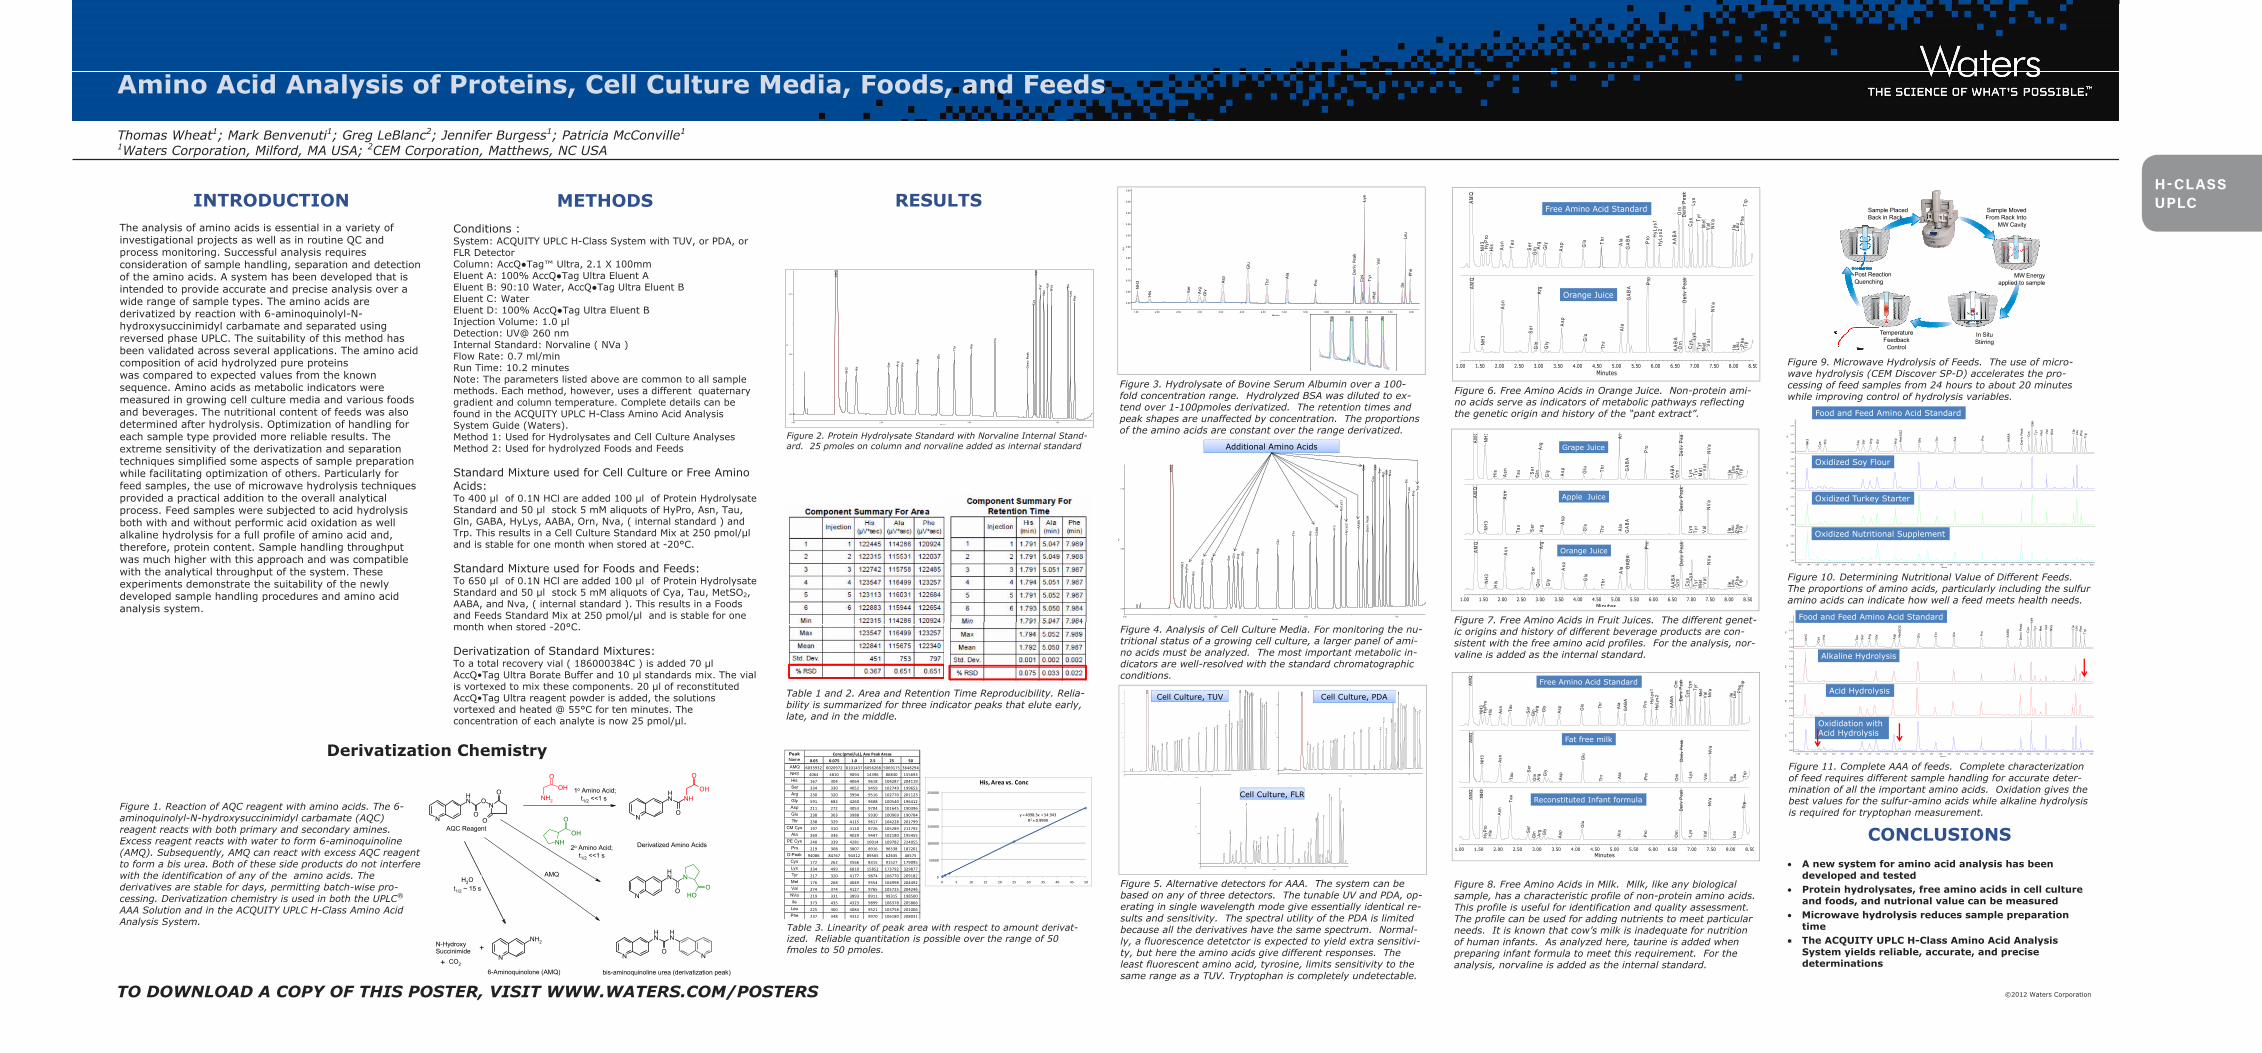
INTRODUCTIONThe analysis of amino acids is essential in a variety of investigational projects as well as in routine QC and process monitoring. Successful analysis requires consideration of sample handling, separation and detection of the amino acids. A system has been developed that is intended to provide accurate and precise analysis over a wide range of sample types. The amino acids are derivatized by reaction with 6-aminoquinolyl-N-hydroxysuccinimidyl carbamate and separated using reversed phase UPLC. The suitability of this method has been validated across several applications. The amino acid composition of acid hydrolyzed pure proteins was compared to expected values from the known sequence. Amino acids as metabolic indicators were measured in growing cell culture media and various foods and beverages. The nutritional content of feeds was also determined after hydrolysis. Optimization of handling for each sample type provided more reliable results. The extreme sensitivity of the derivatization and separation techniques simplified some aspects of sample preparation while facilitating optimization of others. Particularly for feed samples, the use of microwave hydrolysis techniques provided a practical addition to the overall analytical process. Feed samples were subjected to acid hydrolysis both with and without performic acid oxidation as well alkaline hydrolysis for a full profile of amino acid and, therefore, protein content. Sample handling throughput was much higher with this approach and was compatible with the analytical throughput of the system. These experiments demonstrate the suitability of the newly developed sample handling procedures and amino acid analysis system.
Amino Acid Analysis of Proteins, Cell Culture Media, Foods, and Feeds
Thomas Wheat1; Mark Benvenuti1; Greg LeBlanc2; Jennifer Burgess1; Patricia McConville1
1Waters Corporation, Milford, MA USA; 2CEM Corporation, Matthews, NC USA
RESULTS
CONCLUSIONS• A new system for amino acid analysis has been
developed and tested • Protein hydrolysates, free amino acids in cell culture
and foods, and nutrional value can be measured • Microwave hydrolysis reduces sample preparation
time• The ACQUITY UPLC H-Class Amino Acid Analysis
System yields reliable, accurate, and precise determinations
Figure 8. Free Amino Acids in Milk. Milk, like any biological sample, has a characteristic profile of non-protein amino acids.This profile is useful for identification and quality assessment. The profile can be used for adding nutrients to meet particular needs. It is known that cow’s milk is inadequate for nutrition of human infants. As analyzed here, taurine is added when preparing infant formula to meet this requirement. For the analysis, norvaline is added as the internal standard.
Figure 1. Reaction of AQC reagent with amino acids. The 6-aminoquinolyl-N-hydroxysuccinimidyl carbamate (AQC) reagent reacts with both primary and secondary amines. Excess reagent reacts with water to form 6-aminoquinoline (AMQ). Subsequently, AMQ can react with excess AQC reagent to form a bis urea. Both of these side products do not interfere with the identification of any of the amino acids. The derivatives are stable for days, permitting batch-wise pro-cessing. Derivatization chemistry is used in both the UPLC®
AAA Solution and in the ACQUITY UPLC H-Class Amino Acid Analysis System.
N
N
NH
O
O
O
O N
NH
O
NHOH
O
N
NH2
NH2
O
OH
NH
O
OH
N
N
NH
O OHO
NN
NH
NH
O
AQC Reagent
Derivatized Amino Acids
6-Aminoquinolone (AMQ)
1o Amino Acid;t1/2 <<1 s
2o Amino Acid;t1/2 <<1 s
bis-aminoquinoline urea (derivatization peak)
N-HydroxySuccinimide
+ CO2
+
AMQH2O
t1/2 ~ 15 s
Derivatization Chemistry
METHODSConditions : System: ACQUITY UPLC H-Class System with TUV, or PDA, or FLR Detector Column: AccQ●Tag™ Ultra, 2.1 X 100mm Eluent A: 100% AccQ●Tag Ultra Eluent A Eluent B: 90:10 Water, AccQ●Tag Ultra Eluent B Eluent C: Water Eluent D: 100% AccQ●Tag Ultra Eluent B Injection Volume: 1.0 µl Detection: UV@ 260 nm Internal Standard: Norvaline ( NVa ) Flow Rate: 0.7 ml/min Run Time: 10.2 minutes Note: The parameters listed above are common to all sample methods. Each method, however, uses a different quaternary gradient and column temperature. Complete details can be found in the ACQUITY UPLC H-Class Amino Acid Analysis System Guide (Waters). Method 1: Used for Hydrolysates and Cell Culture Analyses Method 2: Used for hydrolyzed Foods and Feeds Standard Mixture used for Cell Culture or Free Amino Acids: To 400 µl of 0.1N HCl are added 100 µl of Protein Hydrolysate Standard and 50 µl stock 5 mM aliquots of HyPro, Asn, Tau, Gln, GABA, HyLys, AABA, Orn, Nva, ( internal standard ) and Trp. This results in a Cell Culture Standard Mix at 250 pmol/µl and is stable for one month when stored at -20°C. Standard Mixture used for Foods and Feeds: To 650 µl of 0.1N HCl are added 100 µl of Protein Hydrolysate Standard and 50 µl stock 5 mM aliquots of Cya, Tau, MetSO2, AABA, and Nva, ( internal standard ). This results in a Foods and Feeds Standard Mix at 250 pmol/µl and is stable for one month when stored -20°C. Derivatization of Standard Mixtures: To a total recovery vial ( 186000384C ) is added 70 µl AccQ•Tag Ultra Borate Buffer and 10 µl standards mix. The vial is vortexed to mix these components. 20 µl of reconstituted AccQ•Tag Ultra reagent powder is added, the solutions vortexed and heated @ 55°C for ten minutes. The concentration of each analyte is now 25 pmol/µl.
NH
3
Cya H
is
Tau Ser Arg
Gly
Asp M
etSO
2
Glu Thr
Ala Pro
AABA
Der
iv P
eak
Cys
Lys
Tyr
Met Val
NVa
IIe
Leu
Phe
TrpAU
0.00
0.05
0.10
0.15
AU
0.00
0.05
0.10
0.15
0.20
AU
0.00
0.05
0.10
0.15
AU
0.00
0.02
0.04
0.06
Minutes1.60 1.80 2.00 2.20 2.40 2.60 2.80 3.00 3.20 3.40 3.60 3.80 4.00 4.20 4.40 4.60 4.80 5.00 5.20 5.40 5.60 5.80 6.00 6.20 6.40 6.60 6.80 7.00 7.20 7.40 7.60 7.80 8.00 8.20
Food and Feed Amino Acid Standard
Oxidized Soy Flour
Oxidized Turkey Starter
Oxidized Nutritional Supplement
Sample Moved From Rack Into
MW Cavity
MW Energy applied to sample
In Situ Stirring
Temperature Feedback
Control
Post Reaction Quenching
Sample Placed Back in Rack
0.05 0.075 1.0 2.5 25 50AMQ 6033932 6020972 6101437 6056268 5069175 3648294NH3 4064 4810 9094 14396 86830 155693His 167 304 4064 9618 104287 204119Ser 334 330 4052 9459 102749 199653Arg 230 320 3994 9516 102770 201123Gly 591 682 4260 9608 100540 196412Asp 211 272 4053 9704 101645 190396Glu 238 303 3988 9330 100969 190784Thr 238 329 4115 9617 104228 201799
CM Cys 197 310 4110 9726 105289 211792Ala 269 336 4029 9447 102180 195455
PE Cys 240 339 4281 10014 109782 224055Pro 219 308 3807 8916 96538 187201
D-Peak 94086 84767 94312 89565 62635 46575Cys 172 262 3566 8315 91527 179095Lys 334 499 6810 15852 173792 329877Tyr 217 320 4177 9874 106770 209182Met 176 268 4049 9354 104998 204492Val 274 374 4127 9765 105725 204246NVa 219 331 3893 8911 99315 198500Ile 373 435 4323 9899 106378 205866
Leu 225 300 4084 9521 103758 201006Phe 237 348 4312 9970 106180 208031
Peak Name
Conc (pmol/uL), Ave Peak Areas
y = 4098.3x + 54.943R² = 0.9999
0
50000
100000
150000
200000
250000
0 5 10 15 20 25 30 35 40 45 50
His, Area vs. Conc
Table 3. Linearity of peak area with respect to amount derivat-ized. Reliable quantitation is possible over the range of 50 fmoles to 50 pmoles.
AM
Q
NH
3
His S
er Arg
Gly A
sp
Glu
Thr Ala
Pro
Der
iv P
eak
Cys
Lys
Tyr
Met
Val
NVa Ile
Leu
Phe
AU
0.00
0.05
0.10
Minutes0.00 2.50 5.00 7.50
Figure 2. Protein Hydrolysate Standard with Norvaline Internal Stand-ard. 25 pmoles on column and norvaline added as internal standard
Table 1 and 2. Area and Retention Time Reproducibility. Relia-bility is summarized for three indicator peaks that elute early, late, and in the middle.
Figure 10. Determining Nutritional Value of Different Feeds.The proportions of amino acids, particularly including the sulfur amino acids can indicate how well a feed meets health needs.
Figure 11. Complete AAA of feeds. Complete characterization of feed requires different sample handling for accurate deter-mination of all the important amino acids. Oxidation gives the best values for the sulfur-amino acids while alkaline hydrolysis is required for tryptophan measurement.
Figure 9. Microwave Hydrolysis of Feeds. The use of micro-wave hydrolysis (CEM Discover SP-D) accelerates the pro-cessing of feed samples from 24 hours to about 20 minutes while improving control of hydrolysis variables.
Figure 4. Analysis of Cell Culture Media. For monitoring the nu-tritional status of a growing cell culture, a larger panel of ami-no acids must be analyzed. The most important metabolic in-dicators are well-resolved with the standard chromatographic conditions.
AM
Q
NH
3H
yPro
His
Asn T
au Ser G
lnArg G
ly Asp
Glu
Thr
Ala
GABA Pro
HyL
ys1
HyL
ys2
AABA
Orn
Der
iv P
eak
Cys
Lys
Tyr
Met Val
NVa
Ile
Leu
Phe T
rp
AU
0.00
0.05
0.10
Minutes0.00 2.50 5.00 7.50
Additional Amino Acids
NH
3
Cya H
is
Tau Ser Arg
Gly
Asp M
etSO
2
Glu Thr
Ala Pro
AABA
Der
iv P
eak
Cys
Lys
Tyr
Met Val
NVa
IIe
Leu
Phe
Trp
AU
0.00
0.05
0.10
0.15
AU
0.00
0.05
0.10
0.15
0.20
AU
0.00
0.02
0.04
0.06
0.08
AU
0.00
0.05
0.10
0.15
Minutes1.60 1.80 2.00 2.20 2.40 2.60 2.80 3.00 3.20 3.40 3.60 3.80 4.00 4.20 4.40 4.60 4.80 5.00 5.20 5.40 5.60 5.80 6.00 6.20 6.40 6.60 6.80 7.00 7.20 7.40 7.60 7.80 8.00 8.20
Food and Feed Amino Acid Standard
Alkaline Hydrolysis
Acid Hydrolysis
Oxididation with Acid Hydrolysis
AM
Q
NH
3H
yPro
His Asn Ta
u
Ser
Gln A
rg Gly
Asp G
lu Thr
Ala
GA
BA
Pro H
yLys
1H
yLys
2
AA
BA
Orn
Der
iv P
eak
Cys
Lys
Tyr
Met
Val NV
a
Ile Leu P
he Trp
AM
Q
NH
3
Asn
Tau S
erG
lnA
rg Gly
Asp
Glu
Thr Ala
Pro
Orn
Der
iv P
eak
Lys
Val
NV
a
Ile Leu Trp
AM
Q
NH
3H
yPro
His
Asn
Tau
Ser
Gln Arg Gly
Asp
Glu
Ala
Pro
Orn
Der
iv P
eak
Lys
Val
NV
a
Leu
Trp
Minutes1.00 1.50 2.00 2.50 3.00 3.50 4.00 4.50 5.00 5.50 6.00 6.50 7.00 7.50 8.00 8.50
Free Amino Acid Standard
Fat free milk
Reconstituted Infant formula
AM
Q
NH
3
His
Asn
Tau Ser
Gln
Arg
Gly Asp G
lu Thr
Ala
GA
BA
Pro
AA
BA
Orn
Der
iv P
eak
Lys
Tyr
Met V
alN
Va
Ile Leu
Phe
Trp
AM
Q
NH
3
Asn
Tau
Ser
Arg
Asp
Glu
Thr
Ala
GA
BA
Der
iv P
eak
Lys
Tyr
Val
NV
a
Ile Leu
Phe Trp
AM
Q
NH
3
His
Asn
Ser
Gln
Arg
Gly
Asp
Glu
Thr
Ala G
AB
A
Pro
AA
BA
Orn
Der
iv P
eak
Cys Ly
sTy
rM
et Val
NV
a
Ile Leu Phe
Trp
Minutes1.00 1.50 2.00 2.50 3.00 3.50 4.00 4.50 5.00 5.50 6.00 6.50 7.00 7.50 8.00 8.50
Grape Juice
Apple Juice
Orange Juice
Figure 7. Free Amino Acids in Fruit Juices. The different genet-ic origins and history of different beverage products are con-sistent with the free amino acid profiles. For the analysis, nor-valine is added as the internal standard.
Figure 6. Free Amino Acids in Orange Juice. Non-protein ami-no acids serve as indicators of metabolic pathways reflecting the genetic origin and history of the “pant extract”.
AM
Q
NH
3H
yPro
His Asn Ta
u
Ser
Gln A
rgG
ly
Asp G
lu Thr
Ala
GA
BA
Pro H
yLys
1H
yLys
2
AA
BA
Orn
Der
iv P
eak
Cys
Lys
Tyr
Met
Val NV
a
Ile Leu P
heTr
p
AM
Q
NH
3
Asn
Ser
Gln
Arg
Gly
Asp
Glu
Thr
Ala
GA
BA
Pro
AA
BA
Orn
Der
iv P
eak
Cys
Lys
Tyr
Met V
alN
Va
Ile Leu Phe
Trp
Minutes1.00 1.50 2.00 2.50 3.00 3.50 4.00 4.50 5.00 5.50 6.00 6.50 7.00 7.50 8.00 8.50
Free Amino Acid Standard
Orange Juice
Figure 3. Hydrolysate of Bovine Serum Albumin over a 100-fold concentration range. Hydrolyzed BSA was diluted to ex-tend over 1-100pmoles derivatized. The retention times and peak shapes are unaffected by concentration. The proportions of the amino acids are constant over the range derivatized.
NH
3
His S
er
Arg
Gly
Asp
Glu
Thr A
la
Pro
Der
iv P
eak
Cys
Lys
Tyr
Met
Val
Ile
Leu
Phe
AU
0.00
0.05
0.10
0.15
0.20
0.25
0.30
0.35
0.40
0.45
0.50
Minutes1.50 2.00 2.50 3.00 3.50 4.00 4.50 5.00 5.50 6.00 6.50 7.00 7.50 8.00
Asp Glu
Thr
Ala
Figure 5. Alternative detectors for AAA. The system can be based on any of three detectors. The tunable UV and PDA, op-erating in single wavelength mode give essentially identical re-sults and sensitivity. The spectral utility of the PDA is limited because all the derivatives have the same spectrum. Normal-ly, a fluorescence detetctor is expected to yield extra sensitivi-ty, but here the amino acids give different responses. The least fluorescent amino acid, tyrosine, limits sensitivity to the same range as a TUV. Tryptophan is completely undetectable.
AM
Q
NH
3H
yPro
His
Asn T
au Ser
Gln A
rgG
ly
Asp
Glu
Th
r Ala
GA
BA
Pro
HyL
ys1
HyL
ys2
AA
BA
Orn
Der
iv P
eak
Cys
Lys
Tyr
Met
Val NV
a
Ile
Leu
Phe Trp
AU
0.00
0.05
0.10
Minutes0.00 2.50 5.00 7.50
Cell Culture, PDA
AM
Q
NH
3
HyP
ro
His
Asn
Tau
Ser
Gln
Arg
Gly
Asp
Glu
Thr
Ala
GA
BA
Pro
HyL
ys1
HyL
ys2
AA
BA
Orn
Der
iv P
eak
Cys
Lys
Tyr
Met
Val
NV
a
Ile
Leu
Phe
Trp
EU
0.00
800.00
1600.00
Minutes0.00 2.50 5.00 7.50
Cell Culture, TUV
Cell Culture, FLR
AM
Q
NH
3H
yPro
His
Asn Ta
u Ser G
lnArg G
ly Asp
Glu
Thr
Ala
GABA Pro
HyLy
s1H
yLys2 AABA
Orn
Der
iv P
eak
Cys
Lys
Tyr
Met
Val
NVa
Ile
Leu
Phe T
rp
AU
0.00
0.05
0.10
Minutes0.00 2.50 5.00 7.50
H-CLASS UPLC

23Automating Amino Acid Analysis using Robotic Sample Preparation Instrumentation
Amino Acid Analysis of Proteins, Cell Culture Media, Foods, and Feeds
24 Automating Amino Acid Analysis using Robotic Sample Preparation Instrumentation
TO DOWNLOAD A COPY OF THIS POSTER, VISIT WWW.WATERS.COM/POSTERS ©2009 Waters Corporation | COMPANY CONFIDENTIAL
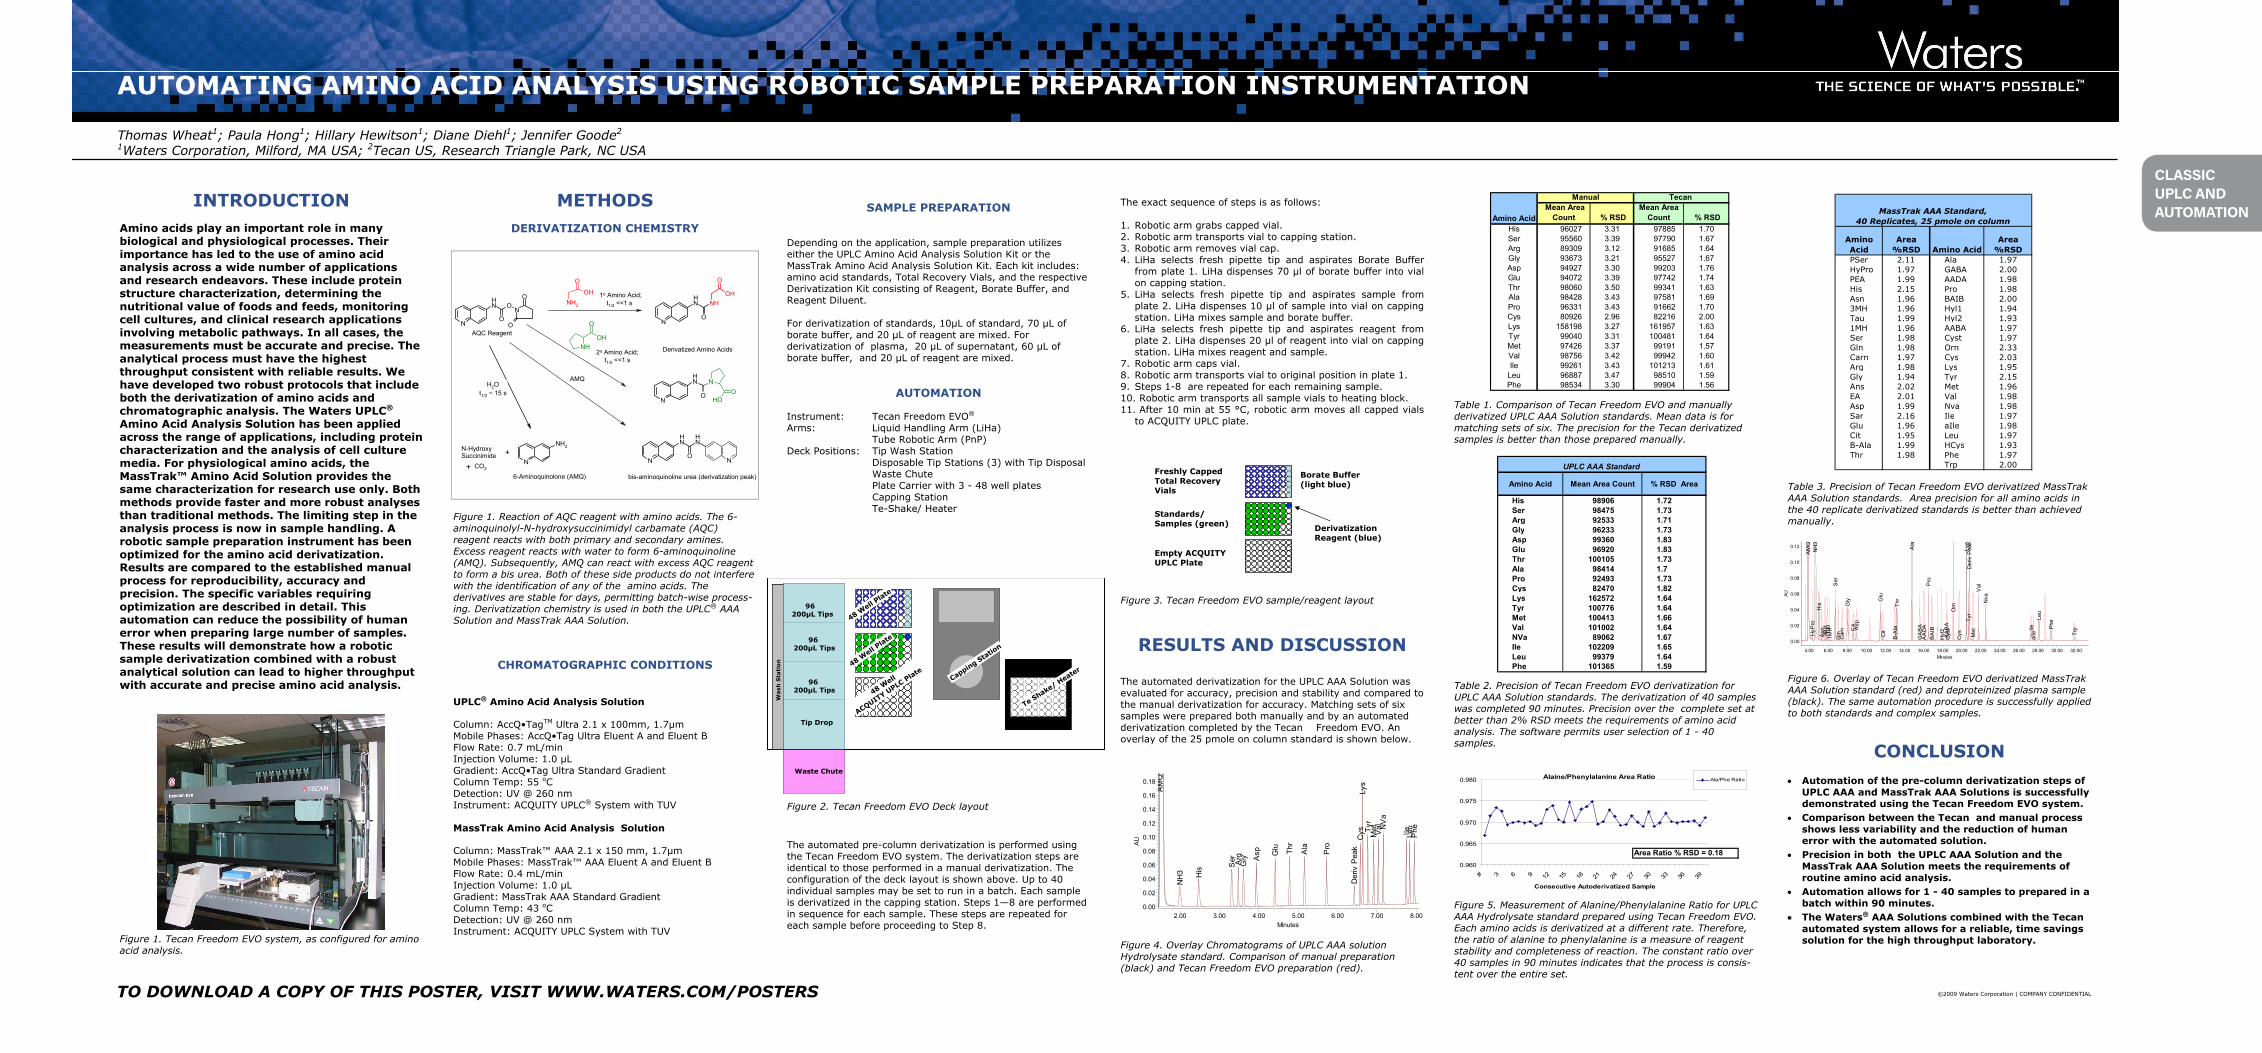
RESULTS AND DISCUSSION
The automated derivatization for the UPLC AAA Solution was evaluated for accuracy, precision and stability and compared to the manual derivatization for accuracy. Matching sets of six samples were prepared both manually and by an automated derivatization completed by the Tecan Freedom EVO. An overlay of the 25 pmole on column standard is shown below.
CHROMATOGRAPHIC CONDITIONS
UPLC® Amino Acid Analysis Solution
Column: AccQ•TagTM Ultra 2.1 x 100mm, 1.7µm Mobile Phases: AccQ•Tag Ultra Eluent A and Eluent B Flow Rate: 0.7 mL/min Injection Volume: 1.0 µL Gradient: AccQ•Tag Ultra Standard Gradient Column Temp: 55 oC Detection: UV @ 260 nm Instrument: ACQUITY UPLC® System with TUV
MassTrak Amino Acid Analysis Solution
Column: MassTrak™ AAA 2.1 x 150 mm, 1.7µm Mobile Phases: MassTrak™ AAA Eluent A and Eluent B Flow Rate: 0.4 mL/min Injection Volume: 1.0 µL Gradient: MassTrak AAA Standard Gradient Column Temp: 43 oC Detection: UV @ 260 nm Instrument: ACQUITY UPLC System with TUV
Figure 1. Reaction of AQC reagent with amino acids. The 6-aminoquinolyl-N-hydroxysuccinimidyl carbamate (AQC) reagent reacts with both primary and secondary amines. Excess reagent reacts with water to form 6-aminoquinoline (AMQ). Subsequently, AMQ can react with excess AQC reagent to form a bis urea. Both of these side products do not interfere with the identification of any of the amino acids. The derivatives are stable for days, permitting batch-wise process-ing. Derivatization chemistry is used in both the UPLC® AAA Solution and MassTrak AAA Solution.
INTRODUCTIONAmino acids play an important role in many biological and physiological processes. Their importance has led to the use of amino acid analysis across a wide number of applications and research endeavors. These include protein structure characterization, determining the nutritional value of foods and feeds, monitoring cell cultures, and clinical research applications involving metabolic pathways. In all cases, the measurements must be accurate and precise. The analytical process must have the highest throughput consistent with reliable results. We have developed two robust protocols that include both the derivatization of amino acids and chromatographic analysis. The Waters UPLC®
Amino Acid Analysis Solution has been applied across the range of applications, including protein characterization and the analysis of cell culture media. For physiological amino acids, the MassTrak™ Amino Acid Solution provides the same characterization for research use only. Both methods provide faster and more robust analyses than traditional methods. The limiting step in the analysis process is now in sample handling. A robotic sample preparation instrument has been optimized for the amino acid derivatization. Results are compared to the established manual process for reproducibility, accuracy and precision. The specific variables requiring optimization are described in detail. This automation can reduce the possibility of human error when preparing large number of samples. These results will demonstrate how a robotic sample derivatization combined with a robust analytical solution can lead to higher throughput with accurate and precise amino acid analysis.
AUTOMATING AMINO ACID ANALYSIS USING ROBOTIC SAMPLE PREPARATION INSTRUMENTATION
Thomas Wheat1; Paula Hong1; Hillary Hewitson1; Diane Diehl1; Jennifer Goode2
1Waters Corporation, Milford, MA USA; 2Tecan US, Research Triangle Park, NC USA
Figure 1. Tecan Freedom EVO system, as configured for amino acid analysis.
CONCLUSION• Automation of the pre-column derivatization steps of
UPLC AAA and MassTrak AAA Solutions is successfully demonstrated using the Tecan Freedom EVO system.
• Comparison between the Tecan and manual process shows less variability and the reduction of human error with the automated solution.
• Precision in both the UPLC AAA Solution and the MassTrak AAA Solution meets the requirements of routine amino acid analysis.
• Automation allows for 1 - 40 samples to prepared in abatch within 90 minutes.
• The Waters® AAA Solutions combined with the Tecan automated system allows for a reliable, time savings solution for the high throughput laboratory.
SAMPLE PREPARATION
Depending on the application, sample preparation utilizes either the UPLC Amino Acid Analysis Solution Kit or the MassTrak Amino Acid Analysis Solution Kit. Each kit includes: amino acid standards, Total Recovery Vials, and the respective Derivatization Kit consisting of Reagent, Borate Buffer, and Reagent Diluent.
For derivatization of standards, 10µL of standard, 70 µL of borate buffer, and 20 µL of reagent are mixed. For derivatization of plasma, 20 µL of supernatant, 60 µL of borate buffer, and 20 µL of reagent are mixed.
AUTOMATION
Instrument: Tecan Freedom EVO®
Arms: Liquid Handling Arm (LiHa) Tube Robotic Arm (PnP) Deck Positions: Tip Wash Station Disposable Tip Stations (3) with Tip Disposal Waste Chute Plate Carrier with 3 - 48 well plates Capping Station Te-Shake/ Heater
N
N
NH
O
O
O
O N
NH
O
NHOH
O
N
NH2
NH2
O
OH
NH
O
OH
N
N
NH
O OHO
NN
NH
NH
O
AQC Reagent
Derivatized Amino Acids
6-Aminoquinolone (AMQ)
1o Amino Acid;t1/2 <<1 s
2o Amino Acid;t1/2 <<1 s
bis-aminoquinoline urea (derivatization peak)
N-HydroxySuccinimide
+ CO2
+
AMQH2O
t1/2 ~ 15 s
Table 1. Comparison of Tecan Freedom EVO and manually derivatized UPLC AAA Solution standards. Mean data is for matching sets of six. The precision for the Tecan derivatized samples is better than those prepared manually.
Figure 2. Tecan Freedom EVO Deck layout
Table 2. Precision of Tecan Freedom EVO derivatization for UPLC AAA Solution standards. The derivatization of 40 samples was completed 90 minutes. Precision over the complete set at better than 2% RSD meets the requirements of amino acid analysis. The software permits user selection of 1 - 40samples.
Alaine/Phenylalanine Area Ratio
0.960
0.965
0.970
0.975
0.980
# 3 6 9 12 15 18 21 24 27 30 33 36 39
Consecutive Autoderivatized Sample
Ala/Phe Ratio
Area Ratio % RSD = 0.18
AM
Q
NH
3 His S
er Arg
Gly A
sp Glu Th
r
Ala
Pro
Der
iv P
eak
Cys
Lys
Tyr
Met Val N
Va
Ile Leu
Phe
AU
0.00
0.02
0.04
0.06
0.08
0.10
0.12
0.14
0.16
0.18
Minutes2.00 3.00 4.00 5.00 6.00 7.00 8.00
Figure 4. Overlay Chromatograms of UPLC AAA solutionHydrolysate standard. Comparison of manual preparation (black) and Tecan Freedom EVO preparation (red).
The exact sequence of steps is as follows:
1. Robotic arm grabs capped vial. 2. Robotic arm transports vial to capping station. 3. Robotic arm removes vial cap. 4. LiHa selects fresh pipette tip and aspirates Borate Buffer
from plate 1. LiHa dispenses 70 µl of borate buffer into vial on capping station.
5. LiHa selects fresh pipette tip and aspirates sample from plate 2. LiHa dispenses 10 µl of sample into vial on capping station. LiHa mixes sample and borate buffer.
6. LiHa selects fresh pipette tip and aspirates reagent from plate 2. LiHa dispenses 20 µl of reagent into vial on capping station. LiHa mixes reagent and sample.
7. Robotic arm caps vial. 8. Robotic arm transports vial to original position in plate 1. 9. Steps 1-8 are repeated for each remaining sample. 10. Robotic arm transports all sample vials to heating block. 11. After 10 min at 55 °C, robotic arm moves all capped vials
to ACQUITY UPLC plate.
METHODSDERIVATIZATION CHEMISTRY
The automated pre-column derivatization is performed using the Tecan Freedom EVO system. The derivatization steps are identical to those performed in a manual derivatization. The configuration of the deck layout is shown above. Up to 40individual samples may be set to run in a batch. Each sample is derivatized in the capping station. Steps 1—8 are performed in sequence for each sample. These steps are repeated for each sample before proceeding to Step 8.
Figure 3. Tecan Freedom EVO sample/reagent layout
Standards/ Samples (green)
Borate Buffer (light blue)
Derivatization Reagent (blue)
Freshly Capped Total Recovery Vials
Empty ACQUITY UPLC Plate
Figure 5. Measurement of Alanine/Phenylalanine Ratio for UPLC AAA Hydrolysate standard prepared using Tecan Freedom EVO. Each amino acids is derivatized at a different rate. Therefore, the ratio of alanine to phenylalanine is a measure of reagent stability and completeness of reaction. The constant ratio over 40 samples in 90 minutes indicates that the process is consis-tent over the entire set.
Table 3. Precision of Tecan Freedom EVO derivatized MassTrak AAA Solution standards. Area precision for all amino acids in the 40 replicate derivatized standards is better than achieved manually.
AM
QH
yPro
NH
3H
isA
sn3M
HTa
u1M
HS
erG
lnC
arn
Gly
EA Asp
Glu
Cit
B-A
laTh
r
Ala
GA
BA
AA
DA
Pro
BA
IB
Hyl
2A
AB
AC
yst
Orn
Cys
Lys
Tyr
Der
iv P
eak
Met
Val
Nva
IleaI
leLe
u
Phe
Trp
AU
0.00
0.02
0.04
0.06
0.08
0.10
0.12
Minutes4.00 6.00 8.00 10.00 12.00 14.00 16.00 18.00 20.00 22.00 24.00 26.00 28.00 30.00 32.00
Figure 6. Overlay of Tecan Freedom EVO derivatized MassTrak AAA Solution standard (red) and deproteinized plasma sample (black). The same automation procedure is successfully applied to both standards and complex samples.
Amino Acid
Area%RSD Amino Acid
Area%RSD
PSer 2.11 Ala 1.97HyPro 1.97 GABA 2.00PEA 1.99 AADA 1.98His 2.15 Pro 1.98Asn 1.96 BAIB 2.003MH 1.96 Hyl1 1.94Tau 1.99 Hyl2 1.931MH 1.96 AABA 1.97Ser 1.98 Cyst 1.97Gln 1.98 Orn 2.33Carn 1.97 Cys 2.03Arg 1.98 Lys 1.95Gly 1.94 Tyr 2.15Ans 2.02 Met 1.96EA 2.01 Val 1.98Asp 1.99 Nva 1.98Sar 2.16 Ile 1.97Glu 1.96 aIle 1.98Cit 1.95 Leu 1.97B-Ala 1.99 HCys 1.93Thr 1.98 Phe 1.97
Trp 2.00
MassTrak AAA Standard, 40 Replicates, 25 pmole on column
Wash
Sta
tio
n
Tip Drop
Waste Chute
96 200µL Tips
96 200µL Tips
96200µL Tips
Wash
Sta
tio
nW
ash
Sta
tio
n
Tip Drop
Waste Chute
96 200µL Tips
96 200µL Tips
96200µL Tips 48 Well Plate
48 Well Plate
48 Well
ACQUITY UPLC Plate
48 Well Plate
48 Well Plate
48 Well
ACQUITY UPLC Plate
Capping Station
Te Shake/ Heater
Mean Area Count % RSD
Mean Area Count % RSD
His 96027 3.31 97885 1.70Ser 95560 3.39 97790 1.67Arg 89309 3.12 91685 1.64Gly 93673 3.21 95527 1.67Asp 94927 3.30 99203 1.76Glu 94072 3.39 97742 1.74Thr 98060 3.50 99341 1.63Ala 98428 3.43 97581 1.69Pro 96331 3.43 91662 1.70Cys 80926 2.96 82216 2.00Lys 158198 3.27 161957 1.63Tyr 99040 3.31 100481 1.64Met 97426 3.37 99191 1.57Val 98756 3.42 99942 1.60Ile 99261 3.43 101213 1.61
Leu 96887 3.47 98510 1.59Phe 98534 3.30 99904 1.56
Manual Tecan
Amino Acid
Amino Acid Mean Area Count % RSD Area
His 98906 1.72Ser 98475 1.73Arg 92533 1.71Gly 96233 1.73Asp 99360 1.83Glu 96920 1.83Thr 100105 1.73Ala 98414 1.7Pro 92493 1.73Cys 82470 1.82Lys 162572 1.64Tyr 100776 1.64Met 100413 1.66Val 101002 1.64NVa 89062 1.67Ile 102209 1.65Leu 99379 1.64Phe 101365 1.59
UPLC AAA Standard
CLASSIC UPLC AND AUTOMATION

25Automating Amino Acid Analysis using Robotic Sample Preparation Instrumentation
Automating Amino Acid Analysis using Robotic Sample Preparation Instrumentation
26 Automating Amino Acid Analysis using Robotic Sample Preparation Instrumentation

TO DOWNLOAD A COPY OF THIS POSTER, VISIT WWW.WATERS.COM/POSTERS ©2009 Waters Corporation | COMPANY CONFIDENTIAL
INTRODUCTIONAmino acid analysis provides fundamental information for many applications and research endeavors. These include protein structure characterization, determining the nutritional value of foods and feeds, monitoring cell cultures and other processes, and clinical research applications involving metabolic pathways. In all cases, the measurements must be accurate and precise with the highest throughput consistent with reliable results. We have previously described development of a robust protocol for derivatization of amino acid samples followed by chromatographic analysis. This UPLC® Amino Acid Analysis Solution has been applied across the range of applications with increased analytical throughput. With faster and more robust analysis, however, the limiting steps in the analysis process are now in sample handling. Two opportunities exist for improving throughput. One is preparation of sample hydrolysates, and the other is the derivatization. Microwave hydrolysis has been suggested to reduce the hydrolysis process from many hours to several minutes. We have optimized that technique for samples of pure proteins and for complex samples represented by biopharmaceutical formulations. The comparison of these tests with conventional oven-based hydrolyses will be reported. The factors in optimization will be described in detail. Secondly, a robotic sample preparation instrument has been optimized for the amino acid derivatization. Results will be compared to the established manual process.The specific variables requiring optimization will be described in detail. The total workflow of optimum rapid hydrolysis, robotic sample derivatization, and a robust analytical solution leads to higher throughput for accurate and precise amino acid analysis.
Improving Sample Handling for Amino Acid Analysis
Thomas E. Wheat1, Paula Hong1, Hillary B. Hewitson1, Diane M. Diehl1, Grace Vanier2, Eric Williamson2, and Jennifer Goode3
1Waters Corporation; Milford, MA 01757; 2CEM Corporation; Matthews NC 28106; 3Tecan US; Research Triangle Park, NC 28106
SAMPLE PREPARATION
Depending on the application, sample preparation utilizes either the UPLC Amino Acid Analysis Solution Kit or the MassTrak Amino Acid Analysis Solution Kit. Each kit includes: amino acid standards, Total Recovery Vials, and the respective Derivatization Kit consisting of Reagent, Borate Buffer, and Reagent Diluent.
For derivatization of standards and samples, 10µL of amino acid solution, 70 µL of borate buffer, and 20 µL of reagent are mixed.
HYDROLYSIS
Instrument: CEM Discover Protein Hydrolysis Conditions: As describred in figure legends Protein Solutions for hydrolysis: A: Horse Heart Myoglobin, 1mg/mL in Water. B: Horse Heart Myoglobin, 1mg/ml in formulation Bovine Serum Albumin, 1mg/ml in formulation Biopharmaceutical formulation: Sucrose, 25mg/mL NaCl, 0.15M NaH2PO4, 0.025M Na2HPO4, 0.025M Tween 80, 0.10M
AUTOMATED DERIVATIZATION
Instrument: Tecan Freedom EVO®
Arms: Liquid Handling Arm (LiHa) Tube Robotic Arm (PnP) Deck Positions: Tip Wash Station Disposable Tip Stations (3) with Tip Disposal Waste Chute Plate Carrier with 3 - 48 well plates Capping Station Te-Shake/ Heater
CHROMATOGRAPHY
Instrument: ACQUITY UPLC System with PDA
CHROMATOGRAPHIC CONDITIONS
UPLC® Amino Acid Analysis Solution Column: AccQ•TagTM Ultra 2.1 x 100mm, 1.7µm Mobile Phases: AccQ•Tag Ultra Eluent A and Eluent B Flow Rate: 0.7 mL/min Injection Volume: 1.0 µL Gradient: UPLC AAA Solution Standard Hydrolysate Gradient Column Temp: 55 oC Detection: UV at 260 nm
MassTrak Amino Acid Analysis Solution Column: MassTrak™ AAA 2.1 x 150 mm, 1.7µm Mobile Phases: MassTrak™ AAA Eluent A and Eluent B Flow Rate: 0.4 mL/min Injection Volume: 1.0 µL Gradient: MassTrak AAA Standard Gradient Column Temp: 43 oC Detection: UV at 260 nm
METHODS
Figure 4. Tecan Freedom EVO Deck layout
Wash
Sta
tio
n
Tip Drop
Waste Chute
96 200µL Tips
96 200µL Tips
96200µL Tips
Wash
Sta
tio
nW
ash
Sta
tio
n
Tip Drop
Waste Chute
96 200µL Tips
96 200µL Tips
96200µL Tips 48 Well Plate
48 Well P
late
48 Well
ACQUITY UPLC Plate
48 Well Plate
48 Well P
late
48 Well
ACQUITY UPLC Plate
Capping Station
Te Shake/ Heater
The automated derivatization for the UPLC AAA Solution was evaluated for accuracy, precision and stability and compared to the manual derivatization for accuracy. Matching sets of six samples were prepared both manually and by an automated derivatization completed by the Tecan Freedom EVO. An overlay of the 25 pmole on column standard is shown below.
AM
Q
NH
3 His S
er Arg
Gly A
sp Glu Th
r
Ala
Pro
Der
iv P
eak
Cys
Lys
Tyr
Met Val N
Va
Ile Leu
Phe
AU
0.00
0.02
0.04
0.06
0.08
0.10
0.12
0.14
0.16
0.18
Minutes2.00 3.00 4.00 5.00 6.00 7.00 8.00
Figure 4. Overlay Chromatograms of UPLC AAA solutionHydrolysate standard. Comparison of manual preparation (black) and Tecan Freedom EVO preparation (red).
Table 3. Comparison of Tecan Freedom EVO and manually derivatized UPLC AAA Solution standards. Mean data is for matching sets of six. The precision for the Tecan derivatized samples is better than those prepared manually.
Mean Area Count % RSD
Mean Area Count % RSD
His 96027 3.31 97885 1.70Ser 95560 3.39 97790 1.67Arg 89309 3.12 91685 1.64Gly 93673 3.21 95527 1.67Asp 94927 3.30 99203 1.76Glu 94072 3.39 97742 1.74Thr 98060 3.50 99341 1.63Ala 98428 3.43 97581 1.69Pro 96331 3.43 91662 1.70Cys 80926 2.96 82216 2.00Lys 158198 3.27 161957 1.63Tyr 99040 3.31 100481 1.64Met 97426 3.37 99191 1.57Val 98756 3.42 99942 1.60Ile 99261 3.43 101213 1.61
Leu 96887 3.47 98510 1.59Phe 98534 3.30 99904 1.56
Manual Tecan
Amino Acid
CONCLUSIONS• Waters UPLC Amino Acid Analysis Solution and
MassTrak Amino Acid Analysis Solution provide robust total solutions for many applications.
• Microwave hydrolysis can be used to reduce the hydrolysis time from about 20 hours to 20 minutes.
• Microwave hydrolysis gives good compositional accuracy for both simple and complex samples.
• Complex samples, such as biopharmaceutical formulations, are best hydrolyzed in the liquid phase
• Automation of the pre-column derivatization steps ofUPLC AAA and MassTrak AAA Solutions is successfully demonstrated using the Tecan Freedom EVO system.
• Comparison between the Tecan and manual process shows the reduction of human error with the automated solution.
• Precision of automated derivatization meets the requirements of routine amino acid analysis.
• The Waters® AAA Solutions combine with the CEM microwave hydrolysis and Tecan automation for a reliable, time saving solution for the high throughput laboratory.
Figure 5. Overlay of Tecan Freedom EVO derivatized MassTrak AAA Solution standard (red) and deproteinized plasma sample (black). The same automation procedure is successfully applied to both standards and complex samples.
AM
QH
yPro
NH
3H
isA
sn3M
HTa
u1M
HS
erG
lnC
arn
Gly
EA Asp
Glu
Cit
B-A
laTh
r
Ala
GA
BA
AA
DA
Pro
BA
IB
Hyl
2A
AB
AC
yst
Orn
Cys
Lys
Tyr
Der
iv P
eak
Met
Val
Nva
IleaI
leLe
u
Phe
Trp
AU
0.00
0.02
0.04
0.06
0.08
0.10
0.12
Minutes4.00 6.00 8.00 10.00 12.00 14.00 16.00 18.00 20.00 22.00 24.00 26.00 28.00 30.00 32.00
Table 4. Precision of Tecan Freedom EVO derivatization for UPLC AAA Solution standards. The derivatization of 40 samples was completed 90 minutes. Precision over the complete set at better than 2% RSD meets the requirements of amino acid analysis. The software permits selection of 1 - 40 samples.
Amino Acid Mean Area Count % RSD Area
His 98906 1.72Ser 98475 1.73Arg 92533 1.71Gly 96233 1.73Asp 99360 1.83Glu 96920 1.83Thr 100105 1.73Ala 98414 1.7Pro 92493 1.73Cys 82470 1.82Lys 162572 1.64Tyr 100776 1.64Met 100413 1.66Val 101002 1.64NVa 89062 1.67Ile 102209 1.65Leu 99379 1.64Phe 101365 1.59
UPLC AAA Standard
Figure 1. Reaction of AQC reagent with amino acids in UPLC®
AAA Solution and MassTrak AAA Solution. The 6-aminoquinolyl-N-hydroxysuccinimidyl carbamate (AQC) reagent reacts with both primary and secondary amines. Excess reagent reacts with water to form 6-aminoquinoline (AMQ). Subsequently, AMQ can react with excess AQC reagent to form a bis urea. These side products do not interfere with the identification of any of the amino acids. The derivatives are stable for days, permitting batch-wise processing.
N
N
NH
O
O
O
O N
NH
O
NHOH
O
N
NH2
NH2
O
OH
NH
O
OH
N
N
NH
O OHO
NN
NH
NH
O
AQC Reagent
Derivatized Amino Acids
6-Aminoquinolone (AMQ)
1o Amino Acid;t1/2 <<1 s
2o Amino Acid;t1/2 <<1 s
bis-aminoquinoline urea (derivatization peak)
N-HydroxySuccinimide
+ CO2
+
AMQH2O
t1/2 ~ 15 s
DERIVATIZATION CHEMISTRY
AUTOMATED DERIVATIZATION
AM
Q
NH
3
His
Ser
Arg
Gly
Asp
Glu
Thr
Ala
Pro
Der
ivPe
ak
Lys
Tyr
Met
Val
NVa
IleLe
uPh
e
AU
0.00
0.03
0.06
0.09
AM
Q
NH
3
His Se
rA
rgG
ly
Asp
Glu
Thr A
la
Pro
Der
ivPe
akC
ysLy
sTy
rM
etVa
lN
Va
IleLe
uPh
e
AU
0.00
0.03
0.06
0.09
Minutes1.50 3.00 4.50 6.00 7.50
Myoglobin
BSA
AM
Q
NH
3
His
Ser
Arg
Gly
Asp
Glu
Thr
Ala
Pro
Der
ivPe
ak
Lys
Tyr
Met
Val
NVa
IleLe
uPh
e
AU
0.00
0.03
0.06
0.09
AM
Q
NH
3
His Se
rA
rgG
ly
Asp
Glu
Thr A
la
Pro
Der
ivPe
akC
ysLy
sTy
rM
etVa
lN
Va
IleLe
uPh
e
AU
0.00
0.03
0.06
0.09
Minutes1.50 3.00 4.50 6.00 7.50
AM
Q
NH
3
His
Ser
Arg
Gly
Asp
Glu
Thr
Ala
Pro
Der
ivPe
ak
Lys
Tyr
Met
Val
NVa
IleLe
uPh
e
AU
0.00
0.03
0.06
0.09
AM
Q
NH
3
His
Ser
Arg
Gly
Asp
Glu
Thr
Ala
Pro
Der
ivPe
ak
Lys
Tyr
Met
Val
NVa
IleLe
uPh
e
AU
0.00
0.03
0.06
0.09
AM
Q
NH
3
His Se
rA
rgG
ly
Asp
Glu
Thr A
la
Pro
Der
ivPe
akC
ysLy
sTy
rM
etVa
lN
Va
IleLe
uPh
e
AU
0.00
0.03
0.06
0.09
Minutes1.50
AM
Q
NH
3
His Se
rA
rgG
ly
Asp
Glu
Thr A
la
Pro
Der
ivPe
akC
ysLy
sTy
rM
etVa
lN
Va
IleLe
uPh
e
AU
0.00
0.03
0.06
0.09
Minutes1.50 3.00 4.50 6.00 7.50
Myoglobin
BSA
Figure 3. Liquid phase hydrolysis of two different proteins in a typical formulation, using the previously determined opti-mal microwave parameters (165ºC, 20min).
Average % RSD Average % RSD
His 0.019 2.874 0.034 4.029
Ser 0.006 15.262 0.029 1.083
Arg 0.022 2.454 0.055 4.246
Gly 0.010 1.369 0.015 4.093
Asp 0.053 3.990 0.092 4.859
Glu 0.104 2.235 0.150 4.824
Thr 0.010 11.058 0.044 2.772
Ala 0.038 2.314 0.047 4.153
Pro 0.028 2.380 0.041 3.440
Cys 0.001 3.122 0.004 5.954
Lys 0.022 15.070 0.108 5.540
Tyr 0.001 5.678 0.039 5.366
Met 0.000 14.159 0.006 4.715
Val 0.031 2.159 0.050 5.370
Ile 0.010 3.900 0.022 5.828
Leu 0.049 4.942 0.103 4.054
Phe 0.016 7.193 0.058 4.615
Total 0.422 0.898
Vapor Phase Liquid PhaseAmino Acid
Table 2b . Comparison of vapor and liquid phase mi-crowave hydrolysis (165ºC, 20min) of BSA prepared as a biopharmaceutical formu-lation. The reported results are given in mg/mL in starting solution. The re-covery of mass is much higher with liquid phase hy-drolysis and the reproduci-bility is better and more consistent. The results are the averages of 4 tubes in each of 3 independently hydrolyzed vessels. The precision indicates good control of the hydrolysis process. Liquid phase hy-drolysis is preferred for complex samples.
Average Std Dev Average Std DevHis 11 12.59 0.60 10.73 0.12Ser 5 1.59 0.43 4.06 0.51Arg 2 1.78 0.19 2.11 0.05Gly 15 18.28 1.17 15.99 0.26Asp 10 11.16 0.45 10.54 0.17Glu 19 26.47 1.50 19.54 0.35Thr 7 2.89 0.48 6.19 0.47Ala 15 21.90 1.53 15.36 0.52Pro 4 5.95 0.33 4.29 0.07Lys 19 7.78 3.17 19.23 0.20Tyr 2 0.18 0.08 1.71 0.08Val 7 7.77 0.36 6.52 0.24Ile 9 8.51 0.49 8.20 0.26
Leu 17 17.71 1.04 17.45 0.09Phe 7 4.46 0.79 7.09 0.10
Vapor PhaseAmino Acid
Known Composition
Liquid Phase
Average Std Dev Average Std DevHis 17 20.18 0.75 16.86 0.21Ser 28 8.49 1.40 23.07 3.09Arg 23 20.04 1.25 24.41 0.37Gly 16 24.15 1.18 18.24 0.35Asp 54 61.97 2.38 56.11 0.79Glu 79 112.63 3.28 81.99 1.17Thr 33 13.94 1.69 29.33 1.61Ala 47 71.39 4.13 47.23 1.39Pro 28 40.21 1.35 29.40 0.35Lys 59 25.26 6.46 59.41 1.12Tyr 20 1.35 0.22 16.17 0.45Val 36 45.23 1.19 35.57 0.55Ile 14 13.78 0.94 13.76 0.22
Leu 61 64.67 4.25 63.15 0.53Phe 27 18.70 3.28 27.29 0.38
Amino Acid
Known Composition
Vapor Phase Liquid Phase
Table 2a . Comparison of vapor and liquid phase mi-crowave hydrolysis (165ºC, 20min) for My-oglobin (top) and BSA (bottom) prepared as a typical biopharmaceutical formulation. The known proteins are prepared in a solution of buffer and sta-bilizers, typical of biophar-maceuticals, that may in-terfere with hydrolysis.Liquid phase hydrolysis gives better fidelity to ex-pected composition. The results are the averages of 4 tubes in each of 3 inde-pendently hydrolyzed ves-sels, indicating good com-positional precision.
Table 1 . Time and temperature optimization of vapor phase microwave hydrolysis, shown by the accuracy of Myoglobin composition. The higher temperature and longer time was cho-sen for further experiments, although loss of labile amino acids is seen.
Amino Acid
Known Composition
150W, 150ºC, 10min
150W, 150ºC, 20min
150W, 165ºC, 10min
150W, 165ºC, 20min
His 11 6.47 9.73 9.72 10.06Ser 5 6.86 4.87 4.65 4.23Arg 2 1.61 1.97 1.98 1.96Gly 15 29.78 18.10 18.25 16.96Asp 10 25.71 11.83 11.77 11.55Glu 19 14.99 20.81 20.62 21.32Thr 7 5.02 5.54 5.28 5.51Ala 15 21.29 16.68 16.74 16.28Pro 4 2.07 4.00 4.02 4.28Lys 19 9.47 17.86 17.49 18.44Tyr 2 0.69 1.81 1.75 1.78Val 7 3.63 4.81 4.91 5.50Ile 9 5.14 7.13 7.37 7.34
Leu 17 10.50 16.98 17.60 17.05Phe 7 5.77 6.88 6.84 6.75
RESULTS AND DISCUSSION MICROWAVE HYDROLYSIS
Figure 2. Microwave Instrument and Chamber. Samples in 300 μ L pyro-lyzed glass tubes are placed in a sealed Teflon chamber. The valve sta-tion permits alternating nitrogen purge and vac-uum to ensure hydrolysis in the absence of oxygen.
The chamber contains a pool of 6N HCl/0.1% phenol. Samples are placed in the chamber dry for vapor phase hydrolysis, or 40 μ L of the same acid is added directly to each tube for liquid phase hydrolysis. The instrument was operated at constant temperature for the times as described in the figure legends. The optimum time and temperature combination for vapor phase hydrolysis was determined based on accuracy of amino acid composition for pure myoglobin.
Figure 2. Comparison of microwave and conventional vapor phase hydrolysis of pure Horse Heart Myoglobin.
AM
Q
NH
3
His Se
rA
rgG
ly
Asp G
lu
Thr
Ala
Pro
Der
ivPe
akC
ysLy
sTy
rM
etVa
lN
Va
IleLe
uPh
eAU
0.000
0.025
0.050
0.075
AM
Q
NH
3
His Se
rA
rgG
ly
Asp G
lu
Thr
Ala
Pro D
eriv
Peak
Cys
Lys
Tyr
Met
Val
NVa
IleLe
uPh
e
AU
0.000
0.025
0.050
0.075
Minutes1.50 3.00 4.50 6.00 7.50
Oven
Microwave
AM
Q
NH
3
His Se
rA
rgG
ly
Asp G
lu
Thr
Ala
Pro
Der
ivPe
akC
ysLy
sTy
rM
etVa
lN
Va
IleLe
uPh
eAU
0.000
0.025
0.050
0.075
AM
Q
NH
3
His Se
rA
rgG
ly
Asp G
lu
Thr
Ala
Pro D
eriv
Peak
Cys
Lys
Tyr
Met
Val
NVa
IleLe
uPh
e
AU
0.000
0.025
0.050
0.075
Minutes1.50 3.00 4.50 6.00 7.50
AM
Q
NH
3
His Se
rA
rgG
ly
Asp G
lu
Thr
Ala
Pro
Der
ivPe
akC
ysLy
sTy
rM
etVa
lN
Va
IleLe
uPh
eAU
0.000
0.025
0.050
0.075
AM
Q
NH
3
His Se
rA
rgG
ly
Asp G
lu
Thr
Ala
Pro
Der
ivPe
akC
ysLy
sTy
rM
etVa
lN
Va
IleLe
uPh
eAU
0.000
0.025
0.050
0.075
AM
Q
NH
3
His Se
rA
rgG
ly
Asp G
lu
Thr
Ala
Pro D
eriv
Peak
Cys
Lys
Tyr
Met
Val
NVa
IleLe
uPh
e
AU
0.000
0.025
0.050
0.075
Minutes1.50 3.00 4.50 6.00
AM
Q
NH
3
His Se
rA
rgG
ly
Asp G
lu
Thr
Ala
Pro D
eriv
Peak
Cys
Lys
Tyr
Met
Val
NVa
IleLe
uPh
e
AU
0.000
0.025
0.050
0.075
Minutes1.50 3.00 4.50 6.00 7.50
Oven
Microwave
CLASSIC UPLC WITH MICROWAVE HYDROLYSIS

27Improving Sample Handling for Amino Acid Analysis
Improving Sample Handling for Amino Acid Analysis
28 Improving Sample Handling for Amino Acid Analysis
29Amino Acid Analysis Application Notebook
Hydrolysates

30 Amino Acids Application Notebook
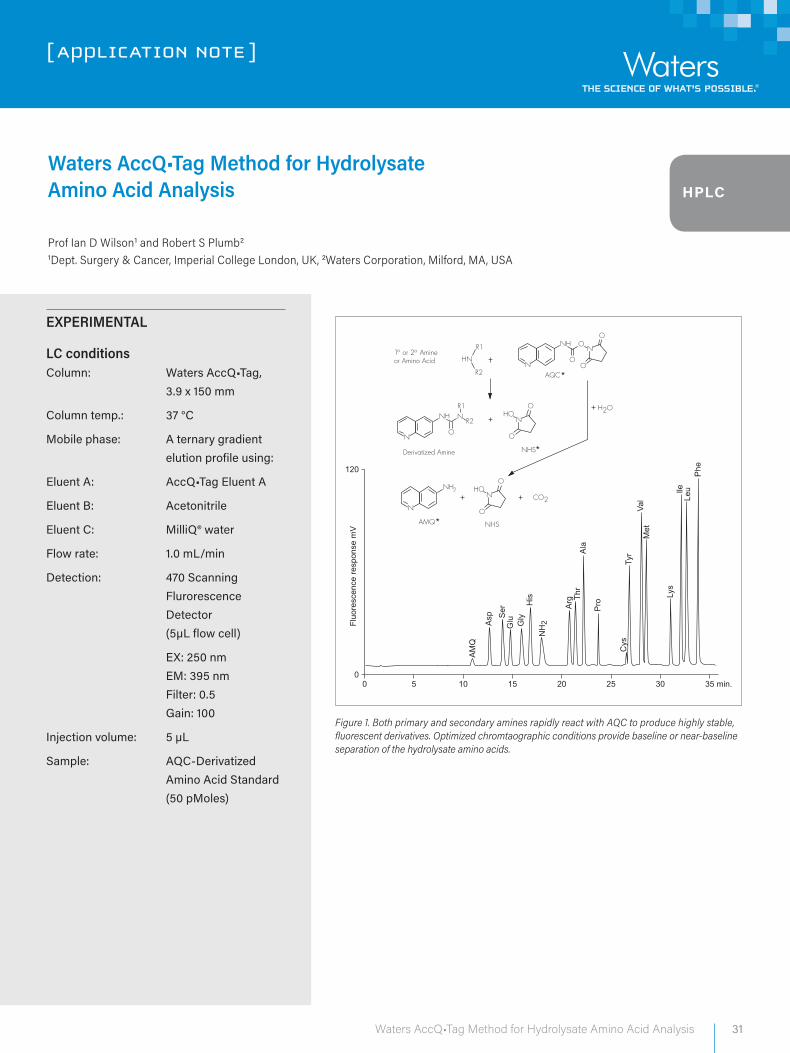
31Waters AccQ•Tag Method for Hydrolysate Amino Acid Analysis
[ APPLICATION NOTE ]
Waters AccQ•Tag Method for Hydrolysate Amino Acid Analysis
Prof Ian D Wilson1 and Robert S Plumb2
1Dept. Surgery & Cancer, Imperial College London, UK, 2Waters Corporation, Milford, MA, USA
EXPERIMENTAL
LC conditions Column: Waters AccQ•Tag,
3.9 x 150 mm
Column temp.: 37 °C
Mobile phase: A ternary gradient elution profile using:
Eluent A: AccQ•Tag Eluent A
Eluent B: Acetonitrile
Eluent C: MilliQ® water
Flow rate: 1.0 mL/min
Detection: 470 Scanning Flurorescence Detector (5µL flow cell)
EX: 250 nm EM: 395 nm Filter: 0.5 Gain: 100
Injection volume: 5 µL
Sample: AQC-Derivatized Amino Acid Standard (50 pMoles)
00
120
Fluo
resc
ence
resp
onse
mV
AM
Q
Asp S
erG
lu Gly
His
Arg Th
rA
la
Pro
Cys
Tyr
Val
Met
Lys
lleLe
uP
he
NH
2
5 10 15 20 25 30 35 min.
Figure 1. Both primary and secondary amines rapidly react with AQC to produce highly stable, fluorescent derivatives. Optimized chromtaographic conditions provide baseline or near-baseline separation of the hydrolysate amino acids.
HPLC

32 Amino Acids Application Notebook
[ NOTES ]

33Separation of Low Levels of Isoleucine from Leucine Using the ACQUITY UPLC H-Class Amino Acid System
WAT E R S SO LU T IO NS
UPLC Amino Acid Analysis Solution
ACQUITY UPLC® H-Class System
AccQ•Tag™ Ultra Chemistry
Empower® 3 Software
K E Y W O R D S
Amino acid analysis, leucine, isoleucine,
European Pharmacopoeia, USP
A P P L I C AT IO N B E N E F I T S
Resolution of leucine and isoleucine at
levels as low as 0.05% Ile/Leu using the
UPLC® Amino Acid Analysis Solution.
IN T RO DU C T IO N
The European Pharmacacopoeia (Ph. Eur.) defines requirements for the qualitative
and quantitative composition of amino acids and mixtures of amino acids. The
requirements for allowed impurities are also defined. Manufacturers of amino
acids are legally bound to prove that their amino acids meet these specifications
before they can distribute their products in Europe.
Leucine (Leu) is a branched-chain α-amino acid and is produced by the
fermentation process. During this process, isoleucine can be produced as a
by-product. The European Pharmacopoeia states that leucine and isoleucine
should have a resolution of 1.5 to levels as low as 0.05%. This application
note is intended to demonstrate that the Waters ACQUITY UPLC H-Class
Amino Acid System can be used to suitably resolve isoleucine from leucine
at these low levels.
The Waters ACQUITY UPLC H-Class Amino Acid System combines UPLC
separation technology with AccQ•Tag Ultra derivatization chemistry, providing
improved resolution and sensitivity, leading to improved sample characterization,
all achieved within a shorter analysis time than conventional methodologies.
The amino acids are derivatized with 6-aminoquinolyl-N-hydroxysuccinimidyl
carbamate (AQC) under largely aqueous conditions. The derivatives are then
separated utilizing the ACQUITY UPLC H-Class System, enabling analysts to
achieve accurate, precise, and robust amino acid analysis utilizing a reversed-
phase separation, and quantification with either UV or fluorescence detection.
Separation of Low Levels of Isoleucine from Leucine Using the ACQUITY UPLC H-Class Amino Acid SystemRichard C. DawWaters Corporation, Milford, MA, USA
H-CLASS
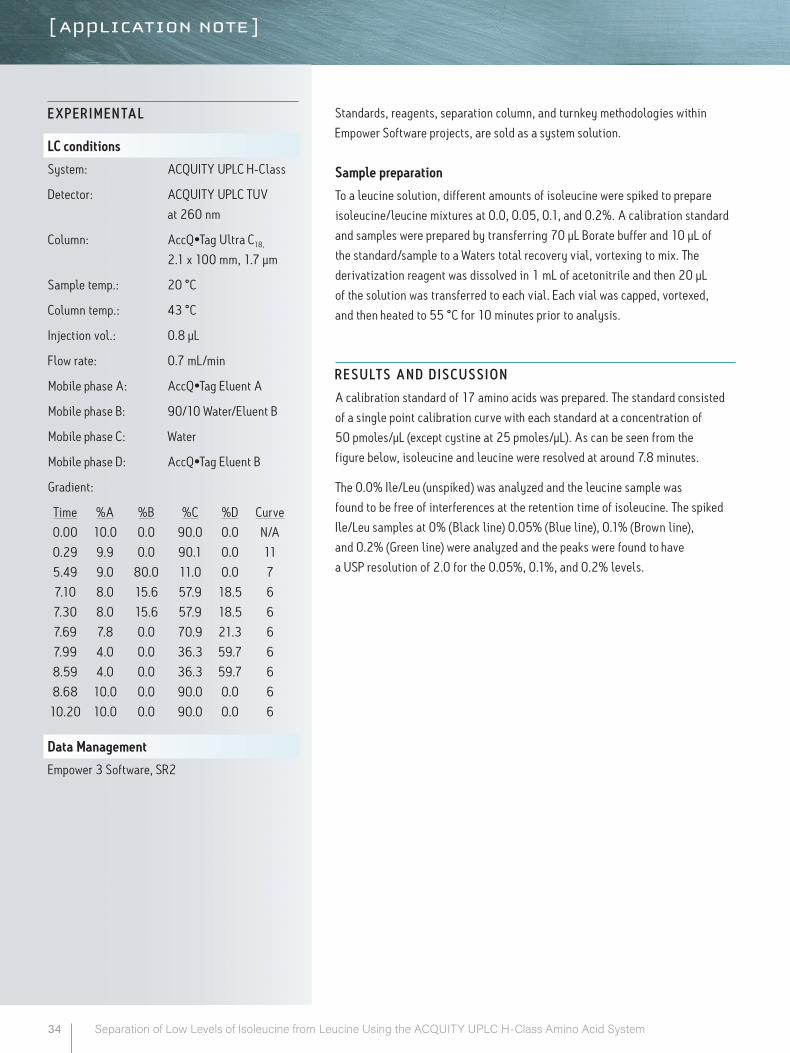
34 Separation of Low Levels of Isoleucine from Leucine Using the ACQUITY UPLC H-Class Amino Acid System
E X P E R IM E N TA L
LC conditions
System: ACQUITY UPLC H-Class
Detector: ACQUITY UPLC TUV
at 260 nm
Column: AccQ•Tag Ultra C18,
2.1 x 100 mm, 1.7 µm
Sample temp.: 20 °C
Column temp.: 43 °C
Injection vol.: 0.8 µL
Flow rate: 0.7 mL/min
Mobile phase A: AccQ•Tag Eluent A
Mobile phase B: 90/10 Water/Eluent B
Mobile phase C: Water
Mobile phase D: AccQ•Tag Eluent B
Gradient:
Time %A %B %C %D Curve
0.00 10.0 0.0 90.0 0.0 N/A
0.29 9.9 0.0 90.1 0.0 11
5.49 9.0 80.0 11.0 0.0 7
7.10 8.0 15.6 57.9 18.5 6
7.30 8.0 15.6 57.9 18.5 6
7.69 7.8 0.0 70.9 21.3 6
7.99 4.0 0.0 36.3 59.7 6
8.59 4.0 0.0 36.3 59.7 6
8.68 10.0 0.0 90.0 0.0 6
10.20 10.0 0.0 90.0 0.0 6
Data Management
Empower 3 Software, SR2
R E SU LT S A N D D IS C U S S IO N
A calibration standard of 17 amino acids was prepared. The standard consisted
of a single point calibration curve with each standard at a concentration of
50 pmoles/µL (except cystine at 25 pmoles/µL). As can be seen from the
figure below, isoleucine and leucine were resolved at around 7.8 minutes.
The 0.0% Ile/Leu (unspiked) was analyzed and the leucine sample was
found to be free of interferences at the retention time of isoleucine. The spiked
Ile/Leu samples at 0% (Black line) 0.05% (Blue line), 0.1% (Brown line),
and 0.2% (Green line) were analyzed and the peaks were found to have
a USP resolution of 2.0 for the 0.05%, 0.1%, and 0.2% levels.
Standards, reagents, separation column, and turnkey methodologies within
Empower Software projects, are sold as a system solution.
Sample preparation
To a leucine solution, different amounts of isoleucine were spiked to prepare
isoleucine/leucine mixtures at 0.0, 0.05, 0.1, and 0.2%. A calibration standard
and samples were prepared by transferring 70 µL Borate buffer and 10 µL of
the standard/sample to a Waters total recovery vial, vortexing to mix. The
derivatization reagent was dissolved in 1 mL of acetonitrile and then 20 µL
of the solution was transferred to each vial. Each vial was capped, vortexed,
and then heated to 55 °C for 10 minutes prior to analysis.

AM
Q -
1.1
71
NH
3 -
1.45
7
His
- 1
.696
Ser
- 2
.717
Arg
- 2
.937
Gly
- 3
.116
Asp
- 3
.566
Glu
- 4
.167
Thr
- 4.
614
Ala
- 5
.094
Pro
- 5.
759
Der
iv P
eak
- 6.
783
Cys
- 6
.946
Lys
- 6.
996
Tyr
- 7.
106
Met
- 7
.193
Val
- 7
.271
Ile
- 7.
784
Leu
- 7.
855
Phe
- 7.
975
AU
-0.020
-0.010
0.000
0.010
0.020
0.030
0.040
0.050
0.060
0.070
0.080
0.090
0.100
0.110
0.120
0.130
0.140
0.150
Minutes0.00 0.40 0.80 1.20 1.60 2.00 2.40 2.80 3.20 3.60 4.00 4.40 4.80 5.20 5.60 6.00 6.40 6.80 7.20 7.60 8.00 8.40 8.80 9.20 9.60 10.00
Figure 1. Standard chromatogram.
Figure 2. 0%, 0.05%, 0.1%, and 0.2% Ile/Leu chromatogram overlay.
AU
0.00
0.10
0.20
0.30
0.40
0.50
0.60
0.70
0.80
0.90
1.00
1.10
1.20
1.30
1.40
1.50
1.60
1.70
1.80
1.90
2.00
Minutes
0.00 0.40 0.80 1.20 1.60 2.00 2.40 2.80 3.20 3.60 4.00 4.40 4.80 5.20 5.60 6.00 6.40 6.80 7.20 7.60 8.00 8.40 8.80 9.20 9.60 10.00
AU
-0.020
-0.010
0.000
0.010
0.020
0.030
0.040
0.050
0.060
0.070
0.080
0.090
0.100
0.110
0.120
0.130
0.140
0.150
Minutes
7.50 7.52 7.54 7.56 7.58 7.60 7.62 7.64 7.66 7.68 7.70 7.72 7.74 7.76 7.78 7.80 7.82 7.84 7.86 7.88 7.90 7.92 7.94 7.96 7.98 8.00 8.02 8.04 8.06 8.08 8.10 8.12 8.14 8.16 8.18 8.20
Figure 3. 0%, 0.05%, 0.1%, and 0.2% Ile/Leu chromatogram overlay (zoomed).
35Separation of Low Levels of Isoleucine from Leucine Using the ACQUITY UPLC H-Class Amino Acid System
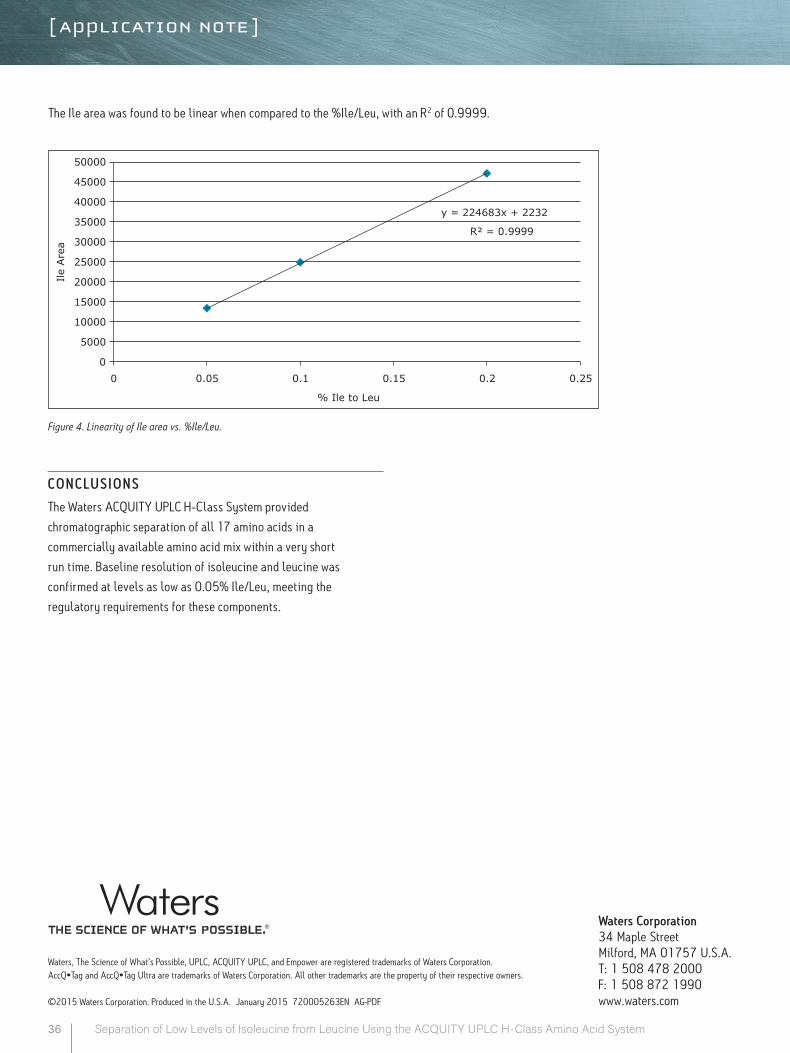
Waters Corporation 34 Maple Street Milford, MA 01757 U.S.A. T: 1 508 478 2000 F: 1 508 872 1990 www.waters.com
36 Separation of Low Levels of Isoleucine from Leucine Using the ACQUITY UPLC H-Class Amino Acid System
Waters, T he Science of What’s Possible, UPLC, ACQUITY UPLC, and Empower are registered trademarks of Waters Corporation. AccQ•Tag and AccQ•Tag Ultra are trademarks of Waters Corporation. All other trademarks are the property of their respective owners.
©2015 Waters Corporation. Produced in the U.S.A. January 2015 720005263EN AG-PDF
CO N C LU S IO NS
The Waters ACQUITY UPLC H-Class System provided
chromatographic separation of all 17 amino acids in a
commercially available amino acid mix within a very short
run time. Baseline resolution of isoleucine and leucine was
confirmed at levels as low as 0.05% Ile/Leu, meeting the
regulatory requirements for these components.
Figure 4. Linearity of Ile area vs. %Ile/Leu.
The Ile area was found to be linear when compared to the %Ile/Leu, with an R2 of 0.9999.
y = 224683x + 2232
R² = 0.9999
0
5000
10000
15000
20000
25000
30000
35000
40000
45000
50000
0 0.05 0.1 0.15 0.2 0.25
Ile
Are
a
% Ile to Leu
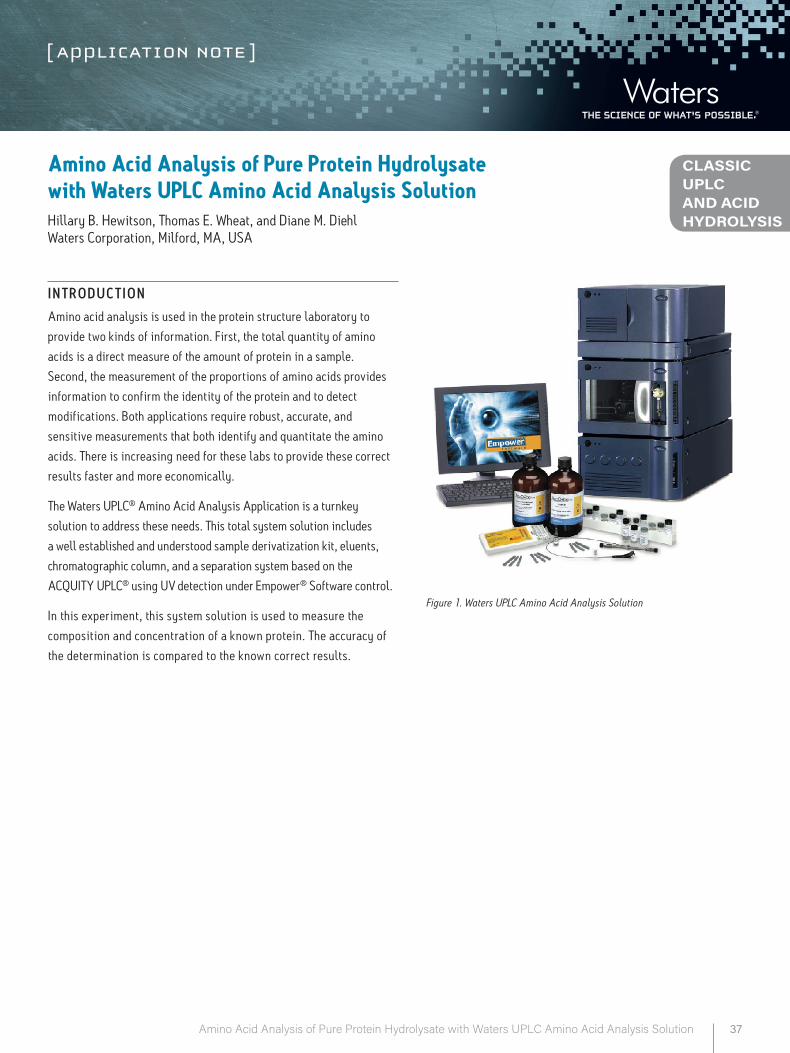
37Amino Acid Analysis of Pure Protein Hydrolysate with Waters UPLC Amino Acid Analysis Solution
CLASSIC UPLC AND ACID HYDROLYSIS
Amino Acid Analysis of Pure Protein Hydrolysate with Waters UPLC Amino Acid Analysis SolutionHillary B. Hewitson, Thomas E. Wheat, and Diane M. DiehlWaters Corporation, Milford, MA, USA
IN T RO DU C T IO N
Amino acid analysis is used in the protein structure laboratory to
provide two kinds of information. First, the total quantity of amino
acids is a direct measure of the amount of protein in a sample.
Second, the measurement of the proportions of amino acids provides
information to confirm the identity of the protein and to detect
modifications. Both applications require robust, accurate, and
sensitive measurements that both identify and quantitate the amino
acids. There is increasing need for these labs to provide these correct
results faster and more economically.
The Waters UPLC® Amino Acid Analysis Application is a turnkey
solution to address these needs. This total system solution includes
a well established and understood sample derivatization kit, eluents,
chromatographic column, and a separation system based on the
ACQUITY UPLC® using UV detection under Empower® Software control.
In this experiment, this system solution is used to measure the
composition and concentration of a known protein. The accuracy of
the determination is compared to the known correct results.
Figure 1. Waters UPLC Amino Acid Analysis Solution
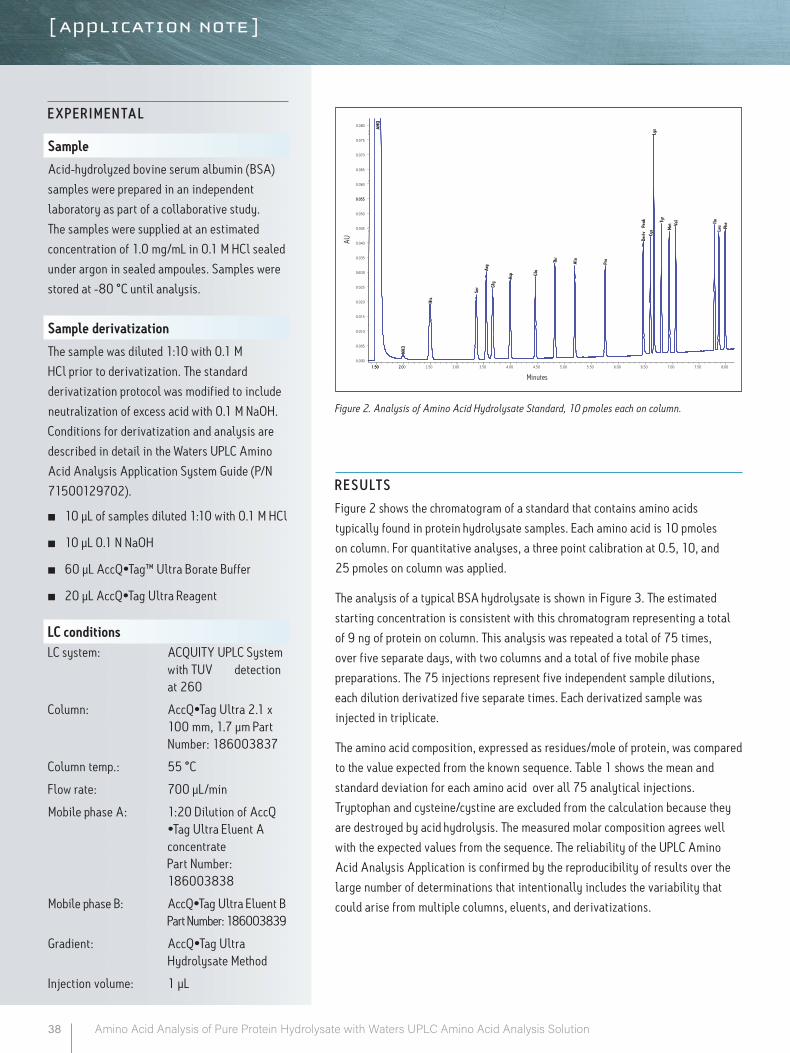
38 Amino Acid Analysis of Pure Protein Hydrolysate with Waters UPLC Amino Acid Analysis Solution
E X P E R IM E N TA L
Sample
Acid-hydrolyzed bovine serum albumin (BSA)
samples were prepared in an independent
laboratory as part of a collaborative study.
The samples were supplied at an estimated
concentration of 1.0 mg/mL in 0.1 M HCl sealed
under argon in sealed ampoules. Samples were
stored at -80 °C until analysis.
Sample derivatization
The sample was diluted 1:10 with 0.1 M
HCl prior to derivatization. The standard
derivatization protocol was modified to include
neutralization of excess acid with 0.1 M NaOH.
Conditions for derivatization and analysis are
described in detail in the Waters UPLC Amino
Acid Analysis Application System Guide (P/N
71500129702).
■■ 10 μL of samples diluted 1:10 with 0.1 M HCl
■■ 10 μL 0.1 N NaOH
■■ 60 μL AccQ•Tag™ Ultra Borate Buffer
■■ 20 μL AccQ•Tag Ultra Reagent
LC conditions LC system: ACQUITY UPLC System
with TUV detection at 260
Column: AccQ•Tag Ultra 2.1 x 100 mm, 1.7 µm Part Number: 186003837
Column temp.: 55 °C
Flow rate: 700 µL/min
Mobile phase A: 1:20 Dilution of AccQ •Tag Ultra Eluent A concentrate Part Number: 186003838
Mobile phase B: AccQ•Tag Ultra Eluent B Part Number: 186003839
Gradient: AccQ•Tag Ultra Hydrolysate Method
Injection volume: 1 μL
AMQ
NH3
His
Ser
Arg
Gly
Asp Gl
u
Thr
Ala
Pro
Deriv
Peak
Cys
Lys
Tyr
Met Va
l IleLe
u Phe
0.000
0.005
0.010
0.015
0.020
0.025
0t030
0.035
0.040
0.045
0.050
0.055
0.060
0.065
0.070
0.075
0.080
Minutes1.50 2.00 2.50 3.00 3.50 4.00 4.50 5.00 5.50 6.00 6.50 7.00 7.50 8.00
0.055
1.50 2.0
AU
1.50
Figure 2. Analysis of Amino Acid Hydrolysate Standard, 10 pmoles each on column.
R E SU LT S
Figure 2 shows the chromatogram of a standard that contains amino acids
typically found in protein hydrolysate samples. Each amino acid is 10 pmoles
on column. For quantitative analyses, a three point calibration at 0.5, 10, and
25 pmoles on column was applied.
The analysis of a typical BSA hydrolysate is shown in Figure 3. The estimated
starting concentration is consistent with this chromatogram representing a total
of 9 ng of protein on column. This analysis was repeated a total of 75 times,
over five separate days, with two columns and a total of five mobile phase
preparations. The 75 injections represent five independent sample dilutions,
each dilution derivatized five separate times. Each derivatized sample was
injected in triplicate.
The amino acid composition, expressed as residues/mole of protein, was compared
to the value expected from the known sequence. Table 1 shows the mean and
standard deviation for each amino acid over all 75 analytical injections.
Tryptophan and cysteine/cystine are excluded from the calculation because they
are destroyed by acid hydrolysis. The measured molar composition agrees well
with the expected values from the sequence. The reliability of the UPLC Amino
Acid Analysis Application is confirmed by the reproducibility of results over the
large number of determinations that intentionally includes the variability that
could arise from multiple columns, eluents, and derivatizations.
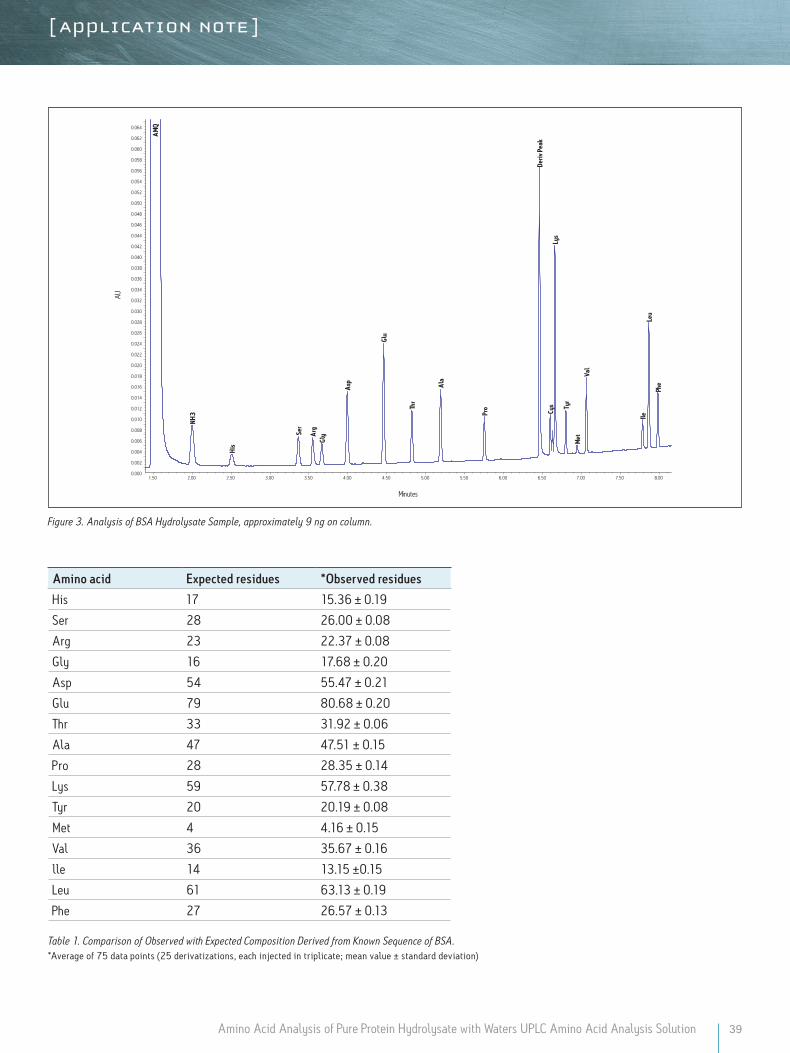
39
AM
Q
NH3
His
Ser
Arg
Gly
Asp
Glu
Thr
Ala
Pro
Deriv
Pea
k
Cys
Lys
Tyr
Met
Val
IleLe
uPh
e
0.000
0.002
0.004
0.006
0.008
0.010
0.012
0.014
0.016
0.018
0.020
0.022
0.024
0.026
0.028
0.030
0.032
0.034
0.036
0.038
0.040
0.042
0.044
0.046
0.048
0.050
0.052
0.054
0.056
0.058
0.060
0.062
0.064
Minutes
1.50 2.00 2.50 3.00 3.50 4.00 4.50 5.00 5.50 6.00 6.50 7.00 7.50 8.00
AU
0.000
0.002
0.004
0.006
0.008
0.010
0.012
0.014
0.016
0.018
0.020
0.022
0.024
0.026
0.028
0.030
0.032
0.034
0.036
0.038
0.040
0.042
0.044
0.046
0.048
0.050
0.052
0.054
0.056
0.058
0.060
0.062
0.064
Figure 3. Analysis of BSA Hydrolysate Sample, approximately 9 ng on column.
Table 1. Comparison of Observed with Expected Composition Derived from Known Sequence of BSA.*Average of 75 data points (25 derivatizations, each injected in triplicate; mean value ± standard deviation)
Amino acid Expected residues *Observed residues
His 17 15.36 ± 0.19
Ser 28 26.00 ± 0.08
Arg 23 22.37 ± 0.08
Gly 16 17.68 ± 0.20
Asp 54 55.47 ± 0.21
Glu 79 80.68 ± 0.20
Thr 33 31.92 ± 0.06
Ala 47 47.51 ± 0.15
Pro 28 28.35 ± 0.14
Lys 59 57.78 ± 0.38
Tyr 20 20.19 ± 0.08
Met 4 4.16 ± 0.15
Val 36 35.67 ± 0.16
lle 14 13.15 ±0.15
Leu 61 63.13 ± 0.19
Phe 27 26.57 ± 0.13
Amino Acid Analysis of Pure Protein Hydrolysate with Waters UPLC Amino Acid Analysis Solution
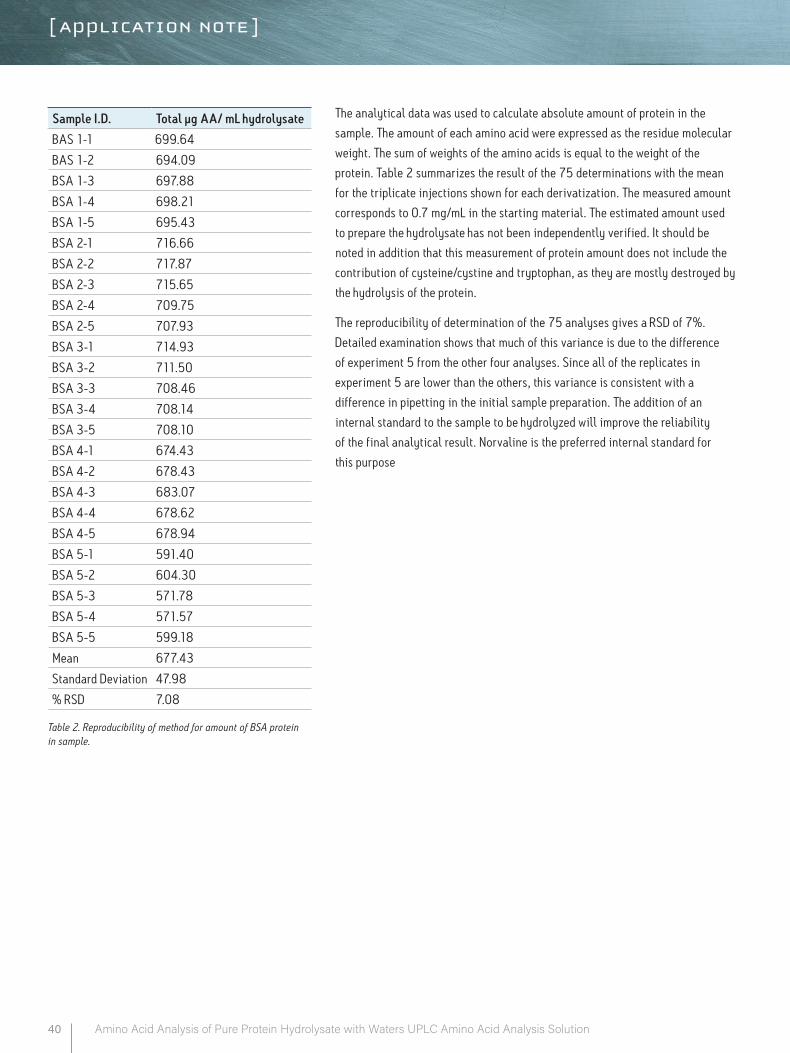
40 Amino Acid Analysis of Pure Protein Hydrolysate with Waters UPLC Amino Acid Analysis Solution
The analytical data was used to calculate absolute amount of protein in the
sample. The amount of each amino acid were expressed as the residue molecular
weight. The sum of weights of the amino acids is equal to the weight of the
protein. Table 2 summarizes the result of the 75 determinations with the mean
for the triplicate injections shown for each derivatization. The measured amount
corresponds to 0.7 mg/mL in the starting material. The estimated amount used
to prepare the hydrolysate has not been independently verified. It should be
noted in addition that this measurement of protein amount does not include the
contribution of cysteine/cystine and tryptophan, as they are mostly destroyed by
the hydrolysis of the protein.
The reproducibility of determination of the 75 analyses gives a RSD of 7%.
Detailed examination shows that much of this variance is due to the difference
of experiment 5 from the other four analyses. Since all of the replicates in
experiment 5 are lower than the others, this variance is consistent with a
difference in pipetting in the initial sample preparation. The addition of an
internal standard to the sample to be hydrolyzed will improve the reliability
of the final analytical result. Norvaline is the preferred internal standard for
this purpose
Sample I.D. Total µg AA/ mL hydrolysate
BAS 1-1 699.64
BAS 1-2 694.09
BSA 1-3 697.88
BSA 1-4 698.21
BSA 1-5 695.43
BSA 2-1 716.66
BSA 2-2 717.87
BSA 2-3 715.65
BSA 2-4 709.75
BSA 2-5 707.93
BSA 3-1 714.93
BSA 3-2 711.50
BSA 3-3 708.46
BSA 3-4 708.14
BSA 3-5 708.10
BSA 4-1 674.43
BSA 4-2 678.43
BSA 4-3 683.07
BSA 4-4 678.62
BSA 4-5 678.94
BSA 5-1 591.40
BSA 5-2 604.30
BSA 5-3 571.78
BSA 5-4 571.57
BSA 5-5 599.18
Mean 677.43
Standard Deviation 47.98
% RSD 7.08
Table 2. Reproducibility of method for amount of BSA protein in sample.
Waters Corporation 34 Maple Street Milford, MA 01757 U.S.A. T: 1 508 478 2000 F: 1 508 872 1990 www.waters.com
41Amino Acid Analysis of Pure Protein Hydrolysate with Waters UPLC Amino Acid Analysis Solution
CO N C LU S IO N
Protein structure and biopharmaceutical laboratories rely on
accurate quantitation of amino acids to confirm the identity and
amount of protein in their samples. The analyses shown here
demonstrate that Waters UPLC Amino Acid Analysis Application
can provide assured results for these laboratories.
The molar ratios of amino acids are reproducible over multiple
derivatizations and replicate injections. The measured
composition agrees with that expected from the sequence of BSA.
Determination of the absolute amount of protein in the samples is
determined by summing the residue weights of amino acids. The
reproducibility of this measurement is on the order of ±7%. The
largest contribution to this variance is the initial sample dilution.
Incorporation of an internal standard in hydrolysis will improve
the precision of the determination. Norvaline is recommended as
an internal standard for the method.
The Waters UPLC Amino Acid Analysis Application provides
a complete turnkey analytical method for analyzing protein
hydrolysate samples. The ACQUITY UPLC System gives very high
resolution for certain peak identification and ease of integration.
With standard UV detection, all the derivatized amino acids have
similar extinction coefficients to facilitate quantitative analysis.
Sensitivity levels corresponding to nanograms of protein can
be achieved routinely. The ruggedness of this turnkey system
solution ensures rapid and unequivocal identification of proteins,
with no interference or ambiguity. The pre-tested column, eluents
and reagents ensure that the user will not spend time adjusting
the method. The small amount of sample required for good
analyses contributes to long column life and minimizes the chance
of failure during a series of runs. The high resolution ensures
reliable peak identification and quantitation so that runs need
not be repeated. The pre-defined methods and reports simplify
reporting of results. These analytical benefits are obtained with a
short analysis time for the high throughput required for the routine
determination of protein composition and concentration.
Waters, The Science of What’s Possible, UPLC, ACQUITY UPLC, and Empower are trademarks of Waters Corporation. AccQ•Tag is a trademark of Waters Corporation. All other trademarks are the property of their respective owners.
©2007 Waters Corporation. Produced in the U.S.A. November 2015 720002404EN KP-PDF

42 Amino Acids Application Notebook
[ NOTES ]
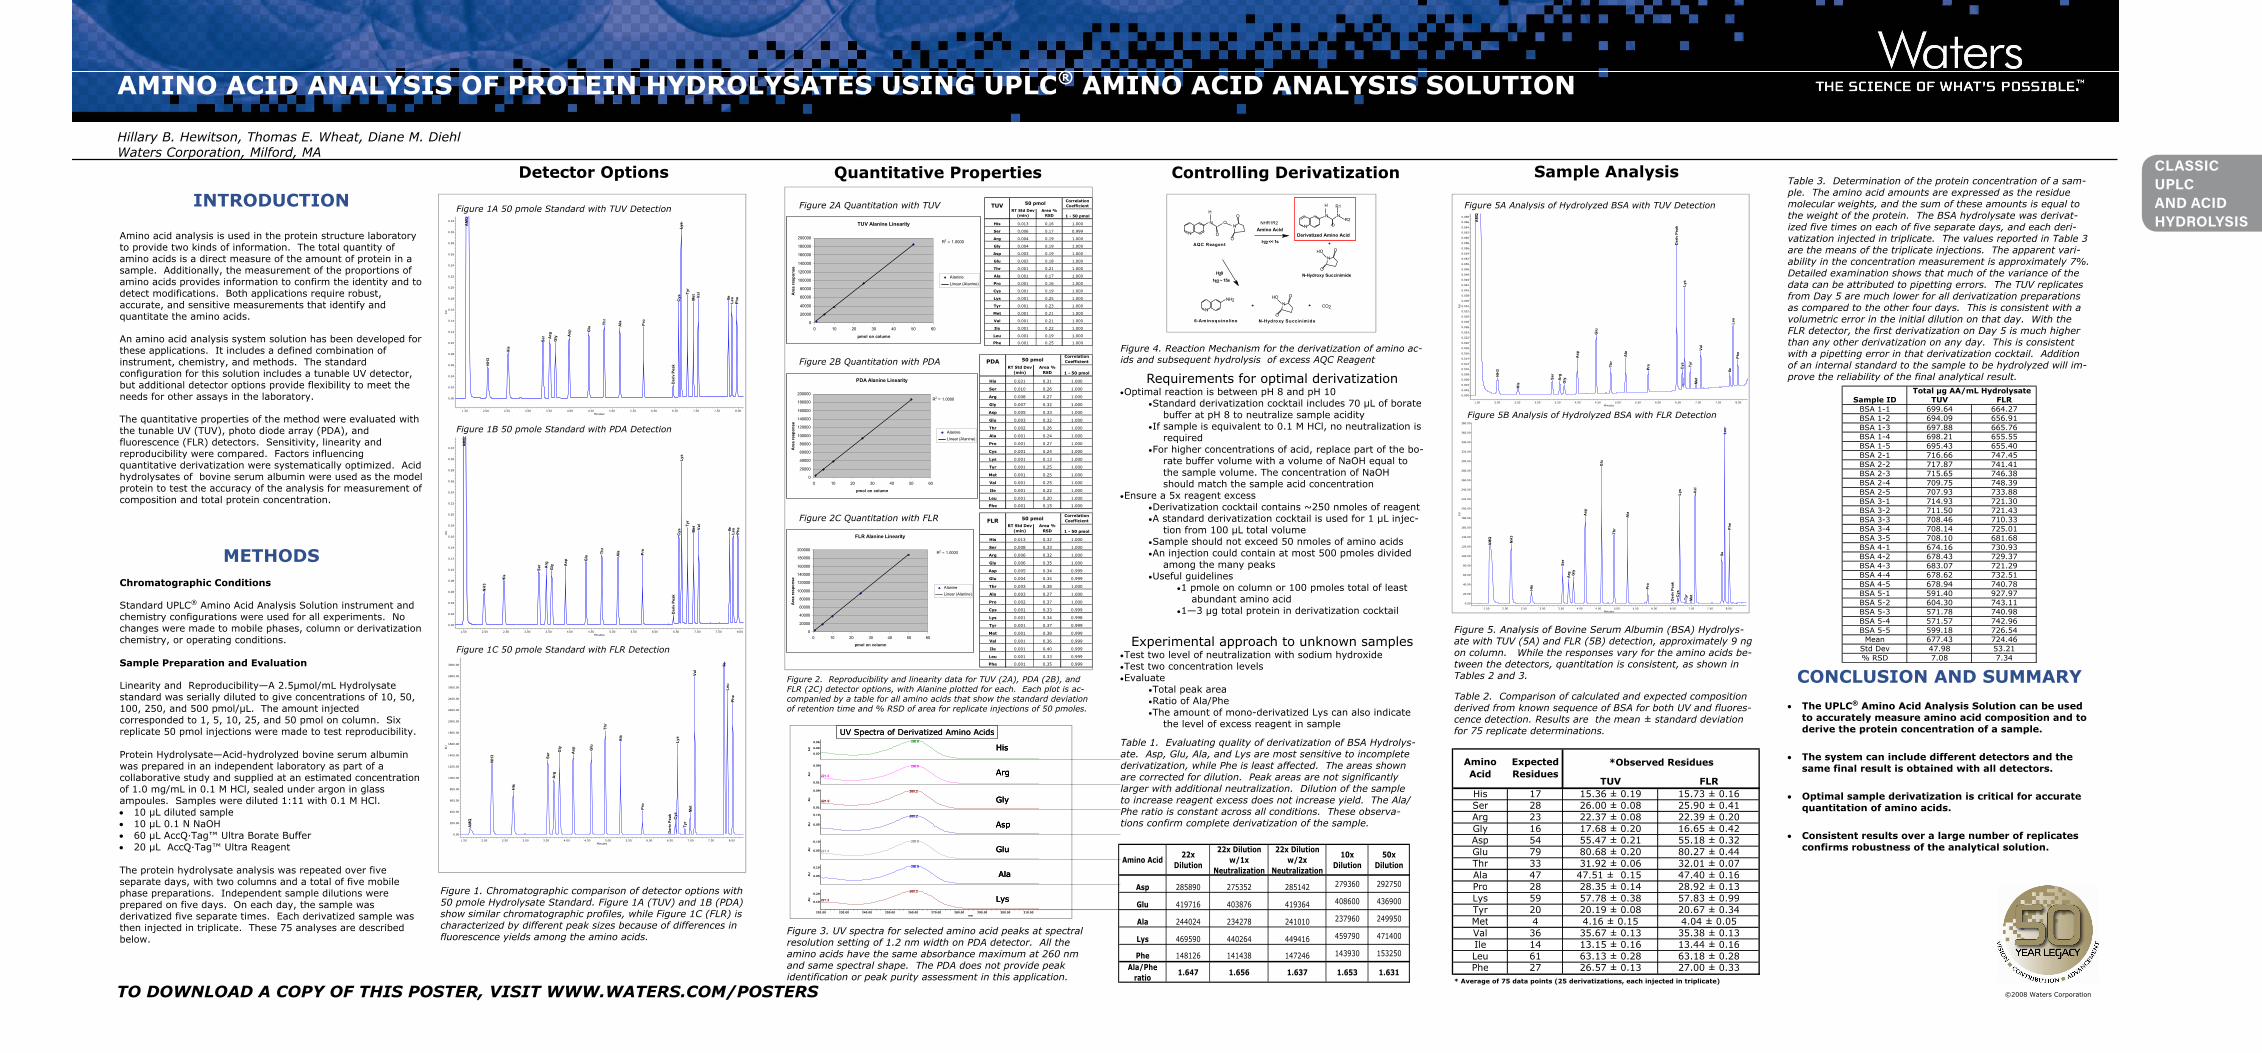
TO DOWNLOAD A COPY OF THIS POSTER, VISIT WWW.WATERS.COM/POSTERS ©2008 Waters Corporation
AMINO ACID ANALYSIS OF PROTEIN HYDROLYSATES USING UPLC® AMINO ACID ANALYSIS SOLUTION
INTRODUCTION
Amino acid analysis is used in the protein structure laboratory to provide two kinds of information. The total quantity of amino acids is a direct measure of the amount of protein in a sample. Additionally, the measurement of the proportions of amino acids provides information to confirm the identity and to detect modifications. Both applications require robust, accurate, and sensitive measurements that identify and quantitate the amino acids.
An amino acid analysis system solution has been developed for these applications. It includes a defined combination of instrument, chemistry, and methods. The standard configuration for this solution includes a tunable UV detector, but additional detector options provide flexibility to meet the needs for other assays in the laboratory.
The quantitative properties of the method were evaluated with the tunable UV (TUV), photo diode array (PDA), and fluorescence (FLR) detectors. Sensitivity, linearity and reproducibility were compared. Factors influencing quantitative derivatization were systematically optimized. Acid hydrolysates of bovine serum albumin were used as the model protein to test the accuracy of the analysis for measurement of composition and total protein concentration.
METHODSChromatographic Conditions
Standard UPLC® Amino Acid Analysis Solution instrument and chemistry configurations were used for all experiments. No changes were made to mobile phases, column or derivatization chemistry, or operating conditions.
Sample Preparation and Evaluation
Linearity and Reproducibility—A 2.5µmol/mL Hydrolysate standard was serially diluted to give concentrations of 10, 50, 100, 250, and 500 pmol/µL. The amount injected corresponded to 1, 5, 10, 25, and 50 pmol on column. Six replicate 50 pmol injections were made to test reproducibility.
Protein Hydrolysate—Acid-hydrolyzed bovine serum albumin was prepared in an independent laboratory as part of a collaborative study and supplied at an estimated concentration of 1.0 mg/mL in 0.1 M HCl, sealed under argon in glass ampoules. Samples were diluted 1:11 with 0.1 M HCl. • 10 µL diluted sample • 10 µL 0.1 N NaOH • 60 µL AccQ·Tag™ Ultra Borate Buffer • 20 µL AccQ·Tag™ Ultra Reagent
The protein hydrolysate analysis was repeated over five separate days, with two columns and a total of five mobile phase preparations. Independent sample dilutions were prepared on five days. On each day, the sample was derivatized five separate times. Each derivatized sample was then injected in triplicate. These 75 analyses are described below.
CONCLUSION AND SUMMARY • The UPLC® Amino Acid Analysis Solution can be used
to accurately measure amino acid composition and to derive the protein concentration of a sample.
• The system can include different detectors and the same final result is obtained with all detectors.
• Optimal sample derivatization is critical for accurate quantitation of amino acids.
• Consistent results over a large number of replicates confirms robustness of the analytical solution.
Table 2. Comparison of calculated and expected composition derived from known sequence of BSA for both UV and fluores-cence detection. Results are the mean ± standard deviation for 75 replicate determinations.
TUV FLRHis 17 15.36 ± 0.19 15.73 ± 0.16Ser 28 26.00 ± 0.08 25.90 ± 0.41Arg 23 22.37 ± 0.08 22.39 ± 0.20Gly 16 17.68 ± 0.20 16.65 ± 0.42Asp 54 55.47 ± 0.21 55.18 ± 0.32Glu 79 80.68 ± 0.20 80.27 ± 0.44Thr 33 31.92 ± 0.06 32.01 ± 0.07Ala 47 47.51 ± 0.15 47.40 ± 0.16Pro 28 28.35 ± 0.14 28.92 ± 0.13Lys 59 57.78 ± 0.38 57.83 ± 0.99Tyr 20 20.19 ± 0.08 20.67 ± 0.34Met 4 4.16 ± 0.15 4.04 ± 0.05Val 36 35.67 ± 0.13 35.38 ± 0.13Ile 14 13.15 ± 0.16 13.44 ± 0.16Leu 61 63.13 ± 0.28 63.18 ± 0.28Phe 27 26.57 ± 0.13 27.00 ± 0.33
*Observed ResiduesAmino Acid
Expected Residues
* Average of 75 data points (25 derivatizations, each injected in triplicate)
Figure 5. Analysis of Bovine Serum Albumin (BSA) Hydrolys-ate with TUV (5A) and FLR (5B) detection, approximately 9 ng on column. While the responses vary for the amino acids be-tween the detectors, quantitation is consistent, as shown in Tables 2 and 3.
Sample ID TUV FLRBSA 1-1 699.64 664.27BSA 1-2 694.09 656.91BSA 1-3 697.88 665.76BSA 1-4 698.21 655.55BSA 1-5 695.43 655.40BSA 2-1 716.66 747.45BSA 2-2 717.87 741.41BSA 2-3 715.65 746.38BSA 2-4 709.75 748.39BSA 2-5 707.93 733.88BSA 3-1 714.93 721.30BSA 3-2 711.50 721.43BSA 3-3 708.46 710.33BSA 3-4 708.14 725.01BSA 3-5 708.10 681.68BSA 4-1 674.16 730.93BSA 4-2 678.43 729.37BSA 4-3 683.07 721.29BSA 4-4 678.62 732.51BSA 4-5 678.94 740.78BSA 5-1 591.40 927.97BSA 5-2 604.30 743.11BSA 5-3 571.78 740.98BSA 5-4 571.57 742.96BSA 5-5 599.18 726.54
Mean 677.43 724.46Std Dev 47.98 53.21% RSD 7.08 7.34
Total µg AA/mL Hydrolysate
Table 3. Determination of the protein concentration of a sam-ple. The amino acid amounts are expressed as the residue molecular weights, and the sum of these amounts is equal to the weight of the protein. The BSA hydrolysate was derivat-ized five times on each of five separate days, and each deri-vatization injected in triplicate. The values reported in Table 3 are the means of the triplicate injections. The apparent vari-ability in the concentration measurement is approximately 7%.Detailed examination shows that much of the variance of the data can be attributed to pipetting errors. The TUV replicates from Day 5 are much lower for all derivatization preparations as compared to the other four days. This is consistent with a volumetric error in the initial dilution on that day. With the FLR detector, the first derivatization on Day 5 is much higher than any other derivatization on any day. This is consistent with a pipetting error in that derivatization cocktail. Addition of an internal standard to the sample to be hydrolyzed will im-prove the reliability of the final analytical result.
Table 1. Evaluating quality of derivatization of BSA Hydrolys-ate. Asp, Glu, Ala, and Lys are most sensitive to incomplete derivatization, while Phe is least affected. The areas shown are corrected for dilution. Peak areas are not significantly larger with additional neutralization. Dilution of the sample to increase reagent excess does not increase yield. The Ala/Phe ratio is constant across all conditions. These observa-tions confirm complete derivatization of the sample.
Amino Acid 22x Dilution
22x Dilution w/1x
Neutralization
22x Dilution w/2x
Neutralization
10x Dilution
50x Dilution
Asp 285890 275352 285142 279360 292750
Glu 419716 403876 419364 408600 436900
Ala 244024 234278 241010 237960 249950
Lys 469590 440264 449416 459790 471400
Phe 148126 141438 147246 143930 153250
Ala/Phe ratio 1.647 1.656 1.637 1.653 1.631
Requirements for optimal derivatization •Optimal reaction is between pH 8 and pH 10
•Standard derivatization cocktail includes 70 µL of borate buffer at pH 8 to neutralize sample acidity
•If sample is equivalent to 0.1 M HCl, no neutralization is required
•For higher concentrations of acid, replace part of the bo-rate buffer volume with a volume of NaOH equal to the sample volume. The concentration of NaOH should match the sample acid concentration
•Ensure a 5x reagent excess •Derivatization cocktail contains ~250 nmoles of reagent •A standard derivatization cocktail is used for 1 µL injec-
tion from 100 µL total volume •Sample should not exceed 50 nmoles of amino acids •An injection could contain at most 500 pmoles divided
among the many peaks•Useful guidelines
•1 pmole on column or 100 pmoles total of least abundant amino acid
•1—3 µg total protein in derivatization cocktail
Experimental approach to unknown samples •Test two level of neutralization with sodium hydroxide •Test two concentration levels •Evaluate
•Total peak area •Ratio of Ala/Phe •The amount of mono-derivatized Lys can also indicate
the level of excess reagent in sample
Hillary B. Hewitson, Thomas E. Wheat, Diane M. Diehl Waters Corporation, Milford, MA
AM
Q
NH
3
His
Ser Arg
Gly A
sp Glu
Thr
Ala Pro
Der
iv P
eak
Cys
Lys
Tyr
Met Va
l
IleLe
uPh
e
AU
0.00
0.02
0.04
0.06
0.08
0.10
0.12
0.14
0.16
0.18
0.20
0.22
0.24
0.26
0.28
0.30
0.32
Minutes1.50 2.00 2.50 3.00 3.50 4.00 4.50 5.00 5.50 6.00 6.50 7.00 7.50 8.00
Figure 1A 50 pmole Standard with TUV Detection
Figure 1. Chromatographic comparison of detector options with 50 pmole Hydrolysate Standard. Figure 1A (TUV) and 1B (PDA) show similar chromatographic profiles, while Figure 1C (FLR) is characterized by different peak sizes because of differences in fluorescence yields among the amino acids.
AM
Q
NH
3
His
Ser Arg
Gly A
sp Glu
Thr
Ala Pro
Der
iv P
eak
Cys
Lys
Tyr
Met Val
IleLe
uPh
e
AU
0.00
0.02
0.04
0.06
0.08
0.10
0.12
0.14
0.16
0.18
0.20
0.22
0.24
0.26
0.28
0.30
0.32
Minutes1.50 2.00 2.50 3.00 3.50 4.00 4.50 5.00 5.50 6.00 6.50 7.00 7.50 8.00
Figure 1B 50 pmole Standard with PDA Detection
Figure 1C 50 pmole Standard with FLR Detection
AM
Q
NH
3
His
Ser
Arg
Gly
Asp G
lu
Thr
Ala
Pro
Der
iv P
eak
Cys
Lys
Tyr
Met
Val
IleLe
uPh
e
EU
0.00
200.00
400.00
600.00
800.00
1000.00
1200.00
1400.00
1600.00
1800.00
2000.00
2200.00
2400.00
2600.00
2800.00
3000.00
Minutes1.50 2.00 2.50 3.00 3.50 4.00 4.50 5.00 5.50 6.00 6.50 7.00 7.50 8.00
AM
Q
NH
3
His
Ser
Arg
Gly
Asp
Glu
Thr
Ala
Pro
Der
iv P
eak
Cys
Lys
Tyr
Met
Val
IleLe
uPh
e
AU
0.000
0.002
0.004
0.006
0.008
0.010
0.012
0.014
0.016
0.018
0.020
0.022
0.024
0.026
0.028
0.030
0.032
0.034
0.036
0.038
0.040
0.042
0.044
0.046
0.048
0.050
0.052
0.054
0.056
0.058
0.060
0.062
0.064
0.066
0.068
Minutes1.50 2.00 2.50 3.00 3.50 4.00 4.50 5.00 5.50 6.00 6.50 7.00 7.50 8.00
AM
Q
NH
3
His
Ser
Arg G
ly
Asp
Glu
Thr
Ala
Pro
Der
iv P
eak
Cys
Lys
Tyr
Met
Val
IleLe
uPh
e
EU
0.00
20.00
40.00
60.00
80.00
100.00
120.00
140.00
160.00
180.00
200.00
220.00
240.00
260.00
280.00
300.00
320.00
340.00
360.00
380.00
Minutes1.50 2.00 2.50 3.00 3.50 4.00 4.50 5.00 5.50 6.00 6.50 7.00 7.50 8.00
Figure 5A Analysis of Hydrolyzed BSA with TUV Detection
Figure 5B Analysis of Hydrolyzed BSA with FLR Detection
PDACorrelation Coefficient
RT Std Dev (min)
Area % RSD 1 - 50 pmol
His 0.021 0.31 1.000
Ser 0.010 0.26 1.000
Arg 0.008 0.27 1.000
Gly 0.007 0.32 1.000
Asp 0.005 0.33 1.000
Glu 0.003 0.32 1.000
Thr 0.002 0.26 1.000
Ala 0.001 0.24 1.000
Pro 0.001 0.27 1.000
Cys 0.001 0.24 1.000
Lys 0.001 0.13 1.000
Tyr 0.001 0.25 1.000
Met 0.001 0.25 1.000
Val 0.001 0.25 1.000
Ile 0.001 0.22 1.000
Leu 0.001 0.20 1.000
Phe 0.001 0.15 1.000
50 pmol
Figure 2. Reproducibility and linearity data for TUV (2A), PDA (2B), and FLR (2C) detector options, with Alanine plotted for each. Each plot is ac-companied by a table for all amino acids that show the standard deviation of retention time and % RSD of area for replicate injections of 50 pmoles.
TUV Alanine Linearity
R2 = 1.0000
0
20000
40000
60000
80000
100000
120000
140000
160000
180000
200000
0 10 20 30 40 50 60
pmol on column
Area
res
pons
e
AlanineLinear (Alanine)
TUVCorrelation Coefficient
RT Std Dev (min)
Area % RSD 1 - 50 pmol
His 0.013 0.16 1.000
Ser 0.006 0.17 0.999
Arg 0.004 0.19 1.000
Gly 0.004 0.19 1.000
Asp 0.003 0.19 1.000
Glu 0.002 0.18 1.000
Thr 0.001 0.21 1.000
Ala 0.001 0.17 1.000
Pro 0.001 0.16 1.000
Cys 0.001 0.19 1.000
Lys 0.001 0.25 1.000
Tyr 0.001 0.23 1.000
Met 0.001 0.21 1.000
Val 0.001 0.21 1.000
Ile 0.001 0.22 1.000
Leu 0.001 0.19 1.000
Phe 0.001 0.25 1.000
50 pmol
PDA Alanine Linearity
R2 = 1.0000
0
20000
40000
60000
80000
100000
120000
140000
160000
180000
200000
0 10 20 30 40 50 60
pmol on column
Area
res
pons
e
AlanineLinear (Alanine)
FLR Alanine Linearity
R2 = 1.0000
0
20000
40000
60000
80000
100000
120000
140000
160000
180000
200000
0 10 20 30 40 50 60
pmol on column
Area
resp
onse
AlanineLinear (Alanine)
FLRCorrelation Coefficient
RT Std Dev (min)
Area % RSD 1 - 50 pmol
His 0.013 0.32 1.000
Ser 0.008 0.33 1.000
Arg 0.006 0.32 1.000
Gly 0.006 0.35 1.000
Asp 0.005 0.34 0.999
Glu 0.004 0.34 0.999
Thr 0.003 0.38 1.000
Ala 0.003 0.27 1.000
Pro 0.002 0.37 1.000
Cys 0.001 0.33 0.999
Lys 0.001 0.34 0.998
Tyr 0.001 0.37 0.999
Met 0.001 0.38 0.999
Val 0.001 0.36 0.999
Ile 0.001 0.40 0.999
Leu 0.001 0.33 0.999
Phe 0.001 0.35 0.999
50 pmol
Figure 2A Quantitation with TUV
Figure 2B Quantitation with PDA
Figure 2C Quantitation with FLR
Figure 4. Reaction Mechanism for the derivatization of amino ac-ids and subsequent hydrolysis of excess AQC Reagent
HN
R1H
R2N
NN
N
O
O
O
N
O
t1/2<< 1s
NHR1R2
+
O
O
HN
H20t1/2~ 15s
+ CO2
6-Aminoquinoline
NH2
N
N-Hydroxy Succin imide
AQC Reagent
O
+
N-Hydroxy Succinimide
O
O OH
O
N
Amino AcidDerivatized Amino Acid
Detector Options Quantitative Properties Controlling Derivatization Sample Analysis
Figure 3. UV spectra for selected amino acid peaks at spectral resolution setting of 1.2 nm width on PDA detector. All the amino acids have the same absorbance maximum at 260 nmand same spectral shape. The PDA does not provide peak identification or peak purity assessment in this application.
260.8
AU
0.02
0.04
0.06
221.3
260.8
AU
0.01
0.09
221.9
260.2
AU
0.01
0.09
260.2
AU 0.05
0.10
221.3
260.8
AU
0.05
0.10
260.8
AU
0.05
0.10
221.3
260.2
AU
0.10
0.20
nm220.00 230.00 240.00 250.00 260.00 270.00 280.00 290.00 300.00 310.00
His
Arg
Gly
Asp
Glu
Ala
Lys
UV Spectra of Derivatized Amino Acids260.8
AU
0.02
0.04
0.06
221.3
260.8
AU
0.01
0.09
221.9
260.2
AU
0.01
0.09
260.2
AU 0.05
0.10
221.3
260.8
AU
0.05
0.10
260.8
AU
0.05
0.10
221.3
260.2
AU
0.10
0.20
nm220.00 230.00 240.00 250.00 260.00 270.00 280.00 290.00 300.00 310.00
His
Arg
Gly
Asp
Glu
Ala
Lys
His
Arg
Gly
Asp
Glu
Ala
Lys
UV Spectra of Derivatized Amino Acids
CLASSIC UPLC AND ACID HYDROLYSIS
43Amino Acid Analysis of Protein Hydrolysates using UPLC Amino Acid Analysis Solution 44 Amino Acid Analysis of Protein Hydrolysates using UPLC Amino Acid Analysis Solution
Amino Acid Analysis oif Protein Hydrolysates Using UPLC® Amino Acid Analysis Solution

Cell Culture
45Amino Acid Analysis Application Notebook

46 Amino Acids Application Notebook
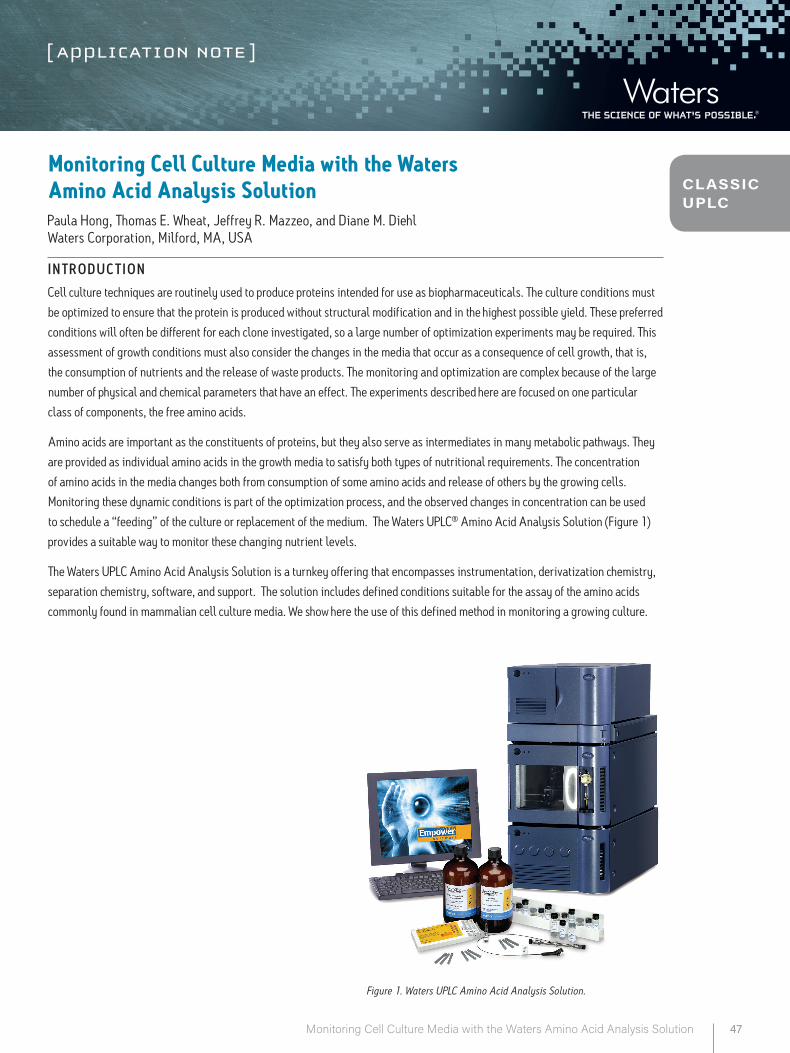
CLASSIC UPLC
Monitoring Cell Culture Media with the Waters Amino Acid Analysis SolutionPaula Hong, Thomas E. Wheat, Jeffrey R. Mazzeo, and Diane M. DiehlWaters Corporation, Milford, MA, USA
IN T RO DU C T IO N
Cell culture techniques are routinely used to produce proteins intended for use as biopharmaceuticals. The culture conditions must
be optimized to ensure that the protein is produced without structural modification and in the highest possible yield. These preferred
conditions will often be different for each clone investigated, so a large number of optimization experiments may be required. This
assessment of growth conditions must also consider the changes in the media that occur as a consequence of cell growth, that is,
the consumption of nutrients and the release of waste products. The monitoring and optimization are complex because of the large
number of physical and chemical parameters that have an effect. The experiments described here are focused on one particular
class of components, the free amino acids.
Amino acids are important as the constituents of proteins, but they also serve as intermediates in many metabolic pathways. They
are provided as individual amino acids in the growth media to satisfy both types of nutritional requirements. The concentration
of amino acids in the media changes both from consumption of some amino acids and release of others by the growing cells.
Monitoring these dynamic conditions is part of the optimization process, and the observed changes in concentration can be used
to schedule a “feeding” of the culture or replacement of the medium. The Waters UPLC® Amino Acid Analysis Solution (Figure 1)
provides a suitable way to monitor these changing nutrient levels.
The Waters UPLC Amino Acid Analysis Solution is a turnkey offering that encompasses instrumentation, derivatization chemistry,
separation chemistry, software, and support. The solution includes defined conditions suitable for the assay of the amino acids
commonly found in mammalian cell culture media. We show here the use of this defined method in monitoring a growing culture.
Figure 1. Waters UPLC Amino Acid Analysis Solution.
47Monitoring Cell Culture Media with the Waters Amino Acid Analysis Solution
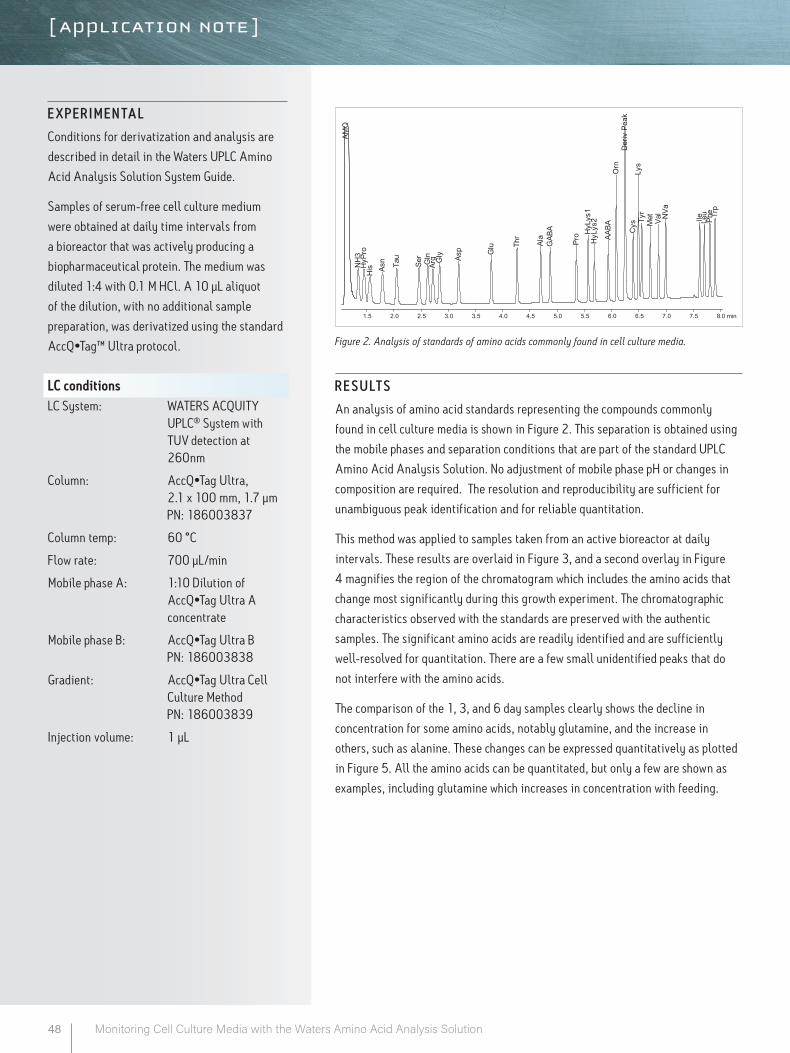
AMQ
NH
3H
yPro
His As
n Tau
Ser
Gln
Arg Gly As
p Glu Th
r
Ala
GAB
A
Pro H
yLys
1H
yLys
2
AABA
Orn
Der
iv P
eak
Cys
Lys
Tyr
Met Va
l NVa
Ile Leu
Phe Trp
1.5 2.0 2.5 3.0 3.5 4.0 4.5 5.0 5.5 6.0 6.5 7.0 7.5 8.0 min
Figure 2. Analysis of standards of amino acids commonly found in cell culture media.
R E SU LT S
An analysis of amino acid standards representing the compounds commonly
found in cell culture media is shown in Figure 2. This separation is obtained using
the mobile phases and separation conditions that are part of the standard UPLC
Amino Acid Analysis Solution. No adjustment of mobile phase pH or changes in
composition are required. The resolution and reproducibility are sufficient for
unambiguous peak identification and for reliable quantitation.
This method was applied to samples taken from an active bioreactor at daily
intervals. These results are overlaid in Figure 3, and a second overlay in Figure
4 magnifies the region of the chromatogram which includes the amino acids that
change most significantly during this growth experiment. The chromatographic
characteristics observed with the standards are preserved with the authentic
samples. The significant amino acids are readily identified and are sufficiently
well-resolved for quantitation. There are a few small unidentified peaks that do
not interfere with the amino acids.
The comparison of the 1, 3, and 6 day samples clearly shows the decline in
concentration for some amino acids, notably glutamine, and the increase in
others, such as alanine. These changes can be expressed quantitatively as plotted
in Figure 5. All the amino acids can be quantitated, but only a few are shown as
examples, including glutamine which increases in concentration with feeding.
E X P E R IM E N TA L
Conditions for derivatization and analysis are
described in detail in the Waters UPLC Amino
Acid Analysis Solution System Guide.
Samples of serum-free cell culture medium
were obtained at daily time intervals from
a bioreactor that was actively producing a
biopharmaceutical protein. The medium was
diluted 1:4 with 0.1 M HCl. A 10 µL aliquot
of the dilution, with no additional sample
preparation, was derivatized using the standard
AccQ•Tag™ Ultra protocol.
LC conditions LC System: WATERS ACQUITY
UPLC® System with TUV detection at 260nm
Column: AccQ•Tag Ultra, 2.1 x 100 mm, 1.7 µm PN: 186003837
Column temp: 60 °C
Flow rate: 700 µL/min
Mobile phase A: 1:10 Dilution of AccQ•Tag Ultra A concentrate
Mobile phase B: AccQ•Tag Ultra B PN: 186003838
Gradient: AccQ•Tag Ultra Cell Culture Method PN: 186003839
Injection volume: 1 µL
48 Monitoring Cell Culture Media with the Waters Amino Acid Analysis Solution
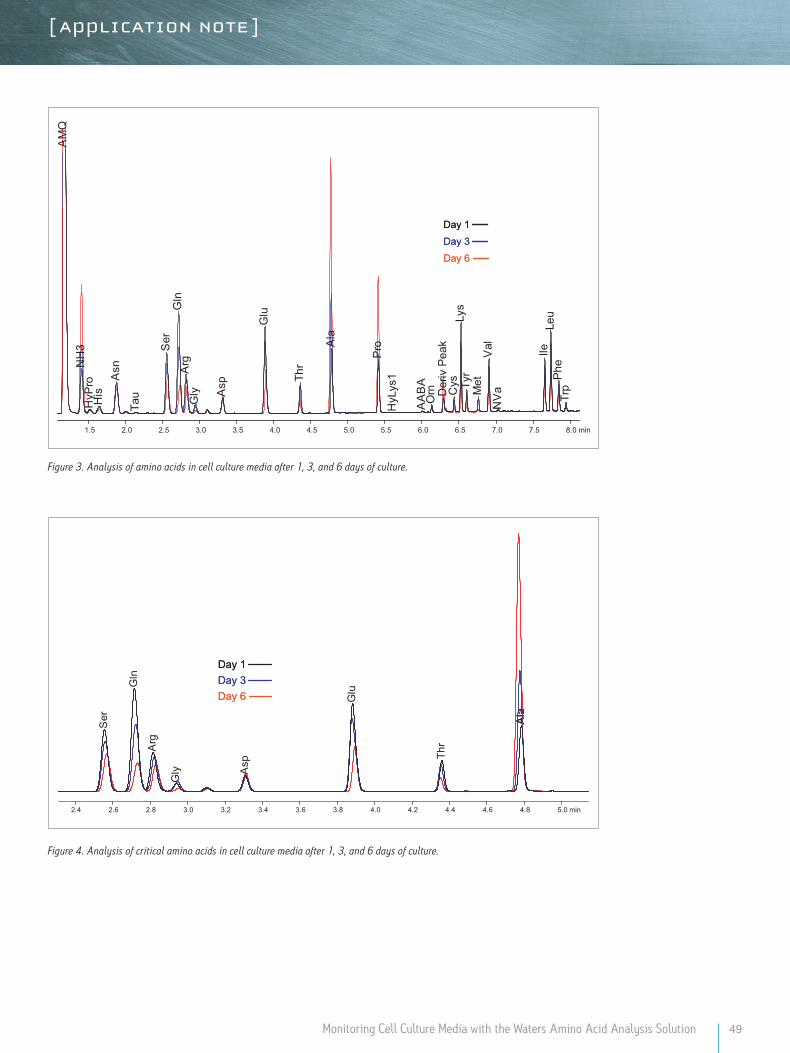
49
Day 1
Day 3
Day 6
Day 1
Day 3
Day 6
AM
QN
H3
HyP
roH
isA
sn
Tau
Ser
Gln
Arg
Gly A
sp
Glu
Thr
Ala
Pro
HyL
ys1
AA
BA
Orn D
eriv
Pea
kC
ysLy
sTy
rM
etV
alN
Va
IleLe
uPh
eTr
p
1.5 2.0 2.5 3.0 3.5 4.0 4.5 5.0 5.5 6.0 6.5 7.0 7.5 8.0 min
Ala
Ala
Ser
Gln
Arg
Gly A
sp
Glu
Thr
2.4 2.6 2.8 3.0 3.2 3.4 3.6 3.8 4.0 4.2 4.4 4.6 4.8 5.0 min
Day 1Day 3Day 6
Day 1Day 3Day 6
Figure 3. Analysis of amino acids in cell culture media after 1, 3, and 6 days of culture.
Figure 4. Analysis of critical amino acids in cell culture media after 1, 3, and 6 days of culture.
Monitoring Cell Culture Media with the Waters Amino Acid Analysis Solution
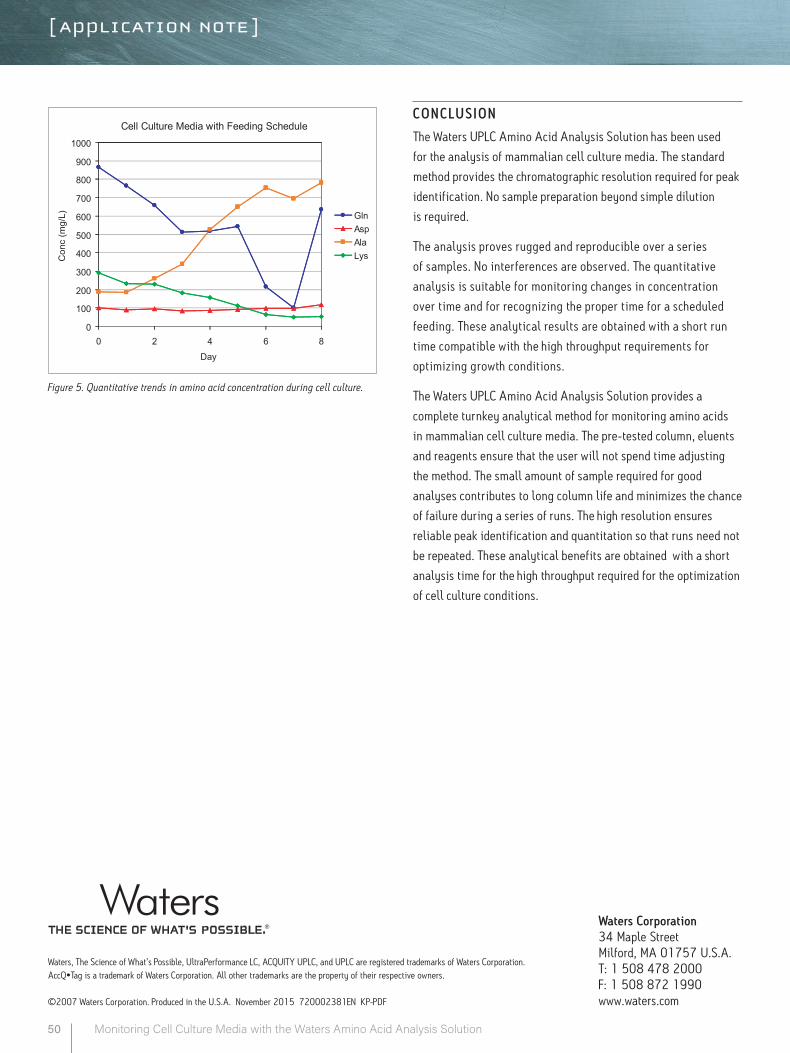
Waters Corporation 34 Maple Street Milford, MA 01757 U.S.A. T: 1 508 478 2000 F: 1 508 872 1990 www.waters.com
Cell Culture Media with Feeding Schedule
0
100
200
300
400
500
600
700
800
900
1000
0 2 4 6 8Day
Con
c (m
g/L) Gln
AspAlaLys
Figure 5. Quantitative trends in amino acid concentration during cell culture.
CO N C LU S IO N
The Waters UPLC Amino Acid Analysis Solution has been used
for the analysis of mammalian cell culture media. The standard
method provides the chromatographic resolution required for peak
identification. No sample preparation beyond simple dilution
is required.
The analysis proves rugged and reproducible over a series
of samples. No interferences are observed. The quantitative
analysis is suitable for monitoring changes in concentration
over time and for recognizing the proper time for a scheduled
feeding. These analytical results are obtained with a short run
time compatible with the high throughput requirements for
optimizing growth conditions.
The Waters UPLC Amino Acid Analysis Solution provides a
complete turnkey analytical method for monitoring amino acids
in mammalian cell culture media. The pre-tested column, eluents
and reagents ensure that the user will not spend time adjusting
the method. The small amount of sample required for good
analyses contributes to long column life and minimizes the chance
of failure during a series of runs. The high resolution ensures
reliable peak identification and quantitation so that runs need not
be repeated. These analytical benefits are obtained with a short
analysis time for the high throughput required for the optimization
of cell culture conditions.
Waters, The Science of What’s Possible, UltraPerformance LC, ACQUITY UPLC, and UPLC are registered trademarks of Waters Corporation. AccQ•Tag is a trademark of Waters Corporation. All other trademarks are the property of their respective owners.
©2007 Waters Corporation. Produced in the U.S.A. November 2015 720002381EN KP-PDF
50 Monitoring Cell Culture Media with the Waters Amino Acid Analysis Solution

Foods and Feeds
51Amino Acid Analysis Application Notebook

52 Amino Acids Application Notebook
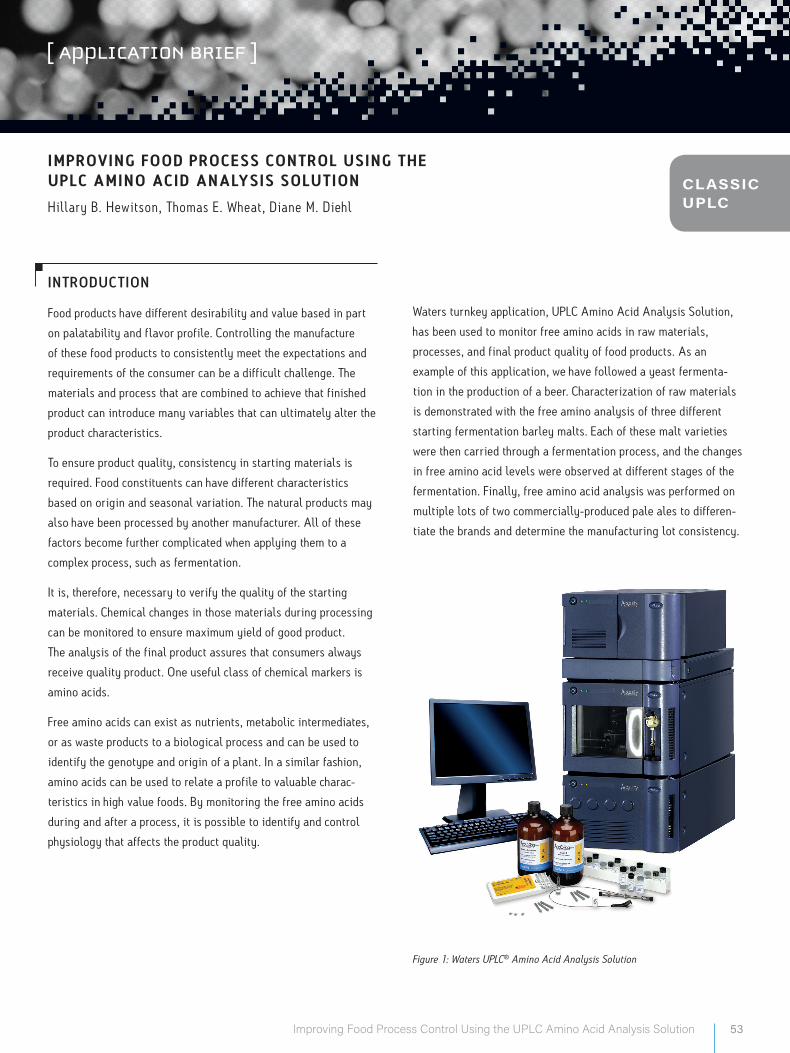
Waters turnkey application, UPLC Amino Acid Analysis Solution,
has been used to monitor free amino acids in raw materials,
processes, and final product quality of food products. As an
example of this application, we have followed a yeast fermenta-
tion in the production of a beer. Characterization of raw materials
is demonstrated with the free amino analysis of three different
starting fermentation barley malts. Each of these malt varieties
were then carried through a fermentation process, and the changes
in free amino acid levels were observed at different stages of the
fermentation. Finally, free amino acid analysis was performed on
multiple lots of two commercially-produced pale ales to differen-
tiate the brands and determine the manufacturing lot consistency.
Figure 1: Waters UPLC® Amino Acid Analysis Solution
IM P ROV ING FOO D P RO C E S S CO N T RO L US ING T H E U P L C AM INO AC I D A NA LYSIS SO LU T IO N
Hillary B. Hewitson, T homas E. Wheat, Diane M. Diehl
INT RODUCT ION
Food products have different desirability and value based in part
on palatability and flavor profile. Controlling the manufacture
of these food products to consistently meet the expectations and
requirements of the consumer can be a difficult challenge. The
materials and process that are combined to achieve that finished
product can introduce many variables that can ultimately alter the
product characteristics.
To ensure product quality, consistency in starting materials is
required. Food constituents can have different characteristics
based on origin and seasonal variation. The natural products may
also have been processed by another manufacturer. All of these
factors become further complicated when applying them to a
complex process, such as fermentation.
It is, therefore, necessary to verify the quality of the starting
materials. Chemical changes in those materials during processing
can be monitored to ensure maximum yield of good product.
The analysis of the final product assures that consumers always
receive quality product. One useful class of chemical markers is
amino acids.
Free amino acids can exist as nutrients, metabolic intermediates,
or as waste products to a biological process and can be used to
identify the genotype and origin of a plant. In a similar fashion,
amino acids can be used to relate a profile to valuable charac-
teristics in high value foods. By monitoring the free amino acids
during and after a process, it is possible to identify and control
physiology that affects the product quality.
CLASSIC UPLC
53Improving Food Process Control Using the UPLC Amino Acid Analysis Solution
54 Improving Food Process Control Using the UPLC Amino Acid Analysis Solution
EX PERIMENTAL
Sample Handling
Starting Barley Malts
• 2-row Pale Malt; 6-row Pale Malt; 2-row Pilsener Malt
• Samples were collected from early suspension of malts
and stored at -80 °C prior to analysis.
• Each thawed sample was centrifuged for one minute at
16110 RCF x g, then the supernatant was diluted 1:10
with 0.1 M HCl.
• Derivatization volumes: 70 µL Borate buffer, 10 µL
diluted sample, 20 µL AccQ•Tag™ Ultra reagent
Brewing Fermentation
• Samples: Beginning, 24 hour, day 4, and end of
primary fermentation
• Samples were drawn from fermentor at intervals during
primary fermentation and stored at -80 °C prior to
analysis.
• Each thawed sample was centrifuged for one minute at
16110 RCF x g, then the supernatant was diluted 1:10
with 0.1 M HCl.
• Derivatization volumes: 70 µL Borate buffer, 10 µL
diluted sample, 20 µL AccQ•Tag Ultra reagent
Commercial Pale Ales
• Two lots each of two brands of pale ale
• Samples were collected from 12 oz. bottles, and stored
at -80 °C prior to analysis.
• Each thawed sample was centrifuged for one minute at
16110 RCF x g, then the supernatant was diluted 1:10
with 0.1 M HCl.
• Derivatization volumes: 50 µL Borate buffer, 10 µL
diluted sample, 20 µL 0.1 M NaOH (to neutralize excess
acid), 20 µL AccQ•Tag Ultra reagent
Sample Derivatization
T he derivatization reagent reacts with both primary and second-
ary amines at an optimal pH of 8.5. T he batch-derivatized
samples are stable at room temperature for up to one week when
tightly capped. Conditions for pre-column derivatization and
analysis are described in detail in the Waters UPLC Amino Acid
Analysis Solution System Guide (P/N 71500129702).
ACQUISIT ION AND P ROC ESSING MET HODS
The Waters UPLC Amino Acid Analysis Application Solution is
provided with all the Empower methods necessary for acquisition
and processing of the samples, as well as reporting of the results.
Details of the methods can be found in the Waters UPLC Amino
Acid Analysis Solution System Guide.
Chromatographic ConditionsLC System: Waters ACQUITY UPLC® System
Column: AccQ•Tag Ultra, 2.1 x 100 mm, 1.7 µm
Column Temp: 60 °C
Sample Temp: 20 °C
Flow Rate: 700 µL/min.
Mobile Phase A: 1:10 Dilution of AccQ•Tag Ultra Eluent A
with Milli-Q® water
Mobile Phase B: AccQ•Tag Ultra Eluent B
Weak Needle Wash: 95:5 Water:Acetonitirile
Strong Needle Wash: 5:95 Water:Acetonitrile
Gradient: AccQ•Tag Ultra Cell Culture Method
(provided in the UPLC Amino Acid
Analysis Solution)
Total Run Time: 9.5 min
Injection Volume: 1 µL, Partial loop with needle overfill
Detection: UV (TUV), 260 nm
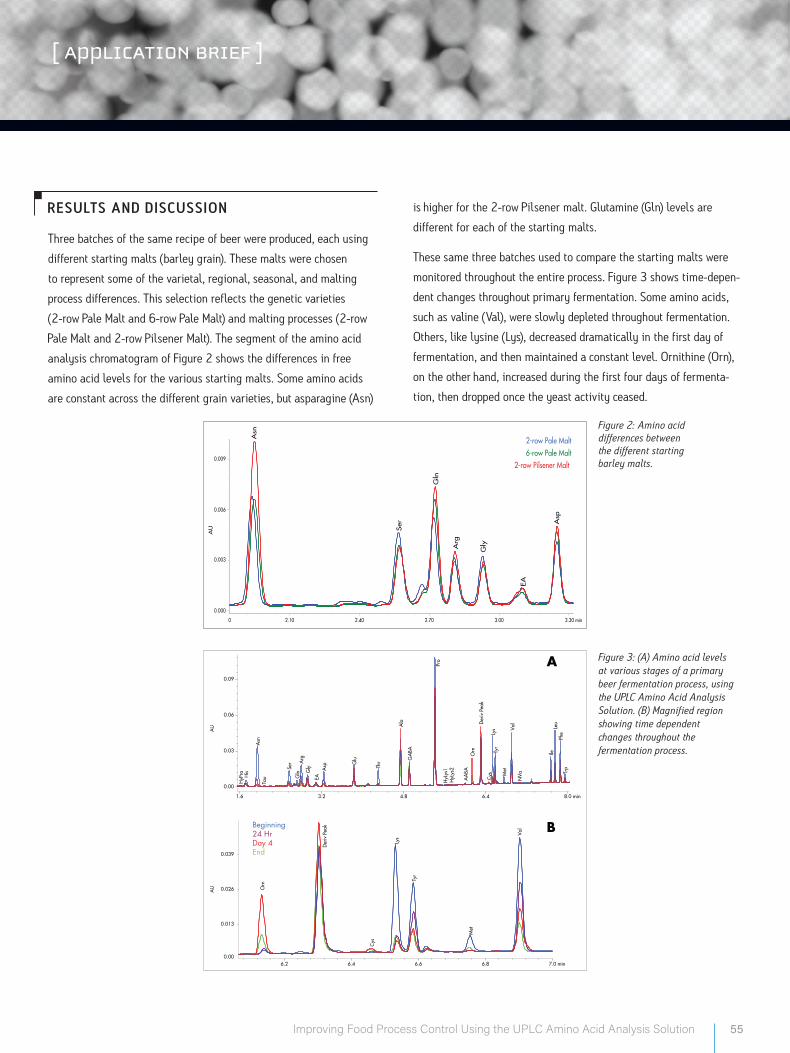
55Improving Food Process Control Using the UPLC Amino Acid Analysis Solution
RESULTS AND DISCUSSION
Three batches of the same recipe of beer were produced, each using
different starting malts (barley grain). These malts were chosen
to represent some of the varietal, regional, seasonal, and malting
process differences. This selection reflects the genetic varieties
(2-row Pale Malt and 6-row Pale Malt) and malting processes (2-row
Pale Malt and 2-row Pilsener Malt). The segment of the amino acid
analysis chromatogram of Figure 2 shows the differences in free
amino acid levels for the various starting malts. Some amino acids
are constant across the different grain varieties, but asparagine (Asn)
is higher for the 2-row Pilsener malt. Glutamine (Gln) levels are
different for each of the starting malts.
These same three batches used to compare the starting malts were
monitored throughout the entire process. Figure 3 shows time-depen-
dent changes throughout primary fermentation. Some amino acids,
such as valine (Val), were slowly depleted throughout fermentation.
Others, like lysine (Lys), decreased dramatically in the first day of
fermentation, and then maintained a constant level. Ornithine (Orn),
on the other hand, increased during the first four days of fermenta-
tion, then dropped once the yeast activity ceased.
Asn
Ser
Gln
Arg
Gly
EA
Asp
AU
0.000
0.003
0.006
0.009
2.100 2.40 2.70 3.00 3.30 min
2-row Pale Malt
Ser
Gln
Arg
Gly
EA
Asp
Ser
Gln
Arg
Gly
EA
Asp
2-row Pale Malt6-row Pale Malt
2-row Pilsener Malt
HyP
ro His
Asn
Tau
Ser
Gln
Arg
Gly
EAA
sp Glu
Thr
Ala
GA
BA
Pro
HyL
ys1
HyL
ys2
AA
BAO
rn
Der
iv P
eak
Cys
Lys
Tyr
Met
Val
NVa
IleLe
uPh
eTr
p
1.6 3.2 4.8 6.4 8.0 min
Orn
Der
iv P
eak
Cys
Lys
Tyr
Met
Val
0.00
0.00
0.03
0.06
0.09
AU
AU
0.013
0.026
0.039
6.2 6.4 6.6 6.8 7.0 min
Beginning24 HrDay 4End
A
B
Figure 2: Amino acid differences between the different starting barley malts.
Figure 3: (A) Amino acid levels at various stages of a primary beer fermentation process, using the UPLC Amino Acid Analysis Solution. (B) Magnified region showing time dependent changes throughout the fermentation process.
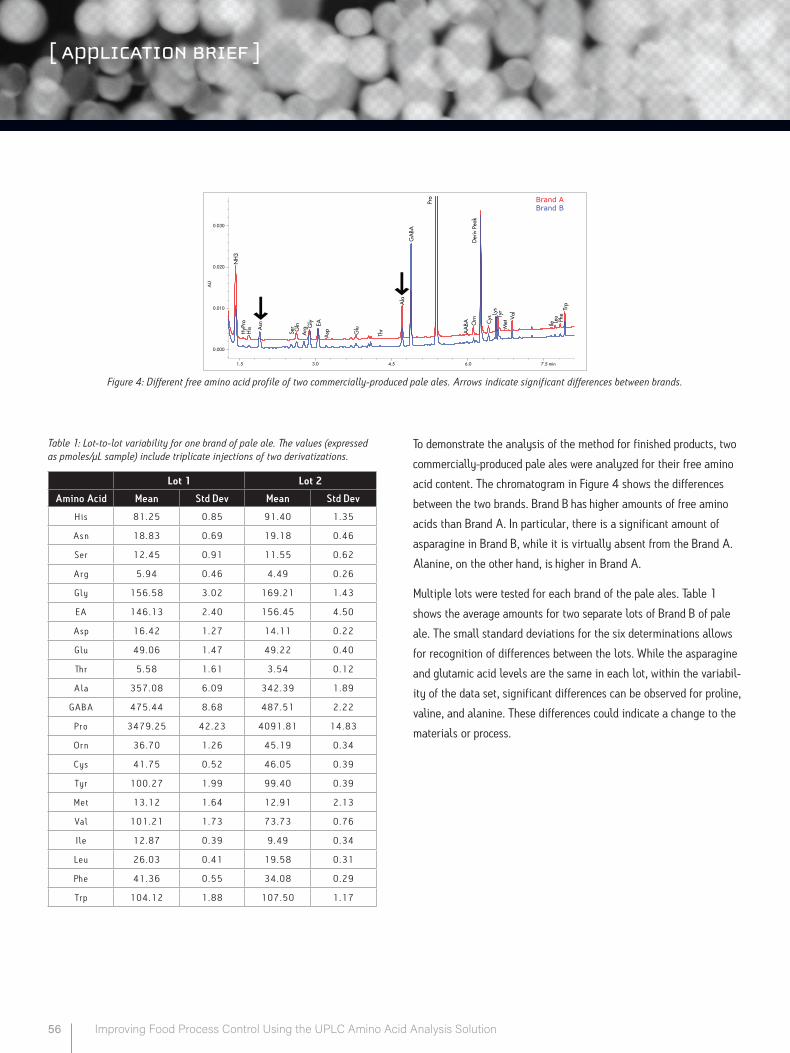
56 Improving Food Process Control Using the UPLC Amino Acid Analysis Solution
NH
3H
yPro
His A
sn
Ser Gln
Arg
Gly EA
Asp G
lu
Thr
Ala
GA
BA
Pro
AA
BA Orn
Der
iv P
eak
Cys
Lys
Tyr
Met
Val
Ile Leu Phe
Trp
AU
0.000
0.010
0.020
0.030
1.5 3.0 4.5 6.0 7.5 min
Brand ABrand B
Figure 4: Different free amino acid profile of two commercially-produced pale ales. Arrows indicate significant differences between brands.
Table 1: Lot-to-lot variability for one brand of pale ale. The values (expressed as pmoles/µL sample) include triplicate injections of two derivatizations.
Lot 1 Lot 2
Amino Acid Mean Std Dev Mean Std Dev
H i s 8 1 . 2 5 0 . 8 5 9 1 . 4 0 1 . 3 5
A s n 1 8 . 8 3 0 . 6 9 1 9 . 1 8 0 . 4 6
S e r 1 2 . 4 5 0 . 9 1 1 1 . 5 5 0 . 6 2
A r g 5 . 9 4 0 . 4 6 4 . 4 9 0 . 2 6
G l y 1 5 6 . 5 8 3 . 0 2 1 6 9 . 2 1 1 . 4 3
E A 1 4 6 . 1 3 2 . 4 0 1 5 6 . 4 5 4 . 5 0
A s p 1 6 . 4 2 1 . 2 7 1 4 . 1 1 0 . 2 2
G l u 4 9 . 0 6 1 . 4 7 4 9 . 2 2 0 . 4 0
T h r 5 . 5 8 1 . 6 1 3 . 5 4 0 . 1 2
A l a 3 5 7 . 0 8 6 . 0 9 3 4 2 . 3 9 1 . 8 9
G A B A 4 7 5 . 4 4 8 . 6 8 4 8 7 . 5 1 2 . 2 2
P r o 3 4 7 9 . 2 5 4 2 . 2 3 4 0 9 1 . 8 1 1 4 . 8 3
O r n 3 6 . 7 0 1 . 2 6 4 5 . 1 9 0 . 3 4
C y s 4 1 . 7 5 0 . 5 2 4 6 . 0 5 0 . 3 9
T y r 1 0 0 . 2 7 1 . 9 9 9 9 . 4 0 0 . 3 9
M e t 1 3 . 1 2 1 . 6 4 1 2 . 9 1 2 . 1 3
V a l 1 0 1 . 2 1 1 . 7 3 7 3 . 7 3 0 . 7 6
I l e 1 2 . 8 7 0 . 3 9 9 . 4 9 0 . 3 4
L e u 2 6 . 0 3 0 . 4 1 1 9 . 5 8 0 . 3 1
P h e 4 1 . 3 6 0 . 5 5 3 4 . 0 8 0 . 2 9
T r p 1 0 4 . 1 2 1 . 8 8 1 0 7 . 5 0 1 . 1 7
To demonstrate the analysis of the method for finished products, two
commercially-produced pale ales were analyzed for their free amino
acid content. The chromatogram in Figure 4 shows the differences
between the two brands. Brand B has higher amounts of free amino
acids than Brand A. In particular, there is a significant amount of
asparagine in Brand B, while it is virtually absent from the Brand A.
Alanine, on the other hand, is higher in Brand A.
Multiple lots were tested for each brand of the pale ales. Table 1
shows the average amounts for two separate lots of Brand B of pale
ale. The small standard deviations for the six determinations allows
for recognition of differences between the lots. While the asparagine
and glutamic acid levels are the same in each lot, within the variabil-
ity of the data set, significant differences can be observed for proline,
valine, and alanine. These differences could indicate a change to the
materials or process.
Waters Corporation 34 Maple Street Milford, MA 01757 U.S.A. T: 1 508 478 2000 F: 1 508 872 1990 www.waters.com
57Improving Food Process Control Using the UPLC Amino Acid Analysis Solution
© 2010 Waters Corporation. Waters, The Science of What’s Possible, UPLC, ACQUITY UPLC, ACQUITY, AccQ•Tag, and Empower are trademarks of Waters Corporation. Milli-Q is a trademark of Millipore Corporation.
March 2010 720003357EN KK-PDF
CONCLUSION
The full characterization of food materials, processes, and products
is essential to assuring consistent product quality. Monitoring the
free amino acid profile can be a useful tool in assessing the stages of
production as well as a final product.
Waters UPLC Amino Acid Analysis Solution was successfully applied
to all stages of the process. Neither modifications to the method nor
any special sample preparation was required.
Differences observed in the levels of amino acids for the starting
malts show how raw materials can be verified for consistency prior to
use in a manufacturing process.
Quantitative changes during the fermentation process were observed.
Both increasing and decreasing concentrations of amino acids were
readily measured.
Analysis of finished product showed differences both between brands
as well as between lots of a single brand. These reliable measure-
ments of chemical markers can reflect palatability or consumer
acceptance of the product.
Waters UPLC Amino Acid Analysis Solution is a total system solution
that is well suited to provide meaningful results for these applica-
tions. The small amounts of sample required make additional sample
handling unnecessary in many cases. The rapid and reproducible
results provide confidence to the user in making quality decisions
about the material and processes that go into making a food product.

58 Amino Acids Application Notebook
[ NOTES ]
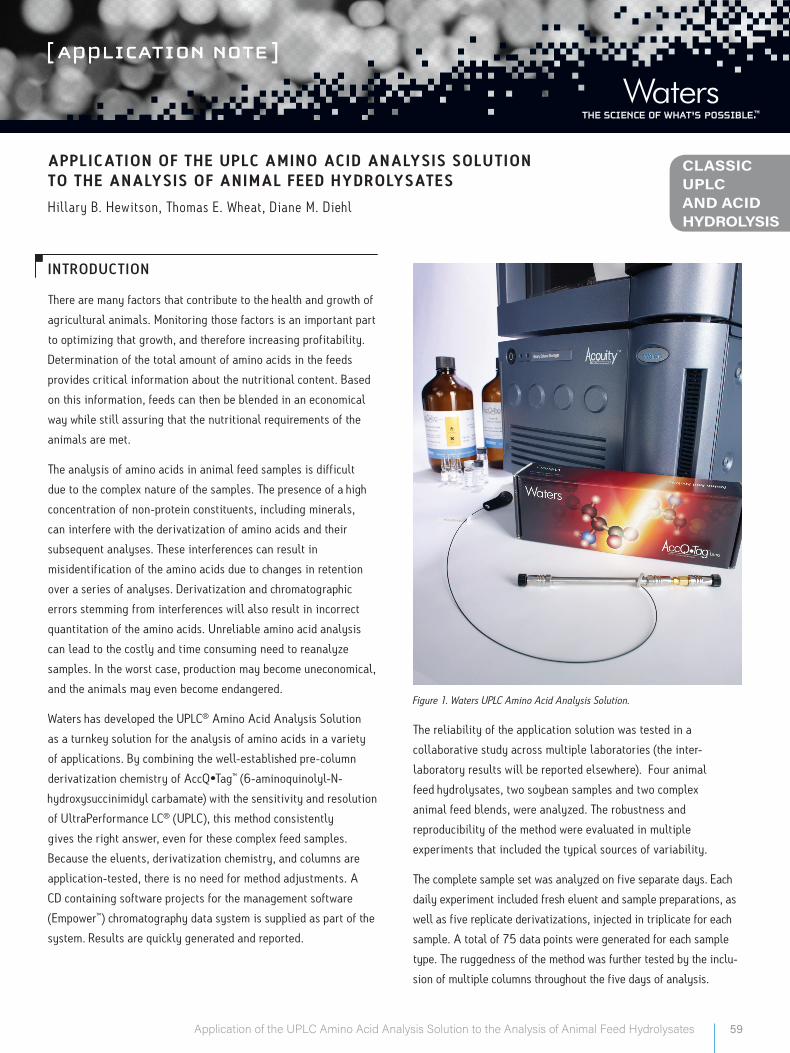
A P P L I C AT IO N O F T H E U P L C AM INO AC I D A NA LYSIS SO LU T IO N T O T H E A NA LYSIS O F A NIMA L F E E D H Y D RO LYSAT E S
Hillary B. Hewitson, T homas E. Wheat, Diane M. Diehl
59Application of the UPLC Amino Acid Analysis Solution to the Analysis of Animal Feed Hydrolysates
Figure 1. Waters UPLC Amino Acid Analysis Solution.
The reliability of the application solution was tested in a
collaborative study across multiple laboratories (the inter-
laboratory results will be reported elsewhere). Four animal
feed hydrolysates, two soybean samples and two complex
animal feed blends, were analyzed. The robustness and
reproducibility of the method were evaluated in multiple
experiments that included the typical sources of variability.
The complete sample set was analyzed on five separate days. Each
daily experiment included fresh eluent and sample preparations, as
well as five replicate derivatizations, injected in triplicate for each
sample. A total of 75 data points were generated for each sample
type. The ruggedness of the method was further tested by the inclu-
sion of multiple columns throughout the five days of analysis.
INT RODUCT ION
There are many factors that contribute to the health and growth of
agricultural animals. Monitoring those factors is an important part
to optimizing that growth, and therefore increasing profitability.
Determination of the total amount of amino acids in the feeds
provides critical information about the nutritional content. Based
on this information, feeds can then be blended in an economical
way while still assuring that the nutritional requirements of the
animals are met.
The analysis of amino acids in animal feed samples is difficult
due to the complex nature of the samples. The presence of a high
concentration of non-protein constituents, including minerals,
can interfere with the derivatization of amino acids and their
subsequent analyses. These interferences can result in
misidentification of the amino acids due to changes in retention
over a series of analyses. Derivatization and chromatographic
errors stemming from interferences will also result in incorrect
quantitation of the amino acids. Unreliable amino acid analysis
can lead to the costly and time consuming need to reanalyze
samples. In the worst case, production may become uneconomical,
and the animals may even become endangered.
Waters has developed the UPLC® Amino Acid Analysis Solution
as a turnkey solution for the analysis of amino acids in a variety
of applications. By combining the well-established pre-column
derivatization chemistry of AccQ•Tag™ (6-aminoquinolyl-N-
hydroxysuccinimidyl carbamate) with the sensitivity and resolution
of UltraPerformance LC® (UPLC), this method consistently
gives the right answer, even for these complex feed samples.
Because the eluents, derivatization chemistry, and columns are
application-tested, there is no need for method adjustments. A
CD containing software projects for the management software
(Empower™) chromatography data system is supplied as part of the
system. Results are quickly generated and reported.
CLASSIC UPLC AND ACID HYDROLYSIS
60 Application of the UPLC Amino Acid Analysis Solution to the Analysis of Animal Feed Hydrolysates
EX PERIMENTAL
Samples
Swine diet, poultry diet, whole soybean, and soybean meal
samples were acid-hydrolyzed in an independent laboratory as
part of a collaborative study. The samples were supplied at an
estimated concentration of 1.0 mg/mL in 0.1 M HCl and sealed
under argon in ampoules. Samples were stored at -80 °C until
analysis. The standard was NIST 2389 Amino Acids in 0.1
mol/L HCl Reference Material, and it was diluted to 5, 100, and
250 pmol/µL.
Sample Derivatization
The samples were diluted 1:16 with 0.1 M HCl prior to derivatiza-
tion. The standard derivatization protocol was modified to include
neutralization of excess acid with 0.1 M NaOH. The derivatization
reagent reacts with both primary and secondary amines. The
samples were derivatized in batches, and are stable at room
temperature for up to one week when tightly capped. Conditions
for pre-column derivatization and analysis are described in detail
in the Waters UPLC Amino Acid Analysis Solution System Guide
(P/N 71500129702). These derivatization conditions were
modified to include additional base.
1. 60 µL AccQ•Tag Ultra Borate Buffer
2. 10 µL diluted sample
3. 10 µL 0.1 N NaOH
4. 20 µL reconstituted AccQ•Tag Ultra Reagent
ACQUISIT ION AND P ROC ESSING MET HODS
The Waters UPLC Amino Acid Analysis Application Solution
is provided with a CD that contains all the Empower methods
necessary for acquisition and processing of the samples, as well
as reporting of the results. Details of the methods can be found in
the Waters UPLC Amino Acid Analysis Solution System Guide.
Chromatographic Conditions
LC System: Waters ACQUITY UPLC® System Column: AccQ•Tag Ultra, 2.1 x 100 mm, 1.7 μm
(two columns were alternated) Part Number: 186003837
Column Temp: 55 °C
Sample Temp: 20 °C
Flow Rate: 700 μL/min.
Mobile Phase A: 1:20 Dilution of AccQ•Tag Ultra Eluent A with MilliQ® water (prepared fresh daily)
Part Number: 186003838
Mobile Phase B: AccQ•Tag Ultra Eluent B Part Number: 186003839
Weak Needle Wash: 95:5 Water:Acetonitirile
Strong Needle Wash: 5:95 Water:Acetonitrile
Gradient: AccQ•Tag Ultra Hydrolysate Method (provided in the UPLC Amino Acid Analysis Solution)
Total run time: 9.5 min
Injection volume: 1 μL, Partial Loop with Needle Overfill
Detection: UV (TUV), 260nm
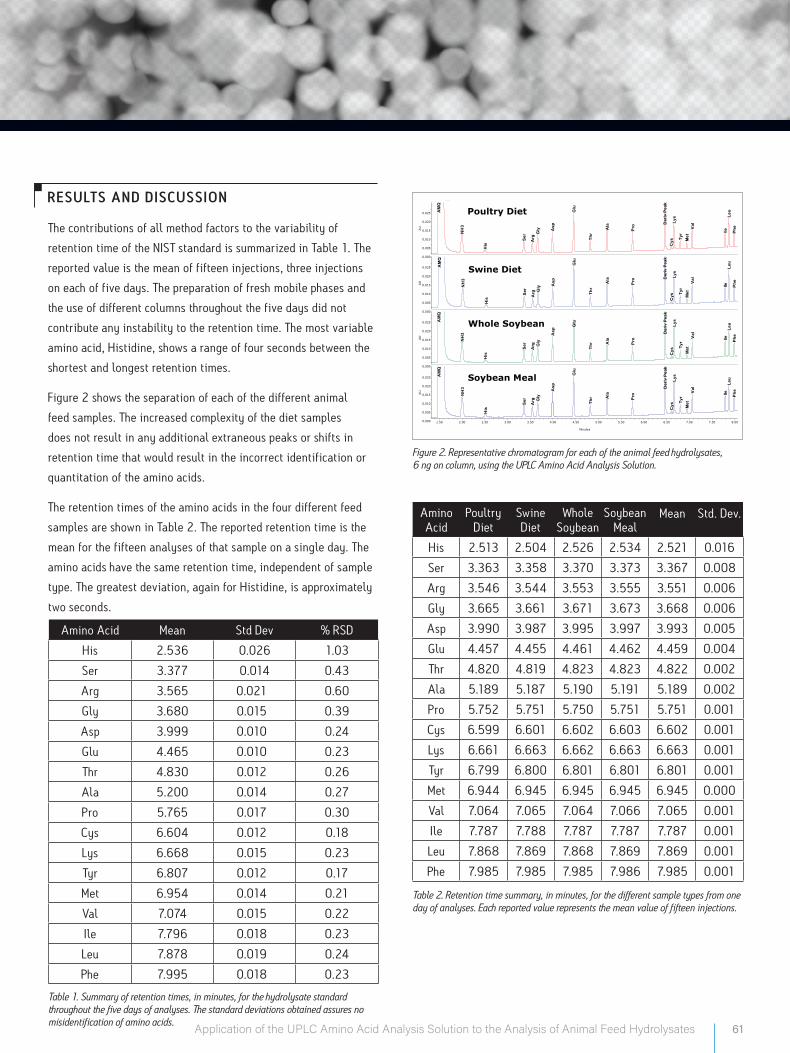
61Application of the UPLC Amino Acid Analysis Solution to the Analysis of Animal Feed Hydrolysates
RESULTS AND DISCUSSION
The contributions of all method factors to the variability of
retention time of the NIST standard is summarized in Table 1. The
reported value is the mean of fifteen injections, three injections
on each of five days. The preparation of fresh mobile phases and
the use of different columns throughout the five days did not
contribute any instability to the retention time. The most variable
amino acid, Histidine, shows a range of four seconds between the
shortest and longest retention times.
Figure 2 shows the separation of each of the different animal
feed samples. The increased complexity of the diet samples
does not result in any additional extraneous peaks or shifts in
retention time that would result in the incorrect identification or
quantitation of the amino acids.
The retention times of the amino acids in the four different feed
samples are shown in Table 2. The reported retention time is the
mean for the fifteen analyses of that sample on a single day. The
amino acids have the same retention time, independent of sample
type. The greatest deviation, again for Histidine, is approximately
two seconds.
Table 1. Summary of retention times, in minutes, for the hydrolysate standard throughout the five days of analyses. The standard deviations obtained assures no misidentification of amino acids.
Amino Acid Mean Std Dev % RSD
His 2.536 0.026 1.03
Ser 3.377 0.014 0.43
Arg 3.565 0.021 0.60
Gly 3.680 0.015 0.39
Asp 3.999 0.010 0.24
Glu 4.465 0.010 0.23
Thr 4.830 0.012 0.26
Ala 5.200 0.014 0.27
Pro 5.765 0.017 0.30
Cys 6.604 0.012 0.18
Lys 6.668 0.015 0.23
Tyr 6.807 0.012 0.17
Met 6.954 0.014 0.21
Val 7.074 0.015 0.22
Ile 7.796 0.018 0.23
Leu 7.878 0.019 0.24
Phe 7.995 0.018 0.23
Figure 2. Representative chromatogram for each of the animal feed hydrolysates, 6 ng on column, using the UPLC Amino Acid Analysis Solution.
Amino Acid
PoultryDiet
SwineDiet
WholeSoybean
SoybeanMeal
Mean Std. Dev.
His 2.513 2.504 2.526 2.534 2.521 0.016
Ser 3.363 3.358 3.370 3.373 3.367 0.008
Arg 3.546 3.544 3.553 3.555 3.551 0.006
Gly 3.665 3.661 3.671 3.673 3.668 0.006
Asp 3.990 3.987 3.995 3.997 3.993 0.005
Glu 4.457 4.455 4.461 4.462 4.459 0.004
Thr 4.820 4.819 4.823 4.823 4.822 0.002
Ala 5.189 5.187 5.190 5.191 5.189 0.002
Pro 5.752 5.751 5.750 5.751 5.751 0.001
Cys 6.599 6.601 6.602 6.603 6.602 0.001
Lys 6.661 6.663 6.662 6.663 6.663 0.001
Tyr 6.799 6.800 6.801 6.801 6.801 0.001
Met 6.944 6.945 6.945 6.945 6.945 0.000
Val 7.064 7.065 7.064 7.066 7.065 0.001
Ile 7.787 7.788 7.787 7.787 7.787 0.001
Leu 7.868 7.869 7.868 7.869 7.869 0.001
Phe 7.985 7.985 7.985 7.986 7.985 0.001
Table 2. Retention time summary, in minutes, for the different sample types from one day of analyses. Each reported value represents the mean value of fifteen injections.
AM
Q
NH
3
His
Ser
Arg
Gly A
sp
Glu
Thr
Ala
Pro
Der
iv P
eak
Cys
Lys
Tyr
Met
Val
IleLe
uP
heAU
0.000
0.005
0.010
0.015
0.020
AM
Q
NH
3
His
Ser
Arg G
ly Asp
Glu
Thr
Ala
Pro D
eriv
Pea
kC
ysLy
sTy
rM
etV
al
IleLe
uP
heAU
0.000
0.005
0.010
0.015
0.020
0.025
AM
Q
NH
3
His
Ser
Arg G
ly
Asp
Glu
Thr A
la
Pro
Der
iv P
eak
Cys
Lys
Tyr
Met
Val
IleLe
uP
heAU
0.000
0.005
0.010
0.015
0.020
0.025
AM
Q
NH
3
His
Ser
Arg G
ly
Asp
Glu
Thr A
la
Pro
Der
iv P
eak
Cys
Lys
Tyr
Met
Val
IleLe
uP
heAU
0.000
0.005
0.010
0.015
0.020
0.025
Minutes
1.50 2.00 2.50 3.00 3.50 4.00 4.50 5.00 5.50 6.00 6.50 7.00 7.50 8.00
AM
Q
NH
3
His
Ser
Arg
Gly A
sp
Glu
Thr
Ala
Pro
Der
iv P
eak
Cys
Lys
Tyr
Met
Val
IleLe
uP
heAU
0.000
0.005
0.010
0.015
0.020
0.025
AM
Q
NH
3
His
Ser
Arg G
ly Asp
Glu
Thr
Ala
Pro D
eriv
Pea
kC
ysLy
sTy
rM
etV
al
IleLe
uP
heAU
0.000
0.005
0.010
0.015
0.020
0.025
AM
Q
NH
3
His
Ser
Arg G
ly
Asp
Glu
Thr A
la
Pro
Der
iv P
eak
Cys
Lys
Tyr
Met
Val
IleLe
uP
heAU
0.000
0.005
0.010
0.015
0.020
0.025
AM
Q
NH
3
His
Ser
Arg G
ly
Asp
Glu
Thr A
la
Pro
Der
iv P
eak
Cys
Lys
Tyr
Met
Val
IleLe
uP
heAU
0.000
0.005
0.010
0.015
0.020
0.025
Minutes
1.50 2.00 2.50 3.00 3.50 4.00 4.50 5.00 5.50 6.00 6.50 7.00 7.50 8.00
Poultry Diet
Swine Diet
Whole Soybean
Soybean Meal
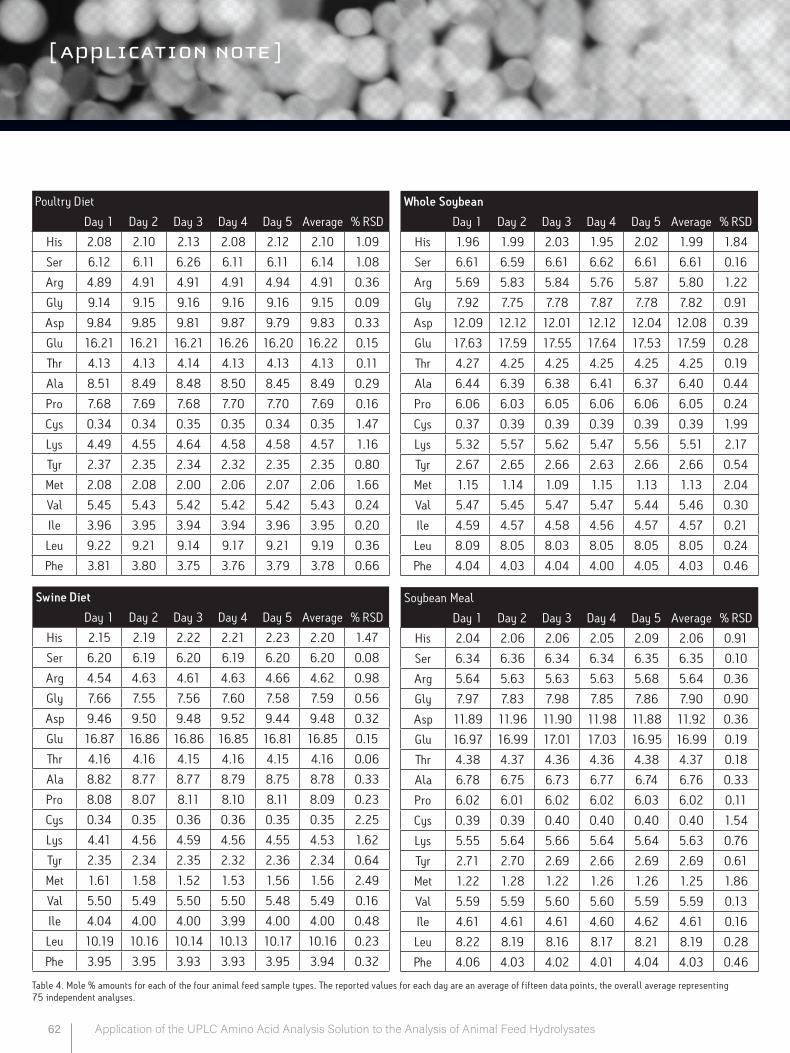
62 Application of the UPLC Amino Acid Analysis Solution to the Analysis of Animal Feed Hydrolysates
Table 4. Mole % amounts for each of the four animal feed sample types. The reported values for each day are an average of fifteen data points, the overall average representing 75 independent analyses.
Poultry Diet
Day 1 Day 2 Day 3 Day 4 Day 5 Average % RSD
His 2.08 2.10 2.13 2.08 2.12 2.10 1.09
Ser 6.12 6.11 6.26 6.11 6.11 6.14 1.08
Arg 4.89 4.91 4.91 4.91 4.94 4.91 0.36
Gly 9.14 9.15 9.16 9.16 9.16 9.15 0.09
Asp 9.84 9.85 9.81 9.87 9.79 9.83 0.33
Glu 16.21 16.21 16.21 16.26 16.20 16.22 0.15
Thr 4.13 4.13 4.14 4.13 4.13 4.13 0.11
Ala 8.51 8.49 8.48 8.50 8.45 8.49 0.29
Pro 7.68 7.69 7.68 7.70 7.70 7.69 0.16
Cys 0.34 0.34 0.35 0.35 0.34 0.35 1.47
Lys 4.49 4.55 4.64 4.58 4.58 4.57 1.16
Tyr 2.37 2.35 2.34 2.32 2.35 2.35 0.80
Met 2.08 2.08 2.00 2.06 2.07 2.06 1.66
Val 5.45 5.43 5.42 5.42 5.42 5.43 0.24
Ile 3.96 3.95 3.94 3.94 3.96 3.95 0.20
Leu 9.22 9.21 9.14 9.17 9.21 9.19 0.36
Phe 3.81 3.80 3.75 3.76 3.79 3.78 0.66
Soybean Meal
Day 1 Day 2 Day 3 Day 4 Day 5 Average % RSD
His 2.04 2.06 2.06 2.05 2.09 2.06 0.91
Ser 6.34 6.36 6.34 6.34 6.35 6.35 0.10
Arg 5.64 5.63 5.63 5.63 5.68 5.64 0.36
Gly 7.97 7.83 7.98 7.85 7.86 7.90 0.90
Asp 11.89 11.96 11.90 11.98 11.88 11.92 0.36
Glu 16.97 16.99 17.01 17.03 16.95 16.99 0.19
Thr 4.38 4.37 4.36 4.36 4.38 4.37 0.18
Ala 6.78 6.75 6.73 6.77 6.74 6.76 0.33
Pro 6.02 6.01 6.02 6.02 6.03 6.02 0.11
Cys 0.39 0.39 0.40 0.40 0.40 0.40 1.54
Lys 5.55 5.64 5.66 5.64 5.64 5.63 0.76
Tyr 2.71 2.70 2.69 2.66 2.69 2.69 0.61
Met 1.22 1.28 1.22 1.26 1.26 1.25 1.86
Val 5.59 5.59 5.60 5.60 5.59 5.59 0.13
Ile 4.61 4.61 4.61 4.60 4.62 4.61 0.16
Leu 8.22 8.19 8.16 8.17 8.21 8.19 0.28
Phe 4.06 4.03 4.02 4.01 4.04 4.03 0.46
Whole Soybean
Day 1 Day 2 Day 3 Day 4 Day 5 Average % RSD
His 1.96 1.99 2.03 1.95 2.02 1.99 1.84
Ser 6.61 6.59 6.61 6.62 6.61 6.61 0.16
Arg 5.69 5.83 5.84 5.76 5.87 5.80 1.22
Gly 7.92 7.75 7.78 7.87 7.78 7.82 0.91
Asp 12.09 12.12 12.01 12.12 12.04 12.08 0.39
Glu 17.63 17.59 17.55 17.64 17.53 17.59 0.28
Thr 4.27 4.25 4.25 4.25 4.25 4.25 0.19
Ala 6.44 6.39 6.38 6.41 6.37 6.40 0.44
Pro 6.06 6.03 6.05 6.06 6.06 6.05 0.24
Cys 0.37 0.39 0.39 0.39 0.39 0.39 1.99
Lys 5.32 5.57 5.62 5.47 5.56 5.51 2.17
Tyr 2.67 2.65 2.66 2.63 2.66 2.66 0.54
Met 1.15 1.14 1.09 1.15 1.13 1.13 2.04
Val 5.47 5.45 5.47 5.47 5.44 5.46 0.30
Ile 4.59 4.57 4.58 4.56 4.57 4.57 0.21
Leu 8.09 8.05 8.03 8.05 8.05 8.05 0.24
Phe 4.04 4.03 4.04 4.00 4.05 4.03 0.46
Swine Diet
Day 1 Day 2 Day 3 Day 4 Day 5 Average % RSD
His 2.15 2.19 2.22 2.21 2.23 2.20 1.47
Ser 6.20 6.19 6.20 6.19 6.20 6.20 0.08
Arg 4.54 4.63 4.61 4.63 4.66 4.62 0.98
Gly 7.66 7.55 7.56 7.60 7.58 7.59 0.56
Asp 9.46 9.50 9.48 9.52 9.44 9.48 0.32
Glu 16.87 16.86 16.86 16.85 16.81 16.85 0.15
Thr 4.16 4.16 4.15 4.16 4.15 4.16 0.06
Ala 8.82 8.77 8.77 8.79 8.75 8.78 0.33
Pro 8.08 8.07 8.11 8.10 8.11 8.09 0.23
Cys 0.34 0.35 0.36 0.36 0.35 0.35 2.25
Lys 4.41 4.56 4.59 4.56 4.55 4.53 1.62
Tyr 2.35 2.34 2.35 2.32 2.36 2.34 0.64
Met 1.61 1.58 1.52 1.53 1.56 1.56 2.49
Val 5.50 5.49 5.50 5.50 5.48 5.49 0.16
Ile 4.04 4.00 4.00 3.99 4.00 4.00 0.48
Leu 10.19 10.16 10.14 10.13 10.17 10.16 0.23
Phe 3.95 3.95 3.93 3.93 3.95 3.94 0.32
63Application of the UPLC Amino Acid Analysis Solution to the Analysis of Animal Feed Hydrolysates
Soybean Meal
Day 1 Day 2 Day 3 Day 4 Day 5 Average % RSD
His 2.04 2.06 2.06 2.05 2.09 2.06 0.91
Ser 6.34 6.36 6.34 6.34 6.35 6.35 0.10
Arg 5.64 5.63 5.63 5.63 5.68 5.64 0.36
Gly 7.97 7.83 7.98 7.85 7.86 7.90 0.90
Asp 11.89 11.96 11.90 11.98 11.88 11.92 0.36
Glu 16.97 16.99 17.01 17.03 16.95 16.99 0.19
Thr 4.38 4.37 4.36 4.36 4.38 4.37 0.18
Ala 6.78 6.75 6.73 6.77 6.74 6.76 0.33
Pro 6.02 6.01 6.02 6.02 6.03 6.02 0.11
Cys 0.39 0.39 0.40 0.40 0.40 0.40 1.54
Lys 5.55 5.64 5.66 5.64 5.64 5.63 0.76
Tyr 2.71 2.70 2.69 2.66 2.69 2.69 0.61
Met 1.22 1.28 1.22 1.26 1.26 1.25 1.86
Val 5.59 5.59 5.60 5.60 5.59 5.59 0.13
Ile 4.61 4.61 4.61 4.60 4.62 4.61 0.16
Leu 8.22 8.19 8.16 8.17 8.21 8.19 0.28
Phe 4.06 4.03 4.02 4.01 4.04 4.03 0.46
The quantitative reproducibility, expressed as mole %, is shown
in Table 4. For all four sample types tested across the five
days of analysis, the mole % is typically better than 1% RSD.
The sulfur-containing amino acids were not protected during
hydrolysis, and are higher.
The composition of the four feed samples is, in general, similar.
There are, however, clear distinctions. For example, Aspartate is
lower in the blended feeds than in the soybean samples. Valine,
on the other hand, is almost identical.
These 75 determinations reflect many sources of variability,
including pipetting errors, incomplete derivatization, injector
error, integration error, standard and sample preparation
error, sample hydrolysis, and coelution of unidentified sample
components with the amino acids. Complete examination of the
raw data for each of the individual injections shows that the
largest contribution to the variability is pipetting. The addition of
an internal standard to the sample to be hydrolyzed will improve
reliability. Norvaline is the preferred internal standard for this
purpose.
CONCLUSION
The measurement of the total amount of amino acids plays a key
role in the efforts to assess the quality and appropriateness of
animal feeds for the best growth and production. While there are
many methods available to obtain that information, the complex-
ity of these kinds of samples can compromise the reliability of
the results. In that case, samples might require reanalysis, or, in
the worst case, the most economical growth conditions can be
misjudged.
The summary of this study of animal feed hydrolysates dem-
onstrates that the Waters UPLC Amino Acid Analysis Solution
can provide accurate, reliable, and timely information. The
robustness of the chromatography is shown by retention time
stability of the standard across multiple columns, eluents, and
days of analysis. The complexity of the samples does not distort
retention time or other chromatographic features.
Quantitation is reliable and reproducible. The sensitivity of the
analytical method requires only small aliquots of these complex
feed samples.
These experiments show that the Waters UPLC Amino Acid
Analysis Solution can be used to determine the nutritional
content of animal feeds. The turnkey solution provides the
derivatization chemistry, the chromatographic column and eluents,
and the software for data acquisition and reduction so that the end
user can be assured accurate and precise results.
©2008 Waters Corporation. Waters, ACQUITY UPLC, UltraPerformance LC , ACQUITY, XBridge, The Science of What’s Possible, are trademarks of Waters Corporation. XBridge and The Science of What’s Possible are trademarks of Waters Corporation. All other trademarks are the property of their respective owners.
September 2008 720002804EN KK-PDF
Waters Corporation 34 Maple Street Milford, MA 01757 U.S.A. T: 1 508 478 2000 F: 1 508 872 1990 www.waters.com

64 Amino Acids Application Notebook
[ NOTES ]
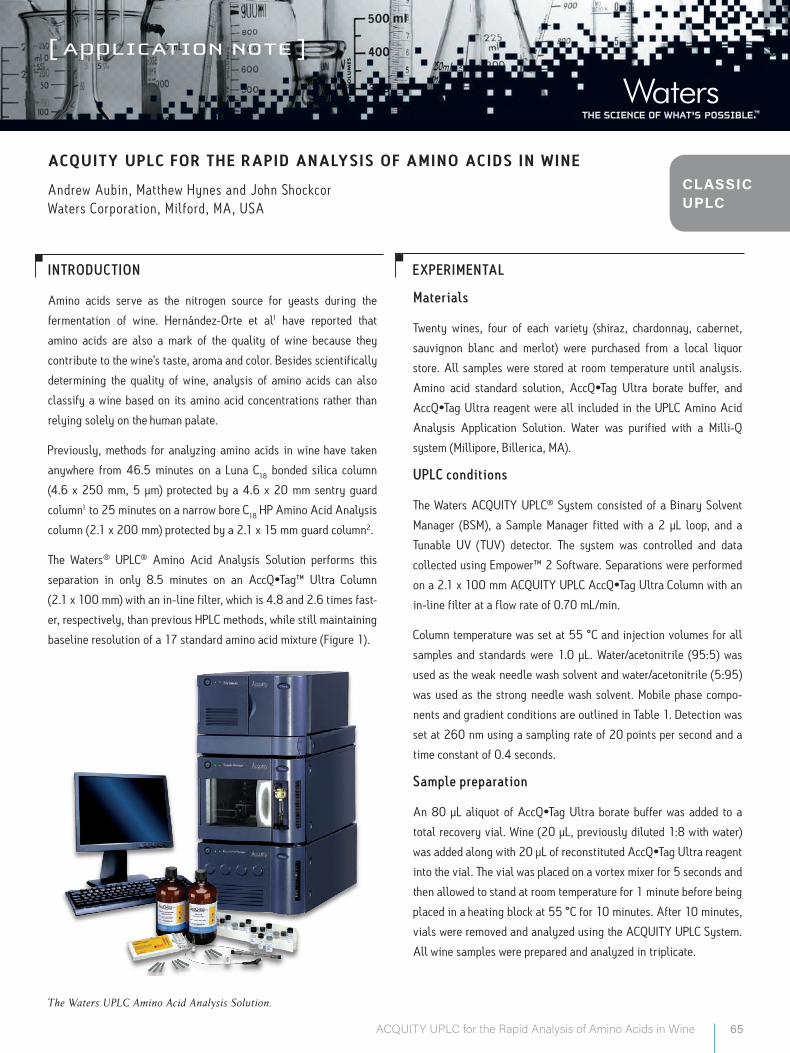
65ACQUITY UPLC for the Rapid Analysis of Amino Acids in Wine
[ application note ][ application note ]
INT RODUCT ION
Amino acids serve as the nitrogen source for yeasts during the
fermentation of wine. Hernández-Orte et al1 have reported that
amino acids are also a mark of the quality of wine because they
contribute to the wine’s taste, aroma and color. Besides scientifically
determining the quality of wine, analysis of amino acids can also
classify a wine based on its amino acid concentrations rather than
relying solely on the human palate.
Previously, methods for analyzing amino acids in wine have taken
anywhere from 46.5 minutes on a Luna C18 bonded silica column
(4.6 x 250 mm, 5 µm) protected by a 4.6 x 20 mm sentry guard
column1 to 25 minutes on a narrow bore C18 HP Amino Acid Analysis
column (2.1 x 200 mm) protected by a 2.1 x 15 mm guard column2.
The Waters® UPLC® Amino Acid Analysis Solution performs this
separation in only 8.5 minutes on an AccQ•Tag™ Ultra Column
(2.1 x 100 mm) with an in-line filter, which is 4.8 and 2.6 times fast-
er, respectively, than previous HPLC methods, while still maintaining
baseline resolution of a 17 standard amino acid mixture (Figure 1).
EX PERIMENTAL
Materials
Twenty wines, four of each variety (shiraz, chardonnay, cabernet,
sauvignon blanc and merlot) were purchased from a local liquor
store. All samples were stored at room temperature until analysis.
Amino acid standard solution, AccQ•Tag Ultra borate buffer, and
AccQ•Tag Ultra reagent were all included in the UPLC Amino Acid
Analysis Application Solution. Water was purified with a Milli-Q
system (Millipore, Billerica, MA).
UPLC conditions
The Waters ACQUITY UPLC® System consisted of a Binary Solvent
Manager (BSM), a Sample Manager fitted with a 2 µL loop, and a
Tunable UV (TUV) detector. The system was controlled and data
collected using Empower™ 2 Software. Separations were performed
on a 2.1 x 100 mm ACQUITY UPLC AccQ•Tag Ultra Column with an
in-line filter at a flow rate of 0.70 mL/min.
Column temperature was set at 55 °C and injection volumes for all
samples and standards were 1.0 µL. Water/acetonitrile (95:5) was
used as the weak needle wash solvent and water/acetonitrile (5:95)
was used as the strong needle wash solvent. Mobile phase compo-
nents and gradient conditions are outlined in Table 1. Detection was
set at 260 nm using a sampling rate of 20 points per second and a
time constant of 0.4 seconds.
Sample preparation
An 80 µL aliquot of AccQ•Tag Ultra borate buffer was added to a
total recovery vial. Wine (20 µL, previously diluted 1:8 with water)
was added along with 20 µL of reconstituted AccQ•Tag Ultra reagent
into the vial. The vial was placed on a vortex mixer for 5 seconds and
then allowed to stand at room temperature for 1 minute before being
placed in a heating block at 55 °C for 10 minutes. After 10 minutes,
vials were removed and analyzed using the ACQUITY UPLC System.
All wine samples were prepared and analyzed in triplicate.
AC QU IT Y U P L C FO R T H E R A P I D A NA LYSIS O F AM INO AC I DS IN W IN E
Andrew Aubin, Matthew Hynes and John Shockcor Waters Corporation, Milford, MA, USA
The Waters UPLC Amino Acid Analysis Solution.
CLASSIC UPLC
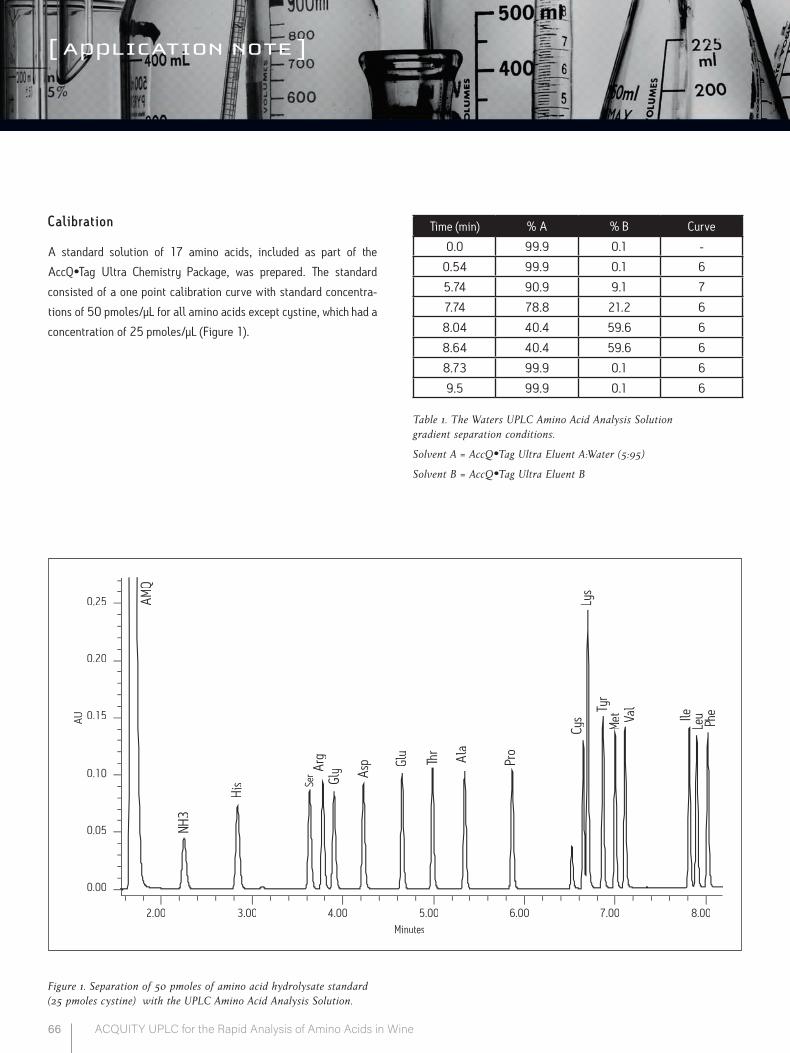
66 ACQUITY UPLC for the Rapid Analysis of Amino Acids in Wine
[ application note ]
Calibration
A standard solution of 17 amino acids, included as part of the
AccQ•Tag Ultra Chemistry Package, was prepared. The standard
consisted of a one point calibration curve with standard concentra-
tions of 50 pmoles/μL for all amino acids except cystine, which had a
concentration of 25 pmoles/μL (Figure 1).
[ application note ]
Time (min) % A % B Curve
0.0 99.9 0.1 -
0.54 99.9 0.1 6
5.74 90.9 9.1 7
7.74 78.8 21.2 6
8.04 40.4 59.6 6
8.64 40.4 59.6 6
8.73 99.9 0.1 6
9.5 99.9 0.1 6
Table 1. The Waters UPLC Amino Acid Analysis Solution gradient separation conditions.
Solvent A = AccQ•Tag Ultra Eluent A:Water (5:95)
Solvent B = AccQ•Tag Ultra Eluent B
AU
0.00
0.05
0.10
0.15
0.20
0.25
Minutes2.00 3.00 4.00 5.00 6.00 7.00 8.00
AMQ
NH3
His Se
r Gly As
p Glu
Thr
Ala
Pro
Cys
Lys
Tyr
Met
M Val
IleLe
u Phe
Arg
Figure 1. Separation of 50 pmoles of amino acid hydrolysate standard (25 pmoles cystine) with the UPLC Amino Acid Analysis Solution.
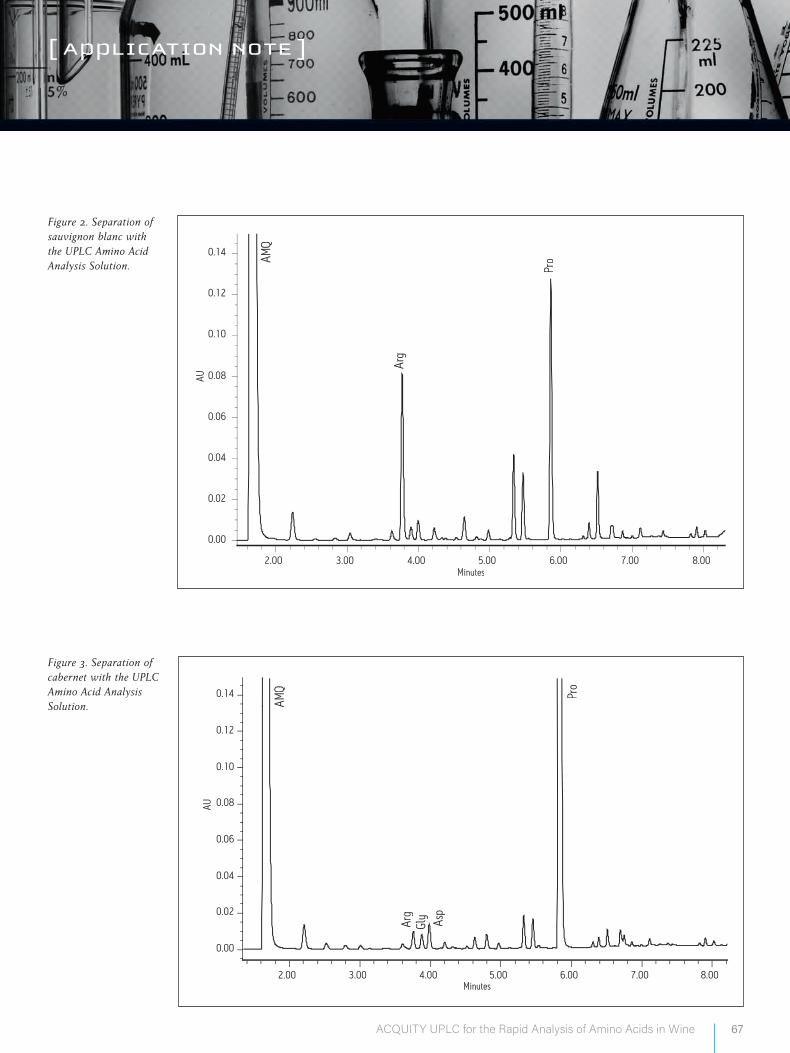
67ACQUITY UPLC for the Rapid Analysis of Amino Acids in Wine
[ application note ]
AU
0.00
0.02
0.04
0.06
0.08
0.10
0.12
0.14
Minutes2.00 3.00 4.00 5.00 6.00 7.00 8.00
AMQ Pro
Arg
Gly Asp
Arg
AU
0.00
0.02
0.04
0.06
0.08
0.10
0.12
0.14
2.00 3.00 4.00 5.00 6.00 7.00 8.00Minutes
ProAM
Q
Figure 2. Separation of sauvignon blanc with the UPLC Amino Acid Analysis Solution.
Figure 3. Separation of cabernet with the UPLC Amino Acid Analysis Solution.
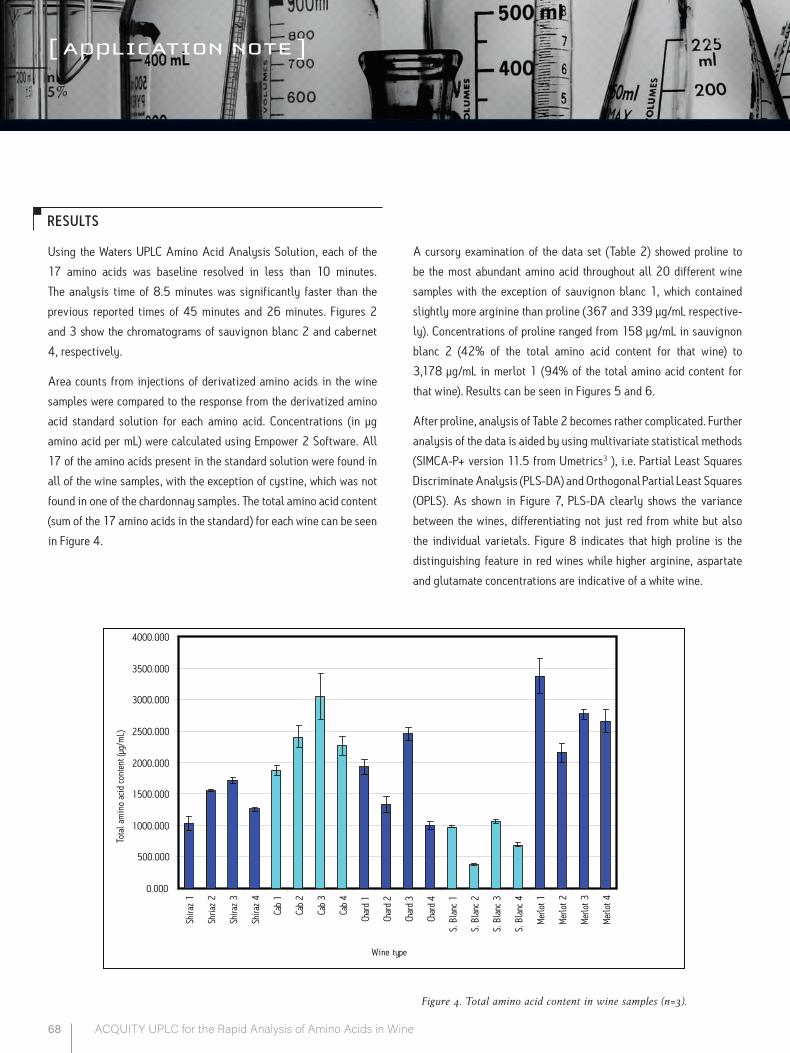
68 ACQUITY UPLC for the Rapid Analysis of Amino Acids in Wine
[ application note ]
RESULTS
Using the Waters UPLC Amino Acid Analysis Solution, each of the
17 amino acids was baseline resolved in less than 10 minutes.
The analysis time of 8.5 minutes was significantly faster than the
previous reported times of 45 minutes and 26 minutes. Figures 2
and 3 show the chromatograms of sauvignon blanc 2 and cabernet
4, respectively.
Area counts from injections of derivatized amino acids in the wine
samples were compared to the response from the derivatized amino
acid standard solution for each amino acid. Concentrations (in µg
amino acid per mL) were calculated using Empower 2 Software. All
17 of the amino acids present in the standard solution were found in
all of the wine samples, with the exception of cystine, which was not
found in one of the chardonnay samples. The total amino acid content
(sum of the 17 amino acids in the standard) for each wine can be seen
in Figure 4.
A cursory examination of the data set (Table 2) showed proline to
be the most abundant amino acid throughout all 20 different wine
samples with the exception of sauvignon blanc 1, which contained
slightly more arginine than proline (367 and 339 µg/mL respective-
ly). Concentrations of proline ranged from 158 µg/mL in sauvignon
blanc 2 (42% of the total amino acid content for that wine) to
3,178 µg/mL in merlot 1 (94% of the total amino acid content for
that wine). Results can be seen in Figures 5 and 6.
After proline, analysis of Table 2 becomes rather complicated. Further
analysis of the data is aided by using multivariate statistical methods
(SIMCA-P+ version 11.5 from Umetrics3 ), i.e. Partial Least Squares
Discriminate Analysis (PLS-DA) and Orthogonal Partial Least Squares
(OPLS). As shown in Figure 7, PLS-DA clearly shows the variance
between the wines, differentiating not just red from white but also
the individual varietals. Figure 8 indicates that high proline is the
distinguishing feature in red wines while higher arginine, aspartate
and glutamate concentrations are indicative of a white wine.
0.000
500.000
1000.000
1500.000
2000.000
2500.000
3000.000
3500.000
4000.000
Shira
z 1
Shria
z 2
Shira
z 3
Shira
z 4
Cab
1
Cab
2
Cab
3
Cab
4
Char
d 1
Char
d 2
Char
d 3
Char
d 4
S. B
lanc
1
S. B
lanc
2
S. B
lanc
3
S. B
lanc
4
Mer
lot 1
Mer
lot 2
Mer
lot 3
Mer
lot 4
Wine type
Tota
l am
ino
acid
cont
ent (
µg/m
L)
Figure 4. Total amino acid content in wine samples (n=3).

69ACQUITY UPLC for the Rapid Analysis of Amino Acids in Wine
[ application note ]
Amino acids in wine, μg/mL
His Ser Arg Gly Asp Glu T hr Ala
Shiraz 1 6.2 6.1 22.9 11.3 9.1 16.3 5.4 19.5
Shriaz 2 11.1 11.2 46.2 21.7 19.5 34.6 10.5 38.8
Shiraz 3 3.5 14.2 76.2 21.9 17.0 36.0 11.9 47.7
Shiraz 4 4.9 9.1 8.7 18.1 17.1 27.5 9.9 35.3
Cab 1 3.9 7.4 6.3 13.2 10.5 17.3 6.5 32.8
Cab 2 2.4 6.2 5.5 11.6 10.1 14.2 5.4 20.5
Cab 3 11.0 8.4 44.9 16.1 13.5 19.4 7.8 32.5
Cab 4 16.7 18.4 130.1 30.6 48.1 46.2 20.6 59.5
Chard 1 13.9 20.1 94.0 24.4 38.2 50.9 17.5 63.3
Chard 2 8.1 13.4 48.8 15.8 30.8 23.3 10.0 30.6
Chard 3 18.3 30.4 258.8 20.6 26.1 76.3 23.3 148.1
Chard 4 16.7 16.2 91.6 15.6 38.9 42.2 12.2 58.6
S. Blanc 1 6.8 14.8 367.6 14.3 27.3 45.6 13.2 87.6
S. Blanc 2 5.4 8.7 48.4 7.4 20.2 36.4 6.2 36.0
S. Blanc 3 12.5 12.3 297.1 15.7 18.2 54.0 9.0 76.4
S. Blanc 4 8.0 8.2 95.4 12.5 19.1 31.5 7.1 38.2
Merlot 1 9.9 8.6 49.6 18.4 10.8 24.9 7.4 29.3
Merlot 2 5.9 6.9 25.7 14.8 10.0 18.2 6.2 21.4
Merlot 3 4.6 10.1 28.1 17.1 15.7 25.6 8.7 30.6
Merlot 4 8.3 10.2 35.6 18.8 15.5 25.0 9.6 37.5
Amino acids in wine, μg/mLPro Cys Lys Tyr Met Val Ile Leu Phe
Shiraz 1 903.8 3.7 6.2 3.3 1.1 5.7 2.1 5.3 4.8
Shriaz 2 1272.2 2.2 25.7 8.8 3.8 11.5 4.9 15.7 12.2
Shiraz 3 1395.6 1.5 25.9 6.7 4.4 14.3 6.2 18.6 13.9
Shiraz 4 1064.7 1.3 18.6 3.7 2.4 10.0 3.7 11.3 11.4
Cab 1 1736.4 1.2 7.9 4.1 1.5 8.2 3.0 6.7 6.8
Cab 2 2294.4 2.6 9.8 2.8 1.5 6.3 2.4 6.4 6.1
Cab 3 2833.1 5.6 15.6 7.5 2.2 7.9 3.5 9.2 7.9
Cab 4 1760.7 3.0 35.5 9.5 6.5 21.9 9.8 24.9 22.3
C hard 1 1456.8 3.2 35.5 20.9 9.2 21.5 11.6 35.4 22.7
C hard 2 1062.6 0.0 27.5 8.3 5.5 10.1 5.8 20.7 12.4
C hard 3 1766.3 1.7 16.3 13.2 4.4 16.7 5.8 17.7 13.6
C hard 4 578.7 0.6 26.4 20.0 6.3 18.5 9.0 24.3 19.9
S. Blanc 1 339.2 0.7 8.9 9.7 2.9 12.4 4.2 12.2 11.1
S. Blanc 2 158.1 0.8 9.6 6.8 2.3 8.0 2.6 8.9 8.7
S. Blanc 3 500.0 2.6 11.1 12.0 2.8 13.8 4.9 11.5 12.9
S. Blanc 4 388.1 1.9 18.2 10.1 4.0 10.6 5.3 16.4 11.7
Merlot 1 3178.4 3.3 7.8 5.7 1.5 5.7 2.0 5.9 6.7
Merlot 2 2009.0 1.1 8.6 3.8 1.5 7.0 2.8 6.8 7.3
Merlot 3 2569.2 7.8 14.5 4.3 2.3 9.9 4.1 10.4 9.9
Merlot 4 2440.9 1.3 12.6 4.7 2.5 9.4 4.0 12.0 11.1
Table 2. Individual amino acid content in wines (µg/mL, mean of three replicates).
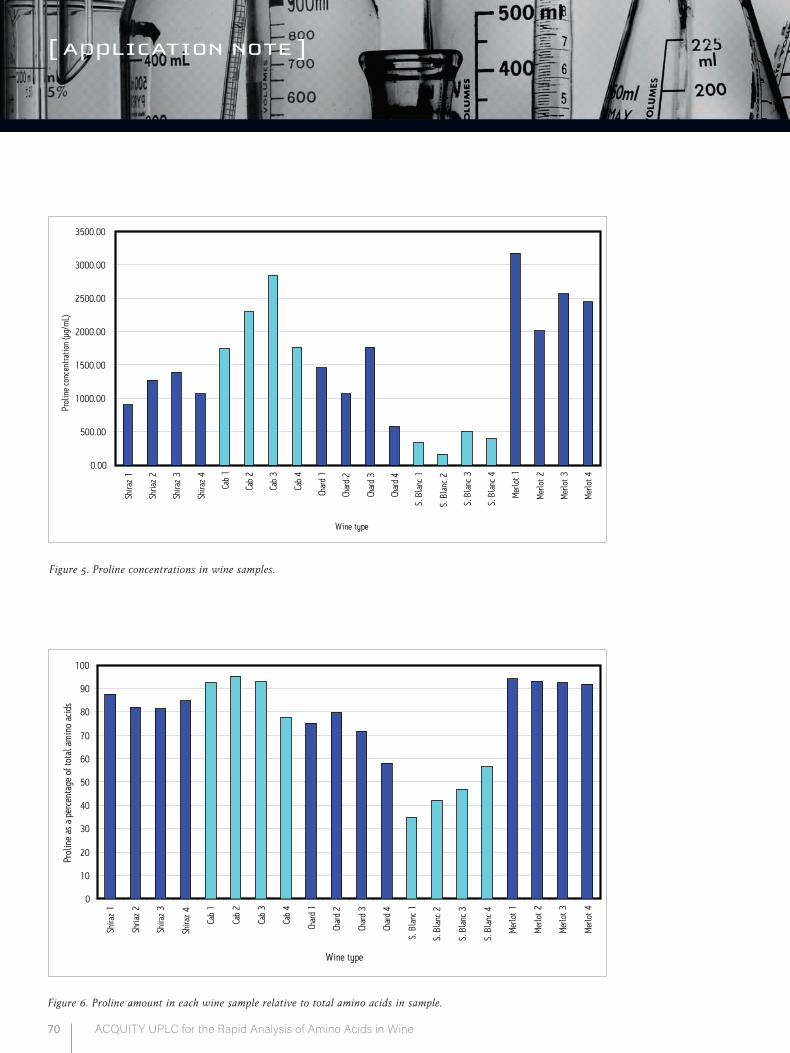
70 ACQUITY UPLC for the Rapid Analysis of Amino Acids in Wine
[ application note ][ application note ]
0
10
20
30
40
50
60
70
80
90
100
Shira
z 1
Shria
z 2
Shira
z 3
Shira
z 4
Cab
1
Cab
2
Cab
3
Cab
4
Char
d 1
Char
d 2
Char
d 3
Char
d 4
S. B
lanc
1
S. B
lanc
2
S. B
lanc
3
S. B
lanc
4
Mer
lot 1
Mer
lot 2
Mer
lot 3
Mer
lot 4
Wine type
Prol
ine
as a
per
cent
age
of to
tal a
min
o ac
ids
0.00
500.00
1000.00
1500.00
2000.00
2500.00
3000.00
3500.00
Shira
z 1
Shria
z 2
Shira
z 3
Shira
z 4
Cab
1
Cab
2
Cab
3
Cab
4
Char
d 1
Char
d 2
Char
d 3
Char
d 4
S. B
lanc
1
S. B
lanc
2
S. B
lanc
3
S. B
lanc
4
Mer
lot 1
Mer
lot 2
Mer
lot 3
Mer
lot 4
Wine type
Prol
ine
conc
entra
tion
(�g/
mL)
Figure 5. Proline concentrations in wine samples.
Figure 6. Proline amount in each wine sample relative to total amino acids in sample.
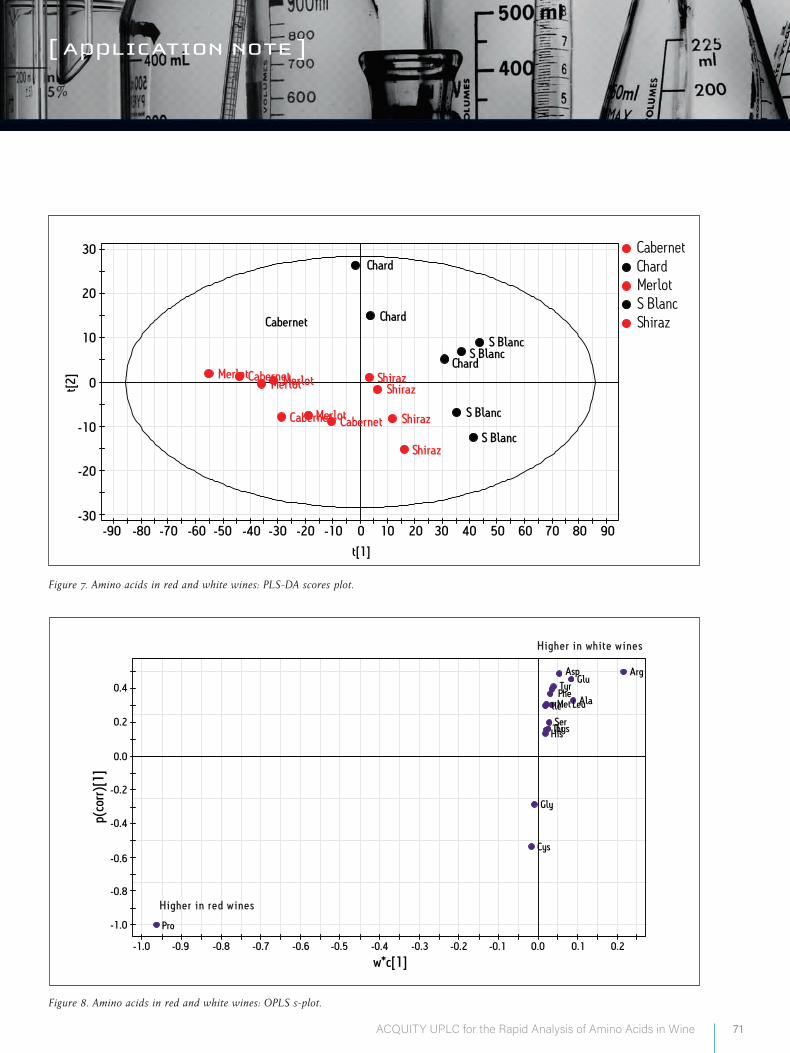
71ACQUITY UPLC for the Rapid Analysis of Amino Acids in Wine
[ application note ]
Tyr
Gly
Cys
ThrLys
Arg
PheAla
Pro
Ser
LeuMetlle
His
GluAsp
-0.6 -0.4 -0.3-0.5-0.7-0.8-0.9-1.0 -0.2 -0.1 0.0 0.1 0.2
w*c[1]
-0.6
-0.4
-0.8
-1.0
-0.2
0.0
0.2
0.4
p(co
rr)[1
]
ChardCabernet
Shiraz
MerlotS Blanc
ChardCabernetMerlot
Chard
Cabernet
Shiraz
Merlot
Chard
S BlancS Blanc
S Blanc
S Blanc
Merlot
MerlotCabernetCabernet Shiraz
ShirazShiraz
9070 8010
10
20
20
-10
-10
0
0
50 6030
30
40-70 -60-90 -80 -30-30
-20
-20
-50 -40
t[1]
t[2]
Figure 8. Amino acids in red and white wines: OPLS s-plot.
Figure 7. Amino acids in red and white wines: PLS-DA scores plot.
Higher in white wines
Higher in red wines
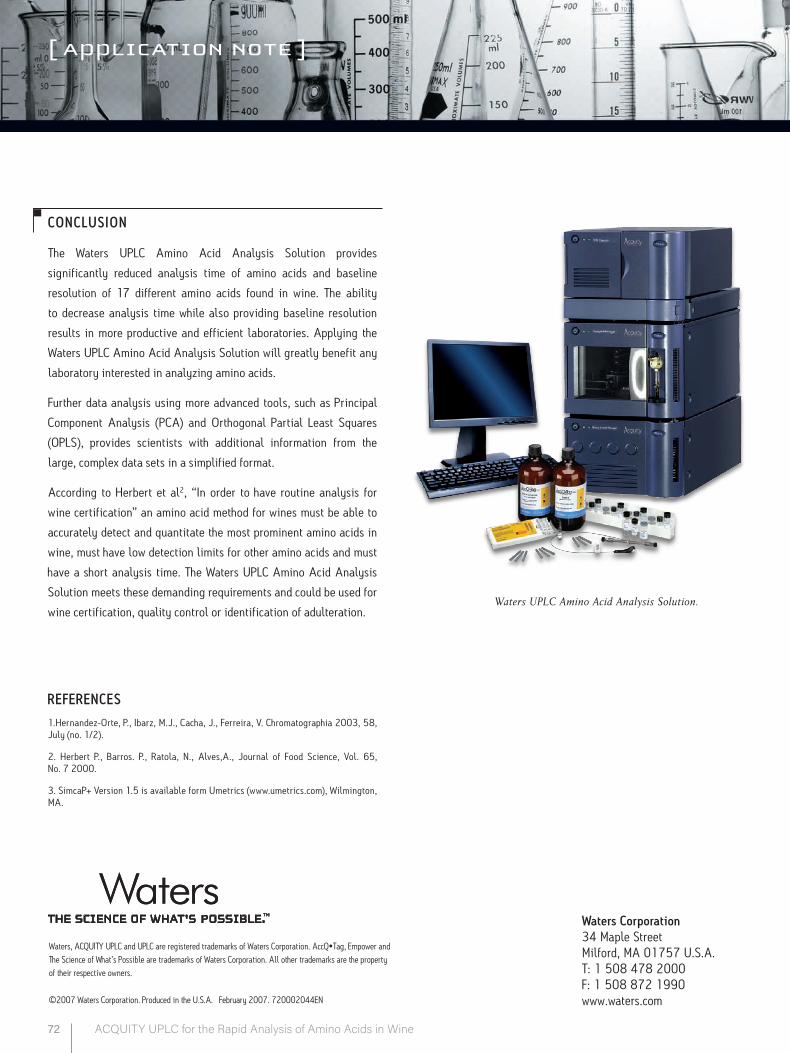
72 ACQUITY UPLC for the Rapid Analysis of Amino Acids in Wine
[ application note ]
Waters Corporation 34 Maple Street Milford, MA 01757 U.S.A. T: 1 508 478 2000 F: 1 508 872 1990 www.waters.com
[ application note ]
Waters Corporation 34 Maple Street Milford, MA 01757 U.S.A. T: 1 508 478 2000 F: 1 508 872 1990 www.waters.com
CONCLUSION
The Waters UPLC Amino Acid Analysis Solution provides
significantly reduced analysis time of amino acids and baseline
resolution of 17 different amino acids found in wine. The ability
to decrease analysis time while also providing baseline resolution
results in more productive and efficient laboratories. Applying the
Waters UPLC Amino Acid Analysis Solution will greatly benefit any
laboratory interested in analyzing amino acids.
Further data analysis using more advanced tools, such as Principal
Component Analysis (PCA) and Orthogonal Partial Least Squares
(OPLS), provides scientists with additional information from the
large, complex data sets in a simplified format.
According to Herbert et al2, “In order to have routine analysis for
wine certification” an amino acid method for wines must be able to
accurately detect and quantitate the most prominent amino acids in
wine, must have low detection limits for other amino acids and must
have a short analysis time. The Waters UPLC Amino Acid Analysis
Solution meets these demanding requirements and could be used for
wine certification, quality control or identification of adulteration.
REFERENCES
1.Hernandez-Orte, P., Ibarz, M.J., Cacha, J., Ferreira, V. Chromatographia 2003, 58, July (no. 1/2).
2. Herbert P., Barros. P., Ratola, N., Alves,A., Journal of Food Science, Vol. 65, No. 7 2000.
3. SimcaP+ Version 1.5 is available form Umetrics (www.umetrics.com), Wilmington, MA.
Waters UPLC Amino Acid Analysis Solution.
Waters, ACQUITY UPLC and UPLC are registered trademarks of Waters Corporation. AccQ•Tag, Empower and The Science of What’s Possible are trademarks of Waters Corporation. All other trademarks are the property of their respective owners.
©2007 Waters Corporation. Produced in the U.S.A.February 2007. 720002044EN
Waters, ACQUITY UPLC and UPLC are registered trademarks of Waters Corporation. AccQ•Tag, Empower and The Science of What’s Possible are trademarks of Waters Corporation. All other trademarks are the property of their respective owners.
©2007 Waters Corporation. Produced in the U.S.A. February 2007. 720002044EN
Waters Corporation 34 Maple Street Milford, MA 01757 U.S.A. T: 1 508 478 2000 F: 1 508 872 1990 www.waters.com

[APPLICATION NOTE]
73Determination Of Amino Acids In Beers Using The UPLC Amino Acid Analysis Solution
D E T E RM INAT IO N O F AM INO AC I DS IN B E E R S US ING T H E U P L C AM INO AC I D A NA LYSIS SO LU T IO N
Mark E. Benvenuti and Paula Hong Waters Corporation, Milford, MA USA
INT RODUCT ION:
Beer is a complex matrix consisting of over 100 components. Water,
ethanol and carbohydrates are the major constituents of beers and
ales. However, there are many minor compounds, some of which are
critical for proper taste and quality. One class of compounds, amino
acids, is metabolized by yeast during fermentation, leading to the
formation of critical flavor components. Therefore, the monitoring
of amino acids is essential to demonstrate product consistency and
ensure customer satisfaction.
Current HPLC methods for amino acids require run times that exceed
30 minutes, with poor resolution between many amino acids. Here
we shall demonstrate the efficacy of the Waters® UPLC® Amino
Acid Analysis Solution to resolve 27 amino acids and an internal
standard in less than 10 minutes and apply this capability to amino
acid analysis of several beer and ale samples.
EX PERIMENTAL:
Conditions:
System: ACQUITY UPLC® with Tunable UV Detector
Method: Cell culture
Column: AccQ•TagTM Ultra, 2.1 x 100 mm
Temperature: 60 °C
Injection volume: 1.0 µL
Detection: UV @ 260 nm
Data: Empower™ software
Standard preparation:
A stock 1000 pmol/µL stock mixed amino acid standard was
prepared per the cell culture method 1,2,3. An intermediate 100
pmol/µL mixture was prepared by mixing 100 µL of stock with
900 µL water. The working derivatized standard was prepared by
adding 10 µL of the 100 pmol/µL mixture to 70 µL borate buffer
followed by 20 µL AQC derivatization reagent in a total recovery
vial and mixing well. The mixture was heated for 10 minutes at
55 °C, cooled to room temperature then injected. The concentra-
tion is 10 pmol/µL for the analytes of interest except Cystein (Cys)
which is 5 pmol/µL.
CLASSIC UPLC
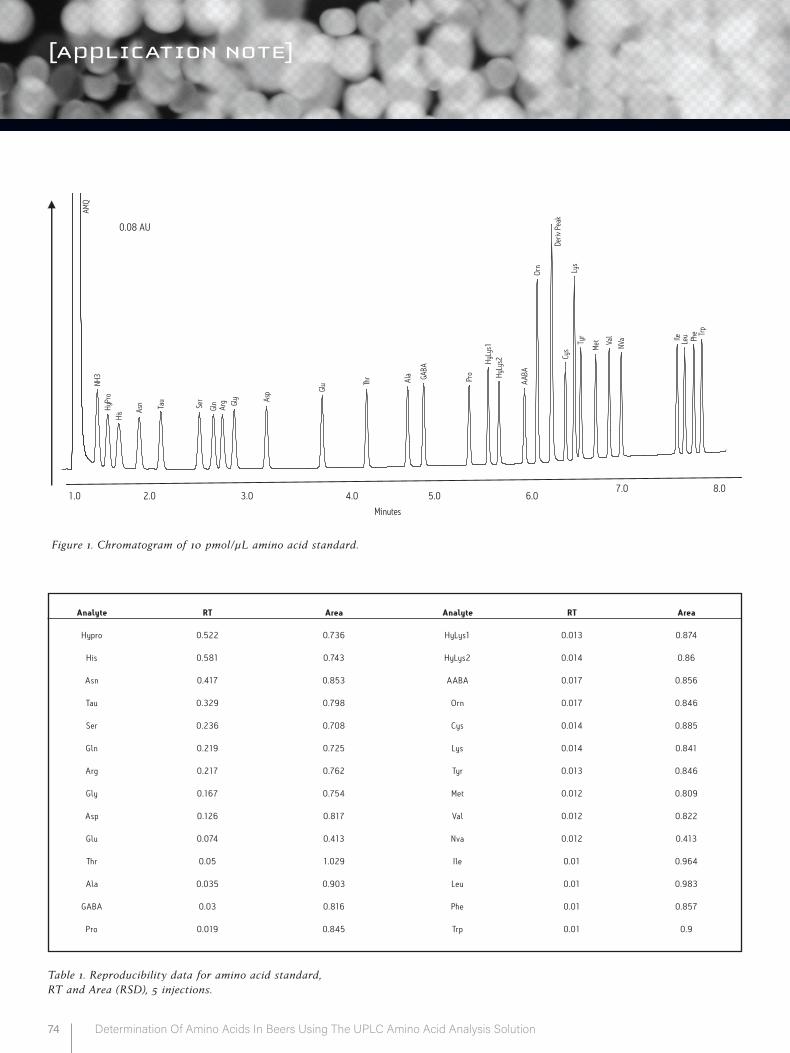
[APPLICATION NOTE]
74 Determination Of Amino Acids In Beers Using The UPLC Amino Acid Analysis Solution
Figure 1. Chromatogram of 10 pmol/µL amino acid standard.
Table 1. Reproducibility data for amino acid standard, RT and Area (RSD), 5 injections.
AMQ
NH3
HyPr
oHi
s Asn Tau
Ser
Gln
Arg Gly As
p Glu Th
r Ala GA
BA
Pro
HyLy
s1Hy
Lys2
AABA
Orn
Deriv
Pea
kCy
sLy
sTy
r
Met Va
l
NVa Ile Leu Phe Tr
p
1.0 2.0 3.0 4.0 5.0 6.07.0 8.0
Minutes
0.08 AU
Analyte RT Area Analyte RT Area
Hypro 0.522 0.736 HyLys1 0.013 0.874
His 0.581 0.743 HyLys2 0.014 0.86
Asn 0.417 0.853 AABA 0.017 0.856
Tau 0.329 0.798 Orn 0.017 0.846
Ser 0.236 0.708 Cys 0.014 0.885
Gln 0.219 0.725 Lys 0.014 0.841
Arg 0.217 0.762 Tyr 0.013 0.846
Gly 0.167 0.754 Met 0.012 0.809
Asp 0.126 0.817 Val 0.012 0.822
Glu 0.074 0.413 Nva 0.012 0.413
Thr 0.05 1.029 Ile 0.01 0.964
Ala 0.035 0.903 Leu 0.01 0.983
GABA 0.03 0.816 Phe 0.01 0.857
Pro 0.019 0.845 Trp 0.01 0.9

[APPLICATION NOTE]
75Determination Of Amino Acids In Beers Using The UPLC Amino Acid Analysis Solution
Sample preparation:
14 samples of beer and ale were purchased commercially. These
included domestic regular, light, non-alcoholic, dark beers and an
imported Belgian ale. Approximately 100 mL of each beer was son-
nicated to remove carbonation. If the sample appeared excessively
cloudy or turbid, it was filtered through a 0.45 micron hydrophilic
filter. 200 µL of each beer and ale was mixed thoroughly with 160
µL water and 40 µL of a 1000 pmol/µL Norvaline (Nva - internal
standard) solution. The preparation of the internal standard is
described in the Cell Culture Method 1,2,3. This resulted in a 1:2
dilution (400 µL total volume) of the beer made 100 pmol /µL in
internal standard.
10 µL of this mixture was then mixed with 70 µL of borate buffer
and 20 µL of AQC derivitazation reagent and heated as described
in the standard preparation section. This working sample mixture,
now a 20 fold dilution of the beer, made 10 pmol /µL in internal
standard (similar to the working standard) was injected.
AM
QN
H3
His
Asn
Ser
Gln
Arg G
ly
Asp
Glu
Ala
GA
BA
Pro
AA
BA
Orn
Deri
v P
eak
Cy
sLy
s Ty
r
Val
NV
a
Phe
Trp
AM
Q
NH
3
His
Asn
Ser
Gln
Asp Glu
Thr
Ala
GA
BA
Pro
AA
BA
Orn
Deri
v P
eak
Lys
Ty
r
Met
Val
NV
a
Ile
Leu
Phe
Trp
AM
Q
NH
3H
yPro
His Asn
Tau
Ser
Gln Arg
Gly
Asp
Glu
Thr
Ala
GA
BA
Pro
Hy
Lys1
Hy
Lys2
AA
BA
Orn
Deri
v P
eak
Cy
sLy
sTy
r
Met
Val
NV
a Ile
Leu Phe
Trp
AM
QN
H3
Hy
Pro
His Ser
Gln
Arg G
ly
Asp
Glu
Thr
Ala
GA
BA
Pro
AA
BA
Orn
Deri
v P
eak
Cy
sLy
s Ty
r
Met
Val
NV
a
Ile Le
uPhe
Trp
1.0 2.0 3.0 4.0 5.0 6.0 7.0 8.0Minutes
Domestic “Lite” Beer
Imported Belgian Ale
Dark Beer
Non-Alcoholic Beer
0.25 Au
0.25 Au
0.25 Au
0.25 Au #7
#12
#9
#3
Figure 2. Chromatographic profiles of amino acid content for various beer types.
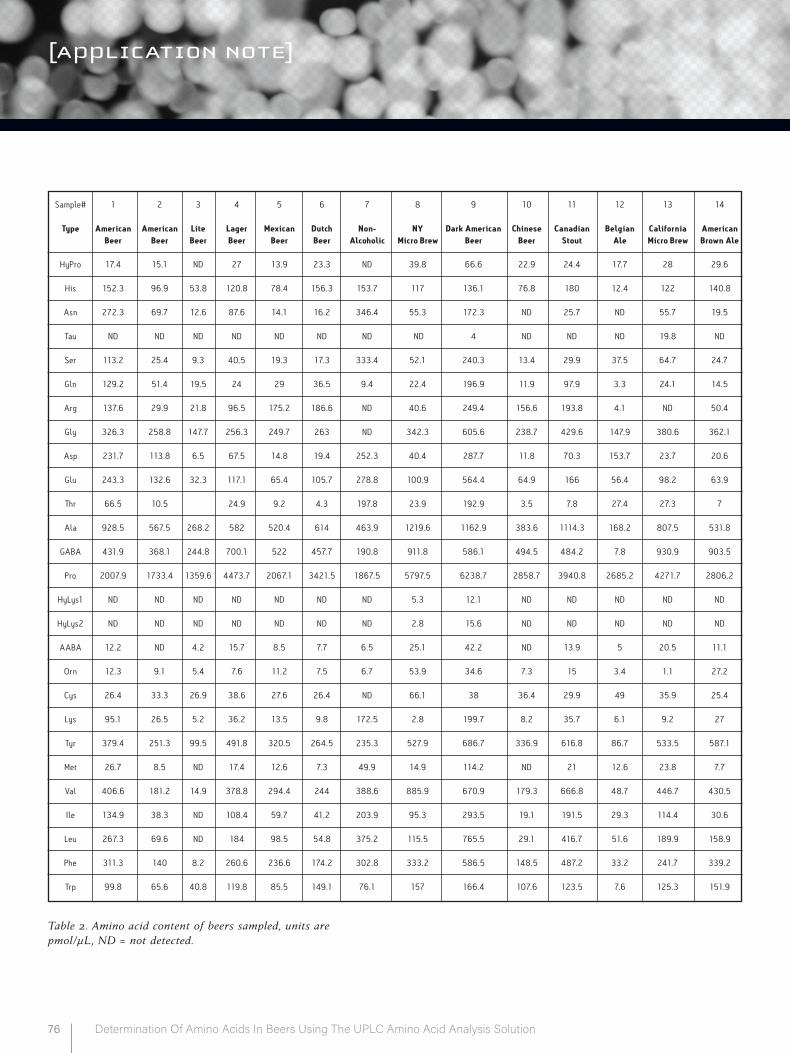
[APPLICATION NOTE]
76 Determination Of Amino Acids In Beers Using The UPLC Amino Acid Analysis Solution
Sample# 1 2 3 4 5 6 7 8 9 10 11 12 13 14
Type American American Lite Lager Mexican Dutch Non- NY Dark American Chinese Canadian Belgian California American Beer Beer Beer Beer Beer Beer Alcoholic Micro Brew Beer Beer Stout Ale Micro Brew Brown Ale
HyPro 17.4 15.1 ND 27 13.9 23.3 ND 39.8 66.6 22.9 24.4 17.7 28 29.6
His 152.3 96.9 53.8 120.8 78.4 156.3 153.7 117 136.1 76.8 180 12.4 122 140.8
Asn 272.3 69.7 12.6 87.6 14.1 16.2 346.4 55.3 172.3 ND 25.7 ND 55.7 19.5
Tau ND ND ND ND ND ND ND ND 4 ND ND ND 19.8 ND
Ser 113.2 25.4 9.3 40.5 19.3 17.3 333.4 52.1 240.3 13.4 29.9 37.5 64.7 24.7
Gln 129.2 51.4 19.5 24 29 36.5 9.4 22.4 196.9 11.9 97.9 3.3 24.1 14.5
Arg 137.6 29.9 21.8 96.5 175.2 186.6 ND 40.6 249.4 156.6 193.8 4.1 ND 50.4
Gly 326.3 258.8 147.7 256.3 249.7 263 ND 342.3 605.6 238.7 429.6 147.9 380.6 362.1
Asp 231.7 113.8 6.5 67.5 14.8 19.4 252.3 40.4 287.7 11.8 70.3 153.7 23.7 20.6
Glu 243.3 132.6 32.3 117.1 65.4 105.7 278.8 100.9 564.4 64.9 166 56.4 98.2 63.9
Thr 66.5 10.5 24.9 9.2 4.3 197.8 23.9 192.9 3.5 7.8 27.4 27.3 7
Ala 928.5 567.5 268.2 582 520.4 614 463.9 1219.6 1162.9 383.6 1114.3 168.2 807.5 531.8
GABA 431.9 368.1 244.8 700.1 522 457.7 190.8 911.8 586.1 494.5 484.2 7.8 930.9 903.5
Pro 2007.9 1733.4 1359.6 4473.7 2067.1 3421.5 1867.5 5797.5 6238.7 2858.7 3940.8 2685.2 4271.7 2806.2
HyLys1 ND ND ND ND ND ND ND 5.3 12.1 ND ND ND ND ND
HyLys2 ND ND ND ND ND ND ND 2.8 15.6 ND ND ND ND ND
AABA 12.2 ND 4.2 15.7 8.5 7.7 6.5 25.1 42.2 ND 13.9 5 20.5 11.1
Orn 12.3 9.1 5.4 7.6 11.2 7.5 6.7 53.9 34.6 7.3 15 3.4 1.1 27.2
Cys 26.4 33.3 26.9 38.6 27.6 26.4 ND 66.1 38 36.4 29.9 49 35.9 25.4
Lys 95.1 26.5 5.2 36.2 13.5 9.8 172.5 2.8 199.7 8.2 35.7 6.1 9.2 27
Tyr 379.4 251.3 99.5 491.8 320.5 264.5 235.3 527.9 686.7 336.9 616.8 86.7 533.5 587.1
Met 26.7 8.5 ND 17.4 12.6 7.3 49.9 14.9 114.2 ND 21 12.6 23.8 7.7
Val 406.6 181.2 14.9 378.8 294.4 244 388.6 885.9 670.9 179.3 666.8 48.7 446.7 430.5
Ile 134.9 38.3 ND 108.4 59.7 41.2 203.9 95.3 293.5 19.1 191.5 29.3 114.4 30.6
Leu 267.3 69.6 ND 184 98.5 54.8 375.2 115.5 765.5 29.1 416.7 51.6 189.9 158.9
Phe 311.3 140 8.2 260.6 236.6 174.2 302.8 333.2 586.5 148.5 487.2 33.2 241.7 339.2
Trp 99.8 65.6 40.8 119.8 85.5 149.1 76.1 157 166.4 107.6 123.5 7.6 125.3 151.9
Table 2. Amino acid content of beers sampled, units are pmol/µL, ND = not detected.
[APPLICATION NOTE]
77Determination Of Amino Acids In Beers Using The UPLC Amino Acid Analysis Solution
Waters, and ACQUITY UPLC are registered trademarks of Waters Corporation. AccQ•TagTM, Empower, AccQ•FluorTM and The Science of What’s Possible are trademarks of Waters Corporation. All other trademarks are the property of their respective owners
©2007 Waters Corporation. Produced in the USA. April 2007 720002158EN AG-PDF
RESULTS AND DISCUSSION:
Figure 1 is a chromatogram of the cell culture standard. Table 1 is
reproducibility data (RSD) for retention time and area for 5 injec-
tions of this standard. An overlay of the chromatograms of several
of the beers analyzed is found in Figure 2. Table 2 lists the quan-
titated amounts for the amino acids in the 14 beer samples tested.
The differences in amino acid content, both qualitative and quan-
titative, for the samples tested are quite evident. Proline (Pro) was
found in all samples tested and at a high level, not surprising given
the fact that beer yeast cannot ferment proline. On the other hand,
Taurine (Tau) and Hydroxy-L-lysine (HyLys) were absent or at a very
low level. In general the darker beers had higher amino acid content
than light beers.
Also note that in Figure 2 there are many unidentified peaks, pos-
sibly amino acids not included in the standard mixture or other
compounds that contain an amino group that would react with the
AccQ•FluorTM reagent. Since the methodology is fully compat-
ible with mass spectrometry detection, it is possible to positively
identify these additional compounds, which may also be of critical
importance to product consistency.
CONCLUSION:
We have successfully demonstrated application of the Waters UPLC
amino acid analysis solution (AAA) to determine the amino acids
found in several different beers and ales. This method demonstrated
excellent resolution of all sample components with a 10 minute
cycle time. Simple sample preparation and analysis times that are
approximately three times faster than traditional HPLC methods
make the UPLC AAA solution ideal for demonstrating consistency
of beer production.
REFERENC ES:
1. Wheat, E, Grumbach, E and Mazzeo et al. “A new Amino Acid Analysis Application Solution”. Waters Corporation, 2006: 720001683EN.
2. “UPLC Amino Acid Analysis Application Solution System Guide” Sections 4, 6, Waters Corporation, 2006: 720001565EN.
3. Paula Hong, Private Communication.
Waters Corporation 34 Maple Street Milford, MA 01757 U.S.A. T: 1 508 478 2000 F: 1 508 872 1990 www.waters.com

78 Amino Acids Application Notebook
[ NOTES ]
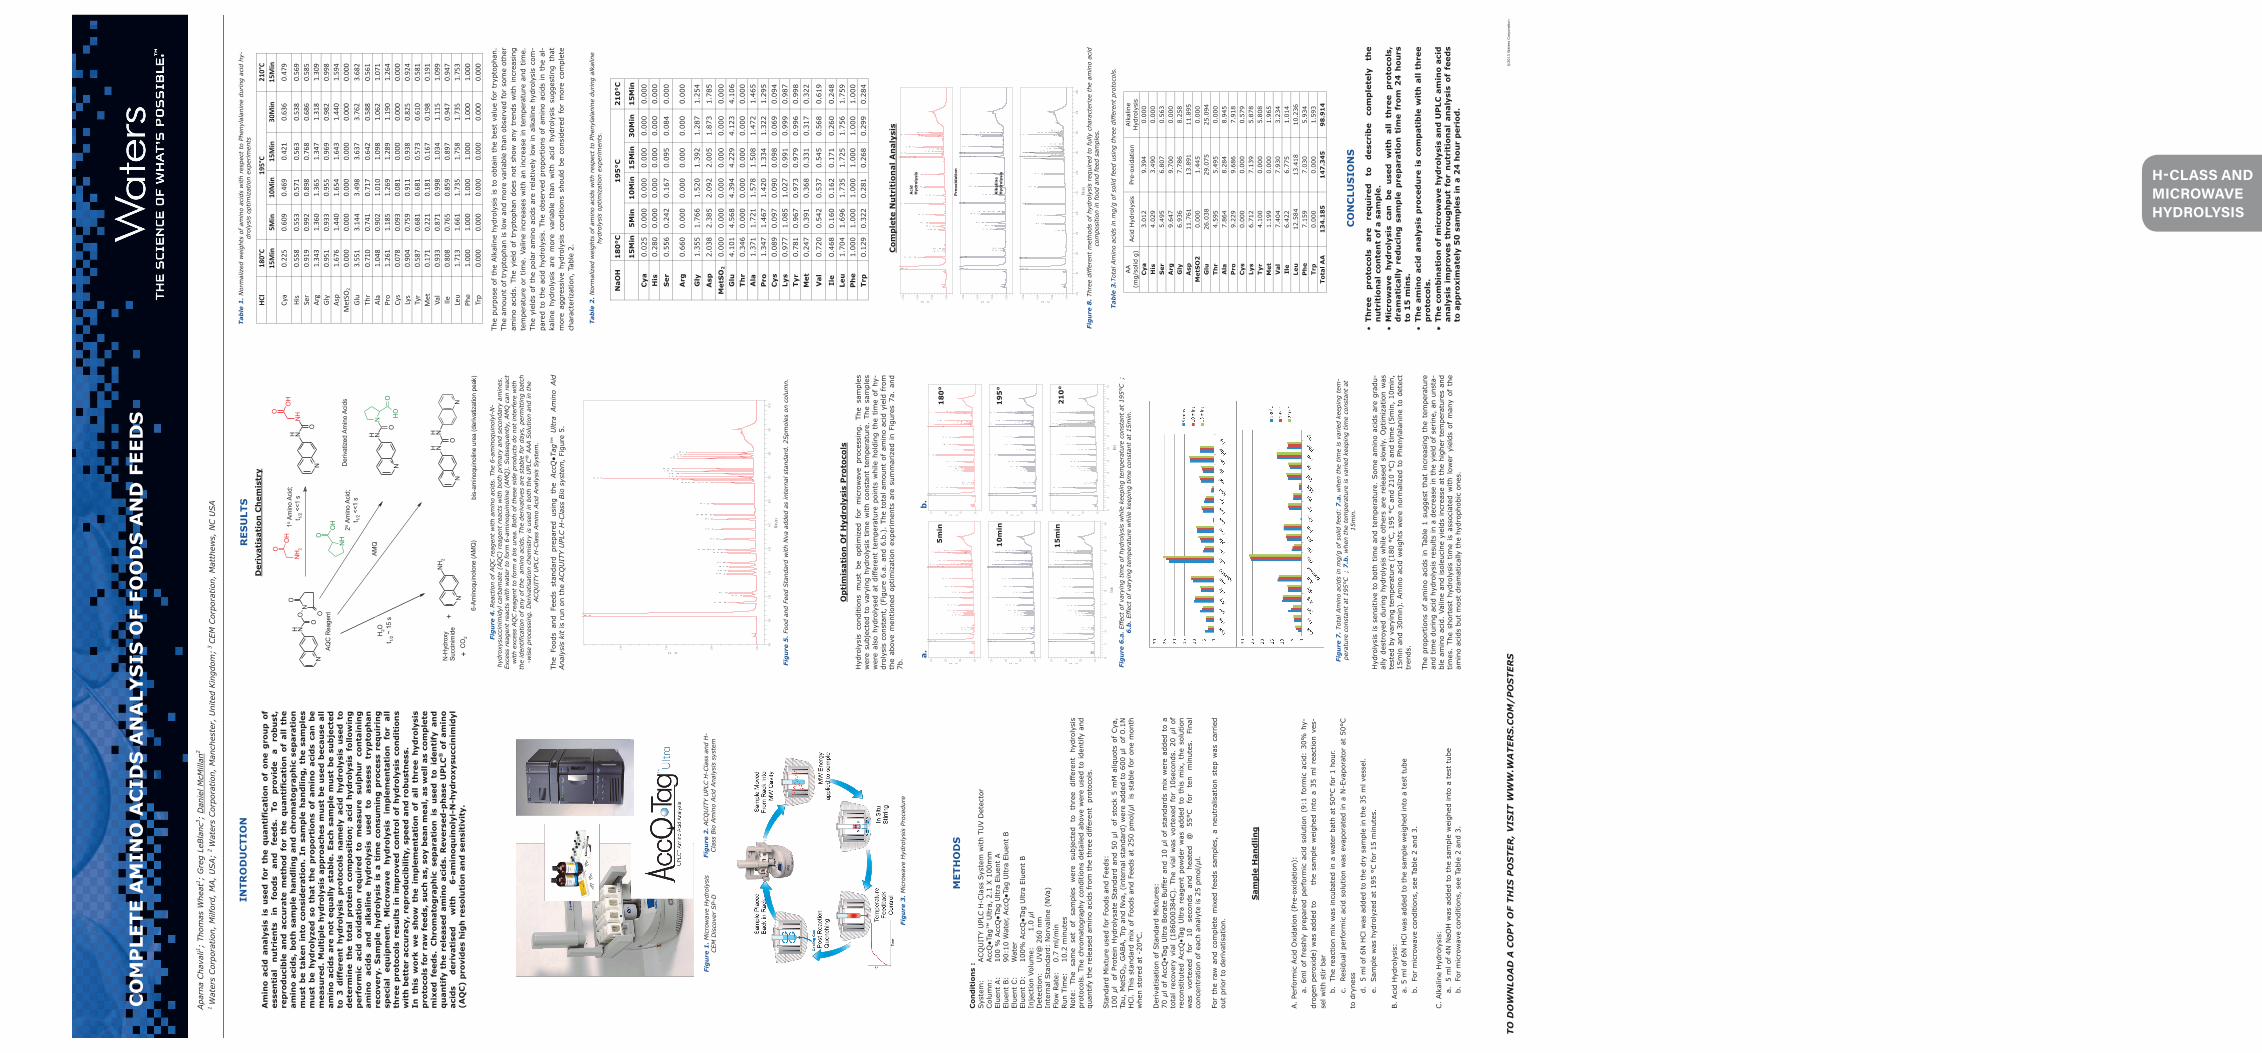
TO D
OW
NLO
AD
A C
OP
Y O
F TH
IS P
OS
TER
, V
ISIT
WW
W.W
ATE
RS
.CO
M/
PO
STE
RS
©
2013
Wat
ers
Cor
pora
tion
INTR
OD
UC
TIO
N
Am
ino
acid
an
alys
is i
s u
sed
for
th
e q
uan
tifi
cati
on o
f o
ne
gro
up
of
esse
nti
al
nu
trie
nts
in
fo
ods
and
fe
eds.
To
p
rovi
de
a ro
bu
st,
rep
rod
uci
ble
an
d a
ccu
rate
met
hod
for
th
e q
uan
tifi
cati
on
of
all
the
amin
o ac
ids,
bot
h s
amp
le h
and
ling
an
d c
hro
mat
ogra
ph
ic s
epar
atio
n
mu
st b
e ta
ken
in
to c
on
sid
erat
ion
. In
sam
ple
han
dlin
g,
the
sam
ple
s m
ust
be
hyd
roly
zed
so
that
th
e p
rop
orti
ons
of a
min
o ac
ids
can
be
mea
sure
d.
Mu
ltip
le h
ydro
lysi
s ap
pro
ach
es m
ust
be
use
d b
ecau
se a
ll
amin
o ac
ids
are
not
eq
ual
ly s
tab
le.
Each
sam
ple
mu
st b
e su
bje
cted
to
3 d
iffe
ren
t h
ydro
lysi
s p
roto
cols
nam
ely
acid
hyd
roly
sis
use
d t
o d
eter
min
e th
e to
tal
pro
tein
com
pos
itio
n;
acid
hyd
roly
sis
follo
win
g
per
form
ic a
cid
oxi
dat
ion
req
uir
ed t
o m
easu
re s
ulp
hu
r co
nta
inin
g
amin
o ac
ids
and
al
kalin
e h
ydro
lysi
s u
sed
to
as
sess
tr
ypto
ph
an
reco
very
. S
amp
le h
ydro
lysi
s is
a t
ime
con
sum
ing
pro
cess
req
uir
ing
sp
ecia
l eq
uip
men
t.
Mic
row
ave
hyd
roly
sis
imp
lem
enta
tion
fo
r al
l th
ree
pro
toco
ls r
esu
lts
in i
mp
rove
d c
ontr
ol o
f h
ydro
lysi
s co
nd
itio
ns
wit
h b
ette
r ac
cura
cy,
rep
rod
uci
bili
ty,
spee
d a
nd
rob
ust
nes
s.
In t
his
wor
k w
e sh
ow t
he
imp
lem
enta
tion
of
all
thre
e h
ydro
lysi
s p
roto
cols
fo
r ra
w f
eed
s, s
uch
as,
so
y b
ean
mea
l, a
s w
ell a
s co
mp
lete
m
ixed
fee
ds.
Ch
rom
atog
rap
hic
sep
arat
ion
is
use
d t
o id
enti
fy a
nd
q
uan
tify
th
e re
leas
ed a
min
o ac
ids.
Rev
erse
d-p
has
e U
PLC
® o
f am
ino
ac
ids
der
ivat
ised
w
ith
6
-am
inoq
uin
olyl
-N-h
ydro
xysu
ccin
imid
yl
(AQ
C)
pro
vid
es h
igh
res
olu
tion
an
d s
ensi
tivi
ty.
CO
MP
LETE
AM
INO
AC
IDS
AN
ALY
SIS
OF
FOO
DS
AN
D F
EED
S
Apa
rna
Cha
vali1 ;
Tho
mas
Whe
at1 ;
Gre
g Le
Bla
nc3 ;
Dan
iel M
cMill
an2
1 W
ater
s Cor
pora
tion,
Milf
ord,
MA,
USA;
2 W
ater
s Cor
pora
tion,
Man
ches
ter,
Uni
ted
Kin
gdom
; 3 C
EM C
orpo
ratio
n, M
atth
ews,
NC U
SA
Fig
ure
3. M
icro
wav
e H
ydro
lysi
s Pr
oced
ure
Fig
ure
1. M
icro
wav
e H
ydro
lysi
s CEM
Dis
cove
r SP-
D
Fig
ure
2. ACQ
UIT
Y U
PLC H
-Cla
ss a
nd H
-Cla
ss B
io A
min
o Aci
d Ana
lysi
s sy
stem
RES
ULT
S
Fig
ure
4. Rea
ctio
n of
AQ
C r
eage
nt w
ith a
min
o ac
ids.
The
6-a
min
oqui
noly
l-N
-hy
drox
ysuc
cini
mid
yl c
arba
mat
e (A
QC)
reag
ent
reac
ts w
ith b
oth
prim
ary
and
seco
ndar
y am
ines
. Ex
cess
rea
gent
rea
cts
with
wat
er t
o fo
rm 6
-am
inoq
uino
line
(AM
Q).
Sub
sequ
ently
, AM
Q c
an r
eact
w
ith e
xces
s AQ
C r
eage
nt t
o fo
rm a
bis
ure
a. B
oth
of t
hese
sid
e pr
oduc
ts d
o no
t in
terf
ere
with
th
e id
entif
icat
ion
of a
ny o
f th
e a
min
o ac
ids.
The
der
ivat
ives
are
sta
ble
for
days
, pe
rmitt
ing
batc
h-w
ise
proc
essi
ng.
Der
ivat
isat
ion
chem
istr
y is
use
d in
bot
h th
e U
PLC
® A
AA S
olut
ion
and
in t
he
ACQ
UIT
Y U
PLC H
-Cla
ss A
min
o Ac
id A
naly
sis
Sys
tem
.
N
N
NHO
O
O
ON
NH
O
NH
OH
O
N
NH
2NH
2O
OH
NHO
OH
N
N
NH
OO
HO N
N
NHNH
O
AQC
Rea
gent
Der
ivat
ized
Am
ino
Acid
s
6-Am
inoq
uino
lone
(AM
Q)
1o A
min
o Ac
id;
t 1/2 <
<1 s
2o Am
ino
Acid
;t 1/
2 <<1
s bis
-am
inoq
uino
line
urea
(der
ivat
izat
ion
peak
)
N-H
ydro
xySu
ccin
imid
e
+C
O2
+
AMQ
H2O
t 1/2 ~
15
s
Der
ivat
isat
ion
Ch
emis
try
MET
HO
DS
C
ond
itio
ns
: Sy
stem
:
ACQ
UIT
Y U
PLC
H-C
lass
Sys
tem
with
TU
V D
etec
tor
Col
umn:
Acc
Q●T
ag™
Ultr
a, 2
.1 X
100
mm
El
uent
A:
10
0 %
Acc
Q●T
ag U
ltra
Elue
nt A
El
uent
B:
90
:10
Wat
er,
Acc
Q●T
ag U
ltra
Elue
nt B
El
uent
C:
W
ater
El
uent
D:
10
0% A
ccQ
●Tag
Ultr
a El
uent
B
Inje
ctio
n Vo
lum
e:
1.0
µl
Det
ectio
n:
UV@
260
nm
In
tern
al S
tand
ard:
Nor
valin
e (N
Va)
Flow
Rat
e:
0.7
ml/
min
Run
Tim
e:
10.2
min
utes
N
ote:
Th
e sa
me
set
of
sam
ples
w
ere
subj
ecte
d to
th
ree
diff
eren
t hy
drol
ysis
pr
otoc
ols.
The
chr
omat
ogra
phy
cond
ition
s de
taile
d ab
ove
wer
e us
ed t
o id
entif
y an
d qu
antif
y th
e re
leas
ed a
min
o ac
ids
from
the
thr
ee d
iffer
ent
pro
toco
ls.
Sta
ndar
d M
ixtu
re u
sed
for
Food
s an
d Fe
eds:
10
0 µ l
of
Pro
tein
Hyd
roly
sate
Sta
ndar
d an
d 50
µl o
f st
ock
5 m
M a
liquo
ts o
f Cya
, Ta
u, M
etSO
2, G
ABA,
Trp
and
Nva
, (i
nter
nal s
tand
ard)
wer
e ad
ded
to 6
00 µ
l of
0.1
N
HCl.
This
sta
ndar
d m
ix o
f Fo
ods
and
Feed
s at
250
pm
ol/ µ
l is
sta
ble
for
one
mon
th
whe
n st
ored
at
-20°
C.
Der
ivat
isat
ion
of S
tand
ard
Mix
ture
s:
70 µ
l of
Acc
Q•T
ag U
ltra
Bor
ate
Buf
fer
and
10 µ
l of
sta
ndar
ds m
ix w
ere
adde
d to
a
tota
l re
cove
ry v
ial
(186
0003
84C).
The
via
l w
as v
orte
xed
for
10se
cond
s. 2
0 µl
of
reco
nstit
uted
Acc
Q•T
ag U
ltra
reag
ent
pow
der
was
add
ed t
o th
is m
ix,
the
solu
tion
was
vo
rtex
ed
for
10
seco
nds
and
heat
ed
@
55°C
fo
r te
n m
inut
es.
Fina
l co
ncen
trat
ion
of e
ach
anal
yte
is 2
5 pm
ol/ µ
l. Fo
r th
e ra
w a
nd c
ompl
ete
mix
ed f
eeds
sam
ples
, a
neut
ralis
atio
n st
ep w
as c
arried
ou
t pr
ior
to d
eriv
atis
atio
n.
Fig
ure
5. Fo
od a
nd F
eed
Sta
ndar
d w
ith N
va a
dded
as
inte
rnal
sta
ndar
d. 2
5pm
oles
on
colu
mn.
Sam
ple
Han
dlin
g
A.
Perf
orm
ic A
cid
Oxi
datio
n (P
re-o
xida
tion)
:
a. 6
ml
of f
resh
ly p
repa
red
perf
orm
ic a
cid
solu
tion
(9:1
for
mic
aci
d: 3
0% h
y-dr
ogen
per
oxid
e) w
as a
dded
to
th
e sa
mpl
e w
eigh
ed i
nto
a 35
ml
reac
tion
ves-
sel w
ith s
tir b
ar
b.
Th
e re
actio
n m
ix w
as in
cuba
ted
in a
wat
er b
ath
at 5
0°C f
or 1
hou
r.
c.
Resi
dual
per
form
ic a
cid
solu
tion
was
eva
pora
ted
in a
N-E
vapo
rato
r at
50°
C
to d
ryne
ss
d.
5
ml o
f 6N
HCl w
as a
dded
to
the
dry
sam
ple
in t
he 3
5 m
l ves
sel.
e.
Sam
ple
was
hyd
roly
zed
at 1
95 °
C f
or 1
5 m
inut
es.
B.
Aci
d H
ydro
lysi
s:
a.
5 m
l of
6N H
Cl w
as a
dded
to
the
sam
ple
wei
ghed
into
a t
est
tube
b.
For
mic
row
ave
cond
ition
s, s
ee T
able
2 a
nd 3
. C.
Alk
alin
e H
ydro
lysi
s:
a.
5
ml o
f 4N
NaO
H w
as a
dded
to
the
sam
ple
wei
ghed
into
a t
est
tube
b.
For
mic
row
ave
cond
ition
s, s
ee T
able
2 a
nd 3
.
AMQ
NH3
Cya
His
Tau
Ser
Arg
Gly
Asp
MetSO2
Glu
Thr
Ala
GABA
Pro
Deriv Peak
CysLys
Tyr
Met
Val
NVa
IIeLeu
PheTrp
AU
0.00
0.06
0.12
0.18
Minute
s0.0
01.0
02.0
03.0
04.0
05.0
06.0
07.0
08.0
09.0
010
.00
The
Food
s an
d Fe
eds
stan
dard
pre
pare
d us
ing
the
Acc
Q●T
ag™
Ultr
a Am
ino
Aid
Ana
lysi
s ki
t is
run
on
the
ACQ
UIT
Y U
PLC H
-Cla
ss B
io s
yste
m,
Figu
re 5
.
Op
tim
isat
ion
Of
Hyd
roly
sis
Pro
toco
ls
Fig
ure
7. To
tal A
min
o ac
ids
in m
g/g
of s
olid
fee
d: 7
.a. w
hen
the
time
is v
arie
d ke
epin
g te
m-
pera
ture
con
stan
t at
195
°C ;
7.b
. w
hen
the
tem
pera
ture
is v
arie
d ke
epin
g tim
e co
nsta
nt a
t 15
min
.
Fig
ure
6.a
. Ef
fect
of va
ryin
g tim
e of
hyd
roly
sis
whi
le k
eepi
ng t
empe
ratu
re c
onst
ant
at 1
95°C
;
6.b
. Ef
fect
of va
ryin
g te
mpe
ratu
re w
hile
kee
ping
tim
e co
nsta
nt a
t 15
min
.
Hyd
roly
sis
cond
ition
s m
ust
be o
ptim
ized
for
mic
row
ave
proc
essi
ng.
The
sam
ples
w
ere
subj
ecte
d to
var
ying
hyd
roly
sis
time
with
con
stan
t te
mpe
ratu
re.
The
sam
ples
w
ere
also
hyd
roly
sed
at d
iffer
ent
tem
pera
ture
poi
nts
whi
le h
oldi
ng t
he t
ime
of h
y-dr
olys
is c
onst
ant,
(Fi
gure
6.a
. an
d 6.
b.).
The
tot
al a
mou
nt o
f am
ino
acid
yie
ld f
rom
th
e ab
ove
men
tione
d op
timiz
atio
n ex
peri
men
ts a
re s
umm
ariz
ed i
n Fi
gure
s 7a
. an
d 7b
.
Hyd
roly
sis
is s
ensi
tive
to b
oth
time
and
tem
pera
ture
. Som
e am
ino
acid
s ar
e gr
adu-
ally
des
troy
ed d
urin
g hy
drol
ysis
whi
le o
ther
s ar
e re
leas
ed s
low
ly.
Opt
imiz
atio
n w
as
test
ed b
y va
ryin
g te
mpe
ratu
re (
180
°C,
195
°C a
nd 2
10 °
C)
and
time
(5m
in,
10m
in,
15m
in a
nd 3
0min
). A
min
o ac
id w
eigh
ts w
ere
norm
aliz
ed t
o Ph
enyl
alan
ine
to d
etec
t tr
ends
.
The
prop
ortio
ns o
f am
ino
acid
s in
Tab
le 1
sug
gest
tha
t in
crea
sing
the
tem
pera
ture
an
d tim
e du
ring
aci
d hy
drol
ysis
res
ults
in a
dec
reas
e in
the
yie
ld o
f se
rine
, an
uns
ta-
ble
amin
o ac
id.
Valin
e an
d is
oleu
cine
yie
lds
incr
ease
at
the
high
er t
empe
ratu
res
and
times
. Th
e sh
orte
st h
ydro
lysi
s tim
e is
ass
ocia
ted
with
low
er y
ield
s of
man
y of
the
am
ino
acid
s bu
t m
ost
dram
atic
ally
the
hyd
roph
obic
one
s.
AMQ
NH3
Cya
His
Ser
Arg
Gly
Asp
Glu
Thr
Ala
Pro
Deriv Peak
CysLys
Tyr
Met
Val
IIeLeu
Phe
AU
0.000
0.025
0.050
0.075
AMQ
NH3
Cya
His
Ser
Arg
Gly
Asp
Glu
Thr
Ala
Pro
Deriv Peak
CysLys
Tyr
Met
Val
IIeLeu
Phe
AU
0.000
0.025
0.050
0.075
AMQ
NH3
Cya
His
Ser
Arg
Gly
Asp
Glu
Thr
Ala
Pro
Deriv Peak
Lys
Tyr
Met
Val
IIeLeu
Phe
AU
0.000
0.025
0.050
0.075
Minutes
0.001.00
2.003.00
4.005.00
6.007.00
8.009.00
10.00
AMQ
NH3
Cya
His
Ser
Arg
Gly
Asp
Glu
Thr
Ala
Pro
Deriv Peak
CysLys
Tyr
Met
Val
IIeLeu
Phe
AU
0.000
0.025
0.050
0.075
AMQ
NH3
Cya
His
Ser
Arg
Gly
Asp
Glu
Thr
Ala
Pro
Deriv Peak
Lys
Tyr
Met
Val
IIeLeu
Phe
AU
0.000
0.025
0.050
0.075
AMQ
NH3
Cya
His
Ser
Arg
Gly
Asp
Glu
Thr
Ala
Pro
Deriv Peak
Lys
Tyr
Met
Val
IIeLeu
Phe
AU
0.000
0.025
0.050
0.075
Minutes
0.001.00
2.003.00
4.005.00
6.007.00
8.009.00
10.00
10
min
15
min
19
5°
21
0°
5m
in
18
0°
HCl
180°
C 19
5°C
210°
C
15M
in
5Min
10
Min
15
Min
30
Min
15
Min
Cy
a 0.
225
0.60
9 0.
469
0.42
1 0.
636
0.47
9
His
0.55
8 0.
553
0.57
1 0.
563
0.53
8 0.
569
Ser
0.91
9 0.
992
0.89
8 0.
768
0.68
6 0.
585
Arg
1.34
3 1.
360
1.36
5 1.
347
1.31
8 1.
309
Gly
0.95
1 0.
933
0.95
5 0.
969
0.98
2 0.
998
Asp
1.67
6 1.
440
1.65
4 1.
643
1.44
0 1.
594
Met
SO2
0.00
0 0.
000
0.00
0 0.
000
0.00
0 0.
000
Glu
3.55
1 3.
144
3.49
8 3.
637
3.76
2 3.
682
Thr
0.71
0 0.
741
0.71
7 0.
642
0.58
8 0.
561
Ala
1.04
8 0.
902
1.01
0 1.
098
1.06
2 1.
071
Pro
1.26
1 1.
185
1.26
9 1.
289
1.19
0 1.
264
Cys
0.07
8 0.
093
0.08
1 0.
000
0.00
0 0.
000
Lys
0.90
4 0.
759
0.91
1 0.
938
0.82
5 0.
924
Tyr
0.58
7 0.
681
0.68
1 0.
573
0.61
0 0.
581
Met
0.
171
0.22
1 0.
181
0.16
7 0.
198
0.19
1 Va
l 0.
933
0.87
1 0.
998
1.03
4 1.
115
1.09
9 Ile
0.
808
0.76
5 0.
859
0.89
7 0.
947
0.94
7 Le
u 1.
713
1.66
1 1.
735
1.75
8 1.
735
1.75
3 Ph
e 1.
000
1.00
0 1.
000
1.00
0 1.
000
1.00
0 Tr
p 0.
000
0.00
0 0.
000
0.00
0 0.
000
0.00
0
NaO
H
18
0°C
1
95
°C
21
0°C
1
5M
in
5M
in
10
Min
1
5M
in
30
Min
1
5M
in
Cya
0.
025
0.00
0 0.
000
0.00
0 0.
000
0.00
0 H
is
0.28
0 0.
000
0.00
0 0.
000
0.00
0 0.
000
Ser
0.
556
0.24
2 0.
167
0.09
5 0.
084
0.00
0
Arg
0.
660
0.00
0 0.
000
0.00
0 0.
000
0.00
0
Gly
1.
355
1.76
6 1.
520
1.39
2 1.
287
1.25
4
Asp
2.
038
2.38
5 2.
092
2.00
5 1.
873
1.78
5
Met
SO
2
0.00
0 0.
000
0.00
0 0.
000
0.00
0 0.
000
Glu
4.
101
4.56
8 4.
394
4.22
9 4.
123
4.10
6 Th
r 0.
346
0.00
0 0.
000
0.00
0 0.
000
0.00
0 A
la
1.37
1 1.
721
1.57
8 1.
508
1.47
2 1.
465
Pro
1.
347
1.46
7 1.
420
1.33
4 1.
322
1.29
5 C
ys
0.08
9 0.
097
0.09
0 0.
098
0.06
9 0.
094
Lys
0.97
7 1.
085
1.02
7 0.
991
0.99
9 0.
987
Tyr
0.78
1 0.
967
0.97
3 0.
979
0.99
6 0.
998
Met
0.
247
0.39
1 0.
368
0.33
1 0.
317
0.32
2
Val
0.
720
0.54
2 0.
537
0.54
5 0.
568
0.61
9
Ile
0.46
8 0.
160
0.16
2 0.
171
0.26
0 0.
248
Leu
1.
704
1.69
6 1.
735
1.72
5 1.
756
1.75
9 P
he
1.00
0 1.
000
1.00
0 1.
000
1.00
0 1.
000
Trp
0.
129
0.32
2 0.
281
0.26
8 0.
299
0.28
4
Tab
le 1
. N
orm
aliz
ed w
eigh
ts o
f am
ino
acid
s w
ith r
espe
ct t
o Ph
enyl
alan
ine
during
aci
d hy
-dr
olys
is o
ptim
izat
ion
expe
rim
ents
The
purp
ose
of t
he A
lkal
ine
hydr
olys
is is
to
obta
in t
he b
est
valu
e fo
r tr
ypto
phan
. Th
e am
ount
of
tryp
toph
an is
low
and
mor
e va
riab
le t
han
obse
rved
for
som
e ot
her
amin
o ac
ids.
The
yie
ld o
f tr
ypto
phan
doe
s no
t sh
ow a
ny t
rend
s w
ith i
ncre
asin
g te
mpe
ratu
re o
r tim
e. V
alin
e in
crea
ses
with
an
incr
ease
in
tem
pera
ture
and
tim
e.
The
yiel
ds o
f th
e po
lar
amin
o ac
ids
are
rela
tivel
y lo
w i
n al
kalin
e hy
drol
ysis
com
-pa
red
to t
he a
cid
hydr
olys
is.
The
obse
rved
pro
port
ions
of
amin
o ac
ids
in t
he a
l-ka
line
hydr
olys
is a
re m
ore
variab
le t
han
with
aci
d hy
drol
ysis
sug
gest
ing
that
m
ore
aggr
essi
ve h
ydro
lysi
s co
nditi
ons
shou
ld b
e co
nsid
ered
for
mor
e co
mpl
ete
char
acte
riza
tion,
Tab
le 2
.
Tab
le 2
. N
orm
aliz
ed w
eigh
ts o
f am
ino
acid
s w
ith r
espe
ct t
o Ph
enyl
alan
ine
during
alk
alin
e hy
drol
ysis
opt
imiz
atio
n ex
perim
ents
.
CO
NC
LUS
ION
S
Th
ree
pro
toco
ls
are
req
uir
ed
to
des
crib
e co
mp
lete
ly
the
nu
trit
ion
al c
onte
nt
of a
sam
ple
.
M
icro
wav
e h
ydro
lysi
s ca
n b
e u
sed
wit
h a
ll th
ree
pro
toco
ls,
dra
mat
ical
ly r
edu
cin
g s
amp
le p
rep
arat
ion
tim
e fr
om 2
4 h
ours
to
15
min
s.
Th
e am
ino
acid
an
alys
is p
roce
du
re i
s co
mp
atib
le w
ith
all
thre
e p
roto
cols
.
The
com
bin
atio
n o
f m
icro
wav
e h
ydro
lysi
s an
d U
PLC
am
ino
acid
an
alys
is i
mp
rove
s th
rou
gh
pu
t fo
r n
utr
itio
nal
an
alys
is o
f fe
eds
to a
pp
roxi
mat
ely
50
sam
ple
s in
a 2
4 h
our
per
iod
.
AMQ
NH3
Cya
His
Ser
Arg
Gly
Asp
Glu
Thr
Ala
Pro
Deriv Peak
Lys
Tyr
Met
Val
IIeLeu
Phe
AU
0.000
0.025
0.050
0.075
AMQ
NH3
Cya
His
Ser
Arg
Gly
Asp
MetSO2
Glu
Thr
Ala
Pro
Deriv Peak
Lys
Val
IIeLeu
Phe
AU
0.000
0.025
0.050
0.075
AMQ
NH3
Ser
Gly
Asp
Glu
Ala
Pro
Deriv PeakCys
LysTyr
Met
Val
NVa
IIeLeu
PheTrp
AU
0.000
0.025
0.050
0.075
Minute
s0.0
01.0
02.0
03.0
04.0
05.0
06.0
07.0
08.0
09.0
010
.00
Aci
d
Hyd
roly
sis
Pre
oxid
atio
n
Alk
alin
e
Hyd
roly
sis
Com
ple
te N
utr
itio
nal
An
alys
is
Tab
le 3
.Tot
al A
min
o ac
ids
in m
g/g
of s
olid
fee
d us
ing
thre
e di
ffer
ent
prot
ocol
s.
Fig
ure
8. Th
ree
diff
eren
t m
etho
ds o
f hy
drol
ysis
req
uire
d to
ful
ly c
hara
cter
ize
the
amin
o ac
id
com
posi
tion
in foo
d an
d fe
ed s
ampl
es.
AA
(mg/
solid
g)
Aci
d H
ydro
lysi
s Pr
e-ox
idat
ion
Alk
alin
e H
ydro
lysi
s C
ya
3.01
2 9.
394
0.00
0 H
is
4.02
9 3.
490
0.00
0 S
er
5.49
5 6.
807
0.56
3 A
rg
9.64
7 9.
700
0.00
0 G
ly
6.93
6 7.
786
8.25
8 A
sp
11.7
61
13.8
91
11.8
95
Met
SO
2
0.00
0 1.
445
0.00
0 G
lu
26.0
38
29.0
75
25.0
94
Thr
4.59
5 5.
495
0.00
0 A
la
7.86
4 8.
284
8.94
5 P
ro
9.22
9 9.
686
7.91
8 C
ys
0.00
0 0.
000
0.57
9 Ly
s 6.
712
7.13
9 5.
878
Tyr
4.10
0 0.
000
5.80
8 M
et
1.19
9 0.
000
1.96
5 V
al
7.40
4 7.
930
3.23
4 Il
e 6.
422
6.77
5 1.
014
Leu
12
.584
13
.418
10
.236
P
he
7.15
9 7.
030
5.93
4 Tr
p
0.00
0 0.
000
1.59
3 To
tal A
A
13
4.1
85
1
47
.34
5
98
.91
4
a.
b.
H-CLASS AND MICROWAVE HYDROLYSIS

79Complete Amino Acid Analysis of Food and Feeds
Complete Amino Acid Analysis of Food and Feeds
80 Complete Amino Acid Analysis of Food and Feeds
Other and References
81Amino Acid Analysis Application Notebook

82 Amino Acids Application Notebook
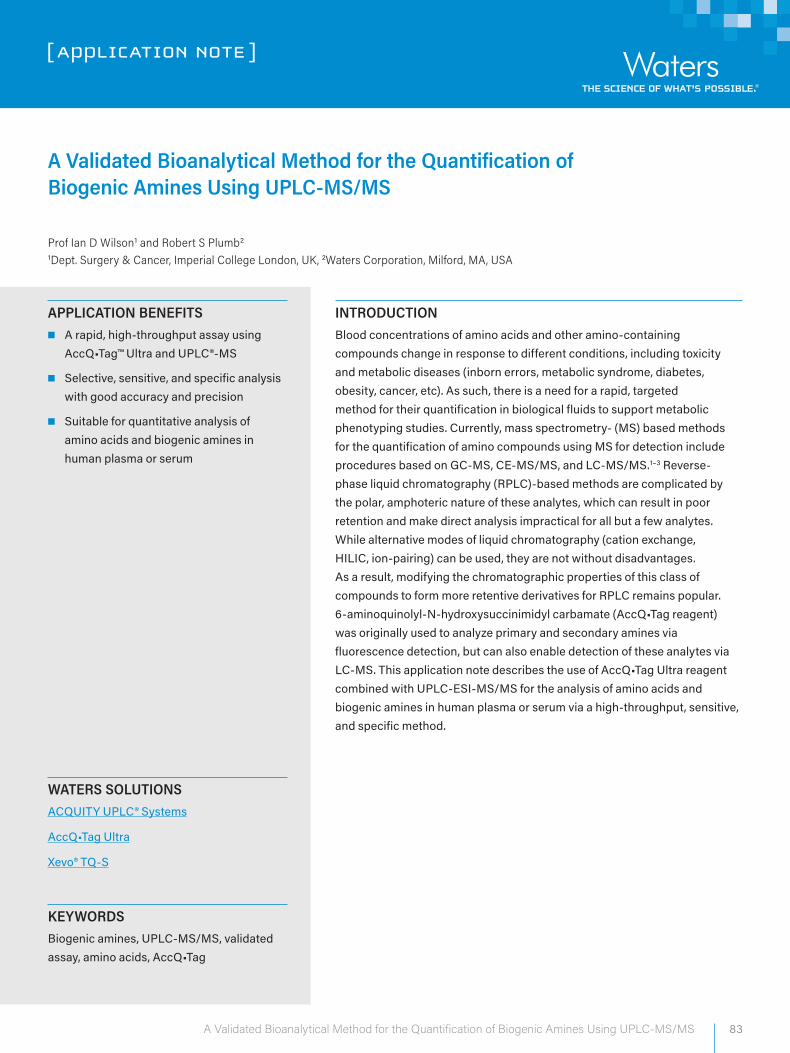
[ APPLICATION NOTE ]
83A Validated Bioanalytical Method for the Quantification of Biogenic Amines Using UPLC-MS/MS
WATERS SOLUTIONSACQUITY UPLC® Systems
AccQ•Tag Ultra
Xevo® TQ-S
KEYWORDSBiogenic amines, UPLC-MS/MS, validated assay, amino acids, AccQ•Tag
APPLICATION BENEFITS■■ A rapid, high-throughput assay using
AccQ•Tag™ Ultra and UPLC®-MS
■■ Selective, sensitive, and specific analysis with good accuracy and precision
■■ Suitable for quantitative analysis of amino acids and biogenic amines in human plasma or serum
INTRODUCTIONBlood concentrations of amino acids and other amino-containing compounds change in response to different conditions, including toxicity and metabolic diseases (inborn errors, metabolic syndrome, diabetes, obesity, cancer, etc). As such, there is a need for a rapid, targeted method for their quantification in biological fluids to support metabolic phenotyping studies. Currently, mass spectrometry- (MS) based methods for the quantification of amino compounds using MS for detection include procedures based on GC-MS, CE-MS/MS, and LC-MS/MS.1–3 Reverse-phase liquid chromatography (RPLC)-based methods are complicated by the polar, amphoteric nature of these analytes, which can result in poor retention and make direct analysis impractical for all but a few analytes. While alternative modes of liquid chromatography (cation exchange, HILIC, ion-pairing) can be used, they are not without disadvantages. As a result, modifying the chromatographic properties of this class of compounds to form more retentive derivatives for RPLC remains popular. 6-aminoquinolyl-N-hydroxysuccinimidyl carbamate (AccQ•Tag reagent) was originally used to analyze primary and secondary amines via fluorescence detection, but can also enable detection of these analytes via LC-MS. This application note describes the use of AccQ•Tag Ultra reagent combined with UPLC-ESI-MS/MS for the analysis of amino acids and biogenic amines in human plasma or serum via a high-throughput, sensitive, and specific method.
A Validated Bioanalytical Method for the Quantification of Biogenic Amines Using UPLC-MS/MS
Prof Ian D Wilson1 and Robert S Plumb2
1Dept. Surgery & Cancer, Imperial College London, UK, 2Waters Corporation, Milford, MA, USA
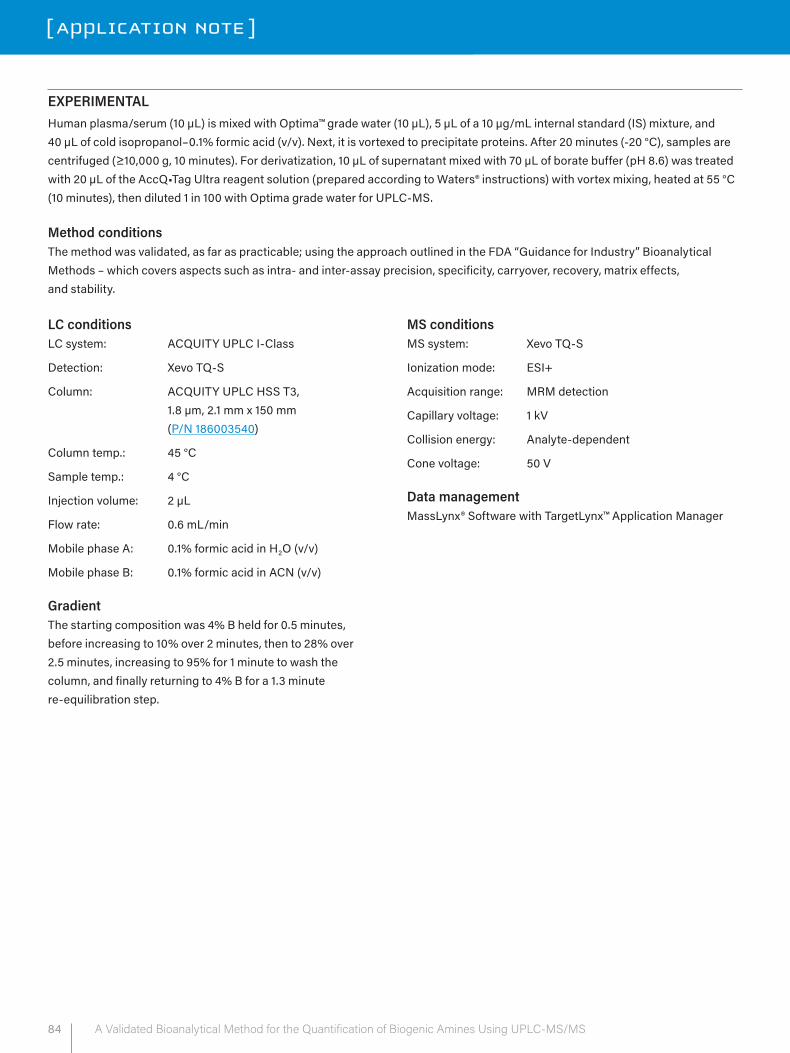
[ APPLICATION NOTE ]
84 A Validated Bioanalytical Method for the Quantification of Biogenic Amines Using UPLC-MS/MS
EXPERIMENTAL Human plasma/serum (10 µL) is mixed with Optima™ grade water (10 µL), 5 µL of a 10 µg/mL internal standard (IS) mixture, and 40 µL of cold isopropanol–0.1% formic acid (v/v). Next, it is vortexed to precipitate proteins. After 20 minutes (-20 °C), samples are centrifuged (≥10,000 g, 10 minutes). For derivatization, 10 µL of supernatant mixed with 70 µL of borate buffer (pH 8.6) was treated with 20 µL of the AccQ•Tag Ultra reagent solution (prepared according to Waters® instructions) with vortex mixing, heated at 55 °C (10 minutes), then diluted 1 in 100 with Optima grade water for UPLC-MS.
Method conditions The method was validated, as far as practicable; using the approach outlined in the FDA “Guidance for Industry” Bioanalytical Methods – which covers aspects such as intra- and inter-assay precision, specificity, carryover, recovery, matrix effects, and stability.
LC conditions LC system: ACQUITY UPLC I-Class
Detection: Xevo TQ-S
Column: ACQUITY UPLC HSS T3, 1.8 µm, 2.1 mm x 150 mm (P/N 186003540)
Column temp.: 45 °C
Sample temp.: 4 °C
Injection volume: 2 µL
Flow rate: 0.6 mL/min
Mobile phase A: 0.1% formic acid in H2O (v/v)
Mobile phase B: 0.1% formic acid in ACN (v/v)
GradientThe starting composition was 4% B held for 0.5 minutes, before increasing to 10% over 2 minutes, then to 28% over 2.5 minutes, increasing to 95% for 1 minute to wash the column, and finally returning to 4% B for a 1.3 minute re-equilibration step.
MS conditionsMS system: Xevo TQ-S
Ionization mode: ESI+
Acquisition range: MRM detection
Capillary voltage: 1 kV
Collision energy: Analyte-dependent
Cone voltage: 50 V
Data managementMassLynx® Software with TargetLynx™ Application Manager
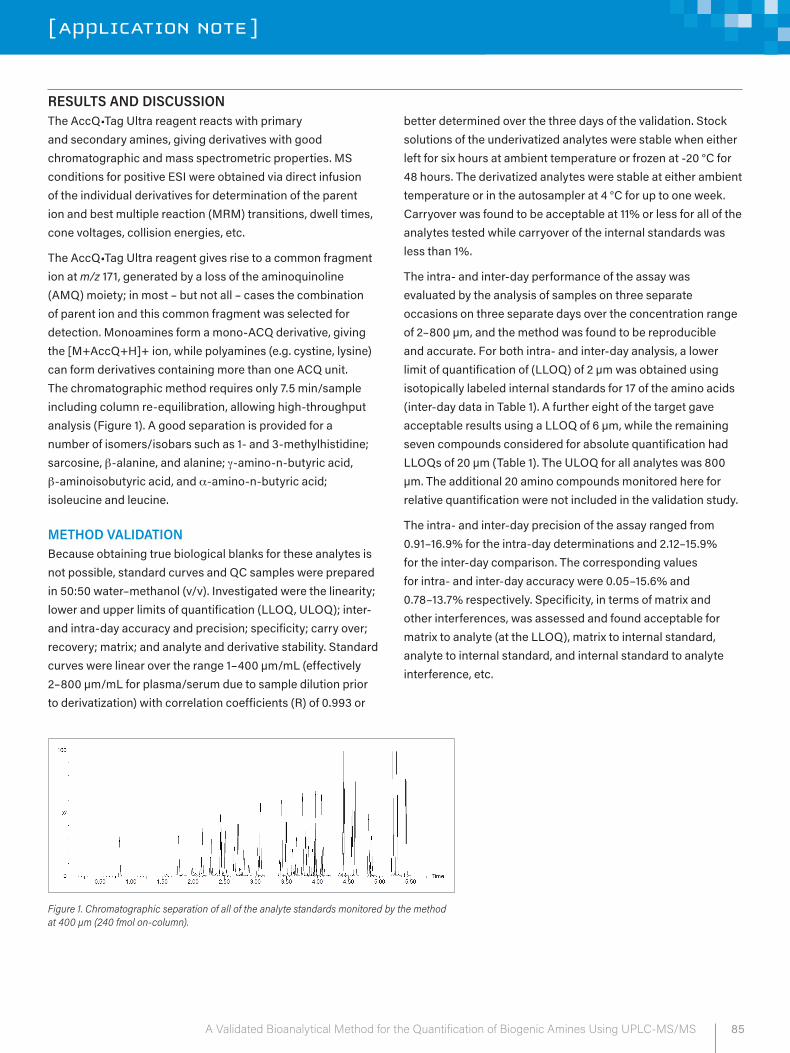
85A Validated Bioanalytical Method for the Quantification of Biogenic Amines Using UPLC-MS/MS
[ APPLICATION NOTE ]
RESULTS AND DISCUSSIONThe AccQ•Tag Ultra reagent reacts with primary and secondary amines, giving derivatives with good chromatographic and mass spectrometric properties. MS conditions for positive ESI were obtained via direct infusion of the individual derivatives for determination of the parent ion and best multiple reaction (MRM) transitions, dwell times, cone voltages, collision energies, etc.
The AccQ•Tag Ultra reagent gives rise to a common fragment ion at m/z 171, generated by a loss of the aminoquinoline (AMQ) moiety; in most – but not all – cases the combination of parent ion and this common fragment was selected for detection. Monoamines form a mono-ACQ derivative, giving the [M+AccQ+H]+ ion, while polyamines (e.g. cystine, lysine) can form derivatives containing more than one ACQ unit. The chromatographic method requires only 7.5 min/sample including column re-equilibration, allowing high-throughput analysis (Figure 1). A good separation is provided for a number of isomers/isobars such as 1- and 3-methylhistidine; sarcosine, β-alanine, and alanine; γ-amino-n-butyric acid, β-aminoisobutyric acid, and α-amino-n-butyric acid; isoleucine and leucine.
METHOD VALIDATIONBecause obtaining true biological blanks for these analytes is not possible, standard curves and QC samples were prepared in 50:50 water–methanol (v/v). Investigated were the linearity; lower and upper limits of quantification (LLOQ, ULOQ); inter- and intra-day accuracy and precision; specificity; carry over; recovery; matrix; and analyte and derivative stability. Standard curves were linear over the range 1–400 µm/mL (effectively 2–800 µm/mL for plasma/serum due to sample dilution prior to derivatization) with correlation coefficients (R) of 0.993 or
better determined over the three days of the validation. Stock solutions of the underivatized analytes were stable when either left for six hours at ambient temperature or frozen at -20 °C for 48 hours. The derivatized analytes were stable at either ambient temperature or in the autosampler at 4 °C for up to one week. Carryover was found to be acceptable at 11% or less for all of the analytes tested while carryover of the internal standards was less than 1%.
The intra- and inter-day performance of the assay was evaluated by the analysis of samples on three separate occasions on three separate days over the concentration range of 2–800 µm, and the method was found to be reproducible and accurate. For both intra- and inter-day analysis, a lower limit of quantification of (LLOQ) of 2 µm was obtained using isotopically labeled internal standards for 17 of the amino acids (inter-day data in Table 1). A further eight of the target gave acceptable results using a LLOQ of 6 µm, while the remaining seven compounds considered for absolute quantification had LLOQs of 20 µm (Table 1). The ULOQ for all analytes was 800 µm. The additional 20 amino compounds monitored here for relative quantification were not included in the validation study.
The intra- and inter-day precision of the assay ranged from 0.91–16.9% for the intra-day determinations and 2.12–15.9% for the inter-day comparison. The corresponding values for intra- and inter-day accuracy were 0.05–15.6% and 0.78–13.7% respectively. Specificity, in terms of matrix and other interferences, was assessed and found acceptable for matrix to analyte (at the LLOQ), matrix to internal standard, analyte to internal standard, and internal standard to analyte interference, etc.
Figure 1. Chromatographic separation of all of the analyte standards monitored by the method at 400 µm (240 fmol on-column).
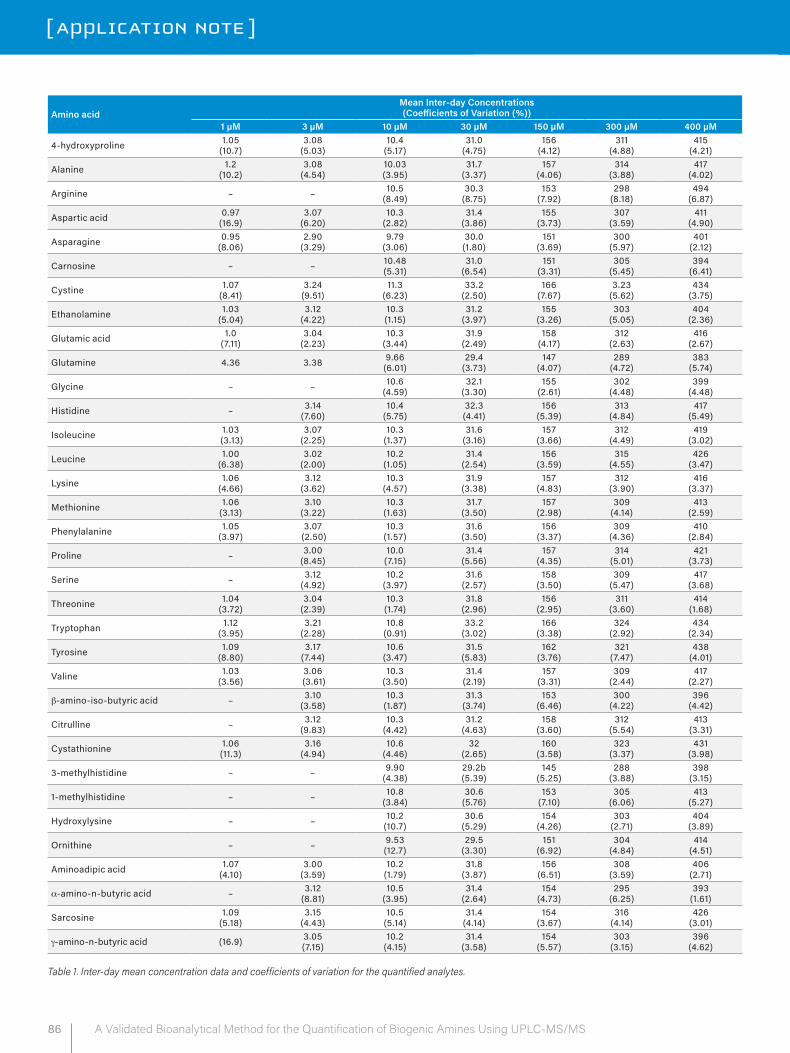
[ APPLICATION NOTE ]
86 A Validated Bioanalytical Method for the Quantification of Biogenic Amines Using UPLC-MS/MS
Amino acidMean Inter-day Concentrations (Coefficients of Variation (%))
1 µM 3 µM 10 µM 30 µM 150 µM 300 µM 400 µM
4-hydroxyproline 1.05 (10.7)
3.08 (5.03)
10.4 (5.17)
31.0 (4.75)
156 (4.12)
311 (4.88)
415 (4.21)
Alanine 1.2 (10.2)
3.08 (4.54)
10.03 (3.95)
31.7 (3.37)
157 (4.06)
314 (3.88)
417 (4.02)
Arginine – – 10.5 (8.49)
30.3 (8.75)
153 (7.92)
298 (8.18)
494 (6.87)
Aspartic acid 0.97 (16.9)
3.07 (6.20)
10.3 (2.82)
31.4 (3.86)
155 (3.73)
307 (3.59)
411 (4.90)
Asparagine 0.95 (8.06)
2.90 (3.29)
9.79 (3.06)
30.0 (1.80)
151 (3.69)
300 (5.97)
401 (2.12)
Carnosine – – 10.48 (5.31)
31.0 (6.54)
151 (3.31)
305 (5.45)
394 (6.41)
Cystine 1.07 (8.41)
3.24 (9.51)
11.3 (6.23)
33.2 (2.50)
166 (7.67)
3.23 (5.62)
434 (3.75)
Ethanolamine 1.03 (5.04)
3.12 (4.22)
10.3 (1.15)
31.2 (3.97)
155 (3.26)
303 (5.05)
404 (2.36)
Glutamic acid 1.0 (7.11)
3.04 (2.23)
10.3 (3.44)
31.9 (2.49)
158 (4.17)
312 (2.63)
416 (2.67)
Glutamine 4.36 3.38 9.66 (6.01)
29.4 (3.73)
147 (4.07)
289 (4.72)
383 (5.74)
Glycine – – 10.6 (4.59)
32.1 (3.30)
155 (2.61)
302 (4.48)
399 (4.48)
Histidine – 3.14 (7.60)
10.4 (5.75)
32.3 (4.41)
156 (5.39)
313 (4.84)
417 (5.49)
Isoleucine 1.03 (3.13)
3.07 (2.25)
10.3 (1.37)
31.6 (3.16)
157 (3.66)
312 (4.49)
419 (3.02)
Leucine 1.00 (6.38)
3.02 (2.00)
10.2 (1.05)
31.4 (2.54)
156 (3.59)
315 (4.55)
426 (3.47)
Lysine 1.06 (4.66)
3.12 (3.62)
10.3 (4.57)
31.9 (3.38)
157 (4.83)
312 (3.90)
416 (3.37)
Methionine 1.06 (3.13)
3.10 (3.22)
10.3 (1.63)
31.7 (3.50)
157 (2.98)
309 (4.14)
413 (2.59)
Phenylalanine 1.05 (3.97)
3.07 (2.50)
10.3 (1.57)
31.6 (3.50)
156 (3.37)
309 (4.36)
410 (2.84)
Proline – 3.00 (8.45)
10.0 (7.15)
31.4 (5.56)
157 (4.35)
314 (5.01)
421 (3.73)
Serine – 3.12 (4.92)
10.2 (3.97)
31.6 (2.57)
158 (3.50)
309 (5.47)
417 (3.68)
Threonine 1.04 (3.72)
3.04 (2.39)
10.3 (1.74)
31.8 (2.96)
156 (2.95)
311 (3.60)
414 (1.68)
Tryptophan 1.12 (3.95)
3.21 (2.28)
10.8 (0.91)
33.2 (3.02)
166 (3.38)
324 (2.92)
434 (2.34)
Tyrosine 1.09 (8.80)
3.17 (7.44)
10.6 (3.47)
31.5 (5.83)
162 (3.76)
321 (7.47)
438 (4.01)
Valine 1.03 (3.56)
3.06 (3.61)
10.3 (3.50)
31.4 (2.19)
157 (3.31)
309 (2.44)
417 (2.27)
β-amino-iso-butyric acid – 3.10 (3.58)
10.3 (1.87)
31.3 (3.74)
153 (6.46)
300 (4.22)
396 (4.42)
Citrulline – 3.12 (9.83)
10.3 (4.42)
31.2 (4.63)
158 (3.60)
312 (5.54)
413 (3.31)
Cystathionine 1.06 (11.3)
3.16 (4.94)
10.6 (4.46)
32 (2.65)
160 (3.58)
323 (3.37)
431 (3.98)
3-methylhistidine – – 9.90 (4.38)
29.2b (5.39)
145 (5.25)
288 (3.88)
398 (3.15)
1-methylhistidine – – 10.8 (3.84)
30.6 (5.76)
153 (7.10)
305 (6.06)
413 (5.27)
Hydroxylysine – – 10.2 (10.7)
30.6 (5.29)
154 (4.26)
303 (2.71)
404 (3.89)
Ornithine – – 9.53 (12.7)
29.5 (3.30)
151 (6.92)
304 (4.84)
414 (4.51)
Aminoadipic acid 1.07 (4.10)
3.00 (3.59)
10.2 (1.79)
31.8 (3.87)
156 (6.51)
308 (3.59)
406 (2.71)
α-amino-n-butyric acid – 3.12 (8.81)
10.5 (3.95)
31.4 (2.64)
154 (4.73)
295 (6.25)
393 (1.61)
Sarcosine 1.09 (5.18)
3.15 (4.43)
10.5 (5.14)
31.4 (4.14)
154 (3.67)
316 (4.14)
426 (3.01)
γ-amino-n-butyric acid (16.9) 3.05 (7.15)
10.2 (4.15)
31.4 (3.58)
154 (5.57)
303 (3.15)
396 (4.62)
Table 1. Inter-day mean concentration data and coefficients of variation for the quantified analytes.
Waters Corporation 34 Maple Street Milford, MA 01757 U.S.A. T: 1 508 478 2000 F: 1 508 872 1990 www.waters.com
[ APPLICATION NOTE ]
87A Validated Bioanalytical Method for the Quantification of Biogenic Amines Using UPLC-MS/MS
Waters, The Science of What’s Possible, UPLC, ACQUITY UPLC, Xevo, and MassLynx are registered trademarks of Waters Corporation. AccQ•Tag and TargetLynx are trademarks of Waters Corporation. All other trademarks are the property of their respective owners.
©2016 Waters Corporation. Produced in the U.S.A. February 2017 720005882EN AG-PDF
CONCLUSIONSThe use of 6-aminoquinolyl-N-hydroxysuccinimidyl carbamate (AccQ•Tag reagent) as a derivatizing reagent for the targeted analysis of amino acids and other amino-containing compounds provides these analytes with good reverse-phase liquid chromotography and mass spectrometry properties, and allows the sensitive and specific analysis of this class of compounds in human serum and plasma in methods that are well suited to high-throughput analysis using UPLC.
References1. Alterman, M.A.; Hunziker, P. Eds . Amino Acid
Analysis Methods and Protocols; Methods in Molecular Biology 828; Humana Press; 2012, 77–99.
2. Dauner, M.; Sauer, U. Biotechnolology Progress 2000, 16, 642–649.
3. Kaspar, H.; Dettmer, K.; Gronwald, W.; Oefner, P.J. Automated GC-MS analysis of free amino acids in biological fluids, J. Chromatogr B. 2008, 870 (2), 222–232.
88 Amino Acids Application Notebook
[ NOTES ]
89Amino Acid Analysis Application Notebook
[ REFERENCES ]
HYDROLYSIS:
Journal of Chromatography A, 826 (1998) 109–134 Hydrolysis and amino acid composition analysis of proteins. Michael Fountoulakis*, Hans-Werner Lahm F. Hoffmann-La Roche Ltd., Pharma Division, Preclinical Central Nervous System Research – Gene Technology, Building 93-444, 4070 Basel, Switzerland
USP: http://www.pharmacopeia.cn/v29240/usp29nf24s0_c1047s1.html
HPLC REFERENCES:
http://www.waters.com/waters/library.htm?cid=511436&lid=1521204
http://www.waters.com/webassets/cms/library/docs/2acqtag.pdf
http://www.waters.com/webassets/cms/library/docs/3acqtag.pdf
AOAC METHODS:
45.4.04 AOAC Official Method 988.15 Tryptophan in Foods and Food and Feed Ingredients
45.4.05 AOAC Official Method 985.28 Sulfur Amino Acids in Food, Feed Ingredients, and Processed Foods
4.1.1.1 AOAC Official Method 994.12 Amino Acids in Feeds
4.1.13 AOAC Official Method 999.13 Lysine, Methionine and Threonine in Food Grade Amino Acids and Premixes

90 Amino Acids Application Notebook
[ NOTES ]
For your local sales office, please visit www.waters.com/contact
Waters Corporation 34 Maple Street Milford, MA 01757 U.S.A. T: 1 508 478 2000 F: 1 508 872 1990 www.waters.com
www.waters.com/aaa
Waters, The Science of What’s Possible, ACQUITY, UPLC, and Empower are registered trademarks of Waters Corporation. ACCQ Tag is a trademark of Waters Corporation. All other trademarks are the property of their respective owners.
©2018 Waters Corporation. Produced in the U.S.A.January 2018 720006130EN IH-SIG
Sales Offices:
Australia 61 2 9933 1777
Austria 43 1 877 18 07
Belgium and Luxembourg 32 2 726 1000
Brazil 55 11 4134 3788
Canada 1 800 252 4752
China 86 21 6156 2666
Czech Republic 420 2 617 11384
Denmark 45 46 59 8080
Finland 358 9 5659 6288
France 33 1 30 48 72 00
Germany 49 6196 400 600
Hong Kong 852 2964 1800
Hungary 36 1 350 5086
India 91 080 49292200 03
Ireland 353 1 448 1500
Israel 9723 3731391
Italy 39 02 265 0983
Japan 81 3 3471 7191
Korea 82 2 6300 9200
Malaysia 603 7841 1688
Mexico 52 55 52 00 1860
The Netherlands 31 76 508 7200
Norway 47 6 384 6050
Poland 48 22 101 5900
Portugal 351 21 893 61 77
Puerto Rico 1 787 747 8445
Singapore 65 6593 7100
Spain 34 93 600 9300
Sweden 46 8 555 115 00
Switzerland 41 56 676 7000
Taiwan 886 2 2508 5500
UAE 971 4 214 62 38
UK 44 208 238 6100
US 1 800 252 4752


