Embed Size (px)
Citation preview

Universität UlmAbteilung Oberflächenchemie & Katalyse
Mechanistic Insights into the
Preferential CO Oxidation in H2-rich Gas (PROX)
over Supported Noble Metal Catalysts
Dissertationvorgelegt von
Markus Matthias Schubert
2000

:PaX]

Abteilung Oberflächenchemie & Katalyse
Universität Ulm
Mechanistic Insights into the
Preferential CO Oxidation in H2-rich Gas (PROX)
over Supported Noble Metal Catalysts
Dissertation
zur Erlangung des Doktorgrades Dr. rer. nat.
der Fakultät für Naturwissenschaften
der Universität Ulm
vorgelegt von
Markus Matthias Schubert
aus München
Ulm 2000

Der experimentelle Teil dieser Arbeit wurde in der Zeit von Oktober 1996 bis September
1999 in der Abteilung Oberflächenchemie und Katalyse der Universität Ulm angefertigt.
Wissenschaftlicher Betreuer: Prof. Dr. R. J. Behm
(Leiter der Abteilung Oberflächenchemie & Katalyse)
Amtierender Dekan: Prof. Dr. O. Marti
1. Gutachter: Prof. Dr. R. J. Behm
2. Gutachter: Prof. Dr. J. Garche
Tag der Promotion: 11. Mai 2000

i
CONTENTS
I. Introduction
1. The selective CO oxidation - reactions..............................................................................1
2. Technical application: PROX............................................................................................3
3. Intention of this work.........................................................................................................5
II. Experimental
1. Setup....................................................................................................................................6
1.1 Reaction gases & mixture facility....................................................................................6
1.2 The plug-flow reactor.......................................................................................................9
1.3 Infrared spectroscopy - DRIFTS.....................................................................................12
1.3.1 DRIFTS-theory.......................................................................................................13
1.3.2 DRIFTS-setup.........................................................................................................15
1.3.3 Processing of DRIFTS spectra...............................................................................17
1.4 On-line GC analysis.......................................................................................................20
1.5 Other methods used........................................................................................................22
1.5.1 XPS.........................................................................................................................22
1.5.2 On-line IMR-MS analysis.......................................................................................22
1.5.3 Isotope studies / pulse experiments.........................................................................23
1.5.4 XRD.........................................................................................................................23
2. Catalyst characterization.................................................................................................24
2.1 Platinum catalysts...........................................................................................................24
2.2 Pt3Sn catalyst..................................................................................................................24
2.3 Gold catalysts.................................................................................................................25

ii
III. Results & discussion
1. The standard catalyst - Pt/γγ-Al2O3..................................................................................26
1.1 The influence of the CO coverage on the activity / selectivity.......................................27
1.1.1 Selectivity & hydrogen induced rate enhancement.................................................27
1.1.2 Experimental limitations - neglecting the reaction rate.........................................29
1.1.3 Adsorption of CO in pure N2..................................................................................32
1.1.4 Adsorption of CO in H2 / N2...................................................................................36
1.1.5 Coadsorption behaviour of CO and H2..................................................................39
1.2 From idealized to more realistic conditions...................................................................46
1.2.1 Self-poisoning by COad...........................................................................................46
1.2.2 Influence of water...................................................................................................48
1.2.3 Performance in CO2-rich gas.................................................................................56
1.3 Other support materials..................................................................................................63
1.3.1. Comparison of activity / selectivity........................................................................63
1.3.2. The water-gas shift - limiting the CO conversion..................................................66
1.4 Summary on platinum catalysts......................................................................................71
2. Improved performance on bimetallic systems - Pt3Sn/Vulcan.....................................73
2.1 Low-temperature CO oxidation over Pt3Sn/Vulcan.......................................................75
2.1.1 Superior performance on Pt3Sn/Vulcan vs Pt/γ-Al2O3...........................................75
2.1.2 Alloying effects........................................................................................................78
2.1.3 Coverage dependence of the selectivity..................................................................82
2.1.4 Catalyst state during conditioning & reaction.......................................................84
2.1.5 Mechanistic proposal - avoiding the CO poisoning...............................................89
2.2 Other important characteristics for an application in a PROX-stage.............................93
2.2.1 Long-term stability.................................................................................................93
2.2.2 Performance in more realistic reformates..............................................................99
2.2.3 The water-gas shift activitiy of Pt3Sn/Vulcan.......................................................103
2.3 Summary on bimetallic Pt3Sn catalyst..........................................................................105

iii
3. An alternative for the low temperature conversion - Au/αα-Fe2O3............................107
3.1 Mechanistic insight into the CO oxidation over gold catalysts....................................109
3.1.1 A short review.......................................................................................................109
3.1.2 The „support-effect“.............................................................................................111
3.1.3 Oxygen supply from the FeOx-support (Transient response measurements).......116
3.1.4 Proposed reaction scheme....................................................................................121
3.2 The influence of structural parameters on the activity / selectivity..............................123
3.2.1 The dependence of the activity on the particle size..............................................123
3.2.2 Influence of the calcination temperature..............................................................129
3.2.3 The dependence of the particle size on the sodium content..................................132
3.3 The CO coverage on Au and its influence on the kinetics...........................................134
3.3.1 Kinetic observations.............................................................................................134
3.3.2 Comparison of the CO coverage on Pt/γ-Al2O3 versus Au/α-Fe2O3....................137
3.3.3 Temperature dependence......................................................................................143
3.4 Deactivation behaviour.................................................................................................147
3.4.1 „Off-line deactivation“.........................................................................................147
3.4.2 „On-line deactivation“ during CO oxidation......................................................148
a) Irreversible poisoning of more crystalline samples...........................................150
b) Reversible deactivation on amorphous samples................................................155
c) Deactivation model.............................................................................................157
3.5 Effects of CO2 and H2O on the activity / selectivity....................................................160
3.5.1 Selectivity enhancement by water.........................................................................160
3.5.2 Performance in CO2-containing mixtures............................................................163
3.6 Reverse water-gas shift over Au/α-Fe2O3....................................................................170
3.7 Other support materials................................................................................................172
3.8. Summary on gold catalysts..........................................................................................177
IV. Summary & future perspectives

iv
V. References
VI. Acknowledgement
Appendix
A) Improved DRIFTS-cell design......................................................................................198
B) Additional figures..........................................................................................................204
C) English abstract.............................................................................................................205
D) Deutsche Zusammenfassung (german abstract).........................................................207
E) List of publications........................................................................................................209
F) Lebenslauf (curriculum vitae).......................................................................................210

The slective CO oxidation - reactions
1
I. INTRODUCTION
1. The selective CO oxidation - reactions
The following work is concerned with a detailed mechanistic investigation of the selective
(preferential) oxidation of CO over supported noble metal catalysts in hydrogen-rich gases. As
will be specified in the following chapter, this reaction has an important commercial
application for the purification of hydrogen feed gas streams for low temperature fuel cells
produced by methanol steam reforming.
Although in the past years numerous studies on the pure CO oxidation (i. e., in UHV, a
nitrogen or a helium background) on noble metal surfaces have appeared (e. g., [1-3] and
many others) only a few pulications were concerned with effects arising from coadsorbates
and parallely occuring surface reactions (e. g., [4-7]). Moreover all the latter studies use a
phenomenological approach by kinetics, but in most cases provide no mechanistic
explanations for the observed reaction orders and rates, which consequently is one of the
central intentions of this work.
For the preferential CO oxidation in H2-rich gases two competing, parallely occuring
processes have to be considered, the CO oxidation reaction
CO + ½ O2 → CO2 ; ∆H0 = -283 kJ/mol [8] (I-1.1)
and the H2 oxidation reaction
H2 + ½ O2 → H2O ; ∆H0 = -242 kJ/mol [8] (I-1.2)
The selectivity, S, indicates, which of the two reactions is favoured by the kinetics. For
practical reasons it has been defined via the oxygen consumption:
Sr
r r
O
O O
CO
CO H
CO oxidation
CO oxidation H oxidation==++
==++
−−
−− −−2 2
2
2 2
∆∆
∆∆ ∆∆(I-1.3)
rX = oxidation rate of CO and H2, resp.; ∆O2X = oxygen consumed by oxidation reactions
In principle for our complex reaction mixture, which contains CO, O2, H2 and the products
CO2 and H2O, also a few other reactions must be taken into consideration, e. g., methanation
or methanol formation. Fortunately, on the catalyst systems, which are investigated in the
following chapters, most of these secondary reactions occur only above the applied operation
temperatures at a significant rate, e. g., over Pt/γ-Al2O3 methanation sets in only for

The slective CO oxidation - reactions
2
temperatures above 250°C, but the optimum temperature range for the selective CO oxidation
is around 200°C [9]. The only interference worth noticing arises from the water-gas shift
(denoted as „WGS“ in the following) reaction:
CO2 + H2 ↔ CO + H2O ; ∆H0 = +41 kJ/mol [8] (I-1.4)
Although the measured rates for the WGS reaction (forward and reverse direction) are at least
2 - 3 orders of magnitude smaller than the CO oxidation rates (see, e. g., chapter III-1.3.2), the
reverse WGS sets the limit for the minimum CO concentration, which may be achieved by the
selective CO Oxidation [10-12].

Technical application: PROX
3
2. Technical application: PROX
An increasing awareness for environmental protection over the last two decades has lead to
new efforts in order to reduce the exhaust emissions. For mobile applications a new
generation of fuel cell power sources (e. g., in the NECAR series by Daimler Chrysler [13]) is
expected to replace the currently employed combustion engines. Most of the vehicles, based
on PEM fuel cells (proton exchange membrane), gain power from the electrochemical
oxidation of hydrogen. As a result the local emission of NOx, CO and CO2 is absent or, for the
latter, at least significantly reduced [14]. Unfortunately, gaseous hydrogen has a very low
energy storage density (1 kJ/cm³ for steel cylinders) [14]. Even if recently developed light-
weight materials for gas cylinders are employed, the required volume and weight is still not
acceptable for a mobile application in cars [13]. Liquid hydrogen would allow for a much
more compact construction (10 kJ/cm³ [14]), but the necessary low-temperature tank wastes a
lot of additional energy for cooling, decreasing the overall efficiency, and bears several
technical problems, e. g., an inevitable leaking of hydrogen or strictly required safety devices
[15]. Other solutions for a direct storage of hydrogen, e. g., nanotube materials or metal
hydrides, are envisaged for the future but still require time for the development of suitable
prototypes [16].
An alternative concept, which is currently envisaged as an intermediate solution, includes the
„on-board“ production of a hydrogen-rich gas from liquid hydrocarbons or alcohols, which
provide a superior energy storage density (17.7 kJ/cm³ for methanol), e. g., by a steam
reformation process [14, 17]. A suitable fuel is methanol, which requires rather low process
temperatures for the reforming step (ca. 250 - 300°C over a Cu/ZnO catalyst), so that the
number of side reactions is limited, and can be easily gained from various sources (methane,
coal, bio-mass) [14, 16]. The steam reformation process provides a feed gas (reformate) which
consists of ∼75% H2 and ∼25% CO2 (compostion of the dry part) and additionally 10 - 15%
H2O [18]:
CH3OH + H2O → 3 H2 + CO2 ; ∆H0 = +131 kJ/mol [19] (I-2.1)
Unfortunately, due the above mentioned reverse water-gas shift reaction (eq. I-1.4), up to 2%
CO are contained in the reformate, which would poison the anode catalyst in a subseqently
placed PEM fuel cell (see fig. I-1) and hence decrease the energy efficiency of the system to
an unacceptable level [17, 20-22]. The maximum amount of CO tolerated by currently
employed Pt catalysts at acceptable losses is ∼20 ppm [18] and the recently introduced PtRu

Technical application: PROX
4
anodes are hardly better (tolerance <100 ppm [16, 23]). A small fraction of the CO can be
removed by dosing traces of oxygen over the anode catalyst (so-called „air-bleed“) [20],
which extends the CO tolerance to 100 - 500 ppm but this technique induces also unwanted
effects like sintering of the anode catalyst or ageing of the membrane [17, 18]. Consequently
an additional purification stage is required, which reduces the CO content down to levels that
are acceptable to the anode catalyst. Various concepts have been proposed, e. g., selective
methanation, pressure swing adsorption or diffusion membranes and also the preferential CO
oxidation, which is named „PROX“ [17, 18, 24]. Currently the latter is preferred, since it
allows for a rather space saving implementation compared to the other alternatives and the
material costs are relatively low [17, 18].
Figure I-1 provides an overview scheme of the above described feed gas supply for a PEM
fuel cell unit including a methanol reformer to produce the H2-rich feed-gas and a
subsequently placed PROX stage for the removal of carbon monoxide.
Fig. I-1: Setup scheme for an indirect methanol fuel cell power source.

Intention of this work
5
3. Intention of this work
The intention of this work is to grant mechanistic insight into the preferential CO oxidation
over a few selected noble metal catalyst systems. Primary object is to explain the activity and
selectivity behaviour, which was recorded in a parallel kinetic study by M. Kahlich [25].
Further aspects of interest are the long-term stability (stable steady-state or deactivation) under
reaction conditions and effects arising from the use of different support materials. Finally,
since the majority of kinetic experiments were performed in a simplified reaction atmosphere
(i. e., without water and CO2; see, e. g., [7, 26]), the influence of a more realistic atmosphere
on the activity and selectivity is another central subject of this work. As a result the detailed
understanding of these reaction processes might be helpful for the design of new catalyst
systems and reactor concepts in future PROX applications.
The experimental priority is set on infrared spectroscopy, which allows for the in-situ
observance of adsorbed surface species under reaction conditions. Nevertheless, a whole
bunch of further methods, e. g., reactor experiments, temperature programmed desorption, and
X-ray diffraction, had to be additionally employed in order to develop comprehensive
explanations for the observed phenomena.
After a short introduction on the experimental setup, we will start with the investigation of
Pt/γ-Al2O3 (and later on also of other platinum catalysts), which was among the first catalysts
proposed for the selective CO oxidation and still represents the basis for most of the currently
employed systems [4, 10, 14, 18, 27, 28]. Consequently all other catalysts in this work are
compared to it as a reference system. In the following chapter we will turn to a bimetal
catalyst, a Pt-Sn alloy, to see, how the modification with another metal affects the activity /
selctivity behaviour compared to the previously investigated pure platinum metal catalysts.
The last catalyst under investigation is a system with a somewhat different CO oxidation
scheme: supported gold, which was already proposed as an active system for PROX at very
low operation temperatures [29-31]. Finally we will conclude the work with a comparative
summary of the previously presented results.
Since large parts of this thesis are based on the results of a parallelly conducted kinetic study
[25], some illustrations have been drawn from the latter work. These figures have been
marked explicitely with „{KAH}“.

Setup Reaction gases & mixture board
6
II. EXPERIMENTAL
1. Setup
1.1 Reaction gases & mixture facility
In order to simulate reaction atmospheres as close as possible to those produced by a real
methanol reformer (see fig. I-1) and to be able to investigate the effect of each contained
component in detail, we arranged a complex gas mixture assembly, which allows for the
variation over a large concentration range for each reactant. The central mixture faciltiy
(scheme shown in fig. II-1) consists of four mass-flow controllers (2 x 100, 1 x 50 and 1 x 20
Nml/min MFCs; Hastings HFC-202), which are set by an electronic control unit (Hastings
power supply 400). Pure gases and commercially available gas mixtures (table II-1) are
attached via steel and copper (for CO-containing gases) tubes (Dockweiler) and switched by
three-way valves (Whitey or Parker). Water could be added in a concentration range between
0.6 and 1.5 kPa by bubbling the feed-gas stream through a tempered water vessel (see fig. II-
1). For each gas the corresponding MFC was calibrated manually by a flow-meter to ensure
accurate flow rates (for more detailed information see [9, 32]). All flows are given in „Norm-
milliliters“ per minute (Nml/min), i. e., standardized to 0°C and 1 atm (ideal gas behaviour
Mixture c [%] purity degree provider
H2 100 5.0 MTI
N2 100 6.0 MTI
CO 100 4.7 Linde / MG
CO in N2 2 4.7 / 6.0 Messer Griesheim
CO in H2 4 4.5 / 5.6 Mess. Gr. / MTI
CO in H2 2 4.7 / 5.6 Messer Griesheim
CO in H2 0.14 4.7 / 5.6 Messer Griesheim
CO2 100 6.0 Messer Griesheim
O2 100 5.0 MTI
O2 in N2 10 5.0 / 5.0 (CO-free) Linde / MTI
O2 in N2 0.35 5.0 / 5.0 (CO-free) MTI
O2 in CO2 10 5.5 / 6.0 Messer Griesheim
1%CO, 1% O2, 1% CO2, ½ % CH4, 75% H2, rest N2 AGA
1% CO, 1%O2, 25% CO2, rest H2 AGA
Table II-1: Different gases used for the experiments.

Fig
. II-
1: S
chem
e of
the
gas
supp
ly s
etup
.
N2
H2
CO
CO Nin
2
O2
CO Hin
2
O N
2 2
inO CO2
2
in
CO
2
MFC
MFC
MFC
MFC
HO
2
reac
tor
DR
IFT
S-
cell
GC

Setup Reaction gases & mixture board
8
presumed). For most experiments flow rates between 80 - 135 Nml/min were applied,
corresponding to a typical space velocity of 15 - 25 s-1.
The most frequently used reaction gas mixtures are listed in table II-2. The term „idealized
reformate“, which will be used frequently in the upcoming chapters, corresponds to a CO
oxidation mixture with 75 kPa hydrogen and rest N2 and was used, e. g., for the majority of
kinetic experiments [7, 9, 25, 26]. For a better overview the exact gas phase compositions,
especially when differing from the standard mixtures, are indicated separately for each
experiment. The partial pressure for the added oxygen in our experiments is expressed
indirectly via the λ-value:
λ = ⋅2 2p
pO
CO
(II-1.1)
pX = partial pressure of CO and O2, resp. [kPa]
By three- and four-way valves the reaction gas mixtures may be directed either into the reactor
tube (described in chapter 1.2), to the in-situ DRIFTS cell (chapter 1.3.2) or directly to the GC
(chapter 1.4) for bypass-measurements, which were required as a reference standard for the
calculation of the degree of conversion (fig. II-1).
term appliedfor
CO[kPa]
O2
[kPa]H2
[kPa]CO2
[kPa]N2
[kPa]H2O[kPa]
λλ
„idealized reformate“ PROX 0.02-1.5 0.02-1.5 ∼75 - rest 0-1.5 2 1)
„more realisticreformate“
PROX 0.02-1.5 0.02-1.5 ∼75 rest - 0-1.5 2 1)
reverseWGS 2)
- - ∼75 rest - 1.5 -
forwardWGS 2)
1.0 - - - rest 1.5 -
1) except indicated differently 2) WGS: water-gas shift reaction
Table II-2: Most frequently used reaction gas compositions

Setup The plug-flow reactor
9
1.2 The plug-flow reactor
The test reactor consists of a small quartz tube (ID 4 mm; for the majority of shift and TPD-
experiments also ID 10 mm), where the catalyst bed (ID 4 mm: ∼100 mg, ID 10 mm: up to
1000 mg powder) is fixed in the middle by quartz wool plugs (see also [9]). A K-type
thermocouple is attached on the tube above the catalyst bed by a ceramic paste (Polytech 905).
The tube is placed inside a steel cylinder (ID 15 mm; endings sealded by steel plugs), whose
temperature can be controlled by a facility for heating and cooling, via a resistant wire (Horst
HSQ 900) wrapped around the cylinder and a parallely attached air cooling (1/8“ steel tube;
Dockweiler). The latter is split up into two parts, both with the air entrance located at the ends
of the steel cylinder. The addition of the cooling facility produced rather satisfying
temperature profiles, with a stationary zone (± 2°C) reaching at least over 2-3 cm, which was
sufficient for a standard catalyst bed (see fig. II-2). For thermal isolation the steel cylinder is
embedded in a thick layer of quartz wool. Operation temperatures of up to 900°C may be
applied to the reactor. On the other hand, when the cooling air is passed through a liquid
nitrogen trap, the reactor may be cooled down to max. -100°C, which was necessary, e. g., for
the temperature-programmed desorption experiments on the bimetallic Pt-Sn catalyst (see
chapter III-2.1.2).
For a plug-flow reactor it is assumed, that axial diffusion is negligible and that there are no
radial variations of the flow rate [33]. The rates for the CO oxidation are calculated by a
distance from thermocouple [cm]-10 -9 -8 -7 -6 -5 -4 -3 -2 -1 0 1 2 3 4 5 6 7 8
T [
°C]
5075
100125150175200225250275300325350375
Entrance O utlet
Figure II-2: Temperature-profiles inside the plug-flow reactor tube.
catalystbed

Setup The plug-flow reactor
10
model, where the changes for a differential mass / volume element over the catalyst bed are
considered via
dm
V
dX
rCO
mCO
CO
X
in
m
•∫ =−∫
0 0(II-1.2).
m = mass of catalyst [g]; VCOin
•= volumetric flow [Nml/min];
X = conversion degree; rCO = rate of CO oxidation [molCO/g*s]
For differential flow conditions (i. e., at small conversion), where no major concentration
changes occur and thus the rate becomes virtually constant along the catalyst bed, the average
reaction rate may be calculated by integration of eq. II-1.1:
r XV
mmCOin= − ⋅
•
(II-1.3).
Practically, differential flow conditions were fullfilled at conversion degrees below 20%. A
more profund review on the plug-flow theory with a detailed derivation of eqs. II-1.2 and II-
1.3, respectively, may be taken from ref. [9]. In order to guarantee differential conversion
most of the catalyst samples had to be diluted with a non-reactive material. For most
experiments α-Al2O3 (BET 4.7 m²/g) was used, since it also mitigates the pressure drop over
the catalyst bed, thus any diffusional effects could be safely excluded. Only for the water-gas
shift experiments, where the reaction proceeds at a much lower rate than the CO oxidation, the
formation of a reactive interface by the mechanical mixing of the catalyst and the α-Al2O3
could have falsified the results significantly. Therefore for those measurements the catalysts
were diluted either by a tempered low-surface-area version of the corresponding support
material (SiO2, MgO, TiO2) or by SiC (Aldrich).
For a better comparison between different catalyst samples, in most plots and tables the rate
was normalized to the number of available surface metal atoms and expressed as a turnover-
frequency (TOF; [s]):
TOF rM
DCOmet= ⋅ (II-1.4)
Mmet = atomic mass of noble metal [g]; D = metal dispersion
The reproducibility of the rates is strongly affected by the type of catalyst used and by
possible deactivation effects during storage (see, e. g., chapter III-3.4.1). For Pt/γ-Al2O3 the

Setup The plug-flow reactor
11
reproducibility was very good (rate less than ±20%, selectivity less than ±5%), for
Pt3Sn/Vulcan and the gold catalysts the deviations between measurements on different catalyst
beds were sometimes larger, so that for many experiments an average over three or more
experiments had to be taken in order to achieve a similar accuracy for the data.

Setup Infrared spectroscopy - DRIFTS
12
1.3 Infrared spectroscopy - DRIFTS
Infrared spectroscopy is one of the few methods that can be easily adapted for the in-situ
characterization of surface species under non-vacuum conditions. The (selective) CO
oxidation over noble metals is an excellently suited object for such studies, since the adsorbed
CO has a large IR cross section (as well as possible by-products, e. g., carbonates) and its
absorbance frequency is very sensitive to both the local environment of the adsorption site
[34] and the presence of other coadsorbed species [35]. This sensitivity is caused by small
variations in the electron density of the substrate metal d-states, which results in an altered
„back-donation“ of electrons from the metal to the 2π*-orbital of the CO, causing a
corresponding shift in the absorbance freqency of the C-O bond [36]. Moreover, CO
molecules adsorbed in close vicinity exhibit dipole-dipole coupling, which induces a slight
coverage-dependent shift of the corresponding IR-bands to higher absorbance frequencies [37-
39]. Therefore not only the absolute intensity (identical adsorption sites presumed) but also
the position of the COad-band serves as a good indicator for the surface CO coverage at the
applied reaction conditions.
Especially the analysis of diffusely scattered light from powdered samples, DRIFTS (diffuse
reflectance infrared Fourier transform spectrometry), has found a wide-spread use for
heterogeneously catalyzed reactions. A fast increasing number of publications on apparative
improvements (see e. g. [41, 42]) as well as many applications for catalytic studies (e. g. [32,
40, 43] have appeared in the last few years. The use of a diffuse reflectance setup (see scheme
in figure II-3) allows for observations on powdered catalysts without any further sample
preparation. Therefore corresponding structural changes, which, e. g., may occur during the
high-pressure formation of a KBr-pellet, required for transmissions FTIR spectroscopy, are
avoided [41, 44, 45]. Moreover, the possibility to conduct high flow rate reactant streams
Fig. II-3: Scheme for the measurement of diffusely scattered
light from a powder sample [40].

Setup Infrared spectroscopy - DRIFTS
13
through the sample, similar to a micro-kinetic reactor, along with the excellent control of
environmental conditions in the used in-situ cells enables measurements under conditions very
close to that of real technical applications and allows for studies at differential-flow
conditions, which suffer less from the danger of mass-transport induced spectral artifacts. A
major disadvantage of DRIFTS, however, is the unknown penetration depth of the incident
beam, so that an absolute quantification as for transmission experiments is not possible. Thus
for the calculation of, e. g., the surface CO coverage some additional informations, e. g.,
theoretical calculations via adsorption-desorption equilibria, are required as an calibration
point (see, e. g., chapter III-1.1.3).
Figure II-3 shows a typical setup scheme for a DRIFTS measurement. With the help of
mirrors the infrared beam is directed to a spherical mirror, which focusses the light onto the
sample. A second spherical mirror collects the diffusely scattered light, which is further lead
to the detector.
Since DRIFTS is not yet fully established as a standard method for applications in
heterogeneous catalysis, we will provide a short review on the DRIFTS theory in the
following section.
1.3.1 DRIFTS-theory
The basic equation for describing the intensity of any diffusely scattered light from a powder
sample is given by the radiation transfer equation [46]:
− = −dI
dSI
j
κρ κ(II-1.5)
I = light intensity at wavelength λ; ρ = density
κ = attenuation coefficient (radiation loss from absorption and scattering);
S = optical pathlength; j = scattering function
This equation may be simplified and solved by introducing well-definded experimental
conditions. For a supported metal catalyst the most suitable approach was shown to be the
Kubelka-Munk theory [47], where the incident and scattered light are approximated by two
opposite fluxes, which are perpendicular to the illuminated surface [48]. For an infinitely thick
sample the diffuse reflection can be described as a function of an apparent absorption and an
apparent scattering coefficient in the so-called Kubelka-Munk equation [46, 49-51]:

Setup Infrared spectroscopy - DRIFTS
14
f RR
R
k
s( )
( )∞
∞
∞=
−=
1
2
2
(II-1.6)
R∞ = diffuse reflection from an infinitely thick sample;
k = absorption coefficient; s = scattering coefficient
The coefficients k and s are in priciple characteristic for each material under investigation, but
it should be mentioned that the scattering coefficient, s, is a not only an intrinsic material
function, but also , e. g., dependent on the particle size, the particle distribution, the packing
density and the humidity of the sample, which even for a known penetration depth would
make an absolute quantification impossible [51, 52].
The required criterium of infinite depth is strongly dependent on the absorption of the sample.
For a weak absorber (e. g., Al2O3) a sample thickness of ca. 1 mm is necessary, for a strongly
absorbing material like carbon the infrared beam penetrates only in the range of micrometers
[53]. Additional experimental conditions for the use of the Kubelka-Munk function are [46]:
• a diffuse irradiation of the sample,
• isotropic light scattering,
• a low absorber concentrations (< 10% [53])
• a uniform absorber distribution
Since the thickness of the catalyst bed in all our DRIFTS cells is 3 mm or more and the
absorber concentration is very low, due to the dilution with the support material, all pre-
conditions are fullfilled and the Kubelka-Munk function should be well suited for evaluating
our infrared spectra.
In order to avoid the measurement of absolute light intensities the reflection is related to a
reference material, yielding the relative reflection, r∞ [40]:
f rr
r
k
s( )
( )∞
∞
∞=
−=
1
2
2
(II-1.7)
For a weakly absorbing sample the absorption coefficient may be replaced by the extinction
coefficient [49]
k’ = 2.303 ⋅ ε ⋅ c (II-1.8)
ε = extinction coefficient; c = absorber concentration

Setup Infrared spectroscopy - DRIFTS
15
and eq. II-1.7 is transformed into
f rc
s
c
k( )
.
'∞ =⋅ ⋅
=2 303 ε
(II-1.9),
hence under these conditions the diffuse reflectance should be linearly related to the absorber
concentration, which is indeed observed experimentally for absorber concentrations below
10% [53]. At higher concentrations, however, deviations due to specular and diffuse Fresnel
reflection (i. e., directly reflected light without penetration into any particle) and due to a
decreasing penetration depth are noticed [55-57].
1.3.2 DRIFTS-setup
For our DRIFTS measurements we used a commercial mirror arrangement by Harricks in the
so-called „praying mantis“ form (PM-DRA-2-XXX) to direct the infrared beam. The
compartment is shown in figure II-4. The mirrors are aligned in an „off-axis“-geometry, i. e.,
the interfering specular Fresnel reflectance is being faded out, which results in an extension of
the linear concentration range for the Kubelka-Munk function [57].
We have employed three different in-situ DRIFTS cells. First we started with a commercial
cell by Harricks (HV-DR2; see fig. II-5), but it was only used for a few of the adsorption
experiments on the Pt/γ-Al2O3 catalyst (chapter III-1.1.1). The major part of work was done in
a closely related imitation by our university workshop. For the latter model the gas leakage
Fig II-4: „praying mantis“ mirror alignment [54].

Setup Infrared spectroscopy - DRIFTS
16
problem, which is described in detail in appendix A, was reduced significantly, so that mass-
transport related artifacts for spectra acquired during reaction could safely be excluded. The
temperature for both cells is adjusted by an electronic controller (Watlow series 965), which
controls a heating rod. The latter is mounted below the sample cup.
Later on, for measurements, which require the parallel recording of accurate kinetic data, we
designed a completely new cell, which is introduced detailed in appendix A. The latter was
used for our studies on the influence of increasing CO2-contents on the selctive CO oxidation
(see e. g. chapter III-3.5.2).
All cells allow for a continous gas flow through the catalyst bed (ca. 0.1g powder), which is
placed on a small steel net. ZnSe had to be used as a window material, since the commonly
employed KBr material was not resistant to the water produced in the H2 + O2 side reaction
during the selective CO oxidation.
In order to achieve a reproducible packing density (which results in a more uniform scattering
coefficient; see eq. II-1.7), we used a small weight to compress the freshly filled catalyst
Fig II-5: Harricks DRIFTS-cell HV-DR2 [58].

Setup Infrared spectroscopy - DRIFTS
17
powder. Nevertheless, absolute intensities of spectra acquired on different catalyst beds
should be compared with much reservation. Even if an identical catalyst is used, the tolerance
for the signal intensity is more than ±10%. Consequently all experiments, where a sample is
examined in different atmospheres were conducted in the form of „switch“-experiments, i. e.,
the same catalyst bed was exposed subsequently to different mixtures. This procedure reduces
the tolerance to 2 - 5%.
1.3.3 Processing of DRIFTS spectra
Spectra were acquired either with an Infinity AR 60 (Mattson) or on a Magna 560 (Nicolet)
spectrometer, both equipped with a narrow-band MCT (mercury cadmium telluride) detector.
The DRIFTS experiments were controlled and evaluated by the WinFIRST (Mattson) and by
the OMNIC software package (Nicolet), respectively.
For each measurement several spectra were added in order to increase the signal to noise ratio
(SNR). The number of coadded scans depended strongly on the penetration depth of the
infrared beam into the powder, which is much larger for brightly coloured samples (i. e., weak
absorbers). Consequently, for Pt/γ-Al2O3 (chapter III-1) 300 scans, corresponding to a total
scanning time of ca. 2.5 min., were sufficient. For the black Pt3Sn/Vulcan catalyst (chapter III-
2) measurements were only possible after dilution with a less strongly absorbing material (in
most cases α-Al2O3; ca. 1:20). Nevertheless, at least 1200 scans were required, for very
accurate measurements even up to 3000 scans (scanning time ca. 25 min.), in order to achieve
an acceptable SNR. The experiments on Au/α-Fe2O3 yielded good results with 400 - 600
coadded scans (depending on the degree of dilution), corresponding to a total scanning time of
up to 5 min..
In order to correct for the DRIFTS geometry, all spectra were evaluated as „diffuse spectra“
(designated by Kubelka-Munk units), following this standard procedure:
• At the beginning of each experiment one or more „background spectra“ (one for each
envisaged measurement temperature - again averaged over the required number of single
scans) are recorded on the freshly conditioned catalyst sample under a flow of pure
nitrogen. Subsequently the „sample spectra“ at the applied reaction conditions are acquired.
Both are recorded in the form of „single-beam spectra“, i. e., as if the infrared light would
be emitted directly from the sample (absolute IR intensity vs. wavelength)

Setup Infrared spectroscopy - DRIFTS
18
• In the next step, a conventional „transmission spectrum“ is calculated by dividing the
sample spectrum through the background reference,
TI
I=
0
(II-1.10)
I = sample emissivity; I0 = background emissivity
which is further transferred into the well-known form of an „absorption spectrum“:
A = - log(T) (II-1.11)
Since the absolute intensity of the diffusely scattered light is highly sensitive to the position
of the catalyst bed’s surface [32, 45, 59], the signal may decrease slightly during a
measurement series as a consequence of a slowly occuring displacement of the surface (e.
g., by the increasing compression of the catalyst bed by the applied gas flow). In order to
correct for such deviations, the sample spectrum is scaled to the background intensity at a
„fixed point“, which is reproducible during the experiment (i. e., where no IR bands are
growing - in most cases between the gas-phase bands of CO and CO2 at around 2250 cm-1,
as was proposed, e. g., by Barth et al. for the CO adsorption on Pt/Al2O3 [60]). To exclude
spectral artifacts in the final DRIFTS form arising from a cross-over of the sample and
background spectra, since the Kubelka-Munk function (eq. II-1.6) produces absolute values
and absorption bands in the negative range would be inverted [61], all sample spectra were
multiplied by a factor 0.96 after the scaling procedure, so that the intensity of the sample
spectrum is safely below the background for all measured wavelenghts.
• In the last transformation the Kubelka-Munk function (eq. II-1.7) is applied to the absorption
spectrum:
KM-spectrum =−( )1
2
2A
A(II-1.12)
• Finally the CO gas-phase signal was removed by scaling and subtracting a reference
spectrum obtained under identical conditions over a non-reactive material (Al2O3, SiO2 or
SiC).
The adjusted nominal spectral resolution was 4 cm-1 (Mattson) or 8 cm-1 (Nicolet),
respectively, corresponding to an effective reproducibility of roughly ± 0.1 cm-1 [59]. Higher
resolutions werw not employed, since the ensueing unfolding of the rotational fine structure
would make a proper subtraction of the gas-phase signal impossible [32].

Setup Infrared spectroscopy - DRIFTS
19
Most catalysts had to be diluted, not only for an improvement of the sampling depth, but also
to fullfill differential flow conditions. In analogy to our reactor measurements for most
experiments α-Al2O3 was employed, which had been tested previously for its non-reactive
character (unpublished results).

Setup On-line GC analysis
20
1.4 On-line GC analysis
The reactant/product mixture leaving the plug-flow reactor or the DRIFTS cell, respectively,
is directed to a gas chromatograph for on-line analysis of the CO conversion and selectivity
(fig. II-1). The GC (model CP9001; Chrompack) is equipped with two parallelly installed
widebore capillary columns (∅ 0.53 mm). H2 is used as carrier gas (18 Nml/min). The GC’s
oven temperature is adjusted to 60°C. A diagram of the column setup is provided in fig. II-6.
After the sample volume (ca. 15 µl) has been introduced via a six-way walve (SV2), in the
first step, CO2 and water are separated from the less polar components by a Poraplot U type
column (25 m, 20 µm coating; Chrompack). Subsequently, via a four-way valve (SV1) the
remaining gases (N2, O2, CH4, and CO) are directed to a Molesive 5Å column (30 m, 15 µm
coating; Chrompack), where they are finally resolved into single peaks. The resulting total run
time is ∼8 min.. Each channel (Poraplot and Molsieve, resp.) is monitored by a thermal
conductivity detector (Chrompack TCD 914). For the analysis of CO and O2 „bypass
measurements“ (i. e., without passing the catalyst bed), acquired prior to the experiment, are
used for calibration. The CO2- and CH4-contents (the latter would evolve from the parallely
occuring CO + H2 reaction) are evaluated via comparison to a „calibration gas“ of known
composition. The GC measurements were controlled by the Maestro software package
(Chrompack), which was also used for the integration of the resulting chromatograms.
The dectection limits for this setup are at least 10 ppm for each component. A reproducibility
(standard deviation) of ±0.2% was calculated at the typical analyte pressure of 1 kPa.

6699��6699��
Fig
ure
II-6
: GC
-Set
up.

Setup Other methods used
22
1.5 Other methods used
1.5.1 XPS
The sample chamber for the XPS experiments has a base pressure of 5*10-9 kPa. It is
equipped with a hemispherical analyzer (Specs EA 2000; ∅ 150 mm) and a standard dual
anode source. The Al-Kα-line (1486.6 eV) was used for our experiments. The pass energy
was set to 147 eV for survey scans and 88 eV for more detailed spectra, corresponding to a
resolution of 1.4 and 1.2 eV, respectively, for the Ag(3d5/2) signal. Signals of Au(4f7/2) at 84.0
and Ag(3d5/2) at 368.3 eV were used for the calibration of the spectrometer. The spectra
acquisition is controlled by the Spectra software package.
For the evaluation of the XP spectra a Shirley background subtraction routine was employed
[62]. The signals were fitted by Gauß-Lorentz functions. In order to compensate for charging
effects on the Au catalysts (chapter III-3), the C(1s)-signal was fixed to 284.6 eV. The
Pt3Sn/Vulcan catalyst (chapter III-2) showed no charging effects due to its excellent electric
conductivity. For futher information the reader is referred to ref. [63].
1.5.2 On-line IMR-MS analysis
The TPD (chapter III-2) experiments on Pt3Sn/Vulcan and the oxygen titration experiments on
Au/α-Fe2O3 and Pt/γ-Al2O3 (III-3.1.3) were performed by on-line analysis with an IMR-MS
(ion molecule reaction mass spectrometer). This type of mass spectrometer (Atomika IMR-
MS SP89) employs low energy noble gas ions (Xe+, Kr+) for the ionization of the analyte gas,
so that the fragmentation process is significantly reduced. Consequently it allows for the
detection of CO on the mass 28 without any interference from, e. g., nitrogen, which is not
ionized under these conditions, or from CO2, which is not fragmented [64].
The employed noble gases are dosed by a calibrated leak, resulting in a pressure of 10-5 kPa in
the ionization chamber; the analyte gas is differentially pumped and then dosed separately via
a 60 µm iris (10-6 kPa). The gate-time for analysis (quadrupole MS) was 2 s for each of the
seven surveyed components (CO, CO2, O2, H2O, CH4, Kr, and Xe) in our TPD measurements.
Together with an additional delay of 1 s, this corresponds to a sampling frequency of 4
datapoints per minute. For the CO titration experiments (chapter III-3.1.3) a shorter gate-time
of 0.2 s (O2, CO2, CO, Kr, Xe) was chosen, equivalent to 1 datapoint per second. The
resulting signals are detected by a SEV. For analysis all signals were normalized to the noble
gas signals and calibrated with the help of reference gases of known composition. The

Setup Other methods used
23
measurements are recorded by a software package from Atomika. The integration of peaks
was performed with the Sigma Plot software (Jandel Scientific). Further details on the analysis
by IMR-MS may be taken from ref. [65]. For futher information on the setup see ref. [66].
1.5.3 Isotope studies / pulse experiments
The isotope / pulse studies were performed in a TAP-reactor (temporary analysis of products;
model 1b, equipped with a high pressure assembly) at the Institute of Technical Chemistry,
University of Bochum. A detailed description of a typical TAP-setup and the employed
reactor type, which contained a mass of ca. 50 mg catalyst powder, is found in ref. [67]. All
experiments were performed in the vacuum-flow mode (i. e., with vacuum applied to one end
of the catalysts bed), which is characterized by a very short contact time for the reactants
(incoming flow rate ca. 1-2 Nml/min).
For our investigations on the Au/α-Fe2O3 catalyst (chapter III-3.1.3) we admitted pulses of
isotopically labeled 36O2 (Cambridge Isotope Laboratories; ca. 95% 18O; diluted with Argon
1:5; ∼2*1015 molecules/pulse) to a continuously flowing reaction mixture for the selective CO
oxidation (ca. 1.7% CO, λ = 2; 75% H2, rest Ne).
1.5.4 XRD
XRD experiments were performed on a Siemens D5000 spectrometer at the ZSW (Center for
Solar Energy and Hydrogen Research) in Ulm, Germany, using the Cu-Kα line (1.540 Å). The
source beam is limited by a variable software-controlled slit. A further „scatter slit“ of 2 mm,
which fades out the diffusely scattered light from the sample, a „receiving slit“ of 0.6 mm and
a graphite monochromator were used for all measurements. The experiments are controlled
and evaluated by software from Bruker. For peak fitting procedures pseudo-Voigt functions
were applied. The determination of the particle size was done via the Scherrer-equation,
where the halfwidth (FWHM) is inversely proportionally related to the particle diameter [68].
Since the very small metal particles on our gold catalysts (see tables III-10) are already close
to the XRD detection limit, the latter is not a very accurate method for determining the
corresponding dispersion. Therefore the calculated TOFs exhibit a rather large tolerance of up
to ±50% for those samples which contain the smallest gold particles. Consequently for some
samples additional TEM photographs were recorded for a more precise determination of the
average particle size.

Catalysts Platinum catalysts / Pt3Sn catalyst
24
2. Catalyst characterization
2.1 Platinum catalysts
Several different Pt-catalysts were employed in our study (table II-3). The majority of the
experiments were performed over a commercial Pt/γ-Al2O3 catalyst (Degussa; F 213 XR/D),
which is closely related to currently employed systems for PROX applications (e. g. [10, 16,
18]). Prior to the experiments all Pt-catalysts were pretreated oxidatively by 10 kPa O2 in N2
(20 Nml/min; 30 min.) and subsequently reduced in flowing hydrogen (20 Nml/min; 30 min.).
The resulting platinum particle sizes and dispersions are included in table II-3.
2.2 Pt3Sn catalyst
The carbon supported bimetallic PtSn catalyst (Pt3Sn/Vulcan by E-TEK) was loaded with 20
wt% metal containing 75 at% Pt. The particle size distribution determined by TEM, with an
average particle diameter of 3.8 ±1 nm after catalysts conditioning (see below), yields a
dispersion of 0.27. The formation of uniform alloy particles with nominal composition is
indicated in spot-resolved EDX measurements on the reduced sample.
For Pt3Sn/Vulcan the best set of pretreatment parameters was evaluated in a series with
different conditioning temperatures (200 - 350°C) and durations (up to 1 h), where the most
active and selective catalyst was achieved after 30 min. calcination (20 Nml/min O2/N2) and
reduction (20 Nml/min H2), respectively, at 300°C.
Catalyst company / product metal loading[wt-%]
Pt particle size[nm]
D[%]
Tconditioning
[°C]
Pt/γ-Al2O3 Degussa F 213 XR/D 0.5 4 (CO-TPD) 1)
2.3 ±0.6 (TEM)
38
42 2)
350
Pt/MgO Engelhard 41621 0.5 4.6 ±1.6 (TEM) 20 2) 350
Pt/SiO23) 0.5 ca. 3 (TEM) 50 350 4)
Pt/TiO2 Degussa F 700 XR/D 0.5 40 5) 350
Pt/Vulcan E-TEK 20 3.7 ±1.0 (TEM) 26 2) 300
Pt black Mateck 100 15.6 (XRD) 10 200
1) see ref. [9]; 2) particle size distribution (TEM) included for calculation of D; 3) preparation via colloid particles; 4) calcination for 90 min. 5) assumption for TOF calculations in chapter III-3.1.3
Table II-3: Pt-catalysts used for our experiemts

Catalysts Gold catalysts
25
2.3 Gold catalysts
All gold catalysts were synthesized (by V. Plzak; ZSW Ulm) in close accordance with
standard procedures from literature (see e. g. [69-72]):
• Coprecipitation (e. g. for Au/Fe2O3, Au/Ni2O3, Au/Mg(OH)2, Au/CeO2):
7 - 10 g catalyst were prepared by titrating a solution containing HAuCl4 and the support
metal nitrate with a Na2CO3-solution (all 1M) at a constant pH-value and (for most
cases) a temperature of 60°C (volume ca. 1 liter). The exact precipitation conditions are
provided in tables III-10 and III-12. Further details on this procedure may be taken from
ref. [73].
• Deposition-precipitation (e. g. for Au/Fe2O3, Au/Co3O4, Au/MnO2, Au/SnO2):
Differently from the above described coprecipitation procedure, in the first step only the
pure support precursor was formed before the HAuCl4 was added in a second step at
changed precipitation conditions (pH near the isoelectric point; see also table III-10-A).
• Impregnation (e. g. for Au/TiO2, Au/Al2O3):
The support material (7 - 10 g) was suspended in a buffered aqueous solution of Na2CO3
(ca. 1 liter) and impregnated near its isoelectric point with chloroauric acid at 60°C.
The amount of employed HAuCl4 was calculated in order to prepare samples containing ca. 2
at-% metal. The exact loading along with a detailed characterization of the freshly calcined
catalyst is given in tables III-10 and III-12.
After filtration the wet samples were redispersed several times in water in order to remove
residual chlorine and especially sodium, which was shown to cause a strongly enhanced
sintering of the gold particles during the following calcination procedure (chapter III-3.2.3).
Subsequently, the samples were dried overnight at 80°C and ground manually.
The resulting catalysts were pretreated by a calcination step with 10% O2/N2 at 400°C prior to
all experiments (20 Nml/min, 30 min.). Differing pretreament procedures are indicated
explicitely in the text.

Pt/Al2O3 The standard catalyst - Pt/γ-Al2O3
26
III. RESULTS & DISCUSSION
1. The standard catalyst - Pt/γγ-Al2O3
Alumina and silica supported platinum metals have been extensively studied for the CO
oxidation in the past (see e. g. [74-77] and references therein). Consequently they were among
the first catalysts proposed for the preferential oxidation of CO in an H2-rich atmosphere
(PROX) [4, 27, 78-80], which is one way for purifying the feed gas streams for polymer
electrolyte fuel cells (PEM-FC) produced from steam reformed methanol [14, 18, 22].
Currently the Pt/Al2O3-system still represents the basis for the majority of commercially used
catalysts in industrial applications [10, 16, 17, 28, 80, 81], although its performance has been
improved over the years by modification with several promotors [80, 82].
Consequently, in our efforts to study the selective CO oxidation reaction over supported noble
metal surfaces, we started from a commercial Pt/γ-Al2O3 catalyst (for characterization see
chapter II-2.1). After evaluating the detailed kinetics and selectivity in idealized reformate for
a variety of reaction conditions (Kahlich et al. - [9][7, 12, 83]), we tried to understand the
exact nature of the reaction mechanisms, which are responsible for the observed properties.
In the following part we will try to relate the data obtained in the kinetic studies to surface
species and processes and to characterize the influences, which additional components (H2,
H2O, CO2), constituting a real methanol steam reformate, exhibit on the basic CO oxidation
reaction. We will begin with the determination of the COad coverage on the metal particles
under reaction conditions by in-situ DRIFTS experiments and demonstrate its close
correlation to the selectivity before we further elucidate the role of coadsorbed hydrogen. In
the subsequent chapter we will focus on effects arising from the presence of H2O and / or CO2
in the reactant feed gas and investigate, whether the simplified approach by idealized
reformate in our kinetic studies is justified. In the last chapter we will compare various
standard support materials with respect to the CO oxidation activity as well as to the water-gas
shift reaction, which determines the minimum CO concentration achievable in a virtual PROX
stage.

Pt/Al2O3 The influence of CO coverage on the activity / selectivity
27
1.1. The influence of the CO coverage on the activity / selectivity
1.1.1 Selectivity & hydrogen induced rate enhancement
From an economic point of view it is crucial to waste as little hydrogen as possible in the
PROX stage, thus the selectivity, S, which is defined by the ratio between the CO and H2
oxidation rate, is of outstanding importance.
Sr
r r
O
O O
CO
CO H
CO oxidation
CO oxidation H oxidation==++
==++
−−
−− −−2 2
2
2 2
∆∆
∆∆ ∆∆(III-1.1)
rX = oxidation rate of CO and H2, resp.; ∆O2X = oxygen consumed by oxidation reactions
On examining the detailed kinetics of the selective CO oxidation over Pt/γ-Al2O3 in idealized
reformate it was found by Kahlich et al., that the dependence of selectivity on the CO partial
pressure changes markedly with temperature (figure III-1) [7, 25]. Whereas at 150 and 200°C
the selectivity remains almost constant at 40 - 45 % over the whole CO partial pressure range
from 1.5 to 0.02 kPa (at a constant λ-value of 2), it decreases significantly at 250°C down to
30% at 0.02 kPa CO. At 300°C the selectivity loss at lower CO partial pressure is even more
pronounced, ending at only 20% for 0.02 kPa.
p(CO,O2) [kPa]
0.01 0.1 1
S [%
]
0
10
20
30
40
50
60
150°C200°C250°C300°C
Fig. III-1: Selectivity over Pt/γ-Al2O3 in idealized reformate at λ = 2 for
different temperatures. {KAH}

Pt/Al2O3 The influence of CO coverage on the activity / selectivity
28
Another interesting phenomenon, which was observed in the kinetic studies by Kahlich et al.,
is a 2 - 3-fold enhancement of the CO oxidation rate, when switching at 150°C from a mixture
of CO and O2 in pure N2 to idealized reformate, which additionally contains 75kPa H2 (inset
in figure III-2) [7, 32]. Consistent with this enhancement, the light-off temperature for the CO
oxidation is shifted to lower temperatures (∆T ≈ 30 - 40°C) in the presence of hydrogen
(figure III-2) [7, 32]. But from the kinetic measurements it could not be clarified how this rate
enhancement is established and if the effect should be attributed to either co-adsorbed
hydrogen or the water, which is produced in-situ as a result of the H2 + O2 reaction. Muraki et
al. also reported rate enhancing effects of similar magnitude on Pt/α-Al2O3 upon adding either
3 kPa water or 0.3 kPa hydrogen to 1 kPa CO (λ ≈ 0.9) in the temperature range between 120
and 200°C [84]. In their DRIFTS spectra they observed a small downward shift of the band
for linearly adsorbed CO and interpreted this as a perturbation of the surface COad-layer
induced by coadsorbed water, which would weaken the self-poisoning effect of the CO, but
they could not further substantiate this proposal. In another kinetic study on the selective CO
oxidation over γ-Al2O3-supported platinum metal catalysts Oh and Sinkevitch noted a 40°C
downward shift in the light-off temperature for the CO oxidation reaction at 0.09 kPa CO (λ ≈
T [°C]100 150 200
CO
con
vers
ion
[%]
0
20
40
60
80
100
p(CO, O2) [kPa]0.1 1
TO
F [s
-1]
0.01
0.1
H2 / N2
N2
2-3
Fig. III-2: CO conversion of 1 kPa CO (λ = 2) at different temperatures in the presence
of 75 kPa hydrogen ( ; rest N2) and in a pure nitrogen background ( ), respectiveley
(data taken after 15 min at each setpoint). Inset: Rate enhancement of the CO conversion
at 150°C in the presence of 75 kPa hydrogen as a funcion of CO and O2 partial pressure
(λ = 2; data taken after 60 min at each point). {KAH}

Pt/Al2O3 The influence of CO coverage on the activity / selectivity
29
2) over Pt, when adding 0.9 kPa hydrogen [4]. Likewise similar effects of hydrogen have been
reported in some other studies dealing with selective CO oxidation [5, 85, 86] and also, e. g.,
by Dümpelmann et al. for the NO/CO conversion reaction on Pt/γ-Al2O3, where a blocking
COad layer limits the NO conversion rate in a similar way as will be shown for the PROX
reaction [87]. All latter studies speculate on the formation of highly reactive H-CO
intermediates on the metal surface, but yet there exists no direct prove for the formation of
such species [3].
In the following we will investigate the relationship between CO coverage and selectivity
behaviour on the basis of CO adsorption isotherms, recorded by DRIFTS at temperatures from
150 to 300°C. Subsequently, we will take a closer look at the influence of coadsorbed
hydrogen and show that a hydrogen induced displacement in the COad-layer may serve as a
good explanation for the above described rate enhancement effects.
1.1.2 Experimental limitations - neglecting the reaction rate
Provided that the CO and H2 oxidation reactions on platinum both follow a Langmuir-
Hinshelwood mechanism [1-3, 88-91], these high selectivities of more than 40% (see fig. III-
1) in a mixture with an H2 to CO ratio of 50 and more can only be achieved if on the surface
of the platinum particles a concentration ratio completely different from the gas phase exists.
For the CO oxidation in a pure nitrogen background such a CO-rich surface would be typical
for the so-called „low rate branch“, where the metal surface is covered predominantly with
CO and dissociative O2 adsorption is rate determining [1, 76]. Indeed, the kinetic studies by
Kahlich et al. in idealized reformate revealed a negative reaction order for CO (-0.4; attributed
to the self-poisoning effect of the COad layer) and an oxygen reaction order close to 1 (+0.8),
which are both typical for the „low rate branch“ [7]. This hypothesis was further supported by
the comparison of DRIFTS spectra of 1 kPa CO in a pure N2 background and during selective
CO oxidation in idealized reformate (1 kPa CO, λ = 2) at 150°C [83]. The tall band in figure
III-3 at ∼2060 cm-1 is assigned to linearly bound CO on the platinum surface. It consists of at
least two overlapping species: a low-frequency band band (∼ 2050 cm-1), which is assorted to
COad on step sites, and a high-frequency band (∼ 2075 cm-1), related to adsorption on
extended terraces [92, 93]. The smaller band at ∼1850 cm-1 represents bridge or multiply
bonded CO (similarly consisting of at least two different species, probably also on terrace and
step sites) [94]. In both spectra the integrated intensity of the adsorbed CO is practically
constant within an experimental uncertainty of ± 5%. It is assumed, that in the CO / N2

Pt/Al2O3 The influence of CO coverage on the activity / selectivity
30
mixture the platinum surface is saturated by COad (this will be essentially proven below), and
hence the selective CO oxidation indeed proceeds on a platinum surface with a comparably
high CO coverage under the applied conditions. The above experiment, however, covers just a
single set of concentration and temperature parameters and needs to be verified generally.
Unfortunately the above described selectivity experiments could not be simply reproduced in
the DRIFTS cell, since at temperatures above 200°C either the catalyst had to be diluted so
much, that there was no sufficient IR-signal for quantification, or differential flow conditions
were not fullfilled. A high background activity of the DRIFTS unit at low CO concentrations
and temperatures above 200°C adds further limitations. An elegant way out, the validity of
which will be shown in the following paragraph, is neglecting the reaction rate, i. e., analysing
the rates of carbon monoxide adsorption and desorption in the absence of oxygen. The steady
state CO coverage can be expressed in terms of an adsorption / desorption balance:
rad = rdes + rr (III-1.2)
rad = rate of adsorption; rdes = rate of desorption; rr = reaction rate (turnover frequency)
[cm-1]
1800190020002100
inte
nsity
[K
M-u
nits
]
0.0
0.1
0.2
0.3
0.4
inte
grat
ed I
nten
sity
[K
M-u
nits
/cm
]
0
5
10
15
Fig. III-3: DRIFTS-spectra on Pt/γ-Al2O3 with 1 kPa CO in pure N2 ( ) and
during selective CO oxidation ( ; 1 kPa CO; λ =2; idealized reformate) at
150°C. Inset: Integrated intensities of the linearly bound COad (also shown for
same experiment at 200°C).
150°C 200°C

Pt/Al2O3 The influence of CO coverage on the activity / selectivity
31
( ) exp12
1−− ⋅⋅ ⋅⋅
⋅⋅⋅⋅ ⋅⋅ ⋅⋅ ⋅⋅
⋅⋅ == ⋅⋅ ⋅⋅ −−
++ΘΘ ΘΘs
N p
R T ME
RT rA
CO
Arπ ρ
ν (III-1.3)
θ = relative CO coverage; s = sticking coefficient; NA = Avogadro number;
p = partial pressure [Pa]; R = gas constant [J/g*K]; T = temperature [K];
MCO = molecular weight of CO [g/mol]; ρ = surface density of Pt [atoms/m²];
ν = preexponential factor [s-1]; EA = activation energy [J]
The desorption term can be estimated theoretically from the adsorption energies and
preexponential factors given in several CO adsorption studies on Pt single crystal faces. In
table III-1 desorption rates at saturation coverage from those studies which represent the most
extreme parameters of EA and ν and thus should cover all possible values [95-98] are
compared with the turnover frequency calculated from our kinetic data [7]. For the calculation
of the rr term it was assumed that the kinetics do not change markedly at high temperatures,
which is indeed fullfilled over the whole range of conditions, where the above selectivity
measurements have been taken [25]. For all temperatures the reaction rates are at least two
orders of magnitude smaller than the desorption term, therefore the rr term may well be
neglected and a variation of the CO partial pressure in a CO / N2 mixture should yield the
same change of CO coverage as would be expected in the presence of O2. In figure III-4 the
integrated IR intensities of the linearly bound CO in different gas mixtures containing 1.5 kPa
CO at 150°C are compared. The first two columns, representing the amount of adsorbed CO
in a CO / N2 mixture and during oxidation reaction (λ = 2) in a pure nitrogen background, are
T [°C] rdes [s-1] rr (TOF) [s-1]
150 7.3 ... 3.2*104 0.08
200 140 ... 4.1*105 0.7
250 1.4*103 ... 3.2*106 4
300 1*104 ... 1.8*107 17
350 5.1*104 ... 7.5*107 55
Table III-1: Comparison of the range for the desorption term rdes
(see eq. III-1.2) with experimental and calculated turnover
frequencies for the selective CO oxidation (1 kPa CO, λ = 2,
idealized reformate; [7]) [95-98].

Pt/Al2O3 The influence of CO coverage on the activity / selectivity
32
indeed almost identical within a measurement accuracy of ± 3%. This clearly verifies the
above proposed simplifications.
1.1.3 Adsorption of CO in pure N2
As was pointed out in chapter II-1.2.1, DRIFTS is only a relative technique, because an
integration over the whole catalyst bed is not possible. Moreover, the CO coverage at a given
partial pressure cannot be determined simply by a temperature raising experiment, because the
IR cross section changes strongly with temperature, mainly caused by the reduced CO dipole
coupling at elevated temperatures [40, 99] (compare also chapter III-2.1.2). Insofar some
additional information is required as an absolute calibration point.
In table III-2 several studies on the adsorption of CO on different platinum single crystal faces
are listed. With each set of parameters (sticking coefficient, s0, preexponential factor and
adsorption energy at high and low coverage) the relative CO coverage at a partial pressure of
1.5 kPa was calculated for temperatures between 150 and 350°C. For simplification purposes
a constant sticking coefficient and a linear relationship between desorption energy and θCO
were assumed. One should be aware, that the absolute saturation coverage of CO on platinum
is around 0.7 ML [95] - the relative coverage of θsat = 1, used in this work, which is calculated
by the simplified model, corresponds to this absolute value. According to the results from
table III-2 it is clearly justified to assume a saturation coverage at 150 °C. At 200°C the
rela
tive
cove
rage
Θ
0.25
0.50
0.75
1.00
Fig. III-4: CO coverage (relative to saturation coverage) on Pt/γ-Al2O3 at 150°C in
different atmospheres containing 1.5 kPa CO: CO / N2; CO / O2 / N2
CO / H2 / N2; CO / O2 / H2 / N2 (PROX); (with H2: 75 kPa; O2: 1.5 kPa).

Pt f
ace
s 0ν
[s-1
]E
a at θ
sat
[kJ/ m
ol]
Ea a
t θ≈0
[kJ/ m
ol]
150°
C20
0°C
θ CO a
t25
0°C
300°
C35
0°C
Met
hod
ref.
111
0.67
1013
135
154
11
11
1T
DS
[98]
111
110
1584
139
0.99
0.93
0.83
0.72
0.60
TD
S[9
5]11
10.
841.
25*1
01510
3(1
)14
6(2
)1
10.
970.
900.
78T
DS
+ M
BS
[101
]11
10.
83(1
013)
9919
21
11
10.
98T
DS
[102
]11
10.
852*
1014
- 3
.2*1
07 (3
)45
138
11
11
1L
I-T
DS
[103
]11
10.
76(1
013)
6818
31
0.99
0.96
0.93
0.89
Cal
orim
etry
[100
]11
1(0
.7)
1013
101
139
(2)
11
11
0.98
TD
S[1
04]
557
(0.7
)10
1310
113
91
11
10.
98T
DS
[104
]11
10.
742.
9*10
13(9
0)12
61
10.
980.
930.
84M
BS
[105
]55
70.
747.
9*10
13(1
05)
141
11
10.
990.
95M
BS
[105
]11
10.
3410
1395
124
11
10.
980.
91Fl
ash-
TD
S[1
06]
110
0.64
1013
8310
91
10.
970.
900.
78„
[106
]10
00.
2410
1399
134
11
10.
980.
94„
[106
]21
00.
9510
1311
415
21
11
11
„[1
06]
211
0.27
1013
114
148
11
11
1„
[106
]11
1(0
.7)
(1013
)(1
05)
139
11
11
0.99
TD
S[1
07]
211
(0.7
)(1
013)
(130
)16
41
11
11
TD
S[1
07]
110
0.8
(1013
)13
516
01
11
11
TD
S[1
08]
110
0.7
6*10
1413
014
81
11
11
TD
S +
MB
S[1
09]
321
(S)
0.8
2*10
1411
3(4
)15
11
11
0.99
0.97
TD
S[9
7]32
1 (T
)0.
82.
5*10
11(6
0)96
10.
980.
930.
860.
77T
DS
[97]
533
(S)
(0.7
)3*
1012
120
134
11
11
1T
DS
[96]
533 (
T)
(0.7
)7*
1012
9811
51
11
10.
98T
DS
[96]
( )
= e
stim
ated
val
ues
TD
S =
ther
mal
des
orpt
ion
spec
tros
copy
Flas
h-T
DS
= f
lash
-des
orpt
ion
(50
- 10
0 K
/s)
LI-
TD
S =
lase
r-in
duce
d T
DS
MB
S =
mol
ecul
ar b
eam
sca
tteri
ng (
1) =
ext
rapo
late
d fr
om 1
16 k
J at
θ =
0.3
3ML
(2)
= in
clud
ing
defe
ct s
ites
(3
) he
re: ν
= f
( θ)
(4)
extr
apol
ated
fro
m 1
34 k
J at
θ =
0.4
5*θ m
ax(S
) =
ste
p bo
und
CO
(T)
= te
rrac
e bo
und
CO
Tab
le I
II-2
: C
O c
over
age
for
1.5
kPa
CO
in
a pu
re N
2 ba
ckgr
ound
at
diff
eren
t te
mpe
ratu
res
calc
ulat
ed w
ith
eq.I
II-1
.3 f
rom
lite
ratu
re d
ata
for
seve
ral s
ingl
e cr
ysta
l fac
es, a
ssum
ing
a lin
ear
rela
tions
hip
betw
een
Ea a
nd θ
.

Pt/Al2O3 The influence of CO coverage on the activity / selectivity
34
studies from Ertl et al. [95], Yeo et al. [100] and McClellan et al. [97] show deviations but the
rest still indicates a Pt surface at saturation condition. At 250°C the number of deviations
increases slightly (in most cases on the densely packed (111) crystal face, where the
adsorption energy is by ∼15% smaller than on the more open faces [107]), but from the vast
majority of studies it should still be justified to assume θ = 1. At higher temperatures,
especially at 350°C, deviations become more severe so that clear conclusions on the coverage
at 1.5 kPa CO cannot be drawn any longer from this table.
In our DRIFTS experiments the equilibrium surface coverage of CO is evaluated via the total
integrated IR intensity of the linearly bound CO. Due to strongly increased half width values
on supported catalysts compared to single crystals the two bands for terrace and step sites are
very difficult to resolve and therefore treated as one in the following measurements. Anyway,
at small particle diameters steps are the main type of adsorption site and terrace sites are just a
small minority [40], which is supported by the dominating IR-signal of step bound CO in our
spectra (see e. g. figure III-3). It is further assumed that the pressure-dependent changes in the
coverage of the COlinear species represent the overall changes of COad in a satisfiying manner
and that bridge bonded CO is only a minority species on our catalyst. According to Luo et al.
at high CO coverages (the dominating) steps should be decorated exclusively with on-top
p(CO) [kPa]0.1 1
rela
tive
cove
rage
Θ
0.6
0.7
0.8
0.9
1.0
p(CO) [kPa]
0.1 1ν
[cm
-1]
2040
2044
2048
2052
Fig. III-5: Change in the relative CO coverage on Pt/γ-Al2O3 with the CO
partial pressure in a pure N2 background at 150 ( ) and 250°C ( ), resp.
Inset: Corresponding positon of the infrared band for linearly adsorbed CO.

Pt/Al2O3 The influence of CO coverage on the activity / selectivity
35
species and their infrared signal is linearly related to the coverage [96]. In our DRIFTS
measurements this is underlined by the extreme ratio of the integrated intensities of COlinear
and CObridge of 20 at 150°C and up to several hundred at higher temperatures.
Figure III-5 shows the experimentally evaluated CO equilibrium coverage in pure nitrogen at
150 and 250°C as a function of the CO partial pressure. The adsorption isotherms were
recorded under a constant gas flow in an ascendig concentration sequence, waiting at least for
2 hours for equilibration at the lowest CO concentration (i. e., 0.025 kPa) and then 30 min. at
every other point before taking a spectrum. According to the calculations above both
isotherms were scaled to the relative saturation coverage (i. e., θ = 1) at 1.5 kPa CO. Whereas
at 150°C the coverage is near saturation coverage over the whole concentration range of two
orders of magnitude, there is a significant drop in the CO coverage at 250°C down to 80% at
0.025 kPa. The small intensity increase between 1 and 1.5 kPa may be either due to an
imperfect gas phase correction or, more likely, caused by a non-linearity of the IR signal due
to strong coupling effects, which would increase with increasing coverage. However, in every
case the same deviation would apply to all measured isothermes and not affect the relative
differences. The peak position of the linearly bound CO (for the band associated with the step
sites) is displayed in the small inset in figure III-5. In both cases a decrease of wavenumbers
with falling CO concentration is noticed, which also points to a small decrease in the local CO
density even at 150°C (Due to intensity shifts arising from coupling effects this decrease in
wavenumbers is not necessarily linearly related to the coverage [110]). At 250°C the shift in
peak position is slightly larger, which parallels the different slope of the adsorption isotherms.
The frequency offset between 150 and 250°C of about 5 cm-1 at 1.5 kPa CO, where in both
cases a saturation coverage has been calculated, is caused by the reduced coupling of CO
dipoles at elevated temperatures, as described by Persson et al. [99] or Kappers [40].
For comparison purposes theoretically calculated adsorption isotherms for CO on Pt(111),
derived from the values of Campbell et al. [101], and on Pt(321) (step sites) according to the
study of McClellan et al. [97] are presented in figure III-6. Especially the coverages
calculculated for Pt(111) (including defect sites) reflect our experimental values excellently,
which demonstrates that the adsorption isotherms recorded by the DRIFTS signal of the
linearly bound CO represent the true surface situation quite well. The fact that the Pt(111)
surface even provides a better fit than the (321)-face, which theoretically should be closer
related to small supported clusters, may likely be caused by the simplified calculations (eq. III-
1), where a constant sticking coefficient (s0) and a linear relationship between desorption

Pt/Al2O3 The influence of CO coverage on the activity / selectivity
36
energy and coverage is assumed (which are both counteracting effects, but do not necessarily
exactly outweight each other.
1.1.4 Adsorption of CO in H2 / N2
The question still remains if all of the above assumptions and simplifications can be applied if
we proceed to a more complex matrix containing 75% hydrogen. First of all we should clarify
whether we can expect an appreciable surface coverage of hydrogen at such high
temperatures, since its adsoption energy is considerably smaller than that of CO [111, 112]. If
we theoretically estimate coverages for pure H2-adsorption by similar calculations as were
performed for CO in table III-2, with the parameters provided in several previous studies
[113-116], assuming second-order desorption kinetics, for every temperature level coverages
greater than θH = 0.1 are obtained at a partial pressure of 75 kPa hydrogen in the gasphase.
Presumed, that the additional presence of COad or Oad does not affect the H2 adsorption /
desorption equilibrium significantly, we truly have a competition situation between CO and
H2 at the reaction conditions for selective CO oxidation.
Before we start a more detailed investigation of the coadsorption behaviour we will compare
quantitatively the total integrated intensities of the COad species in a pure nitrogen background
(after 2 hours) and with 75 kPa H2 (after one additional hour of equilibration). In figure III-4
p(CO) [kPa]
0.1 1
rela
tive
cov
erag
e Θ
0.4
0.6
0.8
1.0
Pt(111) Pt(321)
p(CO) [kPa]
0.1 1
150°C200°C250°C300°C350°C
Fig. III-6: Adsorption isotherms for the Pt(111) and (321) face (step sites)
calculated by the values from table III-2 using eq. III-1.3 [101, 97].

Pt/Al2O3 The influence of CO coverage on the activity / selectivity
37
the third column represents the integrated IR area of the linearly bound CO at 150°C in 1.5
kPa CO in 75 kPa H2 / rest N2. Compared to the hydrogen-free gas mixtures (first two
columns) the IR signal of the linear bond CO is 5% smaller but, as will be explained in more
detail in chapter III-1.2.5, this is compensated by an increase in the bridge bonded region.
Thus it is rather a change in adsorption site than a significant decrease in θCO. So within the
measurement tolerance of ± 3% we are still near saturation coverage with 1.5 kPa CO at
150°C in a H2-rich gas mixture and the corresponding adsorption isotherm may again be
scaled to the relative coverage θ = 1.
The comparison between CO / H2 / N2 and selective CO oxidation in idealized reformate leads
again to almost identical peak areas (columns 3 and 4 in figure III-4), which demonstrates that
the above applied simplification of neglecting the reaction rate is also valid in the presence of
hydrogen. It also clearly proves, that the catalyst operates near saturation coverage during
selective CO oxidation, as was deduced from the kinetic measurements [7, 83] - at least
within the increased measurement tolerance of ± 5%. A small loss in θCO of a few percent,
however, which may be caused by the in-situ produced water, similar to the effects arising
from the addition of water in the gas stream, described in chapter III-1.3.2, cannot be
completely ruled out. Nevertheless, these results undoubtly confirm, that the selective CO
ν [cm-1]180020002200
inte
nsit
y [K
M-u
nits
]
0.00
0.05
0.10
0.15
0.20
0.25
ν [cm-1]
17001800
[KM
-uni
ts]
0.00
1
Fig. III-7: DRIFTS-spectra on Pt/γ-Al2O3 with 1.5 kPa CO in pure N2 ( ) and
in presence of hydrogen ( ; 1.5 kPa CO, 75 kPa H2, balance N2) at 250°C.
Inset: Zoom in the region for bridge bonded COad.

Pt/Al2O3 The influence of CO coverage on the activity / selectivity
38
oxidation proceeds in the „low rate branch“ and therefore explains well the determined
reaction orders.
Due to the lack of published data for calculations in a hydrogen-rich mixture, similar to those
presented in table III-2, for calibration it is also necessary to compare the CO coverage at
other temperatures with 1.5 kPa CO in pure N2 and in CO / H2 / N2. For 200°C there was not
much difference to the switching experiment at 150°C, so the CO coverage at 1.5 kPa CO in
H2 / N2 is still at its saturation value (therefore not shown). For 250°C the corresponding IR
spectra are shown in figure III-7 (The bridge bonded region is magnified in the inset window).
Now there is a significant decrease in the linearly bonded region, which is – other than at
150°C – not compensated by an increase of bridge bonded CO. This represents a true loss in
adsorbed CO, yielding a relative coverage of θCO = 95% in the presence of 1.5 kPa CO and
hydrogen at 250°C. With view on the next chapter it should already be noted that mainly the
step bound CO species (low frequency band) is affected, whereas the signal for the terrace
bound CO is practically retained, although its desorption energy should be approximately 15%
smaller [107]. This is explained with a strong dependence of the hydrogen adsorption upon
site geometry [90, 117, 118], leading to a significant coadsorption of H2 on step sites only.
In figure III-8 the experimental DRIFTS adsorption isotherms between 150 and 300°C of CO
in a mixture of 75 kPa H2 / rest N2 over a concentration range of two orders of magnitude are
p(CO) [kPa]0.1 1
rela
tive
cov
erag
eΘ
0.4
0.5
0.6
0.7
0.8
0.9
1.0
150°C
250°C
300°C
200°C
Fig. III-8: Change in the relative CO coverage with the CO partial pressure
at different temperatures on Pt/γ-Al2O3 in a background containing 75 kPa H2.

Pt/Al2O3 The influence of CO coverage on the activity / selectivity
39
shown. The data were recorded in the same manner as for the above measurement in pure
nitrogen. Since from the theoretical calculations in chapter III.1.2.3 no absolute calibration
point for the CO / N2 isotherm at 300°C could be gained and therefore a switching experiment
between a hydrogen-containing and a hydrogen-free mixture is of no use, the coverage at 1.5
kPa CO can only be estimated roughly with a tolerance of ± 5% on the basis of the coverage
decrease in figure III-6 between 250 and 300°C.
Whereas at 150°C the coverage remains well above 90% of the saturation value, similar to the
adsorption in a pure N2 background, and for 200°C is only slightly less at low concentrations,
at 250°C there is a significant coverage decrease at decreasing CO partial pressure, which is
even more pronounced at 300°C. These adsorption isotherms exactly follow the same trend
which was observed for the selectivity behaviour (fig. III-1) and show the same increasing
slope at higher temperatures. Whereas near saturation coverage (θ > 0.9*θsat) the selectivity is
between 40 - 45% and decreases hardly with decreasing CO partial pressure, indicating a
situation with a relatively tight COad layer, it soon drops down to smaller values below a
critical value of ∼0.8*θsat. Below this point the local COad density seems to be reduced to such
an extent that hydrogen adsorption is strongly facilitated. The somewhat enhanced selectivity
at 200°C at high CO partial pressures compared to 150°C may be explained by a CO coverage
as high as at 150°C but a relatively lower Had coverage, due to a sticking coefficient that
decreases with increasing temperature [103].
These measurements demonstrate that the selectivity is directly related to the CO coverage on
the platinum particles. In view of the results on other catalysts (see chapters III-2.1.2 and III-
3.3.2) this principle may be generalized for supported noble metal catalysts, that a high CO
coverage (at least high compared to the hydrogen coverage, which is a crucial point for the
Au-catalyst) causes high selectivity values in the PROX reaction.
1.1.5 Coadsorption behaviour of CO and H2
Let us now take a detailed look at the coadsorption of CO and hydrogen on the platinum
particles. Reviewing several studies from literature about coadsorption on platinum single
crystal faces does not yield an uniform picture. The nature of the CO-H interaction seems to
be very sensitive to the local surface geometry. Especially for step sites the results depend
strongly on the orientation of the Pt single crystal.

Pt/Al2O3 The influence of CO coverage on the activity / selectivity
40
On the (111)-face island formation is observed due to repulsive interactions between H and
CO [111, 112, 119]. As a result of the compression into islands with a higher local density the
adsorption energy of CO is decreased markedly [112]. It is very interesting that for very small
H2-pressures and coverages, respectively, which were not enough to keep up the compressed
CO islands, Parker et al. could also observe a reduction in CO desorption energy of about 4
kJ/mol [120]. But it was not clear whether this was caused by an increased population of
bridging CO at the expense of atop CO as a result of adsorbate-adsorbate interactions or due
to a weak direct interaction of a similar type as in the case of alkali coadsorption as was
proposed by Hoge et al. [119] – however, the latter could also generate such a diplacement
effect in the CO population. The same island formation behaviour was observed upon H2
adsorption on a CO precoverded Pt(997) face [118]. Henderson et al. investigated the
coadsorption of H and CO on the step sites of a Pt(112) crystal by ESDIAD and LEED and
reported likewise the formation of islands but in small one-dimensional structures consisting
of tilted atop CO [121]. Whereas all the mentioned low-index planes behave in a quite similar
way, a completely different situation was reported for the step sites of a Pt(533) crystal which
differs by only one terrace row from the (112)-structure. After coadsorption with hydrogen,
there seem to exist mixed regions of H and CO which have the same local density as for pure
CO adsorption, along with one dimensional islands of pure CO [122, 123]. Within these
mixed regions the site occupancy of CO is altered from atop places to bridging positions. The
mixed phase is reported to show the same CO-CO distance as is found without hydrogen (i. e.,
no compression occurs). For the on-top CO species at the edge sites only a small downward
shift of a few cm-1 was observed in the EELS spectra, which was attributed rather to a change
in the work function, Φ, caused by the adsorbed hydrogen, than to a change in the local
coverage of CO. As a consequence, coadsorption may be possible at step sites even under
conditions for a saturated COad-layer. On the (111)-terraces of the Pt(533) crystal virtually no
effect due to the coadsorption of hydrogen could be observed which encounters the studies on
the Pt(111) faces. A possible explanation for this discrepancy, given by Wang et al., is that in
their experiment H built up from the step troughs and occupied sites that did not significantly
affect the adsorbed CO [122]. Kim et al. reproduced these UHV results in aqueous
electrochemical studies on a Pt(533) crystal and suggested that the hydrogen mainly coadsorbs
at the step sites, since the observed effects on the IR absorbtion frequency for the terrace
bound CO were again much smaller than on the step species [124]. Finally, in a study of
coadsorption of H and CO on a polycrystalline Pt foil, which showed predominantly (110)

Pt/Al2O3 The influence of CO coverage on the activity / selectivity
41
characteristics, Thrush et al. also proposed the existence of mixed H-CO regions. In their TPD
study a saturation coverage of CO completely blocked H2-adsorption, but in the reverse
experiment only two third of the CO was blocked. And at very low temperatures they
observed coadsorption without desorption of the predosed species, which must have yielded a
very crowded surface. Their results imply the idea that adsorption places exist which are only
accessible to one of the adsorbents and coadsorption of one species may be possible without
desorbing a corresponding fraction of the competing species. On the basis of this short
literature review, coadsorption on terrace sites seems to be possible only at a low CO
coverage, whereas a saturated COad-layer effectively blocks the surface for hydrogen
adsorption. But on step sites coadsorption of CO and H2 may be expected by the formation of
mixed structures.
In figure III-9 the infrared spectra of 1.5 kPa CO in pure N2 and in 75% H2, rest N2,
respectively, at 150°C are compared. Previously the catalyst was allowed to equilibrate in CO
/ N2 for more than two hours before recording the first spectrum and then switching to the
mixture containing 75% H2, where the spectrum was taken after one hour on stream. The IR
band from CO adsorbed linearly on step sites is shifted down for more than 3 cm-1 towards
2048 cm-1 in the presence of hydrogen and the peak is significantly diminished in height and
ν [cm-1]180020002200
inte
nsit
y [K
M-u
nits
]
0.00
0.05
0.10
0.15
0.20
ν [cm-1]
17001800
[KM
-Uni
ts]
0.00
5
Fig. III-9: DRIFTS-spectra on Pt/γ-Al2O3 with 1.5 kPa CO in pure N2 ( ) and
in presence of hydrogen ( ; 1.5 kPa CO; 75 kPa H2; balance N2) at 150°C.
Inset: Zoom in the region for bridge bonded COad.

Pt/Al2O3 The influence of CO coverage on the activity / selectivity
42
broadened to lower wavenumbers. It is difficult to evaluate whether the high frequency band,
assigned to on-top CO on terrace sites, changes its intensity, but from the analysis of the
second derivatives it is obvious that it keeps its position with an accuracy of 1 cm-1. The
overall IR intensity of the linearly bound CO is reduced by approximately 5%. This reduction
of linear bond CO is encountered by an increase in the bridge bound region of 22% (see inset).
This band consists of at least two different species, too. There is a clear increase on the low
frequency side (around 1790 cm-1). Since the change in atop intensity was limited to step sites,
the increased low frequency band at 1790 cm-1 is attributed to the corresponding bridge bond
CO on steps, whereas the less affected higher frequency species at about 1820 cm-1 is assigned
to CObridge located on terrace sites. Although this site conversion phenomenon is most
eyecatching at 150°C, since it is not accompanied by additional CO desorption as was seen at
250°C, it generally applies to all measured temperatures (150 - 300°C) that in a hydrogen-rich
matrix the ratio between COlinear and CObridge decreases by a factor of ∼2 compared to CO
adsorption in pure nitrogen, which corresponds to the displacement of a small fraction of
COlinear to bridging sites.
Our results fully parallel the coadsorption behaviour studied on the Pt(533) face [122-124]:
unaffected terrace bound CO, but a significant influence on step sites. Under our dynamic
conditions (adsorption / desorption equilibrium) such a structure sensitive coadsorption
behaviour may be most likely explained by the strong dependence of the hydrogen adsorption
energy and sticking coefficient upon site geometry. Henderson et al. noticed a difference in
adsorption energy between step and terrace sited of at least 29 kJ/mol in the presence of
coadsorbed CO [121] and Christmann et al. showed that the initial sticking coefficient
increases by a factor 4 on step sites [117]. Therefore a significant H-population is probably
built up only on step sites. Another reason, why the step sites are affected exclusively, may be
the unique coadsorption behaviour found for the Pt(533) step sites, which produces mixed
structures with an unaltered CO density. As an interesting note, the parallel coadsorption
behaviour of our supported catalyst with the Pt(533) single crystal face indeed justifies its
frequent use as a model system for small particles (see e. g. [93])
In figure III-10 the adsorption isotherms in pure N2 and with 75% hydrogen are directly
compared (upper window). Obviously, in the H2-rich gas the CO coverage is reduced by a few
percent, even after regarding the site conversion to bridge bound species by scaling the
relative coverage at 1.5 kPa CO at 150°C in both cases to θ = 1. The more pronounced
decrease of the local CO density with falling CO partial pressure in the presence of H2 is also
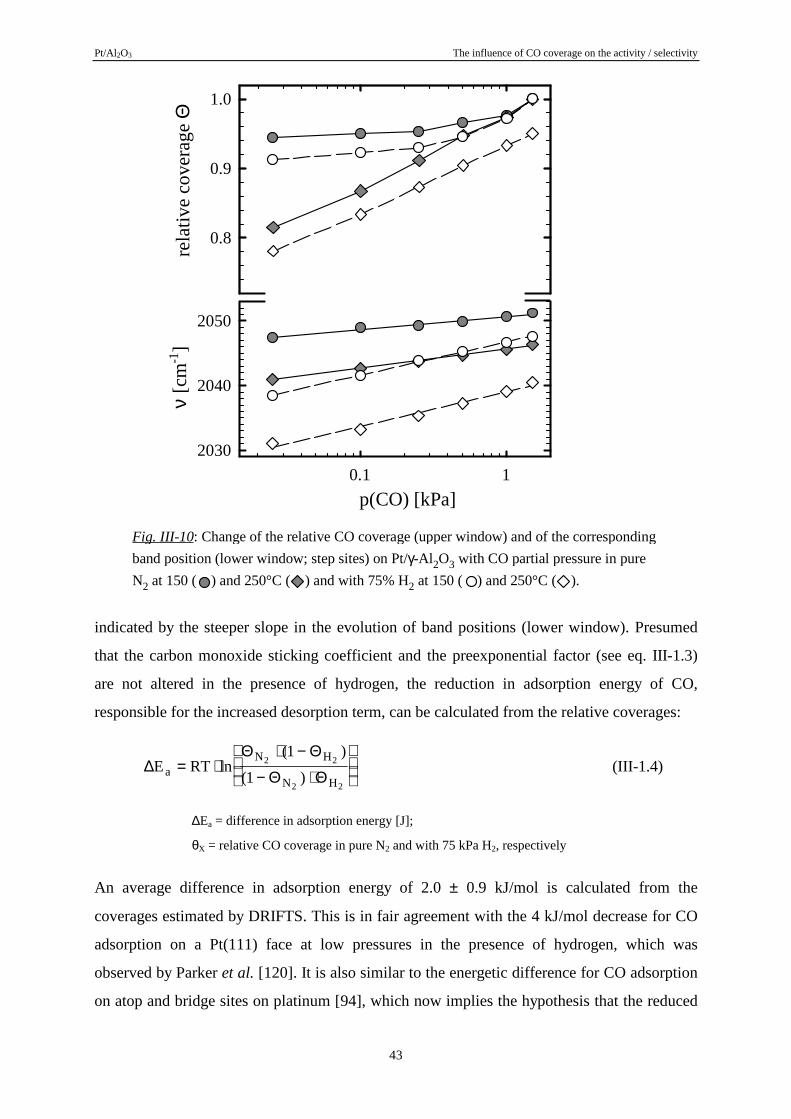
Pt/Al2O3 The influence of CO coverage on the activity / selectivity
43
indicated by the steeper slope in the evolution of band positions (lower window). Presumed
that the carbon monoxide sticking coefficient and the preexponential factor (see eq. III-1.3)
are not altered in the presence of hydrogen, the reduction in adsorption energy of CO,
responsible for the increased desorption term, can be calculated from the relative coverages:
∆Θ Θ
Θ ΘE RTa
N H
N H= ⋅
⋅ −
− ⋅
ln
( )
( )2 2
2 2
1
1(III-1.4)
∆Ea = difference in adsorption energy [J];
θX = relative CO coverage in pure N2 and with 75 kPa H2, respectively
An average difference in adsorption energy of 2.0 ± 0.9 kJ/mol is calculated from the
coverages estimated by DRIFTS. This is in fair agreement with the 4 kJ/mol decrease for CO
adsorption on a Pt(111) face at low pressures in the presence of hydrogen, which was
observed by Parker et al. [120]. It is also similar to the energetic difference for CO adsorption
on atop and bridge sites on platinum [94], which now implies the hypothesis that the reduced
rela
tive
cov
erag
eΘ
0.8
0.9
1.0
p(CO) [kPa]0.1 1
ν[c
m-1
]
2030
2040
2050
Fig. III-10: Change of the relative CO coverage (upper window) and of the corresponding
band position (lower window; step sites) on Pt/γ-Al2O3 with CO partial pressure in pure
N2 at 150 ( ) and 250°C ( ) and with 75% H2 at 150 ( ) and 250°C ( ).

Pt/Al2O3 The influence of CO coverage on the activity / selectivity
44
desorption energy in our case is essentially caused by the observed transfer from linearly to
bridge bound CO in the mixed H-CO structures at step sites. Possibly this effect originally
emanates from direct electronic interaction between H and CO of the alkali-type as was
proposed by Hoge et al. [119].
Since CO oxidation on platinum proceeds in the „low rate branch“ at our conditions, CO
desorption is considered to be the rate limiting step. Therefore we expect the activation energy
for this process to be similar to the activation energy for desorption [7, 88, 125]. If the
turnover frequency is calculated theoretically using a power law approach
r kE
RTp pa
CO O= ⋅−
⋅ ⋅exp α β
2(III-1.5)
r = reaction rate; k = constant; α, β = reaction orders for CO and O2, respectively
the rate enhancing effect of the hydrogen coadsorption can be derived from a change in the
activation energy, Ea, (presumed that Ea ≈ Edes) via
∆∆
rE
RTa=
−
exp (III-1.6)
∆r = enhancement factor in reaction rate
Although the determined effect on the desorption energy seems to be rather small, the change
of 2 kJ/mol calculated from the adsorption isotherms is enough to account for a rate
enhancement of a factor 1.8. Therefore the increased rate for the CO oxidation in the presence
of hydrogen (see figure III-2) is almost solely attributed to the reduced CO adsorption energy
caused by coadsorption of H2 at step sites, and if, then only to a minor part to effects arising
from the in-situ produced water, contrary to the hypothesis by Muraki et al. [84]. There exists
also an analogous influence of water, added to the reaction mixture, on the rate for the CO
oxidation over Pt/γ-Al2O3 [32]. In view of chapter III-1.3.2, however, this effect is more a
direct consequence of the stabilization of the initial CO oxidation rate in the presence of water
and not a true enhancing effect.
Our hypothesis, that the hydrogen and not the water is responsible for the rate enhancement, is
also supported by experiments on Pt powder (for charcterization see chapter II-2.1), where a
similar rate enhancement of even more than a factor five was observed for CO conversion at
150°C with 75 kPa hydrogen (idealized reformate; 1 kPa CO; λ = 2) compared to the
oxidation in pure nitrogen. A concomitant decrease in the IR band positon upon the addition

Pt/Al2O3 The influence of CO coverage on the activity / selectivity
45
of hydrogen from 2079.0 cm-1 to 2076.5 cm-1 for step bound CO is observed, indicating the
reduction of this surface species (probably by conversion to bridge bound species as was
shown for Pt/γ-Al2O3), and, which is again in analogy to Pt/γ-Al2O3, only a very small shift for
the terrace bound CO (2095.4 cm-1 → 2095.0 cm-1), underlining, that it is predominantly the
step sites, which are affected by hydrogen coadsorption (figure III-10a). In contrast, the
additional presence of 1.3 kPa H2O showed absolutely no effect within the measurement
tolerance on either of the CO species adsorbed on the Pt powder, demonstrating, that the
influence of coadsorbed hydrogen is clearly different and has to be treated separately from any
effects, which coadded (or in-situ produced) water may exhibit on the COad layer and its
reactivity (See also section III-1.3.2).
ν [cm-1]
20502100
inte
nsity
[K
M-u
nits
]
0.000
0.003
0.006
0.009
Fig. III-10a: DRIFTS-spectra on Pt-black during CO oxidation (1 kPa CO)
in pure N2 ( ) and during selective CO oxidation ( ; 1 kPa CO; λ =2;
idealized reformate) at 150°C.

Pt/Al2O3 From idealized to more realistic conditions
46
1.2. From idealized to more realistic reformates
After demonstrating qualitatively the dependence of the selectivity on the surface CO
coverage in idealized reformate, the next step is to apply more realistic conditions, i. e., the
addition of water (up to 1.5 kPa) and CO2 (up to 25 kPa) to the reaction mixture. Not only the
immediate response upon switching to the new gas phase components is of interest, but also
the long-time evolution of the catalyst’s properties in an altered reaction atmosphere. If we
think, e. g., of mobile applications, an average life-time of up to 5000 hours would required
for the PROX stage [23].
Here we will first summarize the long-term evolution in idealized reformate. A part of these
investigations (e. g., the in-situ DRIFTS measurements) has already been covered in the
preceeding diploma thesis by Schubert [32]. Subsequently, in the two following chapters the
influence of water and of carbon dioxide is examined in detail.
1.2.1 Self-poisoning by COad
The typical time development of the activity / selectivity during selective CO oxidation over
Pt/γ-Al2O3 at 150°C in idealized reformate (1 kPa CO; λ = 2) is shown in figure III-11. It is
characterized by a continuous decrease in the turnover frequency of around 40% within 1000
min. on-stream. At the same time the corresponding selectivity increases slowly from around
36 to 42%. Exactly the same behaviour was found for the increased reaction temperature of
200°C. In anticipation of chapter III-1.3.1, such a permanent loss in activity, accompanied by
an increasing selectivity, indeed applies to all platinum based systems during selective CO
oxidation which have been evaluated in this work.
Such a loss of reactivity during reaction has often been reported in studies concerned with CO
oxidation, both on single crystals [88] and on real catalysts [7, 74, 75, 126, 127]. For example,
Cant and co-workers observed a reduction in the turnover frequency of around 50% after 1000
min. during CO-Oxidation at 180°C (2 kPa CO, λ ∼1) for a Pt/SiO2 catalyst [126, 128]. They
also demonstrated that this deactivation was reversible, by simply flushing the catalyst at
reaction temperature with He. Likewise, Nibbelke et al. noticed, that their Pt/γ-Al2O3 catalyst
showed a higher CO oxidation rate after the daily startup of their reactor than after a few hours
on-stream [127]. As an explanation Cant and Angove proposed a very slow change of the
surface CO/O concentration eqilibrium, which initially depends on the ratio of sticking
coefficients [128]. Based on the EELS/TPD experiments by Gland et al. [102], they assumed

Pt/Al2O3 From idealized to more realistic conditions
47
„unreactive“ Oad species at step sites as a possible reason for the unexpectedly slow
replacement of Oad by CO. Recent studies with molecular beams indeed suggest the existence
of a fraction of Oad species, which react only at higher temperatures, probably isolated O-
atoms [129].
The deactivation characteristics for selective CO oxidation on Pt/γ-Al2O3 were already
investigated in the diploma thesis of Schubert, where a concomitant slow increase in the IR-
intensity of linearly adsorbed CO, accompanied by a small shift to higher wavenumbers of 1 -
2 cm-1, during CO oxidation (in both cases, with and without H2) at 200°C (1 kPa CO, λ = 2)
was noticed. This was interpreted as a build-up of a more and more perfect COad layer with
time [32]. On a more densely packed COad layer less oxygen and hydrogen adsorb on the
surface, hence the reaction rate decreases by time, whereas the selectivity shows the opposite
trend. This „self-poisoning“ by COad is easily reverted by flushing the catalyst for a few
minutes with a non-reactive gas. Even after only stopping the reactant gas flow for a while or
when changing the temperature level during our screening tests, where the temperature was
increased by 25°C every 30 min., the initial activity was retained, which further confirmed,
Fig. III-11: Time evolution of turnover frequency (upper window) and
selectivity (lower window) during selective CO oxidation over Pt/γ-Al2O3
in idealized reformate with 1 kPa CO and λ = 2 at 150°C.
TO
F [s
-1]
0.060.070.080.09
0.2
0.1
t [min]
10 100 1000
S [%
]
30
35
40
45
50

Pt/Al2O3 From idealized to more realistic conditions
48
that the deactivation of platinum catalysts may be understood as a highly reversible slow
approach to the real steady-state.
1.2.2 Influence of water
Although there exists a number of studies concerned with the reaction kinetics of CO
oxidation on supported platinum metals in hydrogen-rich gases (e. g., [4, 7, 16]), relatively
little attention has been paid to the specific influence of water, although it constitutes up to
15% of the feed gas stream from a methanol reformer. In his diploma thesis Schubert noticed
an increase in reactivity by a factor 2 for the CO oxidation in pure N2 after adding 0.6 kPa
H2O in the feed gas stream (1 kPa CO, λ = 2, 150°C; addition of water after 30 min. of
reaction; [32]). Muraki et al. found promoting effects (ca. factor 2 - 3) for both, hydrogen and
water, on the CO oxidation over alumina suported platinum under steady state conditions at
150°C (1 kPa CO; λ = 0.9) and a small decrease of the activation energy from 55 to 45 kJ/mol
in the presence of 3 kPa water [84]. Since additional CO2 production via the water-gas-shift
reaction could be excluded as an explanation due to the negligible water-gas shift rates (eq. I-
1.4) below 200°C, they proposed that the self-poisoning induced by the blocking CO adlayer
must have been reduced in some way. This was concluded from a small down-shift of the
vibrational COad-band upon admission of water. In their pulse experiments the presence of
water accelerated the CO2 production, which also pointed to a reduced CO inhibition in the
oxidation reaction. Finally, Nibbelke et al. also mentioned a promoting effect (factor ∼2.5) of
1 kPa water for the CO oxidation over Pt/γ-Al2O3 (0.9 kPa CO; λ = 5; 210°C), which
decreases at higher temperatures. They speculated about O2-dissociation on the support,
enabled in the presence of OH-groups, analogous to what they proposed for ceria supports, but
did not substantiate this hypothesis by experimental evidence [127]. Apart from that small
enhancing effect, the water showed no further influence on their kinetics (CO and O2 reaction
orders).
In order to investigate the influence of moisture, we will first compare long-term experiments
over Pt/γ-Al2O3 during CO oxidation without and in the presence of water. The upper part of
figure III-12 diplays the activities for CO oxidation in pure nitrogen and in idealized reformate
at different partial pressures of H2O as a function of time (1 kPa CO, λ = 2; T = 150°C). For
the CO oxidation in pure nitrogen without water a step in the activity behaviour is observed
after 2-3 h. This step, the origin of which is still unclear, is absolutely reproducible, even after
re-conditioning the catalyst. For a better comparison of the initial activity also the

Pt/Al2O3 From idealized to more realistic conditions
49
extrapolation to the „steady-state“-activity after this step is included. Clearly, the initial
activity is only moderately influenced by the presence of 1.3 kPa water (+15% for idealized
reformate, +45% for the CO oxidation in pure N2 – +100% if we regard the initial step). This
is less than the influence of hydrogen (initial activity enhanced by a factor 3.2; x4.4 if the step
is regarded), which was already discussed in the preceeding section. Analogous to the study of
Muraki et al. [84] this „water-effect“ cannot be simply explained by the forward water-gas
shift reaction,
CO + H2O ↔ CO2 + H2 (III-1.7)
TO
F [
s-1]
0.01
0.1
t [min]
10 100 1000
S [%
]
30
40
Fig. III-12: Time evolution of the turnover frequency (upper window) and
selectivity (lower window) during oxidation of 1 kPa CO (λ = 2) at 150°C
over Pt/γ-Al2O3 in pure N2 ( ), pure N2 with 1.3 kPa H2O added ( ),
idealized reformate ( ; = 75% H2), and idealized reformate with 0.65 kPa
( ) and 1.3 kPa H2O ( ) added, repectively.

Pt/Al2O3 From idealized to more realistic conditions
50
because the rate measured at 150°C (1 kPa CO, 1.3 kPa H2O, Rest N2) is only ∼9*10-7
molCO/gPt*s (see also section III-1.3.2), which is more than two orders of magnitude less than
the oxidation rates and a factor 60 smaller than the measured enhancement. And in the
presence of 27 kPa hydrogen it is even one more order of magnitude lower, probably due to
the simultaneously occuring reverse water-gas shift reaction. But what is striking now, is that
the water seems to reduce the deactivation during time on-stream. In idealized reformate, the
rate is almost stabilized on the initial level in the presence of 1.3 kPa water (As would be
expected, with only 0.65 kPa water the effect is somewhat less pronounced). Thus the
measured effect in „switch“-experiments crucially depends on the timing, leading to an
increased apparent reactivity enhacement of water with preceeding reaction time. Therefore
the (predominant) effect of co-added water during (selective) CO oxidation should better be
named a „stabilizing effect“ rather than an „enhancement“. Of course, it is not possible to
separate the influences of hydrogen and water on the CO oxidation completely, since in the
first case water is always produced in-situ by the H2 + O2 side reaction, and in the latter case
adsorbed water may dissociate on the support and produce Had on the platinum.
A second, very unpleasant effect arising from the addition of water during selective CO
oxidation at 150°C over Pt/γ-Al2O3 is a decrease in selectivity, shown in the bottom part of
figure III-12. With 1.3 kPa water in the gas mixture it is reduced from 42% down to 36% at
„steady state“. Additional experiments by Kahlich in idealized reformate have shown, that this
effect is clearly a function of the water partial pressure up to 5 kPa and then remains constant,
leading to selectivities as low as 30% at 150°C and and 1 kPa CO (λ = 2) [25].
In order to gather more information on these water induced effects, we have performed
„switch“-experiments in DRIFTS. Figure III-13 shows a typical result of such an experiment.
First, spectra were recorded during selective CO oxidation over Pt/γ-Al2O3 at 150°C for 3 h (1
kPa CO, λ = 2) and then 1.3 kPa water was admitted to the gas mixture. In the left part of
figure III-13 the infrared bands for linearly bound COad after 60 min. in each atmosphere are
shown. The position of the main peak is down-shifted by ca. 2.5 cm-1 and the integrated
intensity is reduced by roughly 10% (±5%). Similar results were also obtained in mixtures
without hydrogen. In the right part of figure III-13 the time evolution of the intensity (upper
window) and the band position (lower window) are shown for the whole experiment. It may
be noticed that the IR intensity (upper window) increases again after the switch to water, but
now the peak position (lower window) shifts in the opposite direction while approaching the
steady-state, indicating, that a new kind of equilibrium is installed on the catalyst surface. Due

Pt/Al2O3 From idealized to more realistic conditions
51
to repulsive CO-O interactions the COad is compressed into islands during CO oxidation,
whose local coverage is independent from the island size [130, 131]. If there would simply be
less CO on the surface, we would see the reduced intensity but probably no band shift,
because the CO islands just get smaller. Hence in the presence of water also the locals density
of the COad-layer must have been reduced in some way.
To exclude artifacts arising from mass-transport or local temperature change effects, which
cannot be completely ruled out with the used DRIFTS cell model, the influence of water was
also investigated without reaction, i. e., during CO adsorption (1 kPa; 150°C) in 75 kPa H2,
rest N2 (figure III-14). Exactly the same phenomenon as for the „switch“-experiment during
reaction is observed. When comparing the spectra acquired after 1 h in each atmosphere, we
notice a downshift from 2053.3 cm-1 to 2050.9 cm-1 in the presence of 0.65 kPa water and a
further shift down to 2049.9 cm-1 after adding 1.3 kPa H2O (i. e., 3.4 cm-1 overall shift).
But what else happens on the catalyst’s surface after the admission of water during selective
CO oxidation? If we take a look at other spectral regions, we notice, that upon the admission
t [min]
0 100 200
ν[c
m-1
]
2048
2050
2052
inte
gr. i
nt. [
a. u
.]
5.2
5.6
6.0(i) (ii)
ν [cm-1]
20002100
inte
nsity
[K
M-u
nits
]
0.00
0.03
0.06
0.09
0.12
0.15
Fig. III-13: Comparison of DRIFTS spectra during selective CO oxidation in
idealized reformate (1 kPa CO; λ = 2) over Pt/γ-Al2O3 at 150°C, first without
water (black) and after 3 h with 1.3 kPa H2O added (grey). Left window: IR
COad-bands after 60 min. in each atmosphere. Right window: Time-evolution of
the integrated intensity (upper part) and of the band position (lower part).
+ H2O

Pt/Al2O3 From idealized to more realistic conditions
52
of water the growth of several bands in the region between 1700 cm-1 and 1300 cm-1 (and of a
few small bands around 2900 cm-1) is drastically increased. During reaction in a dry
atmosphere formates (HCOO-) were indentified, slowly accumulating on the support as is
indicated by the IR bands at 1593 cm-1 (νOCO/asym.), a doublet at 1375/1393 cm-1 (δCH and
νOCO/sym.) and a few peaks below 3000 cm-1 (νCH & some combination vibrations). The
formates are most likely formed by insertion of COad in a neighbouring OH-group on the
support at the metal/support interface (eq. III-1.8; [133])[134, 135].
The time-evolution of these bands during selective CO oxidation over Pt/γ-Al2O3 at 150°C for
3 h (1 kPa CO, λ = 2) can be followed by the grey spectra in figure III-15. Upon the addition
of 1.3 kPa water to the reaction mixture the growth of bands in the region below 1700 cm-1
increases dramatically. Moreover, new bands arise, whereas the formate species are slowly
reduced (black spectra in figure III-15). Bands at ∼1660, ∼1575, 1460, 1335 and 1395 cm-1
indicate carbonate (CO32-), bicarbonate (HCO3
-) and / or carboxylates species (CO2-), but an
exact assignment of these bands is difficult [71, 136-139]. Even though different IR cross-
sectios for formates and carbonates must be assumed, from the time-evolution of the IR band
intensities is is obvious that the growth rate of these by-products is significantly enhanced in
the presence of water. Of course, (bi-)carbonates could also arise from a reaction between the
ν [cm-1]
20002100
inte
nsit
y [K
M-u
nits
]
0.03
0.06
0.09
p(H2O) [kPa]
0.0 0.5 1.0 1.5
ν[c
m-1
]
2050
2052
2054
Fig. III-14: Comparison of DRIFTS spectra during adsorption of CO at 150°C
on Pt/γ-Al2O3 (1 kPa; in 75 kPa H2, rest N2): dry (black), with 0.65 kPa (light
grey), and with 1.3 kPa H2O added (dark grey). Left window: IR COad-bands
after 60 min. in each atmosphere. Right window: Band position of main peak.

Pt/Al2O3 From idealized to more realistic conditions
53
produced CO2 and support OH-groups, but as will be shown below, this is only a minority
path and the majority of the by-products is formed indirectly from COad via oxidation of
formate species.
Possible reaction pathways are (compare e. g. [134, 138, 140, 141]):
COad + OH- ↔ HCOO- (III-1.8)
HCOO- + H2O (OH-) ↔ HCO3- (CO3
2-) + H2 (III-1.9)
HCO3- + OH- ↔ CO3
2- + H2O (III-1.10)
These formates or bicarbonates decompose predominantly into CO2 and H2 when they are in
contact with noble metals [134, 142-144], which was also indicated by our own temperature
programmed experiments on the decomposition of either by-products accumulated during
reaction or predosed formic acid ([145]; see Appendix B):
HCOO- + H2O (OH-) ↔ CO2 + H2 + OH- (O2-) (III-1.11)
Consistently, they are also observed, when 1.3 kPa water is added during CO adsorption (1
kPa) in 75 kPa H2, rest N2 at 150°C. The complete reaction scheme for these products may be
ν [cm-1]
13001400150016001700
inte
nsity
[K
M-u
nits
]
0.0
0.2
0.4
0.6
0.8
Fig. III-15: Time evolution of the spectral region between 1280 cm-1 and
1740 cm-1 over Pt/γ-Al2O3 in idealized reformate (1 kPa CO, λ = 2; 150°C)
for 3 hours (grey) and then with 1.3 kPa H2O added for another 3 hours (black).
Spectra are acquired after 5, 10, 15, 20, 30, 45, 60, 120, 150, and 180 min.

Pt/Al2O3 From idealized to more realistic conditions
54
quite complex, but without going too much in detail, it can be concluded as a result, that upon
the addition of water the formation of by-products on the support, produced from COad,
increases drastically. The new diffusion and reaction pathway may disturb the build-up of the
steady-state coverage on the platinum surface, described in the preceeding section. CO is
continuosly abstracted from the platinum surface and a new equilibrium between COad(Pt),
Had(Pt), Oad(Pt) and „COad(Support)“ (= formates & (bi-)carbonates) is established. This leads to a
relaxation of those CO islands which are in contact with the metal/support interface, which
explains the lower band position observed in DRIFTS. The equilibration of the surface in
presence of water seems to proceed more slowly, which is indicated by the „stabilized“ rates
observed in our long-term experiments. The small rate enhancement along with the reduced
selectivity in the presence of water may be caused by the somewhat lower steady state CO
coverage along with a more disordered adsorbate layer, where the adsorption probability for
hydrogen should be increased. Another contribution to the rate enhancement could arise from
the dissociation of water on the support, with a subsequent spill-over of hydrogen to the
platinum particles, leading to a small increase of the Had population, which in turn would
decrease the adsorption energy of CO adsorbed in H-CO mixed reagions as was shown in
section 1.2.4.
Consequently and as a final prove for our hypothesis, the water addition should show no effect
for the CO oxidation on usupported platinum powder, where formate formation is not
possible. Indeed, the rate, the deactivation behaviour and the selectivity (figure III-16, right
part) for selective CO oxidation (1 kPa, λ = 2; 150°C) without and in the presence of 1.3 kPa
water are identical after approximately three hours. The initial rate in the presence of water is
even slightly lower, maybe caused by coadsorbed water, which is only slowly removed similar
to the initially adsorbed oxygen species, which are held responsible for the deactivation (see
preceeding section). The same applies to „switching“-measurements on the Pt powder, where
the addition of 1.3 kPa water after several hours of selective CO oxidation (1 kPa CO, λ = 2;
150°C) shows absolutely no effect on the rate or selectivity (not shown here). In the left part
of figure III-16 the corresponding DRIFTS spectra without and in presence of water (after 90
min. in each atmosphere) are compared. To avoid influences from a possible „mechanical“
interface between the platinum particles and the dilution material, which is commonly α-
Al2O3 (apart from the need to guarantee differential flow conditions, especially for the
DRIFTS-measurements it was necessary to dilute the black Pt powder with a brighter
material, in order to achieve an acceptable SNR), SiO2 was used as a dilutent for this

Pt/Al2O3 From idealized to more realistic conditions
55
experiment (see also below). During selective CO oxidation on the Pt powder two bands in
the region for linearly adsorbed CO are recognized: One at 2095.4 cm-1, assigned to extended
low-index planes and one at 2074.8 cm-1, related to defect sites [93]. Upon admission of 1.3
kPa water there is indeed only a small down-shift for the high frequency band of 0.9 cm-1 to
2094.5 cm-1, and absolutely no shift for the low frequency band within the measurement
tolerance for such a small and broad band (around ±1 cm-1).
It should be noted that in analogy these results on Pt/SiO2, where no by-products (at least not
within the detection limit) are formed during selective CO oxidation, consequently there was
also no downshift and no reduction of the integrated DRIFTS intensity of adsorbed CO
observed upon the admission of water to the reaction mixture (1 kPa CO, λ = 2; 150°C; see
Appendix B).
These results show clearly that the effects observed in the presence of water (rate stabilization,
small enhancement of the initial rate and a reduced selectivity) are related to the γ-Al2O3
support, more specifically to the formation of formate / (bi-)carbonate species on the support.
On unsupported platinum or on support materials, where those by-products are not formed to
ν [cm-1]
20502100
inte
nsit
y [K
M-u
nits
]
0.000
0.004
0.008
Fig. III-16: Selective CO oxidation over Pt powder in idealized reformate at 150°C
(1 kPa CO, λ = 2; 150°C): Left part: Comparison of DRIFTS spectra (catalyst
diluted with SiO2) dry ( ) and with 1.3 kPa H2O added ( ), after 1.5 hours in
each atmosphere. Right part: Long-term activity (upper window) and selectivity
(lower window) dry ( ) and with 1.3 kPa water added ( ).
t [min]
10 100 1000
S [%
]
50
60
70
TO
F [s
-1]
10-2

Pt/Al2O3 From idealized to more realistic conditions
56
such an extent (e. g., SiO2), the water has practically no influence on the selective CO
oxidation.
1.2.3 Performance in CO2-rich gas
Up to now, we have simplified most of our experiments by using a matrix for the simulated
reformate, which is made up from ∼75% hydrogen and ∼25% nitrogen. But a real feed gas
produced from a methanol reformer consists of H2 and CO2, therefore it is important to
consider possible differences for the selective CO oxidation arising from the replacement of
N2 by CO2. Unfortunately, there are very few literature data available on the influence of CO2
on the (selective) CO oxdiation reaction over platinum metals. Nibbelke et al. mention that
the addition of 1 kPa CO2 had no significant effect on the CO oxidation activity over Pt/γ-
Al2O3 (0.12-4 kPa CO; 0.12-2.5 kPa O2; 163°C). In kinetic studies from our own group,
where idealized reformate (0.01 - 1.5 kPa CO, λ = 0.5-10) has been compared to a realistic
gas mixture, containing 25 kPa CO2 (in the dry part) plus 10 kPa H2O, virtually no difference
for the rate and selectivity at 300°C was observed, whereas at 150°C the selectivity decreased
by approximately 10% (absolute), attributed to the negative influence of the water, which was
already discussed above [25]. The activity in the realistic reformate at 150°C was even slightly
enhanced compared to the idealized mixture (factor 2 at 0.2 kPa CO, λ = 2). For both
temperature levels the CO reaction order was slightly increased (from -0.44 to -0.14) in the
presence of CO2 and H2O, whereas the oxygen reaction order remained practically the same (∼
+0.8) [25, 132].
In this section we compare the influence of a more realistic gas mixture on the selective CO
oxidation (1 kPa CO, λ = 2) at different temperatures between 100 and 250°C. Every data
point was evaluated on a freshly conditioned catalyst bed after 90 min. on-stream, when the
major deactivation period had been passed. The additional influence of 1.3 kPa water was
investigated by „switch“-experiments, where after 2 hours of reaction with 25% CO2 the water
was added to the reactant flow (data taken after 1 additional hour).
In figure III-17 the CO oxidation activity in the different gas mixtures is compared in the form
of an Arrhenius diagram. The activation energy in the presence of 25 kPa CO2 is reduced from
little less than 70 kJ/mol (± 4 kJ/mol) down to ∼55 kJ/mol (± 4 kJ/mol). We also recognize a
slight reduction of the turnover frequency for all levels above the light-off temperature for the
selective CO oxidation (∼130°C; see figure III-2), being more pronounced at higher
temperatures. The maximum difference is a factor 2.5, observed at 250°C. At 100°C, below

Pt/Al2O3 From idealized to more realistic conditions
57
the light-off temperature, even a small increase compared to idealized reformate is noticed.
The decrease at higher temperatures indeed represents a real reduction of the CO oxidation
activity and is not just an effect of the reverse water-gas shift (eq. III-1.7), which would lead
to a re-creation of CO from CO2, since the observed differences in the turnover frequencies
for mixtures with and without CO2 are for all temperature levels at least one order of
magnitude above the shift rates (see also chapter III-1.3.2). Adding 1.3 kPa water to the CO2-
mixture exhibits only a very small effect on the CO oxidation rate, represented by a slight
increase of the activity of 15 - 45%, similar to the enhancement of the initial rates for the
idealized reformate, which was investigated in the preceeding section, but does not change the
activation energy. hour).
The effect of CO2 / H2O on the hydrogen oxidation reaction (calculated via selectivity; figure
III-18, left window) is shown in figure III-18 (right window). In the presence of 25 kPa CO2
we find similar tendencies as were observed before for the CO oxidation reaction. The
turnover frequencies are slightly decreased, with the effect being more pronounced at higher
temperatures (maximum difference: factor 3 at 250°C). The activation energy decreases to the
same value (∼55 ± 6 kJ/mol) as for the CO oxidation reaction. This absolutely parallel
behaviour implies that both oxidation reactions are still coupled by the same rate limiting step.
The activation energy for CO (H2) oxidation in idealized reformate of around 70 kJ/mol
1/T [1/K] * 103
1.8 2.0 2.2 2.4 2.6 2.8
ln (
TO
FC
O)
[s-1
]
-5
-4
-3
-2
-1
0
1
2
67 kJ/mol
55 kJ/mol 53 kJ/mol
Figure III-17: Arrhenius diagram for the turnover frequency of CO
oxidation over Pt/γ-Al2O3 in idealized reformate ( ; 1 kPa CO, λ = 2),
a mixture containing 25 kPa CO2 ( ), and in a realistic reformate ( ;
25 kPa CO2; 1.3 kPa H2O).

Pt/Al2O3 From idealized to more realistic conditions
58
reflects the CO desorption energy, which is of the same magnitude in the high coverage range
[1, 125]. The decreased activation energy in the presence of CO2 in principle strongly suggests
a reduction of the CO „self-poisoning“, which would be consistent with the observed change
of the CO reaction order, from -0.44 to -0.14 [25, 132]. Such an effect could either be caused
by a reduced CO desorption energy or by a new oxygen-supplying path on the catalyst surface.
Both suggestions, however, would be expected to induce a marked enhancement of reactivity,
but in our experiments just a slight opposite effect is observed. The only explanation left is
that CO2 may indeed reduce the CO poisoning by some way, but exhibits a second poisoning
effect itself which more than compensates the expected rate enhancement.
Up to 200°C the additional admittance of 1.3 kPa water to the CO2-mixture shows a small
enhancement for the turnover frequency of the hydrogen oxidation as was found for the CO
oxidation reaction, probably being caused by the same reasons discussed in the preceeding
section. Again the activation energy compared to the dry „CO2-mixure“ is not changed.
Interestingly, at 250°C the „water-effect“ has vanished – equally, for the CO oxidation
reaction at 250°C the measured effect of water was also very small: just +10%. This is
consistent with the observations by Kahlich, that water shows no effect on the rate and
selectivity at 300°C [25, 132]. It is consequent to take a look at the thermal stability of the by-
products accumulated on the support. Temperature-programmed reaction (TPR) experiments
by Schubert et al. have demonstrated, that the maximum build-up rate of formates during
selective CO oxidation (1 kPa CO, λ = 2) is at ∼170°C, whereas above 200°C the steady state
T [°C]
100 150 200 250
S [%
]
20
40
60
1/T [1/K] * 103
2.0 2.4 2.8
ln (
TO
F H2)
[s-1
]
-4
-2
0
266 kJ/mol
54 kJ/mol
56 kJ/mol
Figure III-18: (a) Selectivity and (b) Arrhenius diagram for the calculated turnover
frequency of H2 oxidation over Pt/γ-Al2O3 in idealized reformate ( ; 1 kPa CO, λ = 2), a
mixture containing 25% CO2 ( ), and in realistic reformate ( ; 25 kPa CO2; 1.3 kPa H2O).

Pt/Al2O3 From idealized to more realistic conditions
59
coverage decreases strongly due to a very rapid decomposition [32]. Hence, if a similar
temperature window applies also to the (bi-)carbonates and carboxylates, a possible
explanation, why the „water-effect“ is only observed at temperatures below 200°C, may be,
that at elevated temperatures there is not such an extended „COad/Support“ coverage (in the form
of formates and the other by-products) formed, which could stay in equilibrium with
molecules adsorbed on the platinum surface and hence affect the rate / selectivity.
As a consequene of the two overlapping effects from CO2 onto the H2 and CO oxidation
reactions, i. e., reduction of the adsorption energy but also reduction of the activity at elevated
temperatures, a quite complex selectivity behaviour results, which is shown in the left window
of figure III-18. Whereas without CO2 the selectivity is constant around 40% over the whole
investigated temperature range, it is slightly enhanced at 100 and 250°C, remaines almost
identical for 200°C and is somewhat reduced around 150°C in the more realistic mixtures. But
most changes induced by CO2 are quite small, also with view on the measurement tolerance of
about ±3-4% for this graph. The additional admittance of 1.3 kPa water to the gas mixture
again causes a drop in selectivity of 5-10% (with the exception at 250°C as was discussed
already above), but the general trends are again not changed compared to the dry CO2-
containing mixture.
In order to investigate the above proposed hypothesis of two overlapping effects (one
enhancing and one, which poisons the reaction) exhibited by the CO2 onto the CO oxidation,
additional in-situ DRIFTS measurements were performed. After starting by 60 min. of
reaction in idealized reformate (1 kPa CO, λ = 2; 200°C; 0.2 kPa CO2 as a result of CO
conversion) the nitrogen was gradually replaced by CO2 (1.2, 3.6, 11.1 and 23.4 kPa CO2;
each mixture subsequently for 30 min.). In figure III-19 the results from this combined
DRIFTS / GC measurement are displayed. For the linearly bound COad-band a blue-shift
(window b), in dependence of the CO2 partial pressure, is recognized, but it is not
accompanied by any significant change in the integrated IR intensity of this band (window a).
Nevertheless, the ratio between linearly and bridge bound CO increases very strongly with
increasing CO2 partial pressure. The corresponding DRIFTS-spectra are shown in window c.
In the right part of figure III-19 the turnover frequency (window d) and selectivity ( window e;
data taken after 30 min. in each mixture) are displayed. The somewhat low overall selectivity
compared to the kinetic measurements may well be attributed to leaking in the used DRIFTS-
cell model, where a part of the reactant stream may pass at the side of the catalyst bed (See
appendix A). Although a slight downward trend for the reactivity and an upward going

Pt/Al2O3 From idealized to more realistic conditions
60
tendency for the selectivity are noticed, these changes are very small (TOF within 6%,
selectivity within 4%). Hence, in accordance with the preceeding experiments, it can be noted,
that the CO2 effectively exhibits only a small influence on the activity / selectivity at 200°C.
Nevertheless, from the DRIFTS spectra a significant effect on the adsorbed CO is noticed.
When oxygen is admitted to a CO-mixture over platinum catalysts, in accordance with
previously published studies [128, 131, 139, 146], generally a blue-shift (3 cm-1 and more on
our catalyst) is noticed as a consequence of the increased dipol-dipol interactions arising from
the compression of COad into island structures [32]. This shift is usually accompanied by an
increase in the IR intensity of the linearly bound COad (around 10% for a mixture of 1 kPa CO
and oxygen in a N2 background over Pt/γ-Al2O3) and of the ratio between linearly and bridge
bound CO (on our catalyst from 20 to 30), which indicates an increased local density of the
COad-layer, characterized by the greater amount of occupied on-top sites [32].
Hence, as a possible explanation for the observed CO2-induced blue-shift, we propose the
dissociation of CO2 (either on platinum or, which is more likely, since CO2 dissociates only at
higher temperatures over Pt metal [147], at the metal-support interface [148]), which would
produce Oad (and COad as well) and therefore enrich the platinum surface with oxygen. This is
supported by the concomitant increase of the linear/bridge CO ratio, which indicates an
CO
line
ar/C
Obr
idge
20
30
40
p(CO2) [kPa]
0.1 1 10
ν[c
m-1
]
2047
2048
2049
ν [cm-1]
200020502100
inte
nsit
y [K
M-u
nits
]
TO
F [s
-1]
0.8
1.0
p(CO2) [kPa]
0.1 1 10
S [%
]
30
40
0.02
1 [a
. u.]
Integr. int.
a)
b)
c)
e)
d)
Figure III-19: CO2 influence on the selective CO oxidation over Pt/γ-Al2O3 (1 kPa CO, λ = 2;
200°C): a) ratio between adsorbed COlinear and CObridge ( ) and total integrated IR intensity of
COlinear ( ), b) peak position of COlinear ( ), c) DRIFTS-spectra of COlinear region with 0.2, 1.2,
3.6, 11.1 and 23.4 kPa CO2 (from bottom to top), d) turnover frequency ( ) and e) selectivity ( ).

Pt/Al2O3 From idealized to more realistic conditions
61
increase in the local CO density. The missing increase in the IR intensity for the linearly
bound CO may be explained by a small reduction of the overall CO coverage, which would
compensate the expected effect. Since CO adsorbs into oxygen islands for reaction, but not
vice versa [76, 129, 149], such an increase of the steady-state oxygen coverage is expected to
reduce the „self-poisoning“ by COad and as a consequence theoretically increase the reactivity
enormously. This scenario is consistent with the reduced CO reaction order (ca. -0.14), which
was observed in the presence of CO2 [25, 132], as well as with the lower activation energy,
which is now less dependent on the desorption energy of COad.
In analogy to the last section, it may also be interesting to take a short look at the spectral
region of by-products (support bound species) in the presence of CO2. In figure III-20 (left
window) the DRIFTS spectra recorded during selective CO oxidation in idealized reformate
(1 kPa CO, λ = 2; 200°C) over Pt/γ-Al2O3 for 60 min. and after subsequent replacement of
background nitrogen by increasing amounts of CO2 (1.2, 3.6, 11.1 and 23.4 kPa CO2; each
mixture for 30 min.) are shown. But neither the formation of new species (apart from a very
small band at 1450 cm-1, which may be assigned to bicarbonates, HCO3-, or carboxylates,
ν [cm-1]
14001600
inte
nsit
y [K
M-u
nits
]
0.00
0.03
0.06
0.09
0.12
0.15
t [min]
0 60 120 180
inte
grat
ed in
tens
ity
[KM
/cm
]
0
2
4
6
8
10
Peak at1590 cm-1
Figure III-20: CO2 influence on the build-up of support-bound by-products on
Pt/γ-Al2O3: Left part: DRIFTS spectra - first during CO oxidation in idealized
reformate for 60 min. (1 kPa CO, λ = 2; 200°C; grey lines: aquired after 5, 10, 15,
20, 30, 45 and 60 min.), then with progressing replacement of N2 by CO2 (0.2, 1.2,
3.6, 11.1 and 23.4 kPa CO2; black lines: spectra aquired subsequently after 30 min.
in each mixture). Right part: integrated intensity of the IR-band at 1590 cm-1.

Pt/Al2O3 From idealized to more realistic conditions
62
CO2-) nor any major deviation from the usual growth rate of the formate bands in idealized
reformate (represented by the integrated IR area of the band at 1590 cm-1; right window) are
observed.
In summary, although the apparent influence of CO2 on the rate and selectivity is small, the
DRIFTS spectra show significant changes for the platinum steady-state surface equilibrium.
For consistence there must exist a second, poisoning, effect of the CO2, which compensates
the expected rate enhancement. With the applied methods, however, it could not be identified
yet. Our model explains well the kinetic changes (reaction order, activation energy) observed
by Kahlich [25, 132], but of course, the hypotheses in this section are based only on two
different methods (DRIFTS + microkinetic reactor measurements) and, not least due to the
lack of data from previous studies, are rather speculative. The CO oxidation in presence of
CO2 should be tested in further experiments, especially on UHV model systems, to gain
further insight into this quite complex behaviour.
In total, the influence of water (small concentrations) and / or CO2 on the selective CO
oxidation over Pt/γ-Al2O3 is rather moderate, causing deviations for the rate and selectivity of
only a few percent, but not of any order of magnitude, so that our measurements in idealized
reformate indeed are an appropriate first approach to real feed gas from a methanol reformer.

Pt/Al2O3 Other support materials
63
1.3 Other support materials
This chapter is focussed on the influence of the support material on the performance
characteristics of platinum catalysts for the PROX reaction, especially, in order to evaluate a
catalyst with a better turndown ratio for the load following behaviour in mobile applications,
which is limited by the simultaneously occuring reverse water-gas shift reaction [10, 11]. In
the first section we will compare the activity and selectivity of various platinum catalysts
supported on conventional supports (γ-Al2O3, MgO, SiO2, TiO2, and carbon) at a standard
temperature of 150°C. The second chapter is concerned with the influence of the support on
the reverse water-gas shift activity and closes with a short summary on the PROX / shift
ratios at 150°C.
1.3.1. Comparison of activity / selectivity
In principle we may think of three possible ways, how the support could influence the CO
oxidation. First, Mojet et al. proposed a direct electronic interaction between the metal and the
support, which would alter the adsorption energy of the carbon monoxide and lead to changes
in the IR frequency of the COad-band and in the COlinear/CObridge ratio [150]. But such a
phenomenon should be expected only for very small platinum cluster sizes. Second, the
support may induce a restructuring of the Pt particles, forcing the exposure of new crystal
faces and changing the site composition on the metal surface, which may lead to different
reaction rates, since, e. g., the CO oxidation on stepped single crystal faces has turned out to
be a structure sensitive reaction [107, 151]. Unfortunately, we do not have access to methods,
which could elucidate such theories, hence we cannot confirm or exclude the additional
influence of restructuring phenomenons in the following context. Third, the support provides
a reactive chemical interface to the metal particles, causing, e. g., COad to spread on the
support via formate or carbonate species (see chapter III-1.2.2) [133].
To our best knowledge, no studies exist, which investigate the support influence upon CO
oxidation on platinum metals extensively. For the „high rate branch“ (0.01-0.1 kPa CO, 0.5
kPa O2) as well as for the „low rate branch“ (> 0.3 kPa CO, 0.5 kPa O2) Fuchs et al. measured
similar turnover frequencies of around 1*101 s-1 for Pt/α-Al2O3 and Pt/ZrO2 at 300°C [152].
The same activity applied to a polycrystalline Pt foil. When comparing Pt/SiO2 and Pt/Al2O3,
Mergler et al. noticed a fivefold higher activity of the latter system (7.2*10-4 s-1 compared to
3.6*10-3 s-1 at 2.7 kPa CO, λ = 1; 150°C) [77], whereas Sarkany et al. recognized a somewhat
enhanced performance (factor three) for the silica-supported catalyst (1.5*10-3 s-1 and 0.5*10-3

Pt/Al2O3 Other support materials
64
s-1, respectively, at 3 kPa CO, λ =1; 100°C; data taken after 60 min) [75]. The discrepancy,
which is relatively small anyway, probably arises from large tolerances for the determination
of the dispersion. Moreover their absolute TOFs seem to be very low compared to other
studies concerned with CO oxidation over such systems, hence should be considered with
care, anyway. Muraki et al., e. g., reported a TOF of 1.1*10-2 s-1 over Pt/γ-Al2O3 (1 kPa CO, λ
= 0.9; 150°C) [84], Cant and co-workers found TOFs of around 1.3-4*10-2 s-1 for Pt/SiO2
(1.3-2 kPa CO, λ = 0.8-1, 177°C) [74, 126, 153]. For single crystal faces Hardacre et al.
observed a conversion of 3*10-2 s-1 (0.9 kPa CO, λ = 1; 157°C) over Pt(111) [154] and
Berlowitz et al. reported a TOF of 1.5*10-2 s-1 (2.1 kPa CO, λ = 1; 150°C) over Pt(100) [88].
The similar magnitude of the measured values for supported and unsupported systems implies
that the support does not exhibit any major effects upon the CO oxidation reaction (at least not
in absence of hydrogen).
In figure III-21 the activities (as a turnover frequency, upper part) and selectivities (lower part)
of several platinum catalysts are compared for the selective CO oxidation in idealized
reformate (1 kPa CO, λ = 2) at 150°C. The characteristic parameters for the various catalysts
(Pt/γ-Al2O3, Pt/MgO, Pt/SiO2, Pt/TiO2, Pt/Vulcan and Pt powder) are summarized in chapter
II-2.1. For comparison the dispersion of Pt/TiO2, which was not known, was estimated to be
40% in order to calculate the TOF roughly. To provide a better overview, the TOFs and
selectivities after 2 hours on-stream are put together in table III-3. Included are also the rates
with 13 kPa water added for some catalysts as well as the hydrogen oxidation rates calculated
via selectivity.
Catalyst TOFCO [s-1] *102 1) S [%] 1) TOFH2 [s-1] *102 1)
Pt/γ-Al2O3 9.6 (15.3) 42 (36) 13.3 (27.2)
Pt/MgO 15.5 (22.2) 53 (40) 13.7 (33.3)
Pt/TiO2 3.5 1.1 315
Pt/SiO2 2.4 58 1.7
Pt powder 2.0 (1.7) 56 (55) 1.6 (1.4)
Pt/Vulcan (freshly cond.) 0.68 (1.0) 2) 87 (57) 2) 0.10 (0.75) 2)
Pt/Vulcan (recond.) 0.88 43 1.2() = with 1.3 kPa water added 1) after 2 h on-stream 2) after 1000 min.
Table III-3: Turnover frequencies for CO and H2 oxidation and selectivities over
various Pt catalysts in idealized reformate (1 kPa CO, λ = 2) at 150°C.

Pt/Al2O3 Other support materials
65
The Pt/γ-Al2O3 catalyst possesses a relatively high activity - one order of magnidute higher
than reported in the above cited references, which may be largely ascribed to the enhancement
in presence of hydrogen and of in-situ produced water (see chapters III-1.1.5 and III-1.2.2).
The conversion over Pt/MgO is even larger (+60%). The TOFs on Pt/SiO2 and Pt/TiO2 are
about a factor three below that of Pt/γ-Al2O3. The apparently more stable conversion rates on
these catalysts may be caused by organic residuals after the conditioning procedure from the
colloid precursor shell, which were removed slowly during the reaction and counteract the
„normal“ deactivation, for Pt/SiO2 and by the strongly enhanced water production (extremely
low selectivity), which may prevent an approach to the steady-state for Pt/TiO2, repsectively.
The activity over Pt powder is again slightly smaller and shows a strongly decreasing tendency
with time on-stream, which is probably caused by the faster approach to the steady state, since
no support bound species participate in the equilibration process. The Pt/Vulcan catalyst
shows a large initial „step“ for the activity. If we regard the rate after ∼1000 min., when the
TO
F [s
-1]
0.01
0.1
t [min]
10 100 1000
S [%
]
0
20
40
60
80
100
10 100 10000
20
40
60
80
100
Figure III-21: Time evolution of turnover frequencies (upper part) and selectivities
(bottom) over various platinum catalysts in idealized reformate (1 kPa CO, λ = 2)
at 150°C: Pt/γ-Al2O3; Pt/SiO2; Pt/Vulcan (freshley conditioned);
Pt/Vulcan (after re-conditioning); Pt/MgO; Pt/TiO2; Pt powder.

Pt/Al2O3 Other support materials
66
„step“ has been passed, it is slightly higher than on the unsupported platinum. Interestingly –
different from the „step“ on Pt/γ-Al2O3, which was observed for CO oxidation in a pure
nitrogen background (see figure III-12) – , after a second conditioning procedure the „step“
has vanished and the catalyst shows the „normal“ deactivation behaviour as it would be
expected. Therefore, we correlate this „step“ to the build-up of thermally rather stable species
on the carbon support (e. g., OH-groups or COO--species) during the reaction, which facilitate
the CO oxidation reaction, similar to what has been observed for OH-groups on the Pt/γ-Al2O3
catalyst (see chapter III-1.2.2). As a general summary, we may claim the following order of
reactivity for the selcective CO oxidation:
Reactivity: Pt/MgO ≈ Pt/γ-Al2O3 > Pt/TiO2 ≈ Pt/SiO2 ≈ Pt/Vulcan ≈ Pt powder
But indeed the effects are relatively small (within one order of magnitude), as was already
expected from the small differences between the literature TOF’s, cited above.
The selectivity are relatively similar, except for the Pt/γ-Al2O3, which shows a relatively low
value. The latter effect may be ascribed to the very small particles (see table II-3), which
should favour hydrogen adsorption and oxidation due to the greater number of step sites,
where the hydrogen coverage builds up preferably (chapter III-1.1.5). Another, much clearer
exception is Pt/TiO2 with an extremely low value, where the H2 + O2 reaction is probably
catalyzed by a redox-mechanism on the titania support (Ti4+ ↔ Ti3+). The selectivity over the
re-conditioned Pt/Vulcan catalyst was also surprisingly small, probably a direct consequence
of the species formed during the preceeding reaction.
Selectivity: Pt/Vulcan ≈ Pt powder ≈ Pt/SiO2 ≈ Pt/MgO > Pt/γ-Al2O3 >> Pt/TiO2
From an economic point of view Pt/MgO seems to be a good alternative to Pt/γ-Al2O3. The
reactivity is somewhat higher and the selectivity is slightly enhanced, hence the required mass
of catalyst for a PROX stage should be less. The reason for the superior conversion on these
two catalysts is probably the large amount of OH-groups on the support surface along with the
stronge basicity, which enables the extensive formation of by-products and therefore increases
the conversion rate (see chapter III-1.2.2).
1.3.2. The water-gas shift - limiting the CO conversion
For the envisaged employment of PROX as a purification stage for methanol reformer gas in
vehicles the requirements are quite restrictive. Currently used anode catalysts (Pt, PtRu) in

Pt/Al2O3 Other support materials
67
PEM fuel cells are poisoned by only traces of carbon monoxide in the feed gas. The maximum
concentration, which is tolerated, is around 100 ppm CO [11, 23], especially when a so-called
air-bleed is employed (oxygen dosage over the anode catalyst) [20], but ideally should be less
than 20 ppm [18, 155]. For such extreme demands also the simultaneously occuring (reverse)
water-gas shift reaction must be considered:
H2 + CO2 ↔ H2O + CO (III-1.12)
The re-creation of CO via the WGS reaction, which parallels the CO oxidation, but is
negligible under oxidation conditions, becomes significant as soon as the oxygen is used up. It
limits the achievable minimum CO concentration from a PROX stage [10, 156] and, as a
consequence, determines the maximum turndown ratio for the load following behaviour in
vehicles, which depends on the ratio between the CO oxidation reaction and the reverse water-
gas shift reaction [25].
Therefore we investigated the shift rates over various platinum catalysts at temperatures,
which result in good selectivities and activities for the primary CO oxidation reaction, i. e.,
between 150 and 300°C [7, 25], and with the simultaneous addition of water, as it would be
found in real methanol reformates.
The exact mechanism of the water-gas shift reaction is still subject of an ongoing debate (see,
e. g., [138, 157-160]). In principle there are two possible pathways: The „associative
mechanism“, which proceeds via intermediates (usually formates, HCOO-):
CO + H2O ↔ intermediate ↔ CO2 + H2 (III-1.13)
and the „regenerative“ or „redox mechanism“ [157]:
H2O + ˘ ↔ H2 + Oad (III-1.14)
Oad + CO ↔ CO2 + ˘ (III-1.15)
Chinchen and Spencer suggested that for catalysts and conditions, which allow the
regenerative mechanism to operate, this mechanism is the faster one [161] and therefore
would be applicable to our platinum systems.
Unfortunately, there are only few reference data available concerned with the WGS over
platinum catalysts, since commercially employed catalysts are based on other metals (e. g.,
copper), which yield much higher rates [162, 163]. Grenoble et al. investigated the forward
water-gas shift reaction over different Pt-catalysts at 300°C (24.3 kPa CO, 31.4 kPa H2O) and

Pt/Al2O3 Other support materials
68
noticed a marked influence of the support material [162]. Pt/Al2O3 (TOF 6.35*10-2 s-1) was
one order more active than Pt/SiO2 (6.1*10-3 s-1) and two orders more than Pt/C (7*10-4 s-1).
They attributed this effect to the different ability of the support materials in activating the H2O
dissociation. Wolf et al. investigated the reverse water-gas shift reaction (2 - 6 kPa CO2 and
H2, resp.) over platinum powder and Pt/MgO, but at much higher temperatures of 800-950°C,
and ascribed the enhanced activity (×25-50) of the latter system to the facilitated CO2
dissociation at the metal/support interface [148]. For iridium catalysts Erdöhelyi et al.
registered an outstanding activity for the forward reaction over the titania supported catalyst,
which turned out to be a factor of ten more active than Ir/Al2O3 and Ir/MgO and an additional
factor three more than Ir/SiO2 (8 kPa CO, 16 kPa H2O; 350°C) [160].
On our platinum catalysts (for characterization see chapter II-2.1) we tested the reverse WGS
reaction in an atmosphere as close as possible to a real methanol steam reformate, consisting
of ∼25 kPa CO2, ∼74 kPa H2 and 1.3 kPa H2O. Figure III-22a provides an overview in the
form of an Arrhenius diagram. The values at 150°C (as mass-specific rates) as well as the
determined activation energies are enclosed in table III-4. For all data points the CO2
conversion was so small that the resulting CO concentration was well below the
thermodynamic equilibrium concentration. The activity for the reverse water-gas shift reaction
follows in principle the same trend as for the H2 oxidation and with the exception of the more
active Pt/TiO2 also that of the CO oxidation reaction (see table III-3):
1/T [1/K] * 103
1.5 1.8 2.1 2.4 2.7
ln(T
OF Sh
ift)
[s-1
]
-12
-10
-8
-6
-4
-2
0
1.6 2.0 2.4 2.8
a) b)
Figure III-22: a) Arrhenius diagram for the reverse water-gas shift activity over platinum catalysts
over various supports (~25 kPa CO2, ~ 74 kPa H2, 1.3 kPa H2O): Pt/γ-Al2O3; Pt/SiO2;
Pt/Vulcan; Pt/MgO; Pt/TiO2; Pt powder; b) comparison of shift-rates over Pt/γ-Al2O3:
reverse WGS; forward WGS (1 kPa CO, 1.5 kPa H2O); forward WGS with 27 kPa H2 added.

Pt/Al2O3 Other support materials
69
Pt/TiO2 > Pt/MgO > Pt/γ-Al2O3 > Pt/SiO2 > Pt/Vulcan > Pt powder.
The order of reactivity as well as the relative differences between the various supports
matches excellently the tendency that would be expected from the above cited references. The
titania supported catalyst is by far more active than the other oxide supported catalysts,
analogous to the outstanding activity, noticed for the hydrogen oxidation, which again points
to an active role of this support in the reaction process.
As a consequence of the same order of reactivity for the oxidation and shift reaction, the ratio
between both remains at a rather constant level for the different supported platinum catalysts
(except Pt/TiO2). The only significant improvement in the turndown ratio of the load
following behaviour would be established for unsupported platinum, but its generally poor
activity and the strong deactivation for the CO oxidation vote unequivocally against a
commercial employment.
Although a rather narrow distribution for the activation energy of the reverse water-gas shift,
ranging between 55 and 90 kJ/mol for oxides as well as for most supported noble metals, is a
generally observed phenomenon [157], the striking similarity of the values in table III-4,
including also the unsupported platinum, implies an identical reaction pathway on all of these
catalysts. The lacking stability of intermedate oxygenates on pure platinum [143, 164]
strongly suggests the regenerative mechanism to be operative as was predicted by Chinchen et
al. [161]. Nevertheless the support exhibits a marked effect on the reaction rate, possibly due
to a facilitated CO2 dissociation on the oxidic supports (or metal-support interfaces).
Catalyst rPROX at 150°C 1)
[molCO/gPt*s]rShift at 150°C 2)
[molCO/gPt*s]
PROX/Shift
ratioEa
Shift (±± 5)[kJ/mol]
Pt/Al2O3 1.9*10-4 2.8*10-6 70 62
Pt/MgO 1.6*10-4 3.0*10-6 55 74
Pt/SiO2 6.8*10-5 9.2*10-7 3) 75 69
Pt/TiO2 7.2*10-5 1.7*10-5 4 69
Pt/Vulcan 9.1*10-6 4) 8.3*10-8 3) 110 69
Pt-Black 1.0*10-5 1.7*10-8 600 65
Pt/Al2O35) 1.9*10-4 9.6*10-7 200 67
1) after 2 hours on-stream 2) after 30 min 3) extrapolated 4) after 1000 min 5) forward WGS
Table III-4: Comparison of PROX and reverse WGS activities over several
platinum catalysts and determined activation energies of the shift reaction.

Pt/Al2O3 Other support materials
70
In figure III-22 b the reverse water-gas shift over Pt/γ-Al2O3 is compared to the forward
reaction (1 kPa CO, 1.5 kPa H2O, rest N2). Both rates are of the same order of magnitude with
the latter being slightly (factor 3) smaller. The activation energy (67 kJ/mol) for the forward
reaction – slighly lower than the 82 kJ/mol observed by Grenoble et al., but the latter was
measured at much higher reactant concentrations (24.3 kPa CO, 31.4 kPa H2O) [162] – is also
of the same magnitude as for the reverse reaction.
After adding 27 kPa hydrogen, the forward WGS turnover freqency decreases by
approximately one order of magnitude, probably due to the simultaneously starting reverse
reaction, which clearly proves that under typical PROX conditions the contribution of the
forward water gas shift is very small compared to the CO oxidation reaction and may well be
neglected for simulations (see, e. g., [12]).
As a comprehensive result, the magnesia supported catalyst may be considered as a possible
alternative due to its high rate and good selectivity. The slightly higher PROX / shift ratio,
however, favours the employment of Pt/γ-Al2O3.

Pt/Al2O3 Summary on platinum catalysts
71
1.4 Summary on platinum catalysts
In the preceeding chapters we have seen, that the selectivity for the PROX reaction is closely
coupled to the COad coverage on the metal surface under reaction conditions. With the help of
adsorption isotherms, recorded by DRIFTS, the existence of an almost saturated COad-layer on
Pt/γ-Al2O3 was directly confirmed for temperatures up to 250°C and over a large variety of
CO partial pressures. This demonstrates that the selective CO oxidation proceeds in the „low
rate branch“, which explains the observed reaction orders on platinum catalysts as well as the
independence of the selectivity from the CO partial pressure. The enhanced reactivity
compared to a hydrogen-free reaction mixture was traced back to the coadsorption of
hydrogen at step sites, which would displace the CO on bridging positions and lower the
desorption energy of the latter by approximately 2 kJ/mol.
During time on-stream the Pt/γ-Al2O3 catalysts looses activity due to the build-up of a more
and more perfect COad-layer, which increasingly blocks the dissociative oxygen adsorption.
This deactivation process is reduced in the presence of water due to the extensive formation of
oxygenate species on the support, which reduce the local CO-density on the metal surface and
alter the approach to the steady-state surface equilibrium. Unfortunately, the lower COad
coverage allows for an enhanced adsorption of hydrogen (and oxygen) on the platinum,
leading to a decreased selectivity, which must be taken into consideration for serious
calculations on PROX reactors employed for the purification of methanol steam reformates.
CO2 exhibits a two-sided effect on the selective CO oxidation when compared to mixtures,
where the CO2 had been replaced by nitrogen. The activation energy is lowered for both, CO
and H2 oxidation, from ∼70 to ∼55 kJ/mol, which suggests that the strong poisoning effect of
the CO is reduced, as was already implied by the more positive CO reaction order in realistic
reformate, determined by Kahlich [25]. DRIFTS measurements suggest a relative increase in
the Oad coverage, most likely as a direct consequence of the CO2 dissociation at the metal-
support interface. But the rate enhancement, which would be expected, is obviously masked
by an additional poisoning effect of the CO2 on the reaction, which could not be identified yet.
In the end, the effects of CO2 and water on the reaction kinetics were found to be of a minor
magnitude, which justifies our initial approach by the simplified model of idealized reformate
[7, 12, 25].
When comparing different support materials, only Pt/MgO turned out to be a possible
alternative, due to its slightly higher activity and selectivity for the CO oxidation.

Pt/Al2O3 Summary on platinum catalysts
72
The generally small PROX-shift ratios over platinum catalysts cause a low turndown ratio for
the load-follwing behaviour in mobile applications, hence allowing only a rough purification
(down to several hunderd ppm CO) of methanol steam reformates at temperatures, which
guarantee a satisfying mass-specific activity of the catalyst [12]. As a consequence, for most
of the recent PROX concepts, based on a two-stage system [11, 156, 165], the Pt/γ-Al2O3-
based catalyst is useful only for the first (high temperature) reaction stage and other catalyst
systems (e. g., supported Au [29, 30]), which exhibit a better PROX-shift ratio at relatively
low λ-values, must be empolyed for the final removal of the carbon monoxide [12].

Pt3Sn/Vulcan Improved performance on bimetallic sytems
73
2. Improved performance on bimetallic systems - Pt3Sn/Vulcan
As was pointed out in the preceeding chapters, alumina supported platinum metals (Pt, Rh,
Ru) were proposed and successfully tested as PROX catalysts by several groups (see, e. g., [4,
6, 14]. There is still a need, however, for improved performance under dynamic conditions
and for lowering the operating temperature to the PEM fuel cell level of about 80°C. The lat-
ter offers advantages in system integration, including improved cold start properties for
mobile applications [166] and the possibility of implementing the catalyst directly into the
fuel cell, in form of a double layer anode [155, 167, 168] and also reduces the role of the
reverse water gas shift reaction [12].
PtSn alloys are already known as good catalysts for the electrooxidation of CO in sulfuric acid
solution [169, 170], and have also been proposed as active catalysts for gas-phase CO oxida-
tion [171, 172]. Very closely related systems, Pt catalysts supported on SnO2, have been
demonstrated in extensive studies to be good catalysts for low temperature CO oxidation (see,
e. g., refs. [173-178].
A general objective for the use of alloyed metals in heterogeneous catalyzed reactions is to
improve the activity or selectivity of the originally employed metal by mixing it with another
element. The second component either induces an electronic (or ligand) effect due to the
formation of metal-metal bonds, which, e. g., for platinum metal causes a modification of the
reactive d-orbitals, leading to a modified adsorption energy for the reactants / products, or it
blocks distinct reaction sites (ensembles), where unwanted side-reactions occur (geometric or
ensemble effect) [179-182]. Moreover, on some alloys the second metal may also actively
participate in the reaction process, equivalent to the formation of a real bifunctional surface.
In the following chapters we will examine in detail how the addition of Sn improves the
PROX characteristics of a Pt catalyst, so that it is now able to match the stringent
requirements of a highly active low-temperature system, capable of reducing the CO content
of feed gas made up from steam reformed methanol down to a level, which is acceptable to
currently used anode catalysts (Pt, PtRu).
In the following chapter we will present first kinetic results on the activity and selectivity of
our vulcan supported PtSn catalyst for the PROX reaction, supplemented by temperature
programmed CO desorption (CO-TPD), infrared spectroscopic (diffuse reflectance infrared
Fourier transform spectrometry - DRIFTS), and photoelectron spectroscopic (XPS) data. For
comparison similar data for a standard Pt/γ-Al2O3 catalyst obtained in a previous study are

Pt3Sn/Vulcan Improved performance on bimetallic sytems
74
included [7]. Based on these results and by comparison with similar data from other systems
such as Au/α-Fe2O3 and Pt/SnO2 catalysts, we will suggest a mechanistic model to explain the
selectivity behavior of the Pt3Sn/Vulcan catalyst. In a further chapter, we will evaluate its
suitability for the envisaged application in a low-temperature PROX stage by investigating the
long-term stability as well as the performance in more realistic reformate gas mixtures and
finally demonstrate its superior water-gas shift characteristics. Further details of the reaction
kinetics, in particular their dependence on reactant partial pressures, are currently determined
and will be published in a parallel thesis by M. Kahlich [25].

Pt3Sn/Vulcan Low-temperature CO oxidation over Pt3Sn/Vulcan
75
2.1. Low-temperature CO oxidation over Pt3Sn/Vulcan
2.1.1 Superior performance on Pt3Sn/Vulcan vs Pt/γ-Al2O3
Results on the activity (top) and selectivity (bottom) of the Pt3Sn/Vulcan and, for comparison,
of the Pt/γ-Al2O3 catalyst in idealized reformate (1 kPa CO, λ = 2) at different temperatures
between 0° and 175°C are presented in figure III-23. Data for the Pt catalyst were recorded
consecutively on the same catalyst bed, waiting for 20 min. at each temperature, so that the
system was close to stationary conditions. Nevertheless, since complete steady state had not
been established yet, the rates on the Pt catalyst are slightly higher, between 0% at 200°C and
50% at 150°C, than those reported in ref. [7]. For Pt3Sn/Vulcan each point was measured on a
freshly conditioned catalyst bed because of the more pronounced tendency for irreversible
deactivation (see also chapter III-2.2.1). These data were recorded after 90 min. on-stream,
where most of the loss in reactivity has already occurred. Figure III-23 clearly reveals the su-
perior performance of the PtSn catalyst for the PROX reaction: Over the entire temperature
range investigated the activity of the bimtallic PtSn catalyst is significantly higher than that of
the Pt catalyst. At 80°C (PEM fuel cell operating temperature) the difference in turnover
TO
F [s
-1]
10-3
10-2
10-1
100
T [°C]
0 40 80 120 160
S [
%]
0
25
50
75
100
Fig. III-23: Turnover frequency (upper window) and corresponding selectivity (lower
window) for selective CO oxidation over Pt3Sn/Vulcan ( ; data acquired after 90 min.
on-stream) and Pt/γ-Al2O3 ( ; after 20 min) in idealized reformate (1 kPa CO; λ = 2).

Pt3Sn/Vulcan Low-temperature CO oxidation over Pt3Sn/Vulcan
76
frequencies is about two orders of magnitude, 0.15 s-1 on Pt3Sn/Vulcan vs 2×10⁻³ s-1 on Pt/γ-
Al2O3. The activity of the PtSn catalyst at 80° is reached only at 150°C by the Pt catalyst. This
reactivity can be compared with that of another low temperature PROX catalyst, Au/α-Fe2O3,
where under identical conditions (80°C) a TOF of 0.7 s-1 was determined [26].
For the CO oxidation on the chemically rather similar Pt/SnO2, in the absence of H2,
significantly lower activities, by about one order of magnitude, were reported for similar
reaction conditions (see lines 1 - 4 in table III-5). On our PtSn catalyst we noted an increase in
CO oxidation activity by a factor of 2 - 3 in the presence of H2 (see chapter III-1.1.1),
nevertheless, a difference by a similar factor remains which must be attributed to differences
between the catalysts. Only for higher reactant concentrations [173] activities of comparable
magnitude were observed (table III-5).
A plot of ln( r CO ) vs 1/T (fig. III-24; idealized reformate with 1 kPa CO, λ = 2) yields an
apparent activation energy of 31 (±4) kJ/mol on Pt3Sn/Vulcan, which is clearly less than the
76 (±5) kJ/mol determined on Pt/γ-Al2O3. Likewise, activation energies of around 49 (±5)
kJ/mol on the bimetallic PtSn catalyst and 77 (±7) kJ/mol on Pt/γ-Al2O3 are determined for
the concomitant hydrogen oxidation ( r H2 calculated via the selectivity), where the latter value
is essentially identical to the activation barrier for the CO oxidation. Note that the values for
System D T[°C]
p(CO)[%]
p(O2)[%]
rCO
x105 [mol/(s�gPt)]TOF
x103 [s-1]Ref.
0.98% Pt-SnO2/α-Al2O3
0.6 60 0.8 1 2.2 (11) 7.3 (70) [177]
2.8%Pt-SnO2/SiO2
- 35 1 0.5 0.4� (4.6) - [176]
0.46% Pt-SnO2/Cordierite
0.6 60 1 6 1.7 (11) 6.5 (70) [175]
3% Pt-SnO2 ∼0.2 150 1.6 1.8 3.7 (∼200�) 39 (∼1300�) [174]
2% Pt-SnO2 - 75 5 5 11� (15) - [173]
2.7% Pt-Sn/SiO2 - 50 16 8 13� (7.1) - [171]
� evaluated at high conversion � with 8% CO2 added � extrapolated
Table III-5: Comparison of published data for CO oxidation rates at atmospheric
pressure in the absence of H2 on similar catalysts. Experimental conditions are listed
above. Data from fig. III-23 at the respective temperature and p(CO) = p(O2) = 1 kPa ,
75 kPa H2, balance N2 are given in parenthesis.

Pt3Sn/Vulcan Low-temperature CO oxidation over Pt3Sn/Vulcan
77
the activation barrier refer to an effective barrier for the complete process, in the presence of
the respective other species (CO or hydrogen), rather than to a specific reaction step.
Similar to the reactivity discussed above also the selectivity and its temperature dependence
(Fig. III-23, bottom) differ significantly between the two catalysts. On Pt3Sn/Vulcan the
selectivity more or less steadily decreases with temperature, starting from a very high value of
about 85% in the low temperature regime around 0 - 20°C to about 45% at 120°C (Note that
because of the very low hydrogen oxidation rates at 0°C the experimental uncertainty is rather
high, so that the seemingly constant selectivity at 0° and 20°C should not be overinterpreted).
In contrast, on Pt/γ-Al2O3 the selectivity is much lower, around 35%, but constant up to
175°C. Only at temperatures above 200°C the selectivity was reported to decay in this system
([7]; see also chapter III-1.1.1). The constant selectivity and small turnover frequencies at low
temperatures on the Pt catalyst were explained by assuming the platinum surface to be fully
covered by CO. In that temperature regime CO desorption controls the dissociative adsorption
1/T [1/K] * 103
2.0 2.5 3.0 3.5 4.0
ln r
H2
-8
-6
-4
-2
0
77 kJ/mol
49 kJ/mol
ln r
CO
-6
-4
-2
0
76 kJ/mol
31 kJ/mol
CO Oxidation
H2 Oxidation
Fig. III-24: Arrhenius diagram of turnover frequencies for CO oxidation (upper
window) and H2 oxidation (calculated via selectivity; lower window) over
Pt3Sn/Vulcan ( ) and Pt/γ-Al2O3 ( ) in idealized reformate (1 kPa CO; λ = 2).

Pt3Sn/Vulcan Low-temperature CO oxidation over Pt3Sn/Vulcan
78
of oxygen and is rate limiting, and the steady state coverages θH and θO are very low ([7]; see
also chapter III-1.1.1). This situation is characteristic for the so-called 'low rate branch' for CO
oxidation [1]. The decay in selectivity sets in at temperatures where these conditions no longer
hold true, i. e., at temperatures where the CO desorption rate is sufficient to cause a decline in
the CO coverage under steady state conditions, allowing the hydrogen and/or oxygen
coverage, θH and θO, to build up. If similar mechanistic explanations are valid also for PtSn,
then the CO adsorption energy should be significantly reduced on the Pt3Sn/Vulcan catalyst as
compared to Pt, at similar conditions, so that the decrease in CO coverage would already
occur above room temperature as compared to above 200°C on Pt/γ-Al2O3. This hypothesis is
tested in the next section by a CO desorption experiment.
2.1.2 Alloying effects
The freshly conditioned Pt3Sn/Vulcan catalyst was cooled down to -48°C and exposed to a
flow of 10 Nml/min CO for 5 min.. After purging the reactor with nitrogen the sample was
heated up linearly at 5°C/min (10.4 Nml/min of nitrogen). Again a CO-TPD on Pt/γ-Al2O3 is
shown for comparison [7].
The CO-TPD spectra in the top part of figure III-25 allow the following conclusions. First of
all the onset of desorption from the PtSn catalyst is shifted to lower temperatures, from about
50°C on Pt to about -20°C on Pt3Sn/Vulcan. For desorption from Pt/γ-Al2O3 two peaks at
110°C and 220°C are found, which are commonly assigned to CO adsorbed on terrace and
step sites, respectively [92, 123]. The additional high temperature peak from the Pt/γ-Al2O3
catalyst at around 280°C is probably due to the decomposition of formates, which accumulate
on the support during adsorption [133]. For Pt3Sn/Vulcan, the first maximum appears at
around 45°C, followed by a shoulder at ∼105°C and another maximum at 215°C. From the
analogy in desorption temperatures the two latter states are tentatively assigned to CO
desorption from small clusters of Pt surface atoms on the alloy particles. The low temperature
peak at 45°C, which is only observed on Pt3Sn/Vulcan, is attributed to CO desorption from Sn
modified Pt sites. Ross explained the lowering of the CO adsorption energy on the Sn
modified Pt sites by an electronic effect due to metal-metal interactions between Pt and Sn,
which would result in a downshift and narrowing of the platinum d-states, so that the overlap
with the 2π*-orbitals of the adsorbed CO molecules and hence the CO adsorption energy is
reduced [183]. This qualitative picture was confirmed by recent calculations in the group of J.

Pt3Sn/Vulcan Low-temperature CO oxidation over Pt3Sn/Vulcan
79
Nørskov, which demonstrated the close correlation between the position of the d-band and the
CO adsorption energy [182].
Assuming first order desorption kinetics and a (coverage independent) preexponential of 1013
s-1 we can estimate an activation energy of Edes ≈ 110 kJ/mol for CO desorption on Pt/γ-Al2O3
(for the first maximum) and around 90 kJ/mol for the first maximum on the Pt3Sn/Vulcan
catalyst, which corresponds to a reduction of Edes by roughly 20 kJ/mol for the alloyed surface.
Similar results were reported by Ross, who determined a temperature shift of 50°C compared
to pure platinum in CO desorption experiments on an ordered Pt3Sn single crystal, equivalent
to a decrease in the desorption barrier of about 20 kJ/mol [183, 184], or by Paffett et al., who
reported desorption maxima at 60°C - 80°C and 110°C resulting in desorption barriers of 100
- 105 kJ/mol and 122 kJ/mol for ordered PtSn surface alloys and pure platinum, respectively
[185] (For these calculations the authors assumed a prexponential of 4*1015 s-1). In total, the
(surface) alloy formation leads to an appreciable reduction in the onset of desorption at high
coverages. For the present purpose, however, it is decisive to estimate the change in steady
Des
orbe
d C
O [
a. u
.]
0
50
100
150
200 Pt/Al2O3
Pt3Sn/Vulcan
T [°C]
0 100 200 3000.0
0.2
0.4
0.6
Los
s in
ΘC
O
0.00
0.05
0.10
Fig. III-25: Upper window: temperature programmed desorption of pre-
adsorbed CO over Pt3Sn/Vulcan ( ; 5°C/min, 10.4 Nml/min N2) and
Pt/γ-Al2O3 (- - - - ; 3°C/min, 15 Nml/min He [7]; size scaled); lower
window: calculated loss of CO in monolayers fractions of metal surface.

Pt3Sn/Vulcan Low-temperature CO oxidation over Pt3Sn/Vulcan
80
state coverage under reaction conditions. Using the desorption parameters determined above
and sticking coefficients between 0.1 and 1, we can calculate that the reduction in CO
coverage is negligible at 60 - 80°C and 1 kPa CO partial pressure. Hence it is unlikely that the
PtSn system is operated in a low coverage situation at these temperatures, contrary to findings
for Au/α-Fe2O3 [186]. Theoretically, for a similar reaction mechanism on Pt3Sn/Vulcan as on
Pt/γ-Al2O3 the decay in selectivity should begin at temperatures around 120°C as concluded
from the difference in the onset of desorption, while based on experimental findings this onset
of a decaying selectivity must be below or at 20°C (see Fig III-23), pointing to additionally
effects contributing to the change in selectivity behavior as well.
In addition to the change in adsorption energy also the CO saturation coverage on the metal
particles differs significantly. Because of the different catalyst loading and dispersion in the
two TPD experiments we also plotted the integrated desorption curves, corrected for these
differences and normalized to adsorbate coverages on the total metal surface, in the bottom
part of figure III-25. Assuming a saturation coverage of 0.7 monolayers (ML) on the Pt
particles [7], we obtain an absolute coverage of slightly more than 0.1 ML on the PtSn
particles. This is by a factor of 5 below the saturation coverage extrapolated for a surface with
Pt3Sn composition, if we assume the same saturation CO density on the Pt surface atoms. The
latter assumption was put forward and confirmed in UHV experiments on ordered single-
crystal PtSn alloy surfaces (e. g., [184, 185, 187]). Hence, the CO adsorption capability of the
PtSn particles must be significantly reduced. Most plausibly the surface has become strongly
enriched in Sn during the pretreatment procedure. Similar effects, significant Sn surface segre-
gation of PtSn-alloys during annealing (or) in the presence of oxygen, were indeed found in
earlier studies [171, 188-190]. Most likely the calcination step during conditioning (20
Nml/min of 10 kPa O2 in N2 for 30 min. at 300°C) causes a massive segregation of Sn to the
surface, forming SnOx clusters or a (partial) SnO2 overlayer, which are not completely
reverted during subsequent reduction in H2. A situation with 80% of the surface covered by Sn
or an oxidic species after the conditioning sequence does not appear unrealistic (see also next
section). This is supported by our XPS results, where the calculated Pt:Sn ratio on the freshly
conditioned catalyst is only 2.0 (table III-6), pointing to a strong surface enrichment of tin of
more than 50%.
Note that the CO TPD experiment does not account for a possible influence of the coadsorbed
hydrogen, which is present under steady state conditions during selective CO oxidation, on the
CO desorption kinetics. Although we found that the influence on θCO is rather small in the

Pt3Sn/Vulcan Low-temperature CO oxidation over Pt3Sn/Vulcan
81
case of Pt/γ-Al2O3, where the adsorption energy of CO is lowered by only 2 kJ/mol in the
presence of coadsorbed hydrogen (chapter III-1.1.5), this may be different for the PtSn system.
Similar effects could also play a role for the CO oxidation kinetics.
More detailed statements require precise knowledge of the temperature dependent CO cover-
age under steady state conditions. This will be topic of the DRIFTS experiments described in
the following section.
Pt/Al2O3
IR in
tens
ity
[KM
-uni
ts]
0.00
0.05
0.10
0.15
0.20
60°C40°C
80°C100°C120°C
Pt3Sn/Vulcan
ν [cm-1]
180020002200
IR in
tens
ity
[KM
-uni
ts]
0.005
0.006
0.007
0.008
0.009
0.010
60°C40°C
80°C100°C120°C
20°C
Fig. III-26: DRIFTS spectra (region for linearly adsorbed CO) in idealized
reformate (0.1 kPa CO; λ = 2) at varying temperatures over Pt/γ-Al2O3
(upper window) and Pt3Sn/Vulcan (lower window).

Pt3Sn/Vulcan Low-temperature CO oxidation over Pt3Sn/Vulcan
82
2.1.3 Coverage dependence of the selectivity
The use of infrared spectroscopy for the determination of temperature dependent changes in
the CO coverage is based on earlier observations, showing that the exact position of the C-O
stretch vibration, on an identical adsorption site, changes both with coverage and with tem-
perature [38, 39]. The former shifts result from static changes in the C-O bond, due to direct
and indirect adsorbate-adsorbate interactions, and from a coverage dependent dynamical
coupling between neighboring dipoles. Temperature dependent shifts, at constant coverage,
arise from thermal decoupling, i. e., from a temperature induced reduction in dynamical cou-
pling [40, 99, 191]. Monitoring the evolution of the C-O stretch frequency with temperature
should therefore allow conclusions on the temperature dependent coverage behavior.
For these experiments IR spectra were recorded on a freshly conditioned catalyst in an
atmosphere of 0.1 kPa CO, 75 kPa H2, and rest N2 for 90 min. at increasing temperatures,
starting at 20°C and staying for 60 min. at each temperature. The spectra obtained on both
catalysts are reproduced in figure III-26, the shift of the band position with increasing
temperature, in the temperature range between 20°C and 120°C, is plotted in figure III-27. As
evident from figure III-26, the overall shape of the spectra does not change significantly with
temperature. On Pt/γ-Al2O3 two distinct CO species appear in the region of linearly adsorbed
CO. A large band at around 2050 cm-1, which is attributed to CO at step sites, and a shoulder
at around 2073 cm-1, which is assigned to a small fraction of CO on extended terraces [133].
Both bands reveal a small shift to lower wavenumbers of 3 - 4 cm-1 in the temperature range
investigated. From parallel adsorption measurements on the Pt/γ-Al2O3 catalyst we know that
the platinum surface is fully saturated with adsorbed CO over the entire temperature range at
the conditions of figure III-23 (chapter III-1.1.4). Therefore this IR-shift is attributed solely to
a thermal reduction of the dipole coupling at constant coverage. Alike conclusions were also
drawn in very similar earlier experiments on Pt/Al2O3 catalysts by Anderson [191] or Primet
[39].
Previous studies had shown that for adsorption on PtSn alloy surfaces the CO band is slightly
shifted to lower frequencies (up to 20 cm-1) compared to pure platinum (at a corresponding
metal dispersion), which was mainly attributed to a dilution effect, which reduces CO
coupling, and an additional small electronic influence (ca. 5 - 10 cm-1) of the tin [192-194].
The band at around 2075 cm-1 found in the present study on the bimetal-PtSn catalyst is there-

Pt3Sn/Vulcan Low-temperature CO oxidation over Pt3Sn/Vulcan
83
fore associated to linearly bound CO on Pt sites on the alloyed surface. With increasing tem-
perature the band shifts by about 9 cm-1 to lower wavenumbers.
For comparison, Balakrishnan et al. reported in a similar study on a PtSn/Al2O3 catalyst con-
taining 1% Pt and 0.1% Sn an infrared band at 2068 cm-1 at room temperature (after saturation
with 101 kPa CO), which down-shifted about 25 cm-1 as the coverage decreased at higher
temperatures [193]. Likewise, de Ménorval et al. observed an IR band at 2072 cm-1 on their
PtSn/Al2O3 catalyst (1.4% Pt, 0.2% Sn; D = 64%), shifting to 2043 cm-1 after desorption at
200°C [195]. For samples containing more tin (up to 1%) the downward shift was
significantly smaller (∼12 cm-1), indicating that the coupling is reduced by the dilution with tin
[193].
If the contribution of direct thermal effects is around 3 cm-1, similar to Pt/γ-Al2O3, the
additional shift of about 6 cm-1 must be attributed to a reduction in CO coverage with
increasing temperature. Comparison with the cited literature data ([193-195]) implies, that the
present shift of 6 cm-1 would correspond to a coverage decrease of ca. 20%, assuming a linear
relationship between the band position and θCO.
Based on these results the CO coverage on the Pt3Sn/Vulcan catalyst drops continuously with
increasing temperature under steady state conditions, especially above 60°C. Even if we take
into account that the kinetic data were recorded under oxidizing conditions and at a somewhat
higher CO content of 1 kPa (a concentration which could not be realized in the IR
COlinear
T [°C]
40 80 120
ν[c
m-1
]
2049
2052
2070
2073
2076
Fig. III-27: Position of the IR band for linearly adsorbed CO in idealized
reformate (0.1 kPa CO; λ = 2) as a function of temperature over Pt3Sn/Vulcan
( ) and Pt/γ-Al2O3 ( terrace bound CO and edge bound CO).

Pt3Sn/Vulcan Low-temperature CO oxidation over Pt3Sn/Vulcan
84
experiments, since under these conditions the gas phase CO signal completely covered the
COad band on the carbon supported catalyst), this infrared experiment confirms the
conclusions from the TPD experiment, that the steady state CO coverage decreases
significantly in the temperature range 60 - 120°C, which in turn would serve as a good
explanation for the decay of selectivity under PROX conditions in fig. III-23. On the other
side, both experiments indicate that the coverage decrease is small, if at all existing, at
temperatures below 40 - 60°C, pointing to another contribution to the increasing selectivity in
this temperature range.
2.1.4 Catalyst state during conditioning & reaction
In addition to alloy formation Sn can affect the reaction also by forming SnOx, which may
cover part of the metal particles. Therefore information on the oxidation state of the Sn
component, under reaction conditions, is a precondition for understanding the reaction
mechanism. This question was investigated by XPS measurements. XP spectra were recorded
binding energy [eV]
483 486 489
XPS
inte
nsit
y [c
ps]
Sn 3d5/2
5000
(c)
(b)
(a)
(e)
Fig. III-28: XPS spectra of the Sn 3d5/2 level on Pt3Sn/Vulcan during conditioning
(a) first 30 min. with 10 kPa O2 in N2, then b) 30 min. H2; both 300°C), c) after exposure
of the freshly conditioned catalyst to air (20°C; 15 min.) d) after 16 h of CO oxidation in
pure nitrogen and e) after 1 h PROX in idealized reformate (spectra d & e with 1 kPa CO;
λ = 2; 80°C; with subsequent exposure to air at 20°C, ca. 15 min.).
(d)

Pt3Sn/Vulcan Low-temperature CO oxidation over Pt3Sn/Vulcan
85
on the freshly conditioned catalyst and on a used catalyst, after 1 and 20 h reaction,
respectively. Since these measurements cannot be performed in-situ, we also characterized a
catalyst conditioned in a high pressure cell of the XP-spectrometer (30 min. 10 kPa O2 + 30
min. 10 kPa H2, both at 300°C) for comparison, avoiding subsequent transport through air.
The spectra (Sn(3d5/2) peak) recorded after the different treatments are shown in figure III-28.
The reactive treatments lead to the following results (also listed in table III-6): After oxidation
in the high pressure cell the Sn(3d5/2) signal appears at a BE of 486.9 eV (spectrum (a) in fig.
III-28), the subsequent reduction cycle causes a down-shift to 485.8 eV. Furthermore,
compared to the rather large width of spectrum (a) (full width at half maximum (FWHM) 2.3
eV) the latter spectrum is significantly narrower, with a FWHM of 1.8 eV. From a comparison
of the positions to those given in previous studies, which were obtained on various supported
and unsupported PtSn and Sn samples (listed in table III-7; the BE-range for the 3d5/2 signal of
Sn in its different states is also graphically illustrated in figure III-29), we attribute the latter
spectrum to Sn in its metallic state (which is slightly shifted upward for alloys and small films
when compared to bulk Sn [196, 197]), whereas after the calcination treatment Sn2+/4+ species
dominate the spectrum. The latter are hardly distinguished by XPS [198, 199]. The large peak
width of 2.3 eV, however, points to contributions from different oxidation states. Hence Sn
oxidation is still incomplete, in agreement with previous findings that oxidation of PtSn alloys
is very slow, much slower than for metallic Sn [196, 200].
After the subsequent reduction cycle, the BE's are reduced but still slightly higher than those
reported in the literature for alloy surfaces/particles. Since significant particle size effects are
Treatment Pt(4f7/2)[eV]
Sn(3d5/2)[eV]
„Sn0“[%]
Pt/Sn-ratio
conditioning: 10 kPa O2 at 300°C 71.6 486.9 9 1.6 + 10 kPa H2 at 300°C 71.7 485.8 ≡ 100 2.0 + exposure to air at 25°C 71.6 486.1 57 1.8
after reaction (ex-situ): 1 h id. reformate (1 kPa CO, λ = 2; 80°C) 71.6 486.3 39 1.7 20 h id. reformate (1 kPa CO, λ = 2; 80°C) 71.6 486.3 37 1.7 16 h CO oxid. in pure N2 (1 kPa CO, λ = 2; 80°C) 71.6 486.1 52 1.8
Table III-6: XPS results on our Pt3Sn/Vulcan catalyst after treatment in different
atmospheres (C(1s) at 284.6 eV).

Syst
emP
retr
eatm
ent
Pt(
4f)
[eV
]Sn
(3d 5
/2)
[eV
] 1)
Oth
erR
ef.
Pt 3
Snsp
utte
ring
70.9
484.
6[1
89]
Sn/
Pt(
100)
anne
aled
at >
600
K 2)
70.9
∼ 485
.0[2
02]
Pt 3
Snai
r (2
5°C
)71
.548
5.0
3)/ 4
86.4
[203
]+
H2
(300
°C)
71.7
485.
3 / 4
86.4
4)
PtSn
foi
l25
0 kP
a H
2 (3
75°C
)72
.048
4.9
(88)
/ 48
6.7
(12)
[204
]O
2 (5
00°C
)48
6.0
PtSn
5)48
5.3
[196
]+
200
kP
a O
2 (2
5°C
)48
5.7
6)
Pt 3
Snai
r (2
5°C
)71
.248
4.7
/ ∼48
6.0
4)[2
05]
Sn/
Pt(
111)
500
L O
2 (5
0°C
)48
4.8
/ 485
.9[1
85]
PtSn
/SiO
2O
2 (4
00°C
)71
.4 (6
1) /
72.5
(39)
484.
0(6) /
485.
4(11)
/ 48
7.6(8
3)S
i(2p
) =
103
.4 e
V[1
71]
+ C
O/O
2 (3
00°C
)71
.248
5.5(2
1) /
487.
3(79)
PtSn
/SiO
27)
250
kPa
H2
(375
°C)
71.5
484.
8 (4
9) /
487.
0 (5
1)S
i(2p
) =
103
.7 e
V[2
04]
O2
(500
°C)
487.
4
PtSn
/SiO
2+
H2
(300
°C)
483.
6(16)
/ 48
4.9(6
6) /
486.
8(18)
Si(
2p)
= 1
03.4
eV
[206
]Pt
Sn/A
l 2O
3+
H2
(300
°C)
71.3
483.
9(20)
/ 48
4.9(5
2) /
486.
8(28)
Al(
2p)
= 7
4.7
eV
PtSn
/Al 2
O3
7)25
0 kP
a H
2 (3
75°C
) 8)
72.1
484.
0 (4
9) /
486.
6 (5
1)A
l(2p
) =
74.
7 eV
[204
]O
2 (5
00°C
)48
7.0
PtSn
/Al 2
O3
air
(500
°C)
∼ 483
.6 (3
3) /
∼ 486
.9 (6
7)[1
94]
PtSn
/CH
2 (3
50°C
)71
.8∼ 4
86.3
(15)
/ 48
7.7
(85)
C(1
s) =
284
.9 e
V[2
07]
Sn/A
l 2O
3re
duce
d by
ion
beam
/ at
omic
H-
484.
8 / 4
86.6
9)A
l(2p
) =
74.
3 eV
[199
]
Snsp
utte
ring
-48
4.7
[198
]+
air
(25
°C)
-48
4.7
+ 4
86.4
Sn-
484.
9[1
96]
+ 2
00 k
Pa
O2
(25°
C)
-48
5.0
/ 486
.4
1) (x
) = in
at%
2) f
orm
atio
n of
PtS
n su
rfac
e al
loys
3)
low
-BE
sho
ulde
r 4)
hig
h-B
E s
houl
der
5) p
repa
red
by v
apor
dep
osit
ion
of S
n (0
.28
ML
Sn)
6) +
bro
aden
ing
to h
igh
BE
7) P
t:S
n =
1:2
.78)
for
min
g an
Pt 3
Sn a
lloy
phas
e9)
sim
ilar
valu
es w
ere
obta
ined
on
an a
ir-e
xpos
ed S
n-fo
il
Tab
le I
II-7
: XPS
lite
ratu
re d
ata
obta
ined
on
vari
ous
PtSn
or
Sn s
yste
ms.

Pt3Sn/Vulcan Low-temperature CO oxidation over Pt3Sn/Vulcan
87
unlikely at an average particle size of 3 - 4 nm, the higher BE might reflect an incomplete
reduction of the particles. Similar effects have in fact been observed, during reduction of an
Al2O3 supported PtSn catalyst at 500°C in a H2 flow, where EXAFS spectra recorded in-situ
showed significant Sn coordination to oxygen atoms [201]. On the other hand, for a SiO2
supported PtSn catalyst the same procedure led to a more complete reduction and alloy
formation. Similar conclusions have been reached in numerous other studies, which confirmed
that after reduction in H2 a significant fraction of the Sn in Al2O3 supported catalysts was
involved in PtSn alloy formation, but a large fraction, presumably unreduced tin oxides,
remained unaffected on the surface [193, 204, 206, 208-211]. For carbon supports the
situation appears to be similar: After reduction part of the Sn is metallic and dissolved in PtSn
alloy particles, another part of it is still in an oxidic state, adsorbed on the PtSn particles and
presumably also on the support material [207, 212]. Likewise, the increased Pt:Sn ratio
measured after reduction, which indicates diffusion of Sn into the alloyed metal particles,
underlines the formation of a real bimetallic catalyst after our conditioning procedure.
Because of the ten times higher H2 partial pressure during reduction in the reactor the degree
of Sn reduction for the conditioned catalyst prior to reaction may be somewhat higher than
after the in-situ reduction in the XP-spectrometer.
Next we compare with spectra recorded on the catalysts after conditioning in the reactor and
after 1h reaction in idealized reformate (1 kPa CO, λ = 2; 80°C), respectively (fig. III-28 c,d),
and subsequent transfer into the spectrometer. For better comparison these spectra are overlaid
on top of each other. The Sn(3d) peaks in these spectra are almost identical, both with respect
to their peak position, with binding energies (BE's) of 486.1 and 486.3 eV, respectively, as
BE [eV]
484 485 486 487
Sn0
Sn0 (alloyed)
SnOx (alloyed)
SnOx
Fig. III-29: Binding energy range for the Sn(3d5/2) peak of various Sn and
PtSn samples in literature studies [171, 185, 189, 196, 198, 199, 202-206]

Pt3Sn/Vulcan Low-temperature CO oxidation over Pt3Sn/Vulcan
88
well as to the Sn(3d)/Pt(4f) intensity ratio. The only significant difference is a shoulder on the
high BE side of the spectrum, which is more pronounced after reaction than after
conditioning, which may be attributed to either an enhanced amount of oxidized Sn species or,
more likely (since the broadening is not observed after CO oxidation in a pure N2
background), to the formation of Sn(OH)x species, which can be expected as a consequence of
the parallely occuring H2 + O2 reaction. A virtually identical spectrum was obtained on a
catalyst after 20 h reaction (see table III-6).
The rather wide peaks (FWHM 2.3 eV) can be deconvoluted into and fitted by contributions
of the 'reduced' and the 'oxidized' component in figs. III-28 a and b (Note that the 'reduced'
component is presumably also partly oxidized.) The apparent shift of 0.3 eV and the increase
in peak width from spectrum (III-28b) to spectrum (III-28c) reflect an increase in the oxidized
component, which is caused by the sample transfer. The relatively low increase in oxidation is
consistent with findings from previous studies on the oxidation of PdSn and PtSn (surface)
alloys, which reported only slight peak shifts of below 0.5 eV for oxygen exposures around
1011 L (1 L = 1.33⋅10-6 mbar s) [196, 200], much less than obtained for bulk Sn or thick Sn
films [185].
In contrast to the tin component, the Pt(4f7/2) signal remains constant at a BE of 71.6 eV for
all treatments, indicating a fully reduced state. The somewhat higher BE compared to the
values listed for pure Pt (ca. 71.2 eV [213]) is probably an effect of the Pt-Sn alloy formation
[214].
In total these results indicate that the working catalyst, under reaction conditions, contains
partly oxidized Sn on the surface. Similar conclusions were reached in additional in-situ
XANES measurements on the Pt3Sn/Vulcan catalyst during reaction in idealized reformate
(The results will be published in detail in an upcoming article). This formation of SnOx
species during CO oxidation was also confirmed in post-mortem AES experiments by Logan
et al. for a Sn overlayer on a Pd(100) substrate (reaction at 1 kPa O2, < 0.2 kPa CO; ∼200°C)
[215]. Nevertheless, part of the tin in our catalyst is present as metallic Sn0 in form of PtSn
alloys. The close similarity of the spectra (III-28c) and (III-28d) indicates that during the
reaction the catalyst largely keeps the morphology and (surface) composition it had after
conditioning, with a slight increase in the amount of oxidized Sn species. After the oxidative
treatment, more highly oxidized SnOx surface species are formed, accompanied by reaction
induced Sn segregation. Similar conclusions can also be drawn from a quantitative analysis of

Pt3Sn/Vulcan Low-temperature CO oxidation over Pt3Sn/Vulcan
89
the Sn(3d)/Pt(4f) intensity ratios. Moreover, the XPS data support the strong Sn surface
enrichment on the freshly conditioned catalyst when compared to the nominal composition
(Pt3Sn), as was already indicated by the low saturation coverage of CO in our TPD
experiment. This is also in agreement with a recent study of de Miguel et al., who reported
extreme surface compositions of Pt:Sn = 1:16 and more on a PtSn/C catalyst after reduction at
350°C [207].
2.1.5 Mechanistic proposal - avoiding the CO poisoning
From the data presented above, the mechanism for preferential CO oxidation on carbon sup-
ported PtSn catalysts, at 1 kPa CO and 1 kPa O2, must satisfy the following conditions:
i) The rate for CO oxidation is much higher on Pt3Sn/Vulcan than on Pt/γ-Al2O3, by about 2
orders of magnitude at 80°C; it is close to that observed on Au/α-Fe2O3 under identical
conditions.
ii) The effective activation energy for CO oxidation on Pt3Sn/Vulcan is much lower than on
Pt/γ-Al2O3, and closely similar to that observed on Au/α-Fe2O3 under identical
conditions. It is also much lower than the CO desorption barrier on this surface, implying
that CO desorption is not the rate limiting step.
iii) The low temperature selectivity of 85% on the PtSn catalyst is much higher than that ob-
tained for the common Pt catalyst (35%) in the temperature range where this is active. It
decreases with temperature above 20°C.
iv) CO adsorption on the PtSn alloy surface exhibits an additional low temperature state not
existent on Pt, which reduces the onset for CO desorption by 60 - 70°C at saturation
coverage. Despite of the resulting decrease in steady state CO coverage with temperature
the reaction proceeds at a substantial local CO coverage on the free Pt surface sites, much
higher than for Au/α-Fe2O3, but below saturation coverage.
v) Under reaction conditions part of the Sn is oxidized, while the remaining part is metallic,
forming PtSn alloy particles. A large fraction of the surface, about 80%, is blocked for
CO adsorption, by both SnOx patches and alloyed Sn atoms on/in the surface.
These requirements are met by the following tentative mechanistic picture for the PROX reac-
tion on the Pt3Sn/Vulcan catalyst in the parameter range investigated here: During reaction the
catalyst operates at high CO coverages, which may reach saturation in the low temperature

Pt3Sn/Vulcan Low-temperature CO oxidation over Pt3Sn/Vulcan
90
regime between 0° and 40°C and decreases steadily with increasing temperature. But even at
120°C the CO coverage is still considerable (reduced by approximately 20% based on the
infrared results). Areas covered by SnOx as well as Sn surface sites are not accessible for CO
adsorption. These areas are active, however, for oxygen adsorption. Since the sticking
probability of oxygen on a CO covered PtSn surface, even with only Pt sites being occupied,
is expected to be low, oxygen adsorption will be dominated by adsorption on small SnOx
islands. Oxygen adsorption on Pt sites vacated by reacting or desorbing CO molecules, which
is the rate limiting step on pure Pt, is still possible, but is much less efficient than on the SnOx
areas. CO oxidation takes place by reaction between CO adsorbed on the Pt areas/sites of the
catalyst particles and Oad adsorbed on adjacent SnOx islands/Sn sites or by spill-over of one
the species and subsequent reaction to CO2. Since oxygen adsorption is not limited by CO
desorption, the activity of the PtSn catalyst is much higher than that of Pt catalysts, at least in
the regime of high CO coverages. A rather similar mechanism had been proposed for low
temperature CO oxidation on Pt/SnO2 catalysts by Lintz and coworkers [177], explaining the
high activity at low temperatures by adsorption of oxygen on the tin-dioxide and subsequent
reaction with CO adsorbed on Pt sites. The still lower activity of the SnO2 supported Pt
catalysts as compared to the present system (see table III-5) can be understood from the higher
dispersion of the SnOx component, if this material is present on the surface of the active metal
particles. The reduced CO adsorption energy and hence decreased steady state coverage of
CO, which work in the same direction, would not be sufficient to explain the rather high
reaction rates even at the lowest temperatures, around 0 - 20°C. Since CO desorption is no
more a precondition for oxygen adsorption and subsequent reaction, the activation energies for
CO oxidation and CO desorption on the PtSn catalyst are distinctly different, in contrast to
pure Pt catalysts, where the creation of vacancies by CO desorption is the rate limiting step, at
least in the 'low rate branch', and the barriers for CO oxidation and CO desorption, in the high
coverage limit, are of similar size [1, 216].
The hydrogen oxidation reaction, in the presence of small amounts of CO in the gas phase,
seems to be dominated by hydrogen adsorption on Pt surface sites. The much higher
selectivity of the PROX reaction on PtSn than on Pt results from the much higher rate for CO
oxidation, while the enhancement of the hydrogen oxidation rate is less pronounced. This
points to a low steady state coverage of Had, which is most easily explained by a hydrogen
adsorption path where hydrogen adsorption on PtSn proceeds in the same way as on Pt, by
adsorption into vacancies of the CO adlayer. This way hydrogen adsorption is effectively

Pt3Sn/Vulcan Low-temperature CO oxidation over Pt3Sn/Vulcan
91
inhibited at high CO coverages. Hydrogen adsorption on SnOx areas, being the dominant route
for oxygen adsorption, does not seem to play a role. Furthermore, even in the absence of CO
the sticking coefficient for hydrogen adsorption on the PtSn surface is significantly lower than
on a pure Pt surface [185], probably a geometric effect, which reduces the number of reactive
Pt ensembles [195, 217, 218].
In that picture it is straightforward to explain the much higher selectivity on the bimetallic
PtSn catalyst as compared to the pure Pt catalyst and the steady decrease of the selectivity
with temperature. At low temperatures (and high CO coverages) hydrogen adsorption and
oxidation are practically inhibited, since limited by CO desorption. With increasing
temperature at least at temperatures above 40 - 60°C, the CO coverage decreases on PtSn,
while on Pt it remains practically constant up to much higher temperatures. Consequently the
hydrogen oxidation rate increases steadily, leading to a steady decline in selectivity. For Pt/γ-
Al2O3, in contrast, the selectivity is constant over a wide temperature range and decays only
above 200°C (chapter III-1.1.1).
These effects are reflected in the activation energies measured for the two oxidation reactions.
While on Pt/γ-Al2O3 the apparent, measured activation energies for CO and H2 oxidation are
practically identical, the latter is significantly higher than the former one on Pt3Sn/Vulcan, in
accordance with the observed decrease in selectivity with temperature. It is important to note
that these activation energies are not simple barriers for the individual oxidation step, i. e., for
the reaction between adjacent COad and Oad (or Had and Oad), but rather result from a complex
interplay between different processes, each of them exhibiting a different temperature
dependence, with considerable consequences for the overall reaction process. For instance for
PtSn, where oxygen adsorption is possible also on Sn areas, CO desorption is no longer rate
limiting and the apparent barrier for reaction (31 kJ/mol) is much lower than that for CO
desorption (∼70 - 90 kJ/mol). In that case the actual reaction step is likely to be rate limiting,
with the measured activation barrier actually describing the activation energy of this reaction
step. For the hydrogen oxidation rate on Pt3Sn/Vulcan, on the other side, the measured
activation barrier must include also effects from the decline in CO coverage with increasing
temperature. On pure Pt the hydrogen oxidation rate is directly coupled to that for CO
removal, i. e., CO desorption, CO oxidation and H2 oxidation exhibit the same apparent
activation energies, at least up to 200 °C [7].

Pt3Sn/Vulcan Low-temperature CO oxidation over Pt3Sn/Vulcan
92
At last we compare the reaction mechanism for CO oxidation on PtSn with that on another
low temperature CO oxidation catalyst, on Au/α-Fe2O3. The latter catalyst is very different
from PtSn in that on the Au surface CO adsorption is much weaker, leading to a very low
steady state CO coverage at operating temperatures between 40° and 80°C ([186]; compare
also chapter III-3.3). On the other side, despite of the low CO coverage oxygen adsorption on
Au is practically not possible because of the very low sticking coefficient for dissociative
oxygen adsorption on Au [219, 220]. Existing reaction models therefore assume oxygen
adsorption on the FeOx support, followed by diffusion to the perimeter of the Au particles and
subsequent reaction either at the perimeter, or, after a spill-over process of one of the compo-
nents, on the adjacent Au or support areas (see chapter III-3.1). Hence, also in this case CO
desorption is not rate limiting, at least not for the supply of oxygen, and this catalyst shows
reaction characteristics similar to the present Pt3Sn/Vulcan catalyst, with the selectivity de-
creasing with temperature [26, 186]. In this case, however, the competing adsorption and
oxidation of hydrogen is not inhibited by a CO adlayer on the metal particle, but by the high
activation barrier for the dissociative hydrogen adsorption on Au [221-223].
Finally we would like to note that if the mechanism suggested above is correct, one would ex-
pect for the PROX reaction on PtSn catalysts that in the parameter range investigated here the
selectivity is independent of the O2 partial pressure in the low temperature regime, where
oxygen adsorption is limited to adsorption on the SnOx islands, and decreases with CO partial
pressure, at least at temperatures above 40°C. These proposals are currently investigated and
will be presented in a parallel thesis work by M. Kahlich [25].

Pt3Sn/Vulcan Other important characteristics for an application in a PROX-stage
93
2.2 Other important characteristics for an application in a PROX-stage
Not only a high activity and selectivity are decisive for an employment in a real PROX
application, there are other important factors, which have to be considered as well, e. g., the
long-term stability or effects arising from a more realistic composition of the reaction gas
mixture.
The currently employed Pt/γ-Al2O3 system showed a quite satisfying long-term stability in our
tests in idealized reformate, characterized by a rather moderate and highly reversible decline
of activity (chapter III-1.2.1). But due to its high operation temperature (150 - 250°C), which
is necessary in order to ensure a sufficient mass-related activity, its performance suffers
strongly from the reverse water-gas shift reaction occuring at the same time in presence of
CO2, which limits the CO purification level achievable in a PROX stage (see, e. g., [11, 12];
compare also chapter III-1.3.2).
Similar to the procedure for Pt/γ-Al2O3 in the preceeding part of this work, in the following
context, we will first investigate the long-term performance of our Pt3Sn/Vulcan catalyst
before we subsequently discuss effects arising from a more realistic reformate containing CO2
and / or H2O. Finally we will evaluate the activity for the water-gas shift reaction and compare
it to the standard Pt/γ-Al2O3 catalyst.
2.2.1 Long-term stability
The evolution of the CO oxidation activity over Pt3Sn/Vulcan during time-on stream in
various gas mixtures (all 1 kPa CO, λ = 2; 80°C) is displayed in figure III-30 and compared to
the deactivation behaviour of the Pt/γ-Al2O3 catalyst in idealized reformate at 150°C (black
circles). The deactivation over the bimetallic PtSn catalyst (diamonds) in idealized reformate
(46% within 1000 min.) is almost identical to that of the Pt catalyst. But due to the different
reaction mechanism, where the oxygen supply is not limited by the CO desorption but occurs
via the Sn component, the activity loss on Pt3Sn/Vulcan cannot be simply traced back to a
slow „self-poisoning“ by a more and more perfect COad-layer as was proposed for Pt/γ-Al2O3
([32, 128]; see also section 1.2.1). For the CO oxidation in pure nitrogen this deactivation is
strongly enhanced (86%; triangles). Moreover, the activity is significantly lower (factor 2 for
the inital TOF), which is in analogy to the pure Pt catalysts and probably caused by a similar
effect of coadsorbed hydrogen on the adsorption energy of CO in idealized reformate (Chapter
III-1.1.5). On the closely related Pt/SnO2 system Gardner et al. observed a similar severe

Pt3Sn/Vulcan Other important characteristics for an application in a PROX-stage
94
deactivation of roughly 70% within 1000 min. (1 kPa CO, λ = 1; 55°C) [224]. The addition
of water (1.3 kPa; hexagons) to the hydrogen-free mixture increases the activity slightly
(+40%), which is again similar to Pt/γ-Al2O3 and also in accordance with alike observations
by Croft et al. on a Pd/SnO2 catalyst (5 kPa CO, λ = 8; 60°C) after the addition of 2.8 kPa
H2O [225], but it does not alter the deactivation behaviour markedly. Such an increase of the
initial activity is also noted for idealized reformate in the presence of water (square symbols),
but here the effect is slowly reduced with proceeding time on-stream, leading to an asymptotic
approach to the data obtained in the dry mixture (see next section).
The reversibility of this activity loss on Pt3Sn/Vulcan (in idealized reformate) was
investigated in subsequent long-term measurements, which are shown in fig. III-31. Other
than for Pt/γ-Al2O3 the activity is not fully restored after intermediate purging with pure
nitrogen at 80°C (i. e., at reaction temperature; 20 Nml/min for 1 h) and 170°C, respectively.
Just 65 - 70% of the initial rate are regained by this procedures. Only after an intermediate
purging step at 270°C (inset window in fig. III-31), which is already close to the conditioning
temperature, the initial activity is restored to the full extent.
t [min]
10 100 1000
TO
F [s
-1]
0.01
0.1
Figure III-30: Long-term activity of Pt3Sn/Vulcan (80°C) in idealized reformate ( ;
1 kPa CO, λ = 2), in idealized reformate + 1.3 kPa H2O ( ), during CO oxidation
in a pure N2 background ( ) and in pure N2 with 1.3 kPa H2O added ( );
for comparison: Pt/γ-Al2O3 in idealized reformate at 150°C ( ;1 kPa CO, λ = 2).

Pt3Sn/Vulcan Other important characteristics for an application in a PROX-stage
95
At the beginning of the experiment and after each purging step the selectivity starts from a
low level (ca. 45%) and then slowly increases to its final value (ca. 67%), a behaviour which
is well known from our experiments on the Pt/γ-Al2O3 system. On the latter, this phenomenon
was explained by a COad-layer approaching its final steady state coverage only very slowly
and hence initially allowing more hydrogen to adsorb on the surface. The fact, that the same
effect exists for the bimetallic PtSn surface, too, underlines that we indeed operate at a rather
high θCO at our reaction conditions (at least high enough to block the H2 adsorption) as was
already suspected in the preceeding chapter. It furthermore confirms clearly that CO and H2
still compete for the same (Pt) adsorption sites and that the latter does not additionally adsorb
on the tin component.
Since we may exclude the „CO-poisoning“ model as an explanation for the observed activity
loss on the Pt3Sn/Vulcan catalyst, in principle two other models must be take into account.
First, by-products may form on the catalyst surface during reaction and block active sites, as
was demonstrated, e. g., for the carbonate species, which accumulate on a Au/α-Fe2O3 catalyst
during time on-stream (see chapter III-3.4). Second, the surface composition, which has
r [m
olC
O/g
Met*s
] *1
0-3
0.0008
0.0009
0.0015
0.002
0.0025
0.001
t [min]
0 500 1000 1500 2000
S [%
]
30
50
70
a)
b)
c)
t [min]0 400 800
0.0015
0.0020.0025
0.001
Figure III-31: "Regeneration-tests" over Pt3Sn/Vulcan after reaction in idealized
reformate at 80°C (1 kPa CO, λ = 2): first by intermediate purging with nitrogen
for 1 hour at reaction temperature, then at 170°C - a) reaction rate and
b) selectivity; Inset: Regeneration-test" by purging with N2 at 270°C (1 h).
N2

Pt3Sn/Vulcan Other important characteristics for an application in a PROX-stage
96
shown to be rather dynamic during the conditioning process, may change gradually in order to
approach a new enthalpy minimum in the employed reaction atmosphere. For this model it is
quite difficult to predict which metal would be expected to accumulate in the surface layer in
idealized reformate: On the one hand CO and H2 would favour a platinum enrichment, on the
other hand oxygen as well as the in-situ produced water support the segregation of tin to the
surface [188, 189, 203, 226]. The following DRIFTS and TPD experiments were recorded in
order to confirm or refute the above hyphotheses.
First, we acquired DRIFTS spectra during several hours of CO oxidation in idealized
reformate and in a pure nitrogen background, respectively (1 kPa CO, λ = 2, 80°C). In figure
III-32 the time-evolution of the integrated IR area of the band for linearly bound CO (at
around 2085 cm-1) is shown. For a better comparison the initial value (acquired after 15 min.
of reaction) is scaled to one. Quite clearly, in both experiments the COad signal grows
significantly during time on-stream. Moreover, this effect even accelerates with progressing
reaction time instead of slowly approaching a steady-state value, which would be expected for
a simple equilibration of adsorbed species as was observed on Pt/γ-Al2O3 [32] (and would
would give rise to changes the intensity by less than 10%, anyway). Since for a bimetallic
PtSn surface the CO adsorbs exclusively on the platinum under our conditions [227, 228], the
t [min]
10 100 1000
inte
grat
ed I
R-i
nten
sity
[a.
u.]
1.0
1.2
1.4
1.6
t [min]10 100 1000
ν[c
m-1
]
2085
2087
Figure III-32: Time-evolution of the IR-band for linearly bound CO
on Pt3Sn/Vulcan in idealized reformate ( ) and during CO oxidation
in a pure nitrogen background ( ; 1 kPa CO, λ = 2; 80°C).
Inset: Time-evolution of the band position in idealized reformate.

Pt3Sn/Vulcan Other important characteristics for an application in a PROX-stage
97
intensity increase in our DRIFTS spectra strongly suggests that the platinum is enriched at the
surface of the alloyed particles during CO oxidation. The parallel increase of the wavenumber
(fig. III-32, inset window) likewise suggests a gradual reduction of the small electronic effect
of tin, which for alloyed particles originally down-shifts the band position compared to pure
Pt particles [192-194].
Nevertheless, the much more pronounced IR-effect in idealized reformate, obviously a
consequence of the high H2-content in this gas mixture, contrasts the more moderate
deactivation compared to the hydrogen-free mixture, which was found in our long-term
experiments (fig. III-30). Hence the observed segregation effect cannot be responsible for the
activity loss on Pt3Sn/Vulcan (at least not for the reversible, major part).
Next, we investigated the formation of by-products in DRIFTS. But due to the very small
penetration depth of the infrared beam into the black coloured catalyst powder, the spectral
region below 1800 cm-1 was hardly accessible, resulting in an extremely low signal-to-noise
ratio (even at a total scanning time of more than 20 min.). The only information, which could
be obtained from a long-term measurement in idealized reformate (0.5 kPa CO, λ = 2; 80°C)
over a Pt3Sn/Vulcan catalyst diluted with diamond powder (which should be a completely
inert material), is that upon dividing the spectra acquired after 15 min. and 10 h on-stream,
respectively, a slight growth of bands at 1590 and 1750 cm-1 appears (fig III-33), which indeed
suggests the accumulation of byproducts (most likely carbonates, CO32-) on the surface during
the reaction.
ν [cm-1]
1200160020002400
IR in
tens
ity
[KM
]0.97
0.98
{Carbonates?COad
CO2 (gas-phase)
Figure III-33: Difference spectra on Pt3Sn/Vulcan obtained in idealized reformate
(0.5 kPa CO, λ = 2; 80°C) between a spectrum acquired after 15 min. and after
10 hours, respectively - Upward bands: increase; downward bands: loss.

Pt3Sn/Vulcan Other important characteristics for an application in a PROX-stage
98
In order to confirm this idea, we performed a temperature programmed desorption (TPD)
experiment post mortem, which is shown in figure III-34 (a CO2-TPD on the pure Vulcan
support is included for comparison). After approximately 12 hours of reaction in idealized
reformate (0.6 kPa CO, λ = 2, ca. 40 kPa H2; 80°C), we cooled the catalyst bed down to
-20°C, removed the adsorbed CO by purging with 10 kPa O2 in N2 (ca. 5 min.; 20 Nml/min)
and then slowly increased the temperature (5°C/min) in a flow of nitrogen (8 Nml/min).
Indeed some CO2 evolved at elevated temperatures, with two broad maxima at ∼170°C and
∼280°C. The measurement was cut off at 300°C, since at temperatures above the conditioning
temperature large contributions from residual catalyst impurities cannot be excluded. From the
parallel TPD experiment on the pure support (grey line in fig. III-34) as well as from the
negligible CO2 signal (up to 300°C) during our CO-TPD experiment in the last section (fig.
III-25), we infer, that the CO2 evolution on the used catalyst is indeed related to by-products,
which are formed during the selective CO oxidation over Pt3Sn/Vulcan. The amount of ca. 1.9
µmol CO2 is slightly less than the total amount of Sn in the catalyst (3 µmol; but of course not
all Sn is at the surface) and hence implies the location of these by-products on the tin
component (probably on the SnOx patches). These results strongly suggest, that an
accumulation of by-products is responsible for the observed deactivation by blocking the
oxygen adsorption on the Sn / SnOx sites. But this deactivation model obviously only holds
T [°C]
-50 0 50 100 150 200 250 300 350
CO
2co
ncen
trat
ion
[ppm
]
0
50
100
150
Figure III-34: TPD experiment (8 Nml/min N2; 5°C/min) after 12 hours of
reaction over Pt3Sn/Vulcan in idealized reformate (0.6 kPa CO; λ = 2; 80°C)
and the subsequent oxidative removal of the COad at -20°C ( ). For
comparison: CO2-TPD over freshly conditioned Vulcan support - Both plots
are normed to the employed mass of support material ( ).
~ 1.9 µmol CO2
ca. 3 µmol Sn

Pt3Sn/Vulcan Other important characteristics for an application in a PROX-stage
99
true for the easily reversible part of the activity loss, since according to our CO2-TPD at a
purging temperature of 170°C (see fig. III-31) the major part of the by-products should have
been removed. Hence, the more irreversible rest of deactivation must be attributed to other
reasons.
Consequently, the rather moderate deactivation in a hydrogen-rich gas compared to the CO
oxidation in pure N2 is traced back to a less pronounced accumulation of by-products (e. g., by
a faster decomposition in idealized reformate), but without further experimental data it is
difficult to speculate for reasons.
The deactivation part, which is reverted only at temperatures close to the initial formation
temperature (at 270°C), may indeed be caused by a superposed segregation effect, as was
inferred by the DRIFTS experiment. Only at very high temperatures the surface composition
is restored closely to the state of the freshly conditioned catalyst.
Very similar conclusions were reached in a study by Hoflund et al. on a Pt/SnOx/SiO2 catalyst,
where the largest part of the observed deactivation could be reverted by heating or exposing
the sample to vacuum, which was accompanied by the evolution of CO2 and therefore
attributed to the accumulation of carbonates during reaction [176]. Yet a portion of the decay
remained irreversible, which they attributed to changes in the surface morphology /
composition.
Finally it should be noted that this section of course was based only on a very limited set of
data, since the Pt3Sn/Vulcan catalyst is hardly accessible by DRIFTS. Hence the developed
model should be considered only as a suggestion. Additional methods (e. g., in-situ XRD,
XAFS) are required in order to ultimately confirm or refute our proposal and are currently
employed on our catalysts. The results will be published later.
2.2.2 Performance in more realistic reformates
At the beginning of this section we will first investigate the effect of the addition of water
only to our idealized reformate on the performance of our Pt3Sn/Vulcan catalyst, before we
proceed to more realistic reformate mixtures, where the balance nitrogen has been replaced by
CO2.
In figure III-35 two long-term measurements in idealized reformate are shown (1 kPa CO, λ =
2; 80°C), one in a dry gas mixture and the other with 1.3 kPa water added. The initial activity
is slightly enhanced in the wet mixture, but this effect diminishes with proceeding time on-

Pt3Sn/Vulcan Other important characteristics for an application in a PROX-stage
100
stream. In analogy to Pt/γ-Al2O3 (see chapter III-1.2.2) we attribute the enhancement to an
extensive by-product formation (probably on the tin component, most likely on SnOx-patches)
in the wet gas mixture. The latter enables the COad to spread on a larger area and in turn
causes a more disordered surface layer with a somewhat lower local coverage on the platinum
component, hence allowing more oxygen (and hydrogen) to adsorb. An additional
contribution may arise form the dissociative adsorption of water on the Sn / SnOx, which, after
a subsequent spill-over of hydrogen to the platinum, would lead to a slightly reduced
adsorption energy of CO due to the displacement of CO from on-top to bridge sites by
coadsorbed Had, as was shown in section III-1.1.5 for Pt/γ-Al2O3. An analogous enhancement
of the CO oxidation rate (without presence of H2) by water (2.8 kPa) of even one order of
magnitude has been observed in earlier studies by Croft et al. over a Pd/SnO2 sample (5 kPa
CO, λ = 8; 60°C) [225].
At prolonged reaction time, the H2O induced enhancement is constantly reduced, probably a
saturation effect, resulting from the limited number of tin (oxide) sites available for the by-
products formation. Indeed, CO2-TPD measurements on Pt3Sn/Vulcan, which were conducted
after PROX reaction in idealized reformate in order to confirm the formation of by-products,
revealed exactly the same quantity of CO2 after ∼12 hours (see preceeding section) and after
Figure III-35: Activity (upper window) and selectivity (lower window)
over Pt3Sn/Vulcan in idealized reformate (1 kPa CO, λ = 2) in idealized
reformate at 80°C: dry ( ) and with 1.3 kPa H2O added ( ).
TO
F [s
-1]
0.060.070.080.09
0.2
0.3
0.1
t [min]
10 100 1000
S [%
]
40
50
60
70

Pt3Sn/Vulcan Other important characteristics for an application in a PROX-stage
101
∼60 hours of reaction (not shown for brevity), respectively, which strongly supports the idea
of a saturation effect.
The time-evolution of selectivity resembles also very closely the observations on the Pt/γ-
Al2O3 catalyst (chapter III-1.2.1). It increases slowly with time on-stream, due to a tighter
COad-layer, which blocks the hydrogen adsorption (but this time not the oxygen adsorption on
the bimetallic metal!). Again in the wet mixture the selectivity is significantly lower (up to
15% with 1.3 kPa H2O), but other than on Pt/γ-Al2O3 on Pt3Sn/Vulcan this effect cannot be
related to an enhanced / stabilized conversion rate (after ∼1000 min.). The fact that (at
advanced reaction time) solely the hydrogen and not the CO oxidation rate is affected, shows
that the equilibrium suface coverage on the Pt has not been altered. This in turn implies, that
the presence of water (probably in the form of OH-groups) catalyzes a second H2 + O2
reaction pathway on the support material or at the Pt-SnOx interface, as will be essentially
shown in the following context (compare also fig. III-37).
The kinetic effects on the CO oxidation reaction arising from a replacement of the balance
nitrogen in the idealized reformate (1 kPa CO, λ = 2) by CO2 are shown in figure III-36 (data
taken after 90 min.; each set of temperatures was measured on a new catalyst bed). The rates
are slightly reduced in a CO2-containing mixture, but the effect is very small (decrease by 25 -
Figure III-36: Arrhenius diagram for the turnover frequency of the CO
oxidation over Pt3Sn/Vulcan in idealized reformate ( ; 1 kPa CO, λ = 2),
a mixture containing 25 kPa CO2 ( ), and in a more realistic reformate
( ; 25 kPa CO2; 1.3 kPa H2O).
1/T [1/K] * 10-3
2.6 2.8 3.0 3.2
TO
F [s
-1]
-4
-3
-2
-1
0
32 kJ/mol
37 kJ/mol
37 kJ/mol
13 kJ/mol

Pt3Sn/Vulcan Other important characteristics for an application in a PROX-stage
102
40%). Consequently the activation energy of 32 ± 6 kJ/mol in idealized reformate remains
quite constant for the CO2-containing mixture (37 ± 6 kJ/mol).
This result was surprising, since Arana et al. noticed a complete inhibition of the CO
oxidation in a pure argon matrix (16 kPa CO; λ = 1; 25°C) in the presence of 32 kPa CO2 for
their PtSn/SiO2 catalyst [171]. They suggested a site blocking of CO by CO2, which, e. g.,
lead in their infrared experiments to a significant intensity reduction of the COad-band after
the previous adsorption of CO2 [229]. Likewise, Hoflund and co-workes mention a negative
influence of 8 kPa CO2 on the performance of their Pt/SnOx/SiO2 catalyst (1 kPa CO, λ = 1;
35 and 55°C, resp.) [176, 230]. At the moment we are not able to explain the discrepancy to
our measurement, but it is interesting to note that in the same study from Arana et al. a
PdSn/SiO2 sample also showed no effect at all upon the addition of up to 48 kPa CO2, which
would resemble the behaviour of our Pt3Sn/Vulcan catalyst much more closely [171].
The additional presence of 1.3 kPa water in the CO2-containing reformate showed virtually no
effect for 80 and 120°C, respectively. But at 40°C the activity is significantly enhanced (∼
factor 2), which results in a strongly decreasing activation energy at lower temperatures,
getting smaller than 13 kJ/mol. This probably indicates a change in the reaction mechanism at
low temperatures in a wet atmosphere. We could think, e. g., of a second pathway, becoming
dominant for these conditions, which involves support OH-groups as oxidizing agents as was
Figure III-37: (a) Selectivity and (b) Arrhenius diagram for the calculated turnover
frequency of the H2 oxidation over Pt3Sn/Vulcan in idealized reformate ( ; 1 kPa CO,
λ = 2), a mixture containing 25 kPa CO2 ( ), and in a more realistic reformate
( ; 25 kPa CO2; 1.3 kPa H2O).
1/T [1/K] * 10-3
2.6 2.8 3.0 3.2
TO
F [s
-1]
-5
-3
-1
T [°C]
40 80 120
S [%
]
0
20
40
60
80
100
a) b)

Pt3Sn/Vulcan Other important characteristics for an application in a PROX-stage
103
proposed by Schryer et al. for the CO oxidation on their Pt/SnOx catalyst at temperatures
around 80°C [231]. This would be well compatible with our observations.
The hydrogen oxidation reaction (TOFs calculated via selectivity in fig. III-37a) follows in
principle a similar scheme (fig. III-37b). At 120°C we observe almost identical rates in all
three gas mixtures, at 80°C the activity is slightly enhanced for the wet mixture (+65%
compared to the dry CO2-containing mixture) and at 40°C we notice very strong enhancing
effects of both CO2 (+80%) and H2O (additional factor 4) on the H2 oxidation. This would
again be consistent with a second reaction pathway, which becomes dominant at low
temperatures and which is promoted by the presence of CO2 and especially H2O.
As a consequence of this „low-temperature“ mechanism the selectivity becomes very poor at
40°C for CO2-containing mixtures, whereas it is hardly affected at higher temperatures, where
the „normal“ CO oxidation mechanism operates (see preceeding chapter). With the additional
presence of water this effect is intensified and now applies already to 80°C and explains
clearly the very low selectivity values in wet gas mixtures (compare also fig. III-35).
2.2.3 The water-gas shift activitiy of Pt3Sn/Vulcan
In analogy to our measurements on Pt/γ-Al2O3, the reverse water gas-shift activity (eq. III-
1.12) over Pt3Sn/Vulcan, which finally is the decisive factor for the minimum CO
concentration achievable at the reactor outlet [11, 12], was tested in an atmosphere as close as
possible to a realistic reformate mixture, containing ∼74 kPa H2, ∼25 kPa CO2 and 1.3 kPa
H2O (compare chapter III-1.3.2). Since the Pt3Sn/Vulcan catalyst had to be diluted in order to
avoid diffusion effects, we used SiC this time instead of the α-Al2O3, which was usually
employed for the PROX measurements, (see also chapter II-1.2), in order to avoid any effects
Catalyst rPROX 1)
[molCO/gMet*s]rShift at 150°C 2)
[molCO/gMet*s]
PROX/Shift
ratio
Pt/γ-Al2O3 1.9*10-4 2.8*10-6 70
Pt/Vulcan 9.1*10-6 4) 8.3*10-8 3) 110
Pt3Sn/Vulcan 2.3*10-4 4.7*10-10 3) 490001) after 2 hours on-stream at 80°C (Pt3Sn/Vulcan) and 150°C (pur Pt catalysts), resp.
2) after 30 min. at 80°C (PtSn) and 150°C (Pt), resp. 3) extrapolated
4) after 1000 min
Table III-8: Comparison of PROX and reverse WGS activities
over Pt3Sn/Vulcan and pure platinum catalysts.

Pt3Sn/Vulcan Other important characteristics for an application in a PROX-stage
104
due to a mechanically formed interface by the mixing procedure). The same applied to the
Pt/Vulcan catalyst, which is used as a comparison in the following.
In figure III-38, the shift activity of Pt3Sn/Vulcan is compared to that of Pt/γ-Al2O3 and
Pt/Vulcan in an Arrhenius diagram. The results are also summarized in table III-8. The
observed activation energy is close to that of the pure platinum catalysts, which suggests an
identical reaction mechanism (i. e., the „regenerative mechanism“, which includes the direct
dissociation of CO2 on the metal surface [157]; eq. III-1.14 and III-1.15). Nevertheless, the
absolute TOF on Pt3Sn/Vulcan is significantly smaller, even when compared to the Pt/Vulcan
catalyst (factor 50). This may be rationalized by a „geometric“ effect of the alloyed tin atoms,
reducing the number of active Pt-ensembles for the H2 and probably also CO2 dissociation,
similar to what has been proposed for PtSn surface alloys [185, 217, 218].
When we compare the PROX/shift ratios calculated for the envisaged operation temperatures,
80°C for Pt3Sn/Vulcan and 150°C for the pure platinum catalysts, we notice an improvement
of almost four orders of magnitude for the bimetallic PtSn system (table III-8). Consequently,
much higher degrees of purity should be obtained for a reformate cleaned over Pt3Sn/Vulcan
at 80°C than for a conventional platinum catalyst operating at temperatures of 150°C and
above, which was indeed demonstrated experimentally by M. Kahlich [25].
Figure III-38: Arrhenius diagram for the reverse water-gas shift activity over
Pt/γ-Al2O3, Pt/Vulcan and Pt3Sn/Vulcan (ca. 74 kPa H2, ca. 25 kPa CO2,
1.3 kPa H2O).
1/T [1/K] * 10-3
1.5 1.8 2.1 2.4
ln(T
OF)
[s-1
]
-10
-8
-6
-4
-2
62 kJ/mol
68 kJ/mol
63 kJ/mol

Pt3Sn/Vulcan Summary on bimetallic Pt3Sn catalyst
105
2.3 Summary on bimetallic Pt3Sn catalyst
In the preceeding sections we have seen that the performance of our bimetallic Pt3Sn/Vulcan
catalyst in idealized reformate (1 kPa CO, λ = 2) is superior compared to that of a commercial
Pt/γ-Al2O3 system. This was explained by a bifunctional surface, where the oxygen can adsorb
also on Sn / SnOx sites and its supply therefore is not limited by the CO desorption from the
platinum metal. Another contribution to its outstanding low-temperature activity arises from
an electronic alloying effect, which reduces the CO adsorption energy by ca. 20 kJ/mol, as
was shown by our TPD experiment. Unfortunately, this effect causes a significant shift of the
on-set temperature for the selectivity decay to much lower temperatures due to a reduced CO
coverage, which progressively deviates from the saturation value at increasing temperatures
under our conditions. Nevertheless, the selectivity, though steadily decreasing with tem-
perature as a consequence, is remarkably high, with 85% at low temperatures around 0°-20°C
and even at 120°C it is with 45% still higher than that of standard Pt catalysts. XPS
measurements indicate that under reaction conditions only part of the Sn is reduced, included
in PtSn alloy particles, while another part is in an oxidic state, forming SnOx islands on and
presumably also aside the active particles.
Our observation that CO desorption is not rate limiting and that the selectivity decreases with
increasing temperature, are consistent with a mechanistic model involving separation of the
reactant adsorption sites (bifunctional surface), with competing CO and hydrogen adsorption
on Pt sites/areas and oxygen adsorption predominantly on SnOx islands on/adjacent to the
active PtSn particles. The reaction takes place at the perimeter of these islands or by invoking
a spill-over process. Due to the possibility of oxygen adsorption also at high CO coverages
CO desorption is not rate limiting, as evidenced by the very different barriers for these proc-
esses, while hydrogen adsorption on the Pt sites/areas is effectively inhibited by the CO
adlayer.
A small drawback for the commercial employment of Pt3Sn/Vulcan, is the irreversible activity
loss, which could not be recovered completely after purging procedures at the operation
temperature level and was traced back to surface segregation effects during reaction. The
largest part of the deactivation, however, which we suspected to arise from the accumulation
of by-products, was easily reverted, similar to the Pt/γ-Al2O3 catalyst.
When we change from idealized reformate to more realistic mixtures, containing CO2 and / or
water, we have seen that at higher temperatures (>80°C) neither CO2 (25 kPa) nor water (1.3

Pt3Sn/Vulcan Summary on bimetallic Pt3Sn catalyst
106
kPa) exhibit significant effects on the selective CO oxidation. At lower temperatures a second
mechanistic pathway for both, the CO and H2 oxidation reaction, seems to become dominant
(probably via OH-groups and carbonate-like intermediates on the SnOx or at the Pt-SnOx
interface), which is catalyzed by the presence of CO2 and especially of H2O and leads to
drastically reduced selectivity values. The resulting optimum operation temperature
(maximum selectivity) on our Pt3Sn/Vulcan catalyst in more realistic reformates (for 1 kPa
CO and λ = 2) is therefore around 80°C.
Its excellent performance along with the extremely low reverse water-gas shift activity makes
Pt3Sn/Vulcan a very interesting candidate for the fuel gas purification in low temperature fuel
cell technology (PEM-FC).

Au/Fe2O3 An alternative for the low-temperature conversion - Au/α-Fe2O3
107
3. An alternative for the low temperature conversion - Au/αα-Fe2O3
Gold has long been disregarded for catalytic reactions due to the inert nature of bulk surfaces,
caused by a high activation barrier for the dissociative adsorption of molecules like O2 or H2
[182, 221, 223, 232, 233]. However, when it is in a highly dispersed state supported on metal
oxides it exhibits a surprisingly high activity for several reactions – not only CO oxidation
[234],[71, 235-238] but also, e. g., catalytic hydrogenation [72, 233, 239, 240], partial
oxidation of hydrocarbons [233, 240, 241], hydrochlorination of ethyne [242] or the NO/CO
conversion [233, 240, 241]. According to Haruta and co-workes, gold clusters supported on
certain reducible oxides (Fe2O3, TiO2, NiOx or CoOx) and on Group II metal-hydroxides
(Mg(OH)2, Be(OH)2), respectively, are able to oxidize CO even at temperatures as low as -
70°C at reasonable conversion rates [234, 243], which led to first applications in gas sensors,
filters or for the recombination in CO2 lasers [71, 233, 235, 244].
Moreover, since the hydrogen oxidation rate is enhanced to a much smaller extent than the CO
oxidation, when compared to pure gold powder [71, 234], these catalysts recently have gained
attraction for the preferential oxidation of CO in H2-rich gas (PROX) [26, 29-31, 240, 244].
The obtained mass-specific reaction rates [molCO/(gAu·s)] on supported Au catalysts are indeed
equally high at 80°C, and even lower temperatures, as compared to standard PROX catalysts
such as Pt/γ-Al2O3 [28, 28, 156] and Ru/γ-Al2O3 [245] at their operating temperature of 150° -
200°C [16]. This, in principle, improves the cold-start properties in a fuel cell system [166]
and also allows for a thermal (and spatial) integration of the PROX unit with the PEM fuel
cell stack in form of a thin second layer placed on top of the anode-side of the membrane
electrode assembly (MEA) [155]. Since the efficiency, in particular with respect to the load-
following behavior, of the PROX unit critically depends upon the rate of CO back-formation
from CO2 via the reverse water-gas shift reaction, a significantly improved performance is
expected at low temperatures, where the shift equilibrium becomes more favorable [12].
In our own group, we started with a Au/α-Fe2O3 catalyst, which was initially studied
extensively for its kinetic properties during selective CO oxidation in idealized reformate (M.
Kahlich [12])[25, 26]. In this work it is the priority purpose, to gain mechanistic insights into
the (preferential) CO oxidation, in order to explain the kinetic observations (reaction orders,
selectivity) as well as the deactivation behaviour or the influence of additional components in
the reaction mixture, which are present in a real reformate (H2, H2O and CO2).

Au/Fe2O3 An alternative for the low-temperature conversion - Au/α-Fe2O3
108
Hence, in the first chapter we will turn to the molecular level of the CO oxidation on gold
catalysts and show that the support is involved in the reaction for some of the systems.
Subsequently we focus closer on the Au/α-Fe2O3 catalyst, by investigating the dependence of
activity / selectivtiy upon the Au particle size and the detailed properties of the iron oxide
support. The third chapter is concerned with the metal CO coverage under reaction conditions
and establishes its influence on the selectivity and the reaction order. Thereupon we will
examine the long-term stability of our gold catalysts, where the observed deactivation will be
related to a poisoning by surface carbonate / carboxylate species, which are produced during
the PROX reaction, before we investigate the influence of water and CO2 on the reactivity /
selectivity. In the next chapter we will take a short look onto the water-gas shift reaction and
show that the oxidation / shift ratio is much more favourable than, e. g., for the commercially
employed Pt/γ-Al2O3 system, before we finally compare the activity and selectivity of several
gold catalysts supported on various metal oxides, to see, if there are other promising
candidates for the envisaged application.
All of the Au catalysts presented in the following chapters were prepared by V. Plzak (ZSW
Ulm). The preparation / pretreatment procedures are given in chapter I-2.3.

Au/Fe2O3 Mechanistic insight into the CO oxidation over gold catalysts
109
3.1 Mechanistic insight into the CO oxidation over gold catalysts
3.1.1 A short review
Due to the inability of large bulk surfaces to adsorb oxygen (or hydrogen) dissociatively at
temperatures below 200 - 300°C [219, 232, 246], which is traced back to a high dissociation
barrier arising from the completely filled d-states of gold [182, 223], the high reactivity of
small supported clusters for the CO oxidation is not straight-forward.
There is a general agreement, that the CO is adsorbed on the gold, characterized by an infrared
band at ∼2110 cm-1 (which is not present on pure Fe2O3) and that the reaction follows a
scheme, where both reactants are adsorbed on the catalyst’s surface [26, 71, 186, 236, 247-
253]. But many details, especially concerning the oxygen adsorption and activation, are still
highly controversial: Where does the oxygen adsorption take place? Is it dissociatively
adsorbed or in a molecular form? Where does the reaction take place? Does the reaction
proceed directly or via intermediate species?
When we start from UHV studies over gold single crystals, we notice that the CO oxidation
reaction only takes place readily when atomic oxygen (produced, e. g., from ozone [254] or by
a hot filament [220, 246]) is preadsorbed on the metal [220, 255]. But oxygen offered in its
molecular form does not adsorb dissociatively over gold single crystal faces up to
temperatures of more than 400°C and consequently no reaction occurs [219, 246, 256]. On the
other side the activation energy for desorption is quite large, leading to desorption maxima in
TPD studies as high as 280°C on Au(111) [120], or 280°C [255] and ∼380°C [246] on
Au(110), respectively, corresponding to an E*des between 120 and 160 kJ/mol.
Several models have been proposed in order to explain why small supported gold clusters
work for the CO oxidation even at temperatures as low as -70°C, in spite of the inhibited
oxygen dissociation. For a better overview the various proposals are visualized in figure III-
39.
The first models were based on intermediates adsorbed on the support, which were observed
by IR spectroscopy. Knell et al. postulated the reaction over a Au/ZrO2 catalyst to proceed via
the formation of a formate species (HCOO-), formed by the insertion of CO into support OH-
groups, followed by the oxidation to carbonate species (CO32-), which finally decompose to
give CO2 [236]. But the presence of formates was solely based on IR bands, which cannot be
assigned unambigously, hence this pathway must be considered with some reservation.

Au/Fe2O3 Mechanistic insight into the CO oxidation over gold catalysts
110
Anyway, we exclude this mechanism for our Au/α-Fe2O3 system, since we never detected
formate bands during our DRIFTS measurements (Therefore this pathway is not included in
fig. III-39). The Haruta group initially proposed a mechanism via carbonate-like
intermediates, which would form at the metal-support interface from a reaction between CO
adsorbed on the gold and oxygen adsorbed on the support (probably in the form of O2--
species, similar to pathway 2b in fig. III-39). But subsequent studies with isotope labelled
oxygen demonstrated that the carbonates (other than the CO2-product), which were observed
over Au/ZnO and Au/TiO2, predominantly originate from a reaction of CO with (unmarked)
support lattice oxygen and not with the atmospheric oxygen offered for the reaction [248,
257]. Therefore, in the more recent papers Haruta and co-workers distanced themselves from
their initial model and assumed, that the latter is just a slow secondary pathway, which is not
relevant for the overall oxidation rate [233, 240].
In analogy to the initial „Haruta-model“ most of the recent papers, the majority of which is
dealing with Au/TiO2 systems, propose the adsorption of oxygen to occur on the support [249,
253, 258-260], probably on oxygen vacancies [250], which are abundant on semiconductor
materials like TiO2, Fe2O3 or ZnO [261], especially in the proximity of Au clusters due to the
formation of a Schottky-junction effect at the interface [262]. Iwasawa and co-workers favour
the adsorption to proceed via superoxide species (O2-; reaction pathway no. 2 in fig III-39),
which were observed in ESR measurements, but did not specify, whether these dissociate at
the interface to give Oad (pathway no. 2a) or react directly with adsorbed CO (pathway no. 2b;
which would probably include a carbonate-like intermediate as in the first „Haruta-model“)
Fig. III-39: Different mechanisms proposed for the CO oxidation over gold
supported on reducible metal oxides (here Fe3O4, which is the active phase
during reaction in simulated reformate for our Au/α-Fe2O3 catalysts).

Au/Fe2O3 Mechanistic insight into the CO oxidation over gold catalysts
111
[250, 258]. Fukushima et al. and Grunwaldt et al. agree in principle with the spatially
separated adsorption of the reactands but assume that the oxygen dissociates on the support
(producing „lattice oxygen“; pathway no. 3 in fig. III-39) with a subsequent reaction at the
interface or after the spill-over of oxygen to the gold metal [249, 260].
Based on infrared measurements on Au/TiO2 and Au/ZnO, where Boccuzzi et al. noticed a
significant blue-shift for the COad-band when oxygen was admitted to the catalyst (a similar
effect was also noticed in our own DRIFTS measurements on Au/α-Fe2O3; see chapter III-
3.3.2), which implies a spatial proximity of the adsorbed reactants, i. e., both are adsorbed on
the gold particles (pathway no. 1 in fig. III-39) [248], the more recent papers from the Haruta-
group now assume a direct adsorption of oxygen on the gold clusters (This model was also
favored in the recent publications by Valden et al. [263, 264]). The oxygen bond cleavage was
suspected to be induced either by the formation of a four-center surface complex including
CO and O2 being adsorbed on a common Au site, which would form a labile precusor state
[240], or to occur on metal surface defect sites [233]. According to this theory, the role of the
support material would be limited to the production of gold particles as small as possible or to
promote the appearance of highly reactive gold sites or crystallite faces.
3.1.2 The „support-effect“
First we want to clarify, how the choice of the support material influences the reactivity of a
gold catalyst for the CO oxidation. In table III-9 numerous previous studies are evaluated
(rates and TOFs are extrapolated to our standard reaction temperature of 80°C) and compared
to our own results.
It is evident that relatively high activities can be obtained on any support material (even on
pure gold), even on those, which are not explicitly known for exhibiting extensive oxygen
adsorption or storage properties at such low temperatures, such as Al2O3, MgO, SiO2 or ZrO2.
Therefore it is a logical consequence that the oxygen adsorption and dissociation must be
possible directly on the gold metal for these systems (Corresponding to pathway 1 in fig. III-
39).
Nevertheless, there are noticable differences in the reactivity between gold on such „inert“
materials and on those catalysts, which are supported on reducible transition metal oxides
(Fe2O3, TiO2, and NiOx). The TOF of the latter seems to be enhanced by up to one order of
magnitude. The existence of such a „support effect“ was also demonstrated by Tsubota et al.,
who

cata
lyst
prep
arat
ion
1)A
u :
Me
[at-
%]
d Au
[nm
]p(
CO
)[k
Pa]
p(O
2)[k
Pa]
r (*
104 )
[mol
CO/g
Au*
s]T
OF
2)
[s-1
]E
a
[kJ/ m
ol]
ref.
Au/
α -Fe
2O3
DP
∼ 12.
6 -
71
139
3)1.
3 -
329
this
wor
k
DP
∼ 12.
6 -
71
2074
4)2.
9 -
6.7
-th
is w
ork,
[26
]
DP
2.0
3.6
0.2
- 6
5)1
- 20
5)13
0.7
35[7
1]
Au/
NiO
xC
P1.
74.
81
120
1.3
this
wor
k
CP
2.0
0.5
100.
4 -
1.2 6
,7)
[265
]
Au/
TiO
xIM
P1.
74.
61
133
2.0
21th
is w
ork
IMP
8)0.
433
4.9
4.9
8.1
4.5
9)29
[253
]D
P1.
32.
91
2033
1.3
27[2
33]
DP
10)
1.8
31
2020
7,11
)0.
8[2
58, 2
66]
DP
10)
1.2
301
202.
00.
712
[258
, 267
]IM
P 12
)0.
72.
0 -
2.5
0.25
0.25
0.7
7)∼ 0
.03
∼ 25
13)
[256
, 268
]
Au/
Mg(
OH
) 2C
P1.
3<
41
114
0.5
- 0.
9th
is w
ork
DP
1.5
0.6
- 1.
21
20>
51
14)
> 1
.2[2
69]
Au/
Al 2
O3
IMP
1.7
∼ 4
11
6.3
0.3
this
wor
k
DP
0.2
2.4
120
130.
532
[270
]
Au/
ZrO
2IM
P 12
)1.
12.
0 -
2.5
0.25
0.25
0.12
7)∼
5*10
-3∼
25 13
)[2
56, 2
68]
Au/
SiO
2C
VD
2.1
6.6
120
1.3
0.1
17[2
70]
DP
15)
0.6
304.
94.
80.
080.
0415
[237
]
Au
pow
der
-10
0 2
01
20∼
0.00
1 7)
∼ 3*
10-4
∼ 20
13)
[71,
234
]
Au
spon
ge-
100
55
0.00
62.
1[2
71]
1) D
P =
dep
osit
ion-
prec
ipit
atio
n, C
P =
cop
reci
pita
tion
, IM
P =
impr
egna
tion
, CV
D =
che
mic
al v
apor
dep
osit
ion
2) s
pher
ical
par
ticle
s as
sum
ed, e
xcep
t whe
re r
epor
ted
othe
r3)
sta
tistic
al a
vera
ge o
f D
P-ca
taly
sts
in ta
ble
III-
104)
cal
cula
ted
via
O2
reac
tion
ord
er o
f 0.
27 [
26]
5) r
epor
ted
reac
tion
orde
rs w
ere
zero
6) e
xtra
pola
ted
from
r =
1.5
*10-5
mol
/gA
u*s
at 2
0° w
ith 1
5 <
Ea
< 3
0 kJ
/mol
7) m
easu
red
at h
igh
conv
ersi
on8)
pre
-red
uced
at 2
00°C
in H
2 af
ter
calc
inat
ion
9) c
a. 2
.3 s
-1, w
hen
calc
ulat
ed f
or 1
kPa
CO
and
λ =
2 w
ith
the
repo
rted
rea
ctio
n or
ders
of
0.5
(CO
) an
d 0.
08 (
O2)
at 3
0°C
10)
with
pho
sphi
ne-s
tabi
lized
Au
com
plex
11)
extr
apol
ated
fro
m r
= 9
.6*1
0-3 m
ol/g
Au*
s at
28°
C w
ith E
a = 1
2 kJ
/mol
12)
gold
col
loid
s 13
) ac
tivat
ion
ener
gy e
stim
ated
fro
m c
onve
rsio
n da
ta
14)
extr
apol
ated
fro
m r
= 1
.2*1
0-4 m
ol/g
Au*
s at
-70
°C w
ith E
a > 1
5 kJ
/mol
15)
pre-
redu
ced
at 4
50°
Tab
le I
II-9
: Com
pari
son
of k
inet
ic d
ata
on A
u ca
taly
sts
with
val
ues
calc
ulat
ed f
rom
lite
ratu
re s
tudi
es (
extr
apol
ated
to 8
0°C
).

Au/Fe2O3 Mechanistic insight into the CO oxidation over gold catalysts
113
mechanically mixed Au-colloids with TiO2 and noticed an increasing activity at increasing
calcination temperature (although the gold particles were sintering rapidly!), caused by the
progressing development of the reactive metal-support interface ([272]; see figure III-40).
Whereas after calcination at 200°C the TOF of the mixture was very low – similar to pure Au
powder –, it matched the initially superior reactivity of a conventionally prepared (DP)
Au/TiO2 catalyst after calcination at 600°C. The enhancing effect of titania for the CO
oxidation can be also inferred from catalyst samples prepared by Grunwaldt et al. (see table
III-9), where the TOF of the titania supported sample is one order of magnitude higher than
the one on zirconia [256, 268] (The generally much lower TOFs in their study are likely to be
caused by the low calcination temperature for the colloid precursors, so that the reactive
interface has not been developed fully yet, as was proposed by Feldmeyer et al. [273]).
Likewise, Bollinger and Vannice demonstrated, that a subsequently added titania coating
increases the reactivity of a gold powder considerably [253].
If we take a closer look, we find another interesting difference between the two groups. For
„inert“ support materials the activity of the catalyst seems to depend very critically upon the
TO
F [s
-1]
10-6
10-5
10-4
10-3
10-2
10-1
100
Tcalc. [°C]
200 400 600
d Au
[nm
]
3
6
9
12
Figure III-40: TOFs (upper window) and Au particle diameters (lower
window) of Au-TiO2-samples (1 kPa CO, λ = 40, 0°C) vs calcination
temperature: physical mixture of Au-colloid and TiO2 powder,
Au/TiO2 prepared by deposition-precipitation method [272].

Au/Fe2O3 Mechanistic insight into the CO oxidation over gold catalysts
114
particle diameter of the gold crystallytes and only extremely small particles yield highly active
samples. This illustrates, why our own catalysts (Au/γ-Al2O3 and Au/Mg(OH)2) are slightly
less reactive than those in the previous studies. It is worth noticing, that a higher conditioning
temperature (400°C instead of 300°C, i. e., the „Au/MgO“-sample) consequently lead to a
reduced TOF on our Au/Mg(OH)2 catalyst (see chapter III-3.7). This dependence of catalysts
with „inert“ support was also observed by Okumura et al. for Au/SiO2, where a sample with
20 nm particles showed no measurable activity [270], as well as by Cunningham et al. for the
Au/MgO system [269]. It may be speculated, if the small clusters simply feature more reactive
defect sites (edge, kink or step sites) [43] or if a gradual change in the electronic structure with
decreasing size is responsible for the high reactivity as was suspected, e. g., in the studies by
Valden et al. [263, 264] and Cunningham et al. [269].
In contrast, the size of the metal component seems to play only a minor role, when an „active“
oxide like TiO2 is used. From the references cited in table III-9, it is obvious, that even gold
particles as large as 30 nm still exhibit a surprisingly large reactivity. This effect was
confirmed for conventionally prepared Au/TiO2 catalysts by Bollinger and Vannice, who
"600
°-T
OF"
[s-1
]
0
1
10
Mg [at-%]
0 25 50 75 100
d Au
at 6
00°C
[nm
]
2
4
6
8
( )
Figure III-41: Au particle size (lower window) at 600°C and activity (upper
window) in idealized reformate (1 kPa CO, λ = 2; 80°C), normed to the dispersion
calculated for 600°C, on Au/Fe2O3*MgO mixed-oxide-support catalysts.

Au/Fe2O3 Mechanistic insight into the CO oxidation over gold catalysts
115
noticed equally high TOFs for 33 and 4.5 nm particles [253], as well as by Iwasawa and co-
workers for their samples (30 vs 3 nm), produced from phosphine-stabilized precursors ([258]
and references therein). Although we did not cover such a large range of particle sizes with
our Au/α-Fe2O3 catalysts (∅ between 2.8 and 11 nm), the same tendency applies, since all
samples exhibit a similar high TOF within ± 50% (see following chapter). But, as will be
shown later on, the microscopic structure of the interface plays a crucial role for the overall
activity of the catalyst.
In order to demonstrate that similar enhancing effects can be expected for iron oxide, a
catalyst with a mixed support, MgO*Fe2O3, in varying compositions was prepared (ZSW
Ulm; preparation by coprecipitation - the exact parameters are not listed here for the
observance of secrecy because of patent applications). The reactivity, which is calculated from
the rate in idealized reformate after calcination at 400°C (1 kPa, λ = 2; 80°C) and this time
normalized to the number of surface atoms after calcination at 600°C (presumed that the
sintering behaviour is similar for all support compostions, the particle growth at the higher
temperature level allows for a much preciser size determination by XRD; dAu ∼ ±1 nm) is
displayed in figure III-41 (upper window) along with the measured size of the gold particles
(lower window). The growth of the support material particles during calcination directly
governs the sintering of the attached gold clusters [274]. For the mid-range of the „Mg-
concentration“ MgO and Fe2O3 form a non-stochiometric hydrotalcite-like precursor, namely
Pyroaurite (Mg6-xFe2+xCO3(OH)16*4.5H2O) [275], which incorporates the gold in its layer
structure (spacing 2.3 nm [276]) after preparation. Therefore the gold precursor is fixed during
the thermal reduction of AuOx to Au0 (> 350°C; TGA results by V. Plzak; to be published
later), which obviously causes the production of very small gold particles for the freshly
conditioned samples in the mid-range of „Mg-concentrations“. On the „Mg-rich“ side as well
as on the „Fe-rich“ side the sintering is increasingly governed by the growth of the pure oxide
components, resulting in larger gold particles. The determined reactivity for the „Mg-rich“
catalysts (> 50-60% MgO) indeed decreases with increasing particle size, as would be
expected from the above context (The lines included in fig. III-41 are just to guide the eye and
do not intend to imply any calculated dependencies). But in the the opposite direction with
increasing amounts of Fe2O3, the activity is even enhanced in spite of the growing Au cluster
size, demonstrating that the iron oxide support also enhances the reactivity of attached gold
particles as was shown above for TiO2 (The sample with 25% MgO yielded a somewhat too
low activity - probably a consequence of a non-uniform gold distribution, with the major part

Au/Fe2O3 Mechanistic insight into the CO oxidation over gold catalysts
116
attached to the magnesia, which is indicated by a very strong deactivation during time on-
stream, typical for pure Au/MgO catalysts).
Hence it seems that for gold catalysts based on these transition metal oxides (TiO2 and Fe2O3,
probably also NiOx), the support ensures the oxygen supply for the reaction and that the direct
dissociative adsorption on the gold particles is no longer the limiting factor. The following
transient response experiments were conducted in order to elucidate this oxygen supplying
role of the iron oxide support further.
3.1.3 Oxygen supply from the FeOx-support (Transient response measurements)
In order to investigate the reaction mechanism over Pt/SnOx, another system which shows a
high low-temperature activity for the CO oxidation, Grass and Lintz performed titration
experiments with one of the reactants, either CO or O being preadsorbed on the catalysts
surface [177]. Whereas they observed a sharp CO2 peak when the CO was predosed (tmax at
0.6 min. and FWHM = 0.5 min.), the resulting response was much slower (tmax at 1.5 min.),
very broad (FWHM = 1.5 min.) and the signal decayed with a pronounced tailing over 2 - 3 h
with preadsorbed Oad. The observed difference was interpreted in terms of COad being
adsorbed on the platinum metal, which would react very fast with the incoming oxygen. On
the contrary, the predosed oxygen is also adsorbed (dissociatively) on the support oxide and
its slow diffusion to the reaction sites (on the platinum or at the interface) causes the retarded
reaction to CO2.
In the following we present similar CO-Titration experiments with and without preadsorbed
oxygen on our Au/α-Fe2O3 system (sample no. 051198; see table III-10) at 80°C and compare
the result to a commercial Pt/γ-Al2O3 catalyst (at 150°C, so that the TOFs in idealized
reformate are of a similar order of magnitude), where it is known that the oxygen adsorbs
exclusively on the metal surface, as well as to a pure α-Fe2O3 support. From these titration
experiments we will not only gain qualitative information, if there are any differences in the
time scale for the CO2 evolution, but we will also be able to roughly quantify the amount of
reactive, preadsorbed oxygen. Prior to the experiment the catalysts were conditioned as usual
(see chapter II-2.3). For the Pt/γ-Al2O3 the reactor (containing ca. 2.76 µmol Pt) was cooled
down to 150°C, then saturated with 10 kPa O2 in N2 for 10 min. (20 Nml/min) and purged
with nitrogen (20 Nml/min) for ca. 5 min. in order to remove the residual gas-phase O2.
Subsequently, a stream of 2 kPa CO in N2 (10 Nml) was admitted and the resulting response

Au/Fe2O3 Mechanistic insight into the CO oxidation over gold catalysts
117
recorded by IMR-MS (ion molecule reaction mass spectrometer) on-line analysis, which
allows for the selective detection of CO in a nitrogen containing background. The resulting
CO2 peak (See figure III-42) shows its maximum at 1.67 min. and is quite sharp (FWHM =
0.26 min.) as would be expected for a fast reaction. The calculated amount of adsorbed
oxygen is ∼1.3 µmol, which corresponds fairly good to the number of surface metal atoms (ca.
1.2 µmol). The small excess may be atributed to the formation subsurface oxygen species
[277] (The off-set in the baseline after admission of the CO is caused by CO2- and O2-
impurities in the feedstream and was corrected for integration).
For comparison the pure support, α-Fe2O3 (ca. 18 µmol Fe), was calcined at 400°C just like
the gold catalysts (30 min. 10 kPa O2 in N2 at 20 Nml/min) and after cooling down in pure
nitrogen titrated with 2 kPa CO in N2 at our standard reaction temperature of 80°C (figure III-
43, window a). Indeed a small fraction of surface lattice oxygen reacts after a while (tmax ≈
12.3 min.; FWHM ≈ 6 min.), corresponding to a partial conversion (ca. 17%) of the α-Fe2O3
to Fe3O4, which is also the stable iron oxide phase formed during the PROX reaction in H2-
rich gas (determined by TGA; ZSW Ulm). After a subsequent pre-adsorption of oxygen at
80°C no further CO2-evolution could be detected upon switching to the CO-mixture,
demonstrating that the Fe3O4-phase was not re-oxidized at this temperature level (not shown
here for brevity).
time [min]
-3 0 3 6 9 12 15 18
conc
entr
atio
n [p
pm]
0
1000
2000
3000
4000
5000
6000
CO2 : 1.29 µmol
Figure III-42: CO2-response ( ) over Pt/γ-Al2O3 (ca. 1.2 µmol
surface metal) upon reaction of predosed oxygen at 150°C with 2 kPa CO
( ; *0.25) in N2 at a flow of 10 Nml/min.

Au/Fe2O3 Mechanistic insight into the CO oxidation over gold catalysts
118
The identical sequence was repeated on the Au/α-Fe2O3 catalyst (ca. 17 µmol Fe and 0.25
µmol Au). After calcination the catalyst was cooled down to 80°C in N2 and then the CO/N2-
mixture admitted to the reactor (window b). As for the pure support we observe a rather broad
CO2 response, but this time the production increases very fast (after ca. 1.7 min.) and shows
its maximum already at ∼7.5 min. along with a pronounced tailing (FWHM ca. 10 min.). The
calculated amount of reactive oxygen is also much larger (corresponding to ca. 43%
conversion of α-Fe2O3 to Fe3O4). It seems, that the presence of gold clusters accelerates the
reduction of the α-Fe2O3 support, probably due to the additional CO adsorption on the gold
component.
0400800
12001600
CO2: 1.20 µmol
0400800
120016002000
CO2: 0.51 µmol
time [min]
0 5 10 15 20 25 30
conc
entr
atio
n [p
pm]
0
400
800
1200
1600
CO2: 0.76 µmol
b)
c)
a)
Figure III-43: CO2-response ( ) at 80°C to a flow of 10 Nml/min of 2 kPa
CO ( ; *0.1) in N2: a) on pure α-Fe2O3 after calcination at 400°C and pre-
dosing oxygen at 80°C, b) on Au/α-Fe2O3 (no. 051198; 0.25 µmol total metal)
after calcination at 400°C and c) after subsequent predosing oxygen on the partly
reduced "Au/Fe3O4" at 80°C.

Au/Fe2O3 Mechanistic insight into the CO oxidation over gold catalysts
119
On this partially reduced catalyst („Au/Fe3O4“), which should be rather close to the „real“
state during PROX reaction, we pre-adsorbed oxygen (at 80°C; 20 Nml of 10 kPa O2 in N2 for
10 min.) and after purging with nitrogen switched again to the CO-mixture (window c). This
time we observe an extremely sharp peak (tmax = 1.38 min; FWHM = 0.38 min.), very similar
to the reaction on the Pt/γ-Al2O3 catalyst (even slightly faster) and no further slowly reacting
oxygen species as on the freshly conditioned sample are found, which was already expected
from the lacking reaction on the pure support. This titration sequence could be duplicatd
repeatedly after the renewed preadsorption of oxygen, even when simulated reformate was
admitted to the reactor in the meantime in order to fully establish the steady state of the
catalyst. From its extremely high reaction rate, we infer, that this oxygen, which is believed to
be the active species for the CO oxidation, is not a „normal“ lattice oxygen (O2-), as would be
characteristic for a reaction sequence including oxygen dissociation on the support and the
subsequent transport to the gold interface by the oxide (scheme no. 3 in fig. III-39). Due to the
large amount (ca. 3 times more oxygen than Au atoms are available), it cannot be solely
adsorbed on gold sites but must be necessarily located (at least the major part of it) on the
support.
We think, that superoxide species (O2-), as were observed by Liu et al. on their Au/TiO2
during reaction by ESR measurements, would indeed serve as a good explanation for the fast
reaction (= high mobility) of the pre-adsorbed oxygen as well as for the large amount [250].
As a result of these step-response experiments, we believe that pathway no. 2 (fig. III-39)
describes best the oxygen adsorption over Au/α-Fe2O3 and that the enhancing effect of the
support originates from this additional oxygen reservoir on the metal oxide.
Perhaps an even more elegant way to distinguish between the different kinds of oxygen
adsorption (and diffusion) would be monitoring the CO2-response after pulsing isotopically
labelled oxygen (36O2) during the CO oxidation in idealized reformate, which would
undoubted guarantee the correct steady state of the support material. We tried to realize this
experiment in a TAP reactor (temporary analysis of products; see, e. g., ref. [67]), but
unfortunately, it did not yield clear results due to the extremely strong readsorption of the
CO2-product on the support material, leading to an enormous broadening of the observed
response signal. Nevertheless, a few other aspects from this experiment are worth noticing.
First, no isotopic scrambling of oxygen,
36O2 + 32O2 ↔ 2 34O2 (III-3.1),

Au/Fe2O3 Mechanistic insight into the CO oxidation over gold catalysts
120
was observed at our reaction temperature between 76 and 99°C, which fully parallels the
findings of Liu et al. on Au/TiO2 [250]. This is a further hint, that the oxygen either does not
dissociate immediately after adsorption (corresponding to the existence of O2- species) and /
or that the desorption step after dissociation is governed by a high energy barrier (as would be
characteristic for Oad on the gold metal). Second, no doubly marked product, C18O18O, was
observed. This is in in strong contrast to the experiments of Boccuzzi et al. over Au/ZnO and
Au/TiO2, who noticed the appearance of all possible products, C16O16O, C16O18O, C18O18O
and even C18O, upon reaction of C16O with 36O2 at room temperature [248, 257]. But due to
the strong interaction of CO2 with our support, which was noticed during our TAP
experiments, we attribute this scrambling to the readsorption on the support, followed by
oxygen exchange, which for CO2 occurs very fast according to Liu et al. [250]. For our own
experimental setup, subsequent reactions of the product are of minor importance due to the
extremely small contact times in the TAP reactor, which clearly explains the difference in the
results. But the fact that no doubly marked CO2 is observed, now rules out any reaction
pathway, which includes the direct reaction between molecular oxygen species and CO via a
carbonate-like intermediate (or transition state):
e. g., C16O + 36O2- + e- ↔ [ ]2- (III-3.2)
For such a carbonate-like molecule the cleavage of each oxygen bond in the following
decomposition step, to give CO2, should have the same probability, which as a consequence
would lead to the formation of 33% doubly marked CO2. Therefore, from the missing
appearance of the latter product, we infer a reaction pathway, where the superoxide molecules
dissociate at the metal-support interface in a first step, probably followed by the subsequent
spill-over to the gold, corresponding to reaction scheme no. 2a in fig III-39. The presence of
Oad on the gold is also indicated by our DRIFTS measurements, where we noticed a
significant blue-shift (8 cm-1) for pre-adsorbed CO upon the admission of oxygen to the cell
(see chapter III-3.3.2), which was also observed by other workgroups [43, 248]. Iwasawa and
co-workers did not notice such a IR shift, however, their IR spectras were rather diffuse and
therefore a change would be rather difficult to recognize [278].
222
16
18 18
Au/Fe2O3 Mechanistic insight into the CO oxidation over gold catalysts
121
3.1.4 Proposed reaction scheme
From the preceeding context along with a few other hints we may draw the following picture
for the CO oxidation over supported gold catalysts:
• The reaction takes place between COad and Oad on the gold surface. This is also mirrored by
the very similar activation energies on the various support materials as well as for the
reaction of pre-adsorbed CO with atomic oxygen on a Au(110) single crystal (38 kJ/mol)
[279].
• With „inert“ support materials, such as SiO2, Al2O3 or MgO also highly active gold catalysts
can be prepared, but only, if the gold is in an extremely high dispersed state. For these
systems the oxygen adsorption probably occurs directly on the gold clusters, either on
defect sites (steps, edges, kinks) or facilitated by variations in the electronic structure of
small metal particles. These catalysts show a strong dependence on the metal particle size
and loose their activity soon with increasing diameters of the gold particles. The additional
role of residual impurities from preparation, which would show a much stronger impact for
small clusters, should also be taken into consideration.
• Some transition metal oxides (FeOx, TiOx, NiOx) enhance the reactivity of the gold particles
significantly by supplying the oxygen, necessary for the CO oxidation. This leads to a
relative independence of the turnover frequency from the gold particle diameter (see also
next chapter), but makes the performance very sensitive upon the microcrystalline structure
of the metal-support interface. The latter explains, why the activity of such systems, often
depends crucially upon the pretreatment method (see, e. g., [237, 280]). Of course, the
argument for a constant TOF should only holds true for low metal loadings, where the gold
particles are sufficiently distant from each other and the oxygen supply rate is not rate-
limiting.
• The oxygen adsorbs in large quantities on these „active“ support materials in the form of a
superoxide (O2-) species, which possess a sufficiently high mobility so that the diffusion to
the gold particles is not the rate-limiting step. Liu et al. proposed the adsorption on oxygen
vacancies [250], which should be abundant numerously in the vicinity of the gold clusters,
due to the Schottky junction effect between the gold and the n-semiconducting support
materials [262]. For the reaction it dissociates probably at the metal-support interface to
produce Oad, adsorbed on the gold. Therefore, these superoxide species may be designated
as a precursor species for the dissociative adsorption on catalyst’s surface. However, a

Au/Fe2O3 Mechanistic insight into the CO oxidation over gold catalysts
122
reaction scheme including the oxidation with molecular oxygen species cannot be ruled out
if other transition states than the carbonate-like type are assumed and which would not give
rise to isotopic scrambling.

Au/Fe2O3 The influence of structural parameters on the activtiy / selectivity
123
3.2 The influence of structural parameters on the activity / selectivity
There is an ongoing debate about the influence of morphological parameters (especially of the
Au cluster size, but also concerning the support particle size or the predominant support
crystal phase) of gold catalysts on the reactivity of those systems (see, e. g., [258] and
references therein). Hence, within this chapter, we will first summarize the measured
properties of our different Au/α-Fe2O3 samples and try to derivate regularities, which relate
the activity and selectivity to structural parameters. Subsequently, the influence of different
conditioning temperatures will be evaluated. The final section focusses on the role of residual
impurites (especially of sodium), left from the preparation procedure.
3.2.1 The dependence of the activity on the particle size
Whereas in former publications based on the early work of the Haruta group (see [71] and
references therein) an inverse proportional relationship between the TOF and the Au particle
size (in the range of 2 - 15 nm) was assumed, Valden et al. proposed in a recent study, that for
particle sizes below 2.5 - 3 nm the activity decreases due to increasing non-metal
characteristics [263, 264] (It should be mentioned that there exist some contradictory studies,
where it was shown that the characteristics remain almost unchanged for gold clusters sizes
above ∼15 atoms [281]). For illustration, the turnover frequencies for the CO oxidation on
dAu [nm]
2 3 4 5 6
TO
F [
s-1]
10-5
10-2
10-1
100
Fig. III-44: Turnover frequency of the CO oxidation on several Au/TiO2 catalyst
samples at room temperature (1 kPa CO in air) as a funcition of the Au particle
diameter according to Haruta [240]: Preparation by deposition-precipitation ( )
and by photodeposition( ).

Au/Fe2O3 The influence of structural parameters on the activtiy / selectivity
124
several Au/TiO2 catalysts observed by the Haruta group are presented as a function of the Au
particle size in figure III-44(data taken from [240]). The maximum acitvity was observed for
particles which are little less then 3 nm. At smaller (down to 2.5 nm) and larger (up to 3.5 nm)
diameters the measured activity was by about one order of magnitude less. Finally, with a
more strongly increased particle size (up to 6 nm) the activity dropped by several orders of
magnitude. But one should be aware that the latter samples were prepared by a different
method (named „photodeposition“) so that not only the particle size but also the form of the
Au crystallites and the nature of the Au-Fe-interface may have changed which can lead to
drastic changes in the reactivity [71]. A similar activity dependence was obtained by Valden et
al. on planar Au/TiO2 model systems leading to a slight difference in reactivity by a factor of
three when comparing Au particles of 6 and 3 nm. Hence, within this section we will, after
summing up the characteristics for a major part of the samples, try to find out, whether
equivalent correlations between the morphology of our Au/α-Fe2O3 catalysts and their activity
or selectivity may be drawn.
In table III-10-A the preparation methods and some characteristic parameters (Au loading,
BET, predominant FeOx-phases in the dried precursor at 80°C and the TEM-results) of the
freshly conditioned (400°C, 30 min synthetic air) catalysts are summarized. Table III-10-B
provides an overview on the Au-particle sizes determinded by XRD after conditioning at 400
and 600°C, respectively, the sodium content after preparation and the results of our activity
tests in idealized reformate (1 kPa CO, λ = 2) at 80°C. Unfortunately, especially with very
small particles there is a large tolerance for the size determination, because only a small
fraction of the Au crystallites is visible in the XRD (The considered fraction is calculated by
comparing the Fe2O3: Au XRD peak ratios after conditioning at 800°C, where 100% of the Au
should be visible, due to the increased particle size, and at 400°C or 600°C, respectively).
Such an effect could arise from either an inhomogeneous particle size distribution with a
fraction of very small particles or be caused by extremely flat shaped Au crystallites as were
observed, e. g., by Blick et al. on Au/MgO [282]. Hence the given particle sizes and the
calculated turnover frequencies contain a quite large tolerance (maximum deviation ± 50% for
the TOF).
With the deposition-precipitation method (Td/p = 80/60 or 60/60°C, pH ca. 7.8 - 8.2; see also
chapter II-3.2), used for most of the recent catalyst samples, the smallest achieved average
particle size was 2.8 nm (no. 061197), which is comparable to the Au/TiO2 catalysts prepared

Sam
ple
no.
Pre
para
tion
1)
/ T [
°C]
Au
load
ing
[wt%
]B
ET
aft
erco
ndit
. [m
²/g]
FeO
x-ph
ases
/ X
RD
:H
M a
t 40
0°C
[nm
] 2)
TE
M:
Au
at 4
00°C
[nm
]D
[%
]fr
om T
EM
1009
96C
P /
50 -
60
3.20
61F
H /
13.
7
3009
96C
P /
50 -
60
2.70
60F
H /
11.
9
2011
96C
P /
75 -
80
3.15
54F
H +
HM
/ 1
3.7
2108
97C
P /
80W
et s
tora
ge f
or 1
0h (
80°C
)4.
5535
HM
+ F
H /
20.
0
0611
97D
P /
80 +
60
2.30
63F
H (
+H
M)
/ 1
6.5
2.8
(3.2
3))
49 (
373)
)
1012
97D
P /
80 +
60
2.52
56F
H (
+H
M)
/ 1
6.4
3.3
(3.8
3))
43 (
313)
)
2605
98N
DP
/ 80
+ 6
02.
7574
FH
(+
HM
) /
16.
3
2605
98K
DP
/ 80
+ 6
0W
et s
tora
ge f
or 1
0h (
80°C
)2.
5035
HM
/ 2
5.8
2805
98N
DP
/ 80
+ 6
02.
5547
FH
(+
HM
) /
18.
8
0707
98D
P /
80 +
60
1.31
46F
H (
+H
M)
/ 1
5.8
2807
98D
P /
80 +
60
2.69
40F
H +
HM
/ 1
7.3
2807
98N
aN
aNO
3-im
preg
nate
d2.
69F
H +
HM
/ 1
6.2
0311
98D
P /
80tr
eate
d w
ith N
aBH
4 at
20°
C2.
4361
GT
(+
FH
+H
M)
/ 1
6.1
0511
98C
P /
603.
5764
FH
/ 1
4.0
1003
99_W
4D
P /
60fo
ur r
edis
pers
ion
step
s2.
7646
FH
/ 1
4.6
1003
99_W
2D
P /
60tw
o re
disp
ersi
on s
teps
3.30
55F
H /
15.
6
1003
99_W
0D
P /
60no
red
ispe
rsio
n st
ep3.
69F
H /
14.
0
1204
99C
P /
803.
47F
H (
+H
M)
/ 1
4.9
1105
99C
P /
60pH
8.5
2.71
55F
H /
15.
4
1805
99C
P /
803.
9042
HM
+ F
H /
20.
9
2308
99D
P 3)
/ 25
+ 6
0pH
6.7
+ 7
.7 -
8.1
3.92
66G
T /
11.
2
2308
99H
pre-
redu
ced
with
H2O
23.
92G
T /
11.
1(1
): C
P =
Cop
reci
pita
tion
, DP
= D
epos
tion
-pre
cipi
tati
on(2
): p
recu
rsor
pha
ses
afte
r dr
ying
at 8
0°C
: FH
= F
erry
hydr
ite F
e 5(O
H) 8
*4H
2O, H
M =
Hem
atite
α-F
e 2O
3, G
T =
Goe
thite
α-F
eOO
H(3
): r
egar
ding
the
part
icle
siz
e di
stri
butio
n (4
): G
oeth
ite f
orm
ed b
y bu
bblin
g ai
r th
roug
h a
solu
tion
of F
eCl 2
at r
oom
tem
pera
ture
Tab
le I
II-1
0-A
: Sev
eral
Au/
α-Fe
2O3
cata
lyst
s pr
epar
ed b
y th
e Z
SW U
lm: p
repa
ratio
n &
cha
ract
eriz
atio
n (s
ee a
lso
sect
ion
II-2
.3)
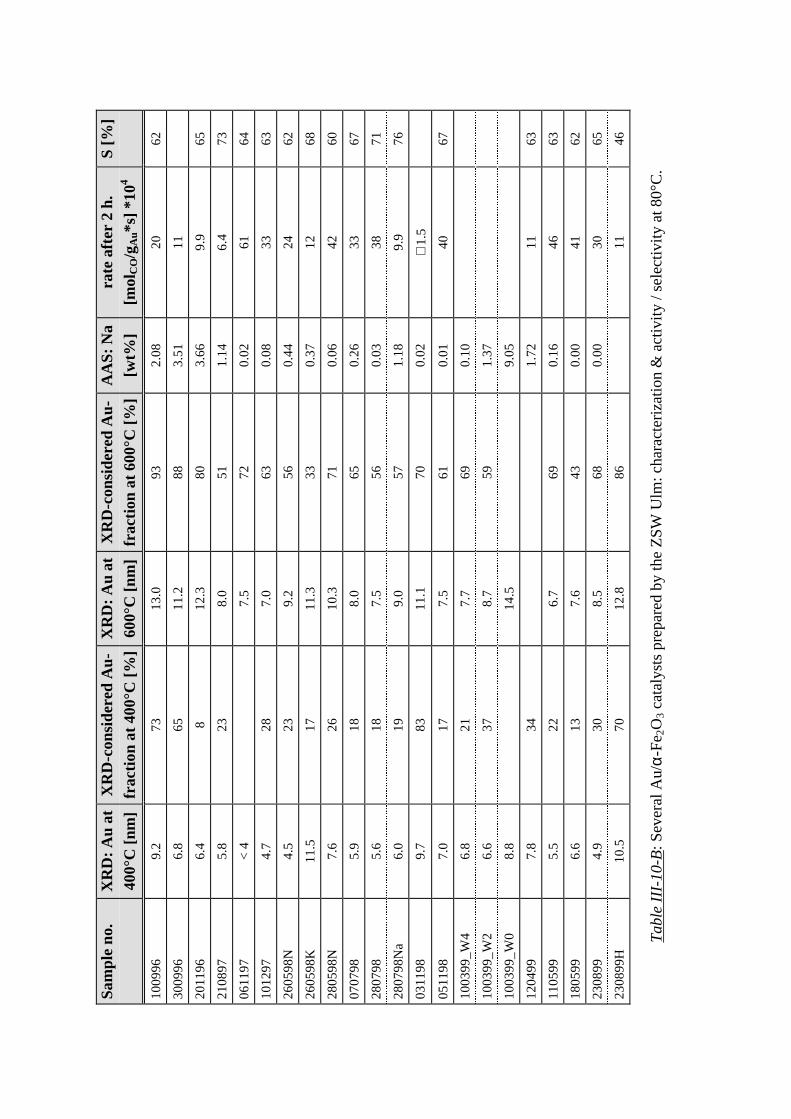
Sam
ple
no.
XR
D:
Au
at40
0°C
[nm
]X
RD
-con
side
red
Au-
frac
tion
at
400°
C [
%]
XR
D:
Au
at60
0°C
[nm
]X
RD
-con
side
red
Au-
frac
tion
at
600°
C [
%]
AA
S: N
a[w
t%]
rate
aft
er 2
h.
[mol
CO
/gA
u*s]
*10
4
S [%
]
1009
969.
273
13.0
932.
0820
62
3009
966.
865
11.2
883.
5111
2011
966.
48
12.3
803.
669.
965
2108
975.
823
8.0
511.
146.
473
0611
97<
47.
572
0.02
6164
1012
974.
728
7.0
630.
0833
63
2605
98N
4.5
239.
256
0.44
2462
2605
98K
11.5
1711
.333
0.37
1268
2805
98N
7.6
2610
.371
0.06
4260
0707
985.
918
8.0
650.
2633
67
2807
985.
618
7.5
560.
0338
71
2807
98N
a6.
019
9.0
571.
189.
976
0311
989.
783
11.1
700.
02∼
1.5
0511
987.
017
7.5
610.
0140
67
1003
99_W
46.
821
7.7
690.
10
1003
99_W
26.
637
8.7
591.
37
1003
99_W
08.
814
.59.
05
1204
997.
834
1.72
1163
1105
995.
522
6.7
690.
1646
63
1805
996.
613
7.6
430.
0041
62
2308
994.
930
8.5
680.
0030
65
2308
99H
10.5
7012
.886
1146
Tab
le I
II-1
0-B
: Sev
eral
Au/
α-Fe
2O3
cata
lyst
s pr
epar
ed b
y th
e Z
SW U
lm: c
hara
cter
izat
ion
& a
ctiv
ity /
sele
ctiv
ity a
t 80°
C.

Au/Fe2O3 The influence of structural parameters on the activtiy / selectivity
127
by Haruta and co-workers by similar procedures [71, 233]. The mass-specific activity (in
molCO/gAu*s) indeed shows an increasing trend at smaller XRD-determined particle sizes. But
upon investigating the dependence of the turnover frequency, which is normalized to the
dispersion of the freshly conditioned samples (for the calculation a (hemi-)spherical droplet
form was assumed for simplification; rAu = 0.144 nm), on the particle diameter (figure III-45),
it becomes evident that this trend is predominantly arises from the increased fraction of
exposed Au surface atoms at decreasing particle size, since the calculated TOF’s remain
surprisingly constant within ±50% (average value ca. 2.5 s-1) for particles ranging from 2.8 up
to 11 nm, which is in contrast to the activity dependence claimed by Haruta [240] or Valden et
al. [263]. The strong scattering is probably caused by the different sodium contents of the
samples (see below): The four samples which deviate significantly in fig. III-45, having a TOF
lower than 1 s-1, are those with extremely large Na+-contents (samples no. 201196, 300996,
100896 and 120499). Exactly the same tendency is recognized, when the TOF for our catalyst
samples is related to the number of exposed surface atoms after calcination at 600°C (see table
III-10-B), which would yield much more precise values due to the larger fraction of XRD-
considered Au particles (not shown here for brevity). Other than in the above cited references
we find no pronounced particle size effect. Likewise, Bollinger and Vannice could not find
any significant differences between the reactivities of Au/TiO2 samples with 4.5 and 33 (!) nm
particles, respectively [253]. This independence of the TOF on the particle diameter agrees
well with our reaction model (oxygen supply via the support), which was developed in the
Fig. III-45: CO conversion rate (80°C, idealized reformate, 1 kPa CO, λ = 2) of
various Au/α-Fe2O3 samples (see Table III-10) as a function of the Au particle size
obtained by XRD after conditioning at 400°C (synthetic air; 30 min). Predominant
precursor support Fe-phase: Ferrihydrite ( ), Hematite ( ), and Goethite ( ).
dAu at 400°C [nm]
36912
TO
F [s
-1]
0.1
1
10
high Na+-content

Au/Fe2O3 The influence of structural parameters on the activtiy / selectivity
128
preceeding chapter. But unfortunately, we have only few samples with Au particles smaller
than 4.5 nm so it cannot be completely excluded, that there may exist a narrow maximum for
the reactivity around 3 nm as was observed by the Haruta group on Au/TiO2 (see figure III-44;
[240]).
Moreover, there seems to be little influence of the iron oxide precursor phase (after drying the
freshly prepared catalyst) on the resulting TOF. This is not very surprising, since in all cases
α-Fe2O3 is formed after calcination at 400°C. But when starting from a Ferrihydrite
(Fe5(OH)8*4H2O) precursor, samples with smaller gold particles could be prepared than on a
support consisting of major parts of Hematite (α-Fe2O3) or Goethite (α-FeOOH). Obviously,
for the Ferrihydrite precursor phase, sintering of the oxide particles is less favourable during
the calcination process. Consequently, with this type of catalysts the smallest gold clusters are
achieved, since the sintering of the support strictly governs the growth of the attached Au
particles, as was shown by detailed XRD measurements after calcination at various
temperature levels [274]. We also tried to pre-reduce the Au on some of the catalyst samples
by adding H2O2 or NaBH4 to the catalyst suspension, but this resulted not only in much larger
gold particles (e. g., sample no 230899H), but also in a very poor performance for the NaBH4-
treated samples (= lower TOF; see table III-10). Probably on these samples the established
Au-FeOx-interface must have been smaller or less reactive [283]. Those results demonstrate
once more that the activity for this type of catalysts crucially depends on the pretreatment
procedure.
Similar effects of different FeOx precursor phases were also observed by Kozlova et al., who
suggested that stronger Au-support interactions on very amorphous FeOx phases indeed
reduce the sintering of Au particles [278, 284].
It is interesting to note that Wagner et al. reported a significant dependence of the reactivity
on the type of the used iron oxide with Ferrihydrite-supported catalysts being superior to
Hematite- and Goethite-supported catalysts, which seems to contrast our results. But they
investigated uncalcined samples, where the original support phase should be largely retained
during CO oxidation, whereas for our catalyst the resulting phase after calcination is
uniformly α-Fe2O3 [285]. Hence these results should be compared with reservation.
Haruta and co-workers claimed that other than for the CO oxidation, the H2 oxidation rate is
almost independent from the Au particle diameter (and also from the kind of support), which,
according to their model, would lead to an increased selectivity at smaller particle sizes as a

Au/Fe2O3 The influence of structural parameters on the activtiy / selectivity
129
consequence [270, 286]. But on our catalyst the selectivity shows no discernible trend, varying
between 60 and 75% on the different samples for particle sizes up to 11 nm (it should be
mentioned that these deviations are well outside the measurement tolerance of < 5%!).
Nevertheless, from our data in table III-10-B (and also from the results in the next section) we
can exclude that it is just a simple function of the gold particle size.
It is interesting to note, that the pre-reduction treatment by H2O2 (sample no. 230899H) led to
a strong decrease in the selectivity, when compared to the untreated, identically produced
fraction (no. 230899), but yet we cannot offer a satisfying explanation for this behaviour at the
moment.
As a result it may be concluded, that the exact nature and morphology of the interface affects
the reactivity of our catalysts very strongly, whereas the particle size of the gold crystallites
seems to have no or little impact on the performance. It is interesting to note that Vannice and
co-workers noticed a very similar trend for the other highly active system (see preceeding
chapter), Au/TiO2, where the activity seemed to depend in a very subtle manner upon the
nature of the support phase (and its interface to the metal) for the conditioned catalysts, but
not on the size of their gold clusters [72, 237, 253, 287]. Our results underline that for this
type of gold catalysts the support plays an active role in the CO oxidation reaction, probably
as an oxygen supply as discussed in the preceeding chapter.
3.2.2 Influence of the calcination temperature
For the Au/α-Fe2O3 sample no. 110599 the long-term stability (fig. III-46a, c), the activity
(window b) and selectivity (window c) were tested for different conditioning temperatures
(calcination in 10% O2 in N2 for 30 min.; each experiment with a new catalyst bed).
When going from 200°C to 300°C, the CO oxidation rate increases significantly, but then
drops again at higher calcination temperatures. This is in excellent agreement to observations
by Haruta et al. on a coprecipitated Au/α-Fe2O3 catalyst employed for the CO oxidation in air
(1 kPa; -70°C). At 200°C the gold, which is initially in an ionic state, is probably not yet
reduced to the full extent. This would be constistent with XPS-measurements of Sze et al.,
Haruta et al. and Kozlova et al. on Au/α-Fe2O3 catalysts, where after calcination at 200°C the
Au(4f) BE is still located at 84.1-84.2 eV (normed to the C1s-peak at 284.6 eV) [234, 278,
288], which is somewhat above the position for metallic Au of ∼83.8 eV [235, 246, 278].
Likewise, for this low temperature pretreatment Park and Lee recorded a very broad XP

Au/Fe2O3 The influence of structural parameters on the activtiy / selectivity
130
spectrum on an impregnated Au/α-Fe2O3 catalyst, which they attributed to the parallel
presence of ionic and metallic Au species [289]. Moreover, the ferrihydrite precursor is not
yet converted to its final Hematite form [71]. We therefore attribute the lower activity of our
catalyst after the low temperature calcination to both of these missing structural
transformations. An additional role of residual carbonate (originating from the preparation
procedure), which is not fully decomposed after calcination at 200°C (TGA results by V.
Plzak) and was shown to decrease the activity (see chapter III-3.4.2), cannot be excluded.
At elevated temperatures (> 300°C) the gold is probably reduced to its metallic state,
Unfortunately, in the above cited XPS studies, there is a slight disagreement about the
resulting gold state after calcination at 300°C. Whereas Sze et al. and Park et al. observed
already metallic Au0 (83.8 - 83.9 eV; normalized to the C1s peak at 284.6 eV), Haruta and co-
workers still claim ionic contributions, which dissappeared only at 400°C (83.9 eV). At higher
temperatures the gold particles probably increase significantly in size, which is responsible for
the corresponding decrease of the mass-related activity rate after calcination at 400 and
500°C, respectively.
It should be mentioned, that there is an intense debate, in which state the gold is in its most
active form. Whereas, e. g., Minico et al., Visco et al. and Park and Lee propagate a superior
t [min]
10 100 1000
r [m
olC
O/g
Au*
s] *
10-3
1
10
r [m
ol/g
Au*
s] *
10-3
1
10
T [°C]
200 300 400 500
[%]
01020305060
Fig. III-46: a) Comparison of the selective CO oxdiation in idealized reformate
(1 kPa CO, λ = 2; 80°C) over Au/α-Fe2O3 after calcination at different temperatures:
200°C, 300°C, 400°C, and 500°C; b) Activities for CO ( ) and H2 oxidation
activity ( ; calculated via selectivity) after 120 min.; c) Selectivity ( ) and loss of
reactivity between 30 and 1000 min. ( ;extrapolated for 500°C data).
a) b)
c)

Au/Fe2O3 The influence of structural parameters on the activtiy / selectivity
131
performance of positively charged Au species [251, 289, 290], the results from Dekkers et al.,
Boccuzzi et al. and Haruta and co-workers [71, 269, 291, 292] and our own data as well
suggest, that ionic gold is a less reactive species. In the former studies the most active
catalysts were the samples calcinated at 200°C and below, whereas in the latter publications
the catalysts only gained high activity after formation at 300°C and above. We cannot solve
this obvious contradiction finally here, but it is noteworthy that even for our own Au/α-Fe2O3
catalysts the optimum conditioning temperature was not identical for all samples. No. 061197
showed, e. g., its highest activity after conditioning at 400°C (Therefore, 400°C had been
chosen as a general calcination temperature for our standard activity tests and the kinetic
measurements). This indicates that the activity is not solely a function of the oxidation state of
gold alone, but probably also of other factors like, e. g., the structure (quality) of the Au-FeOx
interface, which depends in a very subtle manner on the preparation method. For example
Park and Lee produced their catalysts by impregnation of freshly prepared Hematite [289],
whereas on our catalysts this support phase was formed only at higher temperatures, starting
initally from a ferrihydrite precursor. Most likely such differences in preparation account for
the observed differences in the optimum pretreatment procedure.
The hydrogen oxidation activity (window b; grey diamonds in fig. III-46) follows in principle
an identical trend - but is slightly enhanced at lower calcination temperatures, relative to the
CO oxidation rate, leading to somewhat lower selectivities at decreasing calcination
temperatures (window c; white triangles), which in turn implies that on positively charged
gold particles (which are still present after the low-temperature calcination procedure) the H2
+ O2 reaction is more favoured. Similar conclusions were reached in the early work of the
Haruta group [234].
With respect to chapter III-3.4, where we will explicitly examine the deactivation behaviour, it
is interesting to compare the long-term stability after the different pretreatment temperatures.
In figure III-46c (grey triangles) the reactivity loss (in %) between 30 and 1000 min.
(extrapolated for the „500°C“-measurement) is illustrated. The deactivation behaviour is
essentially identical for the three higher temperatures (-30%), only at 200°C the rate decreases
by less than 10%. This is in contrast to the study by Sze et al. on CO oxidation in air at 60°C,
where they noticed a continuous, strong increase in activity loss with increasing pretreatment
temperature for all levels above 300°C, which may be attributed to the somewhat different
reaction atmosphere they used (e. g., absence of hydrogen) [288]. For our series the stabilized
rate at 200°C is likely to be caused by a simultaneous slow reduction of the less reactive ionic

Au/Fe2O3 The influence of structural parameters on the activtiy / selectivity
132
gold species to their metallic state, which would counteract the „normal“ deactivation process
and as a consequence yield an apparently stabilized rate.
3.2.3 The dependence of the particle size on the sodium content
We also investigated the possible influence of impurities on the formation and activity of our
gold catalysts. The preparation starts from HAuCl4, Na2CO3 is used for the precipitation step.
Hence Na+ and Cl- are likely to be included. Other impurities than these were never observed
in XPS or EDX measurements, but of course for both methods the dectection limit is quite
high. Whereas there is a broad agreement that chloride probably acts as a poison for the CO
oxidation and leads to increased Au particle sizes after conditioning [233, 237, 286, 293, 294],
there is no consistence upon the influence of Na+ impurities. Haruta reported reduced activity
and a more pronounced deactivation of the Na-containing samples [233]. In contrast, Yuan et
al. even noted a rate enhancement in the presence of Na+ in their study on Au/Fe2O3 catalysts
[294].
In fact, the chloride was removed quite well from our gold catalysts after several washing
steps, so that only for one sample (no. 120897) traces of Cl- were established by EDX
measurements. Due to the lack of sufficient statistical data we can not draw any conclusions
concerning the Cl-influence on Au/α-Fe2O3.
The Na+ was somewhat more difficult to remove: In a series of samples which differed only
by the cleaning procedure (no. 100399; see tables III-10) four redispersion steps at 80°C,
following the precipitation-deposition procedure, were required to reduce the Na-content
down to 0.1 wt-%. Figure 47a clearly shows that there is just a very moderate negative
influece of sodium on the turnover frequency of Au/α-Fe2O3 (only ferrihydrite-precursor
catalysts are regarded for this figure). An increase of almost three orders of magnitude in the
Na-content reduces the activity by only a factor of 3 - 4, nevertheless, this may well explain
the large scattering in the TOFs in fig. III-45. But there is a striking effect of sodium
impurities on the formation behaviour during calcination. From figure III-47b it is obvious
that above a critical content of approximately 0.2 wt% Na+ promotes the sintering of the gold
clusters. In this figure the particle diameter after conditioning in synthetic air (30 min.) at
600°C is displayed, since at this temperature level the XRD already covers the major part of
particles and the uncertainty hence decreases (see table III-10-B). Nevertheless the same
tendency applies as well for the data obtained at 400°C.

Au/Fe2O3 The influence of structural parameters on the activtiy / selectivity
133
Kang and Wan claim the observation of a similar phenomenon for zeolite supported gold
catalysts, where the resulting particle size of the conditioned catalyst shows a slightly
increasing tendency with increasing NaOH addition during preparation [295]. At the moment
we can just speculate for reasons, but a possible explanation may be the simple blocking of
anchoring sites for gold particles on the support by Na+-ions, so that they possess a higher
mobility during the formation process, leading to larger agglomerates.
Na-content [wt-%]
0.01 0.1 1 10
d Au
[nm
]
6
9
12
Fig. III-47: a) Turnover frequency for CO conversion (80°C; idealized
reformate; 1 kPa CO; λ = 2) of various Au/α-Fe2O3 samples (see tables
III-10-A,B) as a function of the Na-content. b) Average Au particle diameters
(determined by XRD) after conditioning in sythetic air at 600°C (30 min) as
a function of the Na-content after the final washing step.
TO
F [s
-1]
1
10 a)
b)

Au/Fe2O3 The CO coverage and its influence on the kinetics
134
3.3 The CO coverage on Au and its influence on the kinetics
The general suitability of the Au catalysts for the PROX reaction was investigated in a
previous studiy on a Au/α-Fe2O3 catalyst, where Kahlich et al. determined the CO oxidation
rates and selectivity in H2-rich gas [26]. These studies revealed drastic differences in the
reaction kinetics as compared to the PROX reaction over a Pt/γ-Al2O3 catalyst, which we had
studied earlier [7, 12, 83]. While the selectivity remained constant on Pt/γ-Al2O3 for operating
temperatures ≤200°C, it decreased strongly with decreasing CO partial pressure (1.5 -
0.02 kPa) and increasing temperature (40° - 120°C) on the Au/α-Fe2O3 catalyst. It was
proposed that these differences result from different steady state CO coverages on the two
catalysts during the reaction, with the Pt catalyst operating at very high CO coverages,
practically at saturation coverage (see chapter III-1.2), while the Au catalyst was expected to
run at low CO coverages. Direct proof for the latter assumption, which is crucial for the
mechanistic understanding of the reactions, however, is still lacking.
In this section, we will first compare basic kinetic data on the PROX reaction on both
catalysts. We then present in-situ DRIFTS measurements, during CO adsorption/selective
oxidation at varying CO partial pressures, which yield direct information on the steady-state
CO coverage under PROX operating conditions. These data show unambiguously that the
steady state CO concentration is low on the gold particles compared to platinum. This
difference is shown to lead to the observed strong decrease of the selectivity on Au with
decreasing pCO, while it remains independent on Pt. Finally, we show DRIFTS data recordedat
lower temperatures which support the above conclusions and also rationalize the
experimentally observed changes in the CO reaction order with temperature. All data in this
section were obtained on the Au/α-Fe2O3 catalyst no. 201196 (See tables III-10).
3.3.1 Kinetic observations
Figure III-48 compares the turnover frequencies and selectivities of both catalysts at their
envisaged operating temperatures during selective CO oxidation in idealized reformate at a
constant λ-value of 2, demonstrating the high activity of Au/α-Al2O3 at 80°C and its superior
selectivity at high CO partial pressures (figure taken from [25]). Assuming a simple power-
law model for the CO oxidation kinetics, the slope in fig. III-40a corresponds to the sum of
the reaction orders with respect to p(O2) and p(CO) [7].

Au/Fe2O3 The CO coverage and its influence on the kinetics
135
In microkinetic studies on the preferential CO oxidation over Pt/γ-Al2O3 at 150-250°C, the
reaction orders with respect to p(CO) and p(O2) were determined to be -0.4 and +0.8, respec-
tively [7], which is consistent with the selective CO oxidation reaction occurring in the so-
called „low-rate branch“, where the Pt surface is thought to be completely covered by CO
under reaction conditions [83]. Consequently, the oxidation rate of co-adsorbed hydrogen is
also rate-limited by the same step (dissociative O2 adsorption), so that the CO and H2
oxidation rates are coupled, effecting an essentially constant selectivity of ca. 40% (Fig. III-
48b) on Pt/γ-Al2O3 over the entire range of CO and O2 partial pressures at temperatures below
250°C ([7]; see also section III-1.2.1).
As was already mentioned, the Au/α-Fe2O3 catalyst shows a comparable activity at the much
lower temperature of 80°C. However, from the different slope in Fig. III-48a it is already
apparent that the reaction orders, i.e., the reaction kinetics, are very different on the gold
catalyst. The reaction orders with respect to p(CO) and p(O2), determined in microkinetic
studies in idealized reformate, were +0.55 and +0.23, respectively [26]. In terms of a
mechanistic model, the positive CO reaction order suggests that there is no self-poisoning of
the CO oxidation reaction by adsorbed CO, contrary to what is observed for the Pt catalyst.
TO
F [s
-1]
0.01
0.1
1
p(CO, O2) [kPa]
0.01 0.1 1
S [%
]
0
30
60
a)
b)
Fig. III-48: Selective CO oxdiation in idealized reformate (λ = 2) over Pt/γ-Al2O3 at
200°C ( ) and Au/α-Fe2O3 at 80°C ( ): a) CO oxidation activity; b) selectivity. {KAH}

Au/Fe2O3 The CO coverage and its influence on the kinetics
136
Boccuzi et al. [248] proposed that the reaction follows a Langmuir-Hinshelwood type
mechanism where both reactants are adsorbed on the Au surface (see also chapter III-3.1), as it
is well established for CO oxidation on platinum metal surfaces [1]. In this case the positive
CO reaction order implies that under reaction conditions the CO coverage is significantly
below saturation and hence a decrease of the CO partial pressure decreases the reaction
probability for CO oxidation. The relatively high selectivity of the Au catalyst, particularly at
high CO partial pressures (Fig. III-48b), can be rationalized by the very low dissociative
sticking probability for H2 on a gold surface [219, 223, 223]. Assuming low CO coverages
under PROX conditions, hydrogen dissociation would be expected to be essentially
unperturbed by adsorbed CO, so that the H2 oxidation rate (at constant p(O2)) should be inde-
pendent from the CO oxidation rate which, indeed, is experimentally observed [26]. Conse-
quently, a decrease in p(CO) with a concomitant decrease in the CO oxidation rate results in
the loss of selectivity shown in Fig. III-48b, a striking difference to the behavior of the
Pt/γ-Al2O3 catalyst.
inte
gr. i
nten
sity
[a.
u.]
0.1
1
p(CO, O2) [kPa]0.1 1
ν[c
m-1
]
2100
2105
2110
2115
a)
b)
Fig. III-49: a) Integrated IR intensity and b) band position of the linearly bound
COad in idealized reformate (λ = 2) over Pt/γ-Al2O3 at 200°C ( ) and Au/α-Fe2O3
at 80°C ( ) and during CO adsorption in pure N2 over Au/α-Fe2O3 at 80°C ( ).

Au/Fe2O3 The CO coverage and its influence on the kinetics
137
The following in-situ DRIFTS experiments were conducted to support the suggested low CO
coverage conditions during the PROX reaction on Au/α-Fe2O3.[26, 83]
3.3.2 Comparison of the CO coverage on Pt/γ-Al2O3 versus Au/α-Fe2O3
Since the DRIFTS signal depends on the penetration depth of the infrared beam into the pow-
der catalyst sample and is a strong function of the support material, the particle size, and the
packing density, a direct quantitative determination of the CO coverage from the DRIFTS
spectra is generally not possible [50, 51]. Therefore, the experimental CO adsorption intensi-
ties measured during the PROX reaction by in-situ DRIFTS will be referenced to the COad
intensities produced by CO adsorption in a pure N2 background. For the latter, we showed in
section III-1.2.3, that the CO-coverage on the Pt catalyst can be estimated using first order
Langmuir adsorption-desorption kinetics for CO. For a CO partial pressure of 1 kPa and tem-
peratures up to 200°C CO coverages are in all cases are close to saturation (θCO > 0.9*θsat; see
also table III-2). We also proved that under reaction conditions the reaction rate can be
neglected compared to the desorption term (see table III-1). Therefore, on the basis of
equation III-1.2 (and assuming that the IR cross-section of COad is not significantly altered by
the presence of O2 and H2), essentially identical COad intensities were predicted and observed
(see Fig. III-3) for CO in a pure nitrogen background and in idealized reformate. This, in
conjunction with the above estimated CO coverage based on the pure adsorption experiments
provides strong evidence that the PROX reaction under our reaction conditions (1 kPa CO, λ
= 2; T ≤ 200°C) does, ideed occur at saturation coverage on Pt/γ-Al2O3.
Based on equation III-1.2 we can estimate that the CO coverage on Pt/γ-Al2O3 remains close
to saturation during the reaction in idealized reformate even at much lower CO partial
pressures (λ = 2; 200°C), reflecting the adsorption-desorption behavior in the high pressure
regime of a Langmuir isotherm. This is confirmed by the DRIFTS measurements in fig. III-49
(square symbols), which show that the IR intensity and hence the steady-state CO coverage
(see above) decreases by less than 20% as the CO partial pressure is reduced from 1 to
0.05 kPa. At the same time, the CO frequency remained almost constant at 2050 cm-1 (not
shown). Despite the slight loss in CO coverage the adlayer is still sufficiently dense to
efficiently inhibit the adsorption of H2 (and O2) during the reaction, explaining the small loss
in selectivity (Fig. III-48, square symbols). Hence, over the entire pressure range in fig. III-48
the selectivity in the PROX reaction on Pt/γ-Al2O3 catalyst is controlled by the high CO
coverage

Au/Fe2O3 The CO coverage and its influence on the kinetics
138
The IR vibrational spectra of the Au/α-Fe2O3 catalyst during CO adsorption or oxidation are
characterized by a CO band at ca. 2110 cm-1 (see fig. III-50), which is generally assigned to
linearly adsorbed CO on single crystalline gold surfaces [296] and supported Au particles
[257]. An assymetric tailing on the low frequency side was interpreted by Boccuzzi et al. in
terms of a second CO adsorption state at the perimeter places on their Au/ZnO catalyst [248,
248, 257]. However, since such a tailing could also emanate from a heterogeneous particle
dispersion, we will refer to the band at ∼2110 cm-1 as deriving from a single CO adsorption
species. Additional CO species, such as CO adsorbed on (partly) ionic Au atoms (stabilized by
the support) as it had been assigned to the high frequency bands on Au/TiO2 and Au/ZnO at
2130 - 2150 cm-1 [248, 291, 292] as well as on Au/Fe2O3 at around 2138 and 2159 cm1 [251],
were not observed under our experimental conditions. The absence of these species is
probably related to different catalyst pretreatment conditions and/or the presence of H2 during
our CO oxidation experiments.
Similar to the above analysis of the CO adsorption characteristics of the Pt/γ-Al2O3 catalyst
during the PROX reaction, we will first examine the adsorption of CO on the Au/α-Fe2O3
catalyst in the absence of reaction, i.e., in a pure CO/N2 mixture at the PROX operating tem-
[cm-1]20002050210021502200
IR in
tens
ity
[a.u
.]
1 kPa CO
0.5 kPa CO
0.25 kPa CO0.1 kPa CO0.05 kPa CO
Fig. III-50: In-situ DRIFTS spectra (region 1950 - 2250 cm-1) of linearly bonded
CO recorded at adsorption-desorption equilibrium on Au/α-Fe2O3 at varying CO
partial pressures between 0.05 and 1 kPa in pure N2 at 80°C.

Au/Fe2O3 The CO coverage and its influence on the kinetics
139
perature. DRIFTS spectra obtained at different CO partial pressures at 80°C are reproduced in
fig. III-50; the resulting CO adsorption intensities and the corresponding IR frequencies are
plotted in fig. III-49a and b, respectively (triangular symbols) as a function of the CO partial
pressure (balance N2). Upon increasing the CO partial pressure from 0.05 to 1 kPa, the COad-
intensity increases by nearly one order of magnitude. Assuming a roughly linear relationship
between signal intensity and absorber concentration, this represents a significant increase of
the CO coverage on the gold particles. The conclusion is supported by a concomitant decrease
in wavenumber from 2111 cm-1 to 2104 cm-1 (Fig. III-49b) since νCO on gold surfaces is know
to decrease with increasing θCO, contrary to what is observed for platinum metals [247].
For comparison, the CO coverage dependency of the IR vibrational frequency of COad on
various gold surfaces reported in the literature is summarized in Table III-11. In contrast to
platinum, neither the adsorption temperature nor the dispersion (i.e., particle size) seem to
have a significant influence on νCO. The highest values are between 2120 cm-1 and 2130 cm-1
for the low coverage regime and generally decrease to slightly below 2110 cm-1. The
maximum coverage under the conditions listed in Table III-11, which corresponds to the
lowest wavenumbers, does not exceed θCO ≈ 0.2. This relatively low saturation value even at
high pressures may be due to a strong decrease in adsorption energy at higher adsorbate
densities [296]. Therefore, a simple comparison of band positions suggests that the
equilibrium CO coverage in 1 kPa CO (balance N2) on the Au particles of our catalyst should
not exceed θCO ≈ 0.2.
system T [K] pressure range vib. shift [cm-1] θθsat1) ref.
Au(332) 92105
2.5*10-10 - 10-6 kPa2.5*10-10 - 10-6 kPa
2124 - 21102125 - 2113
0.17 [296]
Au powder 273 0.7 - 3 kPa - ∼ 0.2 2) [297]
Au film on Al2O3 2 0.01 - 0.8 L 3) 2125 - 2108 [298]
Au/SiO2 298 0.034 - 10.9 kPa 2120 - 2110 [299]
Au/SiO2 298 1.7*10-4 - 59 kPa 2129 - 2106 0.17 4) [247]
Au/ZnO 298 0.0002 - 5 kPa 2116 - 2106 0.22 [257]
Au/Fe2O3 353 0.05- 1 kPa 2111 - 2104 this work 1) θsat = θ at highest pressure and lowest νCO 2) calculated from their adsorption isothermes using an atomic density of 1019 m-2
3) CO dosing in UHV 4) coverage at 2 kPa
Table III-11: CO vibrational frequency shifts as a function of CO partial pressure (and
CO dosing) reported for unsupported and supported gold particles and estimated CO
coverages for the maximum indicated saturation pressure.

Au/Fe2O3 The CO coverage and its influence on the kinetics
140
The low CO coverage under our conditions (1 kPa CO) is consistent with the data by Iizuka et
al., who for pure gold powder determined a coverage of ∼0.2 at a partial pressure of 3 kPa CO
and 0°C [297]. It is furthermore consistent with an estimate based on Langmuir adsorption-
desorption kinetics for CO, in conjunction with published CO adsorption energies on Au sur-
faces (reconstructed Au(100): 58 kJ/mol [300]; polycrystalline Au: 55 kJ/mol [301]; Au(332):
55 kJ/mol [296]; Au(110): 33 kJ/mol [220] and 40 kJ/mol [302], resp.), preexponential factors
between 1013 and 1015 s-1, and maximum sticking coefficients of 0.1-1. Calculations
(analogous to fig. III-6) based on the values given by Ruggiero et al. on Au(332) [296] are
shown in figure III-51. The resulting CO coverages for 1 kPa CO are indeed in the range
between 0.1 and 0.35*θsat for all applied conditions.
In contrast to the approach used for the Pt/γ-Al2O3 catalyst, where the CO intensity for the
pure adsorption case (CO/N2 mixtures) was directly compared to the intensity observed under
PROX conditions, this direct comparison is not possible for the Au/α-Fe2O3 catalyst. In the
latter case the support phase changes from α-Fe2O3 (Hematite) to Fe3O4 (Magnetite) in the
presence of H2, concomitant with a change in the DRIFTS signal due to a different penetration
depth. Therefore, a comparison of the absolute CO intensities in CO/N2 with those measured
during selective CO oxidation in idealized reformate (λ = 2) is meaningless. We therefore
p(CO) [kPa]
0.001 0.01 0.1 1
ΘC
O
0.0
0.1
0.2
0.3
0.4
Fig. III-51: Adsoption isotherms calculated via Langmuir-kinetics for CO on gold in a
pure nitrogen background at 80°C based on the data by Ruggiero et al. [296].
assumptions: s0 = 1 and ν = 1013 ( ); s0 = 1 and ν = 1015 ( ); s0 = 0.1 and ν = 1013 ( ).

Au/Fe2O3 The CO coverage and its influence on the kinetics
141
estimate the steady state coverage during the PROX reaction under our experimental
conditions from the adsorption/reaction kinetics. As in the case of Pt, rdes (eq. III-1.2) is
several orders of magnitude larger (using the above kinetic parameters) than the TOF for the
gold catalyst (see fig. III-48a), so that the CO coverage in a pure N2 background should be the
same as during the PROX reaction, i.e., ≤ 0.2 ML (assuming that the CO adsorption properties
of the Au particles do not change in the presence of O2 and H2). To reflect the similar
coverages, the CO intensities were normalized to each other at the highest CO partial pressure
in fig. III-49a.
Consistent with a low CO coverage even at the highest CO partial pressure of 1 kPa (filled
circles in fig. III-49a), the CO intensity (and therefore the CO coverage) decreases with
decreasing CO partial pressure. This coverage dependence fits also to the observed positive
reaction order with respect to p(CO), owing to a reduced reaction probability at reduced θCO.
The p(CO)-dependence of the CO vibrational frequency during the selective CO oxidation (λ
= 2) is shown in fig. III-49b (filled circles), the associated DRIFTS spectra are displayed in
fig. III-52. Compared to the case of CO adsorption from a pure CO/N2 mixture (Fig. III-50),
the COad frequency under PROX conditions is now shifted to significantly higher
wavenumbers and barely changes with decreasing CO partial pressure (2113 - 2111 cm-1). A
[cm-1]2040208021202160
IR in
tens
ity
[a.u
.]
1 kPa CO
0.5 kPa CO
0.25 kPa CO
0.1 kPa CO0.05 kPa CO
Fig. III-52: In-situ DRIFTS spectra (region 2000 - 2200 cm-1) of linearly bound
CO recorded during CO oxidation in idealized reformate (λ = 2) on Au/α-Fe2O3
at varying CO partial pressures between 0.05 and 1 kPa in pure N2 at 80°C.

Au/Fe2O3 The CO coverage and its influence on the kinetics
142
very similar blue-shift of the COad band (1 kPa CO partial pressure) upon admission of
oxygen (partial pressure not given in reference) of ∼10 cm-1 was noted by Boccuzi et al. on the
closely related Au/TiO2 system [248].
This increase in νCO is assigned to the coadsorption of oxygen and its effect of decreasing the
electron density in the gold particles. Since the bonding of CO to gold surfaces is dominated
by the 5σ orbital [247], electron donation to the metal becomes more favorable under these
conditions. Owing to the weak antibonding effect of the 5σ orbital with respect to the C-O
bond, the IR band frequency would increase for a reduced electron density of the gold surface.
Since fig. III-52 was recorded at a constant value of λ = 2, p(O2) decreases in the same way as
p(CO), so that the up-shifting effect of O2 is expected to become smaller at lower partial
pressures. The nearly zero net shift observed in fig. III-52 (see also filled symbols in fig. III-
49b) can be understood as a result of these two counteracting effects (decreasing νCO with
increasing θCO, but increasing wavenumber νCO with increasing p(O2)). A similar effect may
also exist for the IR cross-section, which would explain the more pronounced decay of the
intensity with smaller coverages for the PROX reaction as compared to CO adsorption.
Under the above hypothesis of low CO coverages during the PROX reaction even at the
highest CO partial pressure of 1 kPa examined in our study, it is reasonable to assume that the
TO
F [
s-1]
0.1
1
pCO [kPa]0.1 1
25
50
75
S [
%]
b)
a)
Fig. III-53: a) Turnover frequencies of CO ( ) and H2 oxidation ( ) and b) selec-
tivitiy ( ) over Au/α-Fe2O3 at 80°C and pO2= 1 kPa in idealized reformate. {KAH}

Au/Fe2O3 The CO coverage and its influence on the kinetics
143
dissociative adsorption of hydrogen on the Au surface is not significantly perturbed by the
presence of CO. Therefore, one would expect that the H2 oxidation rate is independent of the
CO partial pressure if the O2 partial pressure remains constant. This, indeed, is confirmed by
kinetic measurements (taken by M. Kahlich) on both CO and H2 oxidation rates over Au/α-
Fe2O3 in idealized reformate at 80°C and p(O2) = 1 kPa at 80°C, shown in fig. III-53 [26].
While the CO turnover frequency decreases with decreasing CO partial pressure owing to a
decrease in CO coverage, the H2 oxidation rate remains essentially constant (Fig. III-53a).
This demonstrates that rCO and r H2 are completely decoupled, contrary to what is observed for
the Pt/γ-Al2O3 catalyst. As a consequence, the selectivity of the Au catalyst decreases with
decreasing p(CO) (Fig. III-53b). Since the dissociative sticking probability for H2 on a gold
surface is very low [219], due to a strongly activated adsorption process [223], the overall
selectivity is still rather high. This is different from the case of the Pt/γ-Al2O3 catalyst, where
the high selectivity is only caused by the nearly complete blocking of the surface with
adsorbed CO.
3.3.3 Temperature dependence
In this section we finally present and discuss in-situ DRIFTS data recorded during the PROX
reaction on Au/α-Fe2O3 at varying temperatures, which will provide a final piece of evidence
ν [cm-1]
2100220023002400
IR in
tens
ity [
a. u
.]
COad
CO2 (gas)
T [°C]
20 40 60 80
inte
gr. i
nt. [
a.u.
]
0.0
0.5
1.0 20°
80°
60°
40°
Fig. III-54: In-situ DRIFTS spectra on Au/α-Fe2O3 in idealized reformate
(1 kPa CO; λ = 2) at different temperatures. Inset: Integrated IR intensities
of the linearly bound CO versus temperature.

Au/Fe2O3 The CO coverage and its influence on the kinetics
144
for the hypothesis that the CO coverage under PROX conditions at 80°C is very low, far
below saturation. These data will rationalize the observed decrease in the CO reaction order
during selective CO oxidation with temperature, which was found to change from +0.55 at
80°C down to +0.35 at 40°C [26]. A similar behavior was observed also by Lin et al. on a 2.3
wt% Au/TiO2 catalyst, with a decrease in the CO reaction order from 0.6 to 0.2 as the
temperature was decreased from 87° to 37°C in a H2-free gas mixture (pCO = 0.1-2.5 kPa,
p O2= 0.1-2 kPa, balance He) [237]. Figure III-54 shows in-situ DRIFTS spectra recorded in
idealized reformate (10 kPa CO, λ = 2) at 20°, 40°, 60° and 80°C, respectively (all spectra
taken after 30 min. of equilibration). Clearly, the amount of linearly adsorbed CO decreases
by a factor of three (see inset in fig. III-54) with increasing temperature. It cannot be excluded
that a part of this apparent coverage variation may also be caused by changes in the Oad
coverage, which would influence the band position and probably also the IR cross section of
COad (see below). Nevertheless, a strong decrease of the CO coverage with temperature
resembles the behavior expected in the steep, middle regime of a Langmuir adsorption-
desorption isobar, where the CO coverage is far below saturation, which in turn gives further
credence to the hypothesis that the CO coverage under PROX conditions at 80°C is rather low
on the Au/α-Fe2O3 catalyst. Such a strong variation of the steady-state COad concentration fits
well to a reaction scheme where the CO supply is increasingly rate limiting, which
qualitatively rationalizes the increase in CO reaction order with increasing temperature.
Consequently, one would expect a more moderate decrease of θCO with pCO at lower
temperatures, i. e., at 40°C. In figure III-55 the integrated intensity and peak position of COad
in idealized reformate are shown as a function of the CO and O2 partial pressure (λ = 2; 40
and 80°C, respectively). While at 80°C the COad band is reduced by a factor 11 as pCO is
decreased from 1 to 0.05 kPa, at 40°C only a lowering by a factor 6 is observed. Exactly the
same trend applies for CO adsorption in a pure N2-background (not shown here for brevity):
At 40°C the difference in band area between the highest and lowest CO partial pressure is
only a factor 3 compared to factor 6 at 80°C. This observed reduction in the CO partial
pressure dependence of θCO at lower reaction temperatures implies a somewhat larger absolute
coverage at 40°C (as was already suspected from the temperature-experiment above), which
explains the observed decrease of the CO reaction order from +0.55 at 80°C down to +0.35 at
40°C [26].

Au/Fe2O3 The CO coverage and its influence on the kinetics
145
In contrast to 80°C, where due to the simultaneously occuring oxygen coadsorption the CO-
band position remained almost constant over the whole examined partial pressure range (see
figure III-49b), at 40°C we notice a stronger dependence on the CO partial pressure. It now
resembles more closely the behaviour during CO adsorption in pure N2. The observed blue-
shift upon switching from 1 kPa CO in N2 to idealized reformate (λ = 2) is also reduced to
only 3 cm-1 at 40°C (at 80°C: 10 cm-1). Consequently, the influence (i. e., relative amount) of
coadsorbed oxygen must have been reduced at this lower temperature level, implying that the
COad : Oad ratio must have been increased at 40°C.
In summary we have seen in this chapter by direct in-situ DRIFTS observations that under
typical reaction conditions the reaction kinetics and the selectivity in the PROX reaction on
Au/α-Fe2O3 are largely determined by the steady-state CO coverage on the active metal
surface. θCO changes significantly with temperature or CO pressure, yielding coverages below
0.2 ML at 80°C and at 1 kPa CO. The CO coverage and its variation with partial pressure and
temperature not only parallel the selectivity behavior in the kinetic measurements by M.
Kahlich, i. e., a pronounced loss of selectivity at lower CO partial pressures on Au/α-Fe2O3. It
also rationalizes the observed CO oxidation reaction orders with respect to CO and O2 and
inte
gr. i
nten
s. [
a. u
.]0.1
1
p(CO, O2) [kPa]0.1 1
ν[c
m-1
]
2109
2112
2115
a)
b)
Fig. III-55: a) Integrated IR intensity and b) band position of the linearly
bound COad over Au/α-Fe2O3 at 80°C ( ) and at 40°C ( ) in idealized
reformate (1 kPa CO, λ = 2).

Au/Fe2O3 The CO coverage and its influence on the kinetics
146
their temperature dependence as well as the independence between the H2 and CO oxidation
over Au/α-Fe2O3 (and the coupling over Pt/γ-Al2O3, respectively).

Au/Fe2O3 Deactivation behaviour
147
3.4 Deactivation behaviour
3.4.1 „Off-line deactivation“
For the gold catalysts we have to distinguish two different kinds of deactivation. The loss of
reactivity during reaction („on-line deactivation“), which is the object of the forthcoming
sections, and a deactivation during storage (in air at room temperature), which occurs over a
time-scale of month and years („off-line deactivation“).
In figure III-56 two long-term measurements in idealized reformate (1 kPa CO, λ = 2; 80°C)
are compared, one within four months after preparation of the sample (no. 061197) and
another, which was recorded with a temporal seperation of ca. 11 months („aged“ catalyst).
The initial activity of the latter is reduced by more than 30%, but without any major
consequences for the selectivity. The deactivation during reaction is also somewhat enhanced
(46% instead of 36% within 1300 min. at equal absolute conversion rates). This „off-line
time [min]
10 100 1000
sele
ctiv
ity
[%]
50
60
70
80
90
conv
ersi
on r
ate
[mol
CO
/gA
u*s]
2x10⁻³
3x10⁻³
4x10⁻³
5x10⁻³
6x10⁻³
7x10⁻³
8x10⁻³
Figure 56: Activity (upper window) and selectivity (bottom) of Au/α-Fe2O3 (061197)
at 80°C in idealized reformate (1 kPa CO, λ = 2) four month after catalyst preparation
( ) and one year later ( ).

Au/Fe2O3 Deactivation behaviour
148
deactivation“ applies in the same way for all other „aged“ Au/α-Fe2O3 samples, e. g., sample
no. 280598 lost ∼45% activity within 11 months. This irreversible deactivation is probably
caused by a slow recrystallization process of the initially amorphous support, which induces a
parallel growth of the attached gold clusters, now leading to larger particle sizes after
conditioning. This hypothesis is substantiated by XRD measurements on the 061197 sample,
which indeed showed sharper bands on the „aged“ catalyst (∼16 months after preparation),
indicating larger particles (unpublished results). Of course an additional influence of
contaminations from the surrounding atmosphere, e. g., sulfur, cannot be generally excluded.
As will be shown explicitely in the next section, the enhanced „on-line“ deactivation of the
„aged“ catalyst is related to the increased cristallinity of the support phase.
3.4.2 „On-line deactivation“ during CO oxidation
Apart from this „off-line“ deactivation during storage, all Au/α-Fe2O3 samples suffered from
a strong activity loss during our standard screening tests in idealized reformate (1 kPa CO, λ =
2; 80°C) under differential flow conditions, which, e. g., amounts to ∼40% of the initial
activity after 1000 min. on-stream for the 061197 sample (see figure III-56). But we noticed a
qualitative difference in the deactivation behaviour between our initially prepared samples, e.
g., no. 201196, which were produced by coprecipitation at temperatures >60°C, with the
support consisting of larger hematite parts after drying, leading to a more crystalline structure
after calcination, and the more recent samples, e. g. no. 061197. The latter were prepared by
deposition-precipitation or coprecipitation at only 60°C, resulting in a very amorphous iron
oxide structure after the conditioning procedure (see also table III-10-A). Whereas the first
samples loose their activity very fast and it is hardly regained by any purging procedure, on
the latter the deactivation is much more moderate and the initial rate is fully restored after a
simple flush of the catalyst bed with an inert gas at reaction temperature. Therefore, in the
subsequent sections we will treat the deactivation phenomenon separately on both catalyst
types (investigated exemplary for the samples no. 201196 and 061197, respectively), before
we finally develop a comprehensive model, which explains the activity loss on our Au/α-
Fe2O3 catalysts during the PROX reaction.
For most supported gold catalysts, which were examined in numerous previous studies for the
low-temperature CO oxidation, a similar permanent deactivation during time on-stream was
recognized. Lin et al. noticed, e. g., a reduction of 40 - 60% of the inital activity within 1000
min. on a Au/TiO2 catalyst (0.5 kPa CO, λ = 2; 40°C) [237], Torres Sanchez et al. reported a

Au/Fe2O3 Deactivation behaviour
149
reactivity decrease of roughly 30% during 90 min. of selective CO oxidation over a Au/MnOx
catalyst (1 kPa CO, λ = 2, rest H2; 16°C) [31] and the model systems (Au particles on thin
TiO2 films) studied by Valden et al. even lost 80% activity after only 150 min. reaction (0.9
kPa CO; λ = 10; 27°C) [263, 264].
Since the COad coverage on gold under our reaction conditions is much lower than on
platinum metals (see preceeding chapter), we can safely exclude a CO „self-poisoning“ effect
as is generally observed on the latter systems (compare chapter III-1.2.1).
Several models were proposed in order to rationalize the loss of reactivity during reaction: In a
study on a Au/Mg(OH)2 catalyst during CO oxidation in air (1 kPa CO; -70°C) Haruta.and co-
workers blamed a slow recrystallization process of the gold clusters, which initially are not
deposited in their thermodynamically most stable form, to be responsible [269, 303]. But this
model could not be transferred to a Au/TiO2 catalyst, where the Au particles exist in the stable
fcc geometry from the beginning on [283]. Other studies suggest the blocking of reactive
(interface) sites by the slow accumulation of by-products on the support. Cunningham et al.
claimed that carbonate species were the reason for deactivation on a Au/Co3O4 catalyst (1 kPa
in air; -76°C), whereas Knell et al. suspected formate species, indicated by IR-bands around
1590 and 1370 cm-1, which were exclusively observed in mixtures with excess oxygen (0.25
kPa CO, λ = 2 and 80, resp.; 100°C) on their Au/ZrO2 catalyst [236]. Interestingly, in a
stochiometric reaction mixture (λ = 1) no deactivation (and consequently no formate bands)
was noticed over a period of 1000 min.. Furthermore in several studies on uncalcined or
initially not fully reduced samples the slow transformation from ionic gold species to metallic
gold was held to be responsible for a slow decrease of the activity [251, 280, 290, 304], but on
the contrary recent studies have shown that the positivized gold intrinsically owns no superior
activity [291, 292]. Anyway, this type of deactivation should not be relevant for our Au/α-
Fe2O3 system, since the gold is metallic after calcination at 400°C as is indicated by several
XPS studies on Au/Fe2O3 catalysts [234, 278, 288] (compare also section III-3.2.2).
Other possible aspects that should be seriously taken into consideration are a slow
crystallographic or chemical transformation of the iron oxide support during time on-stream,
which may affect the metal-support interface structure or the oxygen adsorption properties of
the catalyst. If oxygen vacancies on the support material play an important role in the
mechanism of CO oxidation, also a high oxygen content of the gas phase may exhibit a
negative effect due to the complete saturation of these vacancies [262], which could be

Au/Fe2O3 Deactivation behaviour
150
another explanation for the strong activity decay observed by Knell et al. in O2-rich reaction
mixtures over Au/ZrO2 [236]. But the latter theory should be ruled out for the deactivation
during the PROX reaction on our Au/α-Fe2O3 catalyst, since we operate in a much more
reductive atmosphere (containing 75% hydrogen), which would rather favour the existence of
oxygen vacancies.
a) Irreversible poisoning of more crystalline samples
Figure III-57 provides an overview on the deactivation behaviour of Au/α-Fe2O3 (no. 201196)
in different reaction atmospheres (all 1 kPa CO, λ = 2; 80°C). For comparison also the activity
loss on the standard catalyst Pt/γ-Al2O3 is displayed, which is around 37% within the first
1000 min. in idealized reformate (triangle symbols; 1 kPa CO, λ = 2; 200°C). In an identical
gas mixture (containing 75 kPa H2) the gold catalyst clearly deactivates much more severely
than the platinum catalyst, losing almost one order of magnitude of its initial rate (-83% in
1000 min.; black circles). Likewise, all other deactivation values, given in %, in the following
context are calculated for the first 1000 min. on-stream. In a hydrogen-free gas mixture the
deactivation on Au/α-Fe2O3 is even more pronounced (-99.7% = more than two orders of
magnitude; grey circles), independent of the CO:O2 ratio (tested for λ = 2 and 0.5, resp.),
demonstrating, that the deactivation on our catalysts cannot be traced back to a „self-
t [min]101 102 103 104
rCO
[mol
CO/g
Au*
s]
10-6
10-5
10-4
10-3
Fig. III-57: Long-term deactivation over Au/α-Fe2O3 (no. 201196) during CO
oxidation (1 kPa CO, λ = 2 ;80°C) in different atmospheres: in idealized
reformate (containing 75 kPa H2), dry and with 1.3 kPa water added, resp.;
in a pure N2-background; in a pure N2-background at λ = 0.5.
For comparison: idealized reformate over Pt/γ-Al2O3 (1 kPa CO, λ = 2; 200°C).

Au/Fe2O3 Deactivation behaviour
151
poisoning“ from excess oxygen. On the other hand, when 1.3 kPa water is added to the
idealized reformate, the rate becomes surprisingly stable (only -19%; white circles).
We think, that a thorough investigation of these differences in the long-term deactivation (i.
e., stabilizing effects by water and hydrogen (and / or in-situ produced water)) provides an
important key to the understanding of the deactivation process itself. Consequently, in the
next step we follow the time-evolution of surface species during reaction in idealized
reformate (figure III-58a; 1 kPa CO, λ = 2; 80°C) and during CO oxidation in pure nitrogen
(not shown here for brevity) by in-situ DRIFTS. During time on-stream we notice an
enormous growth of IR-bands in the region below 1700 cm-1 (bands at 1300, 1360, 1480-
1530, 1550-1625 and 1635-1720 cm-1), which are attributed to either carbonate (CO32-) or
carboxylate (CO2-) species [71, 136, 250, 305]. As for the formate species, which were
recognized during selective CO oxidation over Pt/γ-Al2O3 (see chapter III-1.2.2), the amount
of by-products (evaluated by a TPD in pure nitrogen conducted after several hours of reaction;
not shown here) exceeds several times the number of surface metal atoms, which is a
indication for the location of these carbonates / carboxylates on the support.
ν [cm-1]12001500180021002400
IR in
tens
ity [
KM
-uni
ts]
0.0
0.1
0.2
0.3
3 min.15 min.60 min.300 min.
zoom
[cm-1]21002300
[KM
-units]
time [min]
0 100 200 300in
teg.
int.
[KM
/cm
]
0
20
40
4*10-3
b)
a)
Figure III-58: a) Time evolution of DRIFTS spectra during CO oxidation in idealized
reformate (1 kPa CO, λ = 2; 80°C) over Au/α-Fe2O3 (no. 201196); b) time-evolution
of carbonate bands (integrated IR intensity) around 1600 and 1300 cm-1.

Au/Fe2O3 Deactivation behaviour
152
In window b of figure III-58, the time evolution for the build-up of these by-products
(evaluated via integration of the bands at 1250-1400 and 1550-1700, resp.) is illustrated. After
a few minutes of reaction the surface is almost saturated and the following increase is only
very slow with proceeding time. This fast saturation, which is on a completely different time-
scale as the activity decrease, seems to vote against a „carbonate poisoning“ model as an
explanation, at least on first sight.
The time-evolution of DRIFTS spectra in a hydrogen-free reaction mixture (1 kPa CO, λ = 2,
rest N2; 80°C) seemed practically identical (and is therefore not shown explicitely here), with
one small exception. The small band at ∼1450 cm-1 (see arrow in figure III-58), which
emerged slowly in idealized reformate, was completely absent during CO oxidation in a pure
N2 background. As will be rationalized in the following context, we assign this band to
bicarbonate species (HCO3-), which are formed by a proton transfer from water (or OH--
groups) to carbonates:
CO32- + H2O ↔ HCO3
- + OH- (III-3.3).
Additionally to the evolution of by-products, we also monitored the IR band for CO adsorbed
on the gold surface during CO oxidation in idealized reformate and in a pure N2 background,
respectively, which is indicated by a band around 2113 cm-1 (after subtracting the gas-phase
CO contributions). From figure III-59 it is evident that the signal decreases slowly during
reaction in idealized reformate (grey circles), which would resemble the time-scale of
t [min]
0 100 200 300 400 500
int.
inte
nsit
y [K
M/c
m]
0.000
0.004
0.008
0.012
0.016
Figure III-59: Time-evolution of the COad-band during selective CO oxidation in
idealized reformate ( ), during CO oxidation in a pure nitrogen background ( )
and after switching back to idealized reformate ( ; 1 kPa CO, λ = 2; 80°C)

Au/Fe2O3 Deactivation behaviour
153
deactivation more closely. Likewise, the COad band decreases much more rapidly in the
hydrogen-free mixture (black circles), again consistently with the activity trend, and is hardly
to recognize after 40 min.. Since the band position of the CO remains unchanged at 2113 cm-1
in both experiments, we feel that not only θCO but also the oxygen coverage must have been
reduced proportionally, since a change in the COad:Oad ratio would influence the COad-band
position markedly ([248]; see also chapter 3.3.2).
When 75 kPa hydrogen are added after the CO signal has disappeared during CO oxidation in
a pure N2 background, the corresponding IR band grows again (grey squares), indicating, that
hydrogen, or, more likely, the in-situ produced water (from the H2 + O2 reaction, which is now
possible in a hydrogen-rich atmosphere), exhibits a stabilizing effect on the COad coverage.
Since the water (or hydrogen) seems to play an important role in the deactivation process, we
decided to take a closer look on possible interactions with the carbonate / carboxylate species
formed during reaction. After accumulating these by-products during one hour of CO
oxidation in a pure nitrogen background (1 kPa CO, λ = 2; 80°C), we exposed the Au/α-
Fe2O3 catalyst to different gases at 80°C and recorded the decomposition behaviour by
DRIFTS. In figure III-60 difference spectra are presented, where the spectrum obtained at the
end of the CO oxidation reaction was divided by a spectrum recorded after 30 min. exposure
ν [cm-1]15002000250030003500
tran
smit
tanc
e [%
]
10
a) in N2
d) in 75 kPa H2 + 1 kPa O2 in N2
b) in 10 kPa O2 in N2
c) in 75 kPa H2 in N2
Figure III-60: Difference of DRIFTS-spectra after 1 h CO oxidation (1 kPa
CO, λ = 2; 80°C) and after purging for 30 min. in different gas mixtures -
Upward bands indicate a loss, downward bands an increase.

Au/Fe2O3 Deactivation behaviour
154
to the „purging gas“. Upward pointing bands indicate a reduction of the corresponding surface
species during „purging“, the growth of species is characterized by downward bands. In the
first three gas mixtures (pure nitrogen, mixed with 10 kPa O2 and with 75 kPa H2) the
carbonate / carboxylate bands decrease somewhat, which indicates the relative lability of these
species, but the degree of decomposition (indicated identical band intensities) is similar in all
three atmospheres. In contrast, a mixtures, which contains 75 kPa hydrogen and 1 kPa oxygen
(similar to idealized reformate), enabling now the in-situ water production, enhances clearly
the decomposition of the by-products. Moreover, new bands arise at 1450, 1650 and 3615
cm-1 (indicated by arrows), which are associated with bicarbonate species (HCO3-) [137, 138,
248, 253]. Hence these rather labile bicarbonate species [306] appear to be the intermediates
of a water induced decomposition process of carbonates:
H2O (or OH-) + CO32- ↔ HCO3
- + OH- (O2-) (III-3.4)
HCO3- ↔ CO2↑ + OH- (III-3.5)
We also investigated the decomposition in an atmosphere of 1.3 kPa water in nitrogen, but
this experiment was recorded on a different spectrometer and in a different DRIFTS cell, so
t [min]
101 102 103 104
rCO
[mol
CO/g
Au*
s]
10-4
10-3
10-2
Figure III-61: Deactivation behaviour of Au/α-Fe2O3 (no. 061197) during CO oxidation
(1 kPa CO, λ = 2; 80°C): idealized reformate (differential flow); idealized reformate
(total conversion); more realistic reformate with 25 kPa CO2(*); CO oxidation in a
pure N2 background (*); idealized reformate with 1.3 kPa H2O; idealized reformate with
switch to 1.3 kPa H2O (*). - For comparison: Pt/γ-Al2O3 (200°C) and Au/α-Fe2O3
(no. 201196) in idealized reformate. - *: "aged" catalyst
101 102 103 104

Au/Fe2O3 Deactivation behaviour
155
that a simple comparison of absolute intensities may be misleading. Consequently, this
difference spectrum was omitted in figure III-60. Nevertheless, we noticed an extremely fast
decomposition of carbonates in the water containing mixture, similar to the H2 + O2 mixture,
along with the evolution of bicarbonate bands, as would be expected from the preceeding
experiments. In a first conclusion, we may record, that the presence of water, which stabilizes
the rate, promotes the decomposition of the support-bound by-products and (as a consequence,
as will be specified below) mitigates the reduction of the surface CO (and also O) coverage
during the PROX reaction.
b) Reversible deactivation on amorphous samples
Figure III-61 shows the deactivation over the Au/α-Fe2O3 sample no. 061197 in different
reaction atmospheres (all 1 kPa CO, λ = 2; 80°C), which was prepared by deposition-
precipitation and featured a much more amorphous iron oxide structure after calcination, as
was confirmed by XRD measurments. The time-evolution of the activity on Pt/γ-Al2O3 (grey
hexagons; at 200°C) and the Au/α-Fe2O3 sample no. 201196 (black triangles), which was
discussed above, in idealized reformate are added for comparison. The stability of the 061197
sample in idealized reformate under differential flow conditions, where the decrease is only
34% (similar to the 37% of Pt/γ-Al2O3), is clearly superior compared to the 83% on the
sample no. 201196. Surprisingly we detected that the degree of deactivation is strongly
dependent upon the absolute conversion (in %CO). When the degree of conversion was
increased – by either reducing the flow rate or decreasing the portion of inert α-Al2O3 in the
reactor, which was required as a dilutent in order to guarantee differential flow conditions for
our conversion measurements [26] – the rate became definitely more stable (not shown here
for brevity). Finally, at total conversion, we could not even recognize any loss of activity for a
period of almost six days (grey circles). We attribute the difference between the differential
and integral measurements to the larger absolute water concentration (produced in-situ) in the
latter case. This is underlined by a similar positive effect of water on the deactivation
behaviour of the sample no. 061197, when it is additionally admitted (1.3 kPa) to the idealized
reformate. On the freshly prepared catalyst the response was small (white dotted squares;
deactivation 28% instead of 34%). But in measurements conducted one year later on the
„aged“ catalyst, the effect was more pronounced with the initial deactivation being 44% for
the dry reaction mixture (diamond symbols), whereas the activity behaviour resembled the
„old“ measurement (on the freshly prepared catalyst) after switching to the wet mixture.

Au/Fe2O3 Deactivation behaviour
156
Similar to what was noticed for the other sample in the preceeding section, in a hydrogen-free
mixture the deactivation is markedly stronger, this time running up to 80%. In a more realistic
reformate, containing 25 kPa CO2, the deactivation is also slightly enhanced (47%), as would
be expected from the enhanced by-product accumulation on the support in such an
atmosphere.
In principle both gold catalyst samples show the same trend, but the deactivation is much
more distinct on the samples which were prepared by coprecipitation at > 60°C. This leads to
a change in the reversibility of the activity loss. Whereas the severely deactivated sample no.
201196 (after several hours of CO oxidation in a pure nitrogen background) showed no
recovery upon purging with pure nitrogen for 30 min. and only a small effect after purging
with a mixture containing 75% H2 and 1% O2 for 30 min. at reaction temperature, the 061197
sample regained more than 80% of its initial activity (idealized reformate; 1 kPa CO, λ = 2;
80°C) after purging the reactor for just 15 min. with pure nitrogen. After prolonged purging
for one hour, almost the complete initial activity is recovered (see figure III-62).
If we compare the formation of by-products during time on-stream, we notice again such a
gradual difference in the DRIFTS spectra (figure III-63). The spectra match each other very
close in shape, but even though the dilution (with α-Al2O3) was 2.5 times higher for the
sample no. 061197, which, in the worst case, may cause a signal decrease of the same
rCO
[mol
CO/g
Au*
s] *
10-3
4.0
5.0
time [min]
0 500 1000 1500 2000 2500
S [%
]
55
60
65
70
75
Figure III-62: Activity (upper window) and selectivity (bottom) of Au/α-Fe2O3 (061197)
at 80°C in idealized reformate (1 kPa CO, λ = 2) - intermediate purging with 135 Nml/min
pure N2 at 80°C for 60 min. after approximately 1200 min. of reaction (dashed line).

Au/Fe2O3 Deactivation behaviour
157
magnitude (but probably much less, since the penetration depth of the infrared beam increases
simultaneously due to the enhanced reflectance), and if we take into consideration that there
might be slight differences in the spectroscopic properties of the two Au/α-Fe2O3 samples,
there is more than one order of magnitude difference in the band intensity for the carbonate /
carboxylate bands. This may serve as a well explanation for the reduced deactivation of the
recent sample. Other than on the sample no. 201196, the intensity of the COad-band is not
reduced during reaction (within a measurement tolerance of 5-10%).
c) Deactivation model
The reversible nature of the deactivation clearly argues against models, where the gold
crystallites or the support are slowly restructured into a thermodynamic more stable
conformation. Furthermore, deactivation is only observed for those substrates, which also
form stable bulk carbonates (such as Fe2O3, Mg(OH)2); but, e. g., not for a Au/γ-Al2O3
catalyst (see chapter III-3.7).
Since the time-scale of the carbonate / carboxylate formation does not match the deactivation
behaviour, but the activity loss is clearly dependent upon the water content, which
decomposes the by-products, we propose the following model:
ν [cm-1]
120014001600180020002200
inte
nsit
y [K
M-u
nits
]
0.00
0.02
0.04
0.06
0.08
Figure III-63: Time-evolution of DRIFTS-spectra in idealized reformate (1 kPa CO;
λ = 2; 80°C) over Au/α-Fe2O3 (no. 061197); spectra taken after 5, 20 and 60 min.,
resp. (arranged ascendingly) - For comparison: DRIFTS-spectrum of Au/α-Fe2O3
(no. 201196) after 1 h CO oxidation (grey line; 1 kPa CO; λ = 2; 80°C)

Au/Fe2O3 Deactivation behaviour
158
* During the (selective) CO oxidation carbonates and carboxylates are produced on the
support, which blocks active sites for the CO oxidation(e. g., at the Au-Fe2O3 interface) or
the oxygen supply from the support phase. On the sample no. 201196 the by-products (or
CO2ad, which is rather stable on gold; see next chapter) are accumulated to such a large
amount, that the COad is even sterically blocked. An alternative explanation for the
pronounced intentsity decrease of the IR COad-band on this sample would also be the slow
formation of bulk iron carbonate. The original Au-Fe2O3 interface (metal-semiconductor)
induces a negative charge at the perimeter atoms of the gold clusters by the Schottky-
junction effect [262], which may influence the adsorption strength of CO [307]. With the
destruction of that interface, adsorption on these sites may become less favourable,
resulting in a decreased surface coverage. Of course we cannot exclude an additional
alteration of the IR cross section by such charge transfer effects, which may over-
emphasize this effect.
* The presence of OH-groups (or water), which are continously replaced (at least partly) in the
immediate surrounding of the gold particles during the PROX reaction by the parallely
occuring hydrogen oxidation, enhances the decomposition of the carbonates and prevents
the fast poisoning of the reaction. Consequently, this would lead to a zone which is
relatively free of carbonates / carboxylates around the gold clusters (see figure III-64).
When the replacement is not fast enough (dry reformate at differential conversion) or
completely missing (CO oxidation in a pure nitrogen background) this carbonate-free zone
melts slowly, which causes the observed permanent loss in reactivity (i. e., the catalyst
surface slowly dries off). When the OH-groups are replaced at a rate which is fast enough,
the deactivation is reduced, or even completely stopped.
* The less deactivating Au/α-Fe2O3 (e. g., 061197) samples feature a much more amorphous
support structure after calcination, which probably contains more OH-groups from the
beginning. We may speculate that in addition the formation of by-products is more difficult
on an amorphous Fe2O3 support, which would explain the somewhat more pronounced
deactivation of the „aged“ catalyst in figure III-56.
In summary we have shown that the degree of deactivation during reaction over Au/α-Fe2O3
catalysts depends on a subtle balance between the hydration degree of the support and its
ability to form poisoning carbonate / carboxylate species. The highly reversible nature (at least

Au/Fe2O3 Deactivation behaviour
159
on the samples with an amorphous support structure) of the deactivation compared to other
catalysts (see, e. g., section III-2.2.1) is a further aspect, which makes Au/α-Fe2O3 a very
promising candidate for industrial applications, e. g., in vehicles for the purification of
hydrogen produced from the steam-reformation of methanol, which is used as a feed gas for
PEM fuel cells [14, 16].
Figure III-64: Surface model for the by-product distribution during reaction –
grey: carbonates / carboxylates; white: water / OH--rich decomposition zone.

Au/Fe2O3 Effects of CO2 and H2O on the activity / selectivity
160
3.5 Effects of CO2 and H2O on the activity / selectivity
Since the CO has a rather moderate adsorption energy on the Au surface, causing a low
steady-state coverage during reaction (see chapter III-3.2), in principle a lot of free metal
surface remains for the coadsorption of other molecules. Therefore, especially for gold
catalysts it is important to take a look at possible effects on the activity or selectivity when
changing from idealized to more realistic reformates, containing water and / or CO2.
As for Pt/γ-Al2O3 (see chapter 1.3) we will first take a short look at the influence of water on
the PROX reaction at 80°C and subsequently investigate CO2-containing mixtures by
combined DRIFTS and GC measurements.
3.5.1. Selectivity enhancement by water
There exists a vast number of studies, where the influence of coadded water on the CO
oxidation over supported gold catalysts has been investigated. But the results differ extremely
– even on equally prepared catalysts and using the same type of support. From the Haruta
group predominantly positive effects are reported over a large variety of support materials, e.
g., the activity of a Au/α-Fe2O3 catalyst (1 kPa CO in air; 30°C) increased from 95% to total
conversion upon addition of water (0.6-4 kPa) [234]. This was different from pure support
oxides, which were deactivated seriously by moisture [240]. Positive effects were also
claimed among others for Au/TiO2, Au/Co3O4 or Au/NiO [71, 240, 243, 248]. Sakurai et al.
demonstrated, that this observed reactivity enhancement cannot be the result of the water-gas
shift equilibrium (eq. III-1.7), since the shift activity over Au/TiO2 was negligible at such low
temperatures [308]. Likewise, Park et al. noticed a very slight but positive effect of 0.7 kPa
for their Au catalyst calcinated at 400°C, supported on TiO2, Fe2O3 or Al2O3 (1 kPa CO, λ =
10 or 20; T = 40 - 80°C). In contrast, Bollinger and Vannice claim an irreversible decrease of
activity by a factor three for Au/TiO2 after the addition 0.6 kPa H2O (4.8 kPa CO, λ = 2;
40°C) [253]. Similar observations were made by Grunwaldt et al., who noted a reduced
activity over Au/TiO2 (0.25 kPa CO, λ = 2; 30°C) with only 0.1 kPa H2O present in the
reaction atmosphere, but in their study the effect was easily reverted by simply switching back
to a dry mixture [268]. As far as the H2 oxidation reaction is concerned, which has to be
regarded for the PROX process, no relevant data could be found.

Au/Fe2O3 Effects of CO2 and H2O on the activity / selectivity
161
In our own measurements we tested the influence of water (1.3 kPa) on the selective CO
oxidation at the envisaged operation temperature of 80°C in idealized reformate (1 kPa CO, λ
= 2) for several Au/α-Fe2O3 catalysts. Surprisingly no uniform effect is observed on the
different samples. Whereas, e. g., on the freshly conditioned sample no. 061197 (See table III-
10) virtually no influence upon the activity was seen after switching to a wet reaction mixture,
the aged (several month after preparation) catalyst shows a slight increase of the reaction rate
(+35% compared to the initial rate; see figure III-65) along with a clearly stabilizing effect,
which was already discussed in the preceeding chapter. In contrast, on the sample no.
280598N even a slightly negative influence of water (rate -35% after admission of 1.3 kPa
water to the reaction mixture) was seen. As a comprehensive conclusion for our catalysts, it
may be claimed, that no matter if one sample reacts somewhat positive and another slightly
negative upon the addition of water, the absolute effect on the CO oxidation is generally rather
moderate (max. ±35%). Since for the sample no. 061197 we observed even a different water
influence on the freshly prepared and aged catalyst (which differ mainly in the crystallinity of
time [min]
10 100 1000 10000
S [%
]
60
70
80
90
rCO
[mol
CO/g
Au*
s]
2x10⁻³
3x10⁻³
4x10⁻³
5x10⁻³
6x10-37x10-38x10-3
Figure 65: Activity (upper window) and selectivity (lower window) during a
switch-experiment over Au/α-Fe2O3 at 80°C in idealized reformate
(1 kPa CO, λ = 2) - first dry mixture and after 1300 min. 1.3 kPa H2O added.
+ H2O

Au/Fe2O3 Effects of CO2 and H2O on the activity / selectivity
162
the support material; see section III-3.4.1), we can conjecture that smallest differences in the
microstructure of our catalysts, which are not obvious from table III-10, may already cause the
observed differences in behaviour.
But whereas the effect on the CO oxidation activity is quite small and not uniform, it is
striking that the admission of water to idealized reformate produces an increase in selectivity
of 15-20%, which is similar for all Au/α-Fe2O3 samples. As a consequence the calculated H2
oxidation rate must have been reduced by a factor 2-3 in the presence of water.
We also tried to repeat the experiment in figure III-65 in our DRIFTS cell. But upon the
admission of 1.3 kPa water to idealized reformate (1 kPa CO, λ = 2; 80°C) the COad band
dissolves in a very broad diffuse band at around 2100 cm-1 (FWHM ∼120 cm-1; not shown
here for brevity), which is very difficult to analyse. Therefore we cannot make any precise
statements on the CO coverage or band shifts in the presence of water. Boccuzzi et al.
observed a similar effect (increase of absorbance around 2000 cm-1, but here with an FWHM
of the same magnitude) after addition of 0.2 kPa water to 0.5 kPa CO over Au/ZnO and
speculated about an electronic effect arising from the icreased production of V0+ (monovalent
oxygen vacancy) levels on the oxide support [248]. A possible reaction pathway is, e. g.:
CO + H2O + O2- → HCO3- + H + V0
2+ → HCO3- + V0
+ + H+ (III-3.6)
In the DRIFTS spectra indeed a strong intensity increase of the bands assigned to bicarbonates
in the presence of water is observed, as was shown in the preceeding section for the sample
no. 201196 (which applies also to the other Au/α-Fe2O3 samples). This would be consistent
with this hypothesis.
During our activity screenings we also tested the influence of water on the performane of a
Au/TiO2 sample (no. 170899; for characterization see tables III-10). It is interesting to note,
that it fully paralleled the above described behaviour of the Au/α-Fe2O3 samples upon
addition of 1.3 kPa water to idealized reformate (1 kPa CO, λ = 2; 80°C) and showed an
increased selectivity by about 15% (not shown here for brevity).
There is much space left for speculation on the exact nature of the water effect, but it can be
definitely concluded that H2O exhibits a strong negative influence on the H2 oxidation
reaction, which leads to the observed selectivity enhancement on Au/α-Fe2O3 (and also on
Au/TiO2). The extremely one-sided nature of the effect (affecting only the H2 oxidation)
implies furthermore either a different reaction scheme for the CO and H2 oxidation or a

Au/Fe2O3 Effects of CO2 and H2O on the activity / selectivity
163
reaction on different surface sites. But due to the lack of reference studies on model systems,
which could provide a more basic insight into the H2 oxidation reaction over supported gold
catalysts, we cannot draw any further conclusions here.
3.5.2 Performance in CO2-containing mixtures
Before we investigate the temperature dependence we will first take a look at changes in the
long-term behaviour at our standard reaction conditions (1 kPa CO, λ = 2; 80°C) when
replacing the nitrogen of the idealized reformate by CO2.
In figure III-66 the activity (upper window) and selectivity (lower window) for the sample no.
061197, recorded over several hours under constant conditions, are compared. Quite clearly
the reactivity for the CO oxidation is reduced by a factor 2.5 in the presence of 25 kPa carbon
dioxide. A similar behaviour applies to all other Au/α-Fe2O3 catalysts, which were tested for
CO2-containing gases - in most cases the activity decrease is even stronger (e. g., factor 4 for
the 280598 sample). Consistently, Hoflund and coworkers noticed a reduced reactivity on
their Au/MnOx catalyst by a factor of two in the presence of 16 kPa CO2 (1 kPa CO, λ = 1;
55°C), but they did not give any explanations [230]. The deactivation during time on-stream is
rCO
[mol
CO/g
Au*
s]
10-3
10-2
t [min]
10 100 1000
S [%
]
40
50
60
Figure 66: Long-term evolution of activity (upper window) and selectivity
(lower window) over Au/α-Fe2O3 in idealized reformate ( ; 1 kPa CO,
λ = 2) and with 25% CO2 ( ) at 80°C.

Au/Fe2O3 Effects of CO2 and H2O on the activity / selectivity
164
also more pronounced in the CO2-rich mixture (-50% compared to -20% in the idealized
reformate; measured at similar absolute CO conversion values). With respect to chapter III-3.4
this may well be attributed to an enhanced by-product formation (carbonates / carboxylates)
on the support, which was assumed to severely inhibit the CO oxidation reaction.
A very striking effect is the change in selectivity, which decreases absolutely by 15-20% in the
presence of CO2 and even keeps a slightly negative tendency during time on-stream. Other
than in the preceeding section, where the water blocked almost exclusively the H2 oxidation,
now predominantly the CO oxidation rate is affected, whereas the conversion of hydrogen,
calculated via selectivity, is about equal in both gas mixtures (only -20% in the presence of
CO2). Hence the effect of CO2 on the selective CO oxidation over Au/α-Fe2O3 seems to be
just the opposite of the water effect described in the preceeding section.
In figure III-67 the temperature dependence (40 - 120°C) of the CO oxidation rate over Au/α-
Fe2O3 (no. 280598) in different gas mixtures is compared in the form of an Arrhenius
diagram. In idealized reformate (1 kPa CO, λ = 2) an activation energy of 29 ± 5 kJ/mol is
obtained, which correlates quite well to the 31 kJ/mol determined by Kahlich et al. under
identical conditions on our sample no. 201196 [26] or to the 35 kJ/mol given by Haruta et al.
for the CO oxidation without hydrogen over a coprecipitated Au/α-Fe2O3 catalyst (0.2 - 6 kPa
CO; 1 - 20 kPa O2) [71].
1/T [1/K] * 103
2.6 2.8 3.0 3.2
ln(r
CO)
[mol
CO/g
Au *
s]
-9
-8
-7
-6
-5
-4
29 kJ/mol
20 kJ/mol33 kJ/mol
Figure III-67: Arrhenius diagram for the turnover frequency of CO oxidation over
Au/α-Fe2O3 in idealized reformate ( ; 1 kPa CO, λ = 2), a mixture containing
25 kPa CO2 ( ), and in a realistic reformate ( ; 25 kPa CO2; 1.3 kPa H2O).

Au/Fe2O3 Effects of CO2 and H2O on the activity / selectivity
165
Upon replacing the nitrogen of the idealized reformate by CO2 (25 kPa), the reactivity is
decreased by a factor 3-4, but the activation energy remains almost constant (33 ± 5 kJ/mol).
When 1.3 kPa water is added to the CO2-containing mixture, the activity is partially restored,
an effect, which is more pronounced at lower temperatures. As a consequence the activation
energy is reduced to a lower value around 20 kJ/mol (± 5 kJ).
The selectivity (figure III-68a) parallels this behaviour: With 25 kPa CO2 the selectivity is
reduced by about 20% as a consequence of the reduced CO oxidation rate, but the
temperature-dependence found for idealized reformate is completely retained. Upon additional
admission of water to the reaction mixture, the selectivity behaviour changes and S decreases
now linearly with higher temperatures at a very steep slope. In window b (figure III-68) the H2
oxidation rates, calculated via selectivity, are displayed. Quite clearly, the changes are much
smaller than for the CO oxidation reaction. In the presence of 25 kPa CO2, the rate decreases
by only 20-40%. And, what is very surprising in view of the preceeding section, in the
additional presence of water, the H2 oxidation rate remains unchanged, hence the influence of
water in CO2-rich mixtures is to restore the CO oxidation reaction and not to suppress the
competing H2 + O2 reaction as was found for idealized reformate. As a consequence of the
minor changes for the rates of the H2 oxidation the resulting activation energy remains
constant at around 45 kJ (± 7 kJ).
To get a better insight into the mechanisms leading to the CO2-induced poisoning of the CO
oxidation over Au/α-Fe2O3, we gradually increased the CO2 content in an idealized reformate
T [°C]
40 80 120
S [%
]
0
20
40
60
80
1/T [1/K] * 103
2.6 2.8 3.0 3.2
ln(r
H2 )
[m
olH
2/gA
u*s]
-9
-8
-7
-6
-543 kJ/mol
47 kJ/mol
46 kJ/mol
a) b)
Figure III-68: (a) Selectivity and (b) Arrhenius diagram for the calculated turnover frequency
of H2 oxidation over Au/α-Fe2O3 in idealized reformate ( ; 1 kPa CO, λ = 2), a mixture
containing 25% CO2 ( ), and in a realistic reformate ( ; 25 kPa CO2; 1.3 kPa H2O).

Au/Fe2O3 Effects of CO2 and H2O on the activity / selectivity
166
(1 kPa CO, λ = 2, 9 kPa N2, up to 22 kPa CO2, balance H2) at 80°C (sample no. 280798). This
experiment was conducted in a newly designed DRIFTS cell (see appendix A), which allows
for a synchronous analysis of IR-bands and conversion data (GC) within very small
tolerances.
In figure III-69 the rates for CO and H2 oxidation (upper window) and the corresponding
selectivities (lower window) at increasing CO2-contents are displayed (each data point
acquired after 30 min.). The selectivity decreases strongly with increasing CO2 content as a
direct consequence of the more pronounced reduction of the CO oxidation rate (factor 4-5)
compared to the H2 oxidation (only factor 2), ending up at only 50% for a CO2 content similar
to real reformates. Upon addition of 1.3 kPa water to this reaction mixture (black symbols)
again exclusively the CO oxidation rate is almost restored to its initial value, wheras the
competing reaction remains totally unaffected, which leads to a strongly enhanced selectivity
of ∼70%.
In the IR data obtained simultaneously, shown in figure III-70, a significant blue-shift of the
linearly bound COad-band (from 2110.5 cm-1 to 2114.1 cm-1) at higher CO2-contents is seen,
accompanied by an increase in the integrated intensity of 25% (Therefore the shift cannot just
Figure III-69: CO2 dependence of the CO ( ) and H2 oxidation activity ( ; upper
window) and of the selectivity ( ;lower window) over Au/α-Fe2O3 in CO2-containing
reformate (1 kPa CO, λ = 2) at 80°C. black symbols: after addition of 1.3 kPa H2O.
r [m
ol/g
Au*
s]
10-3
10-2
p(CO2) [kPa]
0.1 1 10
S [%
]
50
60
70

Au/Fe2O3 Effects of CO2 and H2O on the activity / selectivity
167
be the result of a reduced COad coverage). These effects strongly suggest the coadsorption of
CO2 on the gold particles. CO2 acts as an electron acceptor, reducing the electron density in
the nearby Au-atoms, which should induce such a blue-shift (similar effects for band position
and intensity were also observed upon admission of oxygen to a CO / N2 mixture; see chapter
3.3.2). This coadsorbed CO2 may either directly block the sites for CO oxidation or alter the
reactivity by its electronic influence, characterized by the blue-shift for the COad-band. At
higher partial pressures of CO2 a second band evolves in the spectral region for linearly bound
COad at around 2067 cm-1. It had been neither observed in our own measurements without
CO2 nor reported in any literature study dealing with IR spectroscopy during CO oxidation in
CO2-free mixtures over Au catalysts, therefore it is clearly bound to the presence of
coadsorbed CO2. But the exact nature of this new linearly bound COad species is still
unknown.
The coadsorption of CO2 on Au was already suggested in a study from Bollinger and Vannice
on a Au/TiO2 catalyst, where they noticed shoulders at 2320 and 2378 cm-1 for a central band
at 2342 cm-1 (correlated with adsorbed CO2 on TiO2), which they assigned to adsorbed CO2
ν(C
Oad
) [c
m-1
]
2109
2112
2115
p(CO2) [kPa]
0.1 1 10
inte
gr. i
nten
s. [
a.u.
]
8
14
16
Figure III-70: CO2 dependence of the DRIFTS COad-signal on Au/α-Fe2O3 in CO2-containing
reformate: a) band position ( ), b) integrated IR intensitiy ( ); c) DRIFTS spectra of the
COad-region (CO2 content increases upward); inset: by-products seen in the DRIFTS spectra;
black symbols / line: after addition of 1.3 kPa H2O.
a)
ν [cm-1]
20002100
inte
grat
ed in
tens
ity [
KM
-uni
ts]
0.005
0.010
0.015
0.020
125015001750
[KM
-uni
ts]
[cm-1]
0.05
c)
b)

Au/Fe2O3 Effects of CO2 and H2O on the activity / selectivity
168
on the gold particles [253]. They also mention that the CO2 inhibits the CO oxidation activity
and that this effect is reversible, which fits excellently to the mechanistic picture, developed in
this section. This model, including coadsorption of CO2, is also likely in view of studies by
the Christmann group on Au(110), where an activation energy for desorption of ∼27 kJ/mol
was evaluated for the oxygen-precovered surface, which is not too far away from the Ed* of
CO (40 kJ/mol) [302]. Therefore, at such high partial pressures indeed a significant surface
coverage is expected.
It is interesting to note, that Schwank reported a reduced activity for the reaction
*CO + CO2 ↔ *CO2 + CO (III-3.7)
over supported Au catalysts with an increased p(CO2)/p(CO) ratio, which equally underlines,
that CO2 acts as a poison for the CO adsorption / oxidation [221].
An additional negative contribution for the performance may arise from the adsorption of CO2
on the support, especially at Au-Fe2O3-interface sites, possibly as CO2--species, which would
inhibit the oxygen supply from the support, as was proposed by Fukushima et al., who
observed a negative influence of CO2 on the CO oxidation over a Au/MgO catalyst ([260]; see
also preceeding chapter). But such an effect would be expected to affect both, the CO and H2
oxidation rate, in the same way.
Upon the addition of 1.3 kPa water the COad-band shifts back to the orignal position (figure
III-70), but the integrated intensity is strongly decreased and the band becomes somewhat
broader. A possible explanation for the reverted band shift is, that adsorbed CO2 is removed
from the Au surface in the presence of water. Indeed in the inset window in figure III-70,
which shows the spectral region below 1700 cm-1, a strong increase of bands, assigned to by-
products on the support, is noted. Especially the bands at ∼1600 and 1450 cm-1, which could
be attributed to bicarbonate species, grow strongly (see also section 3.4.2). A possible reaction
pathway on a hydrated surface would be:
CO2ad + OH- → HCO3- (III-3.8)
Other than in the CO2-free mixture (idealized reformate), this time the H2 oxidation is
absolutely not affected by the presence of water. But on the one hand, the rate has already
been reduced somewhat by the presence of CO2. Moreover it may be speculated, if an effect
which creates oxygen vacancies on the support, as was proposed by Boccuzzi et al. for the

Au/Fe2O3 Effects of CO2 and H2O on the activity / selectivity
169
presence of water ([257]; eq. III-3.6) could be inhibited or compensated in the presence of
CO2.
As a short summary of this chapter it can be recorded, that water and CO2 exhibit opposite
effects on the CO oxidation. H2O blocks the H2 + O2 reaction (in a CO2-free mixture), CO2
predominatly reduces the CO oxidation activity. Due to the DRIFTS results the latter is
attributed to the coadsorption of CO2 on the gold particles. Additional adsorption on the
support may inhibit the oxygen supply and further contribute to the reduced performance. The
presence of water in a CO2-containing mixture releases the inhibition of the CO oxidation.
Both effects seem to be more or less additive and, as a consequence, compensate each other.
The one-sided nature of the water- and CO2-effects on either the CO or H2 oxidation strongly
suggest different reaction sites and / or mechanisms for both reactions over Au/α-Fe2O3.

Au/Fe2O3 Reverse water-gas shift over Au/α-Fe2O3
170
3.6 Reverse water-gas shift over Au/αα-Fe2O3
Since supported gold catalysts are not only active for the low-temperature CO oxidation, but
also for a vast variety of other catalytic reactions, e. g., partial oxidation of hydrocarbons,
hydrogenation of CO and unsaturated hydrocarbons or reduction of nitrogen oxides [239,
240], recently some groups examined the water-gas shift reaction over such systems and
reported an outstanding activity, almost similar to the commercially employed Cu/ZnO
catalyst [70, 308, 309].
In this section we will study the reverse water-gas shift reaction
CO2 + H2 → CO + H2O (III-3.9)
analogous to the investigations on the above described catalyst systems (see chapters III-1.3.2
and III-2.2.3). Measurements were performed on the sample no. 061197 (for characterization
see tables III-10), which turned out to be our most active gold catalyst for CO oxidation. The
sample was diluted with α-Al2O3, similar to the PROX measurements. The reactant gas
mixture contained ∼74 kPa, 1.3 kPa H2O and ∼25 kPa CO2. Data points were taken after 30
min. of reaction before increasing the temperature to the next setpoint.
In figure III-71 the reverse water-gas shift activity (Arrhenius diagram) of Au/α-Fe2O3 is
compared to that of Pt/γ-Al2O3. Obviously both catalysts exhibit approximately the same
activity in the temperature interval investigated between 150 and 250°C. The TOF for Au/α-
Fe2O3 at 150°C is 8.3*10-4 s-1 (corresponding to a rate of 2.1*10-6 molCO/gAu*s), which is in
excellent agreement with the activity of ca. 1*10-3 s-1 (2*10-6 molCO/gAu*s) reported by
Sakurai et al. for Au/Fe2O3 in a mixture of 67 kPa H2, 23 kPa CO2, balance Ar [308]. When
extrapolated to the envisaged temperature level for the selective CO oxdiation of 80°C, a TOF
of 1.2*10-5 s-1 (2.9*10-8 molCO/gAu*s) is calculated. In earlier measurements by Kahlich et al.
a similar order of magnitude for the reverse water-gas shift (< 3*10-8 molCO/gAu*s) was
estimated for the sample no. 201196 at 80°C, but the absolute conversion was too small, to
determine more precise values [26]. Since the activity for the selective CO oxidation at 80°C
is comparable to that of Pt/γ-Al2O3 at 200°C, but the rate for the WGS is significantly lower
on the gold catalyst due to the reduced temperature level, the resulting turndown ratio for the
load following behaviour in a PROX stage is theoretically improved by almost three orders of
magnitude. Hence the Au catalyst should be a suitable catalyst for a final PROX stage in the
two stage concept proposed by Kahlich et al. [12]. The activation energy for the reverse
water-gas shift is 76 kJ/mol, somewhat higher than on the platinum catalysts.

Au/Fe2O3 Reverse water-gas shift over Au/α-Fe2O3
171
It should be noted that at temperatures above 250°C the measured rates were lower as would
be expected from a simple extrapolation in the Arrhenius presentation. This is obviously
caused by a progressing reduction of the support to Fe0 [310] as was also confirmed in
subsequent post-mortem XPS-measurements.
1/T [1/K] * 103
1.9 2.0 2.1 2.2 2.3 2.4
ln(T
OF)
[s-1
]
-8
-7
-6
-5
-4
-3
-2
62 kJ/mol
76 kJ/mol
Figure III-71: Arrhenius diagram for the turnover frequency of the reverse
water-gas shift reaction on Au/α-Fe2O3 ( ) and Pt/γ-Al2O3 ( ) in a mixture
of 74 kPa H2, 1.3 kPa H2O, rest CO2.

Au/Fe2O3 Other support material
172
3.7 Other support materials
In chapter III-3.1 we have seen, that the reactivity of gold clusters is significantly enhanced
when they are supported on a metal oxide, which is able to supply large amounts of oxygen
for the CO oxidation reaction, such as Fe2O3. In order to evaluate, whether they are equally
suitable, we have tested several other support materials, which have been reported to yield
highly active gold catalysts, namely Mg(OH)2 [269, 303], MnOx [31, 224, 311], NiOx [234,
265] and TiO2 [237, 240, 253, 258, 312]. Moreover, we have prepared gold catalysts on metal
oxides, which are well known for exhibiting such oxygen storage / adsorption properties when
they are combined with platinum metals, e. g., SnO2 [176-178] or CeO2 [313-315]. The tested
catalysts are listed in table III-12-A (preparation / conditioning methods, Au loading & BET
surface).
Figure III-72 provides a graphical illustration for the activity / selectivity tests of the various
samples for selective CO oxidation in idealized reformate under our standard conditions (1
kPa CO, λ = 2; 80°C). Additionally, the activity and selectivity as well as the calculated
turnover frequencies are listed in table III-12-B. Quite clearly, the Au/α-Fe2O3 samples (grey
circles – no. 061197, which was the most active, and no. 280598, an average sample, are
displayed; see table III-10-B) show a superior activity and a rather high selectivity, when
compared to the other support materials. Only Au/TiO2 (white diamonds) comes close,
catalyst no. prep. (T [°C]/pH) 1) Au:Me[at-%]
calcination at BET 2)
[m2/g]
Au/α-Fe2O3 - DP (80+60/7.8-8.1+8-8.4) ca. 1 400°C - 30 min. 54 3)
Au/NiOx 190499 CP (60/8.5) 1.7 400°C - 30 min. 67
Au/TiO2 170899 IMP (60/5-5.5) 1.7 400°C - 30 min. 56
Au/CeOx 130897 CP (80/6.5-7.2) 2.5 250°C - 30 min. 91
Au/CeOx*VOx 170699 CP (60/5.7) 3.7 4) 400°C - 30 min.
Au/MnOx 200298 DP (60/7.0+4.5-5) 5) 1.0 400°C - 30 min.
Au/SnOx 160699D4 DP (60/5-5.3) 2.1 400°C - 30 min. 82
Au/Mg(OH)2 200499 CP (60/8.5) 1.3 300°C - 30 min. 74
Au/MgO 200499 CP (60/8.5) 1.3 400°C - 30 min. 105
Au/γ-Al2O3 180799 IMP (60/7.5-8) 1.7 400°C - 30 min. 107
1) DP = deposition-precipitation, CP = coprecipitation, IMP = impregnation 2) after calcination 3) statistical average of DP-catalysts in table III-10 4) wt-% 5) from NaMnO4
Table III-12-A: Au catalysts prepared with different support materials (prepared at the
ZSW Ulm): preparation & conditioning.

Au/Fe2O3 Other support material
173
especially after a few hours on stream, due to its superior long-term stability (only -10%
within 1000 min.), but its selectivity is somewhat lower, probably due to the active
participation of the titania in the H2 + O2 reaction via
2 Ti4+ + H2 ↔ 2 Ti3+ + 2 H+ (III-3.10)
2 Ti3+ + ½ O2 ↔ 2 Ti4+ + O2- (III-3.11),
similar to what has been observed for Pt/TiO2 (see chapter III-1.3.1). A similar redox
mechanism probably happens on the vanadium oxide component of the Au/CeOx*VOx, but
due to its low activity it is not of interest, anyway. NiOx also seems to be an interesting
support material, increasing the reactivity of Au, when compared, e. g., to Al2O3, which is not
known to exhibit any oxygen storage properties, but is not as effective as Fe2O3 or TiO2. The
enhanced activity of gold supported on these three metal oxides (Fe2O3, TiO2 and NiOx) as
rCO
[mol
CO/g
Au*
s]
10-4
10-3
10-2
t [min]
10 100 1000
S [%
]
40
50
60
70
8010-5
10-4
10-3
10-2
10 100 1000
203040506070
Figure III-72: Activity (upper window) and selectivity (lower window) of several
Au catalysts in idealized reformate (1 kPa CO, λ = 2; 80°C): Au/α-Fe2O3
(no. 061197), Au/α-Fe2O3 (no. 280598), Au/NiOx, Au/Mg(OH)2, Au/MgO,
Au/TiO2, Au/γ-Al2O3, Au/SnO2, Au/CeOx*VOx, Au/MnOx, Au/CeO2.

cata
lyst
prep
arat
ion
1)A
u:M
e[a
t-%
]d A
u
[nm
]p(
CO
)[k
Pa]
p(O
2)[k
Pa]
r (*
104 )
[mol
CO
/gA
u*s]
TO
F 2)
[s-1
]S [%
]E
a
[kJ/ m
ol]
ref.
Au/
FeO
xD
P2.
03.
60.
2 -
63)
1 -
20 3)
130.
7-
35[7
1]
IMP
4)1.
72.
91
2011
5)0.
5-
15[2
94]
Au/
NiO
xC
P2.
00.
510
0.4
- 1.
2 5,
6)-
[265
]
Au/
TiO
xIM
P7)0.
433
4.9
4.9
8.1
4.5
8)-
29[2
53]
DP
1.3
2.9
120
331.
3-
27[2
33]
IMP
4)1.
83
120
20 5,
9)0.
8[2
58, 2
66]
IMP
4)1.
230
120
2.0
0.7
-12
[258
, 267
]
IMP
10)
0.8
10.
60.
87-
32[3
16]
Au/
MnO
xC
P2.
02.
81
10.
34 5)
0.02
8)>
45
11)
[31]
CP
101
0.5
0.09
- 0
.13
5,12
)-
[224
, 311
]
Au/
Mg(
OH
) 2D
P1.
50.
6 -
1.2
120
> 5
1 13
)>
1.2
-[2
69]
Au/
Al 2
O3
DP
0.2
2.4
120
130.
5-
32[2
70]
1) D
P =
dep
osit
ion-
prec
ipit
atio
n, C
P =
cop
reci
pita
tion
, IM
P =
impr
egna
tion
, CV
D =
che
mic
al v
apor
dep
osit
ion
2) s
pher
ical
par
ticle
s as
sum
ed f
or c
alcu
latio
n3)
rep
orte
d re
acti
on o
rder
s w
ere
zero
4)
with
pho
sphi
ne-s
tabi
lized
Au
com
plex
5) m
easu
red
at h
igh
conv
ersi
on6)
ext
rapo
late
d fr
om r
=1.
5*10
-5 m
ol/g
Au*
s at
20°
C w
ith 1
5 <
Ea
< 3
0 kJ
/mol
7) p
re-r
educ
ed a
t 200
°C in
H2
afte
r ca
lcin
atio
n
8) c
a. 2
.3 s
-1, w
hen
calc
ulat
ed f
or 1
kPa
CO
and
λ =
2 w
ith
the
repo
rted
rea
ctio
n or
ders
of
0.5
(CO
) an
d 0.
08 (
O2)
at 3
0°C
9) e
xtra
pola
ted
from
r =
9.6
*10-3
mol
/gA
u*s
at 2
8°C
with
Ea =
12
kJ/m
ol10
) pr
e-re
duce
d at
500
°C11
) re
actio
n m
ixtu
re c
onta
ins
98 k
Pa H
2
12)
extr
apol
ated
fro
m r
= 6
*10-6
mol
/gA
u*s
at 5
5°C
with
15
< E
a < 3
0 kJ
/mol
13)
extr
apol
ated
fro
m r
= 1
.2*1
0-4 m
ol/g
Au*
s at
-70
°C w
ith E
a > 1
5
Tab
le I
II-1
3: K
inet
ic d
ata
calc
ulat
ed f
rom
pre
viou
s st
udie
s (e
xtra
pola
ted
to o
ur s
tand
ard
tem
pera
ture
of
80°C
) fo
r go
ld c
atal
ysts
sup
port
ed o
n
diff
eren
t sup
port
mat
eria
ls.

Au/Fe2O3 Other support material
175
well as the measured turnover frequencies are in excellent agreement, when compared to the
results of several previous studies – in most cases for the CO oxidation in a pure nitrogen
background – , which are summarized in table III-13. Moreover, Au/NiOx exhibits also a
satisfying long-term stability (-23% within 1000 min.) and a selectivity similar to Au/α-Fe2O3.
With Mg(OH)2 and γ-Al2O3, which should be „inert“ support materials (especially the latter),
nevertheless quite active catalysts are produced, exhibiting turnover frequencies only one
order of magnitude lower than with the reducible metal oxides. But in contrast, their activity
strongly depends on the size of the gold clusters and is only high for very small particles,
which probably causes the lower TOFs on our samples when compared to the literature values
in table III-13. A similar trend was recognized by Okumura et al., who showed that even for
Au/SiO2 high turnover frequencies are obtained, if only the gold clusters are prepared small
enough, which was achieved by a CVD method [270]. As was already discussed in chapter III-
3.1.2 the dissociative oxygen adsorption proceeds probably directly on the Au clusters for
these systems and decreases rapidly with increasing particle size, which in turn causes a
reduced activity. Consequently „Au/MgO“, i. e., the Au/Mg(OH)2 catalysts conditioned at
catalyst dSupport1)
[nm]dAu
1)
[nm]r *104 2)
[mol/gAu*s]TOF 3)
[s-1]S
[%]other
Au/α-Fe2O3 16 - 17 2.6 - 7 39 1.3 - 3 65 4) see tables III-10
Au/NiOx 9.6 4.3 20 1.2 56 XPS: NiIII afterconditioning
Au/TiO2 21 5) 4.6 33 2.0 48 TiO2: Degussa P25
Au/CeOx 4.0 6) 11.0 6) 0.4 7) 0.02 ∼60
Au/CeOx-VOx 0.28
Au/MnOx amorphous < 4 1.4 8) 0.04 - 0.09 ∼70 Mn2O3 afterconditioning
Au/SnOx 9.0 8) 14.8 8) 8.2 0.25 - 0.5 43
Au/Mg(OH)2 13 - 21 < 4 14 0.5 - 0.9 67
Au/MgO 5.3 6.0 3.8 0.3 64
Au/γ-Al2O3 5 - 11 4.4 6.3 0.35 59 γ-Al2O3: Degussano. 213
1) after calcination (XRD or TEM) 2) after 2 h 3) spherical particles assumed for calculation 4) statistical average of DP-catalysts in table III-10 5) 92% anatase 6) after calcination at 300°C (2 h) 6) after 50 min. 7) after 30 min. 8) after calcination at 800°
Table III-12-B: Au catalysts prepared with different support materials (ZSW Ulm):
characterization, activity & selectivity.

Au/Fe2O3 Other support material
176
higher temperatures, shows an even lower rate and TOF, which is caused by the enhanced
sintering of the gold clusters during calcination. A major drawback to the Au/magnesia
catalysts is their very rapid deactivation (-80-90% within 1000 min.), probably a consequence
of the fast formation of a closed MgCO3 surface layer (monitored by TGA), which blocks the
adsorption of further reactants and was also observed in XRD after 3 days in reformate feed
gas [274].
For Au/MnOx, which was proposed for the selective CO oxdiation by Torres Sanches et al.
[31], a rather low reactivity was noticed, but the absolute values are again in good agreement
with the literature values. A possible explanation for the poor performance could be the strong
tendency for the formation of bulk MnCO3, which would occur from the produced CO2.
The catalyst samples, supported on CeO2, SnO2 and on a mixed oxide CeO2*VO2, yielded
dissappointingly low TOFs, although a small enhancing effect for the SnO2 is visible, when it
is compared to Au/γ-Al2O3. But if we consider the support particle diameters obtained by
XRD, it is obvious, that the gold particles are considerably larger than the metal oxide
particles, which counteracts the formation of a large and reactive metal-support interface.
Moreover, the selectivity of Au/SnO2 is quite low with only 44%, which is also more similar
to unsupported gold [234] and therefore underlines the very imperfect interface formation on
this sample.
In summary we may conclude, that Fe2O3 and TiO2 supports yield the most active catalysts
due to their oxygen adsorption properties. Au/α-Fe2O3 owns the better selectivity,
nevertheless Au/TiO2 is interesting, since it exhibits a better long-term stability and, seen from
the engineeric point of view, may allow for a much more simple preparation of formed
catalysts (e. g., pellets). Gold catalysts on non-reducible oxides (e. g., Mg(OH)2, Al2O3) are
only active, when the Au is in a highly dispersed state, but none of our samples could match
the superior activity of the Au/α-Fe2O3 or Au/TiO2 samples. Au/CeO2 or Au/SnOx may be
promising new candidates, but the preparation procedure needs to be improved, so that larger
support particles are obtained after conditioning (e. g., by an impregnation method). These
samples are currently produced, and the results will be published later.

Au/Fe2O3 Summary on gold catalysts
177
3.8. Summary on gold catalysts
On the molecular level of the CO oxidation on supported gold catalyst we have seen that the
reaction proceeds between COad and Oad adsorbed on the metal component. Whereas CO
adsorbs directly on the gold, on active support materials (FeOx, NiOx, TiO2) the oxygen is
supplied via the support, where it adsorbs in the form of molecular species and dissociates
subsequently at the Au-MeOx interface. This mechanism explains the observed independence
of the turnover frequency from the gold particle size for Au/α-Fe2O3, but involves also a
strong dependence on the interface structure. In general, those samples, which were prepared
predominantly from a ferrihydrite precursor, yield the smallest Au particles after conditioning.
The best activity is achieved after calcination at 300-400°C, when the gold is present as Au0.
Na-residuals from the preparation step seem to have only a small direct influence on the
turnover frequency, but induce sintering of the gold particles during calcination.
The CO coverage at our reaction conditions in idealized reformate (up to 1 kPa CO, λ = 2; 20
- 120°C) is far from saturation. Based on a comparison of our DRIFTS results with published
values it is estimated to be ≤ 0.2 ML. The low surface coverage explains the strong
dependence of θCO upon the partial CO pressure, corresponding to the middle, steep regime of
a Langmuir adsorption isotherme, as well as the observed decoupling of the H2 and CO
oxidation reaction. As a consequence, this leads to the observed decrease of selectivity with
decreasing pCO. It also rationalizes the temperature dependence for the CO reaction order,
which was noticed in our kinetic investigations.
The Au/α-Fe2O3 catalysts slowly loose activity during storage („off-line deactivation“),
caused by a slow, irreversible crystallization process of the initially amorphous support, and
during the PROX reaction („on-line deactivation“). The latter shows large gradual differences
on the various samples, being less severe and rather reversible on those catalysts with a very
amorphous support structure. The accumulation of carbonates / carboxylates during time on-
stream on the support and at the interface is believed to be responsible for the slow decrease
of reactivity. The deactivation is mitigated in the presence of water, which decomposes the
poisonous by-products via formation of less stable bicarbonate species, resulting in a reduced
decrease of conversion rates at integral flow conditions.
When proceeding to more realistic reformates, we note, that the presence of water strongly
enhances the selectivity in idealized reformate (+ 15-20% at 1.3 kPa H2O) by suppressing the
H2 oxidation reaction, but the exact nature of this effect could not be elucidated. CO2 exhibits

Au/Fe2O3 Summary on gold catalysts
178
the opposite effect, a strong poisoning of the CO oxidation, leading to a reduced selectivity by
∼20% (at 25 kPa CO2), which is suspected to be caused by the coadsorption of CO2 on the
gold or at interfacial sites. As a result of the enhanced carbonate / carboxylate formation in the
presence of CO2, also the „on-line“ deactivation intensifies. Fortunately, the presence of H2O
compensates the negative effects arising from the presence of CO2, which in the end should
results in an excellent performance of Au/α-Fe2O3 catalysts in real mixtures from steam
reformed methanol.
The low operation temperature level (ca. 80°C) along with a slightly larger activation energy
for the reverse water-gas shift reaction leads to a drastically improved turndown ratio for the
load following behaviour of the PROX stage in mobile applications, when compared to that of
standard platinum metal catalysts.
When comparing different gold / metal oxide systems, the activity of Au/TiO2 comes close to
the performance of our Au/α-Fe2O3 catalyst. The slectivity is slightly lower, but the long-term
stability is superior. Other combinations, like, e. g., Au/SnO2, may also be active, but the
preparation still needs to be improved, in order to optimized the metal-support interface.
In summary, Au/α-Fe2O3 catalysts should be excellently suitable for the envisaged PROX
application due to their high reactivity, relative „inertness“ towards mixtures containing water
and CO2 and their large PROX / shift ratio at the envisaged operation temperature level of
around 80°C.
We believe, that the performance of todays „simple“ supported gold system is near the
maximum achievable level, since the gold particle size is already close to the lower limit with
∼2.5 nm. With other support material (e. g., TiO2) the industrial production of formed catalyst
samples may be facilitated, but in the end these oxides will barely exceed the enhancing
properties of the iron oxide, since diffusion of oxygen is not the rate limiting step on these
catalysts. Improved catalysts may be gained from modifying the metal component by alloying
with other metals, which would increase the adsorption energy and therefore also the resulting
COad coverage and hence lead to a better selectivity and perhaps also higher reactivity (at least
at low CO concentrations). An interesting candidate, e. g., could be gold-copper alloys, since
the second component is quite cheap and the alloy formation probably would decrease the
nobility of the gold but increase it for the copper.

Summary & future perspectives
179
IV. SUMMARY & FUTURE PERSPECTIVES
In the previous chapters we have studied three different catalyst systems for the selective CO
oxidation in H2-rich gas: pure Pt catalysts (especially Pt/γ-Al2O3), a platinum catalyst
modified by alloy formation with another metal (Pt3Sn/Vulcan) and gold catalysts (in
particular Au/Fe2O3). Compared to standard Pt catalysts which require higher temperatures
above 150°C to operate at reasonable rates, the latter low temperature PROX catalysts are
characterized by a combination of facile oxygen adsorption and largely inhibited hydrogen
adsorption under reaction conditions. This can be achieved either by an active material that is
inert for both, hydrogen and oxygen adsorption, but allows for CO adsorption, and where oxy-
gen adsorption proceeds on the support material (i. e., Au/Fe2O3), or by a material that would
be active for adsorption of all reaction partners, but which is blocked for hydrogen and
consequently also for oxygen adsorption by a CO adlayer. In the latter case oxygen adsorption,
but not hydrogen adsorption, must be possible on the support material or on oxidic islands on
the metal particles themselves (Pt3Sn/Vulcan). In all of these cases the oxidation reactions will
take part at the interface between the different areas, or via a spill-over process. In all of these
cases the reaction is not limited by CO desorption, which is the limiting factor for the PROX
reaction on Pt catalysts at temperatures below 150°C.
For all three catalyst systems, the selectivity is a function of the steady-state CO coverage
under operation conditions. On Pt/γ-Al2O3 the saturation coverage, which is maintained over a
large range of operation conditions, leads to a rather constant selectivity by the blocking of the
hydrogen adsorption. On the low-temperature catalysts the selectivity is also very high due to
the high activation barrier for dissociative hydrogen adsorption. However, on the latter it
decreases very fast at decreasing CO partial pressures or increasing temperatures as a result of
the reduced CO surface coverage.
All investigated systems show a more or less severe tendency for deactivation during time on-
stream, but the reasons and therefore the degree of reversibility are very different. The CO
self-poisoning on Pt as well as the blocking by surface carbonate / carboxylate species on the
recently prepared Au/Fe2O3 catalysts are easily relieved, whereas the irreversible deactivation
on Pt3Sn/Vulcan, which is probably the result of a slow segregation effect, constitutes a major
drawback for its technical application.

Summary & future perspectives
180
Upon changing the reaction atmosphere from a simplified composition without CO2 and H2O,
which was used in most of our kinetic experiments (e. g., [7, 12, 26]), to more realistic
simulations of a real methanol reformer gas, we found that the platinum-based systems suffer
especially from large H2O-contents, which decrease the selectivity significantly. Au/α-Fe2O3
is more sensitive to CO2, but this effect is almost outweighted by the presence of water,
therefore this catalyst seems to be the best suited system for an application in real reformate.
Nevertheless, the effects of H2O and CO2 are of such a moderate extent, that the approach via
idealized reformate indeed seems to provide a reasonable basis for quite accurate reactor
calculations.
Within this work we have introduced two low-temperature alternatives for the PROX reaction,
which should be both capable of removing completely the CO impurities from a methanol
reformer feed gas stream. We have explained their high activity as well as the selectivity
behaviour. On basis of this mechanistic understanding new future catalyst systems may be
designed, which are even more effective. One may think of platinum alloys containing other
elements (e. g., Co, Fe, Ni or Ti), which may lead to the formation of more stable bimetallic
particles or of alloyed gold catalysts (e. g., Au-Ti or Au-Cu), where the extremely noble
character of the gold is mitigated, which would increase the steady-state CO coverage.

References
181
V. REFERENCES
[1] T. Engel and G. Ertl, Adv. Catal., 28 (1979) 1
[2] J. A. Rodriguez and D. W. Goodman, Surf. Sci. Rep., 14 (1991) 1
[3] B. E. Nieuwenhuys in „Elementary Reaction Steps in Heterogeneous Catalysis“, R.
W. Joyner, R. A. van Santen, eds., Kluwer Academic Publishers, Dodrecht (1993) 155
[4] S. H. Oh and R. M. Sinkevitch, J. Catal., 142 (1993) 254
[5] J. R. Stetter and K. F. Blurton, Ind. Eng. Chem. Prod. Res. Dev., 19 (1980) 214
[6] M. Watanabe, H. Uchida, H. Igarashi, and M. Suzuki, Chem. Lett, (1995) 21
[7] M. J. Kahlich, H. A. Gasteiger, and R. J. Behm, J. Catal., 171 (1997) 93
[8] E. Riedel, „Anorganische Chemie“, 2nd edition, de Gruyter, Berlin (1990)
[9] M. J. Kahlich, Diploma thesis, University of Ulm (1996)
[10] E. G. Pow, M. Talaba, L. McNeilly, D. S. Watkins, and D. A. Lines, US Patent,
5,316,747 (issued 9. 10. 1994)
[11] R. F. Buswell, R. Cohen, L. McNeilly, and D. S. Watkins, US Patent, 5,750,076
(issued 12. 5. 1999)
[12] M. J. Kahlich, H. A. Gasteiger, and R. J. Behm, J. New Mat. Electrochem. Systems, 1
(1998) 39
[13] Daimler Benz AG, Brochure „Necar II - Fahren ohne Emissionen“ (1996)
[14] R. A. Lemons, J. Power Sources, 29 (1990) 251
[15] J. Schulz, Spektrum der Wissenschaft, April (1993)
[16] S. Kawatsu, J. Power Sources, 71 (1998) 150
[17] D. P. Wilkinson and D. Thompsett in "New Materials for Fuel Cell and Modern
Battery Systems II", 6.-10.07.97, Montreal, Savadogo, O. and Roberge, P. R., Eds.,
Ecole Polytechnique de Montreal, (1997) 266
[18] J. C. Amphlett, R. F. Mann, and B. A. Pappley, Int. J. Hydrogen Energy, 21 (1996)
673
[19] „CRC Handbook of Chemistry and Physics“, 66th edition, Weast, R. C., ed., CRC
Press, Boca Raton (1985)

References
182
[20] S. Gottesfeld, US Patent, 4,910,099 (issued 20. 3. 1990)
[21] G. J. K. Acres, J. C. Frost, G. A. Hards, R. J. Potter, T. R. Ralph, D. Thompsett, G. T.
Burstein, and G. J. Hutchings, Catal. Today, 38 (1997) 393
[22] K. Sekizawa, S.-I. Yano, K. Eguchi, and H. Arai, Appl. Catal. A: General, 169 (1998)
291
[23] T. R. Ralph, Plat. Met. Rev., 41 (1997) 102
[24] G. Colsman, Berichte des FZ Jülich, 3127 (1995)
[25] M. J. Kahlich, Dissertation, University of Ulm (2000)
[26] M. J. Kahlich, H. A. Gasteiger, and R. J. Behm, J. Catal., 182 (1999) 430
[27] M. L. Brown, A. W. Green, G. Cohn, and H. C. Andersen, Ind. Eng. Chem., 52 (1960)
841
[28] C. Plog, W. Maunz, T. Stengel, and R. Andorf, EU Patent, 0,650,923 A1 (issued 3. 5.
1995)
[29] T. Hara, K. Kato, and N. Takada, US Patent, 5,648,182 (issued 15. 7. 1997)
[30] M. Sato and K. Shiraishi, US Patent, 5,658,681 (issued 19. 8. 1997)
[31] R. M. Torres Sanchez, A. Ueda, K. Tanaka, and M. Haruta, J. Catal., 168 (1996) 125
[32] M. M. Schubert, Diploma thesis, University of Ulm (1996)
[33] O. Levenspiel, „Chemical Reaction Engineering“, John Wiley & Sons, New York
(1972)
[34] M. J. Kappers and J. H. van der Maas, Catal. Lett., 10 (1991) 365
[35] R. Queau, D. Labroue, and R. Poilblanc, J. Catal., 69 (1981) 249
[36] G. Blyholder, J. Phys. Chem, 68 (1964) 2772
[37] R. M. Hammaker, S. A. Francis, and R. R. Risches, Spectrochim. Acta, 21 (1965)
1295
[38] A. Crossley and D. A. King, Surf. Sci., 68 (1977) 528
[39] M. Primet, J. Catal., 88 (1984) 273
[40] M. J. Kappers, Dissertation, University of Utrecht (1993)

References
183
[41] A. Drochner, M. Fehlings, K. Krauß, and H. Vogel, GIT Labor-Fachzeitschrift, 5/99
(1999) 476
[42] J. J. Benitez, I. Carrizosa, and J. A. Odriozola, Appl. Spec., 47 (1993) 1761
[43] J.-D. Grunwaldt, M. Maciejewski, O. S. Becker, P. Fabrizioli, and A. Baiker, J. Catal.,
186 (1999) 458
[44] J. J. Benitez, I. Carrizosa, and J. A. Odriozola, Appl. Surf. Sci., 84 (1995) 391
[45] R. S. S. Murthy, J. P. Blitz, and D. E. Leyden, Anal. Chem., 58 (1986) 3167
[46] B. M. Weckhuysen and R. A. Schoonheydt, Catal. Today, 49 (1999) 441
[47] H. G. Hecht, Appl. Spec., 37 (1983) 348
[48] P. Kubelka and F. Munk, Z. Tech. Phys., 11 (1931) 593
[49] M. P. Fuller and P. R. Griffiths, Anal. Chem., 50 (1978) 1906
[50] P. R. Griffiths and J. A. de Haseth, „Fourier Transform Infrared Spectroscopy“, John
Wiley & Sons, New York (1986)
[51] B. C. Smith, „Fundamentals of Fourier Transform Infrared Spectrometry“, CRC
Press, Boca Raton (1996)
[52] I. M. Hamadeh, D. King, and P. R. Griffiths, J. Catal., 88 (1984) 264
[53] D. J. J. Fraser and P. R. Griffiths, Appl. Spec., 44 (1990) 193
[54] Harrick Scientific Corporation, Pamphlet „Diffuse Reflection Attachment“ (1994)
[55] T. Hattori, K. Shirai, M. Niwa, and Y. Murakami, Bull. Chem. Soc. Jpn., 54 (1981)
1964
[56] K. van Every and P. R. Griffiths, Appl. Spec., 45 (1991) 347
[57] P. J. Brimmer and P. R. Griffiths, Appl. Spec., 42 (1988) 242
[58] Harrick Scientific Corporation, Pamphlet „Reaction Chamber for the Praying Mantis
Diffuse Reflectance Attachment“ (1993)
[59] R. L. White, Appl. Spec., 46 (1992) 1509
[60] R. Barth, R. Pitchai, R. L. Anderson, and X. E. Verykios, J. Catal., 116 (1989) 61
[61] S. A. Yeboah, S.-H. Wang, and P. R. Griffiths, Appl. Spec., 2 (1984) 259
[62] D. A. Shirley, Phys. Rev. B, 5 (1972) 4709

References
184
[63] G. Feldmeyer, Dissertation, University of Ulm (2000)
[64] H. Schubert, U. Guntow, K. Hofmann, and R. Schlögl, Fresenius J. Anal. Chem., 356
(1996) 127
[65] S. Hackenberg, Diploma thesis, University of Ulm (1996)
[66] S. Hackenberg, Dissertation, University of Ulm (2000)
[67] J. T. Gleaves, J. R. Ebner, and T. C. Kuechler, Catal. Rev. Sci. Eng., 30 (1988) 49
[68] J. W. Niemantsverdriet, „Spectroscopy in Catalysis“, VCH, Weinheim (1995)
[69] D. Andreeva, V. Idakiev, T. Tabakova, and A. Andreev, J. Catal., 158 (1996) 354
[70] D. Andreeva, T. Tabakova, V. Idakiev, P. Christov, and R. Giovanoli, Appl. Catal. A:
General, 169 (1998) 9
[71] M. Haruta, S. Tsubota, T. Kobayashi, H. Kageyama, M. J. Genet, and B. Delmon, J.
Catal., 144 (1993) 175
[72] S. Lin and M. A. Vannice, Catal. Lett., 10 (1991) 47
[73] O. Heudorfer, Diploma Thesis, FH Ravensburg-Weingarten (1996)
[74] N. W. Cant, P. C. Hicks, and B. S. Lennon, J. Catal., 54 (1978) 372
[75] J. Sarkany and R. D. Gonzalez, Appl. Catal., 5 (1983) 85
[76] Y.-E. Li, D. Boecker, and R. D. Gonzalez, J. Catal., 110 (1988) 319
[77] Y. J. Mergler, A. van Aalst, J. van Delft, and B. E. Nieuwenhuys, Appl. Catal. B:
Environmental, 10 (1996) 245
[78] J. G. E. Cohn, US Patent, 3,216,782 (issued 9. 11. 1965)
[79] J. C. Bonacci, T. G. Otchy, and T. Ackerman, US Patent, 4,238,468 (issued 21. 12.
1980)
[80] J. H. Kolts, P. A. Tooley, and S. H. Brown, US Patent, 5,017,357 (issued 1991)
[81] N. E. Vanderborgh, T. V. Nguyen, and J. Guante, US Patent, 5,271,916 (issued 1993)
[82] H. K. Straschil and W. Egbert, German Patent, 1,567,492 C3 (issued 22. 11. 1999)
[83] M. J. Kahlich, M. M. Schubert, M. Hüttner, M. Noeske, H. A. Gasteiger, and R. J.
Behm in "New Materials for Fuel Cells and Modern Battery Systems II", July 06.-10.,
Montreal, Savadogo, O. and Roberge, P. R., Eds., Ecole Polytechnique de Montreal,
(1997) 642

References
185
[84] H. Muraki, S.-I. Matunaga, H. Shinjoh, M. S. Wainwright, and D. L. Trimm, J. Chem.
Tech. Biotechnol., 52 (1991) 415
[85] D. W. Dabill, S. J. Gentry, H. B. Holland, and A. Jones, J. Catal., 53 (1978) 164
[86] N. D. Hoyle, P. Kumarasamy, V. A. Self, P. A. Sermon, and M. S. W. Vong, Catal.
Today, 47 (1999) 45
[87] R. Dümpelmann, N. W. Cant, and D. L. Trimm, Catal. Lett., 32 (1995) 357
[88] P. J. Berlowitz, C. H. F. Peden, and D. W. Goodman, J. Chem. Phys., 92 (1988) 5213
[89] T. A. Nijhuis, M. Makkee, A. D. van Langenveld, and J. A. Moulijn, Appl. Catal. A:
General, 164 (1997) 237
[90] L. K. Verheij, M. B. Hugenschmidt, L. Cölln, B. Poelsema, and G. Comsa, Chem.
Phys. Lett., 166 (1990) 523
[91] S. Ljungström, B. Kasemo, A. Rosen, T. Wahnström, and E. Fridell, Surf. Sci., 216
(1989) 63
[92] B. E. Hayden, K. Kretzschmar, A. M. Bradshaw, and R. G. Greenler, Surf. Sci., 149
(1985) 394
[93] R. G. Greenler, K. D. Burch, K. Kretzschmar, R. Klauser, A. M. Bradshaw, and B. E.
Hayden, Surf. Sci., 152/153 (1985) 338
[94] B. E. Hayden and A. M. Bradshaw, Surf. Sci., 125 (1983) 787
[95] G. Ertl, M. Neumann, and K. M. Streit, Surf. Sci., 64 (1977) 393
[96] J. S. Luo, R. G. Tobin, D. K. Lambert, G. B. Fisher, and C. L. DiMaggio, Surf. Sci.,
274 (1992) 53
[97] M. R. McClellan, J. L. Gland, and F. R. McFeeley, Surf. Sci., 112 (1981) 63
[98] R. A. Shigeishi and D. A. King, Surf. Sci., 58 (1976) 379
[99] B. N. J. Persson, F. M. Hoffmann, and R. Ryberg, Phys. Rev. B, 34 (1986) 2266
[100] Y. Y. Yeo, L. Vattuone, and D. A. King, J. Chem. Phys., 106 (1997) 392
[101] C. T. Campbell, G. Ertl, H. Kuipers, and J. Segner, Surf. Sci., 107 (1981) 207
[102] J. L. Gland and E. B. Kollin, J. Chem. Phys., 78(2) (1983) 963
[103] E. G. Seebauer, A. C. F. Kong, and L. D. Schmidt, Surf. Sci., 176 (1986) 134

References
186
[104] D. M. Collins and W. E. Spicer, Surf. Sci., 69 (1977) 85
[105] T. H. Lin and G. A. Somorjai, Surf. Sci., 107 (1981) 573
[106] R. W. McCabe and L. D. Schmidt, Surf. Sci., 66 (1977) 101
[107] J. T. Yates, J. Vac. Sci. Technol. A, 13(3) (1995) 1359
[108] T. E. Jackman, J. A. Davies, D. P. Jackson, W. N. Unertl, and P. R. Norton, Surf. Sci.,
120 (1982) 389
[109] J. Fair and R. J. Madix, J. Chem. Phys., 73(7) (1980) 3480
[110] P. Hollins, Surf. Sci. Rep., 16 (1992) 51
[111] S. L. Bernasek, K. Lenz, B. Poelsema, and G. Comsa, Surf. Sci., 183 (1987) L319-
L324
[112] D. H. Parker, D. A. Fischer, J. Colbert, B. E. Koel, and J. L. Gland, Surf. Sci., 258
(1991) 75
[113] P. R. Norton, J. A. Davies, and T. E. Jackman, Surf. Sci., 121 (1982) 103
[114] B. Poelsema, G. Mechtersheimer, and G. Comsa, Surf. Sci., 111 (1981) 519
[115] B. Klötzer and E. Bechthold, Surf. Sci., 295 (1993) 374
[116] C. S. Shern, Surf. Sci., 264 (1992) 171
[117] K. Christmann and G. Ertl, Surf. Sci., 60 (1976) 365
[118] E. Hahn, A. Fricke, H. Röder, and K. Kern, Surf. Sci., 297 (1993) 19
[119] D. Hoge, M. Tüshaus, and A. M. Bradshaw, Surf. Sci., 207 (1988) L935-L942
[120] D. H. Parker, D. A. Fischer, J. Colbert, B. E. Koel, and J. L. Gland, Surf. Sci. Lett.,
236 (1990) L372-L376
[121] M. A. Henderson and J. T. Yates, Surf. Sci., 268 (1992) 189
[122] H. Wang, R. G. Tobin, D. K. Lambert, G. B. Fisher, and C. L. DiMaggio, Surf. Sci.,
330 (1995) 173
[123] H. Wang, R. G. Tobin, and D. K. Lambert, J. Chem. Phys., 101 (1994) 4277
[124] C. S. Kim, C. Korzeniewski, and W. J. Tornquist, J. Chem. Phys., 100 (1994) 628
[125] M. M. Schubert, M. J. Kahlich, G. Feldmeyer, M. Hüttner, S. Hackenberg, H. A.
Gasteiger, and R. J. Behm, J. Catal., in preparation

References
187
[126] N. W. Cant, J. Catal., 62 (1980) 173
[127] R. H. Nibbelke, M. A. J. Campman, J. H. B. J. Hoebink, and G. B. Marin, J. Catal.,
171 (1997) 358
[128] N. W. Cant and D. E. Angove, J. Catal., 97 (1986) 36
[129] F. Zaera, J. Liu, and M. Xu, J. Chem. Phys., 106 (1997) 4204
[130] J. A. Anderson, J. Chem. Soc. Faraday Trans., 88 (1992) 1197
[131] D. M. Haaland and F. L. Williams, J. Catal., 76 (1982) 450
[132] M. J. Kahlich, H. A. Gasteiger, and R. J. Behm, poster contribution at „XXXII.
Jahrestreffen deutscher Katalytiker“, 17.-19.3, Friedrichroda, Germany (1999)
[133] M. M. Schubert, H. A. Gasteiger, and R. J. Behm, J. Catal., 172 (1997) 256
[134] Y. Fu, L. Kraus, and H. Knözinger, J. Molec. Catal., 52 (1989) 113
[135] A. T. Bell, J. Molec. Catal. A, 100 (1995) 1
[136] A. A. Davydov, „Infrared Spectroscopy of Adsorbed Species on the Surface of
Transition Metal Oxides“, C. H. Rochester, ed., John Wiley & Sons, Chichester
(1990)
[137] J. L. Robbins and E. Marucchi-Soos, J. Phys. Chem, 93 (1989) 2885
[138] Y. Fu, L. Kraus, M. I. Zaki, C. Kappenstein, B. Tesche, and H. Knözinger, J. Molec.
Catal., 44 (1988) 295
[139] J. A. Anderson and C. H. Rochester, Catal. Today, 10 (1991) 275
[140] J. J. Benitez, R. Alvero, M. J. Capitan, I. Carrizosa, and J. A. Odriozola, Appl. Catal.,
71 (1991) 219
[141] J. J. Benitez, R. Alvero, I. Carrizosa, and J. A. Odriozola, Catal. Today, 9 (1991) 53
[142] P. Mars, J. J. F. Scholten, and P. Zwietering, Adv. Catal., 14 (1963) 35
[143] M. R. Columbia, A. M. Crabtree, and P. A. Thiel, J. Am. Chem. Soc., 114 (1992) 1231
[144] J. J. Benitez, I. Carrizosa, and J. A. Odriozola, J. Chem. Soc. Faraday Trans., 89
(1993) 3307
[145] M. M. Schubert, M. J. Kahlich, M. Hüttner, S. Hackenberg, H. A. Gasteiger, and R. J.
Behm, poster contribution at „Catalysis: Fundamentals and Practice“ 14.-18.09,
York (1997)

References
188
[146] J. Sarkany, M. Bartok, and R. D. Gonzalez, J. Catal., 81 (1983) 347
[147] F. Solymosi, J. Molec. Catal., 65 (1999) 337
[148] D. Wolf, M. Barre-Chassonnery, M. Höhenberger, A. van Veen, and M. Baerns, Catal.
Today, 40 (1998) 147
[149] S. Akhter and J. M. White, Surf. Sci., 171 (1986) 527
[150] B. L. Mojet, J. T. Miller, and D. C. Koningsberger, J. Phys. Chem. B, 103 (1999) 2724
[151] A. Szabo, M. A. Henderson, and J. T. Yates, J. Chem. Phys., 96 (1992) 6191
[152] S. Fuchs, T. Hahn, and H.-G. Lintz, Chem. Engin. Proc., 33 (1994) 363
[153] N. W. Cant, J. Catal., 74 (1982) 411
[154] C. Hardacre, R. M. Ormerod, and R. M. Lambert, Chem. Phys. Lett., 206 (1993) 171
[155] K. Eberle, B. Rohland, J. Scholta, and R. Stroebel, German Patent, 19,615,562 C1
(issued 9. 10. 1997)
[156] J. C. Trocciola, C. R. Schroll, and R. R. Lesieur, US Patent, 5,330,727 (issued 19. 7.
1994)
[157] M. S. Spencer, Catal. Lett., 32 (1995) 9
[158] Y. Amenomiya and G. Pleizier, J. Catal., 76 (1982) 345
[159] A. Basinska, L. Kepinski, and F. Domka, Appl. Catal. A: General, 183 (1999) 143
[160] A. Erdöhelyi, K. Fodor, and G. Suru, Appl. Catal. A: General, 139 (1996) 131
[161] G. C. Chinchen and M. S. Spencer, J. Catal., 112 (1988) 325
[162] D. C. Grenoble, M. M. Estadt, and D. F. Ollis, J. Catal., 67 (1981) 90
[163] K. Kochloefl in „Handbook of Heterogeneous Catalysis“, G. Ertl, H. Knözinger, and
J. Weitkamp, eds., VCH, Weinheim (1997) 1831
[164] M. R. Columbia and P. A. Thiel, J. Electroanal. Chem., 369 (1994) 1
[165] R. F. Buswell, R. Cohen, L. McNeilly, and D. S. Watkins, US Patent, 5,518,705
(issued 21. 5. 1999)
[166] P. C. H. Mitchell, P. Wolohan, D. Thompsett, and S. J. Cooper, J. Molec. Catal. A:
Chemical, 119 (1997) 223
[167] D. P. Wilkinson, EU Patent, 96302406.1 (issued 1996)

References
189
[168] D. P. Wilkinson, H. V. Voss, J. Dudley, G. J. Lamont, and V. Basura, US Patent,
5,482,680 (issued 1996)
[169] H. A. Gasteiger, N. M. Markovic, and P. N. Ross in "4. Ulmer Elektrochemische Tage
- Elektrochemie für Energie und Umwelt, Ulm, Garche, J., Ed., Universitätsverlag
Ulm GmbH, (1997) 193
[170] T. J. Schmidt, H. A. Gasteiger, and R. J. Behm, J. New Mat. Electrochem. Systems, 2
(1999) 27
[171] J. Arana, P. Ramirez de la Piscina, J. Llorca, J. Sales, N. Homs, and J.-L. G. Fierro,
Chem. Mater., 10 (1998) 1333
[172] M. Shibata and N. Furuya, J. Electroanal. Chem., 269 (1989) 217
[173] D. R. Schryer, B. T. Upchurch, J. D. van Norman, K. G. Brown, and J. Schryer, J.
Catal., 122 (1990) 197
[174] P. A. Sermon, V. A. Self, and E. P. S. Barrett, J. Molec. Catal., 65 (1991) 377
[175] A. Boulahouache, G. Kons, H.-G. Lintz, and P. Schulz, Appl. Catal. A: General, 91
(1992) 115
[176] G. B. Hoflund, B. T. Upchurch, E. J. Kielin, and D. R. Schryer, Catal. Lett., 31 (1995)
133
[177] K. Grass and H.-G. Lintz, J. Catal., 172 (1997) 446
[178] L. S. Sun, S. Y. Li, and B. L. Li, React. Kinet. Catal. Lett., 62 (1997) 151
[179] J. A. Rodriguez, Surf. Sci. Rep., 24 (1996) 223
[180] R. J. Behm, Acta Phys. Polon., in press
[181] C. T. Campbell in „Handbook of Heterogeneous Catalysis“, G. Ertl, H. Knözinger and
J. Weitkamp, eds., VCH, Weinheim (1997) 814
[182] B. Hammer and J. K. Norskov in „Theory of Adsorption and Surface Reaction“, R. M.
Lambert and G. Pacchioni, eds., Kluwer Academic Publishers, Dodrecht (1997) 285
[183] P. N. Ross, J. Vac. Sci. Technol. A, 10(4) (1992) 2546
[184] A. H. Haner, P. N. Ross, U. Bardi, and A. Atrei, J. Vac. Sci. Technol. A, 10(4) (1992)
2718

References
190
[185] M. T. Paffett, S. C. Gebhard, R. G. Windham, and B. E. Koel, J. Phys. Chem., 94
(1990) 6831
[186] M. M. Schubert, M. J. Kahlich, H. A. Gasteiger, and R. J. Behm, J. Pow. Sources, 84
(1999) 175
[187] Y. Li and B. E. Koel, Surf. Sci., 330 (1995) 193
[188] R. Bouwman, L. H. Toneman, and A. A. Holscher, Surf. Sci., 35 (1973) 8
[189] G. B. Hoflund, D. A. Asbury, P. Kirszensztejn, and H. A. Laitinen, Surf. Interface
Anal., 9 (1986) 169
[190] D. A. Asbury and G. B. Hoflund, Surf. Sci., 199 (1988) 552
[191] J. A. Anderson, Catal. Lett., 13 (1992) 363
[192] A. G. T. M. Bastein, F. J. C. M. Toolenaar, and V. Ponec, J. Catal., 90 (1984) 88
[193] K. Balakrishnan and J. Schwank, J. Catal., 138 (1992) 491
[194] S. de Miguel, A. Castro, O. Scelza, J.-L. G. Fierro, and J. Soria, Catal. Lett., 36 (1996)
201
[195] L.-C. de Menorval, A. Chaqroune, B. Coq, and F. Figueras, J. Chem. Soc. Faraday
Trans., 93 (1997) 3715
[196] T. T. P. Cheung, Surf. Sci., 177 (1986) L887-L895
[197] A. F. Lee, C. J. Baddelely, M. S. Tikhof, and R. M. Lambert, Surf. Sci., 373 (1997)
195
[198] D. A. Asbury and G. B. Hoflund, J. Vac. Sci. Technol. A, 5(4) (1987) 1132
[199] B. A. Sexton, A. E. Hughes, and K. Foger, J. Catal., 88 (1984) 466
[200] A. F. Lee and R. M. Lambert, Phys. Rev. B, 58 (1998) 4156
[201] G. Meitzner, G. H. Via, F. W. Lytle, S. C. Fung, and J. H. Sinfelt, J. Phys. Chem., 92
(1988) 2925
[202] M. T. Paffett, A. D. Logan, R. J. Simonson, and B. E. Koel, Surf. Sci., 250 (1991) 123
[203] S. D. Gardner, G. B. Hoflund, and D. R. Schryer, J. Catal., 119 (1989) 179
[204] Y.-X. Li, J. M. Stencel, and B. H. Davis, Appl. Catal., 64 (1990) 71
[205] G. B. Hoflund and D. A. Asbury, Langmuir, 2 (1986) 695

References
191
[206] J. Llorca, P. Ramirez de la Piscina, J.-L. G. Fierro, J. Sales, and N. Homs, J. Molec.
Catal. A: Chemical, 118 (1997) 101
[207] S. R. de Miguel, M. C. Roman-Martinez, E. L. Jablonski, J.-L. G. Fierro, D. Cazorla-
Amoros, and O. A. Scelza, J. Catal., 184 (1999) 514
[208] R. Srinivasan, R. J. de Angelis, and B. H. Davis, J. Catal., 106 (1987) 449
[209] R. Srinivasan, R. J. de Angelis, and B. H. Davis, Catal. Lett., 4 (1990) 303
[210] Y.-X. Li, K. J. Klabunde, and B. H. Davis, J. Catal., 128 (1991) 1
[211] L. D. Sharma, M. Kumar, A. K. Saxena, D. S. Rawat, and T. S. R. Prasada Rao, Appl.
Catal. A: General, 168 (1998) 251
[212] H. H. C. M. Pinxt, B. F. M. Kuster, D. C. Koningsberger, and G. B. Marin, Catal.
Today, 39 (1998) 351
[213] J. F. Moulder, W. F. Stickle, P. E. Sobol, and K. D. Bomben, „Handbook of X-Ray
Photoelectron Spectroscopy“, J. Chastain, ed., Perkin Elmer Corp., Eden Prairie
(1992)
[214] E. Janin, M. Björkqvist, T. M. Grehk, M. Göthelid, C.-M. Pradier, U. O. Karlsson, and
A. Rosengren, Appl. Surf. Sci., 99 (1996) 371
[215] A. D. Logan and M. T. Paffett, J. Catal., 133 (1992) 179
[216] C. T. Campbell, G. Ertl, H. Kuipers, and J. Segner, J. Chem. Phys., 73 (1980) 5862
[217] M. R. Voss, H. Busse, and B. E. Koel, Surf. Sci., 414 (199) 330
[218] P. Samson, A. Nesbitt, B. E. Koel, and A. Hodgson, J. Chem. Phys., 109 (1998) 3255
[219] A. G. Sault, R. J. Madix, and C. T. Campbell, Surf. Sci., 169 (1986) 347
[220] D. A. Outka and R. J. Madix, Surf. Sci., 179 (1987) 351
[221] J. Schwank, Gold Bull., 16 (1983) 103
[222] L. Stobinski and R. Dus, Czech. J. Phys., 43 (1993) 1035
[223] B. Hammer and J. K. Noerskov, Nature, 376 (1995) 238
[224] S. D. Gardner, G. B. Hoflund, B. T. Upchurch, D. R. Schryer, and E. J. Kielin, J.
Catal., 129 (1991) 114
[225] G. Croft and M. J. Fuller, Nature, 269 (1977) 585

References
192
[226] W. M. H. Sachtler and R. A. van Santen, Appl. Surf. Sci., 3 (1979) 121
[227] H. Verbeek and W. M. H. Sachtler, J. Catal., 42 (1976) 257
[228] C. Xu and B. E. Koel, Surf. Sci. Lett., 304 (1994) L505-L511
[229] J. Llorca, N. Homs, J. Arana, J. Sales, and P. Ramirez de la Piscina, Appl. Surf. Sci.,
134 (1998) 217
[230] G. B. Hoflund, S. D. Gardner, D. R. Schryer, B. T. Upchurch, and E. J. Kielin,
Langmuir, 11 (1995) 3431
[231] D. R. Schryer, B. T. Upchurch, B. D. Sidney, K. G. Brown, G. B. Hoflund, and R. K.
Herz, J. Catal., 130 (1991) 314
[232] G. C. Bond, Gold Bull., 5 (1972) 11
[233] M. Haruta, Catal. Today, 36 (1997) 153
[234] M. Haruta, H. Kageyama, N. Kamijo, T. Kobayashi, and F. Delannay, (1988) 33
[235] W. S. Epling, G. B. Hoflund, J. F. Weaver, S. Tsubota, and M. Haruta, J. Phys. Chem.,
100 (1996) 9929
[236] A. Knell, P. Barnickel, A. Baiker, and A. Wokaun, J. Catal., 137 (1992) 306
[237] S. D. Lin, M. A. Bollinger, and M. A. Vannice, Catal. Lett., 17 (1993) 245
[238] S. K. Tanielyan and R. L. Augustine, Appl. Catal. A: General, 85 (1992) 73
[239] C. Mohr, H. Hofmeister, M. Lucas, and P. Claus, Chem. Ing. Tech., 71 (1999) 869
[240] M. Haruta, Catal. Surv. Jap., 1 (1997) 61
[241] D. Thompson, Gold Bull., 32 (1999) 12
[242] D. Thompson, Gold Bull., 31 (1998) 111
[243] M. Haruta, T. Kobayashi, H. Sano, and N. Yamada, Chem. Lett., (1987) 405
[244] A. Grigorova, A. Palazov, J. Mellor, J. A. J. Tumilty, and A. H. Gavin, US Patent,
5,759,949 (issued 2. 6. 1998)
[245] S. Aoyama, EU Patent, 0,743,694 A1 (issued 20. 11. 1996)
[246] N. D. S. Canning, D. A. Outka, and R. J. Madix, Surf. Sci., 141 (1984) 240
[247] J. France and P. Hollins, J. Electr. Spectr. Rel. Phenom., 64/65 (1993) 251
[248] F. Boccuzzi, A. Chiorino, S. Tsubota, and M. Haruta, J. Phys. Chem., 100 (1996) 3625

References
193
[249] J.-D. Grunwaldt and A. Baiker, J. Phys. Chem., 103 (1999) 1002
[250] H. Liu, A. I. Kozlov, A. P. Kozlova, T. Shido, K. Asakura, and Y. Iwasawa, J. Catal.,
185 (1999) 252
[251] S. Minico, S. Scire, A. M. Crisafulli, and S. Galvagno, Catal. Lett., 47 (1997) 273
[252] D. R. Rainer, C. Xu, P. M. Holmblad, and D. W. Goodman, J. Vac. Sci. Technol. A,
15(3) (1997) 1653
[253] M. A. Bollinger and M. A. Vannice, Appl. Catal. B: Environmental, 8 (1996) 417
[254] D. H. Parker and B. E. Koel, J. Vac. Sci. Technol. A, 8(3) (1990) 2585
[255] J. M. Gottfried, K. J. Schmidt, K. Christmann, and S. L. M. Schroeder, Surf. Sci., in
preparation
[256] J.-D. Grunwaldt, Dissertation, ETH Zürich (1998)
[257] F. Boccuzzi, A. Chiorino, S. Tsubota, and M. Haruta, Catal. Lett., 29 (1994) 225
[258] A. I. Kozlov, A. P. Kozlova, H. Liu, and Y. Iwasawa, Appl. Catal. A: General, 182
(1999) 9
[259] K. Fukushima, G. H. Takaoka, J. Matsuo, and I. Yamada, Jpn. J. Appl. Phys., 36
(1997) 813
[260] T. Fukushima, T. Kikuta, K. Shindo, and T. Hattori in "Proceedings of the First Tokyo
Conference on Advanced Catalytic Science and Technology", 1.-5. July 1990, Tokyo,
Yoshida, S., Takezawa, N., and Ono, T., Eds., Kodansh Ltd. and VCH, (1990) 493
[261] J. T. Richardson, „Principles of Catalyst Development“, 2nd edition, Plenum Press,
New York (1992)
[262] J. C. Frost, Nature, 18 (1988) 577
[263] M. Valden, D. Lai, and D. W. Goodman, Science, 281 (1998) 1647
[264] M. Valden, S. Pak, X. Lai, and D. W. Goodman, Catal. Lett., 56 (1998) 7
[265] W.-X. Zhang, Y.-G. Tao, M.-J. Jia, T.-H. Wu, and X.-M. Li, Chem. J. Chin. Univers.,
19 (1998) 1317
[266] Y. Yuan, K. Asakura, A. P. Kozlova, H. Wan, K. Tsai, and Y. Iwasawa, Catal. Today,
44 (1998) 333
[267] Y. Yuan, K. Asakura, H. Wan, K. Tsai, and Y. Iwasawa, Catal. Lett., 42 (1996) 15

References
194
[268] J.-D. Grunwaldt, C. Kiener, C. Wögerbauer, and A. Baiker, J. Catal., 181 (1999) 223
[269] D. A. H. Cunningham, W. Vogel, H. Kageyama, S. Tsubota, and M. Haruta, J. Catal.,
177 (1998) 1
[270] M. Okumura, S. Nakamura, S. Tsubota, T. Nakamura, M. Azuma, and M. Haruta,
Catal. Lett., 51 (1999) 53
[271] N. W. Cant and P. W. Frederickson, J. Catal., 37 (1975) 531
[272] S. Tsubota, T. Nakamura, K. Tanaka, and M. Haruta, Catal. Lett., 56 (1998) 131
[273] G. Feldmeyer, M. M. Schubert, S. Mössmer, M. Möller, and R. J. Behm, J. Catal., in
preparation
[274] V. Plzak, B. Rohland, and L. Jörissen, poster contribution at "50. Annual Meeting of
the International Society of Electrochemistry , Pavia, Italy (1999)
[275] J. Shen, B. Guang, M. Tu, and Y. Chen, Catal. Today, 30 (1996) 77
[276] A. Olowe, Adv. X-Ray Anal., 38 (1995) 749
[277] J. Lauterbach, K. Asakura, and H.-H. Rotermund, Surf. Sci., 313 (1994) 52
[278] A. P. Kozlova, A. I. Kozlov, S. Sugiyama, Y. Matsui, K. Asakura, and Y. Iwasawa, J.
Catal., 181 (1999) 37
[279] J. M. Gottfried, K. J. Schmidt, K. Christmann, and S. L. M. Schroeder, Catal. Lett., in
preparation
[280] Y.-M. Kang and B.-Z. Wan, Catal. Today, 26 (1995) 59
[281] U. Heiz, Lecture „Chemie kleiner Metallcluster auf Oxiden: Jedes Atom zählt“,
University of Ulm (16.04.1999)
[282] K. Blick, T. D. Mitrelias, J. S. J. Hargreaves, G. J. Hutchings, R. W. Joyner, C. J.
Kiely, and F. E. Wagner, Catal. Lett., 50 (1998) 211
[283] D. A. H. Cunningham, W. Vogel, R. M. Torres Sanches, K. Tanaka, and M. Haruta, J.
Catal., 183 (1999) 24
[284] A. P. Kozlova, S. Sugiyama, A. I. Kozlov, K. Asakura, and Y. Iwasawa, J. Catal., 176
(1998) 426
[285] F. E. Wagner, S. Galvagno, C. Milone, A. M. Visco, L. Stievano, and S. Calogero, J.
Chem. Soc. Farady Trans., 93 (1997) 3403

References
195
[286] M. Haruta, N. Yamada, T. Kobayashi, and S. Iijima, J. Catal., 115 (1989) 301
[287] Z. M. Liu and M. A. Vannice, Catal. Lett., 43 (1997) 51
[288] C. Sze, E. Gulari, and B. G. Demczyk, Mat. Res. Soc. Symp. Proc., 286 (1993) 143
[289] E. D. Park and J. S. Lee, J. Catal., 186 (1999) 1
[290] A. M. Visco, A. Donato, C. Milone, and S. Galvagno, React. Kinet. Catal. Lett., 61
(1997) 219
[291] M. A. P. Dekkers, M. J. Lippits, and B. E. Nieuwenhuys, Catal. Lett., 56 (1998) 195
[292] F. Boccuzzi, G. Cerrato, F. Pinna, and G. Strukul, J. Phys. Chem. B, 102 (1998) 5733
[293] C.-K. Chang, Y.-J. Chen, and C.-T. Yeh, Appl. Catal. A: General, 174 (1998) 13
[294] Y. Yuan, A. P. Kozlova, K. Asakura, H. Wan, K. Tsai, and Y. Iwasawa, J. Catal., 170
(1997) 191
[295] Y.-M. Kang and B.-Z. Wan, Appl. Catal. A: General, 128 (199) 53
[296] C. Ruggiero and P. Hollins, Chem. Soc. Faraday Trans., 92 (1996) 4829
[297] Y. Iizuka, H. Fujiki, N. Yamauchi, T. Chijiiwa, S. Arai, S. Tsubota, and M. Haruta,
Catal. Today, 36 (1997) 115
[298] P. Dumas, R. G. Tobin, and P. L. Richards, Surf. Sci., 171 (1986) 579
[299] D. J. C. Yates, J. Colloid Interface Sci., 29 (1969) 194
[300] G. McElhiney and J. Pritchard, Surf. Sci., 60 (1976) 397
[301] M. L. Kottke, R. G. Greenler, and H. G. Tompkins, Surf. Sci., 32 (1972) 231
[302] J. M. Gottfried, K. J. Schmidt, K. Christmann, and S. L. M. Schroeder, Poster
contribution at "18th European Conference on Surface Science", 21.9., Vienna,
Austria, (1999)
[303] W. Vogel, D. A. H. Cunningham, K. Tanaka, and M. Haruta, Catal. Lett., 40 (1996)
175
[304] Y.-M. Kang and B.-Z. Wan, Catal. Today, 35 (1997) 379
[305] K. Tanaka and J. M. White, J. Phys. Chem., 86 (1982) 4708
[306] Y. Fu, L. Kraus, and H. Knözinger, Chin. J. Chem. Phys, 2 (1989) 125

References
196
[307] D. M. Cox, R. O. Brickman, K. Creegan, and A. Kaldor, Mat. Res. Soc. Symp. Proc.,
206 (1991) 43
[308] H. Sakurai, A. Ueda, T. Kobayashi, and M. Haruta, Chem. Commun. (1998) 271
[309] D. Andreeva, V. Idakiev, T. Tabakova, A. Andreev, and R. Giovanoli, Appl. Catal. A:
General, 134 (1996) 275
[310] O. J. Wimmer, P. Arnoldy, and J. A. Moulijn, J. Phys. Chem., 90 (1986) 1331
[311] G. B. Hoflund, S. D. Gardner, D. R. Schryer, B. T. Upchurch, and E. J. Kielin, Appl.
Catal. B: Environmental, 6 (1995) 117
[312] S. Tsubota, D. A. H. Cunningham, Y. Bando, and M. Haruta in „Preparation of
Catalysts IV“, G. Poncelet, ed., Elsevier Science B. V., Elsevier (1995) 227
[313] C. Serre, F. Garin, G. Belot, and G. Maire, J. Catal., 141 (1993) 1
[314] C. Serre, F. Garin, G. Belot, and G. Maire, J. Catal., 141 (1993) 9
[315] C. Hardacre, R. M. Ormerod, and R. M. Lambert, J. Phys. Chem., 98 (1994) 10901
[316] N. W. Cant and N. J. Ossipoff, Catal. Today, 36 (1997) 125

Acknowledgement
197
VI. ACKNOWLEDGEMENT
I want to thank all those numerous people, who have contributed to my work within the last
three years. Especially, I want to acknowledge:
- Prof. R. J. Behm and H. A. Gasteiger for the supervision of my thesis work.
- Prof. J. Garche (ZSW Ulm) for his moral and financial support over the last few months.
- B. Heise (Department of Experimental Physics) for his engaged support within the
Graduiertenkolleg.
- V. Plzak (ZSW Ulm), who prepared the gold catalysts, characterized them by XRD and
TGA and revised the corresponding parts of this thesis.
- M. Kahlich, who performed the largest part of the kinetic measurements within the
PROX project.
- S. Hackenberg for managing the CO titration experiments and the TPDs.
- G. Feldmeyer and M. Hüttner for their XPS measurements and some additional
conversion experiments.
- A. C. van Veen and Prof. M. Muhler (Department of Technical Chemistry, Ruhr-
University Bochum) for the TAP isotope studies.
- S. L. M. Schroeder (Institute of Physical and Theoretical Chemistry, FU Berlin) for
supplementing XAFS and in-situ XRD measurements.
- J.-D. Grunwaldt (Haldor Topsøe) for a revision of the chapters III-3.1 and III-3.2.
- Venugopal (IICT, Hyderabad, India) for his help with the CO2- / H2O-measurements.
- H. H. C. M. Pinxt (DSM group) for providing XAFS reference spectra.
- G. Mestl (Institute of inorganic chemistry, FHI Berlin) for making the TEM photographs
on the platinum catalysts.
- M. Adelt (Institute of chemical physics, FHI Berlin) for his help with the coverage
calculation algorithm.
- E. Auer (Degussa) and J. Giallombardo (E-TEK) for providing the catalyst samples.
- T. Häring and G. Bräth for their engaged technical help with my setup.
Financial support for this work came from the ‘Stiftung Energieforschung’ (project no. A
0000 8295) and via a fellowship by the Deutsche Forschungsgemeinschaft, within the
Graduiertenkolleg ‘Molekulare Organisation und Dynamik an Grenz- und Oberflächen’.
But most of all, I have to thank my parents for their incredible support during the last years.

Appendix A Improved DRIFTS-cell design
198
APPENDIX
A. Improved DRIFTS-cell design
As was explicitely shown in the first chapters, DRIFTS is a quite simple, but nevertheless
powerful method for surveying surface species in-situ on disperse catalysts under realistic
reaction conditions (see, e. g., [41, 46, 51, 56]). But many commercially available DRIFTS
cells are predominantly designed for the identification of organic compounds (e. g., in quality
control) and not optimized for in-situ applications in heterogenous catalysis.
In the preceeding chapters, we presented IR measurements during the selective CO oxdiation
in H2-rich gases over supported noble metal catalysts. Most of the data were obtained in a
commercially available DRIFTS cell by Harricks (HV-DR2) and in a very closely related
copy, produced by our university workshop, respectively (See chapter II-1.2.2). But these cells
have both many disatvantages, which limit the range of applicable reaction conditions and the
reliability of results:
a) An unfavourable geometry of the catalyst bed (ID 6.3 mm, but height only 3.1 mm), which
may lead to flow irregularities in some parts of the catalyst bed, sometimes even to
channeling effects. With exothermic reactions (as is, e. g., the case for the CO or H2
oxidation reaction) large temperature gradients may occur from the center of the catalyst
bed to the outside, especially at irregular flow rates. The existence of flow rate and
temperature gradients may cause artifacts in the resulting spectra, leading to a false
interpretation of the acquired data. Another, more practical problem is the loss of material
by the erosion of the catalyst bed as a consequence of channeling along the wall, which
additionally produces a more rough surface, decreasing the absolute signal during the
measurement.
b) A large background reactivity of the cell itself (stainless steel) for some reactions,
impairing measurements at high temperatures or low reactant concentrations. Schubert
demonstrated in his diploma thesis, that, e. g., for the selective CO oxidation of 1 kPa CO
(λ = 2; atmospheric pressure: 75 kPa H2, balance N2) measurements at more than 200°C
are impossible with the commercial Harricks DRIFTS cell, since the oxygen and CO
conversion exceed 10% (at a flow rate of 120 Nml/min) in the empty cell [32]. At a
reduced CO content of 0.1 kPa (λ = 2; similar conditions), even 150°C, which represents
already the lower limit of the interesting temperature range for, e. g., our Pt/γ-Al2O3

Appendix A Improved DRIFTS-cell design
199
catalyst, is a problem. These large background contributions are predominantly a
consequence of the oversized heating rod, which warms up not only the catalyst bed but
also extended wall surfaces of the cell interior.
c) A large gas volume of the cell (esitmated to be >10 ml), which causes long response times
after changing the reaction atmosphere. Finally, the large surface area of the cell interior
additionally contributes to the above mentioned high background reactivity.
d) Leaking, caused by the outlet gas channel, which is stuck only loosely into a whole at the
bottom of the catalyst bed. Hence, depending on the pressure drop over the catalyst
material, a large fraction of the gas is not passing through the powder, but going directly to
the outlet - sometimes more than 50% of the overall gas flow (estimated by GC analysis of
conversion data). Thus any simultaneously collected conversion data shows large
tolerances (see, e. g., chapter III-1.3.3) and there is always the danger of producing artifacts
in the DRIFTS spectra due to mass transport effects, if for example one reactant component
is completely used up during reaction in the reduced flow rate over the catalyst bed.
Hence we developed a new DRIFTS cell, compatible for the use with the original „praying
mantis“ mirror compartment by Harricks (PM-DRA-2-XXX). The basic concepts of course
can be easily adapted for other products. The major intention was the implementation of a
Fig A-1: Drawing of the new DRIFTS cell.

Appendix A Improved DRIFTS-cell design
200
better catalyst bed into the cell (with a geometry similar to common microreactors),
containing about 80-120 mg of catalyst, which allows for an accurate on-line analysis of
conversion data during a DRIFTS experiment. Important prerequisites were the prevention of
gas leaking and the reduction of the background activity to acceptable values. After
introducing the construction, we will present very detailed examinations on the properties
necessary for the envisaged applications, which will demonstrate, that the new cell design is
well suitable for a simultaneos acquisition of correct kinetic data during a DRIFTS
measurement series.
Figure A-1 provides an overview over the whole construction: The catalyst is situated on a
circular steel net, which rests on the small edge at the bottom of the catalyst bed (CB). The
temperature is regulated by a heater (HT) of hollow cylinder shape which surrounds the outer
wall of the catalyst bed. The latter consists of a ceramic ring with a resistant wire (CrNi; 0.2
mm) mounted on the inner side. Good contact to the catalyst bed walls is established by a
ceramic paste of high thermal conductivity (Polytech 944). On the outside the heater it is
thermally isolated by a small gap. The temperature is regulated by a conventional low voltage
power supply. A K-type thermocouple (TC; Ø 0.1 mm; Watlow) can be inserted into small
holes (two possible positions) inside the catalyst bed walls in order to control the actual
temperature level. Below the catalyst bed an outlet gas tube is attached via a thread (sealed by
a small Viton ring). Tubes for gas supply (as well as for the cooling water) are connected via
VCO fittings to the cell (Swagelok). From above the cell is closed by a dome (DO), with an
identical geometry as in the original HV-DR2 cell. It contains two ZnSe-windows (∅ 13 mm)
and a glass window on the back-side for surveying the experiment. Below the dome a
catalyst bed length
top bottom
T [
°C]
100
200
300
400
Figure A-2: Temperature-profile at the inner wall of the catalyst bed.

Appendix A Improved DRIFTS-cell design
201
horseshoe-shaped water cooling (WC) is implemented into the cell body to prevent an
overheating of the sealing ring (SR; Kalrez). The top part of the cell is made from stainless
steel, wheras the middle block (MB) consists of copper for providing a good thermal
conductivity. On the bottom an adapter part (AD) is attached in order to mount the cell on the
original basis of the HV-DR2 cell.
The changed geometry (catalyst bed ID only 4 mm (top), compared to 6.3 mm for the
commercial Harricks cell, leading to a much smaller probing area) of course causes a
corresponding loss in the absolute signal intensity of roughly 50%. Therefore, the scanning
time now theoretically requires a four-fold increase, in order to obtain spectra of equal quality
(i. e., similar SNR) [50].
Two very important preconditions for measurements on a „real“ microkinetic catalyst bed are
a constant temperature level over the whole bed lenght, which is quite difficult to arrange with
such a small heater, and a correct temperature calibration. In figure A-2, the temperature
profiles for different temperatures up to 400°C are displayed. The difference between the top
and the bottom of the catalyst bed is constant at 5% for all temperatures, a deviation, which is
quite satisfying. It should be mentioned, that the commercial Harricks DRIFTS cell, which we
use here for comparison, has an excellent temperature profile as well.
The recorded temperature calibration (the temperature inside an α-Al2O3 filled catalyst bed vs
the output of the thermocouple) is shown in figure A-3. For the maximum level of 400°C a
TTC [°C]
0 50 100 150 200 250 300 350 400
Tca
taly
st[°
C]
0
100
200
300
400
500
Tcat = 1.04*T + 1.8r ² = 0.9999
Tcat = 1.15*T - 0.3r ² = 0.9998
Figure A-3: Calibration of the temperature in the catalyst bed as a
function of the measured temperature at the thermocouples - white circles:
in 20 Nml/min N2; grey squares: in 100 Nml/min of 75% H2, rest N2

Appendix A Improved DRIFTS-cell design
202
power output of approximately 90W is required. The temperature dependence is linearly,
which allows an easy calculation of the temperature in the catalyst bed from the aquired
equations in fig. A-3. Unfortunately, the calibration revealed a slight dependence upon the
composition of the gas mixture flowing through the cell. When 75% hydrogen are added (grey
squares), the top surface of the cell, and as a consequence also the thermocouple inside the
wall, are cooled down due to the increased thermal conductivity of the gas phase, leading to
larger temperature difference (+ 10%) between the catalyst bed and the thermocouple when
compared to a flow of pure nitrogen (white circles). Hence, for the new DRIFTS cell design a
correction at the temperature controlling device would be necessery, when the composition of
the gas phase changes drastically, e. g., in a „switch experiment“. The dependence upon the
absolute flow rate was much smaller, showing a difference of approximately ± 2°C for 150
and 20 Nml/min at 200°C, respectively. Due to the small dependence of the T-calibration on
the gas phas composition, for most „simple“ experiments, the commercial DRIFTS cell is
preferred, showing virtually no difference between the calibrations in the two different gas
mixtures, at least as long as no synchronous kinetic data is required.
After demonstrating the general suitability of the new design for DRIFTS experiments on a
powder catalyst bed, we checked the background conversion of the new cell in a typical gas
mixture, required for our PROX experiments (1 kPa CO, λ = 2 in 75 kPa H2, rest N2; 40
Nml/min). The CO and oxygen conversion of the α-Al2O3 filled DRIFTS cell, recorded in an
ascending temperature row by on-line analysis with a GC, are displayed in figure A-4. Only at
temperatures as high as 300°C, a noticeable consumption of oxygen is observed (white
circles), but even the loss of 11% oxygen at 400°C would in principle still be tolerable for
rough conversion measurements at high concentrations (i. e., partial pressures of 1 kPa and
more). The background CO conversion performance is excellent as well with a maximum of
only 2% at 400°C (white squares), and absolutely no methanation activity is observed.
In comparison to the background activity of the commercial Harricks cell obtained under
identical conditions (grey symbols), where, e. g., at 250°C already a conversion level of 20%
for both, CO and O2, is reached, the new DRIFTS cell design is clearly superior, which now
enables measurements at low reactant concentrations or elevated temperature levels.
Finally, the cell was tested in a real experiment, i. e., the oxidation of CO in an idealized
reformate over Au/α-Fe2O3 (1 kPa CO, λ = 2 in 9 kPa N2, up to 22 kPa CO2, balance H2;
80°C), where the position of the linearly bound COad species and the by-product formation as

Appendix A Improved DRIFTS-cell design
203
well as the activity and selectivity were recorded as a function of a slowly increasing CO2
partial pressure. The correspondig data along with an interpretation was already presented in
section III-3.4.2. The measured activity in the DRIFTS cell at the lowest CO2-content (i. e.,
without addition) is in excellent agreement with the rate obtained in idealized reformate (1
kPa CO, λ = 2; 75 kPa H2, rest N2) in our microkinetic measurements in the quartz reactor
(4.45*10-3 compared to 4.38*10-3 molCO/gAu*s; data taken after 30 min.) as well as the
selectivity (67% vs 64%), which demonstrates, that very accurate kinetic data may be obtained
with the new cell design.
In summary we have seen, that our new cell is generally suitable for the observation of
heterogeneous catalyst under reaction conditions. The excellently low background activity
along with the new geometry of the catalyst bed allows for the simultaneous recording of very
accurate kinetic data.
CO
con
vers
ion
[%]
0
10
20
30
40
50
60
Figure A-4: Activity of the DRIFTS cells (filled with α-Al2O3) in simulated
reformate (1 kPa CO; λ = 2): a) CO conversion and b) oxygen conversion at a
flow rate of 40 Nml/min - empty symbols: newly designed cell; filled symbols:
original Harricks HV-DR2 cell.
T [°C]
100 150 200 250 300 350 400
O2
conv
ersi
on [
%]
0
20
40
60
80
a)
b)

Appendix B Additional figures
204
B. Addititonal figures
T [°C]
100 200 300 400
conc
entr
atio
n [p
pm]
0
100
200
300
400
CO2
CH4
CO (x10)
Figure B-1: Temperature programmed desorption of formate species from Pt/γ-Al2O3
(accumulated during 6 h of selective CO oxidation at 165°C with 1 kPa CO and λ = 2)
in 12 Nml/min N2 at 5 K/min (residual CO was removed previously with 10 kPa O2 in
N2 at 80°C)
ν [cm-1]
2000205021002150
IR-i
nten
sity
[K
M-u
nits
]
0.00
0.02
0.04
0.06
Fig. B-2: DRIFTS-spectra for region of linearly bound COad on Pt/SiO2:
during selective CO oxidation oin idealized reformate with 1 kPa CO
and λ = 2 at 150°C and after switching to a mixture containig 1.3 kPa
water additionally (both spectra taken after 30 min. in the corresponding
atmosphere).

Appendix C English abstract
205
C. English abstract
The selective CO oxidation in H2-rich gases is investigated over three different catalyst
systems - supported platinum (especially Pt/γ-Al2O3), a supported bimetallic catalyst
(Pt3Sn/Vulcan) and supported gold (especially Au/α-Fe2O3). Compared to standard Pt
catalysts which require higher temperatures above 150°C to operate at reasonable rates, the
latter low temperature PROX catalysts are characterized by a combination of facile oxygen
adsorption and largely inhibited hydrogen adsorption under reaction conditions. This can be
achieved either by an active material that is inert for both, hydrogen and oxygen adsorption,
but allows CO adsorption, and where oxygen adsorption proceeds on the support material (i.
e., Au/Fe2O3), or by a material that would be active for adsorption of all reaction partners, but
which is blocked for hydrogen and consequently also for oxygen adsorption by a CO adlayer.
In all of these cases the oxidation reactions will take part at the interface between the different
areas, or via a spill-over process and the reaction is not limited by CO desorption, which is the
limiting factor for the PROX reaction on Pt catalysts at temperatures below 150°C.
For all catalysts the selectivity is generally a function of the steady-state CO coverage under
operation conditions. On Pt/γ-Al2O3the saturation coverage, which is maintained over a large
range operation conditions, leads to a rather constant selectivity. For the low-temperature
catalysts the selectivity is also very high due to the high activation barrier for the dissociative
adsorption of hydrogen. On the latter systems the selectivity decreases very fast at decreasing
CO partial pressures or increasing temperatures as a result of the reduced CO surface
coverage.
All investigated systems show a more or less severe tendency for deactivation during time on-
stream, but the reasons and also the degree of reversibility are very different.
Upon changing the reaction atmosphere from a simplified composition without CO2 and H2O,
which was used for our kinetic experiments, to more realistic simulations of a real methanol
reformer gas, it is found that especially the platinum-based systems suffer from a large H2O-
content, which decreases the selectivity significantly, wheras Au/α-Fe2O3 is more sensitive to
CO2. Nevertheless, the effects of H2O and CO2 are of such a moderate extent, that the
approach via idealized reformate (without CO2 and H2O) indeed seems to provide a
reasonable basis for future reactor calculations.

Appendix C English abstract
206
For Pt and Au a large variety of support materials is tested, but none of them appears to be
significantly superior to the originally employed Pt/γ-Al2O3 or Au/α-Fe2O3 catalysts.

Appendix D Deutsche Zusammenfassung (german abstract)
207
D. Deutsche Zusammenfassung (german abstract)
Im Rahmen dieser Arbeit werden Mechanismen der selektiven CO Oxidation werden auf
unterschiedlichen geträgerten Edelmetallen untersucht – Platin (v. a. Pt/γ-Al2O3), ein
bimetallischer Katalysator (Pt3Sn/Vulcan) sowie Gold (v. a. Au/α-Fe2O3). Im Vergleich zu
reinen Platinsystemen, die Reaktionstemperaturen von mindestens 150°C erfordern, werden
auf letzteren Systemen durch ein Zusammenspiel vereinfachter Sauerstoffadsorption sowie
großteils blockierter Wasserstoffadsorption enstprechend hohe Aktivitäten schon bei
wesentlich niedrigeren Temperaturen erreicht. Voraussetzung ist ein Metall auf dem lediglich
CO, nicht aber O2 und H2, adsorbiert (Au/α-Fe2O3) oder auf dem die Adsorption letzterer
Moleküle durch eine gesättigte CO Schicht blockiert wird. Der notwendige Sauerstoff wird
jeweils räumlich getrennt über eine weitere Katalysatorkomponente (FeOx bzw. Sn/SnOx)
aufgenommen. Die anschließenden Oxidationsreaktionen finden an der Grenzfläche oder nach
einem „Spill-over“-Prozess eines der Reaktanden statt. In jedem Fall wird die CO Oxidation,
anders als bei reinen Platin-Katalysatoren, nicht durch die CO Desorption limitiert.
Weiterhin ist für alle untersuchten System die gemessene Selektivität direkt von der CO-
Bedeckung unter Reaktionsbedingungen abhängt. Auf Pt/γ-Al2O3führt die Sättungsbedeckung,
die für einen breiten Bereich von Reaktionsbedingungen festgestellt wird, zu einer relativ
konstanten Selektivität. Die ebenfalls sehr hohen Selektivitätswerte der „Niedertemperatur-
Katalysatoren“ erklären sich aus einer hohen Aktivierungsbarriere für die dissoziative
Wasserstoffadsorption. Bei diesen Systemen fällt jedoch die Selektivität stark mit fallendem
CO Partialdruck oder steigender Temperatur als Folge der reduzierten CO Bedeckung.
In Langzeitexperimenten werden für alle untersuchte Systeme Desaktivierungstendenzen
festgestellt. Die genauen Ursachen sowie die Reversibilität der Desaktivierung sind jeweils
individuelle Eigenschaften jedes untersuchten Katalysatorsystems.
Beim Übergang von einer vereinfachten Gaszusammensetzung ohne CO2 und H2O, die für die
Mehrzahl der kinetischen Experimente benutzt wurde, zu realistischeren Simulationen von
Methanol-Reformat wird festgestellt, daß auf Pt basierende Systeme vor allem durch Wasser
beeinträchtigt werden (führt zu niedrigerer Selektivität), während Au/α-Fe2O3 durch CO2
negativ beeinflußt wird. Die Effekte sind allerding in jedem Fall relativ gering, so daß die
Messungen in der vereinfachten Gasatmosphäre in der Tat eine gute Basis für zukünftige
Reaktorrechnungen darstellen.

Appendix D Deutsche Zusammenfassung (german abstract)
208
Ausserdem wurden für Pt und Au noch zahlreiche weitere Trägermaterialien getestet, von
denen jedoch bei keinem eine entscheidende Verbesserung im Vergleich zu den zunächst
verwendeten Pt/γ-Al2O3 und Au/α-Fe2O3-Systemen festzustellen war.

Appendix E List of publications
209
E. List of publications
• M. J. Kahlich, M. M. Schubert, M. Hüttner, M. Noeske, H. A. Gasteiger, R. J. Behm;
Kinetics of the Selective CO Oxidation in H2-Rich Gas on Supported Noble Metal
Catalysts“; Conf. Proc. „New Materials for Fuel Cell and Modern Battery Systems II“, O.
Savadogo and P. R. Roberge, Eds.; Ecole Polytechnique de Montreal, Montreal; 642 (1997)
• M. M. Schubert, H. A. Gasteiger, R. J. Behm; „Surface Formates as Side Products in the
Selective CO Oxidation on Pt/γ-Al2O3“; J. Catal.172, 256 (1997); Research Note
• M. M. Schubert, M. J. Kahlich, H. A. Gasteiger, R. J. Behm; „Correlation between CO
Surface Coverage and Selectivity/Kinetics for the Preferential CO Oxidation over Pt/γ-Al2O3
and Au/α-Fe2O3: An in-situ DRIFTS Study“; J. Pow. Sources 84, 175 (1999)
• M. M. Schubert, M. J. Kahlich, M. Hüttner, S. Hackenberg, G. Feldmeyer, H. A. Gasteiger,
R. J. Behm; „Bimetallic PtSn Catalyst for Selective CO Oxidation in H2-Rich Gases at Low
Temperatures“; J. Catal., in preparation
• M. M. Schubert, S. Hackenberg, A. C. van Veen, M. Muhler, V. Plzak, R. J. Behm; „CO
Oxidation over Supported Gold Catalysts - ‘Inactive’ and ‘Active’ Supports and their Role
in the Reaction Process“; J. Catal., submitted
• G. Feldmeyer, M. M. Schubert, C. Hartmann, M. Möller, R. J. Behm; „Au/TiO2 Catalysts
for the Selective CO Oxidation in H2-rich gas Prepared from Diblockcopolymer Micelles“;
in preparation
• M. M. Schubert, M. J. Kahlich, H. A. Gasteiger, R. J. Behm; „Selective CO Oxidation in
H2-Rich Gas over Pt/γ-Al2O3: Effects from the Coadsorption of CO and Hydrogen and
Dependence of the Selectivity on the CO Coverage“; J. Phys. Chem. B, in preparation
• M. M. Schubert, T. Häring, H. A. Gasteiger, R. J. Behm; „New DRIFTS-cell Design for the
Simultaneous Acquisiton of Spectroscopic and Kinetic Data“; in preparation
• M. M. Schubert, V. Plzak, J. Garche, R. J. Behm; „Activity, Selectivity and Long-Term
Stability of Different Supported Gold Catalysts for the Preferential CO Oxidation in H2-Rich
Gas“; Catal. Lett., in preparation

Appendix F Lebenslauf (curriculum vitae)
210
F. Lebenslauf (curriculum vitae)
Markus Matthias Schubert
Persönliche Daten:
Geboren: 28. August 1971
Geburtsort: München
Eltern: Felix Schubert, geb. 26.03.42, Oberstudienrat, 83313 Siegsdorf, Sportfeldstr. 8
Elisabeth Schubert (geb. Maß), geb. 3.11.44, Studienrätin, 83313 Siegsdorf,
Sportfeldstr. 8
Ausbildung:
09.77 bis 07.81 Grundschule Siegsdorf
09.81 bis 06.90 Chiemgau-Gymnasium Traunstein
06.90 Abitur
10.91 bis 09.96 Studiengang „Diplom Chemie“ and der Universität Ulm
11.93 Vordiplom Chemie
09.96 Abschluß Diplom Chemie im 10. Semester
Betreuer: Prof. Dr. R. Jürgen Behm
Titel: „In-Situ DRIFTS (diffuse reflectance infrared Fourier transform
spectromety) Messungen zur Charakterisierung der selektiven
CO-Oxidation in H2-reichem Gas“
seit 10.96 Promotion an der Universität Ulm
Wehrdienst von 07.90 bis 03.91,
anschließend als Zeitsoldat (W 15) übernommen bis 09.91
Anstellungen:
Studentische Hilfskraft im Praktikum für physikalische Chemie, Universität Ulm:
10.95 bis 02.96 „Fortgeschrittenenpraktikum“
04.96 bis 07.96 „Grundpraktikum“
Wissenschaftliche Hilfskraft im Praktikum für physikalische Chemie, Universität Ulm:
04.97 bis 07.97 „Fortgeschrittenenpraktikum“
Stipendium:
08.97 bis 10.99 Mitglied im Graduiertenkolleg „Struktur und Dynamik an Grenz- und
Oberflächen“ der Universität Ulm


