Embed Size (px)
Citation preview
OTTO-VON-GUERICKE-UNIVERSITÄT
MAGDEBURG
FAKULTÄT FÜR MASCHINENBAU
Institut für Arbeitswissenschaft, Fabrikautomatisierung und
Fabrikbetrieb
Ausgewählte studentische Arbeiten im Rahmen der
„Systems Engineering“ -Vorlesung
Wintersemester 2021/ 2022
Inhaltsverzeichnis Seite
1. What is Frugal Engineering and how does it diverge from common
engineering standards? ................................................................................... 1
2. What is Frugal Engineering and how does it change the life cycle of
technical systems? ........................................................................................... 8
3. What is frugal engineering and how does it impact engineering practice? ...... 16
4. Which AI based early warning systems exists for production systems? ........... 22
5. How is monitoring of major KPIs like delivery reliability, utilized capacity,
and idle times be implemented in production systems? ................................. 29
6. Which digital technologies are currently applied to monitor major KPIs like
delivery reliability, utilized capacity, and idle times in production systems? ... 38
7. What is sustainability considered towards utilization of natural resources
and how does it change the life cycle of technical systems? .......................... 47
8. What is sustainability considered towards utilization of natural resources
and how does it impact engineering practice? ............................................... 57
9. What is sustainability considered towards utilization of natural resources
and how does it impact production system control strategies? ..................... 63
10. What is variability of production systems and how can it impact
production system use effectivity and efficiency? .......................................... 69
11. What is the Industry 4.0 asset administration shell and how will it change
production system engineering? ................................................................... 75
12. What is the AutomationML component and how will it change
production system engineering? ................................................................... 81
13. What is the module type package and how is it applied within
production system engineering? ................................................................... 86
14. What is XML and which role can XML based data exchange
play in engineering organizations? ............................................................... 92
15. What is Json and which role can Json based data exchange
play in engineering organizations? ............................................................... 97
Frugal Engineering and its divergence from
the common engineering standards
Abhi Daxeshbhai Shah
Matriculate no. 239477
Faculty of Mechanical Engineering
Otto von Guericke University, Magdeburg,
Germany
Mohammad Aqeeb Rehan khan
Matriculate no. 239966
Faculty of Mechanical Engineering
Otto von Guericke University, Magdeburg,
Germany
Vanditha Talari
Matriculate no. 236807
Faculty of Mechanical Engineering
Otto von Guericke University, Magdeburg,
Germany
Jagu Venkata Siva Sathya Sairam
Matriculate no. 239538
Faculty of Mechanical Engineering
Otto von Guericke University, Magdeburg,
Germany
Abstract- Frugal engineering is not just low-cost
engineering; it is a fundamental approach for product
development in emerging markets. Frugal engineering
adopts a clean-sheet approach that seeks to maximize
value for the customer while minimizing unwanted and
excessive resource consumption. Companies intending
to use frugal engineering in emerging markets must
consider economic, technical, and socio-cultural
resource constraints. This paper focuses on how frugal
engineering diverges from the common engineering
approach. We will outline the three conceptualizations
of the frugal process and discuss how the frugal
process of the supply chain is different from the
standard processes of the supply chain, by exploring
the three types of archetypes. In addition to it, the three
primary criteria that make it possible to distinguish
between frugal innovation and other innovations. As
well as the key characteristics that differentiate the
process. Firms can overcome resource constraints by
configuring these characteristics at each stage of their
supply chain.
Keywords: Frugal engineering, emerging markets,
supply-chain, Frugal innovation, Resource
constraints, Frugal process.
I. INTRODUCTION
The term "frugal engineering” was coined by
Carlos Ghosn, CEO of Renault, and Nissan, in 2006
to describe the automotive engineering of the
world's most affordable car, the Tata Nano. Suzuki,
for example, paved the way for the development of
low-cost automobiles [1,3]; it is becoming the
umbrella term for the process of developing frugal
products. These are some of the outcomes of "frugal
engineering," a practical and essential approach to
developing products and services for developing
markets. There may be no better example of frugal engineering than the Nano, which will enable
millions of people with limited resources to drive
their cars on a regular basis. Unlike many other low-cost vehicles, the Nano is a simplified version of a
more expensive car design. Other newly frugal
engineered products, from refrigerators to
computers to X-ray machines, are based on a
bottom-up approach. Frugal engineering is an
effective and essential approach to developing
products and services. [1].
The primary focus of frugal engineering is to
reduce costs and resource consumption.
Furthermore, reducing wasteful efforts,
incorporating cost-cutting measures into initial production processes, and designing self-invented
processes. A critical focus always accompanies a
commitment to maximizing customer value on cost.
Frugal engineering requires that companies be open
to organizational change. Three areas are
particularly crucial. Cross-functional teams, an
unconventional supply chain, top-down assistance
[1,3]. Frugal engineering also occurs in system
design and on a large scale. M-Pesa, a mobile
banking application, was developed in cooperation
with Vodafone in Kenya and is now widely used [2].
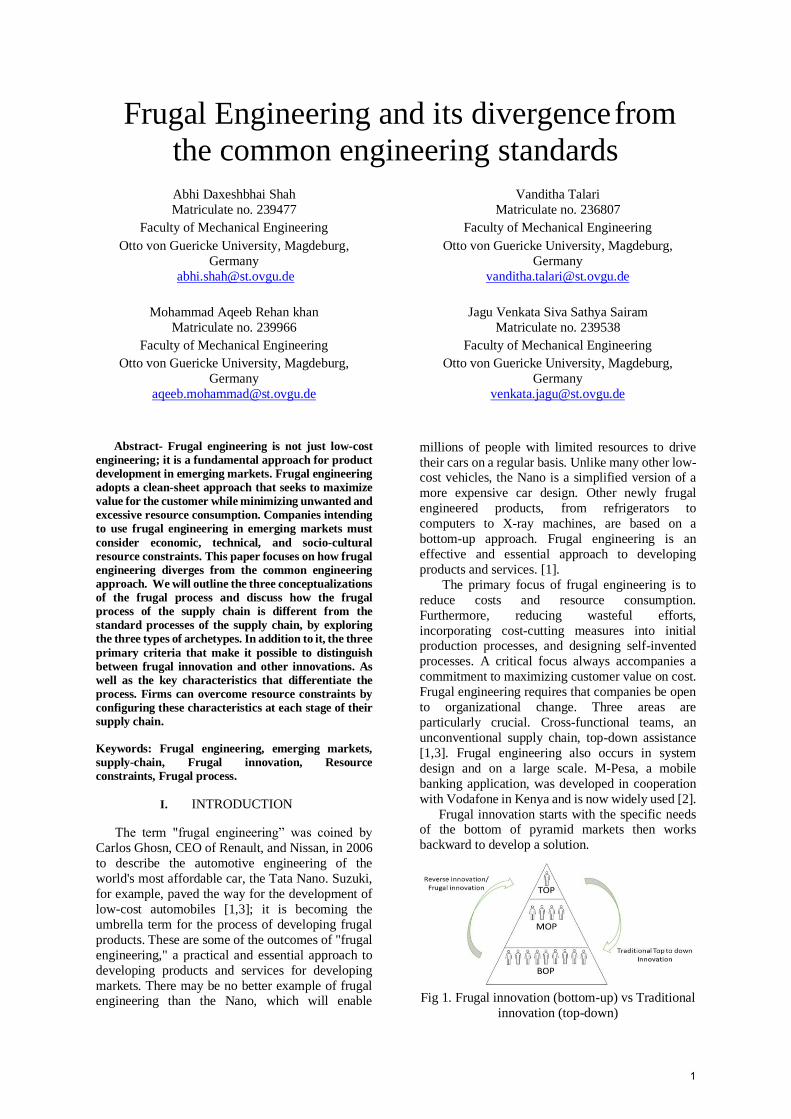
Frugal innovation starts with the specific needs of the bottom of pyramid markets then works
backward to develop a solution.
Fig 1. Frugal innovation (bottom-up) vs Traditional
innovation (top-down)
1
As a result, this approach may differ
substantially from standard engineering solutions
for up-market segments.
In a scalable, sustainable fashion, frugal
innovation involves discovering new business models, reconfiguring value chains, and redesigning
products to accommodate consumers facing extreme
affordability constraints. Creating more inclusive
markets must involve overcoming or leveraging
institutional voids and resource constraints. The
concept of frugal innovation is merely to provide
functional solutions for the many people with little
means through the use of few resources [4]
At times, the word "innovating" is used in the
same sense as "developing.” For example. Agarwal
and Brem [5, p.37] wrote that companies at the
bottom of the pyramid “Businesses started identifying these local innovations more frequently
in emerging markets. They realized the special
competencies of the local population in innovating
cost-effective products, quickly and in a resource-
constrained environment”; which was later referred
to as “frugal engineering” by Carlos Ghosn, the
CEO of Renault-Nissan.
Frugal innovation is sometimes referred to as
the term for both frugal products themselves and as
well as to the process of developing them [6]. Ojha
[6] stated that “the term frugal innovation refers to the systematic innovation process that had been
adopted in order to develop high-end, low-cost
products.” This conceptualization of the frugal
process and frugal innovation is expounded better by
Julia C. Arlinghaus and Stephanie Knizkov in [8].
II. CONCEPTUALIZATIONS OF FRUGAL
PROCESSES
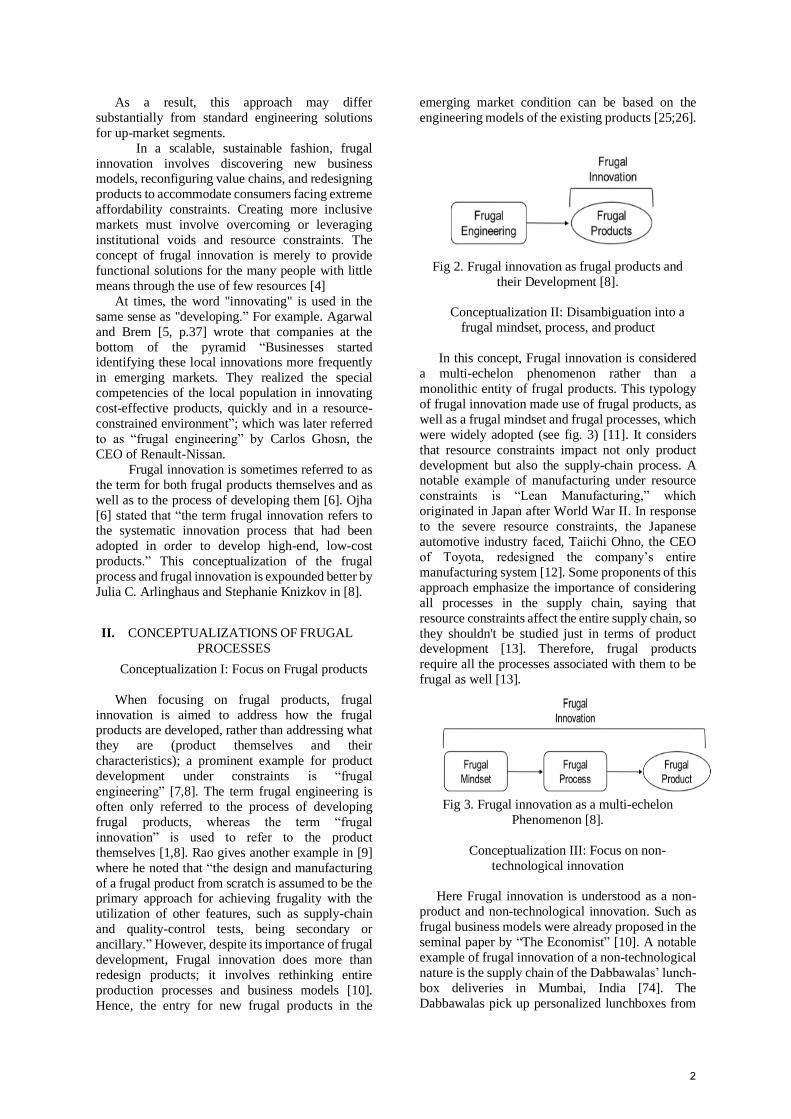
Conceptualization I: Focus on Frugal products
When focusing on frugal products, frugal
innovation is aimed to address how the frugal products are developed, rather than addressing what
they are (product themselves and their
characteristics); a prominent example for product
development under constraints is “frugal
engineering” [7,8]. The term frugal engineering is
often only referred to the process of developing
frugal products, whereas the term “frugal
innovation” is used to refer to the product
themselves [1,8]. Rao gives another example in [9]
where he noted that “the design and manufacturing
of a frugal product from scratch is assumed to be the primary approach for achieving frugality with the
utilization of other features, such as supply-chain
and quality-control tests, being secondary or
ancillary.” However, despite its importance of frugal
development, Frugal innovation does more than
redesign products; it involves rethinking entire
production processes and business models [10].
Hence, the entry for new frugal products in the
emerging market condition can be based on the
engineering models of the existing products [25;26].
Fig 2. Frugal innovation as frugal products and
their Development [8].
Conceptualization II: Disambiguation into a
frugal mindset, process, and product
In this concept, Frugal innovation is considered
a multi-echelon phenomenon rather than a
monolithic entity of frugal products. This typology
of frugal innovation made use of frugal products, as
well as a frugal mindset and frugal processes, which
were widely adopted (see fig. 3) [11]. It considers
that resource constraints impact not only product
development but also the supply-chain process. A notable example of manufacturing under resource
constraints is “Lean Manufacturing,” which
originated in Japan after World War II. In response
to the severe resource constraints, the Japanese
automotive industry faced, Taiichi Ohno, the CEO
of Toyota, redesigned the company’s entire
manufacturing system [12]. Some proponents of this
approach emphasize the importance of considering
all processes in the supply chain, saying that
resource constraints affect the entire supply chain, so
they shouldn't be studied just in terms of product development [13]. Therefore, frugal products
require all the processes associated with them to be
frugal as well [13].
Fig 3. Frugal innovation as a multi-echelon
Phenomenon [8].
Conceptualization III: Focus on non-
technological innovation
Here Frugal innovation is understood as a non-
product and non-technological innovation. Such as
frugal business models were already proposed in the
seminal paper by “The Economist” [10]. A notable
example of frugal innovation of a non-technological
nature is the supply chain of the Dabbawalas’ lunch-
box deliveries in Mumbai, India [74]. The
Dabbawalas pick up personalized lunchboxes from
2
their customers’ homes, deliver them to their
respective offices across the city, and return the
empty lunch box to their homes. Through an
ingeniously designed color-based code system and
using only public transportation and bicycles, the Dabbawalas manage a highly complex network and
deliver over 200,000 lunchboxes daily while
maintaining an astounding accuracy rate (service
level) of 99.99% [14].
Fig 4. Frugal innovation as a nontechnological
Innovation [8].
III. PRIMARY CRITERION FOR FRUGAL INNOVATION
Frugal innovation mainly occurs within the three
main categories
1. Substantial cost reduction
2. Concentration on core functionalities
3. Optimized performance level
Thus, most characteristics that are attributed to
frugal innovation can be related to at least one of the
three primary categories. Using the three categories,
we defined criteria for frugal innovation [22].
1. Substantial cost reduction
Frugal innovation is characterized by a much
lower price or significantly lower costs compared to
conventional products and services. It is not
explicitly mentioned whether lower costs must
always be from a customer perspective, or
innovation can be frugal when there is a cost
reduction only from a manufacturer or service
provider perspective. Some findings clarify that it must always be from a customer perspective. Cost
reductions that only apply to one manufacturer or
service provider are insufficient since they do not
align with most terms that define frugal innovation.
The criterion of substantial cost reduction must,
therefore, always be met from the customer’s
perspective, which includes the view of the
manufacturer or service provider [22,23].
It isn’t easy to specify the extent of the cost
reduction in frugal innovation. Characterizations
such as “minimum cost,” “much lower price,” “significantly lower costs,” or “ultra-low-cost”
indicate that the cost reduction must be significant
for an innovation to be considered a frugal
innovation. It is hard to determine a specific
threshold value for a substantial cost reduction
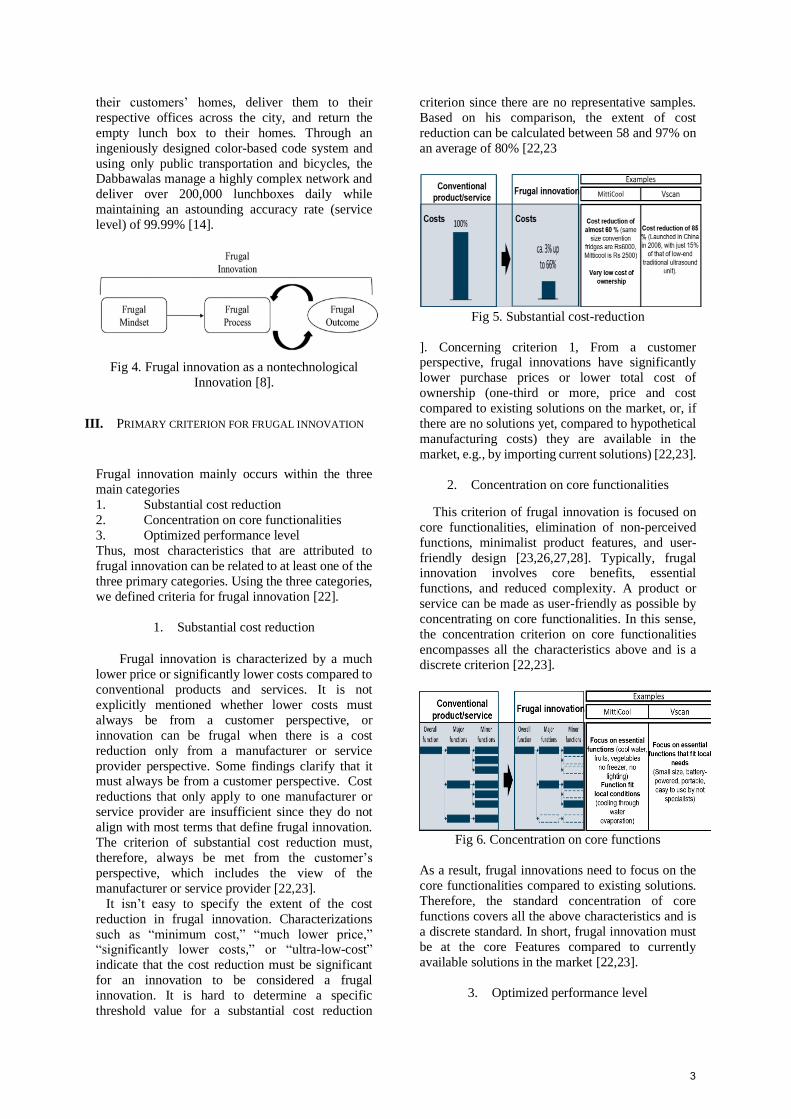
criterion since there are no representative samples.
Based on his comparison, the extent of cost
reduction can be calculated between 58 and 97% on
an average of 80% [22,23
Fig 5. Substantial cost-reduction
]. Concerning criterion 1, From a customer perspective, frugal innovations have significantly
lower purchase prices or lower total cost of
ownership (one-third or more, price and cost
compared to existing solutions on the market, or, if
there are no solutions yet, compared to hypothetical
manufacturing costs) they are available in the
market, e.g., by importing current solutions) [22,23].
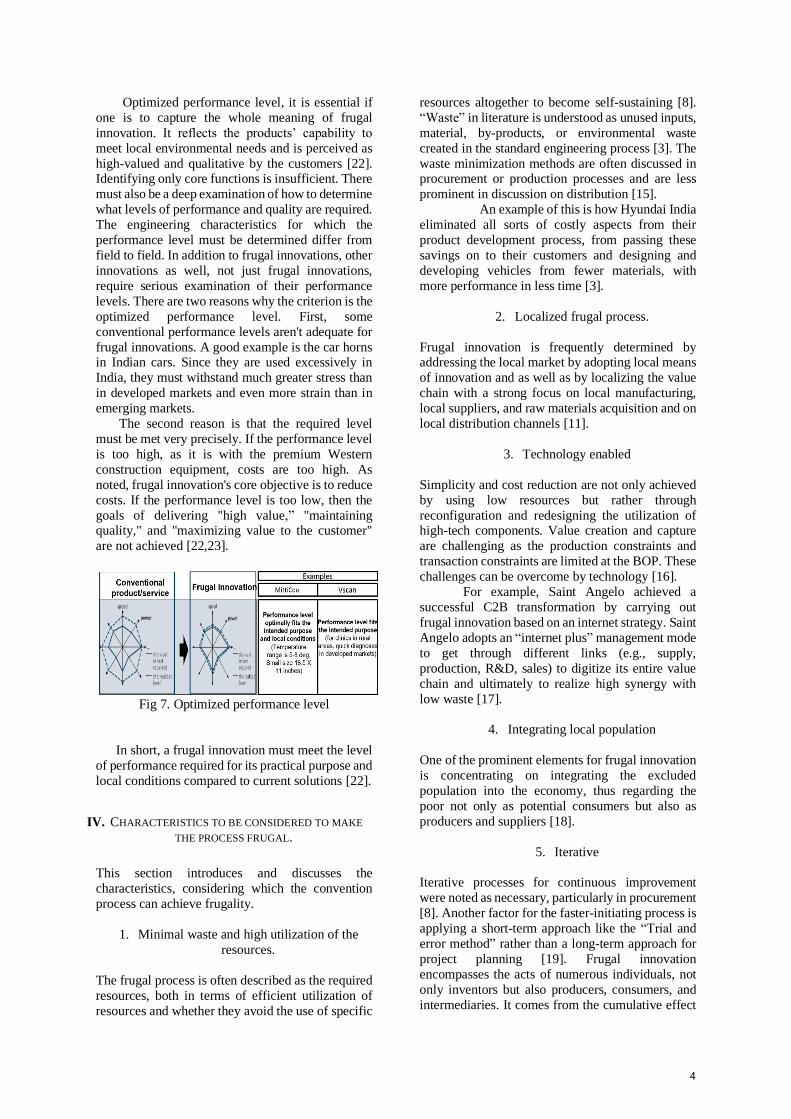
2. Concentration on core functionalities
This criterion of frugal innovation is focused on
core functionalities, elimination of non-perceived
functions, minimalist product features, and user-
friendly design [23,26,27,28]. Typically, frugal innovation involves core benefits, essential
functions, and reduced complexity. A product or
service can be made as user-friendly as possible by
concentrating on core functionalities. In this sense,
the concentration criterion on core functionalities
encompasses all the characteristics above and is a
discrete criterion [22,23].
Fig 6. Concentration on core functions
As a result, frugal innovations need to focus on the
core functionalities compared to existing solutions.
Therefore, the standard concentration of core
functions covers all the above characteristics and is
a discrete standard. In short, frugal innovation must
be at the core Features compared to currently
available solutions in the market [22,23].
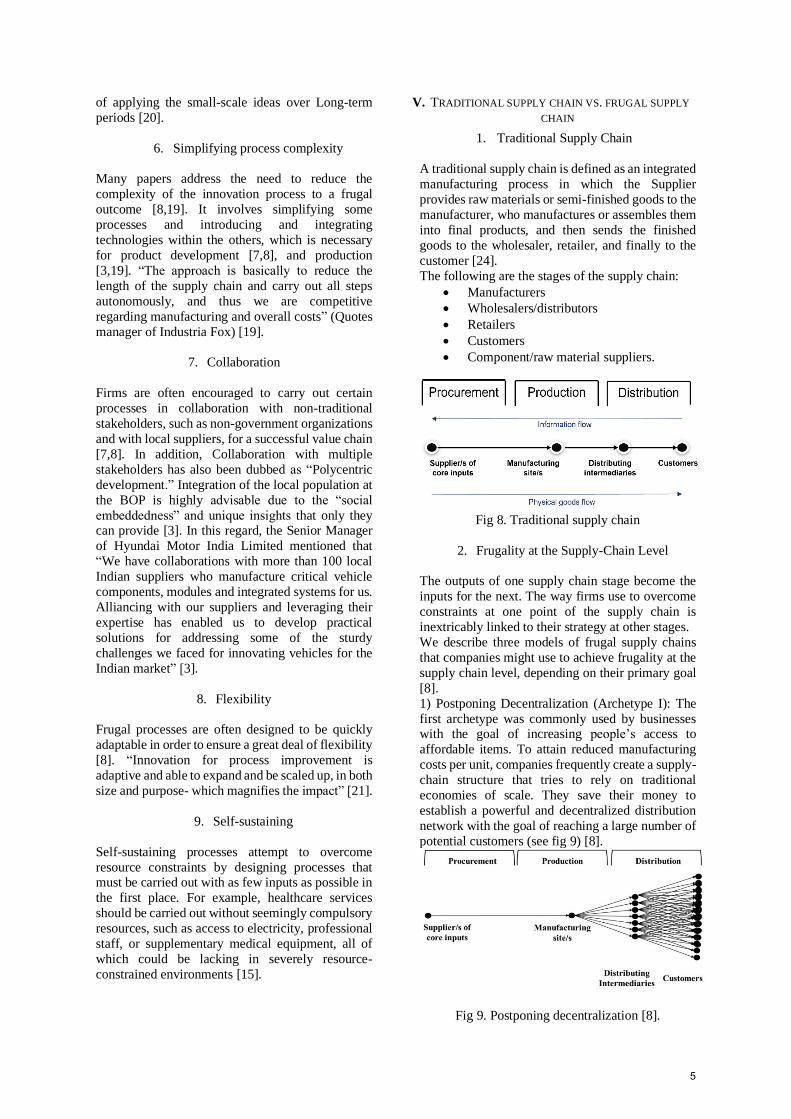
3. Optimized performance level
3
Optimized performance level, it is essential if
one is to capture the whole meaning of frugal
innovation. It reflects the products’ capability to
meet local environmental needs and is perceived as
high-valued and qualitative by the customers [22]. Identifying only core functions is insufficient. There
must also be a deep examination of how to determine
what levels of performance and quality are required.
The engineering characteristics for which the
performance level must be determined differ from
field to field. In addition to frugal innovations, other
innovations as well, not just frugal innovations,
require serious examination of their performance
levels. There are two reasons why the criterion is the
optimized performance level. First, some
conventional performance levels aren't adequate for
frugal innovations. A good example is the car horns in Indian cars. Since they are used excessively in
India, they must withstand much greater stress than
in developed markets and even more strain than in
emerging markets.
The second reason is that the required level
must be met very precisely. If the performance level
is too high, as it is with the premium Western
construction equipment, costs are too high. As
noted, frugal innovation's core objective is to reduce
costs. If the performance level is too low, then the
goals of delivering "high value,” "maintaining quality," and "maximizing value to the customer"
are not achieved [22,23].
Fig 7. Optimized performance level
In short, a frugal innovation must meet the level
of performance required for its practical purpose and
local conditions compared to current solutions [22].
IV. CHARACTERISTICS TO BE CONSIDERED TO MAKE
THE PROCESS FRUGAL.
This section introduces and discusses the
characteristics, considering which the convention
process can achieve frugality.
1. Minimal waste and high utilization of the
resources.
The frugal process is often described as the required
resources, both in terms of efficient utilization of
resources and whether they avoid the use of specific
resources altogether to become self-sustaining [8].
“Waste” in literature is understood as unused inputs,
material, by-products, or environmental waste
created in the standard engineering process [3]. The
waste minimization methods are often discussed in procurement or production processes and are less
prominent in discussion on distribution [15].
An example of this is how Hyundai India
eliminated all sorts of costly aspects from their
product development process, from passing these
savings on to their customers and designing and
developing vehicles from fewer materials, with
more performance in less time [3].
2. Localized frugal process.
Frugal innovation is frequently determined by addressing the local market by adopting local means
of innovation and as well as by localizing the value
chain with a strong focus on local manufacturing,
local suppliers, and raw materials acquisition and on
local distribution channels [11].
3. Technology enabled
Simplicity and cost reduction are not only achieved
by using low resources but rather through
reconfiguration and redesigning the utilization of high-tech components. Value creation and capture
are challenging as the production constraints and
transaction constraints are limited at the BOP. These
challenges can be overcome by technology [16].
For example, Saint Angelo achieved a
successful C2B transformation by carrying out
frugal innovation based on an internet strategy. Saint
Angelo adopts an “internet plus” management mode
to get through different links (e.g., supply,
production, R&D, sales) to digitize its entire value
chain and ultimately to realize high synergy with
low waste [17].
4. Integrating local population
One of the prominent elements for frugal innovation
is concentrating on integrating the excluded
population into the economy, thus regarding the
poor not only as potential consumers but also as
producers and suppliers [18].
5. Iterative
Iterative processes for continuous improvement
were noted as necessary, particularly in procurement
[8]. Another factor for the faster-initiating process is
applying a short-term approach like the “Trial and
error method” rather than a long-term approach for
project planning [19]. Frugal innovation
encompasses the acts of numerous individuals, not
only inventors but also producers, consumers, and
intermediaries. It comes from the cumulative effect
4
of applying the small-scale ideas over Long-term
periods [20].
6. Simplifying process complexity
Many papers address the need to reduce the
complexity of the innovation process to a frugal
outcome [8,19]. It involves simplifying some
processes and introducing and integrating
technologies within the others, which is necessary
for product development [7,8], and production
[3,19]. “The approach is basically to reduce the
length of the supply chain and carry out all steps
autonomously, and thus we are competitive
regarding manufacturing and overall costs” (Quotes
manager of Industria Fox) [19].
7. Collaboration
Firms are often encouraged to carry out certain
processes in collaboration with non-traditional
stakeholders, such as non-government organizations
and with local suppliers, for a successful value chain
[7,8]. In addition, Collaboration with multiple
stakeholders has also been dubbed as “Polycentric
development.” Integration of the local population at
the BOP is highly advisable due to the “social
embeddedness” and unique insights that only they can provide [3]. In this regard, the Senior Manager
of Hyundai Motor India Limited mentioned that
“We have collaborations with more than 100 local
Indian suppliers who manufacture critical vehicle
components, modules and integrated systems for us.
Alliancing with our suppliers and leveraging their
expertise has enabled us to develop practical
solutions for addressing some of the sturdy
challenges we faced for innovating vehicles for the
Indian market” [3].
8. Flexibility
Frugal processes are often designed to be quickly
adaptable in order to ensure a great deal of flexibility
[8]. “Innovation for process improvement is
adaptive and able to expand and be scaled up, in both
size and purpose- which magnifies the impact” [21].
9. Self-sustaining
Self-sustaining processes attempt to overcome
resource constraints by designing processes that must be carried out with as few inputs as possible in
the first place. For example, healthcare services
should be carried out without seemingly compulsory
resources, such as access to electricity, professional
staff, or supplementary medical equipment, all of
which could be lacking in severely resource-
constrained environments [15].
V. TRADITIONAL SUPPLY CHAIN VS. FRUGAL SUPPLY
CHAIN
1. Traditional Supply Chain
A traditional supply chain is defined as an integrated
manufacturing process in which the Supplier
provides raw materials or semi-finished goods to the
manufacturer, who manufactures or assembles them
into final products, and then sends the finished
goods to the wholesaler, retailer, and finally to the
customer [24].
The following are the stages of the supply chain:
• Manufacturers
• Wholesalers/distributors
• Retailers
• Customers
• Component/raw material suppliers.
Fig 8. Traditional supply chain
2. Frugality at the Supply-Chain Level
The outputs of one supply chain stage become the
inputs for the next. The way firms use to overcome
constraints at one point of the supply chain is
inextricably linked to their strategy at other stages.
We describe three models of frugal supply chains
that companies might use to achieve frugality at the
supply chain level, depending on their primary goal
[8].
1) Postponing Decentralization (Archetype I): The
first archetype was commonly used by businesses with the goal of increasing people’s access to
affordable items. To attain reduced manufacturing
costs per unit, companies frequently create a supply-
chain structure that tries to rely on traditional
economies of scale. They save their money to
establish a powerful and decentralized distribution
network with the goal of reaching a large number of
potential customers (see fig 9) [8].
Fig 9. Postponing decentralization [8].
5
Most of these price points are attained through
buyer-supplier interactions that resemble more
traditional methods. For most cases, assembly is
done in a factory in the country where the major components are sourced and then shipped into the
target market's country via bulk shipments. Unlike
procurement and production, which are both
generally centralized, these distribution methods are
extremely decentralized and focused on moving
products down the supply chain and to the final
consumer [8].
2) Balancing Investment Costs and Productivity
(Archetype II): This second frugal supply-chain
type was commonly used by companies that wanted
to promote empowerment. Companies with a mission like this are less interested in building their
supply chain to save money through economies-of-
scale benefits like global sourcing or nonlocal
production, which are common in Archetype I.
These businesses must strike a careful balance
between spending their capital in growing local
talents and reaping the benefits of increased
production while still fulfilling their objective of
local empowerment (see fig 10) [8].
Fig 10. Balancing Costs and Productivity [8].
Raw materials for the products are typically grown
by the company in a central area or purchased from a few suppliers in close proximity to the firm. This
"decommoditization" of suppliers improves the
firm's empowering purpose while ensuring the
quality of inputs and the efficient use and reuse of
limited resources across the supply chain. Firms of
this archetype aim to build enough manufacturing
capacity locally in order to be able to capitalize on
economies of scale. However, in order to build such
capacities at significantly fewer investment costs,
they often rely on labor-intensive and simplified
manufacturing. Simplifying the process also allows firms to employ individuals who would be
challenging to hire otherwise in a non-simplified
process. Firms have a high level of control over their
production processes because manufacturing is done
locally. Some businesses use this control as an
opportunity to develop innovative solutions for
further lowering end price points [8].
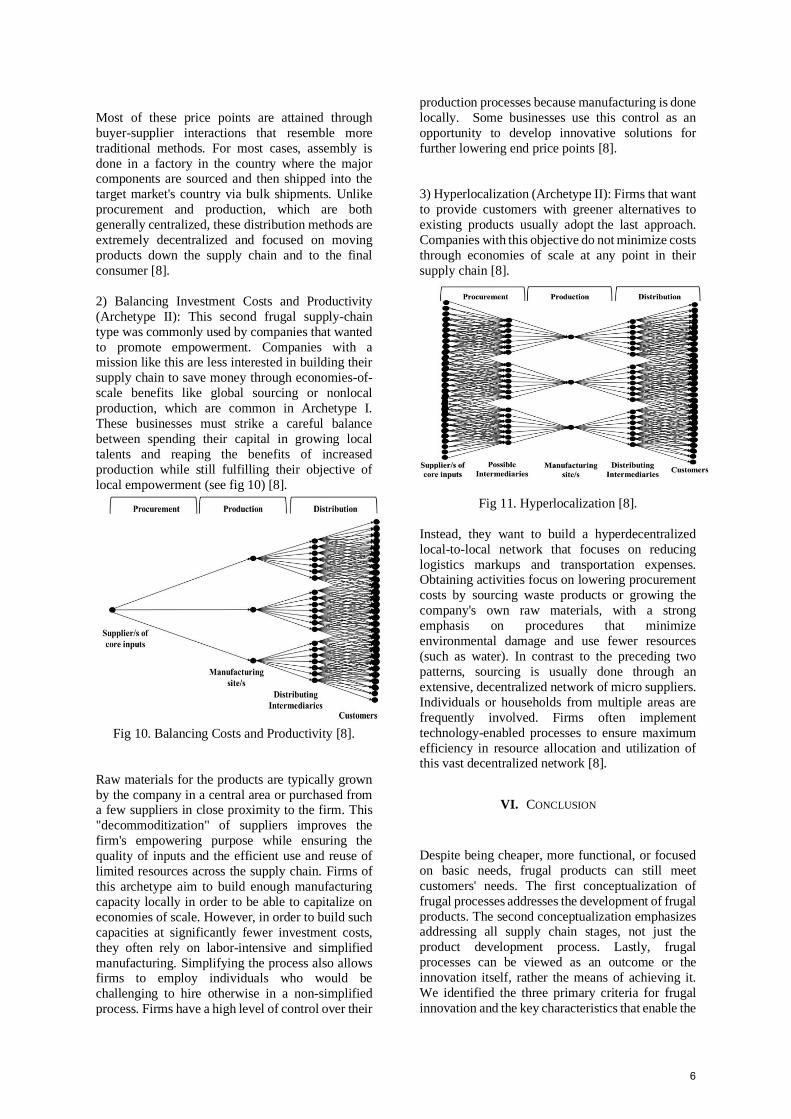
3) Hyperlocalization (Archetype II): Firms that want
to provide customers with greener alternatives to
existing products usually adopt the last approach.
Companies with this objective do not minimize costs
through economies of scale at any point in their
supply chain [8].
Fig 11. Hyperlocalization [8].
Instead, they want to build a hyperdecentralized
local-to-local network that focuses on reducing
logistics markups and transportation expenses. Obtaining activities focus on lowering procurement
costs by sourcing waste products or growing the
company's own raw materials, with a strong
emphasis on procedures that minimize
environmental damage and use fewer resources
(such as water). In contrast to the preceding two
patterns, sourcing is usually done through an
extensive, decentralized network of micro suppliers.
Individuals or households from multiple areas are
frequently involved. Firms often implement
technology-enabled processes to ensure maximum
efficiency in resource allocation and utilization of this vast decentralized network [8].
VI. CONCLUSION
Despite being cheaper, more functional, or focused
on basic needs, frugal products can still meet
customers' needs. The first conceptualization of
frugal processes addresses the development of frugal
products. The second conceptualization emphasizes addressing all supply chain stages, not just the
product development process. Lastly, frugal
processes can be viewed as an outcome or the
innovation itself, rather the means of achieving it.
We identified the three primary criteria for frugal
innovation and the key characteristics that enable the
6
conventional processes to achieve frugality. The
frugal process, as portrayed has the following 9 key
characteristics.
1) Minimal waste creation
2) Localized
3) Technology enabled
4) Integrating the local population
5) Iterative
6) Simplified process complexity
7) Collaboration
8) flexible and easily adaptable
9) self-sustaining
We discussed the three possible archetypes for
achieving frugality in a supply chain and which
archetype is suitable for firms with different primary
goals.
REFERENCES
[1] V. Sehgal, K. Dehoff, and G. Panneer, “The importance of
frugal engineering—Strategy+business,” 2010. Accessed:
Jul. 2, 2020. [Online]. Available: https://www.strategy-
business.com/article/10201?gko=56907#:∼:text=Cost%2
0discipline%20is%20an%20intrinsic,markets%20is%20a
%20losing%20game
[2] R. Beise-Zee, C. Herstatt, and R. Tiwari, "Guest Editorial:
Resource-Constrained Innovation and Frugal
Engineering," in IEEE Transactions on Engineering
Management, vol. 68, no. 3, pp. 643-652, June 2021, DOI:
10.1109/TEM.2020.3040580.
[3] R. Sharmelly and P. K. Ray, “The role of frugal innovation
and collaborative ecosystems: The case of Hyundai in
India,” J. General Manage., vol. 43, pp. 157–174, 2018
[4] http://www.frugal-innovation.com/
[5] N. Agarwal and A. Brem, “Frugal innovation-past, present,
and future,” IEEE Eng. Manage. Rev., vol. 45, no. 3, pp.
37–41, Jul.–Sep. 2017.
[6] A. K. Ojha, “MNCs in India: Focus on frugal innovation,”
J. Indian Bus. Res., vol. 6, pp. 4–28, 2014.
[7] A.C. Lehner, C. Koldewey, and J. Gausemeier, “Approach
for a pattern-based development of frugal innovations,”
Technol. Innov. Manage. Rev., vol. 8, pp. 14–27, 2018.
[8] S. Knizkov and J. C. Arlinghaus, "Frugal Processes: An
Empirical Investigation Into the Operations of Resource-
Constrained Firms," in IEEE Transactions on Engineering
Management, vol. 68, no. 3, pp. 667-684, June 2021, DOI:
10.1109/TEM.2020.3016776.
[9] B. C. Rao, “Science is indispensable to frugal
innovations,” Technol. Innov. Manage. Rev., vol. 8, pp.
49–56, 2018
[10] The Economist, “First break all the rules: The charms of
frugal innovation. Special report on innovation in
emerging markets,” The Economist, pp. 3–5, Apr. 17,
2010. Accessed: Jun. 7, 2019. [Online]. Available:
https://www.economist.com/special
report/2010/04/17/first-break-all-the-rules
[11] P. Soni and R. T. Krishnan, “Frugal Innovation: Aligning
theory, practice, and public policy,” J. Indian Bus. Res.,
vol. 6, pp. 29–47, 2014.
[12] J. P. Womack and D. T. Jones, Lean Thinking: Banish
Waste and Create Wealth in Your Corporation. London,
U.K.: Touchstone Books, 1998.
[13] Y. Bhatti and M. Ventresca, “How can ‘frugal innovation’
be conceptualized?” Jan. 19, 2013. [Online]. Available:
http://dx.doi.org/10.2139/ssrn.2203552
[14] K. T. Shibin, R. Dubey, A. Gunasekaran, Z. W. Luo, T.
Papadopoulos, and D. Roubaud, “Frugal innovation for
supply-chain sustainability in SMEs: Multi-method
research design,” Prod. Planning Control, vol. 29, pp. 908–
927, 2018.
[15] S. Winterhalter, M. B. Zeschky, L. Neumann, and O.
Gassmann, “Business models for frugal innovation in
emerging markets: The case of the medical device and
laboratory equipment industry,” Technovation, vol. 66/67,
pp. 3–13, 2017.
[16] R. Howell, C. Van Beers, and N. Doorn, “Value capture
and value creation: The role of information technology in
business models for frugal innovations in Africa,”
Technol. Forecast. Soc. Change, vol. 131, pp. 227–239,
2018.
[17] F. Lan and X. Liu, “Business model transformation in
digital enablement context through frugal innovation:
Learning from the Chinese experience,” Int. J. Technol.,
Policy Manage., vol. 17, pp. 360–373, 2017
[18] H. Nari Kahle, A. Dubiel, H. Ernst, and J. Prabhu, “The
democratizing effects of frugal innovation: Implications
for inclusive growth and state-building,” J. Indian Bus.
Res., vol. 5, pp. 220–234, 2013.
[19] H.-C. Busch, T. Dauth, L. Fischer, and M. Souza, “Frugal
innovation approaches to sustainable domestic energy:
Two cases of solar water heating from Brazil,” Int. J.
Technol. Learn., Innov. Develop., vol. 10, pp. 231–257,
2018.
[20] A. Leliveld and P. Knorringa, “Frugal innovation and
development research,” Eur. J. Develop. Res., v
[21] Y. A. Bhatti et al., “The search for the holy grail: Frugal
innovation in healthcare from low-income or middle-
income countries for reverse innovation to developed
countries,” BMJ Innov., vol. 3, pp. 212–220, 2017
[22] T. Weyrauch and C. Herstatt, “What is frugal innovation?
Three defining criteria,” J. Frugal Innov., vol. 2, 2016, Art.
no. 1
[23] Thomas Winkler, Anita Ulz, Wolfgang Knöbl, Hans
Lercher, “Frugal innovation in developed markets –
Adaption of a criteria-based evaluation model.” DOI:
10.1016/j.jik.2019.11.004x
[24] Deshmukh, Ashish & Vasudevan, Hari. (2014). Emerging
Supplier Selection Criteria in The Context of Traditional
VS Green Supply Chain Management. International
Journal of Managing Value and Supply Chains. 5. 19-33.
10.5121/ijmvsc.2014.5103.
[25] R. R. Mehr, A. Luder, Managing Complexity Within the
Engineering ¨ of Product and Production Systems, in
Security and Quality in CyberPhysical Systems
Engineering, Springer, 2019, pp. 57–79.
[26] Yazgül Fidan, Arndt Lüder, Kristof Meixner, Laura
Baumann, Julia C. Arlinghaus, “Decision Support for
Frugal Products and Production Systems based on Product-
Process-Resource-Skill & Variability Models”, Procedia
CIRP, Volume 104, 2021, Pages 1619-1625, ISSN 2212-
8271, https://doi.org/10.1016/j.procir.2021.11.273
[27] R. R. Basu, P. M. Banerjee, E. G. Sweeny, Frugal
Innovation – Core Competencies to Adress Global
Sustainability, Journal of Management for Global
Sustainability 1 (2) (2013) 63–82.
[28] J. C. Bendul, E. Rosca, D. Pivovarova, Sustainable Supply
Chain Models for base of the Pyramid, Journal of Cleaner
Production 162 (2017) 107–120.
7
Frugal Engineering and how does it change the life
cycle of technical systems
Raksha Chandrashekar Gowda
Faculty of Mechanical engineering
Otto von Guericke university
Magdeburg, Germany
Rohan Srinivasa
Faculty of Mechanical engineering
Otto von Guericke university
Magdeburg, Germany
Roopal Thakur
Faculty of Mechanical engineering
Otto von Guericke university
Magdeburg, Germany
Shubham Kotian
Faculty of Mechanical engineering
Otto von Guericke university
Magdeburg, Germany
Nayan Amratlal Bafna
Faculty of Mechanical engineering
Otto von Guericke university
Magdeburg, Germany
Abstract— Frugal Innovation and its impact on the Life cycle on
technical systems are the two concepts being deliberated among the
policymakers, engineers, researchers of the developing and
developed countries alike. The current work provides a rundown of
the approaches to the frugal innovation adopted in the
Manufacturing sectors, Defence sectors, Business models, etc., and
the life cycle assessment of the whole process. The current work
establishes the conceptual framework based on the literature reviews
and case studies analysis. Frugal innovation undoubtedly impacts
the life cycle of the technical systems and in many cases validates the
improvement.
The result of our findings shows that the impact of the Life cycle of
systems through the Frugal approach would concern the socio-
economic, geographic context of emerging economies. Rapid
technological development, adopting different supply chain
strategies, and the efforts to generate inclusivity to empower the
communities to achieve the core functionalities are the outcome of
Frugal innovation considering a Resource-constraint environment.
Key Words: Frugal Innovation, Bottom of Pyramid, Constraint-
Based Thinking, Life cycle Assessment, Reusability, Modular
Approach, Microentrepreneurship.
I. INTRODUCTION
The topic of innovation has typically been the realm of emerged
countries, like the United States, Japan, and the United
Kingdom. However, emerging countries are quickly catching
up, not out of greed, but out of need. Emerging countries are
nations with low living standards, underdeveloped industrial
base, and low Human Development Index relative to other
countries.[1]
Frugality, derived from the Latin word frugal is, is a concept
that has been existing in society for several years under different
forms (e.g., ‘DIY’ in the US, ‘Jugaad’ in India, ‘Zizhu’ in
China, and ‘jua kali’ in Africa). Businesses realized the special
competencies of the local population in innovating cost-
effective products, quickly and in a resource-constrained
environment which was later referred to as “Frugal
Engineering”. Resource constraints such as less developed
infrastructure, institutional voids, illiteracy, and low purchasing
power were identified as major driving factors for these
innovations. Other constraint-based innovations such as
inclusive innovation, grassroots innovation, Gandhian
innovation, catalytic innovation, indigenous innovation,
resource-constrained innovations, and reverse innovations are
already introduced in the same context. However, Research
scholars are increasingly using a common term of ‘frugal
innovation’ to refer to all these innovations. Research
acknowledges frugal innovation as a multi-dimensional
phenomenon with three primary dimensions—Product, process,
and context. Product dimension includes the characteristics of
being simple, robust, and focuses on the core and required
functionalities. The process includes a bottom-up creative
process to respond to challenges, localized development, and
scaling options. And the context dimension includes the
affordability aspect, resourcefulness, and radical or
transformative implications.[2]
Over the years, frugal innovation has come a long way from the
initial focus on Bottom of the pyramid (BOP) customers in
emerging markets to be explored as a concept in combating
challenges at a global level. Environmental and demographic
(e.g., aging population) as well as socio-economic changes
(e.g., growing cross-border migrations) are being identified as
sources of this contextual shift beyond Bottom of Pyramid
(BOP) markets. This study attempts to showcase the impact of
frugal engineering on the lifecycle of the technical system. The
rest of this study is organized as follows. Following this
introduction to frugal engineering, there is the current state of
8
the art and then exhibiting the impact of frugal engineering on
the life-cycle of a system by classifying frugal engineering in
two directions,
a) Based on the approach to achieve frugal engineered
products and,
b) Based on the geographical location where frugalism is
to be achieved.
Lastly, the paper closes with some limitations, conclusions, and
references.
II. STATE OF THE ART
When it comes to frugal innovation success or failure, the
motivation for such marketplaces is not comparable. The
market in which Frugal Innovation is created also influences its
definition. Several studies were performed in the field of Frugal
Innovation considering the criteria for significant cost
reduction. To be effective in the success or failure of Frugal
Innovation, optimized performance in combination with user-
related aspects such as acceptance and prestige are useful.
Frugal Innovation can be a tool for sustainable development,
but it requires a collaborative effort, resources, and motivation
from a variety of stakeholders, including private sector actors,
governments, development agencies, and urban society. Frugal Innovation aspects are removing unnecessary features,
replacing expensive materials with available alternatives,
paying attention to personal and societal demands, cultural
problems, having skills, multi-skilled entrepreneurs, and paying
respect to nature. Further research could determine compliance,
participation, and limits on various tactics for local MNCs and
enterprises, as well as international and local businesses. The
importance of the government's Frugal Innovation in combating
COVID 19 was emphasized. While certain governments have
been successful in establishing and maintaining a Frugal
Innovation culture, future research should look into how
governments can embed the values and attitudes that facilitate
Frugal Innovation in the long run. Business acumen,
management reluctances, challenges in R&D, challenges in
prototyping, currency fluctuations, smuggling, information and
difficulty in SCM, lack of infrastructure, fear of competitors,
low protection of intellectual property rights, cultural issues,
and resource scarcity are the most significant barriers to Frugal
Innovation. Like the use of value ratio (the ratio of worth
divided by costs), a frugal value ratio is suggested in which,
enablers and critical success factors are set as numerators and
barriers are set as denominators. Each of the factors can be
given a relative weight, and the components can then be
multiplied by each other. The value of such a ratio can then be
used to rank frugal innovation strategies or opportunities for
new product/process development. This study lays the
groundwork for prioritizing frugal innovation strategies or new
product/process innovation options using multiple criteria
decision making (MCDM).
Finally, the findings of this systematic literature analysis can be
applied to organizations that aim to innovate in low-resource
environments as well as the BOP. Additionally, the proposed
approach can be employed by organizations that want to
innovate while still protecting the environment. Researchers
can utilize the findings to investigate and rank aspects in their
local settings.[3]
III. RESEARCH IMPLICATION
After going through several papers for this research we decide
to divide the outcome part into two sub-parts. Those two sub-
parts are discussed in detail in the following section.
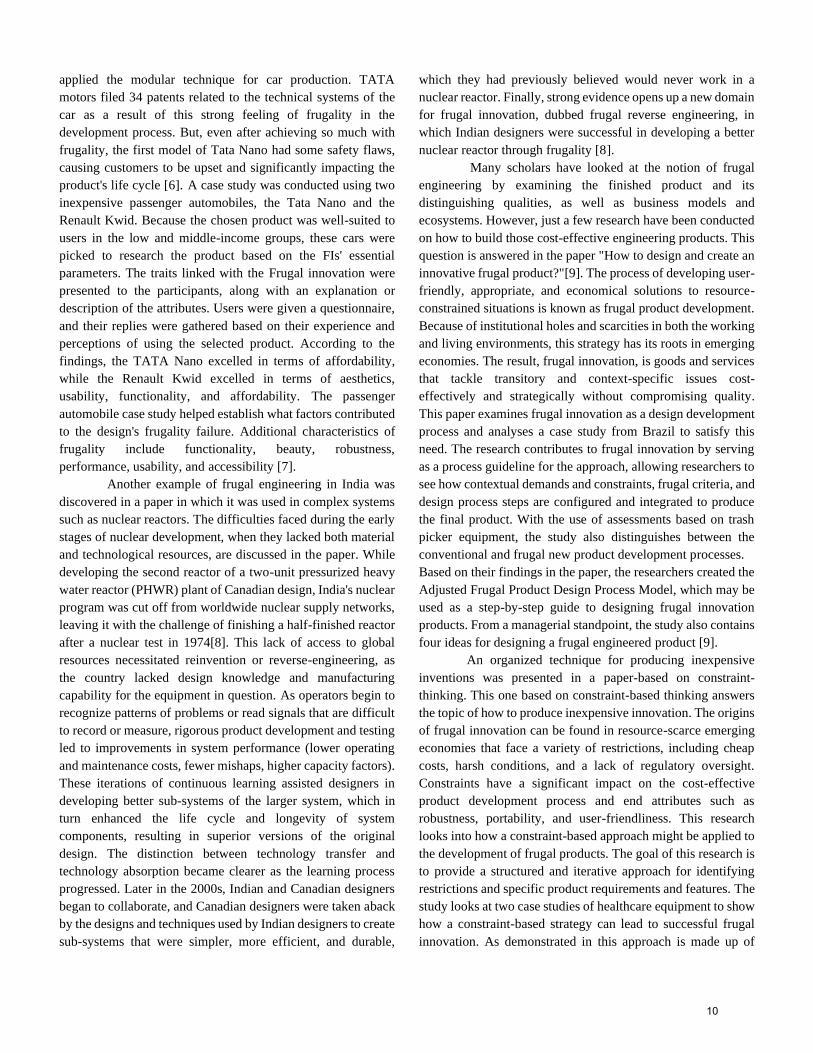
A. Based on a strategy used to achieve Frugal engineered
products
In this section, we will analyze how the method used to achieve
frugality determines a technical system's life cycle. The
management, information technology, and organizational
culture all influence this strategy. [4]. For example, in India's
manufacturing department, cost reduction is achieved by
integrating new and modern frugal engineering technologies in
the manufacturing sector to boost precision, production rate,
and assembly-line efficiency. The six key ideas briefly outlined
below can explain the Indian manufacturing sector's frugal
engineering efforts: Robustness, Portability, Leapfrog
technology, Mega-scale production, Service ecosystem, and
Disfeaturing. The frugal manufacturing strategy entails
dismantling and reconstructing a cycle, which results in a
simpler, more resilient, and easier-to-handle process and a more
cost-effective final product.
Instead of academic literature in emerging countries,
frugal engineering arose from the company's response to
various restrictions. Frugal engineered products must be able to
deal with a variety of infrastructural issues as well as be market
compatible, and they must have a reasonable price for
reasonable product performance. Frugal Engineering is a
systematic technique that has compelled and inspired
manufacturing industries all over the world to re-evaluate and
re-strategize their processes. Frugal engineering breaks down
the entire product engineering phase into its most fundamental
mechanisms and then restores it in the most cost-effective
manner possible. The challenge is to pick between product
features and a cost-cutting decision. The entire strategy revolves
around identifying consumer demands and meeting them
through various methods. [5].
We researched Tata Nano which is one of India's most
significant achievements in terms of frugal innovation. For the
development of the car TATA management chose "concurrent
engineering in real-time" for the development process, and
9
applied the modular technique for car production. TATA
motors filed 34 patents related to the technical systems of the
car as a result of this strong feeling of frugality in the
development process. But, even after achieving so much with
frugality, the first model of Tata Nano had some safety flaws,
causing customers to be upset and significantly impacting the
product's life cycle [6]. A case study was conducted using two
inexpensive passenger automobiles, the Tata Nano and the
Renault Kwid. Because the chosen product was well-suited to
users in the low and middle-income groups, these cars were
picked to research the product based on the FIs' essential
parameters. The traits linked with the Frugal innovation were
presented to the participants, along with an explanation or
description of the attributes. Users were given a questionnaire,
and their replies were gathered based on their experience and
perceptions of using the selected product. According to the
findings, the TATA Nano excelled in terms of affordability,
while the Renault Kwid excelled in terms of aesthetics,
usability, functionality, and affordability. The passenger
automobile case study helped establish what factors contributed
to the design's frugality failure. Additional characteristics of
frugality include functionality, beauty, robustness,
performance, usability, and accessibility [7].
Another example of frugal engineering in India was
discovered in a paper in which it was used in complex systems
such as nuclear reactors. The difficulties faced during the early
stages of nuclear development, when they lacked both material
and technological resources, are discussed in the paper. While
developing the second reactor of a two-unit pressurized heavy
water reactor (PHWR) plant of Canadian design, India's nuclear
program was cut off from worldwide nuclear supply networks,
leaving it with the challenge of finishing a half-finished reactor
after a nuclear test in 1974[8]. This lack of access to global
resources necessitated reinvention or reverse-engineering, as
the country lacked design knowledge and manufacturing
capability for the equipment in question. As operators begin to
recognize patterns of problems or read signals that are difficult
to record or measure, rigorous product development and testing
led to improvements in system performance (lower operating
and maintenance costs, fewer mishaps, higher capacity factors).
These iterations of continuous learning assisted designers in
developing better sub-systems of the larger system, which in
turn enhanced the life cycle and longevity of system
components, resulting in superior versions of the original
design. The distinction between technology transfer and
technology absorption became clearer as the learning process
progressed. Later in the 2000s, Indian and Canadian designers
began to collaborate, and Canadian designers were taken aback
by the designs and techniques used by Indian designers to create
sub-systems that were simpler, more efficient, and durable,
which they had previously believed would never work in a
nuclear reactor. Finally, strong evidence opens up a new domain
for frugal innovation, dubbed frugal reverse engineering, in
which Indian designers were successful in developing a better
nuclear reactor through frugality [8].
Many scholars have looked at the notion of frugal
engineering by examining the finished product and its
distinguishing qualities, as well as business models and
ecosystems. However, just a few research have been conducted
on how to build those cost-effective engineering products. This
question is answered in the paper "How to design and create an
innovative frugal product?"[9]. The process of developing user-
friendly, appropriate, and economical solutions to resource-
constrained situations is known as frugal product development.
Because of institutional holes and scarcities in both the working
and living environments, this strategy has its roots in emerging
economies. The result, frugal innovation, is goods and services
that tackle transitory and context-specific issues cost-
effectively and strategically without compromising quality.
This paper examines frugal innovation as a design development
process and analyses a case study from Brazil to satisfy this
need. The research contributes to frugal innovation by serving
as a process guideline for the approach, allowing researchers to
see how contextual demands and constraints, frugal criteria, and
design process steps are configured and integrated to produce
the final product. With the use of assessments based on trash
picker equipment, the study also distinguishes between the
conventional and frugal new product development processes.
Based on their findings in the paper, the researchers created the
Adjusted Frugal Product Design Process Model, which may be
used as a step-by-step guide to designing frugal innovation
products. From a managerial standpoint, the study also contains
four ideas for designing a frugal engineered product [9].
An organized technique for producing inexpensive
inventions was presented in a paper-based on constraint-
thinking. This one based on constraint-based thinking answers
the topic of how to produce inexpensive innovation. The origins
of frugal innovation can be found in resource-scarce emerging
economies that face a variety of restrictions, including cheap
costs, harsh conditions, and a lack of regulatory oversight.
Constraints have a significant impact on the cost-effective
product development process and end attributes such as
robustness, portability, and user-friendliness. This research
looks into how a constraint-based approach might be applied to
the development of frugal products. The goal of this research is
to provide a structured and iterative approach for identifying
restrictions and specific product requirements and features. The
study looks at two case studies of healthcare equipment to show
how a constraint-based strategy can lead to successful frugal
innovation. As demonstrated in this approach is made up of
10
problem space and solution space, with four iterative steps.
Context-specific tasks are referred to as constraints. They define
a problem area for creativity and regulate the amount of
creativity available as well as the number of alternative
solutions to the initial problem. Constraints do not affect the
development process directly, but rather alter the circumstances
of normal flow. The researcher proposes a novel constraint-
based thinking approach as a structured and iterative process for
identifying constraints and mapping them to specific features
and requirements that may directly or indirectly impact the
development process for frugal innovation [10].
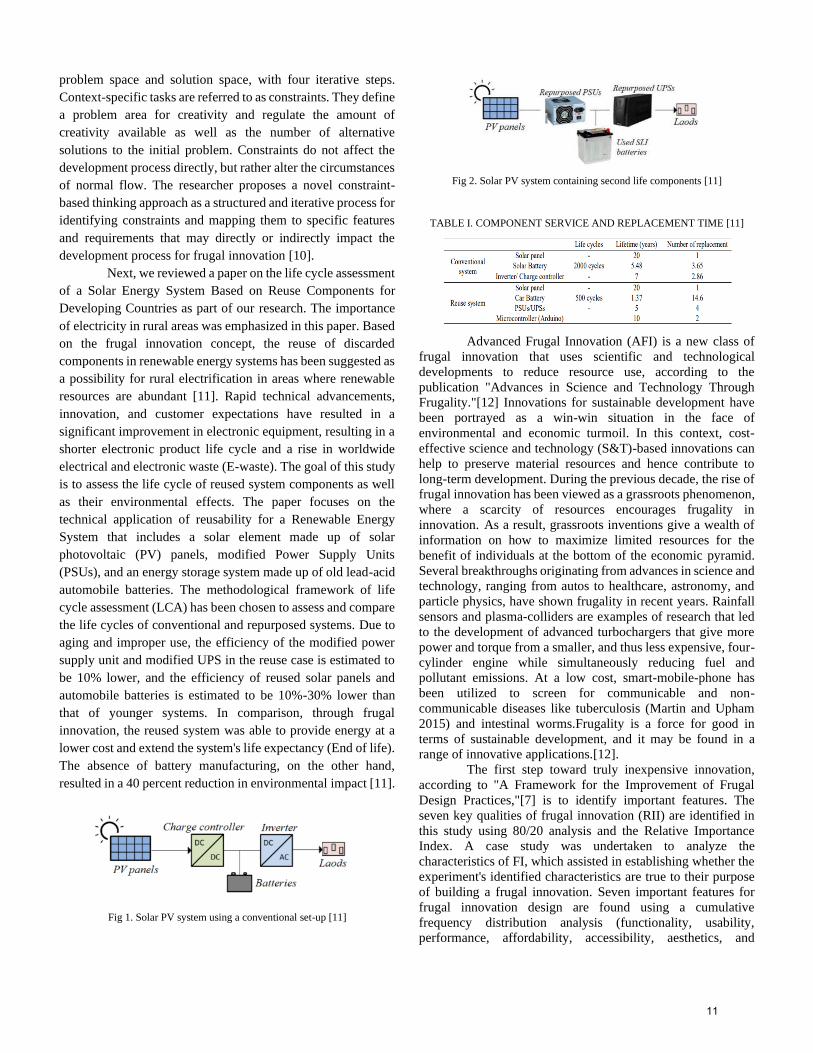
Next, we reviewed a paper on the life cycle assessment
of a Solar Energy System Based on Reuse Components for
Developing Countries as part of our research. The importance
of electricity in rural areas was emphasized in this paper. Based
on the frugal innovation concept, the reuse of discarded
components in renewable energy systems has been suggested as
a possibility for rural electrification in areas where renewable
resources are abundant [11]. Rapid technical advancements,
innovation, and customer expectations have resulted in a
significant improvement in electronic equipment, resulting in a
shorter electronic product life cycle and a rise in worldwide
electrical and electronic waste (E-waste). The goal of this study
is to assess the life cycle of reused system components as well
as their environmental effects. The paper focuses on the
technical application of reusability for a Renewable Energy
System that includes a solar element made up of solar
photovoltaic (PV) panels, modified Power Supply Units
(PSUs), and an energy storage system made up of old lead-acid
automobile batteries. The methodological framework of life
cycle assessment (LCA) has been chosen to assess and compare
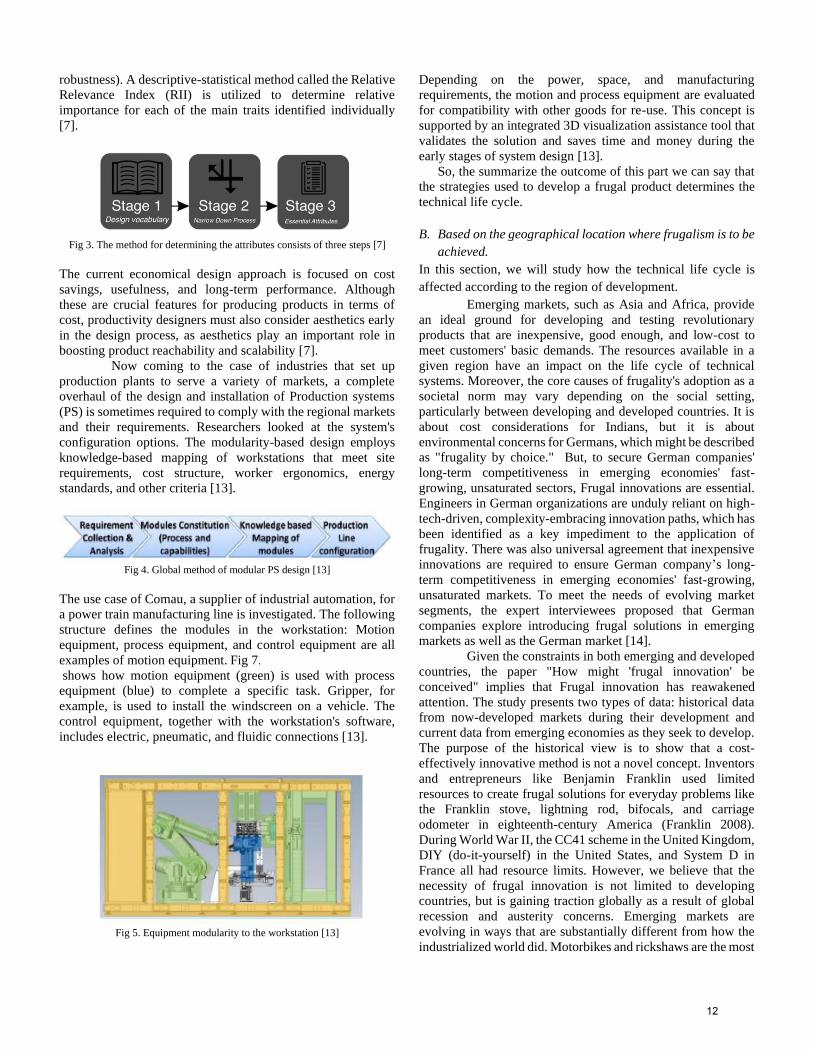
the life cycles of conventional and repurposed systems. Due to
aging and improper use, the efficiency of the modified power
supply unit and modified UPS in the reuse case is estimated to
be 10% lower, and the efficiency of reused solar panels and
automobile batteries is estimated to be 10%-30% lower than
that of younger systems. In comparison, through frugal
innovation, the reused system was able to provide energy at a
lower cost and extend the system's life expectancy (End of life).
The absence of battery manufacturing, on the other hand,
resulted in a 40 percent reduction in environmental impact [11].
Fig 1. Solar PV system using a conventional set-up [11]
Fig 2. Solar PV system containing second life components [11]
TABLE I. COMPONENT SERVICE AND REPLACEMENT TIME [11]
Advanced Frugal Innovation (AFI) is a new class of
frugal innovation that uses scientific and technological
developments to reduce resource use, according to the
publication "Advances in Science and Technology Through
Frugality."[12] Innovations for sustainable development have
been portrayed as a win-win situation in the face of
environmental and economic turmoil. In this context, cost-
effective science and technology (S&T)-based innovations can
help to preserve material resources and hence contribute to
long-term development. During the previous decade, the rise of
frugal innovation has been viewed as a grassroots phenomenon,
where a scarcity of resources encourages frugality in
innovation. As a result, grassroots inventions give a wealth of
information on how to maximize limited resources for the
benefit of individuals at the bottom of the economic pyramid.
Several breakthroughs originating from advances in science and
technology, ranging from autos to healthcare, astronomy, and
particle physics, have shown frugality in recent years. Rainfall
sensors and plasma-colliders are examples of research that led
to the development of advanced turbochargers that give more
power and torque from a smaller, and thus less expensive, four-
cylinder engine while simultaneously reducing fuel and
pollutant emissions. At a low cost, smart-mobile-phone has
been utilized to screen for communicable and non-
communicable diseases like tuberculosis (Martin and Upham
2015) and intestinal worms.Frugality is a force for good in
terms of sustainable development, and it may be found in a
range of innovative applications.[12].
The first step toward truly inexpensive innovation,
according to "A Framework for the Improvement of Frugal
Design Practices,"[7] is to identify important features. The
seven key qualities of frugal innovation (RII) are identified in
this study using 80/20 analysis and the Relative Importance
Index. A case study was undertaken to analyze the
characteristics of FI, which assisted in establishing whether the
experiment's identified characteristics are true to their purpose
of building a frugal innovation. Seven important features for
frugal innovation design are found using a cumulative
frequency distribution analysis (functionality, usability,
performance, affordability, accessibility, aesthetics, and
11
robustness). A descriptive-statistical method called the Relative
Relevance Index (RII) is utilized to determine relative
importance for each of the main traits identified individually
[7].
Fig 3. The method for determining the attributes consists of three steps [7]
The current economical design approach is focused on cost
savings, usefulness, and long-term performance. Although
these are crucial features for producing products in terms of
cost, productivity designers must also consider aesthetics early
in the design process, as aesthetics play an important role in
boosting product reachability and scalability [7].
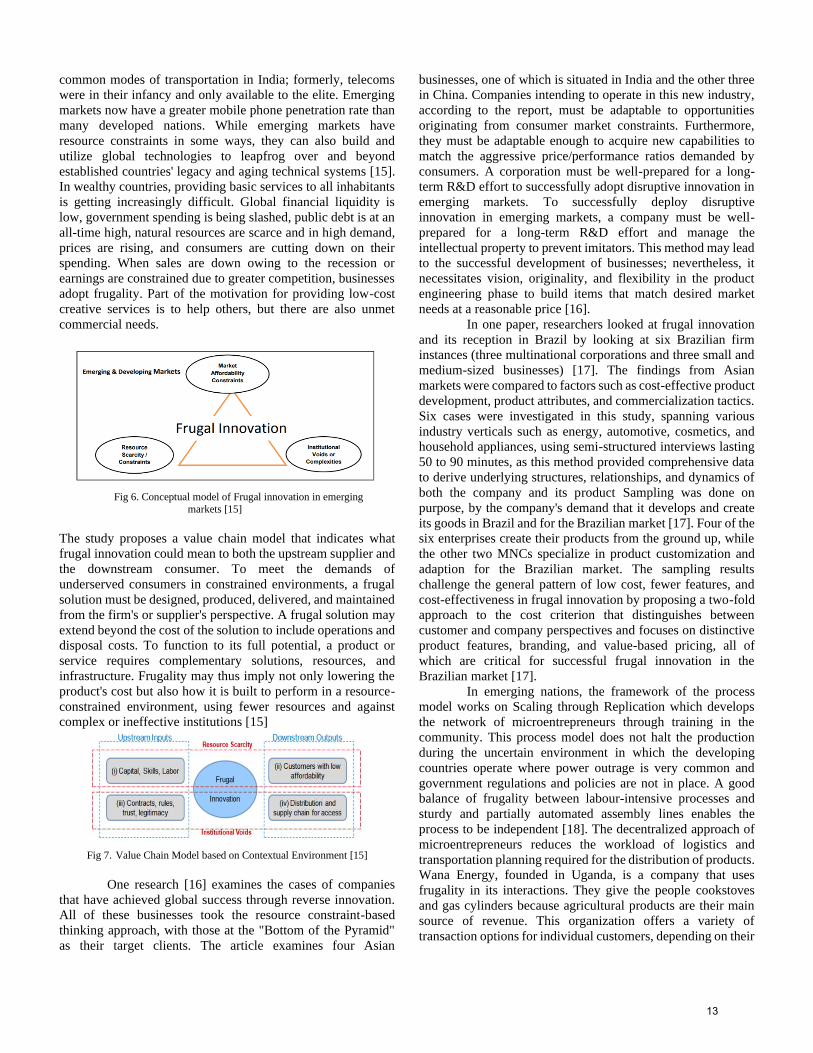
Now coming to the case of industries that set up
production plants to serve a variety of markets, a complete
overhaul of the design and installation of Production systems
(PS) is sometimes required to comply with the regional markets
and their requirements. Researchers looked at the system's
configuration options. The modularity-based design employs
knowledge-based mapping of workstations that meet site
requirements, cost structure, worker ergonomics, energy
standards, and other criteria [13].
Fig 4. Global method of modular PS design [13]
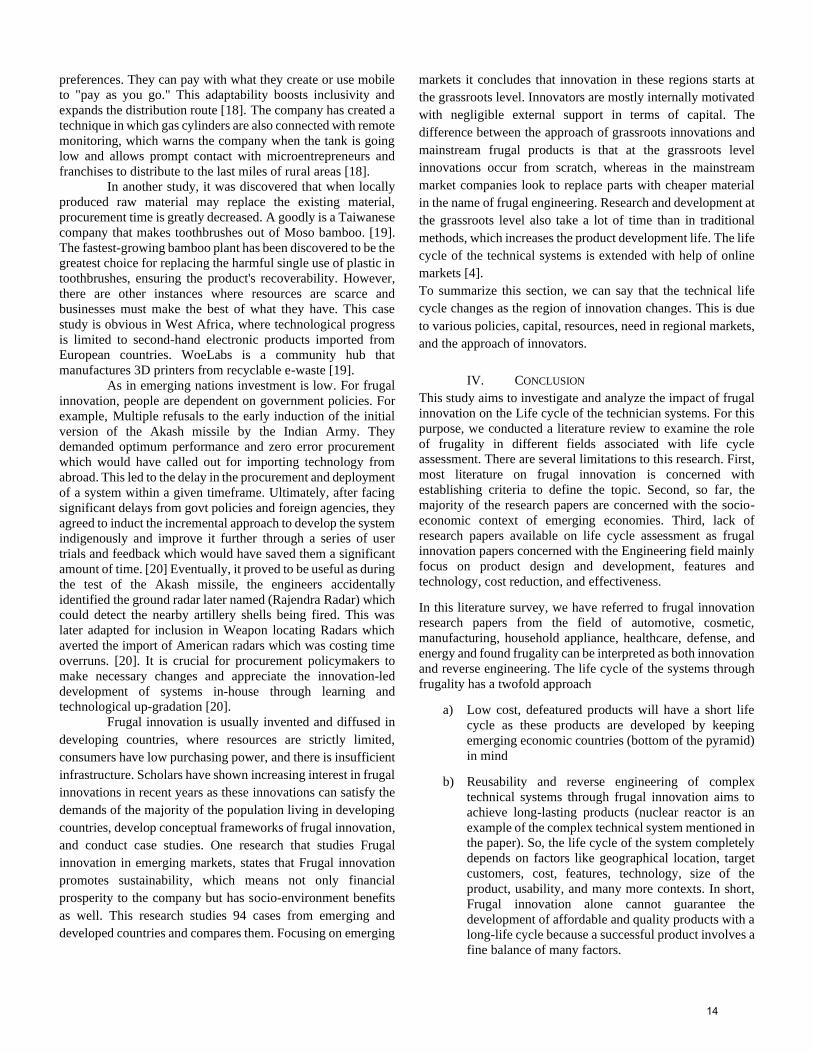
The use case of Comau, a supplier of industrial automation, for
a power train manufacturing line is investigated. The following
structure defines the modules in the workstation: Motion
equipment, process equipment, and control equipment are all
examples of motion equipment. Fig 7.
shows how motion equipment (green) is used with process
equipment (blue) to complete a specific task. Gripper, for
example, is used to install the windscreen on a vehicle. The
control equipment, together with the workstation's software,
includes electric, pneumatic, and fluidic connections [13].
Fig 5. Equipment modularity to the workstation [13]
Depending on the power, space, and manufacturing
requirements, the motion and process equipment are evaluated
for compatibility with other goods for re-use. This concept is
supported by an integrated 3D visualization assistance tool that
validates the solution and saves time and money during the
early stages of system design [13].
So, the summarize the outcome of this part we can say that
the strategies used to develop a frugal product determines the
technical life cycle.
B. Based on the geographical location where frugalism is to be
achieved.
In this section, we will study how the technical life cycle is
affected according to the region of development.
Emerging markets, such as Asia and Africa, provide
an ideal ground for developing and testing revolutionary
products that are inexpensive, good enough, and low-cost to
meet customers' basic demands. The resources available in a
given region have an impact on the life cycle of technical
systems. Moreover, the core causes of frugality's adoption as a
societal norm may vary depending on the social setting,
particularly between developing and developed countries. It is
about cost considerations for Indians, but it is about
environmental concerns for Germans, which might be described
as "frugality by choice." But, to secure German companies'
long-term competitiveness in emerging economies' fast-
growing, unsaturated sectors, Frugal innovations are essential.
Engineers in German organizations are unduly reliant on high-
tech-driven, complexity-embracing innovation paths, which has
been identified as a key impediment to the application of
frugality. There was also universal agreement that inexpensive
innovations are required to ensure German company’s long-
term competitiveness in emerging economies' fast-growing,
unsaturated markets. To meet the needs of evolving market
segments, the expert interviewees proposed that German
companies explore introducing frugal solutions in emerging
markets as well as the German market [14].
Given the constraints in both emerging and developed
countries, the paper "How might 'frugal innovation' be
conceived" implies that Frugal innovation has reawakened
attention. The study presents two types of data: historical data
from now-developed markets during their development and
current data from emerging economies as they seek to develop.
The purpose of the historical view is to show that a cost-
effectively innovative method is not a novel concept. Inventors
and entrepreneurs like Benjamin Franklin used limited
resources to create frugal solutions for everyday problems like
the Franklin stove, lightning rod, bifocals, and carriage
odometer in eighteenth-century America (Franklin 2008). During World War II, the CC41 scheme in the United Kingdom,
DIY (do-it-yourself) in the United States, and System D in
France all had resource limits. However, we believe that the
necessity of frugal innovation is not limited to developing
countries, but is gaining traction globally as a result of global
recession and austerity concerns. Emerging markets are
evolving in ways that are substantially different from how the
industrialized world did. Motorbikes and rickshaws are the most
12
common modes of transportation in India; formerly, telecoms
were in their infancy and only available to the elite. Emerging
markets now have a greater mobile phone penetration rate than
many developed nations. While emerging markets have
resource constraints in some ways, they can also build and
utilize global technologies to leapfrog over and beyond
established countries' legacy and aging technical systems [15].
In wealthy countries, providing basic services to all inhabitants
is getting increasingly difficult. Global financial liquidity is
low, government spending is being slashed, public debt is at an
all-time high, natural resources are scarce and in high demand,
prices are rising, and consumers are cutting down on their
spending. When sales are down owing to the recession or
earnings are constrained due to greater competition, businesses
adopt frugality. Part of the motivation for providing low-cost
creative services is to help others, but there are also unmet
commercial needs.
Fig 6. Conceptual model of Frugal innovation in emerging
markets [15]
The study proposes a value chain model that indicates what
frugal innovation could mean to both the upstream supplier and
the downstream consumer. To meet the demands of
underserved consumers in constrained environments, a frugal
solution must be designed, produced, delivered, and maintained
from the firm's or supplier's perspective. A frugal solution may
extend beyond the cost of the solution to include operations and
disposal costs. To function to its full potential, a product or
service requires complementary solutions, resources, and
infrastructure. Frugality may thus imply not only lowering the
product's cost but also how it is built to perform in a resource-
constrained environment, using fewer resources and against
complex or ineffective institutions [15]
Fig 7. Value Chain Model based on Contextual Environment [15]
One research [16] examines the cases of companies
that have achieved global success through reverse innovation.
All of these businesses took the resource constraint-based
thinking approach, with those at the "Bottom of the Pyramid"
as their target clients. The article examines four Asian
businesses, one of which is situated in India and the other three
in China. Companies intending to operate in this new industry,
according to the report, must be adaptable to opportunities
originating from consumer market constraints. Furthermore,
they must be adaptable enough to acquire new capabilities to
match the aggressive price/performance ratios demanded by
consumers. A corporation must be well-prepared for a long-
term R&D effort to successfully adopt disruptive innovation in
emerging markets. To successfully deploy disruptive
innovation in emerging markets, a company must be well-
prepared for a long-term R&D effort and manage the
intellectual property to prevent imitators. This method may lead
to the successful development of businesses; nevertheless, it
necessitates vision, originality, and flexibility in the product
engineering phase to build items that match desired market
needs at a reasonable price [16].
In one paper, researchers looked at frugal innovation
and its reception in Brazil by looking at six Brazilian firm
instances (three multinational corporations and three small and
medium-sized businesses) [17]. The findings from Asian
markets were compared to factors such as cost-effective product
development, product attributes, and commercialization tactics.
Six cases were investigated in this study, spanning various
industry verticals such as energy, automotive, cosmetics, and
household appliances, using semi-structured interviews lasting
50 to 90 minutes, as this method provided comprehensive data
to derive underlying structures, relationships, and dynamics of
both the company and its product Sampling was done on
purpose, by the company's demand that it develops and create
its goods in Brazil and for the Brazilian market [17]. Four of the
six enterprises create their products from the ground up, while
the other two MNCs specialize in product customization and
adaption for the Brazilian market. The sampling results
challenge the general pattern of low cost, fewer features, and
cost-effectiveness in frugal innovation by proposing a two-fold
approach to the cost criterion that distinguishes between
customer and company perspectives and focuses on distinctive
product features, branding, and value-based pricing, all of
which are critical for successful frugal innovation in the
Brazilian market [17].
In emerging nations, the framework of the process
model works on Scaling through Replication which develops
the network of microentrepreneurs through training in the
community. This process model does not halt the production
during the uncertain environment in which the developing
countries operate where power outrage is very common and
government regulations and policies are not in place. A good
balance of frugality between labour-intensive processes and
sturdy and partially automated assembly lines enables the
process to be independent [18]. The decentralized approach of
microentrepreneurs reduces the workload of logistics and
transportation planning required for the distribution of products.
Wana Energy, founded in Uganda, is a company that uses
frugality in its interactions. They give the people cookstoves
and gas cylinders because agricultural products are their main
source of revenue. This organization offers a variety of
transaction options for individual customers, depending on their
13
preferences. They can pay with what they create or use mobile
to "pay as you go." This adaptability boosts inclusivity and
expands the distribution route [18]. The company has created a
technique in which gas cylinders are also connected with remote
monitoring, which warns the company when the tank is going
low and allows prompt contact with microentrepreneurs and
franchises to distribute to the last miles of rural areas [18].
In another study, it was discovered that when locally
produced raw material may replace the existing material,
procurement time is greatly decreased. A goodly is a Taiwanese
company that makes toothbrushes out of Moso bamboo. [19].
The fastest-growing bamboo plant has been discovered to be the
greatest choice for replacing the harmful single use of plastic in
toothbrushes, ensuring the product's recoverability. However,
there are other instances where resources are scarce and
businesses must make the best of what they have. This case
study is obvious in West Africa, where technological progress
is limited to second-hand electronic products imported from
European countries. WoeLabs is a community hub that
manufactures 3D printers from recyclable e-waste [19].
As in emerging nations investment is low. For frugal
innovation, people are dependent on government policies. For
example, Multiple refusals to the early induction of the initial
version of the Akash missile by the Indian Army. They
demanded optimum performance and zero error procurement
which would have called out for importing technology from
abroad. This led to the delay in the procurement and deployment
of a system within a given timeframe. Ultimately, after facing
significant delays from govt policies and foreign agencies, they
agreed to induct the incremental approach to develop the system
indigenously and improve it further through a series of user
trials and feedback which would have saved them a significant
amount of time. [20] Eventually, it proved to be useful as during
the test of the Akash missile, the engineers accidentally
identified the ground radar later named (Rajendra Radar) which
could detect the nearby artillery shells being fired. This was
later adapted for inclusion in Weapon locating Radars which
averted the import of American radars which was costing time
overruns. [20]. It is crucial for procurement policymakers to
make necessary changes and appreciate the innovation-led
development of systems in-house through learning and
technological up-gradation [20].
Frugal innovation is usually invented and diffused in
developing countries, where resources are strictly limited,
consumers have low purchasing power, and there is insufficient
infrastructure. Scholars have shown increasing interest in frugal
innovations in recent years as these innovations can satisfy the
demands of the majority of the population living in developing
countries, develop conceptual frameworks of frugal innovation,
and conduct case studies. One research that studies Frugal
innovation in emerging markets, states that Frugal innovation
promotes sustainability, which means not only financial
prosperity to the company but has socio-environment benefits
as well. This research studies 94 cases from emerging and
developed countries and compares them. Focusing on emerging
markets it concludes that innovation in these regions starts at
the grassroots level. Innovators are mostly internally motivated
with negligible external support in terms of capital. The
difference between the approach of grassroots innovations and
mainstream frugal products is that at the grassroots level
innovations occur from scratch, whereas in the mainstream
market companies look to replace parts with cheaper material
in the name of frugal engineering. Research and development at
the grassroots level also take a lot of time than in traditional
methods, which increases the product development life. The life
cycle of the technical systems is extended with help of online
markets [4].
To summarize this section, we can say that the technical life
cycle changes as the region of innovation changes. This is due
to various policies, capital, resources, need in regional markets,
and the approach of innovators.
IV. CONCLUSION
This study aims to investigate and analyze the impact of frugal
innovation on the Life cycle of the technician systems. For this
purpose, we conducted a literature review to examine the role
of frugality in different fields associated with life cycle
assessment. There are several limitations to this research. First,
most literature on frugal innovation is concerned with
establishing criteria to define the topic. Second, so far, the
majority of the research papers are concerned with the socio-
economic context of emerging economies. Third, lack of
research papers available on life cycle assessment as frugal
innovation papers concerned with the Engineering field mainly
focus on product design and development, features and
technology, cost reduction, and effectiveness.
In this literature survey, we have referred to frugal innovation
research papers from the field of automotive, cosmetic,
manufacturing, household appliance, healthcare, defense, and
energy and found frugality can be interpreted as both innovation
and reverse engineering. The life cycle of the systems through
frugality has a twofold approach
a) Low cost, defeatured products will have a short life
cycle as these products are developed by keeping
emerging economic countries (bottom of the pyramid)
in mind
b) Reusability and reverse engineering of complex
technical systems through frugal innovation aims to
achieve long-lasting products (nuclear reactor is an
example of the complex technical system mentioned in
the paper). So, the life cycle of the system completely
depends on factors like geographical location, target
customers, cost, features, technology, size of the
product, usability, and many more contexts. In short,
Frugal innovation alone cannot guarantee the
development of affordable and quality products with a
long-life cycle because a successful product involves a
fine balance of many factors.
14

V. REFERENCES
[1] Preeta M. Banerjee: The “Frugal” in Frugal Innovation In Evolution of Innovation Management© Palgrave Macmillan, a division of Macmillan Publishers Limited 2013, pg 290-310.
[2] Alexander Brem: Frugal Innovation—Past, Present, and Future In IEEE Engineering Management Review, Vol. 45, No. 3, Third Quarter, September 2017
[3] Niroumand, M, Shahin, A, Naghsh, A, Peikari, HR. Frugal innovation enablers, critical success factors and barriers: A systematic review. Creat Innov Manag. 2021; 30: 348– 367
[4] Mokter Hossain. ”Frugal innovation: Conception, development, diffusion, and outcome” in Journal of cleaner production 262 (121456), 2020
[5] Shraddha Arya, Manish Bhargava, Tushar Sharma: Importance of Frugal Engineering in Manufacturing Sectors In International Journal of Computational Science, Engineering & Technology (ISSN 2320-4648) Volume III, Issue I, September 2015
[6] Loveleen Gaur, Supriya Lamba Sahdev. “Frugal innovation in India: The case of Tata Nano” in International Journal of Applied Engineering Research Vol 10, No 7, pp. 17411-17420, 2015
[7] Singh, Ravindra, Sumedha Seniaray, and Prateek Saxena. "A Framework for the Improvement of Frugal Design Practices" Designs 4, no. 3: 37.2020
[8] A. Verma. International design conference - design 2018. Frugal innovation in complex systems: from nuclear reactor design and development in India.
[9] Alexander Brem, Christine Wimschneider, Ana Regina de Aguiar Dutra, Anelise Leal Vieira Cubas, Rodney Duarte Ribeiro: How to design and construct an innovative frugal product? An empirical examination of a frugal new product development process In Journal of Cleaner Production 275, 2020
[10] Nivedita Agarwal, Julia Oehler, and Alexander Brem: Constraint-Based Thinking: A Structured Approach for Developing Frugal Innovations In IEEE Transactions on Engineering Management, Vol. 68, No. 3, June 2021
[11] Kim, Bunthern and Azzaro-Pantel, Catherine and David, Maria and Maussion, Pascal. (2019) Journal of Cleaner Production (208). 1459-1468. ISSN 0959-6526 Life Cycle Assessment for a Solar Energy System Based on Reuse Components for developing countries.
[12] B. C. Rao, "Advances in science and technology through frugality," in IEEE Engineering Management Review, vol. 45, no. 1, pp. 32-38, 2017
[13] F.Belkadi*, M. Colledani, M. Urgo, A. Bernard, G. Colombo, G. Borzi, A. Ascheri: Modular design of production systems tailored to regional market requirements: A Frugal Innovation (2018)
[14] Rajnish Tiwari, Luise Fischer & Katharina Kalogerakis. “ Frugal innovation in Germany: A qualitative analysis of potential socio-economic impacts” in Econstor, Working Paper Number 96, March 2017
[15] Bhatti, Yasser Ahmad and Ventresca, Marc, How Can ‘Frugal Innovation’ Be Conceptualized? 2013
[16] Chang-Chieh Hang, Jin Chen & Annapoomima M. Subramian: Developing Disruptive Products for Emerging Economies: Lessons from Asian Cases. In ResearchTechnology Management, 2010, 53:4, 21-26
[17] Christine Wimschneider* and Nivedita Agarwal, Alexander Brem. Int. J. Technology Management, Vol. 83, Nos. 1/2/3, 2020. Frugal innovation for the BoP in Brazil – an analysis and comparison with Asian lead markets.
[18] Knizkov S, Arlinghaus JC: Frugal processes: an empirical investigation into the operations of resource-constrained firms. (2020)
[19] Obiora B. Ezeudu · Jonah C. Agunwamba · Uzochukwu C. Ugochukwu · Tochukwu C. Oraelosi: Circular economy and frugal innovation: a conceptual nexus (2022)
[20] Kapil Patil Saradindu Bhaduri: Zero-error’ versus good-enough: towards a ‘frugality’ narrative for defence procurement policy (2020)
15
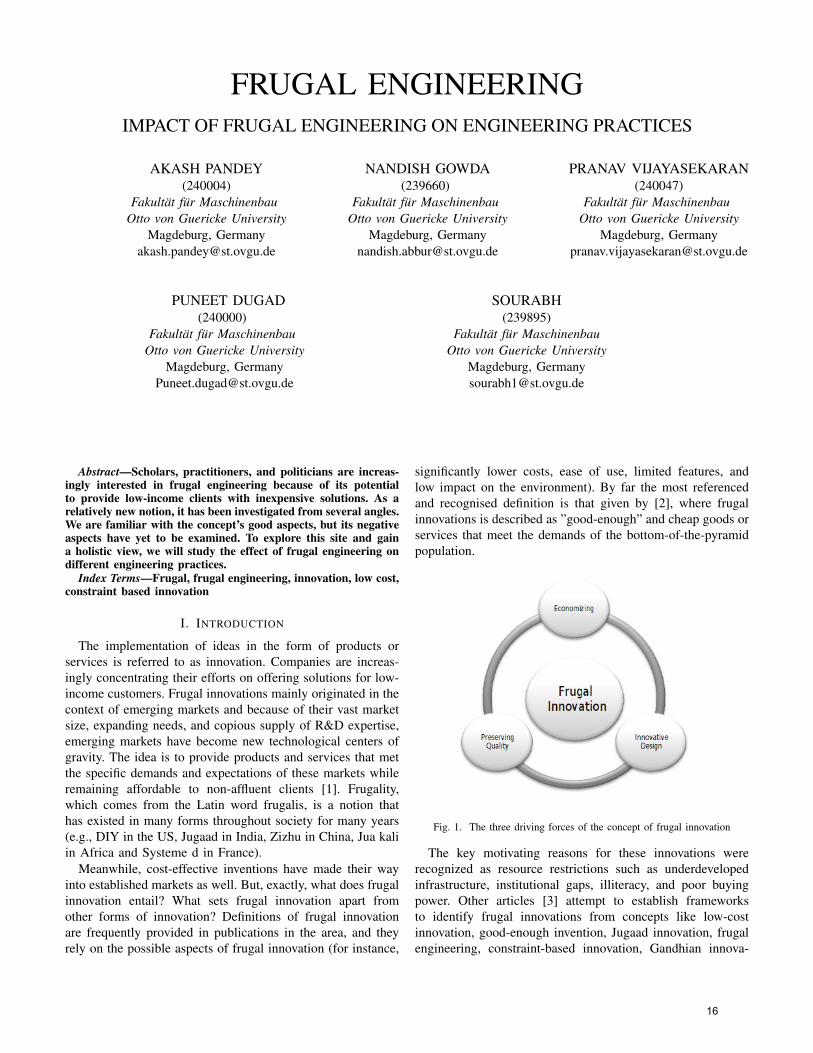
FRUGAL ENGINEERINGIMPACT OF FRUGAL ENGINEERING ON ENGINEERING PRACTICES
AKASH PANDEY(240004)
Fakultat fur MaschinenbauOtto von Guericke University
Magdeburg, [email protected]
NANDISH GOWDA(239660)
Fakultat fur MaschinenbauOtto von Guericke University
Magdeburg, [email protected]
PRANAV VIJAYASEKARAN(240047)
Fakultat fur MaschinenbauOtto von Guericke University
Magdeburg, [email protected]
PUNEET DUGAD(240000)
Fakultat fur MaschinenbauOtto von Guericke University
Magdeburg, [email protected]
SOURABH(239895)
Fakultat fur MaschinenbauOtto von Guericke University
Magdeburg, [email protected]
Abstract—Scholars, practitioners, and politicians are increas-ingly interested in frugal engineering because of its potentialto provide low-income clients with inexpensive solutions. As arelatively new notion, it has been investigated from several angles.We are familiar with the concept’s good aspects, but its negativeaspects have yet to be examined. To explore this site and gaina holistic view, we will study the effect of frugal engineering ondifferent engineering practices.
Index Terms—Frugal, frugal engineering, innovation, low cost,constraint based innovation
I. INTRODUCTION
The implementation of ideas in the form of products orservices is referred to as innovation. Companies are increas-ingly concentrating their efforts on offering solutions for low-income customers. Frugal innovations mainly originated in thecontext of emerging markets and because of their vast marketsize, expanding needs, and copious supply of R&D expertise,emerging markets have become new technological centers ofgravity. The idea is to provide products and services that metthe specific demands and expectations of these markets whileremaining affordable to non-affluent clients [1]. Frugality,which comes from the Latin word frugalis, is a notion thathas existed in many forms throughout society for many years(e.g., DIY in the US, Jugaad in India, Zizhu in China, Jua kaliin Africa and Systeme d in France).
Meanwhile, cost-effective inventions have made their wayinto established markets as well. But, exactly, what does frugalinnovation entail? What sets frugal innovation apart fromother forms of innovation? Definitions of frugal innovationare frequently provided in publications in the area, and theyrely on the possible aspects of frugal innovation (for instance,
significantly lower costs, ease of use, limited features, andlow impact on the environment). By far the most referencedand recognised definition is that given by [2], where frugalinnovations is described as ”good-enough” and cheap goods orservices that meet the demands of the bottom-of-the-pyramidpopulation.
Fig. 1. The three driving forces of the concept of frugal innovation
The key motivating reasons for these innovations wererecognized as resource restrictions such as underdevelopedinfrastructure, institutional gaps, illiteracy, and poor buyingpower. Other articles [3] attempt to establish frameworksto identify frugal innovations from concepts like low-costinnovation, good-enough invention, Jugaad innovation, frugalengineering, constraint-based innovation, Gandhian innova-
16
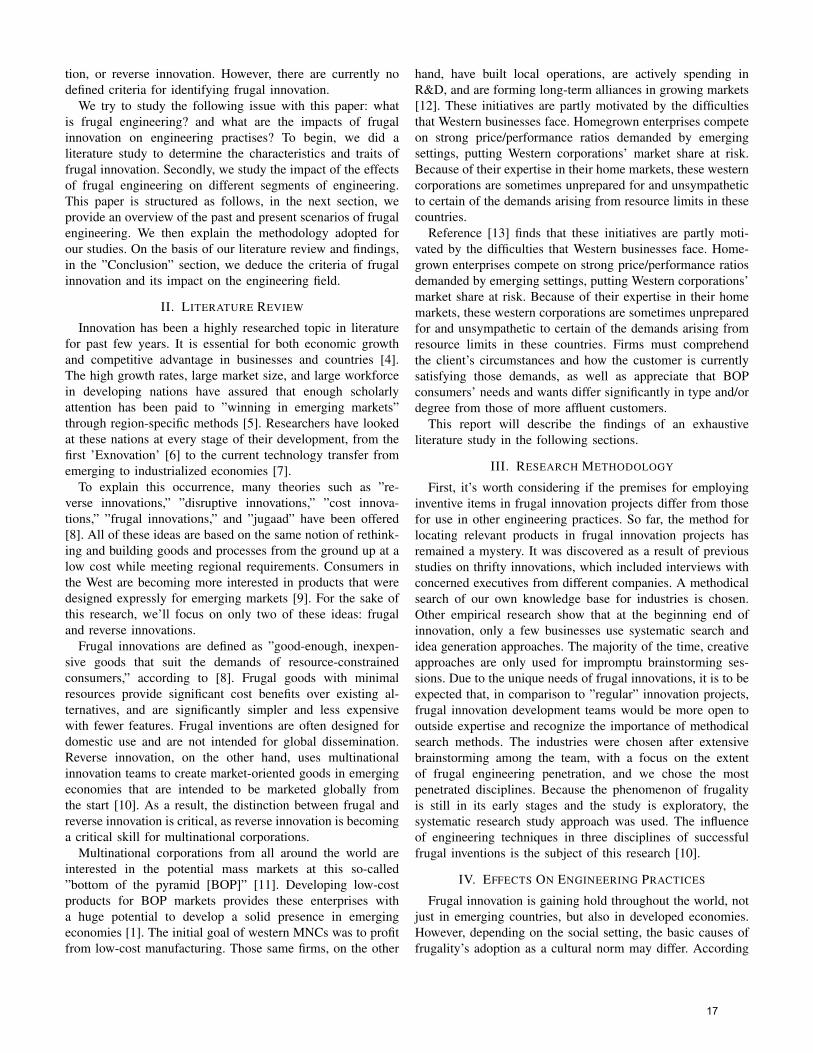
tion, or reverse innovation. However, there are currently nodefined criteria for identifying frugal innovation.
We try to study the following issue with this paper: whatis frugal engineering? and what are the impacts of frugalinnovation on engineering practises? To begin, we did aliterature study to determine the characteristics and traits offrugal innovation. Secondly, we study the impact of the effectsof frugal engineering on different segments of engineering.This paper is structured as follows, in the next section, weprovide an overview of the past and present scenarios of frugalengineering. We then explain the methodology adopted forour studies. On the basis of our literature review and findings,in the ”Conclusion” section, we deduce the criteria of frugalinnovation and its impact on the engineering field.
II. LITERATURE REVIEW
Innovation has been a highly researched topic in literaturefor past few years. It is essential for both economic growthand competitive advantage in businesses and countries [4].The high growth rates, large market size, and large workforcein developing nations have assured that enough scholarlyattention has been paid to ”winning in emerging markets”through region-specific methods [5]. Researchers have lookedat these nations at every stage of their development, from thefirst ’Exnovation’ [6] to the current technology transfer fromemerging to industrialized economies [7].
To explain this occurrence, many theories such as ”re-verse innovations,” ”disruptive innovations,” ”cost innova-tions,” ”frugal innovations,” and ”jugaad” have been offered[8]. All of these ideas are based on the same notion of rethink-ing and building goods and processes from the ground up at alow cost while meeting regional requirements. Consumers inthe West are becoming more interested in products that weredesigned expressly for emerging markets [9]. For the sake ofthis research, we’ll focus on only two of these ideas: frugaland reverse innovations.
Frugal innovations are defined as ”good-enough, inexpen-sive goods that suit the demands of resource-constrainedconsumers,” according to [8]. Frugal goods with minimalresources provide significant cost benefits over existing al-ternatives, and are significantly simpler and less expensivewith fewer features. Frugal inventions are often designed fordomestic use and are not intended for global dissemination.Reverse innovation, on the other hand, uses multinationalinnovation teams to create market-oriented goods in emergingeconomies that are intended to be marketed globally fromthe start [10]. As a result, the distinction between frugal andreverse innovation is critical, as reverse innovation is becominga critical skill for multinational corporations.
Multinational corporations from all around the world areinterested in the potential mass markets at this so-called”bottom of the pyramid [BOP]” [11]. Developing low-costproducts for BOP markets provides these enterprises witha huge potential to develop a solid presence in emergingeconomies [1]. The initial goal of western MNCs was to profitfrom low-cost manufacturing. Those same firms, on the other
hand, have built local operations, are actively spending inR&D, and are forming long-term alliances in growing markets[12]. These initiatives are partly motivated by the difficultiesthat Western businesses face. Homegrown enterprises competeon strong price/performance ratios demanded by emergingsettings, putting Western corporations’ market share at risk.Because of their expertise in their home markets, these westerncorporations are sometimes unprepared for and unsympatheticto certain of the demands arising from resource limits in thesecountries.
Reference [13] finds that these initiatives are partly moti-vated by the difficulties that Western businesses face. Home-grown enterprises compete on strong price/performance ratiosdemanded by emerging settings, putting Western corporations’market share at risk. Because of their expertise in their homemarkets, these western corporations are sometimes unpreparedfor and unsympathetic to certain of the demands arising fromresource limits in these countries. Firms must comprehendthe client’s circumstances and how the customer is currentlysatisfying those demands, as well as appreciate that BOPconsumers’ needs and wants differ significantly in type and/ordegree from those of more affluent customers.
This report will describe the findings of an exhaustiveliterature study in the following sections.
III. RESEARCH METHODOLOGY
First, it’s worth considering if the premises for employinginventive items in frugal innovation projects differ from thosefor use in other engineering practices. So far, the method forlocating relevant products in frugal innovation projects hasremained a mystery. It was discovered as a result of previousstudies on thrifty innovations, which included interviews withconcerned executives from different companies. A methodicalsearch of our own knowledge base for industries is chosen.Other empirical research show that at the beginning end ofinnovation, only a few businesses use systematic search andidea generation approaches. The majority of the time, creativeapproaches are only used for impromptu brainstorming ses-sions. Due to the unique needs of frugal innovations, it is to beexpected that, in comparison to ”regular” innovation projects,frugal innovation development teams would be more open tooutside expertise and recognize the importance of methodicalsearch methods. The industries were chosen after extensivebrainstorming among the team, with a focus on the extentof frugal engineering penetration, and we chose the mostpenetrated disciplines. Because the phenomenon of frugalityis still in its early stages and the study is exploratory, thesystematic research study approach was used. The influenceof engineering techniques in three disciplines of successfulfrugal inventions is the subject of this research [10].
IV. EFFECTS ON ENGINEERING PRACTICES
Frugal innovation is gaining hold throughout the world, notjust in emerging countries, but also in developed economies.However, depending on the social setting, the basic causes offrugality’s adoption as a cultural norm may differ. According
17
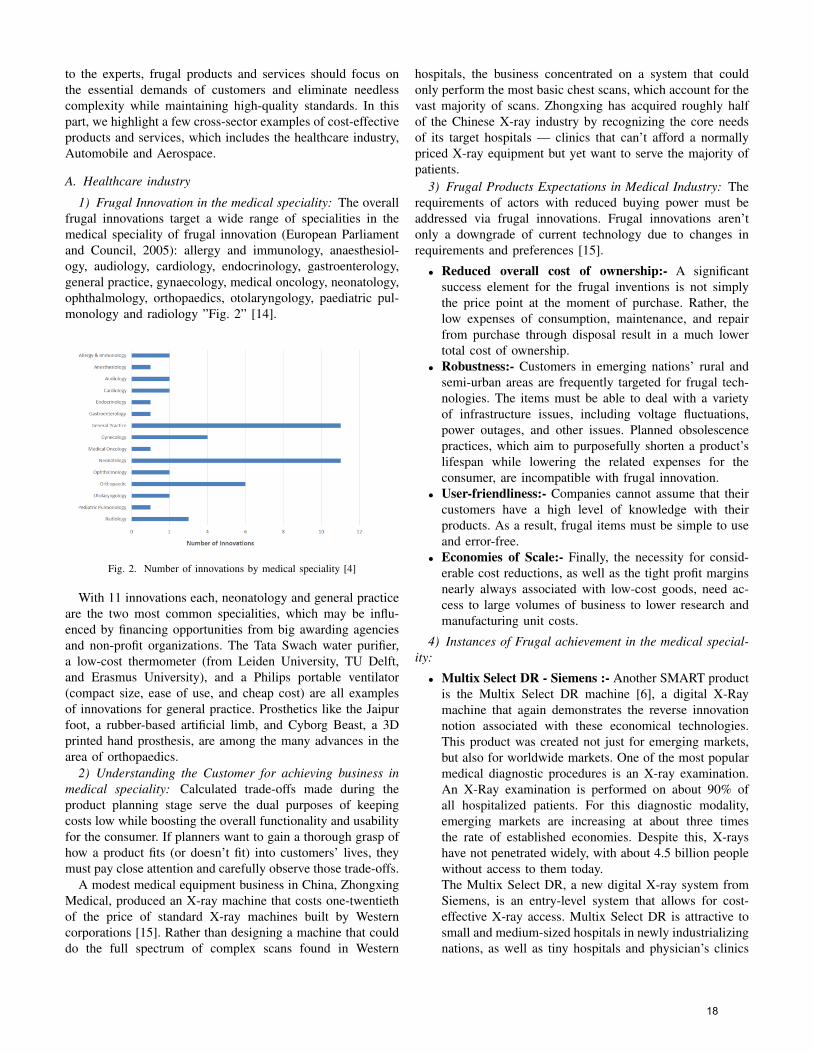
to the experts, frugal products and services should focus onthe essential demands of customers and eliminate needlesscomplexity while maintaining high-quality standards. In thispart, we highlight a few cross-sector examples of cost-effectiveproducts and services, which includes the healthcare industry,Automobile and Aerospace.
A. Healthcare industry
1) Frugal Innovation in the medical speciality: The overallfrugal innovations target a wide range of specialities in themedical speciality of frugal innovation (European Parliamentand Council, 2005): allergy and immunology, anaesthesiol-ogy, audiology, cardiology, endocrinology, gastroenterology,general practice, gynaecology, medical oncology, neonatology,ophthalmology, orthopaedics, otolaryngology, paediatric pul-monology and radiology ”Fig. 2” [14].
Fig. 2. Number of innovations by medical speciality [4]
With 11 innovations each, neonatology and general practiceare the two most common specialities, which may be influ-enced by financing opportunities from big awarding agenciesand non-profit organizations. The Tata Swach water purifier,a low-cost thermometer (from Leiden University, TU Delft,and Erasmus University), and a Philips portable ventilator(compact size, ease of use, and cheap cost) are all examplesof innovations for general practice. Prosthetics like the Jaipurfoot, a rubber-based artificial limb, and Cyborg Beast, a 3Dprinted hand prosthesis, are among the many advances in thearea of orthopaedics.
2) Understanding the Customer for achieving business inmedical speciality: Calculated trade-offs made during theproduct planning stage serve the dual purposes of keepingcosts low while boosting the overall functionality and usabilityfor the consumer. If planners want to gain a thorough grasp ofhow a product fits (or doesn’t fit) into customers’ lives, theymust pay close attention and carefully observe those trade-offs.
A modest medical equipment business in China, ZhongxingMedical, produced an X-ray machine that costs one-twentiethof the price of standard X-ray machines built by Westerncorporations [15]. Rather than designing a machine that coulddo the full spectrum of complex scans found in Western
hospitals, the business concentrated on a system that couldonly perform the most basic chest scans, which account for thevast majority of scans. Zhongxing has acquired roughly halfof the Chinese X-ray industry by recognizing the core needsof its target hospitals — clinics that can’t afford a normallypriced X-ray equipment but yet want to serve the majority ofpatients.
3) Frugal Products Expectations in Medical Industry: Therequirements of actors with reduced buying power must beaddressed via frugal innovations. Frugal innovations aren’tonly a downgrade of current technology due to changes inrequirements and preferences [15].
• Reduced overall cost of ownership:- A significantsuccess element for the frugal inventions is not simplythe price point at the moment of purchase. Rather, thelow expenses of consumption, maintenance, and repairfrom purchase through disposal result in a much lowertotal cost of ownership.
• Robustness:- Customers in emerging nations’ rural andsemi-urban areas are frequently targeted for frugal tech-nologies. The items must be able to deal with a varietyof infrastructure issues, including voltage fluctuations,power outages, and other issues. Planned obsolescencepractices, which aim to purposefully shorten a product’slifespan while lowering the related expenses for theconsumer, are incompatible with frugal innovation.
• User-friendliness:- Companies cannot assume that theircustomers have a high level of knowledge with theirproducts. As a result, frugal items must be simple to useand error-free.
• Economies of Scale:- Finally, the necessity for consid-erable cost reductions, as well as the tight profit marginsnearly always associated with low-cost goods, need ac-cess to large volumes of business to lower research andmanufacturing unit costs.
4) Instances of Frugal achievement in the medical special-ity:
• Multix Select DR - Siemens :- Another SMART productis the Multix Select DR machine [6], a digital X-Raymachine that again demonstrates the reverse innovationnotion associated with these economical technologies.This product was created not just for emerging markets,but also for worldwide markets. One of the most popularmedical diagnostic procedures is an X-ray examination.An X-Ray examination is performed on about 90% ofall hospitalized patients. For this diagnostic modality,emerging markets are increasing at about three timesthe rate of established economies. Despite this, X-rayshave not penetrated widely, with about 4.5 billion peoplewithout access to them today.The Multix Select DR, a new digital X-ray system fromSiemens, is an entry-level system that allows for cost-effective X-ray access. Multix Select DR is attractive tosmall and medium-sized hospitals in newly industrializingnations, as well as tiny hospitals and physician’s clinics
18
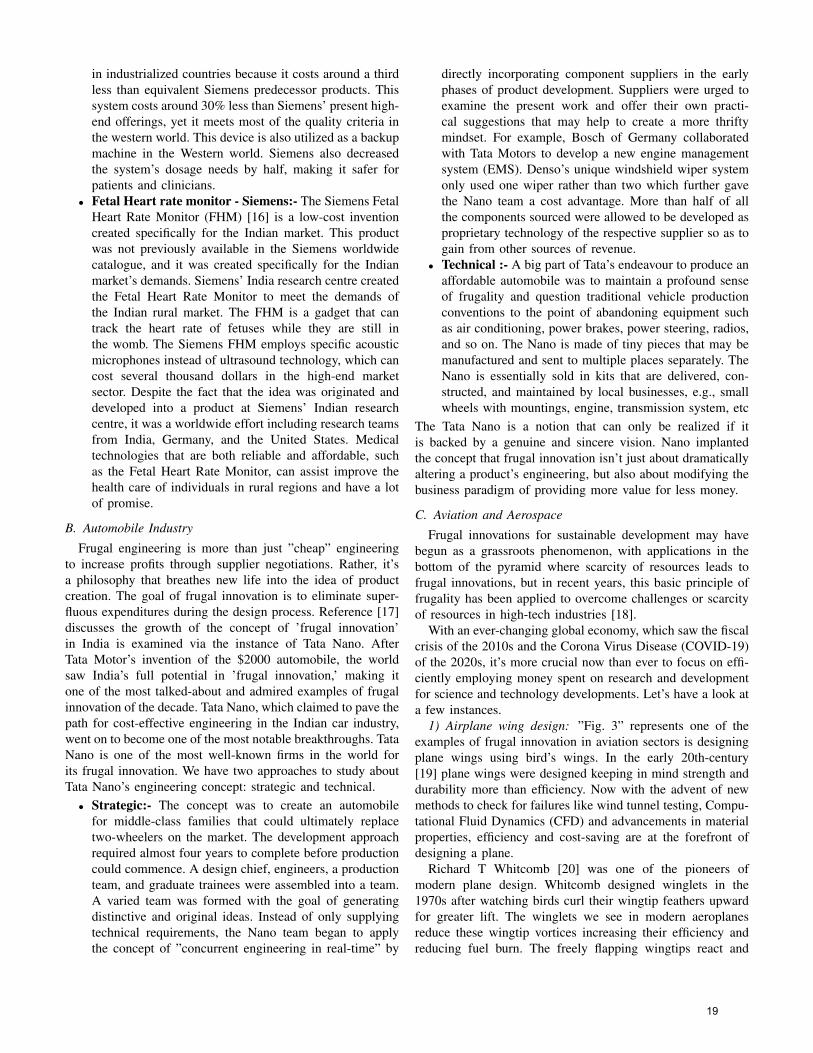
in industrialized countries because it costs around a thirdless than equivalent Siemens predecessor products. Thissystem costs around 30% less than Siemens’ present high-end offerings, yet it meets most of the quality criteria inthe western world. This device is also utilized as a backupmachine in the Western world. Siemens also decreasedthe system’s dosage needs by half, making it safer forpatients and clinicians.
• Fetal Heart rate monitor - Siemens:- The Siemens FetalHeart Rate Monitor (FHM) [16] is a low-cost inventioncreated specifically for the Indian market. This productwas not previously available in the Siemens worldwidecatalogue, and it was created specifically for the Indianmarket’s demands. Siemens’ India research centre createdthe Fetal Heart Rate Monitor to meet the demands ofthe Indian rural market. The FHM is a gadget that cantrack the heart rate of fetuses while they are still inthe womb. The Siemens FHM employs specific acousticmicrophones instead of ultrasound technology, which cancost several thousand dollars in the high-end marketsector. Despite the fact that the idea was originated anddeveloped into a product at Siemens’ Indian researchcentre, it was a worldwide effort including research teamsfrom India, Germany, and the United States. Medicaltechnologies that are both reliable and affordable, suchas the Fetal Heart Rate Monitor, can assist improve thehealth care of individuals in rural regions and have a lotof promise.
B. Automobile Industry
Frugal engineering is more than just ”cheap” engineeringto increase profits through supplier negotiations. Rather, it’sa philosophy that breathes new life into the idea of productcreation. The goal of frugal innovation is to eliminate super-fluous expenditures during the design process. Reference [17]discusses the growth of the concept of ’frugal innovation’in India is examined via the instance of Tata Nano. AfterTata Motor’s invention of the $2000 automobile, the worldsaw India’s full potential in ’frugal innovation,’ making itone of the most talked-about and admired examples of frugalinnovation of the decade. Tata Nano, which claimed to pave thepath for cost-effective engineering in the Indian car industry,went on to become one of the most notable breakthroughs. TataNano is one of the most well-known firms in the world forits frugal innovation. We have two approaches to study aboutTata Nano’s engineering concept: strategic and technical.
• Strategic:- The concept was to create an automobilefor middle-class families that could ultimately replacetwo-wheelers on the market. The development approachrequired almost four years to complete before productioncould commence. A design chief, engineers, a productionteam, and graduate trainees were assembled into a team.A varied team was formed with the goal of generatingdistinctive and original ideas. Instead of only supplyingtechnical requirements, the Nano team began to applythe concept of ”concurrent engineering in real-time” by
directly incorporating component suppliers in the earlyphases of product development. Suppliers were urged toexamine the present work and offer their own practi-cal suggestions that may help to create a more thriftymindset. For example, Bosch of Germany collaboratedwith Tata Motors to develop a new engine managementsystem (EMS). Denso’s unique windshield wiper systemonly used one wiper rather than two which further gavethe Nano team a cost advantage. More than half of allthe components sourced were allowed to be developed asproprietary technology of the respective supplier so as togain from other sources of revenue.
• Technical :- A big part of Tata’s endeavour to produce anaffordable automobile was to maintain a profound senseof frugality and question traditional vehicle productionconventions to the point of abandoning equipment suchas air conditioning, power brakes, power steering, radios,and so on. The Nano is made of tiny pieces that may bemanufactured and sent to multiple places separately. TheNano is essentially sold in kits that are delivered, con-structed, and maintained by local businesses, e.g., smallwheels with mountings, engine, transmission system, etc
The Tata Nano is a notion that can only be realized if itis backed by a genuine and sincere vision. Nano implantedthe concept that frugal innovation isn’t just about dramaticallyaltering a product’s engineering, but also about modifying thebusiness paradigm of providing more value for less money.
C. Aviation and Aerospace
Frugal innovations for sustainable development may havebegun as a grassroots phenomenon, with applications in thebottom of the pyramid where scarcity of resources leads tofrugal innovations, but in recent years, this basic principle offrugality has been applied to overcome challenges or scarcityof resources in high-tech industries [18].
With an ever-changing global economy, which saw the fiscalcrisis of the 2010s and the Corona Virus Disease (COVID-19)of the 2020s, it’s more crucial now than ever to focus on effi-ciently employing money spent on research and developmentfor science and technology developments. Let’s have a look ata few instances.
1) Airplane wing design: ”Fig. 3” represents one of theexamples of frugal innovation in aviation sectors is designingplane wings using bird’s wings. In the early 20th-century[19] plane wings were designed keeping in mind strength anddurability more than efficiency. Now with the advent of newmethods to check for failures like wind tunnel testing, Compu-tational Fluid Dynamics (CFD) and advancements in materialproperties, efficiency and cost-saving are at the forefront ofdesigning a plane.
Richard T Whitcomb [20] was one of the pioneers ofmodern plane design. Whitcomb designed winglets in the1970s after watching birds curl their wingtip feathers upwardfor greater lift. The winglets we see in modern aeroplanesreduce these wingtip vortices increasing their efficiency andreducing fuel burn. The freely flapping wingtips react and
19
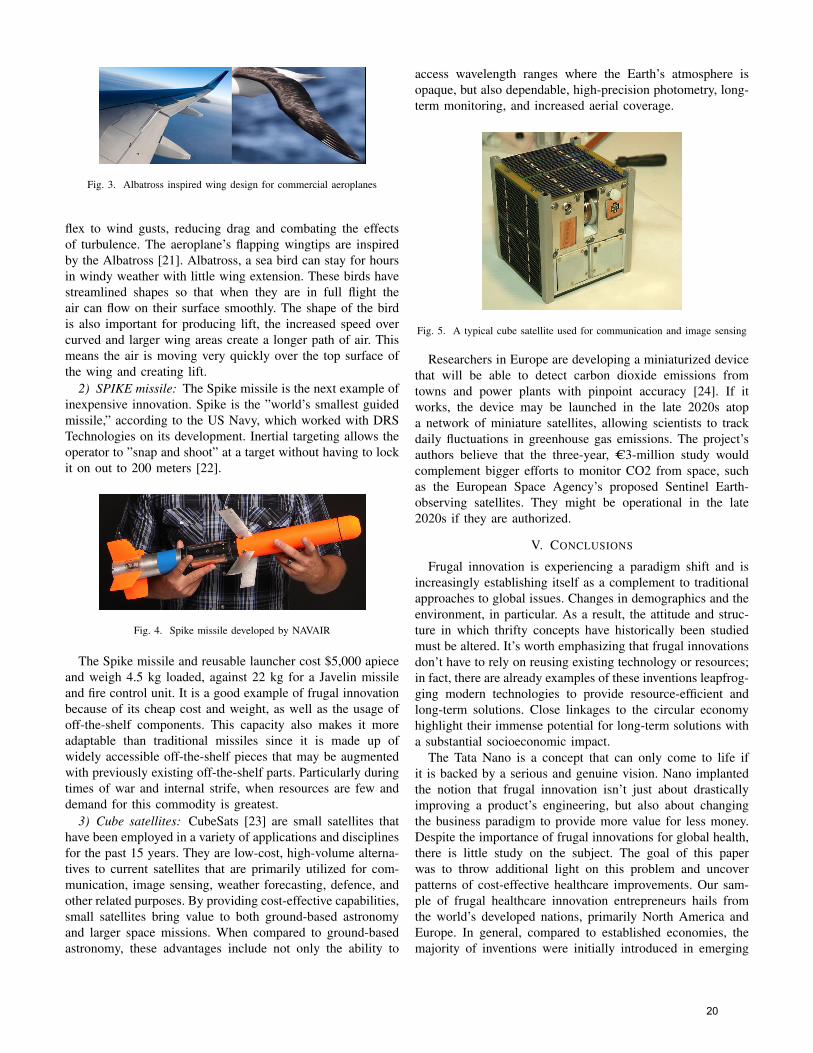
Fig. 3. Albatross inspired wing design for commercial aeroplanes
flex to wind gusts, reducing drag and combating the effectsof turbulence. The aeroplane’s flapping wingtips are inspiredby the Albatross [21]. Albatross, a sea bird can stay for hoursin windy weather with little wing extension. These birds havestreamlined shapes so that when they are in full flight theair can flow on their surface smoothly. The shape of the birdis also important for producing lift, the increased speed overcurved and larger wing areas create a longer path of air. Thismeans the air is moving very quickly over the top surface ofthe wing and creating lift.
2) SPIKE missile: The Spike missile is the next example ofinexpensive innovation. Spike is the ”world’s smallest guidedmissile,” according to the US Navy, which worked with DRSTechnologies on its development. Inertial targeting allows theoperator to ”snap and shoot” at a target without having to lockit on out to 200 meters [22].
Fig. 4. Spike missile developed by NAVAIR
The Spike missile and reusable launcher cost $5,000 apieceand weigh 4.5 kg loaded, against 22 kg for a Javelin missileand fire control unit. It is a good example of frugal innovationbecause of its cheap cost and weight, as well as the usage ofoff-the-shelf components. This capacity also makes it moreadaptable than traditional missiles since it is made up ofwidely accessible off-the-shelf pieces that may be augmentedwith previously existing off-the-shelf parts. Particularly duringtimes of war and internal strife, when resources are few anddemand for this commodity is greatest.
3) Cube satellites: CubeSats [23] are small satellites thathave been employed in a variety of applications and disciplinesfor the past 15 years. They are low-cost, high-volume alterna-tives to current satellites that are primarily utilized for com-munication, image sensing, weather forecasting, defence, andother related purposes. By providing cost-effective capabilities,small satellites bring value to both ground-based astronomyand larger space missions. When compared to ground-basedastronomy, these advantages include not only the ability to
access wavelength ranges where the Earth’s atmosphere isopaque, but also dependable, high-precision photometry, long-term monitoring, and increased aerial coverage.
Fig. 5. A typical cube satellite used for communication and image sensing
Researchers in Europe are developing a miniaturized devicethat will be able to detect carbon dioxide emissions fromtowns and power plants with pinpoint accuracy [24]. If itworks, the device may be launched in the late 2020s atopa network of miniature satellites, allowing scientists to trackdaily fluctuations in greenhouse gas emissions. The project’sauthors believe that the three-year, C3-million study wouldcomplement bigger efforts to monitor CO2 from space, suchas the European Space Agency’s proposed Sentinel Earth-observing satellites. They might be operational in the late2020s if they are authorized.
V. CONCLUSIONS
Frugal innovation is experiencing a paradigm shift and isincreasingly establishing itself as a complement to traditionalapproaches to global issues. Changes in demographics and theenvironment, in particular. As a result, the attitude and struc-ture in which thrifty concepts have historically been studiedmust be altered. It’s worth emphasizing that frugal innovationsdon’t have to rely on reusing existing technology or resources;in fact, there are already examples of these inventions leapfrog-ging modern technologies to provide resource-efficient andlong-term solutions. Close linkages to the circular economyhighlight their immense potential for long-term solutions witha substantial socioeconomic impact.
The Tata Nano is a concept that can only come to life ifit is backed by a serious and genuine vision. Nano implantedthe notion that frugal innovation isn’t just about drasticallyimproving a product’s engineering, but also about changingthe business paradigm to provide more value for less money.Despite the importance of frugal innovations for global health,there is little study on the subject. The goal of this paperwas to throw additional light on this problem and uncoverpatterns of cost-effective healthcare improvements. Our sam-ple of frugal healthcare innovation entrepreneurs hails fromthe world’s developed nations, primarily North America andEurope. In general, compared to established economies, themajority of inventions were initially introduced in emerging
20

and developing countries, with the bulk of them in Africa andAsia.
This chapter identifies emerging technologies with a highpotential for promoting the development of affordable andaccessible frugal innovations in a variety of other engineeringfields, such as 3D printing, mobile services and applications,cloud technologies, machine learning, and artificial intelli-gence technologies [25]. Frugalism, without a doubt, pushesacademics to complement the well-established national inno-vation system with an international innovation system basedon the migration of innovative theories and practices.
REFERENCES
[1] S. L. Hart, C. M. Christensen, “The great leap: Driving innovation fromthe base of the pyramid,” MIT Sloan management review, vol. 44, Oct2002.
[2] M. Zeschky , B. Widenmayer, O. Gassmann, “Frugal innovation inemerging markets,” Research-Technology Management, vol. 4, Jul 2011,pp. 38–45.
[3] Y.A. Bhatti , M. Ventresca, “How can ‘frugal innovation’be conceptu-alized?,” Available at SSRN 2203552, 2013.
[4] N. Agarwal and A. Brem, ”Frugal and reverse innovation - Literatureoverview and case study insights from a German MNC in Indiaand China,” 2012 18th International ICE Conference on Engineering,Technology and Innovation, 2012, pp. 1-11.
[5] T. Khanna, G. P. Krishna, ”Winning in Emerging Markets: A Road Mapfor Strategy and Execution,” Harvard Business Press, 2010.
[6] P. L. Gardner, ”The Globalization of R&D and International Technologytransfer in the 21st century, ” Presented at ICMIT & ISMOT, HangzhouCity, Apr 2002, pp 03–05.
[7] A. Brem, ”The Tenn Innovation and its Front End - Is There a SpecificAsian View?,” In The China information technology handbook, Aug2008, pp 1–12.
[8] M. Zeschky, B. Widenmayer, G. Oliver, ” Frugal Innovation in Emergingmarkets: The case of Mettlet Toledo,” Research Technology Manage-ment, vol. 54, Aug 2011, pp 38–45.
[9] P. Flatters, M. Wilhnott, ”Understanding the post-recession consumer,”Harvard Business Review, Jul 2009, pp 106–112.
[10] J.R. Immelt, V. Govindarajan, C. Trimble, ”How GE is disrupting itself,”Harvard business review, Oct 2009, pp 56-65.
[11] C.K. Prahalad, C.K. Prahalad, H.C. Fruehauf, K. Prahalad, ”The Fortuneat the Bottom of the Pyramid,” Wharton School Pub, 2005.
[12] V. Singhal, ”The Impact of Emerging Economies Innovative new modelsof global growth and vitality are emerging,” 2011, pp 12–14
[13] C. Christensen, M. Raynor, ”The innovator’s solution: Creating andsustaining successful growth,” Harvard Business Review Press, 2013,pp 12–14
[14] H. Arshad, M. Radic, D. Radic, ”Patterns of frugal innovation inhealthcare,” Technology Innovation Management Review, vol. 8, Apr2018.
[15] R. Tiwari, K. Kalogerakis, C. Herstatt, ”Frugal Innovation andAnalogies: Some Propositions for Product Development in EmergingEconomies,” Technology Innovation Management Review, vol. 8, Jun2014, pp 15–23.
[16] V. Sehgal, K. Dehoff, G. Panneer, ”The Importance of Frugal Engineer-ing”, Booz & Company, May 25, 2010. Accessed on: Jan 22, 2021.[Online]. Available: https://www.strategy-business.com/article/10201.
[17] L. Gaur, S. L.Sahdev, “Frugal innovation in India: The case of TataNano”, vol 10, Jan 2015, pp. 17411–17420.
[18] B. C. Rao, “Science Is Indispensable to Frugal Innovations”, TechnologyInnovation Management Review, Jan 2015.
[19] “History of aviation” Wikipedia, From Wikipedia, the free encyclopedia,29 July 2019, https://en.wikipedia.org/wiki/History of aviation.
[20] Richard T. Whitcomb, Jan 2022. In Wikipedia,https://en.wikipedia.org/wiki/Richard T. Whitcomb.
[21] B. Read, ”https://www.aerosociety.com/news/engineering-nature/#: :text=In%202019%20Airbus%20produced%20the,that%20pro-vide%20active%20flight%20control,” Royal Aeronautical Society, Jan2021
[22] “NAVIAR SPIKE” Wikipedia, From Wikipedia, the free encyclopedia,2 August 2021, https://en.wikipedia.org/wiki/NAVAIR Spike.
[23] Cubesat, Nov 2021, In Wikipedia, https://de.wikipedia.org/wiki/Cubesat[24] ”Copernicus at COP 26: Supporting climate change action through
global CO2 monitoring,” Nov 2021,[25] N. Agarwal , K. Chung, A. Brem, ”New technologies for frugal
innovation,” Frugal Innovation. Routledge, Nov 2019, pp 137–149.
21
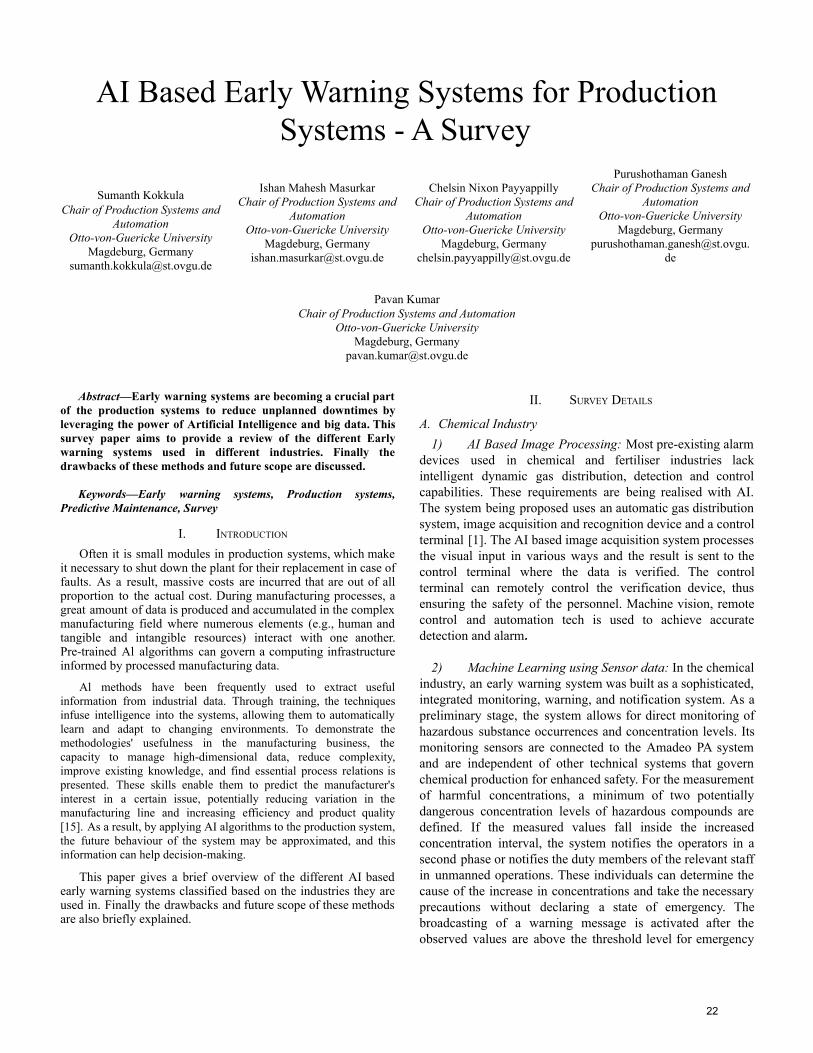
AI Based Early Warning Systems for ProductionSystems - A Survey
Sumanth KokkulaChair of Production Systems and
AutomationOtto-von-Guericke University
Magdeburg, [email protected]
Ishan Mahesh MasurkarChair of Production Systems and
AutomationOtto-von-Guericke University
Magdeburg, [email protected]
Chelsin Nixon PayyappillyChair of Production Systems and
AutomationOtto-von-Guericke University
Magdeburg, [email protected]
Purushothaman GaneshChair of Production Systems and
AutomationOtto-von-Guericke University
Magdeburg, [email protected].
de
Pavan KumarChair of Production Systems and Automation
Otto-von-Guericke UniversityMagdeburg, Germany
Abstract—Early warning systems are becoming a crucial partof the production systems to reduce unplanned downtimes byleveraging the power of Artificial Intelligence and big data. Thissurvey paper aims to provide a review of the different Earlywarning systems used in different industries. Finally thedrawbacks of these methods and future scope are discussed.
Keywords—Early warning systems, Production systems,Predictive Maintenance, Survey
I. INTRODUCTION
Often it is small modules in production systems, which makeit necessary to shut down the plant for their replacement in case offaults. As a result, massive costs are incurred that are out of allproportion to the actual cost. During manufacturing processes, agreat amount of data is produced and accumulated in the complexmanufacturing field where numerous elements (e.g., human andtangible and intangible resources) interact with one another.Pre-trained Al algorithms can govern a computing infrastructureinformed by processed manufacturing data.
Al methods have been frequently used to extract usefulinformation from industrial data. Through training, the techniquesinfuse intelligence into the systems, allowing them to automaticallylearn and adapt to changing environments. To demonstrate themethodologies' usefulness in the manufacturing business, thecapacity to manage high-dimensional data, reduce complexity,improve existing knowledge, and find essential process relations ispresented. These skills enable them to predict the manufacturer'sinterest in a certain issue, potentially reducing variation in themanufacturing line and increasing efficiency and product quality[15]. As a result, by applying AI algorithms to the production system,the future behaviour of the system may be approximated, and thisinformation can help decision-making.
This paper gives a brief overview of the different AI basedearly warning systems classified based on the industries they areused in. Finally the drawbacks and future scope of these methodsare also briefly explained.
II. SURVEY DETAILS
A. Chemical Industry1) AI Based Image Processing: Most pre-existing alarm
devices used in chemical and fertiliser industries lackintelligent dynamic gas distribution, detection and controlcapabilities. These requirements are being realised with AI.The system being proposed uses an automatic gas distributionsystem, image acquisition and recognition device and a controlterminal [1]. The AI based image acquisition system processesthe visual input in various ways and the result is sent to thecontrol terminal where the data is verified. The controlterminal can remotely control the verification device, thusensuring the safety of the personnel. Machine vision, remotecontrol and automation tech is used to achieve accuratedetection and alarm.
2) Machine Learning using Sensor data: In the chemicalindustry, an early warning system was built as a sophisticated,integrated monitoring, warning, and notification system. As apreliminary stage, the system allows for direct monitoring ofhazardous substance occurrences and concentration levels. Itsmonitoring sensors are connected to the Amadeo PA systemand are independent of other technical systems that governchemical production for enhanced safety. For the measurementof harmful concentrations, a minimum of two potentiallydangerous concentration levels of hazardous compounds aredefined. If the measured values fall inside the increasedconcentration interval, the system notifies the operators in asecond phase or notifies the duty members of the relevant staffin unmanned operations. These individuals can determine thecause of the increase in concentrations and take the necessaryprecautions without declaring a state of emergency. Thebroadcasting of a warning message is activated after theobserved values are above the threshold level for emergency
22
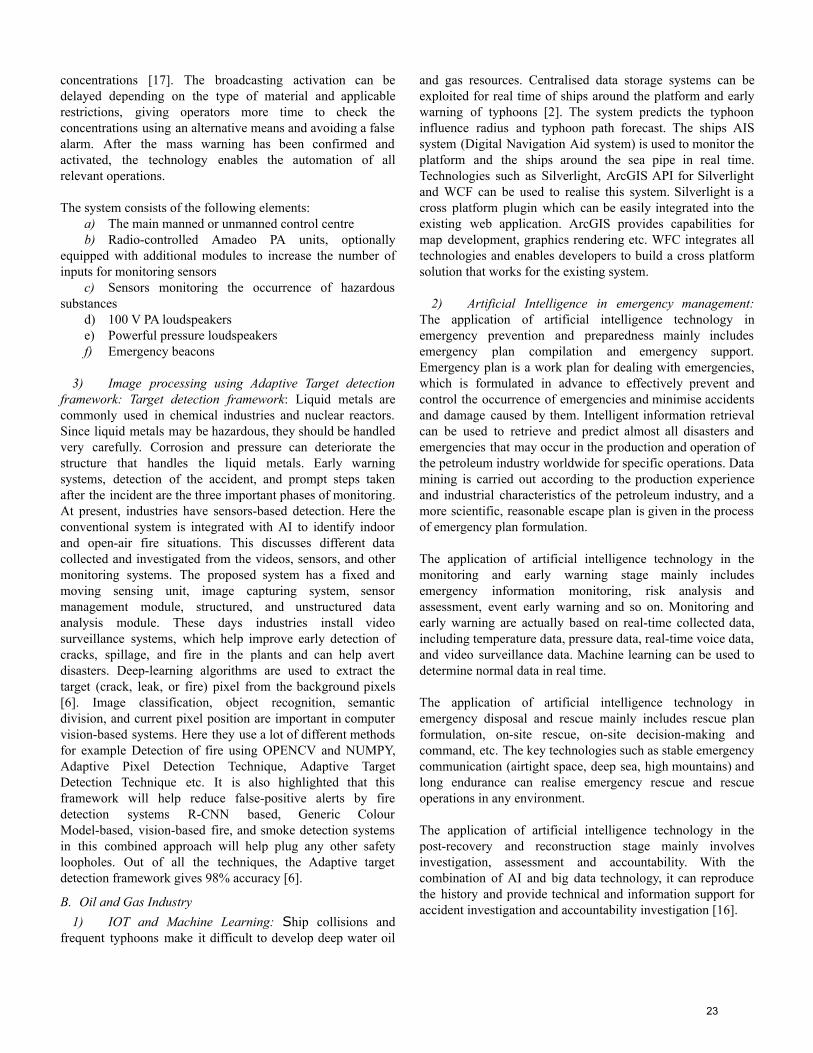
concentrations [17]. The broadcasting activation can bedelayed depending on the type of material and applicablerestrictions, giving operators more time to check theconcentrations using an alternative means and avoiding a falsealarm. After the mass warning has been confirmed andactivated, the technology enables the automation of allrelevant operations.
The system consists of the following elements:a) The main manned or unmanned control centreb) Radio-controlled Amadeo PA units, optionally
equipped with additional modules to increase the number ofinputs for monitoring sensors
c) Sensors monitoring the occurrence of hazardoussubstances
d) 100 V PA loudspeakerse) Powerful pressure loudspeakersf) Emergency beacons
3) Image processing using Adaptive Target detectionframework: Target detection framework: Liquid metals arecommonly used in chemical industries and nuclear reactors.Since liquid metals may be hazardous, they should be handledvery carefully. Corrosion and pressure can deteriorate thestructure that handles the liquid metals. Early warningsystems, detection of the accident, and prompt steps takenafter the incident are the three important phases of monitoring.At present, industries have sensors-based detection. Here theconventional system is integrated with AI to identify indoorand open-air fire situations. This discusses different datacollected and investigated from the videos, sensors, and othermonitoring systems. The proposed system has a fixed andmoving sensing unit, image capturing system, sensormanagement module, structured, and unstructured dataanalysis module. These days industries install videosurveillance systems, which help improve early detection ofcracks, spillage, and fire in the plants and can help avertdisasters. Deep-learning algorithms are used to extract thetarget (crack, leak, or fire) pixel from the background pixels[6]. Image classification, object recognition, semanticdivision, and current pixel position are important in computervision-based systems. Here they use a lot of different methodsfor example Detection of fire using OPENCV and NUMPY,Adaptive Pixel Detection Technique, Adaptive TargetDetection Technique etc. It is also highlighted that thisframework will help reduce false-positive alerts by firedetection systems R-CNN based, Generic ColourModel-based, vision-based fire, and smoke detection systemsin this combined approach will help plug any other safetyloopholes. Out of all the techniques, the Adaptive targetdetection framework gives 98% accuracy [6].
B. Oil and Gas Industry1) IOT and Machine Learning: Ship collisions and
frequent typhoons make it difficult to develop deep water oil
and gas resources. Centralised data storage systems can beexploited for real time of ships around the platform and earlywarning of typhoons [2]. The system predicts the typhooninfluence radius and typhoon path forecast. The ships AISsystem (Digital Navigation Aid system) is used to monitor theplatform and the ships around the sea pipe in real time.Technologies such as Silverlight, ArcGIS API for Silverlightand WCF can be used to realise this system. Silverlight is across platform plugin which can be easily integrated into theexisting web application. ArcGIS provides capabilities formap development, graphics rendering etc. WFC integrates alltechnologies and enables developers to build a cross platformsolution that works for the existing system.
2) Artificial Intelligence in emergency management:The application of artificial intelligence technology inemergency prevention and preparedness mainly includesemergency plan compilation and emergency support.Emergency plan is a work plan for dealing with emergencies,which is formulated in advance to effectively prevent andcontrol the occurrence of emergencies and minimise accidentsand damage caused by them. Intelligent information retrievalcan be used to retrieve and predict almost all disasters andemergencies that may occur in the production and operation ofthe petroleum industry worldwide for specific operations. Datamining is carried out according to the production experienceand industrial characteristics of the petroleum industry, and amore scientific, reasonable escape plan is given in the processof emergency plan formulation.
The application of artificial intelligence technology in themonitoring and early warning stage mainly includesemergency information monitoring, risk analysis andassessment, event early warning and so on. Monitoring andearly warning are actually based on real-time collected data,including temperature data, pressure data, real-time voice data,and video surveillance data. Machine learning can be used todetermine normal data in real time.
The application of artificial intelligence technology inemergency disposal and rescue mainly includes rescue planformulation, on-site rescue, on-site decision-making andcommand, etc. The key technologies such as stable emergencycommunication (airtight space, deep sea, high mountains) andlong endurance can realise emergency rescue and rescueoperations in any environment.
The application of artificial intelligence technology in thepost-recovery and reconstruction stage mainly involvesinvestigation, assessment and accountability. With thecombination of AI and big data technology, it can reproducethe history and provide technical and information support foraccident investigation and accountability investigation [16].
23
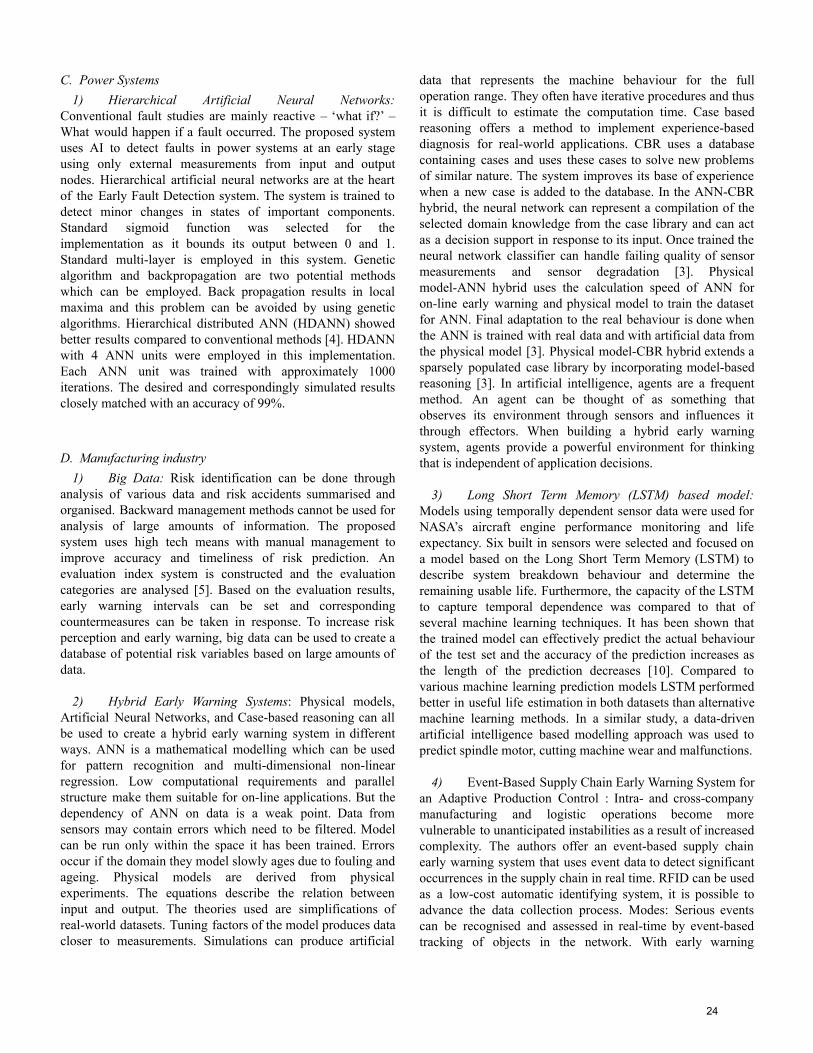
C. Power Systems1) Hierarchical Artificial Neural Networks:
Conventional fault studies are mainly reactive – ‘what if?’ –What would happen if a fault occurred. The proposed systemuses AI to detect faults in power systems at an early stageusing only external measurements from input and outputnodes. Hierarchical artificial neural networks are at the heartof the Early Fault Detection system. The system is trained todetect minor changes in states of important components.Standard sigmoid function was selected for theimplementation as it bounds its output between 0 and 1.Standard multi-layer is employed in this system. Geneticalgorithm and backpropagation are two potential methodswhich can be employed. Back propagation results in localmaxima and this problem can be avoided by using geneticalgorithms. Hierarchical distributed ANN (HDANN) showedbetter results compared to conventional methods [4]. HDANNwith 4 ANN units were employed in this implementation.Each ANN unit was trained with approximately 1000iterations. The desired and correspondingly simulated resultsclosely matched with an accuracy of 99%.
D. Manufacturing industry1) Big Data: Risk identification can be done through
analysis of various data and risk accidents summarised andorganised. Backward management methods cannot be used foranalysis of large amounts of information. The proposedsystem uses high tech means with manual management toimprove accuracy and timeliness of risk prediction. Anevaluation index system is constructed and the evaluationcategories are analysed [5]. Based on the evaluation results,early warning intervals can be set and correspondingcountermeasures can be taken in response. To increase riskperception and early warning, big data can be used to create adatabase of potential risk variables based on large amounts ofdata.
2) Hybrid Early Warning Systems: Physical models,Artificial Neural Networks, and Case-based reasoning can allbe used to create a hybrid early warning system in differentways. ANN is a mathematical modelling which can be usedfor pattern recognition and multi-dimensional non-linearregression. Low computational requirements and parallelstructure make them suitable for on-line applications. But thedependency of ANN on data is a weak point. Data fromsensors may contain errors which need to be filtered. Modelcan be run only within the space it has been trained. Errorsoccur if the domain they model slowly ages due to fouling andageing. Physical models are derived from physicalexperiments. The equations describe the relation betweeninput and output. The theories used are simplifications ofreal-world datasets. Tuning factors of the model produces datacloser to measurements. Simulations can produce artificial
data that represents the machine behaviour for the fulloperation range. They often have iterative procedures and thusit is difficult to estimate the computation time. Case basedreasoning offers a method to implement experience-baseddiagnosis for real-world applications. CBR uses a databasecontaining cases and uses these cases to solve new problemsof similar nature. The system improves its base of experiencewhen a new case is added to the database. In the ANN-CBRhybrid, the neural network can represent a compilation of theselected domain knowledge from the case library and can actas a decision support in response to its input. Once trained theneural network classifier can handle failing quality of sensormeasurements and sensor degradation [3]. Physicalmodel-ANN hybrid uses the calculation speed of ANN foron-line early warning and physical model to train the datasetfor ANN. Final adaptation to the real behaviour is done whenthe ANN is trained with real data and with artificial data fromthe physical model [3]. Physical model-CBR hybrid extends asparsely populated case library by incorporating model-basedreasoning [3]. In artificial intelligence, agents are a frequentmethod. An agent can be thought of as something thatobserves its environment through sensors and influences itthrough effectors. When building a hybrid early warningsystem, agents provide a powerful environment for thinkingthat is independent of application decisions.
3) Long Short Term Memory (LSTM) based model:Models using temporally dependent sensor data were used forNASA’s aircraft engine performance monitoring and lifeexpectancy. Six built in sensors were selected and focused ona model based on the Long Short Term Memory (LSTM) todescribe system breakdown behaviour and determine theremaining usable life. Furthermore, the capacity of the LSTMto capture temporal dependence was compared to that ofseveral machine learning techniques. It has been shown thatthe trained model can effectively predict the actual behaviourof the test set and the accuracy of the prediction increases asthe length of the prediction decreases [10]. Compared tovarious machine learning prediction models LSTM performedbetter in useful life estimation in both datasets than alternativemachine learning methods. In a similar study, a data-drivenartificial intelligence based modelling approach was used topredict spindle motor, cutting machine wear and malfunctions.
4) Event-Based Supply Chain Early Warning System foran Adaptive Production Control : Intra- and cross-companymanufacturing and logistic operations become morevulnerable to unanticipated instabilities as a result of increasedcomplexity. The authors offer an event-based supply chainearly warning system that uses event data to detect significantoccurrences in the supply chain in real time. RFID can be usedas a low-cost automatic identifying system, it is possible toadvance the data collection process. Modes: Serious eventscan be recognised and assessed in real-time by event-basedtracking of objects in the network. With early warning
24

information it is additionally possible to safeguard followingprocesses by evaluation and execution of suitable actions inthe field of adaptive production control. As an outcome,adaptive situational control of intra-company productionprocesses is made possible [8]. The advantages of this methodregarding logistic aims are assessed by using a discrete-eventsimulation based on a prototypical execution of across-company production scenario. As a result, severeincidents can be identified and examined in real time usingevent-based tracking of network objects. It is also feasible toprotect subsequent processes using early warning informationby evaluating and executing appropriate measures in the fieldof adaptive production control. As a result, adaptivesituational control of intra-company manufacturing processesbecomes conceivable. A discrete-event simulation based on aprototypical execution of a cross-company productionscenario is used to examine the merits of this strategy in termsof logistical goals.
5) SVR Model and Fuzzy logic: This early warningsystem helps waste-water processing station operators takeearly action and avoid environmental pollution. The model isbased on historical data collected by data-loggers to predictfuture quality of the waste water. To assess the performance offour time series data consisting of PH, temperature, TSS andCOD are used.
To construct an early warning model for recognizingenvironmental pollution of waste-water in industrial zones,researchers used two soft computing methods that supportvector regression (SVR) and fuzzy logic. The embeddingdimension space for a time series is discovered using a falseclosest neighbour approach, and a model for forecasting thequality of wastewater in industrial zones is built using fuzzylogic and SVR.
Data is collected from a wastewater processing station to buildand test the model. The experiment results show that the SVRmodel obtains the results more accurately than the fuzzymodel for most of the case study data [19].
The fuzzy logic model gives better results than the SVR modelbecause the fuzzy logic model tolerates noise better than theSVR model. In addition, training the fuzzy logic modelrequires less time than the SVR model because training thefuzzy logic model only required using the training data setonce, while training the SVR model required the training dataset several times. Therefore, the fuzzy logic model for noisy,real time and least accurate parameters can be applied.Otherwise, the SVR model is preferred.
6) Wireless Sensor Network - enabled Alarm System:Equipment maintenance is important in intelligentmanufacturing since it directly affects the equipment's servicelife and production efficiency. Existing equipment
maintenance methods rely on system alarms, and an operatornotifies equipment maintenance employees of any issues. Thefault then needs to be exactly located and resolved, leading toa shutdown in the production process. With the support ofmanufacturing big data, device data can be logged in at realtime, including device alarms, device logs, and device status,in order to evaluate the health condition of manufacturingequipment and preemptively detect breakdowns. Therefore,active preventive maintenance is proactive and can findproblems earlier.
Recent research achievements, such as the radio frequencyidentification (RFID)-enabled manufacturing executionsystem, and the wireless sensor networks (WSN)-enabledalarm system [18] have provided a preliminary basis to enablethe design of active preventive maintenance for intelligentmanufacturing.
Three main parts of this method include
1. A cloud-based system architecture for collection ofmanufacturing big data is designed for industrialenvironments, which contributes to theimplementation of active preventive maintenance.
2. Data processing including real-time activemaintenance and offline analysis and prediction inthe cloud is provided.
3. The real-time active maintenance mode and thetraditional maintenance mode are compared. Theoffline prediction algorithm is then implemented in amachining centre to validate its viability andeffectiveness.
The manufacturing big data method used for active preventivemaintenance has the capability to hasten execution of Industry4.0.
In general, manufacturing big data can be categorised intothree sorts: device data, product data, and command data.Using a cloud platform, collected manufacturing big data canbe studied further and used to generate ground-breakingapplications, such as active preventive maintenance,optimization of a production line, and energy consumptionoptimization.
7) AI Safety in Manufacturing: According to analysts,falling accounts for 40% of all safety occurrences, which canbe easily avoided. AI helps improve the safety of employeesand physical assets in manufacturing environments bycombining IoT technology, real-time data collecting, andadvanced analytics. In the area of security, AI encompasseseverything from collaborative robots (cobots) to machinevision technologies to machine learning (ML) to deep learningalgorithms and models. Noncompliance can be monitored byAI systems. People's activity inside the factory can be
25
monitored using computer vision systems or sensors. If peopleare not following the rules, early warnings can be given,which can be used to send alerts or emails to regulators,reducing misbehaviour and enhancing internal safety. FactoryWearable sensors can be attached to a jacket, a wristband, or ahelmet. These sensors can transmit data and monitor activityin potentially dangerous workplace environments. Machinelearning and non-progressive data analytics can be used todetect events and generate warnings before a catastrophicaccident happens [14]. These technologies, similar toautonomous vehicles or self-driving cars, can be used within aplant, where many forklifts can communicate with one anotherusing sensors and technology. They are able to avoid collidingwith and bumping into items within the tree. There will neverbe a perfect AI system. As a result, the major goal with AI isto accomplish 90-95 percent, while people are trained to avoidthe remaining 5-10 percent. Thus, AI can eliminate most ofthe repetitive tasks.
8) Predictive Maintenance of Machine Tools Systemusing AI: External sensors put on the machine can translate theconditions of the machine tool in use into signals (forexample, accelerometers, microphones, dynamometers andthermometers). Raw analog signals must first be treated toremove undesirable frequency bands before extractingvaluable information. The next step is to extract features fromthe processed signal and compress the data in order togenerate condition information. There are three types of AItechniques: supervised, unsupervised, and reinforcementlearning [11]. The retrieved features are trained with theirrespective labels using supervised learning. Unsupervisedlearning develops estimated models rather than labels for eachdata set. The reinforcement learning approach learns fromrewards and punishments before creating a policy toaccomplish the goal. The results of the AI model can beestimated once it has been trained. Cutting tool conditionmonitoring and bearing condition monitoring are among thesimulation outcomes.
E. Pharma Industries1) AI-enabled risk detection: AI-enabled risk detection:
Risk identification is an important aspect of thepharmaceutical production process. Risk should be removedfrom the patient as much as feasible, according to the Qualityby Design principles. This entails safeguarding them againstflaws in the manufacturing process or in the raw ingredients.And that involves identifying weaknesses as quickly asfeasible. Quartic.ai has opted to collaborate on a new AI-basedrisk detection engine with Sparta Systems [13]. Without datascience training, the software will soon identify dangers in thepharmaceutical production process and present consumerswith quality information in real time solutions. Together, thetwo businesses develop an "in-field" data gathering systemthat uses machine learning to detect growing deviations and
odd process behaviour (Quartic), as well as proactive qualityassurance (Sparta).
F. Food Industry
1) IOT based traceability for Food supply chain :Customer’s health awareness is of extreme significance. Foodcan become contaminated at any point during production,storage and delivery. Hence, it is of utmost importance forthe perishable food supply chain to supervise the food qualityand safety. Traceability system offers a comprehensiveinformation on food and thereby guarantees food quality andsafety. The study puts forth an IoT-based traceability systemthat utilises RFID and raspberry pi-based sensors. The RFIDplays a main part to track and trace the product; thus, it canavoid counterfeiting and distribution of low-quality foodproducts along the supply chain. The proposed system usesthe temperature-humidity sensor for raspberry pi to collectdata on the atmospheric conditions of perishable food duringdistribution and storage. Moreover, the machine learningbased forecasting model is put into practice to predicttemperatures, so that early warning can be presented by thesystem if the predicted temperature exceeds the normalrange. The results showed that compared to the traditionalmethods, the proposed system is capable of tracking productsas well as predicting sensor data accurately and effectively[7]. Finally, a forecasting model based on machine learning isutilised to estimate the changes of temperature, so thatcontrolled storage can be maintained.[7]
G. Coal Industry
1) IOT based early warning system : Deadly accidentsassociated with underground coal mines necessitate theimplementation of high-level gas monitoring and miner’slocalization approaches to help with underground safety andhealth problems. For improving safety management andpreventing accidents in underground coal mines, this studypresents a real-time monitoring, event-reporting, andearly-warning platform based on cluster analysis for outlierdetection, spatiotemporal statistical analysis, and an RSSrange-based weighted centroid localization algorithm. Thesuggested platform uses the Internet of Things (IoT), cloudcomputing, a real-time operational database, applicationgateways, and application program interfaces to seamlesslycombine monitoring, analysis, and localization methodologies.The prototype has proven useful at the Hassan Kishore coalmine, which is still in operation. When compared to theircommercial equivalent, sensors for air quality metrics such astemperature, humidity, CH4, CO2, and CO produced greatresults, with regression constants always coming out to bemore than 0.97 for every parameter. In the tough environmentof underground mines, this system allows for real-timemonitoring, abnormal event detection (>90%), and verificationof a miner's location (with 1.8 m of inaccuracy). The
26
development of an open source, configurable, andcost-effective platform for efficiently improving undergroundcoal mine safety is the study's key benefit. This system hasproved important for solving the issues relating toaccessibility, serviceability, interoperability, and flexibilitywith respect to safety in coal mines.[9]
H. Automotive Industry1) Simulation-based Early Warning Systems in
Automotive Industry : The Simulation based Early WarningSystem elements have a variety of roles and tasks. A WebService software is designed to provide help with thecommunication between various software applications runningon discrete platforms over a network. They enable softwareand services from a variety of locations to be combinedseamlessly to an integrated service and to be reused within aninfrastructure [12]. The abilities and characteristics of materialflow systems can be described by a specific spectrum of data.The first group holds data which is deterministic andindependent from the present condition of the system. Thesecond group is dynamic data which describe the currentsystem state. This data is given by different productionplanning systems, production control centres or planning anddocumentation databases. A RFID system typically containstwo main components: RFID tag or transponder and RFIDtransceiver as an antenna reader combination. Passive tags donot demand an internal power source, whereas in active tags apower source is a necessity. Depending on the standard orfrequency they work with and the material they are attachedto, the distance between a passive tag and reader can rangefrom a few millimetres.
III. CONCLUSIONS
In the industrial environment, the requirement ofrobustness and real-time processing plays more importantroles. For example, deep learning, which has provedsuccessful in image recognition and natural languageprocessing, could make use of stored data but may not beappropriate in active preventive maintenance. Algorithmswhich may not be that advanced but with expert knowledgemight lead to better performance. There are also somechallenges like standardisation of processing, management ofmultisource data, data privacy, the complex nature ofIoT-based platforms, and autonomous sensing. Now standingat a new historical starting point, data resources have alreadybecome the whole social and economic development under theera of big data and artificial intelligence. At the same time oftechnological development, big data risk management cannotbe left behind. It is very important to establish a closed-loopmanagement chain of data security protection.
Real- time identification of critical events and earlyimplementation of appropriate measures enables significantreduction of the consequences of unforeseen disruptions.Further work is needed on the crosslinking between earlywarning information and measure determination in the field of
adaptive production control. Furthermore, the technology ofthe eEWS has to be investigated with particular regard toperformance (e.g., accuracy and timeliness of early warninginformation) and cost-effectiveness.
In Manufacturing industries, the estimated time beforefailure is being successfully calculated by using a machinelearning based predictive maintenance system using IoT data.Also Pd.M. systems are being successfully developed using AIalgorithms to represent the conditions of the components inthe system. However, the measurements are affected by manydisturbances. The collected values contain a substantialamount of noise which causes the embedding dimension spaceof the time series to be large. This value not only affects theaccuracy of the model but also affects the training time. In thefuture a Hilbert Huang Transform can be used as an adaptivefilter to denoise the collected time series data before findingthe embedding dimension space and building the model. Thiswork will decrease the model’s complexity and increase theaccuracy prediction. In future, other types of low cost IoTsensors might be utilised, while machine learning methods canbe used to improve the performance of Early Warning System.
Adaptive analytics framework may prove efficient andreliable in handling and mitigating the hazards resulting fromthe fluids and liquid metals. Also, this framework may help inbetter monitoring and much earlier prompt detection ofleakages. It is also highlighted that this framework will helpreduce false-positive alerts by fire detection systems R-CNNbased, Generic Colour Model-based, vision-based fire, andsmoke detection systems. There is also a need for an efficientimage management system to help better the fire hazardprevention system.
REFERENCES
[1] Jinhu Chen, “Research on Intelligent Detection Device of Toxic andHarmful Gas Alarm” Journal of Physics: Conference Series,1992032149, 2021.
[2] Ya Ban, Hongjing Liu, Hongying Liu, Fan Yang, Jing Juan, “Design andimplementation of forecast and early warning system for offshoreplatform based on GIS”, IOP Conference Series: Earth andEnvironmental Science, 34901200, 2019
[3] Karlsson C., Olsson E., Funk, P, Hybrid Early Warning Systems,COMADEM 2009, Spain, Editors: R.B.K.N. Rao, A. Arnaiz, June, 2009
[4] Wong, K. C. P.; Ryan, H. M. and Tindle, J. (1996). Early warning faultdetection using artificial intelligent methods. In: Proceedings: 31stUniversities power engineering conference, Technological EducationalInstitute of Iraklion, Hereklion, Crete, pp. 949–952.
[5] Weiyang Zeng, Yining Jin, “Research on Enterprise Risk Identificationand Early Warning System based on Big Data Background,” Journal ofPhysics: Conference Series, 1302042001., 2019.
[6] Praveen Sankarasubramanian, E. N. Ganesh, “ArtificialIntelligence-Based Detection System for Hazardous Liquid Metal Fire”2021 8th International Conference on Computing for Sustainable GlobalDevelopment (INDIACom 2021), 978-93-80544-43-4/21/$31.00 c 2021IEEE
[7] Ganjar Alfian, Muhammad Syafrudin, Norma Latif Fitriyani, JongtaeRhee, Muhammad Rifqi Ma'arif, Imam Riadi, “Traceability system usingIoT and forecasting model for food supply chain” 2020 InternationalConference on Decision Aid Sciences and Application (DASA),DOI:10.1109/DASA51403.2020.9317011
[8] E. GencN, DuffieG, Reinhart, “Event-Based Supply Chain EarlyWarning System for an Adaptive Production Control” RobustManufacturing Conference (RoMaC 2014), doi:10.1016/j.procir.2014.04.076
[9] Byung Wan Jo, Rana Muhammad Asad Khan, “An Event Reporting andEarly-Warning Safety SystemBased on the Internet of Things for
27

UndergroundCoal Mines: A Case Study”, Appl. Sci. 2017, 7(9), 925;DOI:10.3390/app7090925
[10] Serkan Ayvaz, Koray Alpay. 2020. Predictive maintenance system forproduction lines in manufacturing: A machine learning approach usingIoT data in real-time.
[11] Wo Jae Leea, Haiyue Wua, Huitaek Yunb, Hanjun Kimb, Martin B.G.,Junb, John W. Sutherlanda. 2019. Predictive Maintenance of MachineTool Systems Using Artificial Intelligence Techniques Applied toMachine Condition Data.
[12] Ingo Hotz, André Hanisch, Thomas Schulze. 2007. Simulation-BasedEarly Warning Systems as a Practical Approach for the AutomotiveIndustry
[13] Abi Miller,"AI-enabled risk detection in pharma manufacturing",Analysis Oct 14, 2020.
[14] JUILI EKLAHARE,"ARTIFICIAL INTELLIGENCE SAFETY INMANUFACTURING: THE ROLE OF AI, Feb 22, 2021, Industr.com
[15] Tuomas Uusitalo, 03.06.2021,"Artificial intelligence as a tool forindustrial maintenance".
[16] Lei Wang, Shenghan Gao, Shengli Chu, JiayiLi, Shuli Jin, Na Li andLianfang Zhang, Journal of Physics: Conference Series, 2021 3rdInternational Conference on Artificial Intelligence and ComputerScience (AICS) 2021 29-31 July 2021, Beijing, China, Volume2025Citation Lei Wang et al 2021 J. Phys.: Conf. Ser. 2025 012017, "Artificial Intelligence (AI) Technology Assisted EmergencyManagement in Oil Industry".
[17] Warning systems in the chemical industry, by the telegrafia industry.[18] J. Wan et al., "A Manufacturing Big Data Solution for Active Preventive
Maintenance," in IEEE Transactions on Industrial Informatics, vol. 13,no. 4, pp. 2039-2047, Aug. 2017, doi: 10.1109/TII.2017.2670505.
[19] Ba N.N., Jorge R.R. (2020) Building an Early Warning Model forDetecting Environmental Pollution of Wastewater in Industrial Zones.In: Barolli L., Hellinckx P., Natwichai J. (eds) Advances on P2P,Parallel, Grid, Cloud and Internet Computing. 3PGCIC 2019. LectureNotes in Networks and Systems, vol 96. Springer, Cham.https://doi.org/10.1007/978-3-030-33509-0_78
28
Monitoring of KPI’s like Delivery Reliability,Utilized Capacity, and Idle Time in Production
SystemsAtezaz Ahmed Khan
(239417)Systems Engineering for Manufacturing
Otto von Guericke UniversityMagdeburg, Germany
Hariprasad Kanagaraj(235245)
Systems Engineering for ManufacturingOtto von Guericke University
Magdeburg, [email protected]
Krishna Anant Manore(239540)
Systems Engineering for ManufacturingOtto von Guericke University
Magdeburg, [email protected]
Rahul Nagam(240147)
Systems Engineering for ManufacturingOtto von Guericke University
Magdeburg, [email protected]
Sanket Khanderao Kute(239999)
Systems Engineering for ManufacturingOtto von Guericke University
Magdeburg, [email protected]
Abstract—Monitoring of the Key Performance Indicators(KPIs) has become a crucial aspect in almost every productionsystem. It helps organizations in quantifying their progressand determining how to improve their operations in orderto minimize costs, increase productivity and make use of theproduction systems efficiently. In this paper, we have discussedthe monitoring of three major KPIs delivery reliability, utilizedcapacity, and idle time. Since every production system is uniquein its own way, we have mentioned different methods to monitorthese KPIs.
Index Terms—Monitoring of KPI, Monitoring of Key Per-formance Indicator, Delivery Reliability, Utilized Capacity, IdleTime.
I. INTRODUCTION
A Key Performance Indicator (KPI) is a quantitative mea-surement tool used by the manufacturing industries to measureits performance over time. KPIs are typically used by compa-nies to monitor, analyze, and optimize operations in order toenhance efficiencies. Knowing and measuring the right KPIsis vital to the health and faster growth of a production plant.Monitoring KPIs is important because it helps to measurea company’s progress, monitor its health, analyze patternsover time, solve problems or capitalize on opportunities, makecritical adjustments, and stay on track.
Delivery Reliability is a metric that shows the percentage ofproducts delivered on time, with a goal of 100%. Measuringdelivery reliability is crucial because it determines a com-pany’s success or failure. When a company delivers productsto customers on time, it builds customer loyalty, which leads toretaining the existing customers. Aside from that, if employeescan complete 100 percent of their deliveries on time, it will
keep their motivation high. To achieve delivery reliability,the production schedule must be realistic, material inventoriesmust be accurate, and quality must be prioritized.
Capacity Utilization (CU) is generally defined as howefficiently the company is using its production capacity.it canbe also defined as the ratio of observed output to the designedoutput of the production system. The terminology that isgenerally used while defining capacity utilization is that it isa relative index that gives the rating of the used capacity ofthe resources. If the Relative index shows 60% then it meansonly 60% of the available capacity is used in the plant. Thisis one of the major KPIs and generally relates between theoutput produced using the installed equipment and probableoutput which could be produced out of it.
Idle time is a period when the manufacturing process ison hold and no products are produced. This may occur dueto multiple reasons such as maintenance, breakdown, humanerrors. Employers may face substantial consequences if staff isnot engaged in productive tasks. According to a 2018 HarvardBusiness School study, 78.1 percent of workers experienceinvoluntary idle time on a weekly basis, costing businesses anestimated $100 billion each year [1]. Idle time is of two types:• Normal Idle time: This is mandatory in any working en-
vironment and cannot be eliminated. This represents theamount of time that is getting wasted and cannot be avoidedand the employer must bear the labor cost of this time. Itis best known and referred to as “downtime”.
• Abnormal Idle time: The amount of time wastage that oc-curs due to errors or the amount of time wastage that can beavoided by taking precautions is the abnormal ideal time. A
29
labor strike, for example, is unusual idle time that may, inmany situations, be managed by management. In any firm,time management is critical, especially when there are largefixed expenditures. Depreciation costs are incurred whenmachinery or equipment is idle, and output productivity isreduced.
II. MONITORING DELIVERY RELIABILITY
The industrial market is shifting from seller to buyer in pastfew years. It is important to achieve high delivery reliabilityto meet the increasing importance of customer service. Thedifficulty of this was evident during the coronavirus pandemicwhen quarantine and other restrictions made deliveries unre-liable [2]. As a result, entire supply networks were unableto meet their logistical objectives. Therefore, the situationin the manufacturing industry is becoming dynamic, unclear,challenging, and ambiguous. Manufacturing industries addressthese issues by improving supply networks and integratingtheir supply chains. However, in a volatile, uncertain, complex,and ambiguous environment like this, planning accuracy plum-mets as the time horizon lengthens [2]. Manufacturing control,which is responsible for carrying out the production plan inthe face of unforeseen events, is thus critical and growing inimportance. As a result, in order to reduce delivery reliabilitylosses, manufacturing industries must effectively connect tosupply networks and monitor data of how reliably they candeliver products. There are various methods on how to monitordelivery reliability, but in this paper, we have discussed RadioFrequency Identification (RFID) technology.
A. Radio Frequency Identification (RFID)
RFID technology has provided a variety of methods forspecific problems or to enhance productivity using differentapplications with different systems because of the benefitsof real-time information capturing. In this section, we willexplicitly explain a monitor control system structure for themanufacturing line. The RFID technology is combined witha real-time database and a PLC in the production system.The system explained here is adaptable and can be used ina wide range of factories or businesses. In this section, wewill provide an implementation of a monitoring and controlsystem for a discrete manufacturing system, the requirementsof which have been thoroughly analyzed in terms of universalbenefits. We have explained this system with the help of a casestudy explained by Na LI, Jie TAN, Zhiyuan ZHU in theirpaper “Monitor and Control System with RFID Technologyin Discrete Manufacturing Line [3].”
1) Analysis of process in a Production system: The man-ufacturing process is meticulously examined in order to trackand enhance production efficiency and accuracy. It has beenfound that there are primarily two challenges that need tobe resolved. The following are the issues that exist in theconventional manufacturing industry.• Material delivery problem:
The process of delivering by worker from one manufacturinglocation to another will result in some unexpected losses
or errors. As a result, certain unwanted material wastesand labor expenditures will be added to the manufacturingcosts. However, in comparison with other manufacturingfacilities, the cost of production plays a significant role.Furthermore, in a typical production line, additionalmanpower was required to handle delivery operations.Which in turn results in rising expense of production.To gain a competitive advantage, the amount of timespent working will be raised, and the increasing strainon each worker will reduce efficiency. As a result, thematerial delivery issue will be a significant factor in anorganization’s growth and competition.
• Procedure organization problem:Due to unavailability if real time information of production,as well as the fact that conventional management is oftenbased on experience rather than science and objectivitywhich in turn makes manufacturing management even moredifficult. The experience linked with organization lacksreliability and objective knowledge, causing management towork even more on production. The inefficiency in operationand assessment will result in a waste of labor and anincrease in the amount of time spent on individual stock.Due to a lack of correct information on the manufacturingsites, the scientific statistic approach will be unable todetermine the creating and winning circumstances. However,meaningful direct commands from the central managementare quite crucial in the garment industry. As a result, real-time production state data will be beneficial. In conclusion,the conventional manufacturing process suffers from a lackof information-based linkages between the centralized unitand the operations [3].To solve the problem of material delivery, the material tobe moved between production sites will be positioned on atrack and managed by our PLC-based auto control system.When the material is delivered by employees, this willnot result in unplanned losses or errors. The recommendedmonitor control system has a high level of automation,which saves a lot of manpower and lowers production costs.By reducing worker burdens, it can improve the efficiencyof the product. The host computer, on the other hand, mayeasily organize procedures using the real-time informationprovided by the RFID reader. This will give the managementwith constant and objective information on the state of themanufacturing process, such as the rate of production oneach manufacturing site or a set of manufacturing sitesfor a certain manufacturing step. The scientific statisticapproach will be able to understand the producing andearning circumstances from reliable data. The manager willthen be able to build a better scheduling plan based on thisinformation.
2) Framework for the monitor and control system: Inmodern factories, it is necessary to have a material handlingsystem that will be able to transport materials efficiently in theprocess of a manufacturing plant. RFID and real-time database
30
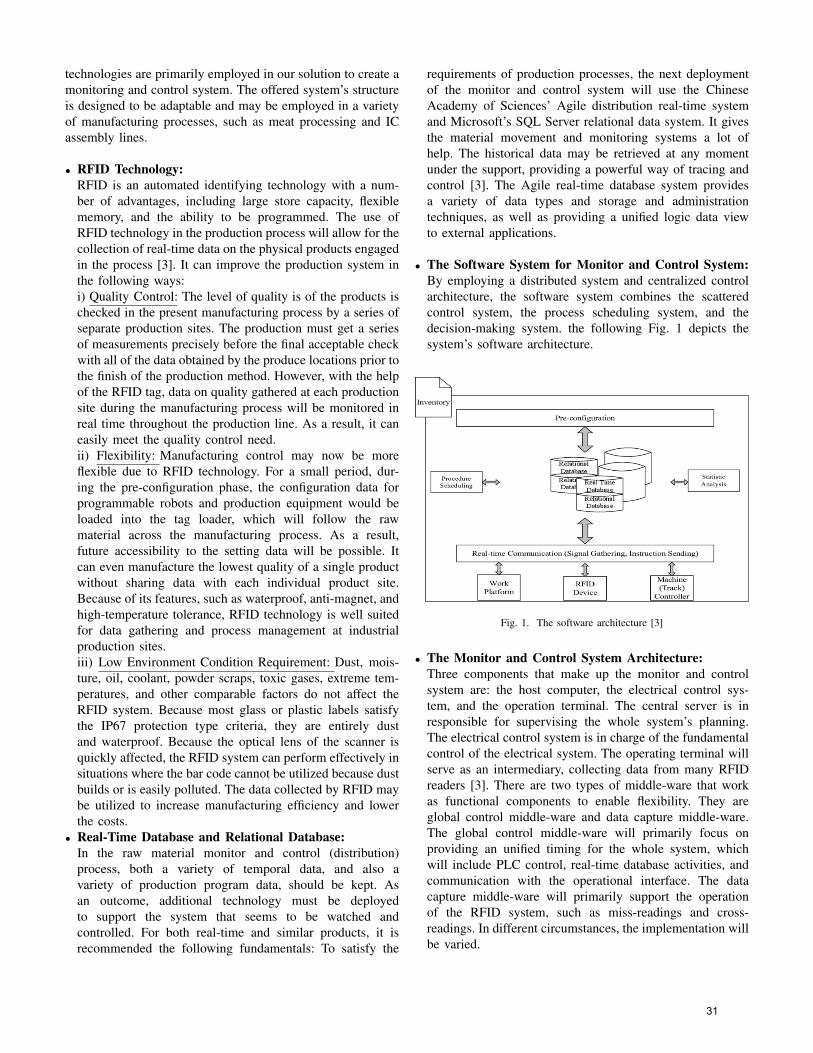
technologies are primarily employed in our solution to create amonitoring and control system. The offered system’s structureis designed to be adaptable and may be employed in a varietyof manufacturing processes, such as meat processing and ICassembly lines.
• RFID Technology:RFID is an automated identifying technology with a num-ber of advantages, including large store capacity, flexiblememory, and the ability to be programmed. The use ofRFID technology in the production process will allow for thecollection of real-time data on the physical products engagedin the process [3]. It can improve the production system inthe following ways:i) Quality Control: The level of quality is of the products ischecked in the present manufacturing process by a series ofseparate production sites. The production must get a seriesof measurements precisely before the final acceptable checkwith all of the data obtained by the produce locations prior tothe finish of the production method. However, with the helpof the RFID tag, data on quality gathered at each productionsite during the manufacturing process will be monitored inreal time throughout the production line. As a result, it caneasily meet the quality control need.ii) Flexibility: Manufacturing control may now be moreflexible due to RFID technology. For a small period, dur-ing the pre-configuration phase, the configuration data forprogrammable robots and production equipment would beloaded into the tag loader, which will follow the rawmaterial across the manufacturing process. As a result,future accessibility to the setting data will be possible. Itcan even manufacture the lowest quality of a single productwithout sharing data with each individual product site.Because of its features, such as waterproof, anti-magnet, andhigh-temperature tolerance, RFID technology is well suitedfor data gathering and process management at industrialproduction sites.iii) Low Environment Condition Requirement: Dust, mois-ture, oil, coolant, powder scraps, toxic gases, extreme tem-peratures, and other comparable factors do not affect theRFID system. Because most glass or plastic labels satisfythe IP67 protection type criteria, they are entirely dustand waterproof. Because the optical lens of the scanner isquickly affected, the RFID system can perform effectively insituations where the bar code cannot be utilized because dustbuilds or is easily polluted. The data collected by RFID maybe utilized to increase manufacturing efficiency and lowerthe costs.
• Real-Time Database and Relational Database:In the raw material monitor and control (distribution)process, both a variety of temporal data, and also avariety of production program data, should be kept. Asan outcome, additional technology must be deployedto support the system that seems to be watched andcontrolled. For both real-time and similar products, it isrecommended the following fundamentals: To satisfy the
requirements of production processes, the next deploymentof the monitor and control system will use the ChineseAcademy of Sciences’ Agile distribution real-time systemand Microsoft’s SQL Server relational data system. It givesthe material movement and monitoring systems a lot ofhelp. The historical data may be retrieved at any momentunder the support, providing a powerful way of tracing andcontrol [3]. The Agile real-time database system providesa variety of data types and storage and administrationtechniques, as well as providing a unified logic data viewto external applications.
• The Software System for Monitor and Control System:By employing a distributed system and centralized controlarchitecture, the software system combines the scatteredcontrol system, the process scheduling system, and thedecision-making system. the following Fig. 1 depicts thesystem’s software architecture.
Fig. 1. The software architecture [3]
• The Monitor and Control System Architecture:Three components that make up the monitor and controlsystem are: the host computer, the electrical control sys-tem, and the operation terminal. The central server is inresponsible for supervising the whole system’s planning.The electrical control system is in charge of the fundamentalcontrol of the electrical system. The operating terminal willserve as an intermediary, collecting data from many RFIDreaders [3]. There are two types of middle-ware that workas functional components to enable flexibility. They areglobal control middle-ware and data capture middle-ware.The global control middle-ware will primarily focus onproviding an unified timing for the whole system, whichwill include PLC control, real-time database activities, andcommunication with the operational interface. The datacapture middle-ware will primarily support the operationof the RFID system, such as miss-readings and cross-readings. In different circumstances, the implementation willbe varied.
31
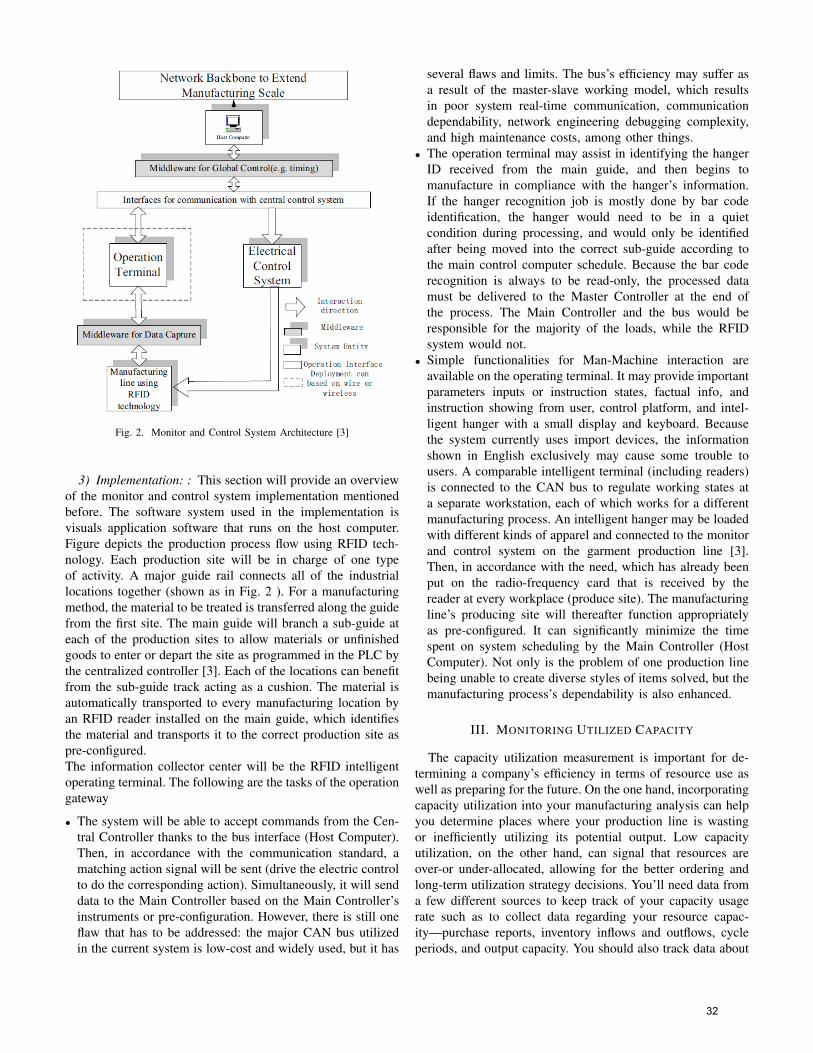
Fig. 2. Monitor and Control System Architecture [3]
3) Implementation: : This section will provide an overviewof the monitor and control system implementation mentionedbefore. The software system used in the implementation isvisuals application software that runs on the host computer.Figure depicts the production process flow using RFID tech-nology. Each production site will be in charge of one typeof activity. A major guide rail connects all of the industriallocations together (shown as in Fig. 2 ). For a manufacturingmethod, the material to be treated is transferred along the guidefrom the first site. The main guide will branch a sub-guide ateach of the production sites to allow materials or unfinishedgoods to enter or depart the site as programmed in the PLC bythe centralized controller [3]. Each of the locations can benefitfrom the sub-guide track acting as a cushion. The material isautomatically transported to every manufacturing location byan RFID reader installed on the main guide, which identifiesthe material and transports it to the correct production site aspre-configured.The information collector center will be the RFID intelligentoperating terminal. The following are the tasks of the operationgateway
• The system will be able to accept commands from the Cen-tral Controller thanks to the bus interface (Host Computer).Then, in accordance with the communication standard, amatching action signal will be sent (drive the electric controlto do the corresponding action). Simultaneously, it will senddata to the Main Controller based on the Main Controller’sinstruments or pre-configuration. However, there is still oneflaw that has to be addressed: the major CAN bus utilizedin the current system is low-cost and widely used, but it has
several flaws and limits. The bus’s efficiency may suffer asa result of the master-slave working model, which resultsin poor system real-time communication, communicationdependability, network engineering debugging complexity,and high maintenance costs, among other things.
• The operation terminal may assist in identifying the hangerID received from the main guide, and then begins tomanufacture in compliance with the hanger’s information.If the hanger recognition job is mostly done by bar codeidentification, the hanger would need to be in a quietcondition during processing, and would only be identifiedafter being moved into the correct sub-guide according tothe main control computer schedule. Because the bar coderecognition is always to be read-only, the processed datamust be delivered to the Master Controller at the end ofthe process. The Main Controller and the bus would beresponsible for the majority of the loads, while the RFIDsystem would not.
• Simple functionalities for Man-Machine interaction areavailable on the operating terminal. It may provide importantparameters inputs or instruction states, factual info, andinstruction showing from user, control platform, and intel-ligent hanger with a small display and keyboard. Becausethe system currently uses import devices, the informationshown in English exclusively may cause some trouble tousers. A comparable intelligent terminal (including readers)is connected to the CAN bus to regulate working states ata separate workstation, each of which works for a differentmanufacturing process. An intelligent hanger may be loadedwith different kinds of apparel and connected to the monitorand control system on the garment production line [3].Then, in accordance with the need, which has already beenput on the radio-frequency card that is received by thereader at every workplace (produce site). The manufacturingline’s producing site will thereafter function appropriatelyas pre-configured. It can significantly minimize the timespent on system scheduling by the Main Controller (HostComputer). Not only is the problem of one production linebeing unable to create diverse styles of items solved, but themanufacturing process’s dependability is also enhanced.
III. MONITORING UTILIZED CAPACITY
The capacity utilization measurement is important for de-termining a company’s efficiency in terms of resource use aswell as preparing for the future. On the one hand, incorporatingcapacity utilization into your manufacturing analysis can helpyou determine places where your production line is wastingor inefficiently utilizing its potential output. Low capacityutilization, on the other hand, can signal that resources areover-or under-allocated, allowing for the better ordering andlong-term utilization strategy decisions. You’ll need data froma few different sources to keep track of your capacity usagerate such as to collect data regarding your resource capac-ity—purchase reports, inventory inflows and outflows, cycleperiods, and output capacity. You should also track data about
32
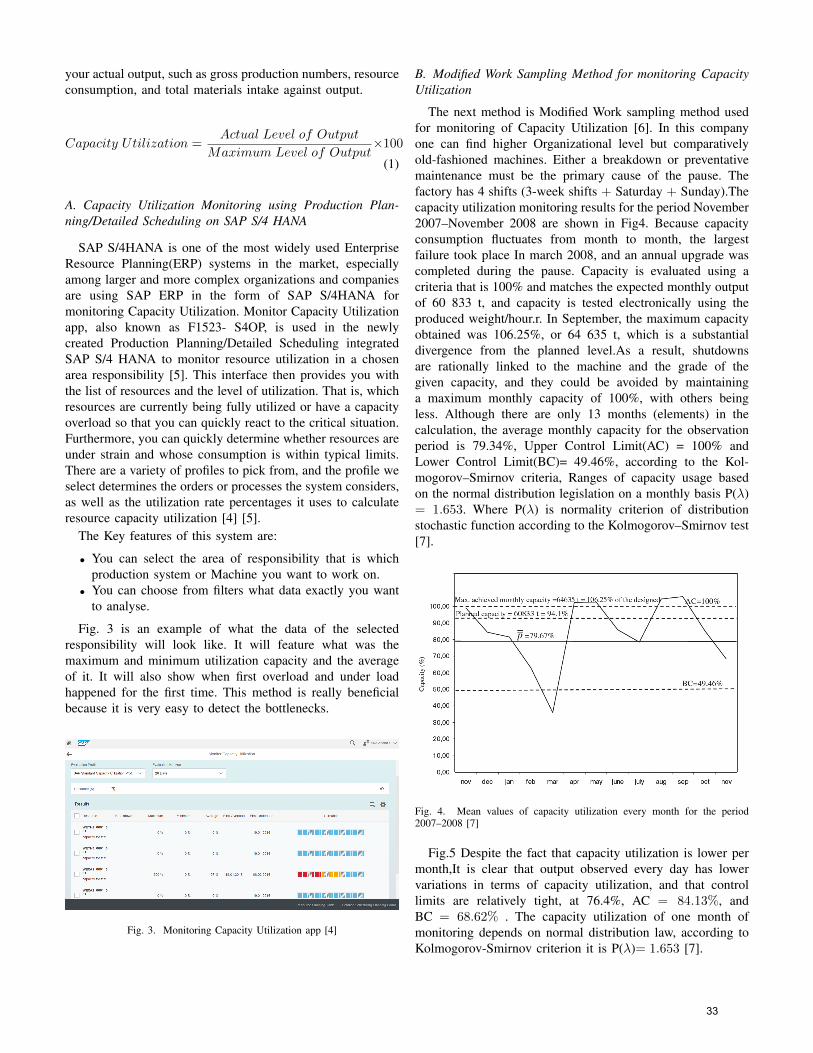
your actual output, such as gross production numbers, resourceconsumption, and total materials intake against output.
Capacity Utilization =Actual Level of Output
Maximum Level of Output×100
(1)
A. Capacity Utilization Monitoring using Production Plan-ning/Detailed Scheduling on SAP S/4 HANA
SAP S/4HANA is one of the most widely used EnterpriseResource Planning(ERP) systems in the market, especiallyamong larger and more complex organizations and companiesare using SAP ERP in the form of SAP S/4HANA formonitoring Capacity Utilization. Monitor Capacity Utilizationapp, also known as F1523- S4OP, is used in the newlycreated Production Planning/Detailed Scheduling integratedSAP S/4 HANA to monitor resource utilization in a chosenarea responsibility [5]. This interface then provides you withthe list of resources and the level of utilization. That is, whichresources are currently being fully utilized or have a capacityoverload so that you can quickly react to the critical situation.Furthermore, you can quickly determine whether resources areunder strain and whose consumption is within typical limits.There are a variety of profiles to pick from, and the profile weselect determines the orders or processes the system considers,as well as the utilization rate percentages it uses to calculateresource capacity utilization [4] [5].
The Key features of this system are:
• You can select the area of responsibility that is whichproduction system or Machine you want to work on.
• You can choose from filters what data exactly you wantto analyse.
Fig. 3 is an example of what the data of the selectedresponsibility will look like. It will feature what was themaximum and minimum utilization capacity and the averageof it. It will also show when first overload and under loadhappened for the first time. This method is really beneficialbecause it is very easy to detect the bottlenecks.
Fig. 3. Monitoring Capacity Utilization app [4]
B. Modified Work Sampling Method for monitoring CapacityUtilization
The next method is Modified Work sampling method usedfor monitoring of Capacity Utilization [6]. In this companyone can find higher Organizational level but comparativelyold-fashioned machines. Either a breakdown or preventativemaintenance must be the primary cause of the pause. Thefactory has 4 shifts (3-week shifts + Saturday + Sunday).Thecapacity utilization monitoring results for the period November2007–November 2008 are shown in Fig4. Because capacityconsumption fluctuates from month to month, the largestfailure took place In march 2008, and an annual upgrade wascompleted during the pause. Capacity is evaluated using acriteria that is 100% and matches the expected monthly outputof 60 833 t, and capacity is tested electronically using theproduced weight/hour.r. In September, the maximum capacityobtained was 106.25%, or 64 635 t, which is a substantialdivergence from the planned level.As a result, shutdownsare rationally linked to the machine and the grade of thegiven capacity, and they could be avoided by maintaininga maximum monthly capacity of 100%, with others beingless. Although there are only 13 months (elements) in thecalculation, the average monthly capacity for the observationperiod is 79.34%, Upper Control Limit(AC) = 100% andLower Control Limit(BC)= 49.46%, according to the Kol-mogorov–Smirnov criteria, Ranges of capacity usage basedon the normal distribution legislation on a monthly basis P(λ)= 1.653. Where P(λ) is normality criterion of distributionstochastic function according to the Kolmogorov–Smirnov test[7].
Fig. 4. Mean values of capacity utilization every month for the period2007–2008 [7]
Fig.5 Despite the fact that capacity utilization is lower permonth,It is clear that output observed every day has lowervariations in terms of capacity utilization, and that controllimits are relatively tight, at 76.4%, AC = 84.13%, andBC = 68.62% . The capacity utilization of one month ofmonitoring depends on normal distribution law, according toKolmogorov-Smirnov criterion it is P(λ)= 1.653 [7].
33
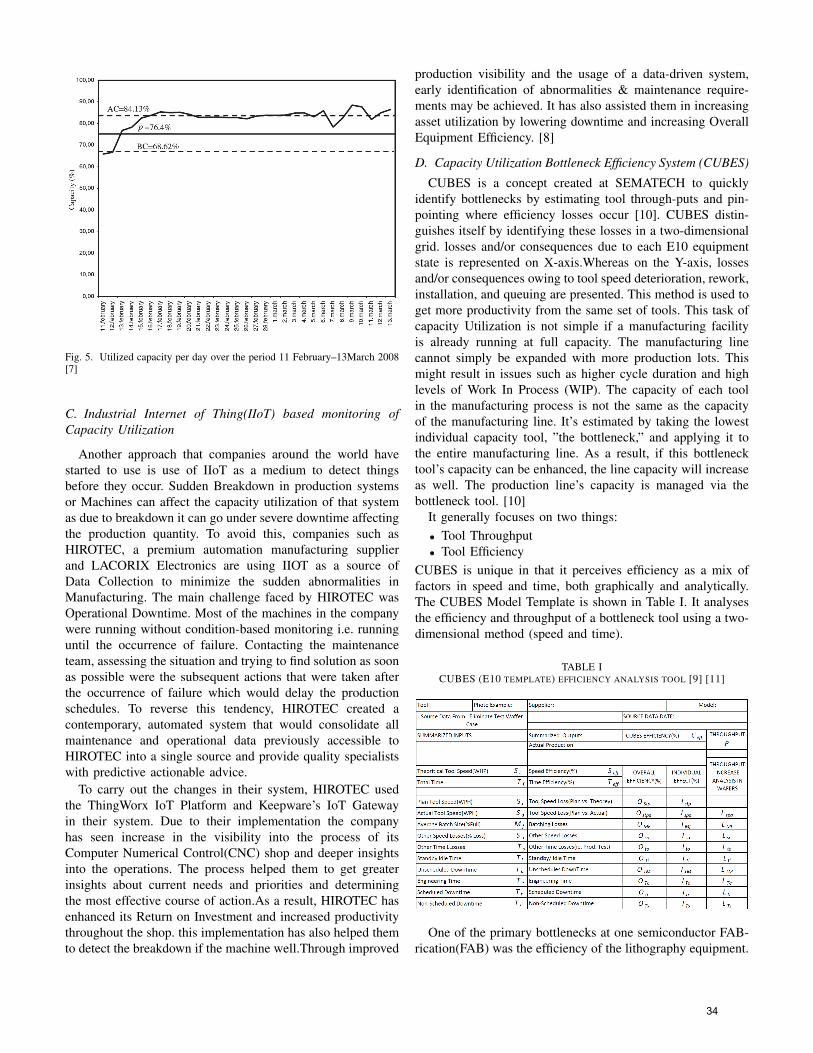
Fig. 5. Utilized capacity per day over the period 11 February–13March 2008[7]
C. Industrial Internet of Thing(IIoT) based monitoring ofCapacity Utilization
Another approach that companies around the world havestarted to use is use of IIoT as a medium to detect thingsbefore they occur. Sudden Breakdown in production systemsor Machines can affect the capacity utilization of that systemas due to breakdown it can go under severe downtime affectingthe production quantity. To avoid this, companies such asHIROTEC, a premium automation manufacturing supplierand LACORIX Electronics are using IIOT as a source ofData Collection to minimize the sudden abnormalities inManufacturing. The main challenge faced by HIROTEC wasOperational Downtime. Most of the machines in the companywere running without condition-based monitoring i.e. runninguntil the occurrence of failure. Contacting the maintenanceteam, assessing the situation and trying to find solution as soonas possible were the subsequent actions that were taken afterthe occurrence of failure which would delay the productionschedules. To reverse this tendency, HIROTEC created acontemporary, automated system that would consolidate allmaintenance and operational data previously accessible toHIROTEC into a single source and provide quality specialistswith predictive actionable advice.
To carry out the changes in their system, HIROTEC usedthe ThingWorx IoT Platform and Keepware’s IoT Gatewayin their system. Due to their implementation the companyhas seen increase in the visibility into the process of itsComputer Numerical Control(CNC) shop and deeper insightsinto the operations. The process helped them to get greaterinsights about current needs and priorities and determiningthe most effective course of action.As a result, HIROTEC hasenhanced its Return on Investment and increased productivitythroughout the shop. this implementation has also helped themto detect the breakdown if the machine well.Through improved
production visibility and the usage of a data-driven system,early identification of abnormalities & maintenance require-ments may be achieved. It has also assisted them in increasingasset utilization by lowering downtime and increasing OverallEquipment Efficiency. [8]
D. Capacity Utilization Bottleneck Efficiency System (CUBES)
CUBES is a concept created at SEMATECH to quicklyidentify bottlenecks by estimating tool through-puts and pin-pointing where efficiency losses occur [10]. CUBES distin-guishes itself by identifying these losses in a two-dimensionalgrid. losses and/or consequences due to each E10 equipmentstate is represented on X-axis.Whereas on the Y-axis, lossesand/or consequences owing to tool speed deterioration, rework,installation, and queuing are presented. This method is used toget more productivity from the same set of tools. This task ofcapacity Utilization is not simple if a manufacturing facilityis already running at full capacity. The manufacturing linecannot simply be expanded with more production lots. Thismight result in issues such as higher cycle duration and highlevels of Work In Process (WIP). The capacity of each toolin the manufacturing process is not the same as the capacityof the manufacturing line. It’s estimated by taking the lowestindividual capacity tool, ”the bottleneck,” and applying it tothe entire manufacturing line. As a result, if this bottlenecktool’s capacity can be enhanced, the line capacity will increaseas well. The production line’s capacity is managed via thebottleneck tool. [10]
It generally focuses on two things:• Tool Throughput• Tool Efficiency
CUBES is unique in that it perceives efficiency as a mix offactors in speed and time, both graphically and analytically.The CUBES Model Template is shown in Table I. It analysesthe efficiency and throughput of a bottleneck tool using a two-dimensional method (speed and time).
TABLE ICUBES (E10 TEMPLATE) EFFICIENCY ANALYSIS TOOL [9] [11]
One of the primary bottlenecks at one semiconductor FAB-rication(FAB) was the efficiency of the lithography equipment.
34
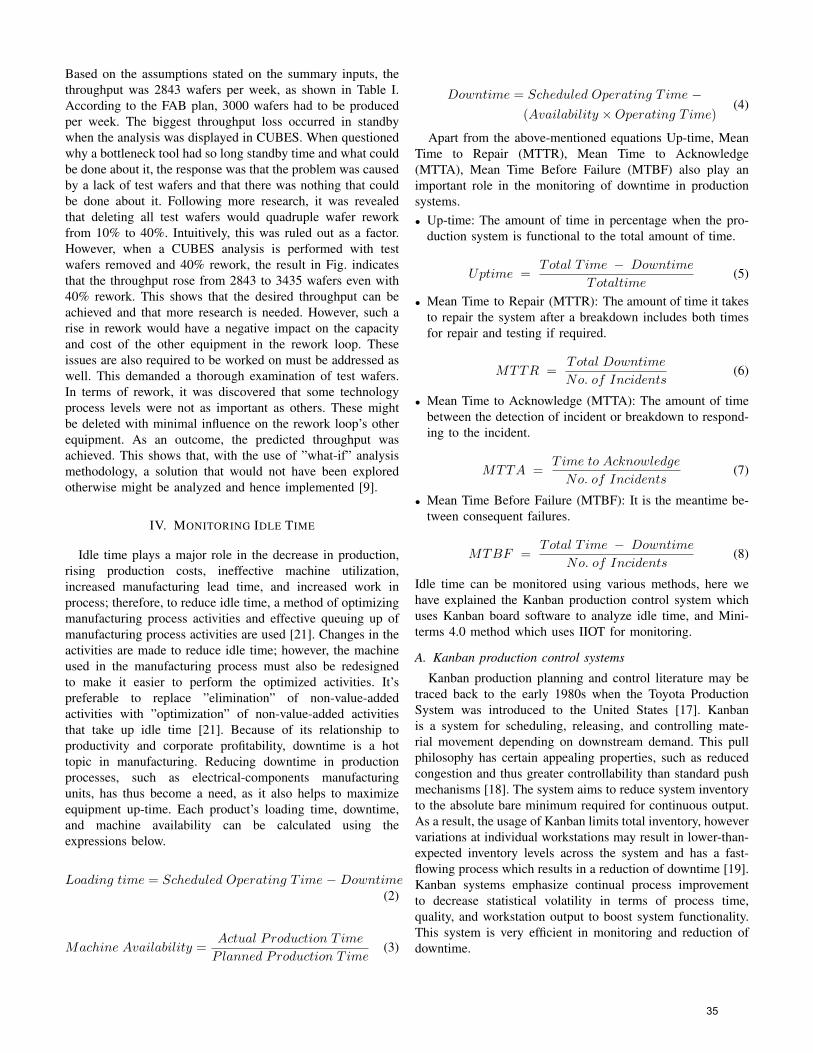
Based on the assumptions stated on the summary inputs, thethroughput was 2843 wafers per week, as shown in Table I.According to the FAB plan, 3000 wafers had to be producedper week. The biggest throughput loss occurred in standbywhen the analysis was displayed in CUBES. When questionedwhy a bottleneck tool had so long standby time and what couldbe done about it, the response was that the problem was causedby a lack of test wafers and that there was nothing that couldbe done about it. Following more research, it was revealedthat deleting all test wafers would quadruple wafer reworkfrom 10% to 40%. Intuitively, this was ruled out as a factor.However, when a CUBES analysis is performed with testwafers removed and 40% rework, the result in Fig. indicatesthat the throughput rose from 2843 to 3435 wafers even with40% rework. This shows that the desired throughput can beachieved and that more research is needed. However, such arise in rework would have a negative impact on the capacityand cost of the other equipment in the rework loop. Theseissues are also required to be worked on must be addressed aswell. This demanded a thorough examination of test wafers.In terms of rework, it was discovered that some technologyprocess levels were not as important as others. These mightbe deleted with minimal influence on the rework loop’s otherequipment. As an outcome, the predicted throughput wasachieved. This shows that, with the use of ”what-if” analysismethodology, a solution that would not have been exploredotherwise might be analyzed and hence implemented [9].
IV. MONITORING IDLE TIME
Idle time plays a major role in the decrease in production,rising production costs, ineffective machine utilization,increased manufacturing lead time, and increased work inprocess; therefore, to reduce idle time, a method of optimizingmanufacturing process activities and effective queuing up ofmanufacturing process activities are used [21]. Changes in theactivities are made to reduce idle time; however, the machineused in the manufacturing process must also be redesignedto make it easier to perform the optimized activities. It’spreferable to replace ”elimination” of non-value-addedactivities with ”optimization” of non-value-added activitiesthat take up idle time [21]. Because of its relationship toproductivity and corporate profitability, downtime is a hottopic in manufacturing. Reducing downtime in productionprocesses, such as electrical-components manufacturingunits, has thus become a need, as it also helps to maximizeequipment up-time. Each product’s loading time, downtime,and machine availability can be calculated using theexpressions below.
Loading time = Scheduled Operating T ime − Downtime(2)
Machine Availability =Actual Production T ime
P lanned Production T ime(3)
Downtime = Scheduled Operating T ime −(Availability ×Operating T ime)
(4)
Apart from the above-mentioned equations Up-time, MeanTime to Repair (MTTR), Mean Time to Acknowledge(MTTA), Mean Time Before Failure (MTBF) also play animportant role in the monitoring of downtime in productionsystems.• Up-time: The amount of time in percentage when the pro-
duction system is functional to the total amount of time.
Uptime =Total T ime − Downtime
Totaltime(5)
• Mean Time to Repair (MTTR): The amount of time it takesto repair the system after a breakdown includes both timesfor repair and testing if required.
MTTR =Total Downtime
No. of Incidents(6)
• Mean Time to Acknowledge (MTTA): The amount of timebetween the detection of incident or breakdown to respond-ing to the incident.
MTTA =Time to Acknowledge
No. of Incidents(7)
• Mean Time Before Failure (MTBF): It is the meantime be-tween consequent failures.
MTBF =Total T ime − Downtime
No. of Incidents(8)
Idle time can be monitored using various methods, here wehave explained the Kanban production control system whichuses Kanban board software to analyze idle time, and Mini-terms 4.0 method which uses IIOT for monitoring.
A. Kanban production control systems
Kanban production planning and control literature may betraced back to the early 1980s when the Toyota ProductionSystem was introduced to the United States [17]. Kanbanis a system for scheduling, releasing, and controlling mate-rial movement depending on downstream demand. This pullphilosophy has certain appealing properties, such as reducedcongestion and thus greater controllability than standard pushmechanisms [18]. The system aims to reduce system inventoryto the absolute bare minimum required for continuous output.As a result, the usage of Kanban limits total inventory, howevervariations at individual workstations may result in lower-than-expected inventory levels across the system and has a fast-flowing process which results in a reduction of downtime [19].Kanban systems emphasize continual process improvementto decrease statistical volatility in terms of process time,quality, and workstation output to boost system functionality.This system is very efficient in monitoring and reduction ofdowntime.
35
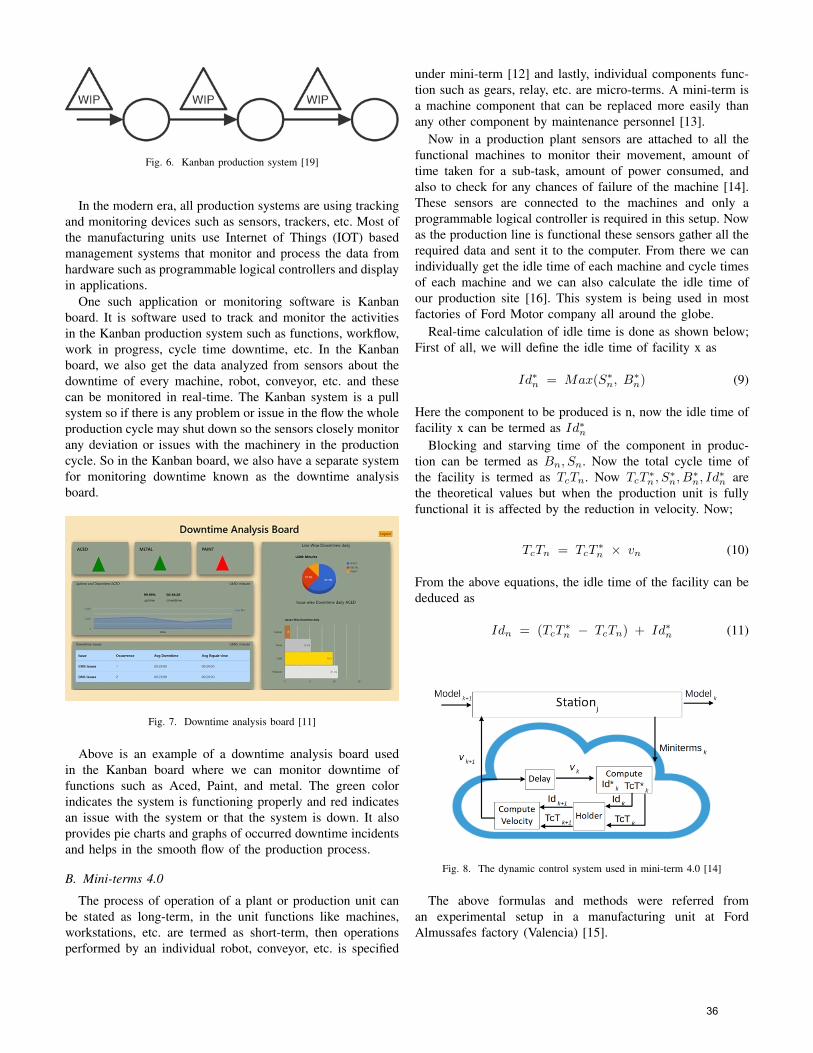
Fig. 6. Kanban production system [19]
In the modern era, all production systems are using trackingand monitoring devices such as sensors, trackers, etc. Most ofthe manufacturing units use Internet of Things (IOT) basedmanagement systems that monitor and process the data fromhardware such as programmable logical controllers and displayin applications.
One such application or monitoring software is Kanbanboard. It is software used to track and monitor the activitiesin the Kanban production system such as functions, workflow,work in progress, cycle time downtime, etc. In the Kanbanboard, we also get the data analyzed from sensors about thedowntime of every machine, robot, conveyor, etc. and thesecan be monitored in real-time. The Kanban system is a pullsystem so if there is any problem or issue in the flow the wholeproduction cycle may shut down so the sensors closely monitorany deviation or issues with the machinery in the productioncycle. So in the Kanban board, we also have a separate systemfor monitoring downtime known as the downtime analysisboard.
Fig. 7. Downtime analysis board [11]
Above is an example of a downtime analysis board usedin the Kanban board where we can monitor downtime offunctions such as Aced, Paint, and metal. The green colorindicates the system is functioning properly and red indicatesan issue with the system or that the system is down. It alsoprovides pie charts and graphs of occurred downtime incidentsand helps in the smooth flow of the production process.
B. Mini-terms 4.0
The process of operation of a plant or production unit canbe stated as long-term, in the unit functions like machines,workstations, etc. are termed as short-term, then operationsperformed by an individual robot, conveyor, etc. is specified
under mini-term [12] and lastly, individual components func-tion such as gears, relay, etc. are micro-terms. A mini-term isa machine component that can be replaced more easily thanany other component by maintenance personnel [13].
Now in a production plant sensors are attached to all thefunctional machines to monitor their movement, amount oftime taken for a sub-task, amount of power consumed, andalso to check for any chances of failure of the machine [14].These sensors are connected to the machines and only aprogrammable logical controller is required in this setup. Nowas the production line is functional these sensors gather all therequired data and sent it to the computer. From there we canindividually get the idle time of each machine and cycle timesof each machine and we can also calculate the idle time ofour production site [16]. This system is being used in mostfactories of Ford Motor company all around the globe.
Real-time calculation of idle time is done as shown below;First of all, we will define the idle time of facility x as
Id∗n = Max(S∗n, B
∗n) (9)
Here the component to be produced is n, now the idle time offacility x can be termed as Id∗n
Blocking and starving time of the component in produc-tion can be termed as Bn, Sn. Now the total cycle time ofthe facility is termed as TcTn. Now TcT
∗n , S
∗n, B
∗n, Id
∗n are
the theoretical values but when the production unit is fullyfunctional it is affected by the reduction in velocity. Now;
TcTn = TcT∗n × vn (10)
From the above equations, the idle time of the facility can bededuced as
Idn = (TcT∗n − TcTn) + Id∗n (11)
Fig. 8. The dynamic control system used in mini-term 4.0 [14]
The above formulas and methods were referred froman experimental setup in a manufacturing unit at FordAlmussafes factory (Valencia) [15].
36
V. CONCLUSIONS
The primary objective of KPIs is to keep track of variousdepartments and activities within an organization. They assistin determining which processes are successful and where thereis room for improvement and cost reduction. Which KPIsshould be monitored and how they should be monitored isentirely dependent on the company and its business model.We have described the methodology that we believe is bestfor monitoring delivery reliability, utilized capacity, and idletime KPIs.
The industrial world is transforming day by day due todigitalization. Therefore, incorporating methods that use dig-ital modes for monitoring will always be beneficial for thecompany to gain superiority in the market. As a result, webelieve that RFID technology can be used in conjunctionwith a PLC to monitor delivery reliability. If we talk aboutUtilization Capacity, use of SAP S/4HANA platform is thebest example of how digitalization has turned some tediousjobs like monitoring utilize capacity into a simple work. Ithelps the manufacturer to have a quick overview of how themachines are working with respect to the actual capacity.Adding to it, Companies have started implementing IIOT byusing softwares like ThingWorx IoT Platform and Keepware’sIoT Gateway into their systems which helps them to predictthe problem like Breakdown well before it could happen.Through this the customer Monitoring idle time can be difficultand prone to errors, if performed using conventional methods.However, when Mini-terms 4.0 is used to monitor idle timeusing IIOT, the results are accurate, and it is also easier toanalyze data because the information is available digitally.
REFERENCES
[1] Harvard Business School. ”American Idle: EmployeesSpend Too Much Time Waiting for Something to Do” -https://hbswk.hbs.edu/item/american-idle-employees-are-wasting-way-too-much-time
[2] Bauer, D., Bauernhansl, T., Sauer, A. (2021). Improvement ofdelivery reliability by an intelligent control loop between sup-ply network and manufacturing. Applied Sciences, 11(5), 2205.https://doi.org/10.3390/app11052205
[3] N. Li, J. Tan and Z. Zhu, ”Monitor and control system with RFIDtechnology in discrete manufacturing line,” 2010 IEEE InternationalConference on RFID-Technology and Applications, 2010, pp. 71-76,doi: 10.1109/RFID-TA.2010.5529863.
[4] Denecken, S. (2017, February 5). #S4HANA 1610 use caseseries: 9b – production planning and detailed scheduling –pp/DS (tech view). SAP Blogs. Retrieved January 30, 2022,from https://blogs.sap.com/2017/02/03/s4hana-1610-use-case-series-9b-production-planning-and-detailed-scheduling-ppds-tech-view/#
[5] Almeida, C. (2019, January 15). S/4HANA embedded PP/DS: Shiftmaintenance in monitor capacity fiori app. SAP Blogs. Retrieved January30, 2022, from https://blogs.sap.com/2019/01/15/s4hana-embedded-ppds-shift-maintenance-in-monitor-capacity-fiori-app./
[6] BARNES, R. M. (1957). Work sampling. (2nd edition.). New York.[7] Misita, Mirjana & Spasojevic-Brkic, Vesna & Jovovic, Aleksandar
& Klarin, Milivoj & Dragan, D.. (2010). A method to assess ca-pacity utilization in short cycle functional layouts. PROCEEDINGSOF THE INSTITUTION OF MECHANICAL ENGINEERS PART E-JOURNAL OF PROCESS MECHANICAL ENGINEERING. 224. 49-58. 10.1243/09544089JPME280.
[8] Ptc. (2022, January 21). Hirotec IOT deployment challenges case study.PTC. Retrieved January 30, 2022, from https://www.ptc.com/en/case-studies/hirotec/
[9] J. M. Konopka, ”Capacity utilization bottleneck efficiency system-CUBES,” in IEEE Transactions on Components, Packaging, and Man-ufacturing Technology: Part A, vol. 18, no. 3, pp. 484-491, Sept. 1995,doi: 10.1109/95.46514
[10] Konopka, J. ”CUBES: a new model to analyze tool efficiency.” SEMAT-ECH Communique. 1993.
[11] Trybula, W. J., and Margaret Pratt. ”Applying SEMI E10 guidelinesto manufacturing.” Proceedings of 16th IEEE/CPMT International Elec-tronic Manufacturing Technology Symposium. IEEE, 1994.
[12] Garcia, E. Analisis de los Subtiempos de ciclo Tecnico para la Mejoradel Rendimiento de las Lineas de Fabricacion. Ph.D. Thesis, UniversidadCEU-Cardenal Herrera, Alfara del Patriarca, Spain, 2016.
[13] Garcia, E.; Montes, N.; Alacreu, M. Towards a knowledge-drivenmaintenance support systems for manufacturing lines. In Proceedings ofthe 15th International Conference on Informatics in Control, Automationand Robotics (ICINCO), Porto, Portugal, 29–31 July 2018; pp. 43–54.https://doi.org/10.5220/0006834800430054
[14] Sun, Z.; Biller, S.; Gu, F.; Li, L. Energy consumption reduction forsustainable manufacturing systems considering machines with multiple-power states. In Proceedings of the ASME 2011 International Manufac-turing Science and Engineering Conference, Corvallis, OR, USA, 13–17June 203; pp. 99–103.
[15] Real-Time Idle Time Cancellation using Miniterm 4.0 by EduardoGarcia 1 andNicolas Montes 2,Ford Spain, Poligono Industrial Ford S/N,Almussafes, 46440 Valencia, Spain.
[16] Garcia, E.; Montes, N.; Alacreu, M. Towards a novel generation ofMaintenance Support Systems based on miniterms. In Lecture Notesin Electrical Engineering; Springer: Berlin, Germany, 2019.
[17] Spearman, ML and Zazanis, MA. 1992. Push and pull productionsystems: issues and comparisons. Operations Research, 40(3): 521
[18] Hopp, WJ and Spearman, ML. 2000. Factory physics: foundationsof manufacturing management, 2nd, New York: McGraw-Hill HigherEducation.
[19] Patti, A. L., Watson, K. J. (2009). Downtime variability: The impactof duration–frequency on the performance of Serial Production Sys-tems. International Journal of Production Research, 48(19), 5831–5841.https://doi.org/10.1080/00207540903280572
[20] Unseen Era Technologies Pvt. Ltd. (n.d.). Unseen era technologies.Retrieved January 31, 2022, from https://unseenera.com/IOT/downtime-monitoring
[21] Laxman, Al & Antony, M & Kumar, Manoj & Ramesh, B. (2018). RE-DUCING THE IDLE TIME OF BORING MACHINE BY QUEUINGUP OF ACTIVITIES AND RE-DESIGNING THE MECHANISM. 186-195.
37
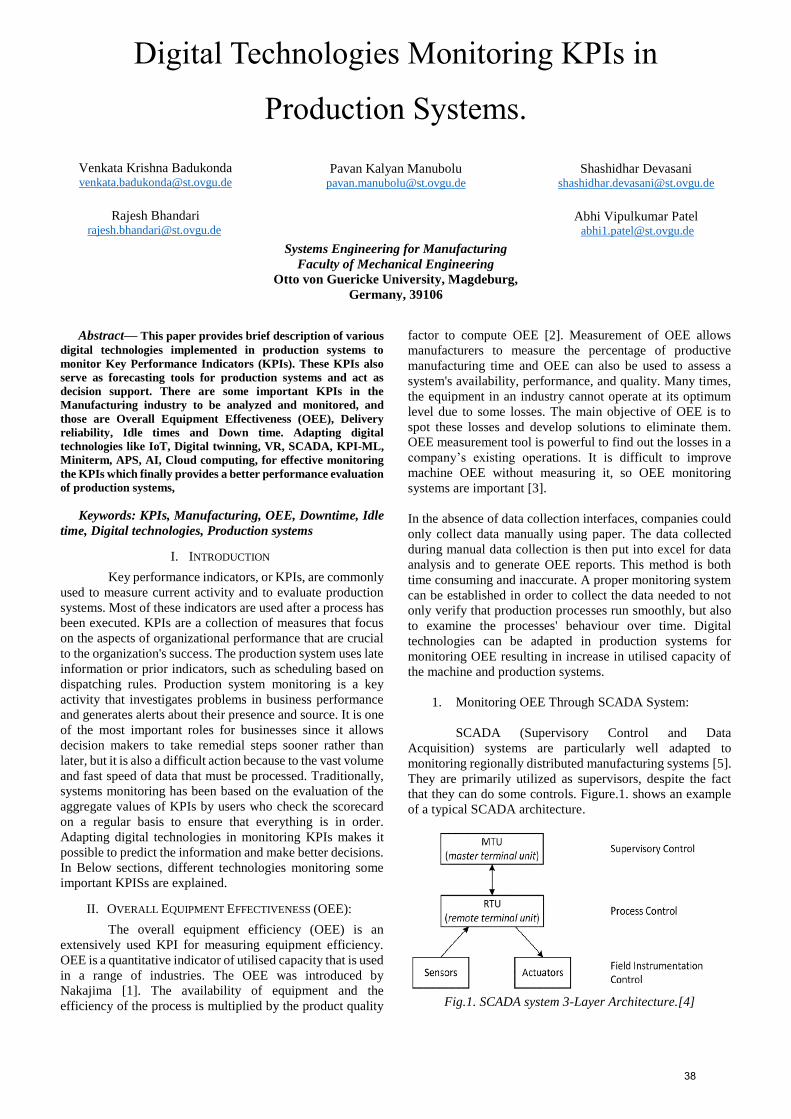
Digital Technologies Monitoring KPIs in
Production Systems.
Venkata Krishna Badukonda
Rajesh Bhandari [email protected]
Pavan Kalyan Manubolu
Shashidhar Devasani [email protected]
Abhi Vipulkumar Patel [email protected]
Abstract— This paper provides brief description of various
digital technologies implemented in production systems to
monitor Key Performance Indicators (KPIs). These KPIs also
serve as forecasting tools for production systems and act as
decision support. There are some important KPIs in the
Manufacturing industry to be analyzed and monitored, and
those are Overall Equipment Effectiveness (OEE), Delivery
reliability, Idle times and Down time. Adapting digital
technologies like IoT, Digital twinning, VR, SCADA, KPI-ML,
Miniterm, APS, AI, Cloud computing, for effective monitoring
the KPIs which finally provides a better performance evaluation
of production systems,
Keywords: KPIs, Manufacturing, OEE, Downtime, Idle
time, Digital technologies, Production systems
I. INTRODUCTION
Key performance indicators, or KPIs, are commonly
used to measure current activity and to evaluate production
systems. Most of these indicators are used after a process has
been executed. KPIs are a collection of measures that focus
on the aspects of organizational performance that are crucial
to the organization's success. The production system uses late
information or prior indicators, such as scheduling based on
dispatching rules. Production system monitoring is a key
activity that investigates problems in business performance
and generates alerts about their presence and source. It is one
of the most important roles for businesses since it allows
decision makers to take remedial steps sooner rather than
later, but it is also a difficult action because to the vast volume
and fast speed of data that must be processed. Traditionally,
systems monitoring has been based on the evaluation of the
aggregate values of KPIs by users who check the scorecard
on a regular basis to ensure that everything is in order.
Adapting digital technologies in monitoring KPIs makes it
possible to predict the information and make better decisions.
In Below sections, different technologies monitoring some
important KPISs are explained.
II. OVERALL EQUIPMENT EFFECTIVENESS (OEE):
The overall equipment efficiency (OEE) is an
extensively used KPI for measuring equipment efficiency.
OEE is a quantitative indicator of utilised capacity that is used
in a range of industries. The OEE was introduced by
Nakajima [1]. The availability of equipment and the
efficiency of the process is multiplied by the product quality
factor to compute OEE [2]. Measurement of OEE allows
manufacturers to measure the percentage of productive
manufacturing time and OEE can also be used to assess a
system's availability, performance, and quality. Many times,
the equipment in an industry cannot operate at its optimum
level due to some losses. The main objective of OEE is to
spot these losses and develop solutions to eliminate them.
OEE measurement tool is powerful to find out the losses in a
company’s existing operations. It is difficult to improve
machine OEE without measuring it, so OEE monitoring
systems are important [3].
In the absence of data collection interfaces, companies could
only collect data manually using paper. The data collected
during manual data collection is then put into excel for data
analysis and to generate OEE reports. This method is both
time consuming and inaccurate. A proper monitoring system
can be established in order to collect the data needed to not
only verify that production processes run smoothly, but also
to examine the processes' behaviour over time. Digital
technologies can be adapted in production systems for
monitoring OEE resulting in increase in utilised capacity of
the machine and production systems.
1. Monitoring OEE Through SCADA System:
SCADA (Supervisory Control and Data
Acquisition) systems are particularly well adapted to
monitoring regionally distributed manufacturing systems [5].
They are primarily utilized as supervisors, despite the fact
that they can do some controls. Figure.1. shows an example
of a typical SCADA architecture.
Fig.1. SCADA system 3-Layer Architecture.[4]
Systems Engineering for Manufacturing
Faculty of Mechanical Engineering
Otto von Guericke University, Magdeburg,
Germany, 39106
38
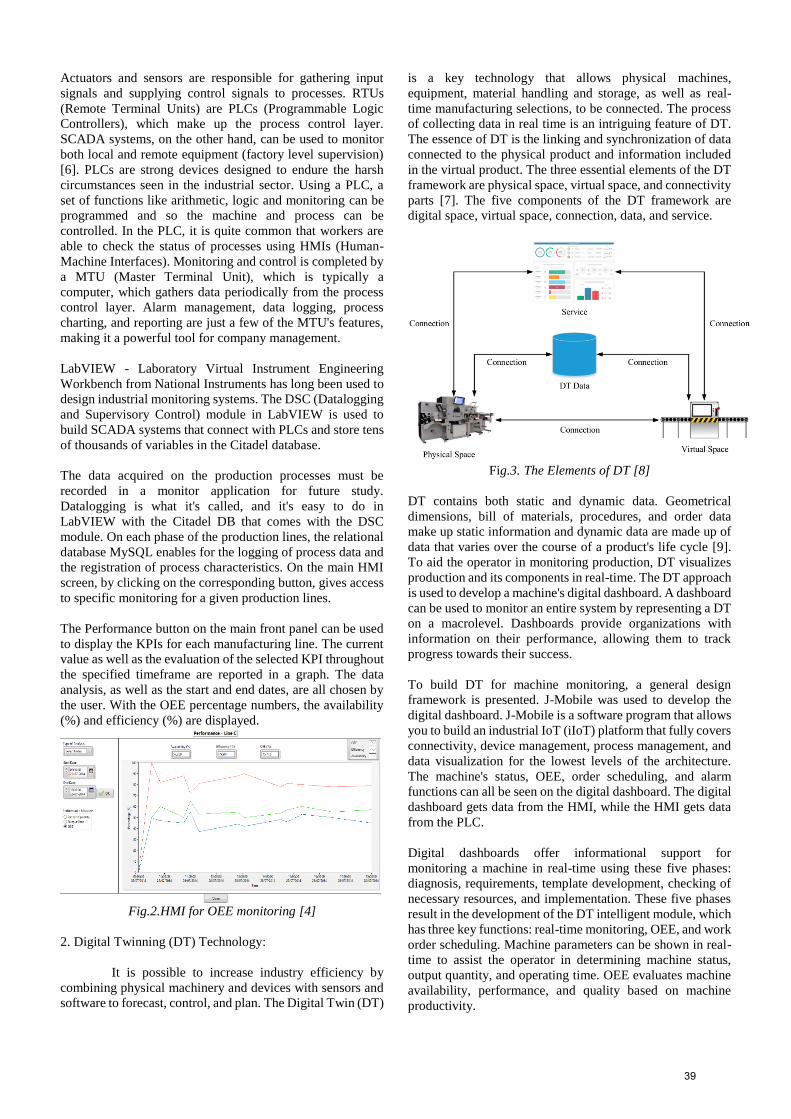
Actuators and sensors are responsible for gathering input
signals and supplying control signals to processes. RTUs
(Remote Terminal Units) are PLCs (Programmable Logic
Controllers), which make up the process control layer.
SCADA systems, on the other hand, can be used to monitor
both local and remote equipment (factory level supervision)
[6]. PLCs are strong devices designed to endure the harsh
circumstances seen in the industrial sector. Using a PLC, a
set of functions like arithmetic, logic and monitoring can be
programmed and so the machine and process can be
controlled. In the PLC, it is quite common that workers are
able to check the status of processes using HMIs (Human-
Machine Interfaces). Monitoring and control is completed by
a MTU (Master Terminal Unit), which is typically a
computer, which gathers data periodically from the process
control layer. Alarm management, data logging, process
charting, and reporting are just a few of the MTU's features,
making it a powerful tool for company management.
LabVIEW - Laboratory Virtual Instrument Engineering
Workbench from National Instruments has long been used to
design industrial monitoring systems. The DSC (Datalogging
and Supervisory Control) module in LabVIEW is used to
build SCADA systems that connect with PLCs and store tens
of thousands of variables in the Citadel database.
The data acquired on the production processes must be
recorded in a monitor application for future study.
Datalogging is what it's called, and it's easy to do in
LabVIEW with the Citadel DB that comes with the DSC
module. On each phase of the production lines, the relational
database MySQL enables for the logging of process data and
the registration of process characteristics. On the main HMI
screen, by clicking on the corresponding button, gives access
to specific monitoring for a given production lines.
The Performance button on the main front panel can be used
to display the KPIs for each manufacturing line. The current
value as well as the evaluation of the selected KPI throughout
the specified timeframe are reported in a graph. The data
analysis, as well as the start and end dates, are all chosen by
the user. With the OEE percentage numbers, the availability
(%) and efficiency (%) are displayed.
Fig.2.HMI for OEE monitoring [4]
2. Digital Twinning (DT) Technology:
It is possible to increase industry efficiency by
combining physical machinery and devices with sensors and
software to forecast, control, and plan. The Digital Twin (DT)
is a key technology that allows physical machines,
equipment, material handling and storage, as well as real-
time manufacturing selections, to be connected. The process
of collecting data in real time is an intriguing feature of DT.
The essence of DT is the linking and synchronization of data
connected to the physical product and information included
in the virtual product. The three essential elements of the DT
framework are physical space, virtual space, and connectivity
parts [7]. The five components of the DT framework are
digital space, virtual space, connection, data, and service.
Fig.3. The Elements of DT [8]
DT contains both static and dynamic data. Geometrical
dimensions, bill of materials, procedures, and order data
make up static information and dynamic data are made up of
data that varies over the course of a product's life cycle [9].
To aid the operator in monitoring production, DT visualizes
production and its components in real-time. The DT approach
is used to develop a machine's digital dashboard. A dashboard
can be used to monitor an entire system by representing a DT
on a macrolevel. Dashboards provide organizations with
information on their performance, allowing them to track
progress towards their success.
To build DT for machine monitoring, a general design
framework is presented. J-Mobile was used to develop the
digital dashboard. J-Mobile is a software program that allows
you to build an industrial IoT (iIoT) platform that fully covers
connectivity, device management, process management, and
data visualization for the lowest levels of the architecture.
The machine's status, OEE, order scheduling, and alarm
functions can all be seen on the digital dashboard. The digital
dashboard gets data from the HMI, while the HMI gets data
from the PLC.
Digital dashboards offer informational support for
monitoring a machine in real-time using these five phases:
diagnosis, requirements, template development, checking of
necessary resources, and implementation. These five phases
result in the development of the DT intelligent module, which
has three key functions: real-time monitoring, OEE, and work
order scheduling. Machine parameters can be shown in real-
time to assist the operator in determining machine status,
output quantity, and operating time. OEE evaluates machine
availability, performance, and quality based on machine
productivity.
39
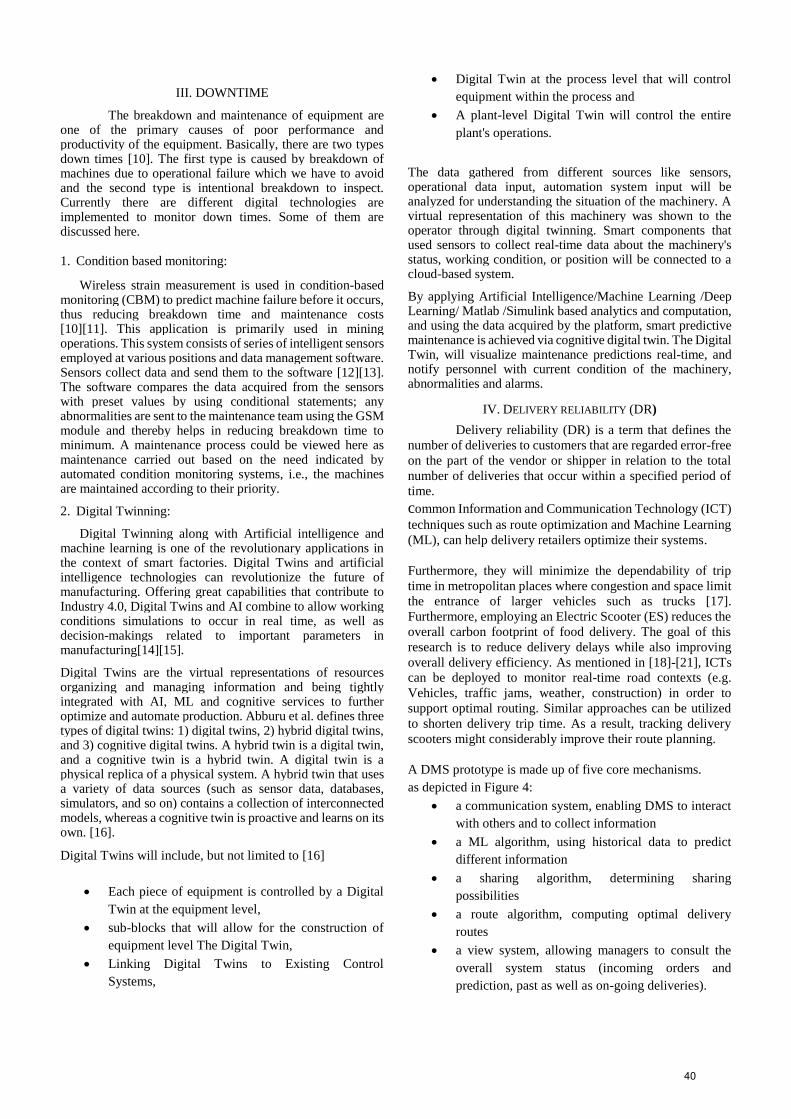
III. DOWNTIME
The breakdown and maintenance of equipment are one of the primary causes of poor performance and productivity of the equipment. Basically, there are two types down times [10]. The first type is caused by breakdown of machines due to operational failure which we have to avoid and the second type is intentional breakdown to inspect. Currently there are different digital technologies are implemented to monitor down times. Some of them are discussed here.
1. Condition based monitoring: Wireless strain measurement is used in condition-based monitoring (CBM) to predict machine failure before it occurs, thus reducing breakdown time and maintenance costs [10][11]. This application is primarily used in mining operations. This system consists of series of intelligent sensors employed at various positions and data management software. Sensors collect data and send them to the software [12][13]. The software compares the data acquired from the sensors with preset values by using conditional statements; any abnormalities are sent to the maintenance team using the GSM module and thereby helps in reducing breakdown time to minimum. A maintenance process could be viewed here as maintenance carried out based on the need indicated by automated condition monitoring systems, i.e., the machines are maintained according to their priority.
2. Digital Twinning:
Digital Twinning along with Artificial intelligence and machine learning is one of the revolutionary applications in the context of smart factories. Digital Twins and artificial intelligence technologies can revolutionize the future of manufacturing. Offering great capabilities that contribute to Industry 4.0, Digital Twins and AI combine to allow working conditions simulations to occur in real time, as well as decision-makings related to important parameters in manufacturing[14][15].
Digital Twins are the virtual representations of resources organizing and managing information and being tightly integrated with AI, ML and cognitive services to further optimize and automate production. Abburu et al. defines three types of digital twins: 1) digital twins, 2) hybrid digital twins, and 3) cognitive digital twins. A hybrid twin is a digital twin, and a cognitive twin is a hybrid twin. A digital twin is a physical replica of a physical system. A hybrid twin that uses a variety of data sources (such as sensor data, databases, simulators, and so on) contains a collection of interconnected models, whereas a cognitive twin is proactive and learns on its own. [16].
Digital Twins will include, but not limited to [16]
Each piece of equipment is controlled by a Digital
Twin at the equipment level,
sub-blocks that will allow for the construction of
equipment level The Digital Twin,
Linking Digital Twins to Existing Control
Systems,
Digital Twin at the process level that will control
equipment within the process and
A plant-level Digital Twin will control the entire
plant's operations.
The data gathered from different sources like sensors, operational data input, automation system input will be analyzed for understanding the situation of the machinery. A virtual representation of this machinery was shown to the operator through digital twinning. Smart components that used sensors to collect real-time data about the machinery's status, working condition, or position will be connected to a cloud-based system.
By applying Artificial Intelligence/Machine Learning /Deep Learning/ Matlab /Simulink based analytics and computation, and using the data acquired by the platform, smart predictive maintenance is achieved via cognitive digital twin. The Digital Twin, will visualize maintenance predictions real-time, and notify personnel with current condition of the machinery, abnormalities and alarms.
IV. DELIVERY RELIABILITY (DR)
Delivery reliability (DR) is a term that defines the
number of deliveries to customers that are regarded error-free
on the part of the vendor or shipper in relation to the total
number of deliveries that occur within a specified period of
time.
common Information and Communication Technology (ICT)
techniques such as route optimization and Machine Learning
(ML), can help delivery retailers optimize their systems.
Furthermore, they will minimize the dependability of trip
time in metropolitan places where congestion and space limit
the entrance of larger vehicles such as trucks [17].
Furthermore, employing an Electric Scooter (ES) reduces the
overall carbon footprint of food delivery. The goal of this
research is to reduce delivery delays while also improving
overall delivery efficiency. As mentioned in [18]-[21], ICTs
can be deployed to monitor real-time road contexts (e.g.
Vehicles, traffic jams, weather, construction) in order to
support optimal routing. Similar approaches can be utilized
to shorten delivery trip time. As a result, tracking delivery
scooters might considerably improve their route planning.
A DMS prototype is made up of five core mechanisms.
as depicted in Figure 4:
a communication system, enabling DMS to interact
with others and to collect information
a ML algorithm, using historical data to predict
different information
a sharing algorithm, determining sharing
possibilities
a route algorithm, computing optimal delivery
routes
a view system, allowing managers to consult the
overall system status (incoming orders and
prediction, past as well as on-going deliveries).
40
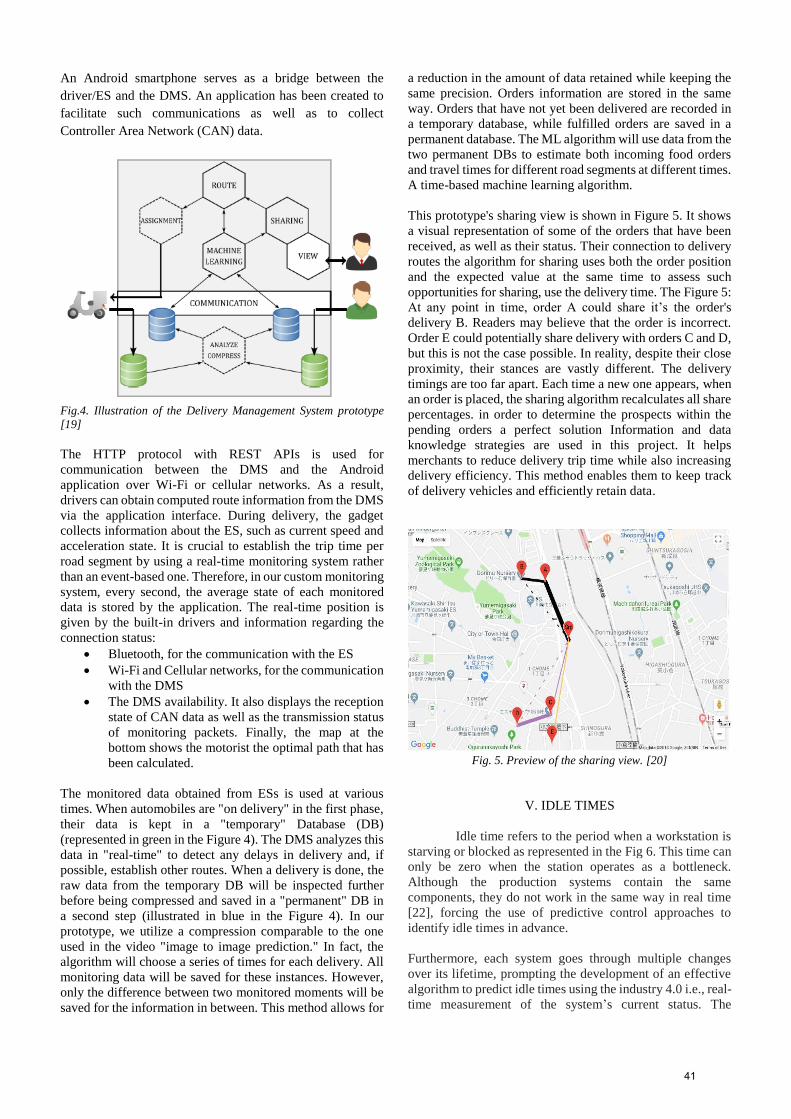
An Android smartphone serves as a bridge between the
driver/ES and the DMS. An application has been created to
facilitate such communications as well as to collect
Controller Area Network (CAN) data.
Fig.4. Illustration of the Delivery Management System prototype
[19]
The HTTP protocol with REST APIs is used for
communication between the DMS and the Android
application over Wi-Fi or cellular networks. As a result,
drivers can obtain computed route information from the DMS
via the application interface. During delivery, the gadget
collects information about the ES, such as current speed and
acceleration state. It is crucial to establish the trip time per
road segment by using a real-time monitoring system rather
than an event-based one. Therefore, in our custom monitoring
system, every second, the average state of each monitored
data is stored by the application. The real-time position is
given by the built-in drivers and information regarding the
connection status:
Bluetooth, for the communication with the ES
Wi-Fi and Cellular networks, for the communication
with the DMS
The DMS availability. It also displays the reception
state of CAN data as well as the transmission status
of monitoring packets. Finally, the map at the
bottom shows the motorist the optimal path that has
been calculated.
The monitored data obtained from ESs is used at various
times. When automobiles are "on delivery" in the first phase,
their data is kept in a "temporary" Database (DB)
(represented in green in the Figure 4). The DMS analyzes this
data in "real-time" to detect any delays in delivery and, if
possible, establish other routes. When a delivery is done, the
raw data from the temporary DB will be inspected further
before being compressed and saved in a "permanent" DB in
a second step (illustrated in blue in the Figure 4). In our
prototype, we utilize a compression comparable to the one
used in the video "image to image prediction." In fact, the
algorithm will choose a series of times for each delivery. All
monitoring data will be saved for these instances. However,
only the difference between two monitored moments will be
saved for the information in between. This method allows for
a reduction in the amount of data retained while keeping the
same precision. Orders information are stored in the same
way. Orders that have not yet been delivered are recorded in
a temporary database, while fulfilled orders are saved in a
permanent database. The ML algorithm will use data from the
two permanent DBs to estimate both incoming food orders
and travel times for different road segments at different times.
A time-based machine learning algorithm.
This prototype's sharing view is shown in Figure 5. It shows
a visual representation of some of the orders that have been
received, as well as their status. Their connection to delivery
routes the algorithm for sharing uses both the order position
and the expected value at the same time to assess such
opportunities for sharing, use the delivery time. The Figure 5:
At any point in time, order A could share it’s the order's
delivery B. Readers may believe that the order is incorrect.
Order E could potentially share delivery with orders C and D,
but this is not the case possible. In reality, despite their close
proximity, their stances are vastly different. The delivery
timings are too far apart. Each time a new one appears, when
an order is placed, the sharing algorithm recalculates all share
percentages. in order to determine the prospects within the
pending orders a perfect solution Information and data
knowledge strategies are used in this project. It helps
merchants to reduce delivery trip time while also increasing
delivery efficiency. This method enables them to keep track
of delivery vehicles and efficiently retain data.
Fig. 5. Preview of the sharing view. [20]
V. IDLE TIMES
Idle time refers to the period when a workstation is
starving or blocked as represented in the Fig 6. This time can
only be zero when the station operates as a bottleneck.
Although the production systems contain the same
components, they do not work in the same way in real time
[22], forcing the use of predictive control approaches to
identify idle times in advance.
Furthermore, each system goes through multiple changes
over its lifetime, prompting the development of an effective
algorithm to predict idle times using the industry 4.0 i.e., real-
time measurement of the system’s current status. The
41
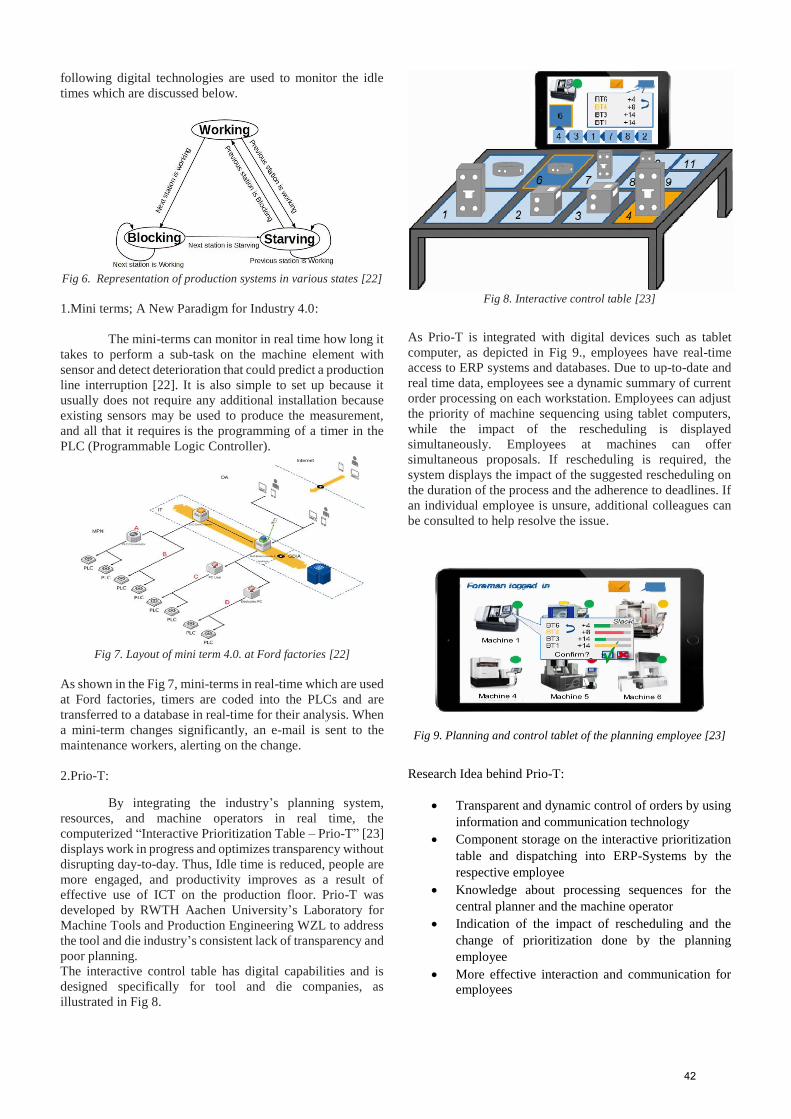
following digital technologies are used to monitor the idle
times which are discussed below.
Fig 6. Representation of production systems in various states [22]
1.Mini terms; A New Paradigm for Industry 4.0:
The mini-terms can monitor in real time how long it
takes to perform a sub-task on the machine element with
sensor and detect deterioration that could predict a production
line interruption [22]. It is also simple to set up because it
usually does not require any additional installation because
existing sensors may be used to produce the measurement,
and all that it requires is the programming of a timer in the
PLC (Programmable Logic Controller).
Fig 7. Layout of mini term 4.0. at Ford factories [22]
As shown in the Fig 7, mini-terms in real-time which are used
at Ford factories, timers are coded into the PLCs and are
transferred to a database in real-time for their analysis. When
a mini-term changes significantly, an e-mail is sent to the
maintenance workers, alerting on the change.
2.Prio-T:
By integrating the industry’s planning system,
resources, and machine operators in real time, the
computerized “Interactive Prioritization Table – Prio-T” [23]
displays work in progress and optimizes transparency without
disrupting day-to-day. Thus, Idle time is reduced, people are
more engaged, and productivity improves as a result of
effective use of ICT on the production floor. Prio-T was
developed by RWTH Aachen University’s Laboratory for
Machine Tools and Production Engineering WZL to address
the tool and die industry’s consistent lack of transparency and
poor planning.
The interactive control table has digital capabilities and is
designed specifically for tool and die companies, as
illustrated in Fig 8.
Fig 8. Interactive control table [23]
As Prio-T is integrated with digital devices such as tablet
computer, as depicted in Fig 9., employees have real-time
access to ERP systems and databases. Due to up-to-date and
real time data, employees see a dynamic summary of current
order processing on each workstation. Employees can adjust
the priority of machine sequencing using tablet computers,
while the impact of the rescheduling is displayed
simultaneously. Employees at machines can offer
simultaneous proposals. If rescheduling is required, the
system displays the impact of the suggested rescheduling on
the duration of the process and the adherence to deadlines. If
an individual employee is unsure, additional colleagues can
be consulted to help resolve the issue.
Fig 9. Planning and control tablet of the planning employee [23]
Research Idea behind Prio-T:
Transparent and dynamic control of orders by using
information and communication technology
Component storage on the interactive prioritization
table and dispatching into ERP-Systems by the
respective employee
Knowledge about processing sequences for the
central planner and the machine operator
Indication of the impact of rescheduling and the
change of prioritization done by the planning
employee
More effective interaction and communication for
employees
42
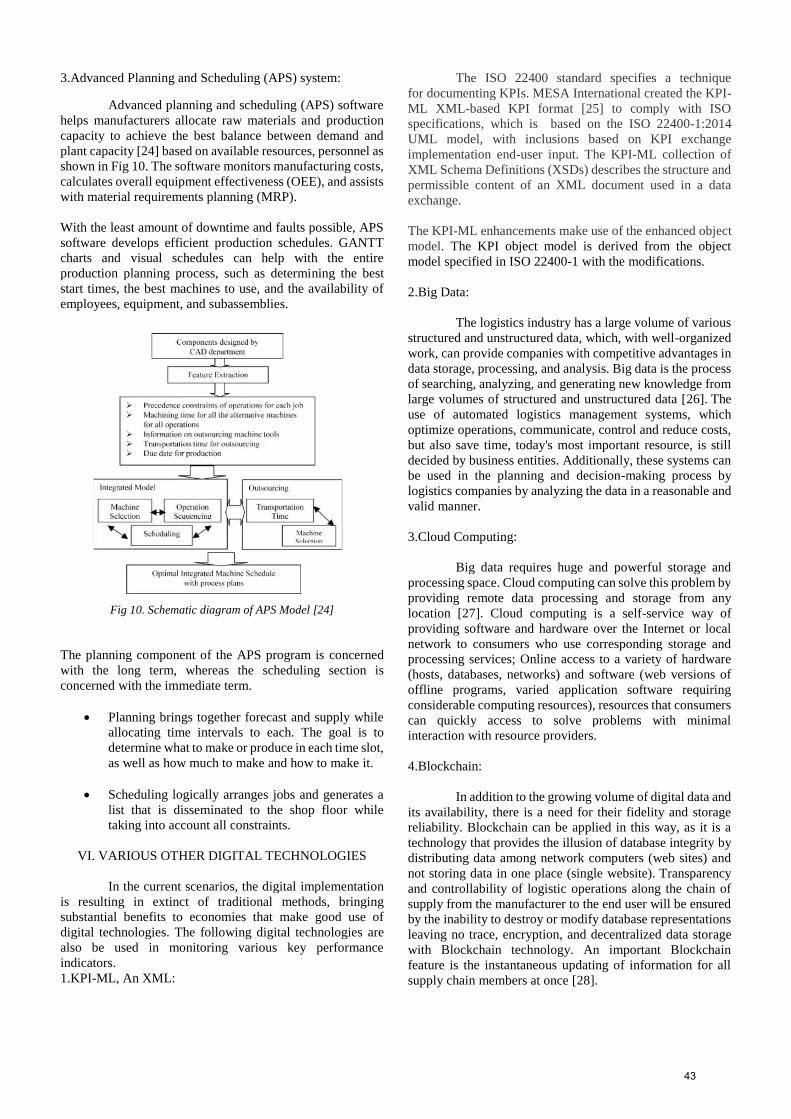
3.Advanced Planning and Scheduling (APS) system:
Advanced planning and scheduling (APS) software
helps manufacturers allocate raw materials and production
capacity to achieve the best balance between demand and
plant capacity [24] based on available resources, personnel as
shown in Fig 10. The software monitors manufacturing costs,
calculates overall equipment effectiveness (OEE), and assists
with material requirements planning (MRP).
With the least amount of downtime and faults possible, APS
software develops efficient production schedules. GANTT
charts and visual schedules can help with the entire
production planning process, such as determining the best
start times, the best machines to use, and the availability of
employees, equipment, and subassemblies.
Fig 10. Schematic diagram of APS Model [24]
The planning component of the APS program is concerned
with the long term, whereas the scheduling section is
concerned with the immediate term.
Planning brings together forecast and supply while
allocating time intervals to each. The goal is to
determine what to make or produce in each time slot,
as well as how much to make and how to make it.
Scheduling logically arranges jobs and generates a
list that is disseminated to the shop floor while
taking into account all constraints.
VI. VARIOUS OTHER DIGITAL TECHNOLOGIES
In the current scenarios, the digital implementation
is resulting in extinct of traditional methods, bringing
substantial benefits to economies that make good use of
digital technologies. The following digital technologies are
also be used in monitoring various key performance
indicators.
1.KPI-ML, An XML:
The ISO 22400 standard specifies a technique
for documenting KPIs. MESA International created the KPI-
ML XML-based KPI format [25] to comply with ISO
specifications, which is based on the ISO 22400-1:2014
UML model, with inclusions based on KPI exchange
implementation end-user input. The KPI-ML collection of
XML Schema Definitions (XSDs) describes the structure and
permissible content of an XML document used in a data
exchange.
The KPI-ML enhancements make use of the enhanced object
model. The KPI object model is derived from the object
model specified in ISO 22400-1 with the modifications.
2.Big Data:
The logistics industry has a large volume of various
structured and unstructured data, which, with well-organized
work, can provide companies with competitive advantages in
data storage, processing, and analysis. Big data is the process
of searching, analyzing, and generating new knowledge from
large volumes of structured and unstructured data [26]. The
use of automated logistics management systems, which
optimize operations, communicate, control and reduce costs,
but also save time, today's most important resource, is still
decided by business entities. Additionally, these systems can
be used in the planning and decision-making process by
logistics companies by analyzing the data in a reasonable and
valid manner.
3.Cloud Computing:
Big data requires huge and powerful storage and
processing space. Cloud computing can solve this problem by
providing remote data processing and storage from any
location [27]. Cloud computing is a self-service way of
providing software and hardware over the Internet or local
network to consumers who use corresponding storage and
processing services; Online access to a variety of hardware
(hosts, databases, networks) and software (web versions of
offline programs, varied application software requiring
considerable computing resources), resources that consumers
can quickly access to solve problems with minimal
interaction with resource providers.
4.Blockchain:
In addition to the growing volume of digital data and
its availability, there is a need for their fidelity and storage
reliability. Blockchain can be applied in this way, as it is a
technology that provides the illusion of database integrity by
distributing data among network computers (web sites) and
not storing data in one place (single website). Transparency
and controllability of logistic operations along the chain of
supply from the manufacturer to the end user will be ensured
by the inability to destroy or modify database representations
leaving no trace, encryption, and decentralized data storage
with Blockchain technology. An important Blockchain
feature is the instantaneous updating of information for all
supply chain members at once [28].
43
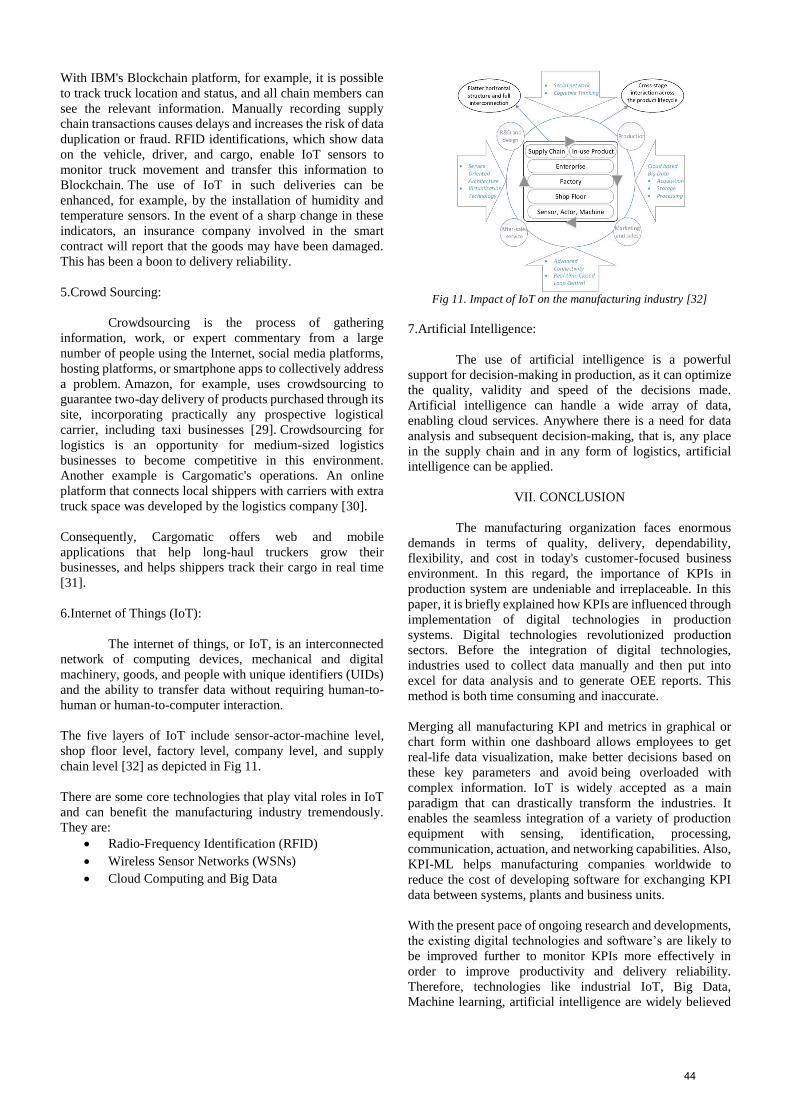
With IBM's Blockchain platform, for example, it is possible
to track truck location and status, and all chain members can
see the relevant information. Manually recording supply
chain transactions causes delays and increases the risk of data
duplication or fraud. RFID identifications, which show data
on the vehicle, driver, and cargo, enable IoT sensors to
monitor truck movement and transfer this information to
Blockchain. The use of IoT in such deliveries can be
enhanced, for example, by the installation of humidity and
temperature sensors. In the event of a sharp change in these
indicators, an insurance company involved in the smart
contract will report that the goods may have been damaged.
This has been a boon to delivery reliability.
5.Crowd Sourcing:
Crowdsourcing is the process of gathering
information, work, or expert commentary from a large
number of people using the Internet, social media platforms,
hosting platforms, or smartphone apps to collectively address
a problem. Amazon, for example, uses crowdsourcing to
guarantee two-day delivery of products purchased through its
site, incorporating practically any prospective logistical
carrier, including taxi businesses [29]. Crowdsourcing for
logistics is an opportunity for medium-sized logistics
businesses to become competitive in this environment.
Another example is Cargomatic's operations. An online
platform that connects local shippers with carriers with extra
truck space was developed by the logistics company [30].
Consequently, Cargomatic offers web and mobile
applications that help long-haul truckers grow their
businesses, and helps shippers track their cargo in real time
[31].
6.Internet of Things (IoT):
The internet of things, or IoT, is an interconnected
network of computing devices, mechanical and digital
machinery, goods, and people with unique identifiers (UIDs)
and the ability to transfer data without requiring human-to-
human or human-to-computer interaction.
The five layers of IoT include sensor-actor-machine level,
shop floor level, factory level, company level, and supply
chain level [32] as depicted in Fig 11.
There are some core technologies that play vital roles in IoT
and can benefit the manufacturing industry tremendously.
They are:
Radio-Frequency Identification (RFID)
Wireless Sensor Networks (WSNs)
Cloud Computing and Big Data
Fig 11. Impact of IoT on the manufacturing industry [32]
7.Artificial Intelligence:
The use of artificial intelligence is a powerful
support for decision-making in production, as it can optimize
the quality, validity and speed of the decisions made.
Artificial intelligence can handle a wide array of data,
enabling cloud services. Anywhere there is a need for data
analysis and subsequent decision-making, that is, any place
in the supply chain and in any form of logistics, artificial
intelligence can be applied.
VII. CONCLUSION
The manufacturing organization faces enormous
demands in terms of quality, delivery, dependability,
flexibility, and cost in today's customer-focused business
environment. In this regard, the importance of KPIs in
production system are undeniable and irreplaceable. In this
paper, it is briefly explained how KPIs are influenced through
implementation of digital technologies in production
systems. Digital technologies revolutionized production
sectors. Before the integration of digital technologies,
industries used to collect data manually and then put into
excel for data analysis and to generate OEE reports. This
method is both time consuming and inaccurate.
Merging all manufacturing KPI and metrics in graphical or
chart form within one dashboard allows employees to get
real-life data visualization, make better decisions based on
these key parameters and avoid being overloaded with
complex information. IoT is widely accepted as a main
paradigm that can drastically transform the industries. It
enables the seamless integration of a variety of production
equipment with sensing, identification, processing,
communication, actuation, and networking capabilities. Also,
KPI-ML helps manufacturing companies worldwide to
reduce the cost of developing software for exchanging KPI
data between systems, plants and business units.
With the present pace of ongoing research and developments,
the existing digital technologies and software’s are likely to
be improved further to monitor KPIs more effectively in
order to improve productivity and delivery reliability.
Therefore, technologies like industrial IoT, Big Data,
Machine learning, artificial intelligence are widely believed
44

as a frontier to induce new and effective innovations to
monitor KPIs.
In future developments, more useful KPIs and their
supporting elements will be introduced in industries. Also,
implementation of KPIs for a multi-stage production system
and energy related KPIs also plays vital role in future.
REFERENCES:
[1]. S. Nakajima, “Introduction to TPM: Total Productive Maintenance,”
Cambridge, MA: Productivity Press Inc., 1988.
[2]. Sivakumar.A, Saravanan.K, “A Systemized Operational Planning,
Implementation and Analysis of Robust Framework for Improvement of Partial and Total Productivity in Textile Fabric Industry: A research paper”
European Journal of Scientific Research, ISSN 1450-216XVol.53 No.3,
pp.385-399, 2011.
[3]. K. M. N. Muthiah and S. H. Huang. (2006. Jan). A review of literature
on manufacturing systems productivity measurement and improvement. International Journal of Industrial System Engineering.1(4), pp. 461-484.
[4] J. Lima, J. F. P. Moreira and R. M. Sousa, "Remote supervision of production processes in the food industry," 2015 IEEE International
Conference on Industrial Engineering and Engineering Management
(IEEM), 2015, pp. 1123-1127, doi: 10.1109/IEEM.2015.7385823.
[5]. B. Galloway, and G. P. Hancke, “Introduction to Industrial Control
Networks,” IEEE Communications Surveys & Tutorials, vol. 15, no. 2, pp. 860-880, second quarter 2013.
[6]. A. Daneels, and W. Salter, “What is SCADA?,” in Proc. International Conference on Accelerator and Large Experimental Physics Control
Systems, ICALEPCS 1999, Trieste, pp. 339–343.
[7]. Tao, F., M. Zhang, J. Cheng, and Q. Qi. 2017. “Digital Twin Workshop:
a new Paradigm for Future Workshop.” International Journal of Computer
Integrated Manufacturing 23 (1).
[8] Kung-Jeng Wang, Ying-Hao Lee & Septianda Angelica (2021) Digital
twin design for real-time monitoring – a case study of die cutting machine, International Journal of Production Research,59:21,64716485,
DOI:10.1080/00207543.2020.1817999
[9]. Schroeder, G. N., C. Steinmetz, C. E. Pereira, and D. B. Espindola.2016.
“Digital Twin Data Modelling with Automation ml and a Communication
Methodology for Data Exchange.”
[10]. Chris Sellathamby, Brian Moore, Steven Slupsky, “Increased Productivity by Condition based maintenance using Wireless strain
measurement system”, Memo conference and trade show, Canadian Institute
of Mining, Sudbury ON Canada, pp. 24–27, 2010.
[11]. Kumbi Mugwindiri, Charles Mbohwa, “Availability, Performance
Improvement by using Autonomous Maintenance – The case of a Developing Country, Zimbabwe.” World Congress on Engineering, London,
U.K, Vol. 1, 2013. Decision Support system for failure and down…563.
[12] Lifang Tang and Chuanjin Wang “Implementation of Mine Equipment
Maintenance Management System based on Web”, Proceedings of the 2012
2nd International Conference on computer and Information Application (ICCIA), Atlantis Press, Paris, France 2012.
[13]. P. Bastos, I. Lopes, and L. Pires, “A maintenance prediction system using data mining techniques”, Proceedings of the World Congress on
Engineering, Vol. 3, WCE, London, U.K. 2012.
[14] Chakraborty, S., Adhikari, S.: Machine learning based digital twin for dynamical systems with multiple time-scales. arXiv preprint
arXiv:2005.05862 (2020).
[15] Hinduja, H., Kekkar, S., Chourasia, S., Chakrapani, H.B.: Industry 4.0:
digital twin and its industrial applications. Int. J. Sci. Eng. Technol. Open
Access J. 8(4) (2020). ISSN 2348-4098. https://www.researchgate.net/profile/Hitesh_Hinduja/publication/34371367
6_Industry_40_Digital_Twin_and_its_Industrial_Applications/links/5f3ba5
0d299bf13404cd6750/Industry40-Digital-Twin-and-its-Industrial-Applications.pdf. Accessed 08 Nov 2020 17. ISO.
https://www.iso.org/standards.html. Accessed 29 Oct 2020.
[16]. Digital Twins for Industrial Applications: Definition, Business Values,
Design Aspects, Standards and Use Cases, An Industrial Internet Consortium
White Paper, Version 1.0, 08 Februrary2020.https://www.iiconsortium.org/pdf/IIC_Digital_Twins_Indus
trial_Apps_ White_Paper_2020-02-18.pdf. Accessed 18 Nov 2020 .
[17]. Delivery Management System based on Vehicles Monitoring and a
Machine-learning Mechanism Guillaume Habault IMT Atlantique, SRCD,
Rennes, FRANCE, [email protected] Yuya Taniguchi, Naoaki Yamanaka Keio University, Yagami Campus, Yamanaka
Laboratory,Yokohama,JAPAN,[email protected],
[email protected] [18]. B. Fleischmann, S. Gnutzmann, and E. Sandvo_, “Dynamic vehicle
routing based on online traffic information,” Transportation Science, vol. 38,
no. 4, pp. 420–433, Nov. 2004. [Online]. Available: http://dx.doi.org/10.1287/trsc.1030.0074
[19]. J. N. O. Fernandes, “A real-time embedded system for monitoring of cargo vehicles, using controller area network (can),” IEEE Latin America
Transactions, vol. 14, no. 3, pp. 1086–1092, March 2016.
[20]. A. T. Akabane, R. W. Pazzi, E. R. M. Madeira, and L. A.
Villas,“Modeling and prediction of vehicle routes based on hidden Markov model,” in 2017 IEEE 86th Vehicular Technology Conference (VTCFall),
Sept 2017, pp. 1–5.
[21]. R. K. Megalingam, V. Mohan, A. Mohanan, P. Leons, and R.
Shooja,“Wireless sensor network for vehicle speed monitoring and traffic
routing system,” in 2010 International Conference on Mechanical and Electrical Technology, Sept 2010, pp. 631–635
[22]. Garcia, E.; Montes, N.; Alacreu, M. Towards a knowledge-driven
maintenance support systems for manufacturing lines. In Proceedings of the
15th International Conference on Informatics in Control, Automation and
Robotics (ICINCO), Porto, Portugal, 29–31 Jul.
[23]. G. Schuh, M. Salmen, A. Begovic and D. Goertz, "Prio-T: Successful
Application of ICT on the Shop Floor in Tool and Die Industry," 2017
Portland International Conference on Management of Engineering and
Technology (PICMET), 2017, pp. 1-7, doi: 10.23919/PI.
[24].Lee, Young Hae, Chan Seok Jeong, and Chiung Moon. “Advanced
Planning and Scheduling with Outsourcing in Manufacturing Supply Chain.”
Computers & Industrial Engineering 43, no. 1-2 (2002): 351–74.
doi:10.1016/S0360-8352(02)00079-7.
[25]. Dennis L. Brandl, Douglas Brandl, KPI Exchanges in Smart
Manufacturing using KPI-ML,IFAC-PapersOnLine,Volume 51, Issue
11,2018,Pages 31-35,ISSN 2405-8963.
[26]. Iliinsky, A., Afanasiev, M., Metkin, D.: Digital technologies of
investment analysis of projects for the development of oil fields of
unallocated subsoil reserve fund. IOP Conf. Ser. Mater. Sci. Eng. 497, 012028 (2019). https://doi.org/10.1088/1757-899X/497/1/012028
[27]. Pustohina, I.V.: Modern development trends of logistics. Russ. J. Entrep. 18(3), 339–346 (2017).
[28] Babkin, A.V., Voronov, D.V., Bobariko, S.A.: Analysis of the application of digital technologies in the proptech industry. In: Shirokowa,
S.V. (eds.) Week of Science SPbPU 2019, vol. 2, pp. 427–431. Peter the
Great St. Petersburg Polytechnic University (SPbPU), Institute of Industrial Management, Economics and Trade (2019).
[29]. Vlasv, A.V., Chebotarev, V.E.: Blockchain as technology of providing digital transformation of transport: economical and legal aspects. Leg. Inst.
Russ. Univ. Transp. 2(55), 66–72 (2019).
[30]. Is crowdsourcing the next big component of supply chain logistics?
Beyond B2B: a digital reality check. Official site.
http://www.b2b.com/blog/2015/02/09/is-crowdsourcing-the-next bigcomponent-of-supply-chain-logistics. Last accessed 04 Sept 2020.
45

[31]. Watson, K.: 3 Ways Crowdsourcing is revolutionizing supply chain
management. https:// blog.kinaxis.com/2015/09/3-ways-crowdsourcing-is-revolutionizing-supply-chain-management. Last accessed 05 Sept 2020
[32]. Yang, Chen & Shen, Weiming & Wang, Xianbin. (2018). The Internet of Things in Manufacturing: Key Issues and Potential Applications. IEEE
Systems, Man, and Cybernetics Magazine. 4. 6-15.
10.1109/MSMC.2017.27023
46
An overview on sustainable practices in a life cycle of technical systems
Anto Francis Systems Engineering for
Manufacturing Otto Von Guericke University
Magdeburg, Germany [email protected]
Imran Mehaboob Hussain Systems Engineering for
Manufacturing Otto Von Guericke University
Magdeburg, Germany [email protected]
Ashley Jason Dsouza Systems Engineering for
Manufacturing Otto Von Guericke University
Magdeburg, Germany [email protected]
Mohamed Ayman El Ghali Systems Engineering for
Manufacturing Otto Von Guericke University
Magdeburg, Germany [email protected]
Harshavardhan Nanjunda Systems Engineering for
Manufacturing Otto Von Guericke University
Magdeburg,Germany [email protected]
Abstract --- Manufacturers are working hard to handle sustainability-related challenges without compromising consumer expectations or market competitiveness in the face of rising sustainability awareness and increased environmental pressure. The paper discusses sustainability in the utilization of natural resources concerning the various technical systems. The different objects of a technical system discussed below include Product, Production systems, Manufacturing technologies, Orders. Every stage of a life cycle of a technical system involves utilization of natural resources, giving opportunity to optimize and innovate different techniques and methodologies which are sustainable in its characteristics. Sustainability means efficient and responsible use of the natural resources and products. In order to understand the effect of sustainable utilization of natural resources on life cycle of technical system, diverse methods and practices discussed in the following paper which include: Life Cycle Assessment (LCA) method, Additive manufacturing (AM) technique in automotive and manufacturing Industry, Sustainable Material based approach, Sustainable Supply Chain Management (SSCM), Industry 4.0 approach and also to achieve measurement of energy efficiency, Models used to analyze energy consumption and traditional recycling using "3R" method (reduce, reuse, and recycle). The dwindling reserves of natural resources has forced the manufacturers to research and develop processes, products, methods and techniques in line with sustainability of resources. In conclusion, it was evident that the modern approach toward Sustainable resource utilization involves application of various methodologies along every stage in the life cycle of a technical system, from design, raw material acquisition to the recycling of the product or a system. Keywords: Material Selection, LCA, AM, IoT, Cyber Manufacturing, Energy Saving Technology, Technical building services, SSCM, Green Information based Manufacturing Process Modeling
I INTRODUCTION
Environmental issues such as global warming and energy usage have risen to the top of the list of the world’s most pressing problems. However, there is a growing understanding of the importance of sustainable design and development of life cycle
systems based on resource consumption, ecosystem safety, durability, and performance. Environmental laws have evolved as a result of rising scarcity of resources and raw materials, with potentially disastrous consequences for manufacturing. Natural resources have been significantly impacted by technical systems over their life cycle. As a result, organizations are increasingly under pressure from consumers and regulators to monitor and enhance the long-term performance of their technical systems and products [1]. Technical systems are systems that humans create and interact with, but humans are not a part of them. It is characterized by transforming inputs and outputs by way of system functions. In systems engineering, the lifecycle addresses all phases of its existence, including system design and development, production or construction, maintenance, disposal, or recycling. For example, consider an Automobile (Car) as a technical system it comprises 4 major phases viz. Engineering/design phase followed by manufacturing and distribution phase, next the largest phase is the usage of the automobile, then comes recycling of the automobile and the recycled parts can later be used in manufacturing of new products.
Figure 1 Life cycles of a product (Automobile)
The sustainability practice can entirely affect the life cycle of technical systems from the very beginning of design till its disposal stage. Product life cycle sustainability aims to manage
47
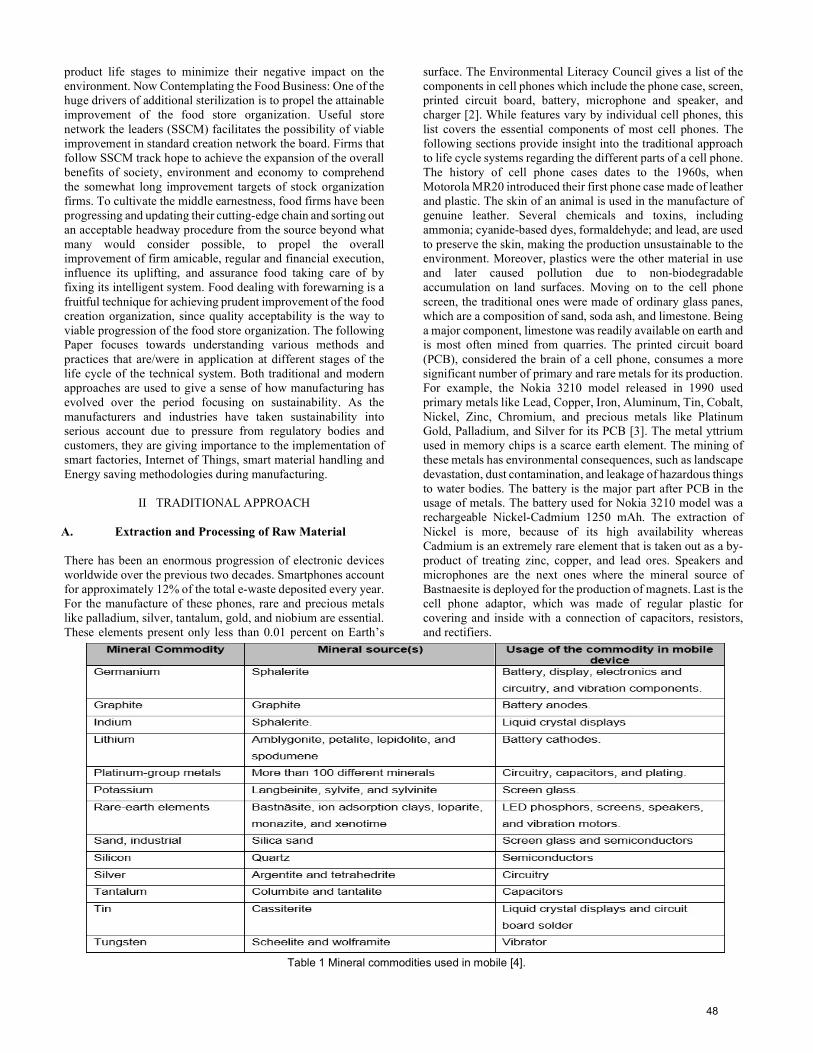
product life stages to minimize their negative impact on the environment. Now Contemplating the Food Business: One of the huge drivers of additional sterilization is to propel the attainable improvement of the food store organization. Useful store network the leaders (SSCM) facilitates the possibility of viable improvement in standard creation network the board. Firms that follow SSCM track hope to achieve the expansion of the overall benefits of society, environment and economy to comprehend the somewhat long improvement targets of stock organization firms. To cultivate the middle earnestness, food firms have been progressing and updating their cutting-edge chain and sorting out an acceptable headway procedure from the source beyond what many would consider possible, to propel the overall improvement of firm amicable, regular and financial execution, influence its uplifting, and assurance food taking care of by fixing its intelligent system. Food dealing with forewarning is a fruitful technique for achieving prudent improvement of the food creation organization, since quality acceptability is the way to viable progression of the food store organization. The following Paper focuses towards understanding various methods and practices that are/were in application at different stages of the life cycle of the technical system. Both traditional and modern approaches are used to give a sense of how manufacturing has evolved over the period focusing on sustainability. As the manufacturers and industries have taken sustainability into serious account due to pressure from regulatory bodies and customers, they are giving importance to the implementation of smart factories, Internet of Things, smart material handling and Energy saving methodologies during manufacturing.
II TRADITIONAL APPROACH
A. Extraction and Processing of Raw Material There has been an enormous progression of electronic devices worldwide over the previous two decades. Smartphones account for approximately 12% of the total e-waste deposited every year. For the manufacture of these phones, rare and precious metals like palladium, silver, tantalum, gold, and niobium are essential. These elements present only less than 0.01 percent on Earth’s
surface. The Environmental Literacy Council gives a list of the components in cell phones which include the phone case, screen, printed circuit board, battery, microphone and speaker, and charger [2]. While features vary by individual cell phones, this list covers the essential components of most cell phones. The following sections provide insight into the traditional approach to life cycle systems regarding the different parts of a cell phone. The history of cell phone cases dates to the 1960s, when Motorola MR20 introduced their first phone case made of leather and plastic. The skin of an animal is used in the manufacture of genuine leather. Several chemicals and toxins, including ammonia; cyanide-based dyes, formaldehyde; and lead, are used to preserve the skin, making the production unsustainable to the environment. Moreover, plastics were the other material in use and later caused pollution due to non-biodegradable accumulation on land surfaces. Moving on to the cell phone screen, the traditional ones were made of ordinary glass panes, which are a composition of sand, soda ash, and limestone. Being a major component, limestone was readily available on earth and is most often mined from quarries. The printed circuit board (PCB), considered the brain of a cell phone, consumes a more significant number of primary and rare metals for its production. For example, the Nokia 3210 model released in 1990 used primary metals like Lead, Copper, Iron, Aluminum, Tin, Cobalt, Nickel, Zinc, Chromium, and precious metals like Platinum Gold, Palladium, and Silver for its PCB [3]. The metal yttrium used in memory chips is a scarce earth element. The mining of these metals has environmental consequences, such as landscape devastation, dust contamination, and leakage of hazardous things to water bodies. The battery is the major part after PCB in the usage of metals. The battery used for Nokia 3210 model was a rechargeable Nickel-Cadmium 1250 mAh. The extraction of Nickel is more, because of its high availability whereas Cadmium is an extremely rare element that is taken out as a by-product of treating zinc, copper, and lead ores. Speakers and microphones are the next ones where the mineral source of Bastnaesite is deployed for the production of magnets. Last is the cell phone adaptor, which was made of regular plastic for covering and inside with a connection of capacitors, resistors, and rectifiers.
Table 1 Mineral commodities used in mobile [4].
48
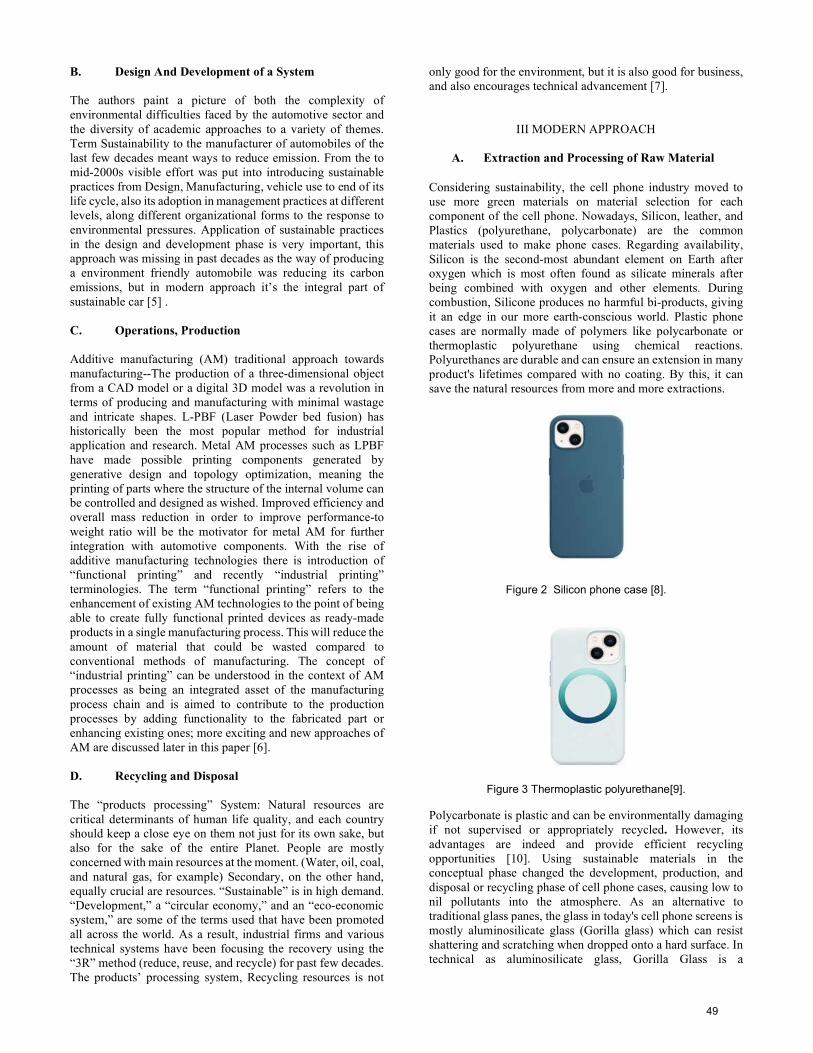
B. Design And Development of a System The authors paint a picture of both the complexity of environmental difficulties faced by the automotive sector and the diversity of academic approaches to a variety of themes. Term Sustainability to the manufacturer of automobiles of the last few decades meant ways to reduce emission. From the to mid-2000s visible effort was put into introducing sustainable practices from Design, Manufacturing, vehicle use to end of its life cycle, also its adoption in management practices at different levels, along different organizational forms to the response to environmental pressures. Application of sustainable practices in the design and development phase is very important, this approach was missing in past decades as the way of producing a environment friendly automobile was reducing its carbon emissions, but in modern approach it’s the integral part of sustainable car [5] . C. Operations, Production Additive manufacturing (AM) traditional approach towards manufacturing--The production of a three-dimensional object from a CAD model or a digital 3D model was a revolution in terms of producing and manufacturing with minimal wastage and intricate shapes. L-PBF (Laser Powder bed fusion) has historically been the most popular method for industrial application and research. Metal AM processes such as LPBF have made possible printing components generated by generative design and topology optimization, meaning the printing of parts where the structure of the internal volume can be controlled and designed as wished. Improved efficiency and overall mass reduction in order to improve performance-to weight ratio will be the motivator for metal AM for further integration with automotive components. With the rise of additive manufacturing technologies there is introduction of “functional printing” and recently “industrial printing” terminologies. The term “functional printing” refers to the enhancement of existing AM technologies to the point of being able to create fully functional printed devices as ready-made products in a single manufacturing process. This will reduce the amount of material that could be wasted compared to conventional methods of manufacturing. The concept of “industrial printing” can be understood in the context of AM processes as being an integrated asset of the manufacturing process chain and is aimed to contribute to the production processes by adding functionality to the fabricated part or enhancing existing ones; more exciting and new approaches of AM are discussed later in this paper [6]. D. Recycling and Disposal The “products processing” System: Natural resources are critical determinants of human life quality, and each country should keep a close eye on them not just for its own sake, but also for the sake of the entire Planet. People are mostly concerned with main resources at the moment. (Water, oil, coal, and natural gas, for example) Secondary, on the other hand, equally crucial are resources. “Sustainable” is in high demand. “Development,” a “circular economy,” and an “eco-economic system,” are some of the terms used that have been promoted all across the world. As a result, industrial firms and various technical systems have been focusing the recovery using the “3R” method (reduce, reuse, and recycle) for past few decades. The products’ processing system, Recycling resources is not
only good for the environment, but it is also good for business, and also encourages technical advancement [7].
III MODERN APPROACH
A. Extraction and Processing of Raw Material
Considering sustainability, the cell phone industry moved to use more green materials on material selection for each component of the cell phone. Nowadays, Silicon, leather, and Plastics (polyurethane, polycarbonate) are the common materials used to make phone cases. Regarding availability, Silicon is the second-most abundant element on Earth after oxygen which is most often found as silicate minerals after being combined with oxygen and other elements. During combustion, Silicone produces no harmful bi-products, giving it an edge in our more earth-conscious world. Plastic phone cases are normally made of polymers like polycarbonate or thermoplastic polyurethane using chemical reactions. Polyurethanes are durable and can ensure an extension in many product's lifetimes compared with no coating. By this, it can save the natural resources from more and more extractions.
Figure 2 Silicon phone case [8].
Figure 3 Thermoplastic polyurethane[9].
Polycarbonate is plastic and can be environmentally damaging if not supervised or appropriately recycled. However, its advantages are indeed and provide efficient recycling opportunities [10]. Using sustainable materials in the conceptual phase changed the development, production, and disposal or recycling phase of cell phone cases, causing low to nil pollutants into the atmosphere. As an alternative to traditional glass panes, the glass in today's cell phone screens is mostly aluminosilicate glass (Gorilla glass) which can resist shattering and scratching when dropped onto a hard surface. In technical as aluminosilicate glass, Gorilla Glass is a
49
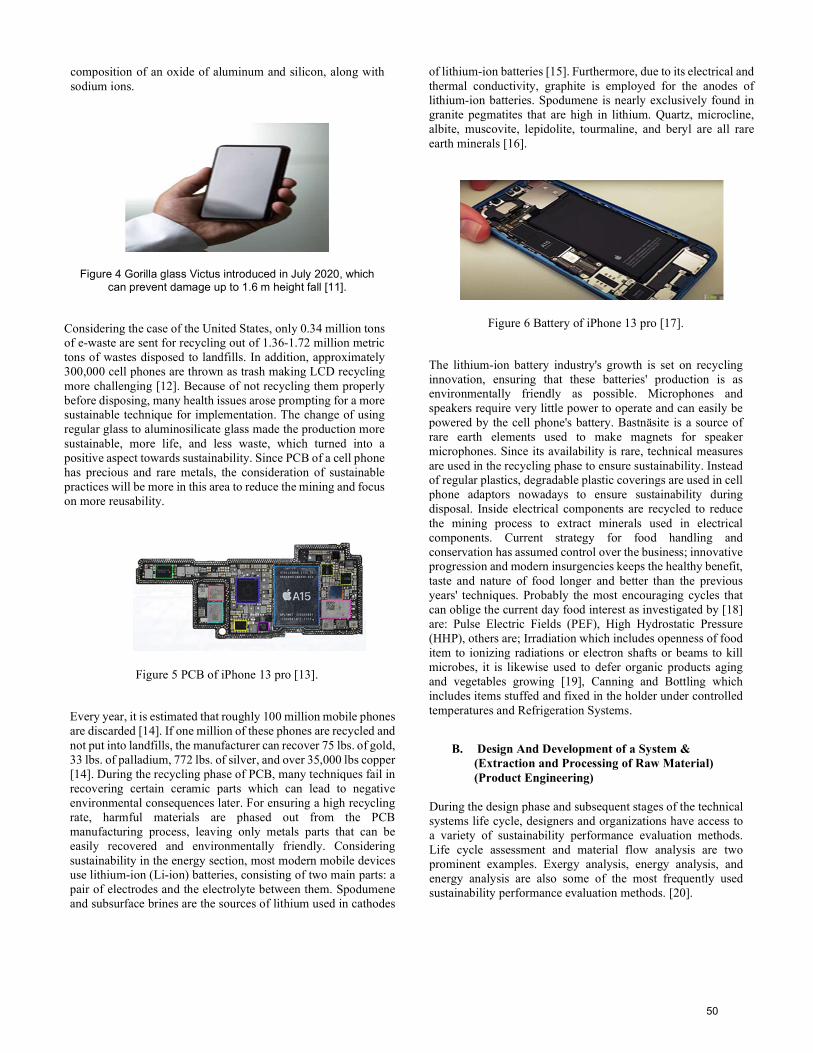
composition of an oxide of aluminum and silicon, along with sodium ions.
Figure 4 Gorilla glass Victus introduced in July 2020, which can prevent damage up to 1.6 m height fall [11].
Considering the case of the United States, only 0.34 million tons of e-waste are sent for recycling out of 1.36-1.72 million metric tons of wastes disposed to landfills. In addition, approximately 300,000 cell phones are thrown as trash making LCD recycling more challenging [12]. Because of not recycling them properly before disposing, many health issues arose prompting for a more sustainable technique for implementation. The change of using regular glass to aluminosilicate glass made the production more sustainable, more life, and less waste, which turned into a positive aspect towards sustainability. Since PCB of a cell phone has precious and rare metals, the consideration of sustainable practices will be more in this area to reduce the mining and focus on more reusability.
Figure 5 PCB of iPhone 13 pro [13].
Every year, it is estimated that roughly 100 million mobile phones are discarded [14]. If one million of these phones are recycled and not put into landfills, the manufacturer can recover 75 lbs. of gold, 33 lbs. of palladium, 772 lbs. of silver, and over 35,000 lbs copper [14]. During the recycling phase of PCB, many techniques fail in recovering certain ceramic parts which can lead to negative environmental consequences later. For ensuring a high recycling rate, harmful materials are phased out from the PCB manufacturing process, leaving only metals parts that can be easily recovered and environmentally friendly. Considering sustainability in the energy section, most modern mobile devices use lithium-ion (Li-ion) batteries, consisting of two main parts: a pair of electrodes and the electrolyte between them. Spodumene and subsurface brines are the sources of lithium used in cathodes
of lithium-ion batteries [15]. Furthermore, due to its electrical and thermal conductivity, graphite is employed for the anodes of lithium-ion batteries. Spodumene is nearly exclusively found in granite pegmatites that are high in lithium. Quartz, microcline, albite, muscovite, lepidolite, tourmaline, and beryl are all rare earth minerals [16].
Figure 6 Battery of iPhone 13 pro [17].
The lithium-ion battery industry's growth is set on recycling innovation, ensuring that these batteries' production is as environmentally friendly as possible. Microphones and speakers require very little power to operate and can easily be powered by the cell phone's battery. Bastnäsite is a source of rare earth elements used to make magnets for speaker microphones. Since its availability is rare, technical measures are used in the recycling phase to ensure sustainability. Instead of regular plastics, degradable plastic coverings are used in cell phone adaptors nowadays to ensure sustainability during disposal. Inside electrical components are recycled to reduce the mining process to extract minerals used in electrical components. Current strategy for food handling and conservation has assumed control over the business; innovative progression and modern insurgencies keeps the healthy benefit, taste and nature of food longer and better than the previous years' techniques. Probably the most encouraging cycles that can oblige the current day food interest as investigated by [18] are: Pulse Electric Fields (PEF), High Hydrostatic Pressure (HHP), others are; Irradiation which includes openness of food item to ionizing radiations or electron shafts or beams to kill microbes, it is likewise used to defer organic products aging and vegetables growing [19], Canning and Bottling which includes items stuffed and fixed in the holder under controlled temperatures and Refrigeration Systems.
B. Design And Development of a System &
(Extraction and Processing of Raw Material) (Product Engineering)
During the design phase and subsequent stages of the technical systems life cycle, designers and organizations have access to a variety of sustainability performance evaluation methods. Life cycle assessment and material flow analysis are two prominent examples. Exergy analysis, energy analysis, and energy analysis are also some of the most frequently used sustainability performance evaluation methods. [20].
50
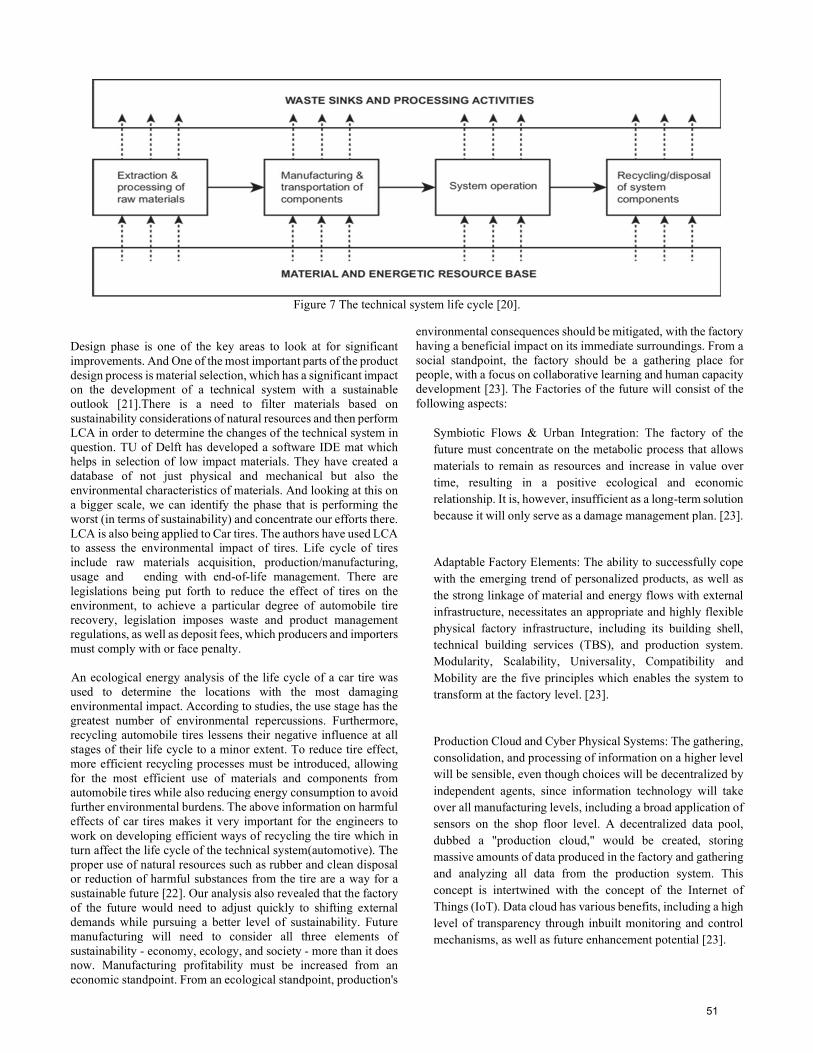
Figure 7 The technical system life cycle [20].
Design phase is one of the key areas to look at for significant improvements. And One of the most important parts of the product design process is material selection, which has a significant impact on the development of a technical system with a sustainable outlook [21].There is a need to filter materials based on sustainability considerations of natural resources and then perform LCA in order to determine the changes of the technical system in question. TU of Delft has developed a software IDE mat which helps in selection of low impact materials. They have created a database of not just physical and mechanical but also the environmental characteristics of materials. And looking at this on a bigger scale, we can identify the phase that is performing the worst (in terms of sustainability) and concentrate our efforts there. LCA is also being applied to Car tires. The authors have used LCA to assess the environmental impact of tires. Life cycle of tires include raw materials acquisition, production/manufacturing, usage and ending with end-of-life management. There are legislations being put forth to reduce the effect of tires on the environment, to achieve a particular degree of automobile tire recovery, legislation imposes waste and product management regulations, as well as deposit fees, which producers and importers must comply with or face penalty.
An ecological energy analysis of the life cycle of a car tire was used to determine the locations with the most damaging environmental impact. According to studies, the use stage has the greatest number of environmental repercussions. Furthermore, recycling automobile tires lessens their negative influence at all stages of their life cycle to a minor extent. To reduce tire effect, more efficient recycling processes must be introduced, allowing for the most efficient use of materials and components from automobile tires while also reducing energy consumption to avoid further environmental burdens. The above information on harmful effects of car tires makes it very important for the engineers to work on developing efficient ways of recycling the tire which in turn affect the life cycle of the technical system(automotive). The proper use of natural resources such as rubber and clean disposal or reduction of harmful substances from the tire are a way for a sustainable future [22]. Our analysis also revealed that the factory of the future would need to adjust quickly to shifting external demands while pursuing a better level of sustainability. Future manufacturing will need to consider all three elements of sustainability - economy, ecology, and society - more than it does now. Manufacturing profitability must be increased from an economic standpoint. From an ecological standpoint, production's
environmental consequences should be mitigated, with the factory having a beneficial impact on its immediate surroundings. From a social standpoint, the factory should be a gathering place for people, with a focus on collaborative learning and human capacity development [23]. The Factories of the future will consist of the following aspects:
Symbiotic Flows & Urban Integration: The factory of the future must concentrate on the metabolic process that allows materials to remain as resources and increase in value over time, resulting in a positive ecological and economic relationship. It is, however, insufficient as a long-term solution because it will only serve as a damage management plan. [23].
Adaptable Factory Elements: The ability to successfully cope with the emerging trend of personalized products, as well as the strong linkage of material and energy flows with external infrastructure, necessitates an appropriate and highly flexible physical factory infrastructure, including its building shell, technical building services (TBS), and production system. Modularity, Scalability, Universality, Compatibility and Mobility are the five principles which enables the system to transform at the factory level. [23].
Production Cloud and Cyber Physical Systems: The gathering, consolidation, and processing of information on a higher level will be sensible, even though choices will be decentralized by independent agents, since information technology will take over all manufacturing levels, including a broad application of sensors on the shop floor level. A decentralized data pool, dubbed a "production cloud," would be created, storing massive amounts of data produced in the factory and gathering and analyzing all data from the production system. This concept is intertwined with the concept of the Internet of Things (IoT). Data cloud has various benefits, including a high level of transparency through inbuilt monitoring and control mechanisms, as well as future enhancement potential [23].
51
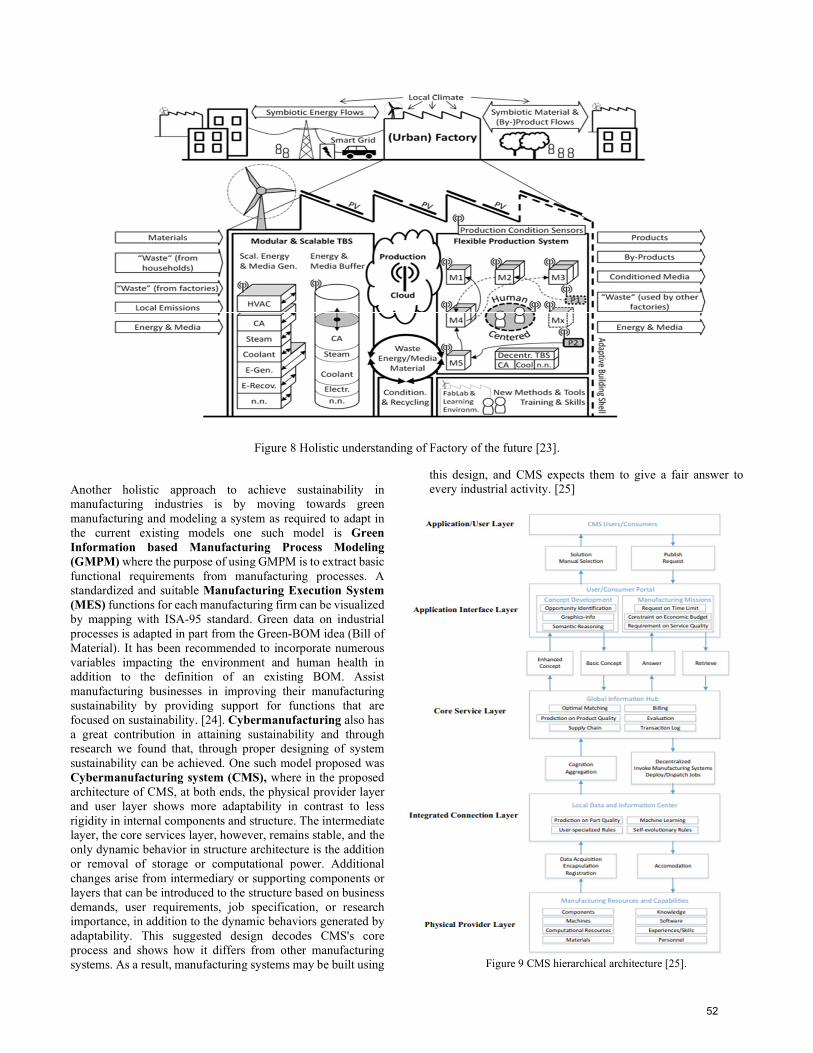
Figure 8 Holistic understanding of Factory of the future [23].
Another holistic approach to achieve sustainability in manufacturing industries is by moving towards green manufacturing and modeling a system as required to adapt in the current existing models one such model is Green Information based Manufacturing Process Modeling (GMPM) where the purpose of using GMPM is to extract basic functional requirements from manufacturing processes. A standardized and suitable Manufacturing Execution System (MES) functions for each manufacturing firm can be visualized by mapping with ISA-95 standard. Green data on industrial processes is adapted in part from the Green-BOM idea (Bill of Material). It has been recommended to incorporate numerous variables impacting the environment and human health in addition to the definition of an existing BOM. Assist manufacturing businesses in improving their manufacturing sustainability by providing support for functions that are focused on sustainability. [24]. Cybermanufacturing also has a great contribution in attaining sustainability and through research we found that, through proper designing of system sustainability can be achieved. One such model proposed was Cybermanufacturing system (CMS), where in the proposed architecture of CMS, at both ends, the physical provider layer and user layer shows more adaptability in contrast to less rigidity in internal components and structure. The intermediate layer, the core services layer, however, remains stable, and the only dynamic behavior in structure architecture is the addition or removal of storage or computational power. Additional changes arise from intermediary or supporting components or layers that can be introduced to the structure based on business demands, user requirements, job specification, or research importance, in addition to the dynamic behaviors generated by adaptability. This suggested design decodes CMS's core process and shows how it differs from other manufacturing systems. As a result, manufacturing systems may be built using
this design, and CMS expects them to give a fair answer to every industrial activity. [25]
Figure 9 CMS hierarchical architecture [25].
52
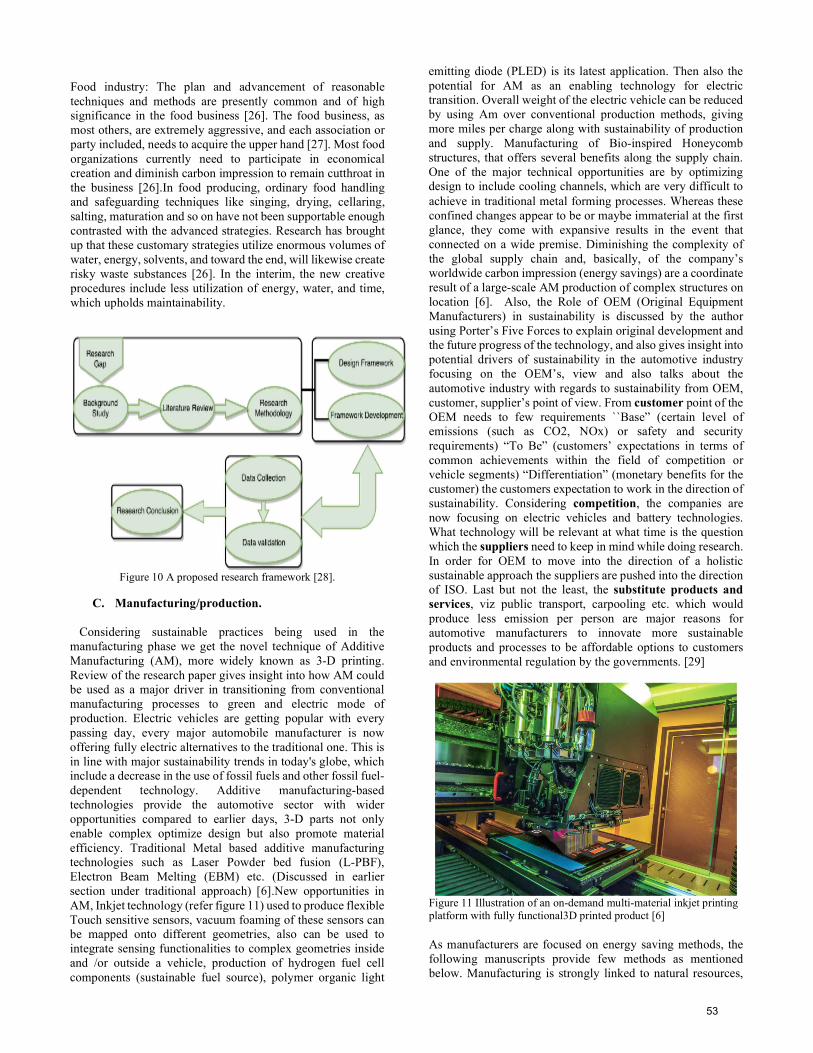
Food industry: The plan and advancement of reasonable techniques and methods are presently common and of high significance in the food business [26]. The food business, as most others, are extremely aggressive, and each association or party included, needs to acquire the upper hand [27]. Most food organizations currently need to participate in economical creation and diminish carbon impression to remain cutthroat in the business [26].In food producing, ordinary food handling and safeguarding techniques like singing, drying, cellaring, salting, maturation and so on have not been supportable enough contrasted with the advanced strategies. Research has brought up that these customary strategies utilize enormous volumes of water, energy, solvents, and toward the end, will likewise create risky waste substances [26]. In the interim, the new creative procedures include less utilization of energy, water, and time, which upholds maintainability.
Figure 10 A proposed research framework [28].
C. Manufacturing/production. Considering sustainable practices being used in the manufacturing phase we get the novel technique of Additive Manufacturing (AM), more widely known as 3-D printing. Review of the research paper gives insight into how AM could be used as a major driver in transitioning from conventional manufacturing processes to green and electric mode of production. Electric vehicles are getting popular with every passing day, every major automobile manufacturer is now offering fully electric alternatives to the traditional one. This is in line with major sustainability trends in today's globe, which include a decrease in the use of fossil fuels and other fossil fuel-dependent technology. Additive manufacturing-based technologies provide the automotive sector with wider opportunities compared to earlier days, 3-D parts not only enable complex optimize design but also promote material efficiency. Traditional Metal based additive manufacturing technologies such as Laser Powder bed fusion (L-PBF), Electron Beam Melting (EBM) etc. (Discussed in earlier section under traditional approach) [6].New opportunities in AM, Inkjet technology (refer figure 11) used to produce flexible Touch sensitive sensors, vacuum foaming of these sensors can be mapped onto different geometries, also can be used to integrate sensing functionalities to complex geometries inside and /or outside a vehicle, production of hydrogen fuel cell components (sustainable fuel source), polymer organic light
emitting diode (PLED) is its latest application. Then also the potential for AM as an enabling technology for electric transition. Overall weight of the electric vehicle can be reduced by using Am over conventional production methods, giving more miles per charge along with sustainability of production and supply. Manufacturing of Bio-inspired Honeycomb structures, that offers several benefits along the supply chain. One of the major technical opportunities are by optimizing design to include cooling channels, which are very difficult to achieve in traditional metal forming processes. Whereas these confined changes appear to be or maybe immaterial at the first glance, they come with expansive results in the event that connected on a wide premise. Diminishing the complexity of the global supply chain and, basically, of the company’s worldwide carbon impression (energy savings) are a coordinate result of a large-scale AM production of complex structures on location [6]. Also, the Role of OEM (Original Equipment Manufacturers) in sustainability is discussed by the author using Porter’s Five Forces to explain original development and the future progress of the technology, and also gives insight into potential drivers of sustainability in the automotive industry focusing on the OEM’s, view and also talks about the automotive industry with regards to sustainability from OEM, customer, supplier’s point of view. From customer point of the OEM needs to few requirements ``Base” (certain level of emissions (such as CO2, NOx) or safety and security requirements) “To Be” (customers’ expectations in terms of common achievements within the field of competition or vehicle segments) “Differentiation” (monetary benefits for the customer) the customers expectation to work in the direction of sustainability. Considering competition, the companies are now focusing on electric vehicles and battery technologies. What technology will be relevant at what time is the question which the suppliers need to keep in mind while doing research. In order for OEM to move into the direction of a holistic sustainable approach the suppliers are pushed into the direction of ISO. Last but not the least, the substitute products and services, viz public transport, carpooling etc. which would produce less emission per person are major reasons for automotive manufacturers to innovate more sustainable products and processes to be affordable options to customers and environmental regulation by the governments. [29]
Figure 11 Illustration of an on-demand multi-material inkjet printing platform with fully functional3D printed product [6]
As manufacturers are focused on energy saving methods, the following manuscripts provide few methods as mentioned below. Manufacturing is strongly linked to natural resources,
53
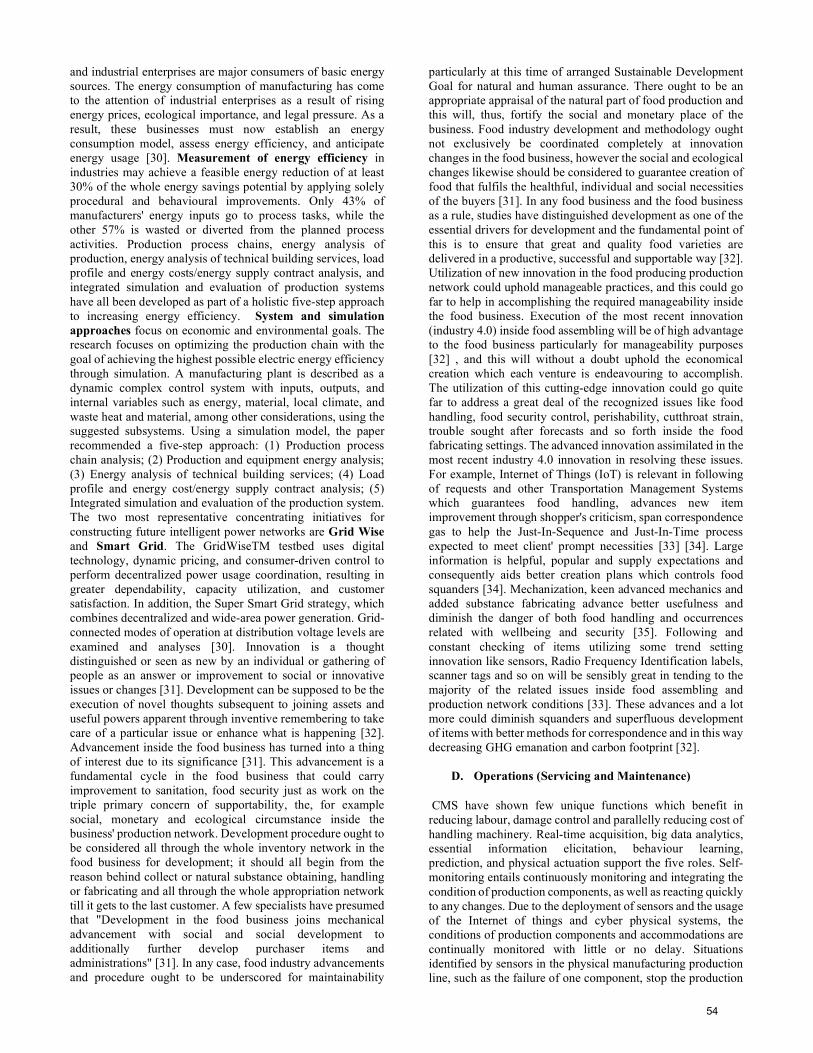
and industrial enterprises are major consumers of basic energy sources. The energy consumption of manufacturing has come to the attention of industrial enterprises as a result of rising energy prices, ecological importance, and legal pressure. As a result, these businesses must now establish an energy consumption model, assess energy efficiency, and anticipate energy usage [30]. Measurement of energy efficiency in industries may achieve a feasible energy reduction of at least 30% of the whole energy savings potential by applying solely procedural and behavioural improvements. Only 43% of manufacturers' energy inputs go to process tasks, while the other 57% is wasted or diverted from the planned process activities. Production process chains, energy analysis of production, energy analysis of technical building services, load profile and energy costs/energy supply contract analysis, and integrated simulation and evaluation of production systems have all been developed as part of a holistic five-step approach to increasing energy efficiency. System and simulation approaches focus on economic and environmental goals. The research focuses on optimizing the production chain with the goal of achieving the highest possible electric energy efficiency through simulation. A manufacturing plant is described as a dynamic complex control system with inputs, outputs, and internal variables such as energy, material, local climate, and waste heat and material, among other considerations, using the suggested subsystems. Using a simulation model, the paper recommended a five-step approach: (1) Production process chain analysis; (2) Production and equipment energy analysis; (3) Energy analysis of technical building services; (4) Load profile and energy cost/energy supply contract analysis; (5) Integrated simulation and evaluation of the production system. The two most representative concentrating initiatives for constructing future intelligent power networks are Grid Wise and Smart Grid. The GridWiseTM testbed uses digital technology, dynamic pricing, and consumer-driven control to perform decentralized power usage coordination, resulting in greater dependability, capacity utilization, and customer satisfaction. In addition, the Super Smart Grid strategy, which combines decentralized and wide-area power generation. Grid-connected modes of operation at distribution voltage levels are examined and analyses [30]. Innovation is a thought distinguished or seen as new by an individual or gathering of people as an answer or improvement to social or innovative issues or changes [31]. Development can be supposed to be the execution of novel thoughts subsequent to joining assets and useful powers apparent through inventive remembering to take care of a particular issue or enhance what is happening [32]. Advancement inside the food business has turned into a thing of interest due to its significance [31]. This advancement is a fundamental cycle in the food business that could carry improvement to sanitation, food security just as work on the triple primary concern of supportability, the, for example social, monetary and ecological circumstance inside the business' production network. Development procedure ought to be considered all through the whole inventory network in the food business for development; it should all begin from the reason behind collect or natural substance obtaining, handling or fabricating and all through the whole appropriation network till it gets to the last customer. A few specialists have presumed that "Development in the food business joins mechanical advancement with social and social development to additionally further develop purchaser items and administrations" [31]. In any case, food industry advancements and procedure ought to be underscored for maintainability
particularly at this time of arranged Sustainable Development Goal for natural and human assurance. There ought to be an appropriate appraisal of the natural part of food production and this will, thus, fortify the social and monetary place of the business. Food industry development and methodology ought not exclusively be coordinated completely at innovation changes in the food business, however the social and ecological changes likewise should be considered to guarantee creation of food that fulfils the healthful, individual and social necessities of the buyers [31]. In any food business and the food business as a rule, studies have distinguished development as one of the essential drivers for development and the fundamental point of this is to ensure that great and quality food varieties are delivered in a productive, successful and supportable way [32]. Utilization of new innovation in the food producing production network could uphold manageable practices, and this could go far to help in accomplishing the required manageability inside the food business. Execution of the most recent innovation (industry 4.0) inside food assembling will be of high advantage to the food business particularly for manageability purposes [32] , and this will without a doubt uphold the economical creation which each venture is endeavouring to accomplish. The utilization of this cutting-edge innovation could go quite far to address a great deal of the recognized issues like food handling, food security control, perishability, cutthroat strain, trouble sought after forecasts and so forth inside the food fabricating settings. The advanced innovation assimilated in the most recent industry 4.0 innovation in resolving these issues. For example, Internet of Things (IoT) is relevant in following of requests and other Transportation Management Systems which guarantees food handling, advances new item improvement through shopper's criticism, span correspondence gas to help the Just-In-Sequence and Just-In-Time process expected to meet client' prompt necessities [33] [34]. Large information is helpful, popular and supply expectations and consequently aids better creation plans which controls food squanders [34]. Mechanization, keen advanced mechanics and added substance fabricating advance better usefulness and diminish the danger of both food handling and occurrences related with wellbeing and security [35]. Following and constant checking of items utilizing some trend setting innovation like sensors, Radio Frequency Identification labels, scanner tags and so on will be sensibly great in tending to the majority of the related issues inside food assembling and production network conditions [33]. These advances and a lot more could diminish squanders and superfluous development of items with better methods for correspondence and in this way decreasing GHG emanation and carbon footprint [32].
D. Operations (Servicing and Maintenance)
CMS have shown few unique functions which benefit in reducing labour, damage control and parallelly reducing cost of handling machinery. Real-time acquisition, big data analytics, essential information elicitation, behaviour learning, prediction, and physical actuation support the five roles. Self-monitoring entails continuously monitoring and integrating the condition of production components, as well as reacting quickly to any changes. Due to the deployment of sensors and the usage of the Internet of things and cyber physical systems, the conditions of production components and accommodations are continually monitored with little or no delay. Situations identified by sensors in the physical manufacturing production line, such as the failure of one component, stop the production
54
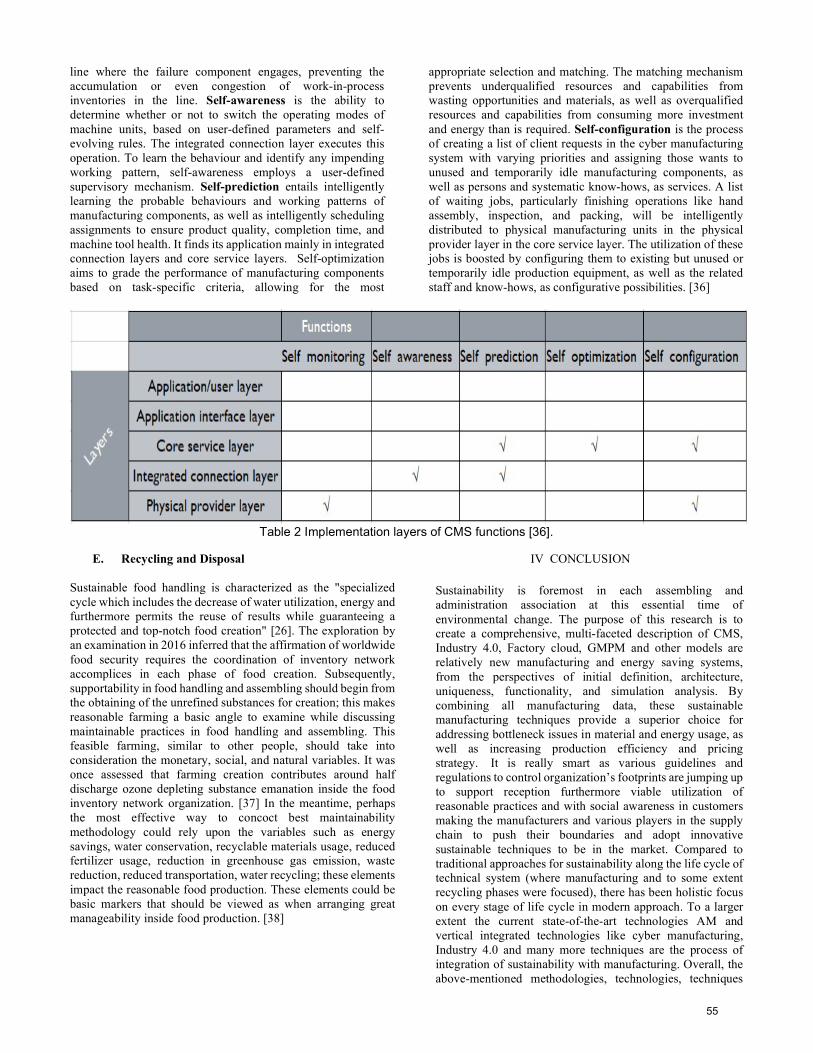
line where the failure component engages, preventing the accumulation or even congestion of work-in-process inventories in the line. Self-awareness is the ability to determine whether or not to switch the operating modes of machine units, based on user-defined parameters and self-evolving rules. The integrated connection layer executes this operation. To learn the behaviour and identify any impending working pattern, self-awareness employs a user-defined supervisory mechanism. Self-prediction entails intelligently learning the probable behaviours and working patterns of manufacturing components, as well as intelligently scheduling assignments to ensure product quality, completion time, and machine tool health. It finds its application mainly in integrated connection layers and core service layers. Self-optimization aims to grade the performance of manufacturing components based on task-specific criteria, allowing for the most
appropriate selection and matching. The matching mechanism prevents underqualified resources and capabilities from wasting opportunities and materials, as well as overqualified resources and capabilities from consuming more investment and energy than is required. Self-configuration is the process of creating a list of client requests in the cyber manufacturing system with varying priorities and assigning those wants to unused and temporarily idle manufacturing components, as well as persons and systematic know-hows, as services. A list of waiting jobs, particularly finishing operations like hand assembly, inspection, and packing, will be intelligently distributed to physical manufacturing units in the physical provider layer in the core service layer. The utilization of these jobs is boosted by configuring them to existing but unused or temporarily idle production equipment, as well as the related staff and know-hows, as configurative possibilities. [36]
Table 2 Implementation layers of CMS functions [36].
E. Recycling and Disposal Sustainable food handling is characterized as the "specialized cycle which includes the decrease of water utilization, energy and furthermore permits the reuse of results while guaranteeing a protected and top-notch food creation" [26]. The exploration by an examination in 2016 inferred that the affirmation of worldwide food security requires the coordination of inventory network accomplices in each phase of food creation. Subsequently, supportability in food handling and assembling should begin from the obtaining of the unrefined substances for creation; this makes reasonable farming a basic angle to examine while discussing maintainable practices in food handling and assembling. This feasible farming, similar to other people, should take into consideration the monetary, social, and natural variables. It was once assessed that farming creation contributes around half discharge ozone depleting substance emanation inside the food inventory network organization. [37] In the meantime, perhaps the most effective way to concoct best maintainability methodology could rely upon the variables such as energy savings, water conservation, recyclable materials usage, reduced fertilizer usage, reduction in greenhouse gas emission, waste reduction, reduced transportation, water recycling; these elements impact the reasonable food production. These elements could be basic markers that should be viewed as when arranging great manageability inside food production. [38]
IV CONCLUSION
Sustainability is foremost in each assembling and administration association at this essential time of environmental change. The purpose of this research is to create a comprehensive, multi-faceted description of CMS, Industry 4.0, Factory cloud, GMPM and other models are relatively new manufacturing and energy saving systems, from the perspectives of initial definition, architecture, uniqueness, functionality, and simulation analysis. By combining all manufacturing data, these sustainable manufacturing techniques provide a superior choice for addressing bottleneck issues in material and energy usage, as well as increasing production efficiency and pricing strategy. It is really smart as various guidelines and regulations to control organization’s footprints are jumping up to support reception furthermore viable utilization of reasonable practices and with social awareness in customers making the manufacturers and various players in the supply chain to push their boundaries and adopt innovative sustainable techniques to be in the market. Compared to traditional approaches for sustainability along the life cycle of technical system (where manufacturing and to some extent recycling phases were focused), there has been holistic focus on every stage of life cycle in modern approach. To a larger extent the current state-of-the-art technologies AM and vertical integrated technologies like cyber manufacturing, Industry 4.0 and many more techniques are the process of integration of sustainability with manufacturing. Overall, the above-mentioned methodologies, technologies, techniques
55
and processes would lead to reduce the dependency on the natural resources in particular. The future prospects in the field of sustainable manufacturing could be integration of current systems for more efficiency also in all industrial sectors, new energy-saving and harvesting technologies have emerged as a crucial driver of future economic growth. This research provides the first exploratory insights into the long-term viability and benefits analysis of manufacturing, and it serves as a good foundation for future research in this field.
V REFERENCES
[1] P.-J. L. K.-M. &. Park and W. Wimmer, "Development of an environmental
assessment method for consumer electronics by combining top-down and bottom-up approaches (11 pp).," The International Journal of Life Cycle Assessment,, vol. 11(4), p. 254–264, 2005.
[2] T. L. P. K. L.Grafman, "LCA of cell phones," https://www.appropedia.org/LCA_of_cell_phones, 2021.
[3] M. A. K. B. D. K. K. a. A. H. Merve Sahan, "Determination of Metal Content of Waste Mobile Phones and Estimation of Their Recovery Potential in Turkey," 2019.
[4] "“A World of Minerals in Your Mobile Device”," United States Geological Survey, 2021.
[5] P. W. B. S. R.J. Orsato (INSEAD), "The Automobile Industry & Sustainability," Journal of Cleaner Production , vol. 15, pp. 989-993, 2007.
[6] A. H. ,. A. E. a. S. G. S. Amal Charles, "Additive Manufacturing(AM) in the Automotive Industry and the Potential for Driving the Green and Electric Transition," Springer Nature Singapore Pte Ltd., Vols. S. G. Scholz et al. (Eds.): KES-SDM 2021, SIST 262,, p. 339–346, 2022.
[7] M. C. Jin Tian, "Sustainable design for automotive products: Dismantling and recycling of end-of-life vehicles.," Elsevier Ltd, 2013.
[8] https://www.apple.com/shop/iphone/accessories/cases-protection, "iPhone Accessories".
[9] https://www.apple.com/shop/product/HPQT2ZM/A/otterbox-aneu-series-case-with-magsafe-for-iphone-13-mini-light-blue, "OtterBox Aneu Series Case with MagSafe for iPhone 13 mini - Light Blue," Apple.
[10] S. B. D. J. J. D. C. J. S Abhijith, "Sustainability as part of product design using a mobile phone case," Journal of Chemical and Pharmaceutical Sciences, 2015.
[11] T. Desk, "What is Corning’s Gorilla Glass Victus?," The Indian Express, 2020.
[12] C. B. S. R. M. S. Abdulaziz Alotaibi, "“Re (Cell) LCD: A Feasibility Study on Recycling Cell Phone LCDS," International Journal of Engineering Research and Applications, 2017.
[13] M. Huilgol, "iPhone 13 and iPhone 13 Pro Series Battery Capacities Revealed in Teardown," https://www.iphonehacks.com/2021/09/iphone-13-battery-capacity-revealed-teardown.html, 2021.
[14] L. H. Y. T. d. M. C. R. E. A. S. Tenório, "Recycling of WEEE: Characterization of spent printed circuit boards from mobile phones and computers," 2011.
[15] L. R. J. D. A. W. B. J. H. a. H. H. Graham N. Newton, "Sustainability of Battery Technologies: Today and Tomorrow," ACS Sustainable Chemistry & Engineering , vol. 9(19), pp. 6507-6509, 2021.
[16] "A World of Minerals in Your Mobile Device," United States Geological Survey, 2021.
[17] D. Y. a. Z. S. Stacy Wegner, "A Look Inside The Apple IPhone 13 Pro," https://semiengineering.com/a-look-inside-the-apple-iphone-13-pro/, 2021.
[18] F. S. A. S. A. P. a. A. M. D. Rodrigo, ""New food processing technologies as a paradigm of safety and quality,"," British Food Journal, vol. 112, no. 5,, pp. 467-475, 2010.
[19] ""Food Facts: Food Irradiation,"," FDA, 2016.
[20] L. D. A. H. &. Hay and R. I. Whitfield, "The S-Cycle Performance Matrix: Supporting Comprehensive Sustainability Performance Evaluation of Technical Systems. Systems Engineering, 20(1),," p. 45–70, 2017.
[21] J. H. F.-L. A. &. Spangenberg and K. Blincoe, "Design for sustainability (DFS): The Interface of sustainable production and consumption.," Journal of Cleaner Production, 18(15), p. 1485–1493, 2010.
[22] W. K. ,. P. B.-W. ,. K. ,. J. R. ,. A. T. ,. J. F. M. O. Katarzyna Piotrowska, "Assessment of the Environmental Impact of a Car Tire throughout Its Lifecycle Using the LCA Method," MDPI(www.mdpi.com/journal/materials), 2019.
[23] C. S. D. K. S. B. a. S. T. Christoph Herrmann, "Sustainability in Manufacturing and Factories of the Future," NTERNATIONAL JOURNAL OF PRECISION ENGINEERING AND MANUFACTURING-GREEN TECHNOLOGY Vol. 1, No. 4, pp. 283-292, 2014.
[24] K. R. Y.-J. S. a. Y. C. Hwaseop Lee, "Capturing Green Information and Mapping with MES Functions for Increasing Manufacturing Sustainability," INTERNATIONAL JOURNAL OF PRECISION ENGINEERING AND MANUFACTURING Vol. 15, No. 8,, pp. 1709-1716, 2014.
[25] Y. M. Zhengyi Song, "Assessing sustainability benefits of cybermanufacturing systems," Springer-Verlag London 2016, 2016.
[26] N. R. A. M. M. T. S. P. A.-. S. F.-T. a. M. A.-V. F. Chemat, ""Review of Green Food Processing techniques. Preservation, transformation, and extraction,"," Innovative Food Science & Emerging Technologies, vol. 41,, pp. 357-377, 2017.
[27] A. L. a. S. S. [4]. P. Beske, ""Sustainable supply chain management practices and dynamic capabilities in the food industry: A critical analysis of the literature,"," International Journal of Production Economics, vol. 152, , pp. 131-143, 2014. .
[28] S. S. A. D. C. O. O. Ojo1, "An Overview of Sustainable Practices in Food Processing Supply Chain," IEEE, 2017.
[29] W. M. B. a. T. Ruhnau, "Drivers of Sustainability in the Automotive Industry Wilfried M. Bunzel and Thomas Ruhnau," Springer International Publishing Switzerland, pp. 137-145, 2014.
[30] K.-S. K. W.-B. K. B.-K. M. S.-J. P. I.-H. S. Y. S. Y. K.-S. L. J.-H. L. a. J. S. Cheol-Woo Park, "Energy Consumption Reduction Technology in Manufacturing – A Selective Review of Policies, Standards, and Research," INTERNATIONAL JOURNAL OF PRECISION ENGINEERING AND MANUFACTURING Vol. 10, No. 5, pp. , pp. 151-173, 2009.
[31] M. D. Earle, " “Innovation in the Food Industry; Review,”," Trends in Food Science & Technology, , vol. 8, pp. 166-175, 1997.
[32] M. E. P. A. d. l. H. a. A. C. A. Luque, "State of the Industry 4.0 in the Andalusian food sector," Procedia Manufacturing, vol. 13, pp. 1199-1205, 2017.
[33] A. A. a. T. P. P. M. L. Barreto, ""Industry 4.0 implications in logistics: an overview,"," Procedia Manufacturing, vol. 13, pp. 1245-1252, 2017.
[34] K. Witkowski, ""Internet of Things, Big Data, Industry 4.0 – Innovative Solutions in Logistics and Supply Chains Management,"," Procedia Engineering, vol. 182, pp. 763-769, 2017.
[35] M. F. O. N. H. N. A. a. M. F. T. M. A. Kamarul Bahrin, " "Industry 4.0: A Review on Industrial Automation and Robotic”," Journal Teknologi, pp. 6-13, 2016.
[36] Y. M. Zhengyi Song, "Assessing sustainability benefits of cybermanufacturing systems," Springer-Verlag London 2016, 2016.
[37] L. M. a. J. M. Soon., "Development of sustainability indicator scoring (SIS) for the food supply chain," British Food Journa, vol. 118, no. 9, pp. 2097-2125, 2016.
[38] N. B.-O. a. H. R. E. F. Beitzen-Heineke, "The prospects of zero-packaging grocery stores to improve the social and environmental impacts of the food supply chain," Journal of Cleaner Production, vol. 140, no. 3, pp. 1528-1541, 2017.
56
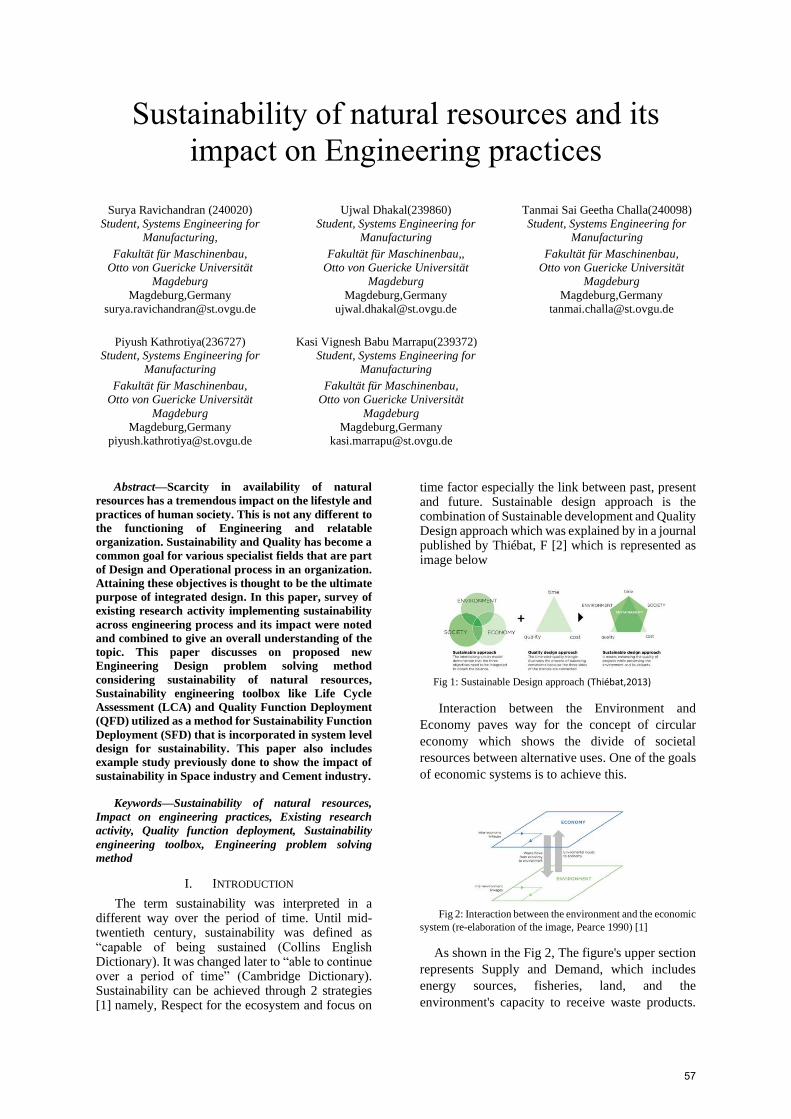
Sustainability of natural resources and its
impact on Engineering practices
Surya Ravichandran (240020)
Student, Systems Engineering for
Manufacturing,
Fakultät für Maschinenbau,
Otto von Guericke Universität
Magdeburg
Magdeburg,Germany
Piyush Kathrotiya(236727)
Student, Systems Engineering for
Manufacturing
Fakultät für Maschinenbau,
Otto von Guericke Universität
Magdeburg
Magdeburg,Germany
Ujwal Dhakal(239860)
Student, Systems Engineering for
Manufacturing
Fakultät für Maschinenbau,,
Otto von Guericke Universität
Magdeburg
Magdeburg,Germany
Kasi Vignesh Babu Marrapu(239372)
Student, Systems Engineering for
Manufacturing
Fakultät für Maschinenbau,
Otto von Guericke Universität
Magdeburg
Magdeburg,Germany
Tanmai Sai Geetha Challa(240098)
Student, Systems Engineering for
Manufacturing
Fakultät für Maschinenbau,
Otto von Guericke Universität
Magdeburg
Magdeburg,Germany
Abstract—Scarcity in availability of natural
resources has a tremendous impact on the lifestyle and
practices of human society. This is not any different to
the functioning of Engineering and relatable
organization. Sustainability and Quality has become a
common goal for various specialist fields that are part
of Design and Operational process in an organization.
Attaining these objectives is thought to be the ultimate
purpose of integrated design. In this paper, survey of
existing research activity implementing sustainability
across engineering process and its impact were noted
and combined to give an overall understanding of the
topic. This paper discusses on proposed new
Engineering Design problem solving method
considering sustainability of natural resources,
Sustainability engineering toolbox like Life Cycle
Assessment (LCA) and Quality Function Deployment
(QFD) utilized as a method for Sustainability Function
Deployment (SFD) that is incorporated in system level
design for sustainability. This paper also includes
example study previously done to show the impact of
sustainability in Space industry and Cement industry.
Keywords—Sustainability of natural resources,
Impact on engineering practices, Existing research
activity, Quality function deployment, Sustainability
engineering toolbox, Engineering problem solving
method
I. INTRODUCTION
The term sustainability was interpreted in a different way over the period of time. Until mid-twentieth century, sustainability was defined as “capable of being sustained (Collins English Dictionary). It was changed later to “able to continue over a period of time” (Cambridge Dictionary). Sustainability can be achieved through 2 strategies [1] namely, Respect for the ecosystem and focus on
time factor especially the link between past, present and future. Sustainable design approach is the combination of Sustainable development and Quality Design approach which was explained by in a journal published by Thiébat, F [2] which is represented as image below
Fig 1: Sustainable Design approach (Thiébat,2013)
Interaction between the Environment and
Economy paves way for the concept of circular
economy which shows the divide of societal
resources between alternative uses. One of the goals
of economic systems is to achieve this.
Fig 2: Interaction between the environment and the economic
system (re-elaboration of the image, Pearce 1990) [1]
As shown in the Fig 2, The figure's upper section
represents Supply and Demand, which includes
energy sources, fisheries, land, and the
environment's capacity to receive waste products.
57
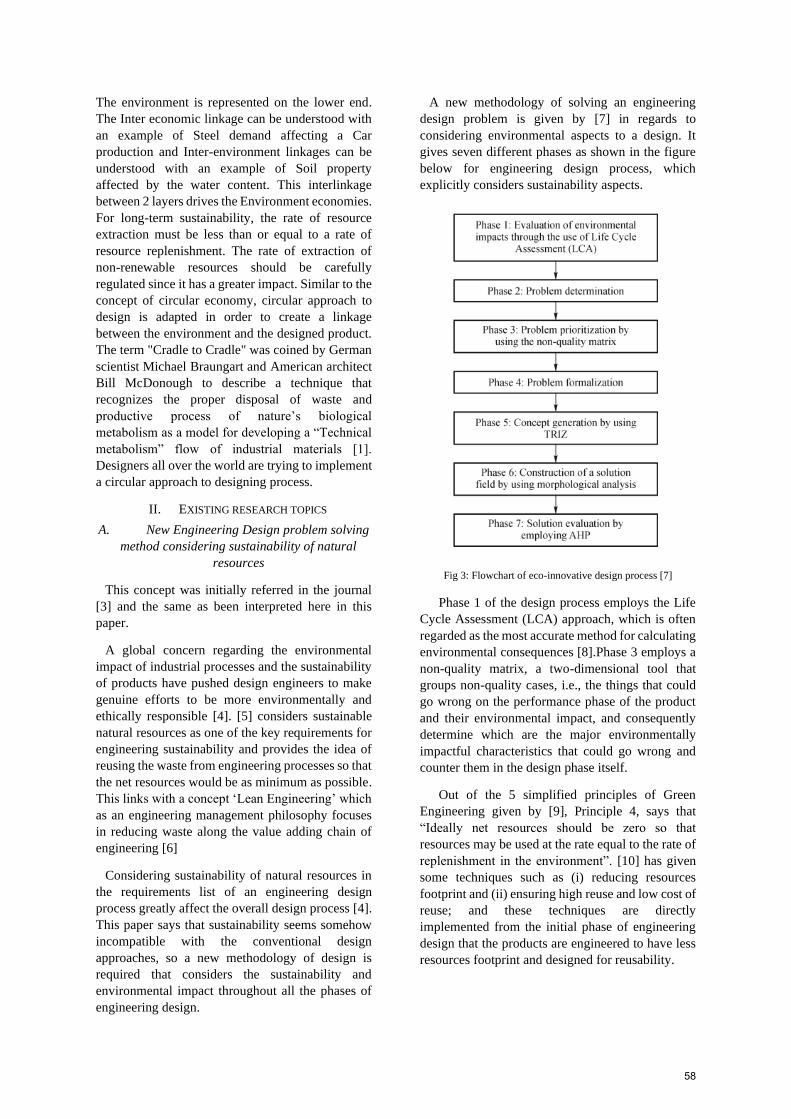
The environment is represented on the lower end.
The Inter economic linkage can be understood with
an example of Steel demand affecting a Car
production and Inter-environment linkages can be
understood with an example of Soil property
affected by the water content. This interlinkage
between 2 layers drives the Environment economies.
For long-term sustainability, the rate of resource
extraction must be less than or equal to a rate of
resource replenishment. The rate of extraction of
non-renewable resources should be carefully
regulated since it has a greater impact. Similar to the
concept of circular economy, circular approach to
design is adapted in order to create a linkage
between the environment and the designed product.
The term "Cradle to Cradle" was coined by German
scientist Michael Braungart and American architect
Bill McDonough to describe a technique that
recognizes the proper disposal of waste and
productive process of nature’s biological
metabolism as a model for developing a “Technical
metabolism” flow of industrial materials [1].
Designers all over the world are trying to implement
a circular approach to designing process.
II. EXISTING RESEARCH TOPICS
A. New Engineering Design problem solving
method considering sustainability of natural
resources
This concept was initially referred in the journal
[3] and the same as been interpreted here in this
paper.
A global concern regarding the environmental
impact of industrial processes and the sustainability
of products have pushed design engineers to make
genuine efforts to be more environmentally and
ethically responsible [4]. [5] considers sustainable
natural resources as one of the key requirements for
engineering sustainability and provides the idea of
reusing the waste from engineering processes so that
the net resources would be as minimum as possible.
This links with a concept ‘Lean Engineering’ which
as an engineering management philosophy focuses
in reducing waste along the value adding chain of
engineering [6]
Considering sustainability of natural resources in
the requirements list of an engineering design
process greatly affect the overall design process [4].
This paper says that sustainability seems somehow
incompatible with the conventional design
approaches, so a new methodology of design is
required that considers the sustainability and
environmental impact throughout all the phases of
engineering design.
A new methodology of solving an engineering
design problem is given by [7] in regards to
considering environmental aspects to a design. It
gives seven different phases as shown in the figure
below for engineering design process, which
explicitly considers sustainability aspects.
Fig 3: Flowchart of eco-innovative design process [7]
Phase 1 of the design process employs the Life
Cycle Assessment (LCA) approach, which is often
regarded as the most accurate method for calculating
environmental consequences [8].Phase 3 employs a
non-quality matrix, a two-dimensional tool that
groups non-quality cases, i.e., the things that could
go wrong on the performance phase of the product
and their environmental impact, and consequently
determine which are the major environmentally
impactful characteristics that could go wrong and
counter them in the design phase itself.
Out of the 5 simplified principles of Green
Engineering given by [9], Principle 4, says that
“Ideally net resources should be zero so that
resources may be used at the rate equal to the rate of
replenishment in the environment”. [10] has given
some techniques such as (i) reducing resources
footprint and (ii) ensuring high reuse and low cost of
reuse; and these techniques are directly
implemented from the initial phase of engineering
design that the products are engineered to have less
resources footprint and designed for reusability.
58
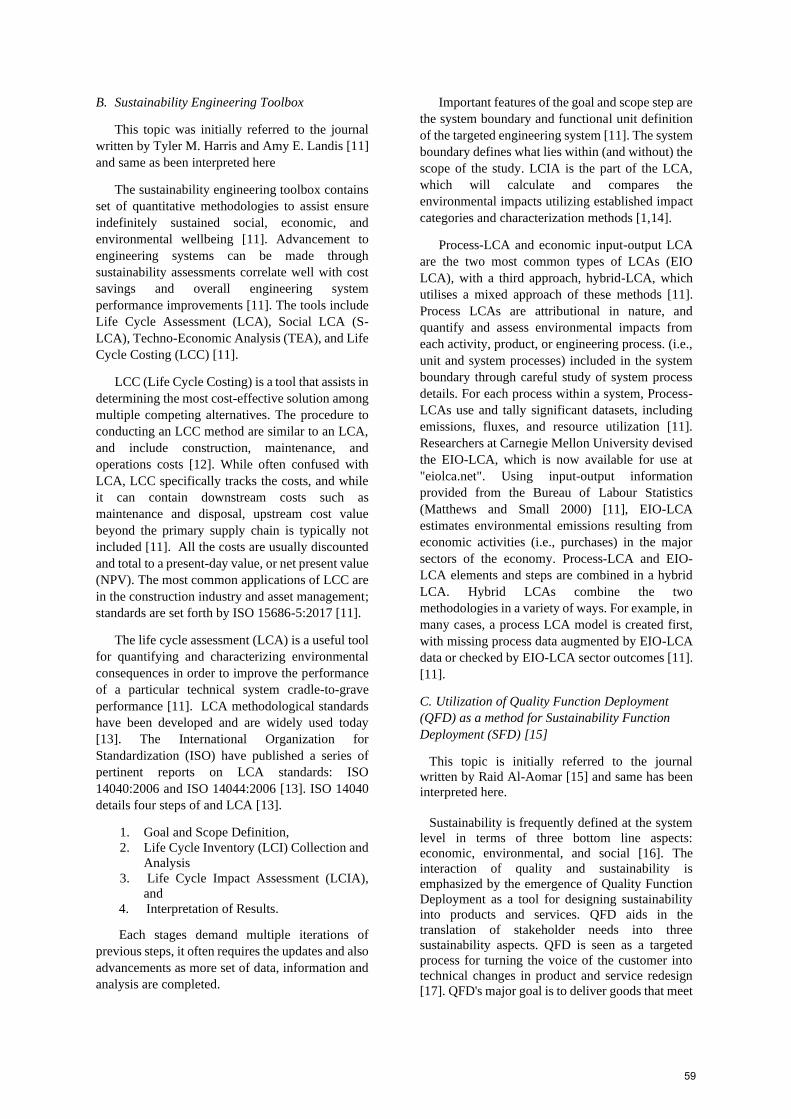
B. Sustainability Engineering Toolbox
This topic was initially referred to the journal
written by Tyler M. Harris and Amy E. Landis [11]
and same as been interpreted here
The sustainability engineering toolbox contains
set of quantitative methodologies to assist ensure
indefinitely sustained social, economic, and
environmental wellbeing [11]. Advancement to
engineering systems can be made through
sustainability assessments correlate well with cost
savings and overall engineering system
performance improvements [11]. The tools include
Life Cycle Assessment (LCA), Social LCA (S-
LCA), Techno-Economic Analysis (TEA), and Life
Cycle Costing (LCC) [11].
LCC (Life Cycle Costing) is a tool that assists in
determining the most cost-effective solution among
multiple competing alternatives. The procedure to
conducting an LCC method are similar to an LCA,
and include construction, maintenance, and
operations costs [12]. While often confused with
LCA, LCC specifically tracks the costs, and while
it can contain downstream costs such as
maintenance and disposal, upstream cost value
beyond the primary supply chain is typically not
included [11]. All the costs are usually discounted
and total to a present-day value, or net present value
(NPV). The most common applications of LCC are
in the construction industry and asset management;
standards are set forth by ISO 15686-5:2017 [11].
The life cycle assessment (LCA) is a useful tool
for quantifying and characterizing environmental
consequences in order to improve the performance
of a particular technical system cradle-to-grave
performance [11]. LCA methodological standards
have been developed and are widely used today
[13]. The International Organization for
Standardization (ISO) have published a series of
pertinent reports on LCA standards: ISO
14040:2006 and ISO 14044:2006 [13]. ISO 14040
details four steps of and LCA [13].
1. Goal and Scope Definition,
2. Life Cycle Inventory (LCI) Collection and
Analysis
3. Life Cycle Impact Assessment (LCIA),
and
4. Interpretation of Results.
Each stages demand multiple iterations of
previous steps, it often requires the updates and also
advancements as more set of data, information and
analysis are completed.
Important features of the goal and scope step are
the system boundary and functional unit definition
of the targeted engineering system [11]. The system
boundary defines what lies within (and without) the
scope of the study. LCIA is the part of the LCA,
which will calculate and compares the
environmental impacts utilizing established impact
categories and characterization methods [1,14].
Process-LCA and economic input-output LCA
are the two most common types of LCAs (EIO
LCA), with a third approach, hybrid-LCA, which
utilises a mixed approach of these methods [11].
Process LCAs are attributional in nature, and
quantify and assess environmental impacts from
each activity, product, or engineering process. (i.e.,
unit and system processes) included in the system
boundary through careful study of system process
details. For each process within a system, Process-
LCAs use and tally significant datasets, including
emissions, fluxes, and resource utilization [11].
Researchers at Carnegie Mellon University devised
the EIO-LCA, which is now available for use at
"eiolca.net". Using input-output information
provided from the Bureau of Labour Statistics
(Matthews and Small 2000) [11], EIO-LCA
estimates environmental emissions resulting from
economic activities (i.e., purchases) in the major
sectors of the economy. Process-LCA and EIO-
LCA elements and steps are combined in a hybrid
LCA. Hybrid LCAs combine the two
methodologies in a variety of ways. For example, in
many cases, a process LCA model is created first,
with missing process data augmented by EIO-LCA
data or checked by EIO-LCA sector outcomes [11].
[11].
C. Utilization of Quality Function Deployment
(QFD) as a method for Sustainability Function
Deployment (SFD) [15]
This topic is initially referred to the journal
written by Raid Al-Aomar [15] and same has been
interpreted here.
Sustainability is frequently defined at the system
level in terms of three bottom line aspects:
economic, environmental, and social [16]. The
interaction of quality and sustainability is
emphasized by the emergence of Quality Function
Deployment as a tool for designing sustainability
into products and services. QFD aids in the
translation of stakeholder needs into three
sustainability aspects. QFD is seen as a targeted
process for turning the voice of the customer into
technical changes in product and service redesign
[17]. QFD's major goal is to deliver goods that meet
59
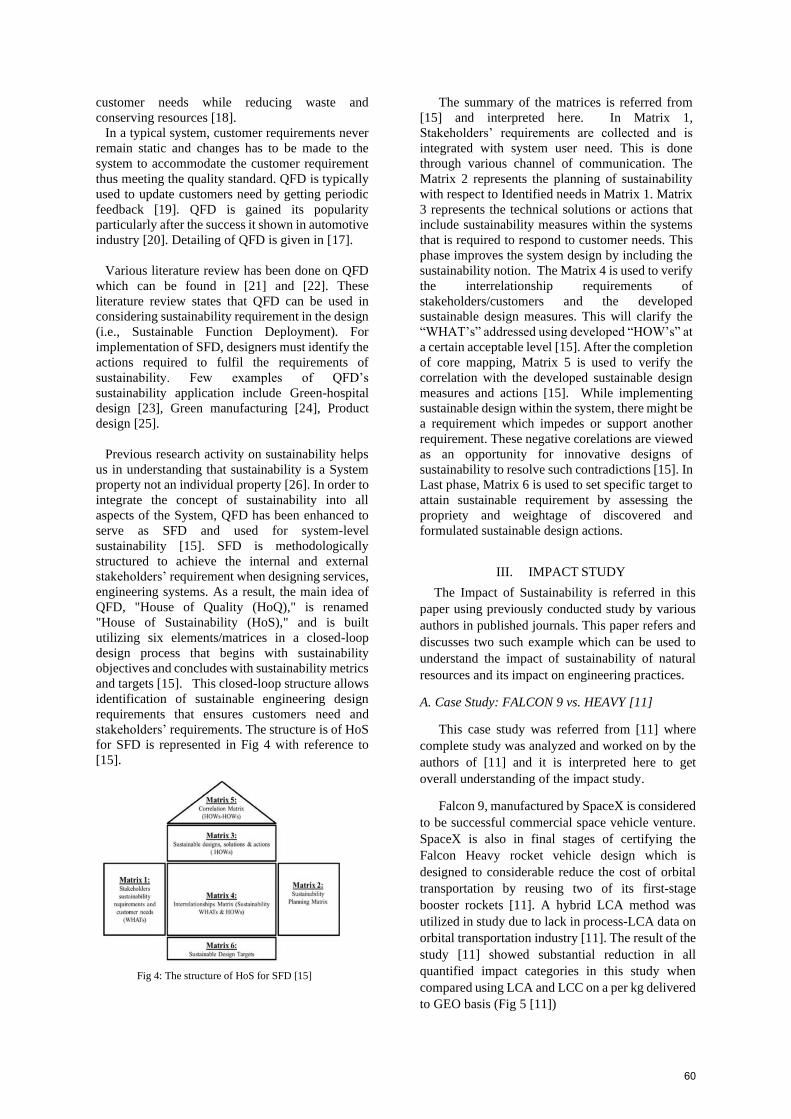
customer needs while reducing waste and
conserving resources [18].
In a typical system, customer requirements never
remain static and changes has to be made to the
system to accommodate the customer requirement
thus meeting the quality standard. QFD is typically
used to update customers need by getting periodic
feedback [19]. QFD is gained its popularity
particularly after the success it shown in automotive
industry [20]. Detailing of QFD is given in [17].
Various literature review has been done on QFD
which can be found in [21] and [22]. These
literature review states that QFD can be used in
considering sustainability requirement in the design
(i.e., Sustainable Function Deployment). For
implementation of SFD, designers must identify the
actions required to fulfil the requirements of
sustainability. Few examples of QFD’s
sustainability application include Green-hospital
design [23], Green manufacturing [24], Product
design [25].
Previous research activity on sustainability helps
us in understanding that sustainability is a System
property not an individual property [26]. In order to
integrate the concept of sustainability into all
aspects of the System, QFD has been enhanced to
serve as SFD and used for system-level
sustainability [15]. SFD is methodologically
structured to achieve the internal and external
stakeholders’ requirement when designing services,
engineering systems. As a result, the main idea of
QFD, "House of Quality (HoQ)," is renamed
"House of Sustainability (HoS)," and is built
utilizing six elements/matrices in a closed-loop
design process that begins with sustainability
objectives and concludes with sustainability metrics
and targets [15]. This closed-loop structure allows
identification of sustainable engineering design
requirements that ensures customers need and
stakeholders’ requirements. The structure is of HoS
for SFD is represented in Fig 4 with reference to
[15].
Fig 4: The structure of HoS for SFD [15]
The summary of the matrices is referred from
[15] and interpreted here. In Matrix 1,
Stakeholders’ requirements are collected and is
integrated with system user need. This is done
through various channel of communication. The
Matrix 2 represents the planning of sustainability
with respect to Identified needs in Matrix 1. Matrix
3 represents the technical solutions or actions that
include sustainability measures within the systems
that is required to respond to customer needs. This
phase improves the system design by including the
sustainability notion. The Matrix 4 is used to verify
the interrelationship requirements of
stakeholders/customers and the developed
sustainable design measures. This will clarify the
“WHAT’s” addressed using developed “HOW’s” at
a certain acceptable level [15]. After the completion
of core mapping, Matrix 5 is used to verify the
correlation with the developed sustainable design
measures and actions [15]. While implementing
sustainable design within the system, there might be
a requirement which impedes or support another
requirement. These negative corelations are viewed
as an opportunity for innovative designs of
sustainability to resolve such contradictions [15]. In
Last phase, Matrix 6 is used to set specific target to
attain sustainable requirement by assessing the
propriety and weightage of discovered and
formulated sustainable design actions.
III. IMPACT STUDY
The Impact of Sustainability is referred in this
paper using previously conducted study by various
authors in published journals. This paper refers and
discusses two such example which can be used to
understand the impact of sustainability of natural
resources and its impact on engineering practices.
A. Case Study: FALCON 9 vs. HEAVY [11]
This case study was referred from [11] where
complete study was analyzed and worked on by the
authors of [11] and it is interpreted here to get
overall understanding of the impact study.
Falcon 9, manufactured by SpaceX is considered
to be successful commercial space vehicle venture.
SpaceX is also in final stages of certifying the
Falcon Heavy rocket vehicle design which is
designed to considerable reduce the cost of orbital
transportation by reusing two of its first-stage
booster rockets [11]. A hybrid LCA method was
utilized in study due to lack in process-LCA data on
orbital transportation industry [11]. The result of the
study [11] showed substantial reduction in all
quantified impact categories in this study when
compared using LCA and LCC on a per kg delivered
to GEO basis (Fig 5 [11])
60
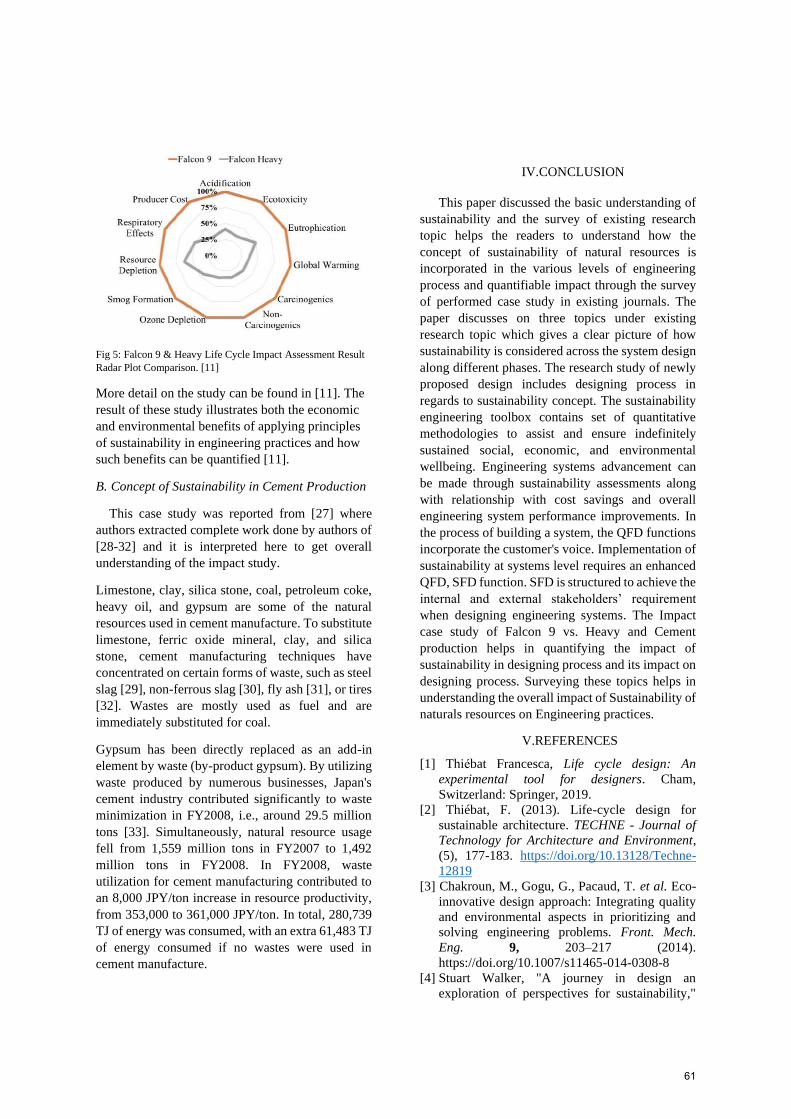
Fig 5: Falcon 9 & Heavy Life Cycle Impact Assessment Result
Radar Plot Comparison. [11]
More detail on the study can be found in [11]. The
result of these study illustrates both the economic
and environmental benefits of applying principles
of sustainability in engineering practices and how
such benefits can be quantified [11].
B. Concept of Sustainability in Cement Production
This case study was reported from [27] where
authors extracted complete work done by authors of
[28-32] and it is interpreted here to get overall
understanding of the impact study.
Limestone, clay, silica stone, coal, petroleum coke,
heavy oil, and gypsum are some of the natural
resources used in cement manufacture. To substitute
limestone, ferric oxide mineral, clay, and silica
stone, cement manufacturing techniques have
concentrated on certain forms of waste, such as steel
slag [29], non-ferrous slag [30], fly ash [31], or tires
[32]. Wastes are mostly used as fuel and are
immediately substituted for coal.
Gypsum has been directly replaced as an add-in
element by waste (by-product gypsum). By utilizing
waste produced by numerous businesses, Japan's
cement industry contributed significantly to waste
minimization in FY2008, i.e., around 29.5 million
tons [33]. Simultaneously, natural resource usage
fell from 1,559 million tons in FY2007 to 1,492
million tons in FY2008. In FY2008, waste
utilization for cement manufacturing contributed to
an 8,000 JPY/ton increase in resource productivity,
from 353,000 to 361,000 JPY/ton. In total, 280,739
TJ of energy was consumed, with an extra 61,483 TJ
of energy consumed if no wastes were used in
cement manufacture.
IV.CONCLUSION
This paper discussed the basic understanding of
sustainability and the survey of existing research
topic helps the readers to understand how the
concept of sustainability of natural resources is
incorporated in the various levels of engineering
process and quantifiable impact through the survey
of performed case study in existing journals. The
paper discusses on three topics under existing
research topic which gives a clear picture of how
sustainability is considered across the system design
along different phases. The research study of newly
proposed design includes designing process in
regards to sustainability concept. The sustainability
engineering toolbox contains set of quantitative
methodologies to assist and ensure indefinitely
sustained social, economic, and environmental
wellbeing. Engineering systems advancement can
be made through sustainability assessments along
with relationship with cost savings and overall
engineering system performance improvements. In
the process of building a system, the QFD functions
incorporate the customer's voice. Implementation of
sustainability at systems level requires an enhanced
QFD, SFD function. SFD is structured to achieve the
internal and external stakeholders’ requirement
when designing engineering systems. The Impact
case study of Falcon 9 vs. Heavy and Cement
production helps in quantifying the impact of
sustainability in designing process and its impact on
designing process. Surveying these topics helps in
understanding the overall impact of Sustainability of
naturals resources on Engineering practices.
V.REFERENCES
[1] Thiebat Francesca, Life cycle design: An
experimental tool for designers. Cham,
Switzerland: Springer, 2019.
[2] Thiébat, F. (2013). Life-cycle design for
sustainable architecture. TECHNE - Journal of
Technology for Architecture and Environment,
(5), 177-183. https://doi.org/10.13128/Techne-
12819
[3] Chakroun, M., Gogu, G., Pacaud, T. et al. Eco-
innovative design approach: Integrating quality
and environmental aspects in prioritizing and
solving engineering problems. Front. Mech.
Eng. 9, 203–217 (2014).
https://doi.org/10.1007/s11465-014-0308-8
[4] Stuart Walker, "A journey in design an
exploration of perspectives for sustainability,"
61
The Journal of Sustainable Product Design, pp.
3-10, 2002.
[5] M. A. Rosen, "Engineering Sustainability: A
Technical Approach to Sustainability,"
Sustainability, vol. 4, pp. 2270-2292, 2012.
[6] Herrmann, C., Schmidt, C., Kurle, D. et al.
Sustainability in manufacturing and factories of
the future. Int. J. of Precis. Eng. and Manuf.-
Green Tech. 1, 283–292 (2014).
https://doi.org/10.1007/s40684-014-0034-z
[7] G. G. T. P. F. T. Mahmoud Chakroun, "Eco-
innovative design approach: Integrating quality
and environmental aspects in prioritizing and
solving engineering problems," Frontiers of
Mechanical Engineering, vol. 9, pp. 203-217,
2014.
[8] E. M. Carlo Vezzoli, "Life Cycle Design," in
Design for Environmental Sustainability,
London, Springer, 2008.
[9] D. D. Moneer Helu, "Principles of Green
Manufacturing," in Green Manufacturing,
Springer, 2012, pp. 107-115.
[10] D. A. Dornfeld, "Moving Towards Green
and Sustainable Manufacturing," International
Journal of Precision Engineering and
Manufacturing Green Technology, vol. 1, no. 1,
pp. 63-66, 2014.
[11] T. M. Harris and A. E. Landis, "Space
Sustainability Engineering: Quantitative Tools
and Methods for Space Applications," 2019
IEEE Aerospace Conference, 2019, pp. 1-6, doi:
10.1109/AERO.2019.8741939.
[12] P. L. E. Tyler M. Harris, Amy E. Landis, Life
Cycle Assessment of Proposed Space Elevator
Designs. Acta Astronautica, (2018).
[13] FAA. (FAA Office of Commercial Space
Transportation Washington, DC, 2018).
[14] P. L. E. Tyler M. Harris, Amy E. Landis,
Sustainability of Space Travel: Life Cycle
Assessment of Orbital Transportation and
Megaprojects. Science Advances, (2018).
[15] R. Al-Aomar, "Sustainability Function
Deployment: A system-level design-for-
sustainability," 2019 IEEE International
Systems Conference (SysCon), 2019, pp. 1-6,
doi: 10.1109/SYSCON.2019.8836926.
[16] J. Elkington, Cannibals with forks: The triple
bottom line of 21st century business. New
Society publishers, Stony Creek, CT, 1997
[17]. L. Bossert, "Quality function deployment", A
practitioner’s approach, 1991.
[18] W. Yongming, L. Luo Baixiang and L. Muzhi,
"Quality Function Deployment for Environment
in Product Eco-design", 2009 International
Conference on Energy and Environment
Technology, vol. 3, pp. 476-479, 2009.
[19] Y. Akao, QFD: Integrating Customer
Requirements into Product Design, Cambridge,
MA: Productivity Press, 1990.
[20] L. Dube, M.D. Johnson and L.M. Renaghan,
"Adapting the QFD approach to extended
service transactions", Production and
Operations Management, vol. 8, no. 3, pp. 301-
317, 1999.
[21] L-K Chan and M-L. Wu, "Quality function
deployment: A literature review", European
Journal of Operational Research, vol. 143, no. 3,
pp. 463-497, 2002.
[22] J.A. Carnevalli and P.C. Miguel, "Review
analysis and classification of the literature on
QFD: Types of research difficulties and benefits",
International Journal of Production Economics,
vol. 114, no. 2, pp. 737-754, 2008.
[23] L.C. Wood, C. Wang, H. Abdul-Rahman and
N.S.J. Abdul-Nasir, "Green hospital design:
integrating quality function deployment and end-
user demands", Journal of Cleaner Production,
vol. 112, no. 1, pp. 903-913, 2016.
[24] F. Francis, "Environmentally conscious quality
function deployment - A new approach for green
manufacturing", International Conference on
Advances in Computational Tools for Engineering
Applications, pp. 340-343, 2009.
[25] C.K. Patil, M, Husain and N.V. Halegowda,
"QFD for Sustainability and Improved Product
(Spring) Design", AIP Conference Proceedings,
vol. 1, pp. 1-11, 2018.
[26] R. Adams, S. Jeanrenaud, J. Bessant, D. Denyer
and P. Overy, "Sustainability-oriented Innovation:
A Systematic Review", International Journal of
Management Reviews, vol. 18, pp. 180-205, 2016.
[27] Kawai, Kosuke, and Masahiro Osako.
"Reduction of natural resource consumption in
cement production in Japan by waste
utilization." Journal of Material Cycles and Waste
Management 14, no. 2 (2012): 94-101.
[28] Tsakiridis PE, Papadimitriou GD, Tsivilis S,
Koroneos C (2008) Utilization of steel slag for
Portland cement clinker production. J Hazard
Mater 152:805–811
[29] Alp I, Deveci H, Su¨ngu¨n H (2008) Utilization
of flotation wastes of copper slag as raw material
in cement production. J Hazard Mater 159:390–
395
[30] Lin KL, Wang KS, Tzeng BY, Lin CY (2003)
The reuse of municipal solid waste incinerator fly
ash slag as a cement substitute. Resour Conserv
Recycl 39:315–324
[31] Nakajima Y, Matsuyuki M (1981) Utilization
of waste tires as fuel for cement production.
Conserv Recycl 4:145–151
[32] Japan Cement Association (2006) Waste
material used in cement industry.
http://www.jcassoc.or.jp/cement/2eng/eh3.html
62
Sustainable Utilization of Natural Resources inProduction System and impact on Control Strategies
Zidan AnvarDepartment of Mechanical Engineering
Matriculation No. 239683Otto von Guericke University
Magdeburg, [email protected]
Karthikeyan MuthukumarDepartment of Mechanical Engineering
Matriculation No. 239802Otto von Guericke University
Magdeburg, [email protected]
Shimal XavierDepartment of Mechanical Engineering
Matriculation No. 239543Otto von Guericke University
Magdeburg, [email protected]
Shashi Vardhan Reddy SamaDepartment of Mechanical Engineering
Matriculation No. 236637Otto von Guericke University
Magdeburg, [email protected]
Muhammad UsmanDepartment of Mechanical Engineering
Matriculation No. 239542Otto von Guericke University
Magdeburg, [email protected]
Abstract—This paper discusses the sustainable utilization ofnatural resources in production systems and its impact on controlstrategies. To utilize and manage resources efficiently, every pro-duction company must have strict and defined policies adheringto standards and, most importantly, an energy managementsystem in place. The energy management system allows theorganization to apply a continuous PDCA cycle to implementthe international energy management standard like ISO 50001.Energy-efficient manufacturing is no longer seen solely from anenvironmental standpoint. It is regarded as a crucial componentof corporate strategy. Manufacturing enterprises are underconstant stress as a result of high energy taxes, large energy bills,and ever-rising energy prices. Companies that employ energymanagement, on the other hand, have a huge opportunity toimprove their financial situation and save money as a result.Standards have provided companies with a roadmap for movingtoward green production. However, companies, particularly smalland medium-sized businesses, are hampered by a lack of know-how and adequate tools and a lack of concepts and procedures forgreen production. The key to transforming a company from leanto sustainable green production is systematic and planned energymanagement. Several production systems control strategies suchas MRP, Kanban, JIT and so on are discussed, along with theimpact the resource allocation has on it are also looked upon inthis paper.
I. INTRODUCTION
In the past few years, sustainable and efficient utilizationof natural resources have become increasingly important. Thisidea has been persuaded equally by the government and thebusinesses, backed by the society’s desire for a sustainableenvironment and high energy prices. As a first step, it isimportant to make the renewable energy cheap, accessible andas a continuous source of energy. The German government hasbeen facing several challenges in this aspect and has devisedcertain legal regulations. It has enacted Renewable EnergyAct (REA) which made the renewable energy production to
rise from 6.8% to 23% in the total electricity production inthe country [1]. The energy cost is comparatively higher inGermany when compared to any other European countries.This high cost can be attributed to the EEG-Umlage, which isa renewable energy reallocation cost charged by the Germangovernment to finance the expansion of renewable energies.About 72% of Germany’s energy requirement is met throughenergy imports, which exposes the country to additional in-crease in prices with supply risks [1]. The superior qualitystandards of products manufactured by German industries areattained through a very high degree of automation, as manuallabour is very expensive [2]. This makes the energy costa critical factor for the competitiveness of the productioncompanies [3]. Therefore, more than the government, theindustries itself must seriously start to consider improvingenergy efficiency in a sustainable way to remain competitivein the market [2]. Not only this, but production companiesare major contributors to the environmental pollution, and thisproves the importance of creating a sustainable and resourceefficient production system and strategies. The target is toattain a transition from prevalently applied lean production toa more sustainable green production. This could be attained byhaving an efficient energy management system to enable thistransition to produce sustainably. Control strategies such aspush and pull techniques have been identified as an efficienttool to optimize the production system. Various techniquessuch as MRP, ERP, Kanban, JIT and TOC are differentpush and pull tools used in the control strategies, that is,different ways of allocating materials upon demand (forecastedor actual). The impact sustainable utilization has on thesecontrol techniques are also identified, and the environmentalimpact have demanded the companies to be inclusive andactive in managing this impact. Shop floor and inventory
63
control are also part of control strategies and by integratingkey performance indicators with this, detailed knowledge onthe impact can be achieved.
II. SUSTAINABLE UTILIZATION OF NATURAL RESOURCES
Due to the need of lowering industrial production’s environ-mental impacts, sustainability and sustainable manufacturinghas become one of the subject for research in the era ofIndustry 4.0. In the manufacturing from low-volume to high-volume production, sustainable manufacturing challenges areextensively researched. It entails creating long-lasting productsthat take into account the entire life cycle, as well as applyingsustainable manufacturing techniques and systems that reducenegative environmental consequences, reduce natural resourceuse, and conserve other resources. Innovation and creativethinking are fuelled by sustainability. Accelerated expansionin manufacturing and the design of new products is aidedby innovation and the fostering of creative thinking. Withsuitable cost-time investment, societal well-being and eco-nomic progress are strongly reliant on the level and qualityof optimized manufacturing systems [20].
To attain a sustainable way of utilizing natural resourcesin a production system, it is essential to have an energymanagement system in place. It allows the organization to havea standardized and efficient way to realize its sustainabilitygoals.
A. Energy Management
Energy management is a well-defined way to deploy meth-ods and measures for energy related task in a sustainableway. It allows the organization to implement a continuousimprovement approach in terms of energy efficiency, withcosts and uninterrupted supply as main factors [2]. An En-ergy Management System includes defining, installing, andcontrolling those parameters that are relevant to energies toachieve the goal of adequate, sustainable, and efficient supplyof energy with ecological and economic aspects under control.
There are several guidelines and international standards forimplementing energy standards at different levels. The depthof implementation is decided by the individual organizationsbased on their goals and requirements. Having an exemplaryEnergy Management System is the way for continuous energyefficiency optimization in a sustainable manner.
The ISO 50001 is the international energy managementstandard and this standard devises conditions for the completeharness of methods and measures of energy management aswell as steps and procedures to achieve the strategic objectives[1]. The ISO 50001 is like other international standards suchas the ISO 9001 for quality and ISO 14001 for environmentmanagement. These standards apply the Deming’s PDCACycle and therefore, it allows the integration of new standardinto already existing standards.
Approximately 50% of the total electricity cost in Germanyare taxes and most of it contributes to EEG reallocationcharges (around 80%). This generates a revenue of a whopping7 billion euros for the German government every year [1].
The EEG Umlage is an incentive system introduced by thegovernment for the production companies to control andoptimize their energy consumption.If the companies couldinitiate a certified ISO 50001 energy management system, thecompanies can benefit from the reimbursement of most ofthe EEG charges.More than economic advantages, this enablesthe companies to reduce their greenhouse gas emissions. Toattain an effective energy management system, the companymust have a regulated resource management, which in turnwill lead to sustainable utilization of natural resources. Itpushes the companies to look for alternative sources of energy,materials, advanced technologies, and improved manufacturingtechniques and this not only leads to reduction in energy costsbut also increases the productivity and improves the quality ofthe output [4].
B. Implementation of Energy Management System
Even with these many benefits, a vast majority of productioncompanies have not introduced an energy management system.The root cause for this is often the need of sufficient knowl-edge of the energy management system. In order to obtainISO 50001 accreditation, a well-defined workflow must beimplemented, and each step done to improve the performanceof a system must be achieved in an appropriate manner. Ittakes a lot of time and money, and mostly the organizationslack the necessary assets to manage and operate an energymanagement system.
Furthermore, the potential energy savings that can be doneby incorporating such a system is still not clear. Consequently,a clear communication and demonstration of resulting out-comes will be critical in reinforcing the adoption of energymanagement as a fundamental portion of an organizationextending the Quality, Time, and Cost (QTC) triangle toQuality, Time, Cost and Sustainability (QTCS) tetrahedronmaking sustainability as a key decision-making parameter[1]. There are still several obstacles, such as employee re-sistance, misunderstanding about energy usage and the lackof knowledge about the optimization potential. Even today,many manufacturing facilities lack basic infrastructure for anenergy monitoring system. This makes for the productioncompanies difficult to find the energy and cost saving potentialof their manufacturing sites. As a result, eliminating these low-level deterrents would be the primary step for execution ofsuccessful energy management system [5].
The energy management system can be implemented us-ing either the existing ISO 50001 standard or a customizedstrategy. Whatever the approach (either standard or custom) isused, the core purpose is to maintain the relationship betweenthe employees and the top management. The Plan-Do-Check-Act paradigm is the foundation of an energy managementsystem. [15]
• Plan: Start with the energy audit. Benchmarking againstsimilar models already on the market. Set objectives,targets and goals you want to achieve. Develop resourcesand actions in order to get the desired results accordingto the energy policy of the organization.
64
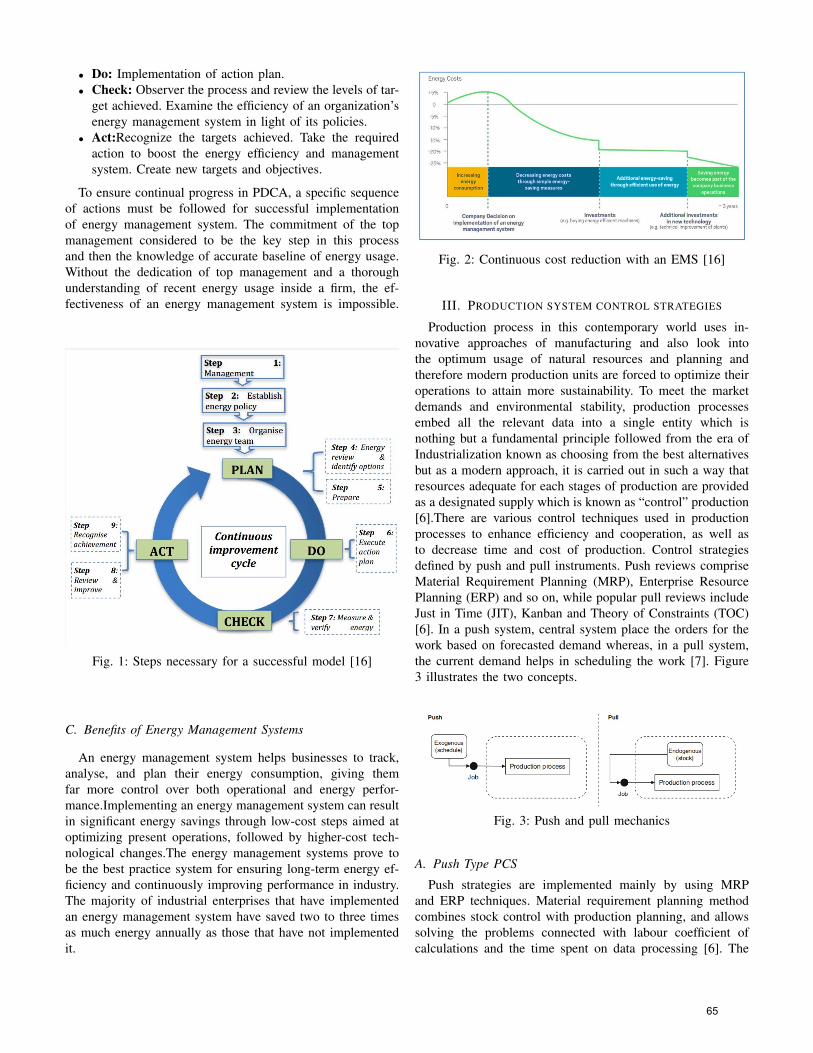
• Do: Implementation of action plan.• Check: Observer the process and review the levels of tar-
get achieved. Examine the efficiency of an organization’senergy management system in light of its policies.
• Act:Recognize the targets achieved. Take the requiredaction to boost the energy efficiency and managementsystem. Create new targets and objectives.
To ensure continual progress in PDCA, a specific sequenceof actions must be followed for successful implementationof energy management system. The commitment of the topmanagement considered to be the key step in this processand then the knowledge of accurate baseline of energy usage.Without the dedication of top management and a thoroughunderstanding of recent energy usage inside a firm, the ef-fectiveness of an energy management system is impossible.
Fig. 1: Steps necessary for a successful model [16]
C. Benefits of Energy Management Systems
An energy management system helps businesses to track,analyse, and plan their energy consumption, giving themfar more control over both operational and energy perfor-mance.Implementing an energy management system can resultin significant energy savings through low-cost steps aimed atoptimizing present operations, followed by higher-cost tech-nological changes.The energy management systems prove tobe the best practice system for ensuring long-term energy ef-ficiency and continuously improving performance in industry.The majority of industrial enterprises that have implementedan energy management system have saved two to three timesas much energy annually as those that have not implementedit.
Fig. 2: Continuous cost reduction with an EMS [16]
III. PRODUCTION SYSTEM CONTROL STRATEGIES
Production process in this contemporary world uses in-novative approaches of manufacturing and also look intothe optimum usage of natural resources and planning andtherefore modern production units are forced to optimize theiroperations to attain more sustainability. To meet the marketdemands and environmental stability, production processesembed all the relevant data into a single entity which isnothing but a fundamental principle followed from the era ofIndustrialization known as choosing from the best alternativesbut as a modern approach, it is carried out in such a way thatresources adequate for each stages of production are providedas a designated supply which is known as “control” production[6].There are various control techniques used in productionprocesses to enhance efficiency and cooperation, as well asto decrease time and cost of production. Control strategiesdefined by push and pull instruments. Push reviews compriseMaterial Requirement Planning (MRP), Enterprise ResourcePlanning (ERP) and so on, while popular pull reviews includeJust in Time (JIT), Kanban and Theory of Constraints (TOC)[6]. In a push system, central system place the orders for thework based on forecasted demand whereas, in a pull system,the current demand helps in scheduling the work [7]. Figure3 illustrates the two concepts.
Fig. 3: Push and pull mechanics
A. Push Type PCS
Push strategies are implemented mainly by using MRPand ERP techniques. Material requirement planning methodcombines stock control with production planning, and allowssolving the problems connected with labour coefficient ofcalculations and the time spent on data processing [6]. The
65
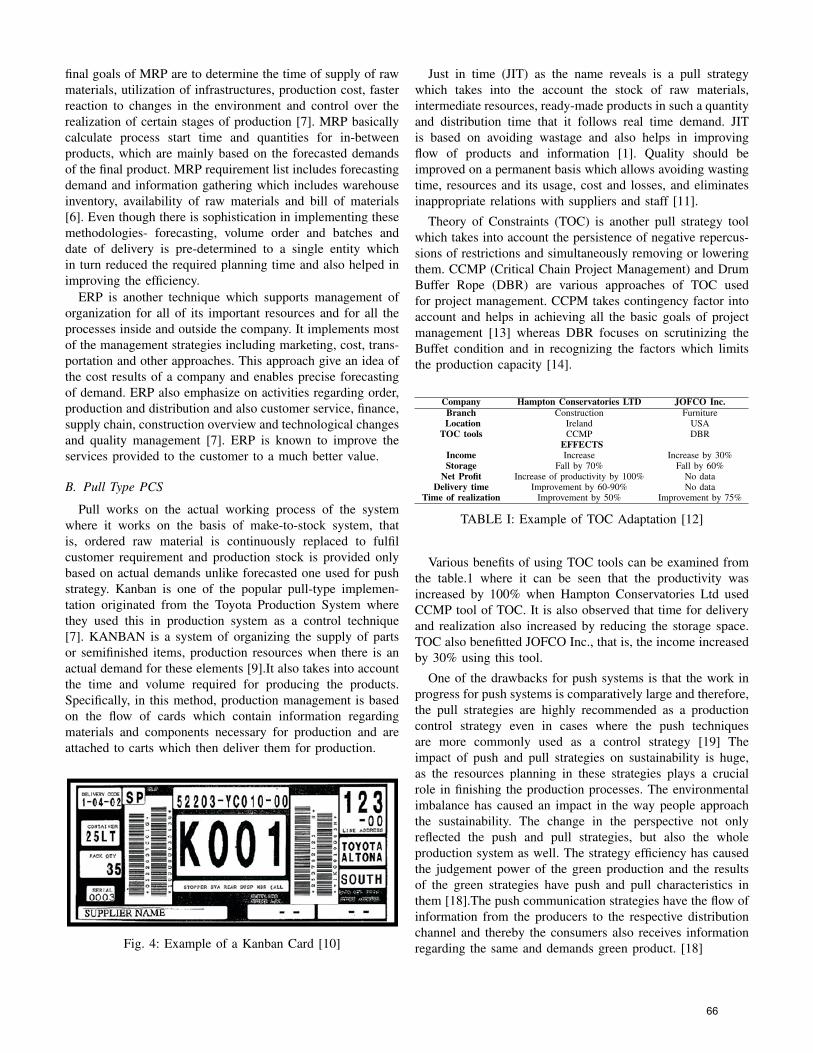
final goals of MRP are to determine the time of supply of rawmaterials, utilization of infrastructures, production cost, fasterreaction to changes in the environment and control over therealization of certain stages of production [7]. MRP basicallycalculate process start time and quantities for in-betweenproducts, which are mainly based on the forecasted demandsof the final product. MRP requirement list includes forecastingdemand and information gathering which includes warehouseinventory, availability of raw materials and bill of materials[6]. Even though there is sophistication in implementing thesemethodologies- forecasting, volume order and batches anddate of delivery is pre-determined to a single entity whichin turn reduced the required planning time and also helped inimproving the efficiency.
ERP is another technique which supports management oforganization for all of its important resources and for all theprocesses inside and outside the company. It implements mostof the management strategies including marketing, cost, trans-portation and other approaches. This approach give an idea ofthe cost results of a company and enables precise forecastingof demand. ERP also emphasize on activities regarding order,production and distribution and also customer service, finance,supply chain, construction overview and technological changesand quality management [7]. ERP is known to improve theservices provided to the customer to a much better value.
B. Pull Type PCS
Pull works on the actual working process of the systemwhere it works on the basis of make-to-stock system, thatis, ordered raw material is continuously replaced to fulfilcustomer requirement and production stock is provided onlybased on actual demands unlike forecasted one used for pushstrategy. Kanban is one of the popular pull-type implemen-tation originated from the Toyota Production System wherethey used this in production system as a control technique[7]. KANBAN is a system of organizing the supply of partsor semifinished items, production resources when there is anactual demand for these elements [9].It also takes into accountthe time and volume required for producing the products.Specifically, in this method, production management is basedon the flow of cards which contain information regardingmaterials and components necessary for production and areattached to carts which then deliver them for production.
Fig. 4: Example of a Kanban Card [10]
Just in time (JIT) as the name reveals is a pull strategywhich takes into the account the stock of raw materials,intermediate resources, ready-made products in such a quantityand distribution time that it follows real time demand. JITis based on avoiding wastage and also helps in improvingflow of products and information [1]. Quality should beimproved on a permanent basis which allows avoiding wastingtime, resources and its usage, cost and losses, and eliminatesinappropriate relations with suppliers and staff [11].
Theory of Constraints (TOC) is another pull strategy toolwhich takes into account the persistence of negative repercus-sions of restrictions and simultaneously removing or loweringthem. CCMP (Critical Chain Project Management) and DrumBuffer Rope (DBR) are various approaches of TOC usedfor project management. CCPM takes contingency factor intoaccount and helps in achieving all the basic goals of projectmanagement [13] whereas DBR focuses on scrutinizing theBuffet condition and in recognizing the factors which limitsthe production capacity [14].
Company Hampton Conservatories LTD JOFCO Inc.Branch Construction FurnitureLocation Ireland USA
TOC tools CCMP DBREFFECTS
Income Increase Increase by 30%Storage Fall by 70% Fall by 60%
Net Profit Increase of productivity by 100% No dataDelivery time Improvement by 60-90% No data
Time of realization Improvement by 50% Improvement by 75%
TABLE I: Example of TOC Adaptation [12]
Various benefits of using TOC tools can be examined fromthe table.1 where it can be seen that the productivity wasincreased by 100% when Hampton Conservatories Ltd usedCCMP tool of TOC. It is also observed that time for deliveryand realization also increased by reducing the storage space.TOC also benefitted JOFCO Inc., that is, the income increasedby 30% using this tool.
One of the drawbacks for push systems is that the work inprogress for push systems is comparatively large and therefore,the pull strategies are highly recommended as a productioncontrol strategy even in cases where the push techniquesare more commonly used as a control strategy [19] Theimpact of push and pull strategies on sustainability is huge,as the resources planning in these strategies plays a crucialrole in finishing the production processes. The environmentalimbalance has caused an impact in the way people approachthe sustainability. The change in the perspective not onlyreflected the push and pull strategies, but also the wholeproduction system as well. The strategy efficiency has causedthe judgement power of the green production and the resultsof the green strategies have push and pull characteristics inthem [18].The push communication strategies have the flow ofinformation from the producers to the respective distributionchannel and thereby the consumers also receives informationregarding the same and demands green product. [18]
66
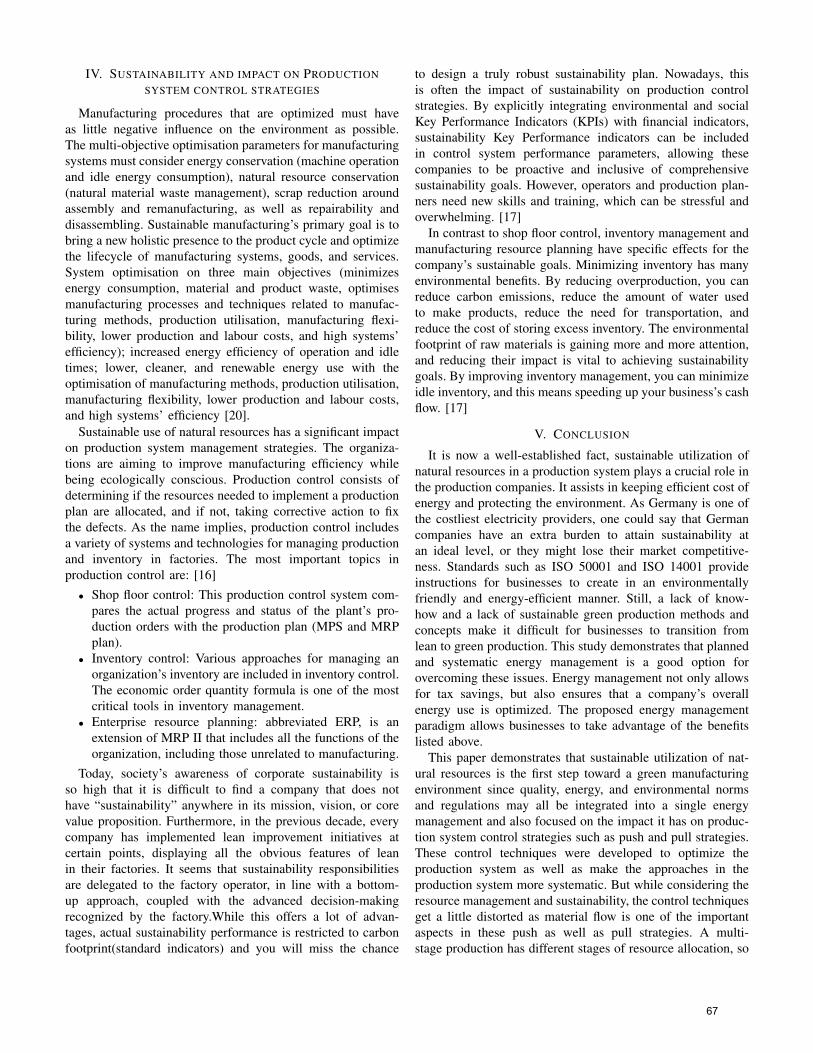
IV. SUSTAINABILITY AND IMPACT ON PRODUCTIONSYSTEM CONTROL STRATEGIES
Manufacturing procedures that are optimized must haveas little negative influence on the environment as possible.The multi-objective optimisation parameters for manufacturingsystems must consider energy conservation (machine operationand idle energy consumption), natural resource conservation(natural material waste management), scrap reduction aroundassembly and remanufacturing, as well as repairability anddisassembling. Sustainable manufacturing’s primary goal is tobring a new holistic presence to the product cycle and optimizethe lifecycle of manufacturing systems, goods, and services.System optimisation on three main objectives (minimizesenergy consumption, material and product waste, optimisesmanufacturing processes and techniques related to manufac-turing methods, production utilisation, manufacturing flexi-bility, lower production and labour costs, and high systems’efficiency); increased energy efficiency of operation and idletimes; lower, cleaner, and renewable energy use with theoptimisation of manufacturing methods, production utilisation,manufacturing flexibility, lower production and labour costs,and high systems’ efficiency [20].
Sustainable use of natural resources has a significant impacton production system management strategies. The organiza-tions are aiming to improve manufacturing efficiency whilebeing ecologically conscious. Production control consists ofdetermining if the resources needed to implement a productionplan are allocated, and if not, taking corrective action to fixthe defects. As the name implies, production control includesa variety of systems and technologies for managing productionand inventory in factories. The most important topics inproduction control are: [16]
• Shop floor control: This production control system com-pares the actual progress and status of the plant’s pro-duction orders with the production plan (MPS and MRPplan).
• Inventory control: Various approaches for managing anorganization’s inventory are included in inventory control.The economic order quantity formula is one of the mostcritical tools in inventory management.
• Enterprise resource planning: abbreviated ERP, is anextension of MRP II that includes all the functions of theorganization, including those unrelated to manufacturing.
Today, society’s awareness of corporate sustainability isso high that it is difficult to find a company that does nothave “sustainability” anywhere in its mission, vision, or corevalue proposition. Furthermore, in the previous decade, everycompany has implemented lean improvement initiatives atcertain points, displaying all the obvious features of leanin their factories. It seems that sustainability responsibilitiesare delegated to the factory operator, in line with a bottom-up approach, coupled with the advanced decision-makingrecognized by the factory.While this offers a lot of advan-tages, actual sustainability performance is restricted to carbonfootprint(standard indicators) and you will miss the chance
to design a truly robust sustainability plan. Nowadays, thisis often the impact of sustainability on production controlstrategies. By explicitly integrating environmental and socialKey Performance Indicators (KPIs) with financial indicators,sustainability Key Performance indicators can be includedin control system performance parameters, allowing thesecompanies to be proactive and inclusive of comprehensivesustainability goals. However, operators and production plan-ners need new skills and training, which can be stressful andoverwhelming. [17]
In contrast to shop floor control, inventory management andmanufacturing resource planning have specific effects for thecompany’s sustainable goals. Minimizing inventory has manyenvironmental benefits. By reducing overproduction, you canreduce carbon emissions, reduce the amount of water usedto make products, reduce the need for transportation, andreduce the cost of storing excess inventory. The environmentalfootprint of raw materials is gaining more and more attention,and reducing their impact is vital to achieving sustainabilitygoals. By improving inventory management, you can minimizeidle inventory, and this means speeding up your business’s cashflow. [17]
V. CONCLUSION
It is now a well-established fact, sustainable utilization ofnatural resources in a production system plays a crucial role inthe production companies. It assists in keeping efficient cost ofenergy and protecting the environment. As Germany is one ofthe costliest electricity providers, one could say that Germancompanies have an extra burden to attain sustainability atan ideal level, or they might lose their market competitive-ness. Standards such as ISO 50001 and ISO 14001 provideinstructions for businesses to create in an environmentallyfriendly and energy-efficient manner. Still, a lack of know-how and a lack of sustainable green production methods andconcepts make it difficult for businesses to transition fromlean to green production. This study demonstrates that plannedand systematic energy management is a good option forovercoming these issues. Energy management not only allowsfor tax savings, but also ensures that a company’s overallenergy use is optimized. The proposed energy managementparadigm allows businesses to take advantage of the benefitslisted above.
This paper demonstrates that sustainable utilization of nat-ural resources is the first step toward a green manufacturingenvironment since quality, energy, and environmental normsand regulations may all be integrated into a single energymanagement and also focused on the impact it has on produc-tion system control strategies such as push and pull strategies.These control techniques were developed to optimize theproduction system as well as make the approaches in theproduction system more systematic. But while considering theresource management and sustainability, the control techniquesget a little distorted as material flow is one of the importantaspects in these push as well as pull strategies. A multi-stage production has different stages of resource allocation, so
67

sustainable utilization of these resources may impact the wayin which these resources have been allocated and distributed.Especially in a pull strategy, where resource planning is donequickly on demand, the distribution of resources may be ham-pered due to an over consideration of sustainability. Also, mod-ern day production system is more lenient towards automationand flexible order management, so control techniques are allalso on the verge of incorporating these changes. Overall, thescope of control techniques by considering resource allocationmust be given a wider approach in the future.
ACKNOWLEDGMENT
The authors are thankful for the support and are responsiblefor the content of this publication. The authors would also liketo express their gratitude and sincere thanks to “Prof. Dr.- Ing.habil. A. Luder” for providing the opportunity to publish thiscontent and also in guiding us throughout the publication.
REFERENCES
[1] Tallal Javied, Alireza Esfandyari, Joerg Franke, “Systematic En-ergy Management: a Foundation for Sustainable Production,“ Institutefor Factory Automation and Production Systems (FAPS)”, Friedrich-Alexander-University of Erlangen- Nuremberg, IEEE 2016
[2] Javied, T.; Rackow, T.; Franke, J.: Implementing Energy ManagementSystem to Increase Energy Efficiency in Manufacturing Companies. In:Procedia CIRP 26 (2015), Nr. , S. 156—161
[3] Abdelaziz, E.; Saidur, R.; Mekhilef, S.: A review on energy saving strate-gies in industrial sector, Renewable and Sustainable Energy Reviews, Nr.15, pp. 150-168, 2011.
[4] W.C. Turner; S. Doty: Energy Management Handbook, Sixth ed., TheFairmont Press, Lilburn, 2007
[5] E. Cagno, E. Worrell, A. Trianni und G. Pugliese, A novel approachfor barriers to industrial energy efficiency,“ Renewable and SustainableEnergy Reviews, Nr. 19 (2013), pp. 290-308, 2013.
[6] Mateusz BUDYNEK, Elzbieta CELINSKA, Adrianna DYBIKOWSKA,Monika KOZAK, Joanna RATAJCZAK, Jagoda URBAN “Strategies OfProduction Control As Tools Of Efficient Management Of ProductionEnterprises”, 2016
[7] Christoph Karrer, “Engineering Production Control Strategies- A Guideto Tailor Strategies that Unite the Merits of Push and Pull”, 2012 pp7–36
[8] Kanban. Opis systemu, wdrozenie, obrot materiałowy. Lean manage-ment. [Online]. Available: http://www.system-kanban.pl/
[9] E. Gołembska (red), Zarzadzanie logistyczne w produkcji. Kompendiumwiedzy o logistyce. Poznan, PL: Wydawnictwo Naukowe PWN, 2001,pp. 198–222.
[10] Karty Kanban. (2013). [Online]. Available: http:// www.system-kanban.pl/ [Accessed: Nov. 11, 2015].
[11] A. Piasecka-Głuszak, Metody planowania potrzeb MRP Just in Timejako strategie wspomagajace system logistyczny w przedsiebiorstwieprodukcyjnym. Zeszyty Naukowe Wyzszej Szkoły Bankowej weWrocławiu, no. 22/2011. Wrocław, 2011, pp. 205–208.
[12] M. Janiszewski. TOC wzmacnia Lean Manufacturing. [Online]. Avail-able: http://vento.net.pl/
[13] Zarzadzanie projektami za pomoca narzedzi CCPM. (2013). [Online].Available: http://vento.net.pl/
[14] Teoria ograniczen, czyli jak pokonac ograniczenia i wyzwolic potencjał.[Online]. Available: http://www.ekonomicznie.pl/
[15] OECD (2014), An introduction to energy management systems: Energysavings and increased industrial productivity for the Iron and SteelSector: [DSTI/SU/SC(2014)14/FINAL]
[16] Clean Energy Ministerial (CEM) (2013), Roundtable 5: Energy Man-agement Systems, background paper for CEM-4, 17 April 2013, Delhi,India
[17] Mikell P Groover, Automation, Production Systems, and Computer-Integrated Manufacturing 4th Edition, Pearson, 2015, Chapter 25, pp.722
[18] Victor Danciu : The Green Marketing at Work: The Push-Pull Effectsof the Green Communication Strategies ,2012
[19] Abraham Grosfeld-Nir , Michael Magazine& Andrew Vanberkel: Pushand pull strategies for controlling multistage production systems,2000
[20] “Simulation Study of a Flexible Manufacturing System regarding Sus-tainability”: Ojstersek, R.; Acko, B. and Buchmeister, B. Universityof Maribor, Faculty of Mechanical Engineering, Smetanova 17, 2000Maribor, Slovenia E-Mail: [email protected], [email protected],[email protected]
68
1
A Study on Variability in Production Systems: It’s
Impact on Efficiency and Effectivity of
Production System
Kshitiz Bohara, Tushar Gandhi, Deepak Devassia and Harsh K. Bhatt
Department of Mechanical Engineering Otto-Von-Guericke University
Magdeburg,Germany [email protected] , [email protected], [email protected] , [email protected]
Abstract— This study addresses one of the most important
parameter of the production system, variability. Understanding
variability and its effect in performance of production system is
necessary. Hence the paper begins with the explanation, causes
and classification of different types of variability. The paper
further progresses to explain different factors which impact the
variability and discussion in terms of measuring the variability
with the aspect of efficiency and effectivity has also been
presented. After analyzing the factors involved in controlling the
variability, the proposed approach in terms of tools and
methods which intends to boost the overall performance of
production plant has also been covered.
Keywords—Production System, Variability, Efficiency and
Effectivity.
I. INTRODUCTION
In today’s competitive global market, every business whether it be service oriented or product based is undergoing challenges to deliver reliable services and products with lower cost. The turbulence in market and innovation in technologies demands continuous modification in system architecture and operational parameters to secure profits and meet market demands [1]. Moreover, the challenge gets intense when the enterprises dealing with consumer-based products also need to address individual needs with products switching to shorter life cycles than ever before. The issue with individualized products tends to bother companies having make to order framework more than those with make to stock and build to order framework.
The production system is the basic pillar of Industry which helps structuring the whole manufacturing process. Proper study of dynamic behavior of production system and estimation of its performance relies on accurate investigation of factors including different elements, functions and interaction of functional structure within the system as well as with its environment. However, inevitable presence of random and unforeseen events in the system makes it difficult to accurately measure the performance. These random set of events give rise to variability in a system.
Variability comes into play when the performance of the plant/unit comes into play. It is categorized on the basis of value addition and the option if it can be eliminated or not. The Japanese approach of categorizing the waste into three types Muda, Muri and Mura helps in identifying the variability of system. Along with this approach of Toyota Production
System, the variability can be measured and controlled with kaizen viewpoints.
Variability in the production system, production processes and even in the orders from the customers have a direct impact on the performance and efficiency of the plant [2]. Even while considering the example of Toyota Production System (TPS), variability is considered a fundamental part and given priority while designing production flow [3]. The primary factor that demarcates between a better performing plant with others is closely associated with variability in the system, stability in the schedules and reliability of the deliveries [4].
The available tools which can be used to reduce the
variability and improve the performance of plant are
significant enough to cater most of the general factors which
impact the variability but the major factor which mostly
impact the performance of plant is fluctuating demand of the
customer.
II. LITERATURE REVIEW
A. Production system
The definition for the production system has seen
variations with respect to content, emphasis and field it has
been used. Adhering to the manufacturing domain, the
production system is defined as utilization of resources like
material, work and capital with an aim to create goods and/or
services [5]. As per the black box principle [6], the production
system can be considered as a transformation system with a
black box, of which the contents are hidden and having
several functions with a definite goal where operands
(resources) are transformed from their original state to
desired state (product) [7].
Based on production volume, continuity of flow and types of
products produced, the production system is classified as:
• Engineer to Order (Job Shop Production)
• Make to Order (Batch Production with Mass
Customization)
• Assemble to Order (Mix of Make to Stock and Make
to Order)
• Make to Stock (Mass production)
In Engineer to Order production system, demands from the customers are specific and significant amount of further engineering analysis is required hence the industries are flexible. As we shift to other types of production systems, this
69
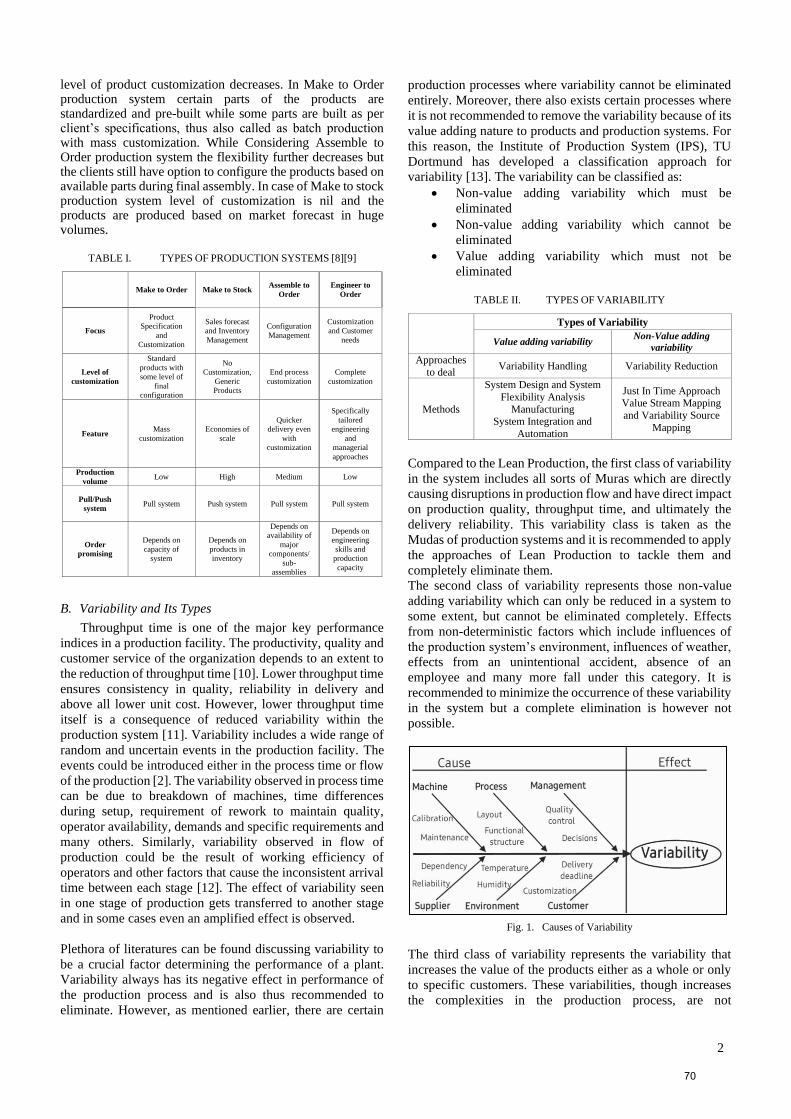
2
level of product customization decreases. In Make to Order production system certain parts of the products are standardized and pre-built while some parts are built as per client’s specifications, thus also called as batch production with mass customization. While Considering Assemble to Order production system the flexibility further decreases but the clients still have option to configure the products based on available parts during final assembly. In case of Make to stock production system level of customization is nil and the products are produced based on market forecast in huge volumes.
TABLE I. TYPES OF PRODUCTION SYSTEMS [8][9]
Make to Order Make to Stock Assemble to
Order
Engineer to
Order
Focus
Product
Specification
and
Customization
Sales forecast
and Inventory
Management
Configuration
Management
Customization
and Customer
needs
Level of
customization
Standard
products with
some level of
final
configuration
No
Customization,
Generic
Products
End process
customization
Complete
customization
Feature Mass
customization
Economies of
scale
Quicker
delivery even
with
customization
Specifically
tailored
engineering
and
managerial
approaches
Production
volume Low High Medium Low
Pull/Push
system Pull system Push system Pull system Pull system
Order
promising
Depends on
capacity of
system
Depends on
products in
inventory
Depends on
availability of
major
components/
sub-
assemblies
Depends on
engineering
skills and
production
capacity
B. Variability and Its Types
Throughput time is one of the major key performance
indices in a production facility. The productivity, quality and
customer service of the organization depends to an extent to
the reduction of throughput time [10]. Lower throughput time
ensures consistency in quality, reliability in delivery and
above all lower unit cost. However, lower throughput time
itself is a consequence of reduced variability within the
production system [11]. Variability includes a wide range of
random and uncertain events in the production facility. The
events could be introduced either in the process time or flow
of the production [2]. The variability observed in process time
can be due to breakdown of machines, time differences
during setup, requirement of rework to maintain quality,
operator availability, demands and specific requirements and
many others. Similarly, variability observed in flow of
production could be the result of working efficiency of
operators and other factors that cause the inconsistent arrival
time between each stage [12]. The effect of variability seen
in one stage of production gets transferred to another stage
and in some cases even an amplified effect is observed.
Plethora of literatures can be found discussing variability to
be a crucial factor determining the performance of a plant.
Variability always has its negative effect in performance of
the production process and is also thus recommended to
eliminate. However, as mentioned earlier, there are certain
production processes where variability cannot be eliminated
entirely. Moreover, there also exists certain processes where
it is not recommended to remove the variability because of its
value adding nature to products and production systems. For
this reason, the Institute of Production System (IPS), TU
Dortmund has developed a classification approach for
variability [13]. The variability can be classified as:
• Non-value adding variability which must be
eliminated
• Non-value adding variability which cannot be
eliminated
• Value adding variability which must not be
eliminated
TABLE II. TYPES OF VARIABILITY
Types of Variability
Value adding variability Non-Value adding
variability
Approaches
to deal Variability Handling Variability Reduction
Methods
System Design and System
Flexibility Analysis
Manufacturing System Integration and
Automation
Just In Time Approach Value Stream Mapping
and Variability Source
Mapping
Compared to the Lean Production, the first class of variability
in the system includes all sorts of Muras which are directly
causing disruptions in production flow and have direct impact
on production quality, throughput time, and ultimately the
delivery reliability. This variability class is taken as the
Mudas of production systems and it is recommended to apply
the approaches of Lean Production to tackle them and
completely eliminate them.
The second class of variability represents those non-value
adding variability which can only be reduced in a system to
some extent, but cannot be eliminated completely. Effects
from non-deterministic factors which include influences of
the production system’s environment, influences of weather,
effects from an unintentional accident, absence of an
employee and many more fall under this category. It is
recommended to minimize the occurrence of these variability
in the system but a complete elimination is however not
possible.
Fig. 1. Causes of Variability
The third class of variability represents the variability that
increases the value of the products either as a whole or only
to specific customers. These variabilities, though increases
the complexities in the production process, are not
70
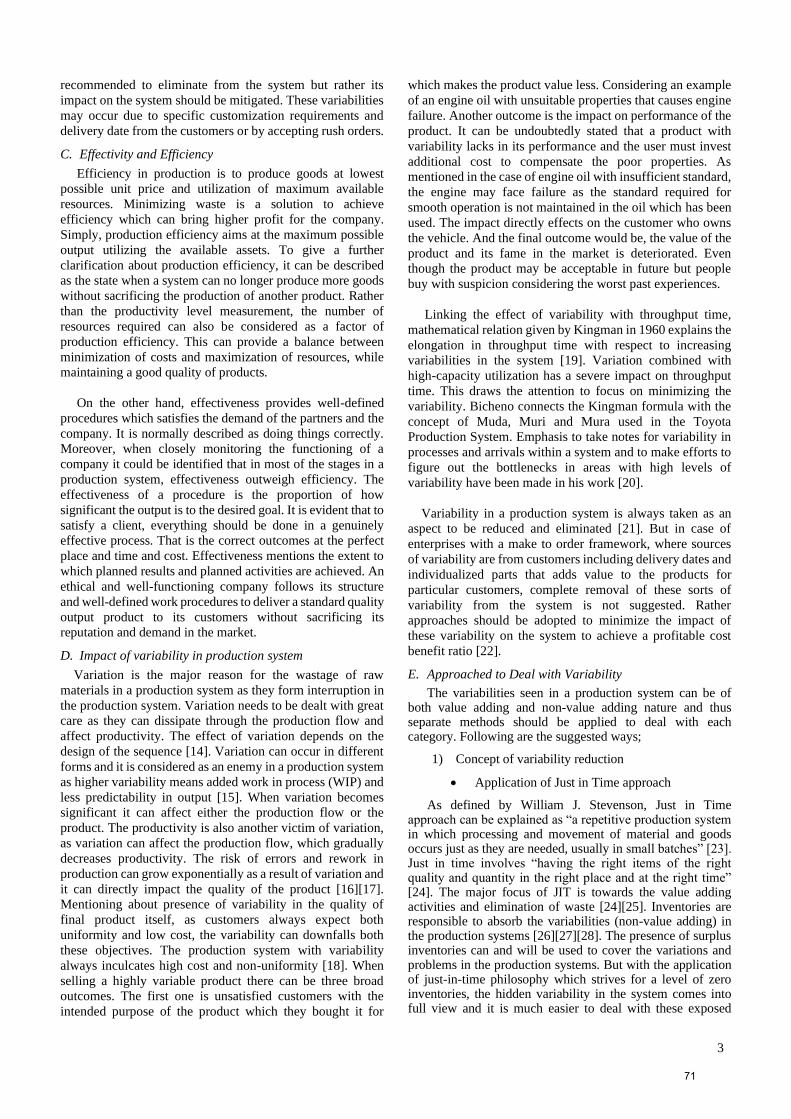
3
recommended to eliminate from the system but rather its
impact on the system should be mitigated. These variabilities
may occur due to specific customization requirements and
delivery date from the customers or by accepting rush orders.
C. Effectivity and Efficiency
Efficiency in production is to produce goods at lowest
possible unit price and utilization of maximum available
resources. Minimizing waste is a solution to achieve
efficiency which can bring higher profit for the company.
Simply, production efficiency aims at the maximum possible
output utilizing the available assets. To give a further
clarification about production efficiency, it can be described
as the state when a system can no longer produce more goods
without sacrificing the production of another product. Rather
than the productivity level measurement, the number of
resources required can also be considered as a factor of
production efficiency. This can provide a balance between
minimization of costs and maximization of resources, while
maintaining a good quality of products.
On the other hand, effectiveness provides well-defined
procedures which satisfies the demand of the partners and the
company. It is normally described as doing things correctly.
Moreover, when closely monitoring the functioning of a
company it could be identified that in most of the stages in a
production system, effectiveness outweigh efficiency. The
effectiveness of a procedure is the proportion of how
significant the output is to the desired goal. It is evident that to
satisfy a client, everything should be done in a genuinely
effective process. That is the correct outcomes at the perfect
place and time and cost. Effectiveness mentions the extent to
which planned results and planned activities are achieved. An
ethical and well-functioning company follows its structure
and well-defined work procedures to deliver a standard quality
output product to its customers without sacrificing its
reputation and demand in the market.
D. Impact of variability in production system
Variation is the major reason for the wastage of raw
materials in a production system as they form interruption in
the production system. Variation needs to be dealt with great
care as they can dissipate through the production flow and
affect productivity. The effect of variation depends on the
design of the sequence [14]. Variation can occur in different
forms and it is considered as an enemy in a production system
as higher variability means added work in process (WIP) and
less predictability in output [15]. When variation becomes
significant it can affect either the production flow or the
product. The productivity is also another victim of variation,
as variation can affect the production flow, which gradually
decreases productivity. The risk of errors and rework in
production can grow exponentially as a result of variation and
it can directly impact the quality of the product [16][17].
Mentioning about presence of variability in the quality of
final product itself, as customers always expect both
uniformity and low cost, the variability can downfalls both
these objectives. The production system with variability
always inculcates high cost and non-uniformity [18]. When
selling a highly variable product there can be three broad
outcomes. The first one is unsatisfied customers with the
intended purpose of the product which they bought it for
which makes the product value less. Considering an example
of an engine oil with unsuitable properties that causes engine
failure. Another outcome is the impact on performance of the
product. It can be undoubtedly stated that a product with
variability lacks in its performance and the user must invest
additional cost to compensate the poor properties. As
mentioned in the case of engine oil with insufficient standard,
the engine may face failure as the standard required for
smooth operation is not maintained in the oil which has been
used. The impact directly effects on the customer who owns
the vehicle. And the final outcome would be, the value of the
product and its fame in the market is deteriorated. Even
though the product may be acceptable in future but people
buy with suspicion considering the worst past experiences.
Linking the effect of variability with throughput time,
mathematical relation given by Kingman in 1960 explains the
elongation in throughput time with respect to increasing
variabilities in the system [19]. Variation combined with
high-capacity utilization has a severe impact on throughput
time. This draws the attention to focus on minimizing the
variability. Bicheno connects the Kingman formula with the
concept of Muda, Muri and Mura used in the Toyota
Production System. Emphasis to take notes for variability in
processes and arrivals within a system and to make efforts to
figure out the bottlenecks in areas with high levels of
variability have been made in his work [20].
Variability in a production system is always taken as an
aspect to be reduced and eliminated [21]. But in case of
enterprises with a make to order framework, where sources
of variability are from customers including delivery dates and
individualized parts that adds value to the products for
particular customers, complete removal of these sorts of
variability from the system is not suggested. Rather
approaches should be adopted to minimize the impact of
these variability on the system to achieve a profitable cost
benefit ratio [22].
E. Approached to Deal with Variability
The variabilities seen in a production system can be of both value adding and non-value adding nature and thus separate methods should be applied to deal with each category. Following are the suggested ways;
1) Concept of variability reduction
• Application of Just in Time approach
As defined by William J. Stevenson, Just in Time approach can be explained as “a repetitive production system in which processing and movement of material and goods occurs just as they are needed, usually in small batches” [23]. Just in time involves “having the right items of the right quality and quantity in the right place and at the right time” [24]. The major focus of JIT is towards the value adding activities and elimination of waste [24][25]. Inventories are responsible to absorb the variabilities (non-value adding) in the production systems [26][27][28]. The presence of surplus inventories can and will be used to cover the variations and problems in the production systems. But with the application of just-in-time philosophy which strives for a level of zero inventories, the hidden variability in the system comes into full view and it is much easier to deal with these exposed
71
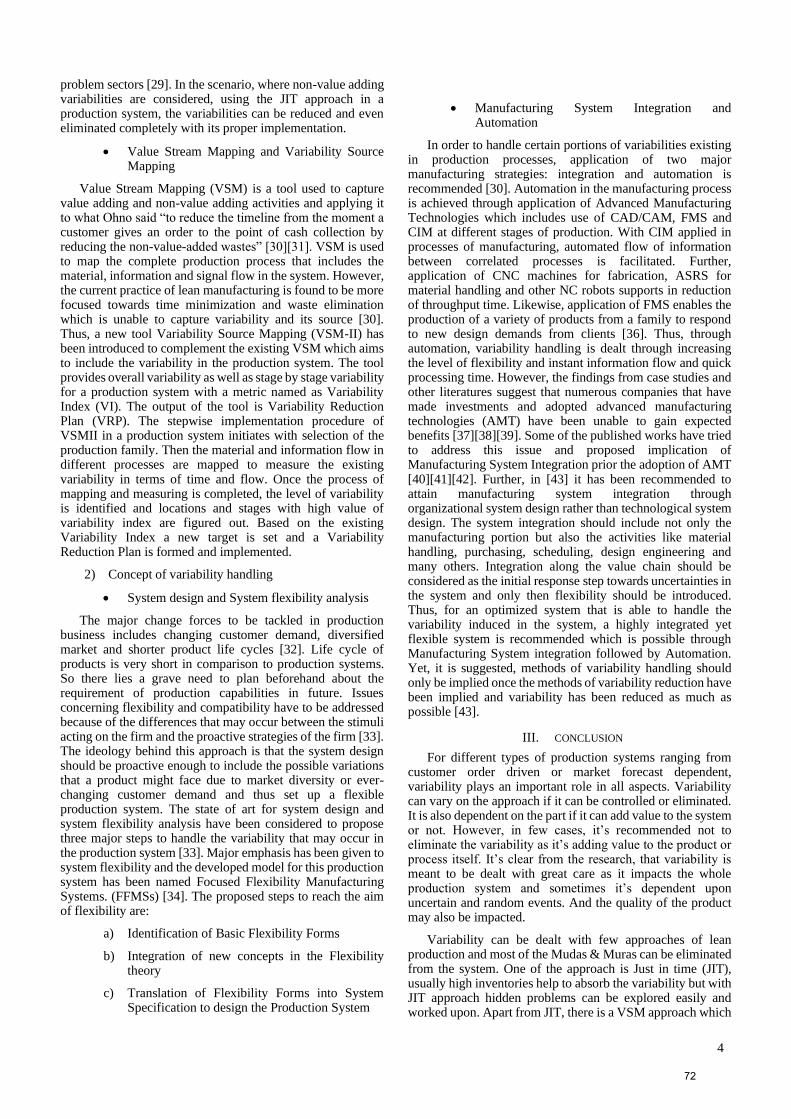
4
problem sectors [29]. In the scenario, where non-value adding variabilities are considered, using the JIT approach in a production system, the variabilities can be reduced and even eliminated completely with its proper implementation.
• Value Stream Mapping and Variability Source Mapping
Value Stream Mapping (VSM) is a tool used to capture value adding and non-value adding activities and applying it to what Ohno said “to reduce the timeline from the moment a customer gives an order to the point of cash collection by reducing the non-value-added wastes” [30][31]. VSM is used to map the complete production process that includes the material, information and signal flow in the system. However, the current practice of lean manufacturing is found to be more focused towards time minimization and waste elimination which is unable to capture variability and its source [30]. Thus, a new tool Variability Source Mapping (VSM-II) has been introduced to complement the existing VSM which aims to include the variability in the production system. The tool provides overall variability as well as stage by stage variability for a production system with a metric named as Variability Index (VI). The output of the tool is Variability Reduction Plan (VRP). The stepwise implementation procedure of VSMII in a production system initiates with selection of the production family. Then the material and information flow in different processes are mapped to measure the existing variability in terms of time and flow. Once the process of mapping and measuring is completed, the level of variability is identified and locations and stages with high value of variability index are figured out. Based on the existing Variability Index a new target is set and a Variability Reduction Plan is formed and implemented.
2) Concept of variability handling
• System design and System flexibility analysis
The major change forces to be tackled in production business includes changing customer demand, diversified market and shorter product life cycles [32]. Life cycle of products is very short in comparison to production systems. So there lies a grave need to plan beforehand about the requirement of production capabilities in future. Issues concerning flexibility and compatibility have to be addressed because of the differences that may occur between the stimuli acting on the firm and the proactive strategies of the firm [33]. The ideology behind this approach is that the system design should be proactive enough to include the possible variations that a product might face due to market diversity or ever-changing customer demand and thus set up a flexible production system. The state of art for system design and system flexibility analysis have been considered to propose three major steps to handle the variability that may occur in the production system [33]. Major emphasis has been given to system flexibility and the developed model for this production system has been named Focused Flexibility Manufacturing Systems. (FFMSs) [34]. The proposed steps to reach the aim of flexibility are:
a) Identification of Basic Flexibility Forms
b) Integration of new concepts in the Flexibility theory
c) Translation of Flexibility Forms into System Specification to design the Production System
• Manufacturing System Integration and Automation
In order to handle certain portions of variabilities existing in production processes, application of two major manufacturing strategies: integration and automation is recommended [30]. Automation in the manufacturing process is achieved through application of Advanced Manufacturing Technologies which includes use of CAD/CAM, FMS and CIM at different stages of production. With CIM applied in processes of manufacturing, automated flow of information between correlated processes is facilitated. Further, application of CNC machines for fabrication, ASRS for material handling and other NC robots supports in reduction of throughput time. Likewise, application of FMS enables the production of a variety of products from a family to respond to new design demands from clients [36]. Thus, through automation, variability handling is dealt through increasing the level of flexibility and instant information flow and quick processing time. However, the findings from case studies and other literatures suggest that numerous companies that have made investments and adopted advanced manufacturing technologies (AMT) have been unable to gain expected benefits [37][38][39]. Some of the published works have tried to address this issue and proposed implication of Manufacturing System Integration prior the adoption of AMT [40][41][42]. Further, in [43] it has been recommended to attain manufacturing system integration through organizational system design rather than technological system design. The system integration should include not only the manufacturing portion but also the activities like material handling, purchasing, scheduling, design engineering and many others. Integration along the value chain should be considered as the initial response step towards uncertainties in the system and only then flexibility should be introduced. Thus, for an optimized system that is able to handle the variability induced in the system, a highly integrated yet flexible system is recommended which is possible through Manufacturing System integration followed by Automation. Yet, it is suggested, methods of variability handling should only be implied once the methods of variability reduction have been implied and variability has been reduced as much as possible [43].
III. CONCLUSION
For different types of production systems ranging from customer order driven or market forecast dependent, variability plays an important role in all aspects. Variability can vary on the approach if it can be controlled or eliminated. It is also dependent on the part if it can add value to the system or not. However, in few cases, it’s recommended not to eliminate the variability as it’s adding value to the product or process itself. It’s clear from the research, that variability is meant to be dealt with great care as it impacts the whole production system and sometimes it’s dependent upon uncertain and random events. And the quality of the product may also be impacted.
Variability can be dealt with few approaches of lean production and most of the Mudas & Muras can be eliminated from the system. One of the approach is Just in time (JIT), usually high inventories help to absorb the variability but with JIT approach hidden problems can be explored easily and worked upon. Apart from JIT, there is a VSM approach which
72
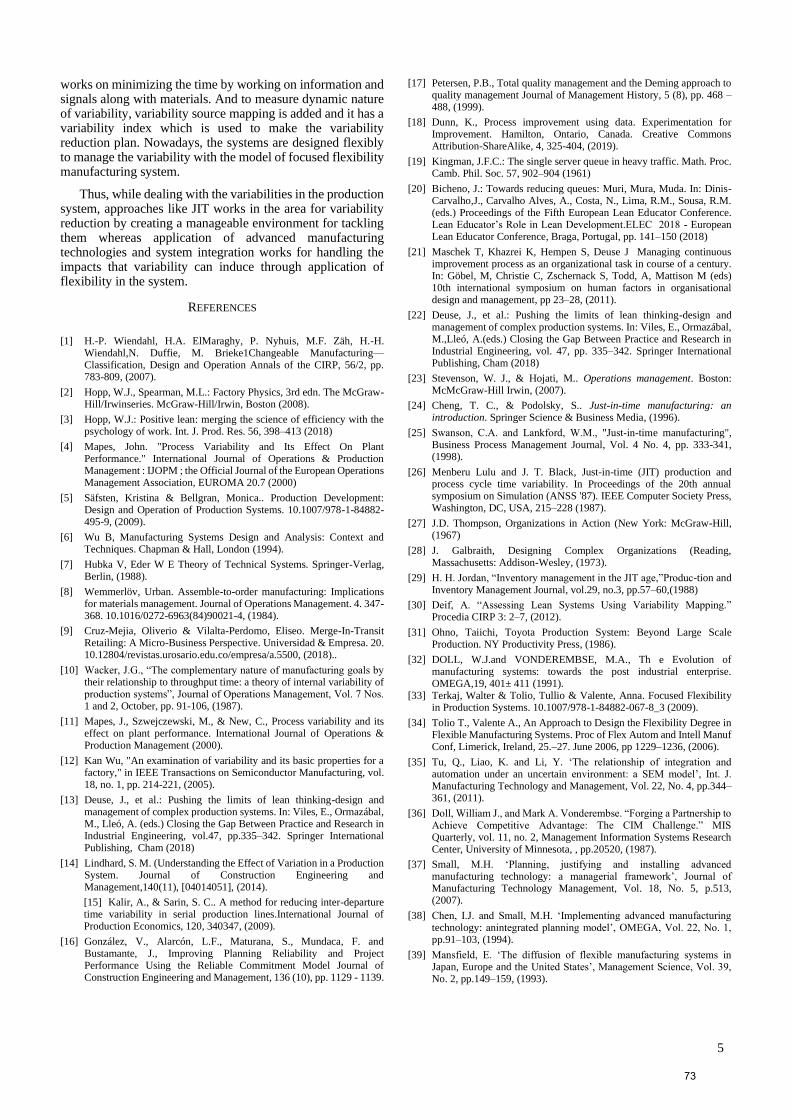
5
works on minimizing the time by working on information and signals along with materials. And to measure dynamic nature of variability, variability source mapping is added and it has a variability index which is used to make the variability reduction plan. Nowadays, the systems are designed flexibly to manage the variability with the model of focused flexibility manufacturing system.
Thus, while dealing with the variabilities in the production system, approaches like JIT works in the area for variability reduction by creating a manageable environment for tackling them whereas application of advanced manufacturing technologies and system integration works for handling the impacts that variability can induce through application of flexibility in the system.
REFERENCES
[1] H.-P. Wiendahl, H.A. ElMaraghy, P. Nyhuis, M.F. Zäh, H.-H.
Wiendahl,N. Duffie, M. Brieke1Changeable Manufacturing—Classification, Design and Operation Annals of the CIRP, 56/2, pp. 783-809, (2007).
[2] Hopp, W.J., Spearman, M.L.: Factory Physics, 3rd edn. The McGraw-Hill/Irwinseries. McGraw-Hill/Irwin, Boston (2008).
[3] Hopp, W.J.: Positive lean: merging the science of efficiency with the psychology of work. Int. J. Prod. Res. 56, 398–413 (2018)
[4] Mapes, John. "Process Variability and Its Effect On Plant Performance." International Journal of Operations & Production Management : IJOPM ; the Official Journal of the European Operations Management Association, EUROMA 20.7 (2000)
[5] Säfsten, Kristina & Bellgran, Monica.. Production Development: Design and Operation of Production Systems. 10.1007/978-1-84882-495-9, (2009).
[6] Wu B, Manufacturing Systems Design and Analysis: Context and Techniques. Chapman & Hall, London (1994).
[7] Hubka V, Eder W E Theory of Technical Systems. Springer-Verlag, Berlin, (1988).
[8] Wemmerlöv, Urban. Assemble-to-order manufacturing: Implications for materials management. Journal of Operations Management. 4. 347-368. 10.1016/0272-6963(84)90021-4, (1984).
[9] Cruz-Mejia, Oliverio & Vilalta-Perdomo, Eliseo. Merge-In-Transit Retailing: A Micro-Business Perspective. Universidad & Empresa. 20. 10.12804/revistas.urosario.edu.co/empresa/a.5500, (2018)..
[10] Wacker, J.G., “The complementary nature of manufacturing goals by their relationship to throughput time: a theory of internal variability of production systems”, Journal of Operations Management, Vol. 7 Nos. 1 and 2, October, pp. 91-106, (1987).
[11] Mapes, J., Szwejczewski, M., & New, C., Process variability and its effect on plant performance. International Journal of Operations & Production Management (2000).
[12] Kan Wu, "An examination of variability and its basic properties for a factory," in IEEE Transactions on Semiconductor Manufacturing, vol. 18, no. 1, pp. 214-221, (2005).
[13] Deuse, J., et al.: Pushing the limits of lean thinking-design and management of complex production systems. In: Viles, E., Ormazábal, M., Lleó, A. (eds.) Closing the Gap Between Practice and Research in Industrial Engineering, vol.47, pp.335–342. Springer International Publishing, Cham (2018)
[14] Lindhard, S. M. (Understanding the Effect of Variation in a Production System. Journal of Construction Engineering and Management,140(11), [04014051], (2014). [15] Kalir, A., & Sarin, S. C.. A method for reducing inter-departure time variability in serial production lines.International Journal of Production Economics, 120, 340347, (2009).
[16] González, V., Alarcón, L.F., Maturana, S., Mundaca, F. and Bustamante, J., Improving Planning Reliability and Project Performance Using the Reliable Commitment Model Journal of Construction Engineering and Management, 136 (10), pp. 1129 - 1139.
[17] Petersen, P.B., Total quality management and the Deming approach to quality management Journal of Management History, 5 (8), pp. 468 – 488, (1999).
[18] Dunn, K., Process improvement using data. Experimentation for Improvement. Hamilton, Ontario, Canada. Creative Commons Attribution-ShareAlike, 4, 325-404, (2019).
[19] Kingman, J.F.C.: The single server queue in heavy traffic. Math. Proc. Camb. Phil. Soc. 57, 902–904 (1961)
[20] Bicheno, J.: Towards reducing queues: Muri, Mura, Muda. In: Dinis-Carvalho,J., Carvalho Alves, A., Costa, N., Lima, R.M., Sousa, R.M. (eds.) Proceedings of the Fifth European Lean Educator Conference. Lean Educator’s Role in Lean Development.ELEC 2018 - European Lean Educator Conference, Braga, Portugal, pp. 141–150 (2018)
[21] Maschek T, Khazrei K, Hempen S, Deuse J Managing continuous improvement process as an organizational task in course of a century. In: Göbel, M, Christie C, Zschernack S, Todd, A, Mattison M (eds) 10th international symposium on human factors in organisational design and management, pp 23–28, (2011).
[22] Deuse, J., et al.: Pushing the limits of lean thinking-design and management of complex production systems. In: Viles, E., Ormazábal, M.,Lleó, A.(eds.) Closing the Gap Between Practice and Research in Industrial Engineering, vol. 47, pp. 335–342. Springer International Publishing, Cham (2018)
[23] Stevenson, W. J., & Hojati, M.. Operations management. Boston: McMcGraw-Hill Irwin, (2007).
[24] Cheng, T. C., & Podolsky, S.. Just-in-time manufacturing: an introduction. Springer Science & Business Media, (1996).
[25] Swanson, C.A. and Lankford, W.M., "Just‐in‐time manufacturing", Business Process Management Journal, Vol. 4 No. 4, pp. 333-341, (1998).
[26] Menberu Lulu and J. T. Black, Just-in-time (JIT) production and process cycle time variability. In Proceedings of the 20th annual symposium on Simulation (ANSS '87). IEEE Computer Society Press, Washington, DC, USA, 215–228 (1987).
[27] J.D. Thompson, Organizations in Action (New York: McGraw-Hill, (1967)
[28] J. Galbraith, Designing Complex Organizations (Reading, Massachusetts: Addison-Wesley, (1973).
[29] H. H. Jordan, “Inventory management in the JIT age,”Produc-tion and Inventory Management Journal, vol.29, no.3, pp.57–60,(1988)
[30] Deif, A. “Assessing Lean Systems Using Variability Mapping.” Procedia CIRP 3: 2–7, (2012).
[31] Ohno, Taiichi, Toyota Production System: Beyond Large Scale Production. NY Productivity Press, (1986).
[32] DOLL, W.J.and VONDEREMBSE, M.A., Th e Evolution of manufacturing systems: towards the post industrial enterprise. OMEGA,19, 401± 411 (1991).
[33] Terkaj, Walter & Tolio, Tullio & Valente, Anna. Focused Flexibility in Production Systems. 10.1007/978-1-84882-067-8_3 (2009).
[34] Tolio T., Valente A., An Approach to Design the Flexibility Degree in Flexible Manufacturing Systems. Proc of Flex Autom and Intell Manuf Conf, Limerick, Ireland, 25.–27. June 2006, pp 1229–1236, (2006).
[35] Tu, Q., Liao, K. and Li, Y. ‘The relationship of integration and automation under an uncertain environment: a SEM model’, Int. J. Manufacturing Technology and Management, Vol. 22, No. 4, pp.344–361, (2011).
[36] Doll, William J., and Mark A. Vonderembse. “Forging a Partnership to Achieve Competitive Advantage: The CIM Challenge.” MIS Quarterly, vol. 11, no. 2, Management Information Systems Research Center, University of Minnesota, , pp.20520, (1987).
[37] Small, M.H. ‘Planning, justifying and installing advanced manufacturing technology: a managerial framework’, Journal of Manufacturing Technology Management, Vol. 18, No. 5, p.513, (2007).
[38] Chen, I.J. and Small, M.H. ‘Implementing advanced manufacturing technology: anintegrated planning model’, OMEGA, Vol. 22, No. 1, pp.91–103, (1994).
[39] Mansfield, E. ‘The diffusion of flexible manufacturing systems in Japan, Europe and the United States’, Management Science, Vol. 39, No. 2, pp.149–159, (1993).
73

6
[40] Duimering, P.R., Safayeni, F. and Purdy, L. ‘Integrated manufacturing:redesignthe organization before implementing flexible technology’, Sloan Management Review, Summer, pp.47–56, (1993).
[41] Burcher, P., Lee, G. and Sohal, A. ‘Lessons for implementing AMT’, International Journal of Operations and Production Management, Vol. 19, Nos. 5–6, pp.515–527, (1999).
[42] Vonderembse, M.A., Raghunathan, T.S. and Rao, S.S. ‘A post-industrial paradigm: to integrate and automate manufacturing’,
International Journal of Production Research, Vol. 35, No. 9, pp.2579–2599, (1997).
[43] Zachery, W.B. and Richman, E., ``Building an operations management foundation that will last: TQM, JIT and CIM'', Industrial Engineer, August, pp. 39-43, (1993).
74
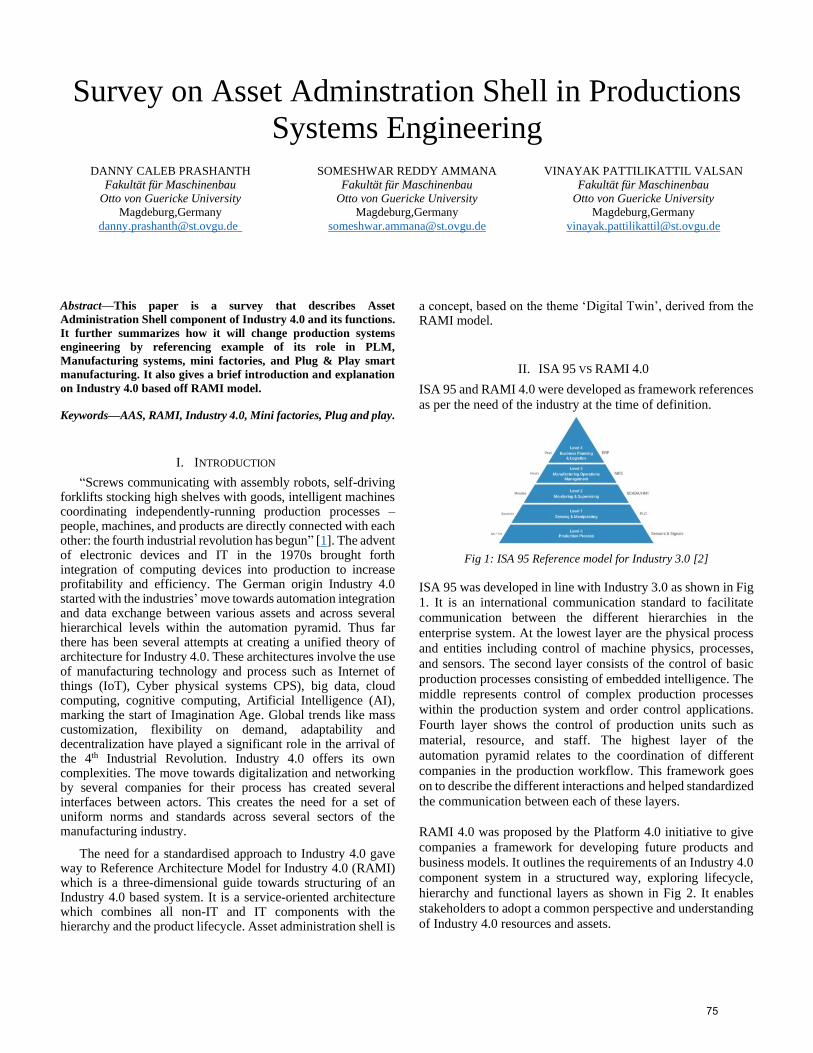
Survey on Asset Adminstration Shell in Productions
Systems Engineering
DANNY CALEB PRASHANTH
Fakultät für Maschinenbau
Otto von Guericke University
Magdeburg,Germany
SOMESHWAR REDDY AMMANA
Fakultät für Maschinenbau
Otto von Guericke University
Magdeburg,Germany
VINAYAK PATTILIKATTIL VALSAN
Fakultät für Maschinenbau
Otto von Guericke University
Magdeburg,Germany
Abstract—This paper is a survey that describes Asset
Administration Shell component of Industry 4.0 and its functions.
It further summarizes how it will change production systems
engineering by referencing example of its role in PLM,
Manufacturing systems, mini factories, and Plug & Play smart
manufacturing. It also gives a brief introduction and explanation
on Industry 4.0 based off RAMI model.
Keywords—AAS, RAMI, Industry 4.0, Mini factories, Plug and play.
I. INTRODUCTION
“Screws communicating with assembly robots, self-driving forklifts stocking high shelves with goods, intelligent machines coordinating independently-running production processes – people, machines, and products are directly connected with each other: the fourth industrial revolution has begun” [1]. The advent of electronic devices and IT in the 1970s brought forth integration of computing devices into production to increase profitability and efficiency. The German origin Industry 4.0 started with the industries’ move towards automation integration and data exchange between various assets and across several hierarchical levels within the automation pyramid. Thus far there has been several attempts at creating a unified theory of architecture for Industry 4.0. These architectures involve the use of manufacturing technology and process such as Internet of things (IoT), Cyber physical systems CPS), big data, cloud computing, cognitive computing, Artificial Intelligence (AI), marking the start of Imagination Age. Global trends like mass customization, flexibility on demand, adaptability and decentralization have played a significant role in the arrival of the 4th Industrial Revolution. Industry 4.0 offers its own complexities. The move towards digitalization and networking by several companies for their process has created several interfaces between actors. This creates the need for a set of uniform norms and standards across several sectors of the manufacturing industry.
The need for a standardised approach to Industry 4.0 gave way to Reference Architecture Model for Industry 4.0 (RAMI) which is a three-dimensional guide towards structuring of an Industry 4.0 based system. It is a service-oriented architecture which combines all non-IT and IT components with the hierarchy and the product lifecycle. Asset administration shell is
a concept, based on the theme ‘Digital Twin’, derived from the RAMI model.
II. ISA 95 VS RAMI 4.0
ISA 95 and RAMI 4.0 were developed as framework references
as per the need of the industry at the time of definition.
Fig 1: ISA 95 Reference model for Industry 3.0 [2]
ISA 95 was developed in line with Industry 3.0 as shown in Fig
1. It is an international communication standard to facilitate
communication between the different hierarchies in the
enterprise system. At the lowest layer are the physical process
and entities including control of machine physics, processes,
and sensors. The second layer consists of the control of basic
production processes consisting of embedded intelligence. The
middle represents control of complex production processes
within the production system and order control applications.
Fourth layer shows the control of production units such as
material, resource, and staff. The highest layer of the
automation pyramid relates to the coordination of different
companies in the production workflow. This framework goes
on to describe the different interactions and helped standardized
the communication between each of these layers.
RAMI 4.0 was proposed by the Platform 4.0 initiative to give
companies a framework for developing future products and
business models. It outlines the requirements of an Industry 4.0
component system in a structured way, exploring lifecycle,
hierarchy and functional layers as shown in Fig 2. It enables
stakeholders to adopt a common perspective and understanding
of Industry 4.0 resources and assets.
75
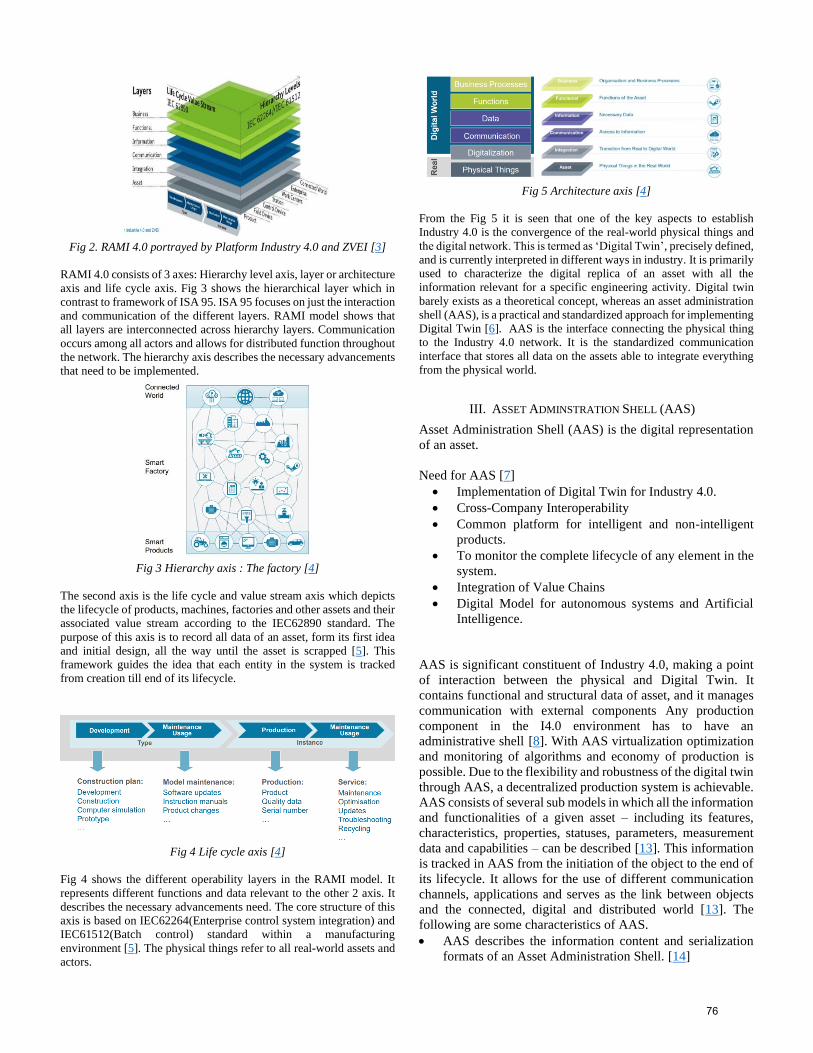
Fig 2. RAMI 4.0 portrayed by Platform Industry 4.0 and ZVEI [3]
RAMI 4.0 consists of 3 axes: Hierarchy level axis, layer or architecture
axis and life cycle axis. Fig 3 shows the hierarchical layer which in
contrast to framework of ISA 95. ISA 95 focuses on just the interaction
and communication of the different layers. RAMI model shows that
all layers are interconnected across hierarchy layers. Communication
occurs among all actors and allows for distributed function throughout
the network. The hierarchy axis describes the necessary advancements
that need to be implemented.
Fig 3 Hierarchy axis : The factory [4]
The second axis is the life cycle and value stream axis which depicts
the lifecycle of products, machines, factories and other assets and their
associated value stream according to the IEC62890 standard. The
purpose of this axis is to record all data of an asset, form its first idea
and initial design, all the way until the asset is scrapped [5]. This
framework guides the idea that each entity in the system is tracked
from creation till end of its lifecycle.
Fig 4 Life cycle axis [4]
Fig 4 shows the different operability layers in the RAMI model. It
represents different functions and data relevant to the other 2 axis. It
describes the necessary advancements need. The core structure of this
axis is based on IEC62264(Enterprise control system integration) and
IEC61512(Batch control) standard within a manufacturing
environment [5]. The physical things refer to all real-world assets and
actors.
Fig 5 Architecture axis [4]
From the Fig 5 it is seen that one of the key aspects to establish
Industry 4.0 is the convergence of the real-world physical things and
the digital network. This is termed as ‘Digital Twin’, precisely defined,
and is currently interpreted in different ways in industry. It is primarily
used to characterize the digital replica of an asset with all the
information relevant for a specific engineering activity. Digital twin
barely exists as a theoretical concept, whereas an asset administration
shell (AAS), is a practical and standardized approach for implementing
Digital Twin [6]. AAS is the interface connecting the physical thing
to the Industry 4.0 network. It is the standardized communication
interface that stores all data on the assets able to integrate everything
from the physical world.
III. ASSET ADMINSTRATION SHELL (AAS)
Asset Administration Shell (AAS) is the digital representation
of an asset.
Need for AAS [7]
• Implementation of Digital Twin for Industry 4.0.
• Cross-Company Interoperability
• Common platform for intelligent and non-intelligent
products.
• To monitor the complete lifecycle of any element in the
system.
• Integration of Value Chains
• Digital Model for autonomous systems and Artificial
Intelligence.
AAS is significant constituent of Industry 4.0, making a point
of interaction between the physical and Digital Twin. It
contains functional and structural data of asset, and it manages
communication with external components Any production
component in the I4.0 environment has to have an
administrative shell [8]. With AAS virtualization optimization
and monitoring of algorithms and economy of production is
possible. Due to the flexibility and robustness of the digital twin
through AAS, a decentralized production system is achievable.
AAS consists of several sub models in which all the information
and functionalities of a given asset – including its features,
characteristics, properties, statuses, parameters, measurement
data and capabilities – can be described [13]. This information
is tracked in AAS from the initiation of the object to the end of
its lifecycle. It allows for the use of different communication
channels, applications and serves as the link between objects
and the connected, digital and distributed world [13]. The
following are some characteristics of AAS.
• AAS describes the information content and serialization
formats of an Asset Administration Shell. [14]
76
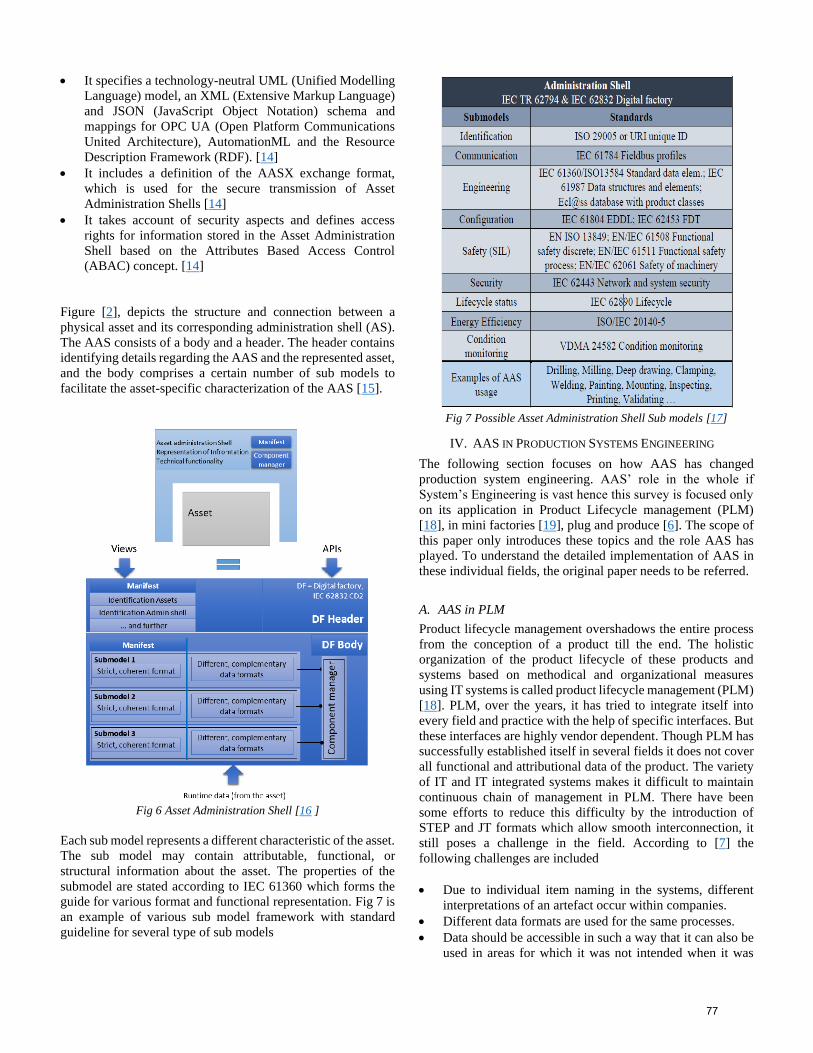
• It specifies a technology-neutral UML (Unified Modelling
Language) model, an XML (Extensive Markup Language)
and JSON (JavaScript Object Notation) schema and
mappings for OPC UA (Open Platform Communications
United Architecture), AutomationML and the Resource
Description Framework (RDF). [14]
• It includes a definition of the AASX exchange format,
which is used for the secure transmission of Asset
Administration Shells [14]
• It takes account of security aspects and defines access
rights for information stored in the Asset Administration
Shell based on the Attributes Based Access Control
(ABAC) concept. [14]
Figure [2], depicts the structure and connection between a
physical asset and its corresponding administration shell (AS).
The AAS consists of a body and a header. The header contains
identifying details regarding the AAS and the represented asset,
and the body comprises a certain number of sub models to
facilitate the asset-specific characterization of the AAS [15].
Fig 6 Asset Administration Shell [16 ]
Each sub model represents a different characteristic of the asset.
The sub model may contain attributable, functional, or
structural information about the asset. The properties of the
submodel are stated according to IEC 61360 which forms the
guide for various format and functional representation. Fig 7 is
an example of various sub model framework with standard
guideline for several type of sub models
Fig 7 Possible Asset Administration Shell Sub models [17]
IV. AAS IN PRODUCTION SYSTEMS ENGINEERING
The following section focuses on how AAS has changed
production system engineering. AAS’ role in the whole if
System’s Engineering is vast hence this survey is focused only
on its application in Product Lifecycle management (PLM)
[18], in mini factories [19], plug and produce [6]. The scope of
this paper only introduces these topics and the role AAS has
played. To understand the detailed implementation of AAS in
these individual fields, the original paper needs to be referred.
A. AAS in PLM
Product lifecycle management overshadows the entire process
from the conception of a product till the end. The holistic
organization of the product lifecycle of these products and
systems based on methodical and organizational measures
using IT systems is called product lifecycle management (PLM)
[18]. PLM, over the years, it has tried to integrate itself into
every field and practice with the help of specific interfaces. But
these interfaces are highly vendor dependent. Though PLM has
successfully established itself in several fields it does not cover
all functional and attributional data of the product. The variety
of IT and IT integrated systems makes it difficult to maintain
continuous chain of management in PLM. There have been
some efforts to reduce this difficulty by the introduction of
STEP and JT formats which allow smooth interconnection, it
still poses a challenge in the field. According to [7] the
following challenges are included
• Due to individual item naming in the systems, different
interpretations of an artefact occur within companies.
• Different data formats are used for the same processes.
• Data should be accessible in such a way that it can also be
used in areas for which it was not intended when it was
77
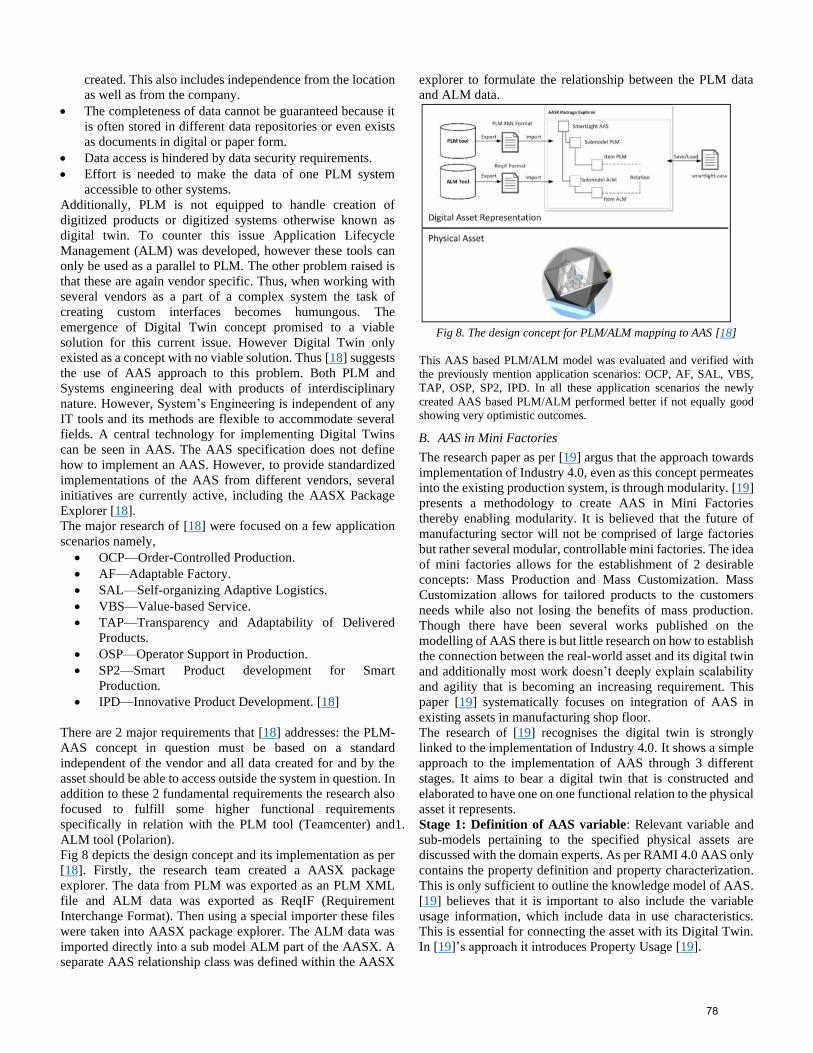
created. This also includes independence from the location
as well as from the company.
• The completeness of data cannot be guaranteed because it
is often stored in different data repositories or even exists
as documents in digital or paper form.
• Data access is hindered by data security requirements.
• Effort is needed to make the data of one PLM system
accessible to other systems.
Additionally, PLM is not equipped to handle creation of
digitized products or digitized systems otherwise known as
digital twin. To counter this issue Application Lifecycle
Management (ALM) was developed, however these tools can
only be used as a parallel to PLM. The other problem raised is
that these are again vendor specific. Thus, when working with
several vendors as a part of a complex system the task of
creating custom interfaces becomes humungous. The
emergence of Digital Twin concept promised to a viable
solution for this current issue. However Digital Twin only
existed as a concept with no viable solution. Thus [18] suggests
the use of AAS approach to this problem. Both PLM and
Systems engineering deal with products of interdisciplinary
nature. However, System’s Engineering is independent of any
IT tools and its methods are flexible to accommodate several
fields. A central technology for implementing Digital Twins
can be seen in AAS. The AAS specification does not define
how to implement an AAS. However, to provide standardized
implementations of the AAS from different vendors, several
initiatives are currently active, including the AASX Package
Explorer [18].
The major research of [18] were focused on a few application
scenarios namely,
• OCP—Order-Controlled Production.
• AF—Adaptable Factory.
• SAL—Self-organizing Adaptive Logistics.
• VBS—Value-based Service.
• TAP—Transparency and Adaptability of Delivered
Products.
• OSP—Operator Support in Production.
• SP2—Smart Product development for Smart
Production.
• IPD—Innovative Product Development. [18]
There are 2 major requirements that [18] addresses: the PLM-
AAS concept in question must be based on a standard
independent of the vendor and all data created for and by the
asset should be able to access outside the system in question. In
addition to these 2 fundamental requirements the research also
focused to fulfill some higher functional requirements
specifically in relation with the PLM tool (Teamcenter) and
ALM tool (Polarion).
Fig 8 depicts the design concept and its implementation as per
[18]. Firstly, the research team created a AASX package
explorer. The data from PLM was exported as an PLM XML
file and ALM data was exported as ReqIF (Requirement
Interchange Format). Then using a special importer these files
were taken into AASX package explorer. The ALM data was
imported directly into a sub model ALM part of the AASX. A
separate AAS relationship class was defined within the AASX
explorer to formulate the relationship between the PLM data
and ALM data.
Fig 8. The design concept for PLM/ALM mapping to AAS [18]
This AAS based PLM/ALM model was evaluated and verified with
the previously mention application scenarios: OCP, AF, SAL, VBS,
TAP, OSP, SP2, IPD. In all these application scenarios the newly
created AAS based PLM/ALM performed better if not equally good
showing very optimistic outcomes.
B. AAS in Mini Factories
The research paper as per [19] argus that the approach towards
implementation of Industry 4.0, even as this concept permeates
into the existing production system, is through modularity. [19]
presents a methodology to create AAS in Mini Factories
thereby enabling modularity. It is believed that the future of
manufacturing sector will not be comprised of large factories
but rather several modular, controllable mini factories. The idea
of mini factories allows for the establishment of 2 desirable
concepts: Mass Production and Mass Customization. Mass
Customization allows for tailored products to the customers
needs while also not losing the benefits of mass production.
Though there have been several works published on the
modelling of AAS there is but little research on how to establish
the connection between the real-world asset and its digital twin
and additionally most work doesn’t deeply explain scalability
and agility that is becoming an increasing requirement. This
paper [19] systematically focuses on integration of AAS in
existing assets in manufacturing shop floor.
The research of [19] recognises the digital twin is strongly
linked to the implementation of Industry 4.0. It shows a simple
approach to the implementation of AAS through 3 different
stages. It aims to bear a digital twin that is constructed and
elaborated to have one on one functional relation to the physical
asset it represents.
1. Stage 1: Definition of AAS variable: Relevant variable and
sub-models pertaining to the specified physical assets are
discussed with the domain experts. As per RAMI 4.0 AAS only
contains the property definition and property characterization.
This is only sufficient to outline the knowledge model of AAS.
[19] believes that it is important to also include the variable
usage information, which include data in use characteristics.
This is essential for connecting the asset with its Digital Twin.
In [19]’s approach it introduces Property Usage [19].
78
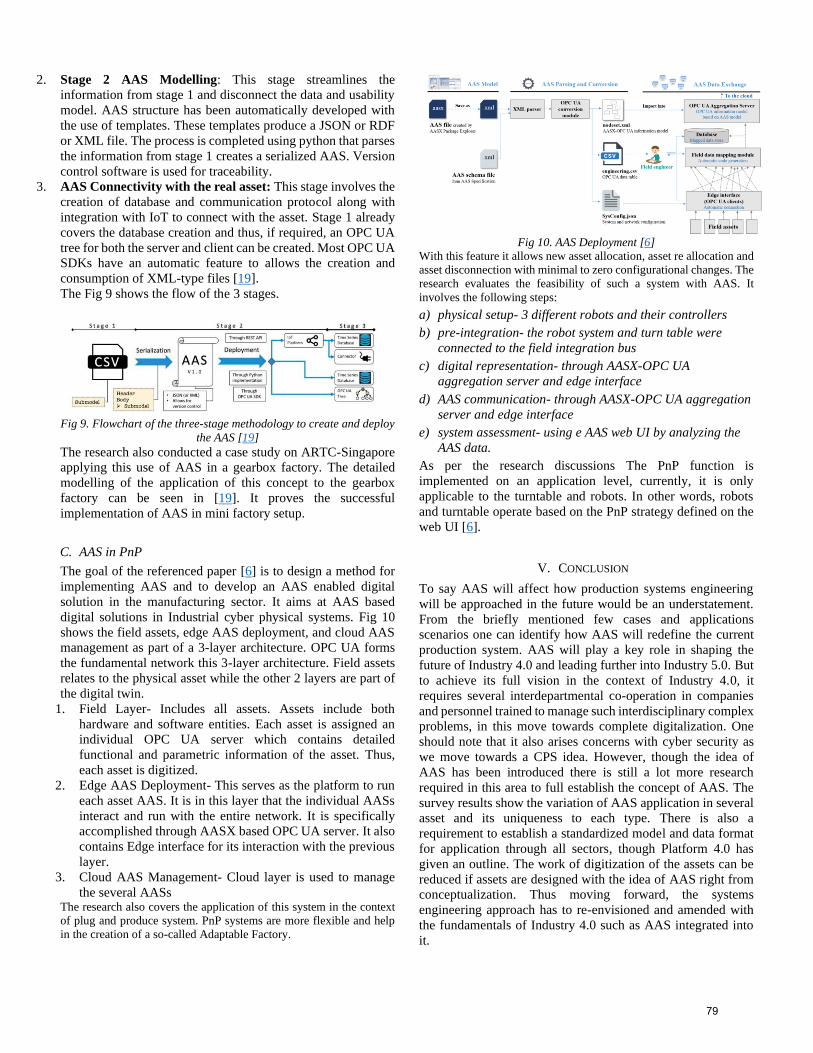
2. Stage 2 AAS Modelling: This stage streamlines the
information from stage 1 and disconnect the data and usability
model. AAS structure has been automatically developed with
the use of templates. These templates produce a JSON or RDF
or XML file. The process is completed using python that parses
the information from stage 1 creates a serialized AAS. Version
control software is used for traceability.
3. AAS Connectivity with the real asset: This stage involves the
creation of database and communication protocol along with
integration with IoT to connect with the asset. Stage 1 already
covers the database creation and thus, if required, an OPC UA
tree for both the server and client can be created. Most OPC UA
SDKs have an automatic feature to allows the creation and
consumption of XML-type files [19].
The Fig 9 shows the flow of the 3 stages.
Fig 9. Flowchart of the three-stage methodology to create and deploy
the AAS [19]
The research also conducted a case study on ARTC-Singapore
applying this use of AAS in a gearbox factory. The detailed
modelling of the application of this concept to the gearbox
factory can be seen in [19]. It proves the successful
implementation of AAS in mini factory setup.
C. AAS in PnP
The goal of the referenced paper [6] is to design a method for
implementing AAS and to develop an AAS enabled digital
solution in the manufacturing sector. It aims at AAS based
digital solutions in Industrial cyber physical systems. Fig 10
shows the field assets, edge AAS deployment, and cloud AAS
management as part of a 3-layer architecture. OPC UA forms
the fundamental network this 3-layer architecture. Field assets
relates to the physical asset while the other 2 layers are part of
the digital twin.
1. Field Layer- Includes all assets. Assets include both
hardware and software entities. Each asset is assigned an
individual OPC UA server which contains detailed
functional and parametric information of the asset. Thus,
each asset is digitized.
2. Edge AAS Deployment- This serves as the platform to run
each asset AAS. It is in this layer that the individual AASs
interact and run with the entire network. It is specifically
accomplished through AASX based OPC UA server. It also
contains Edge interface for its interaction with the previous
layer.
3. Cloud AAS Management- Cloud layer is used to manage
the several AASs The research also covers the application of this system in the context
of plug and produce system. PnP systems are more flexible and help
in the creation of a so-called Adaptable Factory.
Fig 10. AAS Deployment [6]
With this feature it allows new asset allocation, asset re allocation and
asset disconnection with minimal to zero configurational changes. The
research evaluates the feasibility of such a system with AAS. It
involves the following steps:
a) physical setup- 3 different robots and their controllers
b) pre-integration- the robot system and turn table were
connected to the field integration bus
c) digital representation- through AASX-OPC UA
aggregation server and edge interface
d) AAS communication- through AASX-OPC UA aggregation
server and edge interface
e) system assessment- using e AAS web UI by analyzing the
AAS data.
As per the research discussions The PnP function is
implemented on an application level, currently, it is only
applicable to the turntable and robots. In other words, robots
and turntable operate based on the PnP strategy defined on the
web UI [6].
V. CONCLUSION
To say AAS will affect how production systems engineering
will be approached in the future would be an understatement.
From the briefly mentioned few cases and applications
scenarios one can identify how AAS will redefine the current
production system. AAS will play a key role in shaping the
future of Industry 4.0 and leading further into Industry 5.0. But
to achieve its full vision in the context of Industry 4.0, it
requires several interdepartmental co-operation in companies
and personnel trained to manage such interdisciplinary complex
problems, in this move towards complete digitalization. One
should note that it also arises concerns with cyber security as
we move towards a CPS idea. However, though the idea of
AAS has been introduced there is still a lot more research
required in this area to full establish the concept of AAS. The
survey results show the variation of AAS application in several
asset and its uniqueness to each type. There is also a
requirement to establish a standardized model and data format
for application through all sectors, though Platform 4.0 has
given an outline. The work of digitization of the assets can be
reduced if assets are designed with the idea of AAS right from
conceptualization. Thus moving forward, the systems
engineering approach has to re-envisioned and amended with
the fundamentals of Industry 4.0 such as AAS integrated into
it.
79
VI. REFERENCES
1. https://www.plattform-
i40.de/IP/Navigation/EN/Industrie40/WhatIsIndust
rie40/what-is-industrie40.html- Accessed on
20.12.2021 at 11.45pm
2. https://www.crosser.io/media/r4gnymym/crosser-edge-analytics-
isa-95-illustration.svg?width=500&height=375 SA-95-
illustration. Accessed on 22.12.2021 at 9.45pm
3. P. Adolphs, H. Bedenbender, D. Dirzus, M. Ehlich, U.
Epple, M. Hankel,R. Heidel, M. Hoffmeister, H.
Huhle, B. Karcher, H. Koziolek, R. Pichler,S.
Pollmeier, F. Schewe, A. Walter, B. Waser, and M.
Wollschlaeger,“Reference architecture model
industrie 4.0 (rami4.0),” zvei and vdi,
4. https://ec.europa.eu/futurium/en/system/files/ged/a
2-schweichhart-
reference_architectural_model_industrie_4.0_ram
i_4.0.pdf
5. . S. Beden, Q. Cao and A. Beckmann, "Semantic Asset
Administration Shells in Industry 4.0: A Survey," 2021
4th IEEE International Conference on Industrial
Cyber-Physical Systems (ICPS), 2021, pp. 31-38, doi:
10.1109/ICPS49255.2021.9468266
6. X. Ye, S. H. Hong, W. S. Song, Y. C. Kim and X. Zhang,
"An Industry 4.0 Asset Administration Shell-Enabled
Digital Solution for Robot-Based Manufacturing
Systems," in IEEE Access, vol. 9, pp. 154448-154459,
2021, doi: 10.1109/ACCESS.2021.3128580.
7. https://www.plattform-
i40.de/IP/Redaktion/EN/Downloads/Publikation/vws-in-detail-
presentation.pdf?__blob=publicationFile&v=12 Accessed
on 11.12.2021 at 12.46pm
8. . Herrmann, F. The Smart Factory and Its Risks.
Systems 2018, 6, 38, doi:10.3390/systems6040038
9. Examples of Assets Administration Shell for Industrie
4.0 Components—Basic Part; ZVEI: Frankfurt am
Main, Germany, 2016; pp. 1–24
10. . Fuchs, J.; Schmidt, J.; Franke, J.; Rehman, K.;
Sauer, M.; Karnouskos, S. I4.0-compliant integration
of assets utilizing the Asset Administration Shell. In
Proceedings of the 2019 24th IEEE International
Conference on Emerging Technologies and Factory
Automation (ETFA), Zaragoza, Spain, 10–13
September 2019; pp. 1243–1247,
doi:10.1109/ETFA.2019.8869255
11. Marcon, P.; Diedrich, C.; Zezulka, F.; Schröder, T.;
Belyaev, A.; Arm, J.; Benesl, T.; Bradac, Z.; Vesely, I.
The Asset Administration Shell of Operator in the
Platform of Industry 4.0. In Proceedings of the 18th
International Conference on Mechatronics—
Mechatronika (ME), Brno, Czech Republic, 2–4
December 2018; pp. 1–5
12. Inigo, M.A.; Porto, A.; Kremer, B.; Perez, A.;
Larrinaga, F.; Cuenca, J. Towards an Asset
Administration Shell scenario: A use case for
interoperability and standardization in Industry 4.0.
In Proceedings of the NOMS 2020—2020 IEEE/IFIP
Network Operations and Management Symposium,
Budapest, Hungary, 20–24 April 2020; pp. 1–6,
doi:10.1109/NOMS47738.2020.9110410
13. https://www.plattform-
i40.de/IP/Redaktion/EN/Downloads/Publikation/Asset_Admini
stration_Shell_Reading_Guide.html Accessed on
6.12.2021 at 1.46pm
14. https://www.plattform-
i40.de/IP/Redaktion/EN/Downloads/Publikation/vws-in-detail-
presentation.pdf?__blob=publicationFile&v=12 Accessed
on 6.12.2021 at 1.46pm
15. . P. Marcon et al., "The Asset Administration Shell of
Operator in the Platform of Industry 4.0," 2018 18th
International Conference on Me
16. VDI/VDE, “Gesellschaft Mess- und
Automatisierungstechnik – Status report,“ Reference
Architecture Model Industrie 4.0 (RAMI 4.0),2015
17. K. Wei, J. Z. Sun, R. J. Liu, "A Review of Asset
Administration Shell", Industrial Engineering and
Engineering Management (IEEM) 2019 IEEE
International Conference on, pp. 1460-1465, 2019.
18. Deuter, A.; Imort, S.Product Lifecycle Management
with the Asset Administration Shell.Computers 2021,
10, 84. https://doi.org/10.3390/computers10070084
19. Alejandro Seif, Carlos Toro, Humza
Akhtar,Implementing Industry 4.0 Asset
Administrative Shells in Mini Factories,Procedia
Computer Science,Volume 159,2019,ISSN 1877-
0509,https://doi.org/10.1016/j.procs.2019.09.204
80
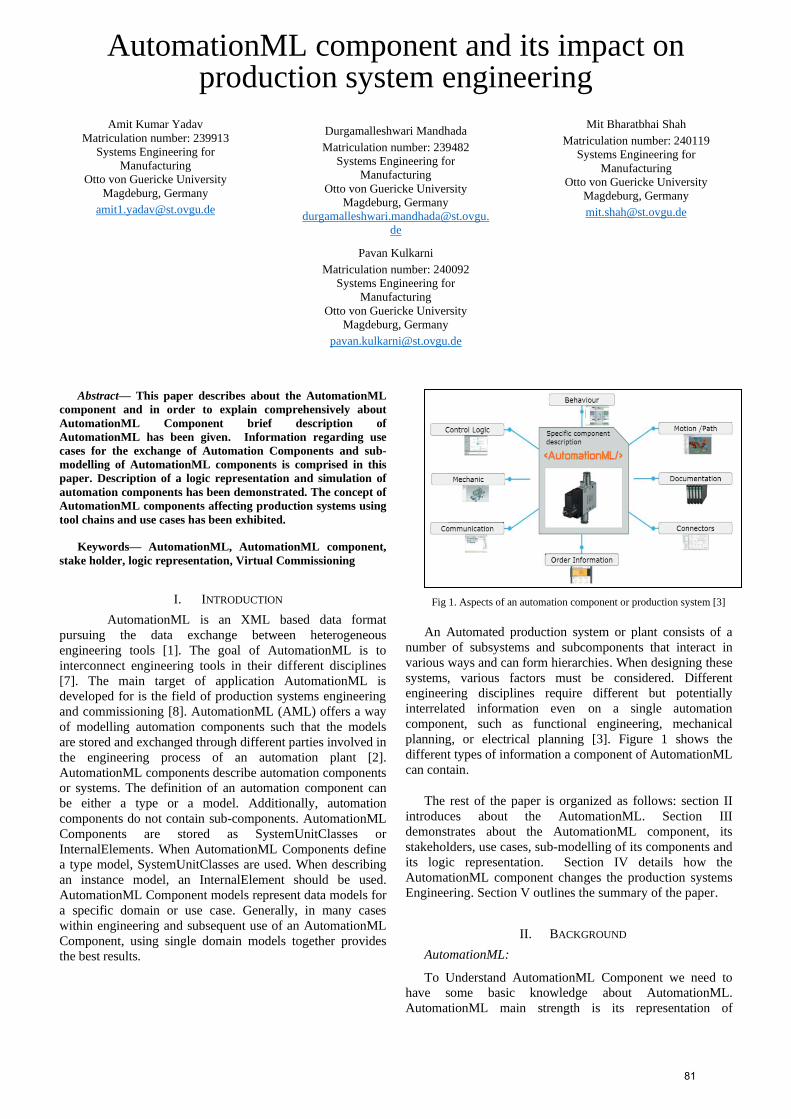
AutomationML component and its impact on production system engineering
Amit Kumar Yadav
Matriculation number: 239913
Systems Engineering for
Manufacturing
Otto von Guericke University
Magdeburg, Germany
Durgamalleshwari Mandhada
Matriculation number: 239482
Systems Engineering for
Manufacturing
Otto von Guericke University
Magdeburg, Germany
de
Pavan Kulkarni
Matriculation number: 240092
Systems Engineering for
Manufacturing
Otto von Guericke University
Magdeburg, Germany
Mit Bharatbhai Shah
Matriculation number: 240119
Systems Engineering for
Manufacturing
Otto von Guericke University
Magdeburg, Germany
Abstract— This paper describes about the AutomationML
component and in order to explain comprehensively about
AutomationML Component brief description of
AutomationML has been given. Information regarding use
cases for the exchange of Automation Components and sub-
modelling of AutomationML components is comprised in this
paper. Description of a logic representation and simulation of
automation components has been demonstrated. The concept of
AutomationML components affecting production systems using
tool chains and use cases has been exhibited.
Keywords— AutomationML, AutomationML component,
stake holder, logic representation, Virtual Commissioning
I. INTRODUCTION
AutomationML is an XML based data format
pursuing the data exchange between heterogeneous
engineering tools [1]. The goal of AutomationML is to
interconnect engineering tools in their different disciplines
[7]. The main target of application AutomationML is
developed for is the field of production systems engineering
and commissioning [8]. AutomationML (AML) offers a way
of modelling automation components such that the models
are stored and exchanged through different parties involved in
the engineering process of an automation plant [2]. AutomationML components describe automation components
or systems. The definition of an automation component can
be either a type or a model. Additionally, automation
components do not contain sub-components. AutomationML
Components are stored as SystemUnitClasses or
InternalElements. When AutomationML Components define
a type model, SystemUnitClasses are used. When describing
an instance model, an InternalElement should be used.
AutomationML Component models represent data models for
a specific domain or use case. Generally, in many cases
within engineering and subsequent use of an AutomationML
Component, using single domain models together provides
the best results.
Fig 1. Aspects of an automation component or production system [3]
An Automated production system or plant consists of a
number of subsystems and subcomponents that interact in
various ways and can form hierarchies. When designing these
systems, various factors must be considered. Different
engineering disciplines require different but potentially
interrelated information even on a single automation
component, such as functional engineering, mechanical planning, or electrical planning [3]. Figure 1 shows the
different types of information a component of AutomationML
can contain.
The rest of the paper is organized as follows: section II
introduces about the AutomationML. Section III
demonstrates about the AutomationML component, its
stakeholders, use cases, sub-modelling of its components and
its logic representation. Section IV details how the
AutomationML component changes the production systems
Engineering. Section V outlines the summary of the paper.
II. BACKGROUND
AutomationML:
To Understand AutomationML Component we need to
have some basic knowledge about AutomationML.
AutomationML main strength is its representation of
81
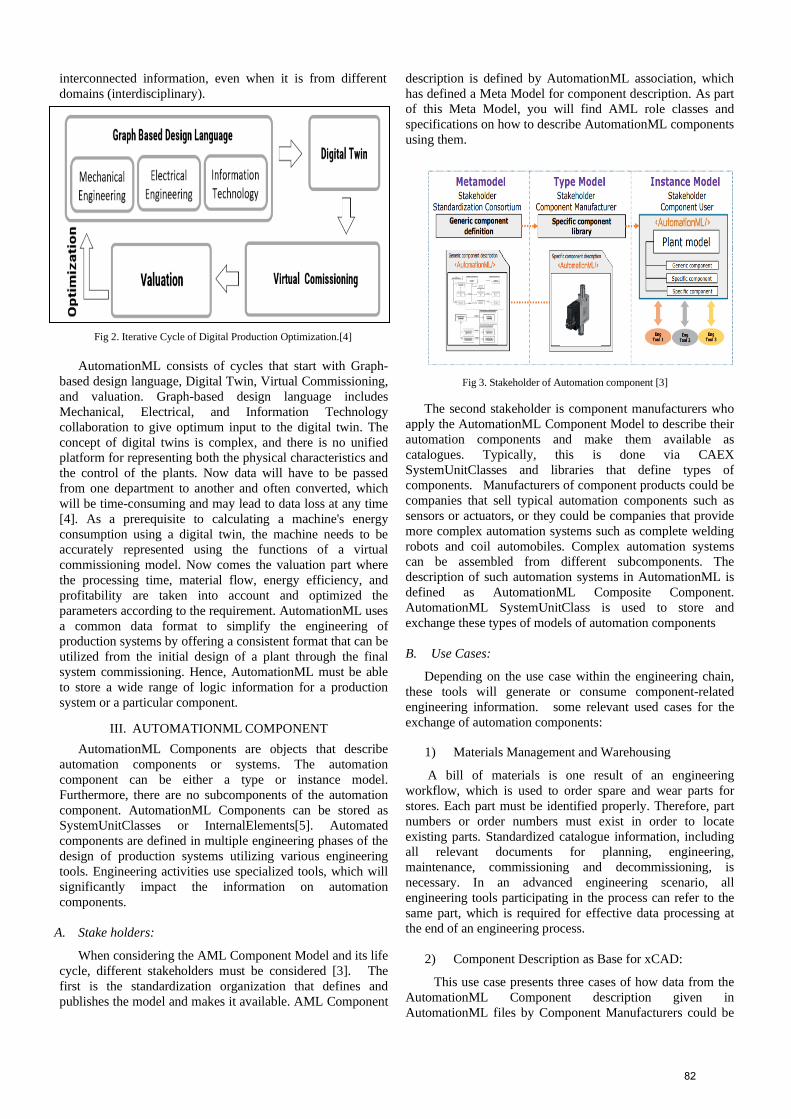
interconnected information, even when it is from different
domains (interdisciplinary).
Fig 2. Iterative Cycle of Digital Production Optimization.[4]
AutomationML consists of cycles that start with Graph-
based design language, Digital Twin, Virtual Commissioning,
and valuation. Graph-based design language includes
Mechanical, Electrical, and Information Technology
collaboration to give optimum input to the digital twin. The
concept of digital twins is complex, and there is no unified
platform for representing both the physical characteristics and
the control of the plants. Now data will have to be passed
from one department to another and often converted, which
will be time-consuming and may lead to data loss at any time
[4]. As a prerequisite to calculating a machine's energy
consumption using a digital twin, the machine needs to be
accurately represented using the functions of a virtual
commissioning model. Now comes the valuation part where
the processing time, material flow, energy efficiency, and
profitability are taken into account and optimized the
parameters according to the requirement. AutomationML uses
a common data format to simplify the engineering of
production systems by offering a consistent format that can be
utilized from the initial design of a plant through the final
system commissioning. Hence, AutomationML must be able
to store a wide range of logic information for a production
system or a particular component.
III. AUTOMATIONML COMPONENT
AutomationML Components are objects that describe
automation components or systems. The automation
component can be either a type or instance model.
Furthermore, there are no subcomponents of the automation
component. AutomationML Components can be stored as
SystemUnitClasses or InternalElements[5]. Automated
components are defined in multiple engineering phases of the
design of production systems utilizing various engineering
tools. Engineering activities use specialized tools, which will
significantly impact the information on automation
components.
A. Stake holders:
When considering the AML Component Model and its life
cycle, different stakeholders must be considered [3]. The
first is the standardization organization that defines and
publishes the model and makes it available. AML Component
description is defined by AutomationML association, which
has defined a Meta Model for component description. As part
of this Meta Model, you will find AML role classes and
specifications on how to describe AutomationML components
using them.
Fig 3. Stakeholder of Automation component [3]
The second stakeholder is component manufacturers who
apply the AutomationML Component Model to describe their
automation components and make them available as
catalogues. Typically, this is done via CAEX
SystemUnitClasses and libraries that define types of
components. Manufacturers of component products could be
companies that sell typical automation components such as
sensors or actuators, or they could be companies that provide
more complex automation systems such as complete welding
robots and coil automobiles. Complex automation systems
can be assembled from different subcomponents. The
description of such automation systems in AutomationML is
defined as AutomationML Composite Component.
AutomationML SystemUnitClass is used to store and
exchange these types of models of automation components
B. Use Cases:
Depending on the use case within the engineering chain,
these tools will generate or consume component-related
engineering information. some relevant used cases for the
exchange of automation components:
1) Materials Management and Warehousing
A bill of materials is one result of an engineering
workflow, which is used to order spare and wear parts for
stores. Each part must be identified properly. Therefore, part
numbers or order numbers must exist in order to locate
existing parts. Standardized catalogue information, including
all relevant documents for planning, engineering,
maintenance, commissioning and decommissioning, is
necessary. In an advanced engineering scenario, all
engineering tools participating in the process can refer to the
same part, which is required for effective data processing at
the end of an engineering process.
2) Component Description as Base for xCAD:
This use case presents three cases of how data from the
AutomationML Component description given in
AutomationML files by Component Manufacturers could be
82
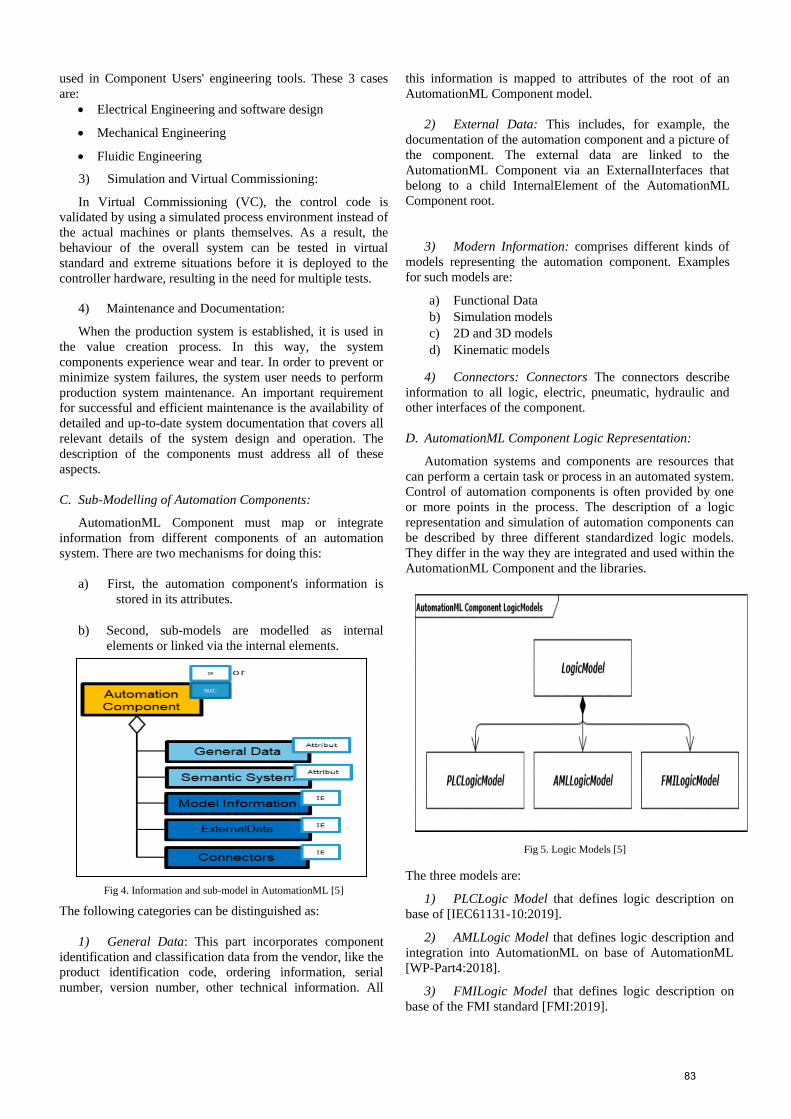
used in Component Users' engineering tools. These 3 cases
are:
• Electrical Engineering and software design
• Mechanical Engineering
• Fluidic Engineering
3) Simulation and Virtual Commissioning:
In Virtual Commissioning (VC), the control code is
validated by using a simulated process environment instead of
the actual machines or plants themselves. As a result, the
behaviour of the overall system can be tested in virtual
standard and extreme situations before it is deployed to the
controller hardware, resulting in the need for multiple tests.
4) Maintenance and Documentation:
When the production system is established, it is used in
the value creation process. In this way, the system
components experience wear and tear. In order to prevent or
minimize system failures, the system user needs to perform
production system maintenance. An important requirement
for successful and efficient maintenance is the availability of
detailed and up-to-date system documentation that covers all
relevant details of the system design and operation. The
description of the components must address all of these
aspects.
C. Sub-Modelling of Automation Components:
AutomationML Component must map or integrate
information from different components of an automation
system. There are two mechanisms for doing this:
a) First, the automation component's information is
stored in its attributes.
b) Second, sub-models are modelled as internal
elements or linked via the internal elements.
Fig 4. Information and sub-model in AutomationML [5]
The following categories can be distinguished as:
1) General Data: This part incorporates component
identification and classification data from the vendor, like the
product identification code, ordering information, serial
number, version number, other technical information. All
this information is mapped to attributes of the root of an
AutomationML Component model.
2) External Data: This includes, for example, the
documentation of the automation component and a picture of
the component. The external data are linked to the
AutomationML Component via an ExternalInterfaces that
belong to a child InternalElement of the AutomationML
Component root.
3) Modern Information: comprises different kinds of
models representing the automation component. Examples
for such models are:
a) Functional Data
b) Simulation models
c) 2D and 3D models
d) Kinematic models
4) Connectors: Connectors The connectors describe
information to all logic, electric, pneumatic, hydraulic and
other interfaces of the component.
D. AutomationML Component Logic Representation:
Automation systems and components are resources that
can perform a certain task or process in an automated system.
Control of automation components is often provided by one
or more points in the process. The description of a logic
representation and simulation of automation components can
be described by three different standardized logic models.
They differ in the way they are integrated and used within the
AutomationML Component and the libraries.
Fig 5. Logic Models [5]
The three models are:
1) PLCLogic Model that defines logic description on
base of [IEC61131-10:2019].
2) AMLLogic Model that defines logic description and
integration into AutomationML on base of AutomationML
[WP-Part4:2018].
3) FMILogic Model that defines logic description on
base of the FMI standard [FMI:2019].
83
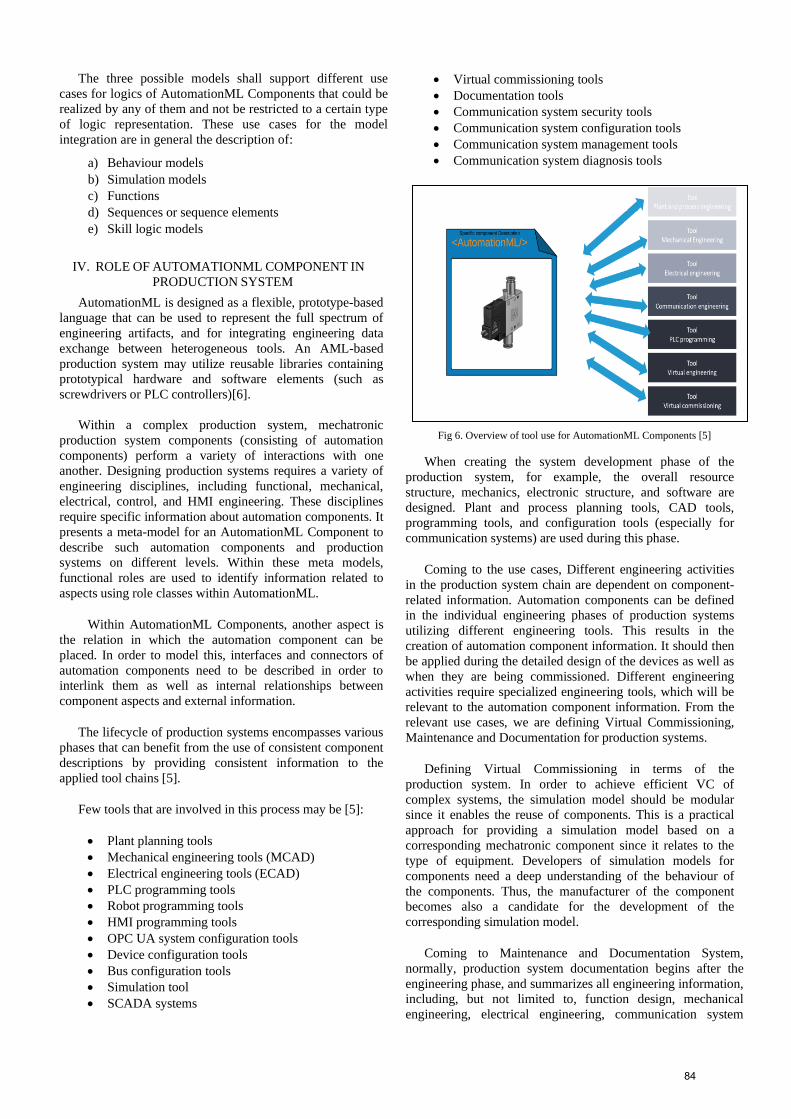
The three possible models shall support different use
cases for logics of AutomationML Components that could be
realized by any of them and not be restricted to a certain type
of logic representation. These use cases for the model
integration are in general the description of:
a) Behaviour models
b) Simulation models
c) Functions
d) Sequences or sequence elements
e) Skill logic models
IV. ROLE OF AUTOMATIONML COMPONENT IN
PRODUCTION SYSTEM
AutomationML is designed as a flexible, prototype-based
language that can be used to represent the full spectrum of
engineering artifacts, and for integrating engineering data
exchange between heterogeneous tools. An AML-based
production system may utilize reusable libraries containing
prototypical hardware and software elements (such as
screwdrivers or PLC controllers)[6].
Within a complex production system, mechatronic
production system components (consisting of automation
components) perform a variety of interactions with one
another. Designing production systems requires a variety of
engineering disciplines, including functional, mechanical,
electrical, control, and HMI engineering. These disciplines
require specific information about automation components. It
presents a meta-model for an AutomationML Component to
describe such automation components and production
systems on different levels. Within these meta models,
functional roles are used to identify information related to
aspects using role classes within AutomationML.
Within AutomationML Components, another aspect is
the relation in which the automation component can be
placed. In order to model this, interfaces and connectors of
automation components need to be described in order to
interlink them as well as internal relationships between
component aspects and external information.
The lifecycle of production systems encompasses various
phases that can benefit from the use of consistent component
descriptions by providing consistent information to the
applied tool chains [5].
Few tools that are involved in this process may be [5]:
• Plant planning tools
• Mechanical engineering tools (MCAD)
• Electrical engineering tools (ECAD)
• PLC programming tools
• Robot programming tools
• HMI programming tools
• OPC UA system configuration tools
• Device configuration tools
• Bus configuration tools
• Simulation tool
• SCADA systems
• Virtual commissioning tools
• Documentation tools
• Communication system security tools
• Communication system configuration tools
• Communication system management tools
• Communication system diagnosis tools
Fig 6. Overview of tool use for AutomationML Components [5]
When creating the system development phase of the
production system, for example, the overall resource
structure, mechanics, electronic structure, and software are
designed. Plant and process planning tools, CAD tools,
programming tools, and configuration tools (especially for
communication systems) are used during this phase.
Coming to the use cases, Different engineering activities
in the production system chain are dependent on component-
related information. Automation components can be defined
in the individual engineering phases of production systems
utilizing different engineering tools. This results in the
creation of automation component information. It should then
be applied during the detailed design of the devices as well as
when they are being commissioned. Different engineering
activities require specialized engineering tools, which will be
relevant to the automation component information. From the
relevant use cases, we are defining Virtual Commissioning,
Maintenance and Documentation for production systems.
Defining Virtual Commissioning in terms of the
production system. In order to achieve efficient VC of
complex systems, the simulation model should be modular
since it enables the reuse of components. This is a practical
approach for providing a simulation model based on a
corresponding mechatronic component since it relates to the
type of equipment. Developers of simulation models for
components need a deep understanding of the behaviour of
the components. Thus, the manufacturer of the component
becomes also a candidate for the development of the
corresponding simulation model.
Coming to Maintenance and Documentation System,
normally, production system documentation begins after the
engineering phase, and summarizes all engineering information,
including, but not limited to, function design, mechanical
engineering, electrical engineering, communication system
84

engineering, and control programming. Therefore, the
engineering tools need to provide the documentation tool with
their results. Documentation is carried out during the
production system commissioning by updating engineering
results based on changes made during the physical realization
of the production system and by incorporating information on
the labelling of system components (such as wire marking or
printed reference signs). The documentation tool must,
therefore, receive results from the related commissioning tools.
Documentation is also carried out during the production system
use phase. Replacement of production system components and
their impact on mechanical, electrical, control, etc. construction
of the production system shall be documented here to ensure an
as-is documentation. Thus, engineering, commissioning, and
maintenance tools must provide their results to the
documentation tool.
V. SUMMARY
In this paper, we surveyed AutomationML and AutomationML
Component and we can say that with AutomationML, we can
effectively model today's engineering aspects as well as future
engineering aspects. AutomationML Component is the first
approach to integrating all relevant engineering information in
one model and making it available. The tool chains use the
information of the AutomationML component to improve the
lifecycle of a production system which depends upon the use
cases which we have described in this paper.
REFERENCES
[1] IEC 62714-1 CD norm draft AutomationML Architecture, www.iec.ch,
2011
[2] R. Drath and D. Weidemann, Datenaustausch in der Anlagenplanung
mit AutomationML: Integration von CAEX, PLCopen XML und
COLLADA. Springer-Verlag, 2009.
[3] Hundt, Lorenz, Wiegand, Mathias and Meyer, Torben. "14 The
AutomationML Component". AutomationML: The Industrial
Cookbook, edited by Rainer Drath, Berlin, Boston: De Gruyter
Oldenbourg, 2021, pp. 255-294
[4] N. Beisheim, T. Ott, S. Amann, Einsatz von AutomationML zur
automatischen Generierung von Digitalen Zwillingen von
Werkzeugmaschinen zur Entwicklung energieeffizienter
Produktionssysteme. 26. Interdisziplinäre Wissenschaftliche Konferenz,
Mittweida, April 14th-15th, 2021.
[5] A. Consortium, “Whitepaper AutomationML Part 6 : AutomationML
Component State October 2020,” no. October, 2020.
[6] L. Berardinelli, S. Biffl, E. Maetzler, T. Mayerhofer, and M. Wimmer,
“Model-based co-evolution of production systems and their libraries
with AutomationML,” IEEE Int. Conf. Emerg. Technol. Fact. Autom.
ETFA, vol. 2015-Octob, 2015, doi: 10.1109/ETFA.2015.7301483
[7] D. Identifier and W. P. Eclassaml, “White paper AutomationML and
ECLASS integration State : November 2021,” no. November, 2021.
[8] A. Lüder and N. Schmidt, “AutomationML in a Nutshell,” Handb. Ind.
4.0 Bd.2, no. November, pp. 213–258, 2017, doi: 10.1007/978-3-662-
53248-5_61.
85
Implementation of Module Type Package in
Production System Engineering
Venkata Nrusimha Maddali
Matriculation Number: 235734
Systems Engineering for
Manufacturing,
Otto von Guericke University
Magdeburg, Germany
email: [email protected]
Rajashekar Reddy Kondam
Matriculation Number: 239808
Systems Engineering for
Manufacturing,
Otto von Guericke University
Magdeburg, Germany
email: [email protected]
Shubham Gupta
Matriculation Number: 239327
Systems Engineering for
Manufacturing,
Otto von Guericke University
Magdeburg, Germany
email: [email protected]
Abstract—The modularization of production systems is
viewed as a potential strategy to meet the growing industry
requirements in terms of flexibility and changing customer
needs. The present study assesses the needs of the current
production system engineering, and how modularization of
production plants can be the breakthrough approach in
fulfilling those needs. A proposal has been devised to address the
present difficulties in the implementation of modular plants,
particularly in their integration. The Module Type Package
(MTP) is a concept for quickly integrating a module's
automation system into the higher-level process control system.
This paper describes the various methods to implement MTP
and to integrate MTP into Production Systems.
Keywords—Modularization, Module Type Package,
Integration, Production system engineering.
ABBREVIATIONS AND ACRONYMS
Table I. Abbreviations Table
Serial
No. Name
Abbreviated
form
1 German User Association for Automation in Process Industries
NAMUR
2 Decentralized Intelligence for Modular
Assets DIMA
3 German Electrical and Electronic
Manufacturers' Association ZVEI
4 Process Equipment Assembly PEA
5 Programmable Logic Controller PLC
6 Process Control Element PCE
7 OPC Unified Architecture OPC UA
8 Process Control System PCS
9 Service-Oriented Architecture SOA
10 Human-Machine Interfaces HMI
11 Verein Deutscher Ingenieure VDI
12 Verband Deutscher Elektrotechniker VDE
I. INTRODUCTION
Rapidly changing customer needs, increased demand for
customized goods, customer-specific specialization and
flexibility are the main reasons for shortening the product life
cycles. These reasons are impacting the market maturity
which in return is a huge problem for the current production
systems to adapt.
We must ensure that a production system has to tackle
such volatile markets and should utilize the advantages of
both continuous production and batch production so that it
could be efficient, versatile and Flexible enough.
Modularization is a promising technique that aims to provide
Interoperability, Decentralization, Virtualization, and Service
Orientation to pave the way for future production systems.
An EU research initiative called F3 Factory (Flexible, Fast,
and Future) created the foundation for this concept.
Modularization ensures the plug and produce process,
thus helping in reducing the time to market. The initial capital
required may be high but cost benefits can be seen when we
compare the time between the first idea of a product and its
production. Modularization acts as a bridge for the
transformation of current production systems to futuristic
ones. In future, modularization will easily coupe up with the
rapidly changing technology and technological
advancements with comparably lowered engineering and
automation costs for the future updates.
As the conventional process systems are incapable of
meeting the requirements of fast-growing customized
markets and production facilities, modularisation has been
considered as a key factor in the process systems.
Before diving into Modularization, Module Type Package
and their integration, we will investigate different existing
integration technologies.
1) GSD/GSDML: The GSD (Generic Station
Description) describes the hierarchical structure of a field
device one-dimensionally XML-based documents use the
model of a hierarchical device as accurately as possible with
the advent of GSDML (General Station Description Markup
Language). GSDML allows to create module and submodule
relationships for modular field devices [1].
2) EDD: The Electronic Device Description
(EDD) provides a clear description of attributes. It contains
information on the field device's behaviour which can be
observed externally. This information grabs the device-
related resources and functionality. The EDD Language
(EDDL), which is defined in IEC 61804-3, allows for the
description of data (parameters), communication
86
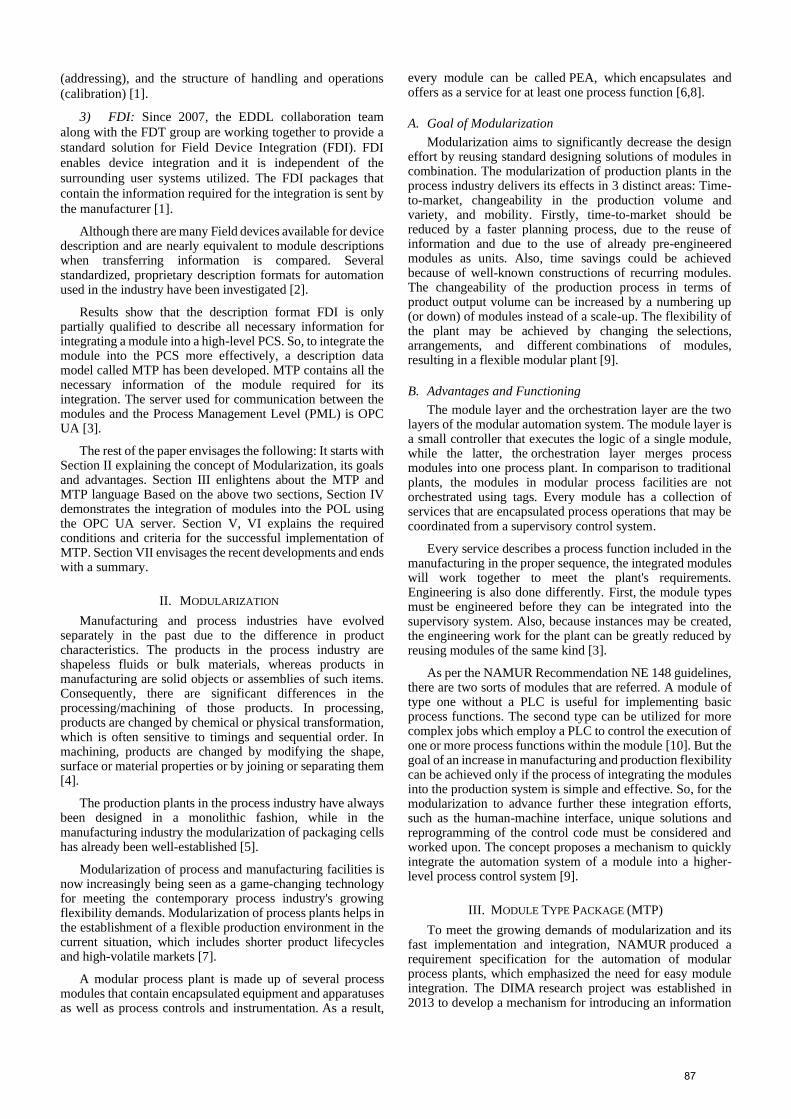
(addressing), and the structure of handling and operations
(calibration) [1].
3) FDI: Since 2007, the EDDL collaboration team
along with the FDT group are working together to provide a
standard solution for Field Device Integration (FDI). FDI
enables device integration and it is independent of the
surrounding user systems utilized. The FDI packages that
contain the information required for the integration is sent by
the manufacturer [1].
Although there are many Field devices available for device description and are nearly equivalent to module descriptions when transferring information is compared. Several standardized, proprietary description formats for automation used in the industry have been investigated [2].
Results show that the description format FDI is only partially qualified to describe all necessary information for integrating a module into a high-level PCS. So, to integrate the module into the PCS more effectively, a description data model called MTP has been developed. MTP contains all the necessary information of the module required for its integration. The server used for communication between the modules and the Process Management Level (PML) is OPC UA [3].
The rest of the paper envisages the following: It starts with Section II explaining the concept of Modularization, its goals and advantages. Section III enlightens about the MTP and MTP language Based on the above two sections, Section IV demonstrates the integration of modules into the POL using the OPC UA server. Section V, VI explains the required conditions and criteria for the successful implementation of MTP. Section VII envisages the recent developments and ends with a summary.
II. MODULARIZATION
Manufacturing and process industries have evolved separately in the past due to the difference in product characteristics. The products in the process industry are shapeless fluids or bulk materials, whereas products in manufacturing are solid objects or assemblies of such items. Consequently, there are significant differences in the processing/machining of those products. In processing, products are changed by chemical or physical transformation, which is often sensitive to timings and sequential order. In machining, products are changed by modifying the shape, surface or material properties or by joining or separating them [4].
The production plants in the process industry have always been designed in a monolithic fashion, while in the manufacturing industry the modularization of packaging cells has already been well-established [5].
Modularization of process and manufacturing facilities is now increasingly being seen as a game-changing technology for meeting the contemporary process industry's growing flexibility demands. Modularization of process plants helps in the establishment of a flexible production environment in the current situation, which includes shorter product lifecycles and high-volatile markets [7].
A modular process plant is made up of several process modules that contain encapsulated equipment and apparatuses as well as process controls and instrumentation. As a result,
every module can be called PEA, which encapsulates and offers as a service for at least one process function [6,8].
A. Goal of Modularization
Modularization aims to significantly decrease the design effort by reusing standard designing solutions of modules in combination. The modularization of production plants in the process industry delivers its effects in 3 distinct areas: Time-to-market, changeability in the production volume and variety, and mobility. Firstly, time-to-market should be reduced by a faster planning process, due to the reuse of information and due to the use of already pre-engineered modules as units. Also, time savings could be achieved because of well-known constructions of recurring modules. The changeability of the production process in terms of product output volume can be increased by a numbering up (or down) of modules instead of a scale-up. The flexibility of the plant may be achieved by changing the selections, arrangements, and different combinations of modules, resulting in a flexible modular plant [9].
B. Advantages and Functioning
The module layer and the orchestration layer are the two layers of the modular automation system. The module layer is a small controller that executes the logic of a single module, while the latter, the orchestration layer merges process modules into one process plant. In comparison to traditional plants, the modules in modular process facilities are not orchestrated using tags. Every module has a collection of services that are encapsulated process operations that may be coordinated from a supervisory control system.
Every service describes a process function included in the manufacturing in the proper sequence, the integrated modules will work together to meet the plant's requirements. Engineering is also done differently. First, the module types must be engineered before they can be integrated into the supervisory system. Also, because instances may be created, the engineering work for the plant can be greatly reduced by reusing modules of the same kind [3].
As per the NAMUR Recommendation NE 148 guidelines, there are two sorts of modules that are referred. A module of type one without a PLC is useful for implementing basic process functions. The second type can be utilized for more complex jobs which employ a PLC to control the execution of one or more process functions within the module [10]. But the goal of an increase in manufacturing and production flexibility can be achieved only if the process of integrating the modules into the production system is simple and effective. So, for the modularization to advance further these integration efforts, such as the human-machine interface, unique solutions and reprogramming of the control code must be considered and worked upon. The concept proposes a mechanism to quickly integrate the automation system of a module into a higher-level process control system [9].
III. MODULE TYPE PACKAGE (MTP)
To meet the growing demands of modularization and its fast implementation and integration, NAMUR produced a requirement specification for the automation of modular process plants, which emphasized the need for easy module integration. The DIMA research project was established in 2013 to develop a mechanism for introducing an information
87
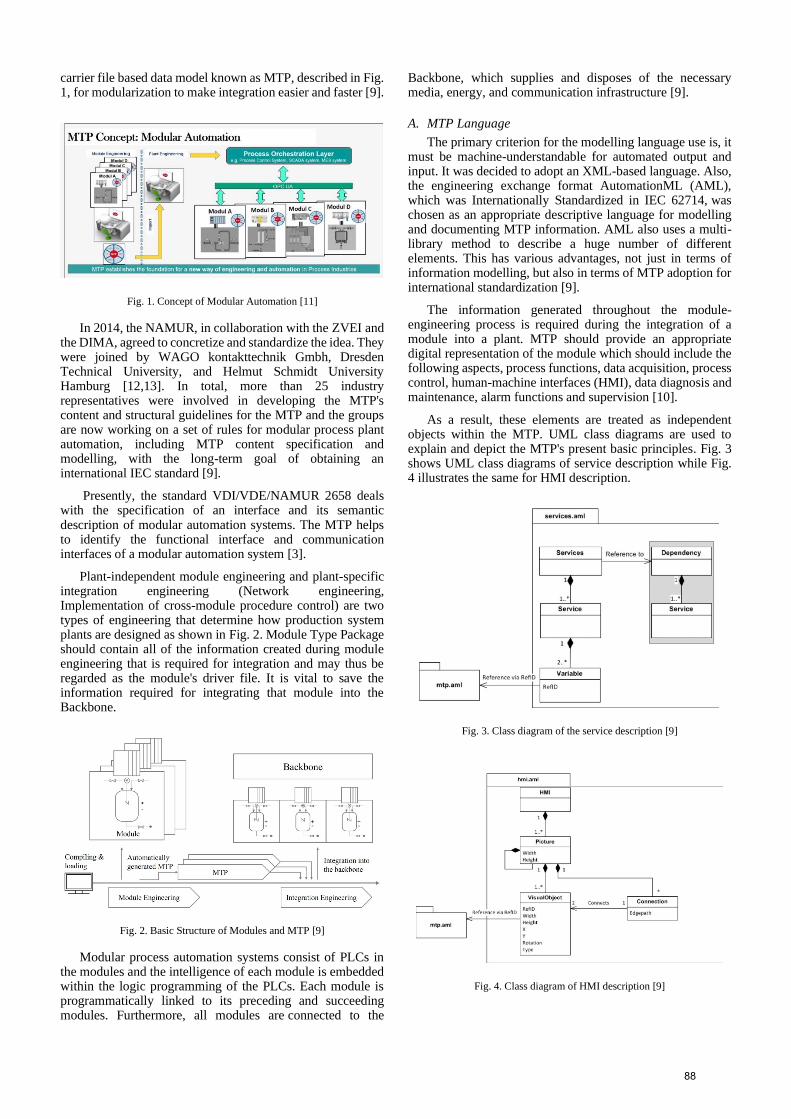
carrier file based data model known as MTP, described in Fig. 1, for modularization to make integration easier and faster [9].
Fig. 1. Concept of Modular Automation [11]
In 2014, the NAMUR, in collaboration with the ZVEI and the DIMA, agreed to concretize and standardize the idea. They were joined by WAGO kontakttechnik Gmbh, Dresden Technical University, and Helmut Schmidt University Hamburg [12,13]. In total, more than 25 industry representatives were involved in developing the MTP's content and structural guidelines for the MTP and the groups are now working on a set of rules for modular process plant automation, including MTP content specification and modelling, with the long-term goal of obtaining an international IEC standard [9].
Presently, the standard VDI/VDE/NAMUR 2658 deals with the specification of an interface and its semantic description of modular automation systems. The MTP helps to identify the functional interface and communication interfaces of a modular automation system [3].
Plant-independent module engineering and plant-specific integration engineering (Network engineering, Implementation of cross-module procedure control) are two types of engineering that determine how production system plants are designed as shown in Fig. 2. Module Type Package should contain all of the information created during module engineering that is required for integration and may thus be regarded as the module's driver file. It is vital to save the information required for integrating that module into the Backbone.
Fig. 2. Basic Structure of Modules and MTP [9]
Modular process automation systems consist of PLCs in the modules and the intelligence of each module is embedded within the logic programming of the PLCs. Each module is programmatically linked to its preceding and succeeding modules. Furthermore, all modules are connected to the
Backbone, which supplies and disposes of the necessary media, energy, and communication infrastructure [9].
A. MTP Language
The primary criterion for the modelling language use is, it must be machine-understandable for automated output and input. It was decided to adopt an XML-based language. Also, the engineering exchange format AutomationML (AML), which was Internationally Standardized in IEC 62714, was chosen as an appropriate descriptive language for modelling and documenting MTP information. AML also uses a multi-library method to describe a huge number of different elements. This has various advantages, not just in terms of information modelling, but also in terms of MTP adoption for international standardization [9].
The information generated throughout the module-engineering process is required during the integration of a module into a plant. MTP should provide an appropriate digital representation of the module which should include the following aspects, process functions, data acquisition, process control, human-machine interfaces (HMI), data diagnosis and maintenance, alarm functions and supervision [10].
As a result, these elements are treated as independent objects within the MTP. UML class diagrams are used to explain and depict the MTP's present basic principles. Fig. 3 shows UML class diagrams of service description while Fig. 4 illustrates the same for HMI description.
Fig. 3. Class diagram of the service description [9]
Fig. 4. Class diagram of HMI description [9]
88
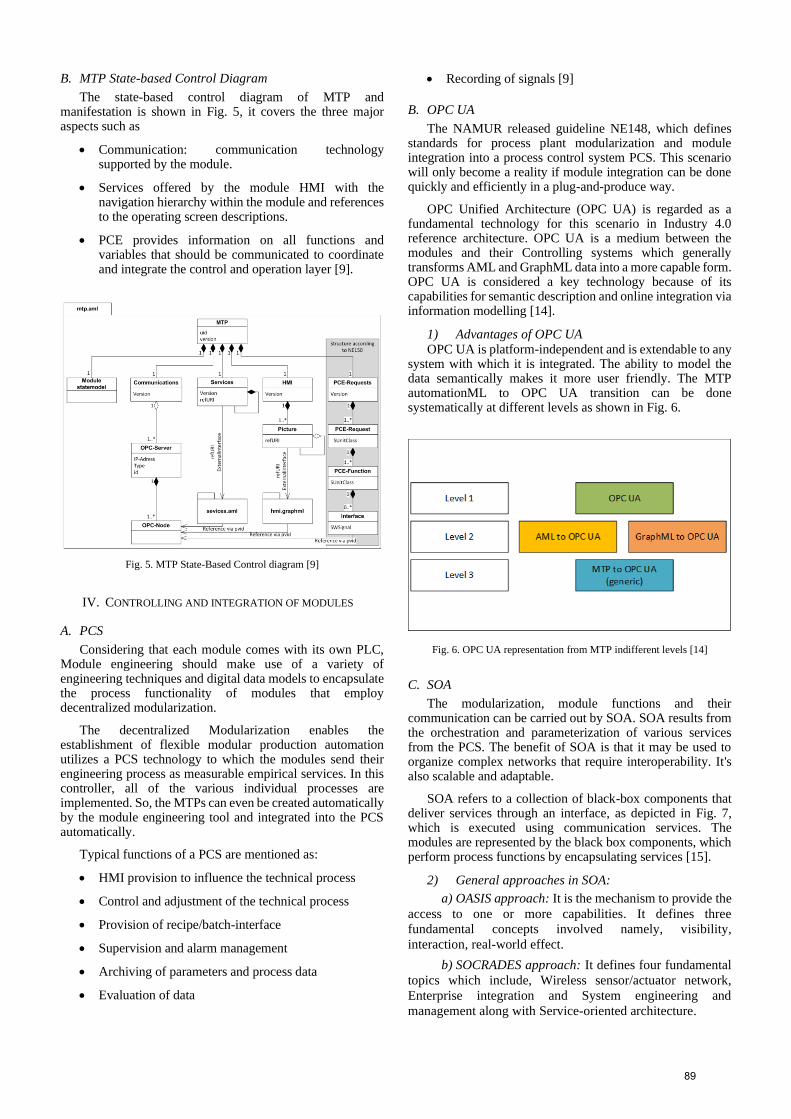
B. MTP State-based Control Diagram
The state-based control diagram of MTP and manifestation is shown in Fig. 5, it covers the three major aspects such as
• Communication: communication technology supported by the module.
• Services offered by the module HMI with the navigation hierarchy within the module and references to the operating screen descriptions.
• PCE provides information on all functions and variables that should be communicated to coordinate and integrate the control and operation layer [9].
Fig. 5. MTP State-Based Control diagram [9]
IV. CONTROLLING AND INTEGRATION OF MODULES
A. PCS
Considering that each module comes with its own PLC, Module engineering should make use of a variety of engineering techniques and digital data models to encapsulate the process functionality of modules that employ decentralized modularization.
The decentralized Modularization enables the establishment of flexible modular production automation utilizes a PCS technology to which the modules send their engineering process as measurable empirical services. In this controller, all of the various individual processes are implemented. So, the MTPs can even be created automatically by the module engineering tool and integrated into the PCS automatically.
Typical functions of a PCS are mentioned as:
• HMI provision to influence the technical process
• Control and adjustment of the technical process
• Provision of recipe/batch-interface
• Supervision and alarm management
• Archiving of parameters and process data
• Evaluation of data
• Recording of signals [9]
B. OPC UA
The NAMUR released guideline NE148, which defines standards for process plant modularization and module integration into a process control system PCS. This scenario will only become a reality if module integration can be done quickly and efficiently in a plug-and-produce way.
OPC Unified Architecture (OPC UA) is regarded as a fundamental technology for this scenario in Industry 4.0 reference architecture. OPC UA is a medium between the modules and their Controlling systems which generally transforms AML and GraphML data into a more capable form. OPC UA is considered a key technology because of its capabilities for semantic description and online integration via information modelling [14].
1) Advantages of OPC UA OPC UA is platform-independent and is extendable to any
system with which it is integrated. The ability to model the data semantically makes it more user friendly. The MTP automationML to OPC UA transition can be done systematically at different levels as shown in Fig. 6.
Fig. 6. OPC UA representation from MTP indifferent levels [14]
C. SOA
The modularization, module functions and their communication can be carried out by SOA. SOA results from the orchestration and parameterization of various services from the PCS. The benefit of SOA is that it may be used to organize complex networks that require interoperability. It's also scalable and adaptable.
SOA refers to a collection of black-box components that deliver services through an interface, as depicted in Fig. 7, which is executed using communication services. The modules are represented by the black box components, which perform process functions by encapsulating services [15].
2) General approaches in SOA:
a) OASIS approach: It is the mechanism to provide the
access to one or more capabilities. It defines three
fundamental concepts involved namely, visibility,
interaction, real-world effect.
b) SOCRADES approach: It defines four fundamental
topics which include, Wireless sensor/actuator network,
Enterprise integration and System engineering and
management along with Service-oriented architecture.
89
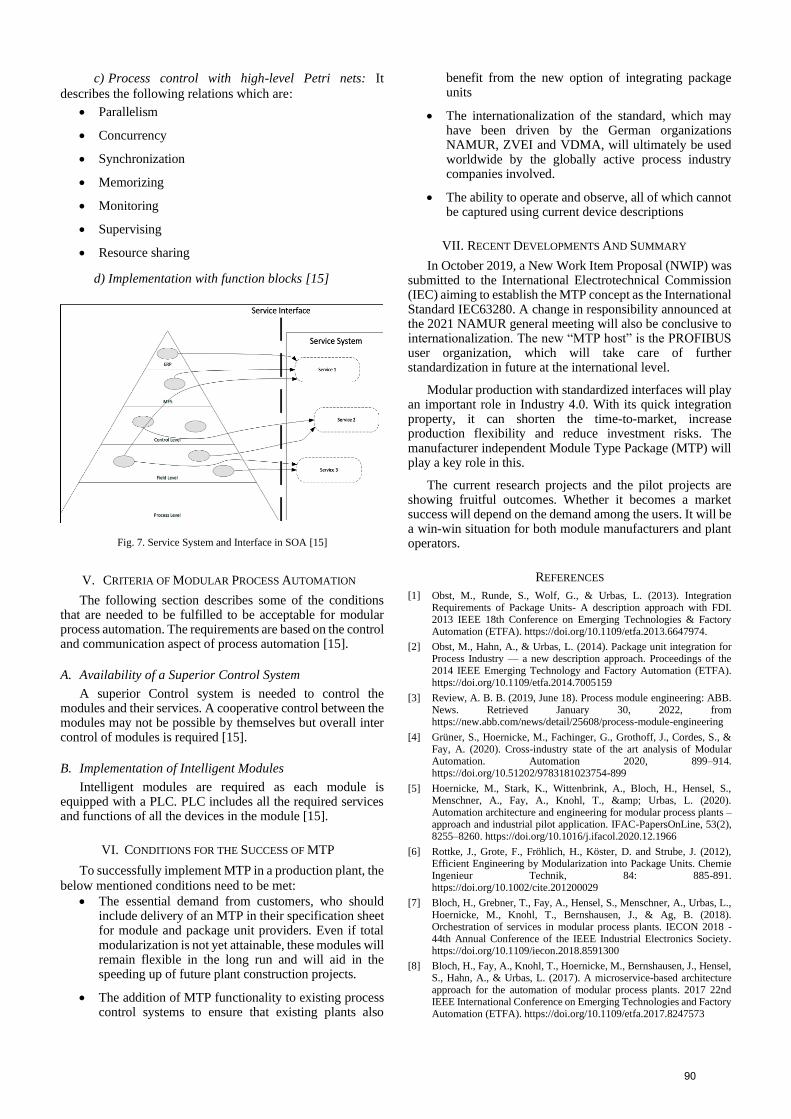
c) Process control with high-level Petri nets: It
describes the following relations which are:
• Parallelism
• Concurrency
• Synchronization
• Memorizing
• Monitoring
• Supervising
• Resource sharing
d) Implementation with function blocks [15]
Fig. 7. Service System and Interface in SOA [15]
V. CRITERIA OF MODULAR PROCESS AUTOMATION
The following section describes some of the conditions that are needed to be fulfilled to be acceptable for modular process automation. The requirements are based on the control and communication aspect of process automation [15].
A. Availability of a Superior Control System
A superior Control system is needed to control the modules and their services. A cooperative control between the modules may not be possible by themselves but overall inter control of modules is required [15].
B. Implementation of Intelligent Modules
Intelligent modules are required as each module is equipped with a PLC. PLC includes all the required services and functions of all the devices in the module [15].
VI. CONDITIONS FOR THE SUCCESS OF MTP
To successfully implement MTP in a production plant, the
below mentioned conditions need to be met:
• The essential demand from customers, who should include delivery of an MTP in their specification sheet for module and package unit providers. Even if total modularization is not yet attainable, these modules will remain flexible in the long run and will aid in the speeding up of future plant construction projects.
• The addition of MTP functionality to existing process control systems to ensure that existing plants also
benefit from the new option of integrating package units
• The internationalization of the standard, which may have been driven by the German organizations NAMUR, ZVEI and VDMA, will ultimately be used worldwide by the globally active process industry companies involved.
• The ability to operate and observe, all of which cannot be captured using current device descriptions
VII. RECENT DEVELOPMENTS AND SUMMARY
In October 2019, a New Work Item Proposal (NWIP) was submitted to the International Electrotechnical Commission (IEC) aiming to establish the MTP concept as the International Standard IEC63280. A change in responsibility announced at the 2021 NAMUR general meeting will also be conclusive to internationalization. The new “MTP host” is the PROFIBUS user organization, which will take care of further standardization in future at the international level.
Modular production with standardized interfaces will play an important role in Industry 4.0. With its quick integration property, it can shorten the time-to-market, increase production flexibility and reduce investment risks. The manufacturer independent Module Type Package (MTP) will play a key role in this.
The current research projects and the pilot projects are showing fruitful outcomes. Whether it becomes a market success will depend on the demand among the users. It will be a win-win situation for both module manufacturers and plant operators.
REFERENCES
[1] Obst, M., Runde, S., Wolf, G., & Urbas, L. (2013). Integration Requirements of Package Units- A description approach with FDI. 2013 IEEE 18th Conference on Emerging Technologies & Factory Automation (ETFA). https://doi.org/10.1109/etfa.2013.6647974.
[2] Obst, M., Hahn, A., & Urbas, L. (2014). Package unit integration for Process Industry — a new description approach. Proceedings of the 2014 IEEE Emerging Technology and Factory Automation (ETFA). https://doi.org/10.1109/etfa.2014.7005159
[3] Review, A. B. B. (2019, June 18). Process module engineering: ABB. News. Retrieved January 30, 2022, from https://new.abb.com/news/detail/25608/process-module-engineering
[4] Grüner, S., Hoernicke, M., Fachinger, G., Grothoff, J., Cordes, S., & Fay, A. (2020). Cross-industry state of the art analysis of Modular Automation. Automation 2020, 899–914. https://doi.org/10.51202/9783181023754-899
[5] Hoernicke, M., Stark, K., Wittenbrink, A., Bloch, H., Hensel, S., Menschner, A., Fay, A., Knohl, T., & Urbas, L. (2020). Automation architecture and engineering for modular process plants – approach and industrial pilot application. IFAC-PapersOnLine, 53(2), 8255–8260. https://doi.org/10.1016/j.ifacol.2020.12.1966
[6] Rottke, J., Grote, F., Fröhlich, H., Köster, D. and Strube, J. (2012), Efficient Engineering by Modularization into Package Units. Chemie Ingenieur Technik, 84: 885-891. https://doi.org/10.1002/cite.201200029
[7] Bloch, H., Grebner, T., Fay, A., Hensel, S., Menschner, A., Urbas, L., Hoernicke, M., Knohl, T., Bernshausen, J., & Ag, B. (2018). Orchestration of services in modular process plants. IECON 2018 - 44th Annual Conference of the IEEE Industrial Electronics Society. https://doi.org/10.1109/iecon.2018.8591300
[8] Bloch, H., Fay, A., Knohl, T., Hoernicke, M., Bernshausen, J., Hensel, S., Hahn, A., & Urbas, L. (2017). A microservice-based architecture approach for the automation of modular process plants. 2017 22nd IEEE International Conference on Emerging Technologies and Factory Automation (ETFA). https://doi.org/10.1109/etfa.2017.8247573
90

[9] Ladiges, J., Fay, A., Holm, T., Hempen, U., Urbas, L., Obst, M., & Albers, T. (2018). Integration of modular process units into process control systems. IEEE Transactions on Industry Applications, 54(2), 1870–1880. https://doi.org/10.1109/tia.2017.2782679
[10] Holm, T., Obst, M., Fay, A., Urbas, L., Hempen, U., Albers, T., & Kreft, S. (2015). Engineering method for the integration of modules into fast-evolving production systems in the process industry. 2015 IEEE International Conference on Automation Science and Engineering (CASE). https://doi.org/10.1109/coase.2015.7294236
[11] Realize your production fast and easily – from modular engineering to Modular Automation with MTP, siemens.com, Global Website Retrieved January 30, 2022, from https://new.siemens.com/global/en/company/topic-areas/digital-enterprise/process-industry/modular-production.html
[12] Obst, M., Holm, T., Urbas, L., Fay, A., Kreft, S., Hempen, U., & Albers, T. (2015). Semantic description of process modules. 2015
IEEE 20th Conference on Emerging Technologies & Factory Automation (ETFA). https://doi.org/10.1109/etfa.2015.7301440
[13] ZVEI, e.v. Joint Status report from NAMUR, VDMA and PROCESSNET on MTP.
[14] Wassilew, S., Urbas, L., Ladiges, J., Fay, A., & Holm, T. (2016). Transformation of the NAMUR MTP to OPC UA to allow plug and produce for Modular Process Automation. 2016 IEEE 21st International Conference on Emerging Technologies and Factory Automation (ETFA). https://doi.org/10.1109/etfa.2016.7733749
[15] Bloch, H., Fay, A., & Hoernicke, M. (2016). Analysis of service-oriented architecture approaches suitable for modular process automation. 2016 IEEE 21st International Conference on Emerging Technologies and Factory Automation (ETFA). https://doi.org/10.1109/etfa.2016.7733651
91
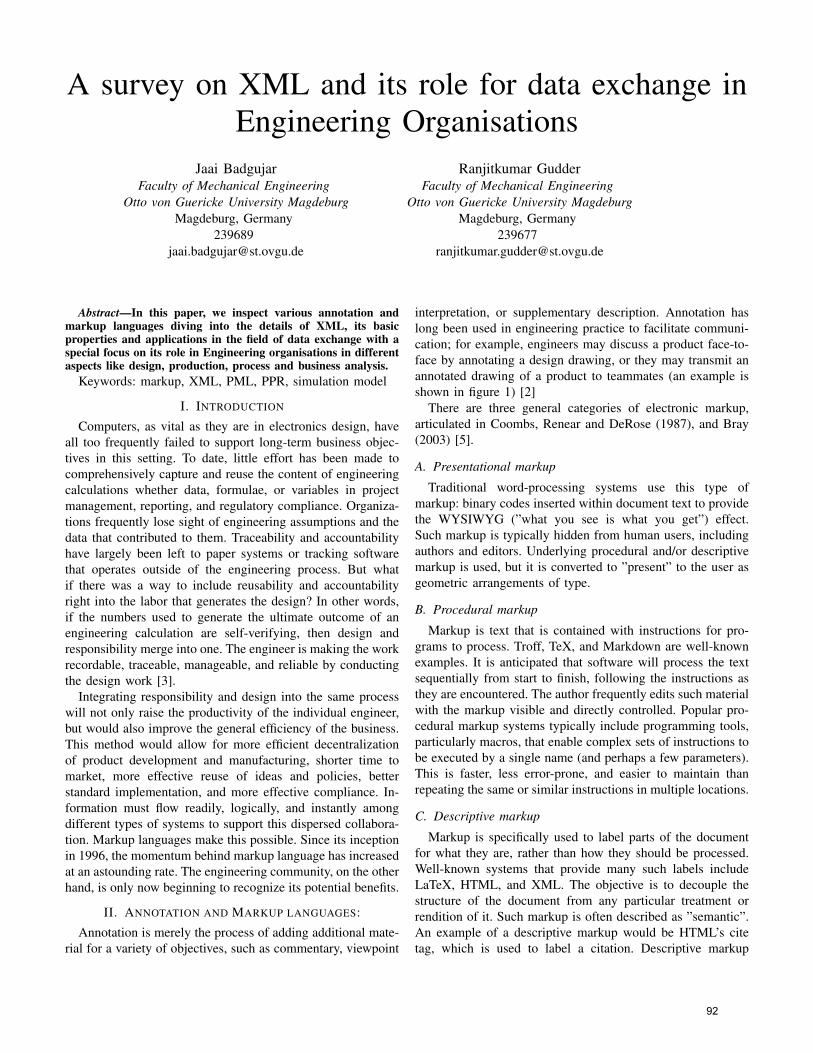
A survey on XML and its role for data exchange inEngineering Organisations
Jaai BadgujarFaculty of Mechanical Engineering
Otto von Guericke University MagdeburgMagdeburg, Germany
Ranjitkumar GudderFaculty of Mechanical Engineering
Otto von Guericke University MagdeburgMagdeburg, Germany
Abstract—In this paper, we inspect various annotation andmarkup languages diving into the details of XML, its basicproperties and applications in the field of data exchange with aspecial focus on its role in Engineering organisations in differentaspects like design, production, process and business analysis.
Keywords: markup, XML, PML, PPR, simulation model
I. INTRODUCTION
Computers, as vital as they are in electronics design, haveall too frequently failed to support long-term business objec-tives in this setting. To date, little effort has been made tocomprehensively capture and reuse the content of engineeringcalculations whether data, formulae, or variables in projectmanagement, reporting, and regulatory compliance. Organiza-tions frequently lose sight of engineering assumptions and thedata that contributed to them. Traceability and accountabilityhave largely been left to paper systems or tracking softwarethat operates outside of the engineering process. But whatif there was a way to include reusability and accountabilityright into the labor that generates the design? In other words,if the numbers used to generate the ultimate outcome of anengineering calculation are self-verifying, then design andresponsibility merge into one. The engineer is making the workrecordable, traceable, manageable, and reliable by conductingthe design work [3].
Integrating responsibility and design into the same processwill not only raise the productivity of the individual engineer,but would also improve the general efficiency of the business.This method would allow for more efficient decentralizationof product development and manufacturing, shorter time tomarket, more effective reuse of ideas and policies, betterstandard implementation, and more effective compliance. In-formation must flow readily, logically, and instantly amongdifferent types of systems to support this dispersed collabora-tion. Markup languages make this possible. Since its inceptionin 1996, the momentum behind markup language has increasedat an astounding rate. The engineering community, on the otherhand, is only now beginning to recognize its potential benefits.
II. ANNOTATION AND MARKUP LANGUAGES:
Annotation is merely the process of adding additional mate-rial for a variety of objectives, such as commentary, viewpoint
interpretation, or supplementary description. Annotation haslong been used in engineering practice to facilitate communi-cation; for example, engineers may discuss a product face-to-face by annotating a design drawing, or they may transmit anannotated drawing of a product to teammates (an example isshown in figure 1) [2]
There are three general categories of electronic markup,articulated in Coombs, Renear and DeRose (1987), and Bray(2003) [5].
A. Presentational markup
Traditional word-processing systems use this type ofmarkup: binary codes inserted within document text to providethe WYSIWYG (”what you see is what you get”) effect.Such markup is typically hidden from human users, includingauthors and editors. Underlying procedural and/or descriptivemarkup is used, but it is converted to ”present” to the user asgeometric arrangements of type.
B. Procedural markup
Markup is text that is contained with instructions for pro-grams to process. Troff, TeX, and Markdown are well-knownexamples. It is anticipated that software will process the textsequentially from start to finish, following the instructions asthey are encountered. The author frequently edits such materialwith the markup visible and directly controlled. Popular pro-cedural markup systems typically include programming tools,particularly macros, that enable complex sets of instructions tobe executed by a single name (and perhaps a few parameters).This is faster, less error-prone, and easier to maintain thanrepeating the same or similar instructions in multiple locations.
C. Descriptive markup
Markup is specifically used to label parts of the documentfor what they are, rather than how they should be processed.Well-known systems that provide many such labels includeLaTeX, HTML, and XML. The objective is to decouple thestructure of the document from any particular treatment orrendition of it. Such markup is often described as ”semantic”.An example of a descriptive markup would be HTML’s citetag, which is used to label a citation. Descriptive markup
92
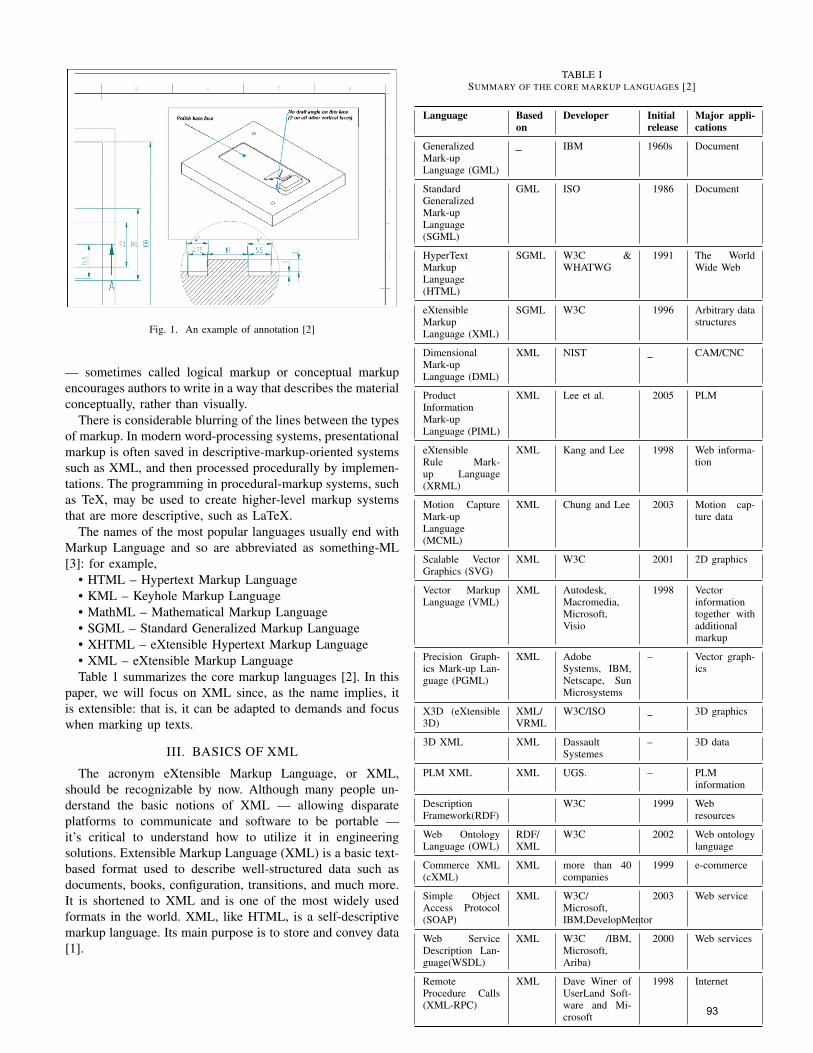
Fig. 1. An example of annotation [2]
— sometimes called logical markup or conceptual markupencourages authors to write in a way that describes the materialconceptually, rather than visually.
There is considerable blurring of the lines between the typesof markup. In modern word-processing systems, presentationalmarkup is often saved in descriptive-markup-oriented systemssuch as XML, and then processed procedurally by implemen-tations. The programming in procedural-markup systems, suchas TeX, may be used to create higher-level markup systemsthat are more descriptive, such as LaTeX.
The names of the most popular languages usually end withMarkup Language and so are abbreviated as something-ML[3]: for example,
• HTML – Hypertext Markup Language• KML – Keyhole Markup Language• MathML – Mathematical Markup Language• SGML – Standard Generalized Markup Language• XHTML – eXtensible Hypertext Markup Language• XML – eXtensible Markup LanguageTable 1 summarizes the core markup languages [2]. In this
paper, we will focus on XML since, as the name implies, itis extensible: that is, it can be adapted to demands and focuswhen marking up texts.
III. BASICS OF XML
The acronym eXtensible Markup Language, or XML,should be recognizable by now. Although many people un-derstand the basic notions of XML — allowing disparateplatforms to communicate and software to be portable —it’s critical to understand how to utilize it in engineeringsolutions. Extensible Markup Language (XML) is a basic text-based format used to describe well-structured data such asdocuments, books, configuration, transitions, and much more.It is shortened to XML and is one of the most widely usedformats in the world. XML, like HTML, is a self-descriptivemarkup language. Its main purpose is to store and convey data[1].
TABLE ISUMMARY OF THE CORE MARKUP LANGUAGES [2]
Language Basedon
Developer Initialrelease
Major appli-cations
GeneralizedMark-upLanguage (GML)
IBM 1960s Document
StandardGeneralizedMark-upLanguage(SGML)
GML ISO 1986 Document
HyperTextMarkupLanguage(HTML)
SGML W3C &WHATWG
1991 The WorldWide Web
eXtensibleMarkupLanguage (XML)
SGML W3C 1996 Arbitrary datastructures
DimensionalMark-upLanguage (DML)
XML NIST CAM/CNC
ProductInformationMark-upLanguage (PIML)
XML Lee et al. 2005 PLM
eXtensibleRule Mark-up Language(XRML)
XML Kang and Lee 1998 Web informa-tion
Motion CaptureMark-upLanguage(MCML)
XML Chung and Lee 2003 Motion cap-ture data
Scalable VectorGraphics (SVG)
XML W3C 2001 2D graphics
Vector MarkupLanguage (VML)
XML Autodesk,Macromedia,Microsoft,Visio
1998 Vectorinformationtogether withadditionalmarkup
Precision Graph-ics Mark-up Lan-guage (PGML)
XML AdobeSystems, IBM,Netscape, SunMicrosystems
– Vector graph-ics
X3D (eXtensible3D)
XML/VRML
W3C/ISO 3D graphics
3D XML XML DassaultSystemes
– 3D data
PLM XML XML UGS. – PLMinformation
DescriptionFramework(RDF)
W3C 1999 Webresources
Web OntologyLanguage (OWL)
RDF/XML
W3C 2002 Web ontologylanguage
Commerce XML(cXML)
XML more than 40companies
1999 e-commerce
Simple ObjectAccess Protocol(SOAP)
XML W3C/Microsoft,IBM,DevelopMentor
2003 Web service
Web ServiceDescription Lan-guage(WSDL)
XML W3C /IBM,Microsoft,Ariba)
2000 Web services
RemoteProcedure Calls(XML-RPC)
XML Dave Winer ofUserLand Soft-ware and Mi-crosoft
1998 Internet
93
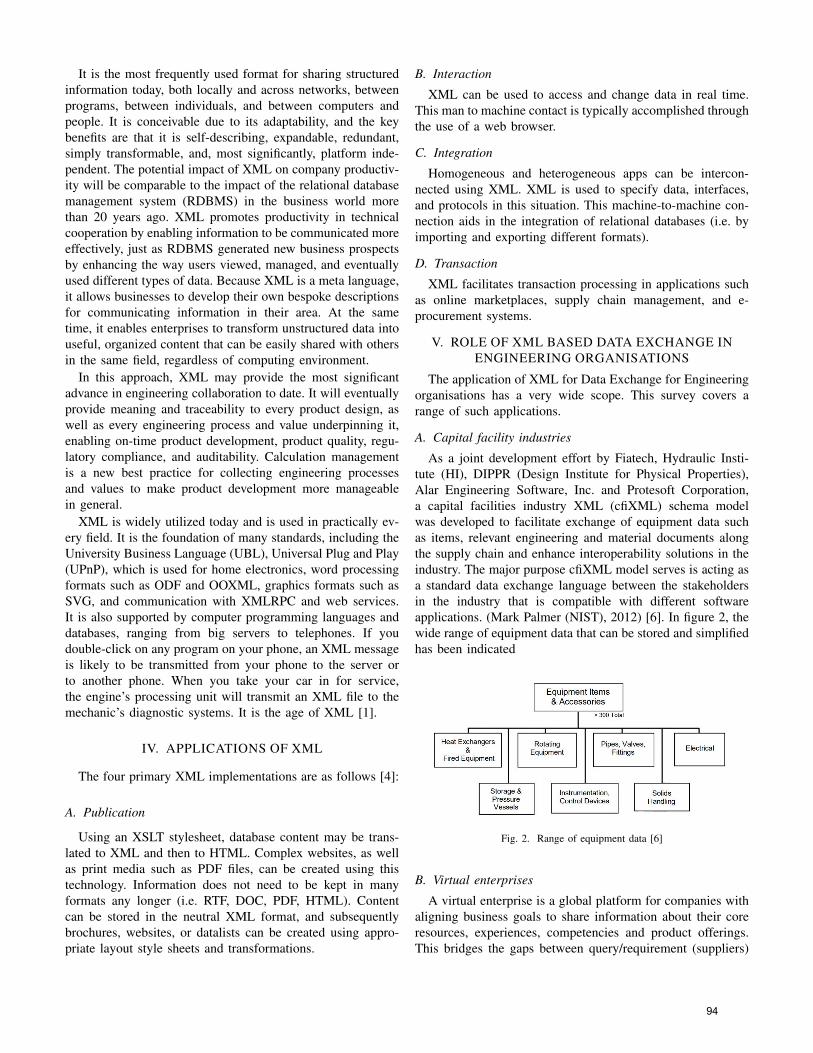
It is the most frequently used format for sharing structuredinformation today, both locally and across networks, betweenprograms, between individuals, and between computers andpeople. It is conceivable due to its adaptability, and the keybenefits are that it is self-describing, expandable, redundant,simply transformable, and, most significantly, platform inde-pendent. The potential impact of XML on company productiv-ity will be comparable to the impact of the relational databasemanagement system (RDBMS) in the business world morethan 20 years ago. XML promotes productivity in technicalcooperation by enabling information to be communicated moreeffectively, just as RDBMS generated new business prospectsby enhancing the way users viewed, managed, and eventuallyused different types of data. Because XML is a meta language,it allows businesses to develop their own bespoke descriptionsfor communicating information in their area. At the sametime, it enables enterprises to transform unstructured data intouseful, organized content that can be easily shared with othersin the same field, regardless of computing environment.
In this approach, XML may provide the most significantadvance in engineering collaboration to date. It will eventuallyprovide meaning and traceability to every product design, aswell as every engineering process and value underpinning it,enabling on-time product development, product quality, regu-latory compliance, and auditability. Calculation managementis a new best practice for collecting engineering processesand values to make product development more manageablein general.
XML is widely utilized today and is used in practically ev-ery field. It is the foundation of many standards, including theUniversity Business Language (UBL), Universal Plug and Play(UPnP), which is used for home electronics, word processingformats such as ODF and OOXML, graphics formats such asSVG, and communication with XMLRPC and web services.It is also supported by computer programming languages anddatabases, ranging from big servers to telephones. If youdouble-click on any program on your phone, an XML messageis likely to be transmitted from your phone to the server orto another phone. When you take your car in for service,the engine’s processing unit will transmit an XML file to themechanic’s diagnostic systems. It is the age of XML [1].
IV. APPLICATIONS OF XML
The four primary XML implementations are as follows [4]:
A. Publication
Using an XSLT stylesheet, database content may be trans-lated to XML and then to HTML. Complex websites, as wellas print media such as PDF files, can be created using thistechnology. Information does not need to be kept in manyformats any longer (i.e. RTF, DOC, PDF, HTML). Contentcan be stored in the neutral XML format, and subsequentlybrochures, websites, or datalists can be created using appro-priate layout style sheets and transformations.
B. Interaction
XML can be used to access and change data in real time.This man to machine contact is typically accomplished throughthe use of a web browser.
C. Integration
Homogeneous and heterogeneous apps can be intercon-nected using XML. XML is used to specify data, interfaces,and protocols in this situation. This machine-to-machine con-nection aids in the integration of relational databases (i.e. byimporting and exporting different formats).
D. Transaction
XML facilitates transaction processing in applications suchas online marketplaces, supply chain management, and e-procurement systems.
V. ROLE OF XML BASED DATA EXCHANGE INENGINEERING ORGANISATIONS
The application of XML for Data Exchange for Engineeringorganisations has a very wide scope. This survey covers arange of such applications.
A. Capital facility industries
As a joint development effort by Fiatech, Hydraulic Insti-tute (HI), DIPPR (Design Institute for Physical Properties),Alar Engineering Software, Inc. and Protesoft Corporation,a capital facilities industry XML (cfiXML) schema modelwas developed to facilitate exchange of equipment data suchas items, relevant engineering and material documents alongthe supply chain and enhance interoperability solutions in theindustry. The major purpose cfiXML model serves is acting asa standard data exchange language between the stakeholdersin the industry that is compatible with different softwareapplications. (Mark Palmer (NIST), 2012) [6]. In figure 2, thewide range of equipment data that can be stored and simplifiedhas been indicated
Fig. 2. Range of equipment data [6]
B. Virtual enterprises
A virtual enterprise is a global platform for companies withaligning business goals to share information about their coreresources, experiences, competencies and product offerings.This bridges the gaps between query/requirement (suppliers)
94
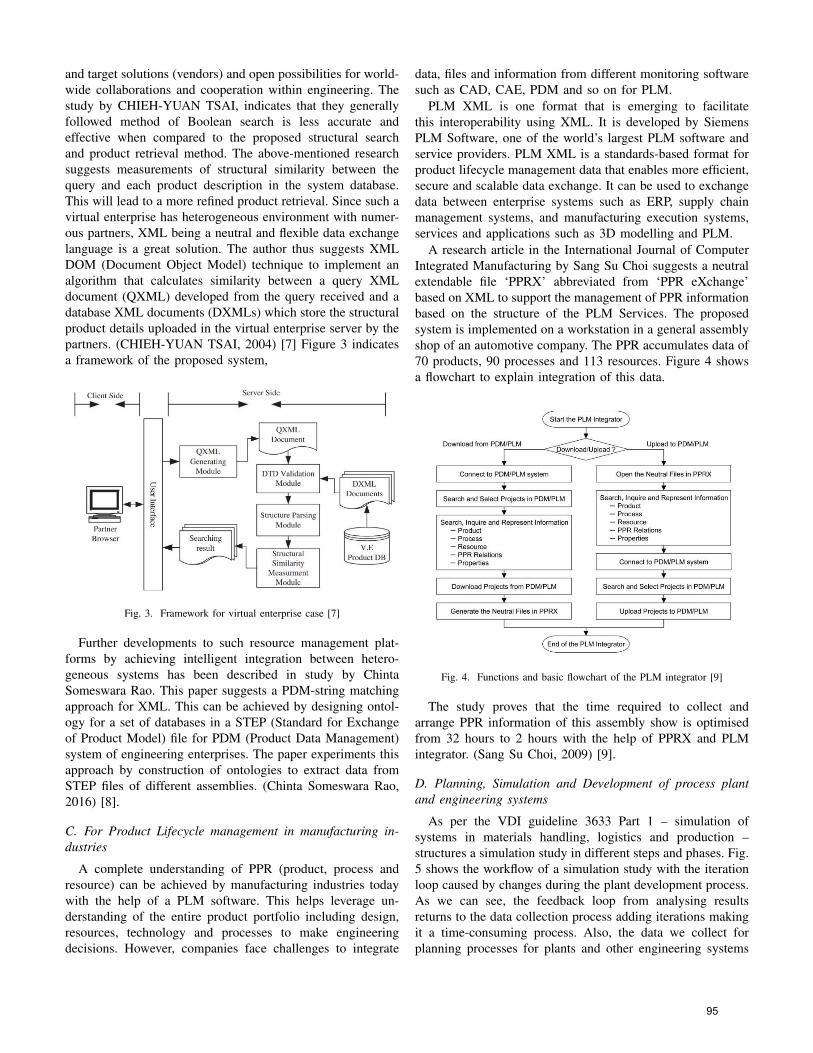
and target solutions (vendors) and open possibilities for world-wide collaborations and cooperation within engineering. Thestudy by CHIEH-YUAN TSAI, indicates that they generallyfollowed method of Boolean search is less accurate andeffective when compared to the proposed structural searchand product retrieval method. The above-mentioned researchsuggests measurements of structural similarity between thequery and each product description in the system database.This will lead to a more refined product retrieval. Since such avirtual enterprise has heterogeneous environment with numer-ous partners, XML being a neutral and flexible data exchangelanguage is a great solution. The author thus suggests XMLDOM (Document Object Model) technique to implement analgorithm that calculates similarity between a query XMLdocument (QXML) developed from the query received and adatabase XML documents (DXMLs) which store the structuralproduct details uploaded in the virtual enterprise server by thepartners. (CHIEH-YUAN TSAI, 2004) [7] Figure 3 indicatesa framework of the proposed system,
Fig. 3. Framework for virtual enterprise case [7]
Further developments to such resource management plat-forms by achieving intelligent integration between hetero-geneous systems has been described in study by ChintaSomeswara Rao. This paper suggests a PDM-string matchingapproach for XML. This can be achieved by designing ontol-ogy for a set of databases in a STEP (Standard for Exchangeof Product Model) file for PDM (Product Data Management)system of engineering enterprises. The paper experiments thisapproach by construction of ontologies to extract data fromSTEP files of different assemblies. (Chinta Someswara Rao,2016) [8].
C. For Product Lifecycle management in manufacturing in-dustries
A complete understanding of PPR (product, process andresource) can be achieved by manufacturing industries todaywith the help of a PLM software. This helps leverage un-derstanding of the entire product portfolio including design,resources, technology and processes to make engineeringdecisions. However, companies face challenges to integrate
data, files and information from different monitoring softwaresuch as CAD, CAE, PDM and so on for PLM.
PLM XML is one format that is emerging to facilitatethis interoperability using XML. It is developed by SiemensPLM Software, one of the world’s largest PLM software andservice providers. PLM XML is a standards-based format forproduct lifecycle management data that enables more efficient,secure and scalable data exchange. It can be used to exchangedata between enterprise systems such as ERP, supply chainmanagement systems, and manufacturing execution systems,services and applications such as 3D modelling and PLM.
A research article in the International Journal of ComputerIntegrated Manufacturing by Sang Su Choi suggests a neutralextendable file ‘PPRX’ abbreviated from ‘PPR eXchange’based on XML to support the management of PPR informationbased on the structure of the PLM Services. The proposedsystem is implemented on a workstation in a general assemblyshop of an automotive company. The PPR accumulates data of70 products, 90 processes and 113 resources. Figure 4 showsa flowchart to explain integration of this data.
Fig. 4. Functions and basic flowchart of the PLM integrator [9]
The study proves that the time required to collect andarrange PPR information of this assembly show is optimisedfrom 32 hours to 2 hours with the help of PPRX and PLMintegrator. (Sang Su Choi, 2009) [9].
D. Planning, Simulation and Development of process plantand engineering systems
As per the VDI guideline 3633 Part 1 – simulation ofsystems in materials handling, logistics and production –structures a simulation study in different steps and phases. Fig.5 shows the workflow of a simulation study with the iterationloop caused by changes during the plant development process.As we can see, the feedback loop from analysing resultsreturns to the data collection process adding iterations makingit a time-consuming process. Also, the data we collect forplanning processes for plants and other engineering systems
95
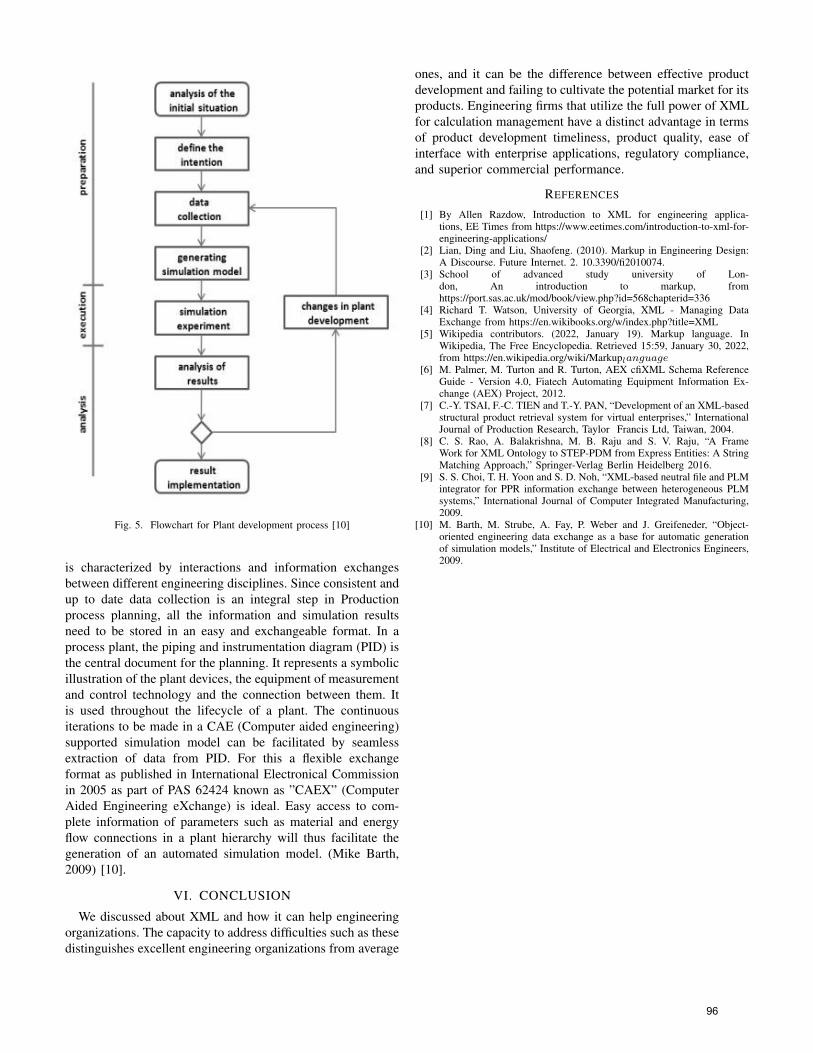
Fig. 5. Flowchart for Plant development process [10]
is characterized by interactions and information exchangesbetween different engineering disciplines. Since consistent andup to date data collection is an integral step in Productionprocess planning, all the information and simulation resultsneed to be stored in an easy and exchangeable format. In aprocess plant, the piping and instrumentation diagram (PID) isthe central document for the planning. It represents a symbolicillustration of the plant devices, the equipment of measurementand control technology and the connection between them. Itis used throughout the lifecycle of a plant. The continuousiterations to be made in a CAE (Computer aided engineering)supported simulation model can be facilitated by seamlessextraction of data from PID. For this a flexible exchangeformat as published in International Electronical Commissionin 2005 as part of PAS 62424 known as ”CAEX” (ComputerAided Engineering eXchange) is ideal. Easy access to com-plete information of parameters such as material and energyflow connections in a plant hierarchy will thus facilitate thegeneration of an automated simulation model. (Mike Barth,2009) [10].
VI. CONCLUSION
We discussed about XML and how it can help engineeringorganizations. The capacity to address difficulties such as thesedistinguishes excellent engineering organizations from average
ones, and it can be the difference between effective productdevelopment and failing to cultivate the potential market for itsproducts. Engineering firms that utilize the full power of XMLfor calculation management have a distinct advantage in termsof product development timeliness, product quality, ease ofinterface with enterprise applications, regulatory compliance,and superior commercial performance.
REFERENCES
[1] By Allen Razdow, Introduction to XML for engineering applica-tions, EE Times from https://www.eetimes.com/introduction-to-xml-for-engineering-applications/
[2] Lian, Ding and Liu, Shaofeng. (2010). Markup in Engineering Design:A Discourse. Future Internet. 2. 10.3390/fi2010074.
[3] School of advanced study university of Lon-don, An introduction to markup, fromhttps://port.sas.ac.uk/mod/book/view.php?id=568chapterid=336
[4] Richard T. Watson, University of Georgia, XML - Managing DataExchange from https://en.wikibooks.org/w/index.php?title=XML
[5] Wikipedia contributors. (2022, January 19). Markup language. InWikipedia, The Free Encyclopedia. Retrieved 15:59, January 30, 2022,from https://en.wikipedia.org/wiki/Markuplanguage
[6] M. Palmer, M. Turton and R. Turton, AEX cfiXML Schema ReferenceGuide - Version 4.0, Fiatech Automating Equipment Information Ex-change (AEX) Project, 2012.
[7] C.-Y. TSAI, F.-C. TIEN and T.-Y. PAN, “Development of an XML-basedstructural product retrieval system for virtual enterprises,” InternationalJournal of Production Research, Taylor Francis Ltd, Taiwan, 2004.
[8] C. S. Rao, A. Balakrishna, M. B. Raju and S. V. Raju, “A FrameWork for XML Ontology to STEP-PDM from Express Entities: A StringMatching Approach,” Springer-Verlag Berlin Heidelberg 2016.
[9] S. S. Choi, T. H. Yoon and S. D. Noh, “XML-based neutral file and PLMintegrator for PPR information exchange between heterogeneous PLMsystems,” International Journal of Computer Integrated Manufacturing,2009.
[10] M. Barth, M. Strube, A. Fay, P. Weber and J. Greifeneder, “Object-oriented engineering data exchange as a base for automatic generationof simulation models,” Institute of Electrical and Electronics Engineers,2009.
96
1
Study on JSON, its Uses and Applications in Engineering Organizations
Ishita Garg Matriculate no. 239403
Systems Engineering for Manufacturing Otto-von-Guericke University,
Magdeburg email: [email protected]
Nagarjuna Reddy Wudaru Matriculate no. 236787
Systems Engineering for Manufacturing Otto-von-Guericke University,
Magdeburg email: [email protected]
Pramod Ramakrishna Matriculate no. 239765
Systems Engineering for Manufacturing Otto-von-Guericke University,
Magdeburg email: [email protected]
Abstract — In today's world, data sharing between multiple devices and applications is a necessity. The storage of data is preferred over cloud than on the device. Web services are being used to communicate with the cloud and exchange data for the purpose of communication. For ensuring a consistent interaction between various platforms and devices, data must be represented using a common data format, such as JSON or XML. JSON is one of the most common data exchange formats on the internet, however there is hardly any consensus on a theoretical foundation for dealing with JSON. As a result, in this paper, we discuss the existing data exchange formats used in engineering firms for transferring information and focus extensively on JSON, what is JSON, how it differs from other markup languages and its uses. In addition to it, there is an extensive research and practice going on towards implementing Industry 4.0 applications in most engineering industries. Hence, we additionally look up on what are Internet of things & Industrial IoT. And finally, the application of JSON in production, manufacturing and other engineering industries, its benefits, drawbacks, future scope, and current research being carried out on implementing cyber physical systems in mechanical industries.
Keywords — Data Exchange, JSON, XML, Mechanical Industries, Industry 4.0, Internet of Things, Industrial Internet of Things, Production and Manufacturing.
I. INTRODUCTION
In the past, data sharing between applications was done
through file transfers. In today’s era, network capacity and reliability have increased to the level where message-based communication between applications has become new standard. Cloud infrastructures and commoditized Web provide more options for data interchange design, each tailored to the needs of the business context’s interactions. The shift away from nightly batch transfers to synchronous, real-time web service interactions demands retooling of development organizations and preference for vendors who support these methodologies.
According to Facebook statistics, there are 2.85 billion monthly active users, with an annual growth rate of 11%. Aside from that, active profiles upload 136,000 photos per minute, make 510,000 comments, and publish 293,000 status updates. Wikipedia pages, on the other hand, create at a rate of 2 modifications per second, according to Wikipedia analyst statistics. Wikipedia currently contains 5,726,316 English articles and adds 553 new ones every twenty-four hours or so. The storage, collecting and managing this vast amount of data is a big challenge for these prestigious organizations. Every company has its own way of dealing with enormous amounts of data; for example, Google has 14 distinct Data Centers throughout the world for the purpose of handling huge amounts of data. [1]
For the purpose of handling massive amounts of data, Facebook developed its own way known as the Presto mechanism. There are a variety of organized, unstructured, and heterogeneous data file formats available, such as CSV, Image file format, Plain text, Binary file, XML, JSON, HTML, Excel, PDF, and others, from which we can extract data based on the requirements. Data management and utilization are more important than ever before in today's data-driven world, as only those organizations that recognized the enormous influence of data analysis early on are dominant and ruling the industry. [1]
There are numerous examples that emphasize this point, such as Netflix's replacement of Blockbuster (an American-based organization that provides home theater, video games, DVD, streaming, and on-demand videos), Amazon's continued disruption of offline retail markets, and Uber's constant dilution of the taxi industry. Many tools, such as EXCEL for beginners and SAS (Base SAS and Enterprise Minor), IBM (Cognos and SPSS), ANGOSS, R, Weka, Pentaho, JMP, Rapid-I, Python, etc. for experts, can be used to explore, prepare, scrubbing, and visualizing data. They can also be used to perform complex algorithms like Machine learning, Natural Language Pro (NLP), Deep learning, Neural network, Artificial Intelligence.[1]
97
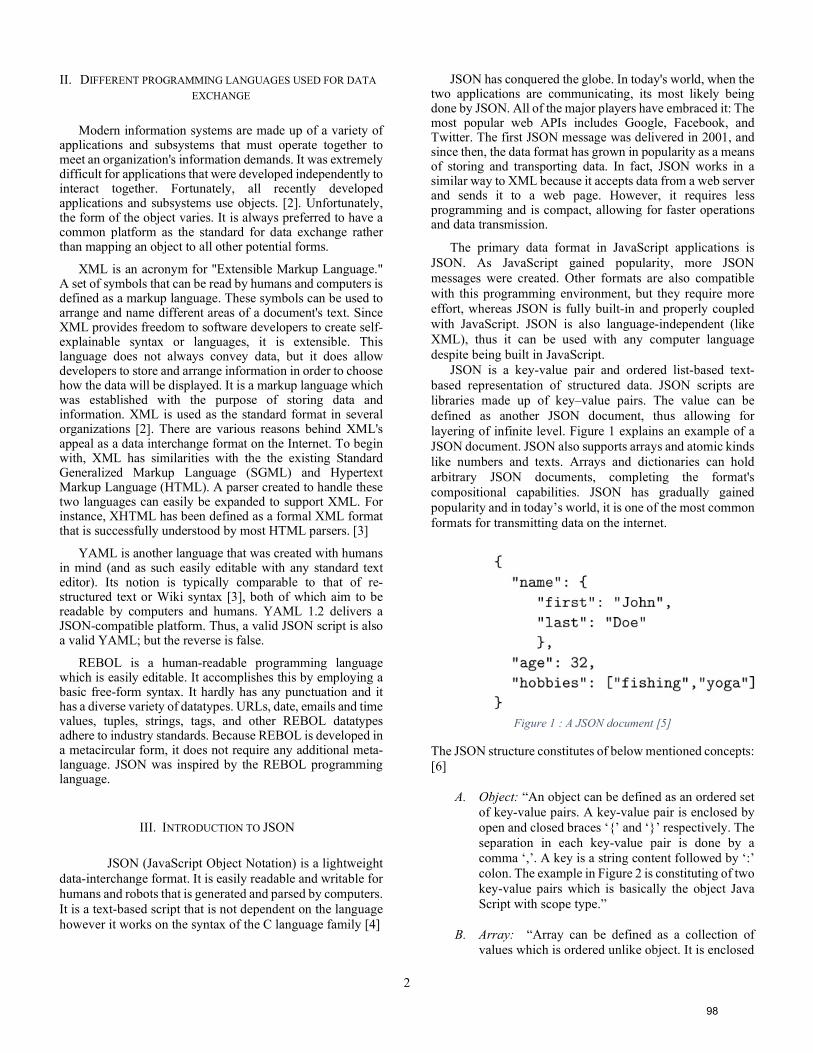
2
II. DIFFERENT PROGRAMMING LANGUAGES USED FOR DATA
EXCHANGE
Modern information systems are made up of a variety of
applications and subsystems that must operate together to meet an organization's information demands. It was extremely difficult for applications that were developed independently to interact together. Fortunately, all recently developed applications and subsystems use objects. [2]. Unfortunately, the form of the object varies. It is always preferred to have a common platform as the standard for data exchange rather than mapping an object to all other potential forms.
XML is an acronym for "Extensible Markup Language." A set of symbols that can be read by humans and computers is defined as a markup language. These symbols can be used to arrange and name different areas of a document's text. Since XML provides freedom to software developers to create self-explainable syntax or languages, it is extensible. This language does not always convey data, but it does allow developers to store and arrange information in order to choose how the data will be displayed. It is a markup language which was established with the purpose of storing data and information. XML is used as the standard format in several organizations [2]. There are various reasons behind XML's appeal as a data interchange format on the Internet. To begin with, XML has similarities with the the existing Standard Generalized Markup Language (SGML) and Hypertext Markup Language (HTML). A parser created to handle these two languages can easily be expanded to support XML. For instance, XHTML has been defined as a formal XML format that is successfully understood by most HTML parsers. [3]
YAML is another language that was created with humans in mind (and as such easily editable with any standard text editor). Its notion is typically comparable to that of re-structured text or Wiki syntax [3], both of which aim to be readable by computers and humans. YAML 1.2 delivers a JSON-compatible platform. Thus, a valid JSON script is also a valid YAML; but the reverse is false.
REBOL is a human-readable programming language which is easily editable. It accomplishes this by employing a basic free-form syntax. It hardly has any punctuation and it has a diverse variety of datatypes. URLs, date, emails and time values, tuples, strings, tags, and other REBOL datatypes adhere to industry standards. Because REBOL is developed in a metacircular form, it does not require any additional meta-language. JSON was inspired by the REBOL programming language.
III. INTRODUCTION TO JSON
JSON (JavaScript Object Notation) is a lightweight
data-interchange format. It is easily readable and writable for humans and robots that is generated and parsed by computers. It is a text-based script that is not dependent on the language however it works on the syntax of the C language family [4]
JSON has conquered the globe. In today's world, when the two applications are communicating, its most likely being done by JSON. All of the major players have embraced it: The most popular web APIs includes Google, Facebook, and Twitter. The first JSON message was delivered in 2001, and since then, the data format has grown in popularity as a means of storing and transporting data. In fact, JSON works in a similar way to XML because it accepts data from a web server and sends it to a web page. However, it requires less programming and is compact, allowing for faster operations and data transmission.
The primary data format in JavaScript applications is JSON. As JavaScript gained popularity, more JSON messages were created. Other formats are also compatible with this programming environment, but they require more effort, whereas JSON is fully built-in and properly coupled with JavaScript. JSON is also language-independent (like XML), thus it can be used with any computer language despite being built in JavaScript.
JSON is a key-value pair and ordered list-based text-based representation of structured data. JSON scripts are libraries made up of key–value pairs. The value can be defined as another JSON document, thus allowing for layering of infinite level. Figure 1 explains an example of a JSON document. JSON also supports arrays and atomic kinds like numbers and texts. Arrays and dictionaries can hold arbitrary JSON documents, completing the format's compositional capabilities. JSON has gradually gained popularity and in today’s world, it is one of the most common formats for transmitting data on the internet.
Figure 1 : A JSON document [5]
The JSON structure constitutes of below mentioned concepts: [6]
A. Object: “An object can be defined as an ordered set
of key-value pairs. A key-value pair is enclosed by open and closed braces ‘{’ and ‘}’ respectively. The separation in each key-value pair is done by a comma ‘,’. A key is a string content followed by ‘:’ colon. The example in Figure 2 is constituting of two key-value pairs which is basically the object Java Script with scope type.”
B. Array: “Array can be defined as a collection of
values which is ordered unlike object. It is enclosed
98
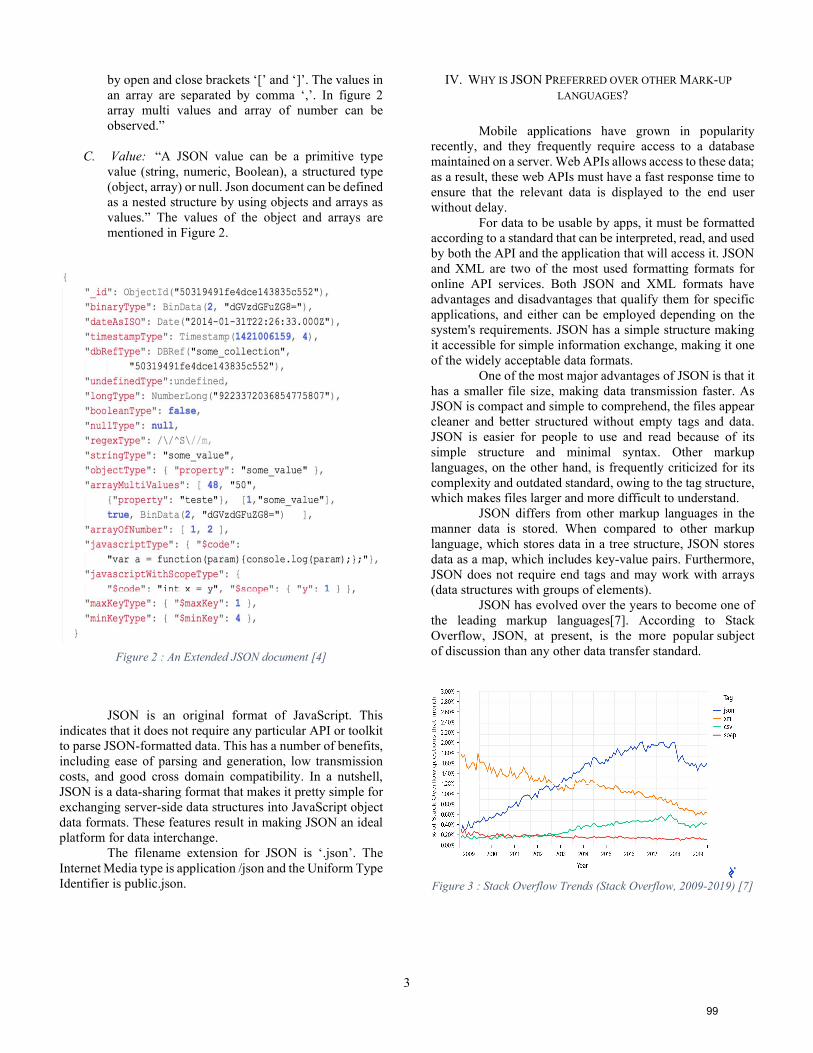
3
by open and close brackets ‘[’ and ‘]’. The values in an array are separated by comma ‘,’. In figure 2 array multi values and array of number can be observed.”
C. Value: “A JSON value can be a primitive type value (string, numeric, Boolean), a structured type (object, array) or null. Json document can be defined as a nested structure by using objects and arrays as values.” The values of the object and arrays are mentioned in Figure 2.
Figure 2 : An Extended JSON document [4]
JSON is an original format of JavaScript. This indicates that it does not require any particular API or toolkit to parse JSON-formatted data. This has a number of benefits, including ease of parsing and generation, low transmission costs, and good cross domain compatibility. In a nutshell, JSON is a data-sharing format that makes it pretty simple for exchanging server-side data structures into JavaScript object data formats. These features result in making JSON an ideal platform for data interchange.
The filename extension for JSON is ‘.json’. The Internet Media type is application /json and the Uniform Type Identifier is public.json.
IV. WHY IS JSON PREFERRED OVER OTHER MARK-UP
LANGUAGES?
Mobile applications have grown in popularity
recently, and they frequently require access to a database maintained on a server. Web APIs allows access to these data; as a result, these web APIs must have a fast response time to ensure that the relevant data is displayed to the end user without delay.
For data to be usable by apps, it must be formatted according to a standard that can be interpreted, read, and used by both the API and the application that will access it. JSON and XML are two of the most used formatting formats for online API services. Both JSON and XML formats have advantages and disadvantages that qualify them for specific applications, and either can be employed depending on the system's requirements. JSON has a simple structure making it accessible for simple information exchange, making it one of the widely acceptable data formats.
One of the most major advantages of JSON is that it has a smaller file size, making data transmission faster. As JSON is compact and simple to comprehend, the files appear cleaner and better structured without empty tags and data. JSON is easier for people to use and read because of its simple structure and minimal syntax. Other markup languages, on the other hand, is frequently criticized for its complexity and outdated standard, owing to the tag structure, which makes files larger and more difficult to understand.
JSON differs from other markup languages in the manner data is stored. When compared to other markup language, which stores data in a tree structure, JSON stores data as a map, which includes key-value pairs. Furthermore, JSON does not require end tags and may work with arrays (data structures with groups of elements).
JSON has evolved over the years to become one of the leading markup languages[7]. According to Stack Overflow, JSON, at present, is the more popular subject of discussion than any other data transfer standard.
Figure 3 : Stack Overflow Trends (Stack Overflow, 2009-2019) [7]
99
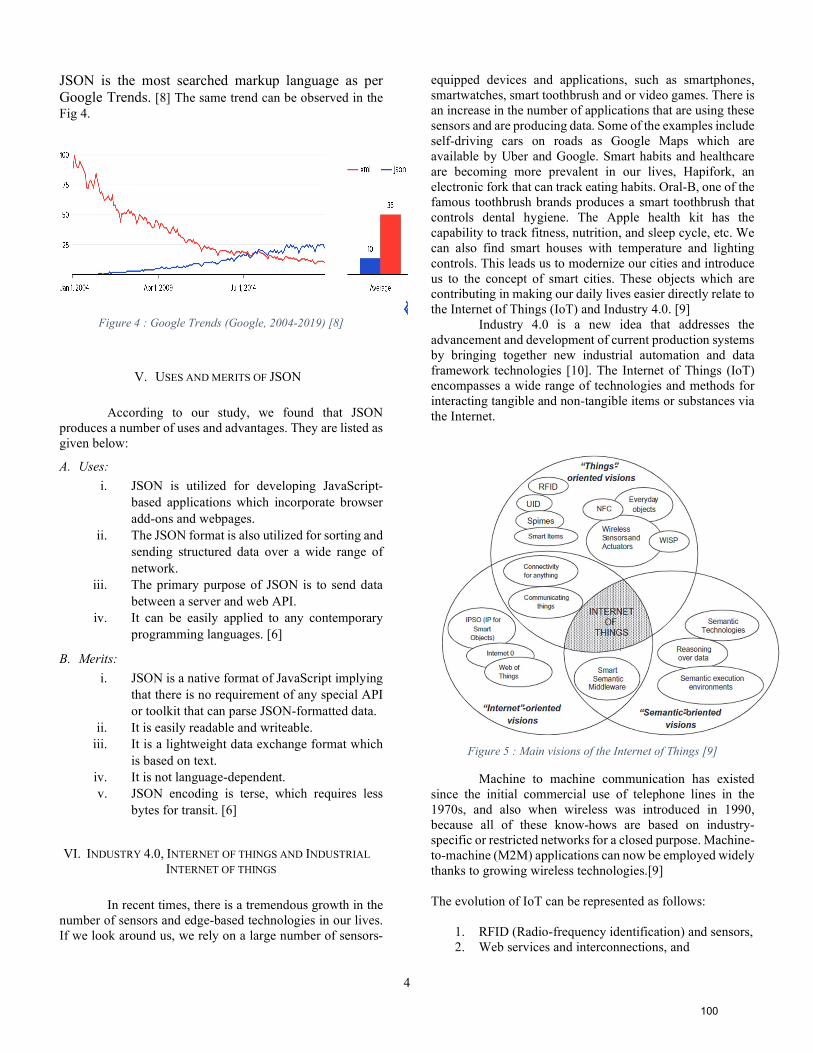
4
JSON is the most searched markup language as per Google Trends. [8] The same trend can be observed in the Fig 4.
Figure 4 : Google Trends (Google, 2004-2019) [8]
V. USES AND MERITS OF JSON
According to our study, we found that JSON
produces a number of uses and advantages. They are listed as given below:
A. Uses:
i. JSON is utilized for developing JavaScript-based applications which incorporate browser add-ons and webpages.
ii. The JSON format is also utilized for sorting and sending structured data over a wide range of network.
iii. The primary purpose of JSON is to send data between a server and web API.
iv. It can be easily applied to any contemporary programming languages. [6]
B. Merits:
i. JSON is a native format of JavaScript implying that there is no requirement of any special API or toolkit that can parse JSON-formatted data.
ii. It is easily readable and writeable. iii. It is a lightweight data exchange format which
is based on text. iv. It is not language-dependent. v. JSON encoding is terse, which requires less
bytes for transit. [6]
VI. INDUSTRY 4.0, INTERNET OF THINGS AND INDUSTRIAL
INTERNET OF THINGS
In recent times, there is a tremendous growth in the
number of sensors and edge-based technologies in our lives. If we look around us, we rely on a large number of sensors-
equipped devices and applications, such as smartphones, smartwatches, smart toothbrush and or video games. There is an increase in the number of applications that are using these sensors and are producing data. Some of the examples include self-driving cars on roads as Google Maps which are available by Uber and Google. Smart habits and healthcare are becoming more prevalent in our lives, Hapifork, an electronic fork that can track eating habits. Oral-B, one of the famous toothbrush brands produces a smart toothbrush that controls dental hygiene. The Apple health kit has the capability to track fitness, nutrition, and sleep cycle, etc. We can also find smart houses with temperature and lighting controls. This leads us to modernize our cities and introduce us to the concept of smart cities. These objects which are contributing in making our daily lives easier directly relate to the Internet of Things (IoT) and Industry 4.0. [9]
Industry 4.0 is a new idea that addresses the advancement and development of current production systems by bringing together new industrial automation and data framework technologies [10]. The Internet of Things (IoT) encompasses a wide range of technologies and methods for interacting tangible and non-tangible items or substances via the Internet.
Figure 5 : Main visions of the Internet of Things [9]
Machine to machine communication has existed since the initial commercial use of telephone lines in the 1970s, and also when wireless was introduced in 1990, because all of these know-hows are based on industry-specific or restricted networks for a closed purpose. Machine-to-machine (M2M) applications can now be employed widely thanks to growing wireless technologies.[9]
The evolution of IoT can be represented as follows:
1. RFID (Radio-frequency identification) and sensors, 2. Web services and interconnections, and
100
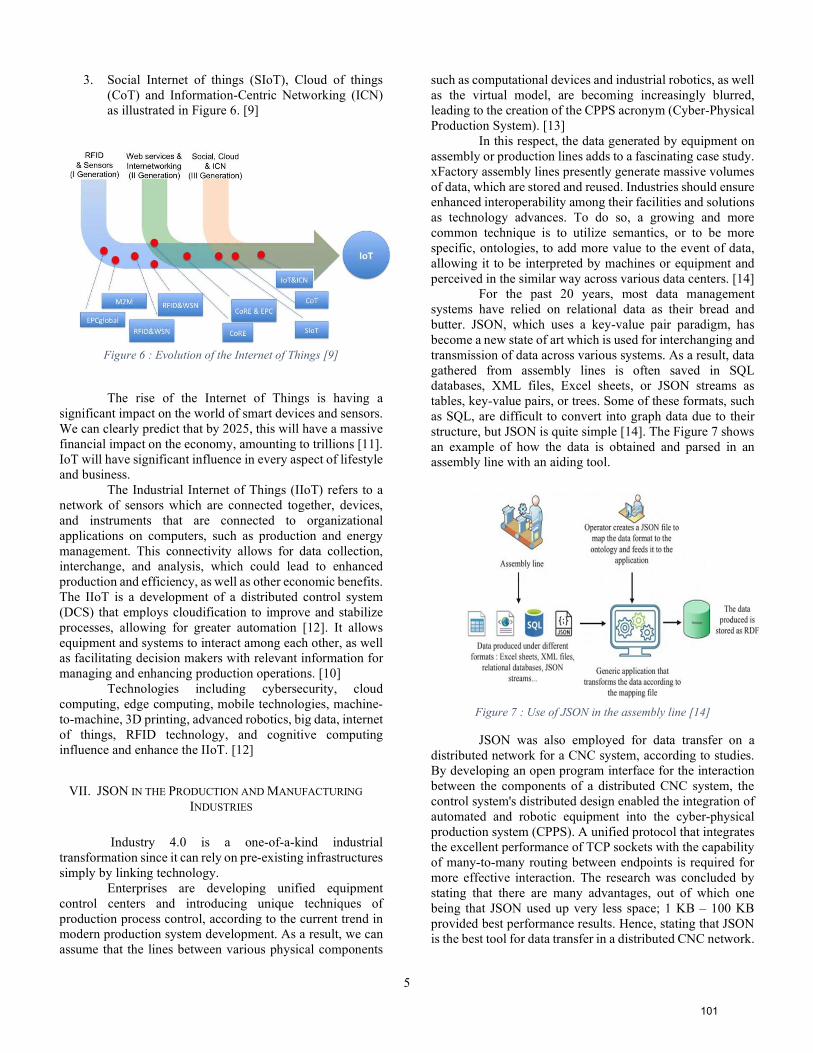
5
3. Social Internet of things (SIoT), Cloud of things (CoT) and Information-Centric Networking (ICN) as illustrated in Figure 6. [9]
Figure 6 : Evolution of the Internet of Things [9]
The rise of the Internet of Things is having a
significant impact on the world of smart devices and sensors. We can clearly predict that by 2025, this will have a massive financial impact on the economy, amounting to trillions [11]. IoT will have significant influence in every aspect of lifestyle and business.
The Industrial Internet of Things (IIoT) refers to a network of sensors which are connected together, devices, and instruments that are connected to organizational applications on computers, such as production and energy management. This connectivity allows for data collection, interchange, and analysis, which could lead to enhanced production and efficiency, as well as other economic benefits. The IIoT is a development of a distributed control system (DCS) that employs cloudification to improve and stabilize processes, allowing for greater automation [12]. It allows equipment and systems to interact among each other, as well as facilitating decision makers with relevant information for managing and enhancing production operations. [10]
Technologies including cybersecurity, cloud computing, edge computing, mobile technologies, machine-to-machine, 3D printing, advanced robotics, big data, internet of things, RFID technology, and cognitive computing influence and enhance the IIoT. [12]
VII. JSON IN THE PRODUCTION AND MANUFACTURING
INDUSTRIES
Industry 4.0 is a one-of-a-kind industrial
transformation since it can rely on pre-existing infrastructures simply by linking technology.
Enterprises are developing unified equipment control centers and introducing unique techniques of production process control, according to the current trend in modern production system development. As a result, we can assume that the lines between various physical components
such as computational devices and industrial robotics, as well as the virtual model, are becoming increasingly blurred, leading to the creation of the CPPS acronym (Cyber-Physical Production System). [13]
In this respect, the data generated by equipment on assembly or production lines adds to a fascinating case study. xFactory assembly lines presently generate massive volumes of data, which are stored and reused. Industries should ensure enhanced interoperability among their facilities and solutions as technology advances. To do so, a growing and more common technique is to utilize semantics, or to be more specific, ontologies, to add more value to the event of data, allowing it to be interpreted by machines or equipment and perceived in the similar way across various data centers. [14]
For the past 20 years, most data management systems have relied on relational data as their bread and butter. JSON, which uses a key-value pair paradigm, has become a new state of art which is used for interchanging and transmission of data across various systems. As a result, data gathered from assembly lines is often saved in SQL databases, XML files, Excel sheets, or JSON streams as tables, key-value pairs, or trees. Some of these formats, such as SQL, are difficult to convert into graph data due to their structure, but JSON is quite simple [14]. The Figure 7 shows an example of how the data is obtained and parsed in an assembly line with an aiding tool.
Figure 7 : Use of JSON in the assembly line [14]
JSON was also employed for data transfer on a distributed network for a CNC system, according to studies. By developing an open program interface for the interaction between the components of a distributed CNC system, the control system's distributed design enabled the integration of automated and robotic equipment into the cyber-physical production system (CPPS). A unified protocol that integrates the excellent performance of TCP sockets with the capability of many-to-many routing between endpoints is required for more effective interaction. The research was concluded by stating that there are many advantages, out of which one being that JSON used up very less space; 1 KB – 100 KB provided best performance results. Hence, stating that JSON is the best tool for data transfer in a distributed CNC network.
101
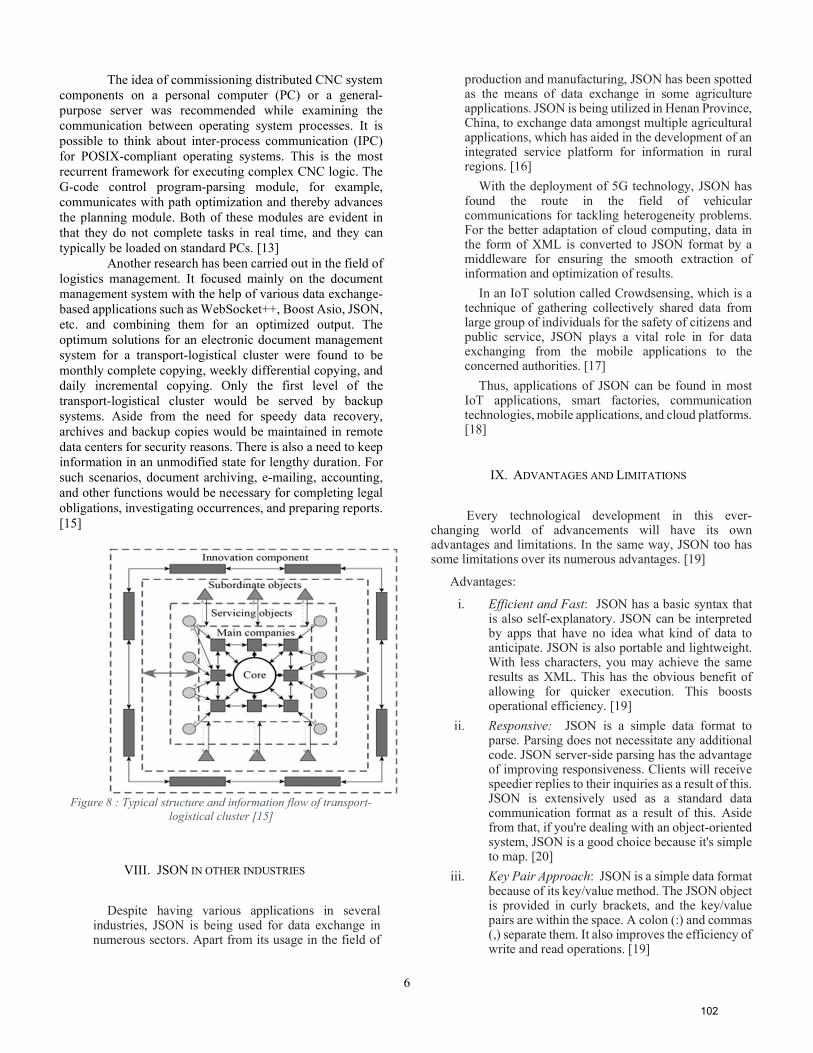
6
The idea of commissioning distributed CNC system components on a personal computer (PC) or a general-purpose server was recommended while examining the communication between operating system processes. It is possible to think about inter-process communication (IPC) for POSIX-compliant operating systems. This is the most recurrent framework for executing complex CNC logic. The G-code control program-parsing module, for example, communicates with path optimization and thereby advances the planning module. Both of these modules are evident in that they do not complete tasks in real time, and they can typically be loaded on standard PCs. [13]
Another research has been carried out in the field of logistics management. It focused mainly on the document management system with the help of various data exchange-based applications such as WebSocket++, Boost Asio, JSON, etc. and combining them for an optimized output. The optimum solutions for an electronic document management system for a transport-logistical cluster were found to be monthly complete copying, weekly differential copying, and daily incremental copying. Only the first level of the transport-logistical cluster would be served by backup systems. Aside from the need for speedy data recovery, archives and backup copies would be maintained in remote data centers for security reasons. There is also a need to keep information in an unmodified state for lengthy duration. For such scenarios, document archiving, e-mailing, accounting, and other functions would be necessary for completing legal obligations, investigating occurrences, and preparing reports. [15]
Figure 8 : Typical structure and information flow of transport-
logistical cluster [15]
VIII. JSON IN OTHER INDUSTRIES
Despite having various applications in several industries, JSON is being used for data exchange in numerous sectors. Apart from its usage in the field of
production and manufacturing, JSON has been spotted as the means of data exchange in some agriculture applications. JSON is being utilized in Henan Province, China, to exchange data amongst multiple agricultural applications, which has aided in the development of an integrated service platform for information in rural regions. [16]
With the deployment of 5G technology, JSON has found the route in the field of vehicular communications for tackling heterogeneity problems. For the better adaptation of cloud computing, data in the form of XML is converted to JSON format by a middleware for ensuring the smooth extraction of information and optimization of results.
In an IoT solution called Crowdsensing, which is a technique of gathering collectively shared data from large group of individuals for the safety of citizens and public service, JSON plays a vital role in for data exchanging from the mobile applications to the concerned authorities. [17]
Thus, applications of JSON can be found in most IoT applications, smart factories, communication technologies, mobile applications, and cloud platforms. [18]
IX. ADVANTAGES AND LIMITATIONS
Every technological development in this ever-changing world of advancements will have its own advantages and limitations. In the same way, JSON too has some limitations over its numerous advantages. [19]
Advantages:
i. Efficient and Fast: JSON has a basic syntax that is also self-explanatory. JSON can be interpreted by apps that have no idea what kind of data to anticipate. JSON is also portable and lightweight. With less characters, you may achieve the same results as XML. This has the obvious benefit of allowing for quicker execution. This boosts operational efficiency. [19]
ii. Responsive: JSON is a simple data format to parse. Parsing does not necessitate any additional code. JSON server-side parsing has the advantage of improving responsiveness. Clients will receive speedier replies to their inquiries as a result of this. JSON is extensively used as a standard data communication format as a result of this. Aside from that, if you're dealing with an object-oriented system, JSON is a good choice because it's simple to map. [20]
iii. Key Pair Approach: JSON is a simple data format because of its key/value method. The JSON object is provided in curly brackets, and the key/value pairs are within the space. A colon (:) and commas (,) separate them. It also improves the efficiency of write and read operations. [19]
102
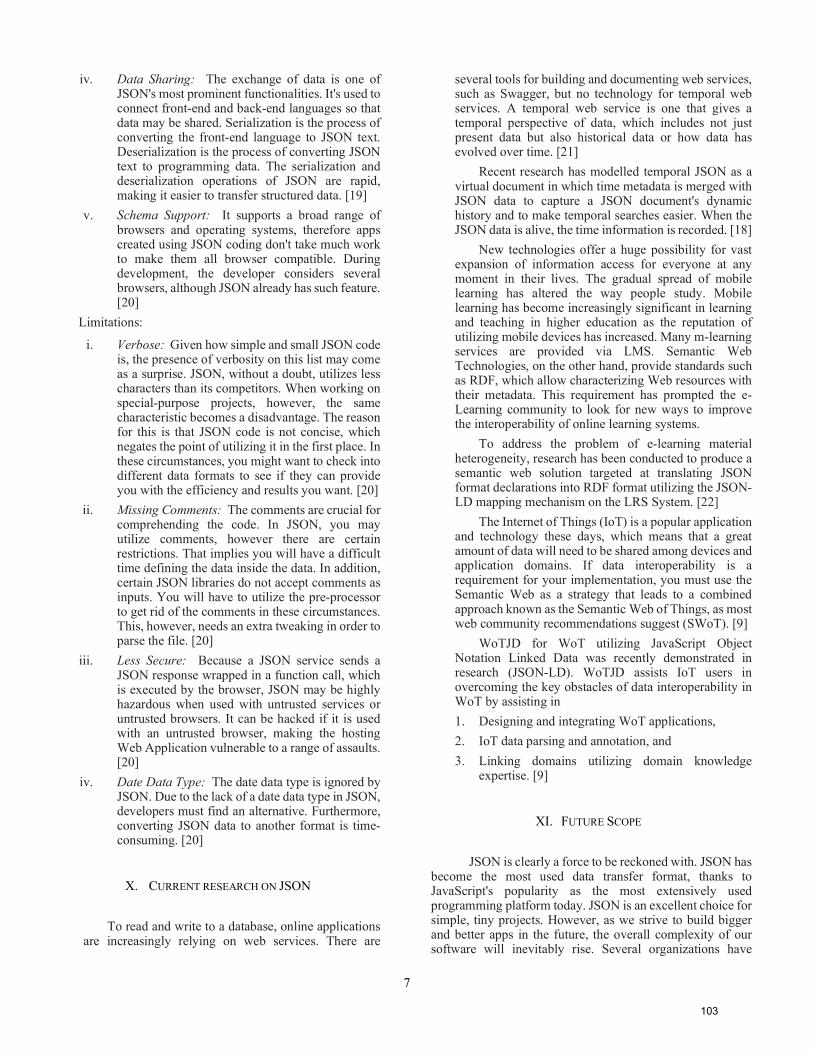
7
iv. Data Sharing: The exchange of data is one of JSON's most prominent functionalities. It's used to connect front-end and back-end languages so that data may be shared. Serialization is the process of converting the front-end language to JSON text. Deserialization is the process of converting JSON text to programming data. The serialization and deserialization operations of JSON are rapid, making it easier to transfer structured data. [19]
v. Schema Support: It supports a broad range of browsers and operating systems, therefore apps created using JSON coding don't take much work to make them all browser compatible. During development, the developer considers several browsers, although JSON already has such feature. [20]
Limitations:
i. Verbose: Given how simple and small JSON code is, the presence of verbosity on this list may come as a surprise. JSON, without a doubt, utilizes less characters than its competitors. When working on special-purpose projects, however, the same characteristic becomes a disadvantage. The reason for this is that JSON code is not concise, which negates the point of utilizing it in the first place. In these circumstances, you might want to check into different data formats to see if they can provide you with the efficiency and results you want. [20]
ii. Missing Comments: The comments are crucial for comprehending the code. In JSON, you may utilize comments, however there are certain restrictions. That implies you will have a difficult time defining the data inside the data. In addition, certain JSON libraries do not accept comments as inputs. You will have to utilize the pre-processor to get rid of the comments in these circumstances. This, however, needs an extra tweaking in order to parse the file. [20]
iii. Less Secure: Because a JSON service sends a JSON response wrapped in a function call, which is executed by the browser, JSON may be highly hazardous when used with untrusted services or untrusted browsers. It can be hacked if it is used with an untrusted browser, making the hosting Web Application vulnerable to a range of assaults. [20]
iv. Date Data Type: The date data type is ignored by JSON. Due to the lack of a date data type in JSON, developers must find an alternative. Furthermore, converting JSON data to another format is time-consuming. [20]
X. CURRENT RESEARCH ON JSON
To read and write to a database, online applications are increasingly relying on web services. There are
several tools for building and documenting web services, such as Swagger, but no technology for temporal web services. A temporal web service is one that gives a temporal perspective of data, which includes not just present data but also historical data or how data has evolved over time. [21]
Recent research has modelled temporal JSON as a virtual document in which time metadata is merged with JSON data to capture a JSON document's dynamic history and to make temporal searches easier. When the JSON data is alive, the time information is recorded. [18]
New technologies offer a huge possibility for vast expansion of information access for everyone at any moment in their lives. The gradual spread of mobile learning has altered the way people study. Mobile learning has become increasingly significant in learning and teaching in higher education as the reputation of utilizing mobile devices has increased. Many m-learning services are provided via LMS. Semantic Web Technologies, on the other hand, provide standards such as RDF, which allow characterizing Web resources with their metadata. This requirement has prompted the e-Learning community to look for new ways to improve the interoperability of online learning systems.
To address the problem of e-learning material heterogeneity, research has been conducted to produce a semantic web solution targeted at translating JSON format declarations into RDF format utilizing the JSON-LD mapping mechanism on the LRS System. [22]
The Internet of Things (IoT) is a popular application and technology these days, which means that a great amount of data will need to be shared among devices and application domains. If data interoperability is a requirement for your implementation, you must use the Semantic Web as a strategy that leads to a combined approach known as the Semantic Web of Things, as most web community recommendations suggest (SWoT). [9]
WoTJD for WoT utilizing JavaScript Object Notation Linked Data was recently demonstrated in research (JSON-LD). WoTJD assists IoT users in overcoming the key obstacles of data interoperability in WoT by assisting in
1. Designing and integrating WoT applications,
2. IoT data parsing and annotation, and
3. Linking domains utilizing domain knowledge expertise. [9]
XI. FUTURE SCOPE
JSON is clearly a force to be reckoned with. JSON has become the most used data transfer format, thanks to JavaScript's popularity as the most extensively used programming platform today. JSON is an excellent choice for simple, tiny projects. However, as we strive to build bigger and better apps in the future, the overall complexity of our software will inevitably rise. Several organizations have
103
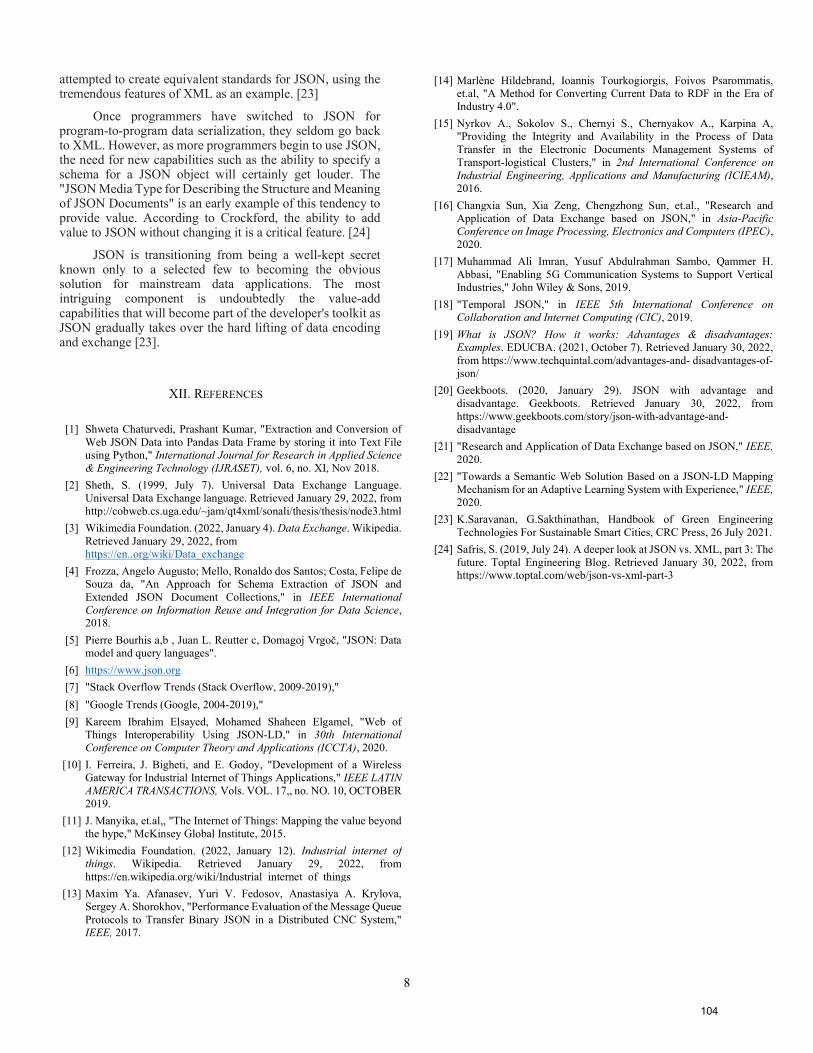
8
attempted to create equivalent standards for JSON, using the tremendous features of XML as an example. [23]
Once programmers have switched to JSON for program-to-program data serialization, they seldom go back to XML. However, as more programmers begin to use JSON, the need for new capabilities such as the ability to specify a schema for a JSON object will certainly get louder. The "JSON Media Type for Describing the Structure and Meaning of JSON Documents" is an early example of this tendency to provide value. According to Crockford, the ability to add value to JSON without changing it is a critical feature. [24]
JSON is transitioning from being a well-kept secret known only to a selected few to becoming the obvious solution for mainstream data applications. The most intriguing component is undoubtedly the value-add capabilities that will become part of the developer's toolkit as JSON gradually takes over the hard lifting of data encoding and exchange [23].
XII. REFERENCES
[1] Shweta Chaturvedi, Prashant Kumar, "Extraction and Conversion of Web JSON Data into Pandas Data Frame by storing it into Text File using Python," International Journal for Research in Applied Science & Engineering Technology (IJRASET), vol. 6, no. XI, Nov 2018.
[2] Sheth, S. (1999, July 7). Universal Data Exchange Language. Universal Data Exchange language. Retrieved January 29, 2022, from http://cobweb.cs.uga.edu/~jam/qt4xml/sonali/thesis/thesis/node3.html
[3] Wikimedia Foundation. (2022, January 4). Data Exchange. Wikipedia. Retrieved January 29, 2022, from https://en..org/wiki/Data_exchange
[4] Frozza, Angelo Augusto; Mello, Ronaldo dos Santos; Costa, Felipe de Souza da, "An Approach for Schema Extraction of JSON and Extended JSON Document Collections," in IEEE International Conference on Information Reuse and Integration for Data Science, 2018.
[5] Pierre Bourhis a,b , Juan L. Reutter c, Domagoj Vrgoč, "JSON: Data model and query languages".
[6] https://www.json.org
[7] "Stack Overflow Trends (Stack Overflow, 2009-2019),"
[8] "Google Trends (Google, 2004-2019),"
[9] Kareem Ibrahim Elsayed, Mohamed Shaheen Elgamel, "Web of Things Interoperability Using JSON-LD," in 30th International Conference on Computer Theory and Applications (ICCTA), 2020.
[10] I. Ferreira, J. Bigheti, and E. Godoy, "Development of a Wireless Gateway for Industrial Internet of Things Applications," IEEE LATIN AMERICA TRANSACTIONS, Vols. VOL. 17,, no. NO. 10, OCTOBER 2019.
[11] J. Manyika, et.al,, "The Internet of Things: Mapping the value beyond the hype," McKinsey Global Institute, 2015.
[12] Wikimedia Foundation. (2022, January 12). Industrial internet of things. Wikipedia. Retrieved January 29, 2022, from https://en.wikipedia.org/wiki/Industrial_internet_of_things
[13] Maxim Ya. Afanasev, Yuri V. Fedosov, Anastasiya A. Krylova, Sergey A. Shorokhov, "Performance Evaluation of the Message Queue Protocols to Transfer Binary JSON in a Distributed CNC System," IEEE, 2017.
[14] Marlène Hildebrand, Ioannis Tourkogiorgis, Foivos Psarommatis, et.al, "A Method for Converting Current Data to RDF in the Era of Industry 4.0".
[15] Nyrkov A., Sokolov S., Chernyi S., Chernyakov A., Karpina A, "Providing the Integrity and Availability in the Process of Data Transfer in the Electronic Documents Management Systems of Transport-logistical Clusters," in 2nd International Conference on Industrial Engineering, Applications and Manufacturing (ICIEAM), 2016.
[16] Changxia Sun, Xia Zeng, Chengzhong Sun, et.al., "Research and Application of Data Exchange based on JSON," in Asia-Pacific Conference on Image Processing, Electronics and Computers (IPEC), 2020.
[17] Muhammad Ali Imran, Yusuf Abdulrahman Sambo, Qammer H. Abbasi, "Enabling 5G Communication Systems to Support Vertical Industries," John Wiley & Sons, 2019.
[18] "Temporal JSON," in IEEE 5th International Conference on Collaboration and Internet Computing (CIC), 2019.
[19] What is JSON? How it works: Advantages & disadvantages: Examples. EDUCBA. (2021, October 7). Retrieved January 30, 2022, from https://www.techquintal.com/advantages-and- disadvantages-of-json/
[20] Geekboots. (2020, January 29). JSON with advantage and disadvantage. Geekboots. Retrieved January 30, 2022, from https://www.geekboots.com/story/json-with-advantage-and-disadvantage
[21] "Research and Application of Data Exchange based on JSON," IEEE, 2020.
[22] "Towards a Semantic Web Solution Based on a JSON-LD Mapping Mechanism for an Adaptive Learning System with Experience," IEEE, 2020.
[23] K.Saravanan, G.Sakthinathan, Handbook of Green Engineering Technologies For Sustainable Smart Cities, CRC Press, 26 July 2021.
[24] Safris, S. (2019, July 24). A deeper look at JSON vs. XML, part 3: The future. Toptal Engineering Blog. Retrieved January 30, 2022, from https://www.toptal.com/web/json-vs-xml-part-3
104


![Fritz Krafft: Experimentum novum Magdeburgicum (1663): Was Otto von Guericke seinem Manuskript bis 1672 hinzugefügt hat. [Angenommene Fassung für:] Monumenta Guerickiana - Zeitschrift](https://img.dokumen.tips/doc/110x75/63623c4a9b985d7ef5024b87/fritz-krafft-experimentum-novum-magdeburgicum-1663-was-otto-von-guericke-seinem-1702204705.jpg)


