Embed Size (px)
Citation preview

CHAPTER 3 UNDERSTANDING DISASTER RISK: HAZARD RELATED RISK ISSUES - SECTION II
193
Understanding disaster risk: hazard related risk issues
SECTION IIHydrological risk
3Chapter
PeterSalamonCoordinating lead author
HannahClokeLead author 3.4
GiulianodiBaldassarreOwenLandegFlorianPappenbergerMaria-HelenaRamos
NicolaCasagliLead author 3.5
FaustoGuzzettiMichelJaboyedoffFarrokhNadimDavidPetley
KevinHorsburghLead author 3.6
InigoLosadaRalfWeisseJudithWolf

194
3 Understanding disaster risk: hazard related risk issuesSection II. Hydrological risk
Introduction . . . . . . . . . . . . . . . . . . . . . . . . . . . . . . . . . . . . . . . . . . . . . . . . . . . . . . . . . . . . . . . . . . . . . .1963.4 Hydrological risk: floods . . . . . . . . . . . . . . . . . . . . . . . . . . . . . . . . . . . . . . . . . . . . . . . . . . . . . . . . .198
3.4.1 Introduction: flood hazards and impacts . . . . . . . . . . . . . . . . . . . . . . . . . . . . . . . . . . . . . . . . . . . . . . .1983.4.2 Living with floods . . . . . . . . . . . . . . . . . . . . . . . . . . . . . . . . . . . . . . . . . . . . . . . . . . . . . . . . . . . . . . . . . . .1993.4.3 Drivers of flood hazard . . . . . . . . . . . . . . . . . . . . . . . . . . . . . . . . . . . . . . . . . . . . . . . . . . . . . . . . . . . . .2003.4.4 Flood hazard and risk mapping . . . . . . . . . . . . . . . . . . . . . . . . . . . . . . . . . . . . . . . . . . . . . . . . . . . . . .2013.4.5 Flood monitoring, forecasting and early warning systems . . . . . . . . . . . . . . . . . . . . . . . . . . . . . . .2033.4.6 Copernicus Emergency Management Service: floods (EFAS and GloFAS) . . . . . . . . . . . . . . . . . . .2043.4.7 Communicating uncertainty and decision making. . . . . . . . . . . . . . . . . . . . . . . . . . . . . . . . . . . . . . .2063.4.8 Conclusions and key messages . . . . . . . . . . . . . . . . . . . . . . . . . . . . . . . . . . . . . . . . . . . . . . . . . . . . . .207
3.5 Hydrological risk: landslides . . . . . . . . . . . . . . . . . . . . . . . . . . . . . . . . . . . . . . . . . . . . . . . . . . . . .2093.5.1 Introduction. . . . . . . . . . . . . . . . . . . . . . . . . . . . . . . . . . . . . . . . . . . . . . . . . . . . . . . . . . . . . . . . . . . . . . . .2093.5.2 Landslide causes and triggers. . . . . . . . . . . . . . . . . . . . . . . . . . . . . . . . . . . . . . . . . . . . . . . . . . . . . . . .2103.5.3 The socio-economic impact of landslides in Europe and climate change. . . . . . . . . . . . . . . . . . .2123.5.4 Landslide zoning: inventory, susceptibility and hazard maps . . . . . . . . . . . . . . . . . . . . . . . . . . . . .2133.5.5 Landslide monitoring and early warning . . . . . . . . . . . . . . . . . . . . . . . . . . . . . . . . . . . . . . . . . . . . . . .2153.5.6 Conclusions and key messages. . . . . . . . . . . . . . . . . . . . . . . . . . . . . . . . . . . . . . . . . . . . . . . . . . . . . . .218
3.6 Hydrological risk: wave action, storm surges and coastal flooding . . . . . . . . . . . . . . . . . . . . .2193.6.1 Overview of coastal flood risk . . . . . . . . . . . . . . . . . . . . . . . . . . . . . . . . . . . . . . . . . . . . . . . . . . . . . . . .2193.6.2 Natural variability of waves, storm surges and mean sea level. . . . . . . . . . . . . . . . . . . . . . . . . . .2203.6.3 Datasets for coastal flood hazard analysis. . . . . . . . . . . . . . . . . . . . . . . . . . . . . . . . . . . . . . . . . . . . .2233.6.4 Future climate projections of waves, storm surges and mean sea level . . . . . . . . . . . . . . . . . . .2243.6.5 Tools and methods for assessing coastal flood hazard . . . . . . . . . . . . . . . . . . . . . . . . . . . . . . . . . .2263.6.6 Conclusions and key messages . . . . . . . . . . . . . . . . . . . . . . . . . . . . . . . . . . . . . . . . . . . . . . . . . . . . . .227
Recommendations . . . . . . . . . . . . . . . . . . . . . . . . . . . . . . . . . . . . . . . . . . . . . . . . . . . . . . . . . . . . . . . . .228References . . . . . . . . . . . . . . . . . . . . . . . . . . . . . . . . . . . . . . . . . . . . . . . . . . . . . . . . . . . . . . . . . . . . . . .230
CONTENTS

CHAPTER 3 UNDERSTANDING DISASTER RISK: HAZARD RELATED RISK ISSUES - SECTION II
195

196
The following subchapters cover the principal hydrological risks and, in the case of landslides, hazards that are triggered through hydrological events. In the case of floods, the subchapters cover fluvial, flash and pluvial floods, as well as coastal flooding caused by wave actions and
storm surges:• Fluvial floods occur when river levels rise and burst or overflow their banks,
inundating the surrounding land forming the river’s floodplain. This can occur in response to storms with higher than normal rainfall totals and/or intensities, to seasonal strong weather systems such as monsoons or winter stormtracks, or to sudden melting of snow in spring.
• Flash floods can develop when heavy rainfall occurs suddenly, particularly in mountainous river catchments, although they can occur anywhere. Strong localised rainfall, rapid flood formation and high water velocities can be particularly threatening to the population at risk and are highly destructive.
• Heavy rainfall may cause surface water flooding, also known as pluvial flooding, particularly in cities where the urban drainage systems become overwhelmed.
• Floods can also be generated by infrastructure failure (e.g. dam breaks), gla-cial/lake outbursts and groundwater rising under prolonged very wet con-ditions, which cause waterlogging. In many cases, flooding occurs as a result of more than one of the generating mechanisms occurring concurrently, making the prediction of flood hazards and impacts even more challenging, and the probable resulting damage more severe.
• Coastal flooding is caused by a combination of high tide, storm surge and wave conditions. Development on flood plains increases the risk as does coastal erosion and sea level rise.
• Landslide occurrence is related to causal factors, which create a propensity for a slope to fail and trigger the specific external event that induces land-slide occurrence at that particular time. In most cases, but not all, the timing of failure is associated with a trigger event.
• Heavy rainfall is a key factor in generating landslides, primarily through the generation of pore water pressures and a reduction in the effective normal stress. The second key factor for landslide generation is the impact of seis-mic events.
Floods and landslides affect a large number of people across the world every year, with severe socioeconomic impacts. Severe fluvial flooding repeatedly af-flicts European populations, with trans-national events often being the most
Introduction

CHAPTER 3 UNDERSTANDING DISASTER RISK: HAZARD RELATED RISK ISSUES - SECTION II
197
damaging. It is estimated that GBP 150 billion (EUR 177 billion) of assets and 4 million people are currently at risk from coastal flooding in the United King-dom alone, for example. Significant advances have been made in recent years to map these risks, to develop and set up EWSs for better preparedness and to improve the communication of risks to decision-makers and the public. How-ever, variations in socioeconomic factors (land use, demography, migration) as well as changes in climate and weather patterns may lead to rapid changes in flood and landslide risk in the future and will require increased levels of adap-tation.
This chapter describes the current knowledge regarding the drivers, impacts and key tools to manage risks for these hazards. It identifies a set of challenges and gaps for key stakeholders to further reduce and better manage their risks and to be prepared for future changes in risk.

198
3.4 Hydrological risk: floodsHannahCloke, Giuliano di Baldassarre, Owen Landeg,Florian Pappenberger, Maria-Helena Ramos
3.4.1Introduction:flood hazardsand impacts
In principle, flooding is a natural phe-nomenon that affects all river basins around the world in more or less reg-ular intervals and that fulfils essential functions in the natural ecosystem. However, owing to human settle-ments being established within flood-plains and common development practices not leaving room for rivers under flood conditions, flooding is mostly considered for its negative rather than its positive effects (Watson and Adams, 2010). Alfieri et al. (2016) estimate flood impact at the Europe-an Union level to be ≈EUR 6 billion per year, affecting 250 000 people per year. Although flood impact assess-ment is an essential step by which to optimise flood mitigation measures, there are many sources of uncertain-ty that affect such complex estimates. For example, uncertainty may come from sparse and short datasets, poor
knowledge of hydraulic structures such as dams and weirs along rivers, assumptions and extrapolations in statistical analyses of extreme floods, and depth-damage functions. The es-timation of flood damages also de-pends on several assumptions (Merz et al., 2010). It involves challenges in defining damages for different el-ements at risk (e.g. houses, public spaces, industries), and transferring solutions in space (from one region to another) and in time (from one flood event to another).
Flooding causes long-term damage to health, with immediate impacts such as drowning, physical trauma, infec-tions and chemical hazards, and also affects well-being, livelihoods and social cohesion. It is also not always easy to identify the local consequenc-es of flooding, such as the effects caused by displacement, the destruc-tion of homes, delayed recovery and the disruption of access to health services (WHO, 2013). Flooding can also cause damage to critical infra-structure and can interrupt health and
social care service delivery and busi-ness supply chains (National Flood Resilience Review, 2016; Landeg and Lawson, 2014). Finally, flooding is also frequently associated with power outages, which themselves can have a detrimental impact on health and businesses (Klinger et al., 2014) and a knock-on effect on other critical infrastructure such as railways and wastewater services.
Flood disasters affect a large number of
people across the world every year, with severe
social and economic impacts. Severe flooding
repeatedly affects European populations,
with trans-national events often being the most
damaging.

CHAPTER 3 UNDERSTANDING DISASTER RISK: HAZARD RELATED RISK ISSUES - SECTION II
199
The vulnerability of riverside com-munities around the world is particu-larly worrying in the light of migra-tion pressures, socioeconomic drivers and climatic change. Even those who live flood-adapted lifestyles are not resilient to severe floods that occur only rarely, particularly when the last big flood was beyond living memory (Garde-Hansen et al., 2016) and in light of the impacts of future climate change.
In this subchapter, the main drivers of flood hazard are introduced and flood hazard and risk mapping are discussed, particularly at the region-
al scale. Flood predictability is then considered, along with a review of the added value of flood monitoring, flood forecasting and EWSs.
3.4.2Living with floods
Learning to live with flooding means that we recognise that flooding will continue to happen, as it is a natural phenomenon. There are many uncer-tainties in knowing when and where a flood will happen, both in the imme-diate term and in terms of probable climate change timescales, and when
it does flood there is inevitably some disruption to our lives. However, there are many things that we can do to pre-pare better for floods and manage the risk, including strengthening compo-nents of flood prevention, flood pre-paredness, flood response and flood recovery, which are part of the dis-aster cycle (Figure 3.). Interventions can be taken during a flood to limit the impact of the disaster, including the evacuation of settlements or the creation of additional flood relief space through the opening of dykes or dams. This response is followed by a recovery phase after the disaster has passed, which includes relief meas-
Hazards and risk event cycleSource: courtesy of authors
FIGURE 3.24
Hazards and risk
Event Cycle
Emergency provisions Management Warning and alert systems Resources for intervention Emergency planning Training and exercise
Prevention Legal bases Land use planning Technical & Environmental measures Biological measures Organisational measures
Reconstruction Reconstruction and strengthening of resilience Financing
Event analysis Documentation Lesson learnt
Recondition Energy & Transport systems Communications Supply and disposal
Intervention Alert Rescue Damage mitigation Emergency measuresPreparations for Intervention
Early warning Raised readiness
Preparedness
Response
Recovery

200
ures, reconstruction and event analy-sis. Often, this phase is aligned with the aim to achieve a similar economic standard to that before the event.
Our best strategy for flood management is
learning to live with flooding, that is, preparing
ourselves today to be better adapted for flood
risks tomorrow. The combination of a
strong flood risk management policy,
advanced early warning technology and increased
international collaboration have the potential to reduce flood risk and
improve disaster response from the local to the
global scale. This requires different disciplines of knowledge, scientists,
policymakers and practitioners to work
closely together.
If society has learned from the event, then any recovery is followed by a dis-aster risk-reduction phase, which in-cludes preventive measures (e.g. cre-ating natural retention in catchments, changing land use, rethinking urban design, planning and architectural norms, and implementing structur-al flood defences) and precautionary measures (e.g. supporting insurance
mechanisms, refitting buildings, train-ing and using EWSs). The aim is to minimise the vulnerability of socie-ty and to prepare it for an adequate response and recovery after the next event. The diversity in the way soci-eties prepare for, respond to and re-cover from floods is largely governed by their experience with flood risk management and the magnitude of the floods that they have historically experienced (Thieken et al., 2007).
Improving flood preparedness re-quires contributions from many different disciplines of knowledge. Efforts are needed in terms of (1) improving risk governance, including institutional governance, legal pro-visions and financial instruments for planning, prevention and crises man-agement, (2) understanding hazard modelling, incorporating meteorolog-ical forcing, hydrological, river and ur-ban drainage processes, (3) forecasts and predictions, from short to long lead time ranges, and (4) emergency response recovery, including coordi-nation of local operations, assistance to affected communities and recovery of disrupted services. Communica-tion with and engagement of the pub-lic, water managers and decision-mak-ers is key to effectively integrate these layers and to improve flood prepared-ness.
3.4.3Drivers of flood
hazardFloods happen for a variety of rea-sons, but the main drivers are usually related to high rainfall, snowmelt and high river flow conditions (see Chap-ter 3.6). Fluvial floods occur when
river levels rise and burst or overflow their banks, inundating the surround-ing land that forms the river’s flood-plain. This can occur in response to storms with higher than normal rain-fall totals and/or intensities, seasonal strong weather systems such as mon-soons or winter stormtracks, or the sudden melting of snow in spring. The spring 2006 flood in the upper part of Elbe river basin is an exam-ple of a flood event driven by snow-melt combined with precipitation (Younis et al., 2008). With the rapid increase in temperature in April, snow that was present in the catchment was completely melted in 7-14 days. While temperature is generally easi-er to forecast than precipitation, the assessment of the quantities of snow accumulated in the catchment during the winter season can be a challenge for many EWSs.
Floods can be triggered by rivers bursting or
overflowing their banks, storm surges in the ocean,
tsunamis, groundwater rising, glacial outbursts
or dam failures and from surface water runoff in
our cities after heavy rain.
The severity of fluvial floods can be enhanced when the landscape is al-ready saturated with water. Runoff due to rainfall cannot infiltrate the ground and, instead, flows directly to the river channel, rapidly contribut-ing to increased river levels. This oc-curred in the winter 2013/14 floods

CHAPTER 3 UNDERSTANDING DISASTER RISK: HAZARD RELATED RISK ISSUES - SECTION II
201
in the south of the United Kingdom, where an unusual series of storms led to widespread flooding (Hunting-ford et al., 2014; Muchan et al., 2015), and in the 2013 floods in Germany (Schröter et al., 2015).
Flash floods can develop when heavy rainfall occurs suddenly, particular-ly in mountainous river catchments, although they can occur anywhere (Gaume et al., 2009; Brauer et al., 2011). In flash floods, the rate at which river water levels rise is very rapid and the flood forms quickly. High levels of localised rainfall, rapid flood for-mation and high water velocities can be particularly threatening to the pop-ulation at risk and highly destructive. Challenges in the management of flash floods include the short prepa-ration time to activate flood alerts and emergency response, the sudden na-ture of the phenomenon, which of-ten catches the population at risk by surprise, the difficulties of numerical weather prediction models in fore-casting localised convective storms, and the lack of quantitative data at small catchment level to improve the understanding and modelling of flash floods (Collier, 2007; Leichti et al., 2013; Alfieri et al., 2011).
Heavy rainfall may cause surface wa-ter flooding, also known as pluvial flooding, particularly in cities where the urban drainage systems become overwhelmed. In these cases, event monitoring from telemetric rain gaug-es or meteorological radar needs to be coupled with hydrological, hydrau-lic and drainage system models for flood mapping (Liguori et al., 2012). Challenges remain with regard to es-timating accurately rainfall displace-ment over an urban area, as well as
with regard to precise knowledge of the capacity of the sewer system as a result of, for instance, debris block-ages, infrastructure failure (broken or cracked pipes) or a reduction of plu-vial capacity (Chen et al., 2016).
Floods can also be generated by in-frastructure failure (e.g. dam breaks), glacial/lake outbursts, storm surges and wave overtopping at the coast (see Chapter 3.6), and groundwater rising under very wet prolonged con-ditions, thereby causing waterlogging (Macdonald et al., 2012). In many cas-es, flooding occurs when more than one of the generating mechanisms happen concurrently, making the pre-diction of flood hazards and impacts even more challenging, and the prob-able resulting damage more severe. In addition, longer-term drivers of flood impacts are also of concern in many vulnerable areas. They include changes in land use, population and geomorphology and the impacts of a changing climate (Alfieri et al., 2015; Slater et al., 2015). These issues are not straightforward to determine be-cause of the many uncertainties in-volved in using climate and socioec-onomic models to drive flood hazard predictions and the difficulties in their evaluation (Cloke et al., 2013; Hall et al., 2014; Hirabayashi et al., 2013; Kendon et al., 2016; Vormoor et al., 2015).
3.4.4Flood hazard and
risk mapping
Flood risk can be calculated from the hydrological flood hazard by in-cluding information on the exposure and vulnerability of populations and
assets. They are needed at different spatial scales, from local and nation-al to global scales, and at different temporal scales, from upcoming days to decades. Flood risk management measures are key to flood hazard and risk mapping. Flood risk management is considered at the European level by the Floods Directive 2007/60/EC (European Commission, 2007) which directs EU Member states to ade-quately assess and manage their flood risk. This involves mapping the flood hazard extent, assessing the flood risk and producing flood risk manage-ment plans, which also consider the longer-term drivers of land use and climate change.
Flood hazard can be calculated by assessing the probability of any par-ticular area being flooded. Usually, it is undertaken with respect to a par-ticular level of flood, for example, the 0.01 Annual Exceedance Probabili-ty threshold (also commonly known as the ‘100-year flood’ with a return period of 100 years, which is better understood as a flood that has a 1 % probability of occurring at any given location in any given year). Flood risk takes the flood hazard and combines this with information on the potential damage to society, such as vulnera-bility and the exposure of assets and populations in the floodplain. Ap-proaches can be different depending on the temporal and spatial scales at which the flood hazard and risk as-sessment are applied, on the model-ling tools and data available and on the type of flood hazard (e.g. if it is a fluvial, surface water or coastal flood).
A fully comprehensive flood risk map requires a great number of data, a se-ries of floods events over a long peri-

202
od and a chain of models and assess-ments (Sampson et al., 2014, Dottori et al., 2016), although simpler map-ping based solely on flood events or other historical information can also be useful (Boudou et al., 2015).
Flood hazard and flood risk maps are required for land use planning,
floodplain management, disaster response
planning and financial risk planning. They can be
produced at increasingly higher resolutions using
flood modelling tools. Uncertainties can be
taken into account by using probabilistic methods. A focus on
flood hazard impacts can enhance communication
to the public.
For fluvial floods, a full risk mapping requires long-term series of hydrome-teorological data, satellite data on the flood extent for the assimilation of spatial information, large datasets on population/asset exposure and flood protection standards (Scussolini et al., 2016), and commercially sensitive damage data from insurance compa-nies, which are often not openly ac-cessible. Longer timescale changes in flood risk are usually assessed through scenarios of climate change and soci-oeconomic development (Apel et al., 2008; Winsemius et al., 2013). These can take into account flood policies,
such as the implementation of flood protection measures, as well as the interaction of human and physical systems, such as the adaptation effect and the failed levee effect (Di Bal-dassare et al., 2015; Collenteur et al., 2015).
Flood hazard maps can be produced by using hydraulic models to simulate water flow along rivers, over flood-plains and in urban surface water accumulation zones. Simulations are often combined with Geographic In-formation System (GIS) techniques to build flood maps. This ideally requires substantial observed data for model calibration and validation. For fluvial floods, hydraulic models can use time series of historical river flows, histori-cal rainfalls or time series of synthetic design rainfall events, in conjunction with catchment hydrology rain-fall-runoff models. However, even the most sophisticated approaches have difficulty producing robust esti-mates of extreme events (Sampson et al., 2014), which can be problematic if these maps are the only resourc-es used to support decision-making processes, such as urban planning. Describing flood inundation hazard and risk using probabilistic methods is therefore encouraged (Romanow-icz and Beven, 2003; Pappenberger et al., 2006). For example, flood in-undation hazard can be mapped from the development and set-up of flood inundation models, a sensitivity analy-sis using observations, the use of the multiple acceptable (‘behavioural’) model parameter sets to perform ‘en-semble’ (multiple) simulations using an uncertain synthetic design event, or an ensemble of scenarios, as input to the flood inundation models (Di Baldassarre et al., 2010). Probabilistic
methods can be used, as they assume that, whichever model is chosen, it will not perfectly represent all flood propagation and inundation process-es involved. This can be very impor-tant when modelling flood inundation in changing environments, when they are subject either to strong land use changes or to climate changes.
Regional-scale fluvial flood hazard mapping has been improved by the use of satellite data assimilation and flood models to map flood inunda-tion pathways. Global flood hazard maps can also be useful in the assess-ment of flood risk in a number of different applications, including (re)insurance and large-scale flood pre-paredness. These maps can be creat-ed using large-scale computer models of rainfall-runoff processes in river catchments and river routing. They may, however, require the use of a variety of post-processing methods to better adjust simulations to local measurements (Pappenberger et al., 2012; Ward et al., 2013; Winsemius et al., 2013; Dottori et al., 2016). At the local scale, surface water flood hazard mapping (pluvial flooding) has benefited from recent improvements to fine-scale surface water modelling, particularly in cities, on 1-metre or 2-metre grids, integrating topography, land use, urban structures and poten-tially also subterranean drainage and flooding impacts (Tyrna et al., 2016; Palla et al., 2016).
All numerically produced flood haz-ard maps, regardless of their spatial scale, require validation in order to be useful. This can be very challenging because of a lack of robust observed data. On local, regional or national scales, validation can be undertaken,

CHAPTER 3 UNDERSTANDING DISASTER RISK: HAZARD RELATED RISK ISSUES - SECTION II
203
at least to some extent, on the basis of past observations of inundation ex-tents, from satellite, ground-based ob-servations or community-based data sources, as well as from river stage and discharge measurements from river gauges. In contrast, the accuracy of global maps is far more challenging, as globally consistent observations can rarely be obtained. Trigg et al. (2016), for instance, describe several differ-ent global flood hazard maps, which have been individually validated with-in a limited context. The estimates of global flood hazard obtained are com-pared to analyse their consistency and to provide an estimate of model un-certainty. In Africa, the agreement be-tween the different models is relatively low (30-40 %), with major differences in magnitude and spatial extent par-ticularly observed for deltas, arid/semi-arid zones and wetlands, which are all areas that suffer from a lack of data for validation. Such discrepan-cies can have significant impact: for example, the models showed a large discrepancy in the Nile delta, where approximately 95 % of the popula-tion of Egypt lives. This highlights the fact that any global flood hazard map should be used with caution and that multimodel products may be use-ful (Trigg et al., 2016). The role of databases and post-event analyses is key to improve our understanding of global flood hazard and risk (de Moel et al., 2015).
3.4.5Flood monitoring,
forecasting and early warning systems
The predictability of hydrological
systems varies because of the large number of non-linearities in these systems, the challenges in the observ-ability of the state of the hydrologi-cal variables, the presence of outliers (rare occurrences), the variability of external forcing and the numerous interactions among processes across scales (Bloschl and Zehe, 2005; Ku-mar et al., 2011; Peña et al., 2015; La-vers et al., 2011). Different types of floods are predictable with different time ranges. Flash floods driven by convective rainfall are notoriously challenging to predict ahead in time to produce effective early warnings (Collier, 2007; Berenguer et al., 2005), whereas slower developing floods in large catchments can be predicted several days ahead of time with the use of probabilistic flood forecasting systems (Emerton et al., 2016). The use of satellites and EWSs based on computer-intensive forecasts has re-cently enabled distinct improvements in our ability to provide effective in-formation on the likelihood and se-verity of upcoming flooding and the extent of the affected area (Alfieri et al., 2013; Revilla-Romero et al., 2015). This information can be provided to agencies, responders, stakeholders and the public in various forms, in-cluding interactive watch or warning maps and flood guidance statements (e.g. FFC, n.d.; Vigicrues, 2017).
However, there is substantial uncer-tainty in predicting floods, which stems from the uncertainty in the atmosphere, the complexity of the land-surface processes and the imper-fection in the computer models used to represent them (Cloke and Pap-penberger, 2009; Rodríguez-Rincón et al., 2015). Ensemble techniques can be used to represent the main
sources of predictive uncertainty. These use multiple simulations based on different model set-ups, model pa-rameters, initial conditions, data, etc. Rather than just providing one ‘best guess’ prediction, ensembles provide a whole range of model realisations and equally possible predictions for the future. Information can be ob-tained on which scenarios are most likely to happen and on the worst possible scenario (given our current knowledge of initial conditions and process representation). This can be useful to communicate forecast un-certainty and to help stakeholders to take more informed decisions (Cloke and Pappenberger, 2009; Stephens and Cloke, 2014; Zsótér et al., 2016). The HEPEX initiative (Hydrologic Ensemble Prediction Experiment, n.d.) seeks to advance the science and practice of hydrologic ensemble pre-diction and its use in risk-based deci-sion-making by engaging researchers, forecasts and users in several commu-nity activities.
Real-time monitoring and rapid map-ping of floods based on satellite data have been implemented at a variety of scales and by a number of different actors to detect flooding severity and extent in affected areas. For instance, the Copernicus Emergency Man-agement Service—Mapping (2017) integrates satellite remote sensing and available in situ data to provide stakeholders with timely and accu-rate geospatial information in emer-gency situations and humanitarian crises (not just for floods, but also other hazards). It operates for the full emergency management cycle and can be broadly divided into (1) a Rap-id Mapping component, which pro-vides on-demand information within

204
hours or days, usually immediately in response to a disaster event, and (2) a risk and recovery mapping to sup-port activities in the area of preven-tion, preparedness and disaster risk reduction. Another activity in the area of monitoring flooding from space and their impacts is the Dartmouth Flood Observatory (n.d.). Maps are published to provide an overview of flooding impact and extent, and a day-to-day record of flooding occurrenc-es is built for analyses at a later stage.The use of space-based information facilitates international flood detec-tion, response, future risk assessment, and community-wide hydrological re-search. Improvements in rainfall data assimilation to meteorological mod-els (e.g. Ballard et al., 2016) and soil moisture, discharge and water level data or flood inundation characteris-tics to flood models (e.g. Garcia-Pin-tado et al., 2015; Alvarez-Garreton et al., 2015) have also provided improve-ments in flood forecasting and hazard mapping. Many other vital data have emerged, derived from ground-based imagery flood monitoring, crowd-sourcing, unmanned aerial vehicles, rapid flood mapping and post-event data collection by authorities, re-searchers and local communities (e.g. Walker et al., 2016; Le Coz et al., 2016; Perks et al., 2016).
Numerical weather prediction models have now improved to the point that operational centres can set up hydro-meteorological systems that are able to forecast river flow and flooding on larger catchments several days, and even weeks, ahead of an upcoming flood event at global scales (Emerton et al., 2016). Transnational forecasting and warning systems can be of par-ticular benefit, as they provide con-
sistent and comparable information for rivers that cross national bound-aries. They can also be useful as sup-port information for all nations that do not have adequate flood forecast-ing and warning capabilities (Alfieri et al., 2012; Thiemig et al., 2015). As Emerton et al. (2016) argue:
Flood forecasting and EWSs are identified as key
preparedness actions for flood risk management
and can be implemented at local scales through
to continental and global scales. Radar
and numerical weather forecasting systems
can be used as inputs to flood forecasts, but
uncertainties should be taken into account using ensemble (probabilistic) forecasting techniques.
Operational systems currently have the capability to produce coarse-scale discharge forecasts in the medi-um-range and disseminate forecasts and, in some cases, early warning products in real time across the globe, in support of national forecasting capabilities. With improvements in seasonal weather forecasting, future advances may include more seamless hydrological forecasting at the glob-al scale alongside a move towards multi-model forecasts and grand en-semble techniques, responding to the
requirement of developing multi-haz-ard EWSs for disaster risk reduction.Flood magnitude and return period (or average frequency of occurrence) can be assessed for single points on a river. However, for those applications that require a measure of flood sever-ity across an entire region, or ‘flood-iness’, as, for example, in the case of initiating and forecasting the need for humanitarian actions, floodiness indi-ces can be used to provide a spatial view of the risk of flooding (Stephens et al., 2015). Although several applica-tions still rely on rainfall forecasts as a proxy for imminent flood hazard, Stephens et al. (op. cit.) have shown that monthly floodiness is not well correlated with precipitation, which demonstrates the need for hydrome-teorological EWSs at such scales.
3.4.6Copernicus Emergency
Management Service: floods (EFAS and
GloFAS)
The European Flood Awareness Sys-tem (EFAS, 2016; operational since 2012) and GloFAS (GloFAS, 2017; due to become operational in ear-ly 2017) aim to provide early flood information to national authorities to support national capabilities, par-ticularly with earlier and probabilis-tic information. EFAS additionally provides information to the Europe-an Commission’s ERCC to support flood disaster response.
The EFAS project was initiated fol-lowing the severe 2002 flooding that took place across Europe and has

CHAPTER 3 UNDERSTANDING DISASTER RISK: HAZARD RELATED RISK ISSUES - SECTION II
205
since been enhanced with research de-velopments and user feedback. Large-scale systems not only save lives by in-creasing flood preparedness, but also have a significant economic benefit. Pappenberger et al. (2015) provide evidence of the monetary benefit in cross-border continental-scale flood EWSs. The potential monetary ben-efit of EFAS was estimated by com-
bining warning information with ex-isting flood damage cost information and calculations of potential avoided flood damages. The benefits were es-timated to be of the order of EUR 400 for every euro invested (Pappen-berger et al., 2015).
The benefits of an EWS can also be demonstrated in individual cases of
flood warning. For example, EFAS proved to be useful in the widespread flooding that occurred in the Bal-kans region in south-eastern Europe in 2014. Weeks of continuous rain, combined with an exceptional storm on 13 May, led to heavy flooding in Bosnia-Herzegovina and Serbia, but also in Slovakia, southern Poland and the Czech Republic. The impact
GloFAS forecasts of the River Ganges floods in July/August 2016.
a) forecast map showing river pixels with upcoming floods; b) forecast ensemble hydrograph for the Ganges at Begusarai (Bihar) on 8 July 2016; 1 week before the flooding started and 18 days before the peak; c) forecast ensemble hydrography on 21 July 2016, showing the flood peak on 27 July with 98% probability of exceeding the severe alert threshold (20 year return period) and 50% probability of exceeding the 50-year return period. The colours of the triangles and pixels in (a) and shad-ing in (b,c) are: purple represents severe alert of ≥ 20 year return period; red, high alert of ≥ 5 year return period; yellow, medium alert of ≥ 2 year return period.
Source: GloFAS (2017)
FIGURE 3.25
a)
b) c)

206
of flooding was so severe that Bos-nia-Herzegovina and Serbia requested assistance from the European Union through the EU Community Civil Protection Mechanism. EFAS pro-vided early warnings from 11 May onwards and notified national author-ities and the ERCC operating within the Commission’s Directorate-Gen-eral for Humanitarian Aid and Civil Protection (DG ECHO). This facil-itated a coherent European disaster response during the numerous emer-gencies.
There is likely to be a substantial monetary
benefit in cross-border continental-scale
flood EWSs. In Europe, transnational flood early
warning is undertaken by the Copernicus
Emergency Management Service: Floods, which
consists of the European Flood Awareness System
(EFAS) and its global twin system, the Global
Flood Awareness System (GloFAS).
Similar examples can be provided for GloFAS. In August 2016, flooding occurred along the Ganges River in India. According to India’s Central Water Commission, the Ganges in the Patna district was just 8 cm below the highest recorded water level, which forced thousands to flee their homes
into relief camps. GloFAS was able to provide flood forecast informa-tion several weeks in advance (Figure 3.25). However, it is also clear that sig-nificant training is still required in or-der for such forecasts to be useful and to enable decisions from probabilistic information (Pagano et al., 2014). Training needs to be provided within the relevant context of international, regional and local organisations. For example, GloFAS has provided train-ing through the RIMES (Regional Integrated Multi-Hazard Early Warn-ing System) and UN-ESCAP (Unit-ed Nations — Economic and Social Commission for Asia and Pacific), with participants from national hy-drometeorological services in Bangla-desh, Bhutan, Nepal, India, China and Pakistan (via the internet) and repre-sentatives from several international organisations.
In a recent case study in Uganda, Coughlan de Perez et al. (2016) have shown that global systems combined with local expertise and knowledge have the potential to assist in reducing flood disaster impacts by triggering preventative action before flooding. The system for forecast-based financ-ing automatically triggers action when a flood forecast arrives and before a potential disaster. While not a perfect indicator of flooding, GloFAS fore-casts proved to be reliable in fore-casting a specific chance of flooding (exceedance of a pre-defined danger level) and was useful as an EWS.
3.4.7Communicatinguncertainty anddecision making
Decisions are taken at different stag-es in the production of a forecast, as well as after its public release (e.g. as a flood warning, often based on expert judgement). Human expertise is in constant interaction with automated tasks in flood forecasting (Pagano et al., 2016) and controls much of the output information of a flood fore-casting system. Training and refore-casting of critical events increases the capacity to deal with uncertain-ty information and enables optimal decisions to be made (Ramos et al., 2013; Crochemore et al., 2016; Arnal et al., 2016). Risk-based decision-sup-port frameworks have to be tailored to the problem in question but also flexible to allow different flooding situations and, often, unprecedent-ed flood events, to be handled (Dale et al., 2014). Challenges at present include providing tailored warnings that are acted upon by responders and the public (Demeritt et al., 2013; Dittrich et al., 2016), and developing decision-support systems that can in-tegrate the different stages of flood risk management, without losing in-formation on uncertainty, warning time, forecast accuracy and reliability. This should help decision-makers to understand the strengths and weak-nesses of a forecasting system for dif-ferent scales and events.
Similarly, flood hazard and risk map-ping also involves many layers of data collection and modelling output dis-play. It is crucial that communication

CHAPTER 3 UNDERSTANDING DISASTER RISK: HAZARD RELATED RISK ISSUES - SECTION II
207
is ensured at all stages and that essen-tial information for decision-making is not lost (see Chapter 4). Communi-cation not only targets decision-mak-ers at public or private companies, but also involves communication to the public and to experts (Environ-ment Agency, 2015) who may prefer information to be described in terms of possible impacts. The visualisation of model outputs and maps is part of the communication process (Pap-penberger et al., 2013). Usually, com-munication will cover information on alerts, watches and warnings, risk maps and vulnerable areas that can be potentially affected by floods of different magnitudes and return pe-riods (100-year flood, 10-year flood, etc.), but also guidance on using and interpreting maps. It is important that communication follows Open Ge-ospatial Consortium (OGC) stand-ards, such as providing information as Web Mapping Services (WMS) or WaterML, so that it can be easily in-tegrated into other systems and be more effective. The communication of flood hazard and risk and the asso-ciated uncertainties should be a strong focus at all stages in the prevention, preparedness, response and recovery cycle. It should also be active during recovery in order to facilitate post-event surveys, to speed up recovery with the help of local communities or to convey lessons learned (Marchi et al., 2009; Stephens and Cloke, 2014; Javelle et al., 2014).
Efficient communication is also de-pendent on how users perceive risk and understand uncertainty, and tend to act in the face of uncertain infor-mation (Ramos et al., 2010; Bubeck et al., 2012). A two-way approach can enhance, and even modify, established
links between modelling outputs (haz-ard and risk maps) and social actions. Through an increased understanding of user needs and institutional and so-cial vulnerability drivers (Rufat et al., 2015, Daupras et al., 2015), existing bottlenecks in flood response, such as areas of difficult access or with high rates of injuries and fatalities, can be detected and targeted in the maps. With time, behaviour changes can even bring modifications to the vul-nerability zones and can modify flood risk maps that cross flood vulnerabil-ity with hazard. In this process, build-ing trust and confidence is essential. Uncertainties are not necessarily unwelcome by the public and stake-holders (McCarthy et al., 2007), and explicitly acknowledging uncertainty in flood risk mapping is also valuable for decision-makers (Michaels, 2015). The communication of uncertainty can help modellers and forecasters by strengthening a relationship of confi-dence between them and the users of their products.
Flood forecasts and flood risk maps have associated
uncertainties and are useful if decision-makers
can understand and act upon the information
provided, so forecasting and mapping must be in
harmony with user needs and requirements to bring added value to the whole
process of flood hazard and risk management.
One uncertainty that it is essential to consider in all aspects of flood risk management is the projected future changes in flooding risks to commu-nities, businesses and infrastructure. This means considering adaptive management approaches in the design of flood risk management policy and infrastructure (Gersonius et al., 2013). The degree of uncertainty in the im-pacts of climate change projections requires the consideration of flexi-ble adaptation pathways. Regardless of the sources of uncertainties, more needs to be done in flood risk man-agement policy and practice to make our societies resilient to future flood risk (CCC, 2017; EEA, 2017).
3.4.8Conclusions and key messages
Flood disasters affect a large num-ber of people across the world every year, with severe social and economic impacts. Severe flooding repeatedly affects European populations, with trans-national events often being the most damaging.
PartnershipOur best strategy for flood manage-ment is to learn to live with flooding, that is, to prepare ourselves today to be better adapted for flood risks to-morrow. The combination of strong flood management policy, advanced early warning technology and in-creased international collaboration has the potential to reduce flood risk and improve disaster response from the local to the global scale. This re-quires stakeholders from different disciplines, scientists, policymakers

208
and practitioners to work closely to-getherin partnership.
KnowledgeFlood hazard and flood risk maps are required for land use planning, flood-plain management, disaster response planning and financial risk planning. They can be produced at increasingly high resolution for fluvial and surface water flooding (and coastal flooding) using flood modelling tools. Uncer-tainties can be taken into account by using probabilistic methods. A focus on flood hazard impacts can enhance communication to the public.
InnovationFlood forecasting and EWSs are in-novations that are key preparedness actions for flood risk management and can be implemented at local scales through to continental and global scales. Radar and numerical weather forecasting systems can be used as inputs to flood forecasts, but uncertainties should be taken into ac-count using ensemble (probabilistic) forecasting techniques.
There is probably a substantial mon-etary benefit in cross-border conti-nental-scale flood EWSs. In Europe, transnational flood early warning is undertaken by the Copernicus Emer-gency Management Service: Floods, which consists of EFAS and its global twin system, GloFAS.
Flood forecasts and flood risk maps have associated uncertainties and are useful if decision-makers can under-stand and act upon the information provided, so forecasting and mapping must be undertaken in harmony with user needs and requirements to bring
added value to the whole process of flood hazard and risk management.

CHAPTER 3 UNDERSTANDING DISASTER RISK: HAZARD RELATED RISK ISSUES - SECTION II
209
3.5 Hydrological risk: landslidesNicolaCasagli, Fausto Guzzetti, Michel Jaboyedoff, Farrokh Nadim, David Petley
3.5.1Introduction
The term landslide encompasses a wide variety of phenomena, from the simple fall of rock blocks from verti-cal rock faces, through to topples and landslides that are dominated either by a sliding motion or by flows of soil and/or rock. Landslides are strongly correlated with other types of natu-ral hazards, such as floods, droughts, wildfires, earthquakes, tsunamis and volcanoes, and are often involved in cascading events of multihazard dis-asters.
Climate change, the increased suscep-tibility of surface soil to instability, anthropogenic activities, growing ur-banisation, uncontrolled land use and the increased vulnerability of popu-lations and infrastructure contribute to the growing landslide risk. In the Thematic Strategy for Soil Protec-tion (European Commission, 2006), landslides are considered one of the main threats to European soils. In
this framework, landslide disaster risk reduction should be properly under-taken in order to reduce the impact of landslides on humans, structures and infrastructures. In areas with high demographic density, protection works often cannot be built owing to economic or environmental con-straints, and is it not always possible to evacuate people because of societal reasons. Forecasting the occurrence of landslides and the risk associated with them, and defining appropriate EWSs, are, therefore, essential needs.
The societal and economic impact of landslide risk is difficult to assess and it is underestimated, since a relevant part of related damage is attributed to other natural hazards, in multihaz-ard chains (e.g. seismically induced failures, rainfall induced debris flows, lahars and rock avalanches associated with volcanism).
An established worldwide scientific landslide community has flourished in the last decades, thanks to several in-ternational organisations, such as the
International Consortium on Land-slides and the Landslide Joint Tech-nical Committee, which periodically organise the World Landslide Forums and the International Landslide Sym-posia, respectively. Regular landslide sessions are also organised at the General Assembly of the European Geoscience Union each year.
The term ‘landslide’ describes a variety of processes that result in the downward and
outward movement of slope-forming
materials, including rock, soil, artificial fill or a
combination of these.
In this subchapter, the main causes and triggers of landslides and their socioeconomic impact at European

210
level are described, before some gen-eral concepts and methodologies on landslide zoning (inventory, suscep-tibility and hazard maps) and EWSs based on the analysis of landslide monitoring data and rainfall data are introduced.
3.5.2 Landslide causes and
triggers
The most recent landslide classifica-tion is found in Hungr et al. (2014). It discerns five main types of move-ment: falls, topples, slides, spreads and flows. Many landslides consist of a variety of movement types occur-ring in sequence. For example, large landslides in high mountainous are-as often start as rock falls involving freefalling rock that detaches from a cliff, which upon impact at the cliff toe may spontaneously transition into a very high-energy rock avalanche (Hutchinson, 1988). The properties of the flow change further as the landslide entrains or deposits debris and water.
Landslides vary greatly in size. At the largest scale, a single landslide can in-volve up to some cubic kilometres of rock and soils. At the other end of the scale, a small boulder has the poten-tial to cause loss of life, if it strikes an individual, or to cause mass fatalities if, for example, it causes a train to de-rail. In general, the potential to cause loss scales with size of the landslide, largely because of the scaling of the kinetic energy and the affected area.
A key causal factor for landslides is the topographic setting of the poten-tial site. In general, the propensity to
failure usually increases as the slope angle increases, from essentially zero on a flat surface to a significantly high-er level when slopes are steep. How-ever, the relationship with geological factors is highly non-linear, and below a key gradient, any given slope is like-ly to be stable under most conditions. Slopes naturally evolve into a stable state under any given set of environ-mental conditions, primarily through landsliding processes. External fac-tors disrupt the slope equilibrium to induce instability; thus, for example, a migrating river channel or an unusual flood may erode the toe of a slope, increasing the slope gradient and the likelihood of failure. The slope will then naturally evolve back to its sta-ble gradient through time, perhaps by means of another landslide that re-moves the excess material.
A second set of causal factors relates to the type of material involved in the potential instability and its geo-technical properties, such as internal friction and cohesion. In hard rock masses, stability is usually defined not by the intact strength of the material but by the joints, fractures and faults. The strength of these discontinuities may be dramatically lower than the intact rock strength, especially where they are lined with a weaker materi-al. Where such a discontinuity has an orientation that promotes failure, the resistance of the slope to land-sliding can be dramatically reduced. Therefore, in many cases, analysis of susceptibility depends on an under-standing of the role played by these discontinuities. Furthermore, the strength of slope materials degrades through the processes of weathering, which may physically and chemically
alter the constituent minerals or may break an intact mass into smaller, weaker pieces. Therefore, the suscep-tibility of a slope to failure may in-crease with time.
Earth materials interact closely with hydrology and hydrogeology. Water is probably the most important fac-tor that promotes slope instability. In many cases, water influences the strength parameters of geological materials, generally reducing strength when materials become saturated. Pore water pressure changes the ef-fective stress state of a slope, typically reducing resistance to shear forces, and promoting instability. The lack of understanding of hydrological con-ditions is a frequent cause of failure in managed slopes; the 1966 Aber-fan disaster in South Wales for ex-ample (Bishop et al., 1969), in which more than 140 people were killed by a landslide from a mine waste tip, was primarily the result of the con-struction of the tip on a spring and watercourse, which promoted condi-tions of full saturation after periods of heavy rainfall. However, water can also have more complex relationships with instability. For example, in some materials partially saturated condi-tions can provide additional strength through the generation of suction forces, while in others saturated con-ditions can promote soil liquefaction after failure, turning a slow landslide into a highly mobile and highly de-structive flow.
Land use can also be a key factor in landslide causation. Some types of vegetation can improve stability by providing additional strength to the soil via root systems, and by regulating the infiltration of water and drawing

CHAPTER 3 UNDERSTANDING DISASTER RISK: HAZARD RELATED RISK ISSUES - SECTION II
211
down pore water pressures through transpiration. In general, forested slopes are more stable than those left bare, and there is a large body of ev-idence to support the argument that there is increased mudflow activity after fires have removed vegetation (Cannon and Gartner, 2005; Shakesby and Doerr, 2006) and increased land-sliding after careless logging (Jakob, 2000). In general, the removal of veg-etation promotes instability. Growing new vegetation is a difficult (but effec-tive where successful) way to restore stability. Deforestation highlights the action of humans as the final key fac-tor. As people modify the landscape, the likelihood of landsliding changes. In many cases, humans promote in-stability by cutting slopes to steeper angles, removing vegetation, changing hydrology and increasing weathering rates.
Landslide occurrence is related to causal factors,
which create a propensity for a slope to fail, and
triggers, namely the specific external event that induces landslide
occurrence at a particular time.
In most cases, the timing of failure is associated with a trigger event. This is not always true, however; there is increasing evidence that slopes can fail through progressive mechanisms that involve the weakening of slope through time until stability is com-promised, but such events are rare,
although they can be destructive. However, most landslides are asso-ciated with a clearly defined trigger. Heavy rainfall is a key factor in gener-ating landslides, primarily through the generation of pore water pressures and thus a reduction in the effective normal stress. For example, the annu-al global landslide cycle is dominated by the effects of rainfall associated with the South Asian and East Asian monsoons (Petley, 2010). The impact of the South Asian monsoon on the southern edge of the Himalayas, al-lied with the topography and materi-als of the region, makes this the glob-al hotspot for landslide occurrence. However, the same correlation holds true everywhere.
The second key factor, and possibly the most important in terms of loss of life, is the impact of seismic events. Large earthquakes in mountain chains can trigger extraordinary numbers of landslides. Recent events include the 2005 Kashmir (Pakistan) earthquake and the 2008 Sichuan (China) earth-quake, both of which killed more than 20 000 people in landslides. The Sichuan earthquake alone triggered more than 100 000 landslides. At present, the nature of the interaction between seismic waves and slopes is poorly understood, and forecasting the impacts of a future earthquake in terms of landslides is fraught with difficulty. However, the high levels of loss suggest that this will be a key area of research in the future.
Humans can also be a key trigger of landslides. The construction of hy-droelectric stations can be significant. The Three Gorges Dam in China, the world’s largest hydroelectric project, is expected to lead to the ultimate
relocation of 1.4 million people ow-ing to the construction of a 650-km long reservoir and the increased land-slide risk; similar problems can be also found in Europe but to a lesser extent. The Vajont rock slide (Italy) resulted in the deaths of more than 2 000 people in 1963, when rock fell into the reservoir impounded by the highest arch dam in the world at the time. Humans trigger landslides through slope cutting (especially for road construction), deforestation, ir-rigation, undercutting and changes in hydrology and blasting, among many other activities. Mining activities have a particularly large impact. In more developed countries, mining is there-fore strictly regulated; sadly, in less af-fluent countries, regulation lags con-siderably, and losses are much higher.
Finally, in active volcanic areas, land-slides can be a major problem. Some of the highest levels of loss have occurred as a result of the high-mo-bility volcanic landslide known as a lahar, and volcanic flank collapses, which can be tsunamigenic, may be the largest terrestrial landslides pos-sible. Some of the deadliest landslide events on record have occurred in volcanic areas. Active volcanism pro-motes instability (the 1980 Mount St Helens eruption started with a land-slide that depressurised the volcano), and dome collapse is common. Vol-canic deposits regularly mobilise into high-energy flows, and hydrothermal activity can cause material strength degradation over large areas. Major debris avalanches, partially submarine, were triggered by the 2002 eruption of Stromboli volcano (Italy) and they caused tsunamis, in a typical multihaz-ard domino effect (Tinti et al., 2006).

212
climate data in Europe for the last two centuries demonstrate a shifting pattern in frequency and intensity of extreme weather events (IPCC, 2012, 2013). Along with the changes in cli-mate and weather patterns, demogra-phy, land use and other factors driving the landslide risk are changing rapid-ly (UN, 2015). Indeed, projections through the 21st century for Europe indicate that societal changes may lead to a larger increase in the impacts from landslides and other natural haz-
ards than climate change. Therefore, the changes in the socioeconomic im-pact of landslides should be consid-ered at two different timescales. The influence of climate change on the spatial and temporal characteristics of landslide risk will be noticeable by the end of the century. At a shorter timescale of one to two decades, the rapid changes in anthropogenic fac-tors such as urbanisation and land use change drive the dynamic risk pattern that we face today.
3.5.3The socio-economicimpact of landslides
in Europe and climate change
The fast-paced changes in society, cli-mate change and the human impact on the environment have a major impact on the frequency and spatial distribution of landslides. Annual
Estimate of changes in the exposure of Europe’s population to landslides in the 21st century Source: SafeLand (2013)
FIGURE 3.26

CHAPTER 3 UNDERSTANDING DISASTER RISK: HAZARD RELATED RISK ISSUES - SECTION II
213
Regional climate model (RCM) sim-ulations from the EU FP6 project ENSEMBLES (Van der Linden and Mitchell, 2009) predicted a consistent large-scale pattern of heavy precipita-tion changes in Europe. The simula-tions generally showed an increase in heavy precipitation over northern and central Europe in winter, although some inconsistencies were found among the predictions from different models in mountainous regions and at the foothills of the mountains. In summer, most models agree on an increase in heavy precipitation over Scandinavia and reduced precipita-tion in southern Europe. The larg-est inconsistencies were found in the transition zone across central Europe, which separates areas with positive trends in the north and areas with negative trends in the south. Con-sidering both the expected changes in patterns of extreme precipitation events and changes in other factors driving the landslide risk, the EU FP7 project SafeLand assessed the expect-ed changes in climate-driven landslide activity (magnitude, frequency) in Eu-rope in the next 100 years.
It must be emphasized that any prognosis of
the changes in the socio-economic impact of
landslides due to climatic change involves a high
level of uncertainty.
The SafeLand study estimated that landslide hazard threatens about 4 % of European citizens today. In addi-
tion to the people directly threatened in their homes, 8 000-20 000 km of roads and railways are exposed to high landslide hazard, causing additional direct threats to life and economic as-sets as well as problems for emergen-cy response and recovery operations (Jaedicke et al., 2013). The SafeLand prognosis was that about 0.7% of the total European population will ex-perience an increase in landslide risk by the end of the century, although in some parts of Europe the risk will be reduced. The spatial pattern of the expected change in the European population exposed to landslide risk is depicted in Figure 3.26. The main changes in landslide risk at the Euro-pean scale shown in the figure are due to the changes in population pattern caused by migration and urbanisation.
The SafeLand project also made a detailed study of the changes in land-slide risk pattern at local scale for selected sites in Europe for the peri-od 1951-2050. For these studies, the climate simulations were downscaled to simulate localised heavy precipita-tion events in regions where rain-in-duced landslides occur on a regular basis. The downscaled climate mod-els predicted an increase in landslide hazard at all sites. These results dif-fered from the predictions provided by larger scale climate models at some locations. These differences might be explained by the refinement in the climate model used, which, for exam-ple, considered the influence of local topography on precipitation. This demonstrated that large-scale mod-els are useful to evaluate the relative spatial variations of landslide activ-ity, while local scale models are nec-essary for urban planners and local authorities to estimate the future risks
associated with landslides and other hydro-meteorological hazards in their communities or regions of interest.
In addition, the large uncertainties in population and traffic evolution sce-narios, land use changes and political decisions regarding urban develop-ment require that the key parameters driving landslide risk are accurately monitored and that the prognosis of landslide risk is continuously updated as new information becomes available and more accurate and refined climate change models are developed.
3.5.4Landslide zoning:
inventory, susceptibility and
hazard maps
The mapping of landslides underpins disaster risk reduction strategies, inte-grating socio-economic impacts, and therefore the challenge is to analyse their causes and triggers in our chang-ing environments. Owing to the ex-traordinary breadth of the spectrum of landslide phenomena, no single method exists to identify and map landslides and to ascertain landslide susceptibility and hazard.
In addition to predicting ‘where’ a slope failure will occur, landslide haz-ard forecasts ‘when’ or ‘how frequent-ly’ it will occur, and ‘how large’ it will be (Guzzetti et al., 2005).
The simplest form of landslide map-ping is a landslide inventory map, which shows the location and, where known, the date of occurrence and the types of landslide that have left

214
discernible traces in an area (Guzzetti et al., 2012). Landslide inventory maps can be prepared by different tech-niques, depending on their scope and the extent of the study area. Small-scale inventories (≤1:200 000) are compiled mostly from data obtained from the literature, through inquiries to public organisations and private consultants, by searching chronicles, journals, technical and scientific re-ports, or by interviewing landslide experts. Medium-scale landslide in-ventories (1:25 000 to 1:200 000) are most commonly prepared through the systematic interpretation of aerial photographs at scales ranging from 1:60 000 to 1:10 000, and by integrat-ing local field checks with historical information. Large-scale inventories (>1:25 000) are prepared, usually for limited areas, using both the interpre-tation of aerial photographs at scales greater than 1:20 000, very high-reso-lution satellite images or digital terrain models, and extensive field investiga-tions.
An archive inventory shows infor-mation on landslides obtained from the literature or from other archive sources. Geomorphological invento-ries can be further classified as histor-ical, event, seasonal or multitemporal inventories. A geomorphological his-torical inventory shows the cumula-tive effects of many landslide events over a period of tens, hundreds or thousands of years. In a historical in-ventory, the age of the landslides is not distinguished, or is given in rela-tive terms (i.e. recent, old or very old). An event inventory shows landslides caused by a single trigger, such as an earthquake, rainfall event or snowmelt event, and the date of the landslide corresponds to the date (or period) of
the triggering event. Examining mul-tiple sets of aerial or satellite images of different dates, multitemporal and seasonal inventories can be prepared. A seasonal inventory shows landsides triggered by single or multiple events during a single season, or a few sea-sons, whereas multitemporal invento-ries show landslides triggered by mul-tiple events over longer periods (years to decades).
Landslide susceptibility is the probability of spatial
occurrence of slope failures, given a set of
geo-environmental conditions. Landslide
hazard is the probability that a landslide of a given magnitude will occur in a
given period and in a given area.
Conventional methods to prepare landslide inventory maps rely primar-ily on the visual interpretation of ste-reoscopic aerial photography, aided by field surveys. New and emerging techniques, based on satellite, air-borne and terrestrial remote sensing technologies, promise to facilitate the production of landslide maps, reduc-ing the time and resources required for their compilation and systemat-ic update. These can be grouped in three main categories, including the analysis of surface morphology, chief-ly exploiting very-high-resolution digital elevation models captured for example by LiDAR (light detection and ranging) sensors, the automatic
or semi-automatic interpretation and analysis of satellite images, including panchromatic, multispectral and syn-thetic aperture radar (SAR) images, and the use of new tools to facilitate field mapping.
Qualitative and quantitative methods for assigning landslide susceptibil-ity can be classified into five groups (Guzzetti et al., 1999): 1. geomorphological mapping,
based on the ability of an expert investigator to evaluate and map the actual and potential slope in-stability conditions;
2. analysis of landslide inventories, which attempts to predict the fu-ture landslide spatial occurrence from the known distribution of past and present landslides (typi-cally, this is obtained by preparing landslide density maps);
3. heuristic or index-based ap-proaches, in which investigators rank and weight the known in-stability factors based on their as-sumed or expected importance in causing landslides;
4. process-based methods that rely on simplified physically based landslide modelling schemes to analyse the stability/instabili-ty conditions using simple limit equilibrium models, such as the ‘infinite slope stability’ model, or more complex approaches;
5. statistically based modelling con-tingent on the analysis of the functional relationships between known or inferred instability factors and the past and present distribution of landslides. Re-gardless of the method used, it is important that the susceptibility zonations are validated using in-dependent landslide information,

CHAPTER 3 UNDERSTANDING DISASTER RISK: HAZARD RELATED RISK ISSUES - SECTION II
215
and that the level of uncertainty associated with the zonation is given (Rossi et al., 2010).
Landslide hazard is more difficult to obtain than landslide susceptibility, since it requires the assessment of the temporal frequency of landslides and the magnitude of the expected fail-ures (Guzzetti et al., 2005). The tem-poral frequency (or the recurrence) of landslides, or of landslide-triggering events, can be established from ar-chive inventories and from multitem-poral landslide maps covering suffi-ciently long periods. Furthermore, where a landslide record is available, an appropriate modelling framework needs to be adopted (Witt et al., 2010). Alternatively, for meteorologi-cally triggered landslides, one can in-fer the frequency of landslide events from the frequency of the triggering factors, for example the frequency (or the return period) of intense or prolonged rainfall periods. The un-certainty inherent in the prediction of triggers that may result in landslides adds to uncertainty inherent in the prediction of occurrence of land-slides.
To determine the magnitude of an expected landslide, investigators most commonly revert to determining the statistics of landslide size (area or volume). Accurate information on landslide area can be obtained from high-quality geomorphological inven-tories. Determining the volume of a sufficiently large number of land-slides is more problematic, and usual-ly investigators rely on empirical rela-tionships linking landslide volume to landslide areas (Guzzetti et al., 2009; Larsen et al., 2010; Catani et al., 2016).Finally, when determining landslide
hazard as the joint probability of landslide size (a proxy for magnitude), the expected temporal occurrence of landslides (frequency) and the expect-ed spatial occurrence (landslide sus-ceptibility), great care must be taken to establish if, or to what extent, the three probabilities are independent. In many areas, given the available in-formation and the local settings, this may be difficult to prove (Guzzetti et al., 2005). We expect that the quanti-tative assessment of landslide hazard will remain a major scientific chal-lenge in the next decade.
Such identification of areas suscepbti-ble to landslide hazard is essential for the landslide risk assessment and pos-sible implementation of effective dis-aster risk reduction strategies. These strategies (Dai et al., 2002) include land-use planning, development con-trol land, the application of building codes with different engineering solu-tions, acceptance, and monitoring and early warning systems. Land planning control reduces expected elements at risk. Engineering solution is the most direct and costly strategy for reducing either the probability of landsliding or the probability of spatial impact of a landslide. One approach is correction of the underlying unstable slope to control initiation of landslides (such as stabilisation of slope, drainage, retaining walls or planting), and the other is controlling of the landslide movement (such as barriers/walls to reduce or redirect the movement when a landslide does occur). The ac-ceptance strategy defines acceptable risk criteria (Fell, 1994;Fell and Hart-ford, 1997); and the monitoring and warning system strategy reduces ex-pected elements at risk by evacuation in advance of failure.
3.5.5Landslide
monitoring and early warning
These systems require a fine assess-ment of the socioeconomic impact of landslides, which must be based on accurate landslide mapping, as well as an understanding of their causes. EWSs for landslides are based on the reliable continual monitoring of rel-evant indicators (e.g. displacements, rainfall, groundwater level) that are assumed to be precursors to trig-gering landslides or reactivations. When values for these indicators ex-ceed predefined thresholds, alarms are transmitted directly to a chain of people in charge of deciding the lev-el of warning and/or emergency that must be transmitted to the relevant stakeholders, following a predefined process (Figure 3.27). In some cases, warnings can also be automatically transmitted. Usually, one to five alert levels are used (Blikra, 2008; Intrieri et al., 2013): the highest level may lead to emergency warnings to the popula-tion, evacuations or the use of sirens and loudspeaker messages in several languages to force people to move to a safer place, as in the case of tsuna-mis induced by landslides.
An EWS needs to be set up with spe-cific requirements. First, the potential impacts must be defined based on a risk analysis informed by hazard map-ping, including the impact of global changes (Corominas et al., 2014). In addition, the causes and triggers of disasters must be thoroughly analysed and the development of local coping capacities must be included (Dash

216
Landslide types determine, first, if the appropriate EWS must be site specific or regional (Intrieri et al., 2013), and also if it is dedicated to identifying trig-gering conditions and/or to detecting an ongoing event (Sättele et al., 2016). For example, monitoring systems of debris-flow or shallow landslide EWSs are usually based on thresholds of rainfall amount over a period of time. These thresholds are based on rainfall intensity-duration, cumulat-ed event rainfall-duration (Guzzetti et al., 2008), or antecedent precipita-tion (including snow depth) measures and soil moisture (Baum and Godt, 2010; Jakob et al., 2012). An extended monitoring of those indicators usual-ly makes it possible, therefore, to set regional alarms. Landslide types also constrain the maximum lead time or time of reaction after the alarm trans-
mission (Sättele et al., 2016). In some specific cases, debris-flow catchments are equipped with monitoring sys-tems such as ultrasonic and seismic sensors that detect the debris-flow movements (Marchi et al., 2002) and automatically send a warning message to shorten the reaction time as much as possible.
For site-specific systems, displace-ments measured by different sensors and pore water pressure and/or pre-cipitation are usually used (Michoud et al., 2013). Various sensors can be set to monitor displacements, includ-ing extensometers (cable or laser) and crackmeters that measure the distanc-es between two points, and total sta-tions that are also used to provide dis-tances and 3D positions using targets positioned on site. Moreover, GPSs
and Gladwin, 2007).
The number of EWSs dedicated to landslides has greatly increased since the beginning of the 21st century be-cause of the progress made in elec-tronics, communication and com-puter programs for monitoring and imaging. In addition, the innovations in satellite technologies and ground remote sensing have greatly im-proved the capacity of remote imag-ing measurements versus in situ point measurements (Tofani et al., 2013). Implementing an EWS depends on the context, namely (1) the type of landslide (Hungr et al., 2014), (2) the disaster scenarios considered, (3) the degree of awareness of the stakehold-ers, including populations, and (4) the allocated resources (e.g. budgetary, human).
(A) Illustration of the components of a modern EWS that does not show the energy sources and the two or three levels of redundancy. (B) Flow chart of the activities of the implementation and operation of an EWS (modified from Intrieri et al., 2012). The blue box in (b) indicates the action linked to the monitoring system.Source: courtesy of authors
FIGURE 3.27
Weather stationCrackmeter
GPS base station(Fixed)
A
GB-InSA
R
Extensometer
(cable displacement)
B Geological knowl-
edge risk scenarios
Installation of the
monitoring system
Data acquisition
Are data within
specified bounds?
Are anomalies due to
instrumental error?
Issue an alarm or pre-alarm
Emergency plans
Troubleshooting
and maintenance
YES
YES
NO
NO
MONITORING
RISK KNOWLEDGE
ANALYSIS AND
FORECASTING
RESPONSE
WARNING
Constant
update
Feedback

CHAPTER 3 UNDERSTANDING DISASTER RISK: HAZARD RELATED RISK ISSUES - SECTION II
217
are nowadays widely used, which can give the real 3D position of a point (Gili et al., 2000). All the above tech-niques usually provide data only at specific point locations; thus, several of them must often be set up in a net-work to monitor areal deformations. Inclinometers give deformations at depth along boreholes, providing es-sential data on the changes in depth of landslide behaviour (Blikra, 2008). For the last few years, ground-based interferometric radar (GB-InSAR) has been used for the most critical landslides (Casagli et al., 2010; Blikra, 2012; Rouyet et al., 2016). It provides a map of the distance changes, from the GB-InSAR to the landslide sur-face, at a millimetre scale and with a time resolution of a few minutes. Satellite InSAR images are also used to monitor long-term displacement trends, with results being strongly dependent on the type of treatment. In optimal cases, the time resolution is about 6 days, with millimetre pre-cision and metre spatial resolution (Berger et al., 2012). Finally, as land-slides react to water infiltration, many instruments are dedicated to monitor water: rain gauges, piezometers, ther-mometers, barometers, moisture con-tent sensors and other meteorological data. Pore water pressure changes monitored with piezometers usually have a good correlation with slope movements (Michoud et al., 2013).
Behind the implementation of the monitoring part of EWSs is the un-derstanding of the landslide mech-anisms, that is, the identification of the main parameters controlling the movements of the landslide (Intrieri et al., 2012 and 2013). For this pur-pose, the design of a landslide con-ceptual model (LCM) is fundamental,
since it will guide the type and the lo-cation of the sensors to install, and it is required to forecast landslide failure scenarios. The updating of an LCM must be continual during the whole life of an EWS. In addition, landslide failures may trigger other hazardous events in a cascade effect, such as tsunamis or dam breaks, that have to be considered in the EWS. The rea-sons why an EWS is implemented are either the identification of an unac-ceptable risk level or an increase in, or abnormal, landslide activity. Although the LMC implementation process provides reasons to fix appropriate sensors that will monitor the most significant failure initiation indicators, there are usually many practical con-straints, such as topography, access, visibility and available resources.
Landslide monitoring and EWSs are tools to forecast the potential
occurrence of disasters, thus contributing to
the implementation of effective disaster risk-
reduction strategies.
Ideally, the first data from a monitor-ing system are used to calibrate and fix alarm thresholds usually based on displacement velocities or accelera-tions, or pore water pressure or pre-cipitations (Cloutier et al., 2015). This approach can be supported by failure forecast models, such as the Fukuzo-no method, or by more complex mod-els (Crosta and Agliardi, 2003; Feder-ico et al., 2012). The alarm thresholds
will be used to trigger chains of ac-tions that will involve different lev-els of people depending on the alert level, from technicians and experts to officers and politicians who will be involved in the assessment of the ab-normal situations and who will have to make decisions (Froese and More-no, 2014). This starts from the initial check of the situation and the coher-ence of the movement detection of the sensors (to avoid false alarm), and it can end with an evacuation decision. It requires that the monitoring system is reliable and is therefore redundant in terms of sensors, communication and the stakeholders involved. Pre-de-fined crisis units must follow decision trees to propagate or stop the warn-ing at each level. This also necessitates the requirement to verify constantly that the observed landslide behaviour is still following the expected course, which also implies that the threshold and alarm levels can be reassessed by the crisis units.
The most important actions that can be prompted by EWS high-alert levels are evacuations and a rapid set-up of protection measures. They imply that all stakeholders, including the relevant population, must be prepared through education and training to implement the appropriate response.
In addition, the methods used to emit and communicate the emergency sit-uation must be adapted to the local population culture. It must be stressed that all stages of implementation or operation must include feedback to the other stages. Frequent feedback and updates are a key point. They must also include the reappraisal of the indirect effects (cascade). A final problem relates to communication to

218
the general population, which, to be effective, needs trust and training and must be an efficient means by which to communicate and emit warnings and actions within the noise of our ‘connected world’. It appears that only 38 % of the EWSs have more than one communication vector to in-form the population (Michoud et al., 2013).
3.5.6Conclusions and key messages
PartnershipUnderstanding landslide risk requires a multihazard approach, based on networking and partnership between different scientific disciplines, with transdisciplinary research that aims to identify those socioeconomic and institutional elements that require at-tention in landslide DRM.
KnowledgeKnowledge of landslide risk is a multidisciplinary task that requires an understanding of processes and mechanisms, spatial and time predic-tion, vulnerability assessment, mon-itoring and modelling of the effects related to environmental and climate change.
InnovationThe effectiveness of landslide risk mitigation measures critically depends on scientific innovation and techno-logical development for rapid map-ping, monitoring and early warning.

CHAPTER 3 UNDERSTANDING DISASTER RISK: HAZARD RELATED RISK ISSUES - SECTION II
219
3.6 Hydrological risk: wave action, storm surges and coastal floodingKevinHorsburgh, Inigo Losada, Michail Vousdoukas, Ralf Weisse, Judith Wolf
3.6.1Overview of
coastal flood risk
Coastal flooding is one of the most significant risks to life and infrastruc-ture both globally and for Europe, with wide-ranging social, economic and environmental impacts. For ex-ample, in the United Kingdom alone, it is estimated that GPB 150 bil-lion (EUR 177 billion) of assets and 4 million people are currently at risk from coastal flooding (Environment Agency, 2009). In Europe, long-term investment in operational flood warn-ing systems has largely ensured that fatalities due to coastal flooding are avoided; however, the damage to in-frastructure and clean-up costs are still significant. For example, during storm Xaver (4-8 December 2013) which brought the highest ever ob-served water levels to many Euro-pean coastlines, there was no loss of life due to coastal flooding (although there were 15 fatalities directly asso-ciated with falling trees and vehicles).
However, the financial impact of the severe coastal flooding was estimat-ed by Credit Suisse to be more than EUR 1.5 billion.
In contrast to European weather systems, tropical cyclones can cause storm surges of up to 10 metres, which continue to cause devastating loss of life in parts of South-East Asia. In 1970, a devastating storm surge resulted in approximately a quarter of a million deaths in Bang-ladesh. Over the past decade, there has been considerable activity in the development of crucial flood warning systems for vulnerable tropical are-as such as Bangladesh (DMB, 2010; WMO, 2010), resulting in the saving of tens of thousands of lives. How-ever, despite the improving availabil-ity of coastal warning systems, trop-ical cyclones continue to cause havoc when this is a lack of preparedness. On 8 November 2013, Typhoon Hai-yan (known as typhoon Yolanda in the Philippines) caused catastrophic damage throughout the Philippines, with the majority of the death toll (es-
timated to be more than 6 000 peo-ple) attributable to the storm surge that struck Tacloban City.
Coastal flooding is caused by a combination of
high tides, storm surges and wave conditions.
Development on floodplains increases the risk as do coastal
erosion and sea-level rise.
Coastal flood risk is growing because of long-term mean sea-level rise and possible future changes in stormi-ness (Church et al., 2013), as well as continued population growth and development in flood-exposed areas (Hallegatte et al., 2013). Irrespective of any future change in storm climate (which would affect storm surges and waves), mean sea-level rises will result in more instances of extreme sea-lev-

220
el thresholds being reached.
Coastal flooding occurs when a com-bination of high tide, storm surges and wave conditions is sufficiently severe to overtop or breach coastal defenc-es and cause inundation of low-lying areas. Extreme high waters around Europe are normally caused by a combination of high tides and severe weather events (with the exception of the Mediterranean Sea where tides are small). Extra-tropical cyclones (the prevailing European weather systems) produce storm surges that can increase tidal levels by 3-4 metres in exceptional cases. The still water level (defined as the sea level before short-period waves are taken into ac-count) can be further elevated at the coast by wave set-up caused by wave breaking. Storms then also produce large wind and swell waves, which can overtop coastal defences/beach-es and cause flooding and erosion. A further factor that drives coastal flood risk is socioeconomic change (Thorne et al., 2007). Changes in land use and increasing asset values in floodplain areas have led to increased exposure to flooding (Horsburgh et al., 2010). Changes in coastal morphology can also influence flood pathways and thus flood risk (Thorne et al., 2007; Nicholls et al., 2015). As erosion is ex-pected to dominate coastal morpho-logical change in the future because of mean sea-level rises, this will add to the overall flood risk.
Waves and storms are a significant fea-ture of global climate and have been included in many assessments of cli-mate, including the latest assessment (AR5) of the Intergovernmental Pan-el on Climate Change (IPCC, 2013). Recently, recognition of the central
role of waves in atmosphere–ocean interactions has led to an initiative to include wave models more directly into climate model projections (Cav-aleri et al., 2012; Hemer et al., 2012). The largest waves in European waters are found on the Atlantic boundaries, where waves can propagate over large fetches from the Atlantic Ocean. Many factors affect the height of waves in European waters, but for the Atlantic margin, the persistence and strength of westerly winds are particularly im-portant (Wolf and Woolf, 2006), as are the intensity and frequency of storms. Waves are affected by currents and water depth and are locally modified by coastal geometry and man-made structures. Waves decrease in height in shallow water as a result of energy dis-sipation by bottom friction and wave breaking; this reduction in wave ener-gy at a particular location may reduce over time, if the sea level rises, unless the coastal morphology in areas of mobile sediment can adapt at a similar rate (Woolf and Wolf, 2013). Extreme waves represent a hazard for any off-shore operation or construction. Haz-ards may be due to, for example, large individual or significant wave heights, steep waves, crossing seas, or rapidly developing sea states (Toffoli et al., 2005). At the coast, wave overtop-ping or the impact of the waves on structures may become important. On longer timescales, changes in coastal wave climate may cause changes in the sedimentation and erosion patterns that in the long run will have impacts on sediment and shoreline dynamics (Wong et al., 2014). As sea levels rise and the rate of rise accelerates, low-ly-ing coastal regions may be inundated, allowing waves to penetrate further in-land, thus causing further damage.
3.6.2Natural variability of waves, storm surges and mean sea level
All components of sea level display considerable natural variability, which influences the frequency of flooding on all timescales. Natural variability in the wave, storm surge and mean sea-level components ranges from variability associated with stochastic processes, to those displaying seasonal and longer period changes associated with regional climate (e.g. the qua-si-decadal cycle known as the North Atlantic Oscillation - NAO). Europe experienced an unusual sequence of extreme storms over the winter of 2013-2014, resulting in some of the most significant coastal flooding since the catastrophic North Sea storm surge of 1953 (Matthews et al., 2014; Haigh et al., 2016). Sea-level change at any particular lo-cation depends on many regional and local processes as well as global climate drivers, so regional sea-lev-el change will differ from the global average. The fifth assessment report (AR5) of the IPCC concluded that it is very likely that the average rate of global averaged sea-level rise was 1.7 mm per year between 1901 and 2010 (IPCC, 2013). For the more re-cent period 1993-2010, this had risen to 3.2 mm per year, with consistency between tide-gauge and satellite al-timeter data. It is likely that similarly high rates occurred between 1920 and 1950. Although there is a great deal of local variability in the measured values, mean sea levels around Europe (from tide gauge records) mostly exhibit

CHAPTER 3 UNDERSTANDING DISASTER RISK: HAZARD RELATED RISK ISSUES - SECTION II
221
bining the global models of eustatic sea-level change (i.e. sea-level rise due to volume changes as well as geologi-cal changes to ocean basins) with lo-cal models of GIA modified localised effects at the coast (e.g. Smith et al., 2012). A further complication is that sea-level change is affected by large-scale gravitational adjustment in re-sponse to polar ice melt. Mitrovica et al. (2001) showed how rapid melting of major ice sources gives rise to spa-tial changes in the Earth’s gravity field (as well as to the volume of water in the oceans); their model predicts a fall in relative sea level close to the source of melting as the gravitational interac-tion between ice and ocean is reduced, but a correspondingly larger rise in sea level further from the melt source.
Storm surges are the large-scale in-creases in sea level due to a storm. They can increase sea levels by 3-4 metres in European coastal seas and may last from hours to days and span hundreds of square kilometres. They are caused by wind stress at the sea surface and the horizontal gradient of atmospheric pressure (Pugh and Woodworth, 2014), although the mag-nitude of any particular storm surge is influenced by many factors, including the intensity and track of the weather system, bathymetry and coastal topog-raphy. The same factors control storm surges caused by mid-latitude weather systems (extra-tropical cyclones) and tropical cyclones (hurricanes). In re-gions of high tidal range, storm surg-es represent the greatest threat when they coincide with tidal high water: most operational forecasting centres now systematically refer to the combi-nation of a storm surge and tidal high water as a storm tide.
In a strongly tidal region such as the European shelf, it is important to understand the interaction between storm surges and tides. Such interac-tions have been extensively studied (e.g. Rossiter, 1961; Prandle and Wolf, 1978). The dominant mechanism for tide-surge interaction is increased wa-ter levels as a result of meteorological forcing that induce a phase shift in the tidal signal (Horsburgh and Wilson, 2007); many properties of a non-tidal residual time series (i.e. the time series of sea-level observations minus tidal predictions) are simply artefacts of small changes to the timing of pre-dicted high water. The most useful measure of storm surges is the skew surge, which is the difference between the maximum observed sea level and the maximum predicted tidal level, re-gardless of their timing during the tid-al cycle (de Vries et al., 1995). Hence, each tidal cycle has one predicted high water value and one associated skew surge value. The advantage of using the skew surge is that it is a simple and unambiguous measure of the storm surge. Williams et al. (2016) have now shown that the magnitude of high wa-ter exerts no influence on the size of the most extreme skew surges. This is the first systematic proof that any storm surge can occur on any tide, which is essential to understand worst-case scenarios. The lack of surge gen-eration dependency on water depth emphasises the dominant natural variability of weather systems. Weak seasonal relationships between skew surges and tidal high waters have been identified, and the inclusion of these in statistical methods will improve the estimates of extreme sea levels.
Storm surges are, of course, generated by storms, and there has been much
20th century rises that are consistent with the global mean value, although the central estimate around the Unit-ed Kingdom is slightly lower than that of the global value (Woodworth et al., 2009). There is high confidence that the rate of observed sea-level rise in-creased from the 19th to the 20th cen-tury (Bindoff et al., 2007; Woodworth et al., 2011) and there is evidence of a slow long-term acceleration in the rate of sea-level rise throughout the 20th
century (Church and White, 2011).
All components of sea level exhibit natural
variability. There is no convincing evidence of
observed changes in European storminess.
Changes in extreme levels are driven by mean sea-
level change.
Whether the faster rate of increase in sea level during the period from the mid-1990s reflects an increase in the longer-term trend or decadal variabil-ity is still not clear. For planning and engineering purposes, it is sea level with respect to the local land level that is of primary interest; furthermore, the Earth itself is moving as it recov-ers from ice loading during the most recent ice age. A key process that af-fects vertical land motion is the vis-coelastic response of the solid Earth to deglaciation, termed glacial isostatic adjustment (GIA). An accurate under-standing of regional sea-level change is a particular area that involves com-

222
recent research aimed at understand-ing past and future changes in storm-iness over Europe due to the chang-es in mid-latitude storms over the North-East Atlantic. Trends in severe wind storms around the United King-dom are difficult to identify, owing to the low numbers of such storms, their decadal variability and the unreliabili-ty of direct wind speed observations (Wang et al., 2009).
Wang et al.’s analysis shows that storminess conditions in this region have undergone profound decadal or longer timescale fluctuations, with considerable seasonal and regional differences. The most notable differ-ences are seen between winter and summer, and between the North Sea area and other parts of the region. Over the last century the number of winter storms has decreased and then increased again. The observational evidence indicates that the strength of mid-latitude sea-level pressure (SLP) gradients and associated west-erly circulation has increased in the northern hemisphere, especially dur-ing winter, since at least the late 1970s (Woolf and Wolf, 2013). The behav-iour of North Atlantic storm tracks is key to understanding present and future changes in storminess. Future climate model projections have a large variability between models and a low signal-to-noise ratio for Europe com-pared with other mid-latitude regions (Hawkins and Sutton, 2009). Wooll-ings (2010) identifies future Europe-an climate as particularly uncertain because (1) the spread between the predictions of current climate models is still considerable and (2) Europe is particularly strongly affected by sever-al processes, which are known to be poorly represented in models, such as
the small-scale structure of storms. Some of this variability seems to be related to the large-scale atmospheric patterns such as the NAO, which is related to the SLP difference between Iceland and the Azores. However, it is not clear that this relationship will per-sist into the future.
Wave climate in the North-East Atlan-tic and in European seas is to a large extent determined by the large-scale atmospheric circulation, the statistics of large-scale extra-tropical storms and smaller scale regional and local wind systems. Natural climate variabil-ity or anthropogenic changes in such factors will affect the wind climate, which results in corresponding chang-es to the wave climate. Changes in lo-cal wind climate will affect the wind sea, while changes in remote storm statistics will have an effect on the swell component of the wave climate. For the North-East Atlantic, Wolf and Woolf (2006) performed a number of sensitivity experiments with a numer-ical wind–wave model. By using syn-thetic wind fields, varying the strength of the prevailing westerly winds and the frequency and intensity of storms, as well as the location of storm tracks and the storm propagation speed, they found that variations in the strength of the westerly winds was most effective at changing mean and maximum sig-nificant wave height, while variations in other parameters had little effect on the mean wave height. Intensity, track and storm propagation speed, how-ever, significantly affected maximum wave height. Generally, in all Europe-an Shelf seas and in the North-East Atlantic, pronounced seasonal varia-bility in wave climate is seen with the highest waves in autumn and winter (e.g. Dodet et al., 2010; Arkhipkin et
al., 2014).
Based on the assessment of literature analysing data from in situ measure-ments, satellite altimeter observations and wave model hindcasts, the IPCC AR5 concluded that it is likely that mean significant wave heights have increased in regions of the North At-lantic over the past half-century and that it is likely that these trends large-ly reflect natural variations in wind forcing (Church et al., 2013). For the North Sea and Baltic Sea, recent work is summarised in Huthnance et al. (2016) and Hünicke et al. (2015), in-dicating that wave height in these seas varies substantially on inter-annual and decadal timescales but does so far not show significant long-term trends. Using 20 years of buoy data for the Bay of Biscay, Dupuis et al. (2006) reported a tendency towards decreas-ing wave heights, which is consistent with the findings published in Dodet et al. (2010). For the Mediterranean Sea, Lionello and Sanna (2005) report-ed decreasing mean winter values of significant wave height in the period 1958–2001, while for the Black Sea, Arkhipkin et al. (2014) reported no significant change in corresponding storm activity.
The IPCC (2013) confirms that at most locations mean sea level is the dominant driver of observed changes in sea-level extremes, although large-scale modes of variability such as the NAO may also be important. There is evidence of increases in extreme water levels over the past 100-200 years around many parts of the global coastline, including Europe (e.g. Me-nendez and Woodworth, 2010). While changes in storminess could contrib-ute to changes in sea-level extremes,

CHAPTER 3 UNDERSTANDING DISASTER RISK: HAZARD RELATED RISK ISSUES - SECTION II
223
vation has since been validated and extended using altimeter wave data and models and attributed largely to changes observed in the North Atlan-tic atmospheric circulation patterns, principally the NAO (Woolf et al., 2002, 2003; Wolf and Woolf, 2006). Owing to the lack of long-term data-sets, numerical models are often used to extend the time series, and many global and regional wave hind-casts and reanalyses are now available (e.g. ERA-Interim, ERA-20C from the European Centre for Medium-range Weather Forecasts (ECMWF, n.d.).
Datasets covering more than 30 years of wave
observations are essential for flood hazard analysis.
All coastal European countries store sea-level data. There are fewer wave datasets but satellite data are
increasingly useful.
Long time series are increasingly available from satellite observations, although these are less reliable in the coastal zone. Improved algorithms now allow these data to be used clos-er to the coast (e.g. Gommenginger et al., 2010). Long time series data can also be generated using proxy data from time series of other variables (e.g. SLP data can be used as a proxy for storminess or can be generated from long hindcasts of dynamical models). Projections of future im-pacts that the relationships between
proxy variables will remain the same in a future climate or may be made by running dynamic models into the fu-ture. Local impact models are highly dependent on the accuracy of projec-tions of storminess in global climate models (where storminess may be de-fined as a measure of the frequency and intensity of storms).
Sea-level data from most European nations are archived and made avail-able through their national data re-positories. For instance, the British Oceanographic Data Centre is re-sponsible for the remote monitoring and retrieval of sea-level data from the tide gauge network. These are then processed and quality controlled prior to being made available for sci-entific use. Several other European nations offer a similar facility (e.g. Système d'Observation du Niveau des Eaux Littorales, SONEL, in France and National Oceanographic Data Committee, NODC, of the Nether-lands). For long-term sea-level anal-ysis, a global record of sea levels is available from the Permanent Service for Mean Sea Level, which is respon-sible for the collection, publication, analysis and interpretation of sea-lev-el data from the global network of tide gauges (PSMSL, 2017).
In order to better understand his-torical magnitudes and footprints of coastal flooding events for the Unit-ed Kingdom, a systematic database of extreme sea level and coastal flooding has been compiled, covering the past 100 years (Haigh et al., 2015; www.surgewatch.org). Using records from tide gauges, all sea levels that reached or exceed the 1 in 5 year return level were identified. These were attribut-ed to 96 distinct storms, the dates of
there is little or no evidence for ei-ther systematic long-term changes in storminess or any detectable change in storm surges (IPCC, 2012). The scientific consensus is that any chang-es in extreme sea levels at most loca-tions are caused by the observed rise in mean sea level (e.g. Woodworth and Blackman, 2004; Menendez and Woodworth, 2010; Wahl and Cham-bers, 2016).
3.6.3Datasets for coastal flood hazard analysis
The importance of having long time series data for assessing the statistics of extremes is well known (e.g. Weisse et al., 2009). A long time series of wave observations (at least 10 years and, ideally, 30 years) is required to describe the wave climate (Wolf et al., 2011). Such knowledge is required to characterise coastal vulnerability and to plan coastal management strate-gies. We know that there is also a large amount of inter-annual and inter-dec-adal variability, which can obscure any observation of long-term trends. There are few long-term wave data-sets for European waters. One exam-ple is the United Kingdom Met Office Marine Automatic Weather Station (MAWS) system, which consists of various met-ocean recording systems, some of which have been main-tained for several decades. A review by Hawkes et al. (2001) assessed the data available and led to the establish-ment of the CEFAS Wavenet network (n.d.). Data collected from the Seven Stones Light Vessel since 1962 led to the earliest observation of an increase in wave height in the North Atlantic (Bacon and Carter, 1991). This obser-

224
which were used as a chronological base from which to investigate wheth-er historical documentation exists for a concurrent coastal flood. For each event, the database contains informa-tion about the storm that generated that event, the sea levels recorded during the event, and the occurrence and severity of coastal flooding that resulted. This database is continu-ously updated. Similar databases for Europe-wide flooding could be con-ceived and created.
3.6.4Future climate
projections of waves, storm surges and mean sea level
The IPCC (2013) has projected glob-al sea-level rise for the period 2081-2100, compared with 1986-2005, to be 0.29-0.82 metres. The precise range varies with the assumed Represent-ative Concentration Pathway (RCP) scenario, which describes the radiative imbalance in Earth’s atmosphere due to greenhouse gas emissions. Unlike in the previous IPCC report, these projections now include a contribu-tion from changes in ice-sheet out-flow, for which the central projection is 0.11 metres (it should be noted that there is only medium confidence in the range of projected contributions from models of ice sheet dynamics). Nevertheless, these new projections are broadly similar to those in the earlier AR4 assessment (IPCC, 2007). It is very likely that the rate of glob-al mean sea-level rise during the 21st century will exceed the rate observed during the period 1970-2010 for all RCP scenarios. Regional patterns of
sea-level change in the 21st century still differ between models. However, about 70 % of the global coastlines are projected to experience a sea-lev-el change within 20 % of the global mean sea-level change.
Some studies use simple statistical, so-called ‘semi-empirical’, models that relate 20th-century (e.g. Rahm-storf, 2007) or earlier (e.g. Vermeer and Rahmstorf, 2009; Grinsted et al., 2010) temperature or radiative forcing (Jevrejeva et al., 2010) with sea-level rise, in order to extrapolate future global mean sea level. These models are motivated by evidence in the pal-aeo record of a connection between global mean sea level and temperature over glacial/interglacial timescales.
These models result in wider rang-ing, and typically larger, projections of sea-level rise than those obtained from physical process-based mod-els. For example, Rahmstorf (2007) has projected sea-level rise by 2100 under a range of climate scenarios to be between 0.50 and 1.40 metres, and Vermeer and Rahmstorf (2009) suggested the higher range of 0.75 to 1.90 metres. Church et al. (2011) note that these models may overesti-mate future sea levels because of the exclusion of key non-linear process-es and climate feedback mechanisms. In addition, future rates of sea-level rise may correlate less well with global mean temperature if ice sheet dynam-ics play an increased role in the future. Many national authorities have intro-duced high-end scenarios to aid con-tingency planning, the value of which justifies the numerous assumptions made. For the United Kingdom (Lowe et al., 2009), this low-probability but high-impact value was estimated to
be 1.9 metres, which is consistent with physical constraints on glacier movement (Pfeffer et al., 2008); this value also encompasses the majori-ty of semi-empirical model projec-tions. For comparison, Katsman et al. (2011) used an alternative method to develop a high-end scenario of a 0.40- to 1.05-metre sea-level rise (ex-cluding land subsidence) on the coast of the Netherlands by 2100. More re-cently, Jevrejeva et al. (2014) obtained a probability density function of the global sea level in 2100, suggesting that there is a 5 % or smaller proba-bility of a global sea-level rise greater than 1.8 metres; this low probability upper limit combined expert opinion and process studies and also indicates that other lines of evidence are need-ed to justify any larger sea-level rise this century. It is very likely that global mean sea-level rise will continue be-yond the 21st century. The thermal ex-pansion of the ocean as a result of in-creased temperatures takes place over centuries to millennia; therefore, ther-mal expansion will continue beyond 2100, even if greenhouse gas con-centrations are stabilised immediately (which is unlikely). Contributions to sea-level rise from ice sheets are ex-pected to continue beyond 2100, but glacier contributions will decrease as the amount of glacial ice diminishes. Some models suggest sea-level ris-es of between 1 metre and 3 metres in response to carbon dioxide (CO2) concentrations above 700 parts per million. Studies of the last interglacial period (e.g. Kopp et al., 2009) indicate a very high probability of a sea-lev-el rise of 2 metres over 1 000 years, and cannot rule out values in excess of 4 metres.
Overall there is low confidence in

CHAPTER 3 UNDERSTANDING DISASTER RISK: HAZARD RELATED RISK ISSUES - SECTION II
225
towards the end of the century and for the high-concentration pathway. Changes in storm surges and waves enhance the effects of sea-level rise along the majority of northern Euro-pean coasts, locally with contributions up to 40 %. In southern Europe, epi-sodic extreme events tend to stay sta-ble, except along the Portuguese coast and the Gulf of Cadiz where reduc-tions in surge and wave extremes off-set sea-level rise by 20-30 %.
Global mean sea level will rise between
0.3 metres and 0.8 metres this century.
Larger rises are possible. There is low confidence
in storm surge and wave projections
due to climate model limitations.
Regarding possible future wave cli-mate changes, the IPCC AR5 notes low confidence in projections of fu-ture storm activity and hence in pro-jections of wind waves (Church et al., 2013). For the Baltic Sea, Groll et al. (2017) found changes in the wave cli-mate towards higher significant wave height for most regions that were consistent across their ensemble sim-ulations. They noted that these chang-es result not only from higher wind speeds but also from a shift towards more westerly winds. In a compa-rable study for the North Sea, Groll et al. (2014) found a robust signal in eastern areas, where wave height was projected to increase towards
the end of the 21st century in most of the analysed projections. For the west European Shelf, Zachariouda-ki et al. (2011) found an increase in mean and extreme winter significant wave height south-west of the Unit-ed Kingdom and the west of France. Elsewhere, decreases were found. This is consistent with the results pro-vided by Charles et al. (2012), Men-taschi (2017) and Perez et al. (2015) who projected a general decrease in wave heights in the Bay of Biscay and Atlantic Europe by the end of the 21st century. Zacharioudaki et al. (2011) further emphasised that swell and wind sea may show different de-velopments. For the north-west Med-iterranean Sea, Casas-Prat and Sierra (2013) found some increase in mean and extreme projected wave heights but noted that these changes were very much dependent on changes in wave direction and thus on wind di-rection in the global models that were not uniform. The findings are consist-ent with those for the Mediterranean Sea reported by Lionello et al. (2008, 2010), who projected a shift in the wave height distribution towards low-er values. Similar changes are report-ed in Perez et al. (2015), who further noted that the decreases were larger for long-term and high-emissions sce-narios.
The effect of sea-level rise on tides remains an open scientific question, since previous studies are not reach-ing consensus. There is observational evidence of changes in tidal constit-uents in the 20th century (Mawdsley et al., 2015) however the significance of the driving processes remains yet unresolved (Woodworth, 2010). Re-gional modelling efforts have shown that sea-level rises exceeding 2 m can
future storm surge and wave height projections because of the lack of consistency between models, and limitations in the model capability to simulate extreme winds (IPCC, 2012). Numerous studies have used regional climate model forcing to drive storm surge and wave models to infer chang-es in extreme sea level for the Medi-terranean (Conte and Lionello, 2013; Jordà et al., 2012; Marcos et al., 2011), North Sea (Debernard and Røed, 2008; Gaslikova et al., 2013; Howard et al., 2010; Woth et al., 2006), as well as the Atlantic coast of Europe (Lowe et al., 2001; Lowe et al., 2009; Lowe et al., 2010; Marcos et al., 2012) and Bal-tic Sea (Gräwe and Burchard, 2012; Meier, 2006; Meier et al., 2004), while the first pan-European study was by Vousdoukas et al. (2016a). Some of these studies suggested increasing levels of storm surge along parts of northern Europe.
While extreme sea levels could change in the future, both as a result of changes in atmospheric stormi-ness and of mean sea-level rise, it is very likely that mean sea-level rise will continue to be the dominant control on upwards trends in extreme future coastal water levels. Vousdoukas et al. (2017; 2016a) concluded that that by the end of this century the 100-year extreme sea-level along Europe’s coastlines is on average projected to increase by 57 cm for RCP4.5 and 81 cm for RCP8.5. The North Sea re-gion is projected to face the highest increase in ESLs, amounting to nearly 1 m under RCP8.5 by 2100, followed by the Baltic Sea and Atlantic coasts of the UK and Ireland. Mean sea-lev-el rise is shown to be the main driv-er of the projected rise in extreme sea-level, with increasing dominance

226
affect tidal amplitudes and phases (Pickering et al., 2012). For smaller sea level rises (~1 m) some studies find significant tidal changes (Arns et al., 2015; Idier et al., 2017; Pelling and Green, 2014) whilst others report negligible effects (Lowe et al., 2001; Sterl et al., 2009; Vousdoukas et al., 2017).
3.6.5Tools and methods
for assessing coastal flood hazard
Downscaling from global to regional climate change projections is vital for the study of meaningful local impacts (Wolf et al., 2015). Downscaling is generally taken to refer to the genera-tion of locally relevant data from the output of Global Circulation Mod-els (GCMs). The aim is to use glob-al-scale projections, using accepted greenhouse gas emissions scenarios, to generate regionally specific and useful forecasts, with increased spatial and temporal resolution, and includ-ing processes that are not resolved in the coarser resolution model. Down-scaling can be done in several ways: (1) using process models, (2) using empirical/statistical relationships, and (3) using hybrid methods (e.g. pattern recognition). Nesting an RCM into an existing GCM is an example of the first method, termed dynamical downscaling. An RCM is a dynam-ic model that gives higher resolution results than a GCM. Downscaling can also be done using statistical re-gression. This aims to capture the es-sential relationships (often calibrated using relationships in the current cli-mate) between the global model and
local variables.
Extreme events are linked to coastal flooding and for that reason inunda-tion maps are a crucial element for coastal management and engineer-ing practices (Ferreira et al., 2006), and evaluation of adaptation options (Cooper and Pile, 2014; Hinkel et al., 2010). The most common and simple way to obtain inundation maps is the static inundation approach consider-ing as flooded all the areas with el-evation lower than the forcing water level, extensively used for studies of different scales (Hinkel et al., 2014; Hinkel et al., 2010; Vousdoukas et al., 2012b).
Statistical or dynamical downscaling methods can be used to derive
local information from global climate models. Reducing uncertainties
and connecting physical models to decision
tools will assist coastal management.
However, given the high complexity of coastal flooding processes, sever-al recent studies showed that that the static approach resulted in substan-tial overestimation of the flood ex-tent compared to dedicated hydraulic models, especially in flatter terrains (Breilh et al., 2013; Gallien, 2016; Ramirez et al., 2016; Seenath et al., 2016; Vousdoukas et al., 2016b).
Intermediate approaches have been developed which are capable of re-ducing the computational cost by taking into consideration either only water mass conservation (Breilh et al., 2013), or aspects of flooding hy-drodynamics (Dottori et al., 2016), or the presence of obstacles (Perini et al., 2016; Sekovski et al., 2015). More elaborate and more computa-tionally intensive are dynamic mod-els like LISFLOOD-FP (Bates et al., 2010), which despite being originally developed for simulating river flow processes, have been proven to be reliable also for coastal flooding ap-plications, such as the reproduction of storm surge events (Ramirez et al., 2016; Smith et al., 2012) and the evaluation of future scenarios of sea level rise (Purvis et al., 2008). Final-ly, process-based models specialized for coastal hydro- and morpho-dy-namics (Lesser et al., 2004; McCall et al., 2010; Roelvink et al., 2009; Vous-doukas et al., 2012a) would appear as the optimal option, however they come with the disadvantages of (i) increased computational costs, which are almost prohibitive for large scale application; and (ii) the fact that they require information about the near-shore topography in detail which is often not available.
Outputs from climate models of var-ious resolutions are often used to force hydrodynamic impacts models such as wave and storm surge mod-els (leading to models of coastal im-pacts such as flooding and erosion). Issues for these model couplings are (1) quantification of model accuracy for past events and (2) understanding the uncertainty for future projections. This uncertainty consists of (1) un-certainty in greenhouse gas emissions,

CHAPTER 3 UNDERSTANDING DISASTER RISK: HAZARD RELATED RISK ISSUES - SECTION II
227
InnovationThere are a number of priority knowl-edge gaps that need to be addressed to improve the ability of the scientific community to assess the hazard-relat-ed risk associated with sea-level ex-tremes, storm surges and waves. First, we require an improved understand-ing of the processes controlling time mean regional sea-level rise, in order to provide accurate regional projec-tions. This implies a more sophisti-cated combination of ocean and solid Earth models, as well as sustained and accurate monitoring of sea level so as to better analyse regional variabil-ity. Sea-level projections also demand improved modelling of physical pro-cesses that couple the ocean and the cryosphere in order to explore the plausibility of rates of sea-level rise outside that suggested by the current models.
Improved process understanding of
regional sea-level change is essential, as
are improvements to the representation of weather
systems in climate models. Multidisciplinarity
is needed to deliver economic planning tools.
To better understand the possibility of changes to future storminess and, therefore, storm surges and waves, re-quires improved high-resolution mod-elling of mid-latitude weather systems
in climate models. This would lead to a more complete assessment of future changes in the wave and storm surge climate with reduced uncertainty.
(2) uncertainty in climate model pro-jections of sea level and storms and (3) uncertainty in the surge and wave models. As models improve, the mod-el uncertainty may be reduced but there remains uncertainty in the emis-sions and some of the model physics. Increasingly, the outputs of physical models such as those described above are combined with socioeconomic data to provide a set of decision tools that allow coastal managers to assess and mitigate risk.
These so-called ‘broad-scale assess-ment tools’ (e.g. Gouldby et al., 2008) connect marine science to engineer-ing and economics and are now wide-ly used in national analyses of coastal flood hazard, helping to define the scale of the problem and the poten-tial mitigations.
3.6.6Conclusions and key messages
Partnership
There is a need for improved multi-disciplinary connections between oceanographers, coastal engineers and coastal planners to deliver deci-sion tools based on sound physical and economic models.
KnowledgeFlood severity analysis would bene-fit from a community-wide Europe-an database and analysis of historic storm events that resulted in coastal flooding, building on the model of Haigh et al. (2015).

228
A set of recommendations relating to the abovementioned hazards has been identified, based around the three pillars of the Disaster Risk Management Knowledge Centre (DRMKC):
PartnershipRecommendation 1: Improving preparedness for hydrological risks requires contributions from many different disciplines of knowledge. Efforts are need-ed to improve (1) risk governance, including institutional governance, legal pro-visions and financial instruments for planning, prevention and crises manage-ment; (2) our understanding of hazard modelling; (3) forecasts and predictions, from short to long lead time ranges; and (4) emergency response recovery, including coordination of local operations, assistance to affected communities and recovery of disrupted services. Communication with and engagement of the public and decision-makers is key to effectively integrate these layers and to improve preparedness.
Recommendation 2: Risk-based decision-support frameworks have to be tai-lored to the problem in question but also need to be flexible to allow different situations to be dealt with as well as often unprecedented hydrological events. Warnings need to be tailored to the specific circumstances so that responders and the public can act accordingly. Information sharing and increased commu-nication with all stakeholders is therefore essential and needs to be fostered further.
KnowledgeRecommendation 3: Hydrological hazard and risk maps should be developed using probabilistic methods to reflect the uncertainty in the underlying data and models and to produce more robust estimates of risk. This is especially relevant considering the sensitivity of hydrological risks to a changing environ-ment such as land use changes or climate change.
Recommendation 4: Forecasting and EWSs are identified as key prepared-ness actions for hydrological risk management and can be implemented at local scales as well as at continental and global scales. Continued efforts to improve these systems are necessary to increase preparedness and society’s resilience to hydrological risks.
Recommendation 5: Hydrological forecasts and risk maps have associated uncertainties that require adaptive management approaches in the design of flood risk management policy and infrastructure. The large uncertainty in the impacts of climate change projections requires flexible adaptation pathways to be considered.
Recommendations

CHAPTER 3 UNDERSTANDING DISASTER RISK: HAZARD RELATED RISK ISSUES - SECTION II
229
Recommendation 6: An improvement of the understanding of the processes controlling hydrological risk including a better representation of weather sys-tems in climate models is necessary, in order to improve regional projections of hydrological risk under a changing climate.
InnovationRecommendation 7: Operational flood EWSs currently have the capability to produce coarse-scale discharge forecasts in the medium-range and to dissemi-nate forecasts and, in some cases, early warning products in real time across the globe, in support of national forecasting capabilities. With improvements in seasonal weather forecasting, future advances may include more seamless hy-drological forecasting at the global scale alongside a move towards multimodel forecasts and grand ensemble techniques, responding to the requirement of developing multihazard EWSs for disaster risk reduction.
Recommendation 8: Improved decision-support systems need to be devel-oped that can integrate the different stages of flood risk management, without losing information on uncertainty, warning time, forecast accuracy and reliabil-ity. This will help decision-makers to understand the strengths and weaknesses of a forecasting system for different scales and events.

230
REFERENCES CHAPTER 3 - SECTION II
3.4 Hydrological risk: floodsAlfieri, L, Feyen L, Salamon P, Thielen J, Bianchi A, Dottori F, Burek P (2016) Modelling the socioeconomic impact of river floods in
Europe. Natural Hazards and Earth System Sciences 16, 1401–1411. Alfieri, L., Burek, P., Dutra, E., Krzeminski, B., Muraro, D., Thielen, J., Pappenberger, F., 2013. GloFAS — global ensemble streamflow
forecasting and flood early warning. Hydrology and Earth System Sciences 17, 1161-1175. Alfieri, L., Burek, P., Feyen, L., Forzieri, G., 2015. Global warming increases the frequency of river floods in Europe. Hydrology and
Earth System Sciences 19, 2247-2260.Alfieri, L., Salamon, P., Pappenberger, F., Wetterhall, F., Thielen, J. (2012) Operational early warning systems for water-related haz-
ards in Europe. Environmental Science and Policy 21, 35-49.Alfieri, L., Velasco, D., Thielen, J., (2011). Flash flood detection through a multi-stage probabilistic warning system for heavy precip-
itation events. Advances in Geosciences 29, 69–75.Alvarez-Garreton, C., Ryu, D., Western, A., W., Su, C.-H., Crow, W. T., Robertson, D. E., Leahy, C. 2015. Improving operational flood
ensemble prediction by the assimilation of satellite soil moisture: comparison between lumped and semi-distributed schemes. Hydrology and Earth System Sciences 19, 1659-1676.
Apel, H., Aronica G.T., Kreibich H., Thieken, H.A., 2008. Flood risk analyses—How detailed do we need to be?. Natural Hazards 49 (1), 79–98.
Arnal, L., Ramos, M.H., Coughlan, E., Cloke, H.L., Stephens, E., Wetterhall, F., Andel, S.J., F. Pappenberger undefined, 2016. Willing-ness-to-pay for a probabilistic flood forecast: a risk-based decision-making game. Hydrology and Earth System Sciences 20, 3109–3128.
Ballard, S.P., Li, Z., Simonin, D.and Caron, J.F., 2016. Performance of 4D-Var NWP-based nowcasting of precipitation at the Met Office for summer 2012. Quarterly Journal of the Royal Meteorological Society 142, 472–487.
Berenguer M., Corral C., Sánchez Diezma, R., Sempere Torres, D., 2005. Hydrological validation of a radar-based nowcasting tech-nique. Journal of Hydrometeorology 6, 532–549.
Blöschl, G., Zehe, E., 2005. On hydrological predictability. Hydrological Processes 19, 3923–3929. Boudou, M., Danière B., Lang M., 2016. Assessing changes in urban flood vulnerability through mapping land use from historical
information. Hydrology and Earth System Sciences 20, 161–173. Brauer, C.C., Teuling, A.J., Overeem, A., Velde, Y., Hazenberg P., Warmerdam, P.M.M., Uijlenhoet, R., 2011. Anatomy of extraordinary
rainfall and flash flood in a Dutch lowland catchment. Hydrology and Earth System Sciences 15, 1991-2005. Bubeck, P., Botzen, W.J.W., Aerts, H J.C.J., 2012. A Review of Risk Perceptions and Other Factors that Influence Flood. Mitigation
Behavior. Risk Analysis 32, 1481–1495. CCC, 2017. Adaptation sub committee of the Committee on Climate Change, UK. www.theccc.org.ukChen, A.S., Leandro, J., Djordjevic, S., 2016. Modelling sewer discharge via displacement of manhole covers during flood events
using 1D/2D SIPSON/P-DWave dual drainage simulations. Urban Water Journal 13(8), 830-840. Cloke, H.L., Pappenberger, F., 2009. Ensemble flood forecasting: a review. Journal of Hydrology 375, 3–4. Cloke, H.L., Wetterhall F., He Y., Freer J.E., Pappenberger, F. undefined, 2013. Modelling climate impact on floods with ensemble
climate projections. Quarterly Journal of the Royal Meteorological Society 139 (671 part B), pp. 282-297. Cole, S.J., Moore, R.J., Aldridge, T.A., Gunawan, O., Balmforth, H., Hunter, N., Mooney, J., Lee, D., Fenwick, K., Price, D., Demeritt, D.,
2016. Natural Hazards Partnership Surface Water Flooding Hazard Impact Model: Phase 2 Final Report. Collenteur, R.A., Moel H., Jongman, B., Di Baldassarre, G., 2015. The failed-levee effect : Do societies learn from flood disasters ?.
Natural Hazards 76 (1), 373–388. Collier, C.G., 2007. Flash flood forecasting: What are the limits of predictability?. Quarterly Journal of the Royal Meteorological
Society 133, 3–23.Copernicus Emergency Management Service—Mapping, 2017. http://emergency.copernicus.eu/mapping, [accessed 24 April,
2017].Coughlan de Perez, E., van den Hurk, B., van Aalst, M. K., Amuron, I., Bamanya, D., Hauser, T., Jongma, B., Lopez, A., Mason, S., Mendler
de Suarez, J., Pappenberger, F., Rueth, A., Stephens, E., Suarez, P., Wagemaker, J., Zsoter, E., 2016. Action-based flood forecasting for triggering humanitarian action. Hydrology and Earth System Sciences 20, 3549-3560.
Crochemore, L., Ramos, M., Pappenberger, F., Andel, S., Wood, A., 2016. An experiment on risk-based decision-making in water man-agement using monthly probabilistic forecasts. Bulletin of the American Meteorological Society 97 (4), 541–551.
Dale, M., Wicks, J., Mylne, K. Pappenberger, F., Laeger, S., Taylor, S., 2014. Probabilistic flood forecasting and decision-making: An innovative risk-based approach. Natural Hazards 70(1), 159-172.
Dartmouth Flood Observatory. http://www.dartmouth.edu/~floods/, [accessed 24 April, 2017].Daupras, F., Antoine, J. M., Becerra, S., Peltier, A., 2015. Analysis of the robustness of the French flood warning system: a study
based on the 2009 flood of the Garonne River. Natural Hazards 75(1), 215-241.de Moel, H., Jongman, B., Kreibich, H,, Merz, B., Penning Rowsell, E., Ward, P., 2015. Flood risk assessments at difference spatial
scapes. Mitigation and Adaptation Strategies for Global Change 20(6) 865-890. Demeritt, D., Nobert, S., Cloke, HL., Pappenberger, F., 2013. The European Flood Alert System and the communication, perception,
and use of ensemble predictions for operational flood risk management. Hydrological Processes 27(1), 147–157. Di Baldassarre, G., Viglione, A., Carr, G., Kuil, L., Yan, K., Brandimarte, L., Blöschl, G., 2015. Debates—Perspectives on socio-hydrolo-
gy: Capturing feedbacks between physical and social processes. Water Resources Research 51, 4770–4781.Dittrich, R., Wreford, A., Butler, A., Moran, D., 2016. The impact of flood action groups on the uptake of flood management measures.
Climatic Change 138(3), 471-489.

CHAPTER 3 UNDERSTANDING DISASTER RISK: HAZARD RELATED RISK ISSUES - SECTION II
231
Dottori, F., Salamon., P., Bianchi., A., Alfieri, L., Hirpa, F.A., Feyen, L., 2016. Development and evaluation of a framework for global flood hazard mapping. Advances in Water Resources 94, 87-102.
EEA, 2017. Climate change adaptation and disaster risk reduction in Europe — Synergies for the knowledge base and policies, forthcoming
EFAS, 2016. European Flood Awareness System (EFAS). European Commission Joint Research Centre. https://www.efas.eu/, [ac-cessed 16 April, 2017].
Emerton, R.E., Stephens, E. M., Pappenberger, F., Pagano, T. C., Weerts, A.H., Wood, A.W., Salamon, P., Brown, J. D., Hjerdt, N., Donnelly, C., Baugh, C., Cloke, H.L., 2016. Continental and global scale flood forecasting systems. Wiley Interdisciplinary Reviews: Water 3 (3), 391-418.
Environment Agency, 2015. Public dialogues on flood risk communication. Final Report — SC120010/R1. Environment Agency, Bristol, UK.
European Commission, 2007. Directive 2007/60/EC of the European Parliament and of the Council of 23 October 2007 on the assessment and management of flood risks. Official Journal of the European Union, L 288/27, 6.11.2007, 27–34.
FFC, n.d. Flood forecasting centre. http://www.ffc-environment-agency.metoffice.gov.uk/, [accessed 16 April, 2017].Garcia Pintado, J., Mason, D., Dance, S. L., Cloke, H., Neal, J. C., Freer, J., Bates, P. D., 2015. Satellite-supported flood forecasting in
river networks: a real case study. Journal of Hydrology 523, 706-724. Garde Hansen, J., McEwen, L., Holmes, A., Jones, O. 2016. Sustainable flood memory: Remembering as resilience. Memory Studies,
1-22. Gaume, E., Bain, V., Bernardara, P., Newinger, O., Barbuc, M., Bateman, A., Blaskovicová, L., Blöschl, g., Borga, M., Dumitrescu, A., Da-
liakopoulos, I., Garcia, J., Irimescu, A., Kohnova, S., Koutroulis, A., Marchi, L., Matreata, S., Medina, V., Preciso, E., Sempere Torres, D., Stancalie, G., Szolgay, J., Tsanis, I., Velasco, D., Viglione, A., 2009. A compilation of data on European flash floods, Journal of Hydrology 367(1–2), 70–78.
Gersonius, B., Ashley, R., Pathirana, A, Zevenbergen, C., 2013. Climate change uncertainty: building flexibility into water and flood risk infrastructure. Climatic Change 116(2), 411-423.
GloFAS, 2017. Emergency Management Service - Global Flood Awareness System. European Commission Copernicus. www.global-floods.eu, [accessed 16 April, 2017].
Hall, J., Arheimer, B., Borga, M., Brazdil, R., Claps, P., Kiss, A., Kjeldsen, T.R., Kriauciuniene, J., Kundzewicz, Z.W., Lang, M., Llasat, M.C., Macdonald, N., McIntyre, N., Mediero, L., Merz, B., Merz, R., Molnar, P., Montanari, A., Neuhold, C., Parajka, J., Perdigao, R.A.P., Plav-cova, L., Rogger, M., Salinas, J.L., Sauquet, E., Schaer, C., Szolgay, J., Viglione, A., Bloeschl, G., 2014. Understanding flood regime changes in Europe: a state-of-the-art assessment. Hydrology and Earth System Sciences 18(7), 2735-2772.
Hirabayashi, Y., Mahendran, R., Koirala, S., Konoshima, L., Yamazaki, D., Watanabe, S., Kim, H., Kanae, S., 2013. Global flood risk under climate change. Nature Climate Change 3, 816–821.
HM Government (2016). National Flood Resilience Review. https://www.gov.uk/government/uploads/system/uploads/attachment_data/file/551137/national-flood-resilience-review.pdf [accessed 06 April, 2016].
Huntingford, C., Marsh, T., Scaife, A.A., Kendon E.J., Hannaford, J., Kay, A.L., Lockwood M., Prudhomme, C., Reynard, N.S., Parry, S., Lowe, J.A., Screen, J.A., Ward, H.C., Roberts, M., Stott, P.A., Bell, V.A., Bailey, M., Jenkins A., Legg, T., Otto, F.E.L., Massey, N., Schaller, N., Slingo, J., Allen, M.R., 2014. Potential influences on the United Kingdom's floods of winter 2013/14. Nature Climate Change 4, 769-777.
Hydrologic Ensemble Prediction Experiment, n.d. www.hepex.org, [accessed 24 April, 2017].Javelle, P., Demargne, J., Defrance, D., Pansu, J. and Arnaud, P., 2014. Evaluating flash-flood warnings at ungauged locations using
post-event surveys: a case study with the AIGA warning system. Hydrological Sciences Journal, 59 (7), 1390–1402. Kendon, E J., Ban, N., Roberts, N.M., Fowler, H.J., Roberts, M.J., Chan, S.C., Evans, J.P., Fosser, G., Wilkinson, J.M., 2016 Do convec-
tion-permitting regional climate models improve projections of future precipitation change?. Bulletin of the American Meteor-ological Society.
Klinger, C, Landeg, O., Murray, V., 2014. Power Outages, Extreme Events and Health: a Systematic Review of the Literature from 2011-2012. PLOS Currents, 6.
Kumar, P., 2011. Typology of hydrologic predictability. Water Resources Research 47(4), W00H05.Landeg, O., Lawson, J., 2014. Effective flood resilience in health providers: Flooding at a major NHS Blood and Transplant Facility.
in Chemical Hazards & Poisons Report, Public Health England, Sep, Iss.24.Lavers, D. A., Allan, R. P., Wood, E. F., Villarini, G., Brayshaw, D. J., Wade, A. J., 2011. Winter floods in Britain are connected to atmos-
pheric rivers. Geophysics Research Letters 38, L23803.Le Coz, J., Patalano, A., Collins, D., Guillén, N.F., García, C. M., Smart, G.M., Bind, J., Chiaverini, A., Le Boursicaud, R., Dramais, G., Braud,
I., 2016. Crowdsourced data for flood hydrology: Feedback from recent citizen science projects in Argentina, France and New Zealand. Journal of Hydrology 541, B, pp. 766-777.
Liechti, K., Zappa, M., Fundel, F., Germann, U., 2013. Probabilistic evaluation of ensemble discharge nowcasts in two nested Alpine basins prone to flash floods. Hydrological Processes 27, 5–17.
Liguori, S., Rico Ramirez, M.A., Schellart, A.N.A., Saul A. J., 2012. Using probabilistic radar rainfall nowcasts and NWP forecasts for flow prediction in urban catchments. Atmospheric Research 103, 80–95.
Macdonald, D., Dixon, A., Newell, A., Hallaways, A., 2012. Groundwater flooding within an urbanised flood plain. Journal of Flood Risk Management 5(1): 68-80.
Marchi, L., Borga, M., Preciso, E., Sangati, M., Gaume, E., Bain, V., Delrieu, G., Bonnifait, L., Pogačnik, N., 2009. Comprehensive post-event survey of a flash flood in Western Slovenia: observation strategy and lessons learned. Hydrological Processes 23, 3761–3770.
McCarthy, S., Tunstall, S., Parker, D., Faulkner, H., Howe, J., 2007. Risk communication in emergency response to a simulated extreme flood. Environmental Hazards 7 (3), 179-192.
Merz, B., Kreibich, H., Schwarze, R.,Thieken, A., 2010. Assessment of economic flood damage. Natural Hazards Earth System Scienc-es 10, 1697–1724.

232
Michaels, S., 2015. Probabilistic forecasting and the reshaping of flood risk management. Journal of Natural Resources Policy Research 7 (1), 41-51.
Muchan, K., Lewis, M., Hannaford, J. Parry, S., 2015. The winter storms of 2013/2014 in the UK: hydrological responses and impacts. Weather 70, 55–61.
Pagano, T.C., Pappenberger, F., Wood, A.W., Ramos, M.H., Persson, A., Anderson, B., 2016. Automation and human expertise in oper-ational river forecasting. WIRES Water 3 (5), 692-705.
Pagano, T.C., Wood, A.W., Ramos, M.H., Cloke, H.L., Pappenberger, F., Clark, M. P., Cranston, M., Kavetski, D., Mathevet, T., Sorooshian, S. Verkade, J.S., 2014. Challenges of Operational River Forecasting. Journal of Hydrometeorology 15, 1692–1707.
Palla, A., Colli, M., Candela, A., Aronica, G.T. Lanza, L.G., 2016. Pluvial flooding in urban areas: the role of surface drainage efficiency. Journal of Flood Risk Management.
Pappenberger, F., Beven, K. J., 2006. Ignorance is bliss: Or seven reasons not to use uncertainty analysis. Water Resources Research 42, W05302.
Pappenberger, F., Cloke, H. L., Parker, D. J., Wetterhall, F., Richardson, D.S., Thielen, J., 2015. The monetary benefit of early flood warnings in Europe. Environmental Science and Policy 51, 278-291.
Pappenberger, F., Dutra, E, Wetterhall F., Cloke H.L., (2012) Deriving global flood hazard maps of fluvial floods through a physical model cascade. Hydrology and Earth System Sciences 16 (11), 4143-4156.
Pappenberger, F., Stephens, E., Thielen, J., Salamon, P., Demeritt, D., van Andel, S. J., Wetterhall, F., Alfieri, L., 2013. Visualizing probabilistic flood forecast information: expert preferences and perceptions of best practice in uncertainty communication. Hydrological Processes 27, 132–146.
Peña, J.C., Schulte, L., Badoux, A., Barriendos, M., Barrera Escoda, A., 2015) Influence of solar forcing, climate variability and modes of low-frequency atmospheric variability on summer floods in Switzerland. Hydrology and Earth System Sciences 19, 3807-3827.
Perks, M.T., Russell, A.J., Large, A.R.G., (2016). Technical Note: Advances in flash flood monitoring using unmanned aerial vehicles (UAVs). Hydrology and Earth System Sciences 20, 4005-4015.
Ramos, M.H., Mathevet, T., Thielen, J., Pappenberger, F., 2010. Communicating uncertainty in hydro-meteorological forecasts: mis-sion impossible?. Meteorological Applications 17(2), 223-235.
Ramos, M.H., van Andel, S.J., Pappenberger, F., 2013. Do probabilistic forecasts lead to better decisions?. Hydrology and Earth Sys-tem Sciences 9 (17), 2219-2232.
Revilla Romero, B., Hirpa. F,A,, Thielen del Pozo, J., Salamon, P., Brakenridge, R., Pappenberger, F., De Groeve T., 2015. On the Use of Global Flood Forecasts and Satellite-Derived Inundation Maps for Flood Monitoring in Data-Sparse Regions. Remote Sensing 7 (11), 15702-15728.
Rodríguez Rincón, J.P., Pedrozo Acuña, A., Breña Naranjo, J.A., 2015. Propagation of hydro-meteorological uncertainty in a model cascade framework to inundation prediction. Hydrology and Earth System Sciences 19, 2981-2998.
Romanowicz, R., Beven, K.J., 2003. Bayesian estimation of flood inundation probabilities as conditioned on event inundation maps. Water Resources Research 39 (3), 1073.
Rufat, S., Tate, E, Burton, C.G., Maroof, A.S., 2015. Social vulnerability to floods: Review of case studies and implications for meas-urement. International Journal of Disaster Risk Reduction 14 (4), 470–486
Sampson, C.C., Fewtrell, T.J., O’Loughlin, F., Pappenberger, F., Bates, P.B., Freer, J. E., Cloke, H.L., 2014. The impact of uncertain precipitation data on insurance loss estimates using a flood catastrophe model. Hydrology and Earth System Sciences 18, 2305-2324.
Schröter, K., Kunz, M., Elmer, F., Mühr, B., Merz, B., 2015. What made the June 2013 flood in Germany an exceptional event? A hy-dro-meteorological evaluation. Hydrology and Earth System Sciences 19, 309-327.
Scussolini, P., Aerts, J.C.J.H., Jongman, B., Bouwer, L.M., Winsemius, H.C., de Moel, H.,Ward, P.J., 2016. FLOPROS: an evolving global database of flood protection standards. Natural Hazards and Earth System Sciences 16, 1049-1061.
Slater, L.J., Singer, M.B., Kirchner, J.W., 2015. Hydrologic versus geomorphic drivers of trends in flood hazard, Geophysical Research Letters 42, 370376.
Stephens, E., Cloke, H., 2014. Improving flood forecasts for better flood preparedness in the UK (and beyond). Geographical Journal 180 (4). pp. 310-316.
Stephens, E., Day, J.J., Pappenberger, F., Cloke, H., 2015. Precipitation and floodiness. Geophysical Research Letters 42 (23), 10316-10323.
Thieken, A. H., Kreibich, H., Muller, M. Merz, B., 2007. Coping with floods: preparedness, response and recovery of flood-affected residents in Germany in 2002. Hydrological Sciences Journal 52(5), 1016-1037.
Thielen del Pozo, J., Salamon, P., Burek, P., Pappenberger, F., Eklund, C., Sprokkereef, E., Hazlinger, M., Padilla Garcia, M., Garcia Sanchez, R., 2017. Handbook of hydrometeorological forecasting. Forthcoming.
Thielen del Pozo, J., Thiemig, V., Pappenberger, F., Revilla-Romero, B., Salamon, P., De Groeve, T., Hirpa, F., 2015. The benefit of continental flood early warning systems to reduce the impact of flood disasters: An assessment for Europe and an outlook for Africa. JRC Science for Policy Report. EUR 27533 EN.
Thiemig, V., Bisselink, B., Pappenberger, F., Thielen, J., 2015. A pan-African medium-range ensemble flood forecast system. Hydrol-ogy and Earth System Sciences 19, 3365-3385.
UNISDR, 2015. Sendai Framework for Disaster Risk Reduction 2015-2030. UNISDR, Geneva, Switzerland.Versini, P.A.., Berenguer, M., Corral, C., Sempere Torres, D., 2014. An operational flood warning system for poorly gauged basins:
demonstration in the Guadalhorce basin (Spain). Natural Hazards 71(3), 1355-1378. Vigicrues, 2017. Service central d’hydrométéorologie et d’appui à la prévision des inondations (Schapi). https://www.vigicrues.gouv.
fr/, [accessed 16 April, 2017] (in French).Vormoor, K., Lawrence, D., Heistermann, M., and Bronstert, A., 2015. Climate change impacts on the seasonality and generation
processes of floods — projections and uncertainties for catchments with mixed snowmelt/rainfall regimes. Hydrology and Earth System Sciences 19, 913-931.

CHAPTER 3 UNDERSTANDING DISASTER RISK: HAZARD RELATED RISK ISSUES - SECTION II
233
Walker, D., Forsythe, N., Parkin, G., Gowing J., (2016). Filling the observational void: scientific value and quantitative validation of hydrometeorological data from a community‐based monitoring programme. Journal of Hydrology 538, 713-725.
Ward, P.J., Jongman, B., Weiland, F.S., Bouwman, A., van Beek, R., Bierkens, M.F.P., Ligtvoet, W., Winsemius, H.C., 2013. Assessing flood risk at the global scale: model setup, results, and sensitivity. Environmental Research Letters 8, 044019,
Watson, D., Adams, M., 2010. Design for Flooding: Architecture, Landscape and Urban Design for Resilience to Climate Change. John Wiley & Sons.
Winsemius, H.C., Van Beek, L.P.H., Jongman, B., Ward, P.J., Bouwmanal, A., 2013. A framework for global river flood risk assessments. Hydrology and Earth System Sciences 17(5), 1871–1892.
Younis, J., Ramos, M. H., Thielen, J., 2008. EFAS forecasts for the March-April 2006 flood in the Czech part of the Elbe River Basin — a case study. Atmospheric Science Letters, 9 (2), 88-94.
Zsótér, E., Pappenberger, F., Smith, P., Emerton, R.E., Dutra, E., Wetterhall, F., Richardson, D., Bogner, K., Balsamo, G., 2016. Building a Multimodel Flood Prediction System with the TIGGE Archive. Journal of Hydrometeorology.
3.5 Hydrological risk: landslidesJakob, M., 2000. The impacts of logging on landslide activity at Clayoquot Sound, British Columbia. CATENA 38 (4), 279-300.Van der Linden, P., Mitchell, J.F.B., (Eds.), 2009: ENSEMBLES: Climate Change and its Impacts: Summary of research and results
from the ENSEMBLES project. 160pp.Cannon, S. H., Gartner, J. E., 2005. Wildfire-related debris flow from a hazards perspective. In: Debris-flow Hazards and Related
Phenomena. Springer Praxis Books. Springer Berlin Heidelberg, pp. 363-385.Shakesby, R., Doerr, S., 2006. Wildfire as a hydrological and geomorphological agent. Earth-Science Reviews 74 (3-4), 269-307.European Commission, 2006. Proposal for a Directive of the European Parliament and of the Council establishing a framework for
the protection of soil and amending Directive 2004/35/EC. COM/2006/0232 final - COD 2006/0086.Baum, R.L., Godt, J.W., 2010. Early warning of rainfall-induced shallow landslides and debris flows in the USA. Landslides 7,
259–272.Berger, M., Moreno, J., Johannessen, J.A., Levelt, P.F., Hanssen, R.F., 2012. ESA’s sentinel missions in support of Earth system science.
Remote Sensing of Environment 120, 84-90.Bishop, A.W., Hutchinson, J. N., Penman, A.D.M., Evans, H.E., 1969. Geotechnical investigation into the causes and circumstances
of the disaster of 21 October 1966. In: A selection of technical reports submitted to the Aberfan Tribunal. HMSO, London, UK, pp. 1-80.
Blikra, L. H., 2008. The Åknes rockslide: Monitoring, threshold values and early-warning. In: Landslides and Engineering Slopes: From the Past to the Future. Proceedings of the 10th International Symposium on Landslides and Engineering Slopes, Xi’an, China.
Blikra, L.H., 2012. The Åknes rockslide, Norway. In: Clague, J. J., Stead, D. (eds), Landslides: types, mechanisms and modeling. Cam-bridge University Press, Cambridge, pp. 323-335.
Casagli, N., Catani, F., Del Ventisette, C., Luzi, G., 2010. Monitoring, prediction, and early warning using ground-based radar inter-ferometry. Landslides 7, 291–301.
Catani, F., Tofani, V., Lagomarsino, D., 2016. Spatial patterns of landslide dimension: A tool for magnitude mapping. Geomorphology 273, 361–373.
Cloutier, C., Agliardi, F., Crosta, G.B., Frattini, P., Froese, C., Jaboyedoff, M., Locat, J., Michoud, C., Marui, H., 2015. The First Interna-tional Workshop on Warning criteria for Active Slides: technical issues, problems and solutions for managing early warning systems. Landslides 12, 205–212.
Corominas, J., Van Westen, C., Frattini, P., Cascini, L., Malet, J.-P., Fotopoulou, S., Catani, F., Van Den Eeckhaut, M., Mavrouli, O., Agliar-di, F., Pitilakis, K., Winter, M.G., Pastor, M., Ferlisi, S., Tofani, V., Hervás, J., Smith, J.T., 2014. Recommendations for the quantitative analysis of landslide risk. Bulletin of Engineering Geology and the Environment 73 (2), 209–263.
Crosta, G.B., Agliardi, F., 2003. Failure forecast for large rock slides by surface displacement measurements. Canadian Geotechnical Journal 40, 176–191.
Dai, F.C., Lee, C.F., Ngai, Y.Y., 2002. Landslide risk assessment and management: an overview. Engineering Geology 64 (1), 65-87.Dash, N., Gladwin, H., 2007. Evacuation Decision Making and Behavioral Responses: Individual and Household. Natural Hazards
Review 8, 69–77. Federico, A., Popescu, M., Elia, G., Fidelibus, C., Internò, G., Murianni, A., 2012. Prediction of time to slope failure: a general frame-
work. Environmental Earth Sciences 66 (1), 245–256. Fell, R., 1994. Landslide risk assessment and acceptable risk. Canadian Geotechnical Journal 31, 261 – 272.Fell, R., Hartford, D., 1997. Landslide risk management. In: Cruden, D., Fell, R. (Eds.), Landslide Risk Assessment. Balkema, Rotter-
dam, pp. 51 – 109.Froese, C., Moreno, F., 2014. Structure and components for the emergency response and warning system on Turtle Mountain. Nat-
ural Hazards 70, 1689–1712. Gili, J., Corominas, J., Riuz, J., 2000. Using global positioning system techniques in landslide monitoring. Engineering Geology 55,
167–192. Guzzetti, F., Ardizzone, F., Cardinali, M., Galli, M., Rossi, M., Valigi, D., 2009. Landslide volumes and landslide mobilization rates in
Umbria, central Italy. Earth and Planetary Science Letters 279 (3), 222–229. Guzzetti, F., Carrara, A., Cardinali, M., Reichenbach, P., 1999. Landslide hazard evaluation: a review of current techniques and their
application in a multi–scale study. Central Italy. Geomorphology 31, 181–216.Guzzetti, F., Peruccacci, S., Rossi, M., Stark, C.P., 2008. The rainfall intensity–duration control of shallow landslides and debris flows:
an update. Landslides 5, 3–17. Guzzetti, F., Mondini, A.C., Cardinali, M., Fiorucci, F., Santangelo, M., Chang, K.-T., 2012. Landslide inventory maps: New tools for an
old problem. Earth-Science Reviews 112 (1-2), 42–66. Guzzetti, F., Reichenbach, P., Cardinali, M., Galli, M., Ardizzone, F., 2005. Probabilistic landslide hazard assessment at the basin scale.
Geomorphology 72 (1), 272–299.

234
Hungr, O., Leroueil, S., Picarelli, L., 2014. The Varnes classification of landslide types — an update. Landslides 11 (2), 167–194Hutchinson, J.N., 1988. General Report: Morphological and geotechnical parameters of landslides in relation to geology and hydro-
geology. In: Proceedings 5th International Symposium on Landslides, Lausanne, Switzerland.Intrieri, E., Gigli, G., Casagli, N., Nadim, F., 2013. Landslide Early Warning System: toolbox and general concepts. Natural Hazards
and Earth System Sciences 13, 85–90. Intrieri, E., Gigli, G., Mugnai, F., Fanti, R., Casagli, N., 2012. Design and implementation of a landslide early warning system. Engi-
neering Geology 147-148, 124–136.IPCC, 2012. Managing the Risks of Extreme Events and Disasters to Advance Climate Change Adaptation. A Special Report of Work-
ing Groups I and II of the Intergovernmental Panel on Climate Change [Field, C.B., V. Barros, T.F. Stocker, D. Qin, D.J. Dokken, K.L. Ebi, M.D. Mastrandrea, K.J. Mach, G.K. Plattner, S.K. Allen, M. Tignor, P.M. Midgley (eds.)]. Cambridge University Press, Cambridge, UK, and New York, NY, USA.
Jaedicke, C., van den Eeckhaut, M., Nadim, F., Hervás, J., Kalsnes, B., Vangelsten B.V., Smith, J.T., Tofani, V., Ciurean, R., Winter, M.G., Sverdrup-Thygeson, K., Syre, E., Smebye, H., 2013. Identification of landslide hazard and risk hotspots in Europe. Bulletin of Engineering Geology and the Environment 73 (2), 325-339.
Jakob, M., Owen, T., Simpson, T., 2012. A regional real-time debris-flow warning system for the District of North Vancouver, Canada. Landslides 9, 165–178.
Larsen, I.J., Montgomery, D.R., Korup, O., 2010. Landslide erosion controlled by hill-slope material. Nature Geoscience 3, 247–251.
Marchi, L., Arattano, M., Deganutti, A.M., 2002. Ten years of debris flows monitoring in the Moscardo Torrent (Italian Alps). Geomor-phology 46, 1–17.
Michoud, C., Bazin, S., Blikra, L.H., Derron, M.H., Jaboyedoff, M., 2013. Experiences from site-specific landslide early warning systems. Natural Hazards and Earth System Sciences 13, 2659-2673.
Petley, D.N., 2010. Document On the impact of climate change and population growth on the occurrence of fatal landslides in South, East and SE Asia. Quarterly Journal of Engineering Geology and Hydrogeology 43(4), 487-496.
Rossi, M., Guzzetti, F., Reichenbach, P., Mondini, A.C., Peruccacci, S., 2010. Optimal landslide susceptibility zonation based on multiple forecasts. Geomorphology 114(3), 129–142.
Rouyet, L., Kristensen, L., Derron, M.H., Michoud, C., Blikra, L.H., Jaboyedoff, M., Lauknes, T.R., 2016. Evidence of rock slope breathing using Ground-Based InSAR. Geomorphology.
Sättele, M., Bründl, M., Straub, D., 2016. Quantifying the effectiveness of early warning systems for natural hazards, Natural Haz-ards and Earth System Sciences 16, 149-166.
IPCC, 2013: Climate Change 2013: The Physical Science Basis. Contribution of Working Group I to the Fifth Assessment Report of the Intergovernmental Panel on Climate Change [Stocker, T.F., D. Qin, G.-K. Plattner, M. Tignor, S.K. Allen, J. Boschung, A. Nauels, Y. Xia, V. Bex, P.M. Midgley (eds.)]. Cambridge University Press, Cambridge, United Kingdom and New York, NY, USA.
Tofani, V., Segoni, S., Agostini, A., Catani, F., Casagli, N., 2013. Technical NB: Use of remote sensing for landslide studies in Europe. Natural Hazards and Earth System Sciences 13, 299–309.
Tinti, S., Pagnoni, G., Zaniboni, F., 2006. The landslides and tsunamis of the 30th of December 2002 in Stromboli analysed through numerical simulations. Bulletin of Volcanology 68 (5), 462–479.
Nations, United, 2015. World population prospects. The 2015 revision. Dept. Economics and Social Affairs. undefined undefined, undefined.
Witt, A., Malamud, B.D., Rossi, M., Guzzetti, F., Peruccacci, S., 2010. Temporal correlations and clustering of landslides. Earth Surface Process and Landforms 35 (10), 1138–1156.
3.6 Hydrological risk: wave action, storm surges and coastal floodingArkhipkin, V.S., Gippius, F.N., Koltermann, K.P., Surkova, G.V., 2014. Wind waves in the Black Sea. Results of a hindcast study. Natural
Hazards and Earth System Sciences 14 (11), 2883–2897. Arns, A., Wahl, T., Dangendorf, S., Jensen, J., 2015. The impact of sea level rise on storm surge water levels in the northern part of
the German Bight. Coastal Engineering 96, 118-131.Bacon, S., Carter, D.J.T., 1991. Wave climate changes in the North Atlantic and North Sea. International Journal of Climatology 11,
545–558.Bates, P.D., Horritt, M.S., Fewtrell, T.J., 2010. A simple inertial formulation of the shallow water equations for efficient two-dimen-
sional flood inundation modelling. Journal of Hydrology 387, 33-45.Bengal and the Arabian Sea, Tropical Cyclone Programme, Report No TCP21. Bindoff, N.L., J. Willebrand, V. Artale, A, Cazenave, J. Gregory, S. Gulev, K. Hanawa, C. Le Quéré, S. Levitus, Y. Nojiri, C.K. Shum, L.D.
Talley and A. Unnikrishnan, 2007. Observations: Oceanic Climate Change and Sea Level. In: Solomon, S., D. Qin, M. Manning, Z. Chen, M. Marquis, K.B. Averyt, M. Tignor, Miller, H.L., (Eds.). Climate Change 2007: The Physical Science Basis. Contribution of Working Group I to the Fourth Assessment Report of the Intergovernmental Panel on Climate Change. Cambridge University Press, Cambridge, UK and New York, USA, pp. 385-432.
Breilh, J.F., Chaumillon, E., Bertin, X., Gravelle, M., 2013. Assessment of static flood modeling techniques: application to contrasting marshes flooded during Xynthia (western France). Natural Hazards and Earth System Sciences 13, 1595-1612.
Casas Prat, M., Sierra, J.P., 2013. Projected future wave climate in the NW Mediterranean Sea. Journal of Geophysical Research Oceans 118 (7), 3548–3568.
Cavaleri, L., Fox-Kemper, B., Hemer, M., 2012. Wind Waves in the Coupled Climate System. Bulletin of the American Meteorological Society 93, 1651–1661.
CEFAS, n.d. WaveNet, Cefas’ strategic wave monitoring network for the United Kingdom. www.cefas.co.uk/cefas-data-hub/wavenet/, [accessed 07 April, 2016].
Charles, E.D., Idier, D., Delecluse, P., Deque, M., Le Cozannet, G., 2012. Climate change impact on waves in the Bay of Biscay. France. Ocean Dynamics 62, 831–848.

CHAPTER 3 UNDERSTANDING DISASTER RISK: HAZARD RELATED RISK ISSUES - SECTION II
235
Church, J.A., Gregory, J.M., White, N.J., Platten, S.M., J.X, Mitrovica, 2011. Understanding and projecting sea level change. Oceanog-raphy 24 (2), 130–143.
Church, J.A., P.U. Clark, A. Cazenave, J.M. Gregory, S. Jevrejeva, A. Levermann, M.A. Merrifield, G.A. Milne, R.S. Nerem, P.D. Nunn, A.J. Payne, W.T. Pfeffer, D. Stammer, A.S. Unnikrishnan, 2013. Sea Level Change. In: Climate Change 2013: The Physical Science Ba-sis. Contribution of Working Group I to the Fifth Assessment Report of the Intergovernmental Panel on Climate Change [Stocker, T.F., D. Qin, G.K. Plattner, M. Tignor, S.K. Allen, J. Boschung, A. Nauels, Y. Xia, V. Bex, P.M. Midgley (eds.)]. Cambridge University Press, Cambridge, UK and New York, USA, pp. 1137–1216.
Church, J.A., White, N., 2011. Sea-Level Rise from the Late 19th to the Early 21st Century. Surveys in Geophysics 32 (4-5), 585–602.
Conte, D., Lionello, P., 2013. Characteristics of large positive and negative surges in the Mediterranean Sea and their attenuation in future climate scenarios. Global and Planetary Change 111, 159-173.
Cooper, J.A.G., Pile, J., 2014. The adaptation-resistance spectrum: A classification of contemporary adaptation approaches to cli-mate-related coastal change. Ocean & Coastal Management 94, 90-98.
De Vries, H., Breton, M., de Mulder, T., Krestenitis, Y., Ozer, J., Proctor, R., Ruddick, K., Salomon, J. C.,Voorrips, A., 1995. A comparison of 2-D storm surge models applied to three shallow European seas. Environmental Software 10(1), 23–42.
Debernard, J.B., Røed, L.P., 2008. Future wind, wave and storm surge climate in the Northern Seas: a revisit. Tellus A 60, 427-438.
Disaster Management Bureau of the Government of the People’s Republic of Bangladesh, 2010. National Plan for Disaster Man-agement 2010-2015. Government of the People’s Republic of Bangladesh.
Dodet, G., Bertin, X., Taborda, R., 2010. Wave climate variability in the North-East Atlantic Ocean over the last six decades. Ocean Modelling 31 (3-4), 120-131.
Dottori, F., Martina, M.L.V., Figueiredo, R., 2016. A methodology for flood susceptibility and vulnerability analysis in complex flood scenarios. Journal of Flood Risk Management, n/a-n/a.
Dupuis, H., Michel, D., Sottolichio, A., 2006. Wave climate evolution in the Bay of Biscay over two decades. Journal of Marine Sys-tems 63 (3-4), 105-114.
ECMWF, n.d. Browse reanalysis datasets.http://www.ecmwf.int/en/research/climate-reanalysis/browse-reanalysis-datasets, [ac-cessed 17 April, 2017].
Environment Agency, 2009. Flooding in England: A National Assessment of Flood Risk. Environemnt Agency report. https://www.gov.uk/government/uploads/system/uploads/attachment_data/file/292928/geho0609bqds-e-e.pdf [accessed 07 April, 2016].
Ferreira, Ó., Garcia, T., Matias, A., Taborda, R., Dias, J.A., 2006. An integrated method for the determination of set-back lines for coastal erosion hazards on sandy shores. Continental Shelf Research 26, 1030-1044.
Gallien, T.W., 2016. Validated coastal flood modeling at Imperial Beach, California: Comparing total water level, empirical and nu-merical overtopping methodologies. Coastal Engineering 111, 95-104.
Gaslikova, L., Grabemann, I., Groll, N., 2013. Changes in North Sea storm surge conditions for four transient future climate realiza-tions. Natural Hazards 66, 1501-1518.
Gommenginger, C., Thibaut, P., Fenoglio-Marc, L., Quartly, G., Deng, X. Gómez Enri, J. Challenor, P., Gao., Y., 2010. Retracking altimeter waveforms near the coasts — A review of retracking methods and some applications to coastal waveforms. In: Vignudelli, S., Kostianoy. A., Cipollini, P., Benveniste, J. (eds), Coastal Altimetry. Springer, Dordrecht, Netherlands.
Gouldby B., Sayers P., Mulet Marti J., Hassan M., Benwell D., 2008. A methodology for regional-scale flood risk assessment. Proceed-ings of the Institution of Civil Engineers-Water Management 161, (3), 169–182.
Gräwe, U., Burchard, H., 2012. Storm surges in the Western Baltic Sea: the present and a possible future. Climate Dynamics 39, 165-183.
Grinsted, A., Moore, A.J., Jevrejeva, S., 2010. Reconstructing sea level from paleo and projected temperatures 200 to 2100 AD. Climate Dynamics 34(4), 461-472.
Groll N., Grabemann I., Hünicke B., Meese ,M., 2017. Baltic Sea wave conditions under climate change scenarios. Boreal Environment Research 22, 1–12.
Groll, N., Grabemann, I., Gaslikova, L., 2014. North Sea wave conditions. An analysis of four transient future climate realizations. Ocean Dynamics 64 (1), 1-12.
Haigh, I.D., Wadey, M.P., Gallo, S.L, Loehr, H., Nicholls, R.J., Horsburgh, K., Brown, J.M, Bradshaw, E., 2015. A user-friendly database of coastal flooding in the United Kingdom 1915-2014. Scientific Data 2, 150021.
Haigh, I.D., Wadey, M.P., Wahl, T., Ozsoy, O., Nicholls, R.J,. Brown, J.M, Horsburgh, K., Gouldby, B., 2016. Spatial footprint and temporal clustering analysis of extreme sea level and storm surge events around the coastline of the UK. Scientific Data 3, 160107.
Hallegatte, S., Green, C., Nicholls, R. J., Corfee Morlot, J., 2013. Future flood losses in major coastal cities. Nature Climate Change, 3, 802–806.
Hawkes, P.J., Atkins, R., Brampton, A.H., Fortune, D., Garbett, R., Gouldby, B.P., 2001. WAVENET: Nearshore Wave Recording Network for England and Wales: Feasibility Study. HR Wallingford Report TR 122.
Hemer, M.A., Wang, X.L., Weisse, R., Swail, V.R., 2012. Advancing wind-waves climate science: The COWCLIP project. Bulletin of the American Meteorological Society 93, 791–796.
Hinkel, J., Lincke, D., Vafeidis, A.T., Perrette, M., Nicholls, R.J., Tol, R.S.J., Marzeion, B., Fettweis, X., Ionescu, C., Levermann, A., 2014. Coastal flood damage and adaptation costs under 21st century sea-level rise. Proceedings of the National Academy of Sciences 111, 3292-3297.
Hinkel, J., Nicholls, R., Vafeidis, A., Tol, R.J., Avagianou, T., 2010. Assessing risk of and adaptation to sea-level rise in the European Union: an application of DIVA. Mitigation and Adaptation Strategies for Global Change 15, 703-719.
Horsburgh, K., Ball, T., Donovan, B., Westbrook, G., 2010. Coastal flooding in MCCIP Annual Report Card 2010-11. MCCIP Science Review. Available from: www.mccip.org.uk/arc.
Howard, T., Lowe, J., Horsburgh, K., 2010. Interpreting Century-Scale Changes in Southern North Sea Storm Surge Climate Derived from Coupled Model Simulations. Journal of Climate 23, 6234-6247.
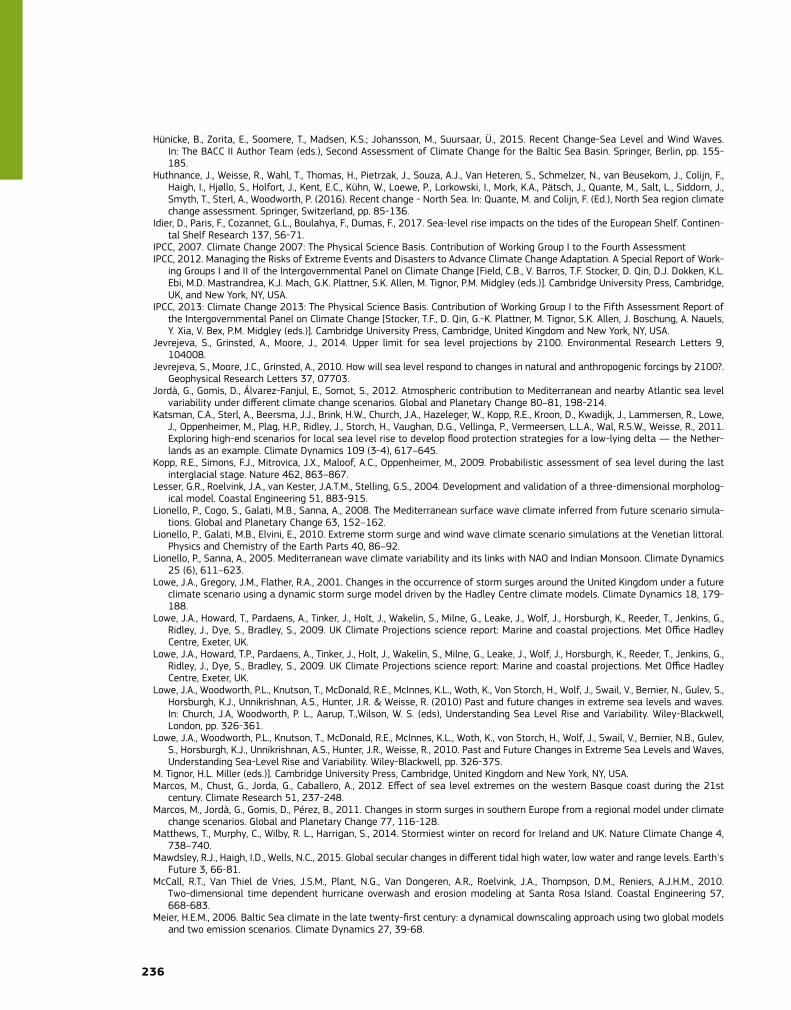
236
Hünicke, B., Zorita, E., Soomere, T., Madsen, K.S.; Johansson, M., Suursaar, Ü., 2015. Recent Change-Sea Level and Wind Waves. In: The BACC II Author Team (eds.), Second Assessment of Climate Change for the Baltic Sea Basin. Springer, Berlin, pp. 155-185.
Huthnance, J., Weisse, R., Wahl, T., Thomas, H., Pietrzak, J., Souza, A.J., Van Heteren, S., Schmelzer, N., van Beusekom, J., Colijn, F., Haigh, I., Hjøllo, S., Holfort, J., Kent, E.C., Kühn, W., Loewe, P., Lorkowski, I., Mork, K.A., Pätsch, J., Quante, M., Salt, L., Siddorn, J., Smyth, T., Sterl, A., Woodworth, P. (2016). Recent change - North Sea. In: Quante, M. and Colijn, F. (Ed.), North Sea region climate change assessment. Springer, Switzerland, pp. 85-136.
Idier, D., Paris, F., Cozannet, G.L., Boulahya, F., Dumas, F., 2017. Sea-level rise impacts on the tides of the European Shelf. Continen-tal Shelf Research 137, 56-71.
IPCC, 2007. Climate Change 2007: The Physical Science Basis. Contribution of Working Group I to the Fourth AssessmentIPCC, 2012. Managing the Risks of Extreme Events and Disasters to Advance Climate Change Adaptation. A Special Report of Work-
ing Groups I and II of the Intergovernmental Panel on Climate Change [Field, C.B., V. Barros, T.F. Stocker, D. Qin, D.J. Dokken, K.L. Ebi, M.D. Mastrandrea, K.J. Mach, G.K. Plattner, S.K. Allen, M. Tignor, P.M. Midgley (eds.)]. Cambridge University Press, Cambridge, UK, and New York, NY, USA.
IPCC, 2013: Climate Change 2013: The Physical Science Basis. Contribution of Working Group I to the Fifth Assessment Report of the Intergovernmental Panel on Climate Change [Stocker, T.F., D. Qin, G.-K. Plattner, M. Tignor, S.K. Allen, J. Boschung, A. Nauels, Y. Xia, V. Bex, P.M. Midgley (eds.)]. Cambridge University Press, Cambridge, United Kingdom and New York, NY, USA.
Jevrejeva, S., Grinsted, A., Moore, J., 2014. Upper limit for sea level projections by 2100. Environmental Research Letters 9, 104008.
Jevrejeva, S., Moore, J.C., Grinsted, A., 2010. How will sea level respond to changes in natural and anthropogenic forcings by 2100?. Geophysical Research Letters 37, 07703.
Jordà, G., Gomis, D., Álvarez-Fanjul, E., Somot, S., 2012. Atmospheric contribution to Mediterranean and nearby Atlantic sea level variability under different climate change scenarios. Global and Planetary Change 80–81, 198-214.
Katsman, C.A., Sterl, A., Beersma, J.J., Brink, H.W., Church, J.A., Hazeleger, W., Kopp, R.E., Kroon, D., Kwadijk, J., Lammersen, R., Lowe, J., Oppenheimer, M., Plag, H.P., Ridley, J., Storch, H., Vaughan, D.G., Vellinga, P., Vermeersen, L.L.A., Wal, R.S.W., Weisse, R., 2011. Exploring high-end scenarios for local sea level rise to develop flood protection strategies for a low-lying delta — the Nether-lands as an example. Climate Dynamics 109 (3-4), 617–645.
Kopp, R.E., Simons, F.J., Mitrovica, J.X., Maloof, A.C., Oppenheimer, M., 2009. Probabilistic assessment of sea level during the last interglacial stage. Nature 462, 863–867.
Lesser, G.R., Roelvink, J.A., van Kester, J.A.T.M., Stelling, G.S., 2004. Development and validation of a three-dimensional morpholog-ical model. Coastal Engineering 51, 883-915.
Lionello, P., Cogo, S., Galati, M.B., Sanna, A., 2008. The Mediterranean surface wave climate inferred from future scenario simula-tions. Global and Planetary Change 63, 152–162.
Lionello, P., Galati, M.B., Elvini, E., 2010. Extreme storm surge and wind wave climate scenario simulations at the Venetian littoral. Physics and Chemistry of the Earth Parts 40, 86–92.
Lionello, P., Sanna, A., 2005. Mediterranean wave climate variability and its links with NAO and Indian Monsoon. Climate Dynamics 25 (6), 611–623.
Lowe, J.A., Gregory, J.M., Flather, R.A., 2001. Changes in the occurrence of storm surges around the United Kingdom under a future climate scenario using a dynamic storm surge model driven by the Hadley Centre climate models. Climate Dynamics 18, 179-188.
Lowe, J.A., Howard, T., Pardaens, A., Tinker, J., Holt, J., Wakelin, S., Milne, G., Leake, J., Wolf, J., Horsburgh, K., Reeder, T., Jenkins, G., Ridley, J., Dye, S., Bradley, S., 2009. UK Climate Projections science report: Marine and coastal projections. Met Office Hadley Centre, Exeter, UK.
Lowe, J.A., Howard, T.P., Pardaens, A., Tinker, J., Holt, J., Wakelin, S., Milne, G., Leake, J., Wolf, J., Horsburgh, K., Reeder, T., Jenkins, G., Ridley, J., Dye, S., Bradley, S., 2009. UK Climate Projections science report: Marine and coastal projections. Met Office Hadley Centre, Exeter, UK.
Lowe, J.A., Woodworth, P.L., Knutson, T., McDonald, R.E., McInnes, K.L., Woth, K., Von Storch, H., Wolf, J., Swail, V., Bernier, N., Gulev, S., Horsburgh, K.J., Unnikrishnan, A.S., Hunter, J.R. & Weisse, R. (2010) Past and future changes in extreme sea levels and waves. In: Church, J.A, Woodworth, P. L., Aarup, T.,Wilson, W. S. (eds), Understanding Sea Level Rise and Variability. Wiley-Blackwell, London, pp. 326-361.
Lowe, J.A., Woodworth, P.L., Knutson, T., McDonald, R.E., McInnes, K.L., Woth, K., von Storch, H., Wolf, J., Swail, V., Bernier, N.B., Gulev, S., Horsburgh, K.J., Unnikrishnan, A.S., Hunter, J.R., Weisse, R., 2010. Past and Future Changes in Extreme Sea Levels and Waves, Understanding Sea-Level Rise and Variability. Wiley-Blackwell, pp. 326-375.
M. Tignor, H.L. Miller (eds.)]. Cambridge University Press, Cambridge, United Kingdom and New York, NY, USA.Marcos, M., Chust, G., Jorda, G., Caballero, A., 2012. Effect of sea level extremes on the western Basque coast during the 21st
century. Climate Research 51, 237-248.Marcos, M., Jordà, G., Gomis, D., Pérez, B., 2011. Changes in storm surges in southern Europe from a regional model under climate
change scenarios. Global and Planetary Change 77, 116-128.Matthews, T., Murphy, C., Wilby, R. L., Harrigan, S., 2014. Stormiest winter on record for Ireland and UK. Nature Climate Change 4,
738–740.Mawdsley, R.J., Haigh, I.D., Wells, N.C., 2015. Global secular changes in different tidal high water, low water and range levels. Earth's
Future 3, 66-81.McCall, R.T., Van Thiel de Vries, J.S.M., Plant, N.G., Van Dongeren, A.R., Roelvink, J.A., Thompson, D.M., Reniers, A.J.H.M., 2010.
Two-dimensional time dependent hurricane overwash and erosion modeling at Santa Rosa Island. Coastal Engineering 57, 668-683.
Meier, H.E.M., 2006. Baltic Sea climate in the late twenty-first century: a dynamical downscaling approach using two global models and two emission scenarios. Climate Dynamics 27, 39-68.

CHAPTER 3 UNDERSTANDING DISASTER RISK: HAZARD RELATED RISK ISSUES - SECTION II
237
Meier, H.E.M., Broman, B., Kjellström, E., 2004. Simulated sea level in past and future climates of the Baltic Sea. Climate Research 27, 59-75.
Menendez, M., Woodworth, P.L., 2010. Changes in extreme high water levels based on a quasi-global tide-gauge dataset. Journal of Geophysical Research 115, C10011.
Mitrovica, J.X., Tamisea, M.E., Davis, J.L. and Milne, G.A., 2001. Recent mass balance of polar ice sheets inferred from patterns of global sea-level change. Nature 409, 1026- 1029.
Nicholls, R.J., French, J., Burningham, H., Van Maanen, B., Payo, A., Sutherland, J., Walkden, M., Thornhill, G., Brown, J., Luxford, F., Simm, J., Reeve, D.E., Hall, J. W., Souza, A., Stansby, P.K., Amoudry, L.O., Rogers, B.D., Ellis, M., Whitehouse, R., Horrillo-Caraballo, J.M., Karunarathna, H.U., Pan, S., Plater, A., Dix, J., Barnes, J., Heron, E., 2015. Improving Decadal Coastal Geomorphic Predictions: An Overview of the ICOASST Project. In: Proceedings of the Coastal Sediments, San Diego, USA.
Pelling, H.E., Mattias Green, J.A., 2014. Impact of flood defences and sea-level rise on the European Shelf tidal regime. Continental Shelf Research 85, 96-105.
Perez, J., Menendez, M., Camus, P., Mendez, F.J., Losada, I.J., 2015. Statistical multi-model climate projections of surface ocean waves in Europe. Ocean Modelling 96, 161–170.
Perini, L., Calabrese, L., Salerno, G., Ciavola, P., Armaroli, C., 2016. Evaluation of coastal vulnerability to flooding: comparison of two different methodologies adopted by the Emilia-Romagna region (Italy). Natural Hazards and Earth System Sciences 16, 181-194.
Pfeffer, W.T., Harper, J.T., O’Neel, S., 2008. Kinematic constraints on glacier contributions to 21st century sea level rise. Science 321, 1340–1343.
Pickering, M.D., Wells, N.C., Horsburgh, K.J., Green, J.A.M., 2012. The impact of future sea-level rise on the European Shelf tides. Continental Shelf Research 35, 1-15.
Prandle, D., Wolf, J., 1978. The interaction of surge and tide in the North Sea and River Thames. Geophysical Journal of the Royal Astronomical Society 55, 203–216.
PSMSL, 2017. Permanent Service for Mean Sea Level. http://www.psmsl.org/, [accessed 17 April, 2017].Pugh, D., Woodworth, P., 2014. Sea-Level Science: Understanding Tides, Surges, Tsunamis and Mean Sea-Level Changes. Cambridge
University Press, Cambridge. Purvis, M.J., Bates, P.D., Hayes, C.M., 2008. A probabilistic methodology to estimate future coastal flood risk due to sea level rise.
Coastal Engineering 55, 1062-1073.Rahmstorf, S., 2007. A semi-empirical approach to projecting future sea-level rise. Science 315 (5810), 368–370. Ramirez, J.A., Lichter, M., Coulthard, T.J., Skinner, C., 2016. Hyper-resolution mapping of regional storm surge and tide flooding:
comparison of static and dynamic models. Natural Hazards 82, 571-590.Report of the Intergovernmental Panel on Climate Change [Solomon, S., D. Qin, M. Manning, Z. Chen, M. Marquis, K.B. Averyt,Roelvink, D., Reniers, A., Dongeren, A.v., Vries, J.v.T.d., McCall, R., Lescinski, J., 2009. Modelling storm impacts on beaches, dunes and
barrier islands. Coastal Engineering 56, 1133-1152.Rossiter, J.R., 1961. Interaction between tide and surge in the Thames. Geophysical Journal of the Royal Astronomical Society 6,
29–53. Seenath, A., Wilson, M., Miller, K., 2016. Hydrodynamic versus GIS modelling for coastal flood vulnerability assessment: Which is
better for guiding coastal management? Ocean & Coastal Management 120, 99-109.Sekovski, I., Armaroli, C., Calabrese, L., Mancini, F., Stecchi, F., Perini, L., 2015. Coupling scenarios of urban growth and flood hazards
along the Emilia-Romagna coast (Italy). Natural Hazards and Earth System Sciences 15, 2331-2346.Smith, D.E., Hunt, N., Firth, C.R., Jordan, J.T., Fretwell, P.T., Harman, M., Murdy, J., Orford, J.D., Burnside, N.G., 2012. Patterns of Holo-
cene relative sea level change in the North of Britain and Ireland. Quaternary Science Reviews 54 (26), 58–76. Smith, R.A.E., Bates, P.D., Hayes, C., 2012. Evaluation of a coastal flood inundation model using hard and soft data. Environmental
Modelling & Software 30, 35-46.Sterl, A., van den Brink, H., de Vries, H., Haarsma, R., van Meijgaard, E., 2009. An ensemble study of extreme storm surge related
water levels in the North Sea in a changing climate. Ocean Science 5, 369-378.Thorne, C.R., Evans, E.P., Penning-Roswell, E.C., 2007. Future Flooding and Coastal Erosion risks. Thomas Telford Ltd, London, UK. Toffoli, A., Lefèvre, J.M., Bitner-Gregersen, E., Monbaliu, J., 2005. Towards the identification of warning criteria: Analysis of a ship
accident database. Applied Ocean Research 27 (6), 281–291. Vermeer, M., Rahmstorf, S., 2009. Global sea level linked to global temperature. Proceedings of the National Academy of Sciences
106 (51), 21527–21532. Vousdoukas, M.I., Ferreira, O., Almeida, L.P., Pacheco, A., 2012a. Toward reliable storm-hazard forecasts: XBeach calibration and its
potential application in an operational early-warning system. Ocean Dynamics 62, 1001-1015.Vousdoukas, M.I., Mentaschi, L., Voukouvalas, E., Verlaan, M., Feyen, L., 2017. Extreme sea levels on the rise along Europe’s coasts.
Earth's Future submitted after minor revision.Vousdoukas, M.I., Voukouvalas, E., Annunziato, A., Giardino, A., Feyen, L., 2016a. Projections of extreme storm surge levels along
Europe. Climate Dynamics 47, 3171–3190.Vousdoukas, M.I., Voukouvalas, E., Mentaschi, L., Dottori, F., Giardino, A., Bouziotas, D., Bianchi, A., Salamon, P., Feyen, L., 2016b.
Developments in large-scale coastal flood hazard mapping. Natural Hazards and Earth System Science 16, 1841-1853.Vousdoukas, M.I., Wziatek, D., Almeida, L.P., 2012b. Coastal vulnerability assessment based on video wave run-up observations at
a mesotidal, steep-sloped beach. Ocean Dynamics 62, 123-137.Wahl, T., Chambers, D.P., 2016. Climate controls multidecadal variability in U. S. extreme sea level records. Journal of Geophysical
Research: Oceans 121, 1274–1290. Wang, X.L., Zwiers, F.W., Swail, V.R., Feng, Y., 2009. Trends and variability of storminess in the Northeast Atlantic region, 1874–2007.
Climate Dynamics 33, 1179–1195. Weisse, R., Storch, H., Callies, U., Chrastansky, A., Feser, F., Grabemann, I., Günther, H., Pluess, A., Stoye, T., Tellkamp, J., Winterfeldt,
J., Woth, K., 2009. Regional meteorological-marine reanalysis and climate change projections: results for northern Europe and

238
potential for coastal and offshore applications. Bulletin of the American Meteorological Society 90 (6), 849–860. Williams, J., Horsburgh, K.J., Williams, J.A., Proctor, R.N.F., 2016. Tide and skew surge independence: New insights for flood risk.
Geophysical Research Letters 43, 6410–6417.WMO (World Meteorological Organization (WMO), 2010. Tropical Cyclone Operational Plan for the Bay ofWolf, J., 2009. Coastal Flooding — Impacts of coupled wave-surge-tide models. Natural Hazards 49 (2), 241-260.Wolf, J., 2016. Measurement and analysis of waves in estuarine and coastal waters. In: Uncles, R.J., Mitchell, S.B. (eds), Estuarine
and coastal hydrography and sediment transport. Estuarine and Coastal Science Association. Cambridge University Press, Cambridge, UK.
Wolf, J., Brown, J. M., Howarth, M.J., 2011. The wave climate of Liverpool Bay — observations and modelling. Ocean Dynamics 61, 639-655.
Wolf, J., Lowe, J., Howard, T., 2015. Climate Downscaling: Local Mean Sea-Level, Surge and Wave Modelling. In: Nicholls, R. J., Daw-son, R.J., Day, S. A. (eds), Broad Scale Coastal Simulation: New Techniques to Understand and Manage Shorelines in the Third Millennium. Springer, Dordrecht, Netherlands.
Wolf, J., Woolf, D. K., 2006. Waves and climate change in the north-east Atlantic. Geophysical Research Letters 33 (6), L06604. Wong, P.P., Losada, I.J., Gattuso, J.P., Hinkel, J., Khattabi, A., McInnes, K.L., Saito, Y., Sallenger, A., 2014. Coastal systems and low-ly-
ing areas. In: Field, C.B., Barros, V.R., Dokken, D.J., Mach, K.J., Mastandrea, M.D., Bilir, T.E., Chatterjee, M., Elbi, K.L, Estrada, Y.O., Genova, R.C., Girma, B., Kissel, E.S., Levy, A.N, MacCracken, S., Mastandrea, P.R., White, L.L. (eds), Climate Change 2014: Impacts, Adaptation, and Vulnerability. Part A: Global and Sectoral Aspects. Contribution of Working Group II to the Fifth Assessment Report of the Intergovernmental Panel on Climate Change. Cambridge University Press, Cambridge,United Kingdom and New York, USA, pp. 361-409.
Woodworth, P.L., 2010. A survey of recent changes in the main components of the ocean tide. Continental Shelf Research 30, 1680-1691.
Woodworth, P.L., Blackman, D.L., 2004. Evidence for systematic changes in extreme high waters since the mid-1970s. Journal of Climate 17(6):1190–1197.
Woodworth, P.L., Gehrels, W.R., Nerem, R.S., 2011. Nineteenth and twentieth century changes in sea level. Oceanography 24 (2), 80–93.
Woodworth, P.L., Teferle, N., Bingley, R., Shennan, I., Williams, S.D.P., 2009. Trends in UK mean sea level revisited. Geophysical Jour-nal International 176, 19–30.
Woolf, D., Wolf, J., 2013. Impacts of climate change on storms and waves. MCCIP Science Review undefined, 20–26. Woolf, D.K., Challenor, P.G., Cotton, P.D., 2002. The variability and predictability of North Atlantic wave climate. Journal of Geophys-
ical Research 107 (10), 3145. Woolf, D.K., Cotton, P.D., Challenor, P.G., 2003. Measurements of the offshore wave climate around the British Isles by satellite
altimeter. Philosophical Transactions: Mathematical, Physical & Engineering Sciences 361 (1802), 27–31. Woollings, T., 2010. Dynamical influences on European climate: an uncertain future. Philosophical Transactions of the Royal Society
A 368, 3733–3756. Woth, K., Weisse, R., Von Storch, H., 2006. Climate change and North Sea storm surge extremes: an ensemble study of storm surge
extremes expected in a changed climate projected by four different regional climate models. Ocean Dynamics 56, 3-15.Zacharioudaki, A., Pan, S., Simmonds, D., Magar, V.Reeve, D.E., undefined, 2011. Future wave climate over the west-European shelf
seas. Ocean Dynamics 61 (6), 807–827.