Embed Size (px)
Citation preview
Communications of the Association for Information Systems Communications of the Association for Information Systems
Volume 46 Article 18
4-2020
Examining Exploitability Risk of Vulnerabilities: A Hazard Model Examining Exploitability Risk of Vulnerabilities: A Hazard Model
Yaman Roumani Oakland University, [email protected]
Joseph Nwankpa Miami University
Follow this and additional works at: https://aisel.aisnet.org/cais
Recommended Citation Recommended Citation Roumani, Y., & Nwankpa, J. (2020). Examining Exploitability Risk of Vulnerabilities: A Hazard Model. Communications of the Association for Information Systems, 46, pp-pp. https://doi.org/10.17705/1CAIS.04618
This material is brought to you by the AIS Journals at AIS Electronic Library (AISeL). It has been accepted for inclusion in Communications of the Association for Information Systems by an authorized administrator of AIS Electronic Library (AISeL). For more information, please contact [email protected].
brought to you by COREView metadata, citation and similar papers at core.ac.uk
provided by AIS Electronic Library (AISeL)
C ommunications of the
A
I
S
ssociation for nformation ystems
Research Article DOI: 10.17705/1CAIS.04618 ISSN: 1529-3181
Volume 46 Paper 18 pp. 421 – 443 April 2020
Examining Exploitability Risk of Vulnerabilities: A Hazard Model
Yaman Roumani
Management Information Systems
Oakland University
Joseph Nwankpa
Information Systems & Analytics
Miami University
Abstract:
With the increasing number and severity of security incidents and exploits, information technology (IT) vendors, security managers, and consumers have begun to place more emphasis on security. Yet, fixing the sheer volume of vulnerabilities remains a challenge as IT vendors race against attackers to evaluate system vulnerabilities, prioritize them, and issue security patches before cybercriminals can exploit them. In this study, we posit that IT vendors can prioritize which vulnerabilities they should patch first by assessing their exploitability risk. Accordingly, we identified the vulnerabilities that cybercriminals will most likely exploit using vulnerability-related attributes and vulnerability types. To do so, we employed survival analysis and tested our models using historical data of vulnerabilities and exploits between 2007 and 2016. Our results indicate that IT vendors benefit the most from fixing remotely exploitable vulnerabilities; non-complex vulnerabilities; vulnerabilities that require no authentication; and vulnerabilities that affect confidentiality, integrity, and availability components. Furthermore, our findings suggest that IT vendors can mitigate the risk of exploit-related attacks by remedying code-injection vulnerabilities, buffer-overflow vulnerabilities, and numeric-error vulnerabilities.
Keywords: Vulnerabilities, Exploitability Risk, Game Theory, Risk Assessment, Survival Analysis.
This manuscript underwent peer review. It was received 29/01/2019 and was with the authors for 5 months for 3 revisions. Alvin Leung served as Associate Editor.
Communications of the Association for Information Systems 422
Volume 46 10.17705/1CAIS.04618 Paper 18
1 Introduction
Software vulnerabilities constitute a major threat to organizations’ information resources and result in direct and indirect financial losses (Hinz, Nofer, Schiereck, & Trillig, 2015). Software vulnerabilities often result from a software flaw, weakness, glitch, or human error that cybercriminals exploit. According to the National Vulnerability Database (NVD), the total number of vulnerabilities reported since 2007 has been rising, reaching a historic high in 2017 and 2018. Exploits, on the other hand, are malicious programs, written by attackers (i.e., hackers), that use software vulnerabilities to penetrate a system. An intrusion takes place when attackers identify and exploit vulnerabilities to break into and compromise a system. Exploits pose a major threat given the time gap between the discovery of a vulnerability and the release of the security patch. During that time, exploits function freely and endanger the security of the vulnerable software. At the same time, the risk of exploits lies in their availability over the Internet and the rise and ease of use of attack tools (Symantec, 2018).
Given the high number of vulnerabilities in software and the associated risk that someone will exploit them, managing vulnerabilities and responding to attacks pose a challenge for IT vendors and organizations (Baskerville, Spagnoletti, & Kim, 2014; Sen, 2018). For IT vendors, addressing a large number of vulnerability reports across numerous products and issuing security patches constitutes a lengthy and a complex process. For each reported vulnerability, an IT vendor must assess its severity, evaluate its impact level, identify a solution, and issue a security patch before attackers exploit it. For instance, Oracle identified 164 vulnerabilities across more than 20 products in January, 2018, and 690 vulnerabilities in total during that year (NVD, 2018). At this rate, assessing vulnerability risk becomes a challenge as security managers race against attackers to fix all reported vulnerabilities.
Given limited time and budgets, administrators cannot afford to issue a security patch to all vulnerabilities; thus, they assess and prioritize vulnerabilities by ranking them according to their impact severity (Arora, Krishnan, Telang, & Yang, 2010). The existing literature on vulnerability assessment highlights three deficiencies in the practice: being perfunctory, not based on evidence, and performed on an intermittent and non-historical basis (Webb, Ahmad, Maynard, & Shanks, 2014). Additionally, while many vulnerability risk-assessment methods exist (see, for e.g., Mell, Scarfone, & Romanosky, 2007; OWASP, 2017b), such methods neither consider the ever-changing security environment nor rely on historical data. Specifically, these methods offer a snapshot analysis and do not consider changes in vulnerability-related attributes and types. Thus, they cannot factor in the rise and decline of vulnerability-related factors when assessing exploitability risk.
Although prior studies have proposed several approaches to assess and measure exploitability risk, they have various limitations (Huang, Lin, Lin, & Sun, 2013; Sen & Heim, 2016; Younis, Malaiya, & Ray, 2016). First, researchers have focused on a wide range of factors that impact exploitability risk (Sen & Heim, 2016; Younis et al., 2016) but ignored specific factors related to vulnerabilities. Second, existing studies have frequently analyzed small-sample data over a short period that may not reflect exploitability risk overtime (Huang et al., 2013; Sen & Heim, 2016; Younis et al., 2016). Finally, implementing some methods researchers have proposed involves much difficulty and complexity (Huang et al., 2013) and requires access to the source code of the vulnerable software (Younis et al., 2016), which one may not be able to attain.
To fill this gap, we analyze historical data of vulnerabilities and their related exploits to identify vulnerabilities with the highest exploitability risk. Specifically, we consider vulnerability-related attributes and vulnerability types and measure their impact on exploitability risk. We use game theory as a theoretical framework and investigate the following research questions:
RQ1: Which vulnerability-related attributes result in the highest exploitability risk?
RQ2: Which vulnerability types result in the highest exploitability risk?
To address our research questions, we conducted survival analysis using the Cox proportional hazard model and examined reported vulnerabilities and exploits between 2007 and 2016. In doing so, we contribute to the information systems (IS) literature on risk assessment and management (Da Veiga & Eloff, 2010; Spears & Barki, 2010; Sen & Heim, 2016). In addition, we answer prior calls for additional factors associated with vulnerability risk and exploits (Sen & Heim, 2016). Finally, we also offer insight into the factors affecting exploitability risk and, thus, address the aforementioned deficiencies in risk assessment (Webb et al., 2014).
423 Examining Exploitability Risk of Vulnerabilities: A Hazard Model
Volume 46 10.17705/1CAIS.04618 Paper 18
Our findings allow IT vendors to handle vulnerabilities more efficiently and provide them with valuable information to assess and prioritize vulnerabilities based on exploitability risk. More specifically, investigating exploitability risk should offer initial insights to security managers who deal with prioritizing issues and resources when fixing vulnerabilities. Furthermore, as new exploits and vulnerabilities emerge, our model can be employed to reanalyze new information. Finally, examining exploitability risk helps to address limitations in existing methods.
The paper proceeds as follows: in Section 2, we provide relevant background information and review relevant literature and game theory. In Section 3, we introduce the research model and hypotheses. In Section 4, we detail our data-collection procedure. In Section 5, we describe how we analyzed the data and the results. In Section 6, we discuss our findings, their theoretical and managerial implications, the study’s limitations, and possibilities for future research. Finally, in Section 7, we conclude the paper.
2 Literature Review and Theory
The IS literature has examined information security predominantly from behavioral and economic paradigms. Hui, Vance, and Zhdanov (2016) recently reviewed the security-related literature and identified four emerging themes: 1) behavioral compliance, 2) risk assessment/management, 3) information security investment, 4) market effects of information security. Prior work in these areas has relied heavily on game theory to model, measure, and mitigate security risk and propose solutions for organizations.
2.1 Game Theory
Game theory deals with problems involving decision makers (players) who compete against each other to achieve their own objectives. Game theory explains the interaction between players with opposite goals where each player’s strategic choices depend on other players’ moves. Specifically, each player attempts to maximize their payoff by implementing the best dominant game strategy. Payoffs are the utility that players receive as the outcome of game play. A positive payoff indicates a win for a player, whereas a negative payoff indicates a loss.
Recent developments of game theoretical models have integrated psychological and behavioral factors, such as perfect rationality, bounded rationality, belief formation, and learning (Chong, Camerer, & Ho, 2006; Li, 2014; Hong, Pavlou, Wang, & Shi, 2016; Xu, 2018; Kim, Chung, & Lim, 2019). Perfect rationality assumes that participants have perfectly rationality, that is, that they can frame complex rational arguments, maximize their payoff, and arrive at the best outcome. The bounded rationality perspective suggests that, rather than optimizing every possible decision, adversaries often satisfice due to incomplete information, time, and their limited ability to process it (Arthur, 1994; Simon, 1955, 1972). Prior research and experimental evidence has widely accepted and supported the bounded rationality concept (Sterman, Henderson, Beinhocker, & Newman, 2007; Ho & Zhang, 2008). Furthermore, learning constitutes an integral part of game theory (Fudenberg, Drew, Levine, & Levine, 1998). Learning involves making sense of information in the context of each player’s own reason. Specifically, learning constitutes an iterative process that specifies how players use information about past actions, observes the current game state and their environment, estimate the prospective payoff, and modify their game strategy based on the observation. Prior research has introduced various learning models such as belief learning (Ioannou & Romero, 2014), rule learning (Stahl, 2000) and strategic learning (Boylu, Aytug, & Koehler, 2010). In addition to learning, players differ in how they form beliefs from information. That is, players form beliefs about other players’ actions that they may derive from their past experience playing the game (Osborne & Rubinstein, 1994). Thus, even with the same information and objectives, players may have heterogeneous behavior rules and different beliefs (Li, 2014).
Communications of the Association for Information Systems 424
Volume 46 10.17705/1CAIS.04618 Paper 18
2.2 Information Security
The information security literature has widely used game theory to examine the impact that attackers (i.e., hackers) have on the software industry (Galbreth & Shor, 2010), model the implications of sharing security information and investments in security technologies (Cavusoglu, Raghunathan, & Yue, 2008; Hua & Bapna, 2013; Gao, Zhong, & Mei, 2014; Wu, Feng, Wang, & Liang, 2015; Fielder, Panaousis, Malacaria, Hankin, & Smeraldi, 2016; Wu, Feng, & Fung, 2018), and understand the speed with which attackers publish exploits and vendors patch the vulnerabilities (Sen & Heim, 2016). For instance, Galbreth and Shor (2010) used game theory to model the impact that attackers have on the enterprise software industry and showed that firms may benefit from the pricing power that vulnerabilities enable. Cavusoglu et al. (2008) employed sequential game theory to model IT security investment levels and concluded that a firm gains the maximum payoff when it participates in a sequential game with hackers that requires a firm to move first before hackers. Gao et al. (2014) showed that firms should focus on their relationship with other firms when choosing a security-investment strategy. Cremonini and Nizovtsev (2009) concluded that the most optimal strategy for attackers who can probe their target involves putting more effort into attacking systems with low security levels than those with higher security levels. Wu et al. (2018) used game theory to show that firms under different business environments should implement different security strategies.
In another research stream, researchers have used game theory and other novel approaches to assess exploitability risk (Huang et al., 2013; Sen & Heim, 2016; Younis et al., 2016). For instance, Younis et al. (2016) proposed that organizations use software properties (i.e., attack surface entry points, vulnerability location, dangerous system calls, and reachability analysis) to assess exploitability risk. Finally, Sen and Heim (2016) used game theory and institutional theory to examine the risk that attackers will exploit vulnerabilities. They used a limited number of vulnerability-related attributes including vulnerability disclosure, vulnerability severity score, and vulnerability access vector in addition to software-related characteristics such as targeted software and software type to measure their impact on exploitability. However, they analyzed only 844 vulnerabilities published between 2002 and 2004.
While existing studies provide important insights into the relationship between attackers and the software industry, we lack studies on the factors that influence exploitability risk. With this work, we extend Sen and Heim’s (2016) study by examining the impact of other as-yet unexplored vulnerability-related factors on exploitability risk. Moreover, we examine the impact that vulnerability types have on exploitability risk and analyze a broader data sample over a 10-year period, which no other study has done.
3 Research Model and Hypotheses Development
Game theory provides the assumptions and the tools one needs to understand attackers’ (i.e., hackers) and defenders’ (i.e., IT vendors) choices. For attackers, successfully exploiting a vulnerability means a winning game. We use game theory to understand the strategic choices that attackers make in choosing which vulnerability to exploit and derive our hypotheses. For defenders, we consider game theory as a means to understand how firms can use exploitability risk to decide which vulnerability to fix in order to mitigate risk and protect their information assets. Our framework focuses on a specific situation based on perfect rationality (Rasmusen & Blackwell, 1994). In the context of perfect rationality, we assume that attackers have full knowledge of their choices and the cost needed to exploit a vulnerability in order to maximize the expected utility. We associate cost (i.e., entry barrier of attacks) with the risk, time, effort, and skill required from attackers to exploit a vulnerability.
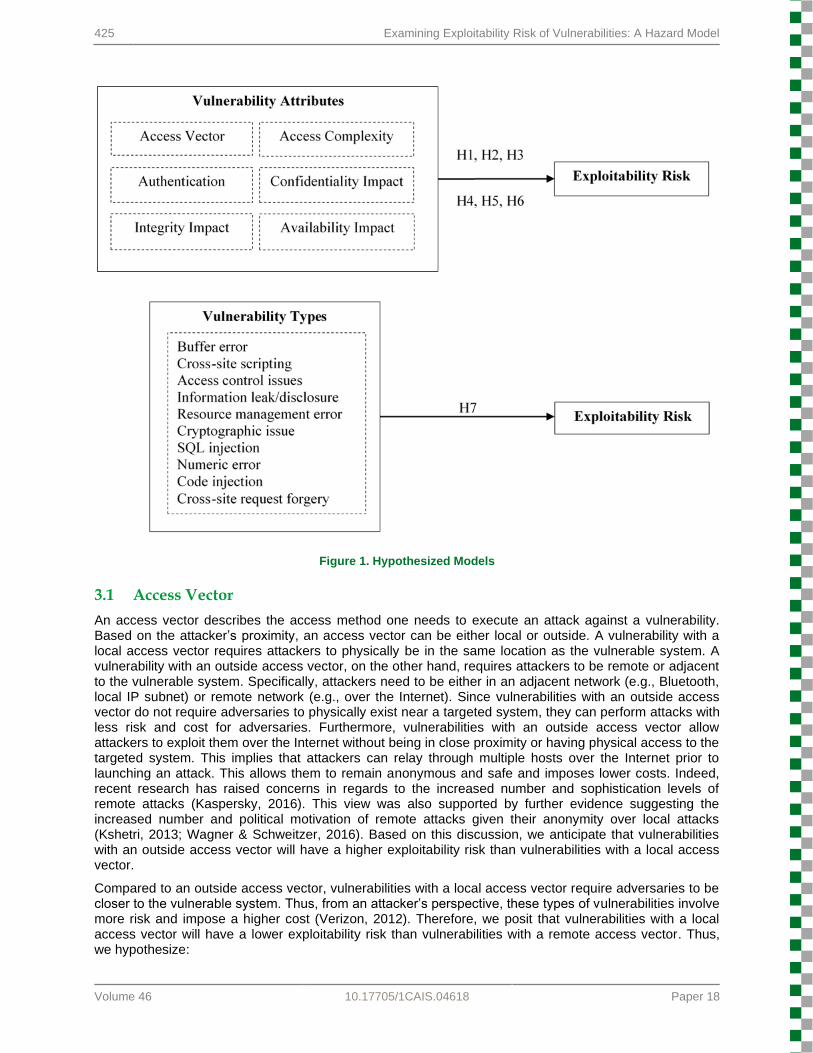
Using perfect rationality assumption of game theory, we draw two models. The first model assesses exploitability risk through six vulnerability attributes (access vector, access complexity, authentication, confidentiality, integrity, and availability impact). We choose these attributes because IT vendors and federal agencies such as the National Institute of Standards and Technology (NIST) (Mell et al., 2007) and the United States Computer Emergency Readiness Team (US-CERT) (Manion, 2012) have validated and widely adopted them. The second model investigates exploitability risk in relation to ten vulnerability types that we selected based on their frequency. We show both models in Figure 1.
425 Examining Exploitability Risk of Vulnerabilities: A Hazard Model
Volume 46 10.17705/1CAIS.04618 Paper 18
Figure 1. Hypothesized Models
3.1 Access Vector
An access vector describes the access method one needs to execute an attack against a vulnerability. Based on the attacker’s proximity, an access vector can be either local or outside. A vulnerability with a local access vector requires attackers to physically be in the same location as the vulnerable system. A vulnerability with an outside access vector, on the other hand, requires attackers to be remote or adjacent to the vulnerable system. Specifically, attackers need to be either in an adjacent network (e.g., Bluetooth, local IP subnet) or remote network (e.g., over the Internet). Since vulnerabilities with an outside access vector do not require adversaries to physically exist near a targeted system, they can perform attacks with less risk and cost for adversaries. Furthermore, vulnerabilities with an outside access vector allow attackers to exploit them over the Internet without being in close proximity or having physical access to the targeted system. This implies that attackers can relay through multiple hosts over the Internet prior to launching an attack. This allows them to remain anonymous and safe and imposes lower costs. Indeed, recent research has raised concerns in regards to the increased number and sophistication levels of remote attacks (Kaspersky, 2016). This view was also supported by further evidence suggesting the increased number and political motivation of remote attacks given their anonymity over local attacks (Kshetri, 2013; Wagner & Schweitzer, 2016). Based on this discussion, we anticipate that vulnerabilities with an outside access vector will have a higher exploitability risk than vulnerabilities with a local access vector.
Compared to an outside access vector, vulnerabilities with a local access vector require adversaries to be closer to the vulnerable system. Thus, from an attacker’s perspective, these types of vulnerabilities involve more risk and impose a higher cost (Verizon, 2012). Therefore, we posit that vulnerabilities with a local access vector will have a lower exploitability risk than vulnerabilities with a remote access vector. Thus, we hypothesize:
Communications of the Association for Information Systems 426
Volume 46 10.17705/1CAIS.04618 Paper 18
H1: A vulnerability with an outside access vector has a greater exploitability risk than a vulnerability with a local access vector.
3.2 Access Complexity
Access complexity refers to how easily one can exploit a vulnerability (Mell et al., 2007). Attackers can more easily exploit vulnerabilities with a low access complexity since doing so requires less knowledge and skill. Moreover, vulnerabilities low in access complexity often arise due to poor protection mechanisms or to the vulnerable system’s open access. For instance, SQL injection, a common type of vulnerability in Web applications, has a low complexity level given the little effort needed to exploit it (Chung, Wu, Chen, & Chang, 2012). In contrast, attackers cannot as easily exploit vulnerabilities with a medium or high complexity levels as doing so requires them to have higher levels of knowledge and skills and to execute special criteria and complex manipulations. For example, the race condition vulnerability, a timing flaw, involves executing two or more operations at the same time. The high complexity level of a race condition vulnerability lies in the perfect timing requirement.
As adversaries race against time to exploit vulnerabilities, less complex vulnerabilities offer attackers the ability to breach a system at a faster rate given the reduced effort doing so requires. Indeed, prior studies have found that attackers rationally make their choices based on the amount of effort and reward required to successfully breach a target (Cavusoglu et al., 2008). Thus, as the complexity level of a vulnerability decreases, we expect the exploitability risk to increase due to the reduced amount of time, level of effort, and skills needed from attackers. On the other hand, we anticipate that the exploitability risk of vulnerabilities with medium/high access complexity will decrease given the increased amount of time, level of effort, and skills required from adversaries. Thus, we hypothesize:
H2: A vulnerability with medium or high access complexity has a lower exploitability risk than a vulnerability with low access complexity.
3.3 Authentication
One sometimes requires access rights to a vulnerable system in order to exploit its vulnerabilities. According to Mell et al. (2007), authentication-related attacks are measured by the number of times an attacker has to authenticate to the vulnerable system prior to exploitation. Specifically, an adversary may need to either have an existing account or gain unauthorized access to an account on the vulnerable system, which means that an attacker needs to make further efforts, such as session hijacking, social engineering, and phishing, to exploit a vulnerability. For instance, a reported vulnerability in Windows 10 and Windows Server 2016 specified that only authenticated users could launch a malicious search query attack (CVE, 2018). Moreover, some attacks require multiple authentication instances before exploitation, which means that an adversary needs to have access to multiple accounts, a complex process that requires attackers to make privilege escalation attacks or hijack multiple user sessions.
As adversaries choose their attack strategy that requires the least amount of effort and constraints, exploiting a vulnerability with no authentication requirement has more value given the amount of time, difficulty, and effort required. However, as the number of required authentication instances increases, attackers face additional constraints and an increased amount of effort to exploit a vulnerability. Therefore, we anticipate that vulnerabilities that require no authentication instances will increase exploitability risks since such vulnerabilities require less time, skill, and effort from attackers. On the other hand, we posit that vulnerabilities that require one or more authentication instances will decrease exploitability risk given the high cost required from attackers. Thus, we hypothesize:
H3: A vulnerability that requires one or more authentication instances has a lower exploitability risk than a vulnerability with no authentication instances.
3.4 Confidentiality, Integrity, and Availability
The confidentiality, integrity, and availability (CIA) framework constitutes one of the earliest and most widely used security dimensions (Hartono, Holsapple, Kim, Na, & Simpson, 2014). Researchers have used the CIA framework to develop practical security objectives, evaluate systems’ security, and assess the impact of attacks on targeted systems (Hedström, Kolkowska, Karlsson, & Allen, 2011). Confidentiality implies protecting confidential information from unauthorized disclosure; protection be achieved through encryption, authentication, and access controls. Integrity refers to preventing individuals from modifying
427 Examining Exploitability Risk of Vulnerabilities: A Hazard Model
Volume 46 10.17705/1CAIS.04618 Paper 18
information without authorization. Common countermeasures include cryptographic algorithms (e.g., symmetric, asymmetric, hashes). Availability implies that intended users can access information at all times; availability can be achieved through regular hardware maintenance, system and security updates, data redundancy, and disaster-recovery procedures. Prior research on the CIA framework has examined its impact on software vendors and found a positive association between confidentiality’s, integrity’s, and availability’s degree of compromise and the likelihood that vendors will release a security patch (Temizkan, Kumar, Park, & Subramaniam, 2012).
An exploit can result in different impact levels on the CIA framework’s components. The impact level depends on the amount of damage done due to a loss of confidentiality, integrity, and availability; an exploit that compromises all CIA components translates to the highest impact level. For instance, Shellshock, a serious bash command vulnerability disclosed in 2014 resulted in complete information disclosure, total compromise of system integrity, and enabled attackers to render the vulnerable resource completely unavailable (National Institute of Standards and Technology, 2016). On the other hand, an exploit that partially or does not compromise CIA components translates to lesser impact levels. The Heartbleed bug, for example, partially impacted confidentially but did not impact on integrity or availability (National Institute of Standards and Technology, 2015).
Vulnerabilities that compromise CIA components represent an attractive target for attackers since they align with their objectives and maximize their payoff. Driven by information theft, an adversary would be interested in exploiting vulnerabilities that compromise a targeted system’s confidentiality. Similarly, an attacker who seeks to modify or destroy information would be interested in vulnerabilities that compromise a vulnerable system’s integrity. Furthermore, as the markets for vulnerabilities and bug bounty programs continue to favor serious vulnerabilities, attackers will continue to target vulnerabilities with the highest CIA impact (Ransbotham, Mitra, & Ramsey, 2012).
Based on this discussion, we anticipate that a strategic attacker will be more likely to exploit vulnerabilities that result in the highest levels of CIA impact since they lead to a bigger payoff. Specifically, vulnerabilities that compromise CIA components offer attackers more control and wider access to the vulnerable system. For IT vendors, such attacks involve the most danger since they compromise business assets and result in substantial losses (Temizkan et al., 2012). On the contrary, attackers may not find vulnerabilities that result in no impact on CIA components appealing given the time and effort needed compared to the reward. Thus, we posit that vulnerabilities that compromise CIA components will increase exploitability risk. On the other hand, vulnerabilities that cause no CIA impact will decrease exploitability risk. Thus, we hypothesize:
H4: A vulnerability that affects confidentiality has a greater exploitability risk than a vulnerability that does not affect confidentiality.
H5: A vulnerability that affects integrity has a greater exploitability risk than a vulnerability that does not affect integrity.
H6: A vulnerability that affects availability has a greater exploitability risk than a vulnerability that does not affect availability.
3.5 Vulnerability Type
Vulnerability type refers to the common attributes that vulnerabilities share with each other. Specifically, each vulnerability has an attack surface that describes an attack’s assumptions, requirements, post-conditions, mechanism, and the overall goal. An attack surface is typically used to classify vulnerabilities into different classes. For instance, a buffer overflow vulnerability refers to a vulnerability that allows an attacker to inject a malicious code by providing extra data and overwriting a system’s memory. While over one hundred vulnerability types exist (CWE, 2018), attackers target and exploit certain vulnerability types more frequently than others, and vulnerability types tend to surge and decline in popularity overtime. Furthermore, the rapid adoption of new technologies such as Web applications, cloud computing, third-party libraries, and frameworks affects how often vulnerability types occur (OWASP, 2017b). For example, buffer overflow was the most common vulnerability type until Web applications rose in prominence in 2006 when injection flaw surpassed it (OWASP, 2017a).
Injection flaw, a vulnerability class, occurs when an attacker passes malicious data to a vulnerable system without proper sanitization. One can often find this type of vulnerability in websites, SQL/NoSQL queries, program arguments, operating system (OS) commands, XML parsers, and other technologies. Compared
Communications of the Association for Information Systems 428
Volume 46 10.17705/1CAIS.04618 Paper 18
to other vulnerability classes, injection flaw involves more risk for IT vendors since one can easily discover and exploit it through code examination, security-/penetration-testing tools, and fuzzers (Palsetia, Deepa, Khan, Thilagam, & Pais, 2016). Indeed, prior research has shown the extent to which automated techniques and hacking tools can discover and exploit injection flaw vulnerabilities (Cadar & Sen, 2013) make them an easier target to exploit for attackers. In addition, injection flaw does not rely on a particular platform, and one can exploit the vulnerability through remote attacks; therefore, they offer attackers with the anonymity and reduced risk. Drawing on these insights, we posit that the exploitability risk of injection flaw vulnerabilities will be higher than the exploitability risk of other vulnerability types given the reduced cost associated with them. Thus, we hypothesize:
H7: An injection flaw vulnerability has a greater exploitability risk than other vulnerability types
4 Data
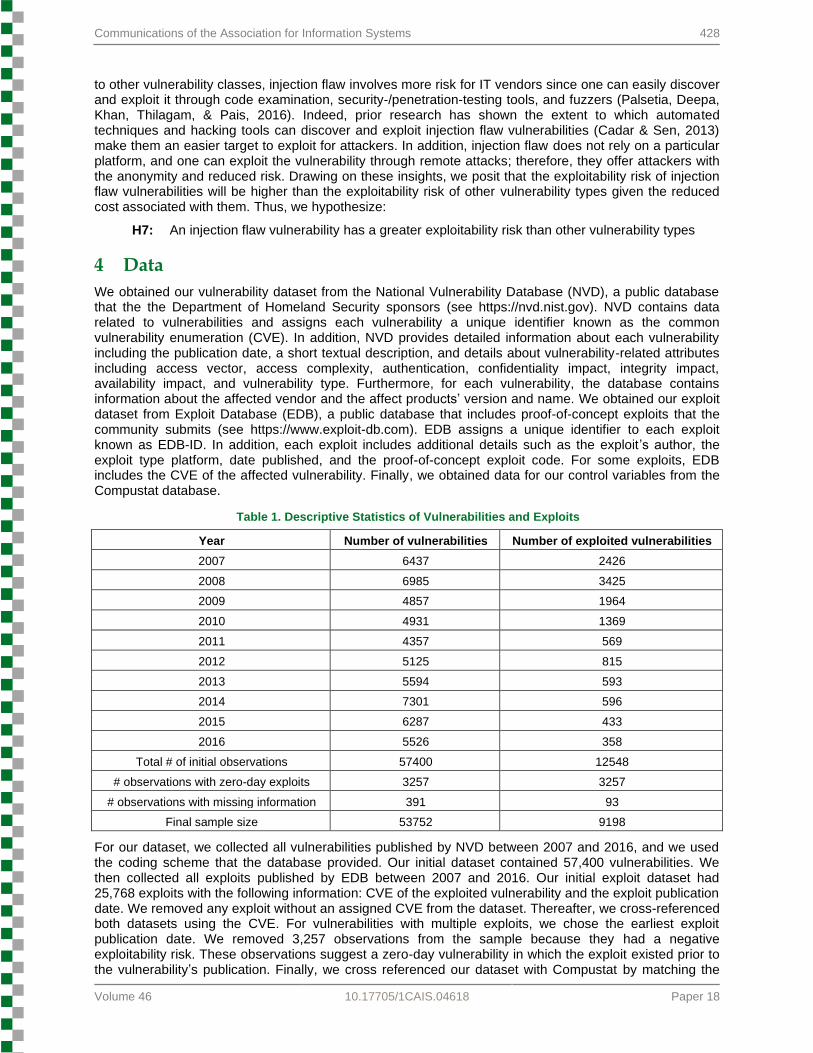
We obtained our vulnerability dataset from the National Vulnerability Database (NVD), a public database that the the Department of Homeland Security sponsors (see https://nvd.nist.gov). NVD contains data related to vulnerabilities and assigns each vulnerability a unique identifier known as the common vulnerability enumeration (CVE). In addition, NVD provides detailed information about each vulnerability including the publication date, a short textual description, and details about vulnerability-related attributes including access vector, access complexity, authentication, confidentiality impact, integrity impact, availability impact, and vulnerability type. Furthermore, for each vulnerability, the database contains information about the affected vendor and the affect products’ version and name. We obtained our exploit dataset from Exploit Database (EDB), a public database that includes proof-of-concept exploits that the community submits (see https://www.exploit-db.com). EDB assigns a unique identifier to each exploit known as EDB-ID. In addition, each exploit includes additional details such as the exploit’s author, the exploit type platform, date published, and the proof-of-concept exploit code. For some exploits, EDB includes the CVE of the affected vulnerability. Finally, we obtained data for our control variables from the Compustat database.
Table 1. Descriptive Statistics of Vulnerabilities and Exploits
Year Number of vulnerabilities Number of exploited vulnerabilities
2007 6437 2426
2008 6985 3425
2009 4857 1964
2010 4931 1369
2011 4357 569
2012 5125 815
2013 5594 593
2014 7301 596
2015 6287 433
2016 5526 358
Total # of initial observations 57400 12548
# observations with zero-day exploits 3257 3257
# observations with missing information 391 93
Final sample size 53752 9198
For our dataset, we collected all vulnerabilities published by NVD between 2007 and 2016, and we used the coding scheme that the database provided. Our initial dataset contained 57,400 vulnerabilities. We then collected all exploits published by EDB between 2007 and 2016. Our initial exploit dataset had 25,768 exploits with the following information: CVE of the exploited vulnerability and the exploit publication date. We removed any exploit without an assigned CVE from the dataset. Thereafter, we cross-referenced both datasets using the CVE. For vulnerabilities with multiple exploits, we chose the earliest exploit publication date. We removed 3,257 observations from the sample because they had a negative exploitability risk. These observations suggest a zero-day vulnerability in which the exploit existed prior to the vulnerability’s publication. Finally, we cross referenced our dataset with Compustat by matching the
429 Examining Exploitability Risk of Vulnerabilities: A Hazard Model
Volume 46 10.17705/1CAIS.04618 Paper 18
names of the affected firms with the extracted information from Compustat. After matching the data and removing cases with missing information, the final dataset contained 53,752 vulnerabilities (9,198 of which had an exploit). We provide descriptive statistics of the vulnerabilities and exploits in Table 1.
5 Analysis and Results
To test the proposed hypotheses, we used survival analysis—a set of statistical methods for studying the occurrence and timing of events. Unlike other statistical methods, survival analysis considers time-dependent variables and does not assume any type of distribution for the survival times (Allison, 2010). Specifically, given that the hazard of an exploited vulnerability lacks an exact distribution, we use the Cox model (also called the Cox proportional hazard model), a semi-parametric method of survival analysis. One can use the Cox model to analyze time-to-event data; it estimates the hazard ratio (relative risk) for each independent variable (Cox, 2018). The Cox model helps reduce potential biases associated with misspecifying statistical models. In other words, in cases where one does not know the baseline risk, one can use the Cox model to estimate the baseline and study the deviations from said baseline. In addition, Cox model accounts for the issue of right censoring, which occurs when one does not observe an event (e.g., exploited vulnerability) during a study. The Cox model addresses censored data by considering all observations regardless of the occurrence of the event of interest. Finally, Cox regression includes a proportionality assumption that changes in the levels of independent variables will produce proportionate changes in the hazard function that remains constant over time. We express Cox regression as follows:
h1(exploitability risk)= h0(exploitability risk) exp (ΣAttributei 𝛾i +ΣX𝑖 β), (1)
where h0(exploitability risk) refers to the base hazard function when all independent variables are zero, attribute refers to our vector of attributes, and Xiβ refers to our vector controls for the ith observation.
For our research, we use exploitability risk as the dependent variable. Thus, we censored vulnerabilities that no one exploited. Researchers suggest that each independent variable should have 40 to 50 required events (Austin, Allignol, & Fine, 2017). Our sample of 53,752 vulnerabilities adequately met that criterion. Furthermore, for each categorical independent variable with n levels, we created n-1 dummy variables. In such cases, the omitted level becomes the reference group. As such, we could measure how a change in the hazard ratio reflects a difference from the baseline hazard containing the reference group.
In this study, we used vulnerability publication date (Dvulnerability) and exploit publication date (Dexploit) to measure the primary dependent variable exploitability risk. Dvulnerability refers to the date when NVD released information about a vulnerability to the public. NVD typically releases such information after it notifies the IT vendor about a vulnerable product and provides them with 30-45 days to release a security patch (Arora et al., 2010). Dexploit refers to an exploit’s publication date. We measured exploitability risk as the duration between vulnerability publication date and exploit publication date (exploitability risk = Dexploit - Dvulnerability). We set the cutoff date for exploitability risk to 31 December, 2016. Thus, we censored published vulnerabilities that lacked an exploit by the cutoff date.
For the vulnerability attributes model, we included six independent variables: access vector, access complexity, authentication, confidentiality, integrity, and availability. Access vector had two values: 0 for local access and 1 for outside access. The access complexity variable had two values according to the complexity level: 0 for low complexity and 1 for medium/high complexity. Authentication variable measures the number of authentication instances required and had two values: 0 for no authentication and 1 for one or more authentication instances. Confidentiality variable had two possible values: 0 for no compromise and 1 for compromise. Similarly, integrity variable had two values: 0 for no compromise and 1 for compromise. Finally, availability variable had two values according to the compromise level: 0 for no compromise and 1 for compromise.
To account for other confounding factors, we controlled for six variables: affected product type, number of affected software versions, year of exploit, number of past exploits, firm size, and research and development (R&D) expenses. Existing research suggests that specific product types attract more attacks and represent main targets for exploits. For example, given the ubiquity of Web browsers and browser plugins, they have become an attractive target for malicious attacks (Onarlioglu, Buyukkayhan, Robertson, & Kirda, 2015). Similarly, the wide adoption of mobile devices has led to a major increase in attacks and malware that exploit and compromise mobile apps (McAfee, 2016). We also controlled for the number of affected software versions since a vulnerability may impact multiple software versions, which would likely
Communications of the Association for Information Systems 430
Volume 46 10.17705/1CAIS.04618 Paper 18
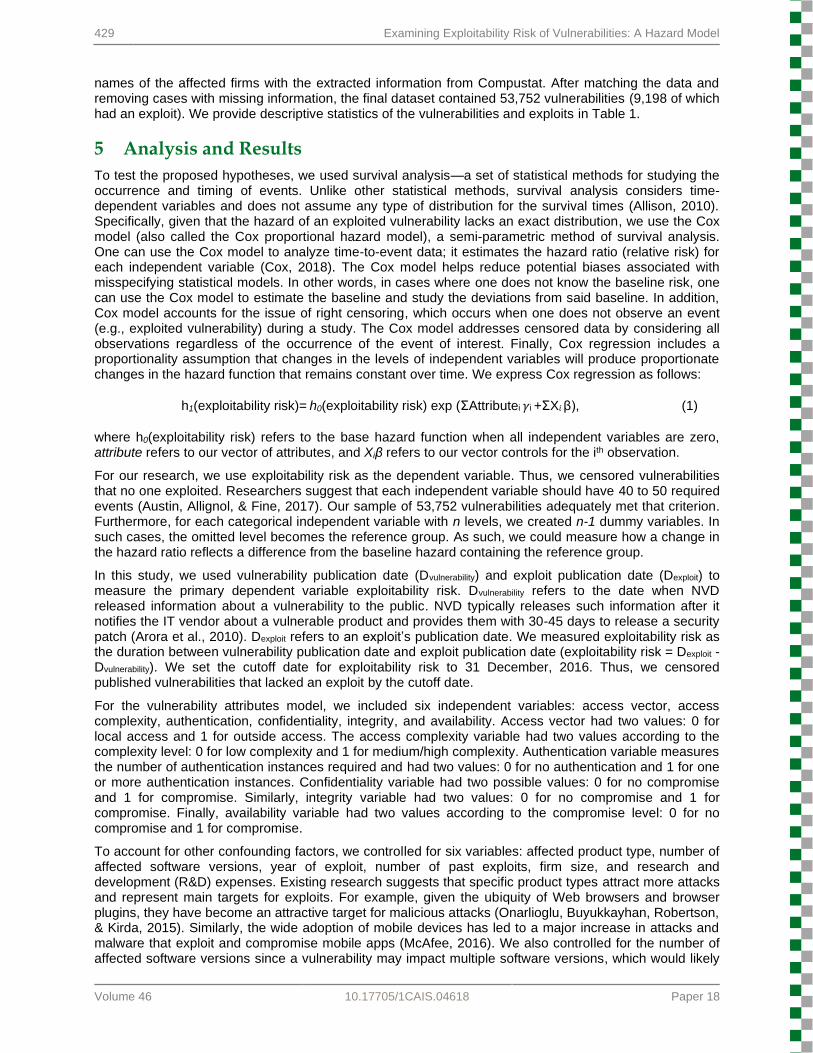
affect attackers’ behavior and their exploit strategy. Furthermore, we also included an additional control variable that counts the number of previous exploits and we controlled for exploited year effects by including dummy variables. Finally, following previous studies, at the firm level, we controlled for firm size and R&D expenses (Higgs, Pinsker, Smith, & Young, 2016; Wang, Kannan, & Ulmer, 2013). We summarize the control variables and how we operationalized them in Table 2.
Table 2. Variables and Descriptions/Measures for the Vulnerability Attributes Model
Variable name Variable type Description/measure
Exploitability risk Dependent The difference (in days) between vulnerability publication and exploit publication dates
Access vector Independent The method of access needed to execute an attack: 0 for local access, 1 outside access
Access complexity Independent The level of difficulty of the attack: 0 for low complexity, 1 for medium/high complexity.
Authentication Independent The number of authentication instances required for an attack: 0 for no instances, 1 for one or more instances.
Confidentiality impact Independent The level of compromise of confidentiality: 0 for no compromise, 1 for compromise
Integrity impact Independent The level of compromise of integrity: 0 for no compromise, 1 for compromise
Availability impact Independent The level of compromise of availability: 0 for no compromise, 1 for compromise
Affected product type Control The type of product affected by the vulnerability: 0 for application, 1 for operating system, 2 for hardware
Number of affected software versions
Control A count of the number of affected software versions
Number of past exploits Control A count of the total number of previous exploits
Year Control Dummy variables that control for exploited year effect
Firm size Control Measures the book value of the firm’s total assets
R&D expenses Control Firm’s research and development expenses
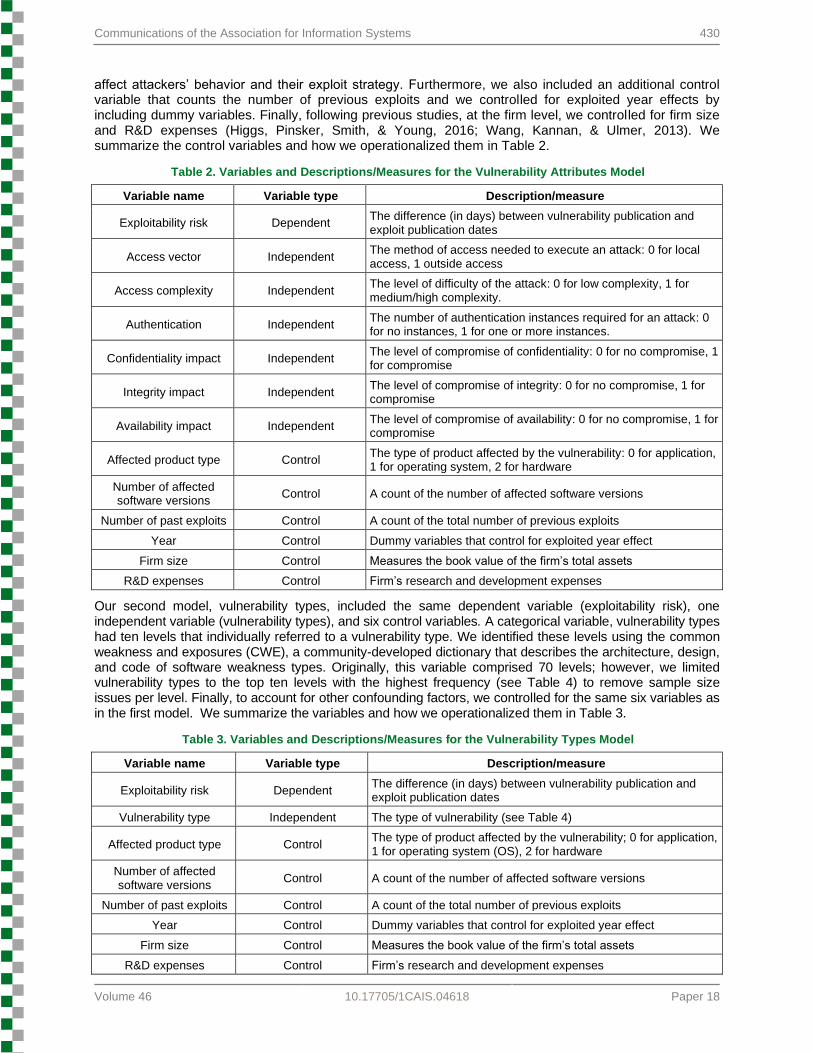
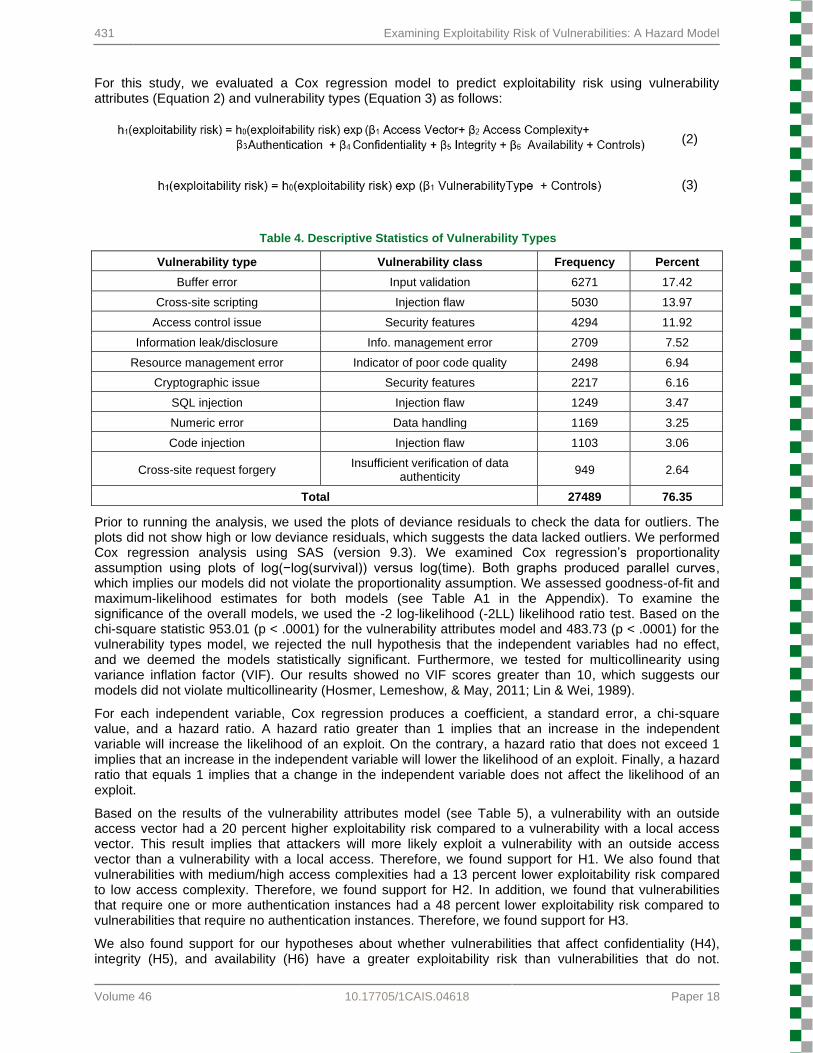
Our second model, vulnerability types, included the same dependent variable (exploitability risk), one independent variable (vulnerability types), and six control variables. A categorical variable, vulnerability types had ten levels that individually referred to a vulnerability type. We identified these levels using the common weakness and exposures (CWE), a community-developed dictionary that describes the architecture, design, and code of software weakness types. Originally, this variable comprised 70 levels; however, we limited vulnerability types to the top ten levels with the highest frequency (see Table 4) to remove sample size issues per level. Finally, to account for other confounding factors, we controlled for the same six variables as in the first model. We summarize the variables and how we operationalized them in Table 3.
Table 3. Variables and Descriptions/Measures for the Vulnerability Types Model
Variable name Variable type Description/measure
Exploitability risk Dependent The difference (in days) between vulnerability publication and exploit publication dates
Vulnerability type Independent The type of vulnerability (see Table 4)
Affected product type Control The type of product affected by the vulnerability; 0 for application, 1 for operating system (OS), 2 for hardware
Number of affected software versions
Control A count of the number of affected software versions
Number of past exploits Control A count of the total number of previous exploits
Year Control Dummy variables that control for exploited year effect
Firm size Control Measures the book value of the firm’s total assets
R&D expenses Control Firm’s research and development expenses
431 Examining Exploitability Risk of Vulnerabilities: A Hazard Model
Volume 46 10.17705/1CAIS.04618 Paper 18
For this study, we evaluated a Cox regression model to predict exploitability risk using vulnerability attributes (Equation 2) and vulnerability types (Equation 3) as follows:
(2)
(3)
Table 4. Descriptive Statistics of Vulnerability Types
Vulnerability type Vulnerability class Frequency Percent
Buffer error Input validation 6271 17.42
Cross-site scripting Injection flaw 5030 13.97
Access control issue Security features 4294 11.92
Information leak/disclosure Info. management error 2709 7.52
Resource management error Indicator of poor code quality 2498 6.94
Cryptographic issue Security features 2217 6.16
SQL injection Injection flaw 1249 3.47
Numeric error Data handling 1169 3.25
Code injection Injection flaw 1103 3.06
Cross-site request forgery Insufficient verification of data
authenticity 949 2.64
Total 27489 76.35
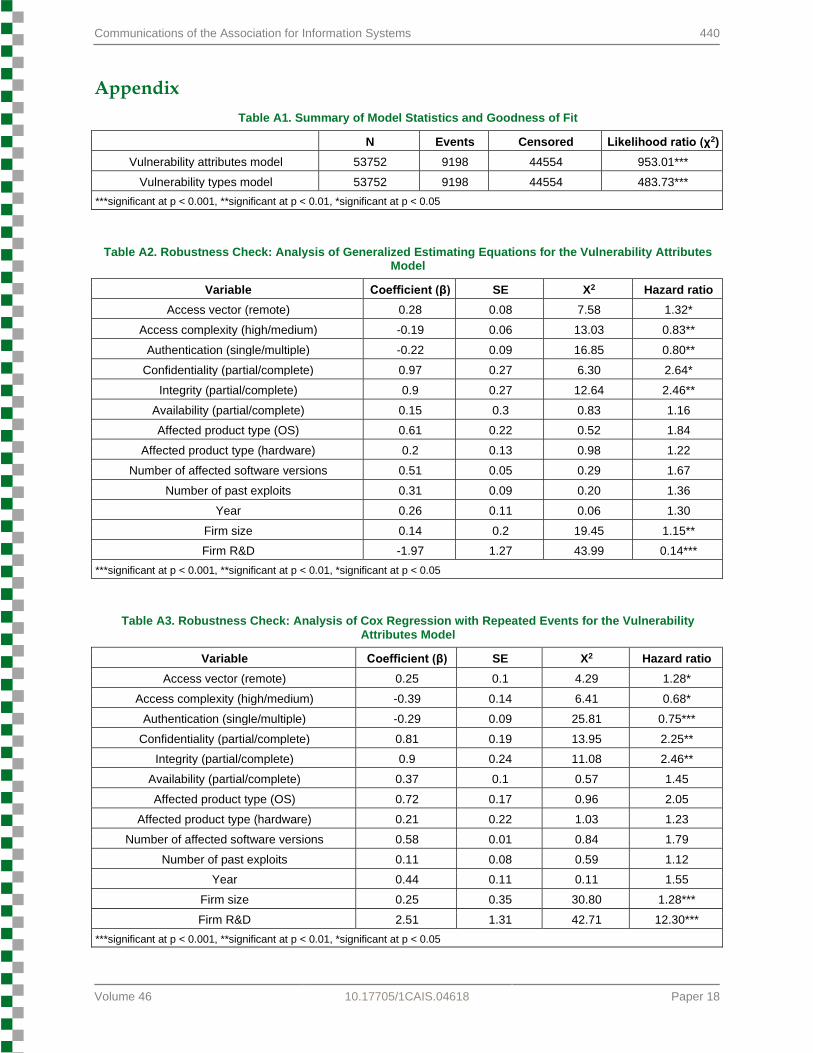
Prior to running the analysis, we used the plots of deviance residuals to check the data for outliers. The plots did not show high or low deviance residuals, which suggests the data lacked outliers. We performed Cox regression analysis using SAS (version 9.3). We examined Cox regression’s proportionality assumption using plots of log(−log(survival)) versus log(time). Both graphs produced parallel curves, which implies our models did not violate the proportionality assumption. We assessed goodness-of-fit and maximum-likelihood estimates for both models (see Table A1 in the Appendix). To examine the significance of the overall models, we used the -2 log-likelihood (-2LL) likelihood ratio test. Based on the chi-square statistic 953.01 (p < .0001) for the vulnerability attributes model and 483.73 (p < .0001) for the vulnerability types model, we rejected the null hypothesis that the independent variables had no effect, and we deemed the models statistically significant. Furthermore, we tested for multicollinearity using variance inflation factor (VIF). Our results showed no VIF scores greater than 10, which suggests our models did not violate multicollinearity (Hosmer, Lemeshow, & May, 2011; Lin & Wei, 1989).
For each independent variable, Cox regression produces a coefficient, a standard error, a chi-square value, and a hazard ratio. A hazard ratio greater than 1 implies that an increase in the independent variable will increase the likelihood of an exploit. On the contrary, a hazard ratio that does not exceed 1 implies that an increase in the independent variable will lower the likelihood of an exploit. Finally, a hazard ratio that equals 1 implies that a change in the independent variable does not affect the likelihood of an exploit.
Based on the results of the vulnerability attributes model (see Table 5), a vulnerability with an outside access vector had a 20 percent higher exploitability risk compared to a vulnerability with a local access vector. This result implies that attackers will more likely exploit a vulnerability with an outside access vector than a vulnerability with a local access. Therefore, we found support for H1. We also found that vulnerabilities with medium/high access complexities had a 13 percent lower exploitability risk compared to low access complexity. Therefore, we found support for H2. In addition, we found that vulnerabilities that require one or more authentication instances had a 48 percent lower exploitability risk compared to vulnerabilities that require no authentication instances. Therefore, we found support for H3.
We also found support for our hypotheses about whether vulnerabilities that affect confidentiality (H4), integrity (H5), and availability (H6) have a greater exploitability risk than vulnerabilities that do not.
Communications of the Association for Information Systems 432
Volume 46 10.17705/1CAIS.04618 Paper 18
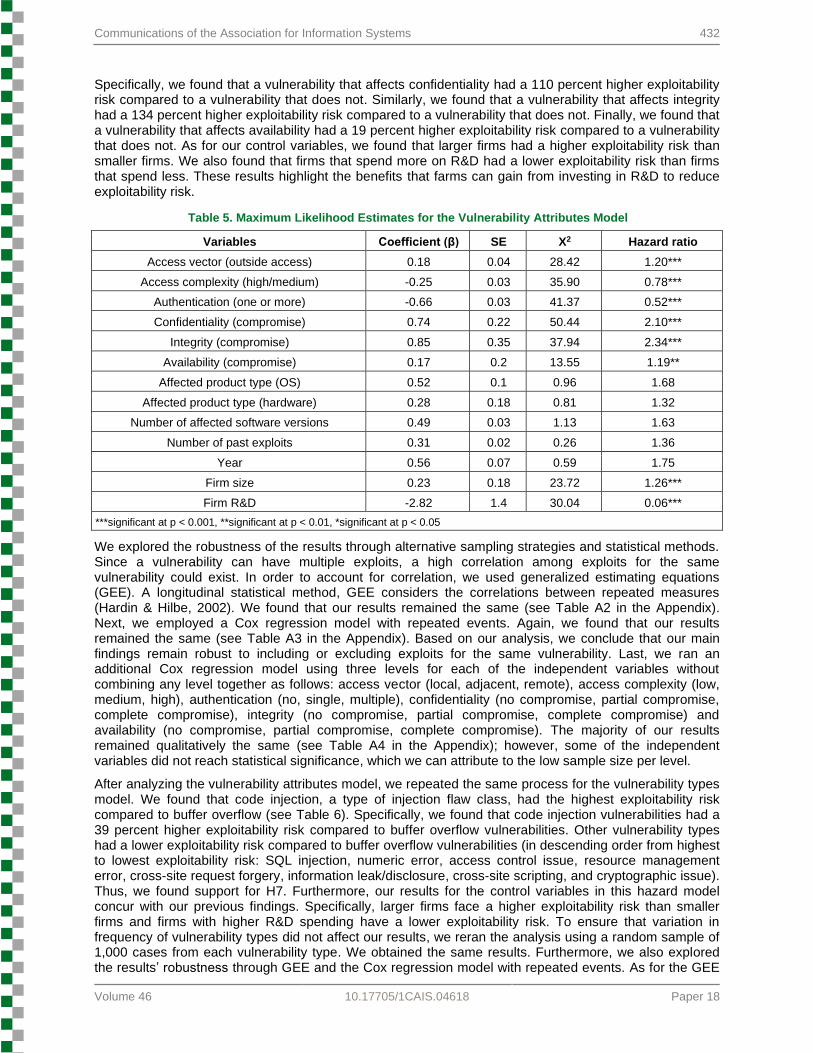
Specifically, we found that a vulnerability that affects confidentiality had a 110 percent higher exploitability risk compared to a vulnerability that does not. Similarly, we found that a vulnerability that affects integrity had a 134 percent higher exploitability risk compared to a vulnerability that does not. Finally, we found that a vulnerability that affects availability had a 19 percent higher exploitability risk compared to a vulnerability that does not. As for our control variables, we found that larger firms had a higher exploitability risk than smaller firms. We also found that firms that spend more on R&D had a lower exploitability risk than firms that spend less. These results highlight the benefits that farms can gain from investing in R&D to reduce exploitability risk.
Table 5. Maximum Likelihood Estimates for the Vulnerability Attributes Model
Variables Coefficient (β) SE X2 Hazard ratio
Access vector (outside access) 0.18 0.04 28.42 1.20***
Access complexity (high/medium) -0.25 0.03 35.90 0.78***
Authentication (one or more) -0.66 0.03 41.37 0.52***
Confidentiality (compromise) 0.74 0.22 50.44 2.10***
Integrity (compromise) 0.85 0.35 37.94 2.34***
Availability (compromise) 0.17 0.2 13.55 1.19**
Affected product type (OS) 0.52 0.1 0.96 1.68
Affected product type (hardware) 0.28 0.18 0.81 1.32
Number of affected software versions 0.49 0.03 1.13 1.63
Number of past exploits 0.31 0.02 0.26 1.36
Year 0.56 0.07 0.59 1.75
Firm size 0.23 0.18 23.72 1.26***
Firm R&D -2.82 1.4 30.04 0.06***
***significant at p < 0.001, **significant at p < 0.01, *significant at p < 0.05
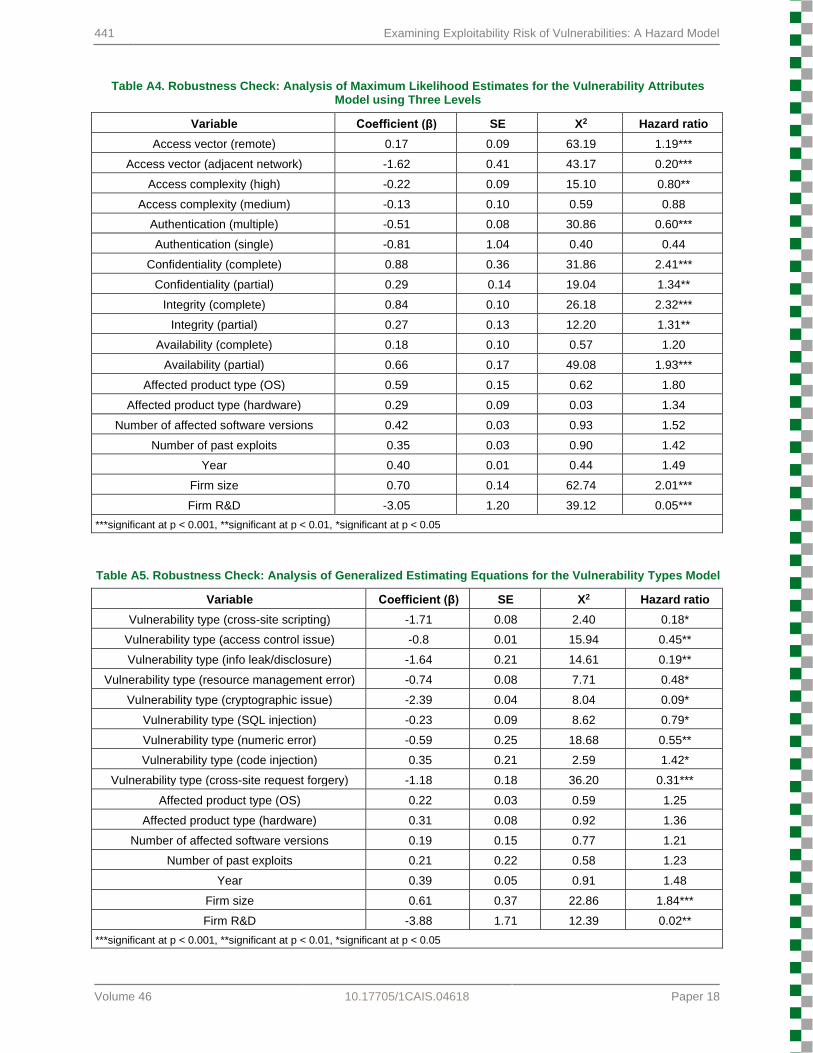
We explored the robustness of the results through alternative sampling strategies and statistical methods. Since a vulnerability can have multiple exploits, a high correlation among exploits for the same vulnerability could exist. In order to account for correlation, we used generalized estimating equations (GEE). A longitudinal statistical method, GEE considers the correlations between repeated measures (Hardin & Hilbe, 2002). We found that our results remained the same (see Table A2 in the Appendix). Next, we employed a Cox regression model with repeated events. Again, we found that our results remained the same (see Table A3 in the Appendix). Based on our analysis, we conclude that our main findings remain robust to including or excluding exploits for the same vulnerability. Last, we ran an additional Cox regression model using three levels for each of the independent variables without combining any level together as follows: access vector (local, adjacent, remote), access complexity (low, medium, high), authentication (no, single, multiple), confidentiality (no compromise, partial compromise, complete compromise), integrity (no compromise, partial compromise, complete compromise) and availability (no compromise, partial compromise, complete compromise). The majority of our results remained qualitatively the same (see Table A4 in the Appendix); however, some of the independent variables did not reach statistical significance, which we can attribute to the low sample size per level.
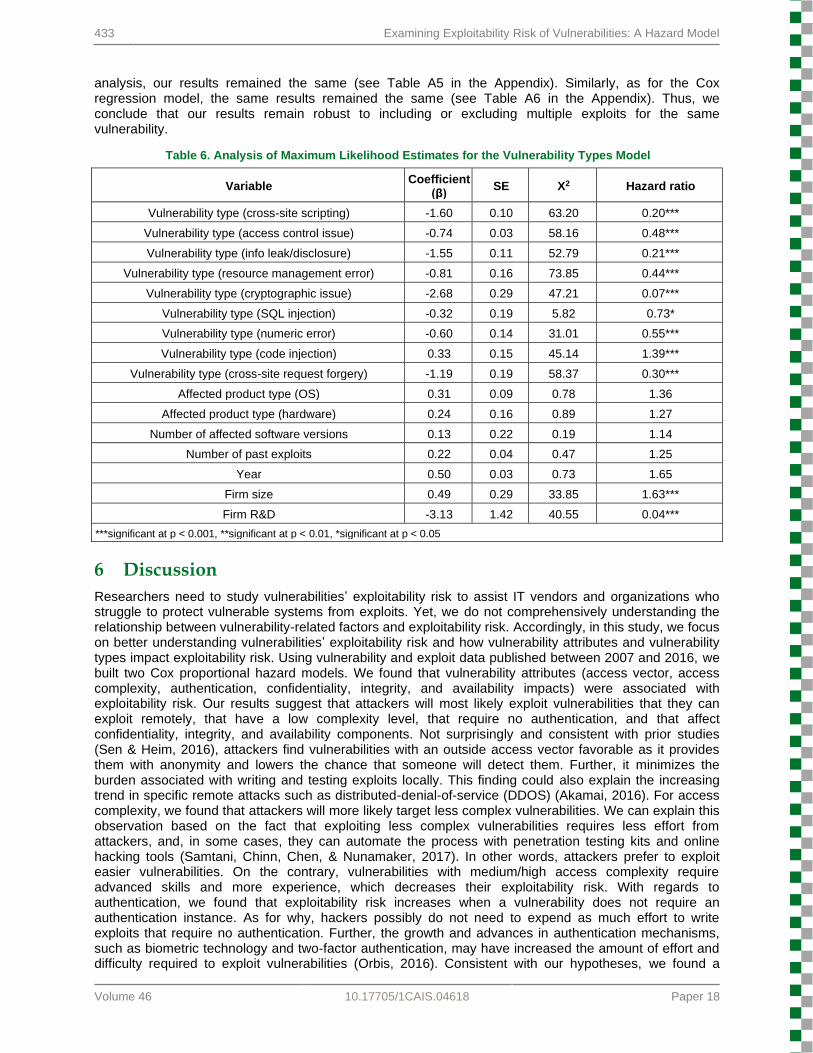
After analyzing the vulnerability attributes model, we repeated the same process for the vulnerability types model. We found that code injection, a type of injection flaw class, had the highest exploitability risk compared to buffer overflow (see Table 6). Specifically, we found that code injection vulnerabilities had a 39 percent higher exploitability risk compared to buffer overflow vulnerabilities. Other vulnerability types had a lower exploitability risk compared to buffer overflow vulnerabilities (in descending order from highest to lowest exploitability risk: SQL injection, numeric error, access control issue, resource management error, cross-site request forgery, information leak/disclosure, cross-site scripting, and cryptographic issue). Thus, we found support for H7. Furthermore, our results for the control variables in this hazard model concur with our previous findings. Specifically, larger firms face a higher exploitability risk than smaller firms and firms with higher R&D spending have a lower exploitability risk. To ensure that variation in frequency of vulnerability types did not affect our results, we reran the analysis using a random sample of 1,000 cases from each vulnerability type. We obtained the same results. Furthermore, we also explored the results’ robustness through GEE and the Cox regression model with repeated events. As for the GEE
433 Examining Exploitability Risk of Vulnerabilities: A Hazard Model
Volume 46 10.17705/1CAIS.04618 Paper 18
analysis, our results remained the same (see Table A5 in the Appendix). Similarly, as for the Cox regression model, the same results remained the same (see Table A6 in the Appendix). Thus, we conclude that our results remain robust to including or excluding multiple exploits for the same vulnerability.
Table 6. Analysis of Maximum Likelihood Estimates for the Vulnerability Types Model
Variable Coefficient
(β) SE X2 Hazard ratio
Vulnerability type (cross-site scripting) -1.60 0.10 63.20 0.20***
Vulnerability type (access control issue) -0.74 0.03 58.16 0.48***
Vulnerability type (info leak/disclosure) -1.55 0.11 52.79 0.21***
Vulnerability type (resource management error) -0.81 0.16 73.85 0.44***
Vulnerability type (cryptographic issue) -2.68 0.29 47.21 0.07***
Vulnerability type (SQL injection) -0.32 0.19 5.82 0.73*
Vulnerability type (numeric error) -0.60 0.14 31.01 0.55***
Vulnerability type (code injection) 0.33 0.15 45.14 1.39***
Vulnerability type (cross-site request forgery) -1.19 0.19 58.37 0.30***
Affected product type (OS) 0.31 0.09 0.78 1.36
Affected product type (hardware) 0.24 0.16 0.89 1.27
Number of affected software versions 0.13 0.22 0.19 1.14
Number of past exploits 0.22 0.04 0.47 1.25
Year 0.50 0.03 0.73 1.65
Firm size 0.49 0.29 33.85 1.63***
Firm R&D -3.13 1.42 40.55 0.04***
***significant at p < 0.001, **significant at p < 0.01, *significant at p < 0.05
6 Discussion
Researchers need to study vulnerabilities’ exploitability risk to assist IT vendors and organizations who struggle to protect vulnerable systems from exploits. Yet, we do not comprehensively understanding the relationship between vulnerability-related factors and exploitability risk. Accordingly, in this study, we focus on better understanding vulnerabilities’ exploitability risk and how vulnerability attributes and vulnerability types impact exploitability risk. Using vulnerability and exploit data published between 2007 and 2016, we built two Cox proportional hazard models. We found that vulnerability attributes (access vector, access complexity, authentication, confidentiality, integrity, and availability impacts) were associated with exploitability risk. Our results suggest that attackers will most likely exploit vulnerabilities that they can exploit remotely, that have a low complexity level, that require no authentication, and that affect confidentiality, integrity, and availability components. Not surprisingly and consistent with prior studies (Sen & Heim, 2016), attackers find vulnerabilities with an outside access vector favorable as it provides them with anonymity and lowers the chance that someone will detect them. Further, it minimizes the burden associated with writing and testing exploits locally. This finding could also explain the increasing trend in specific remote attacks such as distributed-denial-of-service (DDOS) (Akamai, 2016). For access complexity, we found that attackers will more likely target less complex vulnerabilities. We can explain this observation based on the fact that exploiting less complex vulnerabilities requires less effort from attackers, and, in some cases, they can automate the process with penetration testing kits and online hacking tools (Samtani, Chinn, Chen, & Nunamaker, 2017). In other words, attackers prefer to exploit easier vulnerabilities. On the contrary, vulnerabilities with medium/high access complexity require advanced skills and more experience, which decreases their exploitability risk. With regards to authentication, we found that exploitability risk increases when a vulnerability does not require an authentication instance. As for why, hackers possibly do not need to expend as much effort to write exploits that require no authentication. Further, the growth and advances in authentication mechanisms, such as biometric technology and two-factor authentication, may have increased the amount of effort and difficulty required to exploit vulnerabilities (Orbis, 2016). Consistent with our hypotheses, we found a
Communications of the Association for Information Systems 434
Volume 46 10.17705/1CAIS.04618 Paper 18
positive interaction between exploitability risk and confidentiality, integrity, and availability. Thus, our results suggest that attackers will more likely exploit vulnerabilities that affect confidentiality, integrity, and availability. This observation could provide one explanation for the high prevalence of reported data-integrity, confidentiality, and availability attacks (Kharif, 2016).
In terms of the vulnerability types model, our findings suggest that code injection has the highest exploitability risk. Interestingly, this finding indicates that attackers have a preference when it comes to exploiting certain vulnerability types. Code injection may have a high exploitability risk because, unlike other vulnerability types, intrusion-prevention systems cannot detect code injection, and firewalls or SSL encryption cannot block it (Talukder & Chaitanya, 2008). Hence, adversaries can more easily attack a vulnerable system without putting additional effort into bypassing security measures. While we examined other types in the injection flaw class (e.g., cross-site scripting and SQL injection), we found that code injection had the highest exploitability risk level. This finding implies that the exploitability risk of vulnerabilities in the injection flaw class differs across all types—an interesting result that merits further research to examine the specific properties of vulnerability types and their impact on exploitability risk.
6.1 Implications for Research and Practice
With this study, we make key contributions to theory and practice. As we note in Section 1, although significant research attention has focused on assessing vulnerabilities, little attention has focused on analyzing exploitability risk of vulnerabilities using historical data (Webb et al., 2014)—a significant gap in the risk-assessment literature. With this study, we help to fill this gap by examining vulnerabilities and analyzing the relationship between vulnerability attributes and exploitability risk. We also provide insight into the specific interplay between vulnerability types and exploitability risk. Specifically, with this paper, pinpoint the significant attributes of vulnerabilities including access vector, access complexity, authentication, confidentiality, integrity, and availability impacts. In addition, the models we present answer prior calls (Sen & Heim, 2016) for additional factors associated with exploitability risk. Furthermore, our findings make an important contribution to the existing literature on risk assessment and management (see, for e.g., Da Veiga & Eloff, 2010; Spears & Barki, 2010; Sen & Heim, 2016) by highlighting the factors that affect exploitability risk and better explaining their impact. Additionally, an important theoretical implication concerns the added power to explain exploitability risk. Finally, we extend research in the information security theme and contribute to current trends in the IS literature (Goyal, Ahuja & Guan, 2018; Zafar & Clark, 2009)
IT vendors, security managers, and professionals who seek to secure their systems and reduce security related losses should find this study relevant. Interestingly, we found that attackers have preferences regarding the attributes and the type of vulnerabilities which they target. Therefore, as IT vendors learn about hackers’ strategies, they can employ this knowledge to predict future attacks (Cavusoglu, Mishra, & Raghunathan, 2005). Based on our results, IT vendors can prioritize patch development with respect to exploits’ likelihood. Similarly, system administrators and consumers can choose which security patch to apply based on an exploit’s importance and likelihood. In addition, our results can aid security managers who grapple with allocating personnel and non-personnel resources when dealing with numerous security issues. Specifically, IT vendors can demonstrate their proficiency in solving security issues and delivering timely patches by making smart decisions when assessing vulnerable software for risk. With respect to the software development lifecycle (SDLC), our results can guide code developers and quality assurance personnel to implement secure coding practices and test for the most exploited vulnerability types. In addition, software maintenance teams can use our proposed models to discover particular types of vulnerabilities and vulnerabilities with specific attributes to mitigate the risk of exploits. Finally, when faced with multiple vulnerability reports, IT vendors may find it more efficient to consider policies that prioritize security assessment and patching and that promote more secure software-development practices.
6.2 Limitations and Future Research
While this study provides interesting facts surrounding vulnerabilities and exploitability risk, it suffers from several limitations. The first limitation deals with the data we used for analysis. In particular, we relied on publicly disclosed information from NVD and EDB without considering non-disclosed or private information. However, given the difficulty and integrity issues with obtaining private information, we believe that the datasets we used were sufficient to answer our research questions. Second, our theoretical framework assumed perfect rationality and did not consider other psychological and behavioral factors, such as bounded rationality, belief formation, and learning. Third, the survival analysis method relied on
435 Examining Exploitability Risk of Vulnerabilities: A Hazard Model
Volume 46 10.17705/1CAIS.04618 Paper 18
exploits’ earliest publication date; however, with the existence of underground hacker communities, other exploits may have existed prior to that date. Finally, given the dynamic nature of the cyberspace and the growth of the security field, our current findings may not hold as attackers change tactics and IT vendors adapt to security threats. Therefore, researchers need to continuously monitor our results as new vulnerabilities and exploits appear.
Future research on exploitability risk could examine additional attributes related to vulnerable software, such as source code availability and programming language. Since we examined only published vulnerabilities’ exploitability risk, future research could analyze this relationship in the context of zero-day vulnerabilities, which would entail exploring exploits that became available prior to publishing vulnerabilities. In addition, future work may benefit from integrating additional psychological and behavioral factors (e.g., bounded rationality, belief formation, and learning) that may reveal further insight into the interaction between attackers and IT vendors. Furthermore, future studies could contribute to the literature by examining the association between vulnerabilities and how frequently and quickly attackers publish exploits. Additionally, we believe one would benefit from integrating our findings with other assessment methods. Thus, future studies might find examining a hybrid approach to exploitability risk beneficial. Finally, future research might benefit from analyzing exploitability risk for specific IT vendors.
7 Conclusion
As IT vendors continue to face attacks from adversaries who attempt to exploit vulnerabilities, they need to assess and prioritize which vulnerabilities to fix first. In this study, we address two research questions to find out which vulnerability-related attributes and vulnerability types result in the highest exploitability risks. Using datasets from the National Vulnerability Database and Exploit Database, we employed survival analysis to answer our research questions. Our findings indicate that IT vendors benefit the most from fixing remotely exploitable vulnerabilities; low-complexity vulnerabilities; vulnerabilities that require no authentication; and vulnerabilities that affect confidentiality, integrity, and availability components. Furthermore, we found that the code injection vulnerability type has the highest exploitability risk followed by buffer overflow and numeric error vulnerabilities. This study offers insights to IT vendors and security managers on how to assess exploitability risk using vulnerability-related attributes and types.
Communications of the Association for Information Systems 436
Volume 46 10.17705/1CAIS.04618 Paper 18
References
Akamai. (2016). Akamai’s [state of the Internet] / security Q1 2016. Retrieved from https://www.akamai.com/es/es/multimedia/documents/state-of-the-internet/akamai-q1-2016-state-of-the-internet-security-report.pdf
Allison, P. D. (2010). Survival analysis using SAS: A practical guide. Cary. NC: SAS Institute.
Arora, A., Krishnan, R., Telang, R., & Yang, Y. (2010). An empirical analysis of software vendors’ patch release behavior: impact of vulnerability disclosure. Information Systems Research, 21(1), 115-132.
Arthur, W. B. (1994). Inductive reasoning and bounded rationality. The American Economic Review, 84(2), 406-411.
Austin, P. C., Allignol, A., & Fine, J. P. (2017). The number of primary events per variable affects estimation of the subdistribution hazard competing risks model. Journal of Clinical Epidemiology, 83, 75-84.
Baskerville, R., Spagnoletti, P., & Kim, J. (2014). Incident-centered information security: Managing a strategic balance between prevention and response. Information & Management, 51(1), 138-151.
Boylu, F., Aytug, H., & Koehler, G. J. (2010). Induction over strategic agents. Information Systems Research, 21(1), 170-189.
Cadar, C., & Sen, K. (2013). Symbolic execution for software testing: Three decades later. Communications of the ACM, 56(2), 82-90.
Cavusoglu, H., Mishra, B., & Raghunathan, S. (2005). The value of intrusion detection systems in information technology security architecture. Information Systems Research, 16(1), 28-46.
Cavusoglu, H., Raghunathan, S., & Yue, W. T. (2008). Decision-theoretic and game-theoretic approaches to IT security investment. Journal of Management Information Systems, 25(2), 281-304.
Chong, J. K., Camerer, C. F., & Ho, T. H. (2006). A learning-based model of repeated games with incomplete information. Games and Economic Behavior, 55(2), 340-371.
Chung, Y. C., Wu, M. C., Chen, Y. C., & Chang, W. K. (2012). A hot query bank approach to improve detection performance against SQL injection attacks. Computers & Security, 31(2), 233-248.
Cox, D. R. (2018). Analysis of survival data. New York, NY: Routledge.
Cremonini, M., & Nizovtsev, D. (2009). Risks and benefits of signaling information system characteristics to strategic attackers. Journal of Management Information Systems, 26(3), 241-274.CWE. (2018). About CWE. Retrieved from https://cwe.mitre.org/about/index.html
Da Veiga, A., & Eloff, J. H. (2010). A framework and assessment instrument for information security culture. Computers & Security, 29(2), 196-207.
Fielder, A., Panaousis, E., Malacaria, P., Hankin, C., & Smeraldi, F. (2016). Decision support approaches for cyber security investment. Decision Support Systems, 86, 13-23.
Fudenberg, D., Drew, F., Levine, D. K., & Levine, D. K. (1998). The theory of learning in games (vol. 2). Cambridbge, MA: MIT Press.
Galbreth, M. R., & Shor, M. (2010). The impact of malicious agents on the enterprise software industry. MIS Quarterly, 34(3), 595-612.
Gao, X., Zhong, W., & Mei, S. (2014). A game-theoretic analysis of information sharing and security investment for complementary firms. Journal of the Operational Research Society, 65(11), 1682-1691.
Goyal, S., Ahuja, M., & Guan, J. (2018). Information systems research themes: a seventeen-year data-driven temporal analysis. Communications of the Association for Information Systems, 43, 404-431.
Hardin, J. W., & Hilbe, J. M. (2002). Generalized estimating equations. Chapman and Hall/CRC.
437 Examining Exploitability Risk of Vulnerabilities: A Hazard Model
Volume 46 10.17705/1CAIS.04618 Paper 18
Hartono, E., Holsapple, C. W., Kim, K. Y., Na, K. S., & Simpson, J. T. (2014). Measuring perceived security in B2C electronic commerce website usage: A respecification and validation. Decision Support Systems, 62, 11-21.
Hedström, K., Kolkowska, E., Karlsson, F., & Allen, J. P. (2011). Value conflicts for information security management. The Journal of Strategic Information Systems, 20(4), 373-384.
Higgs, J. L., Pinsker, R. E., Smith, T. J., & Young, G. R. (2016). The relationship between board-level technology committees and reported security breaches. Journal of Information Systems, 30(3), 79-98.
Hinz, O., Nofer, M., Schiereck, D., & Trillig, J. (2015). The influence of data theft on the share prices and systematic risk of consumer electronics companies. Information & Management, 52(3), 337-347.
Ho, T. H., & Zhang, J. (2008). Designing pricing contracts for boundedly rational customers: Does the framing of the fixed fee matter? Management Science, 54(4), 686-700.
Hong, Y., Pavlou, P. A., Wang, K., & Shi, N. (2016). On the role of fairness and social distance in designing effective social referral systems. MIS Quarterly, 41(3), 16-038.
Hosmer, D. W., Lemeshow, S., & May, S. (2011). Applied survival analysis: Regression modeling of time to event data (2nd ed.). Hoboken, NJ: Wiley.
Hua, J., & Bapna, S. (2013). The economic impact of cyber terrorism. The Journal of Strategic Information Systems, 22(2), 175-186.
Huang, C. C., Lin, F. Y., Lin, F. Y. S., & Sun, Y. S. (2013). A novel approach to evaluate software vulnerability prioritization. Journal of Systems and Software, 86(11), 2822-2840.
Hui, K., Vance, A., & Zhdanov, D. (2016). Securing digital assets. MIS Quarterly. Retrieved from https://www.misqresearchcurations.org/blog/2017/5/10/securing-digital-assets-1
Ioannou, C. A., & Romero, J. (2014). A generalized approach to belief learning in repeated games. Games and Economic Behavior, 87, 178-203.
Kaspersky. (2016). Kaspersky security bulletin—overall statistics for 2016. Retrieved from https://kasperskycontenthub.com/securelist/files/2016/12/Kaspersky_Security_Bulletin_2016_Review_ENG.pdf
Kharif, O. (2017). 2016 was a record year for data breaches. Bloomberg. Retrieved from https://www.bloomberg.com/news/articles/2017-01-19/data-breaches-hit-record-in-2016-as-dnc-wendy-s-co-hacked
Kim, K., Chung, K., & Lim, N. (2019). Third-party reviews and quality provision. Management Science, 65(6), 2695-2716
Kshetri, N. (2013). Cyber-victimization and cybersecurity in China. Communications of the ACM, 56(4), 35-37.
Li, X. (2014). Relational contracts, growth options, and heterogeneous beliefs: A game-theoretic perspective on information technology outsourcing. Journal of Management Information Systems, 31(2), 319-350.
Lin, D. Y., & Wei, L. J. (1989). The robust inference for the Cox proportional hazards model. Journal of the American statistical Association, 84(408), 1074-1078.
Manion, A. (2012). Vulnerability severity using CVSS. Carnegie Mellon University. Retrieved from https://insights.sei.cmu.edu/cert/2012/04/-vulnerability-severity-using-cvss.html
McAfee. (2016). Mobile threat report what’s on the horizon for 2016. Retrieved from https://www.mcafee.com/us/resources/reports/rp-mobile-threat-report-2016.pdf
Mell, P., Scarfone, K. A., & Romanosky, S. (2007). The common vulnerability scoring system (CVSS) and its applicability to federal agency systems. Retrieved from https://csrc.nist.gov/publications/detail/nistir/7435/final
National Institute of Standards and Technology. (2015). NVD details: CVE-2014-0160. Retrieved from https://web.nvd.nist.gov/view/vuln/detail?vulnId=CVE-2014-0160
Communications of the Association for Information Systems 438
Volume 46 10.17705/1CAIS.04618 Paper 18
National Institute of Standards and Technology. (2016). NVD details: CVE-2014-6271. Retrieved from https://web.nvd.nist.gov/view/vuln/detail?vulnId=CVE-2014-6271
NVD. (2018). National vulnerability database. Retrieved from https://nvd.nist.gov/vuln/full-listing
Onarlioglu, K., Buyukkayhan, A. S., Robertson, W., & Kirda, E. (2015). Sentinel: Securing legacy Firefox extensions. Computers & Security, 49, 147-161.
Orbis. (2016). Multi-factor authentication (MFA)—global market outlook (2016-2022). Retrieved from http://www.orbisresearch.com/reports/index/multi-factor-authentication-mfa-global-market-outlook-2016-2022
Osborne, M. J., & Rubinstein, A. (1994). A course in game theory. Cambridge, MA: MIT Press.
OWASP. (2017a). OWASP top 10—2017: The ten most critical web application security risks. Retrieved from https://www.owasp.org/images/7/72/OWASP_Top_10-2017_(en).pdf.pdf
OWASP. (2017b). Risk rating methodology. Retrieved from: https://www.owasp.org/index.php/OWASP_Risk_Rating_Methodology
Palsetia, N., Deepa, G., Khan, F. A., Thilagam, P. S., & Pais, A. R. (2016). Securing native XML database-driven web applications from XQuery injection vulnerabilities. Journal of Systems and Software, 122, 93-109.
Ransbotham, S., Mitra, S., & Ramsey, J. (2012). Are markets for vulnerabilities effective? MIS Quarterly, 36(1), 43-64.
Rasmusen, E., & Blackwell, B. (1994). Games and information. Cambridge, MA: Blackwell.
Samtani, S., Chinn, R., Chen, H., & Nunamaker Jr, J. F. (2017). Exploring emerging hacker assets and key hackers for proactive cyber threat intelligence. Journal of Management Information Systems, 34(4), 1023-1053.
Sen, R. (2018). Challenges to cybersecurity: Current state of affairs. Communications of the Association for Information Systems, 43, 22-44.
Sen, R., & Heim, G. R. (2016). Managing enterprise risks of technological systems: An exploratory empirical analysis of vulnerability characteristics as drivers of exploit publication. Decision Sciences, 47(6), 1073-1102.
Simon, H. A. (1972). Theories of bounded rationality. Decision and Organization, 1(1), 161-176.
Simon, H. A. (1955). A behavioral model of rational choice. The Quarterly Journal of Economics, 69(1), 99-118.
Spears, J. L., & Barki, H. (2010). User participation in information systems security risk management. MIS Quarterly, 34(3), 503-522.
Stahl, D. O. (2000). Rule learning in symmetric normal-form games: Theory and evidence. Games and Economic Behavior, 32(1), 105-138.
Sterman, J. D., Henderson, R., Beinhocker, E. D., & Newman, L. I. (2007). Getting big too fast: Strategic dynamics with increasing returns and bounded rationality. Management Science, 53(4), 683-696.
Symantec. (2018). Internet security threat report. Retrieved from https://www.symantec.com/content/dam/symantec/docs/reports/istr-23-2018-en.pdf
Talukder, A. K., & Chaitanya, M. (2008). Architecting secure software systems. Amsterdam: Auerbach.
Temizkan, O., Kumar, R. L., Park, S., & Subramaniam, C. (2012). Patch release behaviors of software vendors in response to vulnerabilities: An empirical analysis. Journal of Management Information Systems, 28(4), 305-338.
Verizon. (2012). Verizon 2012 data breach investigations report. Retrieved from http://www.verizonenterprise.com/resources/reports/es_data-breach-investigations-report-2012_en_xg.pdf
439 Examining Exploitability Risk of Vulnerabilities: A Hazard Model
Volume 46 10.17705/1CAIS.04618 Paper 18
Wagner, D., & Schweitzer, B. (2016). The growing threat of cyber-attacks on critical infrastructure. The Huffington Post. Retrieved from http://www.huffingtonpost.com/daniel-wagner/the-growing-threat-of-cyb_b_10114374.html
Wang, T., Kannan, K. N., & Ulmer, J. R. (2013). The association between the disclosure and the realization of information security risk factors. Information Systems Research, 24(2), 201-218.
Webb, J., Ahmad, A., Maynard, S. B., & Shanks, G. (2014). A situation awareness model for information security risk management. Computers & Security, 44, 1-15.
Wu, Y., Feng, G., & Fung, R. Y. (2018). Comparison of information security decisions under different security and business environments. Journal of the Operational Research Society, 69(5), 747-761.
Wu, Y., Feng, G., Wang, N., & Liang, H. (2015). Game of information security investment: Impact of attack types and network vulnerability. Expert Systems with Applications, 42(15-16), 6132-6146.
Xu, H. (2018). Is more information better? An economic analysis of group-buying platforms. Journal of the Association for Information Systems, 19(11), 1130-1144.
Younis, A., Malaiya, Y. K., & Ray, I. (2016). Assessing vulnerability exploitability risk using software properties. Software Quality Journal, 24(1), 159-202.
Zafar, H., & Clark, J. G. (2009). Current state of information security research in IS. Communications of the Association for Information Systems, 24, 557-596.
Communications of the Association for Information Systems 440
Volume 46 10.17705/1CAIS.04618 Paper 18
Appendix
Table A1. Summary of Model Statistics and Goodness of Fit
N Events Censored Likelihood ratio (χ2)
Vulnerability attributes model 53752 9198 44554 953.01***
Vulnerability types model 53752 9198 44554 483.73***
***significant at p < 0.001, **significant at p < 0.01, *significant at p < 0.05
Table A2. Robustness Check: Analysis of Generalized Estimating Equations for the Vulnerability Attributes Model
Variable Coefficient (β) SE X2 Hazard ratio
Access vector (remote) 0.28 0.08 7.58 1.32*
Access complexity (high/medium) -0.19 0.06 13.03 0.83**
Authentication (single/multiple) -0.22 0.09 16.85 0.80**
Confidentiality (partial/complete) 0.97 0.27 6.30 2.64*
Integrity (partial/complete) 0.9 0.27 12.64 2.46**
Availability (partial/complete) 0.15 0.3 0.83 1.16
Affected product type (OS) 0.61 0.22 0.52 1.84
Affected product type (hardware) 0.2 0.13 0.98 1.22
Number of affected software versions 0.51 0.05 0.29 1.67
Number of past exploits 0.31 0.09 0.20 1.36
Year 0.26 0.11 0.06 1.30
Firm size 0.14 0.2 19.45 1.15**
Firm R&D -1.97 1.27 43.99 0.14***
***significant at p < 0.001, **significant at p < 0.01, *significant at p < 0.05
Table A3. Robustness Check: Analysis of Cox Regression with Repeated Events for the Vulnerability Attributes Model
Variable Coefficient (β) SE X2 Hazard ratio
Access vector (remote) 0.25 0.1 4.29 1.28*
Access complexity (high/medium) -0.39 0.14 6.41 0.68*
Authentication (single/multiple) -0.29 0.09 25.81 0.75***
Confidentiality (partial/complete) 0.81 0.19 13.95 2.25**
Integrity (partial/complete) 0.9 0.24 11.08 2.46**
Availability (partial/complete) 0.37 0.1 0.57 1.45
Affected product type (OS) 0.72 0.17 0.96 2.05
Affected product type (hardware) 0.21 0.22 1.03 1.23
Number of affected software versions 0.58 0.01 0.84 1.79
Number of past exploits 0.11 0.08 0.59 1.12
Year 0.44 0.11 0.11 1.55
Firm size 0.25 0.35 30.80 1.28***
Firm R&D 2.51 1.31 42.71 12.30***
***significant at p < 0.001, **significant at p < 0.01, *significant at p < 0.05
441 Examining Exploitability Risk of Vulnerabilities: A Hazard Model
Volume 46 10.17705/1CAIS.04618 Paper 18
Table A4. Robustness Check: Analysis of Maximum Likelihood Estimates for the Vulnerability Attributes Model using Three Levels
Variable Coefficient (β) SE X2 Hazard ratio
Access vector (remote) 0.17 0.09 63.19 1.19***
Access vector (adjacent network) -1.62 0.41 43.17 0.20***
Access complexity (high) -0.22 0.09 15.10 0.80**
Access complexity (medium) -0.13 0.10 0.59 0.88
Authentication (multiple) -0.51 0.08 30.86 0.60***
Authentication (single) -0.81 1.04 0.40 0.44
Confidentiality (complete) 0.88 0.36 31.86 2.41***
Confidentiality (partial) 0.29 0.14 19.04 1.34**
Integrity (complete) 0.84 0.10 26.18 2.32***
Integrity (partial) 0.27 0.13 12.20 1.31**
Availability (complete) 0.18 0.10 0.57 1.20
Availability (partial) 0.66 0.17 49.08 1.93***
Affected product type (OS) 0.59 0.15 0.62 1.80
Affected product type (hardware) 0.29 0.09 0.03 1.34
Number of affected software versions 0.42 0.03 0.93 1.52
Number of past exploits 0.35 0.03 0.90 1.42
Year 0.40 0.01 0.44 1.49
Firm size 0.70 0.14 62.74 2.01***
Firm R&D -3.05 1.20 39.12 0.05***
***significant at p < 0.001, **significant at p < 0.01, *significant at p < 0.05
Table A5. Robustness Check: Analysis of Generalized Estimating Equations for the Vulnerability Types Model
Variable Coefficient (β) SE X2 Hazard ratio
Vulnerability type (cross-site scripting) -1.71 0.08 2.40 0.18*
Vulnerability type (access control issue) -0.8 0.01 15.94 0.45**
Vulnerability type (info leak/disclosure) -1.64 0.21 14.61 0.19**
Vulnerability type (resource management error) -0.74 0.08 7.71 0.48*
Vulnerability type (cryptographic issue) -2.39 0.04 8.04 0.09*
Vulnerability type (SQL injection) -0.23 0.09 8.62 0.79*
Vulnerability type (numeric error) -0.59 0.25 18.68 0.55**
Vulnerability type (code injection) 0.35 0.21 2.59 1.42*
Vulnerability type (cross-site request forgery) -1.18 0.18 36.20 0.31***
Affected product type (OS) 0.22 0.03 0.59 1.25
Affected product type (hardware) 0.31 0.08 0.92 1.36
Number of affected software versions 0.19 0.15 0.77 1.21
Number of past exploits 0.21 0.22 0.58 1.23
Year 0.39 0.05 0.91 1.48
Firm size 0.61 0.37 22.86 1.84***
Firm R&D -3.88 1.71 12.39 0.02**
***significant at p < 0.001, **significant at p < 0.01, *significant at p < 0.05
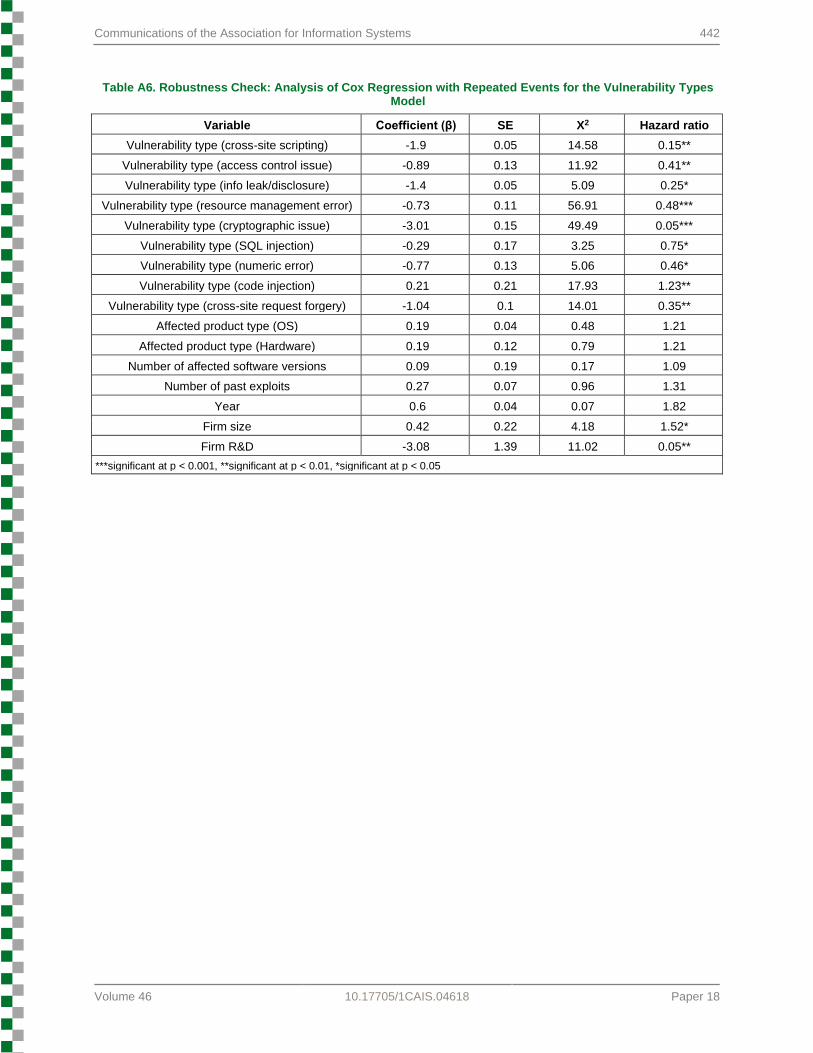
Communications of the Association for Information Systems 442
Volume 46 10.17705/1CAIS.04618 Paper 18
Table A6. Robustness Check: Analysis of Cox Regression with Repeated Events for the Vulnerability Types Model
Variable Coefficient (β) SE X2 Hazard ratio
Vulnerability type (cross-site scripting) -1.9 0.05 14.58 0.15**
Vulnerability type (access control issue) -0.89 0.13 11.92 0.41**
Vulnerability type (info leak/disclosure) -1.4 0.05 5.09 0.25*
Vulnerability type (resource management error) -0.73 0.11 56.91 0.48***
Vulnerability type (cryptographic issue) -3.01 0.15 49.49 0.05***
Vulnerability type (SQL injection) -0.29 0.17 3.25 0.75*
Vulnerability type (numeric error) -0.77 0.13 5.06 0.46*
Vulnerability type (code injection) 0.21 0.21 17.93 1.23**
Vulnerability type (cross-site request forgery) -1.04 0.1 14.01 0.35**
Affected product type (OS) 0.19 0.04 0.48 1.21
Affected product type (Hardware) 0.19 0.12 0.79 1.21
Number of affected software versions 0.09 0.19 0.17 1.09
Number of past exploits 0.27 0.07 0.96 1.31
Year 0.6 0.04 0.07 1.82
Firm size 0.42 0.22 4.18 1.52*
Firm R&D -3.08 1.39 11.02 0.05**
***significant at p < 0.001, **significant at p < 0.01, *significant at p < 0.05
443 Examining Exploitability Risk of Vulnerabilities: A Hazard Model
Volume 46 10.17705/1CAIS.04618 Paper 18
About the Authors
Yaman Roumani received his PhD degree in Information Systems from Kent State University. He is an Associate Professor in the Department of Decision and Information Sciences at Oakland University. His current research interests include information security, data breaches, risk assessment and digital transformation. Roumani's research has been published in numerous conference proceedings including the International Conference on Information Systems (ICIS) and the Hawaii International Conference on System Sciences (HICSS). His research has appeared in European Journal of Information Systems, Information and Management, Communications of the Association for Information Systems, Computers & Security and Journal of Systems and Software.
Joseph K. Nwankpa is an Assistant Professor in the Department of Information Systems and Analytics in the Farmer School of Business at Miami University, Oxford, Ohio. He holds a PhD from Kent State University in Information Systems. His primary research focuses on ERP systems, software security, digital business strategy, IT adoption and accounting Information Systems. His research has appeared in European Journal of Information Systems, Information and Management, Communications of the Association for Information Systems, Computers and Security, Annals of Operations Research, Information Resources Management Journal and in proceedings of various Information Systems conferences including the Americas Conference on Information Systems (AMCIS), the Hawaii International Conference on System Sciences (HICCS), the International Conference on Information Systems (ICIS) and Institute for Operations Research and the Management Sciences (INFORMS).
Copyright © 2020 by the Association for Information Systems. Permission to make digital or hard copies of all or part of this work for personal or classroom use is granted without fee provided that copies are not made or distributed for profit or commercial advantage and that copies bear this notice and full citation on the first page. Copyright for components of this work owned by others than the Association for Information Systems must be honored. Abstracting with credit is permitted. To copy otherwise, to republish, to post on servers, or to redistribute to lists requires prior specific permission and/or fee. Request permission to publish from: AIS Administrative Office, P.O. Box 2712 Atlanta, GA, 30301-2712 Attn: Reprints or via e-mail from [email protected].


