Embed Size (px)
Citation preview
ARTICLE
Transcription coordinates histone amounts andgenome contentKora-Lee Claude1, Daniela Bureik1, Dimitra Chatzitheodoridou1, Petia Adarska1, Abhyudai Singh 2 &
Kurt M. Schmoller 1,3✉
Biochemical reactions typically depend on the concentrations of the molecules involved, and
cell survival therefore critically depends on the concentration of proteins. To maintain con-
stant protein concentrations during cell growth, global mRNA and protein synthesis rates are
tightly linked to cell volume. While such regulation is appropriate for most proteins, certain
cellular structures do not scale with cell volume. The most striking example of this is the
genomic DNA, which doubles during the cell cycle and increases with ploidy, but is inde-
pendent of cell volume. Here, we show that the amount of histone proteins is coupled to the
DNA content, even though mRNA and protein synthesis globally increase with cell volume.
As a consequence, and in contrast to the global trend, histone concentrations decrease with
cell volume but increase with ploidy. We find that this distinct coordination of histone
homeostasis and genome content is already achieved at the transcript level, and is an intrinsic
property of histone promoters that does not require direct feedback mechanisms. Mathe-
matical modeling and histone promoter truncations reveal a simple and generalizable
mechanism to control the cell volume- and ploidy-dependence of a given gene through the
balance of the initiation and elongation rates.
https://doi.org/10.1038/s41467-021-24451-8 OPEN
1 Institute of Functional Epigenetics, Helmholtz Zentrum München, Neuherberg, Germany. 2 Department of Electrical & Computer Engineering, University ofDelaware, Newark, DE, USA. 3 German Center for Diabetes Research (DZD), Neuherberg, Germany. ✉email: [email protected]
NATURE COMMUNICATIONS | (2021) 12:4202 | https://doi.org/10.1038/s41467-021-24451-8 | www.nature.com/naturecommunications 1
1234
5678
90():,;
Maintaining accurate protein homeostasis despite cellgrowth and variability in cell volume is essential for cellfunction. Most proteins need to be kept at a constant,
cell-volume-independent concentration. Since the amount ofribosomes and transcriptional machinery increases in proportionto cell volume, constant protein concentrations can be achievedthrough machinery-limited protein biogenesis, where proteinsynthesis depends on the availability of limiting machinerycomponents and thus increases in direct proportion to cellvolume1,2. While machinery-limited regulation can maintainconstant concentrations of proteins, total mRNA, and individualtranscripts3–6, it poses a conundrum for histones. As componentsof nucleosomes, histones are likely needed at a constant protein-to-DNA stoichiometry, implying that their amount shouldincrease with ploidy but be independent of cell volume. In otherwords, histone concentration, i.e., amount per volume, shouldincrease with ploidy but decrease with cell volume. Since accuratehistone homeostasis is crucial for fundamental biologicalprocesses7–10 and to avoid toxic effects11–13, cells use severallayers of regulation by translation, transcription and degradationto tightly coordinate histone production with genomereplication14–16. However, how cells produce histones in pro-portion to genome content, even though protein biogenesis isgenerally linked to cell volume remains unclear.
Here, we use budding yeast as a model to show that histoneprotein amounts are coupled to genome content, resulting in adecrease of histone concentration in inverse proportion with cellvolume, and an increase in direct proportion with ploidy. We findthat this specific regulation of histones is achieved at the tran-script level and does not necessarily require direct feedbackmechanisms. While our data suggest that 3′-to-5′-degradation bythe nuclear exosome is necessary for the correct decrease ofconcentration with cell volume, we show that histone promotersalone are sufficient to couple transcript amounts to gene copynumber rather than cell volume. Our results suggest that thisdifferential regulation of histones can be achieved throughtemplate-limited transcription, where mRNA synthesis is limitedby the gene itself and does therefore not increase with cellvolume. This provides a general mechanism by which cells cancouple the amount of a subset of proteins to genome contentwhile most protein concentrations are maintained constant.
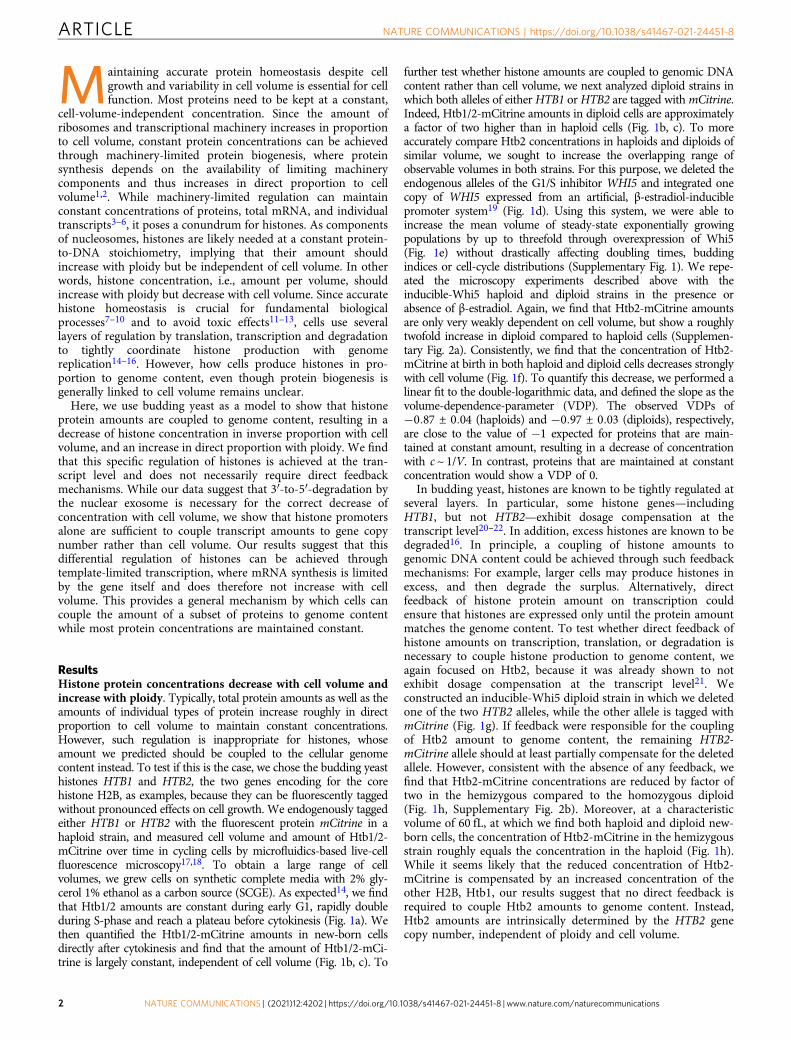
ResultsHistone protein concentrations decrease with cell volume andincrease with ploidy. Typically, total protein amounts as well as theamounts of individual types of protein increase roughly in directproportion to cell volume to maintain constant concentrations.However, such regulation is inappropriate for histones, whoseamount we predicted should be coupled to the cellular genomecontent instead. To test if this is the case, we chose the budding yeasthistones HTB1 and HTB2, the two genes encoding for the corehistone H2B, as examples, because they can be fluorescently taggedwithout pronounced effects on cell growth. We endogenously taggedeither HTB1 or HTB2 with the fluorescent protein mCitrine in ahaploid strain, and measured cell volume and amount of Htb1/2-mCitrine over time in cycling cells by microfluidics-based live-cellfluorescence microscopy17,18. To obtain a large range of cellvolumes, we grew cells on synthetic complete media with 2% gly-cerol 1% ethanol as a carbon source (SCGE). As expected14, we findthat Htb1/2 amounts are constant during early G1, rapidly doubleduring S-phase and reach a plateau before cytokinesis (Fig. 1a). Wethen quantified the Htb1/2-mCitrine amounts in new-born cellsdirectly after cytokinesis and find that the amount of Htb1/2-mCi-trine is largely constant, independent of cell volume (Fig. 1b, c). To
further test whether histone amounts are coupled to genomic DNAcontent rather than cell volume, we next analyzed diploid strains inwhich both alleles of either HTB1 or HTB2 are tagged withmCitrine.Indeed, Htb1/2-mCitrine amounts in diploid cells are approximatelya factor of two higher than in haploid cells (Fig. 1b, c). To moreaccurately compare Htb2 concentrations in haploids and diploids ofsimilar volume, we sought to increase the overlapping range ofobservable volumes in both strains. For this purpose, we deleted theendogenous alleles of the G1/S inhibitor WHI5 and integrated onecopy of WHI5 expressed from an artificial, β-estradiol-induciblepromoter system19 (Fig. 1d). Using this system, we were able toincrease the mean volume of steady-state exponentially growingpopulations by up to threefold through overexpression of Whi5(Fig. 1e) without drastically affecting doubling times, buddingindices or cell-cycle distributions (Supplementary Fig. 1). We repe-ated the microscopy experiments described above with theinducible-Whi5 haploid and diploid strains in the presence orabsence of β-estradiol. Again, we find that Htb2-mCitrine amountsare only very weakly dependent on cell volume, but show a roughlytwofold increase in diploid compared to haploid cells (Supplemen-tary Fig. 2a). Consistently, we find that the concentration of Htb2-mCitrine at birth in both haploid and diploid cells decreases stronglywith cell volume (Fig. 1f). To quantify this decrease, we performed alinear fit to the double-logarithmic data, and defined the slope as thevolume-dependence-parameter (VDP). The observed VDPs of�0:87 ± 0:04 (haploids) and �0:97 ± 0:03 (diploids), respectively,are close to the value of −1 expected for proteins that are main-tained at constant amount, resulting in a decrease of concentrationwith c ~ 1/V. In contrast, proteins that are maintained at constantconcentration would show a VDP of 0.
In budding yeast, histones are known to be tightly regulated atseveral layers. In particular, some histone genes—includingHTB1, but not HTB2—exhibit dosage compensation at thetranscript level20–22. In addition, excess histones are known to bedegraded16. In principle, a coupling of histone amounts togenomic DNA content could be achieved through such feedbackmechanisms: For example, larger cells may produce histones inexcess, and then degrade the surplus. Alternatively, directfeedback of histone protein amount on transcription couldensure that histones are expressed only until the protein amountmatches the genome content. To test whether direct feedback ofhistone amounts on transcription, translation, or degradation isnecessary to couple histone production to genome content, weagain focused on Htb2, because it was already shown to notexhibit dosage compensation at the transcript level21. Weconstructed an inducible-Whi5 diploid strain in which we deletedone of the two HTB2 alleles, while the other allele is tagged withmCitrine (Fig. 1g). If feedback were responsible for the couplingof Htb2 amount to genome content, the remaining HTB2-mCitrine allele should at least partially compensate for the deletedallele. However, consistent with the absence of any feedback, wefind that Htb2-mCitrine concentrations are reduced by factor oftwo in the hemizygous compared to the homozygous diploid(Fig. 1h, Supplementary Fig. 2b). Moreover, at a characteristicvolume of 60 fL, at which we find both haploid and diploid new-born cells, the concentration of Htb2-mCitrine in the hemizygousstrain roughly equals the concentration in the haploid (Fig. 1h).While it seems likely that the reduced concentration of Htb2-mCitrine is compensated by an increased concentration of theother H2B, Htb1, our results suggest that no direct feedback isrequired to couple Htb2 amounts to genome content. Instead,Htb2 amounts are intrinsically determined by the HTB2 genecopy number, independent of ploidy and cell volume.
ARTICLE NATURE COMMUNICATIONS | https://doi.org/10.1038/s41467-021-24451-8
2 NATURE COMMUNICATIONS | (2021) 12:4202 | https://doi.org/10.1038/s41467-021-24451-8 | www.nature.com/naturecommunications
5μm 5μm 5μm
0.0
0.5
1.0
1.5
2.0
Nor
mal
ized
Htb
2-m
Citr
ine
conc
entra
tion
at 6
0fL
HTB2-mCitrine
HemizygotesHTB2-mCitrin
e
Homozygotes HTB2-mCitrin
e
Haploids
Haploid Diploid2.5
b ca
e fd
-50 0 50 100Time relative to bud emergence [min]
0.0
0.5
1.0
1.5
2.0
Htb
2-m
Citr
ine
amou
nt[a
rb.u
nits
]105
S/G2/MG1
-100
Example cellSelected curvesMean (n = 145)
16 32 64 128 256
Htb
2-m
Citr
ine
conc
entra
tion
at b
irth
[arb
. uni
ts /
fL]
Cell volume at birth [fL]
Haploids (n = 413)Diploids (n = 512)64
128
256
512
1024
2048
4096
HTB2-mCitrine Homozygote(both HTB2 alleles)
HTB2-mCitrine Hemizygote (one HTB2 allele deleted)
direct feedback no feedbackHtb2-mCitrine
?
g
Concentrations
50 100 150Cell volume at birth [fL]
0.0
0.5
1.0
1.5
2.0
Htb
2-m
Citr
ine
amou
ntat
birt
h [a
rb.u
nits
]
105
Haploids (n = 185)Diploids (n = 170)
0
Amounts
Whi5
SBF
Start
�-estradiol inducible Whi5}
�-estradiol / Whi5concentration
Haploids (n = 57)Diploids (n = 213)
50 100 150Cell volume at birth [fL]
1.0
2.0
3.0
4.0
5.0
Htb
1-m
Citr
ine
amou
ntat
birt
h [a
rb. u
nits
]
105
00.0
Amounts
h
50
100
150
200
250
WT
Ind.-W
hi5
not in
duce
d
0
Ind.-W
hi5
induc
ed WT
Ind.-W
hi5
not in
duce
d
Ind.- W
hi5
induc
ed
Cel
l vol
ume
[fL]
Single CellsBulk
Haploid cells Diploid cells
Fig. 1 Htb1/2-mCitrine protein concentrations measured by live-cell fluorescence microscopy decrease with cell volume and increase with ploidy.a Htb2-mCitrine amounts during the first cell cycle of new-born cells. Red dashed trace highlights data corresponding to the outlined cell shown in themicroscopy images (new-born cell: red outline, its bud: blue outline), brown traces show additional randomly selected example curves and the black lineshows the mean of n ¼ 145 cells. All traces are aligned at the time of first bud emergence (t= 0). b Htb2-mCitrine amounts at birth for haploid (blue) anddiploid (green) cells as a function of cell volume. Lines connect binned means with error bars indicating standard errors. c Htb1-mCitrine amounts at birthfor haploid (blue) and diploid (green) cells as a function of cell volume. Lines connect binned means with error bars indicating standard errors. Note thatthe fluorescence intensities for Htb2 and Htb1 are not directly comparable due to differences in the microscopy settings. d Whi5 controls cell volume in adose-dependent manner. To manipulate cell volume, WHI5 is expressed from a β-estradiol-inducible promoter. Higher β-estradiol concentrations result inincreased mean cell volumes. e Distribution of cell volumes for non-inducible (WT) and inducible haploids (blue) and diploids (green) measured at birth inHTB2-mCitrine single cells with live-cell fluorescence microscopy, or mean cell volumes in bulk populations of cells with untagged HTB2 measured with aCoulter counter. Colored boxes highlight the 25- and 75-percentiles, whiskers extend to ± 2:7σ of the distributions and colored crosses highlight outliers.Black, horizontal lines indicate the median between single cells for single cell measurements (nWT
haploid ¼ 185, nnot ind:haploid ¼ 120, nind:haploid ¼ 108, nWTdiploid ¼ 170,
nnot ind:diploid ¼ 99, ninddiploid ¼ 243) or the median of population means across seven biological replicates for bulk measurements. Notches indicate the 95%confidence interval of the median. Haploid cells were induced with 30 nM β-estradiol, diploid cells with 50 nM. f Htb2-mCitrine concentrations of non-inducible and inducible haploids and diploids as a function of cell volume are shown in a double-logarithmic plot. Individual data points for the differentconditions are shown in blue for haploids (triangles for 0 nM, circles for WT, and stars for 30 nM) and green for diploids (triangles for 0 nM, squares forWT, and stars for 50 nM). Lines show linear fits to the double-logarithmic data, used to calculate the VDPs. g Illustration of the impact of potentialfeedback mechanisms on the concentration of Htb2-mCitrine concentration in a HTB2-mCitrine/htb2Δ hemizygous diploid compared to a HTB2-mCitrinehomozygous diploid. h Htb2-mCitrine concentrations at 60 fL, estimated from the linear fit to the double-logarithmic dependence of concentration on cellvolume, for haploids (blue bar, fit through n ¼ 413 cells), HTB2-mCitrine homozygous diploids (green bar, n ¼ 512 cells), and HTB2-mCitrine/htb2Δhemizygous diploids (teal bar, n ¼ 266 cells), normalized on the concentration at 60 fL in haploids. Error bars are derived by error propagation of the 95%confidence interval of the linear fit at 60 fL.
NATURE COMMUNICATIONS | https://doi.org/10.1038/s41467-021-24451-8 ARTICLE
NATURE COMMUNICATIONS | (2021) 12:4202 | https://doi.org/10.1038/s41467-021-24451-8 | www.nature.com/naturecommunications 3
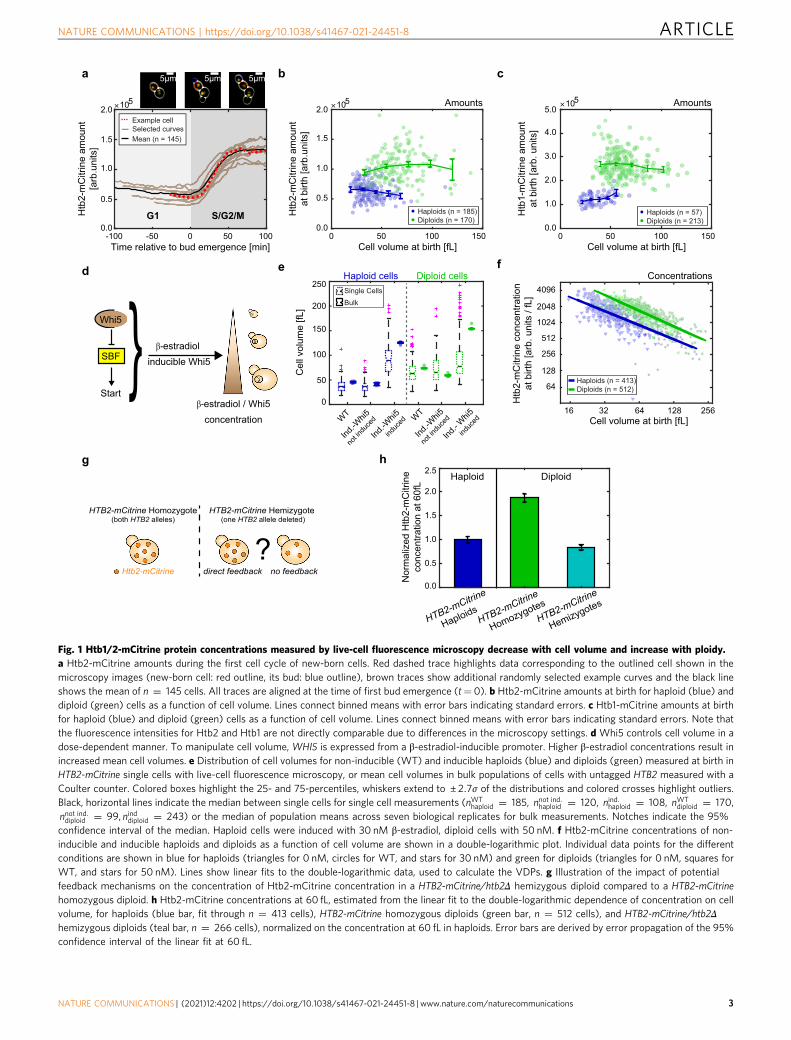
Histone mRNA concentrations decrease with cell volume. Thefact that the decrease of histone Htb2 protein concentrations withcell volume is not simply a consequence of feedback, for examplethrough excess protein degradation, suggests that it might alreadybe established at the transcript level. To test if this is the case, we
employed the Whi5-overexpression system to measure the cell-volume-dependence of transcript concentrations (Fig. 2a). Spe-cifically, we grew wild-type haploid cells, as well as the inducible-Whi5 haploid cells at three different β-estradiol concentrations (0,10, and 30 nM), on SCGE media, which led to a roughly fourfold
RNAextraction
RT-qPCR
6h
16h
24h
YPD
SCGE
�-estradiol
a
e
1.0
0.0
1.5
0.5
2.0
Nor
mal
ized
con
cent
ratio
nat
60
fL [a
rb. u
nits
]
HTB1HTB2
HTB2-HomozygoteHTB2-Hemizygote
b
Log 2(r
el. c
onc.
) [ar
b. u
nits
]
-10
-9
-8
-7
-6
32 64 128 256Mean cell volume [fL]
ACT1VDP = -0.02 ± 0.09
non-ind.
30 nM
0 nM10 nM
c
-14
-13
-12
-11
-10
32 64 128 256
HTB2VDP = -1.08 ± 0.09
Log 2(r
el. c
onc.
) [ar
b. u
nits
]
Mean cell volume [fL]
non-ind.
30 nM
0 nM10 nM
d
ACT1ENO2
RPB1RPB3
HTA1HTA
2HTB1
HTB2HHT1
HHT2HHF1
HHF2HHO1
0.5
0.0
-0.5
-1.0
-1.5
constantconcentration
constantamount
***
*** ***
******
***
***
***
***
*****
Volu
me-
Dep
ende
nce
Para
met
er (V
DP)
f
-2
-1
VDP
-3
0
HTB1 HTB2 HHF1 HHO1ACT1
constantconcentration
constantamount
WThir1�
*
g
VDP
-2
-1
-3
0
HTB1 HTB2 HHF1 HHO1ACT1
constantconcentration
constantamount
WTrtt106�
*
h
VDP
constantconcentration
constantamount
WTrrp6�
-2
-1
-3
0
HTB1 HTB2 HHF1 HHO1ACT1
*** ******
*
Fig. 2 Histone mRNA concentrations decrease with cell volume and increase with gene copy number. a Experimental procedure for RT-qPCRmeasurements. Cells were grown for at least 24 h at the respective β-estradiol concentration before extracting total RNA and performing RT-qPCR. b, c RelativeACT1 (b) or HTB2 (c) mRNA concentrations (normalized on RDN18) for non-inducible and inducible haploid cells over mean cell volume are shown in a double-logarithmic plot. Individual data points for the different conditions (down-pointing triangles for 0 nM, circles for non-inducible, diamonds for 10 nM, right-pointing triangles for 30 nM) are shown in gray. Red (b) or blue (c) symbols indicate the mean of the different conditions with error bars indicating the standarddeviations for nACT1non�ind: ¼ 7; nACT10 ¼ 10; nACT110 ¼ 7; nACT130 ¼ 10 (b), nHTB2non�ind: ¼ 7; nHTB20 ¼ 11; nHTB210 ¼ 9 and nHTB230 ¼ 10 (c) biological replicates. Linesshow linear fits to the double-logarithmic data, with volume-dependence parameters (VDPs) determined as the slope of the fit. d Summary of the VDPs for allmeasured genes with error bars indicating the standard error (fit through nACT1 ¼ 34, nENO2 ¼ 26, nRPB1 ¼ 26, nRPB3 ¼ 25, nHTA1 ¼ 27, nHTA2 ¼ 30,nHTB1 ¼ 36, nHTB2 ¼ 37, nHHT1 ¼ 37, nHHT2 ¼ 30, nHHF1 ¼ 31, nHHF2 ¼ 37, and nHHO1 ¼ 37 biological replicates); significance that the VDP is different from 0was tested using linear regressions: **pRPB1 ¼ 4:1 � 10�3, ***pRPB3 ¼ 9:0 � 10�4, ***pHTA1 ¼ 1:5 � 10�9; ***pHTA2 ¼ 1:8 � 10�10, ***pHTB1 ¼ 7:2 � 10�14,***pHTB2 ¼ 8:0 � 10�14, ***pHHT1 ¼ 1:1 � 10�8; *** pHHT2 ¼ 5:4 � 10�6, *** pHHF1 ¼ 2:2 � 10�9, *** pHHF2 ¼ 1:2 � 10�6, *** pHHO1 ¼ 8:3 � 10�13. e Median mRNAconcentrations at 60 fL, estimated from the linear fit to the double-logarithmic dependence of concentration on cell volume, for HTB2 (left) and HTB1 (right) indiploid HTB2 homozygous (green, fit through nHTB2 ¼ nHTB1 ¼ 18 biological replicates) and HTB2/htb2Δ hemizygous (teal, fit through nHTB2 ¼ nHTB1 ¼ 18biological replicates) strains, normalized on the respective median concentration of the HTB2-homozygote. Error bars indicate the 2.5- and 97.5-percentilesaround the median concentration ratio, determined from 10000 bootstrap samples. f–h Summary of VDPs for hir1Δ (f), rtt106Δ (g), as well as rrp6Δ (h)deletion strains. Error bars indicate the standard error of the VDPs (fit through nhir4ACT1 ¼ 30, nhir4HTB1 ¼ 28, nhir4HTB2 ¼ 30, nhir4HHF1 ¼ 30, nhir4HHO1 ¼ 30 (f), nrtt1064ACT1 ¼ 12,nrtt1064HTB1 ¼ 12, nrtt1064HTB2 ¼ 12, nrtt1064HHF1 ¼ 12, nrtt1064HHO1 ¼ 11 (g), nrrp64ACT1 ¼ 17, nrrp64HTB1 ¼ 17, nrrp64HTB2 ¼ 17, nrrp64HHF1 ¼ 17, nrrp4HHO1 ¼ 17(h) biological replicates). Significant VDPdeviation from the wild-type VDP (carrying no deletion) was tested using linear regressions; *phir4HTB1 ¼ 2:7 � 10�2 (f), *prtt1064HHF1 ¼ 2:3 � 10�2 (g),***prrp64HTB1 ¼ 6:8 � 10�4, ***prrp64HTB2 ¼ 4:6 � 10�4, ***prrp64HHF1 ¼ 2:6 � 10�4, *prrp64HHO1 ¼ 2:0 � 10�2 (h).
ARTICLE NATURE COMMUNICATIONS | https://doi.org/10.1038/s41467-021-24451-8
4 NATURE COMMUNICATIONS | (2021) 12:4202 | https://doi.org/10.1038/s41467-021-24451-8 | www.nature.com/naturecommunications
range in mean cell volumes ranging from 39 ± 4 fL to 143 ± 21 fL(Supplementary Fig. 3a). To ensure steady-state conditions, wegrew cells for at least 24 h at the respective β-estradiol con-centration, before then measuring cell volume distribution,extracting total RNA, and performing reverse-transcription-qPCR (RT-qPCR). First, we measured the concentration of theribosomal RNA RDN18 relative to total RNA and found it to beconstant (Supplementary Fig. 4a). This is consistent with the factthat ribosomal RNA constitutes the large majority of total RNA23,which itself is expected to increase in direct proportion to cellvolume24, and allows us to now normalize other RT-qPCRmeasurements on RDN18.
Next, we quantified the mRNA concentrations of ACT1 andENO2, two genes that we expect to be expressed in proportion tocell volume such that the mRNA concentrations are maintainedconstant. Indeed, we find that the VDPs for both transcripts arenot significantly different from 0 (Fig. 2b, d, SupplementaryFig. 4b). Interestingly, as previously suggested25 we observe aslight decrease in concentration for the transcripts of the RNApolymerase II subunits RPB1 and RPB3 with increasing cellvolume (Fig. 2d, Supplementary Fig. 4c). We then quantified theconcentrations of the transcripts of all core histone genes as wellas the H1-like histone HHO1. In budding yeast, all core histonegenes are present as two copies and expressed from bidirectionalpromoters controlling pairs of H2A–H2B26 or H3–H427,respectively. Since the two copies of each core histone show highsequence similarity, we performed additional tests using deletionstrains where possible to ensure qPCR primer specificity(Supplementary Table 2). We find that all histone transcriptsshow a significant decrease in concentration with cell volume, andmostly exhibit VDPs close to −1 (Fig. 2c, d, SupplementaryFig. 3b–d, Supplementary Fig. 4d). Thus, histone mRNAconcentrations decrease with cell volume to ensure constantamounts—in contrast to global transcription, which increaseswith cell volume.
Hir1-dependent feedback is not necessary for cell-volume-dependence of histone mRNA concentrations. The observationthat histone transcript concentrations decrease with c � 1=Vsuggests that, similar to histone protein amounts (Fig. 1h), alsohistone transcript amounts are determined by gene copy number.We therefore measured the concentrations of representative his-tone transcripts in inducible-Whi5 diploids homozygous orhemizygous for HTB2. Again, we find that all histones analyzedexhibit a VDP close to −1 (Supplementary Fig. 5a), and asobserved for Htb2 protein concentrations (Fig. 1h), the con-centration of HTB2 transcripts at a characteristic volume of 60 fLis clearly reduced in hemizygous compared to homozygousdiploids (Fig. 2e). We do not observe a significant overexpressionof HTB1 which is expected to compensate for the reduced HTB2transcript concentration21 (Fig. 2e). However, given that we see aroughly 50% overexpression of HTB1 (and HTA1) upon deletionof HTB2 in a haploid strain (Supplementary Fig. 5b), we note thatwe might not be able to resolve the comparably weaker (25%)overexpression of HTB1 expected to compensate for one missingHTB2 allele in the diploid strain given our experimental error.
So far, we have shown that in diploid cells with only one HTB2allele, the concentrations of HTB2 transcript and protein arereduced compared to wild-type diploid cells. This highlights theabsence of direct feedback mechanisms sensing and controllingthe concentration of Htb2 with cell volume. However, extensiveprevious studies have shown that the eight budding yeast corehistone genes show remarkably different modes of regulation.Specifically, only the gene pair HTA1-HTB1 is known to exhibitdosage compensation, which is absent for HTA2-HTB220–22.
Moreover, three out of four core histone gene pairs, not includingHTA2-HTB2, show negative feedback regulation of transcriptconcentration upon replication stress14,28. This feedback regula-tion is thought to be mediated by the HIR complex and to bedependent on HIR1 and RTT10629–31. Thus, to test if HIR-dependent sensing and feedback regulation of histone transcriptconcentration may also be responsible for the cell-volume-dependence of HIR-regulated histone genes, we measured thecell-volume-dependence of representative histone genes (HTB1,HTB2, HHF1, and HHO1) in hir1Δ and rtt106Δ strains. While weobserved a significantly weaker cell-volume-dependence forHTB1 upon deletion of HIR1, we find that neither Hir1 norRtt106 are essential for a decrease of concentration with cellvolume for any of the tested histone transcripts (Fig. 2f, g,Supplementary Fig. 5c, d).
3′-to-5′-degradation by the nuclear exosome is not necessaryfor cell-volume-dependence of histone mRNA concentrations.The fact that the correct dependence of histone transcript con-centration on cell volume does not necessarily require directfeedback suggests that instead it is an intrinsic property of eithertranscription rate or mRNA degradation. To test if degradationfrom the 3′-end by the nuclear exosome is required, we analyzedthe cell-volume-dependence of histone transcript concentrationsin strains where we deleted RRP6, a component of the nuclearexosome exonuclease32,33. As shown in Fig. 2h, we find that alsoin rrp6Δ cells, histone transcript concentrations decrease with cellvolume. Surprisingly, due to increased transcript concentrationsin small cells (Supplementary Fig. 5e), this decrease with a VDPclose to −2 is significantly stronger than in wild-type cells, sug-gesting that the volume-dependence of histone transcripts ismodulated by Rrp6-dependent degradation. Thus, while degra-dation by the nuclear exosome is not needed for the volume-dependent decrease of histone transcript concentrations, it maycontribute to achieve the correct VDP of −1.
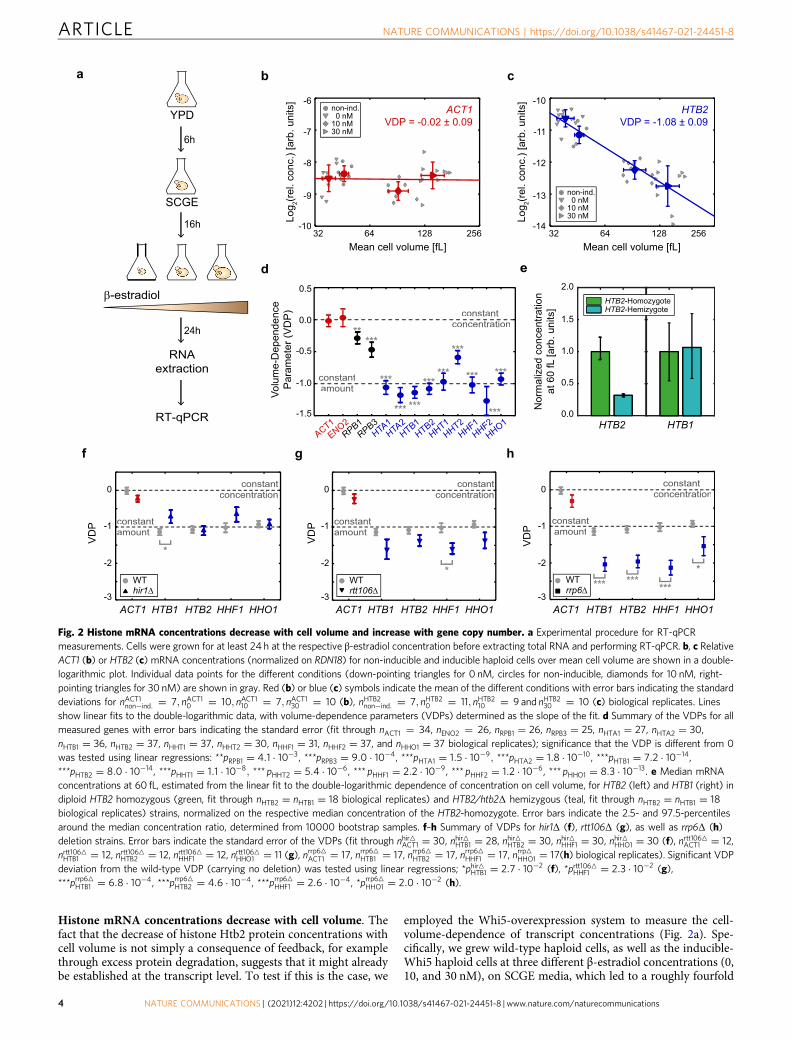
Histone promoters are sufficient for cell-volume-dependenceof transcript concentrations. Given that degradation from the 3′-end does not seem to be crucial for the cell-volume-dependentdecrease of histone transcript concentration, we next askedwhether the promoter alone is sufficient to establish this cell-volume-dependence. To address this, we created strains that carryadditional copies of either the ACT1 or a histone promoter(HTB1, HTB2 or HHF1) driving expression of the fluorescentprotein mCitrine, regulated by the identical ADH1 terminator(Fig. 3a). We first confirmed that the additional promoter doesnot affect the VDPs of the endogenous histone and ACT1 genes(Fig. 3b). Strikingly, we then find that the dependence of mCitrinetranscript concentration on cell volume is determined by thepromoter: If driven by the ACT1 promoter, the VDP of mCitrineresembles that of endogenous ACT1; if driven by histone HTB1,HTB2, or HHF1 promoter, it resembles that of the endogenoushistone.
To verify this result using a different method, we made use ofthe fact that the fluorescent reporter mCitrine enables a fastexperimental readout using flow cytometry (Fig. 3a). We analyzedthe cell-volume-dependent fluorescence of mCitrine expressedfrom either the ACT1 or a histone promoter (HTB1, HTB2, orHHF1). Consistent with the qPCR-based result, we find that allhistone promoters tested show significantly negative VDPs inhaploid and diploid cells, which confirms that flow cytometry canbe used to qualitatively distinguish the distinct volume-dependences (Fig. 3c–e, Supplementary Fig. 6).
Histones not only need to be maintained at cell-volume-independent amounts, leading to a decrease of concentration with
NATURE COMMUNICATIONS | https://doi.org/10.1038/s41467-021-24451-8 ARTICLE
NATURE COMMUNICATIONS | (2021) 12:4202 | https://doi.org/10.1038/s41467-021-24451-8 | www.nature.com/naturecommunications 5
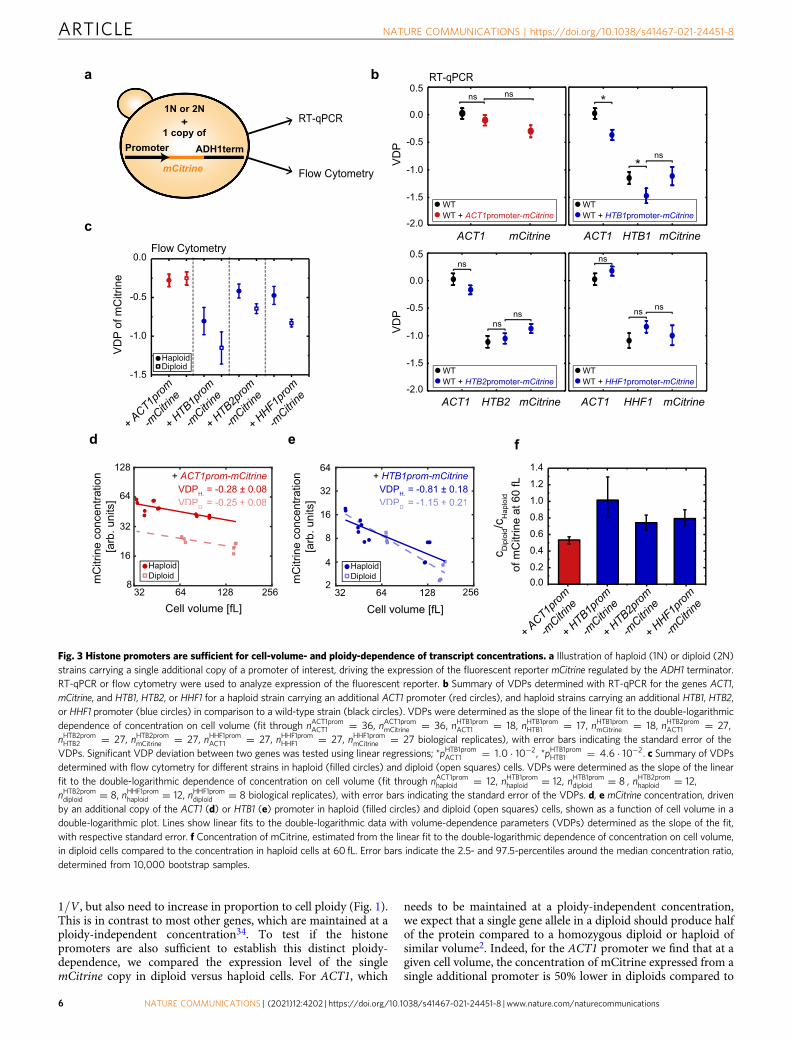
1=V , but also need to increase in proportion to cell ploidy (Fig. 1).This is in contrast to most other genes, which are maintained at aploidy-independent concentration34. To test if the histonepromoters are also sufficient to establish this distinct ploidy-dependence, we compared the expression level of the singlemCitrine copy in diploid versus haploid cells. For ACT1, which
needs to be maintained at a ploidy-independent concentration,we expect that a single gene allele in a diploid should produce halfof the protein compared to a homozygous diploid or haploid ofsimilar volume2. Indeed, for the ACT1 promoter we find that at agiven cell volume, the concentration of mCitrine expressed from asingle additional promoter is 50% lower in diploids compared to
8
16
32
64
128
32 64 128 256
Cell volume [fL]
mC
itrin
e co
ncen
tratio
n [a
rb. u
nits
]
HaploidDiploid
+ ACT1prom-mCitrineVDPH. = -0.28 ± 0.08VDPD. = -0.25 ± 0.08
HaploidDiploid
+ HTB1prom-mCitrine
8
16
32
64
4
32 64 128 256
Cell volume [fL]
2
VDPH. = -0.81 ± 0.18VDPD. = -1.15 ± 0.21
d e
a
Promoter
mCitrine
ADH1term
+ RT-qPCR
Flow Cytometry
1N or 2N
1 copy of
b
0.00.2
1.2
0.8
0.4
0.6
1.0c D
iplo
id/c
Hap
loid
of m
Citr
ine
at 6
0 fL
+ ACT1p
rom
-mCitri
ne
+ HTB1p
rom
-mCitri
ne
+ HTB2p
rom
-mCitri
ne
+ HHF1p
rom
-mCitri
ne
1.4
f
c
-1.5
-0.5
0.0
-1.0
VDP
of m
Citr
ine
HaploidDiploid
+ ACT1p
rom
-mCitri
ne
+ HTB1p
rom
-mCitri
ne
+ HTB2p
rom
-mCitri
ne
+ HHF1p
rom
-mCitri
ne
Flow Cytometry
ACT1 mCitrine ACT1 mCitrineHTB2 HHF1
ns
nsns
ns
ns ns
-1.5
-0.5
0.5
0.0
-1.0
-2.0
-1.5
-0.5
0.5
0.0
-1.0
-2.0
WTWT + ACT1promoter-mCitrine
*
*VDP
ACT1 mCitrine ACT1 mCitrineHTB1
ns
ns ns
WTWT + HTB1promoter-mCitrine
RT-qPCR
VDP
WTWT + HTB2promoter-mCitrine
WTWT + HHF1promoter-mCitrine
mC
itrin
e co
ncen
tratio
n [a
rb. u
nits
]
Fig. 3 Histone promoters are sufficient for cell-volume- and ploidy-dependence of transcript concentrations. a Illustration of haploid (1N) or diploid (2N)strains carrying a single additional copy of a promoter of interest, driving the expression of the fluorescent reporter mCitrine regulated by the ADH1 terminator.RT-qPCR or flow cytometry were used to analyze expression of the fluorescent reporter. b Summary of VDPs determined with RT-qPCR for the genes ACT1,mCitrine, and HTB1, HTB2, or HHF1 for a haploid strain carrying an additional ACT1 promoter (red circles), and haploid strains carrying an additional HTB1, HTB2,or HHF1 promoter (blue circles) in comparison to a wild-type strain (black circles). VDPs were determined as the slope of the linear fit to the double-logarithmicdependence of concentration on cell volume (fit through nACT1promACT1 ¼ 36, nACT1prommCitrine ¼ 36, nHTB1promACT1 ¼ 18, nHTB1promHTB1 ¼ 17, nHTB1prommCitrine ¼ 18, nHTB2promACT1 ¼ 27,nHTB2promHTB2 ¼ 27, nHTB2prommCitrine ¼ 27, nHHF1promACT1 ¼ 27, nHHF1promHHF1 ¼ 27, nHHF1prommCitrine ¼ 27 biological replicates), with error bars indicating the standard error of theVDPs. Significant VDP deviation between two genes was tested using linear regressions; *pHTB1promACT1 ¼ 1:0 � 10�2, *pHTB1promHTB1 ¼ 4:6 � 10�2. c Summary of VDPsdetermined with flow cytometry for different strains in haploid (filled circles) and diploid (open squares) cells. VDPs were determined as the slope of the linearfit to the double-logarithmic dependence of concentration on cell volume (fit through nACT1promhaploid ¼ 12, nHTB1promhaploid ¼ 12, nHTB1promdiploid ¼ 8 , nHTB2promhaploid ¼ 12,nHTB2promdiploid ¼ 8, nHHF1promhaploid ¼ 12, nHHF1promdiploid ¼ 8 biological replicates), with error bars indicating the standard error of the VDPs. d, e mCitrine concentration, drivenby an additional copy of the ACT1 (d) or HTB1 (e) promoter in haploid (filled circles) and diploid (open squares) cells, shown as a function of cell volume in adouble-logarithmic plot. Lines show linear fits to the double-logarithmic data with volume-dependence parameters (VDPs) determined as the slope of the fit,with respective standard error. f Concentration of mCitrine, estimated from the linear fit to the double-logarithmic dependence of concentration on cell volume,in diploid cells compared to the concentration in haploid cells at 60 fL. Error bars indicate the 2.5- and 97.5-percentiles around the median concentration ratio,determined from 10,000 bootstrap samples.
ARTICLE NATURE COMMUNICATIONS | https://doi.org/10.1038/s41467-021-24451-8
6 NATURE COMMUNICATIONS | (2021) 12:4202 | https://doi.org/10.1038/s41467-021-24451-8 | www.nature.com/naturecommunications
haploids (Fig. 3d, f). In contrast, for each of the three histonepromoters tested, we observe that the concentration in diploids isconsiderably higher than 50% of that in haploids of comparablevolume, with a ratio close to 1 for the HTB1 promoter (Fig. 3e, f,Supplementary Fig. 6). This demonstrates that in addition tosetting the cell-volume-dependent decrease in concentration,regulation by the histone promoters also largely accounts for thefact that histones are needed in proportion to ploidy.
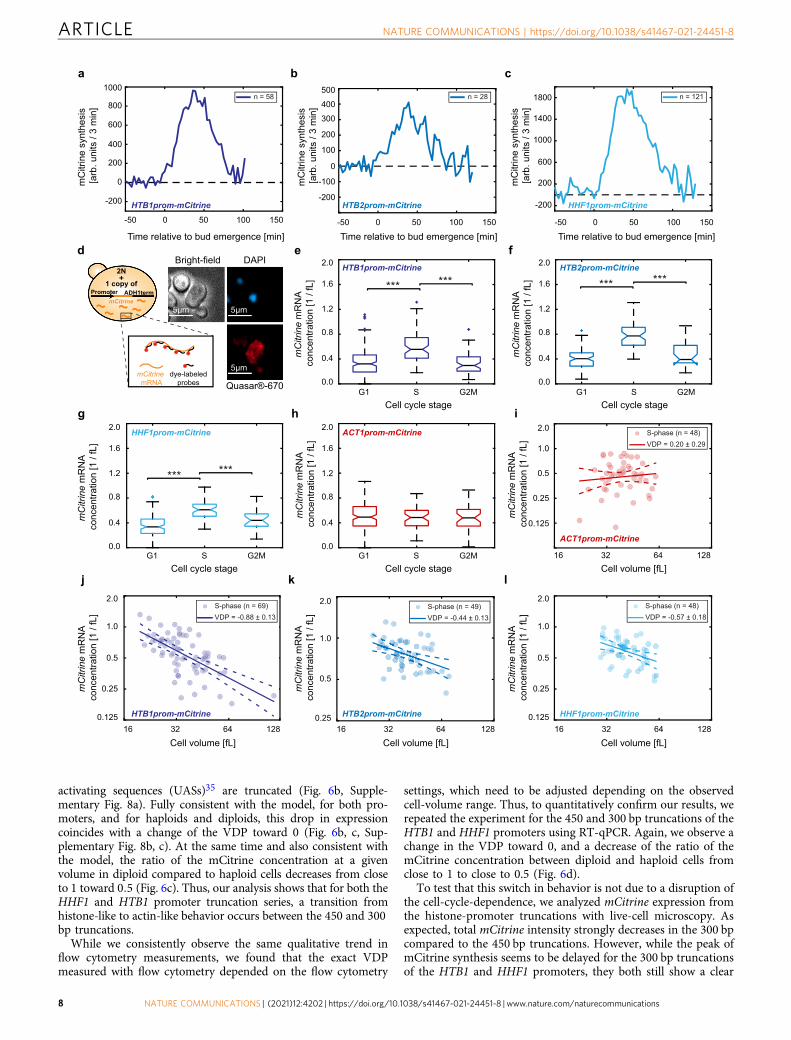
Transcript concentrations during S-phase account for cell-volume-dependence of histone promoters. So far, we haveshown that for mCitrine transcripts expressed from histone pro-moters, average concentrations in asynchronous populationsdecrease with average cell volume. It is well established that his-tone synthesis is temporally linked to DNA replication, restrictinghistone expression to late G1 and S-phase. While also protein andmRNA degradation contribute to this cell-cycle-dependence,regulation mediated by the promoter is sufficient for increasedexpression in S-phase14,35,36. Indeed, using live-cell microscopywe confirmed that all our histone promoter constructs exhibit apeak of mCitrine synthesis after bud emergence, roughly corre-sponding to S-phase (Fig. 4a–c). Thus, two possible scenarioscould account for the decreased mCitrine transcript concentrationin large compared to smaller cells. One explanation is that duringthe period in which mCitrine is expressed, the transcript con-centration decreases in larger cells. However, another explanationwould be that the mCitrine transcript concentration during S-phase is constant independent of cell volume, but S-phase dura-tion decreases in large cells. In an asynchronous cell population,this would then lead to a decrease in the fraction of cells thatexpress mCitrine, which in turn would result in a cell-volume-dependent decrease of the average transcript concentration.
In the live-cell microscopy experiments described above, wedid not observe a relevant decrease in the mCitrine productionperiod with cell volume (Supplementary Fig. 7a–c). To gainfurther insight into the potential contribution of a cell-volume-dependent cell-cycle-dependence, we performed single-moleculefluorescence in situ hybridization (smFISH), which allows us tocount mCitrine mRNA molecules in single cells. At the sametime, we can use bright-field microscopy to estimate cell volumeand – together with a DAPI-stain to visualize the nucleus—classify cells as being in G1, S, or G2/M phase (Fig. 4d).Consistent with our live-cell microscopy result, we again observean increased expression during S-phase for all histone promotersanalyzed (Fig. 4e–g, Supplementary Fig. 7d–f). In contrast, theACT1 promoter results in more uniform expression throughoutthe cell cycle (Fig. 4h, Supplementary Fig. 7g). To test whetherexpression during S-phase accounts for the overall cell-volume-dependence, we analyzed the concentration of transcripts in S-phase as a function of cell volume. Strikingly, we find that allthree histone promoters (HTB1, HTB2, and HHF1 promoters)but not the ACT1 promoter lead to a significant decrease oftranscript concentration with cell volume (Fig. 4i–l).
Different cell-volume and ploidy dependences can be explainedby competition of promoters for limiting transcriptionalmachinery. Taken together, our results suggest that while mostgenes are transcribed at a rate proportional to cell volume tomaintain constant concentrations, transcripts controlled by his-tone promoters are instead transcribed at a cell-volume-independent rate to couple histone production to DNA content.To better understand how the transcription rate of one specificpromoter depends on cell volume and ploidy context, we revisiteda minimal model for transcription that was in essence proposedby Heldt et al.37 (Fig. 5a). We further simplified the model by not
explicitly modeling the dynamics of cell growth. Instead, weassume that transcription can be described by a single (limiting)component of the transcriptional machinery, TM, whose amountincreases in proportion to cell volume. In other words, its con-centration cTM stays constant. We then considered two classes ofpromoters, a specific promoter of interest, p, present as a singlecopy, and a general pool of promoters, g, which are present asnh ¼ 6000 in haploids or nd ¼ 12000 copies in diploids. Eachpromoter is competing for the transcriptional machinery, and ismodeled as a single binding site for TM. Initiation, i.e., binding ofthe machinery, occurs at a rate kpon or kgon, respectively. Further-more, we assume that all other steps of transcription can besummarized in a single rate-limiting step, occurring at a rate kpoffor kgoff , respectively. Each transcript is then degraded with thesame rate kdeg ¼ 1. Depending on the parameters chosen for thespecific promoter, the model predicts qualitatively differentdependences of transcript concentration on cell-volume andploidy (Fig. 5b–e)37.
For example, at a given kpoff , a high on-rate kpon (kpon � kgon) can
result in histone-promoter-like behavior, i.e., cell volume-dependent but ploidy-independent transcript concentration. Thiscan be understood considering that due to the higher on-ratecompared to the general pool of promoters, the promoter ofinterest is already saturated with transcriptional machinery atvery small cell volumes. A further increase of the availablemachinery at larger cell volumes does therefore not result in ahigher occupancy with transcriptional machinery, leading to aconstant, cell-volume-independent transcription rate. Thus, thetranscript concentration obtained from a single promoter ofinterest is independent of ploidy but decreases with cell volume.A homozygous diploid carrying two of the promoters of interestwill therefore show a twofold higher concentration than a haploidwith the same volume. In contrast, at lower kpon (kpon � kgon) weobserve actin-promoter-like behavior, i.e., cell volume-independent but ploidy-dependent transcript concentration. Inthis regime, both the specific and the general promoters competeequally for the transcriptional machinery. As long as not allpromoters are saturated, transcription rate therefore increaseswith the amount of available transcriptional machinery, and thuscell volume. In diploid cells, the single promoter of interestcompetes with twice the number of general promoters, leading toa roughly twofold reduction of the transcription rate compared tohaploids with equal cell volume.
Interestingly, at very low kpon (kpon � kgon) we observe a thirdtype of behavior, in which transcript concentration increases withcell volume. Because the affinity of the promoter of interest to thetranscriptional machinery is very low compared to that of thegeneral promoters, the occupancy is very low as long as thegeneral promoters are not saturated. Only once the generalpromoters approach saturation, machinery becomes available forthe promoter of interest, then leading to a nonlinear increase oftranscription rate with cell volume.
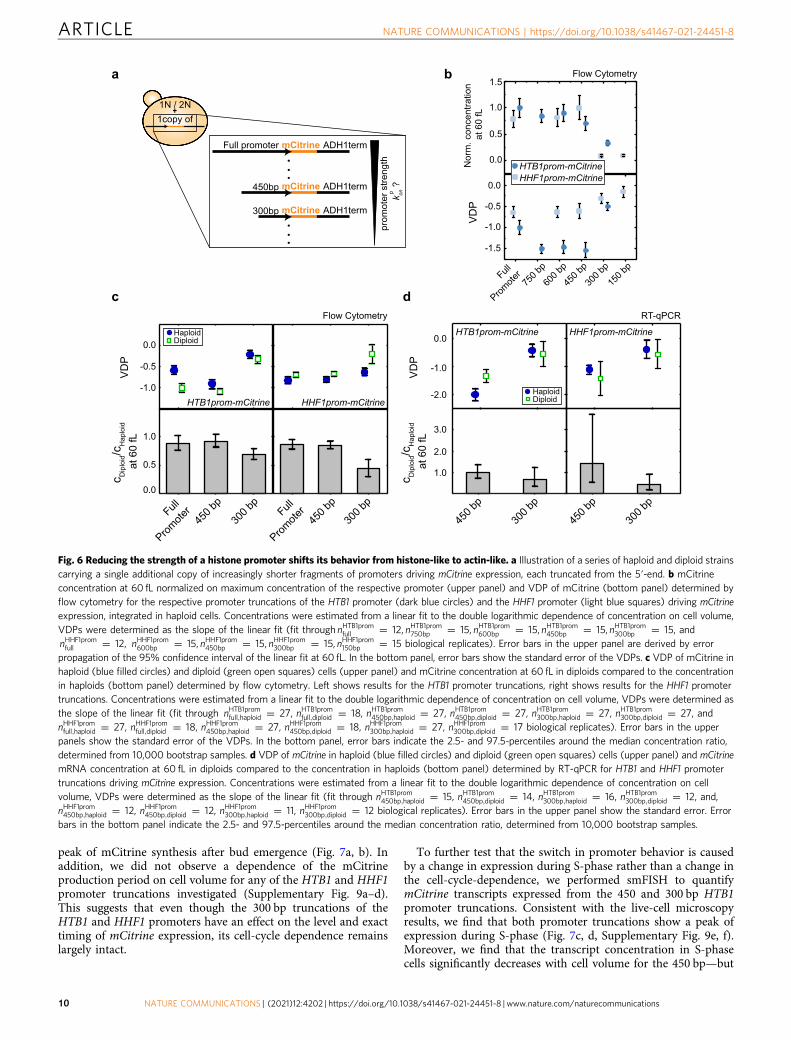
Histone-promoter truncations lead to a switch from histone-like to actin-like behavior. One key prediction of this model isthat if all other parameters are fixed, reducing kpon for a histone-likepromoter should eventually shift its behavior to that of an actin-like promoter (Fig. 5d). To experimentally test this prediction, weaimed to decrease the initiation rate kpon of the HHF1 and HTB1promoters by creating series of haploid and diploid strains withincreasingly shorter fragments of the promoters, each truncatedfrom the 5′-end (Fig. 6a). Again, we used flow cytometry to analyzemCitrine expression driven by these additional, endogenouslyintegrated promoter fragments. For both promoters we observe adecrease of mCitrine expression once part of the known upstream
NATURE COMMUNICATIONS | https://doi.org/10.1038/s41467-021-24451-8 ARTICLE
NATURE COMMUNICATIONS | (2021) 12:4202 | https://doi.org/10.1038/s41467-021-24451-8 | www.nature.com/naturecommunications 7
activating sequences (UASs)35 are truncated (Fig. 6b, Supple-mentary Fig. 8a). Fully consistent with the model, for both pro-moters, and for haploids and diploids, this drop in expressioncoincides with a change of the VDP toward 0 (Fig. 6b, c, Sup-plementary Fig. 8b, c). At the same time and also consistent withthe model, the ratio of the mCitrine concentration at a givenvolume in diploid compared to haploid cells decreases from closeto 1 toward 0:5 (Fig. 6c). Thus, our analysis shows that for both theHHF1 and HTB1 promoter truncation series, a transition fromhistone-like to actin-like behavior occurs between the 450 and 300bp truncations.
While we consistently observe the same qualitative trend inflow cytometry measurements, we found that the exact VDPmeasured with flow cytometry depended on the flow cytometry
settings, which need to be adjusted depending on the observedcell-volume range. Thus, to quantitatively confirm our results, werepeated the experiment for the 450 and 300 bp truncations of theHTB1 and HHF1 promoters using RT-qPCR. Again, we observe achange in the VDP toward 0, and a decrease of the ratio of themCitrine concentration between diploid and haploid cells fromclose to 1 to close to 0.5 (Fig. 6d).
To test that this switch in behavior is not due to a disruption ofthe cell-cycle-dependence, we analyzed mCitrine expression fromthe histone-promoter truncations with live-cell microscopy. Asexpected, total mCitrine intensity strongly decreases in the 300 bpcompared to the 450 bp truncations. However, while the peak ofmCitrine synthesis seems to be delayed for the 300 bp truncationsof the HTB1 and HHF1 promoters, they both still show a clear
-50 0 50 100
Time relative to bud emergence [min]
150
mC
itrin
e sy
nthe
sis
[arb
. uni
ts /
3 m
in] 800
200
0
400
600
-200
1000
-50 0 50 100
Time relative to bud emergence [min]150
mC
itrin
e sy
nthe
sis
[arb
. uni
ts /
3 m
in]
200
-200
0
-100
100
300
400
500
-50 0 50 100
Time relative to bud emergence [min]150
mC
itrin
e sy
nthe
sis
[arb
. uni
ts /
3 m
in]
-200
200
600
1000
1800
1400
b ca
d
*** ***
G1 S G2MCell cycle stage
mC
itrin
e m
RN
A co
ncen
tratio
n [1
/ fL
]
0.8
0.4
0.0
1.2
1.6
2.0e
HTB1prom-mCitrine
*** ***
G1 S G2MCell cycle stage
mC
itrin
e m
RN
A co
ncen
tratio
n [1
/ fL
]
fHTB2prom-mCitrine
***
G1 S G2MCell cycle stage
mC
itrin
e m
RN
A co
ncen
tratio
n [1
/ fL
]
gHHF1prom-mCitrine
h
***
G1 S G2MCell cycle stage
mC
itrin
e m
RN
A co
ncen
tratio
n [1
/ fL
]
ACT1prom-mCitrine
k lj
S-phase (n = 69)VDP = -0.88 ± 0.13
Cell volume [fL]16 32 64 128
1.0
2.0
0.25
0.5
0.125
mC
itrin
e m
RN
A co
ncen
tratio
n [1
/ fL
]
S-phase (n = 49)VDP = -0.44 ± 0.13
Cell volume [fL]16 32 64 128
1.0
2.0
0.25
0.5
mC
itrin
e m
RN
A co
ncen
tratio
n [1
/ fL
]
S-phase (n = 48)VDP = -0.57 ± 0.18
Cell volume [fL]16 32 64 128
1.0
2.0
0.25
0.5
0.125
mC
itrin
e m
RN
A co
ncen
tratio
n [1
/ fL
]
HTB1prom-mCitrine HTB2prom-mCitrine HHF1prom-mCitrine
i
Cell volume [fL]16 32 64 128
1.0
2.0
0.25
0.5
0.125 m
Citr
ine
mR
NA
conc
entra
tion
[1 /
fL]
S-phase (n = 48)VDP = 0.20 ± 0.29
ACT1prom-mCitrine
n = 58
HTB1prom-mCitrine
n = 28
HTB2prom-mCitrine
n = 121
HHF1prom-mCitrine
0.8
0.4
0.0
1.2
1.6
2.0
0.8
0.4
0.0
1.2
1.6
2.0
0.8
0.4
0.0
1.2
1.6
2.0
5μm
Bright-field DAPI
PromotermCitrine
ADH1term
+2N
1 copy of
mCitrine mRNA
dye-labeledprobes Quasar®-670
5μm5μm
ARTICLE NATURE COMMUNICATIONS | https://doi.org/10.1038/s41467-021-24451-8
8 NATURE COMMUNICATIONS | (2021) 12:4202 | https://doi.org/10.1038/s41467-021-24451-8 | www.nature.com/naturecommunications
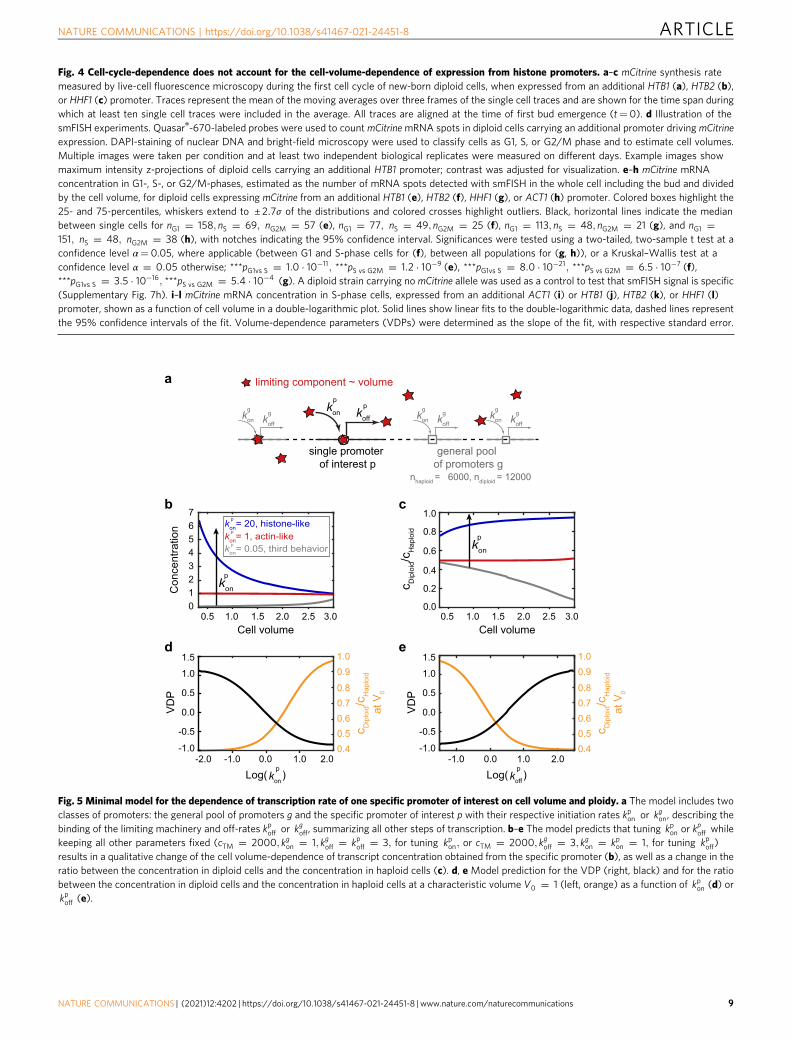
Fig. 4 Cell-cycle-dependence does not account for the cell-volume-dependence of expression from histone promoters. a–c mCitrine synthesis ratemeasured by live-cell fluorescence microscopy during the first cell cycle of new-born diploid cells, when expressed from an additional HTB1 (a), HTB2 (b),or HHF1 (c) promoter. Traces represent the mean of the moving averages over three frames of the single cell traces and are shown for the time span duringwhich at least ten single cell traces were included in the average. All traces are aligned at the time of first bud emergence (t= 0). d Illustration of thesmFISH experiments. Quasar®-670-labeled probes were used to count mCitrinemRNA spots in diploid cells carrying an additional promoter driving mCitrineexpression. DAPI-staining of nuclear DNA and bright-field microscopy were used to classify cells as G1, S, or G2/M phase and to estimate cell volumes.Multiple images were taken per condition and at least two independent biological replicates were measured on different days. Example images showmaximum intensity z-projections of diploid cells carrying an additional HTB1 promoter; contrast was adjusted for visualization. e–h mCitrine mRNAconcentration in G1-, S-, or G2/M-phases, estimated as the number of mRNA spots detected with smFISH in the whole cell including the bud and dividedby the cell volume, for diploid cells expressing mCitrine from an additional HTB1 (e), HTB2 (f), HHF1 (g), or ACT1 (h) promoter. Colored boxes highlight the25- and 75-percentiles, whiskers extend to ± 2:7σ of the distributions and colored crosses highlight outliers. Black, horizontal lines indicate the medianbetween single cells for nG1 ¼ 158; nS ¼ 69; nG2M ¼ 57 (e), nG1 ¼ 77; nS ¼ 49; nG2M ¼ 25 (f), nG1 ¼ 113; nS ¼ 48; nG2M ¼ 21 (g), and nG1 ¼151; nS ¼ 48; nG2M ¼ 38 (h), with notches indicating the 95% confidence interval. Significances were tested using a two-tailed, two-sample t test at aconfidence level α= 0.05, where applicable (between G1 and S-phase cells for (f), between all populations for (g, h)), or a Kruskal–Wallis test at aconfidence level α ¼ 0:05 otherwise; ***pG1vs S ¼ 1:0 � 10�11; ***pS vs G2M ¼ 1:2 � 10�9 (e), ***pG1vs S ¼ 8:0 � 10�21; ***pS vs G2M ¼ 6:5 � 10�7 (f),***pG1vs S ¼ 3:5 � 10�16; ***pS vs G2M ¼ 5:4 � 10�4 (g). A diploid strain carrying no mCitrine allele was used as a control to test that smFISH signal is specific(Supplementary Fig. 7h). i–l mCitrine mRNA concentration in S-phase cells, expressed from an additional ACT1 (i) or HTB1 (j), HTB2 (k), or HHF1 (l)promoter, shown as a function of cell volume in a double-logarithmic plot. Solid lines show linear fits to the double-logarithmic data, dashed lines representthe 95% confidence intervals of the fit. Volume-dependence parameters (VDPs) were determined as the slope of the fit, with respective standard error.
limiting component ~ volume
general pool of promoters g
nhaploid = 6000, ndiploid = 12000
kon
g
koff
g kon
g
koff
gkon
g
koff
gkon
p
koff
p
single promoter of interest p
0.5 1.0 1.5 2.0 2.5 3.0Cell volume
01234567
Con
cent
ratio
n
kon
p
kon= 20, histone-likep
kon= 0.05, third behaviorpkon= 1, actin-likep
0.5 1.0 1.5 2.0 2.5 3.0Cell volume
0.0
0.2
0.4
0.6
0.8
1.0
c Dip
loid/c
Hap
loid
kon
p
c Dip
loid/c
Hap
loid
at V
0
VDP
0.50.60.70.80.91.0
0.4
-0.5
0.0
0.5
1.0
1.5
-1.0
Log( )kon
p-2.0 -1.0 0.0 2.01.0
a
cb
d
c Dip
loid/c
Hap
loid
at V
0
VDP
0.50.60.70.80.91.0
0.4
-0.5
0.0
0.5
1.0
1.5
-1.0
Log( )koff
p-1.0 0.0 2.01.0
e
Fig. 5 Minimal model for the dependence of transcription rate of one specific promoter of interest on cell volume and ploidy. a The model includes twoclasses of promoters: the general pool of promoters g and the specific promoter of interest p with their respective initiation rates kpon or kgon, describing thebinding of the limiting machinery and off-rates kpoff or kgoff, summarizing all other steps of transcription. b–e The model predicts that tuning kpon or k
poff while
keeping all other parameters fixed (cTM ¼ 2000; kgon ¼ 1; kgoff ¼ kpoff ¼ 3; for tuning kpon; or cTM ¼ 2000; kgoff ¼ 3; kgon ¼ kpon ¼ 1; for tuning kpoff)results in a qualitative change of the cell volume-dependence of transcript concentration obtained from the specific promoter (b), as well as a change in theratio between the concentration in diploid cells and the concentration in haploid cells (c). d, e Model prediction for the VDP (right, black) and for the ratiobetween the concentration in diploid cells and the concentration in haploid cells at a characteristic volume V0 ¼ 1 (left, orange) as a function of kpon (d) orkpoff (e).
NATURE COMMUNICATIONS | https://doi.org/10.1038/s41467-021-24451-8 ARTICLE
NATURE COMMUNICATIONS | (2021) 12:4202 | https://doi.org/10.1038/s41467-021-24451-8 | www.nature.com/naturecommunications 9
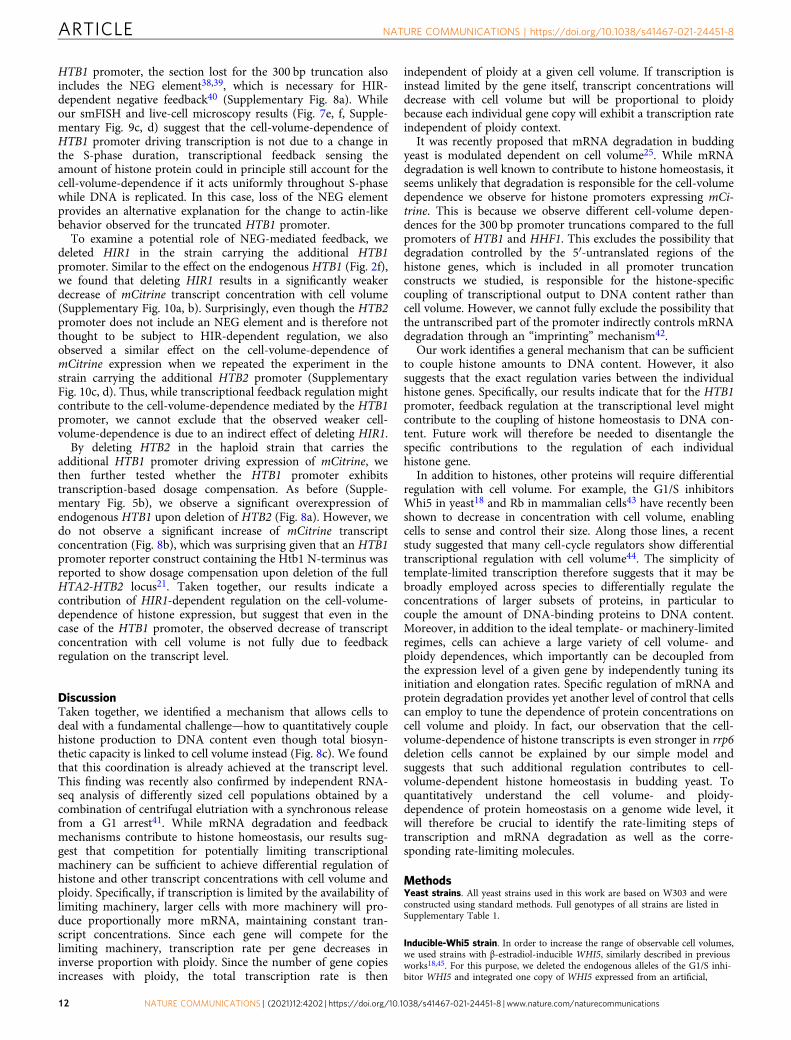
peak of mCitrine synthesis after bud emergence (Fig. 7a, b). Inaddition, we did not observe a dependence of the mCitrineproduction period on cell volume for any of the HTB1 and HHF1promoter truncations investigated (Supplementary Fig. 9a–d).This suggests that even though the 300 bp truncations of theHTB1 and HHF1 promoters have an effect on the level and exacttiming of mCitrine expression, its cell-cycle dependence remainslargely intact.
To further test that the switch in promoter behavior is causedby a change in expression during S-phase rather than a change inthe cell-cycle-dependence, we performed smFISH to quantifymCitrine transcripts expressed from the 450 and 300 bp HTB1promoter truncations. Consistent with the live-cell microscopyresults, we find that both promoter truncations show a peak ofexpression during S-phase (Fig. 7c, d, Supplementary Fig. 9e, f).Moreover, we find that the transcript concentration in S-phasecells significantly decreases with cell volume for the 450 bp—but
a
d
b
+1N / 2N1copy of
Full promoter mCitrine ADH1term
300bp mCitrine ADH1term
mCitrine ADH1term450bp
k on ?
ppr
omot
er s
treng
th
c
450 b
p
300 b
p
HTB1prom-mCitrine
RT-qPCR
HaploidDiploid
c Dip
loid/c
Hap
loid
at 6
0 fL
0.0
-1.0
-2.0
1.0
2.0
HHF1prom-mCitrine
450 b
p
300 b
p
3.0
VDP
Nor
m. c
once
ntra
tion
at 6
0 fL
Full
Promote
r75
0 bp
600 b
p
450 b
p
300 b
p
150 b
p
0.5
1.0
0.0
-1.0
-0.5
-1.5
0.0
Flow Cytometry1.5
HTB1prom-mCitrineHHF1prom-mCitrine
VDP
Full
Promote
r45
0 bp
300 b
pFull
Promote
r45
0 bp
300 b
p
c Dip
loid/c
Hap
loid
at 6
0 fL
Flow Cytometry
HTB1prom-mCitrine HHF1prom-mCitrine
0.0
-0.5
-1.0
0.0
0.5
1.0
HaploidDiploid
VDP
Fig. 6 Reducing the strength of a histone promoter shifts its behavior from histone-like to actin-like. a Illustration of a series of haploid and diploid strainscarrying a single additional copy of increasingly shorter fragments of promoters driving mCitrine expression, each truncated from the 5′-end. b mCitrineconcentration at 60 fL normalized on maximum concentration of the respective promoter (upper panel) and VDP of mCitrine (bottom panel) determined byflow cytometry for the respective promoter truncations of the HTB1 promoter (dark blue circles) and the HHF1 promoter (light blue squares) driving mCitrineexpression, integrated in haploid cells. Concentrations were estimated from a linear fit to the double logarithmic dependence of concentration on cell volume,VDPs were determined as the slope of the linear fit (fit through nHTB1promfull ¼ 12, nHTB1prom750bp ¼ 15, nHTB1prom600bp ¼ 15, nHTB1prom450bp ¼ 15, nHTB1prom300bp ¼ 15, andnHHF1promfull ¼ 12, nHHF1prom600bp ¼ 15, nHHF1prom450bp ¼ 15, nHHF1prom300bp ¼ 15, nHHF1prom150bp ¼ 15 biological replicates). Error bars in the upper panel are derived by errorpropagation of the 95% confidence interval of the linear fit at 60 fL. In the bottom panel, error bars show the standard error of the VDPs. c VDP of mCitrine inhaploid (blue filled circles) and diploid (green open squares) cells (upper panel) and mCitrine concentration at 60 fL in diploids compared to the concentrationin haploids (bottom panel) determined by flow cytometry. Left shows results for the HTB1 promoter truncations, right shows results for the HHF1 promotertruncations. Concentrations were estimated from a linear fit to the double logarithmic dependence of concentration on cell volume, VDPs were determined asthe slope of the linear fit (fit through nHTB1promfull;haploid ¼ 27, nHTB1promfull;diploid ¼ 18, nHTB1prom450bp;haploid ¼ 27, nHTB1prom450bp;diploid ¼ 27, nHTB1prom300bp;haploid ¼ 27, nHTB1prom300bp;diploid ¼ 27, andnHHF1promfull;haploid ¼ 27, nHHF1promfull;diploid ¼ 18, nHHF1prom450bp;haploid ¼ 27, nHHF1prom450bp;diploid ¼ 18, nHHF1prom300bp;haploid ¼ 27, nHHF1prom300bp;diploid ¼ 17 biological replicates). Error bars in the upperpanels show the standard error of the VDPs. In the bottom panel, error bars indicate the 2.5- and 97.5-percentiles around the median concentration ratio,determined from 10,000 bootstrap samples. d VDP of mCitrine in haploid (blue filled circles) and diploid (green open squares) cells (upper panel) and mCitrinemRNA concentration at 60 fL in diploids compared to the concentration in haploids (bottom panel) determined by RT-qPCR for HTB1 and HHF1 promotertruncations driving mCitrine expression. Concentrations were estimated from a linear fit to the double logarithmic dependence of concentration on cellvolume, VDPs were determined as the slope of the linear fit (fit through nHTB1prom450bp;haploid ¼ 15, nHTB1prom450bp;diploid ¼ 14, nHTB1prom300bp;haploid ¼ 16, nHTB1prom300bp;diploid ¼ 12, and,nHHF1prom450bp;haploid ¼ 12, nHHF1prom450bp;diploid ¼ 12, nHHF1prom300bp;haploid ¼ 11, nHHF1prom300bp;diploid ¼ 12 biological replicates). Error bars in the upper panel show the standard error. Errorbars in the bottom panel indicate the 2.5- and 97.5-percentiles around the median concentration ratio, determined from 10,000 bootstrap samples.
ARTICLE NATURE COMMUNICATIONS | https://doi.org/10.1038/s41467-021-24451-8
10 NATURE COMMUNICATIONS | (2021) 12:4202 | https://doi.org/10.1038/s41467-021-24451-8 | www.nature.com/naturecommunications
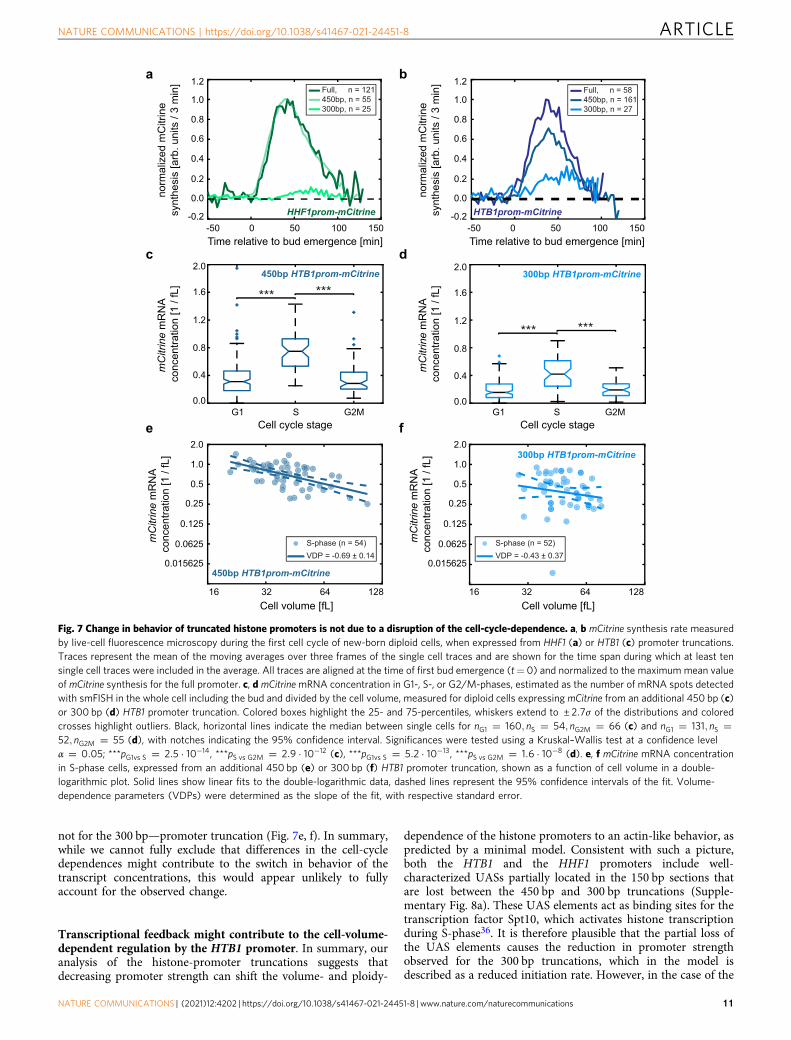
not for the 300 bp—promoter truncation (Fig. 7e, f). In summary,while we cannot fully exclude that differences in the cell-cycledependences might contribute to the switch in behavior of thetranscript concentrations, this would appear unlikely to fullyaccount for the observed change.
Transcriptional feedback might contribute to the cell-volume-dependent regulation by the HTB1 promoter. In summary, ouranalysis of the histone-promoter truncations suggests thatdecreasing promoter strength can shift the volume- and ploidy-
dependence of the histone promoters to an actin-like behavior, aspredicted by a minimal model. Consistent with such a picture,both the HTB1 and the HHF1 promoters include well-characterized UASs partially located in the 150 bp sections thatare lost between the 450 bp and 300 bp truncations (Supple-mentary Fig. 8a). These UAS elements act as binding sites for thetranscription factor Spt10, which activates histone transcriptionduring S-phase36. It is therefore plausible that the partial loss ofthe UAS elements causes the reduction in promoter strengthobserved for the 300 bp truncations, which in the model isdescribed as a reduced initiation rate. However, in the case of the
-50 0 50 100Time relative to bud emergence [min]
150
norm
aliz
ed m
Citr
ine
synt
hesi
s [a
rb. u
nits
/ 3
min
] Full, n = 121450bp, n = 55300bp, n = 25
HHF1prom-mCitrine-50 0 50 100Time relative to bud emergence [min]
150
HTB1prom-mCitrine
Full, n = 58450bp, n = 161300bp, n = 27
*** ***
G1 S G2MCell cycle stage
mC
itrin
e m
RN
A co
ncen
tratio
n [1
/ fL
]
1.2
0.8
1.6
2.0
0.4
0.0
*** ***
G1 S G2MCell cycle stage
mC
itrin
e m
RN
A co
ncen
tratio
n [1
/ fL
]
b
c
a
e f
d450bp HTB1prom-mCitrine 300bp HTB1prom-mCitrine
S-phase (n = 54)VDP = -0.69 ± 0.14
Cell volume [fL]16 32 64 128
1.0
2.0
0.25
0.5
0.125
450bp HTB1prom-mCitrine
0.0625mC
itrin
e m
RN
A co
ncen
tratio
n [1
/ fL
]
0.015625
S-phase (n = 52)VDP = -0.43 ± 0.37
Cell volume [fL]16 32 64 128
mC
itrin
e m
RN
A co
ncen
tratio
n [1
/ fL
] 300bp HTB1prom-mCitrine1.0
2.0
0.25
0.5
0.125
0.0625
0.015625
-0.2
0.0
0.2
0.4
0.6
0.8
1.0
1.2
-0.2
0.0
0.2
0.4
0.6
0.8
1.0
1.2
norm
aliz
ed m
Citr
ine
synt
hesi
s [a
rb. u
nits
/ 3
min
]
1.2
0.8
1.6
2.0
0.4
0.0
Fig. 7 Change in behavior of truncated histone promoters is not due to a disruption of the cell-cycle-dependence. a, b mCitrine synthesis rate measuredby live-cell fluorescence microscopy during the first cell cycle of new-born diploid cells, when expressed from HHF1 (a) or HTB1 (c) promoter truncations.Traces represent the mean of the moving averages over three frames of the single cell traces and are shown for the time span during which at least tensingle cell traces were included in the average. All traces are aligned at the time of first bud emergence (t= 0) and normalized to the maximum mean valueof mCitrine synthesis for the full promoter. c, d mCitrinemRNA concentration in G1-, S-, or G2/M-phases, estimated as the number of mRNA spots detectedwith smFISH in the whole cell including the bud and divided by the cell volume, measured for diploid cells expressing mCitrine from an additional 450 bp (c)or 300 bp (d) HTB1 promoter truncation. Colored boxes highlight the 25- and 75-percentiles, whiskers extend to ± 2:7σ of the distributions and coloredcrosses highlight outliers. Black, horizontal lines indicate the median between single cells for nG1 ¼ 160; nS ¼ 54; nG2M ¼ 66 (c) and nG1 ¼ 131; nS ¼52; nG2M ¼ 55 (d), with notches indicating the 95% confidence interval. Significances were tested using a Kruskal–Wallis test at a confidence levelα ¼ 0:05; ***pG1vs S ¼ 2:5 � 10�14, ***pS vs G2M ¼ 2:9 � 10�12 (c), ***pG1vs S ¼ 5:2 � 10�13, ***pS vs G2M ¼ 1:6 � 10�8 (d). e, f mCitrine mRNA concentrationin S-phase cells, expressed from an additional 450 bp (e) or 300 bp (f) HTB1 promoter truncation, shown as a function of cell volume in a double-logarithmic plot. Solid lines show linear fits to the double-logarithmic data, dashed lines represent the 95% confidence intervals of the fit. Volume-dependence parameters (VDPs) were determined as the slope of the fit, with respective standard error.
NATURE COMMUNICATIONS | https://doi.org/10.1038/s41467-021-24451-8 ARTICLE
NATURE COMMUNICATIONS | (2021) 12:4202 | https://doi.org/10.1038/s41467-021-24451-8 | www.nature.com/naturecommunications 11
HTB1 promoter, the section lost for the 300 bp truncation alsoincludes the NEG element38,39, which is necessary for HIR-dependent negative feedback40 (Supplementary Fig. 8a). Whileour smFISH and live-cell microscopy results (Fig. 7e, f, Supple-mentary Fig. 9c, d) suggest that the cell-volume-dependence ofHTB1 promoter driving transcription is not due to a change inthe S-phase duration, transcriptional feedback sensing theamount of histone protein could in principle still account for thecell-volume-dependence if it acts uniformly throughout S-phasewhile DNA is replicated. In this case, loss of the NEG elementprovides an alternative explanation for the change to actin-likebehavior observed for the truncated HTB1 promoter.
To examine a potential role of NEG-mediated feedback, wedeleted HIR1 in the strain carrying the additional HTB1promoter. Similar to the effect on the endogenous HTB1 (Fig. 2f),we found that deleting HIR1 results in a significantly weakerdecrease of mCitrine transcript concentration with cell volume(Supplementary Fig. 10a, b). Surprisingly, even though the HTB2promoter does not include an NEG element and is therefore notthought to be subject to HIR-dependent regulation, we alsoobserved a similar effect on the cell-volume-dependence ofmCitrine expression when we repeated the experiment in thestrain carrying the additional HTB2 promoter (SupplementaryFig. 10c, d). Thus, while transcriptional feedback regulation mightcontribute to the cell-volume-dependence mediated by the HTB1promoter, we cannot exclude that the observed weaker cell-volume-dependence is due to an indirect effect of deleting HIR1.
By deleting HTB2 in the haploid strain that carries theadditional HTB1 promoter driving expression of mCitrine, wethen further tested whether the HTB1 promoter exhibitstranscription-based dosage compensation. As before (Supple-mentary Fig. 5b), we observe a significant overexpression ofendogenous HTB1 upon deletion of HTB2 (Fig. 8a). However, wedo not observe a significant increase of mCitrine transcriptconcentration (Fig. 8b), which was surprising given that an HTB1promoter reporter construct containing the Htb1 N-terminus wasreported to show dosage compensation upon deletion of the fullHTA2-HTB2 locus21. Taken together, our results indicate acontribution of HIR1-dependent regulation on the cell-volume-dependence of histone expression, but suggest that even in thecase of the HTB1 promoter, the observed decrease of transcriptconcentration with cell volume is not fully due to feedbackregulation on the transcript level.
DiscussionTaken together, we identified a mechanism that allows cells todeal with a fundamental challenge—how to quantitatively couplehistone production to DNA content even though total biosyn-thetic capacity is linked to cell volume instead (Fig. 8c). We foundthat this coordination is already achieved at the transcript level.This finding was recently also confirmed by independent RNA-seq analysis of differently sized cell populations obtained by acombination of centrifugal elutriation with a synchronous releasefrom a G1 arrest41. While mRNA degradation and feedbackmechanisms contribute to histone homeostasis, our results sug-gest that competition for potentially limiting transcriptionalmachinery can be sufficient to achieve differential regulation ofhistone and other transcript concentrations with cell volume andploidy. Specifically, if transcription is limited by the availability oflimiting machinery, larger cells with more machinery will pro-duce proportionally more mRNA, maintaining constant tran-script concentrations. Since each gene will compete for thelimiting machinery, transcription rate per gene decreases ininverse proportion with ploidy. Since the number of gene copiesincreases with ploidy, the total transcription rate is then
independent of ploidy at a given cell volume. If transcription isinstead limited by the gene itself, transcript concentrations willdecrease with cell volume but will be proportional to ploidybecause each individual gene copy will exhibit a transcription rateindependent of ploidy context.
It was recently proposed that mRNA degradation in buddingyeast is modulated dependent on cell volume25. While mRNAdegradation is well known to contribute to histone homeostasis, itseems unlikely that degradation is responsible for the cell-volumedependence we observe for histone promoters expressing mCi-trine. This is because we observe different cell-volume depen-dences for the 300 bp promoter truncations compared to the fullpromoters of HTB1 and HHF1. This excludes the possibility thatdegradation controlled by the 5′-untranslated regions of thehistone genes, which is included in all promoter truncationconstructs we studied, is responsible for the histone-specificcoupling of transcriptional output to DNA content rather thancell volume. However, we cannot fully exclude the possibility thatthe untranscribed part of the promoter indirectly controls mRNAdegradation through an “imprinting” mechanism42.
Our work identifies a general mechanism that can be sufficientto couple histone amounts to DNA content. However, it alsosuggests that the exact regulation varies between the individualhistone genes. Specifically, our results indicate that for the HTB1promoter, feedback regulation at the transcriptional level mightcontribute to the coupling of histone homeostasis to DNA con-tent. Future work will therefore be needed to disentangle thespecific contributions to the regulation of each individualhistone gene.
In addition to histones, other proteins will require differentialregulation with cell volume. For example, the G1/S inhibitorsWhi5 in yeast18 and Rb in mammalian cells43 have recently beenshown to decrease in concentration with cell volume, enablingcells to sense and control their size. Along those lines, a recentstudy suggested that many cell-cycle regulators show differentialtranscriptional regulation with cell volume44. The simplicity oftemplate-limited transcription therefore suggests that it may bebroadly employed across species to differentially regulate theconcentrations of larger subsets of proteins, in particular tocouple the amount of DNA-binding proteins to DNA content.Moreover, in addition to the ideal template- or machinery-limitedregimes, cells can achieve a large variety of cell volume- andploidy dependences, which importantly can be decoupled fromthe expression level of a given gene by independently tuning itsinitiation and elongation rates. Specific regulation of mRNA andprotein degradation provides yet another level of control that cellscan employ to tune the dependence of protein concentrations oncell volume and ploidy. In fact, our observation that the cell-volume-dependence of histone transcripts is even stronger in rrp6deletion cells cannot be explained by our simple model andsuggests that such additional regulation contributes to cell-volume-dependent histone homeostasis in budding yeast. Toquantitatively understand the cell volume- and ploidy-dependence of protein homeostasis on a genome wide level, itwill therefore be crucial to identify the rate-limiting steps oftranscription and mRNA degradation as well as the corre-sponding rate-limiting molecules.
MethodsYeast strains. All yeast strains used in this work are based on W303 and wereconstructed using standard methods. Full genotypes of all strains are listed inSupplementary Table 1.
Inducible-Whi5 strain. In order to increase the range of observable cell volumes,we used strains with β-estradiol-inducible WHI5, similarly described in previousworks18,45. For this purpose, we deleted the endogenous alleles of the G1/S inhi-bitor WHI5 and integrated one copy of WHI5 expressed from an artificial,
ARTICLE NATURE COMMUNICATIONS | https://doi.org/10.1038/s41467-021-24451-8
12 NATURE COMMUNICATIONS | (2021) 12:4202 | https://doi.org/10.1038/s41467-021-24451-8 | www.nature.com/naturecommunications
β-estradiol-inducible promoter system19. Specifically, this inducible promotersystem consists of a β-estradiol-dependent, artificial transcription factor, which canbind an artificial promoter. This promoter is then used to induceWHI5 expression.
To ensure that β-estradiol addition itself has no effect on cell growth, we grewcell cultures of a non-inducible WHI5 haploid strain and cell cultures of a whi5Δhaploid strain, containing the β-estradiol-dependent, artificial transcription factor,but no copy of WHI5. We then added β-estradiol to those cultures and quantifiedthe mean cell volumes after 24 h of growth in the presence of β-estradiol, bymeasuring the cell volume distributions using a Coulter counter (Beckman Coulter,Z2 Particle Counter). Finally, we compared the mean cell volumes to the mean cellvolumes obtained from cell populations without β-estradiol addition(Supplementary Fig. 3a). In addition, we performed reverse-transcription-qPCR(RT-qPCR) on cell populations with and without β-estradiol addition andcompared the obtained mean values for several genes (Supplementary Fig. 3b, c).For the non-inducible WHI5 haploid strain, we could not identify a significantdeviation of the population means between the cell populations with and withoutβ-estradiol addition. For the whi5Δ haploid strain, containing only the β-estradiol-dependent, artificial transcription factor, we observed a slight but significantreduction of the relative mean mRNA concentrations of HTA2, HHF2 and HHO1at 30 nM compared to 0 nM β-estradiol, which was consistent with a slightlyincreased mean cell volumes at 30 nM β-estradiol. In contrast, performing the sameexperimental procedure on cell cultures of an inducible WHI5 haploid strain leads
to much stronger changes of mean cell volumes and relative mean mRNAconcentrations for all histone genes, demonstrating that the observed decrease ofhistone mRNA concentrations is specific to the Whi5-dependent cell volumeincrease (Supplementary Fig. 3a, d).
Live-cell fluorescence microscopy. Cultures (3 mL) were grown at 30 °C insynthetic complete media containing 2% glycerol and 1% ethanol (SCGE) for atleast 6 h in a shaking incubator at 250 rpm (Infors, Ecotron). Appropriate β-estradiol concentrations were then added to inducible cells (0 nM and 30 nM forhaploids or 50 nM for diploids) and the cultures were grown for at least 24 h toensure steady-state conditions. Optical densities were measured using a spectro-photometer (Perkin Elmer, Lambda Bio+) and OD600 < 1:0 was maintainedthrough appropriate dilutions during culture growth. For imaging, 1 mL of cells(OD600 < 1:0) was spun down at 10k g-force for 1 min (Thermo Fisher Scientific,Pico 17), resuspended in 200 µL SCGE and sonicated for 5 s (Bandelin electronics,HD2070 and UW2070). 100 µL of this cell suspension was then introduced in aCellasic microfluidics Y04C (haploids and non-induced diploids) or Y04D(induced diploids) plate. Note that no β-estradiol was used in the microfluidicdevice during the microscopy experiments, resulting in a gradual decrease of cellvolume of induced cells after the start of the experiment.
Live-cell fluorescence microscopy experiments were performed on a Zeiss LSM800 microscope (software installed: Zen 2.3, blue edition) with additional
b
c
aHTB1 ***
WT htb2∆
Nor
mal
ized
rela
tive
conc
entra
tion
2.5
1.5
0.5
2.0
1.0
0.0 + HTB1prom-mCitrine
mCitrine
ns
WT htb2∆
Nor
mal
ized
rela
tive
conc
entra
tion
2.5
1.5
0.5
2.0
1.0
0.0
Cell volume
Ploidy
1N(Haploid)
2N(Diploid)
histone production≈ constant
histoneproductionincreases
kon concentrationdecreases
limiting component oftranscriptional machinery
~ volume
General promoter pool
Histone promoter
+ HTB1prom-mCitrine
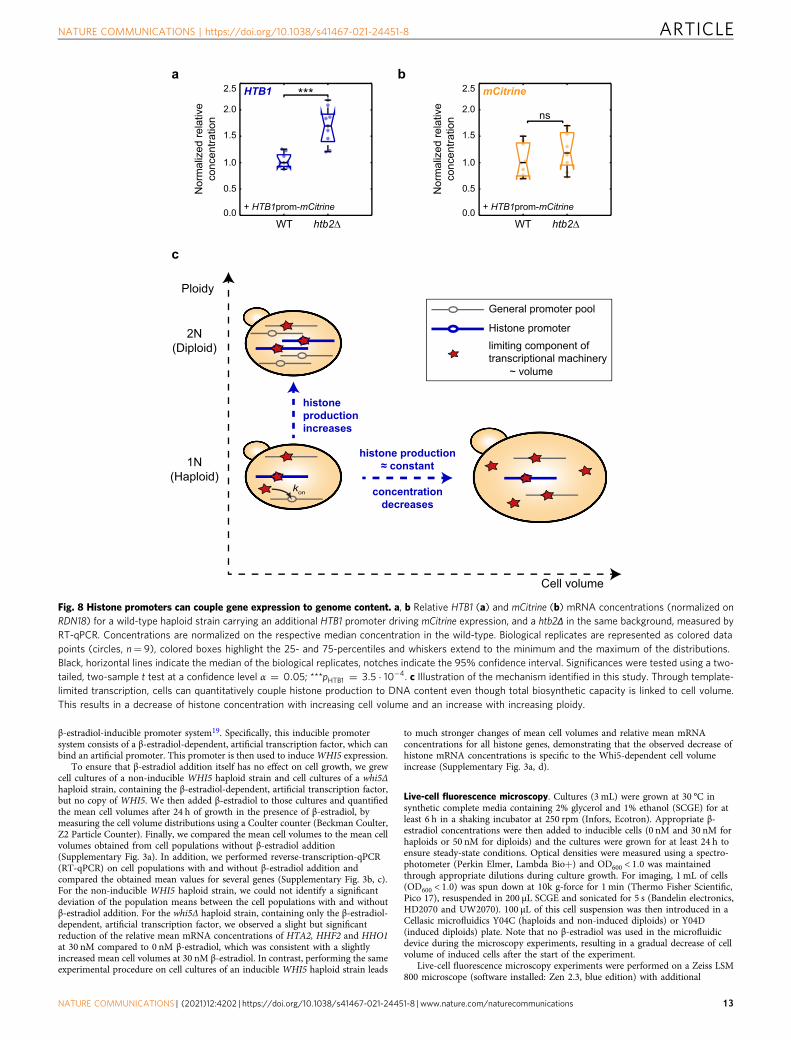
Fig. 8 Histone promoters can couple gene expression to genome content. a, b Relative HTB1 (a) and mCitrine (b) mRNA concentrations (normalized onRDN18) for a wild-type haploid strain carrying an additional HTB1 promoter driving mCitrine expression, and a htb2Δ in the same background, measured byRT-qPCR. Concentrations are normalized on the respective median concentration in the wild-type. Biological replicates are represented as colored datapoints (circles, n= 9), colored boxes highlight the 25- and 75-percentiles and whiskers extend to the minimum and the maximum of the distributions.Black, horizontal lines indicate the median of the biological replicates, notches indicate the 95% confidence interval. Significances were tested using a two-tailed, two-sample t test at a confidence level α ¼ 0:05; ***pHTB1 ¼ 3:5 � 10�4. c Illustration of the mechanism identified in this study. Through template-limited transcription, cells can quantitatively couple histone production to DNA content even though total biosynthetic capacity is linked to cell volume.This results in a decrease of histone concentration with increasing cell volume and an increase with increasing ploidy.
NATURE COMMUNICATIONS | https://doi.org/10.1038/s41467-021-24451-8 ARTICLE
NATURE COMMUNICATIONS | (2021) 12:4202 | https://doi.org/10.1038/s41467-021-24451-8 | www.nature.com/naturecommunications 13
epifluorescence setup using a Cellasic microfluidics device to ensure constantmedia (SCGE) flow in the microfluidics plate throughout the experiment.Experiments ran for 12 h with images being taken every 3 min using an automatedstage (WSB Piezo Drive Can), a plan-apochromat 40×/1.3 oil immersion objectiveand an axiocam 506 camera. Phase-contrast images were taken at an illuminationvoltage of 4.5 V and an exposure time of 30 ms. mCitrine images were taken usingthe Colibri 511 LED module at 25% power and an exposure time of 10 ms. For eachcondition, at least two independent biological replicates were measured on differentdays. For experiments performed on cells with fluorescently tagged HTB1 and cellscarrying an additional promoter driving mCitrine expression, a microscopemaintenance service had to be performed between imaging of biological replicates,which resulted in increased illumination intensities. Imaging parameters for themCitrine channel were adjusted to avoid photo toxicity: images were taken usingthe Colibri 511 LED module at 5% power and an exposure time of 100 ms.
To correct for inaccuracies of the x–y-stage between time points, movies werefirst aligned using a custom Fiji46 script. Then, cell segmentation and quantificationof the fluorescent signal as well as subtraction of background fluorescence and cell-volume-dependent autofluorescence (determined from control strains notexpressing a fluorescent protein), and determination of time points of cell birth,bud emergence, and cytokinesis were performed with MATLAB 2017b usingpreviously described methods17,18,47. For our analyses, we only included cells bornduring the experiment. Total fluorescence intensity after background- andautofluorescence correction was used as a proxy for total protein amount.
In order to determine total protein concentrations as total protein amountsdivided by cell volume, we calculated cell volumes based on phase-contrast images.Briefly, after segmentation, cell areas were aligned along their major axis. We thendivided the cells into slices perpendicular to their major axis, each 1 pixel in width.To estimate cell volume, we then assumed rotational symmetry of each slice aroundits middle axis parallel to the cell’s major axis, and summed the volumes of eachslice to obtain total cell volume. This allowed us to analyze protein amounts andprotein concentrations as a function of cell volume.
Estimation of cell-cycle phases and histone production period using live-cellmicroscopy. To test whether the decrease of histone concentrations with cellvolume could be explained by a decrease in the S-phase duration, and thus ashorter time period during which histones are produced, we aimed to estimate theduration of the histone production period (H-period; referred to as mCitrineproduction period for strains in which a histone promoter is driving mCitrineexpression) from the mCitrine fluorescent intensity traces. For each single cell, wefirst performed a constant linear fit in each of the two plateaus of the fluorescenceintensity, linked to G1- or G2/M-phase, respectively, and denoted them as P1 andP2. P1 was obtained by performing the linear fit through the data points of thefluorescent intensity trace from cell birth to first bud emergence, P2 was obtainedby performing the linear fit through the last 30 min of the fluorescent intensitytrace. We then set a threshold of 5%, determined the last time point for whichImCitrine <P1 þ 0:05 � P1, and defined this time point as the beginning of the H-period. Similarly, we defined the first time point for which ImCitrine > P2 � 0:05 �P2 as the end of the H-period. Finally, the duration of the H-period was calculatedas the difference between those two time points. We defined G1-phase duration asthe time from cell birth to first bud emergence, and G2/M duration as the timebetween the end of the H-period and cytokinesis. Cells for which this approachfailed where excluded from the cell-cycle phases analysis.
Normalization of single cell fluorescent intensity traces after microscopemaintenance service. In order to pool experimental data from two biologicalreplicates imaged before and after maintenance service, respectively (Figs. 1c, 4a–c,7a, b, Supplementary Fig. 7a, b, Supplementary Fig. 9a–d), intensities of single celltraces for the experiments taken before maintenance service were normalized to theintensities of experiments performed after maintenance service. For this purpose,the mean P1 of all single cell traces before and after maintenance service wascalculated and a normalization factor a; determined as:
a ¼ PAfter1;mean=P
Before1;mean ð1Þ
Single cell traces before maintenance service were then multiplied with a andthose normalized single cell traces then pooled with single cell traces obtained aftermaintenance service.
Estimation of mCitrine synthesis peak using live-cell microscopy. To char-acterize the cell-cycle-dependence of transcription from full and truncated histonepromoters, we estimated the mCitrine synthesis rates from the mCitrine fluores-cence intensity traces. For this purpose, we calculated the difference in mCitrineintensity between frame xnþ 1 and frame xn, for each frame of the single cell traces,which corresponds to the mCitrine synthesis as a function of time. To removemeasurement noise, we then calculated moving averages over three frames for themCitrine synthesis curves. Finally, we calculated the mean of those smoothed singlecell curves and show the mean for the time span during which at least ten singlecell traces were included in the average.
RNA extraction and RT-qPCR. Cultures (25 mL) were grown at 30 °C in yeastpeptone media containing 2% glucose (YPD) for at least 6 h in a shaking incubatorat 250 rpm, before being washed and transferred to SCGE. The cultures were grownfor at least 16 h before appropriate β-estradiol concentrations were added toinducible cells (0, 10, and 30 nM). The cultures (final volume of 50 mL) were thengrown for at least 24 h in order to ensure steady-state conditions. During culturegrowth, OD600 < 1:0 was maintained through appropriate dilutions. Cell-volumedistributions of the cultures were measured with a Coulter counter after sonicationfor 5 s.
Remaining cell cultures were spun down at 4000 rpm for 5 min and the cellpellet resuspended in 50 µL nuclease-free water (Qiagen). Total RNA was extractedusing a hot acidic phenol (Sigma-Aldrich) and chloroform (Thermo FisherScientific) extraction method adapted from an established protocol48. Yield of RNAwas increased by precipitation in 100% ethanol (Merck Millipore) at −20 °Covernight, followed by a second precipitation in 100% ethanol at −80 °C for 2–4 h.As a quality check for total RNA extraction, agarose gel electrophoresis (1% agarosegel, run 30 min at 100 V) was performed to check for the presence of the 25, 18,and 5.8 s ribosomal RNA bands. Concentration and purity of the RNA sampleswere measured with a spectrophotometer (Thermo Fisher Scientific, NanoDrop2000) at 260 nm and 280 nm. cDNA was then obtained from 800 ng total RNA in aPCR cycler (Applied Biosystems, ProFlex PCR system 3 × 32-well) using randomprimers and a high-capacity cDNA reverse-transcription kit following the includedprotocol (Thermo Fisher Scientific).
Quantitative PCR (qPCR) measurements were carried out on a LightCycler 480Multiwell Plate 96 (Roche) using a DNA-binding fluorescent dye (BioRad,SsoAdvanced Universal SYBR Green Supermix) and mRNA sequence specificprimers (Sigma-Aldrich). The qPCR was performed with 2 µL of a 1:10 dilution ofthe cDNA for the genes ACT1, HHO1, HTB2 and mCitrine, or a 1:100 dilution forall other genes. Melting curve data were analyzed to verify primer specificity. Eachsample was measured in technical duplicates and the mean value CGene
P was usedfor further analyses if σCGene
P< 0:5. Relative concentrations, normalized on the
reference gene RDN18 were calculated using the equation:
log2 relative concentrationð Þ ¼ � CGeneP � CRDN18
P
� � ð2ÞIn order to analyze relative concentrations as a function of cell volume, the
mean cell volumes were determined from the measured cell volume distributions.For each condition measured, the RT-qPCR experiments were performed at leastthree times on different days.
Test for qPCR primer specificity. To test the specificity of the qPCR primer usedto quantify histone mRNA concentrations, we analyzed deletion strains, wherepossible, for their respective deleted gene to check for unspecific primer binding.For example, we performed a qPCR measurement with the HHO1 primers on ahho1Δ strain and compared the obtained CPvalues with the CP values obtained inthe reference strain MS63-1 (Supplementary Table 1). We constructed deletionstrains for the genes HHO1, HTB2, HHF1, HHF2, HHT1, and HHT2, for which weobtained viable colonies without dramatic growth defects. RNA was extracted asdescribed above, and 1 µg of total RNA was reverse-transcribed using the abovementioned high-capacity cDNA synthesis kit. The qPCR was performed with 2 µLof a 1:10 dilution of each cDNA sample, and measured in 3 or 6 technical repli-cates. CP values and melting curve data were analyzed to verify primer specificity.Results are shown in Supplementary Table 2, deletion strains used are listed inSupplementary Table 1, a list of all qPCR primers used can be found in Supple-mentary Table 3.
Flow cytometry. Cultures (2–5 mL) were grown in YPD for at least 6 h in ashaking incubator (30 °C, 250 rpm) before being washed and transferred to SCGEand grown for at least 16 h. Appropriate β-estradiol concentrations were thenadded to inducible cells (0 nM and 30 nM for haploids or 50 nM for diploids), andthe cultures grown for at least 24 h in a final volume of 3–5 mL. During cell growth,OD600 < 1:3 was maintained through appropriate dilutions.
Cell-volume distributions of cultures were measured with a Coulter counterafter sonication for 5 s. Cells were fixed using a 37% formaldehyde solution (Sigma-Aldrich) by pipetting 100 µL of formaldehyde into 900 µL of cell cultures in orderto achieve a final formaldehyde concentration of 3.7%. Cultures were incubated atroom temperature on a rotator (VWR International, Tube Rotator) for 15 min,spun down at 10 k g-force for 3 min and subsequently washed and resuspended in100–1000 µL 100 mM potassium phosphate (pH 7.5). Samples were then stored onice until being used for flow cytometry.
Flow Cytometry measurements were carried out on a benchtop flow cytometerwith octagon and trigon detector arrays (BD Biosciences, LSR II, software installed:BD FACSDiva 8.0.1). Strains expressing the fluorescent protein mCitrine wereexcited with a 488 nm coherent sapphire solid-state laser paired with a 530/30 nmfilter set. Side-scatter voltage was set to 220 V for all measurements, voltages forforward-scatter and photomultiplier tubes were adjusted depending on whetherhaploid or diploid cells or both were being measured. However, identical settingswere used for replicate experiments. After removing obvious outliers or potentialdoublets through standard gating strategies (Supplementary Fig. 11), at least 10.000cells were measured in the final stopping gate. For each experiment, cells notexpressing mCitrine were measured to determine the cell-volume-dependent
ARTICLE NATURE COMMUNICATIONS | https://doi.org/10.1038/s41467-021-24451-8
14 NATURE COMMUNICATIONS | (2021) 12:4202 | https://doi.org/10.1038/s41467-021-24451-8 | www.nature.com/naturecommunications
autofluorescence background which was subtracted from the mean fluorescenceintensity of each sample measured in the same experiment. In order to calculatefluorescence concentrations, mean cell volumes were determined from the cellvolume distributions measured with the Coulter counter. Mean fluorescenceconcentrations were then calculated by dividing the mean fluorescence intensity ofeach sample by its mean cell volume, allowing us to analyze mCitrine fluorescenceconcentrations as a function of cell volume. For each condition measured, the flowcytometry experiments were performed at least three times on different days.
Cell-cycle analysis using flow cytometry. To get insights into the distributions ofcell-cycle phases in cell populations of non-inducible and inducible-WHI5 haploidand diploid strains, we performed cell-cycle analysis using flow cytometry. For thispurpose, cell cultures (5 mL) were grown in YPD for at least 6 h in a shakingincubator (30 °C, 250 rpm), before being washed and transferred to SCGE, whereappropriate β-estradiol concentrations were added (10 nM or 30 nM for haploidcells, 50 nM for diploid cells). The cultures were then grown for at least 24 h,assuring OD600 < 1:3 during culture growth through appropriate dilutions. Cell-volume distributions of cultures were measured with a Coulter counter aftersonication for 5 s. To fixate the cells and subsequently stain the DNA, we followedan already established protocol49. Specifically, 1 mL of each cell culture waspipetted into 9 mL of cold 80% ethanol and incubated at 4 °C on a rotator over-night. The cultures were then spun down at 4000 rpm for 2 min and washed twicein 50 mM Tris-HCl (pH= 8.0). Cells were then successively treated with a 1 mg/mL RNase A (Thermo Fisher Scientific) solution for 40 min at 37 °C, a 20 mg/mLProteinase K (Promega) solution for 1 h at 37 °C and a 10x SYBR Green I (Sigma-Aldrich) solution for 1 h at room temperature. Between each treatment, cells werewashed twice with 50 mM Tris-HCl and resuspended in 50 mM Tris-HCl. After thelast treatment, cells were sonicated for 5 s. Flow Cytometry measurements werecarried out on the benchtop flow cytometer described above, using the same laser,filter sets and side-scatter voltage. Settings for forward-scatter and photomultipliertubes were adjusted depending on the condition measured. To estimate cell-cyclefractions, imaged DNA content frequency histograms were analyzed using Watsonmodeling. However, we noticed that for cell populations with large cell volumes(i.e., high β-estradiol concentrations), the DNA content distributions showedpronounced tails at large cell volumes that were not fit by the model. We speculatethat this tail represents an increased mitochondrial DNA content in large cells50,which suggests that a fraction of G1 cells would be wrongly identified as S phase.Thus, we decided to limit our analysis to classifying cells as either G1/S-phase orG2/M-phase (Supplementary Fig. 1c). Using this approach, we did not find adrastic influence of the β-estradiol concentration used for Whi5 induction on thecell-cycle distributions. For each condition measured, the experiments were per-formed two times on different days.
Single-molecule fluorescence in situ hybridization (smFISH). To detect indi-vidual mRNA molecules in single cells, we used commercially available Stellaris®
FISH probes. The custom probe set for the coding sequence of mCitrine wasdesigned using the Stellaris® FISH Probe Designer (Biosearch Technologies,available online at www.biosearchtech.com/stellarisdesigner) and consisted of 27probes, each 18 nucleotides long and labeled with the fluorophore Quasar®—670(Biosearch Technologies).
smFISH was carried out according to the Stellaris® RNA FISH Protocol for S.cerevisiae, available online at www.biosearchtech.com/stellarisprotocols. Cultures(5 mL) were grown in YPD for at least 6 h in a shaking incubator (30 °C, 250 rpm)before being washed and transferred to SCGE. Those cultures were then grownovernight to reach OD600 � 0:25� 0:4 and fixed the next morning by adding 5mL of 37% formaldehyde to 45 mL of cell culture (final concentration 3.7%) andincubating at room temperature for 45 min. After washing the cells twice with ice-cold fixation buffer (1.2 M sorbitol (Sigma-Aldrich), 0.1 M K2HPO4 (Sigma-Aldrich), pH 7.5), they were digested at 30 °C in 1 mL fixation buffer containing6.25 µg zymolyase (Biomol). Progression of cell digestion was monitored usingbright-field microscopy (VWR International, VisiScope BL114) and digestion wascontinued until most of the cells appeared dark, which was mostly the case after 55min of incubation. The digested cells were then washed with ice-cold fixationbuffer and stored at 4 °C in 70% EtOH overnight. For hybridization, 300 μL ofdigested cells were centrifuged, resuspended in 100 µL hybridization buffer(Stellaris® RNA FISH Hybridization Buffer (Biosearch Technologies) with 10% v/vformamide (VWR International)) with a final Stellaris® FISH probe concentrationof 125 nM and hybridized overnight at 30 °C. Afterwards, cells were washed withwash buffer A (Stellaris® RNA FISH 1X wash buffer A (Biosearch Technologies)with 10% v/v formamide), incubated in 1 mL of a DAPI solution (5 ng/mL DAPI inwash buffer A) at 30 °C for 30 min to stain the nuclear DNA and washed withStellaris® RNA FISH wash buffer B. For image acquisition, cell samples weremounted between glass microscopes slides (Thermo Fisher Scientific, Superfrostplus, 25 × 75 × 1mm) and cover slides (VWR International, 18 × 18 mm No. 1)using Vectashield® Mounting Medium (Vector Laboratories) and were allowed tosettle overnight. Cells were imaged on a Zeiss LSM 800 microscope with additionalepifluorescence setup using a 63×/1.4 oil immersion objective and an axiocam 506camera. Stacks composed of 20 z-slices (0.24 µm step size) were acquired to coverthe entire depth of cells. For each condition, multiple images were taken perexperiment and at least two independent biological replicates were measured on
different days. Before a microscope maintenance service, mCitrine images weretaken using the Colibri 630 LED module at 55% power and an exposure time of 5 s.DAPI images were taken using the Colibri 385 LED module at 30% power and anexposure time of 130 ms. After microscope maintenance, mCitrine images weretaken at 30% power and an exposure time of 5 s to roughly match the intensities inthe images taken before. DAPI images were taken at 20% power and an exposuretime of 80 ms. Bright-field images were consistently taken at an illuminationvoltage of 3 V and an exposure time of 100 ms.
Quantification of mRNA spots with smFISH. To analyze the smFISH images andquantify single mRNA spots, we used FISH-quant v351. Briefly, we first segmentedthe cells in the FISH-quant interface by manually tracing the outlines of the cellsand the nuclei with the help of bright-field and DAPI images, respectively. In orderto calculate cell volumes from the cell outlines, we then used the same method asdescribed above by aligning the cells along their major axis, dividing them intoslices perpendicular to their major axis, each 1 pixel in width, and then assumingrotational symmetry of each slice around its middle axis parallel to the cell’s majoraxis. Total cell volume was then obtained by summing the volumes of each slice.
To quantify single mRNA spots in the imaged cells, we used the batchprocessing tool of FISH-quant. First, we defined the ideal image filtering settings,resulting in images with little background and bright, localized spots, for eachexperiment by applying a Laplacian of Gaussian filter on one example image ofeach experimental condition. Quality of the filtered image was confirmed by visualinspection. Second, we performed a pre-detection of mRNA spots in this filteredexample image to define the best intensity thresholds to use for the spot detectionin the batch processing. We aimed to use example images containing at least one S-phase cell (with high number of mRNA spots). Finally, we analyzed all imagesbelonging to the same experimental condition via FISH-quant batch processing.mRNA spots were detected and then fit with a 3D Gaussian on the raw, unfilteredimages, allowing us to set different maximum thresholds for the spot sizes in xyand z, as well as a minimum threshold for the amplitude and intensity of thedetected spots in order to differentiate background spots from real mRNA spots.Using this approach, most spots detected in a wild-type strain carrying no mCitrineallele were excluded, and we thus neglected the contribution of background in themRNA mCitrine concentration for further analysis (Supplementary Fig. 7h).mCitrine mRNA concentration was estimated as the number of mRNA spotsdetected with FISH-quant in the whole cell including the bud, divided by the totalcell volume including the bud.
Classification of cell-cycle stages with smFISH. To classify cells in G1, S, or G2/M phase, we used the cell and nucleus segmentations performed with the help ofbright-field and DAPI images. Cells having nuclear signal and no bud were clas-sified as G1 cells, cells having a nuclear signal and a bud without nuclear signalwere classified as S phase. However, if the ratio of bud area divided by mother areawas greater than 0.3, the cells were classified as G2M cells instead. For cells havingnuclear signal and a bud that also had nuclear signal, we ensured that they were stillin G2M (rather than two separate G1 cells) by inspecting the bright-field and DAPIimages.
Volume-dependence parameter. Analyzing protein and mRNA concentrations asa function of cell volume reveals a decrease of concentration with increasing cellvolume for histones. In order to quantify this decrease, we performed a linearregression on the double-logarithmic data and define the slope of the fit as theVDP:
log2 cð Þ ¼ log2ðc0Þ þ VDP � log2 Vð Þ ð3ÞThe VDP gives us a quantitative measure for the relation of protein and mRNA
concentrations with cell volume: a negative VDP indicates a decrease ofconcentration with increasing cell volume. The special case of VDP ¼ �1corresponds to a decrease of concentration with c � 1=V , and therefore signifies aconstant amount of protein or mRNA with increasing cell volume. A positive VDPindicates an increase of concentration with increasing cell volume, and VDP ¼ 0corresponds to a constant concentration c0.
Statistical analysesSignificance of VDPs. To test for a significant deviation of the VDP from 0, weperformed two-tailed one-sample t tests on the regression coefficients of the linearfit at a confidence level of α ¼ 0:05: Our null hypothesis H0 assumes therespective coefficient to be equal to 0. In order to test for the significance of theVDP, we are interested in the slope of the linear fit: for a p value smaller than α, wereject H0 and consider the slope, i.e., the VDP, to be significantly different from 0.
To test whether the VDPs of two different conditions significantly deviate fromeach other, we used a general linear regression model with a categorical variable,Type, to differentiate between the two conditions analyzed:
log2 cð Þ ¼ log2ðc0Þ þ VDP0 � log2 Vð Þ þ δ1 � Type þ δ2 � Type � log2 Vð Þ ð4Þwith c0 and VDP0 corresponding to the reference condition ðType ¼ 0Þ, δ1describing the average difference in the intercepts of the linear fits between the twoconditions, and δ2 describing the change in the slopes (VDPs) between the two
NATURE COMMUNICATIONS | https://doi.org/10.1038/s41467-021-24451-8 ARTICLE
NATURE COMMUNICATIONS | (2021) 12:4202 | https://doi.org/10.1038/s41467-021-24451-8 | www.nature.com/naturecommunications 15
conditions. In order to test for a significant difference between the two VDPs, weperform a two-tailed one-sample t test on δ2; with the null hypothesis H0 assumingδ2 = 0, at a confidence level of α ¼ 0:05. For a p value smaller than α, we reject H0and consider the change between the two slopes to be significant, i.e., we considerthe two VDPs to be significantly different from each other.
Error estimation of concentrations at 60 fL. To calculate concentrations at a char-acteristic cell volume of 60 fL with respective error estimates, we evaluated thelinear fits to the double-logarithmic data at 60 fL and estimated the 95% confidenceintervals of the fit at 60 fL. When normalizing the concentration to a chosen valuex, errors were calculated using error propagation:
4y ¼ y �ffiffiffiffiffiffiffiffiffiffiffiffiffiffiffiffiffiffiffiffiffiffiffiffiffiffiffiffiffiffiffiffiffiffiffiffiffiffiffiffiffi4c2
c2
� �2
þ 4x2
x2
� �2s
ð5Þ
with y being the new normalized concentration and c the previously calculatedconcentration.
To estimate the error associated with the ratio between the concentrations at 60 fLin haploids and diploids, we used bootstrap analysis. Specifically, we treated themeasurements of protein or mRNA concentration and corresponding cell volume as aset of linked variables, both for haploid and diploid cells. We then resampled n=10,000 populations of same size by random sampling with replacement from thisexperimental two-dimensional population. Next, we performed a linear regression onthe double-logarithmic data for each of the resampled populations and estimated theconcentration at 60 fL, giving us a distribution of n= 10,000 concentrations at 60 fLfor both haploid and diploid cells. Finally, we randomly selected a concentration ineach of those distributions, and divide the concentration for diploids by theconcentration for haploids. We repeated this process 10,000 times with replacementto obtain a distribution of n= 10,000 concentration ratios, for which we calculate themedian and the 2.5- and 97.5-percentiles.
Comparison of population means. When comparing distributions of mean cellvolumes determined with a Coulter counter, or mRNA concentrations determinedwith either RT-qPCR or smFISH, we performed the following statistical tests to assesswhether the population means were significantly different from each other. First, weperformed a Shapiro–Wilk test at a confidence level of α ¼ 0:05 to test whether thedistributions were normally distributed. For normal distributions, we then performeda Bartlett test at a confidence level of α ¼ 0:05 to test whether equal variances of thedistributions could be assumed. If we could assume equal variances, we performed atwo-tailed, two-sample t test assuming equal variances with the null hypothesis H0assuming equal means, at a confidence level of α ¼ 0:05. If we could not assumeequal variances, we performed a two-tailed, two-sample t test assuming unequalvariances. For a p value smaller than α, we reject H0 and consider the means of thedistributions to be significantly different from each other.
If we could not assume normal distributions, after performing theShapiro–Wilk test, we performed a Kruskal–Wallis test with the null hypothesis H0assuming that our distributions are from the same population, at a confidence levelof α ¼ 0:05. For a p value smaller than α, we reject H0 and consider thedistributions to not be from the same population.
Minimal model. To obtain mechanistic insight on how the transcription rate ofone specific promoter depends on cell volume and ploidy context, we sought tobuild a minimal model. Similar to Heldt et al.37 we consider transcription beinglimited by one component of the transcriptional machinery, potentially a subunitof the RNA polymerase. In addition, we assume transcript degradation to be thesame for all transcripts, and set the corresponding degradation rate kdeg= 1, i.e., allother rates are normalized with respect to kdeg. Note that in the case of stabletranscripts, kdeg also describes dilution of transcripts by cell growth.
To account for the competition of different promoters for a finite number of thelimiting component of the transcriptional machinery (TM), our modeldistinguishes two classes of promoters—a general pool of promoters, g, with nh �6000 (haploids) or nd � 12000 (diploids), and a single promoter of interest, p,present as a single copy. We describe each promoter as one single binding site forTM and denote the number of TM bound to general promoters as Rg . Binding ofTM at the single promoter of interest is described by Rp, which can assume valuesbetween 0 (not bound) and 1 (bound). Moreover, Rf denotes the number of freeTM. We assume that the total number of TM (free and bound) scalesproportionally to cell volume V and is given by
Rg þ Rp þ Rf ¼ cTMV ð6Þwith cTM being the total TM concentration.
Assuming that the arrival of TM at promoters is proportional to theconcentration of free TM, the change in number of bound general promoters overtime is given by following equation:
dRg
dt¼ kgon nh=d � Rg
� �Rf
V� kgoffR
g ð7Þ
where kgon is the rate at which transcription is being initiated at each generalpromoter, nh=d � Rg are the number of general promoters not bound to TM in
haploids or diploids, respectively, and kgoff models the rate at which bound TMcomplete transcriptional elongation.
Similarly, the change in binding of TM to the single promoter of interest overtime is given by:
dRp
dt¼ kpon 1 � Rpð ÞR
f
V� kpoffR
p ð8Þ
with parameters kpon and kpoff representing transcriptional initiation and elongation,respectively, at the promoter of interest.
Solving (7) and (8) at steady-state ðdRg
dt ¼ dRp
dt ¼ 0Þ, constraints the number ofbound TMs via the following nonlinear equations
kgon nh=d � Rg� �Rf
V¼ kgoffR
g ð9Þ
kpon 1 � Rpð ÞRf
V¼ kpoffR
p ð10Þ
Finally, the steady-state concentration of transcripts produced from the singlepromoter of interest is equal to kpoffR
p=V .Given a set of parameters cTM; k
gon; k
goff ; k
pon k
poff , numerically solving Eqs. (6),
(9) and (10) allows to calculate the transcript concentration, generated by the singlepromoter of interest as a function of cell volume V . We set cTM ¼ 2000; kgon ¼1; kgoff ¼ kpoff ¼ 3 and calculate the steady-state concentration in haploids anddiploids over cell volume for kpon ¼ 0:01; 100½ �.
In order to determine the VDP as a function of kpon, we calculated theconcentration for each value of kpon over a cell volume range of V ¼ 1
3 ; 3
andperformed a linear regression fit on the logarithm of the concentration as afunction of the logarithm of the cell volume, with cell volumes being equally spacedon the log scale. The VDP is then determined as the slope of the linear fit.
Reporting summary. Further information on research design is available in the NatureResearch Reporting Summary linked to this article.
Data availabilityThe data that supports this study is available from the corresponding author uponreasonable request. Source data are provided with this paper.
Received: 10 August 2020; Accepted: 18 June 2021;
References1. Marguerat, S. & Bähler, J. Coordinating genome expression with cell size.
Trends Genet. 28, 560–565 (2012).2. Schmoller, K. M. & Skotheim, J. M. The biosynthetic basis of cell size control.
Trends Cell Biol. 25, 793–802 (2015).3. Zhurinsky, J. et al. A coordinated global control over cellular transcription.
Curr. Biol. 20, 2010–2015 (2010).4. Padovan-Merhar, O. et al. Single mammalian cells compensate for differences
in cellular volume and DNA copy number through independent globaltranscriptional mechanisms. Mol. Cell 58, 339–352 (2015).
5. Sun, X. M. et al. Size-dependent Increase in RNA polymerase II initiation ratesmediates gene expression scaling with cell size. Curr. Biol. 30, 1217–1230 (2020).
6. Nadal-Ribelles, M. et al. Sensitive high-throughput single-cell RNA-seq revealswithin-clonal transcript correlations in yeast populations. Nat. Microbiol. 4,683–692 (2019).
7. Amodeo, A. A., Jukam, D., Straight, A. F. & Skotheim, J. M. Histone titrationagainst the genome sets the DNA-to-cytoplasm threshold for the Xenopusmidblastula transition. PNAS 112, E1086–E1095 (2015).
8. Joseph, S. R. et al. Competition between histone and transcription factorbinding regulates the onset of transcription in zebrafish embryos. Elife 6,e233226 (2017).
9. Hauer, M. H. et al. Histone degradation in response to DNA damage enhanceschromatin dynamics and recombination rates. Nat. Struct. Mol. Biol. 24,99–107 (2017).
10. Chari, S., Wilky, H., Govindan, J. & Amodeo, A. A. Histone concentrationregulates the cell cycle and transcription in early development. Dev 146,dev177402 (2019).
11. Kim, U. J., Han, M., Kayne, P. & Grunstein, M. Effects of histone H4 depletionon the cell cycle and transcription of Saccharomyces cerevisiae. EMBO J. 7,2211–2219 (1988).
12. Han, M., Chang, M., Kim, U. J. & Grunstein, M. Histone H2B repressioncauses cell-cycle-specific arrest in yeast: Effects on chromosomal segregation,replication, and transcription. Cell 48, 589–597 (1987).
ARTICLE NATURE COMMUNICATIONS | https://doi.org/10.1038/s41467-021-24451-8
16 NATURE COMMUNICATIONS | (2021) 12:4202 | https://doi.org/10.1038/s41467-021-24451-8 | www.nature.com/naturecommunications

13. Meeks-Wagner, D. & Hartwell, L. H. Normal stoichiometry of histone dimersets is necessary for high fidelity of mitotic chromosome transmission. Cell 44,43–52 (1986).
14. Eriksson, P. R., Ganguli, D., Nagarajavel, V. & Clark, D. J. Regulation ofhistone gene expression in budding yeast. Genetics 191, 7–20 (2012).
15. Kurat, C. F. et al. Regulation of histone gene transcription in yeast. Cell. Mol.Life Sci. 71, 599–613 (2014).
16. Gunjan, A. & Verreault, A. A Rad53 Kinase-dependent surveillancemechanism that regulates histone protein levels in S. cerevisiae. Cell 115,537–549 (2003).
17. Doncic, A., Eser, U., Atay, O. & Skotheim, J. M. An algorithm to automateyeast segmentation and tracking. PLoS ONE 8, e57970 (2013).
18. Schmoller, K. M., Turner, J. J., Kõivomägi, M. & Skotheim, J. M. Dilution ofthe cell cycle inhibitor Whi5 controls budding-yeast cell size. Nature 526,268–272 (2015).
19. Ottoz, D. S. M., Rudolf, F. & Stelling, J. Inducible, tightly regulated and growthcondition-independent transcription factor in Saccharomyces cerevisiae.Nucleic Acids Res. 42, e130 (2014).
20. Norris, D. & Osley, M. A. The two gene pairs encoding H2A and H2B playdifferent roles in the Saccharomyces cerevisiae life cycle. Mol. Cell. Biol. 7,3473–3481 (1987).
21. Moran, L., Norris, D. & Osley, M. A. A yeast H2A-H2B promoter can beregulated by changes in histone gene copy number. Genes Dev. 4, 752–763(1990).
22. Cross, S. L. & Smith, M. M. Comparison of the structure and cell cycleexpression of mRNAs encoded by two histone H3-H4 loci in Saccharomycescerevisiae. Mol. Cell. Biol. 8, 945–954 (1988).
23. von der Haar, T. A quantitative estimation of the global translational activityin logarithmically growing yeast cells. BMC Syst. Biol. 2, 87–101 (2008).
24. Williamson, D. H. & Scopes, A. W. The distribution of nucleic acids andprotein between different sized yeast cells. Exp. Cell Res. 24, 151–153 (1961).
25. Mena, A. et al. Asymmetric cell division requires specific mechanisms foradjusting global transcription. Nucleic Acids Res. 45, 12401–12412 (2017).
26. Hereford, L., Fahrner, K., Woolford, J., Rosbash, M. & Kaback, D. B. Isolationof yeast histone genes H2A and H2B. Cell 18, 1261–1271 (1979).
27. Smith, M. M. & Murray, K. Yeast H3 and H4 histone messenger RNAs aretranscribed from two non-allelic gene sets. J. Mol. Biol. 169, 641–661 (1983).
28. Libuda, D. E. & Winston, F. Alterations in DNA replication and histone levelspromote histone gene amplification in Saccharomyces cerevisiae. Genetics 184,985–997 (2010).
29. Fillingham, J. et al. Two-color cell array screen reveals interdependent roles forhistone chaperones and a chromatin boundary regulator in histone generepression. Mol. Cell 35, 340–351 (2009).
30. Zunder, R. M. & Rine, J. Direct interplay among histones, histone chaperones,and a chromatin boundary protein in the control of histone gene expression.Mol. Cell. Biol. 32, 4337–4349 (2012).
31. Feser, J. et al. Elevated histone expression promotes life span extension. Mol.Cell 39, 724–735 (2010).
32. Canavan, R. & Bond, U. Deletion of the nuclear exosome component RRP6leads to continued accumulation of the histone mRNA HTB1 in S-phase ofthe cell cycle in Saccharomyces cerevisiae. Nucleic Acids Res. 35, 6268–6279(2007).
33. Beggs, S., James, T. C. & Bond, U. The PolyA tail length of yeast histonemRNAs varies during the cell cycle and is influenced by Sen1p and Rrp6p.Nucleic Acids Res. 40, 2700–2711 (2012).
34. Wu, C. Y., Alexander Rolfe, P., Gifford, D. K. & Fink, G. R. Control oftranscription by cell size. PLoS Biol. 8, e1000523 (2010).
35. Osley, M. A., Gould, J., Kim, S., Kane, M. & Hereford, L. Identification ofsequences in a yeast histone promoter involved in periodic transcription. Cell45, 537–544 (1986).
36. Eriksson, P. R., Ganguli, D. & Clark, D. J. Spt10 and Swi4 control the timing ofhistone H2A/H2B gene activation in budding yeast. Mol. Cell. Biol. 31,557–572 (2011).
37. Heldt, F. S., Lunstone, R., Tyson, J. J. & Novák, B. Dilution and titration ofcell-cycle regulators may control cell size in budding yeast. PLoS Comput. Biol.14, 1–26 (2018).
38. Osley, M. A. The Regulation of Histone Synthesis in the Cell Cycle. Annu. Rev.Biochem. (1991).
39. Mariño-Ramírez, L., Jordan, I. K. & Landsman, D. Multiple independentevolutionary solutions to core histone gene regulation. Genome Biol. 7, R122(2006).
40. Osley, M. A. & Lycan, D. Trans-acting regulatory mutations that altertranscription of Saccharomyces cerevisiae histone genes. Mol. Cell. Biol. 7,4204–4210 (1987).
41. Swaffer, M. P. et al. Size-independent mRNA synthesis and chromatin-basedpartitioning mechanisms generate and maintain constant amounts of proteinper cell. bioRxiv https://doi.org/10.1101/2020.08.28.272690 (2020).
42. Catala, M. & Abou Elela, S. Promoter-dependent nuclear RNA degradationensures cell cycle-specific gene expression. Commun. Biol. 2, 211 (2019).
43. Zatulovskiy, E., Zhang, S., Berenson, D. F., Topacio, B. R. & Jan, M. Cellgrowth dilutes the cell cycle inhibitor Rb to trigger cell division. Science 369,466–471 (2020).
44. Chen, Y., Zhao, G., Zahumensky, J., Honey, S. & Futcher, B. Differentialscaling of gene expression with cell size may explain size control in buddingyeast. Mol. Cell 78, 1–12 (2020).
45. Kukhtevich, I. V., Lohrberg, N., Padovani, F., Schneider, R. & Schmoller, K. M.Cell size sets the diameter of the budding yeast contractile ring. Nat. Commun.11, 2952 (2020).
46. Schindelin, J. et al. Fiji: an open-source platform for biological-image analysis.Nat. Methods 9, 676–682 (2012).
47. Chandler-Brown, D., Schmoller, K. M., Winetraub, Y. & Skotheim, J. M. Theadder phenomenon emerges from independent control of pre- and post-startphases of the budding yeast cell cycle. Curr. Biol. 27, 2774–2783 (2017).
48. Collart, M. A. & Oliviero, S. Preparation of Yeast RNA. Curr. Protoc. Mol.Biol. 23, 13.12.1–13.12.5 (1993).
49. Örd, M., Venta, R., Möll, K., Valk, E. & Loog, M. Cyclin-specific dockingmechanisms reveal the complexity of M-CDK function in the cell cycle. Mol.Cell 75, 76–89 (2019).
50. Rafelski, S. M. et al. Mitochondrial network size scaling in budding yeast.Science 338, 822–824 (2012).
51. Mueller, F. et al. FISH-quant: automatic counting of transcripts in 3D FISHimages. Nat. Methods 10, 277–278 (2013).
AcknowledgementsWe thank Matthew Swaffer and Anika Seel for sharing strains, Thomas Hofer andElfriede Nößner from the HMGU-Immunoanalytics-Core Facility for support with flowcytometry, and the Institute of Functional Epigenetics and the Skotheim lab for dis-cussions. We thank Matthew Swaffer, Amanda Amodeo, and Jan Skotheim for com-ments on the manuscript. This work was supported by the DFG through projectSCHM3031/4-1, by the Human Frontier Science Program (career development award toK.M.S.) as well as the Helmholtz Gesellschaft. A.S. was supported by NIH grants5R01GM124446 and 5R01GM126557.
Author contributionsK.-L.C., D.B., D.C., P.A., and K.M.S. designed and performed experiments and analyzedthe data. A.S. developed the mathematical model. All authors interpreted the results.K.-L.C, D.C., and K.M.S wrote the paper, receiving input from all authors.
Competing interestsThe authors declare no competing interests.
Additional informationSupplementary information The online version contains supplementary materialavailable at https://doi.org/10.1038/s41467-021-24451-8.
Correspondence and requests for materials should be addressed to K.M.S.
Peer review information Nature Communications thanks the anonymous reviewers fortheir contribution to the peer review of this work.
Reprints and permission information is available at http://www.nature.com/reprints
Publisher’s note Springer Nature remains neutral with regard to jurisdictional claims inpublished maps and institutional affiliations.
Open Access This article is licensed under a Creative CommonsAttribution 4.0 International License, which permits use, sharing,
adaptation, distribution and reproduction in any medium or format, as long as you giveappropriate credit to the original author(s) and the source, provide a link to the CreativeCommons license, and indicate if changes were made. The images or other third partymaterial in this article are included in the article’s Creative Commons license, unlessindicated otherwise in a credit line to the material. If material is not included in thearticle’s Creative Commons license and your intended use is not permitted by statutoryregulation or exceeds the permitted use, you will need to obtain permission directly fromthe copyright holder. To view a copy of this license, visit http://creativecommons.org/licenses/by/4.0/.
© The Author(s) 2021
NATURE COMMUNICATIONS | https://doi.org/10.1038/s41467-021-24451-8 ARTICLE
NATURE COMMUNICATIONS | (2021) 12:4202 | https://doi.org/10.1038/s41467-021-24451-8 | www.nature.com/naturecommunications 17


