Embed Size (px)
Citation preview
H I S T O N E - H I S T O N E I N T E R A C T I O N S V O L . 1 7 , N O . 1 8 , 1 9 7 8 3825
Biochemistry 14, 4304-4310. Epstein, M., Levitzki, A., & Reuben, J. (1974) Biochemistry
Frankenhaeuser, B. (1957) J . Physiol. 137, 261-266. Frankenhaeuser, B., & Hodgkin, A. L. (1957) J. Physiol. 137,
Fu, J.-j. L., Donner, D. B., Moore, D. E., & Hess, G. P. ( 1 977)
Goss, F. R., Ingold, C. K., & Wilson, I . S. (1926) J. Chem. SOC.
Hess, G. P., Bulger, J . E., Fu, J.-j. L., Hindy, E. F., & Silber- stein, R. J. (1975a) Biochem. Biophys. Res. Commun. 64,
Hess, G/ P., Andrews, J . P., Struve, G. E., & Coombs, S. E. (1975b) Proc. Natl. Acad. Sci. U.S.A. 72, 4371-4375.
Hess, G. P., Andrews, J . P., & Struve, G. E. (1 976) Biochem. Biophys. Res. Commun. 69, 830-837.
Hucho, F., & Changeux, J.-P. (1973) FEBS Lett. 38, 11- 15.
Hucho, F., Layer, P., Kiefer, H. R., & Bandini, G. (1976) Proc. Natl. Acad. Sci. U.S.A. 73, 2624-2628.
Karlin, A., & Cowburn, D. (1973) Proc. Natl. Acad. Sci.
Karlin, A., Prives, J . , Deal, W., & Winnik, M. (1971) J . Mol.
Klett, R. P., Fulpius, B. W., Cooper, D., Smith, M., Reich, E., & Possani, L. D. (1973) J . Biol. Chem. 248, 6841-6853.
Kohanski, R., Andrews, J . P., Wins, P., Eldefrawi, M. E., & Hess, G. P. (1977) Anal. Biochem. 80, 531-539.
Lindstrom, J., & Patrick, J . (1974) in Synaptic Transmission and Neuronal Interaction (Bennett, M. V. L., Ed.), pp 191-216, Raven Press, New York, N.Y.
Lindstrom, F., Einarson, B., & Merlie, J. (1978) Proc. Natl. Acad. Sci. U.S.A. 75, 769-773.
Lowry, 0. H., Rosebrough, N. J., Farr, A. L., & Randall, R. J . (1951) J . Biol. Chem. 193, 265-275.
Luk, C. K. (1971) Biochemistry 10, 2838-2843.
13, 1777-1782.
218-244.
Biochemistry 16, 678-684.
(11), 129, 2440-2462.
1018-1027.
U.S.A. 70, 3636-3640.
Biol. 61, 175-188.
Magnusson, S., Sottrup-Jensen, L., & Peterson, T. E. (1974) FEBS Lett. 44, 189-193.
Martinez-Carrion, M., & Raftery, M. A. (1973) Biochem. Biophys. Res. Commun. 55, 1156-1 164.
Meunier, J. C., Olsen, R. W., Menez, A., Fromageot, P., Bo- quet, p., & Changeux, J. P. (1972) Biochemistry 11, 1200- 1210.
Meunier, J. C., Sealock, R., Olsen, R., & Changeux, J . P. (1974) Eur. J . Biochem. 45, 371-394.
Michaelson, D., Vandlen, R., Bode, J . , Moody, T., Schmidt, J., & Raftery, M . A. (1974) Arch. Biochem. Biophys. 165,
Nachmansohn, D., & Neumann, E. (1975) Chemical and Molecular Basis of Nerve Activity, Academic Press, New York, N.Y.
Nelsestuen, G. L., Broderius, M., Zytkovicz, T. H., & Howard, J. B. (1975) Biochem. Biophys. Res. Commun. 65, 233- 240.
Patrick, J., Boulter, J., & O’Brien, J . C. (1975) Biochem. Biophys. Res. Commun. 64, 219-225.
Riibsamen, H., Hess, G. P., Eldefrawi, A. T., & Eldefrawi, M. E. (1976a) Biochem. Biophys. Res. Commun. 68, 56-63.
Riibsamen, H., Hess, G. P., Eldefrawi, A. T., & Eldefrawi, M. E. (1976b) Biochem. Biophys. Res. Commun. 70, 1029- 1027.
796-804.
Scatchard, G. (1949) Ann. N.Y. Acad. Sci. 51, 660-672. Schmidt, J., & Raftery, M. A. (1973) Biochemistry 12,
Stedman, E. (1927) J . Chem. SOC. (11), 1902-1906. Stenflo, J . (1974) J . Biol. Chem. 249, 5527-5535. Weber, K., Pringle, J . R., & Osborn, M. (1972) Methods
Enzymol. 26, 1-27. Weill, C. L., McNamee, M. G., & Karlin, A. ( 1 974) Biochem.
Biophys. Res. Commun. 61, 997-1003. Woyski, M. M., & Harris, R. E. (1963) in Treatise on Ana-
lytical Chemistry (Kolthoff, I. M., & Elving, P., Eds.), Part 11, Vol. 8, pp 57-58, Interscience, New York, N.Y.
852-855.
Yeast Inner Histones and the Evolutionary Conservation of Histone-Histone Interactions?
James K. W. Mardiant and Irvin Isenberg*
ABSTRACT: The inner histones of the yeast, Saccharomyces cereuisiae, have been isolated and identified by their amino acid compositions. H4 appears to be close to its calf and pea counterparts. H2a, H2b, and H3 have diverged. The isolation of the histones was accomplished by consecutive slab-gel fractionation, and a number of novel features of the method
s t u d i e s on the histones of Saccharomyces cereuisiae, the common baker’s yeast, began more than 10 years ago (Tonino
~ ~ ~~~~~ ~ ~~ ~
f From the Department of Biochemistry and Biophysics, Oregon State University, Corvallis, Oregon 9733 1. Received March 13, 1978. This in- vestigation was supported by Grant CA 10872, awarded by the National Cancer Institute, Department of Health, Education, and Welfare. * Present address: The University of Tennessee-Oak Ridge School of Biomedical Sciences, Biology Division, Oak Ridge National Laboratory, Oak Ridge, Tenn. 3783 I .
are described. These appear to be generally useful for preparing many types of protein. The binding pattern of the yeast inner histones is identical to the binding pattern for calf and for pea histones. Data on interspecies complexing indicate that the surfaces across which the histones interact are very highly conserved.
and Rozijn, 1966). Since that time, evidence has accumulated indicating that yeast contains four inner histones (Winters- berger et al., 1973; Franco et ai., 1974; Moll and Winters- berger, 1976; Brandt and von Holt, 1976; Thomas and Furber, 1976; Nelson et al., 1977). However, the presence of H1 in yeast has not yet been demonstrated. While partial fraction- ations of the yeast histones have been achieved (Franco et al., 1974; Brandt and von Holt, 1976), a complete fractionation has not yet been reported.
0006-2960/78/0417-3825$01 .OO/O 0 1978 American Chemical Society

3826 B I O C H E M I S T R Y M A R D I A N A h D I S E l c B E R G
Although all four inner histones exist in yeast, their sepa- ration has presented problems: They do not fractionate well when the methods that have worked with mammalian histones are used. For example, the yeast histones do not separate into individual fractions when the fractionation procedures of Johns are used (Franco et aL.1974). Mammalian histones may be separated by exclusion chromatography (Bohm et al., 1973; Sommer and Chalkley, 1974), yet Brandt and von Holt (1 976) reported that yeast histone fractions obtained by such means still contain significant quantities of numerous contaminating proteins.
Because of the difficulties with standard techniques for fractionating histones, we have turned to preparative electro- phoresis on slab gels to isolate the yeast inner histones (Isen- berg et al., 1975; Mardian and Isenberg, 1978). Our methods, in broad outline, are presented below; the general technique is described in more detail elsewhere (Mardian and Isenberg, 1978). Using consecutive slab-gel fractionation, we have been able to prepare the yeast inner histones, obtaining proteins of relatively high purity.
Similarities in gel migration alone cannot identify histones (Fazal and Cole, 1977). Furthermore, marked differences in gel migration do not demonstrate that the histones are not homologous; homologous H2a and H2b from calf and pea, for example, migrate quite differently on both acid-urea and h’aDodS04 gels (Spiker and Isenberg, 1977).
Since gel criteria are not sufficient to identify histones and since a complete fractionation of the yeast histones has not hitherto been made, it has not yet been possible to identify all of the yeast inner histones in a rigorous way.
Gel methods, however, can indicate the number of histones, and acid extracts of yeast show four prominent bands on acid-urea gels (Moll and Wintersberger, 1976; Brandt and von Holt, 1976). NaDodS04 extracts also show four bands on NaDodS04 gels (Thomas and Furber, 1976; Nelson et al., 1976). Although a consistent, definitive identification of all of the yeast inner histones has been lacking, one or another of them has been identified by separate methods (Franco et al., 1974; Brandt and von Holt, 1976).
Wintersberger et al. (1973) found three major fractions on acetic acid-urea gels, one of which comigrated with rat H4. Franco et al. ( 1 974), applying the fractionation procedures of Johns ( 1 964), found an H2a and an H 4 but were unable to observe H3 or H1. Two other fractions could not be separated by the techniques used, though the H2b-like nature of one of the fractions was noted. Brandt and von Holt (1976) confirmed the identification of H 4 and also presented very strong evidence for the existence of H 3 in yeast.
The lack of pure yeast histones has, of course, blocked physical and chemical studies of them. The preparation of the yeast inner histones, which we describe here, and which permits us to give a definitive identification, also permits us to give a description of their elementary properties. We have also studied the complexing of the yeast histones and comment on the evolutionary conservation of histone complexing.
In eukaryotes, two each of the inner histones form the core of the nucleosome ( O h and O h . 1974; Kornberg, 1974; Shaw et al., 1976; Olins et al., 1977; Joffe et al., 1977), with a length of DNA wrapped around the outside (Baldwin et al., 1975; Pardon et al., 1975). For the maintenance of nucleosomal structure, specific histone-histone interactions are necessary. The interactions of calf thymus and chicken erythrocyte his- tones have been studied by a variety of techniques (Skandrani et al., 1972; D’Anna and Isenberg, 1973, 1974a,b; Kornberg and Thomas, 1974; Roark et al., 1974; Clark et al., 1974; Sperling and Bustin, 1975; Weintraub et al., 1975; Lewis,
1976a-c; Bohm et al., 1977). An overall pattern of inner his- tone pairwise complexing has been reported (D’Anna and Isenberg, 1974b) and it has been found that three pairs of histones (H3-H4, H2b-H4, and H2a-H2b) form strong 1 : I complexes with each other, one pair (H2a-H3) forms a com- plex of intermediate strength, and the remaining two pairs (H2a-H4 and H2b-H3) interact weakly. This overall pattern has been shown to hold for pea histones as well (Spiker and Isenberg, 1977) and in fact has been used to identify the four pea inner histones unambiguously. Furthermore, by studying interkingdom interactions between pea and calf histones, it has been shown that, even though H2a and H2b are not conserved throughout the molecule, the binding sites between interacting histones have been highly conserved (Spiker and Isenberg. 1978).
In the five-kingdom classification proposed by Whittaker (1969), the fungi are placed in a separate kingdom and are thought of as representing a third major line of evolution alongside plants and animals. It is therefore of interest to see if fungal inner histones complex with one another in the same way as plant and animal histones do and, if so, whether these binding surfaces are also strongly conserved. To this end we have examined the interactions of the yeast inner histones. We find the histone binding pattern to be the same as that for calf and for pea histones. Furthermore, we find that yeast-calf complexes form with binding constants close to those of the intraspecies complexes. From this we conclude that the actual binding surfaces have been very highly conserved.
Materials and Methods Crude yeast histone was prepared from commercial pressed
baker‘s yeast (Red Star) using a scaled-up version of the method of Tonino and Rozijn (1 966), modified by adding 1 mM PhCH2SOZF to all solutions, from before the rupture of cells to the purification of the chromatin on sucrose
Crude histone preparations were also prepared by first iso- lating nuclei, according to the procedure of Wintersberger et al. (1973). using a pure culture derived from a single colony of Red Star yeast.
Yeast inner histones were isolated by consecutive slab-gel fractionation on polyacrylamide gels 3 X 140 X 102 nim (Bio-Rad Model 220). In the first slab-gel fractionation, H2a was separated from H2b, H3, and H 4 on a Triton gel. This preliminary fractionation also served to separate out a verb large number of proteins, other than histones, that were present in acid extracts of yeast chromatin. In the second slab-gel fractionation. an acetic acid-urea slab was used to separate the individual inner histones. The sequence of steps involved in each fractionation is indicated in Table I .
Acid-urea slabs were made according to Panyim and Chalkley (1969) with minor modifications. These contained 15% ( w / v ) acrylamide, 0.1% (w/v) bisacrylamide. 0.05Y0 (w/v) ammonium persulfate, 5% (w/v) acetic acid, 0.50/0 (u /v ) Temed,’ and 2.5 M urea. Triton slabs contained, in addition, 1% ( w / v ) Triton X-100 (.4lfageme et al., 1974). For Triton slabs, a 16-mL plug without Triton was first poured and al- lowed to polymerize to keep the gel from sliding out.
Preelectrophoresis was for 72 h with 5% (w/v) acetic acid in the upper and lower buffer chambers and an additional 48 h with acetic acid in the upper chamber and 6% ( v / v ) mer- captoacetic acid in the lower chamber. The upper buffer was changed twice daily throughout preelectrophoresis, and the
! Abbreviations used: CD. circular dichroism; F , relative fluorescence intensity; r , anisotropy; X . mole fraction; Temed, h , .~ ,? . ’ . .~’ - te t r ; i - methylethylenediamine.
H I S T O N E - H I S T O N E I N T E R A C T I O N S V O L 1 7 . N O 1 8 , 1 9 7 8 3827 -
r - S P
& - - *d.. -lllbal
TABLE I: The Seauence of Stem Followed in Fractionatine the Yeast Inner Histones by Conskutivc Slab-Gel FractionstTon on Two Different Types of Gels (See Methods).
Triton gel (1st fractionation)
preelectrophoresis scavenging electrophoresis localization by staining a strip drawing of cutting diagram
excision of bands elution Triton removal desalting
acid-urea gel (2nd fractionation)
preelectrophoresis scavenging electrophoresis cooling in liquid Nz photography of phosphorescing
drawing of cutting diagram excision of bands elution desalting
bands
lyophili&ion lyophilization
lower buffer was changed once a day during the first 72 h. For Triton slabs, 4 mL of 2.5 M urea, 5% (w/v) acetic acid, and 1% (w/v) Triton X-100 was layered on the top of the gel after each change of the upper buffer. Otherwise preelectrophoresis and electrophoresis procedures were the same for the two gels. Preelectrophoresis was a t 80 V and electrophoresis was a t 20 mA/slab for 20 h at room temperature. Protein was applied in 1 mL of 4 M urea, 5% (w/v) acetic acid, 0.1 M cysteamine. Immediately prior to electrophoresis, 2.5 mL of 1 M cys- teamine, in 5% (w/v) acetic acid, was loaded on each gel and run at 80 V for 1 h.
Protein on Triton gels was visualized by staining a center vertical strip for 15 min with 0.5% (w/v) Amido black, 7% (w/v) acetic acid, 20% (v/v) ethanol. The gel strips containing the desired protein bands were cut out, diced, and eluted electrophoretically using a gel elutor described elsewhere (Mardian and Isenberg, 1978). The elution buffer was 5% (w/v) acetic acid, 2% (v/v) thiodigiycol. We found that some Triton always entered the collecting chamber along with the protein. This Triton was removed by stirring the solution containing the eluted protein with S M 2 Biobeads (Bio-Rad) according to Holloway (1973).
Protein in acetic acid-urea slabs was visualized by phos- phorescence (Isenberg et al., 1975; Mardian and Isenberg, 1978). Phosphorescing bands were photographed, and the negative was projected and used to cut the gel. A more com- plete description of the visualization of the bands by phos- phorescence and their slicing may be found elsewhere (Isen- berg et al., 1975; Mardian and Isenberg, 1978).
The protein was eluted from the gel as described for Triton slabs. After elution, or after Triton removal, the protein solu- tion (5-6 mL) was desalted on a I .2 X 29 cm Sephadex G-25 column equilibrated with 0.01 N HCI and lyophilized.
NaDodSOa gels (15% acrylamide separating gel, 6% stacking gel)were made according to Laemmli (1971). They were run on a microslab apparatus (Matsudaira and Burgess, 1978). Two-dimensional gels with acid-urea in the first di- mension and Triton in the second dimension were run ac- cording to Spiker (1976). Amino acid analyses were performed as described in Spiker and Isenberg (1977). The samples for analyses were hydrolyzed for 20 h. Proline was determined separately on a Beckman Model 120 B analyzer.
Concentrations of histone stock solutions in water were determined from the absorbance a t 275.5 nm (DAnna and Isenberg, 3974b). Molar extinction coefficients of 4.0 X IO’, 6.7 X IO3, 2.7 X IO’, and 5.4 X IO’cm-’ M-’ were used for yeast histones H2a, HZb, H3, and H4, respectively.
Solutions for continuous variation measurements were mixed as described by DAnna and Isenberg ( I 974b). The final
HI -m
H4 - S-H4
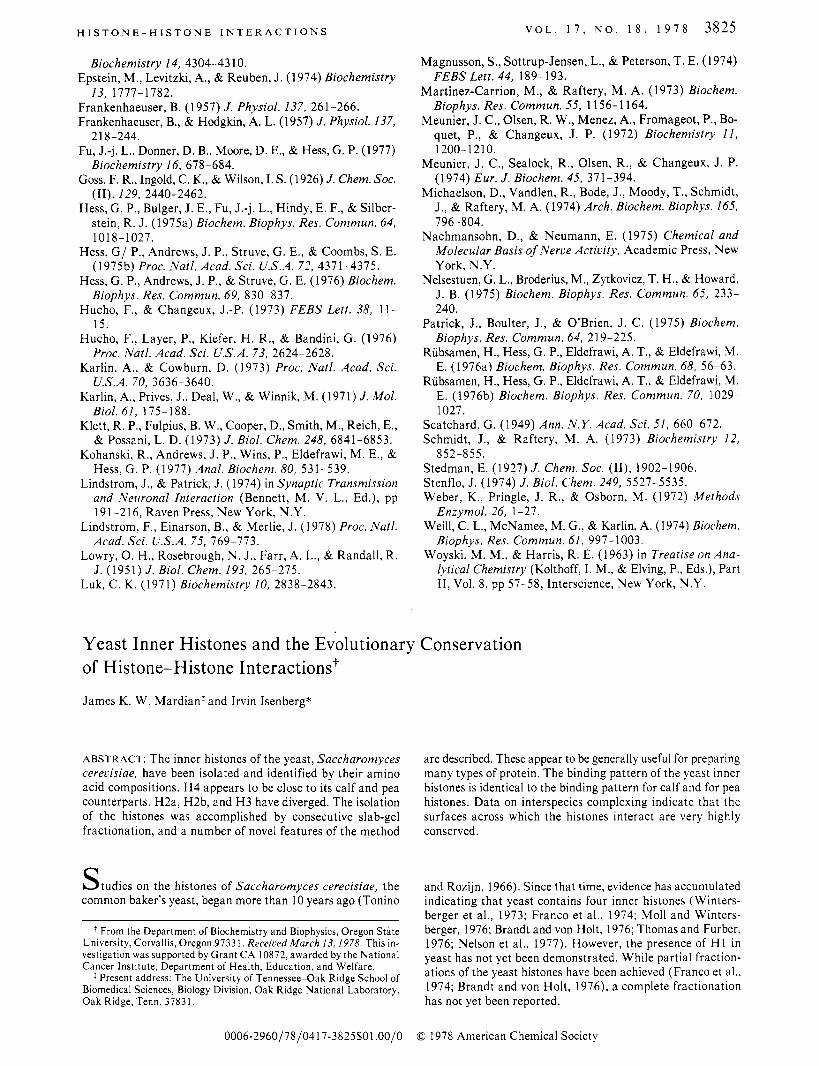
FIGURE I: A comparison of calf thymus and yeast histones in an acid- urea gel.
sodium phosphate buffer concentration was 16 mM. The final pH of all buffered solutions was 7.0.
Fluorescence anisotropy and C D were measured as de- scribed by DAnna and Isenberg (1973). Excitation was at 279 nm and emission was monitored a t 325 nm.
Results Figure I shows an acetic acid-urea gel of a crude histone
preparation with a comparison of histones from calf thymus. At this stage, four prominent inner histone bands may be seen, but the preparation is still contaminated by a variety ofother proteins. Although, from this gel alone, it is not possible to identify the yeast histones, for clarity we have shown the identification that we made ultimately. It is quite clear that H2a, H2b, and H3 show divergencies between yeast and calf.
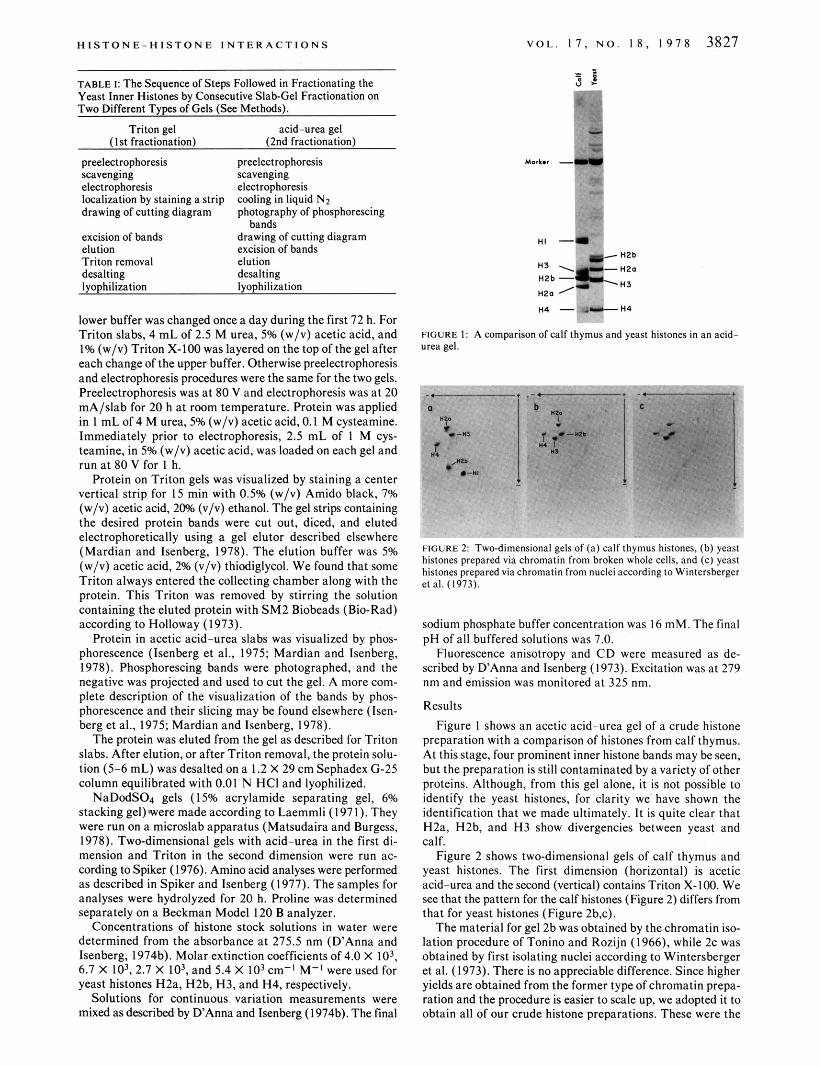
Figure 2 shows two-dimensional gels of calf thymus and yeast histones. The first dimension (horizontal) is acetic acid-urea and the second (vertical) contains Triton X-100. We see that the pattern for the calf histones (Figure 2) differs from that for yeast histones (Figure 2b,c).
The material for gel 2b was obtained by the chromatin iso- lation procedure of Tonino and Rozijn (1966), while 2c was obtained by first isolating nuclei according to Wintersberger et al. (1973). There is no appreciable difference. Since higher yields are obtained from the former type of chromatin prepa- ration and the procedure is easier to scale up, we adopted it to obtain all of our crude histone preparations. These were the
3828 B I O C H E M I S T R Y M A R D I A N A N D I S E N B E R G
TABLE 11: Amino Acid CompositionO of Yeast and Calf Thymus Histones.
H4 (mol %) H3 (mol%) H2a (mol%) H2b (mol %) yeast calfb yeast calfc yeast calfd yeast calfe yeastJ
Asx 4.1 4.9 3.9 3.7 8.3 6.2 4.6 4.8 4.4 Thr 5.5 6.9 6.3 7.4 3.6 3.9 8.6 6.4 8.8 ~~ ~~ ~~
se i 5.4 2.0 7.1 3.7 5.9 3.1 12.3 11.2 12.6 Glx 6.6 5.9 11.6 11.1 8.9 9.3 10.0 8.0 10.0 Pro 1.5 I .o 3.7 4.4 4.0 3.9 3.9 4.8 3.9
15.0 16.7 5.6 5.2 10.5 10.9 3.7 5.6 3.4 Ala 6.6 6.9 12.4 13.3 15.2 13.2 13.9 10.4 13.8 G ~ Y
CYS 0.0 0.0 0.0 1.5 0.0 0.0 0.0 0.0 0.0 Val 7.1 8.8 5.1 4.4 4.6 6.2 4.2 7.2 4.2 Met 0.0 1 .o 0.0 1.5 0.0 0.0 0.0 1.6 0.0 Ile 6.5 5.9 5.5 5.2 4.7 4.7 6.3 4.8 6.4 Leu 9.1 7.8 8.8 8.9 12.8 12.4 5.4 4.8 5.1 Tvr 3.4 3.9 1.5 2.2 1.9 2.3 3.6 4.0 3.7 Pi;; 2.3 2.0 3.5 3.0 0.8 0.8 2.4 1.6 2.5 LYS 10.7 10.8 10.4 9.6 8.8 10.9 14.6 16.0 14.8 His I .9 2.0 1.5 1.5 2.1 3.1 1.3 2.4 1.3 Arg 14.5 13.7 13.2 13.3 8.1 9.3 5.1 6.4 5.0
No corrections have been made for destruction of amino acids or incomplete hydrolysis. Based on sequence (DeLange et al., 1969). Based on sequence (DeLange et al., 1972). d Based on sequence (Yeoman et al., 1972). e Based on sequence (Iwai et al., 1970). JCorrected for the presence of 4% (mol/mol) H2a. S (Lys + His + Arg)/(Asx + Glx).
BIAS 2.53 2.45 1.62 I .65 1.10 1.50 1.44 1.94 1.47
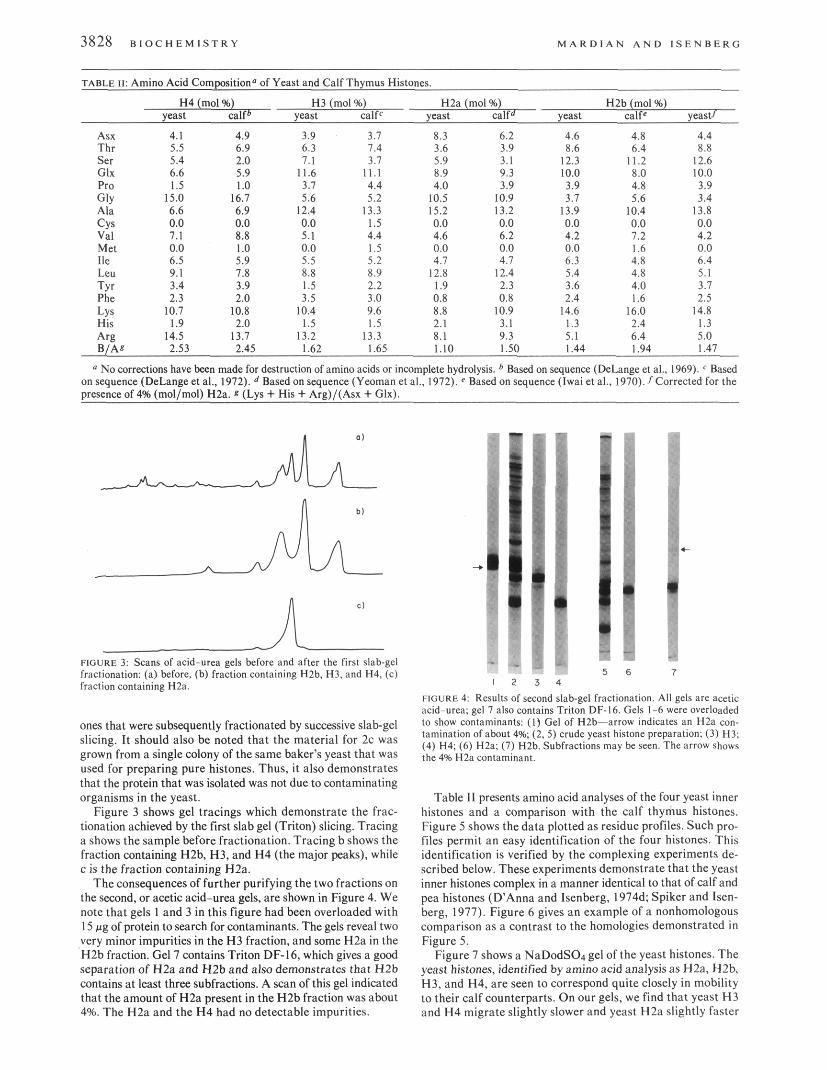
c1 n FIGURE 3; Scans of acid-urea gels before and after the first slab-gel fractionation: (a) before, (b) fraction containing H2b, H3, and H4, (c) fraction containing H2a
ones that were subsequently fractionated by successive slab-gel slicing. It should also be noted that the material for 2c was grown from a single colony of the same baker’s yeast that was used for preparing pure histones. Thus, it also demonstrates that the protein that was isolated was not due to contaminating organisms in the yeast.
Figure 3 shows gel tracings which demonstrate the frac- tionation achieved by the first slab gel (Triton) slicing. Tracing a shows the sample before fractionation. Tracing b shows the fraction containing HZb, H3, and H4 (the major peaks), while c i s the fraction containing H2a.
The consequences of further purifying the two fractions on the second, or acetic acid-urea gels, are shown in Figure 4. We note that gels 1 and 3 in this figure had been overloaded with 15 fig of protein to search for contaminants. The gels reveal two very minor impurities in the H3 fraction, and some H2a in the H2b fraction. Gel 7 contains Triton DF-16, which gives a good separation of H2a and H2b and also demonstrates that H2b contains at least three subfractions. A scan of this gel indicated that the amount of H2a present in the H2b fraction was about 4%. The H2a and the H4 had no detectable impurities.
+
- . . 5 6 7
i t 5 4
FIGURE 4 Results of second slab-gel fractionation. All gels are acetic acid-urea: gel 1 also contains Triton DF-16. Gels 1-6 were overloaded to show contaminants: (1) Gel of H2b-arrow indicates an H2a con- tamination of about 4% (2.5) crude yeast histone preparation; (3) H3; (4) H4; (6) H2a; (7) H2b. Subfractions may bc seen. The arrow shows the 4% H2a contaminant.
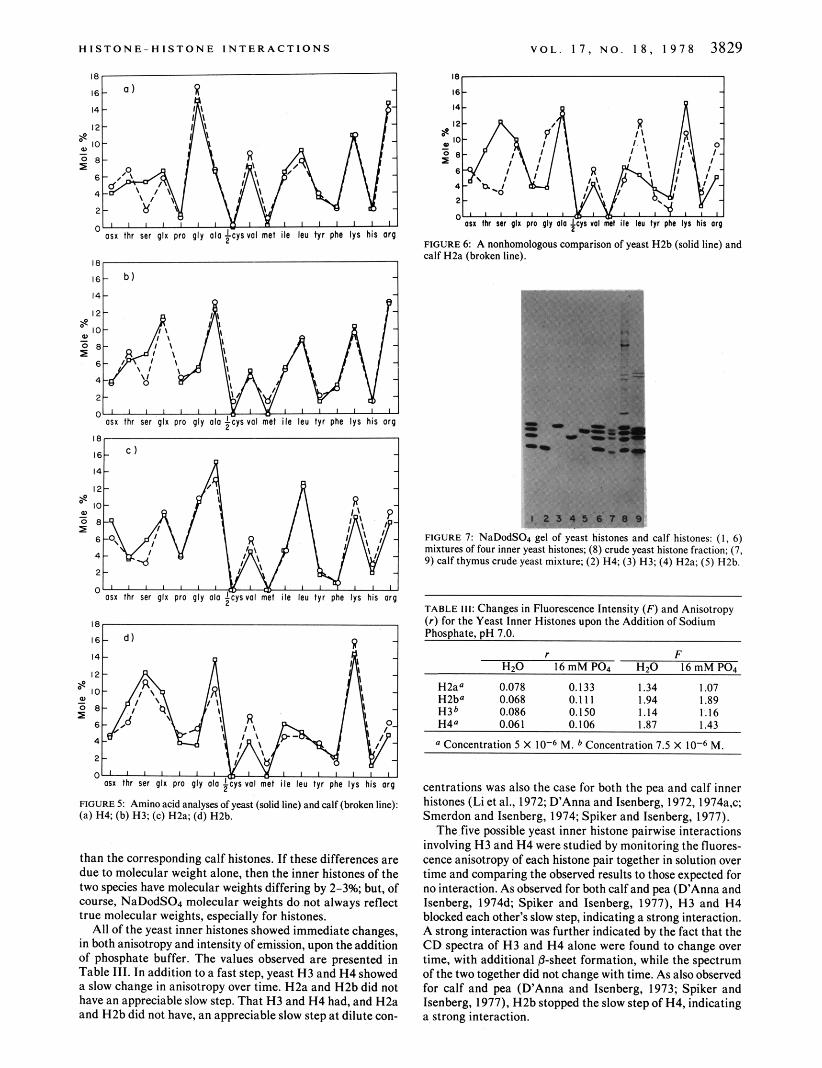
Table 11 presents amino acid analyses of the four yeast inner histones and a comparison with the calf thymus histones. Figure 5 shows the data plotted as residue profiles. Such pro- files permit an easy identification of the four histones. This identification is verified by the complexing experiments de- scribed below. These experiments demonstrate that the yeast inner histones complex in a manner identical to that of calf and pea histones (D’Anna and Isenberg, 1974d: Spiker and Isen- berg, 1977). Figure 6 gives an example of a nonhomologous comparison as a contrast to the homologies demonstrated in Figure 5 .
Figure 7 shows a NaDodS04 gel of the yeast histones. The yeast histones, identified by amino acid analysis as H2a, H2b, H3, and H4, are seen to correspond quite closely in mobility to their calf counterparts. On our gels, we find that yeast H3 and H 4 migrate slightly slower and yeast H2a slightly faster
H I S T O N E - H I S T O N E I N T E R A C T I O N S V O L . 1 7 , N O . 1 8 , 1 9 7 8 3829
la- ie
FIGURE 6: A nonhomologous wmparison of yeast H2b (solid line) and calf H2a (broken line).
: .
1. 2 3 4 5 6 7 8 9 '
FIGURE 7 NaDodSOl gel of yeast histones and calf histones: ( I , 6) mixtures of four inner yeast histones; ( 8 ) crude yeast histone fraction; (7, 9) calf thymus crude yeast mixture: (2) H4; (3) H3; (4) HZa; (5) HZb.
TABLE 111: Changes in Fluorescence Intensity ( F ) and Anisotropy ( r ) for the Yeast Inner Histones upon the Addition of Sodium Phosphate, pH 7.0.
r F H 2 0 16mMPO. HzO 16mMP04
H2a" 0.078 0.133 1.34 1.07 H2b" 0.068 0.111 1.94 1.89 H3b 0.086 0.150 1.14 1.16 H4' 0.061 0.106 1.87 1.43
a Concentration 5 X M. Concentration 7.5 X M.
FIGURE 5: Amino acid analyses of yeast (solid line) and calf (broken line): (a) H4: (b) H3; (e) HZa: (d) H2b.
than the corresponding calf histones. If these differences are due to molecular weight alone, then the inner histones of the two species have molecular weights differing by 2-3%, but, of course, NaDcdS04 molecular weights do not always reflect true molecular weights, especially for histones.
All of the yeast inner histones showed immediate changes, in both anisotropy and intensity of emission, upon the addition of phosphate buffer. The values observed are presented in Table 111. In addition to a fast step, yeast H3 and H 4 showed a slow change in anisotropy over time. H2a and H2b did not have an appreciable slow step. That H3 and H4 had, and HZa and H2b did not have, an appreciable slow step a t dilute con-
centrations was also the case for both the pea and calf inner histones (Li et al., 1972; D'Anna and Isenberg, 1972, 1974a.c; Smerdon and Isenberg, 1974; Spiker and Isenberg, 1977)
The five possible yeast inner histone pairwise interactions involving H3 and H 4 were studied by monitoring the fluores- cence anisotropy of each histone pair together in solution over time and comparing the observed results to those expected for no interaction. As observed for both calf and pea (DAnna and Isenberg, 1974d; Spiker and Isenberg, 1977). H3 and H4 blocked each other's slow step, indicating a strong interaction. A strong interaction was further indicated by the fact that the C D spectra of H3 and H 4 alone were found to change over time, with additional &sheet formation, while the spectrum of the two together did not change with time. As also observed for calf and pea (DAnna and Isenberg, 1973; Spiker and Isenberg, 1977). H2bstopped theslow stepof H4, indicating a strong interaction.
3830 B I O C H E M I S T R Y M A R D I A N A N D I S E N B E R G
Yeast HZa - Yeast HZb I 1
Xyeast HZb
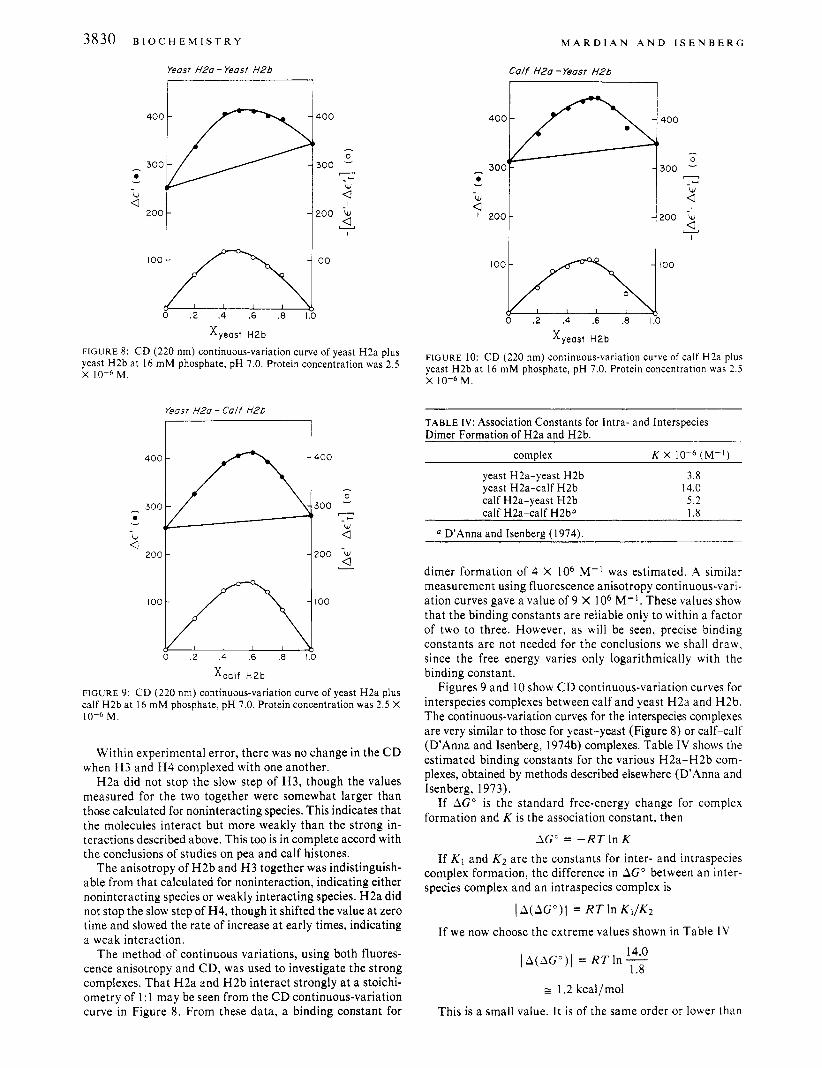
FIGURE 8: CD (220 nm) continuous-variation curve of yeast H2a plus yeast H2b at 16 mM phosphate, pH 7.0. Protein concentration was 2.5 X M.
Yeast H2a - Cal f HZb
Xca l f H Z b
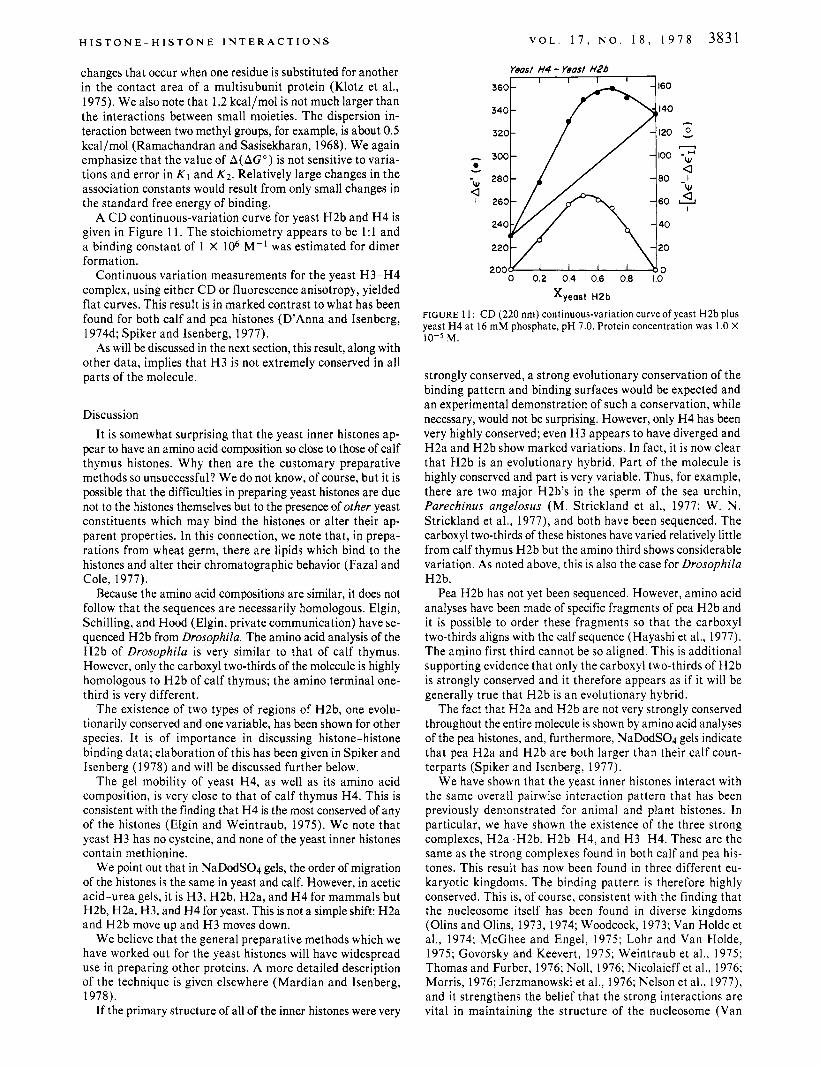
FlGURE 9: CD (220 nm) continuous-variation curve of yeast H2a plus calf H2b at 16 mM phosphate, pH 7.0. Protein concentration was 2.5 X
M.
Within experimental error, there was no change in the C D when H3 and H 4 complexed with one another.
H2a did not stop the slow step of H3, though the values measured for the two together were somewhat larger than those calculated for noninteracting species. This indicates that the molecules interact but more weakly than the strong in- teractions described above. This too is in complete accord with the conclusions of studies on pea and calf histones.
The anisotropy of H2b and H 3 together was indistinguish- able from that calculated for noninteraction, indicating either noninteracting species or weakly interacting species. H2a did not stop the slow step of H4, though it shifted the value a t zero time and slowed the rate of increase a t early times, indicating a weak interaction.
The method of continuous variations, using both fluores- cence anisotropy and CD, was used to investigate the strong complexes. That H2a and H2b interact strongly a t a stoichi- ometry of 1:l may be seen from the CD continuous-variation curve in Figure 8. From these data, a binding constant for
Calf HZa -Yeast H2b
7
I 200
Xyeast H2b
FIGURE 10: CD (220 nm) continuowvariation curve of calf H2a plus yeast H2b at 16 mM phosphate, pH 7.0. Protein concentration was 2.5 X M.
~
TABLE IV: Association Constants for Intra- and Interspecies Dimer Formation of H2a and H2b.
c o m p 1 ex K x (M-I)
yeast H2a-yeast H2b 3.8 yeast H2a-calf H 2 b 14.0 calf H2a-yeast H2b 5 . 2 calf H2a-calf H 2 bo 1.8
a D'Anna and Isenberg (1974).
dimer formation of 4 X lo6 M-' was estimated. A similar measurement using fluorescence anisotropy continuous-vari- ation curves gave a value of 9 X lo6 M-I. These values show that the binding constants are reliable only to within a factor of two to three. However, as will be seen, precise binding constants are not needed for the conclusions we shall draw, since the free energy varies only logarithmically with the binding constant.
Figures 9 and 10 show CD continuous-variation curves for interspecies complexes between calf and yeast H2a and H2b. The continuous-variation curves for the interspecies complexes are very similar to those for yeast-yeast (Figure 8) or calf-calf (D'Anna and Isenberg, 1974b) complexes. Table IV shows the estimated binding constants for the various H2a-H2b com- plexes, obtained by methods described elsewhere (D' Anna and Isenberg, 1973).
If AGO is the standard free-energy change for complex formation and K is the association constant, then
AGO = -RT In K
If K1 and K z are the constants for inter- and intraspecies complex formation, the difference in AGO between an inter- species complex and an intraspecies complex is
I A(AGo) l = RT In K I / K ~
If we now choose the extreme values shown in Table IV
14.0 (A(AG') l = R T h -
1.8 1 1.2 kcal/mol
This is a small value. It is of the same order or lower than
H I S T O N E - H I S T O N E I N T E R A C T I O N S V O L . 1 7 , N O . 1 8 , 1 9 7 8 3831
changes that occur when one residue is substituted for another in the contact area of a multisubunit protein (Klotz et al., 1975). We also note that 1.2 kcal/mol is not much larger than the interactions between small moieties. The dispersion in- teraction between two methyl groups, for example, is about 0.5 kcal/mol (Ramachandran and Sasisekharan, 1968). We again emphasize that the value of A(AGo) is not sensitive to varia- tions and error in K1 and K2. Relatively large changes in the association constants would result from only small changes in the standard free energy of binding.
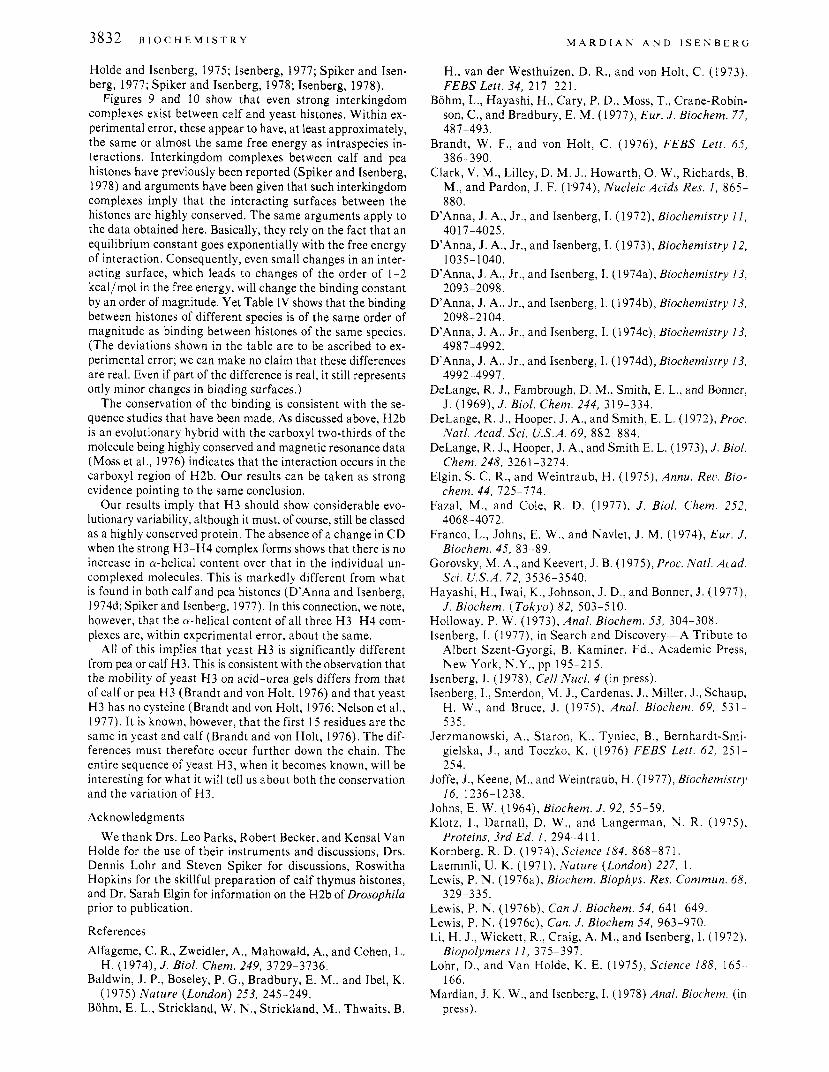
A C D continuous-variation curve for yeast H2b and H 4 is given in Figure 11. The stoichiometry appears to be 1:l and a binding constant of 1 X lo6 M-l was estimated for dimer formation.
Continuous variation measurements for the yeast H3-H4 complex, using either C D or fluorescence anisotropy, yielded flat curves. This result is in marked contrast to what has been found for both calf and pea histones (D'Anna and Isenberg, 1974d; Spiker and Isenberg, 1977).
As will be discussed in the next section, this result, along with other data, implies that H 3 is not extremely conserved in all parts of the molecule.
Discussion It is somewhat surprising that the yeast inner histones ap-
pear to have an amino acid composition so close to those of calf thymus histones. Why then are the customary preparative methods so unsuccessful? We do not know, of course, but it is possible that the difficulties in preparing yeast histones are due not to the histones themselves but to the presence of other yeast constituents which may bind the histones or alter their ap- parent properties. In this connection, we note that, in prepa- rations from wheat germ, there are lipids which bind to the histones and alter their chromatographic behavior (Fazal and Cole, 1977).
Because the amino acid compositions are similar, it does not follow that the sequences are necessarily homologous. Elgin, Schilling, and Hood (Elgin, private communication) have se- quenced H2b from Drosophila. The amino acid analysis of the H2b of Drosophila is very similar to that of calf thymus. However, only the carboxyl two-thirds of the molecule is highly homologous to H2b of calf thymus; the amino terminal one- third is very different.
The existence of two types of regions of H2b, one evolu- tionarily conserved and one variable, has been shown for other species. It is of importance in discussing histone-histone binding data; elaboration of this has been given in Spiker and Isenberg (1978) and will be discussed further below.
The gel mobility of yeast H4, as well as its amino acid composition, is very close to that of calf thymus H4. This is consistent with the finding that H 4 is the most conserved of any of the histones (Elgin and Weintraub, 1975). We note that yeast H3 has no cysteine, and none of the yeast inner histones contain methionine.
We point out that in NaDodS04 gels, the order of migration of the histones is the same in yeast and calf. However, in acetic acid-urea gels, it is H3, H2b, H2a, and H 4 for mammals but H2b, H2a, H3, and H 4 for yeast. This is not a simple shift: H2a and H2b move up and H 3 moves down.
We believe that the general preparative methods which we have worked out for the yeast histones will have widespread use in preparing other proteins. A more detailed description of the technique is given elsewhere (Mardian and Isenberg, 1978).
If the primary structure of all of the inner histones were very
Yeast H4 - Yeast H2b
0 0.2 0.4 0.6 0.8 1.0
0 Y
W ,Q,
Xyeast H2b
FIGURE 11: CD (220 nrn) continuous-variation curve of yeast H2b plus yeast H4 at 16 rnM phosphate, pH 7.0. Protein concentration was 1.0 X 10⁻⁵ M.
strongly conserved, a strong evolutionary conservation of the binding pattern and binding surfaces would be expected and an experimental demonstration of such a conservation, while necessary, would not be surprising. However, only H4 has been very highly conserved; even H 3 appears to have diverged and H2a and H2b show marked variations. In fact, it is now clear that H2b is an evolutionary hybrid. Part of the molecule is highly conserved and part is very variable. Thus, for example, there are two major H2b's in the sperm of the sea urchin, Parechinus angelosus (M. Strickland et al., 1977; W. N. Strickland et al., 1977), and both have been sequenced. The carboxyl two-thirds of these histones have varied relatively little from calf thymus H2b but the amino third shows considerable variation. As noted above, this is also the case for Drosophila H2b.
Pea H2b has not yet been sequenced. However, amino acid analyses have been made of specific fragments of pea H2b and it is possible to order these fragments so that the carboxyl two-thirds aligns with the calf sequence (Hayashi et al., 1977). The amino first third cannot be so aligned. This is additional supporting evidence that only the carboxyl two-thirds of H2b is strongly conserved and it therefore appears as if it will be generally true that H2b is an evolutionary hybrid.
The fact that H2a and H2b are not very strongly conserved throughout the entire molecule is shown by amino acid analyses of the pea histones, and, furthermore, NaDodS04 gels indicate that pea H2a and H2b are both larger than their calf coun- terparts (Spiker and Isenberg, 1977).
We have shown that the yeast inner histones interact with the same overall pairwise interaction pattern that has been previously demonstrated for animal and plant histones. In particular, we have shown the existence of the three strong complexes, H2a-H2b, H2b-H4, and H3-H4. These are the same as the strong complexes found in both calf and pea his- tones. This result has now been found in three different eu- karyotic kingdoms. The binding pattern is therefore highly conserved. This is, of course, consistent with the finding that the nucleosome itself has been found in diverse kingdoms (Olins and O h , 1973, 1974; Woodcock, 1973; Van Holde et al., 1974; McGhee and Engel, 1975; Lohr and Van Holde, 1975; Govorsky and Keevert, 1975; Weintraub et a]., 1975; Thomas and Furber, 1976; Noll, 1976; Nicolaieff et al., 1976; Morris, 1976; Jerzmanowski et al., 1976; Nelson et al., 1977), and it strengthens the belief that the strong interactions are vital in maintaining the structure of the nucleosome (Van
3832 B I oc H E M I S T R Y M A R D I A N A N D I S E N B E R G
Holde and Isenberg, 1975; Isenberg, 1977; Spiker and Isen- berg, 1977; Spiker and Isenberg, 1978; Isenberg, 1978).
Figures 9 and 10 show that even strong interkingdom complexes exist between calf and yeast histones. Within ex- perimental error, these appear to have, a t least approximately, the same or almost the same free energy as intraspecies in- teractions. Interkingdom complexes between calf and pea histones have previously been reported (Spiker and Isenberg, 1978) and arguments have been given that such interkingdom complexes imply that the interacting surfaces between the histones are highly conserved. The same arguments apply to the data obtained here. Basically, they rely on the fact that an equilibrium constant goes exponentially with the free energy of interaction. Consequently, even small changes in an inter- acting surface, which leads to changes of the order of 1-2 kcal/mol in the free energy, will change the binding constant by an order of magnitude. Yet Table IV shows that the binding between histones of different species is of the same order of magnitude as binding between histones of the same species. (The deviations shown in the table are to be ascribed to ex- perimental error; we can make no claim that these differences are real. Even if part of the difference is real, it still represents only minor changes in binding surfaces.)
The conservation of the binding is consistent with the se- quence studies that have been made. As discussed above, H2b is an evolutionary hybrid with the carboxyl two-thirds of the molecule being highly conserved and magnetic resonance data (Moss et al., 1976) indicates that the interaction occurs in the carboxyl region of H2b. Our results can be taken as strong evidence pointing to the same conclusion.
Our results imply that H 3 should show considerable evo- lutionary variability, although it must, of course, still be classed as a highly conserved protein. The absence of a change in CD when the strong H3-H4 complex forms shows that there is no increase in a-helical content over that in the individual un- complexed molecules. This is markedly different from what is found in both calf and pea histones (D’Anna and Isenberg, 1974d; Spiker and Isenberg, 1977). In this connection, we note, however, that the a-helical content of all three H3-H4 com- plexes are, within experimental error, about the same.
All of this implies that yeast H 3 is significantly different from pea or calf H3. This is consistent with the observation that the mobility of yeast H 3 on acid-urea gels differs from that of calf or pea H3 (Brandt and von Holt, 1976) and that yeast H3 has no cysteine (Brandt and von Holt, 1976; Nelson et al., 1977). It is known, however, that the first 15 residues are the same in yeast and calf (Brandt and von Holt, 1976). The dif- ferences must therefore occur further down the chain. The entire sequence of yeast H3, when it becomes known, will be interesting for what it will tell us about both the conservation and the variation of H3.
Acknowledgments We thank Drs. Leo Parks, Robert Becker, and Kensal Van
Holde for the use of their instruments and discussions, Drs. Dennis Lohr and Steven Spiker for discussions, Roswitha Hopkins for the skillful preparation of calf thymus histones, and Dr. Sarah Elgin for information on the H2b of Drosophila prior to publication.
References Alfageme, C. R., Zweidler, A., Mahowald, A., and Cohen, L.
Baldwin, J . P., Boseley, P. G., Bradbury, E. M., and Ibel, K.
Bohm, E. L., Strickland, W. N., Strickland, M., Thwaits, B.
H. ( 1 974), J . Biol. Chem. 249, 3729-3736.
(1975) Nature (London) 253, 245-249.
H., van der Westhuizen, D. R., and von Holt, C . (1973), FEBS Lett. 34, 217-221.
Bohm, L., Hayashi, H., Cary, P. D., Moss, T., Crane-Robin- son, C. , and Bradbury, E. M. (1977), Eur. J . Biochem. 77.
Brandt, W. F., and von Holt, C. (1976), FEBS Lett. 65, 386-390.
Clark, V. M., Lilley, D. M. J., Howarth, 0. W., Richards, B. M., and Pardon, J . F. (1974), Nucleic Acids Res. 1, 865- 880.
D’Anna, J . A., Jr . , and Isenberg, I . (1972), Biochemistry 11,
D’Anna, J. A., Jr., and Isenberg, I. (1973), Biochemistry 12,
D’Anna, J . A., Jr., and Isenberg, I . (1974a), Biochemistry 13,
D’Anna, J. A., Jr., and Isenberg, I. (1974b), Biochemistry 13,
D’Anna, J . A., Jr., and Isenberg, I. (1974c), Biochemistry 13,
D’Anna, J . A., Jr., and Isenberg, I. (1974d), Biochemistry I S ,
DeLange, R. J., Fambrough, D. M., Smith, E. L., and Bonner,
DeLange, R. J . , Hooper, J . A., and Smith, E. L. (1972), Proc.
DeLange, R. J., Hooper, J. A., and Smith E. L. (1973), J . Biol.
Elgin, S . C . R., and Weintraub, H . (1975), Annu. Reo. Bio-
Fazal, M., and Cole, R. D. (1977), J . Biol. Chem. 252,
Franco, L., Johns, E. W., and Navlet, J . M. (1974), Eur. J .
Gorovsky, M. A., and Keevert, J . B. (1979, Proc. Natl. Acad.
Hayashi, H. , Iwai, K., Johnson, J . D., and Bonner, J . (1977),
Holloway, P. W. (1973), Anal. Biochem. 53, 304-308. Isenberg, I. (1977), in Search and Discovery-A Tribute to
Albert Szent-Gyorgi, B. Kaminer, Ed., Academic Press, New York, N.Y., pp 195-215.
487-493.
401 7-4025.
1035-1 040.
2093-2098.
2098-2104.
498 7 -4992.
4992-4997.
J. (1969),J. Biol. Chem. 244, 319-334.
Natl. Acad. Sci. U.S.A. 69, 882-884.
Chem. 248, 3261-3274.
chem. 44, 725-774.
4068-4072.
Biochem. 45, 83-89.
Sci. U.S.A. 72, 3536-3540.
J . Biochem. (Tokyo) 82, 503-510.
Isenberg, I. ( 1 978), Cell Nurl. 4 ( in press). Isenberg, I., Smerdon, M. J., Cardenas, J . , Miller, J., Schaup,
H . W., and Bruce, J . (1975), Anal. Biochem. 69, 531- 535.
Jerzmanowski, A,, Staron, K., Tyniec, B., Bernhardt-Smi- gielska, J.. and Toczko, K. (1976) FEBS Lett. 62, 251- 254.
Joffe, J., Keene, M., and Weintraub, H. ( I 977), Biochemistry
Johns, E. W. (1964), Biochem. J . 92, 55-59. Klotz, I., Darnall, D. W., and Langerman, N . R. (1975).
Kornberg, R. D. (1974), Science 184, 868-871. Laemmli, U. K. (1971), Nature (London) 227, 1. Lewis, P. N. (1976a), Biochem. Biophys. Res. Commun. 68,
Lewis, P. N . (1976b), Can J . Biochem. 54, 641 -649. Lewis, P. N . (1976c), Can. J . Biochem 54, 963-970. Li, H. J . , Wickett, R., Craig, A. M., and Isenberg, I . ( 1972),
Lohr, D., and Van Holde, K. E. (1975), Science 188, 165-
Mardian, J . K. W., and Isenberg, I . (1978) Anal. Biochem. (in
16, 1236-1238.
Proteins, 3rd Ed. I , 294-41 1.
329-335.
Biopolymers 11, 375-397.
166.
press).
T H I A M I N B I O S Y N T H E S I S V O L . 1 7 , N O . 1 8 , 1 9 7 8 3833
Matsudaira, P. I., and Burgess, D. R. (1978), Anal. Biochem.
McGhee, J. D., and Engel, J. D. (1975), Nature (London) 254,
Moll, R., and Wintersberger, E. (1976), Proc. Natl. Acad. Sci.
Morris, N . R. (1976), Cell 8, 357-363. Moss, T., Cary, P. D., Abercrombie, B. D., Crane-Robinson,
C., and Bradbury, E. M. (1976), Eur. J . Biochem. 71,
Nelson, D. A,, Beltz, W. R., and Rill, R. L. (1 977), Proc. Natl. Acad. Sci. U.S.A. 74, 1343-1347.
Nicolaieff, A., Philipps, G., Gigot, C., and Hirth, L. (1976), J . Microsc. (Paris) 26, 1-4.
Noll, M. (1976), Cell 8, 349-355. Ogawa, Y., Quagliarotti, G., Jordan, J., Taylor, C. W., Star-
buck, W. C., and Busch, H. (1969), J . Biol. Chem. 244,
(in press).
449.
U.S.A. 73, 1863-1867.
337-350.
4387-4392. Olins, A. L., and Olins, D. E. (1973), J . Cell Biol. 59, 252. Olins, D. E., and Olins, A. L. (1974), Science 183, 330-
332. Olins, A. L., Breillatt, J. P., Carlson, R. D., Senior, M., Wright,
E. B., and Olins, D. E. (19771, in Caltech Symposium on the Molecular Biology of the Mammalian Genetic Appara- tus-Its Relationship to Cancer, Aging, and Medical Ge- netics, Elsevier-Excerpta Medica, North Holland, in press.
Panyim, S., and Chalkley, R. (1969), Arch. Biochem. Biophys.
Pardon, J . F., Worcester, D. L., Wooley, J . C., Tatchell, K., Van Holde, K. E., and Richards, B. M. (1975), Nucleic Acids Res. 2, 2163-2176.
Patthy, L., Smith, E. L., and Johnson, J. (1973), J. Biol. Chem.
Ramachandran, G. N., and Sasisekharan, V. (1 968), Adu.
Roark, D. E., Geoghegan, T. E., and Keller, G . H. (1974),
130, 337-346.
248, 6834-6840.
Protein Chem. 23, 283.
Biochem. Biophys. Res. Commun. 59, 542-547. Shaw, B. R., Herman, T. M., Kovacic, R. T., Beaudreau, G.
S., and Van Holde, K. E. (1976), Proc. Natl. Acad. Sci.
Skandrani, E., Mizon, J., Sautiere, P., and Biserte, G. (1972),
Smerdon, M. J., and Isenberg, I . (1974), Biochemistry 13,
Sommer, K. R., and Chalkley, R. (1974), Biochemistry 13,
Sperling, R., and Bustin, M. (1975), Biochemistry 14,
Spiker, S. (1976), Nature (London) 259, 418-420. Spiker, S., and Isenberg, I. (1977), Biochemistry 16, 1819-
1826. Spiker, S., and Isenberg, I . (1978), Cold Spring Harbor Symp.
Quant. Biol. 42 (in press). Strickland, M., Strickland, W. N., Brandt, W. F., and von
Holt, C. (1977), Eur. J. Biochem. 77, 263-275. Strickland, W. N., Strickland, M., Brandt, W. F., and von
Holt, C. (1977), Eur. J. Biochem. 77, 277-286. Thomas, J. O., and Furber, V. (1976), FEBS Lett. 66, 274-
280. Tonino, G. J. M., and Rozijn, Th. H. (1 966), in The Cell Nu-
cleus-Metabolism and Radiosensitivity, Taylor and Francis, London, pp 125-1 33.
Van Holde, K. E., and Isenberg, I . (1975), Acc. Chem. Res.
Van Holde, K. E., Sahasrabuddhe, C. G., Shaw, B. R., Van Bruggen, E. F. J., and Arnberg, A. C. (1974), Biochem. Biophys. Res. Commun. 60, 1365- 1370.
Weintraub, H., Palter, K., and Van Lente, F. (1973 , Cell 6,
Whittaker. R. H. (1969), Science 163, 150-160. Wintersberger, U., Smith, P., and Letnansky, K. (1973), Eur.
Woodcock, C. L. F. (1973), J . Cell Biol. 59, 368a.
U.S.A. 73, 505-509.
Biochimie 54, 1267-1272.
4046-4049.
1022-1027.
3322-333 1.
8, 327-335.
85-1 10.
J . Biochem. 33, 123-130.
Stable Isotope Studies on the Biosynthesis of the Thiazole Moiety of Thiamin in Escherichia coli?
Robert H. White
ABSTRACT: Deuterated and I3C-labeled sugars were fed to Escherichia coli growing on defined medium. The position and extent of incorporation of the label into the 4-methyl-5-P- hydroxyethylthiazole portion of thiamin and other cellular components were measured by gas chromatography-mass
M o s t previous studies concerning biosynthetic pathways in microorganisms have involved the feeding of small quantities of radioactive precursors followed by the laborious isolation and chemical degradation of the product to determine both the
From the Department of Biochemistry, Rice University, Houston, Texas 77001. Received March 10, 1978. This work was supported in part by National Institutes of Health Grant CA-14030 and Grant C-582 from the Robert A. Welch Foundation. Operation of the mass spectrometer was provided for by National Institutes of Health Grant H L 15376.
0006-2960/78/04 17-3833$0 1 .OO/O
spectrometry. Based on the findings, it is concluded that the contiguous five-carbon unit of the 4-methyl-5-P-hydroxy- ethylthiazole is biosynthetically derived from pyruvate and a triose phosphate.
extent of incorporation and the position of the incorporated label. This approach has several limitations which can restrict its use with intact microorganisms. These include: inability of the precursor to permeate the cell; feeding of the incorrect form of the precursor for metabolism to the desired compound, i.e., not phosphorylated; and metabolism of the compound to a primary metabolite, i.e., acetate, which often can be incorpo- rated nonspecifically back into the product of interest.
These problems may be avoided by growing the organism
0 1978 American Chemical Society


