Embed Size (px)
Citation preview

Inner Harbor Navigation Canal Lock Replacement- Shallow Draft
General Reevaluation Report (GRR)
Appendix B- Engineering Appendix
Prepared by USACE-MVN ED
Date: 16 December 2016
ProjectWise Location of this document:
pw:\\MVN-APPW02.mvn.ds.usace.army.mil:CEMVN01\Documents\Civil Works\IHNC Studies\IHNC - Inner Harbor Navigation Canal Shallow Draft Lock Replacement\2015 Feasibility Study\22P00 - Engineering & Design & Cost Estimates\GRR Eng Appendix 2016
GRR Eng Appendix 2016
pw://MVN-APPW02.mvn.ds.usace.army.mil:CEMVN01/Documents/P%7b6602e452-ea88-47ff-b827-321ba96f6d50%7d/

This page intentionally left blank

Table of Contents
1. Project Description ................................................................................................................................ 1
1.1 Options for the study .......................................................................................................................... 1
1.1.1 Plan 1 ............................................................................................................................................ 1
1.1.2 Plan 2 ............................................................................................................................................ 1
1.1.3 Plan 3 (TSP) .................................................................................................................................. 1
1.1.4 Plan 4 ............................................................................................................................................ 1
1.1.5 Plan 5 ............................................................................................................................................ 1
2. Hydrology and Hydraulics ..................................................................................................................... 2
2.1 Filling and Empting times from LOCKSIM ........................................................................................... 2
2.2 Navigation Concerns ........................................................................................................................... 3
2.3 Relative Sea Level Change (RSLC)........................................................................................................ 3
3. Surveying, Mapping, and Other Geospatial Data Requirements .......................................................... 5
4. Geotechnical ......................................................................................................................................... 6
5. Environmental Engineering ................................................................................................................... 7
6. Civil Design ............................................................................................................................................ 7
6.1 Embankment, Compacted Fill ............................................................................................................. 8
6.2 Excavation Quantities ......................................................................................................................... 8
6.2.1 Excavation quantities for the TSP .................................................................................................... 9
6.3 Disposal of Contaminated Material .................................................................................................. 10
6.3.1 Assumptions for the landfill alternative ........................................................................................ 11
6.3.2 Assumptions for the CDF alternative ............................................................................................. 11
6.3.3 Recommendation for disposal of material not suitable for open water disposal ......................... 12
7. Sill elevation assessment .................................................................................................................... 12
7.1 Summary of Technical Considerations: ......................................................................................... 12
7.2 Sill at elevation (-) 16.5 ft option .................................................................................................. 13
7.2 Cast-In-Place versus Float-In-Construction of the lock ..................................................................... 13
7.2.1. Design Summary ....................................................................................................................... 13
7.2.2 Comparison of Technical Approaches ........................................................................................ 14
7.2.3 Recommendation ....................................................................................................................... 16
8. Sector gates versus miter gates .......................................................................................................... 16
8.1 Reverse Head .............................................................................................................................. 16
8.2 Durability ..................................................................................................................................... 17

8.3 Gate Geometry............................................................................................................................ 17
8.4 Gate Bay Monolith Geometry ........................................................................................................... 17
8.5 Construction Time ....................................................................................................................... 18
8.6 Culvert Maintenance................................................................................................................... 18
8.7 Costs ............................................................................................................................................ 18
8.8 Conclusions ................................................................................................................................. 18
9. Structural requirements ...................................................................................................................... 18
9.2 Chamber Monoliths .......................................................................................................................... 19
9.3 Sector Gate Monoliths ...................................................................................................................... 21
9.4 Sector Gate Pile Foundation ........................................................................................................... 21
9.5 Steel Sector Gates ......................................................................................................................... 22
9.6 Timber Guide walls ..................................................................................................................... 22
9.7 Floating Guide walls .................................................................................................................... 23
9.8 End Cell Dolphins ........................................................................................................................ 23
9.9 Cofferdam ......................................................................................................................................... 23
9.10 Timber Guide Walls ......................................................................................................................... 23
9.11 Concrete Floodwalls ........................................................................................................................ 24
9.12 Steel Bulkhead Gates ...................................................................................................................... 25
10. Electrical and Mechanical Requirements ........................................................................................ 25
11. Relocations ...................................................................................................................................... 25
11.1 Facility Disposition .......................................................................................................................... 26
11.2 Estimated Relocations Costs ........................................................................................................... 27
12. Cost ................................................................................................................................................. 27
12.1 Cost for each option ........................................................................................................................ 28
12.3 Project Schedule ............................................................................................................................. 29
13. Hazardous and Toxic Materials ....................................................................................................... 29
14. Operation and Maintenance ........................................................................................................... 29
14.1 Overview of Work ........................................................................................................................... 29
14.2 Cost and Closure Matrix Guidelines ................................................................................................ 29
14.3 Cost and Closure Matrix Schedules ................................................................................................. 30
14.4 Cost and Closure Projection Results ............................................................................................... 31
15. Schedule for Design and Construction ............................................................................................ 34
15.1 Design Schedule .............................................................................................................................. 34

15.2 Construction Schedule .................................................................................................................... 34
15.3 Construction Sequencing ................................................................................................................ 35
16. Engineering Assessment of the existing lock .................................................................................. 35
17. Plates, Figures, and Drawings ......................................................................................................... 36
18. References ...................................................................................................................................... 36
ANNEXATIONS
ANNEX 1- Inner Harbor Navigational Canal Lock, LOCKSIM Model Results: A comparison of Lock Filling Times for Various Design Alternatives, New Orleans District (MVN), Engineering Division, Hydraulic and Hydrologic Branch, 2016.
ANNEX 2- Cellular Cofferdam Feasibility Study, Geotechnical Addendum Design Report, New Orleans District, Engineering Division, Geotechnical Branch, 21 January 2016.
ANNEX 3- Inner Harbor Navigational Canal Lock Replacement- Shallow Draft GRR, New Orleans District (MVN), Engineering Division, Cost Section, Design Services Branch, February 4th, 2016.
ANNEX 4- Classic Schedule Layout, 3 February, 2016.
ANNEX 5- Inner Harbor Navigational Canal Lock Replacement- Shallow Draft GRR, Sector Gate versus Miter Gate Analysis, New Orleans District (MVN), Engineering Division, Structures Branch, February 1st, 2016.
ANNEX 6- OMRR&R Analysis. Cost and Closure Matrices for the Inner Harbor Navigational Canal, Lock Replacement Project, New Orleans District, Prepared by Louisville District, 10 August 2015.
ANNEX 7- Cost comparison for disposal of material not found suitable to be disposed of in open water, November 2016.
ANNEX 8- Excavation Quantities, MVN ED Structures Branch, November 2016.
Annex 9- Memorandum CEMVN_ED-T: IHNC Lock Replacement General Re-evaluation Report, Engineering Assessment of the Existing Lock Structure, 14 October 2016.
Annex 10- Plates
TABLES
Table 1: LOCKSIM Results
Table 2: Summary Table of 2015 Updated Relative Sea Level Trends for U. S. Army Corps of Engineers Gages Table 3: IHNC Lock RSLC Projections Table 4: Quantities of excavated material
Table 5: Quantities of material to be disposed in open water, and material found to have contaminants
Table 6: Amount of material to be disposed of from DMMU 5 and 7 for each option (using 2016 surveys) Table 7: ROM cost estimate for Landfill and CDF alternatives
Table 8: Cost for 1200ft x 900ft lock configuration for Sill Elevation (-)16.5 and (-)22
Table 9: Pile Quantities – 24” Prestressed Concrete Piles
Table 10: Concrete Quantity-Lock Structure
Table 11: Load Cases for Sector Gate Monolith Pile Foundation
Table 12: Pile Quantity for Sector Gates
Table 13: Steel Gate Weights
Table 14: Total Number of Floodwalls
Table 15: Cost per option Table 16: OMRR&R total costs for each option
FIGURES
Figure 1: IHNC Lock RSLC Projections by year
Figure 2: Dredged material management units (DMMU) designation and location
Figure 3: New Lock Plan View

1
1. Project Description
The study area is located in Orleans, and St. Bernard Parishes in southeastern Louisiana. Refer to chapter 1 of the main General Reevaluation Report (GRR) for a figure showing the area that the study covers. It is generally bounded by Lake Pontchartrain on the north, the Mississippi River on the south and west, and Lake Borgne, Breton Sound and the Gulf of Mexico on the east and south. The area includes parts of the city of New Orleans, and the communities of Chalmette and Pointe a la Hache. Areas potentially affected by changes in vessel traffic include the navigation channels and related lands in the study area, the inland waterway system on the Gulf Intracoastal Waterway (GIWW), and the Mississippi River.
The Engineering Appendix has been prepared by the New Orleans District, Engineering Division (CEMVN-ED).
All elevations (EL) in this appendix are referenced to NAVD88 (2004.65), unless otherwise noted.
1.1 Options for the study
For the TSP Phase of this GRR, four (4) different lock sizes were evaluated to develop cost estimates.
1.1.1 Plan 1 This option is the No-Action. No engineering activities as part of the study.
1.1.2 Plan 2 This option would consist of building a new lock on the North of Claiborne site; 900 feet long x 75 feet wide x (-)22 ft.
1.1.3 Plan 3 (TSP) This option would consist of building a new lock on the North of Claiborne site; 900 feet long x 110 feet wide x (-)22 ft.
1.1.4 Plan 4 This option would consist of building a new lock on the North of Claiborne site; 1,200 feet long x 75 feet wide x (-)22 ft.
1.1.5 Plan 5 This option would consist of building a new lock on the North of Claiborne site; 1,200 feet long x 110 feet wide x (-)22 ft.

2
2. Hydrology and Hydraulics
2.1 Filling and Empting times from LOCKSIM
In the previous feasibility study completed in 1997, the emptying and filling times for the proposed options were calculated using the Corps of Engineers’ computer program H5320, LOCK FILLING AND EMPTYING—SYMMETRICAL SYSTEMS (Hebler and Neilson 1976). Although, H5320 was widely accepted at the time of the study, it had limitations and required improvements. H5320 did not accurately account for the discharge capability of the lock and was only suitable for symmetrical lock systems. The computer program did not take into account the free surface at the upper and lower approaches and within the lock chamber or the pressure and discharge in the emptying and filling manifolds. For the GRR, the hydraulic modelers decided to use the newer model, LOCKSIM which was developed by Dr. Gerald A. Schohl in 1999, Tennessee Valley Authority in collaboration with the USACE Engineer Research and Development Center (ERDC). LOCKSIM corrected the limitations of the previous model. The newer model uses unsteady pressure-flow equations which are applicable to the conduits within the system in combination with the free-surface equations and allows the user to describe the approach reservoirs, valve wells, and lock chamber. The model computes pressures and flow distributions throughout the entire lock system. The filling times presented in this report supersede the previous feasibility study. The model results from the two models should not be compared because of the difference in hydraulic methodologies.
3
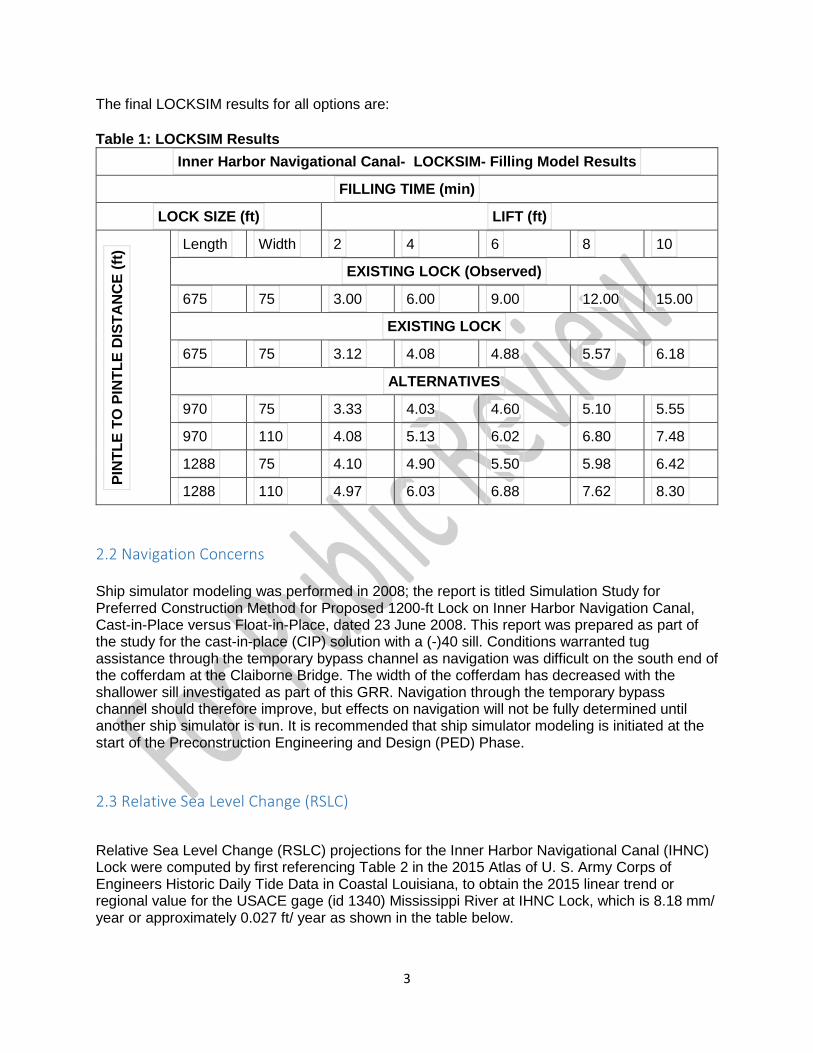
The final LOCKSIM results for all options are: Table 1: LOCKSIM Results
Inner Harbor Navigational Canal- LOCKSIM- Filling Model Results
FILLING TIME (min)
LOCK SIZE (ft) LIFT (ft)
PIN
TLE
TO P
INTL
E D
ISTA
NC
E (ft
) Length Width 2 4 6 8 10
EXISTING LOCK (Observed)
675 75 3.00 6.00 9.00 12.00 15.00
EXISTING LOCK
675 75 3.12 4.08 4.88 5.57 6.18
ALTERNATIVES
970 75 3.33 4.03 4.60 5.10 5.55
970 110 4.08 5.13 6.02 6.80 7.48
1288 75 4.10 4.90 5.50 5.98 6.42
1288 110 4.97 6.03 6.88 7.62 8.30 2.2 Navigation Concerns Ship simulator modeling was performed in 2008; the report is titled Simulation Study for Preferred Construction Method for Proposed 1200-ft Lock on Inner Harbor Navigation Canal, Cast-in-Place versus Float-in-Place, dated 23 June 2008. This report was prepared as part of the study for the cast-in-place (CIP) solution with a (-)40 sill. Conditions warranted tug assistance through the temporary bypass channel as navigation was difficult on the south end of the cofferdam at the Claiborne Bridge. The width of the cofferdam has decreased with the shallower sill investigated as part of this GRR. Navigation through the temporary bypass channel should therefore improve, but effects on navigation will not be fully determined until another ship simulator is run. It is recommended that ship simulator modeling is initiated at the start of the Preconstruction Engineering and Design (PED) Phase. 2.3 Relative Sea Level Change (RSLC)
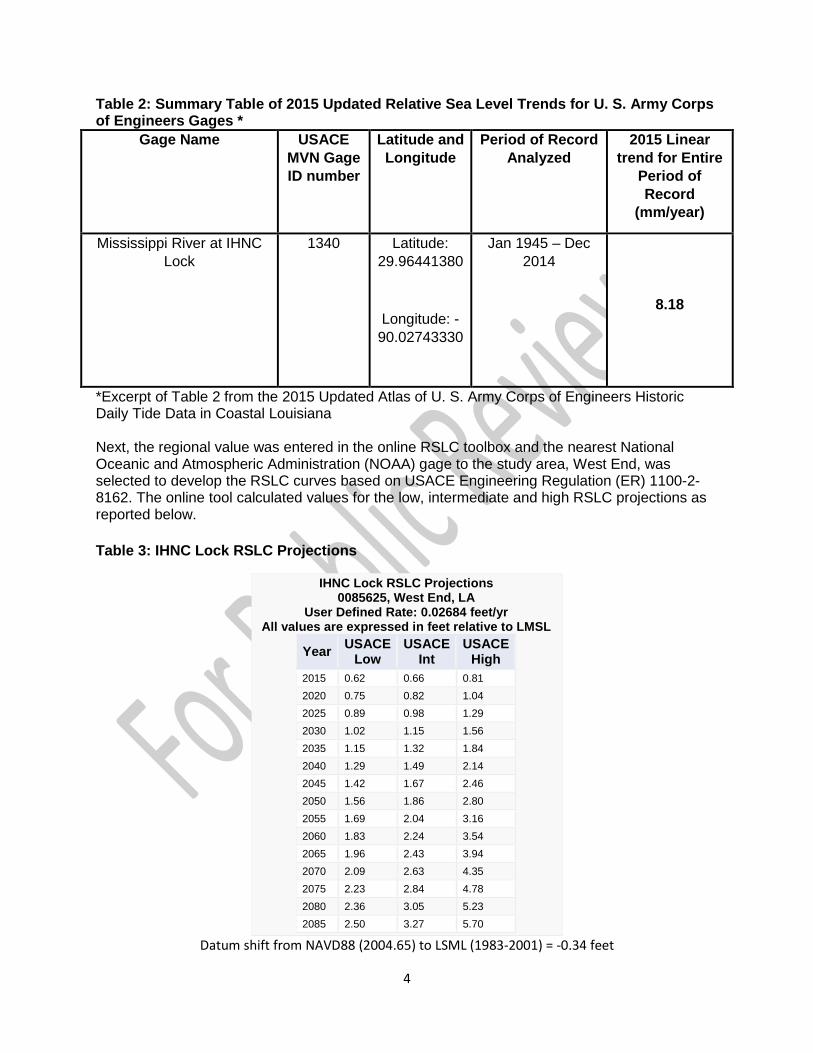
Relative Sea Level Change (RSLC) projections for the Inner Harbor Navigational Canal (IHNC) Lock were computed by first referencing Table 2 in the 2015 Atlas of U. S. Army Corps of Engineers Historic Daily Tide Data in Coastal Louisiana, to obtain the 2015 linear trend or regional value for the USACE gage (id 1340) Mississippi River at IHNC Lock, which is 8.18 mm/ year or approximately 0.027 ft/ year as shown in the table below.
4
Table 2: Summary Table of 2015 Updated Relative Sea Level Trends for U. S. Army Corps of Engineers Gages *
Gage Name USACE MVN Gage ID number
Latitude and Longitude
Period of Record Analyzed
2015 Linear trend for Entire
Period of Record
(mm/year)
Mississippi River at IHNC Lock
1340 Latitude: 29.96441380
Longitude: -90.02743330
Jan 1945 – Dec 2014
8.18
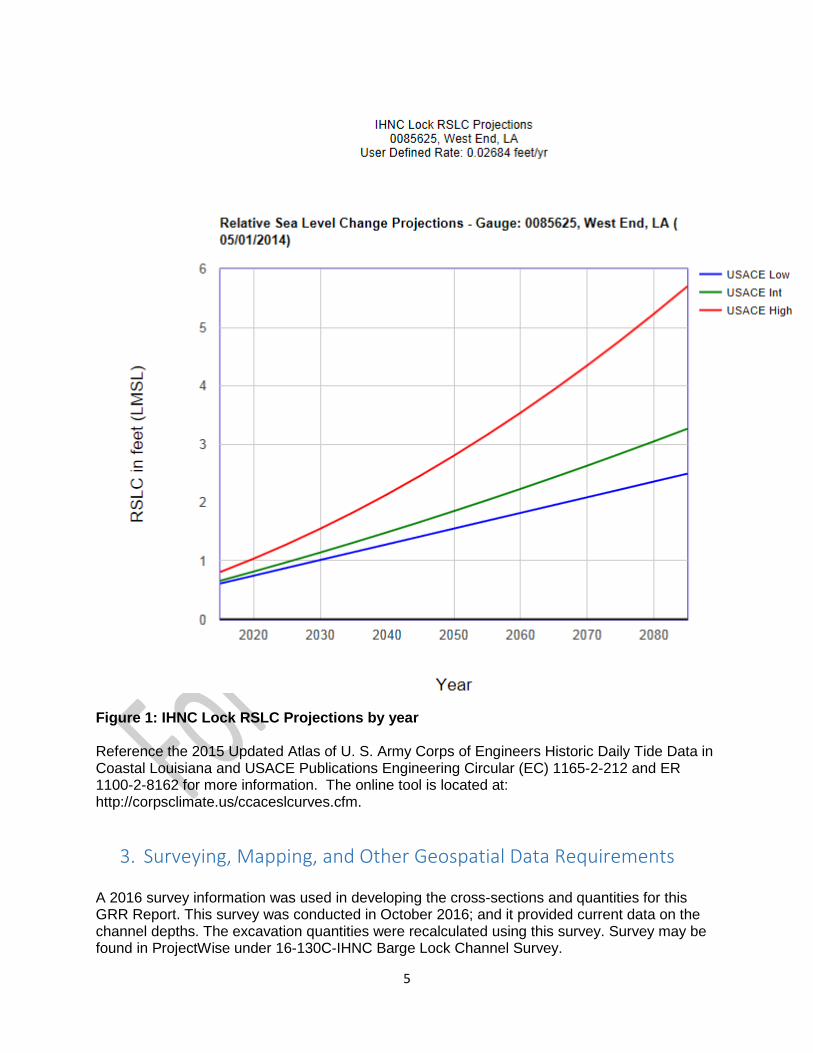
*Excerpt of Table 2 from the 2015 Updated Atlas of U. S. Army Corps of Engineers Historic Daily Tide Data in Coastal Louisiana Next, the regional value was entered in the online RSLC toolbox and the nearest National Oceanic and Atmospheric Administration (NOAA) gage to the study area, West End, was selected to develop the RSLC curves based on USACE Engineering Regulation (ER) 1100-2-8162. The online tool calculated values for the low, intermediate and high RSLC projections as reported below. Table 3: IHNC Lock RSLC Projections
IHNC Lock RSLC Projections 0085625, West End, LA
User Defined Rate: 0.02684 feet/yr All values are expressed in feet relative to LMSL
Year USACE Low
USACE Int
USACE High
2015 0.62 0.66 0.81 2020 0.75 0.82 1.04 2025 0.89 0.98 1.29 2030 1.02 1.15 1.56 2035 1.15 1.32 1.84 2040 1.29 1.49 2.14 2045 1.42 1.67 2.46 2050 1.56 1.86 2.80 2055 1.69 2.04 3.16 2060 1.83 2.24 3.54 2065 1.96 2.43 3.94 2070 2.09 2.63 4.35 2075 2.23 2.84 4.78 2080 2.36 3.05 5.23 2085 2.50 3.27 5.70
Datum shift from NAVD88 (2004.65) to LSML (1983-2001) = -0.34 feet
5
Figure 1: IHNC Lock RSLC Projections by year Reference the 2015 Updated Atlas of U. S. Army Corps of Engineers Historic Daily Tide Data in Coastal Louisiana and USACE Publications Engineering Circular (EC) 1165-2-212 and ER 1100-2-8162 for more information. The online tool is located at: http://corpsclimate.us/ccaceslcurves.cfm.
3. Surveying, Mapping, and Other Geospatial Data Requirements A 2016 survey information was used in developing the cross-sections and quantities for this GRR Report. This survey was conducted in October 2016; and it provided current data on the channel depths. The excavation quantities were recalculated using this survey. Survey may be found in ProjectWise under 16-130C-IHNC Barge Lock Channel Survey.

6
Previous survey were used to prepare the cost for the 4 plans (before the 2016 survey was available). The 2014 Survey areas taken were limited based upon available funding from Project Management. The cross section created from these surveys did not incorporate recent site changes in the field. The specific area of concern is the east side of the channel near the existing water’s edge.
4. Geotechnical
The IHNC Lock is undersized for current traffic needs. Recently, there have been several studies looking into different strategies for replacing the lock. These alternatives require a cellular cofferdam (temporary retaining structure) for construction of the cast-in-place lock & sector gates structures. For a project of this size, the cellular cofferdam approach is the best option in terms of cost and constructability. Jet Grout will be used at the cofferdam to help maintain stability of the structure during excavation. USACE, New Orleans, Engineering Division’s Geotechnical Branch performed design analysis on several items to develop ROM cost estimates. Listed below are items analyzed for the GRR Report, in addition to items that will be further analyzed for the next design milestone. For the next design phase, ED-F will further evaluate the current designs to further reduce costs to the project. Items Designed/Analyzed for GRR Report: -Floodwall stability near the existing lock -Cofferdam Size/Type/Configuration -Cofferdam stability at the New Lock -Jet Grout Limits for Cofferdam -Pile Capacity Curves for 18”x 1/2” Diameter Pipe Piles Items to be Designed/Analyzed for next Project Milestone: -T-Wall Stability Analysis (One the West and East of the IHNC Channel) -New Floodwall Stability analysis (to replace existing floodwalls) -Levee Stability Analysis -Settlement Calculations The Geotechnical Addendum Design Report (Annex 2) takes an already established layout from a previous study, and looks at several options for excavation depth and water load cases for an open cell cofferdam design. The Geotechnical analysis used the Inner Harbor Navigation Canal Lock Replacement Cast‐In‐Place Cofferdam 95% Feasibility Level Design, USACE Contract No. DACW29‐02‐D‐0008, TO 0002, dated September 2006. Analyses on the cofferdam investigated failure modes such as sliding, tilting, overturning, bearing, interlock tension, and global stability. The information in Annex 2 is to be used for cost estimating purposes. A more detailed design is to be performed in the design phase of the project.

7
Guidelines from Engineering Manual 1110‐2‐2503 were followed for design of open‐cell cofferdam design. Stability design follows the most current version of the Hurricane and Storm Damage Risk Reduction System (HSDRRS) Design Guidelines. These analyses are summarized below as they relate specifically to this project. 1) Stability of cofferdam cell on eastern bank with excavation at EL (‐)33.0 and the water level at EL +5.0. 2) Stability of cofferdam cell on eastern bank with excavation at EL (‐)27.5 and the water level at EL +5.0. 3) Stability of cofferdam cell on eastern bank with excavation at EL (‐)33.0 and the water level at EL +3.0 with a 160 kip impact load. 4) Stability of cofferdam cell on eastern bank with excavation at EL (‐)27.5 and the water level at EL +3.0 with a 160 kip impact load. 5) Stability of cofferdam cell at southern end in the channel with excavation at EL (‐)33.0 and the water level at EL +5.0. 6) Stability of cofferdam cell at southern end in the channel with excavation at EL (‐)27.5 and the water level at EL +5.0. 7) Stability of cofferdam cell at southern end in the channel with excavation at EL (‐)33.0 and the water level at EL +3.0 with a 160 kip impact load. 8) Stability of cofferdam cell at southern end in the channel with excavation at EL (‐)27.5 and the water level at EL +3.0 with a 160 kip impact load. 9) Stability of western bank with excavation at EL ‐33.0. 10) Hand calculations of active and passive pressures for cofferdam cell with diameter of 61 feet and height of 95 feet. 11) Hand calculations for risk of overturning for cofferdam cell with diameter of 61 feet and height of 95 feet. 12) Hand calculation for risk against sliding of cofferdam cell with diameter of 61 feet and height of 95 feet. 13) Hand calculation for risk against bearing capacity of cofferdam cell with diameter of 61 feet and height of 95 feet. 14) Hand calculation for risk against tilting of cofferdam cell with diameter of 61 feet and height of 95 feet. 15) Hand calculation of vertical shear and interlock tension of cofferdam cell with diameter of 61 feet and height of 95 feet. For more detailed information and analysis, refer to Annex 2 to this report.
5. Environmental Engineering No detailed environmental engineering was performed as part of this GRR Evaluation Study. For Environmental impacts and other considerations, refer to the GRR main report.
6. Civil Design

8
6.1 Embankment, Compacted Fill
Using the recent surveys listed in Section 3, a final grade section at the New Lock was developed for cost estimating purposes. For backfill at the new lock, semi-compacted fill (granular sand fill) will be placed in the dry within the cofferdam cell up to 3-ft below El. 5.0. After this elevation has been achieved, the granular fill will be capped with 3-ft of clay Embankment, Compacted fill. The final section will be further developed and provided during the next design milestone (Agency Decision Milestone). Embankment, Compacted fill at the T-Walls were estimated using sections from previous reports. Sections for these T-Walls will be developed for the next design milestone.
6.2 Excavation Quantities
The quantities of material to be excavated has been calculated, using the results of the 2016 survey. A portion of the excavated material may be stockpiled for use as backfill once construction is complete. The remainder of the material may be disposed of in the Mississippi river open water disposal site. Materials found to have contaminants may not be deposited in open water. Areas were designated depending on the nature of the sediment, and were defined as dredged material management units (DMMU). The following figure shows the designation and location of each DMMU:
9
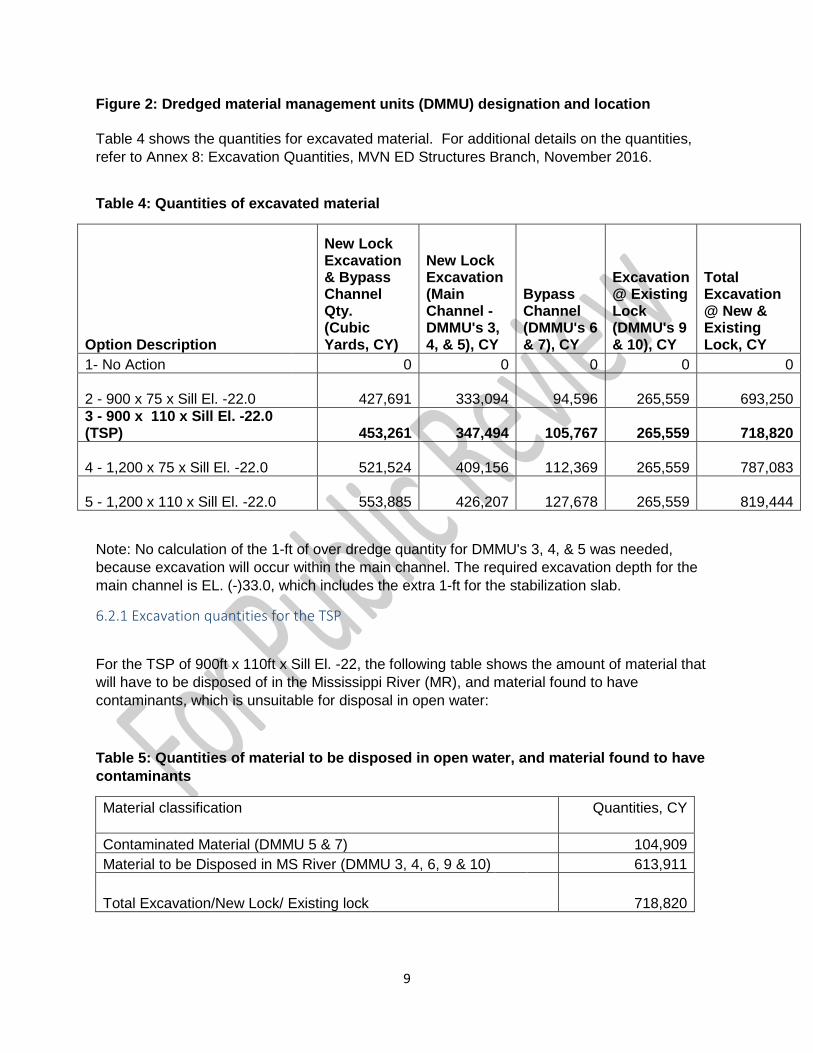
Figure 2: Dredged material management units (DMMU) designation and location Table 4 shows the quantities for excavated material. For additional details on the quantities, refer to Annex 8: Excavation Quantities, MVN ED Structures Branch, November 2016.
Table 4: Quantities of excavated material
Option Description
New Lock Excavation & Bypass Channel Qty. (Cubic Yards, CY)
New Lock Excavation (Main Channel - DMMU's 3, 4, & 5), CY
Bypass Channel (DMMU's 6 & 7), CY
Excavation @ Existing Lock (DMMU's 9 & 10), CY
Total Excavation @ New & Existing Lock, CY
1- No Action 0 0 0 0 0
2 - 900 x 75 x Sill El. -22.0 427,691
333,094
94,596
265,559
693,250 3 - 900 x 110 x Sill El. -22.0 (TSP) 453,261
347,494
105,767
265,559
718,820
4 - 1,200 x 75 x Sill El. -22.0 521,524
409,156
112,369
265,559
787,083
5 - 1,200 x 110 x Sill El. -22.0 553,885
426,207
127,678
265,559
819,444
Note: No calculation of the 1-ft of over dredge quantity for DMMU's 3, 4, & 5 was needed, because excavation will occur within the main channel. The required excavation depth for the main channel is EL. (-)33.0, which includes the extra 1-ft for the stabilization slab.
6.2.1 Excavation quantities for the TSP
For the TSP of 900ft x 110ft x Sill El. -22, the following table shows the amount of material that will have to be disposed of in the Mississippi River (MR), and material found to have contaminants, which is unsuitable for disposal in open water:
Table 5: Quantities of material to be disposed in open water, and material found to have contaminants
Material classification
Quantities, CY
Contaminated Material (DMMU 5 & 7) 104,909 Material to be Disposed in MS River (DMMU 3, 4, 6, 9 & 10) 613,911
Total Excavation/New Lock/ Existing lock 718,820
10
6.3 Disposal of Contaminated Material
In past studies, disposal of the material found not to be suitable for disposal in open water was analyzed. Due to the required shallow draft lock in lieu of the deep draft as previously studied, the amount of the material to be disposed of has been reduced. Based upon guidance from MVN, Environmental, dredged material management units (DMMU) areas 5 & 7 were found to have contaminants. Two alternatives were considered for the disposal of the contaminated material: a confined disposal facility (CDF) and a permitted landfill. The landfill used for the analysis is the landfill located in Venice, Louisiana.
Results of a 2016 survey were used to calculate the quantities that will need to be excavated for the options. A rough order of magnitude (ROM) cost estimate was developed by MVN ED, using these quantities. The cost for the CDF alternative was higher than the landfill alternative. The analysis for the CDF alternative did not include costs related with Real Estate acquisition of the site, and future maintenance of the CDF. The analysis assumed the use of an environmental bucket for the landfill alternative. The total amount of contaminated material from DMMU 5 and 7, for each option is listed within the Table 6 below.
Table 6: Amount of material to be disposed of from DMMU 5 and 7 for each option (using 2016 surveys)
Option Total Required Material (From DMMU 5 & 7) (CY)
1- No action
0
2- 900ftx75ft 93,013
3- 900ftx110 ft 104,909
4- 1200ftx75ft 93,013
5- 1200ftx110ft 104,909
The results of the cost analysis for material not suitable for disposal in open water, for these two alternatives were as follows:

11
Table 7: ROM cost estimate for Landfill and CDF alternatives
Disposal of dredged material that is
unsuitable for open water
ROM cost estimate ($)
Landfill
34,723,877
Confined Disposal Facility
45,369,169
Cost difference
10,645,292
This cost was prepared using the 2016 survey. Both options include the disposal of the material suitable to be disposed into open water, to the Mississippi River.
6.3.1 Assumptions for the landfill alternative
The analysis of the landfill alternative assumed the following:
a. An Environmental Bucket Dredge will be used to excavate DMMU's 5 & 7. This material will become the property of the Contractor and hauled to a permitted landfill.
b. Material suitable for disposal into open water (within DMMU's 3, 4, & 6), will be dredged via cutterhead dredge (hydraulic dredge).
c. The DMMU areas near the existing lock will be excavated via the environmental bucket dredge. Due to current construction sequencing, the bucket dredge is assumed to mob & demobilization twice.
6.3.2 Assumptions for the CDF alternative
The CDF alternative did not include cost for Real Estate Acquisition of the CDF site, or cost for future maintenance of the CDF. Assumptions made to prepare the estimate for the CDF are:
a. The cutterhead (hydraulic dredge) to excavate DMMU's 3, 4, 5, 6& 7. The material excavated from 5 & 7 will be pumped into the CDF. Water Treatment/Handling of Effluent is also included in the estimate.
b. DMMU's 9 & 10, near the existing lock will be bucket dredged due to the small quantity and the complexity/obstructions within the area. The excavation is primary land-based in lieu of open channel.
The detailed results of the cost comparison for disposal of material not found suitable to be disposed of in open water, may be found in Annex 7.

12
6.3.3 Recommendation for disposal of material not suitable for open water disposal
It is the recommendation of MVN Engineering Division, seconded by the study team, to proceed with the disposal alternative of landfill only. The cost of the landfill alternative is over $10 million cheaper than the CDF alternative. In addition, by not considering the CDF alternative any longer, we eliminate mitigation, real estate, and future maintenance costs. Overall, the landfill alternative offers less risks to the government. For further discussion regarding the disposal alternatives, refer to the Environmental appendix of this GRR
7. Sill elevation assessment
A technical analysis was conducted during the GRR to determine the sill elevation for the proposed shallow draft lock. This assessment relied heavily on USACE engineering manuals and studies completed between 1997 and 2009.
7.1 Summary of Technical Considerations: Adequate Clearance for Design Vessel:
• Sill and chamber depths are set to prevent tows from striking the lock floor and permit reasonable entrance and exit times.
• Per EM 1110-2-1604, a sill depth that is 1.5 to 2 times the vessel draft allows for a safe entrance into and exit from the lock. The design draft for a fully loaded liquid tank barge is 11 feet.
• According to the 1997 Evaluation Report, a sill set at EL. (-)22.0 will provide a water depth that is equal to or greater than 2 times the draft depth 95% of the time. This sill will provide a water depth that is equal to or greater than 1.82 times the draft depth 100% of the time.
• Port of New Orleans personnel and representatives of the Gulf Intracoastal Canal Association (GICA) have stated that the expected maximum draft of vessels locking through the new structure is 12 feet. Although this draft exceeds the design draft, a sill set at EL. (-)22.0 will provide a water depth that is equal to or greater than 1.67 times the maximum draft depth 100% of the time. This satisfies the requirements of EM 1110-2-1604 and allows for safe operation of the lock.
Limiting Hawser Forces on Vessels during Lockage:
• Hawser forces are the stresses in the mooring lines during lockage. Per EM 1110-2-1604, this force cannot exceed 5 tons for a barge. Hawser forces can be reduced by increasing the distance between the bottom of the vessel and the lock floor or by increasing filling and emptying times.
• With a sill set at EL. (-)22.0, hawser forces on the vessels can be limited to the allowable range and provide acceptable filling and emptying times.

13
Constructability:
• The existing IHNC channel is maintained to EL. (-)32.0. By setting the sill of the new structure at EL. (-)22.0, minimal excavation or backfill will be required for construction of the new lock. Based on the findings of previous studies and requirements from USACE engineering manuals, Engineering Division recommends proceeding with a sill elevation of (-)22.0 in the GRR. This is a conservative recommendation and must be validated by a physical model during PED.
At the request of the New Orleans District Project Management Division, a quantitative cost comparison was prepared between a sill elevation of EL. (-)22.0 and EL. (-) 16.5 to validate the cost findings of the 1997 Evaluation report, and to be prepared to answer potential questions form the local sponsor regarding whether there were cost savings if a shallower draft lock was constructed. This comparison has been documented, but has not changed Engineering Division technical recommendation. The Inland Navigation Design Center-MCX (INDC) was consulted in this issue and concurs with this determination. There was a concern that the (-)16.5 sill elevation would increase hawser forces to levels that may not be safe.
This option was added to the five options in this report. Detailed cost for this option may be fond below details and assumptions may be found in Annex 3.
7.2 Sill at elevation (-) 16.5 ft option
Engineering Division provided cost for the largest dimensions of 110ft x 1,200 ft lock for a (-)22 ft draft (Option 1) and A ROM cost for a (-)16 ft draft (option 2). As shown in Table 8; the difference in costs between the two options is minimal.
Table 8: Cost for 1200ft x 900ft lock configuration for Sill Elevation (-)16.5 and (-)22
Option Lock Dimensions Construction Cost with 45% contingency ($)
1
1200ft x 110ft x Sill El. (-)22.0 908,174,826
2
1200ft x 110ft x Sill El. (-)16.0 891,933,400
Difference 16,241,426
7.2 Cast-In-Place versus Float-In-Construction of the lock
7.2.1. Design Summary

14
Float-In-Place Design: The preliminary design for a float-in-place lock structure was developed by URS Group, Inc. between 2003 and 2009. The design consisted of five (5) precast, pre-tensioned concrete monoliths which would be built at an offsite graving site. These modules would be floated through the IHNC to the proposed location of the replacement lock. The monoliths would be set down on 48in diameter steel pipe piles with sand ballast and tremie concrete.
Cast-In-Place Design: The proposed design for a cast-in-place lock structure was developed by the Corps of Engineers, New Orleans District between 2004 and 2007. The design consisted of seven (7) lock monoliths founded on 24in square precast concrete piles. Conventional construction techniques, including sheet pile cofferdams, dewatering systems and cast-in-place concrete would be utilized.
7.2.2 Comparison of Technical Approaches
Design Quality:
Design of the float-in-place structure will require marine design experience and will rely heavily on lessons learned from previous Corps projects. The use of innovation and new technologies associated with float-in design invariably involves a steep learning curve and appropriate model development and testing, which are associated with high costs.
Construction Execution:
• The float-in-place structure will require two separate construction sites – one at the new lock structure and one at the graving site. Concurrent construction will be possible at the two sites.
Transportation and set down will be affected by weather and water levels in the canal.
Float-in-place design may receive a high level of scrutiny from Corps of Engineers Headquarters. Per the Olmsted Locks and Dam Project - Frequently Asked Questions, “Experience has shown that the current in‐the‐wet construction method is more expensive and time consuming than originally envisioned and Corps’ headquarters has directed us to build a team of regional and national experts to consider alternative construction techniques such as building cofferdams for in‐the‐dry construction.”
• The cast-in-place structure requires one construction site, but the size of this site is constrained by existing structures. Construction activities at the site are linear, with limited opportunity for concurrent work.
Cofferdam overtopping is possible during storm events. Navigation Issues:
• The float-in-place design requires a bypass channel to maintain navigation on the canal. Helper boats will be required to assist traffic through the bypass. The IHNC will need to be completely shut down during transportation of the five lock modules.
15
• The cast-in-place design requires a bypass channel to maintain navigation on the canal.
Due to the increased footprint of the cofferdam, the bypass channel will be narrower under this approach. Additional vessel simulation is required to confirm alignment is navigable.
Contractor Expertise:
• Transportation, alignment and set down of floating units will require a marine specialist. The local market has little experience with “in-the wet” construction techniques, which will increase the cost of a float-in-place design.
• There is a large local and national pool of contractors capable of performing the construction work associated with the cast-in-place design.
Biddability:
• Historically, “in-the-wet” construction projects have generated limited interest from contractors due to the significant risks associated with this construction technique. The Olmsted Locks and Dam project received no bids when advertised as a firm fixed price contract. In order to be awarded, the contract was changed to a cost-plus contract, placing all risks on the government and ultimately resulting in significant cost overruns.
• The Harvey Canal Floodgate project was redesigned and awarded as a cast-in-place structure based on feedback from potential bidders regarding the float-in-place structure.
• There is a large local and national pool of contractors capable of performing the construction work associated with the cast-in-place design.
Cost:
• A significant economic advantage with the innovative float-in-place construction method comes from its speedy project delivery, assuming that the project will be fully funded. If the contract is underfunded, any perceived cost savings associated with innovative construction will be eliminated. Specialized construction equipment is often needed for the innovative construction technique, further raising costs. A cost comparison performed by LRD in 2007 showed that the float-in-place was more expensive to construct than the cast-in-place design for a deep draft lock. With decreases in the high cost items for the cast-in-place design
• The cast-in-place design features more standardized construction methodologies, providing greater confidence in cost estimates due to less unknowns and risk in construction.
Community/Environmental Impacts:
• The float-in-place design reduces the impact to the community by eliminating cofferdam construction in the channel and a significant portion of the cast-in-place concrete through

16
the offsite construction of the float-in modules. The graving site will require mitigation of wetlands and additional environmental impacts.
• • The cast-in-place design features more standardized construction methodologies,
providing greater confidence in cost estimates due to less unknowns and risk in construction.
7.2.3 Recommendation Based on this assessment and previous studies, it is recommended that only the cast-in-place design is investigated in the GRR. Once completed, the cast-in-place and float-in-place designs would function identically; however, the cast-in-place design presents less chance for cost escalation and schedule delays due to unforeseen design and construction challenges.
This recommendation is based on the USACE experiences with Olmsted Locks and Dam and the Harvey Canal Floodgate. During discussions with the Inland Navigation Design Center (INDC), the USACE’s Mandatory Center of Expertise (MCX) for inland navigation, they have expressed the same concern with in-the-wet construction. For a more detailed discussion on the comparison between float-in-place and cast-in-place designs, refer to the 2007 letter report prepared by LRD.
8. Sector gates versus miter gates
Considerations that set the two gate types apart are:
• The existence of a reverse head at various times of the year. • Durability. • Gate geometry. • Gate Bay Monolith Geometry. • Construction time. • Culvert Maintenance. • Overall costs.
8.1 Reverse Head
Miter gates are not designed to operate against a reverse head. To deal with this condition, either a second set of gates must be installed or the lock must be shut down for the duration of the reverse head. Since the latter is not an option, a second set of gates must be included along with the appurtenant machinery. To accommodate the second set of gates, the gate bay monolith must be lengthened accordingly.
A single set of sector gates, by design, can handle both a direct head and a reverse head without the need for more gates or more machinery.
17
8.2 Durability
Miter gates do not stand up to damage as well as sector gates. Additionally, if a miter gate leaf is damaged such that there is a flow of water into the chamber, flooding of the downstream side could occur and/or the undamaged gates cannot be operated. Consequently, a $1.4 million emergency crane must be provided to lift the emergency bulkheads into place to stem the flow.
Sector gates, on the other hand, have no problem operating against a flow, and can thus temporarily stem the flow until the emergency bulkheads can be placed. Since placement of the emergency bulkheads is no longer imperative, the emergency crane can be eliminated.
8.3 Gate Geometry
Miter gates are routinely built for the rough channel geometry of 110’ wide by 60’ tall.
If built, the sector gates would be atypical and would be among the largest constructed.
However, the large couple (distance between pintle and hinge) distance greatly reduces thrust on the hinge and pintle, and large main chords minimize deflection. Gate deflection due to dead load is mostly cambered out during fabrication. Wheels and flotation tanks were considered in the preliminary design but discounted.
8.4 Gate Bay Monolith Geometry
The miter gates’ gate bay monolith is rectangular in shape, roughly 180’ wide by 436’ long. The sector gates’ gate bay monolith is 218’-8” long by 320’ wide. While in transit, the gate bay will be subjected to wave loadings, the most critical of which is the hogging case (the structure is essentially supported in the center by the wave while the ends behave as cantilevers). The other area potentially affected by the additional 70’ of width is the bypass channel. However, the original clearance between the limits of the bypass channel and the edge of the gate bay concrete of 110’ has been reduced to 40’. This distance is more than sufficient, so no adjustment to the bypass channel would be necessary.
The other area potentially affected by the additional 70’ of width is the bypass channel. However, the original clearance between the limits of the bypass channel and the edge of the gate bay concrete of 110’ has been reduced to 40’. This distance is more than sufficient, so no adjustment to the bypass channel would be necessary.

18
8.5 Construction Time
The construction duration for the sector gate is included within Annex 3 of this appendix. No design and construction duration for the miter gate was included within the GRR report.
8.6 Culvert Maintenance
Miter gates cannot operate without culverts to fill and empty the chamber. Sector gates, on the other hand are capable of filling and emptying the chamber in a sufficient time frame when there is a small head differential. Although the sector gate was shown to need the culverts for high head differentials, the gates are capable of operating without them during periods of low differentials. Being able to end-fill during those times would enable the culverts to be dewatered for maintenance without closing the lock to marine traffic.
8.7 Costs
Excluding spare gates for either option, the sector gate option is roughly $12 million cheaper than the miter gate option.
8.8 Conclusions
A detailed analysis of the sector versus miter gate is presented In Annex 5. The analysis includes details on a 1997 physical model study, structural, naval, chamber and foundation designs, and cost comparison.
When comparing the sector gates versus miter gates, the costs turned out to be roughly comparable. In light of its preference for a sector-gated structure, and the data presented in Annex 5, Corps of Engineers New Orleans District Operations Division (CEMVN-OD) elected to pursue the sector gate option. In addition, CEMVN-OD authorized the elimination of the emergency bulkhead crane.
9. Structural requirements
9.1 Lock structure
Quantities were prorated using the existing quantities and design data as presented within the 1997 Evaluation Report.
19
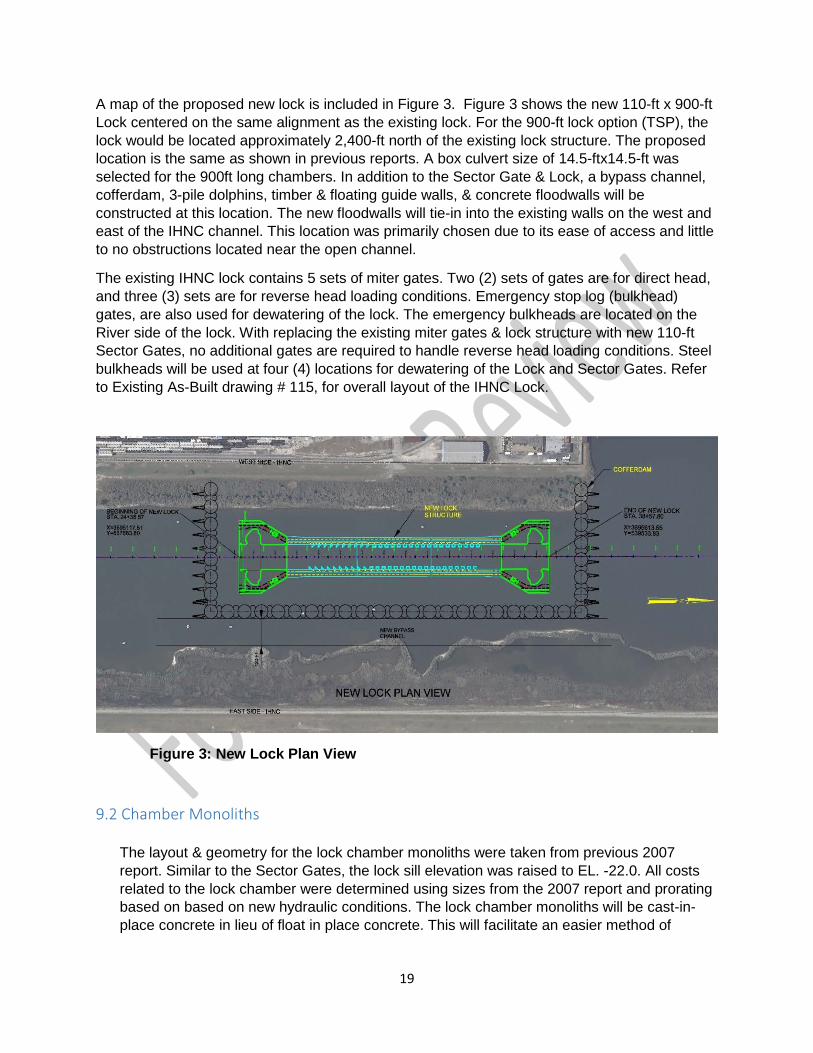
A map of the proposed new lock is included in Figure 3. Figure 3 shows the new 110-ft x 900-ft Lock centered on the same alignment as the existing lock. For the 900-ft lock option (TSP), the lock would be located approximately 2,400-ft north of the existing lock structure. The proposed location is the same as shown in previous reports. A box culvert size of 14.5-ftx14.5-ft was selected for the 900ft long chambers. In addition to the Sector Gate & Lock, a bypass channel, cofferdam, 3-pile dolphins, timber & floating guide walls, & concrete floodwalls will be constructed at this location. The new floodwalls will tie-in into the existing walls on the west and east of the IHNC channel. This location was primarily chosen due to its ease of access and little to no obstructions located near the open channel.
The existing IHNC lock contains 5 sets of miter gates. Two (2) sets of gates are for direct head, and three (3) sets are for reverse head loading conditions. Emergency stop log (bulkhead) gates, are also used for dewatering of the lock. The emergency bulkheads are located on the River side of the lock. With replacing the existing miter gates & lock structure with new 110-ft Sector Gates, no additional gates are required to handle reverse head loading conditions. Steel bulkheads will be used at four (4) locations for dewatering of the Lock and Sector Gates. Refer to Existing As-Built drawing # 115, for overall layout of the IHNC Lock.
Figure 3: New Lock Plan View
9.2 Chamber Monoliths The layout & geometry for the lock chamber monoliths were taken from previous 2007 report. Similar to the Sector Gates, the lock sill elevation was raised to EL. -22.0. All costs related to the lock chamber were determined using sizes from the 2007 report and prorating based on based on new hydraulic conditions. The lock chamber monoliths will be cast-in-place concrete in lieu of float in place concrete. This will facilitate an easier method of

20
construction within the 3 sided cofferdam as discussed within Section 9.9. The lock will utilize a 10-ft thick base slab. Wall thickness will be 4 & 6-ft at the top & bottom respectfully.
The pile foundation for the new lock will utilize 24-inch Prestressed Concrete Piles. No detailed design analysis was performed for this GRR report. The lengths of the piles were determined using the weight of concrete and weight of water (vertical & uplift). Loads were evenly distributed amongst the 10 piles underneath the lock structure, and resulting tip elevation of El. -126 selected thereafter. A FOS of 2.0 was used in determining the pile loads & tip elevation. For detailed quantity calculations, refer Annex 8, “Quantities”
Table 9 shows the pile quantities for each option:
Table 9: Pile Quantities – 24” Prestressed Concrete Piles
Option Area # of Piles Total Pile Quantity
1 Wall 792 79,200
Chamber 900 94,050 2 Wall 792 71,280
Chamber 990 94,050 3 Wall 552 55,200
Chamber 414 43,470 4 Wall 792 79,200
Chamber 594 62,370 5 Wall 552 55,200
Chamber 690 65,550
Table 10 provides the total quantity of concrete for each option:
Table 10: Concrete Quantity-Lock Structure
Option Total Quantity (CY)
1 98,442 2 82,895 3 57,301 4 85,669 5 66,185

21
9.3 Sector Gate Monoliths
Sector gate monoliths) will be constructed at the river side and lake side of the new lock structure. Both Sector Gate monoliths will serve as the mainline protection and for flow control between the Mississippi River and GIWW. The Sector Gates will be constructed within the same cofferdam as the chamber monoliths. The physical features associated with the construction of the Riverside and Lakeside, 110-ft Sector Gate structures are:
The associated Sector Gate Features are:
• Concrete Monolith • Pile Foundation • Steel Gates • Maintenance Bulkheads • Maintenance Bulkhead Storage Platform • Culvert Roller Gates • Culvert Bulkheads • Permanent Mooring Cells 9.4 Sector Gate Pile Foundation
The Sector Gate Pile Foundation was analyzed using Case Pile Group Analysis (CPGA). Similar to the 2006 CIP vs. FIP Evaluation Report, 24in Square Concrete Piles were used in the foundation. A base slab thickness of 13-ft was used in developing pile loads for the Sector Gate (a smaller base slab will be evaluated with selection of the TSP). The Load Cases analyzed to develop pile loads are shown below in Table 11. The pile lengths and quantities for the three (3) separate Lock configurations are as shown below in Table 12:
Table 11: Load Cases For Sector Gate Monolith Pile Foundation
1a Operation, Maximum Direct Head – Gates Closed 1b Operation, Maximum Direct Head – Gates Open 2a Unusual Operation, Maximum Direct Head Plus
Freeboard - Gates Closed 2b Unusual Operation, Maximum Direct Head Plus
Freeboard - Gates Open 3a Unusual Hurricane Plus Freeboard – Gates Open 3b Unusual Hurricane Plus Freeboard – Gates Closed 4 Maintenance Dewatering 5 Unusual Maintenance 7a Normal Operation - Gates Closed 7b Normal Operation – Gates Open
Based upon the varying Lock Sizes & geometry, three (3) separate CPGA analysis were performed for the Sector Gate pile foundations:
22
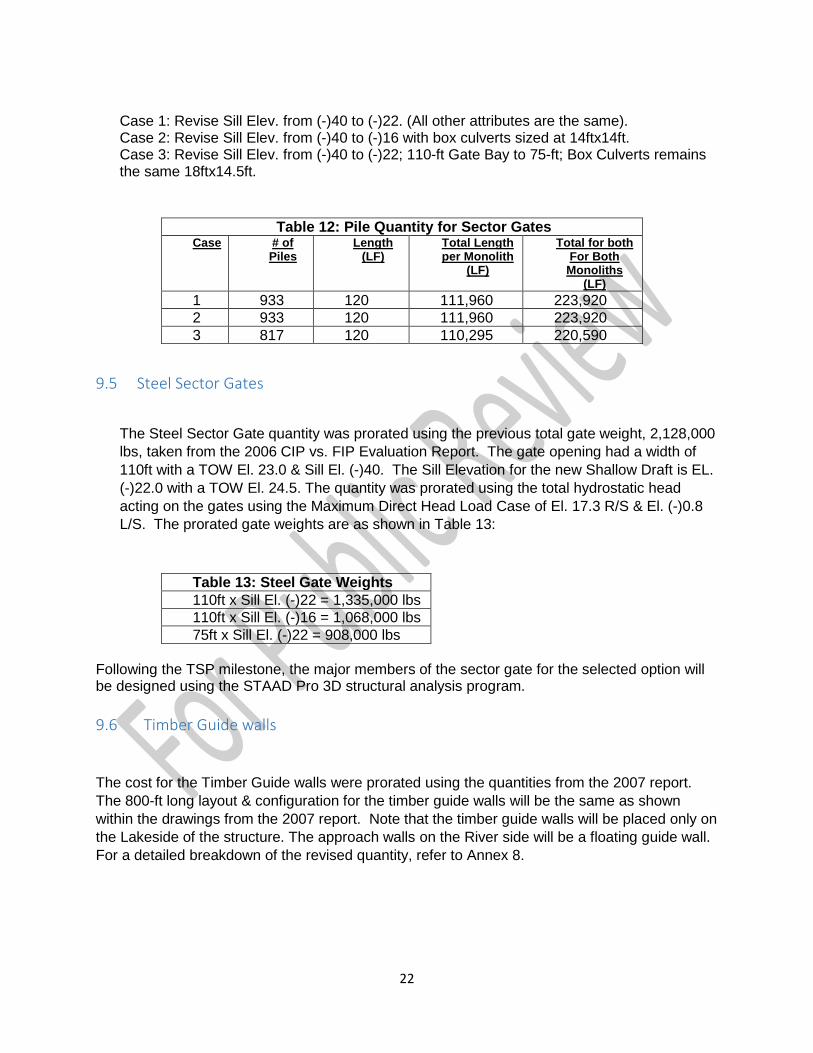
Case 1: Revise Sill Elev. from (-)40 to (-)22. (All other attributes are the same). Case 2: Revise Sill Elev. from (-)40 to (-)16 with box culverts sized at 14ftx14ft. Case 3: Revise Sill Elev. from (-)40 to (-)22; 110-ft Gate Bay to 75-ft; Box Culverts remains the same 18ftx14.5ft.
Table 12: Pile Quantity for Sector Gates Case # of
Piles Length
(LF) Total Length per Monolith
(LF)
Total for both For Both
Monoliths (LF)
1 933 120 111,960 223,920 2 933 120 111,960 223,920 3 817 120 110,295 220,590
9.5 Steel Sector Gates
The Steel Sector Gate quantity was prorated using the previous total gate weight, 2,128,000 lbs, taken from the 2006 CIP vs. FIP Evaluation Report. The gate opening had a width of 110ft with a TOW El. 23.0 & Sill El. (-)40. The Sill Elevation for the new Shallow Draft is EL. (-)22.0 with a TOW El. 24.5. The quantity was prorated using the total hydrostatic head acting on the gates using the Maximum Direct Head Load Case of El. 17.3 R/S & El. (-)0.8 L/S. The prorated gate weights are as shown in Table 13:
Table 13: Steel Gate Weights 110ft x Sill El. (-)22 = 1,335,000 lbs 110ft x Sill El. (-)16 = 1,068,000 lbs 75ft x Sill El. (-)22 = 908,000 lbs
Following the TSP milestone, the major members of the sector gate for the selected option will be designed using the STAAD Pro 3D structural analysis program. 9.6 Timber Guide walls
The cost for the Timber Guide walls were prorated using the quantities from the 2007 report. The 800-ft long layout & configuration for the timber guide walls will be the same as shown within the drawings from the 2007 report. Note that the timber guide walls will be placed only on the Lakeside of the structure. The approach walls on the River side will be a floating guide wall. For a detailed breakdown of the revised quantity, refer to Annex 8.

23
9.7 Floating Guide walls The cost for the Floating Timber Guide walls were prorated using the quantities from the 2007 report. The 1260-ft long layout & configuration for the floating guide wall will be the same as shown within the drawings from the 2007 report. The floating guide wall will only be required on the River Side, along the east wall of the IHNC Channel. An end cell will be used at the end of the guide wall to prevent direct impact at the nose of the structure. For a detailed breakdown of the revised quantity, refer to Annex 8.
9.8 End Cell Dolphins
The cost for the end cell dolphins were included with the design/costs for the cofferdam. For the GRR report/study, an additional cofferdam cell was added to the end of the cofferdam to prevent direct barge impact. At the next design phase, the end cell will be further designed and configured.
9.9 Cofferdam
With constructing the Cast-In-Place lock structure, a 3-sided cofferdam will be required to excavate the existing IHNC Channel to required grade EL. (-)33. The layout for the cellular cofferdam layout was taken from the 2006 CIP vs. FIP Evaluation Report. The east-to-west section of cofferdam cells will tie-into the existing levee on the west side of the channel. Upon completion of the lock and sector gate, the inside of the cofferdam will be backfilled, and the cofferdam removed.
For the GRR, New Orleans District, Geotechnical Branch in Engineering Division (MVN ED-F) performed an analysis to develop the size and length (61-ft diameter, 95-ft long PS-31 sheet pile) for the cellular cofferdam.
Jet Grout columns will be required at the bottom of the cellular cofferdam to provide adequate stability of the structure. A total of 34 cells will be used for Options 1 & 2. A total of 30 cells will be used for Options 3, 4, & 5.
End Cell Dolphins will protect the main flood gate structure and the guide walls from head-on impact from errant vessels. The end cell will consist of a 60ft sheet pile cellular structure with a concrete ring in the interior or the cell.
9.10 Timber Guide Walls

24
The Timber Guide walls were prorated using the original quantities within the 1997 Evaluation Report. The geometry/layout of these guide walls are the same as presented within the previous reports referenced.
9.11 Concrete Floodwalls
The floodwalls for this project will utilize 3 pile rows. The TOW will be constructed to EL. 24.5 to match the required TOW for the Lock. Since the floodwalls will be constructed along the IHNC Channel which is subject to high barge traffic, a 500 kip barge impact force will be used for design. However, for this GRR evaluation report, no detailed designs were performed for the floodwalls.
A typical floodwall plan and section were taken from project MRL 3.2, “Belle Chasse to Oak Pointe”, located in Plaquemines, LA. The floodwalls designed & constructed as part of the MRL 3.2 contract, utilized the 500 kip barge impact and similar hydrostatic loads. The new IHNC floodwalls will extend from the Mississippi River on both East and West sides of the IHNC Channel, and tie into the New Lock. The total linear foot (LF) of floodwall assumed for the GRR was approximately 10,500 LF (263 Floodwall Monoliths, @ 40-ft Lengths).
Table 14: + Total Number of Floodwalls
West Side IHNC Channel
Total Length of Floodwalls = 5,200 LF Total # of 40-ft Floodwall Monoliths = 130
East Side of IHNC Channel Total Length of Floodwalls = 5,300 LF Total # of 40-ft Floodwall Monoliths = 132
*The total Lengths of the Floodwall was taken from Microstation.
Portions of the Existing I-Wall and T-Wall sections along the IHNC Channel require demolition as part of this project. In addition, the existing Concrete Scour Protection will be demolished and replaced with Embankment, Compacted fill. New concrete scour protection will be added after re-grading of this area. The total Cubic yards for demolition of both existing floodwall and scour protection is approximately 13,000 CY.
As part of the new floodwall construction, new T-Wall monoliths are required underneath the existing St. Claude and Claiborne bridges.
The T-Walls required under the St. Claude Bridge will be coordinated with the temporary and new bridge construction. To further note, T-Walls can be constructed up-to the proposed bridge location, prior to removal of the existing bridge. After the existing bridge has been removed, the T-Walls can be tied into the new line of protection.
25
The T-Walls and pile driving installation required underneath the Claiborne Bridge will be performed by vibrating and splicing new pipe piles to the required tip elevation. T-Walls outside of the limit of the bridge can be installed via standard impact hammer which is our typical method of installation.
9.12 Steel Bulkhead Gates
For the EL. (-)40 Sill alternative studied within the 2005/2006 Feasibility Report, the steel bulkheads utilized seven (7) lower bulkheads, and four (4) upper bulkheads. The steel bulkhead structures were prorated based upon the difference in head elevation for the new shallow draft requirements. Based on the higher sill elevation, the total number of bulkheads were revised to three (3) lower bulkheads, and four (4) upper bulkheads. No structural design calculations were performed for developing costs for this GRR Report. More detailed designs (for total gate weights) will be provided at a later date.
10. Electrical and Mechanical Requirements
At this stage, no new electrical and mechanical components will be developed for the sector gates and the lock. For cost purposes, the electrical and mechanical costs were prorated using the lump sum costs from the 1997 Evaluation Report for the Lock Structure. Several Sector Gates structures have been designed and/or constructed within the HSDRRS System for the Greater New Orleans area. For cost estimating purposes, typical electrical and mechanical components from those designs were utilized for this report. The Mechanical and Electrical service will be sized to support the structure loads including power for Gate machinery, lighting, controls, and any other miscellaneous loads.
11. Relocations
Relocation data was collected, tabulated and detailed in this appendix by the U.S. Army Corps of Engineers, New Orleans District, Engineering Division, Relocations Team, to a feasibility level of design. The information gathered was conducted by an in-house investigation of existing reports, files, and past correspondence with affective facility owners. MVN, Engineering Division, The Relocations Team reviewed proposed designs against existing facility maps and databases to obtain information on existing facilities. The Relocations Team then made assumptions based on a proposed feasibility level project design and project location to determine project relocation requirements that were previously recommended. These relocation design assumptions and information were provided in the 1999 Feasibility Report (Facility Relocation Study) and associated (undated) plans (i.e. Plates B-107, B-108, B-109). The plans call for the relocations of several utilities via three (3) utility corridors (conventional trenching) under the channel as well as the modification or replacement of bridges as listed below.

26
11.1 Facility Disposition
Facility Disposition St. Claude Bridge Remove/Replace Claiborne Bridge No modifications South Central Bell Submarine Cables (x8) New Installation Submarine Cables Spare Conduits in Lock New Orleans Public Belt
Railroads, Construction Activities To Be Relocated by Owner during Construction
Cox Cable TV (x2) To Be Relocated by Owner during Construction
New Orleans Public Service, Inc
16" Dia. Gas Main (x6) To be relocated by owner during construction
2-24KV Feeders To be relocated by owner during construction
4-24KV Feeders To be relocated by owner during construction
Power Cable To be relocated by owner during construction
2-24KV PRIM IN 6"CASE (x4) To be relocated by owner during construction
Aerial Transmission Line To be relocated by owner during construction
Communication Cables To be relocated by owner during construction
New Orleans Sewage & Water Board
30" Dia. Gravity Sewer Main (x2) To be relocated by owner during construction
66" Dia. Force Main (x2) To be relocated by owner during construction
54" Dia. Force Main (x2) To be relocated by owner during construction
Sewer Pump Station and 20" P/L To be relocated by owner during construction
20" Dia. Water Main (x4) To be relocated by owner during construction
48" Dia. Water Main (x2) To be relocated by owner during construction
Power Cable To be relocated by owner during construction

27
2-15 KZ 25 HZ Feeder (x6) To be relocated by owner during construction
11.2 Estimated Relocations Costs The total estimated cost for relocations detailed above is $121,521,000. This figure includes basic costs for the relocation items, plus contingency (68.69%) and escalation which was based on the proposed pipeline corridor layout that was proposed during the 1999 Feasibility Study. The 1999 Feasibility Study used the layout of the utility corridors as defined on the Engineering Investigations, of the 1997 Report. The cost for the utility relocations only (excluding the relocations of the temporary and permanent St. Claude bridges, and the relocation of the railroad lines) is $58,545,901. The cost estimates presented in this report were developed by the New Orleans District, Engineering Division, Cost Engineering and Specification Team. These relocation costs represent a feasibility level of design and will be further refined as the investigations advance. The estimated cost for accomplishing the proposed relocations has been prepared in accordance to the total construction cost to replace the existing facilities. Upon initiation of the PED phase, Engineering Division, Relocations Team will provide coordination of proposed relocations with the facility owners. Once this study has been authorized, a complete Compensable Interest Report investigation will be conducted to determine which facilities will be found compensable. A Preliminary Attorney’s Investigation and Report of Compensable Interest was prepared (dated 27 September 1995). The relocation costs for the utilities were deemed to not be compensable. Only the removal of the tracks of the New Orleans Public Belt Railroad was deemed compensable. At the present time, it is assumed that portions of the affected utilities are located within the areas where the Government and the State of Louisiana have a superior right to that of the facility owner crossing the Intercostal Waterway and therefore may not be considered compensable. The proposed bridge work and installation of utility corridors may be considered project features. 11.3 Authority for Accomplishing Relocations The Government will take ownership on coordination for and reporting on the facility relocations plans and the appropriate cost responsibility, if found compensable. Specifically, the Government will coordinate with facility owners to obtain a more detailed relocation plan and specifications that will meet both the affected utility owner and the Corps latest criteria requirements.
12. Cost

28
The project cost estimate was developed in the MCACES MII cost estimating software and used the standard approaches for a feasibility estimate structure regarding labor, equipment, materials, crews, unit prices, quotes, sub- and prime contractor markups. This philosophy was taken wherever practical within the time constraints. It was supplemented with estimating information from other sources where necessary such as the previous report from 1997, quotes, bid data, and A-E estimates. The intent was to provide or convey a “fair and reasonable” estimate that which depicts the local market conditions. The estimates assume a typical application of tiering subcontractors. Given the long time over which this project/program is to be constructed and the unknown economic status during that time, demands from non-governmental civil works projects were not considered to dampen the competition and increase prices. Contingencies were developed using the USACE Abbreviated Cost Risk Analysis (ARA) cost related risks. 12.1 Cost for each option The costs for each option include a 45% contingency calculated using the Abbreviated Cost Risk Analysis may be found in Table 15: Table 15: Cost per option
Option Lock Dimensions Construction Cost with 45% contingency ($)
1
NA NA
2
900ft x 75ft x Sill El. (-)22.0 844,967,477
3
900ft x 110ft x Sill El. (-)22.0 885,825,555
4
1200ft x75ft x Sill El. (-)22.0
879,758,308
5
1200ft x 110ft x Sill El. (-)22.0 908,174,826
Option added by PM
110ft x 1200ft x Sill El. (-)16.0 891,933,400
These costs have taken into account the following:
• Removed costs for construction of the Claiborne bridge • Included Confined Disposal Facility (CDF) • Miscellaneous changes to the lock • Updated dredging activities to account for multiple mobilizations • Added Real Estate cost

29
The estimate includes no costs for any potential Hazardous, Toxic, and Radioactive Waste (HTRW) concerns. Some material to be removed from the canal is assumed to be contaminated and will be disposed of in a landfill. Additional information may be found in Annex 3, which contains the Cost Engineering Appendix. 12.3 Project Schedule The project schedule was developed based on the construction of the individual features of work which includes the dredging of a channel bypass, canal excavation, construction of a cofferdam, the new IHNC lock, a temporary and new bridge for St Claude, earthen levees and floodwalls.
For construction schedule, refer to Annex 4 Classic Schedule Layout.
13. Hazardous and Toxic Materials
For information on Hazardous and Toxic Materials, refer to the GRR report, and to the 2009 SEIS Report, Appendix R, Evaluation of Human Health Risk from the CDF.
14. Operation and Maintenance
Cost and Closure Matrices were prepared by the U.S. Army Corps of Engineers, Louisville District (CELRL-ED-D-S) in 2015 together with the New Orleans District Operations Division (MVN OD).
14.1 Overview of Work The cost and closure schedules are a series of spreadsheet matrices that detail the anticipated maintenance and repair demands for all IHNC Lock Replacement Project options during the fifty-year study period of 2015-2064. The matrices were developed based upon key indicators including historical performance at the project, the New Orleans District’s current maintenance program, as well as multiple large-scale investment strategies from other Corps of Engineers inventory of projects.
14.2 Cost and Closure Matrix Guidelines The IHNC Lock Replacement General Reevaluation Report (GRR) from 2015 was used to support the framework of the matrices. The GRR outlined the screening process and provided five (5) project options.
30
Note that for section 14, Operation and Maintenance, the numbering for each option does not match the numbering of the rest of the engineering appendix and the GRR report.
Option 1: Concrete U-frame Chamber 110ft x 900ft
Option 2: Concrete U-frame Chamber 110ft x 1,200ft
Option 3: Concrete U-frame Chamber 75ft x 900ft
Option 4: Concrete U-frame Chamber 75ft x 1,200ft
The sill elevation of (-)16 was not an option considered during the Operation and Maintenance analysis.
A fifth option is the “without project” option.
There are two scenarios considered when projecting future cost and closure schedules for each option. The first scenario is a ‘Fix as Fails’ option where the historical maintenance pattern is projected into the future and then increased maintenance is required as the structure continues to age. This pattern is based upon the historical data supporting increased maintenance needs. The second scenario will be the ‘Advanced Maintenance’ schedule following either a major rehabilitation or large-scale improvement (i.e., new lock chamber). Once a major rehab or large-scale capacity improvement is made it is assumed that the chamber returns to a much improved maintenance scenario since all the unreliable features have been replaced as necessary.
Fix as Fails Schedule One of the primary purposes and outputs of this analysis is the long-term investments in infrastructure required of the system in order to keep it a safe and reliable transportation link. The more age and operating cycles that the infrastructure sees, the more cumulative damage occurs to the structure. Based on a historical database search of the last 20 years of maintenance costs and closures within the Corps of Engineers inventory of lock structures, it is evident that older facilities require more frequent maintenance closures than the newer facilities.
Advanced Maintenance Scenario An improved maintenance scenario for this analysis means that either a major rehabilitation or large-scale capacity improvement (i.e., new lock chamber) has taken place and the deteriorated lock that was rehabbed or replaced no longer needs additional closures beyond what history has shown to be “typical” frequencies and durations for reliable locks. The advanced maintenance scenario contains much less maintenance closures than those associated with an aged and deteriorated project. This is because it is assumed all unreliable features would be replaced or substantially improved such that the lock can be returned to a maintenance schedule that is more reflective of a “reliable” lock. The other categories of maintenance closures are included in the advanced maintenance scenario following a major rehabilitation or new lock chamber. All maintenance up to the date of the completed work uses the ‘Fix as Fails’ maintenance scenario within the reliability analysis.
14.3 Cost and Closure Matrix Schedules The individual work items and related repairs schedules included in the matrices were determined by a multitude of factors:

31
• Patterns in historical Operations and Maintenance records at the IHNC • Conversations with IHNC project personnel, such as Lockmaster, Project Manager,
Project Engineers, etc regarding current maintenance schedules, recent work items and costs
• Historical Operations and Maintenance performance data of similar New Orleans District projects (Bayou Sorrel and Calcasieu C&C Matrices were completed in 2011)
• Historical Operations and Maintenance performance data of similar lock projects within the USACE inventory
For the purpose of this analysis, chamber closures were broken down into three primary categories based on cost of work and impact to navigation: No impact, Minor Repair and Major Repair.
No Impact to Navigation These columns are dedicated to all work items that are considered routine maintenance and result in the project not needing to shut down operation more than two (2) hours in order to accomplish the tasks. Examples of work include basic routine maintenance, instrumentation calibration or computer system upgrades where implementation of work can occur either during or in-between normal lock operations.
Minor Repair Minor repair items are closures that are essentially independent of routine maintenance work. These involve down time due to instances that are considered unavoidable. Lock chambers are sometimes closed for unforeseen occurrences regardless of historical level of maintenance.
These columns are dedicated to work items that require the project to shut down operation for entire 12-hour shifts up to 175 cumulative hours and carry a cost of less than $1,000,000. Examples of work include guidewall rehabilitation where a floating plant crew must occupy the chamber to perform the work or a critical piece of machinery (i.e., gate sector gear or valve hydraulic cylinder) must be removed for repair or rehabilitation, thusly rendering the chamber inoperable.
Major Repair Many features of a lock chamber deteriorate with time and usage. As can be expected, the older and high-use projects are closed more often for maintenance. These features require more frequent maintenance to keep them operational. Most of these features (gates, operating machinery, and others) require the lock chamber to be closed in order to perform maintenance.
These columns are dedicated to typically large-scale work items that result in the project to shut down operation for entire 12-hour shifts greater than 175 cumulative hours and carry a cost greater than $1,000,000. Examples of work include routine dewatering, emergency repairs such as barge impacts to guidewalls and dolphins or hurricane damage. Chamber closure is a result of emergency failure resulting in direct inoperability and/or extensive repair work with crews occupying the chamber.
14.4 Cost and Closure Projection Results In all scenarios considered for the IHNC Lock Replacement Project, the ‘No Impact to Navigation’ component is broken out separately and holds an equal value in each case. Given the nature of the items (Routine Maintenance, Security Contracts, Periodic Inspections, etc.),

32
this kind of work is considered constant and unlikely to vary in cost or frequency throughout the duration of the study period.
The first matrix compiled was the ‘Without Project’ condition. This scenario assumes no replacement lock chamber will be constructed and the IHNC lock will be the sole chamber for the entire duration of the 50-year study period. The ‘Without Project’ condition also assumes typical maintenance (Fix-as-Fails) will continue and no heightened levels of preventative maintenance will be implemented above what is already in place.
With the original lock chamber construction completed in 1923, the project will be 142 years old by the end of the study period. Much degradation has already occurred in all facets from concrete to machinery and with the assumed lack of preventative maintenance in the future, the degradation of the chamber and all of its components will continue and grow more severe throughout the study period. The frequency of repairs is greatest within this scenario and is adequately captured within the matrix.
Options 1 through 4 quantify each replacement lock chamber configuration option based on the screening process from the IHNC Lock GRR. For each option, construction of the replacement chamber is scheduled to begin in 2020 and will undergo a 12-year construction schedule. From the initiation of the study period (2015) to the completion of construction (2031), the existing chamber will continue to operate under a Fix-as-Fails maintenance schedule. After completion of the replacement chamber (2032) to the end of the study period (2064) the new chamber will operate under an Advanced Maintenance schedule. Note that the assumption on project schedule for the Operation and Maintenance vary from the cost per year analysis prepared by New Orleans District, Engineering Division, Studies Team and Cost section.
The primary difference between the Fix-as-Fails and Advanced Maintenance schedules is the proactive approach to quality control on critical components. For example, sector gate and culvert valve machinery universally hold a 30-year life expectancy, but instead of waiting for the component to fail (FAF), it may be rehabilitated or repaired during a routine dewatering a few years ahead of its expected lifespan (AM). The result is a small increase in cost and closure for that particular year for the added work, but the gains are seen in the less frequent failures and need for closures throughout the study period.
The screened lock replacement options are as follows*:
• Option #1 – 110’ x 900’ concrete U-frame chamber • Option #2 – 110’ x 1200’ concrete U-frame chamber • Option #3 – 75’ x 900’ concrete U-frame chamber • Option #4 – 75’ x 1200’ concrete U-frame chamber
*Note that for section 14, Operation and Maintenance, the numbering for each option does not match the numbering of the rest of the engineering appendix and the GRR report.
The existing IHNC lock chamber has 5 sets of miter gates. With the closure of the Mississippi River – Gulf Outlet, the need for a deep draft-chamber is no longer required, so every option is for a shallow-draft chamber. Subsequently, with a shallow-draft chamber, the need for miter

33
gates is no longer required, so every option will consist of 2 sets of sector gates. This uniformity in design makes the matrices for all options very similar, with slight variation in costs coming from the geometrical differences (i.e., rehabilitation on a 1200’ guidewall will cost more than a 900’ guidewall and similar with a 110’ sector gate versus a 75’ gate). All closure breakdowns are included as a separate ‘Closure Breakdown’ tab as well as individual breakdowns included in each Option (called Alternative) tab.
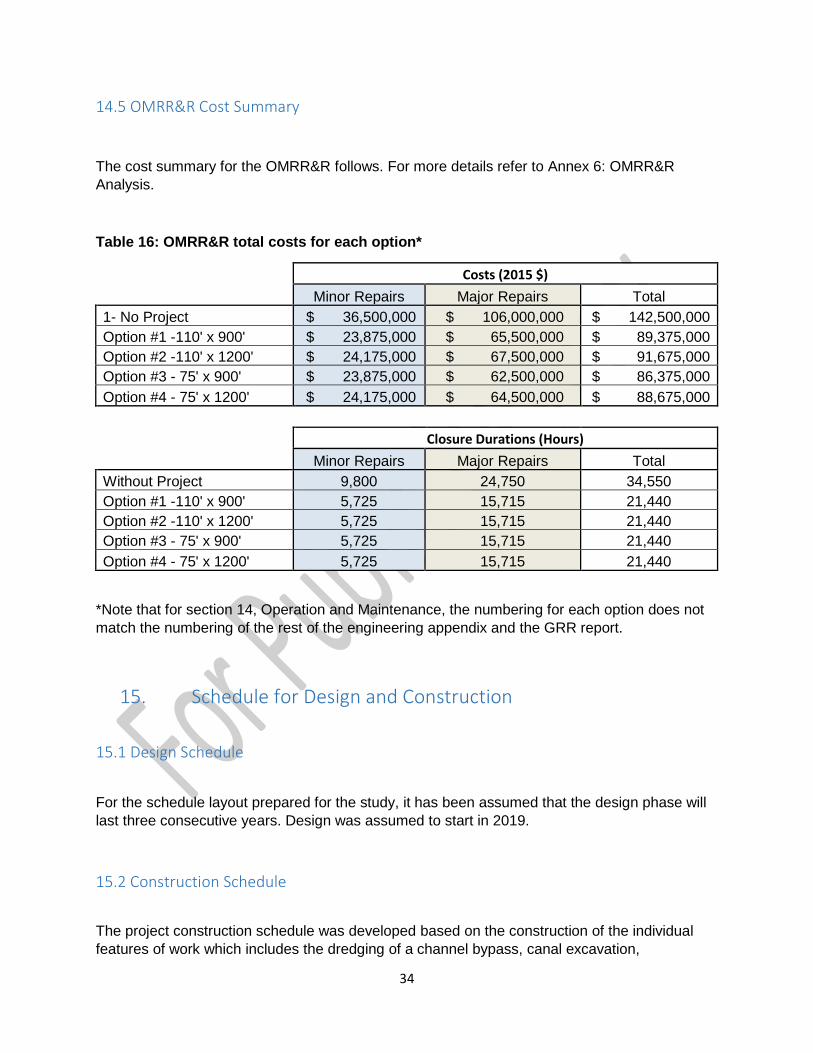
34
14.5 OMRR&R Cost Summary
The cost summary for the OMRR&R follows. For more details refer to Annex 6: OMRR&R Analysis.
Table 16: OMRR&R total costs for each option*
Costs (2015 $)
Minor Repairs Major Repairs Total 1- No Project $ 36,500,000 $ 106,000,000 $ 142,500,000 Option #1 -110' x 900' $ 23,875,000 $ 65,500,000 $ 89,375,000 Option #2 -110' x 1200' $ 24,175,000 $ 67,500,000 $ 91,675,000 Option #3 - 75' x 900' $ 23,875,000 $ 62,500,000 $ 86,375,000 Option #4 - 75' x 1200' $ 24,175,000 $ 64,500,000 $ 88,675,000
Closure Durations (Hours)
Minor Repairs Major Repairs Total Without Project 9,800 24,750 34,550 Option #1 -110' x 900' 5,725 15,715 21,440 Option #2 -110' x 1200' 5,725 15,715 21,440 Option #3 - 75' x 900' 5,725 15,715 21,440 Option #4 - 75' x 1200' 5,725 15,715 21,440
*Note that for section 14, Operation and Maintenance, the numbering for each option does not match the numbering of the rest of the engineering appendix and the GRR report.
15. Schedule for Design and Construction
15.1 Design Schedule
For the schedule layout prepared for the study, it has been assumed that the design phase will last three consecutive years. Design was assumed to start in 2019.
15.2 Construction Schedule
The project construction schedule was developed based on the construction of the individual features of work which includes the dredging of a channel bypass, canal excavation,
35
construction of a cofferdam, the new IHNC lock, a temporary and new bridge for St Claude, earthen levees and floodwalls. For a detailed breakdown of the construction schedule, including the assumptions used in the cost development, refer to Annex 4.
15.3 Construction Sequencing
The overall construction sequencing of the New Lock Structure, etc. is listed below. As part of this GRR, the construction sequencing & cost estimates reflect a Cast-In-Place (CIP) construction methodology in lieu of Float-In-Place (FIP) for the Lock.
For a detailed breakdown of the construction sequencing and project schedule, including the assumptions used in the cost development, refer to Annex 4.
The Proposed Construction Sequencing is as follows. Note that this sequencing is subject to change at later design stages of the study:
a. Install Portion of Cellular Cofferdam (within center of Main Channel). b. Dredge IHNC Channel & Bypass channel at new lock site. c. Complete closure of Cellular Cofferdam. d. Reroute marine traffic through Bypass channel. e. Dewater cofferdam & complete excavation. f. Install sector gate & lock foundation piles. g. Place reinforced concrete for lock monolith and gate bays. h. Install sector gates, machinery and electrical components. i. Backfill Cofferdam & Construct T-Walls. j. Re-water cofferdam. k. Remove cofferdam. l. Complete Construction of Remaining Floodwalls. m. Dredge bypass channel around existing lock. n. Build Temporary Bridge at St. Claude Avenue o. Demolish existing lock and existing St. Claude Ave. Bridge. p. Construct New St. Claude Avenue Bridge.
16. Engineering Assessment of the existing lock
MVN Engineering Division prepared an analysis with the details of the current condition and deficiencies of the existing IHNC Lock structures and components. During Periodic Inspection (PI) No. 11, engineers performed a close visual examination of the lock. A total of thirty-three (33) deficiencies were found, requiring a remedial action. The lock walls are currently 0.8 ft deficient based on the 1973 Mississippi River and Tributaries (MR&T) Flow Line Report. The existing lock is undergoing a dewatering event in 2016. During this event, the machinery, electrical, and several miter gates are being replaced. This will give the lock additional years of operation, but does not address the main structural deficiency which is spalling of the concrete,
36
and replacement of steel reinforcement; which could lead to problems in the future. Additionally, it should be noted that the existing lock is not designed for an unwatering load case. There is a significant wear of the concrete and steel reinforcement due to the age of the structure.
For more information, details and pictures of the damage, refer to MVN Engineering Division. Structures Branch, memorandum, dated 14 October 2016. The memorandum may be found in Annex 9.
17. Plates, Figures, and Drawings
Refer to Annex 10 for plates.
18. References
ER 1110-2-1150, Appendix C, Content of Engineering Appendix to Feasibility Report
ED-F
Engineering Manual 1110‐2‐2503
ED-T
USACE, New Orleans District, Mississippi River-Gulf Outlet, New Lock and Connecting Channels, Louisiana, Evaluation Report, Volumes 1 thru 9, March 1997.
USACE, IHNC Lock, Inner Harbor Navigation Canal, New Orleans, Louisiana, New 1200’ Lock Letter Report of Float-In-Place (FIP) vs. Cast-In-Place (CIP) Comparison, April 2007. USACE, Supplemental Environmental Impact Statement (SEIS), Inner Harbor Navigation Canal Lock Replacement Project, Orleans Parish, Louisiana, March 2009. Cast-in-Place references New Locks and Connecting Channels, Evaluation Report, March 1997 New 1200 Lock, Letter Report of Float-In-Place vs. Cast-In-Place Comparison, July 2007 Supplemental Environmental Impact Statement, Inner Harbor Navigation Canal Lock Replacement Project, Orleans Parish, Louisiana, March 2009 ED-H Hydraulic Design of Navigation Locks (EM 1110-2-1604). US Army Corps of Engineers, 1 May 2006

37
Report of Relocation Alternatives for Facilities along the Inner Harbor Navigational Canal for the Lock Replacement, Facility Relocation Study, Final Submittal, by Waldemar S. Nelson and Company Inc. and Hartman Engineering, Inc., April 1999.


