Embed Size (px)
Citation preview

Evolution of DNA Amounts Across Land Plants (Embryophyta)
I . J . LEITCH1,*, D. E . SOLTIS2, P . S . SOLTIS3 and M. D. BENNETT1
1Jodrell Laboratory, Royal Botanic Gardens, Kew, Richmond, Surrey TW9 3DS, UK, 2Department of Botany and
the Genetics Institute, University of Florida, Gainesville, FL 32611-5826, USA and 3Florida Museum of
Natural History and the Genetics Institute, University of Florida, Gainesville, FL 32611-7800, USA
Received: 16 December 2003 Returned for revision: 12 February 2004 Accepted: 24 March 2004
� Background and Aims DNA C-values in land plants (comprising bryophytes, lycophytes, monilophytes, gymno-sperms and angiosperms) vary�1000-fold from approx. 0�11 to 127�4 pg. To understand the evolutionary significanceof this huge variation it is essential to evaluate the phylogenetic component. Recent increases in C-value data (e.g. PlantDNA C-values database; release 2.0, January 2003; http://www.rbgkew.org.uk/cval/homepage.html) together withimproved consensus of relationships between and within land plant groups makes such an analysis timely.� Methods Insights into the distribution of C-values in each group of land plants were gained by superimposingavailable C-value data (4119 angiosperms, 181 gymnosperms, 63 monilophytes, 4 lycophytes and 171 bryophytes)onto phylogenetic trees. To enable ancestral C-values to be reconstructed for clades within land plants, character-state mapping with parsimony and MacClade was also applied.� Key Results and Conclusions Different land plant groups are characterized by different C-value profiles, dis-tribution of C-values and ancestral C-values. For example, the large (�1000-fold) range yet strongly skeweddistribution of C-values in angiosperms contrasts with the very narrow 12-fold range in bryophytes. Further,character-state mapping showed that the ancestral genome sizes of both angiosperms and bryophytes were recon-structed as very small (i.e.<1�4 pg) whereas gymnosperms and most branches of monilophytes were reconstructedwith intermediate C-values (i.e. >3�5, <14�0 pg). More in-depth analyses provided evidence for several independentincreases and decreases in C-values; for example, decreases in Gnetaceae (Gymnosperms) and heterosperous waterferns (monilophytes); increases in Santalales and some monocots (both angiosperms), Pinaceae, Sciadopityaceaeand Cephalotaxaceae (Gymnosperms) and possibly in the Psilotaceae + Ophioglossaceae clade (monilophytes).Thus, in agreement with several focused studies within angiosperm families and genera showing that C-values mayboth increase and decrease, it is apparent that this dynamic pattern of genome size evolution is repeated on a broadscale across land plants. ª 2005 Annals of Botany Company
Keywords: Genome size, C-values, genomic downsizing, land plants, evolution, bryophytes, pteridophytes, monilophytes,lycophytes, gymnosperms, angiosperms, algae.
INTRODUCTION
Recent years have seen significant advances in our under-standing of how the genome size (1C nuclear DNA amount)of species may change. Increases in DNA occur predomin-antly either via polyploidy or by transposon amplification(e.g. see reviews byWendel, 2000; Bennetzen, 2002; Leitchand Bennett, 2004; Bennetzen et al., 2005), whereasdecreases involve either recombinational mechanisms, forexample, unequal homologous (Vicient et al., 1999; Shirasuet al., 2000) and illegitimate (Devos et al., 2002; Vitte andPanaud, 2003) recombination, or DNA loss during repair ofdouble-stranded breaks (Kirik et al., 2000; Orel and Puchta,2003). There has also been progress in understanding thenature of the evolutionary forces acting on these mechan-isms to drive changes in genome size (e.g. Gregory, 2001,2003; Petrov, 2002).
C-values of different organisms vary extensively (e.g.C-values in eukaryotes vary �3300-fold; Gregory, 2005),so insights into the direction of genome size changes arealso essential for a holistic perspective of genome sizeevolution. Such analyses require that genome size dataare viewed within a robust phylogenetic framework.In angiosperms, a few studies have followed this approach
at the family or genus level (Bennetzen and Kellogg, 1997;Cox et al., 1998; Wendel et al., 2002; Johnston et al., 2005;Price et al., 2005), while Leitch et al. (1998) and Soltis et al.(2003) have conducted broader analyses across the entireangiosperm phylogeny. Together, these studies showed thatboth increases and decreases in genome size have takenplace during angiosperm evolution and provided insightsinto the size of the ancestral angiosperm genome.
This paper extends the studies noted above for angio-sperms by analysing available C-value data for all landplants (Embryophyta) within a robust phylogenetic frame-work. This is timely for two reasons:
(1) Knowledge of C-values in land plants has increasedsignificantly in recent years with estimates now available for4538 species (4119 angiosperms, 181 gymnosperms, 67pteridophytes and 171 bryophytes). These data are locatedeither in the Plant DNA C-values database (release 2.0,January 2003; http://www.rbgkew.org.uk/cval/homepage.html), in Bennett and Leitch (2005), or Hanson and Leitch(2002). Analysis shows that C-values in land plants vary�1000-fold from approx. 0�1 pg in Fragaria viridisDuchesne to 127�4 pg in tetraploid Fritillaria assyriacaBaker (Table 1).
(2) Recent studies have made significant advances inclarifying relationships between and within land plant
Annals of Botany 95/1 ª Annals of Botany Company 2005; all rights reserved
* For correspondence. E-mail [email protected]
Annals of Botany 95: 207–217, 2005
doi:10.1093/aob/mci014, available online at www.aob.oupjournals.org
by guest on January 24, 2016http://aob.oxfordjournals.org/
Dow
nloaded from

groups (Fig. 1; Pryer et al., 2001). These analyses placehornworts, liverworts and mosses as sisters to all other landplants, although relationships among these three bryophytelineages remain controversial (Renzaglia et al., 2000). Theremaining land plants form a clade comprising all extantvascular plants (tracheophytes). Vascular plants are furtherdivided into three monophyletic groups: (a) lycophytes(Lycopodiaceae, Selaginellaceae and Isoetaceae), whichare sister to all other vascular plants; (b) a monilophyteclade comprising Psilotaceae + Ophioglossaceae, horsetails(equisetophytes), and all eusporangiate and leptosporangi-ate ferns; and (c) the seed plants (Spermatophyta) compris-ing a clade of extant gymnosperms as the sister group toangiosperms.
VARIATION IN THE DISTRIBUTION OFC-VALUES ACROSS LAND PLANTS
Superimposing C-value data onto the land plant phylogenyreveals differences between the groups in terms of theminimum and maximum, range, mean and modal C-values(Fig. 1, Table 1). Further differences are highlighted when
histograms, showing the frequency of known C-values, areplotted for each group (Fig. 2). For example, the large(�1000-fold) range, yet strongly skewed distribution, ofC-values in angiosperms (Fig. 2A) contrasts with the verynarrow 12-fold range in bryophytes (Fig. 2E). However, thepercentage of species represented for all but gymnospermsis poor (Table 1). Thus, the analysis presented below mustinclude the caveat that available data may not be entirelyrepresentative and that further data may extend the rangeand distribution of C-values for each group. The exceptionto this might be the angiosperms as the �1000-fold rangewas first reported in 1982 based on C-values for 993 species(Bennett et al., 1982). Since then, the addition of a further3126 species has not extended this range.
INSIGHTS INTO THE ANCESTRAL C-VALUESOF LAND PLANT GROUPS USING
CHARACTER-STATE RECONSTRUCTION
To provide further insights into how C-values are distrib-uted within land plants, C-value data were superimposedonto more detailed phylogenetic trees for each group
Angiosperms (4119)6·3 (0·1–127·4)
17·0 (2·3–32·2)
13·6 (0·8–72·7)
3·8 (0·2–12·0)
Pter
idop
hyte
sSe
ed p
lant
s(s
perm
atop
hyte
s)V
ascu
lar
plan
ts(t
rach
eoph
ytes
)
Lan
d pl
ants
(em
bryo
phyt
es)
0·5 (0·2–2·1)
0 25 50 75
1C DNA amount (pg)
100 125 150
Gymnosperms (181)
Monilophytes (63)
Lycophytes (4)
Bryophytes (171)
F I G . 1. Land plant phylogeny (left; based on Pryer et al., 2001) and C-value data (middle) showing the mean (�) followed by the range of nuclear DNAC-values encountered in each group. The number in brackets following the group name gives the number of species with C-value data. Land plants and their
major subdivisions are shown on the right.
TABLE 1. Minimum (min.), maximum (max.), mean, mode and range (max./min.) of 1CDNA values in major groups of land plantstogether with the level of species representation of C-value data
Min.(pg)
Max.(pg)
Mean(pg)
Mode(pg)
Range(max./min.)
No. of species withDNA C-values
No. of speciesrecognized*
Representation(%)
Bryophytes 0.17 2.05 0.51 0.45 12.1 171 �18 000 �1.0Lycophytes 0.16 11.97 3.81 n/a 74.8 4 �900 �0.4Monilophytes 0.77 72.68 13.58 7.80 95.0 63 �11 000 �0.6Gymnosperms 2.25 32.20 16.99 9.95 14.3 181 730 24.8Angiosperms �0.11 127.40 6.30 0.60 �1000 4119 �250 000 �1.4All land plants �0.11 127.40 6.46 0.60 �1000 4538 �280 000 �1.6
*Numbers of species recognised for bryophytes fromQiu and Palmer (1999), for lycophytes andmonilophytes fromRaven et al. (1999), for gymnospermsfrom Murray (1998) and for angiosperms from Bennett and Leitch (1995).
208 Leitch et al. — Evolution of DNA Amounts Across Land Plants
by guest on January 24, 2016http://aob.oxfordjournals.org/
Dow
nloaded from

(Fig. 3). In addition, to enable ancestral C-values to bereconstructed for clades within the land plants, character-state mapping with parsimony and MacClade (versions 3.04and 4.0; Maddison and Maddison, 1992) was conducted
using the following size categories: species with C-valuesof<1�4 pg and<3�5 pg were defined as having’ very small’and ‘small’ genomes, respectively. C-values of >3�5 and<14�0 pg were defined as ‘intermediate’, whereas specieswith C-values >14�0 pg and >35�0 pg were defined ashaving ‘large’ and ‘very large’ C-values, respectively.Except for the ‘intermediate’ category, these size classesare the same as those originally defined by Leitch et al.(1998) and were used by Soltis et al. (2003).
For character-state reconstructions three ‘trace’ optionsavailable with MacClade were used: ‘all most-parsimoniousstates’, accelerated transformation (ACCTRAN) and del-ayed transformation (DELTRAN). A conservative estimateof phylogeny that contained a polytomy within the lepto-sporangiate ferns was used for the ‘all most-parsimoniousstates’ reconstruction. This polytomy was depicted asresolved in the ACCTRAN and DELTRAN optimizationsbecause these methods cannot be employed whenpolytomies are present. However, the polytomy had noeffect on the reconstructions. The ‘all most-parsimoniousstates’ and DELTRAN optimizations were very similar,with most deep nodes in the land plants reconstructed asequivocal (see Fig. 7). The ACCTRAN optimization hada major impact on the reconstruction of the ancestralstates at these deep nodes (see Fig. 8). However, withinclades the reconstructions obtained were identical regard-less of the trace option used; exceptions are highlightedbelow.
EVOLUTION OF GENOME SIZE IN THEANGIOSPERMS
The first large-scale analysis of genome size evolution inangiosperms (Leitch et al., 1998), based on an analysis ofC-value data for 2802 species, used the most robustphylogenetic tree available at the time, which placedCeratophyllaceae sister to all other angiosperms (Chaseet al., 1993). Superimposing C-value data onto the phylo-geny showed that, while all groups analysed containedspecies with small genome sizes (i.e. <3�5 pg), verylarge genomes (i.e. >35�0 pg) were restricted to just twoclades—monocots and Santalales. It was concluded that thesize of the ancestral angiosperm genome was small.
Subsequently, there have been two important develop-ments. First, an increased amount of DNA sequence datahas resulted in greater resolution and internal support for therelationships among basal angiosperms, revealing thatAmborellaceae are sister to all other angiosperms followedby Nymphaeaceae and Austrobaileyales (e.g. Qiu et al.,1999; Zanis et al., 2002). Second, C-value data for angio-sperms have increased by nearly 50 % and now includerepresentatives of all the most basal families (Leitch andHanson, 2002).
Repeating the analysis by superimposing the larger data-set of 4119 species onto the more robust angiosperm phy-logeny gave similar results (Fig. 3A) to those obtained byLeitch et al. (1998), with just the monocot and Santalalesclades containing species with very large genomes. To gaina more objective insight into the size of the ancestral
0
200
400
600
800
1000
1200
No.
of
spec
ies
Max. C-value127·4 pg
A
0
5
10
15
20
25
No.
of
spec
ies
Max. C-value32·2 pg
B
0
1
2
3
4
5
No.
of
spec
ies
Max. C-value = 11·97 pg
D
0
4
8
12
16
No.
of
spec
ies
Max. C-value72·7 pg
C
0
30
60
90
120
150
180
No.
of
spec
ies
Max. C-value = 2·05 pg
E
0 25 50 75 100 1251C DNA amount (pg)
F I G . 2. Histograms showing the distribution of DNAC-values for (A) 4119angiosperms, (B) 181 gymnosperms, (C) 63monilophytes, (D) 4 lycophytes,and (E) 171 bryophytes. The maximumC-value for each group is indicated.
Leitch et al. — Evolution of DNA Amounts Across Land Plants 209
by guest on January 24, 2016http://aob.oxfordjournals.org/
Dow
nloaded from

genome of angiosperms, character-state reconstructionusing gymnosperms as the outgroup was conducted (Soltiset al., 2003; Fig. 4). This revealed that not only was theancestral genome size of all angiosperms reconstructed asvery small (i.e. <1�4 pg), but that most of the major cladeswithin angiosperms (e.g. monocots, magnoliids, eudicots,Ranunculales, Caryophyllales and asterids) also had verysmall ancestral genomes.
Soltis et al. (2003) also noted that a closer examination ofmonocots and Santalales revealed that species possessing
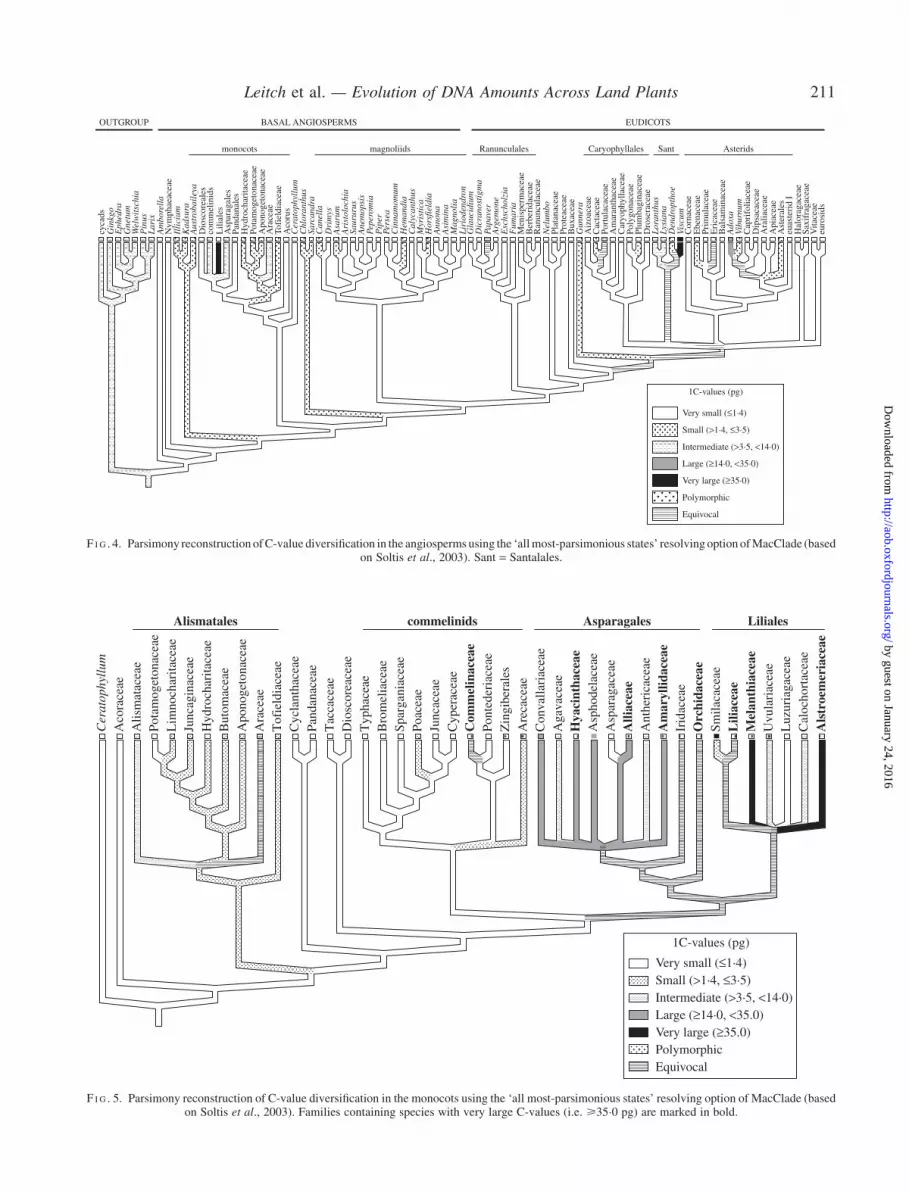
very large C-values occupied derived positions within theseclades. In monocots, species with very large C-values wererestricted to just one family in the commelinids, fivefamilies in Asparagales and three families in Liliales(Fig. 5). Based on character-state reconstruction, verylarge C-values must have evolved at least twice withinmonocots and possibly more (Soltis et al., 2003). However,the number of independent origins in Asparagales andLiliales is currently uncertain. Although some species inthese clades do have very large genomes (for example,
A
Gnetales (13)
Pinaceae (88)
Coniferales II (73)
Ginkgoales (1)
Cycadales (6)
12·4 (2·3–18·5)
21·7 (5·8–32·2)
12·4(6·6–32·1)
10·0
0 5 10 15 20
1C DNA amount (pg)
25 30 35
14·7 (12·1–21·1)
B
Asterids (815)
Saxifragales (45)
Rosids (1097)
Santalales (62)
Caryophyllales (133)+
Berberidopsidaceae (1)
Aextoxicaceae (0)
Gunnerales (1)
Trochodendraceae (1)
Buxaceae (2)
Proteales (3)
Sabiaceae
Ranunculales (192)
Chloranthaceae (3)
Ceratophyllaceae (1)
magnoliids (65)
monocots (1690)
Austrobaileyales (7)
Nymphaeaceae (2)
Amborellaceae (1)
0 25 50 75
1C DNA amount (pg)
100
Bas
al a
ngio
sper
ms
Ear
ly d
iver
ging
eud
icot
sC
ore
eudi
cots
Eud
icot
s
125 150
2·98 (0·19–24·8)
10·63 (0·15–30·05)
1·96 (0·1–27·4)
12·04 (0·29–79·3)
2 (0·2–15·0)
0·26
7·43
1·91
1·11 (0·81–1·42)
0·78 (0·24–1·3)
6·89 (0·5–25·1)
3·6 (2·9–4·3)
0·69
1·7 (0·4–7·1)
10·47 (0·2–127·4)
7·22 (3·4–9·5)
0·85 (0·6–1·1)
0·89
C DSpermatophytes
‘Polypodiaceous’ ferns (39)
Tree ferns (6)
Heterosporous water ferns (2)
Schizaeaceae (1)
Gleichenioid ferns
Filmy ferns (1)
Osmundaceae (1)
Equisetum subgenus Equisetum (3)
Equisetum subgenus Hippochaete (5)
Marattiidae (2)
Ophioglossaceae (2)
Psilotaceae (1)
Lycophytes (4)
0 10 3020 401C DNA amount (pg)
50 60 70 80
9·1 (3·0–19·7)
11·9 (7·1–25·5)
2·4 (0·8–4·0)
11·7
10·7
21·01
13·4 (12·5–14·2)
25·9 (21·3–30·4)
7·4 (7·1–7·7)
65·2 (64·8–65·6)
72·7
3·8 (0·2–12·0)
0 0·5 1·51·0 2·01C DNA amount (pg)
Subclass Bryidae (131)
Buxbaumiaceae
Tetraphidaceae (1)
Andreaeaceae (1)
Polytrichaceae (7)
Sphagnaceae (31)
0·28
0·21
0·74 (0·42–1·98)
0·52 (0·39–0·95)
0·5 (0·17–2·05)
F I G . 3. Molecular phylogeny (left) and C-value data (middle) showing the mean (�) followed by the range of nuclear DNA C-values encountered ineach group or family of (A) angiosperms, (B) gymnosperms, (C) monilophytes and lycophytes, and (D) bryophytes. The number in brackets following thegroup or family name gives the number of species with C-value data. Major subdivisions within the angiosperms are shown on the right. Phylogenetic treestaken from the following sources: angiosperms, APG II (2003); gymnosperms, Soltis et al. (2002); monilophytes and lycophytes, Pryer et al. (2001);
bryophytes, Beckert et al. (1999).
210 Leitch et al. — Evolution of DNA Amounts Across Land Plants
by guest on January 24, 2016http://aob.oxfordjournals.org/
Dow
nloaded from
cyca
dsG
inkg
oE
phed
raG
netu
mW
elw
itsc
hia
Pin
usL
arix
Am
bore
lla
Nym
phae
acea
eIl
lici
umK
adsu
raA
ustr
obai
leya
Dio
scor
eale
sco
mm
elin
ids
Lili
ales
Asp
arag
ales
Pand
anal
esH
ydro
char
itace
ae
OUTGROUP BASAL ANGIOSPERMS EUDICOTS
Asterids
1C-values (pg)
SantCaryophyllalesRanunculalesmagnoliidsmonocots
Pota
mog
eton
acea
eA
pono
geto
nace
aeA
race
aeTo
fiel
diac
eae
Aco
rus
Cer
atop
hyll
umC
hlor
anth
usSa
rcan
dra
Can
ella
Dri
mys
Asa
rum
Ari
stol
ochi
aSa
urur
usA
nem
opsi
sPe
pero
mia
Pip
erPe
rsea
Cin
nam
omum
Hem
andi
aC
alyc
anth
usM
yris
tica
Hor
sfie
ldia
Ann
ona
Asi
min
aM
agno
lia
Lir
iode
ndro
nG
lauc
idiu
mD
icra
nost
igm
aPa
pave
rA
rgem
one
Esc
hsch
olzi
aF
umar
iaM
enis
perm
acea
eB
erbe
rida
ceae
Ran
uncu
lace
aeN
elum
boPl
atan
acea
ePr
otea
ceae
Bux
acea
eG
unne
raA
izoa
ceae
Cac
tace
aePo
rtul
acac
eae
Am
aran
thac
eae
Car
yoph
ylla
ceae
Poly
gona
ceae
Cor
nace
ae
Cap
rifo
liace
aeD
ipsa
cace
aeA
ralia
ceae
Api
acea
eA
ster
ales
euas
teri
d I
Hal
orag
acea
eSa
xifr
agac
eae
Vita
ceae
euro
sids
Ebe
nace
aePr
imul
acea
eE
rica
ceae
Bal
sam
inac
eae
Plum
bagi
nace
aeD
rose
race
aeL
oran
thus
Lysi
ana
Den
drop
thoe
Visc
um
Ado
xaVi
burn
um
Very small (≤1·4)
Small (>1·4, ≤3·5)
Intermediate (>3·5, <14·0)
Large (≥14·0, <35·0)
Very large (≥35·0)
Polymorphic
Equivocal
F I G . 4. Parsimony reconstruction ofC-value diversification in the angiosperms using the ‘allmost-parsimonious states’ resolvingoption ofMacClade (basedon Soltis et al., 2003). Sant = Santalales.
LilialesAsparagalescommelinidsAlismatales
Cer
atop
hyll
umA
cora
ceae
Alis
mat
acea
ePo
tam
oget
onac
eae
Lim
noch
arita
ceae
Junc
agin
acea
eH
ydro
char
itace
aeB
utom
acea
eA
pono
geto
nace
aeA
race
aeT
ofie
ldia
ceae
Cyc
lant
hace
aePa
ndan
acea
eT
acca
ceae
Dio
scor
eace
aeT
ypha
ceae
Bro
mel
iace
aeSp
arga
niac
eae
Poac
eae
Junc
acea
eC
yper
acea
eC
omm
elin
acea
ePo
nted
eria
ceae
Zin
gibe
rale
sA
reca
ceae
Con
valla
riac
eae
Aga
vace
aeH
yaci
ntha
ceae
Asp
hode
lace
aeA
spar
agac
eae
Alli
acea
eA
nthe
rica
ceae
Am
aryl
lidac
eae
Irid
acea
eO
rchi
dace
aeSm
ilaca
ceae
Lili
acea
eM
elan
thia
ceae
Uvu
lari
acea
eL
uzur
iaga
ceae
Cal
ocho
rtac
eae
Als
troe
mer
iace
ae
1C-values (pg)
Very small (≤1·4)Small (>1·4, ≤3·5)Intermediate (>3·5, <14·0)Large (≥14·0, <35.0)Very large (≥35.0)PolymorphicEquivocal
F I G . 5. Parsimony reconstruction of C-value diversification in the monocots using the ‘all most-parsimonious states’ resolving option of MacClade (basedon Soltis et al., 2003). Families containing species with very large C-values (i.e. >35�0 pg) are marked in bold.
Leitch et al. — Evolution of DNA Amounts Across Land Plants 211
by guest on January 24, 2016http://aob.oxfordjournals.org/
Dow
nloaded from
some Allium, Fritillaria, Tulipa and Lilium species), mostspecies, for which C-value data are available, are smaller.Thus, it is unclear whether the common ancestor ofAsparagales and Liliales had a very large genome or if itoriginated multiple times with these two clades (seeequivocal labelling of branch point on Fig. 5). AdditionalC-value data and a better-resolved phylogeny are neededto resolve this issue.
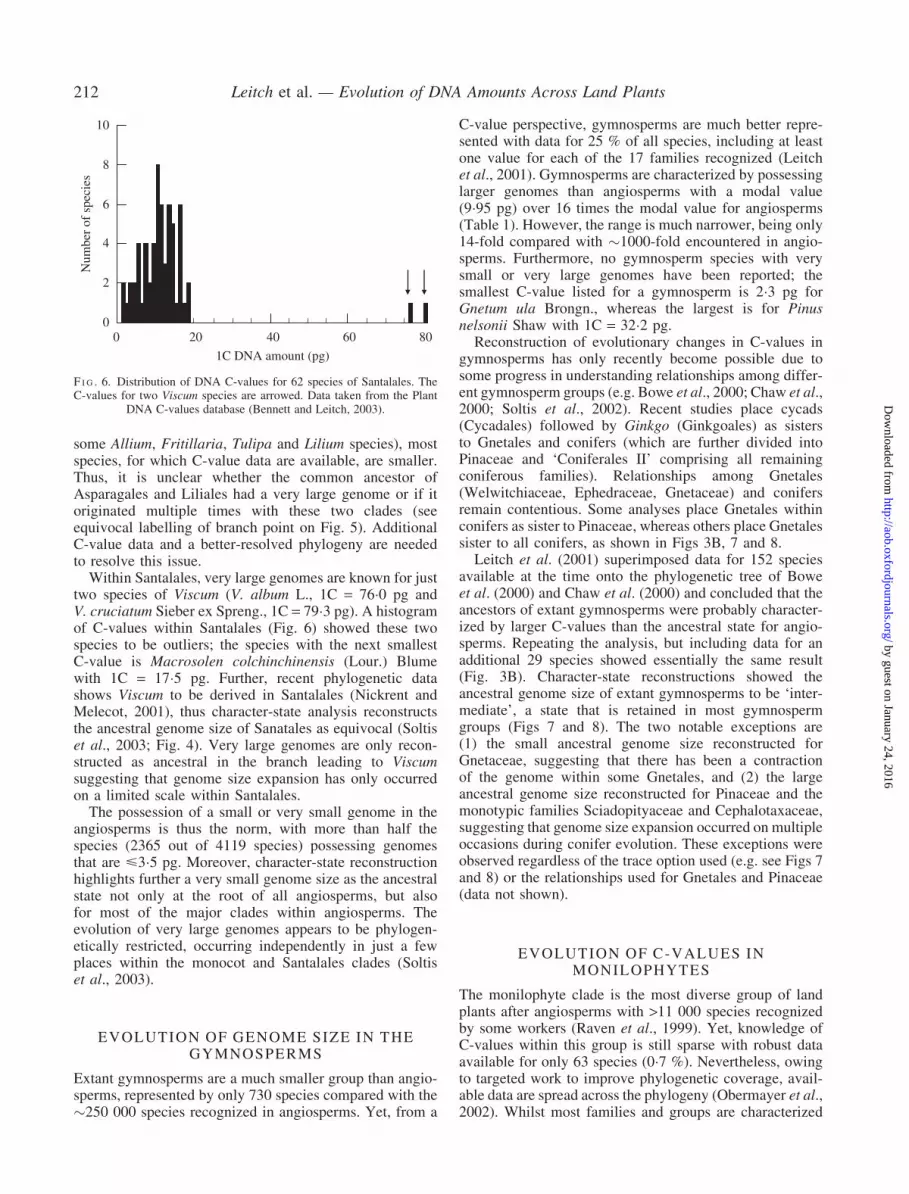
Within Santalales, very large genomes are known for justtwo species of Viscum (V. album L., 1C = 76�0 pg andV. cruciatum Sieber ex Spreng., 1C = 79�3 pg). A histogramof C-values within Santalales (Fig. 6) showed these twospecies to be outliers; the species with the next smallestC-value is Macrosolen colchinchinensis (Lour.) Blumewith 1C = 17�5 pg. Further, recent phylogenetic datashows Viscum to be derived in Santalales (Nickrent andMelecot, 2001), thus character-state analysis reconstructsthe ancestral genome size of Sanatales as equivocal (Soltiset al., 2003; Fig. 4). Very large genomes are only recon-structed as ancestral in the branch leading to Viscumsuggesting that genome size expansion has only occurredon a limited scale within Santalales.
The possession of a small or very small genome in theangiosperms is thus the norm, with more than half thespecies (2365 out of 4119 species) possessing genomesthat are <3�5 pg. Moreover, character-state reconstructionhighlights further a very small genome size as the ancestralstate not only at the root of all angiosperms, but alsofor most of the major clades within angiosperms. Theevolution of very large genomes appears to be phylogen-etically restricted, occurring independently in just a fewplaces within the monocot and Santalales clades (Soltiset al., 2003).
EVOLUTION OF GENOME SIZE IN THEGYMNOSPERMS
Extant gymnosperms are a much smaller group than angio-sperms, represented by only 730 species compared with the�250 000 species recognized in angiosperms. Yet, from a
C-value perspective, gymnosperms are much better repre-sented with data for 25 % of all species, including at leastone value for each of the 17 families recognized (Leitchet al., 2001). Gymnosperms are characterized by possessinglarger genomes than angiosperms with a modal value(9�95 pg) over 16 times the modal value for angiosperms(Table 1). However, the range is much narrower, being only14-fold compared with �1000-fold encountered in angio-sperms. Furthermore, no gymnosperm species with verysmall or very large genomes have been reported; thesmallest C-value listed for a gymnosperm is 2�3 pg forGnetum ula Brongn., whereas the largest is for Pinusnelsonii Shaw with 1C = 32�2 pg.
Reconstruction of evolutionary changes in C-values ingymnosperms has only recently become possible due tosome progress in understanding relationships among differ-ent gymnosperm groups (e.g. Bowe et al., 2000; Chaw et al.,2000; Soltis et al., 2002). Recent studies place cycads(Cycadales) followed by Ginkgo (Ginkgoales) as sistersto Gnetales and conifers (which are further divided intoPinaceae and ‘Coniferales II’ comprising all remainingconiferous families). Relationships among Gnetales(Welwitchiaceae, Ephedraceae, Gnetaceae) and conifersremain contentious. Some analyses place Gnetales withinconifers as sister to Pinaceae, whereas others place Gnetalessister to all conifers, as shown in Figs 3B, 7 and 8.
Leitch et al. (2001) superimposed data for 152 speciesavailable at the time onto the phylogenetic tree of Boweet al. (2000) and Chaw et al. (2000) and concluded that theancestors of extant gymnosperms were probably character-ized by larger C-values than the ancestral state for angio-sperms. Repeating the analysis, but including data for anadditional 29 species showed essentially the same result(Fig. 3B). Character-state reconstructions showed theancestral genome size of extant gymnosperms to be ‘inter-mediate’, a state that is retained in most gymnospermgroups (Figs 7 and 8). The two notable exceptions are(1) the small ancestral genome size reconstructed forGnetaceae, suggesting that there has been a contractionof the genome within some Gnetales, and (2) the largeancestral genome size reconstructed for Pinaceae and themonotypic families Sciadopityaceae and Cephalotaxaceae,suggesting that genome size expansion occurred on multipleoccasions during conifer evolution. These exceptions wereobserved regardless of the trace option used (e.g. see Figs 7and 8) or the relationships used for Gnetales and Pinaceae(data not shown).
EVOLUTION OF C-VALUES INMONILOPHYTES
The monilophyte clade is the most diverse group of landplants after angiosperms with >11 000 species recognizedby some workers (Raven et al., 1999). Yet, knowledge ofC-values within this group is still sparse with robust dataavailable for only 63 species (0�7 %). Nevertheless, owingto targeted work to improve phylogenetic coverage, avail-able data are spread across the phylogeny (Obermayer et al.,2002). Whilst most families and groups are characterized
0
2
4
6
8
10
0 20 40 60 80
1C DNA amount (pg)
Num
ber
of s
peci
es
F I G . 6. Distribution of DNA C-values for 62 species of Santalales. TheC-values for two Viscum species are arrowed. Data taken from the Plant
DNA C-values database (Bennett and Leitch, 2003).
212 Leitch et al. — Evolution of DNA Amounts Across Land Plants
by guest on January 24, 2016http://aob.oxfordjournals.org/
Dow
nloaded from
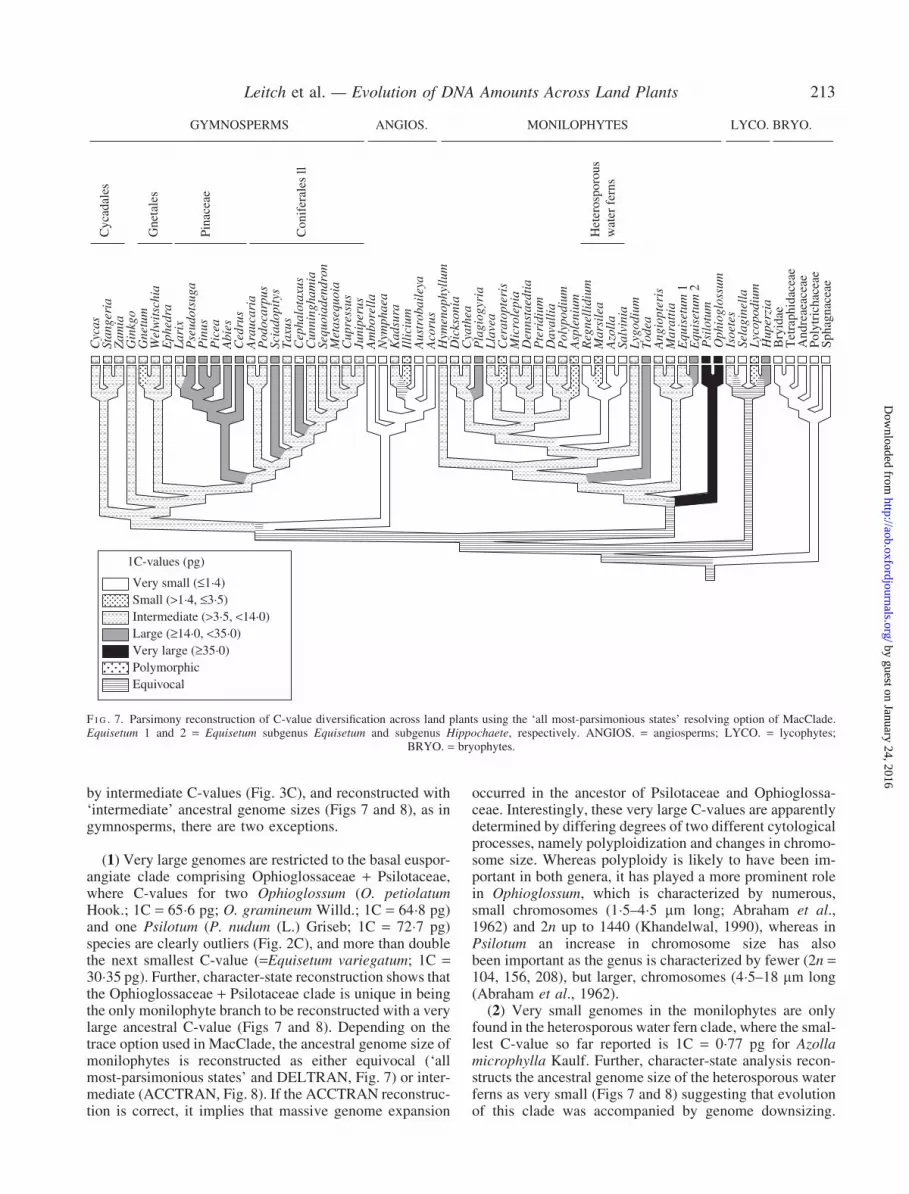
by intermediate C-values (Fig. 3C), and reconstructed with‘intermediate’ ancestral genome sizes (Figs 7 and 8), as ingymnosperms, there are two exceptions.
(1) Very large genomes are restricted to the basal euspor-angiate clade comprising Ophioglossaceae + Psilotaceae,where C-values for two Ophioglossum (O. petiolatumHook.; 1C = 65�6 pg; O. gramineum Willd.; 1C = 64�8 pg)and one Psilotum (P. nudum (L.) Griseb; 1C = 72�7 pg)species are clearly outliers (Fig. 2C), and more than doublethe next smallest C-value (=Equisetum variegatum; 1C =30�35 pg). Further, character-state reconstruction shows thatthe Ophioglossaceae + Psilotaceae clade is unique in beingthe only monilophyte branch to be reconstructed with a verylarge ancestral C-value (Figs 7 and 8). Depending on thetrace option used in MacClade, the ancestral genome size ofmonilophytes is reconstructed as either equivocal (‘allmost-parsimonious states’ and DELTRAN, Fig. 7) or inter-mediate (ACCTRAN, Fig. 8). If the ACCTRAN reconstruc-tion is correct, it implies that massive genome expansion
occurred in the ancestor of Psilotaceae and Ophioglossa-ceae. Interestingly, these very large C-values are apparentlydetermined by differing degrees of two different cytologicalprocesses, namely polyploidization and changes in chromo-some size. Whereas polyploidy is likely to have been im-portant in both genera, it has played a more prominent rolein Ophioglossum, which is characterized by numerous,small chromosomes (1�5–4�5 mm long; Abraham et al.,1962) and 2n up to 1440 (Khandelwal, 1990), whereas inPsilotum an increase in chromosome size has alsobeen important as the genus is characterized by fewer (2n =104, 156, 208), but larger, chromosomes (4�5–18 mm long(Abraham et al., 1962).
(2) Very small genomes in the monilophytes are onlyfound in the heterosporous water fern clade, where the smal-lest C-value so far reported is 1C = 0�77 pg for Azollamicrophylla Kaulf. Further, character-state analysis recon-structs the ancestral genome size of the heterosporous waterferns as very small (Figs 7 and 8) suggesting that evolutionof this clade was accompanied by genome downsizing.
1C-values (pg)
GYMNOSPERMS ANGIOS. MONILOPHYTES LYCO. BRYO.
Cyc
adal
es
Gne
tale
s
Pina
ceae
Con
ifer
ales
ll
Het
eros
poro
usw
ater
fer
ns
Cyc
asSt
ange
ria
Zam
iaG
inkg
oG
netu
mW
elw
itsc
hia
Eph
edra
Lar
ixP
seud
otsu
gaP
inus
Pic
eaA
bies
Ced
rus
Ara
ucar
iaP
odoc
arpu
sSc
iado
pity
sT
axus
Cep
halo
taxu
sC
unni
ngha
mia
Sequ
oiad
endr
onM
etas
equo
iaC
upre
ssus
Juni
peru
sA
mbo
rell
aN
ymph
aea
Kad
sura
Illi
cium
Aus
trob
aile
yaA
coru
sH
ymen
ophy
llum
Dic
kson
iaC
yath
eaP
lagi
ogyr
iaL
lave
aC
erat
opte
ris
Mic
role
pia
Den
nsta
edti
aP
teri
dium
Dav
alli
aP
olyp
odiu
mA
sple
nium
Reg
nell
idiu
mM
arsi
lea
Azo
lla
Salv
inia
Lyg
odiu
mT
odea
Ang
iopt
eris
Mar
atti
aE
quis
etum
1E
quis
etum
2P
silo
tum
Oph
iogl
ossu
mIs
oete
sSe
lagi
nell
aL
ycop
odiu
mH
uper
zia
Bry
idae
Tet
raph
idac
eae
And
reae
acea
ePo
lytr
icha
ceae
Spha
gnac
eae
Very small (≤1·4)Small (>1·4, ≤3·5)Intermediate (>3·5, <14·0)Large (≥14·0, <35·0)Very large (≥35·0)PolymorphicEquivocal
F I G . 7. Parsimony reconstruction of C-value diversification across land plants using the ‘all most-parsimonious states’ resolving option of MacClade.Equisetum 1 and 2 = Equisetum subgenus Equisetum and subgenus Hippochaete, respectively. ANGIOS. = angiosperms; LYCO. = lycophytes;
BRYO. = bryophytes.
Leitch et al. — Evolution of DNA Amounts Across Land Plants 213
by guest on January 24, 2016http://aob.oxfordjournals.org/
Dow
nloaded from
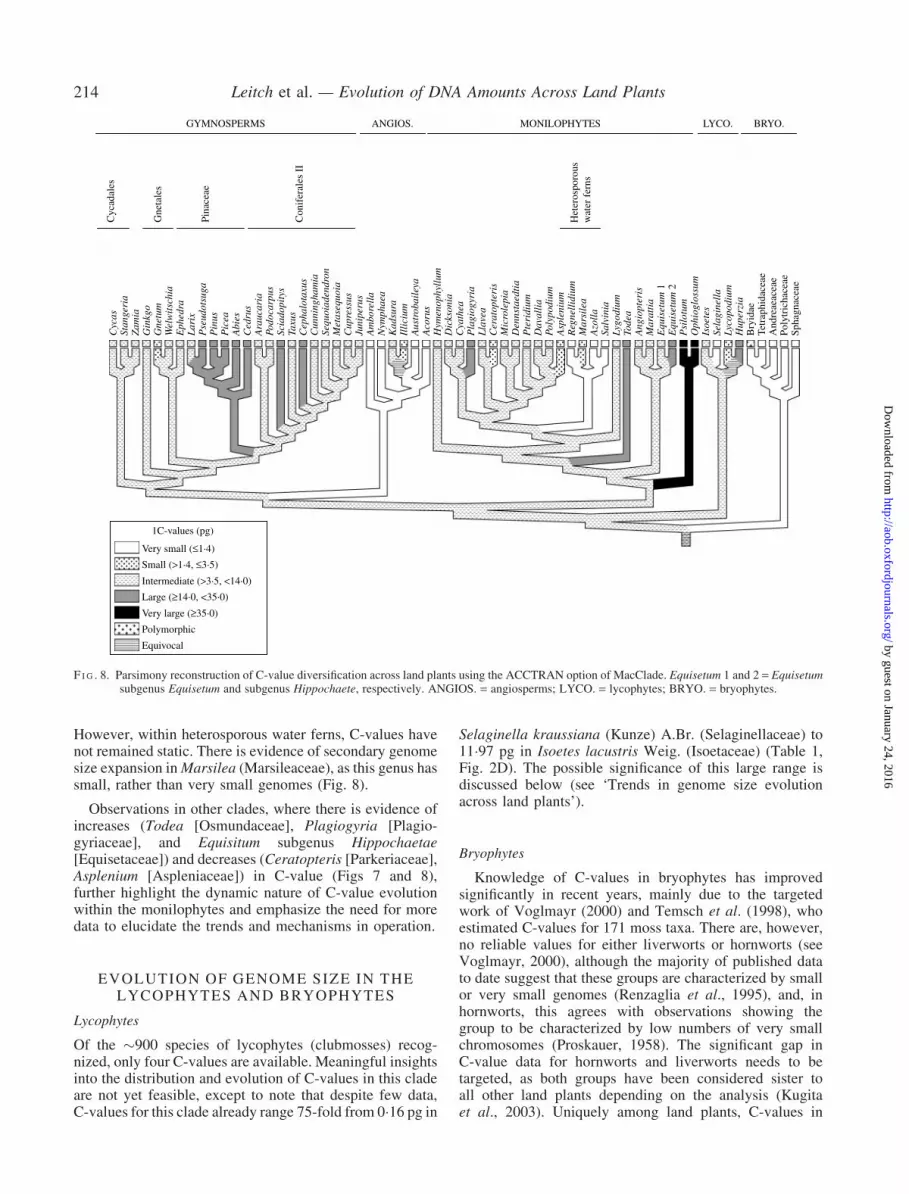
However, within heterosporous water ferns, C-values havenot remained static. There is evidence of secondary genomesize expansion inMarsilea (Marsileaceae), as this genus hassmall, rather than very small genomes (Fig. 8).
Observations in other clades, where there is evidence ofincreases (Todea [Osmundaceae], Plagiogyria [Plagio-gyriaceae], and Equisitum subgenus Hippochaetae[Equisetaceae]) and decreases (Ceratopteris [Parkeriaceae],Asplenium [Aspleniaceae]) in C-value (Figs 7 and 8),further highlight the dynamic nature of C-value evolutionwithin the monilophytes and emphasize the need for moredata to elucidate the trends and mechanisms in operation.
EVOLUTION OF GENOME SIZE IN THELYCOPHYTES AND BRYOPHYTES
Lycophytes
Of the �900 species of lycophytes (clubmosses) recog-nized, only four C-values are available. Meaningful insightsinto the distribution and evolution of C-values in this cladeare not yet feasible, except to note that despite few data,C-values for this clade already range 75-fold from 0�16 pg in
Selaginella kraussiana (Kunze) A.Br. (Selaginellaceae) to11�97 pg in Isoetes lacustris Weig. (Isoetaceae) (Table 1,Fig. 2D). The possible significance of this large range isdiscussed below (see ‘Trends in genome size evolutionacross land plants’).
Bryophytes
Knowledge of C-values in bryophytes has improvedsignificantly in recent years, mainly due to the targetedwork of Voglmayr (2000) and Temsch et al. (1998), whoestimated C-values for 171 moss taxa. There are, however,no reliable values for either liverworts or hornworts (seeVoglmayr, 2000), although the majority of published datato date suggest that these groups are characterized by smallor very small genomes (Renzaglia et al., 1995), and, inhornworts, this agrees with observations showing thegroup to be characterized by low numbers of very smallchromosomes (Proskauer, 1958). The significant gap inC-value data for hornworts and liverworts needs to betargeted, as both groups have been considered sister toall other land plants depending on the analysis (Kugitaet al., 2003). Uniquely among land plants, C-values in
Cyc
asSt
ange
ria
Zam
iaG
inkg
oG
netu
mW
elw
itsc
hia
Eph
edra
Lar
ixP
seud
otsu
gaP
inus
Pic
eaA
bies
Ced
rus
Ara
ucar
iaPo
doca
rpus
Scia
dopi
tys
Taxu
sC
epha
lota
xus
Cun
ning
ham
iaSe
quoi
aden
dron
Met
aseq
uoia
Cup
ress
usJu
nipe
rus
Am
bore
lla
Nym
phae
aK
adsu
raIl
lici
umA
ustr
obai
leya
Aco
rus
Hym
enop
hyll
umD
icks
onia
Cya
thea
Pla
giog
yria
Lla
vea
Cer
atop
teri
sM
icro
lepi
aD
enns
taed
tia
Pte
ridi
umD
aval
lia
Poly
podi
umA
sple
nium
Reg
nell
idiu
mM
arsi
lea
Azo
lla
Salv
inia
Lygo
dium
Tode
aA
ngio
pter
isM
arat
tia
Equ
iset
um 1
Equ
iset
um 2
Psi
lotu
mO
phio
glos
sum
Isoe
tes
Sela
gine
lla
Lyco
podi
umH
uper
zia
Bry
idae
Tetr
aphi
dace
aeA
ndre
aeac
eae
Poly
tric
hace
aeSp
hagn
acea
e
Cyc
adal
es
Gne
tale
s
Pina
ceae
Con
ifer
ales
II
GYMNOSPERMS ANGIOS. MONILOPHYTES LYCO. BRYO.
Het
eros
poro
usw
ater
fer
ns
1C-values (pg)
Very small (≤1·4)
Small (>1·4, ≤3·5)
Intermediate (>3·5, <14·0)
Large (≥14·0, <35·0)
Very large (≥35·0)
Polymorphic
Equivocal
F I G . 8. Parsimony reconstruction of C-value diversification across land plants using the ACCTRAN option of MacClade. Equisetum 1 and 2 = Equisetumsubgenus Equisetum and subgenus Hippochaete, respectively. ANGIOS. = angiosperms; LYCO. = lycophytes; BRYO. = bryophytes.
214 Leitch et al. — Evolution of DNA Amounts Across Land Plants
by guest on January 24, 2016http://aob.oxfordjournals.org/
Dow
nloaded from

mosses are nearly all very small (only three species have C-values >1�4 pg, one of which is a polyploid) and vary only12-fold from 0�17 pg in Holomitrium arboreum Mitt.(Dicranaceae) to 2�05 pg in Mnium marginatum (Dicks.)P. Beauv. (Mniaceae). Moreover, within the narrow range,65 % of species have C-values within 0�1 pg of the mode(0�45 pg). Taken together, mosses occupy the lowest 1�6 %of the known range of land plants.
Current phylogenetic studies show that the basalfamilies of mosses comprise Sphagnaceae, Polytrichaceae,Andreaeaceae, Tetraphidaceae and Buxbaumiaceae as suc-cessive sisters to the subclass Bryidae (Beckert et al., 1999).All of these families have very small C-values, and plottingthe data on to the tree does not reveal any noticeable trends(Fig. 3D). Regardless of how the subclass Bryidae is coded(i.e. very small, small or polymorphic) the ancestral genomesize for mosses is reconstructed as very small (Figs 7 and 8).
TRENDS IN GENOME SIZE EVOLUTIONACROSS LAND PLANTS
The major patterns in the evolution of genome size acrossland plants are:
(1) Different land plant groups are characterized by dif-ferent ancestral C-values. Whilst angiosperms and bryo-phytes are reconstructed with very small ancestralgenomes, in gymnosperms and most branches of the mon-ilophyte clade the ancestral genome is reconstructed asintermediate in size (Figs 4, 7 and 8).
(2) Genome size evolution across land plants has beendynamic with evidence for several independent increasesand decreases. Examples of genome size reductions havebeen noted within the monilophyte clade at the base of theheterosporous water ferns and within the gymnosperms inthe branch leading to Gnetaceae. Evidence of large inde-pendent increases have been observed in the monocots andSantalales (angiosperms), and perhaps in the Ophioglossa-ceae + Psilotaceae clade (monilophytes). Thus, observationsmade within some angiosperm families that both increasesand decreases can take place during genome size evolution(e.g. Wendel et al., 2002) appear to form a pattern that isrepeated across all land plants, except perhaps in bryophyteswhere all species to date have small or very small genomes.
(3) The differences in C-value profiles (Figs 2 and 3)and patterns of evolution based on reconstruction data(Figs 4, 7 and 8) strongly suggest that each major groupof land plants has been subject to different evolutionary orselective forces. The nature of these pressures is currentlyunclear, although some ideas have been proposed. Forexample, it has been suggested that the small ancestralgenome size of angiosperms may help to explain their com-petitive success over gymnosperms. Small genome size isknown to correlate with several developmental phenotypiccharacters (e.g. rapid seedling establishment, short mini-mum generation time, reduced cost of reproduction andan increased reproductive rate; Bennett, 1972, 1987;Midgley and Bond, 1991), which together may permit greatevolutionary flexibility. Thus, smaller genome sizes inangiosperms may provide one functional explanation as
to why they were so successful in competing with otherplants (Leitch et al., 1998).
In bryophytes and two lycophyte genera, Lycopodium(Lycopodiaceae) and Selaginella (Selaginellaceae), allwith biflagellate sperm, the low upper-limit of C-valueshas been suggested to be under strong selection pressureas a consequence of the nucleotypic correlation betweenDNA amount and cell size (Renzaglia et al., 1995). Withonly two flagella, increasing DNA amount would result inlarger sperm cells with reduced mobility, and it is expectedthat this would reduce the efficiency with which spermwere able to move from the antheridia to the archegoniato effect fertilization. Selection is therefore expected tofavour smaller, more mobile sperm and hence those withsmaller DNA amounts. Interestingly, the recent report of aC-value for Isoetes (Isoetaceae; i.e. 1C = 11�97 pg; Hansonand Leitch, 2002) that is up to 75 times greater than those inSelaginellaceae (1C = 0�16–0�36 pg) and Lycopodiaceae(1C = 2�86 pg) supports this hypothesis as Isoetes is theonly lycophyte with multiflagellate sperm for which aC-value is available. It suggests that without the constraintimposed by possessing just two flagella, the DNA amountin Isoetes is not under such tight nucleotypic control andcan therefore increase.
Genomic downsizing is suggested for the heterosporouswater ferns and for the aquatic fern Ceratopteris. Both thewater ferns and Ceratopteris occur in clades with terrestrialferns and the aquatic habit appears to be derived in theselineages. These results pose the question as to whetherselection for smaller genome size may have been associatedwith this shift into an aquatic habit.
BEYOND THE LAND PLANTS
Whilst analyses presented here enable patterns and trends tobe highlighted, due to major differences in the C-valueprofiles between the land plant groups, the ‘all most-parsimonious states’ and DELTRAN trace options ofcharacter-state mapping were unable to resolve ancestralgenome sizes for seed plants, monilophytes and all vascularplants (Fig. 7). Using the ACCTRAN transformation option,the ancestral genome size for all these groups was recon-structed as intermediate (Fig. 8). If correct, this implies thatthe very small ancestral genome size of angiosperms is aderived condition, and that ancestral angiosperms under-went extensive genomic downsizing early in their evolution.
To investigate these observations further, and to shedlight on the ancestral genome size of all land plants(which is reconstructed as equivocal regardless of thetrace option used; Figs 7 and 8), the DNA amount in fossilancestral plants themselves could be estimated. While suchan approach is not straightforward, there are a few studiesthat have used cell sizes in fossils as proxies for C-valuesto detect changes in DNA amounts. In plants, Masterson(1994) used the size of fossil guard cells to track changes inDNA amount in fossil angiosperms over 100 million years.In animals, Conway Morris and Harper (1988) used thisapproach to identify changes in genome size in conodonts(Chordata) over 270 million years, and Thomson (1972)
Leitch et al. — Evolution of DNA Amounts Across Land Plants 215
by guest on January 24, 2016http://aob.oxfordjournals.org/
Dow
nloaded from

examined changes in DNA amount in fossil lungfish over400 million years. These studies highlight the potential ofsuch an approach to shed light on the evolution of DNAamounts at key points in the land plant phylogeny and evento the ancestral C-value of all land plants. Finally, the recentstudies which point to the Charophycean lineage of algaeas sister to all land plants (Karol et al., 2001; Turmel et al.,2003) suggest that adopting a similar approach couldprovide insights into the changes in genome size thattook place during the remarkable evolutionary transitionfrom aquatic algae to terrestrial plants approx. 470 millionyears ago.
LITERATURE CITED
Abraham A, Ninan CA, Mathew PM. 1962. Studies on the cytology andphylogeny of the pteridophytes VII. Observations on one hundredspecies of South Indian ferns. Journal of the Indian Botanical Society41: 339–421.
APG II. 2003. An update of the Angiosperm Phylogeny Group classifi-cation for the orders and families of flowering plants. BotanicalJournal of the Linnean Society 141: 399–436.
Beckert S, Steinhauser S, Muhle H, Knoop V. 1999. A molecular phylo-genyofbryophytesbasedonnucleotide sequencesof themitochondrialnad5 gene. Plant Systematics and Evolution 218: 179–192.
Bennett MD. 1972. Nuclear DNA content and minimum generation timein herbaceous plants. Proceedings of the Royal Society of LondonSeries B, Biological Sciences 181: 109–135.
Bennett MD. 1987. Variation in genomic form in plants and its ecologicalimplications. New Phytologist 106: 177–200.
Bennett MD, Leitch IJ. 1995. Nuclear DNA amounts in angiosperms.Annals of Botany 76: 113–176.
Bennett MD, Leitch IJ. 2003. Plant DNA C-values database (release 2.0,Jan. 2003). http://www.rbgkew.org.uk/cval/homepage.html
Bennett MD, Leitch IJ. 2005. Nuclear DNA amounts in angiosperms:progress, problems and prospects. Annals of Botany 95: 45–90.
BennettMD,SmithJB,Heslop-HarrisonJS. 1982.NuclearDNAamountsin angiosperms. Proceedings of the Royal Society of London Series B,Biological Sciences 216: 179–199.
Bennetzen JL,Ma J, DevosKM. 2005.Mechanisms of recent genome sizevariation in flowering plants. Annals of Botany 95: 127–132.
Bennetzen JL. 2002. Mechanisms and rates of genome expansion andcontraction in flowering plants. Genetica 115: 29–36.
Bennetzen JL, Kellogg EA. 1997. Do plants have a one-way ticket togenomic obesity? Plant Cell 9: 1509–1514.
Bowe LM, Coat G, dePamphilis CW. 2000. Phylogeny of seed plantsbased on all three genomic compartments: Extant gymnospermsare monophyletic and Gnetales’ closest relatives are conifers.Proceedings of the National Academy of Sciences of the USA 97:4092–4097.
Chase MW, Soltis DE, Olmstead RG, Morgan D, Les DH et al. 1993.Phylogenetics of seed plants—an analysis of nucleotide-sequencesfrom the plastid gene rbc L. Annals of the Missouri Botanical Garden80: 528–580.
Chaw SM, Parkinson CL, Cheng YC, Vincent TM, Palmer JD. 2000.Seed plant phylogeny inferred from all three plant genomes: mono-phyly of extant gymnosperms and origin of Gnetales from conifers.Proceedings of the National Academy of Sciences of the USA 97:4086–4091.
Conway Morris S, Harper E. 1988. Genome size in Conodonts(Chordata): inferred variation during 270 million years. Science241: 1230–1232.
Cox AV, Abdelnour GJ, Bennett MD, Leitch IJ. 1998. Genome sizeand karyotype evolution in the slipper orchids (Cypripedioideae:Orchidaceae). American Journal of Botany 85: 681–687.
Devos KM, Brown JKM, Bennetzen JL. 2002. Genome size reductionthrough illegitimate recombination counteracts genome expansion inArabidopsis. Genome Research 12: 1075–1079.
Gregory TR. 2001. Coincidence, coevolution, or causation? DNAcontent, cell size, and the C-value enigma. Biological Reviews 76:65–101.
GregoryTR. 2003. Is small indel bias a determinant of genome size?Trendsin Genetics 19: 485–488.
Gregory TR. 2005. The C-value enigma in plants and animals: a reviewof parallels and an appeal for partnership. Annals of Botany 95:133–146.
Hanson L, Leitch IJ. 2002.DNA amounts for five pteridophyte species fillphylogenetic gaps in C-value data. Botanical Journal of the LinneanSociety 140: 169–173.
Johnston JS, Pepper AE, Hall AE, Chen ZJ, Hodnett G, Drabek J,Lopez R, Price HJ. 2005. Evolution of genome size in Brassicaceae.Annals of Botany 95: 229–235.
Karol KG, McCourt RM, Cimino MT, Delwiche CF. 2001. The closestliving relatives of land plants. Science 294: 2351–2353.
Khandelwal S. 1990.Chromosome evolution in the genusOphioglossumL.Botanical Journal of the Linnean Society 102: 205–217.
Kirik A, Salomon S, Puchta H. 2000. Species-specific double-strandbreak repair and genome evolution in plants. EMBO Journal 19:5562–5566.
Kugita M, Kaneko A, Yamamoto Y, Takeya Y, Matsumoto T,Yoshinaga K. 2003. The complete nucleotide sequence of thehornwort (Anthoceros formosae) chloroplast genome: insight intothe earliest land plants. Nucleic Acids Research 31: 716–721.
Leitch IJ, Bennett MD. 2004. Genome downsizing in polyploid plants.Biological Journal of the Linnean Society 82: 651–663.
Leitch IJ, Chase MW, Bennett MD. 1998. Phylogenetic analysis ofDNA C-values provides evidence for a small ancestral genome sizein flowering plants. Annals of Botany 82: 85–94.
Leitch IJ, Hanson L. 2002. DNA C-values in seven families fill phyloge-netic gaps in the basal angiosperms. Botanical Journal of the LinneanSociety 140: 175–179.
Leitch IJ, Hanson L, Winfield M, Parker J, Bennett MD. 2001. NuclearDNA C-values complete familial representation in gymnosperms.Annals of Botany 88: 843–849.
Maddison WP, Maddison DR. 1992. MacClade: analysis of phylogenyand character evolution. Sunderland, MA: Sinauer Associates Inc.
Masterson J. 1994. Stomatal size in fossil plants—evidence for polyploidyin majority of angiosperms. Science 264: 421–424.
Midgley JJ, BondWJ. 1991.Ecological aspects of the rise of angiosperms:a challenge to the reproductive superiority hypotheses. BiologicalJournal of the Linnean Society 44: 81–92.
Murray BG. 1998. Nuclear DNA amounts in gymnosperms. Annals ofBotany 82: 3–15.
Nickrent DL, Melecot V. 2001. A molecular phylogeny of Santalales. In:Fer AP, Thalouarn P, Joel JM, Musselman, Parker C et al., eds.Proceedings of the 7th International Parasitic Weed Symposium.Nantes, France: Universite de Nantes, 69–74.
Obermayer R, Leitch IJ, Hanson L, Bennett MD. 2002. Nuclear DNAC-values in 30 species double the familial representation in pterido-phytes. Annals of Botany 90: 209–217.
Orel N, Puchta H. 2003. Differences in the processing of DNA ends inArabidopsis thaliana and tobacco: possible implications for genomeevolution. Plant Molecular Biology 51: 523–531.
Petrov DA. 2002.Mutational equilibrium model of genome size evolution.Theoretical Population Biology 61: 531–544.
PriceHJ, Dillon SL,Hodnett G, RooneyWL,Ross L, Johnston JS. 2005.Genome evolution in the genus Sorghum (Poaceae). Annals of Botany95: XXX–YYY.
Proskauer J. 1958. Studies on the Anthocerotales. V. Phytomorphology 7:113–135.
Pryer KM, Schneider H, Smith AR, Cranfill R, Wolf pg, Hunt JS,Sipes SD. 2001. Horsetails and ferns are a monophyletic groupand the closest living relatives to seed plants. Nature 409:618–622.
Qiu YL, Lee JH, Bernasconi-Quadroni F, Soltis DE, Soltis PS et al.1999. The earliest angiosperms: evidence from mitochondrial,plastid and nuclear genomes. Nature 402: 404–407.
Qiu YL, Palmer JD. 1999. Phylogeny of early land plants: insights fromgenes and genomes. Trends in Plant Science 4: 26–30.
Raven PH, Evert RF, Eichhorn C. 1999. Biology of Plants, 6th edn.New York: W.H. Freeman and Company.
216 Leitch et al. — Evolution of DNA Amounts Across Land Plants
by guest on January 24, 2016http://aob.oxfordjournals.org/
Dow
nloaded from

Renzaglia KS, Duff RJ, Nickrent DL, Garbary DJ. 2000. Vegetativeand reproductive innovations of early land plants: implications fora unified phylogeny. Philosophical Transactions of the Royal Societyof London Series B, Biological Sciences 355: 769–793.
Renzaglia KS, Rasch EM, Pike LM. 1995. Estimates of nuclear DNAcontent in bryophyte sperm cells: phylogenetic considerations.American Journal of Botany 82: 18–25.
Shirasu K, Schulman AH, Lahaye T, Schulze-Lefert P. 2000. A conti-guous 66-kb barley DNA sequence provides evidence for reversiblegenome expansion. Genome Research 10: 908–915.
Soltis DE, Soltis PS, Bennett MD, Leitch IJ. 2003. Evolution ofgenome size in the angiosperms. American Journal of Botany 90:1596–1603.
Soltis DE, Soltis PS, Zanis MJ. 2002. Phylogeny of seed plants basedon evidence from eight genes. American Journal of Botany 89:1670–1681.
Temsch EM, Greilhuber J, Krisai R. 1998. Genome size in Sphagnum(peat moss). Botanica Acta 111: 325–330.
Thomson KS. 1972. An attempt to reconstruct evolutionary changes in thecellular DNA content of lungfish. Journal of Experimental Biology180: 363–372.
Turmel M, Otis C, Lemieux C. 2003. The mitochondrial genome ofChara vulgaris: insights into the mitochondrial DNA architecture ofthe last common ancestor of green algae and land plants. Plant Cell15: 1888–1903.
Vicient CM, Suoniemi A, Anamthawat-Jonsson K, Tanskanen J,Beharav A, Nevo E, Schulman AH. 1999. RetrotransposonBARE-1 and its role in genome evolution in the genusHordeum.PlantCell 11: 1769–1784.
Vitte C, Panaud O. 2003. Formation of solo-LTRs through unequalhomologous recombination counterbalances amplifications of LTRretrotransposons in rice Oryza sativa L. Molecular Biology andEvolution 20: 528–540.
Voglmayr H. 2000. Nuclear DNA amounts in mosses (Musci). Annals ofBotany 85: 531–546.
Wendel JF. 2000. Genome evolution in polyploids. Plant MolecularBiology 42: 225–249.
Wendel JF, Cronn RC, Johnston JS, Price HJ. 2002. Feast and faminein plant genomes. Genetica 115: 37–47.
ZanisMJ, SoltisDE, Soltis PS,Mathews S, DonoghueMJ. 2002.The rootof the angiosperms revisited. Proceedings of the National Academyof Sciences of the USA 99: 6848–6853.
Leitch et al. — Evolution of DNA Amounts Across Land Plants 217
by guest on January 24, 2016http://aob.oxfordjournals.org/
Dow
nloaded from