Embed Size (px)
Citation preview
The Intermediate Phase in Ternary GexAsxSe1-2x Glasses
Tao Qu, D.G. Georgiev, P. Boolchand and M. Micoulaut1
Department of Electrical, Computer Engineering and Computer Science,University of Cincinnati, Ohio 45221-0030, USA1 Laboratoire de Physique Theorique des LiquidesUniversite Pierre et Marie Curie, Boite 121, 4 Place Jussieu75252 Paris, Cedex 05, France
ABSTRACT
Melt-quenched AsxGexSe1-2x glasses over the composition range, 0 < x < 0.26, areexamined in Raman scattering, T-modulated Differential Scanning Calorimetry (MDSC),and 119Sn Mossbauer spectroscopy measurements. The non-reversing enthalpy near Tg,∆Hnr(x), accessed from MDSC shows a global minimum (~ 0) in the xc(1) = 0.09 < x <xc(2) = 0.16 range, and increases by an order of magnitude both at x < xc(1) and at x >xc(2). Raman mode frequency of corner-sharing Ge(Se1/2)4 tetrahedra studied as afunction of x, also shows three distinct regimes (or power-laws, p) that coincide with∆Hnr(x) trends. These regimes are identified with mechanically floppy (x < xc(1)),intermediate (xc(1) < x < xc(2)), and stressed-rigid (x > xc(2)) phases. The Ramanelasticity power-law in the intermediate phase, p1 = 1.04(3), and in the stressed rigidphase, p2= 1.52(5), suggest effective dimensionalities of d = 2 and 3 respectively.
STRUCTURE BASED CLASSIFICATION OF GLASSES
In the early 1980s, Phillips [1] and independently Thorpe [2] suggested that a networkof polymeric chains (weakly crosslinked) will spontaneously stiffen or become rigidwhen chain-cross-linking acquires a threshold value. In covalent systems, one usuallyexpresses the degree of cross-linking in terms of a mean coordination number, r . Thefloppy to stressed rigid elastic phase transition was predicted to occur near r = 2.40.However, recent Raman scattering [3-5] and independently T-modulated DSCexperiments [3-8] on chalcogenide glasses have shown that there are in fact two (rigiditytransitions) and not one transition as predicted by mean-field constraint theory. Thus,the onset of stressed rigidity in disordered systems display a far richer structure [9] thanpreviously believed. Specifically, the frequency of corner-sharing Ge(Se1/2)4 tetrahedra inGexSe1-x glasses [5] display a kink (change in slope) near x = 0.20 (or r = 2.40 ;transition 1) , and a discontinuous jump between x = 0.25 and 0.26 (r = 2.55; transition2) followed by a distinct power-law at higher x. Parallel results are now available inbinary Si-Se [3], As-Se[6] and P-Se [7] glasses. These results provide evidence for theopening of intermediate phases [9-12] between floppy and stressed- rigid ones indisordered networks.
The physical picture of elastic phase transitions in network glasses above suggests thatone can generically classify these disordered networks into three distinct phases, floppy-
CC8.1.1Mat. Res. Soc. Symp. Proc. Vol. 754 © 2003 Materials Research Society
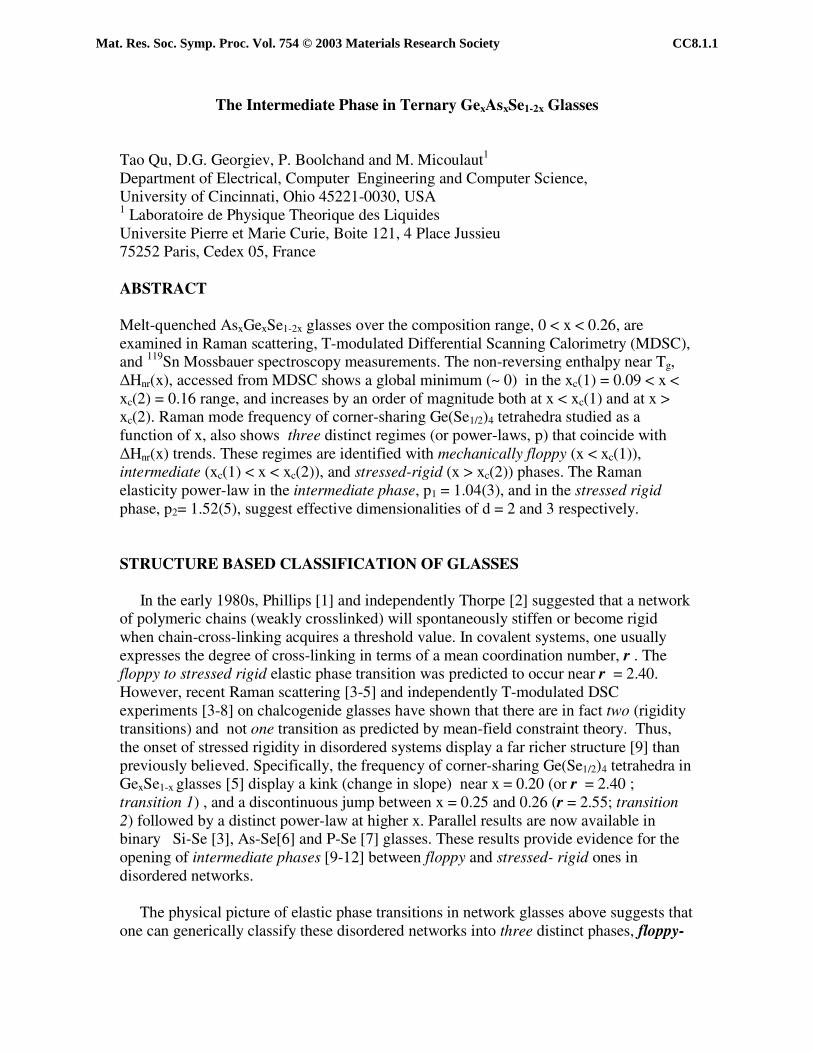
under-constrained optimally constrained"isostatically rigid"
"stress-free""self-organized"
over-constrained
Figure 1. Self-organization of disordered networks leads to opening of intermediatephases between floppy and stressed rigid phases.
intermediate-stressed rigid. Weakly crosslinked networks in which the count ofLagrangian bonding constraints per atom, nc, is less than 3 belong to floppy phases.Optimally crosslinked networks in which nc is near 3, are isostatically rigid and serve todefine intermediate phases. On the other hand, strongly crosslinked networks in whichthe count of nc is greater than 3 belong to stressed rigid phases (Fig. 1). Here the countof 3 comes from the degrees of freedom associated with an atom in a 3d network.
Phillips-Thorpe Rigidity Transition
In select systems the rigidity transition 1 and stress transition 2 can coalesce, and oneobserves a solitary phase transition as first predicted by Phillips [1] and Thorpe [2] usingmean-field constraint theory. Two rather striking examples of the behavior have nowbeen documented and include, (a) a light-induced modification of rigidity transitions [5]in binary Ge-Se glasses and (b) a sharp floppy to stress rigid transition in ternary Ge-S-Iglasses [13]. In binary GexSe1-x glasses, macro-Raman measurements have shown theintermediate phase to extend in the 0.20 < x < 0.25 region. In macro-Ramanmeasurements the exciting laser beam is brought to a loose focus typically 50 µm ormore. On the other hand, in micro-Raman measurements that utilize a microscopeattachment, the exciting laser beam is usually brought to a tight focus (1 µm) with theconsequence that the flux of exciting radiation is usually three orders of magnitude higherthan in macro-Raman measurements. A high photon flux of sub-band gap radiation canlead to rapid switching of bonds and photomelt the backbone of these Ge-Se glasses. Aconsequence of the underlying photo-structural effect is the loss of self-organization, andresults in a sharp and first-order rigidity transition near x = 0.225 as reported by Feng etal. [4]. The interpretation of the micro-Raman results became clear only once results ofmacro-Raman measurements became available more recently [5].
CC8.1.2
The second illustrative example of a sharp rigidity transition [8] is that of ternaryGe1/4S3/4-yIy glasses. Here iodine for sulfur chemical alloying lowers the globalconnectivity of the backbone, and a floppy to stressed-rigid transition is predicted bymean-field theory to occur at y = 1/6. Thermal measurements on the ternary glasses arein surprising accord with the mean-field prediction. Why should this be the case ? Theanswer appears to be that iodine replacement in the ternary alloy glasses apparentlyscissions the backbone stochastically resulting in loss of n-membered rings, with n > 4,where isostatic rigidity is thought to be nucleated [13]. It is because of the absence ofself-organization that the floppy to stressed rigid transition is observed to occur exactlywhere mean-field theory predicts it. A closely similar result of a sharp floppy to rigidtransition has now been observed in corresponding selenide glasses by Wang et al. [14].Each selenium atom like a sulfur atom contributes two constraints per atom as bridgingsites coupling tetrahedral units. Thus, constraint counting algorithms do not distinguishbetween the two chalcogens. These observations underscore that the origin of thesephysical effects undoubtedly results from elastic phase transitions.
The special case of the GexAsxSe1-2x ternary glass system
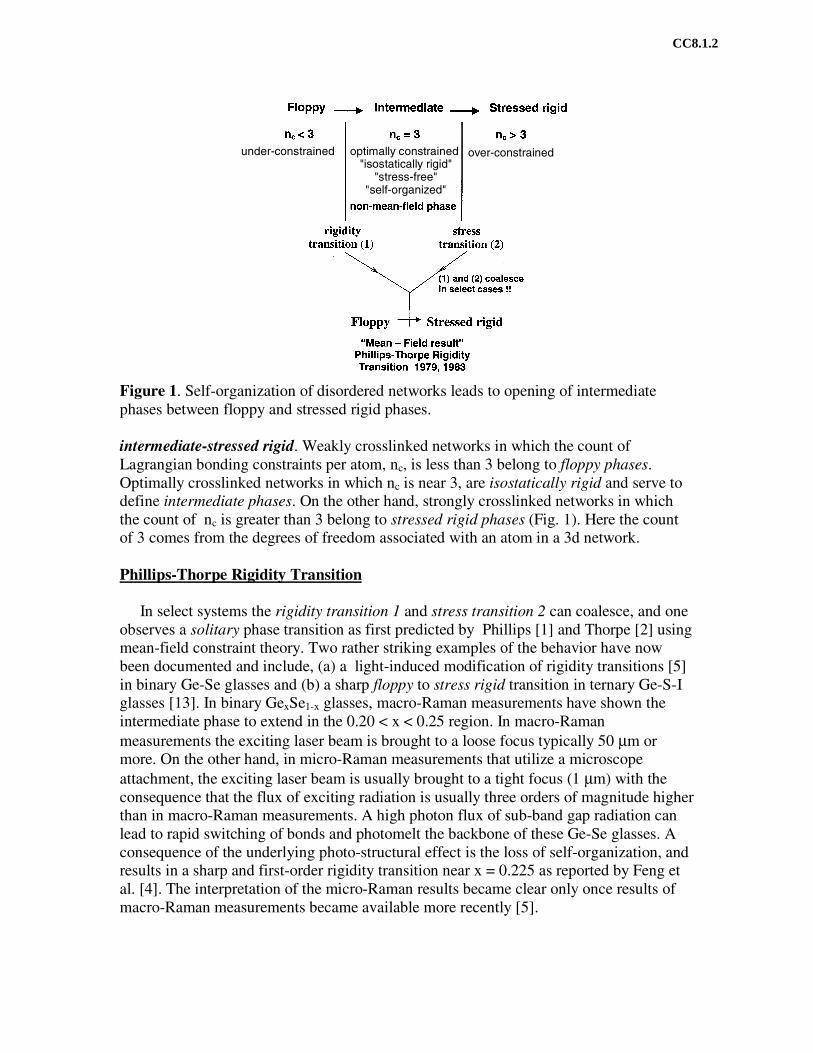
Figure 2 shows a plot of Tg in indicated binary and ternary glasses as a function ofmean coordination number r. We notice that in both binary glasses Tg shows a globalmaximum near the chemical thresholds, while no such maximum is observed in the titledternary. The threshold behavior in Tg near r = 2.4 in the As-Se, and near r = 2.67 in theGe-Se, we have suggested [15], constitutes evidence for demixing of the cation-bearinghomopolar bonds (As-As, Ge-Ge) nucleated near these chemical thresholds from theglass backbone. Such nanoscale phase separation is clearly absent in the present ternarywherein Tgs continue to monotonically increase even when the cation concentration xexceeds the chemical threshold, xt = 0.182, or r = 2.55.The glass transition temperatureTg intimately reflects global connectivity of networks as shown by stochasticagglomeration theory [16]. The cation-bearing homopolar bonds apparently form part ofthe network backbone in the present glasses for Tg to increase monotonically. This is anattractive feature of the ternary glass system for probing rigidity transitions. Presence ofnanoscale phase separation effects in glasses usually produces pronounced changes inglass physical properties that can mask the more subtle connectivity related effectscontributing to rigidity transitions.
In the present work we have now examined the nature of the rigidity transitions [8] internary AsxGexSe1-2x glasses using Raman scattering. The evidence obtained confirms theexistence of three elastic phases with a rather wide intermediate phase. The feature haspermitted a reliable measurement of the elastic power-law in that phase. Furthermore, thestriking jump in mode frequency shift [11] of corner-sharing Ge(Se1/2)4 tetrahedrabetween the intermediate and the stressed-rigid phase suggests that the stress transition 2is first-order (Fig. 1) in character here.
Chemical threshold (xt) in AsxGexSe1-2x ternary
CC8.1.3
Figure 2. Variations in Tg(r) in As-Se (●) , Ge-Se (○) and GexAsxSe1-2x (□) glasses as afunction of mean coordination number r. Note the existence of global maxima in Tg nearchemical thresholds, rt, in the binary glasses, but not in the ternary one. The chemicalthreshold in the ternary occurs at xt = 2/11, or mean rt = 2.55.
The chemical threshold in the present ternary represents the chemical composition thatleaves no free Se in the network. At x > xt , one thus expects homopolar ( As-As, (Ge-Ge) bonds to appear in the network. On stoichiometric grounds one can write,
AsxGexSe1-2x = [(5x/2)(As2/5Se3/5)][(3x)(Ge1/3Se2/3)][ Se1-2x-3x/2-2x] (1)
The chemical threshold would be manifest when the free Se fraction vanishes, i.e.,
1-2xt – 3xt/2 – 2xt = 0
or xt = 2/11 = 0.1818 (2)
Formally, the mean coordination number, rt, corresponding to the threshold becomes
rt = 2 + 3xt = 28/11 = 2.55 (3)
We note the absence of a threshold behavior in Tg near rt (Fig. 2) underscoring theabsence of nanoscale phase separation effects in the present ternary glasses.
EXPERIMENTAL
Temperature Modulated DSC
The starting materials to synthesize the bulk AsxGexSe1-2x glasses in the x < xt rangeconsisted of 99.999 % As2Se3, Ge and Se from Cerac Inc. Glass compositions at x > xt,
CC8.1.4
required the use of elemental As in addition, and the starting material required specialhandling. Details of the synthesis appear in ref [7,8].Once water quenched, the glasseswere allowed to relax at room temperature for 3 weeks or longer prior to initiating anyphysical measurements.
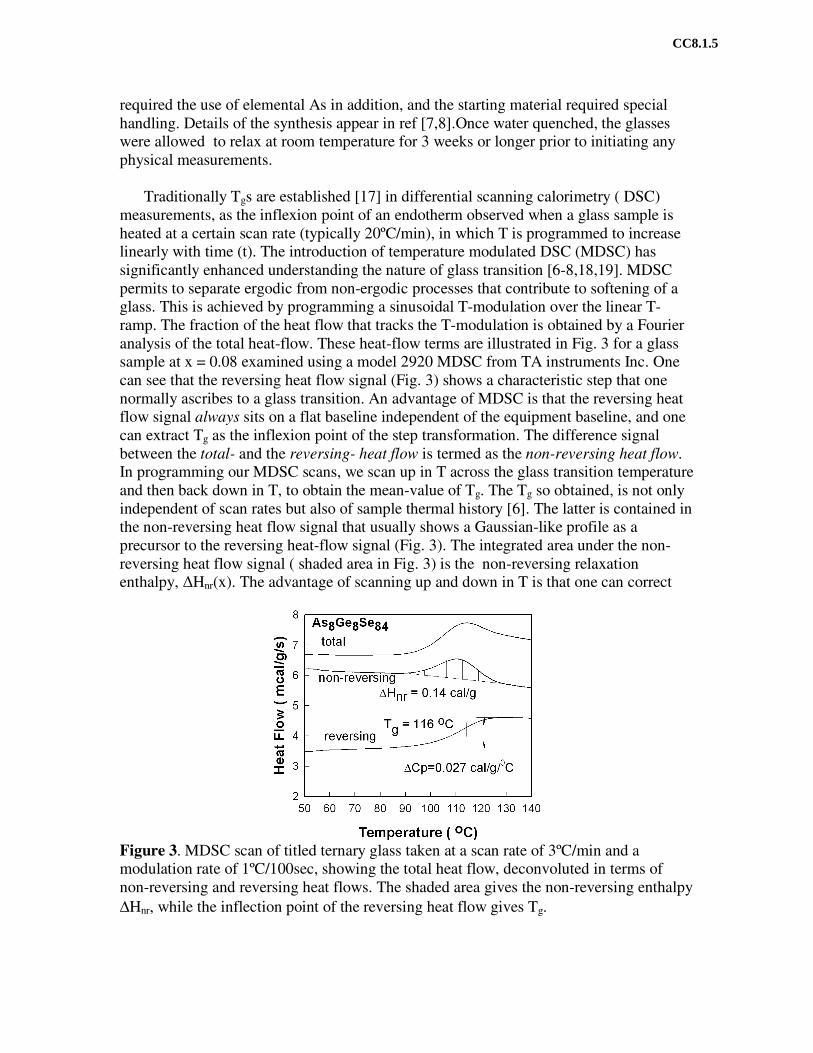
Traditionally Tgs are established [17] in differential scanning calorimetry ( DSC)measurements, as the inflexion point of an endotherm observed when a glass sample isheated at a certain scan rate (typically 20ºC/min), in which T is programmed to increaselinearly with time (t). The introduction of temperature modulated DSC (MDSC) hassignificantly enhanced understanding the nature of glass transition [6-8,18,19]. MDSCpermits to separate ergodic from non-ergodic processes that contribute to softening of aglass. This is achieved by programming a sinusoidal T-modulation over the linear T-ramp. The fraction of the heat flow that tracks the T-modulation is obtained by a Fourieranalysis of the total heat-flow. These heat-flow terms are illustrated in Fig. 3 for a glasssample at x = 0.08 examined using a model 2920 MDSC from TA instruments Inc. Onecan see that the reversing heat flow signal (Fig. 3) shows a characteristic step that onenormally ascribes to a glass transition. An advantage of MDSC is that the reversing heatflow signal always sits on a flat baseline independent of the equipment baseline, and onecan extract Tg as the inflexion point of the step transformation. The difference signalbetween the total- and the reversing- heat flow is termed as the non-reversing heat flow.In programming our MDSC scans, we scan up in T across the glass transition temperatureand then back down in T, to obtain the mean-value of Tg. The Tg so obtained, is not onlyindependent of scan rates but also of sample thermal history [6]. The latter is contained inthe non-reversing heat flow signal that usually shows a Gaussian-like profile as aprecursor to the reversing heat-flow signal (Fig. 3). The integrated area under the non-reversing heat flow signal ( shaded area in Fig. 3) is the non-reversing relaxationenthalpy, ∆Hnr(x). The advantage of scanning up and down in T is that one can correct
Figure 3. MDSC scan of titled ternary glass taken at a scan rate of 3ºC/min and amodulation rate of 1ºC/100sec, showing the total heat flow, deconvoluted in terms ofnon-reversing and reversing heat flows. The shaded area gives the non-reversing enthalpy∆Hnr, while the inflection point of the reversing heat flow gives Tg.
CC8.1.5
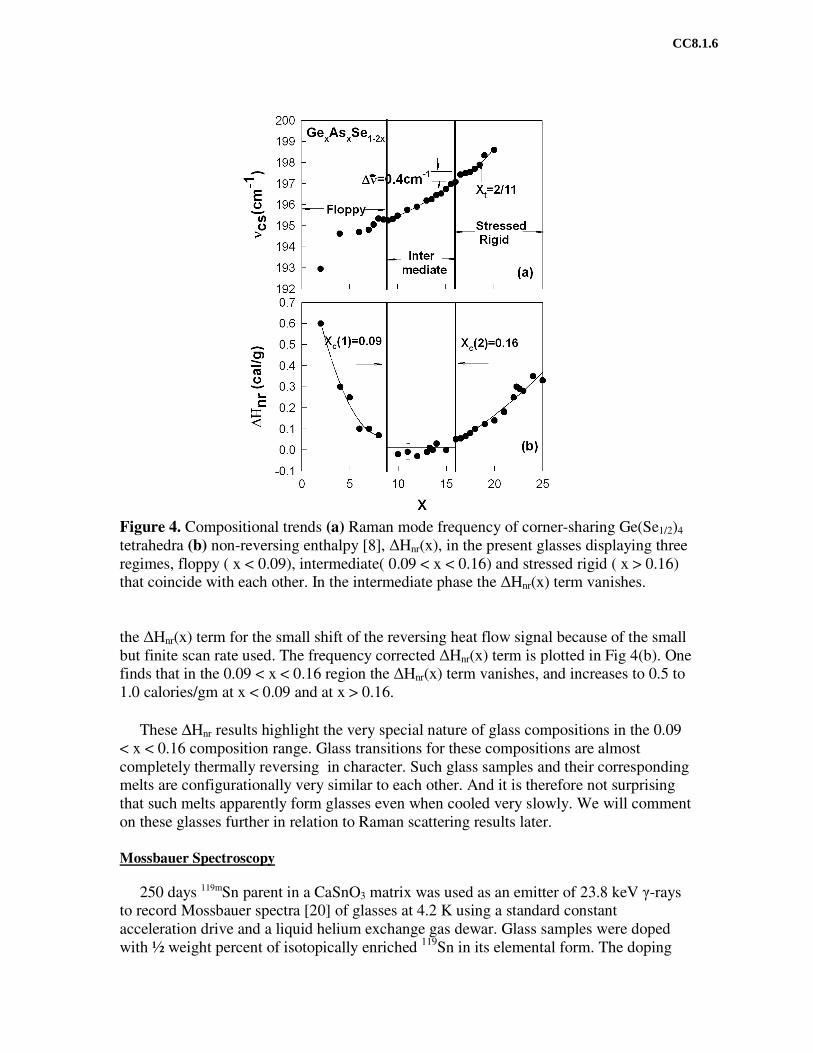
Figure 4. Compositional trends (a) Raman mode frequency of corner-sharing Ge(Se1/2)4
tetrahedra (b) non-reversing enthalpy [8], ∆Hnr(x), in the present glasses displaying threeregimes, floppy ( x < 0.09), intermediate( 0.09 < x < 0.16) and stressed rigid ( x > 0.16)that coincide with each other. In the intermediate phase the ∆Hnr(x) term vanishes.
the ∆Hnr(x) term for the small shift of the reversing heat flow signal because of the smallbut finite scan rate used. The frequency corrected ∆Hnr(x) term is plotted in Fig 4(b). Onefinds that in the 0.09 < x < 0.16 region the ∆Hnr(x) term vanishes, and increases to 0.5 to1.0 calories/gm at x < 0.09 and at x > 0.16.
These ∆Hnr results highlight the very special nature of glass compositions in the 0.09< x < 0.16 composition range. Glass transitions for these compositions are almostcompletely thermally reversing in character. Such glass samples and their correspondingmelts are configurationally very similar to each other. And it is therefore not surprisingthat such melts apparently form glasses even when cooled very slowly. We will commenton these glasses further in relation to Raman scattering results later.
Mossbauer Spectroscopy
250 days 119mSn parent in a CaSnO3 matrix was used as an emitter of 23.8 keV γ-raysto record Mossbauer spectra [20] of glasses at 4.2 K using a standard constantacceleration drive and a liquid helium exchange gas dewar. Glass samples were dopedwith ½ weight percent of isotopically enriched 119Sn in its elemental form. The doping
CC8.1.6
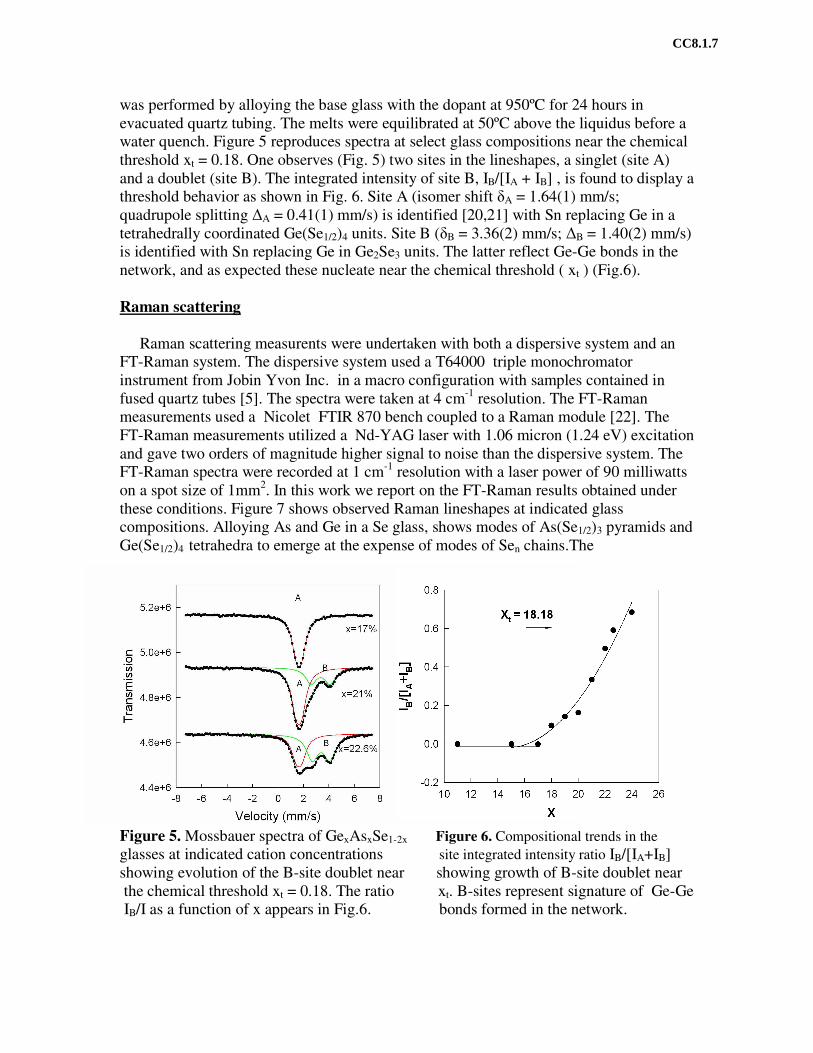
was performed by alloying the base glass with the dopant at 950ºC for 24 hours inevacuated quartz tubing. The melts were equilibrated at 50ºC above the liquidus before awater quench. Figure 5 reproduces spectra at select glass compositions near the chemicalthreshold xt = 0.18. One observes (Fig. 5) two sites in the lineshapes, a singlet (site A)and a doublet (site B). The integrated intensity of site B, IB/[IA + IB] , is found to display athreshold behavior as shown in Fig. 6. Site A (isomer shift δA = 1.64(1) mm/s;quadrupole splitting ∆A = 0.41(1) mm/s) is identified [20,21] with Sn replacing Ge in atetrahedrally coordinated Ge(Se1/2)4 units. Site B (δB = 3.36(2) mm/s; ∆B = 1.40(2) mm/s)is identified with Sn replacing Ge in Ge2Se3 units. The latter reflect Ge-Ge bonds in thenetwork, and as expected these nucleate near the chemical threshold ( xt ) (Fig.6).
Raman scattering
Raman scattering measurents were undertaken with both a dispersive system and anFT-Raman system. The dispersive system used a T64000 triple monochromatorinstrument from Jobin Yvon Inc. in a macro configuration with samples contained infused quartz tubes [5]. The spectra were taken at 4 cm-1 resolution. The FT-Ramanmeasurements used a Nicolet FTIR 870 bench coupled to a Raman module [22]. TheFT-Raman measurements utilized a Nd-YAG laser with 1.06 micron (1.24 eV) excitationand gave two orders of magnitude higher signal to noise than the dispersive system. TheFT-Raman spectra were recorded at 1 cm-1 resolution with a laser power of 90 milliwattson a spot size of 1mm2. In this work we report on the FT-Raman results obtained underthese conditions. Figure 7 shows observed Raman lineshapes at indicated glasscompositions. Alloying As and Ge in a Se glass, shows modes of As(Se1/2)3 pyramids andGe(Se1/2)4 tetrahedra to emerge at the expense of modes of Sen chains.The
Figure 5. Mossbauer spectra of GexAsxSe1-2x Figure 6. Compositional trends in theglasses at indicated cation concentrations site integrated intensity ratio IB/[IA+IB]showing evolution of the B-site doublet near showing growth of B-site doublet nearthe chemical threshold xt = 0.18. The ratio xt. B-sites represent signature of Ge-GeIB/I as a function of x appears in Fig.6. bonds formed in the network.
CC8.1.7
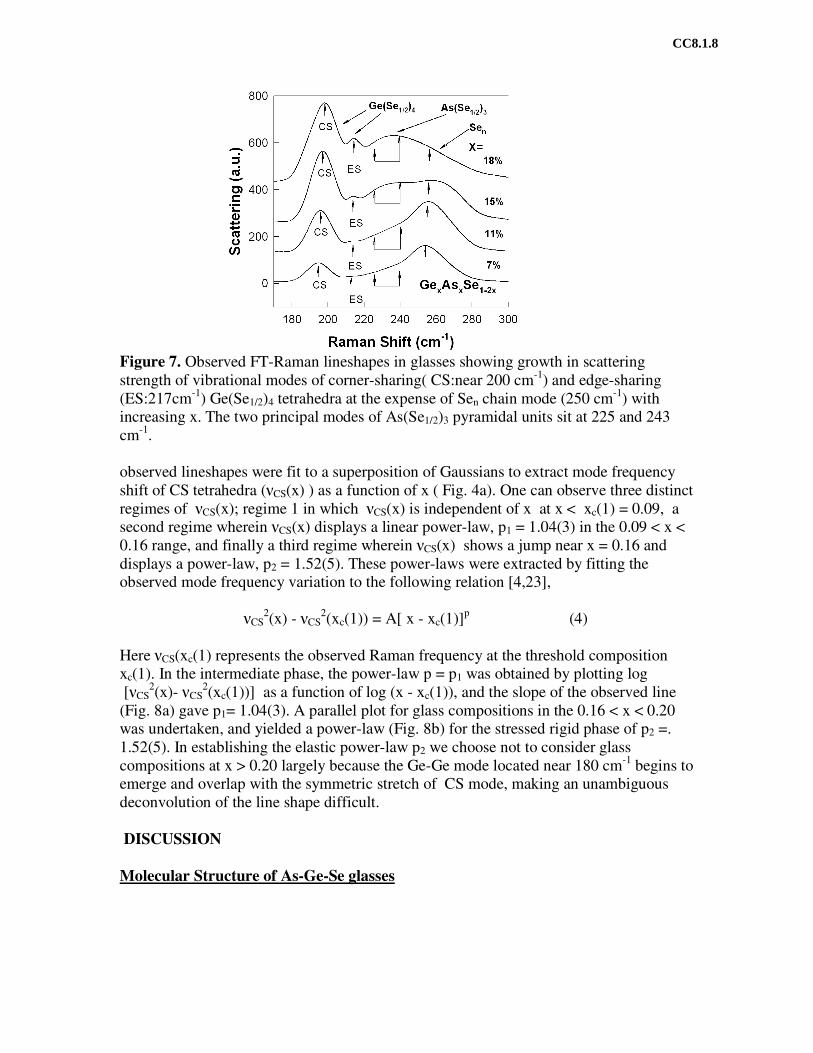
Figure 7. Observed FT-Raman lineshapes in glasses showing growth in scatteringstrength of vibrational modes of corner-sharing( CS:near 200 cm-1) and edge-sharing(ES:217cm-1) Ge(Se1/2)4 tetrahedra at the expense of Sen chain mode (250 cm-1) withincreasing x. The two principal modes of As(Se1/2)3 pyramidal units sit at 225 and 243cm-1.
observed lineshapes were fit to a superposition of Gaussians to extract mode frequencyshift of CS tetrahedra (νCS(x) ) as a function of x ( Fig. 4a). One can observe three distinctregimes of νCS(x); regime 1 in which νCS(x) is independent of x at x < xc(1) = 0.09, asecond regime wherein νCS(x) displays a linear power-law, p1 = 1.04(3) in the 0.09 < x <0.16 range, and finally a third regime wherein νCS(x) shows a jump near x = 0.16 anddisplays a power-law, p2 = 1.52(5). These power-laws were extracted by fitting theobserved mode frequency variation to the following relation [4,23],
νCS2(x) - νCS
2(xc(1)) = A[ x - xc(1)]p (4)
Here νCS(xc(1) represents the observed Raman frequency at the threshold compositionxc(1). In the intermediate phase, the power-law p = p1 was obtained by plotting log[νCS
2(x)- νCS2(xc(1))] as a function of log (x - xc(1)), and the slope of the observed line
(Fig. 8a) gave p1= 1.04(3). A parallel plot for glass compositions in the 0.16 < x < 0.20was undertaken, and yielded a power-law (Fig. 8b) for the stressed rigid phase of p2 =.1.52(5). In establishing the elastic power-law p2 we choose not to consider glasscompositions at x > 0.20 largely because the Ge-Ge mode located near 180 cm-1 begins toemerge and overlap with the symmetric stretch of CS mode, making an unambiguousdeconvolution of the line shape difficult.
DISCUSSION
Molecular Structure of As-Ge-Se glasses
CC8.1.8
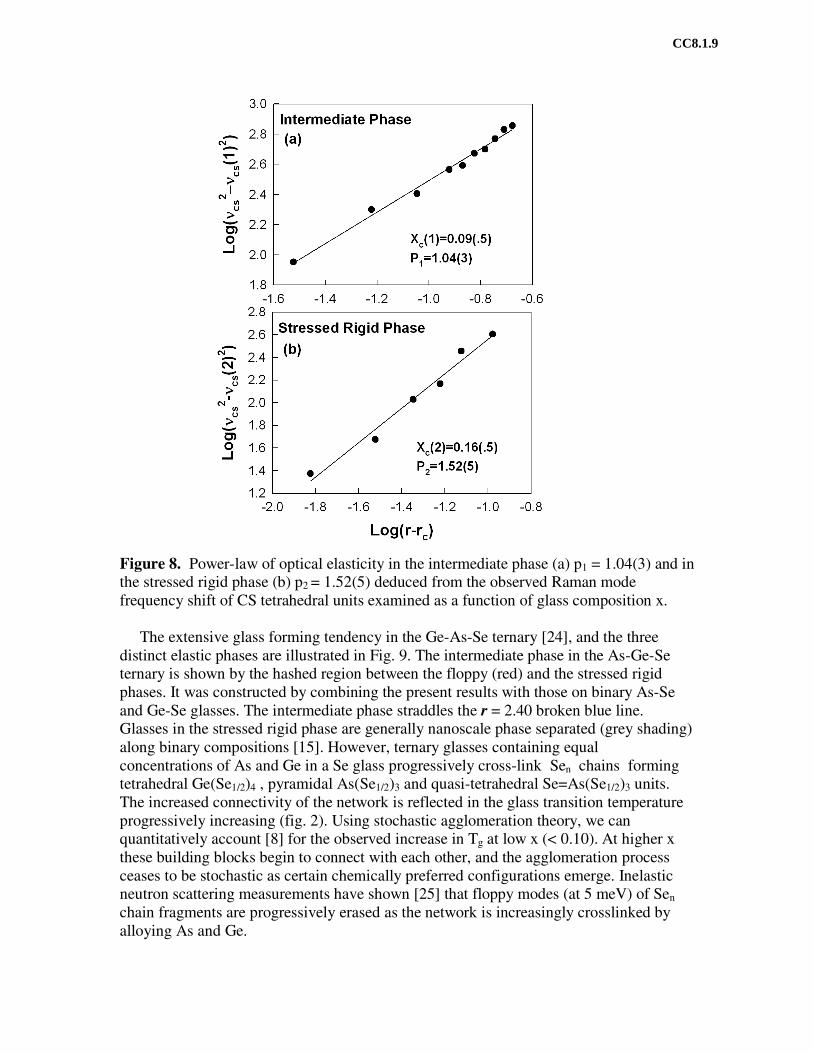
Figure 8. Power-law of optical elasticity in the intermediate phase (a) p1 = 1.04(3) and inthe stressed rigid phase (b) p2 = 1.52(5) deduced from the observed Raman modefrequency shift of CS tetrahedral units examined as a function of glass composition x.
The extensive glass forming tendency in the Ge-As-Se ternary [24], and the threedistinct elastic phases are illustrated in Fig. 9. The intermediate phase in the As-Ge-Seternary is shown by the hashed region between the floppy (red) and the stressed rigidphases. It was constructed by combining the present results with those on binary As-Seand Ge-Se glasses. The intermediate phase straddles the r = 2.40 broken blue line.Glasses in the stressed rigid phase are generally nanoscale phase separated (grey shading)along binary compositions [15]. However, ternary glasses containing equalconcentrations of As and Ge in a Se glass progressively cross-link Sen chains formingtetrahedral Ge(Se1/2)4 , pyramidal As(Se1/2)3 and quasi-tetrahedral Se=As(Se1/2)3 units.The increased connectivity of the network is reflected in the glass transition temperatureprogressively increasing (fig. 2). Using stochastic agglomeration theory, we canquantitatively account [8] for the observed increase in Tg at low x (< 0.10). At higher xthese building blocks begin to connect with each other, and the agglomeration processceases to be stochastic as certain chemically preferred configurations emerge. Inelasticneutron scattering measurements have shown [25] that floppy modes (at 5 meV) of Sen
chain fragments are progressively erased as the network is increasingly crosslinked byalloying As and Ge.
CC8.1.9
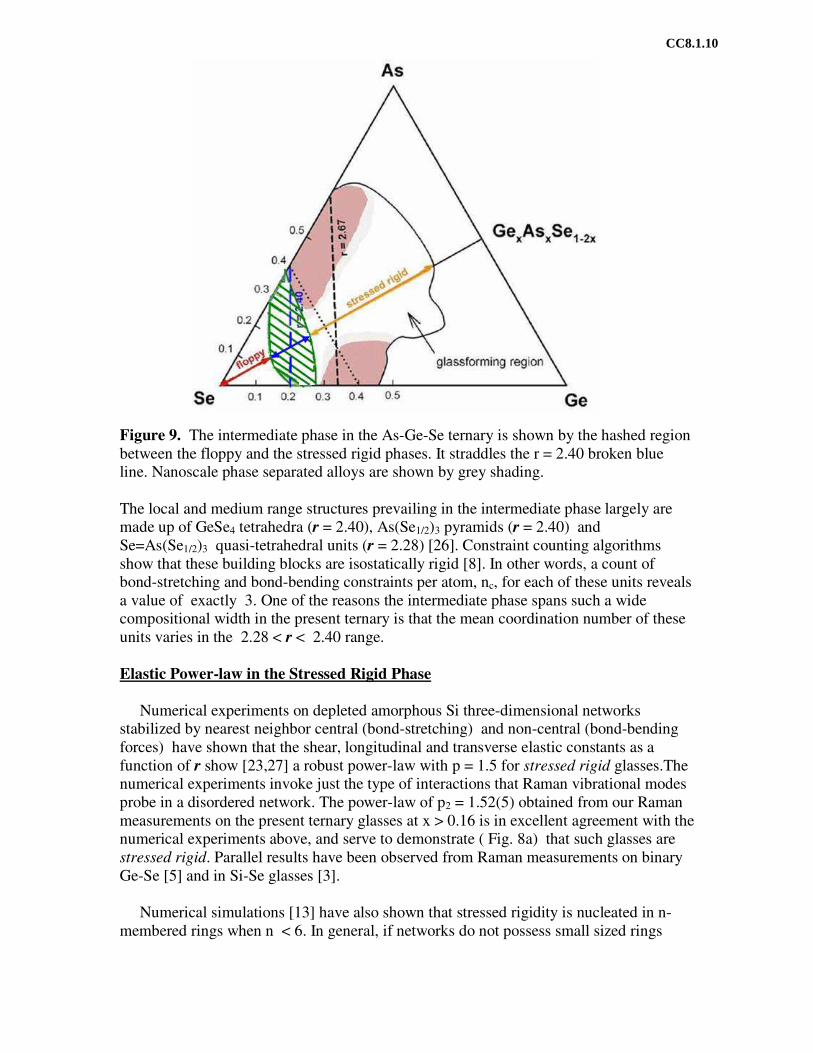
Figure 9. The intermediate phase in the As-Ge-Se ternary is shown by the hashed regionbetween the floppy and the stressed rigid phases. It straddles the r = 2.40 broken blueline. Nanoscale phase separated alloys are shown by grey shading.
The local and medium range structures prevailing in the intermediate phase largely aremade up of GeSe4 tetrahedra (r = 2.40), As(Se1/2)3 pyramids (r = 2.40) andSe=As(Se1/2)3 quasi-tetrahedral units (r = 2.28) [26]. Constraint counting algorithmsshow that these building blocks are isostatically rigid [8]. In other words, a count ofbond-stretching and bond-bending constraints per atom, nc, for each of these units revealsa value of exactly 3. One of the reasons the intermediate phase spans such a widecompositional width in the present ternary is that the mean coordination number of theseunits varies in the 2.28 < r < 2.40 range.
Elastic Power-law in the Stressed Rigid Phase
Numerical experiments on depleted amorphous Si three-dimensional networksstabilized by nearest neighbor central (bond-stretching) and non-central (bond-bendingforces) have shown that the shear, longitudinal and transverse elastic constants as afunction of r show [23,27] a robust power-law with p = 1.5 for stressed rigid glasses.Thenumerical experiments invoke just the type of interactions that Raman vibrational modesprobe in a disordered network. The power-law of p2 = 1.52(5) obtained from our Ramanmeasurements on the present ternary glasses at x > 0.16 is in excellent agreement with thenumerical experiments above, and serve to demonstrate ( Fig. 8a) that such glasses arestressed rigid. Parallel results have been observed from Raman measurements on binaryGe-Se [5] and in Si-Se glasses [3].
Numerical simulations [13] have also shown that stressed rigidity is nucleated in n-membered rings when n < 6. In general, if networks do not possess small sized rings
CC8.1.10
where stressed rigidity can nucleate, onset of stressed rigidity would be catastrophic, i.e.first order. The jump in the corner-sharing mode frequency of Ge(Se1/2)4 tetrahedra , νCS,near the stress transition of xc(2) = 0.16 of ∆νCS = 0.4 cm-1 (Fig. 4a) is suggestive that theunderlying phase transition is first-order in character.
Intermediate Phase in the AsxGexSe1-2x ternary
The wide compositional width of the intermediate phase and the clearly resolvednature of the CS mode in Raman spectra of these glasses have permitted a reliablemeasurement of the elastic-power-law in the intermediate phase. The power-law obtainedfor the intermediate phase (Fig 8b) yields p1 = 1.04(3).On general grounds [28], oneexpects the change in stiffness of coherently scattered regions to vary as (∆r)d/2 , where dis the dimensionality of the network. A power-law p1 = 1 could imply, thus, an effectivedimensionality of d = 2 for the intermediate phase. For stressed-rigid phase, the measuredvalue of p2 = 1.5, would then suggest an effective dimensionality of d = 3.A new approach to understanding the compositional width of self-organization in glassysystems is to use constraint counting algorithms with size-increasing clustercombinatorics [12]. The method was recently used to understand the observedintermediate phases in Si-Se and Ge-Se glasses. The advantage of the method is that onestarts with the appropriate local structures that form the elements of the intermediatephase. The medium range structures are inferred by agglomeration of these localstructures to infer at what point stressed rigidity becomes manifest.
CONCLUSIONS
Temperature modulated DSC and Raman scattering measurements on GexAsxSe1-2x
bulk glasses in the 0 < x < 0.26 range reveal the existence of three distinct elastic phases.In the 0 < x < 0.09 range, glasses are floppy possessing increasingly larger non-reversingenthalpy ∆Hnr as x decreases starting from 0.09. In the 0.09 < x < 0.16 range, glassespossess a vanishing ∆Hnr term and a Raman optical elasticity that varies as a function ofmean coordination, r, as a power-law with a power, p1 = 1.04(3). The behavior isidentified with the intermediate phase of the present ternary. The phase is thought to beself-organized consisting of three distinct optimally coordinated building blocksincluding As(Se1/2)3 pyramidal units, Se=As(Se1/2)4 quasi-tetrahedral units and GeSe4
tetrahedral units. In the 0.16 < x < 0.24 range, the ∆Hnr term increases with xqualitatively, and the Raman optical elasticity is characterized by a power-law, p2 =1.52(4).The behavior is identified with the stressed-rigid phase of the glasses. The smallbut finite jump in Raman mode frequency of Ge-centered corner-sharing tetrahedralunits of 0.4 cm-1 near x = 0.16 suggests that the stress-transition 2, is first order incharacter. The measured elasticity power-laws in the intermediate- and stressed-rigidphases suggest that the effective network dimensionalities d = 2 and 3 respectively.
ACKNOWLEDGEMENT
It is a pleasure to thank J.C. Phillips for correspondence during the course of thiswork. The FT-Raman measurements were made possible by B. Zuk and M. Bradley of
CC8.1.11
Thermo-Nicolet Inc. The work at University of Cincinnati is supported by NSF grantDMR-01-01808. LPTL is Unite Mixte de Recherche associee au CNRS n. 7600.
REFERENCES
1. J.C. Phillips, J.Non-Cryst. Solids 34,153-181 (1979).2. M.F. Thorpe, J.Non-Cryst. Solids 57,355-370 (1983).3. D. Selvanathan, W.J. Bresser, P. Boolchand, Phys. Rev B 61, 15061-76 (2000).4. X.W. Feng, W.J. Bresser, P. Boolchand, Phys .Rev. Lett. 78, 4422-4426 (1997).5. P. Boolchand, X. Feng, W.J. Bresser, J.Non-Cryst. Solids, 293-295,348-356 (2001).6. D.G. Georgiev, P. Boolchand, M. Micoulaut Phys. Rev B 62, R9228-9231 (2000).7. D.G. Georgiev, P. Boolchand, H. Eckert, M. Micoulaut, K.A Jackson, Europhysics
Letters 62, 49-55 (2003).8. Y.Wang, J. Wells, D.G. Georgiev, P. Boolchand, K. Jackson, M. Micoulaut, Phys.
Rev. Lett. 87, 185503-1-4 (2001).9. P. Boolchand, D.G. Georgiev and B. Goodman, J.Optoelectron . Adv. Mater. 3,703-
720 (2001).10. J.C. Phillips, Phys. Rev. Lett. 88, 216401-4 (2002).11. M.F. Thorpe, D.J. Jacobs, M.V. Chubynski, J.C. Phillips, J.Non-Cryst. Solids,266-
269,859-866 (2000).12. M. Micoulaut, J.C. Phillips, Phys. Rev. B 67,104204-9 (2003).13. M.F. Thorpe,D.J. Jacobs,N.V. Chubynsky A.J. Rader, “ Generic Rigidity of Network
Glasses”, Rigidity Theory and Application, ed. M.F.Thorpe and P.M. Duxbury(Kluwer Academic/Plenum Publishers,1999) pp. 239-277.
14. Fei Wang, “Intermediate Phase and Stress in Ge1/4Se3/4-yIy Glasses”, MS Thesis,unpublished (University of Cincinnati, 2002); Fei Wang, P. Boolchand, M.Micoulaut, K.A. Jackson, B. Goodman (unpublished).
15. P. Boolchand, D.G. Georgiev, T. Qu, F. Wang, L. Cai, S. Chakravarty, C.R. Chimie5, 713-724 (2002).
16. M. Micoulaut, Europhys. Lett. 58, 830-836 (2002).17. C.A. Angell, “Glass Formation and the Nature of the Glass Transition”, Insulating
and Semiconducting Glasses, ed. P.Boolchand (World Scientific PublishingCo.,2000) pp.1- 51.
18. E. Verdonck, K. Schaap, L.C. Thomas, Intl. J. of Pharmaceutics, 192, 3-20, (1999).19. P.Boolchand, D.G. Georgiev, M. Micoulaut, J.Optoelect. Adv. Mater.4, 823-
836 (2002).20. P. Boolchand, “ Mossbauer Spectroscopy” ”, Insulating and Semiconducting
Glasses, ed. P. Boolchand (World Scientific Publishing Co.,2000) pp.191-247.21. K. Jackson, S. Srinivas, J. Kortas, M. Pederson, Phys. RevB 65, 214201-8 (2002).22. 900 Series FT-Raman ThermoNicolet, www.thermonicolet.com23. H. He and M.F. Thorpe, Phys. Rev. Lett. 54, 2107-2110 (1985).24. Z.U.Borisova, Glassy Semiconductors, Plenum Press, New York25. W.A. Kamitakahara, et al. Phys. Rev. B 44, 94-100 (1991).26. P. Boolchand and M.F. Thorpe, Phys. Rev. B 50, 10366-10368 (1994).27. D.S. Franzblau and J. Tersoff, Phys. Rev. Lett. 68, 2172-2175 (1992).28. J.C. Phillips (private Communication).
CC8.1.12