Embed Size (px)
Citation preview

The Impact of Capital Requirements on Banks’ Cost of Intermediation and Performance: The Case of Egypt
Samy Ben Naceura,b and Magda Kandilc**
a Université du 7 Novembre, IHEC Carthage, 2016 Carthage Présidence, Tunisia b International Monetary Fund, Research Department, 700 19th Street, Washington DC, 20431, U.S.A.
c International Monetary Fund, Western Hemisphere Dept, 700 19th Street, Washington DC, 20431, U.S.A.
Abstract In 1991, the Central Bank of Egypt increased the minimum capital requirements for the banking industry vis-à-vis risk-weighted assets to 8 percent, along the lines proposed by the Basel Committee on Banking Supervision. In this paper, we investigate the effects of capital regulations on cost of intermediation and profitability. Higher capital adequacy increases the interest of shareholders in managing banks’ portfolios. The result is a higher cost of intermediation and profitability. A number of factors have increased the cost of intermediation in the post-capital regulation period: higher capital-to assets ratios, an increase in management efficiency, an improvement of liquidity and a reduction in inflation. The reduction in output growth countered these effects. A number of factors contributed positively to banks’ profitability in the post-regulation period: higher capital requirements, the reduction in implicit cost, and the increase in management efficiency. The reduction in economic activity had opposite effects on banks’ profitability. Overall, the results support the Central Bank’s efforts to enforce capital regulations to improve the performance of the banking sector in Egypt.
JEL classifications: E44; G21; L51 Keywords: Cost of intermediation; profitability; capital regulation; dynamic panel data
* Corresponding author. E-mail address: [email protected] (M. Kandil)
1
1. Introduction
Recent economic crises have revealed the importance of bank regulations to hedge
against the high risk attributed to imbalances in banks’ balance sheets. Nonetheless,
excessive regulations may have adverse effects. On the one hand, they serve as prudential
measures that mitigate the effects of economic crises on the stability of the banking
system and subsequent accompanying macroeconomic results. On the other hand,
excessive regulations may increase the cost of intermediation and reduce the profitability
of the banking industry. Simultaneously, as banks become more constrained, their ability
to expand credit and contribute to economic growth will be hampered during normal
times.
While most analysts would argue for the need to enforce regulations, the question
remains: What is the right benchmark to enforce regulations without jeopardizing the
ability of banks to service the economy? To properly address this question, it has become
necessary to thoroughly analyze the effect of capital regulations, namely the capital
adequacy ratio.
The literature on this subject is growing. Nonetheless, its scope has been limited by
data availability and methodological issues. Before embarking on our proposed research,
we review the existing literature to identify the contribution of this paper’s analysis. For
more details, see VanHoose (2006), Athanasoglou, Brissimis, and Delis (2005), and
Jackson et al. (1999).
The research undertaken to analyze the effects of capital regulations on banks’
performance has focused on the analysis of either cross-country or individual countries’
banking systems. The first group of studies includes Demirguc-Kunt and Huizinga
(1998). They analyze data for 80 countries during the 1988-95 period to study the
determinants of interest margin and profitability. Chiuri, Ferri, and Majnoni (2002)
examine a panel of data for 572 banks in 15 developing countries. They find consistent
evidence- after seeking to control for banking crises- that the imposition of capital
regulation induced a reduction in loan supply and, hence, in total lending in these
countries. The study by Demirguc-Kunt, Laeven, and Levine (2003) analyzes the impact
of bank regulations as well as other internal determinants, which include concentration,
2
and institutions, on bank profit margins. The study analyzes the impact of bank
regulations, concentration, and institutions using bank- level data across 72 countries
while controlling for a wide array of macroeconomic, financial, and bank-specific traits.
Doliente (2003) investigate the determinants of net interest margins of banks in four
Southeast Asian countries. Net interest margins are partially explained by bank-specific
factors, namely operating expenses, capital loan quality, collateral and liquid assets.
Barth, Caprio, and Levine (2004) use a new data base on bank regulations and
supervision in 107 countries to assess the relationship between specific regulatory and
supervisory practices and banking-sector development, efficiency and fragility. The
results raise a cautionary flag regarding government policies that rely excessively on
direct government supervision and regulation of bank activities.
Single country studies, such as Furlong (1992), and Haubrich and Wachtel (1999),
concluded that capital regulations in the U.S. contributed to a decrease in lending that
helped fuel a post-capital requirements credit crunch. Berger and Udell (1994) examine
whether the risk-based capital requirements put into place in the late 1980s contributed to
the so-called “credit crunch” that occurred in the United States in the early 1990s. They
find evidence that other sources of loan supply reduction or declines in loan demand in
the early 1990s played much more prominent role in reducing bank lending. In contrast,
Peek and Rosengren (1995 a,b) conclude that there is considerable evidence, at least for
New England, that both lower loan demand and a capital-crunch-induced decline in loan
supply together brought about a decline in lending. Brinkmann and Horvitz (1995) also
find evidence of significant loan supply responses to the Basle I capital requirements.
Wagster (1999) reaches the same conclusion for Canada and the U.K. He fails to find
support, however, for this result in the cases of Germany, Japan, and the U.S., where he
concludes that a number of factors played a role in generating a credit crunch.
Benh-Khedhiri, Casu, and Sheik-Rahim (2005), study profitability and interest rates’
differentials in Tunisian banking. More specifically, they focus on the determinants of
banks’ net interest margins as indicators of the sector’s efficiency. Using data for Taiwan
Province of China, Lin, Penm, Garg, and Chang (2005) study the direct effects of capital
regulations and capital requirements. More specifically, they study three areas: (i) the
relation between capital adequacy and the bank insolvency risk index, (ii) the relation
3
between capital adequacy and financial performance, and (iii) the interaction and
relationship between the insolvency risk of banks and financial performance.
Not all researchers agree that capital regulation has had significant effects on bank
lending. Jackson et al. (1999) review a number of prior studies investigating how capital
adequacy regulations influence actual capital ratios; such as Peltzman (1970), Mingo
(1975), Dietrich and James (1983), Shrieves and Dahl (1992), Keeley (1990), Jacques
and Nigro (1997), Aggarwal and Jacques (1997), Hancock and Wilcox (1994), Rime
(2001), and Wall and Peterson (1987, 1995). Jackson et. al’s conclusion is that in the near
term banks mainly respond to strict capital requirements by reducing lending and that
there is little conclusive evidence that capital regulation has induced banks to maintain
higher capital to assets ratios than they otherwise would choose if unregulated.
To sum, since its introduction, the Capital Accord has sparked a debate on the value
of its implementation. On the other hand, it has been acknowledged for its contribution to
the widespread use of risk-based capital ratios. The Accord has also been praised for the
international coverage of capital standards and for the improvement of these standards in
many countries. Its design, however, has been blamed for several distortions to the
business of banking. Growing evidence on these distortions and a reduction in its
effectiveness has led to proposals to redesign it.
There is no consensus on how best to design the regulation of bank capital, Santos
(2002). Restricting bank activities through a higher capital requirements ratio could be
negatively associated with bank development, adversely affecting credit expansion and
credit growth. Moreover, regulatory restrictions on bank activities may increase net
interest margins or overhead costs. The ability of banks to stabilize income flows by
diversifying activities may only work in countries with sufficient securities market
development.
Earlier studies on the subject employed a static estimation approach which does not
account for persistence in the dependent variable and the endogeneity of explanatory
variables, including capital adequacy. To address these shortcomings, recent studies have
followed a dynamic estimation approach. Athanosoglou, Brissimis, and Delis (2005)
investigate, in a single-equation framework, the effect of bank-specific, industry-specific,
and macroeconomic determinants on bank profitability. Using dynamic estimation
4

technique, Goddard, Molyneyx, and Wilson (2004) study the determinants of profitability
of European banks. They find a significant persistence of abnormal profits from year to
year and a positive relationship between the capital-asset ratio and profitability.
Another strand of the literature relates capital ratios to bank profit efficiency, as
measured by frontier techniques. Examples are Kwon and Eisenbeis (1997), Fare et al.
(2004), and Berger and Bonaccarsi di Patti (2006). Higher leverage or a low equity/asset
ratio reduces the agency costs of outside equity and increases its value by constraining or
encouraging managers to act more in the interest of shareholders. Hence, higher leverage
can mitigate conflicts between shareholders and managers concerning the choice of
investment. Along these lines, the studies by Besanko and Kanatas (1996), Blum (1999),
and Calen and Rob (1999) examine the impact of capital regulations on risk taking and
bank’s performance.
The theoretical motivation for the paper’s analysis is firmly rooted in the industrial
organization literature on bank structure and efficiency. The three seminal analyses of the
portfolio impacts of binding capital requirements are the contributions of Kahane (1977),
Koehn and Santomero (1980), and Kim and Santomero (1988). A representative bank
takes asset prices and yields as given and determines its optimal portfolio with an aim to
maximize the expected utility derived from end-of-period capital, which in turn depends
on the degree of the bank’s risk aversion. A tightening of the required leverage ratio
constrains the bank’s efficient asset investment frontier, forcing a response to alter the
mix of assets in portfolio. A non-risk averse will respond by choosing a riskier asset mix.
The effect of capital requirements on the overall banking system depends on the
distribution of risk aversion across banks.
An interesting examination of how capital requirements alter the incentives that banks
face is contained in Demirguc-Kunt and Huzinga (1999). An increase in capital
requirements requires banks to substitute equity for deposit financing, cutting into
shareholder’s surplus. The reduction in surpluses increases the probability of loss, forcing
a rise in the cost of intermediation to maintain profitability. In support of this hypothesis
is the empirical evidence showing a significant impact on interest margins in response to
higher capital holdings and the share of total assets held by banks. The evidence also
supports higher net interest margins and more profitability for well capitalized banks.
5
This is consistent with the fact that banks with higher capital ratios have a lower cost of
funding because of lower prospective bankruptcy costs.
Our paper focuses on the impact of capital regulation on the performance of the
banking industry in Egypt. A variety of factors underlies the contribution of our research
to existing literature. First, our study is the first for Middle East and North Africa
(MENA) countries that analyzes the effects of capital regulation on banks’ performance.
Second, the dearth of banking data has limited the analysis in previous studies to seven
years at the most. We have identified new data sources from the Bankscope data base and
included 16 years of data in the current study. The longer sample period provides the
necessary time frame for a thorough analysis of the impact of capital regulation by
identifying structural breaks, compared with the pre-regulation period. Third, our study
provides a comprehensive framework to explicitly assess the effects of capital adequacy
on two specific measures of banks’ performance: cost of intermediation and profitability.
Fourth, our estimation technique utilizes recent innovations in panel estimation that
incorporates dynamics to take into consideration persistence in the behavior of dependent
variables over time. Fifth, our study accounts for a variety of macroeconomic variables,
including cyclical output fluctuations. Egypt has undergone major structural and policy
changes recently. Our investigation sheds light on the importance of the macro
environment to the performance and stability of the banking industry in Egypt. The
combined evidence provides a menu of important determinants of bank’s performance to
guide policymakers towards upgrading quality and enhancing the stability of an industry
that is considered by many to be the core of economic development.
2. Institutional Background
Our investigation will focus on the analysis of the impact of capital regulation on
banks’ performance in Egypt using two measures of performance: cost of intermediation
and profits. To motivate the investigation, we review the institutional background.
The Egyptian banking sector expanded markedly in the mid-1970s (for details, see
El-Shazly (2006)), spurred by the shift in economic management towards an open-door
policy. This policy aimed at outward-looking growth with an active role for the private
6

sector in economic management. To achieve these objectives, a banking law was enacted
in 1975 (Law 120/1975) defining the nature and mode of operations for all banks. In the
1990s, the Egyptian authorities undertook major banking reforms towards a more liberal
system. This included the strengthening of bank supervision and regulations on the basis
of internationally accepted standards to deal with the risk inherent in the new policy
environment. As the banking sector is a major component of the Egyptian financial
sector, the Central Bank of Egypt (CBE) viewed the soundness of such sector to be of a
paramount importance to ensure full utilization of the sector’s resources towards reviving
economic activity and sustaining high level growth.
The Egyptian banking sector comprises 57 banks, 28 commercial banks of which 4
banks are state-owned, 26 investment banks of which 11 joint venture banks and 15
branches of foreign banks, in addition to 3 specialized banks of which two are state-
owned. The number of licensed branches of these banks in Egypt reached 2443 branches.
All specialized banks are state-owned and are assigned the task of providing long-
term finance for real estate, agricultural, and industrial development. There are also
public sector commercial banks whose volume of business constitutes a significant share
in total bank transactions (nearly 50 percent). Private and joint ventures, as well as
foreign banks, (operating through branches) are private sector institutions. The role of
foreign banks is to raise long-term funds on the international financial market and
promote investment.
The banking industry in Egypt is, therefore, concentrated and segmented, which
weakens competition. The rapid growth of the banking sector during the 1990s, together
with the liberalization of the whole economy added extra burden on the Central Bank of
Egypt as the sole regulator of the banking industry. Recently, in an attempt to reduce
market concentration and enhance competition, the authorities have implemented a bank
privatization program. Public banks are mandated to divest their shares in the joint
venture banks with a maximum ownership of 20 percent.
Banks are supervised by the Banking Control Department of the CBE and, in
practice, supervision is strong. The CBE has made considerable progress in developing
its supervisory framework and staff using materials, procedures, and techniques obtained
7
from other countries’ supervisory systems. According to the FSAP report of 2002,†the
CBE complied with most f the Basle Core Principles for Effective Banking Supervision.
To reinforce the supervisory role, the Government, together with CBE, has drafted a new
Central Bank and Banking Sector Law to increase the degree of independence of the CBE
in maintaining price stability.
Since the end of the first FSAP in June 2002, a number of legislations targeted
additional reform. A new law was enacted in July 2003 to establish the independence of
the CBE. In line with the recommendations of the FSAP report, modifications and
amendments of the CBE prudent rules and regulations have been introduced. All banking
supervision arrangements have been comprehensively documented in the second half of
2202. New regulations regarding connected and related party lending have been enforced
since November 2002. By the end of March 2003, the majority of banks complied with
the new minimum capital adequacy ratio of 10 percent and an additional capital injection
to all state-owned banks has been implemented. Provisioning levels for classified loans
are monitored very closely. Other supervision and prudential regulations include:
increasing the minimum paid-up capital of banks, increasing efficiency of the off-sight
supervision of the CBE Supervision Department and preparing banks for the introduction
of the Basle II new regulations.
Our research focuses on the impact of capital requirements, using the Bank for
International Settlements (BIS) standards of the Basel Accords, on performance of
Egyptian banks. The main regulatory reforms are introduced and implemented by the
Central Bank of Egypt. Prior to reforms in the early 1990s, the banking sector was
heavily regulated through credit controls and portfolio restrictions. In 1991, the Central
Bank of Egypt increased the minimum capital requirements vis-à-vis their risk-weighted
assets to 8 percent, along the lines proposed by the Basel Committee on Banking
Supervision. Capital was defined to consist of two components: primary capital (paid-up
capital and reserves) and other capital (provisions for general banking risks and
subordinated long-term loans of at least five-year maturity). As a general rule, one-half of
the capital adequacy ratio would be met from primary capital. Capital requirements force
banks to have more of their own capital at risk, so that they internalize the inefficiency of
† IMF, FSAP main report, December 2002.
8

gambling or investing in high-risk assets. However, they also reduce banks’ franchise
values (i.e., the capitalized value of expected future profits).
Murinde and Yassen (2006) study the impact of the Basel Accord Regulations on
Bank Capital and Risk Behavior in the MENA region. Using annual observations in
1995-2003, it is found that the capital requirements significantly affect banks’ capital
ratio decisions and that regulatory pressure did not induce banks to increase their capital,
but did positively affect their chosen risk levels.
In general, capital or net worth serves as a buffer against losses and, hence, failure.
Many developing countries have experienced banking problems requiring major reforms
to address weak banking supervision and inadequate capital. In addition to deposit
insurance (implicit or explicit), official capital adequacy regulations play a crucial role in
aligning the incentives of bank owners with those of depositors and other creditors.
Theory provides conflicting predictions on whether capital requirements curtail or
promote bank performance and stability. The soundness of the banking system is
important not only because it limits economic downturns related to financial panics but
also because it avoids adverse budgetary consequences for governments, which often
bear a significant part of the costs of bailouts. Prudential regulation is meant to protect
the banking system from these problems by inducing banks to invest prudently. One form
of prudential regulation is capital requirements.
The introduction of capital adequacy rules will normally strengthen bank capital and
thus improve the resilience of banks to negative shocks. Nonetheless, the introduction of
these rules may cause a shift from making loans to the private sector to providing credit
to the public sector. Banks can fulfill their capital requirement ratios by reducing their
risk-weighted assets or by increasing their capital.
3. The Sample, Models and Methodology
3.1. The sample
The information used to estimate the models is taken from the Bureau Van Dijk’s
Bank Scope data base (Bank Scope, 2006), using unconsolidated financial statements or
consolidated ones if the former are not available. The sample contains 28 banks observed
9
over the period 1989-2004. The macro and finance data were collected from the World
Bank World Development Indicators (WDI).
Table 1 presents a summary of statistics that describe the mean and standard
deviations for all variables employed in our analysis, for the combined sample period,
and in the periods before and after capital regulations.
< Insert table 1 >
Cost of intermediation, NIM1 is considerably lower in the pre-capital-regulation
period, compared with the post-capital-regulation. Statistical significance supports the
hypothesis of a significant increase in the cost of intermediation following introduction of
capital regulations. Higher internal risk for shareholders has induced a significant
increase in the cost of intermediation. This evidence is robust using NIM2, the alternative
measure for the cost of intermediation. In contrast, the evidence does not support a
significant increase in returns on assets (ROA) or on equity (ROE) in the post-capital-
regulation period, compared with the pre-regulation period.
The capital-to-assets ratio increased significantly in response to regulations of higher
capital adequacy ratio. Since capital includes primary capital, paid-up capital, and
reserves, liquidity increases till banks manage to transfer additional capital into assets.
Consistently, there is a significant increase in banks’ liquidity in response to the new
regulations.
Implicit cost, relative to implicit revenues, decreased significantly following the
introduction of regulations. Nonetheless, there is no significant change in management
efficiency (ratio of earning assets to total assets). It is interesting to note the significant
increase in banks’ size in the post-regulation period. As banks were forced to abide by the
new capital requirements, the banking industry became characterized by larger size banks
that pooled larger resources from a variety of shareholders. Cost efficiency
(overhead/total assets) has not changed significantly between the pre- and post-regulation
periods. There was a significant reduction in reserves in the post-regulation period,
compared with the previous period. Two factors might explain the difference: a reduction
10
in the required reserve ratio on banks’ deposits and/or a more developed banking
structure that enabled banks to employ excess reserves effectively.
There was no significant change in bank’s market power following the introduction of
regulations. Consistently, there is evidence of a reduction in banks’ concentration. Banks’
concentration measures the ratio of assets in the three largest banks to total assets.
Despite the increase in the average size of banks, the banking industry became more
competitive after the introduction of regulations. There was a significant reduction in the
size of assets at banks relative to assets in the stock market during the same period. This
reflects development in the stock market that crowded out assets in the banking industry.
Macroeconomic indicators exhibit significant change in the post-regulation period,
compared with the previous period. Inflation was significantly lower in the post-
regulation period. Nonetheless, output appeared to be, on average, below its potential, as
evidenced by the negative output gap following the introduction of regulations. This is in
contrast to a positive output gap, on average, in the previous period. The combined
effects of lower growth and lower inflation indicate a slow-down in aggregate demand
following the introduction of regulations.
3.2. Empirical models
We seek to explain the cost of intermediation and profitability in the banking system
in Egypt, using an empirical model that includes a measure of capital regulations plus a
number of other major determinants. The variables chosen to measure the performance of
banks along with those chosen as proxies of the internal and external determinants are
shown in Table 2.
The specification of the empirical model is as follows:
itmit
M
mm
lit
B
bbtijtij XXYcY εββδ ++++= ∑∑
==−
111,, (1)
where Yij,t-1 is the one period lagged cost of intermediation or profitability, c is a constant
term, δ is the speed of adjustment to equilibrium, Xits with superscripts b and m denote
bank-specific and macroeconomic determinants respectively and εit is the disturbance.
11

The cost of intermediation variable is represented by two alternative measures: the
ratio of net interest revenue over average interest-bearing assets (NIM1) and the ratio of
net interest income over average total assets (NIM2).
The profitability variable is also represented by two alternative measures: the ratio of
net income to assets, i.e., the return on assets (ROA) and the profits to equity ratio, i.e.,
the return on equity (ROE). ROA reflects the ability of a bank to generate profit from the
bank’s assets and ROE indicates the return to shareholders on their equity.
We employ three measures of capital regulation. The first is a continuous measure of
the ratio of capital to total assets (CAPR). Banks attempt to accommodate the capital
requirement by raising the contribution of shareholders or decreasing assets, particularly
risky assets. To test the effects of the capital ratio over time, we incorporate a dummy
variable that takes a zero value before the change in capital regulation and one thereafter.
If the effects of capital regulation on the cost of intermediation persist over time we
expect a statistically significant coefficient on this dummy variable. Further, to study the
short-run dynamics of the effects of the change in capital regulation, we incorporate a
dummy variable that takes the value of one in the year of the change in capital
requirements and increases by an increment of one over subsequent three lags. The
significance of each of the dummies in the current and three subsequent periods indicates
the persistent effect of capital regulations on the dependent variable in the short-run. A
summary of the empirical models is as follows:
• Model 1 with the capital ratio:
itmit
M
mm
lit
B
bbtijtij XXYcY εββλδ +++++= ∑∑
==−
11ti,1,, CAPR (2)
where CAPR is equal to Equity over total assets.
• Model 2 with the long-term dummy variable:
itmit
M
mm
lit
B
bbtijtij XXYcY εββλδ +++++= ∑∑
==−
11ti,1,, CAPD (3)
where CAPD is a dummy variable that takes 1 in the current year and subsequent
years following the implementation of capital requirement and 0 before.
12

• Model 3 with the four short-term dummy variables:
it
mit
M
mm
lit
B
bb
tijtij
XX
YcY
εββ
λλλλδ
+++
+++++=
∑∑==
−
11
ti,4ti,3ti,2ti,11,, PostCrd3PostCrd2PostCrd1 Crd (4)
where Crdi is a variable that equals one in the year that country i implements
capital requirement. PostCrd1i takes the value 1 in the first year after
implementation, PostCrd2i takes the value 1 in the second year after
implementation, and PostCrd3i takes the value 1 in the third year after
implementation.
In addition to capital requirements, the list of bank specific variables in the model
includes the following which are derived from the theoretical models of Ho and Saunders
(1981), Allen (1988) and Angbazo (1997):
• Liquidity (Liq): is the ratio of net loans over deposit and short term borrowing.
Higher figures denote lower liquidity. This variable measures the risk of not
having sufficient reserve of cash to cope with withdrawal of deposits. Predictions
vary regarding the effects of liquidity on the cost of intermediation and
profitability. One view suggests that excess liquidity may force banks to lower the
cost of intermediation as they try to reduce non-earning assets. Alternatively, in a
tight financial market where demand for credit is limited, banks may be forced to
raise the cost of intermediation in an attempt to increase profits.
• Implicit cost (Implicit): non-interest expenses relative to non-interest revenues.
Higher implicit cost is likely to reduce profit and induce an increase in the cost of
intermediation.
• Management efficiency (Maneff): the ratio of earning assets to total assets. The
higher the ratio the higher management efficiency is. As managers strive for more
earnings, it is likely that they would increase the cost of intermediation, which
would enhance profits. However, Casu and Girardone (2004) point out « …the
most cost efficient banking groups seem to be also the least profitable, » p. 693.
• Bank size (Bsize): the log of total assets in a bank. This may serve as a proxy for
the degree of monopoly. The bigger the size of the bank the higher the degree of
13

monopoly power, enabling banks to charge a higher cost of intermediation. Profits
are likely to increase as a result of economies of scale. However the empirical
results concerning bank size are mixed, since some studies found economies of
scale for large banks (Berger and Humphrey, 1997) and others diseconomies for
larger banks (Vander Vennet, 1998).
• Cost efficiency (Costeff): the cost of overhead to total assets. The higher the cost
the less profitable banks are. To counter this effect, banks would charge a higher
cost of intermediation.
• Reserves: banks’ reserves at the central bank. Similar to liquidity, higher reserves
may stimulate a reduction in the cost of intermediation to push out excess reserves
and increase profits. Alternatively, higher reserves may induce an increase in the
cost of intermediation to make up for excess reserves and generate more earnings.
• Market power (Mpower): measured as market share in terms of total assets and
serves as a proxy for the degree of monopoly, which may induce an increase in
the cost of intermediation and banks’ profits. The relationship between bank
profitability and market structure can be studied within three hypotheses: the
structure-conduct-performance (SCP), the efficient-structure (ES) and the
relative-market-power hypotheses. The SCP hypothesis suggests that the positive
relationship between interest margins and market structure is due to non-
competitive pricing behavior in more concentrated markets. However, the RMP
hypothesis asserts that only firms with high market power and product
differentiation from the competitors are able to extract non-competitive profits
(Berger, 1995a). The ES hypothesis suggests that differences in interest margins
are attributable to differences in operational efficiency across banks and lead to a
negative relationship between operational efficiency and interest margins. One
way to deal with the three hypotheses is to include measures for concentration,
market share and operational efficiency into our models.
• Interaction dummy: one if the ratio of equity to total assets is equal or larger than
the median, zero otherwise. The dummy variable interacts with the ratio of equity
to total assets to test whether the impact of bank capitalization on performance
depends on its level.
14

We include also macroeconomic variables as well as financial structure indicators to
control for the effect of external factors on the cost of intermediation and operating
performance of Egyptian banks:
• Inflation (Inf) may affect the cost of intermediation indirectly. Inflation raises
incentives to increase savings and decrease demand for credit and, therefore,
banks’ profits. To generate more demand for credit, banks may lower the cost of
intermediation.
• Bank concentration (Conc): the size of banks’ assets in the three largest banks to
total assets. The higher the concentration ratio, the more monopoly power there is
in the banking system, enabling banks to increase the intermediation cost and
generate more profits.
• Business Cycle (Buscycle): the output gap such that an increase indicates a boom.
During a boom, the demand for credit increases which is likely to increase the
cost of intermediation and generate more profits.
• Financial structure (Fts): banks’ assets relative to assets in the stock market. The
higher this ratio the more dominant banks are in the financial structure, enabling
them to charge a higher cost of intermediation and generate more profits.
• Interest liberalization (Irlib): a dummy variable that marks the change in interest
rate management. As the central bank liberalized the interest rate following a
history of administered rates, the cost of intermediation and, in turn, profitability
are likely to be affected.
< Insert table 2 >
3.3 Econometric modeling
Empirical work on determinants of bank’s profitability can potentially suffer from
two sources of inconsistency: omitted variable and endogeneity biases. With this in mind,
we first describe how these biases affect cross-section and panel data estimators and then
present the Generalized Method of Moments (GMM) estimator, which corrects for both
of these biases and takes into account the dynamics of dividend policy.
15

Pure cross-section regressions give inconsistent estimation results because they suffer
from both the omitted variable and endogeneity bias. Cross-section dividend policy
analyses lead to biased estimates because the firm-specific error term εi is likely to
contain unobserved firm effects, as for example differences in the quality of management,
and is correlated with the lagged dependent variable. Therefore, cross-section regressions
give inconsistent estimates as the assumption that the regressors and the error term are
not correlated is violated.
Combining cross-section and time-series data is useful for three main reasons. First, it
is necessary when analyzing the determinants of the performance of Egyptian banks
because it varies over time, and the time-series dimension of the variables of interest
provides a wealth of information ignored in cross-sectional studies. Secondly, the use of
panel data increases the sample size and the degree of freedom, which is particularly
relevant when a relatively large number of regressors and a small number of firms are
used which is our case here. Thirdly, panel data estimation can improve upon the issues
that cross-section regressions fail to take into consideration, such as potential endogeneity
of the regressors, and controlling for firm-specific effects.
For panels with a limited number of years and a substantial number of observations,
Arellano and Bond (1991) suggest estimating the equation in 3.2 with Generalized
Method of GMM in first-differences. They proceed by first differencing the initial
equation, which removes the time invariant ui and leaves the equation estimable by
instrumental variables.
yit - yit-1 = αi (yit-1 - yit-2) + β (xit - xit-1 ) + (ui - ui ) + ( vit - vit-1 )
Assuming that there is no serial correlation in the disturbance εit, all the lagged levels
of variables can be used as valid instruments in the first-differenced equation. Similarly,
allowing for a possible correlation between xit and vit, only lagged values dated t-2 and
earlier will be used as instruments. This allows the endogeneity of the regressors as it is
likely that shocks affecting dividend choices may also affect other exogenous variables.
However, while first-differencing a new bias is introduced: the new error term
(vit -vit-1) is correlated with the lagged dependent variable (yit-1 - yit-2). Assuming that the
error terms are not autocorrelated and that the xit are weakly exogenous (i.e., uncorrelated
16
with future realizations of the error term), Arellano and Bond (1991) propose the
following set of moment conditions:
E [ yit-s (vit -vit-1) ] = 0 for t =3, …, T and s >= 2
E [ xit-s (vit -vit-1) ] = 0 for t =3, …, T and s >= 2
Under these moment conditions, Arellano and Bond (1991) propose a two-step GMM
estimator. In fact, the one-step estimator is assumed to render vit serially uncorrelated.
However, whenever vit are heteroskedastic, we can obtain a more asymptotically efficient
two-step estimator using vit, the residuals obtained from the preliminary step so as to
construct a consistent estimate of variance-covariance matrix, thus relaxing the
assumptions of independence and homoskedasticity (See White, 1980). In brief, the one-
step estimator assumes homoskedastic errors while the two-step estimator uses the first-
step errors to construct heteroskedasticity-consistent standard errors. Therefore, the one-
step estimators are less efficient than the two-step estimators even in the presence of
homoskedasticity of the error terms. However, the asymptotic standard errors associated
with the two-step estimates may be biased downward when the number of firms is
limited.
Since our T is large enough (T=14), it is more appropriate to use the system GMM
estimator of Arellano and Bower (1995) and Blundell and Bond (1998). The basic idea
behind this estimator is: 1) the unobserved fixed effects µi are removed by taking first
difference in equation, 2) the right hand side variables are instrumented using lagged
values of the regressors, and the equation in first differences and in levels are jointly
estimated and 3) the validity of the instruments is tested using a Hansen test of over-
identifying restrictions and a test of the absence of serial correlation of the residuals.
Although the two-step estimator is asymptotically more efficient in presence of
heteroskedasticity of the error term, Arellano and Bond (1991) and Blundell and Bond
(1998) show that the two step estimates are biased in small samples. As our data contain
a small number of firms, we prefer to display the one-step result both in the level and
system GMM estimations.
17
4. Empirical results:
4.1 The Determinants of the Cost of Intermediation
For each measure of the cost of intermediation, Table 3 summarizes the results of
estimating the three models that employ one of the following: the capital/assets ratio, the
long-term dummy variable for capital regulations, or the four short-term dummy
variables for capital regulations.
The drawback of the static model results is that the right-hand side variables maybe
endogenous and, therefore, affected by the dependent variable. To account for persistence
in the dependent variable and endogeneity of right-hand side variables, we resort to a
dynamic model estimation that uses an instrumental variable approach to proxy for
endogenous variables.
The lagged dependent variable measures the degree of persistence in the cost of
intermediation. The lagged dependent variable is statistically significant across all
models, indicating a high degree of persistence characterizing cost of intermediation and
justifying the use of dynamic models.
The capital variable (capital/assets) has a positive and statistically significant effect,
raising the cost of intermediation. Banks raise the cost of intermediation to make up for a
higher risk to shareholders. This finding is in accordance with those of Berger (1995a),
Demerguc-Kunt and Huizingua (1999), Ben Naceur and Goaied (2003), Kosmidiou and
Pasoiras (2005), indicating that well capitalized Egyptian banks face lower costs of going
bankrupt which facilitate a reduction in the cost of funding. The result is higher
profitability, as further analyzed below. Nonetheless, the long-term dummy variable is
not statistically significant, indicating that capital regulations do not have a sustained
long-term effect on the cost of intermediation. The short-term dummies of capital
regulations, in model 3, present interesting evidence. In the current year, the change of
capital regulations does not impact significantly on the cost of intermediation.
Progressively over time, the cost of intermediation responds positively and significantly
to capital regulations, as evident by the positive and significant coefficients of the dummy
variables at leads two and three. The interactive dummy is not significant, indicating that
18
the impact of bank capitalization on performance does not depend on the level of capital
across banks.
Liquidity has a positive and statistically significant effect on the cost of
intermediation, as evident in models 1 and 2 in Table 3. The ratio of net loans to
customer and short term funding (LOFUND) is statistically significant and positively
related to the profitability of domestic banks, indicating a negative relationship between
bank profitability and the level of liquid assets held by the bank, in consistency with our
expectations and some earlier studies (Molyneux and Thorton, 1992, Guru et al., 1999
and Pasiouras and Kasmidou, 2007). While banks receive lower returns on holding
excess cash or securities, they face a competitive market for deposits (Demerguc-Kunt et
al., 2003).
It is interesting to note the positive effect of liberalizing the interest rate in model 3.
The cost of intermediation increased as a result of a shift from administered to a market
interest rate, although the result is not robust across all specifications. There are micro
and macro factors that may have contributed to this result. At the macro level, the interest
rate may be responding to the priorities set out by the central bank. As the exchange rate
was pegged to the dollar, the central bank managed the interest rate policy with an
objective to defend the pegged exchange rate. As a result, the interest rate was set at a
high rate to guarantee the inflow of foreign capital that is necessary to sustain a peg. At
the micro level, the structure of the banking system (lack of competition) may have
supported high cost of intermediation, absent serious competition from other small non
bank financial institutions and stock market.
Management efficiency has a positive and significant effect on interest margins,
indicating managers shift the cost of improved efficiency by overcharging customers.
None of the coefficients on market power and market share is statistically significant to
explain cost of intermediation. Hence, the results reject all the three hypotheses linked to
market power and suggest that commercial banks in Egypt did not use their monopoly
power in setting their lending and deposit rates
None of the coefficients on bank size or cost efficiency explains the cost of
intermediation significantly. Reserves have a statistically significant negative effect on
the cost of intermediation in all models. Thereby, commercial banks try to reflect the
19

opportunity costs of keeping reserves (financial taxation) that erode their profitability by
widening their interest margins. Financial structure, in models 2 and 3, has a positive and
statistically significant effect on the cost of intermediation. The bigger the share of banks,
relative to the stock market, the higher is the cost of intermediation that banks have. The
dominant role of banks (in light of underdevelopment in the stock market) enables them
to charge a higher lending rate.
Across the three specifications, inflation has a negative and statistically significant
effect on the cost of intermediation contrary to the findings of previous studies (Classens
et al., 1998; Demerguc-Kunt and Huizingua, 1999). This counterintuitive result could be
explained by the fact that higher inflation rate increases uncertainty and reduces demand
for credit. Banks attempt to counter this environment by reducing the cost of
intermediation. Also this negative impact of inflation on interest spread means that
Egyptian banks support the rise of inflation by delaying the increase of their lending rate
rather than widening the spread between lending and deposit rates. The business cycle
measure has a positive and statistically significant effect on the cost of intermediation.
Higher growth during a boom period increases demand for credit, enabling banks to
charge a higher cost of intermediation.
< Insert Table 3 >
The combined evidence suggests that a number of factors have pushed up an increase
in the cost of intermediation in the post-capital regulation period: higher capital to assets
ratio, an increase in management efficiency, and a reduction in inflation. The increase in
cost of intermediation attributed to these factors was countered by a decline in output
growth, which is likely to have moderated the cost of intermediation in the post-capital
regulation period. The results are robust across the two measures of net interest margins,
regardless of the definition of spreads.
4.2 The Determinants of Bank Profitability
To complete the analysis regarding the effects of capital regulations, we study
determinants of banks’ profitability, as measured by the returns on assets and equity.
Table 4 summarizes the results of the model explaining return on equity using dynamic
20
estimation. The GMM-in-System specifications seem to fit the panel data reasonably well
since the Hansen test shows no evidence of over-identifying restrictions and the second-
order autocorrelation was absent. Persistence is evident by the positive and significant
response of return on equity and assets to their lag, justifying the use of dynamic panel
data modeling. Besides, this persistence of profit means the forces of competition are not
sufficiently strong to cause all abnormal profits to dissipate within a one-year time span.
In the present study the estimates on lagged profitability ratios range between 0.425 to
0.579 and this finding is slightly higher compared to the estimate reported by Gibson
(2005) and Athansouglou et al. (2005) for Greek banks but contrast with the finding by
Goddard et al. (2004) indicating lack of profit persistence in European banks. These
results indicate that competition in the Egyptian banking sector lags behind Western
European countries.
The capital adequacy variable (capital/assets) has a positive and significant effect on
returns on assets. This finding is consistent with previous studies (e.g., Berger, 1995,
Demirguc-Kunt and Huizinga, 1999, Goddard et al., 2004, Kosmidou et al., 2005)
providing support to the argument that well capitalized banks face lower costs of going
bankrupt and reduce the cost of funding, resulting in higher profitability. Further, as
Berger (1995b) points out, high capital ratio lowers the cost of insured debt. However,
high capital ratio does not increase returns on equity (ROE),‡ implying unexpected losses
have been exactly offset by an increase in the operating profit through an interest margin
increase. Moreover, the effect of capital regulation on banks’ profitability is not sustained
over time. The coefficient on the long-term dummy is not statistically significant in the
estimation of either return on equity or return on assets. In contrast to the evidence for the
cost of intermediation, returns on equity and assets increase in the current period that
marks the change in capital regulation, which is sustained two years after the
implementation of capital regulation in Egypt. The interactive dummy variable is not
significant, indicating that the relationship between capital and profitability does not vary
with the level of capital across banks.
‡ Return on assets is a better measure of banks’ profitability as it represents the rate of return on portfolio investment and it is not affected by exceptional events.
21
Banks’ liquidity does not determine returns on assets or equity significantly. In
contrast, management efficiency is evident to have a positive and significant effect on
bank’s profits, implying shareholders benefit directly from improvement in management
efficiency. Bank size does not generate higher returns on assets. Cost efficiency
(overhead/total assets) does not impact significantly on banks’ profitability. Inflation and
bank concentration are not statistically significant to determine returns on equity and
capital. Further, the positive and significant effect of the increase in reserves on bank’s
profitability is not robust across models.
Interest rate liberalization does not have a statistically significant effect on returns
on capital or equity. Consistent with our intuition, higher implicit cost (non-interest cost
relative to non-interest return) has a negative and statistically significant effect on return
on assets and equity. Implicit cost is not supported by banks’ customers, instead
shareholders’ profits absorb the additional cost of intermediation. Finally, the business
cycle measure has a positive and statistically significant effect on returns on equity and
assets. During a boom, banks are able to generate higher return and increase profitability,
as evident by the positive and statistically significant coefficients. Downward cycles
generate concerns about the ability of banks to maintain profitability. Statistical
significance does not support a significant change in returns on equity and assets in post-
regulations period.
< Insert Table 4 >
To sum, a number of factors contributed positively to banks’ profitability in the post-
regulation period: higher capital requirements and the reduction in implicit cost. Counter
effects on banks’ profitability are attributed to reduction in economic activity, which is
likely to have decreased banks’ profitability in the post-regulation period. There is also
some evidence, although not robust across models, indicating that the reduction in
reserves may have decreased returns on equity significantly in the post-regulation period.
Banks are less motivated to generate earnings in response to a reduction in reserves. All
estimated equations show that the impact of bank size on return is absent. This result
confirms those of Athansouglou et al. (2005), suggesting that small-size banks usually try
to grow faster, even at the expense of their profitability.
22

5. Summary and Conclusions
The aim of this investigation has been to investigate the effects of capital regulations
on the performance and stability of banks in Egypt. Two measures of performance are
under investigation: cost of intermediation and banks’ profitability, as measured by return
on assets or equity. Higher cost of intermediation would decrease banks’ profitability and
prove to be detrimental to financial stability.
We investigate the effect of capital regulations in three dimensions. First, we test the
effect of the ratio of capital to total assets on the cost of intermediation and profitability.
Second, we introduce a dummy variable that captures the structural break marking the
introduction of capital regulation to test the sustained long-term effects. Third, we
introduce four short-term dummies to test the progressive effects of capital regulations in
the current and three subsequent periods.
The results provide a clear illustration of the effects of capital regulations on the cost
of intermediation and banks’ profits. As the capital adequacy ratio internalizes the risk for
shareholders, banks increase the cost of intermediation, which supports higher return on
assets and equity. These effects appear to increase progressively over time, starting in the
period in which capital regulations are introduced and continuing two years after the
implementation. Nonetheless, the evidence does not support the hypothesis of a sustained
effect of capital regulations over time, or variation in the effects with the size of capital
across banks.
In addition to the above effects, the empirical estimation unveils interesting features
about the effects of banking-specific and macro variables on the performance of banks in
Egypt. Management efficiency, market concentration, and the underdevelopment of the
stock market relative to the dominant size of banks resulted in an increase in the cost of
intermediation. The results are robust, regardless of the definition of spreads defining net
interest margins.
Among the macro variables, inflation proved to be an important factor that depresses
the cost of intermediation in an effort to stimulate demand for credit. A pickup in output
growth appears to be the most important factor that increases demand for credit, enabling
banks to charge a higher cost of intermediation.
23
The combined evidence suggests that a number of factors have pushed up an increase
in the cost of intermediation in the post-capital regulations period: higher capital-to-
assets ratio, an increase in management efficiency, and a reduction in inflation. The
increase in the cost of intermediation attributed to these factors was countered by the
reduction in output growth and an increase of liquidity, which are likely to have
moderated the cost of intermediation in the post-capital regulation period.
A number of factors contributed positively to banks’ profitability in the post-
regulation period: higher capital requirements, the reduction in implicit cost, and the
increase in management efficiency. Countering effects on banks’ profitability were
attributed to the reduction in economic activity and, to a lesser extent, to the reduction in
reserves. An improvement of cost efficiency is not reflected in a reduction in the cost
intermediation or an improvement in profit. The effect of better efficiency is likely to
have been absorbed in banks’ fees and commissions.
Overall, the results point to the importance of capital regulation to the performance of
banks and financial stability in Egypt. Moreover, the state of the economy is a major
factor that determines the performance of the banking industry. Financial stability could
be at risk as a result of shocks impinging on the economic system, absent proper policy
adjustments to mitigate the effects of these shocks. Banks set the cost of intermediation in
an attempt to influence profitability and maintain stability, given excess liquidity and
binding constraints governing demand for credit.
For policy implications, the results indicate the importance of reviving demand for
credit using macroeconomic policies. Provided robust demand for credit exists, structural
reforms should aim at establishing more competition in the banking industry to ensure
that performance indicators are commensurate with the optimal practices of the
intermediation function that guarantees financial stability over time. The results raise a
cautionary flag: government policies that rely excessively on direct government
supervision and regulation of bank activities should in parallel foster incentives for
private agents to promote bank development, performance, and stability.
24
References Aggarwal, R. and K. T. Jacques, 1998, “Assessing the impact of prompt corrective action on bank capital and risk,” Federal Reserve Bank of New York Policy Review, Vol. 4(3), pp. 23-31.
Allen, L., 1988, “The determinants of bank interest margins: A note,” Journal of Financial and Quantitative Analysis, Vol. 23, pp. 231:235.
Angbazo, L., 1997, “Commercial bank interest margins, default risk, interest-rate risk, and off-balance sheet banking,” Journal of Banking and Finance, Vol. 21, 55:87.
Arellano M., and S. Bond, 1991, “Some tests of specification for panel data: Monte Carlo evidence and an application to employment equations,” Review of Economic Studies Vol 58, pp. 277:297.
Arellano, M., and S. Bover, 1995, “Another look at the instrumental variable estimation of error-components models," Journal of Econometrics, Vol. 68, 29:51.
Athanasoglou, P.P, S.N. Brissimis, and M.D. Delis, 2005, “Bank specific, industry specific and macroeconomic determinants of bank profitability,” Bank of Greece Working Paper, No. 25 (Athens: Bank of Greece).
Bank Scope (2006).
Barth, J. R., Caprio G., and R. Levine 2004, “Bank regulation and supervision: what works best?” Journal of Financial Intermediation, 13, 205-248. Ben Naceur S. and M. Goaied, “The determinants of the Tunisian banking industry profitability: panel evidence”, Paper presented at the Proceedings of the Economic Research Forum (ERF) 10th Annual Conference Marrakesh–Morocco, December 16–18, 2003 (2003).
Ben-Khedhiri H., B. Casu, and F. Sheik-Rahim. 2005. “Profitability and interest rates differentials in Tunisian banking,” University of Wales Working Papers. Berger, A. N. 1995a, “The Relationship between Capital and Earnings on Banking” Journal of Money, Credit & Banking, 27 (2), pp.432-56.
Berger, A. N. and di Patti E. 2006, “Capital structure and firm performance: a new approach to testing agency theory and an application to the banking industry,” Journal of Banking and Finance, 30 (4), 1065-1102.
Berger, A. N. and Gregory Udell 1994, “Did Risk-Based Capital Allocate Bank Credit and Cause a “Credit Crunch” in the United States?” Journal of Money, Credit, and Banking, 26, pp. 585-628.
25
Berger, A. N. and Humphrey, David B., 1997, "Efficiency of Financial Institutions: International Survey and Directions for Future Research". Available at SSRN: http://ssrn.com/abstract=2140
Besanko D., and G. Kanatas 1996, “The regulation of bank capital: do capital standards promote bank safety?, Journal of Financial Intermediation, 5, 160-183.
Blum, J. 1999, “Do capital adequacy requirements reduce risk in banking? Journal of Banking and Finance, 23, 755-771.
Blundell, R. and S. Bond 1998, “Initial conditions and Moment Restrictions in Dynamic Panel Data Models,” Journal of Econometrics, Vol 87, pp. 115:144.
Brinkmann, Emile and Paul Horvitz 1995, “Risk-based capital standards and the credit crunch,” Journal of Money and Banking, 27, 848-863
Calem, P. and R. Rob 1999, “The impact of capital-based regulation on bank risk-taking,” Journal of Financial Intermediation 8, 317-352.
Casu B., and C. Girardone 2004, “Financial conglomeration: efficiency, productivity and strategic drive, Applied Financial Economics, 14, 687-696.
Chiuri, Maria Concetta, Giovanni Feeri, and Giovanni Majnoni 2002, “The macroeconomic impact of bank capital requirements in emerging economies: past evidence to assess the future, Journal of Banking and Finance, 26, 881-904. Claessens S., A. Demirguc-Kunt and H. Huizinga 2001, How does foreign entry affect domestic banking markets?, J. Bank. Finance 25, pp. 891–911
Demirgüç-Kunt A., L. Laeven, and R. Levine, 2003, “The impact of bank regulations, concentration, and Institutions on bank margins,” World Bank Development Research Group.
Demirguç-Kunt, A., and H. Huizinga., 1999, “Determinants of commercial bank interest margins and profitability: Some international evidence,” World Bank Economic Review, Vol. 13, pp. 379:408.
Dietrich, J K and C James 1983, “Regulation and the Determination of Bank Capital Changes,” Journal of Finance, 38, pp. 1651-1658.
Doliente, J.S., 2003, “Determinants of bank net interest margins of Southeast Asia,” University of Philippines Working Papers.
El-Shazly, Alaa, 2006, “Incentive-Based Regulations and Bank Restructuring in Egypt,” Working Paper, Cairo University.
26

Fare, R., Grosskopf, S. and W. L. Weber 2004, “The effect of risk-based capital requirements on profit efficiency in banking, Applied Economics, 36, 1731-1743.
Fgurlong, Frederick 1992, “Capital regulation and bank lending,” Federal Reserve Bank of San Francisco Economic Review, 23-33. Goddard J., Ph. Molyneux and J.O.S. Wilson, The profitability of European banks: a cross-sectional and dynamic panel analysis, Manchester School 72 (2004) (3), pp. 363–381.
Goddard, J., P. Molyneux, and J.0. Wilson, 2004, “The profitability of European banks: A cross-sectional and dynamic panel analysis,” The Manchester School, Vol. 72, pp. 363:81. Guru B.K., J. Staunton and B. Balashanmugam, Determinants of commercial bank profitability in Malaysia, Paper presented at the Proceedings of the 12th Annual Australian Finance and Banking Conference Sydney, Australia, December 16–17, 1999 (1999).
Hancock, D. and J. A. Wilcox 1994, “Bank capital and the credit crunch: the roles of risk-weighted and unweighted capital regulation,” Journal of the American Real Estate and Urban Economics Association, 22, pp. 59-94.
Hansen, L. P., 1982, "Large sample properties of generalized method of moments estimators," Econometrica, Vol. 50, pp. 1029:54.
Haubrich, Joseph, and Paul Wachtel, 1993 “Capital requirements and shifts in commercial bank portfolios,” Federal Reserve Bank of Cleveland Economic Review, Vol. 29, Quarter 1, 1-15.
Hausman, J. A., 1978, “Specification Tests in Econometrics,” Econometrica, Vol. 46, pp. 1251:71.
Ho, T., and A. Saunders, 1981, “The determinants of banks interest margins: Theory and empirical evidence,” Journal of Financial and Quantitative Analysis, Vol. 16, pp. 581:600.
Hsiao C. 1986, Analysis of Panel Data, Cambridge, United Kingdom: Cambridge University Press.
IMF FSAP report 2002.
Jackson, Patricia, et. al., 1999 “Capital requirements and bank behavior: the impact of the Basle Accord,” Basle Committee on Banking Supervision, Working Papers, No. 1, April , Bank for International Settlements, Basle Switzerland.
27
Jacques, K. and P. Nigro 1997, “Risk-based capital, portfolio risk and bank capital a simultaneous equations approach,” Journal of Economics and Business, Vol 49 (6), pp. 533-47.
Kahane, Yehuda, 1977, “Capital adequacy and the regulation of financial intermediaries,” Journal of Banking and Finance, 1, 207-218.
Keeley, M. C. 1990 “Deposit insurance, risk, and market power in banking,” American Economic Review, 80 (5) , 1183-1200.
Kim, Daesik, and Anthony Santomero, 1988, “Risk in banking and capital regulation,” Journal of Finance, 43, 1219-1233.
Koehn, Michael, Anthony Santomero, 1980, “Regulation of bank capital and portfolio risk, Journal of Finance, 35, 1235-1244. Kosmidou K., S. Tanna and F. Pasiouras, Determinants of profitability of UK domestic banks: panel evidence from the period 1995–2002, Proceedings of the 37th Annual Conference of the Money Macro and Finance (MMF) Research Group Rethymno, Greece, September 1–3, 2005 (2005)
Kwan, S., and R. A. Eisenbeis 1997, “Bank risk, capitalization, and operating efficiency,” Journal of Financial Services Research, 12 (2/3), 117-131.
Lin S.L, J.H. Penm, S.C Garg and C.S Chang, 2005, “Risk based capital adequacy in assessing on insolvency-risk and financial performances in Taiwan’s banking industry,” Research in International Business and Finance, Vol. 19, pp. 111:53.
Mingo, John 1975, “Regulatory influence on bank capital investment,” Journal of Finance, 30, 1111-1121.
Murinde, Victor and Hadeel Yaseen, 2006, “The Impact of Basle Accord Regulations on Bank Capital and Risk Behavior: 3D Evidence from the MENA Region,” Working Paper, University of Birmingham.
Nickell S., 1981, “Biases in Dynamic Models with Fixed Effects”, Econometrica, Vol. 49, pp. 1417:29. Pasiouras and Kasmidou, 2007 Factors influencing the profitability of domestic and foreign commercial banks in the European Union, Research in International Busienss and Finance, Vol.21 (2), pp 222-237.
Peltzman, Sam 1970 “Capital Regulation in Commercial Banking and Its Relation to Portfolio Regulation,” Journal of Political Economy, 78, 1-26.
Rime, Bertrand 1998, “Capital Requirements and Bank Behavior: Empirical Evidence for Switzerland,” Swiss National Bank.
28

Sailesh, Tanna, Kyriaki Kosmidou, and Fotios Pasiouras, 2005. "Determinants of profitability of domestic UK commercial banks: panel evidence from the period 1995-2002," Money Macro and Finance (MMF) Research Group Conference 2005, Vol. 45, Money Macro and Finance Research Group.
Santos, J. A. C., 2001, “Bank capital regulation in contemporary banking theory: a review of literature, financial markets, institutions and instruments, 10 (2), pp. 4184.
Sargan, J. D., 1958, “The Estimation of Economic Relationship Using Instrumental Variables”, Econometrica, Vol. 26, pp. 393:415.
Shrieves, R. E. and D. Dahl, 1992 “The Impact of Regulation on Bank Equity Infusions,” Journal of Banking and Finance, Vol. 16 (2), pp. 439-57.
VanHoose, David, 2007, “Theories of Bank Bahavior under Capital Regulation,” Journal of Banking and Finance, pp. 1-18. Vennet, V. R, "Cost and Profit Dynamics in Financial Conglomerates and Universal Banks in Europe" (December 1998). Available at SSRN: http://ssrn.com/abstract=160493.
Wagster, John 1999, “The Basel Accord of 1988 and the International Credit Crunch of 1989-1992,” Journal of Financial Services Research 15, 123-143.
Wall, L. D. and D. R. Peterson 1987, “The Effect of Capital Adequacy Guidelines on Large Bank Holding Companies,” Journal of Banking and Finance, 11, pp. 581-600.
Wall, L. D. and D. R. Peterson 1995, “Bank Holding Company Capital Targets in the Early 1990s: The Regulators versus the Markets,” Journal of Banking and Finance, 19, pp. 563-600.
White, H., 1980, "A Heteroskedasticity-Consistent Covariance Matrix Estimator and a Direct Test for Heteroskedasticity," Econometrica, Vol. 48, pp. 817:38
29

Table 2 – Summary statistics
Mean Std. Dev. Mean before reform
Mean after Reform
Difference in mean
Nim1 0.019 0.016 0.015 0.022 0.006*** (4.15)
Nim2 0.018 0.015 0.014 0.021 0.006*** (4.02)
ROA 0.012 0.012 0.011 0.012 0.001 (0.99)
ROE 0.129 0.127 0.141 0.119 -0.021* (-1.62)
Capratio 0.092 0.051 0.083 0.100 0.016*** (3.14)
Liq 0.451 0.133 0.405 0.487 0.081*** (6.24)
Implicit -.0039 .0006 -.0059 -.0026 0.003** (2.62)
Maneff 0.929 0.059 -0.005 -0.002 0.003** (2.62)
Bsize 7.98 1.468 7.648 8.253 0.605*** (4.12)
Costeff 0.018 0.009 0.018 0.018 0.000 (0.06)
Reserves 0.044 0.054 0.052 0.041 -0.012* (-1.81)
Mpower 0.041 0.071 0.046 0.036 -0.009 (-1.37)
Buscycle -0.005 0.269 0.012 -0.010 -0.022*** (-8.94)
Conc 0.615 0.035 0.637 0.599 -0.038*** (12.58)
Fts 0.027 0.015 0.038 0.018 -0.020*** (-16.55)
Inf 0.08 0.058 0.134 0.037 -0.096*** (-28.98)
30

Table 2 - Variables description
Variables
Description
Dependent
NIM1 The ratio of net interest revenue over average interest-bearing assets
NIM2 The ratio of net interest income over average total assets
ROA The ratio of net income to assets
ROE The profits to equity ratio
Independent
Banks characteristics
Capratio This is a measure of capital adequacy, calculated as equity to total assets. High capital-asset ratios are assumed to be indicators of low leverage and therefore lower risk
Dumcap One if the ratio of equity to total assets is equal or larger than the median, zero otherwise. The dummy variable interacts with the ratio of equity to total assets to test whether the impact of bank capitalization on performance depends on its level.
Caplong CAPD is a dummy variable that takes 1 in the current year and subsequent years following the implementation of capital requirement and 0 before.
Maneff The ratio of earning assets to total assets. The higher the ratio the higher management efficiency is.
Reserves Banks’ reserves at the central bank.
Costeff The cost of overhead to total assets. Higher ratios imply a less efficient management. The higher the cost the less profitable banks are.
Liq This is a measure of liquidity calculated as loans to customers and short term funding. Higher figures denote lower liquidity
Bsize The book value of the bank's total assets. This may serve as a proxy for the degree of monopoly.
Markpower This is a measure of market power, calculated as market share in terms of total assets.
Implicit Non-interest expenses relative to non-interest revenues. Higher implicit cost is likely to reduce profit and induce an increase in the cost of intermediation.
Macroeconomic and financial structure
Inf The annual inflation rate.
Fts Banks’ assets relative to assets in the stock market. The higher this ratio the more dominant
31

Variables
Description
banks are in the financial structure.
Conc The size of banks’ assets in the three largest banks to total assets. The higher the concentration ratio, the more monopoly power there is in the banking system.
Buscycle The output gap such that an increase indicates a boom.
Irlib A dummy variable that marks the change in interest rate management. It takes 1 after the liberalization date and 0 otherwise.
32
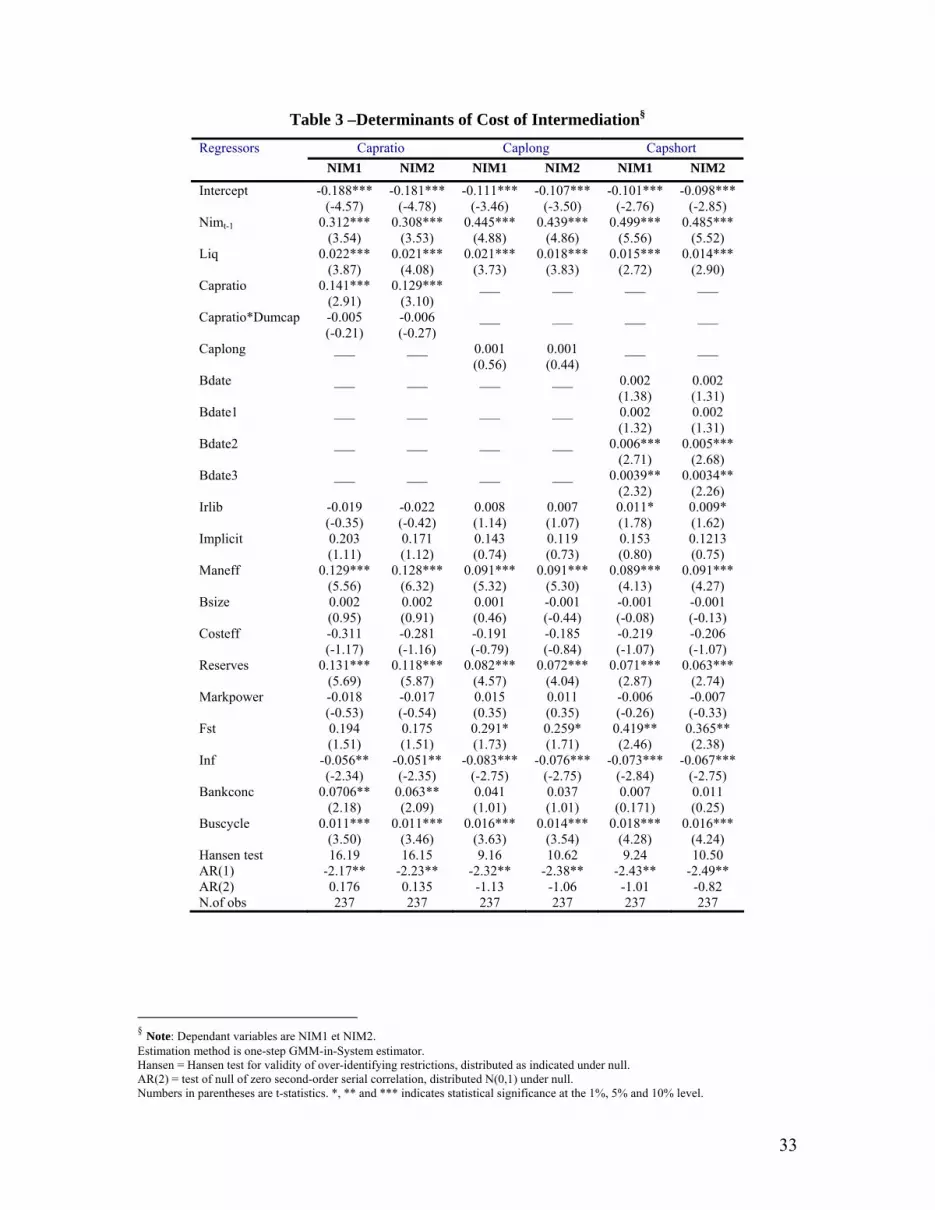
Table 3 –Determinants of Cost of Intermediation§
Capratio Caplong Capshort Regressors NIM1 NIM2 NIM1 NIM2 NIM1 NIM2
Intercept Nimt-1 Liq Capratio Capratio*Dumcap Caplong Bdate Bdate1 Bdate2 Bdate3 Irlib Implicit Maneff Bsize Costeff Reserves Markpower Fst Inf Bankconc Buscycle Hansen test AR(1) AR(2) N.of obs
-0.188*** (-4.57)
0.312*** (3.54)
0.022*** (3.87)
0.141*** (2.91) -0.005 (-0.21)
___
___
___
___
___
-0.019 (-0.35) 0.203 (1.11)
0.129*** (5.56) 0.002 (0.95) -0.311 (-1.17)
0.131*** (5.69) -0.018 (-0.53) 0.194 (1.51)
-0.056** (-2.34)
0.0706** (2.18)
0.011*** (3.50) 16.19
-2.17** 0.176 237
-0.181*** (-4.78)
0.308*** (3.53)
0.021*** (4.08)
0.129*** (3.10) -0.006 (-0.27)
___
___
___
___
___
-0.022 (-0.42) 0.171 (1.12)
0.128*** (6.32) 0.002 (0.91) -0.281 (-1.16)
0.118*** (5.87) -0.017 (-0.54) 0.175 (1.51)
-0.051** (-2.35)
0.063** (2.09)
0.011*** (3.46) 16.15
-2.23** 0.135 237
-0.111*** (-3.46)
0.445*** (4.88)
0.021*** (3.73) ___
___
0.001 (0.56) ___
___
___
___
0.008 (1.14) 0.143 (0.74)
0.091*** (5.32) 0.001 (0.46) -0.191 (-0.79)
0.082*** (4.57) 0.015 (0.35) 0.291* (1.73)
-0.083*** (-2.75) 0.041 (1.01)
0.016*** (3.63) 9.16
-2.32** -1.13 237
-0.107*** (-3.50)
0.439*** (4.86)
0.018*** (3.83) ___
___
0.001 (0.44) ___
___
___
___
0.007 (1.07) 0.119 (0.73)
0.091*** (5.30) -0.001 (-0.44) -0.185 (-0.84)
0.072*** (4.04) 0.011 (0.35) 0.259* (1.71)
-0.076*** (-2.75) 0.037 (1.01)
0.014*** (3.54) 10.62
-2.38** -1.06 237
-0.101*** (-2.76)
0.499*** (5.56)
0.015*** (2.72) ___
___
___
0.002 (1.38) 0.002 (1.32)
0.006*** (2.71)
0.0039** (2.32) 0.011* (1.78) 0.153 (0.80)
0.089*** (4.13) -0.001 (-0.08) -0.219 (-1.07)
0.071*** (2.87) -0.006 (-0.26)
0.419** (2.46)
-0.073*** (-2.84) 0.007
(0.171) 0.018***
(4.28) 9.24
-2.43** -1.01 237
-0.098*** (-2.85)
0.485*** (5.52)
0.014*** (2.90) ___
___
___
0.002 (1.31) 0.002 (1.31)
0.005*** (2.68)
0.0034** (2.26) 0.009* (1.62) 0.1213 (0.75)
0.091*** (4.27) -0.001 (-0.13) -0.206 (-1.07)
0.063*** (2.74) -0.007 (-0.33)
0.365** (2.38)
-0.067*** (-2.75) 0.011 (0.25)
0.016*** (4.24) 10.50
-2.49** -0.82 237
§ Note: Dependant variables are NIM1 et NIM2. Estimation method is one-step GMM-in-System estimator. Hansen = Hansen test for validity of over-identifying restrictions, distributed as indicated under null. AR(2) = test of null of zero second-order serial correlation, distributed N(0,1) under null. Numbers in parentheses are t-statistics. *, ** and *** indicates statistical significance at the 1%, 5% and 10% level.
33

Table 4 –Determinants of Bank Performance**
Capratio Caplong Capshort Regressors ROA ROE ROA ROE ROA ROE
Intercept ROA&Et-1 Liq Capratio Capratio*Dumcap Caplong Bdate Bdate1 Bdate2 Bdate3 Irlib Implicit Maneff Bsize Costeff Reserves Markpower Fst Inf Bankconc Buscycle Hansen test AR(1) AR(2) N.of obs
-0.1463*** (-3.88)
0.479*** (6.15) 0.001 (1.08)
0.122** (2.27) -0.004 (-0.16)
___
___
___
___
___
-0.004 (-0.79)
-0.303*** (-3.50)
0.097*** (3.11)
0.003** (2.04) -0.005
(-0.005) 0.076** (2.30) 0.001 (0.02) 0.056 (0.76)
-0.056** (-2.34) 0.033 (1.40)
0.008*** (4.02) 11.88
-2.77*** 0.79 237
-0.877*** (-3.07)
0.456*** (3.79) 0.043 (0.82) 0.522 (0.70) -0.068 (-0.22)
___
___
___
___
___
-0.083 (-1.60)
-0.2.63*** (-3.66)
0.681*** (2.89) 0.022 (1.40) 0.428 (0.31) 0.491* (1.81) 0.074 (0.18) 0.333 (0.44) -0.074 (-0.39) 0.178 (0.75)
0.101*** (3.00) 10.41 -1.73* -0.88 237
-0.053* (-1.64.)
0.567*** (7.52) 0.004 (0.02) ___
___
0.000 (0.02) ___
___
___
___
-0.004 (-0.79)
-0.357*** (-4.26)
0.053** (1.93) -0.001 (-0.62) -0.115 (-0.71) 0.034 (1.28) -0.015 (-0.51) -0.026 (-0.27) -0.019 (-1.03) 0.025 (0.93)
0.008*** (2.90) 15.49
-2.61*** 0.63 237
-0.512* (-1.79)
0.441*** (4.00) 0.047 (0.78) ___
___
-0.026 (-0.79)
___
___
___
___
-0.123*** (-2.59)
-3.011*** (-4.41)
0.534** (2.46) 0.005 (0.27) 0.815 (0.57) 0.359 (1.49) -0.179 (-0.73) -0.738 (0.404) -0.251 (-1.18) 0.274 (1.14)
0.084** (2.04) 13.37 -1.70* -0.67 237
-0.054* (-1.90)
0.579*** (8.45) -0.001 (-0.05)
___
___
___
0.004** (2.06) 0.002 (1.42)
0.006*** (3.02) 0.002 (0.75) 0.004 (0.82)
-0.313*** (-4.43)
0.048** (2.40) 0.001 (0.73) 0.139 (1.00) 0.022 (1.03) -0.017 (-0.85) 0.153 (1.55) -0.006 (-0.40) -0.008 (-0.29)
0.009*** (3.57) 5.82
-2.66*** 0.47 237
-0.601* (-1.80)
0.425*** (4.00) 0.005 (0.10) ___
___
___
0.059** (2.12) 0.035 (1.33)
0.077** (2.64) 0.034 (1.11) -0.009 (0.15)
-2.657*** (-4.62)
0.518** (2.42) 0.028 (1.34) 0.837 (0.61) 0.271 (1.07)
-0.394* (-1.82) 2.063* (1.77) 0.121 (0.70) -0.107 (-0.31)
0.106*** (2.57) 12.93
-1.65** -1.12 237
** Note: Dependant variables are ROA et ROE. Estimation method is one-step GMM-in-System estimator. Hansen = Hansen test for validity of over-identifying restrictions, distributed as indicated under null. AR(2) = test of null of zero second-order serial correlation, distributed N(0,1) under null. Numbers in parentheses are t-statistics. *, ** and *** indicates statistical significance at the 1%, 5% and 10% level.
34