Embed Size (px)
Citation preview
Edith Cowan University Edith Cowan University
Research Online Research Online
Theses: Doctorates and Masters Theses
1-1-2001
Financial intermediation and economic performance in Zimbabwe Financial intermediation and economic performance in Zimbabwe
Gift Chirozva Edith Cowan University
Follow this and additional works at: https://ro.ecu.edu.au/theses
Part of the Finance and Financial Management Commons
Recommended Citation Recommended Citation Chirozva, G. (2001). Financial intermediation and economic performance in Zimbabwe. https://ro.ecu.edu.au/theses/1081
This Thesis is posted at Research Online. https://ro.ecu.edu.au/theses/1081

Edith Cowan University
Copyright Warning
You may print or download ONE copy of this document for the purpose
of your own research or study.
The University does not authorize you to copy, communicate or
otherwise make available electronically to any other person any
copyright material contained on this site.
You are reminded of the following:
Copyright owners are entitled to take legal action against persons who infringe their copyright.
A reproduction of material that is protected by copyright may be a
copyright infringement. Where the reproduction of such material is
done without attribution of authorship, with false attribution of
authorship or the authorship is treated in a derogatory manner,
this may be a breach of the author’s moral rights contained in Part
IX of the Copyright Act 1968 (Cth).
Courts have the power to impose a wide range of civil and criminal
sanctions for infringement of copyright, infringement of moral
rights and other offences under the Copyright Act 1968 (Cth).
Higher penalties may apply, and higher damages may be awarded,
for offences and infringements involving the conversion of material
into digital or electronic form.
FINANCIAL INTERMEDIATION AND
ECONOMIC PERFORMANCE IN Zlr~BABWE
" ,·.·.
" "
By
Gift CHIROZVA Mbus (Finance) ECowan
A Thesis Submitted in Partial Fulfillment of the Requirements for the
Award of Master of Business - Finance
At the Faculty of Business anci Public Management,
Edith Cowan University, Perth, WA, Australia
Date of submission: December 2001
2

USE OF THESIS
The Use of Thesis statement is not included in this version of the thesis.
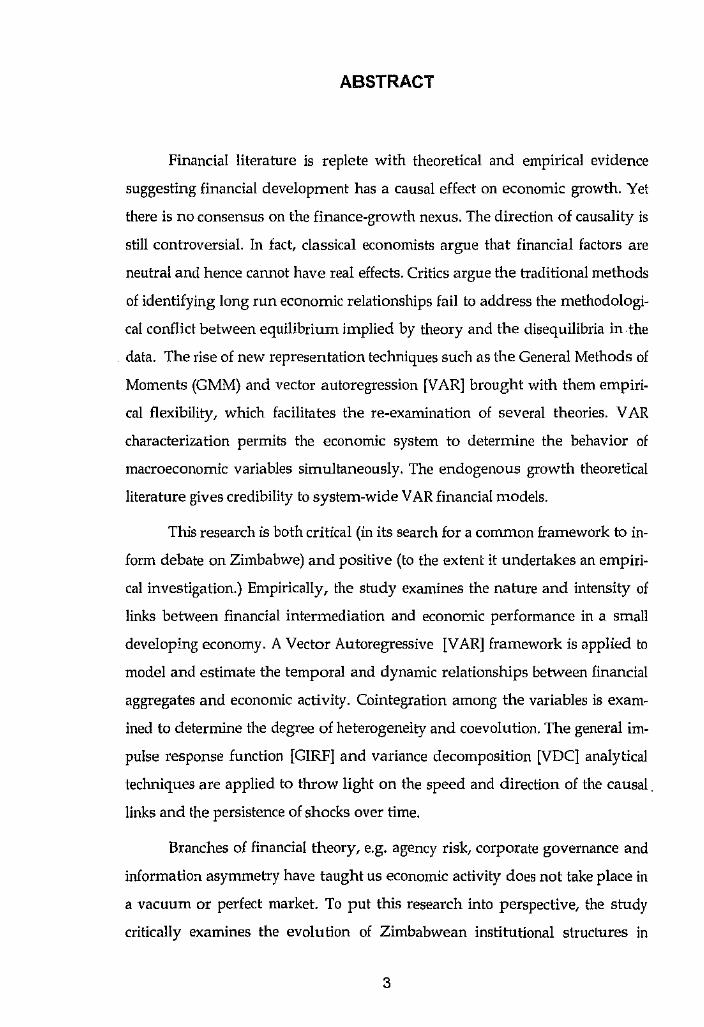
ABSTRACT
Financial literature is replete with theoretical and empirical evidence
suggesting financial development has a causal effect on economic growth. Yet
there is no consensus on the finance-growth nexus. The direction of causality is
still controversial. In fact, classical economists argue that financial factors are
neutral and hence cannot have real effects. Critics argue the traditional methods
of identifying long run economic relationships fail to address the methodologi
cal conflict between equilibrium implied by theory and the diseq uilibria in. the
data. The rise of new representation techniques such as the General Methods of
Moments (GMM) and vector autoregression [VAR] brought with them empiri
cal flexibility, which facilitates the re-examination of several theories. VAR
characterization permits the economic system to determine the behavior of
macroeconomic variables simultaneously. The endogenous growth theoretical
literature gives credibility to system-wide VAR financial models.
This research is both critical (in its search for a common framework to in
form debate on Zimbabwe) and positive (to the extent it undertakes an empiri
cal investigation.) Empirically, the study examines the nature and intensity of
links between financial intermediation and econo:r.:i.ic performance in a small
developing economy. A Vector Autoregressive IVAR] framework is applit:d to
model and estimate the temporal and dynamic relationships between financial
aggregates and economic activity. Cointegration among the variables is exam
ined to determine the degree of heterogeneity and coevolution. The general im
pulse response function [GIRFJ and variance decomposition [VDC] analytical
techniques are applied to throw light on the speed and direction of the causal.
links and the persistence of shocks over time.
Branches of financial theory, e.g. agency risk, corporate governance and
information asymmetry have taught us economic activity does not take place in
a vacuum or perfect market. To put this research into perspective, the shldy
critically examines the evolution of Zimbabwean instihltional structures in
3
search of a new conceptual framework with potential to inform debate. The
works of Levine (1997, 1998) LaPorta, Lopez-de-Silanes, Shleifer and Vishny
(1997,1998, 2000), Beck, Levine and Loayza (2000), Kane (198i, 1983, 2000) Jen
sen and Meckling (1976) and Stiglitz (1989) give consideraJe prominence to I .,
governance and institutional design. Allen and Gale (1994, :°f'lO) emphasized
that institutional settings underlie the process of financial irtii.ovation. In fact, " Schumpeter (1954, p12) exalts history, statistics and "theory" as the three pillars
of economic analysis. Stiglitz (1989, p199) agrees that partic111Iar localized his
torical events could have permanent effects. More recently,' Beck, Demirgi.i.(;
Kunt and Levine (2001) summarized the theory and provided an empirical ex
ami.nation of the links between laws, politics and finance.
4

DECLARATION
I certify that this thesis does not, to the best of my knowledge and belief:
(i) incorporate without acknowledgment any material previously submitted
for a degree or diploma in any institution of higher education;
(ii) contain any material previously published or written by another person
except where due reference is made in the text; or
(iii) contain any defamatory material.
Signature
Date 24 December 2001
5
ACKNOWLEDGMENTS
.I
I 1:
I thank my supervisor, Professor Dave Allen, for inspiration, extraordinary "
understanding, great encouragement, and expert guidance i~·· bringing this re-
search to fruition. My fortunate association with him has hE!fped rekindle my
smouldering interest in financial economics as well as nurture an appetite for
research. When I arrived in Australia my experience in researbh and economet
rics were next to nil. Though not yet self evident, I believe my reluctant tryst and
often-painful collusion with econometrics was a potent rite. It is impossible to
express sufficient gratitude to AusAID whose financial support enabled me to
undertake my studies in Australia. Their generosity is greatly appreciated.
I am especially grateful to my wonderful wife, Millicent, and my remarkably
studious two-year-old daughter, Vanessa, for their genuine support and appre
ciated company. I am deeply indebted to my mother, Maude, to an extent I can
hardly express in words. Her financial and moral support through many years
and difficult times is sincerely appreciated. My friends' advice, correspondence
and interesting discussions also provided valuable moral support. In addition
library staff at various institutions have helped in one way or another towords
the fulfilment of this work. Naturally, the views expressed in this study, conclu
sions arrived at herein, and any remaining errors are entirely my responsibility.
Nevertheless Schumpeter wisely notes "books, like children, become independ
ent beings when once they leave the parents' home." I give the greatest credit
to the Lord for His great mercy, love and wisdom. I praise Him for the natural
gifts of creation and the uniqueness of being. For, "Everyone has a view of the
world that is unique," Johnson, Jr., Johnson and Buse (1987, p395) dare cha~
lenge their readers.
6
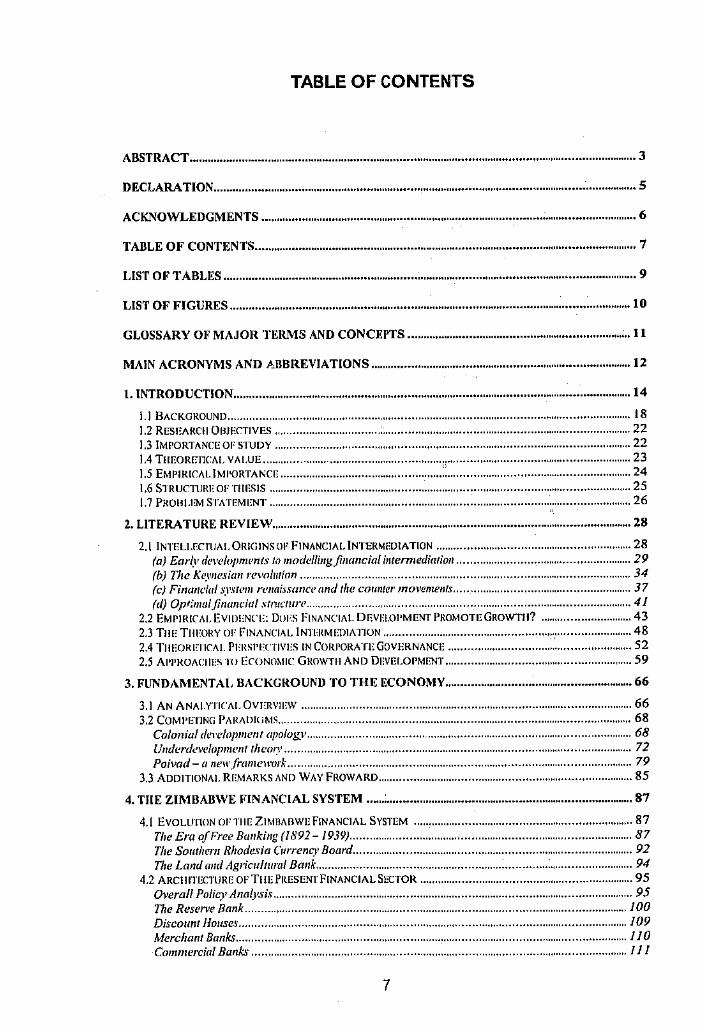
TABLE OF CONTENTS
ABSTRACT ................................................................................................................................................ 3
DECLARATION ........................................................................................................................................ 5
ACKNOWLEDGMENTS ......................................................................................................................... 6
TABLE OF CONTENTS ........................................................................................................................... 7
LIST OFT ABLES ..................................................................................................................................... 9
LIST OF FIGURES ............................................................................................................................. , ... 10
GLOSSARY OF MAJOR TERJVJS AND CONCEPTS ........................................................................ 11
MAIN ACRONYMS AND ABBREVIATIONS .................................................................................... 12
1. INTRODUCTION ................................................................................................................................ 14
I.) BACKGROUND .................................................................................................................................. 18
).2 RESEARCII OBJECTIVES ................................................................................................................... 22
).3 IMPORTANCE OF SlUDY ................................................................................................................... 22 1.4 T!IEORETICAL VALUE ........................................................... , ........................................................... 23 1.5 EMPIRICAL IMl'ORTANCE ................................................................................................................. 24 1.6 STRUC'TlJREOFTIIESIS ..................................................................................................................... 25 l.7 PROBLEM STATEMENT ..................................................................................................................... 26
2. LITERATURE REVIEW .................................................................................................................... 28
2. l INTELLECTUAL ORIGINS OF FINANCIAi. INTERMEDIATION ............................................................... 28 (a) Early developments lo modelli11gfi11ancial i11termediatio11 ........................................................ 29 (b) The Key11esiu11 revolraion ........................................................................................................... 34 (c) Fina11d11/ .\ystem re1111i.1·s,mce11nd the corm/er movemenls ......................................................... 37 (d) Op1;'11111/fimmcia/ s1111c111n' ........................ , ................................................................................ 41
2.2 EMPIRICAL EVIDENCE: DUES FINANCIAL DEVEI.Ol'MENTPROMOTEGROWTII? .............................. 43
2.3 TIIE TJIEORY OF FINANCIAL INTliRMEDlATION ...................................................... ._ ......................... 48 2.4 TIIEORETIC'AI. PERSl'l'("{IVES IN CORPORATE GOVERNANCE ........................................................... 52 2.5 Al'l'IWACll!:s l() ECONOMIC GHOWTll AND D1:v1,1.0PMENT ............................................................ 59
3. FUNDAMENTAi, BACKGROUND TO THE ECONOMY ............................................................ 66
3.) AN ANAl.YTICAl.0VERVIEW ........................................................................................................... 66 3.2 COMl'ETING PARADlliMS ................................................................................................................. 68
Colonial derdopment apology ......................................................................................................... 68 Underdeve/opmenl /hem~' ................................................................................................................ 72 Poivad-" 11e11·Jh1mework ............................................................................................................... 79
3.3 ADDITIONAi. REMARKS AND WAY FROWARD .................................................................................. 85
4. THE Zll\.1BAB\VE FINANCIAL SYSTEM ...... : ............................................................................... 87
4.[ EVOLUTION OF THE ZlMHAllWEF!NANCIAL SYSTEM ....................................................................... 87
The Era of Free Bw1ki11g (1892- 1939) ........................................................................................... 87 Tise So11ther11 Rhodesia Crll"rency Board .......................................................................................... 92 The Lund 1111d Agriculturnl Bank ...................................................................................................... 94
4.2 ARCIIITECTURE OFTIIEPRESENTFINANCIALSECTOR ..................................................................... 95 Overall Policy Ana(11sis .................................................................................................................... 95 The Reserve Bank ........................................................................................................................... I 00 Discount Houses ............................................................................................................................. 109 Merchant Bunks .............................................................................................................................. I JO Commercial Banks ......................................................................................................................... 111
7
Fi11a11ce Houses ................................................................................................. , ............................ 116 Buildillg Societies ........................................................................................................................... 117 People's Own Savi11gs Da11k ............................................................................. ,.f ............................ 122 Development /11slil11tionv ................................................................................................................ 123 Representative Offices ..................................................................................... ~ ............................. 125 lns11r1111ce and Pension Fund!>· ......................................................................... ,11 ............................. I 26 The Zimbobl\'e Stock Erchange ....................................................................... t ............................ I 29 Governmellt Sec11rilies .................................................................................... .J
1 .............. .............. 139
4.3 TltECl!ANGING LANDSCAl'E .................................................. • ......................... J:.' ............................ 140
" S. DATA COLLECTION ....................................................................................... ;,,_.; .......................... 148 . 5.1 SCOl'EOl'!NDICATORS .................................................................................... !,( ............................ 148
5.2 ANALYSISOl'JNDICATORS .............................................................................. : .............................. 149
5.3 OTIIER VARIABLESCON'stDERED ................................. ., ................................................................. 152
5.4 SOUR[ESOF DATA .......................................................................................... ! .............................. 153
5.5 LIMITATIONS ................................................................................................... , .............................. 153
6. RESEARCH METHODOLOGY ..................................................................................................... 154
6,1 INIBODUCTION ............................................................................................... 1 .............................. 154
6.2 VAR USES AND PROCEDURE .......................................................................... : .............................. 154
6.3 TIIE ANALYrlCALFRAMEWORK .................................................................................................... 155
6.4 TllE VEClDR AUTOREGRl:SS!VEMETHOD ..................................................................................... 156
6.5 ORIGINS 01' VAR MODELLING ....................................................................................................... 157
6.6 DISSATISFACTION WITH LSM MODELS .......................................................................................... 159
6.7 BASIC CONCEl'J'S OF VAR ANALYSIS ............................................................... , .............................. 161
(a) Types of VAR models ................................................................................................................ 161 (b) Sttt1iv11ari(\' ............................................................................................................................... 162 (c) As.v11mptio11s ....................................................................................................... .' ...................... 162 (d) /mwvalion processes and unit roots .................................................. .'.' ..................................... 163 (e) Testing for unit roots ................................................................................................................. 164
6.8 PRELIMINARY DATA ANALYSIS ..................................................................................................... 166
6.9 MODEL SPECIFICATION .................................................................... ,, ............................................ 172
(a) The Statistical Jv!odel ........... , ................. , ................................................................................. 172 (b) The Dynamic VAR Model ......................................................................................................... 174
6.10 MODEL ESTJMA TION .................................................................................................................... 177
7. COINTEGRATED VARS ................................................................................................................. 179
7. J INTEGRATED VARIABLES ............................. , ............................ '; ..................................................... 179
7.2 CotNTEGRATION ............................................................................................................................ 179 7.3 THE JOHANSEN COINTEGRATION PROCEDURE ............................................................................... [79 7.4 VECTOR ERROR CORRECTION I\10DEL ............................................................ : .............................. 180
7.5 FORMALCOINTEGRATION ANALYSIS .............................................................. ; .............................. 181
7.6 VAR ORDER AND 0["J"ERMINISTIC VARIABLES .............................................. ~ .............................. 188
7.7 IMPULSERESPONSEANALYSIS ...................................................................................................... 188
7.8 VARIANCE DECOMPOSITION .......................................................................................................... 190
7.9 LIMITATIONS OF VAR ANDCOtNTEGRATlON ANALYSIS ................................ , .............................. 190
(a) The atlieoretical natrll'e of VAR models ..................................................... : .............................. /90 (b) Mitigation: social sciences ,1/'e no/ perfect ............................................................................... 191 (c) Starisrical /imilalions of VAR and cointegration a1ia~vsis ...................................... :::: ............... 193 (d) Mifig(1tion: str11ct11ral considerations ....................................................................................... 194
8. EMPIRICAL COINTEGRA TION TESTS RES UL TS .................................................................. 195
8.1 FINANCIAL INTERMEDIARY DEVELOPMENT ................................................................................... 195
8.2 SELECTED INSTITUTIONAL DETERMINANTS or DEVELOPMENT ....................................................... 208
8.3 EXPLORATORY REMARKS ON FINANCIAL EFFICIENCY .................................................................... 21 l
8.4 S!IORTRUN DYNAMICS ....................................... !.' ......................................................................... 225
9 CONCLUDING REMARKS .................................................................... ; ......................................... 241
10 SUGGESTIONS FOR FURTHER RESEARCH ........................................................................... 244
APPENDICES ........................................................................................................................................ 247
8
APPENDIX I: VAGUE CONCEPTS: CAPITAL AND MONEY ...................................................................... 247
APPENDIX 2: Tl IE COMPLEX ROOT CIRCLE AND EIGENVALUES ............................................................. 250 (a) The complex imit root circle ..................................................................................................... 250 (b) Eigenvecfors anti eigenvalues ................................................................................................... 250
APPENDIX 3: STANDARD BANK STAFFPORTP.AITS .............................................................................. 25 J APPENDIX 4: SOURCES OF DATA .......................................................................................................... 253
BlllLIOGRAPHY .................................................................................................................................. 266
REFERENCES ....................................................................................................................................... 282
LIST OF TABLES
Table 1 Counh)' Classification of Financial Structure ....................................... 16 Table 2 Stylised rads on Economic Growth & Financial Sector Development49 Table 3 US Real GDF Growth During Democratic And Republican
Administrations .......................................................................................... 67 Table 4 Black Miners' Death Rate 1906-50: selected years ............................. 75 Table 5 Early Building Societies ..................................................................... 118 Table 6 ZSE Statistics: selected years ........................................................... 135 Table 7 Selected IPOs on the ZSE ................................................................ 137 Table 8 Unit root tests for variable liquid liabilities (LQL ................................ 167 Table 9 Unit root tests for various financial aggregates ................................. 170 Table 10 Unit root tests for various economic aggregates ............................. 171 Table 11 Testing for the rank of cointegration ................................................ 196 Table 12 Estimated cointegration coefficients ................................................ 197 Table 13 Normalised estimates of cointegration coefficients ......................... 198 Table 14 Cointegration estimates subject to over identifying restriction ......... 199 Table 15 Summary of time series modelling results ....................................... 201 Table 16 Banking sector estimated cointegrated vectors ............................... 205 Table 17 Banking sector exactly identified cointegration vectors ................... 206 Table 18 Required reserves and liquid asset ratios - percentages ................ 221 Table 19 Generalised Forecast Error Variance Decomposition Analyses ...... 234 Table 20 ECM for variable LGPCY estimated by OLS based on cointegrating
VAR(4) ..................................................................................................... 237 Table 21 ECM for variable DMB estimated by OLS based on cointegrating
VAR(4) .................................................................................... : ................ 238 Table 22 Summary results of error correction relations in the VAR model ..... 239 Table 23 Original data set .............................................................................. 259 Table 24 Transformed data set and proxies ................................................... 261
9
Figure 1 Figure 2 Figure 3 Figure 4 Figure 5 Figure 6 Figure 7 Figure 8 Figure 9 Figure 10 Figure 11 Figure 12 Figure 13 Figure 14 Figure 15 Figure 16 Figure 17 Figure 18 Figure 19 Figure 20 Figure 21 Figure 22 Figure 23 Figure 24 Figure 25 Figure 26 Figure 27 Figure 28 Figure 29 Figure 30 Figure 31 Figure 32 Figure 33 Figure 34 Figure 35
LIST OF FIGURES
.I
. I Categories of sources of finance among firms ........ l~ ...................... 40 Caught short on empathy or just free riding? .......... 1 ....................... 78 A cartoonist's impression of an electoral campaign i,., ...................... 82 The first official currency of Zimbabwe .................... , ........................ 89 Standard Bank issued bank notes ........................... j~.· ..................... 90 A Procedure to test for unit roots ............................. ~! .................... 166 Currency in circulation to GOP ................................ '. ..................... 202 Government expenditure to GDP ............................
1 ..................... 203
Zimbabwe current account balance .............................................. 204 Trends in commercial banks' real depos!t rates ... ' ...................... 212 Trends in other real interest rates for savings ............................ 213 Spread between deposit and lendinq r_ates ......... '. ..................... 214 ELA to loans and advances: commercial banks ........................ 218 Excess liquid assets to loans and advances: merchant banks .. 218 Excess liquid assets to loans and advances: finance houses ... 219 Excess liquid assets to loans and advances: building societies 219 Trends in real GDP: 1975 - 2000 .............................................. 220 Stock market capitalisation to GOP ........................................... 222 Total value traded to GDP ......................................................... 223 Stock market turnover 1980 - 2000 ........................................... 224 Real Industrial Price Index and Value Traded lndex .................. 225 PP of the effect of a system-wide shock to Equation A ............. 225 PP of the effect of a system-wide shock to Equation 8 ............. 226 PP of the effect of a system-wide shock to Equation E ............. 226 GIR to one S.E. shock in the equation for LGPCY .................... 227 GIR to one S.E. shock in the equation for CIC .......................... 227 GIR to one S.E. shock in the equation for G .............................. 228 GIR to one S.E. shock in the equation for CAB ......................... 228 GIR to one S.E. shock in the equation for DMB ......................... 229 GIRs to one S.E. shock in the equation for LGPCY ................... 230 GIRs to one S.E. shock in the equation for CIC ......................... 230 GI Rs to one S.E. shock in the equation for G ..... L .................... 231 GI Rs to one S.E. shock in the equation for CAB ....................... 231 GlRs to one S.E. shock in the equation for OMB ....................... 231 Images of institutionalised racism at the work pla'ce? ................ 252
10
GLOSSARY OF MAJOR TERMS AND CONCEPTS
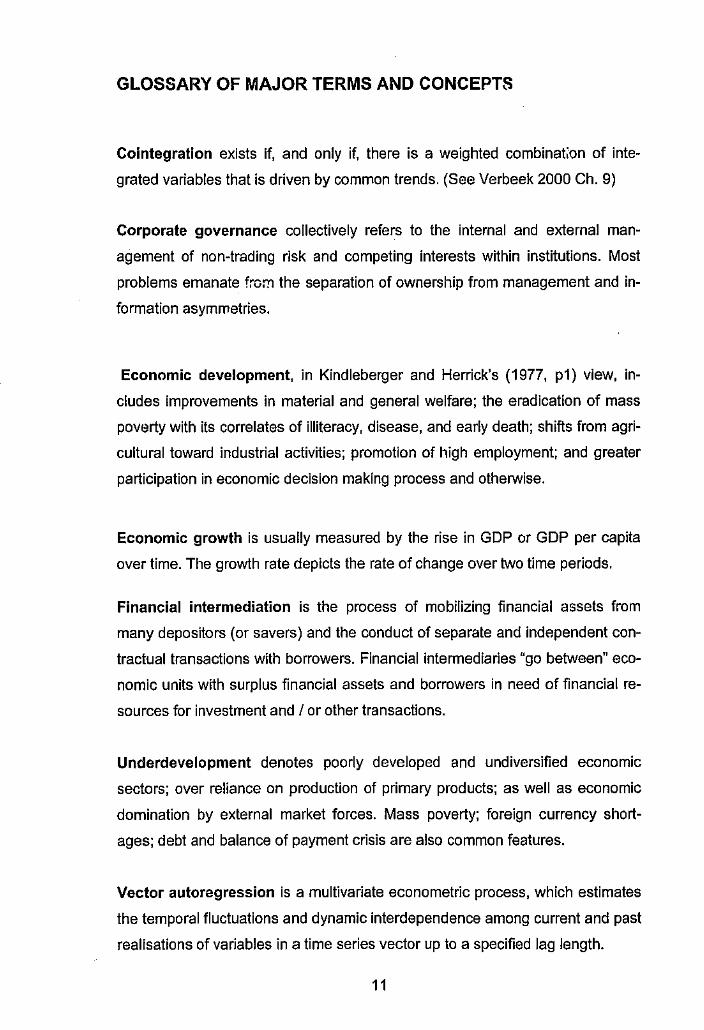
Cointegration exists if, and only if, there is a weighted combinat;on of inte
grated variables that is driven by common trends. (See Verbeek 2000 Ch. 9)
Corporate governance collectively refers to the internal and external man
agement of non-trading risk and competing interests within institutions. Most
problems emanate from the separation of ownership from management and in
formation asymmetries.
Economic development, in Kindleberger and Herrick's (1977, p1) view, in
cludes improvements in material and general welfare; the eradication of mass
poverty with its correlates of illiteracy, disease, and early death; shifts from agri
cultural toward industrial activities; promotion of high employment; and greater
participation in economic decision making process and otherwise.
Economic growth is usually measured by the rise in GDP or GDP per capita
over time. The growth rate depicts the rate of change over two time periods.
Financial intermediation is the process of mobilizing financial assets from
many depositors (or savers) and the conduct of separate and independent con
tractual transactions with borrowers. Financial intermediaries "go between" eco
nomic units with surplus financial assets and borrowers in need of financial re
sources for investment and I or other transactions.
Underdevelopment denotes poorly developed and undiversified economic
sectors; over reliance on production of primary products; as well as economic
domination by external market forces. Mass poverty; foreign currency short
ages; debt and balance of payment crisis are also common features.
Vector autoregression is a multivariate econometric process, which estimates
the temporal fluctuations and dynamic interdependence among current and past
realisations of variables in a time series vector up to a specified Jag length.
11
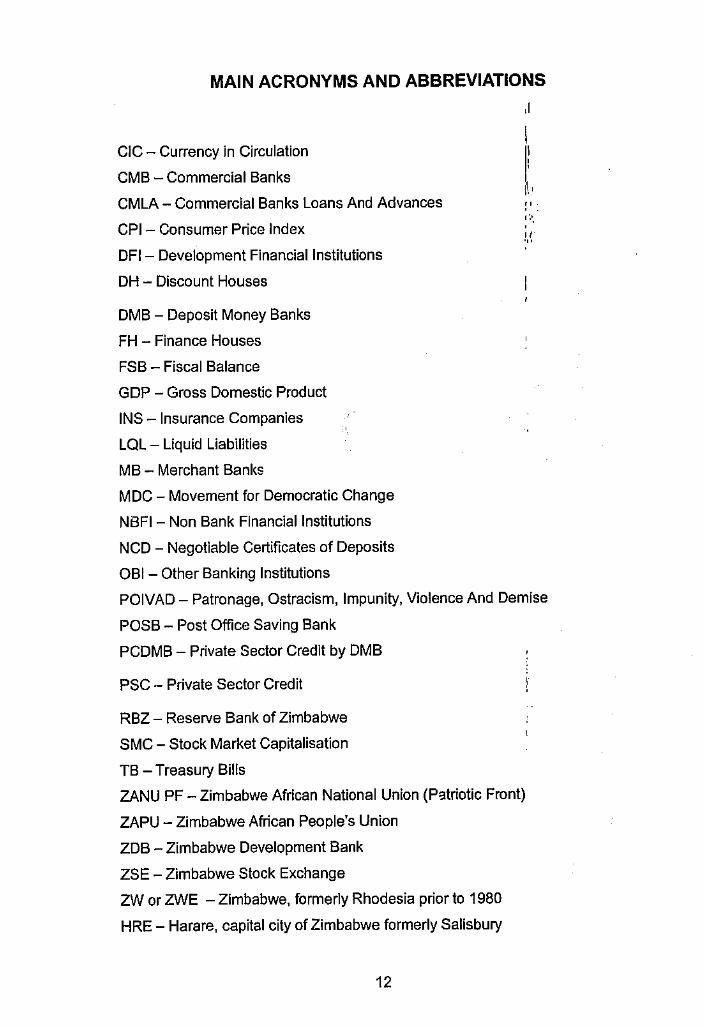
MAIN ACRONYMS AND ABBREVIATIONS
CIC - Currency in Circulation
CMB - Commercial Banks
CMLA - Commercial Banks Loans And Advances
CPI - Consumer Price Index
DFI - Development Financial Institutions
DH - Discount Houses
DMB - Deposit Money Banks
FH - Finance Houses
FSB - Fiscal Balance
GDP - Gross Domestic Product
INS - Insurance Companies
LQL - Liquid Liabilities
MB - Merchant Banks
MDC - Movement for Democratic Change
NBFI - Non Bank Financial Institutions
NCD - Negotiable Certificates of Deposits
OBI - Other Banking Institutions
,I
" . 1·.·. . " '"
POIVAD - Patronage, Ostracism, Impunity, Violence And Demise
POSS - Post Office Saving Bank
PCDMB - Private Sector Credit by DMB
PSC - Private Sector Credit
RBZ - Reserve Bank of Zimbabwe
SMC - Stock Market Capitalisation
TB - Treasury Bills
ZANU PF - Zimbabwe African National Union (Patriotic Front)
ZAPU - Zimbabwe African People's Union
ZDB - Zimbabwe Development Bank
ZSE - Zimbabwe Stock Exchange
ZW or ZWE - Zimbabwe, formerly Rhodesia prior to 1980
HRE - Harare, capital city of Zimbabwe formerly Salisbury
12
I

Economists and politicians from all nations rich and poor, capitalist, socialist
and mixed, have worshipped at the shrine of economic growth
Michael Todaro (1994, p99), Economic Development, Longman.
For as long as we are unable to put our arguments into figures, the voice of our
science, although occasionally it may help dispel errors, will never be heard by
practical men."
Schumpeter (1933, p12), Econometrica, (first issue).
13
1. INTRODUCTION
,I
I Economists and politicians from all nations rich and poor, ~pitalist, socialist
and mixed, have worshipped at the shrine of economic growth!1 .. ,
" Michael Todari>·, (1994, p99) ,,
"
There is a growing theoretical and empirical interest I in the pedagogic '
value of financial aggregates in relation to economic growth. In fact, financial
aggregates constitute the core of observational data collected ·all over the world.
Th1ee competing but not necessarily mutually exclusive hypotheses can be
identified in the literature. Firstly classical economists argue finance has no real
effect; it actually follows income. Secondly many financial economists find fi
nance has a causal effect on grov,!1.h. The third view either takes causality to be
mutual or argues that finance is detrimental to growth. The continual emergence
of new and more sophisticated techniques, as well as broGi.d datasets, facilitates
a rich re:;:ippraisal of this unsettled debate. This study therefore examines
whether financial intermediation aggregates contain statistically significant in
formation about economic performance or movements in real income.
Recent evidence from Latin America and South East Asia demonstrates
that a financial crisis can arise from (1) a currency crisis, (2) banking crisis (3)
debt crisis or (4) stock market crashes. Most empirical studies are myopic in
orientation hence the necessities for a broader focus. Researchers of different
persuasions either exclusively focus on banking aggregates or stock market ac
tivity. Financial intermediation literature is preoccupied with the size, organisa
tion and stability of the banking sector. Empirical research in financial markets is
preoccupied with the predictability of stock prices. Mills (1993, p3) cautions:
We should avoid giving the impression that the only financial time series of interest are stock prices. There are financial markets other than those for stocks, most notably for bonds and foreign currency, but there also exist the various futures and commodity markets all of which provide interesting and important series to analyse.
14
It is important to stress that the financial sector consists of banks, non
bank financial institutions (NBFls) and equity markets. Beck, Demirgii9-Kunt,
and Levine (1999, p2) note that banking sector development and stock market
development both "exert a causal impact on economic growth." Conventionally
financial development is measured in terms of size, activity and efficiency.
This thesis systematically relates economic performance to long run de
velopment in banks, NBFI, and the stock exchange in a Zimbabwean context.
The study amalgamates indicators such as size, activity, and efficiency from
various sources such as Beck, DemirgGc;-Kunt, and Levine (1999), Lynch
(1993, 1994), Levine (1998), and Rousseau P. L. and Wachtel P. (1998).
Demirgii9-Kunt, and Levine (1999, p3) regard a country's financial system to be
underdeveloped "if it has below median values of both bank and market devel
opments" on a global scale. In practical terms both the claims of Deposit Money
Banks (DMB) on private sector to GDP and the total value of securities traded
to GDP are less than the global mean. Generally, the classification produces
three categories of financial structure viz. (a) underdeveloped, (b) bank based
and (c) market based. Due to practical complications Table 1 portrays four
types of financial structure to distinguish the relative strengths of markets and
institutions in less sophisticated financial systems.
Financial intermediation should be of major concern given the current
emphasis on the importance of private sector participation in economic devel
opment. This process was further strengthened by the demise of most com
mand economies at the end of the Cold War. Hellwig (1991 ), cited in Freixas
and Rochet (1997, p?) stresses that banks exert a fundamental influence on
capital allocation, risk sharing and economic growth. Jayaraman (1996, p 1),
citing Killick (1993) adds:
The . . . private sector cannot function unless there is a welllubricated financial system in place because, unlike the public sector, it cannot raise resources through taxation or from money creation. It must save or borrow to invest and the financial sector facilitates these tasks.
Policy makers and applied economists additionally believe fluctuations in
financial variables have real effects both in the short run (stabilization) and in
the long run (growth) and hence warrant close attention. Multinational entities
15
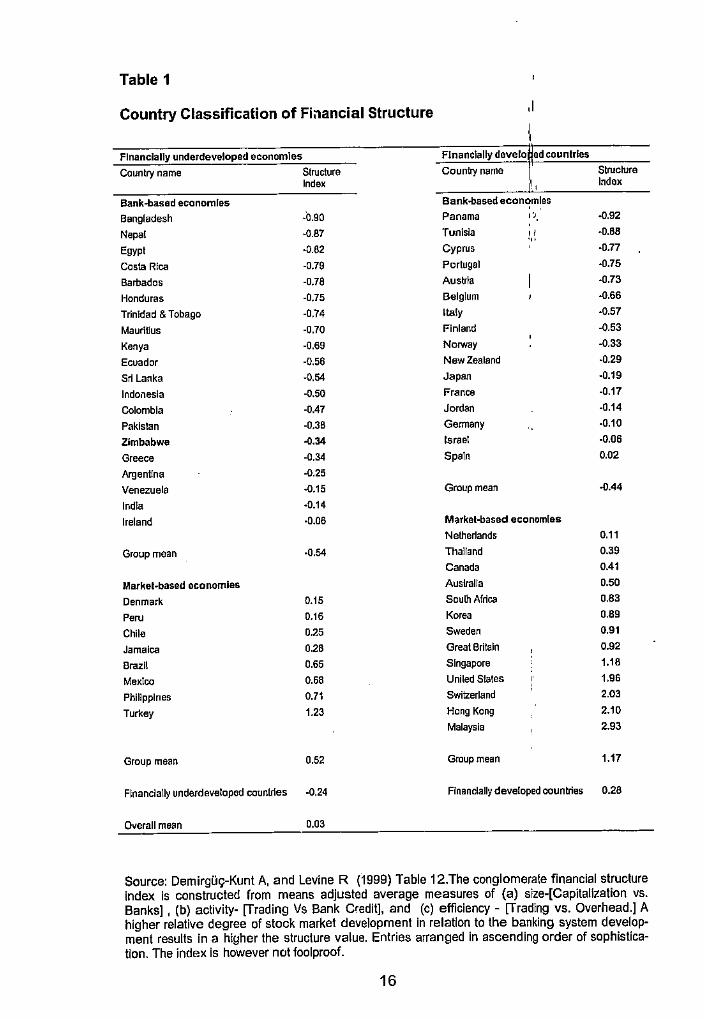
Table 1
Country Classification of Fiilancial Structure ,I
Financially underdeveloped economies Flnanclally develo ad countries
Country name Structure Country name Structure Index ,, Index
Bank-based economies Bank-based economies
Bangladesh -b.90 Panama ,·., -0.92
Nepa! -0.87 Tunisia " -0.88 ... Egypt -0.62 Cyprus ·D.77
Costa Rica -0.79 Portugal -0.75
Barbados -0.78 Austria -0.73
Honduras -0.75 Belgium -0.66
Trinidad & Tobago -0.74 lta!y -0.57
MaurlUus -0.70 Finland -0.53
Kenya -0.69 Norway -0.33
Ecuador -0.56 New Zealand -0.29
Sri Lanka -0.54 Japan -0.19
lndoi1esla -0.50 France -0.17
Colombia -0.47 Jordan -0.14
Pakistan -0.38 Germany -0.10
Zimbabwe ~.34 Israel -0.06
Greece -0.34 Spain 0.02
Argentina -0.25
Venezuela -0.15 Group mean -0.44
lndla -0.14
Ireland ·0.06 M:;irkel-based economies
Netherlands 0.11
Group mean ·0.54 Thailand 0.39
Canada 0.41
Markel-based economies Auslral!a 0.50
Denmark 0.15 South Africa 0.83
""" 0.16 Korea 0.89
Chile 0.25 Sweden 0.91
Jamaica 0.28 Great Britain 0.92
Brazil 0.65 Singapore 1.18
Mexico 0.68 United States 1.96
Philippines 0.71 Switzerland 2.03
Turkey 1.23 Hong Kong 2.10
Malaysia 2.93
Group mean 0.52 Group mean 1.17
Flnanclatly underdeveloped countries ·0.24 Flnancially developed countries 0.28
Overall mean 0.03
Source: DemirgG9-Kunt A, and Levine R (1999) Table 12.The conglomerate financial structure index is constructed from means adjusted average measures of (a) size-[Capitallzation vs. Banks] , (b) activity- [Trading Vs Bank Credit], and (c) efficiency - [Trading vs. Overhead.] A higher relative degree of stock market development in relation to the banking system development results in a higher the structure value. Entries arranged in ascending order of sophistication. The index is however not foolproof.
16
such as the International Monetary Fund (IMF) and The World Bank now rou
tinely include financial liberalization in any serious economic structural adjust
ment program. Recent projects focussing on financial structure and economic
development at the World Bank (Feb 2000) demonstrate the degree of impor
tance the institution attaches to the topic. Mark Gertler (1988, p560), and
Freixas and Rochel (1997, p176) concur that policymakers give close attention
to financial markets and institutions because they affect real output both in the
short run and in the long run. This draws attention to the services financial in
termediaries provide to the economy and how they are organized.
Theories of financial intermediation pJt greater emphasis on the "s_pe
cialness", information services, liquidity, and economic importance of banks. As
instanced by Allen and Gale (1997) the intermediary role of financial markets
(eg. stock) is also stressed. The prominence of banks is also highlighted in pe
riods of crises such as the Great Depression that coincided with the collapse of
40% banks and disappearance of 44 % of demand deposits in the US, ob
served Hixon (1993, p1). According to Friedman and Schwartz (1963) bank fail
ures attenuated the severity of the depression. In all economies financial inter
mediaries play a vital role in the payment system, liquidity services, asset
transformation, risk management, and information services. Financial interme
diaries increase productivity by lowering transaction costs; mitigate moral haz
ard and opportunism; and support commitment through delegation. I discuss the
details later on under the literature review.
The opening quotation from Todaro (1994, p99) emphasizes that eco
nomic growth is a universal concern for all peoples. Owoye (1997, p71) points
out that fluctuations in GDP data depicts "the success or failure of current mac
roeconomic policies ... " Owoye, like Schumpeter (1933) argues that knowledge
about the informational content and the predictive power of financial aggregates
helps authorities and policymakers to optimise economic decisions. Such infor
mation invariably assists authorities in selecting appropriate policy targets. This
thesis contributes to increasing scholarly output on financial institutions, capital
markets and economic growth. It improves communication between the aca
demic community, financial economists and policymakers. I agree with Bow
brick (1988, p56) that accurate economic analysis can make a difference be
tween life and death among less sophisticated communities.
17
1.1 ·3ackground
,I
The role of financial development in economic growth ~as attracted con
siderable theoretical and empirical interest in recent years. Tajlput this research
into perspective I begin with a brief glance at the overall landstape. This seives
to highlight the direction of major studies in this important field.;.: ..
" Martin and Win (1996, p19) suggest that the contribution of the financial
sector can be examined at three closely-knit levels:
(I) At a macroeconomic lev£' a positive correlation with' economic growth
is expected. The contribution of the financial system is affecte,d by its efficiency
as measured by "liquidity, volatility, transaction costs and transparency ... " (p 5).
Poor performance by financial intermediaries retards economic activity.
(II) By quantifying the direct benefits of the financial system. This involves
es~imaUon of the vah.!e added to jobs, services and products generated by the
financial sa:tcir. P. detailed quantification of processes, service flow, revenues
and transaction costs is required to make an accurate assessment. A structural
(production) or functional (intermediation) view of the financial system may be
used. The perspective of financial structure adopted influences details of what
to include in the analysis.
(Ill} By examining the indirect benefits of the market. Financial develop
ment comes with both general and institution-specific benefits to the economy.
The general functions provided by financial intermediaries 8re economies of
scale and scope in information services, liquidity services, consumption
smoothing, transactions cost, and risk reduction services. Other institution
specific functions include credit allocation; the payment system; money supply
transmission; and credit substitution. The actual range of services provided de
pends on the sophistication and regulation of the financial system in a particular
economy.
In practice, level II b difficult to calibrate while paucity of detailed trans
actions data handicap empirical research. As a result, research grapples with
methodological and measurement issues. Apart from Martin and Win (1996),
and Brealey and Soria (1993) cited by the former authors, not much research is
on record. The nearest studies deal with frontier analysis, also known as x-
18
efficiency. Berger and Humphrey (1997) survey this literature and conclude that
various efficiency methods do not lead to identical results because of methodo
logical differences. According to them frontier analysis benchmarks "the relative
performance of production units" and evaluates how close they "are to a 'best
practice' frontier'' (p4 ). A parametric or nonparametric representation may be
applied depending on assumptions imposed on data, the functional form, and
the degree of efficiency. Parametric efficiency analysis specifies a deterministic
functional form whereas nonparametric approaches presuppose less structure
but do not model random errors. In both approaches some input and output
definitional concepts remain controversial. Berger and Humphrey (1997, p32)
note:
The asset, user cost, and va!ue-added methods of assigning financial goods to input and output categories all agree that loans and other major assets of financial institutions should count as outputs. However, there is a longstanding controversy whether deposits should count as inputs or outputs. Deposits have input characteristics because they are paid for in part by interest payments and the funds raised provide the institution with raw material of ingestible funds. However, deposits also have output characteristics because they are associated with a substantial amount of liquidity, safekeeping, and payments services provided to depositors.
The dilemma is resolved by stripping deposits into input (interest paid)
and output (amount of deposits) characteristics. Similarly the definition of
money supply also wrestles with the categorization of various deposits. Regu
latory differences also make cross-country comparisons very difficult.
In the view of Freixas and Rochet (1997, pB) there are five issues at the mac
roeconomic level that require attention: -
(a) the transmission channel of monetary policy.
(b) the fragility of the monetary policy
(c) the existence of financial cycles
(d) the real effect (corporate investment) of financial intenmediation ,
and
(e) the impact of financial intermediation on economic growth.
19
-------------------,.,_,.,..,_ ______ lllllllffl •. !:l.,·.!ii'u
These subsections are major research areas in their own right. Kuh and
Meyer (1963) and Elliot (1973), fur instance, analyse financial1factors in corpo
rate investment. Financial fragility, recessions and crises feat4re prominently in
the works of Kindleberger (1978,1996) and Minsky (1972, 19~6).' Comparative
studies between bank-based and market-based financial syst~,r.n received a fair
share of attention but are no longer informative, Levine (2000).;.:.
My thesis is restricted to (e) because economic well-being has a univer
sal appeal. lt motivates most economic transactions. Indeed Lewis (1995, p18)
cited in Martin and Win (1996, p7) reiterates that the financiai!services industry
is the major engine of economic growth. Prior studies directed at the relation
ship between financial development and economic growth inClude Schumpeter
([1911] 1936), Gurley and Shaw (1955, 1960), Goldsmith (1969), McKinnon
(1973), Shaw (1973), Levine (1991, 1997, 1998) and Beck, Levine and Loayza
(2000.)
It was earlier noted that the contribution of the financial sector is affected
by the efficiency of the financial intermediaries, characterized by the system's
liquidity, volatility, transaction costs and transparency. Financial intermediaries
provide economies of scale and scope in addition to acquiring information, mo
bilising and allocating resources, managing risk, and exerting corporate control.
Martin and Win (1996, p12) note that absence of financial intermediaries in the
risk management process inhibits economic activity in the same way that the
absence of financial intermediaries may inhibit economic activity. Reduction in
the level of intermediation activity and liquidity will reduce the contribution of the
financial markets to the economy. High transaction and information costs retard
economic growth by lowering productivity.
The World Bank (1989, p26) notes that resource accumulation has not
predicted growth in the Malthusian context. '"In 1870, Australia, a country rich in
natural resources, had twice the per capita income of Switzerland, which has
few; today Switzerland's per capita income exceeds Australia's by more than
half." The report notes that the success of Hong Kong, Japan, South Korea and
Singapore does not resemble their resource endowment.
" Details of these citations and those in the next paragraph are fully discussed under the literature review.
20
In this thesis I posit that the operations of financial intermediaries have a
direct impact or. overall economic performance. Typical literature and research
characterise economic development as a process amenable to sound and
proper management and policies. There is no single measure of development
because structural issues such as extent of poverty, income distribution, social
and political change, literacy, leisure and economic well being come into play.
The financial level of analysis generally equates development to the in
crease in GDP per capita over time. The economic growth rate is given by the
rate of change in GDP per capita over two periods in time. Strictly speaking,
there is a distinction between economic development and economic growth.
Positive growth rates derived from the GDP indicate economic growth but not
necessarily economic development. A growing economy may remain underde
veloped if other indicators highlighted supra are not improving. Conventionally,
GDP is accepted as a measure of national income (Y) and economic size while
GDP per capita is the most popular proxy for average human welfare. The rate
of change in GDP per capita (GY), depicts the speed and direction of changes
in wellbeing. For record and research purposes these proxies are measurable
and expressible in pure mathematical form, and assist in the statistical testing of
theories.
Increased interest in economic growth and development literature has
led to a proliferation of empirical work and theories. Michael Todaro, (1997,
p70) who interprets development as a "multidimensional process" summarises
development literature into five competing categories. These are (a) the linear
stages of growth model; (b) theories and patterns of structural change; (c) the
international dependence revolution; (d) the neoclassical, free market counter
revolution; and (e) the endogenous theory of economic growth. Most theories
concentrate on capital formation, a term used to describe increases in net in
vestment in capital assets.
Kindleberger and Herrick (1977, pp 179-89) adopt a leaner classification
for economic development theories. This comprises neoclassical, radical or
Marxist, and structuralist categories. Adam and O'Connell (1997) identify three
policy phases categorised as the "capital shortage" diagnosis (1970s), "policy
failure" diagnosis (1980s), and the "institutional" failure of the 1990s.
21
1.2 Research Objectives
,I
This thesis examines the nature and intensity of links bbtween measures
of financial sophistication and economic performance in Zimtj~bweb for the pe
riod between 1924 and 1998. It relates economic performan~e to the propaga
tion of financial intermediation over a period of seventy-five (7.5) years in order '
to identify any coevolution and I or long-term cumulative e~0cts. Quantitative
tests were conducted to evaluate the speed and direction of causal links be
tween financial intermediation and economic performance. A iector autoregres
sive [VAR] approach is applied to fulfil the purpose of this investigation. To pro
vide a philosophical background to the empirical analysis, tHe thesis explores
the contradictory institutional developments in Zimbabwe over the years.
1.3 Importance of study
In this subsection I briefly outline the significance of this research. Con
ducting this analysis is important as it helps researchers to gain insight into the
finance-growth nexus. Tests were executed to determine whether stylised em
pirical results are valid in a small developing economy. A range of alternative
indicators is applied to gain the broadest perspective and to ensure an in-depth
analysis. This approach is merited by the absence of a universally acceptable
yardstick of financial sophistication. An appreciation of VAR time series tech
niques is an added bonus meant to inspire new comers to the ·concepts.
Very little scholarly work of this nature, if any, has been done in Zim
babwe using the latest time series techniques. In particular both policymakers
and researchers have largely ignored financial intermediatiorl. Apart from gen
eralised newspaper articles, detailed research on financial institutions and mar
kets is at best very sparse, and at worst outdated and wanting of depth. In my
opinion there is much room for material improvement in LDC financial markets
by virtue of their relatively low level of development. ln addition most clients in
b The name Zimbabwe is used to cover the entire historical period under review. Before 1980 Zimbabwe was fonncr!y known as Rhodesia. The name Rhodesia was given Imperial sanction in 1895 as a collective name for the then two provinces of Matebeleland and Mashona)and. Prior to that present day Zambia and Zimbabwe were referred to as Northern and southern Zambezia respectively since l 886. Zambezia was declared a British sphere of influence in 1888. The name Charterland was used briefly.
22
these markets are not financially sophisticated. They stand to benefit from en
lightened policy decisions and market-led innovation. Rousseau and Wachtel
(1998) concur that countries in early stages of development are the most likely
to benefit from financial development. While production to some extent follows
consumer tastes, Schumpeter ([1911] 1936, p65) is emphatic that innovative
producers could "as a rule" educate customers "to want new things." If this as
sumption, like the concept of supply leading finance, is valid, financial sophisti
cation could be instrumental in promoting economic prosperity.
This endeavour will assist in comparative studies because current cross
country studies give inadequate attention to small countries. Future scholars
may learn from past documented experiences. Schumpeter (1936, p83) argues
acquired knowledge is communally beneficial. Even an exceptional "giant of
wisdom and will" cannot be materially and mentally self-sufficient.
1.4 Theoretical value
Empirical findings on the finance and development controversy are still
contradictory; and the theoretical debate is unresolved. Applying new tech
niques to an alternative data set sheds new light onto the course of the debate.
This study makes a worthwhile contribution to the finance and growth body of
knowledge. Demirgu9-Kunt, and Levine (1999, p1) point out that unresolved
debate "hampers the formulation of sound policy advice." I support this view be
cause sound economic policies require accurate judgements about causality.
For academic and empirical purposes, this work hopes to stimulate and
promote intellectual curiosity in time series analysis. To this end I present in
detail, the VAR methodology in a pedagogic framework accessible to beginning
researchers without specialist training in advanced mathematics. Existing formal
works, though shining with elegant l'-revity and richness to an informed ear, feel
esoteric and intimidating to would be converts not yet on the road to Damascus.
Stock's (1994,p2745) comprehensive survey for instance, is addressed to
"graduate students and applied econometricians." Is the mathematical rigor
avoidable, one may wonder? However, in econometrics, running away from
mathematical terminology and parsimonious "Greek" symbolism in favour of
"learning for exams" under the guise of "appreciating the concepts" is not the
23
solution. See Spanos (1999, pp xvii - xviii.) According to Binmore (1992, p
xxvi), as cited in Spanos on the same pages, inadequate dept~ is tantamount to
an unwitting conspiracy between the teacher and thej1student to defraud whoever is paying the fees. The teacher rtretends to teach, and the student pretends to learn, material that[1~oth know in their hearts is so emasculated that it cannot be proAE;!rly under-stood in the form in which it is presented. :··
" ... Many bivariate and trivariate VAR systems are misspScified in order to
accommodate small data sets and the resultant fast exhaus~ion of degrees of ' freedom. Basing policy on flawed small scale VAR modelling systems can be
disastrous. Indeed Watson (1994, p2901) asserts that it is "~ery important" for
structural analysis to take into account all "important macroeconomic shocks"
active in the economic process. This thesis uses a five variable VAR model;
representing core economic sectors.
One or two entirely new contributions contained herein are minor result
of this thesis that requires further investigation by other interested researchers. I
propose a new measure of inefficiency that regards excess liquid assets as po
tential indicators of disintermediation, wh!::h variable is herein termed DRIFT. In
this research I interpret the institutional landscape of Zimbabwe in an entirely
new POIVAD framework. The new paradigm explores how value is created and
distributed among economic agents in Zimbabwe. Despite the Soviet Union's
technological advancement for instance, institutional constraints retarded pros
pects for financial sophistication and economic prosperity.1 On the finance
growth nexus, I urge financial researchers to make greater u~e of risk adjusted
time series data being generated by prudential supervision. Historical cost
based variables may inflate the depth of financial intermediation. On corporate
governance I suggest that future research should conduct more fieldwork.
1.5 Empirical Importance
Charemza and Deadman (1992, p xi) suggest that cointegration and
vector autore'.)ressive [VAR] modelling are "relevant for time series rather than
cross-section econometrics." I agree with this conclusion, hence my focus on a
single developing country. Most researchers have concentrated on more devel-
24
oped countries or give a cursory examination to less developed countries
(LDCs) in cross-country studies. The meagre depth of such studies means that
individual LDC countries cannot draw detailed policy conclusions appropriate to
their structures and circumstances. DemirgU9-Kunt, and Levine (1999, p1) note
that existing comparative studies of the merits of market-based and bank-based
financial systems have primarily focused on four countries namely the US, UK,
Japan and Germany. In their considered view, similar per capita incomes and
long run growth rates shared by these countries shroud the economic impor
tance of financial aggregates. Beck, DemirgU9-Kunt, and Levine's (1999) online
"New Database" (World Bank) allows financial analysts and researchers to un
dertake detailed examination of financial sector development and structure
"across counties and over time along many different dimensions," (p3). Unfortu
nately, the newly constructed data set covers an inadequate span (1975 to
1996) and a few variables on Zimbabwe. The archaeology of financial data in
Zimbabwe should yield a rich treasure as the Central Statistics Office dates
back to 1928. Paucity of data continues to retard research and policy analysis in
LDC. This thesis therefore complements and extends the World Bank data set.
Empirical findings should assist authorities in selecting appropriate policy tar
gets.
1.6 Structure of thesis
Briefly the thesis is organized into eight major parts. Section 1 proposes
the purpose of the study and its significance. The major research questions .are
fully defined in section 1.7. Section 2 covers the literature review, summarising
the stylised facts about financial intermediation theories and the relevant find
ings of leading researchers in that discipline. To put my research into its proper
context, background details of the Zimbabwean economic system are presented
in Section 3. A new theoretical or philosophical framework, Poivad, developed
herein attempts to resolve the inconsistencies and contradictory developments
perversive in the Zimbabwean society. This is followed by a consideration of the
evolution of the Zimbabwe financial system in Section 4. Section 4 also gives a
very brief account of the structure of the Zimbabwe financial system. Chimombe
(1983) and Mataruka (1999) provide full accounts on ihe financial structure.
25
These sources are at best general guides as the financial landscape continually
changes with time. Section 5 discuses variables included in tl~e study and data
transformations. Details of the applied methodology comprise1 Section 6, which
discusses the VAR method, its applications and criticisms. Th~ characterisation
' of the functional form of the equations initiated in Section 6 ~~ends to cointe-
grated VARs in Section 7. In Section 8 the results of the tests, their interpreta-•·. tion and evaluation are presented. After highlighting the mai,(1 findings of this
project, the last part of the thesis suggests directions for further research.
I 1.7 Problem Statement
But research questions are not written in stone. They, like the researcher asking
them, evolve as the research proceeds.
Johnson, Johnson and Buse (1987, p394)
This thesis is a study of financial intermediation and economic perform
ance. It discusses and evaluates the significance of financial intermediation on
real activity. The structural impediments to efficient intermediation and conse
quently economic development are explored using both narrative and quantita
tive frameworks. The three major research questions considered in the course
of this study are briefly outlined below.
Question 1: What relationship, if any, exists between·financial interme
diation and economic performance?
Discussion: This question looks at the economic significance of finan
cial intermediaries. Finance theory has not has not yet resolv8d the issue. Clas
sical theories ascribe no role to financial intermediaries because they owe their
existence to market imperfections. Current literature suggests that banks do not
just offer special services such as providing liquidity and risk management as
economic agents, but could be entrepreneurs in their own right. Statistically the
magnitude of parameters can shed light on whether financial intermediaries
have a positive, negative or neutral effect on economic performance.
26
Question 2: Do financial aggregates relating to size, activity and the de
gree of financial sophistication contain useful information about movements in
economic activity?
Discussion: Proponents of fina11cial intermediation have almost reached
a consensus that intermediaries have a positive effect on real activity. They,
however, differ on the actual mechanics operating the finance and growth inter
action. This thesis uses a broad array of recently developed indicators to test
the direction of causality and the persistence of shocks over time.
Question 3: How relevant are institutional factors (such as governance,
regulation, and societal relations) to the process of economic development in
Zimbabwe?
Discussion: Economic development in the Third World has been very
problematic. Adam and O'Connell (1997) note that poor economic performance
was initially blamed on "capital shortage", a phase that lasted throughout the
1970s. When foreign aid and external debt failed to stimulate sustainable
growth the "policy failure" diagnosis (1980s) emerged. The "institutional" failure
diagnosis of the 1990s came as a result of bleak economic activity in spite of
widespread liberalisation and economic structural adjustment programs. The
emphasis is now on good governance, accountability, transparency and con
tract enforcement. As Delhaise (1998) put it, the collapse of the Asian financial
system was not a surprising due to fundamental weakness. According to him,
what were surprising were the panics and not the crisis. Levine (1998), La Porta
et al (2000) and Zingales (2000) ably incorporate these issues into the theory of
financial intermediation I finance. 1 provide a Zimbabwean overview knowing
that Schumpeter (1954, p12) hails history, statistics and "theory" as the three
pillars of economic analysis.
27
2. LITERATURE REVIEW ,I
I The return to new knowledge is higher, the more you already ,tow.
I
Easterly W and Levine R (2000, p20) " 1',•,
2.1 Intellectual Origins of Financial Intermediation
Money may be the oil of commerce, but intermediaries are its !ngine.
Spulber (1999, p344) '
Financial intermediation literature revolves around three competing hy
potheses. Proponents of financial intermediation propose a positive causal ef
fect on the financial and real sector interaction. Classical theory posits that the
real sector (income) leads money, and the financial &ector with the exception of
money supply, is neutral. The third view regards the rapid development of the
financial system as detrimental to economic prosperity.
Conceptually, the role of sundry financial variables on aggregate eco
nomic activity has always been controversial. Alexander Hamilton (1871) cited
in Beck, Levine and Loayza (2000, p32) argued that "banks were the happiest
engines that ever were invented" for creating economic growth. Bagehot (1873)
as reflected in Becsi and Wang (1997, p50) attributed the rapid 19~ century in·
dustrialisation of England to sophisticated financial intermediation. On the other
hand Levine et al (2000) note that US President John Adams (1819) considered
banks to be harmful to the "morality, tranquillity and even wealth" of nations.
This view supported Ricardo's conception as cited in Schumpeter (1936, p98)
"that 'banking operations' cannot increase a country's wealth." Ajit Singh (1997)
attacks financial sophistication as a luxury developing countries can ill afford. In
his view, financial liberalisation, especially the rapid expansion of stock markets
brings about increased financial fragility that is detrimental to economic per
formance and development. Over the years financial institutions have been
subjected to mechanical limits on liquidity, solvency and credit creation. A high
degree of liquidity, high ratio of indebtedness, high concentration of financial
assets as opposed to real assets, and close regulation distinguish financial in-
28
stitutions, Lewis (1995, pxiii). The Glass-Steagall Act (1933) and "Regulation Q"
institutionalised the distrust of banks in the US. In fact the reqent US Financial
Modernization Act acknowledged that financial intermediatio~ is susceptible to
government intervention and distortion at both a micro and mafro level.
At a macro level, Mark Gertler (1988) and Mattesini (1993) concur on the " fact that theory and research on the linkages between financi~l,.8nd real sectors
have been directed at (i) the relationship between financial :development and
economic growth; (ii) financial factors in corporate investmenti and (iii) financial
crises and business cycles. On a micro level, transaction costs, market organi
sation and microstructure provide a valuable exposition to the understanding of
financial intermediation. A new focus on information asymmetry, liquidity insur
ance, deposit contracts, delegated monitoring has enriched the theory of finan
cial intermediation. Baltensperger (1980), Gertler (1988), Bhattacharya and
Thakor (1992) and Thaker (1996) provide comprehensive revJews of the litera
ture. Rapid advances in the field have taken their toll on Baltensperger. How
ever, the emphasis on complete endogenous models remains a potent chal
lenge. Gertler remains a valuable and very accessible review of developments
before 1988. Thakor's important synthesis brings out crucial advances in the
literature with a particular emphasis on financial design.
(a) Early developments to modelling financial intermediation
Early studies in financial intermediation focused on credit expansion and
creation of money by banks. The existence of financial interll1ediarles was as
sumed. Edgeworth (1888), who regards probability as the "foundation of bank
ing", formally demonstrated that banks could generate economies of scale as
long as withdrawals remain stocl 1astic events and the behaViour of depositors
independent of ec,ch other. A fractional reserve banking system translates into
a money multiplier process. Outside the realms of money and credit creation,
finance and economlcs theory regarded investment as the real engine behind
economic activity and the monetary system was reduced to a neutral process.
Monetary neutrality refors to the irrelevance of money in aggregate economic
analysis as portrayed in classical economics. Classical dichotomy is the sepa
ration of macroeconomics into real and nominal (monetary) variables.
29
·--------_J
Joseph Schumpeter ([1911) 1936) is credited with drawing closer atten
tion to the importance of financial intermediation's influence on innovation and
economic growth. His seminal work merits a closer examination because he
considered the popular Keynesian role of savings and investment in "the tradi
tional doctrine" of capital formation to overlook "essential factors", (p68) and in
some cases amounting to "faulty analysis" (p71). I-ts a result I review his work
at considerable length. This is important because available financial intermedia
tion literature reviews by Baltensperger (1980), Gertler (1988), and Thaker
(1996) all do not discuss his work. Alternative references such as Levine et al
(2000) do not show how his work was linked with financial intermediation.
The chief cornerstones of Schumpeter's analysis are grounded on the
trinity of entrepreneurial talent, destructive innv·!ation [or progressive differen
tiation], and credit funding. Innovation is tt"1a hallmark of entrepreneurial talent
and economic development. Development is change. Schumpeter (1936,p67)
believed that new firms are more innovative than old ones. In a competitive en
vironment the predictable economic consequence is "the competitive elimination
of the old" by drawing productive resources away from them. An important in
sight in Schumpeter's work is his appreciation that disposable property gives
producers command over means of production. While, with hindsight, this ap
pears to be a self-evident privilege, the insight enabled Schumpeter to empha
sise the importance of credit ahead of savings. If innovators are putting together
entirely new processes, and have no previous production or disposable assets
to draw on, it becomes imperative that they rely on credit. fait accompli, if pro
duction is to continue. Even wealthy firms have to resort to credit if their savings
are employed elsewhere and are not available for the new project. Credit also
liberates individuals from reliance on inheritance and the extent of one's fortune.
I cannot put more weight on the importarice of credit than Schumpeter's
(1936, p70) own words when he declared "that talent in economic life 'rides to
success on its debts' ... " Credit enables innovative entrepreneurs to have ac
cess to existing productive resources. In market economies industrialisation
cannot exist without credit (p 70). According to Schumpeter (1936, p108-9),
credit granted to finance entrepreneurial activities results in an increase in real
output while credit expansion to finance consumption leads to inflation.
30
I
The relationship between credit and capital is controversial. Schumpeter
([1911] 1936, p98) acknowledges J. L. Laughlin's observationJhat "Credit does
not increase capital (that is, means of production) but mobilis~s it and makes it
more efficient and thereby leads to an increase in product (si~)." Mises ([1912]
1934, p22t reiterates that the conclusk1n that expansion of cr~pit cannot form a
substitute for capital cannot be disputed. Credit (or money) rn°.~tters and finan
cial intermediaries facilitate and expedite the exchange proc~ss. According to
Mises (p35) the relevant exchange is that of "facilitating credit transactions ...
[which is] nothing but the exchange of present goods againstlfuture goods." Fi-, nancial intermediaries, such as banks, create and mobilize financial "assets"
from many depositors or savers and the conduct of separate· and independent
contractual transactions with borrowers. In Gurley and Shaw's (1956) terminol
ogy financial intermediaries go between economic units with surplus financial
assets and borrowers in need of financial resources for investment and other
transactions (deficit units). Schumpeter, however, suggests banks do more than
providing a link between depositors and producers. Bank contracts in competi
tive markets approve the nature of new real activity that can be undertaken with
intermediary support. In a capitalist environment, Schumpeter (1936, p74) is
unapologetic that the banking system, being "the ephor" of the exchange econ
omy" "authorises people, in the name of society as it were, to" innovate. Theo
retically, only the entrepreneur needs credit for innovation and economic devel
opment. Granting credit in this sense "operates as an order on the economic
system" to provide the entrepreneur with productive resources:· p106.
Recent advances in financial literature focusing on the links between
credit and corporate governance give Schumpeter little credit than he actually
deserves. The basic idea is that financial intermediaries can influence corporate
governance practices within firms via precontract screening and extending
monitored credit. As early as 1911, Schumpeter controversially argued that the
entrepreneur does not bear risk given his reliance on credite. Therefore financial
intermediaries relate limits to credit extended to the borrower's productive ca-
c Although I have not yet read Mises' book "The Theory of Money and Credit", (which was not available to me) I am grateful to one ofmy anonymous examiners for bringing this point to my attention. d The Cassell Dictionary (1994) defines an ephor as "one of the five magistrates chosen at Sparta and invested with the highest power, controlling even the kings." • This ii ~e'f evident if the entrepreneur is totally dependent on credit. In practice financial intermediaries insist on owner contribution to increase commitment to the project and reduce ex-post effort aversion.
31
pacity. The granting of credit beyond entrepreneur's ability to produce com
modities results in losses to financial intermediaries, Schumpeter (1936, p114).
ln order to avoid "making bad commitments" banks devise rules to manage in
dividual cases. This foreshadows concepts of monitoring, screening, adverse
selection and moral hazard problems later pursued by Arrow (1974), Diamond
('1984), Diamond and Dybvig (1986) and Stigiiiz. and Weiss (1990).
Although entrepreneurship affects class po:.1ition, social history, style and
values of life, Schumpeter (1936, p78) warns that it is neither a profession nor a
lasting condition. This adds more weight to the need for monitoring and infor
mation gathering services provided by financial institutions in general and banks
in particular. In addition to entrepreneurship not being a profession, economic
talent is however scarce because innovators employ "unused productive ca
pacity." As Schumpeter puts it, "This mental freedom [to innovate} presupposes
a great surplus force over the everyday demand and is somethinp peculiar and
by nature rare", (p86). This is an important point because goo~ economic lead
ership is not necessarily endowed with every talent. Good leadership should
cultivate an economically conducive environment and permit all good stars to
shine. Every constructive talent works for the good of all. Entrepreneurial talent
thrives on competitive innovation. In turn, competitive innovation promotes
prosperity.
Despite these early leads, financial variables remained on the periphery
of formal economic models. Since Adam Smith [1776] economic theory consid
ered money and financial structure to be a function of the needs of the real
sector (or trade). The classical model assumes capital markets to be perfect
and frictionless. Money is rendered neutral, hence has no effect on capital ac
cumulation other than being a transaction driven medium of exchange. Other
financial assets are regarded as mere claims on physical assets. As late as
1989 the World Bank (p26) was still regarding the provision of a medium of ex
change as the financial system's biggest contribution to growth. The irrelevance
of money in neoclassical real activity is termed monetary neutrality. Classical
macroeconomic theory distinguisi1c3 between real variables and nominal vari
ables. And the resultant separation is termed classical dichotomy. Relative
prices are determined in the real sector while the general price level arises in
32
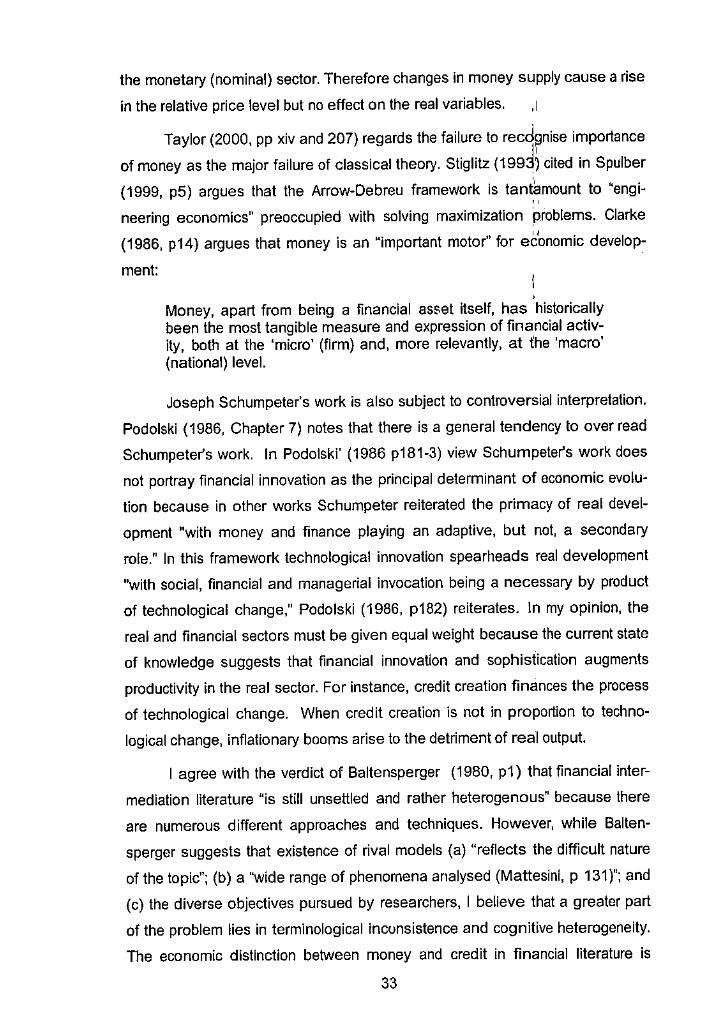
the monetary (nominal) sector. Therefore changes in money supply cause a rise
in the relative price level but no effect on the real variables. .I
Taylor (2000, pp xiv and 207) regards the failure to recdgnise importance
of money as the major failure of classical theory. Stiglitz (199~) cited in Spulber
(1999, p5) argues that the Arrow-Debreu framework is tantamount to "engi-"
neering economics" preoccupied with solving maximization problems. Clarke
(1986, p14) argues that money is an "important motor" for ec'onomic develop
ment:
• Money, apart from being a financial asset itself, has historically been the most tangible measure and expression of financial activity, both at the 'micro' (firm) and, more relevantly, at the 'macro' (national) level.
Joseph Schumpeter's work is also subject to controversial interpretation.
Podolski (1986, Chapter 7) notes that there is a general tendency to over read
Schumpeter's work. In Podolski' (1986 p181-3) view Schumpeter's work does
not portray financial innovation as the principal determinant of economic evolu
tion because in other works Schumpeter reiterated the primacy of real devel
opment "with money and finance playing an adaptive, but not, a secondary
role." In this framework technological innovation spearheads real development
"with social, financial and managerial invocation being a necessary by product
of technological change," Podolski (1986, p182) reiterates. In my opinion, the
real and financial sectors must be given equal weight because the current state
of knowledge suggests that financial innovation and sophistication augments
productivity in the real sector. For instance, credit creation finances the process
of technological change. When credit creation is not in proportion to techno
logical change, inflationary booms arise to the detriment of real output.
I agree with the verdict of Baltensperger (1980, p1) that financial inter
mediation literature "is still unsettled and rather heterogenous" because there
are numerous different approaches and techniques. However, while Balten
sperger suggests that existence of rival models (a) "reflects the difficult nature
of the topic"; (b) a "wide range of phenomena analysed (Mattesini, p 131)"; and
(c) the diverse objectives pursued by researchers, I believe that a greater part
of the problem lies in terminological inconsistence and cognitive heterogeneity.
The economic distinction between money and credit in financial literature is
33
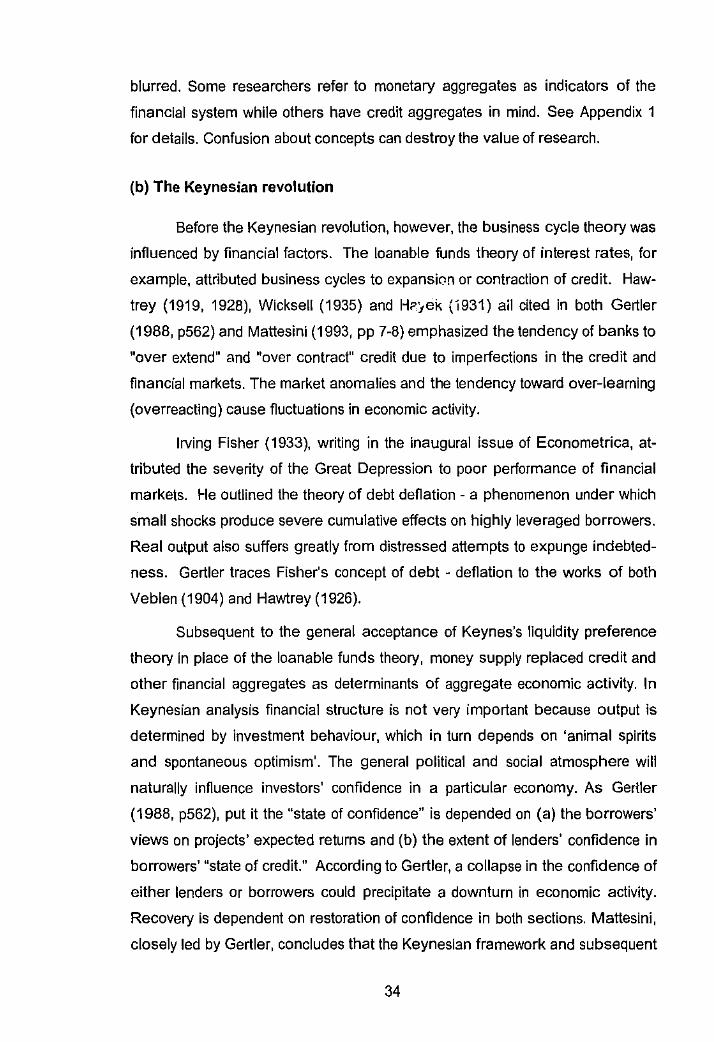
blurred. Some researchers refer to monetary aggregates as indicators of the
financial system while others have credit aggregates in mind. See Appendix 1
for details. Confusion about concepts can destroy the value of research.
(b) The Keynesian revolution
Before the Keynesian revolution, however, the business cycle theory was
influenced by financial factors. The loanable funds theory of interest rates, for
example, attributed business cycles to expansion or contraction of credit. Haw
trey (1919, 1928), Wicksell (1935) and He:,ei< (1931) ail cited in both Gertler
(1988, p562) and Mattesini (1993, pp 7-8) emphasized the tendency of banks to
"over extend" and "over contract" credit due to imperfections in the credit and
financial markets. The market anomalies and the tendency toward over-learning
(overreacting) cause fluctuations in economic activity.
Irving Fisher (1933), writing in the inaugural issue of Econometrica, at
tributed the severity of the Great Depression to poor performance of financial
markets. He outlined the theory of debt deflation - a phenomenon under which
small shocks produce severe cumulative effects on highly leveraged borrowers.
Real output also suffers greatly from distressed attempts to expunge indebted
ness. Gertler traces Fisher's concept of debt - deflation to the works of both
Veblen (1904) and Hawtrey (1926).
Subsequent to the general acceptance of Keynes's liquidity preference
theory in place of the loanable funds theory, money supply replaced credit and
other financial aggregates as determinants of aggregate economic activity. In
Keynesian analysis financial structure is not very important because output ls
determined by investment behaviour, which in turn depends on 'animal spirits
and spontaneous optimism'. The general political and social atmosphere will
naturally influence investors' confidence in a particular economy. As Gertler
(1988, p562), put it the "state of confidence" is depended on (a) the borrowers'
views on projects' expected returns and (b) the extent of lenders' confidence in
borrowers' "state of credit." According to Gertler, a collapse in the confidence of
either lenders or borrowers could precipitate a downturn in economic activity.
Recovery is dependent on restoration of confidence in both sections. Mattesini,
closely led by Gertler, concludes that the Keynesi3n framework and subsequent
34
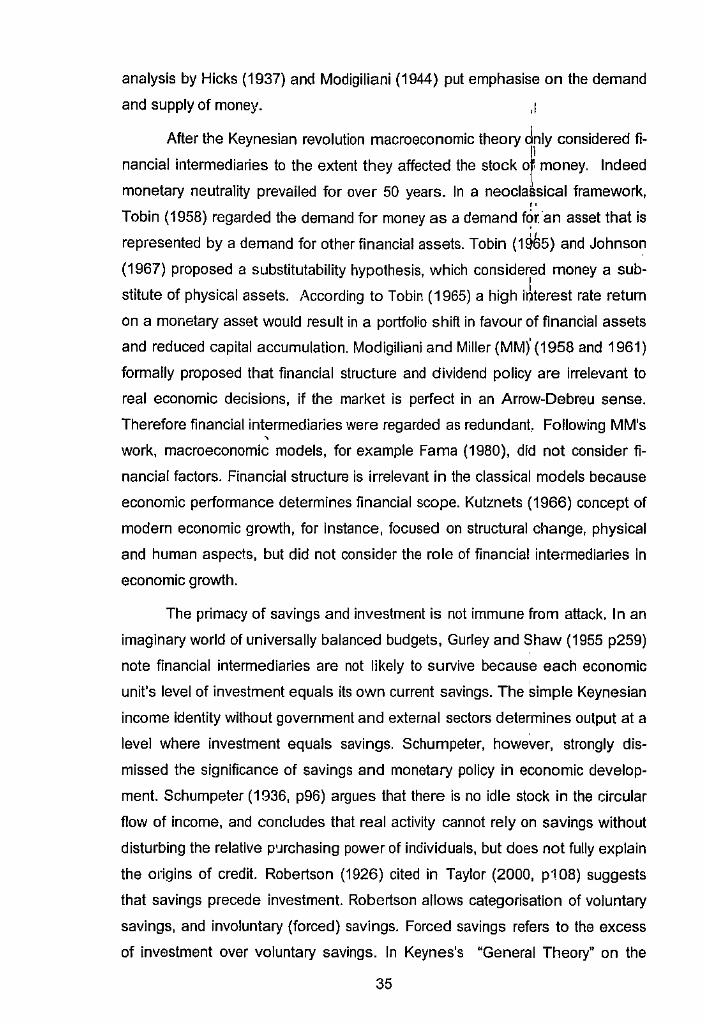
analysis by Hicks (1937) and Modigiliani (1944) put emphasise on the demand
and supply of money. ,I
After the Keynesian revolution macroeconomic theory dnly considered fi
nancial intermediaries to the extent they affected the stock of money. Indeed
monetary neutrality prevailed for over 50 years. In a neoclaSsical framework, "
Tobin (1958) regarded the demand for money as a demand for an asset that is
represented by a demand for other financial assets. Tobin (1965) and Johnson
(1967) proposed a substitutability hypothesis, which considered money a sub
stitute of physical assets. According to Tobin (1965) a high iJterest rate return
on a monetary asset would result in a portfolio shift in favour of financial assets
and reduced capital accumulation. Modigiliani and Miller (MMJ (1958 and 1961)
formally proposed that financial structure and dividend policy are irrelevant to
real economic decisions, if the market is perfect in an Arrow-Debreu sense.
Therefore financial intermediaries were regarded as redundant, Following MM's '
work, macroeconomic models, for example Fama (1980), did not consider fi
nancial factors. Financial structure is irrelevant in the classical models because
economic performance determines financial scope. Kutznets (1966) concept of
modern economic growth, for instance, focused on structural change, physical
and human aspects, but did not consider the role of financial intermediaries in
economic growth.
The primacy of savings and investment is not immune from attack. In an
imaginary world of universally balanced budgets, Gurley and Shaw (1955 p259)
note financial intermediaries are not likely to survive because each economic
unit's level of investment equals its own current savings. The simple Keynesian
income identity without government and external sectors determines output at a
level where investment equals savings. Schumpeter, however, strongly dis
missed the significance of savings and monetary policy in economic develop
ment. Schumpeter (1936, p96) argues that there is no idle stock in the circular
flow of income, and concludes that real activity cannot rely on savings without
disturbing the relative p•Jrchasing power of individuals, but does not fully explain
the migins of credit. Robertson (1926) cited in Taylor (2000, p108) suggests
that savings precede investment. Robertson allows categorisation of voluntary
savings, and involuntary (forced) savings. Forced savings refers to the excess
of investment over voluntary savings. In Keynes's "General Theory" on the
35
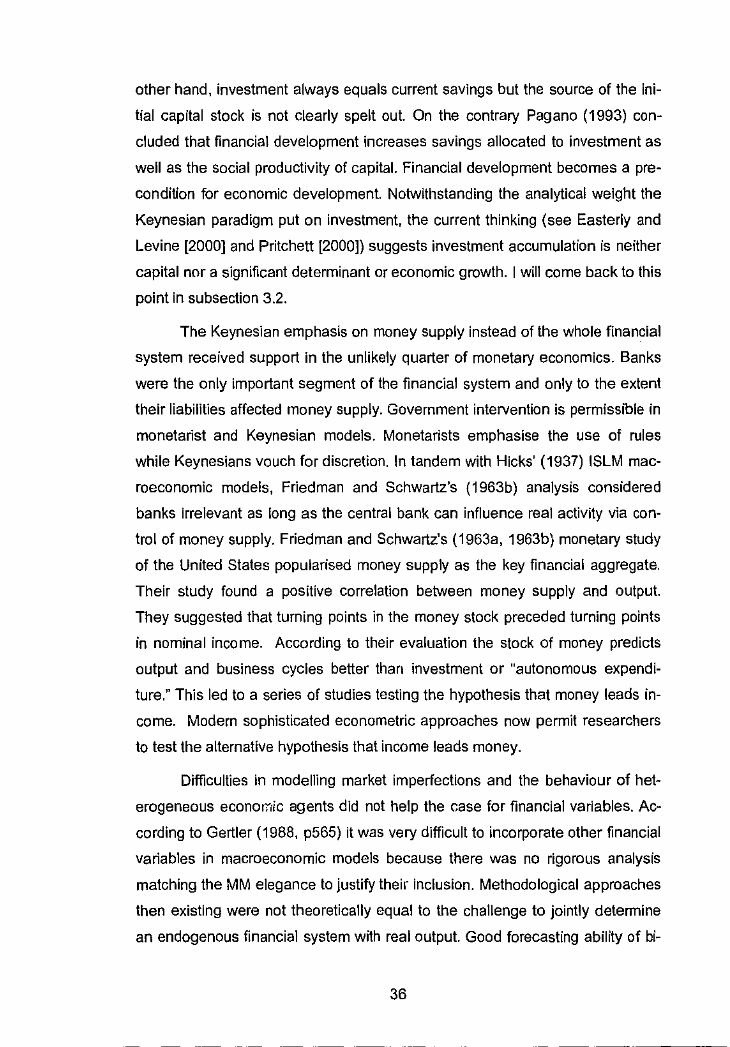
other hand, investment always equals current savings but the source of the ini
tial capital stock is not clearly spelt out. On the contrary Pagano (1993) con
cluded that financial development increases savings allocated to investment as
well as the social productivity of capital. Financial development becomes a pre
condition for economic development. Notwithstanding the analytical weight the
Keynesian paradigm put on investment, the current thinking (see Easterly and
Levine [2000] and Pritchett [2000]) suggests investment accumulation is neither
capital nor a significant determinant or economic growth. I will come back to this
point in subsection 3.2.
The Keynesian emphasis on money supply instead of the whole financial
system received support in the unlikely quarter of monetary economics. Banks
were the only important segment of the financial system and only to the extent
their liabilities affected money supply. Government intervention is permissible in
monetarist and Keynesian models. Monetarists emphasise the use of rules
while Keynesians vouch for discretion. In tandem with Hicks' (1937) ISLM mac
roeconomic models, Friedman and Schwartz's (1963b) analysis considered
banks irrelevant as long as the central bank can influence real activity via con
trol of money supply. Friedman and Schwartz's (1963a, 1963b) monetary study
of the United States popularised money supply as the key financial aggregate.
Their study found a positive correlation between money supply and output.
They suggested that turning points in the money stock preceded turning points
in nominal income. According to their evaluation the stock of money predicts
output and business cycles better than investment or "autonomous expendi
ture." This led to a series of studies testing the hypothesis that money leads in
come. Modern sophisticated econometric approaches now permit researchers
to test the alternative hypothesis that income leads money.
Difficulties in modelling market imperfections and the behaviour of het
erogeneous econm,iic agents did not help the case for financial variables. Ac
cording to Gertler ( 1988, p565) it was very difficult to incorporate other financial
variables in macroeconomic models because there was no rigorous analysis
matching the MM elegance to justify their inclusion. Methodological approaches
then existing were not theoretically equal to the challenge to jointly detennine
an endogenous financial system with real output. Good forecasting ability of bi-
36
·C
..• '
" " ' '
" ' . '
variate VAR models of money and output strengthened the evidence for the hy-
pothesis that money has a strong causal role on output. ,I
I (c) Financial system renaissance and the counter movem,~ts
Gurley and Shaw (1955 and 1960) and Tobin (1963) retlved the study of "
financial intermediaries and the overall financial system. r~·eir research de-,, emphasised the "uniqueness" of banks by highlighting the inrnnse competition
faced by banks at the hands of the non-bank financial instituti~ns. According to
Gurley and Shaw's "new view", portfolio substitution and the role of economies
of scale become important as the financial system grows in sophistication. In an . advanced financial system, money supply is not the only relevant financial ag-
gregate. In such an economy money supply is also a poor proxy for the level of
financial intermediation. Lynch (1993) notes China has a money supply to GDP
ratio equal to that of Japan and higher than Australia's but not equally sophisti
cated. Gurley and Shaw suggest financial sophistication is good for growth.
McKinnon (1973), Shaw (1973), and Fry (1981) advanced the complementary
hypotheses. Baltensperger (1980, p2) finds the disregard of the financial sector
in classical paradigms surprising given the magnitude of real resources such as
labour and capital committed to the financial sector.
Mattesini (1993, p1) attributes this renewed interest in financial structure
to advances in information asymmetry theories and empirical evidence demon
strating the explanatory power of alternative financial aggre~ates. Generally
credit and equity market imperfections are sometimes attribut8d to informational '
asymmetries. The emergence of new representation techniques such as the
General Method of Moments (GMM), Impulse Response Function (IRF) analy
sis, forecast error variance decomposition (VDC) and vector autoregression,
(VAR) brought with them empirical flexibility, which lead to the re-examination of
financial factors. Availability of these and other new econometrics techniques
facilitated the formal characterisation of the financial system as an important
determinant of aggregate economic activity, productivity and economic devel
opment.
Time series studies by Sims (1980, 1988) challenged the primacy of
money as a determinant of output. Traditional inferences about causality were
37
considered 'incredible'. Mishkin (1978) found the collapse in households' finan
cial net worth during the Great Depression was detrimental to aggregate de
mand. Bernanke (1983) supports this finding and concludes that the collapse of
the financial system, not just money supply, worsened the shrinkage in eco
nomic activity. The acceptance of endogenous growth theories popularised by
Lucas (1988) and others has resulted in revival of interest in the determinants of
economic growth. In Farmers (1984) model [yes, Farmer not Fama], financial
markets are imperiect due to asymmetrical information, and incomplete as a re
sult of overlapping generations. The model demonstrates that both current
stocks and the history of previous innovations affect real variables. In
Greenwood and Javonic (1990) intermediation arises endogenously.
Patrick (1966) cited in Jayaraman (1996, p8) argued that the direction of
causality changes over time. Two patterns of causality were suggested namely
demand following and supply leading. The demand following view postulates
that economic activity determines the demand for financial services. On the
other hand the supply-side approach suggests that development of financial
services precede demand for the services. Jung (1986) investigated the direc
tion of causality between financial development and economic growth in 56
countries. The study found that developing countries were generally associated
with a "supply-leading" causality. This indicates that causality runs from financial
to real sector development. The result discredited Tobin's (1965) and Johnson's
(1967) substitutability hypothesis, which considered money a substitute of
physical assets. "Real assets do not bring the benefits of financial assets be
cause they cannot be loaned to investors," Sudweeks (1989, p102) stresses.
Financial economists have built considerable consensus on the impor
tci,nce of the finance and real sector interaction. However the actual mechanics
through which finance affects real activity is still debatable. Freixas and Rochet
(1998, p161), among others, emphasize two monetary transmission mecha
nisms namely the money and credit views.
(i) The money view
The mor.ey view, represented by the ISLM model, only emphasizes the
bank's liabi!\ties, the main constituent of money supply. Short-term interest rates
are determined by the interaction of demand and supply for money. Loans and
38
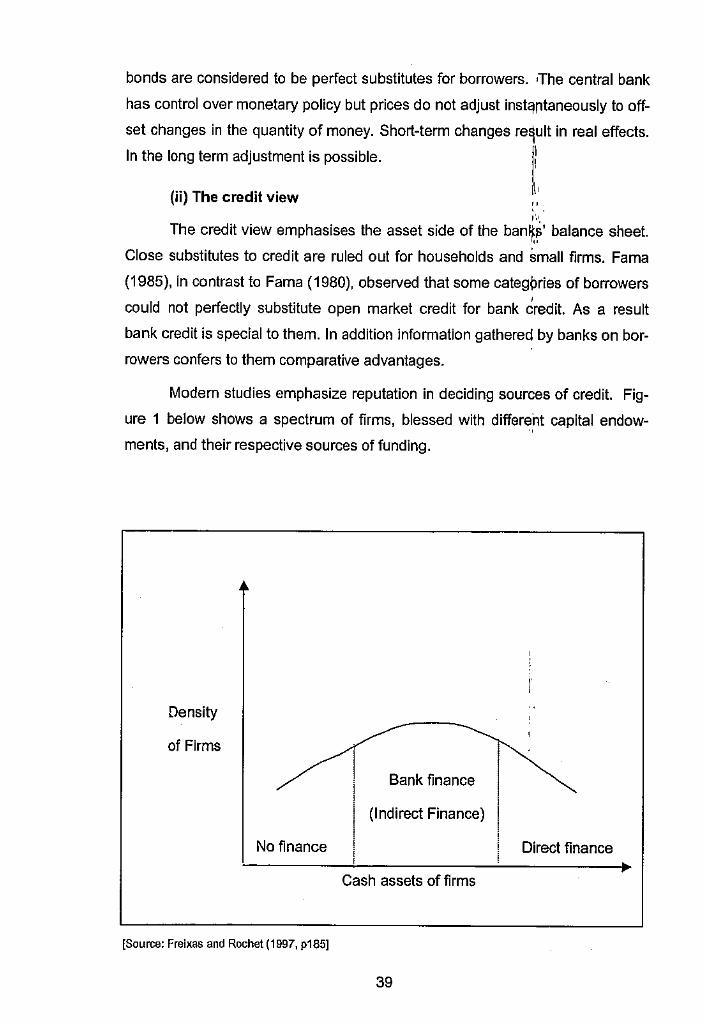
bonds are considered to be perfect substitutes for borrowers. •The central bank
has control over monetary policy but prices do not adjust instc:Jntaneously to off
set changes in the quantity of money. Short-term changes re~ult in real effects.
In the long term adjustment is possible.
(ii) The credit view
1: 1\, " . ,·.,
The credit view emphasises the asset side of the ban~J;· balance sheet. ... Close substitutes to credit are ruled out for households and Small firms. Fama
(1985), in contrast to Fama (1980), observed that some categpries of borrowers
' could not perfectly substitute open market credit for bank credit. As a result
bank credit is special to them. In addition information gathered by banks on bor
rowers confers to them comparative advantages.
Modern studies emphasize reputation in deciding sources of credit. Fig
ure 1 below shows a spectrum of firms, blessed with differe~t capital endow
ments, and their respective sources of funding.
Density
of Firms
No finance
[Source: Freixas and Rochet (1997, p185]
Bank finance
(Indirect Finance)
Direct finance
Cash assets of firms
39
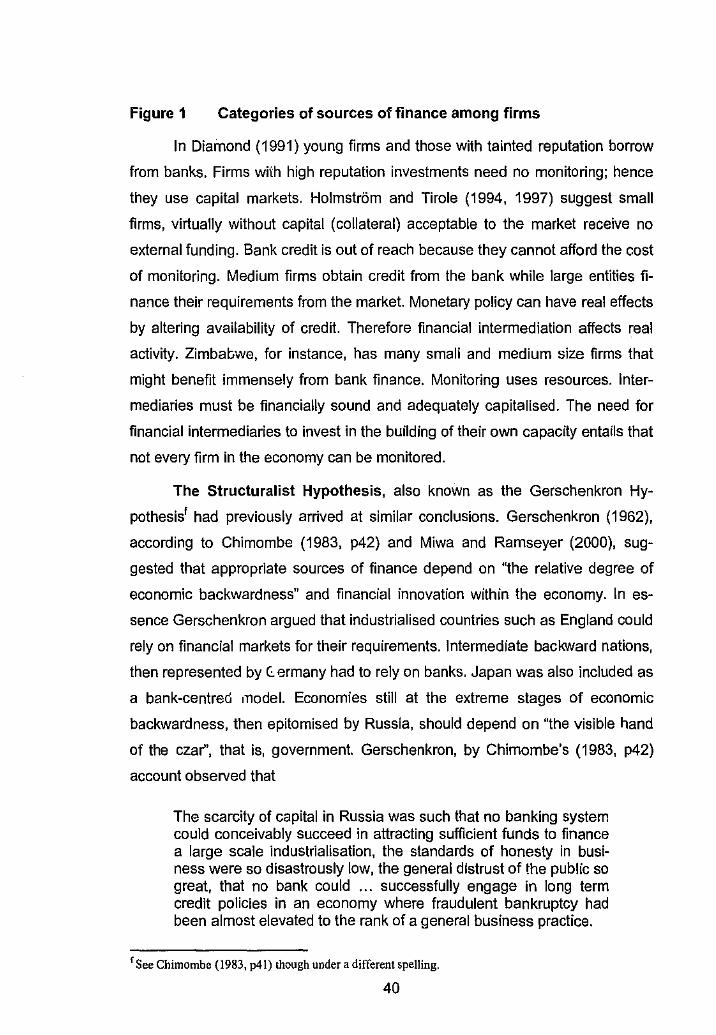
Figure 1 Categories of sources of finance among firms
In Diamond (1991) young firms and those with tainted reputation borrow
from banks. Firms with high reputation investments need no monitoring; hence
they use capital markets. Holmstrom and Tirole (1994, 1997) suggest small
firms, virtually without capital (collateral) acceptable to the market receive no
external funding. Bank credit is out of reach because they cannot afford the cost
of monitoring. Medium firms obtain credit from the bank while large entities fi
nance their requirements from the market. Monetary policy can have real effects
by altering availability of credit. Therefore financial intermediation affects real
activity. Zimbabwe, for instance, has many smali and medium size firms that
might benefit immensely from bank finance. Monitoring uses resources. Inter
mediaries must be financially sound and adequately capitalised. The need for
financial intermediaries to invest in the building of their own capacity entails that
not every firm in the economy can be monitored.
The Structuralist Hypothesis, also known as the Gerschenkron Hy
pothesisf had previously arrived at similar conclusions. Gerschenkron (1962),
according to Chimombe (1983, p42) and Miwa and Ramseyer (2000), sug
gested that appropriate sources of finance depend on "the relative degree of
economic backwardness" and financial innovation within the economy. In es
sence Gerschenkron argued that industrialised countries such as England could
rely on financial markets for their requirements. Intermediate backward nations,
then represented by C:. ermany had to rely on banks. Japan was also included as
a bank-centred model. Economies still at the extreme stages of economic
backwardness, then epitomised by Russia, should depend on "the visible hand
of the czar", that is, government. Gerschenkron, by Chimombe's (1983, p42)
account observed that
The scarcity of capital in Russia was such that no banking system could conceivably succeed in attracting sufficient funds to finance a large scale industrialisation, the standards of honesty in business were so disastrously low, the general distrust of the public so great, that no bank could ... successfully engage in long term credit policies in an economy where fraudulent bankruptcy had been almost elevated to the rank of a general business practice.
r See Chimombe (1983, p41) though under a different spelling,
40
=i::asw:c.d.\,},
Miwa and Ramseyer (2000, p5) note that a vast body of financial inter- iiJ mediation literature such as superior monitoring, screening cqpabilities, agency
theory, information asymmetries, adverse selection, moral h~zard, and credit
rationing could "potentially" be traced to Gerschenkron's role of: banks.
Since the classic study by Gerschenkron (1962) there ~as been a series " of debates on the comparati'Je merits of the "Anglo-Saxon" ~a·rketMbased and
the "Continental" banKMbased views of the financial systeri{ DemirgG~-Kunt
and Levine (1999) find the distinction between banks based and market based
financial systems has run out of steam. There is a tendency fa~ both to increase
as the economy gets sophisticated. Levine (2000) provides strong support to
Merton's (1991) financial services view that regards bankS and markets as
complementary vehicles for financial services. Building on this, La Porta, Lopez
de-Silanes, Shleifer, and Vishny [LLSV for short] (1997, 1998, 1999, 2000) re
ject the bank-based versus market-based debate. They propose a "legal-based
view" which emphasises structural and regulatory factors influencing financial
structure and performance. La Porta et al (1999, p24) view finance as a set of
contracts: "In the end, the rights create finance." A competent legal environment
is required to enable financial markets and institutions to fulfil their roles. LLSV's
evidence supports the need for rule of law and efficient enforcement of con
tracts. Levine (2000, p5-6) concludes that,
There is no cross-country empirical support for either the marketw based or bank-based views. Neither bank-based npr marketbased financial systems are particularly effective at promoting growth .... Thus, cross-country comparisons do not suggest that distinQuishing between bank-based and market based is analytically useful for understanding the process of economic growth.
(d) Optimal financial structure
Baltensperger (1980, p3) argues that most theories of financial intenme
diation are "partial" models that concentrate on portfolio aspects. This is rightly
so since early models of banking either focused on liability management, asset
management, or asset and liability management concepts. The banking chal
lenge was to balance the conflicting demands of profitability and solvency. ln
partial models the size and structure of the banking system are "assumed to be
41
exogenously determined." As a result partial models are preoccupied with allo
cative and operational efficiency. Gertler (1988, p582) argues that disaggre
gated results from partial models generate ambiguous policy implications. This
makes it difficult to evaluate monetary policy.
"Complete" theories of banking, as envisaged by Baltensperger should
"explain the joint determination" of structure, size and portfolio:
A complete theory of the banking firm, however, should not onl;i/ provide an integrated view of the firm's assets and liability choice, but also allow an endogenous determination of the total scale of operation of the firm (p 3).
Baltensperger reviews Klein's (1971) monopoly model but disagrees with
its strong reliance on the assumption of monopoly power. Other models of opti
mal banking are based on risk aversion and they followed Markowitz's general
portfolio theory. In Pyle's model (1971) [see Baltensperger pp 24-29], financial
intermediation exists when there is a positive difference between the expected
return on assets (loans) and liabilities (deposits). Arbitrage is limited by varying
degrees of risk aversion among economic units. The model fails to account for
input costs, solvency, liquidity and the endogenous origins of financiai interme
diaries.
Why will the bank find customers willing to hold a financial asset ('deposits') at an expected rate below the one which the bank can obtain itself, and others ... willing to indebt themselves to the bank at an axpected rate [higher than] the bank has to pay itself?
Santomero and Seater (1998) adopt the Holmstrom and Tirole (1997)
framework to formally derive an optimal structure of banking. The optimal
structure is not dependent on size or state of the economy but on the proportion
of capital allocated to banking sector, degree of inefficient behaviour in the fi
nancial system, and the impact of monitoring [financial intermediation] on out
put. MonitDiing increases the productivity of middle firms, and affects the
growth rate of the economy as well as output. It is my hope that researchers will
soon confront this model with data to evaluate its empirical validity.
With direct reference to Zimbabwe the quest for an optimal banking
structure has caused needless disquiet in the financial circles. There has been
wide speculation on whether Zimbabwe has an overbanked financial system. In
42
my view the conclusion that the Zimbabwe financial market :is overbanked is
based on crude estimates. Mataruka (1999, p66-7), for insta~_ce used the Her
findahl Index, normally applied to analyse monopoly power (m~rket dominance),
to suggest that the "overgrazed" market had room for 5 co~~ercial banks in
stead of 8 then in the market. There is a high risk of confu~,ifl9 concentration
with optimality. Humphrey (1990) demonstrates that "the size of scale econo-'·'.
mies of banking" is affected by a number of economic and P.olitical issues as
well as systematic biases. Different researchers, applying different cost defini
tions and output measurements could arrive at conflicting pblicy conclusions. '
Recent cross-country studies and panel data (See DemirgUg-Kunt and Levine
1999 or Table 1 above) actually suggest Zimbabwe has an underdeveloped fi
nancial system. Attempts to demmcate an optimal banking structure by legislaR
tion or licence could create opportunities for rent seeking and inefficiency.
2.2 Empirical Evidence: Does Financial Development Promote Growth?
Freixas and Rochel (1997, p 176) note that classical theories fail to ex
plain why macroeconomic variables (output, investment, employment) fluctuate,
more than the fundamentals (productivity and demand parameters). Financial
intermediation scholars attribute the residual cyclical fluctuations in macroecoR
nomic variables to financial factors. Policymakers and applied economists also
believe fluctuations in financial variables have a real effect both in the short run '
(stabilization) and in the long run (growth) to the extent of w~rranting close at
tention. ln extreme cases financial markets are regulated "to 'the point of finanR
cial repression," Denizer, Desai and Gueorguiev (1998, p2). [~mphasis original.]
Unfortunately financiai repression is usually detrimental to economic growth.
Empirical evidence in favour of financial factors has been overwhelming
although no consensus has yet emerged. Gurley and Shaw (1955, 1960) were
the first to stress the importance of the financial structure or ''financial deepenR
ing view" in economic growth. Their work promoted the establishment of a wide
network of financial institutions. They argued that banks and other nonRbank fiR
nancial institutions (NBFI) exist to transform financial contracts and securities.
These institutions facilitate the circulation of financial resources between savers
43
and businesses. Benston and Smith (1976) and Fama (1980) extended this
view. Financial intermediation is critical as it affects inter-temporal trade and
general economic activity. In Body and Prescott (1986) financial intermediaries
foster economic growth by enabling improved screening of projects.
Goldsmith (1969) made a rigorous cross-section study to establish the
causal links. A positive correlation was found between economic growth and
the intensity of financial sector development. Mishkin (1978) found that aggre
gate demand during the Great Depression was significantly affected by con
sumers' net financial position. An important study by Bernanke (1983) con
cluded that money supply alone could not account for the Great Depression.
The depth and persistence of the depression can be attributed to the collapse of
the financial system. In particular, Jiabllit;as of failed banks and interest differ
entials on good and bad bonds had significant explanatory power.
By the 1970s, seminal works of McKinnon (1973) and Shaw (1973) es
tablished that financial repression retards economic growth. In the wake of poor
results from foreign aid, two views about financial development were proposed.
McKinnon's (1973) Financial Repression Hypothesis promoted widespread fi
nancial liberalisation in the 1980s as a precursor for economic development.
Shaw (1973) popularised "financial deepening" denoted by the accumulation of
financial assets, as a significant determinant of economic prosperity. Shaw
traces poverty, unemployment and overvalued exchange rates to "shallow" fi
nance and financial repression.
Denizer, Desai and Gueorguiev (1998, p3) define financial repression as
[Al set of policies, laws, formal regulations, and informal controls, imposed by governments on the financial sector, that distort financial prices - interest rates and foreign exchange rates - and inhibit the operation of financial intermediaries at their full potential.
The reasons for and against financial repression are well known. See
either McKinnon or Shaw for example. I have picked only "economic myopia"
and seigniorage for closer scrutiny because they have a direct bearing on finan
cial intermediation. McKinnon (1973, p22) suggests that authorities who suffer
from "the Intervention Syndrome" promote financial repression as "second best
optimisation." The typical arsenals of financial repression commonly deployed in
44
the financial market are exorbitant reserve requirements and artificial interest
rates. Economic myopia, as depicted by Shaw (1973, p15), arise in an economy
where there is no due regard for the consequences of partisan decisions made
in favour of one section of the community. Apart from welfare concerns there is
strong evidence that governments perpetuate financial repression either as a
source of power and revenue. Ironically both the tame and wild characteristics
of financial instruments make them a ready cash cow for fiscal imprudence. At
the wild end, "Capital is so fungible, so slippery for regulation to cope with, that
there is a strong tendency to multiply restrictions," Shaw (1973, p92). On the
tame side, taxation of financial assets is usually more severe and effective than
say taxation of real property and informal trade. The so-called "easy money"
thesis views financial repression as a deliberate policy choice to transfer finan
cial assets to the fiscus. According to Hayek (1976, p27)9 governments engi
neer inflation for their own benefit. "As if the inflation tax were not enough", ar
gues Shaw (1973, p90),
[Other] taxes discriminate against income from financial assets. Suck income is conspicuous, unless it flows through the street market, and easily reached by the tax collector.
The government. especially in economies where it grapples with low tax
yield, costly public debt, and perennial fiscal deficits easily succumbs to the
temptation to debase the currency in order to gain seigniorage revenue. In sim
ple words seigniorage is the profit (purchasing power) raised by the government
from printing money at a rate above its intrinsic value. Schuler's (1992) disser
tation highlights that notes and coin do not pay interest unlike other securities;
hence the issuer acquires purchasing power without sacrificing reserves or
other resources. The Federal Reserve Bank of Cleveland [FRB Clev.] (1995
p9)1 traces the terminology to the "seigneur's" (French for feudal lord) "exclusive
right to coin money on his manor" in the Middle Ages, which prerogative now
vested in government. The risk of governments to "eventually abuse their pow
ers" (FRB Clev.) is so real that some countries erect legislative barriers and
grant cental banks ind1Jpendence from monetary authorities.
g See The Federal Reserve Bank of Cleveland (/995) "Governments and Money" essay.
45
The McKinnon - Shaw studies left a legacy of closer attention to finan
cial liberalization. They argued that liberalisation would proviqf the market with
a wide portfolio choice. High real interest rates were regardeq as favourable to
savings, investment and economic growth. In the ZimbabvJkan context Chi-•
mombe (1983, pp 39-40) reluctantly blames financial repres~ipn for "inefficient
credit allocation" and bias against green projects of all types. :.'.,.
Subsequent financial instability at the heels of liberali~ation convinced
many that the hypothesis was incomplete. Denizer, Desai and Gueorguiev
(1998, p5) argue that the "easy cash" thesis of financial reJression is incom
plete because policymakers facing the same budget constraints react differently
and not axiomatically. Denizer et al observe that directed credi't is an exogenous
cause of financial repression rather than an endogenous outcome of repression
as hypothesized by the easy cash view. Their evidence gleaned from former
Soviet transitional economies attributes financial repression to centralisation of
political power and internal opposition to reforms within the government. Neither
Shaw nor McKinnon drew attention to banking institutions' insolvency or the
need for prudential supervision, observe Cole and Slade (1996, p7). Subse
quent bank failures in all parts of the world convinced many that financial liber-
31ization without structural stability is a recipe for inevitable financial collapse.
Fry (1988) was convinced that regulation and prudential supervision were the
areas in need of critical research.
Fisher's debt-deflation theory was reinvigorated by Minsky (1972) 2 who
proposed the Financial Instability Hypothesis. In Minsky's world, financial sys-.
terns are pathologically unstable. Financial crises become systemic and
endogenously generated events rather than accidents. If the economy is doing
well, for instance, banks may over lend and the borrowers over borrow. When
circumstances change both parties may fail to adjust resulting in bank failures.
Kindleberger ([1978], 1996) like Minsky ar11ues that money and credit
have never been properly managed throughout history. Society has a tendency
to over learn resulting in a series of manias, panics and crushes. Fischer,
Gueyie and Ortiz (1997), using a GMM statistical procedure, conducted event
studies to determine whether financial liberalisation increases risk on banks'
exposures. Their evidence suggests that financial liberalisation increases bank
46
risk. Fischer et al stress that while bank exposures are sensitive to both macro
economic and management factors, management variables could be more criti
cal. Ajit Singh (1997) suggests that rapid expansion of the financial system, es
pecially stock exchanges, is detrimental to economic growth and stability.
Singh's analysis implies that the bigger the financial system the more unstable it
becomes.
Miwa and Ramseyer (2000) argue that contrary to conventional percep
tion Japan does not have a bank centred economy, but relies on equity finance
sourced in competitive markets. However, Hoshi and Kashyap (1999) insist
that dependence on capital markets is a direct result of 20 years of deregula
tion, known as the "Japanese Big Bang." Their paper attributes the protracted
Japanese recession in the 1990s to problems in the financial system. It must
be clear that this Japanese debate is about the relative importance of segments
of the financial sector which we have already seen to complement one another.
For our purposes the debate does not dispute the significance of financial fac
tors in economic activity. Rousseau (1999) argues that financial sector deep
ening contributed to "Japan's rise to world prominence". Rousseau uses a
cointegrated VAR system to demonstrate that unidirectional causality operated
from financial factors to output and inves~ment.
Levine and others have breathed a new lease of life in the finance and
growth nexus. King and Levine (1992, 1993) found significant correlation be
tween the degree of financial sophistication Emd real economic growth. Roubini
and Sala-i-Martin (1991,p 1) arrive at similar results. Recently Beck, Demirgii<;·
Kunt, and Levine (1999) popularised new ratios of size, activity and efficiency to
measure banking sector and stock market development. Their study relates
economic development to bank, nonbank and stock market development. In
Demirgiic;-Kunt and Levine (1999) both foreign banks' share and public banks'
share were found to have a statistically significant relationship with GDP. Levine
(1998) shows that financial intermediation accounts for not only output growth,
but capital stock growth and productivity growth as well. Kuh and Meyer's
(1963) evidence suggests that financial factors are important in corporate in
vestment. Elliot (1973) supports the hypothesis. In my view Levine's (1998) pa
per opens interesting avenues for future research because productivity and fi-
47
nancial intermediation are usually considered as separate determinants of eco-
nomic growth. ,I
Table 2 shows some of the most important studies on\financial interme
diation up to 1995. Monetary and interest rate aggregates w~re then the most
popular indicators of financial activity. In most cases the resea}chers found for a "
positive relationship between financial sophistication and eco~omic growth. The
tendency was to analyse financial development in a cross se'ction pattern. De
Gregorio & Guidotti (1992) demonstrate that cross-country studies are sensitive
to the sample of countries included in the study. Technically ~oth cross section
and time series studies are sensitive to the time period considered. Levine and
others' popularisation of new indicators of financial sophistication coincided with
new time series techniques. At the moment time series studies based on a sin
gle country are becoming as common as their cross section counterparts.
2.3 The Theory of Financial Intermediation
This section consolidates the theoretical underpinnings in the financial
intermediation literature. Integration of existing theories is important in order to
explain the existence and significance of financial intermediation. In classical
theories the financial intermediaries "exist by the grace of market imperfec
tions", (Scholtens and Wensveen 2000, p1245) yet Eichberger and Harper
(1997, p241) observe that both the theory and practice are rising. James and
Smith (1994) agree that for the past two decades the theory of financial inter
mediation was founded on trar,saction costs and asymmetric ·information. In an
imaginary Marshallian and Walrasian world of perfect markets, Eichberger and
Harper (1997, p246) stress, "Theory is quite unequivocal in its prediction that
efficient markets render financial intermediaries obsolete." Benson and Smith
(1976) are emphatic the raison d'e'tre for the industry is the existence of finan
cial costs. Financial intermediation entails reduction in transaction costs and
satisfaction of the demands for time dated consumption. Financial intermediar
ies provide divisible purchasing power, which is converted into goods and serv
ices at low cost at the right time. In this process banks gain economies of scale
and scope, which individuals and markets cannot replicate. Spulber (1999, pix)
48
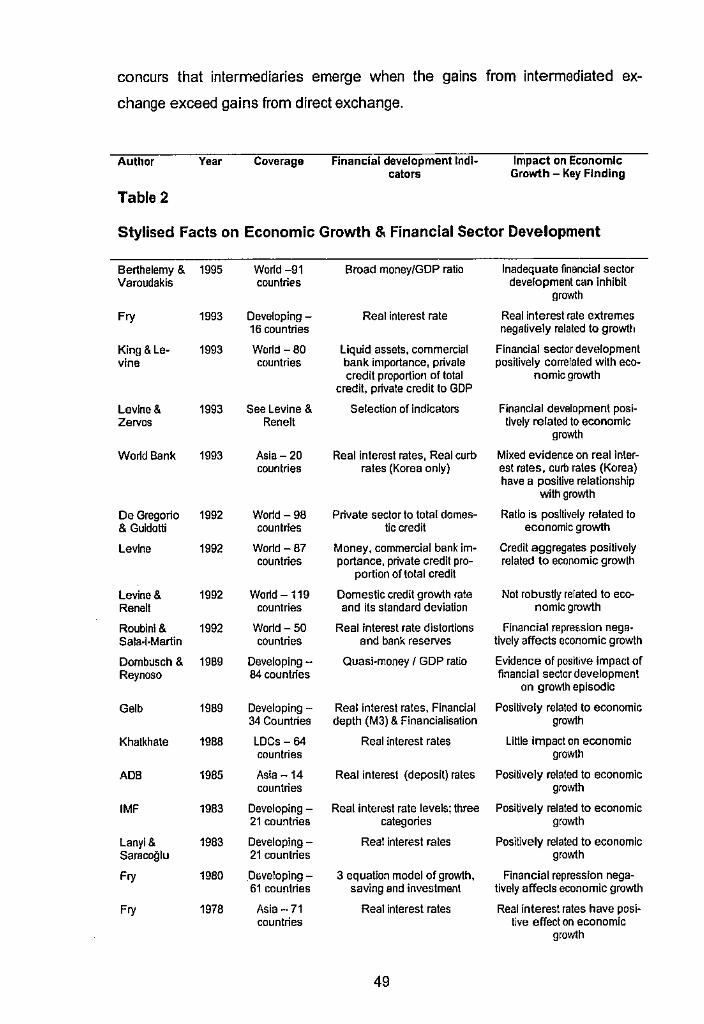
concurs that intermediaries emerge when the gains from intermediated ex
change exceed gains from direct exchange.
Author Year Coverage Financial development lndl- Impact on Economic cators Growth - Key Finding
Table 2
Stylised Facts on Economic Growth & Financial Sector Development
Berthelemy & 1995 World-91 Broad money{GDP ratio Inadequate financial sector Varoudakls countries development can inhibit
growth
F,y 1993 Developing - Real interest rate Real interest rate extremes 16 countries negatively related to growtt1
King & Le- 1993 World-BO Liquid assets, commercial Financial sector dev~?lopmenl vine countries bank importance, private positively correlated with eco-
credit proportion of total nomic growth credit, private credit to GDP
Levine & 1993 See Levine & Selection of indicators Financial development posl-Zervos Renell lively related to economic
growth
World Bank 1993 Asia - 20 Real interest rates, Real curb Mixed evidence on real inter-countries rates (Korea only) est rates, curb rates (Korea)
have a positive relationship with growth
De Gregorio 1992 World-98 Private sector to total domes- Ratio is posltively related to & Guidotti countries lie credit economic growth
Levine 1992 World-87 Money, commercial bank im- Credit aggregates positively countries parlance, private credit pro- related to economic growth
portion of total credit
Levine& 1992 World-119 Domestic credit growth rate Not robustly related lo eco-Renell countries and its standard deviation nomic growth
Roubinl & 1992 World-50 Real interest rate distortions Financial repre~slon nega. Sa!a·l·Martin countries and bank reserves lively affects economic growth
Dornbusch & 1989 Developing - Quasi-money f GDP ratio Evidence of positive Impact of Reynoso 84 countries financial sector development
on growth episodic
Gelb 1989 Developing - Real interest rates, Financial Positively related to economic 34 Countries depth (M3) & Financialisalion growth
Khatkhate 1988 LDCs - 64 Real interest rates Little impact on economic countries growth
ADB 1985 Asia -14 Real interest {deposit) rates Positively related to economic countries growth
IMF 1983 Developing - Real interest rate levels; three Positively related to economic 21 countries categories growth
Lanyl & 1983 Develop!ng - Rea! Interest rates Positively related to economic Saracoglu 21 countries growth
F,y 1980 Oi;ve!oping - 3 equation model of growth, Financial repression nega-61 countries saving and investment lively affects economic growth
Fry 1978 Asia - 71 Real interest rates Real interest rates have posi· countries live effect on economic
growth
49
[Source: Lynch (1994, p5) Table 1] ,I
I Leland and Pyle (1977) propose an information-based theoryl/in which financial
intermediaries resolve information asymmetry between borro~,ers and lenders.
Loan contracts contain special clauses to ward off precontra'Ct adverse selec-, ... tion, and ex-pas: effort -aversion and asset substitution moral hazard.
Fama (1980), inspired by the theory of finance, prof.oses that banks
perform two functions: (a) a transaction function and (b) a portfolio function. In a
competitive world, banks are intermediaries that respond to the tastes of ulti
mate borrowers and lenders (i.e. real activity.) The model 0xcludes costs as
well as the liability side of the balance sheet. Kashyap, Rajan and Stein (1999)
emphasize that the standard distinguishing characteristic of a bank is the si
multaneous engagement in two distinct activities on either side of the balance
sheet: That is [demand] deposit taking and extending monitored credit [lending].
The dual functions provide liquidity insurance at the cost of forgone interest on
cash balances held and double taxation on securities.
Ramakrishnan and Thakor (1984) and Diamond (1984) draw attention to
screening and monitoring activities of banks. Ramakrishnan and Thaker (1984)
propose that financial intermediaries arise endogenously to screen potential
borrowers and provide signals about their creditworthiness. In Diamond's model
monitoring requires considerable investment in human, capital and informational
technology. Due to information asymmetry and opaqueness of bank loans
(Merton, 1992) only specialised institutions, the banks, have the capacity to un
dertake it. King and Levine (1993) add that intangible assets are difficult to
value and only banks have the superior valuation skills to make a difference.
King and Levine, as in Boyd and Prescott (1986), content that banks improve
productivity by generating signals against inferior investments. According to
Mayer (1988), and Shleifer and Summers (1988)3 the process of monitoring re
sults in long-term relationships, which serve to reduce moral hazard. Economies
with better financial intermediaries accumulate more capital, make more effi
cient investments in intangible assets and human capital, and realise higher
productivity.
50
Notwithstanding financial sophistication in the economy, Stiglitz and
Weiss (1981) argue it may be optimal for banks to practice credit rationing be
cause borrowers' credit risk is difficult to observe. High interest rates required to
clear the market have a potential to crowd out good borrowers. Indeed Diamond
(1991) considers the case where borrowers could substitute safe assets for risk
ones to the lender's detriment. Adverse selection can engineer financial col
lapse. Myers and Rajan (1998) argue the agency costs associated with holding
liquid assets are potentially severe in financial institutions, as there is much
scope for risk shifting or asset substitution. A very liquid stock increases mana
gerial discretion and thus increases agency costs. In Diamond and Rajan's
(1998) model, bank managers do not create value but merely redistribute cash
flows once the loan is made. Grossman and Stiglitz (1980) examine the infor
mational content of financial markets, which supposedly emit signals not avail
able in other reported variables such as profits. Stock prices generate informa
tion not available to managers, Holmstrom and Tirole (1994).
The evolution of financial systems is sometimes characterized by the
continuing dialectic struggle between financial markets and financial intermedi
aries as alternative models of financial design. Since Gerschenkron (1962)
banks are considered to perform fundamental functions of capital allocation, risk
sharing and economic growth. More recently Allen and Gale (1994), King and
Levine (1992), Allen and Santomero (1999) and many others have reconsidered
the question of financial design and development. In another paper, Santomero
and Seater (1998) formally prove that the size of an optimal bank structure is
not sensitive to the size or state of the economy but the degree of inefficient be
haviour, impact of monitoring on output, and proportion of capital allocated to
the banking sector.
Allen and Santomero (1997) emphasize that existing theories are too
narrow, as they could not account for the survival of financial intermediaries in
the face of falling transaction costs and superior information technologies. As
market imperfections continue to recede one would expect financial markets to
dominate financial intermediaries. In practice financial intermediaries improve
their services, create new markets and new products, to retain their supremacy
over market-based alternatives.
51
In Allen and Santomero's (1999) model the complexity and depth of
modern markets increase opportunities for risk management.,V\s a result there
is need to focus on participation cost, risk trading and risk nianagement. Risk
management is one of the most important functions of financj~I intermediaries. I
In my view the paper is therefore a very significant contributi9'1 to the theory of
intermediation. However a brid critique by Scholtens and Wensveen (2000) '·'.
suggests Allen and Santomero's analysis is incomplete beca~se risk manage
ment is not a new phenomenon to the financial sector. Scholtens and Wens
veen wholly agree that risk optimisation is crucial to financial Intermediation but '
value addition is equally critical. The emphasis should be on value and financial
innovation rather than costs and market imperfections. If a dynamic framework
is adopted it would account for product differentiation and customer orientation
to both depositors and borrowers. In their view the time has come for literature
to stop seeing financial intermediaries as agents but entrepreneurs in their own
right. Maybe Schumpeter (1936, p74) was again right to regard bankers as
pathologically "the capitalist par excellence."
2.4 Theoretical Perspectives in Corporate Governance
First rule of leadership: Everything is your fault. It's a buggy, buggy world out
there Princ&ss.
Hopper in the classic Disney-Pixar animated movie" A Bug's Life."
This subsection reiterates that both corporate governance (internal gov
ernance) and external governance have great potential to ret9-rd or promote ef
ficiency and creation of wealth. Corporate governance has attracted the atten
tion of the pubhs, academics and researchers because of its connection with the
origins of the fi':m, agency problems, creation of value, distribution of surplus,
capital structure, distribution of risk, and the market for corporate control. With
regards to financial intermediation La Porta et al (2000) and Levine et al (2000)
demonstrate that indicators of governance have good explanatory power. In a
financial framework corporate governance is traced to both Ronald Cease
(1937) and Adolf Berle and Gardiner Means (1932). Corporate governance
52
comprises of ways in which agents with vested interests in an institution ensure
themselves of getting a fair return on their investment. Separation between
ownership and management create several agency problems that are explored
in the path breaking paper by Jensen and Meckling (1976). Financing without
control may be inadequate in an environment of incomplete contracts. Corpo
rate governance is sometimes discussed jointly with theories of the origin of the
firm. Among them the most common paradigms are the nexus of contracts ap
proach, the property view approach, and the nexus of investment approach.
In a broad perspective it is possible to refer to both internal and external
governance. Internal governance describes policies, procedures and inte~al
systems designed to manage interest in a firm. From a parochial financial point
of view, Smithson (1998, p433) defines risk governance as (1) communication
to senior management and Board of Directors (BOD) regarding trading and risk
activities, and (2) oversight of a firm's risk exposures by senior management
and the BOD. In banks and other financial institutions the BOD is tasked with
overall risk oversight within the institution. It approves management policies
and operational procedures. The board is expected to implement and enforce
approved policies, ensure accumulation of technical and conceptual expertise,
and evaluate performance of the inst!tution on an ongoing basis.
Given my concern with overall economic performance, this research
also focuses on the macro aspects of governance. External governance ema
nates from ownership structure, the market structure, and the regulatory envi
ronment. Although Alchian (1950) and Stigler's (1958)' evolutionary theory of
economic exchange argues that competition takes care of corporate govern
ance, it is widely accepted that market discipline is not perfect. In a world of in
formation asymmetry, competitive markets cease to be perfect. In such a realm,
economic agencies are not able to predict all future contingencies. In response,
incomplete contracts are perversive.
It must be emphasised that a reigning corporate governance system
could promote or discourage efficiency. Ex-ante incentives of rational economic
agents determine the actions they will take. Activities properly rewarded by a
distribution system will receive an optimal amount of resources. Ex-post distri
bution will determine the extent of ex-ante cooperation. Chandler (1966), cited
53
in Zingales (1997), discovers that corporate governance also affects managers'
ex-ante incentives to invest or politicise allocation of resource.~. Managers also
exhibit power-seeking tendencies. Dissatisfied economic unit' waste the firm's
resources in an attempt to influence ex-post distribution in thei~favour. i
A clear corporate governance system with distinct right's may also suffer "
from inefficient ex-post bargaining. Defective decisions may ~e made because
of information asymmetry, divergent political interests, and tree rider problems.
Free rider problems violate Coase's principle of entrepreneur coordination and
give managers greater discretion on the use of the funds. Agency problems,
that is conflicts of interest, between (1) shareholders and managers, and (2)
shareholders and debtors become inevitable. Rational share'.holders desire to
maximise the value of the firm. According to Wildsmith, "Managerial Theories of
the Firm", as cited 111 Brigham and Grapenski (1991, p10) the primary goal of
managers is to maximize the size of the firm. A large firm guqrantees manage
ment (a) increased job security, (b) increased power, status and salaries, and
(c) create more opportunities for lower and middle managers. Management that
is no tonger useful to a company sometimes self-entrench themselves. Now and
then managers resist a loss of benefits and corporate mergers in self-interest.
In an effort to minimise agency conflicts shareholders incur monitoring costs,
bonding or structural controls, and residual loss (i.e. opportunity cost form re
strictions imposed.) Jensen and Meckling (1976), the original sponsors of the
concepts, collectively refer to these expenses as agency costs. According to
Fama and Jensen (1983a, 1983b) corporate governance may also affect total
value of the firm by influencing the distribution of risk. Recert research, (Lo
renz, 1999), suggests that reputation and trust also play a cnucial part. A good
reputation will however not ensure ex-post optimality especially in periods of fi
nancial distress when it may be favourable for the borrowers not to repay their
debts.
Corporate governance entails control, which in turn influences the distri
bution of resources and collaboration of other parties. Zingales (1997) defined
corporate governance as a "complete set of constraints that shape the ex-post
bargaining over quasi-rents generated by the firm." Generally the distribution of
quasi-rents is affected by allocation of ownership, capital structure, managerial
incentive schemes, labour, and external investors. According to Williamson
54
' e
'
(1988) the purpose of economic organisation is "to craft governance structures
that economise on bounded rationality while simultaneously safeguarding the
transactions in question against hazards of opportunism." Bounded rationality is
defined as behaviour intended to be rational but is not perfectly so. Both op
portunism and gullibility taint rationality hence the acceptance of incomplete
contracts in spite of contractual hazards. Often there is need to resort to force of
law to address the shortcomings. Therefore governance extends to the eco
nomic and legal institutions that may be altered through the political process.
Siddique (1997) points out that literature on economic development is at
a crossroads. On the one hand liberal economists consider globalisation ~nd
free markets to be "the ultimate goal for developmental economics" which will
eventually solve the problems of poverty and under-development. The other
group now emphasises institutional issues (such as governance) ahead of
structural prescriptions of the Bratton Woods Institutions. The failure of struc
tural adjustment programs in Nigeria and Zimbabwe has been blamed on poor
governance. Poor performance of Latin American countries has also been
traced to their government's poor financial policies
Africa has failed to use external aid for productive purposes. Adam and
O'Connell (1997) highlight that Sub-Saharan Africa (SSA) is the poorest and
most aid-dependent region in the world. It registered the slowest growth be
tween 1960 and 1990. Michael Todaro (1994, p642) concurs that decline and
deprivation were worse in Africa than in any other region in the 1980 and
1990's. Todaro reiterates, "sub-Saharan Africa poses the greatest challenge to
world development efforts ... "
Many, including Joseph Stiglitz, the former chief economist at the World
Bank, row doubt the therapeutical potency of the "capital storage" and "policy
failure" diagnosis in absence the of strong institutional arrangements. Institu
tional issues are very difficult to calibrate and notoriously very controversial.
Sceptics argue that the issue of governance is a vanguard for liberal Western
Ideology. Massive empirical evidence, however, suggest that governance and
agency problems are essential issues both at corporate and national level. In a
highly influential and critical paper Black, Kraakman and Tarassova (1999)
blame institutional failure for rampant corruption, increase in organized crime
55
and economic collapse following economic liberalization in Russia.h The authors
argue convincingly that good governance boosts economic :performance and
give graphic accounts to demonstrate how an institutional va~uum breeds self
dealing, dishonest, corruption and economic collapse. Marke~]transactions and
contracts require a high degree of social trust and recourse tq)aw enforcement
when necessary. " ,·.,.
" Hellman, Jones, Kaufman and Schankerman (2000) argue that corrup·
tion thrives where there is weak rule of law and states are powerless to control
the degree of discretionary power" of their own bureaucrats. ~ow accountability
also reinforces corruption. Kaufmann et al (1999(a), p3) note, "available indica
tors of governance are noise measures of true "governance ' ... which may un
derestimate the impact of governance ... " Hellman et al (2000, p5) show that
corruption is a multidimensional spectrum. lt ranges from bribery (grease pay
ments) on a micro level to state capture on a macro level. State capture reflects
grand corruption under which organs of the state and the legislative process are
influenced, and directed through private payments and interests. Policy making
ceases to be predictable and transparent while the legal system looses its po
tency to "protect prope1ty and contract rights." In such an environment business
shuns publicity and customers cannot effectively benefit from the infonnational
role of prices.
In the Zimbabwean context issues pertaining to governance, transpar
ency and accountability are given lip service and seldom practised as a busi
ness culture. Meda (1999, p 5) shows that the ruling party, ZANU PF, failed to ' implement a self-imposed "Leadership Code" ostensibly due to semantic dis-
agreements on "a definition of a leader." The real threat was fear of exposure by
those who had used their offices to amass wealth, because ~he code required
declaration of personal assets. In the late 1980s, the very popular "Sandura
Commission" (1989) confirmed fears of an increasingly sceptical general public
that self-dealing and scheming were rampant among public officials. Govern
ment largely ignored a lesser-known "Smith Report" (1989), which recom
mended sweeping rationalisation of Zimbabwean parastatals, although the
h Causation between governance and conuption is not yet clear. Siddique {1997, pl5] suggests conuption springs out of ponr governance. "Conuption springs out of poor governance. Accountability, transparency and free flow of information are all distasteful medicine to corrupt people".
56
commission worked on the project for about four years. After all public commis
sions are expensive processes. The dismal Constitutional Commission and a
resultant national referendum of 2000, set up by government to counteract a
constitutional review process pioneered by an independent National Constitu
tion Assembly (NCA), used about $767.2m.5 A number of other reports in colo
nial and independent Zimbabwe were never implemented. Some as instanced
by the "Matebeleland" and the "Chidyausiku" reports never saw the light of day.
A well-known "Nyanga Bus Disaster Fund'', collected from well-wishers touched
by the tragic death of 91 school children and teachers in 1991, had not yet been
disbursed to the intended beneficiaries by December 20006. Trustees of the
fund handed the money to Civil Protection officials in 1993 where it possibly
disappeared into unknown coffers. l have argued elsewhere that the decadence
is not exclusive to government officials. Standard Chartered Bank, the oldest
and biggest bank in Zimbabwe, refused to reinstate 211 workers dismissed after
a 1997 wage dispute despite a Supreme Court ruling and "condemnation by the
International Labour Organisation."7 Given the difficult conditions prevailing in
Zimbabwe in year 2000, ten of the employees who have since died might have
been precluded from calling upon the fruits of their labour in the darkest hour of
their need. A culture of skirting the law, whether in public or private sector, is
tragic because sustainable long-term prosperity requires some degree of trust.
The "Leadership Code" was not applicable to the private sector execu
tives, a loophole quickly exploited by government officials as a personal disad
vantage. Meda (1999) highlights the lack of appreciation among public officials
of a "distinction between public and private resources.'' He acknowledges that
the "Prevention of Corruption Act" does not foster a culture of business integrity
because it is difficult to enforce. To resolve this predicament Meda suggests
that an already existing "Standing Committee on Parliamentary Rules and
Privileges" be upgraded into an independent people's commission reporting to
parliament.
Although Meda has very stimulating ideas regarding the constitution and
operations of the commission, his proposed commission is not destined to be
innovative. Why should all members of the commission be hand picked by the
president (p6) with parliament subordinated to ratification? Under the present
constitutional arrangements, the president currently appoints executives to head
57
government and quasi-government institutions, as well as 20 parliamentarians,
but that does not guarantee their competency, impartiality antj1 intellectual inde
pendence. In any case the immediate problems in Zimbabwe\do not stem from
the want of adequate legislation and commissions, but lack !Pf political will to
implement solutions already in our national cardboard. In D~~ember 2000 the
magistrates' courts had a backlog of about 24000 cases and :was understaffed I,',
to an extent of 37 magistrates.8 i,!
I am not arguing away imaginative solutions to the problem. My point is
unless we mean what we say there is no redress. We have ~ws but justice is
not done. Creating institutions that cannot execute and discharge their declared
mandates is not a meaningful economic exercise. Alfred Marshall, cited in Web
ster put great emphasise on intangible assets (non-material wealth) by illustrat
ing that it took centuries to replenish knowledge lost following the fall of the
Roman Empire while destroyed materials were replaced within. decades.
The constitution of good governance is another problematic issue. For
some, democratic elections are not an accurate measure of political rights or a
critical determinant of economic growth. Gastil [1991] cited in Barro (1997, p53)
suggests "Political rights are rights to participate meaningfully in the political
process ... vote and compete for public office, anct for elected representatives to
have a decisive vote on public policies". Barro adds that minority parties should
also have influence on policy. Kaufmann, Kraay and Zoido-Labat6n (1999a, p2)
regard rule of law, government effectiveness and extent of graft as the three
fundamental aspects of governance. While the extent of graft·cannot be readily '
assessed due to its secretive realm, Zimbabwe continues to tau short on rule of
law and government effectiveness. [For justification see Freedom House and
the World Economic Forum annual ratings.] Suffrage ls not an automatic guar
antee for economic prosperity. ln Barre's view increase in democracy at, low
levels of political rights stimulates economic growth. Barrow notes, "once a
moderate amount of democracy has been attained further expansion reduces
growth".
It has been argued that dictators come in two types. Those who loot na
tional wealth for personal gain (e.g. most African dictators) and those preoccu
pied with economic development. The former is detrimental to economic
58
growth. Schwartz (1992) cited in Barro (1997, p51) notes that some OECD
countries increased economic liberties before their democracies became fully
fledged. Good governance does not need to find or create innovative ideas, as
general society produce talented men and women to fulfil that role. This means
that a good leader does not need to interfere with everything of economic and
social significance. Subordinating economic opportunity and employment to
partisan interests such as political affiliation to a ruling party, (ZANU PF in Zim
babwe's case), could be detrimental to economic prosperity. Schum peter (1936,
p88) suggests that leaders fulfil their function "more by will than by intellect" and
more by "authority," "personal weight," and so forth than by original ideas. Kin
dleberger and Herrick, (1977, p2) insist that matters of governance require
foremost concern as they affect human condition. Haavelmo (1944, p115)
agrees that economic research must pool its expertise and resources because
national income and the welfare of "millions" might depend on it.
2.5 Approaches to Economic Growth And Development
"Development problems", Kindleberger and Herrick (1977, p21) reiterate,
" ... are problems of policy." Typical literature and research characterise eco
nomic development as a process amenable to sound and proper management
and policies. There is no single measure of development because structural is
sues such as extent of poverty, income distribution, social and political change,
literacy, leisure and economic wellbeing come into play. Kindleberger and Her
rick (1977, pp6-7) use terms such as "multiplicity", "multidimensional", "multi
faceted" and "multivariate" to bring home the reality that economic development
is idealistically a broad based spectrum of indicators. They propose a long defi
nition that needs no edification to pinpoint issues involved. ''Economic devel
opment", Kindleberger and Herrick (1977, p1) highlight,
is generally detined to include improvements in material welfare, especially for persons with the lowest incomes; the eradication of mass povetty with its correlates of illiteracy, disease, and early death; changes in the consumption of inputs and output that generally include shifts in the underlying structure of production away from agricultural toward industrial activities; the organization of the economy in such a way that promotes ... [emp/oyment of many rather than] a privileged minority; and ... greater participation ... in
59
making decisions about the directions, economic and otherwise, ... to improve their welfare. (P1, italics added.)
,I
Economic wellbeing is therefore a function of several p~oxles whose cali
bration may not be easy in practice. Traditionally, Gross ~omestic Product
(GDP) is accepted as a measure of national income (Y) aJIEI economic size " while GDP per capita is the most popular proxy for average hl.Jqian welfare. The .
rate of change in GDP per capita (GY), over two periods ir\!time depicts the
speed and direction of changes in wellbeing. I
.f
Development and economic growth theories gained popularity after the ,,
Second World War (WW II). The literature is focused on unsophisticated
economies such as Zimbabwe. Kindleberger and Herrick (1977, p4) note that
poor countries were "initially known" as ''backward" after WW II, a term which is "
"unfortunate, given its connotation of inferiority that go beyond simple lack of
sophistication." The term "underdeveloped" was later preferred as it signalled a
potential for improvement. However, Myint cited in Kanth (1994, p17) is of the
conviction that underdevelopment means backward. The term implies "under-
developed resources and backward people, " a combination argued to consti-
tute the "Third World." The reader should note that by definition a "backward"
people lack sophistication that is a prerequisite for development. This creates a
vicious circle. Kindleberger and Herrick (1977, p4) disagree with this interpreta
tion. In their view the term Third World was coined to indicate political non
alignment with both NATO (North Atlantic Treaty Organisation) and the Soviet
Eastern bloc. Schumpeter taught us that development requires emergence of
innovators in society. Eventually the Third World was "apologetically," (Kanth
1994 ), referred to as "developing countries" a term which Kindleberger and Her
rick (1994, p4) consider flattering because it reflects diplomatic sensitivity rather
than semantic accuracy. The authors are also uncomfortable with th13 popular
initials "LDC" for less developed countries because this cold desitJnation re
sembles the substitution of abbreviations such as "VD" to keep sensitive terms
at "an arm's length."
For the purpose of this research any term other than "backward" will do.
The typical features are well known. Underdevelopment denotes poorly devel
oped economic sectors, over reliance on production of primary products, as well
as economic domination by external market forces. The bulk of export produc-
60
J . .
tion is not diversified but typically concentrated in a few lines of items. In ex
treme cases most manufactured products are imported. Foreign currency short
ages, debt and balance of payment crisis are in most cases not uncommon.
The proportion of inhabitants below the poverty datum line is typically high. A
high proportion of agricultural output in an environment with insignificant serv
ices and manufacturing sectors are often regarded as signs of underdevelop
ment. Extreme poverty and heavily skewed income distribution are also wit
nessed with disheartening frequency.
Increased interest in economic growth and development literature has
led to a proliferation of empirical work and theories. ~ichael Todaro, (1997,
p70) who interprets development as a "multidimensional process" summarises
development literature into five competing categorie!:i. These are (a) the linear
stages of growth model; (b) theories and patterns of structural change; (c) the
international dependence revolution; (d) the neoclassical, free market counter
revolution; and (e) the endogenous theory of economic growth. Most theories
concentrate on capital formation, a term used to describe increases in net in
vestment in capital assets.
The linear stages model was developed soon after World War II and
dominated growth literature in the 1950s and 1960s. Rostow's Stages of Growth
is the most well known. Rostow proposed that countries evolve from being un
derdeveloped to development through a series of steps. In particular nations
make strategic choices from ''take off' to "maturity." According to the model
each economy needs to pass through five stages. These are (1) traditional so
ciety, (i.e. pre-industrial), (2) preconditions for take off (use of scientific methods
and structural change), (3) take off where growth is the norm and is facilitated
by saving and investment, (4) maturity under which the focus is on improvement
in an effort to expand technology, (5) mass consumption accompanied by an
increase in per capita income. This model identified mobilisation of domestic
and foreign saving as "the pre-conditions for take off into self sustaining
growth." The successful US export of technical and financial resources to war
torn Europe under the Marshall Plan lends support to the model.
Lauded as an alternative to Marxism in the West, Rostow's model was
severely criticised by its socialist opponents for being tautological. Critics con-
61
sidered it to be a descriptive account rather than a theoretical, model based on
scientific analysis. There is no good reason why social and,1economic forces
should follow a deterministic sequence of development. \
The Harrod-Damar Growth Model explains how savin~ and investment
ratios are related to economic activity. Damar (1957) posit~d that economic "
growth is a function of the amount and rate of net capital in.Vestment. Capital
accumulation in turn is causally linked savings. The latter in:·tum depends on
surplus income. Surplus income itself is a function of increased productivity.
Nurkse (1962)9 describes this chain of causality as a "vicibus cycle" where
"success breeds success" and "poverty breads poverty". Poverty creates a vi
cious developmental trap: murombo haarovi chinenguwo iS popular Shona
saying. Theoretically, exogenous intervention is required to break the cycle.
Popular solutions are foreign direct investment, external borrowing and export
promotion. In practice not much improvement is noticed on the.ground.
The Solow growth model, named after the Nobel Prize economist Robert
Solow, assumes constant returns to scale in the growth of capital stock, labour
force, and technological innovation. Critics condemn the model as mechanistic.
Some economic growth theories have drawn attention to qualitative fac
tors such to the development question. In Schumpeter's (1936, p66) view de
velopment encompasses creating new products, "new quality", industrial reor
ganisation and the "conquest of new sources of supply." The level of con
sciousness, the value system, religion as well as other social beliefs are also
regarded as Grucial determinants of economic prosperity. M~r>:. Weber's "Prot
estant Ethic And The Spirit of Capitalism" (1930)10 is credited with the pioneer
ing of individual-level theories as well as the "primacy of ideaf as an answer to
Karl Marx's preoccupation with the organisation of society; Jaffee (1990, p20).
Admittedly it is apparent that economic development is more than quan
tifiable economic factors. However, the causality between social and cultural
factors on one hand and economic development on the other is difficult to infer
let alone interpret. Jaffee (1990, p21) argues, "Weber's analysis does not posit
causal ordering" but mutually reinforcing ideas, since capitalism existed before
Protestantism. In fact Portes (1976), in Jaffee (1990, p34) argues that subjec
tive factors, including values, attitudes and beliefs are exaggerated. Ethnic "par-
62
' i\
i
ticularism", like personal traits theories, whether individualistic or holistic, is
fraught with bias and subjectivity. In Portes' view opportunities for acquisition
are predetermined by "the socio-economic position of individuals" rather than
level of consciousness. The "need for achievement" is also moderated by
structural constraints. Take a practical example of Third World postgraduate
international students in Western institutions. One finds accountants, bankers,
economists, financial analysts, civil and electrical engineers - marooned by so
cio-economic forces - unable to land part-time jobs in the fields of their calling.
These men and women end up taking menial jobs such as brick packing, food
processing and other forms of labouring. It would be naiVe and offensive to
suggest they lack the determination to succeed.
Causality between education and productivity is also open to question
unless other necessary resources are available. Education without equal op
portunity is dysfunctional. High literacy rate, for instance has not reduced pov
erty in Third World countries. The educated that are unemployed, argues Jaf
fee (1990, p40-42), "are likely to emigrate or to create political difficulties ... [and
even] generate social regression and 'political decay' ... [because of labour's]
ability consciously to reflect on its role and situation. "
In many countries meaningful participation in the economic and general
prosperity often followed reorganisation of political and economic structures
against those with vested interests and patrons of privilege. In Britain feudalism
had to collapse for the Industrial Revolution lo succeed. Remarkable Japanese
economic prosperity after WW II is often traced to moderation of the Zaibatsu
economic system. In the next chapter I propose that Zimbabwe needs to over
come her Machiavellian economic practices to attain sustAinable economic
prosperity. Class structures based on castes, apartheid or tradition usually
come with unequal opportunity. The "American Dream", though not perfect, is
based on equal opportunity. However, equal opportunity is not equity.
Development economics often grapples with contradicting demands of
equity and growth. Champions of laissez-faire economic policies believe income
disparity or functional inequality is good for growth. They criticise extensive
welfare policies; insisting on "growth first, [trickle down] latter" Economic activity
based on redistribution (consumption), they argue, cannot be sustained in the
63
long term because it destroys incentives to increase productivity (production)
hence retards economic growth. I agree with Jaffee (1990, R~07) who argues
that the laissez-faire analysis is fraudulent. At least in the Thirp World, I qualify.
Policies adopted by developing countries, with the blessi~b of the Bretton
Woods institutions, to promote economic growth often res4.!t in what Jaffee
terms a "trickle up effect" at the expense of mass poverty am?,~9 the poor. The
socialist answer to the problem is redistribution first, growth i{.lter. Jaffee right
fully notes that "the land reform version of the model" is most common across
nations. One does not need to be a Rosa Luxemburg to fin~ that the original •
objectives are never fulfilled. At any rate the dismal failure of Communism in
Eastern Europe suggests that this extreme approach is counterproductive in the
long run. At independence in 1980 Zimbabwe adopted an alternative approach,
"Growth With Equity" also known as redistribute-with-growth. The intention was
to promote investment and growth on one hand while ensuring equity by delib
erate income policies, taxation, mass education and free health. Unfortunately
Zimbabwe accomplished neither growth nor equity by the highly romanticised
"Year 2000." Paul Streetten (1977}" criticises growth with equity's heavy reli
ance on uncertain income policies that leave both growth and equity to chance.
Under the basic needs framework government provide for essential material
needs, services and public utilities unlikely to be optimised by pure market
forces. In my view government has an option to provide for these services di
rectly or indirectly through dole. Intuitively dole is more palatable in capitalist
economies than direct government participation. However, growth is still not
guaranteed and the equity - growth dilemma not resolved.
According to Jaffee (1990, p26) there exist a penchant "to cite the most
ideal and romantic elements of Western capitalist structure as the necessary
conditions for the socio-economic development of Third World nations." The
emphasis is on "stability and harmony" rather than struggles for positive change
(p35). Even international institutions such as the IMF have been accused of
peddling politics rather than policy. Internalisation of rose coloured Western
Values in some ways retards Third World development. To quote Jaffee (1990,
p35) who follows Portes (1976):
64

Third World individuals who have had the greatest exposure to Western Values of entrepreneurship and consumption, [have] a legacy of elite behaviour bordering on fraud, corruption, co-option, and conspicuous consumption. [They] squandered valuable foreign exchange [importing] Western luxury products.
Results from Russia suggest that efforts towards incorporation and pri
vatisation in an environment without sound institutional structures are destined
for long term discredit; especially when the contracts cannot be enforced, and
self-dealing kleptocrats1 remain untouchable. Black et al (1999, pp 3&10) iden
tify lack of political will, "a punitive tax system, {rampant] official corruption, or
ganised crime, an [business] unfriendly bureaucracy", and "a business culture
[oij skirting the law" as the main "micro failures" behind the shrinkage of the
Russian economy between 1991 and 1999.
In any case the Japanese economic success prior to the 1990s taught
the world that self-interest and "possessive individualism" are not the only
panacea for economic prosperity. Furthermore I agree with Schumpeter (1936,
p58) who is explicit "For the economic state of a people does not emerge simply
from the preceding economic conditions, but only from the preceding total situa-
tion."
Beliefs, even when backed by scientific evidence can sometimes go
wrong. As Davies (1997, p88) put it
[One can make a long list] of all the times religion has prevented scientific truths from surfacing. The reverse question is also interesting: How often does science prevent other truths than its own from being heard?
Students of finance need no prompting to recall problems and resistance
Sharpe (1964), Black and Scholes (1971) and Bachelier (1900) encountered in
order to publish their seminal papers.
; In the Russian context most resources used to be state owned. Kleptocrats are defined as "a handful of well-connected men who made their first millions - and sometimes bihions - through sweetheart deals with or outright theft from the government, and then leveraged that initial wealth by buying major com· panies from the government for astonishing low prices." Kleptocrats sometimes give conniving state officials "financial inducement'> to put a good spin on a dirty process ... " Black et al (1999, p5).
65
---a;
""' J"J
'
,I
I /i 11,,
3. FUNDAMENTAL BACKGROUND TO THE ECONOMY ,·.· . . " ...
The modern state is nothing but a conspiracy to exploit, but ,post of all demor·
a/ise its citizens .. .Political Jaws seem to me such prodigious' lies, that I fail to
see how one among them can be better or worse than , any of the oth
ers ... Henceforth I shall never serve in any government anY'tt1here ... Govern
ments are intricate institutions, sanctified by tradition and custom, for the pur
pcse of committing by force and with impunity the most revolting crimes.I
L. N. Tolstoy in "War and Peace"
3.1 An Analytical Overview
To become a millionaire in our country it is not at all necessary to have a good
head or specialised knowledge. Often it is enough to have active support in the
government, the parliament, local power structures and Jaw enforcement agen
cies ... In other words, you are appointed a millionaire.
Pyotr Aven ( 1994) in Black et al ( 1999)
The purpose of this section is to put in perspective governance, and the
general mechanics of income generation, accumulation and distribution in the
Zimbabwean economy. It is hoped to provide a better understanding of the
economy's current, potential or realised productive capacity. Economics, fi
nance and public administration coexist and cross paths on a daily basis. The
evolution of the financial superstructure in Zimbabwe is not immune to the so
cio-economic forces that ushered her birth. Understanding the Japanese Zai-
J I read "War and Peace" in 1990. Due to youthful and intellectual inexperience I did not take down proper page details. Though struck by Tolstoy's disillusionment, alternatives seem bleak. Without the government convention, life could also be "nasty, brutish and short" in Ute Thomas Hobbes sense.
66
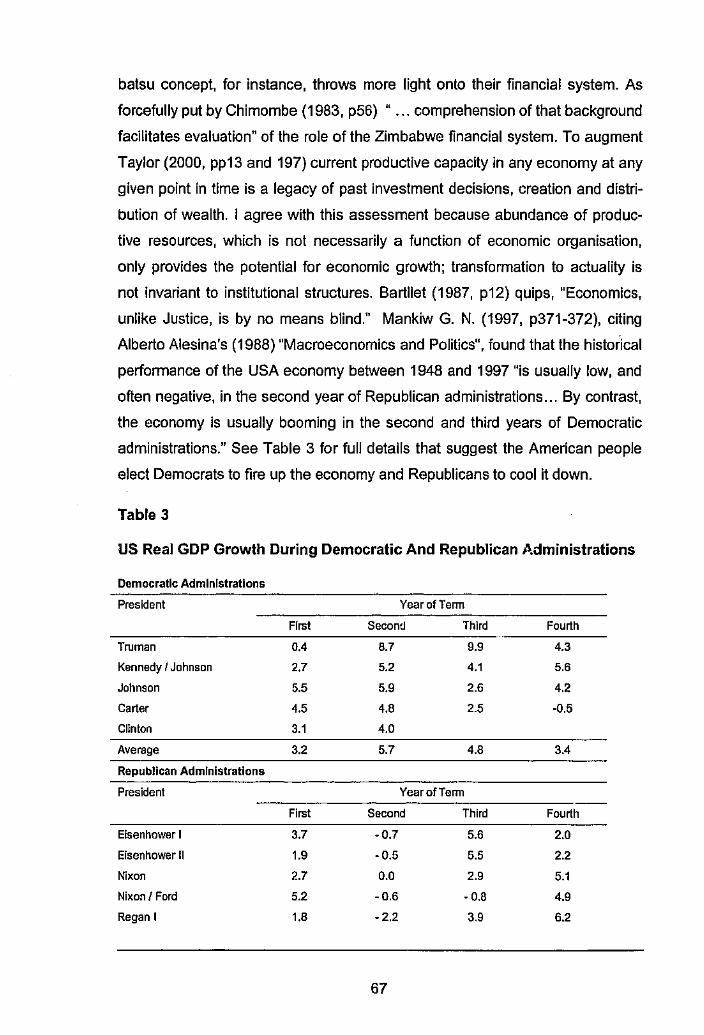
batsu concept, for instance, throws more light onto their financial system. As
forcefully put by Chimombe (1983, p56) " ... comprehension of that background
facilitates evaluation" of the role of the Zimbabwe financial system. To augment
Taylor (2000, pp13 and 197) current productive capacity in any economy at any
given point in time is a legacy of past investment decisions, creation and distri
bution of wealth. I agree with this assessment because abundance of produc
tive resources, which is not necessarily a function of economic organisation,
only provides the potential for economic growth; transformation to actuality is
not invariant to institutional structures. Bartllet (1987, p12) quips, "Economics,
unlike Justice, is by no means blind." Mankiw G. N. (1997, p371-372), citing
Alberto Alesina's (1988) "Macroeconomics and Politics", found that the historical
performance of the USA economy between 1948 and 1997 "is usually low, and
often negative, in the second year of Republican administrations ... By contrast,
the economy is usually booming in the second and third years of Democratic
administrations." See Table 3 for full details that suggest the American people
elect Democrats to fire up the economy and Republicans to cool it down.
Table 3
US Real GDP Growth During Democratic And Republican Administrations
Democratic Administrations
President
First
Truman 0.4
Kennedy I Johnson 2.7
Johnson 5.5
Carter 4.5
Cllnton 3.1
Average 3.2
Republican Administrations
President
First
Eisenhower I 3.7
Eisenhower II 1.9
Nixon 2.7
Nixon I Ford 5.2
Regan I 1.8
Year of Term
Second Third
8.7 9.9
5.2 4.1
5.9 2.6
4.8 2.5
4.0
5.7 4.8
YearofTerm
Second Third
-0.7 5.6
-0.5 5.5
0.0 2.9
-0.6 · 0.8
-2.2 3.9
67
Fourth
4.3
5.6
4.2
-0.5
3.4
Fourth
2.0
2.2
5.1
4.9
6.2
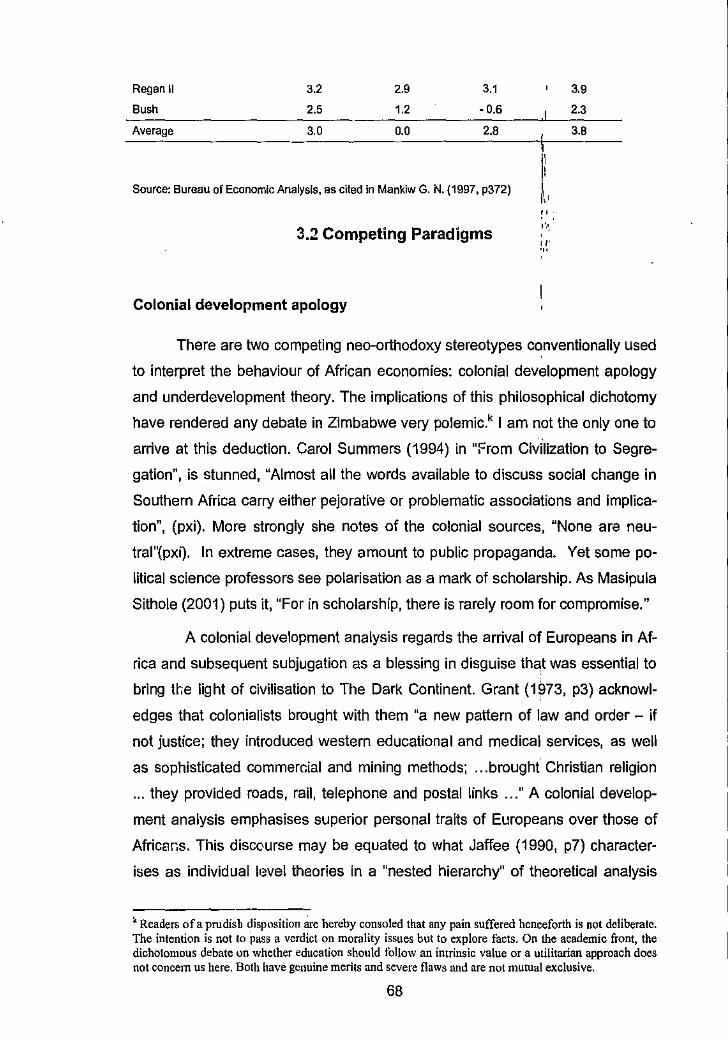
Regan II
Bush
Average
3.2
2.5
3.0
2.9
1.2
0.0
3.1
-0.6
2.8
Source: Bureau of Economic Analysis, as cited In Manklw G. N. {1997, p372)
3.2 Competing Paradigms
Colonial development apology
1,,
" I',•,
' " ...
3.9
2.3
3.B
There are two competing nee-orthodoxy stereotypes conventionally used
to interpret the behaviour of African economies: colonial development apology
and underdevelopment theory. The implications of this philosophical dichotomy
have rendered any debate in Zimbabwe very polemic.k I am not the only one to
arrive at this deduction. Carol Summers (1994) in "From Civilization to Segre
gation", is stunned, "Almost all the words available to discuss social change in
Southern Africa carry either pejorative or problematic associations and implica
tion", (pxi). More strongly she notes of the colonial sources, "None are neu
tral"(pxi). In extreme cases, they amount to public propaganda. Yet some po
litical science professors see polarisation as a mark of scholarship. As Masipula
Sithole (2001) puts it, "For in scholarship, there is rarely room for compromise."
A colonial development analysis regards the arrival of Europeans in Af
rica and subsequent subjugation as a blessing in disguise thc:!t was essential to
bring tee light of civilisation to The Dark Continent. Grant (1973, p3) acknowl
edges that colonialists brought with them "a new pattern of law and order - if
not justice; they introduced western educational and medical seivices, as well
as sophisticated commercial and mining methods; ... brought' Christian religion
... they provided roads, rail, telephone and postal links ... " A colonial develop
ment analysis emphasises superior personal traits of Europeans over those of
Africar.s. This disccurse may be equated to what Jaffee (1990, p7) character
ises as individual l1~vel theories in a "nested hierarchy" of theoretical analysis
k Readers ofa prudish disposition are hereby consoled that any pain suffered henceforth is not deliberate. The intention is not to pass a verdict on morality issues but to explore facts. On the academic front, the dichotomous debate on whether education should follow an intrinsic value or a utilitarian approach does not concern us here. Both have genuine merits and severe flaws and are not mutual exclusive.
68
. ,_,,, ..

stretching from individual theories at the lowest rung, through to organizational,
societal and international theories at the apex.
These [individual} theories of development focus on the values, motives, attributes, and characteristics of individuals as the source of socio-economic development. [They] emphasize individual traits such as the level of achievement motivation, the degree of entrepreneurial talent, the attachment to modern ideas, or the possession of human capital. These perspectives share the assumption that individual characteristics translate into national social development.
In typical colonial myth "underdevelopment in Africa was due to the ab
sence of an economic spirit among Africans," Mosley (1983, p1.) Settlers,
Frankel (1938) elaborates, regarded African civilization as "meagre hoe-culture
or pastoralism" which had to be "compelled to develop a new order." Even mis
sionaries such as Robert Moffat, an eventually tr aacherous guest at King
Mzi\ikazi's kraal, for years dismissed "natives" as a people with "nothing natu
rally engaging, their extreme selfishness, filthiness, obstinate stupidity, and
want of sensibility ... "12 Philip Mason (1958, p71) points out that some English
observers once wrote off the Irish as rude, unclean, and lacking in "civility, hu
mility, or any manner of decency ... " and considered their matrimony no more
"than conjunction between unreasonable beasts." Similarly one would not miss
the contempt with which Russian officials held German soldiers during Napo
leonic Wars as depicted in Tolstoy's War and Peace, yet today their country is
an economic powerhouse. Of course at their peak the Irish had considerable
achievements in scholarship and missionary work.
Early African achievers such as Hannibal of Carthage (247-182 BC),
Augustine of Hippo (354-430 AD), Egyptian and Nubian dynasties (3100 - 332
BC), Tshaka "The Zulu" (1787-1828), and Mwene Mutapa Kingdom (c1000 -
1837), which resisted Portuguese expeditions to Zimbabwe between 1561 and
1667, are easily forgotten. The biblical Moses also received African instruction.
Sympathetic observers such as Dr. David Livingstone noted that Africans had
well developed ideas of what is right and wrong. He was advised, according to
Mason (1958, p26), that they knew "we should not lie or kill or steal ... except
that we must not have more than one wife." Persian and Arabian geographers
report gold mining in Zimbabwe as early as 947 AD to 1060 AD.13 Meda (1999,
69
p4) notes that colonisers were "actively antagonistic" and contemptuous of Afri
can social and religious way of life, whose complexity they dig not understand.
ln the end Missionaries and settlers alike applied their own stfmdards and cus
toms. Cattle for instance, were as valuable an African sourcei/of wealth and in
surance against poverty as are equities in a modern market f~(::onomy, yet set
tler governments in Zimbabwe insisted on compulsory de-stoc~lng. '·'.
Apart from personal traits empirical research has va!idbted causal link~
have been suggested between economic performance and other societal and
cultural values. I have highlighted earlier on that the direction ~f causality could
be bi-directional. Marx Weber's "Protestant Ethic And The Spirit of Capitalism" ' (1930) is one of the earliest to relate society's ideas, values, beliefs and the
urge for achievement to economic activity; Jaffee (1990, p20). Frankel (1938,
p2) continues the colonial argument, highlighting the supposed want of creativity
among Africans.
Unlike the Indians or Chinese, Africans had practically nothing to offer, and as little to demand, from traders who visited them. The only trade of real consequence which could be developed for centuries was the slave trade, the export of Africans themselves 'a trade which destroys all others'.
Some colonial apologists accepted complete expulsion of Africans off the
land into extinction. In Frankel's (1938, p8) opinion colonization could have pro
vided automatic solution to African development:
If the indigenous population had disappeared before the advance of the white man, as the Indians did in AmeriGa, and i{ its climate had favoured European settlement, ... [Fortunately] instead of decadent population, rapidly tending to extinction, the intending settlers encountered a race 11irile, increasing and racially potent.
Philip Mason (1958, p 215) points out that the original inhabitants of
North America and Australia disappeared with "some active assistance from the
invaders." Indirect assaults included esoteric products and diseases such as
"gin, tuberculosis and syphilis," and directly bullets and arsenic. The "persis
tence and virility" of the Bantu peoples was considered undesirable. Ironically,
Colonial Central Africa was also universally dependent on the labour of the in
digenous population to safeguard the interests of a permanent European set-
70
tlement. On the other hand African economies were self-sufficient hence had no
incentive to work for the Europeans. Settlers introduced forced labour. Frankel
(1938, p11) noted that "methods of compulsion" included direct force, conscrip
tion and indirect taxes. Expropriation of land was designed to permanently de
stroy traditional economic self-sufficiency. As noted by Mushayakarara
(2001)14,"ln fact colonialism reinforced feudalism in Africa."
Although personal trait theories incidentally promote ethnicity and other
forms of discrimination based on race, colour, religion and sex, they continue to
be proven empirically valid. A latest example is William Easterly's (2000) "Mid·
die Consensus" that regards low ethnic diversity and low class heterogeneity as
"critical determinants" of economic growth (p2). Economic shrinkage of the So
viet Union, for instance, is liked to "hallowing out" of the middle class whereas
poor economic policies and performance in India, Guatemala, Mexico, Kenya,
Nigeria, Sierra Leone, Zambia and Africa in general are attributed to ~high lin
guistic and or ethnic diversity, (p5). On the flip side miracles in Japan arid Korea
owe their origin to a middle class consensus. Some races, for example Chinese
in East Asia, Lebanese in West Africa and Indians in East Africa are found
elsewhere to be more enterprising than others. Of course Easterly's conclusions
are not new. Kindleberger and Herrick (1977, p28) found it "hard to avoid the
conclusion that [ethnic} diversity is a handicap to development."
Ethnic "particularism", like personal traits theories, whether individualistic
or holistic, is fraught with bias and subjectivity. Rosenthal and Rosnow (1996)
lament, "Belief ls easily confused with evidence, evidence is easily misunder
stood, and misunderstanding perpetuated." Generally countries in Africa are
larger than those in Europe; hence it is not surprising to find linguistic differ
ences. In any case different peoples in say Nigeria and Indonesia were arbitrary
put together by colonial masters. Agreed talent is not ubiquitous and all virtues
not the same, but too much generalisation is harmful to economic prosperity.
There is no reason why ethnic diversity, a worldwide phenomenon, should be
the same as ethnic polarisation. Switzerland, for instance, has achieved re
spectable political stability and economic prosperity despite linguistic diversity
among member cantons and extensive political decentralisation. And contrary
to Weber (1930) some non-protestant countries are economically successful.
71
In my view personal trait theories teach readers that sustainable devel
opment requires sound economic institutions and willpower tq1 enforce the right
decisions. Schumpeter (1936, p86-7) is again right that the iJ,syche of success
economises decision-making and production because it is ~~bconsciol!s and
thus works automatically. Primitive s11cieties are more resista~:, to change, sub
ject innovators to "social ostracism ... physical prevention or td.'direct attack." , ... . " ..
Underdevelopment theory
The underdevelopment theorist reads all the seeds at' African underde
velopment in both slavery and co!oniarism itself. Propagate~ by socialist phi
losophy, and abetted by communist ideology, the underdevelopment theory
emphasises the materialist interests of colonial domination. This was forcefully
argued by Lenin's (1917) "Imperialism: The Highest Stage of Capitalism", cited
in Chimombe (1983, p44). In this light imperialism was a direct result of the
struggle among colonial powers to establish monopolies over material re
sources. In Zimbabwe, as elsewhere in Southern Africa, land expropriation
decimated peasant economies. The results are still being felt today. Whereas
forced !abour reduced skills in African areas compulsory land acquisition led to
untold overcrowding in reserves designated for African use. Grant (1973) notes
that the land would take years to recover even if left fallow. Stringent discrimi
natory laws curtailed peasant industrial activity, as we shall see infra. Even
Frankel (1938, p17) admits that European Settlers introduced policies of delib-, erate economic exploitatim1. In his own words
The mid Victorian Empire did not seek to colonize the wilderness. It was an imperialism that was mainly interested in colonieo and enterprises that could pay their way.
Cecil Rhodes, cited from Lenin (1917) by Chimombe (1983, p45) was
more forthright: "The Empire, as I have always said, is a bread and butter ques
tion: If you want to avoid a civil war, you must become an imperialist." This view
is supported by Schumpeter (1936, p10) who contends "Economic activity may
have any motive, even a spiritual one, but its meaning is always satisfaction of
wants." Several generations after cqlonisation, self appointed guardians of
civilianisation in Africa were indeed forced to relinquish their empires, along with
72
the accustomed comfortable way of life, after many difficult years of resistance.
African policymakers have sporadically raised the question of reparations with
the West on the basis of the underdevelopment theory. Germany's obligations
to make good the past misdeeds of the Nazi era seem to vindicate the claim.
However, according to some critical Western scholars Africans exagger
ate the 'supposed' demerits of colonisation. Colonial settlers introduced cloth
ing, transport, education, hospitals, and advanced technology to an uncivilised
society, they argue. Pre-colonial Africa is deemed to have been on the verge of
total collapse due to tribal wars and raids. Those postcolonial African leaders
given the opportunity to demonstrate otheiwise have dismally failed to rise up to
the challenge. Septics argue there is nothing to write home about in Africa since
the "winds of change" first swept across the continent in the midst of the last
century. According to Mosley (1983, p1) settler colonialism as practiced in
Kenya, Southern Rhodesia, Algeria and South Africa does not fit in the convec
tional centre exploiting the periphery framework. In his view, these
settler economies quickly develop[ed] an economic nationalism of their own and that extent fail to fit the classical-imperialist model of underdeveloped countries whose economic policy and development are dictated by the needs of the European metropolis.
A careful reading of other researchers' work suggests Mosley's thesis
amounts to a generally creative interpretation of economic realities. According
to Phimister (1988, p 117) the Letters of Patent authorising self-governance in
Rhodesia were "considerably circumscribed" by reserved clauses. The clauses
were designed to stop Southern Rhodesia from passing laws contradictory to
Imperial interests as well as curb discrimination against Africans. Laws dealing
with the railways were expected to meet British specifications. The colony had
no jurisdiction over "extra-territorial matters" such as the currency. In fact thi;;,re
was no Rhodesian citizenship before 1945. The 'Rhodes clause' stipulated that
British goods could not be subjected to differential tariffs not levied elsewhere in
the Empire. Ian Smith was actually the first and last native born Rhodesian
Prime Minister. Technocrats heading important international companies sat in
the Legislative Assembly. According to Phimister (1988, p119) closely knit eco
nomic interest were concentrated in a few hands. One Sir Edmund Davis, an
73
Australian national, held influential positions "on the boards of more than 50
[notable] companies." Phimister (1988, p119) reports that by 1 ~39 Davis was
Powerful enough to 'make or break the Rhodesian ec~~omy' sev-eral times over, Davis often loomed large in the calqulations of settler politicians. 'Everybody knows that the economi~ ,dictator of this country is Sir Edmund Davis'... ,',
On the political front the relationship between Britain ahd Rhodesia has
been described as an unconsummated union. The British government never
took direct control of the colony. It soon abdicated its self-decl~red provisions to •
protect Africans from settler discrimination. For the first 33 years since colonisa
tion, the British South Africa Compa11y (BSAC), a private company founded by
Cecil Rhodes, a colonial entrepreneur, empowered with a Royal Charter in 1889
administered Zimbabwe. Despite fraudulent assurances to overseas investors
regarding the vastness and richness of the 'New Eldorado' systematic looting
soon became the main form of capital accumulation to both the settlers and the
Chartered Company.
Armed gangs of settlers and contingents of B.S.A. police equipped with Maxim guns, roamed across the country side, taking what they could ... [And] refusal to reveal where cattle were hidden could end in death, as indeed it did for four women 'shot in cold blood'. (Phimister 1988, p16)
In the eyes of most Africans, Charter Rule was violent, manipulative, vin
dictive and ruthless. Forced labour was widespread. According to Cobbing
(1976)15 raids for forced labour and cattle were characterise9 by "violence, in
cluding molestation and rape of women." Settlers lost no time.'to implement Ma
chiavellian policies bordering on Dan.vinism. "Africa south of,the Zambezi," Sir
Harry Johnson (1893), cited in Mason's (1958, p214) "Birth of a Dilemma", de
clared, " ... must be ruled by whites, developed by Indians, and worked by
blacks." By 1897 Johnson's (leading administrator in Malawi) stance had hard
ened, "the weakest must go to the wall", the verdict descended, "and the black
man must pay for the unprogressive tum his ancestors took some thousands of
years ago ... "(lbid). Protective legislation was ignored with impunity.
Phimister (1988, p55) characterises conditions then prevailing on the
mines as "economics of death and neglect." Forced labourers were subjected to
74
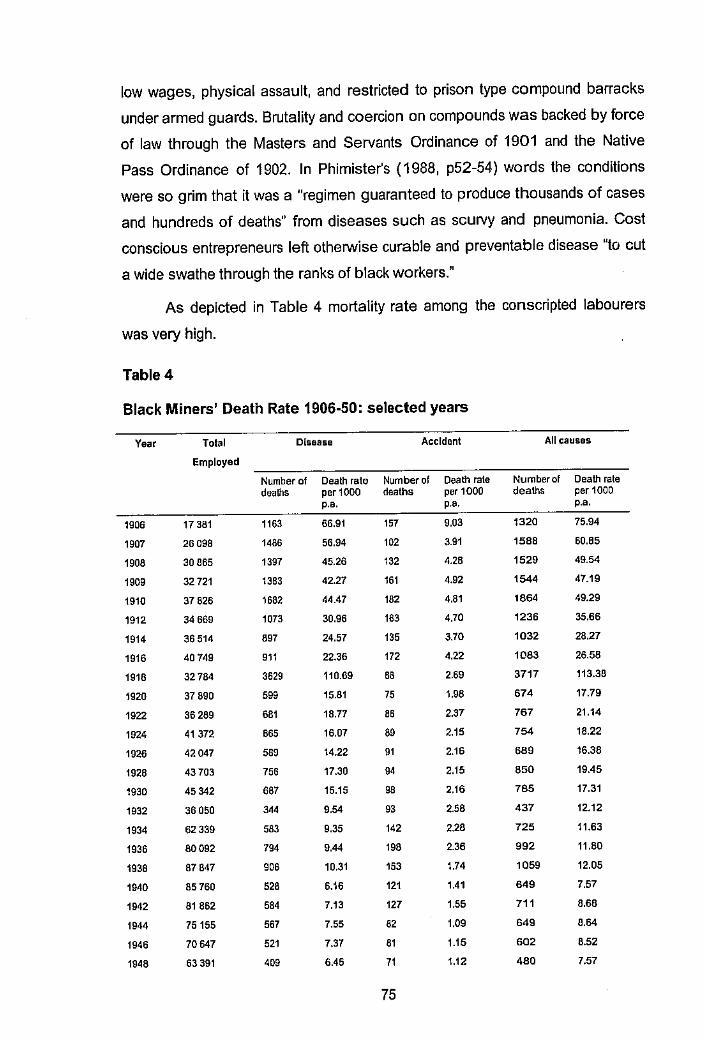
low wages, physical assault, and restricted to prison type compound barracks
under armed guards. Brutality and coercion on compounds was backed by force
of law through the Masters and Servants Ordinance of 1901 and the Native
Pass Ordinance of 1902. In Phi mister's ( 1988, p52-54) words the conditions
were so grim that it was a "regimen guaranteed to produce thousands of cases
and hundreds of deaths" from diseases such as scuivy and pneumonia. Cost
conscious entrepreneurs left otheiwise curable and preventable disease "to cut
a wide swathe through the ranks of black workers."
As depicted in Table 4 mortality rate among the conscripted labourers
was very high.
Table4
Black Miners' Death Rate 1906-50: selected yeans
Yec1r Total Disease Accident All causes
Employed
Number of Death rate Number of Death rate Number of Death rate deaths per 1000 deaths per 1000 deaths per 1000
p.a. p.a. p.a.
1906 17 381 1163 66.91 157 9.03 1320 75.94
1907 26 098 1486 56.94 102 3.91 1588 60.85
1908 30 865 1397 45.26 132 4.28 1529 49.54
1909 32 721 1383 42.27 161 4.92 1544 47.19
1910 37 826 1682 44.47 182 4.81 1864 49.29
1912 34 669 1073 30.96 163 4.70 1236 35.66
1914 36 514 697 24.57 135 3.70 1032 28.27
1916 40 749 911 22.36 172 4.22 1083 26.58
1918 32784 3629 110.69 BS 2.69 3717 113.38
1920 37 890 599 15.81 75 1.98 674 17.79
1922 36 289 681 18.77 "' 2.37 767 21.14
1924 41 372 665 16.07 89 2.15 754 18.22
1926 42047 589 14.22 91 2.16 689 16.36
1928 43 703 756 17.30 94 2.15 850 19.45
1930 45 342 687 15.15 98 2.16 785 17.31
1932 36 050 344 9.54 93 2.58 437 12.12
1934 62 339 583 9.35 142 2.28 725 11.63
1936 80092 794 9.44 198 2.36 992 11.80
1938 87 847 906 10.31 153 1.74 1059 12.05
1940 85 760 528 6.16 121 1.41 649 7.57
1942 81 862 584 7.13 127 1.55 711 8.66
1944 75155 567 7.55 82 1.09 649 8.64
1946 70647 521 7.37 81 1.15 602 8.52
1948 63 391 409 6.45 71 1.12 480 7.57
75

1950 59 548 513 8.62 92 1.15 6051 10.16
[Source Phimister (1988, p53) Table 2.2] I
Notwithstanding the political defeat of Charter Rule bJoon-elite settlers,
the resultant regime was predisposed to crafting its own PriVileges based on
state paternalism and institutionalised racial discrimination. ~ettlers' "reign of
privilege" in Zimbabwe can be contrasted to Zaibatsu dominance in pre WWII
Japan. According to Bison, cited in Miwa and Ramseyer (2odo), Zaibatsu fami-'
lies were "privileged groups [which] had exercised despotic power in every
phase of economic life. Whether one looked at agriculture,' labour, industry,
banking, or trade, the picture was the same."
Prime Ministe, Godfrey Huggins, whose long 20 year reign is probably
only second to that of President Mugabe, set about to implement 'Wilson's twin
pyramid ideology'. Th'3 policy sought to cement once for all the dualisation of
the Rhodesian society into black and white economies. A series of discrimina
tor/ policies and legislation institutionalised "colour bars" to guarantee "the 'ul
tra-exploitability and ultra-cheapness' of black labourers," Phimister (1988,
p192). Education, training, employment and social opportunities were prede
termined by one's racial category. African's long-term competitiveness was ef
fectively curtailed. Rhodesia was deemed a white man's countiy. Prime Minister
Huggins is on record declaring:
The European in this countiy can be likened to an isla.nd of white in a sea of black, with the artisan and the tradesman forming the shores and the professional classes the highlands in the centre. Is the native to be allowed to erode away the shores and gradually attack the highlands? To permit this would mean that the leaven of civilization would be removed from the country, and the black man would inevitably revert to a barbarism worse than ever before. (Rhodesia Herald 1 April 1938, as cited in Phimister (1988, p192).
A discriminatory and improperly named 'Industrial Conciliatory Act' of
1934 excluded blacks from the definition of an employee. It was assumed "the
white artisan with a century of training in his bones and the naturally indolent
native with inherent slipshod methods of workmanship" (Phimister 1988, p92)
could not strive for the same standard of perfection. In some cases white work-
76

ers' claim for superiority was no deeper than the skin: "I do not think that any
body loves the farmer because he is a farmer, or a 'brickie' because he is a
'brickie.' In these capacities they have not much claim, but as white men they
have a claim for fair treatment in this county." (Ibid) The Land Apportionment
Act of 1933 was glorified as the "Magna Carta" of racial segregation. Africans
were destined to be scapegoats of white Rhodesians' misfortunes. During the
Great Depression, the Chief Native Commissioner bragged, "the Natives took
the 'shock' so effectively that our Colonial Treasurer was able to balance the
Colony's revenue and expendlture ... The Native ... has always been the shock
absorber-the 'snubber' - in the State motor car." See Phimister (1988, p183).
It appears the noble goal of bringing civilization to 'the dark continent'
was a by-product rather than the primary goal of colonisation despite populist
pretences of colonial development apologists. I am not suggesting no benEifits
accrued to Africa as a result of the intercourse, whether consensual or looted.
One of the greatest ironies of our country lie in the fact that it is the grandchil
dren of ancestors who collaborated with settlers, rather than those who fought
hardest for autarky, who were destined to be the new rulers. Some of the self
confessed beneficiaries consciously pay homage to Rhodesia as a necessary
foundation for Zimbabwe. Lupe Mushayakarara (2001)16, a prominent and elo
quent Black critic of the Zimbabwean society confessed:
I make no apologies about colonialism because I am one of those Africans who see it as having been a necessary evil. I am part of a much bigger family of individuals sharing a common political ancestor, Britain, in spite of what Mugabe may want people to believe. I am at home thi·oughout this entire continent [then studying in America] and around the world, unthinkable without the gift of the English language ... Whether Britain raped and plundered ancient Zimbabwe, the offspring of that relationship is present day Zimbabwe.
On the other hand exploitation of resources and other sundry causes
cannot be ruled out. As demonstrated in Belgian Congo, localised asset strip
ping and exploitation often unfold in the full glare, and with the tacit consent, of
the international community. Black, Kraakman and Tarassova (1999, p5) cyni
cally regret recent collusion, "The 'Washington Consensus' supported dirty pri
vatisation as better than no privatisation, and supported Russia's privatisation
czar, Anatoli Chubias, as he pursued privatisation by any available means."
77
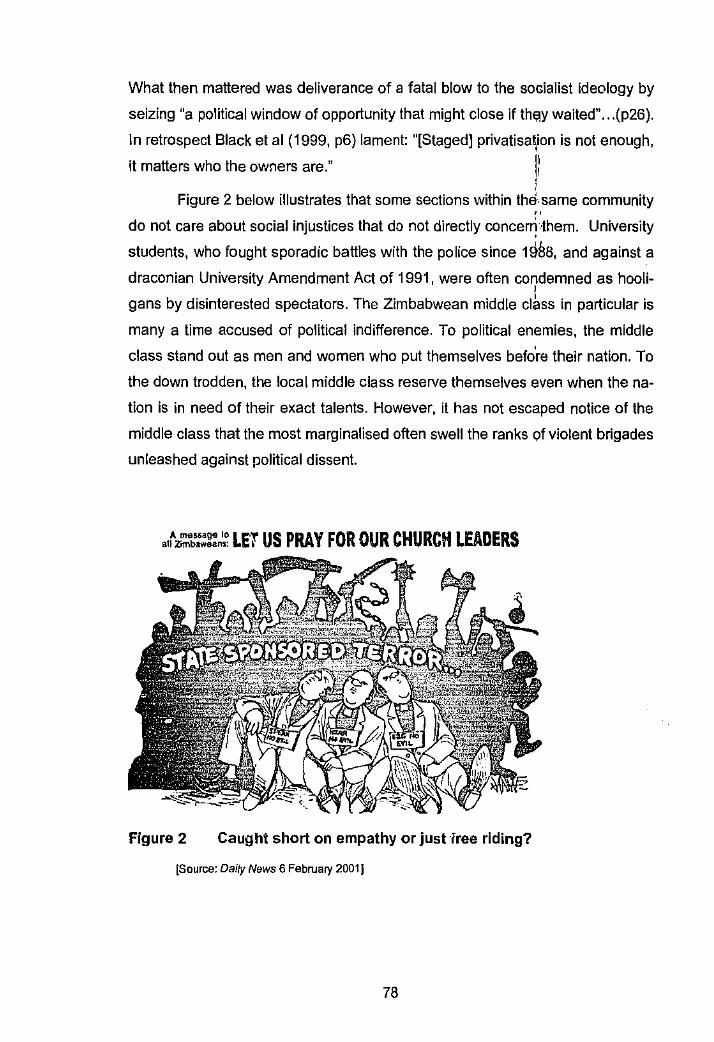
What then mattered was deliverance of a fatal blow to the socialist ideology by
seizing "a political window of opportunity that might close if th~y waited" ... (p26).
In retrospect Black et al (1999, p6) lament: "[Staged] privatisavon is not enough,
it matters who the owners are." ll ' •
Figure 2 below illustrates that some sections within thisame community "
do not care about social injustices that do not directly concer~·,them. University
students, who fought sporadic battles with the police since 1988, and against a
draconian University Amendment Act of 1991, were often condemned as hooli
gans by disinterested spectators. The Zimbabwean middle c11ss in particular is
many a time accused of political indifference. To political enemies, the middle
class stand out as men and women who put themselves beto're their nation. To
the down trodden, the local middle class reserve themselves even when the na
tion is in need of their exact talents. However, it has not escaped notice of the
middle class that the most marginalised often swell the ranks of violent brigades
unleashed against political dissent.
,,tz::'t!:l:,~ LE'r US PRAY FOR OUR CHURCH LEADERS
Figure 2 Caught short on empathy or just free riding?
[Source: Daily News 6 February 2001 J
78

Poivad - a new framework
Having digested our challenging record it is my submission that lessons
from both the past and the present have been the same. Though for want of
vocabulary, I have recharacterised these forces under a new framework, the
intention is not to provide yet another polemic interpretation if it could have been
avoided. Unlike Philip Mason (1958, pv) who suggested potential academic ob
jections to his work would be due to the "confused and complex" situation then
in Central Africa, I welcome constructive criticism.
The central point I am interested in discussing is my proposition that
economic organisation in Zimbabwe has generally followed a pedigree of Ma
chiavellian Economics I have christened POIVAD, an acronym for Patronage,
Ostracism, Impunity, Violence And Demise. A Machiavellian system is unscru
pulous, selfish, cunning, manipulative and ruthless. This economic phenomenon
prevailed under Charter Rule, Settler Colonialism and Independence. ln my
view, the fault does not entirely lie with successive governments, but is shared
with general society, which - either too busy to realise it is doing nothing ur
maximizing private value - has a predisposition to free riding. As a result thinly
veiled, in some cases shocking, Machiavellian designs are blessed by acclama
tion. Elections are triumphantly won despite bad policy, social and economic
decadence.
A Poivad framework does not require any hard thought out ideology to
thrive. Predominantly turning to Bartllet (1987, p1-3) for support and motivation,
three basic baits of human emotion: fear, greed and envy essentially carve out
"the foibles, frailties and strengths of human beings" and personal motivation.
Bartlett (1987, p1-4 and 130-134) argues that leaders strive for power without
responsibility; rendering power an end in itself. Society in turn "abdicates" power
to those who promise security and comfort as each individual considers the
question: "What is in it for me?" Kindleberger and Herrick (1977, p128) add cru
cial supplementary questions, "Who can protect me?" ''To whom do I owe alle
giance and who owes me?" The politician answers by appealing to people's
self interest and deliberate divide and rule tactics: instilling fear in the hearts of
his enemies; promise riches to colleagues; and destruction of common enemies
79

to collaborators. ln moments of fear, greed and envy the majority handover
power to a few without residual constraints and restraints1• ,I
The contract is absolute despite subsequent regrets. I suppose subse
quent rationalisation is periodic rather than continuous becau~e it is expensive
not only in terms of time and productivity, but the obligation i'o have a reason-"
able collective consent. Unfortunately once power is given the:installed leader is
beyond control. Unlike Grossman and Hart's (1986) property Hghts approach to
corporate governance there is no residual right of control to matters within and
not specified by the incomplete contract. The process of addicating power is
often a conscious effort. For instance, students through time have helped over
throw or prop up many a regime. The regalia of power never !"est upon them. A
more discernable eye may find close examples of Garibaldi in Southern Africa.
Bartlett argues that those who surrender power are weakened and made de
pendent on whoever is installed. I however note that, with hindsight society has
erected formidable customs and statutes around power to rein it within the pe
rimeters of its prenuptial promises. Although people dread change fearing the
unknown young regimes are typically benevolent, hence the limit to executive
terms in some democracies. Indeed there is a trade off between stability and
novelty. In an environment where alternative ideas are not allowed to compete
for competence, and where the rule of law is flouted with impunity, of course re
dress is attained at a very high opportunity cost. Contracting requires an ele
ment of trust. If contracts cannot be enforced, risk cannot be trained to those
who can best manage it. Bargaining is generally not Pareto efficient. Society as
a whole cannot generate the highest possible wealth out of its :resources.
Power, whether competent or otherwise, - and like Xenocrates's beautiful
city17 - requires continued support of economic resources to Persevere. Bartlett
identifies land and people as the most important economic resources. Land is at
the apex of all resources because it does not deteriorate with use. Power, like a
bee's sting, ironically depreciates with use. Those who make excessive use of it
are unable to pass it to their preferred heirs. "The threat is many times more
I Although democracy is traditionally defined as a "rule of the people, by the people for the people" the flow of ideas is typically top down. At rallies politicians sell their ideas by telling the audience what it wants to hear rather than harvest grass roots ideas. l11e smokescreen makes it possible for a few to subjugate the acquiescent many. For Bartlett ( 1987, p28) "Democracy remains as it is and will never approach that which it should be."
80

potent than the use", (p4). In my view, excessive use of power renders ii arbi
trary. Lord Acton's famous remark is well known: "Power tends to corrupt, and
absolute power corrupts absolutely." This increases uncertainty to sections that
contracted for "security" and those who bargained for "riches". Even envious
collaborators are unnerved by the growing multitudes of overt enemies. Com
pradors held together by greed and not principle, could, when struck by 'a pris
oner's dilemma', transform into turncoats. In a turbulent environment the op
portunity cost for change diminishes hence absolute power cannot be main
tained efficiently. As Edmund Burke (1777) observed, force can be used for
both nation building and destructive purposes. See Figure 3 below that provides
an appropriate contemporary illustration.
Contrarily to power, land ownership entails absolute long-term advan
tages and latent strength. As a result ownership of land is only relinquished as a
last resort. To avert the real threat of social storms against overt concentration
of ownership, land may be held under anonymous names, subordinates or other
fronts. To devious opportunists, land, Bartlett (1987, p12) notes, "is a most con
venient battle-cry, and an equally effective rallying call. The essence of persua
sion is selfishness which is politically presented as selflessness."
"O.fflOQ"Qtlc p-ocusis mult rt:tnain tM uc:lusiYc reJponslbllity of the r.otlons and pe<iplu in whose: domoifl they are Ufld,rt....,, and proetlsc<I .....
81
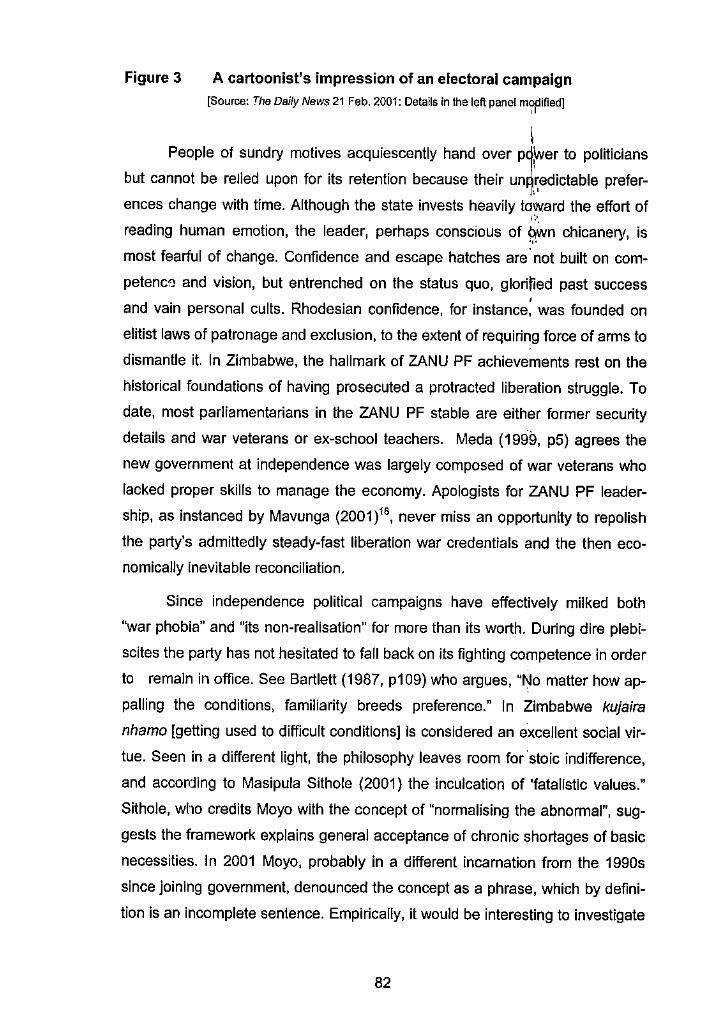
Figure 3 A cartoonist's impression of an electoral campaign
[Source: The Daily News 21 Feb. 2001: Details in the left panel m~ified]
I People of sundry motives acquiescently hand over pq~er to politicians
but cannot be relied upon for its retention because their un~'redictable preferh•
ences change with time. Although the state invests heavily toward the effort of 1:•.
reading human emotion, the leader, perhaps conscious of Qwn chicanery, is .,,
most fearful of change. Confidence and escape hatches are not built on com
petenc';) and vision, but entrenched on the status quo, glorified past success ' and vain personal cults. Rhodesian confidence, for instance, was founded on
elitist laws of patronage and exclusion, to the extent of requiring force of arms to
dismantle it. In Zimbabwe, the hallmark of ZANU PF achievements rest on the
historical foundations of having prosecuted a protracted liberation struggle. To
date, most parliamentarians in the ZANU PF stable are either former security
details and war veterans or ex-school teachers. Meda (1999, p5) agrees the
new government at independence was largely composed of war veterans who
lacked proper skills to manage the economy. Apologists for ZANU PF leader
ship, as instanced by Mavunga (2001)18, never miss an opportunity to repolish
the party's admittedly steady-fast liberation war credentials and the then eco
nomically inevitable reconciliation.
Since independence political campaigns have effectively milked both
''war phobia" and "its non-realisation" for more than its worth. During dire plebi
scites the party has not hesitated to fall back on its fighting competence in order
to remain in office. See Bartlett (1987, p109) who argues, "No matter how ap
palling the conditions, familiarity breeds preference." In Zimbabwe kujaira
nhamo [getting used to difficult conditions] is considered an excellent social vir
tue. Seen in a different light, the philosophy leaves room for 'stoic indifference,
and according to Masipula Sithole (2001) the inculcation of 'fatalistic values."
Sithole, who credits Mayo with the concept of "normalising the abnormal", sug
gests the framework explains general acceptance of chronic shortages of basic
necessities. In 2001 Mayo, probably in a different incarnation from the 1990s
since joining government, denounced the concept as a phrase, which by defini
tion is an incomplete sentence. Empirically, it would be interesting to investigate
82

the extent to which adaptive expectation (i.e. learning from the past) and ra
tional expectations hypotheses hold for Zimbabwe.
Despite very sceptical introductory and concluding remarks, the rest of
Bartlett's thesis is surprisingly gullible. He has lost no love and faith in the pa
ternalism and integrity of modern day princes, the politicians. To him, "Eco
nomics is the study of integrity", (p131) and yet "'there is no morality in econom
ics", (p104). Machiavellian economics is recast as a constructive "pre
determinable pattern of behaviour in the pursuit of [man's] material gain and his
self-preservation ... (p3)" In contrast to his heartfelt admiration of the Japanese
economic organisation he laments the lack of economic philosophy in the f?rit
ain of 1987. In his hands Machiavellian Economics simply meant British survival
and prosperity depended on the nation's ability to "explore objectively and with
integrity the probable alternatives open to it and then have the courage to take a
series of predetermined steps, each of which is uncertain and confirmed only
after commitment", (p28). Economic philosophy and policies are rendered vi
sionary. The implied acceptance of Thomas Hobbes's anarchical "state of na
ture" generates internal inconsistencies and contradictions with the envisaged
archetypal Hegelian nation statehood.
My point of departure is that Machiavellian Economics is more than de
liberate economic vision. By definition a Machiavellian policymaker cannot have
integrity. He or she does not mean what they say. In Bartlett's own words, "the
democratic system is not conducive to the integrity of leadership. Democracy
panders to human nature and therefore shuns, ignores or deliberately disbe
lieves any adverse prognostication", (p90). Under Poivad resource managers
use their proximity to state and commercial resources to craft an elitist society
based on patronage and self-preservation. As Black, Kraakman and Tarassova
(1999) note in their powerful and sombre paper, well-connected technocrats
face two strategies to maximise private wealth. The choice is between honest
entrepreneurship (which success is not guaranteed) and skimming revenue al
ready there, (if vernal the proven skills could already be under their belts.) As
set stripping; resource redistribution in favour of friends, kith and kin; and other
dubious "trusteeships" are the major economic activities instead of increasing
productivity. Pyotr Aven (1994), cited in Black et al (1999) depicts graphical
decadence in post Soviet Russia:
83
To become a millionaire in our country it is not at all necessary to have a good head or specialised knowledge. Often it is enough to have active support in the government, the partian\ent, local power structures and law enforcement agencies ... ln o,her words, you are appointed a millionaire. I/
' I argue infra that politics of patronage has been thrivihg for many dee-" ades. Hellman et al (2000, p24) define patronage as the hiring of friends and .
relatives into official positions by public officials. Rhetoric, ratje, partisan affilia-
tion, discriminatory laws and regulations systematically alienate opponents. This
ostracism is deliberately cultivated and nurturt.d to ensure Jelf-entrenchment.
Except in very extreme cast?s there is usually no redress for injustice suffered
by those outside the circle of patronage at the hands of the untouchables. Na
ked misdeeds, bias and corruption continue with impunity due to token fines,
inconclusive investigations and suspect (if not suggestive) executive clemency
orders. Pretences at the indispensability of the 'godsend' lead.er along with any
dirty methods are not uncommon. The means are condoned 'in the name of na
tional interest'. What excruciating dehumanisation has mankind suffered at the
hands of fellow man professing to be just doing their jobs? Although each gen
eration makes its own heroes, and the spirit of life is destined to eternity, re
source managers often have a contemptuous view of posterity. Phimister
(1988, p229) recounts that a typical m\'" .. o vision concludes, "After me, the de
sert." As we have noted earlier on, excessive reliance on despotic power de
preciates its potency. Openly sponsored social contempt, vigilantism, anarchism
and anachronistic barbarity, even by a small section of the community, in
creases general despondency and violence as affected communities take steps
to safeguard their security and self-preservation. Black et al (1999) demonstrate
that despotic tendencies by government such as unfair taxes and deliberate
non-payment of bills owed to private companies "[reinforce} disrespect for
rules." A Zimbabwean saying advises big baboon to earn respect. Violence,
being a sword of fire, is by definition double edged. In progressive hands it has
a potential to be revolutionary, purificatory and therapeutic. In the dark realms of
anarchists, bandits, criminals, demons and totalitarians; condemns and exe
cutes anything not part of its vortex - good or bad - just or without cause or
form. Violence during a revolution and violence under a repression are as dif
ferent as chalk from cheese. If fear of "violent death" is man's worst phobia,
84
.,,...
(Hobbes) a regime that brings fear of death to the doorstep of its citizens on a
daily basis is building bridges on the Rubicon of their desire for change. It was
argued above that desperate times decrease the opportunity cost for change.
As in any struggle, potential for demise is inevitable though the course is unpre
dictable. Demise takes several forms ranging from destruction, demolition, dev
astation, decimation, dismemberment, downfall or death.
The Poivad premise propagated in this thesis unifies the colonial apology
proposition and the underdevelopment theoiy into a single framework. A Poivad
perspective attempts to resolve the seemingly perplexing thesis that Zimbabwe
amounts to "The Terrain of Contradictory Development" perfected in Sylve~ter
(1991 ). No any one way of looking our past activity can b,, final. Even Bartlett
(1987, p64) who believes human nature does not change, agr;ses that changing
circumstances eliminate benefits of experience and necessil.ate "a constant re
turn to basic studies ... " Zimbabwe has a long history of economic oppression.
Without a consolidated conceptual framework, it is difficult to appreciate funda
mental forces operating beneath her economy. In my view, corporate govern
ance and institutional structures have a significant effect on the economic and
financial developments to warrant a serious study. Although a full analysis of all
the issues raised in the Poivad paradigm is well beyond the scope of this thesis,
the framework is a valuable springboard for further analysis.m
3.3 Additional Remarks and Way Froward
Zimbabwe's nationalist pride has been battered chronically by disap·
pointing economic results. Despite our collective quest for improvement, our
dreams have often gone wrong. Part of the vertigo lies in exultant incorrigibility.
Society should regard with suspicion men and women who believe only their
habits, persuasions and pretensions contain the truth and substance. Height
ened intolerance to non-partisan views and innovation, accompanied by ribald
self-righteousness to the point of autolatry (i.e. self-worship), is ironically a re
ceipt for sectarian violence and mass poverty. Unfortunately, all regimes Zim-
'" A more detailed analysis applying a POJVAD framework to the major historical developments in Zim· babwe, namely Charter Rule (1890- 1923), Settler Government ( 1923- 1953), The Federation ( 1953 -1963), Unilateral Declaration of Independence [UDIJ ( 1965 - 1980). Independence and Post Colonial Contradictions ( 1980 -200 I) is available to serious researchers on request to [email protected].
85
babwe has known believed that the country's destiny was only safe in their
hands; to the extend of blaming everyone except themselve~1 for their failures.
Maybe it comes naturally. I have yet to meet a man who belieyes his wife might
be better loved elsewhere. In the end, politicians sometime1/ put personal as
cendency and superiority over others above needs of the nat\8n. As if that was
not enough Bartlett (1987, p34) argues, "He [the politician] nj~y be wrong and
the destination may not be worth the journey and that he will n~ver know."
Dysfunctional self-interest does not guarantee economic efficiency or
sustainable socio-economic transformation because the markets are not con
testable in a logical way. In the year 2001 life expectancy was 40 years, unem-•
ployment above 70% and inflation around 100%. Real return on most financial
and physical asseti:, including labour, was negative - paralysing economic ac
tivity. The chronic "inability" of several "employers" to pay positive real wages,
above a basic poverty datum line, renders the employees a c::aptive market for
corporate subsidies. In spite of outrageous mark-ups on commodities such as
furniture and electrical goods for instance, a lot of Zimbabwean firms still fail to
make a grade in the world of business. In my view, this is a classical case of a
failure of principles rather than effort on part of both government and industry.
Innovative ways must be found to give practical effect to contract en
forcement, transparency, accountability, stakeholder empowerment and com
petition. In my view, all governments have to be held accountable for macro
economic performance under their reign. Politicians seek and renew their man-,
Jates to govern ostensibly on that account, in the name of doing what is good to '
the general public. They are quick to claim all credit even for fortuitous prosper-
ity. Management by crisis and failure to take into account predictable factors
beyond one's control is an unjustifiable strategic deficiency.
Above all, Taylor (2000) emphasises that economic prosperity is within
the reach of every nation provided there is will power to take the right dt::cisions:
There is, therefore, no 'secret' or 'holy grail' of economic development, no secret formula of growth that is applicable to a poor economy but not to a rich economy. The only secret is an open one: For growth to occur, there must be in place policies that foster the formation of [human and non-human] capital and its subsequent investment in produced means of production ... [Other-
86
wise,] The search for a 'chemistry of growth' nevertheless remains an ignis fatuus, a deceptive hope.
,I
In Zimbabwe there is an urgent need for a conscious \effort to enhance
the productivity of (and return on) all assets. Financial sectfr reform may be
one way of improving overall economic performance through'·. ,more efficient ft-.. nancial intermediation and increased competition. Improved a~cess to financial
setvices at all levels of society might be useful in breaking tH6 vicious cycle of
poverty in small economies such as Zimbabwe. The regulatory framework in
which financial intermediaries operate ls considered an import~nt determinant of
financial sophistication and economic growth.
4. THE ZIMBABWE FINANCIAL SYSTEM
Pecunia non olet: money does not stink.
Roman emperor Vespasian [on taxing public toilets] as cited in Askes (1971, 16)
4.1 Evolution of the Zimbabwe Financial System
The Era of Free Banking (1892 -1939)
Similar to the experiences of many former British Territories, the financial
landscape in Zimbabwe witnessed episodes of free banking, ·a currency board,
and a correspondent system centralised around a central bank. Free banking
refers to a monetary system in which banks issue their own currency and keep
their own reserves without control of a central bank. Bagehot in "Lombard
Street" [as reported in Goodhart 1988] considered this to be the theoretical
"natural state of banking." In a series of provocative articles, Hayek suggested
that banks in a free system should be allowed to compete on the basis of the
standard value of the notes they issue. Other proponents of free banking argue
that central banks are too conservative. They (central banks) prevent innovation
and reduce competition by a plethora of regulations. In Bagehot's view a cen
tralised "one resetve system" makes the financial system more delicate by re
ducing the overall amount of resetves retained in the money market. Such a
87
system is much more likely to frequently draw on state help. In my view, Bage
hot's most important argument is that a "one reserve system" ,is run by a single
board of directors thereby making society "dependent on the Vo{isdom of that one
only, and cannot, as most trades, strike an average of the wis~om and folly, _the
discretion and indiscretion, of many competitors."19 However, ij1,~gree with Henry
Thornton (1802, p94), also cited in Goodhart (1988,p18) tha\.:..a system envis
aged by Bagehot will be ravaged by moral hazard as each inS,titution pursue its
own interest. levy inflation tax, at the peril of financial stability.
For a very long period of time banking operations in Zi~babwe depended
on two expatriate institutions - the Standard Bank of South Africa Limited and
' Barclays Bank (Dominion, Colonial and Overseas). Standard [Chartered] Bank
was the first bank in Zimbabwe. It was established in 1892, two years after the
arrival of the Pioneer Column, at the personal request of Cecil John Rhodes.
The parent Standard Bank was conceived in South Africa hJ 1857 and latter
founded in London in 186220. It had a nominal capital of £1m subdivided in £100
shares of which £500 000 was paid up by 1864. From inception the bank rapidly
expanded through a policy of deliberate amalgamation with other South African
based institutions. "The early policy of absorbing other banking institutions had
the advantage of removing rivals but retaining goodwill, local knowledge and
existing clientele," reveals Standard Bank (1967, p4). The bank expanded into
Malawi (1901), Zambia (1906), Kenya (1911) and Uganda (1912). Growth of the
bank in Africa was solidified by the acquisition of the Bank of West Africa in
1965 with more than 90 branchss in Ghana, Nigeria and Sierra Leone. Accord
ing to Newlyn and Rowan (1954, p74) the Bank of British West Africa had been
established in 1884. Standard Bank merged with the United Kingdom (UK) in
corporated Chartered Bank in 1969 to establish the present day Standard
Chartered Bank. The Chartered Bank of India, Australia and China was incorpo
rated in 1853 in the UK. The Zimbabwean entity is a fully owned subsidiary of
Standard Chartered pie of the UK, via another subsidiary - Standard Chartered
Africa Holdings BV incorporated in the Netherlands.
Banking philosophy and activities in Zimbabwe were closely linked to po
litical developments from inception. By its own admission the Standard Bank
(1967, p9) had close links with the BSAC. Its interests were indiwctly "repre-
88
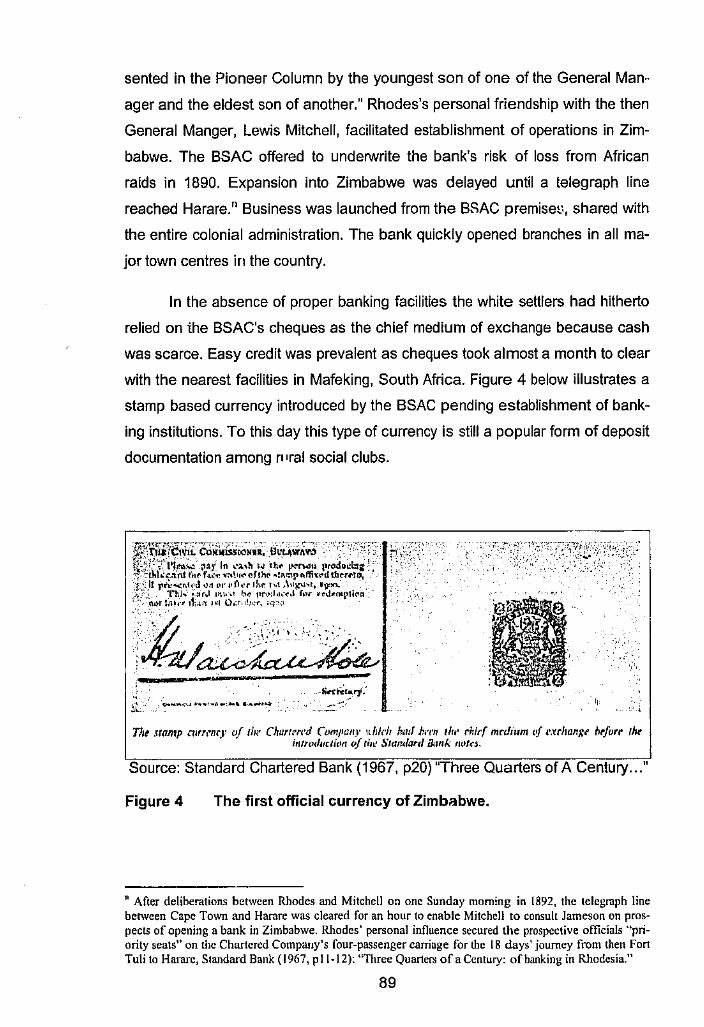
sented in the Pioneer Column by the youngest son of one of the General Man
ager and the eldest son of another." Rhodes's personal friendship with the then
General Manger, Lewis Mitchell, facilitated establishment of operations in Zim
babwe. The BSAC offered to underwrite the bank's risk of loss from African
raids in 1890. Expansion into Zimbabwe was delayed until a telegraph line
reached Harare. n Business was launched from the BSAC premiset1, shared with
the entire colonial administration. The bank quickly opened branches in all ma
jor town centres in the country.
In the absence of proper banking facilities the white settlers had hitherto
relied on the BSAC's cheques as the chief medium of exchange because cash
was scarce. Easy credit was prevalent as cheques took almost a month to clear
with the nearest facilities in Mafeking, South Africa. Figure 4 below illustrates a
stamp based currency introduced by the BSAC pending establishment of bank
ing institutions. To this day this type of currency is still a popular form of deposit
documentation among r• 1ral social clubs.
WJrfiifE;hleriM~~s;~~;.: a~~~;~-:·.,.,._:·. --· 1n)C','.'"i•i.~<,,,·. \'I Ai In ,••,h I.I ~.h~ f1't'rW~ 11rod1td:ll(); ·!· ·,t~\.:,..._,u,t r.,~ r ... , ... ..-,,\""'"'11, ... ~:,.r:,p,.f'lh .. dth~r .. 10, }\ll }'r~..,hh'd <Jtt ,,,.,,\'la 1hr 1,1 ,\,,!{'I,•, ll)'>n. (;.".'.. Th!-." ;_~r,1 ,~u,, bc 1•Nd,,,-~J for ,eJ,.na1•tl<'n···
ni>r l1u,·, ,1;~,, ••I o~r, ,!Je,, ;q "'
·.··i:.. ,· ,· '.(·.,-,. •,.-.... · -:' t-;d_ - ·~-----: .·> . '-, - . / . . ' •. ~AJ ----" . j' • ....~-" ...,_, .... , ... ~ ............. ,L ._ .. ;
T!,t .itamp rnrr,·nr;r ,f thr Clrurtl'~'d (°l)mpu11y 1t/J/ch hwl ~·1•11 //r,• rhlrf mrdium l'f ,•.ulwngl' hrforr /ht i11trmlm:1ion of rh~ Stam{arcl ikmk 1wtcs.
Source: Standard Chartered Bank (1967, p20) "Three Quarters of A Century ... "
Figure 4 The first official currency of Zimb;;1bwe.
n After deliberations between Rhodes and Mitchell on one Sunday morning in 1892, the telegraph line between Cape Town and Harare was cleared for an hour to enable Mitchell to consult Jameson on prospects of opening a bank in Zimbabwe. Rhodes' personal influence secured the prospective officials "priority seats" on the Chartered Company's four-passenger carriage for the l 8 days' journey from then Fort Tu\i to Harare, Siandard Bank (1967, pl l-12): "Three Quarters ofa Century: of banking in Rhodesia."
89
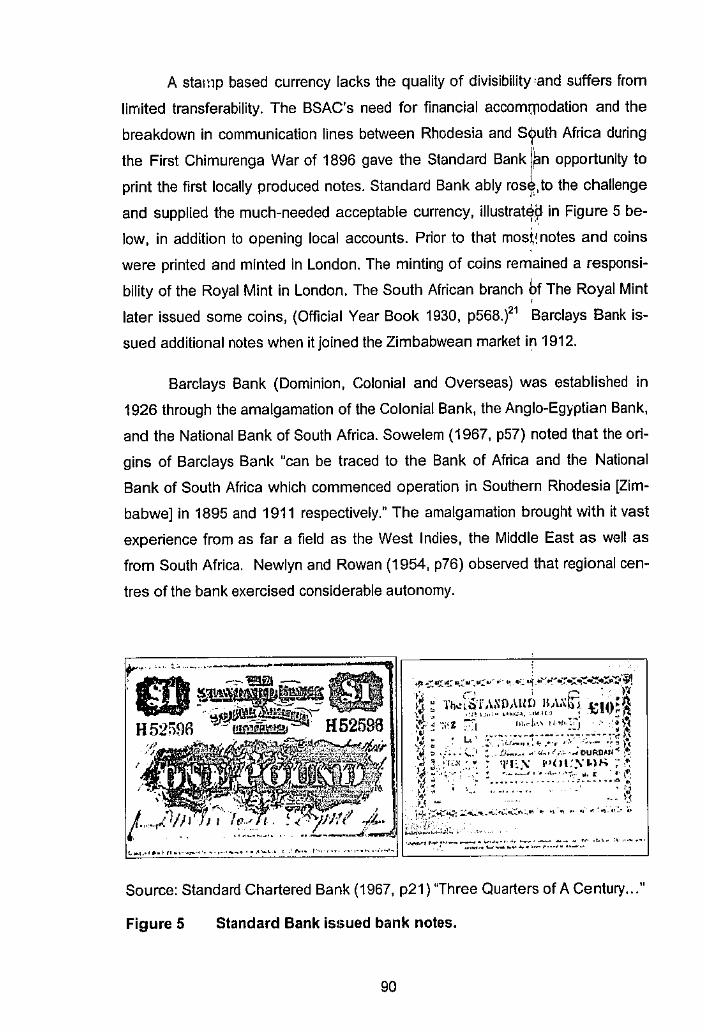
A stamp based currency lacks the quality of divisibility ,and suffers from
limited transferability. The BSAC's need for financial accomwodation and the
breakdown in communication lines between Rhodesia and s9uth Africa during
the First Chimurenga War of 1896 gave the Standard Bank l~n opportunity to
print the first locally produced notes. Standard Bank ably ros~. to the challenge
and supplied the much-needed acceptable currency, illustrat8i:t in Figure 5 be-, ... low, in addition to opening local accounts. Prior to that mos~inotes and coins
were printed and minted in London. The minting of coins remained a responsi
bility of the Royal Mint in London. The South African branch hf The Royal Mint '
later issued some coins, (Official Year Book 1930, p568.)21 Barclays Bank is-
sued additional notes when it joined the Zimbabwean market in 1912.
Barclays Bank (Dominion, Colonial and Overseas) was established in
1926 through the amalgamation of the Colonial Bank, the Anglo-Egyptian Bank,
and the National Bank of South Africa. Sowelem (1967, p57) noted that the ori
gins of Barclays Bank "can be traced to the Bank of Africa and the National
Bank of South Africa which commenced operation in Southern Rhodesia [Zim
babwe] in 1895 and 1911 respectively." The amalgamation brought with it vast
experience from as far a field as the West Indies, the Middle East as well as
from South Africa. Newlyn and Rowan (1954, p76) observed that regional cen
tres of the bank exercised considerable autonomy.
~ ............ ,-.,..-,···-····--·····--·. '·' ..... , . ., ,.,. ,.., .. ,_,.,,_.,
Source: Standard Chartered Bank (1967, p21) "Three Quarters of A Century ... "
Figure 5 Standard Bank issued bank notes.
90
Notwithstanding the existence of local notes, bank notes issued in the
"Gape Colony" in South Africa were recognised as legal tender in Rhodesia. In
deed, prior to the passage of th0 Southern Rhodesia Coinage and Currency Act
of 1933, British and South African coins circulated freely in the country. How
ever, from 1933 South African coins were no longer acceptable as legal tender.
British coins were unacceptable as legal tender from 1939, but remained ac
ceptable in Zambia and Malawi even after the establishment of the Federation.
According to the Standard Bank (1967, p23) established commercial
-~
"'r
•• "
banks actively promoted the use of bank notes rather than coins that were sub- i
ject to exorbitant transport costs. However, employers accustomed to paying
low wages preferred to transact in coins:
Supplying cash to the new colony was a costly undertaking. Coin was preferred to notes and gold to silver, particularly for African wages. To bring gold coin from London to Bulawayo cost 30 shillings per£ 100, and to bring silver coin from Cape Town cost £3 10s. 5d. per cent (sic). To [Harare] the corresponding expenses were £112s. 6d. and £4 5s. 5d.
There is inadequate documentation of the country's banking history and
the respective time series data. Apart from Newlyn and Rowan (1954), Sow
elem (1967), Chimombe (1983), and a series of articles IJy Cole in the 1970s,
there is very little documentation let alone scholarly analysis of this important
sector. Empirical research is constrained by lack of time series data.
From an analytical point of view, 'Three Quarters of A Century: of bank
ing in Rhodesia 1892-1967" by the Standard Chartered Bank (1967) is a
graphical illustration of a wasted opportunity to document the country's banking
activities. As the country's first bank, Standard Chartereu Bank was in a better
place to trace the course of financial evolution in the country. Unfortunately
authors of the document chose to eulogize "pioneering conditions" (p51) and
address a colonial audience rather than a financial clientele. For a piece done
as late as 1967, it compares very unfavourably say :o Herbert Frankel's (1938)
"Investment in Africa" in teims of detail and authority. Although this work con
tains no statistical or graphical portraits of the bank's activities it found space for
a "gang of [African] labourers (p37) in addition to leaving other African employ
ees nameless in annotated staff photographs. See appendix 3. This confirms
91
that political developments had a strong influence on the local financial scene. I
do not attempt to judge the bank as politically incorrect in retrpspect, but argue
that the subject matter of banking was not competently addre~sed. The indiffer
ent attitudes criticised reinforce Theresa Chimombe's (198~) conclusion that I
interests of foreign owned institutions lay elsewhere. Had Standard Bank been
a locally owned institution, it might have evolved into the courifry's central bank "'.
by virtue of its prominence and close liaison with the governl'U€nts of the day°.
The Bank of England, Banca d'ltalia, Banque de France, and the Common
wealth Bank in Australia are successful examples of such I a transmutation. '
Banque de France was founded in 1800 at tile prompt of Napoleon, but was not
owned by the State (Goodhart 1988, p1140).
The Southern Rhodesia Currency Board
The Coinage and Currency Act of 1938 provided for the establishment of
the Southern Rhodesia Currency Board. Prior to its establishment UK coins,
Southern Rhodesian coins, and bank notes issued by the Standard Bank and
Barclays Bank were all recognised as legal te.nder in terms of the Southern
Rhodesia Coinage Act of 1933. The Currency Board was tasked to ensure that
profits arising from the issue of notes and coin accrued to the governmcn+ Sec
ondly the board had a mandate to facilitate quick conversion of local currency
into pound sterling at a fixed rate. It had no supervisory role in relation to other
banks and non-bar,k financial institutions. Although it was subject to Southern
Rhodesian (Zimbabwe) law, agreements were in place with Northern Rhodesia
(Zambia) and Nyasaland (Malawi) for the circulation of its r· 1-rency in those
countries. The distributior. ratio set in 1947 stipulated that profits were to be
shared as Zimbabwe (10 %), Zambia (7 %) and Malawi (3 %) provided the
board attained a 110% sterling cover against the currency in circulaticn. The
chairman of the currency board doubled as a financial adviser to the govern
ment.
With effect from 1939 to March 1940 commercial bank issues ceased.
However StandarrJ Chartered Bank was retained as an agent to transact the
pfmmer bank employees found their way into cabinet positions while ex-government officials such as Sir Robert Hudson and Dr. liuggins, a fom1cr Prime Minister served on Standard Uank 's Board.
92

board's London business presumably up to the establishment of the Central
Bani,. The Currency Board took over liability of the outstanding Southern Rho
desian currency and replaced it with its own by March 1942. The Sterling assets
held to support the currency were also transferred to the Board. A Rhodesian
pound (R£) was introduced in 1942 at the rate of 1R£ to 1£ Sterling. Its tenor
expired in 1970 when the decimalised Rhodesian Dollar {R$) was introduced.
Similar to the Australian currency which was decimalised on 14 February 1966
a conversion rate was 1 R£ = 2R$ was adopted. The new currency only lasted
10 years from 1970 to 1979. A newly designed currency, the Zimbabwe Dollar
(ZWD or 2$) was introduced at par in 1980.
During the Federation, the board was briefly renamed Central Africa Cur
rency Board with effect from 12 March 1954. Southern Rhodesian currency re
mained the sole legal tender because the Federation did not issue a currency of
its own. However, surplus income was now earmarked for preparations to es
tablish a cental bank rather than for distribution.
As part of the preparations for the establishment of a central bank, the
Southern Rhodesian government contracted a Bank of England official, H.C.B.
Mynors, in 1948 to report on the subject. According to Sowelem (1967, p33)
The Mynors report, issued in January 1949, advised against establishment of a
central bank because the economy was dependent on external rather than in
ternal problems. Existing banks were prudently managed hence required no su
per.,isory authority. In Mynors' view, the central banking function potentially
useful to the country were of a personal rather than institutional nature. To this
end, Mynors recommended the appointment of a financial adviser to the gov
ernment capablr. giving policy guidance and of maintaining close liaison with the
financial sector. Sowelem (1967, p34) argues that the Mynors report placed
unwarranted confidence in moral suasion and failed to consider the important
role a central bank could play to foster financial deepening and economic de
velopment. With hindsight Sowelem's criticisms are justified because estab
lishment of a central bank later enhanced the depth of the money market.
On its part, Sowelem obser.,ed that the government was craving for
greater monetary autonomy from financial policies in South Africa or London.
Creation of a central bank was a vehicle to put financial policy in local hands. In
93
fact it was realised that the Currency Board's 100 % coverage of the local cur
rency with British securities and sterling was wasteful. The pra.~tice was blamed
for the flight of liquid financial assets from the country as well as capital short
age that was perceived to be retarding general development. Ef5tablishment of a
central bank provided the government with a mechanism cap~ple of controlling
undesirable expansion in bank credit, which could be inflatioO'ary. Indeed from '·'.
March 1950 the Southern Rhodesian government took concr.~te steps toward
the establishment of a central bank. Progress was only hampered by politico·!
considerations pending establishment of the Federation of R~odesia and Nya-'
saland. The Bank of Rhodesia and Nyasaland commenced operations on 1
April 1956 and took over the assts and liabilities of the currency board.
The Land and Agricultural Bank
This bank had its roots in the Land Bank that was established in 1912
with a share capital of £25 000. The Land and Agricultural bank was established
in 1924 to provide long-term loans for agricultural development on the security
of first mortgage bonds. Operations were confined to European agricultural
sectors because Africans had "no assignable title which would be acceptable for
mortgage," Newlyn and Rowan (1954, p124) insist. By 1950 about 80 % of the
European agricultural community had made use of the Land Bank at some time.
Small loans were only extended to farmers in the African Purchase Areas from
1945. However, Sowelem (1967,p191) reiterates that less than 1 % of African
farmers had title to their land hence very little credit was av8ilable to the Afri
cans. In 1947 functions of the Land Bank were extended to cover urban housing
due to the limited development of Building Societies.
The Agricultural Finance Corporation (AFC) was fomned in 1971 by the
merger of the Agricultural and Land Bank and the Agricultural Assistance
Board. This is a public owned institution that is entirely owned and funded by
government via control of the Ministry of Agriculture rather than of Finance. The
AFC also had access to donor funds targeted at rural labour cooperatives
through the Collective Self Finance Scheme (CSFS). Activities of the CSFS
were augmented by another donor sponsored scheme known as the National
Association of Savings Cooperatives and Credit Unions of Zimbabwe
(NASCCUZ). The AFC is affected by inadequate capitalisation and autonomy.
94
After independence, government guaranteed the upsurge of loans to the
small-scale agricultural sector. High volumes of delinquent facilities plagued the
sector. Government, however, was slow in making good its guarantees. By
June 1993, the corporation was seeking a banking licence to enable it to sepa
rate development activities from commercial ones. It was not until 1999 that the
Agricultural Bank of Zimbabwe (Agribank) commenced operations as a com
mercial bank. Progress was slow due to inadequate capital and lack of trans
parency between the bank and unprofitable non-bank divisions that could jeop
ardise depositors. Recapitalisation of the bank via conversion of government
debt into equity meant that no cash inflow would accrue to the bank. Since
2001, government was again desirous to reconvert Agribank into a Land Bank.
4.2 Architecture of The Present Financial Sector
Overall Policy Analysis
This section evaluates the structure of the Zimbabwean Financial System
over time at a macroeconomic level. Disaggregated micro-level analysis such
as the relative performance of individual entities, for example, is outside the
scope of this thesis. The intention has not been to describe in detail the organi
sation and operations of the constituent units but to sketch an analytical appre
ciation of the main sectoral features of ths financial system. The banking sector
comprises of the cental bank, commercial banks, merchant banks and discount
houses. Among others the main non-bank financial intermediaries operating in
Zimbabwe are building societies, finance houses, the POSB, insurance compa
nies, pension funds, micro finance, and several development Institutions.
The Zimbabwean financial sector, like its real and service industries
counterparts in the economy, is characterised by concentrated (local and for
eign) ownership, high proportion of foreign ownership, and high degree of gov
ernment control. According ta Chapman (1992) the government controlled
about a third of total financial assets through the Zimbabwe Financial Holding
Limited (Finhold) Group, Commercial Bank of Zimbabwe, and the People's Own
[ex-Past Office] Savings Bank (POSS). Foreign direct ownership accounted far
at least 28% of total deposit taking institutions. In 1992 for instance, all privately
95
,-~
owned commercial banks, including the largest - Standard Chartered Bank and
Barclays Bank were foreign owned. Since then the number,1of locally owned
commercial banks has increased significantly. Chapman alsdi emphasised that
Old Mutual, the largest insurance and pension fund manager if the country, had
a 12% controlling interest in deposit taking institutions. Old M4\ual had substan
tial ownership in the Merchant Bank of Central Africa (MBCA)!'CABS - the larg· '·'.
est building society; and in FMB - acronym for First Merchant l'!ank.
Most deposit taking institutions in Zimbabwe are still mesmerised by the
big bank concept hence the sector is prone to aggressive Jergers and take
overs. In an economy where business success often depends on connections,
vertical integration is also motivated by the need to create loYal entities across
the entire financial spectrum. In 2000 there were 35 banks in Zimbabwe with no
less than 10 banking groups. ln the 1990s bank holding companies were ex
empted from the 25 % prudential limit on equity subscription tp a financial insti
tution's shares by a single investor. This provision prevented dilution of owner
ship in influential government and foreign owned financial institutions, and many
players quickly exploited the loophole to carve closely held financial empires.
By world standards Zimbabwe's financial system is underdeveloped.
Demirgui;-Kunt, and Levine (1999, p3) propose that a country's financial system
should be regarded as underdeveloped if its ratios for bank and market devel
opment are both below median values approximated for the global financial
system. Table 1 shows that Zimbabwe does not pass the test. Nevertheless
Zimbabwe's financial system is usually regarded as relatively sophisticated for
an economy of its size. The Reserve Bank of Zimbabwe (RBZ) (1980, p9)22 at·
tributes this to the designation of Harare as the financial centre of the Federa
tion of Rhodesia and Nyasaland between 1953 to 1963; strict exchange con·
trols; and restricted access to international money and capital markets between
1965 and 1980. The country crafted a sophisticated payments system and a re
spectable spread of institutions to facilitate the mobilization of savings, promote
economic growth, and financing of the budget deficit via domestic borrowing.
Banks and government accommodate each other's needs. Successive
governments have tolerated some sort of laissez-faire banking practices as long
as banks gave practical effect to government controls and directives even at the
96
-· 00.<.'
expense of sound financial intermediation. On their part, banks accommodated
government policies and controls as long as concentration of ownership was not
diluted; and the regulatory burden could be passed on to clients in the form of
guaranteed margins and a limited range of service. As Harvey (1996, p2) puts
it, "the system lacked effective competition, and had many of the negative char
acteristics of oligopoly." Financial innovations such as automated teller ma
chines (ATMs), telephone banking and derivatives took a very long time before
being adopted into the country. In other words both government and financial
institutions guaranteed their interests at the expense of the customer. Positive
real interest rates are elusive in the Zimbabwean financial sector. However,
neither government nor banks worry about thl~ persistence of financial repres
sion as both can get income to the detriment of weak clients who have no re
course.
Very few changes were made to the financial sector after independence.
In spite of ZANU PF's socialist rhetoric the Companies Act did not forbid 100%
foreign owned subsidiaries. However, in practice no new 100% foreign owned
banks were tolerated as government policy required new entrants to have at
least 30% local shareholding. According to Harvey (1996, p1) "two American
banks closed their representative offices in Zimbabwe in 1983 and 1984, having
failed to get full banking licences.'' Officially, government at the time attached
great importance to local ownership of economic resources. For instance, the
Insurance Act of 1987 required at least 51 % of the institutions to be localised.
The Act paved the way for a localisation programme pursued from 1988 to
1994. In fact Exchange Control (EiC) spearheaded the localisation of foreign
owned institutions in order to stamp out capital flight. Apart fron1 the registration
of subsidiaries of foreign owned banks as Zimbabwean versions, and the floa
tation of 34% of Barclays Bank's share capital on the Zimbabwe Stock Ex
change, not much localisation emerged in the banking sector. In deed there was
little cooperation between EiC and Banking Supervision departments of the Re
serve Bank because the then powerful EiC department had no intentions to dis
close its criteria. Fears of widespread nationalism proved unfound. Contrary to
Chapman, Harvey (1996, p6) characterised the increased ownership of financial
assets by government as "incidental nationalisation" driven by external events
rather than conscious policy. This conclusior. is valid because the purchase of
97
the 62% equity in Rhobank, now Zimbank under Finhold, was precipitated by
the intention of South African based investors - Nedbank to ;vithdraw from the
market. Similarly, the Commercial Bank of Zimbabwe (CBZ), ~ow trading as the
Jewel Bank, was localised after the worldwide collapse of ~CCI in 1991. In
contrast, no localisation occurred when the Standard Ban~. of South Africa
bought ANZ Grindlays in 1991 and branded it as Stanbic Bank!.' "'·
In my view, there has been inadequate attention to fthancial reform in
Zimbabwe. Notwithstanding the widespread agreement in financial literature re
garding the causal effect of financial intermediation on ecoriomic growth, the
financial sector formed a little part of government economic policy after inde
pendence. Government might have misunderstood the cardin81 role of financial
intermediation in economic development. ln contrast to elaborate discourse on
education, rural and agricultural development, there were only two paragraphs
on money and finance in the Growth With Equity economic pplicy statement of
1981 (p3). The proposal to create a "Commission" to examine "the whole
monetary and financial sector' has never been followed by the Wallis (1997) or
Campbell (1981) type of inquiries, as held in Australia. Harvey (1996, p5) ob
serves that in both 1982 and 1983 the Government of Zimbabwe proposed but
failed to implement a Money and Finance Commission. By 1986 financial sector
reform was no longer part of the government' development agenda. Apart from
secretive IMF and World Bank analytical expeditions, financial sector reform
was not given priority. Prospects for far reaching financial sector reforms were
only rekindled in 1991 prior to the launch of the Economic Structural Adjustment
Programme (ESAP). Ratts0 and Torvik (1998, p326) highlight that a team of
UNDP-funded Australian experts secretly studied possible targets for trade re
form for two years before the programme was announced in July 1990. The
Canberra based Centre for International Economics was, in ten weeks, tasked
to identify impediments to efficient intermediation and opportunities for financial
sector reform. Among other constructive recommendations not adopted was
the proposal to abolish rigid market segmentation in the financial sector.
Harvey (1996, p3, and 6-9) advances five plausible reasons for limited
banking reform after independence: The financial system was considered ex·
tensively developed to warrant any material reform. Intervention in banking was
curtailed to protect interests of the white business community on whose confi-
98
dence the economy rested after generations of discr!'llination against black ad
vancement. Government had also learnt about the cost of inappropriate inter
vention from neighbouring countries such as Zambia and Mozambique. Wide
spread nationalisation ran the risk of provoking direct South African military in
tervention. A highly developed system of stringent l'.:ontrols inherited from the
UDI era provided government with "de facto control over the allocation of
credit." In Harvey's own words, "Direct credit control was therefore unneces
sary; exchange controls provided the government with effective control over
most of the economy, for the purposes of both economic management and po
litical control." Although Harvey considers the last point as the most important
one, the paper fails to explain why exchange controls were used to support.the
status quo rather than restructure the economy to correct the perceived colonial
imbalances.
In the final analysis, in my view, only four hypotheses stand. Firstly, it is
possible that the financial system was considered well developed, and had ac
c1.1mulated reputable expertise to warrant any intervention despite much talk
about colonial underdevelopment. Secondly, the allegations that "government's
political and administrative powers were widely used to divert resources," to
prominent individuals who deliberately avoided repayment (as in Harvey, p11-
12), implies that true reform might have been sacrificed for self-enrichment.
Thirdly, there were a lot of specialist institutions and funds ostensibly targeted at
the Small and Medium-scale enterprises SMEs) for poverty alleviation and eco
nomic development. Such special vel1icle conduits for financial resources may
have invalidated the need for radical reform to ensure efficient financial inter
mediation. Lastly, and perhaps most importantly, the belated proliferation of in
digenously owned banking institutions could have been considered the most
appropriate organic remedy for financial and economic transformation. The fi
nancial sector remained relatively the same from 1960 to 1980. There were 2 to
4 accepting houses, 5 commercial banks, 2 discount houses, 8 to 5 financial
institutions and 8 to 3 building societies. According to Mataruka (1999, p69),
Between 1990 and January 1999 the industry witnessed the entry of 3 commercial banks, 6 merchant bankt;, one finance company, 5 venture capital companies, 56 foreign burt;:;~11 .... ,, 51 money lenders, 8 stockbroking firms and 9 unit trusts.
99
._ ___ .... _____ .. ___________________________ _
However this does not explain why no local commercial banks emerged
between 1980 and 1996. Even under UDI no settler owned ~ommercial banks
were registered. Incidentally there were considerable barriets to entry in the
form of a conservative licensing policy and high minimum s~art up capital re
quirements for commercial banks - set at Z$0.5m in 196~\,and 2$15.0m in
1995. Harvey (1996, p22), citing unconfirmed rumours, sugq~sts that after in
dependence some prospective African bankers failed to me¢ the set criteria,
while white and Asian investors felt that government would not favourably cori
sider their applications. Government might have realised th~t the licensing of •
incompetent deposit taking institutions at a time when the regulatory environ
ment was weak could have made the situation worse. The persistence of finan
·cial repression, characterised by negative rates of return on deposits, is exoge
nously determined sociopolitically, and by the government's appetite for funds.
The Reserve Bank
Friedman (1959, pp6-7), as cited in Goodhart (1988, p2) argued that a
Central Bank is not essential to enforce reserve requirements, but it remains
vital "in order to enforce that sanctity of contract, the prevention of fraud, and
the effective working of the monetary system, in a world in which information is
costly and scarce." Core functions of the central bank may be divided into
monetary and supervisory activities. For Goodhart (1988, p7) the monetary
(macroeconomic) policy functions play second fiddle "supervisory" functions
such as managing the payment system, market liquidity and\soundness of the
financial system. In my view, the debate amounts to splittihg hairs as some
open market operations cut across the both functions. Solvercy and monetary
policy are not mutually exclusive. Moreover the relative importance of monetary
tools and targets change over time. The reassignment of prudential supervision
functions to the Australian Pruden!ial Regulation Authority (APRA), away from
the Reserve Bank Australia,. (RBA), proves supervisory functions need not be
necessarily housed in a central bank despite their close connection with mone
tary policy. What is undisputed is the conclusion tr.at the micro functions _of a
Central Bank cannot be competently provided by a competing commercial brnk
due to conflict of interest.
100
The Reserve Bank of Zimbabwe (RBZ) was established during the Fed
eration of Rhodesia and Nyasaland in 1956 under different names. It is at the
centre of the Zimbabwe Financial System. Sowelem (1967, p47) shows that
since inception the Reserve Bank was not restricted from engaging in ordinary
banking activities. No retail banking activities were ever undertaken. Govern
ance of the bank and some of its core functions have changed very little over
the years. From the time of its establishment government held the bank's entire
share capital. In contrast, the paid up share capital of the South African Reserve
Bank is entirely held by the private sector.' The Reserve Bank of Zimbabwe's
prescribed capital of Z$2m and a general reserve fund of Z$6m has also re
mained static through time despite chronic increases in inflation. Admittedly.the
Reserve bank is authorised to hold special reserves and other investments.
Broadly speaking, the Reserve Bank of Zimbabwe (RBZ) has multifartous
functions. The most important functions, as enumerated in section 6 of the Re
serve Bank Act 1999 [Chapter 22:15], include regulation of the monetary sys
tem; maintenance of currency stability; supervision of banking institutions, foster
financial stability; manage the payment system; banker, financial adviser and
fiscal agent of the state; formulation and execution of monetary policy; and ad
vancement of economic policies of government. The Reserve Bank manages
the issuance of notes and coins and the clearinghouse. It maintains statutory
reserves and clearing balances for other banks. As banker and financial adviser
to the government, the bank also acts as the government' agent in the weekly
issue of tenders. Since 1957 the bank has been responsible for administering
the country's exchange control regulations on behalf of government. The pre
cise date on which exchange controls (E/C) were first introduced in Zimbabwe
is not very clear. What is certain is that E/C was extended to cover the "Sterling
Area" on 23 February 1961 to curb capital flight pending the dissolution of the
Federation. Contrary to general perception, exchange controls were perfected
rather than introduced during UDl. However, the common monetary system of
the Federation was dismantled in 1964, resulting in the creation of central banks
of Rhodesia, Zambia and Malawi. As noted earlier some functions of the bank
remained stable over the years despite the Reserve Bank Act of 1964.
1> However each individual shareholder can only hold up to 0.5% of the bank's share capital. The South African Reserve Bank cannot pay a dividend greater than 10% per annum on its nominal share capital.
101
Under the current law the bank's ability to lend to government is limited
at a given tirne to a statutory maximum of 20% of the previot,.1s year's ordinary
revenue of the government. Ordinary revenue excludes fun~s raised through
loans and sundry forms of financial assistance. Advances tol(government (and
statutory bodies) are required by law to be denominated in ~imbabwean cur
rency and convertible into bearer securities if not repaid withiH ·12 months from '·'.
the end of the financial year (or from date cf issue in case ofi,$tatutory bodies).
Conversion of facilities into government marketable securities potentially en·
ables the central bank to sell the bills on the market and kee~ government bar-'
rowing within the statutory limit of 20%. In the past a cap was also placed on
purchases of government securities by the bank. The Rese"'.e Bank could not
invest more than 20% of its liabilities to the public (including the bank's capital
and general reserves) in government securities with maturities larger than six
months. This provision is not part of the current Reserve Bank Act [Ch. 22:15].
There are a number of loopholes that could be used to evade the ceiling
on advances to the state. Pursuant to monetary policy objectives of the nation,
section 7 (3) (a) of the Reserve Bank Act [Chapter 22:15] empowers the bank to
buy and sell government securities "on its own account" in excess of the statu
tory limit. As banker to the government, the Reseive Bank is required by gov
ernment under section 8, subsection (2) of the Act to facilitate transactions on
such terms as the government may determine. In addition section 39 (5)
authorises the Minister of Finance to prohibit the publication of the bank's
statutory returns to the Treasury "if, in his opinion, it is in the public interest that
they be suspended." The suspension can be indefinite. For instance, there
were no official publications from the Reserve Bank throughout UDI from 1965
1o 1980.
Prior to UDI the Reserve Bani( was by law required to maintain 25% of
its liabilities to the public in form of gold, sterling or other foreign assets con
vertible ir.•o gold and sterling. In practice, the central bank initially dealt only in
sterling, leaving the commercial banks to source other currencies on the Lon
don market. The sterling link was de-emphasised under UDI. Under the current
Reserve Bank Act section 33 (1 ), statutory reserves consist of gold and other
foreign assets convertibie into gold. Section 33 (2) sets the minimum threshold
at 40% of the bank's foreign liabilities. However, in section 49, there is no spe-
102
cific benchmark for international reserves defined therein. Under section 49,
subsection (2) the bank has wide discretion to determine and maintain interna
tional reserves at levels it considers appropriate for the proper conduct of the
country's monetary and exchange rate policies.
Before the 1956 Banking Act there was no specific legislation regulating
banking activities. To its credit, the Mynors report (1949) raised the possibility of
conducting on-site banking supervision to mentor inexperienced and incapable
entrants into the banking system. The Mynors report also recommended a sys
tem of licensing br.nks to ensure that new entrants are adequately capitalised
and managed prudently. In my view, Mynors' emphasis on the "personal" func,.
tions ahe21d of the "institutional" activities of a central bank indirectly contributed
to the subsequent emergence of two supervisory authorities to oversee the
banking sector. Bank licensing was introduced in 1956 but was restricted to new
entrants to the financial system. The Ministry of Finance was the licensing
authority. The 1959 Banking Act provided for the appointment of the Registrar
of Banks and Financial Institutions (now Registrar of Banking Institutions) under
the Ministry of Finance empowered to license and de-license banks. According
to Sowelem (1967, p52) the Registrar had authority to appoint inspectors to in
vestigate any registered institution. However, supervisory objectives and re
sponsibilities were not c:early spelt out. In the end the supervisory capacity was
not developed. The Banking Sup~rvision function was only introduced in 1985
at the Reserve Bank. Progress on establishing the relevant legislation was slow.
There was considerable debate regarding the demarcation of the powers of
Banking Supervision Department and the Reserve Bank on one hand, and the
Registrar of Banking Institutions and the Ministry of Finance on the other. Much
debate centred on the need for central bank independence, and harmonisation
of the functions of bank licensing and supervision in line with international
trends. The Reserve Bank considered the ability to withdraw a license a useful
supervisory tool. Until August 2000 the law did not support the prudential super
visory function of the Reserve Bank. From 1985 to 2000 Banking Supervision
relied on prudential guidelines and moral suasion to promote prudent risk taking
within the financial sector.
As early as 1959 the central bank was granted authority to request in
formation and issue directives under the 1959 Banking Act. All banks were ex-
103
pected to submit regular returns on prescribed forms. Section 59 of the Reserve
Bank Act [Chapter 22:15], authorises the Reserve Bank lo "establish and
maintain an information network" for the benefit of banking institutions. How-'
ever, time series data is not fully developed and automated.1,~heoretically, du-
plication of effort between the office of the Registrar and BaJlking SupeiVision '
cannot be ruled out. In practice there is constructive cooper0tion between the '·'.
Reserve Bank, and the Registrar and Mini::.ter of Finance. TiMe Reserve Bank
and the Registrar are required in terms of Section 78 of the Banking Act 2000
[Chapter 24:20] to report on activities of banks and financiall institutions at the '
end of each calendar year. The Minister of Finance tables the respective reports
before Parliament. A more transparent arrangement would have been to make
the Governor of the Reserve Bank answerable to Parliament.
Under the Banking Act of 1959 four distinct institutions of banking busi
ness were recognised, namely commercial banks, accepting_ houses, discount
houses and financial institutions. Some institutions already in operation were
immediately registered in their respective categorises. These archaic distinc
tions were retained in the Banking Act of 2000 [Chapter 24:20]. The playing field
is not level. Building societies for instance, have legal constraints on the interest
they can pay on deposit or charge for mortgage bonds. As a result the mort
gage business has been abandoned in favour of money market investments. ln
2000 the capital adequacy ratio of building societies was on average 108%
against a regulatory minimum of 10%. That year also saw the conversion of
three merchant banks into commercial banks in order to have access to cheap
funding in the form of retail deposits, which were not accessible to acceptance
houses, that is merchant banks.
Although the Reserve Bank has discharged its responsibilities with due
diligence, its institutional structures are not appropriate for proper corporate
governance. On a positive note, section 21 (1) of the Resetve Bank Act stipu
lates that the board is responsible "for formulating the policy of the Bank's ad
ministration and operations." Section 19 (1) renders the Governor responsible
"for the day to day management, control, administration, operation and direction
of the bank." Section 25 of the new Reserve Bank Act even requires the Gover
nors and directors to disclose their interest and assets, as well as those of their
spouses, to the state President. The Governors setve a maximum of two five-
104 _________ _,,,} ,_ -•.:smm ,arwa:w = == ~

year terms in office although a Deputy Governor remains eligible for election as
a Governor. Members of Parliament and officers, directors or employees of
banking institutions are not eligible to simultaneously hold office as directors or
Governors of RBZ. In section 22 (2) the term of directors was extended to four
years from 2 years, to ensure stability of decision-making. The board approves
all loans and advances by the Reseive Bank to the government and the dis
counting of financial instruments with more than three months to maturity at the
time of their acquisition by the Reserve Bank.
However, in practice there is no clear-cut division of responsibilities be
tween the board and management. Under section 27 (1) of the Act, the Gover
nor of the Reserve Bank is the chairman of the board. In contrast, under section
18 (3) of the Banking Act [Chapter 24:20] an executive officer of a banking in
stitution cannot be chairman of the instituticn's board. The Governor and two
Deputy Governors of the Reserve Bank are appointed by the state President
and automatically sit on the board. Since by law, Reserve Bank Act (21) (2) the
board cannot have more than seven members, and pursuant to section 26 (i)
that specifies a quorum of four, only one non-executive dirGctor is required to
pass crucial decisions at a meeting where all the Governors are present. Sec
tion 28 (3) grants the presiding official a casting vote in the event of equal delib
erative votes. Under section 30 of the Reseive Bank Act no decision can be set
aside solely on the basis of the technical irregularity of the quorum. In contrast,
the Banking Act prohibits the executive directors of any banking institution from
forming a majority of any board quorum. Under the current arrangements [sec
tion 36 (1 )] the Minister appoints the External Auditors for the Reserve Bank
and is responsible for the publication of the bank's statutory returns in the Gov
ernment Gazette. Unlike in the past, the new Reserve Bank Act does not spe
cifically exclude employees and officers of government from serving as directors
or Governors of the Reserve Bank. The provision was enshrined in the previous
Reseive Bank Acts to ensure the independence of central bank advice to the
state. In brief, authorities have set strict corporate governance articles in the
Banking Act compelling banking institutions to adopt standards that are not fol
lowed up in the law governing the operations of the central bank. In other words
the authorities lay rules for others that they are not prepared to follow. Ideally,
the board and Governors of the Reseive Bank should be answerable to a
105
statutory parliamentary committee. Otherwise the Reserve Bank is potentially
vulnerable to Machiavellian Economics. ,I
Nearer to Zimbabwe, control of the South African ResJrve Bank (S.I\RB)
for instance, is vested in a 14-member board, seven of whom rre elected by the
state President and the remainder by the bank's shareholder's. There are only " four executive members of the board; the Governor and the t~ree Deputy Gov-
ernors, who constituted the Monetary Policy Sub-committee of the board. The
SARB is a relatively independent central bank answerable to its shareholders
for internal governance and to Parliament for monetary policy. (
The ability of the Reserve Bank of Zimbabwe (RBZ) to discharge its mul-,
tiple funrtions is compromised by want of autonomy and lack of specific man
dates. RBZ is expected to maintain the value of the Zimbabwe dollar. Implicitly,
this encompasses the internal value (price stability) and the external value (ex
change rate stability) of the local currency. Having said this, there are no clear
targets for price stability and no one is held accountable for any eventuality.
There is neither a definition of what constitutes price stability nor a firm com
mitment to low inflation, which economic theory suggest is good for macroeco
nomic planning. Whereas role ambiguity might have the virtue of flexibility, it
has the potential to suffer from the vice of impunity. In the 1990s, a number of
countries beginning with New Zealand followed by Canada, UK, Australia, Fin
land, Spain and the US adopted clear inflation targets. Clear objectives foster
good corporate governance via enhanced transparency and accountability.
Meyer (2001, pB) argues that transparency is good for monetary policy because ' it helps anchor market expectations. On the other hand accountability supports
the cause for central bank independence.
Meyer (2001, p4) argues that it is generally agreed that objectives of
monetary policy depend on the structure of the economy and the preferences of
its citizenry. RBZ is responsible for formulation and execution of Zimbabwe's
monetary policy as stipulated in section 6 (f) of the Reserve Bank Act. There are
no statutory prescriptions except that, by section 46, a monetary policy state
ment is required in June and December of each year giving "reasons" for the
policy to be followed, "principles" for its implementation, and an "evaluation" of
the previous policy. However, in terms of section 45 of the Act, policy is formu-
106
wmwwe I II 124:W:.ZC W.&1$6,J.,c,.,-.
·'F _______________ _
lated and implemented "in consultation" with the Minister of Finance, which im
plies the need for agreement There is nothing patently wrong with that except
the lack of clear policy goals and the degree of subordination. In fact most
countries including the UK and Canada provide for consultation between the
central bank and the Ministry of Finance. Although RBZ is required to generate
independent advice it is ultimately subordinate to government, the sovereign
authority and representative of the people. However, in South Africa SARB has
full responsibility for implementation of monetary policy. In addition SARB has a
clear mandate, enshrined in the constitution, to maintain the value of the cur
rency. Under the current arrangements some of the Reserve Bank's functions
are residual powers, which the bank can only exercise subject to the approval of
the Minister of Finance, rather than statutory obligations.
Contrary to public perception, in Zimbabwe as in South Africa for that
matter, the exchange rcite policy is a responsibility of the government, imple
mented by the central bank on behalf of the Minister of Finance. Zimbabwean
exchange rate policy alter.1ates between a fixed regime and a managed system.
The currency was linke<1 to the pound sterling from 1942 to October 1972 at
which time a new gold parity standard was adopted. The managed exchange
rate system was typically based on a currency basket. Ramsay (1976, p 170)
strongly suggests that a currency basket was first introduced in Zimbabwe in
December 1971. From 1975 to 1980 the country operated a dual exchange rate
system under which the currency was fixed against the South African Rand but
a trade weighted basket was used to determine the floating rate against all
other major currencies on a daily basis. The Zimbabwe currency was floated
briefly following the introduction of the IMF sponsored Economic Structural Ad
justment Programme in 1995 until it crushed 75% on 14 November 1997. Since
2000 the currency has been fixed against the US dollar giving rise to unprece
dented black market trading and a high degree of unofficial dollarization.
Incidentally successive regimes in Zimbabwe have resisted pressure to
devalue the currency in fear of high prices. In my view the elasticity pessimism
is well found given the nature of Zimbabwe's exports and her high affinity to im
ports. Increase in exports a precondition for development. The Reserve Bank
(1982, p13 Vol. 1) suggested economic fortunes between 1975 and 1982 mir-
107
... ------------------------·" __________ ,. ........ =-·="lil"IRi-·
rared the BOP position. I agree with Girdlestone (1973, p90) that, "Devaluation
is highly likely to be inflationary not because devaluation is iP,;:;o facto inflation
ary, but because an inflationary situation already exists with ~bsorption higher
than domestic output." Technically the Marshall-Lerner condij!on is not met. In
my view fixing the currency is however not the best remedy .. ,r;naginative struc
tural reforms are required in the long run. For now there is fl'eed for a proper I,'.
use of the currency basket and to correct the macroeconomic f.~ndamentals.
In Ramsay's view, it is conventional for a currency ba~ket to refer to the
balance of payments on current account in order to determine an effective ex
change rate. However, an exchange rate targeted on the domestic price stabil-,
ity, which according to Ramsay was the case in Rhodesia, will be based on im
port weights alone. In practice, both import and export weights of the currency
basket relevant to the bank are used to determine the rate of exchange on a
key currency. The other rates are calculated from the cross rates in an influen
tial exchange market. The Reserve bank of Zimbabwe does not divulge the
relative weights in the trade basket, hence they are not known to outsiders.
Profits accruing to the bank as a result of gold and foreign exchange op
erations are transferable to the government's Consolidated Revenue Fund.
Similarly, any exchange losses suffered on the currency are borne by govern
ment. This said, section 34 (4) of the Act specifies that the government's
Comptroller and Auditor General must certify the amount of profit or loss. It is
not clear how this requirement will be fulfilled because in ,the past external
audits at the Reseive Bank were conducted by private sector Practitioners. '
The Reserve Bank conducts lender of last resort functions (as in section
11 ), for liquidity support and/or pursuant to national interests, subject to ministe
rial approval. Government is not obliged to support the centr.31 bank should the
bank find itself with inadequate resources. Notwithstanding the statutory cbli
gations to consult the Minister, section 34 (3) renders the Reserve Bank entirely
liable for any losses suffered in pursuit of price stability and soundness of the
financial system. Whereas the Registrar is responsible for granting and cancel
ling bank licences (albeit in consultation with the Banking Supeivision), section
34 (3) of the Reserve Bank Act holds the Reserve Bank liable for any losses in
curred toward the promotion of a stable financial system. In 1995 the Reserve
108
Bank took upon itself the controversial goal of maximising contribution to the
Consolidated Revenue Fund through cost effectiveness. The resultant restruc
turing exercises coincided with high staff turnover in key departments.
Given the extensive poverty in Zimbabwe, it is surprising that there are
no references to economic prosperity and welfare of the Zimbabwean people in
the Reserve Bank Act. Meyer (2001, p5), following Milton Friedman, acknowl
edges that economic theory suggests that monetary policy "cannot affect the
level of output in the long run," yet research supports the argument that mone
tary policy may be influential for output stabilisation. Meyer reiterates that the
notion of "self-equilibrating forces" in the long run may be misleading beca~se
monetary policy affects both price stability and the variability of output from the
economy's full potential. Indeed, "policy is made in the short run, not the long
run." I agree with the conclusion that the central bank should be held account
able for price stability but government is accountable for macroeconomic per
formance, which it can influence through taxation, government expenditure and
structural reforms. However, a central bank can foster sustainable economic
growth and price stability by adopting appropriate financial policies.
Discount Houses
Discount houses played a crucial role in the development of a flourishing
secondary market for a wide range of assets. The Zimbabwe money market
predates UDI. Its depth was enhanced by the following the establishment of two
discount houses: The Discount Company of Rhodesia (now DCZ) and the Brit
ish and Rhodesian Discount House Limited (BARD) in March and August 1959
respectively. Establishment of discount houses facilitated management of the
monetary system by the central bank. Emergence of a local money market cur
tailed the remittance of local financial resources to other financial centres such
as London as was the case at the time of the Currency Board. The emergence
of a local money market is also expected to enhance liqu!dity of financial institu
tions as well as the marketability of government securities.
Although the discount houses were modelled along South African and
British models there were some important variations. Unlike the practice then in
London in the 1950s, formal links between discount houses and commercial
109
l
banks were tolerated to stem out dysfunctional conflict. In deed the commercial
banks were an important source of surplus funds for the m,q:,ney market. In
South Africa discount houses were allowed to compete with bj1nks for deposits,
but in Zimbabwe head on competition was avoided because!ldiscount houses
thrived on the goodwill of banks. Similarly merchant banks we~~ not expected to
compete with banks for retail deposits. The central bank alsO -issued a list of .... authorised institutions from which discount houses were "allo\iVed to accept of-
fers of call money directly," Sowelem (1967, 100). From 1960 there was close
cooperation between the two discount houses on the weekly treasury Bills ten-'
der. As the discount houses were under no obligation to take the whole lot on
offer, the agreement covered the price but not the volume of paper. Cooperation
between the discount houses did not imply total monopoly because the central
bank had an option to bid for the Treasury Bills in its own right.
The core function of discount houses is accer,tance of call money from
commercial banks, acceptance houses and other financial and non financial in
stitutions for investment in short dated instruments such as Treasury Bills (TB),
Banker's Acceptances (BAs), Negotiable Certificates of Deposits (NCDs), gov
ernment and local authority stocks. Prior to 1998, discount houses provided the
main link between the Reserve Bank and other financial institutions. Discount
houses had had access to the Reserve Bank discount window and the later in
stitution acted as a lender of last resort. There were no reserve requirements
for discount houses because the bulk of their assets are highly liquid and most
of their liabilities relate to inter-bank transactions. In September 1998, the Re
serve Bank of Zimbabwe classified commercial and merchant:banks as primary
dealers that could access the Treasury Bills market directly rather than through
the discount houses. This move was motivated by a desire to increase compet!
tion among the primary dealers in Treasury Bills.
Merchant Banks
Accepting Houses, popularly known as Merchant Banks, also played a
significant role in the development of the Zimbabwe money market. They are
modelled along the British System. The first two acceptance houses, namely
the Merchant Bank of Central Africa and the Rhodesian Acceptances were
founded hot on the hills of the central bank in 1956.
110
<>=•= OU& CU
In contrast with early money market flops witnessed in South Africa
(1923), Australia (1936), and New Zealand the Zimbabwean money market
arose in a safe environment. Ironically, the National Finance Corporation estab
lished by Act of Parliament in South Africa in 1949, later demonstrated the vi
ability of money market operations subsequent to earlier flops in that country.
Private entities, beginning with Union Acceptances founded in 1955, were later
able to replicate the practice. Successful South African ventures played a sig
nificant part in establishing money market institutions in Zimbabwe. The local
money market also had sufficient surplus funds and short-term paper to sustain
the market. Last but not least, the central bank was anxious to see the market
prosper, hence the provision of lender of last resort facilities.
The merchant banks sector has low entry barriers relative to commercial
banking. Merchant banks deal with discerning clients who require limited regu
latory protection. In the late 1990s merchant banks and discount houses re
corded the greatest number of new entrants to the banking sector. In aggregate
indigenous merchant banks have been successful beyond the expectations of
most sceptics. Some of the most successful merchant banks, namely National
Merchant Bank, Trust Merchant Bank, and Kingdom Merchant Bank have since
converted into commercial banks to tap retail deposits. However two of the early
entrants into the merchant banking business - United Merchant Bank {UMB)
and Universal Merchant Bank (Unibank) - have since failed due to poor man
agement, high volume of non-performing loans and fraud. Mataruka (1999, p5)
observed that the Reserve Bank provided $2.311 billion liquidity support to new
financial institutions following the collapse of Boka's United Merchant bank.
Commercial Banks
From 1892 until the 1950s only two commercial banks, Standard Bank
and Barclays Bank comprised the entire banking sector in Zimbabwe. Govern
ment kept substantial balances with the commercial banks because there was
no central bank. The only real competitor for deposits before 1950 was the Post
Office Savings Bank (POSB) now known as the People's Own Savings Bank
but retaining an identical abbreviation. Financial sophistication really began in
the 1950s. The Netherlands Bank of South Africa (Nedbank) commenced op
erations in 1951 with two branches. The National and Grindlays Bank soon fol-
111
W &!Wi B m WWWEZ&U2EL& h1i£iilwiM@tr .& L
' '
, MSW r==w =-
lowed it in October 1953. A few years latter, the Ottoman Bank was established
in August 1958. Up to 1963, Standard Chartered and Barclays Bank between
them still accounted for 90% of total deposits and 85% of loa~s and advz.nces.
Interbank price competition was curtailed by "the existence at/ a deiailed Bank
ing Agreement regulating the various bank charges," Sowele~ (1967, p63) in
sists. Cole (1974, pG1) confirms that price competition arHong commercial '"·
banks was eliminated by a formal agreement known as the.:/Register of Co-
operation" under which the banks operated as a cartel in fixing service tariff$,
the deposit and lending interest rates. !
Cola argues (1974, p64) that the practice enabled banks to pay artificially ' low intP.rest ra~es to "small depositors with insufficient knowledge of the market
or insufficient funds to go elsewhere." In other words banks enjoyed undeserved
profits at the expense of small depositors. Needless for me to say there was no
room for redress. Newlyn and Rowan (1954, p245) observed )hat the" laissez
faire" banking policy has never subject of any official investigation report. The
Register of Cooperation lasted well into the 1990s until it was decimated by fi
nancial liberalisation, which enabled new players to enter the lucrative market.
Economic theory suggests that reduced competition and concentrated owner
ship results in misallocation of resources.
Mergers and acquisitions also reduced the number of competitors on the
market. The National and Grindlays Bank acquired the Ottoman Bank in 1969
following a worldwide takeover. The bank also absorbed the Manica Board of '
Executors in 1971 to establish Grindlays International Finance. Years later, the ' Grindlays group became subject of a regional takeover by the'Standard Bank of
South Africa. Since 1991 operations of the group are now run under the Stanbic
Bank brand name. The name differentiates the group's acti~ities from the UK
headquartered Standard Chartered Bank. Nedbank of South Africa registered a
local subsidiary called the Netherlands Bank of Rhodesia in 1967. Thirty per
cent of the bani< 's equity was floated on the Zimbabwe Stock Exchange in the
same year. In 1972 the bank changed its name to the Rhodesian Banking Cor
poration (Rhobank). At independence the bank was rechristened the Zimbabwe
Banking Corporation (Zimbank) following government's acquisition of Ned
bank's equity. Zimbank established ownership of Syfrets Merchant Bank and
the Scottish Rhodesian Finance (Scotfin) through a series of further acquisi-
112
s-
' '-' s '
'
iions. According to Cole (1974, p55) Standard Bank acquired a unance house
called National Industrial Credii Corporation in 1968, which was designated
Standard Finance. The Standarc Merchant Bank was created in 1973 following
the purchase of a controlling interest in the Accepting Bank of Rhodesia. In the
current market, merchant banking and finance house business are no longer
core functions of the Standard Chartered Bank. The debt ridden finance house
was disposed to ZDB where it operates as ZDB Financial Services.
Prior to the establishment of the Reserve Bank, interest and credit condi~
lions in Zimbabwe were linked to the Bank Rate in the UK. Standard Bank
managed the clearing system and the settlements were made daily in Lon~on.
Independence of the Zimbabwe Financial System from conditions prevailing in
London was one of the major objectives of the new central bank. Local clearing
accounts were opened with the Reserve Bank when it adopted ihe administra
tion of the Salisbury Clearing House. With the arrival of discount houses on the
local scene, banks were able to invest daily surplus balances as money on call.
A local Bank Rate was introduced for the first time in August 1957 to anchor the
nascent money market on its own feet. According to Sowelem (1967, p287) all
money market rates were linked to the Bank Rate: deposit rates on savings
were fixed at 1 % below the rate while the minimum overdraft rate was fixed at
2% above the Bank Rate; originally fixed at 4.5%. Cole (1974, p58) argues that
interest rates in Rhodesia were low by international standards. It seems to me
that the low rates could be attributed to excessive regulation on part of the
authorities as well as collusion and lack of concern for the customers by the
banks, which is evidenced by the Banking Agreement.
Following the establishment a central bank in 1956, commercial banks
became subject to reserve requirements from 1957 thus providing the Reserve
Bank with additional domestic resources to manage the monetary system. The
requirements were first set at 8% for demand deposits and 3% for time depos
its. Ranges permissible under the law were 6 to 25% and 3 to 10% respectively.
The 1959 Banking Act introduced a Liquid Asset Ratio (LAR), derived from Lo
cal Liquid Assets and External Liquid Assets. Negative balances on extemal
liquid asset were ignored to enable local branches of expatriate banks to over
draw their head office accounts. The LAR ratio was enforceable from July 1962
at a rate of 25% for commercial banks and 20% for merchant banks. In theory
113 '
a:=s i:Nfll =
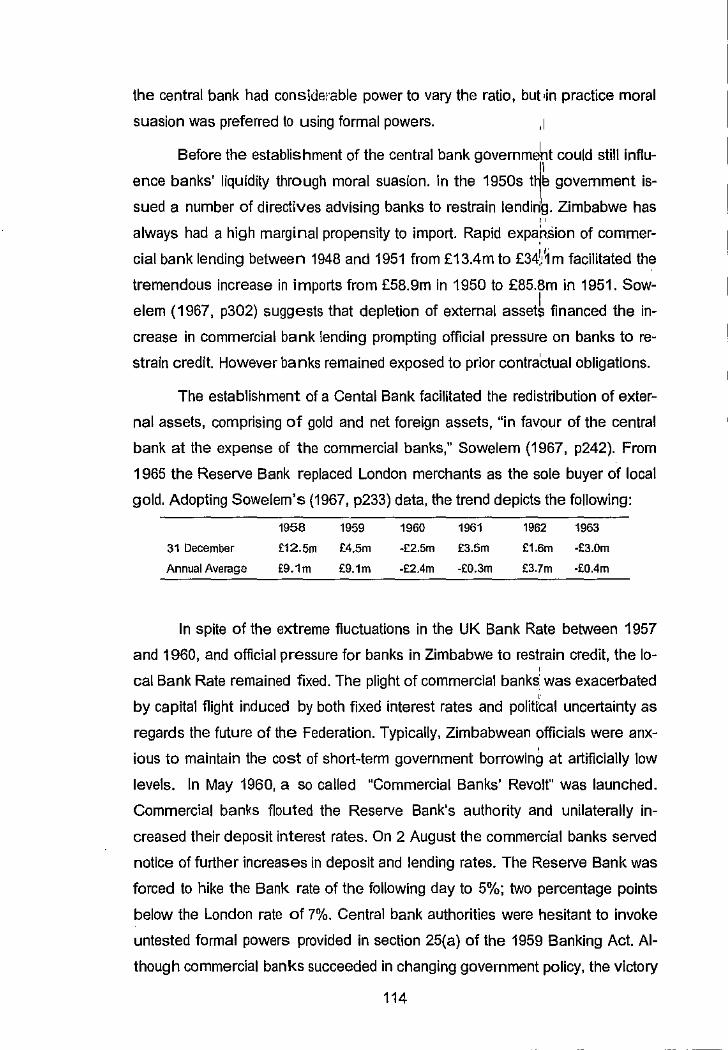
the central bank had conslderable power to vary the ratio, but ,in practice moral
suasion was preferred to using formal powers. ,I
Before the establishment of the central bank govemmeht could still influ
ence banks' liquidity through moral suasion. In the 1950s t1k government is
sued a number of directives advising banks to restrain lendirig. Zimbabwe has .. always had a high marginal propensity to import. Rapid expa.hSion of commer-
cial bank lending between 1948 and 1951 from £13.4m to £3~:1m facilitated the
tremendous increase in imports from £58.9m in 1950 to £85.8m in 1951. Sow
elem (1967, p302) suggests that depletion of external asset~ financed the in
crease in commercial bank !ending prompting official pressure on banks to re
strain credit. However banks remained exposed to prior contraCtual obligations.
The establishment of a Cental Bank facilitated the redistribution of exter
nal assets, comprising of gold and net foreign assets, "in favour of the central
bank at the expense of the commercial banks;· Sowelem (1967, p242). From
1965 the Reserve Bank replaced London merchants as the sole buyer of local
gold. Adopting Sowelem's (1967, p233) data, the trend depicts the following:
31 December
Annual Average
1958 1959
£12.5m £4.5m
£9.1m £9.1m
1960 1961
-£2.5m £3.5m
-£2.4m -£0.3m
1962 1963
£1.6m -£3.0m
£3.7m ·£0.4m
In spite of the extreme fluctuations in the UK Bank Rate between 1957
and 1960, and official pressure for banks in Zimbabwe to restrain credit, the lo-•
cal Bank Rate remained fixed. The plight of commercial banks' was exacerbated •
by capital flight induced by both fixed interest rates and political uncertainty as
regards the future of the Federation. Typically, Zimbabwean officials were anx
ious to maintain the cost of short-term government borrowin9 at artificially low
levels. In May 1960, a so called "Commercial Banks' Revolt" was launched.
Commercial ban~s flouted the Reserve Bank's authority and unilaterally in
creased their deposit interest rates. On 2 August the commercial banks served
notice of further increases in deposit and lending rates. The Reserve Bank was
forced to hike the Bank rate of the following day to 5%; two percentage points
below the London rate of 7%. Central bank authorities were hesitant to invoke
untested formal powers provided in section 25(a) of the 1959 Banking Act. Al
though commercial banks succeeded in changing government policy, the victory
114
' ' i
' -d
j
•
was short lived. In the long run public opinion was sympathetic to increased
government control. In deed Exchange Control (EiC) regulations were extended
to cover Sterling Area transaction from 23 February 1961. Remittances to Lon
don were subject to prior consultation with the central bank.
Participation in the banking sector was limited. No new commercial bank
was licensed between 1960 and 1980. There were only four commercial banks
in 1980 operating 113 branches in various parts of the country. Only one bank,
Zimbank, was locally incorporated. The other three were branches of interna
tional banks. A wide range of products and services were offered, including de
posits, loans and advances, share floatation, mer'!,Jers and takeovers. As arg~ed
at the beginning of section 4.2 very few changes were introduced after inde
pendence until 1995. Commercial banks continued to provide funding to gov
ernment through their high holding of prescribed paper. At independence TBs
comprised 18% of commercial bank assets. Commercial banks were required to
meet a statutory liquid asset ratio of 35 % of their liabilities to the public. Ac
cepting houses and finance companies faced ratios of 30 % and 15 % respec
tively.
Harvey (1996) exaggerates the financial condition of Zimbabwean banks.
A 1992 study by Chapman found that only Standard Chartered Bank and Bar
clays Bank complied with the standard 8% capital adequacy ratio in that year.
Whereas Harvey (1996, p2) argues hypothetically that banks "managed to avoid
or at least contain political pressure to lend on non-commercial grounds," the
paper nevertheless suggests that BCCI licence "was the result of improper lob
bying of politicians," (p12). In fact, surprising deficiencies, including poor asset
quality, high concentration risk, weak internal controls, poor data integrity, and
inadequate board oversight were L'nearthed following the launch of on-site in
spections from 1996. Banking Supervision Department (BSD) Annual Report
(1997, p6) states that eight on-site examinations were conducted that year and
four Corrective Orders were issued to eliminate problems and restore the banks
to a safe and sound condition. Special vehicle companies such as Apex and
CBZ Nominees were established to house bad loans from Zimbank and Com
mercial Ban.'< of Zimbabwe (CBZ) respectively. A Banking Supervision Annual
Report for 2000 (p19) reveals that the banking sector was still plagued by poor
115
aa .am saa:.w,&a 12
' '
corporate governance, high volumes of :1dversely classified l0ans, low capital
adequacy ratios, insufficient provisions for bad and doubtful de.~ts, and failure to
adhere to laid down procedures. I
On average, however, the banking sector was stablt and performed ·,
better than the real and service sectors of the economy in ~000. In nominal
terms this is not surprising because BSD Annual Report (20tlO, p2) highlights " that on average lending rates were "68.2% for commercial bari'ks, 73.7% for ac:-
cepting houses, and 76.1% for finance house hire purchaser at a time when
demand deposits were attracting 10% at commercial banks~ Increased bank
profitability also benefited governnifmt, which introduced a SPf;Cial tax on banks
in 2001.
In recent years some high leveraged clients have argued that they are
being overcharged in additio:i to being subjected to high inter~.st rates. Violation
of the in duplum rut:::, which states that outstanding interest cannot be higher
than the principle amount, has been the major bone of contention. In most
cases there was no redress because the government maintained the issue was
a civil rather than a criminal offence. Logically a finically ruined entity is not in a
position to drag banks before the courts to the logical conclusion of the case.
Finance Houses
Cole (1973, p207)' points out that the first finance hoµses were estab
lished before World War II. A number of the institutions operat8d as subsidiaries '
of merchant banks or commercial banks. Before the 1964 Banking Act several
unregistered finance houses opere.ted in the sector. The nu~ber of registered
finance houses has remained static for a long time. There were five finance
houses in 1962, seven in 1973, six in 1980 and 2000. According to Cole (1973,
p 208) the 1964 Banking Act permitted only registered institutions to take de
posits from the public. In return, finance houses were expected to hold pre
scribed liquid assts not lower than 15% of their liabilities to the public. However,
finance houses are restricted to long term deposits ranging 30 days to five
years. The value of this restriction is academic as most finance houses are af-
116
,,
filiated to commercial banks or merchant banks. There is a heavy bias toward
negotiable certificate of deposits (NCDs), which are tractable in the money mar
ket. Beginning with the 1969 amendment to the Reserve Bank Act, finance
house are expected to comply with statutory reserves requirements, originally
set at 3%. The Minister of Finance also fixes terms of hire purchase. Strict con
trols helped to preserve profit margins by restricting competition.
With effect from 1965, finance houses shifted from the core business of
hire purchase to target the productive sector. Import substitution during UDI
fostered the growth of leasing facilities to meet the needs of firms that could no
longer access external funds. Cole (1973, p212) observed that from 1969 _the
value of leasing agreements has been greater than the traditional hire purchase
business. In addition finance houses were under pressure from the Reserve
Bank not to extend leasing facilities for consumer goods except television sets.
Deposits that find their way to finance houses are interest sensitive. As a
result finance houses are exposed to competition from commercial banks, mer
chant banks and building societies. There were exorbitant interest rates in the
market in 2000. Finance houses experienced some funding problems arising
from the flight of deposits into the money market. On their part, the institutions
curtailed loans in favour of low risk, high return money market instruments.
Building Societies
The concept of modern building societies is known to have originated in
Birmingham, Britain, in 1775 although the sale and purchase of houses could
be traced into the annals of history/ Early friendly societies terminated after
each member was granted a house. The emergence of permanent societies in
place of terminating societies enabled participants and investors to separate
borrowing from lending. These developments enhanced the intermediary role of
building societies by facilitating capital accumulation, which helps to raise a
community's productivity and output. As regards the essential function of inter
mediation, there is no distinction between banks, finance houses, insurance
qThis paragraph draws heavily on Cole (1973) "The Finance houses in R11odesia," The Rhodesian Journal of Economics, December Vol. 7 No. 4 'This subsection is based on Chirozva ( 1991) ''The Role of Building Societies in Zimbabwe." unpublished essay.
117
wwwt OEQZWMS Z&IWWWIW,\1118 i!m@&UWWW\\id
- ,.,
• ':1

companies, building societies, investment trusties, or any other- type of interme
diary. The distinction lies in the nature of claims and services '1'.lffered to borrow
ers and lenders. Regulation also buttresses artificial market se~mentation.
In Zimbabwe, Cunningham (1964), cited in Cole (1973~, p59), identifies :I.,
the Midlands Building and Investment Society founded in ),924 as the first
building society to be established. The Genta\ Africa BuildinfSociety (CABS)
followed on 15 August 1949 after the merger of a number o(Societies. It grew
into the dominant building society in Zimbabwe. Early buildi'g societies oper
ated under the Companies Ordinance because there was no 'appropriate legis
lation. Reliable records can be traced back to 1952. However Sowelem (1967, '
p181) argues prior to that the sector was rather small. This might be true given
that total assets as at 31 December 1952 were only $4m. However, it must be
borne in mind that some societies failed to meet the registration deadline. That
said it is self evident that sustainable expansion was realised· after 1951 when
new laws were enacted to reorganise the industry. The Building Societies Act
1951 drew insight from South Africa. Officially the Act was designed to prevent
the mushrooming of unsafe and unsound institutions. Societies that failed to
register in terms of the Act were either dissolved or allowed to merger with an
existing institution. The legislators, recalls the Registrar in the First Annual Re
port, designed building societies to provide a medium for "investment for the
small man". In my view, building societies have borne the heaviest regulatory
burden.
As shown in the table below Beverley Building Society was one of the
earliest societies to be incorporated in 1952 in terms of the 1951 Building So
cieties Act. Indeed the table shows that the 1950s were characterised by ex
pansion of the building societies movement. Sowelem (1967, p183) insists that
up to 1960 building societies in Zimbabwe were able to attract foreign funds es
pecially from South Africa.
Table 5
Early Building Societies
Name of Society Head Office Date of Registration
118

Beverly Building Society• Harare 1 April 1952
Central Africa Building Society [CABS] Harare 10 April 1952
Midlands Building and Investment Society Gweru 28 November 1952
Centenary Building Society Bulawayo 7 May 1953
Founders Building Society• [lntermarket B. S.]# Harare 12 February 1954
Rhodesia Building Society Harare 26 August 1954
Old Mutual Building Society of Central Africa• Harare a September 1954
Commonwealth Building Society Harare 8 August 1955
Rhodes Building Society N/A 14 June 1958
* These societies still existed in 2001. CABS was actually taken over by Old Mutual Society who decided
to retain the name of the former. # Founder was acquired by the lntermarket Group In 2001 and changed
its name to lntermarket Building Society. [Source: Registrar of Building Societies Annual Report-various]
The proliferation of building societies was short lived. Reports of the
Registrar of Building Societies attribute problems in the sector in to events in
the Belgian Congo in July 1960, and uncertainty about the future of the Federa
tion. However, Sowelem (1967, p183) points outthat the accelerated withdrawal
of funds was precipitated by a 1960 run on Kenyan and then Zambian building
societies. Extension of exchange controls to cover sterling area transactions in
February 1961 also affected the confidence of foreign investors. The resultant
liquidity crisis was so severe such that no new mortgage lending were extended
between July 1960 and December 1961. The crisis brought with it compulsory
consolidation and amalgamation of building societies in Zimbabwe in order to
restore confidence in the building society movement.
Although seriously affected societies received government, central bank
and peer surport mergers and amalgamations reduced the number of societies
from 8 to 3 between 1957 and 1962. One of the earliest mergers took place on
1 July 1957 when Midlands Building and Investment Society merged with Bev
erley Building Society. Assets of the short-lived Rhodes Building Society were
taken over by the Commonwealth Building Society on 1 March 1961. On 30
May 1962 assets of the Commonwealth Bank were transferred to Beverley
Building Society. Meanwhile Rhodesia Building Society had amalgamated with
Founders Building Society on 1 July 1961 to create a new society, which re
tained the name Founders Building Society. As at 1 July 1961 Old Mutual
119
·c
' ' ' ' ; -~
.
l
---•--ae--------,w~.~·-----•••=-•=-=---=-~•'"•'"ii!i"'::.J""'_"'" ______ &_.,..,_...,,,. ....... ..,,...,.,iJiffiel,~®mJ.\\1'!,;,;1
ou,:s,w,,m
Building Society took over the Centenary Building Society (which had changed
its name to Bulawayo and National Building Society on 8 Dec.~mber 1960) and
the Central Africa Building Society. Following the acquisition ~f the two institu
tions, Old Mutual Building Society assumed the name Cent~I Africa Building
Society or CABS for short. By the end of 1962 the building ~9cieties left were
CABS, Beverley and Founders. "
!,( Sowelem (1967,p184) highlights that the amalgamation were initiated by
the central bank. However neither Sowelem nor the Registrar pt Building Socie
ties provide the exact details of the role played by the Reserve Bank. In fact
footnote 14 in Cole (1973b, p147) demonstrates that all societies that survived •
the crisis "had close connections with other powerful financial institutions: CABS
with [Old Mutual]; Founders with the Anglo-American Corporation; the Beverley
with the Pearl Assurance Company." Composition of the societies' board of di
rectors also reflected the close ties. The phenomena of close ties in the Zim
babwe financial system has already been discussed at length in this thesis.
As expected no new entrants joined the building societies movement
between 1962 and 1990. Obviously at independence in 1980 there were three
building societies occupied with the provision of mortgage finance to existing
and new building construction. Two new building societies, Zimbabwe Building
Society (ZBS) and First National Building Society (FNBS), joined the sector in
the 1990s. However these non-aligned societies have not faired very well. ZBS
was taken over by the Reserve Bank in 1999 to save the society from imminent
collapse due to high volume of arrears, poor management and: poor records.
On average building societies operated under difficult conditions in the
1990s. Their problems emanated from stringent regulatory constraints and an
adverse macroeconomic environment. Regulation of building societies is em
bodied in the current Building Societies Act (Chapter 24:02). The law, which
gives them a unique cooperative status, has over the years subjected building
societies to strict state control. Unlike other financial institutions, building socie
ties' operations are entirely domestic because the law forbids them from oper
ating from other countries. In contrast, Sowelem (1967, p182) observes that
building societies in neighbouring Zambia and other British Commonwealth
countries were not subject to this restriction. According to Cole's (1973b, p140)
120
JZ.i =RW.. OZOL&O:wooot.WWWOLiLLh n=aaz.o:zcanwwwwa<x= wwwwa 04ucwztwa.u111w-.1 . .sM 1"11,il - ->"
analysis, in 1972 building societies ranked as the second largest group of
banking institutions as measured by asset values. The BSD Annual Report
(2000, p3) demonstrates that building societies were ranked third after
commercial and merchant banks in 2000.
Nevertheless, building societies have a monopoly in mortgage finance,
which is protected by law. Building societies have minimal reserve requirements
in return for government administered interest rate caps on deposits and ad
vances. In addition it must be acknowledged that building societies do not pay
taxes on any of their earnings. Investment income accruing to depositors on
Class "C" share certificates is also tax exempted. Interest expense on mort
gages loans is also tax deductible in the hands of a borrower liable to tax.
Building societies, however, compete with other deposit taking institu
tions, including the POSB and the stock market for deposits. By law building so
cieties are expected to maintain a liquid asset ratio of at least 15% of their li
abilities to the public. Under the banner of maintaining confidence and liquidity
in the financial system legislators guarantee subscription to government stocks,
bills, bonds, and debentures even at times when the yield is unattractive.
Therefore building 5-ocieties provide funds to government through their holdings
of government paper. Building societies also fund government and local
authorities low cost housing schemes.
Zimbabwean building societies have over the years been encouraged by
the regulatory framework to conform to the ideological persuasions of the time.
Building societies are answerable to the Registrar who in turn reports to the
Minister of Finance and Economic Development. Politicisation of the housing
policy and the ever-increasing cost of building materials have challenged the
service delivery potential of building societies. Building societies are not allowed
by law to own industrial and commercial properties in their own right. The ca
pacity of building societies to invest in residential properties has been conw
strained by a number of factors; among them are administered lending rates
and bureaucratic inefficiency in the public sector. Building societies have not
been given the opportunity to field their own land surveyors. As a result they
depend on resource constrained local authorities to approve projects and serv
ice new stands. The retention of administered interest rate regimes for building
121
_\
societies and the POSS in 1992, at a time when commercial,bank rates were
being liberalised, exposed them to severe liquidity problems. ,I
Although many writers portray building societies as a trainchild of early
industrial workers and tantamount the societies to a "rebe11lbn" against poor
housing conditions, a critical evaluation of their subscriptio~S suggests they
were predominantly middle-class oriented in origin and tasle. Cole (1973b, " p142} found evklence that building societies cut down on lendi'ng even when the
liquidity ratios were on average in excess of 20%. In practicei smoothening ad
vances is a preferred strategy at a time when inflation fed investment demand
for housing is high. Cole's poetic characterisation of the 1972 housing market is '
still valid today in that the rich continue to benefit at the expense of the poor;
property owners at the expense of first time buyers; and the old at the expense
of the young (p146-7). The only notable exception is that residents can no
longer benefit at the expense of the immigrants if the later has· foreign currency,
a highly priced commodity on the black market.
In my view, Zimbabwe probably experienced a general market failure in
year 2000. Exorbitant interest rates on the money market, which were fuelled by
rampant inflation, led to a credit crunch. Most investors switched their savings
into the money market where returns were high and risk low. Like other deposit
taking institutions, building societies experienced acute funding problems. The
societies resorted to expensive NCOs for deposits. Building societies, in tan
dem with other financial institutions, also abandoned their car~ business of pro
viding risky !ow yield mortgage loans in pursuit of high return ~reasury Bills.
People's Own Savings Bank
The POSS is a joint responsibility of the Ministries of Finance and the
Post and Telecommunications. The Post Office Savings Bank Act [Chapter
24:10] regulates it. According to Mataruka (1999,p4) the POSS falls under the
trusteeship of the Secretary of the Treasury, the Governor of the Reserve Bank,
and the Postmaster General. The institution does not lend to the private sector.
Its intermediary role is limited to the channelling of deposits to government. A
large portion of the POSB's liabilities is in the fomn of saving deposits as per
122
statutory requirements. Theoretically the POSB has some discretion over the
composition of its asset portfolio, but in practice it grapples with political pres
sure to hold government securities. The POSB is in fact usually the largest sin
gle holder of government stock among all the banking and financial institutions.
The whole of its asset portfolio is sometimes invested in government paper.
Development Institutions
Zimbabwe has over the years witnessed a plethora of development in
stitutions although their activities are not very conspicuous to the general public.
Most of these institutions are now defunct but some have endured to the pres
ent day in one form or another. Barclays Overseas Development Corporation
Limited, a subsidiary of Barclays Bank D.C.O., was established in 1947 to cover
several colonies. Its initial capital was £5m. It provided medium-term loans for
development purposes and provided underwriting seivices for non-government
projects. The Anglo-American Development Corporation provided funding for
projects in the natural resources sector run by government or the private sector.
This institution also provided offshore finance. A Standard Chartered Bank af
filiated institution known as Standard Bank Finance and Development Corpora
tion was incorporated in London in 1946 with a capitalisation of £500 000.
The Zimbabwe Development Bank (ZDB) was established in the early
1980s. Government held 51 % of its equity. The bank specialises in medium
term lending but expects project promoters to also contribute a substantial por
tion of the equity. ZDB works in close conjunction with the Venture Capital
Company of Zimbabwe (VCCZ), a company set up at the insistence of the Re
serve Bank. As implied in its name VCCZ provides capital for start up ventures.
It also offers entrepreneurial guidance through the provision of board director
ship, accounting, and management services. Promoters of successful ventures
are expected to buyout the VCCZ within five years.
IPCORN, acronym for Industrial Promotion Council for Rhodesia and
Nyasa land was established in 1960. It was run as an independent, privately
owned development board financed, controlled and owned by leading banking,
insurance, mining and industrial companies. Its name was changed to Industrial
123
-,:
;, .-;
'
• ' -i .
--1, • . -·]
;i 'ti
-'' ·.;,
., '
,--- ..
Promotion Corporation of Central Africa in 1964. The institution focused on the
provision of medium-term capital and managerial advice. F,lroject promoters
were expected to meet 50% any project's capital requireme~ts. The Southern
Rhodesia government in 1959 established a related instituti1r, namely the In-
dustrial Development Board. i\,
" . Eventually the Industrial Development Corporation, IDC for short, was
" also created in 1963. It provided long-term capital, via loans a.'nd equity partici-
pation, to new and established ventures that were in tum sub.feted to manage
rial supervision. A lesser-known subsidiary known as Zimbabwa Development
Corporation (ZDC) was also active in this respect. IDC also built factories for '
rent or sell to business concerns. Unlike conventional financi81 institutions, ac
tivities of the IDC are not very accessible to the general public. The institution
operates like a government investment company with very broad objectives
ranching from industrialisation, research, employment and promotion of new
technologies. Its Greenfield portfolio expanded drastically after independence.
At one time both the IDC and ZDC housed some of the worst performing and
debt-ridden companies. Among the projects were notable insolvent entities such
as National Glass and Cone Textiles. As is typical of many state owned corpo
rations, divesture from troubled investment was very slow and fraught with bu
reaucratic wrangles. The need to guarantee employment often had precedence
over economic and financial acumen.
The performance of special soft windows for developfT!ent has been dis
mal, providing no significant contribution to economic develo~ment. The Devel
opment Finance Corp (DFC), a parastatal, was established in 1979 to carter for
the financial needs of the small and emergent businesses. Harvey (1996, p15)
notes that the institution was overwhelmed by rapid expansion, bad debts, and
political pressure to lend to the politicians themselves. By 1981 the new lending
was stopped, the board of directors was dismissed and the administration of the
parastatal was handed over to I DC.
A new organisation, the Small Enterprises Development Corporation
(SEDCO) was created in 1984 to replace DFC, which was wound up in 1985.
Harvey reiterates that SEDCO continued to make losses despite access to con
cessionary grants from government. Like the AFC, SEDCO suffered from in-
124
adequate capital and want of autonomy. Apart from SEDCO there were several
other schemes in the 1990s under which the cost of borrowing was subsidised.
A parallel entity, known as the Credit Guarantee Company (CGC), jointly owned
by the Reserve Bank (50%), commercial banks and ZDB, provided funding to
SMEs at 5% at a time when banks were lending at 39% in the market and de
posit rates were in the region of 20%. The scheme was politicised. Government
guaranteed loan repayment hence there were huge incentives for moral hazard
behaviour on part of both the banks and the borrowers. Even the most sound
privately owned banks carried disastrous CGC portfolios in the late 1990s.
Other subsidised credit schemes such as the Social Development Fund
(SDF), and the Z$100m, Z$400m, 2$700m, 2$1 bn facilities provided for through
donor assistance did not fair any better because recovery rates were next to nil
and there was no resolute follow up on defaulters. Theoretically, these facilities
should have enhanced the viability of SMEs, and indirectly promoted economic
prosperity because credit was usually accessed at 5% at a time when market
rates were in the region of 30 to 40%. Harvey (1996, p26) emphasised that de
fault rates on these soft windows were "typically above 50%, and ranging as
high as 97% for the [SDF] which was used most extensively for political patron
age ... " Despite constitutional complications regarding the appropriation of state
resources, it seems that a National Investment Trust (NIT) is being established
on the sidelines ostensibly to facilitate the transfer of state owned assets to the
indigenous population. There is no mechanism to ensure that the scheme will
benefit the most disadvantages citizens. Listing the NIT on the stock market, for
example will benefit the rich. Until Zimbabwe starts to give practical effect to fi
nancial safety nets such as disclosure, transparency and accountability nothing
will come out of the numerous soft windows for development.
Representative Offices
The Registrar of Banking Institutions' Annual Report (1994) shows that 8
representative offices were operating in the country that year. These included
the African Development Bank (ADS), World Bank, Societe General, State Bank
of India and the Bank of Yugoslavia. In the previous Banking Act [Chapter 188]
registration of a representative office was not a legal requirement. However,
125
representative offices were restricted to arranging external loans subject to prior
Exchange Control approval. Nevertheless registration was rei;:iuired in terms of
the Companies Act and for tax purposes. Section 28 of the 1new Banking Act
[Chapter 24:20] irons out these inconsistencies. Under the n~w Act the Regis
trar's approval is required to open a representative office. Th~, applicants must
have support of their home country's supervisory authorities. ;~o banking busi
ness can be conducted from a representative office. AlthoughJhe new Banking
Act section 8 (4) provides for the establishment of foreign owned banking insti'
tutions, none has opened for business since financial liberali~ation in the early '
1990s. However, the degree of foreign ownership is subject to prior approval by
Exchange Control and the Zimbabwe Investment Centre (ZIC)1s own criteria.
Insurance and Pension Funds
Insurance companies, pension and provident funds play a pivotal role in
mobilising savings and capital formation in Zimbabwe. Payment of insurance
premiums and pension contributions are an important source of personal sav
ings in the country. Insurance companies and pension funds are an important
source of long-term capital for new and existing projects. In fact there is a heavy
presence of pension and insurance funds in government securities, fixed prop
erty, shares, and the money market. Government sets high liquidity levels.
According to Paul Mkondo (1992, p25) there were one or two British life
Insurance companies in Zimbabwe by 1898. However, a more authoritative ac
count by Chimombe (1983) suggests that there were three !nsurance compa
nies originating from South Africa, Britain and Australia by 190.2: Old Mutual, the
biggest insurance company was registered in South Africa in 11888. It began in
surance operations in Harare and Bulawayo in 1900. Norwich Union Insurance
Society, a British Company, opened an agency office in Zimbabwe in 1901. Its
representatives commenced both life and fire insurance in 1903. Colonial Mu
tual Assurance Company, which was founded in Australia in 1873, commenced
operations in Bulawayo in 1902. However, Colonial's activities were directed
from South Africa where the group had established in 1883.
126
i1lllil'"""'---------------------------·-----~· Evolution and structure of the Zimbabwean insurance industry is docu
mented in detail in Chimombe (1983,p190-230). Her account, which covers
about 40 pages, is still very accurate except for a localisation campaign spear
headed by Exchange Control between 1987 and 1993. In brief, Chimombe
demonstrated that foreign owned companies dominated the industry. In 1971
for example, Cole (1974b) noted that only seven out of 76 companies had local
head offices, the rest being branches of British or South African companies. In
surance companies exercised profound influence in the economy, particularly in
the firancial sector, through interlocking directorships. Compulsory insurance
with a preselected insurer was a condition to get a mortgage from any building
society. The industry served a predominantly white clientele until 1980. Chi
mombe, who had great faith in state ownership of resources to accelerate eco
nomic growth, supported wholesale localisation of the industry to curtail capital
flight through external reinsurance premiums, management fees and transfer
pricing. History has not been kind to her conclusions, as evidenced by the de
mise of communism and poor economic growth in postcolonial Zimbabwe.
The idea that overt state control would pertect the allocation of resources
misses the point indirect control was already too high. There is heavy purchase
of government securities by insurance companies and pension funds. Life in
surance companies are required by law to maintain an unimpaired pool of as
sets equal to the sum of their liabilities in Zimbabwe. Both Chimombe
(1983,p206) and Cole (1974b, p67) attribute the high holdings of government
securities to "lack of other suitable investment opportunities" given a small eq
uity market "in relation to the funds whirh the insurance companies have to
place ... " Good quality local script is closely held. Exchange controls regulations
preclude fund managers from investing in externally registered shares. Property
development is retarded by exchange controls and foreign exchange shortages.
Tax concessions also make high concentration on government paper an attrac
tive financial investment. Chimombe, closely led by Cole, correctly noted the
"protiis on the realisation of government, municipal and statutory corporation
securities are generally not 'liable to tax." Of course the law also prescribes high
concentration in government securities. Holdings in excess of the legal require
ments are also reinforced by moral suasion. The transaction demand for money
motivates investment into me,rketable securities.
127

The insurance industry also experienced a number of mergers in the
1970s. As in other industries in the financial sector the lnsurar;ipe Association of
Central Africa enforced collective tariff agreements in the ~on-life insurance
market. The long established agreement helped to eliminat~ cut-throat price
competition. The UDI era monopoly and improvement in seiice delivery also
helped to increase profitability before independence. " . 1·,, • . " About 50 insurance companies operated in the countl'Y by 1980 down
from 76 recorded in 1971. According to Cole (1974b, p59) Jhe 1971 industry
comprised of 17 life only, 21 life and non-life, 35 non-life, and' 3 funeral only in-
surance companies. About 18 brokers were part of the service delivery chain . •
Since 1980 the sector has experienced substantial growth and now carters for a
wider section of the population. The Registrar 0f Insurance Companies dis
closed that there were 9 life only (including 3 life re'nsurers), 24 non-life (5 rein
surers), 18 funeral assurers, 41 brokers, 40 l;jLJltiple agents and 2424 sole
agents by mid 2001. The industry controlled about $55 billion in total assets of
which $1 O billion was in prescribed assets. Mkondo identifies aids, inflation,
taxation, and political stability as the major threats to the insurance industry.
Life insurance is still dominated by Old Mutual. The Zimbabwe Inde
pendent Insurance Survey 2001 indicates that Old Mutual accounted for 70% of
gross premiums, 72% of the net premiums and 77% of the total assets market
share in 1999. Total assets of the industry amounted to $39.6 billion in the
same year. Old Mutuai has investments cut across the entire spectrum of the
Zimbabwean economy. The society has a substantial stak~ in almost every
counter on the Zimbabwe Stock Exchange. State owned Zimbabwe Reinsur-.
ance (ZimRe) controlled 65% of the reinsurance business (or $1.9 billion in
premiums) in 1999 because it is given preferential treatment' by the insurance
law. Mandatory reinsurance with ZimRe may be phased out following the listing
of the company on the stock exchange.
All pension, provident and retirement annuity funds are registered, and
comply with the Pension And Provident Fund Act of 1976 [Chapter 24:09] as
revised in 1996. Not much is recorded about these institutions prior to that date.
It is strange that the first annual report is dated as late as 31 December 1977
yet it records that about 1192 funds were inexistence. Ironically these private
128
-.,
and quasi-government pension funds are significant participants on the ZSE
and the local money market. In my view, the treasure of insurance records prior
to 1977 must be laying forgotten somewhere.
Until the launch of compulsory membership to state owned National So
cial Security Authority (NSSA) in 1994 there was no national scheme for retire
ment pensions. The authority is now a major investment player on the Zimbab
wean equity market. However, it is a moot point whether future NSSA pensions
will sustain life given the paltry contributions levied. Nevertheless there is strong
support for flexible yet compulsory contributory pensions in the literature. Aus
tralian "Superannuation" allow beneficiaries to choose their own fund managers.
Civil servants were exempted form joining NSSA because government
could not afford the obligatory employer's contributions that go with the scheme.
However, civil servants are entitled to contributory Government Pension
Scheme at a subscription of 7.5% of one's monthly salary. According to Cole
(1974b, p92) contributions are paid into the Consolidated Revenue Fund as no
pension fund was established. Payments are also made out of this fund. Fol
lowing upon this it might be possible that taxpayers collectively undeiwrite civil
servants' pensions in addition to paying the salaries out of which the contribu
tions are made from in the first place. In contrast a few private pension schemes
operating in the market are self-administered while the bulk of them are under
written and administered by insurance companies.
As a developing country Zimbabwe does not have old age pension or
unemployment benefits despite a need for the services. Before independence
the state administered a complicated non-contributory old age pension scheme
for non-Africans who qualified. Nowadays all the destitute who are informed ap
proach the Social Welfare Department for assistance. If pegged against inflation
the allowances disbursed are meagre and cannot sustain a decent livelihood.
Given the vicious poverty and scarcity of funds chances of reform are remote.
The Zimbabwe Stock Exchange
In recent years financial literature has shown great interest in "emerging
equity markets" as ideal for diversification and good returns. Emerging markets
129
-----------------···--.......... ,,.. ________ llll!IBlllll!lilllllillllll!!lilmru.,ec.~:"'s7.i'7:ic,:
,, ~ ·,
_;;
are regarded as countries showing high potential for economic growth alongside
with high political, fiscal, economical and market related risks 11 Historically capi
tal markets and financial institutions were regarded as alternative approaches to
financial architecture. This research, following Beck, Demirgll~Kunt, and Levine
(1999, p2) and others, emphasises the complementary roles b~,tween the two.
" In theory there are many benefits and costs to equit;{market develop-
" men\, as argued in Sudweeks (1989,37-47) and Cla!idge and Box (2000) for
example. Apart from raising capital, equity markets facilitate! economic devel
opment in a number of ways. Sound equity markets increase the efficiency of
the financial system via multiple investment opportunities, which implies more '
choice. Increased competition for funds among firms enhances financial system
efficiency if the competitive forces result in a fair return on investment.
Claridge and Box (2000, p~ 1) bring home the point that capital markets
help close the gap between domestic and international cost of capit~I. Integra
tion of capital markets improves the quality of price signals on the local market.
This development enables investors to assess the true value of investment op
portunities more accurately thereby facilitating the efficient allocation of re
sources. Following upon this, productivity is also expected to increase.
Sudweeks emphasises that equity markets contribute to "financial sys
tem solvency" by lowering the debUequity ratios among firms. Existence of deep
secondary markets increases the supply of long-term funds tc:, government and
private firms. Emerging equity markets such as Zimbabwe ,.have potential to
lower the external debt through increased mobilization of local resources and
the use of debt equity swaps. Equity markets also facilitate the transparent pri
vatisation of state owned firms. Listing on the exchange often entails adoption
of better accounting and disclosure standards, which facilitates better economic
decisions. Claridge and Box support the view that capital markets improve allo
cative efficiency through greater transparency, reduced favouritism, rent seek
ing (corruption), and regulatory avoidance.
Broadening the ownership base of firms through capital markets helps
eliminate monopolistic tendencies in the economy. Schumpeter has taught us
that competitive markets facilitate constructive innovation. Claridge and Box
130
(2000) reinforce this idea by emphasising the potential of capital markets to
"encourage innovation and efficiency in domestic financial markets" and the use
of sophisticated instruments such as futures, "which stimulates further trade".
Singh (1997) strongly argues that there are greater costs than benefits to
equity market development in emerging markets. Minsky (1977) and Kindleber
ger (1996) both emphasise that the financial system is inherently unstable.
Critics argue that developing countries lack the sophistication and willpower to
manage the inevitable turbulence. Unsophisticated capital markets are more
vulnerable to the possibility of low investor confidence, speculative attacks, in
terest rates repression, high intermediation costs, loss of local ownership, capi
tal flight. and inefficient allocation of resources from a national viewpoint.
Therefore capital markets could harm economic activity in small open econo
mies.
A lot of other costs are associated with the free flow of international funds
into small economies as highlighted during the East Asian financial crisis of the
late 1990s. In Claridge and Box's (2000, p32) own words, "the real economy
responds to change more slowly than financial capital" which could result in se
vere real adjustment costs to sudden flow of funds. In their view, excess liquidity
in the market exaggerates changes in market sentiment giving rise to the risk of
contagion. Furthermore rapid capital movements could increase interest rate,
exchange rate, and asset prices volatility to levels not supported by economic
fundamentals. Distortions in asset prices may be inflationary whereas exchange
rate shocks could lead to "resource misallocation, particularly between trade
able and non-tradeab\e sectors." Externally induced asset price bubbles have
the potential to magnify inequality. In Zimbabwe, for example, customers with
foreign currency were given first preference in the property and motor vehicles
industries in 2000/1. High reliance on foreign capital may constrain fiscal and
monetaiy policy options to the state as well as create current account deficits,
which could raise "the cost of borrowing for the country as a whole." (Ibid p31)
This said, the barriers are solvable and the long-term benefits are great.
As with anything in life, the long run cost of doing nothing could be more severe.
131
__ ~_,.-.
The International Encyclopaedia of the Stock Market (Volume 2, p1186)
regards the Zimbabwe Stock Exchange (ZSE) as a small (b~;world standards)
but active stock exchange in Africa second only to the Johan~esburg Stock Ex
change (JSE). It is at the pinnacle of the equity capital mark~t in Zimbabwe. It I
operates under an act of parliament as well as self-imposed:i.regulations. Until
the late 1990s, membership of the exchange was limited t(.individuals. New
members were required to have prior experience with an existing broker. The
ZSE requires that companies wishing to go public must make at least 30% Of
the shares available to the public on listing. No less than 1 oobooo shares must •
be issued and the number of shareholders must be more than 300.
The first exchange was established in 1896 in Bulawayo. It was followed
by other exchanges in various centres of the country. A modem stock exchange
was established and located in Bulawayo in 1946. According to Newlyn and
Rowan (1954, p143) the exchange had 22 trading brokers and was modelled on
the lines of the Johannesburg Stock Exchange. A duplicate floor was opened in
Harare in 1951. Brokers also met in Harare for a daily call over of prices, which
were telephoned to Bulawayo for amalgamation and compilation. Sowelem
(1967, p166) noted that there were 96 listed companies in 1963, but the number
of practising brokers had dropped to thirteen: five in Bulawayo, one in Mutare
and the remainder in Harare. The ZSE has been based in Harare since 1975. In
2000 the Stock Exchange had 13 Stockbroking firms in its membership. Each
firm employed a number of advisors who specialised in a wide range of services
such as investment, financial planning and research. The range of services of
fered differs from firm to firm.
The exchange provides a primary market for equity issues and a secon
dary market for all government registered stock; all local' municipal stock;
shares (ordinary and preference), and debentures of listed local companies
(Newlyn and Rowan p145). Parastatal paper, for instance the Zimbabwe Elec
tricity Supply Authority (ZESA) bills, also make its way onto the ZSE. Brokers
meet in Harare for a daily call over of prices. De Caires and Fletcher (1990,
p210) noted that stocks are traded in alphabetic order. Open call overs are held
in mornings and afternoons at the ZSE premises where individual brokers an
nounce buying and bid and selling offer prices for listed stocks in a mini-auction.
132
The system is paper based. Settlement is required on the day of delivery
against the physical delivery of scrip on a Trade date+ seven days (T+7) basis.
Clearing is handled on a transaction-by-transaction basis. Regular board lots
comprise of 100 shares. Brokers can act as agents of buyers and sellers or in
own names as principals.
A trading record stipulating bid and offer prices and the volume of sales
is circulated to all broking firms and published in the daily press by the ZSE.
There are two major indices, the Zimbabwe Industrial Index and the Zimbabwe
Mining Index. Index calculations are based on the capital weighted method.
Plans are underway to design a composite index that incorporates all traded
stocks. However, private asset management firms have introduced several indi
ces of their own, some of which are based on recently introduced derivative
products. Although the Zimbabwe Stock Exchange boast of having share prices
for every trading day since 1946 the data is not in useful form5• The exchange
does not have a single record documenting the appropriate time series data.
Whereas the base date for the ZSE Industrial Index is 1967= 100, reliable data
produced by the Reserve Bank dates back to 1975. Furthenmore, the market
capitalisation attribute is not part of the series kept by the Reserve Bank. The
central bank's data on share turnover is in index format, which renders com
parative studies with other bourses difficult in the absence of market capitalisa
tion figures. Market liquidity for instance, is commonly defined by expressing
turnover over market capitalisation. In this regard Zimbabwean researchers re
sort to the Emerging Stock Markets Factbook(s) for appropriate statistics. The
pedagogic value of empirical research has not been taken seriously. Research
enhances market efficiency and adds new insights to the body of knowledge.
The institutional features of the ZS E closely resemble the financial insti
tutions with regard to concentrated ownership, limited participation and signifi
cant government controls. A few shareholders control a high proportion of
shares in companies listeC'i on the Zimbabwe stock exchange. In 1993 a single
institution, Old Mutual, controlled at least 10% of the total market value of
shares on the bourse. Two industrial giants of Southern Africa - Lonrho and
Anglo American Corporations- controlled substantial holdings. The government
'Sec: Speech by Mr. R. T. G. Williams, Chainnan of The ZSE to the ZNCC on 16 September I 988.
133
'· ~
:< •
also exercised significant control on the ZSE through direct and indirect hold
ings. To date Old Mutual is within the top ten shareholder'" of almost every
counter on the ZSE. Supply of good quality scrip is limited ~ecause dominant
institutional investors usually pursued "buy to hold" strategiesf/ A 1992 study by
Chapman put the proportion of closely held shares at 81.1~%. Therefore the
stock market was characterised by low depth as evidenced bYi.:~ery low ratios of
turnover to market capitalisation. Participation by individual s~reholders is still
limited due to ignorance, risk averseness and lack of adequate disposable iri
come. There might be need to educate the public about stociJ. market activities . •
Fiscal incentives such as tax benefits, positive real incomes, and better stan
dard of living may be required to enhance market depth.
Although Zimbabwe has maintained a relaiively vibrant private sector
over the years there is little reliance on the stock market as a primary source of
capital. In aggregate the exchange remains a minor source new capital, despite
some episodes of high activity over the years. Hawkins (1976, p117) argues
that the private sector was responsible for 60% fixed capital formation between
1965 and 1974. Of this a mere 4.9% was raised through the public issue mar
ket. Sowelem (1967, p 167) observed that on average $3m was raised annually
between 1955 and 1959. Mataruka (1999, p54) argues that t11e 1980s were
characterised by shortage of scrip. Hawkins suggests that listing rules militate
against small companies that dominate the Zimbabwean economy. However, I
agree with Sudweeks (1989, p61) that loss of control and disclosure require
ments are major fears among owners of closely held family firms. A number of •
firms only list the minimum percentage of shares allowed by the exchange.
Authorities may also distrust free ownership and private enterprise resulting in
inefficient or over-regulation. A considerable degree of confidence is necessary
because investors are sensitive to political uncertainty. As highlighted through
out this thesis the institutional framework must facilitate the transfer of informa
tion, disclosure, transparency and accountability to instil confidence in the mar
ket.
In the mid 1990s there was a clear trend towards deregulation in Zim
babwe. ESAP brought with it a significant relaxation of foreign investment
guidelines. Prior to economic liberalisation, activity on the ZSE was adversely
134
. ' -~
l •
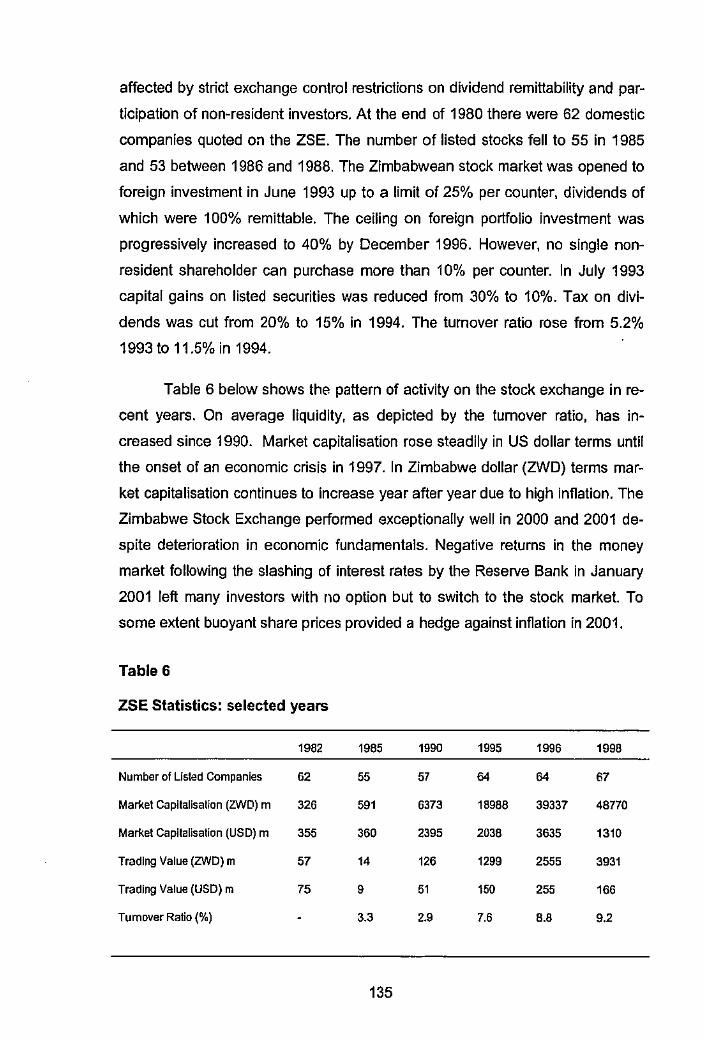
affected by strict exchange control restrictions on dividend remittability and par
ticipation of non-resident investors. At the end of 1980 there were 62 domestic
companies quoted on the ZSE. The number of listed stocks fell to 55 in 1985
and 53 between 1986 and 1988. The Zimbabwean stock market was opened to
foreign investment in June 1993 up to a limit of 25% per counter, dividends of
which were 100% remittable. The ceiling on foreign portfolio investment was
progressively increased to 40% by December 1996. However, no single non
resident shareholder can purchase more than 10% per counter. In July 1993
capital gains on listed securities was reduced from 30% to 10%. Tax on divi
dends was cut from 20% to 15% in 1994. The turnover ratio rose from 5.2%
1993to 11.5% in 1994.
Table 6 below shows the pattern of activity on the stock exchange in re
cent years. On average liquidity, as depicted by the turnover ratio, has in
creased since 1990. Market capitalisation rose steadily in US dollar terms until
the onset of an economic crisis in 1997. In Zimbabwe dollar (ZWD) terms mar
ket capitalisation continues to increase year after year due to high inflation. The
Zimbabwe Stock Exchange performed exceptionally well in 2000 and 2001 de
spite deterioration in economic fundamentals. Negative returns in the money
market following the slashing of interest rates by the Reserve Bank in January
2001 left many investors with no option but to switch to the stock market. To
some extent buoyant share prices provided a hedge against inflation in 2001.
Table 6
ZSE Statistics: selected years
1982 1985 1990 1995 1996 1998
Number of Listed Companies 62 55 57 64 64 67
Markel Capitalisation (ZWD) m 326 591 6373 18988 39337 48770
Market Capitalisation (USD) m 355 360 2395 2038 3635 1310
Trading Value (ZWD) m 57 14 126 1299 2555 3931
Trading Value (USD) m 75 9 51 150 255 166
Turnover Ratio(%) 3.3 2.9 7.6 8.8 9.2
135
[Source: Emerging Stock Markets Factbook- various ir,sues]
Although market activity is on the increase in Zimbabw~ dollar terms, no
clear-cut conclusions can be drawn with regard to efficiency. !n finance theory,
market efficiency refers to the assumption that share prices rtflect all available
information that investors consider relevant to decide wheth r to buy, sell or ,, hold on to their shares. Three form of market efficiency are Well known in the
"'. literature; namely weak form, semi-strong form and the strong_i.form. These con-
cepts reflect respectively the degree to which all historical, all public, and all
available information whether public or private is reflected inlthe share prices. '
Empirically efficiency is evidanced by the absence of significant serial correla-
tions, i.e. price autocorrelations not significantly different fro[!1 zero. Generally
emerging markets such as Zimbabwe are considered to be weak form efficient.
There are some important dimensions of market efficiency other than
price such as allocative, operational and structural efficiency. Conventionally
operational efficiency is assessed on the basis on transaction costs and the
length of the transaction cycle. Theoretically transaction costs reflect the cost of
intermediation. Therefore the lower the transaction costs and the thinner the
margins between bid and offer prices the more efficient the market is deemed to
be. In Zimbabwe brokers do not compete on the basis of commission, as trans
action costs are collectively determined, in concurrence with government, hence
do not reflect competitive efficiency of the brokers. In practice there are long
delays on the transfer of scrip. If one sells shares on the market through a bro
ker, it takes in practice a standard two weeks to receive payment. Another week
or two are required to clear the cheque with banks before vcllue can be given.
Such transactional delays reduce the liquidity and turnover of the market. Tech
nically, liquidity refers to the duration it takes to consummate' trade without un
due lo,;s of value. From a liquidity point of view, an investor is better off placing
money with a bank where access can be unrestricted. Nevertheless plans are
underway to establish a central scrip depository to speed up transactions.
Chronic negative real returns in the money market, however, make the
sock exchange a relatively better medium for investment to enlightened inves
tors. Table 7 below shows that a lot of Zimbabwean Initial Public Offerings
136
' '
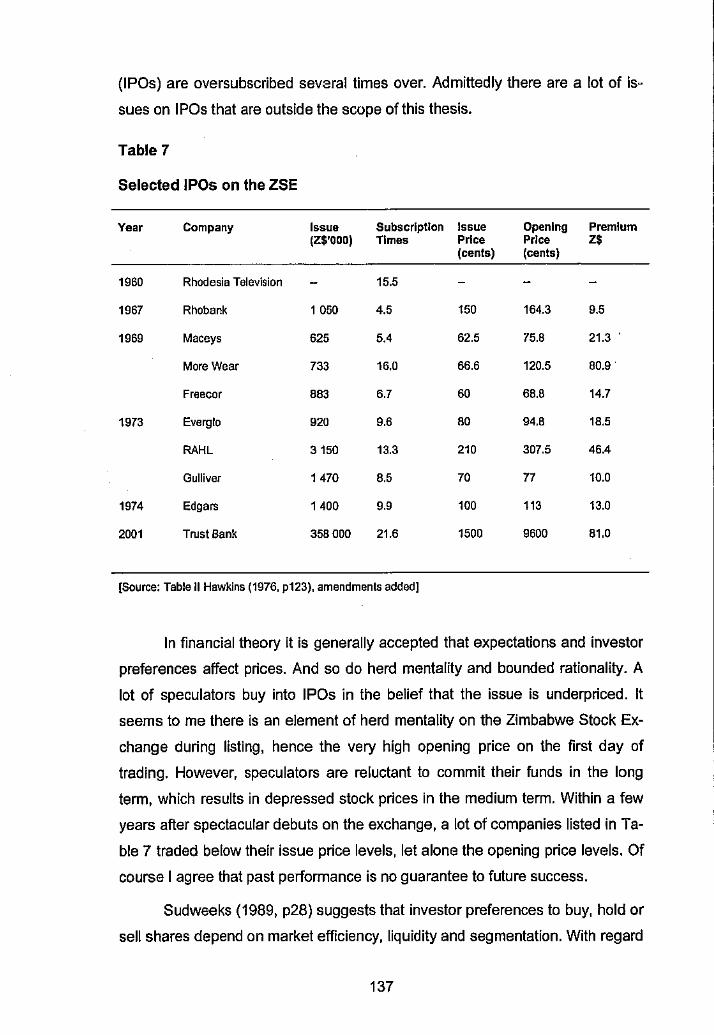
(IPOs) are oversubscribed several times over. Admittedly there are a lot of is~
sues on IPOs that are outside the scope of this thesis.
Table 7
Selected IPOs on the ZSE
Year Company Issue Subscription Issue Opening Premium (Z$'00D) Times Price Price 2$
(cents) (cents)
1960 Rhodesia Televlsion 15.5
1967 Rhobank 1 050 4.5 150 164.3 9.5
1969 Maceys 625 5.4 62.5 75.8 21.3 '
More Wear 733 16.0 66.6 120.5 80.9
Freecor 883 6.7 60 68.8 14.7
1973 Everglo 920 9.6 80 94,B 18.5
RAHL 3150 13.3 210 307.5 46.4
Gulliver 1 470 8.5 70 77 10.0
1974 Ed gars 1 400 9.9 100 113 13.0
2001 Trust Bank 358 000 21.6 1500 9600 81.0
[Source: Table II Hawkins (1976, p123), amendments added]
In financial theory it is generally accepted that expectations and investor
preferences affect prices. And so do herd mentality and bounded rationality. A
lot of speculators buy into IPOs in the belief that the issue is underpriced. It
seems to me there is an element of herd mentality on the Zimbabwe Stock Ex
change during listing, hence the very high opening price on the first day of
trading. However, speculators are reluctant to commit their funds in the long
term, which results in depressed stock prices in the medium term. Within a few
years after spectacular debuts on the exchange, a lot of companies listed in Ta
ble 7 traded below their issue price levels, let alone the opening price levels. Of
course I agree that past performance is no guarantee to future success.
Sudweeks (1989, p28) suggests that investor preferences to buy, hold or
sell shares depend on market efficiency, liquidity and segmentation. With regard
137
to market liquidity, Sudweeks outlines three hypotheses that have been ad
vanced to explain the sale of securities below the present v;.plue of their "risk
adjusted discounted future cash flows." The liquidity premium,\ or price pressure
hypothesis postulates that the price of shares falls when a lar~e block of shares
is offloaded onto the market. The fall in prices for the durationi1pf the transaction
is referred to as the liquidity premium. Recovery in prices u$.~ally takes place
soon after the transaction. ln financial theory share prices haV.e a signalling ef
fect, which conveys information not available to management of the firrri.
Therefore the information effect hypothesis stipulates that 1rading in a com-'
pany's shares brings new information onto the market. As a result no recovery
is envisaged after the fall in stock prices on the market. T~e substitution hy
pothesis, however, presupposes that stocks are perfect substitutes. Therefore
trading in any volumes of shares should not bring about any change in the
price. Price movements only come about as a result of new information re
ceived on the market. According to the modem portfolio theory assets bearing
the same amount of risk should earn the same return in fully integrated markets.
In practice capital markets are exposed to different cultures and resource en
dowment even within the same country. Therefore in segmented capital mar
kets different rates of return can be realised on assets bearing the same level of
risk. Although segmented capital markets have the potential to reduce stock
prices, they also provide an opportunity for diversification.
From a structural efficiency perspective enforcement of ZSE guidelines '
has been subject of a lot of criticism ranging from serious allegations of inside
' dealing and preferential treatment. In the past broking firms were allowed to op-
erate with low asset values and a very small security fund compared to their li
abilities. However bold reforms are in the pipeline. Listed c9mpanies are ex
pected to adopt principles of good corporate governance to enforce good ac
counting standards, disclosure, transparency, accountability, and shareholder
participation. For instance, proposals are being made to publish the packages
and salaries of chief executive officers in a move designed to curb self-dealing
and to promote equity. A Draft Securities Bill ls under consideration. Efforts are
also underway to harmonise listing laws in the 14-member Southern Africa De
velopment Community (SADC) in order to facilitate dual listing.
138
' .....
-~
·' /\
Portfolio investment is not the only medium for foreign investment. Not
withstanding restrictions on foreign investment of the stock market, the Zim
babwe Investment Centre (ZIC) regulations permit 100% new foreign direct in
vestment in priority areas such as manufacturing, mining and tourism. Invest
ment in construction enterprises is limited to 70% external shareholding. For
eign investment participation in reserved sectors such as agriculture, transport
and retail is limited to 35% and can only be undertaken through a joint venture
with a local partner. In all cases investment into existing companies other than
through the stock exchange is approved by the Exchange Control Department.
Foreign owned companies can borrow any amount for working capital on the
local market. Capital projects can only be funded from inward remittances or
through retained earnings. All companies, whether foreign owned or domestic
can borrow offshore through a commercial bank. Loans above US$ 5 million re
quire approval of the External Loans Coordinating Committee (ELCO).
Government Securities
In 1925 government put forward the first local stock issue of £1 million
5% Southern Rhodesia Local Registered Stock 1945-55 at £99 repayable in
Southern Rhodesia. The regular issue of Treasury Bills, first issued in 1952 ac
cording to Harvey (1996, p3) was relaunched in September 1957. The exercise
enabled banks to comply with prescribed liquid asset ratios.
A consolidated sinking fund was established in 1948 in both London and
Harare permitting the National Debt Trustees to retire any stock issue at their
discretion, states Newlyn and Rowan (1954, p149). The objective was to enable
a gradual redemption of government securities. Trustees regularly furnished
stockbrokers with a list of indicative prices at which stocks could be redeemed.
In fact the Trustees laid down the interest rate structure for medium and long
term securities and there were no other ready cash buyers for government se
curities. The Standard Bank acted as an agent of the Trustees up to 1959 when
this function was taken over by the newly established central bank. From 1962,
price list issued in the name of the Reserve Bank were partly influenced by a
desire to smoothen prices of government stocks and maturities in the UK. Sow
elem (1967, p170) highlights that the central bank came with greater financial
139
(
'
J .,
j I ,, '
'
. •
:t ; .
capacity than the sinking funds to deal with government securities on its own
account. In early days, Treasury Bills were issued in excess Q;f government re
quirements to support the emergence of a functional money m~rket. The central
bank was able to buy excess securities offered until the marketJ needed them.
11., Although the central bank was able to maintain reas?nable liquidity of
government fixed income securities, it failed to stimulate the il1lerest of ordinary " investors apart from large mining companies and insurance:"companies. The
market for medium and long-term government securities rem,ined weak. How
ever, authorities were able to have an indirect sourGe of fu'nds from captive
markets such discount houses, the POSB, pension funds, and other financial '
institutions susceptible to regulatory minimum liquid assets requirements and
moral suasion. To date there is no well developed secondary market in gov
ernment securities because interest rates were in the past administered. De
spite formalised liquidity requirements for holding government paper, there are
no formalised secondary market arrangements for trading government stocks.
4.3 The Changing Landscape
In all progressive countries access to financial services is now consid
ered a basic necessity. The Zimbabwean financial infrastructure continues to
evolve over time, spurred on by global integration, technological progress, com
petition, and commercial viability. Although banks, money and, finance are not a ' creation of modernity, they continue to evolve with time as :.society becomes
more informed and articulate in its preferences. Zimbabwe joi~ed the IMF on 29
September 1980 and has in her own small ways strove to k8ep pace with im-'
portant financial developments in the international community. The cause for
further financial liberalisation and the design of appropriate financial safety nets
to suit Zimbabwe's circumstances remains very strong at the time of writing.
In general government has adopted an incremental or gradual approach
to financial liberalisation in Zimbabwe. In positive light, this approach gives in
stitutions and individuals enough time to learn. According to the rational expec
tations proposition, economic agents are likely to commit investments under a
regime of reforms they expect to be sustained. However, timid reforms render
140
. ·- -. ....,..,,
commitment to far reaching changes questionable. The gradual liberalisation
process can easily loose momentum if the economy is faced with more urgent
pressures. In any case, if the roots of financial liberalisation are shallow the op
portunity cost of retrogression is low in the short term (but high in the long term
considering damage to reputation and trust). Wavering economic polices make
it difficult to assess the true impact policy decisions.
A number of market-based reforms introduced in 1993/4 were reversed
since the economic crisis bE:iginning in 1997. For instance, government some
times confiscate corporate deposits in foreign currency denominated accounts
(FCAs) to supplement dwindling official foreign exchange reserves. The IMF
(2001, p18) estimates that usable foreign reserves were less than U$50 million,
or one-week import cover at lhe end of 1999. Following the massive one-day
currency crush by 75% on 14 November 1997 market determined exchange
rates were purged. From January 1999, the exchange rate was pegged at 2$38
to the US dollar but was devalued to 2$50 per US dollar on 1 August 2000. The
rate rapidly depreciated to 2$55 and was pegged there throughout 2001.
According to the IMF the economic crisis was sparked by low investor
confidence following unbudgeted payments of War Veterans gratuities in 1997,
reimposition of price controls, military intervention in the Democratic Republic of
Congo (DRC) in 1998, and uncertainty on the direction of land reform.
The high cost of borrowing in 2000 was also a burden to government,
which was increasing dependent on domestic borrowing following the evapora
tion of international funds. In January 2001, the Reserve Bank cut money mar
ket interest rates by fiat to below 20% at a time when inflation was hoovering
around 85%. This policy magnified negative returns on deposits. Some innova
tive banks were able to increase fee-based income in addition to offering com
pulsory services such insurance on bank loans and credit cards. It is not clear
whether such schemes have the capacity to halt systemic and moral hazard
risks. The ability to transfer risk partially explains the persistence of bank profit
ability when a!I sectors of the economy are collapsing. The persistence of finan
cial repression alongside with innovative continuity and globalisation suggests
Zimbabwe has not yet escaped the tyranny of contradictory development.
141
J
... {
-<
The years 1999 to 2001 were, however, very important.for financial sys
tem safety and soundness. Until then, the banking regulatory f1amework in Zim
babwe was very weak because it had no support of law. Aut~orities have now
put in place three important pieces of legislation. The Riserve Bank Act
[Chapter 22:15], details of which have already been discussJQ under the sub-·'
section on the Reserve Bank, became effective in August 1 ggg_ The new Act I.',
has strengthened the bank's supervisory role, which was noi.~dequately dealt
with in the 1956 and 1964 Reserve Bank Acts as amended over the years. In
brief there still is room to clarify the policy objectives of the c~ntral bank. In fu
ture, the question of central bank independence might require further elabora
tion.
The long awaited Banking Act [Chapter 24:20], whose numerous drafts
were debated since the early 1990s, became effective on 1 August 2000. Con
trary to Reserve Bank expectations, the responsibility to lic.ense and cancel
bank licences is still vested with the Registrar of Banking Institutions under the
Ministry of Finance. It was hoped the capacity to withdraw licences would be a
useful tool if it were transferred to the supervisory authority. As Claridge and
Box (2000, p68) put it, 'the jurisdiction of decision-making should correspond to
the jurisdiction of effects and costs." In other words, "People who make deci-
sions should be those who receive benefits and bear costs" (Ibid). Earlier on it ·~
was noted that the Reserve Bank solely bears the costs incurred in pursuit price
stability and soundness of the financial system. However, the law, that is, sec
tion 12 of the Banking Act, makes annual fees payable by all:registered institu
tions remittable to the Registrar of Banking Institutions.
This said, the Act provides for the Registrar to consult:Banking Supervi
sion on licensing matters. Section 5 of the new Act does aw~y with contradic
tory references to registration of persons as "banks" contained in section 5 of
the previous Act [Chapter 188]. The Reserve Bank, through the Banking Super
vision Department, is now empowered to conduct pre-opening inspections on all
newly licensed institutions. Banking Supervision is required by law, section 45
of the Bank Act, to "continuously" conduct off-site and on-site examinations on
all banking institutions to ensure compliance with the Act. The Act also provides
for the joint issue of banking regulations by the Registrar and the Reserve Bank.
142
'
Banking Supervision may recommend remedial action to the Registrar. The Re
serve Bank is responsible for managing institutions in financial distress.
Financial theory and experience have taught us that despite the best ef
forts by the authorities to competently license, regulate and supervise banks,
the potential for financial distress is inevitable. To paraphrase Lewis (1995,
pxiv) the fragility of banks stems from the truism: Liabilities are liquid: Assets
are risky. The promulgation of the Troubled and Insolvent Banks Policy of 2001
clarifies the Reserve Bank's public interpretation of its lender of last resort func
tion. The central bank reiterates that liquidity support will only be available to
solvent banks that can demonstrate viability. Weak banks shall be required to
merge or consolidate with a financially health institution. Insolvent entities will
be allowed to fail. Existing banking laws and regulations provide for progres
sively harsher "Corrective Actions" and "Orders" which may culminate in man
datory closure and liquidation of insolvent or imminently insolvent institutions
that cannot be recapitalised within stipulated time limits.
Adoption of a standard framework for managing problem banks promotes
a fair, transparent, con5istent and firm regulatory response to various degrees
of financial distress. The policy enables early identification of potential problems
and prompt responses to correct deficiencies. Corrective Orders will be tailored
according to the institutions' overall risk profile. A banking institution's overall
risk profile, as characterised by its performance on the individual components of
the CAMELS1 standardized rating system, determines its composite rating and
the degree of supervisory concern.
It is hoped that the policy will rid Zimbabwe of what Kane and Rice
(2000, p5) characterise as "zombie banks" which are, "Insolvent banks that en
joy such an unnatural prolongation of their existence" "after its ownership capital
has departed" due official indecisiveness. I cannot overemphasise De Juan's
(1991) very influential paper: Does Bank Insolvency Matter? The paper force
fully articulates that insolvent banks, whether financially ruined by micro issues
such as mismanagement, ineffective supervision, political influence or are in a
positioi1 to fraudulently declare profits and pay taxes for that matter, result in
I Acronym for Capital Adequacy, Asset Quality, Management, Earnings, Liquidity, and Sensitivity unifonn bank rating system developed in the United States. The system is widely used throughout the world by Banking Supervision authorities or agencies.
143
<
'
! l
misallocation of resources at a macro level "that will ultimately materialise as
fiscal deficit." (p1) ,1
Nowadays effective banking supervision is regarded Js an essential fi
nancial safety net required to bolster financial stability. For b~~king supervision
to be effective, there is need for adequate capacity in term~· of competence, "
skills and expertise to analyse financial products and data, m~.llitor early warn-,, ing signs potential problems, and initiate adequate corrective responses to
problems. Montes (1998) has attributes the 1998 East Asian crises to weak
nesses in the financial system caused by the "twin liberalisations" of the finan
cial sector and the current account in less developed countries. According to ' him bank failures occur within two to five years if liberalisation is not accompa-
nied by development of a sound banking system. Delhaise (1998) concurs that
the East Asian financial crisis was inevitable due to fundamental weaknesses.
Capacity building has been a permanent feature in every Banking Super
vision Annual Report since 1996. However, the department continues to lose
staff to the regulated institutions at a high rate. Kane (1981) argues that Bank
Examiners preoccupied by post-regulation career prospects will act in self
interest to the detriment of effective prudential supervision. In extreme cases
regulatory capture may occur where discriminatory regulations benefit the politi
cally powerful institutions and customers. Given the value of its core functions,
Banking Supervision should strive to reduce staff turnover and retain the best
skills it can muster. Elsewhere supervision is increasingly becoming a knowl-'
edge-based profession in order to keep abreast with constant innovation. '
Financial literature strongly supports a functional apprOach, also known
as the financial serves view, to financial design. A functional, system does not
support rigid demarcations between financial institutions. Hence the UK, for ex
ample, has adopted the super-regulator concept where one regulatory agency
supervises all the bank and non-bank financial institutions. In Zimbabwe the of
ficial thinking is still dominated by the institutional approach, which supports
separation of activities and institution specific legislation. Nevertheless, there is
need for close cooperation among the various regulators of banks, building so
cieties, insurance, pension and provident funds, collective investment schemes,
micro finance and unit trusts.
144
' .,
Despite numerous regulatory authorities and over a dozen pieces of leg
islation loopholes still exist. Until the late 1990s, no law governed unit trusts. In
the mid 1990s, a lot of people fell victim to pyramid schemes because there was
no legal recourss until the Collective Investment Schemes Act became opera
tional in August 1998. The Securities Bill, which will replace the Zimbabwe
Stock Act, is not yet law. In practice it is impossible to close every regulatory
loophole because economic units act in enlightened self-interest. Kane (1981,
1983) developed an insightful framework of cyclical interaction between oppos
ing political and economic forces known as the "regulatory dialectic." The politi
cal process of regulation and the economic process of "regulates avoidance" or
"loophole mining" interact by interminably adapting to each other.
Derived from the classical presentation of the philosopher Christopher
Hegel, the word dialectic refers to change occurring through a process of action
and reaction by opposing forces. A dialectic process comprises of a thesis (ini
tial set of arguments and rules), the antithesis (conflicting responses) and a
synthesis (the resultant modification from interaction of opposing forces). Kane
(1981) stresses that there is an endless struggle between the invisible hand of
economic power and the visible hand of political power. However the innovative
lags are shorter than the regulatory lags due to institutional constraints. I agree
with Kane that some innovations are overlooked unless they threaten a regula
tory crisis because the political system can forgive excessive delay better than
ill-conceived hasty action. Regulations that are severe, discriminatory or hard to
avoid re.suit in the "politicisation of ordinary citizens," Kane (1981, p365) argues.
Nevertheless, there is need to put in place mechanisms that compel fi
nancial institutions to offer enforceable service guarantees to their customers.
The current Banking Act has no provisions to empower customers against un
fair practices or pricing. For instance, clients have no recourse against institu
tions that offer compulsory services such as unsolicited insurance. Despite the
provisions of the Moneylending and Rates of Interest Act [Chapter 14:14] intro
duced on 1 October 1930, micro-finance institutions reputedly overcharge cli
ents. Apart from banking supervision, no other comprehensive prudential su
pervision arrangements exist to guide the activities of other financial institutions.
145
Section 66 of the Banking Act provides for the establishment of the de
posit protection scheme (DPS), delails of which were still ~nder study by a
standing committee. It is too early to evaluate the proposed s~heme. In theory,
the success of a DPS requires support of additional financiariisafety nets such
as effective supervision, good corporate governance, cont~ct enforcement,
good accounting standards and practices, adequate disclos'Ure, and clauses ,,
that ameliorate against moral hazard behaviour on part of b~nks and deposi~
tors. Attention must also be drawn to macroeconomic c:onditlons, state of the
financial system, market discipline and the regulatory environnlient. •
Notwithstanding the regulatory gaps, there are discernible trends toward '
the adoption of innovative delivery channels and products. Automated teller
machines (ATMs) have been well received and understood by the market.
However current usage is limited to withdrawal of funds 24 hrs a day. Further
deployment of this expensive technology has been adversely affected by the
foreign currency shortage on the Zimbabwean market. ATMs are also widely
used in conjunction with credit cards. The recently introduced in-store banking
concept has met with considerable success among the lower end individual
customers and of course the business corporations hosting the banks.
Scope for use of Electronic Funds Transfer at Point of Sale (EFTPOS)
and telephone banking is still hampered by backward telecommunication and
information technologies. There is hardly any cash withdrawal at Point of Sale in
Zimbabwe in contrast to Australia. Internet banking across nations is particularly
constrained by exchange controls, the shortage of foreign cu.rrency, as well as
affordability of equipment at private homes and small businesses.
Confidence and trust in the alternative technologies has not yet perme
ated across the entire fabric of society. A number of alternative service chan
nels with potential to serve remote rural areas such as credit unions, community
banks, third party agencies, and giro post have not yet caught the imagination
of the Zimbabwean market. It seems to me both banks and clients are stm ob
sessed with the big bank concept. Therefore increased competition among fi
nancial service providers has increased services for those already well off to the
detriment of small clients. This phenomenon is evidenced by the readiness of
banks to put up tenders in order to secure banking business of blue cheap
146
companies. Nevertheless, the regional centres and rural areas may lack the
economic clout to sustain viable financial services hence the agglomeration of
seivice providers in major urban centres.
In my view, authorities should leave no stone unturned to encourage fi
nancial innovation. In fact Merton (1990, p270) considers financial innovation to
"the engine driving the financial system on its prospective journey to economic
efficiency." Even small benefits to individuals aggregate into enormous social
gains for the economy as a whole. In the same vein the hours lost by Zimbab
weans queuing for simple financial services aggregate into enormous loss of
productivity at a national level. Although Van Horne (1985) labours the point
that some innovations could be mere rent seeking "fads", "balloons", and "bub
bles", he agrees that true financial innovation makes the markets either more
efficient or more complete by lowering intermediation costs or inconvenience
costs, (p622).
147
5. DATA COLLECTION
,I -'
-5.1 Scope of indicators l
" . ,:, [Prestige] in the econometrics profession hinges on technical 1.fpertise rather
than on hard work required to collect good data.
K~nnedy(1998,p2) '
This section describes the sources and techniques use'd to construct the J time series data and indicators used in this research. Empirical evidence is )
based on annual data over the period 1924 to 1998. In fact, this study largely
creates a new database because existing primary sources of data on Zimbabwe
are not systematic, consolidated or in electronic format. In practice, financial
development is measured against indicators of size, activity and efficiency of
financial institutions and capital markets. This approach was popularised by
Beck, Demirgu9-Kunt and Levine ('1999). Unfortunately, their database covers
an inadequate span (1975 to 1996) and a few variables on Zimbabwe.
There is no unique indicator of financial sophistication, hence the use of
an array of indicators in the financial literature. Lynch (1993, p5) proposes that a
full set of financial development indicators should include measures of credit
intermediation, liquidity management, risk management an(j pricing mecha
nisms. Lynch's paper identifies five categories of financial development namely:
quantity measures, structural ratios, financial prices, product range and trans
action costs. Quantity measures include aggregates of monetisation, credit in
termediation, and financial assets, whereas structural measures indicate the
relative importance of the different elements. Beck et al's (1999) choice of size,
activity and efficiency indicators has a rich intuitive appeal because they clearly
show the intermediary role of a broad range of financial institutions and the
capital markets. Fischer et al (1998) use economic and accounting variables.
Nevertheless, financial prices, product range, and transaction costs are useful
indicators of the degree of financial sophistication.
148
5.2 Analysis of indicators
This research, similar to several studies on financial intermediation,
adopts the Beck, Demirg09-Kunt and Levine (1999) approach. Five different
groups of financial intermediaries are identified. These are: the Reserve Bank of
Zimbabwe (RBZ), which is the central bank; deposit money banks (DMB); other
banking institutions (OBI); non bank financial institutions (NBFI); and develop
ment financial institutions (DFl). Deposit money banks in Zimbabwe comprise of
Discount Houses, Commercial Banks, and Merchant Banks, which are also
known as Accepting Houses. DMB are distinguished by acceptance of deposits
that are transferable by cheques. OBI refers to Building Societies, Finance
Houses, and the People's Own Savings Bank (POSS). Insurance companies,
provident and pension funds constitute the non-bank financial institutions
(NBFI). Development financial institutions (DFI) are made up of the Agricultural
Finance Corporation (AFC) and the Zimbabwe Development Bank (ZDB).
Total assets of the respective intermediary group are used to determine
the absolute and relative importance of each financial sector. The absolute size
of each financial sector is obtained by expressing the relative assets to the size
of the economy as denoted by the GDP, These indicators of ;;1.bsolute size
measure the importance of financial services provided to the real sector, "in
cluding government, public enterprises and the private sector" [Beck et al (1999,
p6)]. The total assets of financial intermediaries (TFA) series is a sum of the as
sets of the various categories of financial intermediaries. Ideally, the assets of
each intermediary group are adjusted to reflect domestic intermediation of the
respective category, and to net out cross claims on the financial sector. This
practice was not followed in this thesis because, for the period under considera
tion, operations of Zimbabwean banks were largely domestic partly due to ex
change control restrictions. Furthermore, Zimbabwean banks were very small
by international standards and thus could ill afford engagement in cross boarder
intermediation. While banks such as Standard Chartered Bank and Barclays
Bank are in fact locally registered branches of foreign owned banks, for all in
tense and purposes their intermediary role is confined to the Zimbabwean
arena. Claims on the financial sector have not been netted out due to poor dis
aggregated time series data before 1975.
149
' ' '
I
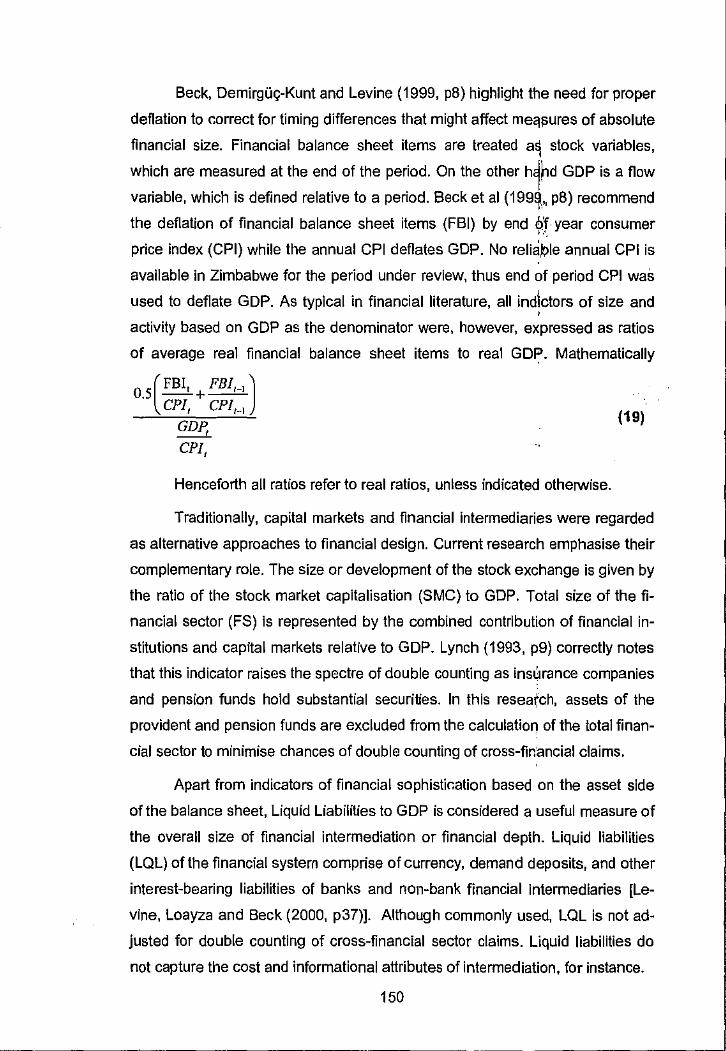
~· - rrn - 7 nnt T =
Beck, DemirgG9-Kunt and Levine (1999, pB) highlight the need for proper
deflation to correct for timing differences that might affect mec1fiures of absolute
financial size. Financial balance sheet items are treated a~ stock variables,
which are measured at the end of the period. On the other h1~d GDP is a flow
variable, which is defined relative to a period. Beck et al (199~., pB) recommend
the deflation of financial balance sheet items (FBI) by end 6r year consumer "'·
price index (CPI) while the annual CPI deflates GDP. No reliaple annual CPI is
available in Zimbabwe for the period under review, thus end of period CPI waS
used to deflate GDP. As typical in financial literature, all indlctors of size and •
activity based on GDP as the denominator were, however, expressed as ratios
of average real financial balance sheet items to real GO~. Mathematically
O.S ( FBI, +FBI,_,) CPI, CP/1_1
GDP,
CPI,
Henceforth all ratios refer to real ratios, unless indicated otherwise.
(19)
Traditionally, capital markets and financial intermediaries were regarded
as alternative approaches to financial design. Current research emphasise their
complementary role. The size or development of the stock exchange is given by
the ratio of the stock market capitalisation (SMC) to GDP. Total size of the fi
nancial sector (FS) is represented by the combined contribution of financial in
stitutions and capital markets relative to GDP. Lynch (1993, p9) correctly notes
that this indicator raises the spectre of double counting as insUrance companies
and pension funds hold substantial securities. In this resea(ch, assets of the
provident and pension funds are excluded from the calculation of the total finan
cial sector to minimise chances of double counting of cross-financial claims.
Apart from indicators of financial sophistir:ation based on the asset side
of the balance sheet, Liquid Liabilities to GDP is considered a useful measure of
the overall size of financial intermediation or financial depth. Liquid liabilities
(LQL) of the financial system comprise of currency, demand deposits, and other
interest-bearing liabilities of banks and non-bank financial intermediaries [Le
vine, Loayza and Beck (2000, p37)]. Although commonly used, LQL is not ad
justed for double counting of cross-financial sector claims. Liquid liabilities do
not capture the cost and informational attributes of intermediation, for instance.
150
,· '
Relative measures of the size of financial intermediaries are computed
as the contribution of a given intermediary category to GDP. Typical ratios cal
culated are RBZ to TF A, DMB to TF A, etc. The relative importance of deposit
money banks to the central bank (DMB to RBZ), or DMRB for short is consid
ered an informative indicator of financial sophistication. The relative contribution
of the central bank is expected to decrease with an increase in economic so
phistication. This indicator has no direct linkage with other benefits of interme·
diation such as exerting corporate governance on enterprises, risk manage·
ment, reduction in transaction costs, quantity and quality of financial services.
Nevertheless, financial theory suggests that DMB have better incentives to pro
vide better monitoring and screening services than the central banks.
Measures of financial institution activity relate credit issued to the private
sector by different combinations of financial intermediaries to GDP. Common
indicators are: Private Credit by Deposit Money Banks to GDP (PCDMB); Pri
vate Credit by Other Banking Institutions to GDP (PCOBI); Private Credit by
Total Banking Sector to GDP (PCBK); Private Credit by Non Bank Financial In
stitutions (PCNBFI); Private Credit by Development Financial Institutions
(PCDFI). Intuitively, total Private Sector Credit by all financial intenmediaries to
GDP (PSC) is a superior measure of the full extent of financial intermediation in
the economy. Indeed, Beck, DemirgGc;-Kunt and Levine (2001, p24) identify
PSC as their indicator of choice. Other things being equal, high reliance on
bank credit is associated with improved productivity on investment and eventu·
ally sustainable economic growth. The indicators discussed in this paragraph
exclude credit granted to the public sector by financial intermediaries. Credit
issued by the cental bank is not considered. Although some researchers, for in
stance Beck, Demirguc;-Kunt and Levine (1999, p7) exclude credits issued to
state-owned enterprises (SOEs), I have not followed the precedent due to data
limitations. However, on one hand SOEs comprise a significant share of eco
nomic activity in small economies such as Zimbabwe and provide essential
seivices in all mixed economies. One the other hand the transactions are not at
anms' length and most likely to be politically rather than economically motivated.
In order to have a meaningful impact on economic activity financial in
termediaries should provide services in an efficient manner. The Campbell
Committee's (1981) Final Report discussed three forms of fir,ancial system effi-
151
' ,,
;' '
ciency: operational efficiency measures economic use of resources; allocative
efficiency directs resouri;es to areas of highest return on inveii,tment; while dy
namic efficiency deals with the system'£ capacity to adapt to c~anges as well as
generate innovations. In pmc.tice, financial institution effici~pcy is based on
bank level accounting data for commercial banks. Typical i~c;licators adopted
include the net interest margin (NIM); overhead costs to total ;~ssets; real inter
est rates; and the spread between deposit and lending inter~st rates. For the
stock market, measures of efficiency include stock traded value to GDP, and
the turnover ratio, i.e. turnover value to market capitalisation. !
5.3 Other variables considered
The principal conditioning variables applied in this research are dis
cussed at length in Section 7.5. LaPorta, Lopez-de-Silanes, Shleifer and Vishny . (1997) proposed an array of legal and regulatory characteristics that detenmine
the level of financial development across counties. ln particular the legal origin,
creditor and shareholder rights, contract enforcement, and accounting stan
dards have empirically been found to be informative. The intuition behind these
indicators is that sound institutional arrangements reduce the effects of transac
tion costs, information asymmetry, agency risk, and moral hazard behaviour. An
adequate regulatory framework ~meliorates the mobilisation and canalisation of
financial resources to their most productive use. lnsecur!ty diminishes the ex
pected value of real and financial assets and undermines inve~tor confidence.
Whereas the legal and regulatory framework is very useful in cross
country studies, some of the indicators (e.g. legal origin) cj!re time invariant
hence less informative in time series analysis based on a single country. This
said, there is need to use proxies that capture the same attribute in a fashion
amenable to time series analysis. This research turns to proxies documented in
Alesina, Ozier, Roubini and Swagel (1996). Reliance was placed on proxies of
democracy (DMD); change in government (CGV); major change in government
(MCGV); and armed internal conflict (WAR)23. I extended the span covered by
these indicators on the basis of available historical knowledge on Zimbabwe.
The use of indicators itemised in this paragraph is motivated along the same
lines as the legal determinants discussed in the previous paragraph.
152
This thesis acknowledges that informational and technological advances
largely determine financial services delivery channels, the range and quality of
services provided. To this end, I propose an indicator that directly measures the
degree to which an economy uses informational technologies. A new proxy,
computed as the logarithm of telephone lines per capita (L TECH) is derived.
Hypothetically, LTECH is an appropriate indicator for dynamic efficiency in a
developing economy such as Zimbabwe. Telephone banking, POS debits,
Internet banking, for instance, depend on sound communication technologies.
5.4 Sources of data
The present section describes the basic sources of data gathered as part
of this research. A full description of the sources is given in Appendix 4. De
tailed statistical notes are avoided due to space limitations. Econometric evi
dence is based on transformed annual data in Table 24. Specifically, some
variables are deflated to reflect real variables. Ratios of real financial balance
sheet items to real GDP are expressed in natural log transformation and used to
represent the variables in levels. Where appropriate, logarithms of ratios based
on real financial balance sheet items have also been taken. Table 23 gives the
data set in its original format. The electronic version has minimal rounding off.
5.5 Limitations
A Government Statistical Bureau was established in April 1928 but no ef
fort has been taken to consolidate time series data into a user-friendly format.
Chapman (1992, p52) emphasises, "delayed publication, lack of transparency
or simple unavailability of information [as] shackling the working of the [Zim
babwe] financial system ... " Statutory publications by the Central Statistic Office,
The Registrar of Provident and Pension Funds, The Registrar of Insurance, and
the Registrar of Banking Institutions are often delayed by a couple of years.
RBZ Quarterly reviews were sometimes delayed. Although capital markets have
existed in Zimbabwe for over a century, stock market data in Zimbabwe is very
fragmented. Non-available and opaque financial statements increase the cost of
information to firms. This affects capital allocation and economic £:uwth.
153
6. RESEARCH METHODOLOGY
6.1 Introduction
The genesis of scientific inquiry and analysis is usually the observation and in
terrogation of manifest phenomena
Weber (1999,p101)
Vector autoregression [VAR] is a multivariate econometric proc~ss,
which estimates the temporal fluctuations and dynamic interdependence among
current and past realisations of variables in a time series vector up to a speci
fied lag length. According to Schumpeter (1936, p64) economic performance
depends on preceding development. l<ing and Levine (1993) among others pro
vide empirical support to this suggestion. Clarke (1986, p6) argues that financial
structure at a given point in time is an amalgam of past "active and passive in
teraction" of finance and the real economy. Current development processes
create "the prerequisites" for subsequent performance. This makes VAR, the
principal technique applied to this research, very suitable to the task. Christ's
(1966) properties of a good model encompass "relevance, simplicity, theoretical
plausibility, explanatory ability, accuracy of coefficients and forecasting ability."
6.2 VAR Uses and Procedure
There are four main uses for VAR, namely (1) data description in the unit
root context; (2) forecasting macroeconomic indicators; (3) policy analysis to
study or infer on the sources, characteristics and persistence of economic flu:::
tuations; and (4) testing competing theories (e.g., investigating validity, direction
of causality, etc). The typical VAR steps are: model fonmulation, tests for sta
tionarity (unit root tests), tests for cointegration, estimation of parameters, and
analysis of the dynamic properties. Impulse response analysis, forecast error
variance decomposition analysis, and forecasting are the usual post estimation
evaluations in a VAR framework. For the sake of simplicity I present the theo
retical VAR model before applying it to the Zimbabwean time series data.
154
6.3 The Analytical Framework
,I
For as long as we are unable to put our arguments into figure$, the voice of our
science, although occasionally it may help dispel errors, will ~bver be heard by
practical men." t. " '
Schumpeter (1933, p12) in the first issufof Econometrica
" '"
Hamilton (2000, p25) defines a time series as "a collJction of observa-'
lions indexed by the date of each observation." Reinsel (1997) adds, "multivari
ate processes arise when several related time series proces~es are observed
simultaneously over time instead of observing just a single series as is the uni
variate time series." The trend, if any, depends on unknown parameters.
Economic modelling assists policy makers and decision-makers to inter
pret, influence, and forecast the behaviour of variables of interest. Recent time
series econometric techniques have been applied to analyse the predictive
power and informational content of financial aggregates with respect to eco
nomic activity. The avalanche of authoritative seminal papers in various learned
journals suggests that economic modelling has been fruitful but is far from being
universally conclusive.
This study principally turns to the methodologies and models applied in
Spanos, Andreou, and Syrichas (1997), Rousseau and Wachtel (1998), Lynch '
(1993, 1994) and Rousseau (1999) with appropriate modifications as and when ' necessary. Spanos et al (1997) propose a VAR perspective,'in a "Probabilistic
Reduction Approach" [PRA] to model relationships among macroeconomic ' variables. Spanos (1999, p xi) defines the probabilistic reduction approach as
the empirical modelling of observational (as opposed to experimental or survey)
data. As conventional, the VAR framework starts off by formally testing time se
ries economic data for stationarity and integration properties. Cointegration
among the variables is examined to identify the long run equilibrium relation
ships. This study applies the usual post estimation forecast error variance de
composition [VDC] and generalised impulse response function [GIRF] analyses
to Investigate the speed and direction of the causal relationship between finan
cial indicators and economic growth, and the persistence of shocks over time.
155
6.4 The Vector Autoregressive Method
The vector autoregressive [VAR] model, also known as vector autore
gressions, is a multivariate econometric process, which estimates the empirical
relationship among macroeconomic variables of interest. In its purest form, the
model is concerned with temporal fluctuations and dynamic interdependence in
a vector of time series variables without theoretical restrictions on the parame
ters relating to endogeneity or exogeneity. As Amisano and Giannini (1897, p2)
put it, "each series under study is regressed on a finite number of lags of all the
series jointly considered."
Yule (1926) and Granger and Newbold (1974) demonstrated the need to
pay particular attention to the economic content of regressions. Ferson, Sarkis
sian and Simin (2000) argue that despite tremendous advances in econometric
literature and the use of large samples, spurious (counterfeit) regressions bi
ases are still prevalent in financial economics. The problem is partially resolved
by the use of lagged variables, which are common in VAR frameworks.
Pure VAR models however do not shed much light on model specifica
tion. Koopmans (1947, p164)24 argues that the relevance of variables selected
for a particular study depend on the underlying theory. According to Koopmans
"the spirit" of empirical research "gropes" for theoretical guidance (Ibid p163). I
agree with Koopmans to the extent he argues that "measurement, without the
ory" offers no policy guidance to the authorities (p167). In my view, the relation
ship between quantitative research and theory is mutually beneficial in spite of
the unsettled controversy on the reciprocity of theory-data confrontations.
In a PRA the variables of interest (chosen data) are initially selected on
the basis of the underlying theoretical foundation. The empirical properties and
distributional features of the time series data are also taken into account. This
gives rise to dynamic linear equations between a vector of variables and their
past history, (Spanos et al 1997, p3). Enders (1995, p12) concurs that the iden
tification of"the dynamic path of a series" enhances forecasting accuracy, inter
pretation of economic data, and hypothesis testing. Spanos (1999, p263) views
the purpose of time series econometrics as to estimate information out of
chance regularity exhibited in the data. Technical wizardry is not an end in itself:
156
·-·,
The ultimate objective of empirical modelling is not just the summation of the systematic information in the data in the form of parsimonious parametric model but the use of such model~ to understand economic phenomena (Spanos 1999, p368). I
However, Spanos does not fully address the treatmentllf possible multi-11.,
pie cointegrating VARs. Pesaran and Pesaran (1997, p437), P~saran and Smith
(1999), Garratt, Lee, Pesaran, and Shin (1999) apply "Lo~$ Run Structural
Modelling" [LRSM] to identify the most appropriate equilibrium. LRSM enables
the researcher to choose among competing cointegrating vertors on the basis
of theoretical plausibility. Signs on the parameters of the so-called "Great Ra
tios", see Mills (1999) for instance, are predicted by theory. Such knowledge '
assists in the selection of appropriate cointegrating vectors. Structural analysis
accommodates the imposition of homogenous and non-homogenous restric
tions on parameters. LRSM is therefore a very valuable extension of the Johan
sen (1988, 1991) Maximum Likelihood cointegration analysis. In this thesis,
LRSM is applied in cases where there are more than one cointegrating vectors,
and in instances where there is a need to examine restrictions on statistically
insignificant parameters.
6.5 Origins of VAR modelling
Watson (1994, p2844) and Spanos et al (1997, p3) agree that Christo
pher Sims introduced VARs to economic analysis in 1980. The building blocks '
were not new. In fact Spanos et al traces the introduction of the VAR concept to
' time series analysis to earlier work by Razonov (1967) and Hanan (1970). Stock
(W94, p2744) reveals that White (1958) advocated the use,of the "functional
central limit theorem" (FCLT) to study "unit root" properties. Diebold (1997,p7)
traces autoregressions to Slutsky (1927) and Yule (1927), and the concepts of
"impulse" and "propagation" to Frisch (1933). In addition, Sargent and Sims
(1977) and Geweke's (1977) dynamic factor model is related to cointegration
because it is based on the idea that a large number of variables in a multivariate
system could be driven by a few common trends or shocks. According to Die
bold (1997, p12) Sargan (1964) introduced the error-correction concept, whose
formal link with cointegra!ion was provided by Engle and Granger (1987). Us
age of the VAR models has increased tremendously since the 1980s. Stock
157
(1994) and Watson (1994) provide authoritative surveys of the lite,·ature. They
single out Philips (1988, 1992), Diebold and Nerlove (1990), Campbell and Per
ron (1991 ), Banerjee (1992a) as some of the notable early works in the field.
To appreciate the influence exerted by VAR models on the econometric
tradition one needs to briefly consider the typical conventions prior to their use.
Before VAR, the macroeconomic tradition used large structural models for hy
pothesis testing and forecasting. Enders (1995, p5) defines a structural model
as one that "expresses [an} endogenous variable as being dependent on the
current realisation of [other} endogenous variables ... " On the other hand, a re
duced form equation
is one expressing the value of a variable in terms of its own lags, lags of other endogenous variables, current and past values of exogenous variables, and disturbance terms
Traditionally macro-economic models are associated with the Cowles
Commission for Research in Economics founded in Chicago in 1932 by Alfred
Cowles originally to investigate stock market prices (Charemza and Deadman
1992, p4). In the words of Diebold (1997, p3) the commission symbolised the
"intellectual marriage of statistics and economic theory." Around the same time
Frisch and Tinbergen, pioneered macro-econometric modelling in Europe, and
were later jointly awarded the first Nobel Prize in Economics for their influential
work (Charemza and Deadman [1992, p10]). According to Diebold (1997, p3)
great talent assembled at Cowles included names such as Arrow, Debreu,
Haavelmo, Klein, Koopmans, Markowitz, Modigiliani and Wald. Haavelmo's in
fluential monograph unified the different approaches in 1944 in order to provide
a "bridge" between "economic theory and actual measurements ... " The book
classified the four problems of quantitative research as (a) construction of ten
tative models, (b) the testing of theories, (c) the problem of estimation, and (d)
the problem of predictions. It placed emphasis on testing theories on the basis
of data (p10) rather than measuring parameters without rigorous, probabilistic,
statistical analysis. According to Haavelmo (1943, 1944) this is important be
cause researchers use observational data as a proxy for actual data to evaluate
equations with unknown parameters; therefore "exact" predictions are impossi
ble.
158
Haavelmo (1944) could have been far ahead of his time. Spanos et al
(1997, p1) point outthat the econometrics profession ignored ~is work and con
tinued with exactly ioentified structural models. Darnell and E1ans (1990, p114)
observe that Tinbergen's (1939) work on business cycles spe~rheaded the con
struction of large macro-economic models. According to Ch~ff3mza and Dead
man (1992, p10) Tinbergen built the first multi-equation sfructural model in ···.
1936. It had 24 equations and was based on the Dutch eco,nomy. Charernza
and Deadman document that researchers had a soft spot for enormous model$.
The 1965 version of the Brookings Model, for example, had 160 equations while •
the Brookings MARK TI model about 200 equations.
6.6 Dissatisfaction with LSM models
If I have one chicken to eat and you have none, we have on the average half a
chicken each, so why are you hungry?
Kindleberger and Herrick (1977, p10)
The pedagogic value of the VAR approach is enhanced by its ability to
circumvent the main limitations of the large structural macroeconomic models
[LSMM]. Therefore, this subsection briefly highlights developments behind the
erosion of the credibility of LSMM. Unlike the LSMM, model specifications are
not implied by theory under the VAR methodology. VAR models are more par
simonious than LSMM. The unrestricted VAR model is simple 13nd general.
The Lucas Critique (1976) challenged the time-honoured assumptions
about endogeneity and exogeneity among variables in LSMM. Sargent ( 1999,
p15) points out that before the Lucas Critique LSMM were "being refined to en
hance their fits to historical data and forecasting ability." Lucas argued that in an
environment of policy intervention, good forecasts did not support the funda
mental assumption of time invariance. In effect, consistent adjustment to inter
cepts of important equations disguised the problem of drifting coefficients. The
intertemporal parameter drift highlighted the instability of macroeconomic rela~
tionships. Lucas' critique resulted in the increased use of rotional expectations
models, which took into account decisions made by economic units. Static neo-
159
m N
' ,, \
i:
'"l!-m·ll!lliii'l!llllillllll111111111111111111111111111111111111111111111111111111 ...................................... ~ .. ~~~~~~~-. . "
classical models assume that economic agents have no memory, and under the
adaptive expectation hypothesis they only learn from the past. The rational ex
pectations hypothesis incorporates all relevant information available.
Empirical evidence suggested that sophisticated structural models failed
ta yield superior forecasting results compared to the Box-Jenkins ARlMA mod~
els. VAR models take into account the intertemporal properties of parameters.
Granger (1969, 1988) and Sims (1972) paid particular attention to the nature
and direction of causality in multivariate systems. Their techniques aid predic
tions about causality in VAR models. In Granger causality the cause comes
before the effect and is not the same as correlation. The effect contains infor
mation about the cause, and the future cannot cause the past. Granger causal
ity is also useful for forecasting. LGtkepohl (1991, p55) identifies "potential in
completeness" as the major limitation of Granger- causality. As in any other
model, effects of omitted variables and measurement errors are taken as inno
vations.
Sims (1980) challenged the LSMM's "incredible identification restrictions"
and their disregard of temporal dependence and the "problem of feedback."
Quoting extensively from Tinbergen (1944), Charemza and Deadman (1992,
pp6-8) document that traditional approaches necessitated the need to know ex
act relation and exact factors. Parameters (regression coefficients) were con
sidered to be invariant in time and structurally (movements in variables). The
"causal ordering", i.e. cause - effect, was known in advance. This implies there
is prior information regarding the exogenous and endogenous variables. In a
pure VAR framework. there are no arbitrary lag patterns or normalization equa
tions. Charemza and Deadman highlight that the unrestricted VAR model, "does
not specify contemporaneous variables that require further ex-ante predictions."
Garratt, Lee, Pesaran and Shin (1999) argue that the classic unit root
studies pioneered by Nelson and Plosser (1982) "resurrected the spectre of
spurious regression" in financial economics. Presence of unit roots in time se
ries data raised serious problems on the validity of LSMM in the long run.
Diebold F. X. (1997) argues that LSMM rose and declined with Keynesian mac
roeconomic theory because of their strong dependence on theory.
160
? _;:;
VAR models are not the only successors lo the territory left by the de
clining influence of LSMM. The Dynamic Stochastic General Equilibrium
(DSGE) models were developed to incorporate issues raised py the Lucas Cri
tique (1976). Briefly DSGE models are fully specified, that is, jhey take into ac
count all information concerning tastes and technology impa~ing on economic
units as they optimise their decisions.u The DSGE does not.' resolve the ten-, ... dency for LSMM to be extremely large. Diebold (1997, p15).iargues that "the
'new' theory is neither new nor radical; rather ... neoclassical" in emphasis. Gar~
ratt et al (1999, p10) support that conclusion and point out th~t the approach is '
"potentially restrictive", with its proponents biased against the monetary sector
and in favour af real shocks. Such bias is undesirable for the purpose of my
thesis that envisages a positive role for financial intermediation. Both Garratt et
al (1999, p8) and Diebold (1997, p17) concur on the point that VAR models can
approximate DSGE models. In fact Garratt et al (1999, p7) insist that VAR mod
els are used "as benchmarks for evaluation of [LSMM] and DSGE models."
6.7 Basic Concepts of VAR analysis
(a) Types of VAR models
There are a number of versions for VAR models such as unrestricted,
Bayesian, structural, and cointegrated VARs. I find LOtkepohl (1991) a very
valuable early introductory text on the VAR literature. Unrestricted VARs make
use of all available information without paying any attention, to theoretical re
strictions. ln theory all variables are put on the same footing and treated as en
dogenous. In practice the use of causal procedures such as the Choleski de
composition adopted by Sims (1980) makes the model sensitive to initial order
ing of the variables. There might be need to tailback on theory whose "incredi
ble" restrictions the VAR model was ironically developed to circumvent. Koop,
Pesaran and Potter (1996) and Pesaran and Shin (1998) developed a General
ised Impulse Response (GIR) function to generate a general result that is in
variant to the order of the variables. However economic interpretation of the
" Keen readers are referred to Diebold {1998), Garratt, Lee, Pesaran and Shin { 1999) and collected work.~ by Cooley T F. {Ed) "Frontiers of Business Cycle research", Princeton: Princeton University Press.
161
fl;
shocks is difficult and controversial. Bayesian VARs [BVAR] permits the effi·
cient use of prior information by allowing the researcher to incorporate other
known facts about the system under consideration. Structural VARs [SVAR]
have a stronger theoretical foundation. They supplement statistical information
with theory-based restrictions on long run impulses and the covariance matrix.
In stnuctural cointegrating VAR models, popularised by Garratt et al (1999) for
instance, the restrictions on long run relationship, trends and intercepts are
more explicit. In practice the specific requirements may be difficult to identify.
(b) Stationarity
The spectre of spurious regression among trended time series data has
made stationarity an important issue in multivariate systems. Intuitively, if two
variables trend upward over time, one could find a significant correlation be
tween them albeit devoid of any logical economic explanation. A process is sta
tionary if its innovations are not predictable from past history. Stationarity
washes out dependence among past observation of the same variable across
time. In Stock's (1994, p2748) terminology stationarity implies existence of "suf·
ficiently many moments." It is a well-known mathematical fact that a stochastic
process is stationary if its first and second moments are time invariant. Strict
stationarity however implies that the joint probability distribution at any point in
time does not change. Reference to stationarity in this thesis refers to weak sta
tionarity, which is concerned with the stability of a series' means, variances and
covariances. Stationarity is taken seriously in the cointegrating VAR literature as
it poses serious challenges to theoretical (long run) relations in time series data.
(c) Assumptions
Judge et al (1988, p754) indicate that a vector stochastic process is stationary if
(i) All random vectors have the same mean vectorµ, E(Y,) =µ,for all t.
(ii) All variables involved have finite variances, Var(Y,), for all t.
(iii) The covariance matrix, Cov[Y,, Y,,.] = E[(Y, - µ)(Y," - µ)'] = n does
not depend on time(!) but on the lag length for all t. No trends, sea
sonal patterns, or time varying variances are permitted.
162
llllllllllllllillllllilllBllallll!llllllm ......... -.. ............... __ ~~--.~ "<1
(iv) The characteristic roots lie outside the complex unit root circle.
The last property, (iv), begs for technical elaboration·~o appreciate its
meaning. Stationarily of a dynamic system requires all roots o~ its characteristic
equation to lie outside the complex unit circle. See Appendix~ for details. If all I
the roots are non-zero the matrix is non-singular or invertible. i8y contrast when " we are considering the eigenvalues, (and the autoregressiv~·.·.polynomial) sta-
tionarity is attained if all eigenvalues have a modulus less th~h one. As Lutke
pohl (1991, p456) put it, stationarity implies all eigenvalues have modulus less
than 1, and the polynomial det(I -M) has no roots in and oJ the complex unit
circle. If all the eigenvalues of the coefficient matrix M have modulus less than 1 ' the VAR(p) process is stable. The stationarity property is important to the in-
vertibility of autoregressive processes. In general references to unit roots in the
time series literature is confined to autoregressive unit roots discussed below.
( d) Innovation processes and unit roots
"': ';
·t
i ' Most researchers, for instance Maddala and Kim (1998, p3), acknowl- ,;
edge that the unit root literature has revolutionalized the conduct of time series
analysis. The new approaches criticise the traditional methods for washing
away important information contained in common trends by detrending and dif
ferencing the data. Traditional methods are further accuse::d of concentrating on
"short run dynamics" at the expense of theoretical relations only valid in the long
run. Presence of nonstationarity could invalidate suppose~ common trends
among variables and by implication results in spurious regresSion. Spanos et al '
(1997, p35) argues, "the time invariance of the statistical parameters of a VAR
model are an essential prerequisite for reliable statistical in,ference ... " Orcutt
(1948), cited in Stock (1948, p2740) found first order serial correlations in USA
annual time series data and prompted other researchers to use first differences.
By current conventions, differencing is no longer acceptable because we have
noted that it removes important information from the series. Testing for unit
roots is an important preliminary step in time series analysis because Nelson
and Plosser's (1982) oft cited formal tests for unit roots in a Dickey and Fuller
methodology has provided a solid foundation to unit root analysis.
163
== Ji +was EM
-1
'
The unit root test has become one of the most popular tests for station
arity. Formal unit root tests help shed light on whether shocks on economic
variables have permanent or transitory effects which information is useful for
policy design and economic analysis. The unit root phenomenon is easier to in
troduce in a univariate autoregressive process. An autoregressive process in
cludes lags of the endogenous variables as explanatory variables. Supposing
Y, is a time series process; a typical autoregressive model, AR(I), with order or
lag 1 for simplicity, is mathematically given by:
(1)
Where Yi is a univariate time series denoted by a sum of a constant
mean, µ; and the weighted sum of its own past up to a specified lag in the
model; and the history of the innovation process ;, with zero mean and con
stant variance. More compactly equation 1 is expressed as
(2)
Where y, is defined as Y-µ. The size of the autoregressive parameter
p detenmines properties of the series. If the parameter is less than 1, the proc
ess is stationary in levels or mean reverting and is said to have a general order
of integration of zero, I (0), for short. A series has an autoregressive unit root if
the autoregressive parameter is equal to 1. Such a process is nonstationary and
its order of integration is one I (1 ). The order of integration refers to the number
of times a series has to be differenced to render it stationary. Processes whose
order of integration is 1 or greater are nonstationary. In presence of unit roots
the time series has a long memory because innovations or shocks produce
permanent effects on the process.
(e) Testing for unit roots
Tl1e standard procedure for formally testing time series economic data in
a VAR framework starts off by testing for stationarity and integration properties
of the series. Hence the properties of the individual series will be assessed. As
noted before the formal identification of the correct order of integration of each
economic variable in a model is a plausible starting point for VAR and cointe
gration analysis. The practice takes care of possible spurious regression that
164
•
' '
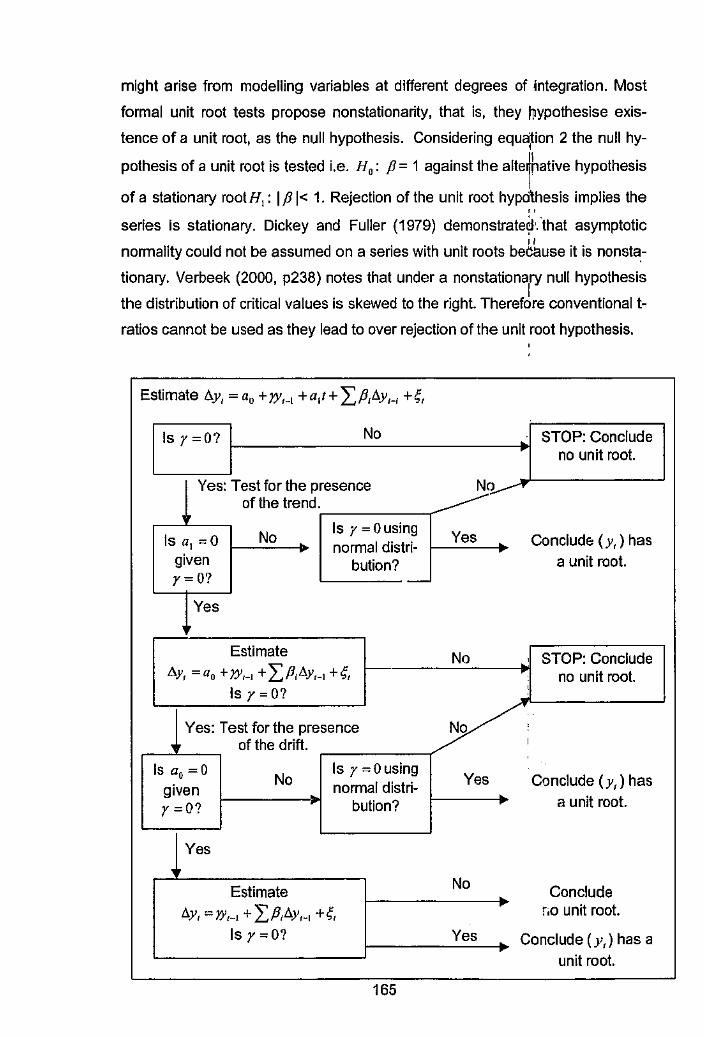
might arise from modelling variables at different degrees of tntegration. Most
formal unit root tests propose nonstationarity, that is, they ~ypothesise exis
tence of a unit root, as the null hypothesis. Considering equa;tion 2 the null hy
pothesis of a unit root is tested i.e. H 0 : p = 1 against the altej~ative hypothesis
of a stationary rootH,: Ip I< 1. Rejection of the unit root hypd\hesis implies the "
series is stationary. Dickey and Fuller (1979) demonstratecl'.that asymptotic
" normality could not be assumed on a series with unit roots beta.use it is nonsta,-
tionary. Verbeek (2000, p238) notes that under a nonstationa1
ry null hypothesis
the distribution of critical values is skewed to the right. Therefore conventional t
ratios cannot be used as they lead to over rejection of the unit root hypothesis.
Estimate 6..y1 = a0 +JY,_1 +a1t+ "f.J3/1y1_1 +;1
Is r =0? No STOP: Conclude no unit root.
Yes: Test for the presence No of the trend.
Is r =Dusing ls a1 =0 No Yes Conclude ( y, ) has . normal distri- . - -given bution? a unit root. r=O? -
Yes
Estimate No ,I STOP: Conclude .6.yr =ao +r.Y,-1 + LP/!1Y1-1 +i;,
:I no unit root.
ts r = O?
Yes: Test for the presence No •
of the drift. '
Is a0 =0 No
Is r=Ousing Yes Conclude ( y, ) has given normal distri-
r =O? bution? a unit root.
Yes
Estimate No Conclude
11y, =JY,-1 + L,P/J..Yr-1 +<;, r,o unit root.
Is r =0? Yes - Conclude ( y,) has a
unit root.
165
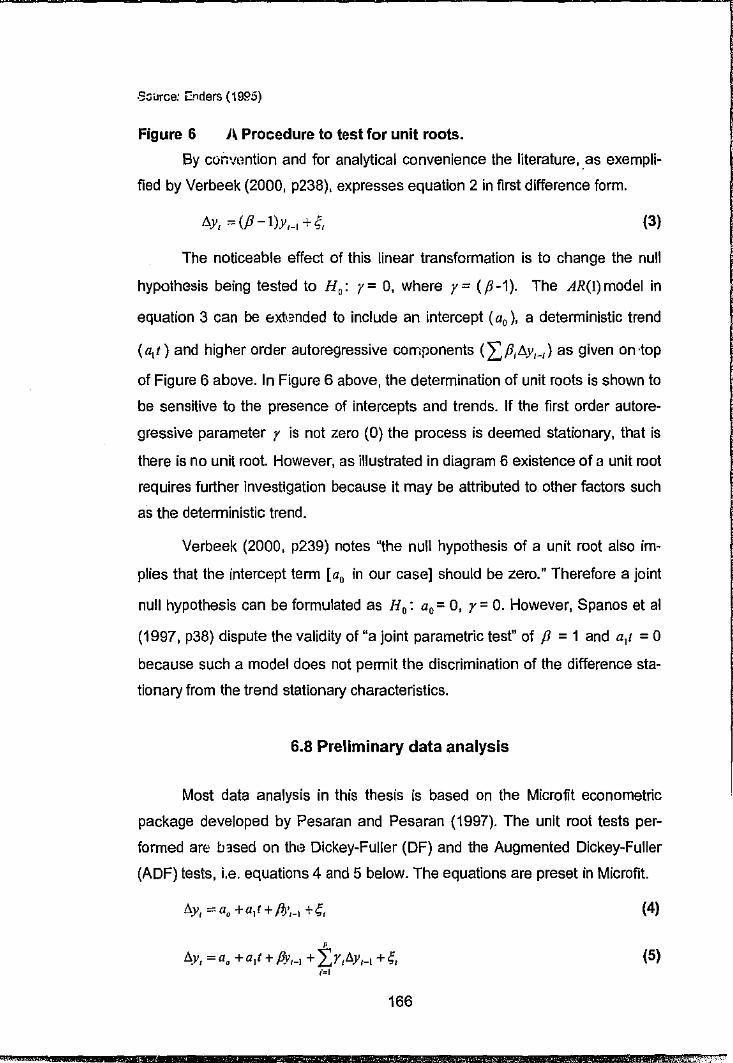
----------------------,,,,;r; ~~ .S;;urce: [nders (19.c?S)
Figure 6 A Procedure to test for unit roots.
l
~ ' ' ,, '
By cor:vHntion and for analytical convenience the literature, .as exempli- ~
fled by Verbeek (2000, p238), expresses equation 2 in first difference form, Ji
t.y, =(P-l)y,_, +4, (3)
The noticeable effect of this linear transformation is to change the null
hypothesis being tested to H 0 : r= 0, where r= (P-1), The AR(l)model in
equation 3 can be exM·nded to include an intercept ( a0 ), a deterministic trend
(a1t) and higher order autoregressive components (L,,B1l!..y1_1 } as given on ·top
of Figure 6 above. In Figure 6 above, the determination of unit roots is shown to
be sensitive to the presence of intercepts and trends. If the first order autore
gressive parameter y is not zero (0) the process is deemed stationary, that is
~]
there is no unit root. However, as illustrated in diagram 6 existence of a unit root i
requires further investigation because it may be attributed to other factors such
as the deterministic trend.
Verbeek (2000, p239) notes "the null hypothesis of a unit root also im
plies that the intercept term [a0 in our case] should be zero." Therefore a joint
null hypothesis can be formulated as H O: a0 = 0, r = 0. However, Spanos et al
(1997, p38) dispute the validity of "a joint parametric test" of p = 1 and a,t = O
because such a model does not permit the discrimination of the difference staR
tionary from the trend stationary characteristics.
6.8 Preliminary data analysis
Most data analysis in this thesis is based on the Microfit econometric
package developed by Pesaran and Pesaran (1997), The unit root tests per
formed are based on th,, Dickey-Fuller (DF) and the Augmented Dickey-Fuller
(ADF) tests, i,e, equations 4 and 5 below. The equations are preset in Microfit
' ~Y1 =aa +alt+ PY1Rl + Lri'~·YH +,;, ,~1
166
(4)
(5)
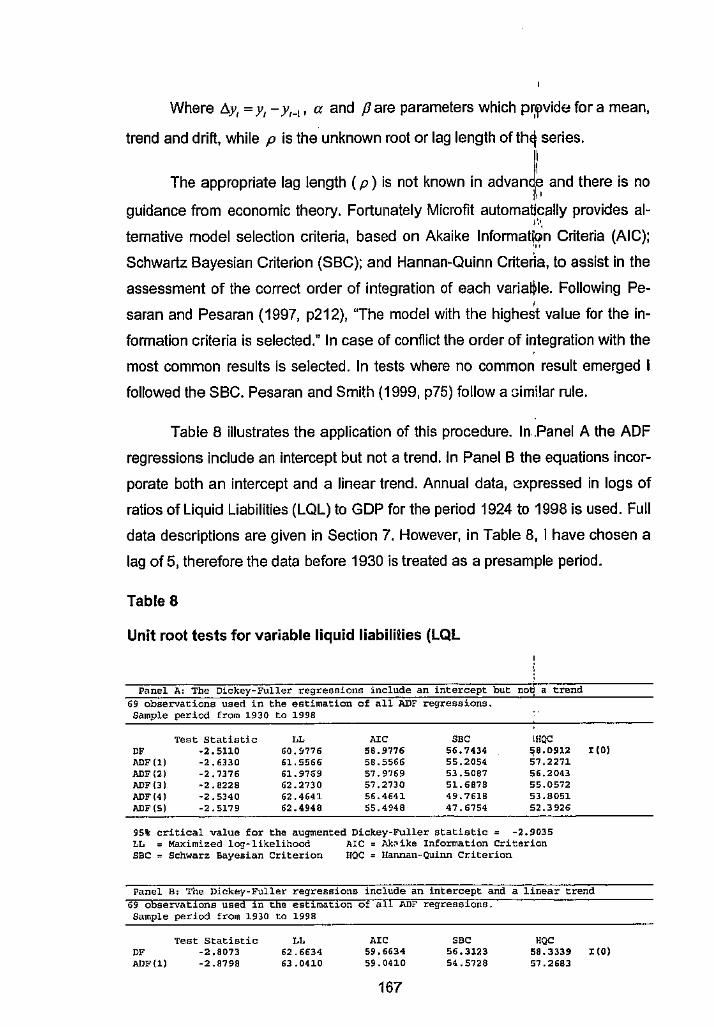
Where D.y1 = y, - y,_11 a and pare parameters which pr,lj>vide for a mean,
trend and drift, while p is the unknown root or lag length of th4 series.
The appropriate lag length ( p) is not known in advanJe1/ and there is no I•
guidance from economic theory. Fortunately Microfit automatically provides al-1·.,
temative model selection criteria, based on Akaike Information Criteria (AJC); '"
Schwartz Bayesian Criterion (SBC); and Hannan-Quinn Criteria, to assist in the
assessment of the correct order of integration of each varia~le. Following Pe-' saran and Pesaran (1997, p212), "The model with the highest value for the in-
formation criteria is selected." In case of conflict the order of integration with the
most common results is selected. In tests where no common result emerged I
followed the SBC. Pesaran and Smith (1999, p75) follow a similar rule.
Table 8 illustrates the application of this procedure. In .Panel A the ADF
regressions include an intercept but not a trend. In Panel B the equations incor
porate both an intercept and a linear trend. Annual data, Gxpressed in logs of
ratios of Liquid Liabilities (LQL) to GDP for the period 1924 to 1998 is used. Full
data descriptions are given in Section 7. However, in Table 8, 1 have chosen a
Jag of 5, therefore the data before 1930 is treated as a presample period.
Table8
Unit root tests for variable liquid liabililies (LQL
Panel A: The Dickey-Fuller regressions include an intercept but norl a trend 69 observations used in the estimation of all ADF regressions. Sample period from 1930 to 1998
Test Statistic LL A<C sac
"' -2.5110 60.9776 58.9776 56.7434 ADF(l) ·2. 6330 61. 5566 56.5566 55,2054 ADF(2) ·2, 7376 61.97S9 57. 9769 53,5007 ADF(3) -2. 0228 62.2730 57 ,2730 51.6878 ADF(4) -2. 5340 62.4641 56.4641 49.7618 ADF(5) -2.5179 62.4948 55.4948 47, 6754
<HOC !:iB,0912 57,2271 56,2043 55.0572 53.8051 52.3926
951 critical value for the augmented Dickey-Fuller statistic= -2.9035 LL = Maximized log-likelihood AIC = Ak~ike Information Criterion SBC= Schwarz Bayesian Criterion ffQC = Hannan-Quinn Criterion
I (OJ
Panel B: The Dickey-Fuller regressions include an intercept and a linear trend 69 observations used in the estimation of all ADF regressions. Sample period from 1930 to 1998
Test Statistic LL DF -2.8073 62.6634 ADF(l) -2.8798 63.0410
A,C 59 ,6634 59 .0410
167
SBC 56.3123 54.5?28
SQC 58.3339 I(O) 57.2683
'
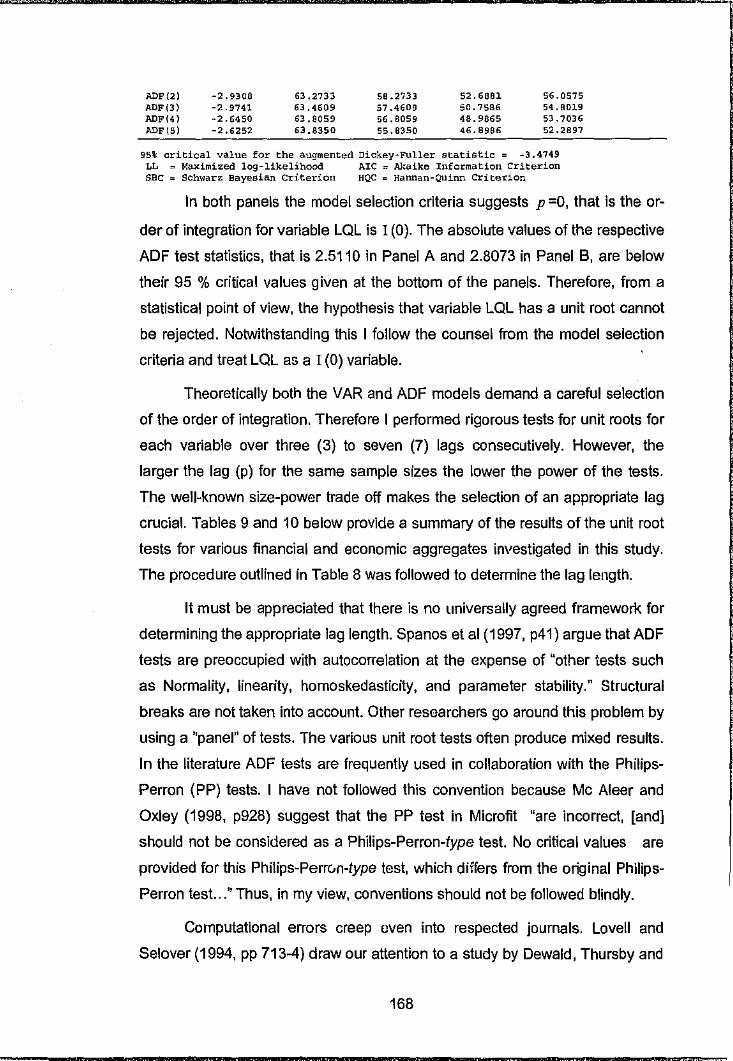
ADF(2) ADF(3) ADF(4) ADF(S)
-2.9300 -2,9741 -2.6450 -2.6252
63.2733 63.4609 63.8059 63 .8350
SB .2733 57 .4609 56.8059 55.8350
52. 6081 50. 7586 48.9865 46.8986
56.0575 54. 8019 53. 7036 52.2897
95\ critical value for the augmented Dickey-Fuller statistic = -3.4749 LL ~ Maximized log-likelihood AIC = J\kaike Information Criterion SBC = Schwarz Bayesian Criterion HQC ~ Hannan-Quinn Criterion
In both panels the model selection criteria suggests p =O, that is the or
der of integration for variable LQL is I (0). The absolute values of the respective
ADF test statistics, that is 2.5110 in Panel A and 2.8073 in Panel B, are below
their 95 % critical values given at the bottom of the panels. Therefore, from a
statistical point of view, the hypothesis that variable LQL has a unit root cannot
be rejected. Notwithstanding this I follow the counsel from the model selection
criteria and treat LQL as a I (0) variable.
Theoretically both the VAR and ADF models demand a careful selection
of the order of integration. Therefore I pertormed rigorous tests for unit roots for
each variable over three (3) to seven (7) lags consecutively. However, the
larger the lag (p) for the same sample sizes the lower the power of the tests.
The well-known size-power trade off makes the selection of an appropriate lag
crucial. Tables 9 and 10 below provide a summary of the results of the unit root
tests for various financial and economic aggregates investigated in this study.
The procedure outlined in Table 8 was followed to determine the lag length.
It must be appreciated that there is no universally agreed framework for
determining the appropriate lag length. Spanos et al (1997, p41) argue that ADF
tests are preoccupied with autocorrelation at the expense of "other tests such
as Normality, linearity, homoskedasticity, and parameter stability." Structural
breaks are not taken into account. Other researchers go around this problem by
using a "panel" of tests. The various unit root tests often produce mixed results.
In the literature ADF tests are frequently used in collaboration with the Philips
Perron (PP) tests. I have not followed this convention because Mc Aleer and
Oxley (1998, p928) suggest that the PP test in Microfit "are incorrect, [and]
should not be considered as a Philips-Perron-type test. No critical values are
provided for this Philips-Perr0n-type test, which differs from the original Philips
Perron test. .. " Thus, in my view, conventions should not be followed blindly.
Computational errors creep oven into respected journals. Lovell and
Selover (1994, pp 7134) draw our attention to a study by Dewald, Thursby and
168
,,:;;
.. ; •
•
·;;

Anderson (1986) who demonstrated many results published in the Journal of
Money, Credit and Bankinr could not be replicated. Dewal<11et al found "that
only 15% of 154 authors" are able to furnish their original da\a sets. And "nine
out of eleven articles contained non~reproducible results." i I,• " 1·.· . . " ...
169
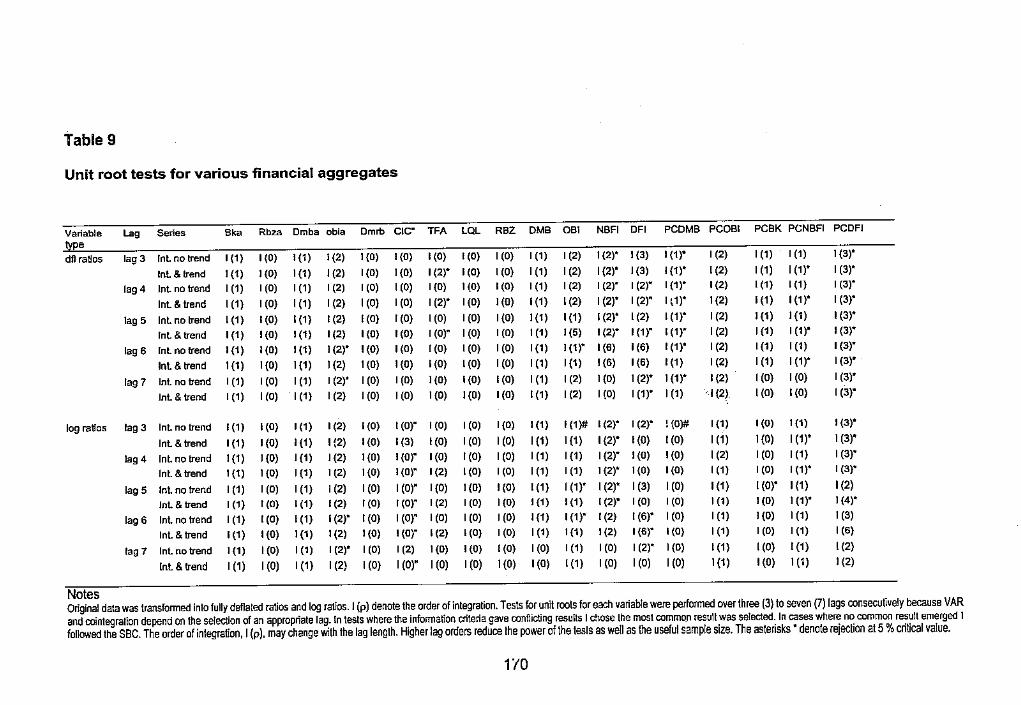
Table 9
Unit root tests for various financial aggregates
Variable Lag Series Ska Rbm Dmba obia Dmrt, CIC" TFA LQL RBZ DMB OBI NBFI DFI PCDMB PCOBI PCBK PCNBFI PCDFJ ,, dll ra!los lag3 lnl no trend I (1) I (0) I (1) I (2) I {O) 1(0) I (0) I (0) I (0) I (1) I (2) 1 {2)" I {3) I (1)* I (2) I (1) I (1) 1 {3)"
lnl & trend I (1) 1{0) 1 {1) J (2) I {O) I (0) I {2)" I (0) I (0) I (1) I (2) I {2)" J (3) I {1)" [ (2) I (1) I (1)" I (3)"
lag 4 lnl no trend I (1) I (0) I (1) I (2) I (0) I (0) I (0) I (0) I (0) I (1) I (2) I (2)" 1(2)" I (1)" I (2) l (1) l (1} 1(3)"
lnl & trend I (1) I (0) I (1) I (2) I (O) I (OJ I (2)" I (0) I {O) I (1) I (2) I (2)" I (2)" I (1)" 1(2) I {1) I (1 )" I (3)"
lag 5 lnL no trend l (1) I (0) I {1} I (2) I (OJ r (OJ I (0) I (0) I {O) 1{1) I (1) I (2)" l (2) l (1)" I (2) I {1) I (1) I {3)"
lnL & trend I (1) I {O) I (1) 1(2) 1(0) I (0) I (O)" I (0) I (0) 1 (1) I (5) I (2)" I (1)" I (1)" I (2) I {1) I (1)" I (3)"
lag6 lnL no trend I {1) I (0) I (1) I {2)" I (0) 1(0) [ (0) I (0) I (0) I (1) I (1)" I (6) I (6) I (1)" I (2) I {1) I (1) I {3)"
lnL & trend 1 (1) 1 {O) 1 (1) 1 (2) 1 (0) I {O) I (0) l (0) I (0) I (1) I (1) I (6) I {6) I (1) I (2) I (1) I (1)" I (3)"
lag 7 lnL no trend I (1) I (0) I (1) I (2)" I (0) I (0) I (0) I (0) I (0) I (1) I (2) 1 {O) 1 (2)" 1 {1)" I (2) I (O) I (0) I (3)"
JnL & trend I (1) I (O) I (1) I (2) I (0) I (0) 1 (0) I {O) I (0) I (1) I (2) I (0) I (1)" I (1) · I (2) l (0) I (0) I (3)"
log ratios lag 3 lnl no trend I (1) I (0) I (1} I (2} I (0) t (O)" I (OJ I (0) I (0) I {1) I (1)# I (2)" I (2)" ! {0)# I (1) I {O) 1 (1) I {3)"
lnl & trend I (1) I (O) I (1) 1(2) I (O) I (3} I (O) I (0) I (O) I (1) 1 {1) I {2)" I (O) I (O) I (1) 1 (0) I (1)• 1 (3)"
lag 4 lnL no trend I (1) I (0) J (1) J {2) I (0) I (O)" I (O) r (OJ I (0) I (1) I (1) I {2)" I (0) I (0) I (2) I (0) I (1) I (3)"
lnL & trend 1 {1) 1 (0) I (1) 1 {2) 1 {O) I {O)" I {2) l (0) I (OJ I (1) I (1) 1 {2)" 1 (0) I {O} I (1) I (0) I (1)" I (3)"
lag5 lnL no trend I (1) I (OJ I (1) I (2) I (0) I (O)" I (0) I {O) 1(0) I (1) I (1)" I (2)" I (3) I (0) I {1) I {O)" I (1) I {2)
Jnl & trend I (1) r (O) I (1) I (2) r (OJ I (O)" I (2) I (0) I {O) I {1) I (1) I (2)" I (0) I (0) 1(1) I (0) I {1)" I {4)"
lag6 lnL no trend I (1) I (0) I (1) I (2)" [ (0) I (O)" I (OJ I (0) I (0) I {1) I (1)" I (2} [ (6)" I (O) I (1) I (0) I (1) 1 (3)
lnL & trend I (1) I (0) I (1) I (2) I (0) I (O)" I (2) I (0) I (0) I (1) 1 (1) I (2) I (6)' I (O} I (1} 1 (0) I (1) I (6)
lag 7 lnL no trend l {1) I {O) I (1) I (2)" I (OJ I (2) 1 (0) 1{0} I (0) I (0) I (1) I (0) I (2)" 1 {O) I (1} l (O) I (1) l (2)
Int & trend I (1) I (OJ I (1) I (2) I (O) I (O)" I (0) I (0) 1 (0) 1(0) [ (1) I (0) I (OJ I (0) 1 (1) I {O) 1 (1) I {2)
Notes Original data was transfonned into fully deflated ratios and log ratios. J (p) denote the order of integration. Tests for unit roots for each variable were performed over three (3) to seven (7) lags consecutively because VAR and cointegralion depend on the seleclion of an appropriate lag. !n tests where the information criteria gave conflicting results I c.'Jose the most commo.n result was selected. In cases where no common result emerged 1 followed the SBC. The order of integration, I (p), may change with the lag length. Higher lag orders reduce the power of the tests as well as the useful sample size. The asterisks" denote rejection at 5 % critical value.
1"/0
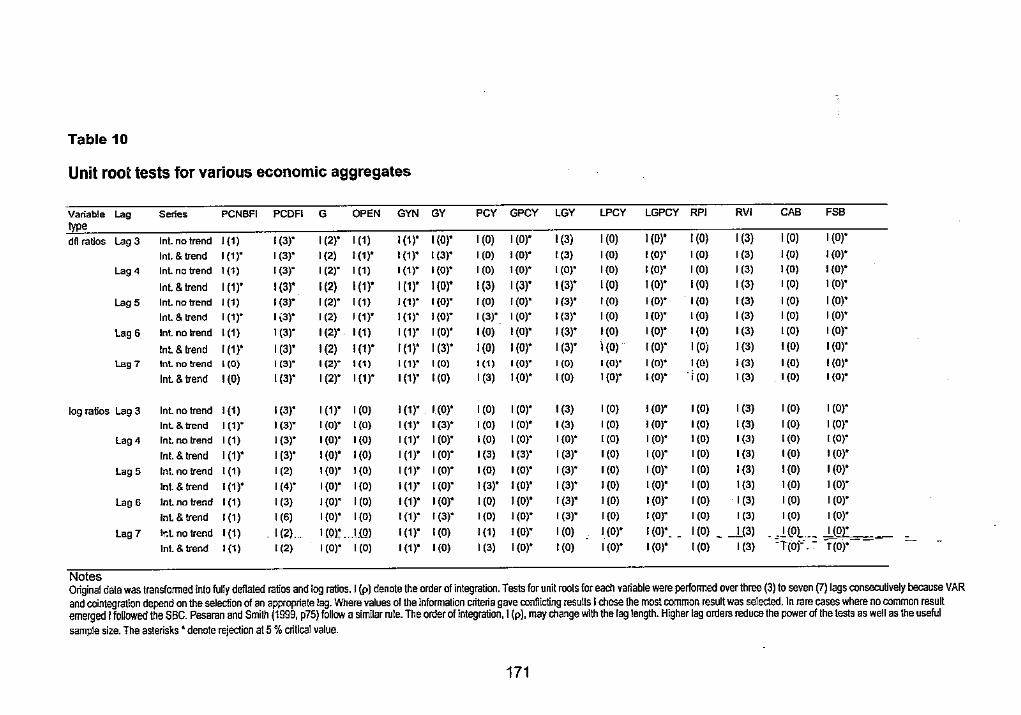
Table 10
Unit root tests for various economic aggregates
Variable Lag Series PCNBFI PCDFI G OPEN GYN GY PCY GPCY LGY LPCY LGPCY RPI RVI CAB FSB
' dft ra~os Lag 3 lnL no trend J {1) I (3)" I (2)" I (1) I (1)" I (O)" I (0) I (O)" I (3) I (0) I (O)' I (0) I (3) I (O) I (O)"
Int. & trend I (1)" I (3)" I (2) I {1)" I (1}" l (3)" I (0) I {O)" I (3) I {O) I (O}' I (0) I (3) J {O) I (O)"
Lag 4 Int. no trend 1 {1) I (3)" 1(2)" 1 (1) I (1)" I {O)" I (0) 1 {0)" l (O}" I {O) I (O)" I (OJ J (3) I (0) I (O)"
lnl & trend I (1)" I (3)" I (2) I (1)" I (1)" I (O)" I (3) 1(3)" I (3)" I (O) I (O)" I (0) I (3) I (0) 1 (O)"
Lag 5 Int. no trend J {1) I (3)" 1(2)" r c1J J {1)" I {O)* r co) I (O)" I (3)" r (OJ I {O)" 1(0) I (3) I (0) I (O)'
Int. & trend I (1)" I \3)" I (2) I (1)* I (1)" I {0)* 1(3)" I (O)" I (3)" I (0) I {0)* l (0) I (3) I (0) 1(0)"
Lag 6 Int. no lrend l (1) 1 (3)" I (2)" I (1) I (1)" I (O)" 1(0) I {O)' l (3)" I (0) I (OJ" I (0) I (3) l (0) I (O)"
Int. & !rend r (1t I (3)" I (2) I (1)" I (1)" 1(3)" I (0) 1(0)" 1(3)" I (0) 1(0)" I (Di I (3) I (0) I (O)*
L.ao7 Int. no !rend L (0) I (3)" I (2)" I (1) l (1)" l(O) I (1) I (0)* I (0) I (O)" I (0)0 1 {O) I {3) I (0) I (O)"
lnl & trend I (0) l (3)" I (2)" I {1)" I (1)" I (O) I (3) I (O)* l (0) 1 {O)* I (O)* ·[ (OJ 1 (3) I (0) I (O)*
log ratios Lag 3 lnl no trend I (1) I (3)* I (1)* I (0) I (1)* I (O)' I (OJ I (O)* I (3) I (0) I (O)" I (O) I (3) I (0) I (O)"
Int. & trend I (1)" I (3)* t (O)" t (0) 1 {1)" I (3)* I (0) I (O)" 1(3) I (0) I (OJ* I (0) l (3) I (0) I (O)"
Lag 4 Int. no trend I (1) J (3)* I (O)" 1(0) I (1)* I (O)* I (0) l (0)" I {0)" [ (0) I (O)* I (0) I (3) I (0) I (OJ"
Int. & trend I (1)" 1(3)" I (O)* I (0) I (1)* 1(0)" I (3) I (3)" I (3)" I {OJ I (O)" I {O) I (3) I (0) I (O)"
Lag 5 In!. no trend t (1) I (2J I (O)" 1(0) I (1)" I (O)" I (0) I (OJ" I (3)" 1(0) I (O)" 1 (OJ I (3) I (O) I (O)*
Int. & trend I (1)' 1(4)* I (O)" I {O) I {1)" l(O)" 1 (3)" I (O)' I (3)" I (O) l(O)" I (OJ 1 (3J 1 (0) I (O)"
Lag 6 lot.no trend I (1) I (3) J {0)" I (O) I {1)" I (O)" I (0) I (O)" r (3J" I {OJ I (O)* I (O) I (3) I (0) I (O)"
Int. & trend I (1) I (6) I {O)" I {O) I {1)" 1(3)" I {O) J {O)" I (3)" I {O) I (OJ" I (OJ I (3) I {OJ I {O)"
lag7 lr.t. no trend I (1) _ l (2) ... 1(0):. _l.(Q) I (1)" I (0) I (1) 1(0)" I (0) I_ {O)* 1(0)' __ I (O) _ _1(3) • .:.!{.Ol .... - _!.{OJ"_ _
lot.& trend I {1) [ (2) I (O)" I {OJ I (1)' 1(0) I (3) I {O)" I (0) I {O)" 1(0)" r (OJ I (3) -r(oi'. - r(o)" -
Notes Original data was transformed into ful!y deflated ratios and log ratios. I (p) denote theorderofintegraUon. Tests for unit roots for each variable were performed over three (3) to seven (7) lags consecuUvely because VAR and cointegralion depend on the selection of an appropriate lag. Where values of the information criteria gaveconfiicting resu!ts I chose the most common result was selected. ln rare cases where no common result emerged 1 followed the SBC. Pesaran and Smith (1999, p75) follow a simllar rule. The order of integration, 1 (p), may change with the lag length. Higher lag orders reduce the power of the tests as well as the useful sample size. The asterisks• denote rejection al 5 % critical value.
171
97Tl7WZT :.11 FF
6.9 Model Specification
For pedagogical completeness, it must be noted that model specification
must pay particular attention to the attendant properties of the individual time
series under consideration. Specification refers to the choice of a valid model.
Spanos (1997) demonstrated that researchers have an option to specify the
VAR model using a statistical approach or a systems approach. The methods
are complementary rather than mutually exclusive.
(a) The Statistical Model
According to Spanos (1997, p14) a statistical framework requires the re
searcher to spell out the assumed joint distribution properties of the multivariate
process. The statistical method makes use of "graphical representations and
descriptive statistics" to condense the properties of the data generating process.
Assumptions help to simplify modelling and statistical inference. As in
any statistical model, assumptions impose restrictions on the properties of vari
ables in order to exorcise (or at least tame) the curses of dimensionality and
over parameterisation. In fact, Mills ( 1993 p1 ?8) argues that the non-zero co
variances in VARs allow temporal dependence among the time series observa
tions thereby increasing unknown parameters with time. Restrictive techniques
are imposed to limit the lag length and effects of over parameterisation. Pa
rameter variances are sometimes assumed to decrease with the increase in lag
length. The statistical concept of conditioning arrests the problems of dimen
sionality (i.e. many unknown parameters) while the assumption of asymptotic
independence enables generalisation of the statistical properties of data sets.
Spanos (1999, p13) emphasises that model specification has to address
three important assumptions pertaining to (a) distribution (b) temporal depend
ence and (c) time heterogeneity. These assumptions "formalises the chance
regularity" of a stochastic data generating process. In a Probabilistic Reduction
Approach [PRAJ the statistical VAR model assumes that the distribution is nor
mal, temporal dependence a Markov (p) process, and the degree of time het
erogeneity to be given by second order stationarity.
172
'i
-
Spanos et al (1997, p17) define the Statistical Generati~g Mechanism of
a statistical VAR model as follows: ,I
I (6)
1: 11,
" . i',,. . /I "
' Z, = 8 0 + LB1Z1-1 +~, l=I
The full model and its assumptions are documented in Spanos (1999)
and Spanos et al (1997, pp 17-18). Their work suggests thal estimated coeffi
cients are difficult to interpret since VAR is a statistical model whose parame
ters represent "partial correlations." In their view, reliance shOuld be placed on
statistical procedures such as Granger causality tests, impulse response analy
sis (\RF], and variance decomposition analysis [VDC] for policy evaluation (Ibid
p 24). I agree that VAR coefficients oscillate with successive .lags and are sen
sitive to data sets. However, Granger causality, IRF and VDC are equally sensi
tive to available information. In my view, the techniques buttress one another.
Graphs provide a useful medium to express relationship among vari
ables, and a visual expression of ideas. Spanos (1999, p14) suggests graphical
analysis is indispensable in empirical modelling. He traces emphasis on graphi
cal techniques to Turkey (1962), RA Fisher (1926) and Pearson (1892).
As early as 1891, Keynes (p321-2) wrote:
In the use of statisti,.;s, considerable assistance may often be derived from the er.,ployment of diagrams. The graphical method is not only useful for ... enabling the mind more accurately to realise numerical ccmparisons; but it has also a genuine scientific value."
Granger (1990), cited in Spanos et al (1997, p14) concurs, "The plotting
of series, both individually and jointly, is an essential step in the modelling proc
ess that it is too frequently missed by experienced researches." DemirgUq-Kunt,
and Levine (1999) largely use graphs and correlations to demonstrate the styl
ised facts relating to economic and financial development. In VAR literature, re
sults of the \RF and VDC analytical techniques are usually presented in graphi
cal format to map the causal links and the persistence of shocks over time.
173
j l
The unrestricted VAR model may be used to test Granger causality. For
economic purposes, causality is tantamount to prediction. Thus, X Granger
causes Y (X -> Y) if past values of X provide better prediction of Y, other infor
mation being equal. Adapting Charemza and Deadman's (1992, p192) bivariate
model given in Equation 7, if B 1 =B 2 =···B1 =0, x does not Grangercausey.
I •
Yr= ao + LajYt-J + LB }xi-} +i;( (7) J=I i=l
The basic insights are that a cause cannot come after the effect; and the
future cannot "cause" ttie present. In addition Charemza and Deadman (1992,
p189) observe that therP, is no simultaneous causation. Furthermore instanta
neous causation does not exist due to the lags between independent actions.
Granger causality tests are sometimes used to eliminate variables whose
coefficients are not statistically significant. Darnell and Evans (1992, p127), cite
several sources arguing that Granger non-causality is not a sufficient condition
for exogeneity. Maddala and Kim (1998, p189) endorse Pagan's (1989) conclu
sion that Granger causality "probably generated more nonsense results" than
any econometric turning in the last two decades. Therefore, no Granger causal
ity tests are performed in this thesis, since they are very sensitive to the infor
mation set available and causal ordering regardless of strucl ·al relationships.
(b) The Dynamic VAR Model
Dynamic models take into account time lags to show the interdepend
ence between current values of the regressand and past values of explanatory
variables, including the predictand's own past values. The dynamic linear equa
tion is divided into systematic and non-systematic components. It is regarded as
the typical VAR representation. Dynamic VAR processes can be presented in a
number of notations. Typical notations are the VAR(p) representation, where p
denotes the lag length of a VAR process, and the polynomial lag operator (BL)
format. A lag operator represents a number of algebraic manipulations that re
place a current realisation by previous observations in the time series. It facili
tates the generation of a weighted moving average of a given time series.
Whatever notation one prefers the end result is the same. The lag operator is
mentioned here for completeness and will not be discussed.
174
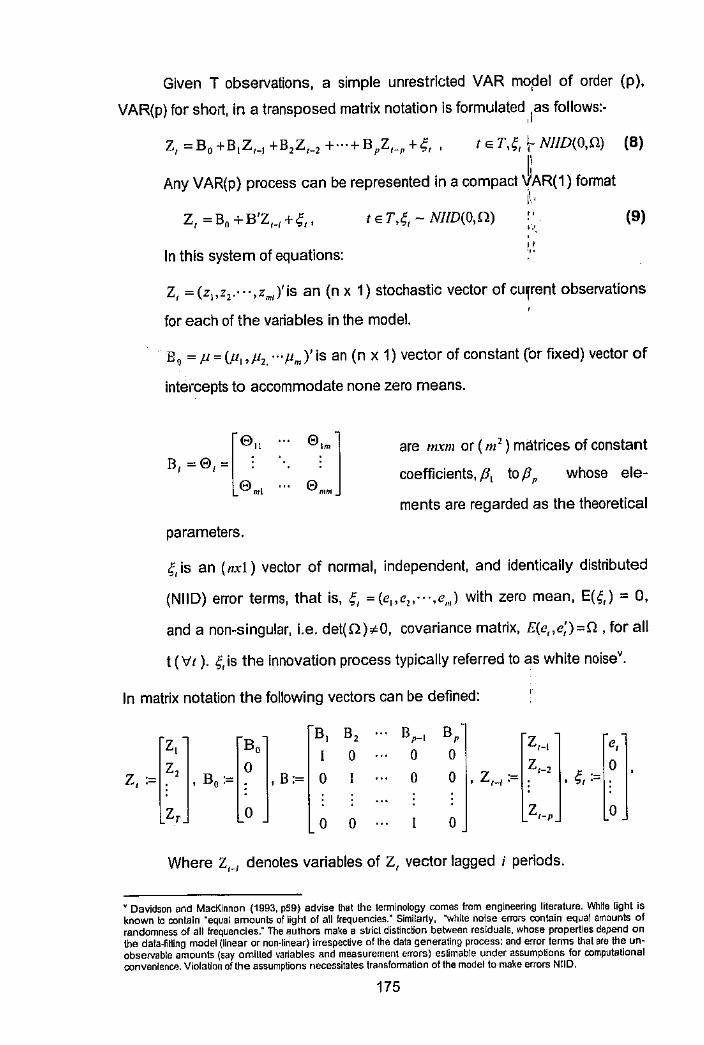
Given T observations, a simple unrestricted VAR mopel of order (p),
VAR(p) for short, in a transposed matrix notation is formulated ,i"s follows:-
Z, = Bo +B1Z1-l +B2Z1-2 +···+ B pzl-p + ,;, I t E TJ, \- NJID(O,Q) (8)
Ii Any VAR(p) process can be represented in a compact VAR(1) format
!\, I e T,I;, - NIID(O,n) .. Z1 = B0 + B'Z,_1 + ,;, , .....
(9)
,, In this system of equations: "'
Z, =(zi,z2.···,zm
1)
1 is an (n x 1) stochastic vector of cu,rent observations
for each of the variables in the model.
BQ =µ=(µ1,µ
2 ... ,µm)'is an (n x 1) vector of constant ('or fixed) vector of
intercepts to accommodate none zero means.
are ,mm or ( m2) matrices of constant
coefficients, /31 to /3 p whose ele-
ments are regarded as the theoretical
parameters.
i;, is an ( nxl) vector of normal, independent, and identically distributed
(NIID) error terms, that is, I;, =(e,,e,, .. ·,e..,) with zero mean, E(I;,) = 0,
and a non-singular, i.e. det(Q)"F-0, covariance matrix, E(e,,e;)=O, for all
t (Vt). {,is the innovation process typically referred to as white noisev.
In matrix notation the following vectors can be defined:
z, B, B, B, Bp-1 B, ZH I 0 0 0
e,
z, 0 Zi-2 , I;, :=
0 z ·- 'Bo:= 'B:= 0 0 0 , 21-1 := , .-
z, 0 zl-p 0 0 0 0
Where z,_; denotes variables of Z1 vector lagged i periods.
• Davidson and MacKlnnon (1993, p59) advise that the terminology comes from engineering literature. While light is known lo contain "equal amounts of light of all frequencies." Similarty, "white noise errors contain equal amounts of randomness of all frequencies." The authors make a strict distinction between residuals. whose properties depend on the da!a-fitting model (linear or non-linear) irrespective of the data generating process: and eiror tenns that are the unobservable amounts (say omilled ~ariables and measurement errors) esUmable under assumptions for computational convenience. Violation of the assumptions necessitates transformation of the model to make errors N!ID.
175
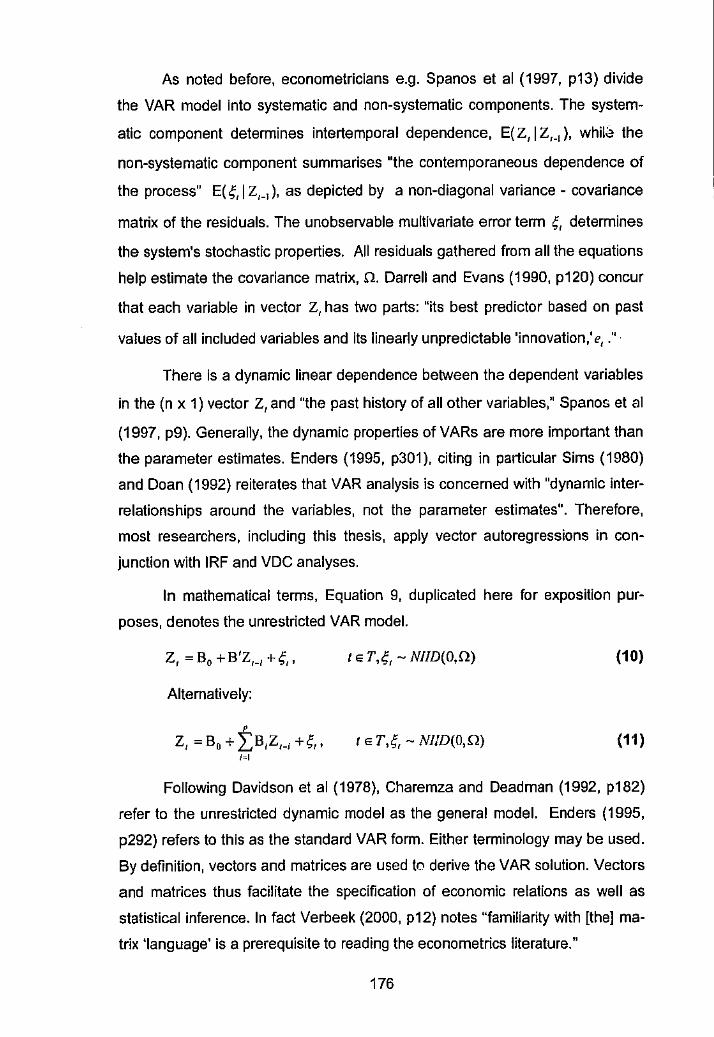
As noted before, econometricians e.g. Spanos et al (1997, p13) divide
the VAR model into systematic and non-systematic components. The system
atic component determines intertemporal dependence, E( z, I Z,_1 ), whUd the
non-systematic component summarises "the contemporaneous dependence of
the process" E( ~1 I Z
1_
1 ), as depicted by a non-diagonal variance - covariance
matrix of the residuals. The unobservable multivariate error term i;, determines
the system's stochastic properties. All residuals gathered from all the equations
help estimate the covariance matrix, n. Darrell and Evans (1990, p120) ccncur
that each variable in vector z, has two parts: "its best predictor based on past
values of all included variables and its linearly unpredictable 'innovation,'e, ."
There is a dynamic linear dependence between the dependent variables
in the (n x 1) vector Z, and "the past history of all other variables," Spanos et al
(1997, p9). Generally, the dynamic properties ofVARs are more important than
the parameter estimates. Enders (1995, p301), citing in particular Sims (1980)
and Doan (1992) reiterates that VAR analysis is concerned with "dynamic inter
relationships around the variables, not the parameter estimates". Therefore,
most researchers, including this thesis, apply vector autoregressions in con
junction with IRF and VDC analyses.
In mathematical terms, Equation 9, duplicated here for exposition pur
poses, denotes the unrestricted VAR model.
Z, = 8 0 +B'Z,_1 +{1 , t e T,/;, - N//D(O,Q) (10)
Alternatively:
' Z, = 8 0 + LB,Z,_; +{,. t e T,/;, - N/JD(O,Q) (11) 1~1
Following Davidson et al (1978), Charemza and Deadman (1992, p182)
refer to the unrestricted dynamic model as the general model. Enders (1995,
p292) refers to this as the standard VAR form. Either terminology may be used.
By definition, vectors and matrices are used to derive the VAR solution. Vectors
and matrices thus facilitate the specification of economic relations as well as
statistical inference. In fact Verbeek (2000, p12) notes "familiarity with [the] ma
trix 'language' is a prerequisite to reading the econometrics literature."
176
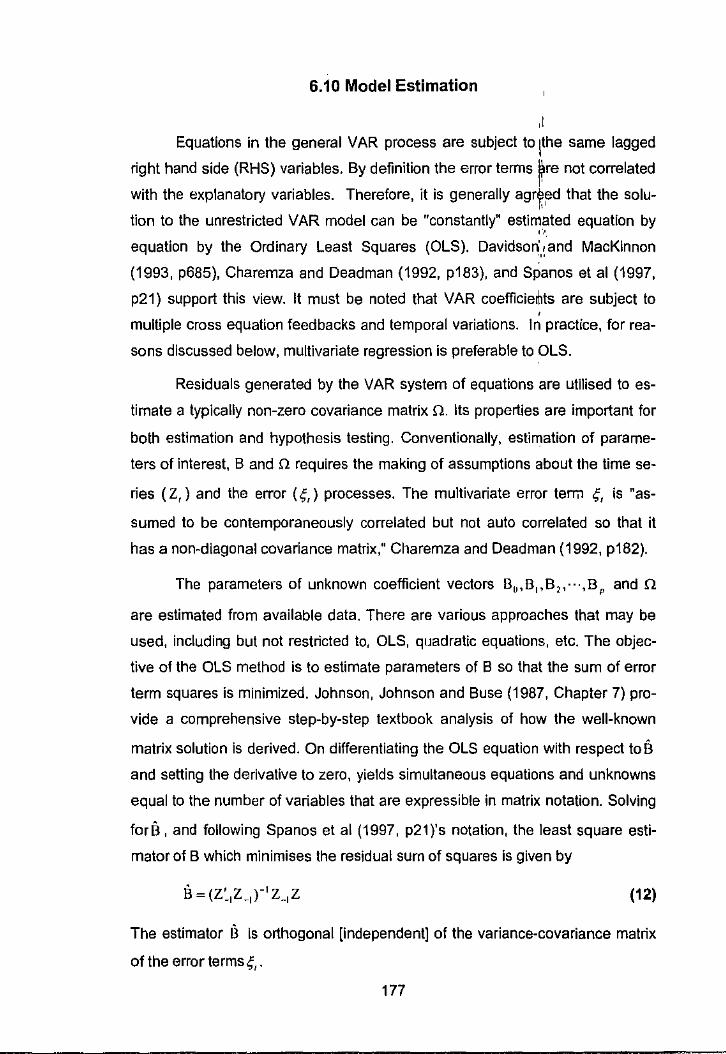
1!1~,·-"ii'ii!i!ililll!lllllllllillllllllllllllll--------------------------.. > "
'
6.10 Model Estimation
,I Equations in the general VAR process are subject to lthe same lagged
right hand side (RHS) variables. By definition the error terms ~re not correlated
with the explanatory variables. Therefore, it is generally agr~ed that the solu-1,'
tion to the unrestricted VAR model can be "constantly" estimated equation by ,·,,
equation by the Ordinary Least Squares (OLS). Davidsori,!and MacKinnon
(1993, p685), Charemza and Deadman (1992, p183), and Spanos et al (1997,
p21) support this view. It must be noted that VAR coefficiemts are subject to •
multiple cross equation feedbacks and temporal variations. ln practice, for rea-
sons discussed below, multivariate regression is preferable to OLS.
Residuals generated by the VAR system of equations are utilised to es
timate a typically non-zero covariance matrix n. Its properties are important for
both estimation and hypothesis testing. Conventionally, estimation of parame
ters of interest, B and n requires the making of assumptions about the time se
ries ( Z1 ) and the error ( ,;, ) processes. The multivariate error term ,;, is "as
sumed to be contemporaneously correlated but not auto correlated so that it
has a non-diagonal covariance matrix," Charemza and Deadman (1992, p182).
The parameters of unknown coefficient vectors 8 0,Bi,8 2 ,· .. ,Br and n
are estimated from available data. There are various approaches that may be
used, including but not restricted to, OLS, quadratic equations, etc. The objec
tive of the OLS method is to estimate parameters of B so that the sum of error
term squares is minimized. Johnson, Johnson and Buse (1987, Chapter 7) pro
vide a comprehensive step-by-step textbook analysis of how the well-known
matrix solution is derived. On differentiating the OLS equation with respect to B and setting the derivative to zero, yields simultaneous equations and unknowns
equal to the number of variables that are expressible in matrix notation. Solving
forB, and following Spanos et al (1997, p21)'s notation, the least square esti
mator of B which minimises the residual sum of squares is given by
B-(Z'.,Z_,r'z_,z (12)
The estimator 13 is orthogonal [independent] of the variance-covariance matrix
of the error terms,;,.
177
''I -~
J -··~ '
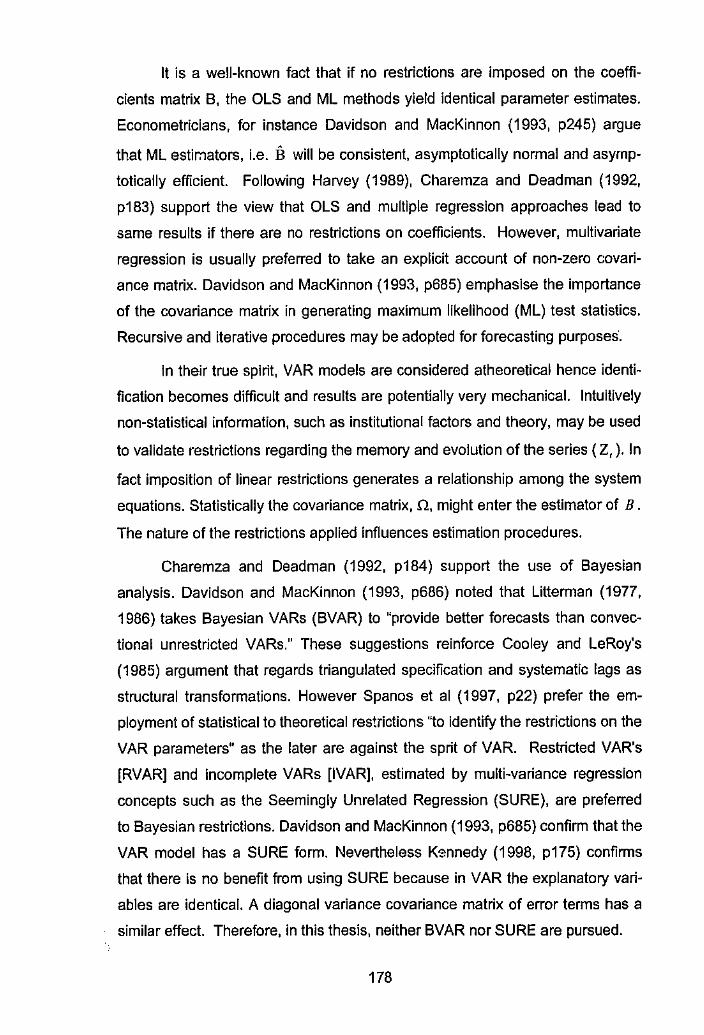
It is a well-known fact that if no restrictions are imposed on the coeffi
cients matrix B, the OLS and ML methods yield identical parameter estimates.
Econometricians, for instance Davidson and MacKinnon (1993, p245) argue
that ML estimators, i.e. ii will be consistent, asymptotically normal and asymp
totically efficient. Following Harvey (1989), Charemza and Deadman (1992,
p183) support the view that OLS and multiple regression approaches lead to
same results if there are no restrictions on coefficients. However, multivariate
regression is usually preferred to take an explicit account of non-zero covari
ance matrix. Davidson and MacKinnon (1993, p685) emphasise the importance
of the covariance matrix in generating maximum likelihood (ML) test statistics.
Recursive and iterative procedures may be adopted for forecasting purposes·.
ln their true spirit, VAR models are considered atheoretical hence identi
fication becomes difficult and results are potentially very mechanical. Intuitively
non-statistical information, such as institutional factors and theory, may be used
to validate restrictions regarding the memory and evolution of the series ( Z, ). In
fact imposition of linear restrictions generates a relationship among the system
equations. Statistically the covariance matrix, n, might enter the estimator of B.
The nature of the restrictions applied influences estimation procedures.
Charemza and Deadman (1992, p184) support the use of Bayesian
analysis. Davidson and MacKinnon (1993, p686) noted that Litterman (1977,
1986) takes Bayesian VARs (BVAR) to "provide better forecasts than convec
tional unrestricted VARs." These suggestions reinforce Cooley and LeRoy's
(1985) argument that regards triangulated specification and systematic lags as
structural transformations. However Spanos et al (1997, p22) prefer the em
ployment of statistical to theoretical restrictions "to identify the restrictions on the
VAR parameters" as the later are against the sprit of VAR. Restricted VAR's
[RVAR] and incomplete VARs [!VAR], estimated by multi-variance regression
concepts such as the Seemingly Unrelated Regression (SURE), are preferred
to Bayesian restrictions. Davidson and MacKinnon (1993, p685) confirm that the
VAR model has a SURE form. Nevertheless Kennedy (1998, p175) confirms
that there is no benefit from using SURE because in VAR the explanatory vari
ables are identical. A diagonal variance covariance matrix of error terms has a
similar effect. Therefore, in this thesis, neither BVAR nor SURE are pursued.
178
7. COINTEGRATED VARS
,I
I 7.1 Integrated variables t,
Integrated variables are individually driven by perman¢nt (or nearty per-
" manent shocks.) Such variables are usually said to be non~Stationary, explo.-
sive, or to contain unit roots. The order of integration, I {d), derotes the number
of times a series has to be differenced to render it stationary.
7 .2 Cointegralion
Cointegrated variables are individually integrated pr(?cesses that are
jointly stationary; that is, jointly driven by transitory shocks. Co integration exists
if, and only if, there is a linear combination of integrated variables that is driven
by common trends. If variables are cointegrated there is a long run link among
them. The weighted sum of cointegrated variables is mean reverting. Residuals
obtained from such linear combinations are station,ary, i.e. I (0) processes, and
hence are subject to time series modelling. The stationarity properties of VAR
processes are used to derive the asymptotic properties of the parameter esti
mators. According to Watson ( 1994, p2844) there are four alternative ways of
representing cointegrated systems. These are the moving average, common ' trends, triangular, and the vector error correction model (V~CM) representa-
' lions. This study adopts the VECM framework and follows the Johansen proce-
dure to test for cointegration and estimate the parameters.
7.3 The Johansen Cointegration Procedure
The Johansen cointegration procedure is one of the most popular ap
proaches to cointegration analysis. Masih and Masih (1999, p8) argue that the
Johansen procedure, unlike the Engle-Granger procedure, is not sensitive to
the choice of the dependent variable and the variable being normalised. The
procedure depends on the assumption that the error vector, i;,, is multivariate
179
' -'
I
' ! ~:
normal across time and independent of observations (NID). Johansen (1988,
1991, 1992, 1995) applies maximum likelihood (ML) to the VAR model and pro
vides for the existence of more than one cointegration relationships.
Johansen and Juselius (1990, 1992, 1994), JJ for short, extended the
model. As noted in Maddala and Kim (1998, p174) Johansen and Juselius
(1994, p8) distinguish among generic [linear statistical] identification, empirical
identification and economic identification. For a start, the JJ approach is atheo
retical with cointegration reduced to a statistical concept, possibly devoid of any
structural interpretation. The model's dynamic properties are completely deter
mined by the sample data under consideration. Theoretical restrictions are
adopted ex-post, that is, after establishing the number of long run cointegrating
relationships. Cointegration analysis of a VAR(p) model can easily be per
formed by rewriting the VAR(p) model into the first difference version. This
transformation takes the analysis to the VECM format.
7.4 Vector Error Correction Model
The Granger Representation Theorem states that a cointegrated VAR
system has a short run error correction mechanism that drives variables to their
long run equilibrium relationship. The error correction model (ECM) represents
deviations from the long run equilibrium. Hoffman and Rasche (1997,p1) define
error correction terms as "mean reverting weighted sums of cointegrating vec
tors and dated t -1." The mechanism drives the system's short run dynamic
properties. It forces adjustments in at least one series to correct for deviations in
the long run relationship. In the Johansen and Juselius (JJ) approach there can
be several short run mechanisms to reach the same long run equilibrium. Simi
larly, it was noted that the Johansen procedure provides for more than one
equilibrium relationship among variables in a model.
There is a general consensus in literature that VAR models can be ana
lysed and tested in a VECM formulation. Pesaran and Pesaran (1997, pp 132-3
and 291) show that the Johansen ML cointegration options in Microfit provide a
unified framework for estimating and testing cointegration relationships based
on a generalised VECM framework. From Equation 8 a typical VAR(p) model is
represented as:
180
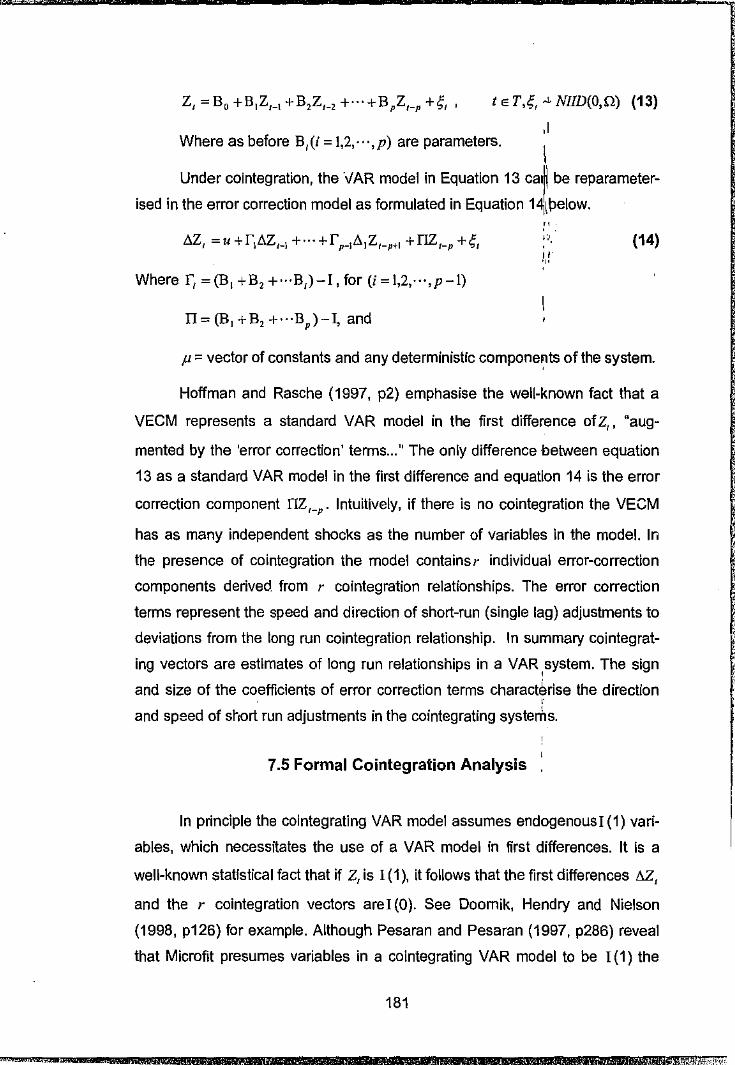
t E T,I;,-'- NIID(O,Q) (13)
,I Where as before B, (i = 1,2, .. , p) are parameters.
I Under cointegration, the \/AR model in Equation 13 ca~ be reparameter-
ised in the error correction model as formulated in Equation 1~\Pelow.
Where r, = (B, +B, + .. ·B,)-1, for (i = 1,2,··,p-I)
II= (B, +B, +···B,)-1, and
" . !',', . " ., . .
(14)
µ::: vector of constants and any deterministic compone~ts of the system.
Hoffman and Rasche ( 1997, p2) emphasise the well-known fact that a
VECM represents a standard VAR model in the first difference ofz,, "aug-
'·'
·, . '
mented by the 'error correction' terms ... " The only difference between equation 1
13 as a standard VAR model in the first difference and equation 14 is the error
correction component nz1_P. Intuitively, if there is no cointegration the VECM
has as many independent shocks as the number of variables in the model. In
the presence of cointegration the model containsr individual error-correction
components derived. from r cointegration relationships. The error correction
terms represent the speed and direction of short-run (single lag) adjustments to
deviations from the long run cointegration relationship. In summary cointegrat
ing vectors are estimates of long run relationships in a VAR system. The sign '
and size of the coefficients of error correction terms charactikrise the direction '
and speed of sJ-,ort run adjustments in the cointegrating systerils.
' 7.5 Formal Cointegration Analysis .
In principle the cointegrating VAR model assumes endogenousJ(1) vari
ables, which necessitates the use of a VAR model in first differences. It is a
well-known statistical fact that if Z, is I (1 ), it follows that the first differences 11Z,
and the r cointegration vectors are! (0). See Doomik, Hendry and Nielson
(1998, p126) for example. Although Pesaran and Pesaran (1997, p286) reveal
that Microfit presumes variables in a cointegrating VAR model to be 1(1) the
181
z anrzn msOlfTBmn:mnw CT
"Cointegrating VAR Menu" in Microfit permits analysis of cointegration models
containing "I (1) jointly determined variables, I (1) exogenous variables, and
I (0) exogenous variables," (Ibid p127). The order of variables is considered im
portant for purposes of orthogonalized IRF analysis and orthogonalized error
variance decompositions analysis. Furthermore Pesaran and Pesaran (1997,
p322) suggest that inclusion of I (0) variables in the VAR "allow for the short-run
movements in the 1(1) variables which moves away from their long-run equilib
rium." Beveridge and Nelson (1981) as cited in Stock ( 1094, pp 2744 and ?.747)
formally show that 1(1) processes can be decomposed into I(O) and !(1) com
ponents. Luintel and Khan (1999, µ391) argue that when a VAR model contains
a mixture of I (1) and I (0) variables the later may be considered as weakly ex
ogenous variables.
As the literature of cointegration progresses, new techniques are
emerging that do not require rigorous determination of whether variables
arel(1) or !(O). Pesaran and Pesaran (1997, pp 302 - 8) discuss an autore
gressive distributed lad (ARDL) procedure in which it is not necessary to deter
mine whether the regressors are !(1) or l(O). Haldrup (1998) reviews the
growing literature on the econometric analysis of I (2) variables and polynomial
cointegration. Shintani (2000) recently proposed fully nonparametric approach
to cointegration that does not require VAR based tests. In my view, the chal
lenge to develop proceduri::.:s that do not depend on fluid distinctions regarding
the order of integration and extent of cointegration is strong.
In practice the order of integration may vary from sample to sample if not
from researcher to researcher, hence Z, is sometimes assumed rather than
"proven" to be I (1 ). In this thesis, the real per capita income expressed in logs,
LPCY, is the principal indicator of macroeconomic development. In Table 10,
the information criteria su[1gest that LPCY is I (0). However, the test statistics
does not reject the null hypothesis that LPCY has a unit root, i.e. is I (1 ). In a
number of other cases depicted in Tables 9 and 10 the test statistics does not
reject the null hypothesis of a unit root for some variables the information crite
ria rendered I (0). Therefore, in empirical literatl•re some variables are treated
as though they are I (1) or I (0) depending on the underlying assumptions of the
adopted procedure. The next paragraph discusses some valid methodological
considerations regarding the potential mixture of I (1) and I (0) variables.
182
If the vector Z, is I (O) the solution can be obtained by OLS methods. In
deed Pesarao and Smith (1998, p65) point out that any linear combination of
I (0) variables are also I (0) variables. In any case the unrestlicted VAR model
has same variables in common hence yield the same estimate~ as the OLS and I
Mb methods. According to Doornik (1998, p159) the asymptotic distributions of " the trace and maximum~eigenvalue test statistics are not affeG.ted by the pres~ '
ence of I (0) components. Therefore Johansen maximum lik~Hhood estimation
can still be used in order to take advantage of system wide diagnostic statistics. j
This thesis employed Microfit's capacity to handle a VAR mo~el with 1(1) and
I (0) variables. Some variables rendered I (0) by the information criter:a might as
well be I (1) if reliance is placed on the fact that the null hypothesis of a unit root
could not be rejected. Masih and Masih (1999, p8) however concur that "the Jo
hansen procedure requires variables not to be 1(2), but can admit both 1(1)
only and a mixture of I (1) and I (0) processes, in systems used for testing the
order of cointegration rank." A temptation arising from Pesaran and Pesaran
(1997, Chapter 16) to order the variables on the basis of endogeneity or exoge
neity was avoided as it runs contrary to the VAR spirit; and restricts system~
wide interactions and by extension the number of cointegration relationships.
The formal cointegration model specified in this thesis is principally
based on a five series VAR methodology incorporating the core economic sec
tors in a small open economy such as Zimbabwe. Watson (1994, p2901) as
serts that it is "very important" for structural analysis to take into account all "im
portant macroeconomic shocks" active in the economic procSss. In fact Luintel
and Khan (1999, p383) concur that many bivariate and trivariate VAR systems
are misspecified rendering the results questionable. Most researchers simply
adopt low dimension models in order to accommodate small data sets and the
resultant fast exhaustion of degrees of freedom. However, basing policy on
flawed small scale VAR modelling systems can be disastrous.
In this study, economic activity in Zimbabwe is assumed to depend on
the monetary base, fiscal policy, international trade, and financial development.
Therefore, a five variable VAR model incorporating indicators representing each
these structural segments is employed to investigate the dynamic interrelation
ships among the variables. Following a rich multivariate analysis is consistent
with similar studies of Lehr and Wang (2000), Levine (1997), Levine et al (2000)
183
' ,;
' ' '
and Luintel and Khan (1999). In the j~rgon of econometrics, Lehr and Wang
(2000) identify four important structural shocks viz: real supply shock (Real
GDP), fiscal expansion shock ( Rea/ G ) , monetary shock (measure of Real GDP
money) and a financial intermediation shock (proxy for financial intermediation).
While their diagnosis is very persuasive, very few countries are closed econo
mies. Economic activity particularly in small economies is vulnerable to the va
garies of international developments hence the inclusion of foreign trade in this
study. In fact Levine et al (2000, p45) include measures of government size, in
flation, parallel market exchange rate premium, and openness to international
trade in their policy conditioning information set. In footnote 12 on the si3me
page Levine et al, however, acknowledge that inflation and government size
both seive as indicators of macroeconomic stability. Similarly the parallel mar
ket exchange premium could be regarded as a composite uindex of trade, ex
change rate, and price distortions." I have not used the parallel exchange r3te
premium because it is difficult to observe; and the available data does not cover
the period under consideration. The data used in this study consists of annual
observations for the period 1924 tc 1998 deflated to reflect 1995 quantities. All
variables are expressed in natural logarithms to represent the levels of the vari
ab!es. For computational convenience, growth rates are expressed as first dif
ference of the logarithms of the variables.
Two variables are employed as alternative proxies for economic activity.
These are logarithms of real per capita in come (LPCY) and the rate of real per
capita income growth (LGPCY). The monetary base is represented by the loga
rithm of the ratio of real currency in circulation (CIC) to real GDP. Both Rous
seau and Wachtel (1998) and Lehr and Wang (2000) include the monetary base
as a separate conditioning variable in their study of the causal links between
from the intensity of financial intermediation and economic activity. Real gov
ernment expenditure to real GDP (G) and the fiscal balance (FSB) are adopced
as proxies for government size or fiscal shocks. The current account balance
(CAB) or the degree of openness to international trade (OPEN) as measured by
the ratio of real exports and real imports to real GDP are treated as alternative
proxies for foreign trade. Financial sophistication (Fl) is measured as a ratio of
alternative real financial assets to real GDP or real credit aggregates to real
184
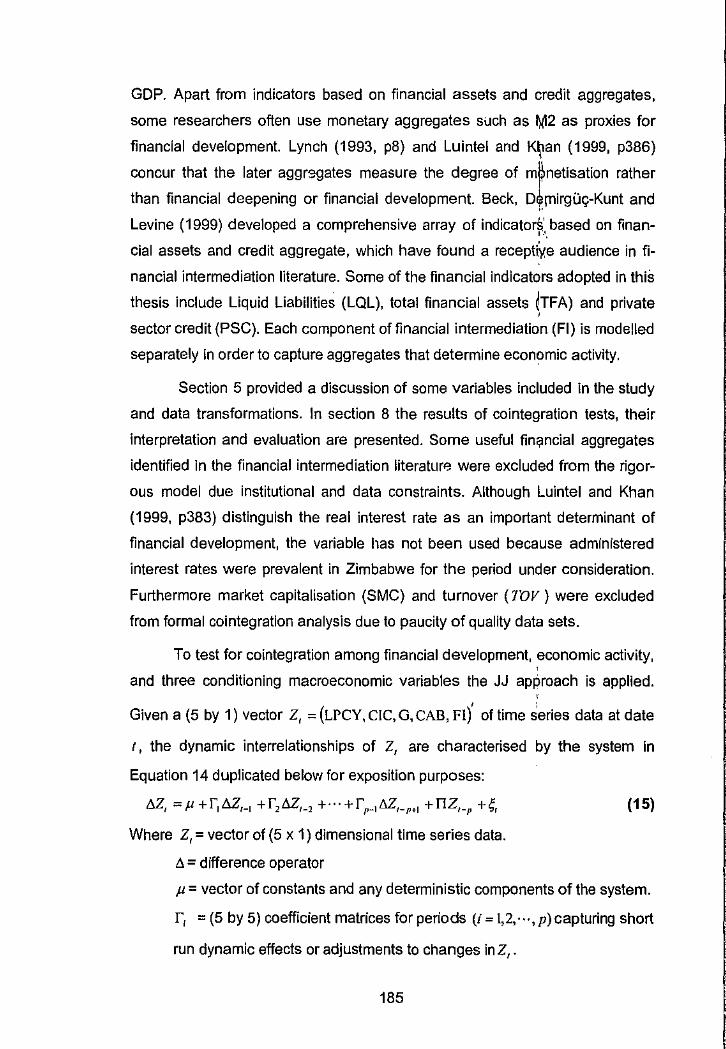
GDP. Apart from indicators based on financial assets and credit aggregates,
some researchers often use monetary aggregates such as t:,(12 as proxies for
financial development. Lynch (1993, p8) and Luintel and K~an (1999, p386)
concur that the later aggrsgates measure the degree of m~netisation rather
than financial deepening or financial development. Beck, O~fTlirgUy-Kunt and
Levine (1999) developed a comprehensive array of indicator~: .. based on finan
cial assets and credit aggregate, which have found a recepti~e audience in fi
nancial intermediation literature. Some of the financial indicators adopted in thiS
thesis include Liquid Liabilities (LQL), total financial assets /TFA) and private •
sector credit (PSC). Each component of financial intermediation (Fl) is modelled
separately in order to capture aggregates that determine econ~mic activity.
Section 5 provided a discussion of some variables included in the study
and data transformations. In section 8 the results of cointegration tests, their
interpretation and evaluation are presented. Some useful fin,;1ncial aggregates
identified in the financial intermediation literaturB were excluded from the rigor
ous model due institutional and data constraints. Although Luintel and Khan
(1999, p383) distinguish the real interest rate as an important determinant of
financial development, the variable has not been used because administered
interest rates were prevalent in Zimbabwe for the period under consideration.
Furthermore market capitalisation (SMC) and turnover ( 10V ) were excluded
from formal cointegration analysis due to paucity of quality data sets.
To test for cointegration among financial development, economic activity, •
and three conditioning macroeconomic variables the JJ approach is applied. ' . '
Given a (5 by 1) vector z, = (LPCY, CIC,G,CAB, FI) of time series data at date
t, the dynamic interrelationships of Z, are characterised by the system in
Equation 14 duplicated below for exposition purposes:
Where Z, = vector of (5 x 1) dimensional time series data.
6. = difference operator
(15)
µ = vector of constants and any deterministic components of the system.
,, = (5 by 5) coefficient matrices for periods (i = 1,2, ... , p) capturing short
run dynamic effects or adjustments to changes in Z,.
185
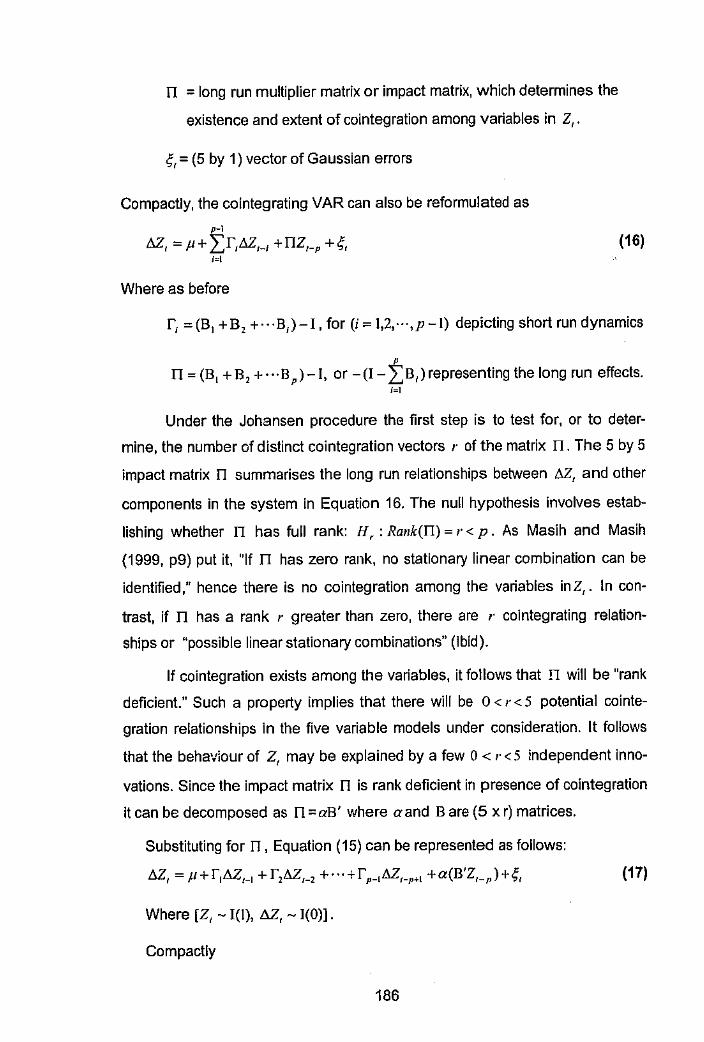
IT = long run multiplier matrix or impact matrix, which determines the
existence and extent of cointegration among variables in Z, .
.;, = (5 by 1) vector of Gaussian errors
Compactly, the cointegrating VAR can also be reformulated as
,-, t:,,,Z,1 =µ+Lr,~,-, + nz,-p + 4,
/o,l
Where as before
(16)
r, = (B, + B, + · · · B,)-1, for (i = 1,2,-··,p - I) depicting short run dynamics
IT = (B, + B, + · ·· B, )- I, or -(I - f B,) representing the long run effects. 1 .. 1
Under the Johansen procedure the first step is to test for, or to deter
mine, the number of distinct cointegration vectors r of the matrix n. The 5 by 5
impact matrix n summarises the long run relationships between ~ 1 and other
components in the system in Equation 16. The null hypothesis involves estab
lishing whether IT has full rank: H, : Rank(l1) = r < p. As Masih and Masih
(1999, p9) put it, "If n has zero rank, no stationary linear combination can be
identified," hence there is no cointegration among the variables inZ1 • In con
trast, if n has a rank r greater than zero, there are r cointegrating relation
ships or "possible linear stationary combinations" (Ibid).
If cointegration exists among the variables, it follows that IT will be "rank
deficient." Such a property implies that there will be O < r < 5 potential co inte
gration relationships in the five variable models under consideration. It follows
that the behaviour of Z, may be explained by a few O < ,. < 5 independent inno
vations. Since the impact matrix n is rank deficient in presence of cointegration
it can be decomposed as n :::aB' where a and Bare (5 x r) matrices.
Substituting for 11, Equation (15) can be represented as follows:
(17)
Where [Z, - 1(1), 62., - 1(0)].
Compactly
186
- El D&fM
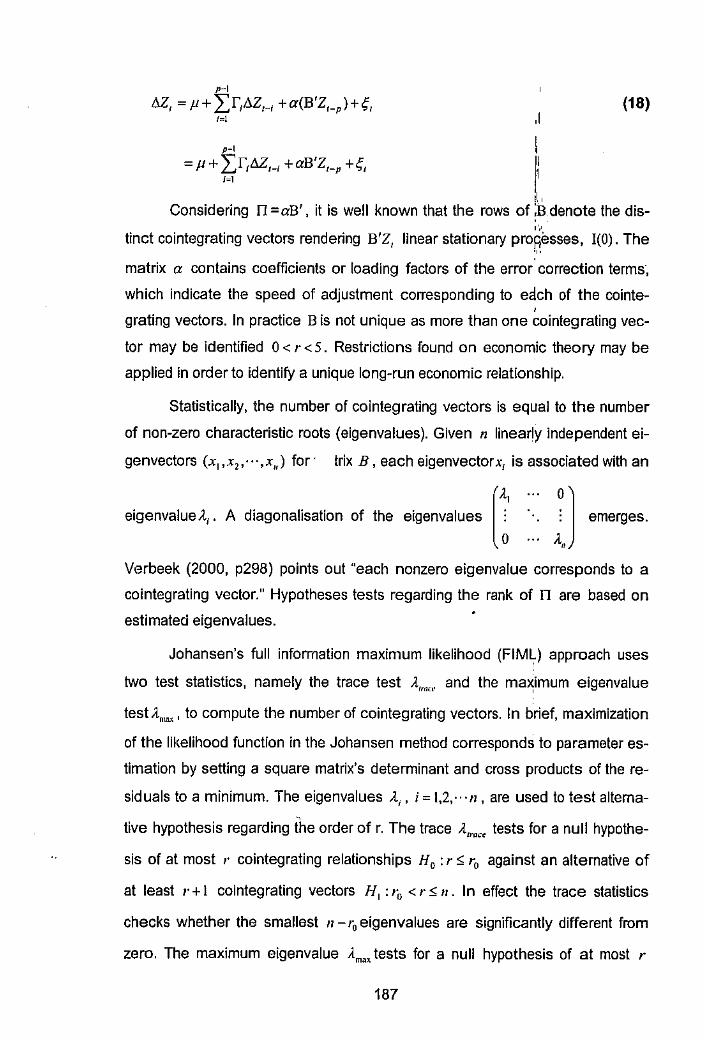
,-, 6.21 = µ+ Z:r,.6.2'1_; +a(B'Z,_P)+~\
/,,!
,-, =µ+ Ll,.6Z,_1 +aB'Z1_P +4,
M
(18) ,I
I 1: 11.,
Considering l1 =aB', it is well known that the rows of ;B denote the dis-,·,,
tinct cointegrating vectors rendering B'Z, linear stationary pronesses, 1(0). The ... matrix a contains coefficients or loading factors of the error correction terms·,
which indicate the speed of adjustment corresponding to edch of the cointe-' grating vectors. In practice Bis not unique as more than one cointegrating vec-
tor may be identified O < r < 5. Restrictions found on economic theory may be
applied in order to identify a unique long-run economic relationship.
Statistically, the number of cointegrating vectors is equal to the number
of non-zero characteristic roots (eigenvalues). Given n linearly independent ei
genvectors (xi,x 2, .. ·,x,,) for- trix B, each eigenvectorx1 is associated with an
[
.!,
eigenvalue A;. A diagonalisation of the eigenvalues ~ ~ J emerges.
~ .. Verbeek (2000, p298) points out "each nonzero eigenvalue corresponds to a
cointegrating vector." Hypotheses tests regarding the rank of TI are based on
estimated eigenvalues.
Johansen's full information maximum likelihood (FIMq approach uses
two test statistics, namely the trace test l,,,"·,· and the max,imum eigenvalue
test A"''"', to compute the number of cointegrating vectors. In brief, maximization
of the likelihood function in the Johansen method corresponds to parameter es
timation by setting a square matrix's determinant and cross products of the re
siduals to a minimum. The eigenvalues l;, i = l,2,···n, are used to test alterna
tive hypothesis regarding ihe order of r. The trace A.,,.,,u tests for a null hypothe
sis of at most r cointegrating relationships HO : r::; r0 against an alternative of
at least r + l cointegrating vectors H 1 : 10 < r::; 11. In effect the trace statistics
checks whether the smallest n - 10 eigenvalues are significantly different from
zero. The maximum eigenvalue Amax tests for a null hypothesis of at most r
187
cointegrating vectors H O : r ~ ,o against an alternative exactly r + I cointegrating
vectors, H, : r = ,, + 1. Verbeek (2000, p296) notes that the maximum eigen
value Am.,. test is based on the estimated (10 + !)11' largest eigenvalue. According
to Masih and Masih (1999, p9), under the JJ approach, "larger eigenvalues are
associated with the cointegrating vector being more correlated with the station
ary component of the process." In the event of conflicting test results, Luintel
and Khan (1999, p392) reveal that under the Johansen procedure trace tests
have been found to be "more robust" than maximal eigenvalues tests.
7.6 VAR Order and Deterministic Variables
There are a number of data depended decisions which have to be made
in conjunction with application of Johansen procedure. Apart from choosing the
number and span of endogenous variables to be included in the model, a deci
sion is required regarding the order of integration among the variables. Fur
thermore an appropriated VAR order (i.e. lag length) needs to be selected in
order to improve model performance. Low order VAR models are prone to serial
correlation while higher order VARs run the risk of over parameterisation and
fast exhaustion of the degrees of freedom. Microfit employs the Akaike Informa
tion Criterion (AlC) and the Schwartz Bayesian Criterion (SBC) to facilitate the
determination of the lag length. Cointegration analysis in this thesis is based on
a VAR model of order of 4. Thus, the first four observations are treated as pre
sample values. This results in the reduction of the sample size by the lag length.
Number of varia!Jles included has similar effect£. Tests for cointegration are
sensitive to the nature of deterministic trends variables (trends and intercepts).
To this end, allowance has been made for a model with restricted intercepts and
no trends in the VARs. This specification is valid because in the presence of
cointegration trends can still be identified. Unrestricted SURE regressions not
reported in this thesis found intercepts and trends to be statistically significant.
7.7 Impulse Response Analysis
According to Sims (1980, p21 ), analysis of a cointegrating system's re
sponse to random shocks is a valuable post estimation tool that can shed light
188
... -· " " .,.
on a system's speed of adjustment to the equilibrium relationship. The Gener
alised impulse response functions (GlRF), popularised by Pes~ran and Pesaran
(1997) among others, captures the short run dynamic properties arising form a '
variable specific shock (or innovation) on the different varia~les in the cointe-' grating VAR model. Shocks to variables in a VAR system ge,r,erate contempo-
raneous interactions among the endogenous variables. A giY,en shock affects
the VAR system in several ways. It directly affects the depen~ent variable in its
own equation. The shock is transmitted to other variables through the system of
equations. Future values of all variables, including the origin~I. may also be af-'
fected since current realisations become future lagged values. If the impulse
responses are zero, the shocked variable has no causal effect, on the system.
Conventionally, the impulse-response function is represented by a graph
characterising the effect of a unit shock (equal to one standard error) on one
variable on the future s "1te of a cointegrating system. As Pesaran and Pesaran
(1997, p444) point out, "the effect of shocks on cointegrating relations is bound
to die out, and their time profile contains useful information on the speed of
convergence of the model to its cointegrating (or 'equilibrium') relations." In
contrast, the effects of variable specific or system wide shocks on individual
variables in a cointegrating VAR model are persistent and may not die out "due
to the rank deficiency of the of the long-run multiplier matrix, (Ibid, p443).
Nevertheless, it is well known that impulse responses pertaining to vari
able specific shocks are difficult to interpret. If the VAR system is incompletely
specified standard errors of IRF tends to be large which renders 1RA "worthless
for structural interpretations," Spanos et al (1997, p63). Similar concerns are
raised in Rankle (1987) who suggests that no strong conclt•"ions should be
drawn about the effect of innovations in time series data, as impulse response
and variance decomposition are data and trend sensitive.
The orthogonalized impulse response function is frequently used in fi
nancial literature. Unlike the generalised impulse responses, the orthogonalized
impulse responses are subject to many permutations if no prior causality tests
have been conducted. Contemporaneous correlations among variables in a
model render determination of unique impulse responses difficult. Modellers
often resort to ordering a system's innovations into an orthogonal transforma-
189
-1
-~
lion. In Sims (1980) Choleski decomposition was arbitrary applied to triangulate
the variables. Ordering dictates the direction of causation among variables in
the system. In other words, each error term is directed to affect only error terms
in equations ranked below the given error term's own equation. Generalised im
pulse responses are not sensitive to the way the variables are ordered.
In real life, economic shocks rarely occur in one variable at a time. Thus,
the persistence profile (PP) may be used to characterise the effect of system
wide shocks on cointegrating relationships. By construction, the impact of a
shock in the persistence profile has a value of unity, which tends to zero as the
time horizon tends to infinity.
Dynamic links in cointegrating systems may also be analysed through er
ror correction terms. ln summary cointegrating vectors represent the long run
relationships. The sign and size of the coefficients of error correction terms
characterise the direction and speed of short run adjustments in the cointegrat
ing systems. This approach was discussed in detail in Section 7.4 above.
7.8 Variance. Decomposition
The forecast error variance decomposition (VDC) provides another way
to chart the short-run properties of the dynamic behaviour of a VAR model. Ac
cording to Spanos et al (' 997, p 63) "It breaks down the variance of the forecast
error for each of variable [in the VAR model] into components that can be attrib
uted to each of the endogenous variables [at different time horizons.]"
7.9 Limitations of VAR and Coin1egration Analysis
Linearity is an aesthetic possibilffy but not an aesthetic necessity.
Davies J. P. (1997, p87)
(a) ·:he atheoretical nature of VAR models
The atheoretical nature of VAR models has been subject to criticism in
financial literature. Failure to select variables on the basis of prior knowledge
could result in mechanical policy analysis. The economic meaning of VAR coef-
190
ficients is embroiled in controversy. Sims (1980, p20) argues VAR coefficients
tend to oscillate with successive lags and are subject to "<;:pmplicated cross
equation feed backs" and time variations. Spanos et al (19~7, p24) conclude
that Granger causality tests, impulse response analysis, and])variance decom
position produce better distinctive results than VAR coeffi~ .. if::!nts. Following
Cooley and LeRoy's (1985) persuasive view, Darnell and Eva)is (1990, p127-8)
argue that in absence of theory VAR representation amountS.ito a summary of
correlations in the data. Therefore, impulse response functions cannot be val-
idly accepted as causal orderings. I
Cooley and LeRoy (1985, p306) accuse some proponents of VAR to be
"more interested in econometrics than economics." In fact, Bciwbrick (1988, p9)
warns that econometrics may be used for image projection to impress layman
and colleagues. Darnell & Evans (1990, p126) hammer on the methodological
limitations, which in their view, fail to reduce economic ignorance through a re
futable representation that can critically test theories. Summers (1991) is even
more pessimistic about the contribution of all econometric work to the develop
ment of macroeconomics. Darnell & Evans (1990,129) conclude that VAR "ap
proach is not a part of science" because it does not contribute "to the scientific
method of economics ... " and its proponents offer nothing new. If the models
are interpreted as non-structural, the VAR itself become.:; the structure and is no
more than a superficially sophisticated summary of the historical correlations of
the economic time series. Runkle's (1987, p13) conclusion is well known, ~In
other words, vector autoregression may let the data speak for themselves, but
the data are not talking very loudly."
(b) Mitigation: social sciences are not perfect
These views run contrary to Leamer (1983) and Sims (1995). I agree
with Sims (1995, p15) that some criticisms amount to "forensic exaggeration."
Although economists are the most vocal critics of econometrics, economic sci
ence is not immune from criticism. Bowbrick (1988, p120) argues, "Pure eco
nomic science is nothing but a string of tautological logic, going from arbitrary
assumptions to conclusions ... " In Sims' (1995, p8) opinion the hypothesis test
ing view of science has several limitations because theories cannot be "tested~
as "true" or "false" on the basis of decisive confrontations with data. Indeed
191

Sims (1995, p2) proposes that all science is a data compression exercise. In
this context, it is possible to have a continuum of theories rather than a single
true theory. Weintraub (1998, p1845) maintains that, "The concept of a true sci
entific theory itself has changed as the image of mathematical knowledge has
changed ... " Thus, the concept of economic and financial knowledge changes
with time. No wonder Sims (1995, p8) regards "orthodoxy, hierarchy and meth
odological prescriptions as potential tools of priestly resistanc~ to change."
In any case perfect knowledge is not available. Leamer (1983, p 36) ar
gues that, "All knowledge is human belief: more accurately, human opinion,"
hence no one can design an experiment free of bias (p33). According to
Mccloskey (1983) as cited in Sims (1995) even the most rigorous writings in
economics is engaged in persuasion. Although economists try to emulate the
rigor of physics Sims (1995, p9) retorts that, "Economics is not physics." There
is no scape for clean consensus in social sciences unlike natural sciences.
Moreover, the difference between scientific experiments and natural experi
ments is one of degree rather than kind. For instance, there is a lot of scientific
knowledge on astronomy though there are no experiments. As cited in Wein
traub (1998, p1839) Mccloskey (1994) concedes that mathematical models
contribute to the advancement of economic knowledge: "Econon1ics made prog
ress without mathematics, but has made faster progress with it. Mathematics
has brought transparency to many hundreds of economic arguments."
Whereas economists provide the most vehement criticism of their cous
ins in econometrics, the question of formalism in economics itself has never
been settled. According to Taylor (2000, p2130) no discipline has yet achieved
that feat "including physics, the science that economics most aspires to emu
late." Physicists themselves are still debating "whether mathematics is 'nature's
language' or is simply a tool for discovering her laws." Despite these methodo
logical limitations, I agree with Mattesini [1993, p153] who notes that VAR tech
niques provide insight into the informational content of selected macro
economic variables. A theory !,hould not be criticised on the validity of its as
sumptions but validity of its implications. Criticising VAR for lack of theoretical
context is logically inconsistent as the model's objective is to curb arbitrary re
strictions in mc1cro-economic models. Krugman (1998, p1829) advise readers
not to confuse a complaint about quality with a compl2i11t about methodology.
192
---··=
(c) Statistical limitations of VAR and cointegration analysis
,I Unrestricted VAR models are over parameterised and non-parsimonious.
Unknown parameters in the unrestricted models increase wit1,i both the number
of variables in the model and lag lengths. Increasing the nurr;iber of repressors :I.,
rapidly increases the number of parameters to be estimated.;·, The degrees of
freedom are reduced and out of sample forecasting capat1ility limited. VAR ,, models require availability of long data sets (i.e. large samplei' size) as a direct
result of the over parameterisation problem. Increasing the time span and fre
quency of observations to a fixed span increases power of the•tests.
Time series analysis, like derivatives, has acquired a habit of excessive
proliferation. Nordhaus (1984) refers to thta Balkanisation of econometrics. As
Rankle (1987, 7) put it, "Vector autoregressions have brought with them their
own terminology and folklore." Anything that works on the canonical data sets
such as Box and Jenkins (1970) or Nelson and Plosser (1982) is considered an
adequate model. While this practice has got an advantage of providing a stan
dard yardstick to justify the relevance of results, the proliferation of jargon has
made some to regard econometrics as a Babel Tower. The multiplication of
conflicting unit root tests indicates the need to develop more robust approaches.
Haivey (1997) strongly attacks the whole concept of unit roots and vector
autoregressions. Maddala and Kim (1998, pp 45, 92, 99, 486-8) strongly contest
that "the unit root mania has gone too far' yet ADF, PP, and KPSS tests are
useless and should not be used. They charge that there is currently too much
asymptotic theory whereas significance levels upon which tests are based have
been found misleading unless samples are very large. In my opinion 100 to 200
years used in some VAR models is too long a time span for effective policy
analysis. A retractable model should produce results preferably in a generation
if not a decade. It is customary to test the hypothesis that there is no cointegra
tion, a practice that increases the probability of finding "spurious cointegration."
In practice, most tests for cointegration search for a linear relationship among
the variables. Following from this fact, if no cointegration is found, this would not
rule out existence of a long-term relationship other than a long-term linear rela
tionship. Fractional unit roots and fractional co-integration may not be ruled out.
193
' ' ' '~ a '
" ' ·,
(d) Mitigation: structural considerations
Spanos et al's (1997, p10) encourage the use of the Probabilistic Reduc
tion Approach [PR] that takes into account theoretical and statistical considera
tions. Proponents of the PRA argue that theory should not exclude other infor
mation because the theoretical data concept is often different from the observ
able data series. Spanos et al (1997 p12) writes,
The theory still determines the structural form, lhe relevant variables, and the general form of the statistical model, but the particular statistical specification is also influenced by the data.
Statistical inforence, causality tests, and post regression analysis dep8nd
on validity of the assumptions. Logically, evaluation of the statistical adequacy
of the model is an important step in the Probabilistic Reduction Approach. An
accurately defined model uniquely summarises the nature and structure of data
without contradicting the theory.
VVithout a statistically adequate model that captures the systematic information in the data, no valid statistical inference is possible, irrespective of the sophistication and/or the potential validity of the theory (Spanos 1999, p16).
Similarly, the Johansen procedure frequently used in cointegration tests
employs statistical properties to determine the rank of cointegration. Overall, the
economic system determines the behaviour of macroeconomic variables si
multaneously. Therefore every variable in VAR is regarded as endogenous and
regressed on its own lagged values and that of all other variables. The Lucas
Critique insisted that that the economic system and policymakers are interde
pendent rather than independent. If more than one cointagrating vectors are
identified Pesaran and Pesaran's (1997) Long Run Structural Modelling (LRSM)
could be used to select the appropriate model on the basis of theoretical con
siderations. Admittedly, Goodhart's Law", (1978) as cited in Kennedy (1998,
p7), states that all econometric models break down when used for policy. In the
final analysis, a model assists rather than substitute decision-making. Robert
son and Tallman (1999, 4) concur that, "No model can he left on automatic pilot
for too iong." Throwing away VAR on the rational of its limitations would be
tantamount to throwing away the baby with the bath water.
194
-,; ·-' '
' . c
c
'
8. EMPIRICAL COINTEGRATION TESTS RESULTS
,I
I
8.1 Financial Intermediary Developmen~ 1\. " .. 1:,
Methodology, like sex, is better demonstrated than discussed, ;f/,ough often ... better anticipated than experienced
LJamer (1983, p40) '
This section reports the main cointegration test results estimated under ' the Johansen full information maximum likelihood (FIML) approach. The idea is
to determine the long run relationship between economic activity and an array
of financial intermediation indicators. Intuitively model reliability should be ad
dressed before it is used for statistical inference if it is to mimic:: the true data
generating process. Three conditioning macroeconomic variables have been
added to the model to address specification problems. Most cointegration tests
conducted in this thesis are, therefore, based on a five variable model.
The JJ approach requires prior specification of an optimal autorcgression
orderw. In all cases a maximum VAR order of 4 was chosen. As noted in Sec
tion 7.6 low order VAR models are prone to serial correlation and over rejection
of the null hypothesis of no cointegration, while higher order VAR models run
the risk of over parameterisation and loss of power. Furthermore, tests for •
cointegration are sensitive to the presence of trends and intercepts. An allow-' ance has been made for a model with restricted intercepts arid no trends in the
VARs. This specification is given by "Case I I" under the "Cointegrating VAR . Option" in Microfit. If cointegration exists "common trends" can: still be identified.
Table 11 overleaf depicts the tests for the number of cointegration rela
tionships. The table is divided into Panels A to C. Panel A gives the test results
for the number of cointegration results based on maximal eigenvalues, which
are listed in descending order on the table. Panel B employees the trace statis
tics to specify the number of cointegration relationships. ln Panel C the model
selection criteria is used to determine the number of cointegration vectors.
" In this thesis the JJ and Johansen approaches are used interchangeably.
195
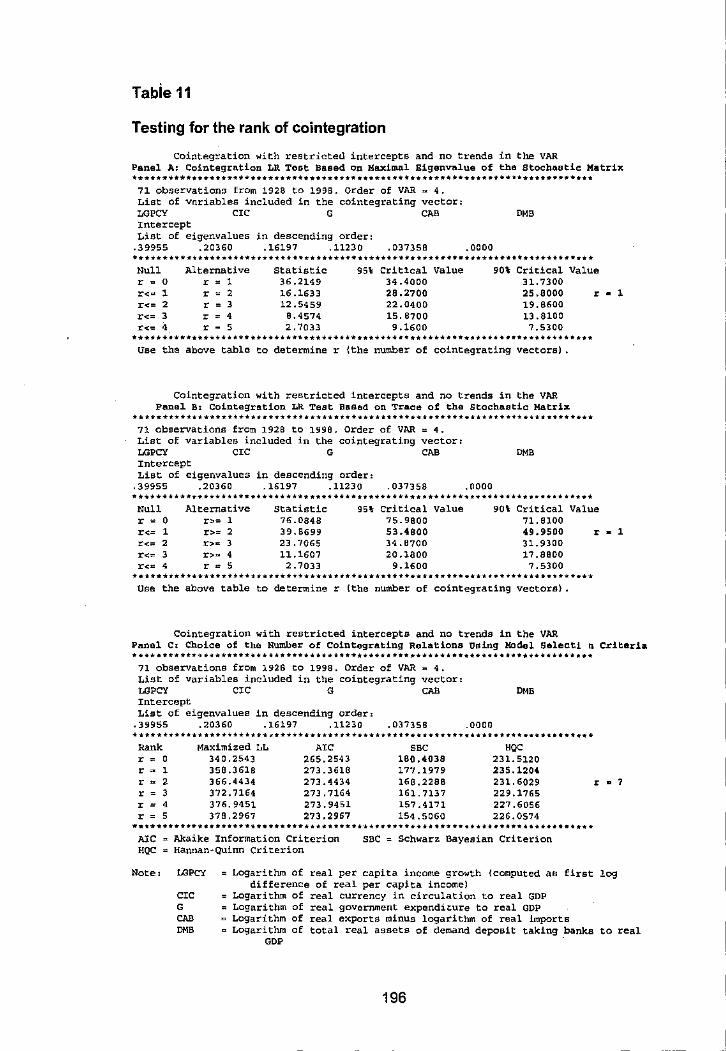
Tabie 11
Testing for the rank of cointegration
Cointegration with restrictetl intercepts and no trends in the VAR Panel A= Cointegration LR Test Based on Maximal Eigenvalue of the Stochastic Matrix
*•············································································ 71 observations from 1928 to 1998. order of VAR~ 4. List of vnriables included in cointegrating vector: LGPCY CIC CAB '"' Intercept List of eigenvalues in descending order:
.39955 .20360 .16197 .11230 . 037350 .0000
NUll Alternative Statistic "' Crit1cal Value '" Critical Value r • ' r 1 36.2149 34.4000 31.7300 r<• 1 r ' 16.1633 28,2700 25,8000 r<= ' r ' 12.5459 22.0400 19.8600 r<= ' r ' B.4574 15. 8700 13.8100 r<= ' r ' 2. 7033 9.1600 7,5300
********************••························································ Use the above table to determiner {the number of cointegrating vectors).
Cointegration with restricted intercepts and no trends in the VAR Panel B: Cointegration LR Test Based on Trace of the Stochastic Ma.tri~
•••••••••••••••••••••••••••••••••••••••••••••••••••••••••••••••••••••••••••••• 71 observations from 1928 to 1998. Order of VAR List of variables included in the cointegrating LGPCY CIC G Intercept List of eigenvalues in descending order,
= 4. vector,
""' ,39955 .20360 .16197 .11230 . 037358
'"' .0000
••••••••••••••••••••••••••••••••••••••••••••••••••••••••••••••••••••••••••••••
r
Null Alternative statistic '" critical Value '°' Critical Value r • 0 r>= ; 71L0848 75.9800 71. 8100 r<= ; r>= ' 39.8699 53.4800 49.9500 r r<" ' r>~ ; 23.7065 34.8700 31.9300 r<" ' r>• ' 11.1607 20.1800 17.8800 r<• ' r • ' 2.7033 9.1600 7.5300
•••••••••••••••••••••••••••••••••••••••••••••••••••••••••••••••••••••••••••••• Use the above table to determiner (the number of cointegrating vectors).
Cointegration with restricted intercepts and no trends in the VAR
. 1
. ;
Panel C: Choice of the Number of Cointegrating Relations using Model Select! n Criteria ···········~··································································
71 observations from 1928 to 1998. Order of VAR List of variables included in the cointegrating LGPCY CIC G Intercept List of eigenvalues in descending order,
... vector, CAB
.39955 .20360 .16197 .11230 . 037358
'"' .0000
•••••••••••••••••••••••••••••••••••••••••••••••••••••••••••••••••••••••••••••• Rank Maximized LL UC sac ,oc r 0 3'10.2543 265.2543 180 ,4038 231.5120 r ' 358 .3618 273.3618 177 .1979 235.1204 r ' 366.4434 273.4434 168.2288 231.6029 r ' 372.7164 273, 7164 161.7137 229.1765 r ' 376.9451 273.9451 157.4171 227.6056 r s 378,2967 273,2967 154 .5060 226.0574
•••••••••••••••••••••••••••••••••••••••••••••••••••••••••••••••••••••••••••••• AlC Akaike Information Criterion HQC ~ Hannan-Quinn Criterion
SBC: Schwarz Bayesian Criterion
r . '
Note: Logarithm of real per capita income growth (computed as first log
c,c G CAB
'"'
difference of real per capita income) Logarithm of real currency in circulation to real GDP Logarithm of real government expenditure to real GDP Logarithm of real exports minus logarithm of real imports Logarithm of total real assets of demand deposit taking banks to real
GDP .
196
• • ' ff;
' I
-ill
1 '!
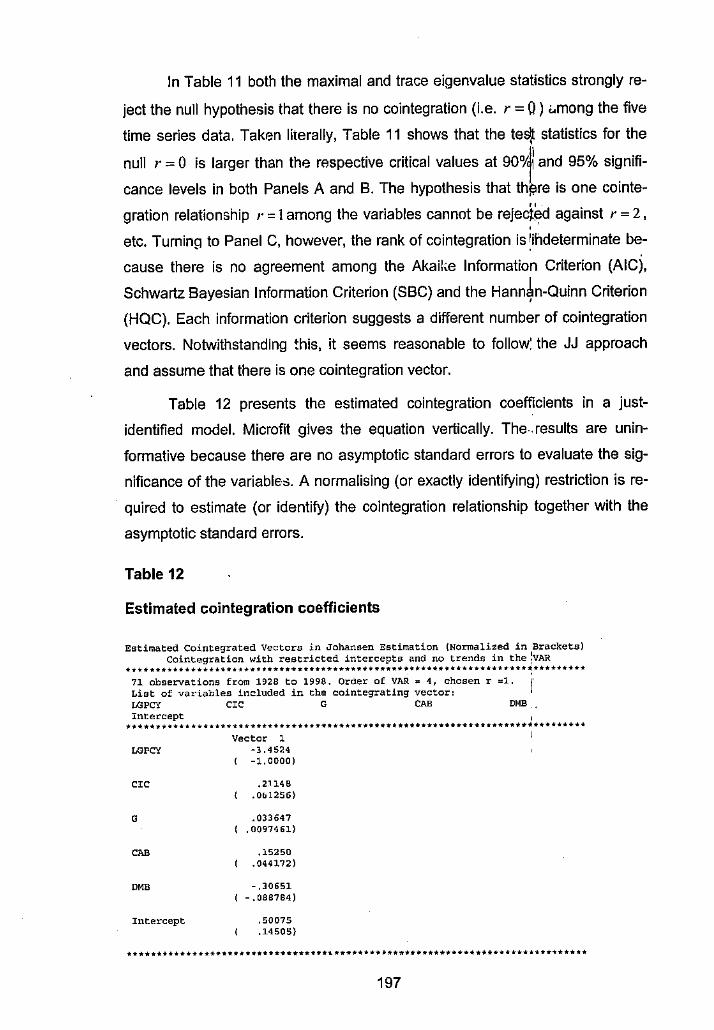
In Table 11 both the maximal and trace eigenvalue statistics strongly re
ject the null hypothesis that there is no cointegration (i.e. r = O) cmong the five
time series data. Taken literally, Table 11 shows that the tea) statistics for the
null r = 0 is larger than the respective critical values at 90°/il and 95% signifi
cance levels in both Panels A and 8. The hypothesis that th~re is one cointe-" gration relationship r = I among the variables cannot be reject~d against r = 2, .
etc. Turning to Panel C, however, the rank of cointegration is !ihdeterminate be-
cause there is no agreement among the Akaike Information Criterion (AIC),
Schwartz Bayesian Information Criterion (SBC) and the Hann~n-Quinn Criterion '
(HOC). Each information criterion suggests a different number of cointegration
vectors. Notwithstanding this, it seems reasonable to follow: the JJ approach
and assume that there is one cointegration vector.
Table 12 presents the estimated cointegration coefficients in a just
identified model. Microfit gives the equation vertically. The-.results are unin
fom1ative because there are no asymptotic standard errors to evaluate the sig
nificance of the variable-::.. A normalising (or exactly identifying) restriction is re
quired to estimate (or identify) the cointegration relationship together with the
asymptotic standard errors.
Table 12
Estimated cointegration coefficients
Estimated Cointegrated Vectors in Johansen Estimation (Normalized in Brackets) Cointegration with restricted intercepts and no trends in the :vAR
•••••••••••••••••••••••••••••••••••••••••••••••••••••••••••••••••••••••••••••• 71 observations from 1928 to 1998. Order of VAR~ 4, chosen r =1. List of variables included in the cointegrating vector: LGPCY CIC G CAB DMB Intercept ' ••••••••••••••••••••••••••••••••••••••••••••••••••••••••••••••••••••••••••••••
Vector ' uaeCY -3.4524 I -1.0000)
c,c .21148 I .Obl2S6)
G .033647 . 0097461)
CAB ,15250 I .044172)
DMB -.30651 I - .088784)
Intercept .50075 .14505)
197
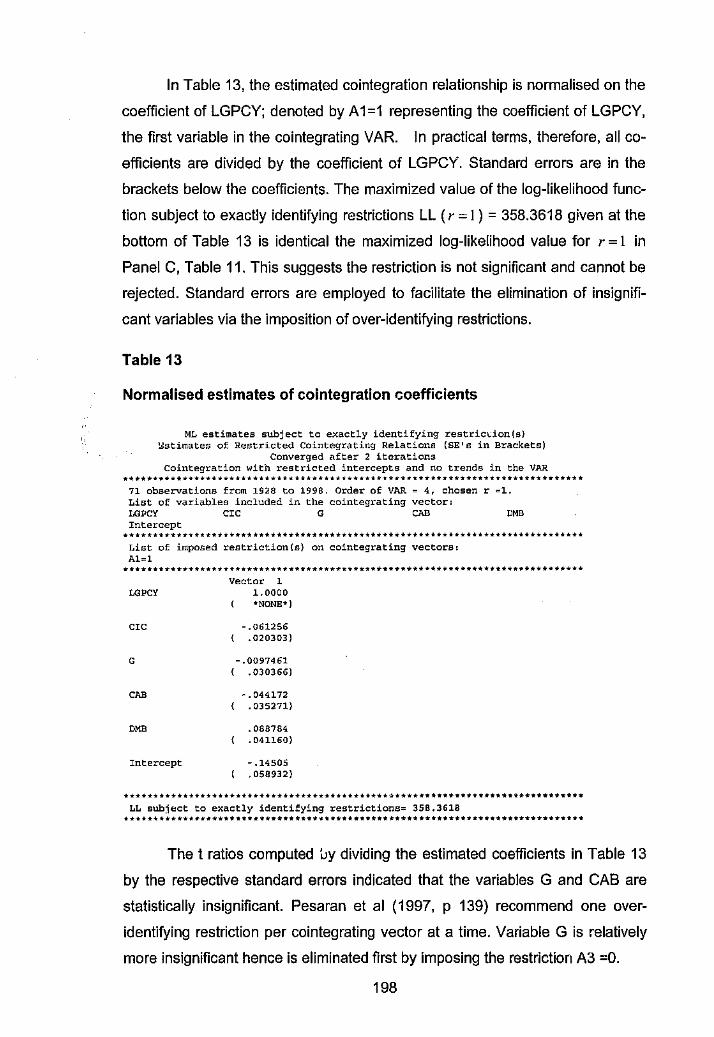
In Table 13, the estimated cointegration relationship is normalised on the
coefficient of LGPCY; denoted by A 1 =1 representing the coefficient of LGPCY,
the first variable in the cointegrating VAR. In practical terms, therefore, all co
efficients are divided by the coefficient of LGPCY. Standard errors are in the
brackets below the coefficients. The maximized value of the log-likelihood func
tion subject to exactly identifying restrictions LL ( r = I ) = 358.3618 given at the
bottom of Table 13 is identical the maximized log-likelihood value for r = 1 in
Panel C, Table 11. This suggests the restriction is not significant and cannot be
rejected. Standard errors are employed to facilitate the elimination of insignifi
cant variables via the imposition of over-identifying restrictions.
Table 13
Normalised estimates of cointegration coefficients
ML estimates subject to exactly identifying restric~ion(s) ~stimates of Restricted Cointegrating Relations (SE's in Brackets)
Converged after 2 iterations Cointegration with restricted intercepts and no trends in the VAR
****************************************************************************** 71 observations from 1928 to 1998. Order of VAR= 4, chosen r ~1. List of variables included in the cointegrating vector: LGPCY CIC G CAB DMB Intercept
List of imposed restriction(s) on cointegrating vectors, Al=l
Vector ' LGPCY 1.0000 *NONE*)
c,c -.061256 .020303)
' -.0097461 ( .030366)
CAB -.044172 • 035271)
DMB • 088784 • 041160)
Intercept - .14505 . 058932)
LL subj~ct to exactly identifying restrictions= 358.3618 ******************************************************************************
The t ratios computed Gy dividing the estimated coefficients in Table 13
by the respective standard errors indicated that the variables G and CAB are
statistically insignificant. Pesaran et al (1997, p 139) recommend one over
identifying restriction per cointegrating vector at a time. Variable G is relatively
more insignificant hence is eliminated first by imposing the restriction A3 =O.
198
i: l
'
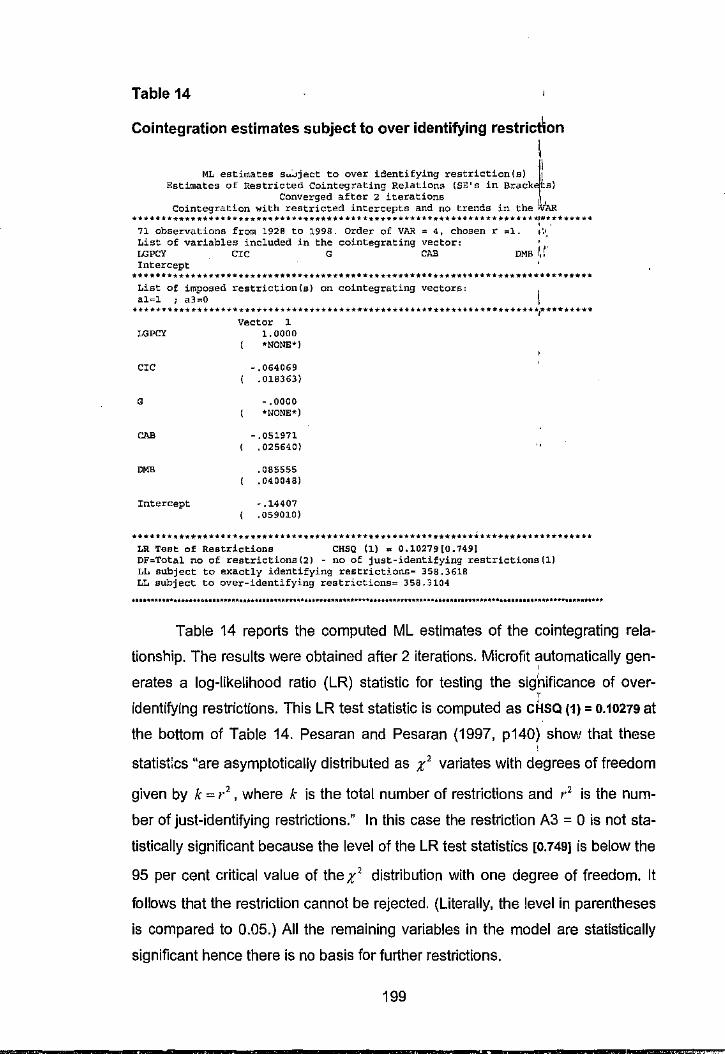
Table 14
Cointegration estimates subject to over identifying restriction
I ML estimates s..:..iject to over identifying restriction(s) 11
Estimates of Restricted Cointegrating Relations (SE's in Brack ts) Converged after 2 iterations
Cointegration with restricted intercepts and no trends in the ivAR ........................................................................ ~#********
71 observations from 1928 to 1998. Order of VAR" 4, chosen r List of variables included in the cointegrating vector: LGPCY CIC G CAB Intercept
List of imposed restriction(s) on cointegrating vectors:
. .. 1. !',•, .
DMB IJ
alcl ; a3"0 ******************************************************************"***,****"***"**
Vector 1 LGPCY 1. 0000
*NONE*)
,,c -.064069 .018363)
' -.0000 *NONE*)
CAB -.051971 , 025640)
OMB .085555 .040048)
Intercept -.14407 .059010)
LR Test of Restrictions CHSQ (1) ~ 0,10279[0.7491 DF,,Total no of restrictions(2) - no of just-identifying restrictions(l) LL subject to exactly identifying restrictions" 358.3618 LL subject to over-identifying restrictions" 358.3104 ...........................................................................................................................
Table 14 reports the computed ML estimates of the cointegrating rela
tionship. The results were obtained after 2 iterations. Microfit automatically gen-'
erates a log-likelihood ratio (LR) statistic for testing the sighificance of over-'
identifying restrictions. This LR test statistic is computed as cHso (1} = 0.10279 at
the bottom of Table 14. Pesaran and Pesaran (1997, p140) show that these
statist:cs "are asymptotically distributed as ,r 2 variates with degrees of freedom
given by k = r 2, where k is the total number of restrictions and r 2 is the num
ber of just-identifying restrictions." In this case the restriction A3 = 0 is not sta
tistically significant because the level of the LR test statistics [0.749] is below the
95 per cent critical value of the ,r 2 distribution with one degree of freedom. It
follows that the restriction cannot be rejected. (Literally, the level in parentheses
is compared to 0.05.) All the remaining variables in the model are statistically
significant hence there is no basis for further restrictions.
199
'
l
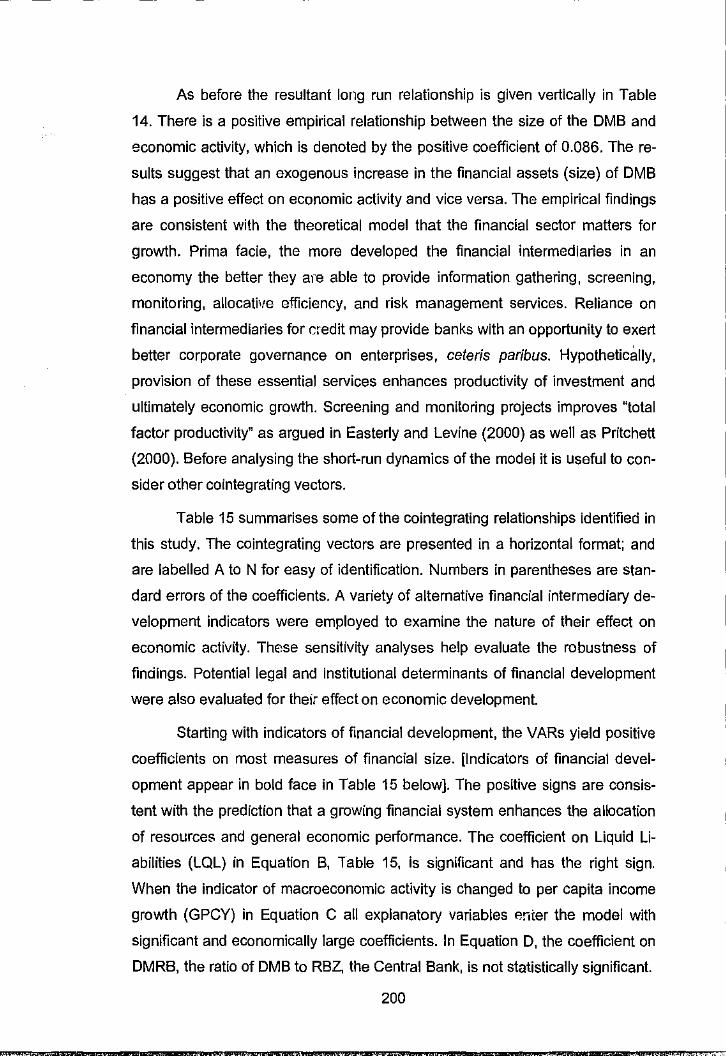
As before the resultant long run relationship is given vertically in Table
14. There is a positive empirical relationship between the size of the DMB and
economic activity, which is denoted by the positive coefficient of 0.086. The re
sults suggest that an exogenous increase in the financial assets (size) of DMB
has a positive effect on economic activity and vice versa. The empirical findings
are consistent with the theoretical model that the financial sector matters for
growth. Prima facie, the more developed the financial intermediaries in an
economy the better they are able to provide information gathering, screening,
monitoring, allocative efficiency, and risk management services. Reliance on
financial intermediaries for credit may provide banks with an opportunity to exert
better corporate governance on enterprises, ceteris paribus. Hypothetic8.lly,
provision of these essential services enhances productivity of investment and
ultimately economic growth. Screening and monitoring projects improves "total
factor productivity" as argued in Easterly and Levine (2000) as well as Pritchett
(2000). Before analysing the short-run dynamics of the model it is useful to con
sider other cointegrating vectors.
Table 15 summarises some of the cointegrating relationships identified in
this study. The cointegrating vectors are presented in a horizontal format; and
are labelled A to N for easy of identification. Numbers in parentheses are stan
dard errors of the coefficients. A variety of alternative financial intermediary de
velopment indicators were employed to examine the nature of their effect on
economic activity. These sensitivity analyses help evaluate the robustness of
findings. Potential legal and institutional determinants of financial development
were also evaluated for their effect on economic development.
Starting with indicators of financial development, the VARs yield positive
coefficients on most measures of financial size. [Indicators of financial devel
opment appear in bold face in Table 15 below]. The positive signs are consis
tent with the prediction that a growing financial system enhances the allocation
of resources and general economic pertormance. The coefficient on Liquid Li
abilities (LQL) in Equation B, Table 15, is significant and has the right sign.
When the indicator of macroeconomic activity is changed to per capita income
growth (GPCY) in Equation C all explanatory variables enter the model with
significant and economically large coefficients. In Equation D, the coefficient on
DMRB, the ratio of DMB to RBZ. the Central Bank, is not statistically significant.
200
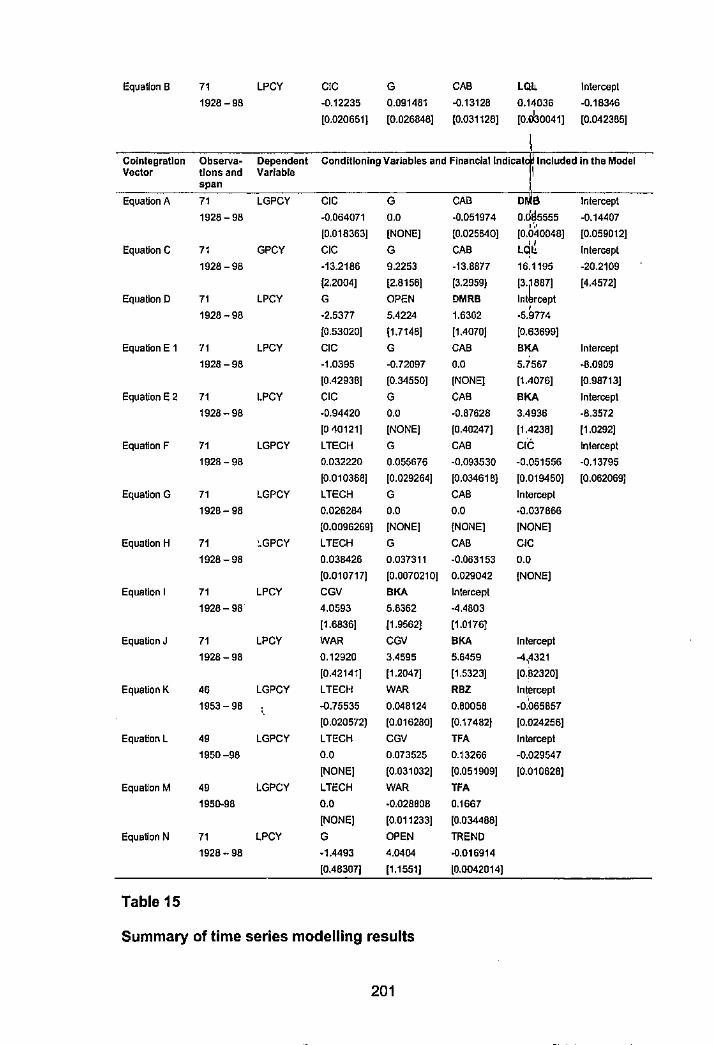
1
Equation B 71 LPCY CIC G CAB LQC Intercept
1928-98 -0.12235 0.091481 -0.13128 0.14036 -0.18346
[0.0206511 [0.026848] {0.031128] [o.0000411 [0.042385]
Colnlegrallon Observa- Dependent Conditioning Varlables and Flnancla1 lndical Included In the Model Vector tlons and Variable I
span
Equation A 71 LGPCY CIC G CAO o~• Intercept
1928-98 -0.064071 0.0 -0.051974 o.d85555 -0.14407 ,·., [0.018363] (NONE] [0.025640] [0.040048] [0.059012]
Equation C 71 GPCY CIC G CAB L(=!l Intercept
1928-98 -13.2186 9.2253 -13.8877 16.1195 -20.2109
(2.2004] (2.8156] [3.2959} ''IB"'
[4.4572]
Equation D 71 LPCY G OPEN OMRB Int rcept ' 1928-98 -2.5377 5.4224 1.6302 -5.9774
{0.53020] [1.7148] [1.4070] [0.63699]
Equation E 1 71 LPCY CIC G CAB BKA Intercept
1928-98 -1.0395 -0.72097 0.0 5.7567 -8.0909 ·l . [0.42938] (0.34550] [NONEJ [1.4076] [0.98713]
Equation E 2 71 LPCY CIC G CAB BKA Intercept
1928-98 -0.94420 0.0 -0.87628 3.4936 -8.3572
[O '10121] (NONE] (0.40247] [1.4238] {1.0292)
Equation F 71 LGPCY LTECH G CAB CIC Intercept
1928- 98 0.032220 0.055676 -0.093530 -0.051556 -0.13795
[0.010368] [0.029264] [0.034618} [0.019450] [0.0620691
Equation G 71 LGPCY LTECH G CAB Intercept
1928-98 0.026284 0.0 0.0 -0.037866
[0.0096269] [NONE] {NONE] [NONE]
Equation H 71 ~GPCY LTECH G CAB CIC
1928-98 0.038426 0.037311 -0.063153 0.0
(0.010717) [0.0070210] 0.029042 {NONE]
Equation I 71 LPCY CGV BKA Intercept
1928-98 4.0593 5.8362 -4.4803
[1.6836] 11,95621 [1.0176]
Equation J 71 LPCY WAR CGV BKA lnlercepl
1928-98 0.12920 3.4595 5.6459 -4,4321
[0.42141] {1.2047] [1.5323] [0.82320]
Equation K 46 LGPCY LTECH WAR RBZ lnt.ercept
1953- 98 --0.75535 0.048124 0.80058 -0.065857
[0.020572) (0.016280] {0.174821 [0.024256]
Equation L 49 LGPCY LTECH CGV TFA Intercept
1950-98 0.0 0.073525 0.13266 -0.029547
[NONE] (0.031032] [0.051909] [0.010628]
Equation M 49 LGPCY LTECH WAR TFA
1950.98 0.0 -0.028808 0.1667
[NONE] [0.011233] (0.034488]
Equation N 71 LPCY G OPEN TREND
1928- 98 -1.4493 4.0404 -0.016914
[0.46307] (1.1551] [0.0042014]
Table 15
Summary of time series modelling results
201 ·~
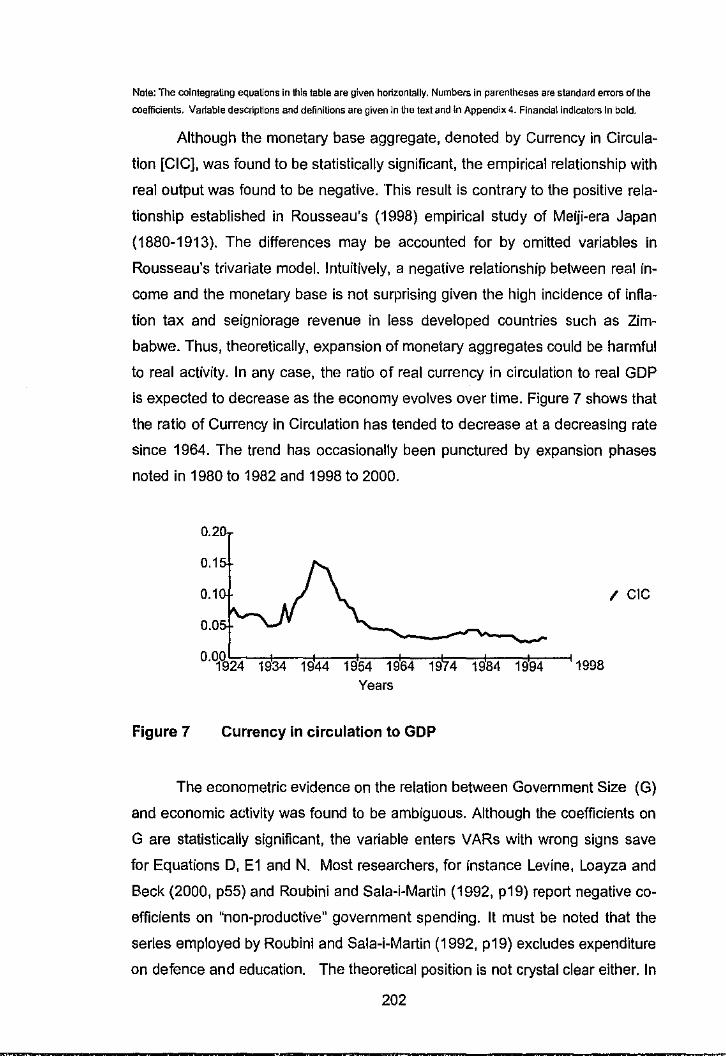
Note: The colntegrating equations in thls table are given horizontally. Numbers in parentheses are standard errors of the
coefficients. Variable descrlp~ons and definitions are given In the text and !n Appendix 4. Financial Indicators In bold.
Although the monetary base aggregate, denoted by Currency in Circula
tion [CIC], was found to be statistically significant, the empirical relationship with
real output was found to be negative. This result is contrary to the positive rela
tionship established in Rousseau's (1998) empirical study of Meiji-era Japan
(1880-1913). The differences may be accounted for by omitted variables in
Rousseau's trivariate model. Intuitively, a negative relationship between real in
come and the monetary base is not surprising given the high incidence of infla
tion tax and seigniorage revenue in less developed countries such as Zim
babwe. Thus, theoretically, expansion of monetary aggregates could be harmful
to real activity. In any case, the ratio of real currency in circulation to real GDP
is expected to decrease as the economy evolves over time. Figure 7 shows that
the ratio of Currency in Circulation has tended to decrease at a decreasing rate
since 1964. The trend has occasionally been punctured by expansion phases
noted in 1980 to 1982 and 1998 to 2000.
Figure 7
0.2
0·0P924 1934 1944 1954 1964 19 4 1984 1994
Years
Currency in circulation to GOP
/ CIC
1998
The econometric evidence on the relation between Government Size (G)
and economic activity was found to be ambiguous. Although the coefficients on
G are statistically significant, the variable enters VARs with wrong signs save
for Equations D, E1 and N. Most researchers, for instance Levine, Loayza and
Beck (2000, p55) and Roubini and Sala-i-Martin (1992, p19) report negative co
efficients on "non-productive" government spending. It must be noted that the
series employed by Roubini and Sala-I-Martin (1992, p19) excludes expenditure
on defence and education. The theoretical position is not crystal clear either. In
202
------------·----,.,, a Keynesian framework, government expenditure can stimulate economic activ
ity. Persistent government deficits are, however, not sustaina~le. The financing
of government deficits through the banking sector is known \lo be inflationary
and detrimental to both financial and economic development. iithough the gov-1
ernment might benefit from financial repression, distorted in~~ntive structures
and price signals curtail the capacity of financial intermediariE!_'s to monitor and '·'.
screen projects. The resultant decrease in total factor pro~µctivity weakens
macroeconomic activity.
/G
0.1
o. ~i24 1934 1944 1954 1964 19 4 1984 19~4 11998 Years
Figure 8 Government expenditure to GDP
The ratio of real Government Expenditure to real GDP in Zimbabwe is
captured in Figure 8 above. Apart from the Federal decade (1953 to 1963) suc
cessive government have not resisted the temptation to increase fiscal expen
dihJre. A high government deficit is expected to retard growth. In fact, critics
partially attributed the unfolding economic crisis in Zimbabwe to fiscal indisci
pline.
By late 2000, the country was in the midst of a serious economic crisis and was saddled with a sizeable stock of public debt and external payments arrears, while usable foreign reserv1.::s had dwindled and inflation was on an upward trend. [IMF Country Report (2001, p5)]
A substantial body of research suggests that the degree of openness to
international trade [OPEN], measured as the sum of real exports and real im
ports to real GDP, has a positive effect on economic activity. The literature on
trade regimes suggests that reliance on autarky in a small economy diminishes
prospects for technical progress, and allocative efficiency, while promoting rent
203
->" ,,fl .·l
1
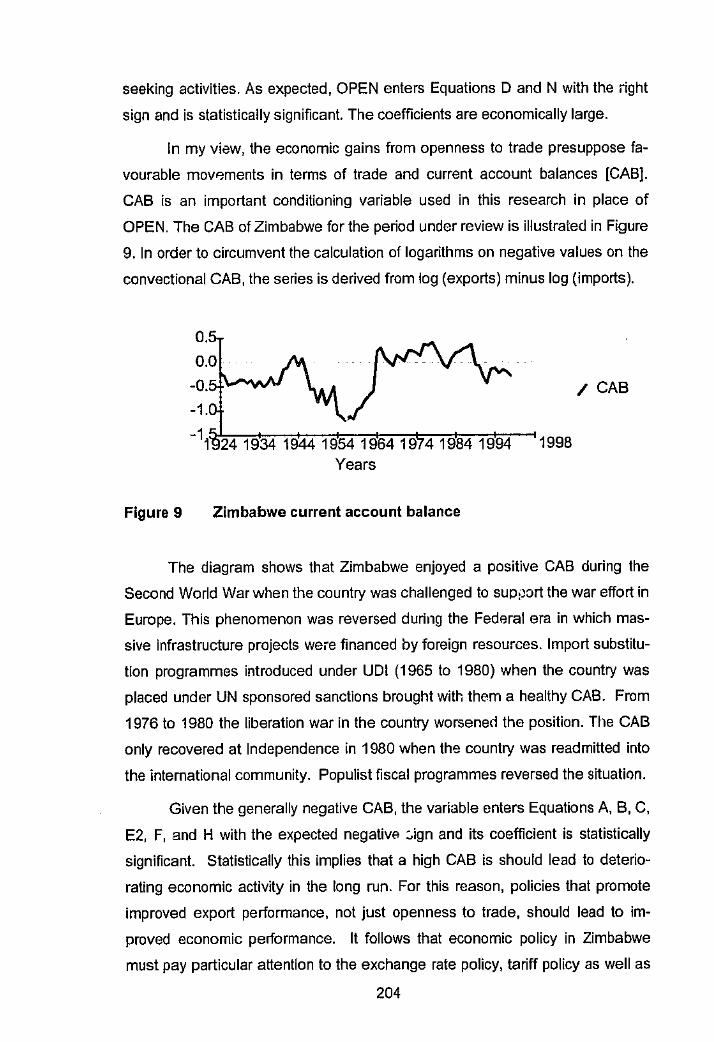
seeking activities. As expected, OPEN enters Equations D and N with the right
sign and is statistically significant. The coefficients are economically large.
In my view, the economic gains from openness to trade presuppose fa
vourable mow~ments in terms of trade and current account balances [CABJ.
CAB is an important conditioning variable used in this research in place of
OPEN. The CAB of Zimbabwe for the period under review is illustrated in Figure
9. In order to circumvent the calculation of logarithms on negative values on the
convectional CAB, the series is derived from log (exports) minus log (imports).
Figure 9
24 1934 1944 1954 196419 41984 1994 Years
Zimbabwe current account balance
/ CAB
1998
The diagram shows that Zimbabwe enjoyed a positive CAB during the
Second World War when the country was challenged to supfJort the war effort in
Europe. This phenomenon was reversed during the Federal era in which mas
sive infrastructure projects we;e financed by foreign resources. Import substitu
tion programmes introduced under UDI (1965 to 1980) when the country was
placed under UN sponsored sanctions brought with them a healthy CAB. From
1976 to 1980 the liberation war in the country worsened the position. Tile CAB
only recovered at Independence in 1980 when the country was readmitted into
the international community. Populist fiscal programmes reversed the situation.
' 'i' '
. ' . ; .,,_
-"
_f .
. '
Given the generally negative CAB, the variable enters Equations A, 8, C, t
E2, F, and H with the expected negative :.ign and its coefficient is statistically
significant. Statistically this implies that a high CAB is should lead to deterio-
rating economic activity in the long run. For this reason, policies that promote
improved export performance, not just openness to trade, should lead to im-
proved economic performance. It follows that economic policy in Zimbabwe
must pay particular attention to the exchange rate policy, tariff policy as well as
204
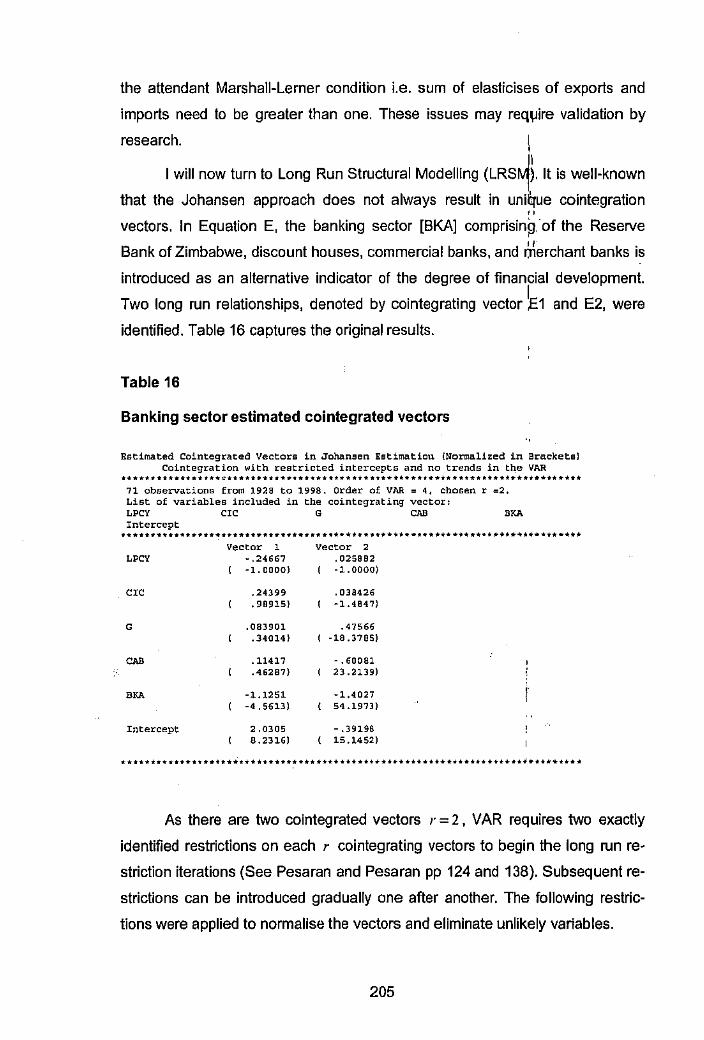
the attendant Marshall-Lerner condition i.e. sum of elasticises of exports and
imports need to be greater than one. These issues may req~ire validation by
research. \
I will now turn to Long Run Structural Modelling (LRS~\. It is well-known
that the Johansen approach does not always result in unitllue cointegration " vectors. In Equation E, the banking sector [BKA] comprisin~.-of the Reserve
Bank of Zimbabwe, discount houses, commercial banks, and Merchant banks is
introduced as an alternative indicator of the degree of financial development.
Two long run relationships, denoted by cointegrating vector ~1 and E2, were
identified. Table 16 captures the original results.
Table 16
Banking sector estimated cointegrated vectors
Estimated Cointegrated Vectors in Johansen Estimation (Normalized in Brackets) Cointegration with restricted intercepts and no trends in the VAR
·················~···························································· 71 observations from 1928 to 1998. Order of VAR = 4, chosen r =2, List of variables included in the cointegrating vector, LPCY CIC G CAB BKA Intercept
Vector ' Vector ' C,CY • .24667 . 025882 I ·1.0000) I -1.0000)
CIC .24399 . 038426 • 90915) I •1.4847)
G .083901 .47566 .34014) I -18.3705)
CAB .11417 - . 60081 .46287) I 23.2139)
B><A -1.1251 ·1.4027 -4, 5613) 54.1973)
Intercept 2.0305 • .39196 8.2316) 15.1452)
As there are two cointegrated vectors r = 2, VAR requires two exactly
identified restrictions on each r cointegrating vectors to begin the long run re
striction iterations (See Pesaran and Pesaran pp 124 and 138). Subsequent re
strictions can be introduced gradually one after another. The following restric
tions were applied to normalise the vectors and eliminate unlikely variables.
205
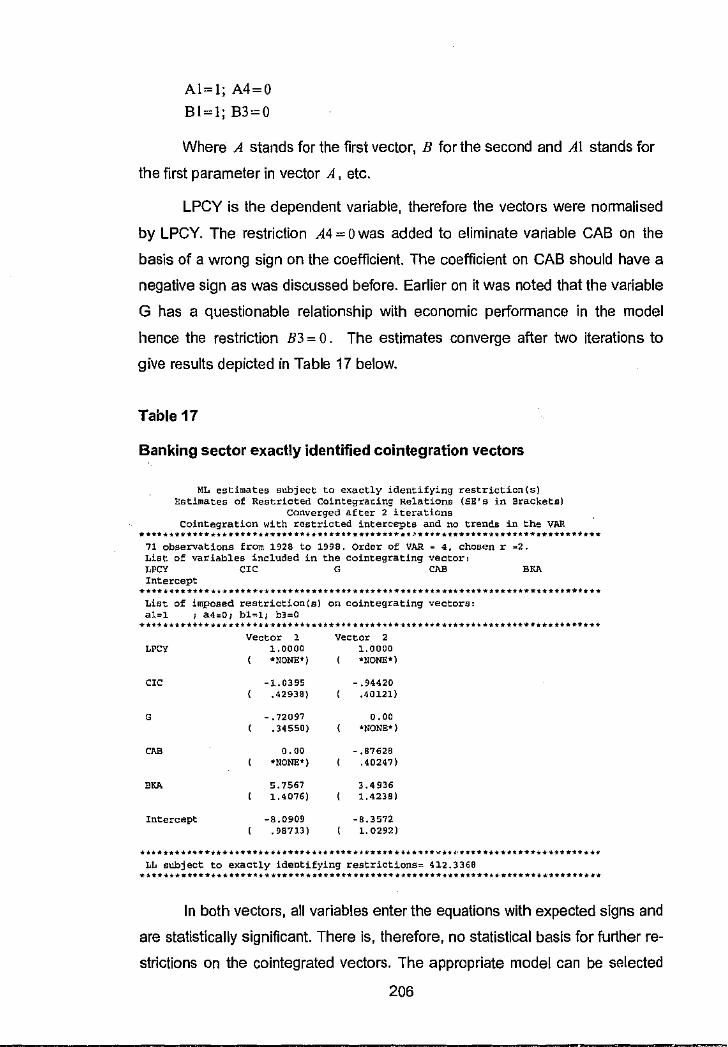
Al=l; A4=0
Bl=!; B3=0
Where A stands for the first vector, B for the second and AI stands for
the first parameter in vector A, etc.
LPCY is the dependent variable, therefore the vectors were normalised
by LPCY. The restriction A4 = o was added to eliminate variable CAB on the
basis of a wrong sign on the coefficient. The coefficient on CAB should have a
negative sign as was discussed before. Earlier on it was noted that the variable
G has a questionable relationship with economic performance in the model
hence the restriction B3 = O. The estimates converge after two iterations to
give results depicted in Table 17 below.
Table 17
Banking sector exactly identified cointegration vectors
ML estimates subject to exactly identifying restriction(s) Estimates of Restricted Cointegracing Relations (SE's in Brackets)
converged after 2 iterations Cointegration with restricted intercepts and no trends in the VAR
........................................ ,. ........ ,. ••••• ·'* ....... ,. ................ ,. ••••• ,.. 71 observations from 1928 to 1998. Order of VAR~ 4, chosen r ~2. List of variables included in the cointegrating vector: LPCY CIC G CAB BKJ\ Intercept
List of imposed restriction(s) on cointegrating vectors: a1=1 ; a4=0; bh,11 b3=0 ................................. ,.,. ............................................... .
Vector ' Vector ' LPC'I 1.0000 1.0000 *NONE*) *NONE*}
c,c -1.0395 - .94420 .42938) .40121)
' - • 72097 O .00 .34550) *NONE•)
"'" 0 .00 -.87628 *NONE*) .40247)
'"' 5.7567 3.4936 1,4076) 1.4238)
Intercept -8.0909 -8.3572 .98713) 1.0292)
***"***********"**•*••••••*••• ••• "******** .......... "**''**** •• ,. .............. ****** LL subject to exactly identifying restrictions= 412.3368
.............. ,. ..................... ,. ................... ,. ...... ,. ................ ,. .... . In both vectors, all variables enter the equations with expected signs and
are statistically significant. There is, therefore, no statistical basis for further re
strictions on the cointegrated vectors. The appropriate model can be selected
206
'
on the basis of theory. The theoretical model underlying this research posits
that financial aggregates have a strong causal effect on grm.vtO. Following upon
this hypothesis, vector A (EQ. E1) is chosen ahead of Bas it g\ves the strongest
relationship between financial intermediation and economic perormance.
Credit aggregates are some of the widely used measures of financial de-"
velopment. Beck, DemirgG9-Kunt, Levine (1999) and King and Levine (1993)
popularised their use. These aggregates relate real private sebtor credit issued
by various categories of financial intermediaries to real GDP. In this rese::irch,
no reliance was placed on credit aggregates for a number of(reasons. The t,.
pothesis that Private S·actor Credit by DMB contains a unit root was statistically
rejected. As shown in Table 9, unit root properties of PCOBI and PCDFI sug
gest the variables are integrated to the orders 1(2)and 1(3) respectively. Incor
porating these variables in VAR would give rise to the spectre of spurious coln
tegration. I avoided the temptation to difference these series, .as the practice is
known to wash away the long run information contained in the original level
form. Private Sector Credit by the Banking Sector (PCBK) did not contain useful
information about real economic activity.
From a statistical perspective, the unit root properties of credit aggre
gates might have been influenced by the poor quality of the various series,
which were partly constructed from second hand sources. Future researchers
should strive to locate original sources such as the "Economic and Statistical
Bulletin (1933 -1954)" and the "Quarterly Bulletin of Financial Statistics" either '
at the National Archives or at the Central Statistics Office:: The present re-'
searcher could not exhaust all possible leads as he was baied in Australia at
the time this research was conceived. Although I was able to visit Zimbabwe for ' data collection purposes the expedition lasted only two weeks ..
Theoretically, credit aggregates in Zimbabwe might not contain useful
information on real economic activity due to fundamental weaknesses. A series
of subsidised and I or directed credit schemes have been instituted in Zim
babwe whose repayment record has been disastrous to say the least. I concur
with Fry (1997, p760) that directed credit programmes increase delinquency
and default rates and fragility of the financial system. Kane and Rice (2000, p5)
describe "zombie banks" which are allowed to operate even when their net
207
' <
worth has evaporated. Credit accumulation might have no relationship to eco
nomic performance, if the financial institution is all but insolvent. Given these
issues there is high risk that credit aggregates may not bear any relationship
real asset values. Although difficult to swallow, financial repression continues to
thrive in Zimbabwe. The constraints distort price signals, and factor productiv
ity.
8.2 Selected institutional determinants of development
The institutional environment in which financial institutions must operate
influences prospects for financial development and by extension economic ac
tivity. In order to assess the econometric importance of proxies for the institu
tional framework, the variables were introduced one at a time. To start with, in-
::-'-'-
-¥
dicators of financial development were temporarily removed from the model. "
This approach allows for the direct evaluation of the informational content of en
vironmental proxies in their own right. The practice also curbs fast exhaustion of
degrees of freedom in VARs by minimising prospects for over parameterisation.
Before proceeding, it must be noted that not all potentially useful legal
and institutional variables are amenable to vector autoregressions. ln section
5.3 it was noted that some indicators such as legal origin maybe time invariant
hence not informative in time series analysis based on a single country. This
section thus zeros in on those variables that can realistically vary with time.
In Section 5.3, this thesis proposes the logarithm of telephone lines per
capita (L TECH) as a new surmgate for dynamic efficiency. In recent years fi
nancial innovations, including point of sale, telephone banking, automated teller
machines (ATMS) as well as e-banking, have increasingly become reliant on
informational technologies. Lynch (1993, p15) argues that financial develop
ment should be reflected in increased sophistication of financial products, effi
cient pricing, and reduction in information asymmetry. Van Horne (1985) argues
that true financial innovations make the market mure efficient and I or more
complete. Increased choice would suggest increased market completeness. Fi
nancial instruments, like market products facilitates price arbitrage across time,
markets and countries. In a small developing economy such as Zimbabwe,
L TECH approximates the market's capacity to adopt new technology or ideas.
208
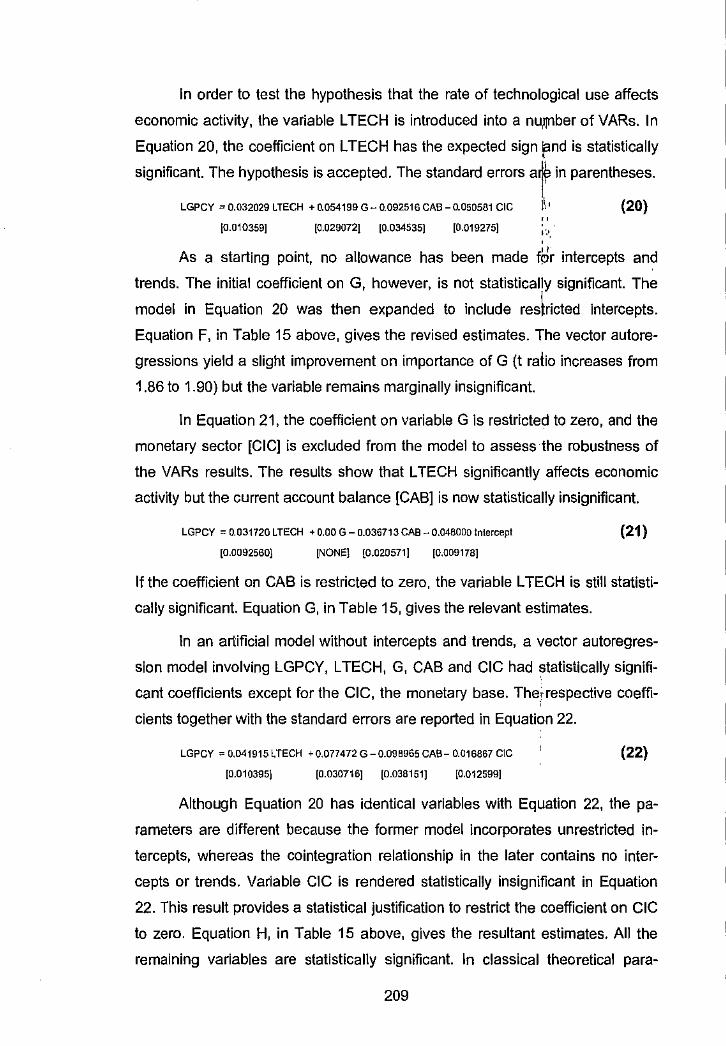
In order to test the hypothesis that the rate of technological use affects
economic activity, the variable LTECH is introduced into a nunnber of VARs. In
Equation 20, the coefficient on L TECH has the expected sign rind is statistically
significant. The hypothesis is accepted. The standard errors at in parentheses.
LGPCY "'0.032029 LTECH + 0.054199 G- 0.092516 CAB-0.050581 CIC )\• (20) " [0.010359] [0.0290721 [0.034535] [0.019275) 1·.·. '
As a starting point, no allowance has been made t8r intercepts and
trends. The initial coefficient on G, however, is not statistically significant. The
model in Equation 20 was then expanded to include restricted intercepts.
Equation F, in Table 15 above, gives the revised estimates. The vector autare
gressions yield a slight improvement on importance of G (t raiio increases from
1.86 to 1.90) but the variable remains marginally insignificant.
In Equation 21, the coefficient on variable G is restricted to zero, and the
monetary sector [CIC] is excluded from the model to assess the robustness of
the VARs results. The results show that LTECH significantly affects economic
activity but the current account balance [CAB] is now statistically insignificant.
LGPCY :: 0.031720 LTECH + 0.00 G - 0.036713 CAB - 0.046000 !ntercept (21) [0.0092560) [NONEl [0.020571] [0.009178]
If the coefficient on CAB is restricted to zero, the variable L TECH is still statisti
cally significant. Equation G, in Table 15, gives the relevant estimates.
In an artificial model without intercepts and trends, a vector autoregres
sion model involving LGPCY, L TECH, G, CAB and CIC had statistically signifi
cant coefficients except for the CIC, the monetary base. The_l·respective coeffi
cients together with the standard errors are reported in Equation 22.
LGPCY :: 0.041915 LTECH +0.077472 G-0.098965 CAB- 0.016667 ClC (22)
[0.010395) [0.030716] [0.038151] [0.012599]
Although Equation 20 has identical variables with Equation 22, the pa
rameters are different because the former model incorporates unrestricted in
tercepts, whereas the cointegration relationship in the later contains no inter
cepts or trends. Variable CIC is rendered statistically insignificant in Equation
22. This result provides a statistical justification to restrict the coefficient on CIC
to zero. Equation H, in Table 15 above, gives the resultant estimates. All the
remaining variables are statistically significant. In classical theoretical para-
209
;;, -~· -
'
·i
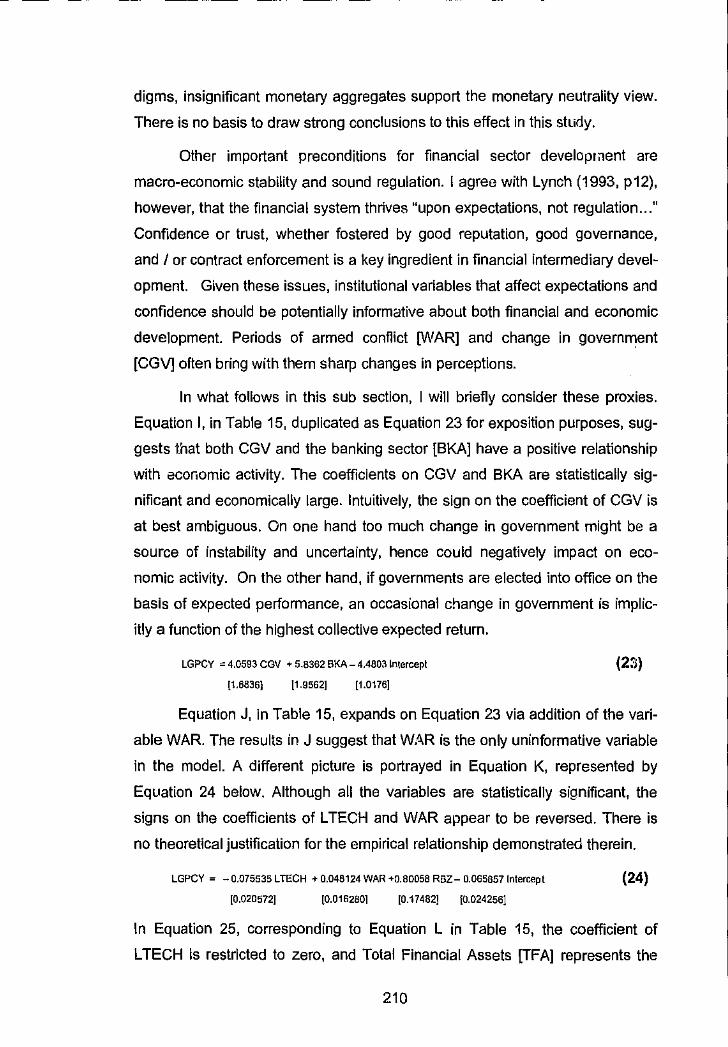
-
digms, insignificant monetary aggregates support the monetary neutrality view.
There is no basis to draw strong conclusions to this effect in this study.
Other important preconditions for financial sector developr,1ent are
macro-economic stability and sound regulation. I agree with Lynch (1993, p12),
however, that the financial system thrives "upon expectations, not regulation ... "
Confidence or trust, whether fostered by good reputation, good governance,
and I or contract enforcement is a key ingredient in financial intermediary devel
opment. Given these issues, institutional variables that affect expectations and
confidence should be potentially informative about both financial and economic
development. Periods of armed conflict [\,VAR] and change in govern~ent
[CGV] often bring with them sharp changes in perceptions.
In what follows in this sub section, I will briefly consider these proxies.
Equation I, in Table 15, duplicated as Equation 23 for exposition purposes, sug
gests that both CGV and the banking sector [BKA] have a positive relationship
with economic activity. The coefficients on CGV and BKA are statistically sig
nificant and economically large. Intuitively, the sign on the coefficient of CGV is
at best ambiguous. On one hand too much change in government might be a
source of instability and uncertainty, hence could negatively impact on eco
nomic activity. On the other hand, if governments are elected into office on the
basis of expected performance, an occasional change in government is implic
itly a function of the highest collective expected return.
LGPCY = 4.0593 CGV + 5.8362 BKA- 4.4803 Intercept (21)) [1.6836} J1.9562] [1.0176]
Equation J, in Table 15, expands on Equation 23 via addition of the vari
able WAR. The results in J suggest that WAR is the only uninformative variable
in the model. A different picture is portrayed in Equation K, represented by
Equation 24 below. Although all the variables are statistically significant, the
signs on the coefficients of L TECH and WAR appear to be reversed. There is
no theoretical justification for the empirical relationship demonstrated therein.
LGPCY = - 0.075535 LTECH + 0.048124 WAR +0.80058 RBZ- 0.065857 Intercept (24) [0.020572] [0.0162801 [0.17482] j0.024256]
In Equation 25, corresponding to Equation L in Table 15, the coefficient of
LTECH is restricted to zero, and Total Financial Assets (TFA] represents the
210
-'" .. -
-,i
. "''"'-- .,.
financial intermediary sector. To be precise, TFA is a summation of the assets
of RBZ, DMB, OBI, insurance, and the Zimbabwe Developmem Bank (ZDB).
LGPCY = 0.00 L TECH + 0.073525 CGV + 0.13266 TFA- 0.029547 Intercept I (25) [NONE] [0.0~1032] [0.051909] (0.010628]
1: The coefficients of all variables in the model appear to have lborrect signs and
" are statistically significant. The LR test suggests the restriction on L TECH can-
not be rejected. L TECH, therefore, seems not to be very inforM-ative when used
simultaneously with indicators of financial development. Computations obtained
in Equation M provide further support to this conclusion. To degin with, the co
efficients on variable L TECH and the intercept were noted to be statistically in
significant. L TECH remained statistically insignificant when the intercept was
restricted to zero. Lastly the LR Test on restrictions on both LTECH and the in
tercept cannot be statistically rejected.
8.3 Exploratory remarks on financial efficiency
There are no adequate time series data to assess the efficiency of the
Zimbabwean Financial System in a vector autoregression framework. Thus, this
section turns to descriptive and graphical techniques to draw insights on the ef
ficiency of the financial system. In section 5.2, reference was made to three
fr1rms of financial system efficiency discussed in The Campbell Committee's
(1981) Final Report. Briefly these are allocative efficiency, operational or tech
nical efficiency, and dynamic efficiency. This section focuse~ on technical effi
ciency, which is typically assessed using bank level accountir,g data. Kam Hon
Chu (1999, p754), for instance, uses profitability measures spch as returns on
assets (ROA), deposits (ROD), loans (ROL), and net worth (ROK) as proxies for
bank quality. Other standard indicators of performance used in the banking
profession include the net interest margin (NIM); overhead costs etc. Bank level
data is not readily accP.ssible in Zimbabwe. As a result, much of what follows
relies on interest trends and spreads.
Positive real interest rates are a fundamental precondition of financial
development. Lynch (1993, p12-14) regards real deposit interest rates as the
most important financial prices. Efficient pricing mechanisms are responsive to
changing economic conditions. In Zimbabwe, the real interest rate on commer-
211
iJJWWW&WWW!ii& i.MM\ Adi!IAWWW!:zz.a:::a::.tid.WC£'.3& Lil.llllW"..MU&i&,WWWA&W!Z.li !ilLlllL
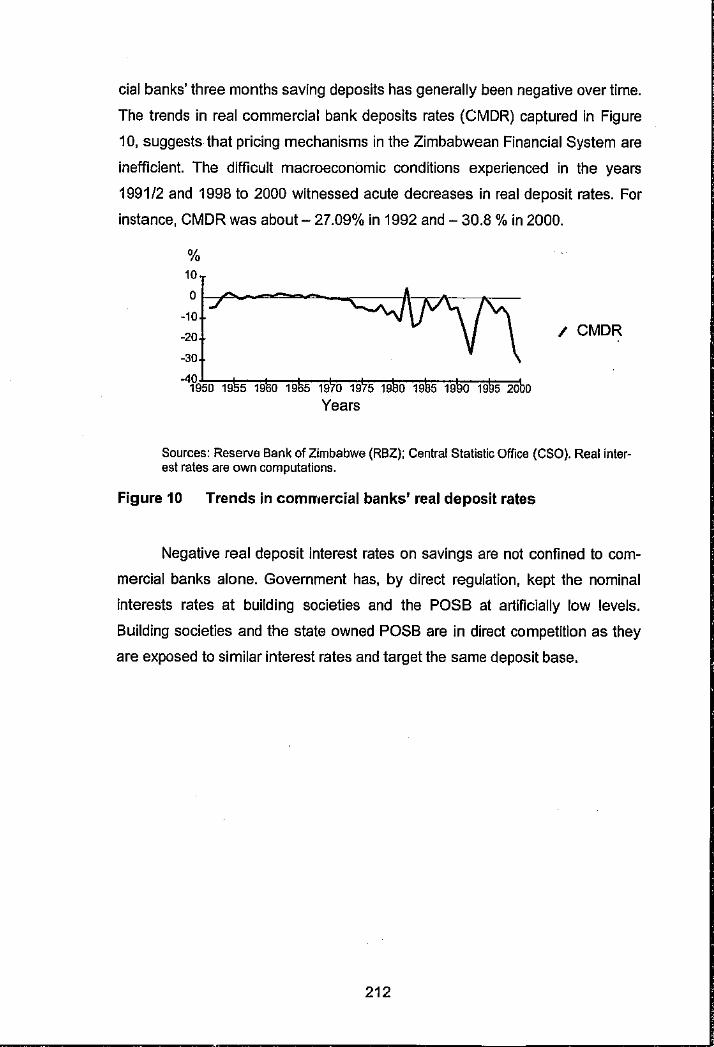
cial banks' three months saving deposits has generally been negative over time.
The trends in real commercial bank deposits rates (CMDR) captured in Figure
10, suggests that pricing mechanisms in the Zimbabwean Financial System are
inefficient. The difficult macroeconomic conditions experienced in the years
1991/2 and 1998 to 2000 witnessed acute decreases in real deposit rates. For
instance, CMDR was about - 27.09% in 1992 and - 30.8 % in 2000.
% 10
-1~ r-,t°'--=---"'\:::::;;;:-frr:..l'i::;-7s;;;;;--·20 ·30
4f9~,~,~--=-"""'~""'~,~.~0~1•"'"'",~,~.~0~19~,~,~.~o~,.,.,,,,~2""-o o Years
/ CMDR
Sources: Reserve Bank of Zimbabwe (RBZ); Central Statistic Office (CSO), Real interest rates are own computations.
Figure 10 Trends in commercial banks' real deposit rates
Negative real deposit interest rates on savings are not confined to com
mercial banks alone. Government has, by direct regulation, kept the nominal
interests rates at building societies and the POSB at artificially low levels.
Building societies and the state owned POSB are in direct competition as they
are exposed to similar interest rates and target the same deposit base.
212
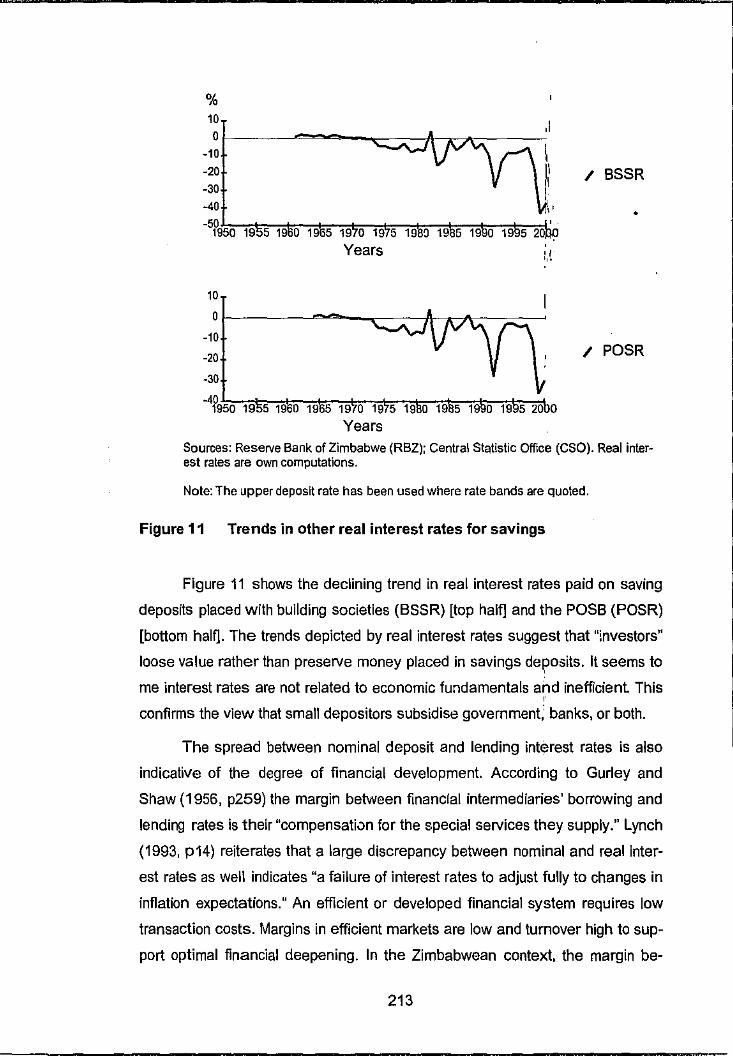
% 10 ,I
-1~ 1--~~---:;:::;-wfnv"~----:;~I
~ /I -30
-40 ,, -50'-;;-,,;!ac-;;;j;;;--;-;;\;;;.-;;l;;;-,;,a;;,:-,,,!;;;--,;;l;;,--«S\;;;-..,;;;!;,,-,;;;\;n 1950 19 s 19 o 19 s 19 o 19 s 19 a 19 s 19 o 19 s 20
Years . ,, ,,.
10
01--~~~~"'---..-----:----f'r-.-7\--:~~,-, -10
-20
-30
-4fgso 19 s 19 o
/ BSSR
•
/ POSR
Sources: Reserve Bank of Zimbabwe (RBZ); Central Statistic Office (CSO). Real inter~ est rates are own computations.
Note: The upper deposit rate has been used where rate bands are quoted.
Figure 11 Trends in other real interest rates for savings
Figure 11 shows the declining trend in real interest rates paid on saving
deposits placed with building societies (BSSR) [top haln and the POSS (POSR)
[bottom haln. The trends depicted by real interest rates suggest that "investors"
loose value rather than preserve money placed in savings de~osits. It seems to
me interest rates are not related to economic fundamentals and inefficient This '
confirms the view that small depositors subsidise government; banks, or both.
The spread between nominal deposit and lending interest rates is also
indicative of the degree of financial development. According to Gurley and
Shaw (1956, p259) the margin between financial intermediaries' borrowing and
lending rates is their "compensativn for the special services they supply." Lynch
(1993, p14) reiterates that a large discrepancy between nominal and real inter
est rates as well indicates "a failure of interest rates to adjust fully to changes in
inflation expectations." An efficient or developed financial system requires low
transaction costs. Margins in efficient markets are low and turnover high to sup
port optimal financial deepening. In the Zimbabwean context, the margin be-
213
-, '
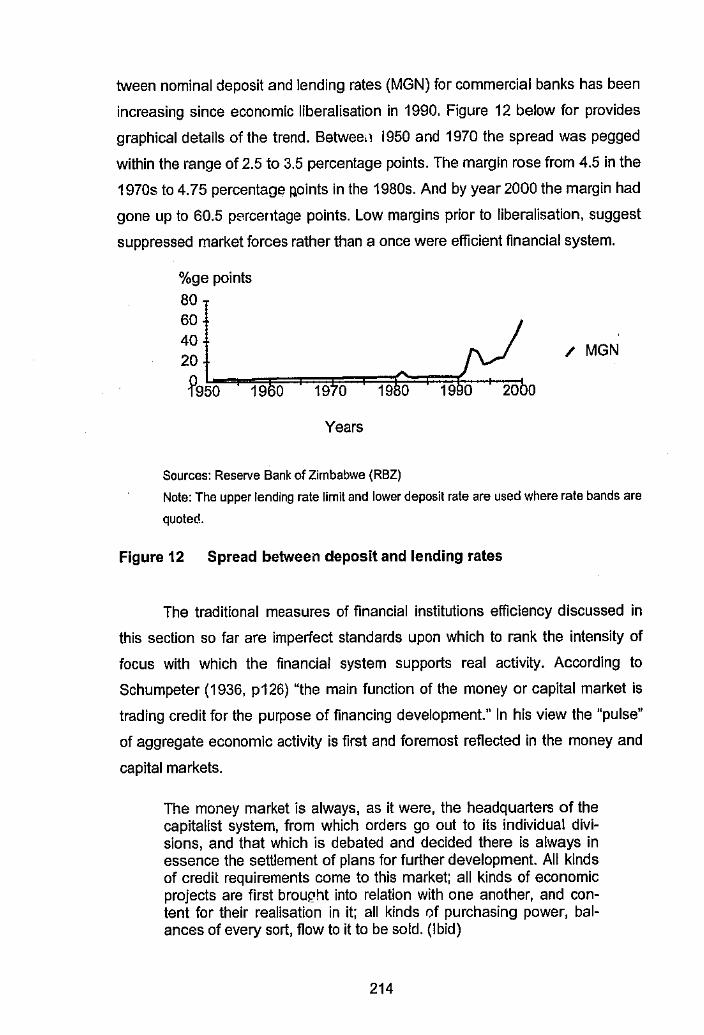
tween nominal deposit and lending rates (MGN) for commercial banks has been
increasing since economic liberalisation in 1990. Figure 12 below for provides
graphical details of the trend. Betwee,1 1950 and 1970 the spread was pegged
within the range of 2.5 to 3.5 percentage points. The margin rose from 4.5 in the
1970s to 4.75 percentage ~oints in the 1980s. And by year 2000 the margin had
gone up to 60.5 percentage points. Low margins prior to liberalisation, suggest
suppressed market forces rather than a once were efficient financial system.
%ge points 80 60
40
20
f 95ko,....-1"=9'E'510==19=70 =:;:19~is~10 =:;:1 :;i99~0-,..~2=000
Years
Sources: Reserve Bank of Zimbabwe (RBZ)
/ MGN
Note: The upper tending rate limit and lower deposil rate are used where rate bands are
quoted.
Figure 12 Spread between deposit and lending rates
The traditional measures of financial institutions efficiency discussed in
this section so far are imperfect standards upon which to rank the intensity of
focus with which the financial system supports real activity. According to
Schumpeter (1936, p126) "the main function of the money or capital market is
trading credit for the purpose of financing development." In his view the "pulse"
of aggregate economic activity is first and foremost reflected in the money and
capital markets.
The money market is always, as it were, the headquarters of the capitalist system, from which orders go out to its individual divisions, and that which is debated and decided there is always in essence the settlement of plans for further development. All kinds of credit requirements come to this market; all kinds of economic projects are first broui;,ht into relation with one another, and content for their realisation in it; all kinds of purchasing power, balances of every sort, flow to it to be sold. (Ibid)
214
Given these issues, I hereby propose a new measure of,efficiency, which
presumably refiects the degree to which financial institutions ~upport real activ
ity. Mathematically, Equation 26 below gives the new surrogat~ of efficiency:
DRIFT= Excess Liquid Assets or Excess Liquid Assets1
l!*IOO% (2G) Private Sector Credit Loans and Advances,\,
" By way of justification, it will be remembered that Pri~ate Sector Credit
" (PSC) is one of the several measures of the "activity" of finari'cial institutions .. 1
will assume PSC, unlike total deposits for instance, embodie~ the mechanisms
with which a financial system applies financial resources to real activity. Being
an absolute measure of activity, it does not capture leakages or efficiency of the ' financial intermediaries. In Equation 26, excess liquid assets (ELA) represent
resources not channelled to the productive or real sector.x In practical terms,
ELA are determined by the difference between actual liquid assets and pre
scribed liquid assets. This definition assumes regulatory authorities know the
right amount and type of liquid assets required to guarantee financial safety. In
general liquid assets of the Zimbabwean commercial banks, for instance, com
prise of (i) notes and coin, (ii) balances with the central bank, (iii) money at call
with discount houses, and (iv) bills which may be Treasury, Trade, Parastatal,
Municipal, and Cental Bank in origin. In a developing economy such assets are
more beneficial to governn1ent rather than financing real sector development.
It is my proposition that low values of DRIFT provide evidence of greater
focus on financial intermediation activities beneficial to real activity and vice '
versa. In theory DRIFT is an appropriate measure of efficiencY at least in devel-'
oping countries where loans and advances are the major soUrce of external fi-
nance. In these economies the market for sophisticated financial products such '
as derivatives, commercial paper, etc. is not fully developed. Holmstrom and
Tirole (1997) provide theoretical support that SMEs, which dominate developing
economies, naturally depend on banks for credit.
x "Money hoarded is seldom well spent," advises Bartlett (1987,p64). ln Myers and Rajan {1998) a very liquid stock increases managerial discretion and thus increases agency costs. There are well-known agency problems and moral hazard issues raised in financial literature against idle resources. Idle resources encourage managers to indulge in effort aversion, and craft schemes that hinder the development of the market for corporate control. In Diamond and Rajan 's ( 1998) model, bank managers do not create value but merely redistribute cash flows once the loan is made. ll1erefore excesses liquid assets have potential to decreases allocative, technical and dynamic efficiency.
215
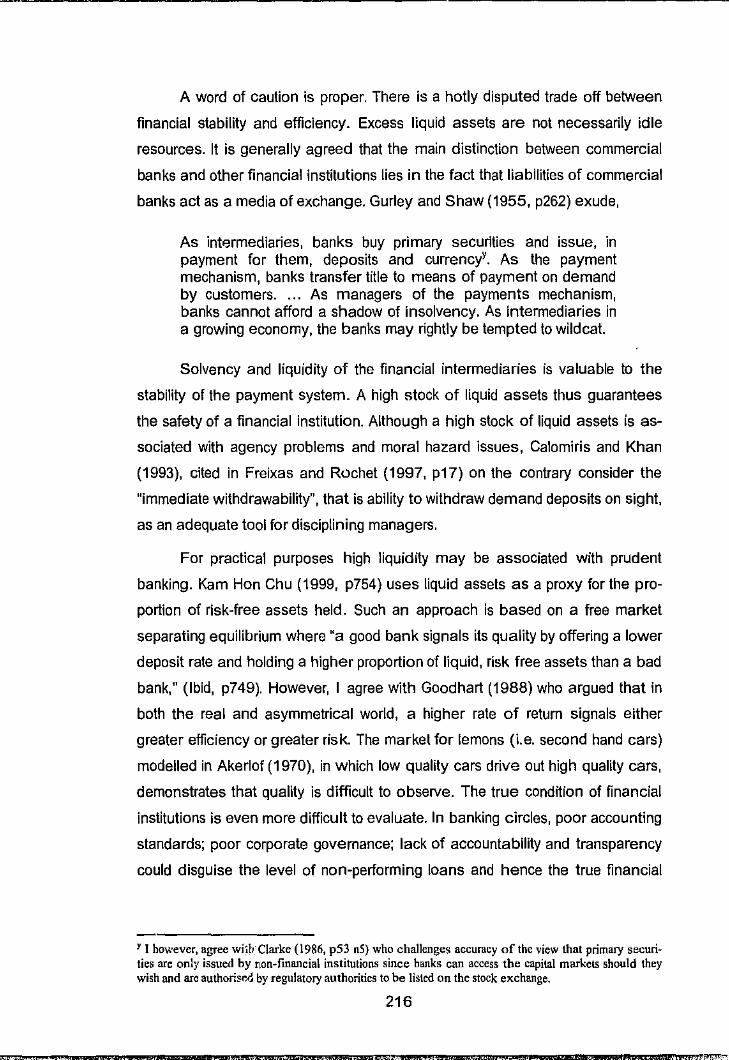
A word of caution is proper. There is a hotly disputed trade off between
financial stability and efficiency. Excess liquid assets are not necessarily idle
resources. It is generally agreed that the main distinction between commercial
banks and other financial institutions lies in the fact that liabilities of commercial
banks act as a media of exchange. Gurley and Shaw (1955, p262) exude,
As intermediaries, banks buy primary securities and issue, in payment for them, deposits and currencyY. As the payment mechanism, banks transfer title to means of payment on demand by customers. . .. As managers of the payments mechanism, banks cannot afford a shadow of insolvency. As intermediaries in a growing economy, the banks may rightly be tempted to wildcat.
Solvency and liquidity of the financial intermediaries is valuable to the
stability of the payment system. A high stock of liquid assets thus guarantees
the safety of a financial institution. Although a high stock of liquid assets is as
sociated with agency problems and moral ha:zard issues, Calomiris and Khan
(1993), cited in Freixas and Rochel (1997, p17) on the contrary consider the
"immediate withdrawability", that is ability to withdraw demand deposits on sight,
as an adequate tool for disciplining managers.
For practical purposes high liquidity may be associated with prudent
banking. Kam Hon Chu (1999, p754) uses liquid assets as a proxy for the pro
portion of risk-free assets held. Such an approach is based on a free market
separating equilibrium where "a good bank signals its quality by offering a lower
deposit rate and holding a higher proportion of liquid, risk free assets than a bad
bank," (Ibid, p749). However, I agree with Goodhart (1988) who argued that in
both the real and asymmetrical world, a higher rate of return signals either
greater efficiency or greater risk. The market for lemons (i.e. second hand cars)
modelled in Akerlof (1970), in which low quality cars drive out high quality cars,
demonstrates that quality is difficult to observe. The true condition of financial
institutions is even more difficult to evaluate. In banking circles, poor accounting
standards; poor corporate governance; lack of accountability and transparency
could disguise the level of non-performing loans and hence the true financial
Y I however, agree wi.!1 Clarke ( 1986, p53 n5) who challenges accuracy of the view that primary securities are only issued by non-financial institutions since banks can access the capital markets should they wish and are authorisf:cl by regulatory authorities to be listed on the stock exchange.
216
' .. ~
·c,,
,,:'.' ·• ,, ;J_
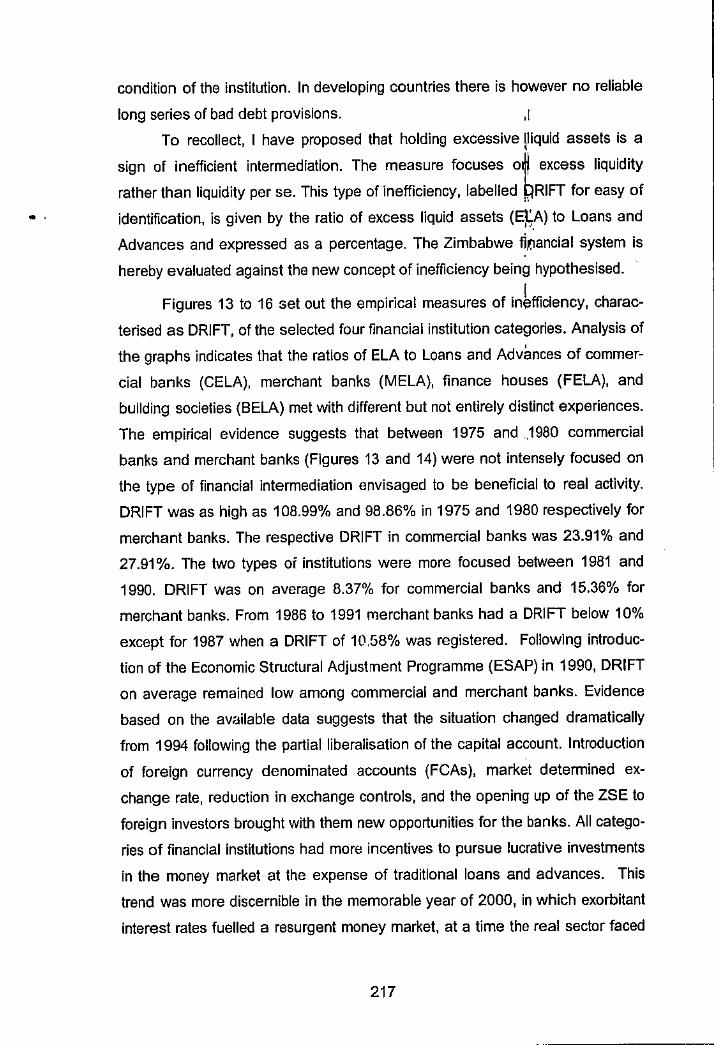
..
" ,
condition of the institution. In developing countries there is however no reliable
long series of bad debt provisions. ,I
To recollect, I have proposed that holding excessive !liquid assets is a
sign of inefficient intermediation. The measure focuses o~ excess liquidity
rather than liquidity per se. This type of inefficiency, labelled pRIFT for easy of i
identification, is given by the ratio of excess liquid assets (EtA) to Loans and u,
Advances and expressed as a percentage. The Zimbabwe tir.iancial system is
hereby evaluated against the new concept of inefficiency being hypothesised.
Figures 13 to 16 set out the empirical measures of in~fficiency, charac
terised as DRIFT, of the selected four financial institution categories. Analysis of
the graphs indicates that the ratios of ELA to Loans and Adv8nces of commer
cial banks (CELA), merchant banks (MELA), finance houses (FELA), and
building societies (BELA) met with different but not entirely distinct experiences.
The empirical evidence suggests that between 1975 and .1980 commercial
banks and merchant banks (Figures 13 and 14) were not intensely focused on
the type of financial intermediation envisaged to be beneficial to real activity.
DRIFT was as high as 108.99% and 98.86% in 1975 and 1980 respectively for
merchant banks. The respective DRIFT in commercial banks was 23.91% and
27.91%. The two types of institutions were more focused between 1981 and
1990. DRIFT was on average 8.37% for commercial banks and 15.36% for
merchant banks. From 1986 to 1991 merchant banks had a DRIFT below 10%
except for 1987 when a DRIFT of 10,58% was registered. Following introduc
tion of the Economic Structural Adjustment Programme (ESAP) in 1990, DRIFT
on average remained low among commercial and merchant banks. Evidence
based on the available data suggests that the situation changed dramatically
from 1994 following the partial liberalisation of the capital account. Introduction
of foreign currency denominated accounts (FCAs), market detemiined ex
change rate, reduction in exchange controls, and the opening up of the ZSE to
foreign investors brought with them new opportunities for the banks. All catego
ries of financial institutions had more incentives to pursue lucrative investments
in the money market at the expense of traditional loans and advances. This
trend was more discernible in the memorable year of 2000, in which exorbitant
interest rates fuelled a resurgent money market, at a time the real sector faced
217
" ,·
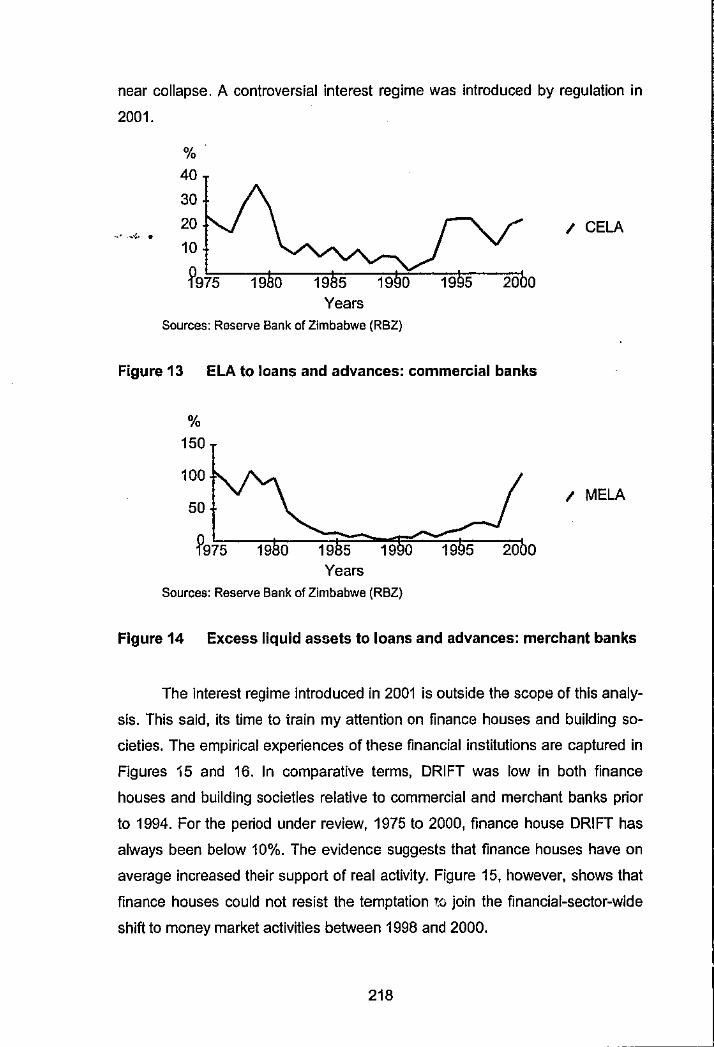
near collapse. A controversial interest regime was introduced by regulation in
2001.
.• ~"· .
%
40
30
20
10
f975 Years
Sources: Reserve Bank of Zimbabwe (RBZ)
Figure 13 ELA to loans and advances: commercial banks
% 150
100
50
Years Sources: Reserve Bank of Zimbabwe (RBZ)
/ CELA
/ MELA
Figure 14 Excess liquid assets to loans and advances: merchant banks
The interest regime introduced in 2001 is outside the scope of this analy
sis. This said, its time to train my attention on finance houses and building so
cieties. The empirical experiences of these financial institutions are captured in
Figures 15 and 16. In comparative tenms, DRIFT was low in both finance
houses and building societies relative to commercial and merchant banks prior
to 1994. For the period under review, 1975 to 2000, finance house DRIFT has
always been below 10%. The evidence suggests that finance houses have on
average increased their support of real activity. Figure 15, however, shows that
finance houses could not resist the temptation t.o join the financial-sector-wide
shift to money market activities between 1998 and 2000.
218 -
~1 i.,,,,,, ................................................. _... ...... ___________ ...,:1
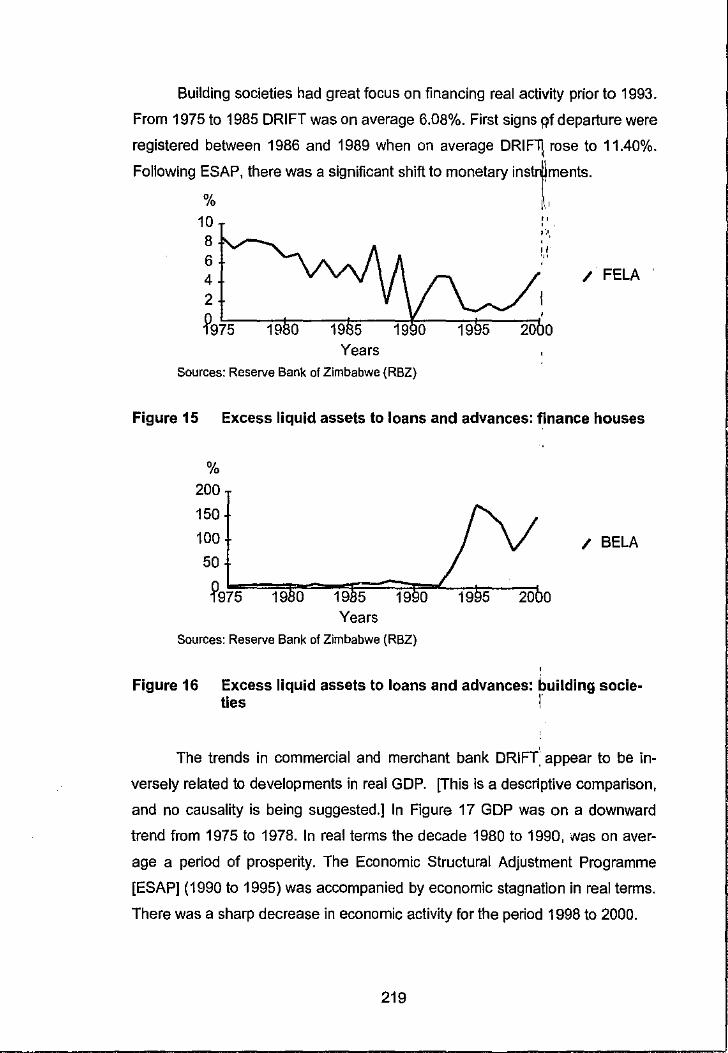
Building societies had great focus on financing real activity prior to 1993.
From 1975 to 1985 DRIFT was on average 6.08%. First signs gf departure were
registered between 1986 and 1989 when on average DRIFlj rose to 11.40%.
Following ESAP, there was a significant shift to monetary inst~ments.
% I:I 10 ('
8 +'-,,---..... 6 4 2
?975 Years
Sources: Reserve Bank of Zimbabwe (RBZ)
/ FELA
Figure 15 Excess liquid assets to loans and advances: finance houses
% 200
150
100
50
?97l,,,5==e,,...="""'1=::::::::-L..,,....,,._,-,,<
Years
Sources: Reserve Bank of Zimbabwe (RBZ)
/ BELA
Figure 16 Excess liquid assets to loans and advances: building socie-ties r
The trends in commercial and merchant bank DRIFT: appear to be in
versely related to developments in real GDP. [This ls a descriptive comparison,
and no causality is being suggested.] In Figure 17 GDP was on a downward
trend from 1975 to 1978. In real terms the decade 1980 to 1990, was on aver
age a period of prosperity. The Economic Structural Adjustment Programme
[ESAP] (1990 to 1995) was accompanied by economic stagnation in real terms.
There was a sharp decrease in economic activity for the period 1998 to 2000.
219
. '
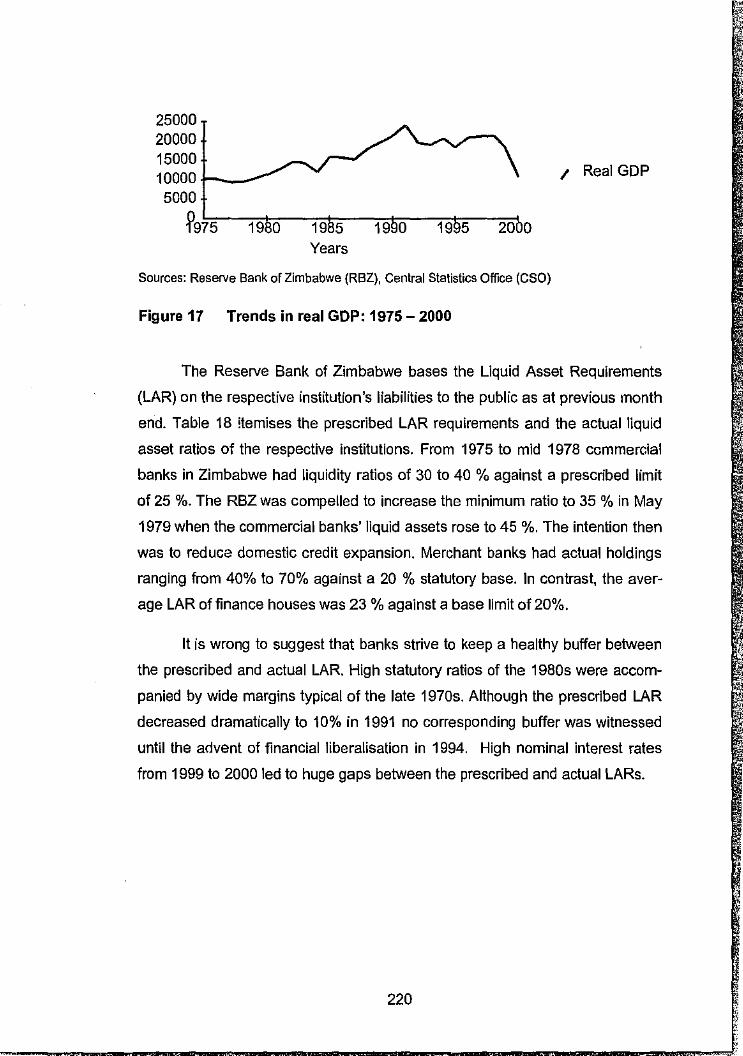
25000 20000 15000
10000t---5000
?975 19 o 19 5
Years
Sources: Reserve Bank of Zimbabwe (RBZ), Central Statistics Office (CSO)
Figure 17 Trends in real GDP: 1975 - 2000
/ Real GDP
The Reserve Bank of Zimbabwe bases the Liquid Asset Requirements
(LAR) on the respective institution's liabilities to the public as at previous month
end. Table 18 !temises the prescribed LAR requirements and the actual liquid
asset ratios of the respective institutions. From 1975 to mid 1978 ccmmercial
banks in Zimbabwe had liquidity ratios of 30 to 40 % against a prescribed limit
of 25 %. The RBZ was compelled to increase the minimum ratio to 35 % in May
1979 when the commercial banks' liquid assets rose to 45 %. The intention then
was to reduce domestic credit expansion. Merchant banks had actual holdings
ranging from 40% to 70% against a 20 % statutory base. In contrast, the aver
age LAR of finance houses was 23 % against a base limit of 20%.
It is wrong to suggest that banks strive to keep a healthy buffer between
the prescribed and actual LAR. High statutory ratios of the 1980s were accom
panied by wide margins typical of the late 1970s. Although the prescribed LAR
decreased dramatically to 10% in 1991 no corresponding buffer was witnessed
until the advent of financial liberalisation in 1994. High nominal interest rates
from 1999 to 2000 led to huge gaps between the prescribed and actual LARs.
220
-~
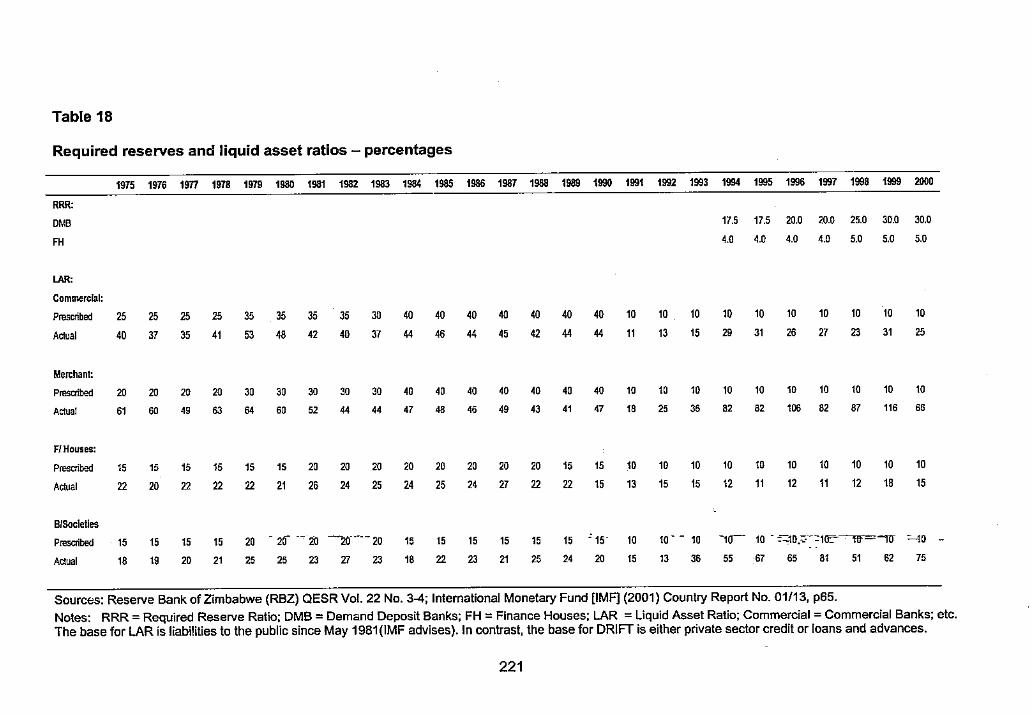
Table 18
Required reserves and liquid asset ratios - percentages
1975 1976 1977 1918 1979 1980 1981 1982 1983 1"' 1985 1986 1987 1988 1989 1990 1991 1992 1993 1994 1995 1996 1997 1998 1999 2000
RRR:
DMB 17.5 17.5 20.0 20.0 25.0 30.0 30.0
FH 4.0 4.0 4.0 4.0 5.0 5.0 5.0
LAR,
Commercial:
Prescribed 25 25 25 25 35 35 35 35 30 40 40 40 40 40 40 40 10 10 10 10 10 10 10 10 10 10
Actual 40 37 35 41 53 48 42 40 37 .. 46 44 45 42 .. .. 11 13 15 29 31 26 27 23 31 25
Merchant:
Presaibed 20 20 20 20 30 30 30 30 30 40 40 40 40 40 40 40 10 10 10 10 10 10 10 10 10 10
Actua! 61 60 49 63 64 60 52 .. 44 47 48 .. 49 43 41 47 18 25 36 " " 106 " 87 116 66
F/Hoines:
PresCfloed 15 15 15 15 15 15 20 20 20 20 20 20 20 20 15 15 10 10 10 10 10 10 10 10 10 10
Actual 22 20 22 22 22 21 26 24 25 24 25 24 27 22 22 15 13 15 15 12 11 12 11 12 18 15
BlSocleUes
Prescribed 15 15 15 15 20 - 20 20 -20··-·-20 15 15 15 15 15 15 ~ 15- 10 10·-10 -,, 10 - -:=:io.:::c·-::1(E'"------w=-ro- "--10
Actual 18 19 20 21 25 25 23 Z7 23 18 22 23 21 25 24 20 15 13 36 55 67 65 81 51 62 75
Sources: Reserve Bank of Zimbabwe (RBZ) QESR Vol. 22 No. 3-4; International Monetary Fund [IMF] (2001) Country Report No. 01/13, p65.
Notes: RRR = Required Reserve Ratio; DMB = Demand Deposit Banks; FH = Finance Houses; LAR = Liquid Asset Ratio; Commercial = Commercial Banks; etc. The base for LAR is liabilities to the public since May 1981(1MF advises). In contrast. the base for DRIFT is either private sector credit or loans and advances.
221
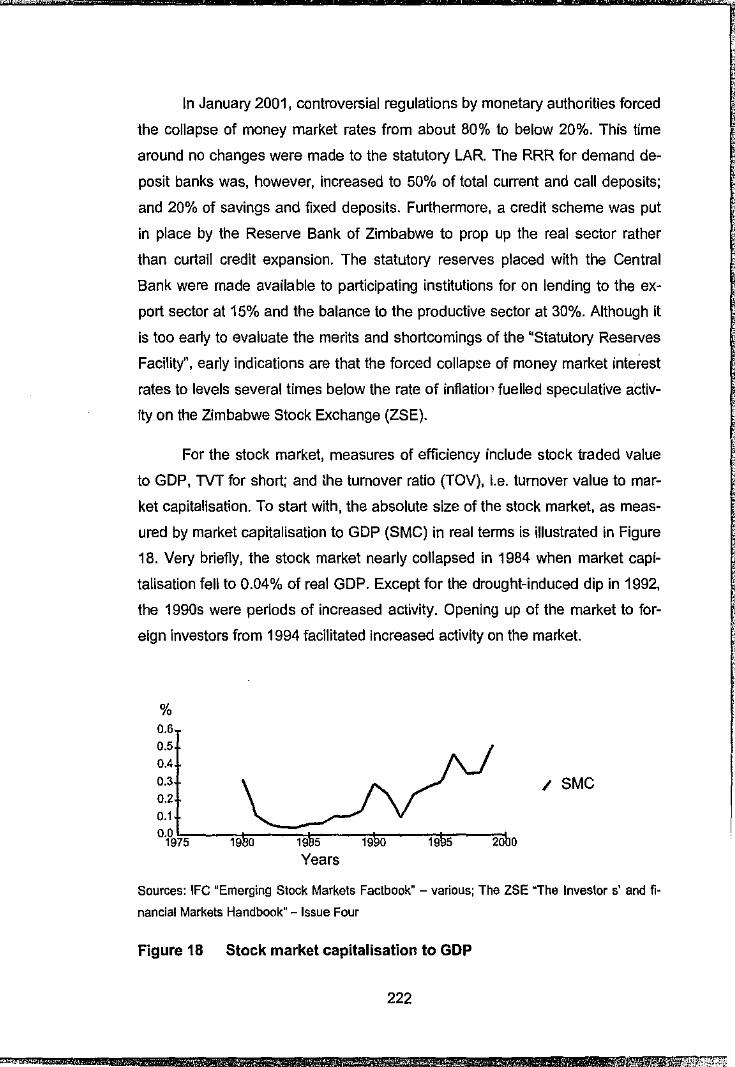
In January 2001, controversial regulations by monetary authorities forced
the collapse of money market rates from about 80% to below 20%. This time
around no changes were made to the statutory LAR. The RRR for demand de
posit banks was, however, increased to 50% of total current and call deposits;
and 20% of savings and fixed deposits. Furthermore, a credit scheme was put
in place by the Reserve Bank of Zimbabwe to prop up the real sector rather
than curtail credit expansion. The statutory reserves placed with the Central
Bank were made available to participating institutions for on lending to the ex
port sector at 15% and the balance to the productive sector at 30%. Although it
is too early to evaluate the merits and shortcomings of the "Statutory Reserves
Facility", early indications are that the forced collapse of money market interest
rates to levels several times below the rate of inflation fuelled speculative activ
ity on the Zimbabwe Stock Exchange (ZSE).
For the stock market, measures of efficiency include stock traded value
to GDP, TVT for short; and the turnover ratio (TOV), i.e. turnover value to mar
ket capitalisation. To start with, the absolute size of the stock market. as meas
ured by market capitalisation to GDP (SMC) in real terms is illustrated in Figure
18. Very briefly, the stock market nearly collapsed in 1984 when market capi
talisation fell lo 0.04% of real GDP. Except for the drought-induced dip in 1992,
the 1990s were periods of increased activity. Opening up of the market to for
eign investors from 1994 facilitated increased activity on the market.
% 0.6
0.5
0.4
0.3 0.2
0.1 L. ____ ;::::=::;;;;:::::=~-~--~-~c\. o._p975 19 o 19 s 20 o
/ SMC
Sources: IFC "Emerging Stock Markets Factbookff - various; The ZSE ~The Investor s' and fi·
nancial Markets Handbook" - Issue Four
Figure 18 Stock market capitalisation to GDP
222
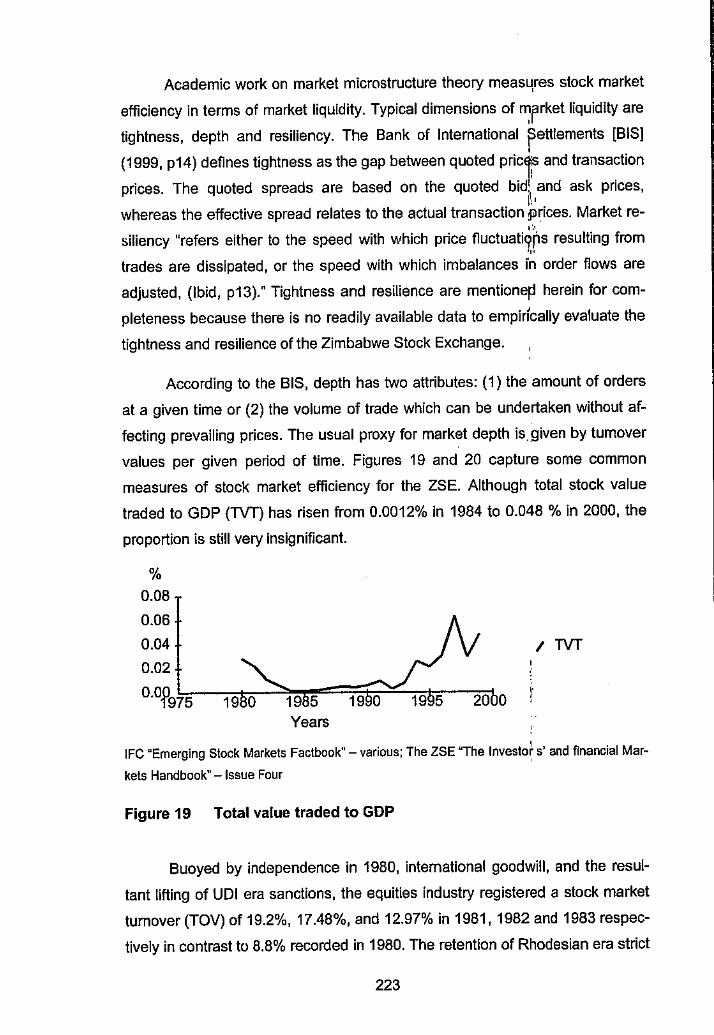
Academic work on market microstructure theory measu,res stock market
efficiency in terms of market liquidity. Typical dimensions of ~rrket liquidity are
tightness, depth and resiliency. The Bank of International fettlements [BIS]
(1999, p14) defines tightness as the gap between quoted prier and transaction
prices. The quoted spreads are based on the quoted bid. and ask prices, 1\,
whereas the effective spread relates to the actual transaction :!]rices. Market re-,·.,
siliency "refers either to the speed with which price fluctuati9ris resulting from ... trades are dissipated, or the speed with which imbalances i'n order flows are
adjusted, (Ibid, p13)." Tightness and resilience are mentione~ herein for com
pleteness because there is no readily available data to empirically evaluate the
tightness and resilience of the Zimbabwe Stock Exchange.
According to the BIS, depth has two attributes: (1) the amount of orders
at a given time or (2) the volume of trade which can be undertaken without af
fecting prevailing prices. The usual proxy for market depth is.given by turnover
values per given period of time. Figures 19 and 20 capture some common
measures of stock market efficiency for the ZSE. Although total stock value
._,
traded to GDP (lVT) has risen from 0.0012% in 1984 to 0.048 % in 2000, the !Ji
proportion is still very insignificant.
I lVT
IFC "Emerging Stock Markets Factbook" - various; The ZSE "The lnvesto~ s' and financial Mar
kets Handbook" - Issue Four
Figure 19 Total value traded to GDP
Buoyed by independence in 1980, international goodwill, and the resul
tant lifting of UDI era sanctions, the equities industry registered a stock market
turnover (TOV) of 19.2%, 17.48%, and 12.97% in 1981, 1982 and 1983 respec
tively in contrast to 8.8% recorded in 1980. The retention of Rhodesian era strict
223
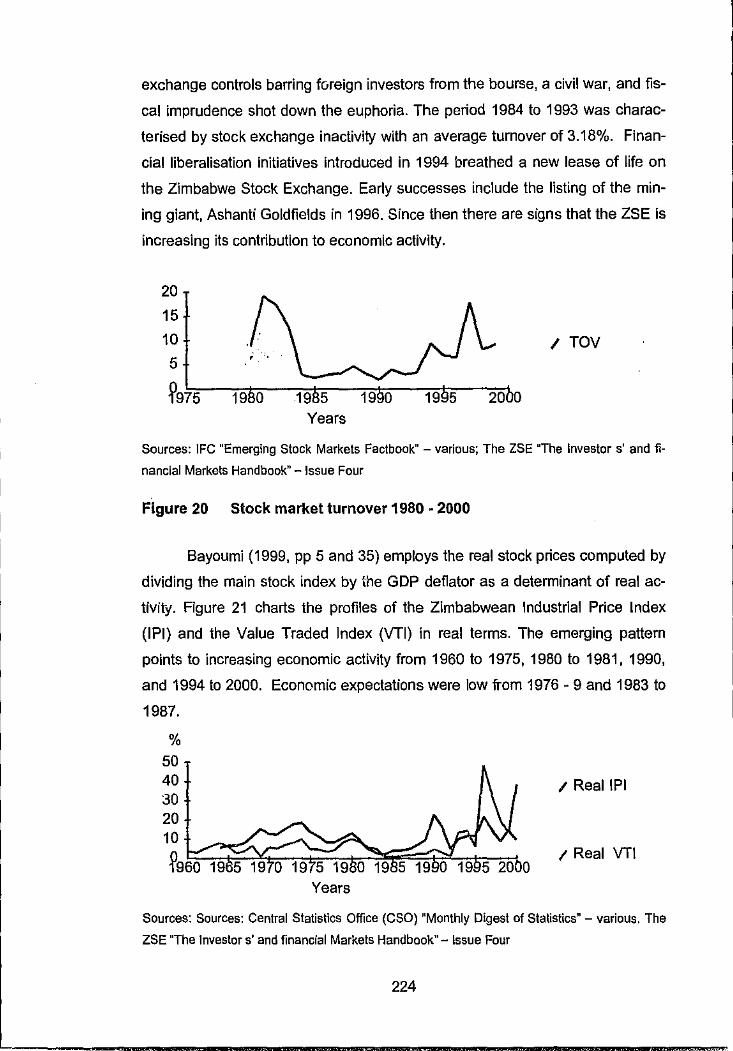
exchange controls barring foreign investors from the bourse, a civil war, and fis-
cal imprudence shot down the euphoria. The period 1984 to 1993 was charac- .;; f,,
terised by stock exchange inactivity with an average turnover of 3.18%. Finan- ~ v
cial liberalisation initiatives introduced in 1994 breathed a new lease of life on )
the Zimbabwe Stock Exchange. Early successes include the listing of the min- ;
ing giant, Ashanti Goldfields in 1996. Since then there are signs that the ZSE is l
increasing its contribution to economic activity. "i
20
15
10
5
\lg7~5~~---~-,-t,~~.,.,-,,~~t--~=1.
Years
I TOV
Sources: lFC "Emerging Stock Markets Factbook" - various; The ZSE "The Investor s' and fi
nancial Markets Handbook" - Issue Four
Figure 20 Stock market turnover 1980 • 2000
Bayoumi (1999, pp 5 and 35) employs the real stock prices computed by
dividing the main stock index by the GDP deflater as a determinant of real ac
tivity. Figure 21 charts the profiles of the Zimbabwean Industrial Price Index
(IPI) and the Value Traded Index (VTI) in real terms. The emerging pattern
points to increasing economic activity from 1960 to 1975, 1980 to 1981, 1990,
and 1994 to 2000. Economic expectations were low from 1976 - 9 and 1983 to
1987.
% 50 40 30 20
1ob:::::::~~i;:::~;;:~;':':!~~~~~::, ?960
Years
I Real IPI
I Real VTI
Sources: Sources: Central Statistics Office (CSO) "Monthly Digest of Statistics" - various. The
ZSE "The Investors' and financial Markets Handbook" - Issue Four
224
J '
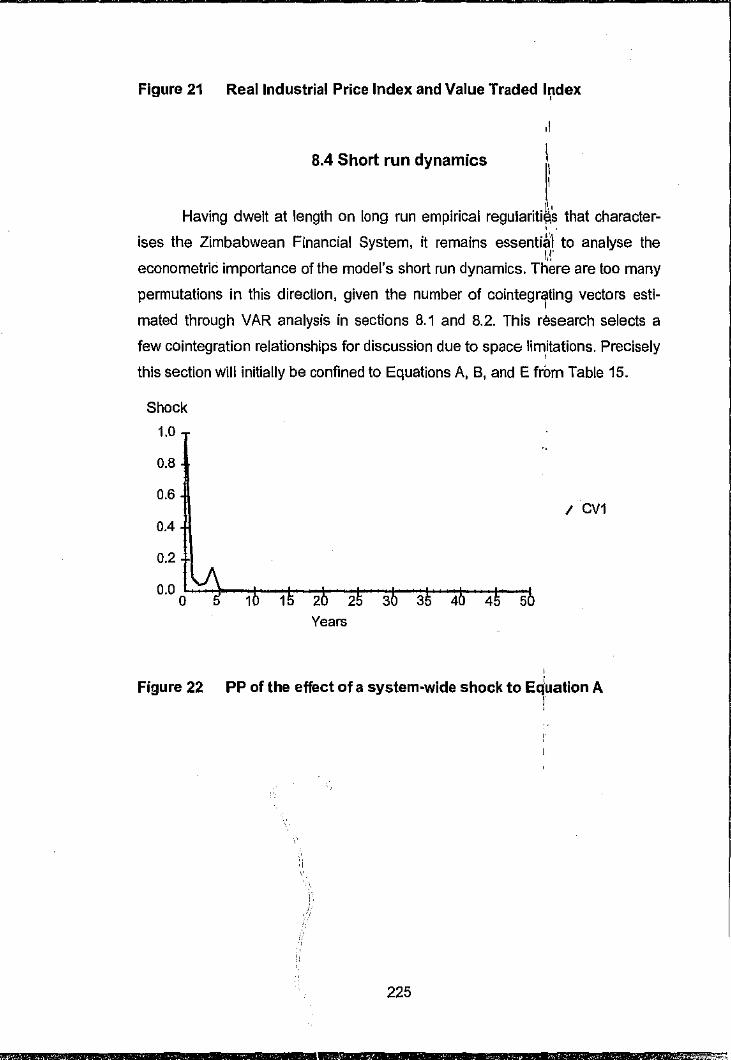
Figure 21 Real Industrial Price Index and Value Traded Index
8.4 Short run dynamics
'
,I
I I I
Having dwelt at length on long run empirical regularitit's that character-, . ises the Zimbabwean Financial System, it remains essenti3'\ to analyse the
1r econometric importance of the model's short run dynamics. Th0re are too many
permutations in this direction, given the number of cointegr.rting vectors esti
mated through VAR analysis in sections 8.1 and 8.2. This research selects a
few cointegration relationships for discussion due to space limitations. Precisely '
this section will initially be confined to Equations A, B, and E from Table 15.
Years
' Figure 22 PP of the effect of a system-wide shock to Equation A
I '
225
.,
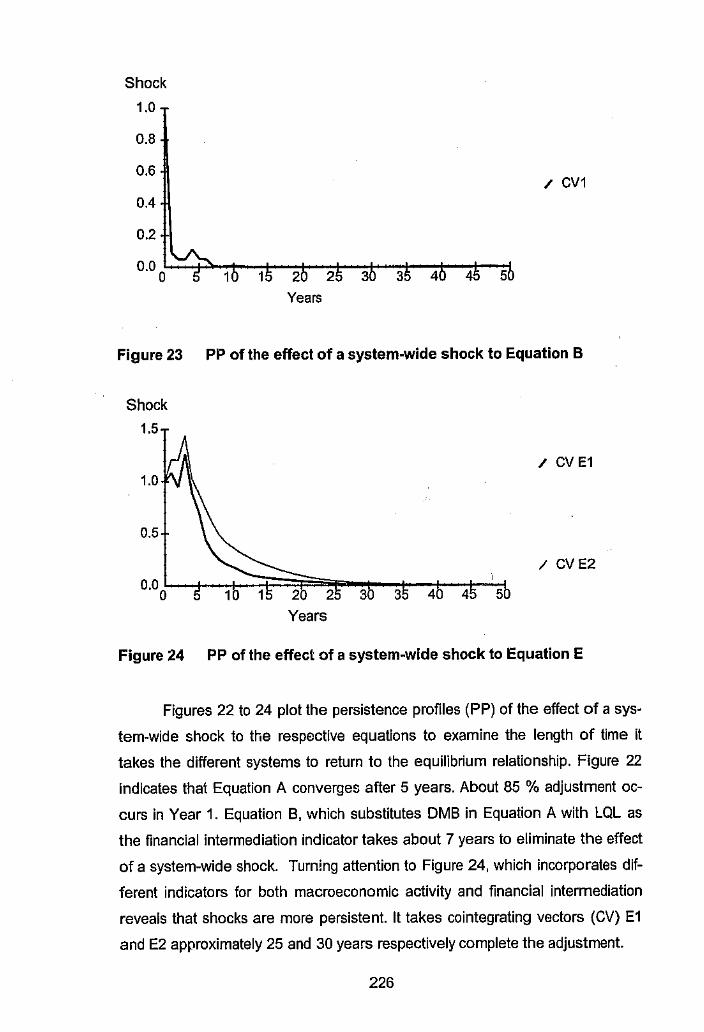
Shock
1.0
0.8
0.6 / CV1
0.4
0.2
0.0 0 1
Years
Figure 23 PP of the effect of a system-wide shock to Equation B
Shock
1.5
1.0
0.5
/ CV E1
/ CVE2
Years
Figure 24 PP of the effect of a system-wide shock to Equation E
Figures 22 to 24 plot the persistence profiles (PP) of the effect of a sys
tem-wide shock to the respective equations to examine the length of time it
takes the different systems to return to the equilibrium relationship. Figure 22
indicates that Equation A converges after 5 years. About 85 % adjustment oc
curs in Year 1. Equation B, which substitutes DMB in Equation A with LQL as
the financial intermediation indicator takes about 7 years to eliminate the effect
of a system-wide shock. Turning attention to Figure 24, which incorporates dif
ferent indicators for both macroeconomic activity and financial intermediation
reveals that shocks are more persistent. It takes cointegrating vectors (CV) E1
and E2 approximately 25 and 30 years respectively complete the adjustment.
226
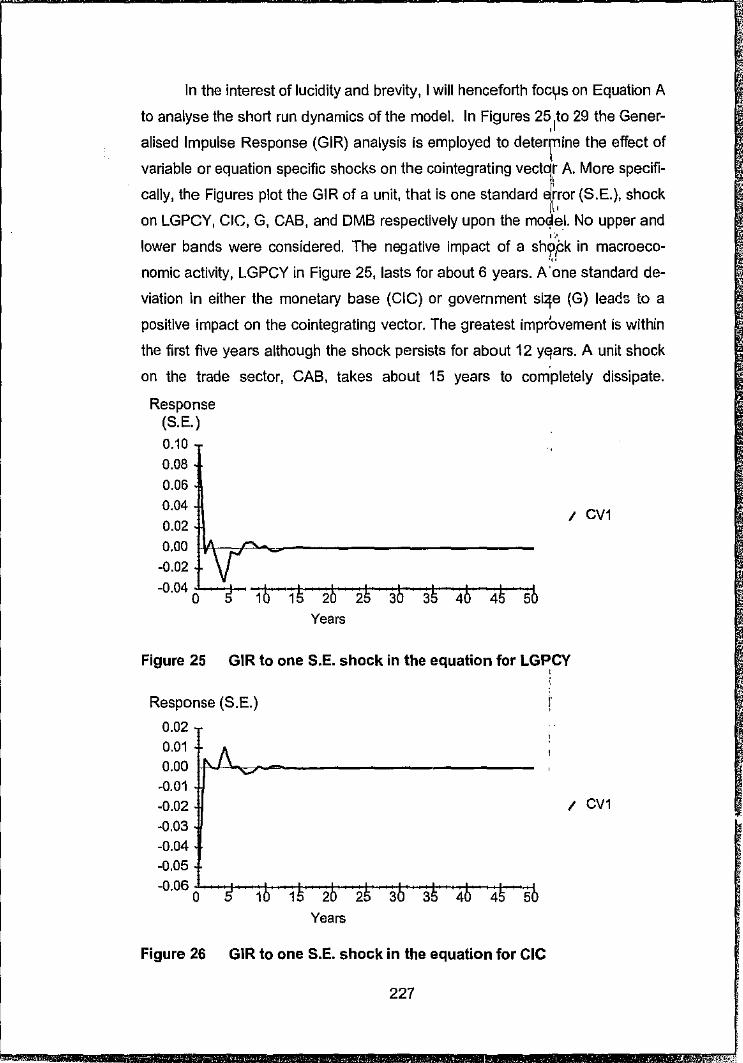
In the interest of lucidity and brevity, I will henceforth focys on Equation A
to analyse the short run dynamics of the model. In Figures 25}o 29 the Gener
alised Impulse Response (GIR) analysis is employed to deterrine the effect of
variable or equation specific shocks on the cointegrating vect\r A. More specifi
cally, the Figures plot the GIR of a unit, that is one standard arror (S.E.), shock 1\ I
on LGPCY, CIC, G, CAB, and DMB respectively upon the mo~eL No upper and ,·.,
lower bands were considered. The negotive impact of a sh9,Ck in macroeco-... nomic activity, LGPCY in Figure 25, lasts for about 6 years. A'one standard de-
viation in either the monetary base (CIC) or government si4e (G) leads to a
positive impact on the cointegrating vector. The greatest imprbvement is within
the first five years although the shock persists for about 12 Yetars. A unit shock
on the trade sector, CAB, takes about 15 years to completely dissipate.
Response (S.E.)
0.10
0.08
0.06
0.04
0.02
0.00 W\:-;;;P,-..... ------------0.02
-0·04 o"---i- -,.1t-li -,-1cli-2t-b -2"""/i-3/jt-3-t5--,.4/jt--4-t5--1sb
Years
I CV1
Figure 25 GIR to one S.E. shock in the equation for LGPCY
Response (S.E.)
0.02 O.Q1
0.00 H"-,__,_=-------------0.01 -0.02 -0.03 -0.04 -0.05
-0.060 L -...,c1--,+--,.t,--,t-,,-,,,.--,t,--,..!,........,t---t-'iili
Years
Figure 26 GIR to one S.E. shock in the equation for CIC
227
' .
I CV1
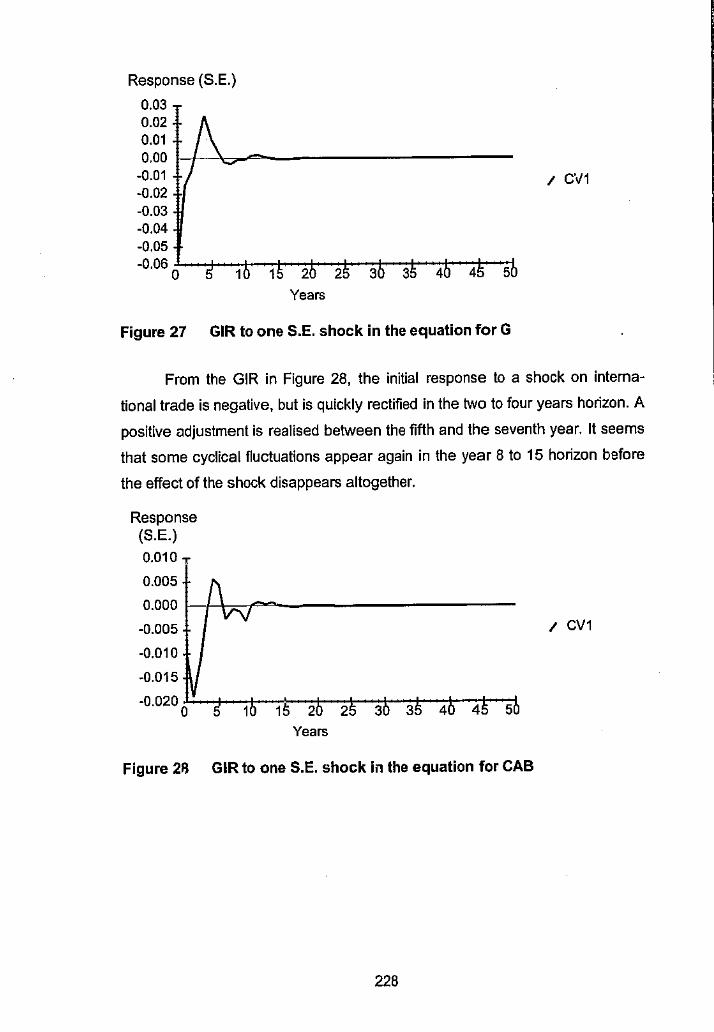
---------------------------- ·-----
Response (S.E.}
0.03 0.02 0.01 0.00 l-l-"o--=-----------
-0.01 -0.02 -0.03 -0.04 -0.05 -0.06 '--+--t-....,-t-+---1--.+--,.i---+--,t-.,-J.
0 Years
Figure 27 GIR to one S.E. shock in the equation for G
I CV1
From the GIR in Figure 28, the initial response to a shock on interna
tional trade is negative, but is quickly rectified in the two to four years horizon. A
positive ndjustment Is realised between the fifth and the seventh year. It seems
that some cyclical fluctuations appear again in the year 8 to 15 horizon before
the effect of the shock disappears altogether.
Response (S.E.} 0.010 T
0.005
0.000 !--Hr=-r'------------0.005
-0.010
-0.015
-0.020 o'-'--+-+----,>--+--+----1--+---1--+-ct
Years
Figure 2ij GIR to one S.E. shock in the equation for CAB
228
I CV1
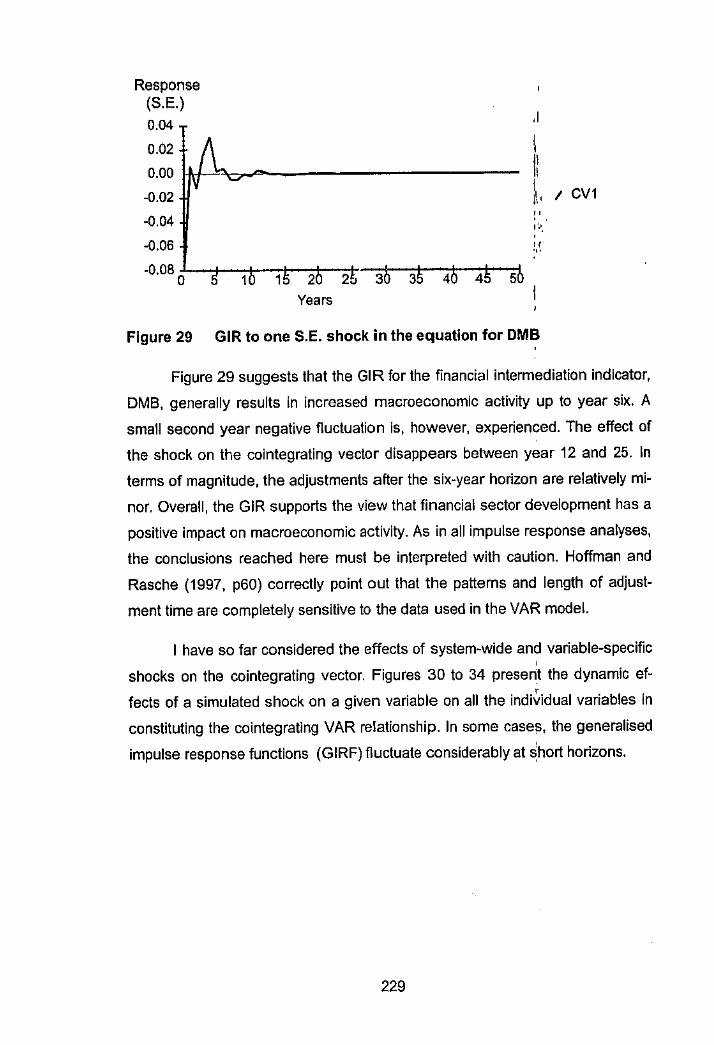
Response ' (S.E.)
0.04 ,I
0.02 I I - I! 0.00 v I
-0.02 1\, I CV1
-0.04 · " 1',•, .
-0.06 " ... -0.08 O
15 20 i& 3b 3~ 4b 4~ sb 5 10 Years I
'
Figure 29 GIR to one S.E. shock in the equation for DMB •
Figure 29 suggests that the GIR for the financial intermediation indicator,
DMB, generally results in increased macroeconomic activity up to year six. A
small second year negative fluctuation is, however, experienced. The effect of
the shock on the cointegrating vector disappears between year 12 and 25. In
terms of magnitude, the adjustments after the six-year horizon are relatively mi
nor. Overall, the GIR supports the view that financial sector development has a
positive impact on macroeconomic activity. As in all impulse response analyses,
the conclusions reached here must be interpreted with caution. Hoffman and
Rasche (1997, p60) correctly point out that the patterns and length of adjust
ment time are completely sensitive to the data used in the VAR model.
I have so far considered the effects of system-wide and variable-specific '
shocks on the cointegrating vector. Figures 30 to 34 preserit the dynamic ef-' fects of a simulated shock on a given variable on all the individual variables in
constituting the colntegrating VAR relationship. In some cases, the generalised
impulse response functions (GIRF) fluctuate considerably at ~hart horizons.
229
'
,,
,._
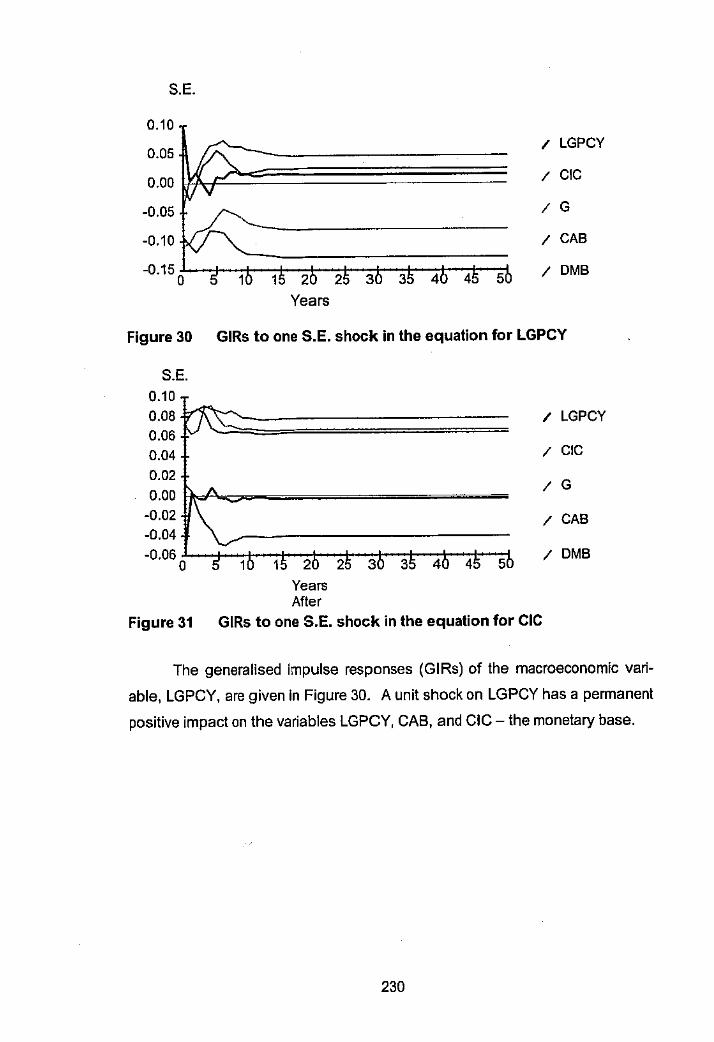
S.E.
0.10
0.05 / LGPCY
0.00 / CIC
-0.05 / G
-0.10 / CAB
-0.15 0
/ DMB
Years
Figure 30 GIRs to one S.E. shock in the equation for LGPCY
S.E. 0.10
0.08 t7~;;;;;;;;:;;:;;:;;:;;:;;:;;:;;:;;:;;:;;:;;=: 0.06 0.04 0.02
0.00 Hl,-A.__..-=========~ -0.02 -0.04
-0.06 .l--1--+--+-+--±-+--+-+--+----l 0
Years After
Figure 31 GIRs to one S.E. shock in the equation for CIC
/ LGPCY
/ CIC
/ G
/ CAB
/ DMB
The generalised impulse responses (GIRs) of the macroeconomic vari
able, LGPCY, are given In Figure 30. A unit shock on LGPCY has a permanent
positive impact on the variables LGPCY, CAB, and CIC - the monetary base.
230
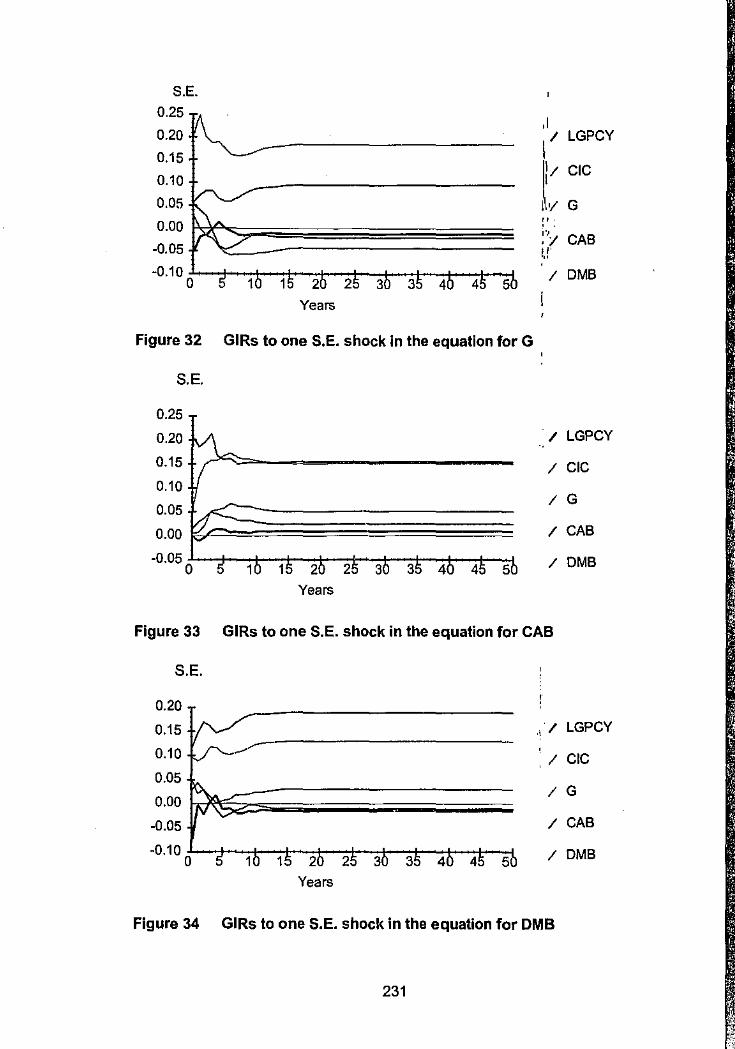
S.E. 0.25
0.20
0.15
0.10
0.05
0.00 ~"""';;;;aa================;:;,; -0.05
-0.10 J..-.....;--+--+-+--±-+--t--t---1-"-i 0
Years
Figure 32 GIRs to one S.E. shock in the equation for G
S.E.
0.25
0.20
0.15
0.10
0.05
0.00
-0.05 0
Years
,I I/ LGPCY
Ii/ CIC
1\,; G " . ,·, . '/ CAB 11 " . / DMB
/ LGPCY
/ CIC
/ G
/ CAB
/ DMB
Figure 33 GIRs to one S.E. shock in the equation for CAB
S.E.
0.20
0.15
0.10
0.05 ~~~;;;;;;;;;;;;;;;;;;;;;;;;;;;;;;;; 0.00 tJ -0.05
-0.10 ..___,_ ...... _,_.....-t--+--+--t--l,--+-...... 0
Years
, / LGPCY
/ CIC
/ G
/ CAB
/ DMB
Figure 34 GIRs to one S.E. shock in the equation for DMB
231
'-------------------------j
Negative adjustments are noted on government size (G) and the financial
intermediation sector (DMB). Positive effects take between 10 to 15 years to
reach the "stead state" values. Negative fluctuations require longer periods to
adjust to their steady state values. The negative reaction of the financial sector
to a shock in macroeconomic activity is not consistent with theory, because a
thriving economy should logically foster financial sector development. In prac
tice, the persistence of profitability in the Zimbabwean financial sector at times
when economic fundamentals is yet another empirical puzzle.
In Figure 31, the monetary base positively affects government size (G),
the financial sector (DMB) and own variable (CIC). There is a strong negative
reaction on the current account balance (CAB), which reaches its deepest point
in year six. There is a strong adjustment to economic activity in year 1, but the
shock is transitory. The pattern in Figure 31 suggests that LGPCY is the only
variable whose effect eventually diminishes to zero.
A different pattern emerges in Figure 32 where a unit shock on G yields
negative, but close to zero, steady state values on LGPCY and CAB. A large
negative effect is projected on the monetary base. The responses of DMB and
the fiscal sector itself suggest large permanent positive effocts. Turning to Fig
ure 33, a unit shock to the international trade sector generates a positive effect
on all variables in the model. The shock generates relatively higher steady state.
values in own variable (CAB) and the fiscal sector (G), while LGPCY and DMB
complete their adjustments with values that are close to zero.
Next, Figure 34 examines the dynamic effects of a simulated shock on
the financial sector upon all other variables. The graph establishes that finandal
aggregates positively affect the fiscal sector (G) and own variable (DMB). The
response pattern suggests that the effect on the monetary base reaches zero in
year four, before settling for a positive steady state value in the 10 and 15 years
time horizon. The initial effect on the current account balance (CAB) in year 1
(one) is positive, but jumps to a negative value in year 3. It reaches its deepest
point in year 5. Turning to LGPCY, an indicator of macroeconomic activity,
points to a response that fluctuates over time. Initially a shock in the financial
sector produces a positive effect on economic activity up to year 4. Thereafter
the adjustment is slightly negative, but settles for a steady state value close to
232
~: '
' ' '
il '
zero. This pattern suggests that a series of innovations in thy financial sector
might be necessary to sustain long run positive responses in LGPCY. In theory, ,I
variable specific shocks are, however, ambiguous and may prsist forever, Pe-
saran and Pesaran (1997, p444- 5). In Figure 34, only LGP<JlY and CAB have
steady state values close to zero, while the rest positive stJ~dy state adjust-11.,
ments. Ideally standard error bounds (plus and minus one s(iilndard deviation) ,:,
could be computed and displayed around the point estimate~ ,to determine the ... statistical significance of whether the response functions are bounded away
from zero. There is no guidance in Microfit to this effect althvugh Garratt et al
(1999, p18 n25) suggest otherwisG.
Short run dynamics can also be analysed through the forecast error vari
ance decomposition (VDC) analysis and the vector error correction model
(VECM) specification. Impulse responses and VECM analysis are regarded as
within-sample causality tests. Variance decomposition ana)yses are out-of
sample causality tests, which quantify the forecast error variance of each vari
able into components that can be attributed to innovations in each variable in
the system including its own. In other words, VDC breaks down the variance of
the forecast error for each variable into proportions that are accounted for by
previous changes in each variable in the system. Generalised VDC, unlike or
thogonalized variance decomposition, is philosophically attractive as it is not
sensitive to the ordering of the variables. A deficiency of generalised VOC,
however, is that there are no perfect percentage decompositions because the
relative weights of the forecast error variance do not add up ~o 100%, contrary
to the case with orthogonalized VDC.
Table 19 below summarises the decomposition information attributed to
each of the lagged variables over six different time horizons, viz Years 1, 5, 10,
20, 30 and 50. The principal diagonal values in each horizon estimate the de
gree of exogeneity for each variable. In fact, the diagonal measures the extent
to which a variable's own variance is determined by innovations in its own vari
able over the forecast horizon. A completely independent variable is exclusively
forecast from its own lagged values. It follows that its forecast error variance is
entirely explained by its own disturbances. In other cases, the contribution of
other variables (extent of endogeneity) is explained by the off diagonal values.
233
.
" '
'
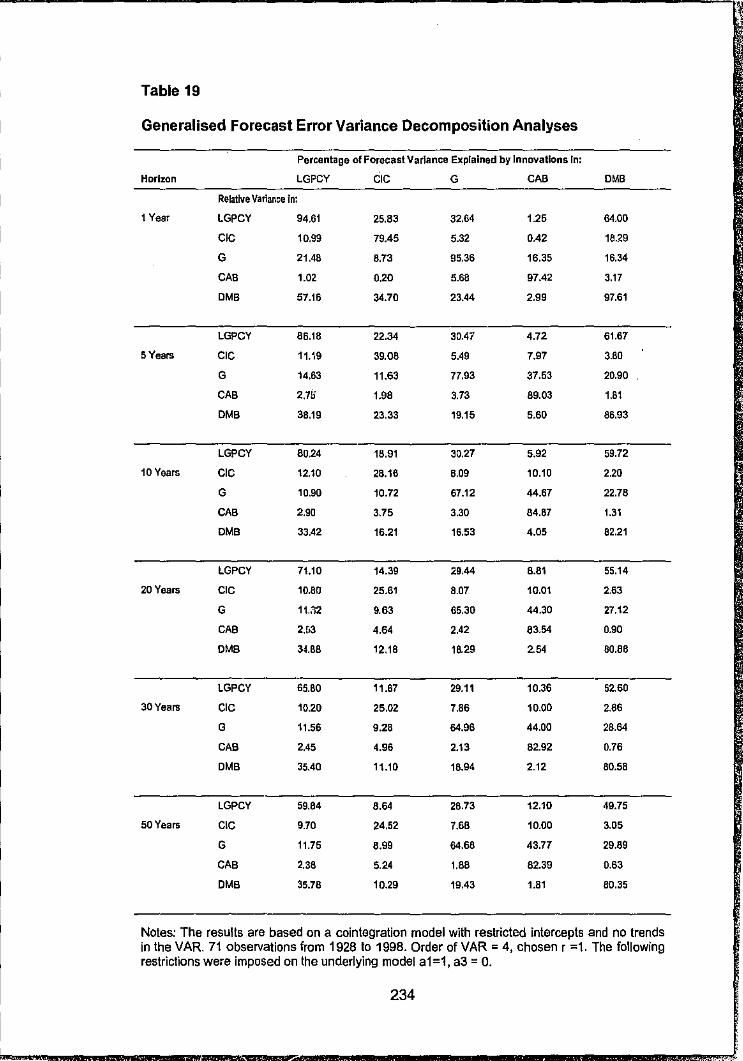
Table 19
Generalised Forecast Error Variance Decomposition Analyses
Percentage of Forecast Variance Explained by Innovations In:
Horizon LGPCY CIC G CAB OMB
Relative Variance Jn:
1 Year LGPCY 94.61 25.83 32.64 1.25 64.00
CIC 10.99 79.45 5.32 0.42 18.29
G 21.48 8.73 95.36 16.35 16.34
CAB 1.02 0.20 5.68 97.42 3.17
OMB 57.16 34.70 23.44 2.99 97.61
LGPCY 86.18 22.34 30.47 4.72 61.67
5 Years CIC 11.19 39.08 5.49 7.97 3.80
G 14,63 11.63 77.93 37.53 20.90
CAB 2.7!i 1.98 3.73 89.03 1.81
OMB 38.19 23.33 19.15 5.60 86.93
LGPCY 80.24 18.91 30.27 5.92 59.72
10 Years CIC 12.10 28.16 6.09 10.10 2.20
G 10.90 10.72 67.12 44.67 22.78
CAB 2.90 3.75 3.30 84.87 1.31
OMB 33.42 16.21 16.53 4.05 82.21
LGPCY 71,10 14.39 29.44 8.81 55.14
20 Years CIC 10.80 25.61 8.07 10.01 2.63
G 11.:'12 9.63 65.30 44.30 27.12
CAB 2.&3 4.64 2.42 83.54 0.90
OMB 34.88 12.18 18.29 2.54 BO.BB
LGPCY 65.BO 11.67 29.11 10.36 52.60
30Years CIC 10.20 25.02 7.86 10.00 2.66
G 11.56 9.28 64.96 44.00 28.64
CAB 2.45 4.96 2.13 82.92 0.76
DMB 35.40 11.10 18.94 2.12 80.58
LGPCY 59.64 8.64 28.73 12.10 49.75
50Years CIC 9.70 24.52 7.68 10.00 3.05
G 11.75 8.99 64.68 43.77 29.89
CAB 2.38 5.24 1.88 82.39 0.63
DMB 35.78 10.29 19.43 1.81 80.35
Notes: The results are based on a cointegration model with restricted intercepts and no trends in the VAR. 71 observations from 1928 to 1998. Order of VAR= 4, chosen r =1. The following restrictions were imposed on the underlying model a1=1, a3 = 0.
234
In Table 19, percentages in columns 3 to 7 depict the e~planatory power
of the respective variables over the variables given by the ro.rs in a particular
time horizon. In simple terms, columns explain influence on rrws. Focusing on
the first year time horizon suggests that the financial intermfdi.ation indicator,
DMB, is the leading variable in the VAR model. About 97.61 °'f of the variable's 1,,
own forecast error variance is attrit-utable to shocks in own l99ged values over ,·.,
the forecast horizon. The exogeneity of financial intermediariE,~ persists across '"
time with an own minimum influence of 80.35% in the 50 years time horizon.
Financial intermediaries and the foreign trade sector (CAB) clpsely compete for
dominance across all time phases. Vagaries of the internati6nal trade sector,
CAB, are, however, the leading (most exogenous) long term yariable. In the in
termediate term, macroeconomic activity (LGPCY) relaces the fiscal sector (G)
as the third most influential variable. The monetary base (CIC) is the least ex
ogenous variable in the model. Only 39.08% of own variance is attributable to
movements in CIC come year 5. This percentage falls to a m·ere 24.52% in the
50 years time horizon.
Turning to endogeneity, with regard to the finance-growth nexus, Table
15 suggests that financial intermediaries (DMB) account for 64 % of macroeco
nomic activity (LGPCY) variance in the horizon year 1. In tum LGPCY explains
57.16% of the variance in financial intermediaries in the same time band.
Across all horizons, the financial intermediaries account for a larger proportion
of macroeconomic activity than the reverse relationship. The disparity is more
pronounced across higher time horizons. In the thirty-year titrie horizon, for in
stance, financial intermediation explains 52.60% of LGPCY:· whereas the re
verse influence is only 35.40%. When contrasted with other variables in the '
model other than LGPCY itself, financial intermediaries consistently outperform
the rest in accounting for the forecast error of macroecor.omic activity. Shocks
to the current account balance (CAB) only have a significant long-term contribu
tion to the fiscal sector (G) forecast error variance, and just that. The contribu
tion of the monetary sector, CIC, appears insignificant across time. This said;
the monetary sector accounts for more variability in the financial sector than
does the financial intermediaries on the monetary sector. Fluctuations in the
monetary sector could be important to the extent they affect financial develop
ment. Positive real interest rates, for instance, can benefit the financial sector.
235
VDC analyses confirm the empirical findings from VAR and GJRs that fi
nancial intermediation facilitates economic growth. These results are consistent
with the main proposition in this study that financial sophistication has a positive
impact on economic activity or growth. Generalised VDC results suggest that, in
relative terms, causality runs from financial intermediation to economic devel
opment rather than the other way round. Needless to say the findings are natu
rally sensitive to quality of data and specification of the VAR model.
The vector error correction model (VECM) is another form in which to
characterise the direction of causality in a cointegrating VAR model. There are
as many lagged error correction terms (ECT), as there are endogenous ~ari
ables in the underlying VAR model. Tables 20 and 21 below provide computa
tional details of the estimated error correction equations associated with the
macroeconomic (LGPCY) and the financial intermediation (DMB) variables re
spectively. Tile same procedure was followed to obtain results for all other vari
ables. In all cases, several differenced variables were temporarily added to the
OLS equation by Microfit in order to help map out the adjustment process. Ta
bles 20 and 21, for instance, list some of the temporary variables added.
The Microfit programme automatically generates diagnostic tests to as
sist in the evaluation of serial correlation; the functional form; normality; and
heteroscedasticity. The various diagnostic statistics, based on Chi-square and
F-test statistics, are given at the bottom of Tables 20 and 21. Apart from non
normal errors in some variables, the various diagnostic test statistics suggests
that there is no evidence of statistical problems in the underlying variables.
As illustrated in Tables 20 and 21, very few coefficients on the differ
enced variables were found to be statistically significant. [Contrary to the gen
eral trend, the ECT for the monetary sector (CIC) equation, however, contained
several statistically significant coefficients on the differenced variables.] Statisti
cally insignificant coefficients on the lagged temporary variables do not affect
the validity of the underlying cointegrating VAR model because the ECM char
acterise short run dynamics. In contrast, cointegration and theory are concerned
with long run relationships. Intuitively, coefficients and signs of the error correc
tion terms give the single lag magnitude and direction of short run dynamics es
sential to correct for deviations from the long run equilibrium relationship.
236
. ,_, 0
'.c. , ..
--. -
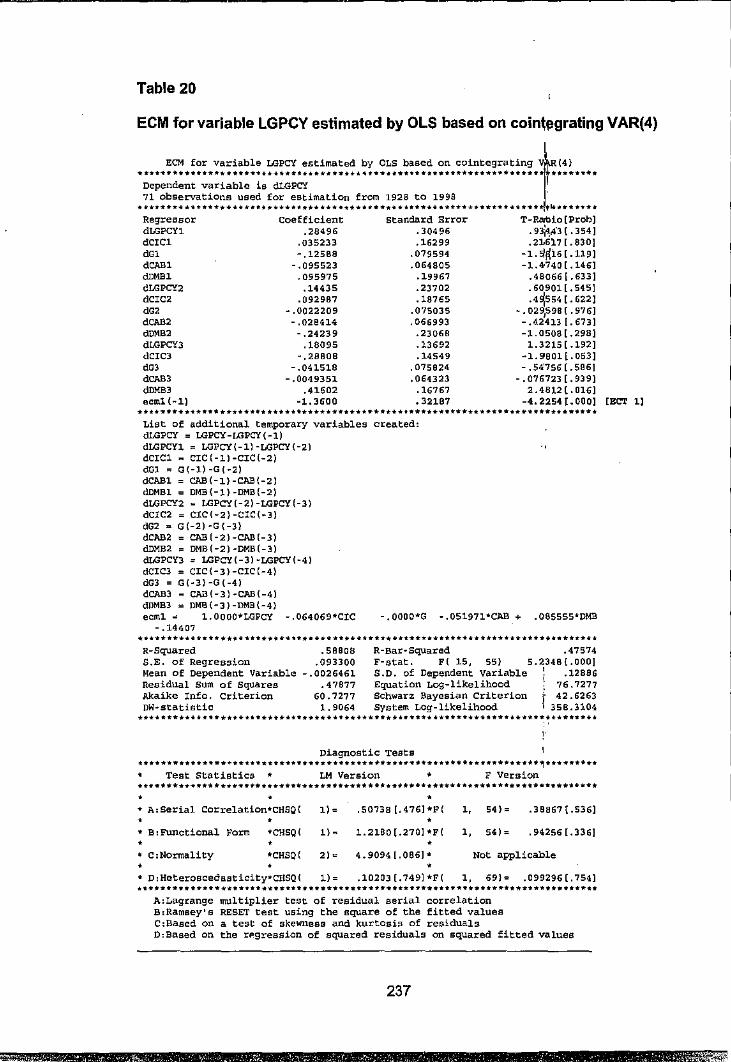
Table 20
ECM for variable LGPCY estimated by OLS based on coinl~grating VAR(4)
······································~······························ ....... . ECM for variable LGPCY estimated by OLS baaed on cointegrating Vr:I•>
Dependent variable is dLGPCY 71 observations used for estimation from 1928 to 1998 ·
····································································J. ~······· Regressor dLGPCY1-dCIC1 a,n
"""'" """" dLGPCY2 dCIC2
"" dCAB2
"""" dLGPCYJ dCIC3
"" "''"" dDMBJ ecml(-1)
coefficient .28496
,035233 - .12588
-.095523 . 095975 .14435
.092987 - .0022209
- .028414 -.24239
.18095 - .28808
- • 041518 - .0049351
.41602 ·1,3600
Standard Error .30496 .16299
.079594
.064805 .19967 .23702 .18765
.075035 , 066993
.23068
.13692
.14549 , 075924 ,064323
.16767 • 32197
T-Rarbio[Proh) .93~,(3{.354] ,21,6'.l.7 [ .930]
-1.:l~i6[.ll9) -1.4'740(.146)
,48066 [ .633] .60901[,545] .4~554 [. 622]
- . 029,598 { . 976) -.42413 [.673] -1.0508[.298}
1.3215 [ .192] -1.9801[.053] -.54'756(.596]
-.076723(.939] 2.4812(.016]
-4, 2254 [. 000] [BCT 1]
List of additional temporary variables created, dLGPCY = LGPCY-LGPCY(-1) dLGPCYl = LGPCY(-1)-LGPCY(-2) dCICl a CIC(-l)-CIC(-2) dGl = G(-1)-G(-2) dCABl CAB(-1)-CJ\B(-2) dDMBl DMB{-1)-DMB(-2) dLGPCY2 ~ LGPCY(-2)-LGPCY(-3) dClC2 CIC(-2)-CIC(-3) dG2 a G(-2)-G{-3) dCAB2 CAB(-2)-CJ\B(-3) dDMB2 DMB(-2) ·DMB(-3) dLGPCY3 = LGPCY(-3)·LGPCY(-4) dCIC3 CIC(-3)-CIC(-4) dG3 = G(-3)-G(-4) dCAB3 CAB(-3) ·CAB(-4) dDMB3 = DMS(-J)-DMB(-4) ecml = 1,0000*LGPCY -.064069*CIC
- ,14407
R-Squared S.E. of Regression Mean of Dependent Variabl~ Residual sum of squares Akaike Info. criterion ow-statistic
.58908 .093300
-.0026461 .47877
60. 7277 1. 9064
-.OOOO*G -.05197l*CAB + .OSSSSS*DMB
R-Bar-Squared .47574 F-stat. F( 15, SS) 5.2349{.000] S.D. of Dependent variable ) .12896 Equation Log-likelihood 76.7277 Schwarz Bayesian Criterion 42.6263 System LOg-likelihood 358.3104
Diagnostic Tests **************•~······························**********•···········~···****** • Test Statistics * LM Version • F Version •••••••••••••••••••••••••••••••••••••••••••••••••••••••••••••••••••••••••••••• • • • • A:Serial Correlation•cHSQ( 1)= .50738 [.476]*F( ,, 54) = .39867{.536) • • • • B,FUnctional Fa~ *CHSQ( ". 1. 2180 [ .270] *F ( ,, 54) = .94256[.336] • • •
C:Normality *CHSQ( ,, . 4.9094(.086]• Not apPlicable • • • • D:Heteroscedasticity*CHSQ( 1)= .10203 [. 749] *F ( ,, 69)= .099296 [. 754} **************•••·····························································
A,Lagrange multiplier test of residual serial correlation B:Ramsey's RESET test using the square of the fitted values C:Based on a test of skewness and kurtosis of residuals D:Based on the rPgression of squared residuals on squared fitted values
237
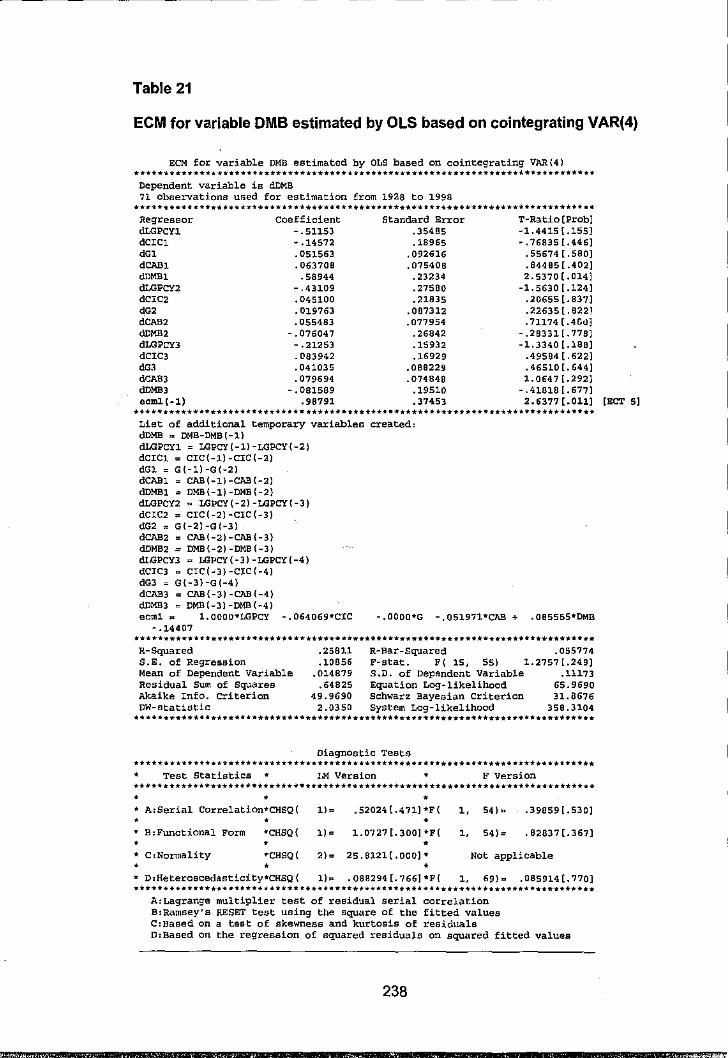
Table 21
ECM for variable DMB estimated by OLS based on cointegrating VAR(4)
ECM for variable DMB estimated by OLS based on cointegrating VAR(4)
·································································~············ Dependent variable is dDMB 71 observations u~ed for estimation from 1928 to 1998
••••••••••••••••••••••••••••••••••••••••••••••••••••••••••••••••••••••••••••••
• • • • • • • • •
Regressor dLGPCYl dCICl dG> dCAB> dDMB> dLGPCY2 dCIC2 do, dCAB, dDMB, dLGPCYJ dCICJ dGj dCAJ33 dDMBa ecm1(-l)
Coefficient - .51153 • -14572 .051563 • 063708
.58944 - .43109 ,045100 , 019763 .055483
- .076047 - ,21253 . 083942 .041035 .079694
- ,081589 ,98791
Standard Error .35485 .18965
, 092616 ,075408
• 23234 .27580 .21835
.087312 ,077954
.26842
.15932
.16929 ,088229 .074848
.19510 ,37453
T-Ratio[Prob] -1.4415{.155] -.76835[.446]
.55674(.580]
.84485 [ .402] 2,5370(.014]
-1.5630(,124] ,20655[.837] .22635 [. 8221 ,71174[.4!:!l]
-.28331[.778) -1.3340 [.188]
.49584 [ .622]
.46510(.644] 1.0647 [.292)
-,41818(,677] 2.6377[.0ll] [BCT 5]
List of additional temporary variables created, dDMB m DMB-DMB(-1) dLGPCYl = LGPCY(-1)-LGPCY{-2) dCICl = CIC{-1)-CIC(-2) dGl = G(-1)-G(-2) dCABl = CAB(-l)-CAB{-2) dDMBl = DMB(-1)-DMB(-2) dLGPCY2 .. LGPCY(-2)-LGPCY{-3) dCIC2 = CIC(-2)-CIC(-3) dG2 = G(-2)-G(-3) dCAB2 CAB(-2)-CAB(-3) dDMB2 DMB(-2)-DMB(-3) dI.GPCY3 .. LGPCY(-3)-LGPCY(-4) dCIC3 CIC(-3)-ClC(-4) dG3 = G(-3)-G(-4) dCAB3 CAB(-3)-CAB(-4) dDMB3 ~ DMB(-3)-DMB(-4) ecml.. 1,0000*LGPCY -,064069*CIC -.OOOO*G -.05197l*CAB + ,085555*DMB
-,14407
R-Squared S.E, of Regression Mean of Dependent Variable Residual Sum of squares Akaike Info. Criterion OW-statistic
Test Statistics •
• A:Serial Correlation•CHSQ(
• B: Functional Fom *CHSQ{
• C:Normality .,.CHSQ(
• D:Heteroscedasticity•CHSQ(
.25811
.10856 .014879
,64825 49.9690
2 .0350
R-Bar-Squared .055774 F-stat. F{ 15, 55) 1.2757(.249] S,D. of Dependent Variable .11173 Equation Log-likelihood 65,9690 Schwarz Bayesian Criterion 31.8676 System Log-likelihood 358.3104
Diagnostic Tests
LM Version • F Version
• ,,. .52024{,471)*F( 1, 54)" ,]9859[,530] •
1) = 1. 0727 [. JOO] .. F ( ,, 54)= .82837(.367) •
2)= 25.0121{,000]* Not applicable • ,,. . 088294 [. 766] *F ( l, 69) .. ,085914(.770) ......................................................................................
A:Lagrange multiplier test of residual serial correlation B:Ramsey's RESET test using the square of ths fitted values C:Based on a test of skewness and kurtosis of residuals D:Based on the regression of squared residuals on squared fitted values
238
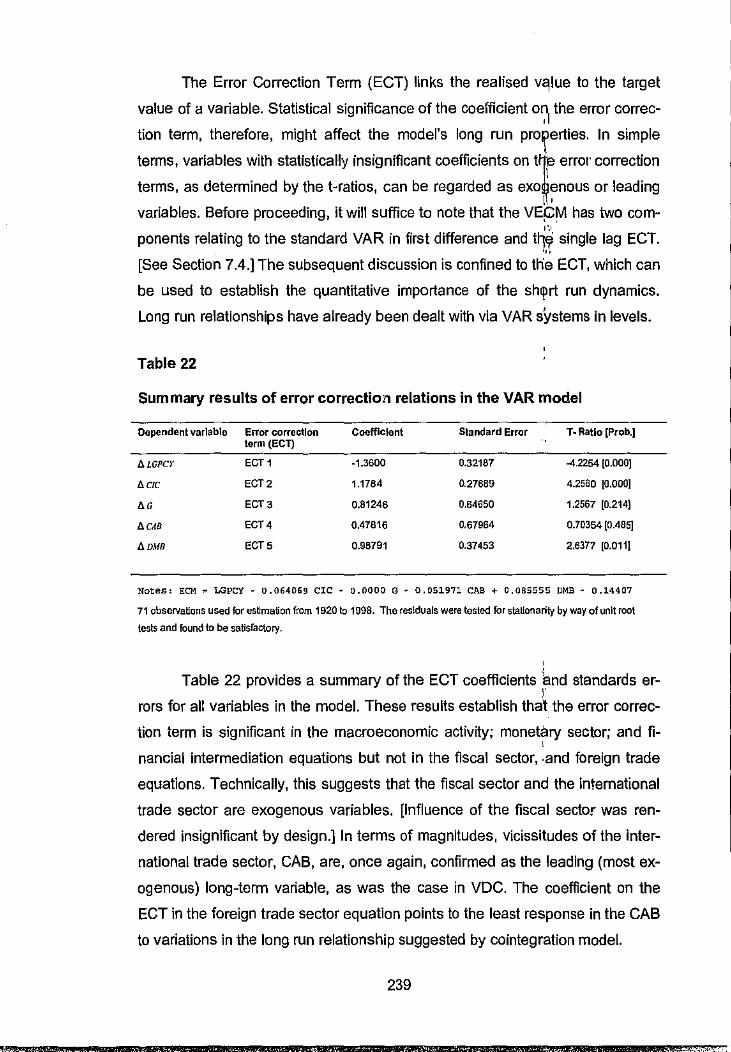
The Error Correction Term (ECT) links the realised v91ue to the target
value of a variable. Statistical significance of the coefficient o~ the error correc
tion term, therefore, might affect the model's long run proferties. In simple
terms, variables with statistically insignificant coefficients on t~r error- correction
terms, as determined by the t-ratios, can be regarded as exo~enous or leading L•
variables. Before proceeding, it will suffice to note that the VEG::M has two com-, ' 1·., ponents relating to the standard VAR in first difference and t~~ single lag ECT.
'" [See Section 7.4.] The subsequent discussion is confined to th'e ECT, which can
be used to establish the quantitative importance of the shiprt run dynamics.
Long run relationships have already been dealt with via VAR sYstems in levels.
Table 22
Summary results of error correction relations in the VAR model
Dependent variable Error correction Coefficient Standard Error T· Ratio (Prob.) term (Ecn
IJ.LGPCY ECT1 ·1.3600 0.32187 -4.2254 (O.OOOJ
IJ.CIC ECT2 1.1784 0.27689 4.2560 {0.000]
OG ECT3 0.81246 0.64650 1.2567 (0.214}
IJ.CAB ECT4 0.47816 0.67964 0.70354 [0.485}
!J.DMB ECT5 0.98791 0.37453 2.6377 [0.0111
Notes: ECM ~ LGPCY · 0.064069 CIC· 0.0000 G • 0.051971 CAB+ 0,085555 DMB - 0.14407
71 observaHons used for estimation from 1920 to 1998. The res\duals were tested for staHonarity by way ofunlt root
tests and found to be satisfactory.
' Table 22 provides a summary of the ECT coefficients knd standards er-
1· rors for al: variables in the model. These results establish that the error correc-
tion term is significant in the macroeconomic activity; monetary sector; and fi-' nancial intermediation equations but not in the fiscal sector, ,and foreign trade
equations. Technically, this suggests that the fiscal sector and the international
trade sector are exogenous variables. [Influence of the fiscal sector was ren
dered insignificant by design.} In terms of magnitudes, vicissitudes of the inter
national trade sector, CAB, are, once again, confirmed as the leading (most ex
ogenous) long-term variable, as was the case in VDC. The coefficient on the
ECT in the foreign trade sector equation points to the least response in the CAB
to variations in the long run relationship suggested by cointegration model.
239
~ ;, ,.-. ,"/_ ,
_le
iJ
In relative terms, it seems that indicators of macroeconomic activity
(LGPCY) and the monetary sector (CIC) are the most endogenous variables in
the model. There is evidence of rapid and highly statistically significant re
sponses to deviations from the long-run relationship in the monetary sector and
in macroeconomic activity. The negative and very significant coefficient on the
ECT in the LGPCY equation suggests that negative fluctuations from the long
run relationship are adjusted by an increase in macroeconomic activity. Con
versely, negative deviations in the long run relationship would necessitate a
negative adjustment in the monetary base to restore equilibrium.
Turning to the indicator of financial intermediation, DMB, the coefficient
on the ECT is statistically significant. This phenomenon suggests that financial
intermediaries respond to deviations in the long run relationship implied by the
model. The statistically significant response renders financial intermediation an
endogenous variable. Furthermore, the positive sign on the ECT in financial in
termediation equation supports the view that economic development or real ac
tivity promotes financial development. Nevertheless, it has already been noted
that the coefficient on the ECT in the real activity equation is highly statistically
significant. This makes economic development an endogenous process capable
of positive response to innovations in other variables such as financial interme
diation. It follows that, it can safely be concluded that the possibility of reciprocal
causality between financial intermediation and economic development cannot
be ruled out. This as the case may be, does not put economic development and
financial sophistication on equal footing. In comparative terms, the coefficient on
the ECT in the real activity equation is 38% more responsive 60% more statisti
cally significant than that on financial intermediation. Thus, the VECM results
might imply that in relative terms net causality flows from financial intermedia
tion to real activity. Logically it follows that policies and measures that enhance
sophistication of the financial system would have a positive impact on real ac
tivity in Zimbabwe. Conversely, poor performance by financial intermediaries
would retard real activity to a gn~ater extent than economic decline would ham
per the financial sector. Thus financial repression can be very costly for society.
240
'i
.,
9 CONCLUDING REMARKS
,I
I Nature will not betray those who approach her with an open h1~rl
(, " . 1',1, .
Wordsworth
This research examines the theoretical links between '.financial intenne
diation and economic performance. Empirical evidence on long-run relation
ships and short-run dynamics is based on an array of multiJ.ariate time series
analyses, using a newly constructed data set from Zimbabwe. More specifically,
Vector Autoregression (VAR), Generalised Impulse Response Analysis (GIR);
Forecast Error Variance Decomposition (VDC); and the Vector Error Correction
Model (VECM) were employed.
A number of factors motivated the adoption of a rich multivariate time se
ries approach. In the first place, there is growing concern that bi-variate and tri
variate VARs are misspecified because they do not capture the core economic
sectors of the economy. There is high risk that conclusions from such studies
are tainted by omitted variables. Secondly, cross-country and panel studies
might be too generalised due to averaging, which renders causality difficult to
interpret. Luintel and Khan (1999, p384) are obviously right that "aggregation
blurs important events and differences across countries." According to them,
Levine and Zervos (1996, p325) conceded that there are "measurement, statis-' tical and conceptual problems" in cross-country studies (Ibid). Focus on one ' country, for instance, avoids problematic currency conversion. Thirdly, most
studies in leading journals tend to concentrate at advanced economies with
similar development patterns. In my view, emerging and trahsition economies
stand to reap great benefits from financial sophistication because demand cur
rently outstrips supply of services. Finally, Beck, Demirgui;-Kunt, and Levine
(1999), constructed a new financial database which provide an array of com
plementary indicators through which finance might influence real activity.
The econometric methodology applied in this study is described in great
detail, in an effort to demystify time series analysis. An equally rigorous ap
proach was followed to determine the nature of links between financial aggre-
241
gates and economic activity both in the long run and short run. Evidence from
the cointegrated VAR system supports the view that financial aggregates have
a causal effect of economic activity in the long run. From a theoretical point of
view, financial sophistication can improve real activity by increasing investment
via deposit mobilisation, or through increased factor productivity emanating from
competent project screening, monitoring and enforcement of sound corporate
governance practices. Financial aggregates pertaining to size were found to be
very informative; and had a positive impact on economic activity. Similarly liquid
liabilities were found to have a causal effect on real activity. These findings
support the growing recognition, since Schumpeter (1911 ), that financial so
phistication positively affects real activity. Irving Fisher (1933),25, Mishkin
(1978), McKinnon (1973), Shaw (1973) and Levine (1997), for example,
reached similar conclusions. Credit aggregates such as private sector credit
(PSC) were, however, not informative about economic development in Zim-
babwe. Most of them were excluded from the model due to unsatisfactory unit
root properties. On one hand this could imply that there is no clear-cut relation- j
ship between credit aggregates and economic activity in Zimbabwe. On the
other, the result merely reflects on poor quality of available data.
In simulated short-run dynamics, the model with demand deposit banks
(DMB) as a measure of financial intermediation converged faster than the alter
native models incorporating liquid liabilities (LQL) and the entire banking sector
(BKA). Evidence from forecast error variance decomposition analyses (VDC)
suggests that financial intermediation (DMB) is the leading variable in the short
horizon. ln the long term, the foreign trade sector, represented by the current
account balance (CAB) takes over as the leading variable. Financial intermedi
aries remain the second most important exogenous variable. The monetary
base (CIC) turns out to be an endogenous variable. There is evidence of recip
rocal causality between financial intermediation and economic activity. In rela
tive terms, the impact of financial intermediation on macroeconomic activity is
greater than the reverse relationship. In the VECM framework, the results are
very similar to those obtained via variance decompositions.
Due to data limitations, analysis of capital markets is largely based on
graphical and descriptive techniques. In terms of costs and margins, the Zim
babwe financial system is not very efficient due to structural constraints espe~
242
'
cially on real interest rates. The persistence of bank profitab\lity in Zimbabwe
during times of adverse macroeconomic developments c~n, among other
things, be attributed to huge interest margins. Tobin (1963) ~emonstrated that
the success of banks does not depend on their size but margi1a.
Financial theory, e.g. agency risk and information asyrri~etry, has taught
us economic activity does not take place in a vacuum or in perf.ect markets. This '·'.
study provides case evidence that political institutions and thei~tate of corporate
governance in Zimbabwe affect the pattern and prospects for both econorniC
and financial development. LaPorta, Lopez--de-Silanes, Shleifer and Vishny
(1997, 2000) provide ample evidence to the effect that a country's legal tradi
tion, for instance, determines financial development throug~ the rule of law,
contract enforcement, and property rights. Beck, DemirgGG-Kunt and Levine
(2001) focus on political structures as influential determinants of the degree of
financial sophistication. The basic idea is that a group in power designs policies
and institutions that guarantee self-entrenchment and self-enrichment. If the
elite stand to benefit from free trade, they will enact laws and create institutions
supportive of competitive markets. In contrast, centralised political systems in
tolerant to competition, transparency, and accountability are bound to retard
rather than encourage financial development. Once entrenched, authoritarian
institutions are very difficult to eradicate. For instance, post independence rulers
of what once were badly run colonies usually exploit the established institutions
to their own advantage and profit. The POIVAD concept proposed in this thesis
would help inform debate on persistent economic oppression i~ Zimbabwe.
One Ralph Waldo Emerson, cited in Maital (1994, p3) reportedly saluted
his fri,;mds with the question: What have you learnt since we last met? A num
ber of constructive recommendations have been put forward throughout this
study. It is hoped this thesis will prompt a broad and open discussion of issues
raised. Innovative practices and constructive research might guide Zimbabwe to
adopt economic and financial policies with a high probability of promoting sus
tainable economic growth. Institutional areas of policy emphasis for Zimbabwe
should include transparency, accountability, and good corporate governance.
Unless prevailing wisdom can stand up to criticism, its aesthetic value may
never be fully appreciated. I agree unreservedly with Davies (1991, p205) that,
"Science progresses by betraying ancient principles for new insights."
243
. 'f !
3 '
i ' ~'. '
.\ '
' ·j '
----------' 10 SUGGESTIONS FOR FURTHER RESEARCH
Traditions are needed, and will persist, because they give continuity and form to
J,'fe ... Without intellectual traditions, ideas would have no focus or direction. II
However, it is part of academic life continually to explore the limits of such tradi
tions, and foster active interchange between them.
Professor Anthony Giddens (1999), "Tradition," BBC Reith Lectures
There has been inadequate attention to financial reform in Zimbabwe.
Rigorous analysis is required to determine whether continued financial repres
sion in Zimbabwe has brought more harm than benefits. Notwithstanding wide
spread agreement in financial literature regarding the causal effect of financial
intermediation on economic growth, the financial sector formed a little part of
government economic policy before and after independence. Government might
have misunderstood the cardinal role of financial intermediation in economic
development. In my view, authorities should leave no stone unturned to encour
age financial innovation. Merton (1990, p270) regards financial innovation as
"the engine driving the financial system on its prospective journey to economic
efficiency." Even small benefits to individuals aggregate into enormous social
gains for the economy as a whole. In the same vein the hours lost by Zimbab
weans queuing for simple financial services aggregate into enormous loss of
productivity at a national level. Van Horne (1985) agrees that true financial in
novation makes the markets either more efficient or more complete by lowering
intermediation costs or inconvenience casts, (p622). Recent advances in finan
cial intermediation literature also suggest that a functional approach to financial
architecture brings more economic benefits than the structural approach Zim
babwe has traditionally followed.
Zimbabwe has also run chronic fiscal deficits from one generation to an
other. Economic theory suggests that fiscal deficits result in a short-term dete
rioration of the curre:it account. A surplus is envisaged in the long term if deficit
expenditure is utilized on investment. Apart from foreign borrowing, a deficit is
either financed through money creation or domestic borrowing. Desperate reli
ance on money creation may be highly inflationary. Since UDI the government
244
_,,--'
-,,
·. '
has occasionally relied on borrowing from the domestic ban~ing sector. Most
economists argue that the practice results in crowding out of.private sector in
vestment. Economic growth decreases while the r.urrent ac~ount deficit rises
due to low exports. Successive devaluations have failed tojigalvanize export
performance. Inelastic import and export demand imply that the Marshall-Lerner 11..,
Condition is never met, resulting in disastrous price increases'. following any de-,·.,
valuation. From 1999 to 2001, economic activity in Zimbabwe '()'as, among other .. things paralysed by rampant inflation, foreign currency shortages, international
isolation and financial disintermediation. Excessive liquidity in\ the financial sec
tor confirms that banking institutions have abandoned their cOre business in fa
vour of money market operations. The resultant economic, decadence was
crowned with the reintroduction of a fixed exchange rate regime and price con
trols. As a matter of policy Zimbabwe need clarity of purpose as to whether she
is pursuing exchange rate or inflation targets. Moves by the RBZ to introduce
higher denominations of banknotes such as the 2$200 and 2$500 notes will not
solve this predicament. What may be required is to restructure the economy
and introduce a new currency. However this question does not concern our im
mediate needs but it could make an interesting subject of a separate study.
Simulated short run dynamics conducted in this study provide strong evi
dence that vicissitudes of the international trade sector is not responsive to in
novations in other variables. A logical extension of this research would be to
examine more sharply the determinants of this sector. One possibility is to ex
plore developments on the current account balance (CAB) via the Marshall
Lerner condition. This issue is import important given the cqnstant debate re
garding an appropriate exchange regime for the Zimbabwe dollar. In addition,
VAR analysis revealed that current account deficits are havi,! a negative long
run impact on macroeconomic activity.
Corporate governance and consumer protection in the Zimbabwe Finan
cial System are other potential candidates for further research. Due to political
unrest in Zimbabwe corporate governance analysis in this research is largely
conceptual. Ideally, future researchers should gather detailed information from
market participants on qualitative issues such as governance, legal issues,
agency problems and dynamic efficiency of the Zimbabwe Financial System. A
questionnaire moulded along Hellman et al (2000) targeting employees in
245
banking, students of finance, and other market participants might be used. It
would be interesting to know what mechanisms cou!d be put in place to en
hance consumer protection in Zimbabwe and how these can be enforced, given
the numerous complaints of overcharging, poor service or outright exploitation.
There is an urgent need for a project dedicated to the construction of an
electronic time series database in Zimbabwe. I have in mind a database that
covers financial, monetary, and economic aggregates for as long a span as
possible. In Zimbabwe it is very difficult, for example, to obtain reliable bank
level data going back to say 1995. The sensitive nature of financial information
sometimes plays in the hands of political calculations. From December 1965 the
RBZ was banned from publishing statements of its assets and liabilities, anl'lual
accounts and reports. The first official Quarterly Economic and Statistical Re
view (QESR) for the period appeared in September 1980. Unfortunately, the
publication only traced the major economic and statistical trends back to 1975.
"Stock Exchange Prices and Yields" first appeared in the RBZ QESR around
March/June 1998. Although the series dates back to 1975, it has no figure for
market capitalisation, for example. By the December 1999, when the QESR se
ries was discontinued in favour of monthly and weekly publications, succeosive
Governors of the Reserve Bank of Zimbabwe had not kept the Dr D. C. Krogh's
(1980, p5)26 promise to extend the Reserve Bank's record of the country's fi
nancial data series back 1965. I am not sure whether anything can be salvaged
from the Quarterly Bulletins of Financial statistics oft cited in Sowelem (1967).
Although the data gathering process is not a significant research output
according to academic traditions, its contribution to research output and poster
ity is immense. A good database is a powerful force to build sustainable interest
in vector autoregressions, cointegration analysis and time series modelling.
Statistically, researchers face a significant challenge to develop reliable
techniques that can handle higher order integration. As the literature of cointe
gration progresses, new techniques are emerging that do not require rigorous
determination of whether variables are! (1) or I (0). In my view, the challenge to
develop procedures that do not depend on fluid distinctions regarding the order
of integration and extent of cointegration very is strong.
246
,_., c
3 '"'
!
APPENDICES
,I
I Appendix 1: Vague Concepts: capital and njbney
1\,
Capita! " !'.>, . I,!
Arbitrary definitions of concepts such as capital, money, investment and
governance render their consideration for purposes of analysi! problematic. Ac-'
cording to Taylor (2000, p144) living Fisher "defines wealth as anything material
that is owned. Cap1!al is then defined as the stock of wealth at:any point in time,
while income is defined as the flows of services generated from wealth." Bartl
let (1987, p59) highlights that the concept of wealth changes with time. "Wealth
is that which has value at a given time. Change time and the constituent ele
ments of wealth must change or deteriorate in value." Taylor (2000, p xiii) learnt
the hard way that the "search for a single concept of capital in the canon of
economics" was problematic because there are several concepts of capital.
Frankel (1938, p3.) had earlier on reached the same conclusion, "For capital is
an abstract term, the careless use of which is apt to hide the real meaning of
the process to which it refers." Use of the word without an adjective can refer to
anything from human capital to "physical capital, capital goods, financial capital,
working capital, circulating capital, fixed capital, etc," Taybr (2000, p xiii). In my
view human capital is more than "the embodiment of invest~ent in human be
ings" that Kindleberger and Herrick's (1977, p79) suggest. ;rhurow (1970) in ' Jaffee (1990, p38) defines human capital as "productive skills, talents and
knowledge." Kindleberger and Herrick's (1977, p79) definition pf financial capital
as "liquid assets which can easily be exchanged for goods but are not the
physical goods themselves " makes it indistinguishable from money. Even
some of the greatest writers have struggled to pinpoint a single definition for the
concept of capital. Taylor argues
Vagueness and ambiguity concerning capital appear in the writings of all great capital theorists, whether Smith, Ricardo, Mane, Jevons, Walras, Bohm-Bawer!<, Clark, Wicksell, Schumpeter, Fisher, Hayek, Keynes, Hicks, Robinson, Samuelson or Solow.
247
. .
Joseph Schumpeter's (1911, 1936 p116-27) concept of capital, for in
stance, is surprisingly indistinguishable from both credit and money, for a man
of his remarkable insight. Schumpeter equates capital to "a fund of purchasing
power ... consisting of money, ... accumulated liquid resources ... and other
assets calculated in money " as distinct from a "stream of income" in the living
Fisher sense. Illuminated as a fund of purchasing power capital is easily con
fused with money because it relates to real activity only as a medium of ex
change. Schumpeter (p116) insists:
Capital is nothing but the lever by which the entrepreneur subjects to his control the concrete goods which he needs, nothing but a means of diverting the factors of production to new uses, or of dictating a new direction to production.
Although Schumpeter reiterates that means of payment not associated
with development does not constitute capital but "exchange media ... for car- :i
rying the customary exchanges"· he provides !ittle guidance to separate the
phenomena. Taylor (2000, pp139-141) argues that Schumpeter had a credit
theory of money (means of payment or generalised purchasing power) created
by banks through the process of credit creation. I agree with this assessment
because Schumpeter's (1936, p117 and 122) concept of capital seems to con-
verge with intermediation.
The function of capital consists in procuring for the entrepreneur the means with which to produce. It stands as a third agent necessary to production in an exchange economy between the entrepreneur and the world of goods. It constitutes a bridge between them .... Capital, then, is an agent in the exchange economy.
Money
Over the years there have been chronic ambiguities in defining what
constitutes as money. Money refers to anything that is generally acceptable as
payment for goods and services. Some economists confine money to legal ten
der, i.e. enforceable 3t law as means of payment for goods and services or in
set!lement of debt Podolski (1986, p184) notes currency theories of money de
fine money narrowly, often in terms of a commodity or quasi-commodity. Finan
cial theories of money (for example by Keynes and Schumpeter) emphasise fi
duciary and flexible money aspects. The general financial practice and custom
248
takes into account currency in crrculation and various categories of deposits to
arrive at hierarchical definitions of money such as M1, M2 ... The constituent
components of money categories vary over time as deposits at sundry institu
tions are added, excluded or reclassified. Tobin (1963, p409) marvels at Shaw's
cynicism that nobody really knows what the money supply is but whatever con
stitutes it increases at a regular rate.
Shaw (1f,73, pp6-7) observes that money, like other financial and non
monetary assets, is characterised by multiple pricing. The four prices of money
are unit of account, index of purchasing power {real money), explicit price (in
terest rate), and ratios of exchange (i.e. four exchange rates - spot, forward,
real and nominal)
In Bartlett's (1987, p63) view, "Money, like blood, has two values": circu
latory (infusion of life) and plasma. As a medium of exchange and the fulcrum of
transactions, money facilitates economic activity. A worthwhile business activity
should generate money if the enterprise is to survive. Unless profit has the po
tential to be translated into money it is illusory. The circulation of money within
and among various sectors of the economy is also essential for good economic
growth. Money, when equated to plasma, takes a credit function that can be
hoarded and canalised into deficient economic units. In real life the financial
system consists of more than either monetary or credit aggregates.
249
' ' -'
Appendix 2: The complex root circle and eige11values
,I
(a) The complex unit root circle 11
If z is a complex number, the solution (or roots) to the!~quation a(z) = O
may exist as real and complex numbers. Following the repre~~ntation in David-,
son (1999, p85) a complex number z may therefore bi3 expressed as
z = z = a -ib, where a and b are real numbers and i is a complex number. The
absolute value or modulus of z is a real number representif1g "the radial dis-,
tance ofz from the origin in the complex plane, in which a and b are measured
on the coordinate axes," Davidson (1999, p85). Its magnitude is given by
J z J= Fzi = ~a' + b' . When the modulus I z J> I, z is said to be outside the unit
circle. (If J z I= I, then it is on, and if J z J< I it is inside the unity root circle.)
(b) Eigenvectors and eigenvalues
Given a square matrix M, say a matrix of coefficients, an eigenvector or
characteristic vector (x) exist if there is a solution A to the equation Mx =A. x.
Such a value ..i for which x cp. O is termed an eigenvalue. According to Kreyszig
(1993, p387) the temn is derived from the German word Eigenwert in which "ei
gen" means "proper'' and "wert," means "value." The eigen vector (x) exists if x
* 0. To determine the eigenvalues of matrix M it is solved for its characteristic
polynomial ,i given by (M-,! I )x = 0, where I is the identity matrix. There are n
roots if M is n x n. Those roots are not necessarily distinct. A set of eigenvalues
is referred to as the spectrum while the largest absolute value is termed the ra
dius. The characteristic detemninant, det ( ,! ) = det(M-,l I), is a necessary and
sufficient condition for A to be a characteristic root of M. If all the roots are non
zero the matrix is non-singular, invertible or stationary.
250
"j
"

Appendix 3: Standard Bank Staff Portraits
1,1 Iii~ :!1 l-1i111d1 11'!.!1 ,.r,...,1rr/ .!Jr u'lfdu . ..t[,01,:-: nl!! (,-wdn .11.mrr,h J/ri!f r11 0.1:-r.mlw, JSY,i", f,r,m Ml f;) riJllU; Jj11J1,1.'.r, H~,'i!Jtam .. (1'1m .lfrJlr1JW.~IJ aml Tt10,;ovJ, 1111'!.!J Tr"r1,c,(;d ulm, in 1910, .._\,lf J,'JU I& E..:lf .~f~fCII Hi v:mnfll't' rh;- pm~.·111,ir ,'.xu1:tfm~ r~,· &,.t'.r i1e1/lille·J ro J11r1t ,irra arm Jub_io1rs..•m(r- uJitll<.'11 r.li,! /l!JI rn-.:,
· liM!h'll,'.i in M1m1..~a.r11 .wd N11IrC!bi. (A)
Note: The nameless man lying down in panel (A) probably cannot take the same pose as his
"racial superior" work mates
Source: Standard Chartered Bank (1967, p22) "Three Quarters of A Century ... "
'/11r• Qta! Q111.• IJ1Tmd1 d,•(wt:r,·,l /1! 1,rnrm11 11/ 111,• ~i.1i1 of rl1r l'tl,rte of 11'.ih·~ /11 191.l. 1'~ r.taff In fm111. ie/1 ro flflrl.' To/!rwr. WritlrJ. f:urvu, f1rlf/wr .rm/ Vi<'lor.
(B)
Source: Standard Chartered Bank (1967, p38) ~Three Quarters of A Century ... H
251
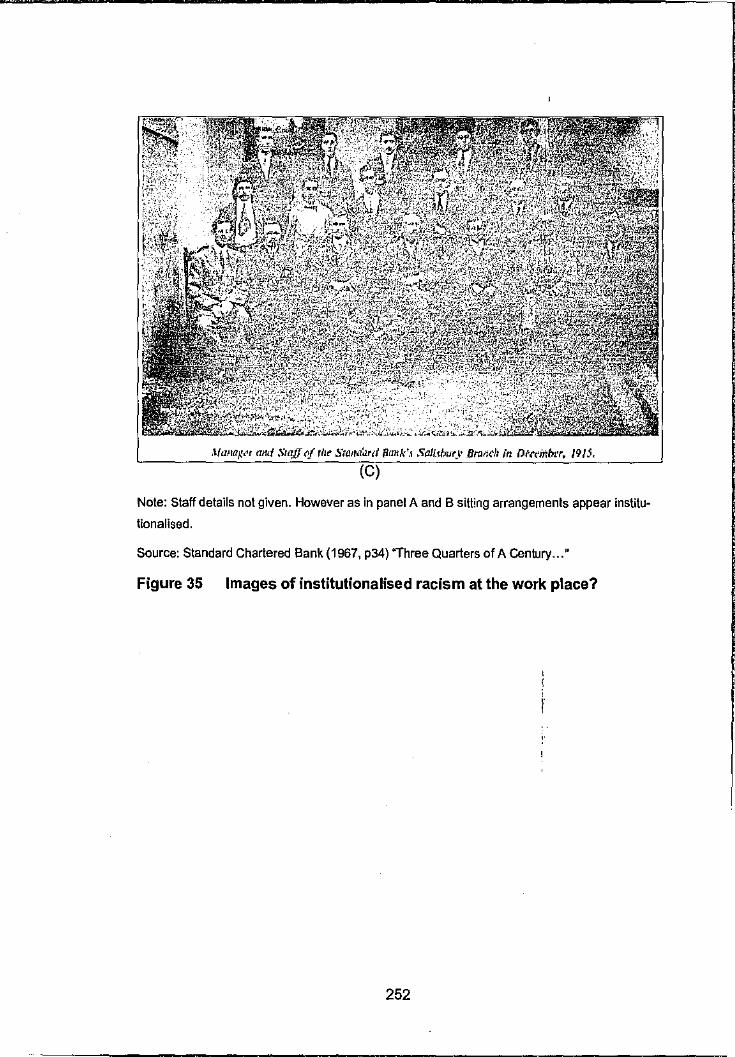
,\fwtaM•'t allli Siaff tf rl1e S'ra,r,.i'J.rd {i1mk'.1 Salltbury Brtll!dl In Ot('('ifrba, 1915,
(C)
Note: Staff details not given. However as in panel A and B sitting arrangements appear institu
tionalised.
Source: Standard Chartered Bank (1967, p34) ~Three Quarters of A Century ... "
Figure 35 Images of institutionalised racism at the work place?
252
w awe ESE
'
'
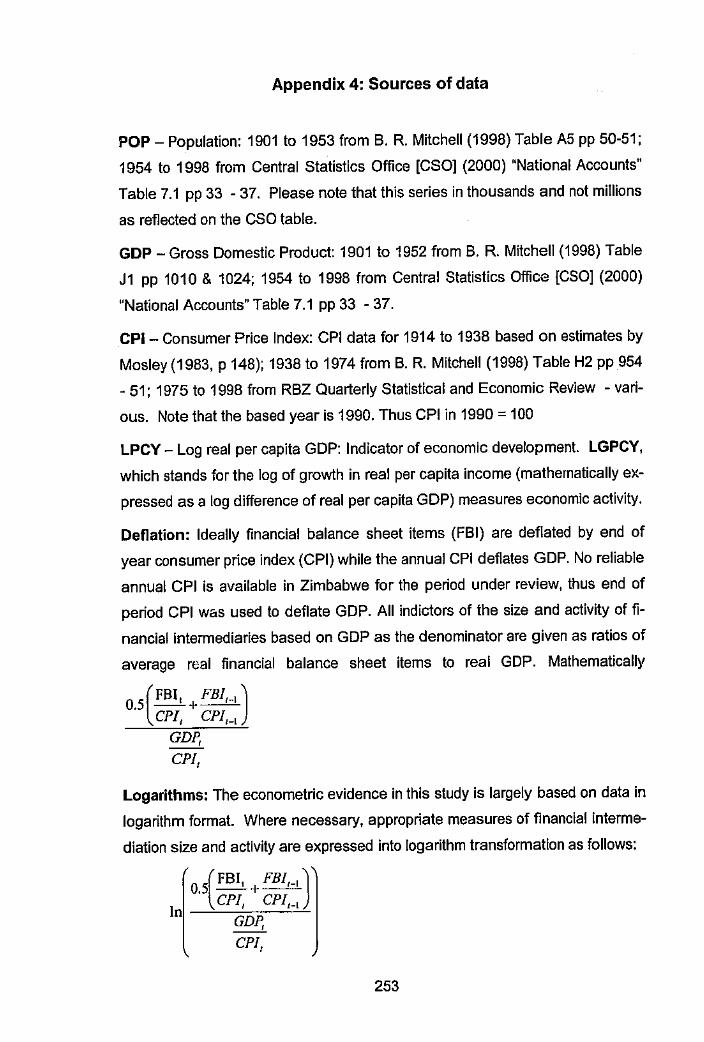
Appendix 4: Sources of data
POP-Population: 1901 to 1953 from B. R. Mitchell (1998) Table A5 pp 50-51;
1954 to 1998 from Central Statistics Office [CSO] (2000) "National Accounts"
Table 7.1 pp 33 - 37. Please note that this series in thousands and not millions
as refiected on the CSO table.
GDP -Gross Domestic Product: 1901 to 1952 from B. R. Mitchell (1998) Table
J1 pp 1010 & 1024; 1954 to 1998 from Central Statistics Office [CSO] (2000)
"National Accounts" Table 7.1 pp 33 - 37.
CPI-Consumer Price Index: CPI data for 1914 to 1938 based on estimates by
Mosley (1983, p 148); 1938 to 1974 from B. R. Mitchell (1998) Table H2 pp 954
- 51; 1975 to 1998 from RBZ Quarterly Statistical and Economic Review - vari
ous. Note that the based year is 1990. Thus CPI in 1990 = 100
LPCY - Log real per capita GDP: Indicator of economic development. LGPCY,
which stands for the log of growth in real per capita income (mathematically ex
pressed as a log difference of real per capita GDP) measures economic activity.
Deflation: Ideally financial balance sheet items (FBI) are defiated by end of
year consumer price index (CPI) while the annual CPI defiates GDP. No reliable
annual CPI is available in Zimbabwe for the period under review, thus end of
period CPI was used to defiate GDP. All indictors of the size and activity of fi
nancial intermediaries based on GDP as the denominator are given as ratios of
average real financial balance sheet items to real GDP. Mathematically
o.s(FBI, +FBI,_,) CP/
1 CPl1_1
GDP, CPI,
Logarithms: The econometric evidence in this study is largely based on data in
logarithm format. Where necessary, appropriate measures of financial interme
diation size and activity are expressed into logarithm transformation as follows:
o.s( FBI, +FBI,_,) -
_,_C:c:P..:I!.., _C_P_,I,::,.-• L In
GDP, CPI,
253
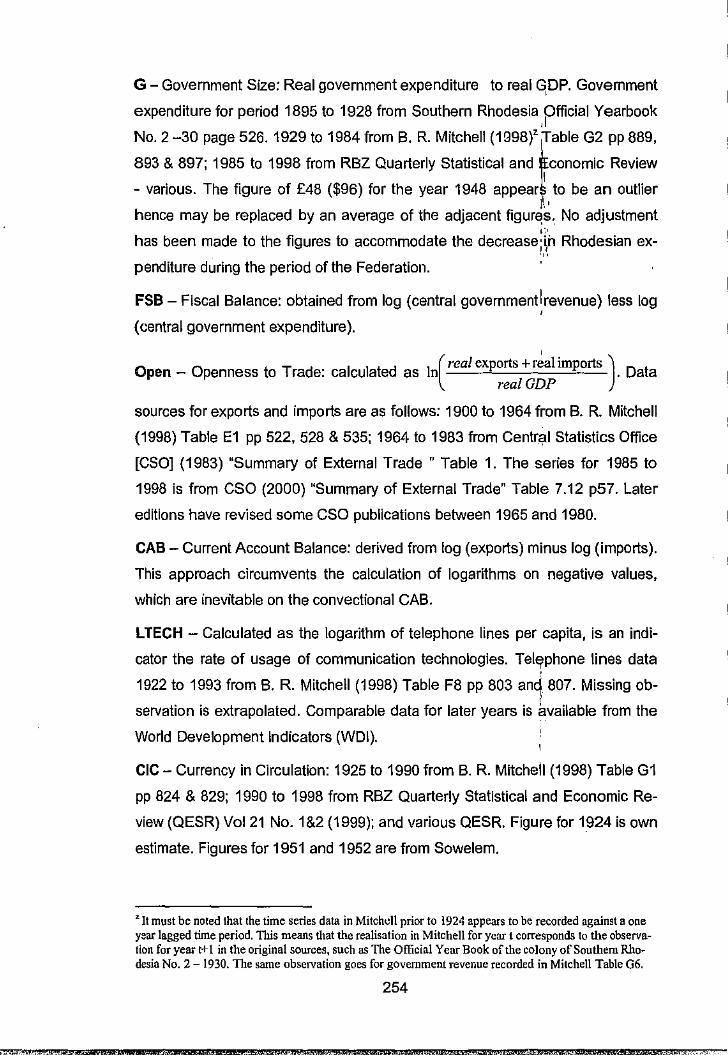
G - Government Size: Real government expenditure to real GpP. Government
expenditure for period 1895 to 1928 from Southern Rhodesia Official Yearbook ,I
No. 2-30 page 526. 1929 to 1984 from B. R. Mitchell (1998)'jfable G2 pp 889,
893 & 897; 1985 to 1998 from RBZ Quarterly Statistical and ~conomic Review
- various. The figure of £48 ($96) for the year 1948 appea{ to be an outlier ),•
hence may be replaced by an average of the adjacent figur~s'. No adjustment 1·,,
has been made to the figures to accommodate the decrease;~i1 Rhodesian ex-,,. penditure during the period of the Federation.
FSB - Fiscal Balance: obtained from log (central government I revenue) less log '
(central government expenditure).
' Open - Openness to Trade: calculated as ln . Data (
real ex.ports + real imports ) real GDP
sources for exports and imports are as follows: 1900 to 1964 from B. R. Mitchell
(1998) Table E1 pp 522, 528 & 535; 1964 to 1983 from Centr;al Statistics Office
[CSO] (1983) "Summary of External Trade" Table 1. The series for 1985 to
1998 is from CSO (2000) "Summary of External Trade" Table 7.12 p57. Later
editions have revised some CSO publications between 1965 and 1980.
CAB - Current Account Balance: derived from log (exports) minus log (imports).
This approach circumvents the calculation of logarithms on negative values,
which are inevitable on the convectional CAB.
LTECH - Calculated as the logarithm of telephone lines per capita, is an indi
cator the rate of usage of communication technologies. TelErphone tines data
1922 to 1993 from B. R. Mitchell (1998) Table F8 pp 803 an~ 807. Missing ob
servation is extrapolated. Comparable data for later years is kvailable from the
World Development Indicators (WDI).
CIC- Currency in Circulation: 1925 to 1990 from B. R. Mitchell (1998) Table G1
pp 824 & 829; 1990 to 1998 from RBZ Quarterly Statistical and Economic Re
view (QESR) Vol 21 No. 1&2 (1999); and various QESR. Figure for 1924 is own
estimate. Figures for 1951 and 1952 are from Sowelem.
z It must be noted that the time series data in Mitchdl prior to 1924 appears to be recorded against a one year lagged time period. This means that the realisation in Mitchell for year t corresponds to the observation for year t+ l in the original sources, such as The Official Year Book of the colony of Southern Rhodesia No. 2- 1930. The same observation goes for government revenue recorded in Mitchell Table G6.
254
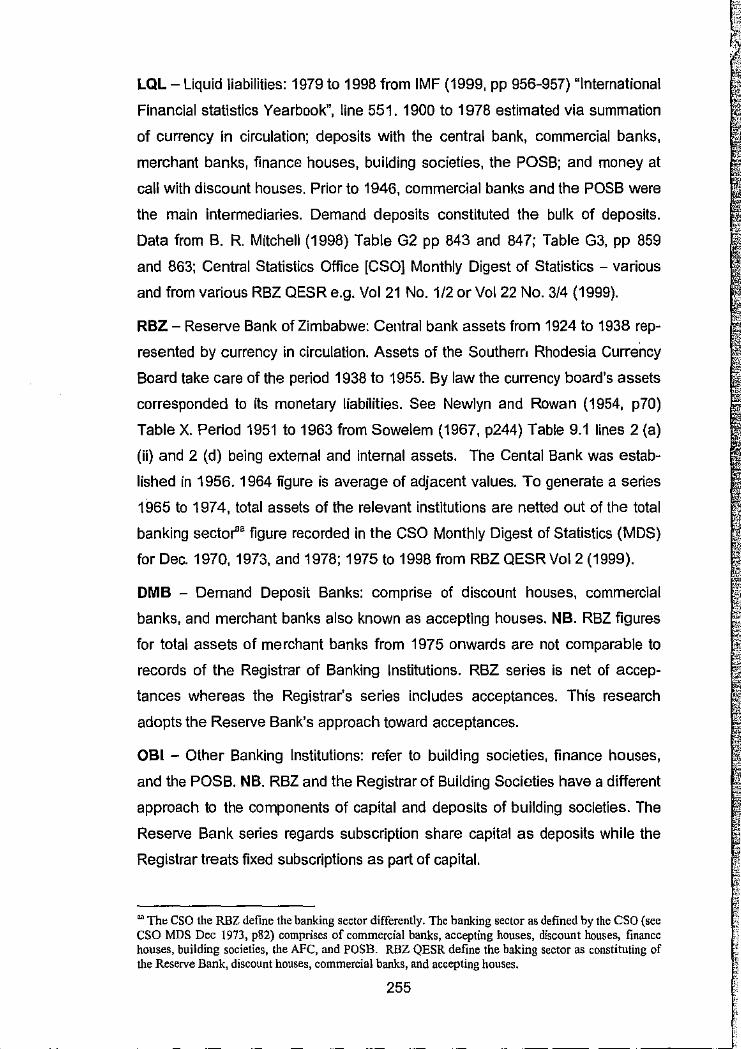
LQL-Liquid liabilities: 1979 to 1998 from IMF (1999, pp 956-957) "International
Financial statistics Yearbook", line 551. 1900 to 1978 estimated via summation
of currency in circulation; deposits with the central bank, commercial banks,
merchant banks, finance houses, building societies, the POSS; and money at
call with discount houses. Prior to 1946, commercial banl<s and the POSB were
the main intermediaries. Demand deposits constituted the bulk of deposits.
Data from B. R. Mitchell (1998) Table G2 pp 843 and 847; Table G3, pp 859
and 863; Central Statistics Office [CSO] Monthly Digest of Statistics - various
and from various RBZ QESR e.g. Vol 21 No. 1/2 or Vol 22 No. 3/4 (1999).
RBZ - Reserve Bank of Zimbabwe: Central bank assets from 1924 to 1938 rep
resented by currency in circulation. Assets of the Southem Rhodesia Currellcy
Board take care of the period 1938 to 1955. By law the currency board's assets
corresponded to its monetary liabilities. See Newlyn and Rowan (1954, p70)
Table X. Period 1951 to 1963 from Sowelem (1967, p244) Table 9.1 lines 2 (a)
(ii) and 2 (d) being external and internal assets. The Cental Bank was estab
lished in 1956. 1964 figure is average of adjacent values. To generate a series
1965 to 1974, total assets of the relevant institutions are netted out of the total
banking sector" figure recorded in the CSO Monthly Digest of Statistics (MOS)
for Dec. 1970, 1973, and 1978; 1975 to 1998 from RBZ QESRVol 2 (1999).
DMB - Demand Deposit Banks: comprise of discount houses, commercial
banks, and merchant banks also known as accepting houses. NB. RBZ figures
for total assets of merchant banks from 1975 onwards are not comparable to
records of the Registrar of Banking Institutions. RBZ series is net of accep
tances whereas the Registrar's series includes acceptances. This research
adopts the Reserve Bank's approach toward acceptances.
OBI - Other Banking Institutions: refer to building societies, finance houses,
and the POSB. NB. RBZ and the Registrar of Building Societies have a different
approach to the components of capital and deposits of building societies. The
Reserve Bank series regards subscription share capital as deposits while the
Registrar treats fixed subscriptions as part of capital.
""Th~ CSO the RBZ define the banking sector differently. The banking sector as defined by the CSO (see CSO MDS Dec 1973, p82) comprises of commercial banks, accepting houses, discount houses, finance houses, building societies, the AFC, and POSB. RBZ QESR define the baking sector as constituting of the Reserve Bank, discount houses, commercial banks, and accepting houses.
255
' ~"',~:._,;-.
,;
'
~: ;1

CMBA - Commercial Banks Assets: 1924 to 1935 estimate~ on the basis of
bank liabilities, especially bank deposits. Data for 1936 to 1 ~148 was obtained
from CSO via a private source. Data for 1954 to 1975 is from pso MDS (1973,
p50) Table 62 and (1980, p33) Table 28. The Ministry of Fin~nce's "Economic
Survey of Rhodesia 1965 [ESR]" Table 10 fills the gap betweeh 1960 and 1963. 11.,
In a few instances, liability side totals have also been used to fl'lake up for gaps ....
on the asset side. Good data for 1975 to 1998 ex RBZ QESR. ii CMLA - Commercial Banks Loans and Advances: 1924 to 1938 constructed on
the basis of best available data basis; 1939 to 1952 based on I movements in lo
cal earning assets in Newlyn and Rowan (1954, pp 170-1), Table IV and Figure
1. Efforts to obtain the original sources, viz "The Economic an~ Statistical Bulle
tins" were not yet fruitful at the time of writing. Data for 1954 to 1975 is from
CSO 1973 and 1978 Tables 10 and 21 respectively. Data from 1975 to 1998
was taken from RBZ QESR.
' CMLG - Commercial Banks Loans to Government series was constructed as t
follows; 1952 to 1964 ex-Sowelem (1967, p221) Table 8.1 line 9 (b) (i), 1964 to
1979 from CSO MDS (1970, 1973, 1978 and 1980).
CMLQ - Commercial Banks Liquid Assets: 1954 to 1963 Ministry of Finance
[MOF] ESR 1965. Data for 1961 to 1963 refers to bills of exchange only. 1965
to 1975 data is from CSO records. And RBZ QESR takes care of period 1975 to
1998.
MB - Merchant Banks Assets: 1957 to 1975 CSO MDS (197Q, p45) and (1980,
p37) Tables 55 and 32 respectively. 1975 to 1998 RBZ QESRj
' MBLA - Merchant Banks Loans and Advances: 1957 to 1975 CSO MDS and
RBZ QESR for the period 1975 to 1998.
MBLQ- Merchant Banks Liquid Assets: Data for period 1957 to 1974 from the
records of the Registrar of Banking Institutions. 1975 to 1998 RBZ QESR.
DHA - Discount House Assets: 1960 to 1975 CSO MDS 1973 and 1978 Tables
72 and 24 respectively. 1975 to 1998 RBZ QESR.
FH - Finance Houses Assets: 1953 to 1963 based on Sowelem (1967, p185)
Table 6.2 and National Archives. Efforts to obtain the original sources viz
"Quarterly Bulletin of Financial Statistics" were not yet fruitful at the time of writ-
256
. . ,,!.;\,

ing. Data for 1964 to 1974 ex CSO MDS and MOF ESR; 1975 to 1998 RBZ
QESR. NB Finance Houses total assets for the period 1994 to 1997 have been
corrected for mathematically inaccuracy.
FHLA- Finance Houses Loans and Advances: 1953 to 1963 as above.
POSB - People's Own Savings Bank: Assets for period 1924 to 1965 estimated
from the liability side of the balance sheet using the data in Mitchell and South
ern Rhodesia Statistical Yearbook (1947); 1964 to 1974 CSO MDS - various;
1975 to 1998 RBZ QESR.
POLQ - POSB Liquid Assets: 1975 to 1998 RBZ QESR.
BSA - Building Society Assets: 1951 to 1996 Registrar of Building Societies
Annual Reports; and 1975 to 1998 RBZ QESR.
BSLA - Building Society Loans and Advances: As in BSA
BSLQ - Building Society Liquid Assets: AS in BSA
AFC - Agricultural Finance Corporation: Originally known as the Land Bank;
1924 to 1952 National Archives records and (1947) "Statistical Year Book";
1954 to 1998 from various e.g. CSO MDS (1973, p 62); (1987, p75); (1992,
p45) and (1998, p59) Tables 75, 20.6, 18.6, and 19.10 respectively.
AFLA - AFC Loans and Advances: Sources as in AFC above.
INS- Insurance Assets: 1924 to 1946 from the Southern Rhodesia (1947) "Sta
tistical Year Book"; 1953 ex- Sowelem; 1957 to 1962 cover the whole Federa
tion; 1965 to 1998 records at rhe National Archives and Report of the Registrar
of Insurance Companies - various.
INPC - Insurance Private sector Credit: Constructed from (i) mortgages on
property: (ii) loans on insurance policies; (iii) and loans on personal securities.
Sources am as in INS above. 1929 to 1945 credit figures are estimates.
PPF -Provident and Pension Funds: 1977 to 1998 ex-Registrar of Pension and
Provident Funds Annual Reports
PSC - Total Private Sector Credit; PCDMB, PCOBI, PCDFI; and PCNBFI re
fers to DMB, OBI, DFI and NBFI Private Sector Credit respectively.
IPI - Industrial Share Price Index: Main equity index on the Zimbabwe Stock
Exchange. 1964 to 1976 from various CSO MDS; 1975 to 1998 RBZ QESR.
257
: •

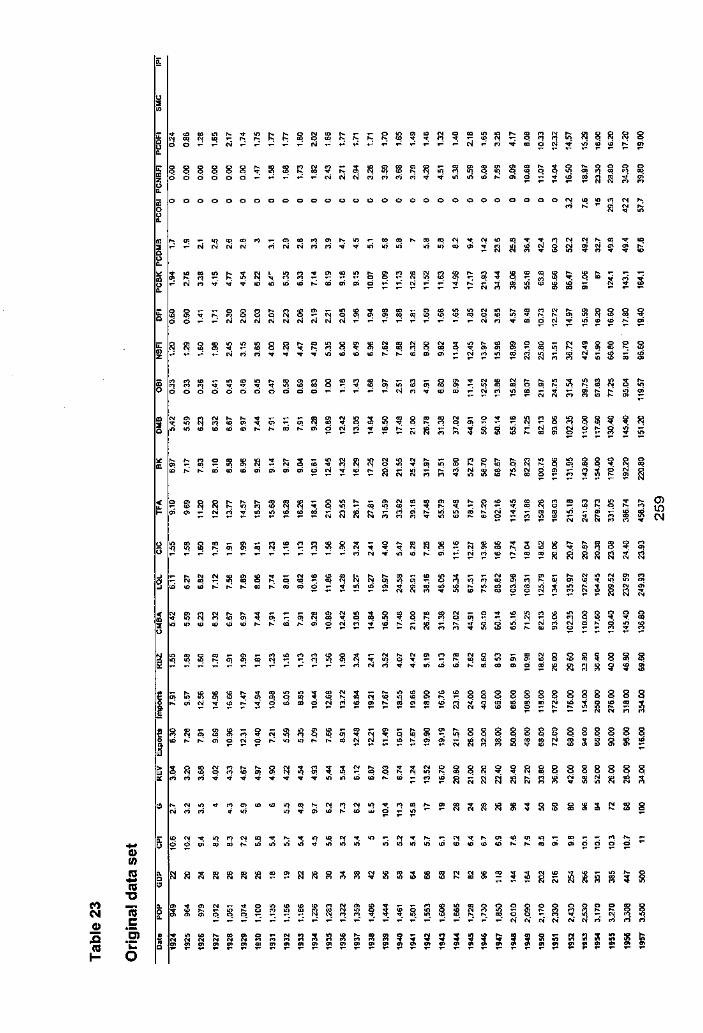
i::i " !
-; .. ~ "C
7i .5 "' ·c: 0
,e;
·~ ,. ·1· I~ a~, ill; i ~ ~ - " .. , . . J:; f:; !li ~ :!; J:; .::; .::; ~ ~ ~ ~ J:! ~ :; ~ ;q :::; :!! 8 1:i :;:; llH! ~ ~ a
- - - - - - " - ... ... "' S' ~ ;!: ';':? \!! ~ :::: ~
l
,1aas:aaai;;:.:::i~~~ ::1 ;: ;i; Ill 81 m N N N .., .., <'i
~ l!l :;; ~ fli ~ fli 2:i :.:p~ .ii Si Si :;i Ii! g g ..,,..,...,..,.,,._ 01 S';::!:!! ~AlG;;;J<: ~ 0 0 0 0 0 0 - - - -
~
0 "' ,._ llJ "' ,.._ 1
'10 0 0 0 0 0 0 0 0 0 0 0 0 0 0 0 0 0 0 0 0 0 0 0 0 0 0 0 "! "!:? "1 "!.., ~ . . I
• I"' "! - ~ "! "! .., ..., "! "! "1 "! .., "1 "" "! "! ... "! "! "' ... "' "' "! ... ... <'l "' "' .., "! ... "! ! __ ,. '""' <'lNN..,,., ...... .,.,., "'"'"'"':!Al!J~~gl;:l!;l!::!~~!o
~
1
~1a;~~:!!J:;~!:I~. :J ~ ... a, o> ., ,._ iS r> o> N <'> «> ,- "' ::i: 8 <D (Q I'S ,-. :!: ,- - - -;::: ; ;;; ;;; ; ::: ~ ~ ; ; ; ; 2 ;;i; ii: a a :& ; ;;; " t ~ ! o - N .., .., " .., "' "' •
I• lfll ~ .; ;:.:, lol 8 I:! q ~ ~ ~ ~ ~ :i; cl; 3l ~ oi ffi: a\ \11 :g :::! :ll :;:; ',il ~ ~ Si fli ~ fl! &: ~ Q O O - - N N N N N N N N N - - - - - - - - - c,j "' ... <O S' ~ ;!: :!! ~ ~ ;:: ~
1·1~ ~Si~~:? :Jl 8 ~ t.: ~ ~ 8; ~:!;~::pp; i;,; ~ ~ ~ :ll 81 ~ ~:;; ~ ~ ~ ~ ~ 1il !:! - - - - N .., "' ... ... ... .. .. "' "' "' .... ... "' "' a, - ~ ::) ';':? :,! A l(l :;; ~ ~ :;; :& ;; 3l
I' I" A "' :; ; ~ ; t;: :X ill : 8 ~ :7 ::l ,.._ .;; :a ;;; g g: :! "' :,g ~ b :;; ~ ;,; ~ i;i lQ O ci ci ci ci ci ci ci ci ci ci O ,..: ..: ..: ..: :'.! N n ..; .,; .; ::: ~ ..i ~ ~ ;::; ,!; ;; itj :;,i ,t
I• lq fli q q ~ ~ ~' ~ ~ ~ ~ q ~ ~ •• 8; ~ ~ ~ ! ., ., "' "' "' "' ,._ ,._ .., ,._ m S' ~ ~ ;!: ~ :::: ~ ~ ~ ~ • 0 •
; $ ~ ',!!l!J::!8"'8;iili <O..:N,::lo..:ci "' ... "' ~ ;: :: :'.!
I~ l!ii :::. :;i ~ ::;j ~ ;q : f:; c!i '"' ~ i:i ~ ;q a ~ ~ !ii ;;; !il ~ ~ ~ !:i: i:i ';:? :s ~ &; a ~ "' " ,._ "' "' "' "' "' "' "' e ~ ;?. ! '::: !i:l N i!J ;;; ::; ~ (;l :X 12 ~ !:J § ~ § ;? ; ~
. " ~ ~
~ ~ ~ §
~ ~ . ~ 1
·10•00,,, ... "" "' "! ,, "' "! "'! .. "'"'::~::!:!! ; : : • 8 ,n ,._ - a, N ol • 0 • ,._ 9 ,c, ,n <O ,P "'o a, :z J'..! f: ;:': ::; 8? .. .... - "'"!"' - ... - "!"" ~"' "! ~ ..... y,
~ ~ A !Ei ~ ;;; ::i ~ ~ ::i ::i ~ ~ ~ ; ~ :? ! ii; i ~ ~ ~ ~ C\I
10 1· 0 • 0 • • - <'I U> <"! <':I <O • 0 • • , ' • «> U:, ,_ a> <b .. ,t N • , - ,n ,n ,- a, "' "! - P "'! "1 N .. .. 0 - N a, <O ,._ 0 «> ... o..: ..:..: ..:..:..:..: - ..: ..:-..: ..:,.; ,.,;..;..;.,;,.,:,,;..: ::!';?'.!! ~'!:'!:!i:l :.! " ' !ii f;i
:3 :;j! :;: A ;"!; ~
lq 1=: !:; ::! M <0 ,0 ..;
N :J: o, 8 " - N "' u, fil f. ~ ,._ :X - u, :S :'Jj - - N 3: -;::: ..: ~ .,; ::: ~ : ;; '::'. ... ..; "' :;; ..; '",· ·,· "' "' :'.! :;: : ..; : e '
~ ~ ,._ N" :;j fl': !'.! "' "' .. _ . "' "' .,; ~ ;i; ~ A ;!.i ---- -"' ""'"'""'2~ ~ - -
I~ 1~ 6'l ~ i:p;; :;; :i: ;;; :::; ;;; !!'l ~ ~ :fl ~ :ii ~ a ~ ~ a °' ~ ::. ',!! iq :'.! :s ~ a :ii ~ ~ i ~ "' "' "' "' "' "' ... " "' ,._ "' 2 ~ ::! ;?. ! ::: N !El ;;; ::; :J :i1 2 :8 ;: &:l S §1 ~ ; ~ i ~
1~1:11 ::i :z] ~ Iii Si le; :q ~ ~ 8 lfl ~~::.:ii'\ I:;~~::!~~ :ii~;;;~~ 8 2 fil !i_ 8 ~ Iii o::---- --------"'"'"'"" .. "'"'"'""'"'"':!~!!l~~l~!i'!lll:
~ I ~ ~ ffi ~ I ~ ~ ~ :J 12 ~ J N ~ ~ ffi g ~ ! . ,,; ::! i ! ~ i s u:i u:i s ::! o;! - - ~ d ~ ~ ~ ~
8 8 a '
~~~~~~,a~ "' ., 2 ;: :: ::: - i'J
8 8 8 ~ ~ ~
I~~~~•.~~~~ ij g ~ i, ~, ij; ~ ~ ~ 8 8 8 8 8 g Q 0 <D ,- ,-. m O N Q ,-. "! "! ,-. ,-. 0) N N - "' ,- <I> m - • 0 ' • • • 0 s - - - - .- .- - - - - N ~ ...
l:!8$888 !l! ;i; :.'! g :g ~
I t ~ ~ • ~ 8 ~ ~ ~ ~ ~ a , ~ ~ ~ a ~ ~ ~ ~ ~ a ~ ~ ~ ~ ~ a a ~ <'> <'> M "' "' "' "' ~ ~ ~ ~ <n ., '° '° ... = ~ = ~ !il ~ ~ ~ ~ ~ ~ ~ Q
8 8 . ' 8 8 8 • • • i" I"· "! "l ... "' ai N <'> <'> ~ "!
• • s • •• :;; : ;:! ::i ::: ; 2 ; :: ~ ~ i!'. re l<l :J: ; 2 Ii: ~ :ii ;i; ~ :s §
'.: I«! "! ..,: "' "' "' "'! si: ..., si: "l ~ "! .... "' -- "! "'. ..., - "! ..,: ... "' ~ Cl "! .., .., .., .., "' ..., -,'-'S!S!"'"'"'""'"'"'"'"'"'"'"' .,.,.,.,.,.,...,.,.., ...... ..,.,..,.eeee-
lg If::! !il ,!'; ~ re ~ ~ !'! ~ f::I i€l i;i ~ ~ Q :g :& i 111 m ~ &:! :§: ~ ! ~ ~ ~ ~ i ~ ~ ; ~
I• 1· •• " .• 0 •••• - " ••• ~ ~ ~ ,-. - "' ,-. o <'> <n m N ., N "' ~ ~ "' ~ ~ ~ ~ ~ ~ ~ ~ ' ' ' ~ ~
I• 1~ ~ i€l ~ l',l ~ ~ ~ ~ ~ ~ ~ ~ ~ ~ ~ O~ "' - "' "' "' "' ~ - "' - "' - "' "' "' "' .. -.. .. --- .. .. - .. - - - .. ..
ID O :;l !!< !2 l'J g ~ S! S: ~ g g ij ~ ~ ~,,~:5,-;.~~~~:.:l;;;~;;;:;i ! ~ I i i :i i i i :i J ! ~ ;i 5 S ~ ~ :!! ~ ___________ ........ ---
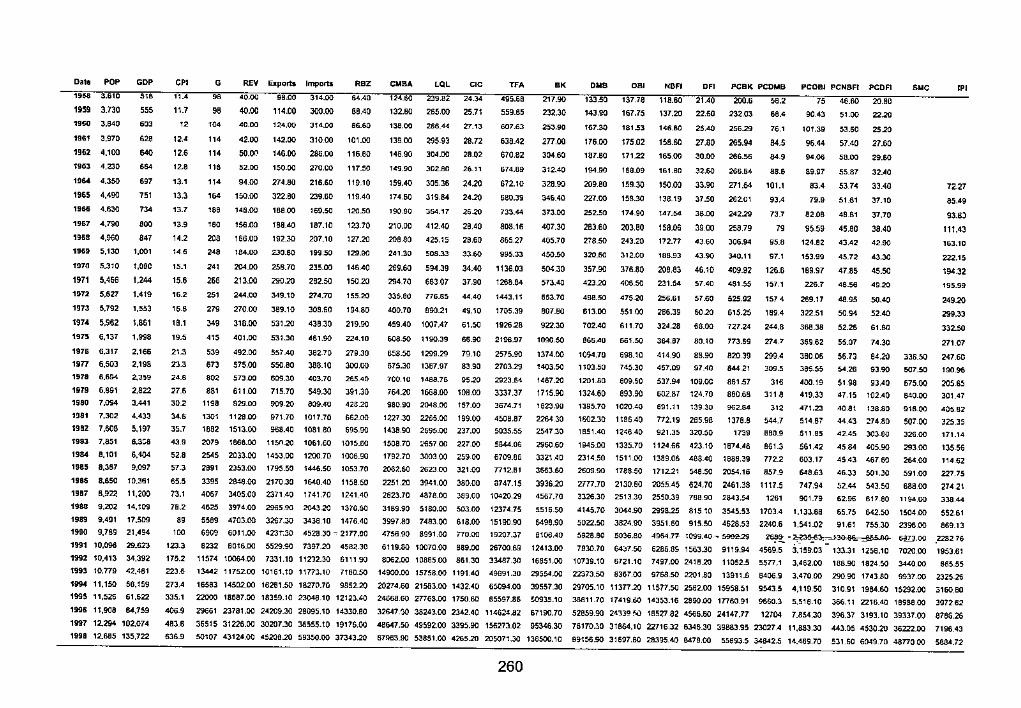
Date PDP
W"8 3.610
1959 3.730
196(1 3.840
1961 M70
1962 4.100
1963 4,ZJO
19M 4.35-0
1965 4.400
1966 4.630
1967 4.790
1958 4.960
1969 5.130
191a 5.310
1971 5.466
1972 5.627
1973 5.792
197' 5.962
1975 6.137
1976 6.317
1977 6.503
1978 6.694
1979 6.891
1980 7.094
1981 7.302
1982 7.608
1983 7.851
1984 a.101
1985 8,387
1986 8,650
1987 6.92.2
19!8 9.202
1989 9,491
1t90 9,769
1t91 10,096
1992 10.413 1993 10,779
199.f 11.15-0
1995 11.526
1996 11,908
1997 12.294
"' "' "' ,w ·~ "' -"' "' = ,oo
'" 1.001
1,08C
1,244
1.419
1,553
1,861
1,998
2,166
2,198
2.359
2.822
3,441
4.433
5.197 6,3C<I
'·"' 9.097
10.361
11.200
14,10'9
17.S09
21.494
29.623
34.392
42.481
56.159
61.622
84,759
102.074
1998 12.665 135,722
"' 11.4
11.7
" 12.4
,2.6
02'
13.1
13.3
13.7
13.9
14.2
'" 15.1
15.6
16.2
16.8
16.1
19.5
21.3
n; 24.8
27.6 ,,, ~· 35.7
m 52.8
57.3
65.5
73.1
78.2
" ,oo 1Z3.3
175.2
223.6
273.4
335.1
"'' 483.6
' " .. ·~ '" '" "' '" ·~ "' OM ~· "' "' ''" ~· "' ~· '" "' m
'" ... 1198 ·~· 1682
~" ,~, 2891
"'" 4067
REV Eiports lmpom '" 40.00 98.00 314.00 84.40
40.00 114.00 300.00 66.40
40.00 124.00 314.00 86.60
42.00 142.00 31000 101.00
50.0C' 146.00 286.00 116.80
52.00
94.00
150.00
148.00
15"6.00
166.00
184.00
=.oo 213.00
244.00
27000
318.00
401.00
492.00
575.00
573.00
611.00
829.00
1128.00
1513.00
1866.00
2033.00
2353.00
"""' 3405 00
150.00
274.SO
322.80
18800
198.40
192.30
230.60
259.70
m.~ 349.10
389.10
531.20
531.30
557.40
550.80
609.30
715.70
909.20
971.70
9ti8.40
\151).20
1453.00
1795.50
2170.30
2371.40
270.00
216.60
239.60
169.5-0
187.10
207.10
19'9.50
235.00
282.5-0
274.70
308.60
438.30
461.90
382.70
388.10
403.70
549.30
80'9.40
1017.70
108180
1061.60
1200 70
1446.5-0
1640.40
1741.70
117.50
119.10
119.40
12!L50
123.70
127.20
129.90
146.40
150.20
155.20
194.80
219.90
Z!4.10
279.JO
300.00
2"5.40
4625 3974.00
5589 4703.00
6909 6011.00
8232 8016.00
\1574 \0064.00
2965.!IO 2043.20
3267.30 3438 10
391.30
428 20
662.00
695.90
\015.60
1006.90
1053.70
1156 50
1241.40
1370.60
1476.40
42'3T.30 45Z!! 30 - 2117.00
55:.19.90 7397.20 4582.30
7331.10 112)2.30 611190
13442 11752-00 10161.10 11773.10 7180.5-0
16583 14502.00 16251.5-0 18270.70 9852.20
22000 18687.00 18359.10 23048.10 12123 . ..0
29661 23781.00 24209.30 28095.10 14330.80
36515 31226.00 30207.30 36555.10 19176.00
'"~ '" ••• 124.60 239.82 24.34
132.80 265.00 25.71
13S.OO 266.44 27.13
139 00 295.93 28.72
146.00 304.00 28.02
149.90 302.80
159.40 305.36
174.60 319.84
190.80 364.17
210.00 412.40
20880 425.15
241.30 508.33
269.60 594.39
294.70 663 07
335.80 776.85
400.70 690.21
459.40 1007.47
608.5-0
658.50
675.30
700.10
764.20
980.90
1227.JO
1438.90
1500.70
1792.70
2062.60
2251.20
1100.39
1299.29
1367.97
1488.76
1668.00
2048.00
22£5.00
2695.00
2135700
=•oo ~noo 3941.00
26.11
"'" "'" "~ 20.40
28.60
33.60 ,.., 37.90
44.40
49.10
6\.50
66.90
79.10
83.90 .. ~ 108.00
157.00
199.00
237.00
227.00
25900
321.00
380.00
495.68
559.85
607.63
63!L42
670.82
674.89
672.10
680.39
733.44
808.16
865 27
995.33
1138.03
1268.84
1443.11
1705.39
1926.28
2196.97
2575.90
2703.29
2923.64
3337.37
3674.71
4508.87
5035.55
5!!44.06
6709.86
1712.81
3747.15
2623.70 4878.00 389.00 1D420.29
3189.90 5180.00 503.00
3997.BO 7483.00 618.00
475690 8991.00 no.oo 6119.8-0 1007000 889.00
12374.75
15\90.90
19207.37
26700.69
8062.00 1086500 861.30 33487.30
14900.00 15758.00 1191.40 49891.30
20274.60 21583.00 1432.40 65094.00
24868 60 27768.00 1750.60 65597.86
32647.',0 38243.00 23-42.40 114624.82
48M7.50 49592.00 3395.90 156273.02
217.90
232.30
253.90
277.00
3D4.60
312.40
328.90
346.40
373.00
407.30
405.70
•oo~ 50430
573.40
653.70
807.80
922.30
1090.5-0
1374.00
1403.50
1~67.20
1715.90 1823.90
'''"' <'547.30
.!960.60
332\.40
3663.60
3938.20
4567.70
5516.50
6498.00
8100.40
12413.00
16851.00
29554.00
39557.30
=J.5.10
67\90.70
95346.30
,., '" '" PCBI( PCDMB
133.50 137.78 118.60 21.40 200.6
143.!IO 167.75 137.20 22.60 232.03
167.30 161.53 146.B-0 25.40 256.29
176.00 175.02 158.50 27.80 265.94
187.BO 171.Z! 165.00 30.00 266.56
194.90
209.80
W.00
"= 28360
278.5-0
=.oo 357.90
m~ 498.5-0
613.00
702.40
866.40
10!>4.70
1103.50
1201.60
1324.60
1395.70
1602.30
168.09
159.30
158.30
174.90
203.80
243.20
Jn.oo 376.80
405.50
475.20
551 00
611.70
661.5-0
698.10
745.30
809.50
893.90 102040
1186 40
1851.40 12~640
1945.00 1335.70
2314.50 1511.00
2609 90 1788.50
vn.10 21Jo.00
161.80
15-0.00
138.19
147.54
158.06
112.n
188.93
208.83
231.54
256.61
266.39
324.ZS
3M.87
414.90
457.09
537.94
602.67
691.11
n2.19
32.60
33.90
37.50
38.00
'""" 4360
43.90
46.10
57.40
57.60
00.~
68.00
80.10
88.90
97.40
109.00
124.70
139 30
285 98
921.35 320.50
1124.66 423.10
1389.06 488.40
1712-21 548.50
2055.45 624.70
266.84
271.64
2620\
242.29
258.79
306.94
340.11
409.92
481.55
525.92
615.25
727.24
773.69
82039
-" 881.57
880.68
9'62.84
1378.8
1739
1874.48
1888.39
2054.16
2461.38
58.2
68.4
76.1
"' "' 88.6
101.1
93.4
73.7
" 95.8
97.1
126.6
157.1
157 4
189.4
244.8
274_7
299.4 ,oo,
'" 311 a
"' -, 880.9
861.3
172.2
857.9
1117.5
3326.30 2513.30 2550.39 78890 2843.54 1261
4145.70 3044.90 2998.25 815 10 3545.53 1703 4
5022.5-0 3824.00 3951.60 915.50 4628.53 2240 6
PCDBJ PCNBFI PCDFl
75 46.60 20.80
90.43 51.00 22.20
101.39 53.60 25.20
96.44 57.40 27.60
9<.06 58.00 29.60
89.97
83.4
79.9
82.08
95.59
124.82
153.99
189.97
=, 259.17
322.51
368.JS
369.62
380 06
385.55
400.19
419.33
471.23
514.67
s11 as
55.87
53.74
51.61
48.81
45.80
43.42
45.72
47.85
46.56
48.95
oo ... 52.26
55.07
56.73
~.~
5198
47.15
~ .. 44.43
37.10
37.70
38.40
42.90 .. ~ 45.5-0
49.20
50.40
52.40
61.00
74.30
"" "~ 93.40
10240
136.80
~74 80
42.45 303.80
45 84 405.90
45 43 467 60
46.33 501.30
52.44 543.50
•••
336.50
675.00
840.00
918.00
~,oo moo ~,oo =oo 591 00
,Moo
561.42
603.17
648.63
747.94
901.79
1.133.88
1,541.02
62.9'6 61780 119400
65.75 642.W 1504 00
91.61 755.30 23,600
"'
72.27
85.49
93.8)
111.43
163.10
222.15
194.32
195.99
249.20
=·" oo= 271.07
247.60
190.96
205 85
301.47
40582
325 35
171.14
135.56
11462
227.75
274 21
·~« 552.61
869.13 5~8-80
7830.70
5036.80 4964.71' 1099.40 - 596!!-.29
64;,7.W 62868S 1563.30 9119.94 .G!'t·~l,=1-~
4569.5 3.159.03 133.31 1258.10
s.l__D.00 _2282 76
7020 00 1953.61 1on9.10 6121.10 N97.oo 241a.20
22373.50 8367.00 9768.50 2201.80
29705.10 11377.20 11577.W 2582.00
11052.5
13911.6
15958.51
5577.1
8406.9
9543.5
3,462.00
3,470 00
4,119.5-0
33811.70 17419.ilO 14353.16 2890.00 17760.91 9660.3 5.518.10
52659.00 2433~ !'>O 16527 82 45"66.60 24147.17 12704 7.854.JO
76170.',0 31884.10 22716.32 &346.30 39883.95 23027.4 11.883.30
188.90 1824.50 3440 00
290 90 1743.80 9937.00
310.91 1984.60 15292.00
:J.66.11 2:!16.40 1898800
396.37 3193.10 39337.00
443.05 4530 20 36222.00
885.55
2325.26
318-080
397262
8786.26
7196.43 636.9 5-0107 43124.00 45208.20 593.W.OO 37343.20 67!163.!IO 53851.00 4265.20 205071.30 136500.10 99156.90 31697.00 28395.40 6478.00 55893.5 34842.5 14.469.70 53160 604970 4817000 5884.72
260
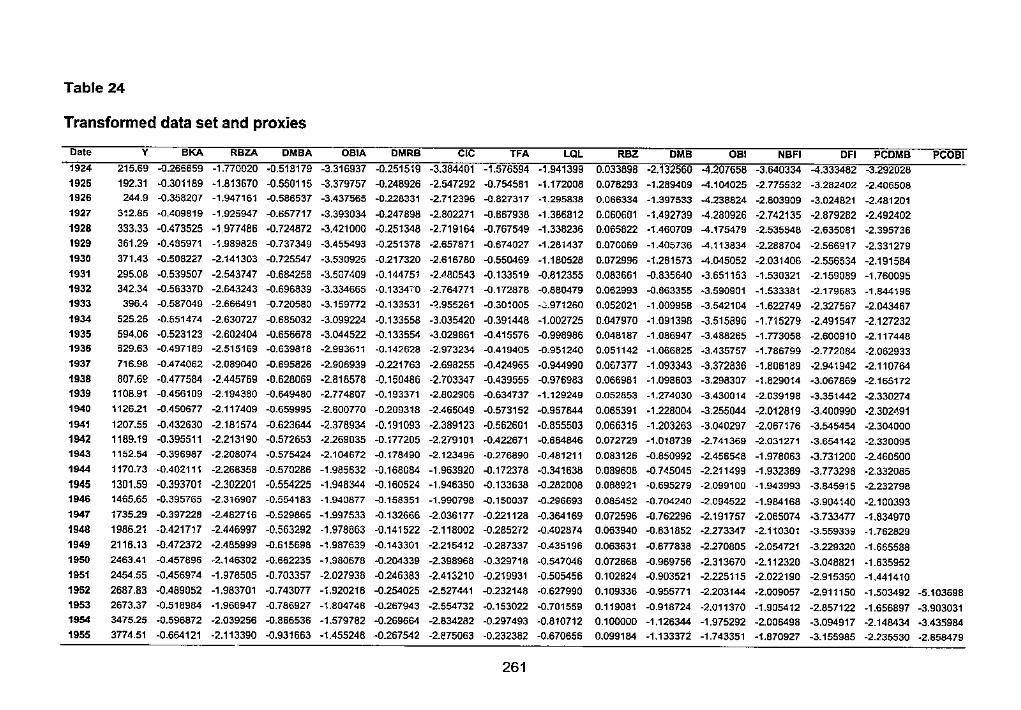
Table 24
Transformed data set and proxies
Date y BKA RBZA DMBA OBIA DMRB CIC TFA LQL RBZ DMB DBI NBFI DFI PCDMB PCOBI 1924 215.69 -0.266659 -1.770020 ·0.518179 -3.316937 -0.251519 -3.384401 -1.576594 -1.941399 0.033898 -2.132560 -4.207658 -3.640334 -4.333482 -3.292028 1925 192.31 -0.301189 -1.813670 -0.550115 -3.379757 -0.248926 -2.547292 -0.754581 ·1.172008 0.078293 -1.289409 -4.104025 -2.775532 -3.282402 -2.406508 1926 244.9 -0.358207 -1.947161 -0.586537 -3.437565 -0.228331 -2.712396 -0.827317 -1.295838 0.066334 -1.397533 -4.238824 -2.803909 -3.024821 -2.481201 1927 3~2.85 -0.409819 -1.925947 -0.657717 -3.393034 -0.247898 -2.802271 -0.867938 -1.386812 0.060601 -1.492739 -4.280926 -2.742135 -2.879282 -2.492402 1928 333.33 -0.473525 -1.9n4B6 -0.724872 -3.421000 -0.251348 ·2.719164 -0.767549 ·1.338236 0.065822 ·1.460709 -4.175479 -2.535548 -2.635081 -2.395736 1929 361.29 -0.485971 -1.989826 -0.737349 -3.455493 -0.251378 -2.657871 -0.674027 -1.281437 0.070069 -1.405736 -4.113834 -2.288704 -2.566917 -2.331279 1930 371.43 ·0.508227 -2.141303 -0.725547 -3.530925 -0.217320 -2.616780 -0.550469 -1.180528 0.072996 -1.261573 -4.045052 -2.031406 -2.556534 -2.191584 1931 295.08 -0.539507 -2.543747 -0.684258 -3.507409 -0.144751 -2.480543 -0.133519 -0.812355 0.083661 -0.835640 -3.651153 -1.530321 -2.159089 ·1.760095 1932 342.34 -0.563370 -2.643243 -0.696839 -3.334665 -0.13347'0 -2.764771 -0.172878 -0.880479 0.062993 -0.663355 -3.590901 -1.533381 -2.179683 -1.844196 1933 396.4 -0.587049 -2.666491 -0.720580 -3.159772 -0.133531 -~.955261 -0.301005 -2.971260 0.052021 -1.009958 -3.542104 -1.622749 ·2.327567 -2.043467 1934 525.25 -0.551474 -2.630727 -0.685032 ·3.099224 -0.133558 -3.035420 -0.391448 -1.002725 0.047970 ·1.091398 -3.515896 ·1.715279 -2.491547 ·2.127232 1935 594.06 -0.523123 -2.602404 -0.656678 -3.044522 -0.133554 -3.029661 -0.415576 -0.998986 0.048187 -1.086947 -3.488265 -1.773058 ·2.600910 -2.117448 1936 629.63 -0.497189 ·2.515169 -0.639818 -2.993611 -0.142628 -2.973234 -0.419405 -0.951240 0.051142 -1.066825 -3.435757 -1.786799 -2.772084 -2.062933 1937 716.98 -0.474062 -2.089040 -0.695826 -2.906939 -0.221763 -2.698255 -0.424965 -0.944990 0.067377 -1.093343 -3.372836 ·1.806189 -2.941942 -2.110764 1938 807.62 -0.477584 -2.445769 -0.628069 ·2.818578 -0.150486 -2.703347 -0.439555 -0.976983 0.066981 -1.098603 -3.298307 ·1.829014 ·3.067869 -2.165172 1939 1108.91 -0.456109 ·2.194380 -0.649480 -2.774807 -0.193371 -2.802906 -0.634737 -1.129249 0.052853 -1.274030 -3.430014 -2.039198 -3.351442 -2.330274 1940 112621 -0.450677 -2.117409 -0.659995 -2.600770 -0.209318 ·2.465049 -0.573152 -0.957844 0.065391 -1.228004 -3.255044 -2.012819 -3.400990 -2.302'191 1941 1207.55 -0.432630 -2.181574 -0.623644 -2.378934 -0.191093 -2.389123 -0.562601 -0.855503 0.066315 -1.203263 -3.040297 ·2.067176 -3.545454 -2.304000 1942 1189.19 -0.395511 -2.213190 -0.572653 -2.269035 -0.177205 ·2.279101 -0.422671 -0.664846 0.072729 ·1.018739 -2.741369 -2.031271 ·3.654142 -2.330095 1943 1152.54 -0.396987 -2.208074 -0.575424 -2.104672 -0.178490 -2.123496 -0.276890 -0.481211 0.083126 -0.850992 -2.4565':8 -1.978063 -3.731200 -2.460500 1944 1170.73 -0.402111 -2.268358 -0.570286 -1.985632 -0.168084 -1.963920 -0.172378 -0.341638 0.089608 -0.745045 -2.211499 -1.932369 -3.773298 -2.332085 1945 1301.59 -0.393701 -2.302201 -0.554225 -1.948344 -0.160524 -1.946350 -0.133638 -0.282008 0.068921 -0.695279 -2.099100 -1.943993 -3.845915 -2.232798 1946 1465.65 -0.395765 ·2.316907 -0.554183 -1.940877 -0.158351 -1.990798 -0.150037 -0.296693 0.085452 -0.704240 -2.094522 -1.984168 -3.904140 -2.100393 1947 1735.29 -0.397228 -2.482716 -0.529865 -1.997533 -0.132666 -2.036177 -0.221126 -0.364169 0.072596 -0.762296 -2.191757 -2.065074 -3.733477 -1.834970 1948 1986.21 -:J.421717 -2.446997 -0.563292 -1.978863 -0.141522 -2.118002 -0.285272 -0.402874 0.053940 -0.631852 -2.273347 -2.110301 -3.559339 -1.762629 1949 2116.13 -0.472372 -2.485999 -0.615698 -1.987639 -0. 143301 ·2.215412 -0.287337 -0.435196 0.063631 -0.877838 -2.270805 -2.054721 -3.229320 -1.665588 1950 2463.41 -0.457896 -2.146302 -0.662235 ·1.980678 -0.204339 -2.398968 -0.329718 -0.547046 0.072668 -0.969756 -2.313670 -2.112320 -3.048821 -1.635952 1951 2454.55 -0.4569?4 ·1.978505 -0.703357 -2.027938 -0.246383 -2.413210 -0.219931 -0.505456 0.102824 -0.903521 ·2.225115 -2.022190 -2.915350 -1.441410 1952 2687.83 -0.489052 -1.983701 -0.743077 ·1.920218 -0.254025 ·2.527441 -0.232148 -0.627990 0.109336 -0.955771 -2.203144 -2.009057 -2.911150 -1.503492 -5.103698 1953 2673.37 -0.518984 -1.966947 -0.786927 -1.804748 -0.267943 -2.554732 -0.153022 -0.701559 0.119081 -0.918724 -2.011370 -1.905412 -2.857122 -1.656897 -3.903031 1954 3475.25 -0.596872 -2.039256 -0.866536 -1.579782 -0.269664 -2.834282 -0.297493 -0.810712 0.100000 -1.126344 ·1.975292 -2.006498 -3.094917 -2.148434 ·3.435984 1955 3774.51 -0.664121 -2.113390 -0.931663 ·1.455248 -0.267542 -2.!;175063 -0.232382 -0.670656 0.099184 -1.133372 -1.743351 ·1.870927 -3.155985 -2.235530 -2.858479
261
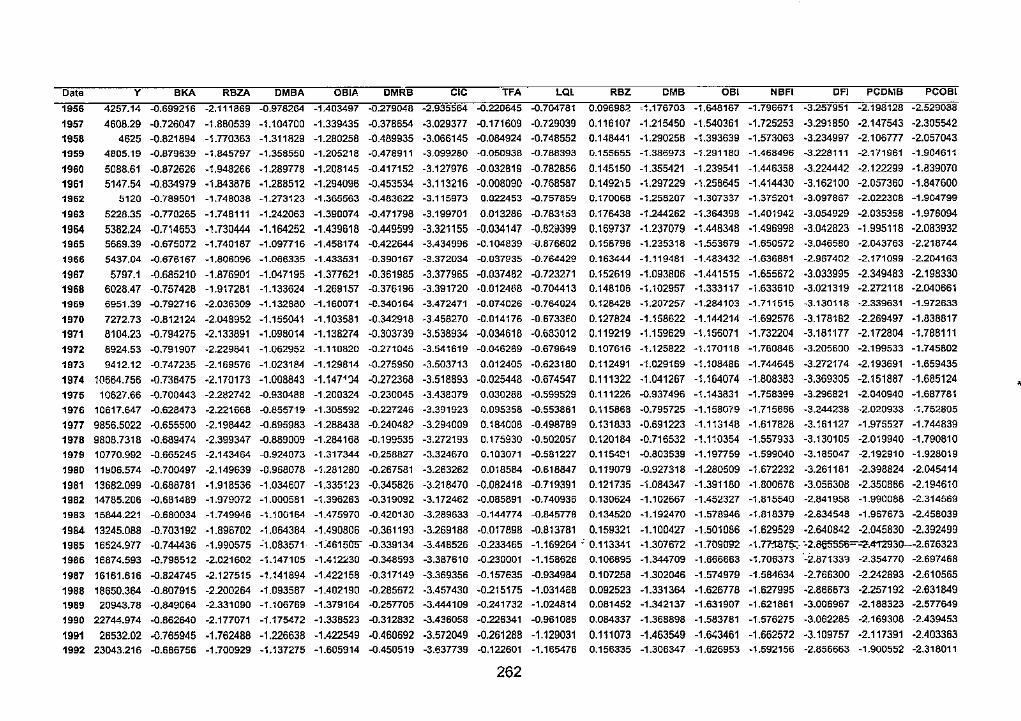
Date y BKA RBZA DMBA OBIA DMRB CIC TFA LQL RBZ CMB OBI NBFI OFI PCDMB PCOBL
1956 4257.14 -0.699216 -2.111869 -0.978264 -1.403497 -0.279048 -2.935564 -0.220645 -0.704781 0.09698i ·~.176703 -1.648167 -1.796671 -3.257951 -2.198128 -2.529038
1957 4608.29 -0.726047 -1.860539 -1.104700 -1.339435 -0.378654 -3.029377 -0.171609 -0.729039 0.116107 -1.215450 -1.540361 -1.725253 -3.291850 ·2.147543 -2.305542
1958 4625 -0.821894 -1.770363 -1.311829 -1.280258 -0.489935 -3.066145 -0.084924 -0.748552 0.148441 -1.290258 -1.393639 -1.573063 ·3.234997 -2.1osm -2.057043
1959 4805.19 -0.879639 -1.845797 -1.358550 -1.205218 -0.478911 -3.099280 -0.050938 -0.788393 !i.155655 -1.386973 -1.291180 ·1.468496 -3.228111 -2.171961 -1.904611
1960 5088.61 -0.872626 -1.948266 -1.289778 -1.208145 -0.417152 -3.127976 -0.032819 -0.782856 0.145150 -1.355421 -1.239541 -1.446358 -3.224442 -2.122299 -1.839070
1961 5147.54 -0.834979 ·1.843876 ·1.288512 ·1.294096 ·0.453534 -3.113216 -0.008090 -0.768587 0.1492)5 ·1.297229 ·1.258645 ·1.414430 -3.162100 -2.057360 -1.847600
1962 5120 -0.789501 -1.748038 -1.273123 -1.365563 -0.483622 ·3.115973 0.022453 -0.757859 0.170068 -1.258207 -1.307337 -1.375201 -3.097867 -2.022308 -1.904799
1963 5228.35 -0.770265 -1.748111 -1.242063 -1.390074 -0.471798 -3.199701 0.013286 -0.7831.53 0.176438 -1.244262 -1.364398 -1.401942 -3.054929 -2.035358 -1.976094
1964 5382.24 ·0.714653 ·1.730444 -1.164252 ·1.439618 -0.449599 -3.321155 -0.034147 -0.823399 0.169737 ·1.237079 -1.448348 -1.496998 -3.042823 -1.995118 -2.083932
1965 5669.39 -0.675072 -1.740187 -1.097716 -1.458174 -0.422644 -3.434996 -0.104839 .. (J.876602 0.158796 -1.235318 -1.553679 -1.650572 -3.046580 ·2.043763 -2.218744
1966 5437.04 -0.676167 -1.806096 -1.066335 -1.433531 -0.390167 -3.372034 -0.037935 -0.764429 0.163444 -1.119481 -1.483432 -1.636881 -2.967402 -2.171099 -2.204163
1967 5797.1 -0.685210 -1.876901 -1.047195 -1.377621 -0.361985 -3.377965 -0.037482 -0.723271 0.152619 -1.093806 -1.441515 -1.655672 -3.033995 -2.349483 -2.198330
1968 6028.47 -0.757428 -1.917281 -1.133624 -1.269157 -0.376196 -3.391720 ·0.0124l\8 -0.704413 0.148106 -1.102957 -1.333117 -1.633610 -3.021319 -2.272118 ·2.040661
1969 6951.39 -0.792716 -2.036309 -1.132880 -1.160071 -0.340164 -3.472471 -0.074026 -0.764024 0.128428 -1.207257 -1.284103 -1.711515 -3.130118 -2.339631 -1.972633
1970 7272.73 -0.812124 -2.048952 -1.155041 -1.103581 -0.342918 ·3.458270 -0.014176 -0.6733E.O 0.127824 -1.158622 -1.144214 -1.692576 -3.178182 -2.269497 -1.838817
1971 8104.23 ·0.794275 ·2.133891 ·1.098014 -1.138274 -0.303739 -3.538934 -0.034618 -0.683012 0.119219 ·1.159629 -1.156071 -1.732204 -3.181177 -2.172804 -1.788111
1972 8924.53 -0.791907 -2.229841 -1.062952 -1.110820 -0.271045 -3.541619 -0.046289 -0.679649 0.107616 ·1.125822 -1.170118 -1.760846 -3.205600 -2.199533 -1.745802
1973 9412.12 -0.747235 -2.169576 -1.023184 -1.129814 -0.275950 -3.503713 0.012405 -0.623180 0.112491 -1.029169 -1.108486 -1.744645 -3.272174 -2.193691 -1.659435
1974 10664.756 ·0.736475 ·2.170173 -1.008843 -1.1471'.)4 -0.272368 -3.518893 -0.025448 -0.674547 0.111322 ·1.041267 -1.164074 -1.808383 -3.369305 -2.151887 -1.685124
1975 10627.66 -0.700443 -2.282742 -0.930488 -1.200324 -0.230045 ·3.438079 0.030288 -0.599529 0.111226 -0.937496 -1.143831 -1.758399 -3.296821 -2.040940 -1.687781
1976 10617.647 -0.628473 -2.221668 -0.855719 -1.305592 -0.227246 -3.391923 0.095358 -0.553861 0.115868 -0.795725 -1.158079 -1.715666 -3.244236 -2.020933 -0.752605
1977 9856.5022 -0.655500 -2.198442 -0.895983 -1.288438 -0.240482 -3.294009 0.184008 -0.498789 0.131833 -0.691223 -1.113148 -1.617828 -3.161127 -1.975527 -1.744839
1978 9808.7318 -0.689474 -2.399347 -0.889009 -1.284168 -0.199535 -3.272193 0.175930 -0.502057 0.120184 -0.716532 ·1.1"10354 -1.557933 -3.130105 -2.019940 -1.790810
1979 10770.992 -0.665245 -2.143464 -0.924073 -1.317344 -0.258827 -3.324670 0.103071 -0.581227 0.1154::!1 -0.803539 -1.197759 -1.599040 -3.185047 -2.192910 -1.928019
1980 11!106.574 -0.700497 -2.149639 -0.968078 -1.281280 -0.267581 -3.263262 0.018584 -0.618847 0.119079 -0.927318 -1.280509 -1.672232 -3.261181 -2.398824 -2.045414
1981 13682.099 -0.688781 ·1.918536 -1.034607 -1.335123 -0.345826 -3.216470 -0.082418 -0.719391 0.121735 -"i.084347 -1.391180 -1.800678 ·3.056308 ·2.350886 -2.194610
1982 14785.206 -0.681489 -1.979072 -1.000581 -1.396263 -0.319092 -3.172462 -0.065891 -0.740936 0.130624 -1.102667 -1.452327 -1.815540 -2.841958 -1.990088 -2.314569
1983 15844.221 -0.680034 -1.749946 -1.100164 -1.475970 -0.420130 -3.289633 -0.144774 -a.84sn8 0.134520 -1.192470 -1.578946 -1.818379 -2.834548 -1.967673 -2.458039
1984 13245.088 -0.703192 -1.896702 -1.064384 -1.490806 -0.361193 -3.269188 -0.017898 -0.813781 0.159321 -1.100427 -1.501086 -1.629529 -2.640842 -2.045830 -2.392499
1985 16524.9n -0.744436 -1.990575 ~1.083571 -1.~61505" -0.339134 -3.446526 -0.233465 -1.169264 · 0.113341 ·1.307672 ·1.709092 -1.771:87~- '-2.8e'S556=-=2'.412930----2.6"Z6323
1986 16874.593 -0.798512 -2.021602 -1.147105 -1.412.::30 -0.348593 -3.387610 -0.230001 -1.158626 0.106895 -1.344709 -1.666663 ·1.706373 ·-2.87133'.l -2.354770 -2.697468
1987 16161.616 -0.824745 -2.127515 -1.141894 -1.422158 -0.317149 -3.369356 -0.157635 -0.934984 0.107256 -1.302046 -1.574979 -1.584634 -2.766300 -2.242893 -2.610565
1988 18650.364 -0.807915 -2.200264 -1.093587 -1.402190 -0.285672 -3.457430 -0.215175 -1.031468 0.092523 -1.331364 ·1.626778 ·1.627995 -2.866873 -2.257192 -2.631849
1989 20943.78 -0.849064 -2.331090 -1.106769 -1.379164 -0.257705 -3.444109 -0.241732 -1.024814 0.081452 -1.342137 -1.631907 -1.621861 -3.006967 -2.188323 -2.577649
1990 22744.974 -0.862640 -2.177071 -i.175472 -1.338523 -0.312832 -3.436058 -0.228341 -0.961086 0.084337 -1.368898 -1.583781 -1.576275 -3.062285 ·2.169308 -2.439453
1991 26532.02 -0.765945 -1.762488 -1.226638 -1.422549 -0.460692 -3.572049 -0.261288 -1.129031 0.111073 -1.463549 -1.643461 -1.662572 ·3.109757 -2.117391 -2.403363
1992 23043.216 -0.686756 -1.700929 -1.137275 -1.605914 -0.450519 -3.637739 -0.122601 -1.165476 0.156335 -1.306347 -1.626953 ·1.592156 -2.856663 -1.900552 -2.318011
262
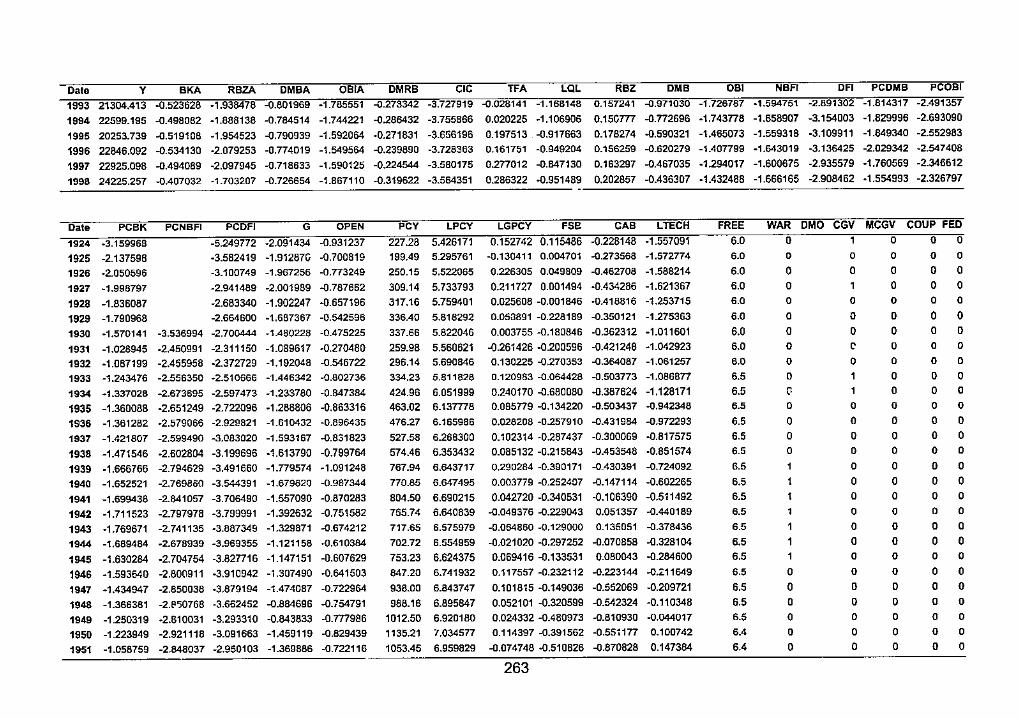
Date y BKA RBZA DMBA OBIA DMRB CIC TFA LQL RBZ DMB DBI NBFI DFI PCDMB PCOBI
1993 21304.413 -0.523628 ·1.938478 -0.801969 ·1.785551 .Q.273342 ·3.727919 .Q.028141 ·1.168148 0.157241 .Q.971030 ·1.726767 ·1.594751 ·2.891302 ·1.814317 ·2.491357
1994 22599.195 -0.498082 ·1.888138 -0.784514 -1.744221 -0.286432 -3.755866 0.020225 ·1.106906 0.15C777 -0.n2696 -1.743na -1.658907 -3.154003 ·1.829996 -2.693090
1995 20253.739 -0.519108 -1.954523 -0.790939 -1.592064 -0.271831 ·3.656196 0.197513 -0.917663 0.178274 -0.590321 ·1.465073 ·1.559318 -3.109911 ·1.849340 ·2.552983
1996 22846.092 -0.534130 ·2.079253 ·0.774019 ·1.549564 -0.239890 -3.728363 0.161751 -0.949204 0.156259 -0.620279 -1.407799 ·1.643019 -3.136425 ·2.029342 ·2.547408
1997 22925.098 -0.494089 ·2.097945 -0.718633 ·1.590125 -0.224544 -3.580175 0.277012 -0.847130 0.163297 -0.467035 -1.294017 -1.600675 -2.935579 -1.760569 -2.346612
1998 24225.257 -0.407032 -1.703207 -0.726654 ·1.867110 -0.319622 -3.564351 0.286322 -0.951489 0.202857 -0.436307 ·1.432488 -1.666165 -2.908462 -1.554993 ·2.326797
Date PCBK PCNBFl PCDFJ G OPEN PCY LPCY LGPCY FSE CAB LTECH FREE WAR DMD CGV MCGV COUP FED
1924 -3.159968 -5.249772 -2.091434 -0.931237 227.28 5.426171 0.152742 0.115486 -0.228148 -1.557091 6.0 0 0 0 0
1925 -2.137598 ·3.582419 -1.91287C -0.700819 199.49 5.295761 -0.130411 0.004701 -0.273568 ·1.572774 6.0 0 0 0 0 0
1926 -2.050596 -3.100749 ·1.967256 -0.773249 250.15 5.522065 0.226305 0.049809 -0.462708 ·1.588214 6.0 0 0 0 0 0
1927 ·1.998797 -2.941489 -2.001989 -0.787662 309.14 5.733793 0.211727 0.001494 -0.434286 ·1.621367 6.0 0 0 0 0
1928 -1.836087 -2.683340 ·1.902247 -0.657196 317.16 5.759401 0.025606 ·0.001846 -0.418816 ·1.253715 6.0 0 0 0 0 0
1929 ·1.790968 ·2.664600 ·1.687367 ·0.542596 336.40 5.818292 0.053891 -0.228189 -0.350121 -1.275363 6.0 0 0 0 0 0
1930 -1.570141 -3.536994 ·2.700444 -1.480228 -0.475225 337.66 5.822046 0.003755 -0.180846 -0.362312 ·1.011601 6.0 0 0 0 0 0
1931 ·1.028945 -2.450991 ·2.311150 -1.089617 -0.270480 259.98 5.560621 -0.261426 -0.200596 -0.421248 ·1.042923 6.0 0 ' 0 0 0
1932 ·1.087199 ·2.455958 ·2.372729 -1.192048 -0.546722 296.14 5.690846 0.130225 --0.270353 -0.364087 ·1.061257 6.0 0 0 0 0 0
1933 -1.243476 ·2.556350 ·2.510666 -1.446342 -0.802736 334.23 5.811828 0.120983 -0.064428 -0.503773 -1.oa08n 6.5 0 0 0 0
1934 -1.337028 -2.673695 ·2.597473 -1.233780 -0.847384 424.96 6.051999 0.240170 -0.680080 -0.387624 ·1.128171 6.5 ' 0 0 0
1935 -1.360088 -2.651249 -2.722096 -1.288806 -0.863316 463.02 6.137778 o.o85n9 -0.134220 -0.503437 -0.942348 6.S 0 0 0 0 0
1936 ·1.361282 -2.579066 -2.929821 ·1.610432 -0.896435 476.27 6.165986 0.028208 -0.257910 -0.431984 -0.972293 6.5 0 0 0 0 0
1937 -1.421807 ·2.599490 -3.083020 ·1.593167 -0.831823 527.58 6.268300 0.102314 -0.287437 -0.300069 -0.817575 6.5 0 0 0 0 0
1938 -1.471546 -2.602804 ·3.199696 ·1.613790 ·0.799764 574.46 6.353432 0.085132 ·0.215843 -0.453548 -0.851574 6.5 0 0 0 0 0
1939 -1.666766 -2.794629 ·3.491660 -1.n9574 ·1.091248 767.94 6.643717 0.290284 -0.390171 -0.430391 -0.724092 6.5 0 0 0 0
1940 ·1.652521 ·2.769860 -3.544391 ·1.679620 -0.987344 no.as 6.647495 0.003779 -0.252407 -0.147114 -0.602265 6.5 0 0 0 0
1941 -1.699438 ·2.841057 -3.706490 -1.557090 -0.870283 804.50 6.690215 0.042720 -0.340531 -0.106390 ·0.511492 6.5 0 0 0 0
1942 ·1.711523 -2.797978 -3.799991 -1.392632 -0.751582 765.74 6.640839 -0.049376 -0.229043 0.051357 -0.440189 6.5 0 0 0 0
1943 -1.769671 ·2.741135 ·3.887349 -1.329871 -0.674212 717.65 6.575979 -0.064860 -0.129000 0.135051 -0.378436 6.5 0 0 0 0
1944 ·1.689484 -2.678939 -3.969355 ·1.121158 -0.610384 702.72 6.554959 -0.021020 -0.297252 -0.070858 -0.328104 6.5 0 0 0 0
1945 -1.630284 ·2.704754 -3.827716 -1.147151 ·0.607629 753.23 6.624375 0.069416 -0.133531 0.080043 -0.284600 6.5 1 0 0 0 0
1946 ·1.593640 ·2.80(1911 -3.910942 ·1.307490 -0.641503 847.20 6.741932 0.117557 -0.232112 -0.223144 -O.L11649 6.5 0 0 0 0 0
1947 ·1.434947 ·2.850038 -3.879194 ·1.474087 -0.722964 938.00 6.843747 0.101815 -0.149036 -0.552069 -0.209721 6.5 0 0 0 0 0
1948 -1.366381 ·2.!1'50768 -3.662452 -0.884696 -0.754791 968.16 6.895847 0.052101 -0.320599 -0.542324 -0.110348 6.5 0 0 0 0 0
1949 -1.250319 -2.810031 -3.293310 -0.843833 -0.777986 1012.50 6.920180 0.024332 -0.480973 -0.810930 -0.044017 6.5 0 0 0 0 0
1950 ·1.223949 ·2.921118 -3.091663 -1.459119 -0.829439 1135.21 7.034577 0.114397 -0.391562 -0.55~1n 0.100742 6.4 0 0 0 0 0
1951 ·1.058759 ·2.848037 -2.950103 ·1.369886 -0.722116 1053.45 6.959829 -0.074748 -0.510826 -0.870828 0.147384 6.4 0 0 0 0 0
263
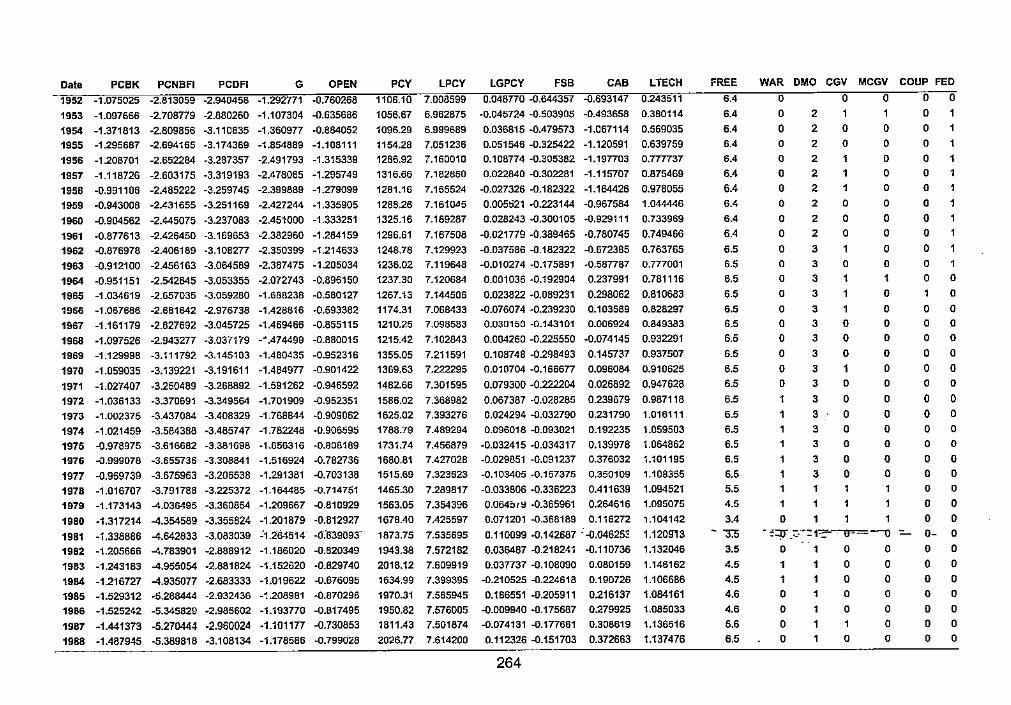
Date PCBK PCNBFI PCDFI G OPEN PCY LPCY LGPCY FSB CAB LTECH ~REE WAR OMO CGV MCGV COUP FED
1952 -1.075025 -2.813059 -2.940458 -1.292n1 -0.760268 1106.10 7.008599 0.048770 -0.644357 -0.693147 0.243511 6.4 0 0 0 0 0
1953 -1.097666 -2.708779 -2.880260 -1.107304 -0.635686 1056.67 6.962875 -0.045724 -0.503905 -0.493658 0.380114 6.4 0 2 1 0
1954 -1.371813 -2.809856 -3.110635 -1.360977 -0.884052 1096.29 6.999689 0.036815 -0.479573 -1.067114 0.569035 6.4 0 2 0 0 0
1955 -1.295687 -2.694165 -3.174389 -1.854889 -1.108111 1154.28 7.051236 0.051546 -0.325422 -1.120591 0.639759 6.4 0 2 0 0 0 1
1956 -1.208701 -2.652284 -3.287357 -2.491793 -1.315339 1286.92 7.160010 0.108774 -0.305382 -1.197703 0.777737 6.4 0 2 1 0 0 1
1957 -1.118726 -2.603175 -3.319193 -2.478065 -1.295749 1316.66 7.182850 0.022840 -0.302281 -1.115707 0.875469 6.4 0 2 1 0 0 1
1958 -0.991106 -2.485222 -3.259745 -2.399889 -1.279099 1281.16 7.155524 -0.027326 -0.182322 -1.164426 0.978055 6.4 0 2 1 0 0 1
1959 -0.943008 -2.431655 -3.251169 -2.427244 -1.335905 1288.26 7.161()<15 0.005ti21 -0.223144 -0.967584 1.044446 6.4 0 2 0 0 0 1
1960 -0.904562 -2.445075 -3.237083 -2.451000 -1.333251 1325.16 7.189287 0.028243 -0.300105 -0.929111 0.733969 6.4 0 2 0 0 0
1961 -0.877613 -2.426450 -3.169653 -2.382960 -1.284159 1296.61 7.167508 -0.021779 -0.389465 -0.780745 0.749466 6.4 0 2 0 0 0
1962 -0.876978 -2.406189 -3.108277 -2.350399 -1214633 1248.78 7.129923 -0.037586 -0.182322 -0.672385 0.763765 6.5 0 3 0 0
1963 -0.912100 -2.456163 -3.064589 -2.387475 -1.205034 1236.02 7.119648 -0.010274 -0.175891 -0.587787 0.777001 6.5 0 3 0 0 0
1964 -0.951151 -2.542645 -3.053355 -2.072743 -0.896150 1237.30 7.120684 0.001036 -0.192904 0.237991 0.781116 6.5 0 3 1 1 0 0
1965 -1.034619 -2.657035 -3.059280 -1.688238 -0.580127 1267.13 7.144506 0.023822 -0.089231 0.298062 0.810683 6.5 0 3 0 1 0
1966 -1.067686 -2.681642 -2.976738 -1.428816 -0.593382 1174.31 7.068433 -0.076074 -0.239230 0.103589 0.828297 6.5 0 3 0 0 0
1967 -1.161179 -2.827692 -3.045725 -1.469466 -0.855115 1210.25 7.098583 0.030150 -0.143101 0.006924 0.849383 6.5 0 3 0 0 0 0
1968 -1.097526 -2.943277 -3.037179 -· .474499 -0.880015 1215.42 7.102843 0.004260 -0225550 -0.074145 0.932291 6.5 0 3 0 0 0 0
1969 -1.129998 -3.111792 -3.145103 -1.480435 -0.952316 1355.05 7.211591 0.108748 -0.298493 0.145737 0.937507 6.5 0 3 0 0 0 0
1970 -1.059035 -3.139221 -3.191611 -1.484977 -0.901422 1369.63 7.222295 0.010704 -0.166677 0.096084 0.910625 6.5 0 3 1 0 0 0
1971 -1.027407 -3.250489 -3.268892 -1.591262 -0.946592 1482.66 7.301595 0.079300 -0.222204 0.026892 0.947628 6.5 0 3 0 0 0 0
1972 -1.036133 -3.370691 -3.349564 -1.701909 -0.952351 1586.02 7.368982 0.067387 -0.028285 0.239679 0.987118 6.5 1 3 0 0 0 0
1973 -1.002375 -3.437084 -3.408329 -1.768844 -0.909062 1625.02 7.393276 0.024294 -0.032790 0.231790 1.016111 6.5 1 3 0 0 0 0
1974 -1.021459 -3.584388 -3.485747 -1.782248 -0.906595 1788.79 7.489294 0.096018 -0.093021 0.192235 1.059503 6.5 3 0 0 0 0
1975 -0.978975 -3.616682 -3.381698 -1.656316 -0.808189 1731.74 7.456879 -0.032415 -0.034317 0.139978 1.064862 6.5 3 0 0 0 0
1976 -0.999078 -3.655736 -3.308841 -1.516924 -0.782736 1680.81 7.427028 -0.029851 -0.091237 0.376032 1.101195 6.5 1 3 0 0 0 0
1977 -0.959739 -3.675963 -3.206538 -1.291381 -0.703138 1515.69 7.323623 -0.103405 -0.157375 0.350109 1.108355 6.5 1 3 0 0 0 0
1978 -1.016707 -3.791788 -3.225372 -1.164485 -0.714751 1465.30 7.289817 -0.033806 -0.336223 0.411639 1.094521 5.5 1 1 0 0
1979 -1.173143 -4.036495 -3.360854 -1.209667 -0.810929 1563.05 7.354396 0.064:Jnt -0.365961 0.264616 1.095075 4.5 1 1 0 0
1980 -1.317214 -4.354589 -3.355824 -1.201879 -0.812927 1678.40 7.425597 0.071201 -0.368189 0.116272 1.104142 3.4 0 1 0 0
1981 -1.338886 -4.642833 -3.083039 ~1.2645i4 -IJJf3909Y 1873.75 7.535695 0.110099 -0.142687 '-0.04625~ 1.1209'13 - er.,; - ~=!)" _::,.. ~:: 1-==------a==----0 - 0- 0
1982 -1.205666 -4.783901 -2.888912 -1.186020 -0.820349 1943.38 7.572182 0.036487 -0.218241 -0.110736 1.132046 3.5 0 1 0 0 0 0
1983 -1.243183 -4.955054 -2.881824 -1.152620 -0.829740 2018.12 7.609919 0.037737 -0.108090 0.080159 1.146162 4.5 1 1 0 0 0 0
1984 -1.216727 -4.935077 -2.683333 -1.019622 -0.676095 1634.99 7.399395 -0210525 -0.224618 0.190726 1.106686 4.5 1 0 0 0 0
1985 -1.529312 -5.286444 -2.932436 -~208981 -0.870296 1970.31 7.585945 0.186551 -0.205911 0.216137 1.084161 4.6 0 1 0 0 0 0
1986 -1.525242 -5.345829 ·2.985602 -1.193770 -0.817495 1950.82 7.576005 -0.009940 -0.175687 0.279925 1.085033 4.6 0 0 0 0 0
1987 -1.441373 -5.2704il-1 -2.960024 ·1.101177 -0.730853 1811.43 7.501874 -0.074131 -0.177661 0.308619 1.136516 5.6 0 0 0 0
1988 -1.487945 -5.389818 -3.108134 -1.178586 -0.799028 2026.77 7.614200 0.112326 -0.151703 0.372663 1.137476 6.5 0 0 0 0 0
264
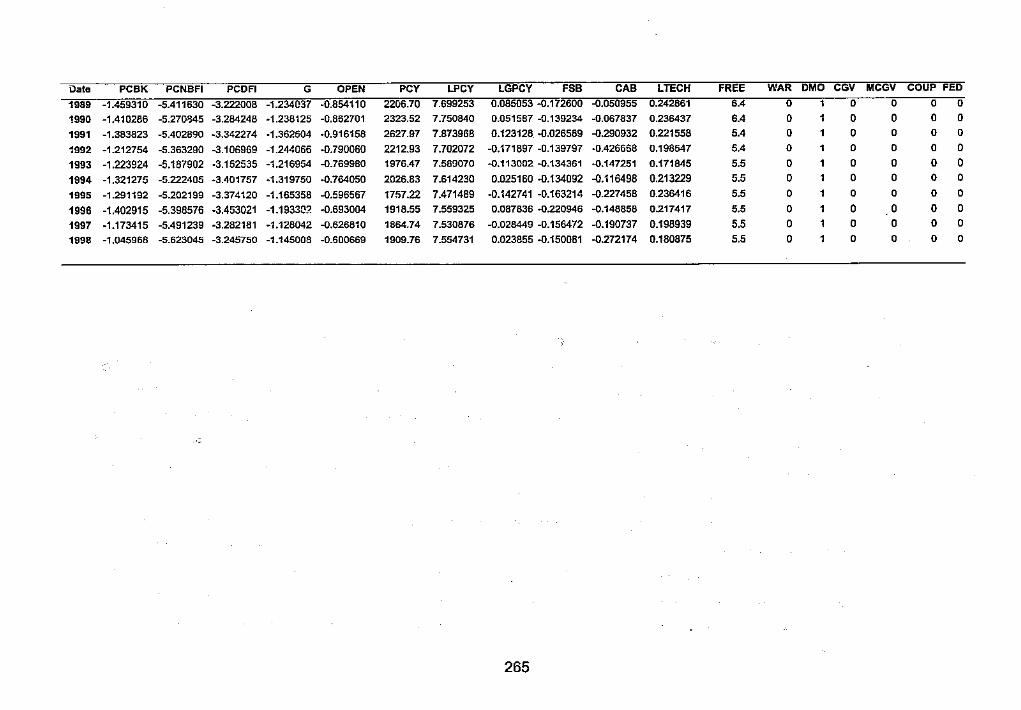
Date PCBK PCNBFI PCDFI G OPEN PCY LPCY LGPCY FSB CAB LTECH FREE WAR OMO CGV MCGV COUP FED
1989 -1.459310 -5.411630 --3.222008 -1.234037 -0.854110 2206.70 7.699253 0.085053 -0.172600 -0.050955 0.242661 6.4 0 1 0 0 0 0
1990 -1.410286 -5.270345 -3.284248 ·1.238125 -0.862701 2323.52 7.750840 0.051567 -0.139234 -0.067837 0.236437 6.4 0 1 0 0 0 0
1991 -1.363823 -5.4026':IO -3.342274 -1.362504 -0.916158 2627.97 7.873968 0.123128 -0.026589 -0290932 0.221558 5.4 0 1 0 0 0 0
1992 -1.212754 -5.363290 --3.106969 -1.244066 -0.790060 2212.93 7.702072 -0.171897 -0.139797 ·0.426668 0.198547 5.4 0 1 0 0 0 0
1993 -1.223924 -5.187902 -3.152535 ·1216954 -0.769960 1976.47 7.569070 -0.113002 -0.134361 -0.147251 0.171845 5.5 0 1 0 0 0 0
1994 -1.321275 -5.222405 ·3.401757 ·1.319750 -0.764050 2026.63 7.614230 0.025160 -0.134092 -0.116498 0.213229 5.5 0 0 0 0 0
1995 -1.291192 -5.202199 -3.374120 -1.165358 -0.596567 1757.22 7.471489 -0.142741 -0.163214 -0.227458 0.236416 5.5 0 1 0 0 0 0
1996 -1.402915 -5.398576 -3.453021 -1.1933::!2 -0.693004 1918.55 7.559325 0.067836 -0.220946 -0.148858 0.217417 5.5 0 1 0 0 0 0
1997 -1.173415 -5.491239 ·3.282181 ·1.128042 -0.626810 1864.74 7.530876 -0.028449 -0.156472 -0.190737 0.198939 5.5 0 0 0 0 0
1998 ·1.045968 -5.623045 -3.245750 -1.145008 -0.600669 1909.76 7.554731 0.023855 -0.150081 -0.272174 0.180875 5.5 0 1 0 0 0 0
265
BIBLIOGRAPHY ,I
I Adam C. S. and O'Connell S. A. (1997)"Aid, Taxation and De~elopment: Ana
lytical Perspectives on Aid Effectiveness in Sub-Sahara!> Africa", Centre for Study of African Economies: Working Paper : ' .
f',•, . Akerlof G. (1970) "The Market For Lemons: Quality Uncertainty and the Market
Mechanism", Quarterly Journal of Economics, 84 (3) pp' 488 - 500
Akerlof G. A. (1998) "Men Without Children", The Economic Jdumal, 108, (March) pp 287 - 309 '
Alesina Ozier, Roubini and Swagel (1996) "Data Set", available at http://www.nuff.ox.uk/Economics/Growth{swagel.htm or' http://www.nber.org/pub/swagel/data50.log
Allen F. and Gale D. (1994) "Financial Innovation and Risk Sharing", MIT Press: Cambridge, MA.
Allen F. and Gale D. (1997) "Financial Markets, Intermediaries and lntertemporal Smoothening", Journal of Political Economy, Vol. 105, pp 523 - 546
Allen F. and Gale D. (1999) "Comparing Financial Systems", MIT Press: Cambridge, MA.
Allen F. and Santomero A. M. (1997) "The Theory of Financial Intermediation", Journal of Banking and Finance, Vol. 21, pp 1461 -1485
Allen F. and Santomero A. M. (1999) "What Do Financial Intermediaries Do?" The Wharton School Working Paper 99-30-B
Amisano G. and Giannini C. (1997) "Topics in Structural VAR l:conometrics," Springer, 2°' Ed :
I' ' Arrow K. J. (1974) "Insurance, Risk and Resource Allocation" in Lewis M. K
(1995) Ed. "Financial Intermediaries (International Library of Critical Writings in Economics; Vol 43) An Elgar Reference Collection
Askes J. (1971) "The Changing Pattern of Banking in Rhodesia Since 1960", The Rhodesian Journal of Economics, Vol. 5 No. 3 (Sept) pp 16 -21
Baltensperger E. (1980) "Alternative Approaches to the Theory of the Baking Firm", Journal of Monetary Economics, 6 pp 1-37
Barro R. J. (1997) "Determinants of Economic Growth: A Cross-Country Empirical Study", The Lionel Robbins Lectures, MIT Press, Cambridge, MA
Bartlett A. F. (1987) "Machiavellian Economics", Ashford Press Publishing: UK, 2nd rev. Ed.
266
' . '
Bayoumi T. (1999) "The Morning ,Ader: Explaining the Slowdown in Japanese Growth in the 1990s", IMF Wor'cin~ Paper WP/99113
Beck T, Demirgu<;-Kunt A, and Levine R (1999), "A New Database On Financial Development and Structure", World Bank Working Paper.
Beck T., DemirgG<;-Kunt A. and Levine R. (2001) "Law, Politics, and Finance", World Bank Working Paper No. 2585
Becsi Z. and Wang P. (1997) "Financial Development and Growth", Economic Review, Federal Reserve Bank of Atlanta, Fourth Quarter pp 46 - 62
Benston G. J. and Smith C. W. Jnr. (1976) "A Transaction Approach To the Theory of Financial Intermediation", Journal of Finance, XXXI, (2), May, pp 215 -231
Berger A. N. and Humphrey D. B. (1997) "Efficiency of Financial institutions: International Survey and Directions for Future Research': European Journal of Operational research: Special Issue on New Approaches in Evaluating the Performance of Financial Institutions.
Berle A. A. and Means C. G. (1932) "The Modem Corporation and Private Property", Macmillan: N.Y.
Bemanke (1983) "Non-monetary Effects of The Financial Crisis in the Propagation of the Great Depression", American Economic Review, Vol. 73 No. 3 (June) pp 257-275
Bhattacharya S. and Thaker A. J. (1993) "Contemporary Banking Theory", Journal of Financial Intermediation, 3, pp 2 - 50
Black B., Kraakman R. and Tarassova A. (1999) "Russian Privatisation and Corporate Governance: What Went Wrong?" SSRN Working Paper available at: http://papers.ssm.com/paper. taf?abstract_id=181348
Black F. and Scholes M. (1973) "The Pricing of Options And Other Corporate Liabilities," The Journal of Political Economy, Vol 81 No 3 (May-June)
Bowbrick P. (1988) "Practical Economics for The Real Economist", Graham & Trotman: UK.
Boyd J. and Prescott E. (1986) "Financial lntenmediary-coalitions", Journal of Economic Theory, 38, pp 211 - 232
Brigham E. F. and Grapenski L. C. (1991) "Financial Management" Prentice Hall
Campbell Committee (1981) "The Final Report of The Commission of Inquiry in into the Australian Financial System", AGPS, Canberra
Central Statistic Office [CSO] (2000) "National Accounts 1985 -1998", Harare Zimbabwe
267
.~
-~ ,,.;
' -'.
'!,•15. ,.- ' 'I:
Chapman R. (1992) "The Zimbabwean Financial Sector: lmpedjments to efficiency and opportunities for reform," Centre for International Economics -unpublished report. ,I
Chimombe T. ( 1983) "The Role of Banks And Financial Institutions In The Accumulation And Reinvestment Of Capital In Zimbabwe", :University of Zimbabwe: M Phil Thesis. ·
I·.' Claridge M. and Box S. (2000) "Economic Integration, Sovereignty and Identity:
New Zealand in the Global Economy, Treasury Workin1{Paper No. 00122 !,!
Clarke L. C. (1986) "Banking Distortions in The Financial Structures of Post-War Economies: (The Experience of Jamaica, Korea, Trinid~d and Tobago and the U.S.A.) University of the West Indies PhD Thes!s
Coase R. (1937) "The Nature of The Firm", Economica, (4) pp 386-405
Cobbing J. (1976) "The Ndebele under the Khumalos 1820-96,'' University of Lancaster, Ph.D. as cited in Phimister (1988, p16).
Cole R. L. (1973) "The Building Societies And the Housing Market", The Rhodesian Journal of Economics, Vol. 7 No. 3 (Sept) pp 13~ -148
Cole R. L. (1973) "The Finance Houses in Rhodesia", The Rhodesian Journal of Economics, Vol. 7 No. 4 (Dec) pp 207 - 215
Cole R. L. (1973) "The Insurance Industry in Rhodesia", The Rhodesian Journal of Economics, Vol. 7 No. 2 (June) pp 59 - 71
Cole R. L. (1974) "Commercial Banking in Rhodesia," The Rhodesian Journal of Economics pp 55-65
Cole R. L. (1974) "Pension and Inflation in Rhodesia", The Rhodesian Journal of Economics, pp 91 - 97
Cooley T. F. and LeRoy S. F. (1985) "Atheoretical Macroeconometrics: A Critique", Journal of Monetary Economics, 16, pp 283-308 ·
' ' Davidson J. (1999) "Econometric Theory", Blackwell Publishers
Davidson R. and MacKinnon J. G. (1993) "Estimation and Inference in Econo~ metrics", Oxford University Press, NY
Davies J.P. (1997) "Mathematical Encounters of The second Kind", Birkhauser, Boston
De Caires B. and Fletcher D. (1990) 'The Guide to Investing in Emerging Securities Markets", Euromoney.
De Gregorio & Guidotti (1992) "Financial Development and Economic Growth", International Monetary Fund Working Paper No. 92-101
268
·,
. _,:
De Juan A. (1991) "Does Bank Solvency Matter? And What to do About It?" Economic Development Institute of the World Bank [EDI] Working Papers
Delhaise P. (1998) "Asian Crisis: The Implosion of the Banking and Finance Systems", John Wiley & Sons (Asia) (Pvt) Ltd
Demirgu9-Kunt A, and Levine R (1999), "Bank-based and Market-Based Financial Systems: Cross-Country Comparisons", World Bank Working Paper.
Denizer C., Desai R. M. and Gueorguiev N. (1998) "The Political Economy of Financial Repression in Transition Economies", World Bank: Policy Research Working Paper# 2030
Devarajan S., Easterly W.R. and Pack H. (1999) "investment in Africa Too High or Too Low? Macro and Micro Evidence', World Bank Working Paper
Diamond D. and Rajan R. (1998) "Liquidity Risk, Liquidity Creation and Financial Fragility: A Theory of Banking", University of Chicago Working Paper
Diamond D. W. (1984) "Financial Intermediation and Delegated Monitoring", Review of Economic Studies, LI (166) pp 393 - 414
Diamond D. W. (1991) "Monitoring and Reputation: The Choice Between Bank Loans and Directly Placed Debt", Journal of Political Economy, 99, pp 689 - 721
Diamond D. W. and Dybvig P.H. (1986) "Banking Theory, Deposit Insurance, and Bank Regulation", Journal of Business, 59 (1), January, pp 55 -68
Diebold F. X. (1997) "The Past, Present, and Future of Macroeconomic Forecasting", University of Pennsylvania and NBER Working Paper No. 97-20
Doomik J. A. (1998) "Approximations To The Asymptotic Distributions of Cointegration Tests", in Ed. McAleer and Oxley L. "Practical Issues in Cointegration Analysis", Blackwell Publishers pp 157 -177
Doornik J. A., Hendry D. F. and Nielsen B. (1998) "Inference In Cointegrating Models: UK M1 Revisited", in Ed. McAleer and Oxley L. "Practical Issues in Cointegration Analysis", Blackwell Publishers pp 117-156
Easterly W. (2000) "The Middle Class Consensus and Economic Development", World Bank Working Papers
Easterly W. and Levine R. (2000) "It's Not Factor Accumulation: Stylized Facts and Growth Models", World Bank: Working Paper
Edgeworth F. Y. Esq., M. M.A. (1886) "The Mathematical Theory of Banking", collected in Lewis M. K. (1995) Financial Intermediaries, Edward Elgar: UK.
269
,-. ;~ -
.; .
.,,-_
) r-_; ·-;
...
Eichberger J and Harper I. R (1997) "Financial Economics", 9x1ord University Press.
,I Enders W. (1995) "Applied Econometric Time Series", Wiley 1.Y. Fama E. and Jensen C. M. (1983a) "Separation of Ownership rnd Control",
Journal of Law and Economics (26) pp 301 - 325 ' I.•
Fama E. and Jensen C. M. (1983b) "Agency Problems and Re~idual Control", Journal of Law and Economics (26) pp 327 - 349 :"·
),(
Fama E. G. (1980) "Banking in the Theory of Finance", Jbumal of Money, Credit, and Banking, 20 (3), August, part 2, pp 559 -58~
Ferson W. E., Sarkissian S. and Simin T. "Spurious Regressions in Financial Economics?" University of Washington Working Paper
Fischer K. P, Gueyie J. and Ortiz E. (1997) "Financial Liberalisation; Commercial Bank's Blessing or Curse?" Canada, CREFA Working paper No. 97-2.
Fisher I. (1933) "The Debt-Deflation Theory of Great Depressions", Econometrica, 1, October, pp 337- 357
Fleming J. M. (1962) "Domestic Financial Policies Under Fixed and Floating Exchange Rates", IMF Staff Papers, Vol. 9, pp 369 - 380
Frankel S. H. (1938) "Capital Investment in Africa", Oxford University Press: UK.
Frexias X. and Rochel J. (1997) "Microeconomics of Banking", Cambridge, MA: MIT Press
Friedman M. and Schwartz A. J. (1963) "Money And Business Cycles", The Review of Economics And Statistics, Supplement, 45 ( 1 ) pp 32-64
Fry M. J. (1997) "In Favour of Financial Liberalisation", The Economic Journal, 107 (May) pp 754 - 770 '
I Gans J. S., King S. P. and Mankiw G. N. (1999) "Principles of Microeconomics",
Harcourt Brace
' Garratt A., Lee K., Pesaran H. M. and Shin Y. (1999) "A Structural Cointegrating VAR Approach to Macroeconomic Modelling", Cambridge University: Working Paper
Gertler M. (1998) "Financial Structure and Aggregate economic Activity: An Overview", Journal of Money, Credit and Banking, Vol. 20
Girdlestone J. A. C. (1973) "The Rate of Exchange for the Rhodesian Dollar: Limited Objectives", Rhodesia Journal of Economics, (June) pp 81 - 91
270
-;, _,,,,, .
'
' ]
' '
'"' .... ,.
Girdlestone J. A. C. (1973) "The Rate of Exchange for the Rhodesian Dollar: Long-term Objectives", Rhodesia Journal of Economics (Sept) pp 109 - • 121
Goodhart C. (1988) "The Evolution of Central Banks'; MIT Cambridge, MA
Government Printers (1981), "Growth With Equity: An Economic Policy Statement."
Government Statistical Bureau (1930) "Official Yearbook of the Colony of Southern Rhodesia, No. 2"
Greene W. H. (2000) "Econometric Analysis", 4fu Ed. Prentice Hall International
Grossman S. and Hart 0. I. (1986) "The Costs And Benefit of Ownership: A Theory of Vertical And Lateral Integration", Journal of Political Economy 94 pp 691 - 719. .
Grossman S. J. and Stiglitz J. E. (1980) "On the Impossibility of Informationally Efficient Markets", American Economic Review
Gurley J. G. and Shaw E. S. (1956) "Financial Intermediation and the Saving -Investment Process", Journal of Finance, XI, pp 257 - 276
Haavelmo T. (1943) "The Statistical Implications of a System of Simultaneous Equations", Econometrica, Vol. 11, pp 1 - 12, reprinted in Ed. Hendry D. F. and Morgan M. S. (1995) "The Foundations of Econometric Analysis" Cambridge University Press
Haavelmo T. (1944) "The Probability Approach in Econometrics", Supplement to Econometrica, Vol. 12 (selected pages) reprinted in Ed. Hendry D. F. and Morgan M. S. (1995) "The Foundations of Econometric Analysis" Cambridge University Press
Haldrup N. (1998) "An Econometric Analysis of 1(2) Variables," in Ed. McAleer and Oxley L. "Practical Issues in Cointegration Analysis", Blackwell Publishers pp 179 - 234
Hamilton J. D. (1994) "Time Series Analysis", Princeton Univere.ity: New Jersey
Harvey A. (1997) "Trends, Cycles and Autoregressions", Economic Journal, 107, pp 192 - 201
Harvey C. (1996) "The Limited Impact of Financial Sector Reforms in Zimbabwe," Institute of Development Studies, Working Paper No 36
Hawkins A. M. (1976), "The New Issues Market," The Rhodesian Journal of Economics, August p117-127
Hellman J. S., Jones G., Kaufmann D. and Schankerman M. (2000) "Measuring Governance corruption, and State Capture: How Firms and Bureaucrats Shape the Business Environment in Transition Economies", World Bank Working Paper
271
'
i .
,,.
Hixon (1993) "The Triurnph of Bankers",
Hoffman D. L. and Rasche R.H. (1997) "A Vector Error-Corr~ption Forecasting Model of the U.S. Economy''. Federal Reserve Bank of ft Louis - Mimeo.
Holmstrom B. and Tirole J. (1994) "Financial Intermediation, L~anable Funds and the Real Sector', Working Paper, IDEI, university of Toulouse ,,
;,' Holmstrom B. and Tirole J. (1997) "Financial Intermediation, L~enable Funds,
And The Real Sector', Quarterly Journal of Economics, :v'ol. CXtl, 3, pp --~1 ~
Hoshi T. and Kashyap (1999) "The Japanese Banking Crisis: Where Did It Come From And how Will It End?" NBER Macroeconorl,ic Annual Final Draft
Hussey J. and Hussey R. (1997) "Business Research: A Practical Guide for Undergraduate and Postgraduate Students", Basingstoke: Macmillan
IFC (1982, 1988, 1999) "Emerging Stock Markets Factbook", International Finance Corporation
IMF (2001) "Zimbabwe: Recent Economic Developments, Selected Issues, and Statistical Appendix", IMF Country Report No. 01/13
Jaffee D. (1990) "Levels of Socio-economic Development Theory", Praeger: Westport.
James C. M. and Smith C. W. Jr. Editors, (1994) Studies in Financial Institutions: Commercial Banks, Mc Graw-Hill
Jayaraman T. K. (1996) "Financial Sector in Fiji: Some Empirical Evidence of Financial Deepening", Centre for South Pacific Studies - University of New South Wales.
Jensen C. M. and Meckling H. M. (1976) "Theory of the Firm: Managerial Behaviour, Agency Costs and Ownership Structure", University of Roches-~~ N~ .
Johansen S. (1988) "Statistical Analysis of Cointegrating Vectors", Journal of Economics and Control, 12, pp 231-254
Johansen S. (1991) "Estimation and Hypothesis testing of Cointegrating Vectors in Gaussian Vector Autoregressive Models", Econometrica, 59, pp 1551-1580
Johansen S. (1992) "Determination of Cointegration Rank in the Presence of a Linear Trend", Oxford bulletin of Economics and Statistics, 54, pp 383 -397
Johansen S. (1995) "Likelihood-based Inference in Cointegrated Vector autoregressive Models", Oxford University Press, Oxford
272
. (i
Johansen S. and Juselius K. (1994) "Identification of the Long-run and Shortrun Structure: an Application of to the IS-LM Model", Journal of Econometrics, 63, pp 7 - 37
Johansen S. and Juselius K. V. (1990)"Maximum Likelihood Estimation and Inference on Cointegration - with application to the demand for money", Oxford Bulletin of Economics and Statistics, 52, pp 169-210
Johansen S. and Juselius K. V. (1992) "Testing Structural Hypotheses In A Multivariate Cointegration Analysis of the PPP and UIP for UK", Journal of Econometrics, 53, 211-244
Johnson A. C, Johnson B. J. and Buse (1987) "Econometrics: Basic and Applied'; Macmillan Publishing.
Judge G. G., Hill C.R., Griffiths W. E., LOtkepohl H. and Lee T. (1988) "Intro, duction To The Theory and Practice of Econometrics" 2nd Ed., John Wiley and Sons
Kam Hon Chu (1999), "Free Banking And Information Asymmetry", Journal of Money, Credit, and Banking Vol. 31 No. 4 (Nov): pp 748 - 762
Kane E. and Rice (2000) "Bank Runs and Banking Policies: Lessons for African Policymakers", National Bureau of Economic Research [NBER] Working Paper 8003 http://www.nber.org1paperslw8003
Kane E. J. (1981) "Accelerating Inflation, Technological Innovation and Decreasing Effectiveness of Bank Regulation", The Journal of Finance, Vol. 36 No. 2 (May) pp 355 - 367
Kane E. J. (1983) ''Policy Implications of Structural Changes in Financial Mar-
;,,i ·;, '\
tc.-
-{ • if
kets", American Economic Review Vd 73 No. 2 (May) pp 97 -100 ,
Kane E. J. (2000) "Designing Safety Nets to Suit Country Circumstances", World Bank Research Worlking Paper
Kanth R. (1994) "Paradigms in Economic Development: Classic Perspectives, Critiques, and Reflections." M. E. Sharpe.
Kashyap A. K., Rajan Rand Stein J.C. (1999) "Banks as Liquidity Providers: An Explanation for the Co-existence of Lending and Deposit Taking", Working Paper, Social Science Research Network [SSRNJ.
Kennedy P (1998) "A Guide To Econometrics", Blackwell Publishers
Keynes J.M. (1891) "The Scope and Method of Political Economy", Macmillan: UK. Extracts reprinted in Ed. Hendry D. F. and Morgan M. S. (1995) "The Foundations of Econometric Analysis" Cambridge University Press
Kindleberger C. P. (1996) "Maniacs, Panics, and Crushes: A History of Financial Crises", John Wiley
273
' '
Kindleberger C. P. and Herrick B. (1977)" Economic Develop"lent", McGrawHill Book Company 3'' Ed.
,I King R. and Levine R. (1992) "Financial Intermediation and 1Economic Devel
opment'; in: C. Mayer and X. Vives Eds. Capital Mar~ets and Financial Intermediation, Cambridge University Press, Cambridgf
King R. G. and Levine :·!. (1992) "Financial Indicators and Growth in a Cross Section of Countries" World Bank Working Paper No. 81'9 , ....
King R. G. and Levine R. (1993) "Finance, Entrepreneurship, ahd Growth: Theory and Evidence," Journal of Monetary Economics, 108 (3), pp 717-738
Koop, G., Pesaran H. M. and Potter M. S. "Impulse Response IAnalysis in Nonlinear Multivariate Models", Journal of Econometrics, 74, p119 -147
Koopmans T. C., Vining R. and Hastay M. (1947 -1951) "Measurement without Theory Debate" Review of Economics and Statistics, Vol. 29, 1947, Vol. 31, 1949, and Journal of the American Statistical Association, Vol 46, 1951, (selected pages} reprinted in Ed. Hendry D. F. and Morgan M. S. (1995) "The Foundations of Econometric Analysis" Cambridge University Press
Krugman P. (1998) "Two Cheers for Formalism", The Economic Journal, 108, pp 1829 - 1836
LaPorta R., Lopez-de-Silanes F., Shleifer A. and Vishny (1997) "Legal Detenminants of External Finance", Journal of Finance, 52, pp 1131 - 1150
LaPorta R., Lopez-de-Silanes F., Shleifer A. and Vishny (1998) Journal of Political Economy, 106, pp 1113 • 1155
LaPorta R., Lopez-de-Silanes F., Shleifer A. and Vishny (1999) "Corporate Ownership Around The World", Journal of Finance, 54, pp 471 - 517
LaPorta R., Lopez-de-Silanes F., Shleifer A. and Vishny (2000) "Investor Protection and Corporate Governance", Journal of Financial Economics, 58, pp3-27 ,
Leamer E. E. (1983) "Let's Take the Con Out of Econometrics", American Economic Review", (March} pp 31 -43)
Lehr C. and Wang P. (2000) "Dynamic Effects of Financial lntenmediation Over the Business Cycle", Economic Inquiry, Vol. 38, Issue 1, pp 34 -57
Leland H. E. and Pyle D. H. (1977) "Information Asymmetries, Financial Structure, and Financial lntenmediation", Journal of Finance, XXXII, (2) May, pp 371 -387
Levine R. (1997) "Law, Finance, and Economic Growth," University of Virginia Working Paper
274
Levine R. (1998) "The Legal Environment, Banks, and Long-Run Economic Growth", Journal of Money, Credit and Banking Vol. 3 No. 3, pp 597-613
Levine R. (2000) "Bank-Based or Market-Based Financial Systems: Which is Better? University of Minnesota: Working Paper
Levine R. Loayza N. and Beck T. (2000) "Financial Intermediation And Growth: Causality And Causes" Journal of Monetary Economics 46 pp 31 - 77.
Lewis M. K. (1995) Ed. "Financial Intermediaries (International Library of Critical Writings in Economics; Vol 43) An Elgar Reference Collection.
Lorenz E. (1999) "Trust, Contract and Economic Cooperation", Cambridge Journal of Economics (23) pp 301-315.
Luintel and Khan (1999) "A Quantitative Reassessment of The Finance-Growth Nexus: Evidence from a multivariate VAR", Journal of Development Economics, Vol. 60 pp 381 -405
Lynch D (1993) "Altamative Measures of Financial Development", Macquarie University: CMBF paper No. 5.
Lynch D (1994) "Economic Growth and Financial Sector Development", Mac-quarie University: CMBF Paper No. 10. ,
Maita! S. (1994) "Executive Economics: Ten Essential Tools for Managers", The Free Press.
Mankiw G. N. (1997) "Macroeconomics", Worth Publishers: N.Y.
Martin P and Win R (1996) "Australia's Financial Markets: Function, Structure and Contribution to the Economy", SIRCA Research Paper.
Marx Weber (1930) "The Protestant Ethic and the Spirit Of Capitalism", as cited in Jaffee D. (1990) "Levels of Socio-economic Development Theory", Praeger.
Masih A. M. M. and Masih R. (1999) "Are Asian Stock Market Fluctuations Due Mainly to Intra-regional Contagion effects? Evidence Based on Asian Emerging Stock Markets", then forthcoming in the Pacific-Basin Finance Journal
Mason P. (1958) "The Birth of A Dilemma", Greenwood Press, Publishers
Mattesini F. (1993) "Financial Markets, Asymmetric Information And Macroeconomic Equilibrium", Dartmouth
Mayer C. (1988)" New Issues in Corporate Finance'; European Economic Review, Vol. 32.
McKinnon R. I. (1973) "Money And Capital", The Brookings Institution, Washington DC
275
<'; ~r•,_-, ,' • \ - • • '•
Meda S. (1999) "Leadership, Ethics and Disciplinary Codes: thl' case of Zimbabwe", Asia Pacific Press: National Australia University, Working Paper 99 -2 available at http://ncdsnet.anu.edu.au ,I
Meredith M (1979, p20) "Ti1e Past is Another Country: Rhodesia 1890-1979'; Andre Deusch: London. 11
Merton J.C. (1990) "The Financial System and Economic Pe nmance", printed in "International Competitiveness In Financial Services" - A Special Issue of The Journal of Financial Services i=?esearch, Vol. 4. No. 4. - Kluwer Academic Publishers !,("
Merton R. C. (1992a) "Financial Innovation and Economic P1rtormance", Journal of Financial Research
' Mills C. T. (1993) "The Econometric Modelling of Financial Time Series", Cam
bridge University Press
Mills T. C. (1999) "Great Ratios and Common Cycles: Do They Exist for the U.K.?" Loughborough University: Economic research Paper No. 9911
Mishkin (1978) F. 'The Household BalRnce Sheet And The Great Depression", Journal of Economic History, 38 (4) pp 918 - 37 ·
Mitchell 8. R. (1998) "International Historical Statistics: Africa, Asia & Oceania 1750 -1993
Miwa Y. ancl Ramseyer M. J. (2000) "Banks And Economic Growth: Implications from Japanese History", Harvard Law School: Discussion Paper No. 289
Mkondo P. T. M. (1992) "Opportunities And Threats facing The Zimbabwean Life Assurance Industry", MBA thesis, University of Keele Staffordshire: UK.
Modigiliani F. (1944) "Liquidity Preference and The Theory of Interest and Money", Econometrica, (Janua,y) pp 45 -88
Modigiliani F. and Miller M. H. (1958) "The Cost of Capital, Corporation Finance and the Theory of Investment", American Economic Review, 48, pp 261 -297
Montes F. M. (1998) "The Currency Crisis in South East Asia"; The Institute of South East Asian Studies
Mosley P. (1983) "The Settler Economies: Studies in the Economic History of Kenya and Southern Rhodesia 1900-1963", Cambridge University Press.
Mullineux A. W. (1990) "Business Cycles and Financial Crises", Harvester Wheatsheaf, N.Y.
Mundell R. A. (1962) "Capital Mobility and Stabilization Polley Under Fixed and Flexible Exchange Rates", Canadian Journal of Economic and Political Science, Vol. 29, pp 4,5 -485.
276
Mundell R. A. (1962) "The Appropriate Use of Monetary and Fiscal Policy for Internal and External Stability" IMF Staff Papers, Vol. 9, pp 70 - 79
Myers S. and Rajan R (1998) "The Paradox of Liquidity•; Quarterly Journal of Economics
Newlyn W. T. and Rowan D. C. (1954) "Money and Banking In British Colonial Africa", Oxford, The Clarendon Press
Owoye 0. (1997) "Money And Economic Activity in Developing Countries: Evidence Based on Cointegration and Causality Tests", American Economist, Los Angeles (Spring)
Pesaran H. Mand Pesaran B. (1997) "Working with Microfit 4.0: "Interactive Econometric Analysis (Windows Version)", Oxford University Press
Pesaran H. M. and Shin Y. (1998) "Generalised Impulse Response Analysis in Linear Multivariate Models", Economic Letters, 58, pp 17-29
Pesaran H. M. and Smith R. P. (1998) "Structural Analysis of Cointegrating VARs" in Ed. McAleer and Oxley L "Practical Issues in Cointegration Analysis", Blackwell Publishers pp 55 - 89
Phimister I. "An Economic And Social History of Zimbabwe 1890-1948: Capital Accumulation And Class Struggle", Longman: N.Y. & London.
Pritchett L. "The Tyranny of Concepts: CUDIE (Cumulated, Depreciated, Investment Effort) is Not Capital
Rajan R. G. and Zingales L (1998) "The Firm as a Dedicated Hierarchy: A Theory of the Origin and Growth of Firms", Working Paper
Ramakrishnan R. T. S. and Thakor A. V. (1984) "Information Reliability And a Theory of Financial Intermediation", Review of Economic Studies, 51, pp 415-432
Ramsay D. I. (1976) "Rhodesia's Exchange Rate Policy-And its Consequences", The Rhodesian Journal of Economics Vol. 10, No. 4 pp 165 -176
Ratts0 J. and Torvik R. (1998) "Zimbabwean Trade Liberalisation: ex-post evaluation," Cambridge Journal of Economics Vol. 22 (3)
Reinsel G. C. (1997) "Elements of Multivariate Time series Analysis", Springer.
Reserve Bank of Zimbabwe (1980) Quarterly Economic And Statistical Review (September) (on going)
Rhodesia (1925 -52) "Official Yearbook of the Colony of Southern Rhodesia", Government Statislical Bureau
Rhodesia (1966) "Economic survey of Rhodesia", Ministry of Finance (on going)
277
Robertson J. C. and Tallman E.W. (1999) "Vector Autoregression: Forecasting ' and Reality", Economic Review, Federal Reserve Bank of Atlanta, first
Quarter pp 4-18 , I
Rosnow I. R. and Rosenthal (1996) "Beginning Behavioural R~search: a Con-ceptual Premier', 2"' Ed, Prentice Hall Ii
Roubini N. and Sala-i-Martin X. (1991) '"Financial Developmebt, The Trade Regime and Economic Growth", NBER: Working Paper NO) 3876.
1·,, • . Roubini N. and Sala-i-Martin X. (1992) "Financial Repressi6h and Economic
Growth", Journal of development Economics, 39, pp 5 -30
Rousseau P. L. "Finance, Investment, and Growth in Meiji- ela Japan", Japan and The World Economy, 11, pp 185 -198 '
Rousseau P. L. and Wachtel P. (1998) "Financial Intermediation and Economic Performance: Historical Evidence from Five lndustri81ised Countries", Journal of Money, Credit and Banking Vol 30 No. 4 pp 657-678.
Runkle (1987) "Vector Autoregressions And Reality", Federal Reserve Bank of Minneapolis, Research Department Staff Report 107 ·
Sandura W. R [Chairman] (1989) "Report of the Commission of Inquiry into the Distribution of Motor Vehicles", Government Printers: Harare.
Santomero M. and Seater J. J., (1998) "Is There an Optimal Size for the Financial Sector?"The Wharton School Working Paper 98-35-B
Sargent T. J. (1999) "The Conquest of American Inflation", Princeton University Press, New Jersey
Scholtens B. and van Wensveen D. (2000) "A Critique On The Theory of Financial Intermediation", Journal of Banking and Finance, 24, pp 1243 -1251
' Schuler K. A. (1992) "Currency Boards", George Mason Unive"rsity: Dissertation
[available at http://users.erols.comlkurrency/webdiss1 .tltm]
Schumpeter J. A. (1911, 1936) "The Theory of Economic Development", Har-vard University Press: Cambrtdge MA. '
Schumpeter J. A. (1933) "The Common Sense of Econometrics", Econometrica, Vol. 1 pp. 5-12, extracts reprinted in Ed. Hendry D. F. and Morgan M. S. (1995) "The Foundations of Econometric Analysis" Cambridge University Press
Schumpeter J. A. (1954) "History of Economic Analysis" New York: Oxford University Press.
Shaw E. S. (1973) "Financial Deepening in Eo,nomic Development", Oxford University Press, N Y
278
Shintani M. (2000) "A Simple Cointegraling Rank Test Without Vector Autoregression", Vanderbilt University Working Paper No. 00 - W44
Shleifer A. and Summers L. (1988) "Break of Trust in Hostile Takeovers" cited in Thaker A. V. (1996) "The Design of Financial Systems: An Overview", Journal of Banking And Finance, 20 pp 917 - 948.
Shleifer A. and Vishny W. R. (1997) "A Survey Of Corporate Governance", Journal of Finance, Vol. Lii No. 2 pp 737 - 783
Siddique M.A. B. (1997) "Economic Development: Then AND Now", University of Western Australia: Discussion Paper 97.05.
Sigh A. (1997) "Financial Liberalisation, Stock Markets and Economic Development", The Economic Journal, 107 (May), pp 771- 782.
Sims C. A. (1980) "Macroeconomics And Reality", Econometrica, Vol. 48, Number 1, pp 1 -48, reprinted in Dale J.P. (1994) Ed. 'The Methodology.of econometrics Volume 11", An Alger Reference Collection
Sims C. A. (1995) "Macroeconomics And Methodology", Working Paper (later appeared in the Journal of Economic Perspectives)
Sithole M. (2001) "The Concept of 'Normalising The Abnonmal' ", The Financial Gazette, 29 March [www.fingaz.co.zw]
Smith L. G. [Chairman] (1989) "General Report of the Committee of Inquiry into the Administration of Parastatals", Government Printers: Harare
Smithson C. W. (1998) "Managing Financial Risk: A Guide to Delivalive Products, Financial Engineering, and Value Maximization", McGraw-Hill.
Southern Rhodesia (1947) "Statistical Yearbook of Southern Rhodesia: The Official Handbook of the Social and Economic Conditions of the Colony", Department of Statistics
Spanos A. (1999) "Probability Theory and Statistical Inference: Econometric Modelling with Observational Data", Cambridge University Press: UK.
Spanos, Andreou, and Syrichas (1997) "The Vector Autoregression (VAR) Approach To Econometric Modelling: Volume 1 A VAR Model For The Monetary Sector of The CyprJs Economy", University of Cyprus and Central Bank of Cyprus
Spulber D. F. (1999)"Market Microstructure: Intermediaries and The Theory of The Firm", Cambridge University Press
St Thomas Aquinas (c. 1260, 1994) "On The Governance of Rulers" as cited in Rick D. Z. "The Economic Theory of Growth and Development, p6.
Standard Bank (1967) "1892-1967 Three Quarters Of A Century: of banking in Rhodesia."
279
Stiglitz J. (1989) "Markets, Market Failures, and Development:·. American Economic Review, Vol. 79 NO. 2 (May) pp 197-203
,I Stiglitz J. and Weiss (1981) "Credit Rationing in Markets With \mperfect Infor
mation", American Economic Review, 71, pp 393 - 410
Stiglitz J.E. and Weiss A. (1990) "Banks as Social Accountanj and Screening Devices for the Allocation of Credit", Greek Economic iview, 12, Sup-plement, Autumn, pp 85-118 i'
I',•, . Stock J. H. (1994) "Unit Roots, Structural Breaks and Trends!:~. in: Engle R. F.
and McFadden D. L. Eds. Handbook of Econometrics,' Elsevier Science B. V, pp 2739-2841
Sudweeks B. L. (1989) "Equity Market Development in Developing Countries," Praeger N.Y. Westport
Summers C. (1994) "From Civilisation To Segregation: Social Ideas and Social Control in Southern Rhodesia, 1890 - 1934" Ohio University Press, Athens.
Summers L. H. (1985) "On Economics And Finance", The Journal of Finance, Vol. XL. No. 3 pp 633 - 635 ..
Summers L. H. (1991) "The Scientific Illusion in Empirical Macroeconomics", Scandinavian Journal of Economics, 93 (2) pp 129 -148
Sylvester C. (1991) "The Terrain of Contradictory Development", Westview Press, Dartmouth: UK.
Taylor L. D. (2000) "Capital, Accumulation, And Money: An Integration Of Capital, Growth, And Monetary Theory''. Kluwer Academic Publishers
Thaker A. V. (1996) "The Design of Financial Systems: An Overview", Journal of Banking And Finance, 20 pp 917 - 948.
The Federal Reserve Bank of Cleveland (1995) "Governments and Money" es-say on http//www.clev.frb.orglannuallessay.htm !
The World Bank (1989) "World Development Report 1989: Financial Systems and Development''. World Development Indicators, Oxford University Press.
Tobin J. (1963) "Commercial Banks As Creators of Money", Banking and Monetary Studies, reprinted in Lewis M. K. (1995) "Financial Intermediaries." An Elgar Reference Collection
Tobin J. (1965) "Money and Economic Growth," Econometrica Vol. 33 No. 14
Todaro M. P. (1997) "Economic Development", Addison Wesley Longman Limited, 7° Ed.
280
Van Home J. C. (1985) "Of Financial Innovations and Excesses", Journal of Finance (July) pp 621 - 631
Watson M. W. (1994) "Vector Autoregression And Cointegration", in: Engle R. F. and McFadden D. L. Eds. Handbook of Econometrics, Elsevier Science B. V, p2843-2915
Weintraub R. E. (1998) "Controversy: Axiomatisches Mibverstandnis", The Journal of Economics, 108, pp 1837 - 1847
Williamson E. 0. (1988) "Corporate Finance And Corporate Governance", Journal of Finance, Vol XLIII No. 1 pp 567-591
Yule G. U. (1926) "Why Do We Sometimes Get Nonsense Correlations between Time-Series?" Journal of the royal Society, Vol. 89 pp 2-9, 30-41, reprinted in Ed. Hendry D. F. and Morgan M. S. (1995) "The Foundations of Econometric Analysis" Cambridge University Press
Zimbabwe (1980) "Monthly Digest of Statistics", Central Statistics Office
Zingales (1997) "Corporate Governance", then forthcoming in The Pa/grave Dictionary of Economics and Law: Chicago, US.
Zingales L. (2000) "In Search of New Foundations", Social Scientists Research Network [SSRN] Working Paoer
ZSE (200011) "The Investors' and Financial Markets Handbook", Zimbabwe Stock Exchange
281
\.t' ;\'llj,l r,f'"':
REFERENCES
,I
I 1 The Federal Reserve Bank of Cleveland (1995) "Governme~ts and Money"
essay on http!/www.clev.frb.org/annual/essay.htm r 11·
2See Mullineux AW. (1990) "Business Cycles and Financial ~.rises", Harvester Wheatsheaf, NY ; ,· ...
3 Shleifer A. and Summers L. (1986) "Break of Trust in HostileTakeovers" cited in Thakor A. V. (1996) "The Design of Financial Systemf An Overview", Journal of Banking And Finance, 20 pp 917 - 948. ,
'As cited in Shleifer A. and Vist,ny W. R. (1997) "A Survey Of Corporate Governance", Journal of Finance 2 (June).
5 The Daily News 23 March 2001 [http://www.dailynews.co.zwldailyn
6 The Zimbabwe Standard 10 December 2000. [http://site.mweb.co.zwlstandardn
7 The Financial Gazette 1 February 2001. [http://www.fingaz.co.zw]
8 The Daily News 15 December 2000 [http://www.dailynews.co.zwldailyn
9 Cited in Jaffee D. (1990, p104) "Levels of Socio-economic Development Theory", Praeger: Westport
10 Marx Weber (1930) "The Protestant Ethic and the Spirit Of Capitalism", as cited in Jaffee D. (1990) "Levels of Socio-economic Development Theory", Praeger.
11 Cited in Jaffee D. (1990) "Levels of Socio-economic Development Theory", Praeger: Westport, p108.
12 Mason P. (1958,p25) The Birth of a Dilemma
13 Government Statistical Bureau (1930) "Official Yearbook of the Colony of Southern Rhodesia, No. 2" 1
14 Zimbabwe Independent 5 January 2001 [http://www.mweb.co.zwlzimin]
15 Cobbing J. (1976) "The Ndebele under the Khumalos 1820-96," University of Lancaster, Ph.D. as cited in Phimister (1988, p16).
10 Zimbabwe Independent 5 January 2001 [http://www.mweb.co.zwlzimin]
17 St Thomas Aquinas (c. 1260, 1994) "On The Governance of Rulers" as cited in Rick D. Z. 'The Economic Theory of Growth and Development, p6.
18 Financial Gazette 22 March 2001 [http://www.fingaz.co.zw]
282
_:)
)i•
-~
'
. '
19 Goodhart(1988, p17)
20 Standard Bank (1967) "1892-1967 Three Quarters Of A Century: of banking in Rhodesia."
21 Government Statistical Bureau (1930) "Official Year Book of The Colony of Southern Rhodesia", No. 2 - 1930
22 Reserve Bank of Zimbabwe (1980) Quarterly Economic And Statistical Review (September)
23 For complete details on these variables see Alesina, Ozier, Roubini and Swagel (1996) data set available at http:/lwww.nuff.ox.ac.uk/Economics/Growth/swagel.html or http://www.nber.org/pub/swagelldata50.log For the purposes of this re: search, the Zimbabwe data set was extended by the author on the basis of historical knowledge.
24 Koopmans T. C., Vining R. and Hastay M. (1947 - 1951) "Measurement without Theory Debate" Review of Economics and Statistics, Vol. 29, 1947, Vol. 31, 1949, and Journal of the American Statistical Association, Vol 46, 1951, (selected pages) reprinted in Ed. Hendry D. F. and Morgan M. S. (1995) "The Foundations of Econometric Analysis" Cambridge Unive;sity Press
25 As cited in Freixas and Rochel (1998) "Microeconomics of Banking", MIT Press, Cambridge, Massachusetts
26 Governor, Reserve Bank of Zimbabwe, Quarterly Economic and Statistical Review, Sept 1980.
283

,I
I /i 11•
\
284