Embed Size (px)
Citation preview

FINANCIAL LIBERALISATION AND ECONOMIC GROWTH:
A VECTOR AUTOREGRESSION APPROACH
Okunoye Ismaila
University of Ibadan, Ibadan, Nigeria
Tel: +2348107504642; E-mail; [email protected];
ABSTRACT
The paper models banking sector liberalisation variables between financial liberalisation and economic growth in Nigeria for the period of 1981 to 2012, based on time series econometrics using granger causality through Vector AutoRegression method. It examines the extent of banking sector liberalisation on growth of the economy using growth in credit to private sector to GDP, growth in demand deposit to narrow money, growth in net domestic credit to GDP, growth in net broad money stock to GDP, and growth in currency in circulation to broad money stock. The finding from the paper indicates that there is no stable long run relationship between the banking sector liberalisation and economic growth in Nigeria. The causality runs between currency in circulation and economic growth, and domestic credit and economic growth. The results suggest the financial sector development can enhance economic growth and development of the country if the growth in currency in circulation, positively influenced by demand deposit and credit to the private sector, is fully monitored to improve investment in real sectors of the domestic economy. The findings suggest that Central Bank of Nigeria with the collaboration of Bankers’ Committee need to adopt more stringent penalties related to unsafe insider and related party lending that does not enhance investment in the real sectors of the economy which is source drivers of growth.
Keywords: Financial liberalisation, time series econometrics, granger causality, Vector Autoregression
JEL Classification
1. Introduction
Despite laudable achievements and certain challenges that have confronted the Nigerian financial
system, the Nigerian economy still witness substantial growth in the separate and co-dependent
components of its financial intermediaries, financial market and financial infrastructural component.
Financial liberalisation is not a contemporary phenomenon. In particular, financial liberalisation may
focus on policies such as banking sector liberalisation, stock market liberalisation, and capital account
liberalisation. For decades, Western countries and companies were operating in a free economy. Thus, it
is difficult to identify the beginnings of financial liberalisation, on which is based the economy
liberalisation. In the late 1970s, the phenomenon of deregulation in the U.S. appears to be the object of
widening freedom to innovate and take in a system of pure competition, by reducing or scrapping rules
authoritarian, which tended to strictly regulate the role and freedom of financial intermediaries action to

impose limits framework lending operations by their nature and duration. Financial liberalisation
includes several elements, as it reflects a variety of restrictions that were imposed. Generally like Nigeria,
financial system in other developing countries witnessed a substantial growth after adopting the mix of
economic measures under the IMF/World Bank supported Structural Adjustment Programme prescribed
as comprehensive reform measures designed to achieve both internal and external balance with a
minimum cost to the economy. A summary of Nigeria’s macroeconomic indicators has revealed a serious
decline in all areas of variable until the introduction of the SAP of 1986. The real effective exchange rate,
for instance, fluctuated between 326 and 652.3 between the period of 1980 and 1986 but went down
drastically to 105 by 1987 but then rose to 699 in 1992. Also, the real gross domestic product growth
rate hovers around -0.32; until 1986 when it started experiencing a positive growth rate.
Due to the high dependence of exports of crude oil as well as foreign capital inflows that compounded
the impact of the external shock arising from the crisis, coupled with the collapse in the international
price of oil, led to severe decline in foreign exchange receipts and volatility and substantial depreciation
of the naira exchange rate, and consequently, government revenue contraction. This confirms the high
level of fragility of Nigeria capital market where the greatest impact was felt. Through the excess liquidity
that found its way into the stock market and banking system which put the banking sector at serious risk
when the global financial crisis of 2008 set in. The 2007/08 global financial and economic crisis which
triggered distressed assets, high bank insolvency and loss of market trust in developed economies, and
threatened large-scale private sector default in emerging economies (IMF, 2009), have led to renewed
interest on the role of financial liberalization in economic development. Many analysts traced the cause
of the crisis to the fallout of financial liberalization and the regime of easy credit in the United States.
This have an indirect effect on Nigeria financial institution and as well not surprising therefore that given
the gravity of the crisis, the demand for government loan bonds comes mainly from financial institution
such as commercial banks and saving-type institutions. It is against this backdrop that a well functioning
banking sector is a precondition for the efficient allocation of resources and the exploitation of an
economy’s growth potential, through other elements of financial liberalisation, the economic literature is
less consensual on how and to what extent banking sector liberalisation has sustain economic growth.
This current study seek answers to, (i) what is the nature of relationship between banking sector
liberalisation and economic growth in Nigeria as well investigate the identification of each channel
through which financial sector affect economic growth (ii) to evaluate the impact of banking sector
liberalization variables on sustainability of economic growth in Nigeria. This study attempts to find

answers to these questions to show the new evidence from Nigeria using an integrated method. This
study will be of utmost importance in providing policy recommendation to the various stakeholders in
Nigeria towards the impact of banking sector liberalisation policies in sustaining economic growth, and in
emerging nations in taking adequate measures in their economy for rapid growth using the findings from
the Nigerian experience as a benchmark to conclude on the efficacy of banking sector liberalisation in
developing economies and make recommendations.
The Nigerian financial system has been recognized as major component of the country’s growth
and development agenda. The government had since the 1970s been characterized by high quasi total
regulation as the government owned majority of the shares of most of the banks existing at the time.
However, by the early 1980s, unfavourable and deteriorating economic conditions implied that the
economy needed some form of structural adjustment. The banking system became weak and fragile and
was thus unable to perform its primary function of financial intermediation. In 1986, the liberalization of
the banking industry was a major component of the Structural Adjustment Programme (SAP) put in place
at that time to drive the economy from austerity to prosperity. In 2004, the banking sector
reform/consolidation exercise in the banking industry took a leading role in the National Economic
Empowerment and Development Strategy (NEEDS), which was in place at that time to drive the
economic agenda of the government. This required all Deposit Money Banks (DMBs) to shore up their
capital base from the hitherto N2.5billion to N25billion naira. This regulation reduced the number of
banks from 89 to 25 commercial banks by the end of 2004.
In 2009, as part of the broad economic measures to respond to the adverse effects of the global financial
and economic crises, the Central Bank of Nigeria in conjunction with the fiscal authorities engineered
measures to avert a collapse of the financial system with a view to maintaining economic growth. The
essence of emphasis on the development of the Nigerian financial sector is in the theory of financial
repression which posits that efficient utilization of resources through a highly organized,
developed and liberal financial system enhances economic growth (McKinnon, 1973; Shaw, 1973,
Odeniran and Udeaja, 2010).
Following this introduction section, the remaining sections of the paper are divided into five. Section 2
describes overview of Nigeria’s Financial Structure. Section 3 describes review of related literature as
well framework of analysis. Section 4 presents the econometric methodology implemented in the study.
Section 5 discusses the empirical results while Section 6 concludes by examine the policy implication of
the study.

2. Overview of Nigeria’s Financial Structure
A financial system is a conglomerate of institutions, markets, instruments and operators that
interacts to provide such financial services as resource mobilization and allocation, financial
intermediation and facilitation of foreign exchange transactions. The Nigerian financial system can be
categorized into formal (money and capital market institutions) and informal (local money lenders, the
thrifts and savings associations and so on) groups. In general the Nigerian financial system comprises the
regulatory/supervisory authorities, banks and non-bank financial institutions. By the end of 2006, the
system comprised Central Bank of Nigeria (CBN), the Nigeria Deposit Insurance Corporation (NDIC), the
Securities and Exchange Commission (SEC), the Federal Ministry of Finance, Federal Mortgage Bank of
Nigeria, the National Insurance Commission (NAICOM), the Financial Services Regulatory Coordinating
Committee (FSRCC), the National Pension Commission (NPC), 25 Deposit Money Banks, 750 Community
(now Microfinance) Banks, 112 Finance Companies, 322 Bureau-de-Change, one Stock Exchange with
branch offices, one Commodity Exchange at Abuja, 91 Primary Mortgage Institutions, 5 Microfinance
Banks and 581 Registered Insurance Brokers (CBN, 2006).
The Banks and Non-Bank Financial Institutions comprises the money market with the following
institutions: Deposit Money Banks (DMBs), the Discount Houses (DHs), the Development Finance
Institutions (DFIs)/Specialized Banks which are further subdivided into Urban Development Bank (UDB),
the Nigerian Export-Import Bank (NEXIM) and the microfinance banks. Besides the money market, the
capital market comprises the following institutions: the Nigerian Stock Exchange (NSE), the Abuja Stock
(now Commodity) Exchange, the Primary Market, the Secondary Market and the Unit Trust Scheme.
Other non-bank financial institutions and funds include finance companies, insurance companies, bureau
de change, primary mortgage institutions (PMIs), the Nigerian Social Insurance Trust Fund (NSITF) and so
on.
In 2004, the current reforms which began with the consolidation programme were necessitated
by the need to strengthen the banks. The policy thrust at inception, was to grow the banks and position
them to play pivotal roles in driving development across the sectors of the economy. As a result, banks
were consolidated through mergers and acquisitions, raising the capital base from N2 billion to a
minimum of N25 billion, which reduced the number of banks from 89 to 25 in 2005, and later to 24.
Although, the consolidation exercise made the banks to be highly capitalised, people were surprised to
hear the pronouncement of the newly appointed Governor of the Central Bank of Nigeria on 21 June,
2009, that all were not well with the Nigerian banks. The audit test by the Central bank of Nigeria of the

24 banks in August, 2009, revealed that only 14 banks were found to have adequate capital and liquidity
to support the level of their current operations and future growth, while 2 banks were asked to re-
capitalise before 30 June, 2010, and 8 banks were adjudged to be in grave situations. The Central Bank of
Nigeria, citing the provisions of the Banks and Other Financial Institutions Act 2004 sacked the Executive
Management of the 8 banks. The criteria employed for the special examination in all the banks were:
Liquidity, capital adequacy, and corporate governance. The apex bank subsequently injected N620 billion
(about US$4.03 billion) in the banks as liquidity support and long term loans. The action of CBN implies
that the banks have not complied with the laid down principles of good banking of ensuring that the
banking system is safe, sound and stable.
Similarly, the importance of Microfinance in a growing economy cannot be over-emphasized,
given its potential in addressing the challenges of excluding a large population from full participation in
economic activities. As at December 2011 there were 24 deposit money banks with 5,789 branches and
816 microfinance banks bringing the total bank branches to 6,605. The ratio of bank branch to total
population is 24,224 persons, indicating a high level of financial exclusion. Under the new Universal
model adopted in 2001, licensed banks will be authorized to carry the following types of business:
Commercial banking (with regional, national or international authorization); Merchant (investment)
banking; Specialized banking (microfinance, mortgage, non-interest banking (regional and national); and
Development finance institutions. The introduction of the non-interest banking in Nigeria is expected to
herald the entry of new markets and institutional players thus deepening the nation’s financial markets
and further the quest for financial inclusion. In fact, the first fully licensed non-interest bank in the
country (Jaiz Bank Plc.) started business on Friday, January 6, 2012.
3. Review of Related Literature
Generally, from the reviewed literature and empirical studies on the finance-growth nexus there
are four documented views; supply leading, demand following, mutual impact of finance and growth and
those that the role of finance in promoting growth is overemphasized. And several empirical studies
carried out using different estimation method on the finance-growth nexus for countries and it is
observed that while some studies have employed a single indicator of financial development, others
have used two or more indicators separately to analyse the underlying relationship. The evidence from
studies on the relationship between financial development and economic growth suggests enormous
dissimilarity across countries, regions, financial factors and direction of causality. These studies can be

broadly classified based on the econometric procedures employed which could be single-period, cross-
section analysis, time series, or panel data econometrics.
Empirical studies on this subject burgeoned in the 1990s, following the prominent work of King
and Levine (1993a). In a study of 80 countries over the period 1960-89 in which they controlled for other
factors that affect long-run growth, their results showed that initial level of financial development is a
good predictor of the subsequent rates of economic growth. Other studies by Benhabib and Spiegel
(2000), Levine, Loayza and Beck (2000) and Rioja and Valev (2004) point to the same conclusion that
financial development has a positive impact on economic growth, however, these broad comparative
analyses conducted at the aggregate level are unable to account for the complexity of the financial
environment and specific institutional context of each individual country (Ang, 2007). Darrat (1999),
contributing to the role of financial deepening on economic growth examined three Middle-Eastern
countries of Saudi Arabia, Turkey, and the United Arab Emirates using multivariate Granger causality
tests within an error-correction framework. They tried to determine the causal link between financial
deepening and economic growth in order to discriminate between several alternative theoretical
hypotheses. The results generally support the view that financial deepening is a necessary causal factor
for economic growth, although the strength of the evidence varied across countries and across the
proxies used to measure financial deepening. The causal relationships were also predominately long-
term in nature hence their recommendations that government policies aimed at promoting financial
deepening in those countries must be persistent and sustainable in order to foster economic
development.
Bhatia and Khatkhate (1975) used correlation graphs to examine the relationship between
economic growth and financial intermediation for eleven African countries. Financial intermediation is
measured by the ratio of currency, demand deposits, and time and savings deposits to GDP. The authors
find no definite relationship between growth and financial intermediation for the countries individually.
Splitting the financial intermediation measure into two – the ratio of money to GDP and the ratio of
quasi-money to GDP – still do not reveal any definite relationship between growth and financial
intermediation. Ogun (1986) used cross-section analysis to estimate the correlation between financial
deepening and economic growth by using data for 20 countries in Africa from 1969 – 1983. The degree
of financial intermediation is measured using the ratio of monetary liabilities (M1, M2 and M3) to GDP.
For the full sample, all the monetary liabilities are negative and only the ratio of M3 to GDP is statistically
significant.

Oshikoya (1992) also used time series econometrics to see how interest rate liberalisation has
affected economic growth in Kenya. The author used data from 1970 to 1989 and the results showed a
negative and significant coefficient for the 1970-1979 period, but was positive and significant for the
1980-1989 period; thus offering no robust result of the effect of interest rate liberalisation on growth.
Choe and Moosa (1999) further examined the relationship between financial development and economic
growth for Korea. The study focused on relative development of financial intermediaries and capital
markets. Causality test shows that financial development in general leads to economic growth. King and
Levine (1999) present evidence that support Schumpeter’s view that financial development leads to
economic growth. The study covers the period 1960 to 1980 for 80 countries. It was a cross-section
regression of real GDP per capita on measures of financial development and other variables such as
initial GDP and the ratio of investment to GDP. The results confirmed that financial development causes
economic growth. Luintel and Khan (1999) examined the long-run relationship between financial
development and economic growth using multivariate vector autoregression for 10 countries. The
examination revealed that there is a bi-directional causality between financial development and
economic growth for all sampled countries.
Besides, Ghali (1999) investigated empirically whether financial development leads to economic
growth in Tunisia. The investigation was also done using the vector autoregression technique. The
empirical results suggest that there is a stable long-run relationship between financial development and
economic growth. The causality runs from financial development to economic growth. Calderon and Liu
(2003) employ a Geweke decomposition test on pooled data of 109 countries (developed and
developing) for the period 1960 to 1964 to examine the causal relationship between financial
development and economic growth. The study confirms that generally, financial development causes
economic growth. There is a bi-directional causality between financial development and economic
growth. Financial development contributes more to economic growth in developing countries than in
developed countries.
Allen and Ndikumana (2000) used the ratio of liquid liabilities, ratio of banks’ private sector
credit, ratio of banks’ total credit, and an index to include all three measures as proxies for financial
intermediation. The authors find that only the ratio of liquid liabilities is positive and significant, and
even this variable is insignificant in the fixed effects estimation and when annual data are used. The
other financial intermediation variables take on different signs but are all insignificant. Furthermore, we
cannot ascertain the effect of financial liberalisation policies on economic growth from these studies
because none of them explicitly measures the different stages involved in financial liberalisation.

Although some of them (Seck and El Nil, 1993; Oshikoya, 1992, Fowowe 2008) try to model liberalisation
by including the real rate of interest as an explanatory variable, liberalisation involves more than just
interest rate liberalisation. It includes an array of measures such as directed credit abolition, bank
denationalisation, and the removal of restrictions of entry into banking. Measuring financial liberalisation
through the real interest rate thus negates the impact of the other liberalisation policy moves and
implies that estimates derived suffer from omitted variable bias (Gibson and Tsakalatos, 1994;
Demetriades and Luintel, 1996). Existing empirical studies (Kasehende and Atingi-Ego, 2003; Suleiman
L.A, Oke M.O, Azeez B.A, 2012) have not adequately identified which element of financial liberalisation
sustained the gradual institutional changes that financial liberalisation measured.
Aziakpono (2004) used the ratio of liquid liabilities and the ratio of banks’ private credit as
measures of financial intermediation and found mixed results. Odhiambo (2004) also investigated the
direction of causality between financial development and economic growth for South Africa using a
vector error correction model. The investigation revealed that the supply-leading hypothesis is rejected
for South Africa. There is a strong evidence of demand-leading hypothesis for South Africa. This implies
that the causality runs from economic growth to financial development and shows that economic growth
drives financial development in South Africa. Odhiambo (2005) applied the same methodology to
Tanzania and the results show that there is bi-directional causality between financial development and
economic growth, although the supply-leading hypothesis dominates. Abu-Bader and Abu-Qarn (2005) in
an attempt to examine the relationship between financial development and economic growth in Egypt,
analyzed time series annual data from 1960 to 2001 using VAR methodology on four variables namely:
Gross Domestic Product to measure economic growth and ratio of money stock to nominal
GDP, ratio of bank credit to the private sector to nominal GDP, ratio of credit issued to non -financial
private firms to total domestic credit, representing proxies for financial development. Their findings
show that the rise in private investment was facilitated by the financial liberalization in 1990 which led to
the rebound in economic performance of Egypt in the 1990s. Their results infer that there is a direct
linkage between financial development and financial liberalization. Seck and El Nil (1993) and Charlier
and Oguie (2002) find a significantly positive relationship between economic growth and the real interest
rate. Another study on financial development and economic growth was conducted by Apergis N.,
Filippidi, I. and Economidou, C. (2007). It employed panel data integration and co-integration for a
dynamic heterogeneous panel of 15 OECD countries over the period 1975 to 2000. The findings reveal
that there is a long-run relationship between financial deepening and economic growth. The causality
between financial development and economic growth is bi-directional.
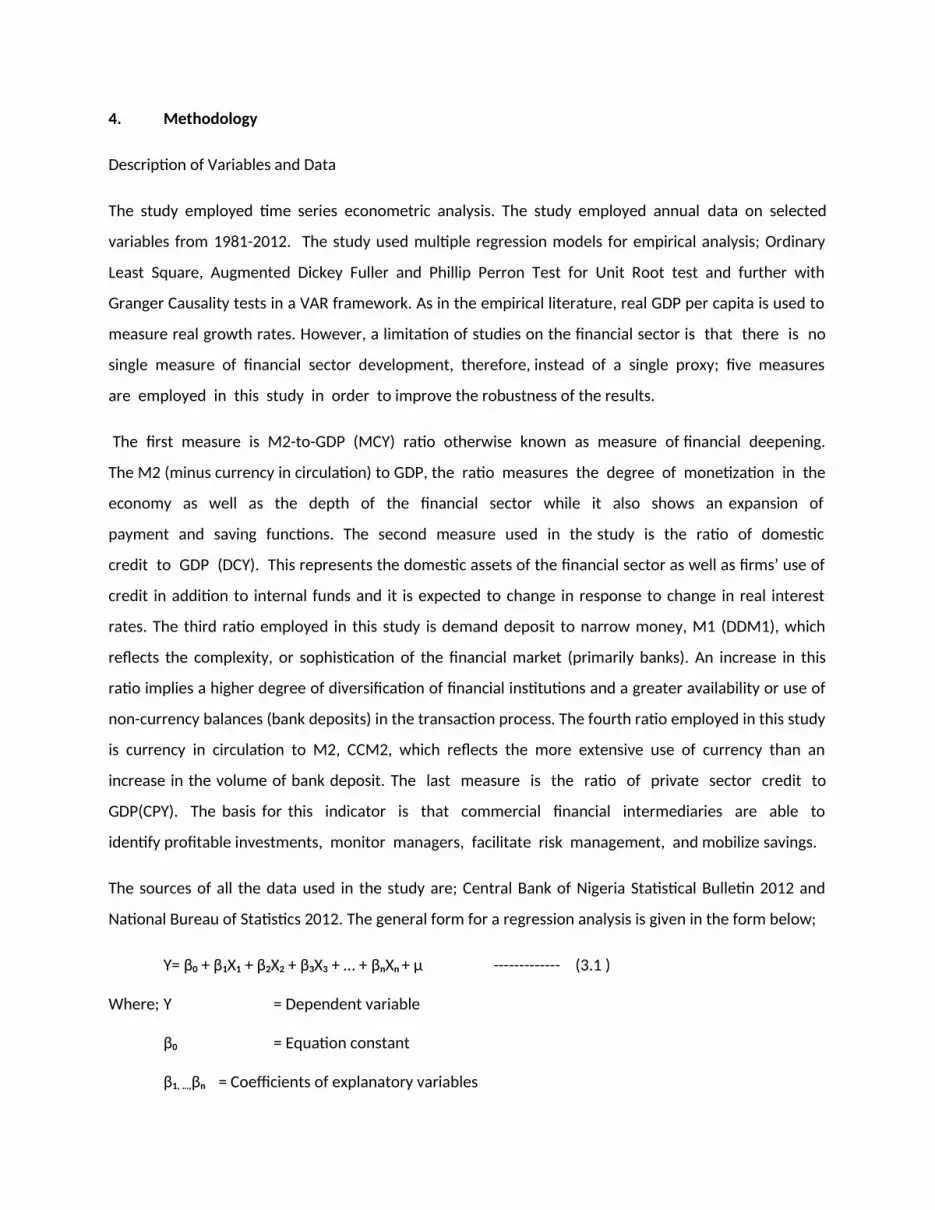
4. Methodology
Description of Variables and Data
The study employed time series econometric analysis. The study employed annual data on selected
variables from 1981-2012. The study used multiple regression models for empirical analysis; Ordinary
Least Square, Augmented Dickey Fuller and Phillip Perron Test for Unit Root test and further with
Granger Causality tests in a VAR framework. As in the empirical literature, real GDP per capita is used to
measure real growth rates. However, a limitation of studies on the financial sector is that there is no
single measure of financial sector development, therefore, instead of a single proxy; five measures
are employed in this study in order to improve the robustness of the results.
The first measure is M2-to-GDP (MCY) ratio otherwise known as measure of financial deepening.
The M2 (minus currency in circulation) to GDP, the ratio measures the degree of monetization in the
economy as well as the depth of the financial sector while it also shows an expansion of
payment and saving functions. The second measure used in the study is the ratio of domestic
credit to GDP (DCY). This represents the domestic assets of the financial sector as well as firms’ use of
credit in addition to internal funds and it is expected to change in response to change in real interest
rates. The third ratio employed in this study is demand deposit to narrow money, M1 (DDM1), which
reflects the complexity, or sophistication of the financial market (primarily banks). An increase in this
ratio implies a higher degree of diversification of financial institutions and a greater availability or use of
non-currency balances (bank deposits) in the transaction process. The fourth ratio employed in this study
is currency in circulation to M2, CCM2, which reflects the more extensive use of currency than an
increase in the volume of bank deposit. The last measure is the ratio of private sector credit to
GDP(CPY). The basis for this indicator is that commercial financial intermediaries are able to
identify profitable investments, monitor managers, facilitate risk management, and mobilize savings.
The sources of all the data used in the study are; Central Bank of Nigeria Statistical Bulletin 2012 and
National Bureau of Statistics 2012. The general form for a regression analysis is given in the form below;
Y= β0 + β1X1 + β2X2 + β3X3 + … + βnXn + μ ------------- (3.1 )
Where; Y = Dependent variable
β0 = Equation constant
β1, …,βn = Coefficients of explanatory variables

X1,…, Xn = Independent or explanatory variables
μ = Error term
5. Empirical Results
Result from Ordinary Least Square (OLS)
Y= β0 + CPYβ1+ CCMβ2+ DDMβ3 + DCYβ4 + M2Yβ5 + μ ----------- (3.2)
Dependent Variable: GDPGRMethod: Least Squares
Sample (adjusted): 1982 2012
Included observations: 31 after adjustments
Variable Coefficient Std. Error t-Statistic Prob.
DDM1 -0.883225 1.969585 -0.448432 0.6577
DCY -0.382476 0.893770 -0.427936 0.6724
CPY 1.128879 1.648992 0.684587 0.4999
CCM2 -0.779471 2.160052 -0.360857 0.7212
M2Y -1.402472 2.069534 -0.677675 0.5042
C 1.177338 1.639049 0.718305 0.4792
R-squared 0.137265 Mean dependent var 0.232514
Adjusted R-squared -0.035282 S.D. dependent var 0.221630
S.E. of regression 0.225506 Akaike info criterion 0.031049
Sum squared resid 1.271328 Schwarz criterion 0.308594
Log likelihood 5.518748 Hannan-Quinn criter. 0.121522
F-statistic 0.795523 Durbin-Watson stat 1.711038
Prob(F-statistic) 0.563164
Y= 1.177 + 1.129CPY - 0.779CCM – 0.883DDM - 0.382DCY – 1.402M2Y + μ ------- (3.3)
From the result/analysis, CPY also called credit to private sector/GDP, had a positive non-significant
impact on gross domestic product growth rate in Nigeria (t=0.684, coefficient of CPY= 1.129). This ratio
indicates that the financial sector impact positively as expected to induce economic growth. CCM, also
called Currency in circulation/Broad Money, had a negative non-significant impact on gross domestic

product growth rate in Nigeria (t=0.360, coefficient of CCM = -0.779). This ratio signifies that more
extensive use of currency did not impact positively on economic growth in Nigeria. DDM, also money
stock diversification, had a negative non-significant impact on the gross domestic product growth rate in
Nigeria (t-0.448, coefficient of DDM = -0.883). This ratio implies that the Nigerian economy is not
sophisticated enough to increase the degree of diversification of financial institutions which will provide
greater use of non-currency balances in its arrangement. DCY, also called domestic credit/GDP, had a
negative non-significant impact on gross domestic product growth rate in Nigeria (t=0.427, coefficient of
DCY=-0.382). This implies the extent to which societies and firms’ credit allocated by the financial
institution, to induce domestic investment had not shown expected impact on the economic growth.
However, broad money (excluding currency in circulation) to GDP, also called M2Y, had a negative non-
significant impact on economic growth (t=0.677, coefficient of M2Y= -1.402). This ratio implies that an
expansion of the financial sector had not impacted positively on the economy. The coefficient of the
constant parameter (B0) is 1.177. This implies that if all the explanatory variables are constant, GDP
which is the explained variable will increase by 1.18 units.
It is almost a convention in time series analyisis, after the Ordinary Least Square result to verify the order
of integration for each series to avoid the problem of spurious regression. The enquiry into stationary
property of each variable is conducted using Augmented Dickey Fuller (ADF) and Phillip-Perron (PP) test
procedures. The Phillip-Perron test method which computes a residual variance that is robust to auto-
correlation is employed as alternative to the ADF. The decision rule is that ADF test statistics must be
greater than Mckinnon critical value at 5% ( or 10%) and at absolute term, i.e ignoring the negative value
of both the ADF test statistics and Mckinnon critical value, before the variable is adjudged to be
stationary, otherwise we accept the null hypothesis (H0) that data is non-stationary and reject the
alternate hypothesis (H1) that data is stationary. The results will be presented as follows:
Results from Unit Root Test
Augmented Dickey-Fuller and Phillip Perron Unit Root Test TableVariables Augmented Dickey-Fuller
(ADF)TestLevel First Diff
Phillip Perron (PP) Test Level First Diff
Decision Rule for ADF
Decision Rule for PP
CCM2 -2.31 -1.44 -0.49 -3.34 I(2) I (1)CPY -1.69 -5.11 -0.78 -3.98 I (1) I (1)DCY -2.04 -4.84 -2.10 -5.69 I (1) I (1)DDM1 -0.38 -4.14 -0.19 -4.16 I (1) I (1)M2Y -0.64 -4.32 -0.76 -4.19 I (1) I (1)Critical 5% and 10%

Values are -2.69 and -3.69
Source: Author’s Computation
With the results of the above unit root tests suggesting that all the variables are stationary of the order
I(1) using PP test, we move a step further to employ the Johansen procedures to test for co-integration
among the variables. The Johansen methodology is a generalization of the Dickey-Fuller test. Two
likelihood ratio test (trace and eigen value) were used to test the hypothesis regarding the number of co-
integrating vectors. The result of the co-integration test will be presented as follows;
Results from Co-Integration
Co-integration Test Table (Trace and Maximum Eigenvalue)
Eigen value Likelihood ratio
5% critical value
Max –Eigen value
5% critical value Hypothesized no of CE(s)
0.816 109.97 95.75 50.86 40.07 Co-integ
0.582 59.11 69.82 26.18 33.88 Nt co-integ
0.439 32.92 47.85 17.36 27.58 Nt co-integ
0.251 15.55 29.79 8.69 21.13 Nt co-integ
0.205 6.87 15.49 6.87 14.26 Nt co-integ
1.92E-06 5.75E-05 3.84 5.75E-05 3.84 Nt co-integ
Source: Author’s computation
Given the Johansen co-integration procedures, the trace statistics (likelihood ratio) show that there is
one co-integrating vector among the five proxies for financial liberalization variables at the 5% level. The
maximum eigen-value shows that there is one co-integrating vector at the 5% level; this is in consonance
when each of the variables is co-integrated with GDP individually.
The economic interpretation of these statistical tests revealed that there is one co-integrating vector,
DCY and GDP, and this is only significant at the 5% level which is indicative of a weaker association. In
this regard, it is infer that there was no stable long run relationship between financial liberalization and
economic growth in Nigeria. The study also employed Vector AutoRegression (VAR) method to find out

the adjustment in the variables when affected by shocks and as well to capture the co-movement of the
variables that cannot be detected in the model. VAR model advocates using of granger causality test,
variance decomposition and impulse response functions. The result of the causality test will be
presented as follows;
Results from Granger Causality Test
Pairwise Granger Causality TestsSample: 1981-2012Lags:2
Null Hypothesis: Obs F-Statistic Prob.
CCM2 does not Granger Cause GDPGR 30 7.62731 0.0026 GDPGR does not Granger Cause CCM2 1.08504 0.3533
CPY does not Granger Cause GDPGR 30 0.12528 0.8828 GDPGR does not Granger Cause CPY 0.21553 0.8076
DCY does not Granger Cause GDPGR 30 2.49687 0.1027 GDPGR does not Granger Cause DCY 0.10769 0.8983
DDM1 does not Granger Cause GDPGR 30 7.98961 0.0021 GDPGR does not Granger Cause DDM1 0.50209 0.6112
M2Y does not Granger Cause GDPGR 30 0.12317 0.8846 GDPGR does not Granger Cause M2Y 0.25924 0.7737
CPY does not Granger Cause CCM2 30 0.74354 0.4857 CCM2 does not Granger Cause CPY 2.66632 0.0892
DCY does not Granger Cause CCM2 30 0.01360 0.9865 CCM2 does not Granger Cause DCY 2.34791 0.1163
DDM1 does not Granger Cause CCM2 30 2.18626 0.1333 CCM2 does not Granger Cause DDM1 1.02264 0.3742
M2Y does not Granger Cause CCM2 30 0.96529 0.3946 CCM2 does not Granger Cause M2Y 5.07753 0.0141
DCY does not Granger Cause CPY 30 3.24866 0.0557 CPY does not Granger Cause DCY 1.34576 0.2786
DDM1 does not Granger Cause CPY 30 6.14906 0.0067 CPY does not Granger Cause DDM1 0.42277 0.6598
M2Y does not Granger Cause CPY 30 0.95333 0.3990 CPY does not Granger Cause M2Y 0.06632 0.9360

DDM1 does not Granger Cause DCY 30 2.35480 0.1156 DCY does not Granger Cause DDM1 0.23177 0.7948
M2Y does not Granger Cause DCY 30 1.75378 0.1938 DCY does not Granger Cause M2Y 8.11743 0.0019
M2Y does not Granger Cause DDM1 30 0.33620 0.7177 DDM1 does not Granger Cause M2Y 11.3358 0.0003
From the table, the results of the selected variables of financial liberalization and economic growth are
tested for bi-directional relationship, as well short run relationship using granger causality test. The test
showed CPY, CCM2, DDM1, M2Y, and DCY as financial liberalization variables and gross domestic product
as economic growth. The results suggest that CPY, CCM2 and DDM1 granger-cause gross domestic
product. In addition, gross domestic product granger-cause CCM2.
More so, there is a bi-directional causality among CPY to CCM2, DDM1 to CCM2, M2Y to CCM2, DCY to
CPY, DDM1 to CPY, M2Y to DCY which suggest that variables granger-cause each other.
The result on domestic credit is in tandem with findings in some developing economies. In China, for
instance, Jean-Claude (2006) shows evidence of causality from domestic credit to economic growth
which was predicated on the fact that large share of the state budget and direct credit in China
constitute some of the official development tools used by the Chinese authorities. The result revealed
that the various measures of financial sector development have impact on economic growth contrary to
most of the earlier studies on Nigeria. In view of this finding, the development of the financial sector is
very critical to overall economic growth. Nevertheless, the bi-directional causality on domestic credit and
credit to private sector, demand deposit to credit to private sector implies that both demand-led and
supply-led hypotheses hold in Nigeria, supporting the finding of Agu and Chukwu (2008).
Results from Variance Decomposition (see Appendix 1)
The results of variance decomposition of the model over a 10-period horizon are presented in the table
above. The variance decomposition apportions the total fluctuations in a particular variable to the
constituent innovations in the system. The results show that the variables are largely driven by
themselves, except DDM1, M2Y and DCY. The contribution of CCM2 to the variation in output growth
became significant from the second period when it reaches 31 per cent. The CPY contributes about 2
percent to the innovations in output growth by second period which increases to 11 percent in the tenth

period. The contribution of other variables is insignificant except M2Y which became significant with 7
percent in the sixth to the tenth period. Thus, the principal drivers of output growth are itself and CCM2.
The variance of CCM2 is driven primarily by itself in the first period, contributing 98.7 percent to the total
variations. The contribution of CPY and DCY became noticeable in the fourth and eighth period
respectively with 19.4 percent and 10.5 percent. Thus, the principal driver of CCM2 is itself with 51 per
cent in the ninth period.
The variance of CPY is driven primarily by itself and other variable, CCM2 and GDP, became noticeable
and significant in the fifth period till it reaches tenth period.
The variance of DCY is driven primarily by output growth, and other variables, GDP and CPY, became
noticeable and significant in the fifth period to the tenth period. Thus, the principal drivers of DCY are
itself, CPY and GDP.
The variance of DDM1 is driven primarily by CCM2 and other variables, DDM1,CPY and GDPGR became
significant in the first period, second period and fourth period respectively. Thus, by tenth period the
principal drivers of DDM1 are CCM2, GDP, CPY and DCY respectively.
The variance of M2Y is driven primarily by CPY, GDP and itself. By second period, CCM2 became
significant with 30.4 per cent, rises to 32.9 per cent by the end of the tenth period. The contribution of
CCM2, GDP and CPY to the variation in the M2Y became significant in the second period, with 30
percent,14per cent and 27 per cent till it reaches the end of tenth period.
In summary, the variance decomposition shows that the significant variation for each variable is due to
its own variation, except DCY, DDM1 and M2Y. The result of variance decomposition analysis confirmed
that CCM2 contributed in the total variation of itself, GDP and other variables significantly suggesting
that a specific shock in CCM2 have a significant impact in forecasting other variable and output growth.
Results from Impulse Response Function (see appendix 2)
From the table, the result of the impulse response function which traced the responses of the system
variables to one standard deviation shocks to the system innovations spanning over the five (5) periods.
The result showed that each variable responded significantly to its own one standard deviation shock.

Meanwhile, the results revealed output growth responded to shocks in CCM2, DCY and DDM1. This
means that a one standard deviation to CCM2, DCY and DDM1 would commence a moderate shock in
output growth from the second period and that it would rise till the end of the tenth period. This
denotes that rise in output growth is driven by CCM2, DCY and DDM1 which necessitates the increase in
currency in circulation i.e. growth in working capital, from the domestic savers’ deposits.
Therefore, it could be observed from the impulse response function that rise in output growth is
primarily driven by CCM2, DCY and DDM1 even though not significant. This has implication for
policymakers and the government to direct financial intermediation to real sectors of the economy
which is source drivers of growth.
6. Summary, Policy Implication and Conclusion
Financial markets have an important role in economics. Development in financial system means
improving functions, policies and evaluation which takes part in the financial system. Development in
financial sector can be achieved through financial liberalization, more generally, to develop and promote
the role of financial markets in financing the economy as well as strengthening the functioning of
financial system.
The results of testing the banking sector liberalization impact on sustainability of economic growth in
Nigeria. The findings show that there was a positive impact of credit to the private sector while other
banking sector liberalization variables that signify the greater use of non-currency balances/bank deposit
(DDM1), societies’ and firms’ credit allocated by the financial institution (DCY), extensive use of currency
(CCM2), and broad money velocity (M2Y) had a negative impact on the gross domestic product growth
rate in Nigeria, even though insignificant.
In view of this, the study of financial liberalization indicators on sustainability of economic growth in
Nigeria for the period of 1981 – 2012 employed granger causality through Vector Auto Regression
method, found that there is no stable long run relationship between the banking sector liberalization and
economic growth in Nigeria. Unlike most of the earlier studies, the major empirical results show that
financial liberalization does not have any influence on Nigeria’s economic growth. The VAR results
indicate that changes in currency in circulation and domestic credit impact on economic growth while
output also influences currency in circulation and domestic credit, that is, there is bi-directional causality
between domestic credit and economic growth and currency in circulation and economic growth. In view
of this findings emanating from this study while desired impacts are yet to be achieved, government

policies direction should focus on how currency in circulation, which is granger-cause by demand
deposit, domestic credit and credit to private sector, will be monitored and directed to the real sector to
improve the gross domestic product growth rate of the economy.
The long run responses of the system variables to one standard deviation shocks show that a one
standard deviation shock to currency in circulation, domestic credit and demand deposit would leads to
a significant positive response in output from the second quarter and the increases would be sustained
up to the tenth quarter horizon. The fact that the growth in the currency in circulation positively
influences demand deposit has major implications.
Finally, to fully realize the growth potentials of the Nigerian economy it is necessary to remove all
obstacle that could undermine the growth of credit to the domestic economy and adopt more stringent
penalties related to unsafe insider and related party lending as well stating limit on government
borrowings that does not improve investment in real sectors of the domestic economy. Nigeria’s target
growth rate can be realized if needs to create a stable political and economic climate conducive to
investment is monitored.
While this analysis is specific to Nigeria and the recommendation are tailored towards it, these following
recommendations proffer possible solutions: considerations should be given to stating limits on
government borrowings from the Central Bank of Nigeria (or other banks) in absolute cash amounts or as
percentages of past revenues that is not directed to investment in real sectors of the economy and the
Central Bank of Nigeria should firmly exercise its newly gained autonomy and enforce the agreed limits
on government borrowing in order to restore the pivotal roles of the banking sector; strengthening of
institutional regulatory framework and capacity as well as maintaining effective coordination of various
regulatory efforts; and making efforts in evaluation of banking sector development is directed to the real
sector of the economy which serves as a source drivers of growth as well adopting more stringent
limitations and penalties related to unsafe insider and related party lending.
REFERENCES
Abu-Bader, S. and Abu-Qarn, S.A. (2005), “Financial Development and Economic Growth: Time Series Evidence from Egypt”, Discussion Paper No. 05-14, Monaster Centre for Economic Research, Ben-Gurion, University of the Negev
Agu, C.C. and J.O. Chukwu (2008) “Toda and Yamamoto causality tests between “bank based” Financial deepening and economic growth in Nigeria”, European Journal of SocialScience, 7(2), pp. 189-98.

Allen, D.S. and Ndikumana, L (2000) Financial Intermediation and Economic Growth in Southern Africa, Journal of African Economies, Vol.9, No.2, pp.132-160
Apergis, N., I., Filippidis and C. Economidou (2007) ‘Financial deepening and economic growth linkages: A panel data analysis’, Review of World Economics, 143, 179-198.
Aziakpono, M.J. (2004) Financial Development and Economic Growth in Southern Africa, Paper presented at the CSAE Conference 2004.
Bhatia, R.J. and Khatkhate, D.R. (1975) Financial Intermediation, Savings Mobilization, and Entrepreneurial Development: The African Experience, IMF Staff Papers, vol.22, issue1, pp.132-158.
Calderon, C. and Liu, L. (2003), ‘The direction of causality between financial development and economic growth’, Journal of Development Economics, 72(1), 321-334.
Central Bank of Nigeria Bullion Various Issues.
Charlier, F. and Oguie, C.N. (2002) The Impact of Interest Rate Liberalization: Empirical Evidence from Sub-Saharan Africa, Savings and Development, Vol.26, no.4, pp.355-379.
Choe, C. and Moosa, I.A. (1999): “Financial System and Economic Growth: The Korean Experience”, World Development, 27(6), pp. 1069-1082.
Darrat A.F. (1999), “Are Financial Deepening and Economic Growth Causally Related? Another look at the Evidence”, International Economic Journal 19, Volume 13, Number 319-35
Fowowe, B. (2008) Financial liberalization policies and economic growth: Panel data evidence from sub-Saharan Africa, [Online], Available: http:/www.africametrics.org/documents/conference08/day2/.../fowowe.pdf
Ghali, K.H. (1999): “Financial Development and Economic Growth: The Tunisian experience”, Review of Development Economics, 3(3), pp. 310-322.
Gibson, H.D. and Tsakalatos, E. (1994) The Scope and Limits of Financial Liberalisation in Developing Countries: A Critical Survey, Journal of Development Studies, vol.30, no.3, April, pp.578-628.
Jean-Claude Maswana (2006). “An Empirical investigation around the Finance- Growth Puzzle in Chinawith a particular focus on Causality and efficiency Considerations”, MPRA Paper No. 897, posted 22.
Kasekende, L.A. and Atingi-Ego, M. (2003), “Financial Liberalization and Its Implication for the Domestic Financial System: The Case of Uganda”, Research Paper 128, African Economic Research Consortium, Nairobi
King, R.G. and Levine, R. (1993a), "Finance and Growth: Schumpeter Might Be Right", Quarterly Journal of Economics, VIII, pp. 717-737.

King, R. G. and Levine, R. (1993b) ‘Finance, entrepreneurship, and growth: Theory and
evidence”, Journal of Monetary Economics, 32, 513-542.
Levine, R., Loayza, N., and Beck, T., 2000, “Financial Intermediation and Growth:Causality and Causes”, Journal of Monetary Economics, Vol. 46, No. 1, pp. 31-77.
Luintel, K.B. and Khan, M. (1999): “A Quantitative Reassessment of the Finance-Growth Nexus: Evidence from a Multivariate VAR”, Journal of Development Economics, 60, pp. 381- 405.
McKinnon, R.I. (1973): Money and Capital in Economic Development, Washington D.C. Brookings Institution.
Odeniran, S. and E. Udeaja (2010), Financial Sector Development and Economic Growth: Empirical Evidence from Nigeria, CBN Economic and Financial Review, Vol. 48 (3)
Odhiambo, N.M. (2005): “Financial Development and Economic Growth in Tanzania: A Dynamic Causality Test”, African Finance Journal, 7(1), pp. 1-17.
Ogun, O.D. (1986) A Note on Financial Deepening and Economic Growth: Evidence from Africa, Nigerian Journal of Economic and Social Studies, Vol.28, no.2, pp.275-283
Oshikoya, T.W. (1992) Interest Rate Liberalization, Savings, Investment and Growth: the Case of Kenya, Savings and Development, Vol.16, No.3, pp.305-320.
Seck, D. and El Nil, Y.H. (1993) Financial Liberalization in Africa, World Development, Vol.21, No.11, pp.1867-1881.
Shaw E, (1973), Financial Deepening in Economic Development, New York: Oxford University Press.
Suleimon L.A, Oke M.O, Azeez B. A (2012): Effect of Financial Liberalisation on Economic Growth in Developing Countries: The Nigerian Experience, International Journal of Economics and Management Sciences, Vol. 1, No. 12, 2012, pp. 16-28

Appendix 1: The Full Estimated VAR results
Vector Autoregression EstimatesSample (adjusted): 1983-2012Included Observations: 30 after adjustmentsStandard errors in ( ) & t-statistics in [ ]
GDPGR CCM2 CPY DCY DDM1 M2Y
GDPGR(-1) 0.161867 0.037516 0.091652 -0.021476 -0.035100 0.049925 (0.29832) (0.03299) (0.05127) (0.10608) (0.05420) (0.04760)[ 0.54259] [ 1.13726] [ 1.78771] [-0.20244] [-0.64755] [ 1.04895]
GDPGR(-2) -0.097490 0.016619 0.014011 0.020659 0.003810 -0.012664 (0.20719) (0.02291) (0.03561) (0.07368) (0.03765) (0.03306)[-0.47052] [ 0.72538] [ 0.39349] [ 0.28040] [ 0.10121] [-0.38310]
CCM2(-1) 4.644952 1.054016 -0.239388 -0.131495 -0.989044 -0.315527 (3.95976) (0.43787) (0.68050) (1.40810) (0.71947) (0.63176)[ 1.17304] [ 2.40715] [-0.35178] [-0.09338] [-1.37468] [-0.49944]
CCM2(-2) -3.688096 -0.442138 0.333745 -0.181008 0.808132 0.297835 (3.10811) (0.34369) (0.53414) (1.10525) (0.56473) (0.49588)[-1.18660] [-1.28643] [ 0.62482] [-0.16377] [ 1.43100] [ 0.60062]
CPY(-1) -2.093609 0.203794 0.478603 -0.124440 -0.809945 -0.105134 (3.28874) (0.36367) (0.56519) (1.16948) (0.59755) (0.52470)[-0.63660] [ 0.56038] [ 0.84681] [-0.10641] [-1.35544] [-0.20037]
CPY(-2) 0.704006 0.043309 0.522030 -0.442910 0.424260 0.066081 (3.00146) (0.33190) (0.51582) (1.06733) (0.54535) (0.47887)[ 0.23455] [ 0.13049] [ 1.01205] [-0.41497] [ 0.77795] [ 0.13799]
DCY(-1) -0.447432 0.121466 0.141460 0.764453 -0.337076 -0.001134 (1.30843) (0.14469) (0.22486) (0.46528) (0.23774) (0.20875)[-0.34196] [ 0.83951] [ 0.62910] [ 1.64299] [-1.41785] [-0.00543]
DCY(-2) 1.279067 -0.084260 -0.198184 -0.344502 -0.017622 -0.227469 (1.43888) (0.15911) (0.24728) (0.51167) (0.26144) (0.22957)[ 0.88893] [-0.52957] [-0.80146] [-0.67329] [-0.06740] [-0.99087]
DDM1(-1) -2.195292 -0.099621 0.376359 0.173307 0.448053 0.371871 (2.53955) (0.28082) (0.43643) (0.90307) (0.46143) (0.40517)[-0.86444] [-0.35475] [ 0.86235] [ 0.19191] [ 0.97102] [ 0.91781]
DDM1(-2) 1.727907 -0.074404 0.061929 -0.233525 -0.025355 -0.039518

(2.19101) (0.24228) (0.37653) (0.77913) (0.39810) (0.34956)[ 0.78864] [-0.30710] [ 0.16447] [-0.29973] [-0.06369] [-0.11305]
M2Y(-1) 5.110224 -0.131320 0.401639 0.014942 0.802208 0.814722 (3.21068) (0.35504) (0.55177) (1.14173) (0.58337) (0.51225)[ 1.59163] [-0.36988] [ 0.72791] [ 0.01309] [ 1.37513] [ 1.59049]
M2Y(-2) -2.556951 -0.236219 -0.760058 0.637209 0.312922 -0.207034 (4.04392) (0.44718) (0.69497) (1.43803) (0.73477) (0.64519)[-0.63229] [-0.52825] [-1.09366] [ 0.44311] [ 0.42588] [-0.32089]
C -0.186052 0.220234 -0.230454 0.167530 0.308698 -0.081067 (1.95104) (0.21575) (0.33530) (0.69379) (0.35450) (0.31128)[-0.09536] [ 1.02080] [-0.68732] [ 0.24147] [ 0.87081] [-0.26043]
R-squared 0.583115 0.957475 0.920528 0.584205 0.945283 0.925248 Adj. R-squared 0.288843 0.927458 0.864431 0.290703 0.906659 0.872482 Sum sq. resids 0.603069 0.007374 0.017811 0.076260 0.019909 0.015351 S.E. equation 0.188347 0.020827 0.032368 0.066977 0.034222 0.030050 F-statistic 1.981554 31.89736 16.40942 1.990464 24.47411 17.53492 Log likelihood 16.03567 82.09619 68.86883 47.05389 67.19819 71.09861 Akaike AIC -0.202378 -4.606413 -3.724588 -2.270259 -3.613212 -3.873241 Schwarz SC 0.404808 -3.999227 -3.117403 -1.663074 -3.006027 -3.266055 Mean dependent 0.237901 0.242332 0.136456 0.189430 0.623336 0.204715 S.D. dependent 0.223345 0.077329 0.087910 0.079526 0.112013 0.084150
Determinant resid covariance (dof adj.) 5.94E-19 Determinant resid covariance 1.97E-20 Log likelihood 425.2185 Akaike information criterion -23.14790 Schwarz criterion -19.50479
Variance Decomposition of GDPGR
Period S.E. GDPGR CCM2 CPY DCY DDM1 M2Y
1 0.188347 100.0000 0.000000 0.000000 0.000000 0.000000 0.000000 2 0.252639 57.14606 31.21037 2.119638 0.171026 0.680457 8.672452 3 0.279747 49.85856 27.74157 10.83243 3.522737 0.804671 7.240037 4 0.281758 49.18114 27.86454 10.79305 4.210702 0.795775 7.154795 5 0.286126 48.40229 27.09807 11.90091 4.331491 1.125801 7.141436 6 0.287267 48.31693 26.93761 12.01964 4.298142 1.320715 7.106964 7 0.289597 48.59470 26.51206 11.85120 4.420434 1.338498 7.283100 8 0.292093 48.97179 26.06221 11.83375 4.510695 1.347321 7.274238 9 0.293967 49.28665 25.73745 11.89008 4.515949 1.363612 7.206264
10 0.295545 49.57247 25.46585 11.94658 4.507225 1.368079 7.139798
Variance Decomposition of CCM2
Period S.E. GDPGR CCM2 CPY DCY DDM1 M2Y
1 0.020827 1.261915 98.73808 0.000000 0.000000 0.000000 0.000000 2 0.033128 1.237423 92.26112 4.879937 0.863287 0.425169 0.333069 3 0.044020 0.717597 85.87322 9.139821 1.436553 1.748456 1.084356 4 0.054917 0.462137 79.62366 12.75543 2.108347 2.890709 2.159716

5 0.065377 0.629666 72.81547 15.86143 3.463489 3.437912 3.792034 6 0.074845 1.400818 66.47658 17.70445 5.101843 3.780455 5.535849 7 0.083083 2.823677 60.83649 18.75461 6.690908 4.056251 6.838067 8 0.089989 4.875056 55.83740 19.34639 8.197211 4.220347 7.523593 9 0.095290 7.255034 51.75757 19.43345 9.526969 4.280850 7.746130
10 0.098845 9.608402 48.80810 19.04347 10.54264 4.290684 7.706713
Variance Decomposition of CPY
Period S.E. GDPGR CCM2 CPY DCY DDM1 M2Y
1 0.032368 15.44605 17.63458 66.91937 0.000000 0.000000 0.000000 2 0.047617 7.328337 32.20427 54.77255 1.472659 2.714169 1.508015 3 0.057132 13.95673 38.04226 38.99557 1.575810 4.322017 3.107606 4 0.067343 18.46452 39.80375 28.15423 3.191095 5.265833 5.120568 5 0.078243 21.00125 41.56243 21.30520 4.578497 5.838978 5.713638 6 0.088727 22.60863 42.10925 17.45072 5.897104 6.054954 5.879339 7 0.098098 23.79501 42.05700 15.06572 7.062005 6.160935 5.859334 8 0.105949 24.86151 41.67557 13.37872 7.936614 6.281409 5.866177 9 0.112455 26.08160 40.99826 12.06114 8.587967 6.408788 5.862240
10 0.117860 27.49580 40.05738 11.01339 9.062112 6.520299 5.851023
Variance Decomposition of DCY
Period S.E. GDPGR CCM2 CPY DCY DDM1 M2Y
1 0.066977 53.67551 2.820120 23.85331 19.65106 0.000000 0.000000 2 0.083258 55.87105 1.927113 21.93476 20.13273 0.133673 0.000683 3 0.085224 55.04142 2.537837 20.96301 20.00637 0.189544 1.261811 4 0.088560 51.09422 4.009927 22.26334 18.85828 0.196781 3.577456 5 0.093443 46.12937 5.773271 24.84894 17.82055 0.292120 5.135752 6 0.099102 41.32408 7.476814 28.52709 16.95053 0.437589 5.283901 7 0.104426 37.49212 8.284256 32.17000 16.53016 0.481999 5.041464 8 0.107743 35.31843 8.432786 34.38162 16.53035 0.478525 4.858290 9 0.109101 34.45083 8.308210 35.33942 16.63653 0.472163 4.792847
10 0.109529 34.18249 8.291987 35.58761 16.70119 0.468488 4.768236
Variance Decomposition of DDM1
Period S.E. GDPGR CCM2 CPY DCY DDM1 M2Y
1 0.034222 7.473154 65.32738 1.691723 0.023301 25.48445 0.000000 2 0.055185 9.580510 58.30232 12.78914 1.481441 13.36746 4.479134 3 0.071513 8.834158 56.50303 13.66751 5.373309 9.244726 6.377270 4 0.085004 7.526274 56.57674 12.73082 6.121503 8.414962 8.629701 5 0.098774 8.463395 54.37374 13.38071 7.107736 7.974125 8.700295 6 0.111675 10.37038 50.07345 14.74002 8.659058 7.391925 8.765162 7 0.121861 12.47274 46.67853 15.04896 10.09546 7.020175 8.684137

8 0.128939 14.50443 44.16161 14.71859 11.12830 6.868134 8.618932 9 0.133716 16.62365 42.17702 14.09530 11.85082 6.804077 8.449137
10 0.136916 18.68494 40.56930 13.46912 12.27566 6.751402 8.249576
Variance Decomposition of M2Y
Period S.E. GDPGR CCM2 CPY DCY DDM1 M2Y
1 0.030050 26.66115 6.495433 39.96852 2.163229 1.237950 23.47373 2 0.041637 14.21113 30.39267 27.79916 1.782922 5.472298 20.34183 3 0.054535 17.40880 34.27749 19.96647 3.453329 5.774523 19.11939 4 0.069626 19.77037 33.97249 19.02976 6.952994 5.125889 15.14849 5 0.081825 19.98399 34.10096 19.32591 8.843838 4.878275 12.86703 6 0.090837 20.13008 34.22165 19.40211 10.12777 4.817342 11.30105 7 0.096806 20.49505 34.02446 19.04803 11.05938 4.862159 10.51092 8 0.100548 21.26976 33.62485 18.30219 11.72108 4.964588 10.11753 9 0.102936 22.35731 32.97883 17.53386 12.12964 5.072214 9.928142
10 0.104716 23.66059 32.15913 16.97376 12.31111 5.139659 9.755759
Cholesky Ordering: GDPGR, CCM2, CPY, DCY, DDM1, M2Y
Appendix 2: The Impulse Response Function

-.2
-.1
.0
.1
.2
.3
1 2 3 4 5
Response of GDPGR to GDPGR
-.2
-.1
.0
.1
.2
.3
1 2 3 4 5
Response of GDPGR to CCM2
-.2
-.1
.0
.1
.2
.3
1 2 3 4 5
Response of GDPGR to CPY
-.2
-.1
.0
.1
.2
.3
1 2 3 4 5
Response of GDPGR to DCY
-.2
-.1
.0
.1
.2
.3
1 2 3 4 5
Response of GDPGR to DDM1
-.2
-.1
.0
.1
.2
.3
1 2 3 4 5
Response of GDPGR to M2Y
-.04
.00
.04
.08
1 2 3 4 5
Response of CCM2 to GDPGR
-.04
.00
.04
.08
1 2 3 4 5
Response of CCM2 to CCM2
-.04
.00
.04
.08
1 2 3 4 5
Response of CCM2 to CPY
-.04
.00
.04
.08
1 2 3 4 5
Response of CCM2 to DCY
-.04
.00
.04
.08
1 2 3 4 5
Response of CCM2 to DDM1
-.04
.00
.04
.08
1 2 3 4 5
Response of CCM2 to M2Y
-.08
-.04
.00
.04
.08
1 2 3 4 5
Response of CPY to GDPGR
-.08
-.04
.00
.04
.08
1 2 3 4 5
Response of CPY to CCM2
-.08
-.04
.00
.04
.08
1 2 3 4 5
Response of CPY to CPY
-.08
-.04
.00
.04
.08
1 2 3 4 5
Response of CPY to DCY
-.08
-.04
.00
.04
.08
1 2 3 4 5
Response of CPY to DDM1
-.08
-.04
.00
.04
.08
1 2 3 4 5
Response of CPY to M2Y
-.08
-.04
.00
.04
.08
1 2 3 4 5
Response of DCY to GDPGR
-.08
-.04
.00
.04
.08
1 2 3 4 5
Response of DCY to CCM2
-.08
-.04
.00
.04
.08
1 2 3 4 5
Response of DCY to CPY
-.08
-.04
.00
.04
.08
1 2 3 4 5
Response of DCY to DCY
-.08
-.04
.00
.04
.08
1 2 3 4 5
Response of DCY to DDM1
-.08
-.04
.00
.04
.08
1 2 3 4 5
Response of DCY to M2Y
-.08
-.04
.00
.04
.08
1 2 3 4 5
Response of DDM1 to GDPGR
-.08
-.04
.00
.04
.08
1 2 3 4 5
Response of DDM1 to CCM2
-.08
-.04
.00
.04
.08
1 2 3 4 5
Response of DDM1 to CPY
-.08
-.04
.00
.04
.08
1 2 3 4 5
Response of DDM1 to DCY
-.08
-.04
.00
.04
.08
1 2 3 4 5
Response of DDM1 to DDM1
-.08
-.04
.00
.04
.08
1 2 3 4 5
Response of DDM1 to M2Y
-.08
-.04
.00
.04
.08
1 2 3 4 5
Response of M2Y to GDPGR
-.08
-.04
.00
.04
.08
1 2 3 4 5
Response of M2Y to CCM2
-.08
-.04
.00
.04
.08
1 2 3 4 5
Response of M2Y to CPY
-.08
-.04
.00
.04
.08
1 2 3 4 5
Response of M2Y to DCY
-.08
-.04
.00
.04
.08
1 2 3 4 5
Response of M2Y to DDM1
-.08
-.04
.00
.04
.08
1 2 3 4 5
Response of M2Y to M2Y
Response to Cholesky One S.D. Innovations ± 2 S.E.
Cholesky Ordering: GDPGR, CCM2, CPY, DCY, DDM1, M2Y


