Embed Size (px)
Citation preview
CPB Document
No 138
December 2006
Liberalisation of European energy markets:
challenges and policy options
CPB, in collaboration with ZEW, Mannheim
2
CPB Netherlands Bureau for Economic Policy Analysis
Van Stolkweg 14
P.O. Box 80510
2508 GM The Hague, the Netherlands
Telephone +31 70 338 33 80
Telefax +31 70 338 33 50
Internet www.cpb.nl
ISBN 90-5833-305-1
3
Abstract in English
The European electricity and gas markets have been going through a process of liberalisation
since the early 1990s. This process has changed the sector from a regulated structure of,
predominantly, publicly owned monopolists controlling the entire supply chain, into a market
where private and public generators and retailers compete on a regulated and unbundled system
of transport infrastructure. This report assesses the evidence of the effects of liberalisation on
efficiency, security of energy supply and environmental sustainability.
Key words: Liberalisation, energy, efficiency, security of supply, environmental policy
JEL code: L5, L94, L95, L98, Q4, Q5
Abstract in Dutch
Het liberaliseringsproces in de Europese elektriciteits- en gasmarkten is begonnen in de jaren
negentig. Door dit proces veranderde de structuur van de sector, die voorheen gedomineerd
werd door gereguleerde staatsmonopolisten die in de hele energieketen actief waren, in een
marktstructuur waarin private en publieke producenten en leveranciers met elkaar concurreren
op een gereguleerd en ontvlecht transportnetwerk. Dit rapport geeft een overzicht van de
literatuur over de effecten van liberalisering op de efficiëntie, leveringszekerheid en
duurzaamheid van de energiesector.
Steekwoorden: Liberalisering, energie, efficiëntie, leveringszekerheid, duurzaamheid
Een uitgebreide Nederlandse samenvatting is beschikbaar via www.cpb.nl.

4
5
Contents
Preface 7
Summary 9
1 Introduction 11
1.1 Liberalising European energy markets 11
1.2 Welfare effects of liberalisation 12
1.3 Scope of the research and the structure of the document 13
2 Reforms in European Energy markets 15
2.1 Introduction 15
2.2 Current situation by industry segment 15
2.2.1 Network access 15
2.2.2 Wholesale markets 16
2.2.3 Retail markets 18
2.3 Conclusions 20
3 Liberalisation and efficiency 23
3.1 Introduction 23
3.2 Performance of energy markets in improving efficiency 24
3.2.1 Productive efficiency 24
3.2.2 Allocative efficiency 28
3.2.3 Dynamic efficiency 31
3.3 Policy options to improve efficiency 34
3.3.1 Introduction 34
3.3.2 Unbundling, merger control, divesture and privatisation 34
3.3.3 Virtual Power Plants, Long-term contracts and site availability 35
3.3.4 Efficient allocation as well extension of transmission capacity 37
3.3.5 Enhancing end-use efficiency 39
3.4 Conclusion 40
4 Liberalisation and security of supply 41
4.1 Introduction 41
4.2 Performance of energy markets in delivering stable and secure supply 42
4.2.1 Volatility of prices 42
4.2.2 Meeting all consumer demand 45
4.2.3 Reliability of networks 48
6
4.3 Performance of energy markets in delivering an efficient level of supply 48
4.4 Policy options 50
4.4.1 Design of balancing markets 50
4.4.2 Price and capacity regulation of wholesale markets 52
4.4.3 Encouraging liquidity of markets 53
4.4.4 Regulation of energy mix and investment in strategic stocks 56
4.4.5 Optimal regulation of grids and system operators 57
5 Liberalisation and environment 59
5.1 Introduction 59
5.2 Effects of liberalisation on environment 59
5.2.1 Electricity consumption 59
5.2.2 Fuel efficiency 60
5.2.3 Mix of generation technologies 60
5.2.4 Voluntary initiatives and environmental regulation 61
5.2.5 Empirical evidence 61
5.2.6 Summary 63
5.3 Effects of the European Emissions Trading Scheme on Competition 64
5.3.1 Introduction 64
5.3.2 Free allocation 65
5.3.3 Allocation rules for new entrants and closures 66
5.3.4 Multi-period nature of allocation (updating) 66
5.3.5 Non-harmonised allocation 67
5.3.6 Hybrid nature of allocation 67
5.3.7 Summary 68
5.4 Macroeconomic costs of environmental regulation in European electricity markets 68
5.4.1 Introduction 68
5.4.2 Theoretical background 68
5.4.3 Macroeconomic effects of European Emissions Trading Scheme (EU ETS) 70
5.4.4 Macroeconomic effects of electricity taxes 71
5.4.5 Macroeconomic effects of promotion of renewable energy sources 73
5.4.6 Summary 74
5.5 Conclusion 75
References 77
7
Preface
The liberalisation process has changed the structure and relationships in the energy industry,
introducing new policy challenges. Given the importance of the energy sector for economic
growth, reforms in the electricity and gas industry remain high on the European policy agenda.
This study analyses the effects of liberalisation on efficiency, security of supply and
environmental sustainability. Insights from the economic literature help us to establish the
major effects of liberalisation and to highlight the policy challenges and options.
The study is an extended version of the document underlying the energy chapter of the
Competitiveness Report 2006, recently published by the European Commission. The project has
been commissioned and financed by the European Commission. Given the broad scope of the
project and the complexity of the issues analysed, it has been done in collaboration with the
German Centre for European Economic Research, ZEW (Zentrum für Europäische
Wirtschaftsforschung, Mannheim, Germany), which provided the opportunity of making the
best use of the expertise of both collaborating parties. CPB focused on the effects of
liberalisation on efficiency and security of supply, while ZEW analysed the environmental
effects.
Within the project team, Machiel Mulder was project leader. He also wrote the introductory
chapter and part of the chapter on efficiency, and did the final editing of this report. Victoria
Shestalova wrote the chapter on the cross-country comparison and the rest of the efficiency
chapter. Gijsbert Zwart wrote the chapter on security of energy supply. Astrid Dannenberg, Tim
Mennel and Ulf Moslener from ZEW, contributed the chapter on environmental effects.
The researchers benefited from comments by the steering group of DG Enterprise and Industry
of the European Commission. The authors are grateful to Erik Canton, Dominique Simonis,
Isabel Grilo, and George Lemonidis from DG Enterprise and Industry for many discussions,
their constructive comments and their efforts in discussing drafts of this document with their
colleagues, which provided additional feedback on this work. We are also grateful to William
Webster and Vicenc Pedret Cusco from DG TREN for their comments. The responsibility for
this publication rests entirely on the CPB and ZEW.
The project team would like to acknowledge the helpful comments of CPB-colleagues Casper
van Ewijk, Marc Lijesen and Paul Veenendaal. Jeannette Verbruggen did technical editing of
the report, fitting it into the CPB standard lay-out.
Coen Teulings
Director

8
9
Summary
The European electricity and gas markets have been going through a process of liberalisation
since the early 1990s. This process has changed the sector from a regulated structure of,
predominantly, publicly owned monopolists controlling the entire supply chain, into a market
where private and public generators and retailers compete on a regulated and unbundled system
of transport infrastructure. In this report we assess the evidence of the effects of liberalisation
on efficiency, security of energy supply and environmental sustainability.
Based on the overview of selected indicators of market development, we conclude that there are
substantial differences among the EU Member countries in the state of the liberalisation of their
energy industries. On average, the reforms began earlier and have advanced more in the
electricity industry than in the gas industry. Although many essential steps have already been
taken since the beginning of the reforms of the energy sector, the creation of well-functioning
competitive energy markets still faces many challenges.
The change of incentives, resulting either from the introduction of competition or from more
stringent regulation, has generally resulted in more cost-efficient operation. Although the
reduced costs have to some extent been passed on to consumers, market behaviour raises
concerns. Wholesale markets have turned out to be particularly vulnerable to market power, as a
consequence of both legacy industry structure and the specific characteristics of electricity and
gas. In the retail segment for domestic customers, the viability of competition, which relies on
the willingness of consumers to switch, is yet to be proved in most markets. With respect to
effects of liberalisation on innovation, evidence indicates that aggregate private spending on
R&D has diminished. The focus of the companies’ R&D activities moves away from
fundamental technology innovation (e.g. fuel cell technology or clean-coal generation) towards
cost-reducing technologies and consumer services. However, given the uncertainty on
efficiency of pre-liberalisation levels and allocation of R&D spending, this evidence does not
allow us to reach firm conclusions on whether dynamic efficiency has deteriorated.
Potential policy responses to improve efficiency centre on mechanisms to increase competition
(e.g. through contracting requirements on dominant players). Also designs of mechanisms for
cross-border trade have scope for improvement, in order to better reap the benefits of
integration of markets. In particular, current steps towards ‘market coupling’, a mechanism
which allows for more efficient utilisation of available transport capacity between countries,
may lead to larger gains from electricity trade.
In assessing the effects of liberalisation on security of supply, care should be taken in defining
the concept. One approach would define supply security as the ability to meet demand at
10
affordable prices. In the second perspective, supply security would involve the question whether
markets are capable of achieving efficient levels of investment in the market. The two
perspectives would lead to opposing views on the effects of liberalisation. Both theory and
evidence indicate that in liberalised markets, short-run prices are more volatile and adjustment
of demand to clear the market becomes more important than before liberalisation. While these
effects may be viewed as undesirable from the ‘affordable price’ perspective, the larger role of
demand in clearing the markets is consistent with the ‘efficiency’ perspective. Adequate pricing
of peak energy consumption allows for lower investment in peak generation capacity, thus
shifting the supply-demand balance to more efficient levels. Market failures, however, might
lead to inefficiently low investments. Such failures can result from ineffective market design (or
from the anticipation of government intervention in prices under scarcity conditions), under
which market prices fail to reflect the real value of energy. In the regulated markets, devising
mechanisms to provoke efficient investments is challenging, especially where (cross-border)
transport capacity is concerned.
Policy concerning security of supply should firstly focus on efficient design of balancing
markets, especially ensuring that correct price signals occur during periods of scarcity. Where −
for political reasons − temporary high prices are deemed unacceptable, so that absence of
intervention cannot be credibly committed to, price caps coupled with mechanisms to ensure
adequate remuneration of suppliers (such as capacity markets) may be considered as a second
best alternative. Further promoting the development of liquid markets where consumers can
insure against price fluctuations may be a less intrusive alternative.
The impact of liberalisation on the environment is ambiguous. While reduction of prices would
increase consumption of energy, and hence emissions, increased fuel efficiency and shifts in
technology mix can reduce emissions. The latter effect is sensitive to the country-specific initial
conditions.
Liberalisation can strengthen the effects of market based environmental policy instruments. One
major market based instrument is the European Emission Trading Scheme. Market prices for
emission allowances constitute (real or opportunity) costs to electricity producers, and therefore
can guide electricity prices and generation decisions in the desired direction. This is so,
irrespective of the allocation procedure. Some of the allocation rules, however, may distort
competition and efficiency of generation and investment decisions.

11
1 Introduction
1.1 Liberalising European energy markets
The European energy markets have been going through a process of liberalisation1 since the
early 1990s in order to increase efficiency of the supply of energy. This liberalisation process of
the electricity and natural gas markets is managed through directives of the European
Commission, mandating non-discriminatory third-party access to the networks in order to
accommodate entry by competitive suppliers, and making end user markets contestable for
competing suppliers.
According to the EU Directives on the liberalisation of the electricity and natural gas market,
the management of both transmission and distribution networks has to be legally and
functionally unbundled from commercial activities by 2007. European countries have made
progress in satisfying this requirement in particular in the case of transmission networks.
Several countries have legally or fully unbundled transmission of both electricity and gas,
although some unbundled transmission system operators (TSOs) do not have an independent
management (EC, 2006). Nevertheless, concerns exist about third-party access to the
transmission infrastructure, in particular in the gas market where third-party shippers appear to
be subject to more costly access procedures. Moreover, distribution system operators remain
closely linked to the supply business of the incumbents in a large number of EU countries.
Consequently, the current level of unbundling in electricity and natural gas markets is viewed to
be insufficient by regulators and many participants in these markets (EC, 2006).
In its inquiry of the energy markets, the European Commission (EC, 2006) concludes that the
functioning of the gas and electricity markets is seriously hindered by a number of factors, i.e.
horizontal concentration, vertical foreclosure (e.g. entrants having limited access to the
infrastructure), lack of market integration (e.g. incumbents controlling import capacity), lack of
transparency (e.g. insufficient information on technical availability of interconnectors) and the
still ill-developed price-formation process (e.g. prices not responding to changes in supply and
demand).
Although the potentially adverse effects of concentrated markets are widely acknowledged, the
EU Electricity Directives have not required horizontal separation. Due to the absence of
proactive regulation and control, the electricity market has shown an ongoing process of
concentration, which may seriously limit effectiveness of competition (Jamasb, et al., 2005a).2 1 By ‘liberalisation’ is meant all measures changing the structure or rules on the energy markets, such as privatisation,
vertical separation, merger control and (de)regulation. 2 In many European countries, the share of the largest three generation firms in generation is above 60%, while comparable
figures exist for the retail market (Jamasb et al., 2005a).
12
Also in the gas market, wholesale supply is highly concentrated. In all countries except the
United Kingdom, incumbent natural gas firms control a large majority of imports as well as
domestic production. Moreover, market opening is not yet fully realised in all EU-countries.
Currently, about 75% of the gas in the EU-15 countries is consumed by end-users who are free
to choose their gas suppliers (Eurostat, 2005).
1.2 Welfare effects of liberalisation
The welfare effects of introducing competition in energy markets have been subject to debate.
As Joskow (2003) states, “replacing the hierarchical governance arrangements with well
functioning decentralised market mechanisms is a very significant technical challenge, about
which even the best experts have disagreements”. The key challenge in electricity liberalisation
is dealing with the tension between the desire for efficient markets on the one hand and for
long-term investment on the other (Newbery, 2002b). In decentralised competitive electricity
markets, investments in (peak) generation plants are risky due to highly uncertain prices during
periods of peak demand, possibly leading to inefficient levels of investments. In less
competitive (oligopoly or monopoly) markets, control over prices reduces this uncertainty but
results in allocative inefficiencies and also in inefficient levels of investment.
In his assessment of experiences in the United States, Joskow (2003) concludes that the
liberalisation process “has encountered more problems and proceeded less quickly than some
had anticipated when the first restructuring and competition programs were first being
implemented in the late 1990s”. In California, for instance, retail prices increased by 30 to 40%
due to market design imperfections, market power problems and poor responses of federal and
state authorities. On the other hand, liberalisation of electricity markets in the United States has
also produced successes, such as substantial investments in new generating plants by merchant
generating companies as well as lower electricity prices for the largest customers (Joskow,
2003).
The most appropriate structure of the electricity industry is still an inconclusive issue, also
because models which work well in some circumstances perform less in other places (Newbery,
2002a). On some issues, however, theoretical and empirical evidence is quite straightforward.
Practice shows, for instance, that ownership unbundling of the transmission system operation
from competitive activities improves welfare.
In addition to the efficiency considerations, the liberalisation of the gas market has generated
concerns about security of supply. IEA (2004), for instance, states that the key question is
“whether the (gas) market itself will value security of supply and deliver timely signals and
13
competitive incentives for investments to guarantee secure and reliable gas supply all the way
to the final consumer.”
Furthermore, the introduction of competition likely also affects patterns of energy production as
well as consumption and, hence, causes environmental effects. The net sign of these effects is
not clear in advance as different types of effects could emerge: both price and substitution
effects. For instance, the opening of markets might encourage the supply from small-scale
combined-heat-power (CHP) power plants, reducing overall emissions, while it may also lower
prices, and hence raise total emissions.
1.3 Scope of the research and the structure of the document
This document presents an assessment of the effects of liberalising the European electricity and
gas markets, addressing the following questions:
• What are effects of liberalisation of energy markets in terms of efficiency, security of supply
and environment?
• What are efficient policy options to improve the performance of energy markets?
By ‘liberalisation’ we refer to the all measures changing the structure or rules on the energy
markets, such as privatisation, vertical separation, merger control and (de)regulation. We first
describe the current situation in the EU Member countries in chapter 2, after which we analyse
the effects of the reforms. We distinguish effects on efficiency (chapter 3), security of supply
(chapter 4) and environment (chapter 5). The analysis in each chapter is divided in two main
parts. The first part is an analysis of the impact of liberalisation on efficiency, security of supply
and environment, respectively. The second part focuses on policy options, both at the national
and the European level, to improve the performance of energy markets. In this part, we also
discuss interactions between the different types of policy measures.
The analyses of the effects on efficiency as well as security of supply involve both the gas
market and the electricity market. In analysing these markets, we pay attention to the different
parts of the industry chain: production, transport, wholesale, distribution and retail.
The environmental chapter is restricted to the electricity industry given its relatively high
environmental impact. In this chapter, however, we give more attention to the effects of
environmental policy measures on the competitiveness of the European economy.

14
15
2 Reforms in European Energy markets
2.1 Introduction
In this chapter we review the market situation in different EU Member States, highlighting
important implementation issues. Liberalisation reforms in the energy sector in the European
Union began with the electricity industry. The EU Gas Directives were adopted later, which
explains why the situation in the electricity industry in the EU Member States is generally
somewhat more developed than for the gas industry. This chapter includes selected indices of
market performance in different segments of the energy supply chain, covering the development
in transmission and distribution networks, wholesale markets and retail markets. The overview
is based on the recent figures from the (preliminary) report of the European Commission on
Progress in Creating the Internal Gas and Electricity Market (EC, 2005).
2.2 Current situation by industry segment
2.2.1 Network access
Non-discriminatory access to the networks is an important condition for competition. In order to
create this condition, a sufficient degree of unbundling of network from commercial businesses
and tariff regulation are necessary. Table 2.1. below gives an overview of the current
unbundling situation, based on the recent report by the European Commission (2005). We
observe a stronger degree of unbundling for transmission system operators (TSO) than for
distribution system operators (DSO). Evaluating the situation with DSO unbundling in
electricity, the European Commission (2005, p.80 of Technical Annexes) concludes that
“Although legal unbundling is not required until 2007, it would appear that [...] many Member
States have failed to implement the basic requirements of management and account unbundling
that are already required.” For gas, “Several Member States [...] intend to implement legal
unbundling of DSOs not before July 2007, while many Member States fully apply the de-
minimis rule.” (EC, 2005, p. 82 of Technical Annexes.) Also, many regulators express concerns
about discriminatory practices of networks.
In an international context, interconnection between national markets is important for the
development of the EU market. In the electricity industry, some EU countries feature a very low
interconnection level. The level of import capacity relative to installed capacity is especially
low in Italy (8%), Portugal (8%), Spain (4%), the UK (3%), Poland (10%) and Baltic states
(collectively 0%). (Source: EC, 2005.) In addition to this, efficient allocation of the existing
capacity remains an issue in many EU Member States, which do not make a sufficient amount
of interconnection capacity available for cross-border transactions. As a result, wholesale
electricity markets in the EU are segmented. The same holds for the gas industry, even though

16
over 60% of gas used in the EU crosses a border. There is only little flexibility for gas network
users of changing their standard delivery patterns, because many network routes are reserved
for one or two users. Hence, also gas markets are not strongly integrated and remain largely
national.
Table 2.1 Unbundling network operators: Legal unbun dling implemented?
Electricity Gas
TSOa DSO TSOa DSO
Austria yes no yes yes
Belgium yes yes yes yes Denmark yes and ownership yes yes and ownership yes Finland yes, state overlap yes France yes, state overlap no yes, state overlap no Germany yes no partly no Greece yes, state overlap no Ireland yes, state overlap no no no Italy yes and ownership see noteb yes and ownership yes Luxembourg yes no no no Netherlands yes and ownership yes yes and ownership yes Portugal yes and ownershipb see noteb Spain yes and ownership see noteb yes see noteb Sweden yes, state overlap yes yes and ownership no UK yes and ownership yes yes and ownership yes and ownership Norway yes, state overlap yes Estonia yes yes no no Latvia yes no no no Lithuania yes, state overlap yes no no Poland yes, state overlap no yes no Czech Rep. yes, state overlap no no no Slovakia yes, state overlap no no no Hungary yes, state overlap see noteb yes no Slovenia yes, state overlap yesc no Cyprus no Malta -
Source: EC(2005), based on Regulators data. a “State overlap” where the state owns the TSO and also has a shareholding in one or more suppliers.
b In Italy, Portugal, Hungary (electricity) and Spain (electricity and gas) the DSO is also a default supplier. However, suppliers to non-
regulated customers must be legally unbundled. c Incorporating corrections.
2.2.2 Wholesale markets
The available indicators of the wholesale market competitiveness are mainly those concerning
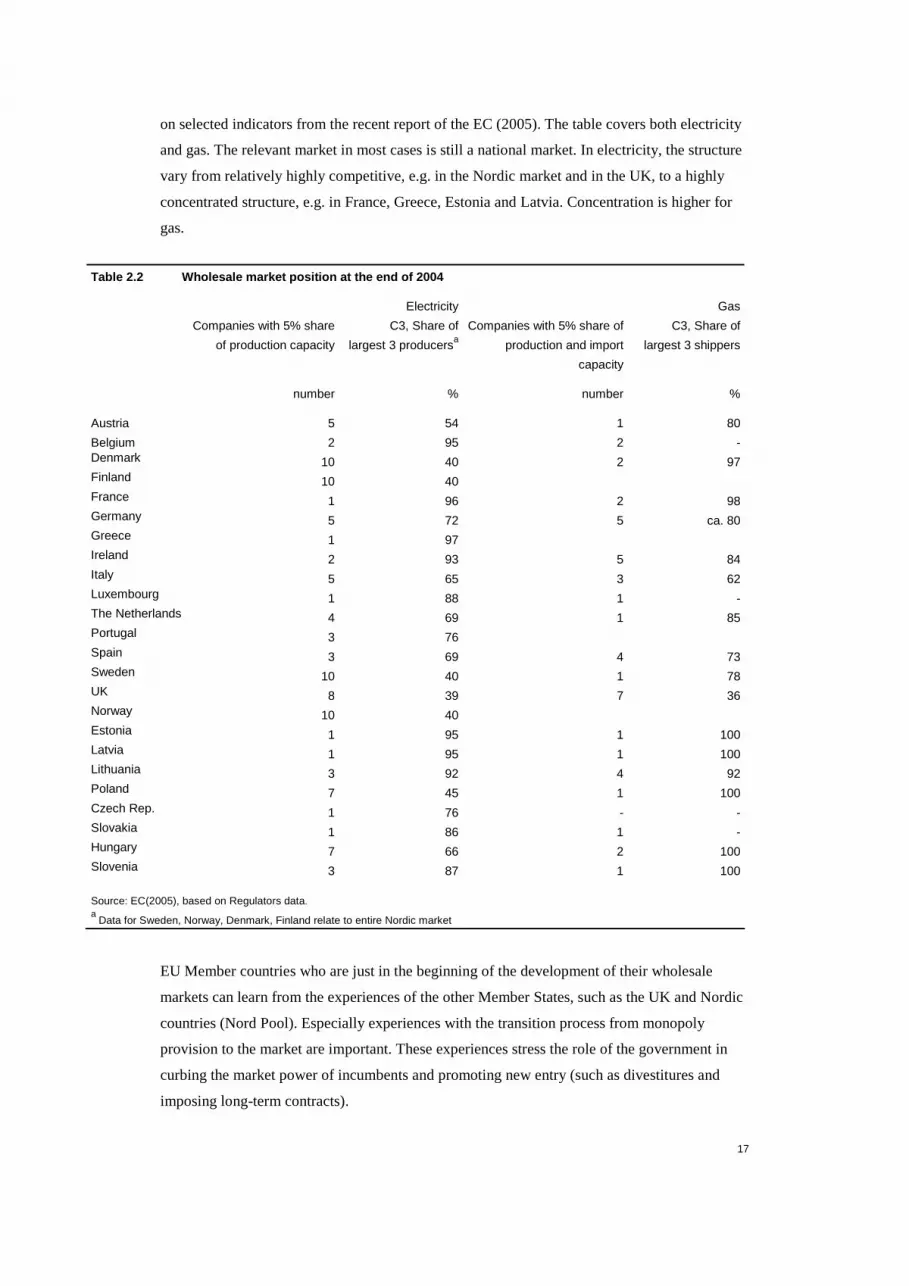
market structure. Table 2.2 below gives an impression of the relative position of the EU
countries with respect to the concentration in their wholesale markets at the end of 2004, based
17
on selected indicators from the recent report of the EC (2005). The table covers both electricity
and gas. The relevant market in most cases is still a national market. In electricity, the structure
vary from relatively highly competitive, e.g. in the Nordic market and in the UK, to a highly
concentrated structure, e.g. in France, Greece, Estonia and Latvia. Concentration is higher for
gas.
Table 2.2 Wholesale market position at the end of 2 004
Electricity Gas
Companies with 5% share
of production capacity
C3, Share of
largest 3 producersa
Companies with 5% share of
production and import
capacity
C3, Share of
largest 3 shippers
number % number %
Austria 5 54 1 80
Belgium 2 95 2 - Denmark 10 40 2 97 Finland 10 40 France 1 96 2 98 Germany 5 72 5 ca. 80 Greece 1 97 Ireland 2 93 5 84 Italy 5 65 3 62 Luxembourg 1 88 1 - The Netherlands 4 69 1 85 Portugal 3 76 Spain 3 69 4 73 Sweden 10 40 1 78 UK 8 39 7 36 Norway 10 40 Estonia 1 95 1 100 Latvia 1 95 1 100 Lithuania 3 92 4 92 Poland 7 45 1 100 Czech Rep. 1 76 - - Slovakia 1 86 1 - Hungary 7 66 2 100 Slovenia 3 87 1 100
Source: EC(2005), based on Regulators data. a
Data for Sweden, Norway, Denmark, Finland relate to entire Nordic market
EU Member countries who are just in the beginning of the development of their wholesale
markets can learn from the experiences of the other Member States, such as the UK and Nordic
countries (Nord Pool). Especially experiences with the transition process from monopoly
provision to the market are important. These experiences stress the role of the government in
curbing the market power of incumbents and promoting new entry (such as divestitures and
imposing long-term contracts).
18
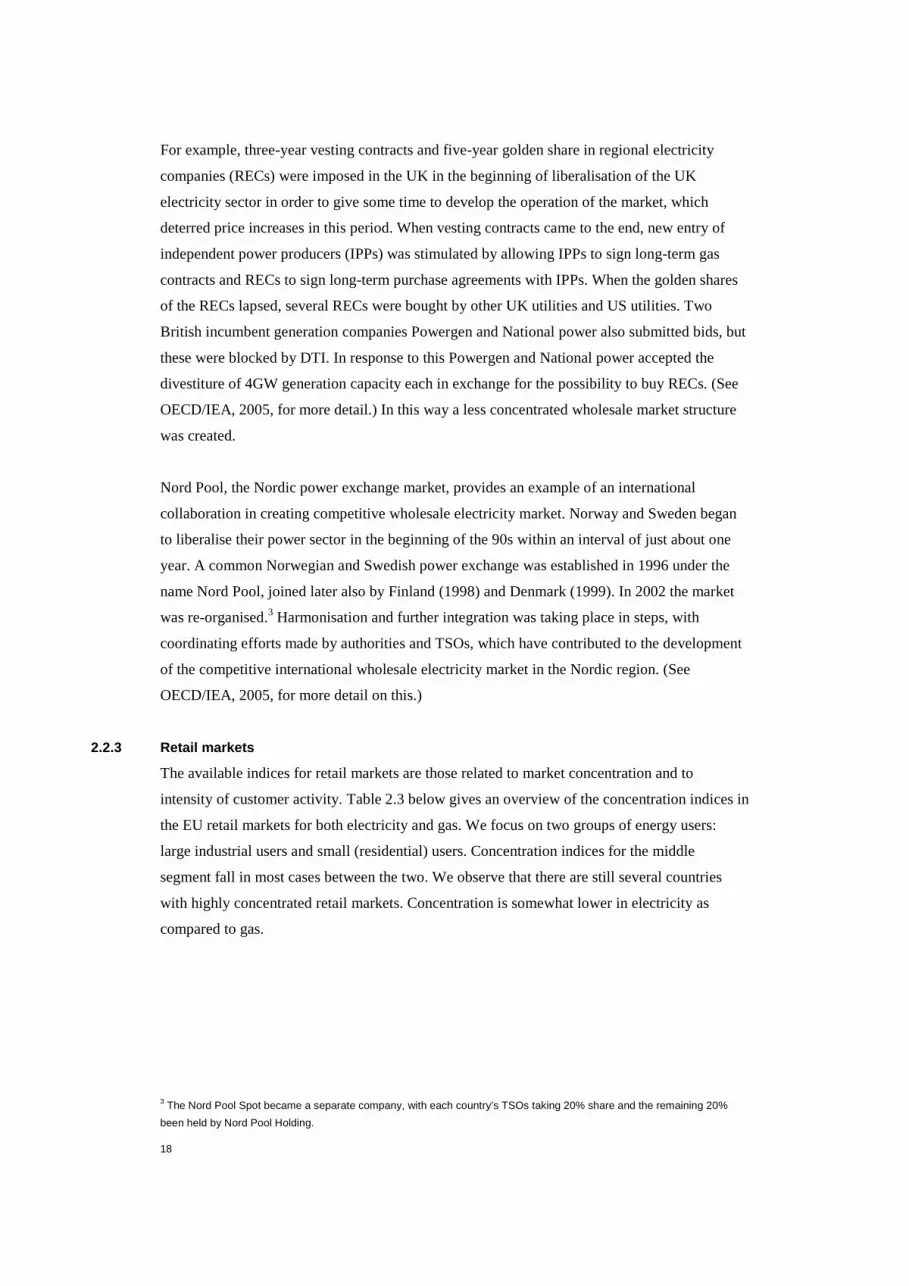
For example, three-year vesting contracts and five-year golden share in regional electricity
companies (RECs) were imposed in the UK in the beginning of liberalisation of the UK
electricity sector in order to give some time to develop the operation of the market, which
deterred price increases in this period. When vesting contracts came to the end, new entry of
independent power producers (IPPs) was stimulated by allowing IPPs to sign long-term gas
contracts and RECs to sign long-term purchase agreements with IPPs. When the golden shares
of the RECs lapsed, several RECs were bought by other UK utilities and US utilities. Two
British incumbent generation companies Powergen and National power also submitted bids, but
these were blocked by DTI. In response to this Powergen and National power accepted the
divestiture of 4GW generation capacity each in exchange for the possibility to buy RECs. (See
OECD/IEA, 2005, for more detail.) In this way a less concentrated wholesale market structure
was created.
Nord Pool, the Nordic power exchange market, provides an example of an international
collaboration in creating competitive wholesale electricity market. Norway and Sweden began
to liberalise their power sector in the beginning of the 90s within an interval of just about one
year. A common Norwegian and Swedish power exchange was established in 1996 under the
name Nord Pool, joined later also by Finland (1998) and Denmark (1999). In 2002 the market
was re-organised.3 Harmonisation and further integration was taking place in steps, with
coordinating efforts made by authorities and TSOs, which have contributed to the development
of the competitive international wholesale electricity market in the Nordic region. (See
OECD/IEA, 2005, for more detail on this.)
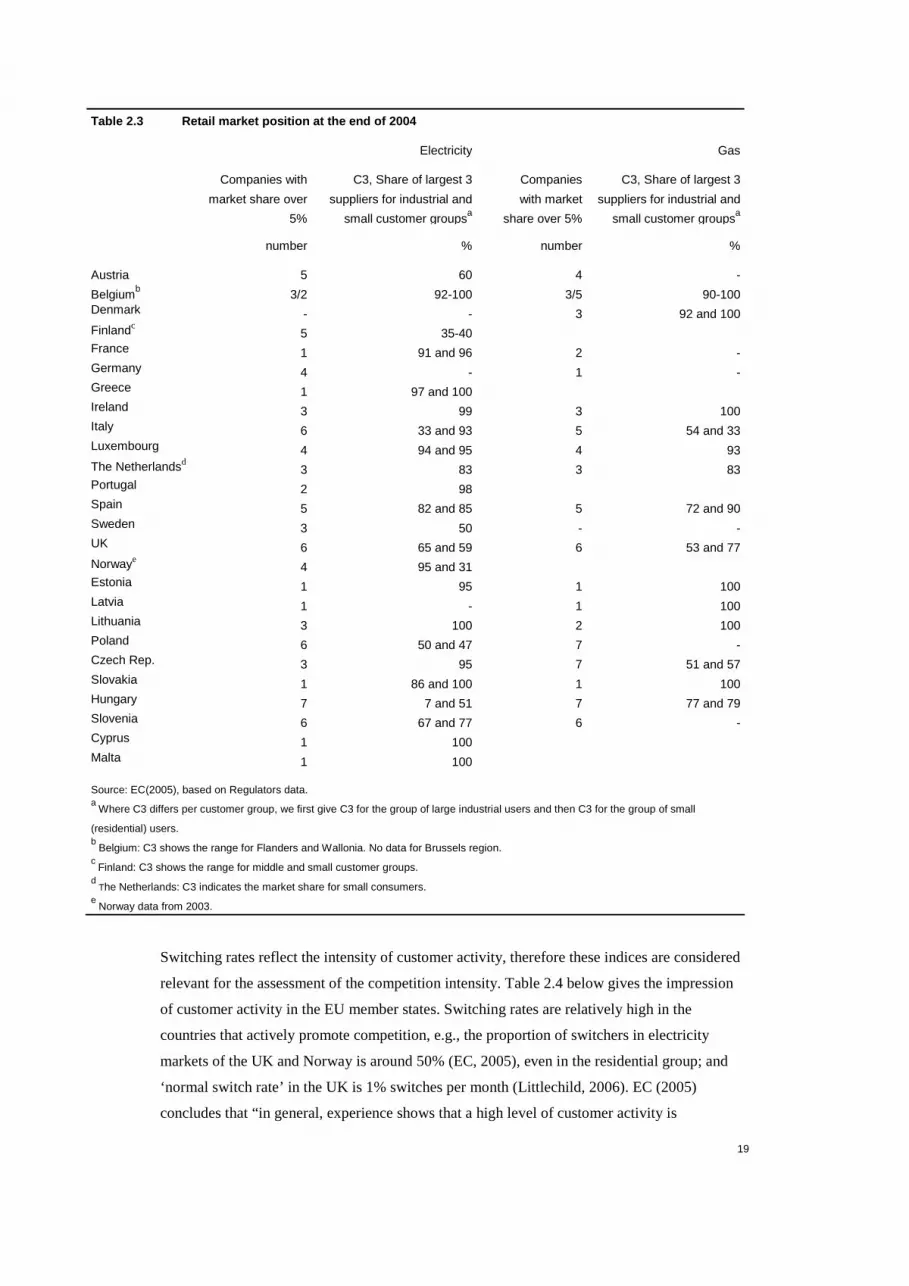
2.2.3 Retail markets
The available indices for retail markets are those related to market concentration and to
intensity of customer activity. Table 2.3 below gives an overview of the concentration indices in
the EU retail markets for both electricity and gas. We focus on two groups of energy users:
large industrial users and small (residential) users. Concentration indices for the middle
segment fall in most cases between the two. We observe that there are still several countries
with highly concentrated retail markets. Concentration is somewhat lower in electricity as
compared to gas.
3 The Nord Pool Spot became a separate company, with each country’s TSOs taking 20% share and the remaining 20%
been held by Nord Pool Holding.
19
Table 2.3 Retail market position at the end of 2004
Electricity Gas
Companies with
market share over
5%
C3, Share of largest 3
suppliers for industrial and
small customer groupsa
Companies
with market
share over 5%
C3, Share of largest 3
suppliers for industrial and
small customer groupsa number % number %
Austria 5 60 4 -
Belgiumb 3/2 92-100 3/5 90-100 Denmark - - 3 92 and 100 Finlandc 5 35-40 France 1 91 and 96 2 - Germany 4 - 1 - Greece 1 97 and 100 Ireland 3 99 3 100 Italy 6 33 and 93 5 54 and 33 Luxembourg 4 94 and 95 4 93 The Netherlandsd 3 83 3 83 Portugal 2 98 Spain 5 82 and 85 5 72 and 90 Sweden 3 50 - - UK 6 65 and 59 6 53 and 77 Norwaye 4 95 and 31 Estonia 1 95 1 100 Latvia 1 - 1 100 Lithuania 3 100 2 100 Poland 6 50 and 47 7 - Czech Rep. 3 95 7 51 and 57 Slovakia 1 86 and 100 1 100 Hungary 7 7 and 51 7 77 and 79 Slovenia 6 67 and 77 6 - Cyprus 1 100 Malta 1 100
Source: EC(2005), based on Regulators data. a
Where C3 differs per customer group, we first give C3 for the group of large industrial users and then C3 for the group of small
(residential) users. b
Belgium: C3 shows the range for Flanders and Wallonia. No data for Brussels region. c Finland: C3 shows the range for middle and small customer groups.
d The Netherlands: C3 indicates the market share for small consumers.
e Norway data from 2003.
Switching rates reflect the intensity of customer activity, therefore these indices are considered
relevant for the assessment of the competition intensity. Table 2.4 below gives the impression
of customer activity in the EU member states. Switching rates are relatively high in the
countries that actively promote competition, e.g., the proportion of switchers in electricity
markets of the UK and Norway is around 50% (EC, 2005), even in the residential group; and
‘normal switch rate’ in the UK is 1% switches per month (Littlechild, 2006). EC (2005)
concludes that “in general, experience shows that a high level of customer activity is

20
encouraged where non discriminatory network access is assured and there are enough
independent competitors in the market to give a degree of real choice.” It also illustrates a
generally low level of market development in new member states.
Table 2.4 Percentage of energy consumption having s witched – cumulative since market opening
Electricity Gas
Respective percentages for large industrial
users and small users
Respective percentages for power plants +
large industrial users and small users
% %
Austria 29 and 4 6 and 4
Belgiuma c. 20 and 10 25 and 9
Denmark >50 and ca. 15 30 and <2
Finland >50 and 30
France 15 and 0 14 and 0
Germany 41 and 5
Greece 2 and 0
Irelandb 56 and 9 100 and 0
Italyc 60 and -. 23 and 1
Luxembourg 25 and 0 2d and 0
The Netherlands - and 11 - and 5
Portugal 16
Spainc 25 and 19 60 and 2
Sweden >50 and 29 -
UK >50 and 48 >85 and 47
Norway >50 and 44
Estonia 0 0
Latvia 0 0
Lithuania 15 and 0 0
Poland 19 and 0 0
Czech Rep. 5 and 0 0
Slovakia - and 0 0
Hungary - and 0 6 and -
Slovenia 8 and 0 0
Cyprus 0
Malta 0 Source: EC (2005) based on regulators data. a The data for Belgium refer to the Flemish region only.
b Ireland (electricity) includes switching to ESB (Independent).
c Italy, Spain includes all customers having left regulated tariffs (i.e. incl. renegotiation).
d Luxembourg: switching rates of 2% corresponds to large customers.
2.3 Conclusions
The figures and the considerations presented above show the current situation in the electricity
and gas industry. There are substantial differences in the market development among the EU

21
Member countries. We observe some useful experiences in market development (such as in the
UK and Nordic countries). On average, the reforms began earlier and have advanced more in
the electricity industry than in the gas industry.
Although many essential steps have already been taken since beginning of reforming the energy
sector, creating well-functioning competitive energy markets still faces many challenges. As
stressed by Jamasb and Pollitt (2005a): “The European electricity market is now approaching
challenges where, in contrast to the consensus-based minimum requirements of the Directives,
more specific and technical issues need to be addressed.”

22
23
3 Liberalisation and efficiency
3.1 Introduction
The liberalisation of the energy industry is largely motivated by expected efficiency
improvements. A more efficient supply of energy contributes to the competitiveness of the
European economy and, hence, increases welfare. In order to assess the effects on efficiency,
three efficiency concepts have to be distinguished: productive, allocative and dynamic
efficiency. See the box below for more detail on measurement issues.
In theory, the relationship between competition and productive efficiency is at least non-
negative (neutral or positive). Traditional theoretical models assume profit-maximising and
cost-minimising behaviour of firms, which implies that firms should be always productively
efficient. Agency models, however, stress the effect of the competitive environment on firms’
incentives, concluding that competition increases productive efficiency.
Liberalisation might also improve allocative efficiency as competitive pricing leads to a higher
demand for services, hence, increasing the sum of consumer and producer surplus. Moreover,
as consumer surplus is often weighted higher than producer surplus, a lower price has not
merely distributional effects but can also be viewed as an improvement of total welfare.
The effect on dynamic efficiency is complex. On the one side, firms need to have profit in order
to innovate (the Schumpeterian view), on the other side competitive pressure may lead to
dynamic efficiency (inefficient firms who do not catch up cannot survive in a competitive
market).
This chapter first gives a brief overview of the empirical literature on the efficiency effects of
liberalising the energy sector. Afterwards, the focus is on policy options to improve the
performance of the energy markets.
24
Box: Efficiency measurement
There are several simple indicators focusing on one aspect of efficiency that are often used in economic analyses of the
effect of liberalisation reforms, namely,
Productive efficiency: change in unit cost
Allocative efficiency: change in prices and markups
Dynamic efficiency: change in R&D expenses, change in the number of new products offered
In addition to these, it is possible to realise more comprehensive efficiency assessments using cost-benefit analyses of
the reforms implemented, or Frontier methods, such as Data Envelopment Analysis (DEA), Corrected Ordinary Least
Squares (COLS) and Stochastic Frontier Approach (SFA). The latter methods provide the possibility to single out
relative inefficiencies among firms and to measure the improvement of the best practice and catch-up towards the best
practice.
Since there are some differences in the interpretation of efficiency changes that stem from different efficiency-
assessment methods, the distinction among three efficiency forms may not be sharp. For example, frontier studies
interpret improvements within the current production set as productive efficiency change, and shifts to a technology
outside of the production set as technical change (dynamic efficiency). In this definition, shifting to a more economic
production technology can be interpreted in two ways, namely, it is interpreted as productive efficiency change, as long
as the firm does not outperform the frontier firms; and it is interpreted as a dynamic efficiency gain as soon as the firm
reaches the frontier. Even though the distinction among different efficiency forms may not be sharp, it is still convenient
to use it to structure the discussion on effects of liberalisation reforms on efficiency in this chapter.
3.2 Performance of energy markets in improving effi ciency
3.2.1 Productive efficiency
An economy achieves productive efficiency when it produces a given amount of output at
minimum total costs. The empirical literature generally finds positive effects of liberalisation on
productive efficiency of generation plants, both in and outside the EU. Newbery et al. (1997)
document benefits from privatization and restructuring of the Central Electricity Generating
Board (CEGB) in the UK. These benefits are achieved by shifting from inefficient coal
production supported by the government to a more economic technology,4 resulting in a
structural reduction of generation costs by about 5%.
Empirical studies by Bushnell et al. (2005) and by Fabrizio et al. (2006) for the US show an
improvement in the efficiency of generation plants after the implementation of reforms. In the
course of these reforms, some plants were divested and began to compete in the market, while
some other (non-divested) plants were subject to more stringent regulation. According to
Bushnell et al., both competition and incentive regulation of generating plants have led to fuel
efficiency improvements (up to 2%). The authors argue that the change of incentives, but not
the change of ownership itself, was the main driver of these improvements. Fabrizio et al.
4 Strictly speaking, shift to another technology has also aspects of dynamic efficiency improvement.
25
(2006) find that competitive pressures reduce non-fuel operating expenses of electricity plants.
In anticipation of increased competition, plant operators most affected by restructuring reduced
their labour and non-fuel expenses per unit of output by 3-5% relative to other investor-owned
plants, and by 6-12% relative to government and cooperatively owned plants which were not
affected by the reforms. Also IEA (2005a) sees an increase in labour productivity in the energy
industry as a result of reforms.
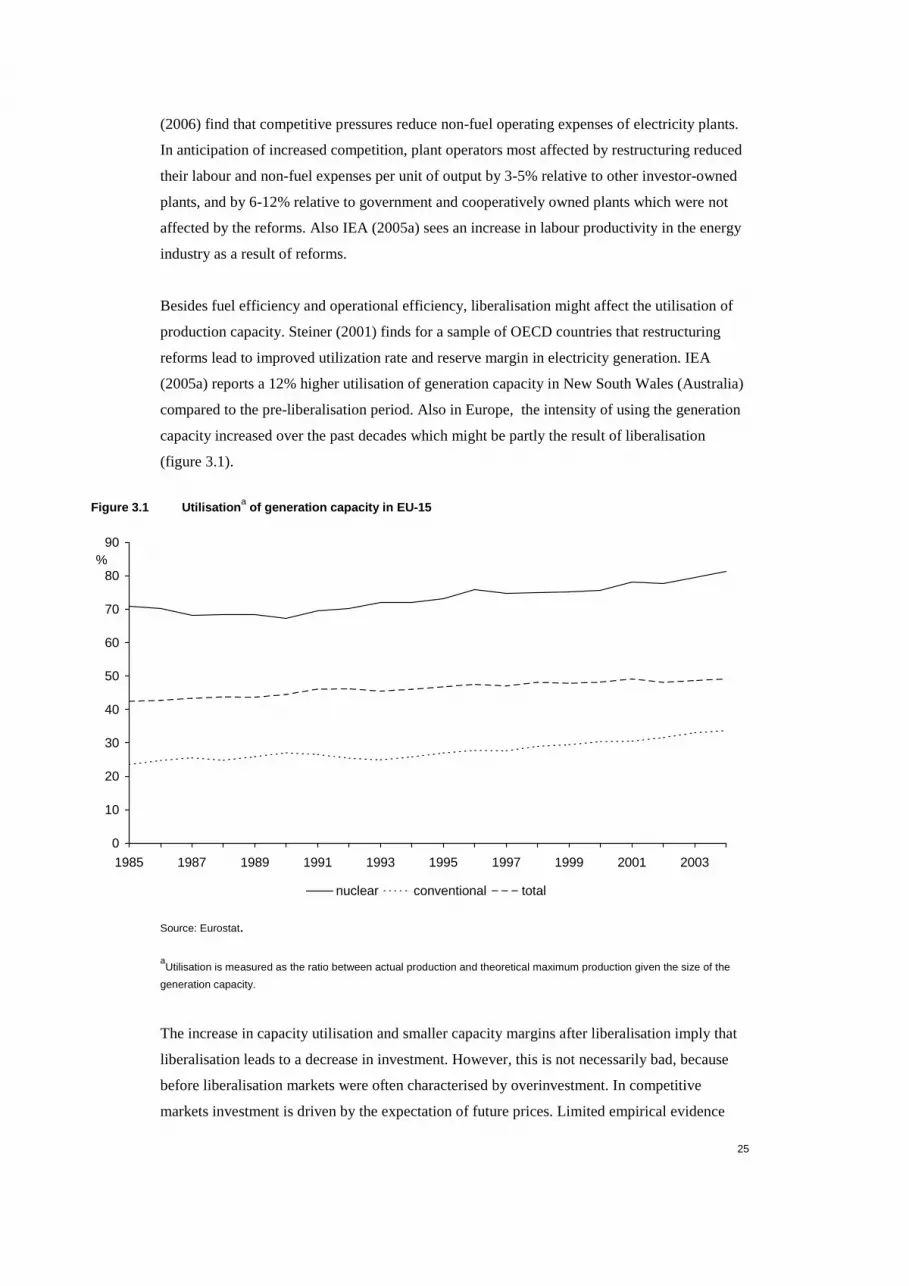
Besides fuel efficiency and operational efficiency, liberalisation might affect the utilisation of
production capacity. Steiner (2001) finds for a sample of OECD countries that restructuring
reforms lead to improved utilization rate and reserve margin in electricity generation. IEA
(2005a) reports a 12% higher utilisation of generation capacity in New South Wales (Australia)
compared to the pre-liberalisation period. Also in Europe, the intensity of using the generation
capacity increased over the past decades which might be partly the result of liberalisation
(figure 3.1).
Figure 3.1 Utilisation a of generation capacity in EU-15
0
10
20
30
40
50
60
70
80
90
1985 1987 1989 1991 1993 1995 1997 1999 2001 2003
%
nuclear conventional total
Source: Eurostat.
aUtilisation is measured as the ratio between actual production and theoretical maximum production given the size of the
generation capacity.
The increase in capacity utilisation and smaller capacity margins after liberalisation imply that
liberalisation leads to a decrease in investment. However, this is not necessarily bad, because
before liberalisation markets were often characterised by overinvestment. In competitive
markets investment is driven by the expectation of future prices. Limited empirical evidence
26
(mostly on the UK, but also on some other countries) shows that indeed markets respond to
price signals. For example, growing gas demand in Europe (and a decline of gas production), is
spurring investment in LNG capacity in for instance the UK, Spain and France (Ernst & Young,
2006). In addition to the effect on productive efficiency, investment decisions affect reliability
of supply. See chapter 4 for further detail on this.
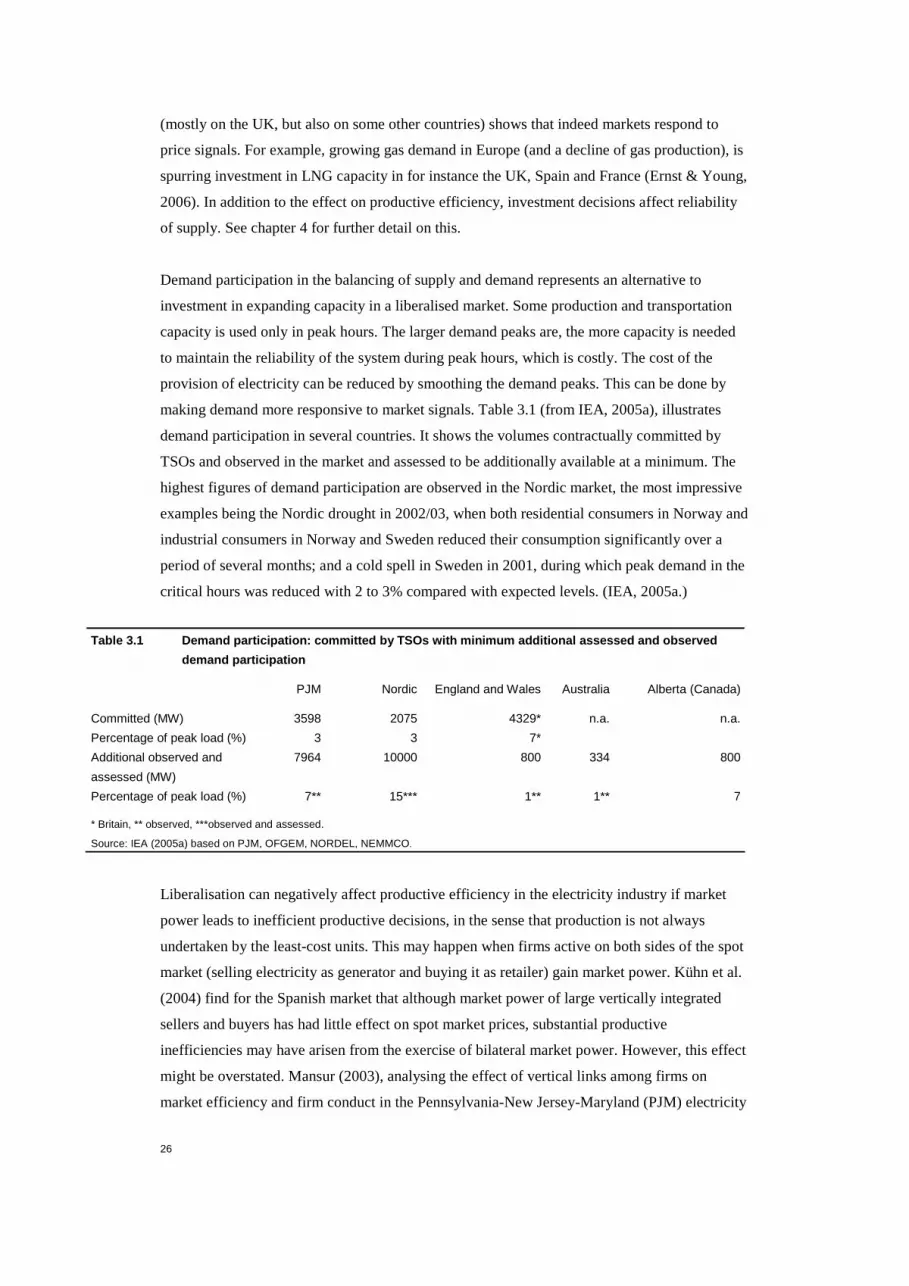
Demand participation in the balancing of supply and demand represents an alternative to
investment in expanding capacity in a liberalised market. Some production and transportation
capacity is used only in peak hours. The larger demand peaks are, the more capacity is needed
to maintain the reliability of the system during peak hours, which is costly. The cost of the
provision of electricity can be reduced by smoothing the demand peaks. This can be done by
making demand more responsive to market signals. Table 3.1 (from IEA, 2005a), illustrates
demand participation in several countries. It shows the volumes contractually committed by
TSOs and observed in the market and assessed to be additionally available at a minimum. The
highest figures of demand participation are observed in the Nordic market, the most impressive
examples being the Nordic drought in 2002/03, when both residential consumers in Norway and
industrial consumers in Norway and Sweden reduced their consumption significantly over a
period of several months; and a cold spell in Sweden in 2001, during which peak demand in the
critical hours was reduced with 2 to 3% compared with expected levels. (IEA, 2005a.)
Table 3.1 Demand participation: committed by TSOs w ith minimum additional assessed and observed
demand participation
PJM Nordic England and Wales Australia Alberta (Canada)
Committed (MW) 3598 2075 4329* n.a. n.a.
Percentage of peak load (%) 3 3 7*
Additional observed and
assessed (MW)
7964 10000 800 334 800
Percentage of peak load (%) 7** 15*** 1** 1** 7
* Britain, ** observed, ***observed and assessed.
Source: IEA (2005a) based on PJM, OFGEM, NORDEL, NEMMCO.
Liberalisation can negatively affect productive efficiency in the electricity industry if market
power leads to inefficient productive decisions, in the sense that production is not always
undertaken by the least-cost units. This may happen when firms active on both sides of the spot
market (selling electricity as generator and buying it as retailer) gain market power. Kühn et al.
(2004) find for the Spanish market that although market power of large vertically integrated
sellers and buyers has had little effect on spot market prices, substantial productive
inefficiencies may have arisen from the exercise of bilateral market power. However, this effect
might be overstated. Mansur (2003), analysing the effect of vertical links among firms on
market efficiency and firm conduct in the Pennsylvania-New Jersey-Maryland (PJM) electricity
27
markets, emphasizes the effect of production constraints (such as start up costs). Accounting for
these constraints, the author finds that the costs in the PJM markets were only 3.4% above the
competitive levels.
Productive efficiency of energy transportation networks may increase as a result of the
introduction of incentive regulation. Regulators in Europe often choose a price-cap mechanism,
according to which the prices should change by RPI-X, where RPI represents a price index and
X represents a productive efficiency target.5 Firms outperforming this target can keep their
profit during the regulatory period. The empirical literature shows that firms respond to
regulatory incentives and reduce their costs. For the UK, there is evidence on cost reductions by
the National Grid after adoption of sliding scale incentive mechanism, where prices only partly
reflect changes in costs (see, e.g., Joskow, 2005). Several other studies (Burns et al., 1996,
Tilley et al., 1999, and Domah et al., 2001) report cost reductions of UK distribution firms after
the introduction of price-cap regulation, especially towards the end of the second regulation
period (the end of the nineties). Both selling the golden shares by the British government in
1995 and stronger regulatory incentives in the second regulatory period could be seen as drivers
behind these productivity gains.
Hattori et al. (2003) compare the performance of the UK electricity distribution companies to
that of Japanese (vertically integrated) utilities between 1985/86 and 1997/98. The industrial
development in these two countries differs in industrial structure, ownership pattern (British
companies were privatised in the 90s, while Japanese companies were private since 1951) and
in regulation methodology (the UK introduced price caps, while Japan had rate-of-return
regulation6). They find that productivity gain in the UK, which was implementing major
restructuring and liberalisation reforms in this period, has been larger than in Japan: on average
2.5% per year in the UK and 0.7% in Japan. In particular, productivity growth in the UK
accelerated in the last 3 years, when the utilities began to operate under tightened price caps.
Decomposition of the productivity growth into technical change and efficiency change shows
that there was technical progress in the UK, however, the efficiency gap between the companies
may have widened. Hattori et al. observe significant variations in the level of costs and
consequently in relative efficiency measures over the years, which arise due to the cyclical
nature of investment in networks.
Hjalmarsson et al. (1992) find no significant impact of ownership and economic organisation on
productivity change of Swedish retail and distribution firms. However, they find a substantial
influence of economies of density, as well as a relative increase in productivity in rural areas.
These authors relate this to the mergers of small regional utilities, thereby implying the
5 Sometimes CPI (Consumer Price Index) is used instead of RPI (Retail Price Index). 6 Rate of return regulation in Japan was slightly modified in 1996, incorporating elements of yardstick regulation.
28
existence of economies of (regional) scale. In a reaction, Mork (1992) states that the lack of
difference due to ownership follows from the fact that neither private nor the public utilities are
profit maximizers. In a later Swedish study, Kumbhakar et al. (1998) find that privately owned
firms in electricity retail and distribution are more efficient than municipal companies. The
difference in technical progress between public, private and mixed firms, however, appears to
be small.
Edvardsen and Forsund (2003) use frontier approach to analyse relative efficiency differences
among electricity distribution utilities in five EU countries (which includes the Nordic countries
and the Netherlands). They construct the common production frontier for the utilities from their
sample and find that there is still a substantial potential for an improvement of operating and
maintenance costs. Remarkably, the efficient firms, i.e. the firms supporting the frontier, come
from all five countries, which supports the use of common technology in benchmarking.7
In retail, liberalisation has introduced new costs, such as loss of potential economies of scope
between the network and retail activities and marketing cost. These costs may affect productive
efficiency negatively. However, since retail cost is a small part of the overall cost, a large effect
of these costs on overall productive efficiency is unlikely.
The conclusion from this evidence is that liberalisation and other reforms in energy markets
(such as change of regulation and ownership structure) improve firms’ productive efficiency, if
this process succeeds to change firms’ incentives.
3.2.2 Allocative efficiency
An economy is allocatively efficient when it produces the quantity of goods that optimises total
welfare. This generally implies that prices equal marginal costs of production8. Liberalisation is
expected to lead to competitive pricing and, hence, to improve allocative efficiency. In practice,
however, the relationship between liberalisation and allocative efficiency is affected by the
market situation. Market power of firms may lead to inefficient outcomes. Therefore, when
evaluating the impact of liberalisation on allocative efficiency, it is necessary to address the
question whether liberalisation reforms have succeeded in creating competitive energy markets.
Although market power is generally measured by the margin between price and the marginal
cost of production, in electricity markets, market power can still be present even when the price
equals the marginal cost of the most expensive producing unit. Here, market power can be used
to raise prices by withdrawing generators having lower marginal costs. Borenstein et al. (2000)
7 The authors also report differences in relative efficiency distribution within each country. In particular, Sweden and Finland
had the most even distributions of efficiency over companies and the highest share of units above the total sample mean. 8 Including potential shadow costs if constraints are involved.
29
present an indicator of market power that reflects the difference between the price and the
marginal cost that would realise if all firms behaved as price takers. According to their estimate
for California, the average markup over the competitive outcome was 15.7% in the period June
1998 to September 1999. Mansur (2001) and Bushnell et al. (2002) provide similar analyses for
the Pennsylvania-New Jersey-Maryland (PJM) and New England electricity markets
respectively, using somewhat different indicators that are based on the same idea. Comparing
the results of these three studies over the period when they overlap (May to December 1999),
controlling for the level of spare generation capacity at the various demand levels, Bushnell et
al. concludes that “the performance of the two eastern markets was comparable, and that both
were more competitive than California at all but the highest capacity ratios.”9 Hence, market
power can be present even in a fairly unconcentrated electricity market.
There is also some evidence on the allocative efficiency effects of reforms in the UK. Newbery
et al. (1997) conclude that the productive efficiency gains achieved by privatisation and
restructuring of the electricity industry mainly went to producers, not to customers. However,
according to a comment by Littlechild (2006), one should take into account that the prices
would probably have gone up under state monopoly (regulated by rate-of-return regulation).
Adopting this view, the benefits of reforms in the UK were actually shared between consumers
and producers. Analyzing the period of the late 1990s for England and Wales, Sweeting (2005)
finds that generators exercised considerable market power, despite that market concentration
was falling. This behaviour was consistent with their tacit collusion or an attempt to raise the
prices that they could negotiate in future hedging contracts by increasing current spot market
prices. If tacit collusion was the reason, then this would support the importance of designing
market institutions in a way that makes tacit collusion difficult to sustain. In this sense, less
centralised systems (such as NETA, which replaced the Pool system in the UK) should be less
vulnerable to collusion. Indeed, there was less exercise of market power under NETA.
To conclude, given the vulnerability of liberalised energy markets to market power, and in view
of the lack of market integration and increasing horizontal concentration (EC, 2006), European
energy markets are at risk of not performing well in terms of allocative efficiency.
In transmission and distribution, allocative efficiency benefits are likely positive. Most
networks are subject to regulated Third-Party Access (TPA). Not only does regulatory pressure
encourage firms to operate more efficiently, it also leads to more efficient pricing of services,
and hence to more optimal use of the network by the firms and customers. Customers in many
countries (such as UK, the Netherlands, Norway) benefited from the price decreases that were
9 Capacity ratio is the ratio of residual demand over capacity. Given that electricity is not storable market power is
intertemporal. Since capacity is constrained, market power is larger in high-demand periods. For example, Müsgens (2004)
finds significant market power in the German electricity market, mainly exhibited during peak periods.

30
forced by the X-factors set by regulators. In the UK, for the rate period 1995/6-1999/2000, the
X-factors for the first two years averaged 14 and 11.5%, and 3% p.a. for the remaining years.
For the rate period 2000/1-2004/5, the average X factor for the first year was 23.4% (some of
which accounts for transfers to the supply businesses) and 3% p.a. for the other years. (Pollitt et
al., 2001). In the Netherlands, only for electricity the X factors saved the consumers 1.1 billion
euros over 2001-2006 (Haffner et al., 2005).
In retail, liberalisation generally increases allocative efficiency in the large consumer segment,
but the effect in the small consumer segment is ambiguous. Large industrial users face lower
prices than small users10 for three reasons: their stronger buyer position, less fluctuating
demand, and lower network cost, since these users are often connected at a higher network
level, e.g. to transmission networks. Empirical work by Steiner (2001) (for earlier years of
reforms) presents evidence that liberalisation is associated with a reduction of industrial user
prices.
The effect of liberalisation on retail prices is less straightforward for small users. Joskow and
Tirole (2004) stress the problems for retail competition associated with the absence of real-time
pricing for small users. Other studies highlight the problem which can arise due to consumer
switching costs (Giulietti et al., 2005 and Pomp et al., 2005). These costs include not only
switching fees, but also the time and effort of switching. If these costs make consumers
unwilling to react to lower prices, then the incumbent retailers will be able to extract extra
consumer surplus. Green (2003) argues that retail competition may lead to reduced long term
contracting. This in turn could reduce competitiveness of the wholesale markets, and increase
prices.
Despite these potential problems, a relevant issue is what would be the alternative to retail
competition. Littlechild (2006) discusses two policy options that seem to be the most reasonable
alternatives: regulation by benchmarking and tendering. He stresses that both alternatives
require a large involvement of the regulator, which is also costly. For instance, “Energy
efficiency obligations on suppliers imposed by the regulator <in the UK> originally cost ₤1 per
electricity customer per year. The latest proposal by the Government will cost about ₤8 per
customer per year” (Littlechild, 2006). Besides, benchmarking is not always feasible because of
the insufficient number of comparators. In the case of tendering (applied in some states in the
US), the regulator has to determine the terms of tendering, but it is unlikely that the regulator
knows more about consumer preferences than consumers themselves. So, both alternative
policies are unlikely to outperform competition. This conclusion is much stronger if we account
for the welfare increase from product innovations in retail (stressed by Littlechild, 2005; see
10 For example, across member states, current electricity prices for large industrial users are 40-55 euros per MWh, while
60-150 euros per MWh for small consumers (EC, 2005).
31
also next section), especially those promoting energy-efficient technologies (addressed in
Directive 2006/32/EC11).
The overall picture here is that the allocative efficiency benefits of liberalisation of European
energy markets have been limited due to insufficient competition on the energy markets up to
now. If the reforms succeed to adequately improve competition on these markets, allocative
efficiency benefits could be significant. In networks, however, regulation has generated
allocative benefits by imposing more efficient prices.
3.2.3 Dynamic efficiency
Dynamic efficiency relates to the extent to which innovation occurs that allows future cost and
benefit functions to change. The relationship between liberalisation and dynamic efficiency is
not straightforward as competition might stimulate as well as dampen incentives to innovate.
Evidence on private R&D expenses, which is often used as a measure for innovations, in
liberalised energy industries suggests that the overall effect of market reforms on private
innovation activity is negative. R&D activities in the electricity industry in many countries have
declined over the past decades (e.g. Eurelectric, 2003; Hattori, 2006; IEA, 2005c; Jamasb et al.,
2005b; Sanyal et al., 2005)12. In the Japanese electricity industry, for instance, the R&D
intensity, i.e. the ratio between R&D expenditures and total sales, declined since the mid 1990s
when the process of liberalisation took off (see figure 3.2). We should note that R&D
expenditure may have been either inefficiently high or ill-directed before liberalisation, when it
was carried out by intransparently regulated public utilities, which did not necessarily act as
profit-maximisers. A lower level of R&D expenditures is therefore not necessarily equal to a
lower level of dynamic efficiency. The question is furthermore whether the decline in R&D is
related to the process of liberalisation.
11 Directive 2006/32/EC of the European Parliament and of the Council of 5 April 2006 on energy end-use efficiency and
energy services and repealing Council Directive 93/76/EEC. 12 Sanyal et al. (2005), for instance, report a decline in the R&D intensity (i.e. R&D expenditures as a percent of sales) in the
US electric industry from 7.9% in 1986 to 6.9% in 1996, caused by significant reductions in both state and private R&D
funding.

32
Figure 3.2 R&D Expenditure and R&D intensity in Jap anese Electricity Industry
0
50
100
150
200
250
1985 1987 1989 1991 1993 1995 1997 1999 2001 2003
0
0,2
0,4
0,6
0,8
1
1,2
1,4
1,6
1,8
R&D Expenditure R&D Intensity
Source: Hattori (2006)
Jamasb et al. (2005b) conclude that vertical as well as horizontal unbundling of the industry
negatively affects R&D spending and technology adoption. This negative relationship follows
from the fact that the size of a firm is an important factor behind innovation. Uncertainty
created by the introduction of competition is also seen as a factor reducing the level of
innovation. Regarding the effect of ownership, these authors conclude that privatisation shifts
the focus of research towards applied and commercial projects. The overall conclusion of
Jamasb et al. (2005b) is that “competitive electricity markets will deliver sub-optimal amounts
of R&D input and output”. Where the lower emphasis on profits of public utilities before
liberalisation, as well as the larger scale of companies, would have mitigated the effects of
positive externalities associated with knowledge spill-overs, according to these authors, these
effects would have been exacerbated with the introduction of competition. As a result,
compared to the pre-liberalised situation, according to these authors, additional policy measures
are needed to encourage fundamental energy research.
This conclusion is challenged by the results of other authors. In their analysis of the relationship
between liberalisation and R&D in the US electricity industry, Sanyal et al. (2005) find mixed
results. They conclude that the uncertainties in the face of anticipated restructuring and
deregulation has adversely affected R&D activities by energy utilities, while, once having
occurred, a higher level of deregulation and competition positively affect R&D. A higher
likelihood of changing the structure of the industry probably creates uncertainty about future
benefits of investments and, hence, reduces the incentive to invest in R&D. When a higher level
33
of competition has been reached, R&D might be encouraged by the prospects of using new
technologies to achieve competitive advantages.
Liberalisation might also affect the composition of R&D. Hattori (2006) finds for the Japanese
electricity industry a shift in the R&D mix towards cost-reducing technologies while R&D in
joint research programmes for public-interest technologies seems to be reduced. In the latter
programmes, research is directed at technologies such as clean-coal generation, fuel cell power
generation and power-system technologies to address the further development of generation
techniques using combined cycle power and renewable energy. The author notes, however, that
the decline in public-interest research may be a result of R&D activities having been genuinely
ill-directed before liberalisation.
A shift of R&D towards efficiency-enhancing technologies due to liberalisation is confirmed by
Markard et al. (2006). These authors find a move from technology-oriented innovation towards
market-oriented innovation. The latter includes both cost-reducing activities and innovations
directed at new products for consumers. In general, they conclude that liberalisation increases
the variety of innovation paths. This picture of the impact of liberalisation on R&D is also
described by Eurelectric (2003).
Hence, liberalisation of the electricity industry does affect the innovation process. The
composition of R&D activities appears to have changed, becoming more directed at
technologies contributing to the profit of the industry in the short term. Conversely, company
funding for more basic research has been reduced in several countries, but it is still an open
question whether this is the result of termination of inefficient R&D activities or whether it
indicates a market failure which calls for additional government intervention compared to the
pre-liberalisation situation.
Besides evidence on R&D expenses, there is also evidence on product innovations in retail.
Littlechild (2005) stresses the effect of competition on product innovation in retail businesses.
From the experience of the Nordic electricity market, Littlechild concludes that retail
competition stimulates the development of new value-added services to customers, such as
offering new terms of contracts, such as fixed-price contracts of different duration and spot-
price related contracts. In addition, Littlechild (2006) lists numerous recently emerged products,
such as energy efficiency packages, duel fuel contracts, various discounts (e.g. for self-reading
meters, for prepayment meters), green tariffs, charity contributions, etc. Hence, liberalisation
encourages more efficient patterns of energy consumption, and leads to more efficient energy
use. The recent European Energy Services Directive (2006/32/EC) stresses the positive role of
product innovation in retail for the development of more efficient energy services.
34
3.3 Policy options to improve efficiency
3.3.1 Introduction
Policy options improving efficiency of the energy supply industry are those which improve
competition in the markets and encourage optimal use and expansion of network capacity.
These measures can be distinguished into structural (i.e. affecting the industry structure) and
behavioral measures. Although structural measures are often more effective for competition,
they also involve higher cost. Therefore, trade-off between these costs and benefits should be
taken into account in policy design.
3.3.2 Unbundling, merger control, divesture and pri vatisation
A key component of the liberalisation of energy markets is the vertical unbundling of networks
from production and supply, in order to ensure efficient pricing of network transportation
services and to create a level playing field for power generators and suppliers, including
entrants. The latest EU directives require legal unbundling (by 2007) of the networks but, given
the importance of independent functioning of transmission networks for good market
facilitation, several EU countries have fully unbundled these networks from commercial
businesses. Although unbundling is likely to improve the competitive situation, it also involves
costs.
The net benefits of ownership unbundling of transmission are widely acknowledged (see e.g.
Joskow, 2003a, and Jamasb et al., 2005a). In contrast, in the distribution industry less
experience has been developed. In New Zealand, for instance, separation of network activities
from retail and generation was followed by an increase in competition and a decrease in
wholesale prices. However, more factors contributed to this improvement, such as improved
switching possibilities and splitting of the dominant incumbent. For the Netherlands, Mulder et
al. (2005) conduct a cost-benefit analysis of ownership unbundling of distribution networks.
Among the costs of unbundling, they distinguish one-off transaction costs associated with the
unbundling process, the loss of scope economies, and reduced financial viability of the
production and supply units that do not hold network assets. On the benefit side, full
unbundling sharpens the focus of the network on their objectives (such as providing
transportation services and facilitating access of market players to the network), which
improves both the position of the regulator and competition conditions in the commercial
segments of the industry. Besides it enables privatisation of the commercial parts of the
industry, even in the case if the networks stay in the government hands. Mulder et al. conclude
that the welfare effects of ownership unbundling are ambiguous as both benefits and costs
depend on uncertain external factors. For example, a fast development of distributed generation
would increase sharply the benefits of keeping distribution networks fully independent from
35
generation, while uncertainty about some of the transaction costs associated with unbundling
may warrant caution.
Despite a clear theoretical argument regarding the adverse effect of a high concentration in the
industry on the performance of firms, empirical evidence on the effect of merger control is
scarce because of the unclear counterfactual: what would be the market development if a
merger actually takes place? Especially in emerging markets, the consequences of a wrongly
approved merger can be large, therefore, some economists plea for more proactive policy in
such markets, emphasizing the relevance of strengthening merger control (see e.g. Canoy et al.,
2003). The key issue here is that of the relevant market. At the moment, energy markets in
Europe are still largely segmented, which urges for the importance of getting the market
structure right at the national level. At the same time, several important market players become
active in many countries. Hence, merger control at the EU level becomes important too,
especially in the light of more integration of the EU markets. Currently, more than two thirds of
the European electricity market is concentrated in the hands of eight large companies13, with the
Europe-wide four-firm concentration ratio at 50%, according to Jamasb and Pollitt (2005a).
The studies on the US show that the performance of generation plants improves after
restructuring because of the improvement of the incentive structure, which is achieved by
privatisation and the change of regulation in divested generation plants. Although such
divestitures are effective, they may involve high cost or be infeasible in practice for political
reasons. Especially with the trend towards more integration of the EU market, some countries
are afraid to split their energy companies as they may be taken over by large foreign utilities. In
these conditions, political lobby groups push towards creating national champions. Behavioral
measures (discussed hereafter) have also been used to mitigate market power.
3.3.3 Virtual Power Plants, Long-term contracts and site availability
Virtual Power Plants (VPP) reduce the scope for strategic playing in the market by reducing the
amount of the generation capacity over which the dominant producers have discretion in
bidding. They represent a physical or financial option on electricity. A physical VPP is a
contract to deliver electricity (against some fixed price); a financial VPP is a contract on price
which works similarly to a usual insurance contract. Willems (2006) argues that the type of the
virtual divestiture is unimportant in the case of monopoly, but it does matter in oligopoly
markets. This is because a physical VPP involves the delegation of production decisions by the
dominant generator, while a financial VPP does not. Hence, in the oligopoly setting, the spot
market is more competitive with a physical divestiture than with financial divestiture.
13 The eight largest companies are EdF, RWE, EoN, ENEL, Vattenfall, Electrabel Endesa, Iberdrola.
36
Practical applications of VPPs can be found in several EU countries (such as Belgium, France,
Italy, Denmark and Czech Republic). For example, in accordance with the agreement between
the EC and Electricité de France (EdF), the company had to make access to 6 000 MW of
generation capacity in France available (in exchange for the approval of the EC to acquire a
further interest in the German electricity utility EnBW in 2001), which is partly done through
VPPs and partly through Power Purchase Agreements.
Long-term forward contracts decrease both the possibility for a dominant producer to exercise
market power and the gains from doing so. Examples are the so-called vesting contracts that
have been used in the US and UK when their electricity industries were restructured. Many
economists (e.g., Newbery, 2002, Wolak, 2001, Bushnell, 2004) emphasize the importance of
long-term contracting for stability of electricity markets. For example, Wolak (2001) stresses
the necessity of “sufficient forward market commitment for fixed-price wholesale electricity to
cover retail obligations.” Also according to the argument of Green (2003), less long-term
contracting (as a result of retail competition) results in price increases, especially in the case of
a large price volatility.
The argument that the introduction of a market for bilateral contracts is helpful in achieving
more competitive resource allocation is also supported by the theoretical result by Allaz and
Vila (1993), according to which the introduction of a futures market leads to a tougher price
competition by producers in the (concentrated) spot market. Empirical evidence on the effect of
such contracts in European electricity markets is provided, for example, by Herguera (2000)
who finds that in England and Wales (under the old system of trade) “..less bilateral coverage
led to price coordination among generators in the pool: the number of price spikes increased
significantly after 1998 <when many such contracts ended> and the number of plants declared
unavailable for spot market bidding also increased”. In contrast, none of these happened in the
Nord Pool market, where the market structure was more evenly distributed and the amount
bilaterally contracted was increasing.
However, long-term forward contracts may create problems for entrants, as they may decrease
the liquidity on the market. Another problem arises in particular in gas markets, where the
incumbent large producers/traders are traditionally purchasers of such contracts, which leads to
an increase of these players’ market power.
Incumbent producers often also own or control many of the (scarce) suitable sites for new
generation plants, enabling them to foreclose the market for new entrants. In theory, dominant
producers benefit from withholding suitable sites, maintaining their market power. However, it
is difficult to assess how large this problem is in practice. The literature has some indications
that the problem of site availability may be important. For instance, Frontier Economics
37
(2006b) reports that the Belgian Energy Regulator (CREG) has indicated that Electrabel may
own a large proportion of such sites, which may create an additional barrier to market entry. A
similar problem arises in Austria, where some DSOs try to secure sites for their own affiliated
companies which increases impediments for market penetration by new market entrants. (Skytte
et al. 2005). Options to improve site availability are, for example, enforced (negotiated) release
of sites, requirements to auction vacant sites and revising the licensing agreement to limit the
scope for capacity expansion by the dominant player.
3.3.4 Efficient allocation as well extension of tra nsmission capacity
Optimal use of the European transmission grid involves sending efficient price signals to both
generators and energy users. Since power flows along different transmission lines are
interrelated, individual lines cannot be viewed (and priced) in isolation. Coordination among
TSOs can enhance efficiency of TSO decisions in the EU context. Also, harmonisation of
regulation is essential for efficiency of the future integrated European market. In order to
achieve this goal a greater consistency is needed in actions of national regulators in different
countries (High Level Group, 2006). A necessary condition for this is that the regulators have
similar powers to promote the market development and to adopt efficiency-increasing policies,
as well as policies enhancing security of supply.
With respect to allocation of network capacity, increasingly non-market mechanisms are
replaced by market mechanisms, such as explicit auctions. Examples of connections where day-
ahead congestion management in the form of explicit auctions have been implemented fairly
recently are the French-Belgian, French-Spanish and German-Swiss borders (see ETSO, 2004
and ETSO, 2006). These mechanisms are supposed to deliver efficient capacity allocation,
however, this is still not always the case in practice. Efficiency would imply that in the presence
of a price difference between two regions, all transport capacity available between two
countries is fully utilised. Frequently, however, one observes unutilised capacity in the presence
of large price differences between neighbouring countries. This may result from illiquidity of
markets, uncertainty in scheduling flows on a day-ahead basis, or the existence of market
power. As an example, Dutch regulator DTe concluded in its review of market liquidity on the
Dutch electricity market (DTe, 2004), that average utilisation of German-Dutch capacity was
well below 100%, even in those hour where price differences were sizable, and attributed this to
uncertainty at time of scheduling. Neuhoff (2004) argues that with explicit auctions, importers
tend to bid non-price-responsively in spot markets (sometimes resulting in suboptimal flows), in
order to avoid costly imbalances in case a bid in either spot market is not accepted. The impact
of market power, and the profitability of withholding import capacity were studied in Joskow et
al. (2000) and Gilbert et al. (2004).
38
Theoretically, the problem of assigning appropriate prices to generation and load for use of the
power grid (including capacity taken up by the loop flows) can be solved in a competitive
market by so-called locational marginal pricing (or nodal pricing), assigning different prices to
each different location in the transmission system (Hogan, 1992). The price differences between
these ‘nodes’ reflect the capacity constraints of the transmission links between them, and the
complicated external effects of input or offtake in one node on the congestion in the various
links. Such systems of locational marginal prices are in operation in some regions in the US.
However, appropriate determination of locational prices is only feasible in a centralised system
where power markets in the system are centrally cleared, which is a long way from the
European system based mostly on bilateral, decentralised markets that operate in the different
countries. Such decentralised markets may have their own merits in providing different
incentives to market participants (Wilson, 2000). Apart from that, giving up national autonomy,
as required for locational marginal pricing, could be hard to realise politically, and a more
gradual improvement may be called for (Brunekreeft et al., 2006).
The approach for the allocation of interconnection capacity currently pursued most actively is
market coupling. In this set-up, instead of auctioning interconnection capacity on individual
borders to individual market participants, the allocation of transmission capacity on all borders
in one region is jointly carried out, on the basis of the bids for supply and demand of energy on
the power exchanges in the regions involved. In this way, energy markets and transmission
markets are simultaneously cleared, taking into account the relations between flows on the
different borders. This allows more efficient utilisation, as firstly, flows are based on actual
rather than predicted price differences, and secondly, the improved information reduces the
need for (over-)conservative estimates of available transmission capacity (Brunekreeft et al.
2006).
A separate issue involves the governance of the system operators who decide on availability of
transmission capacity. The discretion awarded to them creates moral hazard, as they have an
incentive to reduce effort and costs in solving domestic congestion in favour of pushing
problems to their systems’ boundaries (Glachant et al., 2003). Improvements could involve
increased international transparency of procedures and capacity computations and regional
cooperation among TSOs, regulators and governments (Glachant et al. 2006).
Issues in gas transmission markets are to some extent similar to those in electricity
transmission. The key difference is that gas markets are currently much less well developed
than electricity markets in Europe. Access rights to cross-border gas transmission connections
are largely allocated in long-term contracts, leaving little room for market-based allocation of
short-term capacity. Furthermore, short-term wholesale markets for gas are in most countries
still in their infancy. On the other hand, in this situation of ill-developed gas markets, the role
39
for long-term contracts may be more important. Given the longer distances between gas
production regions (often outside of Europe) and the associated larger specific investments,
there may be a greater need for long-term contracting, giving rise to a tension. This situation
will change when markets become more liquid, reducing asset specificity (Mulder et al., 2006).
In the long run, efficiency of the transmission market involves efficient investment in
transmission capacity expansion. Major policy issues arise with respect to accommodation of
transit flows and extension of interconnection capacity.
The first issue involves the remuneration of transit flows: expansion of capacity for transporting
power flows between two regions usually not only involves investment by the two regions’
transmission system operators themselves, but also expansion of capacity in grids that are used
for transit flows. The incentive for capacity investment by the operators of these transit grids
depends on the ways in which such transit flows lead to remuneration for these grid owners. A
second issue is to what extent investment in new interconnections may be carried out by
independent ‘merchant’ parties, and if this occurs, whether these merchant operators should be
subject to regulation. The trade-off here may be between market failure, leading to potential
underinvestment by private investors, and regulatory failure, leading to either under or
overinvestment by regulated transmission investors (see Brunekreeft et al., 2004, for an
overview of both issues).
3.3.5 Enhancing end-use efficiency
In addition to policies directed at the efficiency of the energy production, transportation and
supply, policies on the demand side stimulating the efficient use of energy by consumers can
contribute to European competitiveness as well. Retail competition might play an important role
in demand management and in moving towards energy-efficient technologies on the consumer
side. Retail innovations in the tariff structure and a wider use of real-time meters14 lead to a
more efficient consumption pattern, contributing to the reduction of the cost of energy
provision. New energy services, such as energy-saving advise and promotion of energy saving
equipment, can stimulate energy savings by consumers. The recent European Energy Services
Directive stresses the positive role of product innovation in energy services for energy end-use
efficiency. It requires Member States to create the conditions for a market for energy services in
order to improve the implementation of energy-efficiency measures by final consumers.
In a competitive retail market, retailers likely extend their activities to end-user services
contributing to a more efficient use of energy by reducing the costs of implementing energy- 14 The cost of installing such meters is also substantial, therefore, it is a matter of a cost-benefit analysis to decide if these
‘smart meters’ should be installed in a particular case. Recently there were quite a few examples of promoting switching to
these meters on relatively large scale. For example, Enel in Italy is replacing 30 mln standard meters with new meters. Also
in Sweden 5 mln new meters are due to be installed by 2009 (Frontier Economics, 2006a)
40
saving measures. This effect, however, is likely fairly small compared to the impact of other
factors on energy use, in particular the price of energy. Environmental policy measures raising
the price of energy, such as the European emissions trading scheme, can have a significant
effect on energy use (see chapter 5 for more detail on this issue).
3.4 Conclusion
Based on the evidence presented in this chapter, we conclude that the change of incentives,
resulting either from the introduction of competition or from more stringent regulation, has
generally resulted in more cost-efficient operation. Although the reduced costs have to some
extent been passed on to consumers, market behaviour raises concerns. Wholesale markets have
turned out to be particularly vulnerable to market power, as a consequence of both legacy
industry structure and the specific characteristics of electricity and gas. The viability of
competition on retail markets, which relies on the willingness of smaller consumers to switch, is
in most markets yet to be proved. Evidence on effects on innovation indicates that a shift occurs
in composition of R&D efforts: the companies’ innovation focus moves away from (public-
interest) technology innovation towards cost-reducing technologies and consumer services.
While aggregate private spending appears to have diminished, the focus on efficiency-
improving innovation seems to have increased.
Potential market power issues in energy markets can be dealt with by developing mechanisms
fostering competition. In this chapter we listed a number of policy options to do this, including
both structural (e.g. merger control and unbundling some companies) and behavioural (e.g.
imposing contracting requirements on dominant players). Also designs of mechanisms for
cross-border trade have scope for improvement, in order to better reap the benefits of
integration of markets. In particular, current steps towards ‘market coupling’, a mechanism
which allows for more efficient utilisation of available transport capacity between countries,
may lead to improved gains from electricity trade. Finally, we explain the role of the demand
side in decreasing the cost of energy provision and improving end-use efficiency.
The issues of cross-border market integration can not be solved by each separate country, but
needs integration and harmonisation of efforts at the EU level, which also calls for a greater
consistency in actions of national regulators, as stressed by the High Level Group (2006). This
concerns especially the development of cross-boarder trade between countries and involves the
measures curbing market power at the European level and the mechanisms stimulating efficient
use and expansion of interconnection capacity.
41
4 Liberalisation and security of supply
4.1 Introduction
In the pre-liberalisation era, investments in the electricity and gas sectors were centrally
coordinated. Security of supply generally was a responsibility of the incumbent vertically
integrated monopolist, which incorporated engineering reliability standards in its decisions on
capacity investments. The perception of supply security was chiefly that “all customers should
be able to consume as much electricity as they want at a constant price at any given time”
(Bushnell, 2005). As a result, the pre-liberalised energy industry was characterised by a high
level of overcapacity where costs could be passed on to consumers. Moreover, the role of the
demand side in achieving supply-demand balance was hardly recognised. Liberalisation has led
to a shift of investment risk from consumers to the investors themselves, creating incentives to
increase efficiency. In addition, liberalisation gives stronger incentives to consumers to respond
to supply shortages.
A consequence of the abolition of the supply monopoly is that the responsibility for supply
security is not anymore assigned explicitly to an identifiable party. Rather, in the liberalised
environment the market mechanism is relied upon to generate optimal investment. The
question, therefore, is to what extent the security of supply is compromised by the decentralised
management of energy supply. In order to answer this question, it is important to note that two
different perspectives on ‘security of supply’ can be distinguished.
Some view security of supply as guaranteeing a stable supply of energy at an ‘affordable’ price,
no matter what the circumstances are (see e.g. EC, 2000). The 2005 Directive on Security of
Supply (2005/89/EC) defines: “security of electricity supply means the ability of an electricity
system to supply final customers with electricity, (...) the satisfaction of foreseeable demands of
consumers to use electricity without the need to enforce measures to reduce consumption.”
Eurostat (2006) views “reliable electricity supply at acceptable prices a key driver to economic
growth and competitiveness”. The North-American Electricity Reliability Council (NERC)
defines adequacy as “the ability of the system to supply the aggregate electric power and energy
requirements of the consumers at all times”, and security as “the ability of the system to
withstand sudden disturbances” (Meade, 2006). These definitions are close to pre-liberalisation
goals as they take demand as an exogenous factor.15 From a purely economic point of view,
however, the concept of security of supply is related to the efficiency of the provision of
electricity or gas to consumers. Markets will always show variations in supply and demand,
15 Although the 2005 Directive also stresses the importance of “removing barriers that prevent the use of interruptible
contracts” and “encouragement of the adoption of real-time demand management technologies”.
42
and, hence, in prices. A reduction in supply allows prices to rise and demand to fall, while an
upward shift in demand raises prices and, hence, supply.
The two perspectives, therefore, lead to conflicting goals, as from an economic (welfare) point
of view, supplying all demand is bound to be inefficient, and prices will have to fluctuate to
clear the markets16. The remainder of this chapter looks at supply security from both
perspectives.
4.2 Performance of energy markets in delivering sta ble and secure supply
4.2.1 Volatility of prices
Liberalisation of markets leads to decentralisation of operational and investment decisions,
coordinated through the price-forming process. Comparison of prices with short-run marginal
costs of supplying to the market (or, conversely, marginal value derived from consuming
energy) informs market participants in making these decisions. In the days of the vertically
integrated monopolists supplying to consumers in a centralised fashion, such short-term price
signals were not required, and consumers typically faced average prices for energy (which for
gas were usually indexed to oil price fluctuations). As a result, liberalisation results in more
volatile short-run prices, which were effectively hidden under the centralised regime. Compared
to other commodities, the volatility of short-run prices of electricity and gas is large. As
examples of the volatility in energy markets, figure 4.1 plots the daily spot prices for the Dutch
APX electricity market as well as the UK gas market spot prices. While overall volatility of
prices is noticeable, the short-lived price spikes to values which may exceed normal prices by
tenfold are particularly striking.
The volatility of prices results from the particular characteristics of electricity and gas, in
particular the inelasticity of both demand and supply in the short term. These in turn are related
to the difficulty of storing electricity and the high costs of storing gas, respectively, as well as to
the strict capacity limit of production and transmission capacities. The high investment costs of
production equipment makes it uneconomic to keep large amounts of spare capacity available,
which leads to congestion on infrastructure in times of high demand. This congestion is
internalised, in turn, through rising spot prices.
16 Moreover, as Joskow et al. (2006) point out, in an efficient market price insensitive consumers’ demand may have to be
involuntarily curtailed.
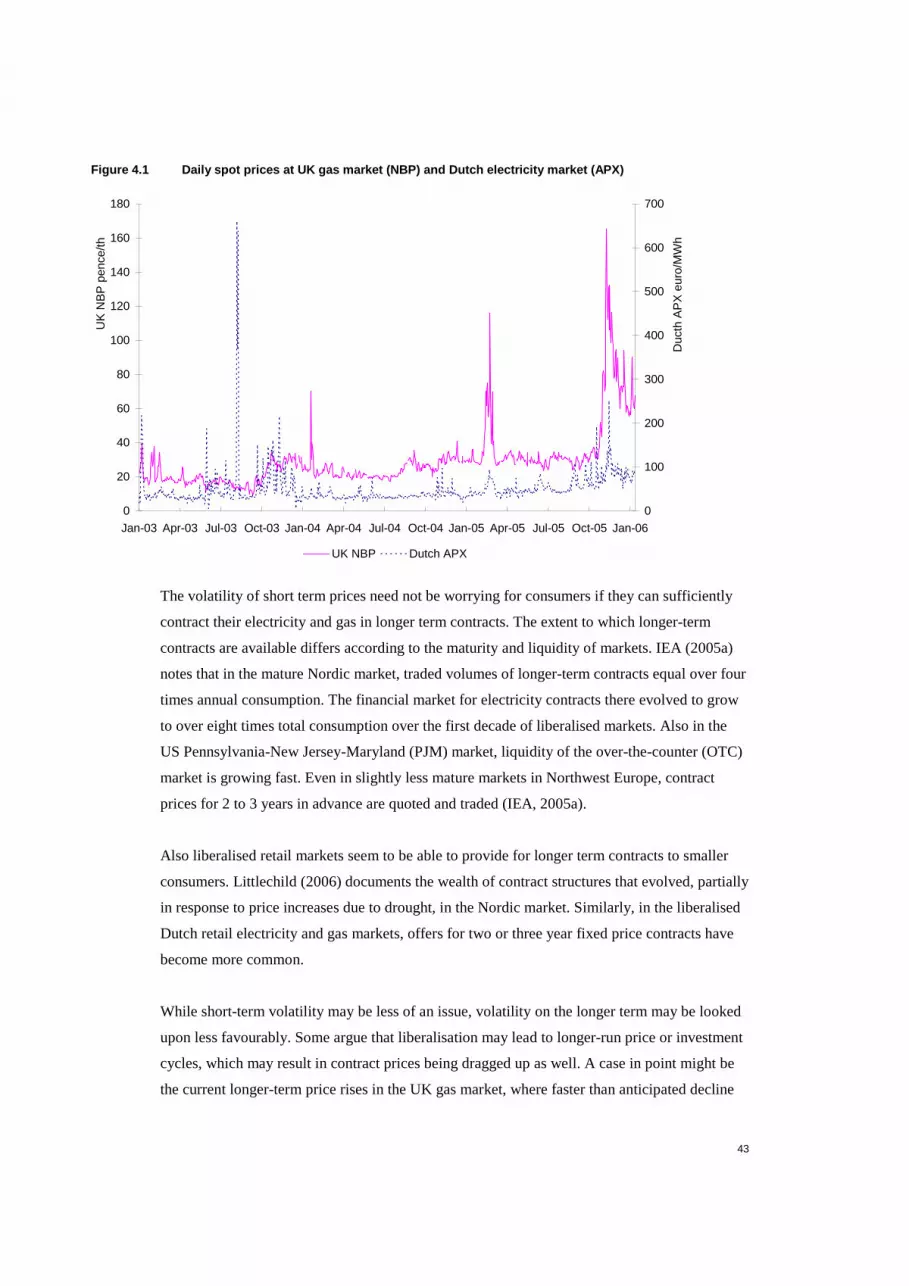
43
Figure 4.1 Daily spot prices at UK gas market (NBP) and Dutch electricity market (APX)
0
20
40
60
80
100
120
140
160
180
Jan-03 Apr-03 Jul-03 Oct-03 Jan-04 Apr-04 Jul-04 Oct-04 Jan-05 Apr-05 Jul-05 Oct-05 Jan-06
UK
NB
P p
ence
/th
0
100
200
300
400
500
600
700
Duc
th A
PX
eur
o/M
Wh
UK NBP Dutch APX
The volatility of short term prices need not be worrying for consumers if they can sufficiently
contract their electricity and gas in longer term contracts. The extent to which longer-term
contracts are available differs according to the maturity and liquidity of markets. IEA (2005a)
notes that in the mature Nordic market, traded volumes of longer-term contracts equal over four
times annual consumption. The financial market for electricity contracts there evolved to grow
to over eight times total consumption over the first decade of liberalised markets. Also in the
US Pennsylvania-New Jersey-Maryland (PJM) market, liquidity of the over-the-counter (OTC)
market is growing fast. Even in slightly less mature markets in Northwest Europe, contract
prices for 2 to 3 years in advance are quoted and traded (IEA, 2005a).
Also liberalised retail markets seem to be able to provide for longer term contracts to smaller
consumers. Littlechild (2006) documents the wealth of contract structures that evolved, partially
in response to price increases due to drought, in the Nordic market. Similarly, in the liberalised
Dutch retail electricity and gas markets, offers for two or three year fixed price contracts have
become more common.
While short-term volatility may be less of an issue, volatility on the longer term may be looked
upon less favourably. Some argue that liberalisation may lead to longer-run price or investment
cycles, which may result in contract prices being dragged up as well. A case in point might be
the current longer-term price rises in the UK gas market, where faster than anticipated decline

44
of indigenous production produced a sequence of several winters with tight supply-demand
conditions (see figure 4.2).
Figure 4.2 Gas prices in US (Henry Hub) and UK (NBP ), monthly average, 2000-2008
0
5
10
15
20
25
30
35
40
45
50
Jan-00 Jan-01 Jan-02 Jan-03 Jan-04 Jan-05 Jan-06 Jan-07 Jan-08
euro
cent
/ m
3
US Henry Hub-price UK NBP-price
Investments in liberalised markets are sometimes characterised as ‘just-in-time’, which may,
while ex ante optimal, from an ex post perspective actually be just too late in adverse
conditions. While the UK system so far has been able to withstand the above-mentioned shock
in terms of balancing supply and demand, this comes at the cost of high prices and significant
demand response. Before liberalisation, such conditions were less likely to happen as risks of
overinvestment were not borne by the investor, but by the consumer (who would pay a higher
average price) as well as, where subsidisation was involved, the tax-payer. As a result, the
larger margin of spare capacity (to be on the safe side) in the pre-liberalisation period tended to
dampen such price fluctuations.
The long-run average energy price fluctuations are not incomparable in magnitude to those in
other commodity markets (e.g. oil, metals). A major difference with these markets is that
electricity and, to a smaller extent, gas prices are of a more local nature: as a consequence of
infrastructure capacity constraints, global arbitrage of prices cannot occur (see e.g. figure 4.2
for differences between UK and US prices). Average price conditions among various local
markets may diverge more significantly than in other commodity markets, creating larger
fluctuations in relative competitiveness between regions, and potentially reducing liquidity of
forward markets. Long-run price fluctuations may be manageable by consumers through long-

45
term fixed price contracts. However, a market for such longer term contracts (of many years’
duration) does not appear liquid.
4.2.2 Meeting all consumer demand
Shortages may occur in gas and power markets as a consequence of inadequacy of generation
capacity, outages in the transmission system, or local problems in distribution grids. One may
furthermore distinguish between involuntary curtailment of consumers and controlled demand
reduction, or economic shortage.
Real physical shortages17 have always been mainly restricted to problems in system
management or distribution grids, and have not in general been caused by insufficient
production capacity. A well-known exception might be the Californian power crisis, where
indeed consumers did experience (controlled) forced disconnections. Even here, as explained in
Bushnell (2004), this appeared not so much a consequence of insufficient capacity, but rather of
insolvability of the utility firms.
Figure 4.3 Effect of Norwegian 2002-2003 price spik e on electricity consumption by the boiler market
0
100
200
300
400
500
600
700
800
Jan-02 Apr-02 Jul-02 Oct-02 Jan-03 Apr-03 Jul-03
GWh
0
10
20
30
40
50
60
70
80
øre/kWh
Consumption Consumption in the previous year spot price
Source: Bye (2003)
On the supply side of the market, on the other hand, economic shortages (closing of production
activities because of high energy prices) have been more widespread: liberalised markets do
generate market prices where consumers decide to reduce their energy use. In the UK gas
17 In power markets, these would either be uncontrolled black-outs, or controlled rotating black-outs, brown-outs (voltage
reductions below normal operational limits), or forced interruptions of industrial users.

46
market, for instance, demand response over the high priced winter 05/06 was significant.
Regulator Ofgem estimated this as up to 10% of total gas consumption; the majority of this
came about by electricity producers switching to other fuels. Energy intensive firms (e.g. in the
ceramics and paper industries) shut down during large parts of winter. Also in the US, higher
gas prices have led to the delocation of some of the more energy intensive consumers (e.g.
fertilizer production, see Fertilizer Institute, 2005). In the Norwegian market, in the 2002-2003
winter, price spikes emerged, provoking significant demand response, even from domestic
consumers, who were generally on short-term contracts and were therefore soon confronted
with the price rise, and as a result the market coped remarkably well in preserving supply-
demand balance (Bye, 2003; see figure 4.3).
Apart from actual experience of incidents where economic shortages appeared, one may also
investigate whether risks of supply shortages have increased since liberalisation. One indicator
of this is the evolution of spare electricity generation capacity after liberalisation. Declining
capacity margins make the system more susceptible to incidental supply shortage. In the EU-15,
the growth in electricity demand over the last two decades has slightly outpaced growth in
capacity: average utilisation of capacity increased by 7% (see also figure 3.1). Focussing on
individual technologies, it appears that the average spare margin18 on nuclear and conventional
capacity has decreased (with utilisation rates increasing by over 10% for each) (Eurostat). When
focussing on the last 5 years, this trend is even more apparent.
The lower margins of flexible capacity in EU-15 have to be viewed in the perspective of
increased power trade among countries. In addition, allocation of rights to use interconnection
capacity has become more flexible and swifter response of power flows to short-run local
supply or demand changes is now possible. As a result, by better pooling of national spare
capacity margins (diversification), similar levels of security may be attained with lower
capacity margins.
Another indicator of risks of supply shocks is the level of diversification of supplies. More
diversity of supplies leads to pooling of risks of interruption of supplies from individual
sources. This leads to lower aggregate risk provided the alternatives are equally reliable19, and
shocks are uncorrelated. In electricity generation, one often looks at diversity of technology
(and fuel) of electricity production. It is evident that gas-fuelled production and wind energy
have grown significantly, at the expense of nuclear and, mostly, coal (see figure 4.4). Given the
traditionally high shares of the latter two fuels, diversification seems to have increased. This is
18 Defined as the ratio of available capacity from these technologies and annual output. 19 Risks of different technologies do obviously differ in practice. Gas, for instance, is generally viewed to be more vulnerable
to political risk.
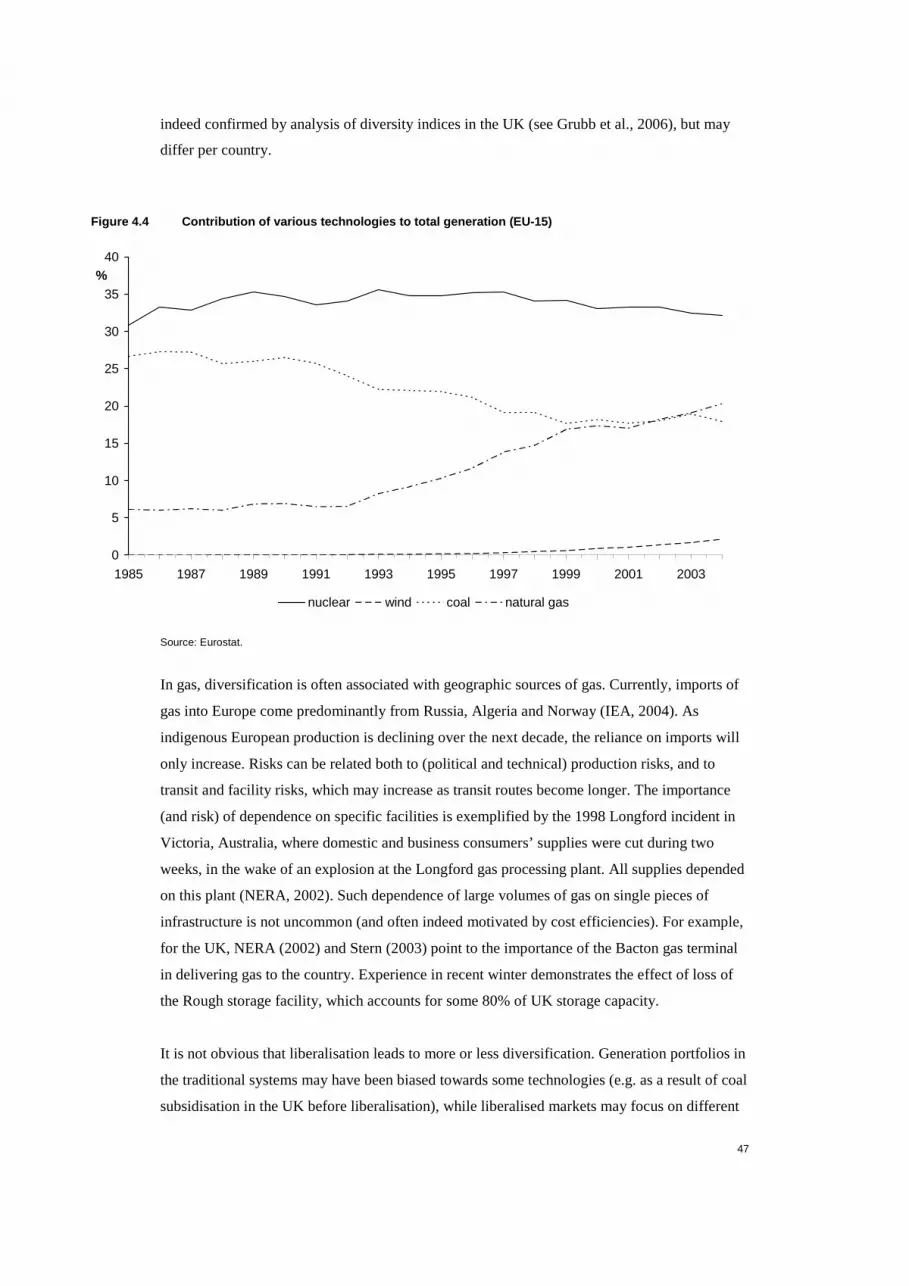
47
indeed confirmed by analysis of diversity indices in the UK (see Grubb et al., 2006), but may
differ per country.
Figure 4.4 Contribution of various technologies to total generation (EU-15)
0
5
10
15
20
25
30
35
40
1985 1987 1989 1991 1993 1995 1997 1999 2001 2003
%
nuclear wind coal natural gas
Source: Eurostat.
In gas, diversification is often associated with geographic sources of gas. Currently, imports of
gas into Europe come predominantly from Russia, Algeria and Norway (IEA, 2004). As
indigenous European production is declining over the next decade, the reliance on imports will
only increase. Risks can be related both to (political and technical) production risks, and to
transit and facility risks, which may increase as transit routes become longer. The importance
(and risk) of dependence on specific facilities is exemplified by the 1998 Longford incident in
Victoria, Australia, where domestic and business consumers’ supplies were cut during two
weeks, in the wake of an explosion at the Longford gas processing plant. All supplies depended
on this plant (NERA, 2002). Such dependence of large volumes of gas on single pieces of
infrastructure is not uncommon (and often indeed motivated by cost efficiencies). For example,
for the UK, NERA (2002) and Stern (2003) point to the importance of the Bacton gas terminal
in delivering gas to the country. Experience in recent winter demonstrates the effect of loss of
the Rough storage facility, which accounts for some 80% of UK storage capacity.
It is not obvious that liberalisation leads to more or less diversification. Generation portfolios in
the traditional systems may have been biased towards some technologies (e.g. as a result of coal
subsidisation in the UK before liberalisation), while liberalised markets may focus on different
48
technologies. The Longford incident in Australia was attributed to the monopolistic status of the
gas sector. However, if observed current (lack of) diversity gives rise to political concerns, this
may necessitate policy measures complementing the liberalised market.
4.2.3 Reliability of networks
The reliability of the electricity generation system is intimately connected with security of the
transmission system. Indeed, major power failures of recent years did not originate from
inadequacy of generation capacity, but were a consequence of failures of system operations.
System operators are in charge of keeping electricity demand and supply balance intact over the
network. Failure to do so results firstly in overloaded transmission lines, and soon afterwards
from loss of equipment that may send the system into a cascade of failing components and loss
of power over large areas. Well known examples are the 2003 black-outs in the Eastern US and
Canada, leaving 50 million people disconnected for up to 4 days, and in Switzerland and Italy,
that left Italy without power for a day.
IEA (2005b) provides some evidence indicating that the frequency and extent of (smaller)
North-American outages may have increased since the early 90s. Secondly, IEA also notes that
larger black-outs occur mostly when systems operate close to their security limits. EU-15 cross-
border trade volume has increased by 4% per annum over the last decade, compared to a 2%
increase in generation (Eurostat). As a result of liberalisation and increased trade, many
interconnections between European countries are congested a large part of the time (UCTE,
2005).
Another reason for strain on transmission capacity may be the higher share of intermittent
generation (in particular, wind) in Europe. The more erratic supply patterns resulting from this
cause larger short-turn variation in transmission flows across European networks, and hence
place greater strains on reliability. A near-incident challenging stability of the Belgian power
grid as a result of German wind production is an example of this (UCTE, 2005).
The impact of liberalisation on the distribution sector is mainly through stronger requirements
on unbundling and regulation in the member states. A drive for efficiency as a result of
increased regulatory incentives might compromise distribution grid quality, though this much
depends on the form of regulation. Figures on outages in the UK grid do not show significant
increases of distribution disruptions, while outages as a result of planned maintenance have
decreased (see CPB, 2004).
4.3 Performance of energy markets in delivering an efficient level of supply
From a welfare economic point of view, the question of an optimum level of supply security
can be rephrased as whether the market succeeds in achieving efficient balancing of supply and

49
demand in the short run, and efficient levels of investment in the long run. Efficiency does
require that short run prices fluctuate to reflect changing supply and demand conditions. While
in many periods, prices will be related to marginal costs of supply (in efficient markets), in
periods of scarcity prices rise to willingness to pay by consumers. Prices in both regimes may
differ by orders of magnitude, where the high prices may be required to recover the
investments. In these periods, furthermore, not all demand will be met. Security of supply
interpreted in terms of short- and long-run efficiency is therefore at odds with the concepts of
supply security analysed above.
The evidence of fluctuating prices and demand response presented so far may be consistent with
a drive towards efficiency. Since security of supply is itself costly, the optimal benefit-cost
situation may well involve lower levels of supply security than those enforced by central
planners in the past or currently imposed through public-service obligations. In this approach,
policy measures may be called for when markets may fail to achieve the efficient level of
supply.
An evident reason for intervention in energy markets exists because small consumers are not
aware of (real-time) electricity prices and many consumers do not have the opportunity to react
to short-lived price rises by reducing their demand. The potential failure to balance the system
as a result of such demand rigidities might lead to system collapse, imposing an externality on
all users. System security is therefore a public good. In practice, the solution adopted to this
failure is that responsibility for balancing the system and making decisions on curtailing
consumption is assigned to a system operator.
Uncertainty over peak prices is sometimes mentioned as impediment to efficient investments.
Producers would not invest if they perceive the revenues to be too risky. This argument
disregards the fact that not investing would be equally risky to those being short in energy:
consumers or those from whom they contract energy. However, market failures may also occur
if prices in periods of price spikes do not adequately reflect the value of energy. This may result
from ill-designed real-time (balancing) markets (or balancing mechanisms), but also for
instance from (investors’ anticipation of) interventions by governments or system operators in
mitigating temporary price rises (e.g. Bushnell, 2005). As Joskow (2005) points out, especially
under scarcity conditions prices will be extremely sensitive to the system operator’s
discretionary actions.
Incompleteness of markets can also result in suboptimal behaviour. If markets, in particular for
long-term contracts, are not sufficiently liquid, optimal transactions may fail to take place.
Reasons for insufficient long-term contracting may arise from transaction costs, but also from
inadequate design of retail markets. If consumers favour contracting with financially unreliable
50
retailers since they are not exposed to the imbalance costs in the event of the retailer’s
bankruptcy, insufficient contracting may result (Bushnell, 2005).
Do markets deliver suboptimal diversity? Again, when risks of certain sources or technologies
translate into adequate price risk exposure to those contracting from these sources, market
parties internalise those risks. An exception might occur in the gas market, if increased
dependence on (political) sources increases these sources’ incentives to interrupt supplies to
achieve political goals. In addition, there is an obvious public good involved in trade relations
and international frameworks of property rights: foreign policy affects costs and risks of
international supplies.
As to technology choice, there is, finally, a clear environmental externality. In addition,
Neuhoff et al. (2005) argue that in the presence of market power, base load plants (i.e. the low
marginal cost plants producing across all hours of the day) or intermittent generation benefit
less from exercise of market power than peak plant. The equilibrium mix of technologies may
therefore be distorted under market power.
Regarding transmission and distribution, optimal regulation should incorporate incentives for
internalising reliability of the grids. A difficulty in transmission grid regulation in particular is
that local grids’ security is intimately connected to operations in adjacent grids (that will
typically be regulated by different regulators). This creates moral hazard where operators can
shift responsibilities to adjacent operators (see e.g. Glachant et al., 2003). In addition, benefits
of investments spill over to other operators, and are sensitive to (imperfect) compensation
mechanisms for transit flows.
4.4 Policy options
4.4.1 Design of balancing markets
As discussed, the cornerstone of market efficiency lies in prices that adequately reflect the (real-
time) value of electricity or gas, as well as market actors’ decisions that translate into exposure
to these prices. This allows market players to internalise the effects of their actions on the
supply security of the system.
Most transactions in the wholesale electricity and gas markets are regular contracts between
private counterparties, where rights and responsibilities are well-defined. The special features of
these markets are reflected in the necessity of centrally-run balancing markets. Both in
electricity and gas markets, given the public-good character of system security, the system has
to be managed by an operator having the responsibility for keeping the system in balance. The
system operator translates its responsibilities into obligations on users of the system through the

51
design of a balancing regime with associated rights and responsibilities. Under the balancing
regime, market parties generally have rights to execute (balanced) transactions, but are charged
for imbalances between input into the system, and offtake from the system. The design of the
balancing arrangements is critical in appropriately making market parties internalise the
consequences of their decisions. In particular, efficiency requires that real-time prices reflect
real-time value of electricity or gas, in order to give adequate incentives to participants to
contribute to supply security.
All other contract prices (in day-ahead and longer-term markets) are essentially forward prices
on the balancing price, so that inadequate design of this market feeds through into flawed
pricing in the complete wholesale market. As an example, if market parties anticipate that a
supply incident (such as a pipeline outage) will not result in costly imbalances, there will be no
incentive to hedge against such incidents through longer term contracts. Moreover, there will be
no need of adjusting behaviour to reduce exposure to such incidents, leading to overreliance on
the supply source.
Not all EU markets have so far implemented market-based balancing arrangements in gas and
electricity markets, relying instead on balancing mechanisms whose prices at best imperfectly
reflect the real system balancing situation. Introducing such markets would be a first step
towards ensuring adequate market provision of supply security.
Secondly, in particular (balancing) prices in situations of system tightness are crucial in
provoking behaviour consistent with optimal supply security. Ex ante transparency on system
operator disconnection policy in case of real-time shortage, as well as pricing behaviour under
these conditions, can signal that system operators will allow prices to reflect scarcity, and that
governments will refrain from interfering in the market in these events, thus providing
assurance to investors. A principal component of such policies would be the definition of the
so-called value of lost load, or the average value attached to remaining connected by smaller
customers (who cannot independently decide to disconnect). Values for price caps adopted in
various systems across the world are given in table 4.1. In effect, this price would serve as a
price cap in the market, since when the market price exceeds the cap it is, by definition, welfare
improving to stop supplies to these consumers. Conversely, whenever non-price-responsive
consumers are disconnected to solve balancing problems, the (efficient) price for balancing
power would equal this disconnection value. Furthermore those consumers disconnected (or the
suppliers responsible for them) are in this case suppliers of balancing power to the market, and
it should be ex ante specified whether they would be remunerated as such.

52
Table 4.1 Price caps (per MWh) in various electrici ty markets (from IEA, 2005a)
PJM Australia Britain Denmark Finland Norway Sweden
USD 1000 AUD 10 000 none none none NOK 50 000 SEK 20 000
EUR 830 EUR 6 250 EUR 6 300 EUR 2 100
4.4.2 Price and capacity regulation of wholesale ma rkets
If high prices reflecting scarcity are either not (politically) acceptable, or cannot be credibly
committed to by government or system operators, capping prices at some maximum level may
be considered. To keep incentives for investment optimal, this requires additional compensation
for investors to make up for those profits that would have occurred in hours of scarcity. Various
methods to provide such payments have been considered. In the United States, various regions,
in particular in the North-East, have so-called Installed Capacity (ICAP) markets, where
electricity suppliers have to buy sufficient ‘capacity credits’ from generators. The amount of
these credits is related to the buyer’s level of peak demand. Credits, being limited in supply,
command a positive price. Sales of credits forms a source of revenues to generators in addition
to electricity prices, and contributes to the maintenance of a margin of supply over peak
demand. Effectively, the required margin is set by the regulator. Such a system was advocated
more generally by the federal regulator FERC in its so-called Standard Market Design, a
programme developed after the California crisis.
An alternative mechanism is that of capacity payments, or subsidies related to having
generation capacity available. In England and Wales, the so-called Pool, which offered capacity
payments in addition to a price for electricity, was abandoned in 2000 in favour of the New
Electricity Trading Arrangements (NETA). One of the reasons was that the Pool mechanism
turned out to be sensitive to market power in the UK market (Newbery, 2005). Also in Spain, a
capacity mechanism is implemented, the details of which have continued to be subject of much
debate (Batlle et al., 2006). In the Netherlands, concerns over inadequate investment in
generation were met by the introduction of a ‘safety net’, providing the system operator with the
possibility to contract additional reserves to mitigate damage in case of a system emergency.
The system was designed to interfere minimally with ordinary market operation (see Lijesen
and Zwart, 2005). However, as producers appear to have responded to the tightening supply
situation by increasing investment, it was concluded that implementation of the system was not
yet called for (TenneT, 2005). Brunekreeft (2005) notes that in Scandinavia, except Sweden,
there are no plans for central acquisition of capacity.
Disadvantages of such approaches are the necessity of detailed regulation and central planning
of required capacity. In the credits system, the regulator has to determine the level of capacity
required to be contracted by consumers, the penalty for non-compliance, as well as the price cap

53
in the wholesale market. In addition, in integrated systems, a price-capped system will lead to
muted incentives on market participants for providing system security in times of stress, since
the benefits of making available additional supplies or reducing demand are lower (see e.g.
Hogan, 2005, and Batlle et al., 2006). Too low price caps will effectively eliminate all potential
for demand side participation. Furthermore, in integrated systems, price caps might give
perverse incentives to lean on the system and export power to regions not affected by the cap.
Price caps are sometimes advocated as a device for market power mitigation. However, as
argued by Bushnell (2005) and Joskow et al. (2006), market power might well migrate to the
capacity market instead.
Insofar as inadequate contracting (and inability of consumers to hedge against price volatility)
is the cause of concern, measures may be taken to improve liquidity of contract markets. This
may require regulation on market transparency, regulatory endorsement of market places, but
potentially also requirements on retail firms to hedge their price risks, and avoidance of
regulation that provides consumers (low) default rates to switch to in times of high prices. The
latter would lead retailers to shy away from purchasing power or gas on longer term contracts,
as their customer base would decline as soon as spot prices would drop below the long-term
contract price.
More draconian measures would be to force long-term (option) contracts on consumers (see e.g.
Perez-Arriaga, 1999, Oren, 2005, and Hogan, 2005). Such proposals, which have so far not
been implemented anywhere, resemble capacity credit schemes to some extent. Selling an
option obliges generators, when prices rise above an agreed strike price, to remunerate
consumers, the buyers of the options, the price difference. The gains from the contract sales
should provide the investors with sufficient return on their investments. Such obliged contracts
may mainly have merit if risk averse consumers have no access to (long-run) contracts
protecting them from occasional price rises. Littlechild (2006) demonstrates that absence of
such regulation may result in desired outcomes as well, with those consumers that prefer such
price protection voluntarily contracting with suppliers. Other measures may be support for
industrial consumers in negotiating collectively long-term contracts with producers, as e.g.
occurs in France (Ministère de l’Economie, 2005) and the Netherlands (Electrabel Nieuwsbrief,
2005).
4.4.3 Encouraging liquidity of markets
A liquid market gives a number of benefits to market players, both at the supply and the
demand side. On the demand side, market liquidity allows consumers to efficiently hedge their
exposure to short-term price fluctuations, and to take advantage of their ability to respond by
reducing demand when this is profitable in case of short-lived price rises (potentially through
the services of specialised intermediaries).
54
On the supply side, apart from a loss in efficiency as a result of a failure in adequate trading
among players, a lack of volume and depth of the wholesale market is also likely to prove an
entry barrier for new players investing in the market. A liquid market lowers transaction costs
for new players in the market (e.g. entrants in the retail supply market) and facilitates entry of
independent investors (in for instance LNG terminals) by reducing potential hold up problems.
This is because liquidity of the market strongly decreases the asset specificity and the ensuing
need for long-term contracts (see box ‘Liquidity of the market and investments’). As a result,
liquidity of markets may decrease market power and, by removing investment barriers, increase
efficiency of investments.
The emergence of liquid markets may also change the motivation for investment. Whereas in
the past, market parties would invest in e.g. storage in accordance with their needs to balance
their own supply portfolios, increased market liquidity offers more opportunities to build
storage capacity for the purpose of trading, making use of (shorter-term) fluctuations in supply
and demand. In the gas market this increases the focus on flexible short-term storage such as
salt caverns, while in electricity, flexible gas plants may become more attractive. The mix of
supply assets may therefore change.
It should not be concluded that competitive and liquid markets will call forth more investments
in infrastructure than relatively non-liquid markets dominated by incumbents. Indeed, one of the
goals of liberalisation was to avoid overinvestment in infrastructure. Dominant incumbent
parties typically do not face hold-up risks if they themselves control the end-user markets and
can shift costs towards captive consumers. It does seem true, however, that liquid markets, by
removing a barrier for entry, can attract a more diverse range of investors, introducing
investment competition that favours the more efficient investors.

55
Box: Liquidity of the market and investments
Assets in the gas market (such as LNG terminals, storage facilities, production) are of a long-lived nature. Market
parties, in their decision to invest, will only invest if the prospect of reaping the future rewards for these investments is
sufficiently certain. Risks may include both price and volume risks. Of particular concern is the danger of opportunistic
behaviour when large initial, relation-specific investments are involved (Williamson, 1979). After the investment has
been sunk, a buyer has the incentive to exploit its bargaining power to expropriate the resulting rents. Anticipating this,
the investor does not invest, or is ’held up’.
The standard answer to such hold-up problems is the use of long-term contracts, which indeed abound in the gas
industry. For Dutch gas producers, such contracts are mainly used to mitigate volume risk: contract prices are
renegotiated annually, with prices within the year being updated on the basis of price movements in baskets of traded
commodities. Most long-term contracts have some degree of price flexibility (see e.g. Creti and Villeneuve, 2003), or link
the price to some external benchmark (e.g. the UK NBP price).
Volume risk, or the risk that one’s output cannot be sold against market prices, is of particular concern if the number of
potential buyers is limited, which indeed makes investments relation-specific. Liquidity of the gas market strongly
decreases this specificity and the ensuing need for long-term contracts. A liquid gas market by definition is able to
absorb gas sales at market prices. Quoting Newbery (2000) on the UK gas market, “In the past the lack of a competitive
market for gas has meant that gas development faced the same problems of opportunism as other capital-intensive
sunk investments tied to a single market, which they managed by signing long-term contracts. If there is a genuinely
competitive gas market with a sufficiently large number of buyers and sellers, [...] then these problems of opportunism
are reduced, and only commercial risks remain. Oil companies are familiar with these potential problems, and manage
them with rather shorter-lived contracts, futures, and by shifting the remaining risks onto their shareholders who can
hold diversified portfolios.”
The fact that liquid gas markets reduce investment risk (or risk of hold-up) is illustrated by the Ormen Lange project, a
multi-billion dollar investment connecting a Norwegian gas field to the UK market, as described by Honoré and Stern
(2004): “Many of these companies have said on many occasions that it would be impossible to invest in multi-billion
dollar projects without long term contracts. And yet, it is striking that although the project is under construction, no long
term contracts have been announced and Norsk Hydro has said that it does not intend to sign any such contracts for its
share of the gas. The only company which could use an existing contract is Statoil which has a contract with Centrica for
5 Bcm/year for 10 years at NBP prices for delivery at that location. It appears that other sellers intend to develop a
portfolio of long, medium and short term sales and possibly also arbitrage between UK and Continental European gas
markets depending on price differentials.” Stern and Honoré cite the liquidity of the UK market as one of the
explanations. Similarly, Newbery (2000) describes the developments of the UK market in the period 1995-1998: “The
development of increasingly liquid spot and futures markets created a serious alternative to long-term contracts for
producers and suppliers [...]. Contract lengths shortened, producers were encouraged to release supplies, and prices
dropped [...].”
Liquid markets may require, however, some help from policy makers to get established. Firstly,
markets may be characterised by the existence of network externalities (see e.g. Economides
and Siow, 1988). This means that the benefits of having a market is an increasing function of
the number of players because the number of options for carrying out efficient transactions
grows as the number of market players active in the market increases. As individual trading
parties in a market are not fully able to capture these benefits, a market may therefore fail to
56
develop. Especially in the starting-up phase, a push from government may be required. This
may take the form of active endorsement of a market place, instilling confidence in a market by
introducing trade oversight through market surveillance committees, and stimulating
transparency of markets, e.g. with the help of the independent system operator. Also, especially
in more concentrated markets, policies to prevent incumbents from frustrating the development
of liquidity by impeding retrading (e.g. through contractual clauses) of power or gas can be
warranted.
4.4.4 Regulation of energy mix and investment in st rategic stocks
Dependence of energy supplies on only a small number of different sources will increase the
aggregate supply’s exposure to external risks, and hence may add to the risk of price or supply
shocks to consumers. This risk should be weighed against the potential efficiencies of some
sources of supply over others. As noted, generally competitive markets may achieve finding the
efficient trade-off between these effects, as private investors and consumers internalise the
benefits of diversification. Where either the resulting exposure to price shocks is deemed
(politically) undesirable, or where market failures may play a role, policy measures to increase
diversification may be sought.
In some cases, the historical situation may differ sufficiently from the driving forces of
competitive markets so that increase of diversification may be automatic. This is the case for
example with the increase of relatively low capital-intensive gas technology in markets that
were for historical reasons dominated by coal-fired generation technology. Furthermore, in the
electricity market, relatively recent environmental (emissions) regulations tend to increase
generation diversity (see Grubb et al., 2006, for projections of diversity in the UK under low
carbon objectives).
Diversification in the electricity market may also be achieved by stronger linkage of markets in
various countries, pooling the risks of local disturbances. As such interconnection increases
diversity, existing policy goals setting minimum bounds on interconnection capacity may be
beneficial. Since regulatory structures may face difficulty in promoting sufficient availability of
interconnection capacity (see below), such goals may be a second-best answer to market or
regulatory failures associated to the natural monopoly characteristics of transmission grids. The
risk of overinvestment should be recognised, however. Improving regulation on congestion
management and investment would be preferable.
In the gas market, diversity is probably a bigger issue, in particular concerning geopolitical
sources of gas. In principle, those political or technological risks that are exogenous to market
participants’ behaviour may be internalised by them. This does require that importers do face
these risks in terms of exposure to price rises in case of incidents. In particular, force majeure
57
clauses in balancing arrangements, or the possibility of financial default against the system
operator would undermine this internalisation and lead to overreliance by market parties on the
risky source.
However, as noted, it can well be argued that the risk of politically motivated supply restrictions
by gas producing countries increases with the dependence of a consumer country on this source.
In that case, there is a negative externality to procuring gas from such countries (i.e. by buying
the producing country’s gas, a party increases the risk of supply interruptions to other
importers), and policy measures to reduce dependence might be efficient. One such measure
could be limiting the share of gas from individual supply countries, a measure adopted for
example by Spain.
Restricting shares of imports from individual countries may be difficult to enforce in liquid
markets (except by directly limiting pipeline capacity), as a result of potential retrading of gas.
This in particular is the case for shipments of LNG, that may easily change ownership. The
costs of any such import constraints would depend on the substituting supplies. In the long-run,
these would presumably be increased imports of liquefied natural gas (LNG), shipped from
diverse locations. On the other hand, direct containment of political risk through foreign policy
is warranted (CIEP, 2004). Another viable route may be political efforts towards the reduction
of (transaction) costs for (other) sources of gas. This could take the form of coordination of
siting permits for transmission infrastructure, as would be the case for a planned alternative gas
route from the Caspian region through Turkey to Europe.
Other policy measures could involve investment in strategic reserves, as these would reduce the
effect of withholding supply, and hence the risk of such actions occurring. The major risk here
is that private initiatives are crowded out: private investors may decrease their investment by a
similar amount of capacity. This clearly depends on the deployment criteria of the strategic
reserves, but it would seem hard for governments to commit not to employ the strategic reserves
in all cases where prices rise significantly, thus muting incentives for private investment. If only
used under contingencies, a cost-benefit analysis would be called for: voluntary disconnection
of consumers may well be a less costly alternative. As an example, IEA(2004) notes that gas
stocks are much more costly than oil reserves.20
4.4.5 Optimal regulation of grids and system operat ors
The natural monopoly of transmission system operation and investment evidently requires
regulation. In contrast to regulation of distribution grids, analysis of, and experience with
regulation of transmission systems is still underdeveloped. A notable example that is often
considered to be successful is that in the UK, where the independent system operator is 20 See also cost-benefit analyses in De Joode et al. (2004) and Mulder et al. (2006).

58
regulated under a mix of cost of service and profit sharing mechanisms, under performance
metrics which include quality (Joskow, 2005). Giving adequate incentives for inter-TSO
transmission investment is a more difficult issue, however. Increasing transparency to
stakeholders of system characteristics and computation of available capacities may be a useful
step.
Vertical integration with generation likely gives distorted incentives as system operator
decisions may have great impact on generator profitability. Joskow (2005) argues that
ownership unbundling is optimal.
Minimum quality standards are widely used by regulators to protect customers from quality
decreases below a certain level. In particular for distribution networks, such a standard may
require that the company has to pay a fine or even may loose its licence for violating this
standard. Minimum quality standards are used, for example, in the UK (Ofgem, 2003).
Although minimum quality standards are effective to prevent the drop of quality below a certain
level, they do not reward companies for the provision of a higher quality or achieving a better
price-to-quality ratio. There have been regulatory attempts to introduce these incentives by
adjusting regulated tariffs with change in consumer interruption cost (e.g., in Norway and the
Netherlands, see Langset et al., 2001, and DTe 2002). That way, the regulator balances cost-
reducing incentives with incentives for a better price-to-quality ratio.

59
5 Liberalisation and environment
5.1 Introduction
Electricity generation is a major source of environmental pollution. Emissions from burning
fossil fuels to produce electricity contribute substantially to urban ozone and other air pollution,
acid deposition, regional haze and visibility problems as well as the build up of greenhouse gas
concentration in the earth’s atmosphere. The consequences are human health problems,
damages of ecosystems, crops, and building material, amenity losses, and global warming (cf.
European Commission, 2003).
Against this background it is important to know how increased competition in the European
electricity markets is likely to affect the size of the environmental impact. The answer to this
question is not obvious because restructuring can affect the environmental performance of
electricity generation in many different ways, some leading to increases of air pollution and
global warming and some leading to decreases. The effect depends on four key factors: how
liberalisation affects electricity consumption, how it affects fuel efficiency, how it changes the
mix of technology to produce electricity, and how liberalisation affects voluntary environmental
initiatives and the performance of environmental regulation. This chapter first discusses these
issues based on theoretical literature (Brennan et al., 2002). Afterwards, some empirical
findings are presented both from inside and outside the EU and the results of a game theoretic
model of the EU electricity market are outlined.
Beforehand, it is important to note that in principle liberalisation does not lead to any change in
total CO2 emissions because they are capped by the European Emissions Trading Scheme (EU
ETS). If the emission cap is fixed and liberalisation facilitates fuel efficiency and clean
technologies, this will only lead to more available allowances that could be sold to other sectors
also covered by the EU ETS. It is, however, possible that liberalisation results in a higher level
of electricity consumption with equal CO2 emissions (see 5.3).
5.2 Effects of liberalisation on environment
5.2.1 Electricity consumption
A primary motivation for more competition in the electricity market is the expectation that it
will lead to lower electricity prices. If prices fall, the consumption of electricity and emissions
from electricity generation can be expected to increase, though not by a large amount since
electricity demand tends to be inelastic. Whether and how much electricity prices fall as a result
of liberalisation depends on a number of factors. If, for instance, the new market is very
competitive and therefore leads to more efficient production and more purchase options for all
60
classes of consumers, this can result in significantly lower electricity prices. In the short term,
prices may also fall because overcapacities that have been produced by regulation and subsidies
may be abolished. Conversely, if the regulated utility is a low cost supplier relative to its
neighbours, prices in this area can actually increase under competition. Prices may also be
higher than they would have been under regulation due to mergers and strategic behaviour of
the electricity suppliers, as is described in chapter 3 (see also Haas et al., 2000). Thus,
liberalisation has to be accompanied by a strong enforcement of antitrust laws.
Liberalisation could also lead to greater use of real-time pricing of electricity, leading to higher
prices during periods of peak electricity demand and lower prices during off-peak periods,
increasing market efficiency. Consumers may decide to shift their electricity consuming
activities to off-peak periods. As the baseload generation in many countries produces more
emissions than the peak units because of a higher share of coal, the shift from peak to baseload
could lead to higher emissions. In single countries that have a high share of nuclear power in the
baseload generation, such as France, the shift could lead to lower emissions. In these cases other
problems like nuclear waste disposal or reactor accidents may become severer.
5.2.2 Fuel efficiency
Rate of return regulation, that was the leading regulation in the old days of electricity
generation, covered generators’ costs of production plus some fixed capital rent. This did not
enhance investments into innovative energy efficient power plants. In contrast, after
liberalisation, electricity generators economise on fuel use, as is seen in chapter 3, for example
by improving their degree of energy cycle efficiency, because they have stronger incentives to
reduce production costs. This could lead to reductions in primary energy use and emissions per
produced kWh.
5.2.3 Mix of generation technologies
Liberalisation can have different effects on the development of nuclear generation, coal-fired
and gas-fired generation as well as generation based on renewable energy sources. For each
technology the effect can be theoretically either positive or negative. For example more
competition can on the one hand lead to an increased use of relatively cheap coal-fired
generators. On the other hand, some older coal plants will require capital investments to extend
their lives and the costs of these investments might not be recoverable in a competitive market.
Increasing the output of these older plants will additionally increase their maintenance costs,
potentially making them unprofitable and thus marking them for replacement by more efficient
plants. The chances of renewables may be affected if, as expected, increased competition leads
to lower electricity prices and no other instruments to promote renewables are in place.
Conversely, liberalisation creates greater possibilities for differentiating purchase options that
can provide a boost to renewables. Incumbents as well as new operators offer service packages
61
featuring green electricity for which consumers are willing to pay a premium above the market
price of conventional power (see also the section on dynamic efficiency).
In general, whether a certain technology penetrates the European electricity markets faster than
it would have in the absence of liberalisation is an open question, for several reasons.
Competitive markets are riskier for investors, so that the capital costs will be higher than under
regulation and tend to yield lower levels of investment in new generation plants. Uncertainty
about future developments of environmental regulation, available locations for new plants,
primary energy prices, or costs of the required equipment may have investment-reducing effects
as well (IEA, 2003).
5.2.4 Voluntary initiatives and environmental regul ation
More competition in the electricity market can lead to fewer utility-sponsored electricity
conservation programs that help to slow the growth of electricity consumption. If these
programs are actually effective in reducing electricity demand, eliminating them would result in
higher emission levels. Liberalisation of U.S. electricity for instance has contributed to the
demise of many utility-sponsored conservation programs. Voluntary commitments to reduce
emissions are also less likely to be forthcoming in a more competitive market where electricity
generators have a stronger incentive to keep costs low.
Greater competition may, at the same time, improve the generators’ willingness to comply with
some environmental regulations, provided that monitoring is effective and thus, complying
doesn’t create competitive disadvantages. In a more deregulated market, generators are more
concerned about minimising costs, so that the incentives to install low cost abatement
techniques or to switch to cleaner fuels due to taxes or emissions trading are stronger. The
advantage of market based policies relative to command-and-control methods is greater in a
competitive than in a regulated electricity market. Market based policies are therefore seen as
more consistent with liberalisation. Note, however, that overall efficiency comparison between
regulated and competitive markets must include monitoring costs which tend to be higher in the
latter case.
5.2.5 Empirical evidence
As the process of liberalisation in many countries is still ongoing, the existing literature doesn’t
provide a comprehensive research on all effects. The following findings, however, present some
impacts of liberalisation which have been observed so far. Pearson (2000) shows that
liberalisation of the U.K. electricity market in 1989 was associated with a rapid decrease of both
total emission of several key pollutants as well as emissions per unit of electricity generated.
The main reason for this development was that coal was to a large extent replaced by gas. The

62
author argues that this encouraged the government to take a more proactive environmental
stance than they would have otherwise done.
Several studies analyse the effects of the market liberalisation on energy efficiency and use of
renewables in the U.K. They conclude that liberalisation coupled with other policies helps to
enhance energy efficiency but is in itself insufficient (e.g. Eyre, 2000; Wohlgemuth, 2000). This
result is confirmed by the development of the demand for green electricity after liberalisation of
the German electricity market. Only 1.2% of the electricity consumers switched from
conventional to green electricity due to higher prices and switching costs. Thus, the diffusion of
renewable energy technologies relies on additional promotion measures (Börner, 2002).
Filippini et al. (2002) analyse the chances of the Swiss hydropower sector after the deregulation
of the Swiss and the European electricity markets. They conclude that in the short run only a
few producers have financial difficulties to cover operational costs and that the majority of the
firms will not reduce or shut down their activities. The chances in the long run will depend
crucially on the long run market price and on the capability of the producers to innovate.
Eikeland (1998) compares the impacts of liberalisation of electricity markets on the
environment in the U.K. and Norway. The short-term effects were different due to different
initial situations. Compared to the environmental improvement after liberalisation in the U.K.
due to an intensified use of natural gas instead of coal, the impacts in Norway have been more
complex. In Norway, nearly all electricity had historically been generated by hydro. Shortly
after the reform in 1990, a temporary stop in new development of hydro projects occurred,
leading to short-term environmental improvements, because the abolition of politically set
prices and the area franchise system revealed excessive supply capacity. More fundamental
changes came because the reform led to increased power trade between Norway, Sweden,
Finland, and Denmark, coupling the Norwegian hydro-based electricity systems with thermal-
based systems relying on coal, gas, and nuclear power. Whether or not the trade has led to a net
decrease in environmental damages in the whole area is not clear. With respect to the long-term
environmental impacts, the patterns seem to have been quite similar in both countries. The new
electricity legislation allocated the responsibility for environmental challenges to the state
(regulator), industry, and consumers.
Focussing on the climate change problem, Eikeland (1998) ascertains that after liberalisation
regulators and industries had lower incentives to promote energy efficiency and renewables due
to other overriding interests. Consumers were still relatively passive. He emphasised however,
that the Swedish example of labelling green electricity led to a massive demand for green
electricity, pushing the liberalised market towards an improved environmental performance.
63
Fabrizio et al. (2006) examine whether liberalisation of the U.S. electricity market has increased
the productive efficiency on the plant level. They find that investor-owned utility (IOU) plants
in restructuring regimes reduced their labour and non-fuel operating costs by 3 to 5% relative to
IOU plants in states that did not restructure their electricity market. The utilities in the
restructuring regimes have therefore a greater potential to reduce electricity prices which could
in principle lead to a higher level of electricity consumption. The authors also find little
evidence of increases in fuel efficiency relative to plants in regulated markets, although the
power of this test is limited due to a lack of data. Another US study, Bushnell et al. (2005),
finds that fuel efficiency of divested plants improved by about 2%. Similar, though somewhat
smaller, improvements were also observed at utility-owned plants in states that imposed more
stringent regulation during the same time period.
Ringel (2003) takes a closer look at the first trends of the European electricity markets after the
liberalisation. The author states that the liberalisation does not only imply opportunities, but
also risks for the creation of a sustainable power sector. Many risks are due to market
distortions caused by the delay in forming a fully functional single European market. In the
short term, market liberalisation tends to create more risks than opportunities because of lower
end-user electricity prices which increase the cost disadvantage of renewable energies and
combined heat and power (CHP) plants. In the long run however, the efficiency gains of the
sector and the appearance of new actors, such as new energy service suppliers, are likely to
bring forth the opportunities and foster a transformation towards a sustainable electricity sector.
Kemfert et al. (2003) apply a game theoretic model to study the strategic behaviour of energy
suppliers and their impacts on the environmental situation in the liberalised European electricity
market. The effects on environment are ambiguous. Liberalisation leads, on the one hand, to an
application of low cost technologies which are generally more damaging. On the other hand, in
the Nordic countries that have an initially high share of renewable energy production
technology, the share of environmentally friendly technologies is further increased.
5.2.6 Summary
According to both theoretical as well as empirical results, the impacts of liberalisation of the
electricity markets on the environment are ambiguous. The overall effect on the environment
consists of the various effects that liberalisation has on electricity consumption, mix of
technologies, fuel efficiency, and the effectiveness of environmental regulations. According to
the theoretical literature the single effects can be either positive or negative. The case studies of
the U.K. and Norway show that the impacts also crucially depend on the initial situation in a
country before liberalisation. The initial situations differ with regard to natural resources and
geographical conditions, technological know-how, and requirements of the existing
environmental regulation. Furthermore, the degree of market opening and the adjustment of
64
environmental policy measures are crucial. For these reasons the impacts of liberalisation on the
environment will differ across the Member States. Anyway, liberalisation is generally not
opposed to environmental objectives and can strengthen the effect of market based
environmental instruments.
5.3 Effects of the European Emissions Trading Schem e on Competition
5.3.1 Introduction
The European Emissions Trading Scheme (EU ETS) is by far the most important policy
measure in the European electricity market directed at environmental concerns.21 It was
launched at the beginning of 2005 to control CO2 emissions of the power generation and heavy
industry. The aim of emissions trading is to meet the emissions reduction targets at least costs.
The cap-and-trade mechanism makes sure that those emitters reduce emissions for whom it is
cheapest to do. The comment in the previous subsection on the positive interaction between
market based regulation and liberalisation holds true for the EU ETS in particular. In a
liberalised market firms minimise their costs including costs of CO2 emissions. Comparing
allowance price and marginal abatement costs a firm decides either to reduce emissions or to
buy allowances. The market mechanism of the EU ETS therefore achieves the efficient
distribution of emission allowances at least information requirements for the regulator, i.e. the
regulator does not need to know the marginal abatement costs of the emitters.
The initial allocation of allowances lies with the responsibilities of the Member Sates. Some
design elements of the allocation mechanism may risk the efficiency and effectiveness of the
EU ETS:
• free allocation
• allocation rules for new entrants and closures
• multi-period nature of allocation (updating)
• non-harmonised allocation
• hybrid nature of allocation.
This section presents a short analysis of the consequences of these features. As the EU ETS has
been started very recently the analysis is mainly based on the results of analytic and numerical
simulation models but also contains a limited number of empirical results.
21 The use of other policies, such as electricity taxes or measures to promote green electricity, differs across Member States.
They are mainly set at the national level (cf. Speck, 2003).
65
5.3.2 Free allocation
The power companies have to reduce emissions only slightly as compared to business-as-usual
and receive most of the emission allowances for free. Nevertheless, facing a market price of
permits constitutes opportunity costs for the firms. Here the question comes up whether the
opportunity costs of allowances are passed on to consumers through higher electricity prices,
even though the allowances were allocated for free. The free allocation of allowances can be
interpreted as lump-sum transfer to the participating companies which lower their average costs
of CO2 emissions. In the ideal case however, competitive prices reflect marginal costs, not
average costs. Opportunity costs are part of marginal costs so that passing on the emission
opportunity costs is generally in line with economic theory. Due to a largely regionally traded
good, not fully liberalised markets, and a rather inelastic demand for electricity, the power
sector is in a very comfortable position to pass on the opportunity costs. Indeed, empirical and
simulation model estimates for Germany and the Netherlands indicate that the share of CO2
costs which is passed on to consumers ranges from 60 to 100% depending on market and
technology specific factors. As a result, power companies realise substantial windfall profits
and increase their profitability. At an allowance price of 20 €/t, the windfall profits in the Dutch
power sector are estimated at 300 – 600 million € per year, i.e. about 3 – 5 € per MWh
produced and sold (Sijm et al., 2006). The windfall profits constitute a competitive advantage
vis-à-vis other sectors that also participate in the EU ETS but do not have the possibility to pass
on the costs due to international competition. Depending on the input structure of the
companies, they do not only face CO2 opportunity costs but also higher production costs due to
higher electricity prices. Many electricity intensive industries, such as the aluminium industry
that compete internationally with their goods are put at a competitive disadvantage vis-à-vis
industries from countries without CO2 control. This problem, however, arises with any type of
costly environmental regulation. More competition in the power sector could help to mitigate
these distortions, though the disadvantage of internationally competing industries will probably
persist.
Independent from passing on CO2 costs, the problem of windfall profits would be mitigated, if
allowances were, at least partly, auctioned. The literature indicates that auctioning would lead to
higher overall efficiency regarding the optimal level of output and emissions (cf. Böhringer and
Lange, 2005). Furthermore, auctioning provides the possibility of generating revenues which
could be used to reduce distortionary taxes and create welfare gains (cf. Smith and Ross, 2002).
Given that one aim of the EU ETS is the reduction of energy demand the rise of gross energy
prices is unavoidable. Without special provisions for internationally competing and particularly
energy intensive companies higher energy prices lead to competitive distortions. Auction,
however, provides an instrument to redistribute windfall profits to households and the economy.
66
5.3.3 Allocation rules for new entrants and closure s
Like any other environmental regulation, the EU ETS tends to increase the costs of entry and
therefore limits the number of potential competitors seeking to enter the market. For this reason,
most Member States reserve allowances for new entrants and thereby, facilitate competition.
The promotion of competition, however, may come at a cost. If the allocation depends on
technology, i.e. carbon intensive technologies receive relatively more allowances, the choice for
new power plants will be distorted away from CO2 efficient plants towards more CO2 intensive
technologies22. Although the overall emissions are capped the technology mix will then be
inefficient. In order to create efficient investment incentives the allocation should be based on
output independent from technology. An alternative would be the auction of allowances. More
investments in CO2 efficient technologies tends to lower allowance prices because less
allowances are needed for the same level of electricity output.
Allocation of allowances to incumbent generators requires in some Member States that the
power station operates a minimum number of hours or produces a minimum number of MWh
per year. An operator then will run the power station even if the marginal production costs
exceed the wholesale price, as long as the loss is less then the value of his allowances. As a
result, old and unprofitable power stations that otherwise might have been replaced by new
build power plants could stay online (Neuhoff et al. 2005). The allowance price tends to be
higher because these operators keep the allowances instead of closing down and selling the
allowances. As both rules for newcomers and closures vary, the incentives for new entrants and
operators of old and unprofitable power stations also vary between Member States.
5.3.4 Multi-period nature of allocation (updating)
The allocation of allowances is based on historical emissions and follows a sequential process.
Allocation plans are decided on for one trading period at a time with repeated negotiations
about the allocation for the following periods. It is therefore likely that present emissions have
an impact on the negotiations and therefore on future allocations. A grandfathering scheme of
this type is likely to lead to dynamic inefficiencies. If electricity generators anticipate that their
present behaviour affects future allowance allocations, the CO2 efficiency incentives of the EU
ETS will be reduced because any improvement may reduce future allocations. Analytic and
simulation models show that this strategic behaviour results in higher CO2 prices compared to
one-off allocation. The models also predict that as electricity prices are lower, electricity
consumption will increase (Neuhoff et al. 2006; Böhringer and Lange, 2003). A fixed reference
date could avoid strategic behaviour because present day emissions decisions would not affect
future allowance allocations. It is, however, questionable, whether future allocations could
22 There are other policy measures to promote CO2 efficient power plants such as renewable energy sources or CHP plants.
Note, however, that the instruments can interfere with each other and that an inefficient allocation can result. For discussion
see Böhringer et al., 2006.
67
really be based on an old reference date, ignoring the intermediate technological change.
Another possibility is to base allowance allocation on output or benchmarks. Output based
allocation is independent from emissions and technology and would therefore avoid strategic
behaviour and also create efficient investment incentives. Benchmarks compare existing
technologies and define specific emissions levels (standards) for each technology. They could
also help to avoid strategic behaviour but could lead to false investment incentives because they
are not independent from technology, i.e. CO2 intensive technologies may be favoured (see
5.3.3). Due to technological innovations benchmarking has to be repeated regularly.
5.3.5 Non-harmonised allocation
The amount of national emission allowances is decided by the Member States. They are,
however, required to be on the pathway to their reduction targets from the Kyoto Protocol and
the EU Burden Sharing Agreement, but they have discretion over what share of their overall
emissions reduction they plan to achieve in the EU ETS sectors, in the non-participating sectors,
or through the flexible mechanisms of the Kyoto Protocol. In other words the Member States
have discretion in allocating allowances to the participating sectors. As there is no
harmonisation across countries, there is a real risk that differences in the assignment of free
allowances to firms could distort competition. Böhringer and Lange (2004) show that it is in
general impossible to obtain efficient CO2 reductions when requiring 100% free allocation of
allowances and non-discrimination of similar firms across countries. They propose a continuous
increase of the auctioned ratio to promote harmonisation and efficiency in the longer run,
leading the EU ETS to unfold its strength.
The allocation of allowances has also to consider the existing mix of technology. A large share
of nuclear power can help to reduce CO2 emissions but may lead to other problems such as
nuclear waste disposal or reactor accidents. Countries with a high share of nuclear baseload
power generation should therefore allocate fewer allowances.
5.3.6 Hybrid nature of allocation
The EU ETS covers almost half of all EU CO2 emissions of which two-thirds are from power
generation. The CO2 emissions of the sectors not covered by the EU ETS are to be controlled by
complementary policy measures. If the reduction targets from the Kyoto Protocol and the EU
Burden Sharing Agreement are supposed to be reached mainly by national reduction efforts and
not by using the international Kyoto mechanisms, the allocation of allowances to the EU ETS
sectors also determines the reduction obligation for the non-participating sectors. That is, a
generous allocation to the energy intensive EU ETS sectors implies high reduction efforts for
the other sectors which have generally higher marginal abatement costs. Such a shift of the
reduction burden can lead to substantial excess costs compared to a comprehensive emissions
trading system covering all segments of the economy (Böhringer et al., 2005). Furthermore the

68
hybrid nature of the current allocation design can create distribution problems, i.e. discriminate
against non-participating sectors that will have to bear a higher burden of abatement costs.
5.3.7 Summary
Some of the allocation rules favour carbon intensive investments and tend to increase the
allowance price for a given cap in the long run. The consequence of higher CO2 prices are
higher abatement costs to meet the reduction targets, risking the principally efficient and
effective design of emissions trading. This could lead to competitive disadvantages for the EU
compared the other countries with less CO2 regulation.
The analysis of the EU ETS allocation mechanisms shows that various provisions are likely to
create distortions of competition in the electricity market. This includes distortions between
different participants, between participating and non-participating sectors within one country as
well as between Member States.
The EU ETS co-exists with the liberalisation process. The impacts on the electricity sector and
the environment are therefore a result of their interaction. At this stage, we cannot quantify the
overall effect. There is, however, consensus that market-based regulations are clearly more
compatible with a liberalised environment.
5.4 Macroeconomic costs of environmental regulation in European electricity
markets
5.4.1 Introduction
This section analyses the macroeconomic costs of the most important environmental policies in
the European electricity markets, namely the EU emissions trading scheme (EU ETS),
electricity taxes, and measures to promote renewables. The analysis is based on selected
simulation studies that calculate the development of macroeconomic variables, such as GDP,
employment, or welfare, after the implementation of the environmental policy measures. The
baseline which serves as reference scenario in all simulation studies is business-as-usual. It
denotes the hypothetical scenario where the policy measure was never introduced and no certain
environmental objective is installed.
5.4.2 Theoretical background
There are several dimensions of efficiency of environmental policies. The first dimension
concerns efficient taxation according to optimal taxation theory and distortionary effects of
taxes. Unless we have lump-sum transfers or completely inelastic demand for a good taxation
will always involve dead weight welfare loss. As all three policies, EU ETS, electricity taxes,
69
and promotion of green electricity, tend to increase electricity prices23 they create inefficiencies
in terms of dead weight welfare loss. However, the distortionary effects of a tax on a good
decrease with the elasticity of demand. As the demand elasticity of electricity tends to be
relatively small dead weight welfare loss of electricity taxes and ETS is expected to be also
small. Energy taxes can even have positive economic impacts if they replace more distortionary
taxes on goods with higher elasticity of demand (Double Dividend). However, electricity is an
important input factor for many goods. Therefore, higher electricity prices usually lead to
higher product prices which in turn create inefficiencies. Furthermore, higher electricity prices
reduce the competitiveness of firms that face international competition.
Optimal taxation theory does not consider external costs of electricity generation and
consumption. The second dimension of efficiency, therefore, concerns the design of the policy
measures with respect to the internalisation of external costs related to electricity generation and
consumption. Environmental policy measures, for instance, should target the fuel mix to reduce
emissions efficiently, i.e. they should raise marginal costs of emissions rather than costs of
electricity as a whole. In this respect, ETS is superior to taxes and standards because the
legislator determines only the total quantity of emissions and leaves abatement decisions to the
emitters. Efficiently set taxes and standards, in contrast, require information about marginal
abatement costs of all emitters. Another aspect is that policy measures should principally target
marginal costs rather than fixed costs, since these determine the actors’ decisions. That means
that a policy measure that increases marginal costs is able to internalise external costs at lower
macroeconomic costs than a policy that targets fixed costs.
The third dimension addresses distributional effects. Electricity taxes increase costs for
electricity consumers, i.e. households and companies, and increase government income.
Recycling of the additional government income to the economy can disburden tax payers.
Considering the EU ETS, the initial allocation of allowances to the participating sectors is for
free and covers the need of the participating firms (see 5.3.2). So, at first, firms bear only CO2
opportunity costs. If the power sector is able to pass on the CO2 opportunity costs through
higher prices the burden is assigned to electricity consumers. The free allocation can be taken as
a lump-sum transfer to the power sector. Hence, electricity taxes and EU ETS change the
distribution. Both of them tend to burden electricity consumers and disburden other actors, such
as the power sector, government, or tax payers.
In this section we deal mainly with the first dimension of efficiency. Accordingly, we do not
focus on the internalisation of external costs and distributional effects but rather on
macroeconomic costs that arise from dead weight welfare losses and losses of international
23 We observe that the power sector is in a comfortable position to pass on the CO2 opportunity costs to consumers so that
the EU ETS is likely to increase electricity prices. See e.g. Oberndorfer and Rennings, 2006 or Sijm et al., 2006.
70
competitiveness due to increasing electricity prices. Higher electricity prices can also have
positive impacts if they lead to the development and implementation of new energy efficient
technologies. This effect is commonly known as the Porter Hypothesis. It says that stringent
environmental regulations can in principal increase the competitiveness of firms, sectors and
economies because they trigger environmentally benign innovations which may reduce
production costs or create other competitive advantages. In addition, follower countries that also
introduce ambitious environmental regulation may buy these new technologies (Porter and van
der Linde, 1995; Porter, 1999). 24
5.4.3 Macroeconomic effects of European Emissions T rading Scheme (EU ETS)
The previous section, 5.3, presented the implications of the design of the EU ETS for
competition and efficient investment decisions. In this section we describe the impact on
welfare and other macroeconomic variables. The impact is on the one hand due to the hybrid
regulation principle of the EU ETS. The segments of the economy that do not participate in the
EU ETS have to be regulated by complementary domestic policies. On the other hand the
inclusion of the international flexible mechanisms from the Kyoto Protocol plays an important
role. The Kyoto target can be achieved by emissions reductions in the ETS sector as well as in
the non-ETS sector. Furthermore, countries can decide to buy carbon credits in the framework
of the international flexible mechanisms from the Kyoto Protocol, namely the international
Emissions Trading, Clean Development Mechanism (CDM), and Joint Implementation (JI).
CDM and JI projects can also be used by ETS firms in order to comply with their allowance
endowment.
Oberndorfer and Rennings (2006) review the results of various simulation studies in order to
assess the competitiveness effects of the EU ETS. They find small negative effects on the
sectoral and macroeconomic level, if the baseline is business-as-usual. The losses in most
sectors are modest except for the aluminium sector with its particular competitive situation,
very limited options to reduce electricity consumption, and hence profits highly dependent on
electricity prices.
Klepper and Peterson (2005) employ the computable general equilibrium model DART to
assess the effects of the EU ETS in the year 2012 when the Kyoto targets will have to be met.
The baseline is business-as-usual that keeps all climate policy measures introduced until the
year 2002 in place but does not include any new climate policies. The simulation includes the
actual NAP of each EU15 Member State for the first trading period 2005 to 2007. The use of
24 The inclusion of innovations and technological progress in economic modeling is still at the beginning. So most simulation
models set technological progress as an exogenous variable and therefore cannot testify to the Porter Hypothesis (cf.
Löschel, 2002; Goulder, 2004). Many empirical studies, however, that analyse the Porter Hypothesis do not find a significant
correlation between environmental regulation and competitiveness, neither positive nor negative. For literature surveys, see
for example Jaffe et al. (1995), Jenkins (1998), Taistra (1999), or Kaiser and Schulze (2003).
71
CDM and JI is unrestricted for the ETS sectors but the government purchases are restricted to
the existing official plans. For the emissions reductions in the non-ETS sectors a uniform but
regionally differentiated CO2 tax is assumed. The implementation of the EU ETS leads to a
welfare loss of 0.9% compared to the business-as-usual baseline. Without the use of CDM and
JI the welfare loss would rise to 1.7%.
Peterson (2006) applies the same model to assess the effects of the NAPs for the second trading
period 2008 to 2012. The baseline is business-as-usual without any climate policy measure
enacted after 2001. It is assumed that both the ETS and the non-ETS sector contribute a
proportionate share in order to achieve the Kyoto target. The governmental purchases of
international carbon credits are restricted to existing official plans. They do not increase the
allowances allocation to the ETS sector and therefore reduce the reduction burden of the non-
ETS sector. The reduction target for the non-ETS sector in each country is achieved through a
uniform CO2 tax. The purchases of CDM and JI credits by the ETS firms altogether are
restricted to 8% of total allowances in the EU ETS. The welfare loss vis-à-vis the baseline
amounts to 1.1%. The analysis of other policy scenarios with different allowances allocations
for the second trading period shows that the welfare loss would be considerably greater if more
of the reduction burden were shifted from the ETS to the non-ETS sector.
5.4.4 Macroeconomic effects of electricity taxes
Most Member States have implemented electricity taxes. The level of taxes differs substantially.
In order to avoid loss of competitiveness most Member States, especially those with relatively
high tax levels, offer tax exemptions or rebates for the electricity intensive industry as well as
recycling of tax revenues, e.g. through cutting other taxes. For this reason the existing tax
schemes have only small impacts on the macroeconomic level.25
On the EU level, the EU Directive 2003/96/EC on the harmonisation of energy taxation defines
minimum tax rates between 0.5 and 1 €/MWh for all energy products, namely coal, oil, gas, and
electricity. It contains a number of general and Member specific exemptions and transitional
periods particularly for the new Member States. The changes of national energy taxation due to
the EU Directive differ between the Member States. The impacts on tax rates are generally low
for most of the EU15 countries because the minimum tax rates are not very high relative to
existing rates. The directive leads to more important changes in some southern countries, such
as Greece, Portugal, and Spain, and in most new Member States.
Kohlhaas et al. (2004) investigate the economic effects of the EU directive by means of the
CGE model GTAP-E. They assume that all EU25 countries fulfil the minimum tax rates and all
25 See for example Kohlhaas (2005) for an analysis of the German Eco-tax and Agnolucci et al. (2005) for an analysis of the
British Climate Change Levy.
72
countries with higher tax rates hold them on the higher level. The additional tax revenue is
allocated to government spending, private consumption, and private savings in the same
proportions as total spending in the initial situation. The baseline is business-as-usual as if the
EU directive had never been introduced. The effects on the national GDPs are very small. They
range from – 0.01 to – 0.18% for those countries which need to substantially increase their
energy taxes, namely the new Member States, because the increase in energy taxes reduces
energy use and therefore reduces the productivity of the other production factors. The effects in
the other countries are negligible. The CO2 emissions decrease in all Member States,
particularly in the new Member States.
Kouvaritakis et al. (2003) apply the general equilibrium model GEM-E3 to analyse the impacts
of an energy tax scheme in the EU15. The baseline is business-as-usual including existing
energy taxes levied for climate change in some Member States. Three policy scenarios are
investigated: minimum energy tax rates corresponding approximately to the EU Directive, a
more climate friendly energy tax scheme that better reflects the carbon content of each energy
product, and the EU minimum energy taxation when the Kyoto target is fulfilled by EU ETS
and a domestic carbon tax. Tax revenues are directly recycled through a decrease of social
security contributions (Double Dividend). The introduction of minimum energy tax rates
reduces CO2 emissions by 0.5% vis-à-vis business-as-usual. The overall impacts on GDP,
employment, and welfare are nearly zero because the induced price increase is very small. In
the case of the more climate friendly energy taxation CO2 emissions are reduced by 2.7%. The
effects on GDP (0.02%) and welfare (0.06%) are slightly positive because the induced price
increase is still limited and the negative effects are compensated by reducing the labour cost
through the reduction of social security contributions. As the CO2 constraint is stronger in the
third policy scenario, the economic impacts become negative. GDP decreases by 0.09% and
welfare by 0.5%. The negative effects are however limited by the efficient design of the EU
ETS and the tax revenue recycling strategy.
These results are confirmed by a more recent study based on the same model (Kouvaritakis et
al., 2005) which analyses the impacts of an energy tax scheme in the enlarged EU.26 The
baseline is business-as-usual with minimum tax rates of the EU Directive or national tax rates
(if they are higher) applying in the EU15. In the new Member States only the current tax rates
apply regardless of whether they are higher than the minimum tax rates or not. As before, three
policy scenarios are considered: the introduction of the EU minimum energy tax rates in the
new Member States, the EU-wide implementation of a more climate friendly tax, and the EU
minimum energy taxation when the Kyoto target is fulfilled by EU ETS and a domestic carbon
26 For numbers see table 5.1 in the conclusion.
73
tax. The overall economic effects as well as the effects on CO2 emissions are minor in the case
of EU minimum energy taxation or the more climate friendly energy taxation. The impacts on
the EU economy are negative if the Kyoto target is to be achieved. An efficient initial allocation
of emission allowances and tax revenues recycling can limit these negative effects.
5.4.5 Macroeconomic effects of promotion of renewab le energy sources
According to the EU Directive 2001/77/EC on the promotion of electricity produced from
renewable energy sources, 22% of electricity consumption is to be produced from renewables in
2010, compared to 14% in 1997. In consideration of the national targets of the ten new Member
States the collective objective of the EU25 decreases to 21%. The EU Directive does not
specify any particular instruments in order to achieve the targets but rather leaves the
responsibility for the implementation of appropriate measures with the Member States. The
analysis of the policies and measures currently in place in the EU15 shows that they will
probably achieve a share of only 18 – 19% in 2010. Only Denmark, Germany, Spain, and
Finland are on track whereas the remaining countries in the EU15 have to implement further
measures to reach their targets (European Commission 2004). A longer term target, stated in at
the Renewables Conferences in 2004 in Berlin and Bonn, is a 20% share of renewable energy
sources in primary energy consumption in 2020.
The dominating support system in the EU15 are feed-in tariffs which exist for instance in
Germany, Denmark, and the Netherlands. The second important support system are quota
obligations associated with a system of tradable green certificates (TGC) which exist for
instance in the U.K., Sweden or Italy. Feed-in tariffs are specific prices for green electricity,
normally set for a fixed-term period, which electricity companies have to pay to producers of
green electricity. The prices are typically differentiated by the type of renewables source, e.g.
hydropower, wind, biomass, and solar. The additional costs of electricity generation due to a
larger use of renewables are usually passed on to power consumers by premiums on end-user
prices. In the case of a TGC system electricity consumers are required to purchase a certain
share of green electricity, i.e. green certificates, according to their electricity consumption.
Alternatively producers can be obliged to produce a certain share of green electricity according
to their production. In order to exploit the cheapest possibilities consumers or producers are free
to trade the green certificates between each other. Thus, in addition to the power market there
exists a market for green certificates.
The CASCADE MINTS project of the EU (Uyterlinde et al., 2004 and 2005) contains three
CGE models, namely NEMESIS, PACE, and NEWAGE-W, which assess the economic
impacts of a high penetration of renewables in the electricity sector. The models show the
consequences of increasing the share of green electricity up to roughly 30% by 2020, which
corresponds to the long term EU target of 20% renewable energy sources in primary energy
74
consumption. Similar to a TGC system, the 30% target is achieved through a quota financed by
either endogenous uniform subsidies or potentially higher electricity prices. The baseline in all
simulation models is business-as-usual including all policy instruments existent by the end of
2003 and a moderate carbon tax from 2012 onward, representing future European climate
policy. The NEMESIS model assumes uniform subsidies from 2005 to 2020 in order to meet
the 30% target. The subsidies are passed on to consumers through higher electricity prices. The
impacts on macroeconomic indicators for the EU15 are negative. By the end of the simulation
period in 2020 both GDP and private consumption decrease by about 0.2%, employment
decreases by 0.15% compared to the baseline. In the PACE model, the 30% quota on renewable
electricity production is also achieved through an endogenous uniform subsidy. The result is a
relatively modest welfare loss for the EU15 ranging from 0.03% in 2010 to 0.08% in 2020. In
the NEWAGE-W model the introduction of the 30% quota results in substantially higher
electricity prices and higher product prices. The GDP loss of the EU15 amounts to 0.3% in
2010 and 0.8% in 2020.
5.4.6 Summary
Table 5.1 summarises the results. Due to differences in models and assumptions the results
cannot be compared directly with each other. Nevertheless, we observe some tendencies. The
economic impacts are likely to be small if the environmental effects are also small. In contrast,
the achievement of more ambitious environmental objectives would lead to higher costs. The
economic effects tend to be small, and in some cases even positive, if tax revenues are recycled
to the economy. The economic implications of the EU ETS depend on the division of the
reduction burden between the ETS sector and the Non-ETS sector as well as the inclusion of the
international Kyoto mechanisms. Note that we consider only effects on the macroeconomic
level. The impacts may be severe on the sector or firm level.

75
Table 5.1 Environmental effects and macroeconomic c osts of EU ETS, energy taxes, and promotion of
renewables in relation to business-as-usual baselin e
Study Model Policy Level Year Environmental Effects Macroeconomic Costs
Oberndorfer et
al. 2006
Various
models
EU ETS EU15 Mostly Kyoto compliance Mostly small negative
effects on macro-
economic variables
Klepper and
Peterson 2005
DART EU ETS EU15 2012 Kyoto compliance Welfare – 0.9%
Peterson 2006 DART EU ETS EU25 2012 Kyoto compliance Welfare – 1.1%
Kohlhaas et al.
2004
GTAP-E Energy tax EU 25 2004 CO2 reductions
in all MS from
– 0.04 % to – 3.23 %
GDP reductions
in a few MS from
– 0.01% to – 0.18%
Kouvaritakis et
al. 2003
GEM-E3 Energy tax EU15 2010 CO2 – 0.5%
CO2 – 2.7%
Kyoto compliance
GDP +/– 0%
Welfare + 0.01%
GDP + 0.02%
Welfare + 0.02%
GDP – 0.09%
Welfare – 0.50%
Kouvaritakis et
al. 2005
GEM-E3 Energy tax EU25 2010 CO2 – 0.5%
CO2 – 3.5%
Kyoto compliance
No effects
GDP + 0.01%
Welfare + 0.03%
GDP – 0.10%
Welfare – 0.13%
NEMESIS Promotion of
renewables
EU15 2020 30% green electricity GDP – 0.2%
Employment – 0.15%
PACE Promotion of
renewables
EU15 2020 30% green electricity Welfare – 0.08%
Uyterlinde et al.
2004 and 2005
NEWAGE-W Promotion of
renewables
EU15 2020 30% green electricity GDP – 0.8%
5.5 Conclusion
The theoretical and empirical literature indicates that liberalisation triggers many effects which
can be either positive or negative for environmental quality. This includes effects of
liberalisation on electricity consumption, fuel efficiency, technology mix, and environmental

76
regulation. The comparison between Norway and the U.K. points furthermore that the effects
differ across EU Member States due to different initial situations and different developments of
liberalisation and environmental regulation. Principally, liberalisation is not opposed to
environmental objectives and can strengthen the effect of market based environmental
instruments which aim to reach environmental objectives in a cost efficient way.
The second and third part of the chapter study the economic effects of the most important
environmental policy measures in European electricity markets, namely EU ETS, electricity
taxes, and measures to promote green electricity. The implications for welfare or other
macroeconomic variables depend on both the underlying environmental target and the design of
the instruments. Considering the EU ETS which has been in the focus of our analysis, the
division of the reduction requirement between ETS sectors, non-ETS sectors, and reductions
abroad plays an important role. Furthermore the design of allowances allocation rules is a
critical factor with regard to efficient investment incentives and long term macroeconomic
costs. Even though emissions trading is generally an effective and efficient instrument the
literature indicates that the EU ETS in its current form is far from perfect and many design
elements could be changed for the better.
77
References
Agnolucci, P., D. Anthony, T. Barker, P. Ekins, B. Etheridge, B. Gardiner, S. Junankar, O.
Lofsnaes, and J. Stenning , 2005, Modelling the Initial Effects of the Climate Change Levy,
University of Cambridge and the Policy Studies Institute (PSI).
Allaz, B., Vila, J.L. 1993 Cournot competition, futures markets and efficiency, Journal of
economic theory, vol. 59, no. 1, pp 1-16.
Batlle, C., C. Vázquez, M. Rivier and I. J. Pérez-Arriaga, 2006, A regulatory instrument to
enhance security of suply in the Spanish wholesale electricity market, IIT Working Paper IIT-
06-025A.
Borenstein, S., J. Bushnell and F. Wolak, 2000, Diagnosing market power in California’s
deregulated wholesale electricity market, PWP-064, University of California Energy Institute,
US.
Böhringer, C. and A. Lange, 2003, On the Design of Optimal Grandfathering Schemes for
Emission Allowances, ZEW Discussion Paper 03-08.
Böhringer, C. and A. Lange, 2004, Mission Impossible!? On the Harmonisation of National
Allocation Plans under the EU Emissions Trading Directive, ZEW Discussion Paper 04-15.
Böhringer, C. and A. Lange, 2005, Economic Implications of Alternative Allocation Schemes
for Emission Allowances, Scandinavian Journal of Economics , vol. 107, no. 3, 2005.
Böhringer, C., T. Hoffmann, A. Lange, A. Löschel, and U. Moslener, 2005, Assessing Emission
Regulation in Europe: An Interactive Simulation Approach, The Energy Journal, vol. 26 , no.4.
Böhringer, C., H. Koschel, and U. Moslener, Efficiency Losses from Overlapping Economic
Instruments in European Carbon Emissions Regulation, ZEW Discussion Paper No. 06-018,
Mannheim, 2006.
Börner, K., 2002, Die Folgen der Strommarktliberalisierung für regenerative Energiequellen,
Wirtschaftsdienst 2002, 1.
Brennan, T. J., K. L. Palmer, and S. A. Martinez, 2002, Alternating Currents – Electricity
Markets and Public Policy, Washington DC.

78
Brunekreeft, G., 2005, Voorzieningszekerheid op de Nederlandse stroommarkt, TILEC report,
Tilburg, July.
Brunekreeft, G., K. Neuhoff and D. M. Newbery, 2004, Electricity transmission: an overview of
the current debate, Cambridge, CMI Working paper 60.
Burns, P. en T. Weyman-Jones, 1996, Cost Functions and Cost Efficiency in Electricity
Distribution: A Stochastic Frontier Approach, in: Bulletin of Economic Research, Blackwell
Publishing, , vol. 48, no.1, pp. 41-64.
Bushnell, J., 2004, California’s Electricity Crisis: a Market Apart?, Energy Policy, vol. 32, pp.
1045-1052.
Bushnell, J., 2005, Electricity Resource Adequacy: Matching Policies and Goals, CSEM WP
146.
Bushnell, J. and C. Saravia, 2002, An empirical assessment of the competitiveness of the New
England electricity markets, CSEM WP-101, University of California Energy Institute, US.
Bushnell, J. and C. Wolfram, 2005, Ownership Change, Incentives and Plant Efficiency: The
Divestiture of U.S. Electric Generation Plants, SCEM WP 140, US.
Bye, T., 2003, A Nordic Energy Market under Stress, Economic Survey 4, 2003.
Canoy, M. and D. Newbery, 2003, Fusie Controle Voldoet Niet bij Elektriciteit, Het
Financieele Dagblad, January 18, 2003.
Clingendael International Energy Programme (CIEP), 2004, Study on Energy Supply Security
and Geopolitics, Report for DG-TREN, January 2004.
CPB, 2004, Better safe than sorry?, CPB Document 73, December 2004.
Creti, A., B. Villeneuve, 2003, Long-term contracts and take-or-pay clauses in natural gas
markets, University of Toulouse working paper.
Skytte, K. and S. Ropenus, 2005, Regulatory Review and International Comparison of EU-15
Member States, DG-Grid project.
79
Domah P. en M. Pollitt, 2001, The Restructuring and Privatisation of Electricity Distribution
and Supply Businesses in England and Wales: A Social Cost-Benefit Analysis, Fiscal Studies,
vol. 22, no. 1, pp. 107-146.
DTe, 2002, Yardstick Competition, Regional Electricity Network Companies, Second
Regulation Period, Information and Consultation Document.
DTe, 2004, Onderzoek Ontwikkeling Liquiditeit Elektriciteitsmarkt 2003-2004.
Economides, N. and A. Siow, 1988, The division of markets is limited by the extent of
liquidity, The American Economic Review , vol. 78, no. 1, pp 108-121.
Edvardsen, D.F., F. R. Førsund, 2003, International benchmarking of electricity distribution
utilities, Resource and Energy Economics, vol. 25, no. 4, pp.353-371.
Eikeland P. O., 1998, Electricity market liberalisation and environmental performance: Norway
and the U.K., Energy Policy, vol. 26, no. 12, pp. 917-927.
Eikmeier, B., J. Gabriel, and W. Pfaffenberger, 2005, Perspektiven für die energieintensive
Industrie im europäischen Strommarkt unter Berücksichtigung der Regulierungsentgelte,
Gutachten des Bremer Energie Instituts für die RWE Aktiengesellschaft, Bremen.
Electrabel Nieuwsbrief, 2005, “Brinkhorst: Van Duyne boekt vooruitgang in gesprekken met
stroomproducenten”, Nieuwsbrief E-ditie Grootzakelijk , 45, 2005.
Ernst & Young, 2006, Final report on the research project on “The case for liberalisation“ of the
Department of Trade and Industry, the UK.
Eurelectric, 2003, R&D in EURELECTRIC Countries; overview of R&D organisation, 2002,
update, January.
European Commission, 2000, Green Paper: Towards a European strategy for the security of
energy supply, Brussels, 29.11.2000, COM(2000) 769 final.
European Commission, 2003, External Costs, Research results on socio-environmental damages
due to electricity and transport, Brussels.
European Commission, 2004, The share of renewable energy in the EU, Communication from
the Commission, COM (2004) 366 final.
80
European Commission, 2005, Report on Progress in Creating the Internal Gas and Electricity
Market, Technical Annex.
European Commission, 2006, Energy Sector Inquiry, sector inquiry under Art 17 Regulation
1/2003 on the gas and electricity markets, preliminary report, February.
European Transmission System Operators (ETSO), 2004, Overview of congestion management
methods - Sept 2004.
European Transmission System Operators (ETSO), 2006, Overview of congestion management
methods - May 2006.
European Union, 2001, Directive 2001/77/EC of the European Parliament and of the Council of
27 September 2001 on the promotion of electricity produced from renewable energy sources in
the internal electricity market, Official Journal of the European Union 27.10.2001.
European Union, 2003, Council Directive 2003/96/EC of 27 October 2003 restructuring the
Community framework for the taxation of energy products and electricity, Official Journal of
the European Union 31.10.2003.
Eurostat, 2005, Competition indicators in the gas market of the European Union, Statistics in
Focus, 08/2005.
Eurostat, 2006, European electricity market indicators of the liberalisation process 2004-2005,
Statistics in Focus, 6/2006.
Eyre, N., 2000, Retail Market Liberalisation and Energy Efficiency: A Golden Age or a False
Dawn?, in: MacKerron G. and P. Pearson (Eds.), The International Energy Experience –
Markets, Regulation and the Environment.
Fabrizio, K., N. Rose, C. Wolfram, 2006, Does Competition Reduce Costs? Assessing the
Impact of Regulatory Restructuring on U.S. Electric Generation Efficiency, working paper,
http://faculty.haas.berkeley.edu/wolfram/Papers/frw.041306.pdf
Fertilizer Institute, 2005, Testimony of Ford B. West, President, The Fertilizer Institute Before
the U.S. Senate Appropriations Interior and Related Agencies Subcommittee Regarding The
High Price of Natural Gas and its Impact on the U.S. Fertilizer Industry, October 2005.
81
Filippini, M., S. Banfi, and C. Luchsinger, 2002, Deregulation of the Swiss Electricity Industry:
Implication for the Hydropower Sector, CEPE Working Paper Nr. 13.
Frontier Economics, 2006a, Current prices, anybody?, Bulletin February 2006.
Frontier Economics, 2006b, Addressing the adverse effects of market power, a final report
prepared for CREG.
Gilbert, R., K. Neuhoff and D. M. Newbery, 2004, Allocating transmission to mitigate market
power in electricity networks, RAND Journal of Economics, vol. 34.
Giulietti, M., C. Waddams Price and M. Waterson, 2005, Consumer Choice and Competition
Policy: a Study of UK Energy Markets, Economic Journal, vol. 115, no. 506, pp. 949-969.
Glachant, J-M. and V. Pignon, 2003, Nordic Electricity Congestion’s Arrangement as a Model
for Europe: Physical Constraints or Operators’ Opportunity, DAE Working Paper WP313.
Glachant, J-M. and F. Lévêque, 2006, Electricity Internal Market in the European Union: What
to do Next?, Cambridge Working Papers in Economics, CWPE 0623 and EPRG 0605.
Goulder, L. H., 2004, Induced Technological Change and Climate Policy, Pew Center on
Global Climate Change.
Green, R., 2003, Retail Competition and Electricity Contracts, Cambridge Working Papers in
Economics CWPE 0406, UK.
Grubb, M. and K. Neuhoff, 2006, Allocation and Competitiveness in the EU Emissions Trading
Scheme: Policy Overview, Cambridge Working Papers in Economics, CWPE 0645 and EPRG
0622.
Grubb, M., L. Butler and G. Sinden, 2006, Diversity and Security in UK Electricity Generation:
The Influence of Low Carbon Objectives, Cambridge Working Papers in Economics CWPE
511.
Haas, R., H. Auer, C. Huber, and W. Orasch, 2000, How will Electricity Prices in Deregulated
Markets Develop in the Long Run? Arguments why there won’t be any really Cheap Electricity,
in: MacKerron G. and P. Pearson (Eds.), 2000, The International Energy Experience – Markets,
Regulation and the Environment.
82
Haffner, R.C.G. en P. Meulmeester, 2005, Evaluatie van de regulering van het
elektriciteitsnetwerk, ESB, vol. 90, no. 4472, pp. 430-433.
Hattori, T., 2006, Liberalization and R&D in Japanese electricity industry - an initial
observation of patent data, Central Research Institute of Electric Power Industry, Japan.
Hattori, T., T. Jamasb, M. Pollitt, 2003, A comparison of UK and Japanese electricity
distribution performance 1985-1998: lessons for incentive regulation, DAE WP 0212/CMI WP
03.
Herguera, I., 2000, Bilateral contracts and the spot market for electricity: some observations on
the British and the NordPool experiences, Utilities Policy, vol. 9, no. 2, pp. 73-80.
High Level Group on Competitiveness, energy and the environment, 2006, Functioning of the
energy market, access to energy , energy. First report, June 2006.
Hjalmarsson, L and A. Veiderpass, 1992, Efficiency and Ownership in Swedish electricity retail
distribution, Journal of productivity analysis, 3, pp.7-23.
Hogan, W.W., 1992, Contract networks for electric power transmission, Journal of Regulatory
Economics 4, pp 211–42.
Hogan, W.W., 2005, On an “Energy Only” Electricity Market Design for Resource Adequacy.
Honoré A and J. Stern, 2004, Large Scale Investments in Liberalised Gas Markets: The Case of
UK, Oxford Institute of Energy Studies.
International Energy Agency (IEA), 2003, Power Generation Investment in Electricity Markets.
International Energy Agency (IEA), 2004, Natural Gas Information. Paris.
International Energy Agency (IEA), 2005a, Lessons from Liberalised Electricity Markets, Paris.
International Energy Agency (IEA), 2005b, Learning from the Blackouts, Paris.
International Energy Agency (IEA), 2005c, Energy Policies in IEA Countries, 2005 Review,
Paris.
83
Jaffe, A. B., S. R. Peterson, P. R. Portney, and R. N. Stavins, 1995, Environmental Regulation
and the Competitiveness of the U.S. Manufacturing: What does the Evidence Tell Us? Journal
of Economic Literature 33, 132-163.
Jamasb, T. and M. Pollitt, 2005a, Electricity market reform in the European Union: review of
progress towards liberalisation and integration, CMI WP 66 and CWPE 0471, Cambridge
University, UK.
Jamasb, T. and M. Pollitt, 2005b, Deregulation and R&D in network industries: the case of the
electricity industry, CWPE 0533 and EPRG 02.
Jenkins, R., 1998, Environmental Regulation and International Competitiveness: A review of
Literature and Some European Evidence, United nations University, Institute for new
technologies, Discussion paper Series 9801, Maastricht.
Joode, J. de, D. Kingma, M. Lijesen, M. Mulder and V. Shestalova, 2004, Energy policies and
risks on energy markets; a cost-benefit analysis, CPB, The Hague, Special Publication 51.
Joskow, P., 2003, The difficult transition to competitive electricity markets in the U.S., The
Cambridge-MIT Institute, CMI-Working Paper 28.
Joskow, P., 2005, Patterns of Transmission Investment, Electricity Infrastructure Investment
Workshop, CRE, Paris, March 2005.
Joskow, P., and J. Tirole, 2000, Transmission Rights and Market Power on Electric Power
Networks, RAND Journal of Economics, vol. 31.
Joskow, P., and J. Tirole, 2004, Retail Electricity Competition, mimeo, MIT and IDEI.
Joskow, P. and J. Tirole, 2006, Reliability and Competitive Electricity Markets, forthcoming in
RAND Journal of Economics.
Kaiser, K. and G. G. Schulze, 2003, International Competition and Environmental
Expenditures: Empirical Evidence from Indonesian Manufacturing Plants, HWWA Discussion
Paper 222, Hamburg.
Kemfert, C., W. Lise, and R. Östling, 2003, The European Electricity Market – Does
Liberalisation Bring Cheaper and Greener Electricity?, University of Oldenburg.
84
Klepper, G. and S. Peterson (2005), Emissions Trading, CDM, JI, and More – The Climate
Strategy of the EU, Kieler Working Paper No. 1238, Kiel.
Kohlhaas, M., 2005, Gesamtwirtschaftliche Effekte der ökologischen Steuerreform,
Forschungsprojekt im Auftrag des Umweltbundesamtes, FKZ 204 41 194, Berlin.
Kohlhaas, M., K. Schumacher, J. Diekmann, D. Schumacher, and M. Cames, 2004, Economic,
Environmental and International Trade Effects of the EU Directive on Energy Tax
Harmonisation, DIW Discussion Papers 462, Berlin.
Koschel, H., 2002, A CGE Analysis of the Employment Double Dividend-Hypothesis:
Substitution Patterns in Production, Foreign Trade, and Labour Market Imperfections.
Dissertation, University of Heidelberg (http://www.ub.uni-heidelberg.de/archiv/1839 visited on
21.08.06).
Kouvaritakis, N., L. Paroussos, and D. Van Regemorter, 2003, The macroeconomic evaluation
of energy tax policies within the EU, with the GEM-E3-Europe model, Final Report of the
Study for the European Commission, TAXUD/2002/DE/302.
Kouvaritakis, N., N. Stroblos, and L. Paroussos, 2005, Impacts of Energy Taxation in the
enlarged European Union – Evaluation with GEM-E3 Europe, Final Report of the Study for the
European Commission, TAXUD/2003/DE/308.
Kumbhakar, S. C. and L. Hjalmarsson, 1998, Relative performance of public and private
ownership under yardstick competition: electricity retail distribution, European Economic
Review, vol. 42, no.1, pp. 97-122.
Kühn K.-U. and M.Machado, 2004, Bilateral market power and vertical integration in the
Spanisch electricity spot market, CEMFI WP-0414, Madrid, Spain.
Langset, T., Trengereid, F., Samdal, K. and J. Heggset, 2001, Quality Dependent Revenues -
Incentive Regulation of Quality of Supply, NVE, Norway.
Lijesen, M. and G.T.J. Zwart, 2005, Op zoek naar een onzichtbaar vangnet; hoe geven we de
publieke rol in leveringszekerheid vorm zonder de markt te verstoren?, CPB, The Hague, CPB-
Document 89.
Littlechild, S., 2005, Competition and Contracts in the Nordic electricity markets, CWPE 0550
and EPRG 06.
85
Littlechild, S., 2006, Beyond regulation, CWPE 0616 and EPRG 0516.
Löschel, A., 2002, Technological Change in Economic Models of Environmental Policy: A
Survey, Ecological Economics 43, 105-126.
Mansur, E.T., 2001, Pricing behaviour in the initial summer of the restructured wholesale
electricity market, PWP-083, University of California Energy Institute, US.
Mansur, E.T., 2003, Vertical Integration in restructured electriity markets: measuring market
efficiency and firm conduct, WP 32, Yale School of Management, US.
Markard, J. and B. Truffer, 2006, Innovation processes in large technical systems: Market
liberalization as a driver for radical change, Research Policy.
Meade, R., 2006, Electricity Investment and Security of Supply in Liberalized Electricity
Systems, The European Power Supply Industry, Forthcoming.
Ministère de l'Économie, des Finances et de l'Industrie, 2005, Thierry Breton et François Loos
prennent acte de l'avis du Conseil de la Concurrence sur le dispositif de consortium pour les
électrointensifs, Communiqué de presse 06/12/2005.
Mork, K. A., 1992, Productivity in Swedish Electricity Retail Distribution: Comment,
Scandinavian Journal of Economics, 94(0), pp S207-09, Supplement.
Müsgens, F., 2004, Market Power in the German Wholesale Electricity Market, EWI WP 04.03,
University of Cologne, Germany.
Mulder, M., V. Shestalova and M. Lijesen, 2005, Vertical separation of the energy-distribution
industry: An assessment of several options for unbundling, CPB Document 84, The
Netherlands.
Mulder, M. and G.T.J. Zwart, 2006, Government involvement in liberalised gas markets; a
welfare-economic analysis of the Dutch gas-depletion policy, CPB, The Hague, CPB-Document
110.
NERA, 2002, Security in Gas and Electricity Markets, Report for Department of Trade and
Industry, October 2002.
86
Neuhoff, K., 2003, Integrating Transmission and Energy Markets Mitigates Market Power,
DAE Working Paper WP 0310.
Neuhoff, K., M. Grubb, and K. Keats, 2005, Impact of the Allowance Allocation on Prices and
Efficiency, CWPE 0552 and EPRG 08.
Neuhoff, K., K. Keats Martinez, and M. Sato, 2006, Allocation, Incentives and Distortions: The
Impact of the EU ETS Emissions Allowance Allocations to the Electricity Sector, CWPE 0642
and EPRG 0618.
Neuhoff, K. and P. Twomey, 2005, Market Power and Technological Bias: The Case of
Electricity Generation, EPRG Working Paper 01, August 2005.
Newbery, D. en M. Pollitt, 1997, The Restructuring and Privatisation of the CEGB – Was It
Worth It?, Journal of Industrial Economics, vol. 45, no.3, pp. 269-303.
Newbery, D. M., 2000, Privatization, restructuring, and regulation of network utilities, Walras-
Pareto Lectures, MIT Press.
Newbery, D.M., 2002a, Issues and Options for Restructuring Electricity Supply Industries,
University of Cambridge, CMI Working Paper 01.
Newbery, D.M., 2002b, Regulatory Challenges to European Electricity Liberalisation,
University of Cambridge, CMI Working Paper 12.
Newbery, D.M., 2005, Capacity markets and capacity prices, presentation at The Economics of
Electricity Markets conference, Toulouse.
Oberndorfer, U. and K. Rennings, 2006, The Impacts of the European Union Emissions Trading
Scheme on Competitiveness in Europe, ZEW Discussion Paper No. 06-051, Mannheim.
Ofgem, 2003, 2001/2002 Electricity distribution and quality of supply report.
Oren, S., 2005, Generation Adequacy via Call Option Obligations: Safe Passage to the
Promised Land, Electricity Journal, November 2005.
Pearson, P. 2000, Electricity Liberalisation, Air Pollution and Environmental Policy in the
U.K., in: MacKerron G. and P. Pearson (Eds.), 2000, The International Energy Experience –
Markets, Regulation and the Environment.
87
Pérez-Arriaga, J. I., 1999, Reliability in the new market structure (part 1): Reliability and
generation adequacy, IEEE Power Engineering Review, December 1999.
Peterson, S., 2006, Efficient Abatement in Separated Carbon Markets: A Theoretical and
Quantitative Analysis of the EU Emissions Trading Scheme, Kieler Working Paper No. 1271,
Kiel.
Pollitt, M.G. and Jamasb, T., 2001, Benchmarking and Regulation of Electricity Distribution
and Transmission Utilities: Lessons from International Experience, December, DAE Working
Paper No.0101. Cambridge University, UK.
Pomp, M., Shestalova, V. and L. Rangel, 2005, Switch on the competition: causes,
consequences and policy implications of consumer switching costs, CPB Document 97.
Porter, M. E., 1999, Nationale Wettbewerbsvorteile, in: Porter, M. E. (Ed.), Wettbewerb und
Strategie, München, 165-206.
Porter, M. E. and C. van der Linde, 1995, Towards a new Conception of the Environment-
Competitiveness Relationship, The Journal of Economic Perspectives 9 (4), 97-118.
Ringel, Marc, 2003, The Common European Market for Energy and the Environment: Towards
a Sustainable Electricity Provision? Chemnitz Working Paper 55, pp. 1-23.
Sanyal, P. and L.R. Cohen, 2005, Deregulation, restructuring and changing R&D paradigms in
the US electric utility industry, Brandeis University/University of Southern California Law
School, February.
Sijm, J., K. Neuhoff, and Y. Chen, 2006, CO2 Cost Pass Through and Windfall Profits in the
Power Sector, CWPE 0639 and EPRG 0617.
Smith, A. and M. Ross, 2002, Allowance Allocation, who Wins and Loses Under a Carbon
Dioxide Control Program? Study of Charles River Associates.
Speck, S., 2003, Liberalisation of the Electricity Market and Environmental Policy Issues:
Synergy or Controversy, Research Symposium European Electricity Markets, The Hague.
Steiner, F., 2001, Regulation, Industry Structure and Performance in the Electricity Supply
Industry, OECD Economics Department Working Papers, nr. 238, OECD Publishing.
88
Stern, J., 2003, UK Gas Security: time to get serious, Oxford Institute for Energy Studies
(OIES), Oxford.
Sweeting, A., 2005, Market Power in the England and Wales Wholesale Electricity Market
1995-2000, Working Paper.
Taistra, G., 1999, Die Porter-Hypothese zur Umweltpolitik, Wiesbaden.
TenneT, 2005, Rapport Monitoring Leveringszekerheid 2004-2012, Arnhem, April.
Tilley, B. and T. Weyman-Jones, 1999, Productivity Growth and Efficiency Change in
Electricity Distribution, Working Paper.
UCTE, 2005, System Adequacy Retrospect 2004.
Uyterlinde, M.A., G. H. Martinus, E. van Thuijl, N. Kouvaritakis, L. Mantzos, V. Panos, M.
Zeka-Paschou, K. Riahi, G. Totsching, I. Keppo, P. Russ, L. Szabo, S. Kypreos, P. Rafaj, C.
Böhringer, A. Löschel, I. Ellersdorfer, M. Blesl, P. le Mouël, A. S. Kydes, K. Akimoto, F.
Sano, T. Homma, T. Tomoda, 2004, Energy Trends for Europe in a Global Perspective,
CASCADE MINTS project, Vol. 1.
Uyterlinde, M. A., G. H. Martinus, H. Rösler, N. Kouvaritakis, V. Panos, L. Mantzos, M. Zeka-
Paschou, S. Kypreos, P. Rafaj, M. Blesl, I. Ellersdorfer, U. Fahl, I. Keppo, K. Riahi, C.
Böhringer, A. Löschel, F. Sano, K. Akimoto, T. Homma, T. Tomoda, F. Pratlong, P. le Mouël,
L. Szabo, P. Russ, A. Kydes (2005), The Contribution of Renewable Energy to a Sustainable
Energy System, CASCADE MINTS project, Vol. 2.
Willems, B., 2006, Virtual Divestitures, Will They Make A Difference? Cournot Competition,
Option Markets and Efficiency, CSEM WP 150, Berkeley, US.
Williamson, O.E., 1979, Transaction costs economics: The governance of contractual relations,
Journal of Law and Economics, vol. 22, pp. 233-260.
Wolak, F., 2001, Designing a Competitive Wholesale Electricity Market That Benefits
Consumers, working paper, ftp://zia.stanford.edu/pub/papers/hoover.paper.pdf
Wohlgemuth, N., 2000, Renewable Energy and Energy Efficiency in Liberalized European
Electricity Markets, Eur. Env. 10, 1-11.


