Embed Size (px)
Citation preview

Banks and Bank Systems / Volume 1, Issue 3, 2006
© Chinedu B. Ezirim, Michael I. Muoghalu, 2006
116
FINANCIAL MANAGEMENT IMPERATIVES OF INTERMEDIATION FUNCTION OF FINANCIAL
INSTITUTIONS: EMPIRICAL EVIDENCE FROM NIGERIA
Chinedu B. Ezirim, Michael I. Muoghalu
Abstract This paper focuses on the funding sources, repayments, and maturity implications of financial in-stitutions in Nigeria at the supply side of their financial intermediation function. It also concerns itself with the investment outlets and maturity imperatives of the demand side financial interme-diation. The principal aim was to compare the two sets of activities in a bid to bring out the critical financial management undertones of the operations of the institutions. The questionnaire was used as the research instrument, while analyses were made using descriptive statistics and the multivari-ate generalized linear model. The results indicate that all the financial institutions studied dis-played unalloyed preference for short-term funding and investing operations. The institutions were highly geared when equity is related to debt obligations. Insurance companies are the most highly-geared and as such are more susceptible to financial risks. There was a near-perfect synchrony between the maturity structure of the funding sources and the investment outlets.
Key words: Financial Management, Financial Institutions, Financial Intermediation, Commercial Banks, Investments, Portfolio Management. JEL Classifications: G21.
1. Introduction Financial management of economic agents concerns itself with answers to the critical questions of how do the agent would plan for, source, organize, allocate and/or utilize, and apportion funds available to him in order to accomplish nominated objectives. For a typical financial institution, this would include issues relating to how the institution would raise needed capital, organize or structure the funding sources, and utilized the sourced funds to maximize the wealth of the owners. The institution must be poised to raise funds from convenient sources that would guarantee cost effectiveness and time efficiency. These generated funds must be channeled into outlets that would increase or improve the productive quality of the funds by way of profitable investments. The structure of the funding sources and investment outlets must be properly harmonized or arranged such that the institution can attain the wealth maximization objective.
A cursory look at the above reveals some important points. One is that financial management in a financial institution relates directly with its financial intermediation function. Second, concerted functions implicated in financing decisions of firms are actually the same functions performed at the inflow or supply side of financial intermediation. Third, investment decisions of financial man-agement are basically the functions performed at the outflow or demand side of financial interme-diation. Fourth, efficient intermediation function must include goal-oriented capital and assets structuring that would do the financial institution the most good.
Many studies have been conducted on the financial intermediation function of financial institutions in Nigeria. For instance, Agiobenebo and Ezirim (2003) examined the impact of financial interme-diation on the profitability of insurance industry. Ezirim (1999) studied the intermediation func-tions of the financial superstructure and economic growth. Ezirim (2003) modeled, econometri-cally, intermediation functions of the financial institutions in Nigeria. Ezirim and Muoghalu (2002) investigated the “net intermediation behavior of the financial superstructure by making a comparative analysis of commercial banks and insurance companies in Nigeria”. Ezirim, Muoghalu, and Emenyonu (2004) empirically analyzed the relationship between financial inter-mediation and environmental factors. The paper brought out the managerial implications of the

Banks and Bank Systems / Volume 1, Issue 3, 2006
117
observed relationship. These papers approached the chosen topics mainly from the econometric viewpoint and not from the quasi-experimental design methodology. More so, the previous papers did not concern themselves with the financial management aspect of the intermediation function of four major institutional divides in the Nigerian economy, which this paper attempts to do.
This paper is basically concerned with an x-ray of why and how selected financial institutions in Nigeria perform the critical financial management functions that inform the two sides of financial intermediation. Specifically, it addresses the issues of: 1) from what sources do financial institu-tions generate their funds from operations; 2) what avenues do the institutions channel these funds; 3) from what sources do they pay back generated funds; and 4) what maturity structure of funding sources and investments post with their implications. It is hoped that answers to these questions would bring to light the imperatives of aspects of financial management on the intermediation function of financial institutions in Nigeria. The rest of the paper is organized as follows: The sec-ond section is concerned with theoretical underpinnings and review of literature. The third section deals with the scope, limitations and method of study, while the fourth section analyzes the survey information generated during the study and tests relevant hypotheses. The final part is the conclud-ing remarks and recommendations.
2. Some Theoretical Issues Financial management has been broadly defined “as the process of planning, acquisition, utiliza-tion, and apportionment of scarce monetary resources among economic units with a view to achieving predetermined objectives”, such as the maximization of an owner’s wealth (Ezirim, 2005: 26). Viewed from this angle, we can underline at least four managerial finance decisions – namely, financing, investment, dividend, and working capital management decisions. For a typical financial institution, the decisions to plan for and raise needed funds would be part of its financing or funding decision. Raising needed funds has an additional component of organizing such funds into a convenient capital structure. In order to ensure the maximization of owners’ wealth, for in-stance, the institutional finance managers must raise funds from convenient sources that would guarantee cost effectiveness and time efficiency. Available sources of funds for financial institu-tions include shareholders’ contributions, deposits from customers and other financial institutions (in case of banks), premiums generated from policyholders (in the case of insurance companies), borrowings from customers, owners, and other financial and non-financial institutions, retentions, repayments from loans and investments, and the like. It is the responsibility of finance managers to ensure a comfortable mix of these and other sources to ensure that the weighted average and/or marginal costs of capital is at its lowest possible level (Ezirim, 2005).
Investment or asset mix decisions involve all the basic decisions or functions of financial man-agement geared towards the allocation, utilization, and deployment of funds into viable assets, ventures, projects, or outlets that would generate returns in the future. This also includes the han-dling of the assets, projects or outlets in question (Ezirim, 2005). To the extent that financial insti-tutions engage in decisions relating to commitment of funds to given economic activities in antici-pation of future benefits under conditions of risks, they undertake institutional investment deci-sions. Such activities as lending, investments or money and capital markets, foreign exchange dealings, etc., would represent investment activities (Ezirim, 2000). Institutional investments are usually conceptualized in terms of portfolio management. In some cases, authors have even taking institutional portfolio management to mean the same thing as institutional financial management. For instance, Koch (1992: 1, 525) defined financial management of commercial banks as involving “selecting the portfolio and mix of products and services offered to balance expected returns with assumed risk, within the objective of maximizing shareholders value”. A bank’s investment port-folio comprises different kinds of money and capital markets’ instruments. These would include treasury bills, negotiable certificate of deposits (NCDs), bankers’ acceptances, commercial paper security repurchase agreements, longer term treasury securities (such as treasury certificates), gov-ernment bonds and development stocks, and others. On the part of insurance companies, they “in-

Banks and Bank Systems / Volume 1, Issue 3, 2006
118
vest in a wide range of public and private sector securities, property, mortgages, and cash” (Ezirim, 2000: 40). For the purposes of this paper, the portfolio of loans and advances of financial institutions are seen to be part of their total investment portfolio.
Generally, profitability of financial institutions depends on their investment performance, which in turn, depends on the way portfolios are managed. For a typical bank, portfolio management repre-sents the prudent management of banks’ assets and liabilities in order to seek some optimum com-bination of income, profit, liquidity, and safety (Jhinghan, 1994). For Diacon and Carter (1984), the overall objective of portfolio management of insurance companies is to meet obligations as they fall due, while earning the highest possible yield without incurring too great a risk. Thus, both liquidity and profitability seem to receive equal emphasis. Koch (1992) contends that a bank’s investment portfolio considerations are uniquely different in that investment securities are held to meet one of six general objectives: safety or preservation of capital, liquidity, yield, diversification of credit risk, managing interest rate risk exposure, and meeting pledging requirements. Accord-ingly, “securities with different return and risk features meet each objective differently so that the average portfolio is quite varied in terms of composition and price sensitivity”. No matter the ob-jective pursued, the consensus in finance theory is that investments must contribute generally to the over-riding objective of shareholder’s wealth maximization.
Some important considerations and tasks often challenge typical financial managers of banks and other financial institutions (BOFI). For instance, what specific activities or courses of actions are to be taken in order to maximize the wealth of owners? It is of note that as recognized by finance theory, a trade-off exists between returns and risks, such that investors that are willing to assume higher risk levels are greeted with higher returns. But what level of risk is optimal for the institu-tional investor given consideration to the nature of liabilities and operations? This is where the liquidity and profitability objectives begin to part ways. Whereas there is the general desire for higher earnings, the nature of operations demands great attention to be paid to liquidity. Failure to meet arising obligations exposes the institution to default risk and associated bankruptcy costs. Failure to make as much earnings as expected exposes management to the wrath of shareholders. The question of what particular purpose must be served has plagued institutional management for a very long time. Possible resolution lies in prudently harmonizing the requirements of concerned objectives with a view to striking a balance between them.
A possible way out of the problem of conflict of objectives is to put in place efficient systems of cash flow and working capital management. Recognizing the peculiarities of individual institu-tional divide, managing cash outflows and inflows efficiently can help in achieving the required prudential balance between liquidity and profitability, and generally contribute to the overriding objective of shareholder’s wealth maximization. The other dimension relates to tenor management of assets and liabilities. This is a very important aspect of working capital management of financial institutions. The general body of working capital management involves the administration, within policy guidelines, of current assets and liabilities Neveu (1985: 154) saw working capital man-agement as “the management of a corporation’s sources and uses of working capital so as to ad-vance the financial welfare of its stockholders”. A sound working capital policy, as in Ezirim (1995) would attempt to determine the optimum level of investments in current assets and how they are financed. It is conventional to finance short-term assets with short-term liabilities. Neglect of this convention breeds a regime of tenor mismatch.
Two alternative strategies are usually identified with working capital policies of financial institu-tions. One is the conservative strategy that attempts to allow for more liquidity over and above profitability. The concerned institutions display risk-averting tendencies relating to the inability to finance spontaneous asset growth and that of default in respect of maturing obligations. When fi-nancial institutions embark upon conservative working capital management, they are termed low-risk, low-return institutions. The second is the aggressive working capital strategy which empha-sized higher profitability and minimum liquidity while meeting short-maturing obligations. Institu-tions that employ this strategy are known as high-risk, high-return investors. These working capi-
Banks and Bank Systems / Volume 1, Issue 3, 2006
119
tal management strategies, thus, obey the risk-return trade-off rules. Notwithstanding, an optimal working capital policy is one that contributes to the maximization of shareholders’ wealth (Ezirim, 1995; Neveu, 1985).
3. Methodology 3.1. Research Design, Instrument, and Sampling Procedure
The study followed the quasi-experimental research design which is very suitable for studies in social and management sciences where respondents’ opinion are sought and evaluated for possible inferences. The critical research instrument was the questionnaire. Construction of the question-naire followed the Likert scale of rank-observations on a five-point maximum scale. The question-naire constructed was relevant in that it sought to generate information that is not usually con-tained in the statutory returns or annual reports of the concerned institutions. The study covered all the deposit banks (115 in number including their regional, area, and major offices: 64 for commer-cial banks and 51 for merchant banks) operating at the time of the survey. For ease of comparabil-ity, the same number of insurance companies (115) and finance houses (115) were selected. The sampling procedure for the insurance companies followed the random sampling method. Accord-ingly, we listed the companies registered with the Nigerian Insurance Association including five reinsurance companies. We numbered the 150 companies from 000 (for the first unit), 001 for the second; to 149 (for the last unit) as per the listing. We then used the simple random procedure with the table of random digits and selected the companies with numbers appearing on the table until we got 115 companies.
On the other hand, there were 279 finance companies operating in the system. We also numbered a list of the finance companies from 000 (for the first unit) to 278 (for the last unit) and drew 115 companies from the random table as per the assigned numbers. The reason for the writer’s decision and subsequent adjustments is to place the selected institutional divides – deposit banks, insurance companies and finance companies – on equal footing for reliable analysis and comparison. We distributed the questionnaire to responsible personnel in the selected institutions. Care was taken to ensure that the respondents were not below the rank of managers.
3.2. Tools of Analysis
The analysis of survey data was carried out, first, using simple descriptive statistical techniques involving the construction and analysis of frequency distribution tables of the type and number of responses which we afterwards translated into percentages, where applicable. The second tool of analysis involved the use of the multivariate general linear model (GLM). The GLM multivariate procedure provided regression analysis and analysis of variance for multiple dependent variables by one or more factor variables or covariables. The procedure enables one to investigate interac-tions between factors as well as the effects of individual factors. Calculations were made of effects using Pillai’s Trace, Wilks’ Lambda, Hotelling’s Trace, and Roy’s Largest Root tests. Also, the paper conducted tests of between-subjects effects with type III sum of squares as the default method of evaluating different hypotheses. Inclusively, we conducted the univariate analysis of variance tests of between-subjects effects under the same default scenario as in the multivariate case. This helped us to dichotomize individual effects as they apply to respective financial institu-tions. (For more detailed explanation of the GLM procedure, see Nurosis, 2001). The results of the univariate analysis of variance tests produced similar results as those obtained in the multivariate case, so they are not reported in this paper. Only the results of the multivariate model were re-ported.
3.3. Scope and Limitations of Study
Our investigation covers mainly the activities of commercial banks, merchant banks, insurance companies, and finance houses. Commercial banks in Nigeria are generally those retail banks that accept deposits that are withdrawn by check. Merchant banks, unlike commercial banks, concen-trate on wholesale banking, and thus serve the financial needs of corporate and institutional cus-
Banks and Bank Systems / Volume 1, Issue 3, 2006
120
tomers. Whereas commercial banks customarily engaged in short-term financial transactions, mer-chant banks were created to provide medium-term financing for development. However, with the taking into effect of the universal banking scheme in 2001, the traditional wall of demarcation be-tween the two institutional divides has been broken. Nevertheless, most banks that started as mer-chant banks have remained so in ‘spirit’. Insurance companies are financial institutions, occupying the same position that commercial banks occupy among banking institutions in Nigeria. A finance company is a person licensed to carry on financial businesses of extending credit facilities to cus-tomers and to industrial, commercial, or agricultural enterprises, including lending of money; leas-ing business; business of hire purchase; factoring; project financing and consultancy; debt admini-stration, local purchase order financing, export finance; and others. They are not expected to ac-cept deposits but can borrow monies for their operations. They are the next non-bank financial institution in importance, after insurance companies. Thus, this study limits its scope to the activi-ties of the two most important banking institutions and the two most important non-banking finan-cial institutions in Nigeria (Ezirim, 2005). The study does not cover the funds mobilization and investment activities of such banking activities as community banks, peoples’ bank, development banks, and mortgage banks (known as the primary mortgage institutions (PMIs)). Also other non-bank finance institutions were not covered in the present study owing to the enormous work in-volved that is beyond the present monetary resource base of this study, especially since it is self-financed. More so, such non-banking institutions as discount houses, bureau de change, stock broking firms, insurance brokerage firms and loss adjusters, do not have clearly defined interme-diation processes and activities that are congruent with the dictates of the purposes of this study, neither are their activities consistent with those required by our primary survey tool, as con-structed. The primary mortgage institutions (PMIs) are basically hybrid institutions as defined by the Nigerian monetary authorities. They are neither full-bankers nor full-non-banking institutions. They possess the features of both. They become non-classificatory for the purpose of our primary evidence. However, giving that the institutions covered in this study account for over 97% of the total institutional savings and investments in the country, we have good reason to believe that de-ductions made in this paper would pass the test of reliability.
4. Presentation and Analysis of Data 4.1. Data Information
Out of the total number of questionnaires distributed, only 260 sets were retrieved: 100 from de-posit banks (52 from commercial banks and 48 from merchant banks), 100 from insurance compa-nies, and 60 from finance houses. This implies a response rate of 75%. It is of note that most fi-nance house operators were secretive and averse to divulging information on their operations. Notwithstanding, the information generated from all the institutional divides was sufficient to yield reliable inferences.
4.2. Sources of Funds and Repayments
On the question of available sources of funds for operations of the institutions studied, a list of their most mentioned sources include capital contribution, borrowed funds, deposits, other debt instruments, premiums, foreign exchange reserves, and roll-over of existing obligations. The summary of responses from institutions studied is made in Table 1, which shows the ways and avenues financial institutions mobilize monetary resources and savings. From the Table, the most prominent sources for all financial institutions put together are deposits/premium generation (31.61%) followed by capital contribution (12.63%) and retained earnings (12.32%). Interest in-come (9.84%), roll-overs (8.95%), and reserves (8.12%) follow the first three sources, and leaving borrowed funds (6.40%), other debt instruments (5.06%) and foreign exchange accounts (5.02%) to trail the list of principal sources.
A more critical look will reveal five major components of funding sources namely (i) sharehold-ers’ funds (capital contribution + retained earnings + reserves), (ii) deposits/premiums, (iii) debts (including borrowed funds and other debt instruments), (iv) foreign exchange accounts, and (v)

Banks and Bank Systems / Volume 1, Issue 3, 2006
121
interest income. Following this classification, we see the shareholders’ funding sources becoming the most prominent sources of funds for operation and claims about 33.07% of the entire distribu-tion, and is closely followed by deposits/premiums (31.61%). Debts occupied the third place with 11.46%; with the least prominence accorded foreign exchange accounts.
If, however, we appeal to the tenets of law relating to banking and the theory of financial intermedia-tion and apply it to all financial instruments, deposits/premiums and foreign exchange domiciliary accounts can then be seen as borrowed funds. This will automatically reverse the order of debts ac-counting for over 52% of the entire distribution, while shareholders’ fund accounts for 33.07%. This yields a gearing of (57.07 ÷ 33.07 =) 1.75. By implication, every N1.00 of equity is set as a cushion against N1.72 of borrowed funds. In financial management parlance these institutions are highly geared. Another interesting observation is the least prominence accorded foreign exchange accounts as a source of funds. This is quite enlightening, especially in respect of the attitude and performance of financial institutions toward export financing and promotion. Exports are supposed to be the prin-cipal source of income for the foreign exchange accounts. That these accounts fail to provide the much-needed funds for other operations as expected is an indication of the dismal performance of the institutions in export financing and promotion. This is yet another area of further research.
For commercial banks, the distribution is such that the first place of prominence goes to deposits (26.64%) – as expected – and is followed by retained earnings (11.63%) and interest income (9.27%). Borrowed funds (8.09%) tied with foreign exchange accounts (8.09%) are at the sixth position. Other debt instruments (7.92%) and roll-overs (7.58%) accounted for the seventh and eight positions, respectively. Traditional capital structuring would define total debt to include bor-rowed funds, deposits, other debt instruments and roll-overs, and in extreme cases, foreign ex-change domiciliary account. This would claim about 58.32% of the entire distribution for commer-cial banks. The shareholders’ funds, thus, represent 32.36% of the distribution and yield a debt-equity ratio of 1.8. This shows that for every N1.00 of owner-contributed funds, commercial banks borrow over N1.80 to lever it. By interpretation Nigerian commercial banks are highly geared even more than the industrial average of 1.72.
Table 1
Ways and Avenues Financial Institutions Mobilize Monetary Resources and Savings
WAYS/AVENUES ALL COMM MERC INSU FH Capital Contribution 367
(12.63) 66
(11.12) 106
(11.32) 50
(7.57) 145
(20.27) Borrowed Funds 186
(6.40) 48
(8.09) 68
(7.26) 0
(0) 70
(9.79) Deposit/Premium Generation 918
(31.61) 158
(26.64) 120
(12.82) 480
(72.72) 160
(22.37) Other Debt Instruments 147
(5.06) 47
(7.92) 80
(8.54) 0
(0) 20
(2.79) Foreign Exchange Account 146
(5.02) 48
(8.09) 88
(9.40) 10
(1.15) 0
(0) Interest Income 286
(9.84) 55
(9.27) 86
(9.18) 5
(0.75) 140
(19.58) Retained Earnings 358
(12.32) 69
(11.63) 174
(18.58) 35
(5.30) 80
(11.18) Reserves 236
(8.12) 57
(9.61) 104
(11.11) 40
(6.06) 35
(4.89) Roll-overs 260
(8.95) 45
(7.58) 110
(11.75) 40
6.06 65
(9.09) Total 2904
(100) 593
(100) 936
(100) 660
(100) 715
(100)
Source: Computation based on primary data.

Banks and Bank Systems / Volume 1, Issue 3, 2006
122
Merchant banks emphasize retained earnings (18.58%) as the most important source of funds and consider them superior to deposit-taking (12.82%). This is not easily understandable except in a regime of super-profits when retained earnings can become a very significant source of funds. While this can be substantiated for the Structural Adjustment Program (SAP) period (1986-1992), it cannot be done for the period beyond 1992. This being the case, our possible inference was that merchant banks’ respondents were perhaps living in the past. Following our traditional classifica-tion, total debts represent 49.77% of the entire distribution while total equity represents 41%. This reduces to a financial leverage ratio of 1.21. Thus, for every N1.00 of capital contributed, mer-chant banks borrow N1.21 to gear up the institutional capital base.
Respondents from the insurance companies believe that premiums are the dominant source of funds for operations. This accounted for over 72% of the total distribution followed by capital con-tribution (7.57%). The total debt for the insurance companies (excluding roll-overs, which are not indicated) represents 73.87%, while total shareholders’ funds account for 18.93%. These yield a gearing ratio of 3.9, revealing a very high gearing for these companies where N1.00 of capital is levered by N3.90 of debt. As also revealed by Table 1, ordinary borrowings and other debt instru-ments are not mentioned as sources of funds for insurance companies. A policy implication in re-spect of boosting the capital base to support highly geared operations of these companies is indi-cated.
For finance houses, the total debt represents about 44.04% of the entire distribution while total shareholders’ fund claims 36.34%. These yield a debt equity ratio of 1.21, implying that finance houses gear up every N1.00 contributed as capital by N1.21 of debt. It is noticeable that the same degree of gearing was obtained for merchant banks indicating a high degree of correlation in their financing operations. Another worthy observation is the relatively high degree of reliance on inter-est income (19.58%) as a veritable source of funds for finance houses. This can be explained by the high financial charges, which these companies collect for their services. On the average, they charge between 10% and 15% interest on their loans per month, and this is apart from commitment and administrative fees.
All in all, deposits remain the most important source of funds for financial institutions in Nigeria.
4.3. Payment of Financial Obligations by Institutions
Table 2 describes the available sources through which financial institutions meet obligations to depositors, claimants and creditors. The popular sources are cash kept in vaults, returns from commercial securities, repayments from government securities, loan repayments and recoveries, roll-over of existing obligations, newly sourced funds from treasury customers and specified liquid assets. Others are borrowings from CBN or other controlling bodies to meet temporary liquidity needs, and non-statutory reserves. A global analysis of all the financial institutions (see Table 2) shows that newly sourced funds constitute the most important source for meeting current liquidity needs. This accounted for 16.77% of the entire distribution. Closely following newly sourced funds were returns from investment in commercial securities (15.88%) and vault cash (12.58%), while statutory reserves with CBN claimed 10.6%. These are followed by repayments from gov-ernment securities (9.56%), roll-over of treasury obligations (9.44%), non-statutory reserves (6.06%), and borrowings from CBN and other bodies (4.02%). For commercial banks, vault cash constitutes the most important source of meeting current obligations (21.35%), followed by returns from investments in commercial securities (15.32%), newly sourced funds (13.74%), and loan repayment (12.07%). Reserves with CBN accounted for 10.39%; roll-overs for 9.84%, repayment from CBN (5.10%), and non-statutory reserves (3.53%) were the least important sources for repay-ing obligations to depositors and creditors.

Banks and Bank Systems / Volume 1, Issue 3, 2006
123
Table 2
Sources Used to Meet Obligations to Depositors, Claimants and Treasury Customers
SOURCES ALL COMM MERC INSU. FH
Cash kept in vault/safe 623 (15.48)
230 (21.35)
128 (13.97)
40 (4.30)
225 (20.48)
Repayments from Investment in commercial securities
639 (15.88)
165 (15.32)
144 (15.72)
205 (22.04)
125 (11.36)
Repayments from Govt. Securities 385 (9.56)
93 (8.63)
72 (7.86)
70 (7.52)
150 (13.63)
Roll-over of Treasury obligations 380 (9.44)
106 (9.84)
104 (11.35)
55 (5.91)
115 (10.45)
Newly sourced funds 675 (16.77)
148 (13.74)
122 (13.3)
245 (26.34)
160 (14.54)
Reserves with CBN 409 (10.6)
112 (10.39)
42 (4.58)
185 (19.89)
70 (6.36)
Borrowing from CBN & others 162 (4.02)
55 (5.10)
92 (10.04)
5 (0.53)
10 (0.90)
Non statutory Reserves 244 (6.06)
38 (3.53)
86 (9.39)
60 (6.45)
60 (5.45)
Recoveries from Loans & Advances 506 (12.57)
130 (12.07)
126 (13.75)
65 (6.98)
185 (16.8)
Total 4023 (100)
1077 (100)
916 (100)
930 (100)
1100 (100)
Source: Based on primary data.
Merchant bankers studied believed that repayment and returns from commercial securities are the most important sources which they rely on in order to meet current repayments, with about 15.72% of the distribution while vault cash occupied the second place with 13.97%. These are followed by loan repayments (13.75%), newly sourced funds (13.3%), roll-overs (11.35%), and borrowing from CBN (10.04%). Lesser reliance is placed on government securities (7.86%), statutory re-serves (4.58%), and non-statutory reserves (9.39).
Respondents from the insurance companies indicate that their heaviest reliance is on newly sourced premiums to meet current liquidity needs (for settling current indemnity claims). This is followed by repayments and returns from commercial securities (22.04%) and reserves from moni-toring bodies, such as the Nigerian Insurance Corporation and Nigerian Reinsurance Corporation. Evidently, these reserves would include reinsurance settlements from the bigger corporations. This took third place, accounting for about 19.89% of the entire distribution. Other sources, in their order, include repayments form government securities (7.52%), loan repayments (6.98%) and non-statutory reserved (6.45%). Roll-overs, vault cash and borrowing from CBN are not particularly relied upon by insurance companies in Nigeria to meet arising claims from policy holders.
In the case of finance houses, cash in safes or placed with commercial banks (20.48%) are the most important sources. Next in importance are the repayments from loans (16.8%) while newly sourced funds (14.54%) follow closely. Two other sources averagely mentioned are repayments from commercial investments and roll-over of existing obligations. Reserves with CBN, non-statutory reserves and borrowings from CBN did form part of the important sources of repayments by finance houses.
Banks and Bank Systems / Volume 1, Issue 3, 2006
124
4.4. Maturity Structure of Funding Sources
The maturity structure of funding sources (demand, call deposits and other deposits) of financial institutions can be sub-divided into seven classes: (a) those maturing within 30 days, (b) those ma-turing between 30 and 90 days, (c) those maturing between 91 and 120 days, (d) those maturing between 121 and 360 days, (e) those maturing within 1-3 years; (f) those maturing between 3-5 years, and finally (g) those maturing above 5 years. Funding sources above 5 years are usually made possible by the effect of roll-overs. The distribution of maturity structure of funding sources of financial institutions in Nigeria is depicted in Table 3.
Table 3
Maturity Structure of Funding Sources of Financial Institutions
MATURITY STRUCTURE ALL COMM MERC INSU. FH Demand & Call Deposit (CLASS A)
681 (26.27)
350 (44.92)
156 (18.84)
10 (2.63)
165 (27.27)
30-90 days (CLASS B)
358 (13.18)
13 (17.07)
70 (8.45)
15 (3.94)
140 (27.14)
91-120 days (CLASS C)
429 (16.55)
128 (16.3)
146 (17.63)
15 (3.94)
140 (23.14)
121-360 days (CLASS D)
390 (15.04)
104 (13.35)
126 (15.21)
75 (19.73)
85 (14.04)
1 year-3 years (CLASS E)
177 (6.82)
38 (4.87)
44 (5.31)
60 (15.78)
35 (5.78)
3 years-5 years (CLASS F)
243 (9.37)
26 3.33)
122 (14.73)
65 (17.10)
30 (4.95)
Above 5 years (Rollovers) (CLASS G)
314 (12.11)
0 (0)
164 (19.80)
140 (36.84)
10 (1.65)
Total 2592 (100)
779 (100)
828 (100)
380 (100)
605 (100)
Source: Based on primary data.
As shown in the Table, for the entire BOFI considered together, the most important funding sources are demand, call, savings and time deposits expected to mature within 30 days. They rep-resent the class A maturity sources with a distribution of 26.27%. The next predominant class ma-tured between 91 and 120 days (16.55%), followed by class D sources maturing between 121 and 360 days (15.04%). The fourth place went to class B with funds maturing between 30 and 90 days (13.18%). It is noticeable that classes A to D have maturities less than or equal to one year. Thus, the short-term maturing funds represent over 71% of the entire distribution. The medium-term sources maturing between 1 and 5 years accounted for about 16% of the entire distribution. Thus, classes E and F account for about 6.82% and 9.37%, respectively. Long-term maturing funds (class G) of above 5 years maturity represented only about 12% of the entire distribution. Putting our observations together we can infer a general ability to mobilize more short-term funds than medium-term or long-term ones. The preponderance of short maturing funds has the implication of restraining these institutions from engaging in longer-term financing, which is indicated for eco-nomic growth and development.
In the case of commercial banks, we see a particularly interesting trend that indicates the shorter the maturity is the higher is the ability of these banks to generate more funds. We see class A be-ing the most prominent maturity for the banks’ funds with 44.92%, class B (17.07%), class C (16.3%), class D (13.35%), class E (4.87%) and class F (3.33%), following in a descending order. Commercial banks are not known to source funds exceeding five years in maturity according to the observations. Short-term maturing funds of one year or less accounted for over 91% of the entire distribution, while medium-term accounted for less than 9%.

Banks and Bank Systems / Volume 1, Issue 3, 2006
125
For merchant banks the distribution was not quite even as is the case with commercial banks. The total proportion for their short-term maturity of within one year was about 60% of the entire distri-bution. Medium-term maturing funds and long-term ones claimed about 20% each. This distribu-tion tends to suggest that merchant banks should channel at least 40% of their funds to finance medium- and long-term transactions. The gap thesis argument is validated.
Insurance companies’ respondents revealed that they generate longer maturing funds than their insured banking counterparts. This is evidenced by their funds within class G representing over 36.8% of the entire distribution to take the first place in their maturity structure. Classes D, F, and E follow with 19.73%, 17.1% and 15.78%, respectively. Thus, insurance companies were not in-terested in sourcing short term since such funds would be mostly irrelevant to their primary opera-tions and responsibilities to policyholders. Recognizing this, they go all out for longer maturing funds. This is consistent with the observed growth in the life insurance premiums over the years. Generally, however, we see short-term funds accounting for about 30%, medium-term funds for about 33%, and long-term funds about 37% of the distribution.
Finance houses’ respondents revealed by their answers, a maturity pattern similar to that of com-mercial banks. Thus, their funds generation ability and efforts increase and yield more results as the maturity declines. Thus, it is no wonder that class A became the most prominent with 27.27%, followed by class B (23.14%), class C (23.14%) in that order to class G which records only 1.65% of the distribution. This development is revelatory in at least one respect. It throws some light why finance houses in Nigeria are found clamoring for and competing with commercial banks in short-term financing transactions.
The overall picture reflects a greater ability in generating more short-term funds by the banking insti-tutions (commercial banks with 91% and merchant banks with 60%) than long maturing ones. The opposite is true for insurance companies whose short-term funds accounted for only about 30% of the distribution. The indication is suggestive of better and superior funds generation instruments at the disposal of insurance companies (the premiums) than that at the disposal of the banks (deposits). Another inference would be that the nature of services of insurance companies – guarantee of protec-tion through risk transfer – gives better impetus to naturally generate more funds with longer matur-ity than shorter ones. The presence of life policies particularly is a case in point. The other possibility may be in a possible superiority in the ability of Nigerian insurers in mobilizing funds than the bank-ers. This is not suggested by this paper or its author. Yet another possibility is the legal enablement that requires the compulsory payment of premiums for a contract to exist.
4.5. Investment Outlets and Avenues
Table 4 summarizes the avenues into which financial institutions channel their investible funds. These avenues are: government securities; other money market instruments (commercial securi-ties); short-term, medium-term, and long-term loans and advances; equipment leasing; trade fi-nance and commodities; foreign exchange dealings; capital market operations; and project financ-ing and loan syndication. For all the institutions, the most prominent outlet is the money market, where they invest in government and commercial securities. These accounted for 30.63% of the entire distribution. Loans and advances (defined for short-term, long-term, and medium-term) came next in prominence with about 17.62% of the entire distribution. However, if we define loans and advances to include project financing, syndication, and trade finance, then loans and advances take over the prime place of dominance from money market instruments. By so doing, they ac-count for over 40% of the entire distribution. Equipment leasing claims 12.22% of the distribution while capital market operations (8.83%) and foreign exchange dealings (7.72%) trails the list.
For commercial bankers, loans and advances broadly defined accounts for over 46% of the distri-bution to occupy the first place of importance among the avenues to which they channel funds. After loans and advances, money market instruments came next in importance by claiming about 25.45% of the distribution. Foreign exchange dealings occupy the third position with 11.13%. Notwithstanding the lofty place of loans and advances, it is interesting to notice the increasing
Banks and Bank Systems / Volume 1, Issue 3, 2006
126
interest of commercial bankers in trade finance and commodities (11.06%) and short-term loans (10.59%), both of which are short maturing.
Table 4 Outlets/Avenues Financial Institutions Channel Funds
OUTLETS/AVENUES ALL COMM MERC INSU. FH Govt. Securities 629
(14.03) 173
(11.74) 96
(8.21) 285
(25.67) 75
(10.27) Other Money Market Instruments 744
(16.60) 202
(13.71) 162
(13.86) 225
(20.27) 155
(21.23) Medium Term Loans & Advances 230
(5.13) 122
(8.28) 68
(5.28) 40
(3.60) 0
(0.00) Short-term Loans & Advances 203
(4.53) 156
(10.59) 12
(1.02) 35
(3.15) 0
0.00 Long term Loans & Advances 357
(7.96) 109
(7.39) 98
(8.39) 70
(6.30) 80
(10.95) Equipment Leasing 548
(12.22) 107
(7.26) 136
(11.64) 205
(1846) 100
(13.69) Trade Finance & Commodities 504
(11.24) 163
(11.06) 136
(11.64) 20
(1.80) 185
25.34 Foreign Exchange Dealings 346
(7.72) 164
(11.13) 152
(13.0) 20
(1.80) 10
(1.36) Capital Market Operation 396
(8.83) 143
(9.70) 108
(9.24) 135
(12.16) 10
(1.36) Project Financing & Syndication 524
(11.69) 134
(9.09) 200
(17.12) 75
(6.75) 115
(15.34) Total
4481 (100)
1473 (100)
1168 (100)
1110 (100)
730 (100)
Source: Computed from primary data.
Merchant bankers are seen to channel a good chunk of their investible funds into loans and ad-vances (broadly defined) with a distribution of over 43%. It is interesting to observe the lofty posi-tion accorded project financing and syndication (accounting for 17.12%) and trade finances (11.64%). Money market investments claim about 22.07%, to come second after loans and ad-vances. Merchant banks still find foreign exchange dealings (13%) and equipment leasing (11.64%) veritable avenues for investment. A surprising observation is the low emphasis given to capital market operation (9.24%) activities that earned them the name Investment Bankers.
Respondents in the insurance industry affirm that they channel their investible funds mostly to money market investments, which on the whole account for 45.94% of the entire distribution. It is interesting to know that the two main divisions of money market investment namely government securities and commercial securities took the first and second places of prominence with 25.67% and 20.27%, respectively. Total loans and advances according to the Table accounted for only 19.8% (with the exclusion of trade finance and commodities). An irreconcilable development is the claim by insurers that they engage in equipment leasing. It is not yet clear to the researcher how and when they do it. However, some professional insurers personally interviewed by the re-searcher offered some useful insights. They all agreed on the fact that equipment leasing is not one of the customary services of insurers; that any insurance company involved in it would be, at best, doing so indirectly through subsidiaries or other arrangements that support their survival bid.
As expected, for finance houses, their principal avenue for investing funds was trade finance and commodities (25.34%), followed by commercial money market instruments (21.23%). Prominent among these instruments were placements, call deposits, and commercial papers. The respondents agree that they also engage in project financing and syndication of loans (15.34%), as well as the associated long-term loans (10.95%).
Banks and Bank Systems / Volume 1, Issue 3, 2006
127
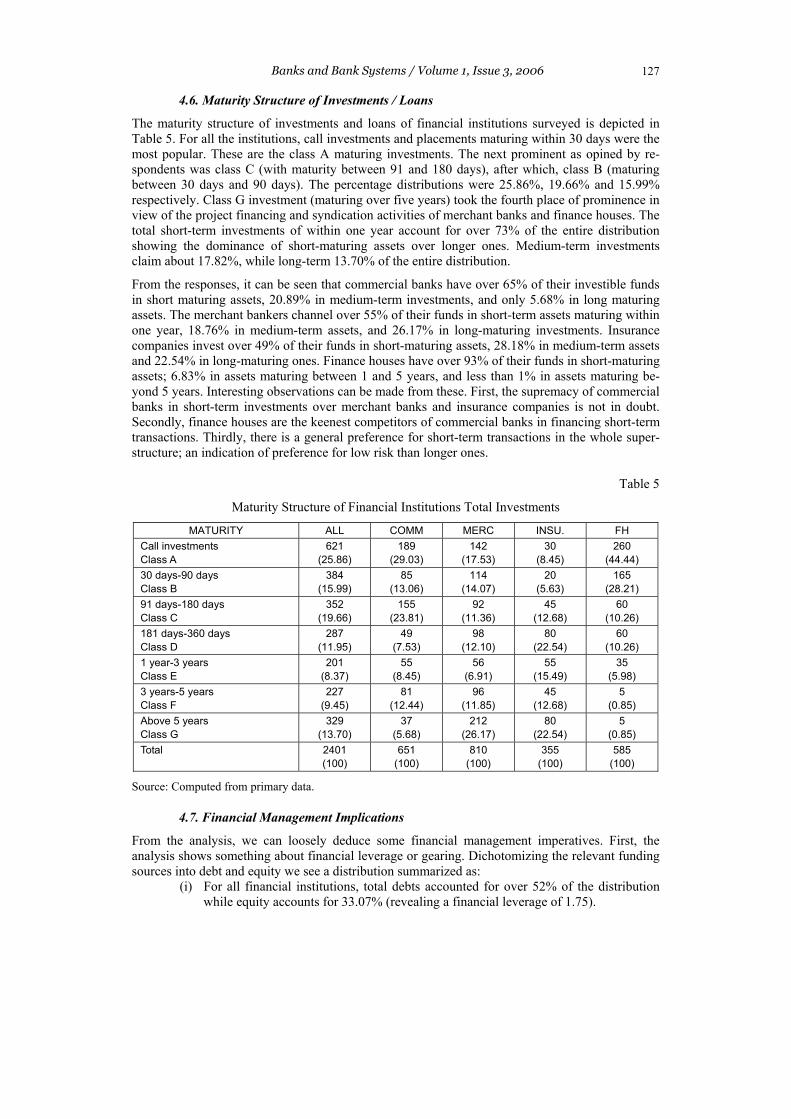
4.6. Maturity Structure of Investments / Loans
The maturity structure of investments and loans of financial institutions surveyed is depicted in Table 5. For all the institutions, call investments and placements maturing within 30 days were the most popular. These are the class A maturing investments. The next prominent as opined by re-spondents was class C (with maturity between 91 and 180 days), after which, class B (maturing between 30 days and 90 days). The percentage distributions were 25.86%, 19.66% and 15.99% respectively. Class G investment (maturing over five years) took the fourth place of prominence in view of the project financing and syndication activities of merchant banks and finance houses. The total short-term investments of within one year account for over 73% of the entire distribution showing the dominance of short-maturing assets over longer ones. Medium-term investments claim about 17.82%, while long-term 13.70% of the entire distribution.
From the responses, it can be seen that commercial banks have over 65% of their investible funds in short maturing assets, 20.89% in medium-term investments, and only 5.68% in long maturing assets. The merchant bankers channel over 55% of their funds in short-term assets maturing within one year, 18.76% in medium-term assets, and 26.17% in long-maturing investments. Insurance companies invest over 49% of their funds in short-maturing assets, 28.18% in medium-term assets and 22.54% in long-maturing ones. Finance houses have over 93% of their funds in short-maturing assets; 6.83% in assets maturing between 1 and 5 years, and less than 1% in assets maturing be-yond 5 years. Interesting observations can be made from these. First, the supremacy of commercial banks in short-term investments over merchant banks and insurance companies is not in doubt. Secondly, finance houses are the keenest competitors of commercial banks in financing short-term transactions. Thirdly, there is a general preference for short-term transactions in the whole super-structure; an indication of preference for low risk than longer ones.
Table 5
Maturity Structure of Financial Institutions Total Investments
MATURITY ALL COMM MERC INSU. FH Call investments Class A
621 (25.86)
189 (29.03)
142 (17.53)
30 (8.45)
260 (44.44)
30 days-90 days Class B
384 (15.99)
85 (13.06)
114 (14.07)
20 (5.63)
165 (28.21)
91 days-180 days Class C
352 (19.66)
155 (23.81)
92 (11.36)
45 (12.68)
60 (10.26)
181 days-360 days Class D
287 (11.95)
49 (7.53)
98 (12.10)
80 (22.54)
60 (10.26)
1 year-3 years Class E
201 (8.37)
55 (8.45)
56 (6.91)
55 (15.49)
35 (5.98)
3 years-5 years Class F
227 (9.45)
81 (12.44)
96 (11.85)
45 (12.68)
5 (0.85)
Above 5 years Class G
329 (13.70)
37 (5.68)
212 (26.17)
80 (22.54)
5 (0.85)
Total 2401 (100)
651 (100)
810 (100)
355 (100)
585 (100)
Source: Computed from primary data.
4.7. Financial Management Implications
From the analysis, we can loosely deduce some financial management imperatives. First, the analysis shows something about financial leverage or gearing. Dichotomizing the relevant funding sources into debt and equity we see a distribution summarized as:
(i) For all financial institutions, total debts accounted for over 52% of the distribution while equity accounts for 33.07% (revealing a financial leverage of 1.75).

Banks and Bank Systems / Volume 1, Issue 3, 2006
128
In financial management parlance, the financial institutions are observed to be highly geared. (ii) For commercial banks this traditional capital structuring reveals a debt/equity ratio of
58.32% / 32.36% (indicating a gearing of about 1.8). (iii) For merchant banks the ratio is 49.77% to 41% and a gearing of 1.21. Thus, for every
N1.00 of capital contributed, merchant banks borrow N1.21 to gear up. (iv) The gearing ratio for insurance companies is 3.9 while that of finance houses is 1.21.
This indicates that among all the institutions in the finance sector, insurance companies are most vulnerable to financial risks. This is understandable in view of the nature of their operations. There appears to be general agreement among the respondents on a near-perfect synchrony between the maturity structure of funding sources and that of investments of the financial institutions. The funding sources and funds investment maturities are respectively as follows:
(i) Short-term maturity; 71% : 73% (ii) Medium-term maturity; 16.19%: 17.82% (iii) Long-term maturity; 12.11%: 13.70%
The above indicates that the institutions mobilize more short-maturing funds than medium- and long-maturing funds. In the same way, short-term investments dominate the portfolio of assets of the institutions. Other observations include: (a) excessive holding of cash or near-cash items, and generally, short-term low-income earning assets (such as government securities); (b) as a result, insufficient allocation of funds to high income earning assets (such as loans and investments in blue-chip financial and real assets); (c) inefficiency in the utilization of available monetary re-sources generated from deposits, premium and capital funds as indicated by the excessive tying of funds in short-term investments; and (d) these metamorphosing into serious financial management problems of working capital mismanagement and inefficient investment portfolio management.
4.8. Test of Hypothesis
Some general statements can easily be made in respect of the some issues raised in this paper. A foremost issue of interest would relate to the maturity structure of the funding sources and invest-ments of the financial institutions. For ease in understanding the relationships and/or any differ-ence in the structuring of the sources and uses of funds, the paper hypothesizes:
There is no significant difference between the maturity structure of funding sources and in-vestments of financial institutions in Nigeria.
A general statement as this would seek to confirm whether or not there exists a synchrony between the two activities among the institutions studied. This analysis is important in view of the implica-tions of a possible tenor mismatch problem, which wrecked many financial institutions in the country during the 1990s.
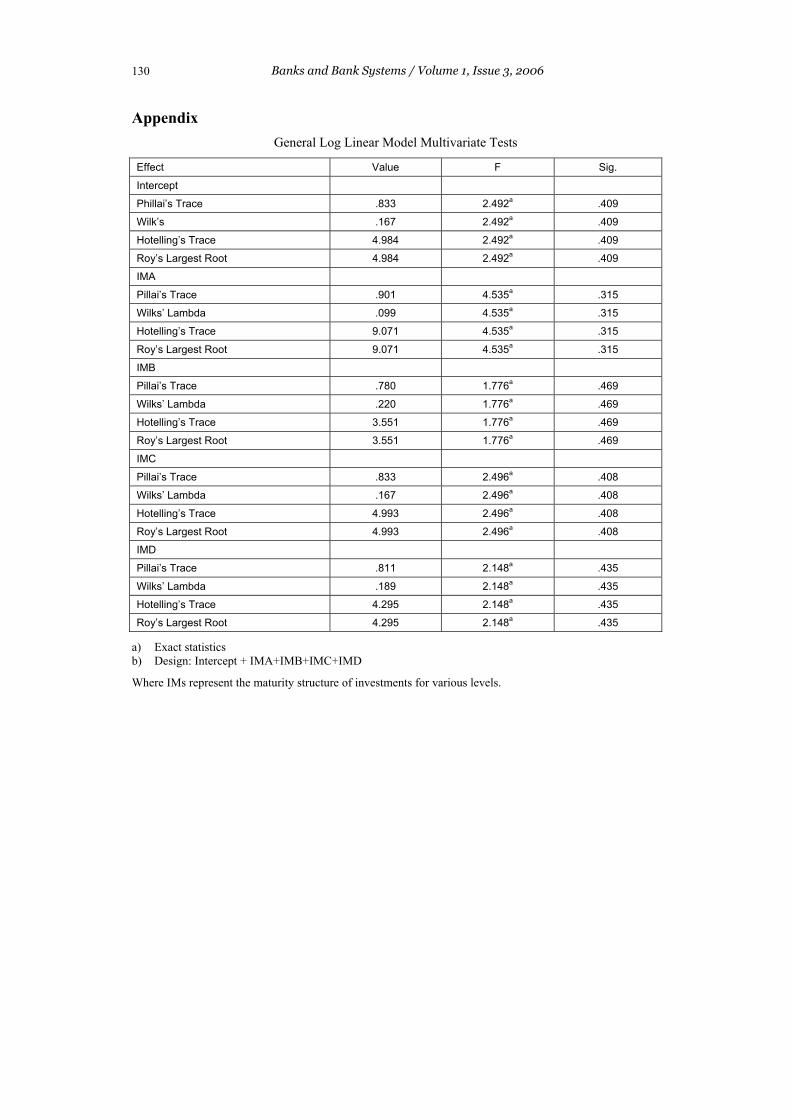
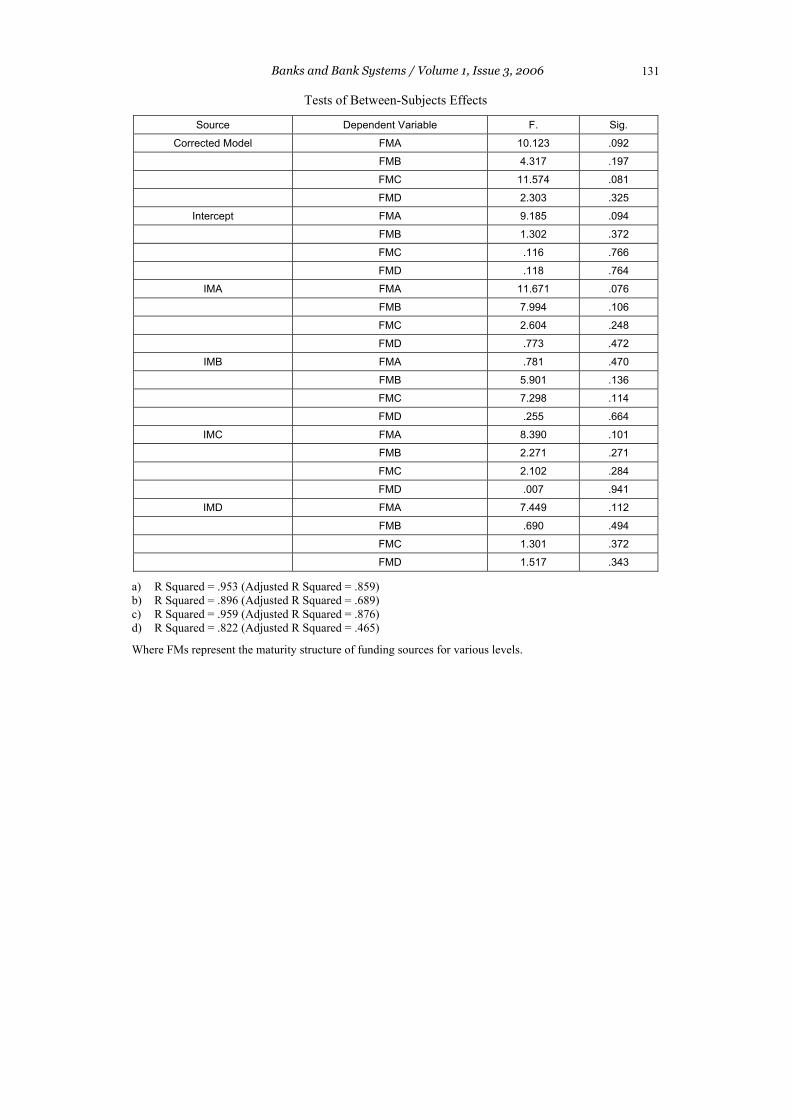
In order to test this hypothesis, we employ the multivariate tests under the general linear model. The results of the tests of between-subjects effects and multivariate tests are summarized in Tables 6 and 7 in the appendix. From the multivariate tests as shown in Table 6, we see that all the indi-cated tests [Philip’s Trace, Wilks’ Lambda, Hotelling’s Trace, Roy’s Largest Root] for all the in-dependent variables produced insignificant results. The highest observed F-statistic was 4.535, which has a probability (Sig.) of 0.315 that is far above the conventional levels of 0.01 or 0.05. Thus, we cannot reject a hypothesis of no significant difference in maturity structure. The implica-tion is that during the period of this study, the institutions have learnt from experience to construct their investment portfolios to follow the maturity pattern of their funding sources. It should be noted that in the early and mid 1990s, there was a serious wave of distress and crisis situations in the financial system that was partly blamed on tenor mismatch of assets and liabilities. With the above results, it is clear that the institutions seem to have learned some vital lessons. Even the tests of between-subject effects also confirm the same trend of no significant difference in their as-sets/liability structure. The observed F-and significant F-statistics failed to be significant at con-ventional levels. It appears that financial institutions in the country have imbibed, for good, the

Banks and Bank Systems / Volume 1, Issue 3, 2006
129
doctrines and tenets of prudential operations and sound conservative working capital policies dur-ing the latter part of the 1990s and early 2000s.
5. Concluding Remarks A general ability is observed to exist among financial institutions to mobilize more short-maturing funds than medium and long-term ones. A growing awareness is also revealed among the respon-dents of the tenets and benefits of sound conservative working capital management with its atten-dant emphasis on liquidity. This is confirmed from the observation regarding the use of maximum amount of short-term debt to finance current assets. The reasons for this may not be unconnected with the need to avert the problems associated with tenor mismatch, vulnerability to financial risks of default, and conditions of distress.
Policy Implications
An important policy implication of the foregone results relates to the issue of high gearing ob-served among institutions. There is need to improve the equity or capital base of the financial insti-tutions in order to reduce their vulnerability to financial risks. It is on this note that a policy of in-creasing the paid-up capital of banks and other financial institutions in the country can be justified. Thus, the CBN policy of minimum capital requirement of N25 billion as at year end 2005 is to be commended. Also, undue attachment to a conservative working capital policy is not consistent with the critical overriding objective of shareholders’ wealth maximization. While not throwing away the virtues of prudential policies, the need to stay relevant to owners cannot be compro-mised. Accordingly, excessive liquidity should be moderated on the altar of profitability. Suitable mix of aggressive and conservative working capital management strategies should be adopted.
A possible policy suggestion in respect of excessive holding of cash or near-cash items and insufficient allocation of funds to high income earning assets would involve the practice of portfolio adjustments and reconstructions. Management should aim at developing, adopting and pursuing policies that will ensure that more high-income earning assets are included in their assets portfolio to enhance profitabil-ity. They should do this in a manner that would not frustrate the interests of their public.
References 1. Agiobenebo T.J., C.B. Ezirim. Impact of Financial Intermediation on the Profitability of In-
surance Companies in Nigeria // First Bank Quarterly Review, 2003 – March – pp. 20-31. 2. Carter C., D.R. Diacon. Success Insurance. – London: John Murray (Publishers) Ltd., 1984. 3. Ezirim B.C. Business Financial Management // Business: A Managerial Approach. – Baridam
D.M. ed. Port Harcourt: Paragraphics, 1995. – pp. 222-263. 4. Ezirim B.C. Intermediation Functions of the Financial Superstructure and Economic Growth: Evi-
dence from Nigeria – Doctoral Dissertation, University of Port Harcourt, Port Harcourt, 1999. 5. Ezirim B.C. Some Theoretical Issues in Institutional Investment Decisions: An Eclectic Ap-
proach // Nigerian Journal of Monetary Economies, 2000. – Vol. 3, No. 4. – pp. 30-45. 6. Ezirim B.C. Modeling the Intermediation Functions of the Financial Superstructure in Nige-
ria: A Synoptic Treatment // Journal of Industrial Business & Economic Research, 2003. – Vol. 7, No. 2. – pp. 69-95.
7. Ezirim B.C. Finance Dynamics: Principles, Techniques and Applications. – Port Harcourt: Markowitz Centre for Research and Development, 2005.
8. Ezirim B.C., M.I. Muoghalu, E.N. Emenyonu. The Nigerian Financial Superstructure, Finan-cial Intermediation, and Environmental Factors: Issues, Empirical Evidence, and Managerial Implications // Journal of African Business, 2004. – Vol. 5, No. 2. – pp. 137-161.
9. Jhinghan M.L. Macroeconomic Theory. – Delhi: Konark Publishers, PVT Ltd., 1994. 10. Koch T. Bank Management. – Forth Worth: The Dryden Press, 1992. 11. Neveu R.P. Fundamentals of Managerial Finance. 2ed. – Cincinnati: South-Western Publish-
ing Co., 1985.
Banks and Bank Systems / Volume 1, Issue 3, 2006
130
Appendix General Log Linear Model Multivariate Tests
Effect Value F Sig.
Intercept
Phillai’s Trace .833 2.492a .409
Wilk’s .167 2.492a .409
Hotelling’s Trace 4.984 2.492a .409
Roy’s Largest Root 4.984 2.492a .409
IMA
Pillai’s Trace .901 4.535a .315
Wilks’ Lambda .099 4.535a .315
Hotelling’s Trace 9.071 4.535a .315
Roy’s Largest Root 9.071 4.535a .315
IMB
Pillai’s Trace .780 1.776a .469
Wilks’ Lambda .220 1.776a .469
Hotelling’s Trace 3.551 1.776a .469
Roy’s Largest Root 3.551 1.776a .469
IMC
Pillai’s Trace .833 2.496a .408
Wilks’ Lambda .167 2.496a .408
Hotelling’s Trace 4.993 2.496a .408
Roy’s Largest Root 4.993 2.496a .408
IMD
Pillai’s Trace .811 2.148a .435
Wilks’ Lambda .189 2.148a .435
Hotelling’s Trace 4.295 2.148a .435
Roy’s Largest Root 4.295 2.148a .435
a) Exact statistics b) Design: Intercept + IMA+IMB+IMC+IMD
Where IMs represent the maturity structure of investments for various levels.
Banks and Bank Systems / Volume 1, Issue 3, 2006
131
Tests of Between-Subjects Effects
Source Dependent Variable F. Sig.
Corrected Model FMA 10.123 .092
FMB 4.317 .197
FMC 11.574 .081
FMD 2.303 .325
Intercept FMA 9.185 .094
FMB 1.302 .372
FMC .116 .766
FMD .118 .764
IMA FMA 11.671 .076
FMB 7.994 .106
FMC 2.604 .248
FMD .773 .472
IMB FMA .781 .470
FMB 5.901 .136
FMC 7.298 .114
FMD .255 .664
IMC FMA 8.390 .101
FMB 2.271 .271
FMC 2.102 .284
FMD .007 .941
IMD FMA 7.449 .112
FMB .690 .494
FMC 1.301 .372
FMD 1.517 .343
a) R Squared = .953 (Adjusted R Squared = .859) b) R Squared = .896 (Adjusted R Squared = .689) c) R Squared = .959 (Adjusted R Squared = .876) d) R Squared = .822 (Adjusted R Squared = .465)
Where FMs represent the maturity structure of funding sources for various levels.