Embed Size (px)
Citation preview
Volume 25 No 1 Tahun 2021 | 41
THE EFFECT OF LEVERAGE, FIRM SIZE, EARNINGS GROWTH, AND
EARNING PERSISTENCE ON EARNING RESPONSE COEFFICIENT
Ferry Irawan1, Politeknik Keuangan Negara STAN
Lili Talpia Direktorat Jenderal Bea dan Cukai
ABSTRACT This study aims to investigate the effect of leverage, firm size, earnings growth, and earning persistence on earnings response coefficient. The population used in this study are all manufacturing companies listed in Indonesia Stock Exchange from 2015 until 2019 and had positive earnings before tax. Consequently, the samples in this research are 68 manufacturing companies so that the observations are 340. For examining data, this research uses a panel data regression model. After running the chow test and Lagrange multiplier test, the most suitable method for the regression model is the common effect model. This research shows that leverage and firm size do not influence earning response coefficient. Meanwhile, earnings growth and earnings persistence have a positive effect on the earnings response coefficient. Keywords: Earning growth; earning persistence; earning response coefficient; firm size; leverage
ABSTRAK Penelitian ini bertujuan untuk mengetahui pengaruh leverage, ukuran perusahaan, pertumbuhan laba, dan persistensi laba terhadap koefisien respon laba. Populasi yang digunakan dalam penelitian ini adalah seluruh perusahaan manufaktur yang terdaftar di Bursa Efek Indonesia dari tahun 2015 sampai dengan tahun 2019 dan memiliki laba sebelum pajak yang positif. Oleh karena itu, sampel dalam penelitian ini adalah 68 perusahaan manufaktur sehingga jumlah observasinya 340. Untuk pengujian data, penelitian ini menggunakan model regresi data panel. Setelah menjalankan uji chow dan Lagrange multiplier test, metode yang paling cocok untuk model regresi adalah common effect model. Penelitian ini menunjukkan bahwa leverage dan ukuran perusahaan tidak berpengaruh terhadap koefisien respon laba. Sedangkan, pertumbuhan laba dan persistensi laba berpengaruh positif terhadap koefisien respon laba. Kata kunci: Pertumbuhan laba; persistensi laba; koefisien respon laba; ukuran perusahaan; leverage Klasifikasi JEL:
1. INTRODUCTION
The development and potential of the Indonesian capital market are increasing, this is
evidenced by the number of Indonesian capital market investors who continue to grow every year.
This growth occurred during the Covid-19 pandemic and was dominated by domestic retail
investors. Therefore, for the first time in the history of the Indonesian capital market, the number
of stock assets of domestic investors exceeds the total assets of foreign investors. This increase
reflects the enthusiasm of the public in investing so that in the end it can support the Indonesian
economy. Investors in making investment decisions, whether buying or selling shares, need
complete information regarding the actual condition of the company. The condition of the
company is generally described in the company's financial statements. The financial report is
1 Jalan Bintaro Utama Sektor V, Bintaro Jaya, Tangerang Selatan, Tangerang Selatan. Telp 021-7361654, email: [email protected]
42 | Bina Ekonomi
expected to be sufficient for investors to predict the rate of return and risk in the future. The
income statement is one of the financial statements produced by a company that is used by
investors to evaluate company performance and assess the risk or uncertainty of obtaining future
cash flows (Kieso et al., 2019). One of the important information for investors in the income
statement is the profit figure. Theoretically, investors will act rationally by investing in companies
that can generate profit figures and create value for shareholders. This profit figure is closely
related to the profitability of the company so that companies with high profits will be more
attractive to investors. However, the facts on the ground show that not all profit figures have been
responded to positively by investors. Investors responded negatively to several companies that
resulted in increased profits as seen from the decline in their share prices. Scott (2012) states that
earnings information published by companies triggers investors to revise their previous
expectations regarding company performance. A positive response means that the profit figures
published by the company match or exceed investors' expectations and vice versa, a negative
response occurs when the profit figures published by the company are below their expectations.
This means that not all profit figures have the same information content or quality. Assessment of
the quality of the company's earnings figures is carried out using the Earnings Response
Coefficient (ERC), which identifies differences in investor responses to earnings figures
announcements (WR Scott, 2012). A high ERC number means that earnings have high-value
relevance and vice versa if the ERC number is low (Mulyani & Asyik, 2007).
Previous studies related to the quality of earnings information were conducted by Lev
(1989) who found that company earnings only contributed 2 - 5% to returns stock. Besides, Yosefa
and Wondabio (2007) state that the contribution of earnings in predicting stock prices is weak.
Thus, this means that there are other factors beyond the profit figures used by investors in
considering or making investment decisions. In other words, earnings figures contain statistically
significant information but are not economically significant (Lev, 1989). Several factors that
influence ERC apart from earnings information are earnings persistence, capital structure, beta or
systematic risk, growth opportunity, and firm size (WR Scott, 2000).
Furthermore, new studies investigating the factors that influence investor behavior apart
from profit figures conducted by An (2015) and Dewi and Yadnyana (2019) examined the
relationship between levels of leverage and ERC which concluded similar results that leverage
negatively affects ERC. This means that investors respond negatively to the profit figures
published by companies with leverage high. The results of this study are not in line with m and
Herawaty (2019) who found that leverage does not affect ERC. The relationship between firm size
and ERC was investigated by Mashayekhi and Aghel (2016) who found that firm size had a positive
effect on ERC, but Pande and Putra (2017) found that firm size had a negative effect on ERC.
Research related to the relationship between earnings growth and ERC was also conducted by
Mashayekhi and Aghel (2016) who found that there was a positive influence between the two
variables. This means that investors respond positively to earnings growth announcements issued
by companies and vice versa.
Furthermore, research related to the relationship between earnings persistence and ERC
was carried out by Mashayekhi and Aghel (2016) and Wijaya et al. (2020) who found that these
two variables did not affect them. However, Gurusinga and Pinem (2019) found different results
that showed that earning persistence had a positive effect on ERC. Measurement of current
earnings informativeness is carried out using ERC so that the current stock price will be obtained
from current earnings. Besides, based on the description above, several factors used in this study
aim to see the effect of leverage, firm size, earnings growth, and earning persistence on ERC.
Therefore, this study aims to analyze the effect of leverage, firm size, earnings growth, and
earnings persistence on ERC.
Volume 25 No 1 Tahun 2021 | 43
According to Scott (2015), agency theory is a relationship or contract between the
principal (owner of funds) and the agent (company manager). Agency theory assumes that
managers and owners of funds aim to maximize wealth or profits and have the desire to satisfy
their respective interests as high as possible. The fund owner wants the managers to produce the
highest performance and be paid the lowest. Conversely, managers want to be paid the highest
with the lowest possible workload. The difference of interest (conflict of interest) between the
owner of the fund and the manager creates agency problems.
Jensen and Meckling (1976) state that companies in reducing agency problems must incur
a cost called agency cost, which includes monitoring costs, bonding costs, and residual loss.
Understanding agency theory means understanding the role of accounting in harmonizing legal
contractual relationships between fund owners and managers. Accounting is used in the
preparation of financial statements to evaluate the performance of managers. Furthermore, the
income statement is used as a means of making engagement and determining bonuses received
by managers. Besides, the profit figures in the income statement show the value the manager has
managed to create for the owners of funds. This profit figure shows that the manager's interests
are in line with the interests of the fund owners. Thus, concerning ERC, quality profit figures will
be responded to positively by investors because they reflect the actual condition of the company.
Signaling theory is based on the asymmetry of information between the manager (well-
informed) and the shareholders (poor informed). According to Scott and Brigham (2008), a signal
or sign is an action taken by management to guide investors regarding how management views
the company's prospects. Also, managers as fund managers are required to be accountable for
their performance by giving signals to fund owners through the issuance of financial reports.
However, the issuance of financial reports alone is not enough, investors need concrete evidence
that the signal is of quality. Therefore, giving these signals requires high costs so that they are not
easily imitated and can only be done by large companies.
According to this theory, managers consider investors to rely heavily on signals given by
managers. Managers also want a good image and are considered honest because they announce
information related to the company, both good and bad information. This theory also explains the
reasons for managers to report certain things in financial reports (Godfrey, 2010), as well as the
basis for voluntary disclosure by managers outside of the obligations specified in the applicable
standards.
The Hypothesis Development
1. The Effect of Leverage on Earning Response Coefficient
Financial reports are an important instrument for external parties in assessing
management performance (Godfrey, 2010). These external parties, both investors and creditors,
use the company's financial reports to assess the optimal return they will get on the funds they
have invested (Kieso et al., 2019). Creditors, as providers of funds who receive a steady income
from debt used by the company, will welcome good news in the form of announcements of the
debtor's earnings. Besides, the profit rate is one of the considerations in examining the
creditworthiness of prospective borrowers (Ditiya & Sunarto, 2019).
Furthermore, the use of debt by companies is expected to produce a multiplier effect in
the form of financial increases to finance company expansion, both in the form of increased sales,
increased company ownership, and timely dividend payments for shareholders (Aviliani, 2009).
In short, using debt at a certain amount on a target allows companies to get a greater return on
investment (ROI) than without using debt (levers) because it can increase EPS and attract
potential investors (Assagaf et al., 2019).
44 | Bina Ekonomi
However, excessive and ineffective use of debt can lead to the risk of default, and can even
lead to bankruptcy (Moradi et al., 2010). Besides, the use of debt also has a major impact on the
company because the company has to pay principal and interest (financial charges) at maturity
and if the company is late in paying the financial burden, creditors may impose additional late fees
which further worsen the company's liquidity. The use of high debt is also dangerous for
companies when domestic economic conditions are less conducive, especially the use of debt
denominated in foreign currencies which are appreciated due to the weakening of the rupiah
(Prastya, 2019).
Furthermore, when a company goes bankrupt and has to be liquidated, the creditor's
rights must be preceded by the rights of shareholders (Firmansyah & Herawaty, 2019). Besides,
debt which has a fixed cost for each period illustrates the rights of creditors to take precedence
over shareholder rights, which is reflected in the value of earnings per share. The value of earnings
per share can vary from period to period and the financial expense does not. The rights of
creditors are also prioritized over the rights of the government in the form of an annual income
tax. Therefore, when the company's revenue decreases, shareholder rights tend to decrease as
well.
Based on the description above, when the earnings announcement is made by a company
with a high amount of debt, investors will respond negatively (Firmansyah & Herawaty, 2019).
Investors avoid the risks and complexities that will result from this high amount of debt. This idea
supports research conducted by An (2015), which shows that the level of state leverage is
negatively related to ERC. This means that investors prefer earnings announcements
accompanied by bond redemptions rather than earnings announcements accompanied by the
issuance of new bonds. Therefore, based on the description above, the first hypothesis in this
study is:
H1: The level of leverage has a negative effect on ERC.
2. The Effect of Firm Size on Earning Response Coefficient
Firm size is measured by the natural logarithm of total assets as previously explained. The
higher the assets, the higher the value of the natural logarithm, meaning that the bigger the size
of the company (Murhadi, 2013). A big and stable company (well established) because it has large
resources, it tends to be easier to get the trust of fund owners. This means that it is easier to obtain
funds in the capital market compared to small companies (Yuliana & Yuyetta, 2017). Besides, large
companies are more flexible and can survive against government regulations.
Large companies are easier to provide information about management performance. The
realization of this performance is not only in the form of financial reports but also in the form of
other reports that are difficult to reach by small companies with limited resources
(Herdirinandasari et al., 2016). This is because the disclosure of other information (voluntary
disclosure) requires enormous costs, but has a positive impact on the company's credibility and
long-term strategy, for example, the sustainability report (David, 2016). Therefore, companies
with large sizes tend to be considered more stable, prospective, and have more mature
governance (Firmansyah & Herawaty, 2019). On the other hand, companies with smaller sizes are
considered to have low strength or sustainability.
Furthermore, the information disclosed by the company is important because it can
influence the investment decisions of the company's external parties. The more complete and
comprehensive the information presented, the more resources are spent and only large
companies can do this. Besides, large companies can also signal the strength of the company
through corporate actions in the form of dividend distribution or buybacks shares in circulation
Volume 25 No 1 Tahun 2021 | 45
(Brigham & Houston, 2011). Such corporate action can only be carried out by companies well-
established. The number of sources of information provided and the ease of accessing information
provided by the company to external parties causes information on company profit figures to no
longer be the only instrument in making investment decisions (Lev, t). Therefore, when large
companies publish earnings announcements, investors will respond positively (Herdirinandasari
et al., 2016; Mashayekhi & Aghel, 2016). Conversely, smaller companies when announcing
earnings will be responded negatively to investors because of the limited information needed to
support these profit figures.
This idea supports research conducted by Mashayekhi and Aghel (2016) who found that
there is a positive relationship between firm size and ERC. Therefore, based on the theories and
several previous studies that have been described above, the researcher proposes the second
hypothesis in this study as follows.
H2: Firm size has a positive effect on ERC.
3. The Effect of Earning Growth on Earning Response Coefficient
Earnings growth is one indicator of the success of management in improving the
operational effectiveness of the company. This success is a form of responsibility (stewardship)
for the funds invested by the owners of capital in the company (Godfrey, 2010). One form of this
responsibility is to optimally improve the company's performance to create value for
shareholders or owners of capital. Furthermore, creating shareholder value is done by generating
profits that grow over time. The higher the level of profit, the higher the returns that will be
received by the owners of capital, both in the form of dividends and capital the gain on the increase
in share prices. Increased profit means creating added value to the company's EPS (Cashmere,
2012).
The increase or growth in profit is reflected in the PER value of the company. The higher
the PER number, the better the company's ability to improve its performance. A high PER explains
that the company has succeeded in creating value on each share many times above the net
earnings per share, that is, the share price continues to increase because investors believe in
management performance so that the company's shares continue to be purchased by investors
(Subramanyam, 2014). This statement supports the results of research conducted by Mashayekhi
and Aghel (2016) which found that there was a positive relationship between earnings growth
and ERC. This means that if the company announces earnings growth positively, investors will
respond positively so that the ERC value will also increase. In other words, when the company's
net income has increased from the previous period, then the net profit per share will also increase
if the number of shares outstanding is fixed. Furthermore, investors will respond to this increase
in net income by buying shares or increasing their ownership.
Therefore, based on the description above, the researcher proposes the third hypothesis
in this study, which is as follows.
H3: Earning growth has a positive effect on ERC.
4. The Effect of Earning Persistence on Earning Response Coefficient
If earning growth describes earnings per share, the variable earning persistence describes
the company's earnings before tax (EBT). EBT reflects the company's ability to generate profits
from routine company activities, including corporate income and/or financial expenses. EBT does
not include income or other comprehensive expenses that are not routine so that it reflects the
actual management capability in running the company. A company with a low amount of EBT, but
46 | Bina Ekonomi
has a high EPS value, means that the EPS value is boosted by income items contained in other
comprehensive income, most of which are unrealized income because this income is not from
sales activities, but from changes. or an increase in the fair value of financial assets, foreign
exchange differences on the translation of foreign activity accounts, or an increase in the value of
assets that were revalued during that period (Kieso et al., 2019). Conversely, if the amount of NRE
is high, then the possibility that what will occur is an increase in sales revenue, either due to an
increase in demand, price, or a decrease in production costs and expenses related to
administrative and sales activities in the related period. Therefore, the value of increased earning
persistence which is proxied by EBT divided by total equity from time to time will attract investors
to invest. This is because investors as the wealth maximizers will achieve their goals if they invest
in these companies (Subramanyam, 2014). Earning persistence describes return on a sustainable
and ongoing basis so that shareholders and investors can feel confident and more secure in their
investment (Asadi et al., 2021). In short, investors prefer announcing an increase in profits due to
an increase in sales of new products or an increase in sales due to the addition of a new geographic
area than an increase in profits caused by a sale of fixed assets or other income that is incidental
or irregular. Earnings like this are of higher quality because they have a better predictive value
for future uncertainty (Delvira & Nelvirita, 2013)
Even though the results of Mashayekhi and Aghel's (2016) study found that there was no
relationship between earnings persistence and ERC, the above description supports the concept
put forward by Raza et al. (2017) in their research, namely earning persistence is positively
related to ERC. Based on the description above, the fourth hypothesis in this study is.
H4: Earning persistence has a positive effect on ERC.
2. METHOD AND DATA
This study aims to examine the effect of the independent variable on the dependent
variable. The method in this research is carried out using the panel data regression method. The
data used is the data cross-section. The population used in this study is a manufacturing company
listed on the Indonesia Stock Exchange. This research sample selection technique using purposive
sampling or non-random sample selection with the following criteria.
a. Manufacturing companies listed on the IDX before January 1, 2015,
b. The company presented financial reports for the period 2015 to 2019, and
c. The company obtained positive profit before tax in the period 2015 to 2019.
2.1. Independent Variable 2.1.1. Leverage
According to Harahap (2010), leverage is the ratio between total debt to equity. which is
used to see how much the company is financed by debt versus equity. Scott (2009) states that a
high level of leverage will cause a company to have a low ERC because the profits generated by a
company with a leverage high are allocated more to creditors than investors. The formula for
measuring leverage is as follows.
Debt to Equity Ratio (DER) = Total d𝑒𝑏𝑡
Total Equity
2.1.2. Firm Size
Volume 25 No 1 Tahun 2021 | 47
Firm size is a proxy of price informativeness. Large companies are considered to have
more information than small companies. Murhadi (2013) measures firm size by transforming the
company's total assets into natural logarithms to reduce excess data fluctuations. The Formula
firm size is as follows.
Firm Size (FS) = Ln (Total Assets)
2.1.3. Earnings Growth
Godfrey (2010) states that one of the factors affecting ERC is temporary and permanent
profit. Temporary earnings information is used to estimate permanent profit, which is expected
to last a long time so that it will influence investors' perceptions of share prices. Mashayekhi and
Aghel (2016) in A Study on the Determinants of Earnings Response Coefficient in An Emerging
Market found that there is a positive relationship between earnings growth and ERC. The
following is the formula for measuring earnings growth based on research by Mashayekhi and
Aghel (2016).
𝑃𝐸𝑅 = 𝑃𝑖,𝑡
𝐸𝑃𝑆𝑖,𝑡
2.1.4. Earning Persistence
Measurement of earning persistence refers to the research of Wijaya et al. (2020) which
shows the relationship between earnings before tax current period and earnings before tax the
previous period divided by the total equity of the current period. This proxy is chosen based on
the argument that earning before tax is more accurate in describing the company's true ability
because it is the profit generated from the company's activities before being subject to income tax
expense. Furthermore, the operating profit is highly dependent on the total net assets (equity)
owned and used by the company. Based on the research of Wijaya et al. (2020), the formula is
earning persistence as follows.
𝐸𝑃 =𝐸𝐵𝑇𝑡 − 𝐸𝐵𝑇𝑡−1
𝑇𝑜𝑡𝑎𝑙 𝐸𝑞𝑢𝑖𝑡𝑦
2.2. Dependent Variable 2.2.1. Earning Response Coefficient (ERC)
ERC is the slope (β) obtained from the regression between cumulative abnormal return
(CAR) and unexpected earnings (UE) as stated in the empirical model as follows.
CAR = α + β (UE) + ε
ERC can be measured in several steps. The first step is calculating the CAR, the second is
calculating the EU, then calculating the ERC value.
2.2.2. Cumulative Abnormal Return (CAR)
Cho and Jung (1991) classified the theoretical approaches to ERC in two groups. First, ERC
uses a research model that is based on economic (information economics-based valuation model)
such as that developed by Holthausen and Verrecchia (1988) and uses the power of investor
responses to earnings information signals as was done by Lev (1989). Second, ERC uses a research
model based on time series earnings (time series based valuation models) as developed by Beaver
et al. (1980). In this study, ERC is measured based on earnings information such as in research
48 | Bina Ekonomi
models such as Lev (1989), this is because this model is relatively more widely applied in previous
research and is easier to do.
Furthermore, the first step to obtain an ERC value is to calculate the CAR value. CAR
calculation uses cumulative market-adjusted return as done in previous studies by Collins and
Kothari (1989), Kohlbeck and Warfield (2011), and Delvira and Nelvirita (2013). CAR is obtained
from the accumulated abnormal return of each company in the event window, namely 2015 to
2019. This approach is called the association method study which is used to measure the
relationship of accounting information to stock prices over a relatively long period, usually one
year or more (Collins & Kothari, 1989) and (Al-Baidhani et al., 2017). CAR is calculated by the
following formula.
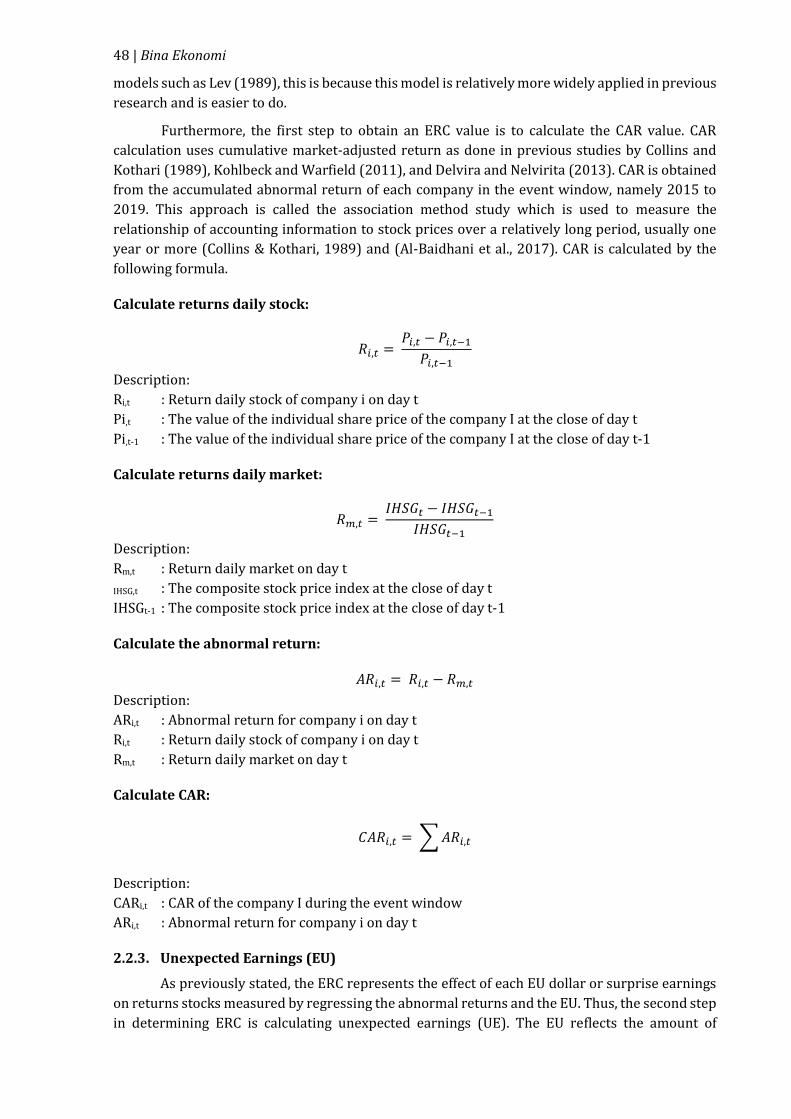
Calculate returns daily stock:
𝑅𝑖,𝑡 = 𝑃𝑖,𝑡 − 𝑃𝑖,𝑡−1
𝑃𝑖,𝑡−1
Description:
Ri,t : Return daily stock of company i on day t
Pi,t : The value of the individual share price of the company I at the close of day t
Pi,t-1 : The value of the individual share price of the company I at the close of day t-1
Calculate returns daily market:
𝑅𝑚,𝑡 = 𝐼𝐻𝑆𝐺𝑡 − 𝐼𝐻𝑆𝐺𝑡−1
𝐼𝐻𝑆𝐺𝑡−1
Description:
Rm,t : Return daily market on day t
IHSG,t : The composite stock price index at the close of day t
IHSGt-1 : The composite stock price index at the close of day t-1
Calculate the abnormal return:
𝐴𝑅𝑖,𝑡 = 𝑅𝑖,𝑡 − 𝑅𝑚,𝑡
Description:
ARi,t : Abnormal return for company i on day t
Ri,t : Return daily stock of company i on day t
Rm,t : Return daily market on day t
Calculate CAR:
𝐶𝐴𝑅𝑖,𝑡 = ∑ 𝐴𝑅𝑖,𝑡
Description:
CARi,t : CAR of the company I during the event window
ARi,t : Abnormal return for company i on day t
2.2.3. Unexpected Earnings (EU)
As previously stated, the ERC represents the effect of each EU dollar or surprise earnings
on returns stocks measured by regressing the abnormal returns and the EU. Thus, the second step
in determining ERC is calculating unexpected earnings (UE). The EU reflects the amount of
Volume 25 No 1 Tahun 2021 | 49
unexpected profit, which is the difference between expected earnings and actual profits. The EU
is describing the information that the market hasn't revealed yet so the market will react to the
earnings announcement.
The calculation of the EU in this study uses a model random-walk as done by Beaver et al.
(1987), Collins and Kothari (1989), and Kohlbeck and Warfield (2011). Therefore, by the
understanding of ERC, the EU as part of the ERC measurement is carried out with the same formula
as some previous studies because it is easier to apply. The EU is determined by the following
formula.
𝑈𝐸𝑖,𝑡 = 𝐸𝑖,𝑡 − 𝐸𝑖,𝑡−1
𝑃𝑖,𝑡−1
Description:
Ei, t : Earnings per share (EPS) of the company I in year t
Ei, t-1 : Earnings per share (EPS) of the company I in year t-1
Pi, t-1 : The share price of the company i at the end of year t-1
2.3. Hypothesis Testing
Model This research model refers to research conducted by Kohlbeck and Warfield (2011)
which uses ERC as a proxy of investor behavior. This research model is formulated as follows.
𝐶𝐴𝑅𝑖,𝑡 = 𝛼 + 𝛽1𝑈𝐸𝑖,𝑡 − 𝛽2𝐷𝐸𝑅𝑖,𝑡 + 𝛽3𝐹𝑆𝑖,𝑡 + 𝛽4𝐸𝐺𝑖,𝑡 + 𝛽5𝐸𝑃𝑖,𝑡 + 𝜀𝑖,𝑡
Description:
CARi, t : The CAR company's daily during the event window, namely 2015 - 2019
UEi, t : Unexpected earnings of the company i
DERi, t : DER ratio of the company I in period t
FSi, t : The value of firm size firm I in period t
EGi, t : PER ratio company I in period t
EPi, t : The value persistence of company I in period t
The stage in the panel regression model is to select the model and referring to the results
obtained that the panel data used is the Common Effect Model (CEM). Testing of the hypothesis
either partially or simultaneously is carried out after the regression model is free from violations
of classical assumptions. Interpretation of research results, either partially through the t-test or
simultaneously through the F test, is carried out on the independent variables which statistically
have a significant effect on the dependent variable.
3. DISCUSSIONS
Descriptive Statistics
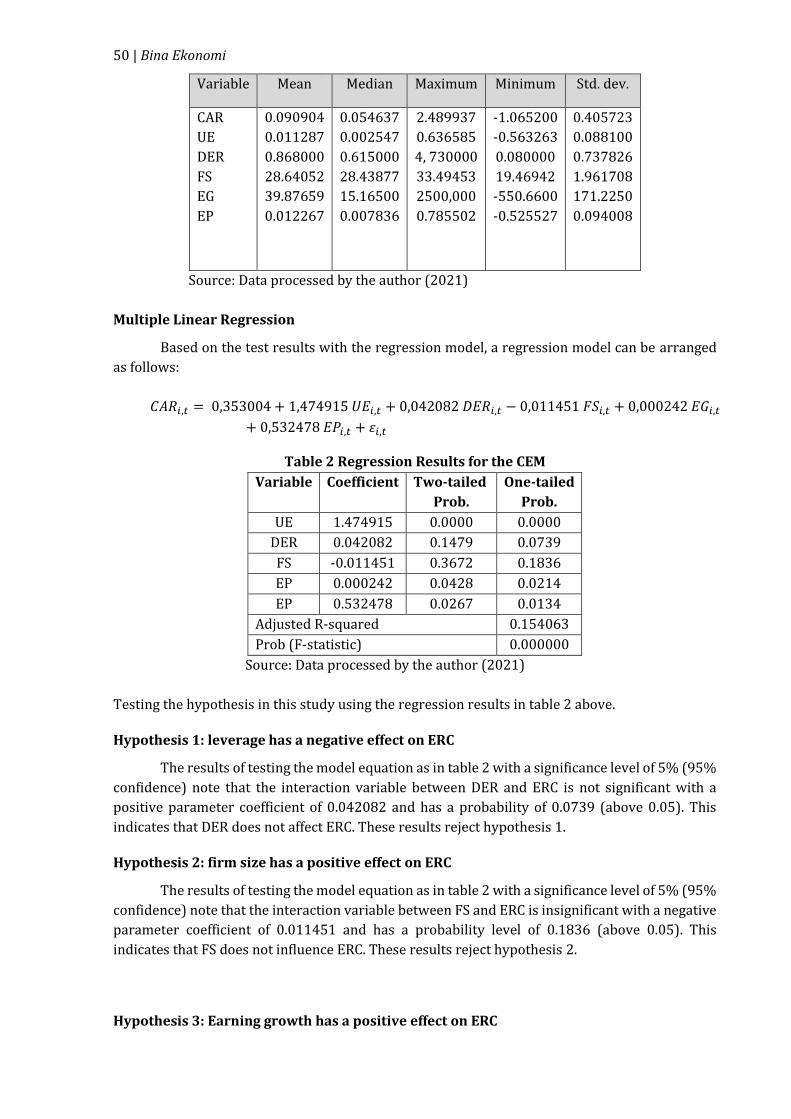
Table 1 below shows the results of descriptive statistics that describe the information on
the characteristics of the variables in this study. The results show that the average CAR of
manufacturing companies' shares during the observation period was 9.09%, with a maximum
CAR value of 2.489937, and a minimum CAR value of -1.065200. The average EU is 1.13%, the
average DER is 86.8%, the average FS is 28.64, the average EG is 39.88%, and the average EP is
1.23%.
Table 1 Descriptive Statistics
50 | Bina Ekonomi
Variable Mean Median Maximum Minimum Std. dev.
CAR
UE
DER
FS
EG
EP
0.090904
0.011287
0.868000
28.64052
39.87659
0.012267
0.054637
0.002547
0.615000
28.43877
15.16500
0.007836
2.489937
0.636585
4, 730000
33.49453
2500,000
0.785502
-1.065200
-0.563263
0.080000
19.46942
-550.6600
-0.525527
0.405723
0.088100
0.737826
1.961708
171.2250
0.094008
Source: Data processed by the author (2021)
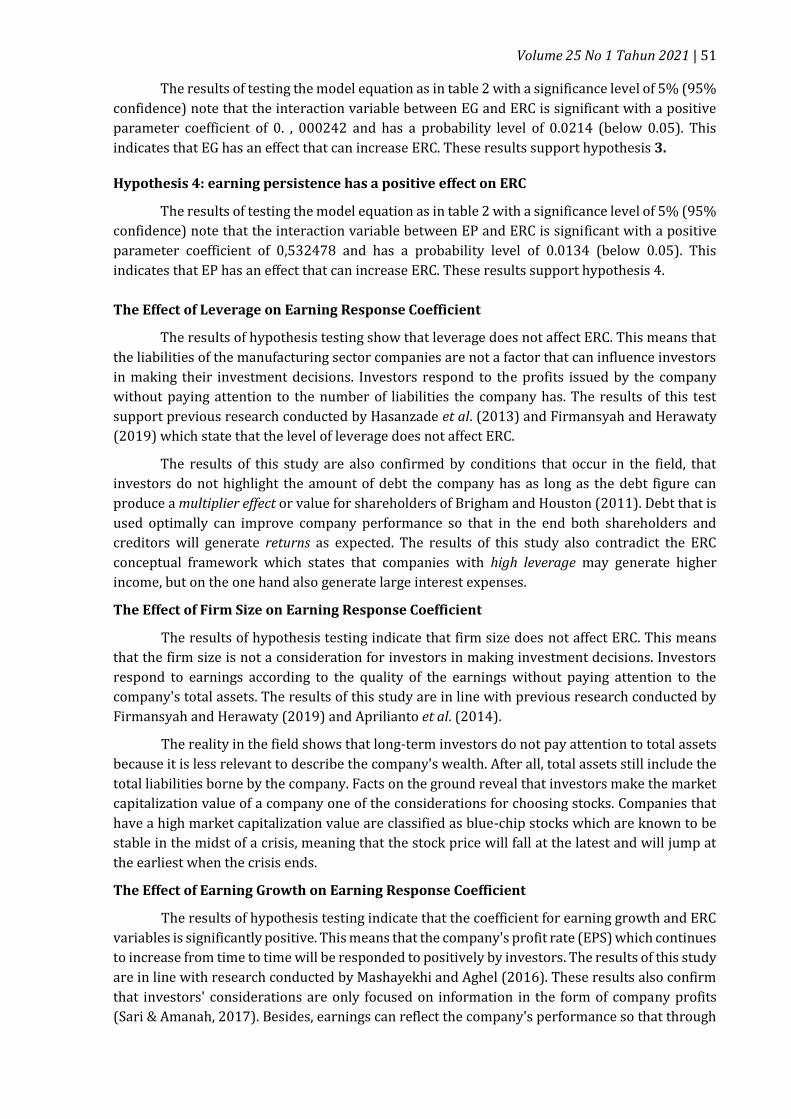
Multiple Linear Regression
Based on the test results with the regression model, a regression model can be arranged
as follows:
𝐶𝐴𝑅𝑖,𝑡 = 0,353004 + 1,474915 𝑈𝐸𝑖,𝑡 + 0,042082 𝐷𝐸𝑅𝑖,𝑡 − 0,011451 𝐹𝑆𝑖,𝑡 + 0,000242 𝐸𝐺𝑖,𝑡
+ 0,532478 𝐸𝑃𝑖,𝑡 + 𝜀𝑖,𝑡
Table 2 Regression Results for the CEM
Variable Coefficient Two-tailed
Prob.
One-tailed
Prob.
UE 1.474915 0.0000 0.0000
DER 0.042082 0.1479 0.0739
FS -0.011451 0.3672 0.1836
EP 0.000242 0.0428 0.0214
EP 0.532478 0.0267 0.0134
Adjusted R-squared 0.154063
Prob (F-statistic) 0.000000
Source: Data processed by the author (2021)
Testing the hypothesis in this study using the regression results in table 2 above.
Hypothesis 1: leverage has a negative effect on ERC
The results of testing the model equation as in table 2 with a significance level of 5% (95%
confidence) note that the interaction variable between DER and ERC is not significant with a
positive parameter coefficient of 0.042082 and has a probability of 0.0739 (above 0.05). This
indicates that DER does not affect ERC. These results reject hypothesis 1.
Hypothesis 2: firm size has a positive effect on ERC
The results of testing the model equation as in table 2 with a significance level of 5% (95%
confidence) note that the interaction variable between FS and ERC is insignificant with a negative
parameter coefficient of 0.011451 and has a probability level of 0.1836 (above 0.05). This
indicates that FS does not influence ERC. These results reject hypothesis 2.
Hypothesis 3: Earning growth has a positive effect on ERC
Volume 25 No 1 Tahun 2021 | 51
The results of testing the model equation as in table 2 with a significance level of 5% (95%
confidence) note that the interaction variable between EG and ERC is significant with a positive
parameter coefficient of 0. , 000242 and has a probability level of 0.0214 (below 0.05). This
indicates that EG has an effect that can increase ERC. These results support hypothesis 3.
Hypothesis 4: earning persistence has a positive effect on ERC
The results of testing the model equation as in table 2 with a significance level of 5% (95%
confidence) note that the interaction variable between EP and ERC is significant with a positive
parameter coefficient of 0,532478 and has a probability level of 0.0134 (below 0.05). This
indicates that EP has an effect that can increase ERC. These results support hypothesis 4.
The Effect of Leverage on Earning Response Coefficient
The results of hypothesis testing show that leverage does not affect ERC. This means that
the liabilities of the manufacturing sector companies are not a factor that can influence investors
in making their investment decisions. Investors respond to the profits issued by the company
without paying attention to the number of liabilities the company has. The results of this test
support previous research conducted by Hasanzade et al. (2013) and Firmansyah and Herawaty
(2019) which state that the level of leverage does not affect ERC.
The results of this study are also confirmed by conditions that occur in the field, that
investors do not highlight the amount of debt the company has as long as the debt figure can
produce a multiplier effect or value for shareholders of Brigham and Houston (2011). Debt that is
used optimally can improve company performance so that in the end both shareholders and
creditors will generate returns as expected. The results of this study also contradict the ERC
conceptual framework which states that companies with high leverage may generate higher
income, but on the one hand also generate large interest expenses.
The Effect of Firm Size on Earning Response Coefficient
The results of hypothesis testing indicate that firm size does not affect ERC. This means
that the firm size is not a consideration for investors in making investment decisions. Investors
respond to earnings according to the quality of the earnings without paying attention to the
company's total assets. The results of this study are in line with previous research conducted by
Firmansyah and Herawaty (2019) and Aprilianto et al. (2014).
The reality in the field shows that long-term investors do not pay attention to total assets
because it is less relevant to describe the company's wealth. After all, total assets still include the
total liabilities borne by the company. Facts on the ground reveal that investors make the market
capitalization value of a company one of the considerations for choosing stocks. Companies that
have a high market capitalization value are classified as blue-chip stocks which are known to be
stable in the midst of a crisis, meaning that the stock price will fall at the latest and will jump at
the earliest when the crisis ends.
The Effect of Earning Growth on Earning Response Coefficient
The results of hypothesis testing indicate that the coefficient for earning growth and ERC
variables is significantly positive. This means that the company's profit rate (EPS) which continues
to increase from time to time will be responded to positively by investors. The results of this study
are in line with research conducted by Mashayekhi and Aghel (2016). These results also confirm
that investors' considerations are only focused on information in the form of company profits
(Sari & Amanah, 2017). Besides, earnings can reflect the company's performance so that through
52 | Bina Ekonomi
profit, investors can evaluate management performance and estimate the company's long-term
earnings capability in the future (Dwiatmini & Nurkholis, 2001).
The ability to increase profits from time to time (profitability) will be responded to
positively by investors because it can increase investors' wealth. Increasing this wealth can take
the form of maintaining, increasing value, or giving return a positive(Sutha, 2000). Besides, the
facts on the ground show that one of the considerations for the value of investors in making
investment decisions is the PER number, this is because this figure determines the expensive or
cheap price of shares. Stocks with good performance and low PER are more attractive to value
investors. Conversely, stocks with good performance and high EPS are more attractive to growth
investors. This means that the use of PER as a proxy for earnings growth is significant and relevant
in assessing the behavior of stock investors.
The Effect of Earning Persistence on Earning Response Coefficient
The results of hypothesis testing show that the coefficient for the variable earning
persistence and ERC is positive and significant. This means that the profit rate from the company's
normal activities which continues to increase from time to time will be responded to positively by
investors. The results of this study are in line with research conducted by Gurusinga and Pinem
(2019) which states that the more persistent the company's profits are, the higher the market
response is reflected in the increase in the company's stock price.
Facts on the ground show that investors respond positively to the profit figures as long as
the profit figures match or are above the expectations they have done. Suwardjono (2013) states
that company profits come from a series of activities carried out to cover costs incurred and are
evidence of the company's performance and survival. Investors pay attention to company profits
because profit figures are important information in a financial report that can be used as a basis
for calculating taxes, the basis for calculating dividends to be distributed to shareholders, the basis
for making policies or investment decisions, as well as a reference in estimating the profits and
economic benefits of the company in the future (Harahap, 2010).
Supporting Analysis
Based on the partial test results, only two variables affect investors' responses, namely
earning growth and earning persistence. This supports the fact in the field that the profit rate is
one of the considerations, but with a very small portion, namely 2 - 5% (Lev, 1989). Facts in the
field reveal that several variables are influencing Most of the investor's behavior is
macroeconomic conditions, the movement of the S&P 500 index, regulations, motives, and herding
behavior.
4. CONCLUSIONS
Based on the discussion, the conclusions of this study are as follows. First, the level of
leverage does not affect ERC. This means that investors do not question the number of the
company's liabilities as long as it can increase profitability optimally so that in the end it can
maximize investor wealth in the form of dividends. and capital gains. Second, Firm size does not
affect ERC. This means that investors do not make firm size (total assets) a benchmark in making
investment decisions, whether in terms of buying, adding, or selling their ownership of a
company. Third, Earnings growth has a positive effect on ERC. This means that when a company
publishes a net profit that continues to increase from time to time, investors will give a positive
reaction which is reflected in the increase in the company's stock price. Lastly, Earning persistence
has a positive effect on ERC. This means that the level of earnings persistence is one of the factors
Volume 25 No 1 Tahun 2021 | 53
that can attract investors. Companies that can generate increased profits and originate from
normal company activities will be responded to positively by investors.
This study has also several limitations as follows. It only uses manufacturing sector
companies as the research sample and given the diversity of previous research results, the results
of this study can also be different for sector companies other than manufacturing listed on the
IDX. Furthermore, it only uses the company's annual financial statements. Moreover, It only uses
company financial report data published on the IDX. Lastly, It uses five years, and as previously
stated that the results of the research can be different if the period changes, both being shorter
and longer.
For future research, it can be carried out related to investor behavior by doing the
following. First, include non-manufacturing sector companies or all companies listed on the IDX.
Second, use data not only from the company's financial statements but also from other sources
published by the company so that the research results are more varied and broader. Third, Add
independent variables, for example, related to market capitalization, corporate social
responsibility (CSR) disclosure reports, company operating cash flows, systematic risk, and other
macroeconomic variables. Forth, Modify the period in the study to obtain better results related to
investor behavior. Fifth, Use the company's quarterly financial reports.
REFERENCES
Al-Baidhani, AM, Abdullah, A., Ariff, M., Cheng, FF, & Karbhari, Y. (2017). Earnings response
coefficient: Applying individual and portfolio methods. Corporate Ownership and Control,
14(3), 188–196.
An, Y. (2015). Earnings Response Coefficients and Default Risk: Case of Korean Firms.
International Journal of Financial Research, 6(2), 67–71.
Aprilianto, B., Wulandari, N., & Kurrohman, T. (2014). The behavior of individual stock investors
in making investment decisions: Crisis Hermeneutics Study. Journal of Business Economics
and Accounting, 1(1), 16–31.
Asadi, A., Zendehdel, A., & Sanagostar, B. (2021). The Effect of Earning and Information Quality on
Stock Trading. Iranian Journal Of Accounting, Auditing & Finance, 4(4), 71-82.
https://doi.org/10.22067/IJAAF.2021.39508
Assagaf, A., Murwaningsari, E., Gunawan, J., & Mayangsari, S. (2019). Factors Affecting the Earning
Response Coefficient with Real Activities Earning Management as Moderator: Evidence
from Indonesia Stock Exchange. Asian Journal of Economics, Business, and Accounting,
11(2), 1–14.
Aviliani. (2009). Has government debt had an impact on national economic growth?. Retrieved from
http://www.bpkp.go.id/berita/read/4503/6550/Sudah-Utang-Pemerintah-Berdampak-
Pada-Pertentuk-Ekonomi-Nasional
Beaver, H., Lambert, A., & Ryan, SG (1987). The Information Content of Security Prices: A Second
Look. Journal of Accounting and Economics, 9(2), 139–157.
Beaver, W., Lambert, R., & Morse, D. (1980). The Information Content of Security Prices. Journal of
Accounting and Economics, March, 3–28.
54 | Bina Ekonomi
Brigham, EF, & Houston, JF (2011). Fundamentals of Financial Management. Four Salemba.
Cashmere. (2012). Financial Statement Analysis. PT Rajagrafindo Persada.
Cho, JY, & Jung, K. (1991). Earning Response Coefficient: A Synthesis of Theory and Empirical
Evidence. Journal of Accounting Literature, 10, 85–116.
Collins, DW, & Kothari, SP (1989). An Analysis of Intertemporal and Cross-Sectional Determinants
of Earnings Response Coefficients. Journal of Accounting and Economics, 11(2–3), 143–
181.
David, RF (2016). Strategic Management. Book I, 12–30.
Delvira, M., & Nelvirita. (2013). The Effect of Systematic Risk, Leverage, and Earnings Persistence
on the Earnings Response Coefficient (Erc). WRA Journal, 1(1), 129–154.
Dewi, NS, & Yadnyana, IK (2019). The Effect of Profitability and Leverage on the Earnings
Response Coefficient with Company Size as a Moderating Variable. E-Journal of Accounting,
26, 2041.
Ditiya, YD, & Sunarto. (2019). Company Size, Profitability, Financial Leverage, Book-Tax
Differences and Public Ownership of Income Smoothing (Empirical Study of
Manufacturing Companies Listed on the Indonesia Stock Exchange 2014-2017 Period).
Dynamics of Accounting, Finance, and Banking, 8(1), 51–63.
Dwiatmini, S., & Nurkholis. (2001). Analysis of Market Reactions to Profit Information: A Case of
Income Smoothing Practices in Companies Listed on the JSE. Journal of Accounting Studies,
2(1), 35–48.
Firmansyah, A., & Herawaty, V. (2019). The Effect of Income Smoothing, Dividend Policy, Leverage,
and Company Size on the Earnings Response Coefficient and the Future Earnings
Response Coefficient. In the Journal of Information, Taxation, Accounting, and Public
Finance (Vol. 11, Issue 1, p. 31).
Godfrey, J. (2010). Accounting Theory (7th ed.). John Wiley & Sons.
Gurusinga, JJ, & Pinem, DB (2019). The Effect of Profit Persistence and Leverage on the Earnings
Response Coefficient. Equity, 19(1), 25.
Harahap. (2010). Critical Analysis of Financial Statements. PT Rajagrafindo Persada.
Hasanzade, M., Darabi, R., & Mahfoozi, G. (2013). Factors Affecting the Earnings Response
Coefficient: An Empirical study for Iran. European Online Journal of Natural and Social
Sciences, 2(3), 2551–2560. www.european-science.com
Herdirinandasari, Sherlia, S., & Fadjrih, N. (2016). The Effect of Firm Size, Profitability, and
Voluntary Disclosure on the Earnings Response Coefficient (ERC). Journal of Accounting
Science and Research, 5(November), 1–19.
Holthausen, RW, & Verrecchia, RE (1988). The Effect of Sequential Information Releases on the
Variance of Price Changes in an Intertemporal Multi-Asset Market. Journal of Accounting
Research, 26(1), 82.
Volume 25 No 1 Tahun 2021 | 55
Jensen, C., & Meckling, H. (1976). Theory of The Firm : Managerial Behavior, Agency Costs and
Ownership Structure I. Introduction and summary in This Paper WC Draw on Recent
Progress in The Theory of (1) Property Rights, Firm. In addition to tying together elements
of the theory of e. 3, 305–360.
Kieso, DE, Weygandt, JJ, & Warfield, TD (2019). Intermediate accounting (17th ed.). USA: Wiley.
Kohlbeck, MJ, & Warfield, TD (2011). The Effects of Accounting Standard Setting on Accounting
Quality. SSRN Electronic Journal, 608.
Lev, B. (1989). Discussion of On the Usefulness of Earnings and Earnings Research: Lessons and
Directions from Two Decades of Empirical Research. Journal of Accounting Research, 27,
193.
Mashayekhi, B., & Aghel, ZL (2016). A Study on the Determinants of Earnings Response Coefficient
in an Emerging Market. World Academy of Science, Engineering and Technology
International Journal of Economics and Management Engineering, 10(7), 2479–2482.
Moradi, M., Salehi, M., & Erfanian, Z. (2010). A Study of the Effect of Financial Leverage on Earnings
Response Coefficient Through Out Income Approach: Iranian Evidence. International
Review of Accounting, Banking, and Finance, 2(2), 103–115.
Mulyani, S., & Asyik, NF (2007). Factors Affecting the Earnings Response Coefficient. Accounting
Analysis Journal, 2(3), 35–45.
Murhadi, WR (2013). Analysis of Projected Financial Statements and Stock Valuation. Jakarta: Four
Salemba.
Pande, IM, & Putra, D. (2017). The Effect of Leverage and Company Size on the Earnings Response
Coefficient. E-Journal of Accounting, 2017(1), 367–391.
Prastya, Y. (2019). What are the advantages and disadvantages of financial leverage for a
company?. www.inforexnews.com. https://www.inforexnews.com/berita/forex/apa-
keuntung-dan-kerugian-dari-financial-leverage-bagi-sebuah-per company
Raza, W., Ihsan, A., & Jan, S. (2017 ). Effect of Big 4 on Earning Response Coefficient: Evidence from
Pakistan. Journal of Managerial Sciences, XI(03), 499–512.
Sari, IP, & Amanah, L. (2017). Factors Affecting Income Smoothing at Manufacturing Companies
on the IDX. Journal of Accounting Science and Research, 6(6).
Scott, B., & Brigham, EF (2008). Essentials of Managerial Finance. Thomson South-Western.
Scott, WR (2000). Financial Accounting Theory. Prentice Hall Inc.
Scott, WR (2009). Financial Accounting Theory (5th ed.). Pearson Prentice Hall.
Scott, WR (2012). International Financial Accounting Theory. Prentice Hall Inc.
Scott, WR (2015). Financial Accounting Theory (7th ed.). Pearson Canada.
Subramanyam, KR (2014). Financial Statement Analysis (11th ed.). Singapore: McGraw Hill.
Sutha, IPGA (2000). Towards a Modern Capital Market. Jakarta: SAD Satria Bhakti Foundation.

56 | Bina Ekonomi
Suwardjono. (2013). Accounting Theory: Engineering Financial Reporting. Yogyakarta: BPFE.
Wijaya, H., Adhitya, S., Cahyadi, H., & Salim, S. (2020). Factors Affecting Earning Response
Coefficient with Profitability as Moderating Variable in Manufacturing Companies.
145(Icebm 2019), 246–254.
Yosefa, S., & Wondabio, ludovicus sensi. (2007). The influence of CSR. Response, 1–35.
Yuliana, L., & Yuyetta, ENA (2017). Analysis of Factors Affecting Company Leverage (Empirical
Study of Manufacturing Companies Listed on the Indonesia Stock Exchange 2013-2015).
Diponegoro Journal of Accounting, 6(3), 1–13.