Embed Size (px)
Citation preview
Paper ID #26193
Teaching Thermodynamic Properties of Water Without Tears
Dr. Smitesh Bakrania, Rowan University
Dr. Smitesh Bakrania is an associate professor in Mechanical Engineering at Rowan University. He re-ceived his Ph.D. from University of Michigan in 2008 and his B.S. from Union College in 2003. Hisresearch interests include combustion synthesis of nanoparticles and combustion catalysis using nanopar-ticles. He is also involved in developing educational apps for instructional and research purposes.
Dr. Francis (Mac) Haas, Rowan University
Mac Haas, Assistant Professor of Mechanical Engineering at Rowan University, holds undergraduatedegrees in chemical and environmental engineering and a doctorate in mechanical and aerospace engi-neering from Drexel University and Princeton University, respectively. His primary research interestsinclude chemically reacting flows applied to energy conversion and air pollutant formation/destruction,advanced manufacturing, and biomedical device development.
c©American Society for Engineering Education, 2019
Teaching Thermodynamic Properties of Water Without Tears
A typical thermodynamics course begins with the familiar ideal gas law to determine the state properties. Water properties are introduced next. Considering students have already seen the ideal gas law in chemistry courses, the instruction is brief and often pertains to its engineering application with the mass-based form of the equation of state. The thermodynamic behavior of water, on the other hand, proves relatively challenging for many students. The existence of phase change within engineering conditions renders an intractable equation of state for water. Instead, we rely on property data references such as steam tables to determine state properties. This apparent disconnect between ideal gases and water, and the introduction of a new tool for property retrieval, often leads to appreciable time allocated to the instruction of water properties and subsequent struggles. This allocation of instructional time is at the expense of performing advanced thermodynamic analysis of engineering processes and cycles. Recognizing the need to quickly and effectively introduce thermodynamic properties of water and at the same time reinforce the fundamentals, a new instructional approach was implemented. The approach relied on targeted videos to (a) make the transition from ideal gas model to water properties seem less disconnected and (b) convey state relationships in a visual form, namely property charts. Two separate videos on ideal gases and water were produced with a clear overlap related to real fluids. Both videos used property charts to visualize the thermodynamic property relationships. After students watched the videos outside the lecture period, a short lecture was dedicated to the mechanics of property retrieval from a T-s chart. Following the lecture, a group activity was conducted to assess student comfort with paper-based property charts for property retrieval. When surveyed, student opinion was highly favorable towards the use of videos for instruction, review, and the visual approach. The direct outcome of the control and treatment activities showed statistically significant advantage (p-value 0.038) of this approach. Students displayed adequate competence in solving water property problems using property charts. The results also showed how the use of property charts reinforces the thermodynamic fundamentals, as opposed to the use of online databases or the steam tables. The implementation yielded a marked decrease in lecture time dedicated to introducing properties of water, allowing more time to be spent on practicing thermodynamic analytical skills. This non-traditional approach, without steam tables or online reference tools, also optimally aligned with the course learning outcomes.
Introduction
Developing students’ fluency in determining thermodynamic state properties is a critical skill common to engineering thermodynamics courses regardless of specific instructional approach [1, -4]. When introducing thermodynamic properties, ideal gas properties are initially highlighted to leverage student familiarity with ideal gas concepts taught in prior chemistry courses. Beyond recapitulating familiar P-v-T behavior and differentiating the mass- and mole-based forms of the ideal gas law, initial introduction of ideal gas properties serves to develop a conceptual platform with which to approach working fluids such as water. Water, in particular, exhibits more complex phase behavior as a result of phase changes at engineering conditions as well as significant non-ideality in the vapor phase. Relative to the closed-form P-v-T equation of state describing ideal gas properties, the property relationships for water are significantly more complex and defy relation through a simple equation broadly applicable across a large range of conditions. Instead, students are often introduced to tabular property data references (i.e., “steam tables” that are composed of multiple tables pertaining to discrete phases of water) to determine state properties. An appreciable amount of instructional time is devoted to the differentiation of ideal gas and water property behavior and use of steam tables for water property retrieval [5, 6]. This displaces time that could be spent performing advanced thermodynamic analysis of engineering processes and cycles or tackling other concepts in engineering thermodynamics.
Toward streamlining the teaching of water properties and comparing it with ideal gas properties, we present here a study of a flipped classroom model involving a pair of videos highlighting a chart-based approach to learning the property behaviors of ideal gases and water. The advantages of chart-based property determination are highlighted elsewhere [7, 8], and include facile interpretation of thermodynamic property trends [9, 10] compared to properties determined by either tabular lookup or many online property lookup tools (e.g., NIST Chemistry WebBook [11]). As shown later, distinction among these three approaches to determining thermodynamic properties distinguish this study from those more generally involving a flipped classroom, for which successful learning hinges on leveraging the medium best suited for knowledge transfer. In particular, the highly visual nature of chart-based property determination and trend interpretation lends itself to an animated medium in a way that table or online lookups do not, with animation serving to add a dynamic element to the global property features evident from paper chart-based analysis. Consequently, adoption of a chart-based instructional approach may enable some of the general advantages of flipped classroom instruction, such as ability for students to review video material at their own pace and as many times as desired (outside of class time). Further, this approach may also appeal to more technologically inclined students and their expectations, as highlighted in recent studies by Pearson, Microsoft, and Forbes [12-14].
This work explores the effectiveness of teaching chart-based thermodynamic properties using targeted animated videos. We conducted an impact study involving one course section each of treatment and control students, and report below (1) quantitative performance results between control and treatment, as well as (2) students’ sentiments regarding the video-based property chart instruction. Both forms of results highlight the advantages of emphasizing use of property charts over the use of steam tables to expedite acquisition of thermodynamic fundamentals. Instructional implementation and the embedded resources are presented in detail to encourage easy adoption within the engineering curriculum. The major contribution of this work is to extend prior emphasis of the several advantages of chart-based approach teaching water properties [7,8], now including video delivery of instruction.
Instructional Implementation using Videos
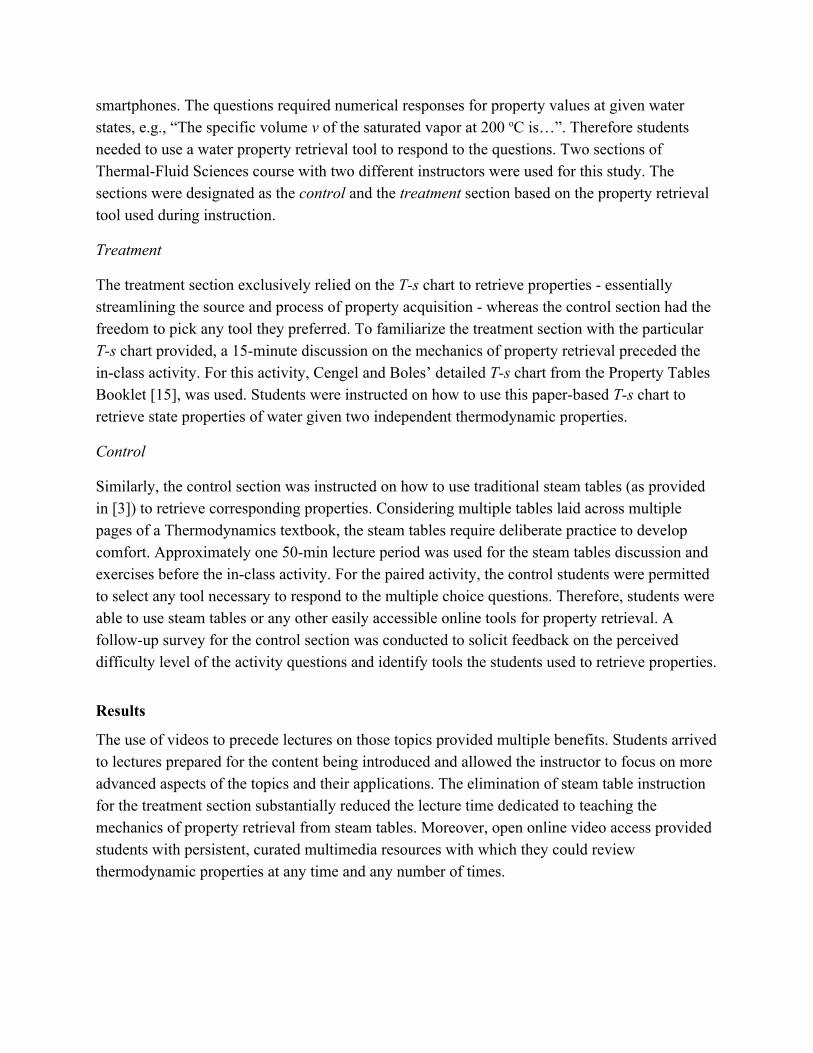
Property charts were used to bridge the disconnect between ideal gas law and properties of water. Two-dimensional property charts that depict behavior of ideal gases on P-v, T-v, and P-T space map easily to the phase-change behavior of water and student’s a priori intuition about this familiar substance. Considering the highly visual nature of this content, two animated videos were designed, developed, and produced by one of the authors for this study. Figure 1 provides screenshots of the two videos. The first video on ideal gases described the ideal gas equation of state and plotted the P-v-T behavior on property charts. The video emphasized how the property charts can be used to retrieve state properties. At the end of this first video, a key limitation of the ideal gas law assumption was visually highlighted. Namely, the exclusion of phase change at low temperatures and high pressures. The limitation was depicted on a T-v chart with isobars approaching zero specific volume at 0K (see Fig. 2). The second video then introduced students to the properties of water using the, now familiar, T-v chart. The second video reiterated how state properties of water can be directly determined from the property charts because water state equations are more complicated. These properties included P, T, v, u, h, and s. Following the second video, students were asked to complete a short online quiz to review the content discussed. The quiz asked questions related to the terms and concepts explored in the video, including superheating, isobars, critical point, and mixture quality. The quiz ensured students were at least familiar with the content within the video and returned to lecture prepared. Students were also asked to comment on the video for feedback.
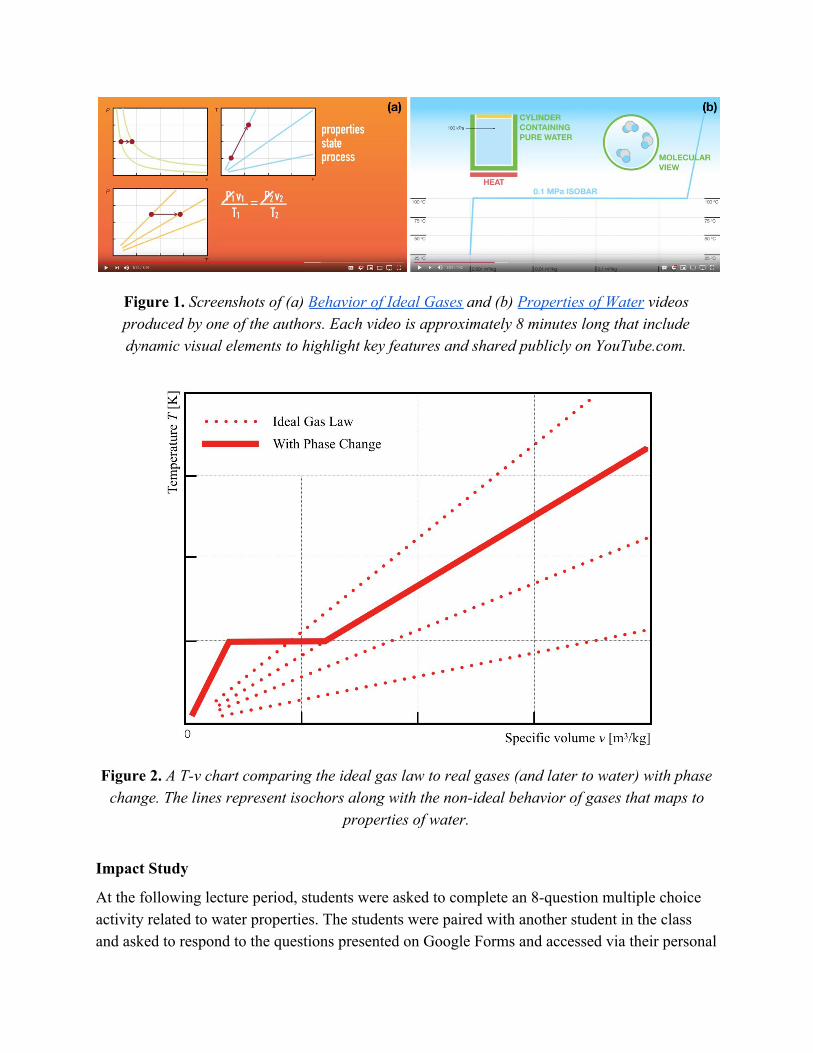
Figure 1. Screenshots of (a) Behavior of Ideal Gases and (b) Properties of Water videos produced by one of the authors. Each video is approximately 8 minutes long that include dynamic visual elements to highlight key features and shared publicly on YouTube.com.
Figure 2. A T-v chart comparing the ideal gas law to real gases (and later to water) with phase change. The lines represent isochors along with the non-ideal behavior of gases that maps to
properties of water.
Impact Study
At the following lecture period, students were asked to complete an 8-question multiple choice activity related to water properties. The students were paired with another student in the class and asked to respond to the questions presented on Google Forms and accessed via their personal
smartphones. The questions required numerical responses for property values at given water states, e.g., “The specific volume v of the saturated vapor at 200 oC is…”. Therefore students needed to use a water property retrieval tool to respond to the questions. Two sections of Thermal-Fluid Sciences course with two different instructors were used for this study. The sections were designated as the control and the treatment section based on the property retrieval tool used during instruction.
Treatment
The treatment section exclusively relied on the T-s chart to retrieve properties - essentially streamlining the source and process of property acquisition - whereas the control section had the freedom to pick any tool they preferred. To familiarize the treatment section with the particular T-s chart provided, a 15-minute discussion on the mechanics of property retrieval preceded the in-class activity. For this activity, Cengel and Boles’ detailed T-s chart from the Property Tables Booklet [15], was used. Students were instructed on how to use this paper-based T-s chart to retrieve state properties of water given two independent thermodynamic properties.
Control
Similarly, the control section was instructed on how to use traditional steam tables (as provided in [3]) to retrieve corresponding properties. Considering multiple tables laid across multiple pages of a Thermodynamics textbook, the steam tables require deliberate practice to develop comfort. Approximately one 50-min lecture period was used for the steam tables discussion and exercises before the in-class activity. For the paired activity, the control students were permitted to select any tool necessary to respond to the multiple choice questions. Therefore, students were able to use steam tables or any other easily accessible online tools for property retrieval. A follow-up survey for the control section was conducted to solicit feedback on the perceived difficulty level of the activity questions and identify tools the students used to retrieve properties.
Results
The use of videos to precede lectures on those topics provided multiple benefits. Students arrived to lectures prepared for the content being introduced and allowed the instructor to focus on more advanced aspects of the topics and their applications. The elimination of steam table instruction for the treatment section substantially reduced the lecture time dedicated to teaching the mechanics of property retrieval from steam tables. Moreover, open online video access provided students with persistent, curated multimedia resources with which they could review thermodynamic properties at any time and any number of times.
Both the treatment and the control section completed watching the water thermodynamic property video and completed the short online quiz thereafter. The treatment (N = 30) and control sections (N = 40) performed equally well on the follow-up quiz; with 77 ± 17% and 78 ± 12% correct responses, respectively. At the end of the quiz, students were asked to comment on the video. The results of the feedback are discussed here.
Student Feedback on Implementation
The response for the videos was overwhelmingly positive. Most students specifically commented on the visual nature of the presentation that helped them grasp the key concepts better. Few students also noted the added benefit of video lectures with its provision to review at leisure - a feature that is lacking when considering in-class lectures. The following are representative comments from over 80 responses (a third section of Thermal-Fluid Science course was also included at this stage). Out of these over 87% of the comments were strongly positive and the rest could be considered ‘neutral.’ None of the comments could be categorized as ‘negative.’
“Having the ability to watch the video multiple times helps solidify the information given, which is very helpful. I think more videos of this nature would help substantially in the learning process.”
“Very well edited. Some questions required multiple viewings of the video to discover answer, but helped break down video to understand each point.”
“The explanations of the topics were clear, concise, and most importantly entertaining enough to not lose an audience mid-way through. The time taken on the visuals like property charts, and referencing molecules on a subatomic level really helped put a more concrete perspective on understanding such properties of water.”
“This video was very informative for different thermodynamic properties of water and it helped me to understand concepts that I was struggling on.”
“I thought that the video and questions combination was good because it made me go back and really understand the video.”
“Much better for visualization! Even looking at still pictures can be a bit confusing and overwhelming. The animations, even as brief as they are, really clear things up. Thanks!”
“Very well produced, gives detailed insight into the uses and results of the graphical representations. The term 'quality' was simplified more than the textbook definition, making it much more comprehensive.”
“The graphics were very useful in explaining the different ideas discussed. This video was excellent for a visual learner, like myself.”
“Good video. Hardly seemed 7 minutes long.”
The preceding student comments (and others not included here) strongly endorse this implementation and highlight the value of video-based content to augment lectures and text resources. It is also important to note the highly visual nature of the content itself that is conducive to video or animation based delivery. In other words, certain topics may be difficult to translate to a video-based instruction, while others, such as might be envisioned for steam table interpretation, may lack engaging/entertaining substance for this medium. Having said that, effective animation and delivery can greatly impact the production quality of a video, just as effective instructors and transform a classroom experience. A criticism that some students noted can be summed up in the following student comment:
“I was a little bit confused following the video because it was a lot of information thrown at me, but once I went through the questions and looked at the video a few more times, I understood the concepts much better.”
Indeed, the videos were not designed to serve as a standalone resource but supplemental to the lectures and the activities surrounding the content to reinforce the ideas discussed. Several students watched the videos repeatedly, likely in an effort to internalize the key ideas in much the same way as can be done with several other study media (e.g., textbook, notes, returned homework), but repetition was not necessary for this implementation.
The student feedback on the video can be summarized as follows:
1. Videos can be viewed multiple times for content review 2. Videos are better suited for visual content that can be animated 3. Short videos can be effective for engaging students with content
To recognize the utility of this video-based resource over a longer term, the treatment section was asked to indicate resources used to prepare for the next assessment on water properties. Results showed that 75% of the students noted they re-watched the video for review. Figure 3 displays a summary of responses from the students on the resources used to prepare; with Homework Assignments (100%), Lecture Notes (85.7%), and Pikme Questions (78.6%) [16] as being more popular than video review. An interesting note here is that, more students relied on the Water Behavior video than reading the corresponding textbook sections (60.7% only). The results here confirm that the video content can serve as an important resource for students.
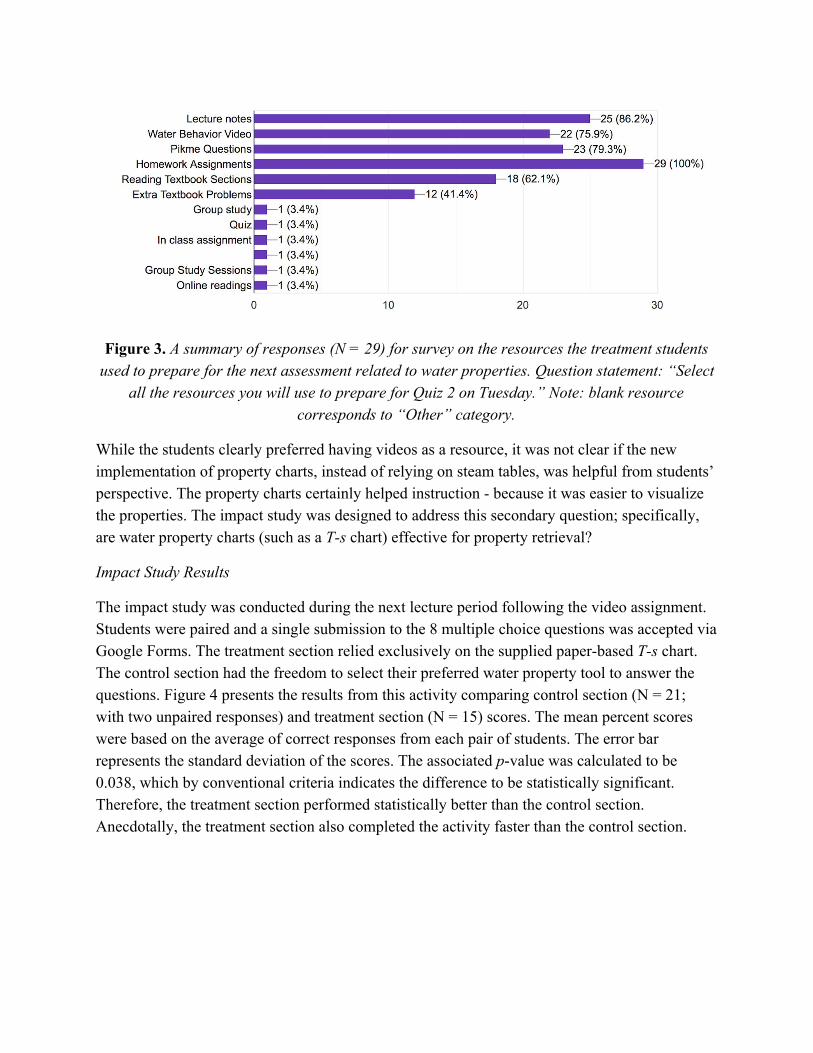
Figure 3. A summary of responses (N = 29) for survey on the resources the treatment students used to prepare for the next assessment related to water properties. Question statement: “Select
all the resources you will use to prepare for Quiz 2 on Tuesday.” Note: blank resource corresponds to “Other” category.
While the students clearly preferred having videos as a resource, it was not clear if the new implementation of property charts, instead of relying on steam tables, was helpful from students’ perspective. The property charts certainly helped instruction - because it was easier to visualize the properties. The impact study was designed to address this secondary question; specifically, are water property charts (such as a T-s chart) effective for property retrieval?
Impact Study Results
The impact study was conducted during the next lecture period following the video assignment. Students were paired and a single submission to the 8 multiple choice questions was accepted via Google Forms. The treatment section relied exclusively on the supplied paper-based T-s chart. The control section had the freedom to select their preferred water property tool to answer the questions. Figure 4 presents the results from this activity comparing control section (N = 21; with two unpaired responses) and treatment section (N = 15) scores. The mean percent scores were based on the average of correct responses from each pair of students. The error bar represents the standard deviation of the scores. The associated p-value was calculated to be 0.038, which by conventional criteria indicates the difference to be statistically significant. Therefore, the treatment section performed statistically better than the control section. Anecdotally, the treatment section also completed the activity faster than the control section.
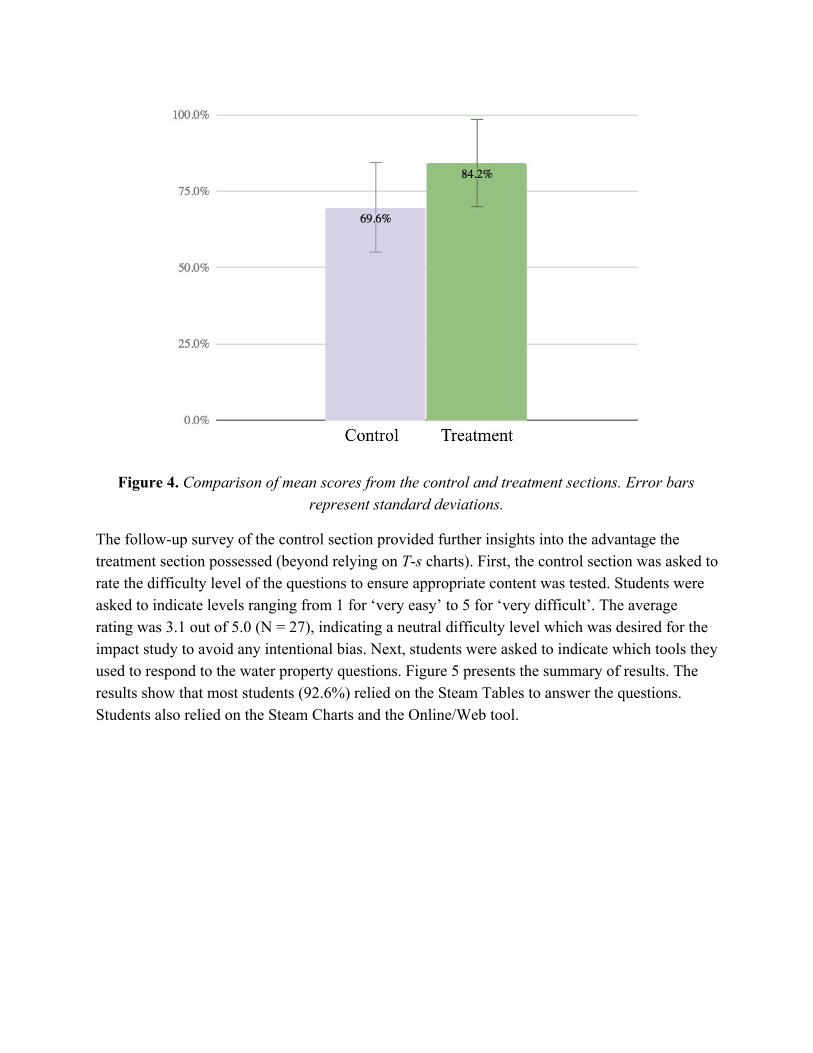
Figure 4. Comparison of mean scores from the control and treatment sections. Error bars represent standard deviations.
The follow-up survey of the control section provided further insights into the advantage the treatment section possessed (beyond relying on T-s charts). First, the control section was asked to rate the difficulty level of the questions to ensure appropriate content was tested. Students were asked to indicate levels ranging from 1 for ‘very easy’ to 5 for ‘very difficult’. The average rating was 3.1 out of 5.0 (N = 27), indicating a neutral difficulty level which was desired for the impact study to avoid any intentional bias. Next, students were asked to indicate which tools they used to respond to the water property questions. Figure 5 presents the summary of results. The results show that most students (92.6%) relied on the Steam Tables to answer the questions. Students also relied on the Steam Charts and the Online/Web tool.
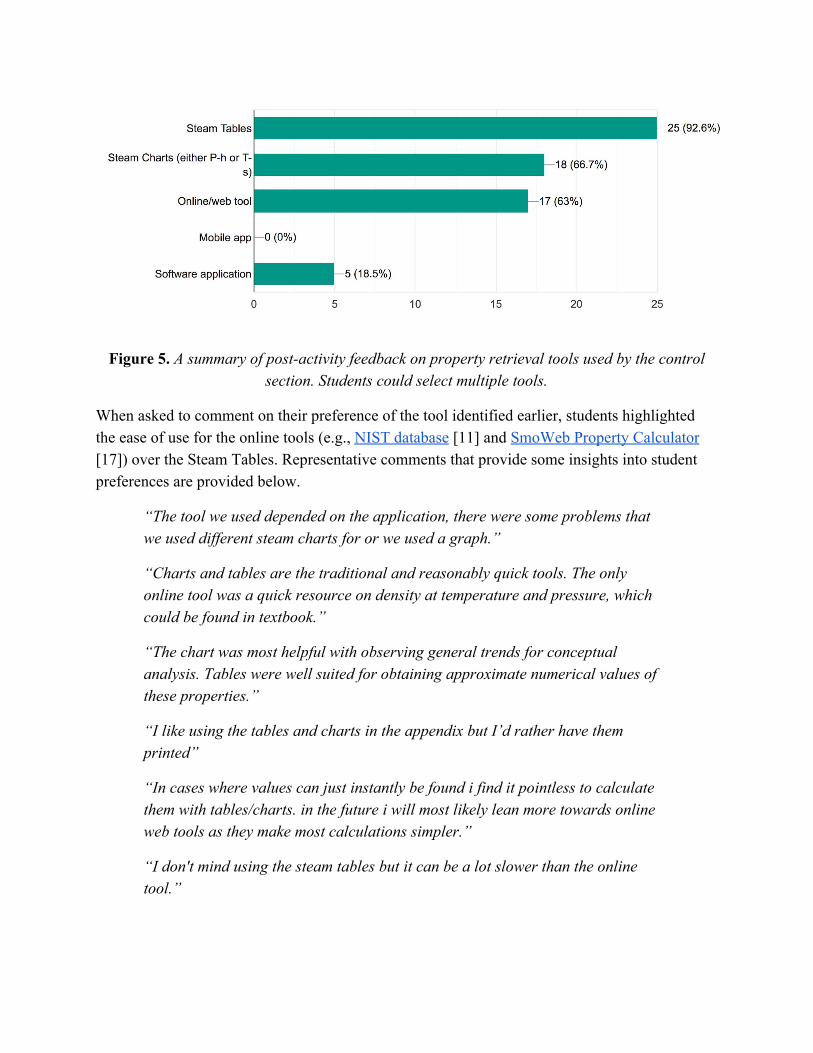
Figure 5. A summary of post-activity feedback on property retrieval tools used by the control section. Students could select multiple tools.
When asked to comment on their preference of the tool identified earlier, students highlighted the ease of use for the online tools (e.g., NIST database [11] and SmoWeb Property Calculator [17]) over the Steam Tables. Representative comments that provide some insights into student preferences are provided below.
“The tool we used depended on the application, there were some problems that we used different steam charts for or we used a graph.”
“Charts and tables are the traditional and reasonably quick tools. The only online tool was a quick resource on density at temperature and pressure, which could be found in textbook.”
“The chart was most helpful with observing general trends for conceptual analysis. Tables were well suited for obtaining approximate numerical values of these properties.”
“I like using the tables and charts in the appendix but I’d rather have them printed”
“In cases where values can just instantly be found i find it pointless to calculate them with tables/charts. in the future i will most likely lean more towards online web tools as they make most calculations simpler.”
“I don't mind using the steam tables but it can be a lot slower than the online tool.”
“The tables were pretty easy to understand, but it was sometimes difficult to identify from the question itself to determine which table to use. Mainly because there are so many of them.”
“While the steam tables are useful, I can often feel like I'm wasting time / spinning my wheels and getting little done. I often prefer online tools (or even just digital versions of the same paper tables) for expedience, that way I spend less time on numbers and more time on the concept.”
“Steam charts because there is a visual I can follow and know I am correct”
Overall, the students seem to recognize the advantages of tools at their disposal. Students inherently recognize the challenge of using the steam tables: identifying where the thermodynamic state of water lies and the corresponding table that must be used for property retrieval. When given a choice between the Steam Tables or an online reference (web tool), students preferred the simplest method to obtain the state properties: online/web tools.
Discussion
Videos and Charts Connection
The strong positive student response towards the videos must be evaluated from the standpoint that the use of property charts is a highly visual exercise. Given static two-dimensional information combined with dynamic changes in states with multiple properties, a visual animation is a natural fit. Therefore, it is expected that video delivery of this content is an effective vehicle. The same can not be said for the steam tables, which warrant considerable practice to develop familiarity with the property retrieval process. As presented in the implementation section, the present videos are intended to be supplementary and do not completely replace an in-class instruction prior to application. However, one can anticipate an additional video elaborating on the mechanics of property retrieval from a T-s chart to possibly supplant the final step to satisfy the strictest definition of a flipped classroom. For now, a short lecture prior to the application is used to address any questions or discomfort with this important tool. Furthermore, the same visual approach can be used to elaborate on other thermodynamic concepts involving property derivatives, including specific heats, compressibility factor, and sound speed to tie-in concepts from calculus. In other words, charts are highly conducive for a video delivery as opposed to traditional steam tables, in order to streamline the instruction.
Charts vs. the rest (online/web tools or steam tables)
As demonstrated by the impact study, students are notably better at evaluating properties of water using charts than any other methods of retrieval. Additionally, charts reinforce the interdependent nature of the state properties and help the students develop a mental model of
equation of state for water. Previous studies have already demonstrated that the students who use water property charts are better at predicting state property trends when going from one state to the other [7, 8]. Online/web tools or the steam tables, on the other hand, often deliver only point values without contextual information related to the fluid region. While the online tools are convenient for quick property retrieval, they rarely reinforce the thermodynamic fundamentals. To avoid misuse, it is recommended that students are made aware of other tools besides property charts, and their limitations. However, primary instruction should rely on property charts to teach thermodynamic properties of water both to benefit student understanding and use of scarce classroom time. When combined with video delivery, property charts provide several benefits as described earlier.
Historical Performance on Assessment involving Properties of Water
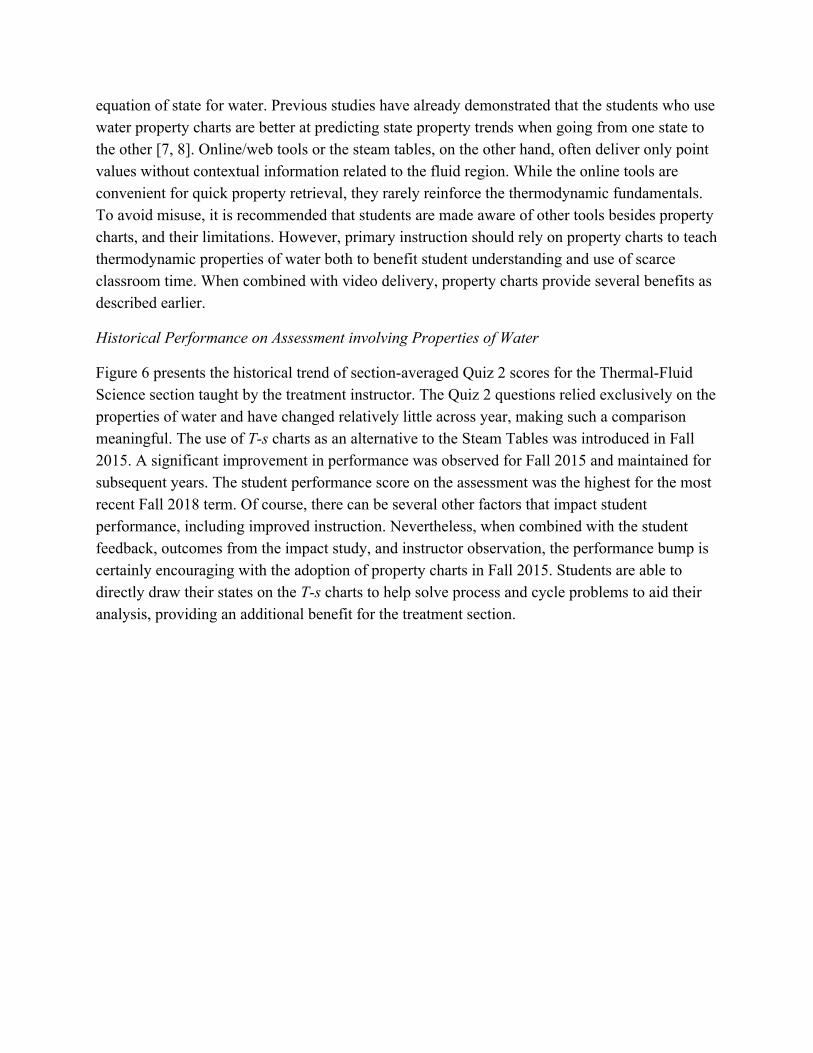
Figure 6 presents the historical trend of section-averaged Quiz 2 scores for the Thermal-Fluid Science section taught by the treatment instructor. The Quiz 2 questions relied exclusively on the properties of water and have changed relatively little across year, making such a comparison meaningful. The use of T-s charts as an alternative to the Steam Tables was introduced in Fall 2015. A significant improvement in performance was observed for Fall 2015 and maintained for subsequent years. The student performance score on the assessment was the highest for the most recent Fall 2018 term. Of course, there can be several other factors that impact student performance, including improved instruction. Nevertheless, when combined with the student feedback, outcomes from the impact study, and instructor observation, the performance bump is certainly encouraging with the adoption of property charts in Fall 2015. Students are able to directly draw their states on the T-s charts to help solve process and cycle problems to aid their analysis, providing an additional benefit for the treatment section.
Figure 6. Historical averages of Quiz 2 scores for the treatment section instructor.
Transitioning to Property Charts
Eliminating steam table instruction and its use from thermodynamics or thermal-fluid science courses can be challenging when one considers all textbooks currently in print exclusively rely on them for exercises [1, 2, 4]. For the treatment section, the in-class problems and assignment problem solutions were reworked to accept property chart value ranges. Assessments were redesigned to enable a range of values within a multiple choice format [18]. To encourage students to embrace the property charts and familiarize them with the overall concept, custom designed T-shirts with printed T-s charts were distributed. Students continue to wear these T-shirts beyond the course completion, often inspiring discussions with other colleagues on what the chart represents [8]. An iPad app, titled Clausius, was designed to demonstrate the dynamic changes in properties as one glides their fingers across a T-s chart [19]. The app was often used to demonstrate the constant property lines (e.g., isobars, isotherms, and isochors) directly on the chart and how properties vary as one moves along the lines. While the impact of the T-shirt and the iPad app was not measured, there is anecdotal evidence for these tools helping students grasp the value of property charts over the steam tables. Additionally, side-by-side comparison of problems solved using steam tables vs. property charts also helped convince the students of the utility of property charts.
Conclusions
The preceding quantitative and anecdotal results suggest that videos animating a visual approach (e.g., charts) for thermodynamic property lookup has advantages for both (1) student acquisition and retention of this skill and (2) effective use of classroom time. Impact study results indicate a statistically significant improvement in concept application, as measured between the treatment and control sections using a common follow-up assessment. Moreover, student response to the videos was overwhelmingly positive. When considering the tools selected by the control group, students prefer other methods of property retrieval over traditional steam tables. From a pedagogical standpoint, greater emphasis on property chart interpretation may be not only a compromise among competing tools, but actually offer a much better alternative (than low-context web-based tools) in reinforcement of engineering thermodynamics fundamentals. Consequently, we propose a reduction in emphasis of traditional steam tables toward priority given to thermodynamic property chart analysis, and we offer the Behavior of Ideal Gases and Properties of Water videos as popular blended learning tools that can facilitate this shift in emphasis and streamline instruction.
Acknowledgements
The authors thank Dr. Tom Merrill from Mechanical Engineering Department at Rowan University for participating in this study, and Dr. Krishan Bhatia for pioneering the use of property diagrams within thermodynamics courses and providing guidance in preparing for the instruction.
References
[1] Cengel, Y. A.; Boles, M. A., Thermodynamics: An Engineering Approach; McGraw Hill: Boston, 2018.
[2] Moran, M.J., Shapiro, H.N., Boettner, D.D., Bailey, M.B., Fundamentals of Engineering Thermodynamics, 9th Edition; Wiley, 2019.
[3] Turns, S.R., Thermal-Fluid Sciences: An Integrated Approach, Cambridge, 2008. [4] Reisel, J.R., Principles of Engineering Thermodynamics, Cengage Learning, 2015. [5] Lai, F. C., & Ngo, C. C., “Web Based Thermodynamics Wizard” 2002 ASEE Annual
Conference, Montreal, Canada. June 2002. https://peer.asee.org/10540 [6] Mulop, N., Yusof., K.M., Tasir, Z., A Review on Enhancing the Teaching and Learning
of Thermodynamics, Procedia - Social and Behavioral Sciences, 56 (2012) 703-712. [7] Bakrania, S.D., Are Steam Tables running out of steam? American Society for
Engineering Education, Zone II Conference, Puerto Rico. March 2-5, 2017. [8] Bakrania, S., & Mallouk, K., Blowing off Steam Tables, Paper presented at 2017 ASEE,
American Society for Engineering Education, Columbus, OH. June 2017.
[9] Urieli, I. Engineering Thermodynamics: A Graphical Approach. Paper presented at 2010 ASEE Annual Conference & Exposition, Louisville, Kentucky. June 2010 https://peer.asee.org/15662.
[10] Maixner, M., & Baughn, J. Teaching Psychrometry To Undergraduates. Paper presented at 2007 ASEE Annual Conference & Exposition, Honolulu, Hawaii. June 2007. https://peer.asee.org/1568.
[11] NIST Chemistry Webbook SRD 69, Thermophysical Properties of Fluid Systems, http://webbook.nist.gov/chemistry/fluid/ (accessed Feb 3, 2019).
[12] Pearson (2018), What do Gen. Z and millennials expect from technology in education?, https://www.pearsoned.com/generation-z-millennials-expect-technology-education/ (accessed Feb 3, 2019).
[13] Microsoft (2018), How can technology power the class of 2030?, https://educationblog.microsoft.com/2018/05/technology-empower-class-of-2030/, (accessed Feb 3, 2019).
[14] Forbes (2018), How technology and education are evolving, https://www.forbes.com/sites/quora/2018/05/04/how-education-and-technology-are-evolving-together/#29f5e03d7806 (accessed Feb 3, 2019).
[15] Cengel, Y. A.; Boles, M. A. Property Tables Booklet for Thermodynamics: An Engineering Approach; McGraw Hill: Boston, 2015.
[16] S. Bakrania, Getting Students Involved in a Classroom with an iPhone App, ASEE Annual Conference and Exposition, San Antonio, TX, June 2012.
[17] SmoWeb -The computational platform, Property Calculator, http://platform.sysmoltd.com/ThermoFluids/FluidPropsCalculatorView, (accessed Feb 3, 2019)
[18] Wildgoose, A., and Bakrania, “Development and implementation of rapid feedback using cloud-based assessment tool.” Frontiers in Engineering, Indianapolis, IN, October 18-20, 2017.
[19] Bakrania, S., & Carrig, A. Touching Water: Exploring Thermodynamic Properties with Clausius App. Paper presented at 2016 ASEE Annual Conference & Exposition, New Orleans, Louisiana. June 2016. 10.18260/p.27051


