Embed Size (px)
Citation preview
Tcf3 Governs Stem CellFeatures and RepressesCell Fate Determination in SkinHoang Nguyen,1 Michael Rendl,1 and Elaine Fuchs1,*1Howard Hughes Medical Institute, Department of Mammalian Cell Biology and Development, The Rockefeller University,
1230 York Avenue, Box 300, New York, NY 10021, USA*Contact: [email protected]
DOI 10.1016/j.cell.2006.07.036
SUMMARY
Many stem cells (SCs) respond to Wnt signal-ing, but whether b-catenin’s DNA binding part-ners, the Tcfs, play a role in SCs in the absenceof Wnts, is unknown. In adult skin, quiescentmultipotent progenitors express Tcf3 and com-mit to a hair cell fate in response to Wnt signal-ing. We find that embryonic skin progenitorsalso express Tcf3. Using an inducible systemin mice, we show that upon Tcf3 reactivation,committed epidermal cells induce genes asso-ciated with an undifferentiated, Wnt-inhibitedstate and Tcf3 promotes a transcriptional pro-gram shared by embryonic and postnatal SCs.Further, Tcf3-repressed genes include tran-scriptional regulators of the epidermal, seba-ceous gland and hair follicle differentiation pro-grams, and correspondingly, all three terminaldifferentiation pathways are suppressed whenTcf3 is induced postnatally. These data suggestthat in the absence of Wnt signals, Tcf3 mayfunction in skin SCs to maintain an undifferenti-ated state and, through Wnt signaling, directsthese cells along the hair lineage.
INTRODUCTION
In response to Wnt signaling, b-catenin is stabilized and
can associate with the Tcf/Lef1 family of DNA binding pro-
teins to transactivate downstream target genes. Increas-
ing evidence underscores a major role for Wnt signaling
in stem cell (SC) biology (Reya and Clevers, 2005). Loss
of function studies in the mouse intestine show that Tcf4
is essential for establishing epithelial crypts (Korinek
et al., 1998), and gain-of-function studies suggest that
Tcf4 and Wnt/b-catenin signaling act in concert to maintain
the progenitor pool and inhibit differentiation (van de We-
tering et al., 2002). Similarly, the Wnt/b-catenin pathway
is active in the progenitor cells of the hippocampus (Lie
et al., 2005). In vitro, Wnt signaling expands the pools of
hematopoietic SCs (Willert et al., 2003).
While Tcfs/b-catenin signaling is important in progenitor
proliferation, it is also used by SCs to specify certain line-
ages at the expense of others. In skin, b-catenin/Lef1 sig-
naling promotes hair-shaft differentiation, and, at exces-
sive levels, tumors of this cell lineage arise (Gat et al.,
1998; DasGupta and Fuchs, 1999; Van Mater et al.,
2003; Lo Celso et al., 2004). Analogously, elevated Wnt
signaling instructs neural SCs to adopt a sensory neuronal
fate (Lee et al., 2004), coaxes skeletal progenitors toward
osteoblast rather than chondrocyte differentiation (Day
et al., 2005), and promotes Paneth cell differentiation in
the intestine (van Es et al., 2005). Whether SCs proliferate
or differentiate in response to Wnt signaling is likely to de-
pend upon factors that influence the levels and activities
of Tcf/Lef1/b-catenin complexes and their associated
proteins. Despite the well-established link between Wnt
signaling and SC biology, however, little is known about
the functional significance and the underlying mecha-
nisms involved in this link.
Whether Lef1/Tcf proteins function in SCs in the ab-
sence of Wnt signaling is even less clear, although some
evidence suggests that they can do so in other situations
(Brannon et al., 1999; Cavallo et al., 1998; Roose et al.,
1998; Hamada and Bienz, 2004; Shetty et al., 2005; Dan-
iels and Weis, 2005). In Drosophila, for example, interac-
tion of dTcf with the Groucho/TLE family of transcriptional
repressors antagonizes Wnt/Wingless signaling (Cavallo
et al., 1998). Similarly, forced Groucho/TLE expression in
Xenopus embryos can block activation of b-catenin target
genes necessary for axis formation (Roose et al., 1998). In
mammalian cell lines, Lef1 has been shown to occupy a
site in the c-Myc enhancer that is accompanied by TLE
and five other chromatin repressor proteins, while stabili-
zation of b-catenin displaces the TLE/chromatin repressor
complex and recruits chromatin activators without dis-
placing Lef1 (Sierra et al., 2006).
These findings suggest that in the absence of stabilized
b-catenin, Lef1/Tcfs may be functionally important in reg-
ulating gene expression. Consistent with this notion are
gene-targeting studies on Tcf3, a Lef1/Tcf family member
that has been increasingly viewed as a transcriptional
Cell 127, 171–183, October 6, 2006 ª2006 Elsevier Inc. 171
repressor. In mice, Tcf3 ablation results in gastrulation
defects that resemble a Wnt gain-of-function phenotype
(Merrill et al., 2004), and the headless phenotype dis-
played by Tcf3-deficient zebrafish is complemented by
an N-terminally truncated Tcf3 lacking its b-catenin bind-
ing domain (Kim et al., 2000).
In adult skin, Tcf3 is naturally expressed in the hair-
follicle bulge, which is thought to be a niche for the multi-
potent stem cells that are required for hair cycling and
epidermal wound repair (Cotsarelis et al.,1990; Taylor
et al., 2000; Oshima et al., 2001; Merrill et al., 2001). In
contrast to many SC niches, the bulge maintains a size-
able pool of infrequently cycling cells, which become
activated at the start of each hair growth phase. At this
time, the new hair germ appears at the base of the bulge
and shows Wnt reporter gene (TOPGAL) activity and
nuclear b-catenin (DasGupta and Fuchs, 1999; Merrill
et al., 2001). When levels of stabilized b-catenin are genet-
ically elevated, SC activation and hair growth occur pre-
cociously (Gat et al., 1998; Van Mater et al., 2003; Lo
Celso et al., 2004), and many cell proliferation-associated
genes are upregulated (Lowry et al., 2005). These studies
have suggested that Tcf3 might repress proliferation in
the bulge and that Wnt signaling acts to stimulate SC
activation.
During the growth phase of the hair cycle, Tcf3 is ex-
pressed not only in the quiescent bulge SCs but also in
the outer basal layer of the newly formed outer root sheath
(ORS) (DasGupta and Fuchs, 1999). These cells are
thought to represent mobilized SCs on route to the base
of the hair follicle (Oshima et al., 2001; Vidal et al., 2005).
An ORS/bulge morphology can be achieved by express-
ing Tcf3 in the epidermis of transgenic mice, suggesting
that Tcf3 may specify some of these characteristics (Mer-
rill et al., 2001). Interestingly, the same phenotype can be
obtained by expressing DNTcf3 lacking the b-catenin
interacting domain, suggesting that Tcf3 might function
independently of Wnt signaling in determining these
features (Merrill et al., 2001).
The questions of whether and how Tcf3 functions to
regulate gene expression in follicle SCs reside at the
nexus of defining the physiological importance of Tcfs
and Wnt signaling in SC and cell lineage determination.
To resolve this issue, we first showed that Tcf3 is ex-
pressed in early embryonic skin, which is composed of
multipotent progenitors, and that it is downregulated con-
comitant with fate specification. We then engineered mice
that enable us to control the expression of Tcf3 and either
sustain it embryonically or switch it back on postnatally.
We then conducted microarray profilings and molecular
analyses, which reveal Tcf3 as a key transcriptional regu-
lator of both embryonic and adult skin progenitors. We
show that, surprisingly, Tcf3 temporally represses tran-
scriptional regulators of epidermal and sebaceous gland
differentiation, two lineages not known to be regulated
by Wnt signaling. Finally, we demonstrate that when the
Tcf3 signature is applied to postnatal epidermis in vivo,
all three programs of terminal differentiation are repressed
172 Cell 127, 171–183, October 6, 2006 ª2006 Elsevier Inc.
and the epithelium transforms into a relatively undifferen-
tiated state that resembles that of stem cells.
RESULTS
Tcf3 Is Expressed in Proliferating, Unspecified
Embryonic Epidermal Progenitors
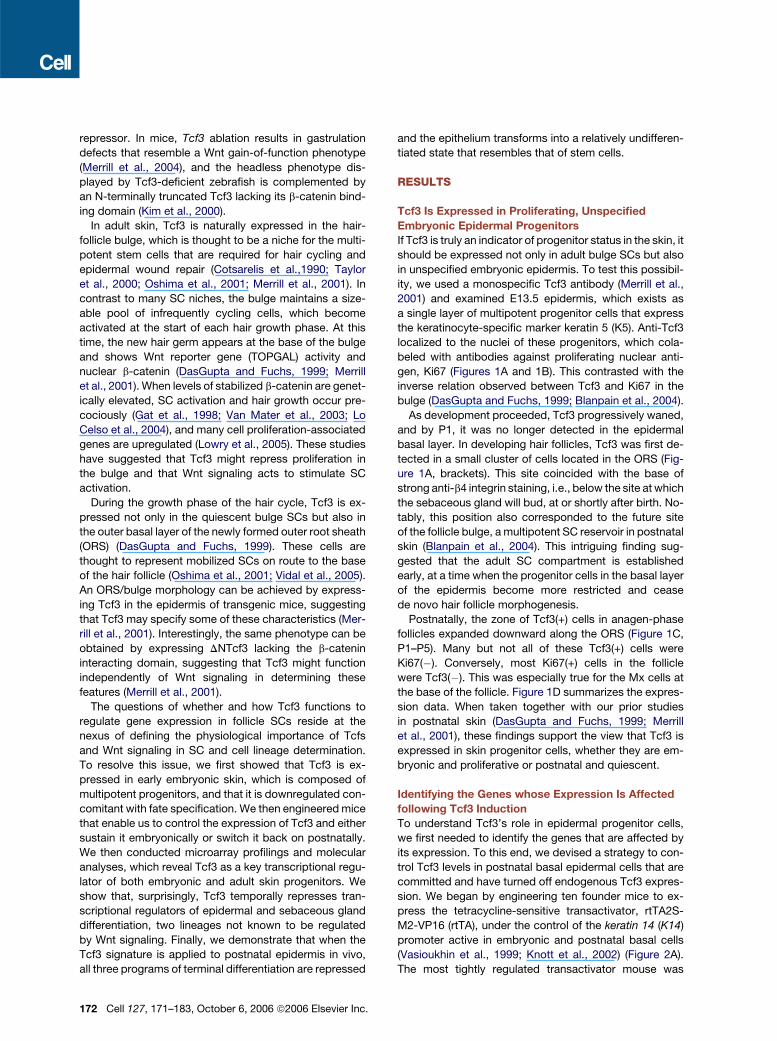
If Tcf3 is truly an indicator of progenitor status in the skin, it
should be expressed not only in adult bulge SCs but also
in unspecified embryonic epidermis. To test this possibil-
ity, we used a monospecific Tcf3 antibody (Merrill et al.,
2001) and examined E13.5 epidermis, which exists as
a single layer of multipotent progenitor cells that express
the keratinocyte-specific marker keratin 5 (K5). Anti-Tcf3
localized to the nuclei of these progenitors, which cola-
beled with antibodies against proliferating nuclear anti-
gen, Ki67 (Figures 1A and 1B). This contrasted with the
inverse relation observed between Tcf3 and Ki67 in the
bulge (DasGupta and Fuchs, 1999; Blanpain et al., 2004).
As development proceeded, Tcf3 progressively waned,
and by P1, it was no longer detected in the epidermal
basal layer. In developing hair follicles, Tcf3 was first de-
tected in a small cluster of cells located in the ORS (Fig-
ure 1A, brackets). This site coincided with the base of
strong anti-b4 integrin staining, i.e., below the site at which
the sebaceous gland will bud, at or shortly after birth. No-
tably, this position also corresponded to the future site
of the follicle bulge, a multipotent SC reservoir in postnatal
skin (Blanpain et al., 2004). This intriguing finding sug-
gested that the adult SC compartment is established
early, at a time when the progenitor cells in the basal layer
of the epidermis become more restricted and cease
de novo hair follicle morphogenesis.
Postnatally, the zone of Tcf3(+) cells in anagen-phase
follicles expanded downward along the ORS (Figure 1C,
P1–P5). Many but not all of these Tcf3(+) cells were
Ki67(�). Conversely, most Ki67(+) cells in the follicle
were Tcf3(�). This was especially true for the Mx cells at
the base of the follicle. Figure 1D summarizes the expres-
sion data. When taken together with our prior studies
in postnatal skin (DasGupta and Fuchs, 1999; Merrill
et al., 2001), these findings support the view that Tcf3 is
expressed in skin progenitor cells, whether they are em-
bryonic and proliferative or postnatal and quiescent.
Identifying the Genes whose Expression Is Affected
following Tcf3 Induction
To understand Tcf3’s role in epidermal progenitor cells,
we first needed to identify the genes that are affected by
its expression. To this end, we devised a strategy to con-
trol Tcf3 levels in postnatal basal epidermal cells that are
committed and have turned off endogenous Tcf3 expres-
sion. We began by engineering ten founder mice to ex-
press the tetracycline-sensitive transactivator, rtTA2S-
M2-VP16 (rtTA), under the control of the keratin 14 (K14)
promoter active in embryonic and postnatal basal cells
(Vasioukhin et al., 1999; Knott et al., 2002) (Figure 2A).
The most tightly regulated transactivator mouse was
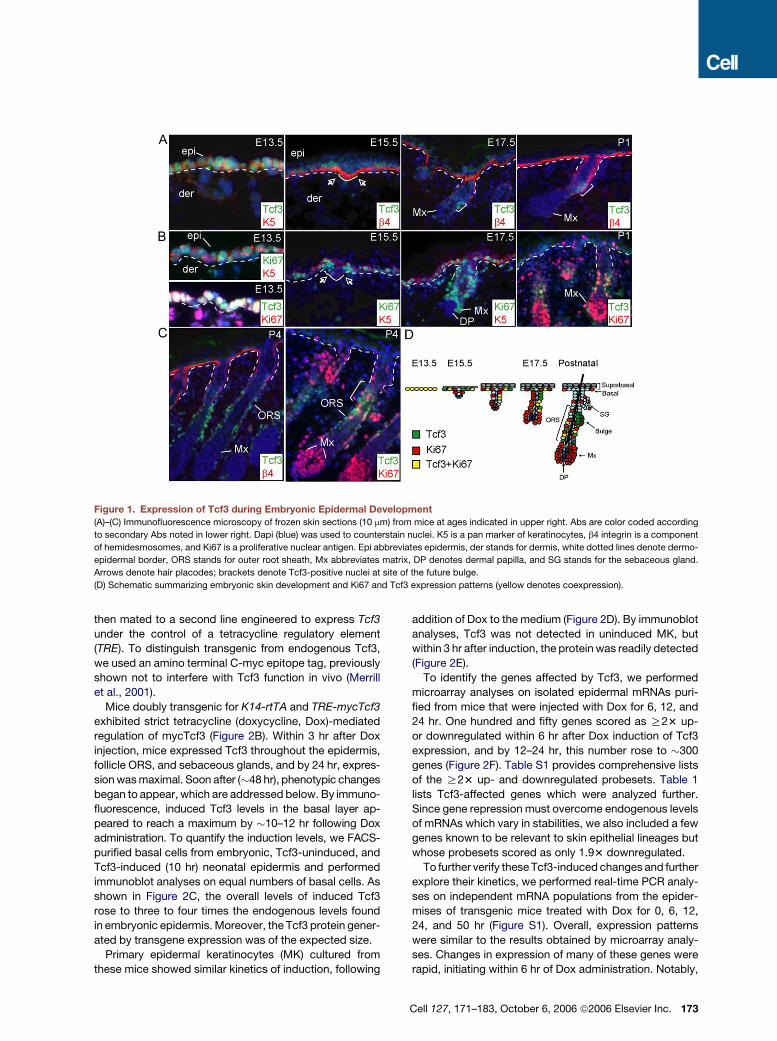
Figure 1. Expression of Tcf3 during Embryonic Epidermal Development
(A)–(C) Immunofluorescence microscopy of frozen skin sections (10 mm) from mice at ages indicated in upper right. Abs are color coded according
to secondary Abs noted in lower right. Dapi (blue) was used to counterstain nuclei. K5 is a pan marker of keratinocytes, b4 integrin is a component
of hemidesmosomes, and Ki67 is a proliferative nuclear antigen. Epi abbreviates epidermis, der stands for dermis, white dotted lines denote dermo-
epidermal border, ORS stands for outer root sheath, Mx abbreviates matrix, DP denotes dermal papilla, and SG stands for the sebaceous gland.
Arrows denote hair placodes; brackets denote Tcf3-positive nuclei at site of the future bulge.
(D) Schematic summarizing embryonic skin development and Ki67 and Tcf3 expression patterns (yellow denotes coexpression).
then mated to a second line engineered to express Tcf3
under the control of a tetracycline regulatory element
(TRE). To distinguish transgenic from endogenous Tcf3,
we used an amino terminal C-myc epitope tag, previously
shown not to interfere with Tcf3 function in vivo (Merrill
et al., 2001).
Mice doubly transgenic for K14-rtTA and TRE-mycTcf3
exhibited strict tetracycline (doxycycline, Dox)-mediated
regulation of mycTcf3 (Figure 2B). Within 3 hr after Dox
injection, mice expressed Tcf3 throughout the epidermis,
follicle ORS, and sebaceous glands, and by 24 hr, expres-
sion was maximal. Soon after (�48 hr), phenotypic changes
began to appear, which are addressed below. By immuno-
fluorescence, induced Tcf3 levels in the basal layer ap-
peared to reach a maximum by �10–12 hr following Dox
administration. To quantify the induction levels, we FACS-
purified basal cells from embryonic, Tcf3-uninduced, and
Tcf3-induced (10 hr) neonatal epidermis and performed
immunoblot analyses on equal numbers of basal cells. As
shown in Figure 2C, the overall levels of induced Tcf3
rose to three to four times the endogenous levels found
in embryonic epidermis. Moreover, the Tcf3 protein gener-
ated by transgene expression was of the expected size.
Primary epidermal keratinocytes (MK) cultured from
these mice showed similar kinetics of induction, following
addition of Dox to the medium (Figure 2D). By immunoblot
analyses, Tcf3 was not detected in uninduced MK, but
within 3 hr after induction, the protein was readily detected
(Figure 2E).
To identify the genes affected by Tcf3, we performed
microarray analyses on isolated epidermal mRNAs puri-
fied from mice that were injected with Dox for 6, 12, and
24 hr. One hundred and fifty genes scored as R23 up-
or downregulated within 6 hr after Dox induction of Tcf3
expression, and by 12–24 hr, this number rose to �300
genes (Figure 2F). Table S1 provides comprehensive lists
of the R23 up- and downregulated probesets. Table 1
lists Tcf3-affected genes which were analyzed further.
Since gene repression must overcome endogenous levels
of mRNAs which vary in stabilities, we also included a few
genes known to be relevant to skin epithelial lineages but
whose probesets scored as only 1.93 downregulated.
To further verify these Tcf3-induced changes and further
explore their kinetics, we performed real-time PCR analy-
ses on independent mRNA populations from the epider-
mises of transgenic mice treated with Dox for 0, 6, 12,
24, and 50 hr (Figure S1). Overall, expression patterns
were similar to the results obtained by microarray analy-
ses. Changes in expression of many of these genes were
rapid, initiating within 6 hr of Dox administration. Notably,
Cell 127, 171–183, October 6, 2006 ª2006 Elsevier Inc. 173
Figure 2. Generation of Transgenic Mice
Able to Induce Tcf3 in Skin Epithelium in
Response to Doxycycline
(A) Constructs used to generate transgenic
mice expressing skin epithelial-specific Tcf3
under the control of doxycycline (Dox).
(B) Tcf3 induction in vivo. K14rtTA/TRE-mycTcf3
mice were injected intraperitoneally with Dox
for the times indicated prior to reaching 4 days
of age. At P4, backskins were frozen, sec-
tioned, and subjected to immunofluorescence
microscopy using the Abs indicated (color cod-
ing according to secondary Abs). Second 48 hr
Dox frame is at higher magnification.
(C) Anti-Tcf3 immunoblot of protein extracts
isolated from equal numbers of FACS-purified
basal cells from backskins of E13.5 embryos
and P5 transgenic mice either uninduced (0 hr)
or induced for 10 hr with Dox.
(D) Tcf3 induction in vitro. Primary mouse kera-
tinocytes (MK) isolated from double or single
transgenic mice were cultured ±100 ng/ml
Dox for 24 hr, followed by immunostaining for
Tcf3 (red) and Dapi (blue).
(E) Immunoblot analyses of Tcf3 induction
in vitro. Total protein lysates were prepared
from MK exposed to Dox as indicated. Immu-
noblots were probed with Abs against Tcf3
(test) and tubulin (control for loadings).
(F) Numbers of genes up- and downregulated
following Tcf3 induction in vivo. mRNAs were
isolated from Tcf3-induced skins from (B) and
subjected to microarray analyses. Shown are
the overall numbers of genes whose expression
changed by R23.
genes involved in lipid metabolism and electron transport
were preferentially suppressed by Tcf3, while genes in-
volved in carbohydrate metabolism, energy pathways,
and cell motility were preferentially induced (Figure S1,
graph C). Marked changes, both up- and downregulated,
were also observed in genes involved in signal transduc-
tion, cell growth, and maintenance.
The Tcf3-Signature Is Similar to the Bulge/ORS
Signature but Divergent from Signatures of Transit-
Amplifying Basal Epidermal and Matrix Cells
Since Tcf3 correlated with epidermal progenitor status, we
first compared our Tcf3 signature with previously pub-
lished bulge signature genes (Legg et al., 2003; Tumbar
et al., 2004; Blanpain et al., 2004; Morris et al., 2004). As
Tcf3 levels increased, similarities between Tcf3 and bulge
signatures also rose (Figure 3A). This was true for both
Tcf3-induced and Tcf3-repressed signature genes. The
similarities between bulge and Tcf3-induced signatures
were documented by comparing the expression levels of
these genes in purified populations of Tcf3(+) bulge SCs
(a6highCD34+K14+) relative to Tcf3(�) basal epidermal
cells (a6lowCD34�K14+). Figure S2 provides representa-
tive examples delineating these marked similarities.
To more fully ascertain the potential significance of the
overlap between Tcf3 and bulge signatures, we devised
174 Cell 127, 171–183, October 6, 2006 ª2006 Elsevier Inc.
strategies to isolate, purify, and transcriptionally profile
the proliferative cells of P5 epidermis, follicle matrix, and
ORS. When cross-compared, a molecular signature was
obtained identifying the distinguishing features for each
population. We then determined the degree to which
Tcf3-induced and -repressed genes overlapped with
these three new signatures. The results show clearly that
as Tcf3 levels rose, the induced gene pattern became in-
creasingly similar to the ORS signature, while genes re-
pressed by Tcf3 were typically features of the epidermal
signature (Figure 3B). Neither Tcf3 signature showed sim-
ilarity to the matrix gene expression pattern (Figure 3B).
These data document the specificity of the signature
that was generated by Tcf3 induction in the skin. More-
over, the data reveal that the Tcf3 signature faithfully
parallels the molecular distinctions that naturally occur
between Tcf3(+) follicle ORS/bulge and the so-called tran-
sit amplifying cells of the epidermis and hair follicle. A full
list of all Tcf3-induced and -repressed genes sharing
similarities with the bulge, ORS, and epidermis is provided
in Table S2.
Identifying Genes Associated with Progenitor Status
Irrespective of Proliferative State
Despite interesting parallels, certain facets of the bulge
signature were distinct from the Tcf3-induced epidermal
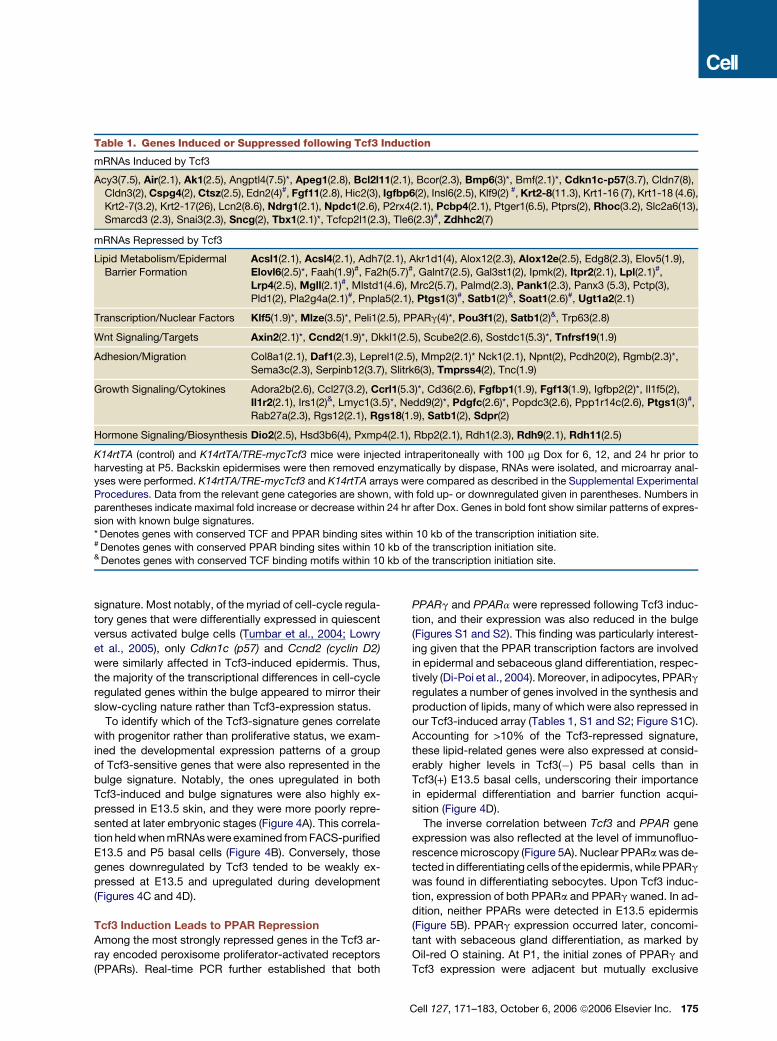
Table 1. Genes Induced or Suppressed following Tcf3 Induction
mRNAs Induced by Tcf3
Acy3(7.5), Air(2.1), Ak1(2.5), Angptl4(7.5)*, Apeg1(2.8), Bcl2l11(2.1), Bcor(2.3), Bmp6(3)*, Bmf(2.1)*, Cdkn1c-p57(3.7), Cldn7(8),
Cldn3(2), Cspg4(2), Ctsz(2.5), Edn2(4)#, Fgf11(2.8), Hic2(3), Igfbp6(2), Insl6(2.5), Klf9(2) #, Krt2-8(11.3), Krt1-16 (7), Krt1-18 (4.6),Krt2-7(3.2), Krt2-17(26), Lcn2(8.6), Ndrg1(2.1), Npdc1(2.6), P2rx4(2.1), Pcbp4(2.1), Ptger1(6.5), Ptprs(2), Rhoc(3.2), Slc2a6(13),
Smarcd3 (2.3), Snai3(2.3), Sncg(2), Tbx1(2.1)*, Tcfcp2l1(2.3), Tle6(2.3)#, Zdhhc2(7)
mRNAs Repressed by Tcf3
Lipid Metabolism/Epidermal
Barrier Formation
Acsl1(2.1), Acsl4(2.1), Adh7(2.1), Akr1d1(4), Alox12(2.3), Alox12e(2.5), Edg8(2.3), Elov5(1.9),
Elovl6(2.5)*, Faah(1.9)#, Fa2h(5.7)#, Galnt7(2.5), Gal3st1(2), Ipmk(2), Itpr2(2.1), Lpl(2.1)#,
Lrp4(2.5), Mgll(2.1)#, Mlstd1(4.6), Mrc2(5.7), Palmd(2.3), Pank1(2.3), Panx3 (5.3), Pctp(3),
Pld1(2), Pla2g4a(2.1)#, Pnpla5(2.1), Ptgs1(3)#, Satb1(2)&, Soat1(2.6)#, Ugt1a2(2.1)
Transcription/Nuclear Factors Klf5(1.9)*, Mlze(3.5)*, Peli1(2.5), PPARg(4)*, Pou3f1(2), Satb1(2)&, Trp63(2.8)
Wnt Signaling/Targets Axin2(2.1)*, Ccnd2(1.9)*, Dkkl1(2.5), Scube2(2.6), Sostdc1(5.3)*, Tnfrsf19(1.9)
Adhesion/Migration Col8a1(2.1), Daf1(2.3), Leprel1(2.5), Mmp2(2.1)* Nck1(2.1), Npnt(2), Pcdh20(2), Rgmb(2.3)*,
Sema3c(2.3), Serpinb12(3.7), Slitrk6(3), Tmprss4(2), Tnc(1.9)
Growth Signaling/Cytokines Adora2b(2.6), Ccl27(3.2), Ccrl1(5.3)*, Cd36(2.6), Fgfbp1(1.9), Fgf13(1.9), Igfbp2(2)*, Il1f5(2),Il1r2(2.1), Irs1(2)&, Lmyc1(3.5)*, Nedd9(2)*, Pdgfc(2.6)*, Popdc3(2.6), Ppp1r14c(2.6), Ptgs1(3)#,
Rab27a(2.3), Rgs12(2.1), Rgs18(1.9), Satb1(2), Sdpr(2)
Hormone Signaling/Biosynthesis Dio2(2.5), Hsd3b6(4), Pxmp4(2.1), Rbp2(2.1), Rdh1(2.3), Rdh9(2.1), Rdh11(2.5)
K14rtTA (control) and K14rtTA/TRE-mycTcf3 mice were injected intraperitoneally with 100 mg Dox for 6, 12, and 24 hr prior to
harvesting at P5. Backskin epidermises were then removed enzymatically by dispase, RNAs were isolated, and microarray anal-yses were performed. K14rtTA/TRE-mycTcf3 and K14rtTA arrays were compared as described in the Supplemental Experimental
Procedures. Data from the relevant gene categories are shown, with fold up- or downregulated given in parentheses. Numbers in
parentheses indicate maximal fold increase or decrease within 24 hr after Dox. Genes in bold font show similar patterns of expres-
sion with known bulge signatures.* Denotes genes with conserved TCF and PPAR binding sites within 10 kb of the transcription initiation site.# Denotes genes with conserved PPAR binding sites within 10 kb of the transcription initiation site.& Denotes genes with conserved TCF binding motifs within 10 kb of the transcription initiation site.
signature. Most notably, of the myriad of cell-cycle regula-
tory genes that were differentially expressed in quiescent
versus activated bulge cells (Tumbar et al., 2004; Lowry
et al., 2005), only Cdkn1c (p57) and Ccnd2 (cyclin D2)
were similarly affected in Tcf3-induced epidermis. Thus,
the majority of the transcriptional differences in cell-cycle
regulated genes within the bulge appeared to mirror their
slow-cycling nature rather than Tcf3-expression status.
To identify which of the Tcf3-signature genes correlate
with progenitor rather than proliferative status, we exam-
ined the developmental expression patterns of a group
of Tcf3-sensitive genes that were also represented in the
bulge signature. Notably, the ones upregulated in both
Tcf3-induced and bulge signatures were also highly ex-
pressed in E13.5 skin, and they were more poorly repre-
sented at later embryonic stages (Figure 4A). This correla-
tion held when mRNAs were examined from FACS-purified
E13.5 and P5 basal cells (Figure 4B). Conversely, those
genes downregulated by Tcf3 tended to be weakly ex-
pressed at E13.5 and upregulated during development
(Figures 4C and 4D).
Tcf3 Induction Leads to PPAR Repression
Among the most strongly repressed genes in the Tcf3 ar-
ray encoded peroxisome proliferator-activated receptors
(PPARs). Real-time PCR further established that both
PPARg and PPARa were repressed following Tcf3 induc-
tion, and their expression was also reduced in the bulge
(Figures S1 and S2). This finding was particularly interest-
ing given that the PPAR transcription factors are involved
in epidermal and sebaceous gland differentiation, respec-
tively (Di-Poi et al., 2004). Moreover, in adipocytes, PPARg
regulates a number of genes involved in the synthesis and
production of lipids, many of which were also repressed in
our Tcf3-induced array (Tables 1, S1 and S2; Figure S1C).
Accounting for >10% of the Tcf3-repressed signature,
these lipid-related genes were also expressed at consid-
erably higher levels in Tcf3(�) P5 basal cells than in
Tcf3(+) E13.5 basal cells, underscoring their importance
in epidermal differentiation and barrier function acqui-
sition (Figure 4D).
The inverse correlation between Tcf3 and PPAR gene
expression was also reflected at the level of immunofluo-
rescence microscopy (Figure 5A). Nuclear PPARa was de-
tected in differentiating cells of the epidermis, while PPARg
was found in differentiating sebocytes. Upon Tcf3 induc-
tion, expression of both PPARa and PPARg waned. In ad-
dition, neither PPARs were detected in E13.5 epidermis
(Figure 5B). PPARg expression occurred later, concomi-
tant with sebaceous gland differentiation, as marked by
Oil-red O staining. At P1, the initial zones of PPARg and
Tcf3 expression were adjacent but mutually exclusive
Cell 127, 171–183, October 6, 2006 ª2006 Elsevier Inc. 175
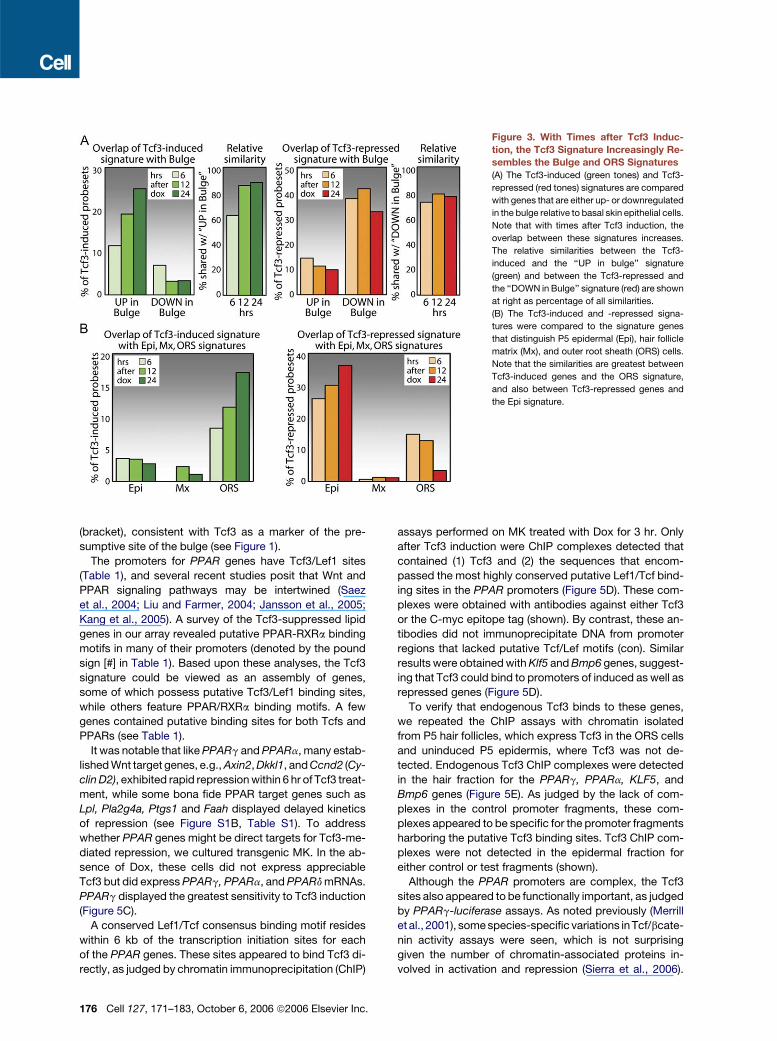
Figure 3. With Times after Tcf3 Induc-
tion, the Tcf3 Signature Increasingly Re-
sembles the Bulge and ORS Signatures
(A) The Tcf3-induced (green tones) and Tcf3-
repressed (red tones) signatures are compared
with genes that are either up- or downregulated
in the bulge relative to basal skin epithelial cells.
Note that with times after Tcf3 induction, the
overlap between these signatures increases.
The relative similarities between the Tcf3-
induced and the ‘‘UP in bulge’’ signature
(green) and between the Tcf3-repressed and
the ‘‘DOWN in Bulge’’ signature (red) are shown
at right as percentage of all similarities.
(B) The Tcf3-induced and -repressed signa-
tures were compared to the signature genes
that distinguish P5 epidermal (Epi), hair follicle
matrix (Mx), and outer root sheath (ORS) cells.
Note that the similarities are greatest between
Tcf3-induced genes and the ORS signature,
and also between Tcf3-repressed genes and
the Epi signature.
(bracket), consistent with Tcf3 as a marker of the pre-
sumptive site of the bulge (see Figure 1).
The promoters for PPAR genes have Tcf3/Lef1 sites
(Table 1), and several recent studies posit that Wnt and
PPAR signaling pathways may be intertwined (Saez
et al., 2004; Liu and Farmer, 2004; Jansson et al., 2005;
Kang et al., 2005). A survey of the Tcf3-suppressed lipid
genes in our array revealed putative PPAR-RXRa binding
motifs in many of their promoters (denoted by the pound
sign [#] in Table 1). Based upon these analyses, the Tcf3
signature could be viewed as an assembly of genes,
some of which possess putative Tcf3/Lef1 binding sites,
while others feature PPAR/RXRa binding motifs. A few
genes contained putative binding sites for both Tcfs and
PPARs (see Table 1).
It was notable that like PPARg and PPARa, many estab-
lished Wnt target genes, e.g., Axin2, Dkkl1, and Ccnd2 (Cy-
clin D2), exhibited rapid repression within 6 hr of Tcf3 treat-
ment, while some bona fide PPAR target genes such as
Lpl, Pla2g4a, Ptgs1 and Faah displayed delayed kinetics
of repression (see Figure S1B, Table S1). To address
whether PPAR genes might be direct targets for Tcf3-me-
diated repression, we cultured transgenic MK. In the ab-
sence of Dox, these cells did not express appreciable
Tcf3 but did express PPARg, PPARa, and PPARd mRNAs.
PPARg displayed the greatest sensitivity to Tcf3 induction
(Figure 5C).
A conserved Lef1/Tcf consensus binding motif resides
within 6 kb of the transcription initiation sites for each
of the PPAR genes. These sites appeared to bind Tcf3 di-
rectly, as judged by chromatin immunoprecipitation (ChIP)
176 Cell 127, 171–183, October 6, 2006 ª2006 Elsevier Inc.
assays performed on MK treated with Dox for 3 hr. Only
after Tcf3 induction were ChIP complexes detected that
contained (1) Tcf3 and (2) the sequences that encom-
passed the most highly conserved putative Lef1/Tcf bind-
ing sites in the PPAR promoters (Figure 5D). These com-
plexes were obtained with antibodies against either Tcf3
or the C-myc epitope tag (shown). By contrast, these an-
tibodies did not immunoprecipitate DNA from promoter
regions that lacked putative Tcf/Lef motifs (con). Similar
results were obtained with Klf5 and Bmp6 genes, suggest-
ing that Tcf3 could bind to promoters of induced as well as
repressed genes (Figure 5D).
To verify that endogenous Tcf3 binds to these genes,
we repeated the ChIP assays with chromatin isolated
from P5 hair follicles, which express Tcf3 in the ORS cells
and uninduced P5 epidermis, where Tcf3 was not de-
tected. Endogenous Tcf3 ChIP complexes were detected
in the hair fraction for the PPARg, PPARa, KLF5, and
Bmp6 genes (Figure 5E). As judged by the lack of com-
plexes in the control promoter fragments, these com-
plexes appeared to be specific for the promoter fragments
harboring the putative Tcf3 binding sites. Tcf3 ChIP com-
plexes were not detected in the epidermal fraction for
either control or test fragments (shown).
Although the PPAR promoters are complex, the Tcf3
sites also appeared to be functionally important, as judged
by PPARg-luciferase assays. As noted previously (Merrill
et al., 2001), some species-specific variations in Tcf/bcate-
nin activity assays were seen, which is not surprising
given the number of chromatin-associated proteins in-
volved in activation and repression (Sierra et al., 2006).
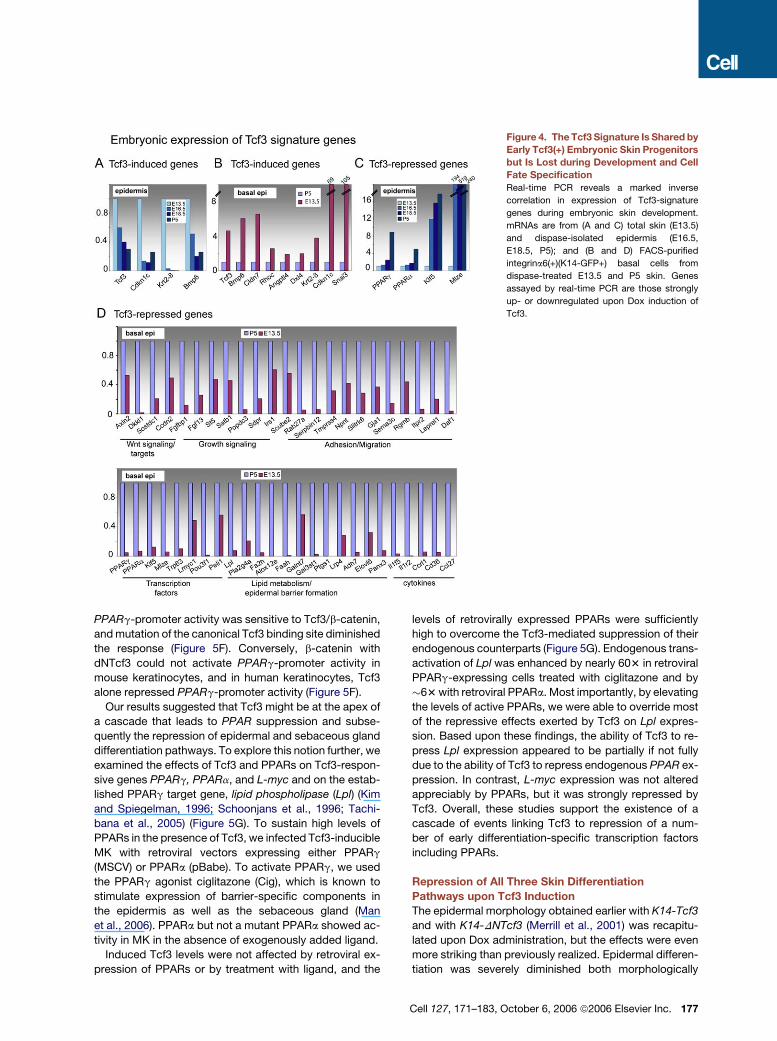
Figure 4. The Tcf3 Signature Is Shared by
Early Tcf3(+) Embryonic Skin Progenitors
but Is Lost during Development and Cell
Fate Specification
Real-time PCR reveals a marked inverse
correlation in expression of Tcf3-signature
genes during embryonic skin development.
mRNAs are from (A and C) total skin (E13.5)
and dispase-isolated epidermis (E16.5,
E18.5, P5); and (B and D) FACS-purified
integrina6(+)(K14-GFP+) basal cells from
dispase-treated E13.5 and P5 skin. Genes
assayed by real-time PCR are those strongly
up- or downregulated upon Dox induction of
Tcf3.
PPARg-promoter activity was sensitive to Tcf3/b-catenin,
and mutation of the canonical Tcf3 binding site diminished
the response (Figure 5F). Conversely, b-catenin with
dNTcf3 could not activate PPARg-promoter activity in
mouse keratinocytes, and in human keratinocytes, Tcf3
alone repressed PPARg-promoter activity (Figure 5F).
Our results suggested that Tcf3 might be at the apex of
a cascade that leads to PPAR suppression and subse-
quently the repression of epidermal and sebaceous gland
differentiation pathways. To explore this notion further, we
examined the effects of Tcf3 and PPARs on Tcf3-respon-
sive genes PPARg, PPARa, and L-myc and on the estab-
lished PPARg target gene, lipid phospholipase (Lpl) (Kim
and Spiegelman, 1996; Schoonjans et al., 1996; Tachi-
bana et al., 2005) (Figure 5G). To sustain high levels of
PPARs in the presence of Tcf3, we infected Tcf3-inducible
MK with retroviral vectors expressing either PPARg
(MSCV) or PPARa (pBabe). To activate PPARg, we used
the PPARg agonist ciglitazone (Cig), which is known to
stimulate expression of barrier-specific components in
the epidermis as well as the sebaceous gland (Man
et al., 2006). PPARa but not a mutant PPARa showed ac-
tivity in MK in the absence of exogenously added ligand.
Induced Tcf3 levels were not affected by retroviral ex-
pression of PPARs or by treatment with ligand, and the
levels of retrovirally expressed PPARs were sufficiently
high to overcome the Tcf3-mediated suppression of their
endogenous counterparts (Figure 5G). Endogenous trans-
activation of Lpl was enhanced by nearly 603 in retroviral
PPARg-expressing cells treated with ciglitazone and by
�63 with retroviral PPARa. Most importantly, by elevating
the levels of active PPARs, we were able to override most
of the repressive effects exerted by Tcf3 on Lpl expres-
sion. Based upon these findings, the ability of Tcf3 to re-
press Lpl expression appeared to be partially if not fully
due to the ability of Tcf3 to repress endogenous PPAR ex-
pression. In contrast, L-myc expression was not altered
appreciably by PPARs, but it was strongly repressed by
Tcf3. Overall, these studies support the existence of a
cascade of events linking Tcf3 to repression of a num-
ber of early differentiation-specific transcription factors
including PPARs.
Repression of All Three Skin Differentiation
Pathways upon Tcf3 Induction
The epidermal morphology obtained earlier with K14-Tcf3
and with K14-DNTcf3 (Merrill et al., 2001) was recapitu-
lated upon Dox administration, but the effects were even
more striking than previously realized. Epidermal differen-
tiation was severely diminished both morphologically
Cell 127, 171–183, October 6, 2006 ª2006 Elsevier Inc. 177
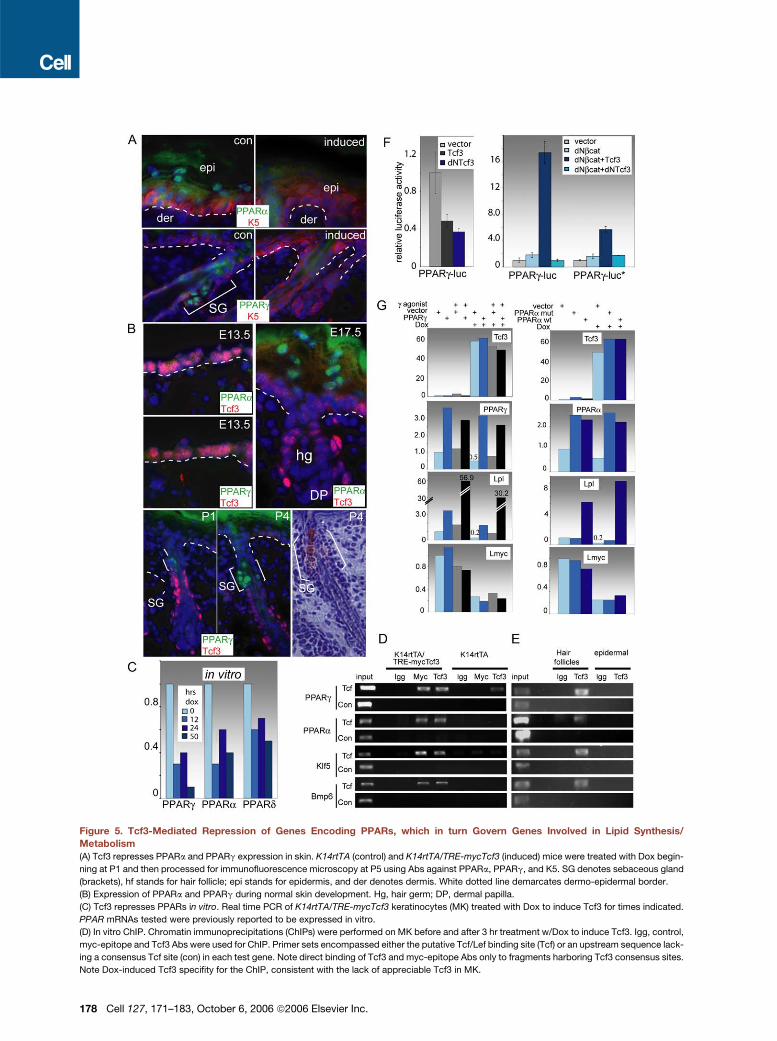
Figure 5. Tcf3-Mediated Repression of Genes Encoding PPARs, which in turn Govern Genes Involved in Lipid Synthesis/
Metabolism
(A) Tcf3 represses PPARa and PPARg expression in skin. K14rtTA (control) and K14rtTA/TRE-mycTcf3 (induced) mice were treated with Dox begin-
ning at P1 and then processed for immunofluorescence microscopy at P5 using Abs against PPARa, PPARg, and K5. SG denotes sebaceous gland
(brackets), hf stands for hair follicle; epi stands for epidermis, and der denotes dermis. White dotted line demarcates dermo-epidermal border.
(B) Expression of PPARa and PPARg during normal skin development. Hg, hair germ; DP, dermal papilla.
(C) Tcf3 represses PPARs in vitro. Real time PCR of K14rtTA/TRE-mycTcf3 keratinocytes (MK) treated with Dox to induce Tcf3 for times indicated.
PPAR mRNAs tested were previously reported to be expressed in vitro.
(D) In vitro ChIP. Chromatin immunoprecipitations (ChIPs) were performed on MK before and after 3 hr treatment w/Dox to induce Tcf3. Igg, control,
myc-epitope and Tcf3 Abs were used for ChIP. Primer sets encompassed either the putative Tcf/Lef binding site (Tcf) or an upstream sequence lack-
ing a consensus Tcf site (con) in each test gene. Note direct binding of Tcf3 and myc-epitope Abs only to fragments harboring Tcf3 consensus sites.
Note Dox-induced Tcf3 specifity for the ChIP, consistent with the lack of appreciable Tcf3 in MK.
178 Cell 127, 171–183, October 6, 2006 ª2006 Elsevier Inc.
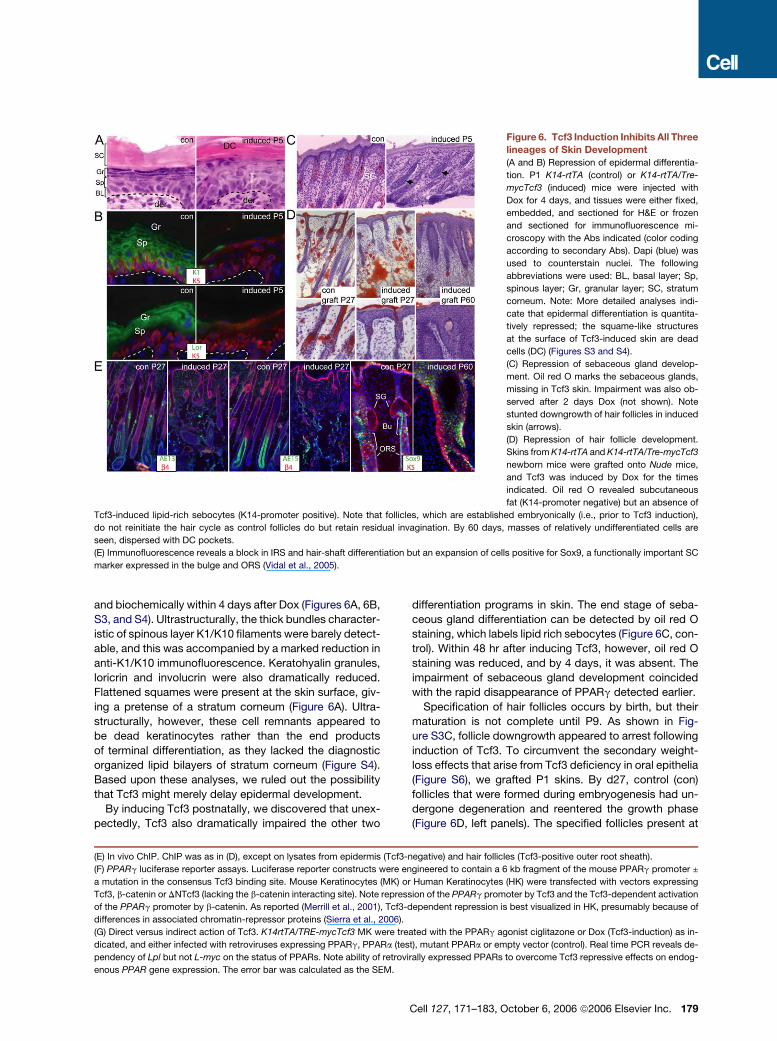
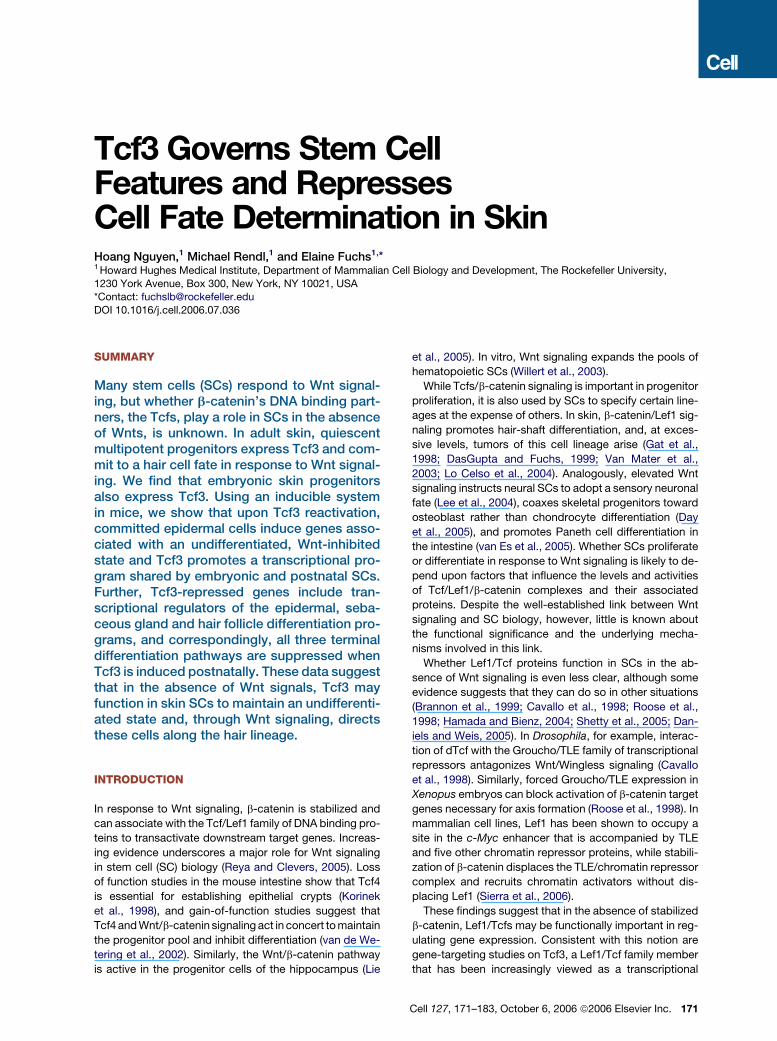
Figure 6. Tcf3 Induction Inhibits All Three
lineages of Skin Development
(A and B) Repression of epidermal differentia-
tion. P1 K14-rtTA (control) or K14-rtTA/Tre-
mycTcf3 (induced) mice were injected with
Dox for 4 days, and tissues were either fixed,
embedded, and sectioned for H&E or frozen
and sectioned for immunofluorescence mi-
croscopy with the Abs indicated (color coding
according to secondary Abs). Dapi (blue) was
used to counterstain nuclei. The following
abbreviations were used: BL, basal layer; Sp,
spinous layer; Gr, granular layer; SC, stratum
corneum. Note: More detailed analyses indi-
cate that epidermal differentiation is quantita-
tively repressed; the squame-like structures
at the surface of Tcf3-induced skin are dead
cells (DC) (Figures S3 and S4).
(C) Repression of sebaceous gland develop-
ment. Oil red O marks the sebaceous glands,
missing in Tcf3 skin. Impairment was also ob-
served after 2 days Dox (not shown). Note
stunted downgrowth of hair follicles in induced
skin (arrows).
(D) Repression of hair follicle development.
Skins from K14-rtTA and K14-rtTA/Tre-mycTcf3
newborn mice were grafted onto Nude mice,
and Tcf3 was induced by Dox for the times
indicated. Oil red O revealed subcutaneous
fat (K14-promoter negative) but an absence of
Tcf3-induced lipid-rich sebocytes (K14-promoter positive). Note that follicles, which are established embryonically (i.e., prior to Tcf3 induction),
do not reinitiate the hair cycle as control follicles do but retain residual invagination. By 60 days, masses of relatively undifferentiated cells are
seen, dispersed with DC pockets.
(E) Immunofluorescence reveals a block in IRS and hair-shaft differentiation but an expansion of cells positive for Sox9, a functionally important SC
marker expressed in the bulge and ORS (Vidal et al., 2005).
and biochemically within 4 days after Dox (Figures 6A, 6B,
S3, and S4). Ultrastructurally, the thick bundles character-
istic of spinous layer K1/K10 filaments were barely detect-
able, and this was accompanied by a marked reduction in
anti-K1/K10 immunofluorescence. Keratohyalin granules,
loricrin and involucrin were also dramatically reduced.
Flattened squames were present at the skin surface, giv-
ing a pretense of a stratum corneum (Figure 6A). Ultra-
structurally, however, these cell remnants appeared to
be dead keratinocytes rather than the end products
of terminal differentiation, as they lacked the diagnostic
organized lipid bilayers of stratum corneum (Figure S4).
Based upon these analyses, we ruled out the possibility
that Tcf3 might merely delay epidermal development.
By inducing Tcf3 postnatally, we discovered that unex-
pectedly, Tcf3 also dramatically impaired the other two
differentiation programs in skin. The end stage of seba-
ceous gland differentiation can be detected by oil red O
staining, which labels lipid rich sebocytes (Figure 6C, con-
trol). Within 48 hr after inducing Tcf3, however, oil red O
staining was reduced, and by 4 days, it was absent. The
impairment of sebaceous gland development coincided
with the rapid disappearance of PPARg detected earlier.
Specification of hair follicles occurs by birth, but their
maturation is not complete until P9. As shown in Fig-
ure S3C, follicle downgrowth appeared to arrest following
induction of Tcf3. To circumvent the secondary weight-
loss effects that arise from Tcf3 deficiency in oral epithelia
(Figure S6), we grafted P1 skins. By d27, control (con)
follicles that were formed during embryogenesis had un-
dergone degeneration and reentered the growth phase
(Figure 6D, left panels). The specified follicles present at
(E) In vivo ChIP. ChIP was as in (D), except on lysates from epidermis (Tcf3-negative) and hair follicles (Tcf3-positive outer root sheath).
(F) PPARg luciferase reporter assays. Luciferase reporter constructs were engineered to contain a 6 kb fragment of the mouse PPARg promoter ±
a mutation in the consensus Tcf3 binding site. Mouse Keratinocytes (MK) or Human Keratinocytes (HK) were transfected with vectors expressing
Tcf3, b-catenin or DNTcf3 (lacking the b-catenin interacting site). Note repression of the PPARg promoter by Tcf3 and the Tcf3-dependent activation
of the PPARg promoter by b-catenin. As reported (Merrill et al., 2001), Tcf3-dependent repression is best visualized in HK, presumably because of
differences in associated chromatin-repressor proteins (Sierra et al., 2006).
(G) Direct versus indirect action of Tcf3. K14rtTA/TRE-mycTcf3 MK were treated with the PPARg agonist ciglitazone or Dox (Tcf3-induction) as in-
dicated, and either infected with retroviruses expressing PPARg, PPARa (test), mutant PPARa or empty vector (control). Real time PCR reveals de-
pendency of Lpl but not L-myc on the status of PPARs. Note ability of retrovirally expressed PPARs to overcome Tcf3 repressive effects on endog-
enous PPAR gene expression. The error bar was calculated as the SEM.
Cell 127, 171–183, October 6, 2006 ª2006 Elsevier Inc. 179
the time of Tcf3 induction had also undergone degenera-
tion, but in the presence of Tcf3, these follicles failed to re-
enter the hair cycle (Figure 6D, middle panels). As judged
by staining with monoclonal antibodies AE15 and AE13,
inner root sheath and hair-shaft markers were absent
(Figure 6E).
After an additional month, both the epidermis and resid-
ual permanent portion of embryonically established folli-
cles had developed into large masses of relatively undif-
ferentiated epithelial cells in the Tcf3-induced skin grafts
(Figure 6D, right panels). The resulting skin epithelium
lacked all major markers of terminal differentiation for epi-
dermis, sebaceous glands, and hair follicles (Figure S3
and data not shown). However, these cells did express
Sox9 (Figure 6E, right panels), which is an essential marker
of bulge/ORS SCs important for their formation and/or
maintenance (Vidal et al., 2005). Thus, Tcf3 expression
seems to functionally promote features characteristic of
skin progenitor cells as well as repress the three differen-
tiation lineages afforded to them.
DISCUSSION
Tcf3, Wnt Signaling, and SC Maintenance
Our inducible Tcf3 system has yielded important new in-
sights into how Tcf3 functions in skin progenitor cells.
Consistent with our prior finding that Tcf3 acts as a tran-
scriptional repressor in skin (Merrill et al., 2001), many
affected genes were downregulated by Tcf3 induction.
Since transgenic expression of constitutively stabilized
b-catenin in Tcf3-positive bulge cells results in premature
activation of the hair cycle (Lowry et al., 2005), one might
have predicted that epidermal genes repressed by Tcf3
expression would be primarily cell-cycle regulated genes.
Surprisingly, however, Tcf3-induced epidermal cells only
repressed a few proliferation-associated genes, and this
did not result in quiescence. Thus, if Tcf3 plays a role in
slowing the cell cycle in the bulge, it does not seem to
act on its own in this regard.
Although cell-cycle similarities between bulge and Tcf3-
induced signatures were modest, the degree of overlap in
signatures suggested that a number of bulge-cell charac-
teristics are likely to be impacted by Tcf3. The relation be-
tween Tcf3 and progenitor status was further strength-
ened when we identified Tcf3 as a marker of embryonic
skin progenitors and uncovered additional correlations
between developmental expression patterns of Tcf3-
and Tcf3-signature genes. We also uncovered similarities
between the Tcf3 signature and that of the outer layer of
the ORS, which is also thought to contain SCs (Oshima
et al., 2001). Importantly, the similarities increased with
time of Dox treatment, correlating with increasing levels
of Tcf3. By contrast, the Tcf3-induced signature bore little
resemblance to either epidermal or matrix signatures.
Taken together, our results suggest that Tcf3 re-expres-
sion results in a reprogramming of postnatal epidermal
cells to display a molecular signature that more closely re-
sembles that of Tcf3-positive stem cells. Moreover, based
180 Cell 127, 171–183, October 6, 2006 ª2006 Elsevier Inc.
upon our comparative analyses of the Tcf3-induced epi-
dermal signature to endogenous Tcf3-positive skin stem
cells, Tcf3 appears to be more closely linked to the pro-
genitor status of the keratinocyte than its proliferative or
Wnt-activation state.
Tcf3 as a Regulator of the Undifferentiated
State of Skin Progenitor Cells
The quantitative inhibition of all three skin SC lineages by
Tcf3 was both remarkable and unexpected. The repres-
sion was already evident within 6–48 hr of Tcf3 induction,
but it was graphic in adult mice that expressed Tcf3 for
longer time periods. In these animals, Tcf3 transformed
the skin epithelium into masses of K5-positive, Sox9-pos-
itive keratinocytes with relatively undifferentiated mor-
phology. Although intercellular adhesion and the epider-
mal-dermal border were still intact, molecular markers of
epidermal, sebaceous gland, and hair follicle differentia-
tion were repressed. The global inhibition of terminal dif-
ferentiation pathways upon Tcf3 induction in vivo was par-
ticularly significant given our observation that Tcf3 is
expressed not only in the bulge but also in the unspecified
epidermal progenitor cells of embryonic skin. This relation
was further paralleled by the developmental downregula-
tion of Tcf3 as cell fates were determined. A final intriguing
twist was our discovery that Tcf3 first appeared in embry-
onic hair follicles in a region that appears to mark the
future site of the bulge, providing insights into when and
how the skin epithelium might establish its reservoir of
SCs for use in postnatal homeostasis and wound repair.
Overall, whether adult or embryonic and whether prolif-
erating or quiescent, Tcf3 appears to be a characteristic
of progenitor cells and incompatible with their ability to es-
tablish a terminally differentiating tissue. This newfound
role for Tcf3 in maintaining an undifferentiated progenitor
status may also explain why Tcf3 is restricted postnatally
to bulge cells and is expressed albeit at reduced levels in
the lower ORS cells, which retain certain features of their
quiescent progenitors (Oshima et al., 2001; Vidal et al.,
2005).
The Tcf3-PPAR Connection
Our microarray analyses exposed a key role for Tcf3 in re-
pressing epidermal and sebaceous gland differentiation,
which has not been implicated in canonical Wnt signaling.
Notably, among the earliest genes to be affected by Tcf3
were PPARg and PPARa, which were repressed shortly
after Dox exposure both in vivo and in vitro. The rapidity
of these changes and their dependency on Tcf3 was
explained in part by the existence of Tcf/Lef1 regulatory
elements in the endogenous PPAR promoters, which we
showed bind Tcf3 directly in vitro as well as in vivo. More-
over, PPARg reporter activity is also specifically repressed
by Tcf3, as are the endogenous PPARg and PPARa genes.
Although PPARs have long been known to regulate adi-
pogenesis, their more general role in regulating secretory
and lipid-related differentiation programs has only re-
cently been realized (Di-Poi et al., 2004; Michalik et al.,
2002; Tontonoz et al., 1995). Interestingly, PPAR activities
are often high in colon and other epithelial cancers where
elevated levels of stabilized b-catenin are involved (Saez
et al., 2004; Jansson et al., 2005). Our in vitro findings
suggest that stabilized b-catenin can enhance PPARg re-
porter gene activity and that this is dependent upon Tcf3.
In this regard, it will be interesting in the future to evaluate
whether Wnt signaling normally plays an active role in
promoting sebaceous gland differentiation, or whether
Tcf3 functions physiologically only in repressing this differ-
entiation pathway in SCs.
CONCLUSIONS
Our results favor the view that Tcf3 functions in maintain-
ing a certain program of relatively undifferentiated strati-
fied epithelium that is characteristic of progenitor cells.
Our finding further suggests that the activation and/or re-
lief of Tcf3 target genes may be crutial for activating pro-
genitor cells to enter differentiation programs in the skin.
The particular lineage chosen by a progenitor cell appears
to depend upon both intrinsic and extrinsic factors, and it
need not necessarily involve canonical Wnt signaling. In
hair cell fate specification, mesenchymal-epithelial inter-
actions lead to a downregulation in Tcf3 expression and
Wnt/b-catenin signaling. In embryonic skin development,
other stimuli appear to be involved in the relief of Tcf3
repression and the concomitant induction of PPARg in se-
baceous gland specification and PPARa in epidermal dif-
ferentiation. These findings underscore the importance of
future studies aimed at understanding how Tcf genes are
regulated during development and differentiation.
EXPERIMENTAL PROCEDURES
Generation and Analysis of Transgenic Mice
Transgenic mice were engineered as described (Vasioukhin et al.,
1999). The SacI and HindIII fragment of K14-rtTA and the AattII and
DrdI fragment of TRE-mycTcf3 were used for injection (details of plas-
mid constructions are in Supplemental Data). For histology, dorsal
backskins were fixed for preservation of lipids and embedded in
Epon as described (Segre et al., 1999). Semithin sections (0.75 mm)
were then stained with toluidine blue and counterstained with oil red
O. IP injections of 100 mg Dox were administered to induce Tcf3. For
Tcf3 expression beyond 3 days, mice were fed Dox-containing food
(BIO-SERV, Frenchtown, NJ).
Skin grafts were performed as described (Kaufman et al., 2003).
Skins from newborn K14rtTA or K14rtTA/TRE-Tcf3 mice were grafted
onto Nude mice, which were then placed on a Dox-containing diet.
Skins were isolated for analyses after 27 days and 60 days post
grafting.
Sample Preparation for Microarrays
P5 K14rtTA or K14rtTA/TRE-Tcf3 mice were treated with Dox for 6, 12,
and 24 hr to induce Tcf3. Backskins were harvested and treated with
dispase at 37�C for 30 min to obtain epidermis. For P5 matrix, ORS,
and basal epidermal cell arrays, we used K14-H2B-GFP transgenic
mice (Tumbar et al., 2004). P5 Mx and ORS cells were isolated from
hair-follicle preparations based on GFP levels as described (Rendl
et al., 2005). For the isolation of Epi, the basal epidermal fractions
from the same animals were isolated by surface a6 integrin and GFP.
RNAs were isolated by Trizol (Sigma) and then purified using
RNAeasy minikits (Qiagen) and fluorometrically quantified (Ribogreen,
Molecular Probes). Quality was assessed by RNA 6000 Pico Assay
(Agilent), and 800 ng were primed with oligo(dT)-T7 and reverse tran-
scribed (Superscript III cDNA synthesis kit; Invitrogen). One round of
amplification/labeling was performed to obtain biotinylated cRNA
(MessageAmp aRNA kit, Ambion), and 10 mg labeled cRNA was hy-
bridized at 45�C for 16 hr to Affymetrix GeneChip Mouse Genome
430 2.0 arrays. Processed chips were read by an argon-ion laser
confocal scanner (Genomics Core Facility, MSKCC).
Basal Cell Isolation and Purification
Backskins of E13.5 K14-H2B-GFP embryos and P5 neonatal mice
were removed and incubated in 0.05% trypsin for 10 min at 37�C. Dis-
sociated cells were removed of debris with cell strainers and subse-
quently stained with PE-conjugated a6 integrin antibody (red). Basal
cells were FACS sorted on the basis of level of surface a6 and GFP.
Real-Time PCR
Total RNAs were purified as above, and after quantification with Ribo-
green (Molecular Probes), normalized RNA quantities were reverse
transcribed (Superscript III First-Strand Synthesis System, Invitrogen)
using oligo(dT) primers. cDNAs were adjusted to equal levels by PCR
amplification with primers to Gapdh. PCR amplifications of genes of
interest were performed using, where possible, primers designed
within the target sequences of the microarray probesets to ensure
the uniqueness of the primers and amplicon. Amplifications with ‘‘mi-
nus reverse transcriptase’’ control cDNAs yielded no products for any
of the primer pairs at the cycles tested. For real-time PCR, we used the
LightCycler System (Roche), LightCycler 3.5 software, and the Light-
Cycler DNA Master SYBR Green I reagents. Differences between sam-
ples and controls were calculated based on the 2-DDCP method. Primer
sequences used are listed in Table S3.
ChIP
ChIPs using primary epidermal MK were performed essentially as de-
scribed (Chamorro et al., 2005, Lowry et al., 2005) . Both K14rtTA and
K14rtTA-mycTcf3 MK were induced, with 100 ng/ml Dox for 3 hr, prior
to harvesting. In vivo ChIPs were done as described (Boyer et al., 2005)
using protein A (Repligen) instead of magnetic beads. Skins from wild-
type mice were treated with dispase to remove the epidermis, and the
dermis was then treated with collagenase to remove the hair follicles
(Rendl et al., 2005). ChIP lysates were then immunoprecipitated with
the following Abs: guinea pig anti-Tcf3 (Fuchs lab), mouse anti-myc
tag (Zymed), and guinea pig Igg or mouse Igg (Jackson Laboratory).
Lef1/Tcf sites identified by rVista analysis of 50 upstream sequences
were defined by the ECR Browser and Ensemble software. Lef1/Tcf
sites were chosen for ChIP analysis based on the conservation and
alignment between mouse and at least one other species, including
human, canine, and rat, and clustering of sites when applicable. As
a control, PCR was also performed using primers that recognize other
sites within the same promoter or downstream portions of these
same genes to demonstrate the specificity of the pull-down. Primer
sequences used are listed in Table S3.
Cell Culture and Retroviral Infections
MK were cultured in the presence of 15% serum and 0.3 mM CaCl2 as
described (Blanpain et al., 2004). Primary human keratinocytes (HKs)
were grown in serum-free Epi-life media (Cascade Biologics). Trans-
fections were done with low passage cells (%53). Retroviral stocks
were produced by transfecting Babe-PPARa or MSCV-PPARg in
Phoenix cells and virus supernatants were collected 24 and 48 hr
post transfection. Keratinocytes were infected, and after 48 hr, cells
were harvested for RNAs, purified with Absolutely RNA Microprep kit
(Stratagene). Transfections were with Fugene (Roche). Luciferase
activity was measured with the Dual Luciferase Kit (Promega) with
firefly luciferase values normalized to renilla-luciferase values.
Cell 127, 171–183, October 6, 2006 ª2006 Elsevier Inc. 181
Supplemental Data
Supplemental Data include six figures, three tables, and experimental
procedures and can be found with this article online at http://www.cell.
com/cgi/content/full/127/1/171/DC1/.
ACKNOWLEDGMENTS
We extend a special thank you to H. Amalia Passoli for conducting the
ultrastrucural analyses presented in this paper. For generous gifts of
reagents and Abs, we thank Wolfgang Hillen, Pierre Coulombe, and
Hans Clevers. We thank the Rockefeller University core facility staff
(Fred Quimby, LARC; Alison North, Bioimaging Facility; Agnes Viale,
Juan Li, and Hui Zhao, Genomics Core Facility; Memorial Sloan Ketter-
ing Cancer Research Center), Fuchs’ laboratory staff for technical as-
sistance (Maria Nikolova, Lisa Polak, and Nicole Stokes), and the other
members of the Fuchs lab for their genuine scientific curiosity and will-
ingness to share ideas, reagents, and protocols. H.N. is the recipient
of an NIH-NIAMS postdoctoral fellowship. E.F. is an investigator of
the Howard Hughes Medical Institute. This work was supported in
part by a grant R01 AR31737 from the NIH (E.F.).
Received: February 18, 2006
Revised: May 30, 2006
Accepted: July 31, 2006
Published: October 5, 2006
REFERENCES
Blanpain, C., Lowry, W.E., Geoghegan, A., Polak, L., and Fuchs, E.
(2004). Self-renewal, multipotency, and the existence of two cell pop-
ulations within an epithelial stem cell niche. Cell 118, 635–648.
Boyer, L.A., Lee, T.I., Cole, M.F., Johnstone, S.E., Levine, S.S., Zucker,
J.P., Guenther, M.G., Kumar, R.M., Murray, H.L., Jenner, R.G., et al.
(2005). Core transcriptional regulatory circuitry in human embryonic
stem cells. Cell 122, 947–956.
Brannon, M., Brown, J.D., Bates, R., Kimelman, D., and Moon, R.T.
(1999). XCtBP is a XTcf-3 corepressor with roles throughout Xenopus
development. Development 126, 3159–3170.
Cavallo, R.A., Cox, R.T., Moline, M.M., Roose, J., Polevoy, G.A.,
Clevers, H., Peifer, M., and Bejsovec, A. (1998). Drosophila Tcf and
Groucho interact to repress Wingless signalling activity. Nature 395,
604–608.
Chamorro, M.N., Schwartz, D.R., Vonica, A., Brivanlou, A.H., Cho,
K.R., and Varmus, H.E. (2005). FGF-20 and DKK1 are transcriptional
targets of beta-catenin and FGF-20 is implicated in cancer and devel-
opment. EMBO J. 24, 73–84.
Cotsarelis, G., Sun, T.T., and Lavker, R.M. (1990). Label-retaining cells
reside in the bulge area of pilosebaceous unit: implications for follicular
stem cells, hair cycle, and skin carcinogenesis. Cell 61, 1329–1337.
Daniels, D.L., and Weis, W.I. (2005). Beta-catenin directly displaces
Groucho/TLE repressors from Tcf/Lef in Wnt-mediated transcription
activation. Nat. Struct. Mol. Biol. 12, 364–371.
DasGupta, R., and Fuchs, E. (1999). Multiple roles for activated LEF/
TCF transcription complexes during hair follicle development and
differentiation. Development 126, 4557–4568.
Day, T.F., Guo, X., Garrett-Beal, L., and Yang, Y. (2005). Wnt/beta-
catenin signaling in mesenchymal progenitors controls osteoblast
and chondrocyte differentiation during vertebrate skeletogenesis.
Dev. Cell 8, 739–750.
Di-Poi, N., Michalik, L., Desvergne, B., and Wahli, W. (2004). Functions
of peroxisome proliferator-activated receptors (PPAR) in skin homeo-
stasis. Lipids 39, 1093–1099.
Gat, U., DasGupta, R., Degenstein, L., and Fuchs, E. (1998). De Novo
hair follicle morphogenesis and hair tumors in mice expressing a trun-
cated beta-catenin in skin. Cell 95, 605–614.
182 Cell 127, 171–183, October 6, 2006 ª2006 Elsevier Inc.
Hamada, F., and Bienz, M. (2004). The APC tumor suppressor binds to
C-terminal binding protein to divert nuclear beta-catenin from TCF.
Dev. Cell 7, 677–685.
Jansson, E.A., Are, A., Greicius, G., Kuo, I.C., Kelly, D., Arulampalam,
V., and Pettersson, S. (2005). The Wnt/beta-catenin signaling pathway
targets PPARgamma activity in colon cancer cells. Proc. Natl. Acad.
Sci. USA 102, 1460–1465.
Kang, S., Bajnok, L., Longo, K.A., Petersen, R.K., Hansen, J.B., Kris-
tiansen, K., and MacDougald, O.A. (2005). Effects of Wnt signaling
on brown adipocyte differentiation and metabolism mediated by
PGC-1{alpha}. Mol. Cell. Biol. 25, 1272–1282.
Kaufman, K.C., Zhou, P., Pasolli, H.M., Rendl, M., Bolotin, D., Lim, K.,
Dai, X., Alegre, M., and Fuchs, E. (2003). GATA-3: an unexpected reg-
ulator of cell lineage determination in skin. Genes Dev. 17, 2108–2122.
Kim, C.H., Oda, T., Itoh, M., Jiang, D., Artinger, K.B., Chandrasekhar-
appa, S.C., Driever, W., and Chitnis, A.B. (2000). Repressor activity of
Headless/Tcf3 is essential for vertebrate head formation. Nature 407,
913–916.
Kim, J.B., and Spiegelman, B.M. (1996). ADD1/SREBP1 promotes
adipocyte differentiation and gene expression linked to fatty acid
metabolism. Genes Dev. 10, 1096–1107.
Knott, A., Garkle, K., Urlinger, S., Guthmann, J., Muller, Y., Thellman,
M., and Hillen, W. (2002). Tetracycline-dependent gene regulation:
combinations of transregulators yield a variety of expression windows.
Biotechniques 32, 796, 798, 800.
Korinek, V., Barker, N., Moerer, P., van Donselaar, E., Huls, G., Peters,
P.J., and Clevers, H. (1998). Depletion of epithelial stem-cell compart-
ments in the small intestine of mice lacking Tcf-4. Nat. Genet. 19,
379–383.
Lee, H.-Y., Kleber, M., Hari, L., Brault, V., Suter, U., Taketo, M.M.,
Kemler, R., and Sommer, L. (2004). Instructive role of Wnt/{beta}-
catenin in sensory fate specification in neural crest stem cells. Science
303, 1020–1023.
Legg, J., Jensen, U.B., Broad, S., Leigh, I., and Watt, F.M. (2003). Role
of melanoma chondroitin sulphate proteoglycan in patterning stem
cells in human interfollicular epidermis. Development 130, 6049–6063.
Lie, D.C., Colamarino, S.A., Song, H.J., Desire, L., Mira, H., Consiglio,
A., Lein, E.S., Jessberger, S., Lansford, H., Dearie, A.R., and Gage,
F.H. (2005). Wnt signalling regulates adult hippocampal neurogenesis.
Nature 437, 1370–1375.
Liu, J., and Farmer, S.R. (2004). Regulating the balance between
peroxisome proliferator-activated receptor gamma and beta-catenin
signaling during adipogenesis. A glycogen synthase kinase 3beta
phosphorylation-defective mutant of beta-catenin inhibits expression
of a subset of adipogenic genes. J. Biol. Chem. 279, 45020–45027.
Lo Celso, C., Prowse, D.M., and Watt, F.M. (2004). Transient activation
of beta-catenin signalling in adult mouse epidermis is sufficient to in-
duce new hair follicles but continuous activation is required to maintain
hair follicle tumours. Development 131, 1787–1799.
Lowry, W.E., Blanpain, C., Nowak, J.A., Guasch, G., Lewis, L., and
Fuchs, E. (2005). Defining the impact of beta-catenin/Tcf transactiva-
tion on epithelial stem cells. Genes Dev. 19, 1596–1611.
Man, M.Q., Choi, E.H., Schmuth, M., Crumrine, D., Uchida, Y., Elias,
P.M., Holleran, W.M., and Feingold, K.R. (2006). Basis for improved
permeability barrier homeostasis induced by PPAR and LXR activa-
tors: liposensors stimulate lipid synthesis, lamellar body secretion,
and post-secretory lipid processing. J. Invest. Dermatol. 126, 386–
392.
Merrill, B.J., Gat, U., DasGupta, R., and Fuchs, E. (2001). Tcf3 and Lef1
regulate lineage differentiation of multipotent stem cells in skin. Genes
Dev. 15, 1688–1705.
Merrill, B.J., Pasolli, H.A., Polak, L., Rendl, M., Garcia-Garcia, M.J.,
Anderson, K.V., and Fuchs, E. (2004). Tcf3: a transcriptional regulator
of axis induction in the early embryo. Development 131, 263274.
Michalik, L., Desvergne, B., Dreyer, C., Gavillet, M., Laurini, R.N., and
Wahli, W. (2002). PPAR expression and function during vertebrate
development. Int. J. Dev. Biol. 46, 105–114.
Morris, R.J., Liu, Y., Marles, L., Yang, Z., Trempus, C., Li, S., Lin, J.S.,
Sawicki, J.A., and Cotsarelis, G. (2004). Capturing and profiling adult
hair follicle stem cells. Nat. Biotechnol. 22, 411–417.
Oshima, H., Rochat, A., Kedzia, C., Kobayashi, K., and Barrandon, Y.
(2001). Morphogenesis and renewal of hair follicles from adult multipo-
tent stem cells. Cell 104, 233–245.
Rendl, M., Lewis, L., and Fuchs, E. (2005). Molecular dissection of
mesenchymal–epithelial interactions in the hair follicle. PLoS Biol. 3,
e331.
Reya, T., and Clevers, H. (2005). Wnt signalling in stem cells and can-
cer. Nature 434, 843–850.
Roose, J., Molenaar, M., Peterson, J., Hurenkamp, J., Brantjes, H.,
Moerer, P., van de Wetering, M., Destree, O., and Clevers, H. (1998).
The Xenopus Wnt effector XTcf-3 interacts with Groucho-related tran-
scriptional repressors. Nature 395, 608–612.
Saez, E., Rosenfeld, J., Livolsi, A., Olson, P., Lombardo, E., Nelson, M.,
Banayo, E., Cardiff, R.D., Izpisua-Belmonte, J.C., and Evans, R.M.
(2004). PPAR gamma signaling exacerbates mammary gland tumor
development. Genes Dev. 18, 528–540.
Schoonjans, K., Peinado-Onsurbe, J., Lefebvre, A.M., Heyman, R.A.,
Briggs, M., Deeb, S., Staels, B., and Auwerx, J. (1996). PPARalpha
and PPARgamma activators direct a distinct tissue-specific transcrip-
tional response via a PPRE in the lipoprotein lipase gene. EMBO J. 15,
5336–5348.
Segre, J.A., Bauer, C., and Fuchs, E. (1999). Klf4 is a transcription fac-
tor required for establishing the barrier function of the skin. Nat. Genet.
22, 356–360.
Shetty, P., Lo, M.C., Robertson, S.M., and Lin, R. (2005). C. elegans
TCF protein, POP-1, converts from repressor to activator as a result
of Wnt-induced lowering of nuclear levels. Dev. Biol. 285, 584–592.
Sierra, J., Yoshida, T., Joazeiro, C.A., and Jones, K.A. (2006). The APC
tumor suppressor counteracts b-catenin activation and H3K4 methyl-
ation at Wnt target genes. Genes Dev. 20, 586–600.
Tachibana, K., Kobayashi, Y., Tanaka, T., Tagami, M., Sugiyama, A.,
Katayama, T., Ueda, C., Yamasaki, D., Ishimoto, K., Sumitomo, M.,
et al. (2005). Gene expression profiling of potential peroxisome prolif-
erator-activated receptor (PPAR) target genes in human hepatoblas-
toma cell lines inducibly expressing different PPAR isoforms. Nucl.
Recept. 3, 3.
Taylor, G., Lehrer, M.S., Jensen, P.J., Sun, T.T., and Lavker, R.M.
(2000). Involvement of follicular stem cells in forming not only the folli-
cle but also the epidermis. Cell 102, 451–461.
Tontonoz, P., Hu, E., Devine, J., Beale, E.G., and Spiegelman, B.M.
(1995). PPAR gamma 2 regulates adipose expression of the phospho-
enolpyruvate carboxykinase gene. Mol. Cell. Biol. 15, 351–357.
Tumbar, T., Guasch, G., Greco, V., Blanpain, C., Lowry, W.E., Rendl,
M., and Fuchs, E. (2004). Defining the epithelial stem cell niche in
skin. Science 303, 359–363.
van de Wetering, M., Sancho, E., Verweij, C., de Lau, W., Oving, I.,
Hurlstone, A., van der Horn, K., Batlle, E., Coudreuse, D., Haramis,
A.P., et al. (2002). The beta-catenin/TCF-4 complex imposes a crypt
progenitor phenotype on colorectal cancer cells. Cell 111, 241–250.
van Es, J.H., Jay, P., Gregorieff, A., van Gijn, M.E., Jonkheer, S., Hat-
zis, P., Thiele, A., van den Born, M., Begthel, H., Brabletz, T., et al.
(2005). Wnt signalling induces maturation of Paneth cells in intestinal
crypts. Nat. Cell Biol. 7, 381–386.
Van Mater, D., Kolligs, F.T., Dlugosz, A.A., and Fearon, E.R. (2003).
Transient activation of beta catenin signaling in cutaneous keratino-
cytes is sufficient to trigger the active growth phase of the hair cycle
in mice. Genes Dev. 17, 1219–1224.
Vasioukhin, V., Degenstein, L., Wise, B., and Fuchs, E. (1999). The
magical touch: genome targeting in epidermal stem cells induced by
tamoxifen application to mouse skin. Proc. Natl. Acad. Sci. USA 96,
8551–8556.
Vidal, V.P., Chaboissier, M.C., Lutzkendorf, S., Cotsarelis, G., Mill, P.,
Hui, C.C., Ortonne, N., Ortonne, J.P., and Schedl, A. (2005). Sox9 is
essential for outer root sheath differentiation and the formation of the
hair stem cell compartment. Curr. Biol. 15, 1340–1351.
Willert, K., Brown, J.D., Danenberg, E., Duncan, A.W., Weissman, I.L.,
Reya, T., Yates, J.R., and Nusse, R. (2003). Wnt proteins are lipid-
modified and can act as stem cell growth factors. Nature 423, 448–
452.
Cell 127, 171–183, October 6, 2006 ª2006 Elsevier Inc. 183