Embed Size (px)
Citation preview

n
Alqadi, Abdulaziz Abdullah (2017) Studies of antihypertensive drug persistence and adherence in the Glasgow Blood Pressure Clinic. PhD thesis.
http://theses.gla.ac.uk/7664/
Copyright and moral rights for this thesis are retained by the author A copy can be downloaded for personal non-commercial research or study, without prior permission or charge
This thesis cannot be reproduced or quoted extensively from without first obtaining permission in writing from the Author
The content must not be changed in any way or sold commercially in any format or medium without the formal permission of the Author
When referring to this work, full bibliographic details including the author, title, awarding institution and date of the thesis must be given
Glasgow Theses Service http://theses.gla.ac.uk/
Studies of Antihypertensive Drug Persistence and
Adherence in the Glasgow Blood Pressure Clinic
Abdulaziz Abdullah Alqadi
BSc., MSc.
Submitted in fulfilment of requirements for the degree of Doctor of Philosophy (Ph.D.) in the Faculty of Medicine, University of Glasgow
April 2016
BHF Glasgow Cardiovascular Research Centre
Institute of Cardiovascular and Medical Sciences
College of Medical, Veterinary, and Life Sciences
University of Glasgow
1
Abstract
Hypertension (HTN) is a major risk factor for cardiovascular diseases including
stroke, coronary heart disease (CHD), chronic renal failure, peripheral vascular
disease, myocardial infarction, congestive heart failure and premature death. The
prevalence of HTN in Scotland is very high and although a high proportion of the
patients receive antihypertensive medications, blood pressure (BP) control is very
low. Recommendations for starting a specific antihypertensive class have been
debated between various guidelines over the years. Some guidelines and HTN
studies have preferred to start with a combination of an antihypertensive class
instead of using a single therapy, and they have found greater BP reductions with
combination therapies than with monotherapy. However, it has been shown in
several clinical trials that 20% to 35% of hypertensive patients could not achieve
the target BP, even though they received more than three antihypertensive
medications. Several factors were found to affect BP control. Adherence and
persistence were considered as the factors contributing the most to uncontrolled
hypertension. Other factors such as age, sex, body mass index (BMI), alcohol
intake, baseline systolic BP (SBP), and the communication between physicians and
patients have been shown to be associated with uncontrolled BP and resistant
hypertension.
Persistence, adherence and compliance are interchangeable terms and have been
used in the literature to describe a patient’s behaviour with their antihypertensive
drugs and prescriptions. The methods used to determine persistence and
adherence, as well as the inclusion and exclusion criteria, vary between
persistence and adherence studies. The prevalence of persistence and adherence
have varied between these studies, and were determined to be high in some
studies and low in others. The initiation of a specific antihypertensive class has
frequently been associated with an increase or decrease in adherence and
persistence. The tolerability and efficacy of the initial antihypertensive class have
been the most common methods of explaining this association. There are also
many factors that suggest a relationship with adherence and persistence. Some
factors in previous studies, such as age, were frequently associated with
adherence and persistence. On the other hand, relationships with certain factors
have varied between the studies. The associations of age, sex, alcohol use,
2 smoking, baseline systolic blood pressure (SBP) and diastolic BP (DBP), the
presence of comorbidities, an increase in the number of pills and the relationship
between patients and physicians with adherence and persistence have been the
most commonly investigated factors.
Most studies have defined persistence in terms of a patient still taking medication
after a period of time. A medication possession ratio (MPR) ≥ 80 has been used to
define compliance. Either of these terminologies, or both, have been used to
estimate adherence. In this study, I used the same definition for persistence to
identify patients who have continued with their initial treatment, and used
persistence and MPR to define patients who adhered to their initial treatment.
The aim of this study was to estimate the prevalence of persistence and adherence
in Scotland. Also, factors that could have had an effect on persistence and
adherence were studied. The number of antihypertensive drugs taken by patients
during the study and factors that led to an increase in patients being on a
combination therapy were also evaluated. The prevalence of resistance and BP
control were determined by taking the BP after the last drug had been taken by
persistent patients during five follow-up studies. The relationship of factors such
as age, sex, BMI, alcohol use, smoking, estimated glomerular filtration rate
(eGFR), and albumin levels with BP reductions for each antihypertensive class
were determined.
Information Services Division (ISD) data, which includes all antihypertensive drugs,
were collected from pharmacies in Scotland and linked to the Glasgow Blood
Pressure Clinic (GBPC) database. This database also includes demographic
characteristics, BP readings and clinical results for all patients attending the
GBPC. The case notes for patients who attended the GBPC were reviewed and all
new antihypertensive drugs that were prescribed between visits, BP before and
after taking drugs, and any changes in the hypertensive drugs were recorded. A
total of 4,232 hypertensive patients were included in the first study. The first
study showed that angiotensin converting enzyme inhibitor (ACEI) and beta-
blockers (BB) were the most prescribed antihypertensive classes between 2004
and 2013. Calcium channel blockers (CCB), thiazide diuretics and angiotensin
receptor blockers (ARB) followed ACEI and BB as the most prescribed drugs during
the same period. The prescription trend of the antihypertensive class has changed
3 over the years with an increase in prescriptions for ACEI and ARB and a decrease
in prescriptions for BB and diuretics. I observed a difference in antihypertensive
class prescriptions by age, sex, SBP and BMI. For example, CCB, thiazide diuretics
and alpha-blockers were more likely to be prescribed to older patients, while
ACEI, ARB or BB were more commonly prescribed for younger patients.
In a second study, 4,232 and 3,149 hypertensive patients were included to
investigate the prevalence of persistence in the Scottish population in 1- and 5-
year studies, respectively. The prevalence of persistence in the 1-year study was
72.9%, while it was only 62.8% in the 5-year study. Those patients taking ARB and
ACEI showed high rates of persistence and those taking diuretics and alpha
blockers had low rates of persistence. The association of persistence with clinical
characteristics was also investigated. Younger patients were more likely to totally
stop their treatment before restarting their treatment with other antihypertensive
drugs. Furthermore, patients who had high SBP tended to be non-persistent.
In a third study, 3,085 and 1,979 patients who persisted with their treatment were
included. In the first part of the study, MPR was calculated, and patients with an
MPR ≥ 80 were considered as adherent. Adherence rates were 29.9% and 23.4% in
the 1- and 5-year studies, respectively. Patients who initiated the study with ACEI
were more likely to adhere to their treatments. However, patients who initiated
the study with thiazide diuretics were less likely to adhere to their treatments.
Sex, age and BMI were different between the adherence and non-adherence
groups. Age was an independent factor affecting adherence rates during both the
1- and 5-year studies with older patients being more likely to be adherent. In the
second part of the study, pharmacy databases were checked with patients' case
notes to compare antihypertensive drugs that were collected from the pharmacy
with the antihypertensive prescription given during the patient’s clinical visit.
While 78.6% of the antihypertensive drugs were collected between clinical visits,
21.4% were not collected. Patients who had more days to see the doctor in the
subsequent visit were more likely to not collect their prescriptions.
In a fourth study, 3,085 and 1,979 persistent patients were included to calculate
the number of antihypertensive classes that were added to the initial drug during
the 1-year and 5-year studies, respectively. Patients who continued with
treatment as a monotherapy and who needed a combination therapy were
4 investigated during the 1- and 5-year studies. In all, 55.8% used antihypertensive
drugs as a monotherapy and 44.2% used them as a combination therapy during the
1-year study. While 28.2% of patients continued with treatment without the
required additional therapy, 71.8% of the patients needed additional therapy. In
all, 20.8% and 46.5% of patients required three different antihypertensive classes
or more during the 1-year and 5-year studies, respectively. Patients who started
with ACEI, ARB and BB were more likely to continue as monotherapy and less likely
to need two more antihypertensive drugs compared with those who started with
alpha-blockers, non-thiazide diuretics and CCB. Older ages, high BMI levels, high
SBP and high alcohol intake were independent factors that led to an increase in
the probability of patients taking combination therapies.
In the first part of the final study, BPs were recorded after the last drug had been
taken during the 5 year study. There were 815 persistent patients who were
assigned for this purpose. Of these, 39% had taken one, two or three
antihypertensive classes and had controlled BP (controlled hypertension [HTN]),
29% of them took one or two antihypertensive classes and had uncontrolled BP
(uncontrolled HTN), and 32% of the patients took three antihypertensive classes
or more and had uncontrolled BP (resistant HTN). The initiation of an
antihypertensive drug and the factors affecting BP pressure were compared
between the resistant and controlled HTN groups. Patients who initiated the study
with ACEI were less likely to be resistant compared with those who started with
alpha blockers and non-thiazide diuretics. Older patients, and high BMI tended to
result in resistant HTN. In the second part of study, BP responses for patients who
initiated the study with ACEI, ARB, BB, CCB and thiazide diuretics were compared.
After adjusting for risk factors, patients who initiated the study with ACEI and ARB
were more respondent than those who took CCB and thiazide diuretics. In the last
part of this study, the association between BP reductions and factors affecting BP
were tested for each antihypertensive drug. Older patients responded better to
alpha blockers. Younger patients responded better to ACEI and ARB. An increase
in BMI led to a decreased reduction in patients on ACEI and diuretics (thiazide and
non-thiazide). An increase in albumin levels and a decrease in eGFR led to
decreases in BP reductions in patients on thiazide diuretics. An increase in eGFR
decreased the BP response with ACEI.
5 In conclusion, although a high percentage of hypertensive patients in Scotland
persisted with their initial drug prescription, low adherence rates were found with
these patients. Approximately half of these patients required three different
antihypertensive classes during the 5 years, and 32% of them had resistant HTN.
Although this study was observational in nature, the large sample size in this study
represented a real HTN population, and the large pharmacy data represented a
real antihypertensive population, which were collected through the support of
prescription data from the GBPC database. My findings suggest that ACEI, ARB and
BB are less likely to require additional therapy. However, ACEI and ARB were
better tolerated than BB in that they were more likely to be persistent than BB.
In addition, users of ACEI, and ARB have good BP response and low resistant HTN.
Linkage patients who participated in these studies with their morbidity and
mortality will provide valuable information concerning the effect of adherence on
morbidity and mortality and the potential benefits of using ACEI or ARB over other
drugs.
6
Table of contents Abstract ...................................................................................... 1
List of tables ............................................................................... 10
List of figures .............................................................................. 13
Acknowledgement ......................................................................... 14
Declaration ................................................................................. 15
List of abbreviations ...................................................................... 16
Chapter 1 Introduction ................................................................. 18
1.1 Historical perspectives of hypertension ...................................... 18
1.1.1 Historical perspectives in the Measurement of Blood Pressure ...... 18
1.1.2 Historical perspectives in the pathogenesis of primary hypertension 19
1.1.3 Drug development and clinical trials .................................... 20
1.2 Hypertension definition, blood pressure target, and measurements .... 22
1.2.1 Development of hypertension definition ................................ 22
1.2.2 Blood pressure targets ..................................................... 25
1.2.3 Blood pressure measurement ............................................. 31
1.3 Cardiovascular disease and hypertension .................................... 32
1.3.1 Epidemiology ................................................................ 32
1.3.2 Risk factors .................................................................. 33
1.3.3 Cardiovascular risk and hypertension .................................... 33
1.4 Hypertension management ..................................................... 37
1.4.1 Non pharmacological treatment .......................................... 37
1.4.2 Pharmacological therapy .................................................. 42
1.4.3 Antihypertensive classes and hypertension treatment ................ 44
1.4.4 Antihypertensive classes and specific conditions ...................... 49
1.4.5 Initial drug recommendations in the NICE guidelines ................. 53
1.4.6 Monotherapy versus Combination Therapy ............................. 54
1.5 Mortality and morbidity attributable to high blood pressure ............. 55
1.6 Global burden of hypertension ................................................ 57
1.6.1 Hypertension prevalence in the worldwide ............................. 57
1.6.2 Hypertension prevalence in Scotland .................................... 58
1.7 Hypertension control rates ..................................................... 60
1.8 Resistant HTN .................................................................... 61
1.9 Factors influencing BP control ................................................. 62
1.9.1 Individual factors ........................................................... 63
1.9.2 Existing comorbidities ..................................................... 64
1.9.3 Social and economic conditions .......................................... 65
1.9.4 Physician-related factors .................................................. 66
7
1.9.5 Health system factors ...................................................... 68
1.10 Adherence ...................................................................... 68
1.10.1 Definition and its issues ................................................. 68
1.10.2 Methods used to measure adherence rates .......................... 69
1.10.3 Comparison between different adherence methods ................ 72
1.10.4 Factors effecting on adherence. ....................................... 73
1.11 Persistence ..................................................................... 76
1.11.1 Definition and its issues ................................................. 76
1.11.2 Factors effecting persistence .......................................... 78
Chapter 2 Methodology ................................................................. 80
2.1 Study population ................................................................. 80
2.2 The Glasgow Blood Pressure Clinic (GBPC) .................................. 82
2.3 Physician communication and the number of visits ........................ 82
2.4 Laboratory and clinical measurements ....................................... 83
2.4.1 Blood pressure measurement ............................................. 83
2.4.2 Obesity ....................................................................... 84
2.4.3 Renal function .............................................................. 84
2.5 Smoking status and alcohol status ............................................ 84
2.6 The GBPC database.............................................................. 85
2.7 The Information Services Division (ISD) database ........................... 85
2.8 Coding of antihypertensive drugs from patients case note. ............... 86
2.9 Repeatability and reproducibility ............................................. 87
2.9.1 Introduction ................................................................. 87
2.9.2 Methods ...................................................................... 87
2.9.3 Results........................................................................ 88
2.10 Ethical approval ............................................................... 89
2.11 Statistical Analyses ........................................................... 89
2.11.1 Statistical packages used ............................................... 89
2.11.2 Summary statics .......................................................... 89
2.11.3 Comparison of two means .............................................. 89
2.11.4 Comparison of more than two means ................................. 90
2.11.5 Logistic regression ....................................................... 90
2.11.6 Linear regression ......................................................... 90
Chapter 3 Characteristics of new patients and initiation of first antihypertensive drugs ................................................................... 92
3.1 Introduction ...................................................................... 92
3.2 Method ............................................................................ 95
3.3 Results ............................................................................ 96
3.3.1 Study population ............................................................ 96
8
3.3.2 Patient characteristics ..................................................... 98
3.3.3 Initial antihypertensive monotherapy drugs ........................... 100
3.3.4 Demographics of patients grouped according to initial antihypertensive monotherapy .................................................... 103
3.4 Discussion ........................................................................ 107
Chapter 4 Persistence ................................................................. 110
4.1 Introduction ..................................................................... 110
4.2 Methods .......................................................................... 111
4.3 Results ........................................................................... 113
4.3.1 Persistence and non-persistence outcome ............................. 113
4.3.2 Characteristics and predictors of persisters and non-persistors at 1-year 116
4.3.3 Characteristics and predictors of persistors and non-persistors at 5-year 121
4.4 Discussion ........................................................................ 126
Chapter 5 Antihypertensive Drug Adherence In Relation To Persistence ...... 131
5.1 Introduction ..................................................................... 131
5.2 Methodology ..................................................................... 133
5.3 Results ........................................................................... 137
5.3.1 Patient’s characteristics for adherence at one year ................. 141
5.3.2 Patient’s characteristics for adherence at five year ................. 143
5.3.3 Assessment of concordance using data from both case notes and refill prescriptions .................................................................. 144
5.3.4 Patient characteristics of concordance ................................ 146
5.4 Discussion ........................................................................ 149
Chapter 6 Additional therapy ......................................................... 152
6.1 Introduction ..................................................................... 152
6.2 Methodology ..................................................................... 153
6.3 Results ........................................................................... 154
6.3.1 Additional therapy during persistence period of different antihypertensive drug classes ..................................................... 154
6.3.2 Percentage patients who required two or three antihypertensive drug based on the initial antihypertensive drugs............................... 157
6.3.3 Patient characteristics for additional drug therapy at one year ... 161
6.3.4 Patient characteristics for additional drug therapy at five years .. 163
6.4 Discussion ........................................................................ 165
Chapter 7 Antihypertensive Persistence and Adherence on Blood pressure response and Resistant Hypertension.................................................. 167
7.1 Introduction ..................................................................... 167
7.2 Methodology ..................................................................... 168
7.3 Results ........................................................................... 171
9
7.3.1 The prevalence of resistant hypertension ............................. 171
7.3.2 Effect of the choice of initial antihypertensive therapy on resistance 173
7.3.3 Patient characteristics and predictors of resistant and controlled hypertension ......................................................................... 175
7.3.4 A compassion blood pressure response between the antihypertensive classes 177
7.4 Discussion ........................................................................ 185
Chapter 8 General discussion ......................................................... 189
8.1 General overview ............................................................... 189
8.2 Comparing methods ............................................................ 192
8.3 Future plans ..................................................................... 196
Reference .................................................................................. 199
10
List of tables
Table 1-1: Hypertension definition according to recent ESH/ECH guidelines ..... 26
Table 1-2: BHS protocol of blood pressure measurement using standard mercury sphygmomanometer or semiautomated device ....................................... 31
Table 1-3: Comparisons between different recent guidelines for initial drug therapy ............................................................................................... 43
Table 1-4: Classification of hypertension in adult according to Scottish Health Survey (SHS) .............................................................................. 59
Table 1-5: Causes of uncontrolled Hypertension ...................................... 63
Table 3-1: Antihypertensive classes recommended for specific indications ....... 94
Table 3-2: Demographics of patients who were prescribed first new antihypertensive drugs. ................................................................... 99
Table 3-3: Summary of the number of patients first newly prescribed antihypertensive drugs. .................................................................. 100
Table 3-4: Percentage of first antihypertensive prescription by year of prescription. .............................................................................................. 101
Table 3-5: Comparison gender between different first-line antihypertensive classes .............................................................................................. 103
Table 3-6: Comparison smoking between different first-line antihypertensive classes ...................................................................................... 104
Table 3-7: Comparison alcohol between different first-line antihypertensive classes ...................................................................................... 104
Table 3-8: Comparison age between different first-line antihypertensive classes105
Table 3-9: Comparison BMI between different first-line antihypertensive classes .............................................................................................. 105
Table 3-10: Comparison systolic blood pressure between different first-line antihypertensive classes................................................................. 106
Table 3-11: Comparison diastolic blood pressure between different first-line antihypertensive classes................................................................. 106
Table 4-1: Definitions of persistence, switching, discontinuation. .................. 112
Table 4-2: Persistence of different antihypertensive drug classes in 1 and 5 years. .............................................................................................. 114
Table 4-3: The rate of persistence at 1 year between different drugs. ............ 115
Table 4-4: The rate of Persistence at 5 year between different drugs. ............ 115
Table4-5: Patterns of non-persistence categories during 1 year follow-up. ....... 116
Table 4-6: Comparison of demographics between persisters and non-persisters categories at 1 year follow-up. ......................................................... 118
Table 4-7: Comparison of demographics between persisters and non-persisters at 1 year follow-up. .......................................................................... 119
Table 4-8: Comparison of predictors between non-persistence categories using Multinomial Logistic Regression at 1 year follow-up. ............................... 119
Table 4-9: Comparison of predictors between persistence and non-persistence categories using Multinomial Logistic Regression at 1 year follow-up. ............ 120
Table 4-10: Comparison of predictors between persistence and non-persistence using Binary Logistic Regression at 1 year follow-up ................................ 120
Table 4-11: Patterns of non-persistence categories during 5 year follow-up. .... 121
Table 4-12: comparison of demographics between persisters and non-persisters categories at 5 year follow-up. .......................................................... 123
Table 4-13: comparison of demographics between persisters and non-persistors at 5 year follow-up. .......................................................................... 124
11 Table 4-14: Comparison of predictors between non-persistence categories using Multinomial Logistic Regression at 5 year follow-up. Significant at P-value<0.05. .............................................................................................. 124
Table 4-15: Comparison of predictors between persistence and non-persistence categories using Multinomial Logistic Regression at 5 year follow-up. ............ 125
Table 4-16: Comparison of predictors between persistence and non-persistence using Binary Logistic Regression at 5 year follow-up. ............................... 125
Table 5-1: Patterns of adherence of different antihypertensive drug classes for persistent patients during one year and five follow-up studies ..................... 138
Table 5-2: The rate of adherence at 1 year between the initial and persist antihypertensive monotherapy. ......................................................... 139
Table 5-3: The rate of adherence at 5 year between the initial and persist antihypertensive monotherapy. ......................................................... 139
Table 5-4: Patterns of adherence categories of different antihypertensive drug classes for persistent patients during one year and five year follow-up studies .. 140
Table 5-5: Demographics and characteristics of persistent patients classified according to pattern of adherence at one year follow up. ........................... 141
Table 5-6: Binary logistic regression of association between predictors and adherence at one year follow up. ....................................................... 142
Table 5-7: Demographics and characteristics of persistent patients classified according to pattern of adherence at five year follow up ......................... 143
Table 5-8: Binary logistic regression of association between predictors and adherence at five year follow up. ....................................................... 143
Table 5-9: Demographics and characteristics of patients classified into high concordance and low concordance (partial+ non- concordance)................... 146
Table 5-10: Binary logistic regression of association between predictors and high concordance .............................................................................. 147
Table 5-11: Demographics and characteristics of patients grouped into high concordance, partial+ non- concordance. ............................................. 147
Table 5-12: Multinomial logistic regression of association between predictors and high concordance. ........................................................................ 148
Table 6-1: The proportion of additional and non-additional therapy for patients who persist with first line- antihypertensive drugs during one and 5 years. ............ 155
Table 6-2: Comparison between the initial and persistence antihypertensive therapies based on additional therapy requirements at one year study ........... 156
Table 6-3: Comparison between the initial and persistence antihypertensive therapies based on additional therapy requirements at five year study. .......... 156
Table 6-4: Number of antihypertensive drugs were required after the initial the drug. ........................................................................................ 158
Table 6-5: Comparison patients who required one or two additional therapy based on their initial antihypertensive therapy in one year study. .......................... 159
Table 6-6: Comparison patients who required one or two additional therapy based on their initial antihypertensive therapy in five year study. .......................... 159
Table 6-7: Patient demographics of Additional antihypertensive therapy in persistent patients during one year study. ............................................. 161
Table 6-8: Binary logistic regression of association between variant predictors and additional therapy at five year study. ................................................... 162
Table 6-9: Patient demographics of Additional antihypertensive therapy in persistent patients during 5 year study. .............................................. 163
Table 6-10: Binary logistic regression of association between variant predictors and additional therapy at five year study. ........................................... 164
Table 7-1: The percentage of controlled and resistant hypertensive patients based on first-line antihypertensive class. ..................................................... 173
12
Table 7-2: Binary logistic regression of the association between the first-line antihypertensive drug and resistance HTN. ........................................... 174
Table 7-3: Demographic and characteristics of controlled and resistance groups .............................................................................................. 175
Table 7-4: Binary logistic regression of association of different predictors with resistance HTN ........................................................................... 176
Table 7-5: Demographic of hypertensive patients who started with first-line antihypertensive drugs. .................................................................. 179
Table 7-6: Percentage of responder and non-responder before and after blood pressure adjusted. ........................................................................ 180
Table 7-7: Multinomial logistic regression of association between the initiation of antihypertensive class and BP response for unadjusted population. ............. 181
Table 7-8: Multinomial logistic regression of association between the initiation of antihypertensive class and BP response for adjusted population. ................ 181
Table 7-9: Multiple linear regression of association between predictors and BP pressure response for each antihypertensive class. ................................. 184
13
List of figures
Figure 1-1: Evolution of blood pressure classification in systolic blood pressure (SBP) per the Joint National Committee (JNC) guidelines between 1976 and 2003. ........................................................................................ 23 Figure 1-2: Evolution of blood pressure classification in diastolic blood pressure (DBP) per the Joint National Committee (JNC) guidelines between 1976 and 2003. ........................................................................................ 24 Figure 1-3: NICE protocol for treating hypertension ................................. 54 Figure 1-4: Risk factors leading to mortality based on country income level, estimated by WHO publication (2004). ................................................. 56 Figure 1-5 Worldwide age standardised prevalence of hypertension as estimated in 2014. ..................................................................................... 58 Figure 1-6: Percentage of patients achieving the JNC-7 BP goals across the number of studies. Adapted from Sarafidis et al study. ............................. 60 Figure 3-1: Flowchart of inclusion and exclusion criteria. .......................... 97 Figure 3-2: Percentage of first antihypertensive prescription by year of prescription. .............................................................................. 102 Figure 4-1: 1-5 year persistence for the first-line antihypertensive class. ...... 113 Figure 5-1: Percentage of adherence for all antihypertensive classes during one and five years. ............................................................................ 138 Figure 5-2: Comparison between drugs prescribed and drug collections. ....... 145 Figure 5-3: Patient’s behaviours with their antihypertensive prescriptions. .... 145 Figure 6-1: Percentage of patients required one or two additional therapy in five year study. ................................................................................ 160 Figure 6-2: Percentage of patients required one or two additional therapy in one year study. ................................................................................ 160 Figure 7-1: Percentage of hypertensive patients who received antihypertensive drug during five years dividing based on blood pressure control (<140/90 mm Hg). ......................................................................................... 172 Figure 7-2: Flowchart of inclusion and exclusion criteria for the new antihypertensive classes. ................................................................ 178

14
Acknowledgement
I wish to express my sincerest gratitude to Allah for providing me with health,
commitment and patience for completing my Thesis. I am deeply grateful to my
principal supervisor, Professor Sandosh Padmanabhan, for his immense support,
continuous encouragement and motivation throughout my PhD studies. My thanks
also extend to Dr Safa Alsanosi, a PhD student who recorded some patients case
note data with me to study reproducibility. Particular thanks are owed to
Dorothy Ronney who works as administrative assistant to Professor Eleanor
Davies at the BHF for her continuous support during my PhD studies.
I wish to offer my sincere gratitude to my parents for their emotional support
and prayers. I am also grateful to my wife and my kids for their patience,
support and love. I also wish to thank all my friends, especially Dr. Adel Alharf
and Dr. Jahad Algamdi for their support during my stay in Glasgow. Finally, I
wish to thank the Ministry of Interior Kingdom of Saudi Arabia for sponsoring my
PhD studies.

15
Declaration
I declare that this thesis represents my own work. I was responsible for the
analysis and interpretation of the results. The work represented in my thesis has
not been previously submitted for any degree to the University of Glasgow or any
other institutions.
Abdulaziz A Alqadi
April 2016
16
List of abbreviations
AASK African American Study of Kidney Disease and Hypertension
ABCD Appropriate Blood Pressure Control in Diabetes
ABPM Ambulatory blood pressure monitoring
ACCELERATE Aliskiren and the calcium channel blocker amlodipine combination as an initial treatment strategy for hypertension control
ACCOMPLISH Avoiding Cardiovascular Complications in People Living with Systolic Hypertension
ACCORD Action to Control Cardiovascular Risk in Diabetes
ACEI Angiotensin converting-enzyme inhibitor
ALERT Assessment of Lescol in Renal Transplantation
ALLHAT Antihypertensive and Lipid-Lowering Treatment to Prevent Heat Attack Trial
ARB Angiotensin II receptor blockers
ARIC Atherosclerosis Risk in Communities
ASCOT Anglo-Scandinavian Cardiac Outcome Trial
ASCOT-BPLA Anglo-Scandinavian Cardiac Outcomes Trial-Blood Pressure Lowering Arm
BB beta-blocker
BHS British Hypertension Society
BMI body mass index
BP blood pressure
CAPPP captopril prevention project
CCB calcium channel blocker
CHD Coronary heart disease
CHF congestive heart failure
CHI Community Health Index
CKD Chronic kidney disease
CV Cardiovascular
CVD Cardiovascular disease
DALYs Disability adjusted life years lost
DASH Dietary Approaches to Stop Hypertension
DBP Diastolic blood pressures
DETECT Diabetes Cardiovascular Risk-Evaluation: Targets and Essential Data for Commitment of Treatment
DM Diabetes mellitus
ECG Echocardiogram
eGFR Estimate glomerular filtration rate
ESH/ESC European Society of Hypertension and of the European Society of Cardiology
ESRD End stage renal disease
EUROPA Efficacy of perindopril in reduction of cardiovascular events among patients with stable coronary artery disease
FEVER Felodipine Event Reduction
FHS Framingham Heart Study
FHS Framingham Heart Study
GBPC Glasgow Blood Pressure clinic
GFR Glomerular filtration rate
HBPM Home blood pressure monitoring
17 HDFP Hypertension Detection and Follow-Up Program
HOPE Heart Outcomes Prevention Evaluation
HOT Hypertension Optimal Treatment
HSE Health Survey England
HTN hypertension
ICC Intraclass correlation coefficient
ISD Information and Statistics Division
ISH Isolated systolic hypertension
LIFE Losartan Intervention for Endpoint
LVH Left ventricular hypertrophy
MEMS Medication Events Monitoring System
MI Myocardial infarction
MRFIT Multiple Risk Factor Intervention Trial
NHANES National Health and Nutrition Examination Survey
NHS National Health Service
NICE National Institute of Health and Clinical Excellence
NSS National Services Scotland
ONTARGET Ongoing Telmisartan Alone and in Combination with Ramipril Global Endpoint Trial
PAD peripheral artery disease
PAF population attributable fraction
PATHS Prevention and Treatment of Hypertension Study
PIR poverty income ratio
PIS Prescribing Information System
PPAR Peroxisome proliferator-activated receptor
PROFESS Prevention Regimen for Effectively Avoiding Second Strokes
PROGRESS The perindopril protection against recurrent stroke study
PWV Pulse wave velocity
RAS Renin angiotensin system
RCT Randomized controlled trials
SBP Systolic blood pressure
SHEP Systolic Hypertension in the Elderly Program
SHS Scottish Health Survey
SPRINT Systolic Blood Pressure Intervention Trial
Syst-Eur Systolic Hypertension in Europe
TOD Target organ damage
TOHP Trials of Hypertension Prevention
TRANSCEND Telmisartan randomized assessment study in ACE-I intolerant subjects with cardiovascular disease
US United States
VALUE Valsartan Antihypertensive Long-term Use Evaluation
WCH White coat hypertension
WHO World Health Organization
18
Chapter 1 Introduction
1.1 Historical perspectives of hypertension
1.1.1 Historical perspectives in the Measurement of Blood Pressure
The history of hypertension research starts with the development of suitable
methods for measuring blood pressure (BP). The first published account of blood
pressure measurement was by the clergyman Stephen Hales in 1733, with
illustrated experiments on animal including the measurement of direct arterial
pressure in the horse (1,2). In 1856, using a surgical method the surgeon Faivre
measured the first truly accurate blood pressure in humans (3).
Until 1854 there was no method for measuring arterial pressure other than by
surgery. The first external, non-invasive device used to measure blood pressure
was invented by Vierordt in 1855. He showed that BP could be determined by
measuring the counter pressure necessary to cause obliteration of the radial pulse
(4,5). This device was cumbersome and relatively insensitive and was further
improved upon by individuals, such as Etienne Jules Marey, and R.E. Dudgeon (6).
The first sphygmomanometer was invented by Samuel K. von Basch in 1881(3). It
was von Basch who decided to obtain a direct measure of the blood pressure by a
column of fluid rather than obtain blood pressure measurements from an arterial
puncture. His device consisted of an inflatable rubber bag which was filled with
water and tightly connected to the neck of a manometer bulb. The manometer
bulb was filled with mercury used to determine the pressure required to obliterate
the arterial pulse (5).
The introduction of Von Basch's sphygmomanometer into clinical medicine was
accepted by some physicians as a valuable aid to diagnosis. However, many
practitioners of the time were sceptical of new technology, and the British Medical
Journal held the view that by using the sphygmomanometer 'we pauperize our
senses and weaken clinical acuity'. Despite the accusation of weakening clinical
acuity, this did not stop some from attempting to produce a more useful device
(6)
19 In 1896 Riva-Rocci reported the method which led to a prototype of the modern
mercury sphygmomanometer. His technique involved a rubber bag surrounded by
a cuff that was wrapped round the whole circumference arm and inflated with
air. This inflatable cuff was connected to a glass mercury manometer to measure
the systolic blood pressure. However, Riva-Rocci’s sphygmomanometer used a
narrow cuff, only 5 cm wide, which resulted in slightly inaccurate readings. In
1900, von Recklinghausen corrected this error by replacing the narrow armband
with one about 13 cm wide (4,6).
In 1905 Nikolai Korotkoff reported that tapping sounds could be heard as the cuff
was deflated by placing a stethoscope over the brachial artery at the cubital fossa,
caused by blood flowing back into the artery. This auscultatory technique to
measure blood pressure became widespread in the first half of the 20th century.
This technique was used for more than half a century with practically no changes
made (7).
Toward the end of the 20th century, the mercury manometer was replaced with
electronic devices and aneroid devices because of mercury-related health
concerns. However, using mercury to ensure accuracy for these devices have been
recommended by standardized protocols and mercury is still used for calibrating
these devices (8,9). More recently, the emergence of automated BP measurement
such as home or ambulatory blood pressure monitoring devices has been increased
recognition of the prognostic and clinical value of BP measured in different
settings. The introduction these devices allow blood pressure to be measured
repeatedly during the day and night(10–13).
1.1.2 Historical perspectives in the pathogenesis of primary hypertension
Improvements in BP measurement techniques facilitated the discovery of the
association between mortality and hypertension in the early 20th century. In 1918,
BP was measured by insurance companies in the United States. The Actuarial
Society of the United States (US) first reported on BP in 1925, and a subsequent
report in 1939, showed a positive relationship between age and BP elevations as
well as mortality (14,15). Relatively small increases in BP were associated with
sharp increases in mortality, and the relationships of gradual increases in BP to
20 both age and weight were reported by the Build and Blood Pressure Studies in
1959(16). Though these data were obtained from those participants who were
either issued or applied for life insurance policies, the basic conclusions of the
Actuarial Society of the US reports have been corroborated and extended to the
general population in studies such as the large Multiple Risk Factor Intervention
Trial (MRFIT) and the Framingham Heart Study (FHS). Multiple risk factors were
screened in more than 350,000 individuals and a graded and continuous influence
of BP on end stage renal disease (ESRD) and coronary heart disease (CHD) were
documented by the MRFIT cohort (1993)(17). The BP increases associated with
incremental increases in mortality, even within the non-hypertensive range, were
observed by investigators in the FHS in 2001(18). In 2002, consistent with a
positive relationship between BP increases and mortality, a meta-analysis from 61
prospective studies on more than one million adults reported that mortality
increased progressively throughout the BP range, and there was no evidence of an
abnormal BP threshold(19).
1.1.3 Drug development and clinical trials
Despite evidence for relationships between increased BP and mortality and
Cardiovascular disease (CV) events, there have been doubters in the medical
profession and in the lay press about the imperative need to reduce BP.
“Hypertension may be an important compensatory mechanism which should not
be tampered with, even were it certain that we could control it.” was written by
cardiologist Dr. Paul Dudley White in 1931(20). Also, Dr. John Hay in the British
Medical Journal in 1931 stated “The greatest danger to a man with high BP lies in
its discovery, because then some fool is certain to try and reduce it.” (21) Nitrites,
thiocyanates, dehydrogenated alkaloids of ergot, pyrogens and Veratrum viride
and its extracts were the earliest pharmacological treatments. Diuretics,
Rauwolfia alkaloids, ganglion blockers and sympathetic antagonists were the most
frequently used drugs in the late 1960s(22)
Early clinical trials provided the evidence that antihypertensive agents reduced
the incidence of cardiovascular (CV) events; these trials were the landmark
Veterans Administration Cooperative Studies published in 1967 and 1970. In these
studies, active drug treatments were compared to placebos for their ability to
reduce the incidence of CV events in patients with diastolic blood pressures (DBPs)
21 of 115 to 129 mmHg in 1967, and DBPs of 90 to 114 mmHg in 1970 (23,24). Lowering
DBP with antihypertensive drugs in mildly hypertensive patients also reduced the
incidence of CV events as evaluated by several placebo-controlled trials including
the US Public Health Service Cooperative Study in 1977, the Hypertension
Detection and Follow-Up Program (HDFP) in 1979 and the Oslo Study in 1980 (25–
27). Additionally, antihypertensive treatments have demonstrated their ability to
reduce the incidence of stroke and major CV events in older patients with isolated
systolic hypertension (ISH) (e.g., Systolic Hypertension in the Elderly Program
[SHEP] in 1991, and Systolic Hypertension in Europe [Syst-Eur] in 1997) (28,29).
Lower BP targets for hypertension control have been evaluated in many trials
(e.g., Hypertension Optimal Treatment (HOT) study in 1998) (30). The HOT study
showed that the lowest rate of CV events for patients who were allocated to three
DPB targets, ≤90, ≤85, ≤80 mm Hg, appeared to lower the DBP level to less than
85 mm Hg (30). Antihypertensive drugs have also been evaluated to determine
effective drug-induced decreases in BP and the incidence of CV events and
mortality (e.g., Losartan Intervention For Endpoint [LIFE] Reduction in
Hypertension Study, and the Antihypertensive and Lipid-Lowering Treatment to
Prevent Heart Attack Trial [ALLHAT] in 2002)(31,32). LIFE suggested that CV
morbidity and mortality have been prevented with losartan more than with
atenolol for similar BP reduction in hypertensive patients who had left ventricular
hypertrophy (LVH) (33). There was no difference in the primary outcome of
combined fatal coronary heart disease or non-fatal myocardial infarction in
patients who enrolled to receive one of these (antihypertensive class
chlorthalidone, amlodipine, or Lisinopril) in the ALLHAT study (32). Recently, the
Systolic Blood Pressure Intervention Trial (SPRINT) study noted that the lower the
systolic blood pressure (SBP) (a level less than 120 mm Hg), the better the CV
mortality and morbidity outcomes, some of which were even lower than normal
SBP control levels (140 mm Hg in patients with a high risk of CV events but non-
diabetic) (34).
22
1.2 Hypertension definition, blood pressure target, and measurements
1.2.1 Development of hypertension definition
Hypertension has been known to be extremely difficult to define and the BP
threshold at which an individual is considered hypertensive or not has been
considered arbitrary for a long time. The definition has changed many times over
the years. During the mid-twentieth century, the great divide in hypertension was
debated by Pickering versus Platt, who were considered the two giants in this
field. Platt's viewpoint was that hypertension is a discrete disorder, whereas
Pickering’s position was that hypertension is the upper end of a normal
distribution, and this vision ultimately triumphed (35).
The threshold BP level, that is used to define hypertension, is the BP level to
which BP should be reduced to the point at which the level is more beneficial than
harm (36). For most of the 20th century, the consensus was to use DBP as the basis
for diagnosis and treatment of hypertension (37), because of the general belief
DBP contributed more to CV risk than SBP.
The guidelines were revised in 2000 with SBP considered to be a stronger predictor
of CV disease than DBP. SBP was recommended to be reviewed, evaluated and
treated for hypertension by the Clinical Advisory Statement (38). The threshold
used to define hypertension has been downgraded over the last 20 years; for
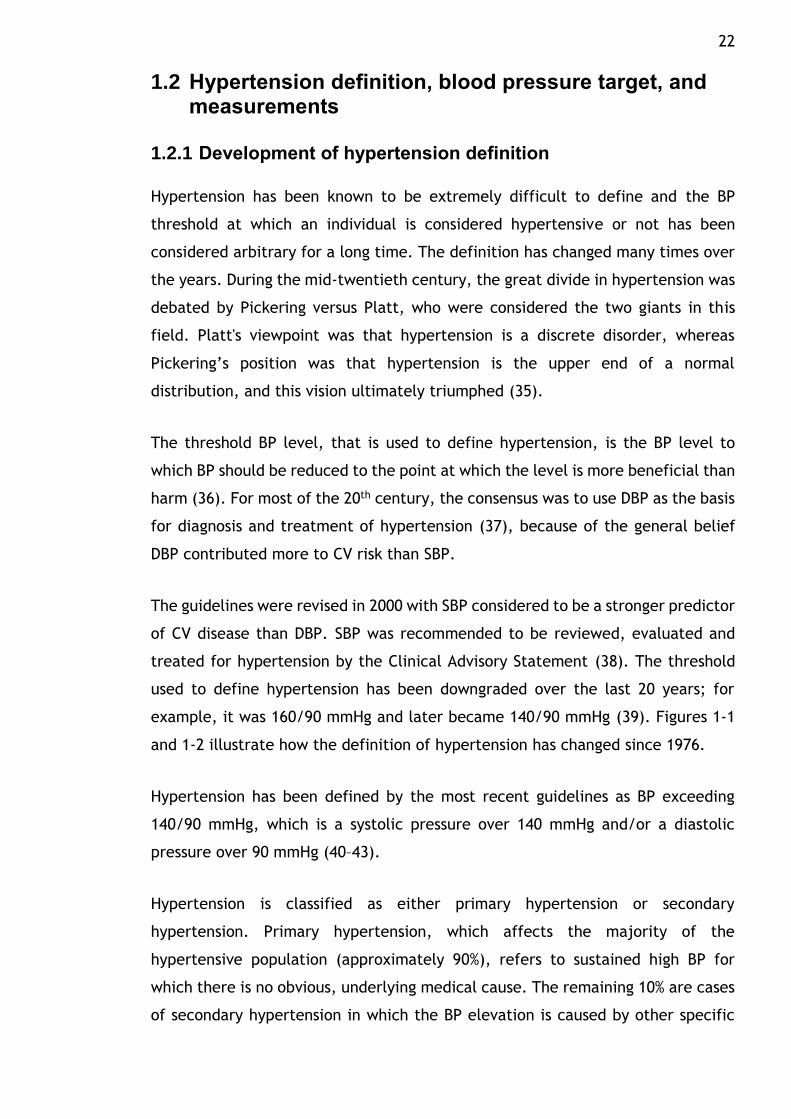
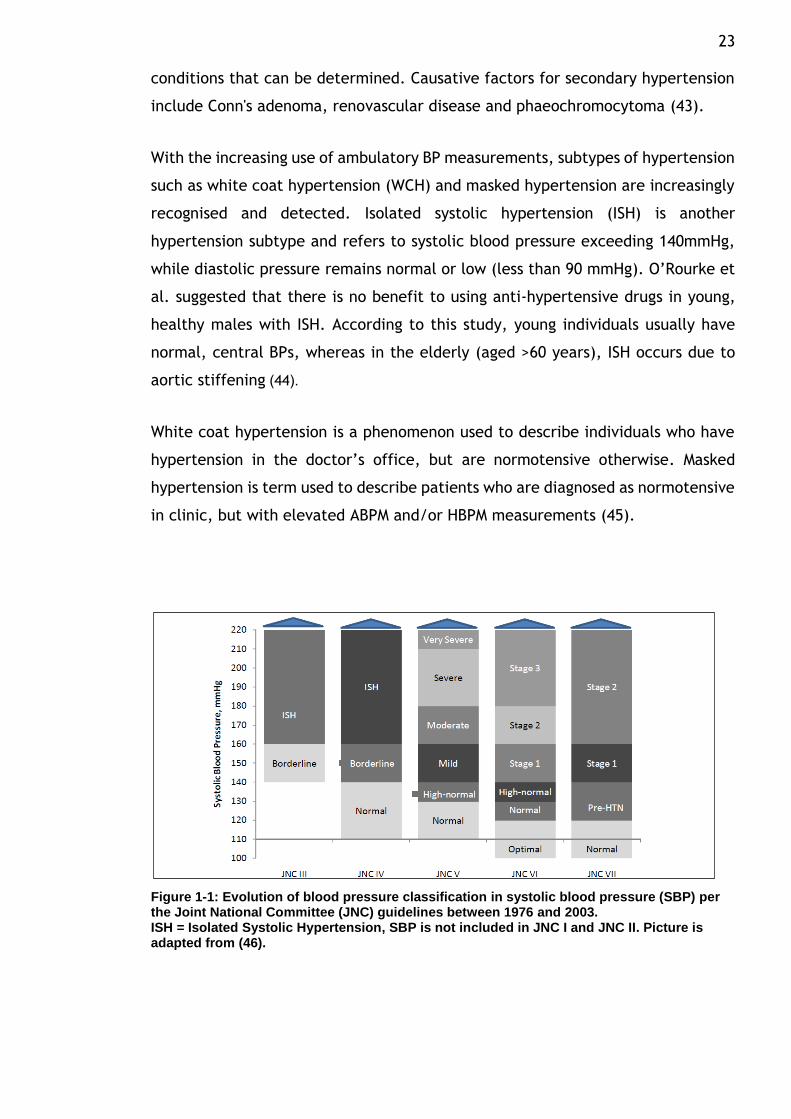
example, it was 160/90 mmHg and later became 140/90 mmHg (39). Figures 1-1
and 1-2 illustrate how the definition of hypertension has changed since 1976.
Hypertension has been defined by the most recent guidelines as BP exceeding
140/90 mmHg, which is a systolic pressure over 140 mmHg and/or a diastolic
pressure over 90 mmHg (40–43).
Hypertension is classified as either primary hypertension or secondary
hypertension. Primary hypertension, which affects the majority of the
hypertensive population (approximately 90%), refers to sustained high BP for
which there is no obvious, underlying medical cause. The remaining 10% are cases
of secondary hypertension in which the BP elevation is caused by other specific
23 conditions that can be determined. Causative factors for secondary hypertension
include Conn's adenoma, renovascular disease and phaeochromocytoma (43).
With the increasing use of ambulatory BP measurements, subtypes of hypertension
such as white coat hypertension (WCH) and masked hypertension are increasingly
recognised and detected. Isolated systolic hypertension (ISH) is another
hypertension subtype and refers to systolic blood pressure exceeding 140mmHg,
while diastolic pressure remains normal or low (less than 90 mmHg). O’Rourke et
al. suggested that there is no benefit to using anti-hypertensive drugs in young,
healthy males with ISH. According to this study, young individuals usually have
normal, central BPs, whereas in the elderly (aged >60 years), ISH occurs due to
aortic stiffening .(44)
White coat hypertension is a phenomenon used to describe individuals who have
hypertension in the doctor’s office, but are normotensive otherwise. Masked
hypertension is term used to describe patients who are diagnosed as normotensive
in clinic, but with elevated ABPM and/or HBPM measurements (45).
Figure 1-1: Evolution of blood pressure classification in systolic blood pressure (SBP) per the Joint National Committee (JNC) guidelines between 1976 and 2003. ISH = Isolated Systolic Hypertension, SBP is not included in JNC I and JNC II. Picture is adapted from (46).
24
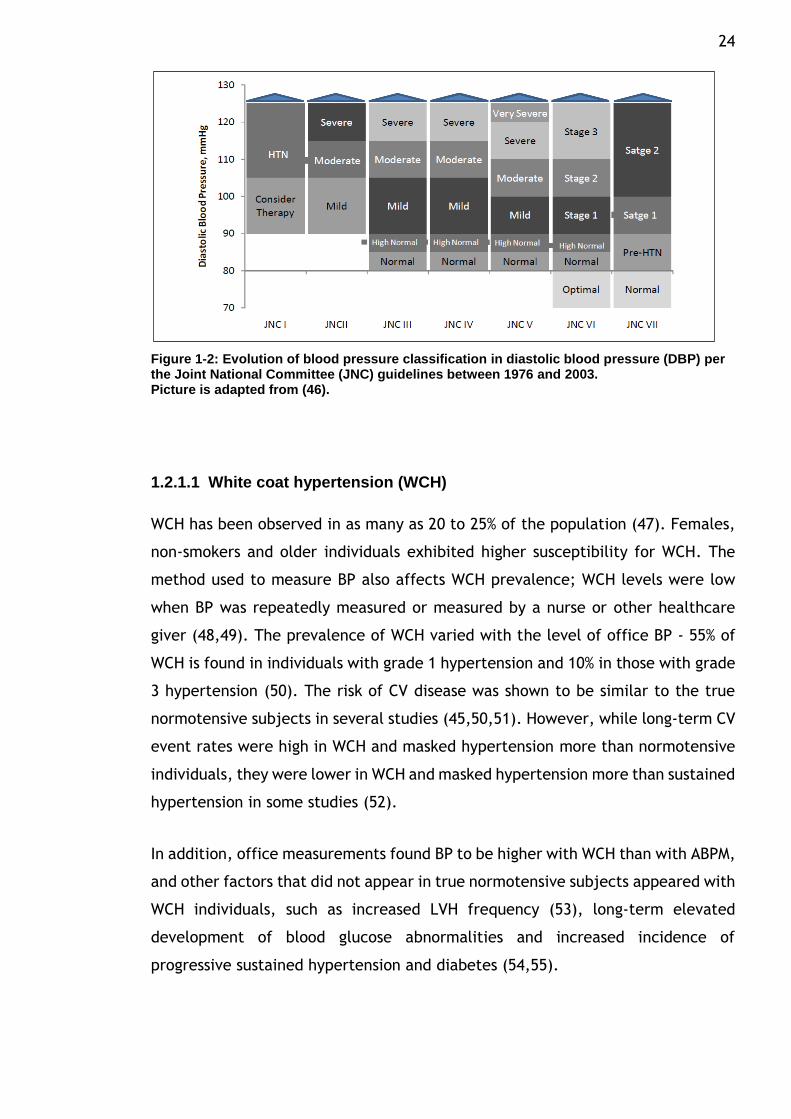
Figure 1-2: Evolution of blood pressure classification in diastolic blood pressure (DBP) per the Joint National Committee (JNC) guidelines between 1976 and 2003. Picture is adapted from (46).
1.2.1.1 White coat hypertension (WCH)
WCH has been observed in as many as 20 to 25% of the population (47). Females,
non-smokers and older individuals exhibited higher susceptibility for WCH. The
method used to measure BP also affects WCH prevalence; WCH levels were low
when BP was repeatedly measured or measured by a nurse or other healthcare
giver (48,49). The prevalence of WCH varied with the level of office BP - 55% of
WCH is found in individuals with grade 1 hypertension and 10% in those with grade
3 hypertension (50). The risk of CV disease was shown to be similar to the true
normotensive subjects in several studies (45,50,51). However, while long-term CV
event rates were high in WCH and masked hypertension more than normotensive
individuals, they were lower in WCH and masked hypertension more than sustained
hypertension in some studies (52).
In addition, office measurements found BP to be higher with WCH than with ABPM,
and other factors that did not appear in true normotensive subjects appeared with
WCH individuals, such as increased LVH frequency (53), long-term elevated
development of blood glucose abnormalities and increased incidence of
progressive sustained hypertension and diabetes (54,55).
25
1.2.1.2 Masked hypertension
The prevalence of masked hypertension has been estimated to be 10%–17% in the
population(50). Factors associated with the increased prevalence of masked
hypertension include young age, male gender, alcohol consumption, smoking,
physical activity, anxiety, exercise-induced hypertension, job stress, diabetes,
obesity, family history of hypertension, CKD and high normal range of office BP
(56). Asymptomatic organ damage and increased incidence of diabetes and
sustained hypertension have been shown to correlate frequently with masked
hypertension (53–56). The similarity of CV event incidence with masked
hypertension and sustained hypertension have been shown in several meta-
analyses of prospective studies. The incidence of CV events in masked
hypertension and sustained hypertension was higher than in true normotensive
people by approximately two times (45,50,56). Increased risk of nephropathy was
associated with masked hypertension in diabetic patients. This was evident
particularly among patients who had nocturnal BP elevation (57,58).
1.2.2 Blood pressure targets
Most guidelines recommend the initiation of antihypertensive treatment in all
patients with a BP level ≥140/90 mmHg to lower the pressure to be below this
threshold. This definition of hypertension is rather arbitrary as BP is directly
related to CV events, even at levels below that defined as hypertensive. Several
clinical trials have shown the benefit of reducing BP targets to levels less than
140/90 in CV events for patients with low to moderate CV risk (34,59–61). CV
outcomes among patients who were observed for 10 years in a Felodipine Event
Reduction (FEVER) study were reduced to approximately 11 and 17% when SBP
values were reduced to 137 mmHg in place of 142 mmHg for patients with low to
moderate CV risk (62). The 2007 European Society of Hypertension and the
European Society of Cardiology (ESH/ESC) guideline recommend the
administration of antihypertensive agents in patients with diabetes or in those
with a history of cardiovascular or renal diseases and have a high-normal BP range
(130–139/85–89 mmHg), aiming at achieving blood pressure values <130/ 80 mmHg
(63). However, the ESH/ESC guidelines published after 2007 (ESH/ESC 2009, 2014)
reappraised this recommendation and suggested a new target (140/90 mmHg) to
initiate antihypertensive drugs with these conditions (diabetes or history of
26 cardiovascular or renal diseases) based on a recent study showing that CV risks
that were diminished by reducing SBP at a target less than 130 mmHg were not
different than CV reductions achieved by reducing SBP to less than 140 mmHg
(64). These recent guidelines (2009, 2013) recommended the reduction of SBP
targets to levels <150 instead of <140 for patients with SPB >160 mmHg and aged
>80 years (41,65).
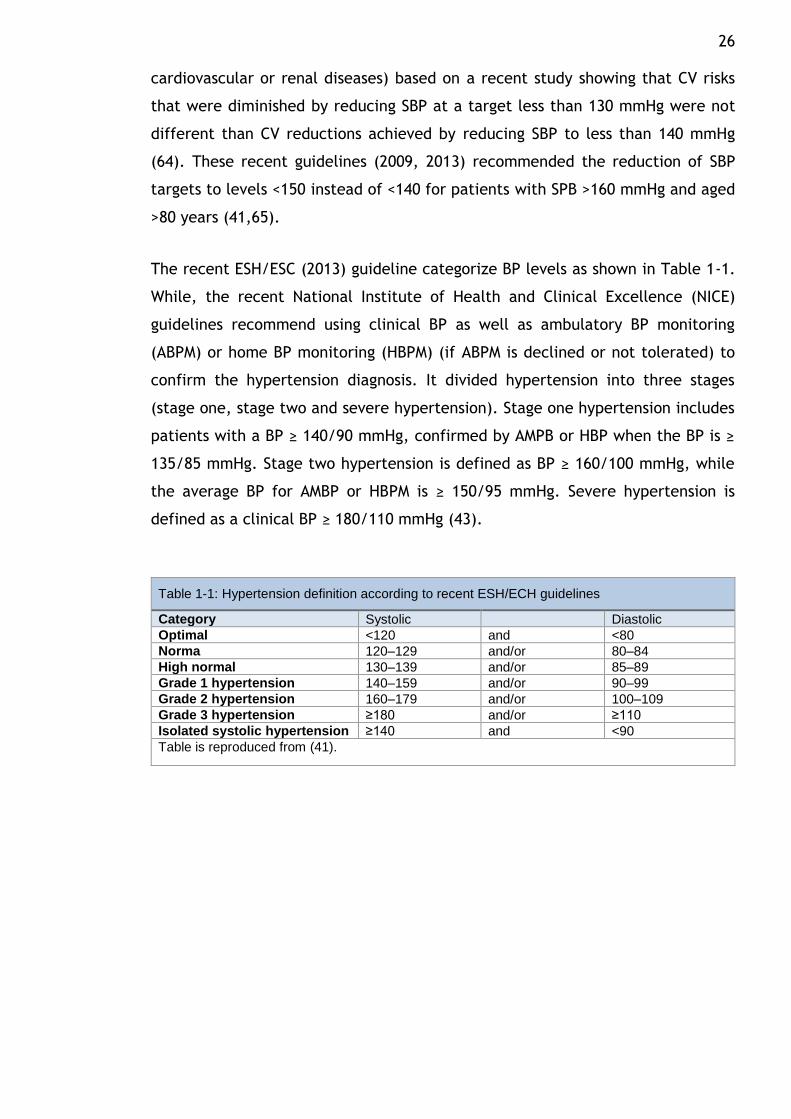
The recent ESH/ESC (2013) guideline categorize BP levels as shown in Table 1-1.
While, the recent National Institute of Health and Clinical Excellence (NICE)
guidelines recommend using clinical BP as well as ambulatory BP monitoring
(ABPM) or home BP monitoring (HBPM) (if ABPM is declined or not tolerated) to
confirm the hypertension diagnosis. It divided hypertension into three stages
(stage one, stage two and severe hypertension). Stage one hypertension includes
patients with a BP ≥ 140/90 mmHg, confirmed by AMPB or HBP when the BP is ≥
135/85 mmHg. Stage two hypertension is defined as BP ≥ 160/100 mmHg, while
the average BP for AMBP or HBPM is ≥ 150/95 mmHg. Severe hypertension is
defined as a clinical BP ≥ 180/110 mmHg (43).
Table 1-1: Hypertension definition according to recent ESH/ECH guidelines
Category Systolic Diastolic
Optimal <120 and <80
Norma 120–129 and/or 80–84
High normal 130–139 and/or 85–89
Grade 1 hypertension 140–159 and/or 90–99
Grade 2 hypertension 160–179 and/or 100–109
Grade 3 hypertension ≥180 and/or ≥110
Isolated systolic hypertension ≥140 and <90
Table is reproduced from (41).
27
1.2.2.1 The ‘lower the better’ vs. the J-shaped curve
The hypothesis that ‘the lower the better’ was described in a large meta-analysis
that observed for approximately 14 years one million subjects with no
Cardiovascular disease (CVD). This study noted that the lower the BP, the better
the CV and mortality outcomes, some of which were even lower than normal BP
control levels (140/90). The lowest levels achieved were 115/75 mmHg SBP
(SBP/DBP) (19). In a meta-analysis of 32 randomized controlled trials (RCT) of
201,566 individuals, comparable benefits were observed between SBP reductions
to 126 mmHg and SBP level 131 mmHg, and between SBP reduction to 140 mmHg
and SBP level 145 mmHg (66).
Upon examining the now-known benefits of reducing BP, it can be observed that
the association between BP reduction and its benefits seems to obey a J-shaped
pattern. This relationship appears in more aggressive BP reduction that can lead
to CV risk. The concept of the J-curve relationship has been supported by several
studies. For example, the reduction of BP values to less than 120/85 was
associated with an increase in CVD, CV mortality and congestive heart failure
(CHF)-related hospitalisation (67–69). Some studies assume that the relationship
between more intensive BP reduction and serious CV risk is applicable to coronary
events but not to stroke (67,69–71). Okin et al. concluded that BP at the 130 target
or less has no CV event-associated benefits, unlike SBP at a target between 131
and 141 mmHg. This study also found that the reduction of BP to levels less than
130 was related to an increase in risk of death (72). However, many studies have
suggested that no J-shaped relationship exists. In such studies, no serious
complications have been observed as a result of intensive BP reduction (30,73,74).
Recently, the SPRINT study showed that the lowest rates of morbidity and
mortality due to CV events have been found in patients with a high risk of CV
events but non-diabetic when targeting their SBP of less than 120 mm Hg, as
compared with an SBP of less than 140 mm Hg. Despite the benefit of the intensive
reduction of SBP to less than 120 mmHg, the rate of some adverse events in the
intensive treatment subjects were higher than standard treatment group (SBP
<140 mm Hg)(34).
28
1.2.2.2 Hypertension in the elderly
A large randomised trial study involving 3,845 individuals aged 80 and above with
SBP 160 mmHg or more to investigate the effect of antihypertensive drugs on
elderly hypertensive patients (75) found that CV events and mortality declined
when BP levels reduced, even though the SBP did not achieve levels less than 140
mmHg. The benefits of lowering BP were examined by comparing more and less
intensive BP reductions in recent Japanese trials; no benefits were found in
reducing SBP to the 136 or 137mmHg level rather than 142 or145 mmHg (76,77).
However, the FEVER study showed that reducing BP to less than 140 mmHg in turn
reduced CV events. CV events were reduced to a greater degree in patients with
SBP of less than 140 than among those with SBP of 145 mmHg (62).
1.2.2.3 Diabetes mellitus
A number of large trials have demonstrated the effect of lowering BP on reducing
CV events in diabetic patients (30,62,78–80). Some of these results are applicable
exclusively with diabetic patients (81,82). The benefit of reducing DBP to levels
between 80 and 85 has been reported in two trials. However, none of the trials
found any benefit of reducing BP to less than 130 mmHg (30,79). The effect of
intensive SBP reduction to just below 130 mmHg in normotensive people with
diabetes was shown to be significant for a secondary endpoint (it reduced overt
and incipient diabetic nephropathy development, slowed the progression of
diabetic retinopathy and reduced the stroke incidence). However, the study was
small and the primary endpoint (change in creatinine clearance) was non-
significant (83). In an Action to Control Cardiovascular Risk in Diabetes (ACCORD)
study, no differences in the incidence of major CV events were found between
diabetic patients in whom the average SBP was lowered to 119 mmHg and those
for whom the SBP average was lowered to 133 mmHg (84).
1.2.2.4 Previous cardiovascular events
The benefit of intensive reduction of BP to less than 130/80 mmHg in patients
with previous CV events has been tested in several studies. The effect of reducing
BP to less than 130/80 mmHg in individuals treated with ACEI and with previous
CV events was examined by the Efficacy of Perindopril in Reduction of
Cardiovascular Events among Patients with Stable Coronary Artery Disease: a
29 Randomised, Double-blind, Placebo-controlled, Multicentre Trial Study (EUROPA).
CV events were reduced significantly in this study (85). The effects of blood-
pressure-lowering on the risk of stroke for hypertensive and non-hypertensive
subjects with a previous history of stroke or transient ischaemic attacks were
tested by the Perindopril Protection Against Recurrent Stroke Study (PROGRESS);
the risks of stroke were reduced in both hypertension and non-hypertension groups
(86).
The effects of CCB and ACEI drugs on CV events for patients who had previous
coronary artery disease (CAD) and normal BP were shown in Nissen et al.’s study.
BP levels of less than 130/80 mmHg were achieved and CV events were reduced
in patients with amlodipine (CCB) but not with enalapril (ACEI) (87). Only minor
CV events were affected by the reduction of BP to less than 130/80 mmHg among
patients with previous CV events (major CV events non-significant) in three studies
(88–90). The results in these trials were inconsistent, while a much larger study
found no significant differences in CV events between normal SBP (140 mmHg) and
more aggressive SBP reductions (136 mm Hg) in patients with previous CV events
(91). Finally, two studies showed that BP reductions in patients with previous CV
events lead to decreased stroke and CV events. However, SBP levels in these
studies never reached the SBP target of less than 130 mmHg (85,86).
1.2.2.5 Renal disease
The objective of treating hypertensive patients with chronic kidney disease (CKD)
is to prevent CV events and renal deterioration or failure. Several studies have
reported varied prevention outcomes; some improved CV events and renal failure
through aggressive BP reduction in hypertensive patients who had CKD or both CKD
and diabetes.
The benefit of reducing BP to lower than 130/80 mmHg to prevent renal function
deterioration leading to End Stage Renal Disease (ESRD) in patients with CKD has
been tested in three trials. No significant differences in the decline of glomerular
filtration rate (GFR), ESRD or mortality were noted in these studies between
patients with conventional BP targets and those for whom BP was intensively
lowered to 130/80 mmHg (93–95). In contrast, the incidence of ESRD was reduced
in two observational studies of patients on intensive BP control (96,97). The
30 follow-up for these patients was long and the decline in the incidence of events
was clearer in patients with proteinuria.
The effect of reducing BP in patients with diabetic nephropathy on limiting the
progression to ESRD has been reported by two large trials. However, patients in
both studies did not achieve SBP targets of less than 130 mmHg (mean SBP was
140 and 143) (98,99). A reduction in GFR and ESRD was reported in a recent
cooperative study involving paediatric patients with intensive BP targets below
the 50th percentile. Although the intensive BP reduction reached goal in this
study, it is difficult to compare these values with adult values (100).
The results of the Action to Control Cardiovascular Risk in Diabetes (ACCORD)
study should also be considered. The effect of more intensive BP targets on CV
events in reducing normal SBP targets (140 mmHg) to levels less than 120 mmHg
in patients with type 2 diabetes who were at high risk of CV events was
investigated in this study. According to the results, CV events were not reduced,
and the intensive treatment group exhibited double the incidence of estimated
glomerular filtration rates (eGFRs) below 30ml/min/1.73 m2 (84). Although,
SPRINT study showed that, fatal and nonfatal CV events were reduced significantly
with intensive treatment group who their SBPs were reduced less than 120 mm
Hg, more than that in standard treatment group who their SBPs were reduced less
than 140, the incidence of acute kidney injury or acute renal failure was higher in
intensive group. It has been noted that value of eGFR was decease 30% less than
60 ml/min/1.73 m2 in intensive group higher than standard group (34).
Finally, two meta-analyses conducted recently observed no benefits from using
more intensive treatment (<130/80) on renal, clinical or CV events in patients with
CKD (101,102). The benefit to using intensive BP targets applied only to patients
with proteinuria. However, the evidence of this benefit was of low quality, and
these meta-analyses recommend further study to prove this benefit (102).
31
1.2.3 Blood pressure measurement
The British Hypertension Society (BHS) recommends that adults should measure
routinely blood pressure at least 5 yearly and annual re-measurement for those
who with high blood pressure readings at any time previously or with high-normal
blood pressure (systolic blood pressure 130–139 mmHg and/or diastolic blood
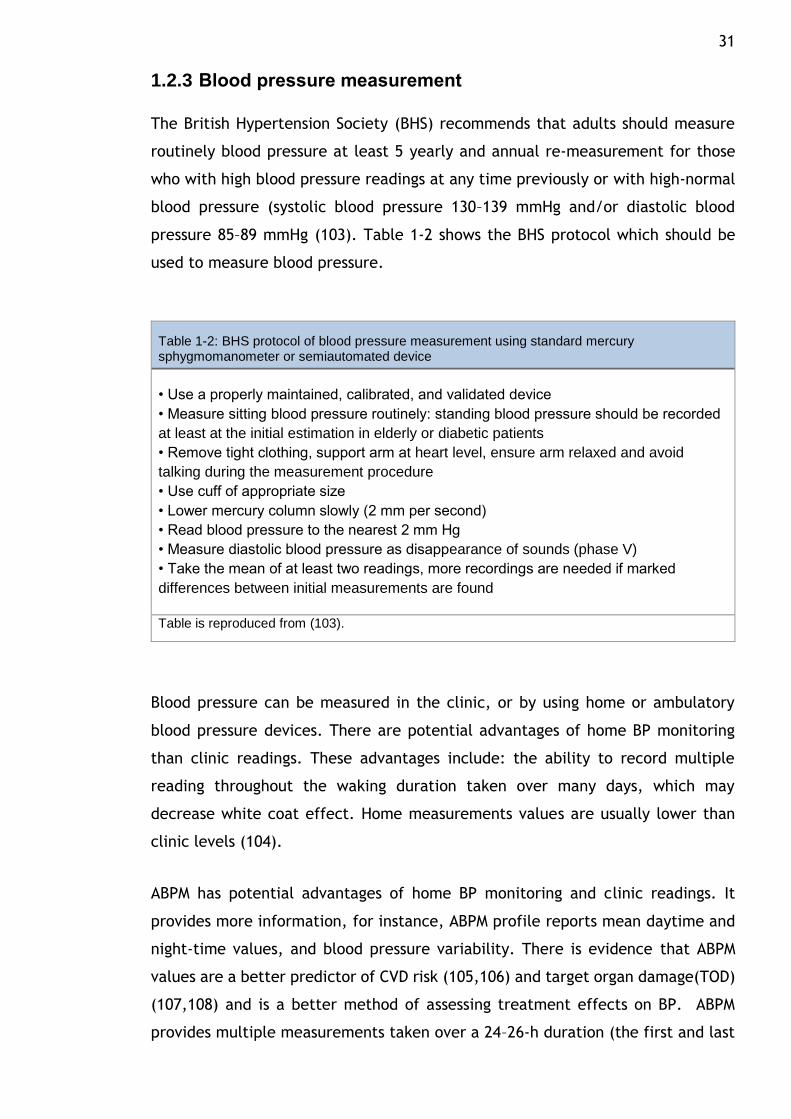
pressure 85–89 mmHg (103). Table 1-2 shows the BHS protocol which should be
used to measure blood pressure.
Table 1-2: BHS protocol of blood pressure measurement using standard mercury sphygmomanometer or semiautomated device
• Use a properly maintained, calibrated, and validated device
• Measure sitting blood pressure routinely: standing blood pressure should be recorded
at least at the initial estimation in elderly or diabetic patients
• Remove tight clothing, support arm at heart level, ensure arm relaxed and avoid
talking during the measurement procedure
• Use cuff of appropriate size
• Lower mercury column slowly (2 mm per second)
• Read blood pressure to the nearest 2 mm Hg
• Measure diastolic blood pressure as disappearance of sounds (phase V)
• Take the mean of at least two readings, more recordings are needed if marked
differences between initial measurements are found
Table is reproduced from (103).
Blood pressure can be measured in the clinic, or by using home or ambulatory
blood pressure devices. There are potential advantages of home BP monitoring
than clinic readings. These advantages include: the ability to record multiple
reading throughout the waking duration taken over many days, which may
decrease white coat effect. Home measurements values are usually lower than
clinic levels (104).
ABPM has potential advantages of home BP monitoring and clinic readings. It
provides more information, for instance, ABPM profile reports mean daytime and
night-time values, and blood pressure variability. There is evidence that ABPM
values are a better predictor of CVD risk (105,106) and target organ damage(TOD)
(107,108) and is a better method of assessing treatment effects on BP. ABPM
provides multiple measurements taken over a 24–26-h duration (the first and last
32 hours of reading are sometimes ignored, though the value of doing this is unclear).
It can estimate more than 70 BP values during a single 24-h period which may
minimise the white coat effect. Similar to home readings, ABPM values tend
usually to be lower than clinic levels (109). Consequently, ABPM and home BP
thresholds should probably be adjusted downwards (eg by 10/5mmHg) for
diagnosis of and treatment target for hypertension (110).
The emergence of automated BP monitoring into the clinic has revealed that there
can be marked discrepancies between clinic BP measurement and home or
ambulatory BP averages, which are known as either white coat hypertension or
masked hypertension. The identification of these variations in the blood measure
has prompted consideration about whether the traditional method which is used
to measure blood pressure in the clinic is still the most accurate at predicting the
risk of future cardiovascular disease. The recent NICE guideline recommends out-
of-office such as ABPM or home BP for the diagnosis of HTN. NICE guideline
recommends of using ABPM for patient’s diagnosis as a first choice and home BP
as second choice if a patient is unable to tolerate ABPM. The recommendation was
based on the results from numerous studies and health economic evaluation. The
results showed that ABPM is superior to clinic BP in many features. These studies
conclude that: 1. ABPM is the best method to measure blood pressure in predicting
the development of cardiovascular events. 2. APBM is a best measurement for
diagnosing HT followed by home BP. 3. ABPM is the most cost-effective method to
establish the diagnosis of hypertension by avoiding misdiagnosis and individuals
being put on unnecessary treatment (43).
1.3 Cardiovascular disease and hypertension
1.3.1 Epidemiology
Worldwide, approximately 16.7 million individuals die annually because of
cardiovascular (CV) disease (42) and it is considered the leading cause of the death
globally (111). CV mortality in developing countries was higher than in developed
countries for middle-aged patients (112). Nearly half of all deaths in Europe are
attributable to CV disease (113). In Scotland, almost 38% of deaths are due to this
condition (114). Furthermore, CV disease costs approximately £29.1 billion a year
in the United Kingdom (115).
33
1.3.2 Risk factors
Several factors are known to be associated with developing CV disease. The classic
factors include hypertension, obesity, diabetes, hyperlipidaemia, and cigarette
smoking. These factors are modifiable and have been widely used in risk
evaluations of CV disease. Whilst these factors are important in predicting CV
disease, they do not completely explain or predict future CV disease (116).
Microalbuminuria, c-reactive protein, eGFR and homocysteine levels are novel risk
factors that have been assessed in the risk stratification of developing CV disease
(117,118).
1.3.3 Cardiovascular risk and hypertension
Hypertension is one of the major risk factors for stroke, coronary heart disease
(CHD), chronic renal failure, peripheral vascular disease, myocardial infarction,
congestive heart failure and premature death. CV risks associated with
hypertension vary with age, sex and population.
1.3.3.1 Hypertension and its relationship with coronary heart disease and stroke
The associations between blood pressure increases and ischemic heart disease and
stroke have been confirmed by a meta-analysis including 61 observational studies
for one million individuals. They observed a log-linear relationship even at low BP
values at just above 115/75 mmHg. Each 20 mmHg increase in SBP and 10 mmHg
increase in diastolic blood pressure (DBP) resulted in a two-fold increase in death
in this study (19). A continuous association between BP and stroke has also been
reported by the Framingham Heart Study (FHS) (119). The importance of
hypertension was clearly demonstrated by these studies as a modifiable risk factor
for stroke. These studies also emphasized the importance of decreasing BP with
the aim of reducing the incidence of stroke.
The importance of high BP as a modifiable risk factor has also been shown for
Coronary heart disease (CHD). Evidence that CHD risk increases linearly with
increases in BP has been suggested by several epidemiological studies. For
example, the strong association between high BP and CHD has been shown in
361,662 subjects who participated in the Multiple Risk Factor Intervention Trial
34 (120). The prevalence of hypertension in CHD patients was 32% in Khot et al study
(121). After total cholesterol, hypertension is considered the second most
important factor that needs to be reduced to decrease CHD-associated mortality
in the United States (122).
It has been shown that antihypertensive drugs are able to reduce the risk of CHD
and stroke. Law et al. analysed 147 randomized clinical trials to investigate the
effects of antihypertensive drugs on CV disease protection. With a reduction of 10
mmHg SBP and 5 mmHg DBP reduction, the risk of CHD and stroke were reduced
by 20% and 32%, respectively (123).
1.3.3.2 Hypertension and its relationship with risk of left ventricular hypertrophy (LVH) and heart failure
Prolonged high BP results in an increased workload on the heart, which can result
in left ventricular hypertrophy (LVH) (124). Depending on the method of
assessment, the prevalence of LVH in hypertensive patients range from 36% to 41%
as estimated in a systematic review of 30 studies (125).
The association between high BP and heart failure has been reported by several
studies. Between 1997 and 2007, a meta-analysis involving 193,424 patients from
23 hypertension trials showed that the risk of heart failure was elevated in
hypertensive patients. The heart failure rate was 8.5 events per 1,000 subjects
per year (126). Dunlay et al study suggested that hypertension The most powerful
risk factor for heart failure in the general population (127).In a cohort study, a
liner-correlation between SBP and heart failure was found in patients not receiving
antihypertensive drugs (128).
1.3.3.3 Hypertension and its relationship with kidney function
There is a close relationship between hypertension and kidney disease (129). The
regulation of BP by water and sodium excretion is a fundamentally important
physiological function of the kidneys. Hypertension is a recognised predisposing
factor for kidney dysfunction (130). Among individuals with chronic kidney disease
(CKD), the prevalence of hypertension is nearly 80% (131). African Americans show
a particularly strong relationship between essential hypertension and end-stage
renal disease (ESRD) (132). However, it is not clear if this finding can be extended
35 to other ethnic groups. However, the progression to ESRD in uncomplicated
hypertensive patients who attended the tertiary/secondary services in the
Glasgow Blood Pressure Clinic was rare (133).
1.3.3.4 Evidence for cardiovascular protection using antihypertensive agents
The CV protection provided by antihypertensive drugs has been clearly
demonstrated in several trials of BP lowering (66,134). This protection of CV risk
was shown in people of different ages and different risk profiles. Based on the BP
reduction magnitude achieved by the antihypertensive class, the risk of CV disease
reduces regardless of which drug was used (123).
Hypertensive patients whose BP is >20/10 mmHg above treatment target appear
to need a combination of antihypertensive drugs to reduce the CV risk that a single
agent is unable to provide (135,136). The Aliskiren and the calcium channel
blocker amlodipine combination as an initial treatment strategy for hypertension
control (ACCELERATE) trial suggested that initiating combination therapy had a
greater benefit than monotherapy. In this trial, a group of patients received either
aliskiren or amlodipine while another group were assigned to a combination of
these drugs at baseline. The results indicated combination therapy had greater
efficacy in reducing BP than a single agent (137). The superiority of combination
therapy has also been confirmed by an Egan et al study (138). During the first year,
the BP levels with monotherapy did not reach the reductions in BP achieved by
those who started with the combination therapy. A limitation of this study was
that it was retrospective and lacked randomisation (137).
CV risk reduction was noted to be greater for certain combinations of drugs
compared with other combinations. For instance, greater reductions of primary
endpoints (myocardial infarction, stroke, CHD, angina, CV mortality and
resuscitation after sudden cardiac arrest) were observed for a combination of
angiotensin-converting-enzyme inhibitor (ACEI) and calcium channel blocker
(CCB). This combination proved to be better than the combination of ACEI and
diuretics in the Avoiding Cardiovascular Complications in People Living with
Systolic Hypertension (ACCOMPLISH) trial. The BP reduction was slightly greater
36 in the ACEI plus CCB combination than the ACEI and diuretic combination where
the difference was only 1/1 mmHg (139).
A meta-analysis designed to investigate the effect of BP reductions on the risk of
stroke and myocardial infarction in diabetic patients analysed 73,913 patients
from 31 trials, and showed the greater protection from stroke with greater BP
reductions; however, no such correlation was observed with myocardial
infarction. The risk of stroke was significantly reduced with rigorous BP control
compared with less-tight control. No significant differences in myocardial
infarction between less-tight and tighter BP controls were shown in this study.
However, some evidence has shown that extreme BP reductions lead to increased
myocardial infarctions and other CV diseases (140).
The CV protection was equivalent between diabetic and non-diabetic patients who
received antihypertensive drugs in a meta-analysis of 157,709 patients from 27
trials. No significant difference was observed in this study between
antihypertensive classes in lowering CV disease risks (141).
A strong relationship was found between CV risk reduction and BP control in
patients with high CV risk (135). Evidence from a landmark study involving 9,297
high-risk individuals (with CV disease risk factor plus vascular disease or diabetes
mellitus) who were followed for 5 years demonstrated a significant reduction in
CV complications with ACEI compared to placebo (142). Although, any dissimilar
effects of antihypertensive classes in high-risk individuals have been investigated
in many studies, it is difficult to interpret the results of these studies because the
sample sizes were insufficient and the number of events was low (143,144).
For very elderly, antihypertensive treatment has also been shown to reduce CV
risks (145). One cohort study evaluated 3,845 individuals aged 80 years or older
who were assigned to receive diuretics with or without ACEI and followed-up for
a median of 1.8 years. The rate of stroke in this study was significantly reduced
when BP was reduced to less than the target, which was 150/80 mmHg (75). Also,
reductions in total CV risk and mortality in the elderly population with short term
BP treatments have been reported by a sub-analysis study (145).
37
1.4 Hypertension management
1.4.1 Non pharmacological treatment
1.4.1.1 Lifestyle changes
The effectiveness of lifestyle modifications in reducing blood pressure has been
demonstrated in several studies. Clinical studies show that lifestyle changes and
antihypertensive monotherapy drugs may have an equivalent effect on BP
reduction. However, the low BP levels observed in monotherapy may be the result
of low-levels of drug adherence (146). A suitable lifestyle can protect against
hypertension or delay it in normotensive people. Other advantages of lifestyle
modifications include the reduction of doses or amount of medical therapy,
prevention of the initiation of drug therapy in grade 1 hypertension and the
reduction of BP in patients already on antihypertensive drugs (147). Lifestyle
changes have also been shown to reduce CV risk (148). Such lifestyle change
includes salt restriction, weight reduction (while maintaining adequate BMI),
moderate alcohol consumption, smoking cessation, regular exercise and diet
adjustment.
1.4.1.2 Salt restriction
High salt consumption leads to an increase in extracellular fluid volume (149) and
an increase in peripheral vascular resistance (150). A causal association has been
shown between salt consumption and BP elevation. Excessive salt intake may also
result in resistant hypertension(150). Salt intake reductions have been shown in
several studies to lead to BP reductions. Greater BP reductions with salt restriction
is seen in people who are black, older, with diabetes or metabolic syndrome
(151,152). A meta-analysis of 167 studies investigated the effects of a decreased
salt intake of 120 mmol less than the usual intake (150 mmol) on BP levels in
normotensive and hypertensive Caucasian, Black and Asian patients. The
reductions of SBP/DBP were -1.27/-0.05 mmHg in normotensive Caucasian
patients, -4.02/-2.01 mmHg in Blacks, and -1.27/-1.68 mmHg in Asians. The
reductions of SBP/DBP were higher in hypertensive patients -5.48/-2.75 mmHg, -
6.44/-2.40 mmHg, and -10.21/-2.60 mmHg in Caucasians, Blacks, and Asians,
respectively (151). A meta-analysis of 34 trials reported that after adjusting for
age and ethnic groups, SBP reductions for a population with a salt-intake reduction
38 from 9–12 g/day to 6 g/day was -10.8 mmHg in hypertensive and -4.3 mmHg in
normotensive subjects (152). Salt intake reduction has also been associated with
increases of CV protection, as suggested by the Trials of Hypertension Prevention
(TOHP) (153). However, this causal relationship between dietary salt reduction
and decreased CV risk is not clear (41,154,155).
Currently the consensus public health recommendation is 5 to 6 g/day of salt
intake. Better results have been shown with further reductions of salt intake (to
3 g/day); this should be considered for the population as the long-term salt intake
target (152,156). O'Donnell et al. conclude that no evidence exists showing that
very low sodium intake or reductions of intake to a moderate level can cause harm
(157). A recent study included 133,118 participants from 49 countries showed that
high sodium intake (> 6 g/day) leads to an increase in risk of CV events and death
in hypertensive patients but not in normotensive individuals, however very low
sodium intake (< 3 g/day) was associated with an increased risk in individuals with
and without hypertension. Morning fasting urine samples have been collected in
this study to estimate 24-h urinary excretion of sodium and potassium by using the
Kawasaki formula as an alternative for daily sodium and potassium intake.
Although this method has been validated against 24-h urine collections in the
previous studies, there is about a 10% overestimation of 24-h sodium excretion,
demonstrating that the true level of sodium intake at which risk of CV events and
death changes might appear at a slightly lower of sodium intake range (158).
previous studies of healthy individuals Quality-adjusted life years have been
observed to increase with reduced salt at the manufacturing level in processed
cheeses and meats, margarine, bread and cereals. However, 80% of
commercial/manufacturing use of salt in products is hidden. A combined effort
among the public, governments and the food industry is necessary to reduce salt
intake in the overall population (159).
1.4.1.3 Weight reduction
Excess body weight is closely associated with high BP (160). Evidence from many
studies shows that weight loss is followed by a fall in BP. An average 5.1 kg weight
reduction results in a decrease of 4.4/3.6 mmHg (SBP/DBP) from meta-analysis
(161). The probability of total mortality increases with higher body mass index
39 (BMI). A meta-analysis of 57 prospective studies involving 894,576 subjects
concluded that every 5 kg/m2 of BMI above the 22.5-25 kg/m2 range leads to a
30% increase in total mortality with mortality at a minimum for this range (162).
A meta-analysis of 97 studies showed that total mortality was the lowest in
overweight subjects in the BMI range of 25 to <30, and higher mortality was
observed in all levels of obesity (163). Exercise and diet should be combined to
achieve greater weight loss and CV protection. A systematic review of 43 RCT
studies involving 3,476 individuals found greater weight loss and better CVD risk
improvement when exercise and diet were combined compared to diet alone.
Furthermore, CVD risk factors improved with exercise even when no weight
reduction occurred (164). A systematic review of 5,168 participants across 9
studies showed that combining dietary and physical activity in weight control
strategies resulted in improvements in weight and lowered diabetes incidence
among subjects with prediabetes (165). Other methods used to decrease weight,
such as anti-obesity drugs (orlistat) or bariatric surgery, also appear to reduce CV
risk (166).
1.4.1.4 Moderation of alcohol consumption
The linear relationship between regular alcohol consumption and high BP and
hypertension prevalence has been shown in several epidemiological studies (167).
Additionally, some studies have linked alcohol intake to increased risk of stroke
(168). Moderate alcohol consumption has also been attributed to low risk of
myocardial infarction (MI). The improvement in BP control was seen in treated
hypertensive patients who reduced their alcohol consumption from heavy or
moderate to low (167). The Prevention And Treatment of Hypertension Study
(PATHS) showed that a 50% reduction in alcohol consumption among moderate to
heavy consumers for six months reduced BP by 1.2/0.7mmHg in the intervention
group compared to the control group (169). Total alcohol intake in male
hypertensive patients should not exceed 14 standard drinks per week, and in
women should not exceed nine standard drinks per week (a standard drink = 14 g
of alcohol) (43).
40
1.4.1.5 Smoking cessation
Heart rate and BP measurements were high in young healthy females after
exposure to passive smoking (170). After smoking one cigarette, an acute increase
in heart rate and BP for more than 15 minutes was observed in healthy people
(171). The daily BP levels in untreated hypertensive and normotensive smokers
were higher than those in non-smokers, as noted by studies using ABPM (172,173).
However, no chronic effect of smoking on BP levels was observed with office BP
measurement (174). Smoking is associated with an increase in mortality and CV
risk (175). Thus, smoking cessation leads to increased CV protection, including
myocardial infarction, stroke and peripheral vascular disease (175–177). A
motivated patient and smoking cessation medication are two important tools that
aid patients to discontinue smoking. A minor impact on smoking rates have been
effected by simple advice (178). A meta-analysis of 36 trials noted the relatively
successful cessation rates of 1.69 (1.53–1.85) among participant smokers who took
bupropion compared to the control group at long-term follow-up (179). No
additional effect was found by adding bupropion to nicotine replacement therapy
(180). A modest benefit has been shown with use of varenicline (the partial
nicotine-receptor agonist), producing better results than bupropion and nicotine
replacement therapy in terms smoking cessation (179). However, a warning
against using varenicline has recently been issued by the Food and Drug
Administration (FDA). A side effects of varenicline have been reported with
individuals who drank alcohol such as increased drunkenness, or unusual or
aggressive behaviour. In addition, occurring seizure after using varenicline in some
subjects who had had no history of seizures(181).
1.4.1.6 Regular physical exercise
The benefit of regular aerobic physical activity in preventing hypertension and in
reducing BP, CV risk and mortality has been observed by several of epidemiological
studies. A meta-analysis of 72 clinical trials involving 3,936 inactive normotensive
and hypertensive participants showed that regardless of hypertension,
participants achieved a reduction of 6.9/4.9mmHg in SBP and DBP, respectively,
and 3.0/2.4 (SBP/DSBP) mmHg of overall resting BP with aerobic endurance
training (182). Moderate and vigorous exercise lower mortality risk by 27% and
32%, respectively, as shown in a large cohort study of 1,265,347 subjects (183). A
41 systematic review showed that inactive hypertensive patients exhibited a two-
fold increased mortality risk compared with those who participated in regular
physical activity (184). Moderate exercise of at least 30 minutes of aerobic
exercise (walking, running/jogging, swimming or cycling) for five to seven days
per week was recommended for hypertensive patients (185). The reduction of BP
and CV risk were also achieved with use of the aerobic interval training method
(186). The impact of other forms of physical activity, such as isometric and
dynamic resistance exercises, on BP values have been tested. Reductions in BP
and other metabolic risk traits were noted with use of dynamic resistance exercise
(i.e. force enlargement related with movement). Cornelissen et al. suggested that
isometric exercises (muscular force enlargement without movement) may be more
effective in reducing BP than dynamic resistance, but few isometric studies are
available (187,188).
1.4.1.7 Other dietary changes
There is strong evidence for CHD prevention with a diet based on vegetables, nuts,
Mediterranean which is type of diet, monounsaturated fatty acids and high-quality
dietary patterns in a systematic review involving 146 prospective cohort (189). BP
levels were lowered by the consumption of fruits, vegetables, low-fat dairy
products and reduced saturated fat in the Dietary Approaches to Stop
Hypertension (DASH) diet (190). The Mediterranean diet has attracted interest
from a number of studies and meta-analyses in recent years due to its ability to
protect against CV risk (191,192). Soy milk appears to reduce BP reduction more
than skimmed cows’ milk (193). Diet adjustment has even greater effect on
hypertension when accompanied with other lifestyle changes. For example, BP
reduction was 16.1/9.9 mmHg when the DASH diet, weight reduction and exercise
were combined rather than using the DASH diet alone (11.2/7.5 mm Hg) (194).
Drinking 2 to 3 cups of coffee daily has been shown to increase SBP and DBP by 3
to 14 mmHg and 4 to 13 mmHg, respectively, in normotensive people (195). The
effect of chronic coffee consumption on BP increase or the risk of hypertension
was investigated by a recent systematic review of 15 studies. No recommendation
was made in this study for or against coffee consumption associated to BP
elevation or hypertension risk because of the deficient quality of the 15 studies
(196).
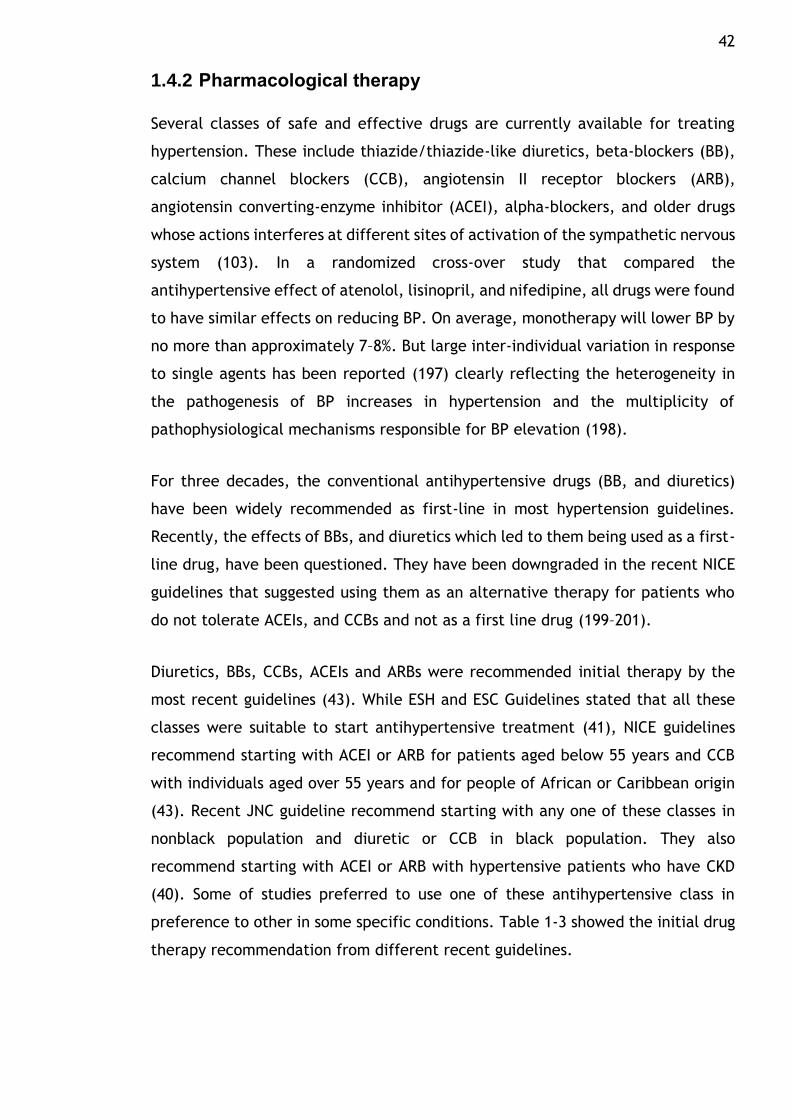
42
1.4.2 Pharmacological therapy
Several classes of safe and effective drugs are currently available for treating
hypertension. These include thiazide/thiazide-like diuretics, beta-blockers (BB),
calcium channel blockers (CCB), angiotensin II receptor blockers (ARB),
angiotensin converting-enzyme inhibitor (ACEI), alpha-blockers, and older drugs
whose actions interferes at different sites of activation of the sympathetic nervous
system (103). In a randomized cross-over study that compared the
antihypertensive effect of atenolol, lisinopril, and nifedipine, all drugs were found
to have similar effects on reducing BP. On average, monotherapy will lower BP by
no more than approximately 7–8%. But large inter-individual variation in response
to single agents has been reported (197) clearly reflecting the heterogeneity in
the pathogenesis of BP increases in hypertension and the multiplicity of
pathophysiological mechanisms responsible for BP elevation (198).
For three decades, the conventional antihypertensive drugs (BB, and diuretics)
have been widely recommended as first-line in most hypertension guidelines.
Recently, the effects of BBs, and diuretics which led to them being used as a first-
line drug, have been questioned. They have been downgraded in the recent NICE
guidelines that suggested using them as an alternative therapy for patients who
do not tolerate ACEIs, and CCBs and not as a first line drug (199–201).
Diuretics, BBs, CCBs, ACEIs and ARBs were recommended initial therapy by the
most recent guidelines (43). While ESH and ESC Guidelines stated that all these
classes were suitable to start antihypertensive treatment (41), NICE guidelines
recommend starting with ACEI or ARB for patients aged below 55 years and CCB
with individuals aged over 55 years and for people of African or Caribbean origin
(43). Recent JNC guideline recommend starting with any one of these classes in
nonblack population and diuretic or CCB in black population. They also
recommend starting with ACEI or ARB with hypertensive patients who have CKD
(40). Some of studies preferred to use one of these antihypertensive class in
preference to other in some specific conditions. Table 1-3 showed the initial drug
therapy recommendation from different recent guidelines.
43
Table 1-3: Comparisons between different recent guidelines for initial drug therapy
Guideline Population Goal BP, mm Hg Initial Drug Treatment Options
2014 Hypertension guideline
General ≥60 y <150/90 Nonblack: thiazide-type diuretic, ACEI, ARB, or CCB; black: thiazide-type diuretic or CCB
General <60 y <140/90
Diabetes <140/90
CKD <140/90 ACEI or ARB
ESH/ESC 2013
General nonelderly <140/90 Diuretic, β-blocker, CCB, ACEI, or ARB
General elderly <80 y <150/90
General ≥80 y <150/90
Diabetes <140/85 ACEI or ARB
CKD no proteinuria <140/90 ACEI or ARB
CKD + proteinuria <130/90
CHEP 2013
General <80 y <140/90 Thiazide, β-blocker (age <60y), ACEI (nonblack), or ARB
General <80 y <150/90
Diabetes <130/80
ACEI or ARB with additional CVD risk ACEI, ARB, thiazide, or DHPCCB without additional CVD risk
CKD <140/90 ACEI or ARB
ADA 2013 Diabetes <140/80 ACEI or ARB
KDIGO 2012 CKD no proteinuria ≤140/90
ACEI or ARB CKD + proteinuria ≤130/80
NICE 2011 General <80 y <140/90 <55 y: ACEI or ARB
General ≥80 y <150/90 ≥55 y or black: CCB
ISHIB 2010 Black, lower risk <135/85
Diuretic or CCB Target organ damage or CVD risk
<130/80
ADA, American Diabetes Association; CHEP, Canadian Hypertension Education Program; ESC, European Society of Cardiology; ESH, European Society of Hypertension; ISHIB, International Society for Hypertension in Blacks; JNC, Joint National Committee; KDIGO, Kidney Disease: Improving Global Outcome; NICE, National Institute for Health and Clinical Excellence. Table is reproduced from (40)
44
1.4.3 Antihypertensive classes and hypertension treatment
1.4.3.1 Beta blockers
Beta blockers are able to lower BP and reduce CV outcomes and have been
recommended as a first-choice antihypertensive drug in some hypertension
guidelines (200). A meta-analysis of nine randomized controlled trials reported a
significant association between heart rate reductions, which were achieved by
beta blockers, and increased the risk of CV events and mortality for hypertensive
individuals(202). Although, some study showed that the beneficial effect of using
beta blockers in reducing heart rate which was associated of reducing the risk of
CV events and deaths in these studies (203,204).
a greater effect of using beta blockers more than other agents was found in
patients who had recent coronary events, but a slight attenuation in stroke
reduction (17% reduction with beta blockers compared with 29% with other drugs).
the effect of using beta blockers that was similar to using other antihypertensive
agents in preventing heart failure and coronary events was reported in a recent
study of 147 randomized trials (123). Moreover, The incidence of CV outcomes was
similar when using beta blockers or ACEIs in diabetic patients who were followed
up for 20 years in the United Kingdom Prospective Diabetes Study (UKPDS), but
the reduction of all-cause mortality was greater with beta blockers (205). Also.
Retrospective observational data found that the incidence of CV outcomes was
not higher with beta blockers than with other antihypertensive drugs in a large
number of patients (206).
On the other hand, beta blockers may be worse than some drug classes but not
all. For example, The effect of BB on reducing the risk of stroke was less than that
of renin-angiotensin system (RAS) blockers and calcium antagonists , and less
effectiveness than calcium antagonists for reducing CV events and total mortality
(207). Moreover, beta blockers have been shown to be less effective in delaying
organ damage when compared with ACEIs, RAS blockers and calcium antagonists.
This decreased organ damage has been reported in left ventricular mass (208),
carotid intima-media thickness (IMT) thickening (209), aortic stiffness (210) and
artery remodelling (211–213). Also, a significant association between body weight
gain and beta blockers was noted by Sharma et al (214).
45
1.4.3.2 Diuretics
Diuretics were recommended as the only first-choice antihypertensive drug to
start hypertension treatments by the Joint National Committee (JNC) and WHO in
1977(215) and 1978(216), respectively; and continued in 2003 for both (217,218).
A recent JNC (2014) report still recommended diuretics as the initial therapy for
hypertensive patients, but it also indicated that ACEI, angiotensin-receptor
blocker (ARB) and CCB were all suitable for the initial treatment (40).
Diuretics have been recommended as a first-step treatment based on several
studies suggesting they can reduce various CV events compared with placebos.
Diuretics have a similar effectiveness on BP control compared with other classes.
Diuretics were also as effective in reducing CV outcomes as CCBs and ACEIs.
Finally, another useful aspect is that diuretics are inexpensive (219).
Recently, the choice of diuretics as a first therapy has been debated in many
studies and guidelines (219,220). For example, diuretics have been moved from
the first choice to the second choice in the recent NICE guidelines (43). The
findings from ACCOMPLISH were the main reasons for the NICE guidelines decision.
ACCOMPLISH found that the ability of calcium antagonists with ACEIs has a
diminished ability to reduce CV events compared to diuretics with the same ACEI.
However, the superiority of a calcium antagonist above a diuretic was not proven
by other randomized studies (201). Diuretics with beta blockers have been shown
to have a low tolerance and persistence when they were compared with other
classes (221,222).
Some have asked, Is chlorthalidone really better than conventional diuretics? The
NICE committee preferred to use chlorthalidone or indapamide instead of using
conventional diuretics such as hydrochlorothiazide (43). This was based on the
statement, “There is limited evidence confirming benefit of initial therapy on
clinical outcomes with low doses of hydrochlorothiazide”. However, this
statement was not supported by a number of studies (201,223). Also, the results
of meta-analyses, which showed an inferiority of hydrochlorothiazide in lowering
ambulatory BP compared with chlorthalidone and other classes, were criticised as
they were based on a limited number of trials with no head-to-head comparisons
(224,225).
46
1.4.3.3 CCBs
The effectiveness of CCB in lowering blood pressure and reducing CV morbidity
and mortality events has been confirmed by several recent large clinical trials.
Anglo-Scandinavian Cardiac Outcomes Trial-Blood Pressure Lowering Arm (ASCOT-
BPLA) showed that more major cardiovascular events were prevented with a
combination of amlodipine with perindopril than with a combination of atenolol
with thiazide (226). The superiority of a calcium antagonist above a diuretic in
reducing CV events for hypertension disease has been proven by the ACCOMPLISH
study. This study found that the ability of CCB combined with ACEI to reduce CV
events was higher than that of diuretics with the same ACEI in hypertension
patients who were at high risk for CV events (139). Although no differences were
found between the outcomes of ARB and CCB in reducing CV morbidity and
mortality in hypertensive patients, the Valsartan Antihypertensive Long-term Use
Evaluation (VALUE) study found that blood pressure was reduced more with CCB
treatment than with ARB (227). The ALLHAT study showed that black hypertensive
patients had better cardiovascular outcomes when using CCB rather than ACEI
(32). Because of greater effectiveness in reducing blood pressure and CV events,
CCBs have been recommended by most recent hypertension guidelines, as shown
in Tables 1-3.
The authors who had raised the suspicion that calcium antagonists cause a relative
excess of coronary events, have cleared the class from this suspicion. Calcium
antagonists may be more effective in preventing strokes, which has been
suggested by recent meta-analyses (123,141,228). The reason they led to
preventing strokes was not clear, and it was uncertain if it was because a slightly
better BP control is achieved by this class or because of a specific protective effect
on brain circulation (65).
Calcium antagonists appeared to be less effective than other classes in preventing
new-onset heart failure as reported by large meta-analyses. A recent meta-
analysis showed that incipient heart failure was reduced by about 20% by calcium
antagonists compared with a placebo, but calcium antagonists were inferior in
reducing heart failure when compared with other antihypertensive agents (19%
with calcium antagonists versus 24% with other antihypertensive agents) (123).
The trial design may be a reason that led the authors to conclude that calcium
47 antagonists have a lower effectiveness in preventing new-onset heart failure than
others. The design of the trials was that patients who were randomized to take
calcium antagonists needed to withdraw drugs essential in heart failure
treatment, such as diuretics, beta-blockers and ACEIs (229). Alternatively, no
inferior results were found with calcium antagonists in preventing heart failure
when compared with diuretics, beta-blockers or ACEIs in the trials designed to
allow the simultaneous use of these classes (87,89,226). A greater effectiveness
of calcium antagonists compared with beta-blockers in delaying the development
of carotid atherosclerosis and in lowering LV hypertrophy were observed by
several controlled studies (209,230).
1.4.3.4 ACEI and ARB (Renin angiotensin system (RAS) blocker)
Renin angiotensin system blockers (ACEI, ARB) have been widely recommended in
the recent hypertension guidelines table (1-3). Both antihypertensive classes have
been shown to be effective in lowering CV events and reducing blood pressure in
hypertensive patients (231). The effects of ACEI on reducing blood pressure and
CV events have been found in three large population trials to be similar to or lower
than those of diuretics, BB, or CCB. The ALLHAT study suggested that diuretics of
the antihypertensive class have a greater effect on preventing major CV risk than
that of ACEI, BB and CCB (32). The rates of fatal and non-fatal myocardial
infarction for 10985 hypertensive patients who were assigned to ACEI, or diuretics
or BB in the captopril prevention project (CAPPP) study were the same for all
antihypertensive classes. However, the rate of fatal and non-fatal stroke for
patients who were assigned to ACEI in this study was more than that of those who
were assigned to diuretics or BB (232). Hansson et al.’s study showed that the
blood pressure reduction and the rate of CV mortality for patients who received
ACEI, CCB, BB, or diuretics were similar (233). However, the superiority of RAS for
both ACEI and ARB in preventing CV risk in hypertension patients was found in two
large population trials (ASCOT-BPLA and LIFE studies). The ASCOT-BPLA study
showed that the effect of ACEI in combination with CCB on reducing the risk of CV
events in hypertensive patients was higher than that of diuretics in combination
with BB (226). The LIFE study suggested that ARB is more effective than BB at
reducing BP and cardiovascular morbidity and motility risk (31).
48 The effects of ACEI and ARB on reducing blood pressure and preventing CV events
were different in several studies. George et al.’s study showed that ACEI is more
effective at reducing blood pressure measured by ambulatory blood pressure
monitoring (ABPM) than ARB antihypertensive class (234). A meta- analysis of 20
trials including 158998 patients showed that reductions in CV events and the
overall death-rate were higher with ACEI than with ARB antihypertensive class
(235).
ACEIs appear somewhat inferior in preventing strokes according to some meta-
analyses that compared ACEIs with other antihypertensive classes (123,228,236).
However, there is a lower effectiveness of angiotensin receptor antagonists in
preventing myocardial infarction (237,238). CV outcomes were directly compared
in patients who were treated with the ramipril (ACEI) or with the telmisartan
(angiotensin receptor blocker) by the large Ongoing Telmisartan Alone and in
Combination With Ramipril Global Endpoint Trial (ONTARGET) study (239).
ONTARGET found no significant differences between telmisartan and ramipril in
the incidence of major cardiac outcomes. Also, the incidence of strokes was
similar in both therapies. The similar effect in preventing myocardial infarction
for both classes has also been confirmed by other meta-analyses (240,241). The
hypotheses of peroxisome proliferator-activated receptor (PPAR) of telmisartan
may be able to prevent the onset of diabetes more than other drugs has been
tested (242). ONTARGET found no significant difference in the incidence of new
diabetes between telmisartan and ramipril (239). Fewer new diabetes incidences
were found with telmisartan but these results were not significant in the
Telmisartan randomized assessment study in ACE-I intolerant subjects with
cardiovascular disease (TRANSCEND) and Prevention Regimen for Effectively
Avoiding Second Strokes (PROFESS) studies (91,243). The hypothesis that using
angiotensin receptor blockers may lead to an increased cancer incidence has been
raised recently (244), however, it was been not supported by a larger meta-
analysis (245).
49
1.4.4 Antihypertensive classes and specific conditions
Some of studies showed that some antihypertensive classes have inferior on other
in reducing BP with some patient’s characteristics or have ability to prevent CVD
more than other.
1.4.4.1 Age and sex
Recent NICE guidelines recommend patients younger than 55 years initiate
treatment with an ACEI, an angiotensin receptor blocker or a beta blocker, or to
initiate treatment with a CCB or diuretic for patients older than 55 years (43).
Dividing patients into groups at age 55 years has been questioned by many non-
British experts who question the evidence used to support this recommendation.
First, the evidence to support this recommendation was taken from two BP studies
that compared drugs for patients younger than 55 years (246,247). However, these
studies have been criticized by stating that they were small. Second, evidence
was drawn from a BP study that compared drugs for patients older or younger than
60 years of age (248). This study was large but there were no significant
differences between younger and older than age 60 years. Third, the
recommendation relied on data from the ASCOT-BPLA trial, which compared CCB
with ACEI versus beta blockers with diuretics for patients with a mean age of 63
years (226). Although the results were significant between drugs, the study
included data not related to the NICE line recommendation.
Moreover, the NICE guidelines ignored the results from a very large meta-analysis
published by the BP Lowering Treatment Trialists’ Collaboration. In this meta-
analysis, the benefits of various antihypertensive classes in reducing BP and
reducing the outcome ability were compared in patients older or younger than 65
years of age. This study found no differences in the effectiveness of different
classes in the younger or older patients (249). The advantageous effects of
different drugs with elderly patients have been shown in different
antihypertensive classes by a number of randomised control trials (RCTs)
performed with diuretic (75,250–252) beta-blockers (28,253), calcium antagonists
(29,233,254), ACEIs (233), and angiotensin receptor blockers (255). Recent
European Society of Hypertension (ESH) and European Society of Cardiology (ESC)
Guidelines recommended using any one of these antihypertensive classes for
50 elderly patients, or calcium antagonists and diuretics for elderly patients who
have Isolated systolic hypertension (ISH) (41).
ACEIs, calcium antagonists, angiotensin receptor blockers or diuretics/beta-
blockers have been compared by 31 RCTs to determine which is more effective in
reducing BP in one sex over the other. However, no differences in BP reductions
were found between these classes (256).
1.4.4.2 Diabetes mellitus
A meta-analysis showed that all antihypertensive classes can be used in diabetes
mellitus patients (141). RAS blockers exhibited a greater effect at reducing
albuminuria compared to a placebo and other antihypertensive drugs as shown in
several RCTs in patients with diabetic nephropathy, non-diabetic nephropathy or
CVD (257–259). Also, RAS blockers have been shown to be effective in protection
against incident microalbuminuria. For these reasons, RAS blockers have been
recommended for use with diabetes mellitus, especially in patients who have
proteinuria or microalbuminuria, and in hypertensive patients with nephropathy
(41).
1.4.4.3 Metabolic syndrome
RAS blockers and calcium antagonists are preferred for metabolic syndrome
because these treatments have been shown to improve insulin sensitivity, or at
least not worsen it. However, beta blockers (except for the vasodilating effects)
have been shown to worsen insulin sensitivity (260–262). Because hypokalaemia
worsens insulin sensitivity (263), potassium-sparing agents should be used in
association with diuretics in metabolic syndrome to prevent hypokalaemia, which
may result from diuretic side effects (262).
1.4.4.4 Cerebrovascular disease (Stroke prevention)
A slightly greater effectiveness of calcium antagonists in preventing stroke were
suggested by meta-analyses and meta-regression analyses. As stroke prevention is
the most consistent benefit of antihypertensive therapy, and has been observed
in almost all large RCTs using different drug regimens, all regimens are considered
acceptable for stroke prevention provided that BP is effectively reduced (264).
51 Meta-analyses and meta-regression analyses suggest that calcium antagonists may
have a slightly greater effectiveness on stroke prevention (123,228,236) However,
the incidence of stroke has also been reduced by using diuretics or a combination
of diuretics and ACEIs (86,92). Meta-analyses and single trials found that ARBs
have a greater effectiveness on cerebrovascular protection than other
antihypertensive agents (240,265). All of these medicines are acceptable for
stroke protection, on the condition that BP is effectively decreased.
1.4.4.5 Heart disease
I. Coronary heart disease
A greater protective effect of beta-blockers has been reported after recent
myocardial infarctions in patients with a clinical history of CHD (123). Highly
beneficial effects of an ACEI have been shown with acute myocardial infarctions
(266,267). All antihypertensive drugs have similar effects in cases of other CHDs
(123).
II. Heart failure
ACEIs, diuretics and beta blockers prevent heart failure better than calcium
antagonists (236). In ALLHAT, diuretics showed a greater effectiveness in
preventing heart failure than an ACEI, but this may have resulted from a study
design that depended on the initial diuretic withdrawal, which could lead to a
small excess of early heart failure incidences (32). Hospitalizations for heart
failure were not reduced in patients taking ARBs below the levels of placebo
patients according to the PROFESS and TRANSCEND trials (91,243). In patients with
heart failure or sever left ventricular dysfunction (LVD), it is preferable to use
BBs, ACEIs, ARBs and/or mineralocorticoid receptor antagonists to reduce
hospitalization and mortality (268).
III. Left ventricular hypertrophy
Randomized comparative studies found greater effects of ARBs, ACEIs and calcium
antagonists in LVH reduction than with beta-blockers, but they have similar BP
reductions (230).
52 IV. Atherosclerosis
Atherosclerosis progression has been delayed with calcium antagonists and ACEIs
to a greater extent than with diuretics and beta-blockers (209,269).
V. Peripheral artery disease (PAD)
The advantages of ACEIs was shown in more than 4,000 patients with peripheral
artery disease (PAD) who had enrolled in the Heart Outcomes Prevention
Evaluation (HOPE) study (142). The Appropriate Blood pressure Control in Diabetes
(ABCD) showed that a major benefit benefits of calcium antagonists or ACEIs for
PAD patients who had intensive BP reductions (<130/80 mm Hg) (270).
VI. Increased arterial stiffness
Pulse wave velocity (PWV), which measures arterial stiffness, was reduced by
ACEIs and ARBs in a meta-analysis and meta-regression analysis (271,272).
However, the superiority of ACEIs and ARBs to other antihypertensive drugs in
reducing arterial stiffness is not clear due to the lack of properly powered and
high-quality RCTs.
53
1.4.5 Initial drug recommendations in the NICE guidelines
Step one provides treatment guidelines for 80-year-old individuals with stage one
hypertension (as defined in NICE guideline) if they exhibit one or more of the
following factors: target organ damage, established CVD, renal disease, diabetes,
and 10-year cardiovascular risk equivalent to 20% damage or more. In addition, it
provides guidelines for stage two hypertensive people of any age. For patients
aged below 55 years, an ACEI or a low-cost ARB is prescribed and they should not
be combined. A low-cost ARB is prescribed in place of an ACEI, if the ACEI is not
tolerated by the patient. For individuals aged over 55 years and for people of
African or Caribbean origin irrespective of age, a CCB is prescribed and substituted
with a thiazide-like diuretic if the CCB is not tolerated. A thiazide-like diuretic
such as chlorthalidone or indapamide is replaced by a conventional thiazide
diuretic such as bendroflumethiazide or hydrochlorothiazide if treatment with a
thiazide is being started, or changed. However, it is preferred to continue with a
thiazide for people with a stable and controlled BP. Although a beta-blocker is not
recommended in step one, it may be considered for younger patients who are
started on an ACEI or an ARB and if it is not suitable due to contraindication or
intolerance, and for women who could potentially become pregnant.
In step one, a combination of either an ACEI or ARB with a CCB is prescribed for
people with uncontrolled BP. A CCB is substituted with a thiazide-like diuretic if
the CCB is not suitable. An ARB is preferred to an ACE in the case of individuals of
African or Caribbean origin. A CCB in preferred to a thiazide-like diuretic in the
case of people using a beta-blocker to decrease the risk of developing diabetes.
In step three, a thiazide-like diuretic is added to a combination of CCB and either
an ACEI or ARB if the BP is not yet under control. In step four (if the BP is not yet
under control), a spironolactone low-dose (25 mg once daily) is prescribed as the
fourth medication if the blood potassium level is ≤4.5 mmol/l or a higher-dose
thiazide-like diuretic is prescribed if the blood potassium level is >4.5 mmol/l, in
addition to the drugs in step three. Blood levels of sodium and potassium and renal
function should be monitored within one month and repeated as needed for
further therapy with a diuretic. An alpha- or beta-blocker is considered in place
of the additional diuretic in case of contraindication or ineffectiveness (43). Figure
1-3 illustrate NICE recommendation.
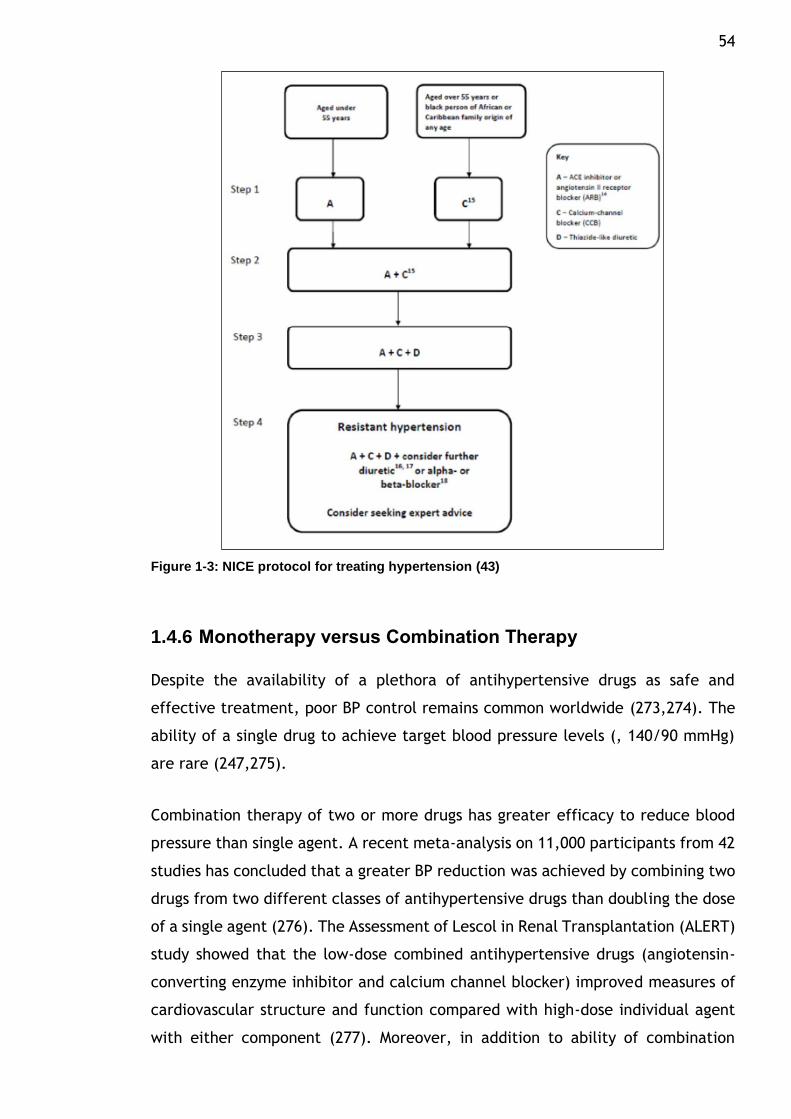
54
Figure 1-3: NICE protocol for treating hypertension (43)
1.4.6 Monotherapy versus Combination Therapy
Despite the availability of a plethora of antihypertensive drugs as safe and
effective treatment, poor BP control remains common worldwide (273,274). The
ability of a single drug to achieve target blood pressure levels (, 140/90 mmHg)
are rare (247,275).
Combination therapy of two or more drugs has greater efficacy to reduce blood
pressure than single agent. A recent meta-analysis on 11,000 participants from 42
studies has concluded that a greater BP reduction was achieved by combining two
drugs from two different classes of antihypertensive drugs than doubling the dose
of a single agent (276). The Assessment of Lescol in Renal Transplantation (ALERT)
study showed that the low-dose combined antihypertensive drugs (angiotensin-
converting enzyme inhibitor and calcium channel blocker) improved measures of
cardiovascular structure and function compared with high-dose individual agent
with either component (277). Moreover, in addition to ability of combination
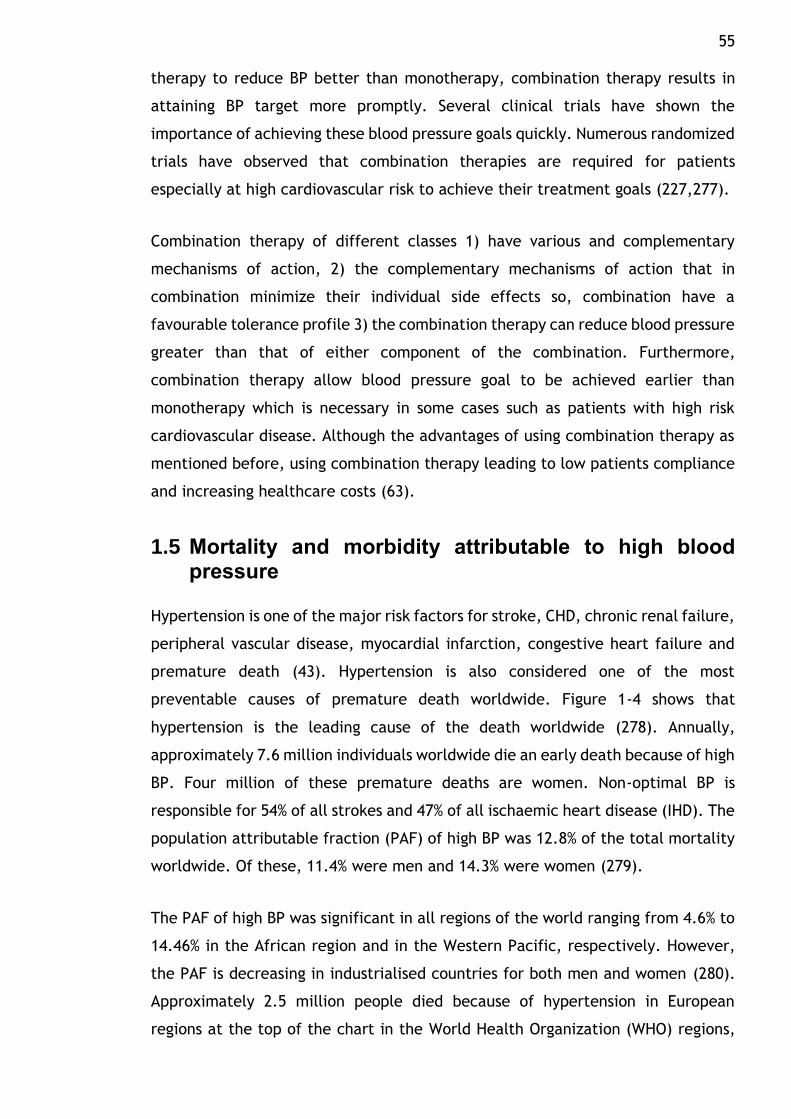
55 therapy to reduce BP better than monotherapy, combination therapy results in
attaining BP target more promptly. Several clinical trials have shown the
importance of achieving these blood pressure goals quickly. Numerous randomized
trials have observed that combination therapies are required for patients
especially at high cardiovascular risk to achieve their treatment goals (227,277).
Combination therapy of different classes 1) have various and complementary
mechanisms of action, 2) the complementary mechanisms of action that in
combination minimize their individual side effects so, combination have a
favourable tolerance profile 3) the combination therapy can reduce blood pressure
greater than that of either component of the combination. Furthermore,
combination therapy allow blood pressure goal to be achieved earlier than
monotherapy which is necessary in some cases such as patients with high risk
cardiovascular disease. Although the advantages of using combination therapy as
mentioned before, using combination therapy leading to low patients compliance
and increasing healthcare costs (63).
1.5 Mortality and morbidity attributable to high blood pressure
Hypertension is one of the major risk factors for stroke, CHD, chronic renal failure,
peripheral vascular disease, myocardial infarction, congestive heart failure and
premature death (43). Hypertension is also considered one of the most
preventable causes of premature death worldwide. Figure 1-4 shows that
hypertension is the leading cause of the death worldwide (278). Annually,
approximately 7.6 million individuals worldwide die an early death because of high
BP. Four million of these premature deaths are women. Non-optimal BP is
responsible for 54% of all strokes and 47% of all ischaemic heart disease (IHD). The
population attributable fraction (PAF) of high BP was 12.8% of the total mortality
worldwide. Of these, 11.4% were men and 14.3% were women (279).
The PAF of high BP was significant in all regions of the world ranging from 4.6% to
14.46% in the African region and in the Western Pacific, respectively. However,
the PAF is decreasing in industrialised countries for both men and women (280).
Approximately 2.5 million people died because of hypertension in European
regions at the top of the chart in the World Health Organization (WHO) regions,
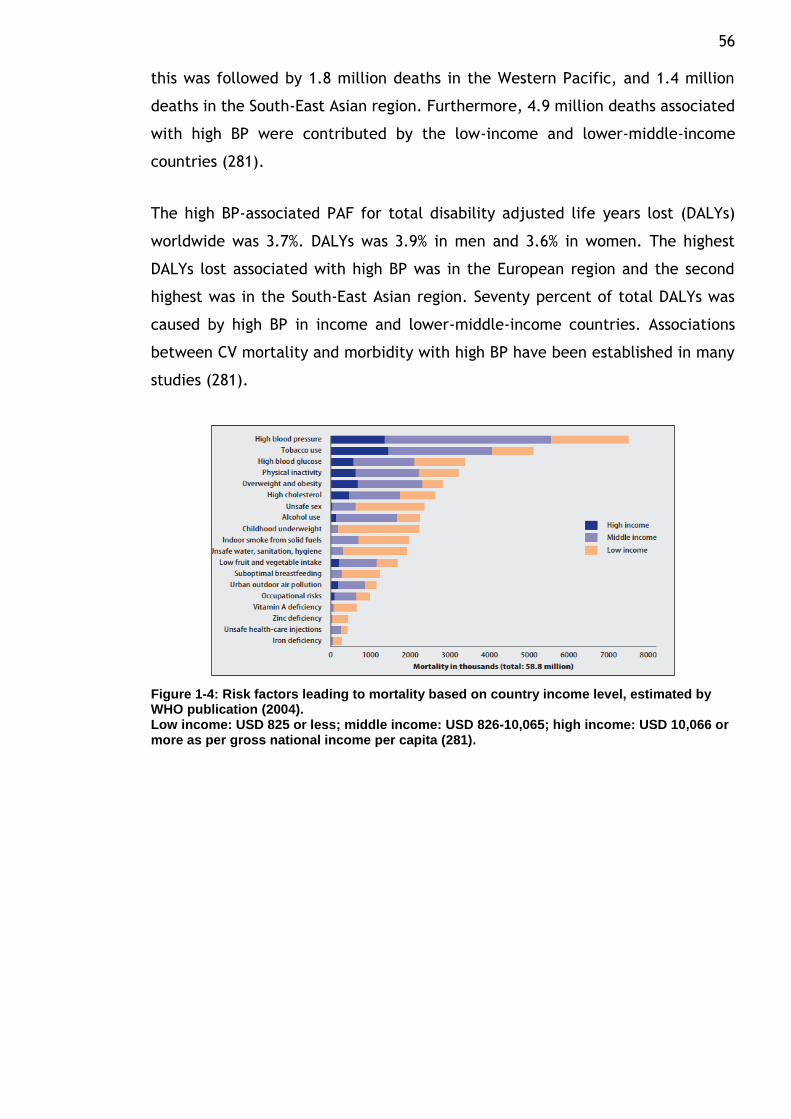
56 this was followed by 1.8 million deaths in the Western Pacific, and 1.4 million
deaths in the South-East Asian region. Furthermore, 4.9 million deaths associated
with high BP were contributed by the low-income and lower-middle-income
countries (281).
The high BP-associated PAF for total disability adjusted life years lost (DALYs)
worldwide was 3.7%. DALYs was 3.9% in men and 3.6% in women. The highest
DALYs lost associated with high BP was in the European region and the second
highest was in the South-East Asian region. Seventy percent of total DALYs was
caused by high BP in income and lower-middle-income countries. Associations
between CV mortality and morbidity with high BP have been established in many
studies (281).
Figure 1-4: Risk factors leading to mortality based on country income level, estimated by WHO publication (2004). Low income: USD 825 or less; middle income: USD 826-10,065; high income: USD 10,066 or more as per gross national income per capita (281).
57
1.6 Global burden of hypertension
1.6.1 Hypertension prevalence in the worldwide
Kearney and colleagues estimated that 972 million (26.4%) of the global adult
population had hypertension in 2000. The number of people with hypertension in
economically developed and developing countries were 333 and 639 million,
respectively. The population of individuals with hypertension is estimated to be
1.56 billion (29.2%) in 2025: 413 million in developed countries and 1.15 billion in
developing regions. Although the prevalence of hypertension in developing
countries was higher than that in developed countries according to the report by
Kearney and colleagues, which included years 1980–2002 (282), studies published
from 2001 through 2007 showed no significant difference in the prevalence of
hypertension between those countries. However, the prevalence of hypertension
in men of developing countries was lower than that in developed countries by 6.5%
(283).
The World Health Organization published a study on the prevalence of
hypertension in 189 different countries in 2009. The age-standardised prevalence
of hypertension in men aged ≥25 years was found to be the lowest (17%) and
highest (50%) in United States of America and Niger, respectively. Hypertension
prevalence in women of the same age group was found to be the lowest (13.1%)
and highest (42.4%) in Republic of Korea and Sao Tome and Principe, respectively
(284). The prevalence of hypertension among adult men and women (aged 18 and
above) in WHO-member countries is summarised in Figures 1-5.
A study by Kearney and colleagues published in 2004 showed that the lowest
hypertension prevalence rates in both men and women were in rural India: 3.4%
and 6.8%, respectively, and the highest rates in both men and women were in
Poland: 68.9 and 72.5%, respectively (285). Progress in economic development,
increased globalisation, demographic changes in populations, reduction in
physical activity, and increase in food availability are considered the major factors
contributing to this rapid increase in hypertension (286).
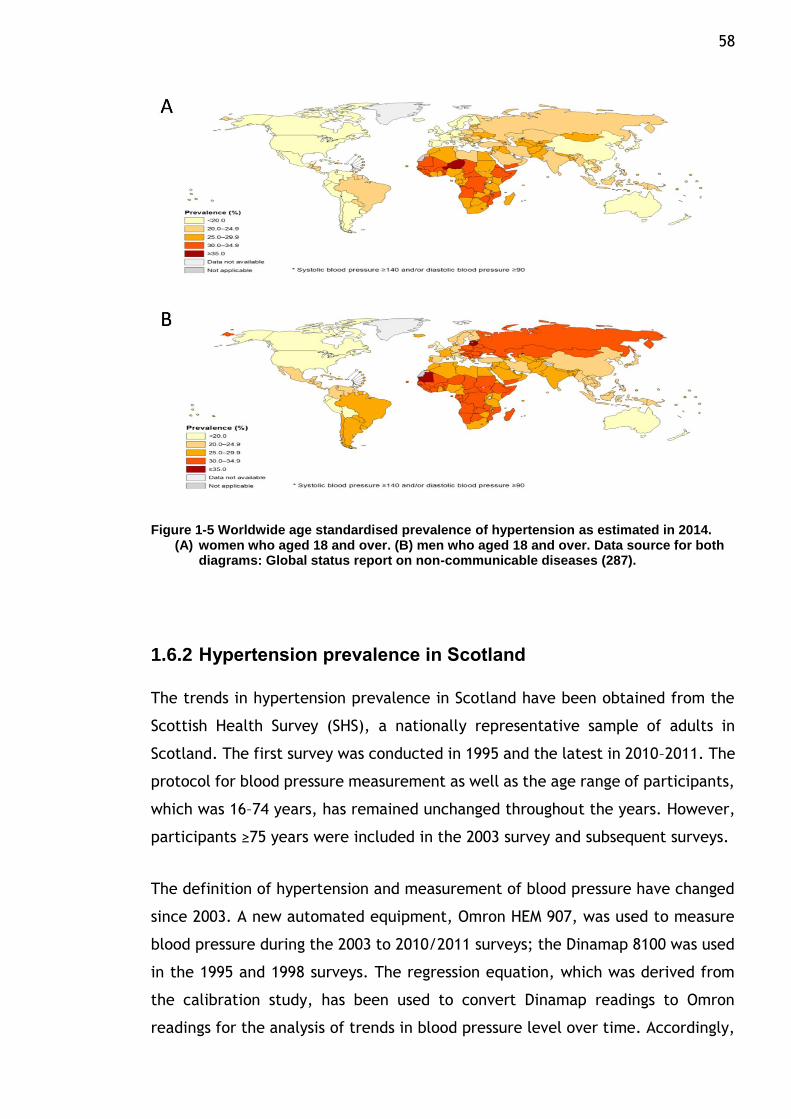
58
Figure 1-5 Worldwide age standardised prevalence of hypertension as estimated in 2014. (A) women who aged 18 and over. (B) men who aged 18 and over. Data source for both
diagrams: Global status report on non-communicable diseases (287).
1.6.2 Hypertension prevalence in Scotland
The trends in hypertension prevalence in Scotland have been obtained from the
Scottish Health Survey (SHS), a nationally representative sample of adults in
Scotland. The first survey was conducted in 1995 and the latest in 2010–2011. The
protocol for blood pressure measurement as well as the age range of participants,
which was 16–74 years, has remained unchanged throughout the years. However,
participants ≥75 years were included in the 2003 survey and subsequent surveys.
The definition of hypertension and measurement of blood pressure have changed
since 2003. A new automated equipment, Omron HEM 907, was used to measure
blood pressure during the 2003 to 2010/2011 surveys; the Dinamap 8100 was used
in the 1995 and 1998 surveys. The regression equation, which was derived from
the calibration study, has been used to convert Dinamap readings to Omron
readings for the analysis of trends in blood pressure level over time. Accordingly,
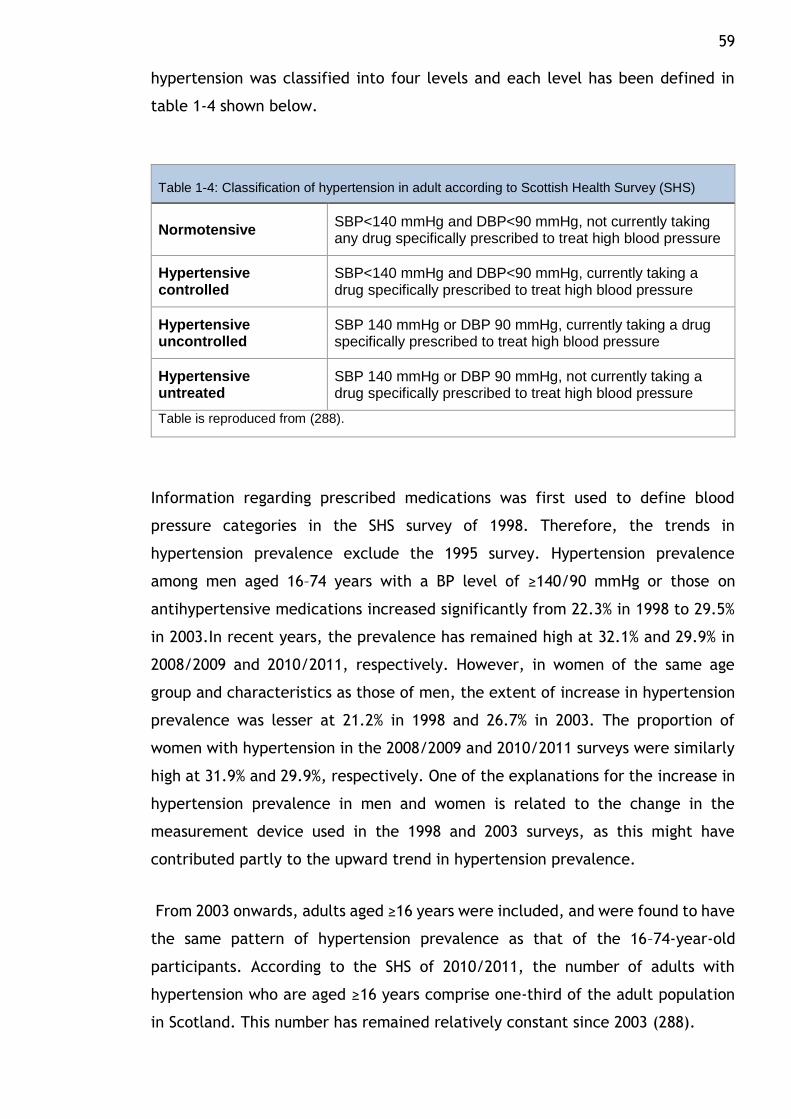
59 hypertension was classified into four levels and each level has been defined in
table 1-4 shown below.
Table 1-4: Classification of hypertension in adult according to Scottish Health Survey (SHS)
Normotensive SBP<140 mmHg and DBP<90 mmHg, not currently taking any drug specifically prescribed to treat high blood pressure
Hypertensive controlled
SBP<140 mmHg and DBP<90 mmHg, currently taking a drug specifically prescribed to treat high blood pressure
Hypertensive uncontrolled
SBP 140 mmHg or DBP 90 mmHg, currently taking a drug specifically prescribed to treat high blood pressure
Hypertensive untreated
SBP 140 mmHg or DBP 90 mmHg, not currently taking a drug specifically prescribed to treat high blood pressure
Table is reproduced from (288).
Information regarding prescribed medications was first used to define blood
pressure categories in the SHS survey of 1998. Therefore, the trends in
hypertension prevalence exclude the 1995 survey. Hypertension prevalence
among men aged 16–74 years with a BP level of ≥140/90 mmHg or those on
antihypertensive medications increased significantly from 22.3% in 1998 to 29.5%
in 2003.In recent years, the prevalence has remained high at 32.1% and 29.9% in
2008/2009 and 2010/2011, respectively. However, in women of the same age
group and characteristics as those of men, the extent of increase in hypertension
prevalence was lesser at 21.2% in 1998 and 26.7% in 2003. The proportion of
women with hypertension in the 2008/2009 and 2010/2011 surveys were similarly
high at 31.9% and 29.9%, respectively. One of the explanations for the increase in
hypertension prevalence in men and women is related to the change in the
measurement device used in the 1998 and 2003 surveys, as this might have
contributed partly to the upward trend in hypertension prevalence.
From 2003 onwards, adults aged ≥16 years were included, and were found to have
the same pattern of hypertension prevalence as that of the 16–74-year-old
participants. According to the SHS of 2010/2011, the number of adults with
hypertension who are aged ≥16 years comprise one-third of the adult population
in Scotland. This number has remained relatively constant since 2003 (288).
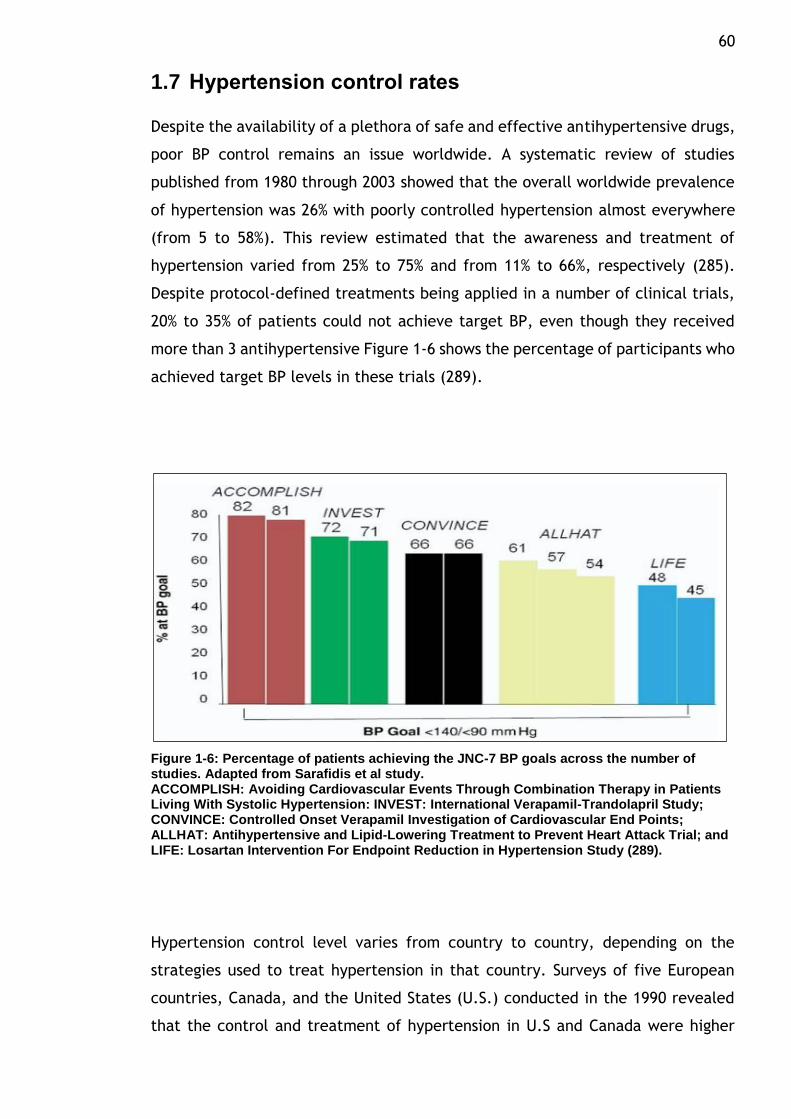
60
1.7 Hypertension control rates
Despite the availability of a plethora of safe and effective antihypertensive drugs,
poor BP control remains an issue worldwide. A systematic review of studies
published from 1980 through 2003 showed that the overall worldwide prevalence
of hypertension was 26% with poorly controlled hypertension almost everywhere
(from 5 to 58%). This review estimated that the awareness and treatment of
hypertension varied from 25% to 75% and from 11% to 66%, respectively (285).
Despite protocol-defined treatments being applied in a number of clinical trials,
20% to 35% of patients could not achieve target BP, even though they received
more than 3 antihypertensive Figure 1-6 shows the percentage of participants who
achieved target BP levels in these trials (289).
Figure 1-6: Percentage of patients achieving the JNC-7 BP goals across the number of studies. Adapted from Sarafidis et al study. ACCOMPLISH: Avoiding Cardiovascular Events Through Combination Therapy in Patients Living With Systolic Hypertension: INVEST: International Verapamil-Trandolapril Study; CONVINCE: Controlled Onset Verapamil Investigation of Cardiovascular End Points; ALLHAT: Antihypertensive and Lipid-Lowering Treatment to Prevent Heart Attack Trial; and LIFE: Losartan Intervention For Endpoint Reduction in Hypertension Study (289).
Hypertension control level varies from country to country, depending on the
strategies used to treat hypertension in that country. Surveys of five European
countries, Canada, and the United States (U.S.) conducted in the 1990 revealed
that the control and treatment of hypertension in U.S and Canada were higher
61 than that in Europe. Based on a threshold level of 140/90 mmHg, the hypertension
control rate was one-third of patients in U.S and Canada, compared with 5% to
10% in the European regions, and according to a BP threshold of 160/95 mmHg,
the control rate was 49% to 66% in the North America compared with 23% to 38%
in Europe. This variation of hypertension control in these countries reflected the
differences in the treatment guidelines and diagnosis of hypertension among these
countries (290).
In 2009–2011, the hypertension control rate in the U.S. was 40.3% for men and
56.3% for women. An improvement in the awareness, management, and control of
hypertension was observed from 1999 to 2010. However, these indices did not
improve from 2007 to 2010. The improvement in hypertension control have been
explained by the increased efforts of several national initiatives, such as strong
campaigning of programs, guidelines, and policies to simplify the detection,
awareness, treatment, and control of hypertension in the US (291).
Among the nations of the United Kingdom (U.K.), hypertension control rate is
higher in England than in Scotland. The control rate in Scotland was 53% compared
with 60% in England in 2011(288,292). An improvement of hypertension control
rate has been observed in England over time; however, the control rate has
remained constant in Scotland since 2003. The improvement in England can be
attributed to an increase in patients taking more than two antihypertensive drugs
in recent years (293).
1.8 Resistant HTN
Resistant HTN is a phrase used to describe hypertensive patients whose blood
pressure remains over treatment goal despite the concomitant use of a three drug
regimen of different antihypertensive classes one of which is a diuretic. This
definition of Resistant HTN is somewhat arbitrary with regard to the number of
medications required(294).
In an analysis of National Health and Nutrition Examination Survey (NHANES)
participants, only 53% of treated participants were at goal blood pressure (295).
A cross-sectional analysis of Framingham Heart Study showed that only 48% of
treated participants achieved a reduction in blood pressure of under 140/90 mm
62 Hg. Fewer than 40% of elderly participants aged over 75 years had their blood
pressure controlled (296).
The proportion of poorly controlled BP in diabetes mellitus or chronic kidney
disease (CKD) is higher than other high risk populations, and these are the groups
for whom guidelines recommend the application of the lower goal BP. NHANES
showed 37% of participants with chronic kidney disease achieved a reduction in BP
of <130/80 mm Hg (297) and only 25% of diabetes participants achieved a
reduction in BP of <130/85 mm (295).
Uncontrolled hypertension may be secondary to poor drug adherence and/or an
insufficient drug regimen. It also includes those with true treatment resistance.
There is evidence that uncontrolled hypertension can be explained by true
treatment resistance. For instance, according to a study surveying 10,017
hypertension patients, an estimated 30% of those treated took one
antihypertensive drug, 40% took two antihypertensive drugs and 30% took three or
more antihypertensive drugs(298).
In the ALLHAT study, a large number of participants (>33 000) from different
ethnic backgrounds (47% female, 35% African American, 19% Hispanic and 36% of
people with diabetes), after approximately five years of follow-up, 34% of
participants remained poorly BP control and were on an average of two
antihypertensive drugs. Approximately 50% of participants needed three or more
antihypertensive drugs to achieve target BP. However, this percentage might
overestimate or underestimate the degree of treatment resistance due to the
inclusion criteria and the restrictions posed by the study treatment protocols (32).
1.9 Factors influencing BP control
Age, gender, and ethnicity are factors influencing BP control (295,296,299–301).
Other factors contributing to uncontrolled hypertension include the following:
non-compliance to prescribed therapy, which is considered one of the most
common reasons for uncontrolled hypertension; inappropriate measurement
method; white-coat effect; lifestyle (BMI, alcohol intake, dietary salt, etc.); drug-
related causes (e.g. non-steroidal anti-inflammatory agents (NSAIDs)); secondary
hypertension (294,302,303). Others causes are shown in table 1-5 (289). The
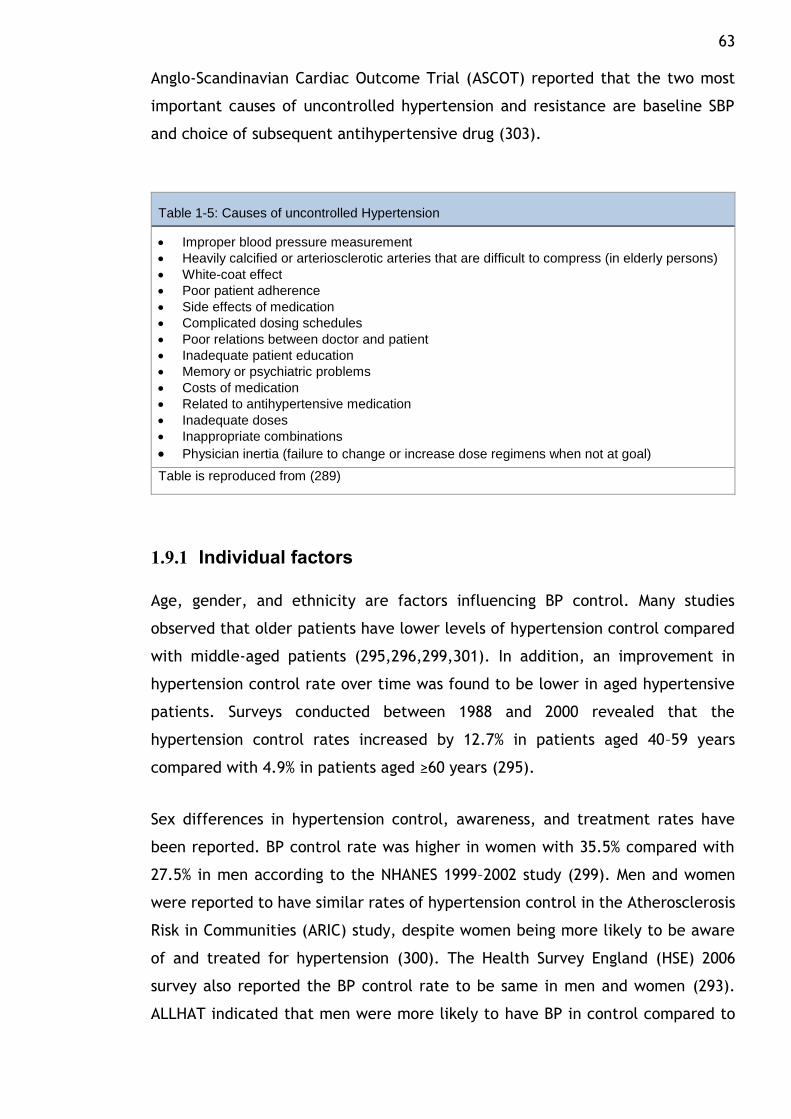
63 Anglo-Scandinavian Cardiac Outcome Trial (ASCOT) reported that the two most
important causes of uncontrolled hypertension and resistance are baseline SBP
and choice of subsequent antihypertensive drug (303).
Table 1-5: Causes of uncontrolled Hypertension
Improper blood pressure measurement
Heavily calcified or arteriosclerotic arteries that are difficult to compress (in elderly persons)
White-coat effect
Poor patient adherence
Side effects of medication
Complicated dosing schedules
Poor relations between doctor and patient
Inadequate patient education
Memory or psychiatric problems
Costs of medication
Related to antihypertensive medication
Inadequate doses
Inappropriate combinations
Physician inertia (failure to change or increase dose regimens when not at goal)
Table is reproduced from (289)
1.9.1 Individual factors
Age, gender, and ethnicity are factors influencing BP control. Many studies
observed that older patients have lower levels of hypertension control compared
with middle-aged patients (295,296,299,301). In addition, an improvement in
hypertension control rate over time was found to be lower in aged hypertensive
patients. Surveys conducted between 1988 and 2000 revealed that the
hypertension control rates increased by 12.7% in patients aged 40–59 years
compared with 4.9% in patients aged ≥60 years (295).
Sex differences in hypertension control, awareness, and treatment rates have
been reported. BP control rate was higher in women with 35.5% compared with
27.5% in men according to the NHANES 1999–2002 study (299). Men and women
were reported to have similar rates of hypertension control in the Atherosclerosis
Risk in Communities (ARIC) study, despite women being more likely to be aware
of and treated for hypertension (300). The Health Survey England (HSE) 2006
survey also reported the BP control rate to be same in men and women (293).
ALLHAT indicated that men were more likely to have BP in control compared to
64 women (304). In the Scotland survey of 2010/2011, the overall hypertension
control rate was similar in men and women. Hypertension control rates were the
highest for men aged 75 years among different ages, while it was the lowest for
women of this age (288).
Several studies have reported that hypertension control levels are lower in
African-Americans than in Caucasians (300,304,305). In contrast, according to the
NHANES data of 1992–2002, non-Hispanics and African-Americans had a similar
rate of hypertension control (299). Low rates of hypertension control, awareness,
and treatment were more common in Mexican-Americans than in other ethnic
groups. Only 17% of Mexican-Americans had their hypertension controlled;
however, this result may not be accurate because of a large sampling error (299).
1.9.2 Existing comorbidities
The association between poor BP control and high BMI has been confirmed by
several studies. Lloyd et al. reported that high BMI contributed to poor rates of
SBP control in 1,189 hypertensive patients treated with antihypertensive drugs,
only 49.0% of whom achieved their SBP targets (296). In Sandoval et al.’s study,
only 59.7% of 1,194 hypertensive patients reached their BP goals, and high BMI
was one of factors influencing poor BP control (306). Chmiel et al. found that BMI
was an independent factor strongly related to high BP in uncontrolled
hypertension patients (307). The probability of having BP controlled decreased by
30% in hypertensive patients with BMIs over 30 kg/m2 according to Diabetes
Cardiovascular Risk-Evaluation: Targets and Essential Data for Commitment of
Treatment (DETECT), a study that surveyed 55,518 individuals (308). The
relationship between uncontrolled BP and BMI was also found at just above 25
kg/m2 in Abaci et al.’s study (309).
Associations between CVD, diabetes mellitus (DM) and CKD and uncontrolled BP
have been found in several studies. Diabetes is the most independent comorbidity
frequently associated with uncontrolled BP. Older hypertensive patients receiving
more than one antihypertensive agent were the primary focus of these studies.
Patients in these studies exhibited high baseline BP and long-established
hypertension (296,310–316). The relationship between longstanding hypertension
and poor BP control in hypertensive patients was also demonstrated in Kim et al.’s
65 study (314). However, some studies reported that hypertensive patients with CVD
and DM had optimal controlled BP (317,318), or that CVD had good BP control and
DM had no ill effects or poor control on BP (306,308,319). Some found that the BP
control for hypertensive patients with DM and CVD was better than for those with
DM alone (320). Petersen et al. suggested that the quality of care provided to
hypertensive individuals with comorbidity influenced BP control, and that the care
of these patients was better than that given to patients without comorbidities
(321).
Multi-antihypertensive drugs can be independent predictors of poor BP control, as
shown in some survey studies (322,323). Dennison et al. found that hypertensive
patients who received few antihypertensive drugs had BP below 140/90 (324).
However, no association was found in Hedblad et al.’s study between BP reduction
and the number of antihypertensive drugs (325).
1.9.3 Social and economic conditions
Interest in the influence of socioeconomic conditions on health has been growing.
A complex consideration, these conditions include intersecting factors such as
occupation, income, place of residence and education (326). Between 1990 and
2000, 3.5 million deaths in Europe were determined by Mackenbach et al. to be
due to selected causes including hypertension (327). Differences in healthy habits
and access to healthcare over socioeconomic status may lead to inequalities in
the rate of deaths. Kagamimori et al. suggested that health in Japan is less
effected by socioeconomic status than in Western countries due to Japan’s smaller
socioeconomic inequalities (328). Even though the National Health and Nutrition
Examination Survey (NHANES)’s data reported that the prevalence of uncontrolled
BP declined between 1999 and 2010, the rate of lower income individuals with
uncontrolled hypertension was higher than that among other income groups (329).
Hypertensive patients with the lowest income poverty income ratio (PIR) <1 (PIR,
used to measure family income based on family size) were found to be less likely
to have good BP control according to NHANES 1999 to 2004 (312). Low
socioeconomic status has been shown to relate to increases of other CVD as well,
such as stroke.
66 The association between education level and BP control has been evaluated in a
number of studies (306,330–332). According to patient information (5,260
hypertensive patients from 184 general practices) in Paulsen et al.’s study, BP
control is higher among those with high-level education (>10-year education) than
among those with low-level education (<10-year education) (319). The same
results were found in Sandoval et al.’s study, which reported that poor BP control
was associated with lower levels of education (306). Between 1986 and 1994, the
National Health Interview Survey was conducted to estimate the specific causes
of mortality. Wong et al. showed that life years lost were higher by 3.5 times
among individuals with low-level education compared to those with high-level
education. Hypertension contributed 3.5% to the disparity in death according to
education (333).
Other social factors, such as whether patients lived alone, have been found to
hinder the achievement of BP targets. One study recruited 222 subjects from
outpatient clinics (316). BP control among single patients was compared to that
of those with partners; poor BP was much more prevalent among the single
individuals (319). Patients who lived in inner regional areas exhibited better BP
control than those who lived in major cities, as shown in a longitudinal study of
6,010 individuals (334).
1.9.4 Physician-related factors
Positive physician performance is essential to achieving optimal BP control (335).
Clinical inertia, which refers to the lack of therapy initiation and/or
intensification in patients with high BP readings, physician communication skills
and the physician’s acknowledgment have been associated with BP control
(336,337). Clinical inertia has been reported as a barrier to achieving BP targets
in primary care settings. Antihypertensive drugs are not intensified by physicians
in 20 to 45% of clinical visits from hypertensive individuals with high BP (336,338–
340). Even when SBP levels among 169 patients were observed to be above BP
targets (>140 mmHg), physicians did not intensify the treatments (335). This lack
of therapy intensification occurs in 16 to 30% of consultations by physicians who
observe above-target BP in their patients (336). Viera et al. revealed that 53% of
the BP targets among 3,742 hypertensive patients continually treated in primary
care were poor. Only 46% of them were given intensified treatment by physicians,
67 despite their above-target BP levels (341). A positive association between
treatment intensification and good BP control has been reported by Hicks et al.
(342). Some physicians prefer to keep patients with the same antihypertensive
treatments, even when their BP are high, before intensifying their therapy to give
the drugs adequate chance to reach their full effect (337).
Clinical guidelines have been produced to assist physicians in making correct
decisions about suitable hypertension treatment, to reduce variation in clinical
practices and to measure the quality of care(343,344). The purpose of such
guidelines is to enhance the outcomes of hypertensive patients by a change in
physician practices based on evidence (345,346). Many studies have shown the
adherence of physicians to hypertension guidelines to be low (347–351). This could
be due in part to differences between drug establishment recommendations and
BP goals and the criteria used by physicians when commencing treatment
(136,339,352–357). However, some studies have found that physicians are more
likely to use clinical guidelines for hypertension management (358–360). In
response, physicians have argued that universal prescriptions and ‘one size fits
all’ prescription attitudes present in the clinical guidelines can restrict medical
autonomy and may not apply to all scales of hypertensive subjects
(353,354,361,362). It should be noted that most methodologies used to measure
physician adherence to clinical guidelines are limited, and thus underestimate
results (363). The measurement of physician adherence to the former guidelines
is difficult to estimate because of a lack of a universal standard (364–366).
Communication between physicians and patients is necessary to improve BP
control. Instructions given by physicians to patients during clinical visits have been
observed to affect patient adherence to antihypertensive drugs (367,368). In
Qureshi et al.’s study, general practitioners attended a programme about
hypertension. This programme provided standard hypertension treatment based
on recent guidelines and information about the best communication skills to
improve BP targets. BP levels were lower in patients who received care from
trained general practitioners compared to those who received usual care(369).
68
1.9.5 Health system factors
Health service performance and access to healthcare have been associated with
hypertension management and BP control. Access to services includes service use
and healthcare supply (370). Hypertensive patients with insurance were more
likely to have BP controlled than those without insurance, according to an NHANES
survey conducted between 1999 and 2002 (371). In addition, BP control was better
in health-insured patients who attended physician frequently according to a
NHANES III survey carried out between 1998 and 2004 (312,372). Similar
connections between health insurance and good BP control have been found in
other studies as well (373,374).
The impact of access to healthcare on BP control has been observed in many
studies. Improving access to healthcare leads to enhanced BP control (375,376).
Hyman et al., however, found no association between health insurance and
frequent healthcare visits and good BP control in an NHANES survey (1992 to 1994)
(377).
1.10 Adherence
1.10.1 Definition and its issues
Adherence is “The extent to which a person’s behaviour—taking medication,
following a diet, and/or executing lifestyle changes—corresponds with agreed
recommendations from a health care provider” as defined by the WHO (378).
Non-adherence is a serious issue that leads to a decrease in the effectiveness of
drug treatments, substantial worsening of diseases, higher healthcare costs,
increasing mortality rates and a failure to achieve and maintain BP control with
hypertensive patients. Poor medication adherence causes 33–69% of all
medication-related hospitalizations, and costs approximately $100 billion a year
in the United States (379–382). Sokol et al. observed that overall healthcare costs
and hospitalization rates were significantly higher for diabetes mellitus,
hypertension and hypercholesterolemia patients who were non-adherent to their
medications (383). The Express Scripts Drug Trend Report estimated non-
adherence cost more than $317.4 billion in 2011 (384). In England, the treatment
costs for hypertensive patients associated with non-adherence were estimated to
69 be more than £390 million per year (385). Non-adherence can lead to significant
increases in mortality that have been shown in patients who have discontinued
their relevant medication therapy (i.e., aspirin, β-blockers, and statins) after
myocardial infarction (MI) (386).
Non-adherence to prescribed therapy is considered one of the most important and
common reasons for uncontrolled hypertension, and is recognised as an important
barrier to the successful treatment of hypertension and many chronic diseases
(294,387). More than two thirds of hypertensive patients did not achieve BP
control, and these were associated with poor adherence (388). BP has been found
to be 30% different between those with high and low adherence in hypertensive
patients (389). Moreover, increased adherence to antihypertensive drugs shows a
decline in BP among patients who enrolled in pharmacy care programmes (390).
For these reasons, adherence plays a big part in research. Measures of adherence
methods and the factors related to adherence rates have been evaluated by many
studies to determine suitable methods of identifying accurate results and finding
the factors that decrease adherence rates and the suitable solutions for this
problem.
1.10.2 Methods used to measure adherence rates
Several adherence methods have been developed in clinical research that aim to
achieve valid and reliable methods to estimate adherence in antihypertensive
medication and other medications related to chronic diseases. Information
collected from patients, prescription refill data and devices are used to measure
adherence. Methods of adherence measurement are divided into two types, direct
and indirect methods. Some of the methods used to monitor adherence are
described below.
70
1.10.2.1 Indirect methods
I. Self-reporting:
Patient diaries, patient interviews and questionnaires are three commonly used
methods for self-reporting (391). Because of the feasibility, practicality and
simplicity of these methods (391–393), these were recommended as being the
most suitable methods for observing adherence in clinical practice by the National
Collaborating Centre for Primary Care and the Royal College of General
Practitioners (London, UK) and NICE (394,395). However, these are also
considered to be less valid estimates and less reliable methods (396–399).
Limitations of self-reporting include the patient hiding non-adherence leading to
overestimating adherence, there may also be recall bias and patients may be
influenced by the quality of questions and the interviewers’ skills (391,400).
Combining self-reports with prescription fill data or other objective information
may be necessary to allow for more accurate adherence measurements (400).
II. Electronic adherence monitoring devices:
The Medication Events Monitoring System (MEMS) cap is a special prescription
bottle cap that is an example of an electronic monitoring device for drug
adherence. Every time the MEMS cap is opened, the date and time are recorded
by a computer chip built into the MEMS cap (392,401,402). MEMS caps are
considered the gold standard for adherence due to the successful empirical
performance results reported in numerous studies (402–405). Disadvantages of this
method include the fact that it is expensive, cumbersome and could adversely
affect medication adherence measurements. An example of adversely affecting
medication adherence measurements is the data recorded when the patient
simply opens and shuts the cap (unintentionally, or otherwise) (391,394,406).
III. Pharmacy Refill Rates:
The appearance of centralized computing and the increased availability of drug
insurance claims data led to an increase in the use of pharmacy refill data to
71 measure medication adherence (391). The most appropriate methods used for
calculating adherence from pharmacy refill data are the proportion of days
covered (PDC) and the medication possession ratio (MPR) (407–409). Some
assumptions should be available in this kind of method to ensure good results,
such as all the prescription fill data should be completed. Furthermore, all of the
necessary variables and records should be available (391), and all prescription fill
data should be obtained from one source (e.g., a nationalized healthcare system).
For example, the data obtained from different sources (e.g., another pharmacy,
another healthcare insurer, etc.) may not indicate if all of the medications were
consumed (392). Pharmacy refill rates are becoming more widely used because
they are objective, good for large populations and long treatment times, average
adherence and gaps in medication can be calculated, and the frequency of
medications obtained by the patient are captured. However, they have some
drawbacks as variations in prescribed use do not record all of the instructions
(e.g., pill splitting), the consumption of medication is assumed, and the data may
not complete if the patients receive medication from other sources (410).
IV. Pill Counts:
The dosage units not taken by patients are counted at the time of the
appointment. The proportion of adherence is calculated by dividing the number
of dosage units actually taken by the expected number of dosage units that should
have been taken, and multiplied by 100 (401,411,412).
Despite the fact that this method is one of the most commonly used in clinical
trials (413) due to it being relatively simple, objective and economical (392), some
limitations still exist. One limitation is called an over-adherence estimate that
occurs when the patient wants to appear more adherent by discarding some of the
dosage before the scheduled check. Another disadvantage involves the dispensing
date shown on the label, which may not reflect the actual date when the patient
began to consume the medication. Also, pill counts do not provide certain
information about adherence such as behavioural information (396,402,410,412).
72
1.10.2.2 Direct methods
I. Direct patient observation:
This technique is considered the ideal method to measure adherence since one
can directly observe patients while they are taking their medications. These
methods involve many limitations including the difficulty of use in an outpatient
setting or in large studies, and the medications can be hidden in the mouth and
discarded later (391,392,401)
II. Drug levels in biological fluids/biological assays and biomarkers:
Adherence can be monitored by detecting the existence of the drug or its
metabolite in a biological fluid, or by adding a non-toxic marker to the target
medication and then measure the endogenous biomarker of the drug or its
associated metabolites (391). For example, an endogenous biomarker of an ACEI
drug was measured for patients who had hypertension and diabetes mellitus. The
creatinine ratio for patients who received ACEI drugs was six-times higher than in
patients who received a placebo (414). These methods are considered objective
techniques and direct measures of medication adherence. However, criticisms for
these methods noted by researchers include that these methods are difficult to
apply on a routine basis, and there is an inability to measure adherence for more
than one drug, or to detect short-term changes in adherence (391,392,401). Also,
a patients’ actual medication-taking behaviour is not measured in these methods.
For example, they can find the required level of the drug or associated metabolite
in the biological fluids, but the medication may not have been taken as directed
(391).
1.10.3 Comparison between different adherence methods
The level of agreement between different adherence methods measurements
were compared in several recent reports. Wide variations in adherence were
reported between these methods. The level of agreement between three
validated self-report tools and a refill rates method was found to be moderate by
Cook and colleagues (415). The medication adherence in self-report and non-self-
report methods was evaluated by Garber and colleagues. In this study, the
comparison of adherence by the three methods of self-report (interview, diary
73 and questionnaire) and several non-self-reports such as pill counting, plasma drug
concentrations and MEMS was performed (416). The self-reports were compared
with the non-self-reports in the 86 comparisons, and 17% of these comparisons
reported high adherence with self-report and electronic methods, while 58%
reported high adherence with self-report and other non-self-report measures.
Hamilton et al found a significant correlation between electronic method (MEMS)
and self-report measures (417). The BP goals were achieved by 50% of adherent
patients in the African American Study of Kidney Disease and Hypertension (AASK),
which determined their adherence by electronic and pill counts (418).
The validity of refill rates and pill counts was assessed by Choo et al. Adherence
was measured in 286 hypertensive patients using an electronic method as the
validation standard. They found that the electronic method was highly correlated
with the quantity of dose adherence for both the pharmacy refill rate and pill
count (419).
In a study with 107 hypertensive individuals, Hamilton found significant
correlations between pill counts and MEMS with partial-to-complete adherence
(417).
Regarding the biologic fluid drug assays, adherence was assessed with MEMS and
the method by Braam et al. In their study, they gave capsules of potassium
bromide to 24 healthy participants and found a linear relationship between the
dosage taken and the increased mean serum bromide concentrations (420).
1.10.4 Factors effecting on adherence.
A wide variability of the adherence rates across hypertensive patients and
antihypertensive therapies have been shown in several studies. The number of
participants and duration of follow up were different, which could lead to
variability of adherence rates. Many studies found moderate to high adherence
(50–80%) in hypertensive patients (390,421–424). However, low adherence and
persistence rates (≤ 30% of patients) have been documented by a number of
studies (425,426).
74 Factors such as sociodemographic, psychosocial or behavioural variables,
healthcare system, therapeutic regimen and comorbidity factors have been
studied in an attempt to find associations between these factors and adherence
rates. The association between these factors and adherence were collected from
hypertension studies which investigated the relation between antihypertensive
drug and hypertensive patients. Factors-related-adherence are described below.
1.10.4.1 Sociodemographic factors
Some outcomes for these factors, such as sex, age, race, and status marital were
inconsistent between different studies. Men were more adherent in some studies
(426–428) while others found that women were more adherent (424,429), and
there was no difference in adherence between men and women in other studies
(430). Age was treated as a continuous variable (428–430) or categorised into two
or three groups. The cut-off point at 65 years was used to investigate the effect
of age on adherence above or below this point (418,422,423). Adherence rates
increased with age in some studies (428,430). Some studies observed that patients
aged 65 or more were more likely to adhere to their drugs than those aged less
than 65 years (422,427), while Krousel-Wood et al., who compared adherence
among patients aged over 75 with those under 75, found no association between
age and adherence rates (424). In addition, some studies reported an association
between younger patients (aged less than 65 years) and good adherence rates
(426).
According to Rizzo’s study, Caucasians exhibit better drug adherence (430);
however, other studies reported no significant association between race and
antihypertensive drug adherence (422,424). Patients’ education levels and
knowledge of hypertension were not associated with adherence either (424,431).
Krousel-Wood et al. found that patients who were married were more likely to
adhere to their drugs (424). However, no significant difference in adherence was
observed between patients who were married or living alone in Ren et al.’s study
(422).
75
1.10.4.2 Psychosocial / behavioural variable factors
A negative relationship between depression symptom severity and adherence rates
was reported in some studies (424,431). Other factors such as health beliefs and
smoking or drinking habits were not associated with adherence (424,431). Low
health-related quality of life in a physical way, high Stressful Life Event scores
and high perceived stress were associated with low adherence rates (424). The
involvement of patients in treatment decisions enhanced patient adherence (422).
1.10.4.3 Healthcare systems
There was a positive relationship between the number of visits to the doctor and
the adherence measures in several studies (424,425). Patients treated by younger
doctors were more likely to be adherent (422). Also, patients treated by nurses or
physicians’ assistants tended to be more adherent to their therapy than patients
treated by physicians (422). Patients who collected all their antihypertensive
prescriptions from the same pharmacy were more likely to be compliant (425).
Moreover, medication adherence increased among patients who entered
pharmacy care programmes for 12 months, as shown by Lee et al. (390).
1.10.4.4 Therapeutic regimen and Comorbidity factors
Various other studies examined aspects of the association between patients and
the therapeutic regimen factors. Patients who took two drugs in one tablet as a
combination were more adherence than those who took the drugs separately
(426,432,433). Also, patients who took multiple doses per day were less likely to
be adherent (423).
Adherence and a large number of other medications other than antihypertensive
drugs were analysed in some studies. A large number of other medications was
defined as patients who took more than eight other medications in some studies,
or more than three other medications in other studies (424,425). Patients who
took more than eight other medications were found to have a negative effect on
adherence (425), while three other medications was found to have a positive
effect on adherence (425). High adherence was also found among patients with
high ‘other medication’ numbers (patients who took five or more medications)
76 (426). The number of other medications was treated as a continuous variable, and
higher numbers were associated with better adherence (422).
The effect of initiating a specific antihypertensive class on adherence has been
tested in a several studies. Most studies concluded that the adherence rate with
diuretics was the lowest. High adherences was associated with ACEIs, and
angiotensin-II antagonists in most adherence studies (425,428,430,434).
Concerning comorbidity factors, patients who had evidence of two or more
comorbidities (e.g. diabetes, heart disease, dyslipidaemia or obesity) were found
to exhibit better adherence (426,428,430).
1.11 Persistence
1.11.1 Definition and its issues
Terms such as continuation, discontinuation and switching are widely used in
persistence studies. Different persistence methods and definitions have been
used to define continuers, discontinuers and switchers in these studies.
Persistence was used to determine if the patient is still taking medication after a
period of time. The terms persistent and continuation are typically used to
describe the outcome. Patients who refilled their initial antihypertensive drug on
or within three months after the one-year anniversary of the beginning date were
described as persistent users in some studies (435,436). Degli Esposti et al.
observed patients over one year and considered them as persistent if they
continued with their initially prescribed drug at enrolment for a duration of > 273
days (437). Other studies defined a patient as persistent if the last prescription
covered the study period until the last day of the observation (438,439). Patients
were also defined as persistent if they did not miss any three of their scheduled
refills during the year (440).
A gap in treatment is defined as discontinuation. The duration of the period
without medication varies in different studies and ranged from 30 to 180 days
(434,437,440–443). Switchers are patients who change the initial monotherapy to
another antihypertensive drug. Switchers of a regimen were considered as
77 continuation of therapy in some studies (431,437–439). However, some studies
considered this as discontinuation (435,442–444). The additional drugs were
ignored in most studies that focused on studying the initial therapy continuation
(435,436,442,443). On the other hand, some studies classified the additional drugs
as modifications of therapy (445,446). Rate of switching varied across studies and
ranged between 4-15% (443,447).
Although there are a number of effective antihypertensive agents that have
proven ability to protect against CV risk and mortality, most of these studies
included large number of patients who discontinued or switched their drugs.
persistence rates varied between studies and ranged between 5% to 75% (448). A
cohort study that examined 5,225 individuals from 48 Swedish primary healthcare
centres showed that 1% of patients who received antihypertensive prescriptions
from general practitioners never purchased their drugs, and 14% of patients
discontinued their drugs after one antihypertensive prescription (449).
Discontinuation and drug switching may reflect the drugs’ tolerability; in simpler
terms, patients discontinue or switch medications due to the side effects of the
drugs (450–452).
Non-persistence may lead to poor BP control (450,453,454). Moreover, it leads to
an increase in the cost of medication. It has been estimated that 76.5 million
pound sterling is spent to treat hypertension per year, and around 26.9 million
pound sterling of this total cost is attributed to switching or discontinuation
therapy (455). Corrao et al. reported that 37% of CV outcomes were reduced
among patients with high persistence compared with those who had very low
continuation (429).
Many studies have focused on the use of the initial therapy to measure persistence
(435,437–439,442). However, others did not (422). Initial therapy was defined by
the class of antihypertensive drug in some studies (435,437–439,442,443),whilst
others specified a specific antihypertensive drug from an antihypertensive drug
class and compared this with another other specific antihypertensive drug from
another specific antihypertensive class (432).
The purpose of studying new patients is to compare relevant variables at baseline
and avoid biases that occur with increased duration of therapy that leads to an
78 increase risk of discontinuation (456). New patients are usually identified either
from the date of diagnosis (446) or by prescription data. For prescription data,
new antihypertensive drug users are identified if they did not have any
prescription records during a certain period prior to the inception date. This
period varied in these studies and ranged between 3 to 12 months
(434,435,439,443,447,457).
1.11.2 Factors effecting persistence
1.11.2.1 Demographic and social factors
Older (>65 years) female patients exhibit better drug persistence than do young
men (aged <65) (435,437,439,447,449). Qvarnström et al found that patients with
high blood pressure tend to have high persistence (449). In contrast, patients with
severe BP value were shown to be more likely to be non-persistent in Mazzaglia et
al study (447). High income was associated with good persistence, and there was
no significant correlation between education levels and persistence in Qvarnström
et al study (449).
1.11.2.2 Healthcare systems
Several studies showed good direct correlation between number of visits to the
doctor and the persistence rates (438,443). Patients treated by younger doctors
were more likely to be adherent(437). Large Canadian and Italian studies found
high persistence rates in patients who had previously been admitted to a hospital
(437,438). Although, Degli Esposti et all found no association between previous
hospitalization and persistence using the same Italian population, but with a
smaller sample (437). Hospital admission was found to be non-significantly
associated with persistence in Caro et al. study (439).
1.11.2.3 Comorbidity factors
Qvarnström reported that patients with diabetes were more likely to continue
with their drugs. Other CV comorbidities were not significant in this study (449).
Patients who had evidence of two or more comorbidities, such as diabetes and
heart disease, were found to be more persistent with their drugs, as shown in
Degli Esposti et al. study (437). However, Mazzaglia et al. found that comorbidities
79 were associated with a higher risk of discontinuation among patients with chronic
disease scores of at least three (447).
1.11.2.4 Therapeutic regimen factors
Various other studies examined aspects of the association with therapeutic
regimen factors. Patients who took two drugs in one tablet as a combination were
more persistent than those who took the drugs separately (432,440). Also, patients
who took multiple doses per day were less likely to be persistent (435). Patients
who took large number of non-hypertensive medications were found to be more
persistent (439).
The variation of persistence rates between antihypertensive classes has been
examined in several studies. Although Benson et al. suggested there were no
differences in persistence rates between drug classes (442), most studies
concluded that the persistence rate with diuretics was the lowest. Low
persistence, in no particular order, were found with β-blockers, CCBs, ACEIs, and
angiotensin-II antagonists (435–437,447).
1.11.2.5 Factors affecting switching and additional therapy
Wong et al. reported that old age, high baseline SBP, increased comorbidity levels
and patients living in less urbanised regions were associated with medication
switching. However, this study observed no significant relationship between
antihypertensive drug switching; they concluded that all drugs have similar
switching rates (441). Mazzaglia et al.’s study found high treatment switching
rates, in no particular order, for alpha-blockers, diuretics and CCBs. No significant
association was found between other factors and switching in this study (447).
With regards to additional therapy, Patel et al. noted ACEI and diuretics as the
drugs most needed in addition to other antihypertensive drugs (434). Mazzaglia et
al. suggested that ARBs, CCBs and ACE were the most required drugs in
antihypertensive additional therapy. According to this study, the risk of patients
requiring additional drugs increases with elevated baseline BP and familial history
of CVD, but decreases with higher chronic disease scores (447).
80
Chapter 2 Methodology
2.1 Study population
More than 16000 hypertensive patients attending the Glasgow Blood Pressure
clinic (GBPC), participated in this series of studies. The GBPC provided the clinical
information for these subjects. The Information Services Division (ISD) data of
11568 patients, which included all their antihypertensive prescription
information, were available through data linkage from the NHS Scotland (ISD).
Further, information for 613 patients was recorded from the patients’ case notes,
including their antihypertensive treatment, blood pressure, and clinical
information. The total number of patients who had GBPC and ISD data was 10,040.
The number of hypertensive patients who participated in the initiation of
antihypertensive drug chapter after inclusion and exclusion criteria was 4232. A
total of 4232 and 3149 participants were included in the persistence study to
examine persistence at one year and five years, respectively. The study of
adherence and additional therapy was restricted to those patients who were
persistent with the medications (3085 for one year and 1979 for five years). The
concordance study included 443 patients who had GBPC, ISD, and case note data.
The resistance study included 864 patients who initiated and persisted with their
treatment for five years and had BP readings. The inclusion and exclusion criteria
varied between chapters and will be discussed in detail for each chapter. The
number of patients who were included in each chapter is displayed in flow chart
2-1.
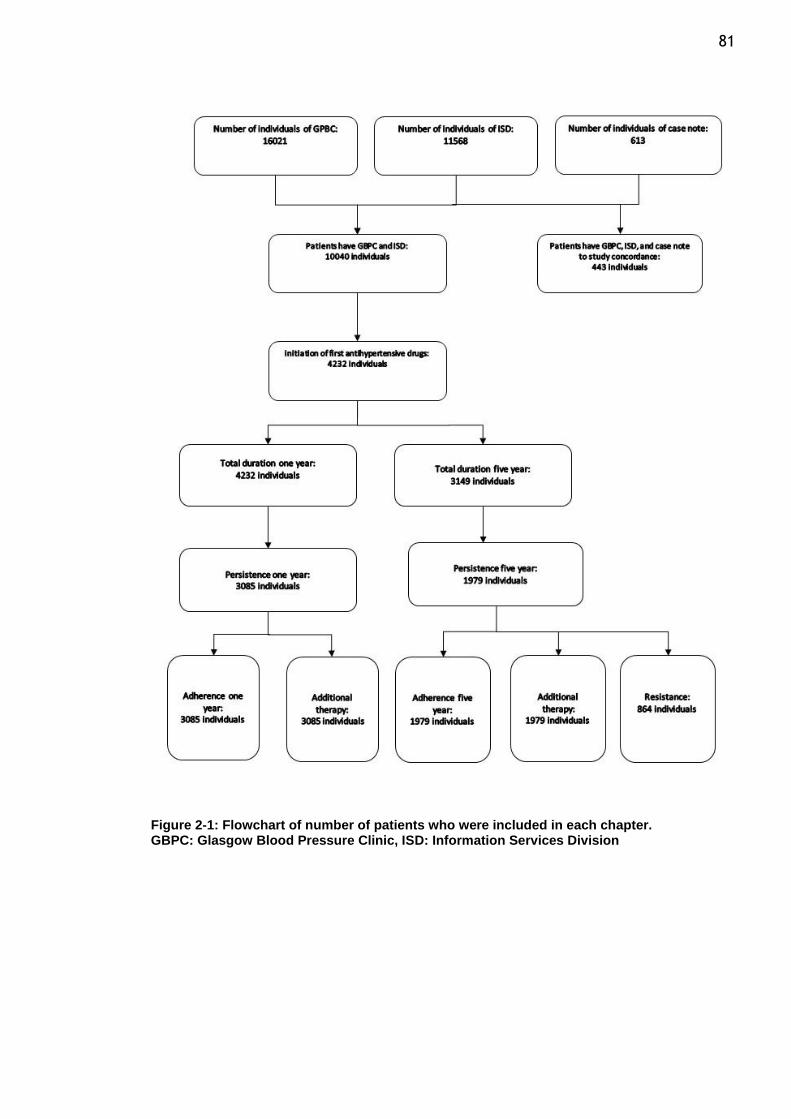
81
Figure 2-1: Flowchart of number of patients who were included in each chapter. GBPC: Glasgow Blood Pressure Clinic, ISD: Information Services Division
82
2.2 The Glasgow Blood Pressure Clinic (GBPC)
The GBPC provides secondary- and tertiary-level services to hypertensive
individuals from the West of Scotland. Information from patients attending the
clinic from 1968 are stored in a computerised database (458,459).
Demographic and clinical information for more than 16,000 subjects have been
recorded until 2011. All patients referred to the GBPC were diagnosed with
hypertension in primary care clinics, using the definitions of hypertension based
on contemporary guidelines, and if appropriate, treatment was commenced in
primary care. All patients were treated at the GBPC until their blood pressure (BP)
control was stabilized by continuing with follow-up at the clinic or in primary care.
A structured format was used to enter clinical details such as age, weight, height,
family history of hypertension and heart rate. A structured format was also used
to assess the presence of existing cardiovascular disease (such as airways diseases,
angina, cerebrovascular disease, heart failure, ischaemic heart disease,
myocardial infarction, and stroke), left ventricular hypertrophy, tobacco (any
versus none) and alcohol use (any versus none).
24 hours ambulatory blood pressure monitoring, echocardiogram (ECG), exercise
tolerance testing, plasma renin and aldosterone, chest X-ray, and magnetic
resonance imaging are available for a subset of patients who need these
investigation. A structured format transfer to the electronic database afterward.
2.3 Physician communication and the number of visits
Blood samples collected at the first visit and during follow-up at the clinic were
analysed using the hospital laboratory’s auto-analyser. One month after their first
visit, patients attended the clinic to review all laboratory and clinical results.
At the clinic, BP measurements were taken manually three times using
standardized sphygmomanometers at each visit by specialist hypertension nurses;
the mean of the last two measurements was recorded at each visit. Patients
attending the clinic were advised to take their regular medications as usual.
83 The frequency of visits to the GBPC mainly depended on the BP levels of the
individual patients and the presence of other co-morbidities. Usually, more
frequent clinical visits occurred during the first year for new patients until their
blood pressure (BP) were control.
During each visit, the doctor asked the patient about his/her prescribed
antihypertensive drugs. If the patient was unsure, the doctor requested that the
patient bring the drug(s) to the next visit.
2.4 Laboratory and clinical measurements
2.4.1 Blood pressure measurement
The patient was placed in either a supine or sitting position for five minutes prior
to BP measurement.
Maintained, and calibrated mercury sphygmomanometers (Accoson Dekamet MK3,
UK) were used for reading blood pressure. The tight clothing was removed, and
arm was supported at heart level position. The appropriate cuff size was taken.
The cuff was inflated above the brachial artery until the pulse disappeared. When
the pulse appeared again by deflating the cuff, the systolic blood pressure (SBP)
was recorded as an estimation. The cuff was then re-inflated to 30 mm Hg over
the SBP estimation, a stethoscope was placed and the cuff was deflated at the
rate of 2 mm Hg per second. The SBP was recorded when the rhythmic sound
appeared, and diastolic blood pressure (DBP) was recorded when the sound
disappeared by continuing the deflation.
BP measurements were obtained manually two times. Third measurement was
taken if the second reading was significantly lower. The mean of the last two
measurements was recorded.
The difference between the SBP and DBP was defined as pulse pressure. SBP < 140
mm Hg and DBP < 90 mm Hg were the therapeutic target of blood pressure.
84
2.4.2 Obesity
The World Health Organisation (WHO) has classified the weight of adults into the
categories of obesity, underweight and overweight (460). A BMI equal to or more
than 30 kg/m2 was defined as obesity. Overweight or pre-obesity was defined as
a BMI between 25 and 29.99 kg/m2. A BMI between 18.5 and 24.99 kg/m2 was
defined as an optimal weight.
Calibrated weighing machines were used to measure body weight (Seca 955 chair
scale). A height stick was used to measure height.
2.4.3 Renal function
Estimated glomerular filtration rate (eGFR) was used to evaluate renal function.
eGFR was calculated from the baseline serum creatinine values. Modification of
Diet in Renal Disease Study Group (MDRD) equation was used to calculate eGFR.
The three variable modification were included with serum creatinine values in this
equation. These variable are age, race, and sex as shown in equation below (461).
eGFR= 32788 × serum creatinine (in μmol/L) -1.154 × age -0.203 *(1.212 if black) ×
(0.742 if female)
According to the National Kidney Foundation Kidney Disease Outcomes Quality
Initiative (NKFKDOQI) and based on eGFR, kidney function was classified into
normal or 3, 4, and 5 stages (Levey et al., 2003). While a normal kidney was
considered as having an eGFR ≥ 60 mL/min/1.73 m2, CKD stage 3 was determined
if the eGFR was between 30 and 59 mL/min/1.73 m2. The eGFRs between 15–29
mL/min/1.73 m2 and < 15 mL/min/1.73 m2 were considered as CKD stages 4 and
5, respectively.
2.5 Smoking status and alcohol status
Specialist nurses or physicians interviewed patients during their first visit to obtain
smoking status, alcohol status and family history of hypertension information. A
copy of this information was kept in the case notes as well as transferred to the
GBPC electronic database.
85
2.6 The GBPC database
Clinical characteristics were recorded in the electronic database for all patients
who had visited the GBPC since its establishment. The database stores the
information of more than 16,000 patients; it is available for audit and research
purposes.
Information from the first visit was recorded in the first row for each patient,
including the date, SBP and DBP reading, and heart rate. These information during
subsequent visits to the GBPC were also coded.
The demographic characteristics were also stored. The stored information
contains age, gender, BMI, alcohol intake and smoking status.
In addition, electronic database contains biochemistry results such as eGFR, total
cholesterol, bilirubin, albumin, ALT, and gamma GT. Other information such as
the presence of existing cardiovascular disease, LVH, and family history of
hypertension were also entered.
The ambulatory blood pressure (AMPB) and the date of blood measurements for
more than 2000 patients were also saved as database.
2.7 The Information Services Division (ISD) database
Pharmacy refill data were obtained from the Prescribing Information System (PIS),
an electronic database of all National Health Service (NHS) prescriptions dispensed
to individuals across Scotland, which is maintained by NHS National Services
Scotland (NSS) (462) and linked to the hospitalisation using the unique patient
Community Health Index (CHI) number. The PIS is created from information
supplied by the Practitioner Services Division of the NSS, which is responsible for
the processing and pricing of all NHS prescriptions dispensed in Scotland (463).
Data on private (non-NHS) prescriptions are not routinely collected and were
therefore unavailable for analysis; however, as prescription charges were
abolished in Scotland in 2011 and the NHS is free at the point of use for the entire
population, the relative contribution of these prescriptions is expected to be low.
86 The PIS contains fields for a variety of metrics, including prescriber and dispenser
information (e.g. location and organizational structure) and prescription details
(e.g. the name, strength, formulation and cost of the medicine).
Data fields included date of dispensation, the class and name of the medicine,
and the number of items. Medicines were categorized by both British National
Formulary (BNF) subsection and approved name. Antihypertensive drugs were
classified as alpha blockers, angiotensin converting enzyme inhibitor (ACEI)
Angiotensin II receptor antagonist (ARB), beta blocker (BB), calcium channel
blockers (CCBs), centrally acting antihypertensive, non-thiazide diuretic,
potassium sparing diuretics, thiazide diuretic, and vasodilators antihypertensive
drugs. The number of items referred to those items processed and paid for under
NHS Scotland, excluding those from GP10A (Stock Order) forms and hospital-based
prescription forms.
Prescription data and outcome data was obtained from the Information Services
Division (ISD) Scotland which provided data for all patients attending the Glasgow
Blood Pressure Clinic during the period of 31/12/2003 to 31/03/2013. The CHI
number had been used to connect the ISD prescription data and the GBPC data
including the patient’s BP, demographic characteristics and biochemistry results.
2.8 Coding of antihypertensive drugs from patients case note.
Drug treatment and patient characteristics were reviewed and recorded using two
MS Excel sheets. The history of antihypertensive drug use for each patient was
coded in the first sheet.
The antihypertensive drug usage of each patient was recorded from the time they
were referred to the GBPC from primary care until the last visit. Information from
the first visit was recorded in the first row for each patient, including the date
and BP reading, all antihypertensive drugs being taken, discontinuation of any
antihypertensive drugs.
87 Changes in the patient’s medications during subsequent visits to the GBPC were
also coded. These changes included the addition of new drugs, substituting a drug
with another drug, discontinuing a drug, and changes in the dose of the drug.
Alterations in clinical BP readings due to these changes were coded. The clinical
BP was recorded before and after the alterations in drug consumption. The
information recorded in the first sheet included age, sex, and family history of
hypertension, as well as other CVD episodes.
Patient characteristics were coded in the first sheet and include the following
information: all concurrent diagnoses in addition to hypertension, ECHO results,
ECG results, and ABPM results.
2.9 Repeatability and reproducibility
2.9.1 Introduction
Repeatability is defined as the variation in measurements made on one item
measured repeatedly by one observer under identical circumstances.
Reproducibility is defined as the variation in measurements made on the same
item when one or more factors are varied. This means that measurements are
made by a different observer, in a different environment or with different
measurement methods(464).
The purpose of studying both repeatability and reproducibility was to test
agreement between two results obtained from the same data, which was recorded
twice by the same or a different person, to test its precision and/or reliability.
2.9.2 Methods
Drug treatment and BP were reviewed and recorded using MS Excel sheet.
Patient’s information was recorded from the time they were referred to the GBPC
from primary care until the last visit. These information such as the date of visit,
BP reading, all their antihypertensive drugs being were coded.
88 The clinical BP was recorded before and after the alterations in drug consumption.
These information were taken from patient's record which was written by his/her
physician after patient’s visit.
For repeatability purposes, these data were recorded twice at two different
times. For example, the information was first recorded when a patient’s case
notes were collected during his/her clinical visit and before being seen by his/her
doctor. The information was recorded a second time when the patient’s case notes
were collected during his/her subsequent visit and before being seen by his/her
doctor.
For reproducibility, Dr Safa Alsanosi, a PhD student, was involved in this study so
the data would be recorded by another investigator. Dr Alsanosi recorded the
information that I had independently recorded. Safa and I had the same Excel
sheet, and we agreed to follow the same protocol when recording information.
Therefore, these data were recorded by two people at the same time when case
notes were collected during clinical visits and prior to patients being seen by a
doctor.
The effect of changes in BP therapy were calculated by take the difference
between the BP before and after drug change or addition. Intraclass correlation
coefficient (ICC) was used to estimate the agreement between two BP value
alterations, which were repeatedly recorded for the same individuals, same drugs
and on the same visit date (BP alteration by me versus BP alteration by me for
repeatability and BP alteration by me versus BP alteration by Safa for
reproducibility).
2.9.3 Results
I recorded 113 patients in duplicate twice at different times. Dr Alsanosi and I
recorded a total of 265 patients independently. Regarding repeatability, a high
degree of reliability was found between alteration of SBP and DBP in both sets of
my data. The single measure of ICC was 0.976 with a 95% confidence interval from
0.969 - 0.982, and 0.988 with a 95% confidence interval from 0.984 - 0.991 for
SBP, and DBP, respectively.
89 SBP, and DBP for reproducibility were 0.985 with a 95% confidence interval from
0.983 - 0.987, and 0.965 with a 95% confidence interval from 0.960 - 0.969,
respectively. A high degree of reliability was found between alteration of SBP and
DBP in my data and Safa data.
2.10 Ethical approval
The West of Scotland research ethics service (WoSRES) of the National Health
Service approved the study of the GBPC database (11/WS/0083).
2.11 Statistical Analyses
2.11.1 Statistical packages used
A statistical analysis was performed using Statistical Package for the Social
sciences (SPSS) software for Microsoft Windows Version 22.0 (IBM Corporation,
Armonk, New York, US).
2.11.2 Summary statistics
The mean ± standard deviation (SD) for the data normally distributed was used to
summarise the quantitative variable. A natural logarithm and back-transformed
were used to transform some of the data that were not normally distributed. The
percentage of the cohort was used to summarise the categorical data. P-values
were considered significant when the difference between the groups was less than
0.05. The Bonferroni method was used to correct the various significance tests
that resulted from multi comparisons on the same dataset.
2.11.3 Comparison of two means
Two sample t test was used to compare the differences between two groups for
normally distributed continuous data. A natural logarithm was used to transform
some of the data that were not normally distributed to obtain normal distribution.
Chi-square or Fisher’s exact tests (for small sizes) were used to compare the
categorical data. A P-value less than 0.05 between the two groups was considered
significant. Multiple testing correction was applied to all statistical tests using the
90 Bonferroni method. The Bonferroni was calculated by dividing the number of
variables that were compared by 0.05.
2.11.4 Comparison of more than two means
For normally distributed, the difference between more than two groups of
continuous data were compared using one way analysis of variance (ANOVA). A
natural logarithm was used to transform some of the data that were not normally
distributed to obtain normal distribution.
Chi-square or Fisher exact tests (for small sizes) were used to compare the
categorical data. Chi-square test for trend was used to examine the linear
association in categorical data. P value at 0.05 and Bonferroni value after
calculation were considered as significant results.
2.11.5 Logistic regression
The association of a binary result with possible predictors was investigated by
using binary logistic regression. Multinomial logistic regression was used to test
the association of more than two categories with possible predictors.
The impacts of age, BMI, SBP, DBP, sex, smoking status, alcohol intake, eGFR,
albumin on persistence, adherence, additional therapy, resistance HT, and blood
pressure response were tested. These factors were determined based on the
possibility of an association between the predictors and the outcome, which has
been shown in previous studies, and on the availability of data.
The P-value was considered significant when the compression between 2 groups
was less than 0.05. The Bonferroni method was used to correct the multiple
significant results.
2.11.6 Linear regression
The antihypertensive responses were treated as continuous variables, and the
association between each class and the patient’s characteristics were examined
by performing linear correlations.
91 The effects of age, BMI, SBP, DBP, sex, smoking status, alcohol intake, eGFR, and
albumin on blood pressure response were examined. The selection of predictors
was based on the possible interaction between the result and these predictors.
Such an interaction has been shown in previous studies and is dependent on the
availability of the data. The significance level was considered as a P-value less
than 0.05.
92
Chapter 3 Characteristics of new patients and initiation of first antihypertensive drugs
3.1 Introduction
The initiation antihypertensive therapy with BB and diuretics was widely
recommended in most hypertension guidelines for over three decades. These
recommendations were based on available evidence of their ability to lower BP
and reduce mortality and CV outcomes. However, more recently, guidelines have
changed with BB, and diuretics no-longer recommended as first-line
antihypertensive drugs (200,219,220). The recent NICE guidelines recommend
using them as third- or fourth-line agents (43).
The superiority of one antihypertensive versus others for certain outcomes has
been suggested by some meta-analyses (235,465,466). However, these have not
been validated in larger meta-analyses. The ESH and ESC guidelines state that
diuretics, BBs, CCBs, ACEIs and ARBs are suitable when starting antihypertensive
treatment. ESH and ESC guidelines have defined compelling indications for the use
of specific antihypertensive classes versus as shown in the table 3-1 (41).
Regarding this table, the ESH and ESC guidelines recommend the use of ACEI or
ARB with patients who have ESRD or proteinuria. This recommendation is based
on prior studies. The first study supporting this recommendation was a review
showing that ACEI and ARB were associated with a reduction in the risk of ESRD
and a reduction in the level of proteinuria in patients with and without diabetes
who had advanced renal failure (466). The second study was drawn from a meta-
analysis that concluded that ARBs and ACEI are more effective in reducing
proteinuria than placebos or calcium-channel blockers in patients with or without
diabetes and with microalbuminuria or proteinuria (467). However, none of these
studies recommend the use of AECI or ARBs in patients with ESRD.
Additionally, recent JNC guidelines have recommended starting with any of the
main antihypertensive classes (diuretics, BBs, CCBs, ACEIs and ARBs) in non-black
hypertensive patients. However, JNC guidelines recommend starting with Diuretic
or CCB in black population and ACEI or ARB with patients who have CKD (40).
93 The recent NICE guidelines recommend starting with ACEI or ARB for patients aged
below 55 years and CCB for those over 55 years and for people of African or
Caribbean origin. They suggest using BB and thiazide diuretic as an alternative
therapy for patients who do not tolerate ACEIs, and CCBs. The NICE committee
also recommended using a thiazide-like diuretic such as chlorthalidone or
indapamide instead of using conventional thiazide diuretic such as
bendroflumethiazide or hydrochlorothiazide. Recent NICE guidelines are
explained in detail in chapter one, section (1.4.5)(43).
The purpose of this analysis was to review the treatment regimens of patients who
attend the GBPC, to identify the characteristics of hypertensive patient who
started his/her antihypertensive drug in the GBPC, to identify the most prescribed
antihypertensive drug classes, to evaluate the change of anti-hypertensive drug
usage during the study period, and to assess the adherence of physicians to
hypertension guidelines.
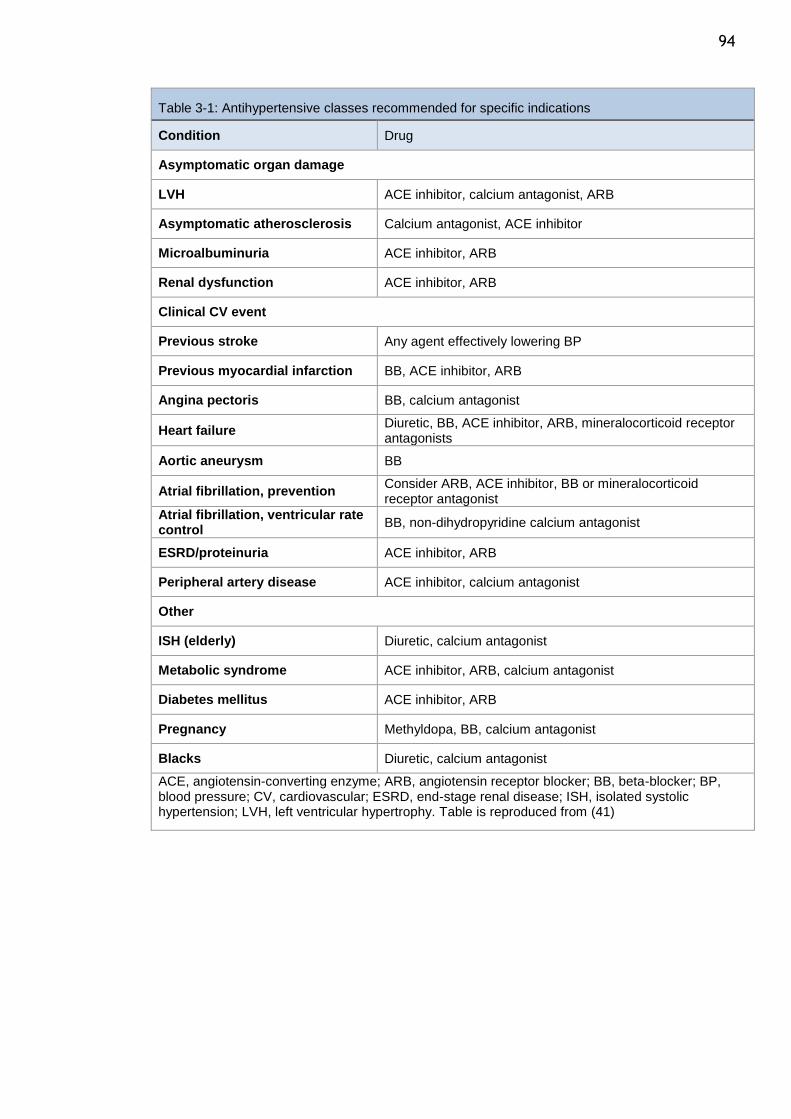
94
Table 3-1: Antihypertensive classes recommended for specific indications
Condition Drug
Asymptomatic organ damage
LVH ACE inhibitor, calcium antagonist, ARB
Asymptomatic atherosclerosis Calcium antagonist, ACE inhibitor
Microalbuminuria ACE inhibitor, ARB
Renal dysfunction ACE inhibitor, ARB
Clinical CV event
Previous stroke Any agent effectively lowering BP
Previous myocardial infarction BB, ACE inhibitor, ARB
Angina pectoris BB, calcium antagonist
Heart failure Diuretic, BB, ACE inhibitor, ARB, mineralocorticoid receptor antagonists
Aortic aneurysm BB
Atrial fibrillation, prevention Consider ARB, ACE inhibitor, BB or mineralocorticoid receptor antagonist
Atrial fibrillation, ventricular rate control
BB, non-dihydropyridine calcium antagonist
ESRD/proteinuria ACE inhibitor, ARB
Peripheral artery disease ACE inhibitor, calcium antagonist
Other
ISH (elderly) Diuretic, calcium antagonist
Metabolic syndrome ACE inhibitor, ARB, calcium antagonist
Diabetes mellitus ACE inhibitor, ARB
Pregnancy Methyldopa, BB, calcium antagonist
Blacks Diuretic, calcium antagonist
ACE, angiotensin-converting enzyme; ARB, angiotensin receptor blocker; BB, beta-blocker; BP, blood pressure; CV, cardiovascular; ESRD, end-stage renal disease; ISH, isolated systolic hypertension; LVH, left ventricular hypertrophy. Table is reproduced from (41)
95
3.2 Method
The GBPC database was linked to the ISD database to identify initial
antihypertensive drug usage. This study analysed 4232 hypertensive patients with
a new antihypertensive prescription who had filled their prescriptions for a period
of more than one year.
The definition of a new antihypertensive drug prescription was based on the
patient showing no receipt of the drug class for at least a continuous four-month
period prior to 30/04/2004; these patients were on no other antihypertensive
medications at the time of the initial prescription. The selection of a four-month
period was based on the fact that the maximum refill prescription in Scotland is
three months for chronic therapy. Patients who did not have a prescription for a
period of four months or more simply initiated treatment. All patients with a new
prescription of an antihypertensive medication, used as monotherapy, were
included in the analysis. The mortality records obtained from the ISD were
reviewed to ensure that all the patients were alive during the study period.
Demographic and clinical characteristics were compared between
antihypertensive classes. Variables such as age, gender, SBP, DBP, BMI, smoking
status, and alcohol intake were studied. Age was determined at the date of
prescription initiation. The baseline SBP and DBP were recorded one year prior to
the initiation of treatment.
One-way ANOVA were used to compare age, SBP, DBP, and BMI. Gender, smoking
status, and alcohol intake differences were assessed using chi-square test. The
Bonferroni method was used to correct the significance tests which resulted from
multiple comparisons on the same dataset.
96
3.3 Results
3.3.1 Study population
The initial population of 10,040 represented the total number of patients who had
GBPC and ISD data. As the inclusion criteria required patients to be selected based
on data of no drug receipt for at least a continuous four-month period prior to the
start date, 2077 patients were excluded because they had commenced their drug
before 30/04/2004.
Patients with total duration of any prescription data (between the first
prescription and the last prescription of CV and non-CV drugs) of less than one
year were excluded (520). This was to study persistence at I year and further
details are provided in chapter (3).
Patients with a new prescription of an antihypertensive medication, used as
monotherapy, were included in the analysis. Thus, 3211 patients were excluded
because they were on combination antihypertensive drug classes.
After these exclusions, 4232 patients who received a prescription for an
antihypertensive drug during the study period were eligible. The inclusion and
exclusion details are depicted in the flow chart in figure 3-1.
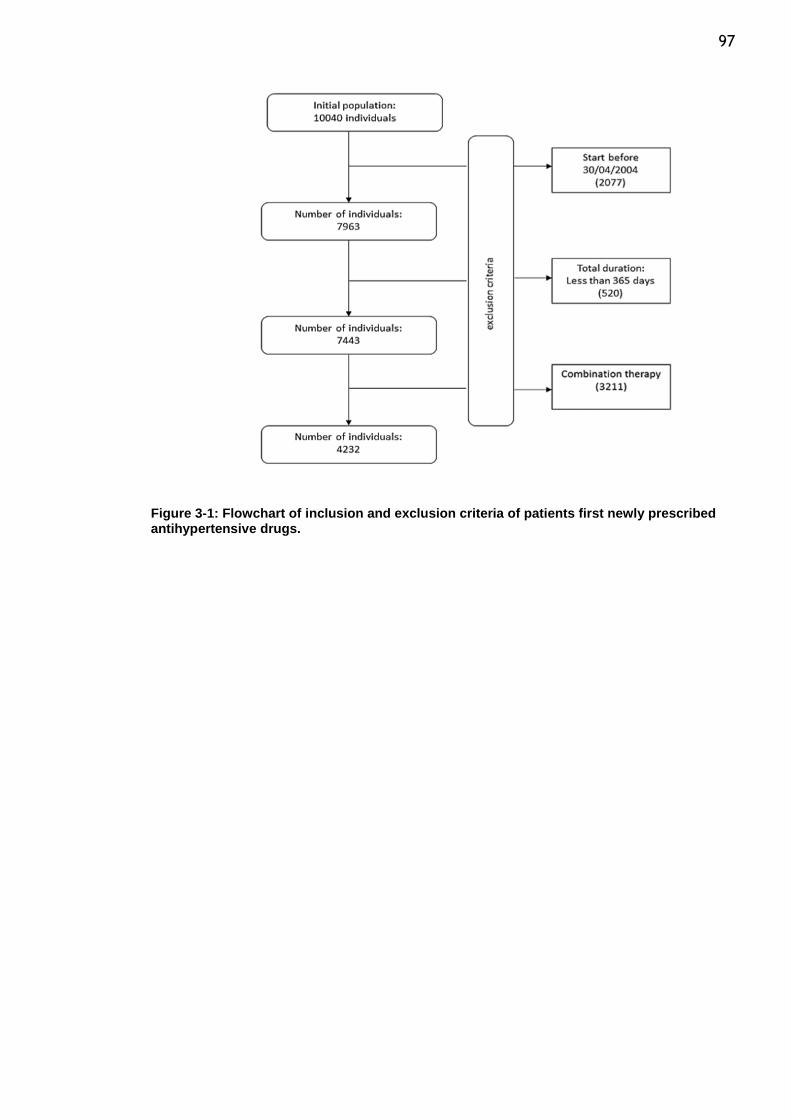
97
Figure 3-1: Flowchart of inclusion and exclusion criteria of patients first newly prescribed antihypertensive drugs.
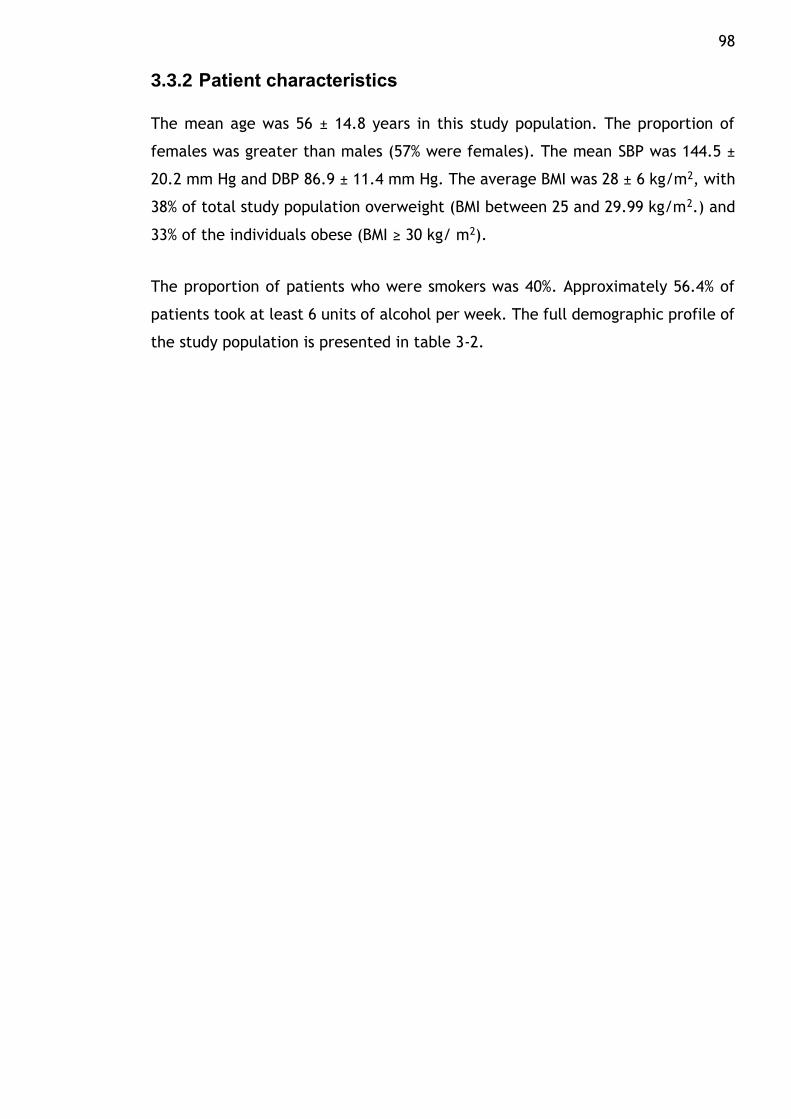
98
3.3.2 Patient characteristics
The mean age was 56 ± 14.8 years in this study population. The proportion of
females was greater than males (57% were females). The mean SBP was 144.5 ±
20.2 mm Hg and DBP 86.9 ± 11.4 mm Hg. The average BMI was 28 ± 6 kg/m2, with
38% of total study population overweight (BMI between 25 and 29.99 kg/m2.) and
33% of the individuals obese (BMI ≥ 30 kg/ m2).
The proportion of patients who were smokers was 40%. Approximately 56.4% of
patients took at least 6 units of alcohol per week. The full demographic profile of
the study population is presented in table 3-2.
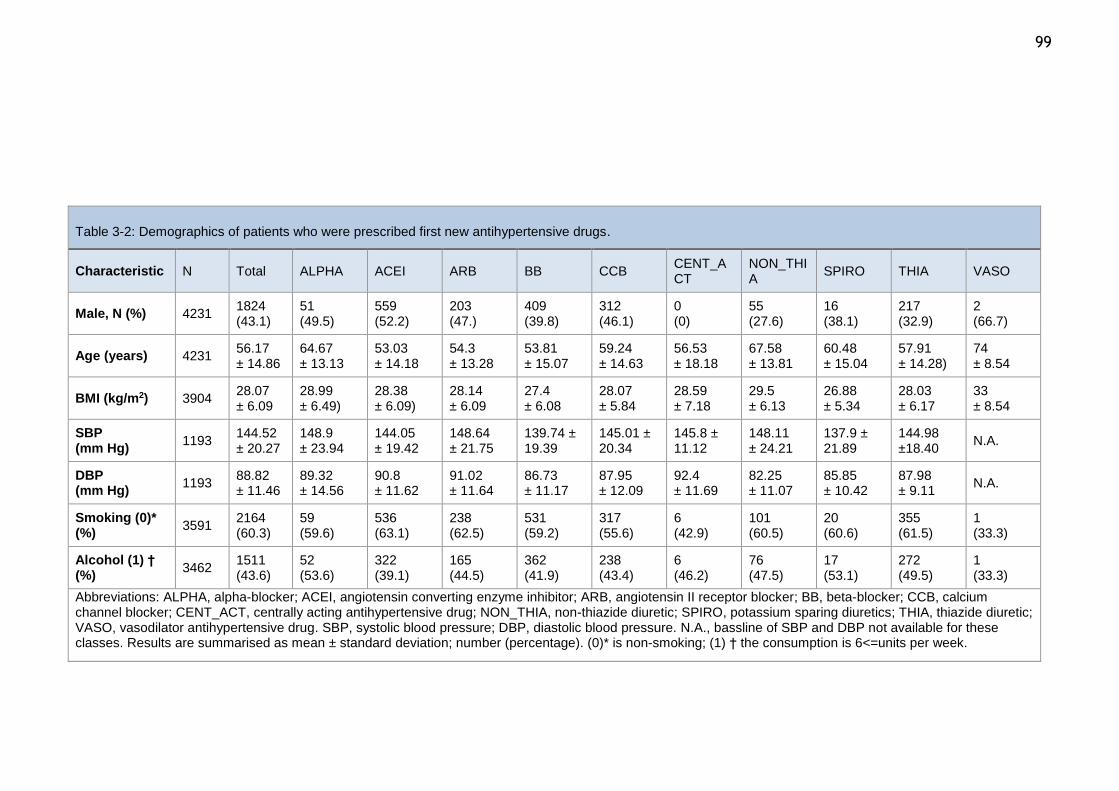
99
Table 3-2: Demographics of patients who were prescribed first new antihypertensive drugs.
Characteristic N Total ALPHA ACEI ARB BB CCB CENT_ACT
NON_THIA
SPIRO THIA VASO
Male, N (%) 4231 1824 (43.1)
51 (49.5)
559 (52.2)
203 (47.)
409 (39.8)
312 (46.1)
0 (0)
55 (27.6)
16 (38.1)
217 (32.9)
2 (66.7)
Age (years) 4231 56.17 ± 14.86
64.67 ± 13.13
53.03 ± 14.18
54.3 ± 13.28
53.81 ± 15.07
59.24 ± 14.63
56.53 ± 18.18
67.58 ± 13.81
60.48 ± 15.04
57.91 ± 14.28)
74 ± 8.54
BMI (kg/m2) 3904 28.07 ± 6.09
28.99 ± 6.49)
28.38 ± 6.09)
28.14 ± 6.09
27.4 ± 6.08
28.07 ± 5.84
28.59 ± 7.18
29.5 ± 6.13
26.88 ± 5.34
28.03 ± 6.17
33 ± 8.54
SBP (mm Hg)
1193 144.52 ± 20.27
148.9 ± 23.94
144.05 ± 19.42
148.64 ± 21.75
139.74 ± 19.39
145.01 ± 20.34
145.8 ± 11.12
148.11 ± 24.21
137.9 ± 21.89
144.98 ±18.40
N.A.
DBP (mm Hg)
1193 88.82 ± 11.46
89.32 ± 14.56
90.8 ± 11.62
91.02 ± 11.64
86.73 ± 11.17
87.95 ± 12.09
92.4 ± 11.69
82.25 ± 11.07
85.85 ± 10.42
87.98 ± 9.11
N.A.
Smoking (0)* (%)
3591 2164 (60.3)
59 (59.6)
536 (63.1)
238 (62.5)
531 (59.2)
317 (55.6)
6 (42.9)
101 (60.5)
20 (60.6)
355 (61.5)
1 (33.3)
Alcohol (1) † (%)
3462 1511 (43.6)
52 (53.6)
322 (39.1)
165 (44.5)
362 (41.9)
238 (43.4)
6 (46.2)
76 (47.5)
17 (53.1)
272 (49.5)
1 (33.3)
Abbreviations: ALPHA, alpha-blocker; ACEI, angiotensin converting enzyme inhibitor; ARB, angiotensin II receptor blocker; BB, beta-blocker; CCB, calcium channel blocker; CENT_ACT, centrally acting antihypertensive drug; NON_THIA, non-thiazide diuretic; SPIRO, potassium sparing diuretics; THIA, thiazide diuretic; VASO, vasodilator antihypertensive drug. SBP, systolic blood pressure; DBP, diastolic blood pressure. N.A., bassline of SBP and DBP not available for these classes. Results are summarised as mean ± standard deviation; number (percentage). (0)* is non-smoking; (1) † the consumption is 6<=units per week.
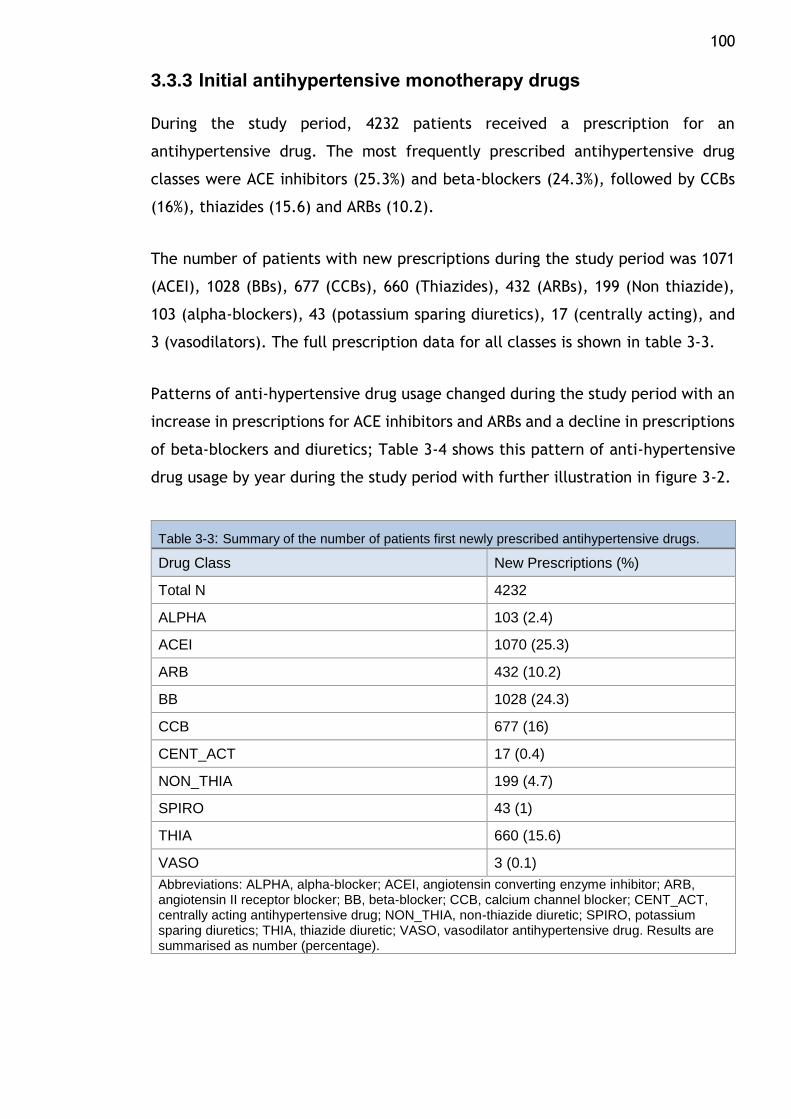
100
3.3.3 Initial antihypertensive monotherapy drugs
During the study period, 4232 patients received a prescription for an
antihypertensive drug. The most frequently prescribed antihypertensive drug
classes were ACE inhibitors (25.3%) and beta-blockers (24.3%), followed by CCBs
(16%), thiazides (15.6) and ARBs (10.2).
The number of patients with new prescriptions during the study period was 1071
(ACEI), 1028 (BBs), 677 (CCBs), 660 (Thiazides), 432 (ARBs), 199 (Non thiazide),
103 (alpha-blockers), 43 (potassium sparing diuretics), 17 (centrally acting), and
3 (vasodilators). The full prescription data for all classes is shown in table 3-3.
Patterns of anti-hypertensive drug usage changed during the study period with an
increase in prescriptions for ACE inhibitors and ARBs and a decline in prescriptions
of beta-blockers and diuretics; Table 3-4 shows this pattern of anti-hypertensive
drug usage by year during the study period with further illustration in figure 3-2.
Table 3-3: Summary of the number of patients first newly prescribed antihypertensive drugs.
Drug Class New Prescriptions (%)
Total N 4232
ALPHA 103 (2.4)
ACEI 1070 (25.3)
ARB 432 (10.2)
BB 1028 (24.3)
CCB 677 (16)
CENT_ACT 17 (0.4)
NON_THIA 199 (4.7)
SPIRO 43 (1)
THIA 660 (15.6)
VASO 3 (0.1)
Abbreviations: ALPHA, alpha-blocker; ACEI, angiotensin converting enzyme inhibitor; ARB, angiotensin II receptor blocker; BB, beta-blocker; CCB, calcium channel blocker; CENT_ACT, centrally acting antihypertensive drug; NON_THIA, non-thiazide diuretic; SPIRO, potassium sparing diuretics; THIA, thiazide diuretic; VASO, vasodilator antihypertensive drug. Results are summarised as number (percentage).
101
Table 3-4: Percentage of first antihypertensive prescription by year of prescription.
Class 2004
% 2005
% 2006
% 2007
% 2008
% 2009
% 2010
% 2011
% 2012
%
ALPHA 4 2 0 0 1 0 0 1 0
ACEI 19 21 25 40 39 45 52 50 54
ARB 10 8 12 12 10 11 15 7 23
BB 26 29 23 14 21 18 11 14 15
CCB 16 14 15 19 17 16 13 23 8
CENT 1 0 0 0 0 0 1 0 0
NON-THIA 6 4 4 2 2 1 2 1 0
SPIRO 1 1 1 2 1 1 0 0 0
THIAZ 17 20 20 11 9 7 7 4 0
VASO 0 0 0 0 0 0 0 0 0
Abbreviations: ALPHA, alpha-blocker; ACEI, angiotensin converting enzyme inhibitor; ARB, angiotensin II receptor blocker; BB, beta-blocker; CCB, calcium channel blocker; CENT_ACT, centrally acting antihypertensive drug; NON_THIA, non-thiazide diuretic; SPIRO, potassium sparing diuretics; THIA, thiazide diuretic; VASO, vasodilator antihypertensive drug. Results are summarised as percentage.
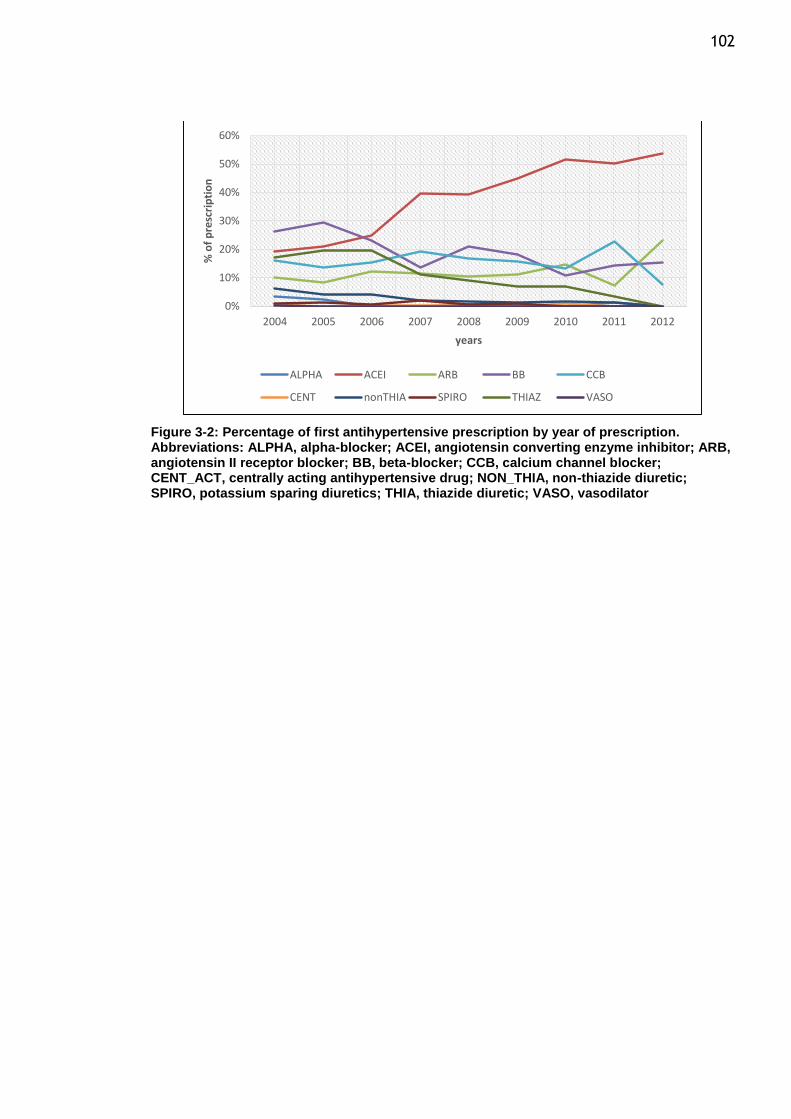
102
Figure 3-2: Percentage of first antihypertensive prescription by year of prescription. Abbreviations: ALPHA, alpha-blocker; ACEI, angiotensin converting enzyme inhibitor; ARB, angiotensin II receptor blocker; BB, beta-blocker; CCB, calcium channel blocker; CENT_ACT, centrally acting antihypertensive drug; NON_THIA, non-thiazide diuretic; SPIRO, potassium sparing diuretics; THIA, thiazide diuretic; VASO, vasodilator
0%
10%
20%
30%
40%
50%
60%
2004 2005 2006 2007 2008 2009 2010 2011 2012
% o
f p
resc
rip
tio
n
years
ALPHA ACEI ARB BB CCB
CENT nonTHIA SPIRO THIAZ VASO
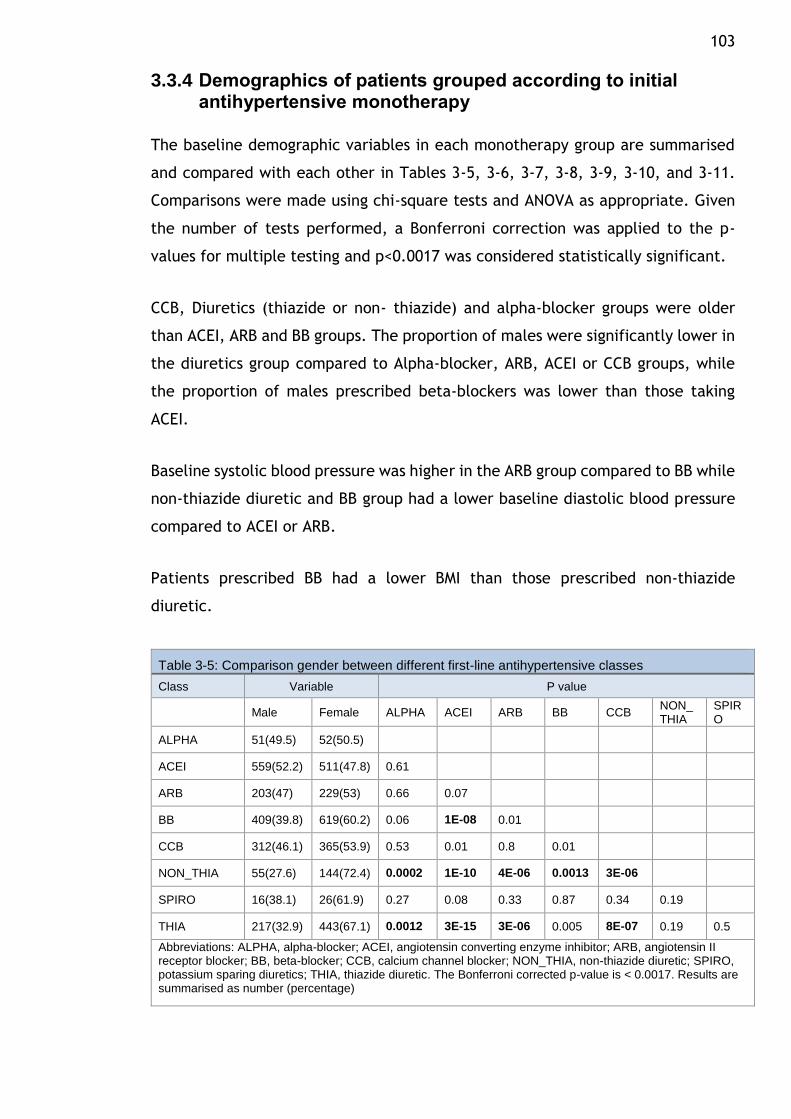
103
3.3.4 Demographics of patients grouped according to initial antihypertensive monotherapy
The baseline demographic variables in each monotherapy group are summarised
and compared with each other in Tables 3-5, 3-6, 3-7, 3-8, 3-9, 3-10, and 3-11.
Comparisons were made using chi-square tests and ANOVA as appropriate. Given
the number of tests performed, a Bonferroni correction was applied to the p-
values for multiple testing and p<0.0017 was considered statistically significant.
CCB, Diuretics (thiazide or non- thiazide) and alpha-blocker groups were older
than ACEI, ARB and BB groups. The proportion of males were significantly lower in
the diuretics group compared to Alpha-blocker, ARB, ACEI or CCB groups, while
the proportion of males prescribed beta-blockers was lower than those taking
ACEI.
Baseline systolic blood pressure was higher in the ARB group compared to BB while
non-thiazide diuretic and BB group had a lower baseline diastolic blood pressure
compared to ACEI or ARB.
Patients prescribed BB had a lower BMI than those prescribed non-thiazide
diuretic.
Table 3-5: Comparison gender between different first-line antihypertensive classes
Class Variable P value
Male Female ALPHA ACEI ARB BB CCB NON_ THIA
SPIRO
ALPHA 51(49.5) 52(50.5)
ACEI 559(52.2) 511(47.8) 0.61
ARB 203(47) 229(53) 0.66 0.07
BB 409(39.8) 619(60.2) 0.06 1E-08 0.01
CCB 312(46.1) 365(53.9) 0.53 0.01 0.8 0.01
NON_THIA 55(27.6) 144(72.4) 0.0002 1E-10 4E-06 0.0013 3E-06
SPIRO 16(38.1) 26(61.9) 0.27 0.08 0.33 0.87 0.34 0.19
THIA 217(32.9) 443(67.1) 0.0012 3E-15 3E-06 0.005 8E-07 0.19 0.5
Abbreviations: ALPHA, alpha-blocker; ACEI, angiotensin converting enzyme inhibitor; ARB, angiotensin II receptor blocker; BB, beta-blocker; CCB, calcium channel blocker; NON_THIA, non-thiazide diuretic; SPIRO, potassium sparing diuretics; THIA, thiazide diuretic. The Bonferroni corrected p-value is < 0.0017. Results are summarised as number (percentage)
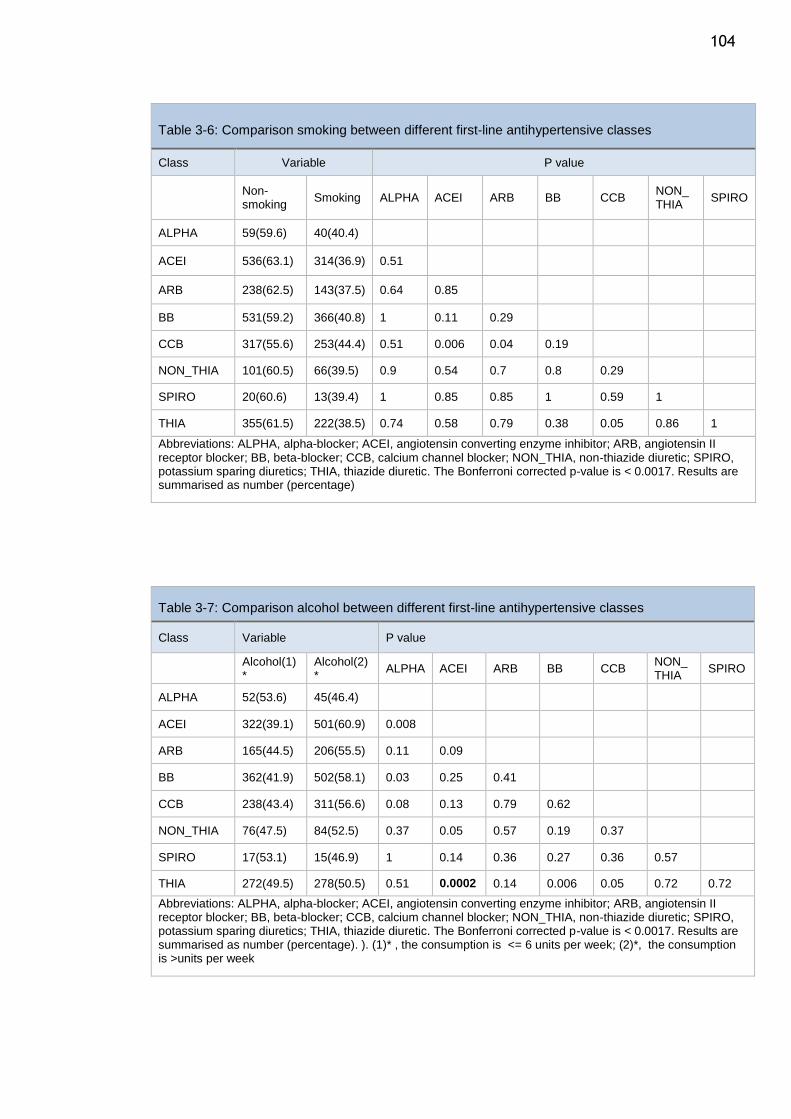
104
Table 3-6: Comparison smoking between different first-line antihypertensive classes
Class Variable P value
Non-smoking
Smoking ALPHA ACEI ARB BB CCB NON_ THIA
SPIRO
ALPHA 59(59.6) 40(40.4)
ACEI 536(63.1) 314(36.9) 0.51
ARB 238(62.5) 143(37.5) 0.64 0.85
BB 531(59.2) 366(40.8) 1 0.11 0.29
CCB 317(55.6) 253(44.4) 0.51 0.006 0.04 0.19
NON_THIA 101(60.5) 66(39.5) 0.9 0.54 0.7 0.8 0.29
SPIRO 20(60.6) 13(39.4) 1 0.85 0.85 1 0.59 1
THIA 355(61.5) 222(38.5) 0.74 0.58 0.79 0.38 0.05 0.86 1
Abbreviations: ALPHA, alpha-blocker; ACEI, angiotensin converting enzyme inhibitor; ARB, angiotensin II receptor blocker; BB, beta-blocker; CCB, calcium channel blocker; NON_THIA, non-thiazide diuretic; SPIRO, potassium sparing diuretics; THIA, thiazide diuretic. The Bonferroni corrected p-value is < 0.0017. Results are summarised as number (percentage)
Table 3-7: Comparison alcohol between different first-line antihypertensive classes
Class Variable P value
Alcohol(1)*
Alcohol(2)*
ALPHA ACEI ARB BB CCB NON_ THIA
SPIRO
ALPHA 52(53.6) 45(46.4)
ACEI 322(39.1) 501(60.9) 0.008
ARB 165(44.5) 206(55.5) 0.11 0.09
BB 362(41.9) 502(58.1) 0.03 0.25 0.41
CCB 238(43.4) 311(56.6) 0.08 0.13 0.79 0.62
NON_THIA 76(47.5) 84(52.5) 0.37 0.05 0.57 0.19 0.37
SPIRO 17(53.1) 15(46.9) 1 0.14 0.36 0.27 0.36 0.57
THIA 272(49.5) 278(50.5) 0.51 0.0002 0.14 0.006 0.05 0.72 0.72
Abbreviations: ALPHA, alpha-blocker; ACEI, angiotensin converting enzyme inhibitor; ARB, angiotensin II receptor blocker; BB, beta-blocker; CCB, calcium channel blocker; NON_THIA, non-thiazide diuretic; SPIRO, potassium sparing diuretics; THIA, thiazide diuretic. The Bonferroni corrected p-value is < 0.0017. Results are summarised as number (percentage). ). (1)* , the consumption is <= 6 units per week; (2)*, the consumption is >units per week
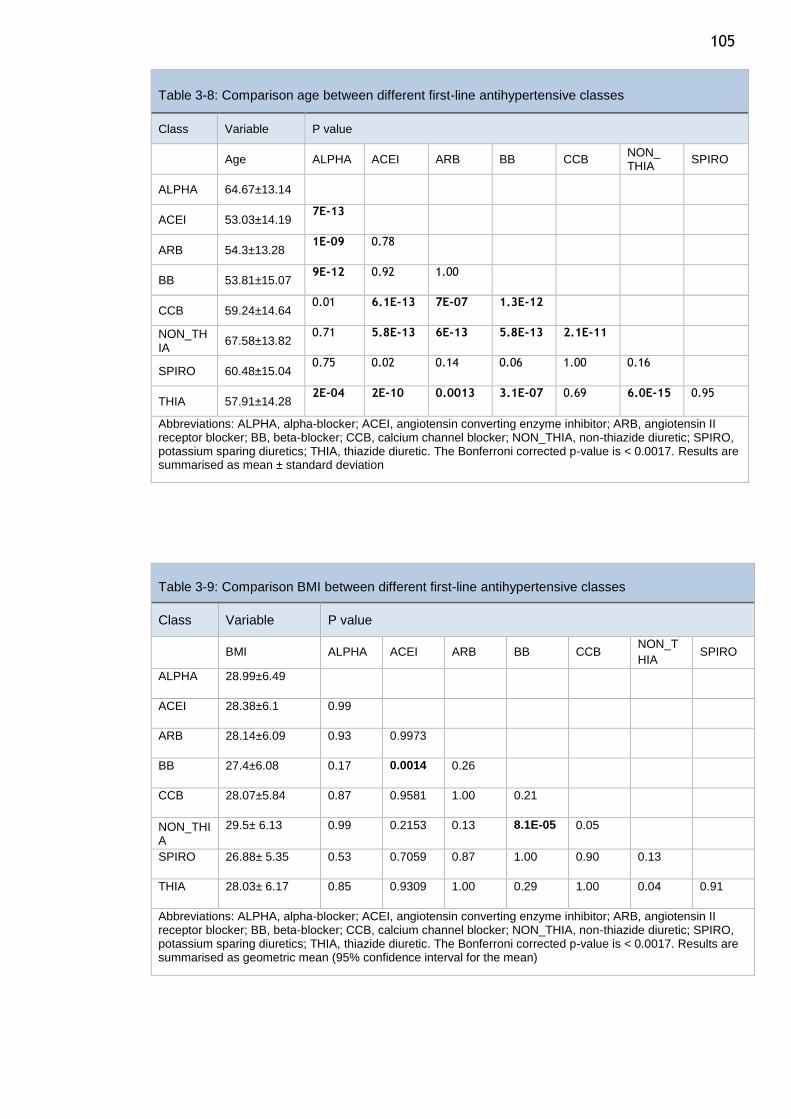
105
Table 3-8: Comparison age between different first-line antihypertensive classes
Class Variable P value
Age ALPHA ACEI ARB BB CCB NON_ THIA
SPIRO
ALPHA 64.67±13.14
ACEI 53.03±14.19 7E-13
ARB 54.3±13.28 1E-09 0.78
BB 53.81±15.07 9E-12 0.92 1.00
CCB 59.24±14.64 0.01 6.1E-13 7E-07 1.3E-12
NON_THIA
67.58±13.82 0.71 5.8E-13 6E-13 5.8E-13 2.1E-11
SPIRO 60.48±15.04 0.75 0.02 0.14 0.06 1.00 0.16
THIA 57.91±14.28 2E-04 2E-10 0.0013 3.1E-07 0.69 6.0E-15 0.95
Abbreviations: ALPHA, alpha-blocker; ACEI, angiotensin converting enzyme inhibitor; ARB, angiotensin II receptor blocker; BB, beta-blocker; CCB, calcium channel blocker; NON_THIA, non-thiazide diuretic; SPIRO, potassium sparing diuretics; THIA, thiazide diuretic. The Bonferroni corrected p-value is < 0.0017. Results are summarised as mean ± standard deviation
Table 3-9: Comparison BMI between different first-line antihypertensive classes
Class Variable P value
BMI ALPHA ACEI ARB BB CCB NON_T
HIA SPIRO
ALPHA 28.99±6.49
ACEI 28.38±6.1 0.99
ARB 28.14±6.09 0.93 0.9973
BB 27.4±6.08 0.17 0.0014 0.26
CCB 28.07±5.84 0.87 0.9581 1.00 0.21
NON_THIA
29.5± 6.13 0.99 0.2153 0.13 8.1E-05 0.05
SPIRO 26.88± 5.35 0.53 0.7059 0.87 1.00 0.90 0.13
THIA 28.03± 6.17 0.85 0.9309 1.00 0.29 1.00 0.04 0.91
Abbreviations: ALPHA, alpha-blocker; ACEI, angiotensin converting enzyme inhibitor; ARB, angiotensin II receptor blocker; BB, beta-blocker; CCB, calcium channel blocker; NON_THIA, non-thiazide diuretic; SPIRO, potassium sparing diuretics; THIA, thiazide diuretic. The Bonferroni corrected p-value is < 0.0017. Results are summarised as geometric mean (95% confidence interval for the mean)
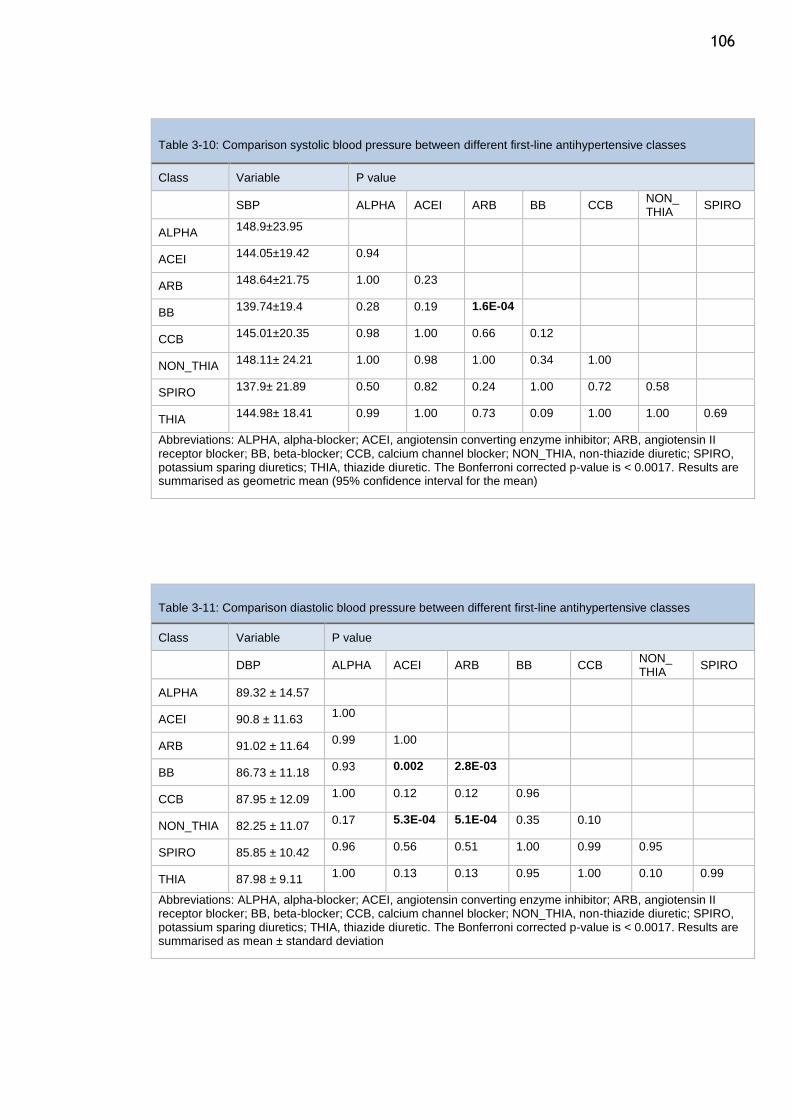
106
Table 3-10: Comparison systolic blood pressure between different first-line antihypertensive classes
Class Variable P value
SBP ALPHA ACEI ARB BB CCB NON_ THIA
SPIRO
ALPHA 148.9±23.95
ACEI 144.05±19.42 0.94
ARB 148.64±21.75 1.00 0.23
BB 139.74±19.4 0.28 0.19 1.6E-04
CCB 145.01±20.35 0.98 1.00 0.66 0.12
NON_THIA 148.11± 24.21 1.00 0.98 1.00 0.34 1.00
SPIRO 137.9± 21.89 0.50 0.82 0.24 1.00 0.72 0.58
THIA 144.98± 18.41 0.99 1.00 0.73 0.09 1.00 1.00 0.69
Abbreviations: ALPHA, alpha-blocker; ACEI, angiotensin converting enzyme inhibitor; ARB, angiotensin II receptor blocker; BB, beta-blocker; CCB, calcium channel blocker; NON_THIA, non-thiazide diuretic; SPIRO, potassium sparing diuretics; THIA, thiazide diuretic. The Bonferroni corrected p-value is < 0.0017. Results are summarised as geometric mean (95% confidence interval for the mean)
Table 3-11: Comparison diastolic blood pressure between different first-line antihypertensive classes
Class Variable P value
DBP ALPHA ACEI ARB BB CCB NON_ THIA
SPIRO
ALPHA 89.32 ± 14.57
ACEI 90.8 ± 11.63 1.00
ARB 91.02 ± 11.64 0.99 1.00
BB 86.73 ± 11.18 0.93 0.002 2.8E-03
CCB 87.95 ± 12.09 1.00 0.12 0.12 0.96
NON_THIA 82.25 ± 11.07 0.17 5.3E-04 5.1E-04 0.35 0.10
SPIRO 85.85 ± 10.42 0.96 0.56 0.51 1.00 0.99 0.95
THIA 87.98 ± 9.11 1.00 0.13 0.13 0.95 1.00 0.10 0.99
Abbreviations: ALPHA, alpha-blocker; ACEI, angiotensin converting enzyme inhibitor; ARB, angiotensin II receptor blocker; BB, beta-blocker; CCB, calcium channel blocker; NON_THIA, non-thiazide diuretic; SPIRO, potassium sparing diuretics; THIA, thiazide diuretic. The Bonferroni corrected p-value is < 0.0017. Results are summarised as mean ± standard deviation
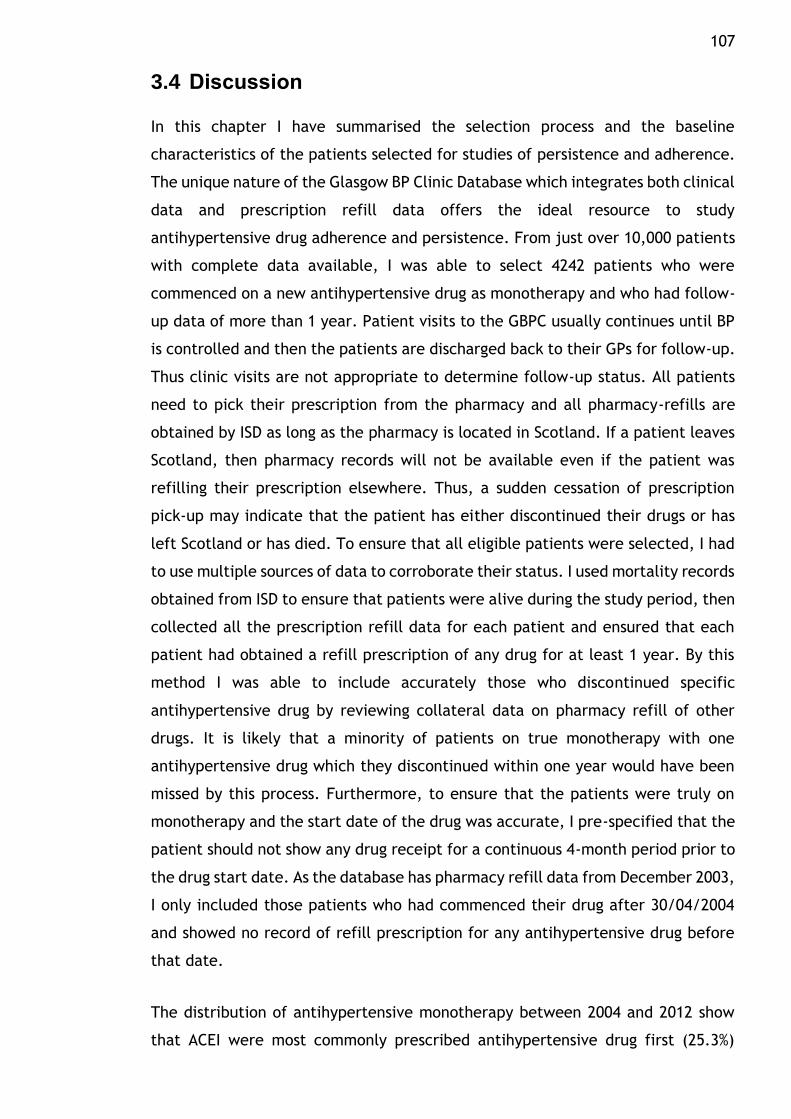
107
3.4 Discussion
In this chapter I have summarised the selection process and the baseline
characteristics of the patients selected for studies of persistence and adherence.
The unique nature of the Glasgow BP Clinic Database which integrates both clinical
data and prescription refill data offers the ideal resource to study
antihypertensive drug adherence and persistence. From just over 10,000 patients
with complete data available, I was able to select 4242 patients who were
commenced on a new antihypertensive drug as monotherapy and who had follow-
up data of more than 1 year. Patient visits to the GBPC usually continues until BP
is controlled and then the patients are discharged back to their GPs for follow-up.
Thus clinic visits are not appropriate to determine follow-up status. All patients
need to pick their prescription from the pharmacy and all pharmacy-refills are
obtained by ISD as long as the pharmacy is located in Scotland. If a patient leaves
Scotland, then pharmacy records will not be available even if the patient was
refilling their prescription elsewhere. Thus, a sudden cessation of prescription
pick-up may indicate that the patient has either discontinued their drugs or has
left Scotland or has died. To ensure that all eligible patients were selected, I had
to use multiple sources of data to corroborate their status. I used mortality records
obtained from ISD to ensure that patients were alive during the study period, then
collected all the prescription refill data for each patient and ensured that each
patient had obtained a refill prescription of any drug for at least 1 year. By this
method I was able to include accurately those who discontinued specific
antihypertensive drug by reviewing collateral data on pharmacy refill of other
drugs. It is likely that a minority of patients on true monotherapy with one
antihypertensive drug which they discontinued within one year would have been
missed by this process. Furthermore, to ensure that the patients were truly on
monotherapy and the start date of the drug was accurate, I pre-specified that the
patient should not show any drug receipt for a continuous 4-month period prior to
the drug start date. As the database has pharmacy refill data from December 2003,
I only included those patients who had commenced their drug after 30/04/2004
and showed no record of refill prescription for any antihypertensive drug before
that date.
The distribution of antihypertensive monotherapy between 2004 and 2012 show
that ACEI were most commonly prescribed antihypertensive drug first (25.3%)
108 closely followed by BB (24.3%), then CCB (16%), Thiazides (15.6%), ARB (10.2%).
The other antihypertensive drugs were less than 5%.
ACEI or ARBs were the most common monotherapy drugs for hypertension in the
Health Survey of England 2003 and 2006 (293), which aligns well with the data
from this study showing around 35% of patients on ACEI/ARB as monotherapy.
Though BB are the second most commonly prescribed drug as monotherapy in this
study, reviewing the temporal trends in BB prescription indicates the impact of
recent guidelines on practice and the lag between publication of guidelines and
clinical implementation(200). Prior to 2006, NICE Guideline 18 recommended that
patients under the age of 55 years be commenced on either an ACEI or BB whilst
those over 55 years or of Afro-Carribean origin be commenced on a CCB or
thiazide-like diuretic (103). The 2006 NICE Guideline 34 saw the removal of BB as
a first line agent in hypertension management.
In the GBPC data, BB monotherapy was the highest in 2004 and 2005 (~25%) then
it progressively declined to around 14% in 2012. Indeed there was an abrupt
decline in 2007 to 14% reflecting the publicity around beta-blockers on outcomes
in hypertensive patients. In comparison, the use of BB monotherapy in HSE
declined from 29% in 2003 to 21% in 2006 (293). This decline in BB prescription in
the GBPC is compensated by an increase in ACEI and ARB prescriptions. ACEI
prescriptions increased from 19% in 2004 to 54% in 2012.
Current and earlier BHS/NICE guidelines recommend CCBs for those of African
origin and for those>55 years of age(43). In the GBPC study, almost all patients
were Caucasian. The GBPC study cohort demonstrates that this guideline
recommendation is adhered to - the mean age of CCB and diuretic groups are 59
and 60 years respectively while the mean age of ACEI and ARB group was 53 and
54 years respectively. The age differences between ACE/ARB and CCB/Diuretic
groups were statistically significant.
The sex distribution was similar in the ACEI and ARB monotherapy groups. In
contrast, there was a preponderance of females (>60%) in BB and thiazide groups.
The reason for this is unclear and may reflect awareness of sexual dysfunction in
109 males being a common side effect of BB and thiazides(467–470). The high
representation of women in this cohort is a strength of the study.
The mean SBP/DBP was 144.5/86.9 for patients who did not initiate treatment.
These numbers are relatively low, and this could be explained by the gap between
the date of blood pressure measurement and the initiation date. The BP
measurements were taken more than one year prior to the initiation date. They
should be low at the date of measurement, increasing until the date of initiation.
Although CCBs are typically prescribed for patients who have isolated systolic HT,
ARBs were prescribed for patients with high SBP. However, the data represent
patients who had essential hypertension, and those who had high SBP did not
necessarily have isolated systolic HT.
Thus the demographic profile of the GBPC monotherapy cohort reflects a cohort
of hypertensive patients whose management conforms to contemporary
guidelines. There are some limitations to this design – the cohort was selected
from patients referred to a tertiary care hypertension clinic and may not be
representative of the general hypertensive population. There is no data on
whether the patient actually took the drug after picking them up from pharmacy.
The drug therapy is not randomised, so between groups comparisons will be prone
to confounding which cannot be overcome by simple adjustment for covariates.
So any results need to be considered in light of this and further confirmatory
studies will be required before change in clinical practice can happen.
110
Chapter 4 Persistence
4.1 Introduction
As discussed in the Introduction, randomised clinical trials have clearly shown the
benefit of BP reduction using antihypertensive medications. However, the full
benefit of antihypertensive therapy in real life practice can only be obtained if
patients keep taking their medicines regularly(392,471,472). Persistence with
treatment is a crucial element in determining the success of any long-term
therapy. Persistence is the continuous use of medications for the specified
treatment time period, which, for hypertension, should be maintained life-
long(473). Studies from Europe and North America have estimated that around
50% of all patients using antihypertensive drugs had discontinued within 6 months
to 4 years(392,472) implying that poor persistence is a likely explanation for the
discrepancy observed between the efficacy of drug treatment established through
clinical trials and the results observed in clinical practice (474). Corrao et al.
reported that 37% of CV outcomes were reduced among patients with high
persistence compared with those who had very low persistence (429). Thus an
important modifiable reason for lack of BP control is failure by patients to take
their medications as prescribed. Furthermore, high persistence can decrease the
cost of medications Longer persistence with beta-blockers for the treatment of
hypertension has been shown to reduce the overall medical costs(388). On the
other hand, non-persistence leads to an increase in the cost of the treatment. It
has been estimated that 76.5 million pound sterling is spent to treat hypertension
per year, and around 26.9 million pound sterling of this total cost is attributed to
switching or discontinuation therapy. A Department of Health report suggested
that the expected annual treatment savings in England would be more than £390
from moving hypertensive patients from non-adherence to adherence (385).
Discontinuation rates varied between studies and ranged between 5% to 75% (448).
For instance, a retrospective cohort study by Boris et al demonstrated 10 year
persistence with antihypertensive medications of 39% (427). Wogen et al showed
persistence rates of 54% at one year (428). Tremblay et al showed a 1 and 2 year
persistence of 69.1% and 69.2% respectively in treated hypertensive patients
(475).
111 A wide variability in the persistence of initial antihypertensive therapy classes
have been shown in several studies. Most studies showed the highest rates of
persistence with ARBs and ACE inhibitors, and the lowest with diuretics (435–437).
Several factors influence persistence. Factors such as sociodemographic,
psychosocial or behavioural variables, healthcare system, therapeutic regimen
and comorbidity were associated persistence rates.
The purpose of this study was to investigate the patterns of long and short-term
persistence and patterns the variation of persistence rates between
antihypertensive classes, in a population of treated hypertensive patients
attending the Glasgow Blood Pressure Clinic. Also, I sought to determine the
association of persistence with different clinical characteristics such as age, sex,
BMI, BP value, smoking status, and alcohol intake.
4.2 Methods
This study analysed hypertensive patients who filled their first prescription with
an alpha blocker, ACEI, ARB, CCB, BB, potassium sparing diuretics, centrally acting
antihypertensive drug, vasodilator antihypertensive drug, non-thiazide diuretic,
or thiazide diuretic. The details of the patient selection and description of the
study cohort are presented in Chapter 3.
While all patients were initially started on monotherapy, during follow-up many
patients had additional antihypertensive therapies added to the first
antihypertensive class they had been prescribed. In this study, persistence was
calculated only for the initial antihypertensive class. Terms such as persistence,
switching (switching before 120 days, and switching after 120 days), and
discontinuation are defined in Table 4-1.
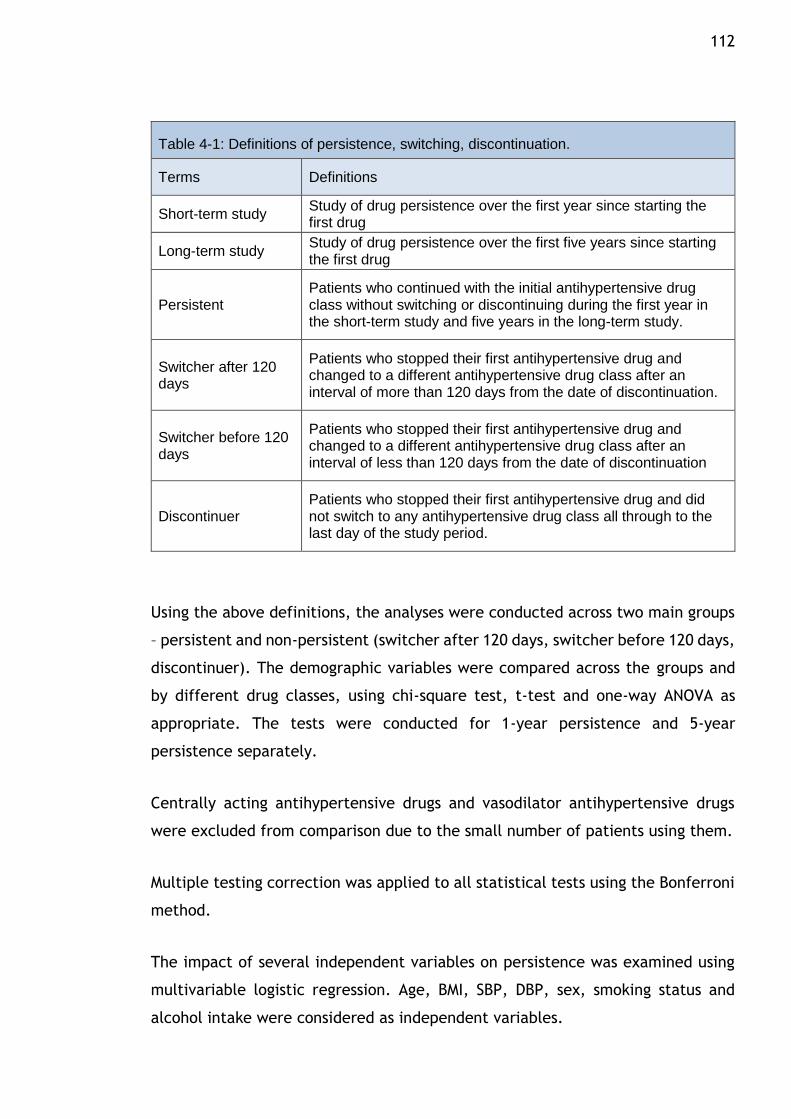
112
Table 4-1: Definitions of persistence, switching, discontinuation.
Terms Definitions
Short-term study Study of drug persistence over the first year since starting the first drug
Long-term study Study of drug persistence over the first five years since starting the first drug
Persistent Patients who continued with the initial antihypertensive drug class without switching or discontinuing during the first year in the short-term study and five years in the long-term study.
Switcher after 120 days
Patients who stopped their first antihypertensive drug and changed to a different antihypertensive drug class after an interval of more than 120 days from the date of discontinuation.
Switcher before 120 days
Patients who stopped their first antihypertensive drug and changed to a different antihypertensive drug class after an interval of less than 120 days from the date of discontinuation
Discontinuer Patients who stopped their first antihypertensive drug and did not switch to any antihypertensive drug class all through to the last day of the study period.
Using the above definitions, the analyses were conducted across two main groups
– persistent and non-persistent (switcher after 120 days, switcher before 120 days,
discontinuer). The demographic variables were compared across the groups and
by different drug classes, using chi-square test, t-test and one-way ANOVA as
appropriate. The tests were conducted for 1-year persistence and 5-year
persistence separately.
Centrally acting antihypertensive drugs and vasodilator antihypertensive drugs
were excluded from comparison due to the small number of patients using them.
Multiple testing correction was applied to all statistical tests using the Bonferroni
method.
The impact of several independent variables on persistence was examined using
multivariable logistic regression. Age, BMI, SBP, DBP, sex, smoking status and
alcohol intake were considered as independent variables.
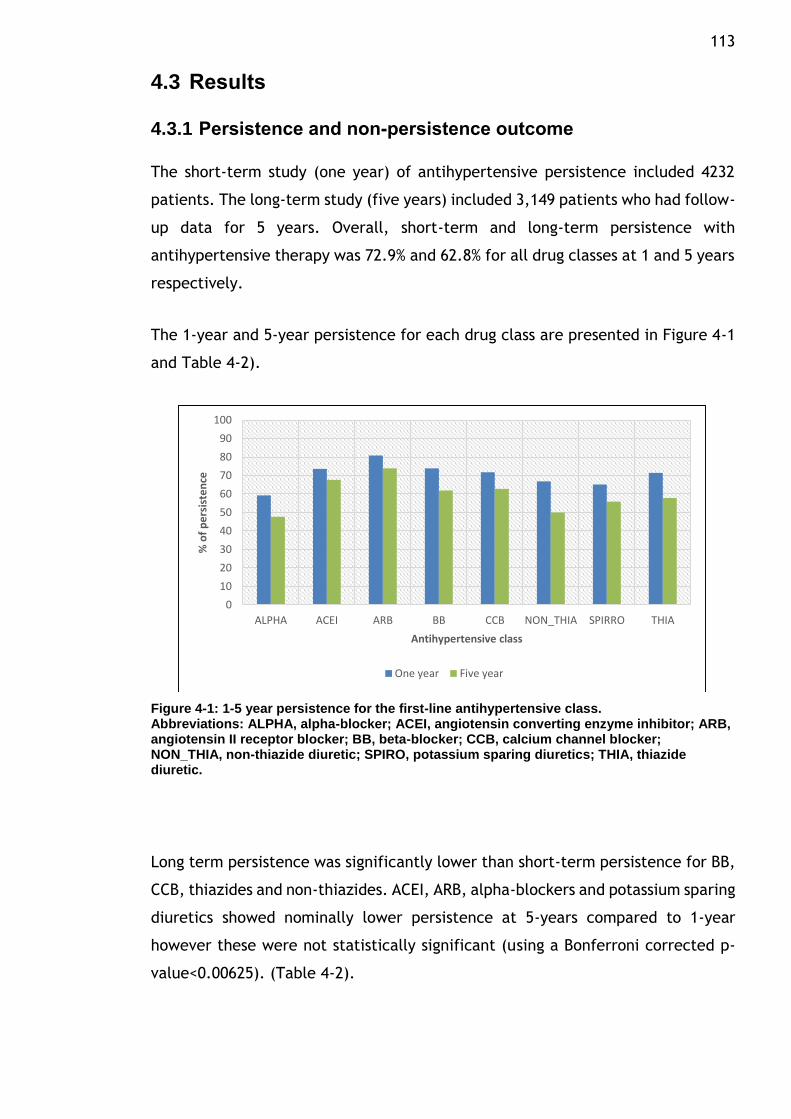
113
4.3 Results
4.3.1 Persistence and non-persistence outcome
The short-term study (one year) of antihypertensive persistence included 4232
patients. The long-term study (five years) included 3,149 patients who had follow-
up data for 5 years. Overall, short-term and long-term persistence with
antihypertensive therapy was 72.9% and 62.8% for all drug classes at 1 and 5 years
respectively.
The 1-year and 5-year persistence for each drug class are presented in Figure 4-1
and Table 4-2).
Figure 4-1: 1-5 year persistence for the first-line antihypertensive class. Abbreviations: ALPHA, alpha-blocker; ACEI, angiotensin converting enzyme inhibitor; ARB, angiotensin II receptor blocker; BB, beta-blocker; CCB, calcium channel blocker; NON_THIA, non-thiazide diuretic; SPIRO, potassium sparing diuretics; THIA, thiazide diuretic.
Long term persistence was significantly lower than short-term persistence for BB,
CCB, thiazides and non-thiazides. ACEI, ARB, alpha-blockers and potassium sparing
diuretics showed nominally lower persistence at 5-years compared to 1-year
however these were not statistically significant (using a Bonferroni corrected p-
value<0.00625). (Table 4-2).
0
10
20
30
40
50
60
70
80
90
100
ALPHA ACEI ARB BB CCB NON_THIA SPIRRO THIA
% o
f p
ers
iste
nce
Antihypertensive class
One year Five year
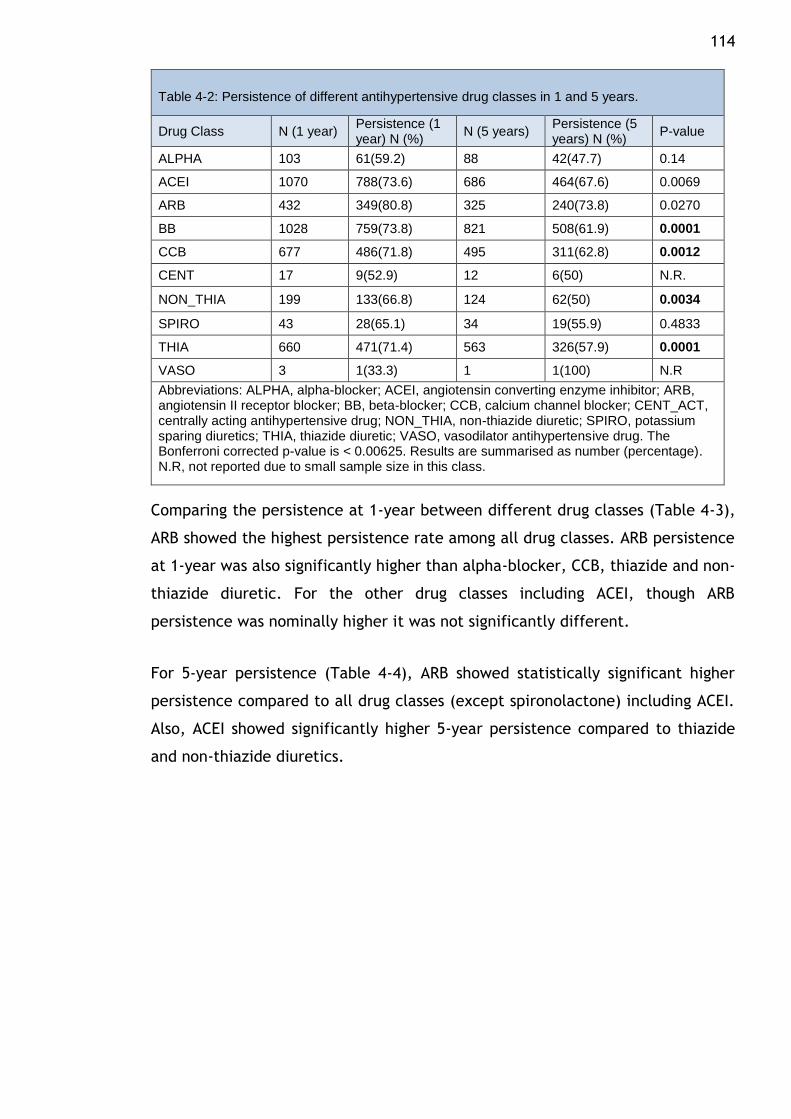
114
Table 4-2: Persistence of different antihypertensive drug classes in 1 and 5 years.
Drug Class N (1 year) Persistence (1 year) N (%)
N (5 years) Persistence (5 years) N (%)
P-value
ALPHA 103 61(59.2) 88 42(47.7) 0.14
ACEI 1070 788(73.6) 686 464(67.6) 0.0069
ARB 432 349(80.8) 325 240(73.8) 0.0270
BB 1028 759(73.8) 821 508(61.9) 0.0001
CCB 677 486(71.8) 495 311(62.8) 0.0012
CENT 17 9(52.9) 12 6(50) N.R.
NON_THIA 199 133(66.8) 124 62(50) 0.0034
SPIRO 43 28(65.1) 34 19(55.9) 0.4833
THIA 660 471(71.4) 563 326(57.9) 0.0001
VASO 3 1(33.3) 1 1(100) N.R
Abbreviations: ALPHA, alpha-blocker; ACEI, angiotensin converting enzyme inhibitor; ARB, angiotensin II receptor blocker; BB, beta-blocker; CCB, calcium channel blocker; CENT_ACT, centrally acting antihypertensive drug; NON_THIA, non-thiazide diuretic; SPIRO, potassium sparing diuretics; THIA, thiazide diuretic; VASO, vasodilator antihypertensive drug. The Bonferroni corrected p-value is < 0.00625. Results are summarised as number (percentage). N.R, not reported due to small sample size in this class.
Comparing the persistence at 1-year between different drug classes (Table 4-3),
ARB showed the highest persistence rate among all drug classes. ARB persistence
at 1-year was also significantly higher than alpha-blocker, CCB, thiazide and non-
thiazide diuretic. For the other drug classes including ACEI, though ARB
persistence was nominally higher it was not significantly different.
For 5-year persistence (Table 4-4), ARB showed statistically significant higher
persistence compared to all drug classes (except spironolactone) including ACEI.
Also, ACEI showed significantly higher 5-year persistence compared to thiazide
and non-thiazide diuretics.
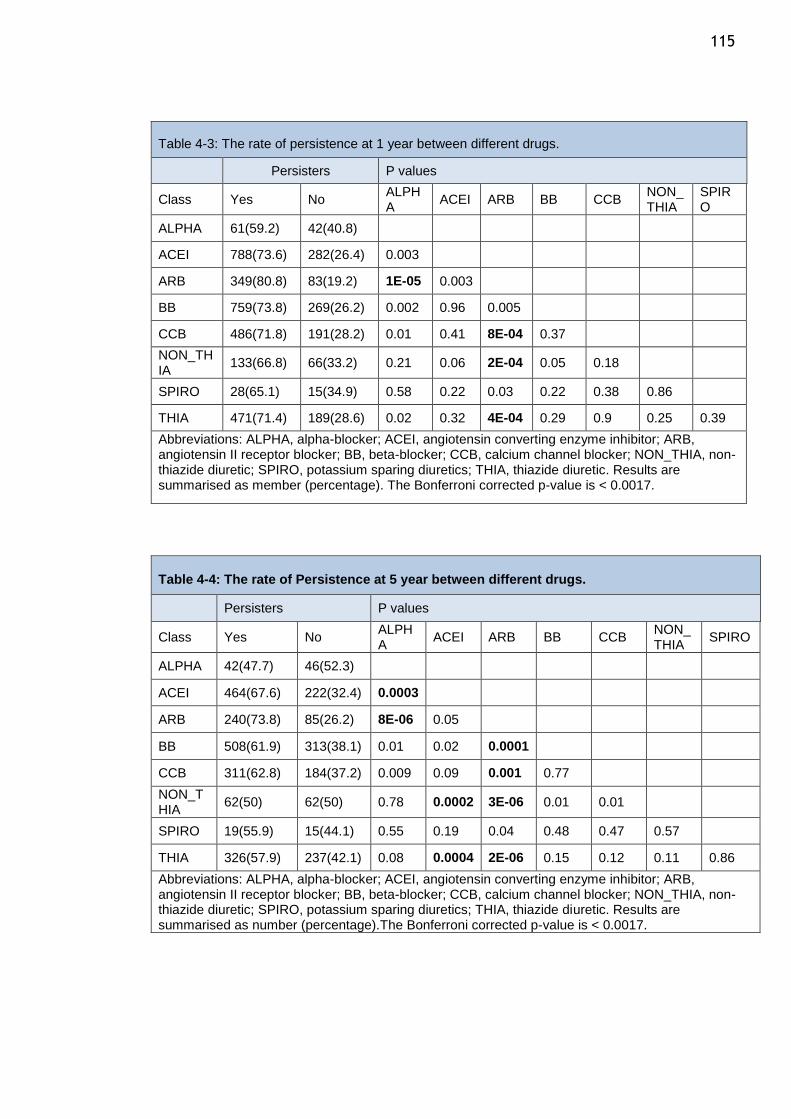
115
Table 4-3: The rate of persistence at 1 year between different drugs.
Persisters P values
Class Yes No ALPHA
ACEI ARB BB CCB NON_ THIA
SPIRO
ALPHA 61(59.2) 42(40.8)
ACEI 788(73.6) 282(26.4) 0.003
ARB 349(80.8) 83(19.2) 1E-05 0.003
BB 759(73.8) 269(26.2) 0.002 0.96 0.005
CCB 486(71.8) 191(28.2) 0.01 0.41 8E-04 0.37
NON_THIA
133(66.8) 66(33.2) 0.21 0.06 2E-04 0.05 0.18
SPIRO 28(65.1) 15(34.9) 0.58 0.22 0.03 0.22 0.38 0.86
THIA 471(71.4) 189(28.6) 0.02 0.32 4E-04 0.29 0.9 0.25 0.39
Abbreviations: ALPHA, alpha-blocker; ACEI, angiotensin converting enzyme inhibitor; ARB, angiotensin II receptor blocker; BB, beta-blocker; CCB, calcium channel blocker; NON_THIA, non-thiazide diuretic; SPIRO, potassium sparing diuretics; THIA, thiazide diuretic. Results are summarised as member (percentage). The Bonferroni corrected p-value is < 0.0017.
Table 4-4: The rate of Persistence at 5 year between different drugs.
Persisters P values
Class Yes No ALPHA
ACEI ARB BB CCB NON_ THIA
SPIRO
ALPHA 42(47.7) 46(52.3)
ACEI 464(67.6) 222(32.4) 0.0003
ARB 240(73.8) 85(26.2) 8E-06 0.05
BB 508(61.9) 313(38.1) 0.01 0.02 0.0001
CCB 311(62.8) 184(37.2) 0.009 0.09 0.001 0.77
NON_THIA
62(50) 62(50) 0.78 0.0002 3E-06 0.01 0.01
SPIRO 19(55.9) 15(44.1) 0.55 0.19 0.04 0.48 0.47 0.57
THIA 326(57.9) 237(42.1) 0.08 0.0004 2E-06 0.15 0.12 0.11 0.86
Abbreviations: ALPHA, alpha-blocker; ACEI, angiotensin converting enzyme inhibitor; ARB, angiotensin II receptor blocker; BB, beta-blocker; CCB, calcium channel blocker; NON_THIA, non-thiazide diuretic; SPIRO, potassium sparing diuretics; THIA, thiazide diuretic. Results are summarised as number (percentage).The Bonferroni corrected p-value is < 0.0017.
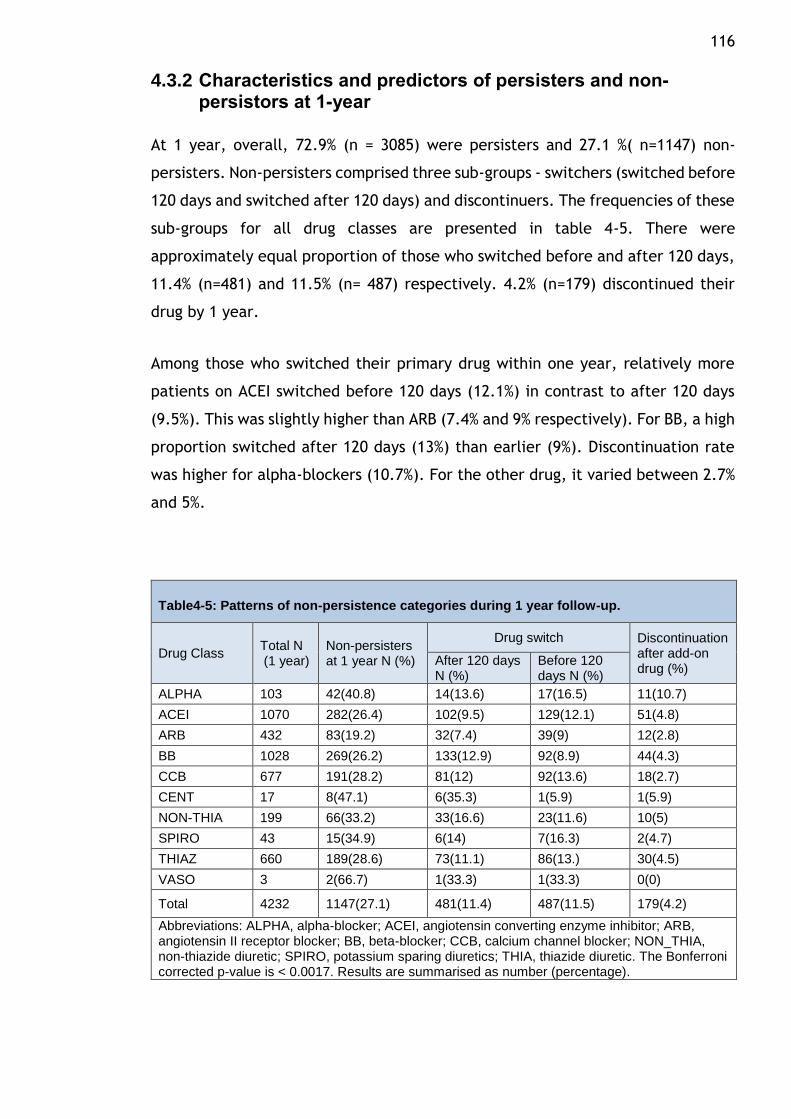
116
4.3.2 Characteristics and predictors of persisters and non-persistors at 1-year
At 1 year, overall, 72.9% (n = 3085) were persisters and 27.1 %( n=1147) non-
persisters. Non-persisters comprised three sub-groups - switchers (switched before
120 days and switched after 120 days) and discontinuers. The frequencies of these
sub-groups for all drug classes are presented in table 4-5. There were
approximately equal proportion of those who switched before and after 120 days,
11.4% (n=481) and 11.5% (n= 487) respectively. 4.2% (n=179) discontinued their
drug by 1 year.
Among those who switched their primary drug within one year, relatively more
patients on ACEI switched before 120 days (12.1%) in contrast to after 120 days
(9.5%). This was slightly higher than ARB (7.4% and 9% respectively). For BB, a high
proportion switched after 120 days (13%) than earlier (9%). Discontinuation rate
was higher for alpha-blockers (10.7%). For the other drug, it varied between 2.7%
and 5%.
Table4-5: Patterns of non-persistence categories during 1 year follow-up.
Drug Class Total N (1 year)
Non-persisters at 1 year N (%)
Drug switch Discontinuation after add-on drug (%)
After 120 days N (%)
Before 120 days N (%)
ALPHA 103 42(40.8) 14(13.6) 17(16.5) 11(10.7)
ACEI 1070 282(26.4) 102(9.5) 129(12.1) 51(4.8)
ARB 432 83(19.2) 32(7.4) 39(9) 12(2.8)
BB 1028 269(26.2) 133(12.9) 92(8.9) 44(4.3)
CCB 677 191(28.2) 81(12) 92(13.6) 18(2.7)
CENT 17 8(47.1) 6(35.3) 1(5.9) 1(5.9)
NON-THIA 199 66(33.2) 33(16.6) 23(11.6) 10(5)
SPIRO 43 15(34.9) 6(14) 7(16.3) 2(4.7)
THIAZ 660 189(28.6) 73(11.1) 86(13.) 30(4.5)
VASO 3 2(66.7) 1(33.3) 1(33.3) 0(0)
Total 4232 1147(27.1) 481(11.4) 487(11.5) 179(4.2)
Abbreviations: ALPHA, alpha-blocker; ACEI, angiotensin converting enzyme inhibitor; ARB, angiotensin II receptor blocker; BB, beta-blocker; CCB, calcium channel blocker; NON_THIA, non-thiazide diuretic; SPIRO, potassium sparing diuretics; THIA, thiazide diuretic. The Bonferroni corrected p-value is < 0.0017. Results are summarised as number (percentage).
117 Table 4-6 summarises the demographic characteristics of the different groups and
table 4-7 shows the comparison between persistors and non-persistors. There are
no substantial differences in the demographic variables between any of the
groups. Whilst some p-values were nominally significant, these do not remain
significant when the number of statistical tests are considered. The mean of SBP
was around 143.78 ± 20.13 mmHg lower among persistors compared to non-
persistors which was 146.88 ± 20.02.
Patient characteristics were compared between the three non-persistence
categories (switched after 120 days, switched before 120 days and discontinued).
The mean age of individuals who switched their drug after 120 days was
significantly lower than those who switched their drug before 120 days: 53.73 ±
15.2 years versus 58.13 ± 14.3 years, respectively (P= 0.00001). There were no
differences between these groups in terms of sex, BMI, SBP, DBP, smoking status
and alcohol intake, as seen in table 4-6. Age, smoking and alcohol intake were
found to be nominally different between those who switched before 120 days and
those who switched after 120 days in the results of the multinomial logistic
regression model’s table regression (table 4-8).
Patient characteristics of persistence were compared with non-persistence
categories (switched after 120 days, switched before 120 days and discontinued).
Persistent patients were significantly older than those who switched after 120
days; the mean age of the continuers and those who switched after 120 days were
56.3 ±14.8 years and 53.7 ± 15.2 years, respectively, and the p-value was 0.002.
BMI was significantly different between those who persisted and those who
switched before 120 days. BMI was higher in patients who switched their drug
before 120 days with mean of 28.75 ± 6.19 kg/m2 compared with those who
persisted with their drug with mean of 27.95 ± 6.11 kg/m2 (P= 0.042), as seen in
table 4-6.
The significant different result was only found with smoking factors between
continuers and switchers after 120 days in the multinomial logistic regression
models table (table 4-9).
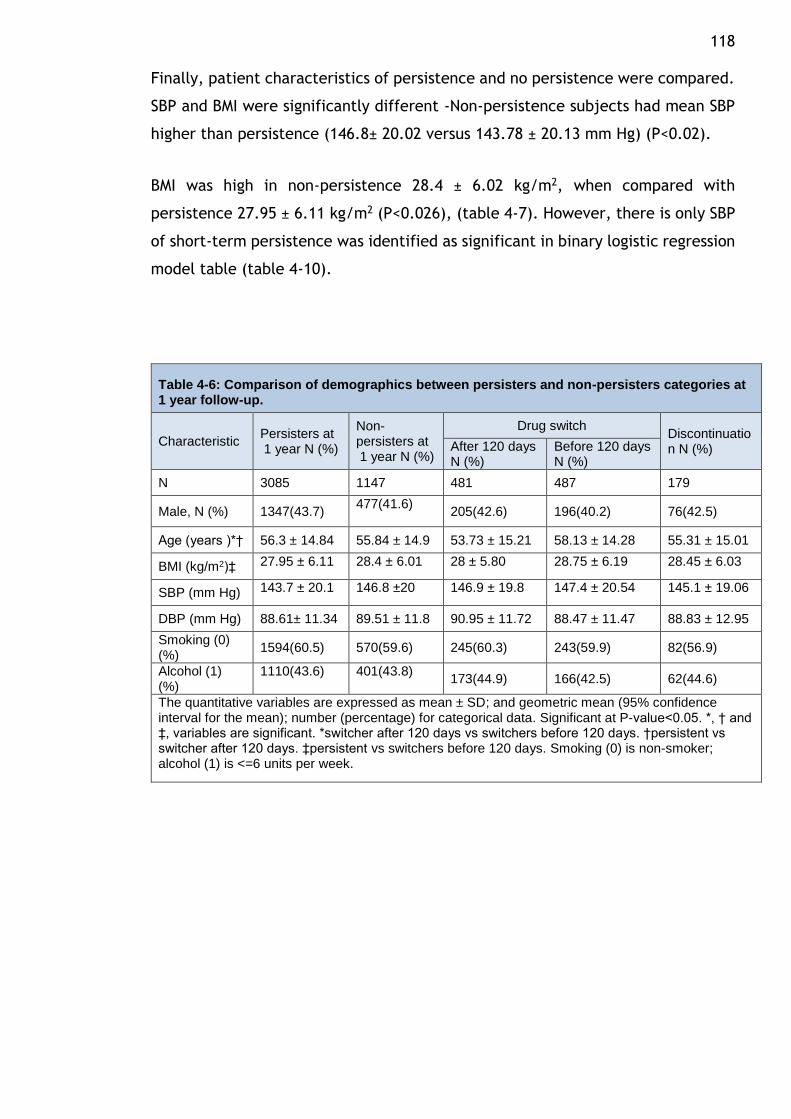
118 Finally, patient characteristics of persistence and no persistence were compared.
SBP and BMI were significantly different -Non-persistence subjects had mean SBP
higher than persistence (146.8± 20.02 versus 143.78 ± 20.13 mm Hg) (P<0.02).
BMI was high in non-persistence 28.4 ± 6.02 kg/m2, when compared with
persistence 27.95 ± 6.11 kg/m2 (P<0.026), (table 4-7). However, there is only SBP
of short-term persistence was identified as significant in binary logistic regression
model table (table 4-10).
Table 4-6: Comparison of demographics between persisters and non-persisters categories at 1 year follow-up.
Characteristic Persisters at 1 year N (%)
Non-persisters at 1 year N (%)
Drug switch Discontinuation N (%) After 120 days
N (%) Before 120 days N (%)
N 3085 1147 481 487 179
Male, N (%) 1347(43.7) 477(41.6)
205(42.6) 196(40.2) 76(42.5)
Age (years )*† 56.3 ± 14.84 55.84 ± 14.9 53.73 ± 15.21 58.13 ± 14.28 55.31 ± 15.01
BMI (kg/m2)‡ 27.95 ± 6.11 28.4 ± 6.01 28 ± 5.80 28.75 ± 6.19 28.45 ± 6.03
SBP (mm Hg) 143.7 ± 20.1 146.8 ±20 146.9 ± 19.8 147.4 ± 20.54 145.1 ± 19.06
DBP (mm Hg) 88.61± 11.34 89.51 ± 11.8 90.95 ± 11.72 88.47 ± 11.47 88.83 ± 12.95
Smoking (0) (%)
1594(60.5) 570(59.6) 245(60.3) 243(59.9) 82(56.9)
Alcohol (1) (%)
1110(43.6)
401(43.8)
173(44.9) 166(42.5) 62(44.6)
The quantitative variables are expressed as mean ± SD; and geometric mean (95% confidence interval for the mean); number (percentage) for categorical data. Significant at P-value<0.05. *, † and ‡, variables are significant. *switcher after 120 days vs switchers before 120 days. †persistent vs switcher after 120 days. ‡persistent vs switchers before 120 days. Smoking (0) is non-smoker; alcohol (1) is <=6 units per week.
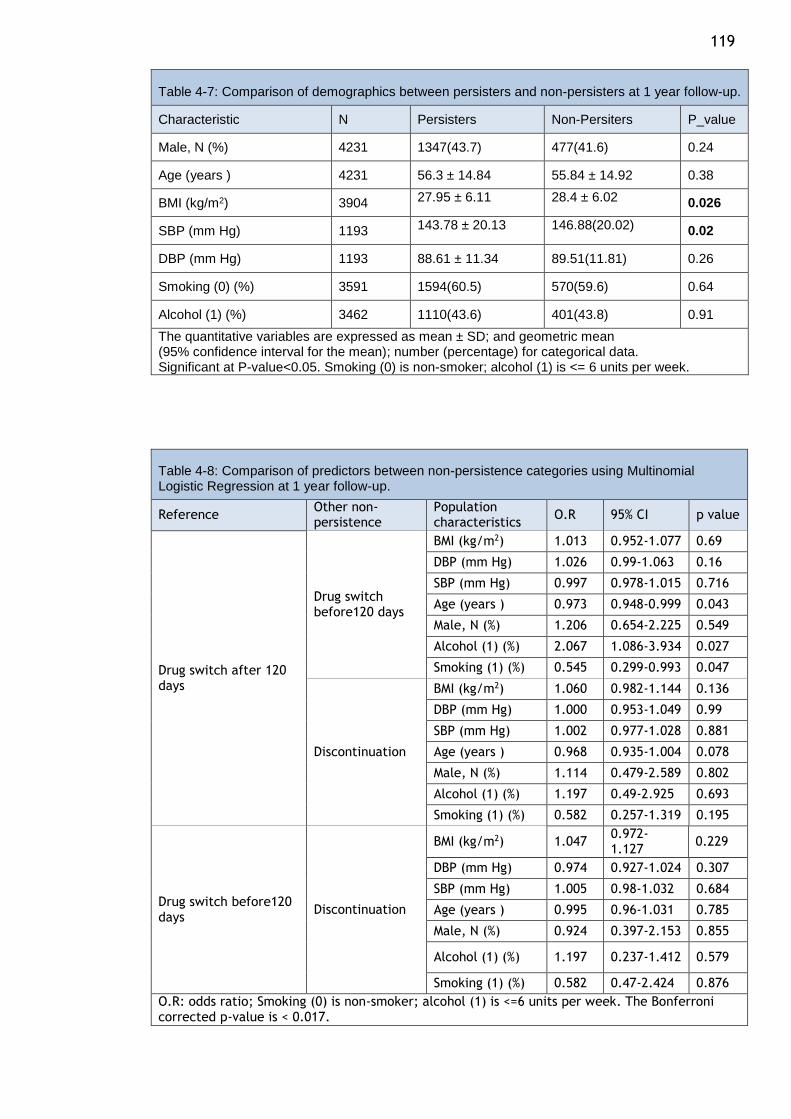
119
Table 4-7: Comparison of demographics between persisters and non-persisters at 1 year follow-up.
Characteristic N Persisters Non-Persiters P_value
Male, N (%) 4231 1347(43.7) 477(41.6) 0.24
Age (years ) 4231 56.3 ± 14.84 55.84 ± 14.92 0.38
BMI (kg/m2) 3904 27.95 ± 6.11 28.4 ± 6.02 0.026
SBP (mm Hg) 1193 143.78 ± 20.13 146.88(20.02) 0.02
DBP (mm Hg) 1193 88.61 ± 11.34 89.51(11.81) 0.26
Smoking (0) (%) 3591 1594(60.5) 570(59.6) 0.64
Alcohol (1) (%) 3462 1110(43.6) 401(43.8) 0.91
The quantitative variables are expressed as mean ± SD; and geometric mean (95% confidence interval for the mean); number (percentage) for categorical data. Significant at P-value<0.05. Smoking (0) is non-smoker; alcohol (1) is <= 6 units per week.
Table 4-8: Comparison of predictors between non-persistence categories using Multinomial Logistic Regression at 1 year follow-up.
Reference Other non-persistence
Population characteristics
O.R 95% CI p value
Drug switch after 120 days
Drug switch before120 days
BMI (kg/m2) 1.013 0.952-1.077 0.69
DBP (mm Hg) 1.026 0.99-1.063 0.16
SBP (mm Hg) 0.997 0.978-1.015 0.716
Age (years ) 0.973 0.948-0.999 0.043
Male, N (%) 1.206 0.654-2.225 0.549
Alcohol (1) (%) 2.067 1.086-3.934 0.027
Smoking (1) (%) 0.545 0.299-0.993 0.047
Discontinuation
BMI (kg/m2) 1.060 0.982-1.144 0.136
DBP (mm Hg) 1.000 0.953-1.049 0.99
SBP (mm Hg) 1.002 0.977-1.028 0.881
Age (years ) 0.968 0.935-1.004 0.078
Male, N (%) 1.114 0.479-2.589 0.802
Alcohol (1) (%) 1.197 0.49-2.925 0.693
Smoking (1) (%) 0.582 0.257-1.319 0.195
Drug switch before120 days
Discontinuation
BMI (kg/m2) 1.047 0.972-1.127
0.229
DBP (mm Hg) 0.974 0.927-1.024 0.307
SBP (mm Hg) 1.005 0.98-1.032 0.684
Age (years ) 0.995 0.96-1.031 0.785
Male, N (%) 0.924 0.397-2.153 0.855
Alcohol (1) (%) 1.197 0.237-1.412 0.579
Smoking (1) (%) 0.582 0.47-2.424 0.876
O.R: odds ratio; Smoking (0) is non-smoker; alcohol (1) is <=6 units per week. The Bonferroni corrected p-value is < 0.017.
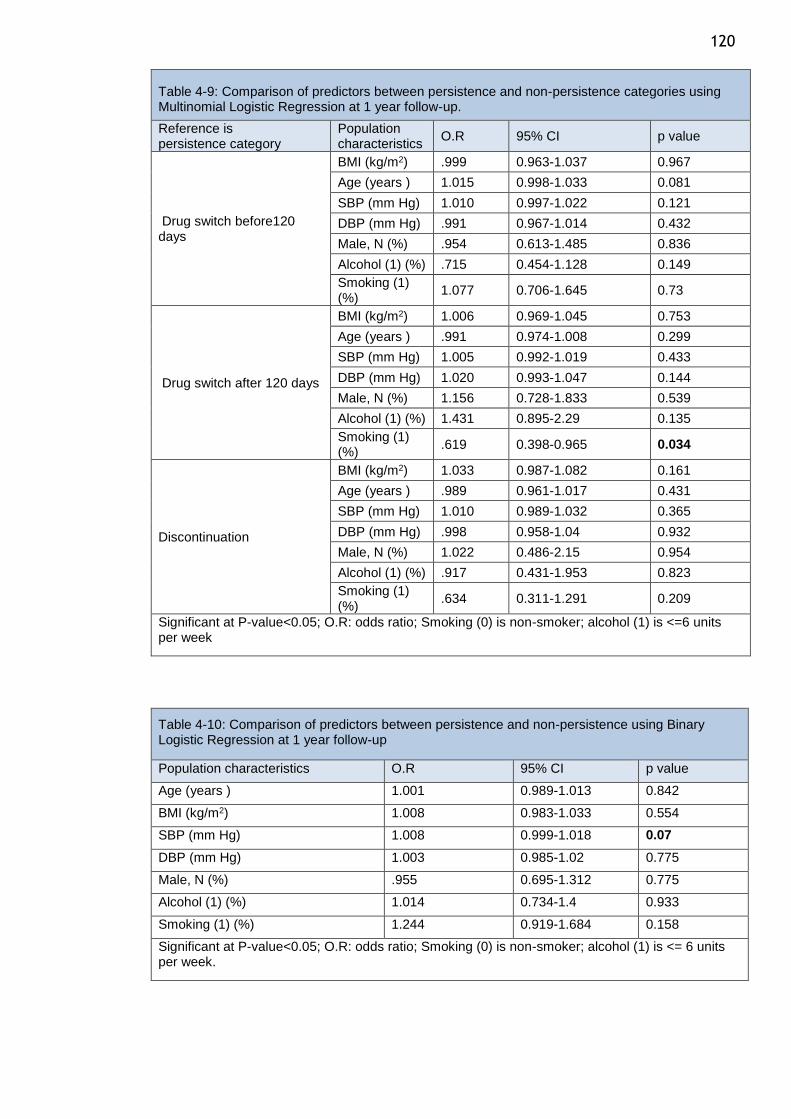
120
Table 4-9: Comparison of predictors between persistence and non-persistence categories using Multinomial Logistic Regression at 1 year follow-up.
Reference is persistence category
Population characteristics
O.R 95% CI p value
Drug switch before120 days
BMI (kg/m2) .999 0.963-1.037 0.967
Age (years ) 1.015 0.998-1.033 0.081
SBP (mm Hg) 1.010 0.997-1.022 0.121
DBP (mm Hg) .991 0.967-1.014 0.432
Male, N (%) .954 0.613-1.485 0.836
Alcohol (1) (%) .715 0.454-1.128 0.149
Smoking (1) (%)
1.077 0.706-1.645 0.73
Drug switch after 120 days
BMI (kg/m2) 1.006 0.969-1.045 0.753
Age (years ) .991 0.974-1.008 0.299
SBP (mm Hg) 1.005 0.992-1.019 0.433
DBP (mm Hg) 1.020 0.993-1.047 0.144
Male, N (%) 1.156 0.728-1.833 0.539
Alcohol (1) (%) 1.431 0.895-2.29 0.135
Smoking (1) (%)
.619 0.398-0.965 0.034
Discontinuation
BMI (kg/m2) 1.033 0.987-1.082 0.161
Age (years ) .989 0.961-1.017 0.431
SBP (mm Hg) 1.010 0.989-1.032 0.365
DBP (mm Hg) .998 0.958-1.04 0.932
Male, N (%) 1.022 0.486-2.15 0.954
Alcohol (1) (%) .917 0.431-1.953 0.823
Smoking (1) (%)
.634 0.311-1.291 0.209
Significant at P-value<0.05; O.R: odds ratio; Smoking (0) is non-smoker; alcohol (1) is <=6 units per week
Table 4-10: Comparison of predictors between persistence and non-persistence using Binary Logistic Regression at 1 year follow-up
Population characteristics O.R 95% CI p value
Age (years ) 1.001 0.989-1.013 0.842
BMI (kg/m2) 1.008 0.983-1.033 0.554
SBP (mm Hg) 1.008 0.999-1.018 0.07
DBP (mm Hg) 1.003 0.985-1.02 0.775
Male, N (%) .955 0.695-1.312 0.775
Alcohol (1) (%) 1.014 0.734-1.4 0.933
Smoking (1) (%) 1.244 0.919-1.684 0.158
Significant at P-value<0.05; O.R: odds ratio; Smoking (0) is non-smoker; alcohol (1) is <= 6 units per week.
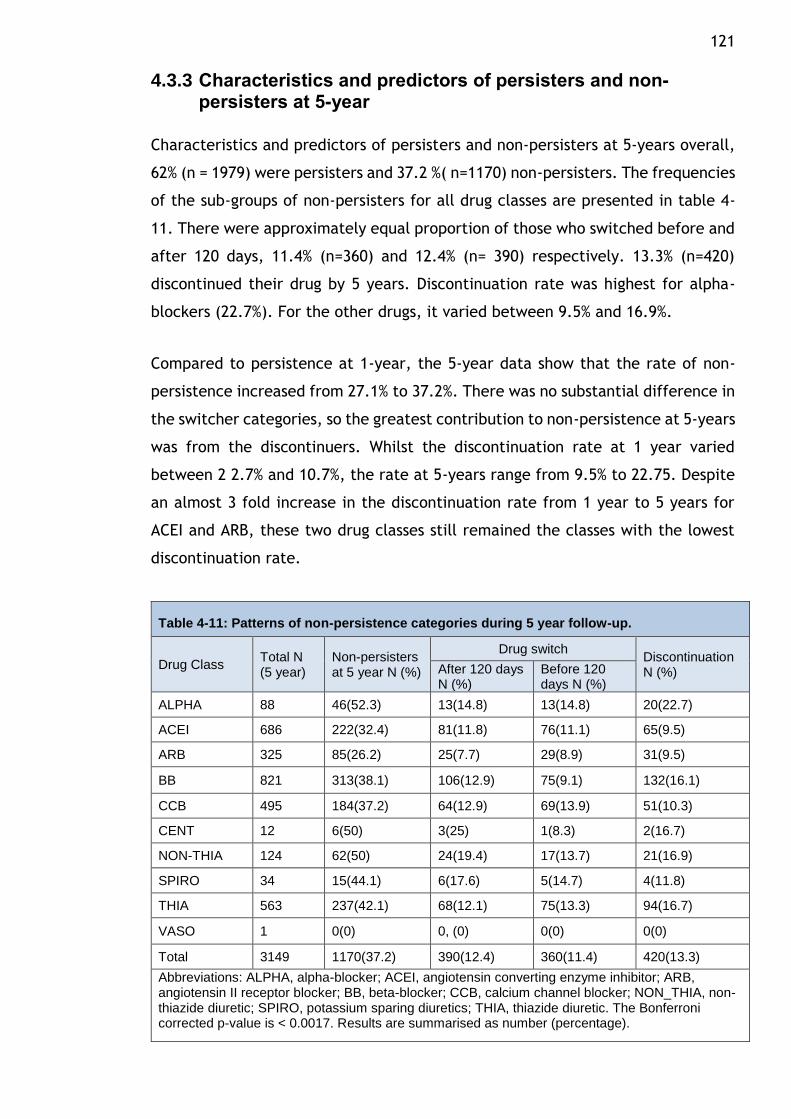
121
4.3.3 Characteristics and predictors of persisters and non-persisters at 5-year
Characteristics and predictors of persisters and non-persisters at 5-years overall,
62% (n = 1979) were persisters and 37.2 %( n=1170) non-persisters. The frequencies
of the sub-groups of non-persisters for all drug classes are presented in table 4-
11. There were approximately equal proportion of those who switched before and
after 120 days, 11.4% (n=360) and 12.4% (n= 390) respectively. 13.3% (n=420)
discontinued their drug by 5 years. Discontinuation rate was highest for alpha-
blockers (22.7%). For the other drugs, it varied between 9.5% and 16.9%.
Compared to persistence at 1-year, the 5-year data show that the rate of non-
persistence increased from 27.1% to 37.2%. There was no substantial difference in
the switcher categories, so the greatest contribution to non-persistence at 5-years
was from the discontinuers. Whilst the discontinuation rate at 1 year varied
between 2 2.7% and 10.7%, the rate at 5-years range from 9.5% to 22.75. Despite
an almost 3 fold increase in the discontinuation rate from 1 year to 5 years for
ACEI and ARB, these two drug classes still remained the classes with the lowest
discontinuation rate.
Table 4-11: Patterns of non-persistence categories during 5 year follow-up.
Drug Class Total N (5 year)
Non-persisters at 5 year N (%)
Drug switch Discontinuation N (%) After 120 days
N (%) Before 120 days N (%)
ALPHA 88 46(52.3) 13(14.8) 13(14.8) 20(22.7)
ACEI 686 222(32.4) 81(11.8) 76(11.1) 65(9.5)
ARB 325 85(26.2) 25(7.7) 29(8.9) 31(9.5)
BB 821 313(38.1) 106(12.9) 75(9.1) 132(16.1)
CCB 495 184(37.2) 64(12.9) 69(13.9) 51(10.3)
CENT 12 6(50) 3(25) 1(8.3) 2(16.7)
NON-THIA 124 62(50) 24(19.4) 17(13.7) 21(16.9)
SPIRO 34 15(44.1) 6(17.6) 5(14.7) 4(11.8)
THIA 563 237(42.1) 68(12.1) 75(13.3) 94(16.7)
VASO 1 0(0) 0, (0) 0(0) 0(0)
Total 3149 1170(37.2) 390(12.4) 360(11.4) 420(13.3)
Abbreviations: ALPHA, alpha-blocker; ACEI, angiotensin converting enzyme inhibitor; ARB, angiotensin II receptor blocker; BB, beta-blocker; CCB, calcium channel blocker; NON_THIA, non-thiazide diuretic; SPIRO, potassium sparing diuretics; THIA, thiazide diuretic. The Bonferroni corrected p-value is < 0.0017. Results are summarised as number (percentage).
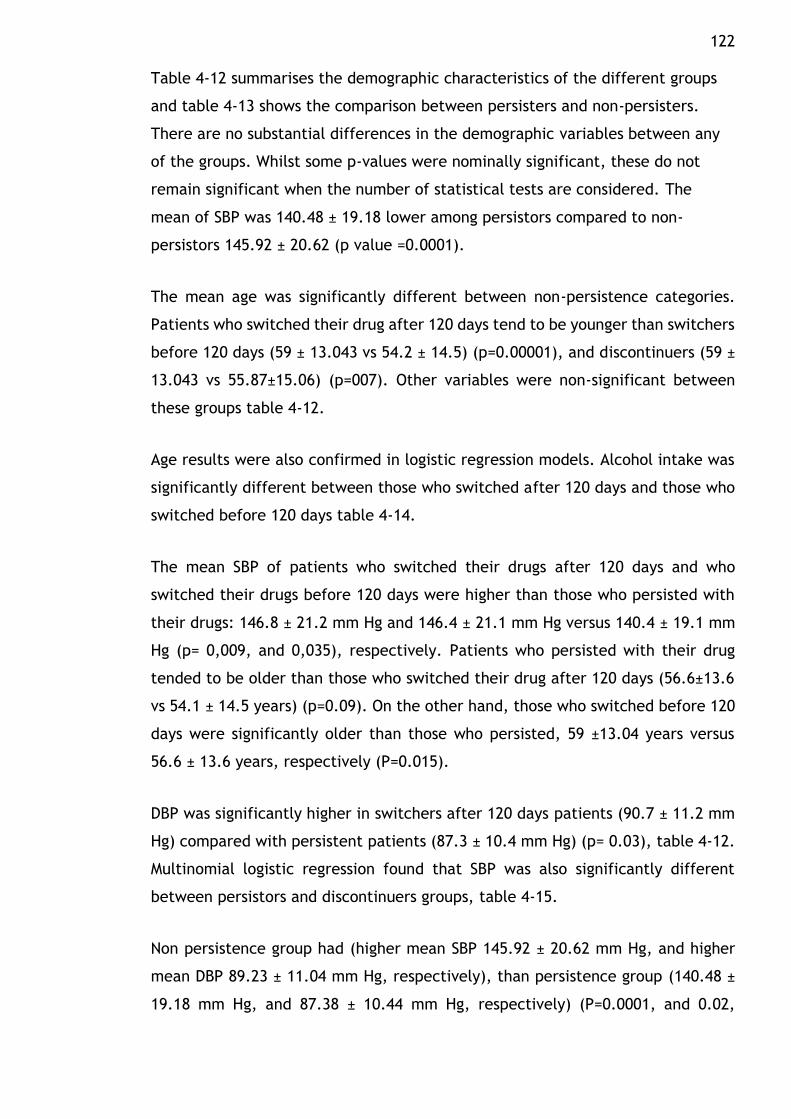
122 Table 4-12 summarises the demographic characteristics of the different groups
and table 4-13 shows the comparison between persisters and non-persisters.
There are no substantial differences in the demographic variables between any
of the groups. Whilst some p-values were nominally significant, these do not
remain significant when the number of statistical tests are considered. The
mean of SBP was 140.48 ± 19.18 lower among persistors compared to non-
persistors 145.92 ± 20.62 (p value =0.0001).
The mean age was significantly different between non-persistence categories.
Patients who switched their drug after 120 days tend to be younger than switchers
before 120 days (59 ± 13.043 vs 54.2 ± 14.5) (p=0.00001), and discontinuers (59 ±
13.043 vs 55.87±15.06) (p=007). Other variables were non-significant between
these groups table 4-12.
Age results were also confirmed in logistic regression models. Alcohol intake was
significantly different between those who switched after 120 days and those who
switched before 120 days table 4-14.
The mean SBP of patients who switched their drugs after 120 days and who
switched their drugs before 120 days were higher than those who persisted with
their drugs: 146.8 ± 21.2 mm Hg and 146.4 ± 21.1 mm Hg versus 140.4 ± 19.1 mm
Hg (p= 0,009, and 0,035), respectively. Patients who persisted with their drug
tended to be older than those who switched their drug after 120 days (56.6±13.6
vs 54.1 ± 14.5 years) (p=0.09). On the other hand, those who switched before 120
days were significantly older than those who persisted, 59 ±13.04 years versus
56.6 ± 13.6 years, respectively (P=0.015).
DBP was significantly higher in switchers after 120 days patients (90.7 ± 11.2 mm
Hg) compared with persistent patients (87.3 ± 10.4 mm Hg) (p= 0.03), table 4-12.
Multinomial logistic regression found that SBP was also significantly different
between persistors and discontinuers groups, table 4-15.
Non persistence group had (higher mean SBP 145.92 ± 20.62 mm Hg, and higher
mean DBP 89.23 ± 11.04 mm Hg, respectively), than persistence group (140.48 ±
19.18 mm Hg, and 87.38 ± 10.44 mm Hg, respectively) (P=0.0001, and 0.02,
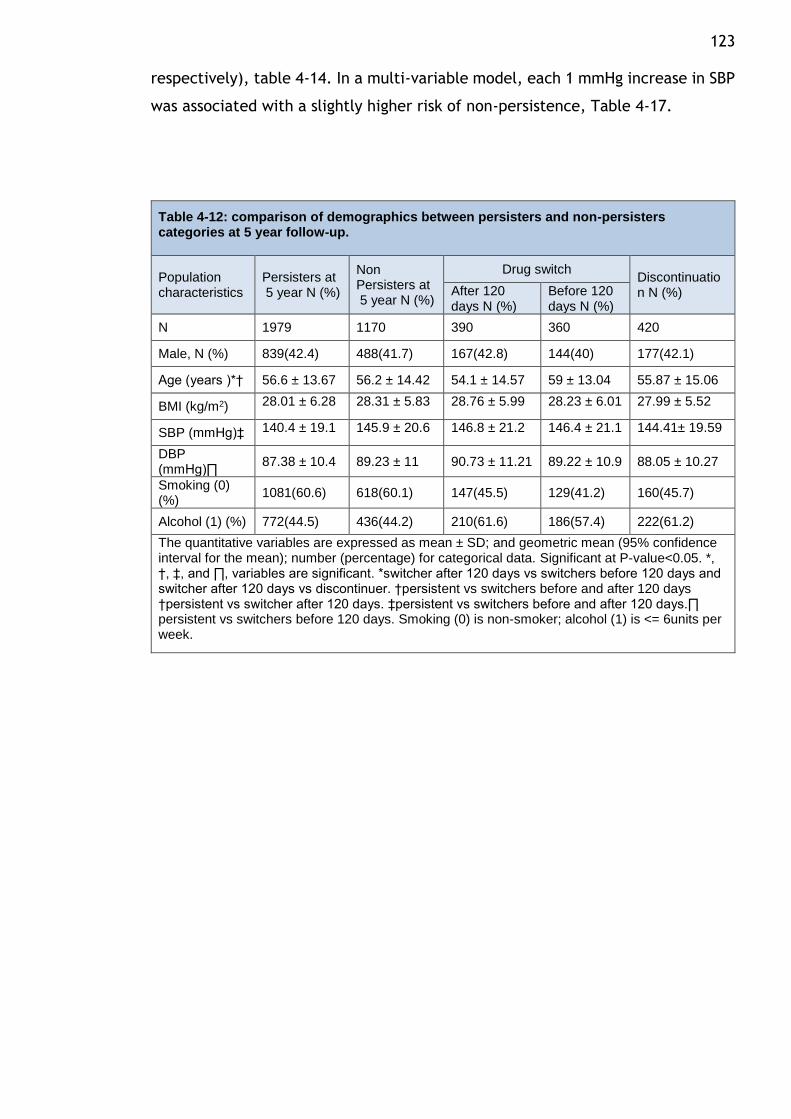
123 respectively), table 4-14. In a multi-variable model, each 1 mmHg increase in SBP
was associated with a slightly higher risk of non-persistence, Table 4-17.
Table 4-12: comparison of demographics between persisters and non-persisters categories at 5 year follow-up.
Population characteristics
Persisters at 5 year N (%)
Non Persisters at 5 year N (%)
Drug switch Discontinuation N (%) After 120
days N (%) Before 120 days N (%)
N 1979 1170 390 360 420
Male, N (%) 839(42.4) 488(41.7) 167(42.8) 144(40) 177(42.1)
Age (years )*† 56.6 ± 13.67 56.2 ± 14.42 54.1 ± 14.57 59 ± 13.04 55.87 ± 15.06
BMI (kg/m2) 28.01 ± 6.28 28.31 ± 5.83 28.76 ± 5.99 28.23 ± 6.01 27.99 ± 5.52
SBP (mmHg)‡ 140.4 ± 19.1 145.9 ± 20.6 146.8 ± 21.2 146.4 ± 21.1 144.41± 19.59
DBP (mmHg)∏
87.38 ± 10.4 89.23 ± 11 90.73 ± 11.21 89.22 ± 10.9 88.05 ± 10.27
Smoking (0) (%)
1081(60.6) 618(60.1) 147(45.5) 129(41.2) 160(45.7)
Alcohol (1) (%) 772(44.5) 436(44.2) 210(61.6) 186(57.4) 222(61.2)
The quantitative variables are expressed as mean ± SD; and geometric mean (95% confidence interval for the mean); number (percentage) for categorical data. Significant at P-value<0.05. *, †, ‡, and ∏, variables are significant. *switcher after 120 days vs switchers before 120 days and switcher after 120 days vs discontinuer. †persistent vs switchers before and after 120 days †persistent vs switcher after 120 days. ‡persistent vs switchers before and after 120 days.∏ persistent vs switchers before 120 days. Smoking (0) is non-smoker; alcohol (1) is <= 6units per week.
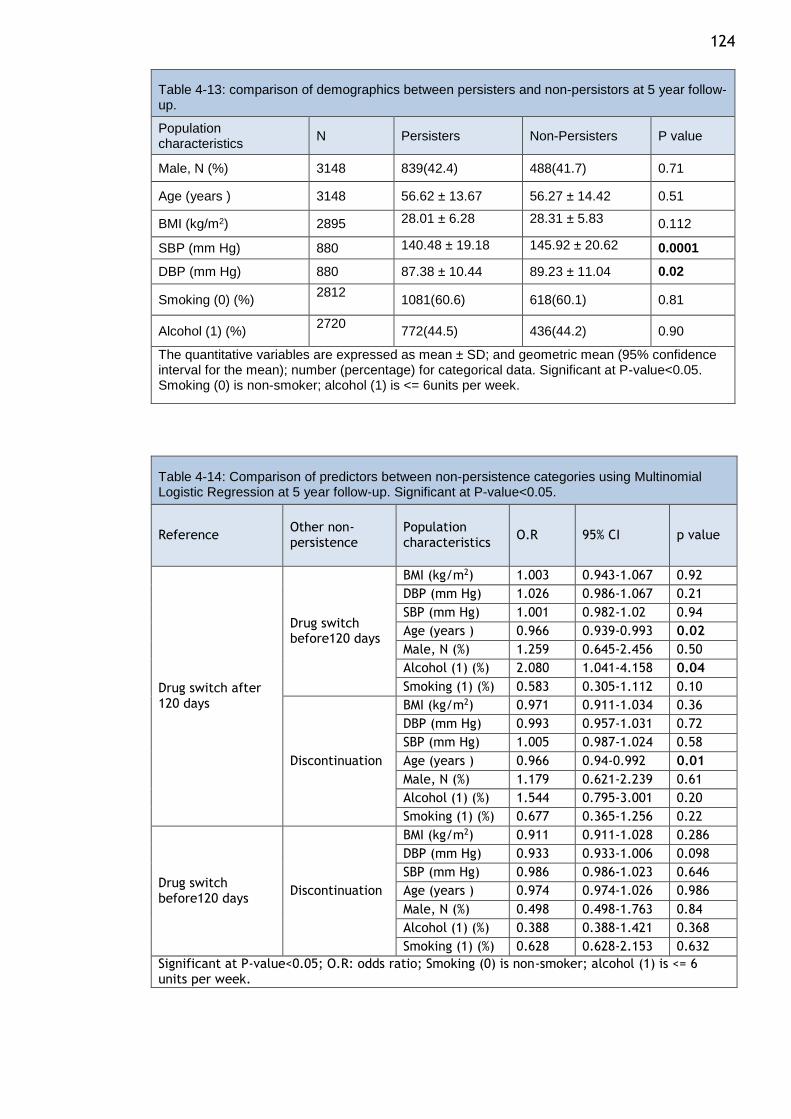
124
Table 4-13: comparison of demographics between persisters and non-persistors at 5 year follow-up.
Population characteristics
N Persisters Non-Persisters P value
Male, N (%) 3148 839(42.4) 488(41.7) 0.71
Age (years ) 3148 56.62 ± 13.67 56.27 ± 14.42 0.51
BMI (kg/m2) 2895 28.01 ± 6.28 28.31 ± 5.83 0.112
SBP (mm Hg) 880 140.48 ± 19.18 145.92 ± 20.62 0.0001
DBP (mm Hg) 880 87.38 ± 10.44 89.23 ± 11.04 0.02
Smoking (0) (%) 2812
1081(60.6) 618(60.1) 0.81
Alcohol (1) (%) 2720
772(44.5) 436(44.2) 0.90
The quantitative variables are expressed as mean ± SD; and geometric mean (95% confidence interval for the mean); number (percentage) for categorical data. Significant at P-value<0.05. Smoking (0) is non-smoker; alcohol (1) is <= 6units per week.
Table 4-14: Comparison of predictors between non-persistence categories using Multinomial Logistic Regression at 5 year follow-up. Significant at P-value<0.05.
Reference Other non-persistence
Population characteristics
O.R 95% CI p value
Drug switch after 120 days
Drug switch before120 days
BMI (kg/m2) 1.003 0.943-1.067 0.92
DBP (mm Hg) 1.026 0.986-1.067 0.21
SBP (mm Hg) 1.001 0.982-1.02 0.94
Age (years ) 0.966 0.939-0.993 0.02
Male, N (%) 1.259 0.645-2.456 0.50
Alcohol (1) (%) 2.080 1.041-4.158 0.04
Smoking (1) (%) 0.583 0.305-1.112 0.10
Discontinuation
BMI (kg/m2) 0.971 0.911-1.034 0.36
DBP (mm Hg) 0.993 0.957-1.031 0.72
SBP (mm Hg) 1.005 0.987-1.024 0.58
Age (years ) 0.966 0.94-0.992 0.01
Male, N (%) 1.179 0.621-2.239 0.61
Alcohol (1) (%) 1.544 0.795-3.001 0.20
Smoking (1) (%) 0.677 0.365-1.256 0.22
Drug switch before120 days
Discontinuation
BMI (kg/m2) 0.911 0.911-1.028 0.286
DBP (mm Hg) 0.933 0.933-1.006 0.098
SBP (mm Hg) 0.986 0.986-1.023 0.646
Age (years ) 0.974 0.974-1.026 0.986
Male, N (%) 0.498 0.498-1.763 0.84
Alcohol (1) (%) 0.388 0.388-1.421 0.368
Smoking (1) (%) 0.628 0.628-2.153 0.632
Significant at P-value<0.05; O.R: odds ratio; Smoking (0) is non-smoker; alcohol (1) is <= 6 units per week.
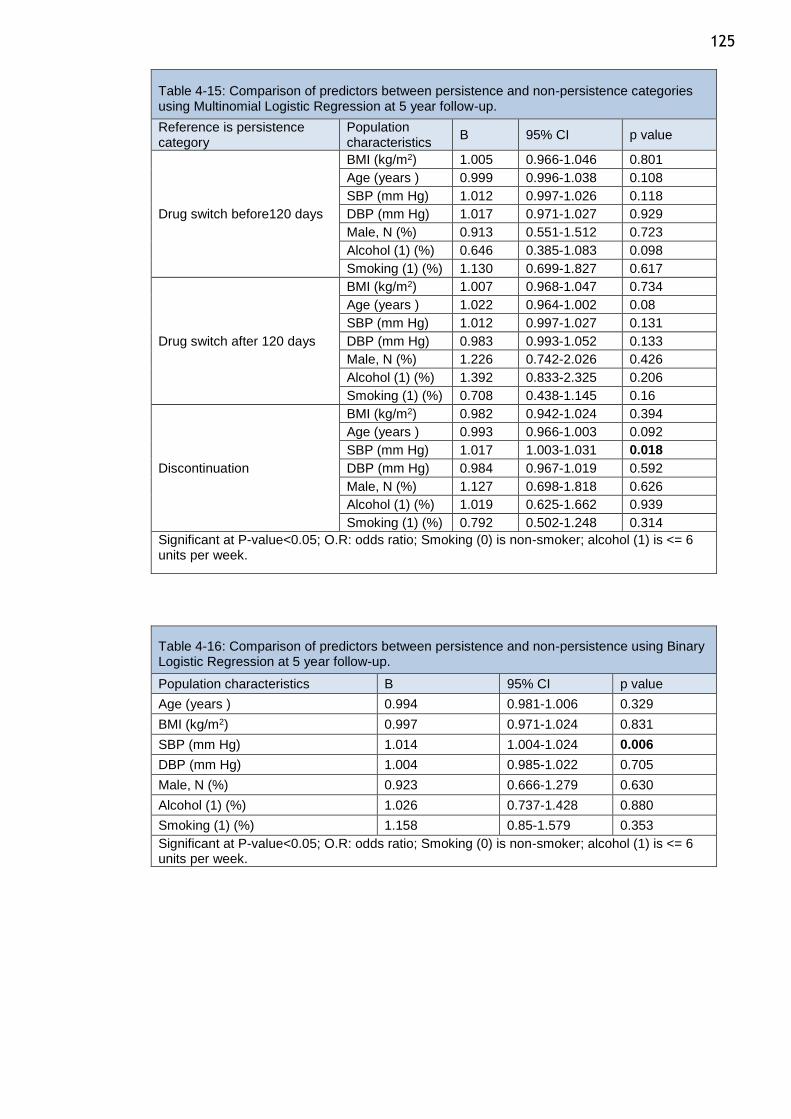
125
Table 4-15: Comparison of predictors between persistence and non-persistence categories using Multinomial Logistic Regression at 5 year follow-up.
Reference is persistence category
Population characteristics
B 95% CI p value
Drug switch before120 days
BMI (kg/m2) 1.005 0.966-1.046 0.801
Age (years ) 0.999 0.996-1.038 0.108
SBP (mm Hg) 1.012 0.997-1.026 0.118
DBP (mm Hg) 1.017 0.971-1.027 0.929
Male, N (%) 0.913 0.551-1.512 0.723
Alcohol (1) (%) 0.646 0.385-1.083 0.098
Smoking (1) (%) 1.130 0.699-1.827 0.617
Drug switch after 120 days
BMI (kg/m2) 1.007 0.968-1.047 0.734
Age (years ) 1.022 0.964-1.002 0.08
SBP (mm Hg) 1.012 0.997-1.027 0.131
DBP (mm Hg) 0.983 0.993-1.052 0.133
Male, N (%) 1.226 0.742-2.026 0.426
Alcohol (1) (%) 1.392 0.833-2.325 0.206
Smoking (1) (%) 0.708 0.438-1.145 0.16
Discontinuation
BMI (kg/m2) 0.982 0.942-1.024 0.394
Age (years ) 0.993 0.966-1.003 0.092
SBP (mm Hg) 1.017 1.003-1.031 0.018
DBP (mm Hg) 0.984 0.967-1.019 0.592
Male, N (%) 1.127 0.698-1.818 0.626
Alcohol (1) (%) 1.019 0.625-1.662 0.939
Smoking (1) (%) 0.792 0.502-1.248 0.314
Significant at P-value<0.05; O.R: odds ratio; Smoking (0) is non-smoker; alcohol (1) is <= 6 units per week.
Table 4-16: Comparison of predictors between persistence and non-persistence using Binary Logistic Regression at 5 year follow-up.
Population characteristics B 95% CI p value
Age (years ) 0.994 0.981-1.006 0.329
BMI (kg/m2) 0.997 0.971-1.024 0.831
SBP (mm Hg) 1.014 1.004-1.024 0.006
DBP (mm Hg) 1.004 0.985-1.022 0.705
Male, N (%) 0.923 0.666-1.279 0.630
Alcohol (1) (%) 1.026 0.737-1.428 0.880
Smoking (1) (%) 1.158 0.85-1.579 0.353
Significant at P-value<0.05; O.R: odds ratio; Smoking (0) is non-smoker; alcohol (1) is <= 6 units per week.
126
4.4 Discussion
Persistence is an important and modifiable element in the success of chronic
hypertension therapy in real clinical practice. Understanding patterns of
persistence in different populations and to different drugs will provide valuable
insights into the applicability of results from randomised clinical trials in real-life
clinical practice. The experience from clinical trials is that for antihypertensive
therapy to be effective in controlling BP and then lowering cardiovascular
morbidity and mortality, antihypertensive drugs must be administered in adequate
doses continuously for a long period of time. There are many factors that influence
persistence to antihypertensive medications including tolerability, complexity of
treatment regimen, cost of therapy, physician factors, perceived or real change
in quality of life(453).
In this retrospective analysis of patients started on antihypertensive monotherapy
at a tertiary care hypertension clinic using data obtained from record linkage
provided by NHS Scotland Information Services Division, my primary objective was
to study patterns of persistence over the short-term and long-term to different
classes of antihypertensive drugs.
The most important results of my study are the high levels of overall persistence
to the initial antihypertensive drug in patients attending the Glasgow BP Clinic
between 2004 and 2012. Specifically, in the first year of therapy overall
persistence was 73% and at five years it was 63%. In general, 5-year persistence
was lower than 1-year persistence for all drug classes. These results are slightly
different from studies in other countries and reflect differences in healthcare
systems and nature of the study population and the study period. A 3-year study
from Australia between 2004 and 2006 of 10% random sample of all Australian
long-term health concession card holders who had been commenced on an
angiotensin II receptor antagonist (A2RA), an angiotensin-converting enzyme
inhibitor (ACEI) and/or a calcium channel blocker (CCB) showed the 3 year
persistence overall of 44%(476). In a German study of health insurance records of
9513 patients followed-up for 4 years, 66% were persistent at 1 year and 44% at 4
years (477). A retrospective analysis the drugs database of the Local Health Unit
of Ravenna (Italy) in 7312 subjects receiving a first prescription for diuretics, beta-
blockers, calcium channel blockers, angiotensin-converting enzyme (ACE)
127 inhibitors or angiotensin II antagonists showed the overall 3 year persistence was
57.9%(437). An analysis of new users of antihypertensive drugs in the Italian region
of Lombardy (n=493623), 42% were persistent on monotherapy at 1 year(478).
Finally, one year persistence among newly treated uncomplicated Korean
hypertensive patients (n=45787) was 62.1%(479). Whilst all the above studies were
observational studies of large cohorts using administrative data, Veronesi et
al(480). Conducted a controlled study of 2-year persistence of 347 patients
randomly allocated to ACEI, CCB, ARB, BB and diuretics. They found the overall 2
year persistence of antihypertensive drugs to be 46%. Thus, in general, the GBPC
hypertensive population showed greater short-term and long-term persistence
compared to other cohorts. This difference may reflect true population
differences in terms of drug persistence and adherence. For example, the
population of Lombardy is known to have low adherence to antihypertensive
treatment and this has been shown to be associated with a greater risk of
hospitalisation for cardiovascular events(481). So while the Lombardy population
showed very 1-year persistence compared to GBPC, the German and Korean
populations showed comparable though lower 1-year persistence with GBPC.
Though there were no studies that studied 5-year persistence, it is clear that long-
term persistence is lower than short-term persistence. It is also likely that the
GBPC population demonstrates higher persistence in contrast to other studies
because these patients were a selected cohort as they were referred to a tertiary
clinic, reviewed by specialist nurses and physicians and attended follow-up at the
clinic until their BP was controlled. Thus, it is likely that physician and hospital
factors may have had a role in the high levels of persistence demonstrated.
Another factor that would have an impact on the estimates of persistence is the
method of assessment of prescription data used. This is illustrated well in the
German study (477) where persistence was assessed using two criteria. They used
two different intervals within which a repeat prescription had to be issued: 180
days and 360 days. A normal prescription in Germany typically comprises a
package of up to 100 units (e.g. tablets) representing on average about 100 days
of treatment. Chronically ill patients usually meet their GP once every 3 months
for a new prescription. Patients who received repeat prescriptions after 180 days
were considered as non-persistent in regard to the 180 day criterion. However,
patients receiving prescriptions after 180 days and before 360 days were
considered as persistent when using the 360 day criterion. The 180 day criterion
128 is stricter than the 360 day criterion, and it is also more precise since those
patients who do not take their treatment regularly are less likely to be included
in 180 day criterion as they will be considered to be non-persistent. Thus, applying
the 180 day criterion, 66% of the patients were persistent at one year. Applying
the 360 day criteria, the one year rate was 90%. Similarly, the four-year
persistence rates using the 180 day and 360 criteria were 44% and 79%,
respectively. As expected, the rates of persistence were higher when a repeat
prescription interval of 360 days was applied as the criterion for persistence.
For the GBPC analysis, I did not define a specific interval for prescription refill in
the analysis. In Scotland, prescription refills for chronic therapy are usually
provided for 30 days or 90 days. Thus, our results are more aligned with the 180
day criterion in the German study.
The choice of the antihypertensive class initially prescribed appear to be
associated with persistence rates. Analysing different drug classes separately, BB,
CCB and diuretics showed significantly lower 5-year persistence compared to 1-
year persistence. While ACEI and ARB did not show any significant difference
between short-term and long-term persistence.
Across all drug classes, ARB showed the highest persistence both at 1-year and at
5 years. ACEI showed significantly higher persistence long-term persistence
compared to non-ARB classes. Thus this study confirms results from multiple
studies that showed high persistence of ARBs in contrast to other antihypertensive
drug classes. In the GBPC, ARB persistence was 81% at one year and 74% at 5 years.
This is comparable to the results from the German primary care cohort(477) which
showed ARB persistence of 88% and 69% at 1 year and 4 years using the 360 day
criteria, however, using the 180 day criterion showed a persistence of 64% and
30%. The 1-year persistence of ARB was 33% and 44% in the Lombardy and Korean
cohorts respectively(478,479).
Several studies have linked discontinuation and side effects that resulted from
antihypertensive classes (450,482). ARBs have been shown in a number of studies
to have the best tolerability, and may explain the high persistence of patients
using ARBs in this study and others (483,484). The side effects of ARBs are
comparable with those of ACEI; however, ACEI caused cough greater than that
129 caused by ARBs (485). The percentage of patients who suffered from cough
occurred in 10% of patients who treated with ACEI compared with 2–3% of patients
who treated with ARBs (486). It is surprising that the both short-term and long-
term persistence rates are comparable between ACEI and ARB. Also the low rates
of discontinuation of ACEI in the first year, though higher than ARBs not
substantially higher. This would indicate that the rates of discontinuation of ACEI
due to its well known side-effect, cough, is not a major issue in its use.
Studies have shown a relationship between the persistence and cardiovascular
outcomes (429,487). So, it may be beneficial in the longer term to initiate
treatment with an ARB first line in preference to other classes of antihypertensive
drug to improve treatment persistence which may improve cardiovascular
outcomes that the low persistence lead to increase the cardiovascular events.
I divided those who switched into two groups: switching after 120 days and
switching before 120 days. Patients who switched after 120 days had stopped all
antihypertensive medication for more than 120 days and restarted another
antihypertensive class. For those switching before 120 days, the period between
the discontinuation date of the initial antihypertensive class and the switching
date to another antihypertensive class was less than 120 days; hence, patients
switched from the initial class to another class yet did not completely stop all
antihypertensive medication.
The group that switched after 120 days was younger than other groups
(persistence, switching before 120 days and discontinuation). Because patients
completely stopped their drug before restarting other classes in the switching
after 120 days group, the reason for switching may not have been related to side
effects or drug efficacy and may be related to the patient’s behaviour such as
non-compliance with the drug. Younger patients were non-compliant with their
drug in some studies that support this theory (422,427,428,430). Other reasons
may be related to medical advice from doctors to try non-pharmacological therapy
such as changing lifestyle to control BP without antihypertensive drugs, especially
in younger patients. In those who switched before 120 days, the reasons were
adverse effects or poor efficacy.
130 Patients with higher BP at baseline appear to be more likely to be non-persistent.
This result confirm what found in some study such Mazzaglia et al study (450)
Strengths and Limitations:
A major strength of this study is the large cohort of specialist referrals linked to
prescription refill data over a long period of time. Though the data was
anonymised, because all the patients were initiated treatment at the Glasgow BP
clinic, it is unlikely that the study drugs were prescribed to treat other
concomitant conditions and not hypertension. Refill prescription data are an
efficient way of determining prescription uptake and avoids errors and biases
associated with other methods of treatment adherence assessment such as self-
report data and pill-count. However, we can’t reasonably assume that if patients
continue to pick up repeat prescriptions on a regular basis, they must be taking
them. Refill prescription data are not affected by recall bias, social desirability of
response or single point estimation(488). In this study as I reviewed the records of
all the patients attending the GBPC, this avoided selection bias that is normally
encountered in questionnaire based studies – this is because in questionnaire
based studies, there is a greater likelihood that discontinuers may not respond. A
major limitation is the lack of standardised criteria for estimation of drug
persistence. This makes it difficult to directly compare results across multiple
studies. Another limitation is that this study focusses on monotherapy and not
combination therapy. There is data to suggest that persistence is better and lower
rates of discontinuation with combination therapy and this needs to be addressed
in future studies.
My persistence analysis was based on all patients who were started on an
antihypertensive drug and there was no requirement for patients to fulfil a
minimum number of prescriptions to be included in the study. Thus my estimates
of persistence are not over-optimistic as even patients who did not pick-up a
second prescription were included in the analyses. Thus drug discontinuation and
not picking up a second prescription are all examples of poor persistence.
In this analysis, the main focus was on persistence to antihypertensive therapy.
The next question is whether patients who persist with therapy actually adhere to
the treatment regimen and this is the subject of the next chapter.
131
Chapter 5 Antihypertensive Drug Adherence In Relation To Persistence
5.1 Introduction
Medication adherence is defined as the extent to which a patient takes
medications as prescribed by their healthcare providers (489). Adherence rates
are typically higher among patients with acute conditions, as compared with those
with chronic conditions (392). Suboptimal adherence is known to reduce the
effectiveness of essential medications (490). Medication nonadherence is
recognised as a global public health problem by the WHO (491) mainly because
this is considered a diagnosable and treatable medical condition (492). For
instance, almost half of patients become non adherent to their antihypertensive
medication within 1 year of initiating therapy(427). A recent meta-analysis of
observational studies involving 376,162 patients assessing drug adherence using
prescription refill frequency for 7 drug classes (aspirin, statins, and 5
antihypertensive drug classes) prescribed for primary and secondary prevention of
cardiovascular diseases showed the mean adherence over all studies was only 57%
after a median of 2 years (493). Furthermore, mean drug adherence was
substantively and significantly lower in primary than in secondary prevention
(493). Kronish et al systematically reviewed and pooled results from observational
studies of adherence to antihypertena sive medications (n=935920 patients) and
found adherence to be highest among those prescribed ARBs and lowest among
diuretic users (494). Several outcome studies found that nonadherence to
antihypertensive agents significantly increased cardiac and cerebrovascular risk
(426,429,495). In a study of over 2 million participants, Chowduury et al (489)
found the absolute risk difference associated with poor medication adherence to
CVD medication was 13 per 100 000 CVD deaths per year, and ~9% of all CVD cases
in the EU could be attributable to poor adherence. It has been shown that
increasing adherence in patients who enrolled in pharmacy care programmes lead
to improvement in their BP (390). Moreover, non-adherence leads to increased
treatment costs. An estimated $317.4 billion was spent in 2011 due to non-
adherence (384). Sokol et al. showed that overall healthcare costs and
132 hospitalisation rates were significantly higher in hypertensive patients who were
non-adherent to their medications (383).
Several methods were used to determine the adherence rate. The medication
possession ratio (MPR) is considered one of the most appropriate methods to
calculate adherence from pharmacy refill data (407–409). MPRs are becoming
more widely used because they are objective, good for large populations and long
treatment times, can be used to calculate average adherence and gaps in
medication, and capture the frequency of medications obtained by the patient
(410). Patients were considered to be adherent to their antihypertensive drugs if
the MPR was 80% or more for their received prescription. This range has been
determined based on a study showing that patients who received at least 80% of
their antihypertensive drug tended to achieve their blood pressure goal (496).
Adherence rates varied between studies. Based on MPR calculations, adherence
ranged between 50–80% in some studies and ≤ 30% in other studies
(390,421,423,426,427). Several studies have tested whether adherence was
affected by initiating with a specific antihypertensive drug class. The highest
adherence rates were shown with ACEIs and angiotensin-II antagonists, and the
lowest adherence rate was shown with diuretics in most studies (425,428,434).
Adherence has been shown to be affected by several factors such as
sociodemographic, psychosocial or behavioural variables, the healthcare system,
therapeutic regimen, and comorbidity which have been discussed in introduction
chapter.
Appropriate use of medications need to be considered in the context of both
adherence (taking medications at the prescribed intervals and dosing regimen)
and persistence (continuous use of medications for the specified treatment time
period), which, for hypertension, should be maintained life-long. In the previous
chapter, I conducted a detailed analysis of persistence to antihypertensive
therapy and now in this chapter I focus on studying patterns of adherence to
antihypertensive drugs. I specifically focus on those patients who show persistence
either short-term or long-term to study adherence patterns. The aim of the study
is to accurately map out persistence patterns in patients who are persistent as
patients who discontinue their drugs are both non-adherent and non-persistent
133 and including them in the study will not inform accurately the real adherence
level of those who continue to take their drugs long term.
5.2 Methodology
Assessment of adherence using refill prescription data only:
This study analysed persistence patients in chapter 4. 3085 hypertensive patients
at one-year and 1979 at five- year study who filled their first prescription alpha
blocker, ACEI, ARB, CCB, BB, spironolactone, centrally acting antihypertensive
drug, vasodilator antihypertensive drug, non-thiazide diuretic, or thiazide
diuretic, and persisted with them. The details of the patient and antihypertensive
selection of the study cohort are presented in Chapter 4, section 4.3.1.
Adherence is defined as the percentage of patients who persist with their
treatment and having an MPR >80%. MPR was calculated for initial
antihypertensive drug which was persisted at one year and at 5 year to estimate
adherence. MPR defined as the percentage the quantity of medication actually
consumed by individuals who persisted with therapies during the study period
(476). MPR was calculated in the previous studies as the total number of days'
supply was summed for any antihypertensive medication dispensed (the supply
days of last dispense were excluded), divided by the sum of the elapsed intervals
between the last date of prescription and the first date of prescription during the
specific period and the result multiplied by 100 (422,434). The formulae for
measuring MPR have been given below.
𝐌𝐏𝐑 =𝑺𝒖𝒎 𝒐𝒇 𝒕𝒉𝒆 𝒅𝒂𝒚𝒔 𝒔𝒖𝒑𝒑𝒍𝒚 𝒇𝒐𝒓 𝒂𝒍𝒍 𝒇𝒊𝒍𝒍𝒔 𝒐𝒇 𝒕𝒉𝒆 𝒅𝒓𝒖𝒈 𝒊𝒏 𝒕𝒉𝒆 𝒔𝒕𝒖𝒅𝒚 𝒑𝒆𝒓𝒊𝒐𝒅
𝑵𝒖𝒎𝒃𝒆𝒓 𝒐𝒇 𝒅𝒂𝒚𝒔 𝒊𝒏 𝒕𝒉𝒆 𝒔𝒕𝒖𝒅𝒚 𝒑𝒆𝒓𝒊𝒐𝒅× 𝟏𝟎𝟎
So, the quantity of antihypertensive class which was persisted for one year, was
summed (except the last quantity) and divided by the sum of the elapsed intervals
between the last date of prescription and the first date of prescription to calculate
the adherence in one-year. And the quantity of antihypertensive class which was
persisted for five year, was summed (except the last quantity) and divided by the
sum of the elapsed intervals between the last date of prescription and the first
date of prescription to calculate the adherence in five-year. The pharmacy refill
134 prescription data included the date a patient collected their antihypertensive
drugs and the drug's name, strength of dose, and quantity. The pharmacy refill
prescription data didn’t show the frequency of doses. I took the first
antihypertensive drugs that were dispensed in the first prescription date and
checked with the British National Formulary (BNF) and I found most of these drugs
should be taken once daily. So, I have made an assumption that all
antihypertensive agents were taken once daily.
Some of the antihypertensive drugs were taken with 2 different strengths on the
same date of collection, and both strengths had same quantity and then dispensed
in the subsequent prescriptions. In this case, I didn't sum the quantity for both
strengths, instead; I took only one quantity. For example, if a patient collected
30 tablets from 5 mg amlodipine and 30 tablets for 10 mg from the same drug at
the same date, I considered that the patient obtained only 30 tablets at that date.
MPR was calculated for one-year and five-year from drug initiation. Patients who
had an MPR ≥80% were considered adherent or highly adherent. Patients who had
an MPR <80% were described as non-adherent. Non-adherent patients were sub-
divided into moderatel and low adherence. Moderate adherence was defined as
having an MPR between <80 and ≥60%, and low adherence was defined as having
an MPR <60%. The terms initial antihypertensive drug, persistence, and
monotherapy have been defined in the previous chapters (Chapter 4 section 4-2).
Assessment of concordance using both clinical notes and refill prescription
data:
Concordance is defined as the agreement between the prescriptions that were
written during the clinical visits and the antihypertensive drugs that were
collected from the pharmacy. Linking the patient’s clinical records with refill
prescription data allows a detailed analysis of concordance by including data on
when the medication was prescribed, the interval between prescription and
pharmacy pick-up, the concordance between prescription and pharmacy pick-up,
frequency of clinic visits. The clinical summary obtained from the outpatient notes
included patient-doctor conversations, all patient clinical results, and current
antihypertensive drugs for each clinic visit. The doctor’s report included
instructions such as if the patient needed additional clinical tests whether a new
135 antihypertensive drug was prescribed. All of a new antihypertensive prescription's
detail were noted including the name of the drug and the amount and frequency
of the dosage. The date of visit and all the report information were then coded
for each patient into an Excel spreadsheet.
The prescription visit is defined as the date of the clinical visit when the new
antihypertensive drug was prescribed by the doctor, and the subsequent visit is
defined as the date of the clinical visit following the prescription visit. Patient’s
were expected to take the new antihypertensive drug before the subsequent visit
for the doctor to evaluate the effectiveness of the new drug on the subsequent
visit.
A drug was considered "taken" if the patient collected the new antihypertensive
drug prescribed at the prescription visit and before the date of the subsequent
visit. A drug was considered "not taken" if the patient did not collect the new
antihypertensive drug prescribed at the prescription visit before the date of
subsequent visit. The name of the drug collected from the pharmacy was cross-
checked with the name of the drug prescribed by the doctor. The duration
between the date of the prescription visit and the date of the drug collection from
the pharmacy was calculated. In summary, three measures were evaluated:
whether the new drug was taken between the prescription visit and subsequent
visit or not, whether the patient took the same drug which was prescribed, and
the duration between prescription visit and drug collection. Using this
information, patients were classified into three groups. High concordance -
patients who took their new prescriptions within 30 days from date of prescription
visits; Partial concordance - patients who took their new prescriptions late (after
30 days from date of prescription visit); non- concordance – patients who did not
take their new prescriptions from pharmacy.
Chi-square test, t-test as appropriate were used to compare the demographic
variables across the groups and by different drug classes. The tests were
conducted for 1-year and 5-year separately.
Centrally acting antihypertensive drugs and vasodilator antihypertensive drugs
were excluded from comparison due to the small number of patients using them.

136 Multiple testing correction was applied to all statistical tests using the Bonferroni
method. The impact of several independent variables on persistence was
examined using multivariable logistic regression. Age, BMI, SBP, DBP, sex, smoking
status and alcohol intake were considered as independent variables.
137
5.3 Results
The adherence for patients who persisted with their initial antihypertensive
classes in chapter 4 was estimated in this chapter. Table 4-2 in chapter 4 included
number of patients who were persistence and their initial antihypertensive drug.
Also, the demographic of patients who persistence in one year and the five year
were represented in table 4-7 and 4-13, respectively.
3085 of persistent patients who received an initial antihypertensive drug were
involved in a one-year follow-up study to evaluate their adherence. 1979 were
involved in a study to evaluate their adherence during a five-year follow-up study.
Assessment of adherence using data from refill prescriptions and MPR Using MPR,
adherence was defined if MPR was >80%. Non-adherence (MPR<80%) was sub-
classified into moderate (MPR 60-80%) and low adherence (MPR<60%) using refill
prescription data in persistent patients. Only 922(29.9%) out of 3085 patients were
adherent to their drugs in the one-year study. The number of adherent patients
in the five-year study 464(23.4%) (Table 5-1).
Adherence by drug class for the 1-year and 5-year study are presented in Table 5-
1 and Figure 5-1. Thiazide diuretics had the lowest adherence among the drugs
for the one- and five- year follow-up studies and it showed the greatest decline in
adherence between 1-year and 5-years (from 20.4% to 9.4%) The highest
adherence rate for one and five years was ACEIs. Though the numbers were small,
alpha blockers, potassium sparing diuretics and non-thiazide diuretics showed an
increased in adherence between 1 and 5 years, whilst all other drug classes
showed a decline in adherence at 5 years.
Despite overall low rates of adherence, relatively, the adherence rates for ACEI
were significantly higher ARB, BB, CCB and thiazides at 1 year (table 5-2). CCB
showed significantly higher adherence compared to thiazides at 1 year. At 5 years,
ACEI showed significantly higher adherence compared to BB and thiazides;
potassium sparing diuretics showed significantly higher adherence compared to
ARB, BB and CCB; and thiazides showed significantly lower adherence compared
to all other drug classes (table 5-3).
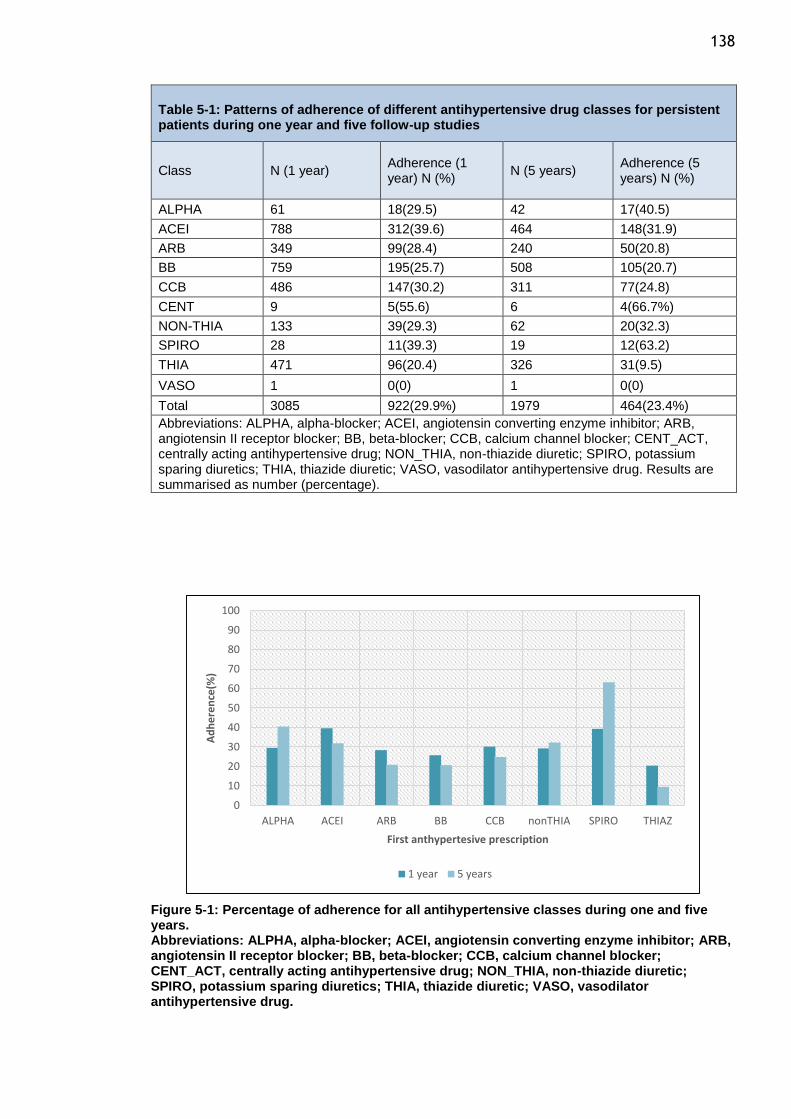
138
Table 5-1: Patterns of adherence of different antihypertensive drug classes for persistent patients during one year and five follow-up studies
Class N (1 year) Adherence (1 year) N (%)
N (5 years) Adherence (5 years) N (%)
ALPHA 61 18(29.5) 42 17(40.5)
ACEI 788 312(39.6) 464 148(31.9)
ARB 349 99(28.4) 240 50(20.8)
BB 759 195(25.7) 508 105(20.7)
CCB 486 147(30.2) 311 77(24.8)
CENT 9 5(55.6) 6 4(66.7%)
NON-THIA 133 39(29.3) 62 20(32.3)
SPIRO 28 11(39.3) 19 12(63.2)
THIA 471 96(20.4) 326 31(9.5)
VASO 1 0(0) 1 0(0)
Total 3085 922(29.9%) 1979 464(23.4%)
Abbreviations: ALPHA, alpha-blocker; ACEI, angiotensin converting enzyme inhibitor; ARB, angiotensin II receptor blocker; BB, beta-blocker; CCB, calcium channel blocker; CENT_ACT, centrally acting antihypertensive drug; NON_THIA, non-thiazide diuretic; SPIRO, potassium sparing diuretics; THIA, thiazide diuretic; VASO, vasodilator antihypertensive drug. Results are summarised as number (percentage).
Figure 5-1: Percentage of adherence for all antihypertensive classes during one and five years. Abbreviations: ALPHA, alpha-blocker; ACEI, angiotensin converting enzyme inhibitor; ARB, angiotensin II receptor blocker; BB, beta-blocker; CCB, calcium channel blocker; CENT_ACT, centrally acting antihypertensive drug; NON_THIA, non-thiazide diuretic; SPIRO, potassium sparing diuretics; THIA, thiazide diuretic; VASO, vasodilator antihypertensive drug.
0
10
20
30
40
50
60
70
80
90
100
ALPHA ACEI ARB BB CCB nonTHIA SPIRO THIAZ
Ad
he
ren
ce(%
)
First anthypertesive prescription
1 year 5 years
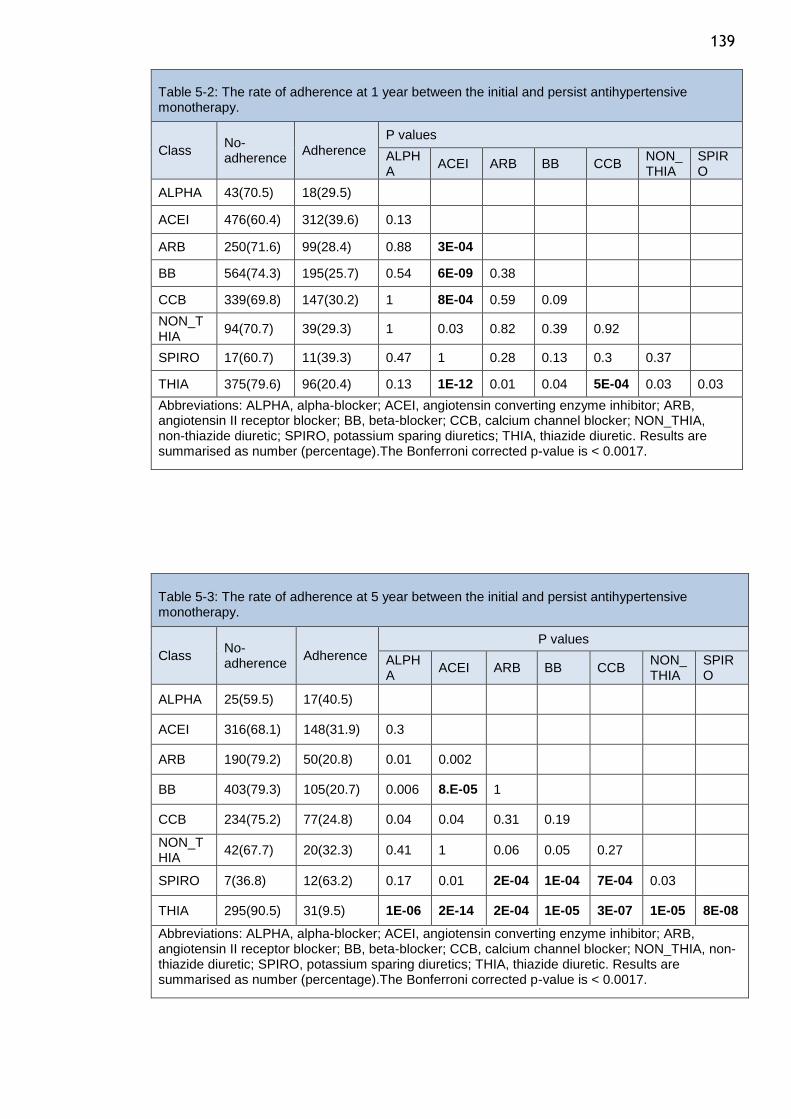
139
Table 5-2: The rate of adherence at 1 year between the initial and persist antihypertensive monotherapy.
Class No-adherence
Adherence
P values
ALPHA
ACEI ARB BB CCB NON_THIA
SPIRO
ALPHA 43(70.5) 18(29.5)
ACEI 476(60.4) 312(39.6) 0.13
ARB 250(71.6) 99(28.4) 0.88 3E-04
BB 564(74.3) 195(25.7) 0.54 6E-09 0.38
CCB 339(69.8) 147(30.2) 1 8E-04 0.59 0.09
NON_THIA
94(70.7) 39(29.3) 1 0.03 0.82 0.39 0.92
SPIRO 17(60.7) 11(39.3) 0.47 1 0.28 0.13 0.3 0.37
THIA 375(79.6) 96(20.4) 0.13 1E-12 0.01 0.04 5E-04 0.03 0.03
Abbreviations: ALPHA, alpha-blocker; ACEI, angiotensin converting enzyme inhibitor; ARB, angiotensin II receptor blocker; BB, beta-blocker; CCB, calcium channel blocker; NON_THIA, non-thiazide diuretic; SPIRO, potassium sparing diuretics; THIA, thiazide diuretic. Results are summarised as number (percentage).The Bonferroni corrected p-value is < 0.0017.
Table 5-3: The rate of adherence at 5 year between the initial and persist antihypertensive monotherapy.
Class No-adherence
Adherence
P values
ALPHA
ACEI ARB BB CCB NON_THIA
SPIRO
ALPHA 25(59.5) 17(40.5)
ACEI 316(68.1) 148(31.9) 0.3
ARB 190(79.2) 50(20.8) 0.01 0.002
BB 403(79.3) 105(20.7) 0.006 8.E-05 1
CCB 234(75.2) 77(24.8) 0.04 0.04 0.31 0.19
NON_THIA
42(67.7) 20(32.3) 0.41 1 0.06 0.05 0.27
SPIRO 7(36.8) 12(63.2) 0.17 0.01 2E-04 1E-04 7E-04 0.03
THIA 295(90.5) 31(9.5) 1E-06 2E-14 2E-04 1E-05 3E-07 1E-05 8E-08
Abbreviations: ALPHA, alpha-blocker; ACEI, angiotensin converting enzyme inhibitor; ARB, angiotensin II receptor blocker; BB, beta-blocker; CCB, calcium channel blocker; NON_THIA, non-thiazide diuretic; SPIRO, potassium sparing diuretics; THIA, thiazide diuretic. Results are summarised as number (percentage).The Bonferroni corrected p-value is < 0.0017.
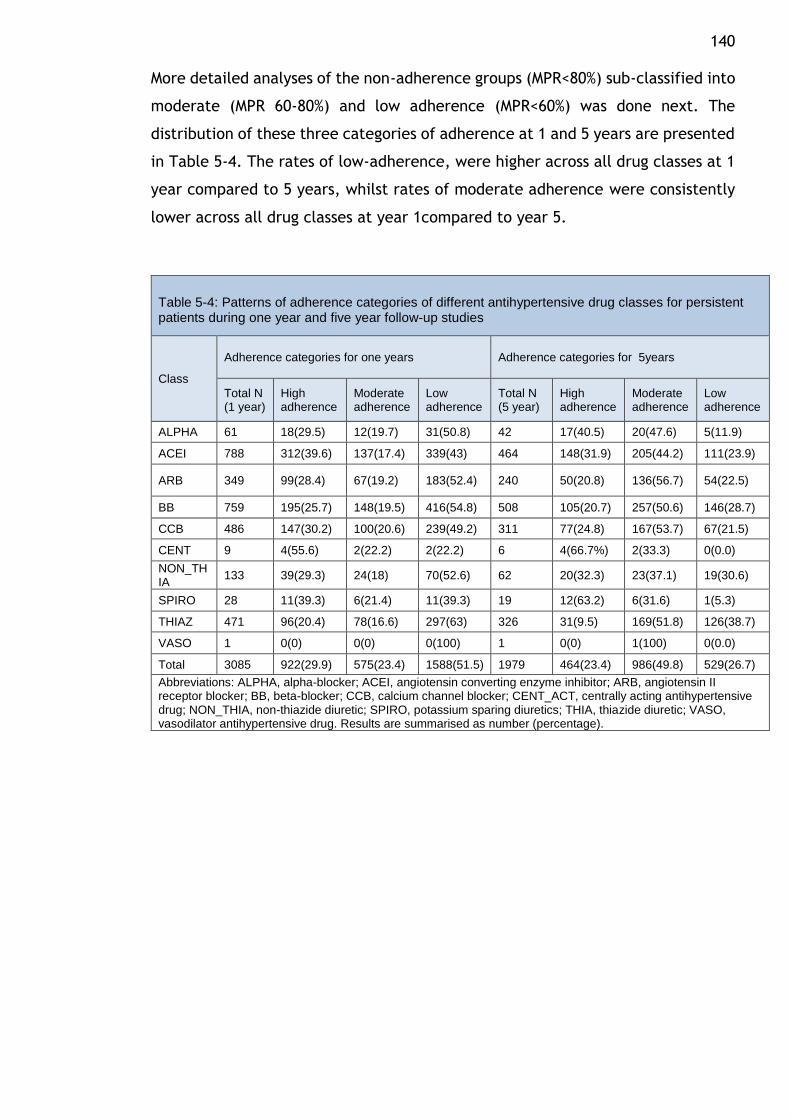
140 More detailed analyses of the non-adherence groups (MPR<80%) sub-classified into
moderate (MPR 60-80%) and low adherence (MPR<60%) was done next. The
distribution of these three categories of adherence at 1 and 5 years are presented
in Table 5-4. The rates of low-adherence, were higher across all drug classes at 1
year compared to 5 years, whilst rates of moderate adherence were consistently
lower across all drug classes at year 1compared to year 5.
Table 5-4: Patterns of adherence categories of different antihypertensive drug classes for persistent patients during one year and five year follow-up studies
Class
Adherence categories for one years Adherence categories for 5years
Total N (1 year)
High adherence
Moderate adherence
Low adherence
Total N (5 year)
High adherence
Moderate adherence
Low adherence
ALPHA 61 18(29.5) 12(19.7) 31(50.8) 42 17(40.5) 20(47.6) 5(11.9)
ACEI 788 312(39.6) 137(17.4) 339(43) 464 148(31.9) 205(44.2) 111(23.9)
ARB 349 99(28.4) 67(19.2) 183(52.4) 240 50(20.8) 136(56.7) 54(22.5)
BB 759 195(25.7) 148(19.5) 416(54.8) 508 105(20.7) 257(50.6) 146(28.7)
CCB 486 147(30.2) 100(20.6) 239(49.2) 311 77(24.8) 167(53.7) 67(21.5)
CENT 9 4(55.6) 2(22.2) 2(22.2) 6 4(66.7%) 2(33.3) 0(0.0)
NON_THIA
133 39(29.3) 24(18) 70(52.6) 62 20(32.3) 23(37.1) 19(30.6)
SPIRO 28 11(39.3) 6(21.4) 11(39.3) 19 12(63.2) 6(31.6) 1(5.3)
THIAZ 471 96(20.4) 78(16.6) 297(63) 326 31(9.5) 169(51.8) 126(38.7)
VASO 1 0(0) 0(0) 0(100) 1 0(0) 1(100) 0(0.0)
Total 3085 922(29.9) 575(23.4) 1588(51.5) 1979 464(23.4) 986(49.8) 529(26.7)
Abbreviations: ALPHA, alpha-blocker; ACEI, angiotensin converting enzyme inhibitor; ARB, angiotensin II receptor blocker; BB, beta-blocker; CCB, calcium channel blocker; CENT_ACT, centrally acting antihypertensive drug; NON_THIA, non-thiazide diuretic; SPIRO, potassium sparing diuretics; THIA, thiazide diuretic; VASO, vasodilator antihypertensive drug. Results are summarised as number (percentage).
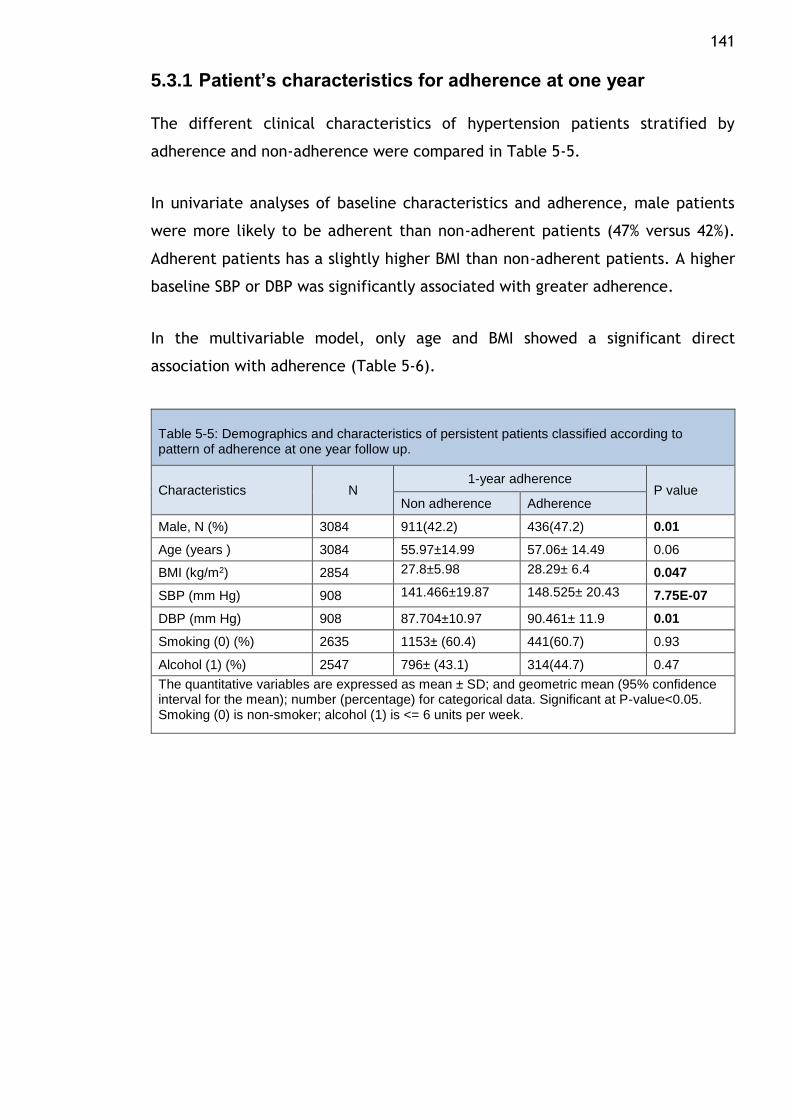
141
5.3.1 Patient’s characteristics for adherence at one year
The different clinical characteristics of hypertension patients stratified by
adherence and non-adherence were compared in Table 5-5.
In univariate analyses of baseline characteristics and adherence, male patients
were more likely to be adherent than non-adherent patients (47% versus 42%).
Adherent patients has a slightly higher BMI than non-adherent patients. A higher
baseline SBP or DBP was significantly associated with greater adherence.
In the multivariable model, only age and BMI showed a significant direct
association with adherence (Table 5-6).
Table 5-5: Demographics and characteristics of persistent patients classified according to pattern of adherence at one year follow up.
Characteristics N 1-year adherence
P value Non adherence Adherence
Male, N (%) 3084 911(42.2) 436(47.2) 0.01
Age (years ) 3084 55.97±14.99 57.06± 14.49 0.06
BMI (kg/m2) 2854 27.8±5.98 28.29± 6.4 0.047
SBP (mm Hg) 908 141.466±19.87 148.525± 20.43 7.75E-07
DBP (mm Hg) 908 87.704±10.97 90.461± 11.9 0.01
Smoking (0) (%) 2635 1153± (60.4) 441(60.7) 0.93
Alcohol (1) (%) 2547 796± (43.1) 314(44.7) 0.47
The quantitative variables are expressed as mean ± SD; and geometric mean (95% confidence interval for the mean); number (percentage) for categorical data. Significant at P-value<0.05. Smoking (0) is non-smoker; alcohol (1) is <= 6 units per week.
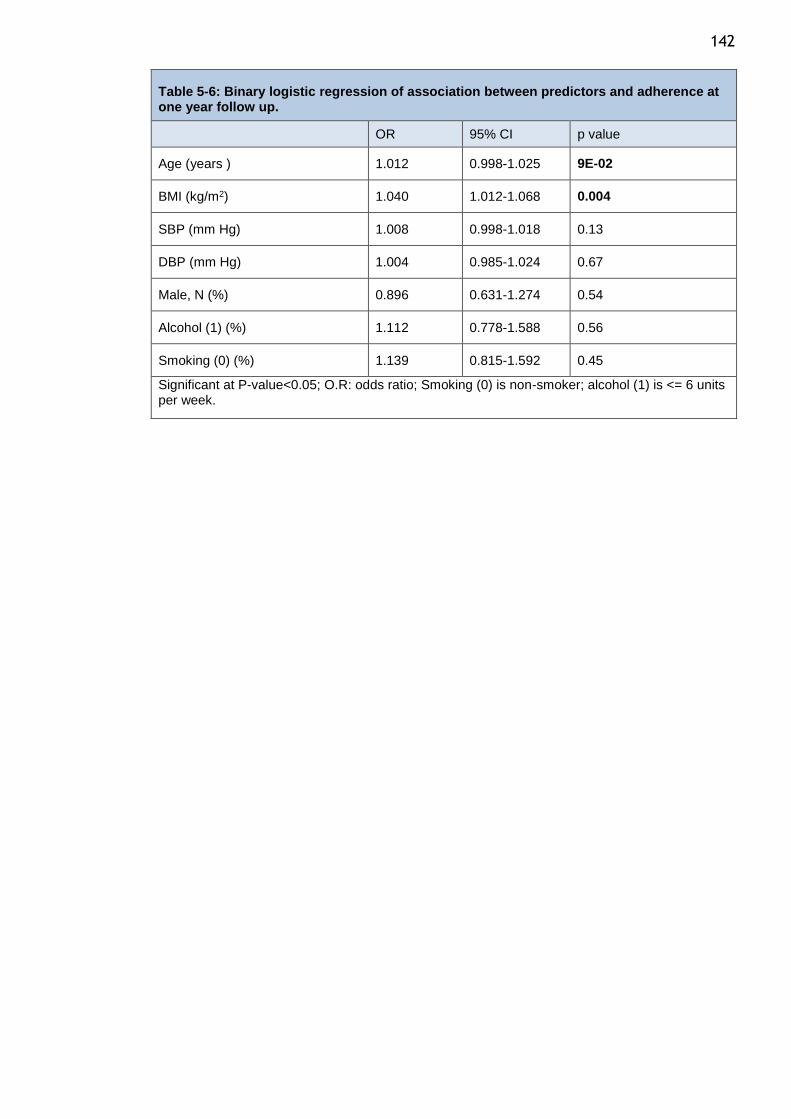
142
Table 5-6: Binary logistic regression of association between predictors and adherence at one year follow up.
OR 95% CI p value
Age (years ) 1.012 0.998-1.025 9E-02
BMI (kg/m2) 1.040 1.012-1.068 0.004
SBP (mm Hg) 1.008 0.998-1.018 0.13
DBP (mm Hg) 1.004 0.985-1.024 0.67
Male, N (%) 0.896 0.631-1.274 0.54
Alcohol (1) (%) 1.112 0.778-1.588 0.56
Smoking (0) (%) 1.139 0.815-1.592 0.45
Significant at P-value<0.05; O.R: odds ratio; Smoking (0) is non-smoker; alcohol (1) is <= 6 units per week.
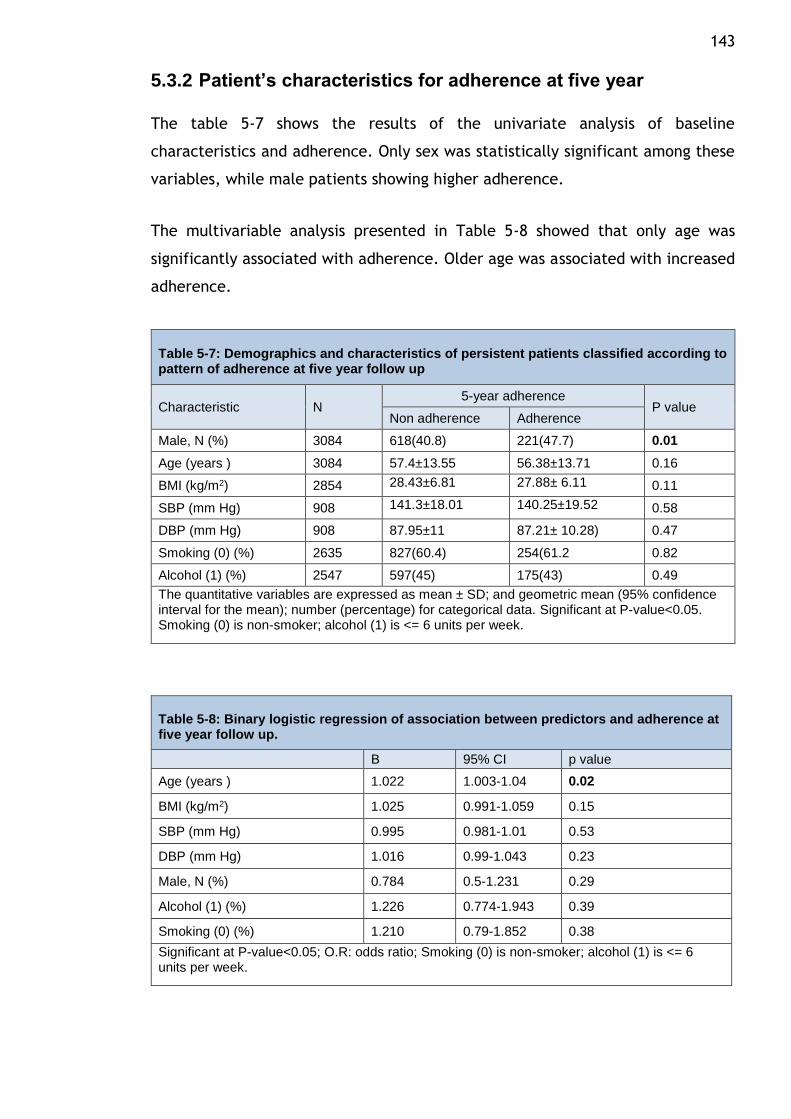
143
5.3.2 Patient’s characteristics for adherence at five year
The table 5-7 shows the results of the univariate analysis of baseline
characteristics and adherence. Only sex was statistically significant among these
variables, while male patients showing higher adherence.
The multivariable analysis presented in Table 5-8 showed that only age was
significantly associated with adherence. Older age was associated with increased
adherence.
Table 5-7: Demographics and characteristics of persistent patients classified according to pattern of adherence at five year follow up
Characteristic N 5-year adherence
P value Non adherence Adherence
Male, N (%) 3084 618(40.8) 221(47.7) 0.01
Age (years ) 3084 57.4±13.55 56.38±13.71 0.16
BMI (kg/m2) 2854 28.43±6.81 27.88± 6.11 0.11
SBP (mm Hg) 908 141.3±18.01 140.25±19.52 0.58
DBP (mm Hg) 908 87.95±11 87.21± 10.28) 0.47
Smoking (0) (%) 2635 827(60.4) 254(61.2 0.82
Alcohol (1) (%) 2547 597(45) 175(43) 0.49
The quantitative variables are expressed as mean ± SD; and geometric mean (95% confidence interval for the mean); number (percentage) for categorical data. Significant at P-value<0.05. Smoking (0) is non-smoker; alcohol (1) is <= 6 units per week.
Table 5-8: Binary logistic regression of association between predictors and adherence at five year follow up.
B 95% CI p value
Age (years ) 1.022 1.003-1.04 0.02
BMI (kg/m2) 1.025 0.991-1.059 0.15
SBP (mm Hg) 0.995 0.981-1.01 0.53
DBP (mm Hg) 1.016 0.99-1.043 0.23
Male, N (%) 0.784 0.5-1.231 0.29
Alcohol (1) (%) 1.226 0.774-1.943 0.39
Smoking (0) (%) 1.210 0.79-1.852 0.38
Significant at P-value<0.05; O.R: odds ratio; Smoking (0) is non-smoker; alcohol (1) is <= 6 units per week.
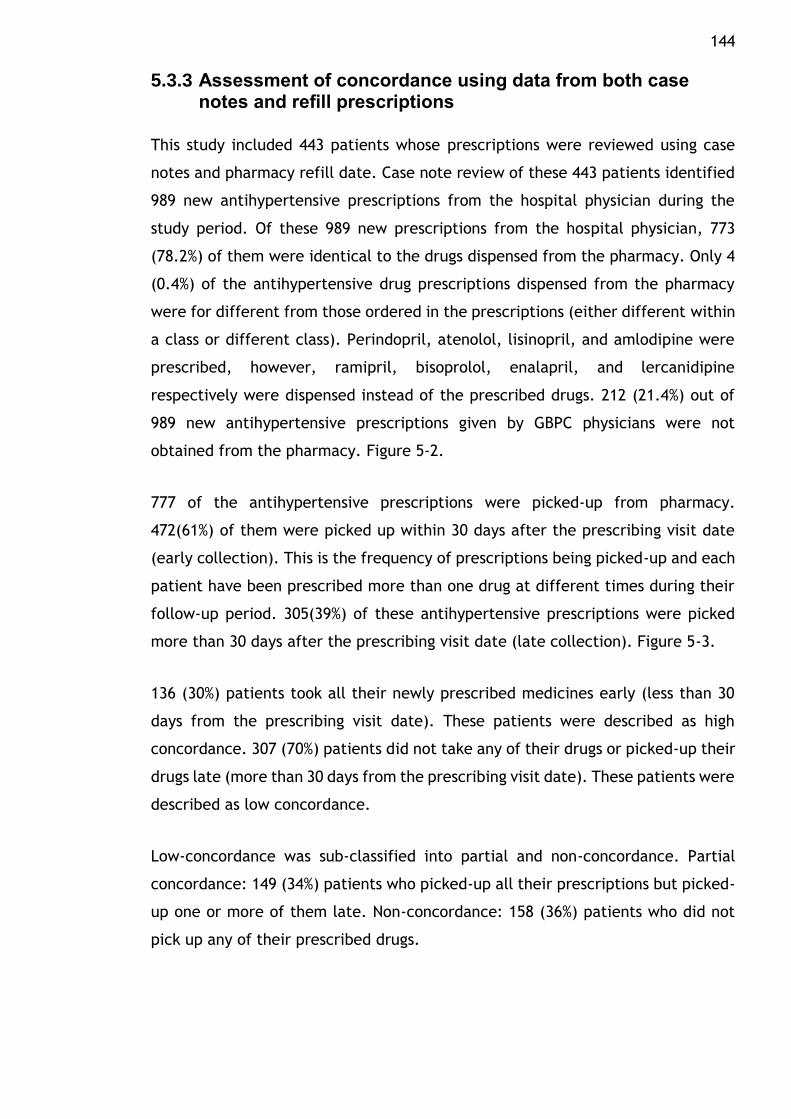
144
5.3.3 Assessment of concordance using data from both case notes and refill prescriptions
This study included 443 patients whose prescriptions were reviewed using case
notes and pharmacy refill date. Case note review of these 443 patients identified
989 new antihypertensive prescriptions from the hospital physician during the
study period. Of these 989 new prescriptions from the hospital physician, 773
(78.2%) of them were identical to the drugs dispensed from the pharmacy. Only 4
(0.4%) of the antihypertensive drug prescriptions dispensed from the pharmacy
were for different from those ordered in the prescriptions (either different within
a class or different class). Perindopril, atenolol, lisinopril, and amlodipine were
prescribed, however, ramipril, bisoprolol, enalapril, and lercanidipine
respectively were dispensed instead of the prescribed drugs. 212 (21.4%) out of
989 new antihypertensive prescriptions given by GBPC physicians were not
obtained from the pharmacy. Figure 5-2.
777 of the antihypertensive prescriptions were picked-up from pharmacy.
472(61%) of them were picked up within 30 days after the prescribing visit date
(early collection). This is the frequency of prescriptions being picked-up and each
patient have been prescribed more than one drug at different times during their
follow-up period. 305(39%) of these antihypertensive prescriptions were picked
more than 30 days after the prescribing visit date (late collection). Figure 5-3.
136 (30%) patients took all their newly prescribed medicines early (less than 30
days from the prescribing visit date). These patients were described as high
concordance. 307 (70%) patients did not take any of their drugs or picked-up their
drugs late (more than 30 days from the prescribing visit date). These patients were
described as low concordance.
Low-concordance was sub-classified into partial and non-concordance. Partial
concordance: 149 (34%) patients who picked-up all their prescriptions but picked-
up one or more of them late. Non-concordance: 158 (36%) patients who did not
pick up any of their prescribed drugs.
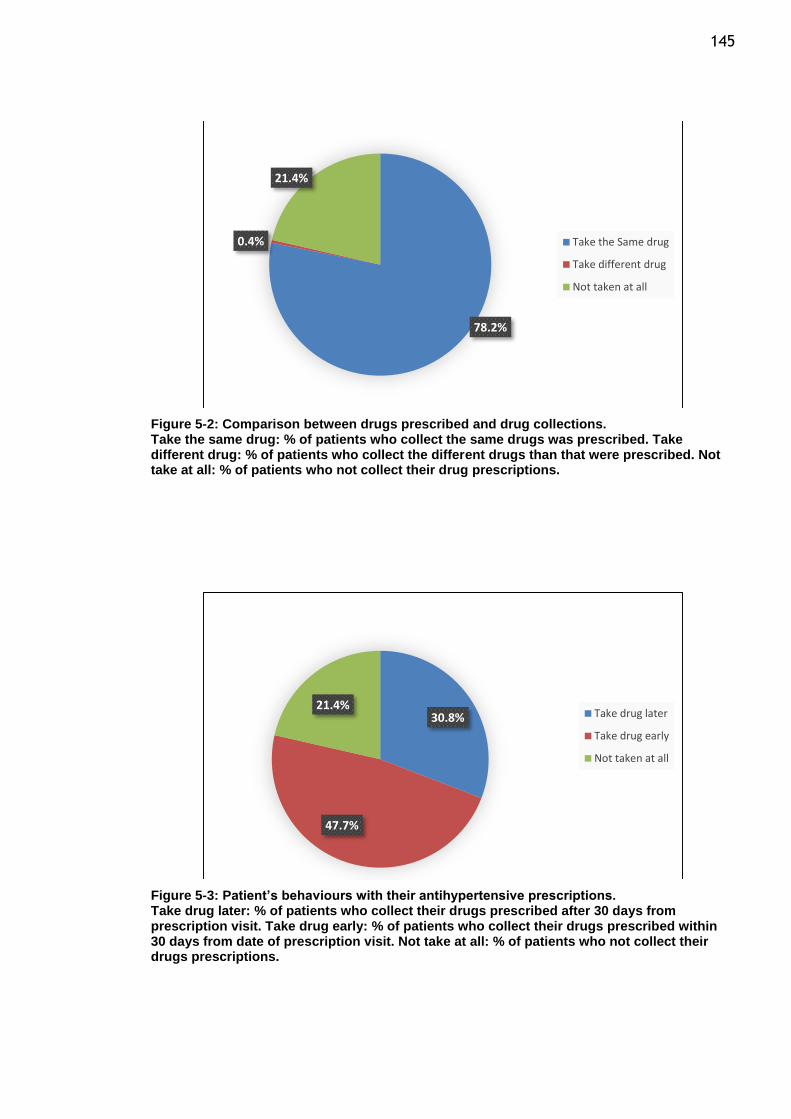
145
Figure 5-2: Comparison between drugs prescribed and drug collections. Take the same drug: % of patients who collect the same drugs was prescribed. Take different drug: % of patients who collect the different drugs than that were prescribed. Not take at all: % of patients who not collect their drug prescriptions.
Figure 5-3: Patient’s behaviours with their antihypertensive prescriptions. Take drug later: % of patients who collect their drugs prescribed after 30 days from prescription visit. Take drug early: % of patients who collect their drugs prescribed within 30 days from date of prescription visit. Not take at all: % of patients who not collect their drugs prescriptions.
78.2%
0.4%
21.4%
Take the Same drug
Take different drug
Not taken at all
30.8%
47.7%
21.4%Take drug later
Take drug early
Not taken at all
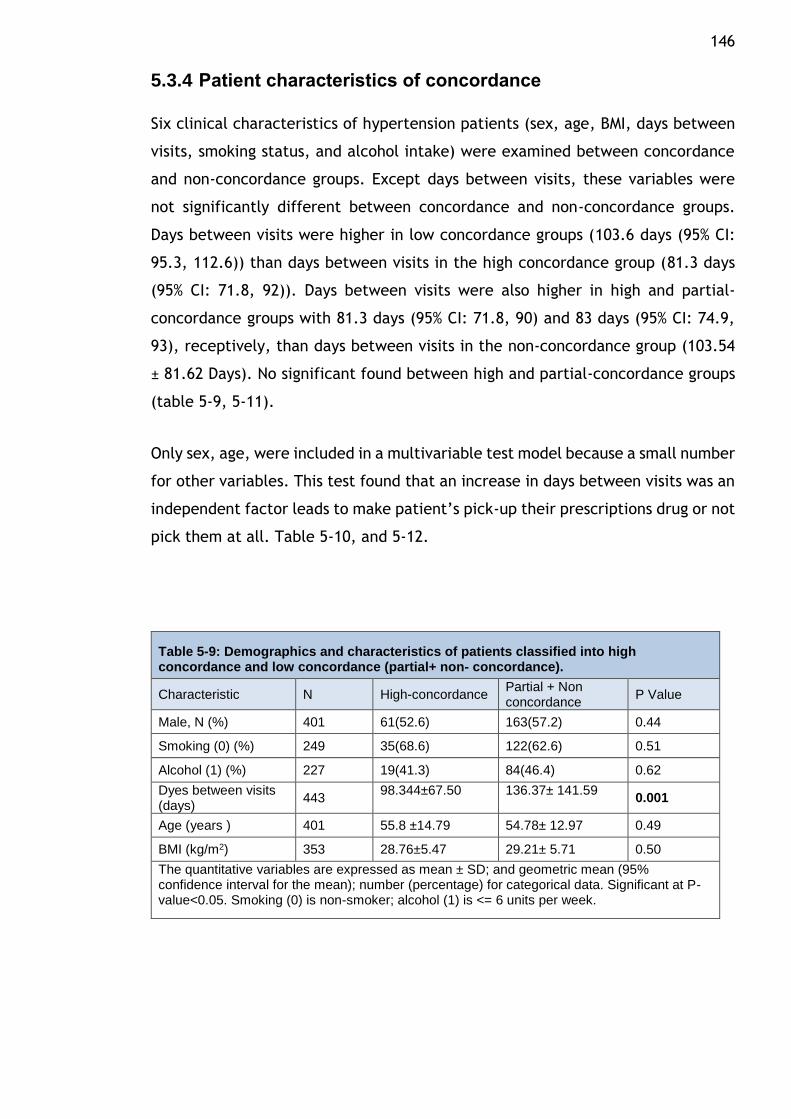
146
5.3.4 Patient characteristics of concordance
Six clinical characteristics of hypertension patients (sex, age, BMI, days between
visits, smoking status, and alcohol intake) were examined between concordance
and non-concordance groups. Except days between visits, these variables were
not significantly different between concordance and non-concordance groups.
Days between visits were higher in low concordance groups (103.6 days (95% CI:
95.3, 112.6)) than days between visits in the high concordance group (81.3 days
(95% CI: 71.8, 92)). Days between visits were also higher in high and partial-
concordance groups with 81.3 days (95% CI: 71.8, 90) and 83 days (95% CI: 74.9,
93), receptively, than days between visits in the non-concordance group (103.54
± 81.62 Days). No significant found between high and partial-concordance groups
(table 5-9, 5-11).
Only sex, age, were included in a multivariable test model because a small number
for other variables. This test found that an increase in days between visits was an
independent factor leads to make patient’s pick-up their prescriptions drug or not
pick them at all. Table 5-10, and 5-12.
Table 5-9: Demographics and characteristics of patients classified into high concordance and low concordance (partial+ non- concordance).
Characteristic N High-concordance Partial + Non concordance
P Value
Male, N (%) 401 61(52.6) 163(57.2) 0.44
Smoking (0) (%) 249 35(68.6) 122(62.6) 0.51
Alcohol (1) (%) 227 19(41.3) 84(46.4) 0.62
Dyes between visits (days)
443 98.344±67.50 136.37± 141.59
0.001
Age (years ) 401 55.8 ±14.79 54.78± 12.97 0.49
BMI (kg/m2) 353 28.76±5.47 29.21± 5.71 0.50
The quantitative variables are expressed as mean ± SD; and geometric mean (95% confidence interval for the mean); number (percentage) for categorical data. Significant at P-value<0.05. Smoking (0) is non-smoker; alcohol (1) is <= 6 units per week.
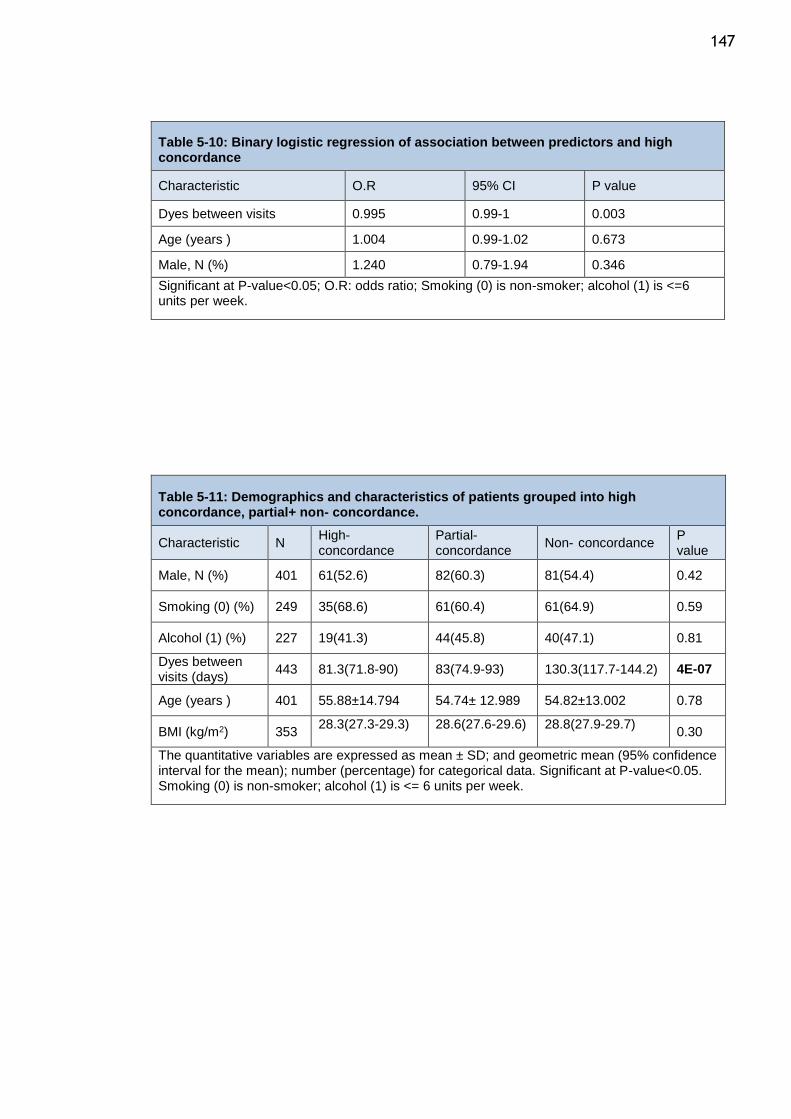
147
Table 5-10: Binary logistic regression of association between predictors and high concordance
Characteristic O.R 95% CI P value
Dyes between visits 0.995 0.99-1 0.003
Age (years ) 1.004 0.99-1.02 0.673
Male, N (%) 1.240 0.79-1.94 0.346
Significant at P-value<0.05; O.R: odds ratio; Smoking (0) is non-smoker; alcohol (1) is <=6 units per week.
Table 5-11: Demographics and characteristics of patients grouped into high concordance, partial+ non- concordance.
Characteristic N High- concordance
Partial- concordance
Non- concordance P value
Male, N (%) 401 61(52.6) 82(60.3) 81(54.4) 0.42
Smoking (0) (%) 249 35(68.6) 61(60.4) 61(64.9) 0.59
Alcohol (1) (%) 227 19(41.3) 44(45.8) 40(47.1) 0.81
Dyes between visits (days)
443 81.3(71.8-90) 83(74.9-93) 130.3(117.7-144.2) 4E-07
Age (years ) 401 55.88±14.794 54.74± 12.989 54.82±13.002 0.78
BMI (kg/m2) 353 28.3(27.3-29.3) 28.6(27.6-29.6) 28.8(27.9-29.7)
0.30
The quantitative variables are expressed as mean ± SD; and geometric mean (95% confidence interval for the mean); number (percentage) for categorical data. Significant at P-value<0.05. Smoking (0) is non-smoker; alcohol (1) is <= 6 units per week.
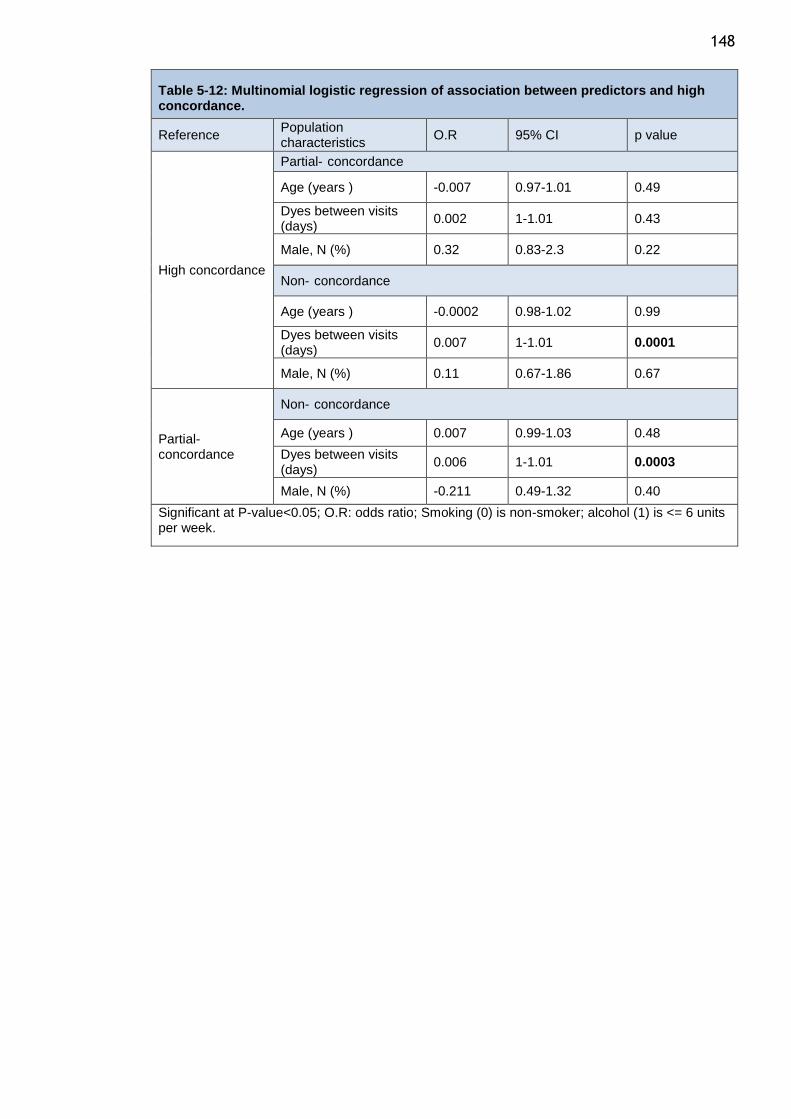
148
Table 5-12: Multinomial logistic regression of association between predictors and high concordance.
Reference Population characteristics
O.R 95% CI p value
High concordance
Partial- concordance
Age (years ) -0.007 0.97-1.01 0.49
Dyes between visits (days)
0.002 1-1.01 0.43
Male, N (%) 0.32 0.83-2.3 0.22
Non- concordance
Age (years ) -0.0002 0.98-1.02 0.99
Dyes between visits (days)
0.007 1-1.01 0.0001
Male, N (%) 0.11 0.67-1.86 0.67
Partial- concordance
Non- concordance
Age (years ) 0.007 0.99-1.03 0.48
Dyes between visits (days)
0.006 1-1.01 0.0003
Male, N (%) -0.211 0.49-1.32 0.40
Significant at P-value<0.05; O.R: odds ratio; Smoking (0) is non-smoker; alcohol (1) is <= 6 units per week.
149
5.4 Discussion
The main findings from the analyses presented in this chapter are low levels of
adherence over the short term (1-year) and long-term (5-years). the study of
adherence was restricted to those patients who were persistent with medications
for the duration of the study. The reason for restricting the study of adherence to
only those who are persistent is to obtain a more reliable estimate of patient
adherence those exposed to the drug for specified periods of time. This would
remove any biases introduced by discontinuers (patients who took the drug
initially but then discontinued early), as lots of discontinuers would inflate the
estimates of non-adherence among those who are persistent and make any
comparison between drugs impossible. Concordance has been also studied in this
chapter. I reviewed the patients’ case notes and their prescription refill data to
check whether or not the prescribed medications were picked up from the
pharmacy during clinical visits. This chapter answered two important questions:
Have the prescribed medications been collected? Have the medications that were
collected have been taken regularly? Thus, the results of this chapter complement
the results of the previous chapter.
Around 30% of patients were adherent to their antihypertensive drugs at 1 year
and only 23% at 5-years using an MPR >80% criteria for defining high adherence.
Thiazide diuretics showed the lowest adherence at 5 year compared to all drug
classes and the greatest decline in adherence from year 1 (from 20% to 9.5%).
compared to all drug classes. In contrast ACEI showed the highest adherence
compared to all major drug classes in year 1 and also showed the highest
adherence in Year 5 against BB and thiazide diuretics. On undertaking a more
granular analysis of non-adherence by classifying them into moderate and low
adherence, the striking finding was the consistency in these rates across all drug
classes. More importantly the higher rates of low adherence at year 1 declined by
over half in year 5 and this was related to a corresponding increase in the rates of
moderate adherence.
In a large meta-analysis (489) of adherence to cardiovascular drugs in over a
million participants, the overall prevalence of good adherence to cardiovascular
medications was 60% and adherence to antihypertensive drugs was 59% (42% to
77%). This is quite different from the adherence in the GBPC in my study and there
150 are various reasons for this. The Chowdhury et al study was a meta-analysis of 26
studies which included data from clinical trial registers, insurance databases and
healthcare registers and thus were based on affluent settings which may spuriously
report higher levels of adherence than in the general population. The
measurement of adherence in the Chowdhury et al study also were not uniform
across studies and the types of adherence assessments were pharmacy refill data
based on the MPR(14 studies) or PDC (12 studies); by other indirect measures
including self-reports (6 studies); and 2 by direct measures (e.g. electronic
monitoring systems or blood tests) (489). In contrast my study was a study of
hypertensive patients attending a specialist clinic and required to have data on
persistence over two study time-periods, 1-year and 5-year for inclusion in the
study. The Chowdhury et al study reported the range of adherence to be very wide
from 4.9% to 93.3%.
The novel findings from my study is the estimation of adherence in the same
population attending a specialist hypertension clinic over the short-term and long-
term. The results indicate that even in patients are persistent, adherence tend to
decline over the long term. Whilst the rate of low adherence were high by year 1,
the rates of moderate low adherence were increased by 50% by year 5. The impact
of this moderate change in adherence over the long term has not been studied
before and this merits further outcome studies. Most of the published studies on
adherence have studied adherence only at one time point usually around 1- 2 years
and the results show consistently poor adherence to cardiovascular medications.
My study provides rigorous estimates of the problem in a hypertensive population.
I have also studied concordance and it is surprising that only 30% of patients were
concordant by picking up their prescriptions within 30 days of clinic visit. Though
my measure of concordance is not the ideal metric, it provides insight into the
behaviour of patients in terms of pharmacy pickup of prescriptions. More
importantly 36% of patients did not pick up any prescriptions after first
prescription. Thus measures to improve adherence will require interventions to
improve concordance.
Analyses of the determinants of adherence in this study showed only age to be a
significant determinant. The duration between the prescription visit and
subsequent visit was significant for prescriptions taken, and prescriptions not
151 taken. Patients who had a fewer days between their prescription visit and
subsequent visit seemed to take their antihypertensive prescription. On the other
hand, patients who had more days between the prescription visit and subsequent
visit seemed to not taken at all. The relationship between the number of visits to
the doctor and adherence has been investigated in numerous studies. It has been
shown that patients who had more visits to the doctor showed higher adherence
to the antihypertensive drugs than those who had fewer visits (424,425). Other
studies have shown variable association between adherence and age, social status,
health literacy, existence of co-morbid conditions, polypharmacy, no-fill of first
prescription, irregular refills obtained, uncertainty about the effectiveness,
prohibitive costs, and serious adverse events (422,428,430,489,497).
The main limitation of using the MPR method is that it does not provide
information about dose frequency or whether patients have been advised to split
pills which is on the known disadvantage of using MPR (410). However, 98% of the
antihypertensive drugs used in my adherence study are recommended to be used
once daily based on the British National Formulary. In most cases, old CCBs and
BBs may be used more than once daily, but they are less likely to be prescribed
nowadays according to most recent guidelines. The availability of drugs in
different strengths minimises the chance that patients will split pills. Also, only
patients with certain co-morbidities (e.g., those with renal or hepatic impairment)
might need very low doses.
In summary, whilst adherence to antihypertensive drugs is low, adherence is not
greatly dependent on the class of drugs prescribed. This means interventions to
improve adherence can be broadly applied. However, few interventions to
improve adherence to cardiovascular drugs have been successfully implemented,
and those that have shown a benefit have tended to be complex, costly, and
difficult to sustain (498–500). The results of my study reinforce the need to reliably
measure adherence levels over the short and long term and assess their impact on
outcomes and test interventions that can improve adherence and consequently
survival.
152
Chapter 6 Additional therapy
6.1 Introduction
The initiation of a specific antihypertensive drug class was varied according to
hypertensive guidelines. Recent NICE guidelines recommend initiating with ACEI
or ARB for patients under 55 years and with CCB for patients over 55 years or of
African-Caribbean descent (43). Recent JNC guidelines recommend starting with
a diuretic or CCB for black patients and diuretics, BBs, CCBs, ACEIs and ARBs with
non-black patients (40). On the other hand, ESH and ESC guidelines suggest
initiating with diuretics, BBs, CCBs, ACEIs and ARBs are viable (41). Despite the
proven safety and efficacy of these recommended antihypertensive drug classes
(or other antihypertensive classes), poor BP control remains an issue worldwide
(273,274). Few patients are able to achieve a blood pressure goal (140/90 mm Hg)
using only one antihypertensive drug as a monotherapy (247,275).
Initiating a combination therapy of two or more antihypertensive drugs has shown
greater efficacy in reducing blood pressure and CV events than monotherapy. A
recent meta-analysis of 11,000 hypertensive patients revealed that greater BP
reductions were achieved when combining two different antihypertensive drug
classes than the reductions achieved by doubling the dose of an individual agent
(276). The ALERT study showed that cardiovascular structure and function
measurements were more improved when low doses of two antihypertensive drugs
(angiotensin-converting enzyme inhibitor and calcium channel blocker) were
combined than with a high dose of either single agent(277). Despite the greater
efficacy of using multiple antihypertensive drug classes, initiating with
antihypertensive drug combinations leads to increased pill burdens, which is
associated with lower adherence rates(423,433).
This chapter will analyse the following items: evaluate the number of patients
who were persistent with an initial antihypertensive drug class without any
additional therapy and the number of patients who needed additional
antihypertensive therapy; investigate which antihypertensive drug classes
required one or more additional antihypertensive drugs than others; study which
independent variables increased the probability that patients required additional
antihypertensive therapy.
153
6.2 Methodology
3,085 and 1,979 hypertensive patients were analysed for one-year and five-year
studies, respectively. This analysis included patients who initiated a new
antihypertensive drug class and were persistent with this intonation during the
one- and five-year follow-up studies. The terms persistence and new
antihypertensive drugs were defined in chapters two and three.
The number of antihypertensive drug classes that were added to the initial
antihypertensive drug class was calculated. All additional antihypertensive drug
classes were counted until the last day of the study. Additional therapy was
defined as the number of antihypertensive drug classes that were added to the
persistence-initiated antihypertensive drug during 365 days for the one-year study
and 1,825 days for the five-year study.
The non-additional therapy group was defined as patients who continued with the
initial antihypertensive drug class without needing additional antihypertensive
therapy. The additional therapy group was defined as patients who required
antihypertensive therapy in addition to their initial antihypertensive drug. The
proportion of non-additional to additional patients was estimated. A chi-square
test was used to compare the proportions of each initial antihypertensive drug
class that were persistent without requiring additional therapy and which needed
additional therapy with the other initial antihypertensive classes. The Bonferroni
method was used to correct the various significance tests resulting from multiple
comparisons on the same dataset.
Chi-square test, t-test were used to compare the demographic variables across
the groups and by different drug classes. The tests were conducted for 1-year and
5-year separately.
The impact of age, BMI, SBP, DBP, sex, smoking status and alcohol intake as the
independent variables on the additional therapy was tested using multivariate
logistic regression.
154
6.3 Results
6.3.1 Additional therapy during persistence period of different antihypertensive drug classes
3,085 and 1,979 patients who were persistent with their initial antihypertensive
drug were included in the one- and five-year studies respectively. Of these
subjects, 1363(44.2%) needed additional antihypertensive drugs in the one-year
study and 1422(71.8%) required additional antihypertensive drug therapy in the
five-year study.
The number of patients who required additional antihypertensive drug therapy
during the one-year study was 47(77%) (Alpha-blockers), 76 (57%) (Non-thiazide
diuretic), 5 (55%) (Centrally acting), 240 (49.4%) (CCBs), 230 (48.8%) (Thiazide
diuretic), 156 (44.7%) (ARBs), 326 (41.4%) (ACEIs), 272(35.8%) (BBs), and 10(35.7%)
(potassium sparing diuretics). The number of patients in the five-year study was
38 (90.5%) (Alpha-blockers), 50 (80.6%) (Non-thiazide diuretics), 255(78.2%)
(Thiazide diuretics), 237(76.2%) CCBs, 173(72.1%) (ARBs), 319(68.8%) (ACEIs),
335(65.9%) (BBs), and 8(42.1%) (potassium sparing diuretics) Table 6-1.
The percentage of patients who were persistent for one and five years and who
required additional antihypertensive drug therapy was highest for alpha-blockers
and lowest for BB. Those on BB monotherapy who were persistent at one year
were less likely to require additional drug therapy than those on alpha-blockers,
CCB, non-thiazide diuretic, or thiazide diuretic. Patients on BB were less likely to
need additional therapy than those on alpha-blockers, and non-thiazide during the
five-year study. Patients on ACEI is significantly higher than those on alpha-
blockers or on non-thiazide diuretic at one-year study, no significant difference
occurred between patients on ACEI and those on other antihypertensive classes at
five-year study. Table 6-2, and table 6-3.
All antihypertensive classes at five year appeared to require additional therapy,
with no significant difference between most antihypertensive classes.
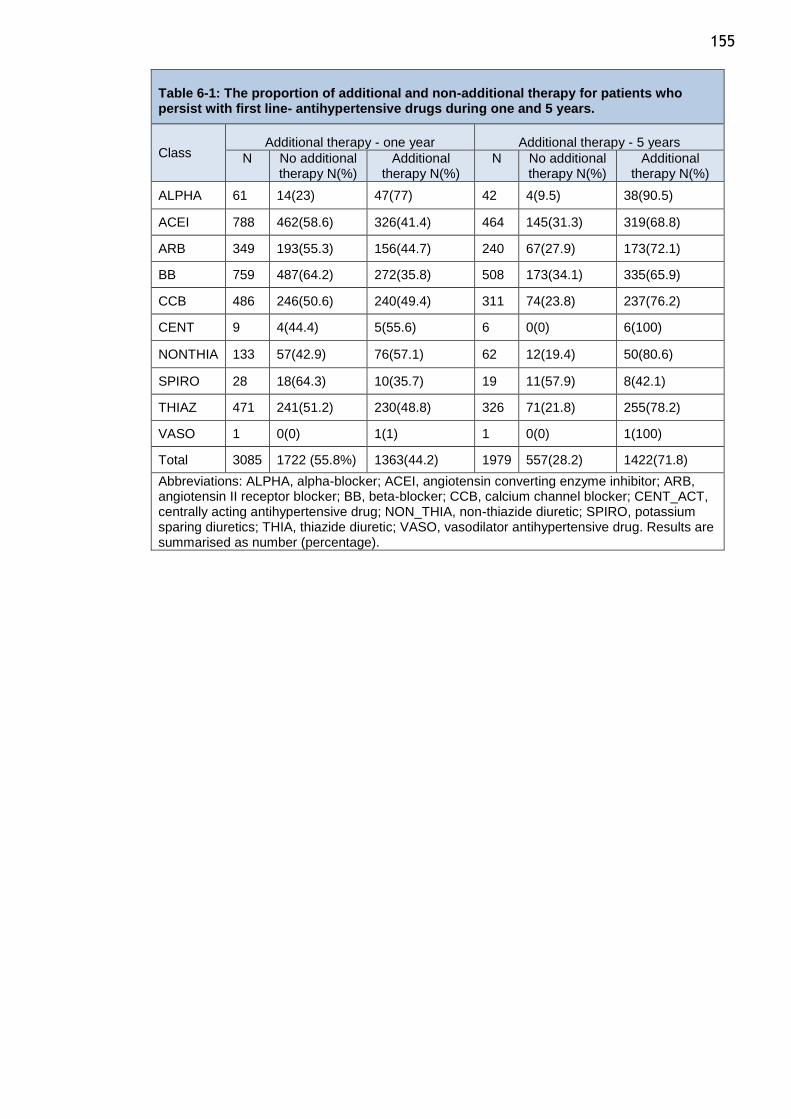
155
Table 6-1: The proportion of additional and non-additional therapy for patients who persist with first line- antihypertensive drugs during one and 5 years.
Class Additional therapy - one year Additional therapy - 5 years
N No additional therapy N(%)
Additional therapy N(%)
N No additional therapy N(%)
Additional therapy N(%)
ALPHA 61 14(23) 47(77) 42 4(9.5) 38(90.5)
ACEI 788 462(58.6) 326(41.4) 464 145(31.3) 319(68.8)
ARB 349 193(55.3) 156(44.7) 240 67(27.9) 173(72.1)
BB 759 487(64.2) 272(35.8) 508 173(34.1) 335(65.9)
CCB 486 246(50.6) 240(49.4) 311 74(23.8) 237(76.2)
CENT 9 4(44.4) 5(55.6) 6 0(0) 6(100)
NONTHIA 133 57(42.9) 76(57.1) 62 12(19.4) 50(80.6)
SPIRO 28 18(64.3) 10(35.7) 19 11(57.9) 8(42.1)
THIAZ 471 241(51.2) 230(48.8) 326 71(21.8) 255(78.2)
VASO 1 0(0) 1(1) 1 0(0) 1(100)
Total 3085 1722 (55.8%) 1363(44.2) 1979 557(28.2) 1422(71.8)
Abbreviations: ALPHA, alpha-blocker; ACEI, angiotensin converting enzyme inhibitor; ARB, angiotensin II receptor blocker; BB, beta-blocker; CCB, calcium channel blocker; CENT_ACT, centrally acting antihypertensive drug; NON_THIA, non-thiazide diuretic; SPIRO, potassium sparing diuretics; THIA, thiazide diuretic; VASO, vasodilator antihypertensive drug. Results are summarised as number (percentage).
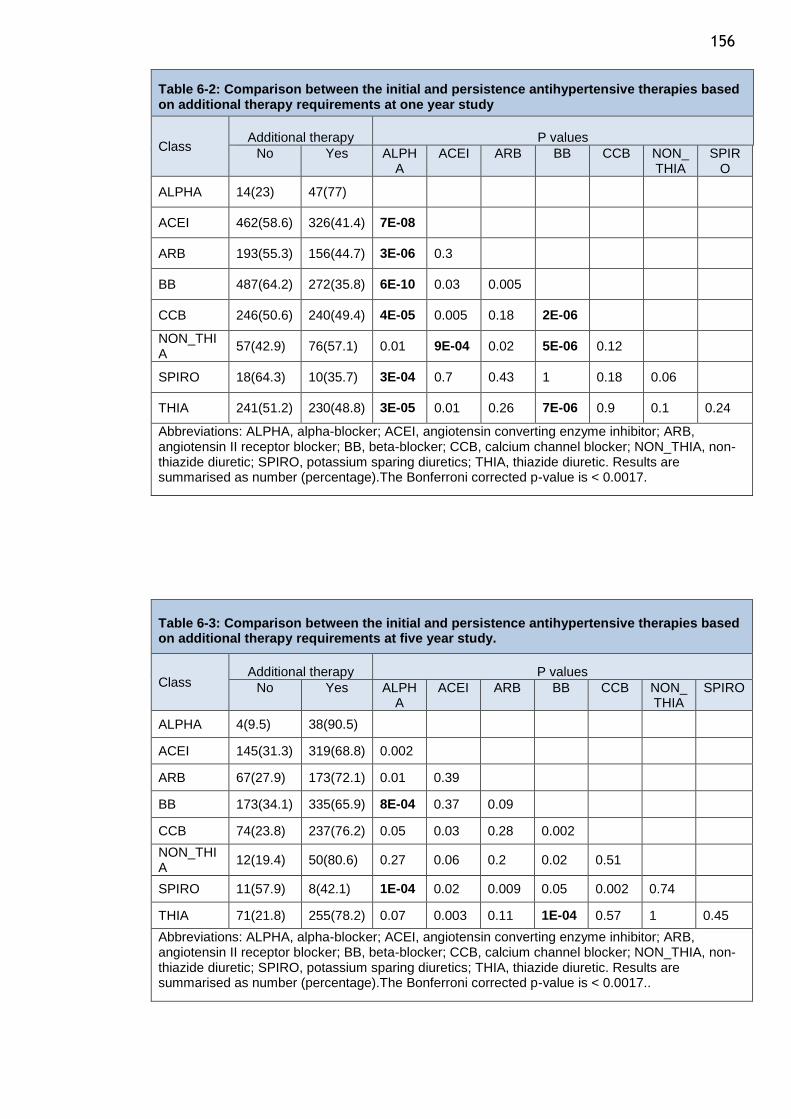
156
Table 6-2: Comparison between the initial and persistence antihypertensive therapies based on additional therapy requirements at one year study
Class Additional therapy P values
No Yes ALPHA
ACEI ARB BB CCB NON_ THIA
SPIRO
ALPHA 14(23) 47(77)
ACEI 462(58.6) 326(41.4) 7E-08
ARB 193(55.3) 156(44.7) 3E-06 0.3
BB 487(64.2) 272(35.8) 6E-10 0.03 0.005
CCB 246(50.6) 240(49.4) 4E-05 0.005 0.18 2E-06
NON_THIA
57(42.9) 76(57.1) 0.01 9E-04 0.02 5E-06 0.12
SPIRO 18(64.3) 10(35.7) 3E-04 0.7 0.43 1 0.18 0.06
THIA 241(51.2) 230(48.8) 3E-05 0.01 0.26 7E-06 0.9 0.1 0.24
Abbreviations: ALPHA, alpha-blocker; ACEI, angiotensin converting enzyme inhibitor; ARB, angiotensin II receptor blocker; BB, beta-blocker; CCB, calcium channel blocker; NON_THIA, non-thiazide diuretic; SPIRO, potassium sparing diuretics; THIA, thiazide diuretic. Results are summarised as number (percentage).The Bonferroni corrected p-value is < 0.0017.
Table 6-3: Comparison between the initial and persistence antihypertensive therapies based on additional therapy requirements at five year study.
Class Additional therapy P values
No Yes ALPHA
ACEI ARB BB CCB NON_ THIA
SPIRO
ALPHA 4(9.5) 38(90.5)
ACEI 145(31.3) 319(68.8) 0.002
ARB 67(27.9) 173(72.1) 0.01 0.39
BB 173(34.1) 335(65.9) 8E-04 0.37 0.09
CCB 74(23.8) 237(76.2) 0.05 0.03 0.28 0.002
NON_THIA
12(19.4) 50(80.6) 0.27 0.06 0.2 0.02 0.51
SPIRO 11(57.9) 8(42.1) 1E-04 0.02 0.009 0.05 0.002 0.74
THIA 71(21.8) 255(78.2) 0.07 0.003 0.11 1E-04 0.57 1 0.45
Abbreviations: ALPHA, alpha-blocker; ACEI, angiotensin converting enzyme inhibitor; ARB, angiotensin II receptor blocker; BB, beta-blocker; CCB, calcium channel blocker; NON_THIA, non-thiazide diuretic; SPIRO, potassium sparing diuretics; THIA, thiazide diuretic. Results are summarised as number (percentage).The Bonferroni corrected p-value is < 0.0017..
157
6.3.2 Percentage patients who required two or three antihypertensive drug based on the initial antihypertensive drugs
Additional therapy was classified into three groups one, two, and three groups.
Group one represented patients who persist with the initial antihypertensive drugs
without need to any additional therapy. Group two, patients who persist with
initial drug and required one more antihypertensive drug. Group three, patents
who persist first line drug and required to adding two or more antihypertensive
drug during the study.
722 (23.4%) persistent patients required one more antihypertensive drug class and
641 (20.8%) patients needed two or more antihypertensive drugs in addition to the
initial antihypertensive drug therapy during the one-year study. In the five-year
study, the number of persistent patients who required one additional drug therapy
was 501 (25.3%) and those who required two or more additional drug therapies
was 921 (46.5%). Table 6-4.
Persistent patients at one year were most likely to require one additional
antihypertensive drug therapy if they were taking thiazide diuretic and less likely
if they were on alpha blocker, and non-thiazide diuretic. During the five-year
study, patients on alpha-blocker, CCB or non-thiazide diuretic were less likely to
need one additional antihypertensive drug therapy and more likely if they were
on thiazide diuretics. In general, Patient on thiazide diuretic more likely to need
one more antihypertensive drug at one and five year studies.
Persistent patients at one year and five years who were on BB, ACEI, and ARB were
the less likely to require two or more additional antihypertensive and more likely
if they were on alpha-blockers, CCB, and non-thiazide diuretic (table 5-6, and 5-
7, figure 6-1, and 6-2).
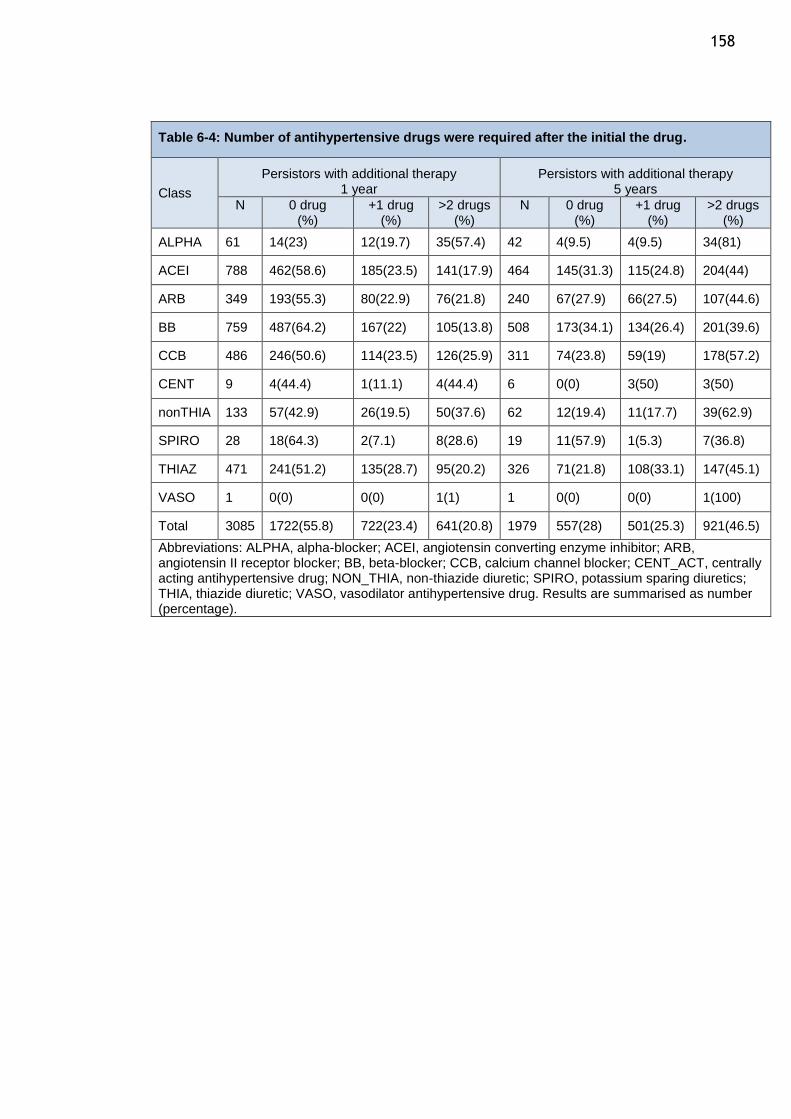
158
Table 6-4: Number of antihypertensive drugs were required after the initial the drug.
Class
Persistors with additional therapy 1 year
Persistors with additional therapy 5 years
N 0 drug (%)
+1 drug (%)
>2 drugs (%)
N 0 drug (%)
+1 drug (%)
>2 drugs (%)
ALPHA 61 14(23) 12(19.7) 35(57.4) 42 4(9.5) 4(9.5) 34(81)
ACEI 788 462(58.6) 185(23.5) 141(17.9) 464 145(31.3) 115(24.8) 204(44)
ARB 349 193(55.3) 80(22.9) 76(21.8) 240 67(27.9) 66(27.5) 107(44.6)
BB 759 487(64.2) 167(22) 105(13.8) 508 173(34.1) 134(26.4) 201(39.6)
CCB 486 246(50.6) 114(23.5) 126(25.9) 311 74(23.8) 59(19) 178(57.2)
CENT 9 4(44.4) 1(11.1) 4(44.4) 6 0(0) 3(50) 3(50)
nonTHIA 133 57(42.9) 26(19.5) 50(37.6) 62 12(19.4) 11(17.7) 39(62.9)
SPIRO 28 18(64.3) 2(7.1) 8(28.6) 19 11(57.9) 1(5.3) 7(36.8)
THIAZ 471 241(51.2) 135(28.7) 95(20.2) 326 71(21.8) 108(33.1) 147(45.1)
VASO 1 0(0) 0(0) 1(1) 1 0(0) 0(0) 1(100)
Total 3085 1722(55.8) 722(23.4) 641(20.8) 1979 557(28) 501(25.3) 921(46.5)
Abbreviations: ALPHA, alpha-blocker; ACEI, angiotensin converting enzyme inhibitor; ARB, angiotensin II receptor blocker; BB, beta-blocker; CCB, calcium channel blocker; CENT_ACT, centrally acting antihypertensive drug; NON_THIA, non-thiazide diuretic; SPIRO, potassium sparing diuretics; THIA, thiazide diuretic; VASO, vasodilator antihypertensive drug. Results are summarised as number (percentage).
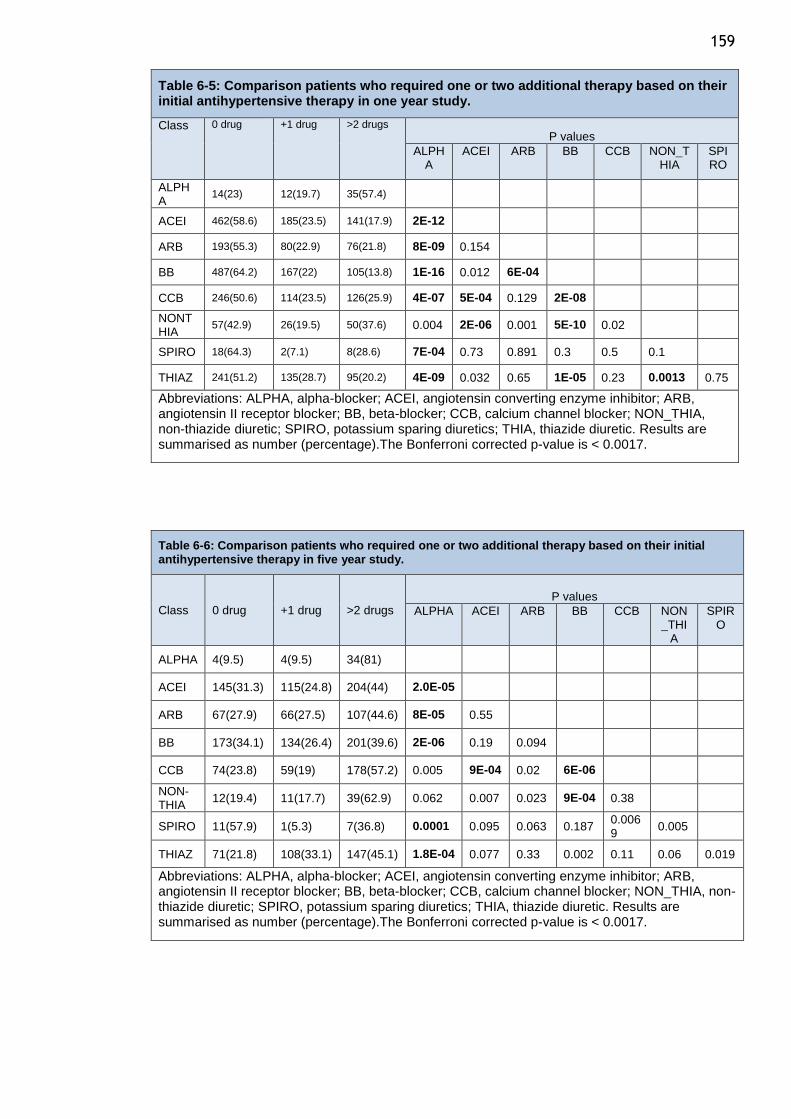
159
Table 6-5: Comparison patients who required one or two additional therapy based on their initial antihypertensive therapy in one year study.
Class 0 drug +1 drug >2 drugs
P values
ALPHA
ACEI ARB BB CCB NON_THIA
SPIRO
ALPHA
14(23) 12(19.7) 35(57.4)
ACEI 462(58.6) 185(23.5) 141(17.9) 2E-12
ARB 193(55.3) 80(22.9) 76(21.8) 8E-09 0.154
BB 487(64.2) 167(22) 105(13.8) 1E-16 0.012 6E-04
CCB 246(50.6) 114(23.5) 126(25.9) 4E-07 5E-04 0.129 2E-08
NONTHIA
57(42.9) 26(19.5) 50(37.6) 0.004 2E-06 0.001 5E-10 0.02
SPIRO 18(64.3) 2(7.1) 8(28.6) 7E-04 0.73 0.891 0.3 0.5 0.1
THIAZ 241(51.2) 135(28.7) 95(20.2) 4E-09 0.032 0.65 1E-05 0.23 0.0013 0.75
Abbreviations: ALPHA, alpha-blocker; ACEI, angiotensin converting enzyme inhibitor; ARB, angiotensin II receptor blocker; BB, beta-blocker; CCB, calcium channel blocker; NON_THIA, non-thiazide diuretic; SPIRO, potassium sparing diuretics; THIA, thiazide diuretic. Results are summarised as number (percentage).The Bonferroni corrected p-value is < 0.0017.
Table 6-6: Comparison patients who required one or two additional therapy based on their initial antihypertensive therapy in five year study.
Class 0 drug +1 drug >2 drugs P values
ALPHA ACEI ARB BB CCB NON_THI
A
SPIRO
ALPHA 4(9.5) 4(9.5) 34(81)
ACEI 145(31.3) 115(24.8) 204(44) 2.0E-05
ARB 67(27.9) 66(27.5) 107(44.6) 8E-05 0.55
BB 173(34.1) 134(26.4) 201(39.6) 2E-06 0.19 0.094
CCB 74(23.8) 59(19) 178(57.2) 0.005 9E-04 0.02 6E-06
NON-THIA
12(19.4) 11(17.7) 39(62.9) 0.062 0.007 0.023 9E-04 0.38
SPIRO 11(57.9) 1(5.3) 7(36.8) 0.0001 0.095 0.063 0.187 0.0069
0.005
THIAZ 71(21.8) 108(33.1) 147(45.1) 1.8E-04 0.077 0.33 0.002 0.11 0.06 0.019
Abbreviations: ALPHA, alpha-blocker; ACEI, angiotensin converting enzyme inhibitor; ARB, angiotensin II receptor blocker; BB, beta-blocker; CCB, calcium channel blocker; NON_THIA, non-thiazide diuretic; SPIRO, potassium sparing diuretics; THIA, thiazide diuretic. Results are summarised as number (percentage).The Bonferroni corrected p-value is < 0.0017.
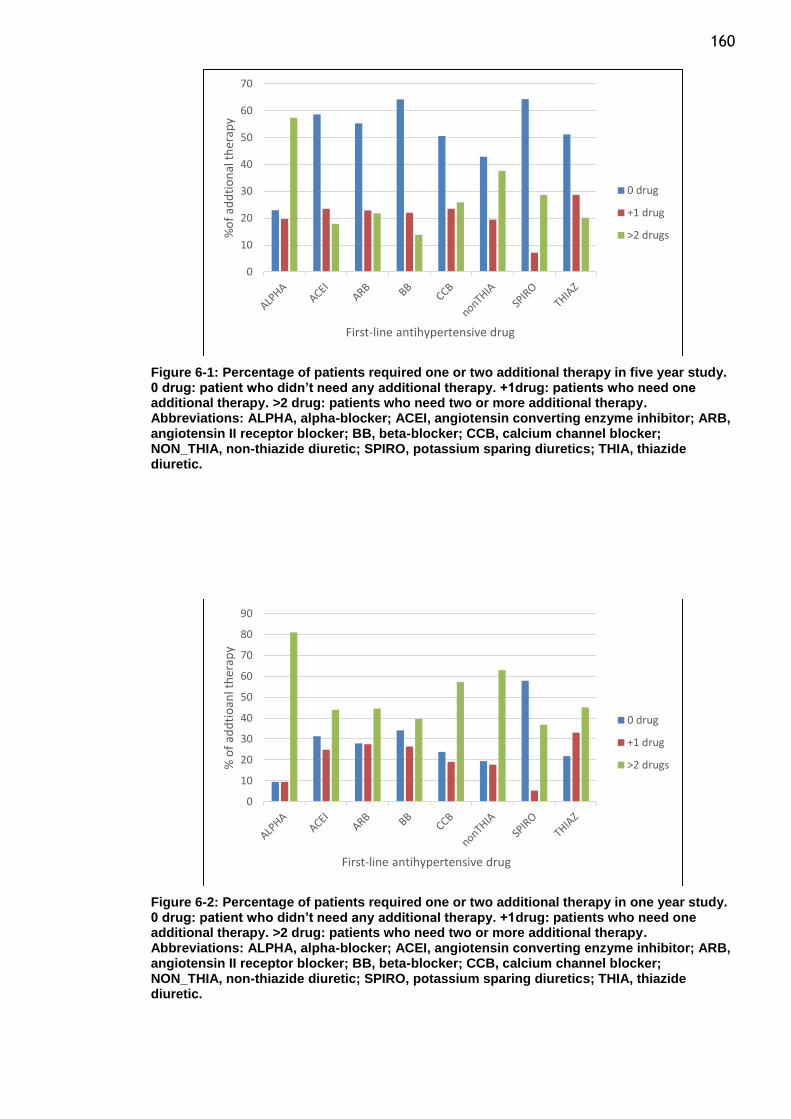
160
Figure 6-1: Percentage of patients required one or two additional therapy in five year study. 0 drug: patient who didn’t need any additional therapy. +1drug: patients who need one additional therapy. >2 drug: patients who need two or more additional therapy. Abbreviations: ALPHA, alpha-blocker; ACEI, angiotensin converting enzyme inhibitor; ARB, angiotensin II receptor blocker; BB, beta-blocker; CCB, calcium channel blocker; NON_THIA, non-thiazide diuretic; SPIRO, potassium sparing diuretics; THIA, thiazide diuretic.
Figure 6-2: Percentage of patients required one or two additional therapy in one year study. 0 drug: patient who didn’t need any additional therapy. +1drug: patients who need one additional therapy. >2 drug: patients who need two or more additional therapy. Abbreviations: ALPHA, alpha-blocker; ACEI, angiotensin converting enzyme inhibitor; ARB, angiotensin II receptor blocker; BB, beta-blocker; CCB, calcium channel blocker; NON_THIA, non-thiazide diuretic; SPIRO, potassium sparing diuretics; THIA, thiazide diuretic.
0
10
20
30
40
50
60
70
%o
f ad
dti
on
al t
her
apy
First-line antihypertensive drug
0 drug
+1 drug
>2 drugs
0
10
20
30
40
50
60
70
80
90
% o
f ad
dti
oan
l th
erap
y
First-line antihypertensive drug
0 drug
+1 drug
>2 drugs
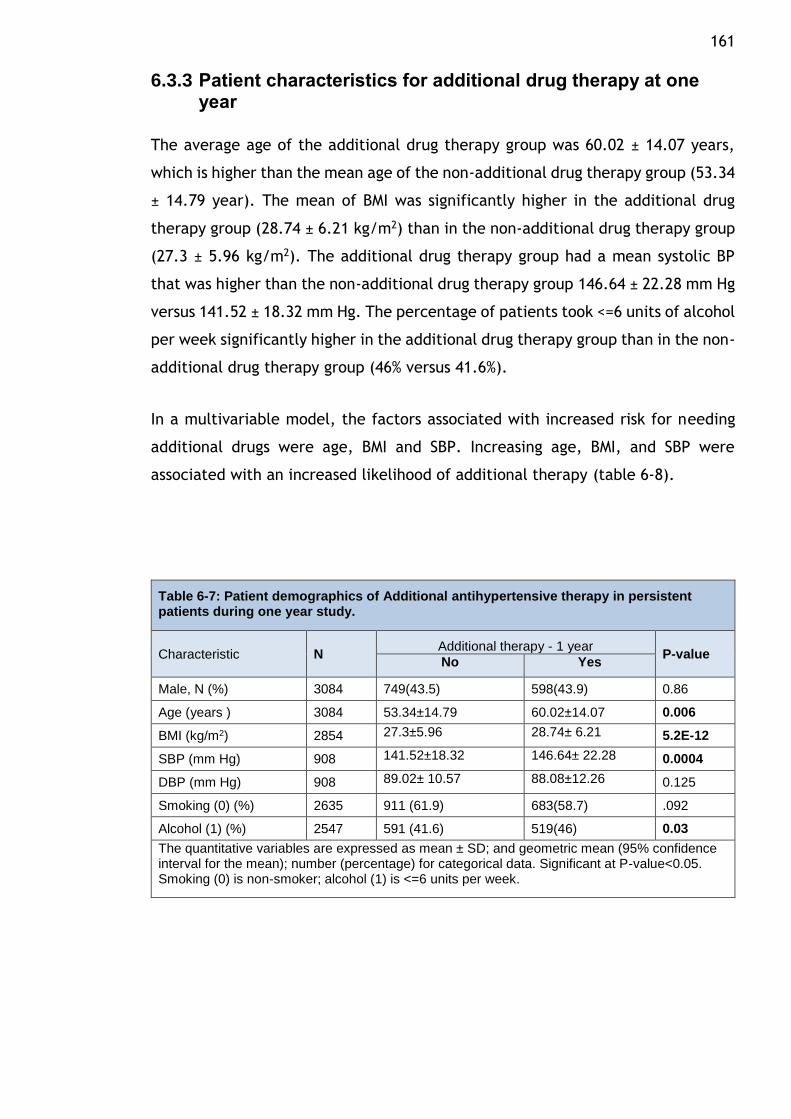
161
6.3.3 Patient characteristics for additional drug therapy at one year
The average age of the additional drug therapy group was 60.02 ± 14.07 years,
which is higher than the mean age of the non-additional drug therapy group (53.34
± 14.79 year). The mean of BMI was significantly higher in the additional drug
therapy group (28.74 ± 6.21 kg/m2) than in the non-additional drug therapy group
(27.3 ± 5.96 kg/m2). The additional drug therapy group had a mean systolic BP
that was higher than the non-additional drug therapy group 146.64 ± 22.28 mm Hg
versus 141.52 ± 18.32 mm Hg. The percentage of patients took <=6 units of alcohol
per week significantly higher in the additional drug therapy group than in the non-
additional drug therapy group (46% versus 41.6%).
In a multivariable model, the factors associated with increased risk for needing
additional drugs were age, BMI and SBP. Increasing age, BMI, and SBP were
associated with an increased likelihood of additional therapy (table 6-8).
Table 6-7: Patient demographics of Additional antihypertensive therapy in persistent patients during one year study.
Characteristic N Additional therapy - 1 year
P-value No Yes
Male, N (%) 3084 749(43.5) 598(43.9) 0.86
Age (years ) 3084 53.34±14.79 60.02±14.07 0.006
BMI (kg/m2) 2854 27.3±5.96 28.74± 6.21 5.2E-12
SBP (mm Hg) 908 141.52±18.32 146.64± 22.28 0.0004
DBP (mm Hg) 908 89.02± 10.57 88.08±12.26 0.125
Smoking (0) (%) 2635 911 (61.9) 683(58.7) .092
Alcohol (1) (%) 2547 591 (41.6) 519(46) 0.03
The quantitative variables are expressed as mean ± SD; and geometric mean (95% confidence interval for the mean); number (percentage) for categorical data. Significant at P-value<0.05. Smoking (0) is non-smoker; alcohol (1) is <=6 units per week.
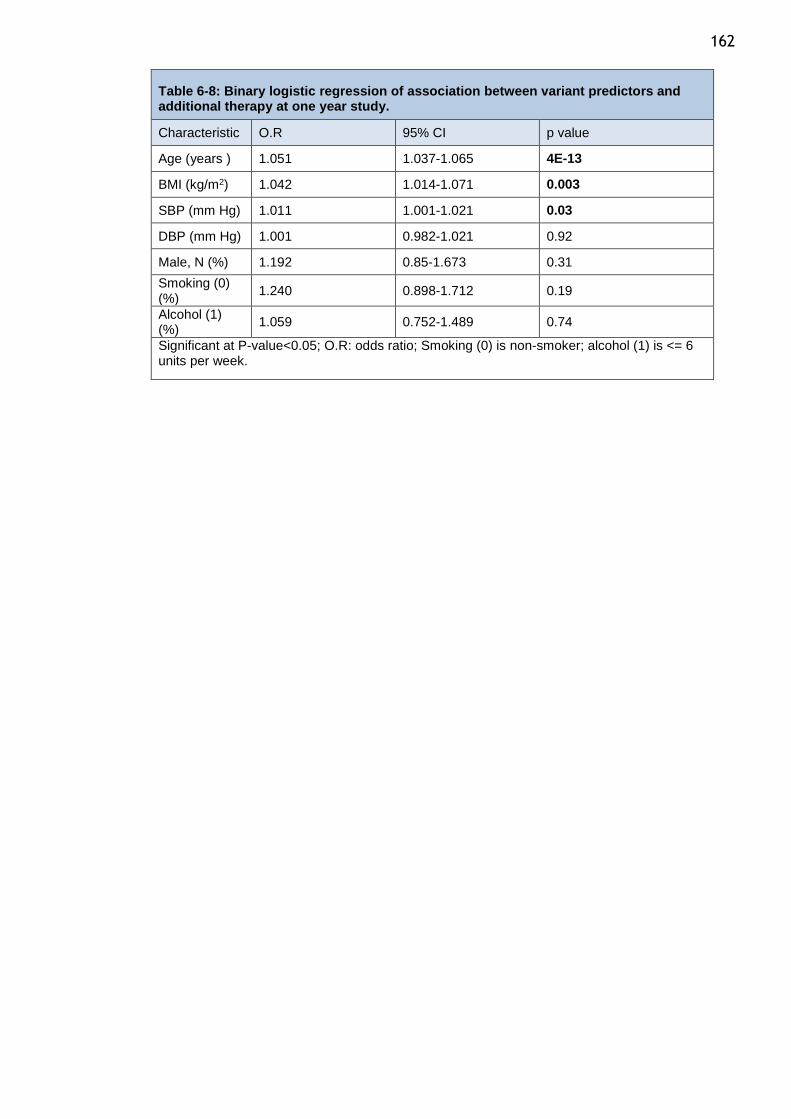
162
Table 6-8: Binary logistic regression of association between variant predictors and additional therapy at one year study.
Characteristic O.R 95% CI p value
Age (years ) 1.051 1.037-1.065 4E-13
BMI (kg/m2) 1.042 1.014-1.071 0.003
SBP (mm Hg) 1.011 1.001-1.021 0.03
DBP (mm Hg) 1.001 0.982-1.021 0.92
Male, N (%) 1.192 0.85-1.673 0.31
Smoking (0) (%)
1.240 0.898-1.712 0.19
Alcohol (1) (%)
1.059 0.752-1.489 0.74
Significant at P-value<0.05; O.R: odds ratio; Smoking (0) is non-smoker; alcohol (1) is <= 6 units per week.
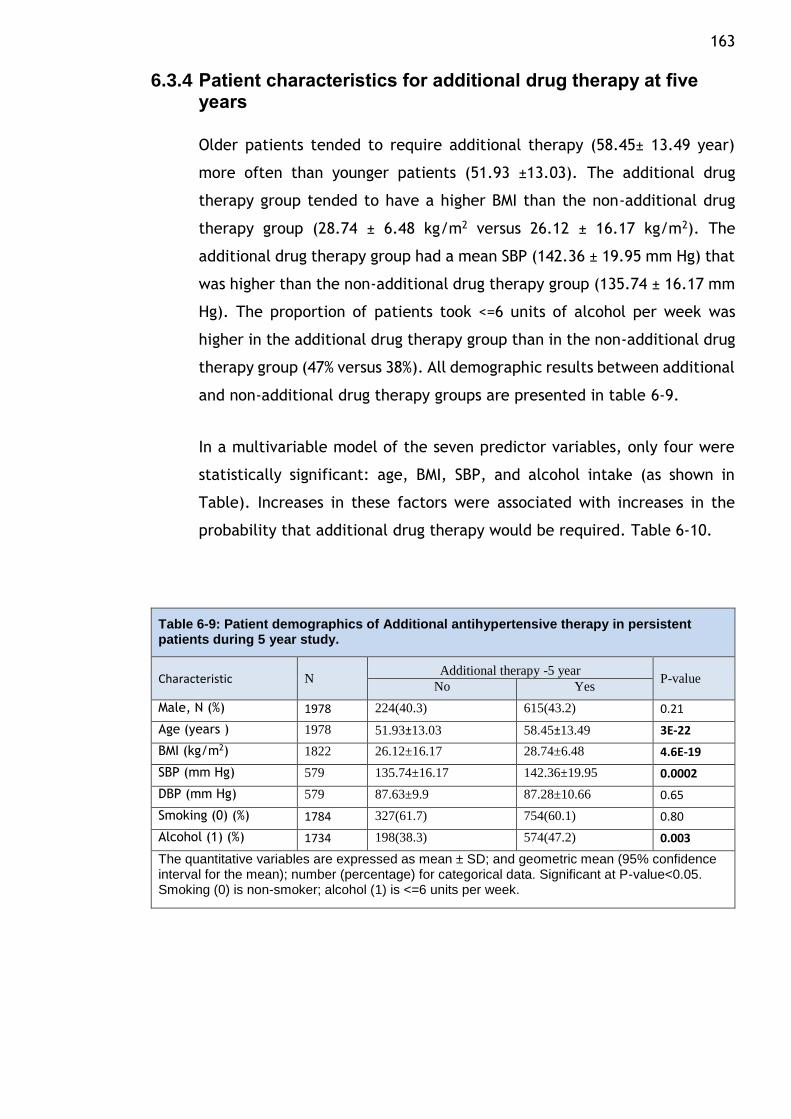
163
6.3.4 Patient characteristics for additional drug therapy at five years
Older patients tended to require additional therapy (58.45± 13.49 year)
more often than younger patients (51.93 ±13.03). The additional drug
therapy group tended to have a higher BMI than the non-additional drug
therapy group (28.74 ± 6.48 kg/m2 versus 26.12 ± 16.17 kg/m2). The
additional drug therapy group had a mean SBP (142.36 ± 19.95 mm Hg) that
was higher than the non-additional drug therapy group (135.74 ± 16.17 mm
Hg). The proportion of patients took <=6 units of alcohol per week was
higher in the additional drug therapy group than in the non-additional drug
therapy group (47% versus 38%). All demographic results between additional
and non-additional drug therapy groups are presented in table 6-9.
In a multivariable model of the seven predictor variables, only four were
statistically significant: age, BMI, SBP, and alcohol intake (as shown in
Table). Increases in these factors were associated with increases in the
probability that additional drug therapy would be required. Table 6-10.
Table 6-9: Patient demographics of Additional antihypertensive therapy in persistent patients during 5 year study.
Characteristic N Additional therapy -5 year
P-value No Yes
Male, N (%) 1978 224(40.3) 615(43.2) 0.21
Age (years ) 1978 51.93±13.03 58.45±13.49 3E-22
BMI (kg/m2) 1822 26.12±16.17 28.74±6.48 4.6E-19
SBP (mm Hg) 579 135.74±16.17 142.36±19.95 0.0002
DBP (mm Hg) 579 87.63±9.9 87.28±10.66 0.65
Smoking (0) (%) 1784 327(61.7) 754(60.1) 0.80
Alcohol (1) (%) 1734 198(38.3) 574(47.2) 0.003
The quantitative variables are expressed as mean ± SD; and geometric mean (95% confidence interval for the mean); number (percentage) for categorical data. Significant at P-value<0.05. Smoking (0) is non-smoker; alcohol (1) is <=6 units per week.
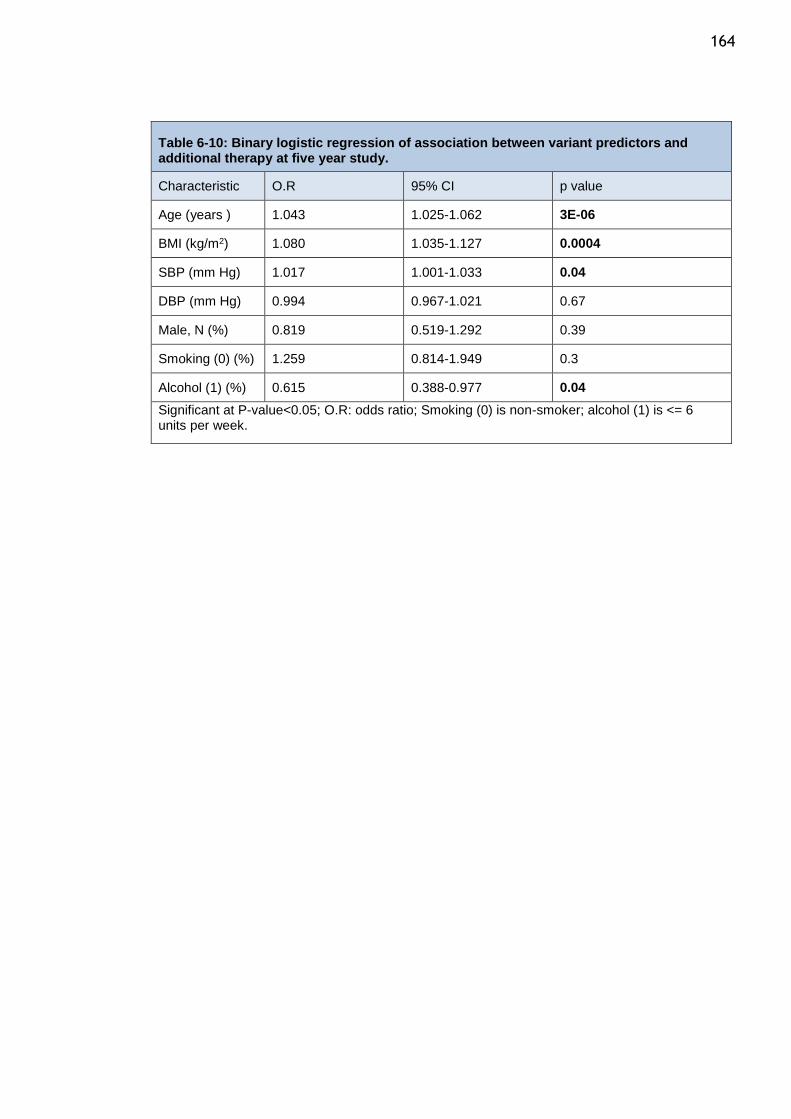
164
Table 6-10: Binary logistic regression of association between variant predictors and additional therapy at five year study.
Characteristic O.R 95% CI p value
Age (years ) 1.043 1.025-1.062 3E-06
BMI (kg/m2) 1.080 1.035-1.127 0.0004
SBP (mm Hg) 1.017 1.001-1.033 0.04
DBP (mm Hg) 0.994 0.967-1.021 0.67
Male, N (%) 0.819 0.519-1.292 0.39
Smoking (0) (%) 1.259 0.814-1.949 0.3
Alcohol (1) (%) 0.615 0.388-0.977 0.04
Significant at P-value<0.05; O.R: odds ratio; Smoking (0) is non-smoker; alcohol (1) is <= 6 units per week.
165
6.4 Discussion
44.2% of patients who were persistent after one year required additional
antihypertensive drug therapy, while 71.8% of them required additional
antihypertensive drug therapy at five years. The percentage of patients who
required three different antihypertensive drug classes or more was 20.8% and
46.5% in the one-year and five-year studies, respectively.
BB and AECI are the antihypertensive drug classes most likely to continue as a
monotherapy without requiring additional antihypertensive drug classes during the
initial year and five years of follow-up.
Clinical trials and observational studies showed that white individuals who
received monotherapy antihypertensive drugs, particularly younger patients,
responded to BB and ACEI better than CCB and diuretics, while black patients,
especially older patients, responded better to CCB and diuretics than BB and ACEI
(501–503). Also, higher plasma renin activity (PRA) was shown to be associated
with weaker blood pressure responses to thiazide diuretics and greater responses
to BB in monotherapy drugs(504). Black people 55 years or older tend to have
lower renin concentrations than individuals who are younger than 55 or are in the
white population(103). On this basis, NICE Guideline 18 recommends that patients
under the age of 55 years begin with either an ACEI or BB whilst those over 55
years or of African-Caribbean origin be commenced on a CCB or thiazide-like
diuretic. Subsequent publications of NICE guidelines have seen BB and thiazide
removed as first-line agents following publications concluding that BBs are less
effective and associated with a higher risk of stroke and that thiazide is associated
with increased risk of developing diabetes (200,505). The most recent NICE
publication refined the guideline for first-line hypertension management by
removing thiazide-like diuretics and BBs as first-line agents while retaining ACEI
and CCB based on age and race considerations (43).
In this study, BB and ACEI were the antihypertensive drug classes most likely to
continue as drug monotherapy without requiring additional antihypertensive drug
classes during the one- and five-year follow-up studies. The higher responses to
BB and ACEI to additional drug therapy study may relate to the demographic

166 population in Scotland where most people are white and black/African people
represent less than 0.5% of the Scottish population (506).
Age, sex, BMI, and alcohol intake were the independent factors most likely to lead
an increase in the probability of patients to take multiple antihypertensive drugs.
Several studies showed these factors were associated with uncontrolled blood
pressure (295,299,304,507).
167
Chapter 7 Antihypertensive Persistence and Adherence on Blood pressure response and Resistant Hypertension
7.1 Introduction
The hypertension control rate in Scotland is low and was estimated at 53% in 2011.
Many factors that affect BP response have been discussed in the introduction
chapter. Some of these factors relate to (1) patient characteristics such as age,
sex, and ethnicity; (2) patient behaviour such as obesity, excessive alcohol intake,
smoking, and adherence or (3) healthcare systems such as the patient-doctor
relationship, and the number of visits.
There are large inter-individual variations in patients' response to the
antihypertensive drug classes (197). A number of studies have shown that younger
white individuals responded better to BB and ACEI than CCB and diuretics and that
older black patients responded better to CCB and diuretics than BB and
ACEI(248,501–503). These studies have been considered by the NICE guidelines in
its recommendations for initiation of antihypertensive drugs. NICE guidelines
classified patients starting antihypertensive drug therapy into two classes based
on age and race (ACEI or ARB for patients age <55 and CCB for patient ≥ 55)(43).
Also, JNC guidelines have recommended starting antihypertensive drug classes
based on ethnicity but did not recommend a specific class based on age (diuretic
or CCB were recommended for black patients and diuretics, BBs, CCBs, ACEIs, and
ARBs for non-black patients) (40).
Resistant HTN is defined as the failure to achieve BP control despite the
concomitant use of three antihypertensive drug classes. BP is controlled when
SBP<140 mm Hg and DBP<90 mm Hg. This definition of resistant HTN is somewhat
arbitrary with regard to the requirements that a diuretic be one of the three
classes, the blood pressure goal for diabetes mellitus or renal dysfunction be
<130/80 (SBP/DBP) mm Hg, or the number of medications required to achieve the
BP control (508).
Resistant HTN is a global issue. Several studies have found that 20-35% of patients
could not achieve BP target even though they received more than three
168 antihypertensive drug classes (31,32,509). The prevalence of resistant HTN varied
among hypertensive patients and ranged from 10-30% in different studies.
However, this percentage might overestimate or underestimate resistance due to
the inclusion criteria and the restrictions posed by the study treatment
protocols(508,510,511). A higher risk of renal and CV events has been associated
with resistant HTN (512).
Resistant HTN can be true or false. It has been shown that false resistant HTN is
frequently caused by poor adherence, white coat hypertension, or inappropriate
BP measurement methods, such as using small cuffs on large arms. True resistant
HTN may result from many factors. Factors contributing to true resistant HTN
include the following: lifestyle factors (weight gain, obesity, excessive alcohol
intake, dietary salt, etc.); drug-related causes (e.g., non-steroidal anti-
inflammatory agents (NSAIDs)); obstructive sleep apnoea; and secondary
hypertension (renal artery stenosis, renal parenchymal disease, etc.)(508).
This aim of this chapter is evaluate the prevalence of resistant HTN. The effect of
the initiation of different antihypertensive classes on resistant HTN, and to study
which independent variables that affect BP response.
7.2 Methodology
Assessment of resistance hypertension:
All primary HTN patients who initiated their antihypertensive drugs and attended
the outpatient hypertension clinic at Western Infirmary hospital were included in
this part of this study. Antihypertensive prescriptions for these patients were
taken from ISD data and linked with GBPC data. The initiation of antihypertensive
drugs was selected from ISD data as described in chapter two. This study only
included patients who were persistent with their initial drugs for five years. The
BP measurements were recorded during the five-year period. All additional
therapies that were added to the initial drug therapy were calculated until the
last day of the five-year follow-up study.
For patients who took one or two different antihypertensive classes during the
five-year follow-up study, the BP measurements were taken after the last
169 antihypertensive class that was added during the study. For patients who took
three different antihypertensive classes or more during the study, the BP
measurements were taken after third antihypertensive class.
Patients were classified into three groups: controlled, uncontrolled, and resistant
HTN. Controlled patients took one, two, or three different antihypertensive
classes of drugs and achieved BP control (<140/90 mm Hg). Uncontrolled patients
took one or two different antihypertensive classes of drugs and did not achieve BP
control. Resistant patients took three or more different antihypertensive classes
of drugs and did not achieve BP control. The BP readings taken more than a week
after the antihypertensive drugs were prescribed were analysed.
The rates of resistance and control were compared between the initial
antihypertensive classes (Alpha, ACEI, ARB, BB, CCB, non-thiazide diuretics,
spironolactone, and thiazide diuretics). The aim of this comparison was to
investigate which antihypertensive classes led to BP control or resistance if the
patients initiated and were persistent with one of them. Multivariable multinomial
logistic regression was used to assess the factor of the initiation a specific
antihypertensive class on the resistance HTN. P-values were considered significant
if the value was less than 0.05.
Lifestyle factors (BMI, smoking, and alcohol), patient characteristics (age and
sex). In addition to these factors, eGFR and albumin were tested between these
groups. These factors were found to affect some of the antihypertensive drug
classes discussed in this chapter. A chi-square test for categorical and numerical
data was used to compare these factors between resistant and controlled groups.
P-values were considered significant if the value was less than 0.05. A t-test was
used for quantitative variables.
These factors were also tested as independent factors to evaluate which one of
them could be associated with resistance. Multivariable binary logistic regression
was used to assess these factors and their relation to resistance. P-values were
considered significant if the value was less than 0.05.
170
Assessment of blood pressure response:
This part of the study used data collected from patients attending the GBPC who
had hypertension. BP measurements, antihypertensive drugs data, patient’s
characteristics, and clinical results for those patients were taken from patient
case notes, GBPC data, and ISD data. ISD data has been used to detect the initial
antihypertensive class and any new antihypertensive classes have been taken after
the initiation. The terms initiation antihypertensive drugs were defined in
chapters three. A new mono antihypertensive class was collected between two
clinical visits and only one drug prescribed medication lie between these visits. A
new antihypertensive classes from case notes were considered. A new
antihypertensive drugs prescription in the case note, should be collected from
pharmacy if the pharmacy prescription data available. The blood pressures were
taken close to when the antihypertensive drug was collected, so the BP was taken
within the six months before the date of collection antihypertensive therapy from
pharmacy. The BP measures that were used to assess BP reduction were taken
between one week to one year following the collection of the antihypertensive
drug. Although, one year is a long time to determine BP readings, this period is
based on observation data, and thus the date of measurement could not be
controlled. This is the only available method with which to include a large number
of patients. The duration between two clinical visits (date of prescribed drug and
subsequent visit) for the new antihypertensive classes from the case note which
were prescribed but they didn’t have the relevant information of prescription
data, were two weeks and one year. The antihypertensive drug was not changed
during the period between the two BP measures. SBP must be above 140 at the
date of the prescribed drug or prior date of drug collection.
The BP responses were compared for the different antihypertensive drug classes
that were initially used as monotherapies. To compare the rate of blood pressures
response between these antihypertensive classes, antihypertensive drugs were
classified as responders and non-responders. A drug is defined as a responder when
it leads to a reduction in a BP that is greater than the median fall. Drugs that
cannot achieve this target are defined as non-responders. Median reduction fall
171 has been taken for all antihypertensive drugs which were initiated. Factors effect
on blood pressure response have been adjusted between the various
antihypertensive classes. The rate of blood pressure response has been compared
before and after adjustment between these drugs, using multinomial logistic
regression. Chi-square and analysis of variance (ANOVA) were used test the
demographic variation between antihypertensive classes.
Secondly, the new antihypertensive class medications which were prescribed at
the initiation or after the initiation were considered. Any a new single
antihypertensive class was prescribed or collected between two clinical visits, was
selected. The SBP was measured in these two clinical, before and after collections
drugs. Age, gender, smoking, alcohol, BMI, eGFR, and albumin were considered
and tested with the blood response for each antihypertensive class. A multiple
linear regression is used predict the association between these factors and blood
pressure reduction.
7.3 Results
7.3.1 The prevalence of resistant hypertension
A total of 864 patients who were persistent with their initial antihypertensive drug
for five years and had their BP data available. Of these patients, 20 patients were
excluded because the BP reading was taken less than a week after the
antihypertensive prescription was collected. In addition, 29 patients received
more than three antihypertensive classes and were excluded they could not be
classified as controlled, uncontrolled, or resistant HTN by the definitions used for
this study. The final sample included 815 patients who were persistent with their
initial antihypertensive drug and either had controlled on blood pressure one to
three antihypertensive classes or had uncontrolled blood pressure on more than
one antihypertensive classes.
The controlled HTN group included 318(39%) patients (took ≤3 antihypertensive
classes and BP controlled), uncontrolled HTN group included 234 (29%) patients
(took < 3 antihypertensive classes and BP uncontrolled) and resistant HTN group
included 263(32%) (took ≥ 3 antihypertensive classes and BP uncontrolled). Figure
7-1.
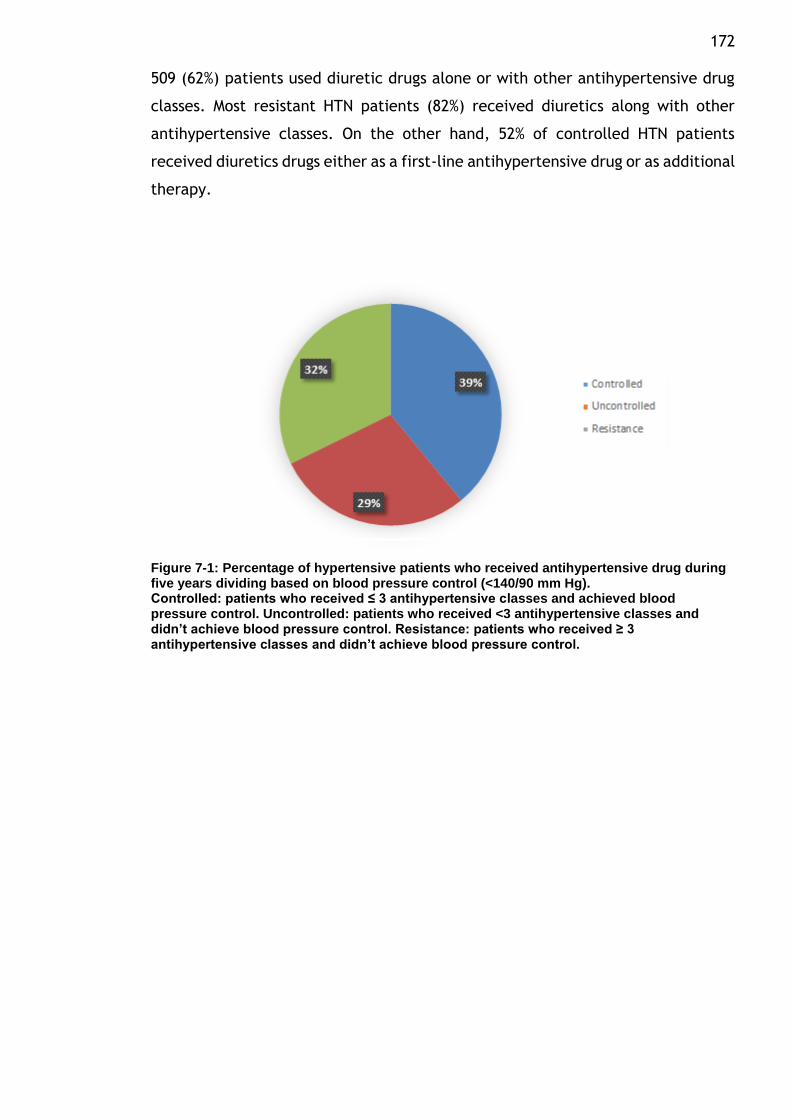
172 509 (62%) patients used diuretic drugs alone or with other antihypertensive drug
classes. Most resistant HTN patients (82%) received diuretics along with other
antihypertensive classes. On the other hand, 52% of controlled HTN patients
received diuretics drugs either as a first-line antihypertensive drug or as additional
therapy.
Figure 7-1: Percentage of hypertensive patients who received antihypertensive drug during five years dividing based on blood pressure control (<140/90 mm Hg). Controlled: patients who received ≤ 3 antihypertensive classes and achieved blood pressure control. Uncontrolled: patients who received <3 antihypertensive classes and didn’t achieve blood pressure control. Resistance: patients who received ≥ 3 antihypertensive classes and didn’t achieve blood pressure control.
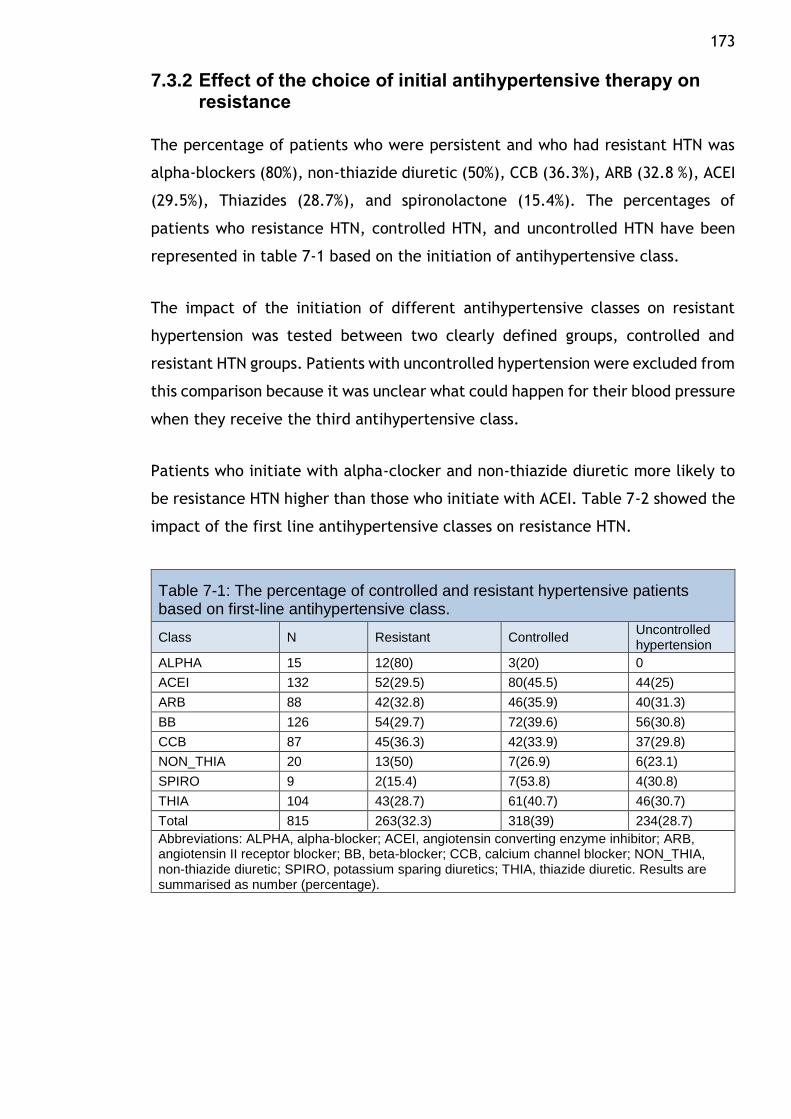
173
7.3.2 Effect of the choice of initial antihypertensive therapy on resistance
The percentage of patients who were persistent and who had resistant HTN was
alpha-blockers (80%), non-thiazide diuretic (50%), CCB (36.3%), ARB (32.8 %), ACEI
(29.5%), Thiazides (28.7%), and spironolactone (15.4%). The percentages of
patients who resistance HTN, controlled HTN, and uncontrolled HTN have been
represented in table 7-1 based on the initiation of antihypertensive class.
The impact of the initiation of different antihypertensive classes on resistant
hypertension was tested between two clearly defined groups, controlled and
resistant HTN groups. Patients with uncontrolled hypertension were excluded from
this comparison because it was unclear what could happen for their blood pressure
when they receive the third antihypertensive class.
Patients who initiate with alpha-clocker and non-thiazide diuretic more likely to
be resistance HTN higher than those who initiate with ACEI. Table 7-2 showed the
impact of the first line antihypertensive classes on resistance HTN.
Table 7-1: The percentage of controlled and resistant hypertensive patients based on first-line antihypertensive class.
Class N Resistant Controlled Uncontrolled hypertension
ALPHA 15 12(80) 3(20) 0
ACEI 132 52(29.5) 80(45.5) 44(25)
ARB 88 42(32.8) 46(35.9) 40(31.3)
BB 126 54(29.7) 72(39.6) 56(30.8)
CCB 87 45(36.3) 42(33.9) 37(29.8)
NON_THIA 20 13(50) 7(26.9) 6(23.1)
SPIRO 9 2(15.4) 7(53.8) 4(30.8)
THIA 104 43(28.7) 61(40.7) 46(30.7)
Total 815 263(32.3) 318(39) 234(28.7)
Abbreviations: ALPHA, alpha-blocker; ACEI, angiotensin converting enzyme inhibitor; ARB, angiotensin II receptor blocker; BB, beta-blocker; CCB, calcium channel blocker; NON_THIA, non-thiazide diuretic; SPIRO, potassium sparing diuretics; THIA, thiazide diuretic. Results are summarised as number (percentage).
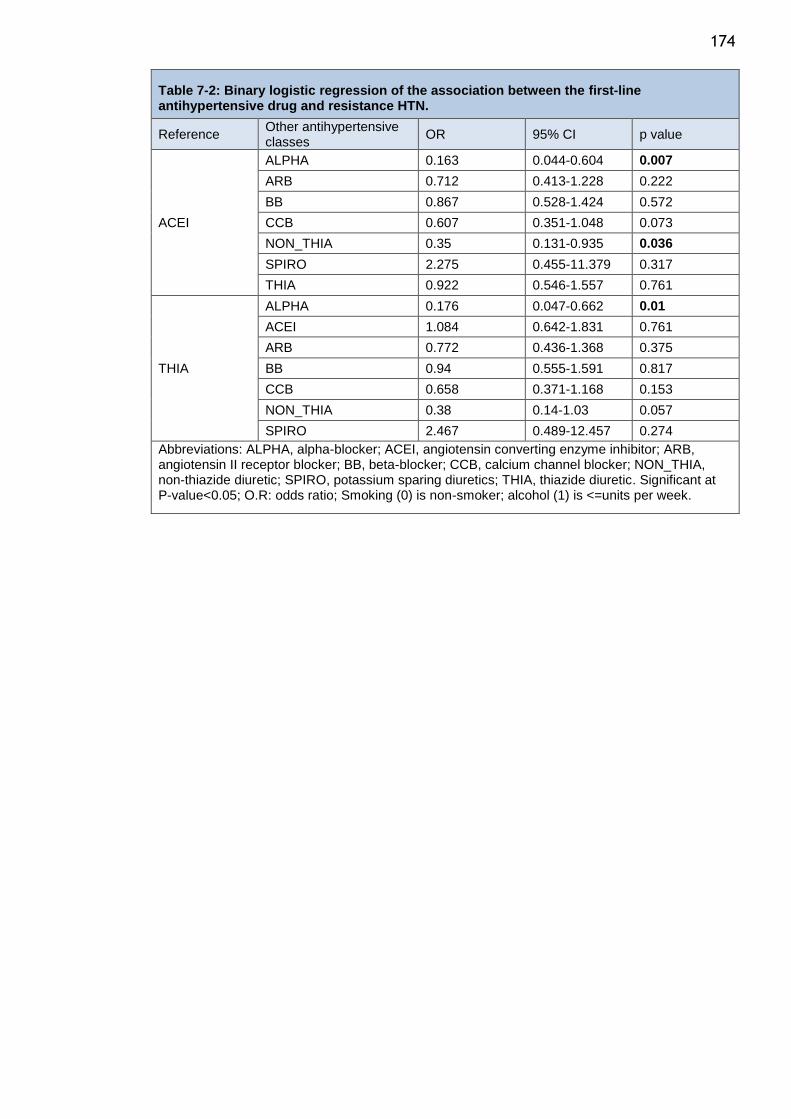
174
Table 7-2: Binary logistic regression of the association between the first-line antihypertensive drug and resistance HTN.
Reference Other antihypertensive classes
OR 95% CI p value
ACEI
ALPHA 0.163 0.044-0.604 0.007
ARB 0.712 0.413-1.228 0.222
BB 0.867 0.528-1.424 0.572
CCB 0.607 0.351-1.048 0.073
NON_THIA 0.35 0.131-0.935 0.036
SPIRO 2.275 0.455-11.379 0.317
THIA 0.922 0.546-1.557 0.761
THIA
ALPHA 0.176 0.047-0.662 0.01
ACEI 1.084 0.642-1.831 0.761
ARB 0.772 0.436-1.368 0.375
BB 0.94 0.555-1.591 0.817
CCB 0.658 0.371-1.168 0.153
NON_THIA 0.38 0.14-1.03 0.057
SPIRO 2.467 0.489-12.457 0.274
Abbreviations: ALPHA, alpha-blocker; ACEI, angiotensin converting enzyme inhibitor; ARB, angiotensin II receptor blocker; BB, beta-blocker; CCB, calcium channel blocker; NON_THIA, non-thiazide diuretic; SPIRO, potassium sparing diuretics; THIA, thiazide diuretic. Significant at P-value<0.05; O.R: odds ratio; Smoking (0) is non-smoker; alcohol (1) is <=units per week.
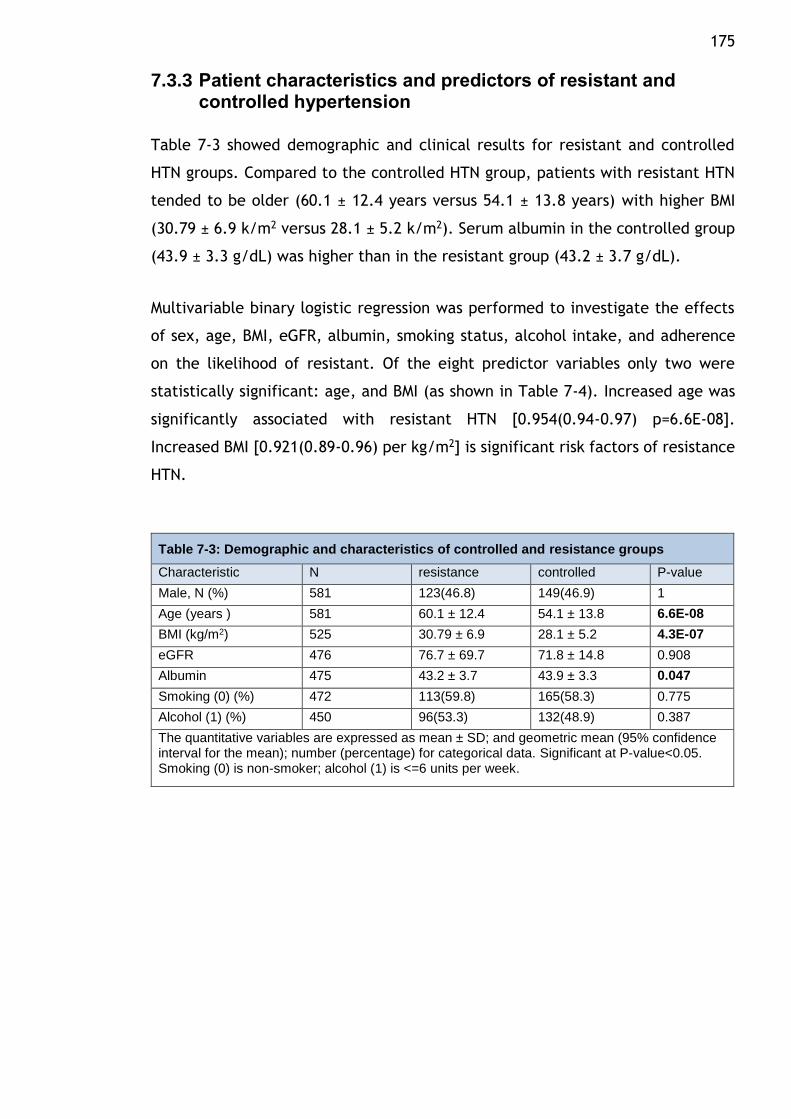
175
7.3.3 Patient characteristics and predictors of resistant and controlled hypertension
Table 7-3 showed demographic and clinical results for resistant and controlled
HTN groups. Compared to the controlled HTN group, patients with resistant HTN
tended to be older (60.1 ± 12.4 years versus 54.1 ± 13.8 years) with higher BMI
(30.79 ± 6.9 k/m2 versus 28.1 ± 5.2 k/m2). Serum albumin in the controlled group
(43.9 ± 3.3 g/dL) was higher than in the resistant group (43.2 ± 3.7 g/dL).
Multivariable binary logistic regression was performed to investigate the effects
of sex, age, BMI, eGFR, albumin, smoking status, alcohol intake, and adherence
on the likelihood of resistant. Of the eight predictor variables only two were
statistically significant: age, and BMI (as shown in Table 7-4). Increased age was
significantly associated with resistant HTN [0.954(0.94-0.97) p=6.6E-08].
Increased BMI [0.921(0.89-0.96) per kg/m2] is significant risk factors of resistance
HTN.
Table 7-3: Demographic and characteristics of controlled and resistance groups
Characteristic N resistance controlled P-value
Male, N (%) 581 123(46.8) 149(46.9) 1
Age (years ) 581 60.1 ± 12.4 54.1 ± 13.8 6.6E-08
BMI (kg/m2) 525 30.79 ± 6.9 28.1 ± 5.2 4.3E-07
eGFR 476 76.7 ± 69.7 71.8 ± 14.8 0.908
Albumin 475 43.2 ± 3.7 43.9 ± 3.3 0.047
Smoking (0) (%) 472 113(59.8) 165(58.3) 0.775
Alcohol (1) (%) 450 96(53.3) 132(48.9) 0.387
The quantitative variables are expressed as mean ± SD; and geometric mean (95% confidence interval for the mean); number (percentage) for categorical data. Significant at P-value<0.05. Smoking (0) is non-smoker; alcohol (1) is <=6 units per week.
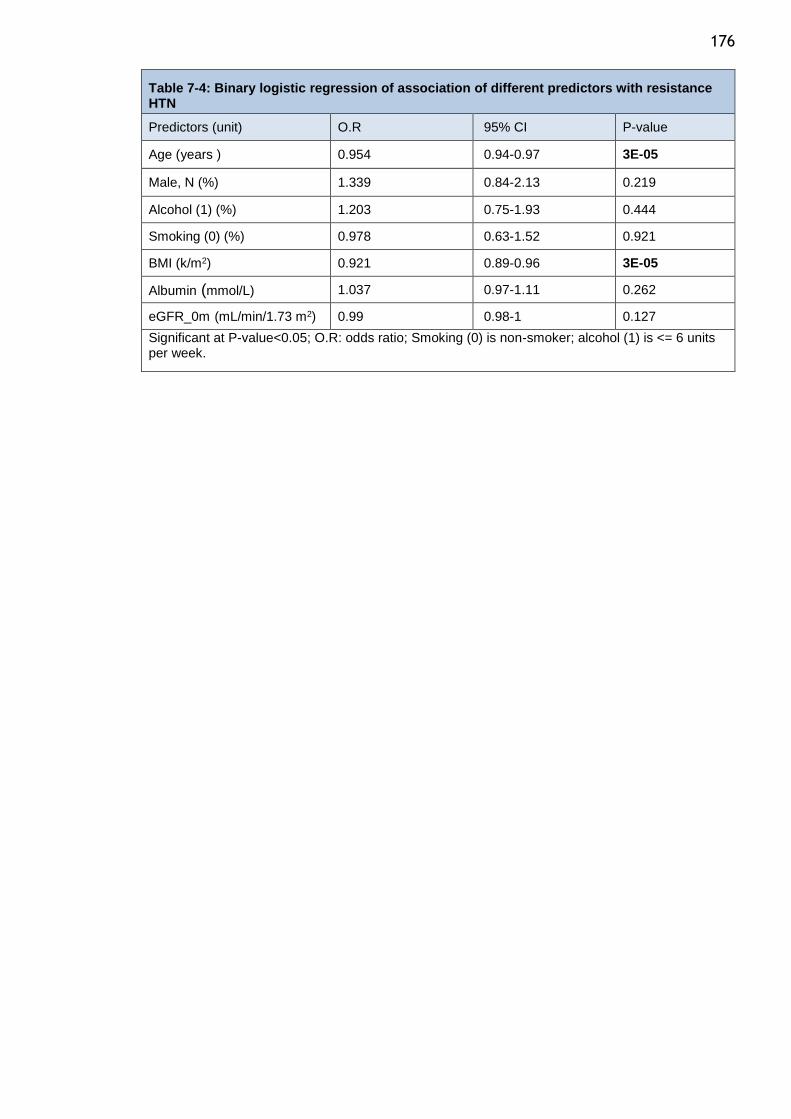
176
Table 7-4: Binary logistic regression of association of different predictors with resistance HTN
Predictors (unit) O.R 95% CI P-value
Age (years ) 0.954 0.94-0.97 3E-05
Male, N (%) 1.339 0.84-2.13 0.219
Alcohol (1) (%) 1.203 0.75-1.93 0.444
Smoking (0) (%) 0.978 0.63-1.52 0.921
BMI (k/m2) 0.921 0.89-0.96 3E-05
Albumin (mmol/L) 1.037 0.97-1.11 0.262
eGFR_0m (mL/min/1.73 m2) 0.99 0.98-1 0.127
Significant at P-value<0.05; O.R: odds ratio; Smoking (0) is non-smoker; alcohol (1) is <= 6 units per week.
177
7.3.4 A compassion blood pressure response between the antihypertensive classes
7.3.4.1 Study population
The total number of new antihypertensive classes was 9324. A total of 6714
antihypertensive classes were excluded for the following reasons. First, other
antihypertensive classes were prescribed with new antihypertensive classes
before the blood pressure measurement (3091 new drugs were excluded). Second,
212 new antihypertensive classes were excluded because they were not collected
from the pharmacy. Third, the new antihypertensive classes were excluded
because the SBP was less than 140 mm Hg on the date of the clinical visit when
the drug was prescribed (2265 drugs). Fourth, new drugs were excluded (1080 new
antihypertensive drugs) when SBP was not measured in the six months before the
date of antihypertensive class collection, for a period of more than one year after
the date of antihypertensive class collection, or within one week prior to the date
of collection. Finally, 66 new drugs were excluded because the duration between
the two clinical visits was less than two weeks or was more than one year for
antihypertensive classes that were prescribed based on case notes but without ISD
data information.
After these exclusions, 2610 new antihypertensive class were included. Of these
antihypertensive classes, 494 were defined as the first-line prescriptions. The
antihypertensive classes that were included were classified as alpha blockers,
ACEI, ARB, BB, CCB, non-thiazide diuretics, spironolactone, and thiazide diuretics.
There were 217, 376, 405, 267, 566, 139, 237, and 403 classes, respectively. The
inclusion and exclusion profiles are illustrated in figure 7-2.
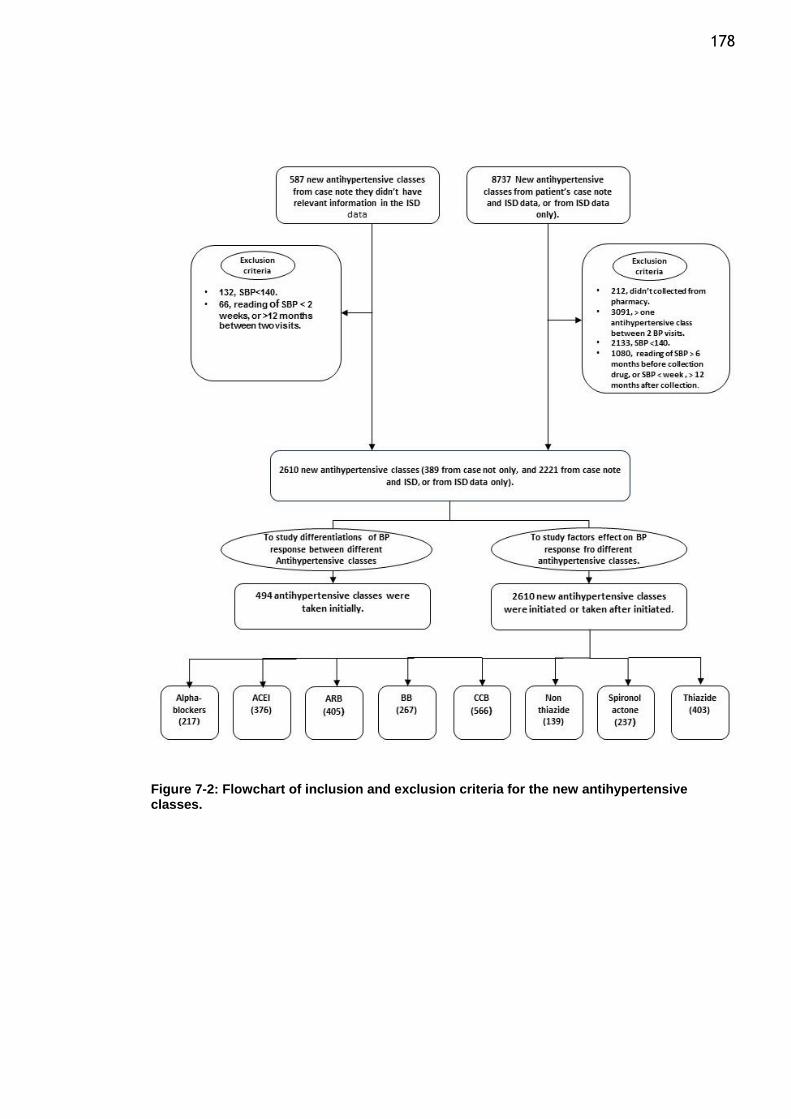
178
Figure 7-2: Flowchart of inclusion and exclusion criteria for the new antihypertensive classes.
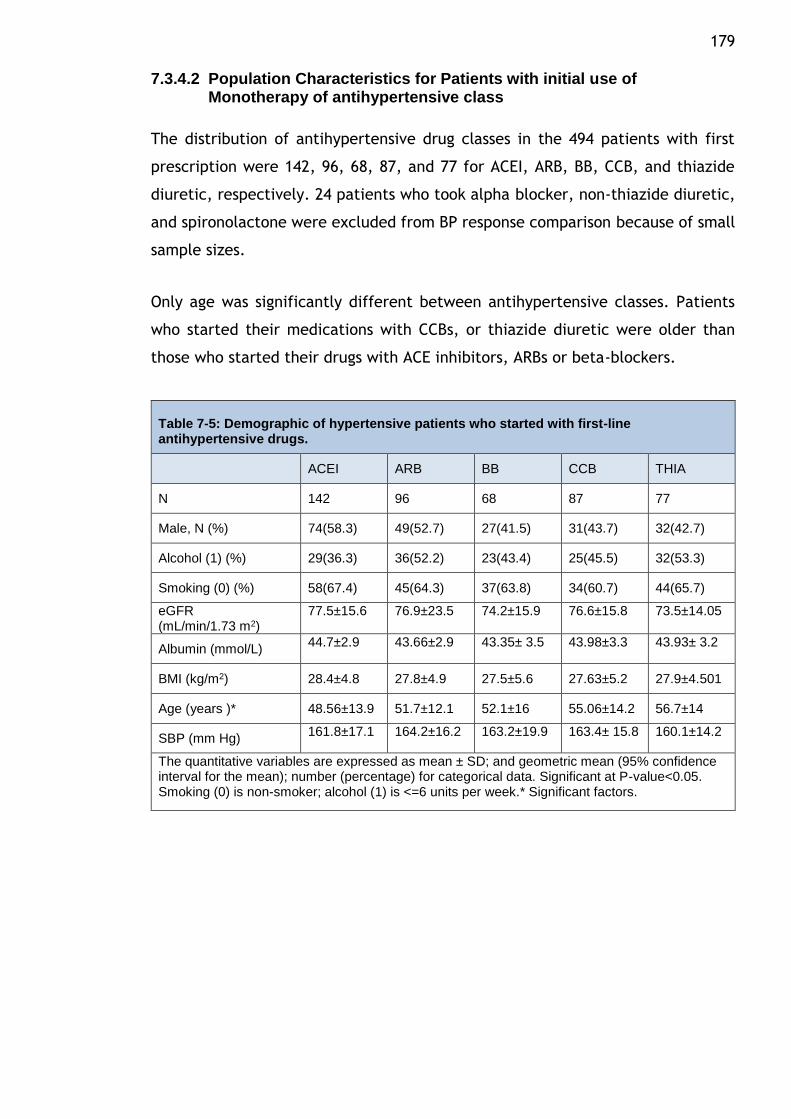
179
7.3.4.2 Population Characteristics for Patients with initial use of Monotherapy of antihypertensive class
The distribution of antihypertensive drug classes in the 494 patients with first
prescription were 142, 96, 68, 87, and 77 for ACEI, ARB, BB, CCB, and thiazide
diuretic, respectively. 24 patients who took alpha blocker, non-thiazide diuretic,
and spironolactone were excluded from BP response comparison because of small
sample sizes.
Only age was significantly different between antihypertensive classes. Patients
who started their medications with CCBs, or thiazide diuretic were older than
those who started their drugs with ACE inhibitors, ARBs or beta-blockers.
Table 7-5: Demographic of hypertensive patients who started with first-line antihypertensive drugs.
ACEI ARB BB CCB THIA
N 142 96 68 87 77
Male, N (%) 74(58.3) 49(52.7) 27(41.5) 31(43.7) 32(42.7)
Alcohol (1) (%) 29(36.3) 36(52.2) 23(43.4) 25(45.5) 32(53.3)
Smoking (0) (%) 58(67.4) 45(64.3) 37(63.8) 34(60.7) 44(65.7)
eGFR (mL/min/1.73 m2)
77.5±15.6 76.9±23.5 74.2±15.9 76.6±15.8 73.5±14.05
Albumin (mmol/L) 44.7±2.9 43.66±2.9 43.35± 3.5 43.98±3.3 43.93± 3.2
BMI (kg/m2) 28.4±4.8 27.8±4.9 27.5±5.6 27.63±5.2 27.9±4.501
Age (years )* 48.56±13.9 51.7±12.1 52.1±16 55.06±14.2 56.7±14
SBP (mm Hg) 161.8±17.1 164.2±16.2 163.2±19.9 163.4± 15.8 160.1±14.2
The quantitative variables are expressed as mean ± SD; and geometric mean (95% confidence interval for the mean); number (percentage) for categorical data. Significant at P-value<0.05. Smoking (0) is non-smoker; alcohol (1) is <=6 units per week.* Significant factors.
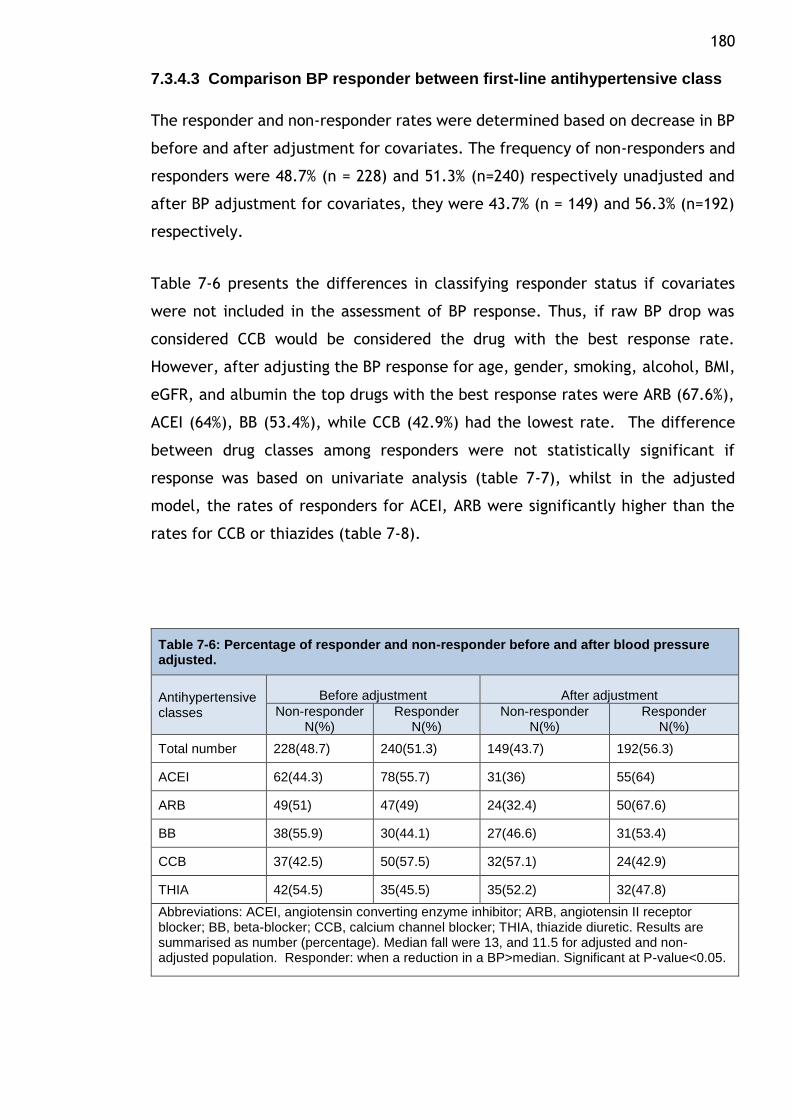
180
7.3.4.3 Comparison BP responder between first-line antihypertensive class
The responder and non-responder rates were determined based on decrease in BP
before and after adjustment for covariates. The frequency of non-responders and
responders were 48.7% (n = 228) and 51.3% (n=240) respectively unadjusted and
after BP adjustment for covariates, they were 43.7% (n = 149) and 56.3% (n=192)
respectively.
Table 7-6 presents the differences in classifying responder status if covariates
were not included in the assessment of BP response. Thus, if raw BP drop was
considered CCB would be considered the drug with the best response rate.
However, after adjusting the BP response for age, gender, smoking, alcohol, BMI,
eGFR, and albumin the top drugs with the best response rates were ARB (67.6%),
ACEI (64%), BB (53.4%), while CCB (42.9%) had the lowest rate. The difference
between drug classes among responders were not statistically significant if
response was based on univariate analysis (table 7-7), whilst in the adjusted
model, the rates of responders for ACEI, ARB were significantly higher than the
rates for CCB or thiazides (table 7-8).
Table 7-6: Percentage of responder and non-responder before and after blood pressure adjusted.
Antihypertensive classes
Before adjustment After adjustment
Non-responder N(%)
Responder N(%)
Non-responder N(%)
Responder N(%)
Total number 228(48.7) 240(51.3) 149(43.7) 192(56.3)
ACEI 62(44.3) 78(55.7) 31(36) 55(64)
ARB 49(51) 47(49) 24(32.4) 50(67.6)
BB 38(55.9) 30(44.1) 27(46.6) 31(53.4)
CCB 37(42.5) 50(57.5) 32(57.1) 24(42.9)
THIA 42(54.5) 35(45.5) 35(52.2) 32(47.8)
Abbreviations: ACEI, angiotensin converting enzyme inhibitor; ARB, angiotensin II receptor blocker; BB, beta-blocker; CCB, calcium channel blocker; THIA, thiazide diuretic. Results are summarised as number (percentage). Median fall were 13, and 11.5 for adjusted and non-adjusted population. Responder: when a reduction in a BP>median. Significant at P-value<0.05.
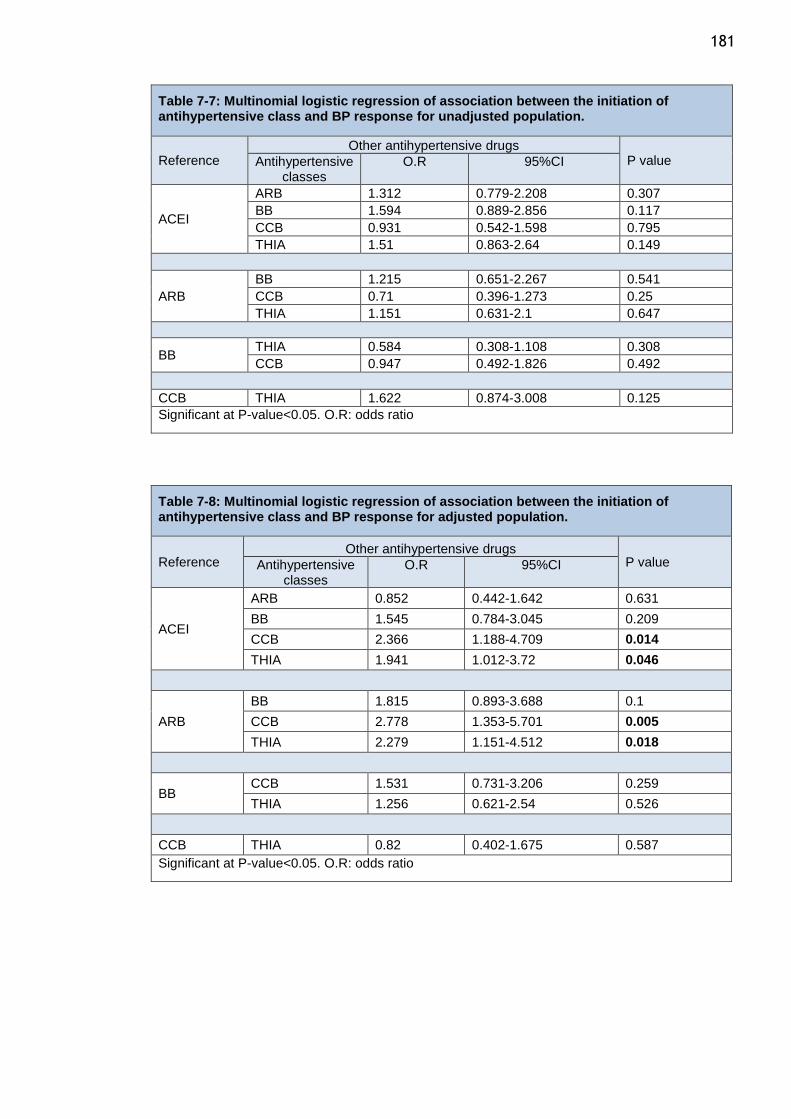
181
Table 7-7: Multinomial logistic regression of association between the initiation of antihypertensive class and BP response for unadjusted population.
Reference Other antihypertensive drugs
P value Antihypertensive classes
O.R 95%CI
ACEI
ARB 1.312 0.779-2.208 0.307
BB 1.594 0.889-2.856 0.117
CCB 0.931 0.542-1.598 0.795
THIA 1.51 0.863-2.64 0.149
ARB
BB 1.215 0.651-2.267 0.541
CCB 0.71 0.396-1.273 0.25
THIA 1.151 0.631-2.1 0.647
BB THIA 0.584 0.308-1.108 0.308
CCB 0.947 0.492-1.826 0.492
CCB THIA 1.622 0.874-3.008 0.125
Significant at P-value<0.05. O.R: odds ratio
Table 7-8: Multinomial logistic regression of association between the initiation of antihypertensive class and BP response for adjusted population.
Reference Other antihypertensive drugs
P value Antihypertensive classes
O.R 95%CI
ACEI
ARB 0.852 0.442-1.642 0.631
BB 1.545 0.784-3.045 0.209
CCB 2.366 1.188-4.709 0.014
THIA 1.941 1.012-3.72 0.046
ARB
BB 1.815 0.893-3.688 0.1
CCB 2.778 1.353-5.701 0.005
THIA 2.279 1.151-4.512 0.018
BB CCB 1.531 0.731-3.206 0.259
THIA 1.256 0.621-2.54 0.526
CCB THIA 0.82 0.402-1.675 0.587
Significant at P-value<0.05. O.R: odds ratio
182
7.3.4.4 The association between predictors and different antihypertensive classes
A multivariable regression analyses was conducted to determine the best
predictors of response in each drug class separately and the results of these are
summarised below. The relations between some factors were positive between
predictors and blood pressure response, with an increase of predictors leading to
an increase in blood pressure response. On the other hand, some of these relations
were negative, with an increase in the factor leading to a decrease in blood
pressure response. The relations between different predictors and BP response for
each class are illustrated in table 7-9.
Alpha-blockers
217 patients who took alpha- blockers. Age was a statistically significant predictor
of a SBP response to alpha-blockers. Each 1-year increase in age equated to an
increase in the BP response of 0.31 mm Hg for patients who took alpha-blockers.
ACEI
ACEI antihypertensive class was taken by 376 patients. Age, BMI, and eGFR were
statistically significant predictors of a BP response to ACEI. Each 1-year increase
in age equated to a decrease in BP response of 0.31 mm Hg for patients who took
ACEI. Similarly, for BMI, an increase of 1 kg/m2 in BMI equated to a 0.66 mm Hg
decrease in BP response for patients who took ACEI. Also, for eGFR, an increase
of 1 mL/min/1.73 m2 in eGFR equated to a 0. 0.25 mm Hg decrease in BP response
for patients who took ACEI.
ARBs
405 of ARB antihypertensive class were received by hypertensive patients. Age
was a statistically significant predictor of a BP response to ARBs. Each 1-year
increase in age resulted in an increase in the BP response of 0.2 mm Hg for patients
who took ARBs.
183
Non-thiazide diuretics
139 patients were included. For BMI, an increase of 1 kg/m2 in BMI equated to a
1.2 mm Hg decrease in the BP response for patients who took non-thiazide
diuretics.
Potassium sparing diuretics
237 patient using spironolactone were included. Each 1-unit decrease in alcohol
intake equated to a 9.498 mm Hg decrease in the BP response for patients who
took spironolactone.
Thiazide
403 Patients taking thiazide were included. For BMI, an increase of 1 kg/m2 in BMI
equated to a 0.61 mm Hg decrease in the BP response for patients who took
thiazide. Each 1-unit increase in albumin equated to a 0.770 mm Hg decrease in
the BP response for patients who took thiazide. For eGFR, an increase of 1
mL/min/1.73 m2 in eGFR equated to a 0.15 mm Hg increase in the BP response for
patients who took thiazide.
Patients who took CCB, and BB were 566, and 267, respectively. No association
was found between these predictors and BB and CCB. All these results were
represented in table 7-9.
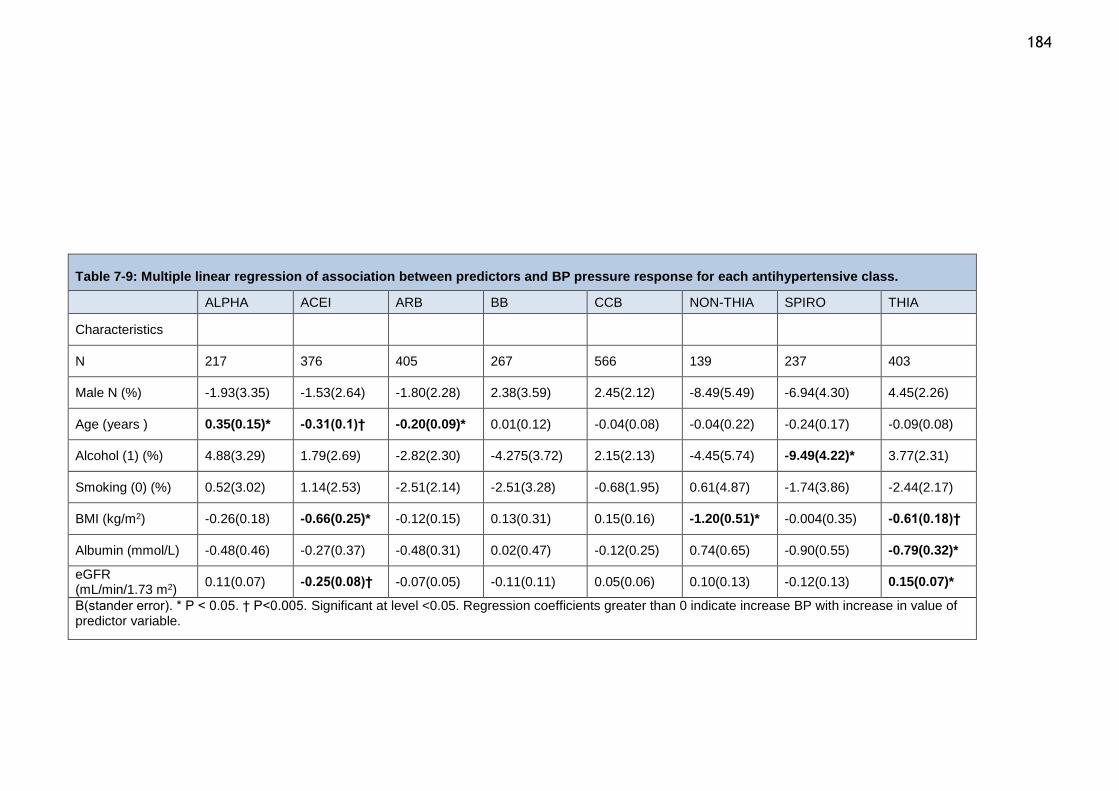
184
Table 7-9: Multiple linear regression of association between predictors and BP pressure response for each antihypertensive class.
ALPHA ACEI ARB BB CCB NON-THIA SPIRO THIA
Characteristics
N 217 376 405 267 566 139 237 403
Male N (%) -1.93(3.35) -1.53(2.64) -1.80(2.28) 2.38(3.59) 2.45(2.12) -8.49(5.49) -6.94(4.30) 4.45(2.26)
Age (years ) 0.35(0.15)* -0.31(0.1)† -0.20(0.09)* 0.01(0.12) -0.04(0.08) -0.04(0.22) -0.24(0.17) -0.09(0.08)
Alcohol (1) (%) 4.88(3.29) 1.79(2.69) -2.82(2.30) -4.275(3.72) 2.15(2.13) -4.45(5.74) -9.49(4.22)* 3.77(2.31)
Smoking (0) (%) 0.52(3.02) 1.14(2.53) -2.51(2.14) -2.51(3.28) -0.68(1.95) 0.61(4.87) -1.74(3.86) -2.44(2.17)
BMI (kg/m2) -0.26(0.18) -0.66(0.25)* -0.12(0.15) 0.13(0.31) 0.15(0.16) -1.20(0.51)* -0.004(0.35) -0.61(0.18)†
Albumin (mmol/L) -0.48(0.46) -0.27(0.37) -0.48(0.31) 0.02(0.47) -0.12(0.25) 0.74(0.65) -0.90(0.55) -0.79(0.32)*
eGFR (mL/min/1.73 m2)
0.11(0.07) -0.25(0.08)† -0.07(0.05) -0.11(0.11) 0.05(0.06) 0.10(0.13) -0.12(0.13) 0.15(0.07)*
B(stander error). * P < 0.05. † P<0.005. Significant at level <0.05. Regression coefficients greater than 0 indicate increase BP with increase in value of predictor variable.
185
7.4 Discussion
The goal of hypertension management is to reduce long-term cardiovascular risk
and this is achieved through lifestyle modification and lifelong prescription of
antihypertensive drugs. Success of this approach requires not only physician
factors but also a patient motivated to take the prescribed medications and
maintain a healthy lifestyle. Resistant hypertension, commonly defined as the
failure to reach blood pressure goals in patients adhering to adequate or maximal
doses of an appropriate 3-drug regimen that includes a diuretic. This definition of
resistant hypertension implies that patients fully adhere to their therapy and
hence the reason why the true prevalence resistant hypertension in the population
is variable in different studies ranging from 5-30% (41). None of the large surveys
of resistant hypertension considered drug adherence or persistence as a potential
cause of resistant hypertension. However, recent studies where drug assays have
been used to measure drug adherence showed about 50% of patients of the
patients labelled as having resistant hypertension have been reported to be non-
adherent to prescribed medication (513).
In my study of drug response and resistant hypertension, I proposed to examine
the prevalence of resistant hypertension in patients attending the Glasgow BP
Clinic who were persistent to antihypertensive therapy. The reason for this
analysis is to determine the rates of controlled hypertension and resistant
hypertension in patients attending a secondary care clinic using a combination of
case-note review and pharmacy prescription refill data. Thus this study is a very
detailed analysis of response in hypertensive patients that incorporates both data
on physician prescription and patient behaviour in terms of prescription pick-up.
The striking finding from my analysis is that even in the tertiary care clinic and
despite evidence of persistence to therapy, only 39% of patients had controlled
hypertension and 32% of patients were classified as resistant hypertension. More
importantly, almost 82% of patients with resistant hypertension were
appropriately prescribed diuretics, and 52% of controlled hypertensive patients
were on diuretic therapy. Thus this cohort of patients with resistant hypertensions
were rationally prescribed appropriate drugs of proven efficacy. One limitation of
my study is that I do not have objective evidence of the bioavailability of the
prescribed drugs through surrogate measures – for instance, urine drug assays
186 (514,515). However, all the patients included in my study did pick up their
prescriptions and were persistent, so this data reflects the rates of control and
resistance when long term drug therapy is considered. Most of the studies of
resistant hypertension that incorporated adherence measures used urine drug
assays at one time point. Urine drug assays while useful do have some limitations
- while they unequivocally document the ingestion of a drug, they cannot provide
information on when the drugs were taken or omitted; drug measurement is
affected by the white-coat adherence phenomenon whereby patients tend to
improve their adherence before and after clinic visits. Another limitation of my
study is that using refill prescription data alone may result in an overestimation
of adherence, for example patients may not consume the drugs they picked up
from pharmacy. Despite these limitations, the estimate of resistant hypertension
in my cohort of patients who are persistent on therapy is within the range reported
by other studies. It is more important to consider the low rates of controlled
hypertension. It is likely that this may reflect low adherence to therapy or true
non-response to drugs.
To determine responder status in this observational study is challenging as there
is no way to control for confounding. Nevertheless, it would be useful to assess if
all drug classes have similar response. In randomised controlled trials of
antihypertensive therapy, the usual metric used to assess drug response is a drop
in systolic blood pressure of 10 mmHg or more. Whilst this is a simple and suitable
measure in RCTs where treatment is controlled and groups are matched for known
and unknown confounders, this cannot be applied in observational studies. So in
my study, a metric of BP response that takes in account the overall population
response to therapy is required. Thus, I decided to define overall response by first
obtaining the overall median decline in BP in the groups and then define responder
as those whose BP response was greater than the median drop in BP. Furthermore,
to address covariates that may affect BP response, I calculated the adjusted BP
response after correcting for covariates and defined responder status using the
median of the adjusted response. Using this method, ARB, and ACEI showed
significantly higher responder rates than thiazides or CCB.
The ASCOT study included 19,257 hypertensive patients were randomized to
receive one of two antihypertensive drugs: BBs and thiazide diuretics, or CCBs and
187 ACEIs to achieve BP targets <140/90 mmHg for patients without diabetes and
<130/80 mmHg for those with diabetes at baseline. Patients who randomized to
CCBs and ACEIs treatment were the most protective against the risk of developing
resistant hypertension. In my study, patients who initiated with ACEI achieved BP
control in greater numbers and had lower rates of resistant hypertension than
patients who were initiated with other antihypertensive classes. Patients who
were initiated with alpha-blocker and non-thiazide diuretics were more likely to
have resistant hypertension.
Age and BMI were the factors with the greatest influence on resistant HTN. As
shown in previous studies(302,303,510), hypertensive patients who were older and
had higher BMIs were more likely to be resistant.
Hypertensive patients who started their treatment with ACE, ARB, or BB were
better responders and this is supported by data presented in chapter six, which
showed that patients who started their treatment with BB, ACEI, and ARB were
less likely to require additional antihypertensive drug compared with those on
CCB, or thiazides.
Age was the factor with the greatest effect on BP response for different
antihypertensive drug classes. The BP response with ACEI and ARB increased in
younger patients and decreased in older patients. In contrast, the BP response
with alpha-blockers increased in older patients and decreased in younger patients.
BMI was the second factor that frequently affected the BP response. Increased BMI
lead to decreased BP response in patients taking ACEI, thiazide, and non-thiazide
districts. Several studies have shown that increased BMI is associated poor BP
control for patients who received antihypertensive drugs (296,306,307) and there
is a close relationship between BMI and sympathetic activity and salt sensitivity
(516–519).
The effect of eGFR on SBP response was different in ACEI and thiazide diuretics.
The decease eGFR led to decreased SBP response in patients taking thiazide, while
an increase in eGFR led to decreased BP response in patients taking ACEI. It has
been shown in a previous study that the effectiveness of thiazide was decreased
188 when eGFR was decreased to less than 40 mL/min/1.73 m2 (520).
Antihypertensive. Some studies have found that the relationship between eGFR
and ACEI can lead to a temporary decrease of eGFR, particularly during the first
two weeks after initiation with ACEI(521).
Finally, the increase of albumin led to decreased BP response in patients taking
thiazide diuretics (522). Free thiazide diuretic concentration can be reduced
because a high affinity of binding between thiazide diuretic and albumin which
has been cited in several studies (523,524).
189
Chapter 8 General discussion
8.1 General overview
A recent health survey showed that the prevalence of hypertension is Scotland is
32.5%. Despite 15.5% of hypertensive patients receiving antihypertensive drugs,
47% of them failed to achieve BP control (288). BP control varies in different
regional groups. For instance, the HTN control rate is higher in England than in
Scotland, with rates of 60% and 53%, respectively(288,292). Adherence and
persistence are considered the most common reasons for uncontrolled HTN and
have led to increases in HTN treatment costs. While it is important to study
persistence and adherence and the factors that lead to their increase, the
prevalence of adherence and persistence in Scotland remains unknown. Previous
studies that have estimated the prevalence of adherence and persistent were
performed mainly in England or overall UK and more importantly in specific
subgroups of patients requiring renal denervation. Data from Scotland is lacking
and this is required because though the same healthcare system operates across
the UK, there are crucial differences – for instance, there are no prescription
charges in Scotland in contrast to England and this will have a major impact on
adherence and persistence for chronic disease management.
Pharmacy refill data is becoming more widely used to estimate adherence and
persistence because it provides large population information for adherence and
has been validated by comparing it with the gold standard method, electronic
monitoring (MEMS)(419). Only two studies by Jones et al (1995) and Hasford et al
(2002) have estimated persistence based on prescription databases in the UK.
Jones et al (1995) found that 40–50% of a new prescribed medication showed
persistence (443). However, a high proportion of practices in Scotland were not
included in this study. Data from hypertensive patients from France, Germany and
the UK in the Hasford et al study (446) showed persistence to be 46.8% at 1-year.
I demonstrated for the first time the prevalence of both persistence and
adherence in Scotland based on a large hypertension clinic database of
prescriptions and patients’ characteristics. The rate of persistence, adherence,
patients needing additional therapy and resistance was estimated from
190 hypertensive patients who started their first-line antihypertensive drug and
showed that National Institute for Health and Clinical Excellence (NICE) guidelines
were adhered to for HTN management. Patients who were first prescribed ACEI,
ARB or BB were younger than those prescribed CCB or diuretics (thiazide and non-
thiazide). Sex was also different between the antihypertensive classes, and
patients who started with thiazide diuretics or BB were less likely to be men
compared with those prescribed ARB or ACE. ACEI and BB were the most newly
prescribed antihypertensive classes. However, the patterns of antihypertensive
drug usage changed during the course of the study. Over the years, while new
prescriptions of BB and thiazide diuretics declined, prescription of ACEI and ARB
increased
This study revealed a high rate of persistence with patients who started their new
antihypertensive classes. Persistence rates were 72.9% and 62.8% for all
antihypertensive classes at 1 and 5 years, respectively. The adherence rate for
those patients who persisted with their initial antihypertensive drug was low with
only 29.9% and 23.4% of patients adhering to their drugs during the 1- and 5-year
studies, respectively. The higher persistence and adherence rates were found with
patients who started their treatments with renin-angiotensin system (RAS) (ACEI
and ARB) antihypertensive classes. Diuretics (thiazide and non-thiazide) had the
lowest persistence and adherence rates among the drugs for the 1- and 5-year
follow-up studies. Age was an important factor affecting persistence and
adherence. Older patients were more likely to persist and adhere to their
antihypertensive treatment than younger patients. Baseline BP, BMI and alcohol
use also had an effect on adherence and persistence. Days between visits was an
important factor that led to patients either not collecting their prescriptions.
Patients who had later follow-up appointments for the subsequent visit were more
likely to not collect their prescriptions.
The additional therapy rate for patients who persisted with their initial
antihypertensive drug was high, particularly 5 years after starting their treatment.
Of the patients who were persistent with the initial antihypertensive treatments,
44.2% and 71.8% required additional antihypertensive drug therapy in the 1- and
5-year studies, respectively. There were 20.8% of patients in 1 year and 46.5% in
5 years that required two or more antihypertensive drugs be added to the first
191 antihypertensive drug. Patients on ACEI, ARB and BB were more likely to continue
with their drug without the need for additional therapy and were less likely to
need two or more additional therapies in both 1 and 5 years. In contrast, alpha
blockers, non-thiazide diuretics and CCB were the antihypertensive classes
requiring the addition of two or more antihypertensive drugs with the first drug.
When I assessed the BP responses in patients who persisted with the first
antihypertensive drug for 5 years, 61% did not achieve BP control and 32% had
resistant HTN. Patients who started with alpha-blockers, non-thiazide diuretics
and CCB were more likely to have resistant HTN. Patients on ACEI, thiazide
diuretics and BB tended be less likely to have resistant HTN. The BP responses for
the initial antihypertensive drugs were better in patients who started with ACEI,
ARB and BB. These patients had higher rates of BP responses than other groups
after adjusting for risk factors. However, only ACEI and ARB were significant.
Increasing age, and BMI levels were the most important factors associated with
increases in additional therapy rates and persistent HTN. Other factors, such as
an increase in alcohol use, were associated with an increase in additional therapy
rates.
Finally, factors that were shown to have an effect on BP responses were tested
with the reduction of SBP. BMI increases were associated with attenuated
decreases in BP with ACEI, non-thiazide diuretics and thiazide diuretics. The
effect of age on BP reductions varied between antihypertensive drugs. Younger
patients were more likely to respond to ACEI and ARB, while older patients were
more likely to respond to alpha blocker. An increase in eGFR was associated with
a decrease in SBP reduction with ACEI and a decrease in eGFR was related with a
decrease of SBP reduction in thiazide diuretics. Alcohol use was associated with
the decreased BP reductions of spironolactone. Patients who had high albumin
levels and were taking thiazide diuretics were more likely to have low BP
reductions.
192
8.2 Comparing methods
It is important to identify the initiation of antihypertensive drugs in persistence
and adherence studies for the following reasons: to compare relevant variables,
to determine the duration of drug therapy that leads to the increased risk of
discontinuation (456), and to identify the initial drug and any drugs that were
switched with or added to the initial drug. For these reasons, initial
antihypertensive drugs were identified in most studies so as to evaluate the
persistence and adherence using an antihypertensive drug database. New
antihypertensive drug users have been identified in several studies by that if
patients did not have any prescription records during a certain period prior to the
inception date (434,435,439,447,457). Although, Suarez et al suggested that going
1 year without antihypertensive medication is an accurate duration to identify a
new user of an antihypertensive class (525), several studies chose durations of less
than 1 year to determine new users. Thirty-two new users were determined from
the UK General Practice Research Database (UKGPRD) and were compared using
their questionnaire data in the Suarez et al study. New users in this study were
defined as those patients who did not have any antihypertensive prescription for
the same class during a 4-month period prior to 1 June 1994. Patients who
initiated, added or switched their antihypertensive drug were considered as new
users (525). In spite of finding a low agreement between the UKGPRD and
questionnaire in detecting new users during the 4 months before the inspection
date, there are several limitations to this study. Some of these limitations include:
the study had a small number of patients and failed to distinguish between
patients who initiated and those who were ongoing with their therapy; a
questionnaire is not a standard method to compare the results with the
prescription data method; some patients appeared confused about the recent
initiation of an antihypertensive drug; and the data from antihypertensive
prescriptions were taken from a database of general practices in the UK, but not
from pharmacy data, which reflects the reality of drug collections from the
pharmacy.
193 The duration without medication of less than 1 year has been identified in a
several studies. Other studies have used 3 months (e.g. Benson et al study ) (442),
4 months (e.g. Jones et al study) (443), 6 months (e.g. Dezii et al; and Patel et al)
(434,440) and 10 months was used in studies by Caro, Salas et al and Caro,
Speckman et al(438,439). However, in a number of studies, the new users of an
antihypertensive class were not determined (422,430,432).
In this study, new users of antihypertensive drugs were determined if no receipt
of any antihypertensive class of drugs was identified for at least a continuous 4-
month period prior to the inspection date, which was 30 April 2004. Choosing a 4-
month period was based on the fact that most patients refill their prescription
monthly, and the maximum refill is for 3 months in some cases. Patients who did
not have a prescription for a period of 4 months or more, they just initiated their
treatment. Other possibilities included those patients who did not have a
prescription for a 4-month duration and those that stopped taking their
medication. In this case, patients who initiated their treatment after 4 months or
more of discontinuation, restarted their treatment. Age, which has been seen as
an important factor in choosing a drug, and is also an important factor affecting
adherence, persistence and BP control, was determined at the date of the
prescription initiation. The baseline SBP and DBP were recorded 6 months prior to
the initiation of treatment.
Compliance or persistence have been used interchangeably in the literature to
estimate adherence (526). Persistence is the term used to identify if the patient
is still taking medication after a period of time, and has been used to estimate
adherence in a number of studies (439,440,442,443). The MPR has typically been
used to estimate compliance. Patients were considered compliant if they took at
least 80% of their medication during the study period (MPR ≥ 80). MPR or
compliance has been used to estimate adherence in several studies (421,430,431).
Several studies have defined both terminologies in their reports (e.g. Wogen et
al; Giovanni et al; Boris et al; Bimal et al) (427–429,434). Wogen et al used MPR
to define compliance and a continuation of therapy without discontinuation for
persistence (428). Giovanni et al used persistence and MPR to express a patient’s
compliance and persistence at continuing treatment during their study (429).
Patients needed to be persistent (i.e. continue their therapy) and compliant (MPR
194 ≥ 80) to be considered adherent in the Boris et al and Bimal studies (427,434). A
gap in treatment is defined as a discontinuation. The duration of the period
without medication varies between these studies. Discontinuation was a 60 day
gap in studies by Bimal et al and Jenifer et al, and 90 days in the Giovanni et al
study. Boris et al used a different definition of discontinuation, whereby a patient
discontinued their treatment if they failed to collect at least two prescriptions
during the year. The duration of the period without medication varies in different
studies and ranges from 30 to 90 days, but in some studies it was 180 days (441).
In this study, I defined persistence as patients continuing their therapy during the
study period. I used both MPR and persistence to estimate adherence. Thus, the
MPR was calculated for patients who persisted with their treatment, and when
MPR ≥ 80 for these patients was considered to be adherence to their treatment.
In most studies, the MPR has been calculated for all patients. The MPR was
calculated for patients who stopped the initial treatment and switched to another
treatment in the studies by Rizzo and Simons et al, Okano et al and Wang et al
studies (421,430,431). Furthermore, MPR was calculated for persistence and
discontinuation in the studies by Wogen et al, Giovanni et al, Boriset al, and Bimal
et al (427–429,434). The aim of calculate MPR only for patients who persisted with
their treatment to estimate adherence in my thesis was for the following reasons:
patients who discontinued their treatment were considered partially non
adherent, to calculate MPR for patients who persisted with their treatment make
patients using the drug for the same time period. Using 120 days without
treatment to define discontinuation to include all patients who could still take the
medication. The maximum refill in Scotland is 3 months in some conditions,
choosing 60 or 90 to define discontinuation may lead to consider some of patients
who still take their medications as discontinuer.
Terminologies pertaining to switching therapy and additional therapy have been
used in several studies. Switching usually indicates that a patient has discontinued
the initial drug and changed to another drug, and the percentage of switching has
been estimated in several studies (435,445–447,457). Additional therapy is
defined as having a drug be added to the initial drug and this has also been
estimated in various studies (446,447). If the drug is added to the initial drug,
195 patients are still considered persistent while switching is considered in sometime
considered as continuous (457), and as discontinue (428,435).
I used the same terminology (switching and additional therapy) with the same
definitions, and patients who switched their initial antihypertensive class to
another class were considered as non-persistent. Patients are considered
persistent even if the persisted antihypertensive class, which was prescribed at
enrolment, was combined with another antihypertensive class. However,
switching has been classified into two groups. The first group involves a new
antihypertensive medication that has been changed from the original
antihypertensive drug after 120 days from the date of discontinuance. The second
group includes a new antihypertensive medication that has been changed from
the antihypertensive agent before 120 days from the date of discontinuance.
There is significant differences between these two groups. Patients in group one
totally stop their drug usage and restart again with a different drug. Patients in
group two continue with their medication but with a different antihypertensive
class.
The selection of patients, drugs and inclusion and exclusion criteria varied
between studies. Most or all antihypertensive classes were included in most
adherence and persistence studies. Some studies selected a specific drug instead
of studying all classes. For instance, amlodipine, atenolol triamterene, nifedipine
and quinapril were selected in the Benson et al study(442), while valsartan,
amlodipine and lisinopril were investigated in the Wogen et al study(428).
Exclusion criteria were also different. Patients taking nitrates, antiarrhythmics,
digoxin, warfarin, loop diuretics and migraine medicines, or patients with
cardiovascular disease or hepatic and renal diseases were excluded in several
studies. The reason for excluding these patients may have been because certain
drugs may not be used as an antihypertensive drug for HTN alone, but may be used
for other diseases(435,436,438,445).
Different ages were used in the studies and included patients who were ≥ 18, >
20, > 30, > 40 and ≥ 65 years. The reason for selecting specific ages was unknown
in several studies and may have been related to the patients’ demographic data.
Some studies gave reasons for selecting a specific age. For instance, Jones et al
196 included patients who were aged > 40 years because, as they claim, the
prevalence of HTN in patients ≤ 40 years was low (443). However, Boris et al
included patients aged > 20 years because patients younger than 20 years were
more likely to have secondary HTN(427).
I include all adults hypertensive patients aged 18 and more who took any type of
antihypertensive drugs that patients were initiated treatment at the Glasgow BP
clinic, it is unlikely that the study drugs were prescribed to treat other
concomitant conditions and not hypertension.
8.3 Future plans
The future directions from my study can be described under three themes –
validation, clinical implication and clinical application.
Validation
This study is observational and thus validation is required to a) confirm the
adherence levels using a more objective measure like urinary drug assays,
medication event monitoring system (MEMS) or Proteus Digital Health Inc
(Redwood City, CA). MEMS provide unique information about patients’ behaviour
regarding the use of their medications. This information could not be obtained by
any other method and was used to measure medication adherence. The
information that was recorded on a computer chip each the time bottle was
opened included the number of doses taken daily (displayed as a calendar plot),
the number of hours that elapsed since the last time the bottle was opened, and
the frequency of days on which a dose was taken at a specific hour. This device
can collect reliable data that can then be transferred to a computer for analysis.
Although some consider MEMS as the gold standard for adherence assessment, the
data could be recorded even when the patients open and shut the cap without
taking the medication. Urinary drug assays are the only adherence method that
can confirm that patients have actually taken the drugs. Adherence can be
monitored by detecting the existence of the drug in the urinary sample. The
disadvantages of this method are that urine drug levels cannot detect fluctuations
in adherence between clinic visits, and the assessment of the degree of adherence
197 can be influenced by variations in pharmacokinetics and metabolism between
individuals. Moreover, adherence can be affected by so-called white coat
adherence, where patients temporarily improve their drug adherence a few days
prior to urine analysis. b) assess persistence and adherence level in a more
representative cohort of patients – for example those treated in primary care as
this is the centre where the greatest proportion of hypertensive patients are
managed c) Determine the best and representative metric of adherence and
persistence – adherence and persistence are dynamic processes and the relevance
of short-term omissions, duration of therapy, switching of drugs, the uncertainty
due to long refill intervals, short persistence versus prolonged persistence all need
to be evaluated in the overall assessment.
Clinical implications
The relationship between drug adherence/persistence and BP control is difficult
to demonstrate. Nevertheless, this is important to obtain an unbiased estimate of
this effect and it will inform clinical applications. The major challenge here is the
fact that patient behaviour promptly changes when they realise that drug
adherence is being assessed. This results in white coat adherence which is
temporary improvement in adherence and thus dilutes any blood pressure
differences between treated and control patients. Any studies will also need to
consider selection bias as patients who participate in adherence studies tend to
have a higher drug adherence compared to those who decline to participate. Any
validation study should also show effect on outcomes, so future studies of drug
adherence and persistence should demonstrate not only improvements in BP
control but also test if this improvement in BP control leads to improved
cardiovascular benefit, better quality of life.
Clinical applications
There is a large volume of observational data mainly from analyses of
administrative databases that suggest good drug adherence is associated with
better clinical prognosis. However, it is not evident whether interventions that
improve adherence will reduce cardiovascular events. More crucially, there are
no simple interventions to improve adherence and persistence. Simple
198 interventions like reminders (phone, mobile text, email), pill organisers,
involvement of family members need to be tested in different subgroups to
identify who would benefit the most and if these lead to a significant impact in
outcomes or quality of life. Other methods like a multi-disciplinary approach using
psychologists, pharmacists, nurses may be effective but not economical for
universal use. As hypertension therapy inevitably requires poly therapy, any
method that simplifies therapy, for example using combination pills or poly pills
enabling single day dosing may have advantages. Another solution is to try and
avoid pharmacotherapy for hypertension by using device therapy, but
unfortunately recent experience with device therapy have not be encouraging.
In summary, adherence and persistence is an important area of future research
that is essential to develop novel treatment methods to decrease the global
burden of hypertension. My studies in the Glasgow BP Clinic have shown how the
utilisation of multiple strands of clinical data can yield useful information which
can inform future studies.
199
Reference
1. Esunge PM. From blood pressure to hypertension: the history of research. J R Soc Med. 1991 Oct;84(10):621.
2. Lewis O. Stephen Hales and the measurement of blood pressure. J Hum Hypertens. 1994 Dec;8(12):865–71.
3. Chávez Domínguez R, de Micheli A. [Epistemological focus on sphygmomanometry]. Rev Investig clinica; organo del Hosp Enfermedades la Nutr. 2002 Jan;54(1):84–91.
4. Roguin A. Scipione Riva-Rocci and the men behind the mercury sphygmomanometer. Int J Clin Pract. 2006 Jan;60(1):73–9.
5. Soto-Perez-de-Celis E. Karl Samuel Ritter Von Basch: the sphygmomanometer and the Empire. J Hypertens. 2007 Jul;25(7):1507–9.
6. Booth J. A short history of blood pressure measurement. Proc R Soc Med. 1977 Nov;70(11):793–9.
7. Paskalev D, Kircheva A, Krivoshiev S. A centenary of auscultatory blood pressure measurement: A tribute to Nikolai Korotkoff. Kidney Blood Press Res. 2005 Jan;28(4):259–63.
8. Pickering TG. What will replace the mercury sphygmomanometer? Blood Press Monit. 2003 Feb;8(1):23–5.
9. Kotchen TA. Historical trends and milestones in hypertension research: a model of the process of translational research. Hypertension. 2011 Oct 1;58(4):522–38.
10. Pickering TG, White WB. When and how to use self (home) and ambulatory blood pressure monitoring. J Am Soc Hypertens. Elsevier; 2008 Jan 5;2(3):119–24.
11. Dawes MG, Coats AJ, Juszczak E. Daytime ambulatory systolic blood pressure is more effective at predicting mortality than clinic blood pressure. Blood Press Monit. 2006 Jun;11(3):111–8.
12. Hodgkinson J, Mant J, Martin U, Guo B, Hobbs FDR, Deeks JJ, et al. Relative effectiveness of clinic and home blood pressure monitoring compared with ambulatory blood pressure monitoring in diagnosis of hypertension: systematic review. BMJ. 2011 Jan;342:d3621.
13. Fagard RH, Thijs L, Staessen JA, Clement DL, De Buyzere ML, De Bacquer DA. Prognostic significance of ambulatory blood pressure in hypertensive patients with history of cardiovascular disease. Blood Press Monit. 2008 Dec;13(6):325–32.
14. Society of Actuaries - Blood Pressure: Report of the Joint Committee on Mortality of the Association of Life Insurance Medical Directors and the Actuarial Society of America. New York, NY: 1925.
15. Blood Pressure Study, 1939. The Actuarial Society of America and the Association of Life Insurance Medical Directors. New York, NY: 1940.
16. Build and Blood Pressure Study. Society of Actuaries; Chicago, IL: 1959. 17. Stamler J, Stamler R, Neaton JD. Blood pressure, systolic and diastolic,
and cardiovascular risks. US population data. Arch Intern Med. 1993 Mar 8;153(5):598–615.
18. Vasan RS, Larson MG, Leip EP, Evans JC, O’Donnell CJ, Kannel WB, et al. Impact of high-normal blood pressure on the risk of cardiovascular disease. N Engl J Med. 2002/01/17. 2001 Nov 1;345(18):1291–7.
19. Lewington S, Clarke R, Qizilbash N, Peto R, Collins R. Age-specific relevance of usual blood pressure to vascular mortality: A meta-analysis of
200
individual data for one million adults in 61 prospective studies. Lancet. Elsevier; 2002 Dec 14;360(9349):1903–13.
20. Moser M. Myths, Misconceptions, and Heroics: The Story of the Treatment of Hypertension From the 1930s. Greenwich, CT: Le Jacq Communications, Inc; 1997.
21. Hay J. The significance of a raised blood pressure. BMJ. 1931;2:43–47. 22. Fries E. A history of hypertension treatment. In: Oparil S, Weber MA, eds.
Hypertension: Companion to Brenner & Rector’s The Kidney. 2nd ed. Philadelphia, PA: Elsevier/Saunders; 2005:1–6 (chapter 1).
23. Veterans Administration Cooperative Study Group on Anti-hypertensive Agents. Effects of treatment on morbidity in hypertension: results in patients with diastolic blood pressure averaging 115 through 129 mmHg. JAMA. 1967;202:1028–1034.
24. Veterans Administration Cooperative Study Group on Anti-hypertensive Agents. Effects of treatment on morbidity in hypertension: II–results in patients with diastolic blood pressure averaging 90 through 114 mmHg. JAMA. 1970;213:1143–1152.
25. Smith WM. Treatment of mild hypertension: results of a ten-year intervention trial. Circ Res. 1977 May;40(5 Suppl 1):I98-105.
26. Hypertension Detection and Follow-up Program Cooperative Group. Five-year findings of the hypertension detection and follow-up program. I. Reduction in mortality of persons with high blood pressure, including mild hypertension. Hypertension Detection and Follow-up Program Cooperative Group. Jama. 1979;242(23):2562–71.
27. Helgeland A. Treatment of mild hypertension: a five year controlled drug trial–the Oslo Study. Am J Med. 1980;69:725–732.
28. Dahlöf B, Lindholm LH, Hansson L, Scherstén B, Ekbom T, Wester PO. Morbidity and mortality in the Swedish Trial in Old Patients with Hypertension (STOP-Hypertension). Lancet (London, England). 1991 Nov 23;338(8778):1281–5.
29. Staessen JA, Fagard R, Thijs L, Celis H, Arabidze GG, Birkenhäger WH, et al. Randomised double-blind comparison of placebo and active treatment for older patients with isolated systolic hypertension. Lancet. Elsevier; 1997 Sep 13;350(9080):757–64.
30. Hansson L, Zanchetti A, Carruthers SG, Dahl??f B, Elmfeldt D, Julius S, et al. Effects of intensive blood-pressure lowering and low-dose aspirin in patients with hypertension: Principal results of the Hypertension Optimal Treatment (HOT) randomised trial. Lancet. Elsevier; 1998 Jun 13;351(9118):1755–62.
31. Dahlöf B, Devereux RB, Kjeldsen SE, Julius S, Beevers G, de Faire U, et al. Cardiovascular morbidity and mortality in the Losartan Intervention For Endpoint reduction in hypertension study (LIFE): a randomised trial against atenolol. Lancet (London, England). 2002 Mar 23;359(9311):995–1003.
32. The ALLHAT Officers and Coordinators for the ALLHAT Collaborative Research Group. Major Outcomes in High-Risk Hypertensive Patients Randomized to Angiotensin-Converting Enzyme Inhibitor or Calcium Channel Blocker vs Diuretic: The Antihypertensive and Lipid-Lowering Treatment to Prevent Heart Attack Trial (ALLHAT). JAMA J Am Med Assoc. 2002/12/20. American Medical Association; 2002 Dec 18;288(23):2981–97.
33. Dahlof B, Devereux R, De Faire U, Fyhrquist F, Hedner T, Ibsen H, et al. The Losartan Intervention For Endpoint reduction (LIFE) in Hypertension
201
study rationale, design, and methods. Am J Hypertens. 1997 Jul;10(7 I):705–13.
34. Wright JT, Williamson JD, Whelton PK, Snyder JK, Sink KM, Rocco M V, et al. A randomized trial of intensive versus standard blood-pressure control. N Engl J Med. Massachusetts Medical Society; 2015 Nov 26;373(22):2103–16.
35. Zanchetti A. Platt versus Pickering: an episode in recent medical history. By J. D. Swales, editor. An essay review. Med Hist. 1986 Jan 1;30(1):94–6.
36. Evans JG, Rose G. Hypertension. Br Med Bull. 1971 Jan;27(1):37–42. 37. Neaton JD, Wentworth D. Serum cholesterol, blood pressure, cigarette
smoking, and death from coronary heart disease. Overall findings and differences by age for 316,099 white men. Multiple Risk Factor Intervention Trial Research Group. Arch Intern Med. 1992 Jan;152(1):56–64.
38. Izzo JL, Levy D, Black HR. Importance of Systolic Blood Pressure in Older Americans. Hypertension. 2000 May 1;35(5):1021–4.
39. Whitworth JA. Blood pressure and control of cardiovascular risk. Vasc Health Risk Manag. 2005 Jan;1(3):257–60.
40. James PA, Oparil S, Carter BL, Cushman WC, Dennison-Himmelfarb C, Handler J, et al. 2014 evidence-based guideline for the management of high blood pressure in adults: report from the panel members appointed to the Eighth Joint National Committee (JNC 8). JAMA. American Medical Association; 2014 Feb 5;311(5):507–20.
41. Kitahara Y, Saito F, Akao M, Fujita H, Takahashi A, Taguchi H, et al. Effect of Morning and Bedtime Dosing with Cilnidipine on Blood Pressure, Heart Rate, and Sympathetic Nervous Activity in Essential Hypertensive Patients. J Cardiovasc Pharmacol. 2004 Jan 2;43(1):68–73.
42. WHO Report. WHO | The world health report 2003 - shaping the future. WHO Rep 2003. World Health Organization; 2003;
43. NICE. National Clinical Guideline Center. Hypertension. The Clinical Manage- ment of Primary Hypertension in Adults. Clinical Guideline 127. Commis- sioned by the National Institute for Health and Clinical Excellence, 2011. London Natl Inst Clin Excell. NICE; 2013;(Clinical guideline 127.).
44. O’Rourke MF, Adji A. Guidelines on guidelines: focus on isolated systolic hypertension in youth. J Hypertens. 2013 Apr;31(4):649–54.
45. Pierdomenico SD, Cuccurullo F. Prognostic value of white-coat and masked hypertension diagnosed by ambulatory monitoring in initially untreated subjects: an updated meta analysis. Am J Hypertens. 2011 Jan;24(1):52–8.
46. Giles TD. Examining therapeutic goals: population versus individual-based approaches. Am J Hypertens. 2003 Nov;16(11 Pt 2):26S–30S.
47. O’Brien E, Parati G, Stergiou G. Ambulatory blood pressure measurement: what is the international consensus? Hypertension. 2013 Dec 1;62(6):988–94.
48. Staessen JA, O’Brien ET, Amery AK, Atkins N, Baumgart P, De Cort P, et al. Ambulatory blood pressure in normotensive and hypertensive subjects: results from an international database. J Hypertens Suppl. 1994 Feb;12(7):S1-12.
49. Dolan E, Stanton a, Atkins N, Den Hond E, Thijs L, McCormack P, et al. Determinants of white-coat hypertension. Blood Press Monit. 2004 Dec;9(6):307–9.
202 50. Fagard RH, Cornelissen VA. Incidence of cardiovascular events in white-
coat, masked and sustained hypertension versus true normotension: a meta-analysis. J Hypertens. 2007 Nov;25(11):2193–8.
51. Franklin SS, Thijs L, Hansen TW, Li Y, Boggia J, Kikuya M, et al. Significance of white-coat hypertension in older persons with isolated systolic hypertension: a meta-analysis using the International Database on Ambulatory Blood Pressure Monitoring in Relation to Cardiovascular Outcomes population. Hypertension. 2012 Mar;59(3):564–71.
52. Mancia G, Facchetti R, Bombelli M, Grassi G, Sega R. Long-term risk of mortality associated with selective and combined elevation in office, home, and ambulatory blood pressure. Hypertension. 2006 May 1;47(5):846–53.
53. Sega R, Trocino G, Lanzarotti A, Carugo S, Cesana G, Schiavina R, et al. Alterations of cardiac structure in patients with isolated office, ambulatory, or home hypertension: Data from the general population (Pressione Arteriose Monitorate E Loro Associazioni [PAMELA] Study). Circulation. 2001 Sep 18;104(12):1385–92.
54. Mancia G, Bombelli M, Facchetti R, Madotto F, Quarti-Trevano F, Grassi G, et al. Increased long-term risk of new-onset diabetes mellitus in white-coat and masked hypertension. J Hypertens. 2009 Aug;27(8):1672–8.
55. Mancia G, Bombelli M, Facchetti R, Madotto F, Quarti-Trevano F, Friz HP, et al. Long-Term Risk of Sustained Hypertension in White-Coat or Masked Hypertension. Hypertension. 2009 Jun 29;54(2):226–32.
56. Bobrie G, Clerson P, Ménard J, Postel-Vinay N, Chatellier G, Plouin P-F. Masked hypertension: a systematic review. J Hypertens. 2008 Sep;26(9):1715–25.
57. Lurbe E, Redon J, Kesani A, Pascual JM, Tacons J, Alvarez V, et al. Increase in nocturnal blood pressure and progression to microalbuminuria in type 1 diabetes. N Engl J Med. 2002;347(11):797–805.
58. Wijkman M, Länne T, Engvall J, Lindström T, Ostgren CJ, Nystrom FH. Masked nocturnal hypertension--a novel marker of risk in type 2 diabetes. Diabetologia. 2009 Jul;52(7):1258–64.
59. MRC trial of treatment of mild hypertension: principal results. Medical Research Council Working Party. Br Med J (Clin Res Ed). 1985 Jul 13;291(6488):97–104.
60. Anonymous. The Effect of Treatment on Mortality in Mild Hypertension. N Engl J Med. 1982 Oct 14;307(16):976–80.
61. Liu L, Zhang Y, Liu G, Li W, Zhang X, Zanchetti A. The Felodipine Event Reduction (FEVER) Study: a randomized long-term placebo-controlled trial in Chinese hypertensive patients. J Hypertens. 2005 Dec;23(12):2157–72.
62. Zhang Y, Zhang X, Liu L, Zanchetti A. Is a systolic blood pressure target <140 mmHg indicated in all hypertensives? Subgroup analyses of findings from the randomized FEVER trial. Eur Heart J. 2011 Jun;32(12):1500–8.
63. Mancia G, De Backer G, Dominiczak A, Cifkova R, Fagard R, Germano G, et al. 2007 Guidelines for the Management of Arterial Hypertension. J Hypertens. 2007/06/15. 2007 Jun 2;25(6):1105–87.
64. Zanchetti A, Grassi G, Mancia G. When should antihypertensive drug treatment be initiated and to what levels should systolic blood pressure be lowered? A critical reappraisal. J Hypertens. 2009 May;27(5):923–34.
65. Mancia G, Laurent S, Agabiti-Rosei E, Ambrosioni E, Burnier M, Caulfield MJ, et al. Reappraisal of European guidelines on hypertension
203
management: a European Society of Hypertension Task Force document. J Hypertens. 2009;27(11):2121–58.
66. Czernichow S, Zanchetti A, Turnbull F, Barzi F, Ninomiya T, Kengne A-P, et al. The effects of blood pressure reduction and of different blood pressure-lowering regimens on major cardiovascular events according to baseline blood pressure: meta-analysis of randomized trials. J Hypertens. 2011 Jan;29(1):4–16.
67. Messerli FH, Mancia G, Conti CR, Hewkin AC, Kupfer S, Champion A, et al. Dogma disputed: can aggressively lowering blood pressure in hypertensive patients with coronary artery disease be dangerous? Ann Intern Med. 2006/06/21. 2006;144(12):884–93.
68. Berl T, Hunsicker LG, Lewis JB, Pfeffer MA, Porush JG, Rouleau J-L, et al. Impact of achieved blood pressure on cardiovascular outcomes in the Irbesartan Diabetic Nephropathy Trial. J Am Soc Nephrol. 2005 Jul 1;16(7):2170–9.
69. Sleight P, Redon J, Verdecchia P, Mancia G, Gao P, Fagard R, et al. Prognostic value of blood pressure in patients with high vascular risk in the Ongoing Telmisartan Alone and in combination with Ramipril Global Endpoint Trial study. J Hypertens. 2009 Jul;27(7):1360–9.
70. Mancia G, Schumacher H, Redon J, Verdecchia P, Schmieder R, Jennings G, et al. Blood pressure targets recommended by guidelines and incidence of cardiovascular and renal events in the Ongoing Telmisartan Alone and in Combination With Ramipril Global Endpoint Trial (ONTARGET). Circulation. 2011 Oct 18;124(16):1727–36.
71. Redon J, Mancia G, Sleight P, Schumacher H, Gao P, Pogue J, et al. Safety and efficacy of low blood pressures among patients with diabetes: subgroup analyses from the ONTARGET (ONgoing Telmisartan Alone and in combination with Ramipril Global Endpoint Trial). J Am Coll Cardiol. 2012 Jan 3;59(1):74–83.
72. Okin PM, Hille DA, Kjeldsen SE, Dahlöf B, Devereux RB. Impact of lower achieved blood pressure on outcomes in hypertensive patients. J Hypertens. 2012 Apr;30(4):802–10; discussion 810.
73. Arima H, Chalmers J, Woodward M, Anderson C, Rodgers A, Davis S, et al. Lower target blood pressures are safe and effective for the prevention of recurrent stroke: the PROGRESS trial. J Hypertens. 2006 Jun;24(6):1201–8.
74. Adler AI. Association of systolic blood pressure with macrovascular and microvascular complications of type 2 diabetes (UKPDS 36): prospective observational study. BMJ. 2000 Aug 12;321(7258):412–9.
75. Beckett N, Peters R, Fletcher A, et al. Treatment of Hypertension in Patients 80 Years of Age or Older. N Engl J Med. 2008;358(18):1887–98.
76. Group JS. Principal results of the Japanese trial to assess optimal systolic blood pressure in elderly hypertensive patients (JATOS). Hypertens Res. The Japanese Society of Hypertension; 2008 Dec;31(12):2115–27.
77. Ogihara T, Saruta T, Rakugi H, Matsuoka H, Shimamoto K, Shimada K, et al. Target blood pressure for treatment of isolated systolic hypertension in the elderly: valsartan in elderly isolated systolic hypertension study. Hypertension. 2010 Aug;56(2):196–202.
78. Outcomes H, Evaluation P, Study H. Effects of ramipril on cardiovascular and microvascular outcomes in people with diabetes mellitus: results of the HOPE study and MICRO-HOPE substudy. Heart Outcomes Prevention Evaluation Study Investigators. Lancet. 2000 Jan 22;355(9200):253–9.
204 79. Curb JD, Pressel SL, Cutler JA, Savage PJ, Applegate WB, Black H, et al.
Effect of diuretic-based antihypertensive treatment on cardiovascular disease risk in older diabetic patients with isolated systolic hypertension. Systolic Hypertension in the Elderly Program Cooperative Research Group. JAMA. 1996 Dec 18;276(23):1886–92.
80. Tuomilehto J, Rastenyte D, Birkenhäger WH, Thijs L, Antikainen R, Bulpitt CJ, et al. Effects of Calcium-Channel Blockade in Older Patients with Diabetes and Systolic Hypertension. N Engl J Med. 1999 Mar 4;340(9):677–84.
81. Patel A. Effects of a fixed combination of perindopril and indapamide on macrovascular and microvascular outcomes in patients with type 2 diabetes mellitus (the ADVANCE trial): a randomised controlled trial. Lancet. Elsevier; 2007 Sep 8;370(9590):829–40.
82. UK Prospective Diabetes Study Group. Tight blood pressure control and risk of macrovascular and microvascular complications in type 2 diabetes: UKPDS 38. BMJ. 1998 Sep 12;317(7160):703–13.
83. Schrier RW, Estacio RO, Esler A, Mehler P. Effects of aggressive blood pressure control in normotensive type 2 diabetic patients on albuminuria, retinopathy and strokes. Kidney Int. 2002 Mar;61(3):1086–97.
84. Cushman W, Evans G. Effects of intensive blood-pressure control in type 2 diabetes mellitus. New Engl …. 2010;362(17):1575–85.
85. Fox KM. Efficacy of perindopril in reduction of cardiovascular events among patients with stable coronary artery disease: randomised, double-blind, placebo-controlled, multicentre trial (the EUROPA study). Lancet. 2003 Sep 6;362(9386):782–8.
86. MacMahon S, Neal B, Tzourio C, Rodgers A, Woodward M, Cutler J, et al. Randomised trial of a perindopril-based blood-pressure-lowering regimen among 6105 individuals with previous stroke or transient ischaemic attack. Lancet. 2001 Sep 29;358(9287):1033–41.
87. Nissen SE, Tuzcu EM, Libby P, Thompson PD, Ghali M, Garza D, et al. Effect of antihypertensive agents on cardiovascular events in patients with coronary disease and normal blood pressure: the CAMELOT study: a randomized controlled trial. JAMA. 2004 Nov 10;292(18):2217–25.
88. Pitt B, Byington RP, Furberg CD, Hunninghake DB, Mancini GB, Miller ME, et al. Effect of amlodipine on the progression of atherosclerosis and the occurrence of clinical events. PREVENT Investigators. Circulation. 2000 Sep 26;102(13):1503–10.
89. Poole-Wilson PA, Lubsen J, Kirwan B-A, van Dalen FJ, Wagener G, Danchin N, et al. Effect of long-acting nifedipine on mortality and cardiovascular morbidity in patients with stable angina requiring treatment (ACTION trial): randomised controlled trial. Lancet (London, England). Jan;364(9437):849–57.
90. Peace T, Investigators T. Angiotensin-Converting–Enzyme Inhibition in Stable Coronary Artery Disease. Coron Artery Dis. 2004 Nov 11;351(20):2058–68.
91. Yusuf S, Diener H-C, Sacco RL, Cotton D, Ôunpuu S, Lawton WA, et al. Telmisartan to Prevent Recurrent Stroke and Cardiovascular Events. N Engl J Med. 2008 Sep 18;359(12):1225–37.
92. PATS Collaborating Group. Post-stroke antihypertensive treatment study. A preliminary result. Chin Med J (Engl). 1995 Sep;108(9):710–7.
93. Klahr S, Levey AS, Beck GJ, Caggiula AW, Hunsicker L, Kusek JW, et al.
205
The Effects of Dietary Protein Restriction and Blood-Pressure Control on the Progression of Chronic Renal Disease. N Engl J Med. 1994 Mar 31;330(13):877–84.
94. Wright JT, Bakris G, Greene T, Agodoa LY, Appel LJ, Charleston J, et al. Effect of blood pressure lowering and antihypertensive drug class on progression of hypertensive kidney disease: results from the AASK trial. JAMA. 2002 Nov 20;288(19):2421–31.
95. Ruggenenti P, Perna A, Loriga G, Ganeva M, Ene-Iordache B, Turturro M, et al. Blood-pressure control for renoprotection in patients with non-diabetic chronic renal disease (REIN-2): multicentre, randomised controlled trial. Lancet (London, England). Jan;365(9463):939–46.
96. Sarnak MJ, Greene T, Wang X, Beck G, Kusek JW, Collins AJ, et al. The effect of a lower target blood pressure on the progression of kidney disease: long-term follow-up of the modification of diet in renal disease study. Ann Intern Med. 2005 Mar 1;142(5):342–51.
97. Appel LJ, Wright JT, Greene T, Agodoa LY, Astor BC, Bakris GL, et al. Intensive Blood-Pressure Control in Hypertensive Chronic Kidney Disease. N Engl J Med. 2010 Sep 2;363(10):918–29.
98. Lewis EJ, Hunsicker LG, Clarke WR, Berl T, Pohl MA, Lewis JB, et al. Renoprotective Effect of the Angiotensin-Receptor Antagonist Irbesartan in Patients with Nephropathy Due to Type 2 Diabetes. N Engl J Med. 2001 Sep 20;345(12):851–60.
99. Brenner BM, Cooper ME, de Zeeuw D, Keane WF, Mitch WE, Parving H-H, et al. Effects of Losartan on Renal and Cardiovascular Outcomes in Patients with Type 2 Diabetes and Nephropathy. N Engl J Med. 2001 Sep 20;345(12):861–9.
100. Wühl E, Trivelli A, Picca S, Litwin M, Peco-Antic A, Zurowska A, et al. Strict Blood-Pressure Control and Progression of Renal Failure in Children. N Engl J Med. 2009 Oct 22;361(17):1639–50.
101. Arguedas JA, Perez MI, Wright JM. Cochrane Database of Systematic Reviews. The Cochrane database of systematic reviews. Chichester, UK: John Wiley & Sons, Ltd; 1996. CD004349.
102. Upadhyay A, Earley A, Haynes SM, Uhlig K. Systematic review: blood pressure target in chronic kidney disease and proteinuria as an effect modifier. Ann Intern Med. 2011 Apr 19;154(8):541–8.
103. Williams B, Poulter NR, Brown MJ, Davis M, McInnes GT, Potter JF, et al. British Hypertension Society guidelines for hypertension management 2004 (BHS-IV): summary. BMJ. 2004/03/17. 2004;328(7440):634–40.
104. Yarows Sa JSPTG. HOme blood pressure monitoring. Archives of Internal Medicine. 2000;160(9):1251-7.
105. Clement DL, De Buyzere ML, De Bacquer DA, de Leeuw PW, Duprez DA, Fagard RH, et al. Prognostic value of ambulatory blood-pressure recordings in patients with treated hypertension. N Engl J Med. 2003/06/13. 2003;348(24):2407–15.
106. Ohkubo T, Hozawa A, Yamaguchi J, Kikuya M, Ohmori K, Michimata M, et al. Prognostic significance of the nocturnal decline in blood pressure in individuals with and without high 24-h blood pressure: the Ohasama study. J Hypertens. 2002/11/01. 2002;20(11):2183–9.
107. Ohkubo T, Hozawa A, Nagai K, Kikuya M, Tsuji I, Ito S, et al. Prediction of stroke by ambulatory blood pressure monitoring versus screening blood pressure measurements in a general population: the Ohasama study. J
206
Hypertens. 2000/08/10. 2000;18(7):847–54. 108. Staessen JA, Thijs L, Fagard R, O’Brien ET, Clement D, de Leeuw PW, et
al. Predicting cardiovascular risk using conventional vs ambulatory blood pressure in older patients with systolic hypertension. Systolic Hypertension in Europe Trial Investigators. JAMA. 1999/08/18. 1999;282(6):539–46.
109. Stergiou GS, Efstathiou SP, Argyraki CK, Gantzarou AP, Roussias LG, Mountokalakis TD. Clinic, home and ambulatory pulse pressure: comparison and reproducibility. J Hypertens. 2002/10/03. 2002;20(10):1987–93.
110. Sforza VF. 2003 European Society of Hypertension – European Society of Cardiology guidelines for the management of arterial hypertension Ã. J Hypertens. 2003;21:1011–54.
111. Lloyd-Jones D, Adams RJ, Brown TM, Carnethon M, Dai S, De Simone G, et al. Heart disease and stroke statistics--2010 update: a report from the American Heart Association. Circulation. 2010 Feb 23;121(7):e46–215.
112. Kim AS, Johnston SC. Global variation in the relative burden of stroke and ischemic heart disease. Circulation. 2011 Jul 19;124(3):314–23.
113. Allender, S., Peter, S., Peto, V. & Rayner, M. 2008. European cardiovascular disease statistics: 2008 edition. London: British Heart Foundation.
114. Lowther, M., Mordue, A. & the Heart Health Network Executive Group 2006. Primary prevention of cardiovascular disease in Scotland: we must go further Edinburgh: Health Scotland.
115. Luengo-Fernández R, Leal J, Gray A, Petersen S, Rayner M. Cost of cardiovascular diseases in the United Kingdom. Heart. 2006 Oct;92(10):1384–9.
116. Kuulasmaa K, Tunstall-Pedoe H, Dobson A, Fortmann S, Sans S, Tolonen H, et al. Estimation of contribution of changes in classic risk factors to trends in coronary-event rates across the WHO MONICA Project populations. Lancet (London, England). 2000 Mar 26;355(9205):675–87.
117. Danesh J, Wheeler JG, Hirschfield GM, Eda S, Eiriksdottir G, Rumley A, et al. C-Reactive Protein and Other Circulating Markers of Inflammation in the Prediction of Coronary Heart Disease. N Engl J Med. 2004 Apr;350(14):1387–97.
118. Bello AK, Hemmelgarn B, Lloyd A, James MT, Manns BJ, Klarenbach S, et al. Associations among estimated glomerular filtration rate, proteinuria, and adverse cardiovascular outcomes. Clin J Am Soc Nephrol. 2011 Jun;6(6):1418–26.
119. Seshadri S, Beiser A, Kelly-Hayes M, Kase CS, Au R, Kannel WB, et al. The lifetime risk of stroke: estimates from the Framingham Study. Stroke. 2006 Mar 1;37(2):345–50.
120. Eberly LE, Neaton JD, Thomas AJ, Yu D. Multiple-stage screening and mortality in the Multiple Risk Factor Intervention Trial. Clin Trials. 2004 Jan;1(2):148–61.
121. Khot UN. Prevalence of Conventional Risk Factors in Patients With Coronary Heart Disease. JAMA. 2003 Aug 20;290(7):898.
122. Ford ES, Ajani UA, Croft JB, Critchley JA, Labarthe DR, Kottke TE, et al. Explaining the decrease in U.S. deaths from coronary disease, 1980-2000. N Engl J Med. 2007 Jun 7;356(23):2388–98.
123. Law MR, Morris JK, Wald NJ. Use of blood pressure lowering drugs in the prevention of cardiovascular disease: meta-analysis of 147 randomised
207
trials in the context of expectations from prospective epidemiological studies. BMJ. 2009 Jan 19;338(may19_1):b1665.
124. Frohlich ED, González A, Díez J. Hypertensive left ventricular hypertrophy risk: beyond adaptive cardiomyocytic hypertrophy. J Hypertens. 2011 Jan;29(1):17–26.
125. Cuspidi C, Sala C, Negri F, Mancia G, Morganti A. Prevalence of left-ventricular hypertrophy in hypertension: an updated review of echocardiographic studies. J Hum Hypertens. 2012 Jul;26(6):343–9.
126. Tocci G, Sciarretta S, Volpe M. Development of heart failure in recent hypertension trials. J Hypertens. 2008 Jul;26(7):1477–86.
127. Dunlay SM, Weston SA, Jacobsen SJ, Roger VL. Risk factors for heart failure: a population-based case-control study. Am J Med. 2009 Dec;122(11):1023–8.
128. Butler J, Kalogeropoulos AP, Georgiopoulou V V, Bibbins-Domingo K, Najjar SS, Sutton-Tyrrell KC, et al. Systolic blood pressure and incident heart failure in the elderly. The Cardiovascular Health Study and the Health, Ageing and Body Composition Study. Heart. 2011 Aug;97(16):1304–11.
129. Bidani AK, Griffin KA. Pathophysiology of hypertensive renal damage: implications for therapy. Hypertension. 2004 Dec 1;44(5):595–601.
130. Tozawa M, Iseki K, Iseki C, Kinjo K, Ikemiya Y, Takishita S. Blood pressure predicts risk of developing end-stage renal disease in men and women. Hypertension. 2003 Jul;41(6):1341–5.
131. Buckalew VM, Berg RL, Wang SR, Porush JG, Rauch S, Schulman G. Prevalence of hypertension in 1,795 subjects with chronic renal disease: the modification of diet in renal disease study baseline cohort. Modification of Diet in Renal Disease Study Group. Am J Kidney Dis. 1996 Dec;28(6):811–21.
132. Klag MJ, Whelton PK, Randall BL, Neaton JD, Brancati FL, Stamler J. End-stage renal disease in African-American and white men. 16-year MRFIT findings. JAMA. Jan;277(16):1293–8.
133. Mackinnon B, Padmanabhan S, Murray L, Sloan W, Meredith P, Reid J, et al. Is end stage renal disease a common outcome among patients attending a hypertension clinic? Journal of Hypertension. 2008.
134. Neal B, MacMahon S, Chapman N. Effects of ACE inhibitors, calcium antagonists, and other blood-pressure-lowering drugs: results of prospectively designed overviews of randomised trials. Blood Pressure Lowering Treatment Trialists’ Collaboration. Lancet (London, England). 2000 Dec 9;356(9246):1955–64.
135. Weber MA, Julius S, Kjeldsen SE, Brunner HR, Ekman S, Hansson L, et al. Blood pressure dependent and independent effects of antihypertensive treatment on clinical events in the VALUE Trial. Lancet (London, England). 2004 Jul 19;363(9426):2049–51.
136. Gradman AH, Basile JN, Carter BL, Bakris GL, Materson BJ, Black HR, et al. Combination therapy in hypertension. J Am Soc Hypertens. Jan;4(2):90–8.
137. Brown MJ, McInnes GT, Papst CC, Zhang J, MacDonald TM. Aliskiren and the calcium channel blocker amlodipine combination as an initial treatment strategy for hypertension control (ACCELERATE): a randomised, parallel-group trial. Lancet (London, England). Elsevier; 2011 Jan 22;377(9762):312–20.
138. Egan BM, Bandyopadhyay D, Shaftman SR, Wagner CS, Zhao Y, Yu-Isenberg KS. Initial monotherapy and combination therapy and hypertension control
208
the first year. Hypertension. 2012 Jul;59(6):1124–31. 139. Jamerson K, Weber MA, Bakris GL, Dahlöf B, Pitt B, Shi V, et al. Benazepril
plus Amlodipine or Hydrochlorothiazide for Hypertension in High-Risk Patients. N Engl J Med. 2008 Dec 4;359(23):2417–28.
140. Reboldi G, Gentile G, Angeli F, Ambrosio G, Mancia G, Verdecchia P. Effects of intensive blood pressure reduction on myocardial infarction and stroke in diabetes: a meta-analysis in 73,913 patients. J Hypertens. 2011 Jul;29(7):1253–69.
141. Turnbull F, Neal B, Algert C, Chalmers J, Chapman N, Cutler J, et al. Effects of different blood pressure-lowering regimens on major cardiovascular events in individuals with and without diabetes mellitus: results of prospectively designed overviews of randomized trials. Arch Intern Med. 2005 Jun 27;165(12):1410–9.
142. INVESTIGATORS THOPES. Correction: Effects of an Angiotensin-Converting-Enzyme Inhibitor, Ramipril, on Cardiovascular Events in High-Risk Patients. N Engl J Med. 2000 May 4;342(18):1376.
143. Kasanuki H, Hagiwara N, Hosoda S, Sumiyoshi T, Honda T, Haze K, et al. Angiotensin II receptor blocker-based vs. non-angiotensin II receptor blocker-based therapy in patients with angiographically documented coronary artery disease and hypertension: the Heart Institute of Japan Candesartan Randomized Trial for Evaluation in . Eur Heart J. 2009 May;30(10):1203–12.
144. Ogihara T, Nakao K, Fukui T, Fukiyama K, Ueshima K, Oba K, et al. Effects of candesartan compared with amlodipine in hypertensive patients with high cardiovascular risks: candesartan antihypertensive survival evaluation in Japan trial. Hypertension. 2008 Mar;51(2):393–8.
145. Beckett N, Peters R, Tuomilehto J, Swift C, Sever P, Potter J, et al. Immediate and late benefits of treating very elderly people with hypertension: results from active treatment extension to Hypertension in the Very Elderly randomised controlled trial. BMJ. 2012 Jan 4;344(jan04_2):d7541.
146. Elmer PJ, Obarzanek E, Vollmer WM, Simons-Morton D, Stevens VJ, Young DR, et al. Effects of comprehensive lifestyle modification on diet, weight, physical fitness, and blood pressure control: 18-month results of a randomized trial. Ann Intern Med. 2006 Apr 4;144(7):485–95.
147. Frisoli TM, Schmieder RE, Grodzicki T, Messerli FH. Beyond salt: lifestyle modifications and blood pressure. Eur Heart J. 2011 Dec;32(24):3081–7.
148. Perk J, De Backer G, Gohlke H, Graham I, Reiner Z, Verschuren M, et al. European Guidelines on cardiovascular disease prevention in clinical practice (version 2012): The Fifth Joint Task Force of the European Society of Cardiology and Other Societies on Cardiovascular Disease Prevention in Clinical Practice (constituted by re. Eur Heart J. 2012;33(13):1635–701.
149. Twardowski ZJ. Sodium, hypertension, and an explanation of the ‘lag phenomenon’ in hemodialysis patients. Hemodial Int. 2008 Oct;12(4):412–25.
150. Guild S-J, McBryde FD, Malpas SC, Barrett CJ. High dietary salt and angiotensin II chronically increase renal sympathetic nerve activity: a direct telemetric study. Hypertension. 2012 Mar;59(3):614–20.
151. Graudal NA, Hubeck-Graudal T, Jurgens G. Effects of low sodium diet versus high sodium diet on blood pressure, renin, aldosterone, catecholamines, cholesterol, and triglyceride. Cochrane database Syst
209
Rev. 2011 Jan;(11):CD004022. 152. He FJ, Li J, Macgregor GA. Effect of longer term modest salt reduction on
blood pressure: Cochrane systematic review and meta-analysis of randomised trials. BMJ. 2013 Jan 4;346(apr03_3):f1325.
153. Cook NR, Cutler J a, Obarzanek E, Buring JE, Rexrode KM, Kumanyika SK, et al. Long term effects of dietary sodium reduction on cardiovascular disease outcomes: observational follow-up of the trials of hypertension prevention (TOHP). Bmj. 2007 Apr 28;334(7599):885–885.
154. Bibbins-Domingo K, Chertow GM, Coxson PG, Moran A, Lightwood JM, Pletcher MJ, et al. Projected Effect of Dietary Salt Reductions on Future Cardiovascular Disease. N Engl J Med. 2010;362(7):590–9.
155. He FJ, Burnier M, Macgregor GA. Nutrition in cardiovascular disease: salt in hypertension and heart failure. Eur Heart J. 2011 Dec;32(24):3073–80.
156. He FJ, MacGregor GA. How far should salt intake be reduced? Hypertension. 2003 Dec 1;42(6):1093–9.
157. O’Donnell MJ, Mente A, Smyth A, Yusuf S. Salt intake and cardiovascular disease: why are the data inconsistent? Eur Heart J. 2013 Apr;34(14):1034–40.
158. Mente A, O’Donnell M, Rangarajan S, Dagenais G, Lear S, McQueen M, et al. Associations of urinary sodium excretion with cardiovascular events in individuals with and without hypertension: a pooled analysis of data from four studies. Lancet (London, England). 2016 Jul 30;388(10043):465–75.
159. Cobiac LJ, Vos T, Veerman JL. Cost-effectiveness of interventions to reduce dietary salt intake. Heart. 2010 Dec 1;96(23):1920–5.
160. Romero R, Bonet J, de la Sierra A, Aguilera MT. Undiagnosed obesity in hypertension: clinical and therapeutic implications. Blood Press. 2007 Jan;16(6):347–53.
161. Neter JE, Stam BE, Kok FJ, Grobbee DE, Geleijnse JM. Influence of weight reduction on blood pressure: a meta-analysis of randomized controlled trials. Hypertension. 2003 Nov;42(5):878–84.
162. Whitlock G, Lewington S, Sherliker P, Clarke R, Emberson J, Halsey J, et al. Body-mass index and cause-specific mortality in 900 000 adults: collaborative analyses of 57 prospective studies. Lancet. 2009 Mar 28;373(9669):1083–96.
163. Flegal KM, Kit BK, Orpana H, Graubard BI. Association of all-cause mortality with overweight and obesity using standard body mass index categories: a systematic review and meta-analysis. JAMA. American Medical Association; 2013 Jan 2;309(1):71–82.
164. Shaw K, Gennat H, O’Rourke P, Del Mar C. Exercise for overweight or obesity. Cochrane Database Syst Rev 2006;CD003817.
165. Norris SL, Zhang X, Avenell A, Gregg E, Schmid CH, Lau J. Long-term non-pharmacological weight loss interventions for adults with prediabetes. Cochrane database Syst Rev. 2005 Jan;(2):CD005270.
166. Jordan J, Yumuk V, Schlaich M, Nilsson PM, Zahorska-Markiewicz B, Grassi G, et al. Joint statement of the European Association for the Study of Obesity and the European Society of Hypertension: obesity and difficult to treat arterial hypertension. J Hypertens. 2012 Jun;30(6):1047–55.
167. Puddey IB, Beilin LJ, Vandongen R. REGULAR ALCOHOL USE RAISES BLOOD PRESSURE IN TREATED HYPERTENSIVE SUBJECTS. Lancet. 1987 Mar;329(8534):647–51.
168. Hansagi H, Romelsjo A, de Verdier MG, Andreasson S, Leifman A. Alcohol
210
Consumption and Stroke Mortality : 20-Year Follow-up of 15 077 Men and Women. Stroke. 1995 Oct 1;26(10):1768–73.
169. Cushman WC, Cutler JA, Hanna E, Bingham SF, Follmann D, Harford T, et al. Prevention and Treatment of Hypertension Study (PATHS): effects of an alcohol treatment program on blood pressure. Arch Intern Med. 1998 Jun 8;158(11):1197–207.
170. Yarlioglues M, Kaya MG, Ardic I, Calapkorur B, Dogdu O, Akpek M, et al. Acute effects of passive smoking on blood pressure and heart rate in healthy females. Blood Press Monit. 2010 Oct;15(5):251–6.
171. Groppelli A, Omboni S, Parati G, Mancia G. Blood pressure and heart rate response to repeated smoking before and after beta-blockade and selective alpha 1 inhibition. J Hypertens Suppl. 1990 Sep;8(5):S35-40.
172. Groppelli A, Giorgi DM, Omboni S, Parati G, Mancia G. Persistent blood pressure increase induced by heavy smoking. J Hypertens. 1992 May;10(5):495–9.
173. Mann SJ, James GD, Wang RS, Pickering TG. Elevation of ambulatory systolic blood pressure in hypertensive smokers. A case-control study. JAMA. 1991 May 1;265(17):2226–8.
174. Primatesta P, Falaschetti E, Gupta S, Marmot MG, Poulter NR. Association Between Smoking and Blood Pressure : Evidence From the Health Survey for England. Hypertension. 2001 Feb 1;37(2):187–93.
175. Doll R, Peto R, Wheatley K, Gray R, Sutherland I. Mortality in relation to smoking: 40 years’ observations on male British doctors. BMJ. 1994 Oct 8;309(6959):901–11.
176. Rosenberg L, Kaufman DW, Helmrich SP, Shapiro S. The risk of myocardial infarction after quitting smoking in men under 55 years of age. N Engl J Med. 1985 Dec 12;313(24):1511–4.
177. Manson JE, Tosteson H, Ridker PM, Satterfield S, Hebert P, O’Connor GT, et al. The primary prevention of myocardial infarction. N Engl J Med. 1992;326(21):1406–16.
178. Lancaster T, Stead L. Physician advice for smoking cessation. In: Stead L, editor. Cochrane Database of Systematic Reviews. Chichester, UK: John Wiley & Sons, Ltd; 2004. p. CD000165.
179. Cahill K, Stead LF, Lancaster T. Nicotine receptor partial agonists for smoking cessation. In: Cahill K, editor. Cochrane Database of Systematic Reviews. Chichester, UK: John Wiley & Sons, Ltd; 2012. p. CD006103.
180. Hughes JR, Stead LF, Lancaster T. Antidepressants for smoking cessation. Cochrane database Syst Rev. 2007 Jan;(1):CD000031.
181. (FDA) RC for DE. Drug Safety and Availability - FDA Drug Safety Communication: Multaq (dronedarone) and increased risk of death and serious cardiovascular adverse events. Center for Drug Evaluation and Research; 2011.
182. Cornelissen VA, Fagard RH. Effects of endurance training on blood pressure, blood pressure-regulating mechanisms, and cardiovascular risk factors. Hypertension. 2005 Oct;46(4):667–75.
183. Leitzmann MF, Park Y, Blair A, Ballard-Barbash R, Mouw T, Hollenbeck AR, et al. Physical activity recommendations and decreased risk of mortality. Arch Intern Med. 2007 Dec 10;167(22):2453–60.
184. Rossi A, Dikareva A, Bacon SL, Daskalopoulou SS. The impact of physical activity on mortality in patients with high blood pressure. J Hypertens. 2012 Jul;30(7):1277–88.
211 185. Fagard RH. Exercise therapy in hypertensive cardiovascular disease. Prog
Cardiovasc Dis. 2011 Jan;53(6):404–11. 186. Molmen-Hansen HE, Stolen T, Tjonna AE, Aamot IL, Ekeberg IS, Tyldum GA,
et al. Aerobic interval training reduces blood pressure and improves myocardial function in hypertensive patients. Eur J Prev Cardiol. 2012 Apr 1;19(2):151–60.
187. Cornelissen VA, Fagard RH, Coeckelberghs E, Vanhees L. Impact of resistance training on blood pressure and other cardiovascular risk factors: a meta-analysis of randomized, controlled trials. Hypertension. 2011 Nov;58(5):950–8.
188. Vanhees L, Geladas N, Hansen D, Kouidi E, Niebauer J, Reiner Z, et al. Importance of characteristics and modalities of physical activity and exercise in the management of cardiovascular health in individuals with cardiovascular risk factors: recommendations from the EACPR. Part II. Eur J Prev Cardiol. 2012 Oct 1;19(5):1005–33.
189. Mente A, de Koning L, Shannon HS, Anand SS. A Systematic Review of the Evidence Supporting a Causal Link Between Dietary Factors and Coronary Heart Disease. Arch Intern Med. 2009 Apr 13;169(7):659.
190. Conlin PR, Chow D, Miller ER, Svetkey LP, Lin PH, Harsha DW, et al. The effect of dietary patterns on blood pressure control in hypertensive patients: results from the Dietary Approaches to Stop Hypertension (DASH) trial. Am J Hypertens. 2000 Sep;13(9):949–55.
191. Sofi F, Abbate R, Gensini GF, Casini A. Accruing evidence on benefits of adherence to the Mediterranean diet on health: an updated systematic review and meta-analysis. Am J Clin Nutr. 2010 Nov;92(5):1189–96.
192. Estruch R, Ros E, Salas-Salvadó J, Covas M-I, Corella D, Arós F, et al. Primary Prevention of Cardiovascular Disease with a Mediterranean Diet. N Engl J Med. 2013 Apr 4;368(14):1279–90.
193. Rivas M, Garay RP, Escanero JF, Cia P, Alda JO. Soy milk lowers blood pressure in men and women with mild to moderate essential hypertension. J Nutr. 2002 Jul;132(7):1900–2.
194. Blumenthal JA, Babyak MA, Hinderliter A, Watkins LL, Craighead L, Lin P-H, et al. Effects of the DASH diet alone and in combination with exercise and weight loss on blood pressure and cardiovascular biomarkers in men and women with high blood pressure: the ENCORE study. Arch Intern Med. 2010 Jan 25;170(2):126–35.
195. Nurminen ML, Niittynen L, Korpela R, Vapaatalo H. Coffee, caffeine and blood pressure: a critical review. Eur J Clin Nutr. 1999 Nov;53(11):831–9.
196. Steffen M, Kuhle C, Hensrud D, Erwin PJ, Murad MH. The effect of coffee consumption on blood pressure and the development of hypertension: a systematic review and meta-analysis. J Hypertens. 2012 Dec;30(12):2245–54.
197. Attwood S, Bird R, Burch K, Casadei B, Coats A, Conway J, et al. Within-patient correlation between the antihypertensive effects of atenolol, lisinopril and nifedipine. J Hypertens. 1994/09/01. 1994;12(9):1053–60.
198. Sever P S, Roberto F. The heterogeneity of hypertension. European heart journal supplements. 1999;1(L):L10-L3.
199. Mancia G, Zanchetti A. Choice of antihypertensive drugs in the European Society of Hypertension-European Society of Cardiology guidelines: specific indications rather than ranking for general usage. J Hypertens. 2008 Feb;26(2):164–8.
212 200. Lindholm LH, Carlberg B, Samuelsson O. Should beta blockers remain first
choice in the treatment of primary hypertension? A meta-analysis. Lancet (London, England). Jan;366(9496):1545–53.
201. Zanchetti A, Mancia G. Longing for clinical excellence: a critical outlook into the NICE recommendations on hypertension management--is nice always good? J Hypertens. 2012 Apr;30(4):660–8.
202. Bangalore S, Sawhney S, Messerli FH. Relation of Beta-Blocker-Induced Heart Rate Lowering and Cardioprotection in Hypertension. J Am Coll Cardiol. 2008 Oct 28;52(18):1482–9.
203. Cucherat M. Quantitative relationship between resting heart rate reduction and magnitude of clinical benefits in post-myocardial infarction: a meta-regression of randomized clinical trials. Eur Heart J. 2007 Dec;28(24):3012–9.
204. Houghton T, Freemantle N, Cleland JG. Are beta-blockers effective in patients who develop heart failure soon after myocardial infarction? A meta-regression analysis of randomised trials. Eur J Heart Fail. 2000 Sep;2(3):333–40.
205. Holman RR, Paul SK, Bethel MA, Neil HAW, Matthews DR. Long-Term Follow-up after Tight Control of Blood Pressure in Type 2 Diabetes. N Engl J Med. 2008 Oct 9;359(15):1565–76.
206. Blackburn DF, Lamb DA, Eurich DT, Johnson JA, Wilson TW, Dobson RT, et al. Atenolol as initial antihypertensive therapy: an observational study comparing first-line agents. J Hypertens. 2007 Jul;25(7):1499–505.
207. Bradley HA, Wiysonge CS, Volmink JA, Mayosi BM, Opie LH. How strong is the evidence for use of beta-blockers as first-line therapy for hypertension? Systematic review and meta-analysis. J Hypertens. 2006 Nov;24(11):2131–41.
208. Klingbeil AU, Schneider M, Martus P, Messerli FH, Schmieder RE. A meta-analysis of the effects of treatment on left ventricular mass in essential hypertension. Am J Med. 2003 Jul;115(1):41–6.
209. Zanchetti A, Bond MG, Hennig M, Neiss A, Mancia G, Dal Palù C, et al. Calcium antagonist lacidipine slows down progression of asymptomatic carotid atherosclerosis: principal results of the European Lacidipine Study on Atherosclerosis (ELSA), a randomized, double-blind, long-term trial. Circulation. 2002 Nov 5;106(19):2422–7.
210. Laurent S, Briet M, Boutouyrie P. Large and small artery cross-talk and recent morbidity-mortality trials in hypertension. Hypertension. 2009 Aug 1;54(2):388–92.
211. Schiffrin EL, Deng LY. Comparison of effects of angiotensin I-converting enzyme inhibition and beta-blockade for 2 years on function of small arteries from hypertensive patients. Hypertension. 1995 Apr;25(4 Pt 2):699–703.
212. Schiffrin EL, Pu Q, Park JB. Effect of amlodipine compared to atenolol on small arteries of previously untreated essential hypertensive patients. Am J Hypertens. 2002 Feb;15(2 Pt 1):105–10.
213. Smith RD, Yokoyama H, Averill DB, Schiffrin EL, Ferrario CM. Reversal of vascular hypertrophy in hypertensive patients through blockade of angiotensin II receptors. J Am Soc Hypertens. Jan;2(3):165–72.
214. Sharma AM, Pischon T, Hardt S, Kunz I, Luft FC. Hypothesis: Beta-adrenergic receptor blockers and weight gain: A systematic analysis. Hypertension. 2001 Feb;37(2):250–4.
213 215. Moser M, Guyther R, Finnerty F, Richardson DW, Langford H, Perry HM, et
al. Report of the Joint National Committee on Detection, Evaluation, and Treatment of High Blood Pressure. A cooperative study. J Am Med Assoc. 1977 Jan 17;237(0098–7484 (Print)):255–61.
216. Arterial hypertension. Report of a WHO expert committee. World Heal Organ - Tech Rep Ser. 1978 Jan;(628):7–56.
217. Whitworth JA. 2003 World Health Organization (WHO)/International Society of Hypertension (ISH) statement on management of hypertension. J Hypertens. 2003 Nov;21(11):1983–92.
218. Chobanian A V., Bakris GL, Black HR, Cushman WC, Green LA, Izzo JL, et al. Seventh report of the Joint National Committee on Prevention, Detection, Evaluation, and Treatment of High Blood Pressure. Hypertension. 2003/12/06. 2003 Dec;42(6):1206–52.
219. Cutler JA, Davis BR. Thiazide-type diuretics and beta-adrenergic blockers as first-line drug treatments for hypertension. Circulation. 2008 May 20;117(20):2691–704; discussion 2705.
220. Messerli FH, Bangalore S, Julius S. Risk/benefit assessment of beta-blockers and diuretics precludes their use for first-line therapy in hypertension. Circulation. 2008 May 20;117(20):2706–15; discussion 2715.
221. Corrao G, Zambon A, Parodi A, Poluzzi E, Baldi I, Merlino L, et al. Discontinuation of and changes in drug therapy for hypertension among newly-treated patients: a population-based study in Italy. J Hypertens. 2008 Apr;26(4):819–24.
222. Burke TA, Sturkenboom MC, Lu S, Wentworth CE, Lin Y, Rhoads GG. Discontinuation of antihypertensive drugs among newly diagnosed hypertensive patients in UK general practice. J Hypertens. 2006 Jun;24(6):1193–200.
223. Zanchetti A. Hypertension: meta-analyses: first-rank evidence or second-hand information? Nat Rev Cardiol. 2011 May;8(5):249–51.
224. Messerli FH, Makani H, Benjo A, Romero J, Alviar C, Bangalore S. Antihypertensive efficacy of hydrochlorothiazide as evaluated by ambulatory blood pressure monitoring: a meta-analysis of randomized trials. J Am Coll Cardiol. 2011 Feb 1;57(5):590–600.
225. Roush GC, Holford TR, Guddati AK. Chlorthalidone compared with hydrochlorothiazide in reducing cardiovascular events: systematic review and network meta-analyses. Hypertension. 2012 Jun;59(6):1110–7.
226. Dahlöf B, Sever PS, Poulter NR, Wedel H, Beevers DG, Caulfield M, et al. Prevention of cardiovascular events with an antihypertensive regimen of amlodipine adding perindopril as required versus atenolol adding bendroflumethiazide as required, in the Anglo-Scandinavian Cardiac Outcomes Trial-Blood Pressure Lowering Arm (ASCOT-B. Lancet (London, England). Jan;366(9489):895–906.
227. Julius S, Kjeldsen SE, Weber M, Brunner HR, Ekman S, Hansson L, et al. Outcomes in hypertensive patients at high cardiovascular risk treated with regimens based on valsartan or amlodipine: The VALUE randomised trial. Lancet. Elsevier; 2004 Jun 19;363(9426):2022–31.
228. Verdecchia P, Reboldi G, Angeli F, Gattobigio R, Bentivoglio M, Thijs L, et al. Angiotensin-converting enzyme inhibitors and calcium channel blockers for coronary heart disease and stroke prevention. Hypertension. 2005 Aug;46(2):386–92.
229. Zanchetti A. Calcium channel blockers in hypertension. In: Black HR,
214
Elliott WJ, editors. Hypertension, a companion to Braunwald Heart Disease. Elsevier; 2012; chapt 22:204–218.
230. Fagard RH, Celis H, Thijs L, Wouters S. Regression of left ventricular mass by antihypertensive treatment: a meta-analysis of randomized comparative studies. Hypertension. 2009 Nov;54(5):1084–91.
231. Unger T, Jakobsen A, Heroys J, Ralph A, Rees T, Shaw M. Targeting cardiovascular protection: the concept of dual renin-angiotensin system control. MedscapeJ Med. 2008 Jan;10 Suppl:S4.
232. Hansson L, Lindholm LH, Niskanen L, Lanke J, Hedner T, Niklason A, et al. Effect of angiotensin-converting-enzyme inhibition compared with conventional therapy on cardiovascular morbidity and mortality in hypertension: the Captopril Prevention Project (CAPPP) randomised trial. Lancet. 1999 Feb 20;353(9153):611–6.
233. Hansson L, Lindholm LH, Ekbom T, Dahlöf B, Lanke J, Scherstén B, et al. Randomised trial of old and new antihypertensive drugs in elderly patients: cardiovascular mortality and morbidity the Swedish Trial in Old Patients with Hypertension-2 study. Lancet (London, England). 1999 Nov 20;354(9192):1751–6.
234. Stergiou GS, Skeva II, Baibas NM, Kalkana CB, Roussias LG, Mountokalakis TD. Does the Antihypertensive Response to Angiotensin Converting Enzyme Inhibition Predict the Antihypertensive Response to Angiotensin Receptor Antagonism ? 2001;7061(1):688–93.
235. van Vark LC, Bertrand M, Akkerhuis KM, Brugts JJ, Fox K, Mourad J-J, et al. Angiotensin-converting enzyme inhibitors reduce mortality in hypertension: a meta-analysis of randomized clinical trials of renin-angiotensin-aldosterone system inhibitors involving 158,998 patients. Eur Heart J. 2012 Aug;33(16):2088–97.
236. Turnbull F. Effects of different blood-pressure-lowering regimens on major cardiovascular events: results of prospectively-designed overviews of randomised trials. Lancet (London, England). 2003 Nov 8;362(9395):1527–35.
237. Verma S, Strauss M. Angiotensin receptor blockers and myocardial infarction. BMJ. 2004 Nov 27;329(7477):1248–9.
238. Strauss MH, Hall AS. Angiotensin receptor blockers may increase risk of myocardial infarction: unraveling the ARB-MI paradox. Circulation. 2006 Aug 22;114(8):838–54.
239. Teo KK, Pogue J, Dyal L, Copland I, Health P, Sciences HHH, et al. Telmisartan, Ramipril, or Both in Patients at High Risk for Vascular Events: ONTARGET. N Engl J Med. 2008 Apr 10;358(15):1547–59.
240. Reboldi G, Angeli F, Cavallini C, Gentile G, Mancia G, Verdecchia P. Comparison between angiotensin-converting enzyme inhibitors and angiotensin receptor blockers on the risk of myocardial infarction, stroke and death: a meta-analysis. J Hypertens. 2008 Jul;26(7):1282–9.
241. Volpe M, Tocci G, Sciarretta S, Verdecchia P, Trimarco B, Mancia G. Angiotensin II receptor blockers and myocardial infarction: an updated analysis of randomized clinical trials. J Hypertens. 2009 May;27(5):941–6.
242. Schupp M, Janke J, Clasen R, Unger T, Kintscher U. Angiotensin type 1 receptor blockers induce peroxisome proliferator-activated receptor-gamma activity. Circulation. 2004 May 4;109(17):2054–7.
243. Yusuf S, Teo K, Anderson C, Pogue J, Dyal L, Copland I, et al. Effects of the angiotensin-receptor blocker telmisartan on cardiovascular events in
215
high-risk patients intolerant to angiotensin-converting enzyme inhibitors: a randomised controlled trial. Lancet (London, England). 2008 Sep 27;372(9644):1174–83.
244. Sipahi I, Debanne SM, Rowland DY, Simon DI, Fang JC. Angiotensin-receptor blockade and risk of cancer: meta-analysis of randomised controlled trials. Lancet Oncol. 2010 Jul;11(7):627–36.
245. Effects of telmisartan, irbesartan, valsartan, candesartan, and losartan on cancers in 15 trials enrolling 138,769 individuals. J Hypertens. 2011 Apr;29(4):623–35.
246. Deary AJ, Schumann AL, Murfet H, Haydock SF, Foo RS-Y, Brown MJ. Double-blind, placebo-controlled crossover comparison of five classes of antihypertensive drugs. J Hypertens. 2002 Apr;20(4):771–7.
247. Dickerson JE, Hingorani AD, Ashby MJ, Palmer CR, Brown MJ. Optimisation of antihypertensive treatment by crossover rotation of four major classes. Lancet (London, England). 1999 Jun 12;353(9169):2008–13.
248. Materson BJ, Reda DJ, Cushman WC. Department of veterans Affairs single-drug therapy of hypertension study. Revised figures and new data. Department of Veterans Affairs Cooperative Study Group on Antihypertensive Agents. Am J Hypertens. 1995 Feb;8(2):189–92.
249. Turnbull F, Neal B, Ninomiya T, Algert C, Arima H, Barzi F, et al. Effects of different regimens to lower blood pressure on major cardiovascular events in older and younger adults: meta-analysis of randomised trials. BMJ. 2008 May 17;336(7653):1121–3.
250. SHEP Cooperative Research Group. Prevention of Stroke by Antihypertensive Drug Treatment in Older Persons With Isolated Systolic Hypertension: Final Results of the Systolic Hypertension in the Elderly Program (SHEP). JAMA J Am Med Assoc. American Medical Association; 1991 Jun 26;265(24):3255–64.
251. Amery A, Birkenhäger W, Brixko P, Bulpitt C, Clement D, Deruyttere M, et al. Mortality and morbidity results from the European Working Party on High Blood Pressure in the Elderly trial. Lancet (London, England). 1985 Jun 15;1(8442):1349–54.
252. Medical Research Council trial of treatment of hypertension in older adults: principal results. MRC Working Party. BMJ. 1992 Mar 15;304(6824):405–12.
253. Coope J, Warrender TS. Randomised trial of treatment of hypertension in elderly patients in primary care. Br Med J (Clin Res Ed). 1986 Nov 1;293(6555):1145–51.
254. Liu L, Wang JG, Gong L, Liu G, Staessen JA. Comparison of active treatment and placebo in older Chinese patients with isolated systolic hypertension. Systolic Hypertension in China (Syst-China) Collaborative Group. J Hypertens. 1998 Dec;16(12 Pt 1):1823–9.
255. Lithell H, Hansson L, Skoog I, Elmfeldt D, Hofman A, Olofsson B, et al. The Study on Cognition and Prognosis in the Elderly (SCOPE): principal results of a randomized double-blind intervention trial. J Hypertens. 2003 May;21(5):875–86.
256. Turnbull F, Woodward M, Neal B, Barzi F, Ninomiya T, Chalmers J, et al. Do men and women respond differently to blood pressure-lowering treatment? Results of prospectively designed overviews of randomized trials. Eur Heart J. 2008 Nov;29(21):2669–80.
257. Lea J, Greene T, Hebert L, Lipkowitz M, Massry S, Middleton J, et al. The
216
relationship between magnitude of proteinuria reduction and risk of end-stage renal disease: results of the African American study of kidney disease and hypertension. Arch Intern Med. 2005 Apr 25;165(8):947–53.
258. de Zeeuw D, Remuzzi G, Parving H-H, Keane WF, Zhang Z, Shahinfar S, et al. Albuminuria, a therapeutic target for cardiovascular protection in type 2 diabetic patients with nephropathy. Circulation. 2004 Aug 24;110(8):921–7.
259. Schmieder RE, Mann JFE, Schumacher H, Gao P, Mancia G, Weber MA, et al. Changes in albuminuria predict mortality and morbidity in patients with vascular disease. J Am Soc Nephrol. 2011 Jul;22(7):1353–64.
260. Bakris GL, Fonseca V, Katholi RE, McGill JB, Messerli FH, Phillips RA, et al. Metabolic effects of carvedilol vs metoprolol in patients with type 2 diabetes mellitus and hypertension: a randomized controlled trial. JAMA. 2004 Nov 10;292(18):2227–36.
261. Celik T, Iyisoy A, Kursaklioglu H, Kardesoglu E, Kilic S, Turhan H, et al. Comparative effects of nebivolol and metoprolol on oxidative stress, insulin resistance, plasma adiponectin and soluble P-selectin levels in hypertensive patients. J Hypertens. 2006 Mar;24(3):591–6.
262. Stears AJ, Woods SH, Watts MM, Burton TJ, Graggaber J, Mir FA, et al. A double-blind, placebo-controlled, crossover trial comparing the effects of amiloride and hydrochlorothiazide on glucose tolerance in patients with essential hypertension. Hypertension. 2012 May;59(5):934–42.
263. Shafi T, Appel LJ, Miller ER, Klag MJ, Parekh RS. Changes in serum potassium mediate thiazide-induced diabetes. Hypertension. 2008 Dec;52(6):1022–9.
264. Gueyffier F, Boissel JP, Boutitie F, Pocock S, Coope J, Cutler J, et al. Effect of antihypertensive treatment in patients having already suffered from stroke. Gathering the evidence. The INDANA (INdividual Data ANalysis of Antihypertensive intervention trials) Project Collaborators. Stroke. 1997 Dec;28(12):2557–62.
265. Schrader J, Lüders S, Kulschewski A, Hammersen F, Plate K, Berger J, et al. Morbidity and Mortality After Stroke, Eprosartan Compared with Nitrendipine for Secondary Prevention: principal results of a prospective randomized controlled study (MOSES). Stroke. 2005 Jun;36(6):1218–26.
266. Borghi C, Bacchelli S, Esposti DD, Bignamini A, Magnani B, Ambrosioni E. Effects of the administration of an angiotensin-converting enzyme inhibitor during the acute phase of myocardial infarction in patients with arterial hypertension. SMILE Study Investigators. Survival of Myocardial Infarction Long-term Evaluation. Am J Hypertens. 1999 Jul;12(7):665–72.
267. Gustafsson F, Køber L, Torp-Pedersen C, Hildebrandt P, Ottesen MM, Sonne B, et al. Long-term prognosis after acute myocardial infarction in patients with a history of arterial hypertension. TRACE study group. Eur Heart J. 1998 Apr;19(4):588–94.
268. Camm AJ, Kirchhof P, Lip GYH, Schotten U, Savelieva I, Ernst S, et al. Guidelines for the management of atrial fibrillation. Eur Heart J. 2010 Jul 2;31(19):2369–429.
269. Zanchetti A, Crepaldi G, Bond MG, Gallus G, Veglia F, Mancia G, et al. Different effects of antihypertensive regimens based on fosinopril or hydrochlorothiazide with or without lipid lowering by pravastatin on progression of asymptomatic carotid atherosclerosis: principal results of PHYLLIS--a randomized double-blind trial. Stroke. 2004 Dec;35(12):2807–
217
12. 270. Mehler PS, Coll JR, Estacio R, Esler A, Schrier RW, Hiatt WR. Intensive
blood pressure control reduces the risk of cardiovascular events in patients with peripheral arterial disease and type 2 diabetes. Circulation. 2003 Feb 11;107(5):753–6.
271. Ong K-T, Delerme S, Pannier B, Safar ME, Benetos A, Laurent S, et al. Aortic stiffness is reduced beyond blood pressure lowering by short-term and long-term antihypertensive treatment: a meta-analysis of individual data in 294 patients. J Hypertens. 2011 Jun;29(6):1034–42.
272. Shahin Y, Khan JA, Chetter I. Angiotensin converting enzyme inhibitors effect on arterial stiffness and wave reflections: a meta-analysis and meta-regression of randomised controlled trials. Atherosclerosis. 2012 Mar;221(1):18–33.
273. AlGhatrif M, Al Ghatrif M, Kuo Y-F, Al Snih S, Raji MA, Ray LA, et al. Trends in hypertension prevalence, awareness, treatment and control in older Mexican Americans, 1993-2005. Ann Epidemiol. 2011 Jan;21(1):15–25.
274. Wagner A, Sadoun A, Dallongeville J, Ferrières J, Amouyel P, Ruidavets J-B, et al. High blood pressure prevalence and control in a middle-aged French population and their associated factors: the MONA LISA study. J Hypertens. 2011 Jan;29(1):43–50.
275. Morgan T. Ace inhibitors, beta-blockers, calcium blockers, and diuretics for the control of systolic hypertension. Am J Hypertens. 2001 Mar 1;14(3):241–7.
276. Wald DS, Law M, Morris JK, Bestwick JP, Wald NJ. Combination therapy versus monotherapy in reducing blood pressure: meta-analysis on 11,000 participants from 42 trials. Am J Med. 2009 Mar;122(3):290–300.
277. Weber MA. Creating a combination antihypertensive regimen: what does the research show? J Clin Hypertens (Greenwich). Jan;5(4 Suppl 3):12–20.
278. Ezzati M, Lopez AD, Rodgers A, Vander Hoorn S, Murray CJ, Comparative Risk Assessment Collaborating G. Selected major risk factors and global and regional burden of disease. Lancet. 2002/11/09. 2002;360(9343):1347–60.
279. Guilbert J-J. The World Health Report 2002 - Reducing Risks, Promoting Healthy Life. Educ Heal Chang Learn Pract (Taylor Fr Ltd). World Health Organization; 2003;16(2):230.
280. Ford ES. Trends in mortality from all causes and cardiovascular disease among hypertensive and nonhypertensive adults in the United States. Circulation. 2011 Apr 26;123(16):1737–44.
281. World Health Organization. Global health risks: mortality and burden of disease attributable to selected major risks. Geneva World Health Organization, 2009.
282. Kearney PM, Whelton M, Reynolds K, Muntner P, Whelton PK, He J. Global burden of hypertension: analysis of worldwide data. Lancet. 2005/01/18. 2005;365(9455):217–23.
283. Pereira M, Lunet N, Azevedo A, Barros H. Differences in prevalence, awareness, treatment and control of hypertension between developing and developed countries. J Hypertens. 2009/04/30. 2009;27(5):963–75.
284. Mathers C, Stevens G, Mascarenhas M, World Health O, editors. Global health risks : mortality and burden of disease attributable to selected major risks. Geneva, Switzerland: World Health Organization; 2009.
285. Kearney PM, Whelton M, Reynolds K, Whelton PK, He J. Worldwide
218
prevalence of hypertension: a systematic review. J Hypertens. 2004/04/27. 2004;22(1):11–9.
286. Perkovic V, Huxley R, Wu Y, Prabhakaran D, MacMahon S. The burden of blood pressure-related disease: a neglected priority for global health. Hypertension. 2007/10/24. 2007;50(6):991–7.
287. World Health Organization. WHO | Global status report on noncommunicable diseases 2014. WHO. World Health Organization; 2015;298.
288. Catherine Bromley and Jennifer Mindell (2011). CHAPTER 8 CARDIOVASCULAR DISEASE, DIABETES AND HYPERTENSION. [eds.] The 2011 Scottish Health Survey - Volume 1: Main Report. Edinburgh, Scottish Government. http://www.scotland.gov.uk/Publications/2012/09/785.
289. Sarafidis PA, Bakris GL. Resistant hypertension: an overview of evaluation and treatment. J Am Coll Cardiol. 2008/11/22. 2008;52(22):1749–57.
290. Wolf-Maier K, Cooper RS, Kramer H, Banegas JR, Giampaoli S, Joffres MR, et al. Hypertension treatment and control in five European countries, Canada, and the United States. Hypertension. 2003/11/26. 2004;43(1):10–7.
291. Guo F, He D, Zhang W, Walton RG. Trends in Prevalence, Awareness, Management, and Control of Hypertension Among United States Adults, 1999 to 2010. J Am Coll Cardiol. 2012;60(7):599–606.
292. Craig Knott & Jennifer Mindell. CHAPTER 3 HYPERTENSION .Health Survey for England - 2011, Health, social care and lifestyles [NS] (2012) . https://catalogue.ic.nhs.uk/publications/public-health/surveys/heal-surv-eng-2011/HSE2011-Ch3-Hypertension.pdf [Onl.
293. Falaschetti E, Chaudhury M, Mindell J, Poulter N. Continued improvement in hypertension management in England: results from the Health Survey for England 2006. Hypertension. 2009/02/11. 2009;53(3):480–6.
294. Calhoun DA, Jones D, Textor S, Goff DC, Murphy TP, Toto RD, et al. Resistant hypertension: diagnosis, evaluation, and treatment. A scientific statement from the American Heart Association Professional Education Committee of the Council for High Blood Pressure Research. Hypertension. 2008 Jun 1;51(6):1403–19.
295. Hajjar I, Kotchen TA. Trends in prevalence, awareness, treatment, and control of hypertension in the United States, 1988-2000. JAMA. 2003/07/10. 2003;290(2):199–206.
296. Lloyd-Jones DM, Evans JC, Larson MG, O’Donnell CJ, Roccella EJ, Levy D. Differential control of systolic and diastolic blood pressure : factors associated with lack of blood pressure control in the community. Hypertension. 2000/10/21. 2000;36(4):594–9.
297. Peralta CA, Hicks LS, Chertow GM, Ayanian JZ, Vittinghoff E, Lin F, et al. Control of hypertension in adults with chronic kidney disease in the United States. Hypertension. 2005 Jun;45(6):1119–24.
298. Thoenes M, Neuberger H-R, Volpe M, Khan B V, Kirch W, Böhm M. Antihypertensive drug therapy and blood pressure control in men and women: an international perspective. J Hum Hypertens. 2010 May;24(5):336–44.
299. Cent. Dis. Control Prev. 2005. Racial/ ethnic disparities in prevalence, treatment, and control of hypertension— United States, 1999–2002. MMWR. 54:7–9.
300. Nieto FJ, Alonso J, Chambless LE, Zhong M, Ceraso M, Romm FJ, et al.
219
Population awareness and control of hypertension and hypercholesterolemia. The Atherosclerosis Risk in Communities study. Arch Intern Med. 1995/04/10. 1995;155(7):677–84.
301. Satish S, Stroup-Benham CA, Espino D V., Markides KS, Goodwin JS. Undertreatment of Hypertension in Older Mexican Americans. J Am Geriatr Soc. 1998/04/29. 1998 Apr 27;46(4):405–10.
302. Pimenta E, Gaddam KK, Oparil S. Mechanisms and treatment of resistant hypertension. J Clin Hypertens. 2008/03/11. 2008;10(3):239–44.
303. Gupta AK, Nasothimiou EG, Chang CL, Sever PS, Dahlof B, Poulter NR, et al. Baseline predictors of resistant hypertension in the Anglo-Scandinavian Cardiac Outcome Trial (ASCOT): a risk score to identify those at high-risk. J Hypertens. 2011/09/02. 2011;29(10):2004–13.
304. Cushman WC, Ford CE, Cutler JA, Margolis KL, Davis BR, Grimm RH, et al. Success and predictors of blood pressure control in diverse North American settings: the antihypertensive and lipid-lowering treatment to prevent heart attack trial (ALLHAT). J Clin Hypertens. 2002/12/04. 2002;4(6):393–404.
305. Kramer H, Han C, Post W, Goff D, Diez-Roux A, Cooper R, et al. Racial/ethnic differences in hypertension and hypertension treatment and control in the multi-ethnic study of atherosclerosis (MESA). Am J Hypertens. 2004/10/16. 2004;17(10):963–70.
306. Sandoval D, Bravo M, Koch E, Gatica S, Ahlers I, Henríquez O, et al. Overcoming barriers in the management of hypertension: the experience of the cardiovascular health program in chilean primary health care centers. Int J Hypertens. 2012 Jan;2012:405892.
307. Chmiel C, Wang M, Senn O, Del Prete V, Zoller M, Rosemann T, et al. Uncontrolled arterial hypertension in primary care--patient characteristics and associated factors. Swiss Med Wkly. 2012 Jan;142:w13693.
308. Labeit AM, Klotsche J, Pieper L, Pittrow D, Einsle F, Stalla GK, et al. Changes in the prevalence, treatment and control of hypertension in Germany? A clinical-epidemiological study of 50.000 primary care patients. PLoS One. 2012 Jan;7(12):e52229.
309. Abaci A, Oguz A, Kozan O, Toprak N, Senocak H, Deger N, et al. Treatment and control of hypertension in Turkish population: a survey on high blood pressure in primary care (the TURKSAHA study). J Hum Hypertens. 2006 May;20(5):355–61.
310. Schäfer HH, Sudano I, Theus G-R, Noll G, Burnier M. Target blood pressure attainment with antihypertensive therapy in Swiss primary care. Blood Press. 2012 Aug;21(4):211–9.
311. Brenner R, Waeber B, Allemann Y. Medical treatment of hypertension in Switzerland. The 2009 Swiss Hypertension Survey (SWISSHYPE). Swiss Med Wkly. 2011 Jan;141:w13169.
312. Ostchega Y, Hughes JP, Wright JD, McDowell MA, Louis T. Are demographic characteristics, health care access and utilization, and comorbid conditions associated with hypertension among US adults? Am J Hypertens. 2008 Feb;21(2):159–65.
313. Degli Esposti E, Di Martino M, Sturani A, Russo P, Dradi C, Falcinelli S, et al. Risk factors for uncontrolled hypertension in Italy. J Hum Hypertens. 2004 Mar;18(3):207–13.
314. Kim K-I, Kim Y, Kim H-J, Kang D-H, Park JB, Choi D-J, et al. Current status and characteristics of hypertension treatment by primary physicians in
220
Korea: data from Korean epidemiology study on hypertension (KEY study). Am J Hypertens. 2008 Aug;21(8):884–9.
315. Paulsen MS, Sondergaard J, Reuther L, Larsen PS, Munck AP, Larsen P V, et al. Treatment of 5413 hypertensive patients: a cross-sectional study. Fam Pract. 2011 Dec;28(6):599–607.
316. Morgado M, Rolo S, Macedo AF, Pereira L, Castelo-Branco M. Predictors of uncontrolled hypertension and antihypertensive medication nonadherence. J Cardiovasc Dis Res. 2010 Oct;1(4):196–202.
317. Petrella RJ, Merikle EP, Jones J. Prevalence, treatment, and control of hypertension in primary care: gaps, trends, and opportunities. J Clin Hypertens (Greenwich). 2007 Jan;9(1):28–35.
318. Senior H, Anderson CS, Chen M-H, Haydon R, Walker D, Fourie D, et al. Management of hypertension in the oldest old: a study in primary care in New Zealand. Age Ageing. 2006 Mar;35(2):178–82.
319. Paulsen MS, Andersen M, Munck AP, Larsen P V, Hansen DG, Jacobsen IA, et al. Socio-economic status influences blood pressure control despite equal access to care. Fam Pract. 2012 Oct;29(5):503–10.
320. Paulsen MS, Andersen M, Thomsen JL, Schroll H, Larsen P V, Lykkegaard J, et al. Multimorbidity and blood pressure control in 37 651 hypertensive patients from Danish general practice. J Am Heart Assoc. 2013 Feb;2(1):e004531.
321. Petersen LA, Woodard LD, Henderson LM, Urech TH, Pietz K. Will hypertension performance measures used for pay-for-performance programs penalize those who care for medically complex patients? Circulation. 2009 Jun 16;119(23):2978–85.
322. Godet-Mardirossian H, Girerd X, Vernay M, Chamontin B, Castetbon K, de Peretti C. Patterns of hypertension management in France (ENNS 2006-2007). Eur J Prev Cardiol. 2012 Apr;19(2):213–20.
323. Knight EL, Bohn RL, Wang PS, Glynn RJ, Mogun H, Avorn J. Predictors of Uncontrolled Hypertension in Ambulatory Patients. Hypertension. 2001 Oct 1;38(4):809–14.
324. Dennison CR, Peer N, Steyn K, Levitt NS, Hill MN. Determinants of hypertension care and control among peri-urban Black South Africans: the HiHi study. Ethn Dis. 2007 Jan 1;17(3):484–91.
325. Hedblad B, Nerbrand C, Ekesbo R, Johansson L, Midlöv P, Brunkstedt I, et al. High blood pressure despite treatment: results from a cross-sectional primary healthcare-based study in southern Sweden. Scand J Prim Health Care. 2006 Dec;24(4):224–30.
326. Michal M, Wiltink J, Lackner K, Wild PS, Zwiener I, Blettner M, et al. Association of hypertension with depression in the community: results from the Gutenberg Health Study. J Hypertens. 2013 May;31(5):893–9.
327. Mackenbach JP, Stirbu I, Roskam A-JR, Schaap MM, Menvielle G, Leinsalu M, et al. Socioeconomic Inequalities in Health in 22 European Countries. N Engl J Med. 2008 Jun 5;358(23):2468–81.
328. Kagamimori S, Gaina A, Nasermoaddeli A. Socioeconomic status and health in the Japanese population. Soc Sci Med. 2009 Jun;68(12):2152–60.
329. Fryar CD, Chen T-C, Li X. Prevalence of uncontrolled risk factors for cardiovascular disease: United States, 1999-2010. NCHS Data Brief. 2012 Aug;(103):1–8.
330. Agyemang C, van Valkengoed I, Koopmans R, Stronks K. Factors associated with hypertension awareness, treatment and control among ethnic groups
221
in Amsterdam, the Netherlands: the SUNSET study. J Hum Hypertens. 2006 Nov;20(11):874–81.
331. Ebrahimi M, Mansournia MA, Haghdoost AA, Abazari A, Alaeddini F, Mirzazadeh A, et al. Social disparities in prevalence, treatment and control of hypertension in Iran: second National Surveillance of Risk Factors of Noncommunicable Diseases, 2006. J Hypertens. 2010 Aug;28(8):1620–9.
332. Mancia G, Pessina AC, Trimarco B, Grassi G. Blood pressure control according to new guidelines targets in low- to high-risk hypertensives managed in specialist practice. J Hypertens. 2004 Dec;22(12):2387–96.
333. Wong MD, Shapiro MF, Boscardin WJ, Ettner SL. Contribution of Major Diseases to Disparities in Mortality. N Engl J Med. 2002 Nov 14;347(20):1585–92.
334. Chowdhury EK, Owen A, Krum H, Wing LMH, Ryan P, Nelson MR, et al. Barriers to achieving blood pressure treatment targets in elderly hypertensive individuals. J Hum Hypertens. 2013 Sep;27(9):545–51.
335. Hyman DJ, Pavlik VN, Vallbona C. Physician Role in Lack of Awareness and Control of Hypertension. J Clin Hypertens (Greenwich). 2000 Oct;2(5):324–30.
336. Guthrie B, Inkster M, Fahey T. Tackling therapeutic inertia: role of treatment data in quality indicators. BMJ. 2007 Sep 15;335(7619):542–4.
337. Ferrari P. Reasons for therapeutic inertia when managing hypertension in clinical practice in non-Western countries. J Hum Hypertens. 2009 Mar;23(3):151–9.
338. Phillips LS. Clinical Inertia. Ann Intern Med. American College of Physicians; 2001 Nov 6;135(9):825.
339. Nicodème R, Albessard A, Amar J, Chamontin B, Lang T. Poor blood pressure control in general practice: in search of explanations. Arch Cardiovasc Dis. Jan;102(6–7):477–83.
340. Oliveria SA, Lapuerta P, McCarthy BD, L’Italien GJ, Berlowitz DR, Asch SM. Physician-related barriers to the effective management of uncontrolled hypertension. Arch Intern Med. 2002 Feb 25;162(4):413–20.
341. Viera AJ, Schmid D, Bostrom S, Yow A, Lawrence W, DuBard CA. Level of blood pressure above goal and clinical inertia in a Medicaid population. J Am Soc Hypertens. Jan;4(5):244–54.
342. Hicks LS, Fairchild DG, Horng MS, Orav EJ, Bates DW, Ayanian JZ. Determinants of JNC VI guideline adherence, intensity of drug therapy, and blood pressure control by race and ethnicity. Hypertension. 2004 Oct;44(4):429–34.
343. Bodenheimer T, Wagner EH, Grumbach K. Improving primary care for patients with chronic illness. JAMA. 2002 Oct 9;288(14):1775–9.
344. Wagner EH. Chronic disease management: what will it take to improve care for chronic illness? Eff Clin Pract. Jan;1(1):2–4.
345. Worrall G, Chaulk P, Freake D. The effects of clinical practice guidelines on patient outcomes in primary care: a systematic review. Can Med Assoc J. 1997 Jun 15;156(12):1705–12.
346. Gupta L, Ward JE, Hayward RS. Clinical practice guidelines in general practice: a national survey of recall, attitudes and impact. Med J Aust. 1997 Jan 20;166(2):69–72.
347. Monane M, Glynn RJ, Gurwitz JH, Bohn RL, Levin R, Avorn J. Trends in medication choices for hypertension in the elderly. The decline of the thiazides. Hypertension. 1995 May 1;25(5):1045–51.
222 348. Siegel D. Trends in Antihypertensive Drug Use in the United States. JAMA.
American Medical Association; 1997 Dec 3;278(21):1745. 349. Clause SL, Hamilton RA. Medicaid Prescriber Compliance with Joint
National Committee VI Hypertension Treatment Guidelines. Ann Pharmacother. SAGE Publications; 2002 Oct 1;36(10):1505–11.
350. Mehta SS, Wilcox CS, Schulman KA. Treatment of hypertension in patients with comorbidities: results from the study of hypertensive prescribing practices (SHyPP). Am J Hypertens. 1999 Apr;12(4 Pt 1):333–40.
351. Dickerson JE, Garratt CJ, Brown MJ. Management of hypertension in general practice: agreements with and variations from the British Hypertension Society guidelines. J Hum Hypertens. 1995 Oct;9(10):835–9.
352. Fagard RH, Van Den Enden M, Leeman M, Warling X. Survey on treatment of hypertension and implementation of World Health Organization/International Society of Hypertension risk stratification in primary care in Belgium. J Hypertens. 2002 Jul;20(7):1297–302.
353. Hagemeister J, Schneider CA, Barabas S, Schadt R, Wassmer G, Mager G, et al. Hypertension guidelines and their limitations--the impact of physicians’ compliance as evaluated by guideline awareness. J Hypertens. 2001 Nov;19(11):2079–86.
354. Ferrari P, Hess L, Pechere-Bertschi A, Muggli F, Burnier M. Reasons for not intensifying antihypertensive treatment (RIAT): a primary care antihypertensive intervention study. J Hypertens. 2004 Jun;22(6):1221–9.
355. Tu K, Mamdani MM, Tu J V. Hypertension guidelines in elderly patients: is anybody listening? Am J Med. 2002 Jul;113(1):52–8.
356. Frisk P, Mellgren T-O, Hedberg N, Berlin A, Granath F, Wettermark B. Utilisation of angiotensin receptor blockers in Sweden: combining survey and register data to study adherence to prescribing guidelines. Eur J Clin Pharmacol. 2008 Dec;64(12):1223–9.
357. Frijling BD, Spies TH, Lobo CM, Hulscher ME, van Drenth BB, Braspenning JC, et al. Blood pressure control in treated hypertensive patients: clinical performance of general practitioners. Br J Gen Pract. 2001 Jan;51(462):9–14.
358. Farquhar CM, Kofa EW, Slutsky JR. Clinicians’ attitudes to clinical practice guidelines: a systematic review. Med J Aust. 2002 Nov 4;177(9):502–6.
359. Carlsen B, Norheim OF. ‘What lies beneath it all?’--an interview study of GPs’ attitudes to the use of guidelines. BMC Health Serv Res. BioMed Central; 2008 Jan 22;8(1):218.
360. Ikeda N, Hasegawa T, Saito I, Saruta T. Awareness of the Japanese Society of Hypertension Guidelines for the Management of Hypertension (JSH 2000) and compliance to its recommendations: surveys in 2000 and 2004. J Hum Hypertens. 2006 Apr;20(4):263–6.
361. Cabana MD, Rand CS, Powe NR, Wu AW, Wilson MH, Abboud P-AC, et al. Why Don’t Physicians Follow Clinical Practice Guidelines? JAMA. American Medical Association; 1999 Oct 20;282(15):1458.
362. Johnson DW. Clinicians’ attitudes to clinical practice guidelines. Med J Aust. 2003 Apr 7;178(7):354-5-6.
363. Milchak JL, Carter BL, James PA, Ardery G. Measuring adherence to practice guidelines for the management of hypertension: an evaluation of the literature. Hypertension. 2004 Nov;44(5):602–8.
364. Milchak JL, Carter BL, Ardery G, Black HR, Bakris GL, Jones DW, et al. Development of explicit criteria to measure adherence to hypertension
223
guidelines. J Hum Hypertens. 2006 Jun;20(6):426–33. 365. Steinman MA, Goldstein MK. When tight blood pressure control is not for
everyone: a new model for performance measurement in hypertension. Jt Comm J Qual Patient Saf. 2010 Apr;36(4):164–72.
366. Ardery G, Carter BL, Milchak JL, Bergus GR, Dawson JD, James PA, et al. Explicit and implicit evaluation of physician adherence to hypertension guidelines. J Clin Hypertens (Greenwich). 2007 Feb;9(2):113–9.
367. Zolnierek KBH, Dimatteo MR. Physician communication and patient adherence to treatment: a meta-analysis. Med Care. 2009 Aug;47(8):826–34.
368. Svensson S, Kjellgren KI, Ahlner J, Säljö R. Reasons for adherence with antihypertensive medication. Int J Cardiol. Jan;76(2–3):157–63.
369. Qureshi NN, Hatcher J, Chaturvedi N, Jafar TH. Effect of general practitioner education on adherence to antihypertensive drugs: cluster randomised controlled trial. BMJ. 2007 Nov 17;335(7628):1030.
370. Di Cesare M, Khang Y-H, Asaria P, Blakely T, Cowan MJ, Farzadfar F, et al. Inequalities in non-communicable diseases and effective responses. Lancet. Elsevier; 2013 Feb 16;381(9866):585–97.
371. Duru OK, Vargas RB, Kermah D, Pan D, Norris KC. Health insurance status and hypertension monitoring and control in the United States. Am J Hypertens. 2007 Apr;20(4):348–53.
372. He J, Muntner P, Chen J, Roccella EJ, Streiffer RH, Whelton PK. Factors associated with hypertension control in the general population of the United States. Arch Intern Med. 2002 May 13;162(9):1051–8.
373. Durant RW, Parmar G, Shuaib F, Le A, Brown TM, Roth DL, et al. Awareness and management of chronic disease, insurance status, and health professional shortage areas in the REasons for Geographic And Racial Differences in Stroke (REGARDS): a cross-sectional study. BMC Health Serv Res. 2012 Jan;12:208.
374. Brooks EL, Preis SR, Hwang S-J, Murabito JM, Benjamin EJ, Kelly-Hayes M, et al. Health insurance and cardiovascular disease risk factors. Am J Med. 2010 Aug;123(8):741–7.
375. Starfield B, Shi L, Macinko J. Contribution of primary care to health systems and health. Milbank Q. 2005 Jan;83(3):457–502.
376. Rizza P, Bianco A, Pavia M, Angelillo IF. Preventable hospitalization and access to primary health care in an area of Southern Italy. BMC Health Serv Res. 2007 Jan;7:134.
377. Hyman, DJ, Pavlik V. Characteristics of patients with uncontrolled hypertension in the United States. N Engl J Med. 2001 Aug 16;345(7):479–86.
378. Elliott R. Non-adherence to medicines: not solved but solvable. J Health Serv Res Policy. 2009;14(1):58–61.
379. McDonnell PJ, Jacobs MR. Hospital admissions resulting from preventable adverse drug reactions. Ann Pharmacother. 2002 Sep;36(9):1331–6.
380. Senst BL, Achusim LE, Genest RP, Cosentino LA, Ford CC, Little JA, et al. Practical approach to determining costs and frequency of adverse drug events in a health care network. Am J Health Syst Pharm. 2001 Jun 15;58(12):1126–32.
381. Levy G, Zamacona MK, Jusko WJ. Developing compliance instructions for drug labeling. Clin Pharmacol Ther. 2000 Dec;68(6):586–91.
382. Berg JS, Dischler J, Wagner DJ, Raia JJ, Palmer-Shevlin N. Medication
224
compliance: a healthcare problem. Ann Pharmacother. 1993 Sep;27(9 Suppl):S1-24.
383. Sokol MC, McGuigan KA, Verbrugge RR, Epstein RS. Impact of medication adherence on hospitalization risk and healthcare cost. Med Care. 2005 Jun;43(6):521–30.
384. Frazee S, Miller S, Nease R, Stettin G. Express Scripts 2011 Drug Trend Report [Internet]. 2012 [cited 2015 Aug 6]. p. 1–188. Available from: file://psf/Home/Downloads/Drug Trend Report 2011 (3).pdf
385. Trueman P, Lowson K, Blighe A, Meszaros A. Evaluation of the Scale , Causes and Costs of Waste Medicines Evaluation of the Scale , Causes and Costs of Waste Medicines. Evaluation. York Health Economics Consortium and The School of Pharmacy, University of London.; 2011;17:327–49.
386. Ho PM, Spertus JA, Masoudi FA, Reid KJ, Peterson ED, Magid DJ, et al. Impact of medication therapy discontinuation on mortality after myocardial infarction. Arch Intern Med. 2006 Sep 25;166(17):1842–7.
387. Steiner JF. Rethinking adherence. Ann Intern Med. 2012 Oct 16;157(8):580–5.
388. JNC 6. National High Blood Pressure Education Program. The Sixth Report of the Joint National Committee on Prevention, Detection, Evaluation, and Treatment of High Blood Pressure. Arch Intern Med. American Medical Association; 1997 Nov 24;157(21):2413–46.
389. DiMatteo MR, Giordani PJ, Lepper HS, Croghan TW. Patient adherence and medical treatment outcomes: a meta-analysis. Med Care. 2002 Sep;40(9):794–811.
390. Lee JK, Grace KA, Taylor AJ. Effect of a pharmacy care program on medication adherence and persistence, blood pressure, and low-density lipoprotein cholesterol: a randomized controlled trial. JAMA. 2006 Dec 6;296(21):2563–71.
391. Farmer KC. Methods for measuring and monitoring medication regimen adherence in clinical trials and clinical practice. Clin Ther. 1999 Jun;21(6):1074–90; discussion 1073.
392. Lars O, Terrence B, Osterberg L, Blaschke T. Adherence to medication. N Engl J Med. Massachusetts Medical Society; 2005 Aug 4;353(5):487–97.
393. Willey C, Redding C, Stafford J, Garfield F, Geletko S, Flanigan T, et al. Stages of change for adherence with medication regimens for chronic disease: development and validation of a measure. Clin Ther. 2000 Jul;22(7):858–71.
394. Garfield S, Clifford S, Eliasson L, Barber N, Willson A. Suitability of measures of self-reported medication adherence for routine clinical use: a systematic review. BMC Med Res Methodol. 2011 Jan;11:149.
395. Medicines adherence: involving patients in decisions about prescribed medicines and supporting adherence | Guidance and guidelines | NICE. NICE;
396. Matsui D, Hermann C, Klein J, Berkovitch M, Olivieri N, Koren G. Critical comparison of novel and existing methods of compliance assessment during a clinical trial of an oral iron chelator. J Clin Pharmacol. 1994 Sep;34(9):944–9.
397. Grymonpre RE, Didur CD, Montgomery PR, Sitar DS. Pill count, self-report, and pharmacy claims data to measure medication adherence in the elderly. Ann Pharmacother. Jan;32(7–8):749–54.
398. Craig HM. Accuracy of indirect measures of medication compliance in
225
hypertension. Res Nurs Health. 1985 Mar;8(1):61–6. 399. Inui TS, Carter WB, Pecoraro RE. Screening for noncompliance among
patients with hypertension: is self-report the best available measure? Med Care. 1981 Oct;19(10):1061–4.
400. Wang PS, Benner JS, Glynn RJ, Winkelmayer WC, Mogun H, Avorn J. How well do patients report noncompliance with antihypertensive medications?: a comparison of self-report versus filled prescriptions. Pharmacoepidemiol Drug Saf. 2004 Jan;13(1):11–9.
401. Vik SA, Maxwell CJ, Hogan DB. Measurement, correlates, and health outcomes of medication adherence among seniors. Ann Pharmacother. 2004 Feb;38(2):303–12.
402. Cramer JA, Mattson RH, Prevey ML, Scheyer RD, Ouellette VL. How often is medication taken as prescribed? A novel assessment technique. JAMA. 1989 Jun 9;261(22):3273–7.
403. Zeller A, Schroeder K, Peters TJ. Electronic pillboxes (MEMS) to assess the relationship between medication adherence and blood pressure control in primary care. Scand J Prim Health Care. 2007 Dec;25(4):202–7.
404. Cramer JA, Scheyer RD, Mattson RH. Compliance declines between clinic visits. Arch Intern Med. 1990 Jul;150(7):1509–10.
405. Elixhauser A, Eisen SA, Romeis JC, Homan SM. The effects of monitoring and feedback on compliance. Med Care. 1990 Oct;28(10):882–93.
406. Peterson AM, Nau DP, Cramer JA, Benner J, Gwadry-Sridhar F, Nichol M. A checklist for medication compliance and persistence studies using retrospective databases. Value Health. Jan;10(1):3–12.
407. Benner JS, Glynn RJ, Mogun H, Neumann PJ, Weinstein MC, Avorn J. Long-term persistence in use of statin therapy in elderly patients. JAMA. Jan;288(4):455–61.
408. Skaer TL, Sclar DA, Robison LM, Markowski DJ, Won JK. Effect of pharmaceutical formulation for diltiazem on health care expenditures for hypertension. Clin Ther. Jan;15(5):905–11.
409. Karve S, Cleves MA, Helm M, Hudson TJ, West DS, Martin BC. An empirical basis for standardizing adherence measures derived from administrative claims data among diabetic patients. Med Care. 2008 Nov;46(11):1125–33.
410. Hawkshead J, Krousel-Wood MA. Techniques for Measuring Medication Adherence in Hypertensive Patients in Outpatient Settings. Dis Manag Heal Outcomes. 2007;15(2):109–18.
411. Ho PM, Bryson CL, Rumsfeld JS. Medication adherence: its importance in cardiovascular outcomes. Circulation. 2009 Jun 16;119(23):3028–35.
412. Rudd P, Byyny RL, Zachary V, LoVerde ME, Mitchell WD, Titus C, et al. Pill count measures of compliance in a drug trial: variability and suitability. Am J Hypertens. 1988 Jul;1(3 Pt 1):309–12.
413. Spilker B. Methods of Assessing and Improving Patient Compliance in Clinical Trials. IRB Ethics Hum Res. 1992 May;14(3):1.
414. Azizi M, Ménard J, Peyrard S, Lièvre M, Marre M, Chatellier G. Assessment of patients’ and physicians’ compliance to an ACE inhibitor treatment based on urinary N-acetyl Ser-Asp-Lys-Pro determination in the Noninsulin-Dependent Diabetes, Hypertension, Microalbuminuria, Proteinuria, Cardiovascular Events, and Ramipril. Diabetes Care. 2006 Jun;29(6):1331–6.
415. Cook CL, Wade WE, Martin BC, Perri M. Concordance among three self-reported measures of medication adherence and pharmacy refill records. J
226
Am Pharm Assoc (2003). Jan;45(2):151–9. 416. Garber MC, Nau DP, Erickson SR, Aikens JE, Lawrence JB. The concordance
of self-report with other measures of medication adherence: a summary of the literature. Med Care. 2004 Jul;42(7):649–52.
417. Hamilton GA. Measuring adherence in a hypertension clinical trial. Eur J Cardiovasc Nurs. 2003 Sep;2(3):219–28.
418. Lee JY, Kusek JW, Greene PG, Bernhard S, Norris K, Smith D, et al. Assessing medication adherence by pill count and electronic monitoring in the African American Study of Kidney Disease and Hypertension (AASK) Pilot Study. Am J Hypertens. 1996 Aug;9(8):719–25.
419. Choo PW, Rand CS, Inui TS, Lee ML, Cain E, Cordeiro-Breault M, et al. Validation of patient reports, automated pharmacy records, and pill counts with electronic monitoring of adherence to antihypertensive therapy. Med Care. 1999 Sep;37(9):846–57.
420. Braam RL, van Uum SHM, Russel FGM, Swinkels DW, Thien T. Bromide as a marker to measure adherence to drug therapy. Eur J Clin Pharmacol. 2006 Apr;62(4):285–90.
421. Okano GJ, Rascati KL, Wilson JP, Remund DD, Grabenstein JD, Brixner DI. Patterns of antihypertensive use among patients in the US Department of Defense database initially prescribed an angiotensin-converting enzyme inhibitor or calcium channel blocker. Clin Ther. Jan;19(6):1433-45-5.
422. Ren XS, Kazis LE, Lee A, Zhang H, Miller DR. Identifying patient and physician characteristics that affect compliance with antihypertensive medications. J Clin Pharm Ther. 2002 Feb;27(1):47–56.
423. Claxton AJ, Cramer J, Pierce C. A systematic review of the associations between dose regimens and medication compliance. Clin Ther. 2001 Aug;23(8):1296–310.
424. Krousel-Wood M, Joyce C, Holt E, Muntner P, Webber LS, Morisky DE, et al. Predictors of decline in medication adherence: results from the cohort study of medication adherence among older adults. Hypertension. 2011 Nov;58(5):804–10.
425. Monane M, Bohn RL, Gurwitz JH, Glynn RJ, Levin R, Avorn J. The effects of initial drug choice and comorbidity on antihypertensive therapy compliance: results from a population-based study in the elderly. Am J Hypertens. 1997 Jul;10(7 Pt 1):697–704.
426. Mazzaglia G, Ambrosioni E, Alacqua M, Filippi A, Sessa E, Immordino V, et al. Adherence to antihypertensive medications and cardiovascular morbidity among newly diagnosed hypertensive patients. Circulation. 2009 Oct 20;120(16):1598–605.
427. Van Wijk BL, Klungel OH, Heerdink ER, de Boer A. Rate and determinants of 10-year persistence with antihypertensive drugs. J Hypertens. 2005 Nov;23(11):2101–7.
428. Wogen J, Kreilick CA, Livornese RC, Yokoyama K, Frech F. Patient adherence with amlodipine, lisinopril, or valsartan therapy in a usual-care setting. J Manag Care Pharm. Jan;9(5):424–9.
429. Corrao G, Parodi A, Nicotra F, Zambon A, Merlino L, Cesana G, et al. Better compliance to antihypertensive medications reduces cardiovascular risk. J Hypertens. 2011 Mar;29(3):610–8.
430. Rizzo JA, Simons WR. Variations in compliance among hypertensive patients by drug class: implications for health care costs. Clin Ther. Jan;19(6):1446-57-5.
227 431. Wang PS, Bohn RL, Knight E, Glynn RJ, Mogun H, Avorn J. Noncompliance
with antihypertensive medications: the impact of depressive symptoms and psychosocial factors. J Gen Intern Med. 2002 Jul;17(7):504–11.
432. Taylor AA, Shoheiber O. Adherence to antihypertensive therapy with fixed-dose amlodipine besylate/benazepril HCl versus comparable component-based therapy. Congest Heart Fail. Jan;9(6):324–32.
433. Gupta AK, Arshad S, Poulter NR. Compliance, safety, and effectiveness of fixed-dose combinations of antihypertensive agents: a meta-analysis. Hypertension. 2010 Feb;55(2):399–407.
434. Patel B V, Remigio-Baker RA, Mehta D, Thiebaud P, Frech-Tamas F, Preblick R. Effects of initial antihypertensive drug class on patient persistence and compliance in a usual-care setting in the United States. J Clin Hypertens (Greenwich). 2007 Sep;9(9):692–700.
435. Bloom BS. Continuation of initial antihypertensive medication after 1 year of therapy. Clin Ther. Jan;20(4):671–81.
436. Conlin PR, Gerth WC, Fox J, Roehm JB, Boccuzzi SJ. Four-Year persistence patterns among patients initiating therapy with the angiotensin II receptor antagonist losartan versus other artihypertensive drug classes. Clin Ther. 2001 Dec;23(12):1999–2010.
437. Degli Esposti E, Sturani A, Di Martino M, Falasca P, Novi M V, Baio G, et al. Long-term persistence with antihypertensive drugs in new patients. J Hum Hypertens. 2002 Jun;16(6):439–44.
438. Caro JJ, Speckman JL, Salas M, Raggio G, Jackson JD. Effect of initial drug choice on persistence with antihypertensive therapy: the importance of actual practice data. CMAJ. 1999 Jan 12;160(1):41–6.
439. Caro JJ, Salas M, Speckman JL, Raggio G, Jackson JD. Persistence with treatment for hypertension in actual practice. CMAJ. 1999 Jan 12;160(1):31–7.
440. Dezii CM. A retrospective study of persistence with single-pill combination therapy vs. concurrent two-pill therapy in patients with hypertension. Manag Care. 2000 Sep;9(9 Suppl):2–6.
441. Wong MCS, Tam WWS, Cheung CSK, Tong ELH, Sek ACH, John G, et al. Initial antihypertensive prescription and switching: a 5 year cohort study from 250,851 patients. PLoS One. 2013 Jan;8(1):e53625.
442. Benson S, Vance-Bryan K, Raddatz J. Time to patient discontinuation of antihypertensive drugs in different classes. Am J Health Syst Pharm. 2000 Jan 1;57(1):51–4.
443. Jones JK, Gorkin L, Lian JF, Staffa JA, Fletcher AP. Discontinuation of and changes in treatment after start of new courses of antihypertensive drugs: a study of a United Kingdom population. BMJ. 1995 Jul 29;311(7000):293–5.
444. Marentette MA, Gerth WC, Billings DK, Zarnke KB. Antihypertensive persistence and drug class. Can J Cardiol. 2002 Jun;18(6):649–56.
445. Bourgault C, Rainville B, Suissa S. Antihypertensive drug therapy in Saskatchewan: patterns of use and determinants in hypertension. Arch Intern Med. Jan;161(15):1873–9.
446. Hasford J, Mimran A, Simons WR. A population-based European cohort study of persistence in newly diagnosed hypertensive patients. J Hum Hypertens. Nature Publishing Group; 2002 Aug 2;16(8):569–75.
447. Mazzaglia G, Mantovani LG, Sturkenboom MCJM, Filippi A, Trifirò G, Cricelli C, et al. Patterns of persistence with antihypertensive medications in newly diagnosed hypertensive patients in Italy: a retrospective cohort
228
study in primary care. J Hypertens. 2005 Nov;23(11):2093–100. 448. Cardinal H, Monfared AAT, Dorais M, LeLorier J. A comparison between
persistence to therapy in ALLHAT and in everyday clinical practice: a generalizability issue. Can J Cardiol. 2004 Mar 15;20(4):417–21.
449. Qvarnström M, Kahan T, Kieler H, Brandt L, Hasselström J, Bengtsson Boström K, et al. Persistence to antihypertensive drug treatment in Swedish primary healthcare. Eur J Clin Pharmacol. 2013 Nov;69(11):1955–64.
450. Grégoire J-P, Moisan J, Guibert R, Ciampi A, Milot A, Gaudet M, et al. Determinants of discontinuation of new courses of antihypertensive medications. J Clin Epidemiol. 2002 Jul;55(7):728–35.
451. Düsing R, Weisser B, Mengden T, Vetter H. Changes in antihypertensive therapy--the role of adverse effects and compliance. Blood Press. 1998 Nov;7(5–6):313–5.
452. Düsing R. Adverse events, compliance, and changes in therapy. Curr Hypertens Rep. 2001 Dec;3(6):488–92.
453. Ambrosioni E, Leonetti G, Pessina AC, Rappelli A, Trimarco B, Zanchetti A. Patterns of hypertension management in Italy: results of a pharmacoepidemiological survey on antihypertensive therapy. Scientific Committee of the Italian Pharmacoepidemiological Survey on Antihypertensive Therapy. J Hypertens. 2000 Nov;18(11):1691–9.
454. Hill MN, Miller NH, DeGeest S. ASH position paper: Adherence and persistence with taking medication to control high blood pressure. J Clin Hypertens (Greenwich). 2010 Oct;12(10):757–64.
455. Hughes D, McGuire A. The direct costs to the NHS of discontinuing and switching prescriptions for hypertension. J Hum Hypertens. 1998 Aug;12(8):533–7.
456. Aponte M, Fusco V, Andolfi R, Coppola S. Lactic acid bacteria occurring during manufacture and ripening of Provolone del Monaco cheese: Detection by different analytical approaches. Int Dairy J. 2008;18(4):403–13.
457. Degli Esposti L, Degli Esposti E, Valpiani G, Di Martino M, Saragoni S, Buda S, et al. A retrospective, population-based analysis of persistence with antihypertensive drug therapy in primary care practice in Italy. Clin Ther. 2002 Aug;24(8):1347–57; discussion 1346.
458. Paul L, Jeemon P, Hewitt J, McCallum L, Higgins P, Walters M, et al. Hematocrit predicts long-term mortality in a nonlinear and sex-specific manner in hypertensive adults. Hypertension. 2012/07/18. 2012 Sep;60(3):631–8.
459. Dunn FG, McLenachan J, Isles CG, Brown I, Dargie HJ, Lever AF, et al. Left ventricular hypertrophy and mortality in hypertension: an analysis of data from the Glasgow Blood Pressure Clinic. J Hypertens. 1990 Aug;8(8):775–82.
460. World Health Organization (WHO). Obesity: preventing and managing the global epidemic. Report of a WHO consultation. World Health Organ Tech Rep Ser. 2000;894:i–xii, 1-253.
461. Levey AS, Bosch JP, Lewis JB, Greene T, Rogers N, Roth D. A more accurate method to estimate glomerular filtration rate from serum creatinine: a new prediction equation. Modification of Diet in Renal Disease Study Group. Ann Intern Med. 1999 Mar 16;130(6):461–70.
462. Ahmed A, Armstrong M, Robertson I, Morris AJ, Blatchford O, Stanley AJ.
229
Upper gastrointestinal bleeding in Scotland 2000-2010: Improved outcomes but a significant weekend effect. World J Gastroenterol. 2015 Oct 14;21(38):10890–7.
463. Ness V, Malcolm W, McGivern G, Reilly J. Growth in nurse prescribing of antibiotics: the Scottish experience 2007-13. J Antimicrob Chemother. 2015 Dec;70(12):3384–9.
464. McAlinden C, Khadka J, Pesudovs K. Statistical methods for conducting agreement (comparison of clinical tests) and precision (repeatability or reproducibility) studies in optometry and ophthalmology. Ophthalmic Physiol Opt. 2011 Jul;31(4):330–8.
465. Psaty BM, Lumley T, Furberg CD, Schellenbaum G, Pahor M, Alderman MH, et al. Health outcomes associated with various antihypertensive therapies used as first-line agents: a network meta-analysis. JAMA. 2003 May 21;289(19):2534–44.
466. Costanzo P, Perrone-Filardi P, Petretta M, Marciano C, Vassallo E, Gargiulo P, et al. Calcium channel blockers and cardiovascular outcomes: a meta-analysis of 175,634 patients. J Hypertens. 2009 Jun;27(6):1136–51.
467. Blumentals WA, Brown RR, Gomez-Caminero A. Antihypertensive treatment and erectile dysfunction in a cohort of type II diabetes patients. Int J Impot Res. 2003 Oct;15(5):314–7.
468. Fogari R. Sexual activity in hypertensive men treated with valsartan or carvedilol: a crossover study. Am J Hypertens. 2001 Jan 1;14(1):27–31.
469. Peart W.S., Barnes G.R. BP. Adverse reactions to bendrofluazide and propranolol for the treatment of mild hypertension. Report of medical research council working party on mild to moderate hypertension. Lancet. 1981 Sep 12;2(8246):539–43.
470. Nicolai MPJ, Liem SS, Both S, Pelger RCM, Putter H, Schalij MJ, et al. A review of the positive and negative effects of cardiovascular drugs on sexual function: a proposed table for use in clinical practice. Neth Heart J. 2014 Jan;22(1):11–9.
471. Miller NH, Hill M, Kottke T, Ockene IS. The multilevel compliance challenge: recommendations for a call to action. A statement for healthcare professionals. Circulation. 1997 Feb 18;95(4):1085–90.
472. After the diagnosis: Adherence and persistence with hypertension therapy. Am J Manag Care. 2005 Nov;11(SUPPL. 13):S395-9.
473. Burnier M. Medication Adherence and Persistence as the Cornerstone of Effective Antihypertensive Therapy. Am J Hypertens. 2006 Nov;19(11):1190–6.
474. Fujita T, Shimamoto K, Wu Z, Zhu J, Chung NS, Park JB, et al. What are the major challenges in getting patients to the optimal BP goal? Difficulties in educating doctors and patients. Int J Clin Pract. 2006 Sep 21;60(SUPPL. 150):20–2.
475. Tremblay É, Turgeon M, Gaudet M, Guénette L. Quality of hypertension pharmacotherapy in Quebec: a population-based study. J Popul Ther Clin Pharmacol = J la therapeutique des Popul la pharamcologie Clin. 2014 Jan;21(3):e431-41.
476. Simons LA, Ortiz M, Calcino G. Persistence with antihypertensive medication: Australia-wide experience, 2004-2006. Med J Aust. 2008 Feb 18;188(4):224–7.
477. Grimmsmann T, Himmel W. Persistence of antihypertensive drug use in German primary care: A follow-up study based on pharmacy claims data.
230
Eur J Clin Pharmacol. 2014 Mar;70(3):295–301. 478. Mancia G, Zambon A, Soranna D, Merlino L, Corrao G. Factors involved in
the discontinuation of antihypertensive drug therapy: an analysis from real life data. J Hypertens. 2014 Aug;32(8):1708–16.
479. Ah Y, Lee J, Choi Y, Kim B, Choi KH, Kong J. Persistence with Antihypertensive Medications in Uncomplicated Treatment-Naïve Patients : Effects of Initial Therapeutic Classes. J Korean Med Sci. 2015 Dec;30(12):1800–6.
480. Veronesi M, Cicero AFG, Prandin MG, Dormi A, Cosentino E, Strocchi E, et al. A prospective evaluation of persistence on antihypertensive treatment with different antihypertensive drugs in clinical practice. Vasc Health Risk Manag. 2007 Jan;3(6):999–1005.
481. Corrao G, Zambon A, Parodi A, Merlino L, Mancia G. Incidence of cardiovascular events in Italian patients with early discontinuations of antihypertensive, lipid-lowering, and antidiabetic treatments. Am J Hypertens. 2012 May;25(5):549–55.
482. Burnier M, Hess B, Greminger P, Waeber B. Determinants of persistence in hypertensive patients treated with irbesartan: results of a postmarketing survey. BMC Cardiovasc Disord. BioMed Central; 2005 Jan 8;5(1):13.
483. Black HR, Graff A, Shute D, Stoltz R, Ruff D, Levine J, et al. Valsartan, a new angiotensin II antagonist for the treatment of essential hypertension: efficacy, tolerability and safety compared to an angiotensin-converting enzyme inhibitor, lisinopril. J Hum Hypertens. 1997 Aug;11(8):483–9.
484. Grégoire JP, Moisan J, Guibert R, Ciampi A, Milot A, Côté I, et al. Tolerability of antihypertensive drugs in a community-based setting. Clin Ther. 2001 May;23(5):715–26.
485. Matchar DB, McCrory DC, Orlando LA, Patel MR, Patel UD, Patwardhan MB, et al. Systematic review: comparative effectiveness of angiotensin-converting enzyme inhibitors and angiotensin II receptor blockers for treating essential hypertension. Ann Intern Med. 2008 Jan 1;148(1):16–29.
486. Fletcher AE, Palmer AJ, Bulpitt CJ. Cough with angiotensin converting enzyme inhibitors: how much of a problem? J Hypertens Suppl. 1994 Jul;12(2):S43-7.
487. Elliott WJ. Improving outcomes in hypertensive patients: focus on adherence and persistence with antihypertensive therapy. J Clin Hypertens (Greenwich). 2009 Jul;11(7):376–82.
488. Hill MN, Miller NH, Degeest S. Adherence and persistence with taking medication to control high blood pressure. J Am Soc Hypertens. 2011 Jan;5(1):56–63.
489. Chowdhury R, Khan H, Heydon E, Shroufi A, Fahimi S, Moore C, et al. Adherence to cardiovascular therapy: A meta-analysis of prevalence and clinical consequences. Eur Heart J. 2013 Oct;34(38):2940–8.
490. Choudhry NK, Fischer M a, Avorn J, Liberman JN, Schneeweiss S, Pakes J, et al. The implications of therapeutic complexity on adherence to cardiovascular medications. Arch Intern Med. 2011 May 9;171(9):814–22.
491. Organisation WH. Essential Medicines and Health Products Information Portal [Internet]. 2015 [cited 2016 Apr 20]. Available from: http://apps.who.int/medicinedocs/en/d/Js6169e/7.6.html
492. Marcum ZA, Sevick MA, Handler SM. Medication nonadherence: a diagnosable and treatable medical condition. JAMA. American Medical Association; 2013 May 22;309(20):2105–6.
231 493. Naderi SH, Bestwick JP, Wald DS. Adherence to drugs that prevent
cardiovascular disease: meta-analysis on 376,162 patients. Am J Med. 2012 Sep;125(9):882–7.e1.
494. Kronish IM, Woodward M, Sergie Z, Ogedegbe G, Falzon L, Mann DM. Meta-analysis: impact of drug class on adherence to antihypertensives. Circulation. 2011 Apr 19;123(15):1611–21.
495. Mathes J, Kostev K, Gabriel A, Pirk O, Schmieder RE. Relation of the first hypertension-associated event with medication, compliance and persistence in naïve hypertensive patients after initiating monotherapy. Int J Clin Pharmacol Ther. 2010 Mar;48(3):173–83.
496. Black DM, Brand RJ, Greenlick M, Hughes G, al et. Compliance to treatment for hypertension in elderly patients: The SHEP pilot study. J Gerontol. 1987 Sep;42(5):552–7.
497. Bosworth HB, Granger BB, Mendys P, Brindis R, Burkholder R, Czajkowski SM, et al. Medication adherence: a call for action. Am Heart J. 2011 Sep;162(3):412–24.
498. Piette JD. Interactive voice response systems in the diagnosis and management of chronic disease. Am J Manag Care. 2000 Jul;6(7):817–27.
499. Murray MD, Young J, Hoke S, Tu W, Weiner M, Morrow D, et al. Pharmacist intervention to improve medication adherence in heart failure: a randomized trial. Ann Intern Med. 2007 May 15;146(10):714–25.
500. Haynes RB, McDonald H, Garg AX, Montague P. Interventions for helping patients to follow prescriptions for medications. Cochrane database Syst Rev. 2002 Jan;(2):CD000011.
501. Moser M. Black-white differences in response to antihypertensive medication. J Natl Med Assoc. 1995 Aug;87(8 Suppl):612–3.
502. Preston RA, Materson BJ, Reda DJ, Williams DW, Hamburger RJ, Cushman WC, et al. Age-race subgroup compared with renin profile as predictors of blood pressure response to antihypertensive therapy. Department of Veterans Affairs Cooperative Study Group on Antihypertensive Agents. JAMA. 1998 Oct 7;280(13):1168–72.
503. Group CS, Agents A. Comparison of propranolol and hydrochlorothiazide for the initial treatment of hypertension. II. Results of long-term therapy. Veterans Administration Cooperative Study Group on Antihypertensive Agents. JAMA. 1982 Oct 22;248(16):2004–11.
504. Turner ST, Schwartz GL, Chapman AB, Beitelshees AL, Gums JG, Cooper-DeHoff RM, et al. Plasma renin activity predicts blood pressure responses to beta-blocker and thiazide diuretic as monotherapy and add-on therapy for hypertension. Am J Hypertens. 2010 Sep;23(9):1014–22.
505. Barzilay JI, Davis BR, Cutler JA, Pressel SL, Whelton PK, Basile J, et al. Fasting glucose levels and incident diabetes mellitus in older nondiabetic adults randomized to receive 3 different classes of antihypertensive treatment: a report from the Antihypertensive and Lipid-Lowering Treatment to Prevent Heart Attack Trial (ALLHA. Arch Intern Med. 2006 Nov 13;166(20):2191–201.
506. Scottish Government, St. Andrew’s House, Regent Road EE 3DG T 556 8400 ceu@scotland. gsi. gov. u. Analysis of Ethnicity in the 2001 Census - Summary Report [Internet]. Scottish Government, St. Andrew’s House, Regent Road, Edinburgh EH1 3DG Tel:0131 556 8400 [email protected]; 2004 [cited 2016 Mar 2]. Available from: http://www.gov.scot/Publications/2004/02/18876/32939
232 507. McAlister FA, Lewanczuk RZ, Teo KK. Resistant hypertension: an overview.
Can J Cardiol. 1996/09/01. 1996;12(9):822–8. 508. Fagard RH. Resistant hypertension. Heart. 2012 Feb 1;98(3):254–61. 509. Pepine CJ, Handberg EM, Cooper-DeHoff RM, Marks RG, Kowey P, Messerli
FH, et al. A calcium antagonist vs a non-calcium antagonist hypertension treatment strategy for patients with coronary artery disease. The International Verapamil-Trandolapril Study (INVEST): a randomized controlled trial. JAMA. 2003/12/06. 2003;290(21):2805–16.
510. Persell SD. Prevalence of resistant hypertension in the United States, 2003-2008. Hypertension. 2011 Jun;57(6):1076–80.
511. de la Sierra A, Segura J, Banegas JR, Gorostidi M, de la Cruz JJ, Armario P, et al. Clinical features of 8295 patients with resistant hypertension classified on the basis of ambulatory blood pressure monitoring. Hypertension. 2011 May;57(5):898–902.
512. Daugherty SL, Powers JD, Magid DJ, Tavel HM, Masoudi FA, Margolis KL, et al. Incidence and prognosis of resistant hypertension in hypertensive patients. Circulation. 2012 Apr 3;125(13):1635–42.
513. Jung O, Gechter JL, Wunder C, Paulke A, Bartel C, Geiger H, et al. Resistant hypertension? Assessment of adherence by toxicological urine analysis. J Hypertens. 2013 Apr;31(4):766–74.
514. Lawson AJ, Shipman KE, George S, Dasgupta I. A Novel ‘Dilute-and-Shoot’ Liquid Chromatography-Tandem Mass Spectrometry Method for the Screening of Antihypertensive Drugs in Urine. J Anal Toxicol. 2016 Jan;40(1):17–27.
515. Burnier M, Wuerzner G, Struijker-Boudier H, Urquhart J. Measuring, analyzing, and managing drug adherence in resistant hypertension. Hypertension. 2013 Aug 1;62(2):218–25.
516. Seravalle G, Grassi G. Sympathetic Nervous System, Hypertension, Obesity and Metabolic Syndrome. High Blood Press Cardiovasc Prev. 2016 Mar 4;
517. Kotsis V, Nilsson P, Grassi G, Mancia G, Redon J, Luft F, et al. New developments in the pathogenesis of obesity-induced hypertension. J Hypertens. 2015 Aug;33(8):1499–508.
518. Grassi G, Mark A, Esler M. The Sympathetic Nervous System Alterations in Human Hypertension. Circ Res. 2015 Mar 13;116(6):976–90.
519. Van kova I, Maletinska L, Behuliak M, Nagelova V, Zicha J, Kune J. Obesity-related hypertension: possible pathophysiological mechanisms. J Endocrinol. 2014 Nov 10;223(3):R63–78.
520. Sarafidis PA, Khosla N, Bakris GL. Antihypertensive Therapy in the Presence of Proteinuria. Am J Kidney Dis. 2007 Jan;49(1):12–26.
521. Schoolwerth AC, Sica DA, Ballermann BJ, Wilcox CS. Renal considerations in angiotensin converting enzyme inhibitor therapy: a statement for healthcare professionals from the Council on the Kidney in Cardiovascular Disease and the Council for High Blood Pressure Research of the American Heart Association. Circulation. 2001 Oct 16;104(16):1985–91.
522. Duarte JD, Cooper-DeHoff RM. Mechanisms for blood pressure lowering and metabolic effects of thiazide and thiazide-like diuretics. Expert Rev Cardiovasc Ther. 2010 Jun;8(6):793–802.
523. Pang YH, Yang LL, Shuang SM, Dong C, Thompson M. Interaction of human serum albumin with bendroflumethiazide studied by fluorescence spectroscopy. J Photochem Photobiol B Biol. 2005 Aug 1;80(2):139–44.
524. Kitamura K, Niinobu M, Omran a a, Takegami S, Kitade T. Binding of
233
diuretic antihypertensive bendroflumethiazide to human serum albumin studied by 19F nuclear magnetic resonance method. Eur J Pharm Sci. 2012 Jan 23;45(1–2):195–200.
525. Suarez AP, Staffa JA, Fletcher P, Jones JK. Reason for discontinuation of newly prescribed antihypertensive medications: Methods of a pilot study using computerized patient records. Pharmacoepidemiol Drug Saf. 2000;9(5):405–16.
526. Coons SJ. Medication compliance: The search for answers continues. Clin Ther. 2001 Aug;23(8):1294–5.


