Embed Size (px)
Citation preview
National Park Service U.S. Department of the Interior Natural Resource Stewardship and Science
Southeast Alaska Network
Freshwater Water Quality Monitoring Program
2010 Annual Report
Natural Resource Technical Report NPS/SEAN/NRTR—2012/547

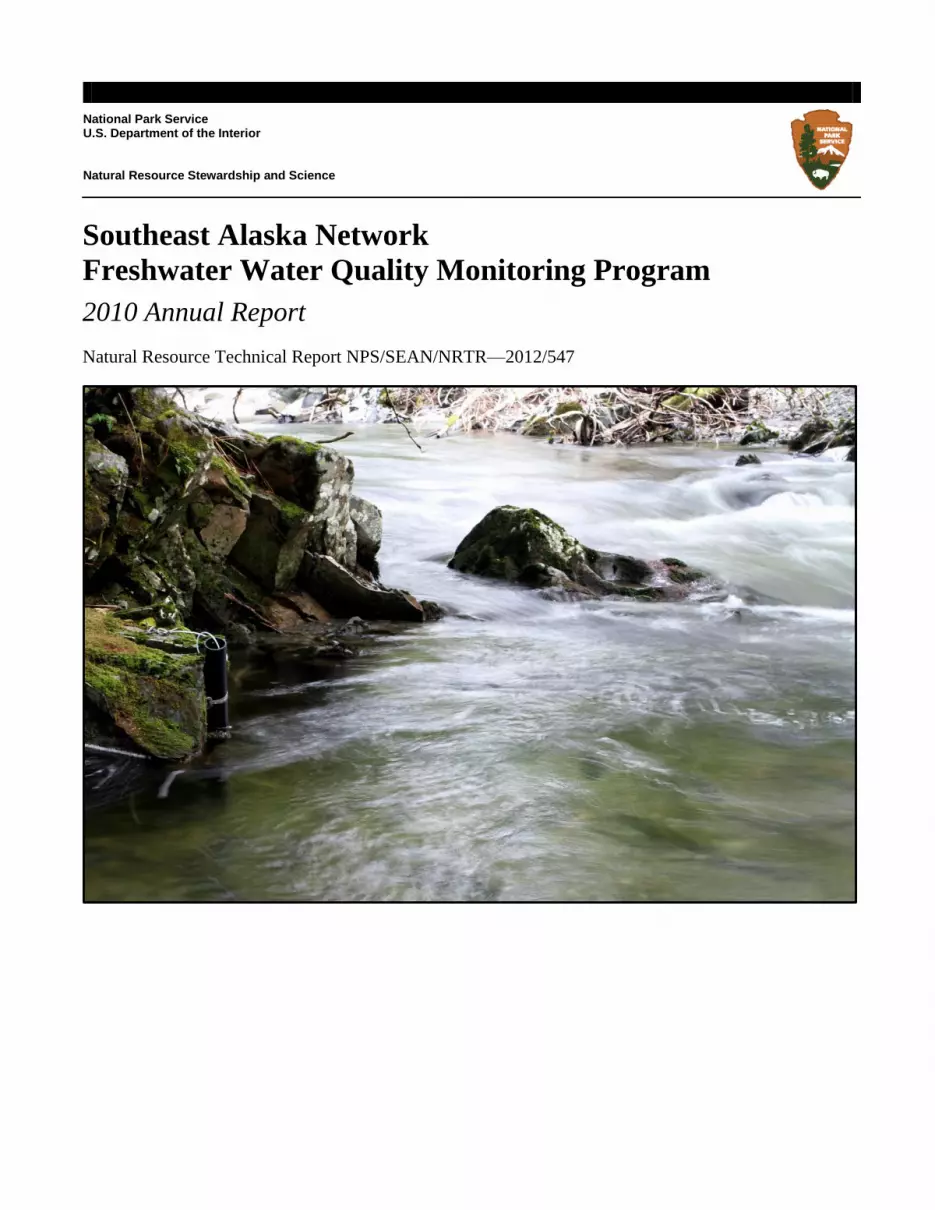
ON THE COVER
Indian River water quality monitoring site
Photograph by: Christopher J. Sergeant, Southeast Alaska Network, National Park Service

Southeast Alaska Network
Freshwater Water Quality Monitoring Program
2010 Annual Report
Natural Resource Technical Report NPS/SEAN/NRTR—2012/547
Christopher J. Sergeant, William F. Johnson, and Brendan J. Moynahan
National Park Service
Inventory & Monitoring Program, Southeast Alaska Network
3100 National Park Road
Juneau, AK 99801
February 2012
U.S. Department of the Interior
National Park Service
Natural Resource Stewardship and Science
Fort Collins, Colorado

ii
The National Park Service, Natural Resource Stewardship and Science office in Fort Collins,
Colorado publishes a range of reports that address natural resource topics of interest and
applicability to a broad audience in the National Park Service and others in natural resource
management, including scientists, conservation and environmental constituencies, and the public.
The Natural Resource Technical Report Series is used to disseminate results of scientific studies
in the physical, biological, and social sciences for both the advancement of science and the
achievement of the National Park Service mission. The series provides contributors with a forum
for displaying comprehensive data that are often deleted from journals because of page
limitations.
All manuscripts in the series receive the appropriate level of peer review to ensure that the
information is scientifically credible, technically accurate, appropriately written for the intended
audience, and designed and published in a professional manner.
This report received informal peer review by subject-matter experts who were not directly
involved in the collection, analysis, or reporting of the data. Data in this report were collected
and analyzed using methods based on established, peer-reviewed protocols and were analyzed
and interpreted within the guidelines of the protocols.
Views, statements, findings, conclusions, recommendations, and data in this report do not
necessarily reflect views and policies of the National Park Service, U.S. Department of the
Interior. Mention of trade names or commercial products does not constitute endorsement or
recommendation for use by the U.S. Government.
This report is available from the Southeast Alaska Network
(http://science.nature.nps.gov/im/units/sean) and the Natural Resource Publications Management
website (http://www.nature.nps.gov/publications/nrpm/).
Please cite this publication as:
Sergeant, C. J., W. F. Johnson, and B. J. Moynahan. 2012. Southeast Alaska Network freshwater
water quality monitoring program: 2010 annual report. Natural Resource Technical Report
NPS/SEAN/NRTR—2012/547. National Park Service, Fort Collins, Colorado.
NPS 953/112861, February 2012
iii
Contents
Page
Figures............................................................................................................................................. v
Tables ............................................................................................................................................ vii
Appendices ..................................................................................................................................... ix
Executive Summary ....................................................................................................................... xi
Acknowledgments........................................................................................................................ xiii
List of Acronyms ......................................................................................................................... xiii
Introduction ..................................................................................................................................... 1
Study Areas .............................................................................................................................. 1
Salmon River (GLBA) ........................................................................................................ 1
Indian River (SITK) ............................................................................................................ 2
Methods........................................................................................................................................... 5
Station instrumentation ............................................................................................................ 5
Data processing ........................................................................................................................ 5
Comparison of cool/wet versus warm/dry periods .................................................................. 6
Results ............................................................................................................................................. 7
Data collection ......................................................................................................................... 7
Temperature ............................................................................................................................. 7
Conductivity, DO, and pH ....................................................................................................... 9
Compliance with water quality standards .............................................................................. 14
Discussion ..................................................................................................................................... 17
Considerations ....................................................................................................................... 17
Literature Cited ............................................................................................................................. 19

v
Figures
Page
Figure 1. Monitoring station on the Salmon River ........................................................................ 2
Figure 2. Monitoring station on the Indian River .......................................................................... 3
Figure 3. Daily mean water temperature for the Salmon and Indian Rivers ................................. 8
Figure 4. Box plots summarizing DO, pH, and conductivity ...................................................... 10
Figure 5. Hourly readings of DO, pH, water temperature, and conductivity for the
Salmon River during a warm/dry period ...................................................................................... 11
Figure 6. Hourly readings of DO, pH, water temperature, and conductivity for the
Salmon River during a cool/wet period ........................................................................................ 12
Figure 7. Hourly readings of DO, pH, water temperature, and conductivity for the
Indian River during a warm/dry period ........................................................................................ 13
Figure 8. Hourly readings of DO, pH, water temperature, and conductivity for the
Indian River during a cool/wet period .......................................................................................... 14
Figure 9. Hourly water temperature data for the Salmon and Indian Rivers ............................... 21
Figure 10. Hourly conductivity data for the Salmon and Indian Rivers ...................................... 22
Figure 11. Hourly dissolved oxygen data for the Salmon and Indian Rivers. ............................. 23
Figure 12. Hourly pH data for the Salmon and Indian Rivers ..................................................... 24
Figure 13. Daily average streamflow vs. conductivity in the Indian River ................................. 25
Figure 14. Daily average streamflow vs. temperature, DO, and pH in the Indian River ............. 26

vii
Tables
Page
Table 1. Instruments used for water quality sampling ................................................................... 5
Table 2. Summary of 2010 freshwater water quality sampling effort ........................................... 5
Table 3. Summary of 2010 freshwater water quality data grades .................................................. 7
Table 4. Monthly mean, minimum daily mean, and maximum daily mean water
temperature for the Salmon and Indian Rivers ............................................................................... 8
Table 5. Period of record and summary statistics for water quality data collected and
reported by the SEAN ................................................................................................................... 15
Table 6. ADEC water quality standards ....................................................................................... 15


ix
Appendices
Page
Appendix A: Hourly time series data for all water quality parameters ........................................ 21
Appendix B: Indian River streamflow time series versus all water quality parameters ............... 25

xi
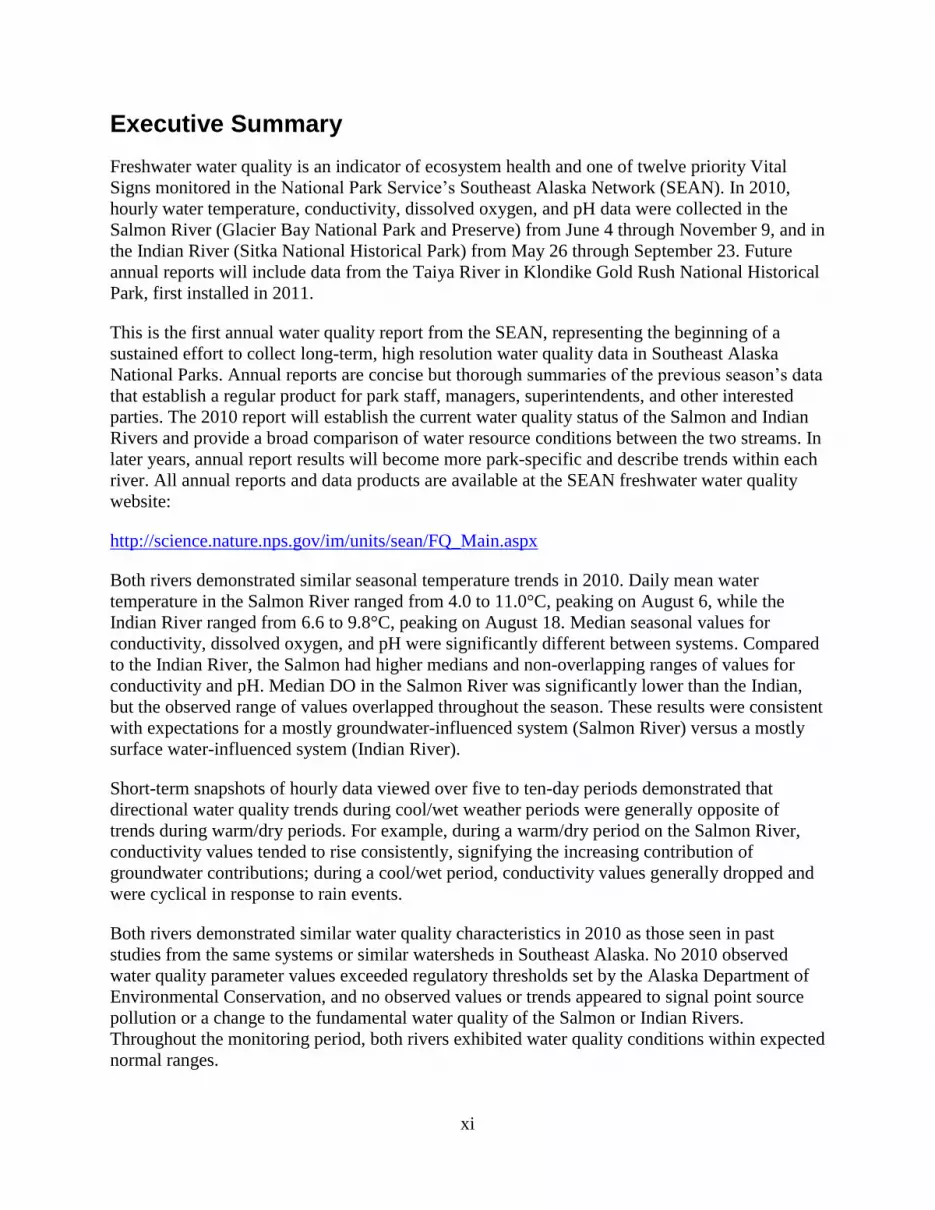
Executive Summary
Freshwater water quality is an indicator of ecosystem health and one of twelve priority Vital
Signs monitored in the National Park Service’s Southeast Alaska Network (SEAN). In 2010,
hourly water temperature, conductivity, dissolved oxygen, and pH data were collected in the
Salmon River (Glacier Bay National Park and Preserve) from June 4 through November 9, and in
the Indian River (Sitka National Historical Park) from May 26 through September 23. Future
annual reports will include data from the Taiya River in Klondike Gold Rush National Historical
Park, first installed in 2011.
This is the first annual water quality report from the SEAN, representing the beginning of a
sustained effort to collect long-term, high resolution water quality data in Southeast Alaska
National Parks. Annual reports are concise but thorough summaries of the previous season’s data
that establish a regular product for park staff, managers, superintendents, and other interested
parties. The 2010 report will establish the current water quality status of the Salmon and Indian
Rivers and provide a broad comparison of water resource conditions between the two streams. In
later years, annual report results will become more park-specific and describe trends within each
river. All annual reports and data products are available at the SEAN freshwater water quality
website:
http://science.nature.nps.gov/im/units/sean/FQ_Main.aspx
Both rivers demonstrated similar seasonal temperature trends in 2010. Daily mean water
temperature in the Salmon River ranged from 4.0 to 11.0°C, peaking on August 6, while the
Indian River ranged from 6.6 to 9.8°C, peaking on August 18. Median seasonal values for
conductivity, dissolved oxygen, and pH were significantly different between systems. Compared
to the Indian River, the Salmon had higher medians and non-overlapping ranges of values for
conductivity and pH. Median DO in the Salmon River was significantly lower than the Indian,
but the observed range of values overlapped throughout the season. These results were consistent
with expectations for a mostly groundwater-influenced system (Salmon River) versus a mostly
surface water-influenced system (Indian River).
Short-term snapshots of hourly data viewed over five to ten-day periods demonstrated that
directional water quality trends during cool/wet weather periods were generally opposite of
trends during warm/dry periods. For example, during a warm/dry period on the Salmon River,
conductivity values tended to rise consistently, signifying the increasing contribution of
groundwater contributions; during a cool/wet period, conductivity values generally dropped and
were cyclical in response to rain events.
Both rivers demonstrated similar water quality characteristics in 2010 as those seen in past
studies from the same systems or similar watersheds in Southeast Alaska. No 2010 observed
water quality parameter values exceeded regulatory thresholds set by the Alaska Department of
Environmental Conservation, and no observed values or trends appeared to signal point source
pollution or a change to the fundamental water quality of the Salmon or Indian Rivers.
Throughout the monitoring period, both rivers exhibited water quality conditions within expected
normal ranges.

xiii
Acknowledgments
K. Fraley, C. Murdoch, G. Smith, and C. Soiseth conducted field work and transmitted data for
processing. C. Smith and C. Soiseth reviewed and commented on the draft report. The SEAN
Vital Signs program is supported by funding from the NPS National Inventory and Monitoring
Program and the NPS Water Resources Division.
List of Acronyms
DO: Dissolved oxygen
NPS: National Park Service
GLBA: Glacier Bay National Park and Preserve
NIST: National Institute of Standards and Technology
SEAN: Southeast Alaska Network
SITK: Sitka National Historical Park
SOP: Standard Operating Procedure
USGS: United States Geological Survey


1
Introduction
Water quality is an indicator of aquatic and terrestrial ecosystem health in Southeast Alaska, a
rainforest landscape dominated by a wet and mild maritime climate. The Southeast Alaska
Network (SEAN) of the National Park Service (NPS) has prioritized Freshwater Water Quality
as one of 12 Vital Signs for long-term ecological monitoring based on its vulnerability to
alteration by human stressors and sensitivity for detecting fundamental environmental changes
(Moynahan et al. 2008). Trends in water quality can signify chronic or developing watershed
issues within national parks.
The SEAN water quality monitoring program has the following objectives:
Track the status and trends of each core water quality parameter (conductivity, dissolved
oxygen, pH, and water temperature)
Describe the timing and magnitude of seasonal and annual variation for each core water
quality parameter
Evaluate whether state and/or federal water quality standards are met or exceeded
The SEAN water quality monitoring protocol (Nagorski et al. 2012) includes an extended
description of each water quality parameter (Sections 1.3-1.7) and a discussion of future
priorities for expanding the monitoring program (Section 7.0). We expect future monitoring to
include an expanded stream temperature monitoring component and additional water quality
sondes in more rivers within the SEAN.
This report summarizes results from the 2010 sampling season and compares historical data in
the same rivers or similar systems, where data was available. Some comparisons between rivers
are made to provide a broader context for the range of water resources within the SEAN. In later
years, annual report results will become more park-specific and describe trends within each river.
It should be noted that the 2010 report was written in early 2012 after data management
processes were finalized. Guidance for report formatting and analytical techniques is described
in Standard Operating Procedure (SOP) 10 of the water quality monitoring protocol (Nagorski et
al. 2012). Every five years, beginning in 2014, a five-year synthesis report will present more in-
depth trend analyses and broadened discussion.
Study Areas The initial sampling goal of the monitoring program was to track water quality status and trends
in at least one river in each of the three SEAN parks. In 2010, sondes were installed in the
Salmon (GLBA) and Indian (SITK) Rivers. The Taiya River (KLGO) was added in 2011.
Sampling sites were chosen based on park prioritization and dependable site access.
Salmon River (GLBA)
The Salmon River is 32.7 km long within an 11,552 ha watershed and collects most of its water
from Excursion Ridge. The lowermost portion of the river (river km 0.0 to 9.0) is outside of NPS
boundaries and within the town of Gustavus. The Salmon River has gravel riverbed habitat and
supports populations of gamefish species such as pink salmon (Oncorhynchus gorbuscha), chum
salmon (O. keta), coho salmon (O. kisutch), steelhead (O. mykiss), cutthroat trout (O. clarkii),
and Dolly Varden (Salvelinus malma; Eckert et al. 2006a). Staghorn (Leptocottus armatus) and
2
coastrange sculpin (Cottus aleuticus) have been documented in the river but not formally
reported (C. Soiseth personal communication). Although there is no direct evidence from past
data, it is possible due to local septic system design and proximity that sewage input from
Gustavus residents affects Salmon River water quality downstream of the park boundary and
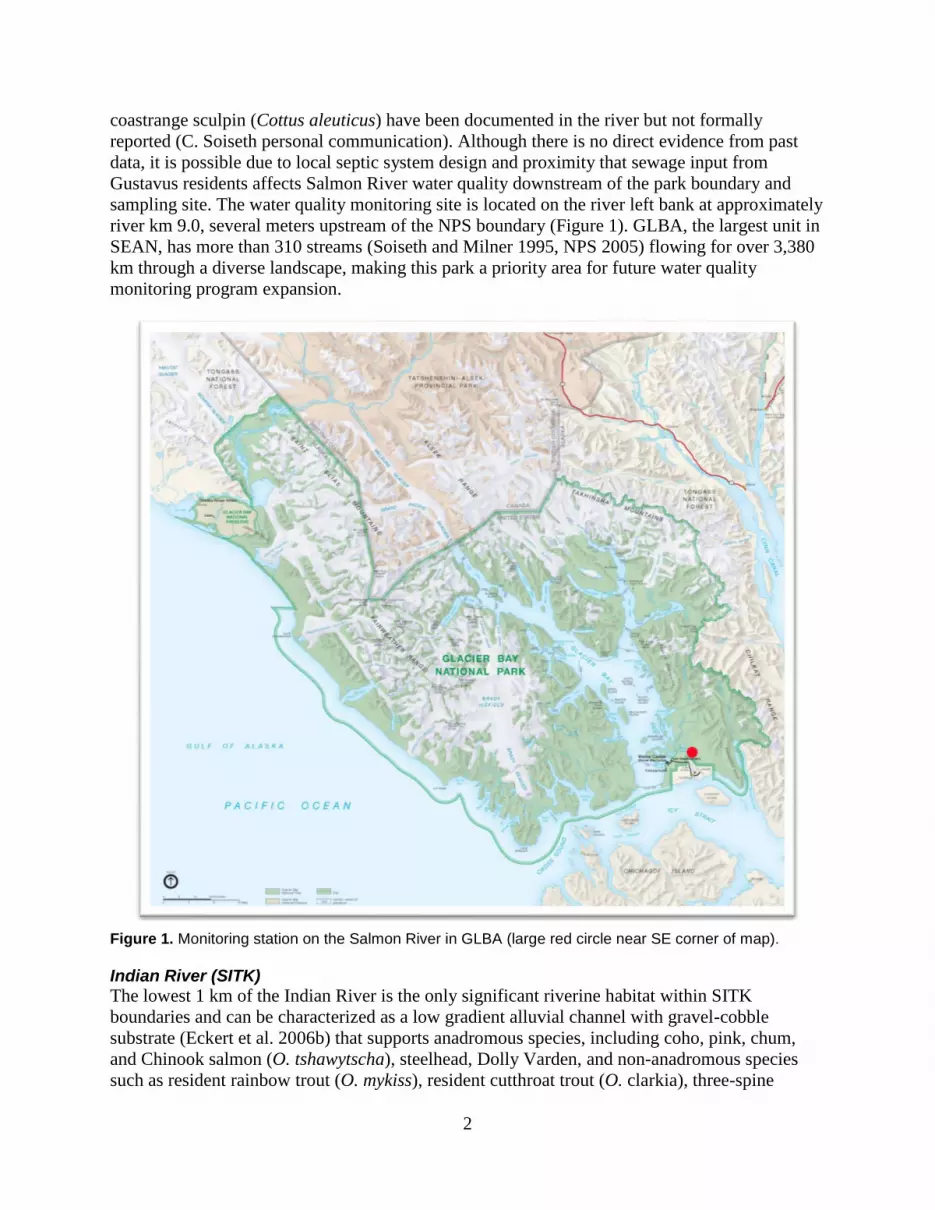
sampling site. The water quality monitoring site is located on the river left bank at approximately
river km 9.0, several meters upstream of the NPS boundary (Figure 1). GLBA, the largest unit in
SEAN, has more than 310 streams (Soiseth and Milner 1995, NPS 2005) flowing for over 3,380
km through a diverse landscape, making this park a priority area for future water quality
monitoring program expansion.
Figure 1. Monitoring station on the Salmon River in GLBA (large red circle near SE corner of map).
Indian River (SITK)
The lowest 1 km of the Indian River is the only significant riverine habitat within SITK
boundaries and can be characterized as a low gradient alluvial channel with gravel-cobble
substrate (Eckert et al. 2006b) that supports anadromous species, including coho, pink, chum,
and Chinook salmon (O. tshawytscha), steelhead, Dolly Varden, and non-anadromous species
such as resident rainbow trout (O. mykiss), resident cutthroat trout (O. clarkia), three-spine
3
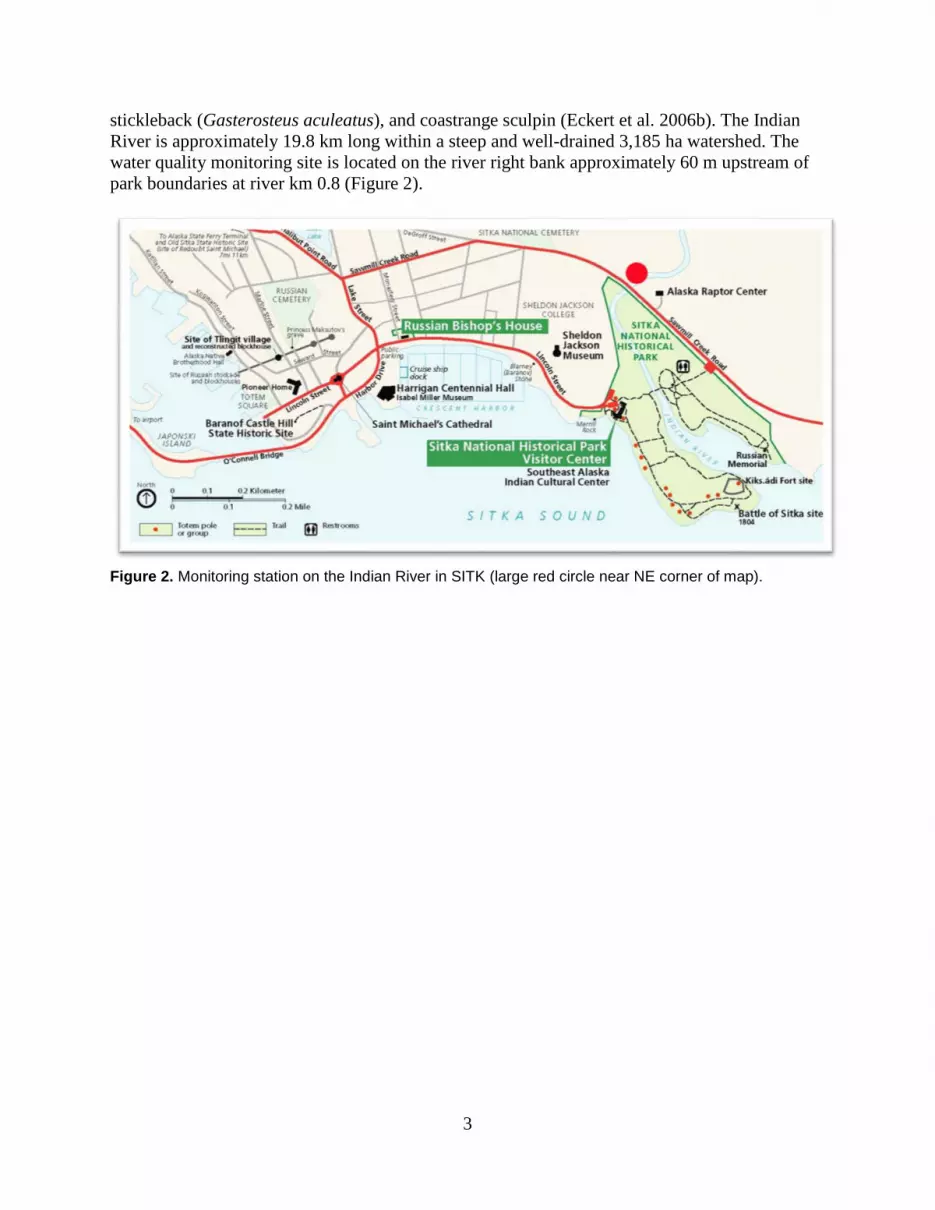
stickleback (Gasterosteus aculeatus), and coastrange sculpin (Eckert et al. 2006b). The Indian
River is approximately 19.8 km long within a steep and well-drained 3,185 ha watershed. The
water quality monitoring site is located on the river right bank approximately 60 m upstream of
park boundaries at river km 0.8 (Figure 2).
Figure 2. Monitoring station on the Indian River in SITK (large red circle near NE corner of map).

5
Methods
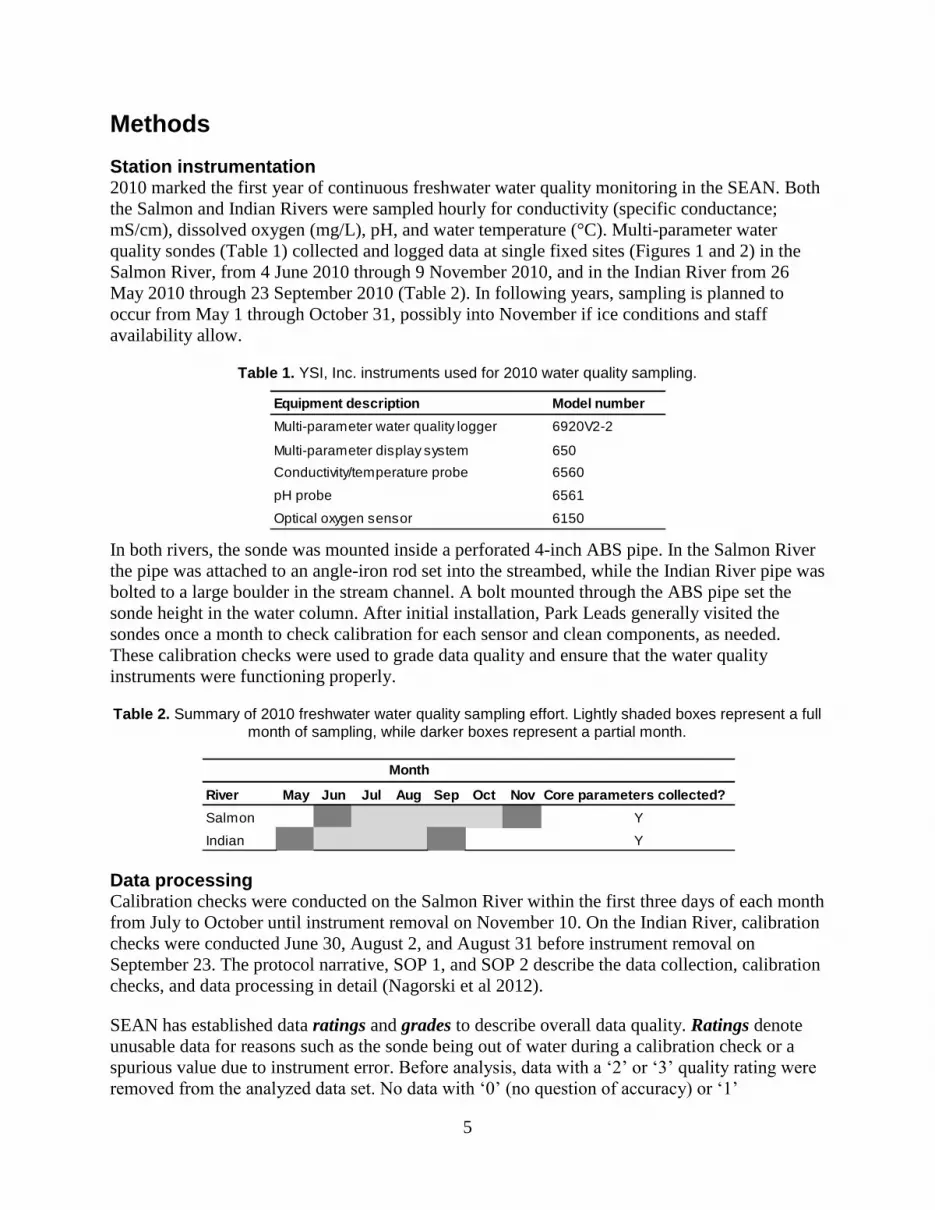
Station instrumentation 2010 marked the first year of continuous freshwater water quality monitoring in the SEAN. Both
the Salmon and Indian Rivers were sampled hourly for conductivity (specific conductance;
mS/cm), dissolved oxygen (mg/L), pH, and water temperature (°C). Multi-parameter water
quality sondes (Table 1) collected and logged data at single fixed sites (Figures 1 and 2) in the
Salmon River, from 4 June 2010 through 9 November 2010, and in the Indian River from 26
May 2010 through 23 September 2010 (Table 2). In following years, sampling is planned to
occur from May 1 through October 31, possibly into November if ice conditions and staff
availability allow.
Table 1. YSI, Inc. instruments used for 2010 water quality sampling.
In both rivers, the sonde was mounted inside a perforated 4-inch ABS pipe. In the Salmon River
the pipe was attached to an angle-iron rod set into the streambed, while the Indian River pipe was
bolted to a large boulder in the stream channel. A bolt mounted through the ABS pipe set the
sonde height in the water column. After initial installation, Park Leads generally visited the
sondes once a month to check calibration for each sensor and clean components, as needed.
These calibration checks were used to grade data quality and ensure that the water quality
instruments were functioning properly.
Table 2. Summary of 2010 freshwater water quality sampling effort. Lightly shaded boxes represent a full month of sampling, while darker boxes represent a partial month.
Data processing Calibration checks were conducted on the Salmon River within the first three days of each month
from July to October until instrument removal on November 10. On the Indian River, calibration
checks were conducted June 30, August 2, and August 31 before instrument removal on
September 23. The protocol narrative, SOP 1, and SOP 2 describe the data collection, calibration
checks, and data processing in detail (Nagorski et al 2012).
SEAN has established data ratings and grades to describe overall data quality. Ratings denote
unusable data for reasons such as the sonde being out of water during a calibration check or a
spurious value due to instrument error. Before analysis, data with a ‘2’ or ‘3’ quality rating were
removed from the analyzed data set. No data with ‘0’ (no question of accuracy) or ‘1’
Equipment description Model number
Multi-parameter water quality logger 6920V2-2
Multi-parameter display system 650
Conductivity/temperature probe 6560
pH probe 6561
Optical oxygen sensor 6150
River May Jun Jul Aug Sep Oct Nov Core parameters collected?
Salmon Y
Indian Y
Month

6
(determined useable by Project Leader despite potential mistakes in following protocols) data
quality ratings were deleted from the data summaries. SOP 13 of the water quality protocol
(Nagorski et al. 2012) describes each data rating in detail. Comments contained in the processed
CSV files available on the SEAN website
(http://science.nature.nps.gov/im/units/sean/FQ_Main.aspx) also contain justification for each
rating.
Data grades refer to the point-in-time accuracy of each water quality sensor during regular
calibration checks and range from ‘Poor’ to ‘Excellent’. The grades determined by these point
checks were back dated to the previous calibration check and applied to all data during that time
period. Currently, SEAN does not correct (adjust) data values based on calibration checks (as
described in Wagner et al. 2006), but will develop a proposal for future consideration of data
correction procedures around early 2013.
The final data sets were analyzed and summarized according to the guidelines in SOP 10
(Nagorski et al. 2012).
Comparison of cool/wet versus warm/dry periods Hourly readings from short time periods were used to compare fine-scale water quality trends
during warm/dry versus cool/wet periods. To determine warm and cool periods, daily mean air
temperature data were taken from Sitka and Gustavus airports. Dry and wet periods were
determined using total precipitation data from the Sitka airport for the Indian River and the
Hoonah airport for the Salmon River. The Hoonah airport is approximately 40 km from
Gustavus, but is the nearest reliable source of precipitation data.
7
Results
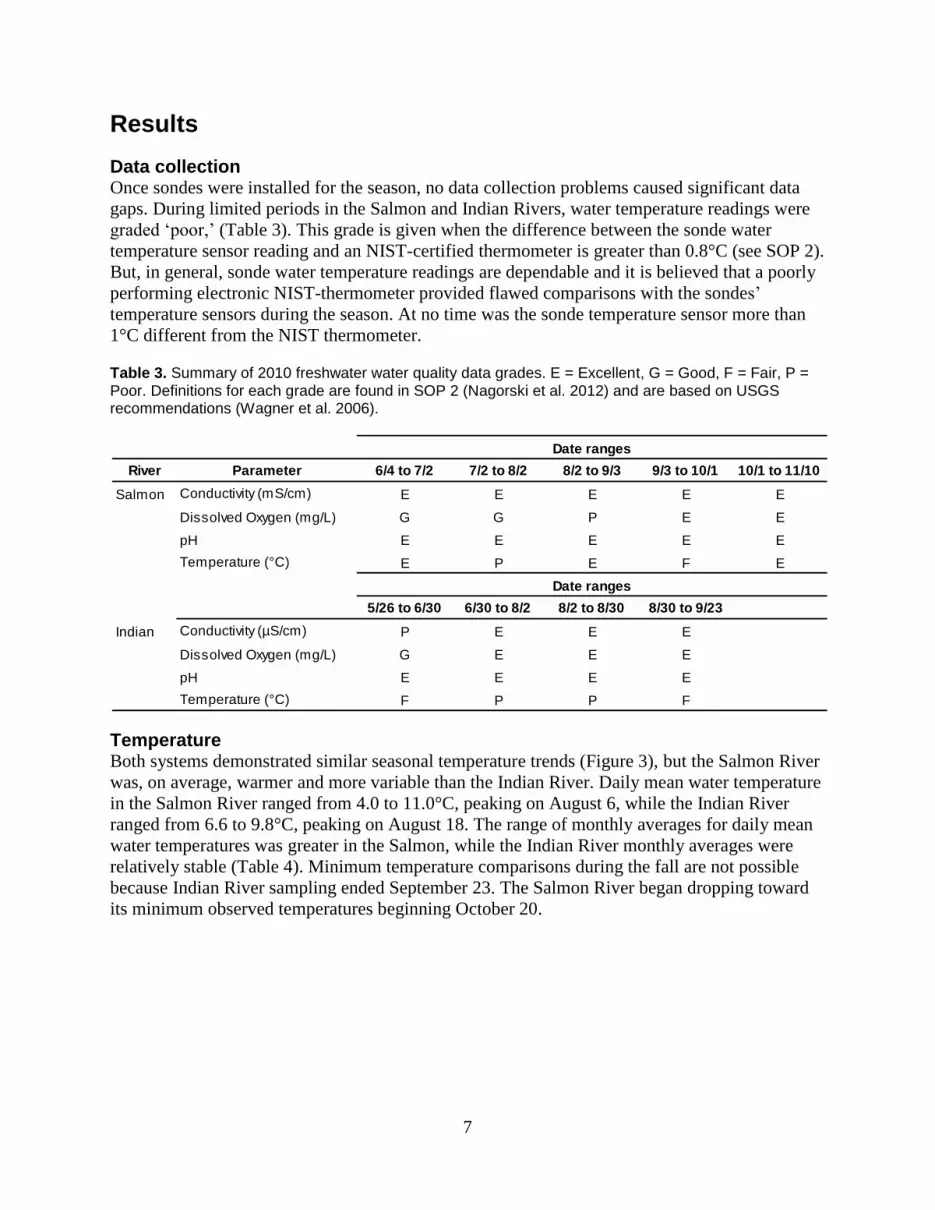
Data collection Once sondes were installed for the season, no data collection problems caused significant data
gaps. During limited periods in the Salmon and Indian Rivers, water temperature readings were
graded ‘poor,’ (Table 3). This grade is given when the difference between the sonde water
temperature sensor reading and an NIST-certified thermometer is greater than 0.8°C (see SOP 2).
But, in general, sonde water temperature readings are dependable and it is believed that a poorly
performing electronic NIST-thermometer provided flawed comparisons with the sondes’
temperature sensors during the season. At no time was the sonde temperature sensor more than
1°C different from the NIST thermometer.
Table 3. Summary of 2010 freshwater water quality data grades. E = Excellent, G = Good, F = Fair, P = Poor. Definitions for each grade are found in SOP 2 (Nagorski et al. 2012) and are based on USGS recommendations (Wagner et al. 2006).
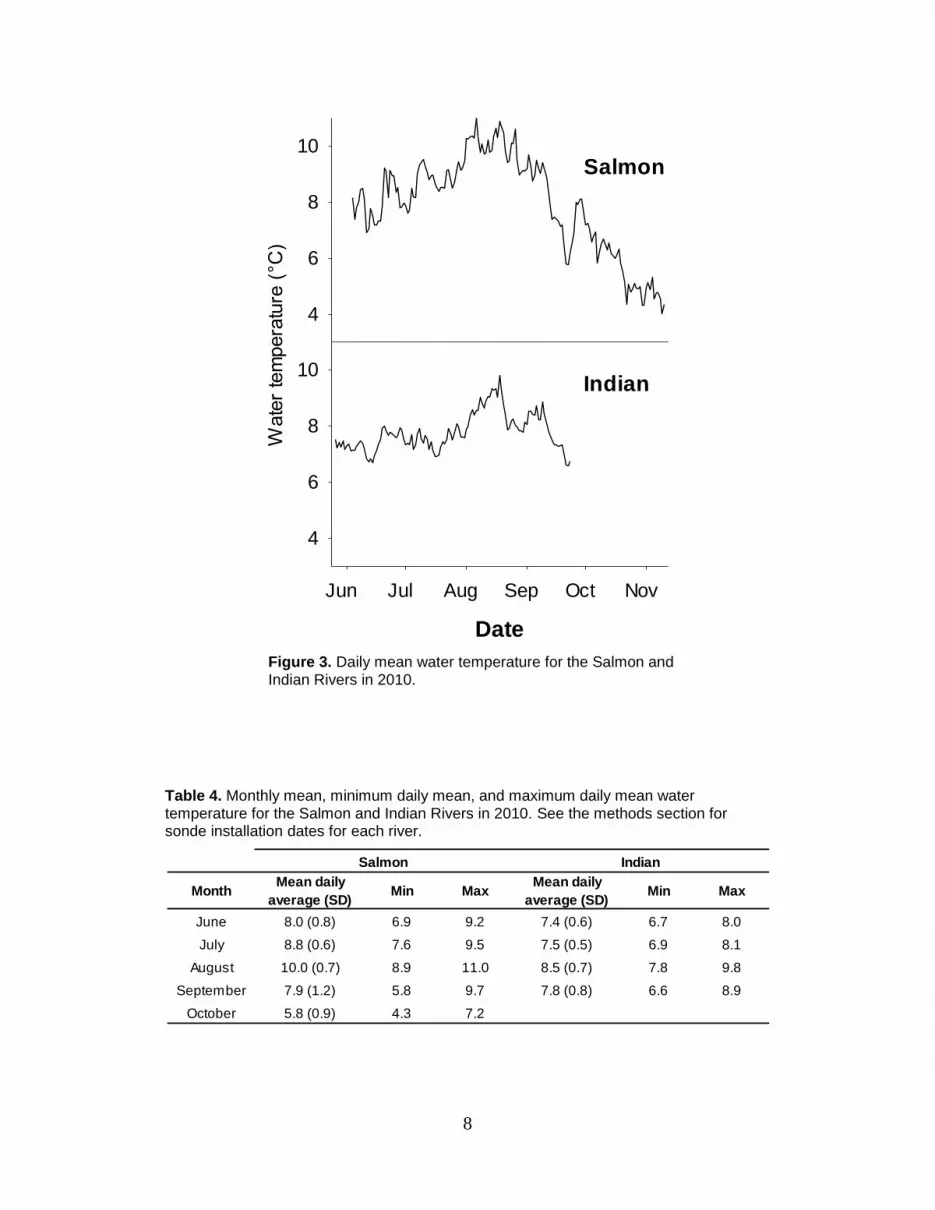
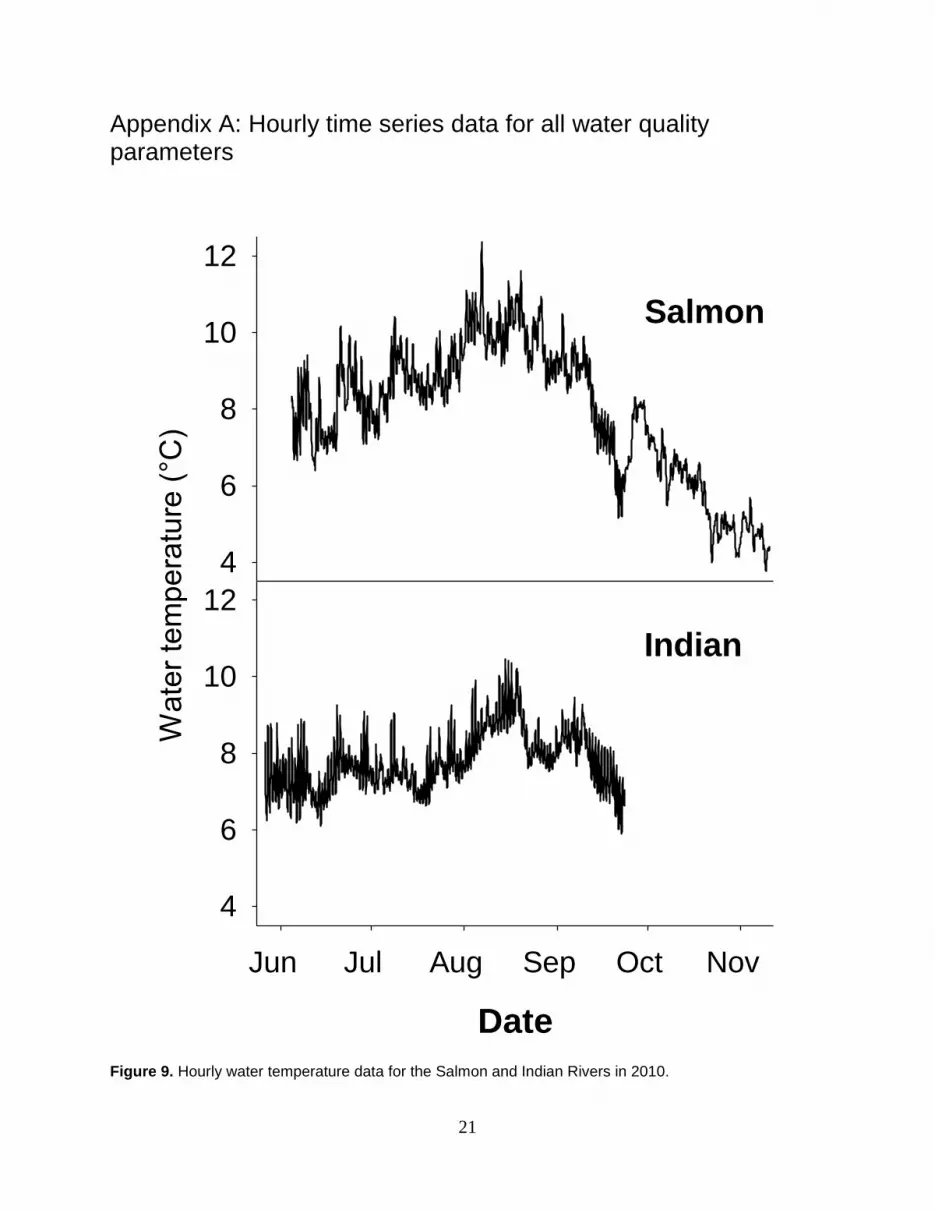
Temperature Both systems demonstrated similar seasonal temperature trends (Figure 3), but the Salmon River
was, on average, warmer and more variable than the Indian River. Daily mean water temperature
in the Salmon River ranged from 4.0 to 11.0°C, peaking on August 6, while the Indian River
ranged from 6.6 to 9.8°C, peaking on August 18. The range of monthly averages for daily mean
water temperatures was greater in the Salmon, while the Indian River monthly averages were
relatively stable (Table 4). Minimum temperature comparisons during the fall are not possible
because Indian River sampling ended September 23. The Salmon River began dropping toward
its minimum observed temperatures beginning October 20.
River Parameter 6/4 to 7/2 7/2 to 8/2 8/2 to 9/3 9/3 to 10/1 10/1 to 11/10
Salmon Conductivity (mS/cm) E E E E E
Dissolved Oxygen (mg/L) G G P E E
pH E E E E E
Temperature (°C) E P E F E
5/26 to 6/30 6/30 to 8/2 8/2 to 8/30 8/30 to 9/23
Indian Conductivity (µS/cm) P E E E
Dissolved Oxygen (mg/L) G E E E
pH E E E E
Temperature (°C) F P P F
Date ranges
Date ranges
8
Figure 3. Daily mean water temperature for the Salmon and Indian Rivers in 2010.
Table 4. Monthly mean, minimum daily mean, and maximum daily mean water temperature for the Salmon and Indian Rivers in 2010. See the methods section for sonde installation dates for each river.
Wate
r te
mpera
ture
(°C
)
4
6
8
10
Date
Jun Jul Aug Sep Oct Nov
4
6
8
10
Salmon
Indian
MonthMean daily
average (SD)Min Max
Mean daily
average (SD)Min Max
June 8.0 (0.8) 6.9 9.2 7.4 (0.6) 6.7 8.0
July 8.8 (0.6) 7.6 9.5 7.5 (0.5) 6.9 8.1
August 10.0 (0.7) 8.9 11.0 8.5 (0.7) 7.8 9.8
September 7.9 (1.2) 5.8 9.7 7.8 (0.8) 6.6 8.9
October 5.8 (0.9) 4.3 7.2
Salmon Indian
9
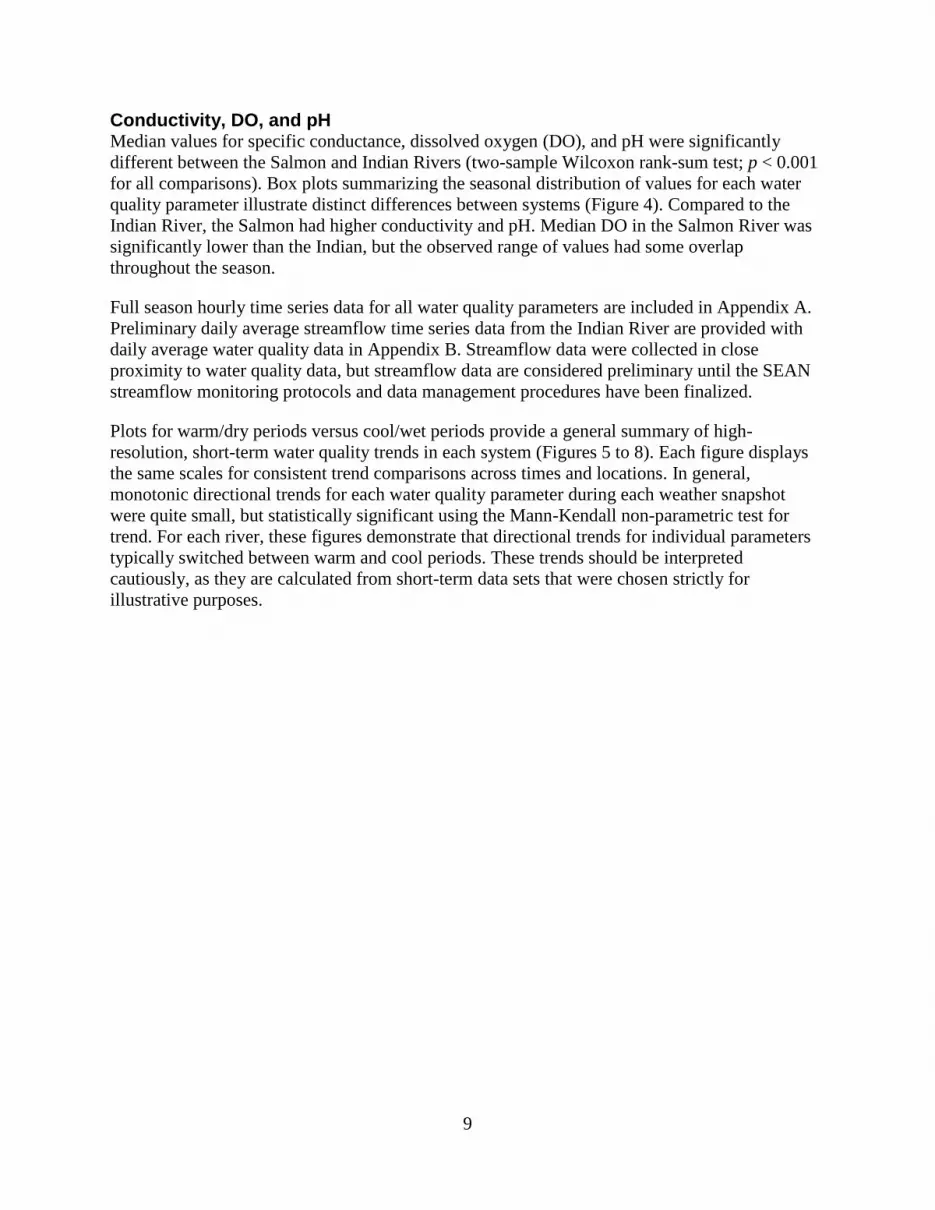
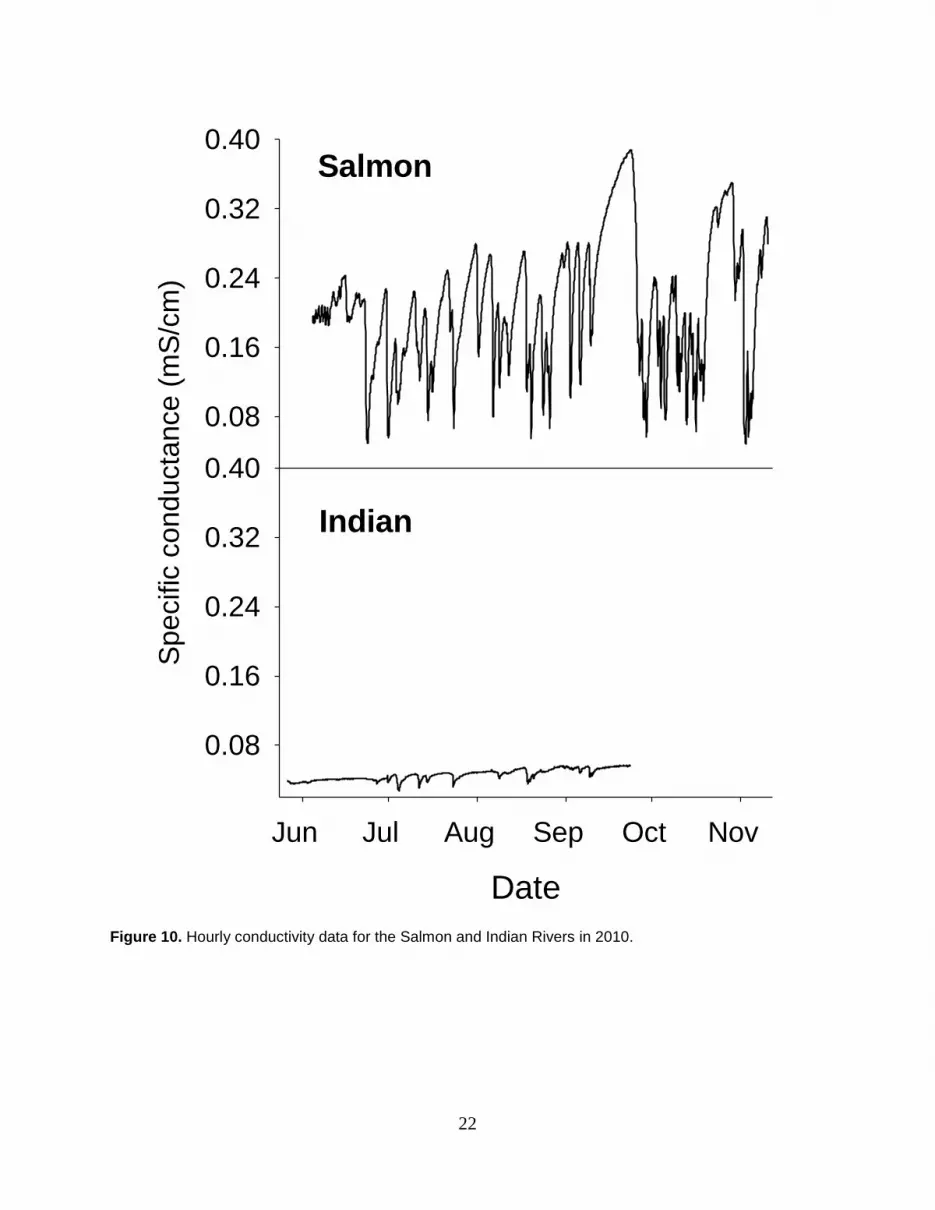
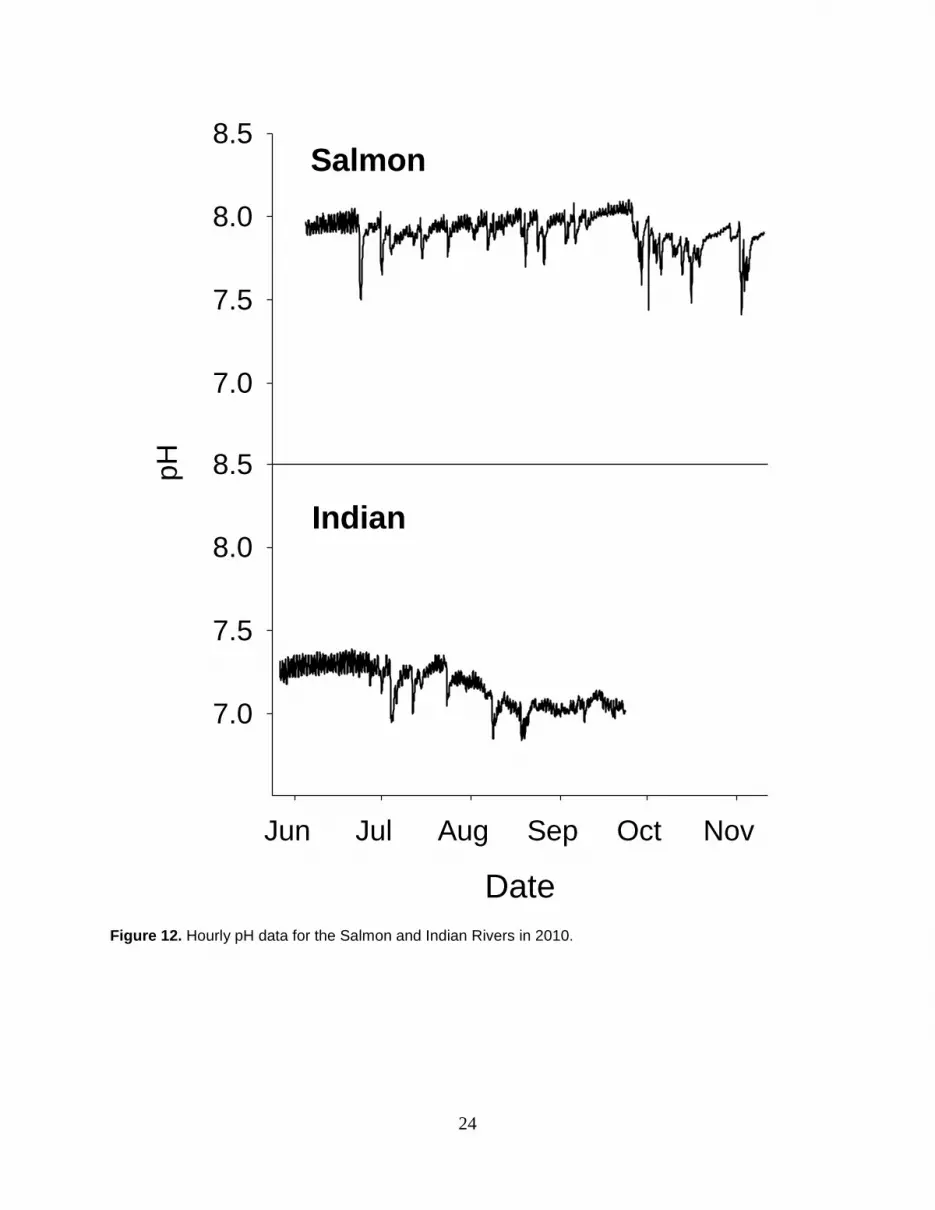
Conductivity, DO, and pH Median values for specific conductance, dissolved oxygen (DO), and pH were significantly
different between the Salmon and Indian Rivers (two-sample Wilcoxon rank-sum test; p < 0.001
for all comparisons). Box plots summarizing the seasonal distribution of values for each water
quality parameter illustrate distinct differences between systems (Figure 4). Compared to the
Indian River, the Salmon had higher conductivity and pH. Median DO in the Salmon River was
significantly lower than the Indian, but the observed range of values had some overlap
throughout the season.
Full season hourly time series data for all water quality parameters are included in Appendix A.
Preliminary daily average streamflow time series data from the Indian River are provided with
daily average water quality data in Appendix B. Streamflow data were collected in close
proximity to water quality data, but streamflow data are considered preliminary until the SEAN
streamflow monitoring protocols and data management procedures have been finalized.
Plots for warm/dry periods versus cool/wet periods provide a general summary of high-
resolution, short-term water quality trends in each system (Figures 5 to 8). Each figure displays
the same scales for consistent trend comparisons across times and locations. In general,
monotonic directional trends for each water quality parameter during each weather snapshot
were quite small, but statistically significant using the Mann-Kendall non-parametric test for
trend. For each river, these figures demonstrate that directional trends for individual parameters
typically switched between warm and cool periods. These trends should be interpreted
cautiously, as they are calculated from short-term data sets that were chosen strictly for
illustrative purposes.

10
Figure 4. Box plots summarizing seasonal values for pH, dissolved oxygen (DO), and specific conductance for the Salmon and Indian Rivers in 2010. The central horizontal line within each box indicates median values, horizontal lines bounding the upper and lower portion of the boxes represent 25
th and 75
th percentiles,
lower and upper whiskers represent 10th and 90
th percentiles, and
single points represent 5th and 95
th percentiles.
Salmon Indian
pH
7.0
7.2
7.4
7.6
7.8
8.0
DO
(m
g/L
)
9
10
11
12
13Sp
ec
ific
Co
nd
uc
tan
ce
(m
S/c
m)
0.1
0.2
0.3
0.4
11
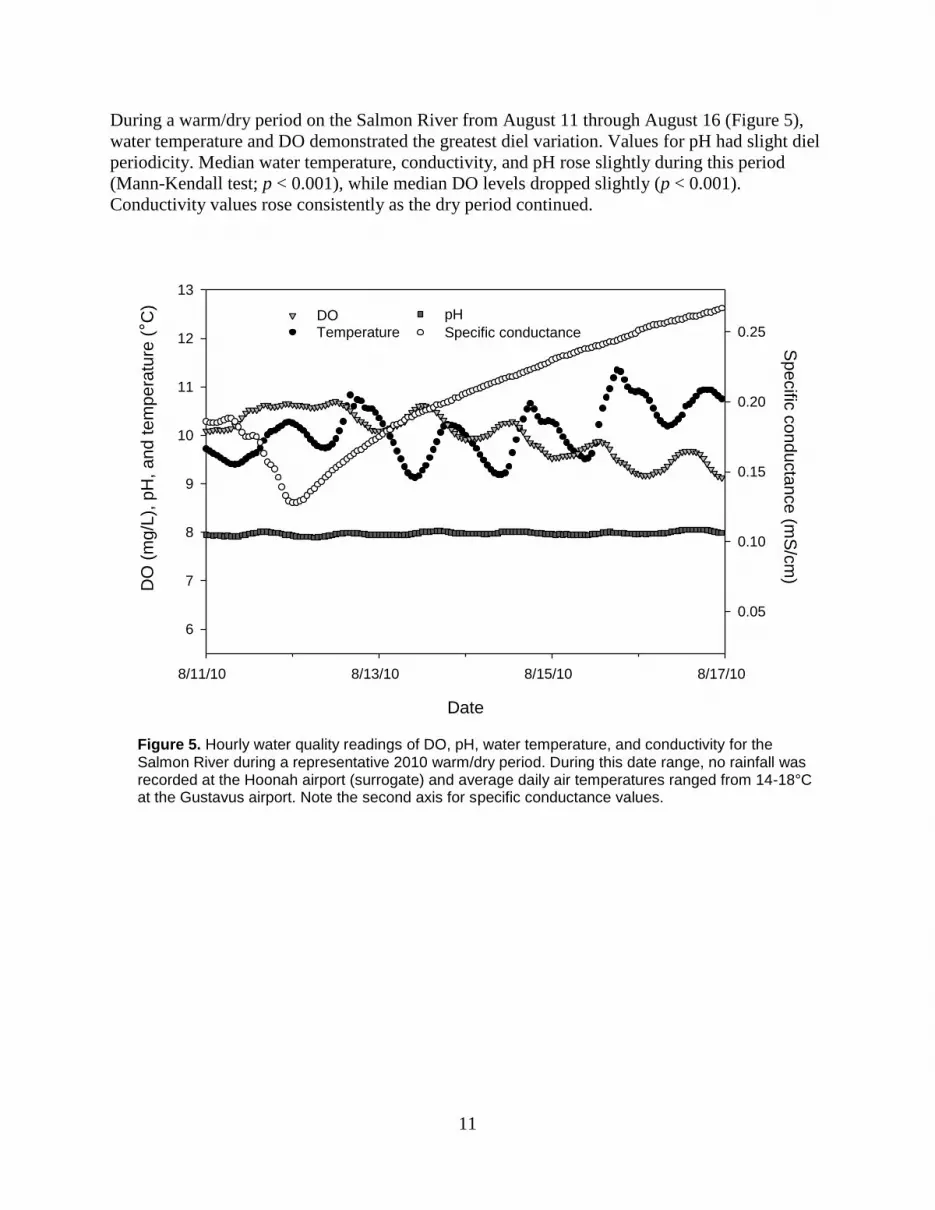
During a warm/dry period on the Salmon River from August 11 through August 16 (Figure 5),
water temperature and DO demonstrated the greatest diel variation. Values for pH had slight diel
periodicity. Median water temperature, conductivity, and pH rose slightly during this period
(Mann-Kendall test; p < 0.001), while median DO levels dropped slightly (p < 0.001).
Conductivity values rose consistently as the dry period continued.
Figure 5. Hourly water quality readings of DO, pH, water temperature, and conductivity for the Salmon River during a representative 2010 warm/dry period. During this date range, no rainfall was recorded at the Hoonah airport (surrogate) and average daily air temperatures ranged from 14-18°C at the Gustavus airport. Note the second axis for specific conductance values.
Date
8/11/10 8/13/10 8/15/10 8/17/10
DO
(m
g/L
), p
H,
an
d t
em
pe
ratu
re (
° C)
6
7
8
9
10
11
12
13
Sp
ecific
co
nd
ucta
nce
(mS
/cm
)
0.05
0.10
0.15
0.20
0.25Temperature DO pH
Specific conductance
12
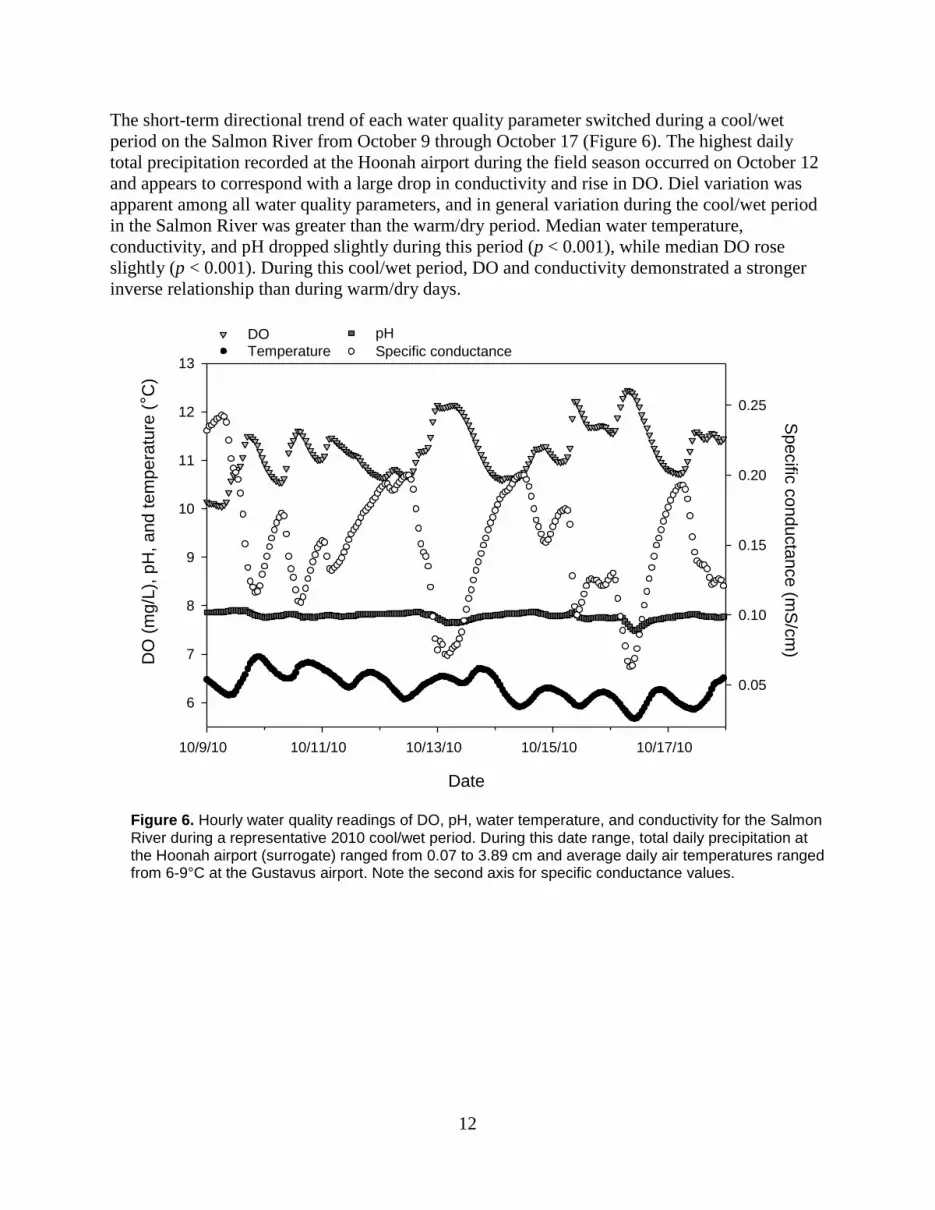
The short-term directional trend of each water quality parameter switched during a cool/wet
period on the Salmon River from October 9 through October 17 (Figure 6). The highest daily
total precipitation recorded at the Hoonah airport during the field season occurred on October 12
and appears to correspond with a large drop in conductivity and rise in DO. Diel variation was
apparent among all water quality parameters, and in general variation during the cool/wet period
in the Salmon River was greater than the warm/dry period. Median water temperature,
conductivity, and pH dropped slightly during this period (p < 0.001), while median DO rose
slightly (p < 0.001). During this cool/wet period, DO and conductivity demonstrated a stronger
inverse relationship than during warm/dry days.
Figure 6. Hourly water quality readings of DO, pH, water temperature, and conductivity for the Salmon River during a representative 2010 cool/wet period. During this date range, total daily precipitation at the Hoonah airport (surrogate) ranged from 0.07 to 3.89 cm and average daily air temperatures ranged from 6-9°C at the Gustavus airport. Note the second axis for specific conductance values.
Date
10/9/10 10/11/10 10/13/10 10/15/10 10/17/10
DO
(m
g/L
), p
H,
and t
em
pera
ture
(° C
)
6
7
8
9
10
11
12
13
Specific
conducta
nce (m
S/c
m)
0.05
0.10
0.15
0.20
0.25
Temperature DO pH
Specific conductance

13
During a warm/dry period on the Indian River from August 12 through August 16 (Figure 7),
water temperature and DO demonstrated the greatest diel variation. Median water temperature
and conductivity rose slightly during this period (p < 0.001), while median DO and pH levels
dropped slightly (p < 0.001). The direction and magnitude of warm/dry trends for DO, pH, and
water temperature were similar between the Salmon and Indian rivers, but considerably different
in magnitude for conductivity. While both systems demonstrated rising conductivity during
warm/dry periods, the Indian River exhibited a smaller proportional and absolute increase.
Figure 7. Hourly water quality readings of DO, pH, water temperature, and conductivity for the Indian River during a representative 2010 warm/dry period. During this date range, no rainfall was recorded at the Sitka airport and average daily air temperatures ranged from 14-17°C. Note the second axis for specific conductance values.
Date
8/12/10 8/14/10 8/16/10
DO
(m
g/L
), p
H,
and t
em
pera
ture
(° C
)
6
7
8
9
10
11
12
13
Specific
conducta
nce (m
S/c
m)
0.05
0.10
0.15
0.20
0.25Temperature DO pH
Specific conductance
14
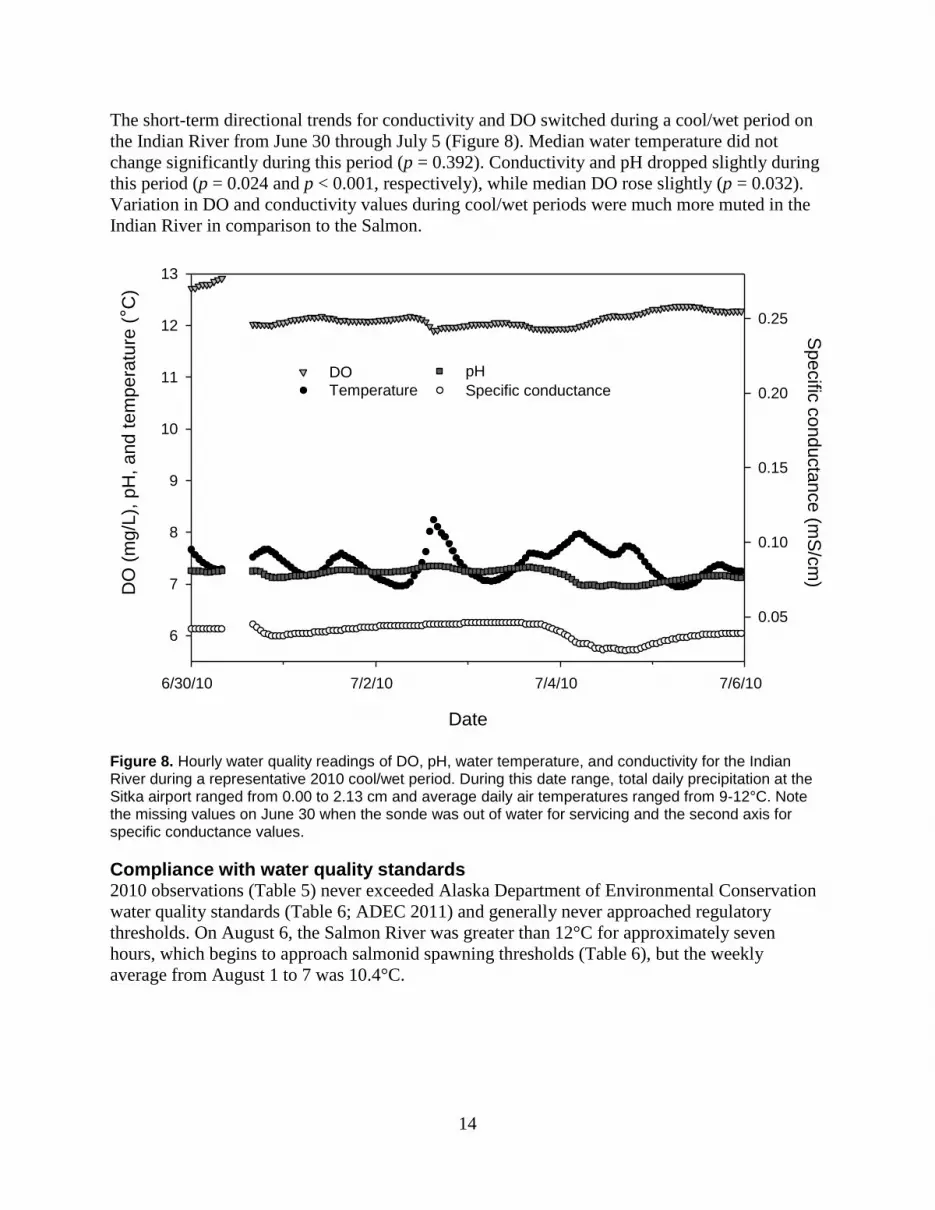
The short-term directional trends for conductivity and DO switched during a cool/wet period on
the Indian River from June 30 through July 5 (Figure 8). Median water temperature did not
change significantly during this period (p = 0.392). Conductivity and pH dropped slightly during
this period (p = 0.024 and p < 0.001, respectively), while median DO rose slightly (p = 0.032).
Variation in DO and conductivity values during cool/wet periods were much more muted in the
Indian River in comparison to the Salmon.
Figure 8. Hourly water quality readings of DO, pH, water temperature, and conductivity for the Indian River during a representative 2010 cool/wet period. During this date range, total daily precipitation at the Sitka airport ranged from 0.00 to 2.13 cm and average daily air temperatures ranged from 9-12°C. Note the missing values on June 30 when the sonde was out of water for servicing and the second axis for specific conductance values.
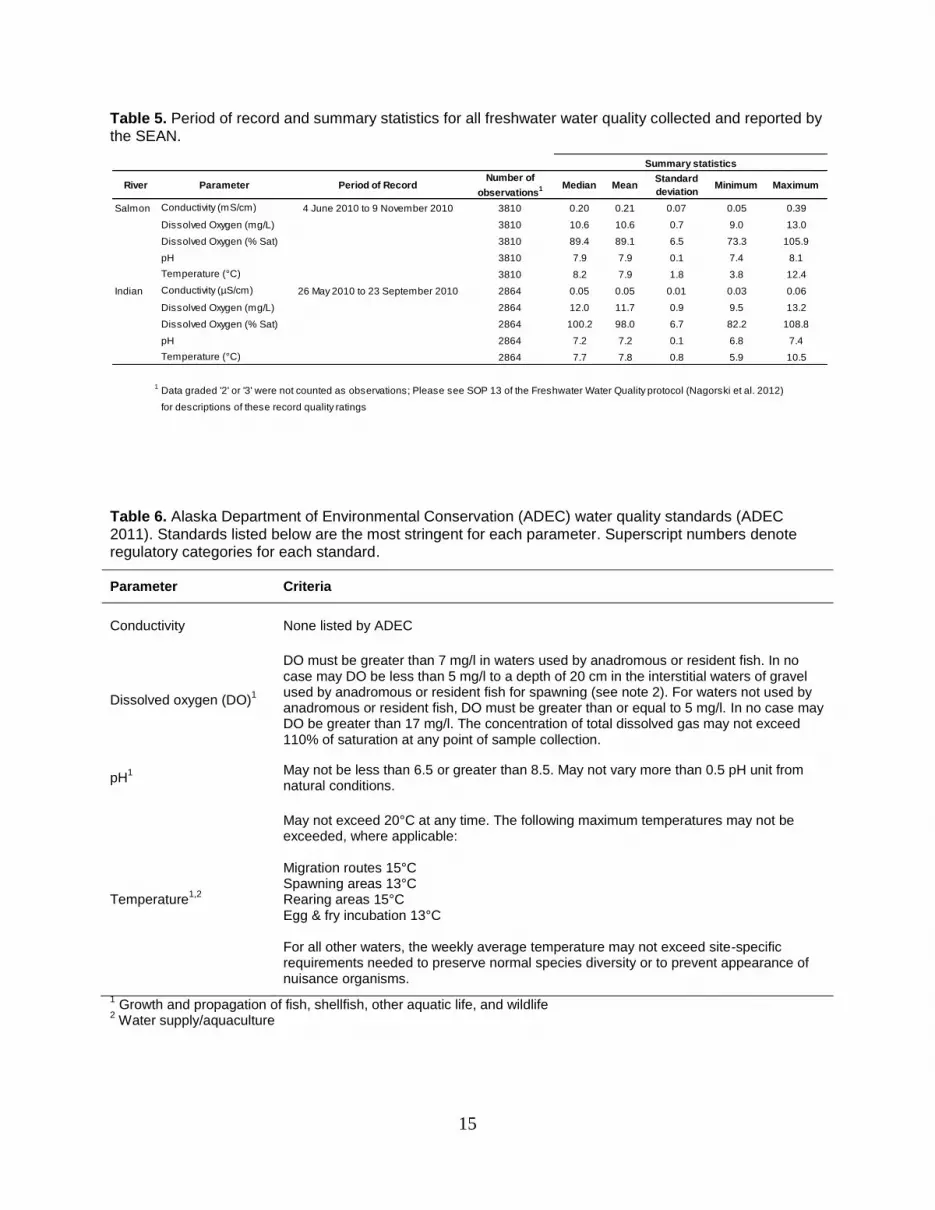
Compliance with water quality standards 2010 observations (Table 5) never exceeded Alaska Department of Environmental Conservation
water quality standards (Table 6; ADEC 2011) and generally never approached regulatory
thresholds. On August 6, the Salmon River was greater than 12°C for approximately seven
hours, which begins to approach salmonid spawning thresholds (Table 6), but the weekly
average from August 1 to 7 was 10.4°C.
Date
6/30/10 7/2/10 7/4/10 7/6/10
DO
(m
g/L
), p
H,
and t
em
pera
ture
(° C
)
6
7
8
9
10
11
12
13
Specific
conducta
nce (m
S/c
m)
0.05
0.10
0.15
0.20
0.25
Temperature DO pH
Specific conductance
15
Table 5. Period of record and summary statistics for all freshwater water quality collected and reported by the SEAN.
Table 6. Alaska Department of Environmental Conservation (ADEC) water quality standards (ADEC 2011). Standards listed below are the most stringent for each parameter. Superscript numbers denote regulatory categories for each standard.
Parameter Criteria
Conductivity None listed by ADEC
Dissolved oxygen (DO)1
DO must be greater than 7 mg/l in waters used by anadromous or resident fish. In no case may DO be less than 5 mg/l to a depth of 20 cm in the interstitial waters of gravel used by anadromous or resident fish for spawning (see note 2). For waters not used by anadromous or resident fish, DO must be greater than or equal to 5 mg/l. In no case may DO be greater than 17 mg/l. The concentration of total dissolved gas may not exceed 110% of saturation at any point of sample collection.
pH1 May not be less than 6.5 or greater than 8.5. May not vary more than 0.5 pH unit from
natural conditions.
Temperature1,2
May not exceed 20°C at any time. The following maximum temperatures may not be exceeded, where applicable: Migration routes 15°C Spawning areas 13°C Rearing areas 15°C Egg & fry incubation 13°C For all other waters, the weekly average temperature may not exceed site-specific requirements needed to preserve normal species diversity or to prevent appearance of nuisance organisms.
1 Growth and propagation of fish, shellfish, other aquatic life, and wildlife
2 Water supply/aquaculture
River Parameter Period of RecordNumber of
observations1 Median Mean
Standard
deviationMinimum Maximum
Salmon Conductivity (mS/cm) 4 June 2010 to 9 November 2010 3810 0.20 0.21 0.07 0.05 0.39
Dissolved Oxygen (mg/L) 3810 10.6 10.6 0.7 9.0 13.0
Dissolved Oxygen (% Sat) 3810 89.4 89.1 6.5 73.3 105.9
pH 3810 7.9 7.9 0.1 7.4 8.1
Temperature (°C) 3810 8.2 7.9 1.8 3.8 12.4
Indian Conductivity (µS/cm) 26 May 2010 to 23 September 2010 2864 0.05 0.05 0.01 0.03 0.06
Dissolved Oxygen (mg/L) 2864 12.0 11.7 0.9 9.5 13.2
Dissolved Oxygen (% Sat) 2864 100.2 98.0 6.7 82.2 108.8
pH 2864 7.2 7.2 0.1 6.8 7.4
Temperature (°C) 2864 7.7 7.8 0.8 5.9 10.5
1Data graded '2' or '3' were not counted as observations; Please see SOP 13 of the Freshwater Water Quality protocol (Nagorski et al. 2012)
for descriptions of these record quality ratings
Summary statistics

17
Discussion
Before the 2010 field season, no known long-term water quality records existed for the Salmon
River (Eckert et al. 2006a). Falls Creek, located on the east side of Gustavus, is a similar
watershed with some available data collected during the design of a hydroelectric facility. During
spot measurements taken in August 1999, November 1999, and February 2000, Falls Creek pH
ranged from 7.9 to 8.2, and DO ranged from 8.5 to 12.2 mg/L (FERC and NPS 2004). These
ranges are very consistent with the observed 2010 Salmon River data (Table 5).
Data were collected through a USGS-NPS partnership from January 2001 to September 2002
near the current Indian River monitoring site. Those data characterized Indian River water
resources as high quality and relatively pristine, despite the potential for pollution from urban
runoff and continued development (Eckert et al. 2006b; Neal et al. 2004). During this period,
water temperature ranged from 2.0 to 8.5°C, DO from 11.4 to 14.1 mg/L, pH from 6.5 to 8.1, and
specific conductance from 0.036 to 0.053 mS/cm. While the 2010 maximum observed water
temperature (10.5°C) was higher and the minimum DO (9.5 mg/L) slightly lower, all other
observed water quality parameter values fell within the range of the Neal et al. study (Table 5).
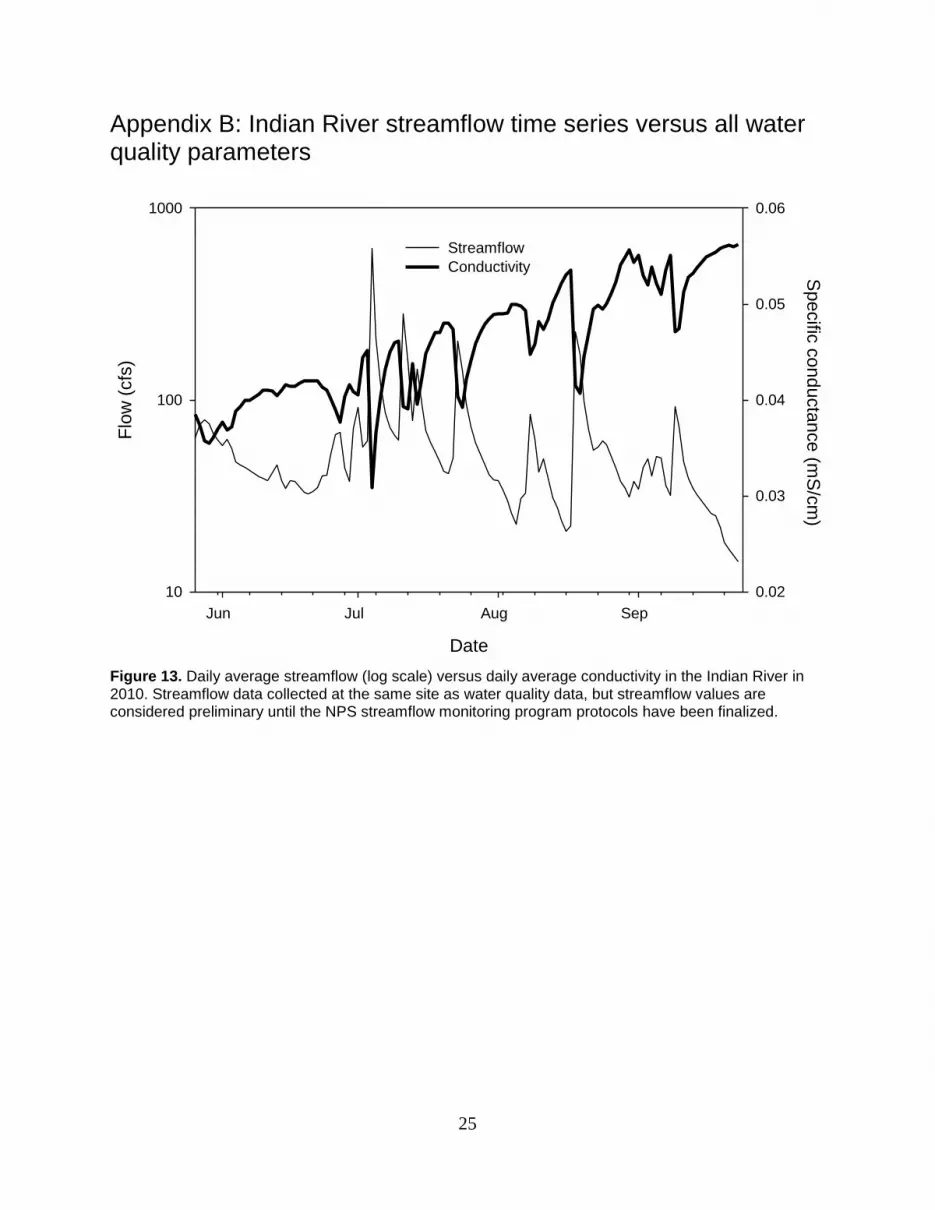
Based on preliminary Indian River streamflow data, flow patterns generally mirror precipitation
events, which on average peak during September through November (Eckert et al. 2006b). In
2010, the highest daily average flows occurred in July (Appendix B). The influence of surface
waters are also seen in the extremely low conductivity values compared to the Salmon River.
Low values are typically seen in rainfall because it contains small amounts of dissolved ions that
would increase observed conductivity values. Combined, the flow and conductivity data strongly
suggest that surface water is the main driver of flow patterns for the Indian River.
Water quality observations in 2010 were consistent with the expected results for a more
groundwater and mature wetland-influenced system (Salmon River) versus a mostly surface
water-influenced system (Indian River). Both rivers generally demonstrated similar water quality
patterns in 2010 as those seen in past studies from the same systems or similar watersheds in
Southeast Alaska (Hood and Berner 2009).
No 2010 observed water quality parameter values exceeded regulatory thresholds set by the
ADEC (Table 6), and no observed values or trends appeared to signal point source pollution or a
change to the fundamental water quality of the Salmon or Indian Rivers. Throughout the
monitoring period, both rivers exhibited water quality conditions within expected normal ranges.
Considerations
Readers interested in accessing SEAN water quality data can download data from the SEAN
Freshwater Water Quality webpage: http://science.nature.nps.gov/im/units/sean/FQ_Main.aspx
Currently, SEAN does not correct (adjust) data values based on calibration checks (see Wagner
et al. 2006), but will develop a proposal for considering future data correction procedures around
early 2013. If data customers decide that analyses may benefit from data correction, all data
necessary to develop correction procedures are available on the SEAN website (e.g., site visit
worksheets including calibration check results).

19
Literature Cited
Alaska Department of Environmental Conservation (ADEC). 2011. Water quality standards (18
AAC 70) as amended through May 2011. Alaska Department of Environmental
Conservation, Anchorage, Alaska. Available from:
http://dec.alaska.gov/water/wqsar/wqs/pdfs/18_AAC_70_as_Amended_Through_May_26_2
011.pdf (accessed February 2012)
Eckert, G., E. Hood, S. Nagorski, and C. Talus. 2006a. Assessment of coastal water resources
and watershed conditions at Glacier Bay National Park and Preserve, Alaska. National Park
Service Water Resources Division Technical Report NPS/NRWRD/NRTR-2006/353.
National Park Service, Fort Collins, Colorado. Available from
http://www.nature.nps.gov/water/watershed_reports/WSCondRpts.cfm (accessed February
2012).
Eckert, G., E. Hood, C. Talus, and S. Nagorski. 2006b. Assessment of coastal water resources
and watershed conditions at Sitka National Historical Park, Alaska. National Park Service
Water Resources Division Technical Report NPS/NRWRD/NRTR-2006/347. National Park
Service, Fort Collins, Colorado. Available from
http://www.nature.nps.gov/water/watershed_reports/WSCondRpts.cfm (accessed February
2012).
Federal Energy Regulatory Commission (FERC) and Glacier Bay National Park and Preserve
(NPS). 2004. Falls Creek Hydroelectric Project and Land Exchange, Alaska (FERC Project
No. 11659-002). Final Environmental Impact Statement. US Federal Energy Regulatory
Commission, Office of Energy Projects, Divison of Hydropower Licensing and U.S.
Department of the Interior, Glacier Bay National Park and Preserve (co-preparers).
Applicant: Gustavus Electric Company.
Hood, E., and L. Berner. 2009. Effects of changing glacial coverage on the physical and
biogeochemical properties of coastal streams in southeastern Alaska. Journal of Geophysical
Research 114: GO3001, doi: 10.1029/2009JG000971.
Moynahan, B. J., W. F. Johnson, D. W. Schirokauer, L. Sharman, G. Smith, and S. Gende. 2008.
Vital sign monitoring plan: Southeast Alaska Network. Natural Resource Report
NPS/SEAN/NRR—2008/059. National Park Service, Fort Collins, Colorado.
Nagorski, S., C. J. Sergeant, W. F. Johnson, and B. J. Moynahan. 2012. Freshwater water quality
monitoring protocol: Version FQ–2012.1, Southeast Alaska Network. Natural Resource
Report NPS/SEAN/NRR—2012/496. National Park Service, Fort Collins, Colorado
National Park Service (NPS). 2005. Freshwater monitoring scoping workshop. National Park
Service, Southeast Alaska Inventory and Monitoring Network, Juneau, Alaska. Available
from:
http://science.nature.nps.gov/im/units/sean/AuxRep/0_SEAN/0_Scoping_freshwater.pdf
(accessed February 2012).
20
Neal, E. G., T. P. Brabets, and S. A. Frenzel. 2004. Water quality and streamflow of the Indian
River, Sitka, Alaska, 2001–2002. U.S Geological Survey Scientific Investigation Report.
Anchorage, Alaska.
Soiseth, C. R., and A. M. Milner. 1995. Predicting salmonid occurrence from physical
characteristics of streams in Glacier Bay National Park and Preserve. Pages 174–183 in D. R.
Engstrom, editor. Proceedings of the Third Glacier Bay Science Symposium,1993. National
Park Service, Anchorage, Alaska.
Wagner, R.J., Boulger, R.W., Jr., Oblinger, C.J., and Smith, B.A. 2006. Guidelines and standard
procedures for continuous water-quality monitors—Station operation, record
computation, and data reporting: U.S. Geological Survey Techniques and Methods 1–D3.
51 p. + 8 attachments. Available from: http://pubs.water.usgs.gov/tm1d3 (accessed
February 2012).
21
Appendix A: Hourly time series data for all water quality parameters
Figure 9. Hourly water temperature data for the Salmon and Indian Rivers in 2010.
Wate
r te
mpera
ture
(°C
)
4
6
8
10
12
Date
Jun Jul Aug Sep Oct Nov
4
6
8
10
12
Salmon
Indian
22
Figure 10. Hourly conductivity data for the Salmon and Indian Rivers in 2010.
Specific
conducta
nce (
mS
/cm
)
0.08
0.16
0.24
0.32
0.40
Date
Jun Jul Aug Sep Oct Nov
0.08
0.16
0.24
0.32
0.40
Salmon
Indian

23
Figure 11. Hourly dissolved oxygen data for the Salmon and Indian Rivers in 2010.
DO
(m
g/L
)
9
10
11
12
13
Date
Jun Jul Aug Sep Oct Nov
9
10
11
12
13
Salmon
Indian
24
Figure 12. Hourly pH data for the Salmon and Indian Rivers in 2010.
pH
7.0
7.5
8.0
8.5
Date
Jun Jul Aug Sep Oct Nov
7.0
7.5
8.0
8.5
Salmon
Indian
25
Appendix B: Indian River streamflow time series versus all water quality parameters
Figure 13. Daily average streamflow (log scale) versus daily average conductivity in the Indian River in 2010. Streamflow data collected at the same site as water quality data, but streamflow values are considered preliminary until the NPS streamflow monitoring program protocols have been finalized.
Date
Jun Jul Aug Sep
Flo
w (
cfs
)
10
100
1000
Specific
conducta
nce (m
S/c
m)
0.02
0.03
0.04
0.05
0.06
Streamflow
Conductivity
26
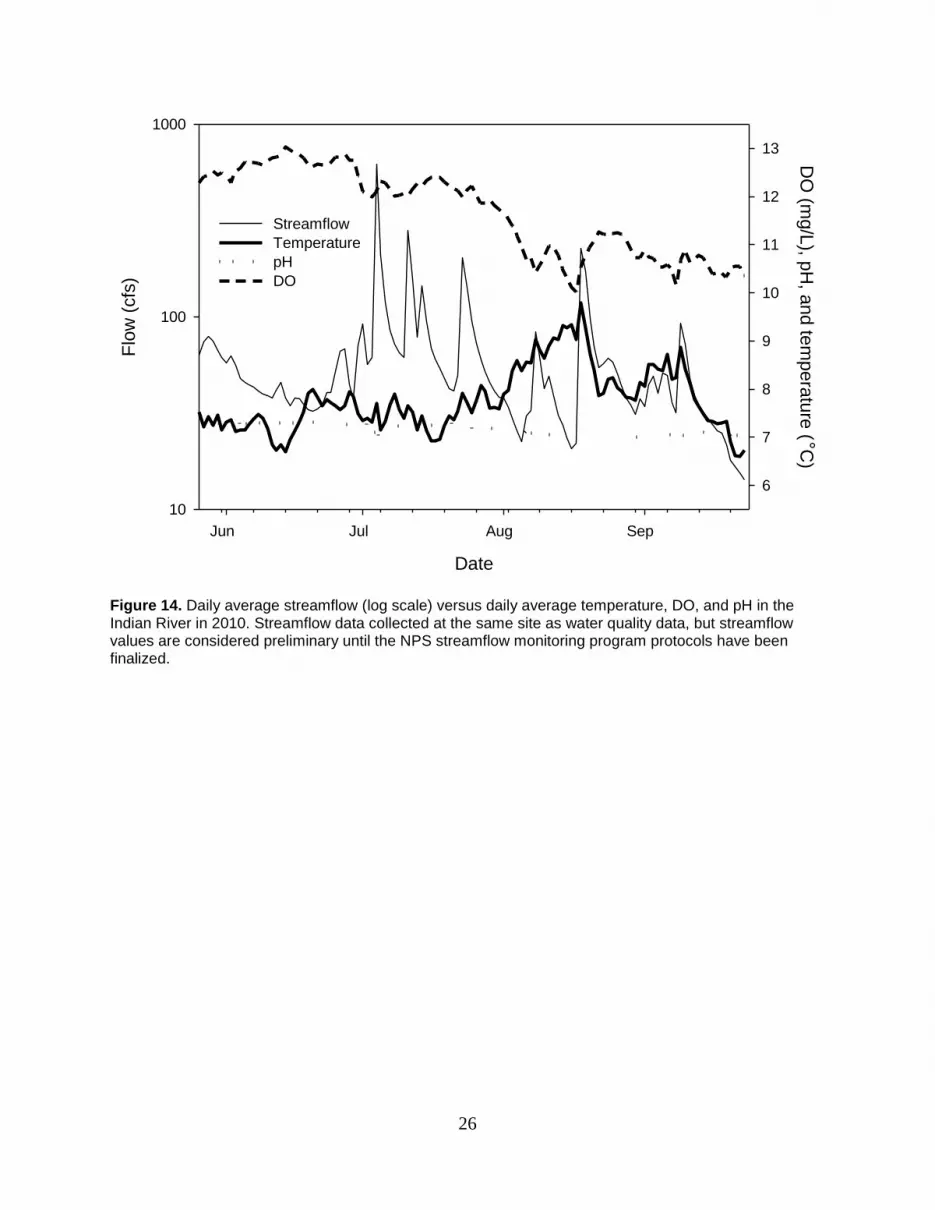
Figure 14. Daily average streamflow (log scale) versus daily average temperature, DO, and pH in the Indian River in 2010. Streamflow data collected at the same site as water quality data, but streamflow values are considered preliminary until the NPS streamflow monitoring program protocols have been finalized.
Date
Jun Jul Aug Sep
Flo
w (
cfs
)
10
100
1000D
O (m
g/L
), pH
, and te
mpera
ture
( °C)
6
7
8
9
10
11
12
13
Streamflow
Temperature
pH
DO

The Department of the Interior protects and manages the nation’s natural resources and cultural heritage; provides scientific and
other information about those resources; and honors its special responsibilities to American Indians, Alaska Natives, and
affiliated Island Communities.
NPS 953/112861, February 2012

National Park Service U.S. Department of the Interior
Natural Resource Stewardship and Science
1201 Oakridge Drive, Suite 150 Fort Collins, CO 80525 www.nature.nps.gov
EXPERIENCE YOUR AMERICA TM