Embed Size (px)
Citation preview

SOUTH SUDAN
Movement and Displacement in South Sudan, 1983-2019
September 2020
Population Movement Baseline Report

ii
Population Movement Baseline Report: Movement and Displacement in South Sudan, 1983-2019
About REACH InitiativeREACH facilitates the development of information tools and products that enhance the capacity of aid actors to make evidence-based decisions in emergency, recovery and development contexts. The methodologies used by REACH include primary data collection and in-depth analysis, and All REACH activities are conducted through inter-agency aid coordination mechanisms. REACH is a joint initiative of IMPACT Initiatives, ACTED and the United Nations Institute for Training and Research - Operational Satellite Applications Programme (UNITAR-UNOSAT).Visit www.reach-initiative.org and follow us @REACH_info.
Photo credit: Anu Atre, Panyijiar county, South Sudan, August 2019.

Population Movement Baseline Report
Movement and Displacement in South Sudan, 1983-2019
1
TABLE OF CONTENTS
Table of Contents 1List of Figures 3List of Tables 3Abbreviations 4
I. Summary 5II. Introduction 7III. Methodology 7 Research Questions 7 Population Movement Baseline Database 7 Qualitative Data Collection 8 Limitations 9
FINDINGS IV. Population Movement Baseline Database by the Numbers 10V. Inter-county and Intra-county Unique Routes 11VI. Movements Across the South Sudanese Border 12VII. Population Movements by Driver 13 Insecurity 14 Resource Stress 14 Climate Shocks 14 CASE STUDY 1: Ruon Nyakuajok in Leer county 16 Disease 17 Livelihood Movement 17 Micro- and Major Displacement 18 Restrictions on Movement 18 Displacement, Mobility Restriction, and Vulnerability 18VIII. Returns 20IX. Decision-making during Population Movement 21 Exogenous Factors Influencing Decision-making 21 Process of Elimination: Environmental and Socio-political Barriers 21 Resource Access 22

Population Movement Baseline Report
Movement and Displacement in South Sudan, 1983-2019
2
TABLE OF CONTENTS (Continued)
Endogenous Factors Influencing Decision-making 22 Household Asset Base and Wealth 22 Social and Familial Networks 23 Household Composition 23 Voluntary Household Fragmentation 24 Cost-Benefit Thinking in Movement 24 Levels of Decision-making 25X. Challenges along Population Movement Routes 25XI. Changes in Movements over Time 26 Changing Routes 26 Disappearing Routes 26 Emerging Routes 29 Contextualising Changes over Time 29 Heightened Violence, Narrowing Choices 29 Overlapping Stressors, Weakened Resilience 30 CASE STUDY 2: Overlapping shocks in Leer county 31 CASE STUDY 3: Sub-national conflict in Warrap and Lakes states 32 XII. Future Exploration 33XIII. Conclusion 33
ANNEXES 35 Annex A: Displacement Participatory Mapping and Focus Group Discussion Tool 35 Annex B: Population Movement Baseline Database Sample 41 Annex C: List of Sources Used for Population Movement Baseline Database 42 Annex D: Map I: All inter-county movements, 1983-2012 and 2013-2019 45 Annex E: Maps II-VI: Top 5 years of movement, by year 46 Annex F: Glossary of Population Movement Terminology 51

Population Movement Baseline Report
Movement and Displacement in South Sudan, 1983-2019
3
LIST OF FIGURESFigure 1: Displacement movements versus returns in database 10Figure 2: Administrative levels of locations in database entries 10Figure 3: Years with highest recorded number of displacement movements >5,000 people, 1983-2019 10Figure 4: Percentage of movements recorded between 1983-2012 versus 2013-2019 movements 11Figure 5: Top 5 most prevalent departure and arrival states recorded, 1983-2019 11Figure 6: Top 5 most prevalent departure and arrival counties recorded, 1983-2019 11Figure 7: Proportion of routes used once versus repeated multiple times, 1983-2019 11Figure 8: Inter-county movement versus intra-county movement, 1983-2019 11Figure 9: Top unique intra-county movement routes, 1983-2019 11Figure 10: Most frequently repeated unique inter-county movement routes, 1983-2019 12Figure 11: Displacement movements by country of arrival 13Figure 12: Population movements by primary driver 13Figure 13: Intersecting drivers of population movement (flooding example) 13Figure 14: Key influencing factors in decision-making for movement in South Sudan 24Figure 15: Top unique movement routes (inter-county) occurring in both historic and contemporary periods 26Figure 16: Top states with highest proportion of unique movement routes (inter-county) occurring in both historic and contemporary periods 26Figure 17: Evolving movement environment in 2013-2019 period 33
LIST OF TABLESTable 1: Qualitative Data Collection: FGDs 8Table 2: Micro-displacement, major displacement, and restriction of movement by driver 19Table 3: Vulnerability versus shock severity by movement type 20
LIST OF MAPSMap 1: Inter-county displacement movements of >5,000 people during 2017 and 1992, years with highest recorded numbers of movements 10Map 2: Proportion of intra-county movement by county, 1983-2019 11Map 3: Cross-border displacement movements of >5,000 people, 1983-2019 12Map 4: Insecurity-driven displacement movements of >5,000 people (Inter-county), 1983-2019 15Map 5: Non-insecurity-driven displacement movements of >5,000 people (Inter-county), 1983-2019 15Map 6: Leer county distress migration driven by food insecurity, 1983-2019 16Map 7: Historic (1983-2012) and contemporary (2013-2019) inter-county movements repeating 3 or more times in each period 27Map 8: Inter-county movements occurring in both the historic (1983-2012) and contemporary (2012-2019) periods 28Map 9: Displacement movements driven by insecurity in Leer county, 1983-2019 31Map 10: Displacement movements in southern Warrap and western Lakes driven by sub-national conflict, 2016-17 32

Population Movement Baseline Report
Movement and Displacement in South Sudan, 1983-2019
4
ACRONYMS & ABBREVIATIONS
CAR Central African RepublicDRC Democratic Republic of CongoFAO Food and Agriculture OrganizationFGD Focus Group Discussion HH HouseholdGoS Government of Sudan ICV Intra-/Inter-Communal Violence IDMC Internal Displacement Monitoring CentreIDP Internally Displaced PersonIOM-DTM International Organization of Migration Displacement Tracking MatrixIPC Integrated Food Security Phase ClassificationOLS Operation Lifeline SudanPMB Population Movement BaselinePoC Protection of CiviliansR-ARCSS Revitalised Agreement on the Resolution of the Conflict in South Sudan SDR Secondary Data ReviewSPLA Sudan People’s Liberation ArmySPLA-iO SPLA in OppositionUNHCR United Nations High Commissioner for RefugeesUNOCHA United Nations Office for the Coordination of Humanitarian Assistance

5
Population Movement Baseline Report: Movement and Displacement in South Sudan, 1983-2019
I. Summary
Since the Second Sudanese Civil War in 1983, South Sudan has seen significant levels of displacement driven by conflict, resource stress, climate shocks, and disease. Movement, already an endemic feature of life in South Sudan, has enabled many South Sudanese households or household members to escape or mitigate years of shocks, but those deciding to move have often faced competing needs, physical risks, and constraints on movement. In order to better understand how both displacement routes and displacing households’ decision-making regarding movement has evolved over the past 35 years, REACH conducted research, consisting of secondary data review and quantitative and qualitative analysis, on long-term population movements trends in South Sudan between 1983-2019, to help humanitarians improve their ability to plan for early response in areas likely to receive displacement.
Population Movement Baseline Database by the Numbers • Across all movements recorded in the Population Movement
Baseline (PMB) database (which may not represent all movements that took place in actuality), the most prevalent year of displacement was 2017 in the contemporary conflict, followed by 1992 in the Second Sudanese Civil War;
• Among unique movements tracked at the county level, Upper Nile and Unity states comprised much of the most prevalent intra- and inter-county movements from 1983-2019;
• Movement within contemporary South Sudan characterised 85% of the movements tracked in the PMB database, while 15% were movements that crossed the border of contemporary South Sudan, mainly from or into Ethiopia and Sudan;
Population Movements by Driver
• Focus Group Discussions (FGDs) revealed that micro-movements of shorter distance and duration were the most common form of movement in response to most drivers, while populations resorted to farther and longer displacements more often when shorter movements were not an option, or when shocks became prolonged or widespread;
• Severe or widespread shocks could also result in movement restrictions, in which the most vulnerable households could not take advantage of movement to alleviate resource stress or exposure to flooding, disease, or insecurity;
• Displacement, and particularly farther and longer-term displacement, was often the result of drivers occurring in conjunction or in succession, such as flooding destroying crops and triggering food insecurity, or insecurity restricting livelihood access and exacerbating pre-existing food insecurity;
Returns
• In FGDs, many Internally Displaced Person (IDP) participants said that they would not return until peace was more certain; some reported that they would not return until armed forces moved from their areas of origin, or until populations reportedly occupying their homes left;
• FGD participants also reported that returns that were occurring were often a single household member returning to cultivate or check on safety conditions, or people “returning” from abroad to a secondary location close to their home settlement and deemed secure, while they waited for safety conditions to improve;
Decision-making during Population Movement
• In deciding where, when, and how to move, households were influenced by exogenous factors which included access to relevant resources or services and the existence of movement constraints, and by endogenous factors which included the attributes of a given household, such as their and financial and household asset base, what pre-existing social connections they could rely on, and the gender/age composition of the household;
• The most vulnerable households, i.e. those facing movement restrictions and lacking coping resources or capacity, generally have fewer movement options, and these households in particular are often forced to make choices between movement towards physical safety and movement to meet essential resource needs, sometimes risking an individual family member’s welfare in order to increase their family’s chances of survival;
• The decision of whether and where to displace reportedly was almost always made at the level of the family unit, by the head of household;
• During population movement, households often voluntarily fragmented, splitting up their household as a means of diversifying their use of movement-related coping mechanisms in order to maximise access to physical security, resources and services (including humanitarian aid), or income-generating activities, or to preserve existing livelihood profiles. Whole households moving together was often an indication of more acute or sudden-onset drivers or higher levels of vulnerability;
Challenges along Displacement Routes
• Protection concerns such as violent theft or sexual violence, as well as lack of access to enough food, water, and essential medicines were reported as challenges across many different displacement routes;
• Despite these challenges, in times of conflict or serious resource stress, many still chose to make journeys known to be potentially risky to their physical safety;

6
Population Movement Baseline Report: Movement and Displacement in South Sudan, 1983-2019
Changes in Routes over Time
• Among the inter-county routes analysed, only 9.7% (22 routes) occurred during both the historic (1983-2012) and contemporary (2013-2019) periods, suggesting that historic use of a route may not predict repeated use of the same route in the contemporary period;
• Observed changes in the routes used from the historic period to the contemporary period indicated loss of access to old routes and emergence of new routes representing a shift from micro-displacement to farther and longer-term displacement, especially for vulnerable households;
• These changes appeared to be driven by a collection of intersecting factors: a more restricted movement environment partially related to the perception of worsening fault lines between identity groups, a perceived escalation of violence against civilians and theft or looting of their property, and severely weakened household resilience as a result of years of accrued shocks and escalated asset-stripping.

7
Population Movement Baseline Report: Movement and Displacement in South Sudan, 1983-2019
1 OCHA, 2020 Humanitarian Needs Overview: South Sudan, November 2019. 2 UNHCR, UNHCR Position on Returns to South Sudan – Update II, April 2019.3 REACH, “Now the Forest is Blocked”: Shocks and Access to Food, March 2018.4 Ibid.5 REACH, Gogrial West, Twic and Mayom Counties Food Security Profile, October 2018.6 IPC, January Integrated Food Security Phase Classification (IPC) analysis, February 2020.
7 IOM-DTM, REACH, UNHCR, IDMC 8 ACAPS, South Sudan Analysis Ecosystem, Strengthening the Information Landscape in South Sudan, forthcoming in 2020.9 The Terms of Reference can be accessed here.
II. Introduction
The civil war that broke out in South Sudan in 2013 has cumulatively triggered the displacement of nearly 2.2 million people internationally and 2 million internally over the last 6 years.1 Historically, populations in South Sudan have experienced episodic displacement for over three decades of conflict, while at the same time commonly relying on population movement for seasonal livelihoods, trade, or coping strategies in times of resource stress. Movement is a vital component of the South Sudanese landscape that humanitarians seek to understand in order to better respond to needs.
Since the signing of the Revitalised Agreement on the Resolution of the Conflict in South Sudan (R-ARCSS) in September 2018, the country has seen a decrease in episodes of large-scale displacement; however, localised displacement driven by various shocks and decreased resilience has continued.2 The compounded negative impacts of repeated shocks and displacement have resulted in the deterioration of household ability to cope, heightened vulnerability and increased humanitarian need.3 Waves of displacement have caused higher reliance of Internally Displaced Persons (IDPs) on host communities, quicker resource exhaustion, loss of livelihoods, and the depletion of household assets, often either due to leaving them behind or selling them as a coping strategy to mitigate resource gaps.4,5 The January 2020 Integrated Food Security Phase Classification (IPC) in South Sudan found that 45.2 percent of South Sudan’s population (5.29 million people) faced acute food insecurity (IPC Phase 3) or worse in January 2020, with flood-affected and other populations facing severe acute food insecurity.6 Given the frequency with which population movement happens in South Sudan, especially for highly vulnerable populations, an understanding of the complex nuances of displacement and population movement is necessary for humanitarian actors to identify the locations and needs of the most vulnerable people in the country to include them in the response.
Displacement and population movement has been widely tracked in South Sudan.7 Humanitarian organizations have been monitoring cross-border movement at many major crossing points, and a large proportion of information products published in the contemporary conflict have been related to displacement.8 However, there has been minimal attempt to contextualise current displacement with a historical lens, by using a combined perspective of South Sudanese population’s historical memory of past movements and the institutional memory of past humanitarian responses in South Sudan alongside current displacement data. This gap in knowledge reduces humanitarian actors’ ability to plan for early response or preposition aid in areas already identified as likely to receive influxes of movement.
III. Methodology
In order to enable better humanitarian response planning along displacement routes and in locations expected to receive internally displaced persons, the current project aimed to foster understanding of displacement routes upon the onset of shocks in South Sudan, including how different drivers of population movement lead to variation in displacement patterns and migration routes, challenges and needs along displacement routes, and contextualisation of current routes through comprehensive mapping of historical routes.
To meet this objective, REACH used a mixed methods approach for this research project, comprised of two stages: a secondary data review (SDR), which included a comprehensive review of historic population movement routes, compiling movements found in SDR sources into a database to generate a population movement baseline (PMB), and qualitative focus group discussions (FGDs) and participatory displacement mapping.9
Research Questions
1. How do communities in South Sudan differentiate between types of population movement?
2. What have been the key drivers of larger population movements (those over 5,000 people) over the last 35 years in South Sudan?
3. What are the most prevalent population movement routes that have been used over the last 35 years and to what extent do they differ based on the driver of the population movement?
4. What challenges and vulnerabilities do populations face along population movement routes?
5. To what extent do recent large-scale population movement routes remain consistent with routes used in the last 35 years?
Population Movement Baseline Database
The first stage of the research, which ran from March 2019 to December 2019 entailed a secondary data review (SDR) of historic movement routes. Aiming to get an understanding of population movement in South Sudan from the Second Sudanese Civil War (1983-2005) and through the contemporary South Sudan Civil War (2013-2019), the findings of the SDR fed directly into the PMB Database that tracked departure and arrival locations (movement routes) of historic movement of 5,000 people or more between 1983 and 2019. The review entailed a comprehensive analysis of publicly available reports, assessments, press releases, maps and

8
Population Movement Baseline Report: Movement and Displacement in South Sudan, 1983-2019
journal articles, with the data primarily sourced from the Sudan Open Archive, ReliefWeb, and from previous REACH products. Some of the main sources used were Operation Lifeline Sudan (OLS) reports, historic United Nations (UN)/non-governmental organization (NGO) response updates, REACH products, UN Office for the Coordination of Humanitarian Affairs (OCHA) Humanitarian Bulletins and Humanitarian Snapshots, IOM Displacement Tracking Monitor (DTM) reports and flow monitoring, and IOM Event Tracking briefs (See Annex C for a full list of sources).
The criteria for inclusion of a movement in the PMB database were:
• Movements of roughly 5,000 people or more • Taking place within or into/out of contemporary South Sudan• Taking place during the years of 1983-2019 • Driven by insecurity, food insecurity, disease outbreak, or climatic
shocks such as flooding or drought• Sources specified the departure and arrival locations at least at
the country level (i.e. Ethiopia to South Sudan)• Sources specified the year(s) of movementREACH scanned sources for movements within these inclusion criteria by tracking keywords such as “flee/fled,” “move/movement,” “travel,” “displace,” etc. In addition to the above inclusion criteria, entries were included if they specified the departure and arrival locations at least at the country level (e.g. Ethiopia to South Sudan) as well as the year(s) of movement. If a movement did not specify the exact population number of the movement but stated that “many” people moved, it was assumed to meet the 5,000-person threshold. Information for the year(s) of movement, departure location, arrival location, whether the movement was a displacement or return, and driver of the movement were all recorded for each entry in the PMB database. Departure and arrival locations were recorded at the lowest possible administrative level. The administrative levels recorded included settlement, county, state, region and country.
A sources workbook, tracking the source of information for each line of data, was also developed. This workbook contained verbatim text or a short summary describing the movement, the driver, and the year, as well as a corresponding ID number to the entry in the PMB database for cross-referencing. This workbook allowed for easy access to the referenceable context for each movement entered into the database.
Movements of over 5,000 people that were mapped during qualitative data collection were also entered into the PMB database using the same process and criteria. For the majority of the PMB database
analysis, REACH tracked unique movements that were repeated from 1983 to 2019, analysing recorded movements wherein at least county-level information on departure and arrival locations was available.
Qualitative Data Collection
The second stage of the research included qualitative data collection, which was carried out between June and September 2019 and primarily included Participatory Mapping FGDs, to further contextualise historic and present movement in South Sudan. The FGD tool (See Annex A) was partially informed by the SDR and included both standard questions as well as an interactive mapping exercise through which the participants drew population movement routes at the county level.
Qualitative data collection through FGDs and participatory population movement mapping occurred from June to November 2019, in Lakes, Upper Nile, and Unity states, and Juba Protection of Civilians (PoC) site 1 (with participants from Jonglei state). In total, 33 FGDs were conducted with 229 participants. FGDs generally included 6-10 participants, disaggregated by gender when possible; 11 FGDs were held with only men, 13 were with only women, and 9 were mixed-gender.
Lakes Upper Nile Unity Juba PoCMale 4 4 3 -Female 5 5 3 -Mixed-gender
- 2 5 2
Total 9 11 11 2
Table 1: Qualitative Data Collection: FGDs
Locations for qualitative data collection were chosen based on two factors: 1) areas characterised by high movement flows in the Second Civil War and/or the most recent war as indicated by the PMB Database (e.g. central/southern Unity state and the western bank of Upper Nile state) or 2) there had been large-scale sudden-onset movement, or high frequency micro-displacements in the area, within the last 3 months (e.g. western Lakes state). Participatory mapping FGDs were conducted in the Juba PoC 1 site, Rumbek Centre and Cueibet counties in western Lakes state, Malakal PoC site and Malakal town in Malakal county, Tonga town in Panyikang county, Kodok town in Fashoda county, and Nyal town, and Meer and Nanjim islands in Panyijiar county. FGDs were typically conducted with either IDPs or host community populations. Talking to both host communities and IDPs in these locations, REACH mapped

9
Population Movement Baseline Report: Movement and Displacement in South Sudan, 1983-2019
movement in 15 counties spread across 4 states.10 To add contextual knowledge on areas not covered, REACH also used findings from past REACH participatory mapping FGDs and other qualitative research conducted in locations such as Western Equatoria state and Pibor, Wau, and Gogrial West counties.
The unit of analysis for most questions asked during qualitative data collection was the household, since most FGD participants were best able to answer about movements that their household or household members engaged in, or describe the movements of others in their community which tended to take place at the household level. These qualitative findings are thus frequently reported in terms of households throughout the report, though it should be noted that this phrasing is not referring to any kind of household survey data collection. This assessment used administrative areas from the former 10-state system in use by the UN for humanitarian purposes.
Data was recorded by hand in the field and then notes were transcribed at field bases. FGD transcripts were analysed for common themes in decision-making factors and changes in movement routes over time.
Limitations
• Coverage: The ability of the PMB database to capture movements throughout the past 36 years was limited by the secondary data publicly available, particularly where qualitative data collection was not possible. Accordingly, lack of reported movement in a specific area recorded in the PMB database does not mean that that area did not see any movement of 5,000 people or more between 1983-2019, but that such movement was not captured in accessed reports. In addition, the drivers of movements captured in the PMB database were also limited by the focus of the sources contributing to the database. In particular, sources frequently reported exclusively on movement caused by insecurity over movements triggered by other drivers, such as climate events, disease outbreaks, or food insecurity. Qualitative data collection could not fully make up for this gap; therefore, analysis of differing routes by driver may be somewhat distorted. Some geographic areas were also likely over-represented in the PMB database, which introduces bias on regional movement trends. Given that qualitative data collection was carried out in areas already identified as having high frequency of historic movement, movements in these areas may be over-represented in the database and analysis. Additionally, while efforts to limit duplication were made, it is likely that some duplicate movements remain. Some geographic areas may also have been originally over-represented in source materials drawn from for the PMB database as a result of greater reporting in places of existing humanitarian presence or assumed political
significance. Conversely, other areas with less assumed political significance or lower humanitarian presence, such as Western and Eastern Equatoria, may be under-assessed.
• Method of input in PMB database: Given that exact numbers of population movements were not consistently available throughout primary or secondary data collection, movement routes could not be weighted by size of population moving; only routes’ frequency of use, when indicated in separate years, could be calculated. Although the PMB database included data on the numbers of each movement where it was available, many movements did not have this information, so it was not possible to weight each movement by population size. Furthermore, if a movement was described in a single source as taking place throughout a series of years (i.e. 1999-2002), each year was given its own entry. If a single source described a movement coming from or going to multiple locations as part of the same incident, each individually-specified location was recorded as a separate entry. As such, the prevalence of a unique movement represents only the number of times that movement was mentioned, including the possibility of multiple departure/arrival settlements related to the same incident or multiple years of repeated or continuous movement. At the same time, because the PMB database tracked movement on a yearly rather than monthly basis, use of the same route multiple times within a single year was only able to be tracked if multiple uses were explicitly mentioned in a source. In combination with the qualitative nature of the supporting research, all the information presented in this report should be considered indicative of key themes and locations, and as such, findings should not be taken as representative of all movements that occurred during the 1983-2019 time period or of the entire population of interest.
10 FGDs took place in Rumbek North, Cueibet, and Rumbek Centre counties in Lakes state; Fashoda, Malakal, Panyikang, and Ulang counties in Upper Nile state; Leer, Mayendit, and Panyijiar counties in Unity state, and Fangak, Ayod, Akobo, Uror, and Nyirol counties in Jonglei state.

Population Movement Baseline Report
Movement and Displacement in South Sudan, 1983-2019
10
FINDINGS
The following sections highlight findings related to the most prevalent movements found in the PMB database, including top unique movements and years that saw the most movement. Drawing from FGDs conducted across 4 states, subsequent sections also discuss differing population movements by driver, decision-making for population movement, challenges during population movement, and changes in population movement over time.
IV. Population Movement Baseline Database by the Numbers
The PMB database captured a total of 990 movements between 1983 and 2019.11 Among these, 934 (94.3%) were reported as caused by insecurity (i.e. displacement, see p.13 for definition) or resource stress (i.e. distress migration, see p.13 for definition), while 56 movements (5.7%) were return movements. Return movements were analysed separately and not reflected in the findings that follow.
Years of Most Movement12
Out of the 934 displacement and distress migration movements recorded in the PMB database between 1983 and 2019, the years with the greatest number of movement entries were split between the Second Sudanese Civil War and the contemporary South Sudanese Civil War (Table 2, Map 1).
Departure - Arrival
Country border
State line
County line
Movements from 2017
Movements from 1992
Map 1: Inter-county displacement movements of >5,000 people during 2017 and 1992, years with highest recorded number of movements
2017: One of the highest concentrations of military offensives in the contemporary conflict, driving displacement in Equatoria region, Western Bahr el Ghazal, Jonglei, southeast Unity, and Malakal; also heightened sub-national conflict in Lakes and Tonj1992: Offensives in Rumbek and Yirol towns and major attacks in Juba and Kapoeta leading to mass displacement; militia and Government of Sudan (GoS) cross-border offensive in Pochalla leads to relocation of thousands of former refugees2002: Continued offensives and large-scale forced displacement out of oil-rich regions of northern Unity state into Warrap; offensives in Gogrial town; mass movements out of Raja following GoS offensive2018: Extensive conflict and food insecurity in Greater Baggari and central Unity state; ongoing conflict in eastern Western Equatoria; sub-national armed conflict in Lakes1999: Onset of offensives and large-scale forced displacement/depopulation out of oil fields in Unity state driving movement into northern Unity; insecurity in Sobat River area causing displacement into Malakal
15+6+6+5+5Figure 3: Years with highest recorded number of displacement movements of >5,000 people, 1983-2019 (n=934)
Year of movement
2017 199220022018 1999
141 15.1% 60 6.4%53 5.7%49 5.2%49 5.2%
11 Although the PMB database recorded 14 entries from years prior to 1983, recorded during FGDs, the scope of the current report is restricted to movements from 1983 onward, so those entries were excluded from the analysis. 12 The analysis of top years of movement and top departure and arrival states and counties shown in Tables 2-4, as well as Figures 1, 2, 3, and 5, used all 934 displacement entries regardless of the administration level of the information available on departure and arrival location. However, maps 1, 4, 5, 7, and 8 display only movements that had county or settlement level information available for both departure and arrival, and were further restricted to cross-county movements for the sake of visualisation. These restrictions ruled out all movement to other countries, as sources generally did not list counties in other countries. However, the data in Table 2, “Years with highest recorded displacement movements,” matched the top 5 years of unique movements recorded when they were restricted to intra- and inter-county movements (for which either county or settlement level data had to be available for inclusion).
946+AFigure 1: Displacement movements versus returns in database (n=990)
5% Country 14% 4% State 3%44% County 17% 46445+5+A 46% Settlement 66%
Figure 2: Administrative levels of locations in database entries (n=934)
94% Displacement/Distress Migration6% Returns
Number and percentage of movements
66173+14+A Departure Arrivals
N

11
Population Movement Baseline Report: Movement and Displacement in South Sudan, 1983-2019
Similar to what is seen in the top 5 years of movements, Unity state, which saw repeated offensives during both conflict periods, was the most prevalent departure state and arrival state for movements in the database. Although the vast majority of movements were intra-state movements, the top 5 departure states and the top 5 arrival states varied somewhat from each other. This is partially because states like Jonglei and Warrap acted as catchments for many IDPs from states with higher displacement such as Unity and Upper Nile states, and partially because sources used in the PMB database were less likely to include arrival information than departure information specific to the state level.
V. Inter-county and Intra-county Unique Routes14
Among the 934 entries for displacement movements, 751 had departure and arrival information at the county level or settlement level. These 751 movements, drawn from 281 unique routes, comprised the movements analysed in the following sections.
Figure 4: Percentage of movements recorded between 1983-2012 versus 2013-2019 movements (n=934)
63% 1983-2012
37% 2013-20196337+A
25+18+17+10+0
Figure 5: Top 5 most prevalent departure and arrival states recorded, 1983-2019 (n=934)13
State
Unity Upper Nile JongleiWestern Bahr el GhazalEastern Equatoria
25.3% 18.3%17.1%10.0%
18+13+12+9+7+0State
Unity Jonglei Upper NileWarrapWestern Bahr el Ghazal
17.7% 13.4%11.9%9.1%6.7%
9+5+5+4+4+0County
Leer RajaMalakalPanyikangMayendit
9.2% 5.0%5.0%4.2%4.0%
County
Leer FashodaMalakalWauRubkona
6.1% 5.3%5.2%4.9%4.5%
Map 2: Proportion of intra-county movement by county, 1983-2019 (n=291 intra-county movements)
Figure 7: Proportion of routes used once versus repeated multiple times, 1983-2019 (n=751)
63% Routes used more than once
37% Routes used once6337+A
The most-repeated routes for intra-county movement (movement within a county) were scattered across the country. Wau county was the site of relatively high movements from the Greater Baggari area in 2016, 2017, and 2018.15 16 Movement within Pibor county was reportedly due to heightened armed conflict between the Lou Nuer and Murle groups throughout 2012, as well as conflict between Bor Dinka and Murle in 2017.17, 18
Departures and Arrivals
13 Percentages for top states are taken from the total of 934 movements, including .8% of movements that did not have state-level information.14 In this analysis, a “unique route” is a unique combination of departure county and arrival county (i.e. Ayod to Duk or Leer to Leer). Each unique route found in the database had 1 or more movements, i.e. instances in which that route was recorded being used. 15 REACH, Bagarri Displacement and Food Security and Livelihoods Brief, Wau County, Western Bahr el-Ghazal
State, South Sudan, September 2017.16 Sarah Vuylsteke, Identity and Self-Determination: The Fertit Opposition in South Sudan, HSBA, Small Arms Survey, December 2018.17 OCHA, South Sudan: Humanitarian Snapshot, May 2017.18 OCHA, South Sudan Weekly Humanitarian Bulletins, September–October 2012.
6+06.4%
Percentage of movements Percentage of movements
6+5+5+5+5+0Figure 9: Top unique intra-county movement routes, 1983-2019 (n=751) 36+22+16+13+13
County of movement
Within Leer county 36Within Wau county 22Within Pibor county 16Within Raja county 13Within Ayod county 13
Number of recorded movements for route
Percentage of movements Percentage of movements
Departures Arrivals
Figure 6: Top 5 most prevalent departure and arrival counties recorded, 1983-2019 (n=934)
Departures Arrivals
Figure 8: Inter-county movement versus intra-county movement, 1983-2019 (n=751)
61% Inter-county39% Intra-county6139+A

12
Population Movement Baseline Report: Movement and Displacement in South Sudan, 1983-2019
Movement from Malakal county to Fashoda county, the most prevalent inter-county route recorded in the PMB database, occurred primarily in 2017. Following earlier displacement from the East Bank to the West Bank in 2013, in 2017 tens of thousands of Shilluk civilians displaced again, moving further north into Fashoda county as conflict on the western bank began to escalate.19 Movement from Gogrial West to Aweil South was mainly comprised of the displacement of over 6,000 people from several Gogrial West towns to several settlements in Aweil South between 2002-2003, and is likely over-represented as a result of the PMB database’s entry process20 (See Case Studies 1 and 2 for inter- and intra-county movement from and
within Leer county).
The top routes in the PMB database appeared to indicate a general preference to move shorter distances when possible. For movements recorded at least at the county level, the most prevalent routes in the PMB database (those with the most repeat movements) occurred within individual counties. Although a greater proportion of routes overall were inter-county,21 most of the top recorded inter-county movements were to a neighbouring county. The only exception was the Leer to Rubkona route, in which many IDPs travelled farther for the available services and relative safety of Bentiu or Rubkona town, particularly during a period of severe insecurity in 1999-2002 (See Case Study 2).22
VI. Movements Across the South Sudanese Border
Among displacement movements recorded in the PMB database, 85.5% were purely internal movements within contemporary South Sudan, with 14.5% of displacement movements crossing what is currently regarded as the border between South Sudan and other countries.24
19 Amnesty International, “It was as if my village was swept by a flood”: The Mass Displacement of the Shilluk Population from the West Bank of the White Nile, South Sudan, 2017.20 Norwegian Refugee Council/Global IDP Project, Global IDP Database, Profile of Internal Displacement: Sudan, 2005.21 A methodology reliant on humanitarian sources, which tend to emphasize farther movements associated with higher needs in need of response, may also have led to an under-representation of intra-county movements.22 Human Rights Watch, Sudan, Oil, and Human Rights, September 2003.
23 All entries for “South Sudan” listed South Sudan for both departure AND arrival (i.e. internal movements). 4 entries listing another departure country (i.e. displacements from other countries to South Sudan) were excluded from this analysis. One movement came from Ethiopia to South Sudan (1991), and 3 movements came from Sudan to South Sudan (2011).24 For the purpose of comparability of movements over time, the national border delineation of South Sudan post-independence was used for all years of analysis.
Map 3: Cross-border displacement movements >5,000 people, 1983-2019
Country border
State line
County line
Movements from 2013-2019
Movements from 1983-2012
Departure - Arrival
Figure 10: Most frequently repeated unique inter-county movement routes, 1983-2019 (n=751) 68+43+42+38+17
County-to-county route
Malakal to Fashoda 21Gogrial West to Aweil South 14Leer to Panyijiar 14Panyikang to Malakal 13Leer to Rubkona 11
Number of repeated movements for route

13
Population Movement Baseline Report: Movement and Displacement in South Sudan, 1983-2019
The most prevalent cross-border movement from a single county was from Akobo county to Ethiopia, spread out over most years between 1989 and 2004, as well as 2009, 2014, and 2017. Movement into Akobo and out to Ethiopia throughout these years was mainly driven both by longstanding conflict between Murle and Lou Nuer groups and by military offensives to take Akobo town and surrounding areas. Akobo residents as well as those initially displaced to Akobo from elsewhere in Jonglei state typically made their way to camps in Ethiopia to access resources and services commonly perceived to be available there.25, 26 More broadly, Ethiopia has frequently been used as a displacement destination for residents of the Greater Akobo counties and the Jikany Nuer on the eastern border of Upper Nile state, both historically and in the contemporary conflict; aside from the perception of reliable resources in Gambella refugee camps, the route to Ethiopia has often been more secure than in-country routes westward from Greater Akobo or southeast Upper Nile.
The most prevalent years of cross-border movement recorded in the PMB database were 2001 and 2017. Movements in 2001 were primarily destined for Sudan (not a separate country at the time), from Unity and Western Bahr el Ghazal states, during a time of major offensives in those areas, particularly in Raja county. The year 2017, meanwhile, saw repeated movement into Ethiopia from Jonglei state as well as from counties with high populations of Jikany Nuer in eastern Upper Nile. Additionally, displacement from western Upper Nile state to Sudan was also taking place in 2017.
VII. Population Movements by Driver
Across the 934 displacements captured in the PMB database, 92.3% were driven by insecurity, with the remaining 7.7% of movements driven by food insecurity (3.2%), climate shocks such as flooding and drought (2.4%), and disease outbreak (2.0%).27
In FGDs, participants were asked their perception of what had triggered large-scale movements over the last 35 years. Five main drivers emerged across the majority of groups, further supported by the secondary data compiled in the PMB database: conflict, food 25 REACH, Akobo, Uror, and Nyirol county FGDs, Juba PoC site, November 2019.26 HSBA/Small Arms Survey, My neighbour, my enemy: Inter-tribal violence in Jonglei, Sudan Issue Brief No. 21, October 2012.27 It should be noted that these proportions are only reflective of movement tracked in the database, rather than all movement in South Sudan history. Insecurity-driven movements are likely over-represented in the PMB database
due to the emphasis on conflict-based displacement in many of the source documents used.
Figure 12: Population Movements by Primary Driver (n=934)
92% Insecurity3% Food insecurity3% Climate Shocks9233+2+A 2% Disease Outbreak
insecurity or other forms of resource stress, climatic shocks, disease outbreaks, and livelihood movement. While each discrete driver reportedly had the power to trigger movement on its own, many movements were in fact the product of a sequence or combination of drivers. Acknowledging that movements often resulted from multiple inter-linked or sequential drivers, analysis in this report categorized each movement by a single “main” driver, better understood as the explicit trigger that finally prompted a household or household members to move. This conceptualisation of a main driver or trigger was also reflective of FGD participants’ descriptions of what caused large-scale displacement or distress migration in their areas.
When interpreting movement triggered by individual or accumulated drivers, mobility is used as a resource to cope during during periods of insecurity, gaps in resources or services, climate shocks, and disease outbreak. Mobility is furthermore a vital part of everyday livelihood activities, with household members often engaging in movement for cattle migration, fishing, collection of wild foods, and market activities. “Movement” as such is therefore not inherently negative, and constraints on movement can be just as detrimental to households as forced displacement. Nonetheless, irregular movement and/or displacement can indicate unmet needs of importance to humanitarians, and the more extreme and disruptive the movement the more serious the needs are likely to be.
Figure 13: Intersecting Drivers of Population Movement (Flooding example)
Indirect Driver
Flooding
Indirect Outcome
Loss of crops or livestock; blocked or minimised market access; breakdown of livelihoods
Main Driver/Trigger
Food insecurity (Lack of acces to/ availability of food)
Movement Outcome
Distress migration
Figure 11: Displacement movements by country of arrival (n=934)23
Country of Arrival
South Sudan (internal) 85.5%Ethiopia 6.0%Sudan 4.9%Uganda 1.7%Kenya 1.0%DRC 0.4%CAR 0.4%
86+6+5+2+1+1+1
Percentage of movements
A note on definitions: throughout the remainder of the report, displacement is generally used to mean a forced movement prompted by an external shock or shocks. Distress migration, on

14
Population Movement Baseline Report: Movement and Displacement in South Sudan, 1983-2019
the other hand, is used to more narrowly describe movement towards resources in response to the breakdown of livelihoods and exhausted capacity to cope resulting in a lack of access to resources, such as food and services necessary to meet basic needs, as an outcome to either slow or sudden-onset shocks. The terms micro-displacement or major displacement (see p.18), which refer to distance and stay duration rather than the type or acuteness of the shock driving the movement, may still include distress migration. Other forms of migration, such as cattle migration or seasonal migration, refer to movements that are typically repeated in seasonal or other predictable patterns, though those patterns may become altered or disrupted in response to external factors. Finally, movement is used as a general umbrella term which can include any of the above, as well as other forms of movement (see Annex F).
Insecurity
Displacement was understandably a frequent response to insecurity. The types of destination households or household members sought in times of conflict varied considerably depending on the degree and location of the insecurity, as well as households’ individual resources and constraints. Short-term displacement in nearby bush areas (“micro-displacement,” see p.18) was found to be a common response to bursts of conflict that seemed likely to end quickly. On the other hand, if conflict was perceived as more severe, widespread, or was anticipated to go on for longer, partial or entire households tended to move to urban centres, displacement sites (i.e. IDP and refugee camps or PoC sites), or other areas perceived to be more reliably secure while simultaneously offering food and resources for a longer stay. For example, in response to conflict expanding from Malakal county into Fashoda county in early 2017, large numbers of Kodok residents reported moving across the border to Sudan’s White Nile refugee camps, which were perceived to have good health facilities, access to clean water, and regular food distributions.28
Resource Stress
Lack of access to resources (resource stress), and particularly food insecurity, was also noted as a major driver of distress migration, with food insecurity itself often caused or compounded by other indirect drivers such as conflict or climate shocks. The routes used during distress migration varied greatly by region, livelihood profile, and the resources households had access to. However, most people moved toward areas with higher availability of or access to food, including markets, towns, bush areas, or displacement sites, where displaced households or household members could leverage food distributions, social networks, or natural resources to mitigate food consumption gaps. When using movement to cope with food insecurity, households often relied on multiple strategies which were
divided up among household members in order to mitigate gaps in the ability to meet basic needs. Splitting up was especially common when pursuing shorter-term movements, such as moving into the bush to gather wild foods or accessing food distributions or markets and then returning to share food with the rest of the family (“micro-displacement,” see p.18).29
Distress migration often occurs in stages, first typically involving the movement of some household members to nearby areas to access alternative livelihoods and food sources in locations such as the bush, wetlands, fishing camps or cattle camps (primary distress migration). However, if food insecurity was particularly widespread, and/or if other drivers such as insecurity limited their movement options, household members, entire households, or even communities sometimes resorted to farther and longer-term relocations, including to urban areas and IDP or refugee camps (“secondary distress migration”) to seek out more consistent sources of food.30 One such occasion was the “Ruon Nyakuajok” event of 1988, a time when drought in Upper Nile and Unity states caused crops to fail over a wide area in conjunction with ongoing insecurity that constrained movements (see Case Study 1). During this time, livelihoods broke down and coping capacity for households and communities was low, and as a result vulnerable households, particularly those from Leer county, engaged in secondary distress migration, moving farther distances and staying for longer periods of time in order to meet basic needs.
Food insecurity is not the only form of resource stress that can prompt distress migration. Lack of access to resources like drinking water can also trigger movement, as in the case of Cueibet county, where seasonal lack of water access near the homestead drives households to move to the Bahr Gel River for several months each year.
Climate Shocks
Although drivers other than insecurity, such as flooding and drought, have reportedly driven less movement in South Sudan, climate shocks sometimes triggered secondary impacts that did prompt displacement. Many FGD participants did not appear to consider drought or flooding themselves to be major causes of displacement; rather, climate events such as flooding and drought were seen as causes of crop failure or livestocks disease and consequent food insecurity, which then drove atypical movement. Flooding that affected a harvest was considered more likely to cause hunger and be a possible trigger for displacement, while according to FGD participants from Ulang county, past flooding that occurred during November – January 1997 after crops had been harvested did not cause hunger or trigger movement aside from moving out of flooded tukuls.31 When FGD participants did mention movements directly
28 REACH, Fashoda county FGDs, Kodok town, October 2019.29 REACH, “Now the Forest is Blocked”: Shocks and Access to Food, March 2018.30 Ibid.31 REACH, Ulang county FGD, Malakal PoC site, October 2019.

15
Population Movement Baseline Report: Movement and Displacement in South Sudan, 1983-2019
Map 4: Insecurity-driven displacement movements of >5,000 people (Inter-county), 1983-2019
Departure - Arrival
Country border
State line
County line
Movements recurring 1-2 times
Movements recurring 3-5 times
Movements recurring 6-10 times
Movements recurring 11-20 times
Movements recurring 21+ times
N
Map 5: Non-insecurity-driven displacement movements of >5,000 people (inter-county), 1983-2019
Departure - Arrival
Country border
State line
County line
Movements driven by food insecurity
Movements driven by disease
Movements driven by climatic shocks (flooding, drought)
N

16
Population Movement Baseline Report: Movement and Displacement in South Sudan, 1983-2019
CASE STUDY 1: Ruon Nyakuajok in Leer county
In the PMB database, 1988 was the top year for movement driven by food insecurity, intersecting with Leer county being a top site of displacement for both inter- and intra-county movements. In 1988, parts of Upper Nile and Unity states experienced a period of severe hunger called “Ruon Nyakuajok” (named after the type of wild food people ate at the initial onset of the hunger), when drought reportedly caused the majority of all harvests to fail. During this period, households from the hard-hit Leer county moved in different directions to cope, leveraging household composition as a resource while weighing tradeoffs between physical danger and hunger. Members of the household who moved north for food only did so temporarily, because although the north was perceived to have stocked markets with supplies from Sudan, youth militias were active in northern Unity. In order to mitigate risk and safeguard the households’ overall productive capacity, one household member would make the trip north to purchase food and return, typically a healthy young woman, as men were perceived to be at greater risk of abduction or being killed. Households that lacked the “resource” of a young female household member moved south and east to islands in the swamp to find water lilies and fish. Movement to these islands in Panyijiiar and Ayod counties was more drastic, uprooting entire households who then stayed until the next year brought the hope of a new harvest. Short-term trips to the north with one household member constituted a less disruptive micro-movement in contrast to whole-household movement to the islands, but still represented the difficult choice to risk a household member’s safety.
Map 6: Leer county distress migration driven by food insecurity, 1983-2019
Main road
State lineTertiary road
Settlement
Direction of offensives
County capital
Swamp (toich)
Swamp/Island areas
Area affacted by food insecurity
Temporary/short-term movememt
Long-term movement
County line

17
Population Movement Baseline Report: Movement and Displacement in South Sudan, 1983-2019
caused by flooding, these were often small movements to nearby highlands. Even the severe flooding in Greater Akobo in 2019, which was reportedly much worse than past episodes of flooding, did not displace people beyond the nearby highlands, because of the limitations of pastoralists needing to move with their cattle.32
However, repeated periods of flooding have also driven the adaptive displacement of entire communities, through which households resettle in a new location due to repeated shocks in their previous settlement (see “Micro- and Major Displacement” for adaptive displacement. p.18).33 While outside the time-scope of this report, in the 1960s and 70s, severe and repeated flooding, particularly in low elevation areas with poor soil quality, caused repeated temporary displacements that eventually resulted in adaptive displacement in many areas of South Sudan. An example of this was the resettlement of many households from Rumbek North to Rumbek Centre counties, between which lies a notable elevation change from lower, unviable cultivation land to higher and more fertile ground.34
Flooding was equally noted as a constraint on movement, limiting the areas available for movement-based coping strategies or regular livelihood movement. This appeared to be true for pastoralist households in particular, with some cattle keepers in Pibor county mentioning that late 2019 flooding had forced them to avoid their normal seasonal grazing areas and reroute to alternate pastures not impacted by flooding.35
Disease
During past disease outbreaks, partial or entire households frequently moved towards towns with hospitals, or sought areas with traditional medical care or access to familial support networks. For example, during the kala-azar outbreak in Unity state in the early 1990s, many people from Leer and Mayendit counties moved towards Leer town where there was a functioning hospital.36 Others moved north to Bentiu town in Rubkona county in Unity state or northeast to Ayod county in Jonglei state, driven by familial support networks or the perception of urban centres as areas with greater access to support, despite these areas reportedly having inadequate health facilities.
Some FGD participants from Panyijiar county reported moving to Yirol town, which was reportedly perceived as an accessible area with both a good hospital and fair social relations with local communities up through 1996, when social relations deteriorated.37
During disease outbreaks, households did not always report moving to the nearest hospital; some indicated moving farther to urban areas with hospitals that had specialised care for a particular disease. However, according to an assessment of health-seeking intentions in the event of an EVD outbreak in Western Equatoria, most FGD participants reported that they would seek treatment at the nearest
hospital or clinic and would only escalate to more distant facilities if nearer ones failed to resolve their case. Often closer facilities were preferred to avoid direct costs such as transportation fees, as well as indirect costs such loss of time needed for livelihood activities.38 In particular, more vulnerable households with elderly or young household members or fewer financial resources face de facto limitations on movement towards larger hospitals and may be less likely to seek out disease-appropriate facilities.
Livelihood Movement
Movement was also shown to be inextricably linked to livelihoods based on livestock rearing, market activities, and resource-gathering practices, which individual households often pursued simultaneously in various combinations, constituting complex “livelihood profiles.” Mobility is an essential resource for livelihood activities such as cattle-herding, which depends upon seasonal movement to toich areas that usually provide water and pasture in dry season, and movement to the homestead in the wet season when grazing in non-toich areas is viable and cattle products can provide an additional food source for families during the lean period. Movement also enables livelihoods such as fishing, gathering wild foods, and many market activities, as household members situated farther from these resources shift from their homes to access areas in which these options are available during particular parts of the year.39
Timing and routes of seasonal livelihood movement generally differs by environment-based livelihood zones which are not adherent to South Sudan’s administrative boundaries,40 with pastoralist or agro-pastoralist communities, such as the Murle in Pibor, usually the most mobile groups.41 Notably, seasonal livelihood movement not only occurs within the country, but also crosses borders, as in the case of seasonal movement from Northern Bahr el Ghazal state up to the Kiir River in Sudan for fishing and trading in seasonal markets. While seasonal livelihood movement is not bound by internal administrative boundaries or national borders, it is nonetheless often shaped by the ethno-political context of a given time and place (See Case Study 3).
Not all livelihood movement is inherently seasonal; another way of understanding livelihood movement is by regarding it as being primarily resource-driven. Resource-driven livelihood movements are indeed commonly tied to seasonal patterns of availability of resources (e.g. availability of pasture in a particular area, availability of wild foods or fish during particular parts of the year), but do not necessarily have to be. Although households often try to base their livelihood movements on anticipated seasonal patterns, previously described shocks such as insecurity, unexpected resource stress, climate shocks, and disease can disrupt availability of or access to resources necessary for livelihood activities. This can cause households to move earlier
32 REACH, Akobo county FGD, Juba PoC site, November 2019.33 REACH, “Now the Forest is Blocked”: Shocks and Access to Food, March 2018.34 Key Informant, Rumbek town, Rumbek Centre, June 2019.35 REACH, Pibor County Rapid Flood Assessment Brief, December 2019.36 REACH, Mayendit county and Leer county FGDs, Nyal town, August 2019.37 In 1996, cattle-raiding and conflict erupted between Panyijiar Nuer and Yirol DInka communities. REACH,
Mayendit county and Panyijiar county FGDs, Nyal town, August 2019.38 REACH, Ebola Preparedness: Western Equatoria Health-seeking and Population Movements Brief, 2019.39 Muchomba and Sharp, Southern Sudan Livelihood Profiles. Southern Sudan Commission for Census, Statistics, and Evaluation/Livelihoods Evaluation Forum, 2006.40 FEWSNET, South Sudan, Livelihood Zones and Descriptions, August 2013.41 REACH, Pibor County Rapid Flood Assessment Brief, December 2019.

18
Population Movement Baseline Report: Movement and Displacement in South Sudan, 1983-2019
or later than usual, or not at all. Such disruptions in usual livelihood movement patterns are indicative of more severe resource stress, and are thus of concern to humanitarian actors.
Shocks were also commonly reported in most FGDs to cause shifts in how livelihood movements occur—who engaged in them, where people went, or which livelihood activity within a household’s livelihood profile was used.42 For example, FGD participants from Panyijiar county mentioned travelling farther from home for fishing or cattle grazing than they used to, and spending longer time periods away; as flooding and conflict killed many people’s cattle they increasingly turned to fishing, but as this change led to over-fishing of nearby areas, household members were forced to move farther to find adequate fishing grounds.43 While more difficult to detect in South Sudan’s highly mobile context, irregular livelihood movements diverging from the typical timing, location, or modes that households regularly employ can be grouped in with other forms of displacement and distress migration that occur in response to deteriorating conditions, and may likewise result in high levels of humanitarian need.
Micro- and Major Displacement
Diverging categories of micro-displacement and major displacement emerged during FGD discussions, the latter including adaptive displacement. Micro-displacement was characterised by shorter-term movements (from a few days up to a few months) and/or movements to nearby areas, often prompted by sudden-onset crises of lower intensity. Micro-displacement decisions were usually made with the intention to return to home settlements, but if the context in home settlements intensified, micro-displacement sometimes switched to major displacement as populations engaged in secondary displacement.
Major displacement was characterised by farther and longer-term movements, staying in a new location for months or even years. Major displacement was more likely to be prompted by higher-intensity drivers (including stressors accrued over time) such as severe food insecurity, or prolonged or widespread conflict. It was also sometimes characterised by secondary displacement, in which partial or entire households were displaced initially only to encounter another shock in their displacement area, forcing them to move again. For example, following offensives in and around Raja town in 2001, many households initially displaced north to South Darfur, but when a counter-attack made South Darfur just as insecure, thousands of people made the lengthy journey to Mabia IDP camp in Western Equatoria state’s Tambura county in response to sequential rounds of insecurity.44, 45
One specific type of major displacement, as identified in REACH’s
report “Now the Forest is Blocked: Shocks and Access to Food,” that sometimes occurred was adaptive displacement. Adaptive displacement can be understood as recurrent displacement out of a high-threat area into a low-threat area turning into a permanent relocation, sometimes of whole communities. This sometimes occurred when repeated incidents of insecurity or climate shock made living in a particular area less and less viable, such as when residents of eastern Duk county in Jonglei state responded to repeated raids from other groups in Jonglei by relocating en masse to western Duk county near the Sudd.46 As in this example, adaptive displacement sometimes exposed the shifting population to new hazards, such as human or livestock diseases, or overuse of natural resources in already-inhabited areas.
Restrictions on Mobility
On other occasions, shocks were found to limit movement rather than initiate it. FGD participants indicated that insecurity in particular often constrained movement; households or household members might weigh their options and decide that remaining in a volatile or resource-depleted area carried less risk (i.e exposure to the potential for physical harm) than the journey required to move away from it, or stay to protect household assets that would be looted upon desertion (See Section IX). This was the case with some FGD participants from Malual Chum in Cueibet county, who reported that if food security decreased in their area, which was affected by both inter-communal violence and resource stress, “we will not move; we will just die.”47 In addition, food insecurity that covered a wide area also seemed to discourage displacement towards food access areas, as the distance required to reach a less affected area was too great. Areas with high insecurity or dire resource needs therefore may not always be accompanied by large population movements. Often, absence of displacement can be a sign of restriction on movement that could otherwise enable coping capacity, indicating that resource needs are in fact higher, particularly where traditional livelihoods are rooted in seasonal migration.
The decision to move or remain in an environment of insecurity or severe resource needs is complex and varies from one household to another, relying on each household’s own cost-benefit analysis of the options available to them. Overall then, it is important to note that the prevalence versus absence of displacement movements or distress migration in a given area should not preclude it from being identified as a site of either insecurity or resource needs.
Displacement, Mobility Restriction, and Vulnerability
A trend of utilising micro-movements where possible and resorting to farther and longer major displacements when facing conditions
42 REACH, Ameth Pakam Cattle Camp and Gok FGDs, Cueibet county, June 2019.43 REACH, Mayendit and Panyijiar county FGDs, Nyal town and Nanjim Island (Panyijiar county), August 2019.44 ICRC, Update on ICRC activities in Sudan: 30-11-2001 Operational Update, November 2001.45 Norwegian Refugee Council/Global IDP Project, Global IDP Database, Profile of Internal Displacement: Sudan, 2005.
46 REACH, “Now the Forest is Blocked”: Shocks and Access to Food, March 2018.47 REACH, Malual Chum settlement FGDs, Cueibet county, June 2019.

19
Population Movement Baseline Report: Movement and Displacement in South Sudan, 1983-2019
48 REACH, “Now the Forest is Blocked”: Shocks and Access to Food, March 2018. Notably, not all micro-displacements in response to food insecurity align completely with the framing of primary distress migration described in “Now the Forest is Blockedt”, which focuses more on distance to and type of destination, rather than the duration of displacement.49 Ibid. As above, not all major displacements in response to food insecurity align completely with the framing of
secondary distress migration described in “Now the Forest is Blocked,” which focuses more on distance to and type of destination, rather than the duration of displacement.
Table 2: Micro-displacement, major displacement, and restriction of movement by driver
Driver Restriction of Movement Micro-displacement Major Displacement
Insecurity Caused by broader insecurity (targeting of civilians, blocking road travel, expansion of offensives into both urban centres and rural areas)
More likely in times of anticipated short-term conflict, conflict perceived as not targeting civilians, and/or conflict that remains in either rural areas or urban centres (but not both)
More likely if conflict is anticipated to take longer, if civilians are targeted, if conflict is between identity groups, or if violence expands into both urban centres and rural areas
Food Insecurity
If perception is that hunger is widespread and “everyone is affected” (e.g. neighbouring counties, relevant social networks), households may not pursue movement-based coping strategies and may stay where they are despite lack of livelihood engagement or lack of access to/availability of food
Primary distress migration:48 used particularly by households to access wider variety of resources in closer proximity with less time commitment (e.g. temporarily relocating to surrounding bush to access wild foods, sending members or entire household to cattle or fishing camps)
Secondary distress migration:49 Typically used if food insecurity is severe/widespread and households have exhausted options for/do not have the resources for primary distress migration (e.g. enough productive members of household, money for travel etc.); households may relocate to urban centres or displacement sites or less affected counties until next harvest season/livelihood cycle, or longer depending on severity of resource stress
Climate Shocks
Severe flooding can temporarily restrict most movement, including movement-based livelihood activities (cattle migration routes, going to markets) or coping strategies (moving to urban areas, camps) to access food
More frequently relied on: movement to nearby highlands, or to islands, typically varying depending on livelihood of the household (e.g. pastoralists have to go to highlands and use routes their cattle can use, but fishing households can go to rivers/islands)
Used by some cattle owners in Unity state who cannot go to islands and may travel northward to other counties instead; repeated severe flooding may sometimes trigger adaptive displacement (relocation of communities)
Disease Outbreak
Vulnerable households may rely on inadequate medical facilities in vicinity if facing barriers to transportation; extreme weakness due to disease may cause some to be unable to move (may still be able to draw on healthy household members or social networks for medicine)
Varies with distance to site of treatment; may be used if “good” medical facilities are fairly nearby or if disease is just associated with specific area (e.g. if disease is associated with toich, household members engaging in toich-based livelihood activities will move elsewhere in the area)
Varies with distance to site of treatment; may be used if “good” medical facilities are far, if more distant location is seen as source of support (e.g. urban centre, location with robust social support), or if household has financial means for easier transport

20
Population Movement Baseline Report: Movement and Displacement in South Sudan, 1983-2019
that ruled out micro-displacements was apparent in response to most drivers, though each driver had fairly unique conditions influencing whether micro- or major movements were used (see Table 9). Partial or entire households that moved farther or for longer often appeared to be doing so because they had exhausted micro-movement as a coping strategy, or because the security context had become too dangerous for small movements to nearby areas followed by returns. However, while households shifting from micro-displacement to major displacement were often dealing with increasingly severe shocks, they also implicitly had the resources necessary for such a major move, mitigating their vulnerability—this was especially true of cross-border displacement or displacement to major urban centres, which were often only possible for those who had some level of wealth (See Section IX). The most vulnerable households were often those who faced the same severe conditions but could not move at all, such as households that included family members too weak to move, or those that lacked transportation resources or social connections to facilitate farther movements. Particularly when sequential shocks occurred, vulnerable households that were unable to move in response to the first shock often suffered the worst effects of situations that continued to deteriorate and frequently restricted their mobility further over time.
Though outside of the scope of this report, early 2020 mobility restrictions in Akobo West provided a clear example of different strata of vulnerability. While Akobo West settlements had previously contained a mixture of classes ranging from the comparatively wealthy to the very poor, following a 2017 uptick in insecurity, the wealthier households moved out of Akobo West into refugee camps in Ethiopia, leaving behind a few middle class households, and almost all households from the poor and very poor classes, who were not able to move to the relative safety of the camps. In early 2020, raids increased in severity and, in conjunction with earlier flooding, cut off access to almost all routes used for livelihood activities or potential escape. The vulnerable households that remained in Akobo West were only able to concentrate in a few settlements for safety, over-relying on small fish in the area and exhausting local wild foods, resulting in pockets of catastrophic food insecurity (IPC Phase 5) in Akobo West in January 2020.50,51
VIII. Returns
Returns, like displacement movements, are often rooted in people’s understanding of where they and their families have the best chance of safety and access to services or resources, often representing a coping strategy as much as a wish to be home.52 Despite the signing of the September 2018 Revitalised Agreement on the Resolution of Conflict in South Sudan, many FGD participants reported perceiving that returns were fairly minimal, with many IDPs reporting that they were not yet ready to return. This may be because current incentives to return are weaker than they were following the 2005 Comprehensive Peace Agreement (CPA); after years of economic crisis, employment options are less robust and civil society organisations that previously facilitated returns are less equipped to do so.53 At the household level, IDPs living in the Malakal and Akobo PoCs expressed fears of “starting from scratch” following loss of assets.
In addition to economic barriers, uncertainty about security conditions prevailed as a concern for returning. A common narrative among FGD participants in western Upper Nile and central Unity states was that displaced individuals would not return until armed actors left their home town or settlement. Until their removal, few said that they would consider returning. Some Shilluk participants said that their homes were occupied by armed actors, and consequently did not feel safe returning until their homes were vacant. FGD participants contrasted the current returns environment with the period following an earlier conflict between the Shilluk and Nuer. Shilluk FGD participants perceived that although armed forces had occupied their land during the 1992-1997 conflict, land was not a pervasive issue because those forces departed Shilluk lands after the 1997 peace deal with Khartoum was signed, enabling Shilluk to return to their homes.
Others mentioned that small-scale returns had begun, but in many cases only partial households (often single members) were returning temporarily to prepare for cultivation or secure land claims. In other cases, elders were returning to ensure the safety of the area and make preparations for other family members to follow. In Fashoda county, for example, households reportedly used a strategy of having men briefly return to scout their settlement area for secure conditions, and subsequently sent elders to prepare the home for the remainder of the family to eventually return.54 Many FGD participants said that entire households, and particularly women and children, were not returning on a large scale yet. Participants originally from Leer town also reported pursuing a strategy of moving to nearby “transit areas” outside of Leer town as they assessed the security situation and the evolving peace process.
For households that intended to permanently return and/or return
50 REACH and FSL cluster, Akobo West FGDs and KIIs, Akobo West, March 2020.51 IPC, January Integrated Food Security Phase Classification (IPC) analysis, February 2020.52 Oxfam International, Nile Hope, Titi Foundation, Danish Refugee Council, Norwegian Refugee Council and CARE, No Simple Solutions: Women, Displacement, and Durable Solutions in South Sudan, September 2019.53 Nicki Kindersley. Returns and Peace in South Sudan: Challenges, opportunities and the way forward. Conflict
Sensitivity Resource Facility, December 2019.54 REACH, Fashoda county FGD, Kodok town (Fashoda county), October 2019.
Micro-displacement
Major displacement
Restriction of movement
Common response to less severe shocks/situations; employed by households within a wide range of vulnerability
Common response to more severe shocks/situations, but usually employed by less vulnerable households
Inability to move is often a sign of the most vulnerable households as well as more severe shocks/situations
Table 3: Vulnerability versus shock severity by movement type

21
Population Movement Baseline Report: Movement and Displacement in South Sudan, 1983-2019
with the entire household, return movements often were reportedly motivated by push factors in their displacement sites. For example, FGD participants reported that returns from Liri camp and the White Nile refugee camps in Sudan to counties in Upper Nile state were mainly because returnees faced poor conditions or protection concerns in the camps. Reportedly, protection concerns particularly affected women, who were subject to sexual violence or threat of abduction from other groups in the area, impacting their ability to carry out livelihood activities.55,56 Some households returned to their settlements, prioritising the immediate concern of insecurity and inability to engage in livelihood activities in the camps over less acute security concerns back home. Many returned to difficult conditions, facing a lack of shelter, assets, or food assistance in their return settlements, exemplifying the competing risks households or household members must balance in making decisions to return.
IX. Decision-making during Population Movement
In order for humanitarians to better anticipate large-scale movement following certain shocks or combinations of shocks, it is critical to understand the factors that influence how people decide where, when, and how movement is made, particularly for the most vulnerable populations. While learning from past routes can be helpful in indicating future movement patterns, analysing departure and arrival locations alone risks obscuring the complexities of these decisions. Similarly, binary analyses of push and pull factors often oversimplify the nuanced motivations governing displacement or distres migration. FGDs with people from Lakes, Jonglei, Upper Nile and Unity states revealed a variety of factors that influenced people’s decision-making surrounding movement as a result of a single shock or accruing shocks.
FGDs highlighted a complex mix of both exogenous (external) and endogenous (internal) factors that influenced households when deciding where, when, and how to move in both sudden and slow-onset crises. Exogenous influences included: 1) access to relevant resources or services, and 2) existence of restrictions, such as environmental barriers or political or identity group-based divides. Meanwhile, endogenous influences were equally important and included the attributes of a given household, such as 1) the household and financial assets they owned, 2) what pre-existing social connections they could rely on across locations, and 3) the gender/age composition of the household—all were enabling or restricting factors that reportedly influenced movement decisions, routes, and destinations. These factors were found to be key contributors to decision-making consistent across both historic and contemporary periods of conflict, although different permeations and combinations of these factors (and likely many others) applied to households depending on the particular context triggering their
movement. Furthermore, differing priorities, vulnerabilities, and willingness to take risk varied from one household to the next as individual households weighed the importance of each of these factors differently while navigating their external evironment (See “Cost-Benefit-Thinking”).
Exogenous Factors Influencing Decision-making
Process of Elimination: Environmental and Socio-political Barriers
Ruling out certain destinations or routes based on environmental, political, or social attributes arose as a key initial decision for households in determining where and how they moved. This was nearly unanimously reported across all participatory mapping exercises. Households or entire communities reported certain no-go zones shaped by the presence of environmental barriers or the contemporary political context (including the politicisation of ethnicity or identity groups), for example directions of offensives, recent local peace agreements, identity group-based territorial divides, or waves of sub-national conflict. The presence or change in these factors at any given time typically determined the relative risk for individuals to move in a certain direction, which often limited the household’s or community’s perceived access to a given destination and dramatically narrowed their option-base, creating common corridors of movement (i.e. central Unity to Panyijiar county between 2013-2018; see Case Study 2). Understanding these fault lines and the corridors of movement they created is critical for better indicating future population movement. Simultaneously, it is important to acknowledge that such dynamics are constantly evolving, and historic or current no-go areas may shift or subside in future contexts. Furthermore, presumed fault lines between different identity groups do not constitute uncrossable lines in all cases, and movement across such lines has sometimes occurred, even as the perception that such identity-based tensions have contributed to increasingly restricted movement has grown.
FGD participants reported ruling out areas that were perceived to be affected by insecurity or areas perceived as being at high risk of conflict. This could be land traditionally occupied by identity groups involved in long-standing cycles of armed conflict, as in the case of the Lou Nuer of northeastern Jonglei state not displacing south to the Murle-dominant area of Pibor county,57 or territory in which developing political landscapes had exacerbated fault lines between identity groups, such as the border between Unity state and Lakes and Warrap states in the 1990s.58 Displaced people also reported avoiding areas that were locally known to be occupied by armed actors from opposing identity groups, even if conflict had not occurred there recently.
55 REACH, Panyikang county FGD, Tonga town (Panyikang county), October 2019.56 REACH, Fashoda county FGD, Kodok town (Fashoda county), October 2019.57 REACH, Akobo, Uror, and Nyirol county FGDs, Juba PoC site (Juba county), November 2019.58 Naomi Pendle. “Contesting the militarization of the places where they met: the landscapes of the western Nuer and Dinka (South Sudan).” Journal of East African Studies, Volume 11, Issue 1, 2017.

22
Population Movement Baseline Report: Movement and Displacement in South Sudan, 1983-2019
In some cases, the volatility of the political climate in South Sudan over the last 35 years has resulted in changes in the areas that households perceived to be no-go zones in terms of insecurity or heightened divisions between identity groups. According to an FGD with Jikany Nuer participants, when a historically-used route to Malakal county became blocked by offensives starting in 2014, people from southern Upper Nile state (Maiwut, Ulang, Nasir and Longochuk counties) began displacing to Ethiopia instead.59 Other FGD participants reported that movement from Leer county northward to counties such as Rubkona, Mayom, and Guit became much less common following the start of the war in 2013, given that the offensives were primarily coming from that direction. Following these changes, households from Leer county reportedly shifted movement southward, to the better-protected areas of Panyijiar county.
Resource Access
Access to and availability of resources and services60 often dictated the intended destination of displacement, according to multiple FGDs. Resources being sought were primarily dependent on the type or combination of shocks a household faced; for example, household members frequently moved towards locations with hospitals during past disease outbreaks, or moved towards locations where there were known food distributions or other means of addressing food consumption gaps during periods of food insecurity. During movements primarily driven by insecurity, FGD participants still mentioned steering towards locations that could provide basic resources such as food, water, protection and/or settings that could sustain at least some livelihood activities.
Urban centres or towns were reportedly preferred in situations where they were perceived to have either more protection than rural areas or greater access to life-saving resources or income-generating activities. In 1987, for example, an increase in conflict and consequent restrictions on livelihoods combined with heightened hunger, and reportedly prompted many people from Malakal county to displace to Khartoum, where they perceived better access to safety and services.61 Residents of Akobo county reported that they responded to frequent instances of insecurity or resource stress by moving to refugee camps in the Gambella region of Ethiopia that were perceived as locations with reliable resource supplies, protection, and consistent humanitarian support.62 However, households with vulnerabilities limiting their movement (i.e. elderly household members, lack of funds for transportation) would often travel short distances to the bush or a nearby river to access natural resources, such as wild foods and water, in periods of insecurity or anticipated insecurity or during primary distress migration.
Resource access or availability at both the household level and the community level had the potential to influence household decision-
making. While a household-level access to resources such as food or income-generating activities was a frequent factor, the availability of resources across an entire community also sometimes swayed household-level decisions of where to go or whether to stay, even when an individual household within the community did not have ownership of or immediate access to them. For example, if food is generally available at the community level, vulnerable populations without direct access to food within their own households may nonetheless remain in the community, as begging or borrowing could still provide a chance to access food.
Endogenous Factors Influencing Decision-making
Household Asset Base and Wealth
Household asset bases or relative wealth were also determining factors that influenced decision-making on where, when and how households or household members moved across both periods of conflict. Many household assets, though not all, were directly linked to a household’s livelihood profile (all the ways in which a household could earn an income or access food). During periods of food insecurity, access to certain assets reportedly enabled some households to avoid or defer distress migration, while other families would have no choice but to move. This was especially true of cattle ownership in Unity state, where participants in multiple FGDs reported that in times of hunger, those who owned cattle had the ability to prematurely sell livestock as a coping strategy when other assets were depleted, and could therefore delay or even completely avoid distress migration. Meanwhile, vulnerable households without such assets were more likely to resort to distress migration sooner.
At the same time, having certain household assets could also reduce mobility of households or force them to use specific routes during times of flooding or insecurity. In Unity state, households that did not own cattle reportedly could move to nearby islands during times of flooding. The few who still owned and kept cattle used routes by which they could move with their herd and to destinations with accessible grazing land, though these households often split up and sent other household members to the islands. In more recent 2019 flooding in Jonglei, those with cattle could only move to nearby highlands, according to FGDs with residents of Uror and Nyirol counties.
Risk tolerance in times of physical and food insecurity based on asset ownership also often weighed into the decision as to whether or when to move, notably during periods of physical insecurity. Among households whose livelihood profiles included agricultural activities, the potential impact of losing related assets such as land and crops, which were bound to a fixed location, reportedly deterred some households from moving during periods of insecurity. According to FGD participants, during the 1988-1992 conflict in Malakal county
59 REACH, Ulang county and Jikany Nuer (southeast Upper Nile states) FGDs, Malakal PoC site (Malakal county), October 2019.60 Resources and services influencing decision-making included humanitarian assistance, markets, food availability, medical and educational facilities, rivers, wild foods, viable cattle grazing lands including highlands during flooding, etc.
61 REACH, Malakal county FGD, Malakal PoC site, October 2019.62 REACH, Akobo county FGD, Juba PoC site (Juba county), November 2019.

23
Population Movement Baseline Report: Movement and Displacement in South Sudan, 1983-2019
many households that owned land and had cultivated that season were reluctant to abandon their productive assets to seizure or burning when conflict flared, and remained in place. Many of those who stayed were reportedly killed. The desire to safeguard other productive assets households owned, such as farm tools or household items, sometimes acted as an impediment to movement as well. For example, FGD participants from Malual Chum in Cueibet county said that they were usually hesitant to move at all, given the risk of asset stripping if they left their homes.63 Overall, while ownership of assets such as cattle or land for cultivation often increased a household’s capacity to cope, and either delayed or prevented distress migration during times of food insecurity, these assets reportedly acted as a constraint or liability for some households during periods of flooding and conflict. Meanwhile, fishing, which involved ownership of nets and canoes, appeared to offer more flexibility for movement, particularly households in Unity and Upper Nile states, facilitating easier travel to and coping on the islands or swamp land during periods of food insecurity.
However, wealth, as well as asset liquidity, generally broadened households’ movement options by enabling access to both destinations and transport modes that were more advantageous. During times of insecurity, money reportedly enabled some people to travel to other countries perceived as safer (or to Khartoum prior to South Sudanese independence), covering costs such as border crossing fees. Money also facilitated more direct modes of transport, such as cars, motorbikes, or air travel. More vulnerable households without money, meanwhile, often had no choice but to go by foot, often along bush paths or rivers, which further heightened the risks to vulnerable household members, including children, elderly family members, and people with disabilities (PWDs).
Social and Familial Networks
The location of social and familial networks also played an important role in determining where people moved. During times of displacement and distress migration, many FGD participants reported choosing locations where their identity group was situated or dominant, or where relatives were present. This varied by what drove the movement and the acuteness of the situation: FGD participants often reported prioritising directions or destinations where their own or an allied identity group was present during times of acute or sudden-onset insecurity, rather than specifically choosing to go to locations where relatives were present, likely due to the short timeframe in which the decision had to be made. While households or household members might eventually seek places where relatives were present, in the immediate onset of an insecurity event, choosing a route and location that had the safety of identity group affiliation was a primary consideration for physical security.
During times of resource stress, or when less acute insecurity contributed to or co-occurred with increases in resource stress, it was reportedly very common for people to seek out family members in other locations for food assistance or other support. Similarly, seasonal patterns of migration sometimes drew on families as resources, such as seasonal migration related to flooding described by FGD participants in Nyal town, where it was reported that most households living in low-lying islands moved to stay with their families in Nyal town every year to avoid flooding and to gain better access to cultivation lands.
Though it was a common coping strategy, movement towards familial networks was generally reported as being dependent upon the perception that relatives had the means to offer resource support: FGD participants in northern Cueibet county in 2019 noted that although a typical response to food insecurity was to reach out to family, their relatives were also facing food insecurity, so the usual coping movement to their relatives’ lands was not an option.
The relative or combined wealth of a household’s social networks also influenced where and how a household travelled. Connections to relatives living abroad, or to wealthy or well-positioned people, were also mentioned as facilitating more expensive travel, such as travel to other countries, or travel to Juba by plane when roads were too insecure.
Household Composition
Another factor contributing to where movement occurred was household composition, such as gender and age breakdown and the number of productive members in the household.64 Household composition enabled a particular micro-displacement tactic used during times of both hunger and insecurity in Unity state. In 1988 and 2014-2018, food insecurity was high in central Unity state, but food and markets were available in the conflict-ridden north. During these times, some households in Leer and Panyijiar counties with capable daughters would send them to cross the frontlines to the northern markets, to either stay or collect and return with food. Households could only send young women as men were believed to be targeted for abduction, forcible recruitment, or killed by opposing groups in the north, and while risks such as rape and abduction were perceived to exist for women as well, the risk was reportedly assumed to be lower. On the other hand, households that did not have daughters of this age could only opt to move south, where there was less food but greater security.65
Additionally, transportation of elderly, ill, or disabled household members reportedly restricted a household’s movement choices or their ability to move at all in some cases. This was particularly true for households that were more financially vulnerable or asset-poor,
63 REACH, Malual Chum FGD, Cueibet county, June 2019.64 A productive Household member is one who can earn income, engage in a livelihood, and/or take on essential tasks for survival, such as collecting water or wild foods. See REACH, Western Lakes Population Movement, Food Security, and Livelihoods Profile, July 2019.65 REACH, Leer county and Panyijiar county FGDs, Nyal town, August 2019.

24
Population Movement Baseline Report: Movement and Displacement in South Sudan, 1983-2019
when means of assisting less mobile family members, such as carts or canoes, could not be obtained.
Voluntary Household Fragmentation
A frequently reported tactic across many FGDs was voluntary household fragmentation during population movement, in which households strategically divided themselves, often according to traditional gender roles. During periods of conflict, for example, men reportedly tended to engage in fighting as women fled with children. During periods of resource stress, households were commonly reported to use household fragmentation to diversify their use of movement-related coping mechanisms and maximise access to food, services, and income-generating activities, or to preserve existing livelihood profiles. For example, FGDs from Leer county reported that in times of food insecurity, male heads of households would take the oldest son(s) to fishing camps while women and children hid on the islands where they could access wild foods.66
While household fragmentation was reportedly a common response to shocks, it also plays a key role in times of “ordinary” seasonal changes in resource availability. During the lean period, pastoralist communities generally rely on sending small children and sometimes elderly men from the homestead to cattle camps in order to access milk, a common failsafe to sustain children’s health during predictable periods of less food.67 As such, household fragmentation is not
necessarily a sign of acute or unusually high needs. Conversely, the movement of an entire household to a single location such as a cattle or fishing camp was often noted as a sign of more severe food insecurity or acute physical insecurity, or possibly decreased resilience.
Cost-Benefit Thinking in Movement
Throughout the decision-making process for choosing where, when, and how to move, those affected by certain shocks or an accumulation of shocks reportedly must weigh these endogenous and exogenous factors, among many others. Households are often forced to make choices between physical safety and meeting basic needs, and sometimes individual family members take on potentially fatal risks to increase their family’s chances of survival. As such, humanitarians cannot always assume that affected populations will move away from areas of danger or depleted resources; they often have no choice but to remain in or move towards one at the expense of the other.
Particularly when resource scarcity co-occurs with insecurity, affected households must balance both concerns, sometimes risking movement to insecure areas to access food, or sometimes remaining in or moving to areas with dwindling resources to avoid insecurity. FGD participants from Rumbek Centre county in Lakes state reported that ordinarily Pakam women and children would stay home to begin
66 REACH, Leer county FGDs, Nyal town, August 2019.67 REACH, Pakam and Gok cattle camp FGDs, Rumbek Centre, June 2019.
EXOGENOUS FACTORS
-socio-political divides; social stigma; political instability; topography; physical barriers
Environmental, political, &social barriers
Resource & service availability
ENDOGENOUS FACTORS-market dynamics; natural resources; employment & education opportunities; food availability; humanitarian assistance; physical protection
-location, connectedness, wealth, and breadth of aligned identity groups
Social & familial networks
Wealth & asset base
Householdcomposition
Livelihoodprofile
-financial access (within HH or social network), asset liquidity, risk tolerance
- # of productive HH members, single-headed HH, dependency ratio, # of children, elderly & PWDs
-all means through which a HH earns income i.e. agropastoralism + fishing + trade + casual labour
DRIVER(S) / SHOCK(S) PROFILE (Type, immediacy, location, severity, & magnitude)
Figure 8: Key influencing factors in household (HH) decision-making for where, when, and how movement happens in South Sudan
Exogenous refers to influences external the control of a given HH
Endogenous refers to characteristics distinct to a given HH that may differentiate-it from others within their community
The relationship between the driver(s)/shock(s), exogenous factors, and endogenous factors is complex and multi-directional and influences where, when, and how populations make decisions around population movement. It is important to note that the shock or driver profile inherently impacts the exogenous influencing factors for movement (e.g. flooding increases physical barriers for movement); however, the exogenous factors can then spark other differing shocks (e.g. the limited access to resources due to flooding triggers increases in conflict), which triggers further episodes of population movement. Note that the coping capacity of a household and community is comprised of both exogenous and endogenous factors (e.g. wild food availability in surrounding bush and # of productive household members to collect and prepare wild foods within the household)
*Immediacy refers to the time-element of sudden versus slow-onset stressors/shocks, deteriming how long the household has to make a decision given the type of stressors/shocks. Note that physical, financial, and consumption-based risk tolerance levels differ per household.
Example of the interplay of factors leading to movement decision:
SHOCK PROFILE: Sudden outbreak of organised violence in a food insecure area, offensive coming from the eastern direction with use of heavy weaponry, resulting in the burning of most tukuls, 500 cattle raided, 15 civilian deaths, and wide-spread asset stripping
A - Conflict delays the delivery of humanitarian food assistance (HFA) and disrupts trade across county, increasing market prices; conflict further deepens existing divides between identity groups due east, south, and west of the targeted community, resulting in households only being able to displace to the northern direction, which requries the crossing of deep rivers, which poses as a physical barrier and consequent mobility restriction for the two elderly household members given no access to a canoe.
B - High market prices and delayed HFA limits food accessibility, resulting in households prematurely selling remaining assets (e.g. cattle) to meet basic needs, leading to decreased wealth and reduction in livelihood profile, and minimising future coping capacity. Household no longer has the wealth to travel across the border to camps further north, so the entire household first moves to fishing camps along the river to access food and seek protection.
C - Fighting kills 3 productive members of the household; household’s productive assets looted, restricting ability to carry out future cultivation, with limited ability mitigate future shocks. With the large loss of assets and increasing food consumption gaps, and with fewer productive household members to help carry out daily tasks, the men and elderly remain in the fishing camp, while the women and children displace further to stay with their nearest relatives in a safer area, 40km away.
A
C
B
Figure 14: Key influencing factors in household (HH) decision-making for where, when, and how movement happens in South Sudan

25
Population Movement Baseline Report: Movement and Displacement in South Sudan, 1983-2019
cultivation in March, but that heightened insecurity had caused entire households to move to cattle camps which were considered more secure than the homesteads.68 In this case, household members chose to safeguard their physical security, at the cost of accessing more resources and carrying out typical livelihood activities. In other cases, such as those of young women crossing frontlines in Unity to bring back food for their families, household members accepted physical risk as a necessary cost for the overall household’s survival. This was also true of pastoralist men, who reported in FGDs that they would die for their cattle, as the herd was a durable asset which provided long-term status, marriage options, and food security for their household.69
Broadly, households were fairly willing to pursue movements that involved exposure to insecurity for at least some family members if the risk could be mitigated in some way (i.e. women travelling in groups or escorted by armed youth from cattle camps to markets to sell milk despite the potential for looting or rape). When there were no risk mitigation measures possible, some households appeared to prioritise safety over food security, but other households appeared to accept risk if it could be restricted to one or a few family members. The most vulnerable households often had fewer mitigation options, and of necessity were more likely to take greater risks to access needed resources. Ultimately, perceptions of acceptable risk in balancing basic needs with safety still varied from one household to the next.
Levels of Decision-making
Overall, most FGDs revealed that whether and where to displace was a decision made at the level of the family unit, by the head of household. In the absence of a male head of household, a female head of household was reported as the decision-maker. Episodes of conflict in particular reportedly necessitated quick decision-making in family units, with no chance of consultation with the wider community. In a few cases in which the onset of a shock was less sudden, such as gradually-worsening flooding70 or insecurity that was slowly advancing, FGD participants noted that there might be more time to call a community meeting, enabling group decision-making about where to go.71 Decisions about movement primarily driven by food insecurity were reportedly also made at the household level, but it was repeatedly noted that households with similar endogenous factors, especially those with similar livelihoods, tended to collectively take similar approaches and go to locations based on those factors.
X. Challenges Along Population Movement Routes
Partial or entire households in the midst of displacement reportedly encountered numerous challenges during their travel. Protection concerns, such as looting, sexual violence, and targeted killings
were all described as the most prevalent challenges faced by populations moving along displacement routes. For example, FGD participants in Rumbek Centre county described the threat of rape by armed youth as a problem restricting and affecting movement on the roads surrounding town, particularly increasing from 2017 onwards. Women in particular were vulnerable to the threat of sexual violence, though FGD participants in western Lakes reported that women also adapted to these dangers by travelling with armed youth to and from cattle camps or markets.72 Men faced protection concerns as well; for example, in central Unity FGD participants reported that men faced killing and forcible recruitment and were perceived to be more at risk during travel than women. Another FGD conducted with men from Mayendit county who had been displaced to Nyal county reported that soldiers would target those travelling with cattle or weapons in order to steal their assets.73
During regular travel to urban centres for trade, looting of goods was also noted as a challenge, though one that could be mitigated by using a car or motorbike. Similar looting risks were reported by female FGD respondents during their return movement from Liri Refugee Camp in South Khordofan, Sudan to Panyikang county in western Upper Nile state. Given that households often exercise fragmented returns, women and children travelling alone reportedly faced increased risk of protection issues.74
Another challenge faced during displacement was limited access to food, water, and medical treatment on the journey, particularly when people were travelling for several days through the bush without passing any towns to access resources. For example, FGD participants reported that several displaced people died en route to Liri Refugee Camp while fleeing conflict in Panyikang county in 2017 because of the several day walk through a harsh environment with minimal towns or rivers to access water along the way.75
General lack of transportation in South Sudan, which caused many to travel by foot, was described as another challenge, particularly for the most vulnerable households. Following conflict in central Unity between 2014-2018, displacement was primarily to the islands southeast of Leer town. While fishermen and households that had financial access could use canoes to flee, the most vulnerable households, including households with persons with disabilities, could not afford this form of transport, resulting in some family members being left at home or families having to wade through water for long periods of time, which reportedly exposed them to waterborne diseases and urinary tract infections, as well as animals in the river. Despite these challenges, in times of conflict or serious resource stress, many still chose to make journeys known to be unsafe or arduous, exemplifying the difficult cost-benefit analyses affected households were sometimes forced to make.
68 REACH, Ameth and Aboldit Pakam cattle camp FGDs, Rumbek Centre, June 2019.69 Yacob Aklilu Gebreyes, The Impact of Conflict on the Livestock Sector in South Sudan, FAO, February 2016.70 REACH, Uror and Nyirol county FGDs, Juba PoC site, November 2019.71 Men in an FGD with Jikany Nuer IDPs reported that if a war was known but had not yet affected an area, some communities had traditions in which chiefs decided where women and children should go, either moving somewhere or remaining in place depending on the location of the insecurity, while men would either remain or
move to fight against the other armed groups. See REACH, Jikany Nuer (Southeast Upper Nile) FGD, Malakal PoC site, October 2019.72 REACH, Pakam cattle camp FGDs, Rumbek Centre, June 2019.73 REACH, Mayendit county FGDs, Nyal town, August 2019.74 REACH, Panyikang county FGDs, Tonga town (Fashoda county), October 2019.75 Ibid.

26
Population Movement Baseline Report: Movement and Displacement in South Sudan, 1983-2019
XI. Changes in Movements over Time
In analysing changes in movements over the past 35 years, some routes, patterns, and types of movement have varied between the two active war periods, while others have shown consistency over time. Map 7 shows inter-county movements from the PMB database by those that occurred in the historic period (1983-2012), and those that occurred in the contemporary conflict period (2013-2019). Out of those inter-county routes, only 9.7% (22 routes) occurred during both the historic and contemporary period (see Map 9). Meanwhile, 63.7% of inter-county routes reported in the PMB database occurred only during the Second Civil War, and 26.6% reportedly occurred only during the contemporary conflict period.
Notably, western Upper Nile and central Unity states have had high numbers of repeat unique movements both historically and from 2013-2019. Unity state and Upper Nile state saw heavy offensives in both the Second Civil War and the contemporary South Sudanese Civil War, driving high overall displacement in both periods.76,77
Movement out of central Unity counties going either north to Rubkona or south to Panyijiar occurred during both periods, but also saw shifts at the county level. Movement northward was concentrated in the historic period (primarily 1999-2002), while movement south to the swamp areas of Panyijiar county increased in frequency during the contemporary conflict as the northern route became less secure
(see Case Study 2). In Upper Nile state, movement from Panyikang county to Malakal county was fairly evenly divided between a period of fighting from 1984-1985 and another from 2014-2015, the latter noted by FGD participants as being the “worst conflict” to affect the area. But while familiarity with the route from use during the mid-eighties may have made some households more likely to repeat the movement when conflict broke out in 2014, the reported loss of access to alternate routes to Canal/Pigi and Fangak counties previously used, in conjunction with the protective appeal the newly-established Malakal PoC, also likely influenced the Panyikang-to-Malakal route’s repeat use in the contemporary period.78
Movement from Uror county to Akobo also occurred in both periods, as Akobo town has been consistently perceived as a destination with resources as well as a landing point that could facilitate onward travel to well-provisioned refugee camps in Ethiopia if necessary. At the same time, the vast majority of Uror to Akobo county movements took place in 2017, as offensives that had initially been restricted to Bor town expanded into the Greater Akobo countryside, suggesting new dynamics driving movement patterns in the contemporary period.80
Given the scarcity of routes that are recorded during both the 1983-2012 period and the 2013-2019 period, and the fact that even the routes occurring in both periods saw various shifts in parameters over time, historic use of a route on its own may not hold high predictive utility for repeated use of the same route between time periods. In each of the cases mentioned above, restricted access to alternate routes previously used, so that one particular route from the past was the best remaining option, seemed to have more salience in households’ choice of destination than simple familiarity. Ultimately, differences between the routes used historically versus currently appeared to provide more information about how and where people move, and why.
Changing Routes
In comparing movement in the historic period (1983-2012) with the contemporary one (2013-2019), certain unique movements have disappeared as conflict flashpoints have shifted and access to historic routes has been lost to new insecurity or tensions between identity groups. At the same time, as new conflict fronts have appeared and both decreasing resilience and changing conflict norms have spurred farther displacement, new routes have also emerged.
Disappearing Routes
Certain routes were extremely prevalent in the historic period (1983-2012), but did not reappear in the PMB database for the years 2013-2019. For example, displacement movements from Gogrial West
76 Amnesty International, “We are still running”: War Crimes in Leer, South Sudan, 2016.77 Amnesty International, “It was as if my village was swept by a flood”: Mass Displacement of the Shilluk from the West Bank of the White Nile, 2017. 78 REACH, Panyikang county FGDs, Tonga town (Panyikang county), October 2019.79 Among the movement routes crossing a state border, three were from Raja county (Raja county to Aweil West county with 6 movements, Raja to Tambura county with 5 movements, and Raja to Wau county with 2). The
other routes included Leer county to Ayod county with 5 movements, and Tonj North county to Wau county with 2 movements.80 REACH, Akobo, Uror, and Nyirol county FGDs, Juba PoC, November 2019.
Figure 15: Top unique movement routes (inter-county) occurring in both historic and contemporary periods (n=460)21+14+13+11+8+7+0+0
County-to-county route
Malakal to Fashoda 21Leer to Panyijiar 14Panyikang to Malakal 13Leer to Rubkona 11Uror to Akobo 8Koch to Rubkona 7
Number of repeated movements for route
21+14+13+11+8+7+0+0
Figure 16: Top states with highest proportion of unique movement routes (inter-county) occurring in both historic and contemporary periods (n=460)
State of inter-county movement
Unity 55 40.2%Upper Nile 41 29.9%Cross-border79 20 14.6%Jonglei 15 11.0%Lakes 4 2.9%Central Equatoria 2 1.5%
Number and percentage of repeated movements for route

27
Population Movement Baseline Report: Movement and Displacement in South Sudan, 1983-2019
Map 7: Historic (1983-2012) and contemporary (2013-2019) inter-county movements repeating 3 or more times in each period
Departure - Arrival
Country border
State line
County line
Movements recurring 3-5 times
Movements recurring 6-10 times
Movements recurring 11-20 times
Movements recurring 21+ times
Historic movements (1983-2012)
Current movements (2013-2019)
N

28
Population Movement Baseline Report: Movement and Displacement in South Sudan, 1983-2019
Map 8: Inter-county movements occurring in both the historic period (1983-2012) and contemporary period (2013-2019)
Departure - Arrival
Country border
State line
County line
Movements recurring 3-5 times
Movements recurring 6-10 times
Movements recurring 11-20 times
Movements recurring 21+ times
Historic movements (1983-2012)
Current movements (2013-2019)
Movements recurring 1-2 times
N

29
Population Movement Baseline Report: Movement and Displacement in South Sudan, 1983-2019
county to Aweil South county constituted the second most-prevalent unique inter-county movement in the PMB database overall, but this route appeared exclusively during 2002-2003, when it was a flashpoint between Sudan People’s Liberation Army (SPLA) and Government of Sudan (GoS) forces.81
FGD participants also indicated that some routes had become barred in the contemporary conflict: According to Jikany Nuer FGD participants, households from southern Upper Nile state (Maiwut, Ulang, Nasir and Longochuk counties) began displacing to Ethiopia instead of coming to Malakal county, where they historically sought refuge from insecurity during the Second Civil War, because the route to Malakal became inaccessible due to conflict in 2014.82
Similarly, movement from Unity state south and west into Lakes and Warrap states, which were routes available and used by residents of Panyijiar county during the 1988 Ruon Nyakuajok famine, became inaccessible in the contemporary context, as both expanding sub-national conflict and increasingly significant tensions between identity groups heightened the risks of these routes for southern Panyijiar’s Nuer residents. The decreased use of these routes is indicative of broader changes in movement, wherein not only emerging areas of outright conflict, but also the perception of starker identity group divisions and greater danger in crossing into opposing groups’ territories in the contemporary civil war, appears to play a larger role in eliminating routes that were formerly considered accessible.
While identity group affiliation reportedly played an increasingly determinative role in the more recent movement environment, inter-group tensions ruling out areas of movement is not new; long-standing tension between identity groups and the leveraging of ethnic divisions in national-level conflict in Jonglei has resulted in minimal displacement out of or into Murle areas of Pibor. However, many FGD participants, such as those from Panyikang county, noted that the previous civil war was less governed by conflict between identity groups, while they perceived that conflict became increasingly driven by which ethnic sub-division someone belongs to.83 This indicates that an environment of heightened fear is likely to be a key contributor to the disappearance of certain routes in the contemporary period.
Emerging Routes
Other routes either became more prominent or appeared for the first time post-2013, as changes in civil war actors and dynamics brought insecurity and associated displacement to new areas on the one hand, and drove more major displacement where micro-displacement had previously sufficed on the other.
Displacement routes in Western Equatoria, which were largely
81 Norwegian Refugee Council/Global IDP Project, Global IDP Database, Profile of Internal Displacement: Sudan, 2005.82 REACH, Jikany Nuer (Southeast Upper Nile State) FGDs, Malakal PoC site (Malakal county), October 2019.83 REACH, Panyikang county FGDs, Malakal PoC site (Malakal county), October 2019.84 HSBA/Small Arms Survey, Conflict in Western Equatoria: Describing events through 17 July 2016.
85 Amnesty International, “It was as if my village was swept by a flood”: Mass Displacement of the Shilluk from the West Bank of the White Nile, 2017.
absent from the PMB database for the duration of historical crises, began appearing from 2015 onward, especially intra-county movement in Yambio, Maridi, Mundri West, and Mvolo counties. Western Equatoria effectively opened a new front in the most recent conflict when local youth militias joined together with more prominent armed groups, turning the previously-calm Equatorian region into a hotspot driving increased displacement. Overall, the Equatorias demonstrated movement based on a new dynamic of support for particular armed actors despite a lack of identity group affiliation, contrasted with movement in some Dinka and Nuer areas perceived as increasingly influenced by which identity group controlled which area.84
Malakal-to-Fashoda, the most prevalent inter-county unique movement route tracked in the PMB database, was primarily used during 2017, when prior micro-displacement routes within Malakal county were no longer viable and movement across county lines became necessary. Much of the movement out of Malakal was driven by populations who had already been displaced from the East Bank to the West Bank who were then forced to make secondary displacements from the West Bank to farther safe havens in Fashoda county, as attacks were perceived to expand in range and civilian impact.85
Contextualising Changes over Time
Disappearing and emerging routes in the contemporary period indicated changing flashpoints of conflict, as well as shifts from micro-displacement to more enduring or distant displacement, especially for vulnerable households. These broad categories of movement change appeared to be driven by a collection of intersecting factors: a more restricted movement environment partially related to the perception of worsening fault lines between identity groups, a perceived escalation of violence against civilians and theft or looting of their property, and severely weakened household resilience as a result of years of accrued shocks and escalated asset-stripping.
Heightened Violence, Narrowing Choices
Underlying the differences between historic movements and more recent ones were perceived changes in the modes of conflict, such as targeting of civilians and property that reportedly increased in the contemporary conflict. As a result of these changes in the mode of conflict, many FGD participants reported that they have fewer movement options than before. Many are now reportedly forced to displace farther and/or for longer periods of time, while before they did not have to move as far from their homes to reach some form of refuge; others do not have any viable movement options.
One perception reported across multiple FGDs was that civilians, particularly women and children, have been increasingly targeted in the
30
Population Movement Baseline Report: Movement and Displacement in South Sudan, 1983-2019
most recent civil war, whereas fighting in historic episodes of conflict had mainly been between armed actors.86,87,88 This is contingent on a new environment in which the conflict dimensions are perceived as more rooted in social divides between segmentary lineage systems. FGD participants from both Greater Upper Nile and Greater Bahr el Ghazal regions reported that civilians are often perceived to be associated with certain armed groups based on where they live or what their identity group affiliation is, resulting in the targeting of civilians, which causes people to feel forced to flee longer distances to reach safety. Many FGD participants also mentioned that the increased availability of heavier weaponry, while not necessarily causing an increase in conflict, has exacerbated conflict’s impact over the past 30 years, especially in the case of sub-national conflict in parts of the Greater Bahr el Ghazal region and Jonglei state. Given the perception of increased risk to civilians, partial or entire households started to displace farther and for longer than before. Civilian property has also become a more common target. Repeated theft of household assets and burning of tukuls, often leading to episodic micro-displacement, has therefore reportedly become more frequent, further decreasing the resilience of already-vulnerable households.
These changes in conflict particularly apply to fighting in Lakes. FGD participants reported that an increase in targeting of women and entire villages began to emerge after fighting between Pakam and Rup clans escalated in 2013. Concurrently, raiding that was previously less violent reportedly became more so with the greater proliferation of guns among cattle keepers. Accordingly, while many participants reported never having been displaced prior to 2012 due to raids, in the last 8 years sequential displacement has become more frequent, with women and children traveling longer distances.
The relationship between the perception of more frequent attacks on civilians and farther and longer displacement is further exemplified by older instances in which attacks were carried out against civilians, including women and children, prior to the contemporary conflict. For example, residents of Akobo county reported that when women and children were harmed in Murle raids in Akobo county in 2005 and 2009, Akobo residents went longer distances to Ethiopia and stayed for longer periods of time, with many choosing to remain in there permanently.89
The heightened displacement that is characterised by farther movements for longer periods has also been paired with increasing restriction of mobility. Previous micro-displacement, wherein people temporarily displaced and then returned quickly, relied on an environment permissive of fairly high mobility that seemed to erode in the contemporary conflict. In Greater Baggari, for example, 2016, 2017, and 2018 saw consecutive episodes of conflict in which IDPs initially displaced southwest of Wau town became hemmed in by
worsening insecurity to the north and east and by a vast stretch of bush where food and water access was too limited to travel across to the southwest. Available and accessible foods were rapidly depleted in their area of displacement, and although humanitarians were carrying out food distributions in Wau town, IDPs’ route to Wau town was blocked by insecurity while humanitarians were simultaneously unable to access Greater Baggari.90,91 Such dynamics tend to be further compounded by a feedback loop in which higher levels of displacement and mobility restriction weaken household resilience, and weakened resilience reinforces higher levels of displacement and mobility restriction in turn.
Overlapping Stressors, Weakened Resilience
The contemporary environment, in which people’s assets are more likely to be stripped and their movement choices more likely to be reduced, has serious implications for resilience, which then further drives or impedes movement. Many livelihood activities that rely on seasonal migration for at least some members of the household are being disrupted by movement restrictions, or by the need to move farther than before. In Rumbek Centre county, FGD participants noted that travelling in order to graze their cattle had become too dangerous, so that they could only graze nearby.92 This was in fact only the case for those who still retained cattle; whereas many households had reportedly lost a large proportion of their cattle over the last several years of conflict and raiding. In Panyijiar county, large-scale loss of livestock has led to over-reliance on fishing to make up for the food deficit, which has caused people to have to move farther for fishing as nearby fishing supplies are depleted.93 In Lakes state, episodes of conflict, displacement, and ongoing perceived insecurity have prevented many Pakam households from cultivating for several consecutive years, an option households had used to diversify their food options; instead, women and children had reportedly been staying at cattle camps with the rest of the household.94 The disruption of livelihoods on top of loss of assets has likely negatively impacted the resilience of many households and communities, sometimes triggering additional movements going longer distances or to locations with poorer conditions.
Furthermore, in times of accrued shocks, especially overlapping hunger and insecurity, many households previously employed moderate-risk movement strategies that relied on norms against targeting women and enabled women to individually pursue livelihood movements such as trips to preferred markets to buy food or sell goods, supplementing food for the household. Other coping strategies were shaped by a context with a lower threat of looting, either on the road or at home. In the contemporary context in which both of these protective norms are eroded, such coping mechanisms have become less feasible, even if some households still take the
86 REACH, Malual Chum FGDs, Cueibet county, June 2019.87 REACH, Panyijiar county FGDs, Nanjim Island and Nyal town (Panyijiar county), August 2019.88 REACH, Akobo county FGD, Juba PoC site, November 2019.89 Ibid.90 REACH, Bagarri Displacement and Food Security and Livelihoods Brief, Wau County, Western Bahr el-Ghazal State, South Sudan, September 2017.
91 Sarah Vuylsteke, Identity and Self-Determination: The Fertit Opposition in South Sudan, HSBA, Small Arms Survey, December 2018.92 REACH, Rumbek Centre and Cattle Camp FGDs, June 2019.93 REACH, Panyijiar county FGDs, Nanjim Island (Panyijiar county), August 2019. 94 REACH, Ameth Pakam Cattle Camp and Gok FGDs, Cueibet county, June 2019.

31
Population Movement Baseline Report: Movement and Displacement in South Sudan, 1983-2019
95 Human Rights Watch, Sudan, Oil, and Human Rights, September 2003.96 REACH, Southern Unity Profile, August 2019.97 REACH, Leer county FGDs, Nyal town and Meer and Nanjim islands, August 2019.98 REACH, South Sudan “Now the Forest is Blocked”: Shocks and Access to Food, March 2018.
CASE STUDY 2: Overlapping Shocks in Leer county
Leer county, located in central Unity state, has experienced episodes of mass displacement in response to conflict affecting civilian life and property in both the Second Sudanese Civil War and the South Sudan Civil War, making it one of the top reported sources of movement in the PMB database.95;96 In the late 1990s and early 2000s, Leer experienced widespread violence and displacement. As armed actors burned down villages and killed civilians, Leer residents displaced en masse from Leer into others areas of Unity, Jonglei and Warrap state, resorting to the kind of farther movements more typical of the contemporary conflict wherein the targeting of civilians is perceived to be common.In the contemporary period, successive incidents of conflict have contributed to shifts from micro- to major displacement over time, while weakening household resilience. In 2014 and 2015, offensives in Leer town forced civilians to relocate to nearby islands, where they could hide from armed actors in reeds and grasses. While this smaller movement worked initially, in 2016 and 2017, attacks expanded to rural areas, along with an escalation in violence against civilians and looting and burning of homes. This was followed by mass population movement out of Leer county. With movement north blocked by insecurity, and both armed conflict and exacerbated identity group fault lines discouraging movement west or southwest into Warrap and Lakes states, households moved to the south and southeast areas of Panyijiar and Ayod counties, while others crossed to Old Fangak.97 While severity of violence, loss of assets, and constrained mobility in certain directions were driving factors behind this farther, more long-term movement, households’ threshold for major displacement was also likely lower as a result of multiple years of conflict and other shocks that had eroded their ability to cope with insecurity.98
Map 9: Displacement movements driven by insecurity in Leer county, 1983-2019
Main roadTertiary road
County capitalSettlement
Offensives direction
X
State line
Swamp (toich)
Major dsiplacement
Micro-displacement
Area of increased risk (2013-2019)
Area of increased risk (1983-2012 and 2013-2019 conflicts)
X
County line
1999 Year of movement (1983-2012 period)
2013 Year of movement (2013-2019 period)

32
Population Movement Baseline Report: Movement and Displacement in South Sudan, 1983-2019
99 REACH, Warrap and Lakes States Displacement and Service Access Brief, November 2017.100 Ibid.
CASE STUDY 3: Sub-national conflict in Warrap and Lakes states
Increased population movement in western Lakes and southern Warrap states showcases the increasing prevalence of sub-national conflict in the contemporary period, which seems to be both a response to and cause of worsening resource stress. According to the PMB database, in the 1983-2012 period, there was minimal population movement between Lakes and Greater Tonj. In recent years, however, movement between Greater Tonj and western Lakes state has risen in prominence. Against the backdrop of loss of grazing land access due to insecurity throughout the 1990s and 2000s, followed by the 2012 economic collapse, resource stress in this area increased in the lead-up to the contemporary period. In 2016, spurred by this accumulated resource stress, sub-national conflict and raiding in Cueibet, Greater Rumbek, and Tonj sparked widespread micro-displacement of people from rural areas into the nearest respective urban towns, such as Cueibet, Rumbek, Tonj, Romich, and Warrap towns.99 In 2017, armed conflict and raiding reportedly escalated and spread into towns that had previously served as safety nets. This escalation was accompanied by intensified violence against civilians and destruction of property as well as revenge killings, causing households in greater Rumbek to resort to movement across counties. Much of the rural population in western Cueibet fled to Tonj town, while others fled to Wau town, due to the perceived security and service availability in both.100 The add-on effect of the increased sub-national conflict, which has restricted cattle migration, has been decreased resilience that has made some households more likely to move. Combined with the severity and civilian impact of violence in the contemporary period, major displacement movements appear to be the result of a feedback loop of worsening sub-national conflict and resource stress.
Map 10: Displacement movements in southern Warrap and western Lakes driven by sub-national conflict, 2016 and 2017
Cueibet
Rumbek Centre
Rumbek East
Rumbek North
Koch
LeerMayendit
Panyijiar
Gogrial EastGogrialWest
Tonj East
Tonj North
Tonj South
Jur River
Wau
Marial-Lou
Akop
Apaboung
RualbetWarrap
Ngabagok Mapura
Wun-Kot
Romich
Thiet
Wanh Alel
Maper
TholTiap Tiap
MalualcumMajak
Malou-Pech Duony
Adhion
Mayath AbiriuCuiebet
Rumbek
Tiit Cok
Cuei Cok
Ameth
Malek
Tonj
ApetAbiol Dit
Gan
Aliet
MabilMakuac
Manyango
N
Main roadTertiary road
County capitalSettlement
2017 displacement routes
State line
Swamp (toich)
Conflict-affected areas 2016-2017River
2016 displacement routes
County line

33
Population Movement Baseline Report: Movement and Displacement in South Sudan, 1983-2019
provide valuable insight into coping possibilities (or lack thereof) available to households experiencing a shock. At the same time, factors such as distance and duration of displacement can help humanitarians anticipate future needs caused by current disruption of livelihood activities. More broadly, assessing not only current needs but also the accumulation of past shocks experienced by households over time, including major displacement, repeated micro-displacement, loss of access to livelihood routes, and loss of productive assets, can give humanitarians a more accurate picture of household vulnerability.
XII. Future Exploration
While the PMB has provided a general look at some of the key dynamics around population movement drivers, routes, and decision-making in South Sudan, several notable aspects of population movement in South Sudan were not addressed in-depth, such as gender dynamics in population movement, patterns of secondary displacement, or a deeper examination of return movements in South Sudan over time. Additionally, the research identified several gaps in research on population movement in South Sudan, raising new topics of population movement analysis in South Sudan that can be explored moving forward. While there was a multitude of reports on conflict-related displacement, there was a wide gap in secondary data discussing the nuances of population movement driven by other factors. Thus, some of the key gaps in the existing research include: patterns and trends in climate-related migration and displacement; the dynamics and thresholds for population movement driven by the breakdown of livelihoods, including distress migration; and trends in rural-urban and urban-rural migration in South Sudan. In addition, there is a need to look beyond political boundaries or administrative levels and include analysis of movement in relation to topographical maps, livelihood zones, and other spatial breakdowns of the country to further nuance humanitarians’ understanding of the who, what, where, when, why and how of population movement in South Sudan. Lastly, designing a more in-depth analytical or conceptual framework on population movement decision-making would better equip humanitarians to respond to population movement and the needs of displaced populations.
XIII. Conclusion
Over the past 36 years the people of South Sudan have experienced countless episodes of displacement, caused by back-to-back civil wars alongside episodes of food insecurity, flooding, drought, and disease outbreak, often overlapping with each other. Upper Nile and Unity states have been especially hard-hit, with frequent displacement during conflicts and famine. While displacement has been disruptive, it has also been used as a resource, allowing people to escape
Figure 17: Evolving movement environment in 2013-2019 period
Higher perceived physical risk and potential for higher conflict impact
and fatality due to shift in type, number, and lethality of weapons
being used
Politicisation of social divides, increasing role of divisions between identity groups in
national and sub-nation conflict perceived to be associated with increase in harm to civilians and
civilian housing, property and livelihood assets
Causes those who can move to go farther for longer periods under increasingly restrictive movement environment with
fewer route options; threshold for distress migration
simultaneously lower due to decreased resilience
Conversely also restricts movements towards safety/cop-
ing strategy movements for resource distress, also restricts
traditional livelihood movements
Decreased household resilience on multiple fronts: property may be destroyed, household assets stripped, and productive house-hold members injured or killed; coping options involving move-ment constrained by widened
scope of insecurity while livelihoods are interrupted by farther, long-term movement)
Pre-conditions of decreased resilience: Cattle migration
occurring less frequently (cattle have been stolen, concerns of
theft and looting by those who still have cows); multiple years of
interrupted harvests
risk. Thus, contemporary conflict dynamics appear to be triggering feedback loops that reduce household resilience by disrupting livelihood activities and then secondarily disrupting livelihood alternatives, even as they continue to endanger civilians.
In this environment of mutually-reinforced loss of resilience and displacement, humanitarians should be mindful that the most vulnerable households are sometimes immobilised rather than displaced, and screen for both in conducting needs assessments. Analysing the movement options and restrictions of an area can

34
Population Movement Baseline Report: Movement and Displacement in South Sudan, 1983-2019
violence, rebuild livelihoods, allay hunger, and avoid disease and environmental shocks. Many South Sudanese have become adept at balancing protection concerns with possible avenues of obtaining needed resources, while also negotiating constraining and enabling factors specific to their household situation, from livelihood profiles to household composition to available social networks. Unfortunately, changes in the nature of conflict from the previous civil war to the contemporary one have decreased people’s options for displacement routes, simultaneously preventing some from moving while causing others to displace farther and for longer periods of time—either of which could compound their vulnerability. Ultimately, these findings suggest that the combined effects of years of violence, new norms of asset stripping, successive disruptions of livelihood activities, and increasingly restricted movement options have contributed to the erosion of resilience for many households. As humanitarians attempt to anticipate displacement in response to future shocks while also dealing with a possible influx of returns, understanding of the changing landscape of conflict and movement and its deleterious effects on resilience will be crucial to providing assistance where it is needed.

35
Population Movement Baseline Report: Movement and Displacement in South Sudan, 1983-2019
ANNEX A: Focus Group Discussion and Participatory Mapping Tool
FGD: South Sudan REACH: COMMUNITY PERCEPTIONS OF POPULATION MOVEMENT and PARTICIPATORY POPULATION
MOVEMENT MAPPING
Moderator Name: Assistant Moderator Name: Location:
Date: Time (start/end):
County of Knowledge (the area we are seeking information about)
How do they know about this county? (Recently left, Household member visited, Regular contact etc.)
State of origin Age Sex
Facilitator’s welcome, introduction and instructions to participants [5 minutes]
Introductory note [2 minutes]
− Welcome and thank you for volunteering to take part in this focus group discussion about population movement in South Sudan, which is about a better understanding of community and settlements in your country of origin. You have been asked to participate as your point of view and knowledge about your community situation and current needs will be used to inform response strategy and planning. I appreciate your time.
− Please note that this meeting does not have any impact on whether you or your family receives assistance. These discussions are only meant to better understanding how you, your household, and the community perceive the situation in your villages of origin
− Anonymity: I would like to assure you that the discussion will be anonymous. I and the other focus group participants would appreciate it if you would refrain from discussing the comments of other group members outside the focus group. If there are any questions or discussions that you do not wish to answer or participate in, you do not have to do so; however please try to answer and be as involved as possible.
− The discussion will take no more than one hour. − We are asking for your ration card number because we might want to contact you again to know how things have changed in
your home communities several weeks of months after this focus group discussion.
Ground rules [2 minutes]
1. The most important rule is that only one person speaks at a time. There may be a temptation to jump in when someone is talking but please wait until they have finished.
2. There are no right or wrong answers

36
Population Movement Baseline Report: Movement and Displacement in South Sudan, 1983-2019
ANNEX A
3. You do not have to speak in any particular order4. When you do have something to say, please do so. There are many of you in the group and it is important that I obtain the views
of each of you5. You do not have to agree with the views of other people in the group you can say that.6. Does anyone have any questions? (answers). 7. OK, let’s begin
INSTRUCTIONS TO MODERATORS1. Questions to participants: these are the questions that should be read to the participants. If there are some specific vocabulary
which may be unclear, do not hesitate to provide a definition for the purpose of the exercise.
2. Probing questions: Probes and clarifying questions are an important part of interviewing and have two main purposes: 1) To help clarify what an interview respondent has said and 2) To help get more detailed information on topics of interest. Probes allow the interview respondent to provide more than just a one-sentence answer to the questions you ask. Do not read probing questions together with the questions to participants. Use or adapt them if necessary
Introduction of Purpose of FGD (Please read this to FGD participants)
- REACH is conducting this assessment to try to understand where, when, and why populations move in South Sudan to help better provide assistance to communities that are displaced or in need of assistance.
- We will be carrying out this study in many counties in South Sudan to get a broad picture of movement in the country- We would like to ask you questions on community perceptions of population movement, as well as use the map to show us
where populations travel seasonally and where they travel following different events or shocks happen. - We will also be asking about historical movement in the area, such as where populations moved following similar events in
the past, and if these locations have changed.
Questioning Route : Section 1: Community Perceptions on Population Movement
What are the different drivers that have caused large groups of people to move or migrate within or out of this county in the last 30 years? / What are the different reasons large groups of people have moved or migrated within or out of this county?
- Probe for “large scale” [ideally, movement of 5,000 people or more]- Probe for conflict? Flooding? Cattle migration? Food insecurity? Resource stress? Access to services? IDP re-
turns? Refugee returns? Livelihood migration? Disease outbreak?- Do any of these movements happen every year / on a seasonal basis?
o Which ones? [Mark or circle the movements that happen seasonally]
[NOTE TO FACILITATOR: The group will likely start listing or recalling specific historic events that have caused the population to move. In this case, note down all of the specific events that they list, then go through the next set of questions for each individual event. It is often helpful to map the all historic movements by driver. (i.e. map the first period of conflict that caused movement, then other periods of conflict that caused movement).

37
Population Movement Baseline Report: Movement and Displacement in South Sudan, 1983-2019
ANNEX A
Section 2: Population Movement Mapping
Introduce participants to the map: show them where we are now, and the area of interest on the map. Show them major towns in the region so they understand the map.
Exercise to build participant familiarity with the map: Through showing them key roads, towns etc., work with each participant to identify their hometown on the map. Circle each participant’s home town/village on the map, if the settlement name doesn’t exist, identify approximately where the village/town is and circle with the name. This helps participants orientate themselves to the map and ensures a reference point for discussions.
Note on using map: Wherever possible during the discussion mark details on the map, aka original homes prior to displacement, where people moved to, where was the fighting, cattle camps, flood-prone areas, most fertile areas/cultivation areas etc.
For ATYPICAL or SUDDEN-ONSET movement:
When was the last time there was a large movement of people because of [X driver of movement]?- What were the events that led up to this, causing people to move?
Where did people go? [Draw routes on map, marking directions with arrows and circling transit locations]- What routes did people take?- Did everyone go to the same location? If not, please map other directions and locations people moved to.- Were there any key transit towns where people stopped along the way? How long did they stay there? Did anyone
remain in this location?
Why did people move to this/these particular location(s)?- Protection? Access to resources? Proximity to family? - How did people decide where to move? Did Households decide on their own or was there a group decision in the
community?
Did all members of the Household move?- If not, who did move?- How was the decision made as to who moved?- Did anyone stay behind in or around the community following the incident/event/shock?- Probe for breast-feeding/ pregnant women, unaccompanied minors, elderly Household members, special needs
Household members?- What challenges did those who stayed behind face?
What means of transportation did most people use?- By foot, car, bus, moto?- Using the road, bush paths, along a river? [Map, if possible]- How long did the journey take?- Were there any barriers to using the preferred means of transportation?
What major challenges did people face while traveling along this route?- Access to resources? Access to food? Transportation?

38
Population Movement Baseline Report: Movement and Displacement in South Sudan, 1983-2019
ANNEX A
Did the population displaced face protection issues traveling along this route?- Who was most at risk? Women? Children? Men?
Are people still displaced from this incident?- If yes, do they intend to return? - If no, how long did they stay in the displacement location?
Before this most recent event/occurrence, when else has this [type of event/incident/driver] occurred and caused large-scale movement historically?
- Probe for large scale movement due to similar reasons in the 1980s, 1990s, and 2000s – or refer to movement during Second Sudanese Civil War?
o Probe for if there are local words/names/phrases for these incidents?- Did people take the same routes / travel to the same locations in these incidents?
o Go through each major event reported- If no, where did they move? [draw routes on the map in different colours, marking the route lines with a date]- Why did people go to a different location then? - Why do they no longer travel to this location now?
Refer to the list of drivers from the first question. Go down the list and ask the following set of questions for each of the SEASONAL drivers.
Where do people go? [Draw routes on map, marking directions with arrows and circling transit locations]- What routes do people take?- Does everyone go to the same location? If not, please map other directions/locations people travel to?
o If mapping cattle migration, mark location of specific cattle camps and movement arrows between them. - When this movement happened most recently, did people take the route they would in a “normal” year?
o If not, why did they travel on a different route? What is the route they would take in a “normal” year?
Are people travelling to their most preferred location for the seasonal migration?- If not, where is the preferred location? - Why are they not travelling to this location?
Why do people travel to this/these particular location(s) specifically?- If the movement is due to an annual lack of resources, what is the geographic scale of the lack of resources, the entire map
or a specific sub-section?- If the movement is due to a lack of resources, mark on the map where the resources are accessible.
What time of year do populations move? [Note down month of departure and month of return]- How long do seasonal migrants stay out of their homesteads?- [mark on seasonal calendar]
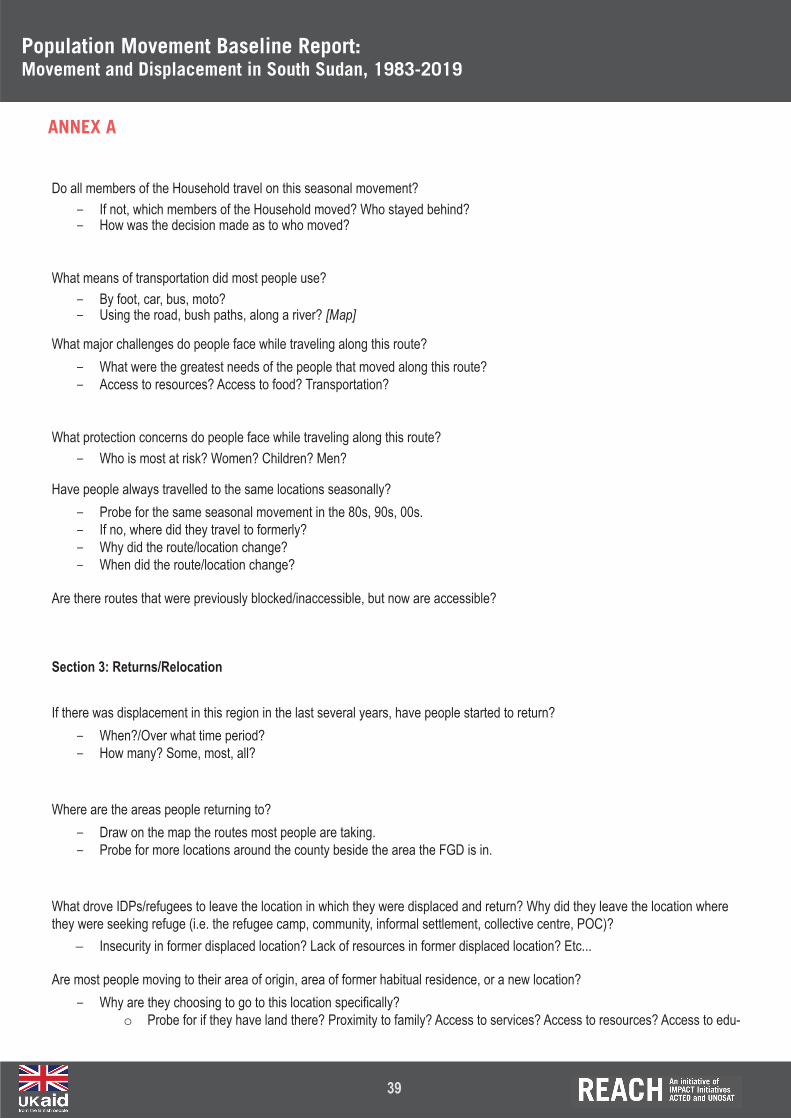
39
Population Movement Baseline Report: Movement and Displacement in South Sudan, 1983-2019
ANNEX A
Do all members of the Household travel on this seasonal movement?- If not, which members of the Household moved? Who stayed behind?- How was the decision made as to who moved?
What means of transportation did most people use?- By foot, car, bus, moto?- Using the road, bush paths, along a river? [Map]
What major challenges do people face while traveling along this route?- What were the greatest needs of the people that moved along this route?- Access to resources? Access to food? Transportation?
What protection concerns do people face while traveling along this route?- Who is most at risk? Women? Children? Men?
Have people always travelled to the same locations seasonally?- Probe for the same seasonal movement in the 80s, 90s, 00s.- If no, where did they travel to formerly?- Why did the route/location change? - When did the route/location change?
Are there routes that were previously blocked/inaccessible, but now are accessible?
Section 3: Returns/Relocation
If there was displacement in this region in the last several years, have people started to return?- When?/Over what time period?- How many? Some, most, all?
Where are the areas people returning to?- Draw on the map the routes most people are taking.- Probe for more locations around the county beside the area the FGD is in.
What drove IDPs/refugees to leave the location in which they were displaced and return? Why did they leave the location where they were seeking refuge (i.e. the refugee camp, community, informal settlement, collective centre, POC)?
− Insecurity in former displaced location? Lack of resources in former displaced location? Etc...
Are most people moving to their area of origin, area of former habitual residence, or a new location? - Why are they choosing to go to this location specifically?
o Probe for if they have land there? Proximity to family? Access to services? Access to resources? Access to edu-

40
Population Movement Baseline Report: Movement and Displacement in South Sudan, 1983-2019
ANNEX A
cation?
How long do they intend to stay in this location?− Just for cultivation period? Permanently? − If not, where do they plan to go?
Are all members of the Households returning?- If not, why not? Where are the others? - Who makes the decision as to who returns?- Do the other Household members intend to return at a later point? When?
What means of transportation did most people use?- By foot, car, bus, moto?- Using the road, bush paths, along a river? [Map, if possible]
What challenges do people face while traveling along this route?

41
Population Movement Baseline Report: Movement and Displacement in South Sudan, 1983-2019
ANNEX B: Population Movement Database Sample

42
Population Movement Baseline Report: Movement and Displacement in South Sudan, 1983-2019
ANNEX C: List of Sources Used for PMB Database
Author/Organization Tittle Date of publicationAmnesty International “It was as if my village was swept by a
flood:” The Mass Displacement of the Shilluk Population from the West Bank of the White Nile, South Sudan
June 2017
Amnesty International Nowhere Safe: Civilians Under Attack in South Sudan
May 2014
Coordinated Assessment/FCA, ROSS, Nile Hope, SALF, HCO, NPA, CAO
IRNA Report: Bei Boma, barboy Payam, Fangak, Jonglei State
28 April –2 May 2017
Danish Refugee Councol South Sudan Wandako and Renk: Rapid Protection Assessment
May 2019
DRC SSD Leer TPA Assessment Report 11-18 May 2018
Human Rights Watch (HRW) Sudan: The Lost Boys November 1994HRW Human Rights Consequences of Oil
Development2003
Human Rights Watch Civilian Devastation:Abuses by All Parties in the War in Southern Sudan
3 March 2004
Human Security Baseline Assessment Displaced and Immiserated: The Shilluk of Upper Nile in South Sudan’s Civil War
September 2019
Internal Displacement Monitoring Centre (IDMC)
Global Report on Internal Displacement:Conflict Displacement Figures Analysis
2018
Internal Displacement Monitoring Centre (IDMC)/Norwegian Refugee Council.
Sudan: “Durable solutions elusive as southern IDPs return and Darfur remains tense”: A Profile of the Internal Displacement Situation
23 December, 2010
Internal Displacement Monitoring Centre (IDMC)/Norwegian Refugee Council.
SUDAN: Slow IDP return to south while Darfur crisis continues unabated(A profile of the internal displacement situation)
17 August 2006
International Crisis Group (ICG) South Sudan, Jonglei: – “We have always been at war”
22 December 2014
International Crisis Group (ICG) Jonglei’s Tribal Conflict: Countering Insecurity in South Sudan
23 December 2009
International Organization for Migration (IOM)
IOM DTM Event Tracking: Tambura 13 August 2018
IOM IOM DTM Event Tracking: Yambio 13 August 2018IOM IOM DTM Wau PoC AA Headcount December 2018IOM IOM DTM South Sudan – Uganda Flow
Monitoring April-October 2018
IOM IOM DTM Event Tracking: Influx from Gambella
5 February 2019

43
Population Movement Baseline Report: Movement and Displacement in South Sudan, 1983-2019
ANNEX C: List of Sources Used for PMB Database
IOM Mobility Tracking Round 3 Focus Report: Unity
July-August 2018
IOM Mobility Tracking Round 3 Focus Report: Lakes
July-August 2018
IOM IOM DTM Event Tracking: Yei 13 March 2019Norwegian Refugee Council/Global IDP Project
Profile of Internal Displacement: Sudan
24 March 2005
Organization for the Coordination of Humanitarian Affairs (OCHA)
South Sudan Weekly Humanitarian Bulletin
17 November 2011-17-23 December 2012
OCHA Humanitarian Bulletin South Sudan 3 March 2016- 16 July 2018OCHA South Sudan: Humanitarian Snapshot January-April 2017OCHA South Sudan Situation Report 30 Aug 2019
OCHA South Sudan: Crisis Situation Report 10 April 2015OCHA South Sudan: Flash Update on Upper
Nile 27 April 2017
OCHA, FAO, REACH, WFP, FH, ACEM, WHO, CMMB, WVSS, LCED, IMC, UNICEF, CARD, CMMB, MAYA, NP, UNMAS, INTERSOS, SEM
Mvolo Multi-Cluster Rapid Assessment Report
4 August 2017
Operation Lifeline Sudan (OLS) Operation Lifeline Sudan Weekly, Bi-weekly, and Monthly Reports
November 1996- December 2000.
OLS Operation Lifeline Sudan North and Southern Sector Weekly and Monthly Updates and Reports
October 1996-13 October 1999
OLS Operation Lifeline Sudan: A weekly Report on Major Developments Concerning the Relief Operation in Southern Sudan
30 July 1996
OLS Operation Lifeline Sudan: UNICEF Operation in South Sudan Monthly Report
June - 30 October 2000
REACH Initiative South Sudan: Cross Border Population Movement Dynamics Brief
April 2019
REACH Initiative Kurwai Rapid Assessment Brief 13-27 March 2019REACH Initiative Baggari Displacement, Fodd Security,
and Livelihoods BriefSeptember 2017
REACH Initiative Deim Zubier Rapid Displacement Brief April 2018REACH Initiative Diel Displacement and Access to
Services Brief March 2018
REACH Initiative Chandioy Food Security and Livelihoods Brief
February 2018
REACH Initiative Warrap and Lakes States Displacement and Service Access Brief
November 2017
REACH Initiative Tambura Displacement Brief November 2017

44
Population Movement Baseline Report: Movement and Displacement in South Sudan, 1983-2019
ANNEX C: List of Sources Used for PMB Database
REACH Initiative Situation Overview: Greater Bahr el Ghazal, South Sudan
April - June 2018, July - September 2018
REACH Initiative Conflict Analysis: Lakes, Northern Bahr el Ghazal, and Warrap States
August 2014
REACH Initiative Western Lakes Population Movement, Food Security, and Livelihoods Profile
July 2019
REACH initiative Renk Multi-Sectoral Needs Assessment Brief
June 2019
REACH Initiative Situation Overview: Upper Nile State, South Sudan
April - June 2019
Solutions Working Group/Inter-Cluster Working Group
Report on Facilitated Returns from Melut to Baliet, Upper nile Region
12 June 2019
Unpublished Briefs CONFLICT ANALYSIS WEEKLY BRIEF 4 January 2016-12 July 2017

45
Population Movement Baseline Report: Movement and Displacement in South Sudan, 1983-2019
ANNEX D: Map I
All inter-county movements, 1983-2012 and 2013-2019
Departure - Arrival
Country border
State line
County line
Movements recurring 3-5 times
Movements recurring 6-10 times
Movements recurring 11-20 times
Movements recurring 21+ times
Historic movements (1983-2012)
Current movements (2013-2019)
Movements recurring 1-2 times
N

46
Population Movement Baseline Report: Movement and Displacement in South Sudan, 1983-2019
ANNEX E: Maps II-VI: Top 5 Years of Movement, by Year
All inter-county movements, 2017
N
Departure - Arrival
Country border
State line
County line
Movements from 2017

47
Population Movement Baseline Report: Movement and Displacement in South Sudan, 1983-2019
ANNEX E: Maps II-VI: Top 5 Years of Movement, by Year
All inter-county movements, 1992
N
Departure - Arrival
Country border
State line
County line

48
Population Movement Baseline Report: Movement and Displacement in South Sudan, 1983-2019
ANNEX E: Maps II-VI: Top 5 Years of Movement, by Year
All inter-county movements, 2002
N
Departure - Arrival
Country border
State line
County line

49
Population Movement Baseline Report: Movement and Displacement in South Sudan, 1983-2019
ANNEX E: Maps II-VI: Top 5 Years of Movement, by Year
All inter-county movements, 2018
N
Departure - Arrival
Country border
State line
County line
Movements from 2017

50
Population Movement Baseline Report: Movement and Displacement in South Sudan, 1983-2019
ANNEX E: Maps II-VI: Top 5 Years of Movement, by Year
All inter-county movements, 1999
N
Departure - Arrival
Country border
State line
County line

51
Population Movement Baseline Report: Movement and Displacement in South Sudan, 1983-2019
ANNEX F: Glossary of Population Movement Terminology
Adaptive Displacement: Permanent relocation of communities from settlements or clusters of settlements in response to persistent physical insecurity, food insecurity, climatic shocks or other forms of resource stress. The movement is often understood as displacement out of a high-threat area into a low-threat area. Source: REACH, Now the forest is blocked: Shocks and access to food, 2018
Displacement: The movement of persons who have been forced or obliged to flee or to leave their homes or places of habitual residence, in particular as a result of or in order to avoid the effects of armed conflict, situations of generalized violence, violations of human rights or natural or human‐made disasters. Source: Adapted from Guiding Principles on Internal Displacement, annexed to United Nations Commission on Human Rights, Report of the Representative of the Secretary-General
Distress Migration: Movement in response to the breakdown of livelihoods and an exhausted capacity to cope resulting in a lack of access to or availability of the resources and services necessary to meet basic needs, such as food, typically an outcome of a series of slow or sudden-onset stressors and/or shocks. This often occurs in stages, first involving movement of some household members to nearby areas to access alternative livelihoods and food sources before the relocation of entire households or communities to urban centres or displacement camps in more severe situations of resource stress (See Primary Distress Migration and Secondary Distress Migration). Distress migration is typically considered temporary until people are able to return to rebuild livelihoods. Source: Adapted from Suhrke 1993; Renaud et al., 2011; FAO, Scoping study on defining and measuring distress migration, 2017; REACH, Now the forest is blocked: Shocks and access to food, 2018
Internally Displaced Person (IDP): Persons or groups of persons who have been forced or obliged to flee or to leave their homes or places of habitual residence, in particular as a result of or in order to avoid the effects of armed conflict, situations of generalized violence, violations of human rights or natural or human‐made disasters, and who have not crossed an internationally recognized State border. Source: Guiding Principles on Internal Displacement, annexed to United Nations Commission on Human Rights, Report of the Representative of the Secretary-General, Mr Francis M. Deng, Submitted Pursuant to Commission Resolution 1997/39, Addendum (11 February 1998) UN Doc E/CN.4/1998/53/Add.2, 6.
Livelihood: Means through which people access food and earn income to meet basic needs.Source: Fewsnet, Livelihoods Guidance Document
Major Displacement: Displacement that is both of longer-duration and longer-distance, often carried out in response to higher intensity, but lower frequency shocks. Often involves the movement of a partial or entire household for periods of several months to several years before return, often including subsequent movements throughout that period due to repeated shocks. Major displacement also encompasses notions of secondary displacement, which can be defined by protracted or long-term displacement during which people are forced to move repeatedly from successive sites of refuge, often subsequentially moving further and further away from their area of former residence.
Micro-Displacement: Shorter-term, shorter-distance, recurrent displacement followed by subsequent return movement, typically following sudden-onset shocks of higher-frequency, but lower intensity (such as raids, small-scale outbreaks of organised violence, or epsiodic flooding). Movement is often towards immediate bush areas, highlands, or nearby urban/peri-urban centres in search of temporary protection or access to resources.

52
Population Movement Baseline Report: Movement and Displacement in South Sudan, 1983-2019
ANNEX F
Migration: The movement of persons away from their place of usual residence, either across an international border or within a country. Source: IOM Glossary on Migration, 2019
Primary Distress Migration: Relocation of community members during periods of food insecurity within a limited geographic area, such as to seasonal cattle and fishing camps or nearby forest and bush to improve food access. This movement of people, with or without livestock, may appear initially as movement related to typical livelihoods or as more general internal displacement, but is more specific to periods of food insecurity.Source: REACH, Now the forest is blocked: Shocks and access to food, 2018
Resource Stress: Lack of access to or availability of the resources and services necessary to meet basic needs at the household or community level.
Return: The act or process of going back or being taken back to the point of departure. This could be within the territorial boundaries of a country, as in the case of returning internally displaced persons (IDPs) and demobilized combatants; or between a country of destination or transit and a country of origin, as in the case of migrant workers, refugees or asylum seekers. Source: IOM Glossary on Migration, 2019
Seasonal Migration (Livelihood movement): Migration to carry out income-generating activity or seek employment, dependent on seasonal conditions and performed only during part of the year as part of a household’s livelihood profile. Seasonal migrants are members of the household who left for part of the year to work but are still considered household members. Examples include but are not limited to movement to fishing or cattle camps, trade engagement, or movement to seek seasonal casual labour during harvest season. Source: Adapted from (Art. 2(2)(b), International Convention on the Protection of the Rights of All Migrant Workers and Members of Their Families, 1990); FAO
Secondary Distress Migration: Relocation of individual, households, or entire communities to urban centres, IDP or Protection of Civilian (PoC) sites, or refugee camps as a result of coping strategy exhaustion during periods of food insecurity. This out-migration is usually longer distance and for longer periods of time.Source: REACH, Now the forest is blocked: Shocks and access to food, 2018
Sub-national Conflict: A situation of violence involving armed actors without identified nationally oriented objectives, but pursuing political agendas beyond limited local issues, such as sub-county areas or groupings of villages, while engaging in violence characterized by multiple indicators of organization and intensity. If armed conflict shows strong indications of organization and intensity despite being localized, it may also be considered as sub-national conflict. Sub-national conflict may or may not involve objectives focused on natural resource access and control, as such economic issues are inherently political.Source: Humanitarian sub-group on adjustment of conflict terminology document, 2020