Embed Size (px)
Citation preview

Section F Baseline Survey
F Baseline Survey ................................................................................. F-1
F.1 Public Opinion Survey on SWM in Ulaanbaatar ................................F-1
F.2 Illegal Dump Site ..............................................................................F-19
F.3 Waste Fee Collection Rate in Ger Area ............................................F-30
F.4 Baseline Survey on Public Awareness for SWM..............................F-34
F.5 Waste flow in 2009 ...........................................................................F-40
F.6 Opinion Survey on Waste Collection at Ger Area............................F-44
F.7 Pilot Project (Waste Separation and Recycling) ...............................F-53
F.7.1 Time & Motion Survey (Summary)...................................................... F-53
F.8 Waste amount transported to NEDS .................................................F-67
Project for Strengthening the Capacity for SWM in Ulaabaatar City JICA Annex F: Baseline Survey KOKUSAI KOGYO CO., LTD.
F-1
F Baseline Survey
F.1 Public Opinion Survey on SWM in Ulaanbaatar
a. Purpose of the Survey
In the project PDM, "People’s satisfaction level for urban environment and sanitation throughout the City reaches to X%" has been set up as the indicator of "Overall Goal", and "People’s satisfaction level for the SWM service throughout the City reaches to X%." has been set up as the indicator of "Project Purpose".
In this project, public opinion survey (POS) was conducted for the residents who live in the 6 pilot districts of the Central District of the Ulaanbaatar City as means of verification.
This survey is planned to be conducted 3 times at the time of the beginning, intermediate, and the end of this project. 420 households of respondents of POS conducted this time will also be the target of the other two times of POS. The result of the POS will be used as the criterion whether or not the aim of the project is achieved.
In the UB City, the waste collection systems differ greatly between the Ger Area and the Apartment Area according to the differences in the system and life style of a community. This survey puts emphasis on collecting the consciousness and the opinions of residents about surrounding urban environment, public health, and waste collection service, paying attention to the difference among such resident statuses.
b. Method of the Survey
b.1 Outline of the survey
This survey was roughly divided and conducted in the Ger Area and the Apartment Area. The same number of the interviewees was chosen out of 6 pilot districts of the Central District of the UB City so that partiality might not appear in the survey. The two khoroos were selected respectively from the Ger Khoroo and the Apartment Khoroo in each district, and 35 households were further selected as interviewees of the survey. The first approach to each khoroo was taken by EPWMD staffs who take charge of each district, and actual distribution and collection of questionnaires were carried out by each khoroo officials.
* Khoroo is the administration unit which constitutes district. Each district consists of about 20 khoroos on average, and the khoroo where apartment residents are majority is called Apartment Khoroo, and the other where ger surrounded by khashaa (wooden enclosure) or detached house residents are majority is called Ger Khoroo.
The method and outline of the survey are shown below.
1. Survey Method: Distribution and collection of questionnaire
2. Object: Households who live in the 6 pilot districts of the Central District of the UB City.
3. Number of Object: (1) 420 households which reside in Ger Area (6 District X 2 khoroos X 35 = 420)
(2) 420 Households which reside in Apartment Area
(6 District X 2 khoroos X 35 = 420)

Project for Strengthening the Capacity for SWM in Ulaabaatar City JICA Annex F: Baseline Survey KOKUSAI KOGYO CO., LTD.
F-2
4. Target Area: Two khoroos selected respectively from the Ger Khoroo and the Apartment Khoroo in each 6 district of the Central District of the UB City. Total: 24 Khoroos.
5. Number of questions : 13
6. The theme of a question: (1) Urban environment and sanitation of the UB City
(2) Problem of SWM in the UB City
(3) Question on characteristics of the respondent
b.2 Selection of Target
b.2.1 Selection of Target Khoroo
The EPWMD staffs in charge of each district selected the 2 target khoroos respectively from Apartment Khoroo and Ger Khoroo.
b.2.2 Selection of Object
The object in each Khoroo was selected by each Khoroo official requested by the EPWMD staff. The EPWMD staff instructed each Khoroo official on a basis of selection so that the places of residence of the respondent would not be partial.
b.3 Execution of Survey
b.3.1 Method of Survey
Each Khoroo official distributed the questionnaire to the interviewees and collected them. The collected questionnaire was inputted into designated form by each Khoroo official, and was sent to the EPWMD staff as a digital file.
b.3.2 Period of Survey
Although the JET instructed to distribute questionnaire to each Khoroo and collect them within the limit of 1 to 2 weeks, it took one month to distribute questionnaire to each Khoroo official and collect all the digital files. Moreover, it took two weeks to analyze the received data.
The period of reply day of the questionnaire obtained from the effective ones out of all collected questionnaires was between November 10 and 20, 2009.
b.4 Questionnaire Contents
The question was roughly divided into three categories; 1) Question on urban environment and sanitation of the UB City, 2) Question on waste management in the UB City, 3) Question on characteristics of the respondent. The purpose, the contents, etc. in each item were described below, respectively.
b.4.1 Question on Urban Environment and Sanitation of the UB City
The question was considered for analyzing the consciousness and the opinion of residents about the urban environment and sanitation of the UB City. It aims at measuring "People’s satisfaction level for urban environment and sanitation throughout the City reaches to X%"

Project for Strengthening the Capacity for SWM in Ulaabaatar City JICA Annex F: Baseline Survey KOKUSAI KOGYO CO., LTD.
F-3
which has been set up as the indicator of "Overall Goal". The contents of question were roughly divided into two; 1) the degree of satisfaction on urban environment and sanitation, 2) the most serious problem in the UB City.
b.4.2 Question on Waste Management in the UB City
The question was considered for analyzing the consciousness and the opinion of residents about waste management in the UB city. It aims at measuring "People’s satisfaction level for the SWM service throughout the City reaches to X%." which has been set up as the indicator of "Project Purpose". The contents of question were roughly divided into four; 1) the degree of satisfaction on SWM and its reason, 2) the degree of satisfaction on waste collection service and its reason, 3) evaluation on each level of local governments, 4) the degree of understanding and cooperation for separate discharge and collection.
b.4.3 Question on Characteristics of the Respondent
It aims at understanding whether there is any impartiality in distribution of a respondent, and what kind of resident answered the questions from the viewpoints of a place of residence, age, sex, education level, etc., which would make analysis of the reply to other questions even deeper.
c. Result of Survey
c.1 Information on Respondents
c.1.1 Distribution of Respondents(Place of Residence)
2 Apartment Khoroos and 2 Ger Khoroos were selected from each District respectively and questionnaire survey was conducted for 35 households from each khoroo. The number of questionnaire distributed was 840 sheets, and 826 sheets among them have been collected. The distribution of the respondent according to each place of residence is shown below. A total of 826 households consist of 411 households from Apartment Khoroo and 415 households from Ger Khoroo.
Table F-1: : Distribution of Respondents(District, Khoroo, Place of Residence)
District Khorooapartment
area ger area total
Bayangol 4 35 35 9 35 35 10 34 34 13 35 35 Bayanzurkh 9 35 35 12 35 35 15 35 35 18 34 34 Chingeltei 1 33 33 6 36 36 10 33 33 11 33 33 Khan-Uul 1 35 35 2 35 35 4 35 35 6 35 35 Sukhbaatar 1 31 31 8 32 32 11 32 32

Project for Strengthening the Capacity for SWM in Ulaabaatar City JICA Annex F: Baseline Survey KOKUSAI KOGYO CO., LTD.
F-4
13 39 39 Songinokhairkhan 10 34 34 12 35 35 18 35 35 23 35 35 total 411 415 826
c.1.2 Distribution of Respondents(Age and Sex)
The distribution of respondent according to the age and sex is shown below. There were 39.3% of males, and 58.6% of females. Furthermore, according to age, 48 years old and over accounts for 44.1% and the age groups not more than 48 years old are scattered on the average. In addition, the method of the classification of more than 48 year old is based on the statistics on population and age of the UB City, and was determined based on the request of EPWMD that the method of such a classification is suitable because a life expectancy is shorter than Japan in Mongolian and the 50 or older-year people account for only 14.3%1 of all population based on age distribution of the UB City in 2008. In this sense, it can be said that the ratio which senior occupies in this survey is higher to the ratio of the senior to the population of the UB city.
Table F-2: Distribution of Respondents (Age and Sex)
Age male female (Blank) Total Total (number) 18-23 1.5% 2.5% 0.0% 4.0% 33 24-29 4.5% 6.5% 0.0% 11.0% 91 30-35 4.6% 8.0% 0.0% 12.6% 104 36-41 5.3% 8.0% 0.1% 13.4% 111 42-47 5.0% 8.2% 0.0% 13.2% 109 48 above 18.5% 25.2% 0.4% 44.1% 364 (Blank) 0.0% 0.1% 1.6% 1.7% 14 Total 39.3% 58.6% 2.1% 100.0% 826
c.1.3 Distribution of Respondents(Education Level and Residence Area)
The following table shows the distribution of final academic background of respondents. 40% or more of all respondents has the academic background of the university graduation, and 70% or more among them is those who live in the Apartment Area.
Table F-3: Distribution of Respondents(Education Level and Residence Area)
Educational background apartment
area ger area Total
Total (number)
1.University 31.0% 12.6% 43.6% 360 2.Special Secondary (Diploma) 8.5% 13.3% 21.8% 180 3.Secondary School 7.7% 16.7% 24.5% 202 4.Half Secondary School 1.9% 5.1% 7.0% 58 5.Primary School or no education 0.2% 1.0% 1.2% 10 (Blank) 0.4% 1.6% 1.9% 16 Total 49.8% 50.2% 100.0% 826
c.2 Question on Urban Environment and Sanitation of the UB City
1 “Capital City” statistical bulletin 2008
Project for Strengthening the Capacity for SWM in Ulaabaatar City JICA Annex F: Baseline Survey KOKUSAI KOGYO CO., LTD.
F-5
c.2.1 Degree of Satisfaction on Urban Environment and Sanitation of the UB City
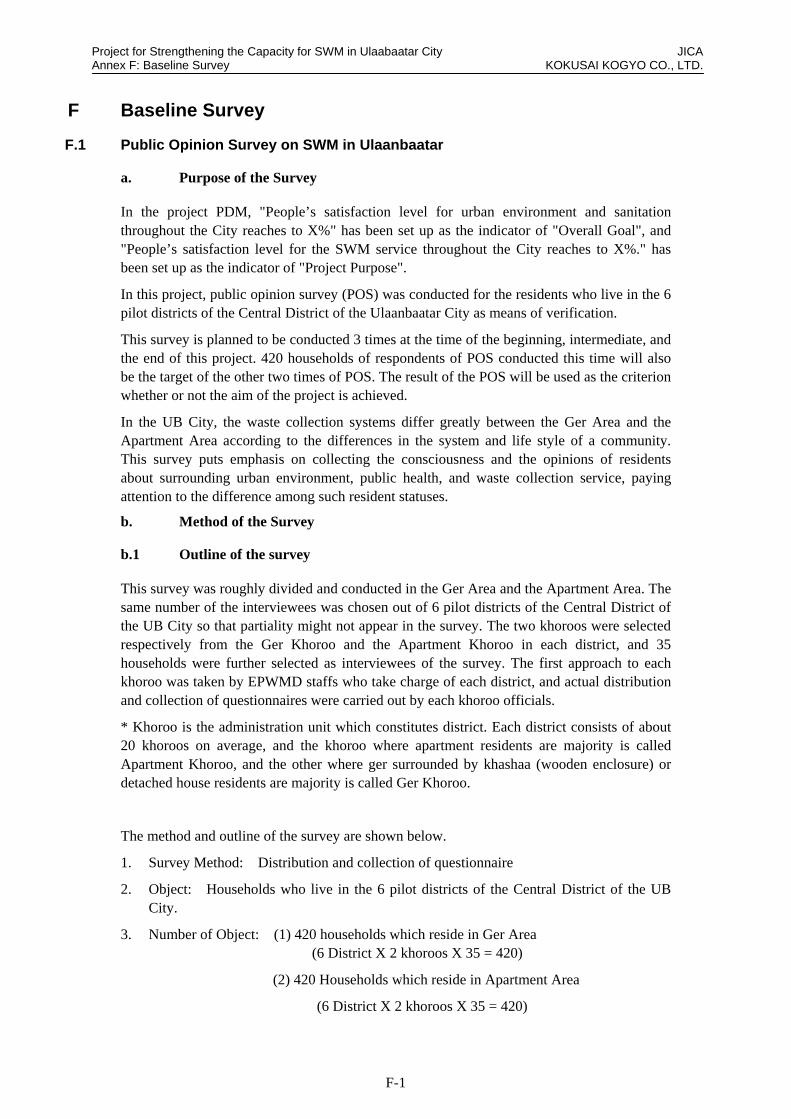
Q1-1: Are you satisfied with urban environment and sanitary conditions in Ulaanbaatar City?
The answer to the question was analyzed from three kinds of viewpoints and summarized into the table. One was totaled and analyzed by residence area, and other two were analyzed by District; Apartment Area and Ger Area.
Answer to the Q1-1 (by Residence Area)
The answer to Q1-1 was totaled and analyzed by the residence area. 43.6% or more in the Apartment Area and 40.8% or more in the Ger Area and 42.1% on average show the satisfaction rating more than average for the urban environment and sanitation of the UB city. A big difference is not seen though the resident in Apartment Area shows some high degree of satisfactions overall. It can be said to this question that the public opinion in the UB city is common regardless of the residence area.
Table F-4: Are you satisfied with urban environment and sanitary conditions in Ulaanbaatar City?
apartment area ger area total Q.1-1
number rate number rate number rate
1. Yes, it is very good conditions 9 2.2% 5 1.2% 14 1.7%
2. Yes, it is good conditions 23 5.6% 21 5.1% 44 5.3%
3. Yes, but it is average conditions 147 35.8% 143 34.5% 290 35.1%
4. No, it is poor conditions 135 32.8% 161 38.8% 296 35.8%
5. No, it is very poor conditions 93 22.6% 77 18.6% 170 20.6%
invalid 4 1.0% 8 1.9% 12 1.5%
total 411 100.0% 415 100.0% 826 100.0%
: Satisfaction rating more than the average
Figure F-1: Answer to the Q1-1(by Residence Area)
Answer to the Q1-1 (by District, the Case of Apartment Area)
The answer to Q1-1 in the Apartment Area was totaled by District. When we see the data of each district that shows the satisfaction rating more than average, it is BGD31.5%,
Project for Strengthening the Capacity for SWM in Ulaabaatar City JICA Annex F: Baseline Survey KOKUSAI KOGYO CO., LTD.
F-6
BZD57.9%, ChD39.1, KhUD 41.4%, SBD60.2%, and SKhD32.9%. BZD is 57.9% after 60.2% of highest SBD, and the lowest one is 31.5% of BGD, and 32.9% of SKhD comes next.
Table F-5: Are you satisfied with urban environment and sanitary conditions in Ulaanbaatar City (In case of Apartment area)?
BGD BZD ChD KhUD SBD SKhD total Q.1-1
Num rate Num rate Num rate Num rate Num rate Num rate Num rate
1. Yes, it is very good conditions
2 2.9% 0 0.0% 0 0.0% 2 2.9% 4 6.3% 1 1.4% 9 2.2%
2. Yes, it is good conditions
2 2.9% 5 7.2% 4 5.8% 1 1.4% 5 7.9% 6 8.6% 23 5.6%
3. Yes, but it is average conditions
18 25.7% 35 50.7% 23 33.3% 26 37.1% 29 46.0% 16 22.9% 147 35.8%
4. No, it is poor conditions
25 35.7% 13 18.8% 35 50.7% 21 30.0% 16 25.4% 25 35.7% 135 32.8%
5. No, it is very poor conditions
23 32.9% 16 23.2% 6 8.7% 19 27.1% 8 12.7% 21 30.0% 93 22.6%
invalid 0 0.0% 0 0.0% 1 1.4% 1 1.4% 1 1.6% 1 1.4% 4 1.0%
total 70 100% 69 100% 69 100% 70 100% 63 100% 70 100% 411 100%
: Satisfaction rating more than the average
Answer to the Q1-1 (by District, the Case of Ger Area)
The answer to Q1-1 in the Ger Area was totaled by district. When we see the data of each district that shows the satisfaction rating more than average, it is BGD31.8%, BZD41.4%, ChD44.0%, KhUD50.1%, SBD40.8%, and SKhD36.2%. ChD is 44.0% after 50.1% of highest KhUD, and the lowest one is 31.8% of BGD, and 36.2% of SKhD comes next. It can be understood that BGD and SKhD are the lowest in the satisfaction level in case of Apartment Area as well, these two districts shows low satisfaction rating for urban environment and sanitation of the UB city.
Table F-6: Are you satisfied with urban environment and sanitary conditions in Ulaanbaatar City? (In case of Ger Area)
BGD BZD ChD KhUD SBD SKhD total Q.1-1
Num rate Num rate Num rate Num rate Num rate Num rate Num rate
1. Yes, it is very good conditions
1 1.4% 0 0.0% 0 0.0% 3 4.3% 0 0.0% 1 1.4% 5 1.2%
2. Yes, it is good conditions
4 5.8% 4 5.7% 5 7.6% 2 2.9% 2 2.8% 4 5.8% 21 5.1%
3. Yes, but it is average conditions
17 24.6% 25 35.7% 24 36.4% 30 42.9% 27 38.0% 20 29.0% 143 34.5%
4. No, it is poor conditions
29 42.0% 27 38.6% 28 42.4% 22 31.4% 25 35.2% 30 43.5% 161 38.8%
5. No, it is very poor conditions
18 26.1% 13 18.6% 7 10.6% 13 18.6% 13 18.3% 13 18.8% 77 18.6%
invalid 0 0.0% 1 1.4% 2 3.0% 0 0.0% 4 5.6% 1 1.4% 8 1.9%
total 69 100% 70 100% 66 100% 70 100% 71 100% 69 100% 415 100%
: Satisfaction rating more than the average

Project for Strengthening the Capacity for SWM in Ulaabaatar City JICA Annex F: Baseline Survey KOKUSAI KOGYO CO., LTD.
F-7
0%
10%
20%
30%
40%
50%
60%
70%
80%
90%
100%
BGD BZD ChD KhUD SBD SKhD
invalid
5. No, it is very poor conditions
4. No, it is poor conditions
3. Yes, but it is averageconditions
2. Yes, it is good conditions
1. Yes, it is very good conditions
Figure F-2: Answer to the Q1-1 (by District, the Case of Ger Area)
c.2.2 Problem on Urban Environment and Sanitation of the Ulaanbaatar City
Most Serious Problem
Q1-2: Which do you think the most serious problem is in whole Ulaanbaatar City at present?
The answer to the question was totaled as follows. In both Apartment Area and Ger Area, about 80% of the respondents has answered that the most serious problem in the urban environment and sanitation of the UB city is "air pollution", and it is overwhelming other items. Although there is a big difference considering air pollution, 3.4% of respondent has chosen the "waste problem" as the 2nd as a serious problem.
Table F-7: Which do you think the most serious problem is in whole Ulaanbaatar City at present
Apartment area Ger area Total Q.1-2
num rate num rate num rate
01. Inadequate supply of safe water 3 0.7% 0 0.0% 3 0.4%
02. Air pollution 328 79.8% 345 83.1% 673 81.5%
03. Water pollution 9 2.2% 11 2.7% 20 2.4%
04. Soil contamination 8 1.9% 5 1.2% 13 1.6%
05. Noise problems 4 1.0% 0 0.0% 4 0.5%
06. Solid waste (garbage) problems 17 4.1% 11 2.7% 28 3.4%07. Inadequate capacity of sewerage treatment
0 0.0% 3 0.7% 3 0.4%
08. Public toilet is not sanitary conditions
1 0.2% 3 0.7% 4 0.5%
09. sanitary conditions of pit latrine 1 0.2% 1 0.2% 2 0.2%
10. Traffic congestions 9 2.2% 4 1.0% 13 1.6%
11. Inadequate supply of electricity 1 0.2% 1 0.2% 2 0.2%12. Inadequate supply of public transport
1 0.2% 4 1.0% 5 0.6%
13. I do not know 0 0.0% 0 0.0% 0 0.0%
14. Others 1 0.2% 0 0.0% 1 0.1%
invalid 28 6.8% 27 6.5% 55 6.7%
total 411 100% 415 100% 826 100%
: Item with most answers

Project for Strengthening the Capacity for SWM in Ulaabaatar City JICA Annex F: Baseline Survey KOKUSAI KOGYO CO., LTD.
F-8
Other Serious Problems
Q1-3: Other than the most serious problems, what problems are there in Ulaanbaatar City?
(Multiple Answers)
The answer to the question was totaled as follows. Although 80% or more people answered that "air pollution" is the most serious problem in question Q1-2, 18.8% of people still considers "air pollution" as the most serious problem, which means how seriously "air pollution" is regarded as problem by citizens. After that, 14.3% of "Traffic jam", 12.9% of "Soil contamination", and 12.8% of "Waste issue" follows. "Soil contamination" mentioned here seems to refer to what happens from some causes which pose a problem in the UB city at present. There are contaminations by dumping waste directly on the ground, by the lavatory in a Ger Area (the type of lavatory which digs a hole in the ground and excretes directly human waste), by illegal dumping of oil and chemical etc., from car repair plant, and by lead contained in the smoke by coal combustion that becomes a problem due to air pollution that began to come up in conversation permeating the ground out of the atmosphere.
Incidentally, there is also no big difference in the public opinion regardless of the difference in residence area. The problem mentioned here can be said to be the problem which UB citizen is conscious of in common irrespective of the form and area of residence.
Table F-8: Other than the most serious problems, what problems are there in Ulaanbaatar City?
Apartment area Ger area Total Q.1-3
num rate num rate num rate
01. Inadequate supply of safe water 50 3.9% 52 3.9% 102 3.9%
02. Air pollution 226 17.5% 266 20.0% 492 18.8%
03. Water pollution 120 9.3% 124 9.3% 244 9.3%
04. Soil contamination 154 11.9% 184 13.8% 338 12.9%
05. Noise problems 93 7.2% 56 4.2% 149 5.7%
06. Solid waste (garbage) problems 171 13.2% 165 12.4% 336 12.8%07. Inadequate capacity of sewerage treatment
52 4.0% 26 2.0% 78 3.0%
08. Public toilet is not sanitary conditions
79 6.1% 103 7.7% 182 6.9%
09. sanitary conditions of pit latrine 46 3.6% 75 5.6% 121 4.6%
10. Traffic congestions 201 15.6% 173 13.0% 374 14.3%
11. Inadequate supply of electricity 27 2.1% 46 3.5% 73 2.8%12. Inadequate supply of public transport
65 5.0% 53 4.0% 118 4.5%
13. I do not know 2 0.2% 1 0.1% 3 0.1%
14. Others 5 0.4% 6 0.5% 11 0.4%
invalid 1 0.1% 0 0.0% 1 0.0%
total 1292 100% 1330 100% 2622 100%
: Item with most answers
c.3 Question on SWM in the Ulaanbaatar City
c.3.1 Degree of Satisfaction on SWM in the Ulaanbaatar City

Project for Strengthening the Capacity for SWM in Ulaabaatar City JICA Annex F: Baseline Survey KOKUSAI KOGYO CO., LTD.
F-9
Q2-1: Are you satisfied with Solid Waste Management services (discharge, collection, transportation and disposal) in Ulaanbaatar City?
The answer to the question was totaled and analyzed from three kinds of viewpoints. One was totaled and analyzed by residence area, and other two were analyzed by each district; Apartment Area and Ger Area.
Answer to the Q2-1 (by Residence Area)
When the answer to Q2-1 was totaled by residence area, the respondent of 53.8% in Apartment Area and 58.1% in Ger Area, and 55.9% on average showed the satisfaction rating more than average. The high degree of satisfaction was shown here overall compared with the answer of the satisfaction level to the urban environment and sanitation of the UB city in Q1-1.
Table F-9: Are you satisfied with Solid Waste Management services? (According to Residence Area)
apartment area ger area total Q. 2-1
number rate number rate number rate
1. Yes, it is very good services 6 1.5% 9 2.2% 15 1.8%
2. Yes, it is good services 42 10.2% 57 13.7% 99 12.0%
3. Yes, it is average services 173 42.1% 175 42.2% 348 42.1%
4. No, it is poor services 136 33.1% 118 28.4% 254 30.8%
5. No it is very poor services 43 10.5% 38 9.2% 81 9.8%
6. I do not know 5 1.2% 6 1.4% 11 1.3%
invalid 6 1.5% 12 2.9% 18 2.2%
total 411 100% 415 100% 826 100%
: Satisfaction rating more than the average
Figure F-3: Answer to the Q2-1 (by Residence Area)
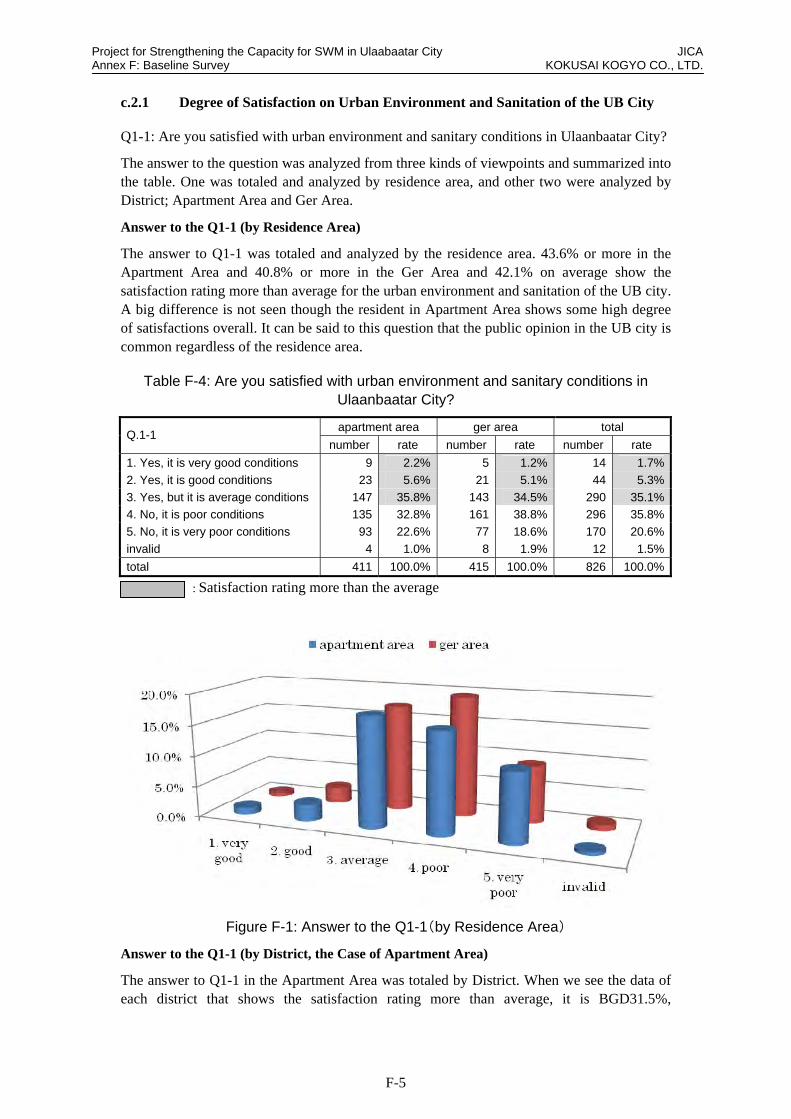
Answer to the Q2-1 (by District, the Case of Apartment Area)
The answer to Q2-1 in the Apartment Area was totaled by district. When we see the data of
Project for Strengthening the Capacity for SWM in Ulaabaatar City JICA Annex F: Baseline Survey KOKUSAI KOGYO CO., LTD.
F-10
each district that shows the satisfaction rating more than average, it is BGD 35.8%, BZD 62.3%, ChD59.4%, KhUD48.6%, SBD68.3%, SKhD50.0%. BZD was 62.3% after 68.3% of highest SBD, and the lowest one is 35.8% of BGD, 48.6% of KhUD comes next.
Table F-10: Are you satisfied with Solid Waste Management services?(by District, the Case of Apartment Area)
BGD BZD ChD KhUD SBD SKhD total Q.2-1
num rate num rate num rate num rate num rate num rate num rate
1. Yes, it is very good services
0 0.0% 2 2.9% 0 0.0% 1 1.4% 3 4.8% 0 0.0% 6 1.5%
2. Yes, it is good services
2 2.9% 8 11.6% 14 20.3% 3 4.3% 11 17.5% 4 5.7% 42 10.2%
3. Yes, it is average services
23 32.9% 33 47.8% 27 39.1% 30 42.9% 29 46.0% 31 44.3% 173 42.1%
4. No, it is poor services
35 50.0% 17 24.6% 20 29.0% 24 34.3% 12 19.0% 28 40.0% 136 33.1%
5. No it is very poor services
10 14.3% 8 11.6% 7 10.1% 9 12.9% 4 6.3% 5 7.1% 43 10.5%
6. I do not know 0 0.0% 1 1.4% 1 1.4% 1 1.4% 1 1.6% 1 1.4% 5 1.2%
invalid 0 0.0% 0 0.0% 0 0.0% 2 2.9% 3 4.8% 1 1.4% 6 1.5%
total 70 100% 69 100% 69 100% 70 100% 63 100% 70 100% 411 100%
: Satisfaction rating more than the average
0%
10%
20%
30%
40%
50%
60%
70%
80%
90%
100%
BGD BZD ChD KhUD SBD SKhD
invalid
6. I do not know
5. No it is very poor services
4. No, it is poor services
3. Yes, it is average services
2. Yes, it is good services
1. Yes, it is very good services
Figure F-4: Answer to the Q2-1(by District, the Case of Apartment Area)
Answer to the Q2-1 (by District, the Case of Ger Area)
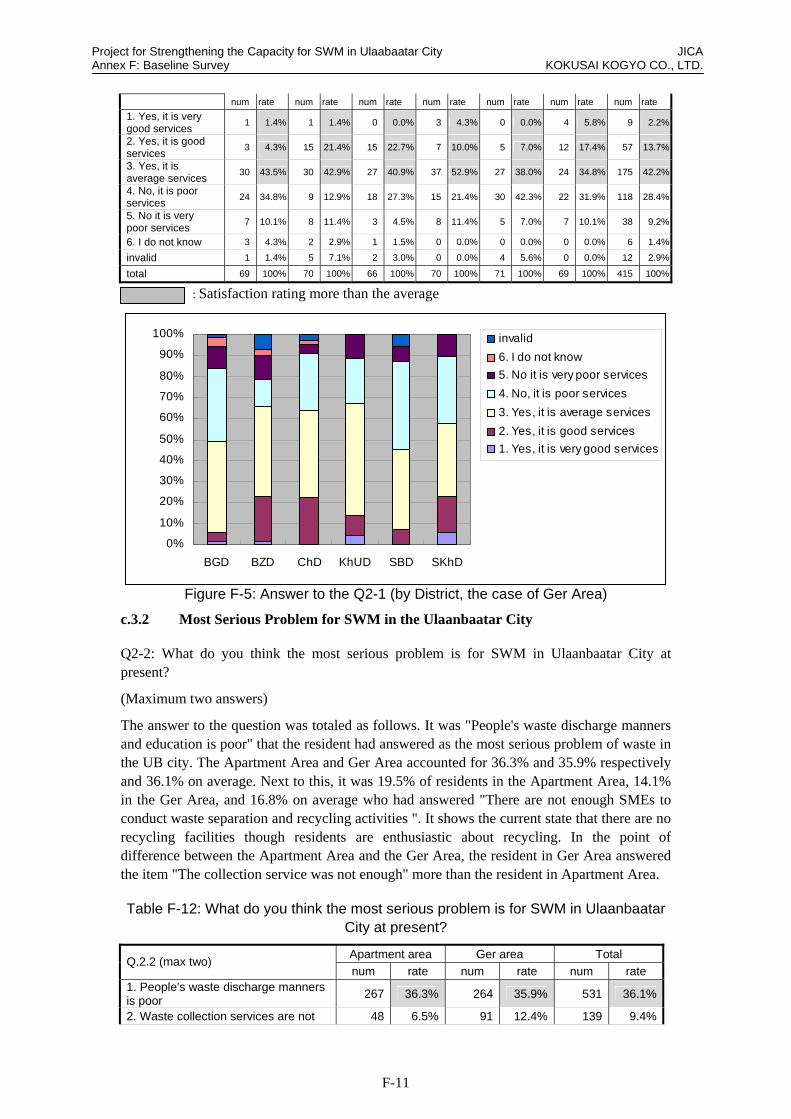
The answer to Q2-1 in the Ger Area was totaled by district. When we see the data of each district that shows the satisfaction rating more than average, it is BGD49.2%, BZD65.7%, ChD63.6%, KhUD67.2%, SBD45%, SKhD58%. BZD was 65.7% after 67.2% of highest KhUD, and the lowest one is 45% of SBD, 49.2% of BGD comes next. In SBD, although the residents in Apartment Area showed the highest degree of satisfaction among the 6 districts, the residents in Ger Area showed the lowest. In BZD, both in the Apartment Area and the Ger Area showed the high degree of satisfaction, and the low degree was shown in both Areas in BGD.
Table F-11: Are you satisfied with Solid Waste Management services? (by District, the case of Ger Area)
Q.2-1 BGD BZD ChD KhUD SBD SKhD total
Project for Strengthening the Capacity for SWM in Ulaabaatar City JICA Annex F: Baseline Survey KOKUSAI KOGYO CO., LTD.
F-11
0%
10%
20%
30%
40%
50%
60%
70%
80%
90%
100%
BGD BZD ChD KhUD SBD SKhD
invalid
6. I do not know
5. No it is very poor services
4. No, it is poor services
3. Yes, it is average services
2. Yes, it is good services
1. Yes, it is very good services
num rate num rate num rate num rate num rate num rate num rate
1. Yes, it is very good services
1 1.4% 1 1.4% 0 0.0% 3 4.3% 0 0.0% 4 5.8% 9 2.2%
2. Yes, it is good services
3 4.3% 15 21.4% 15 22.7% 7 10.0% 5 7.0% 12 17.4% 57 13.7%
3. Yes, it is average services
30 43.5% 30 42.9% 27 40.9% 37 52.9% 27 38.0% 24 34.8% 175 42.2%
4. No, it is poor services
24 34.8% 9 12.9% 18 27.3% 15 21.4% 30 42.3% 22 31.9% 118 28.4%
5. No it is very poor services
7 10.1% 8 11.4% 3 4.5% 8 11.4% 5 7.0% 7 10.1% 38 9.2%
6. I do not know 3 4.3% 2 2.9% 1 1.5% 0 0.0% 0 0.0% 0 0.0% 6 1.4%
invalid 1 1.4% 5 7.1% 2 3.0% 0 0.0% 4 5.6% 0 0.0% 12 2.9%
total 69 100% 70 100% 66 100% 70 100% 71 100% 69 100% 415 100%
: Satisfaction rating more than the average
Figure F-5: Answer to the Q2-1 (by District, the case of Ger Area)
c.3.2 Most Serious Problem for SWM in the Ulaanbaatar City
Q2-2: What do you think the most serious problem is for SWM in Ulaanbaatar City at present?
(Maximum two answers)
The answer to the question was totaled as follows. It was "People's waste discharge manners and education is poor" that the resident had answered as the most serious problem of waste in the UB city. The Apartment Area and Ger Area accounted for 36.3% and 35.9% respectively and 36.1% on average. Next to this, it was 19.5% of residents in the Apartment Area, 14.1% in the Ger Area, and 16.8% on average who had answered "There are not enough SMEs to conduct waste separation and recycling activities ". It shows the current state that there are no recycling facilities though residents are enthusiastic about recycling. In the point of difference between the Apartment Area and the Ger Area, the resident in Ger Area answered the item "The collection service was not enough" more than the resident in Apartment Area.
Table F-12: What do you think the most serious problem is for SWM in Ulaanbaatar City at present?
Apartment area Ger area Total Q.2.2 (max two)
num rate num rate num rate 1. People's waste discharge manners is poor
267 36.3% 264 35.9% 531 36.1%
2. Waste collection services are not 48 6.5% 91 12.4% 139 9.4%

Project for Strengthening the Capacity for SWM in Ulaabaatar City JICA Annex F: Baseline Survey KOKUSAI KOGYO CO., LTD.
F-12
enough
3. Waste disposal operations is not appropriate
72 9.8% 42 5.7% 114 7.7%
4. There are no waste treatment facilities like an incineration plant
84 11.4% 80 10.9% 164 11.1%
5. There are not enough SMEs to conduct waste separation and recycling activities
143 19.5% 104 14.1% 247 16.8%
6. Waste separation at household level is not conducted
74 10.1% 86 11.7% 160 10.9%
7. Public Education activities are not enough
40 5.4% 61 8.3% 101 6.9%
8. Others 7 1.0% 8 1.1% 15 1.0%
total 735 100% 736 100% 1471 100%
: Item with most answers
c.3.3 Degree of Satisfaction on Waste Collection Service in the Ulaanbaatar City
Here, the result of survey about the degree of satisfaction on waste collection in the UB City was analyzed. In UB city, the group that collects waste is different in each district and khoroo. Therefore, the object is various even if it calls it at a word "the degree of satisfaction on collection service.” Furthermore, it is doubt whether all residents know the exact waste collection provider in their own districts. Therefore, first of all, how much respondent correctly understood the exact collection provider in their own districts was analyzed (c.3.1).
With that in mind, then, the degree of satisfaction of residents for waste collection itself (c.3.2), and the public opinion for the group actually collecting waste (c. 3.3) were analyzed.
Answer to the Q2-3 (Comparison with the Actual Waste Collection Provider in Each Khoroo)
Q2-3: Who is providing waste collection service in your area?
The answer to the question was totaled as follows. The item indicated in the column shows an actual collection service implementing body at the POS target area, and the item indicated in the row shows the collection service implementing body that the respondent recognizes. The square in which it adds shading in each column shows the right answer. The percentage of correct answers in each column is shown in the lowest row.
It is 48.2% of TUK that the percentage of correct answers was the highest, and 39.5% of Organization under District Government follows it. On the other hand, the lowest was 7.2% of CMPUA, and it seems that many of residents of the area where collection is carried out by CMPUA recognize it as District Government and TUK. On the whole, there are few respondents who answered it as Private Company, and it seems that it is seldom recognized that the private company is providing the collection service. Furthermore, it turned out that residents' recognition to waste collector is not so high because the whole average percentage of correct answers was only 29.3%.
Table F-13: Who is providing waste collection service in your area?
Q2-3 Actual Collection implementing body on each khoroo
Options of answer
Organization under District
Khoroo CMPUA TUK Private company Total

Project for Strengthening the Capacity for SWM in Ulaabaatar City JICA Annex F: Baseline Survey KOKUSAI KOGYO CO., LTD.
F-13
1.WSF under District Government 68 25 58 61 7 2192. Khoroo Government 12 16 11 48 1 883. CMPUA 10 9 10 26 0 554. TUK 45 9 43 198 13 3085. Private Company other than TUK 24 2 4 7 10 476. I do not know 10 6 9 57 3 857.Others 0 0 0 6 0 6invalid 3 2 4 8 1 18Total 172 69 139 411 35 826Rate of correct answer 39.5% 23.2% 7.2% 48.2% 28.6% 29.3%
: Correct answer in each item
Answer to the Q2-4 (Degree of Satisfaction for the Collection Service)
Q2-4: Are you satisfied with the collection services in your area?
The answer to the question was totaled as follows. The respondents who showed the degree of satisfaction more than average were 67.9% of Apartment Area, 67.1% of Ger Area, and an average of 67.4% of the whole. In this question, the big difference between the opinions of the residents in Apartment Area and Ger Area was not seen, but brought a result satisfied in general on the whole.
Table F-14: Are you satisfied with the collection services in your area?
apartment area ger area total Q. 2-4
number rate number rate number rate
1. Yes, it is very good services 13 3.2% 11 2.7% 24 2.9%
2. Yes, it is good services 53 12.9% 75 18.1% 128 15.5%
3. Yes, it is average services 213 51.8% 192 46.3% 405 49.0%
4. No, it is poor services 100 24.3% 98 23.6% 198 24.0%
5. No, it is very poor services 27 6.6% 23 5.5% 50 6.1%
invalid 5 1.2% 16 3.9% 21 2.5%
total 411 100% 415 100% 826 100%
: Satisfaction rating more than the average
Answer to the Q2-4 (Degree of Satisfaction on Activities of Collection Service Provider)
Q2-4: Are you satisfied with the collection services in your area?
The answer to the question was totaled as follows. When the answer of Q2-4 and the list of groups who are actually providing collection service in each area of respondent are combined, the degree of satisfaction shown in Q2-4 would correspond to the one made for actual collection service providers.
The item indicated in the column in most left-hand side shows the group which is actually collecting waste in the POS target area, and the items on degree of satisfaction to the waste collection service which is the answer of Q2-4 is shown in the 2nd column from the left.
In this POS target area, the group which is providing collection service to most residents in both Apartment and Ger Areas is TUK, and the number of the residents who receive their service is 240 persons and 171 persons respectively. The organization belonging to District Government follows the next, and they are 67 persons and 105 persons respectively. And it turned out that Khoroo Government does not collect in the Apartment Area, and Private Company is not collecting on the contrary in the Ger Area.

Project for Strengthening the Capacity for SWM in Ulaabaatar City JICA Annex F: Baseline Survey KOKUSAI KOGYO CO., LTD.
F-14
Table F-15: Are you satisfied with the collection services in your area?
Apartment area
Ger area Total Actual collection implementing body on each khoroo
Q.2.4 num rate num rate num rate
1. Yes, it is very good services 1 1.5% 2 1.9% 3 1.7%
2. Yes, it is good services 13 19.4% 14 13.3% 27 15.7%
3. Yes, it is average services 41 61.2% 53 50.5% 94 54.7%
4. No, it is poor services 10 14.9% 28 26.7% 38 22.1%
5. No, it is very poor services 2 3.0% 4 3.8% 6 3.5%
1. Organization under District Government
(Blank) 0 0.0% 4 3.8% 4 2.3%
1. WSF under District Government total 67 100% 105 100% 172 100%
1. Yes, it is very good services 0 0.0% 1 1.4% 1 1.4%
2. Yes, it is good services 0 0.0% 7 10.1% 7 10.1%
3. Yes, it is average services 0 0.0% 29 42.0% 29 42.0%
4. No, it is poor services 0 0.0% 25 36.2% 25 36.2%
5. No, it is very poor services 0 0.0% 6 8.7% 6 8.7%
2. Khoroo Government
(Blank) 0 0.0% 1 1.4% 1 1.4%
2. Khoroo Government total 0 0% 69 100% 69 100%
1. Yes, it is very good services 3 4.3% 3 4.3% 6 4.3%
2. Yes, it is good services 9 13.0% 16 22.9% 25 18.0%
3. Yes, it is average services 47 68.1% 29 41.4% 76 54.7%
4. No, it is poor services 8 11.6% 11 15.7% 19 13.7%
5. No, it is very poor services 1 1.4% 5 7.1% 6 4.3%
3. CMPUA
(Blank) 1 1.4% 6 8.6% 7 5.0%
3. CMPUA total 69 100% 70 100% 139 100%
1. Yes, it is very good services 8 3.3% 5 2.9% 13 3.2%
2. Yes, it is good services 29 12.1% 38 22.2% 67 16.3%
3. Yes, it is average services 113 47.1% 81 47.4% 194 47.2%
4. No, it is poor services 66 27.5% 34 19.9% 100 24.3%
5. No, it is very poor services 20 8.3% 8 4.7% 28 6.8%
4. TUK
(Blank) 4 1.7% 5 2.9% 9 2.2%
4. TUK total 240 100% 171 100% 411 100%
1. Yes, it is very good services 1 2.9% 0 0.0% 1 2.9%
2. Yes, it is good services 2 5.7% 0 0.0% 2 5.7%
3. Yes, it is average services 12 34.3% 0 0.0% 12 34.3%
4. No, it is poor services 16 45.7% 0 0.0% 16 45.7%
5. No, it is very poor services 4 11.4% 0 0.0% 4 11.4%
5. Private Company other than TUK
(Blank) 0 0.0% 0 0.0% 0 0.0%
5. Private Company other than TUK total 35 100% 0 0% 35 100%
total 411 415 826
: Satisfaction rating more than the average
Only the rate of the respondent who showed the degree of satisfaction more than average is extracted from the above table, and it is shown as a table below.
In Apartment Area, 85.4% of residents of an area that CMPUA provides with collection service showed the highest degree of satisfaction more than average, and 42.9% of residents of an area that, as for the lowest one, Private Company (except TUK) provides with collection service. In Ger Area, 72.5% of residents of an area that TUK provides with collection service showed the highest degree of satisfaction more than average, and 53.5% of residents of an area that, as for the lowest one, Khoroo Government provides with collection service.
As a whole, 77.0% of the residents of an area that CMPUA provides collection service showed the highest degree of satisfaction more than average, and the lowest one, when

Project for Strengthening the Capacity for SWM in Ulaabaatar City JICA Annex F: Baseline Survey KOKUSAI KOGYO CO., LTD.
F-15
removing the provider that is collecting only in one of the two areas in which the respondent of the POS lives, was 66.7% of the residents of an area that TUK provides collection service.
Table F-16: Answer to Q2-4 - The rate of the respondent who showed the degree of satisfaction more than average was added and extracted out of Table 0-15
apartment area
ger area total
1. Organization under District Government 82.1% 65.7% 72.1%2. Khoroo Government - 53.6% 53.6%3. CMPUA 85.5% 68.6% 77.0%4. TUK 62.5% 72.5% 66.7%5. Private Company other than TUK 42.9% - 42.9%
- The collection service is not given in the POS target area.
c.3.4 Problem on Waste Collection Service in the Ulaanbaatar City
Q2-5: Why aren’t you satisfied with waste collection services?
(Multiple Answers)
The answer to the question was totaled as follows. It was "1. Waste collection manner is poor” that most respondents answered as a problem in collection service, and it was 25.6% in the Apartment Area, 19.8% in the Ger Area, and 22.6% on average. If it sees from this result, the residents of an area to whom collection is provided by CMPUA showed the highest degree of satisfaction in Q2-4 of (c.3.3), it can be put in another way as such a high degree of satisfaction having been shown just because they were satisfied with the collection manners of the workers of CMPUA to some extent. "6. Some people do not pay waste collection fee" follows to the next as a problem, and it was 15.9% in the Apartment Area, 26.9% in the Ger Area, 21.5% on average, and especially high ratio was shown in the Ger Area. "3. Waste collection schedule is not fixed" was answered mostly to the third as a problem, and it was 19.7% in the Apartment Area, 22.9% in the Ger Area, and 21.3% on average.
In addition, for example in the Ger Area of the UB City, waste collection is conducted only once per month, and there is no telling when it comes. The selection item of "3.Waste collection schedule is not fixed" was prepared based on such a background.
Regarding "4.Waste collection time is not fixed", for example in the Apartment Area, there are areas where waste collection service is provided everyday, but also in such a case, at what time of the day it comes is not fixed so that it is hard for residents when to take out waste. Taking into account such an actual condition of the UB City, the selection item was prepared.
In any case, both items essentially correspond as "a problem resulting from there being no schedule of the time of collection." When the number of residents answered to both items in such meaning is added together, it is 32.9% in Apartment Area, 35.1% in Ger Area and 34% on average. Most of the residents seem to recognize this as a problem in waste collection service.
Table F-17: Why aren’t you satisfied with waste collection services?
Apartment area
Ger area Total Q.2.5(Multiple answer)
num rate num rate num rate
1. Waste collection manner is poor 190 25.6% 152 19.8% 342 22.6%2. Frequency of waste collection is not enough 116 15.6% 85 11.1% 201 13.3%

Project for Strengthening the Capacity for SWM in Ulaabaatar City JICA Annex F: Baseline Survey KOKUSAI KOGYO CO., LTD.
F-16
3. Waste collection schedule is not fixed 146 19.7% 176 22.9% 322 21.3%4. Waste collection time is not fixed 98 13.2% 94 12.2% 192 12.7%
5. Waste is not collected 18 2.4% 28 3.6% 46 3.0%
6. Some people do not pay waste collection fee 118 15.9% 207 26.9% 325 21.5%7. Others 56 7.5% 27 3.5% 83 5.5%
total 742 100% 769 100% 1511 100%
: Item with most answers
c.3.5 Evaluation on Each Level of Local Governments in the Ulaanbaatar City
Q2-6: How do you evaluate waste management services of your Khoroo, District and City Government?
The answer to the question was totaled as follows. The respondent who gave the evaluation more than average to the Khoroo was 82.7% in the Apartment Area, 84.8% in the Ger Area and 83.8 % on average. As for the District, it was 69.6% in the Apartment Area, 67.5% in the Ger Area and 68.5% on average. As for the City, it was 51.0% in the Apartment Area, 56.0% in the Ger Area and 53.5% on average. Although the administration unit of Khoroo, District, and City is set as order with a near distance from residents, the degree of satisfaction to them also decrease in proportion to distance. As a result, the highest degree of satisfaction has been shown to Khoroo that is working most closely in visible way with residents. The blank to each administrative unit has increased gradually with Khoroo7.1%, District14.3%, and City19.9% in conjunction with it.
Table F-18: How do you evaluate waste management services of your Khoroo, District and City Government?
apartment area ger area total Q2-6
number rate number rate number rate Khoroo 1. very poor 7 1.7% 6 1.4% 13 1.6% 2. poor 33 8.0% 29 7.0% 62 7.5% 3. average 156 38.0% 139 33.5% 295 35.7% 4. good 174 42.3% 186 44.8% 360 43.6% 5. very good 10 2.4% 27 6.5% 37 4.5% blank 31 7.5% 28 6.7% 59 7.1%Khoroo total 411 100% 415 100% 826 100%District 1. very poor 19 4.6% 9 2.2% 28 3.4% 2. poor 56 13.6% 58 14.0% 114 13.8% 3. average 209 50.9% 189 45.5% 398 48.2% 4. good 76 18.5% 87 21.0% 163 19.7% 5. very good 1 0.2% 4 1.0% 5 0.6% blank 50 12.2% 68 16.4% 118 14.3%District total 411 100% 415 100% 826 100%City 1. very poor 46 11.2% 36 8.7% 82 9.9% 2. poor 83 20.2% 55 13.3% 138 16.7% 3. average 169 41.1% 165 39.8% 334 40.4% 4. good 40 9.7% 65 15.7% 105 12.7% 5. very good 1 0.2% 2 0.5% 3 0.4% blank 72 17.5% 92 22.2% 164 19.9%City total 411 100% 415 100% 826 100%
: Satisfaction rating more than the average
Project for Strengthening the Capacity for SWM in Ulaabaatar City JICA Annex F: Baseline Survey KOKUSAI KOGYO CO., LTD.
F-17
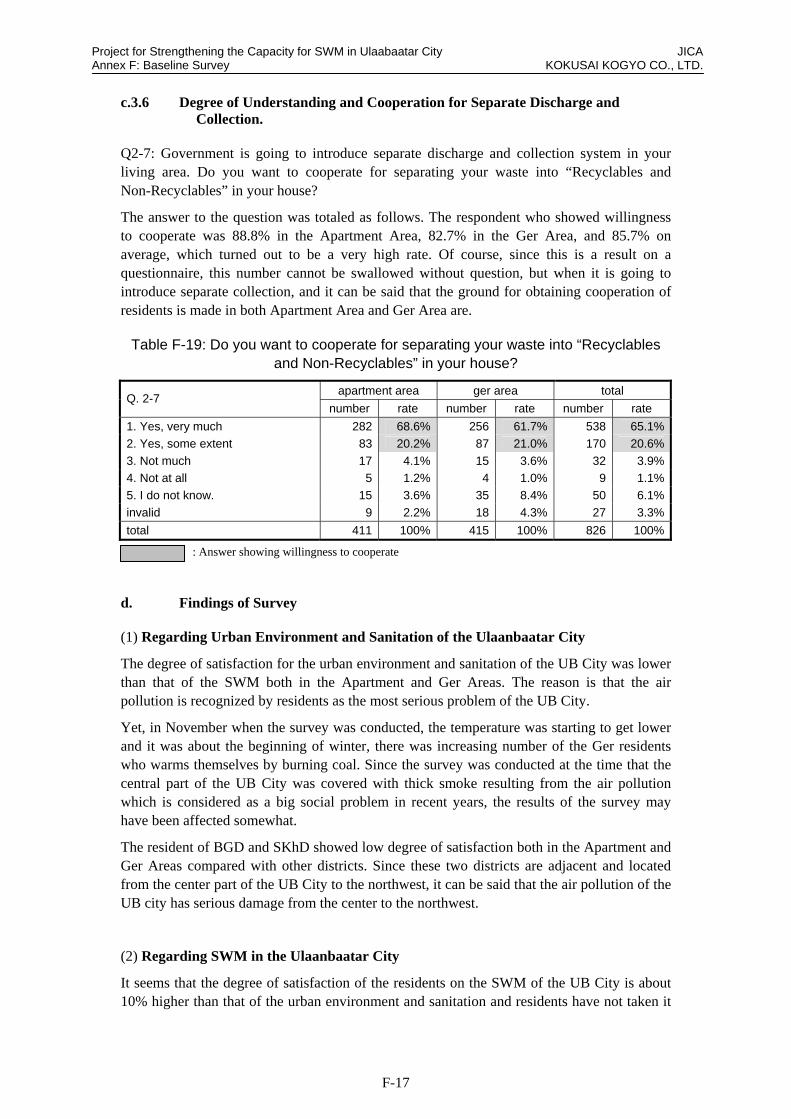
c.3.6 Degree of Understanding and Cooperation for Separate Discharge and Collection.
Q2-7: Government is going to introduce separate discharge and collection system in your living area. Do you want to cooperate for separating your waste into “Recyclables and Non-Recyclables” in your house?
The answer to the question was totaled as follows. The respondent who showed willingness to cooperate was 88.8% in the Apartment Area, 82.7% in the Ger Area, and 85.7% on average, which turned out to be a very high rate. Of course, since this is a result on a questionnaire, this number cannot be swallowed without question, but when it is going to introduce separate collection, and it can be said that the ground for obtaining cooperation of residents is made in both Apartment Area and Ger Area are.
Table F-19: Do you want to cooperate for separating your waste into “Recyclables and Non-Recyclables” in your house?
apartment area ger area total Q. 2-7
number rate number rate number rate
1. Yes, very much 282 68.6% 256 61.7% 538 65.1%
2. Yes, some extent 83 20.2% 87 21.0% 170 20.6%
3. Not much 17 4.1% 15 3.6% 32 3.9%
4. Not at all 5 1.2% 4 1.0% 9 1.1%
5. I do not know. 15 3.6% 35 8.4% 50 6.1%
invalid 9 2.2% 18 4.3% 27 3.3%
total 411 100% 415 100% 826 100%
: Answer showing willingness to cooperate
d. Findings of Survey
(1) Regarding Urban Environment and Sanitation of the Ulaanbaatar City
The degree of satisfaction for the urban environment and sanitation of the UB City was lower than that of the SWM both in the Apartment and Ger Areas. The reason is that the air pollution is recognized by residents as the most serious problem of the UB City.
Yet, in November when the survey was conducted, the temperature was starting to get lower and it was about the beginning of winter, there was increasing number of the Ger residents who warms themselves by burning coal. Since the survey was conducted at the time that the central part of the UB City was covered with thick smoke resulting from the air pollution which is considered as a big social problem in recent years, the results of the survey may have been affected somewhat.
The resident of BGD and SKhD showed low degree of satisfaction both in the Apartment and Ger Areas compared with other districts. Since these two districts are adjacent and located from the center part of the UB City to the northwest, it can be said that the air pollution of the UB city has serious damage from the center to the northwest.
(2) Regarding SWM in the Ulaanbaatar City
It seems that the degree of satisfaction of the residents on the SWM of the UB City is about 10% higher than that of the urban environment and sanitation and residents have not taken it

Project for Strengthening the Capacity for SWM in Ulaabaatar City JICA Annex F: Baseline Survey KOKUSAI KOGYO CO., LTD.
F-18
as seriously as the environmental problem. When we look at it by district, the residents of BZD showed the high degree of satisfaction, and on the other hand the BGD showed the low degree. In SBD, although the highest degree of satisfaction was shown among those six districts in the Apartment Area, the lowest degree of satisfaction was shown in the Ger Area. Moreover, BGD showed the lowest degree of satisfaction in total as well as that of the urban environment and sanitation.
Regarding the problem on the SWM of the UB City, most residents both in the Apartment and Ger Area answered "People's waste discharge manners is poor" as a problem. Although the degree of satisfaction for waste collection service was comparatively high, in response to the question on the first problem on waste collection, most residents answered "Collection manner is poor" as a problem. It talks about manners again here.
Because of the fact mentioned above and that more than 85% of respondents show willingness to cooperate when the UB City implements waste separation and recycling, it seems that the consciousness of the UB citizen for environment and SWM are comparatively high.
Project for Strengthening the Capacity for SWM in Ulaabaatar City JICA Annex F: Baseline Survey KOKUSAI KOGYO CO., LTD.
F-19
F.2 Illegal Dump Site
The JET, in cooperation with the C/P staffs, visited places were waste is dumped illegally in the 6 central districts of the UB city from 4 Nov and 6 Nov 2009. The detailed report on the field survey and its results are the following.
a. Purpose of the Survey
The purpose of this field survey is for the C/P to identify possible illegal dump sites with willingness to improve as criteria by which the degree of achievement of the overall goal in PDM is evaluated.
b. Members
The JET: Mr. Fujita, Mr. Gantumur The C/P: Mr. Arigun, Mr. Ganbaatar Others: District officials and staffs of WSFs
c. Contents of the Survey
c.1 Visited Sites:
Although the total number of illegal dump sites suggested by the EPWMD to visit was 38, the JET visited 21 sites; 17 of which were those suggested by the EPWMD while the rest were additional sites. At the time of the survey, many among the suggested sites were extremely small in waste amount or waste has been already removed and some of them were those permitted by khoroo governors as a legal disposal site (sites in khoroos #11 and #20 of Bayanzurkh). The JET excluded those sites in consultation with Mr. Ariguun, the EPWMD staff. The number of visited sites in each district is as follows: Khan-Uul District -4
Chingeltei District -2
Bayangol District -6
Songinokhairkhan District -4
Bayanzurkh District -4
Sukhbaatar District -1 Total-21 places
At each site, the JET members observed present condition, shoot photos of the site and obtained general information about illegal dumping through interviewing the attended staffs of Mongolian side (For detailed information about the sites, please refer to the file named “Visited Illegal Dump Sites” attached to this report). Based on these, the main descriptions of each site is explained below. There are codes written before the names of the sites such as “(KhU5)”. The letters of the code shows the abbreviations of district name and the number indicates khoroo number where the site exists. c.2 Khan-Uul district:
1. (KhU5) Khoroo #5 (West of School #41): The dumping place is in the middle of the ditch located in the west of the Secondary School #41. On both sides, there are ger areas. The content is solely household waste (ash included). Waste is dumped by residents during the nights. Although waste is removed 3 to 4 times a year (amount of removal is

Project for Strengthening the Capacity for SWM in Ulaabaatar City JICA Annex F: Baseline Survey KOKUSAI KOGYO CO., LTD.
F-20
about 50 to 60 trucks), the amount of waste remains big in quantity as it was at the time of the survey. Last cleaning was done on 17 and 18 Oct 2009.
2. (KhU9) Khoroo #9 (Tain Street): Waste is dumped illegally along the fence made of blocks at the outer edge of ger areas that is located in the north of White Gate in Yarmag. The content is solely household waste. Waste is dumped by residents during the nights in two ways: direct disposal by a household and joint disposal by 4 to 5 households. Although the place was cleaned 3 times from July 2009 (the last cleaning was conducted in early Oct), the amount of waste is still considerable.
3. (KhU12) Khoroo #12 (Habitat): Exact location is at the west edge of habitat house area. The distance from the site to the nearest houses is just around 40 m. According to kheseg staff, local residents dispose their waste regularly at the place. The latest cleaning was conducted on 17 and 18 Oct 2009. As Morin Davaa FDS is located not too far from the place, separated by a mountain, trucks often dispose their waste along the road on their way to MDDS. Although the amount of waste was not large in the dumping site, it is supposed that there is considerable amount of waste along the road to Morin Davaa.
4. (KhU13) Khoroo #13 (Shuvuu Village): The exact location is in the southern part of Shuvuu Fabric village. The distance to the residential area is several hundred meters. Illegal dumping at the place has been existed for years. Most of the waste is construction waste. However, local residents are still dumping household waste. It seems that waste is brought by small-scale trucks. The biggest problem is construction waste dumped by outsiders. As a gravel mining site exists in the south of the place, outsiders who come to take gravel bring construction waste to the dump site with their trucks. Although the waste spread around the site used to be clearned before, the place has not been cleaned recent years. The waste spread area is 14,000 m2, according to GPS estimation.
c.3 Chingeltei district:
5. (Ch12) Khoroo #12 (Ditches; North of pig house & top of the mountain): The covered area is very big: from 3 ditches laid at the back edge of ger areas (in the north from the central workshop of the CMPUA) to the backside of the mountain in the khoroo #12. By the ditches, there are newly settled ger households. The content of waste is household waste dumped by residing households who do not pay for waste collection service. Considerable area over the mountain is covered with waste brought by trucks, since the main ger areas are located at distances of 1 to 2 km at the opposite side of the mountain. Therefore, there is a possibility that dumpers are outsiders as well as the local residents. The amount of waste was impossible to estimate.
6. (Ch9) Khoroo #9 (Dalan Davkhar grave) : The place of illegal dumping is the strip land or ditch along the road of Dalan Davkhar grave. The waste has been accumulated for years. Ger area is separated with the ditch from the grave. The content of the waste is household and construction waste. As for the construction waste, it seems that the local residents brought them on purpose to elevate the land so that they can extend their fences to the ditch-side. As for household waste, it is dumped not only by the local residents living along the ditch, but also trucks that carry wastes along the road (The road becomes a shortcut to the FDS for ger areas of the northern UB). As the informant says, the amount of waste dumped in this way is considerable. Complete removal of waste has not been conducted. Cleaning is not conducted regularly. The latest was done in July 2009.
c.4 Bayangol district
7. (BG11) Khoroo #11 (Zuun Ard Ayush & Khuvisgalchid D): Waste is dumped illegally at the 3 places along the road between the ger areas Zuun Ard Ayush and Khuvisgalchdiin D. The amount of waste is not large as waste collection staffs remove regularly. The content is solely household waste. Complete removal is done once a month. However, the residents dump their waste habitually from the following day. Last complete removal was conducted on 25 and 26 Oct 2009.
8. (BG10-1) Khoroo #10 (Str-15): The dumping site is located under the high voltage pole on the street #15. As it is surrounded by gers, the residents dump waste habitually.
Project for Strengthening the Capacity for SWM in Ulaabaatar City JICA Annex F: Baseline Survey KOKUSAI KOGYO CO., LTD.
F-21
The content is household waste. Although complete removals are done twice or three times a month, illegal dumping does not allow eliminating the site. The latest complete removal was done on 25 and 26 Oct 2009.
9. (BG10-2) Khoroo #10 (Str-12): The location of illegal dumping is under the high voltage pole in the middle of ger area in the street #12. Content is household waste dumped by residents. There were occasions that waste was brought by small-scale trucks. Complete removal of waste is done once in 2 months. The latest was on 20 and 21 Oct 2009.
10. (BG9-1) Khoroo #9 (Str-18): The dumping site is located at the water station in street-18 in the middle of ger area. The content is solely household waste dumped by residents. Collection staffs take waste regularly and a complete removal is done once a month. The latest complete removal was done on 20 Oct 2009.
11. (BG20) Khoroo #20: Illegal dumping occupies huge area in the east and south-east of the Power Plant #4; along the road and the thermal line. The waste is solely consisted of construction waste such as blocks, bricks and cements. It is impossible to measure the waste scale. The dumpers are usually construction companies.
12. (BG9-2) Khoroo #9 (SOT service center; additional site): The location is at the electric pole located in the right-side street of SOT Service center, in the middle of ger area. It came into existence recently. According to the staff of the WSF, there was no waste before a month. The amount of the waste is about 2.4 m3, according to a rough estimation. Waste collection staffs were removing the waste at the time of the survey.
c.5 Songinokhairkhan district:
13. (SH6&23) Khoroos #6 & #23 (border): Large-scale waste is accumulated in the whole ditch located between khoroo #6 and #23. Waste has been accumulated for years; it is still used as dump site by the residents. The content is household waste. The content of the waste is household waste. There is a possibility that residents bring their waste by small scale trucks. Complete removal is somehow difficult due to its large amount (must be considered when selecting the site).
14. (SH4&7) Border of khoroos #4 and #7: The exact place of illegal dumping is difficult to identify due to its wide-spread waste. Generally, it is located in the east of former UCDS, separated by a mountain and accumulated for years. The illegal dumping at the place came into existence when UCDS was in operation since waste collection trucks and private transporters used to dump their waste at the place without entering UCDS. Although the city financed 13 mln Tg for the removal of the waste in Jun 2009, half of the waste remained since the budget was not sufficient for a complete removal. Regular cleaning is not conducted. However, the amount of waste dumped illegally has not increased after the closure of UCDS. As new settlements of gers have been extending to the area, it is supposed that the local residents who settled near the area have been dumping their waste. The content of waste is household waste.
15. (SH24-1) Khoroo #24 (South East from NEDS): The location of the waste is in the south east ditch of NEDS; separated by mountain from the NEDS. It is supposed to have existed for years. Newly settled ger households are at the distance of 300 m from the place. According to the district officials, the origin of the waste is waste collection trucks, private operators and individuals who used to transport waste from Bayankhoshuu and the northern part of Chingeltei and Sukhbaatar districts to UCDS. Cleaning or removal of waste has not been conducted. However, the amount of waste is not so large in comparison with typical accumulated large-scale waste. Presently, illegal dumping has not been conducted regularly.
16. (SH24-2) Khoroo #24 (North east from NEDS): The location of the waste is the ditch in the north east from NEDS. Ger areas are at the distance of 500 m approximately. The content of the waste is household waste. Cleaning has not been conducted. No one knows when it came into existence. The district officials consider that most of the waste was dumped by trucks. They assume that waste carriers who do not want to pay for disposal fee at NEDS dump their waste at the place.

Project for Strengthening the Capacity for SWM in Ulaabaatar City JICA Annex F: Baseline Survey KOKUSAI KOGYO CO., LTD.
F-22
c.6 Bayanzurkh district:
17. (BZ22) Khoroo #22 (Near the Grave): The dumping site is located along the road in front of the grave in the northern territory of khoroo #22. Ger areas have been extended along the road on its west side. Content is household waste dumped by residents and construction waste in smaller extent. Waste on the west side of the road was removed in May 2009. However, amount of waste has been increased after the latest removal.
18. (BZ2&21) Khoroo #2 and #21 (Selber river): The exact location is along the river Selbe in the territory of khoroo #2 and #21. The content of the waste is mainly construction waste. Residing people bring construction waste in order to elevated land for the purpose to extend their fences to the river side. At the time of the survey, amount of household waste is very small. However, it had long been illegal dump site and residents throw their waste customarily to places where construction waste is dumped, according to the chief of the WSF. Household waste was removed completely this summer.
19. (BZ21) Khoroo #21: The dumping place is located in the north-west valley of Tsagaan Davaa mt. in the northern territory of the khoroo #21. The exact location is along the road that stretches out of ger area to the north. The distance between ger areas and the waste is getting shorter from time to time as ger areas extend gradually. Illegal dumping has been existed for years. The amount is too large. It is not known whether residents dump their household waste habitually. Anyhow, most of the waste is construction waste and transported by trucks from elsewhere of UB to the place. Cleaning or waste removal is not conducted.
20. (BZ9) Khoroo #9: The location of the site is along the road of Khadan Khoshuu in Uliastai, the north east of Khoroo #9. It is said that waste has been dumped here illegally for years. However, the amount of waste is not so considerable. As most of the waste is old, it can be considered that illegal dumping is relatively few. Cleaning or removal is not conducted.
c.7 Sukhbaatar district:
21. (SK15) Khoroo #15: The location of the illegal dump point is in east side of main road to Sharga Morit near the final stop of bus route of Sharga Morit. Illegal dumping at the point came into existence in July this year. Although the allowed disposal point is located at the distance of 200 to 300 m, people living in houses located in the east side of the road dumped their waste. Since cleaning was not conducted after its appearance, the amount of waste has become considerable. The waste spread area is around 60 m2, according to a rough estimation. The content of the waste is solely household waste and ash. As the area is summer camp area, relatively few households were residing at the time of the survey. However, the households still keep dumping their waste and coal ash at the point.
The location of each site is shown in the map inserted below:

Project for Strengthening the Capacity for SWM in Ulaabaatar City JICA Annex F: Baseline Survey KOKUSAI KOGYO CO., LTD.
F-23
KhU12
KhU13
KhU9
KhU5
BG20
Ch12
Ch9
BG9‐1
BG10‐1
BG9‐2
BG10‐2
BG11SH6&23SH4&7
SH24‐2
SH24‐1
BZ2&21
BZ21
BZ22
BZ9
SK15
Figure F-6: The Location of the Visited Sites
d. Findings:
The main findings of the survey are the following:
1. Illegal dump sites are usually located in the middle or near ger areas in the suburbs of UBC;
2. Active dumpers are usually households residing near the places. Those households are usually those who do not pay waste fees;
3. Illegal dumping is conducted at nights in two ways: directly by a household or joint disposal by several households with trucks; and
4. Subjects who dump construction waste are difficult to identify.
e. Criteria for Selection of Illegal Dump Sites
When selecting sites for evaluation of improvements on illegal dumping, the following items have been investigated and set as criteria through consultation with the C/P.
1. Contents of the waste dumped illegally at the site; 2. Location of the site in terms of distances to residential areas; 3. Amount of waste dumped; 4. People or organizations who dump illegally at sites; and

Project for Strengthening the Capacity for SWM in Ulaabaatar City JICA Annex F: Baseline Survey KOKUSAI KOGYO CO., LTD.
F-24
5. Current condition of illegal dumping (ongoing or stopped)
As a result of investigating the above items, comparison table is shown below.
Table F-20: Comparison table of the illegal dump sites based on selection criteria
In gerarea
Near gerarea
Far fromger area
Localresidents
Outsiders Large Small Ongoing Stopped
1(1)(KhU5) Khoroo #5 (West of School-41)
1 1 1 1
2(2)(KhU9) Khoroo #9 (North of WhiteGate)
1 1 1 1
3(3) (KhU12) Khoroo #12 (Khabitat) 1 1 1 1
4(5)(Ch12) Khoroo #12 (Ditches in theNorth of Central workshop and top ofthe mountain)
1 1 1 1
5(7)(BG11) Khoroo #11 (Zuun Ard Ayush& Khuvisgalchid D)
1 1 1 1
6(8) (BG10-1) Khoroo #10 (Str-15) 1 1 1 17(9) (BG10-2) Khoroo #10 (Str-12) 1 1 1 1
8(12)(BG9-2) Khoroo #9 (near SOT ServiceCenter)
1 1 1 1
9(10) (BG9-1) Khoroo #9 (Str-18) 1 1 1 1
10(14) (SH4&7) Khoroos #4 & #7 (border) 1 1 1 1
11(15)(SH24-1) Khoroo #24 (South East ofNEDS)
1 1 1 1
12(16)(SH24-2) Khoroo #24 (North East ofNEDS)
1 1 1 1
13(13) (SH6&23) Khoroos #6 & #23 (border) 1 1 1 1
14(17)(BZ22) Khoroo #22 (Near the blockfactory and the Grave)
1 1 1 1
15(20)(BZ9) Khoroo #9 (Uliastai khadankhoshuu)
1 1 1 1
16(21) (SK15) Khoroo #15 (Sharga morit) 1 1 1 1
17(11) (BG20) Khoroo #20 (Power Plant-4) 1 1 1 1
18(19) (BZ21) Khoroo #21 (Tsagaan Davaa) 1 1 1 1
19(4) (KhU13) Khoroo #13 (Shuvuu) 1 1 1 1 1
20(6) (Ch9) Khoroo #9 (Dalan davkhar) 1 1 1 1 1
21(18)(BZ2&21) Khoroos #2 & #21 (Selberiver)
1 1 1 1
Location Dumpers
Khan-Uul
Amount ofWaste
Bayanzurkh
Sukhbaatar
Con
stru
ctio
nw
aste
Bayangol
Bayanzurkh
Con
tent
of
was
te
Site name/locationPresent Condition
Mix
ed w
aste
Khan-Uul
Chingeltei district
Bayanzurkh
#
Hou
seho
ld w
aste
Chingeltei district
Bayangol
Songinokhairkhan
Cleaning campaignes have been conducted several times in 2009. In districts such as Khan-Uul and Bayangol, the last cleaning was conducted in Oct 2009; and thus, it is supposed that the illegal dumping at the time of the survey was decreased. f. Selected Sites

Project for Strengthening the Capacity for SWM in Ulaabaatar City JICA Annex F: Baseline Survey KOKUSAI KOGYO CO., LTD.
F-25
Based on the information the JET presented to the C/P, the EPWMD selected 10 from the visited sites as indicators for evaluation of improvements on illegal dumping and reported to the JET on 23 Nov 2009. The main description, location and present conditions of the selected sites are shown in the following table and figures:
Table F-21: Main Description of the Selected Sites
# Sites GPS data Description
1
(KhU5)* Khoroo #5 (West of
School-41)
635692 5303701
1281
The dumping place is in the middle of the ditch located in the west of the Secondary School #41. On both sides, there are ger areas. The content is solely household waste (ash included). Waste is dumped by residents during the nights. Although waste is removed 3 to 4 times a year (amount of removal is about 50 to 60 trucks), the amount of waste remains big in quantity as it was at the time of the survey. Last cleaning was done on 17 and 18 Oct 2009.
2
(KhU9) Khoroo #9
(Tain Street)
633239 5302434
1319
Waste is dumped illegally along the fence made of blocks at the outer edge of ger areas that is located in the north of White Gate in Yarmag. The content is solely household waste. Waste is dumped by residents during the nights in two ways: direct disposal by a household and joint disposal by 4 to 5 households. Although the place was cleaned 3 times from July 2009 (the last cleaning was conducted in early Oct), the amount of waste is still considerable.
639551 5314137
1536
3
(Ch12) Khoroo #12
(Ditch in the north of pig house &
top of the mountain)
639011 5314016
1531
The covered area is very big: from 3 ditches laid at the back edge of ger areas (in the north from the central workshop of the CMPUA) to the backside of the mountain in the khoroo #12. By the ditches, there are newly settled ger households. The content of waste is household waste dumped by residing households who do not pay for waste collection service. Considerable area over the mountain is covered with waste brought by trucks, since the main ger areas are located at distances of 1 to 2 km at the opposite side of the mountain. Therefore, there is a possibility that dumpers are outsiders as well as the local residents. The amount of waste was impossible to estimate.
4 (BG10-1)
Khoroo #10 (Str-15)
639932 5310572
1392
The dumping site is located under the high voltage pole on the street #15. As it is surrounded by gers, the residents dump waste habitually. The content is household waste. Although complete removals are done twice or three times a month, illegal dumping does not allow eliminating the site. The latest complete removal was done on 25 and 26 Oct 2009.
5 (BG10-2)
Khoroo #10 (Str-12)
639662 5310307
1381
The location of illegal dumping is under the high voltage pole in the middle of ger area in the street #12. Content is household waste dumped by residents. There were occasions that waste was brought by small-scale trucks. Complete removal of waste is done once in 2 months. The latest was on 20 and 21 Oct 2009.
6
(SH4&7) Border of
khoroos #4 and #7
635089 5311302
1312
The exact place of illegal dumping is difficult to identify due to its wide-spread waste. Generally, it is located in the east of former UCDS, separated by a mountain and accumulated for years. The illegal dumping at the place came into existence when UCDS was in operation since waste collection trucks and private transporters used to dump their waste at the place without entering UCDS. Although the city financed 13 mln Tg for the removal of the waste in Jun 2009, half of the waste remained since the budget was not sufficient for a complete removal. Regular cleaning is not conducted. However, the amount of waste dumped illegally has not increased after the closure of UCDS. As new settlements of gers have been extending to the area, it is supposed that the local residents who settled near the area have been dumping their waste. The content of waste is household waste.
7 (SK15) 643753 The location of the illegal dump point is in east side of main road
Project for Strengthening the Capacity for SWM in Ulaabaatar City JICA Annex F: Baseline Survey KOKUSAI KOGYO CO., LTD.
F-26
Khoroo #15 5325729 1504
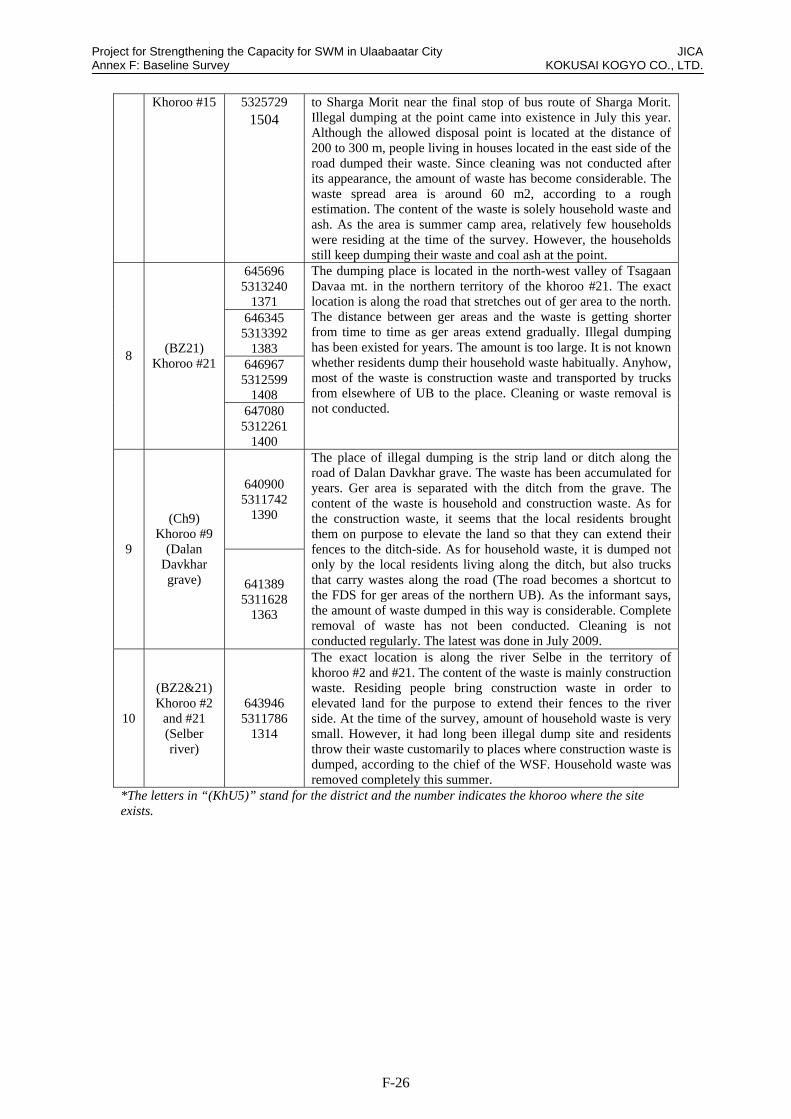
to Sharga Morit near the final stop of bus route of Sharga Morit. Illegal dumping at the point came into existence in July this year. Although the allowed disposal point is located at the distance of 200 to 300 m, people living in houses located in the east side of the road dumped their waste. Since cleaning was not conducted after its appearance, the amount of waste has become considerable. The waste spread area is around 60 m2, according to a rough estimation. The content of the waste is solely household waste and ash. As the area is summer camp area, relatively few households were residing at the time of the survey. However, the households still keep dumping their waste and coal ash at the point.
645696 5313240
1371 646345 5313392
1383 646967 5312599
1408
8 (BZ21)
Khoroo #21
647080 5312261
1400
The dumping place is located in the north-west valley of Tsagaan Davaa mt. in the northern territory of the khoroo #21. The exact location is along the road that stretches out of ger area to the north. The distance between ger areas and the waste is getting shorter from time to time as ger areas extend gradually. Illegal dumping has been existed for years. The amount is too large. It is not known whether residents dump their household waste habitually. Anyhow, most of the waste is construction waste and transported by trucks from elsewhere of UB to the place. Cleaning or waste removal is not conducted.
640900 5311742
1390
9
(Ch9) Khoroo #9
(Dalan Davkhar grave) 641389
5311628 1363
The place of illegal dumping is the strip land or ditch along the road of Dalan Davkhar grave. The waste has been accumulated for years. Ger area is separated with the ditch from the grave. The content of the waste is household and construction waste. As for the construction waste, it seems that the local residents brought them on purpose to elevate the land so that they can extend their fences to the ditch-side. As for household waste, it is dumped not only by the local residents living along the ditch, but also trucks that carry wastes along the road (The road becomes a shortcut to the FDS for ger areas of the northern UB). As the informant says, the amount of waste dumped in this way is considerable. Complete removal of waste has not been conducted. Cleaning is not conducted regularly. The latest was done in July 2009.
10
(BZ2&21) Khoroo #2
and #21 (Selber river)
643946 5311786
1314
The exact location is along the river Selbe in the territory of khoroo #2 and #21. The content of the waste is mainly construction waste. Residing people bring construction waste in order to elevated land for the purpose to extend their fences to the river side. At the time of the survey, amount of household waste is very small. However, it had long been illegal dump site and residents throw their waste customarily to places where construction waste is dumped, according to the chief of the WSF. Household waste was removed completely this summer.
*The letters in “(KhU5)” stand for the district and the number indicates the khoroo where the site exists.

Project for Strengthening the Capacity for SWM in Ulaabaatar City JICA Annex F: Baseline Survey KOKUSAI KOGYO CO., LTD.
F-27
KhU9
KhU5
Ch12
Ch9
BG10‐1
BG10‐2
SH4&7
BZ2&21
BZ21
SK15
Figure F-7: The Location of the Selected Sites
Project for Strengthening the Capacity for SWM in Ulaabaatar City JICA Annex F: Baseline Survey KOKUSAI KOGYO CO., LTD.
F-28
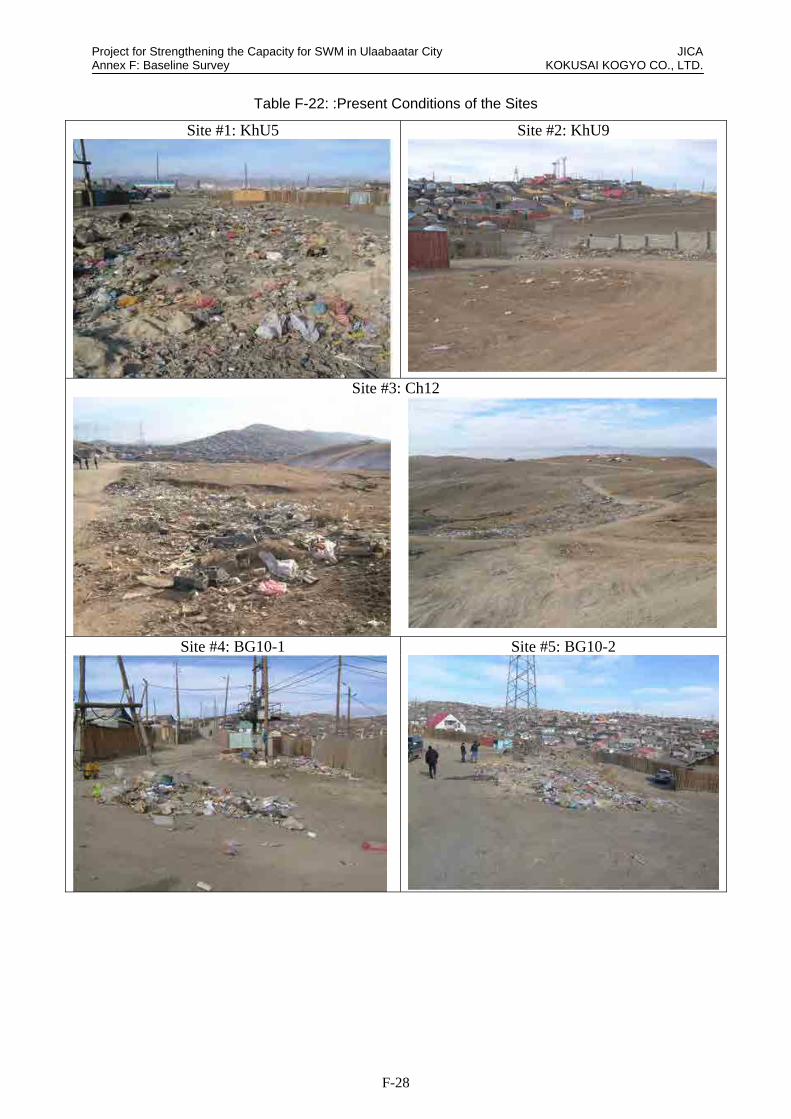
Table F-22: :Present Conditions of the Sites
Site #1: KhU5 Site #2: KhU9
Site #3: Ch12
Site #4: BG10-1 Site #5: BG10-2

Project for Strengthening the Capacity for SWM in Ulaabaatar City JICA Annex F: Baseline Survey KOKUSAI KOGYO CO., LTD.
F-29
Site #6: SH4&7 Site #7: SK15
Site #8: BZ21 Site #9: Ch9
Site #10: BZ2&21

Project for Strengthening the Capacity for SWM in Ulaabaatar City JICA Annex F: Baseline Survey KOKUSAI KOGYO CO., LTD.
F-30
F.3 Waste Fee Collection Rate in Ger Area

Pro
ject
for
Str
engt
heni
ng
the
Cap
acity
for
SW
M in
Ula
aba
atar
City
JI
CA
A
nne
x F
: B
asel
ine
Sur
vey
KO
KU
SA
I K
OG
YO
CO
., LT
D.
F-31
Rat
eA
mount
Am
oun
tH
ou
seh
old
sP
opul
atio
nH
ou
seh
old
sP
opul
atio
nTg/
Month
100
0Tg
/M
ont
h10
00Tg
/Year
910
11
12
12
34
56
78
KU
D①
②③
=①
X②
④=③
x12M
th
⑤⑥
=⑤
/④
12,
840
9,66
469
512
2,5
0017
2.5
2,07
0.0
21,
847
7,90
138
175
2,5
009
5.0
1,14
0.0
31,
791
7,55
057
234
2,5
0014
2.5
1,71
0.0
448
238
1,6
906
,251
2,5
004,
225.
050
,70
0.0
271
736
770
659
1,480
405
941
745
742
867
321
-7
,93
516
%5
00
1,3
565
,855
2,5
003,
390.
040
,68
0.0
153
662
662
298
938
1,041
673
758
447
487
155
-6
,27
015
%6
00
1,6
787
,826
2,5
004,
195.
050
,34
0.0
686
43629
282
624
700
424
423
279
560
111
-4
,75
79%
70
01
,444
5,5
682
,500
3,61
0.0
43,3
20.
0556
945
676
483
482
925
327
588
385
857
108
-6
,33
115
%8
00
2,4
109
,128
00.
00.
00
Indip
enden
t Khoro
o9
00
3,6
9713
,153
2,5
009,
242.
51
10,9
10.
0161
767
590
387
685
945
530
596
335
707
110
-5
,81
15%
10
650
2,58
11
,153
4,2
472
,500
2,88
2.5
34,5
90.
0259
220
447
297
638
436
514
427
281
618
107
-4
,24
212
%1
11,
067
3,99
940
21
,663
00.
00.
0N
o d
ata
12
224
896
1,3
564
,691
00.
00.
0In
dip
enden
t Khoro
o1
31
0843
589
53
,005
00.
00.
0In
dip
enden
t Khoro
o1
40
086
72
,475
00.
00.
0In
dip
enden
t Khoro
oT
ota
l8,
575
33,2
641
7,11
264
,783
27,9
55.
03
35,4
60.
02,
085
3,37
23,
772
2,40
44
,846
4,45
23,
408
3,53
62,
467
4,0
9591
03
5,3
46
11%
SH
D①
②③
=①
X②
④=③
x12M
th
⑤⑥
=⑤
/④
186
324
3,0
7113
,538
1,5
004,
606.
555
,278
1,518.5
1,167.5
1,500.0
2,505.0
2,350.0
1,136.6
1,134.5
772.5
1,973.0
700.0
706.5
1,174.5
16
,63
930
%2
00
1,1
355
,302
1,5
001,
702.
520
,430
173.5
336.0
344.7
320.5
388.7
422.5
174.3
311.6
986.0
696.5
419.5
769.5
5,3
43
26%
30
02
,764
13,0
091
,500
4,14
6.0
49,7
52646.7
459.9
305.9
492.5
460.3
899.5
1,222.9
1,393.5
1,795.6
1,742.5
1,405.1
1,614.5
12
,43
925
%4
00
2,6
6812
,875
1,5
004,
002.
048
,024
1,243.0
443.0
474.0
610.0
747.0
1,446.3
1,024.0
1,023.1
1,065.5
1,519.5
1,566.2
1,638.4
12
,80
027
%5
446
1,68
91
,910
9,1
921
,500
2,86
5.0
34,3
801,530.4
1,273.5
1,250.5
1,293.7
1,606.1
1,173.0
1,587.1
1,272.9
1,228.0
1,446.0
1,266.5
1,398.5
16
,32
647
%6
602
2,47
31
,126
4,8
021
,500
1,68
9.0
20,2
6834.5
99.5
97.5
121.1
90.0
248.6
192.5
209.8
667.5
688.0
914.0
952.0
4,3
15
21%
70
02
,583
11,3
841
,500
3,87
4.5
46,4
942,628.0
1,587.7
2,348.4
2,667.1
1,456.0
1,702.4
1,157.6
1,488.9
816.0
1,403.0
935.5
1,521.5
19
,71
242
%8
00
1,6
777
,797
1,5
002,
515.
530
,186
0.0
0.0
170.2
95.0
201.8
325.5
225.5
350.6
498.4
611.1
405.2
982.9
3,8
66
13%
90
01
,796
7,9
381
,500
2,69
4.0
32,3
28799.5
537.0
689.9
448.5
127.5
692.1
410.5
410.7
277.4
1,457.9
995.8
932.3
7,7
79
24%
10
315
1,30
22
,082
10,8
891
,500
3,12
3.0
37,4
76831.8
481.5
166.0
166.7
88.0
443.7
508.2
324.5
920.7
1,651.2
1,630.9
2,234.0
9,4
47
25%
11
00
2,5
6211
,800
1,5
003,
843.
046
,116
1,250.7
236.0
776.5
824.6
235.5
91.5
887.1
885.0
1,636.5
1,331.3
1,300.3
1,454.0
10
,90
924
%1
21,
311
4,62
555
12
,563
1,5
0082
6.5
9,91
80.0
0.0
0.0
0.0
4.5
154.0
134.0
293.0
367.3
30.0
159.0
320.0
1,4
62
15%
13
1,2
905,
312
425
2,1
431
,500
637.
57,
650
232.0
0.0
0.0
24.0
67.5
81.0
115.6
403.0
238.5
237.0
222.0
377.0
1,9
98
26%
14
1,3
344,
616
987
4,7
061
,500
1,48
0.5
17,7
66124.0
0.0
34.5
0.0
65.5
29.0
0.0
111.7
446.0
288.0
401.0
337.0
1,8
37
10%
15
1,2
565,
919
386
1,9
631
,500
579.
06,
948
190.2
0.0
0.0
0.0
53.6
72.0
22.5
147.7
88.6
83.0
85.2
116.5
85
912
%1
61,
284
5,24
329
21
,910
1,5
0043
8.0
5,25
6285.0
70.5
64.5
115.5
141.0
153.5
97.5
164.0
276.5
264.5
164.0
187.0
1,9
84
38%
17
1,2
814,
076
400
2,7
351
,500
600.
07,
200
35.5
0.0
0.0
0.0
0.0
53.3
132.5
52.6
175.0
149.5
108.0
160.5
86
712
%1
82,
481
10,6
0215
066
11
,500
225.
02,
700
0.0
0.0
0.0
0.0
0.0
0.0
0.0
0.0
6.0
12.0
0.0
0.0
18
1%
19
1,8
879,
529
4840
11
,500
72.
086
436.0
15.0
52.0
27.0
0.0
65.0
10.5
0.0
0.0
27.0
9.0
40.5
28
233
%2
01,
110
3,97
21
,073
5,9
111
,500
1,60
9.5
19,3
14583.0
69.0
0.0
680.5
130.0
293.0
96.0
453.2
290.0
958.6
647.4
537.4
4,7
38
25%
21
00
1,6
435
,500
00.
00
0.0
0.0
0.0
0.0
0.0
0.0
0.0
0.0
0.0
0.0
0.0
0.0
0R
em
ote
Khoro
o2
272
394
2,2
1010
,111
1,5
003,
315.
039
,780
930.5
305.0
531.0
330.0
205.5
454.1
729.9
559.0
517.5
881.0
373.5
478.5
6,2
96
16%
23
00
2,5
3010
,299
1,5
003,
795.
045
,540
936.5
578.0
273.0
371.5
327.0
485.0
272.6
754.5
1,328.0
2,030.0
1,446.4
2,587.5
11
,39
025
%2
40
01
,560
5,4
751
,500
2,34
0.0
28,0
80589.5
1,126.0
1,021.7
345.0
672.6
773.0
391.8
583.5
1,044.5
783.0
830.0
902.0
9,0
63
32%
25
00
2,2
718
,908
1,5
003,
406.
540
,878
1,044.0
1,105.2
1,110.2
865.5
746.6
1,101.1
900.1
1,759.5
2,545.8
3,152.0
3,125.2
2,978.7
20
,43
450
%T
ota
l14
,755
60,0
763
7,90
017
1,8
1254
,386
652,
626
15,643
9,890
11,211
12,304
10,165
12,296
11,427
13,725
19,188
22,143
19,116
23,695
18
0,8
02
28%
Rem
arks
Up t
o S
ep 2
009.
ther
e is
no W
SF
and T
UK is
ope
rating
and
colle
ctin
g W
aste
Fee
To
tal
Was
te F
ee
Colle
ctio
n R
ate
%20
082009
Was
te F
ee a
ctu
ally
colle
cted
(Sep 2
009
to A
ug 2
008
) : 1
,000
Tg
Ik
h:In
dip
enden
t Khoro
o1y
ear
Tota
l
Was
te F
ee s
uppors
ed t
o b
eC
olle
cte
d b
y G
er
Are
aA
pa
rtm
en
t a
rea
To
tal
Ge
r a
rea
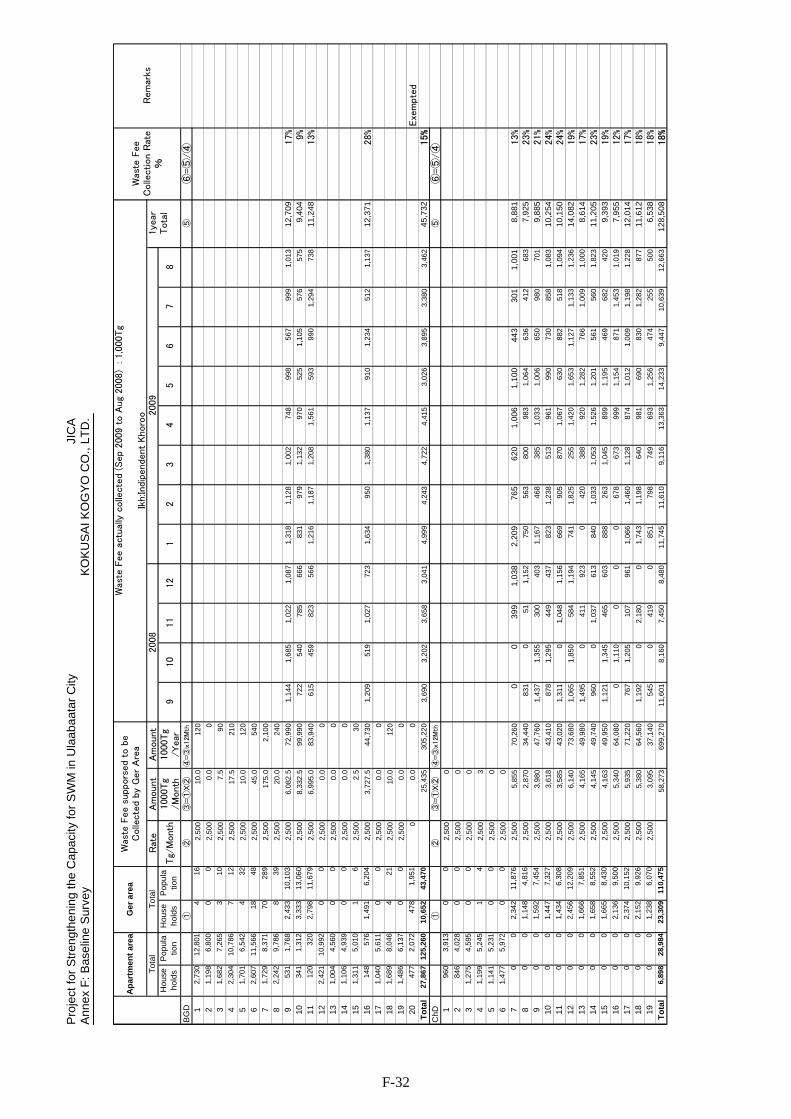
Pro
ject
for
Str
engt
heni
ng
the
Cap
acity
for
SW
M in
Ula
aba
atar
City
JI
CA
A
nne
x F
: B
asel
ine
Sur
vey
KO
KU
SA
I K
OG
YO
CO
., LT
D.
F-32
Rat
eA
mount
Am
ount
Hou
seh
olds
Po
pula
tion
Hou
seh
olds
Pop
ula
tion
Tg/
Mont
h100
0Tg
/Month
1000
Tg
/Year
910
1112
12
34
56
78
BG
D①
②③
=①
X②
④=③
x12M
th
⑤⑥
=⑤
/④
12
,73
01
2,8
014
16
2,50
010
.012
0
21,
198
6,80
00
02,
500
0.0
0
31,
682
7,26
53
10
2,50
07
.59
0
42
,30
41
0,7
867
12
2,50
017
.521
0
51,
701
6,54
24
32
2,50
010
.012
0
62
,60
71
1,5
661
84
82,
500
45.0
540
71
,72
98,
371
70
289
2,50
017
5.0
2,1
00
82,
242
9,78
68
39
2,50
020
.024
0
953
11,
768
2,4
33
10,1
03
2,50
06,
082
.572
,99
01,
144
1,6
851,
022
1,0
87
1,3
18
1,1
281,
002
748
998
567
999
1,01
312
,709
17%
1034
11,
312
3,3
33
13,0
60
2,50
08,
332
.599
,99
07
225
4078
566
683
19
791,
132
970
525
1,1
0557
657
59,
404
9%
1112
03
202
,79
811
,67
92,
500
6,99
5.0
83,9
40
615
459
823
566
1,2
16
1,1
871,
208
1,56
159
39
901,
294
738
11,2
4813%
122
,42
11
0,9
920
02,
500
0.0
0
131,
004
4,56
00
02,
500
0.0
0
141,
106
4,93
90
02,
500
0.0
0
151,
311
5,01
01
62,
500
2.5
30
1614
85
761
,49
16
,20
42,
500
3,72
7.5
44,7
30
1,2
095
191,
027
723
1,6
34
950
1,38
01,
137
910
1,2
3451
21,
137
12,3
7128%
171,
040
5,61
10
02,
500
0.0
0
181,
689
8,04
64
21
2,50
010
.012
0
191,
486
6,13
70
02,
500
0.0
0
2047
72,
072
478
1,9
51
00
.00
Exe
mpte
dT
ota
l27
,86
712
5,2
6010
,65
243
,47
02
5,4
3530
5,2
20
3,6
903,
202
3,65
83
,04
14
,99
94,
243
4,72
24,
415
3,0
26
3,8
953,
380
3,46
245
,732
15%
Ch
D①
②③
=①
X②
④=③
x12M
th
⑤⑥
=⑤
/④
196
03,
913
00
2,50
00
284
64,
028
00
2,50
00
31,
275
4,59
50
02,
500
0
41,
199
5,24
51
42,
500
3
51,
141
5,23
10
02,
500
0
61,
477
5,97
20
02,
500
0
70
02,
342
11,8
76
2,50
05,
855
70,2
60
00
399
1,0
382,
209
765
620
1,00
61
,100
443
301
1,00
18,
881
13%
80
01,
148
4,8
162,
500
2,8
7034
,44
08
310
511
,15
275
05
6380
098
31
,06
46
3641
268
37,
925
23%
90
01,
592
7,4
542,
500
3,9
8047
,76
01,
437
1,3
5530
040
31
,16
74
6838
51,
033
1,0
06
650
980
701
9,8
8521%
100
01,
447
7,3
272,
500
3,6
1843
,41
08
781,
295
449
437
823
1,2
3851
396
199
07
3085
81,
083
10,2
5424%
110
01,
434
6,3
082,
500
3,5
8543
,02
01,
311
01,
048
1,1
56
669
905
870
1,06
763
08
8251
81,
094
10,1
5024%
120
02,
456
12,2
09
2,50
06,
140
73,6
80
1,0
651,
850
584
1,1
94
741
1,8
2525
51,
420
1,6
53
1,1
271,
133
1,23
614
,082
19%
130
01,
666
7,8
512,
500
4,1
6549
,98
01,
495
041
192
30
420
388
920
1,2
82
766
1,00
91,
000
8,6
1417%
140
01,
658
8,5
522,
500
4,1
4549
,74
09
600
1,03
761
384
01,
033
1,05
31,
526
1,2
01
561
560
1,82
311
,205
23%
150
01,
665
8,4
302,
500
4,1
6349
,95
01,
121
1,3
4546
560
388
82
631,
045
899
1,1
95
469
682
420
9,3
9319%
160
02,
136
9,5
002,
500
5,3
4064
,08
00
1,1
100
00
678
673
999
1,1
54
871
1,45
31,
019
7,9
5512%
170
02,
374
10,1
52
2,50
05,
935
71,2
20
767
1,2
0510
796
11
,06
61,
460
1,12
887
41
,01
21,
009
1,19
81,
228
12,0
1417%
180
02,
152
9,9
262,
500
5,3
8064
,56
01,
192
02,
180
01
,74
31,
198
640
981
690
830
1,28
287
711
,612
18%
190
01,
238
6,0
702,
500
3,0
9537
,14
05
450
419
085
17
9874
969
31
,25
64
7425
550
06,
538
18%
To
tal
6,89
82
8,98
423
,30
911
0,4
755
8,2
7369
9,2
70
11,
601
8,1
607,
450
8,4
80
11,7
45
11,
610
9,11
613
,36
314
,23
39,
447
10,6
3912
,663
128,
508
18%
Rem
arks
Tot
al
Was
te F
eeC
olle
ction R
ate
%200
82009
Was
te F
ee a
ctual
ly c
olle
cted
(Sep
2009
to A
ug
200
8)
: 1
,000T
g
Ikh:
Indi
pende
nt K
horo
o1ye
arTota
l
Was
te F
ee s
uppors
ed t
o b
eC
olle
cte
d by
Ger
Are
aA
par
tmen
t ar
ea
To
tal
Ger
are
a
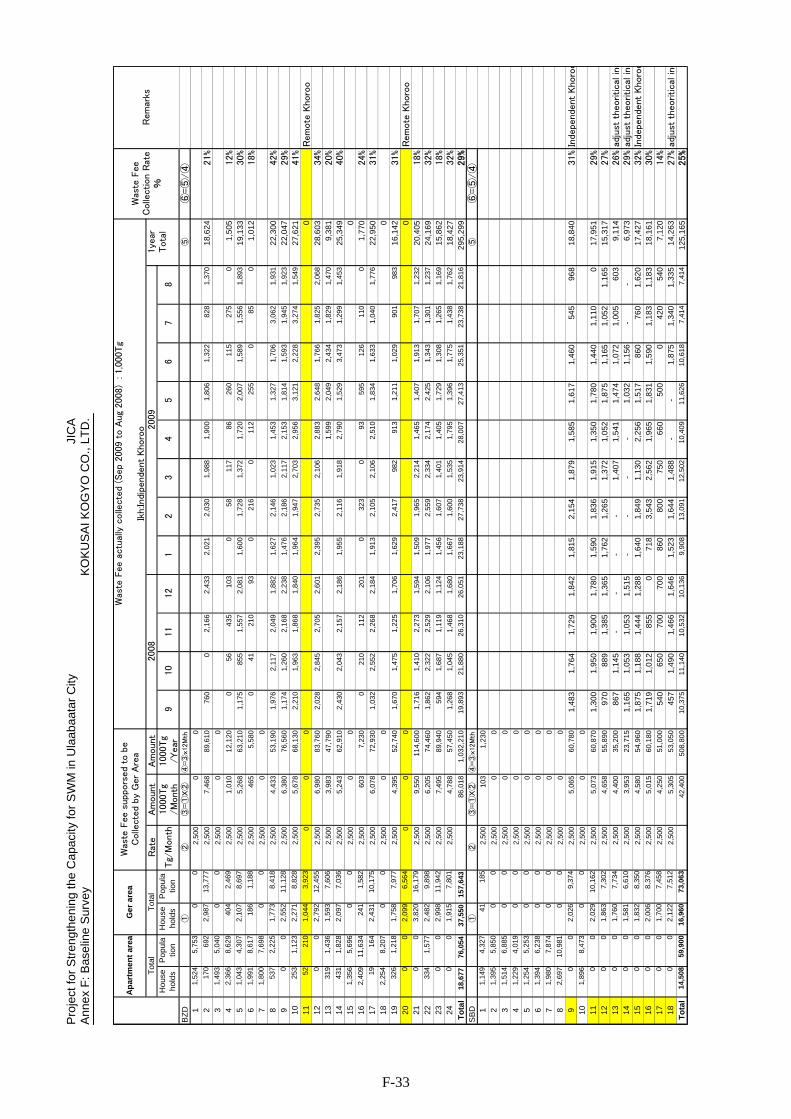
Pro
ject
for
Str
engt
heni
ng
the
Cap
acity
for
SW
M in
Ula
aba
atar
City
JI
CA
A
nne
x F
: B
asel
ine
Sur
vey
KO
KU
SA
I K
OG
YO
CO
., LT
D.
F-33
Rat
eA
moun
tA
moun
tH
ou
seh
old
sP
opu
latio
nH
ou
seh
old
sP
op
ula
tion
Tg/
Month
100
0Tg
/M
ont
h100
0Tg
/Year
910
1112
12
34
56
78
BZ
D①
②③
=①
X②
④=③
x12M
th
⑤⑥
=⑤
/④
11,
524
5,75
30
02,
500
00
217
069
22,
987
13,7
772,
500
7,46
889
,610
760
02,
166
2,4
332
,02
12,
030
1,98
81,
900
1,8
061,
322
828
1,37
01
8,6
24
21%
31,
493
5,04
00
02,
500
00
42,
366
8,62
940
42,
469
2,50
01,
010
12,1
200
5643
510
30
5811
786
260
115
275
01
,50
512%
51,
043
4,30
72,
107
8,69
72,
500
5,26
863
,210
1,17
585
51,
557
2,0
811
,60
01,
728
1,37
21,
720
2,0
071,
589
1,55
61,
893
19
,13
330%
61,
991
8,61
718
61,
188
2,50
046
55
,58
00
4121
093
021
60
112
255
085
01
,01
218%
71,
800
7,69
80
02,
500
00
853
72,
225
1,77
38,
418
2,50
04,
433
53,1
901,
976
2,11
72,
049
1,8
821
,62
72,
146
1,02
31,
453
1,3
271,
706
3,06
21,
931
22
,30
042%
90
02,
552
11,1
282,
500
6,38
076
,560
1,17
41,
260
2,16
82,
238
1,4
76
2,18
62,
117
2,15
31,
814
1,59
31,
945
1,92
32
2,0
47
29%
10
253
1,12
32,
271
8,82
82,
500
5,67
868
,130
2,21
01,
963
1,86
81,
840
1,9
64
1,94
72,
703
2,95
63,
121
2,22
83,
274
1,54
92
7,6
21
41%
11
5221
01,
044
3,92
30
00
0R
em
ote
Khoro
o1
20
02,
792
12,4
552,
500
6,98
083
,760
2,02
82,
845
2,70
52,
601
2,3
95
2,73
52,
106
2,88
32,
648
1,76
61,
825
2,06
82
8,6
03
34%
13
319
1,43
61,
593
7,60
62,
500
3,98
347
,790
1,59
92,
049
2,43
41,
829
1,47
09
,38
120%
14
431
1,82
82,
097
7,03
62,
500
5,24
362
,910
2,43
02,
043
2,15
72,
186
1,9
55
2,11
61,
918
2,79
01,
529
3,47
31,
299
1,45
32
5,3
49
40%
15
1,35
65,
696
00
2,50
00
00
16
2,40
911
,634
241
1,58
22,
500
603
7,2
30
021
011
220
10
323
093
595
126
110
01
,77
024%
17
1916
42,
431
10,1
752,
500
6,07
872
,930
1,03
22,
552
2,26
82,
184
1,9
13
2,10
52,
106
2,51
01,
834
1,63
31,
040
1,77
62
2,9
50
31%
18
2,25
48,
207
00
2,50
00
00
19
326
1,21
81,
758
7,97
72,
500
4,39
552
,740
1,67
01,
475
1,22
51,
706
1,6
29
2,41
798
291
31,
211
1,02
990
198
31
6,1
42
31%
20
00
2,09
96,
564
00
00
Rem
ote
Khoro
o2
10
03,
820
16,1
792,
500
9,55
011
4,6
00
1,71
61,
410
2,27
31,
594
1,5
09
1,96
52,
214
1,46
51,
407
1,91
31,
707
1,23
22
0,4
05
18%
22
334
1,57
72,
482
9,89
82,
500
6,20
574
,460
1,86
22,
322
2,52
92,
106
1,9
77
2,55
92,
334
2,17
42,
425
1,34
31,
301
1,23
72
4,1
69
32%
23
00
2,99
811
,942
2,50
07,
495
89,9
4059
41,
687
1,11
91,
124
1,4
56
1,60
71,
401
1,40
51,
729
1,30
81,
265
1,16
91
5,8
62
18%
24
00
1,91
57,
801
2,50
04,
788
57,4
501,
268
1,04
51,
468
1,6
801
,66
71,
600
1,53
51,
795
1,3
961,
775
1,43
81,
762
18
,42
732%
To
tal
18,6
7776
,054
37,5
5015
7,64
386
,018
1,03
2,2
10
19,8
9321
,880
26,3
102
6,0
5123
,18
827
,738
23,9
1428
,007
27,
413
25,3
51
23,7
3821
,816
29
5,2
99
29%
SB
D①
②③
=①
X②
④=③
x12M
th
⑤⑥
=⑤
/④
11,
149
4,32
741
185
2,50
010
31
,23
0
21,
395
5,85
00
02,
500
00
31,
514
6,88
50
02,
500
00
41,
229
4,01
90
02,
500
00
51,
254
5,25
30
02,
500
00
61,
394
6,23
80
02,
500
00
71,
980
7,87
40
02,
500
00
82,
697
10,9
810
02,
500
00
90
02,
026
9,37
42,
500
5,06
560
,780
1,4
83
1,7
64
1,7
29
1,8
42
1,8
152
,15
41
,87
91
,58
51
,61
71
,460
54
59
68
18
,84
031%
Indep
end
ent
Kho
roo
10
1,89
68,
473
00
2,50
00
0
11
00
2,02
910
,162
2,50
05,
073
60,8
701
,30
01
,95
01
,90
01
,78
01
,590
1,8
36
1,9
15
1,3
50
1,7
80
1,4
401
,11
00
17
,95
129%
12
00
1,86
37,
302
2,50
04,
658
55,8
909
70
88
91
,38
51
,36
51
,762
1,2
65
1,3
72
1,0
52
1,8
75
1,1
651
,05
21
,16
51
5,3
17
27%
13
00
1,76
07,
734
2,50
04,
400
35,2
008
67
1,1
45
--
--
1,4
07
1,5
41
1,4
74
1,0
721
,00
56
03
9,1
14
26%
adju
st t
heoritical
inc
14
00
1,58
16,
610
2,50
03,
953
23,7
151
,16
51
,05
31
,05
31
,51
5-
--
-1
,03
21
,156
--
6,9
73
29%
adju
st t
heoritical
inc
15
00
1,83
28,
350
2,50
04,
580
54,9
601
,87
51
,18
81
,44
41
,28
81
,640
1,8
49
1,1
30
2,2
56
1,5
17
860
76
01
,62
01
7,4
27
32%
Indep
end
ent
Kho
roo
16
00
2,00
68,
376
2,50
05,
015
60,1
801
,71
91
,01
28
55
07
183
,54
32
,56
21
,96
51
,83
11
,590
1,1
83
1,1
83
18
,16
130%
17
00
1,70
07,
458
2,50
04,
250
51,0
005
40
65
07
00
70
08
608
00
75
06
60
50
00
42
05
40
7,1
20
14%
18
00
2,12
27,
512
2,50
05,
305
53,0
504
57
1,4
90
1,4
66
1,6
46
1,5
231
,64
41
,48
8-
-1
,875
1,3
40
1,3
35
14
,26
327%
adju
st t
heoritical
inc
To
tal
14,5
0859
,900
16,9
6073
,063
42,4
0050
8,8
00
10,3
7511
,140
10,5
321
0,1
369
,90
813
,091
12,5
0210
,409
11,
626
10,6
18
7,41
47,
414
12
5,1
65
25%
Rem
arks
To
tal
Was
te F
eeC
olle
ction R
ate
%20
0820
09
Was
te F
ee a
ctu
ally
colle
cte
d (S
ep
2009
to A
ug 2
008
) : 1
,000T
g
Ikh:
Indip
enden
t Kho
roo
1ye
arTota
l
Was
te F
ee s
uppors
ed t
o b
eC
olle
cte
d by
Ger
Are
aA
pa
rtm
en
t a
rea
To
tal
Ge
r a
rea
Project for Strengthening the Capacity for SWM in Ulaabaatar City JICA Annex F: Baseline Survey KOKUSAI KOGYO CO., LTD.
F-34
F.4 Baseline Survey on Public Awareness for SWM
a. Purpose of Survey
Regarding "Prototypes of education materials for citizens are prepared" and "Public awareness raising campaign has been held xx times in UB City" set up as indicators of the output 5) "Development of human resources of EPWMD and District Officers for promoting public awareness and participation in SWM" in this project, the baseline survey was carried out for the following purposes;
1) To understand capacity, present condition, and needs for public education in the 6 pilot districts
2) To measure the degree of cooperation of each district for separate discharge and recycling, and the prevention of illegal dumping in the UB City
3) To clarify duties and responsibilities of the organizations related to SWM and public education.
In addition, these results of survey are taken as reference for selecting pilot site, and preparing training program and materials to strengthen the capacity of public education.
b. Method of Survey
The method of survey is shown below.
1. Survey method: Interview (questionnaire is used)
2. Target population: (1) Production and Service Department (PSD), i.e. Staff in charge of SWM in 6 pilot district offices
(2) Department staff in charge of public education on SWM of each related ministries and government offices*
3. Period of survey: From December 17, 2009 to January 4, 2010
4. Number of questions: 14
5. Contents of questions: (1) Outline of each organization
(2) Existing teaching tools on waste education in each district
(3) Current state of environmental education (EE) in school education
(4) Existing problem in conducting public education (5) Needs for public education tool (6) Degree of cooperation for the activities on separate discharge and prevention of illegal dumping
(7) Others
* As for related ministries and government offices, the number of questions and the contents were slightly changed according to each organization's activities.
c. Results of Survey
c.1 Current State of Each District
c.1.1 Outline of Each District
All 6 pilot district offices have Production & Service Department (the number of the staff is 6 to 8 persons), and one member of the staff takes charge of SWM as a whole including public education. However, as for BZD, WSF takes charge of waste management business, and the

Project for Strengthening the Capacity for SWM in Ulaabaatar City JICA Annex F: Baseline Survey KOKUSAI KOGYO CO., LTD.
F-35
PSD staff is only in charge of monitoring and advising for WSF. In all district offices, the budget is not given to the public education on SWM but given to the activities such as cleanup campaign etc. However, as for WSF of BZD, the budget of 3 millions tg was given to the preparation of teaching-materials for public education in 2009. c.1.2 Existing Teaching Tools on Waste Education in Each District
Although there is a difference in degree among each district, the teaching tools and activities on SWM are already implemented in all 6 districts. Moreover, the frequency and the number of times of those activities are recorded by every district in the annual report etc. As for SKhD and SBD, they establish general waste management program on their own and conduct public education activities positively.
Table F-23: Q2. Answer to “What kind of waste education materials do you have in your district at present?”
KhUD ChD BGD SKhD BZD SBD Flier or PR magazine regarding
waste reduction ✓ ✓ ✓
Plate or signboard to promote
“no littering” or “banning on
illegal disposal”
✓ ✓ ✓ ✓ ✓ ✓
Campaigns such as “cleanup”
and “eco bag” ✓ ✓ ✓ ✓ ✓ ✓
Environmental events such as
recycling fair ✓ ✓ ✓
Workshop or seminar on waste
disposal manner ✓ ✓ ✓ ✓ ✓ ✓
Guidance tools such as
signboard or pamphlet for the
promotion of waste separation. ✓ ✓
c.1.3 Current State of Environmental Education (EE) in School Education
Although EE program is included in the curriculum of the primary and secondary schools in all 6 districts, about how far it is actually conducted is a question. Except for ChD, PSD of all districts answered that they had offered technical support to environmental activities in schools. However, it can be said that the waste issue does not have so high priority compared with air pollution, water pollution, deforestation, etc. in school education.
Table F-24: Q7. Answer to “What kind of themes and contents are discussed in EE?”
KhUD ChD BGD SKhD BZD SBD
Air pollution ✓ ✓ ✓
Water pollution ✓ ✓ ✓
Waste problem ✓ Deforestation and
desertification ✓ ✓ ✓
We don’t know ✓ ✓
c.1.4 Existing Problem in Conducting Public Education
Each district answered to the question on existing problem in conducting public education as follows; 1) budget, 2) expertise, and public participation

Project for Strengthening the Capacity for SWM in Ulaabaatar City JICA Annex F: Baseline Survey KOKUSAI KOGYO CO., LTD.
F-36
Table F-25: Q11. Answer to “What kind of problems does your district have when conducting public education?”
KhUD ChD BGD SKhD BZD SBD Budget ✓ ✓ ✓ ✓ ✓ ✓
Expertise ✓ ✓
Education materials
Public participation ✓ ✓
c.1.5 Needs for Public Education Tool
The Needs for public education tools of each district are as follows; 1) the signboard, 2) the poster, and the video or DVD, and 3) collections of good practices on EE activities.
Table F-26: Q12. Answer to “What kind of waste education materials would you like to prepare as the district office?”
KhUD ChD BGD SKhD BZD SBD Signboard ✓ ✓ ✓ ✓ ✓ ✓
Poster ✓ ✓ ✓
Video or DVD ✓ ✓ ✓ Collection of good
practices on EE ✓ ✓
Text
c.1.6 Degree of Cooperation for the Activities on Separate Discharge and Prevention of Illegal Dumping
Regarding the question “the UB City is now trying to implement waste separation at source in order to reduce the amount of waste and prevent illegal dumping, are you willing to cooperate with them?”, all of the districts answered “yes”. As for waste separation and recycling, SBD has already implemented community recycling in the Apartment Area of khoroo 7, and they showed the idea that their experiences should be introduced to the other areas. As for prevention of illegal dumping, BGD and BZD mentioned that it was more important to take preventive measures through public education rather than just merely cleaning up waste so that illegal dumping would not recur.
c.1.7 Others
There are only few NGOs which conduct activities specialized in waste problem in the UB City, and almost all the environmental NGOs are mainly working for forestation and prevention of desertification. In SBD and BZD, the staff members support these NGOs to cleanup waste as part of forest conservation in a refuge. While the activities of international NGOs such as the Soros Foundation and World Vision are very active, those of local NGOs are not so active. In KhUD, they have been conducting the SWM project (30,000US$) aiming at prevention of illegal dumping in Ger Area in collaboration with World Vision from 2007, and it also includes public education, which turned out to be successful. As for SKhD, they also have contact with local NGO that deals with the problem of illegal dumping. c.2 Current Status of Each Related Organization
In the central government and the Municipality of Ulaanbaatar (MUB), the governmental agency considered to relate to the public education for SWM is as follows.

Project for Strengthening the Capacity for SWM in Ulaabaatar City JICA Annex F: Baseline Survey KOKUSAI KOGYO CO., LTD.
F-37
(1) Environmental Pollution and Waste management Department(EPWMD) of MUB (2) Environmental Protection Department(EPD) of MUB (3) Ministry of Education, Culture and Science(MECS) (4) Ministry of Nature, Environment and Tourism(MONET) (5) Ministry of Health(MOH)
When the survey was conducted to its department which takes charge of the SWM and public education in each of above mentioned organizations, it turned out that each of them are conducting public education activities on prevention and management of environmental pollution caused by waste within official authority. The contents of activity of each department are simply summarized below. A number in ( ) shows the number of the staff.
Figure F-8: Administrative organization chart that relates to SWM and public education in Mongolia
c.2.1 EPWMD
EPWMD is positioned as an organization which presides over SWM in the UB City but it has been just newly established in January, 2009. The independent activity of each district is left to the district though EPWMD can exercise the imperium to PSD of each district in the UB City, and EPWMD initiates the activity concerning SWM of the entire city. One member of 7 staffs takes charge of public education. EPWMD has installed signboard for prevention of illegal dumping and cleanup campaign etc., and offered technical and financial support for the environmental preservation activities of the university, and the social welfare organizations until now. However, in order for EPWMD to lead recycling promotion activity in the whole UB City in the future, further knowledge and experience on the public education need to be acquired. The current problems of EPWMD includes luck of budget, luck of collaboration with NGOs and other organizations, and luck of knowhow about how to prepare the waste education program. Moreover, they also focused on the school education, and carried out the painting contest and the poem contest under the slogan "For the healthier UB City where no waste exists" in the secondary school in 2009.
MONET
-Policy making for environmental protection-Overseeing environmental issues such as desertification, air pollution, water pollution, mine pollution etc. in the framework of legislations-No position allocated for waste issue nor EE
MECS MOHMUB
Dept. of Environment &
Natural Resources (8)
Dept. of Primary & Secondary
Education (10) Environmental Health (1)
Health Promotion & Health Education (1)
EPWMD(7)
Environmental Protection Dept.
(60)
The Central Government
-Formulating school curriculum and educational guideline in primary & secondary school-No specialized position allocated for EE-EE is taught as a part of ”Civil Education Class”(68 hours in total)
-Implementing policy related to the diseases caused by air pollution, water pollution and waste (medical waste) -No position allocated for urban waste issues
Public Health Care Policy Implementation & Coordination Dept. (9)
-Conducting public education activities related to sanitation and prevention of diseases though mass media (waste-related disease in flood season in Ger)-Coordination among relating organizations, groups and experts
Institute of Public Health - Environmental Center -
-Conducting research on waste reduction & recycling, relation between
waste problem & public health
-Conducting public education but focus more on forest issue-Overseeing waste issue in the reserve such as summer camp area-Collaboration with EPWMD in waste issue-Member of the MNET’s weekly meeting
-One person is specially in charge of public education-Conducting various public waste education activities in UB-Collaborating with environmental NGOs
Mayor’s Office
District Gov. PSD (6~8)
-One person is in charge of SWM including waste education

Project for Strengthening the Capacity for SWM in Ulaabaatar City JICA Annex F: Baseline Survey KOKUSAI KOGYO CO., LTD.
F-38
c.2.2 EPD
There are 60 staff members in EPD and 38 members out of them are working as Rangers in nature reserve in summer camp areas. There is no staff member specialized in waste education in EPD, but there is one Information Officer in charge of publicity work and conducts the waste PR activity. EPD participates in a weekly meeting organized by MONET from 2009 and always exchange information with MONET. EPWMD does control on the SWM in the MUB, but EPD is in charge of waste issue in nature reserve. The budget specialized in waste education is not allocated, but there is a budget for seminar and workshop in a general budget. Deputy Director showed the intention of getting involved in public education activities in this project.
c.2.3 MECS
The department in charge of school education in MECS is divided into a few levels (Primary & Secondary Education, Vocational Education), and there are 10 staff members in each level. There is no staff member who is specialized in EE in Dept. of Primary & Secondary Education, but there are 2 staff members in charge of making curriculum and standard for the primary and secondary education. The EE is being taught in a subject called the "Civil Education Class" (it seems that it is “Integrated Study” in Japan) as well as in a formal subject such as science and the mathematics. Moral education and health education are also included in "Civil Education Class" as well as EE, but it is decided by the free hand of each school to which subject is given the priority according to actual local situation and needs. 68 hours are assigned to "Civil Education Class" in a regular curriculum, and EE is taught on a theme called “Human Environment” for students from the 1st to 3rd grade, “Human & Nature” for students from the 4th to 5th grade, and “Human Society” for students from the 6th to 7th grade of the primary and secondary school. In addition, in another JICA project called "Teaching Improvement Project to Support Children's Development in Mongolia (2,006.4-2009.7)", various teaching textbooks for primary and secondary school teachers have been made; a lot of elements of EE are included in such teaching textbooks as "Primary Science: Human Being and Environment" or "Integrated Study ".
c.2.4 MONET
The Dept. of Environment and Natural Resources of MONET is the planning unit of environmental policy, and 8 staff members take charge of each theme (desertification, air pollution, water contamination, mine pollution, etc.) respectively. Although the budget for the position of waste problem has been cut due to insufficient budget, Deputy Director (just taken up this post from December, 2009) holds an additional post of a waste problem. The public education activities on waste have not been conducted so far. The most important issues for MONET are air pollution in the first place, followed by water contamination, desertification, mine pollution etc., and waste issue has not been given the high priority at present.
c.2.5 MOH
Although the Environmental Health section of MOH takes charge of the diseases brought about with waste problem, air pollution, and water contamination, and chemical problem, etc., as for waste, it only deals with medical waste but not municipal waste. Regarding public education, the Health Promotion and Health Education section takes charge of planning effective strategy in order to conduct public education on health problem or disease prevention through various media, as well as coordinating among various related organizations, groups and specialists. Although it is the duty of MOH that deals with the

Project for Strengthening the Capacity for SWM in Ulaabaatar City JICA Annex F: Baseline Survey KOKUSAI KOGYO CO., LTD.
F-39
health problem brought by illegal dumping in Ger Area, they have not stated yet to tackle with the municipal waste problem due to the lack of labor. Although MOH itself does not deal with municipal waste at present, one of the subordinate agencies of MOH called the Environmental Center in the Institute of Public Health (research organization on pollution) is now working for the problem of waste reduction and promotion of recycling. They are now implementing a project which researches on the amount of household waste and medical waste generated in the UB City and the relevance with the public health problem.
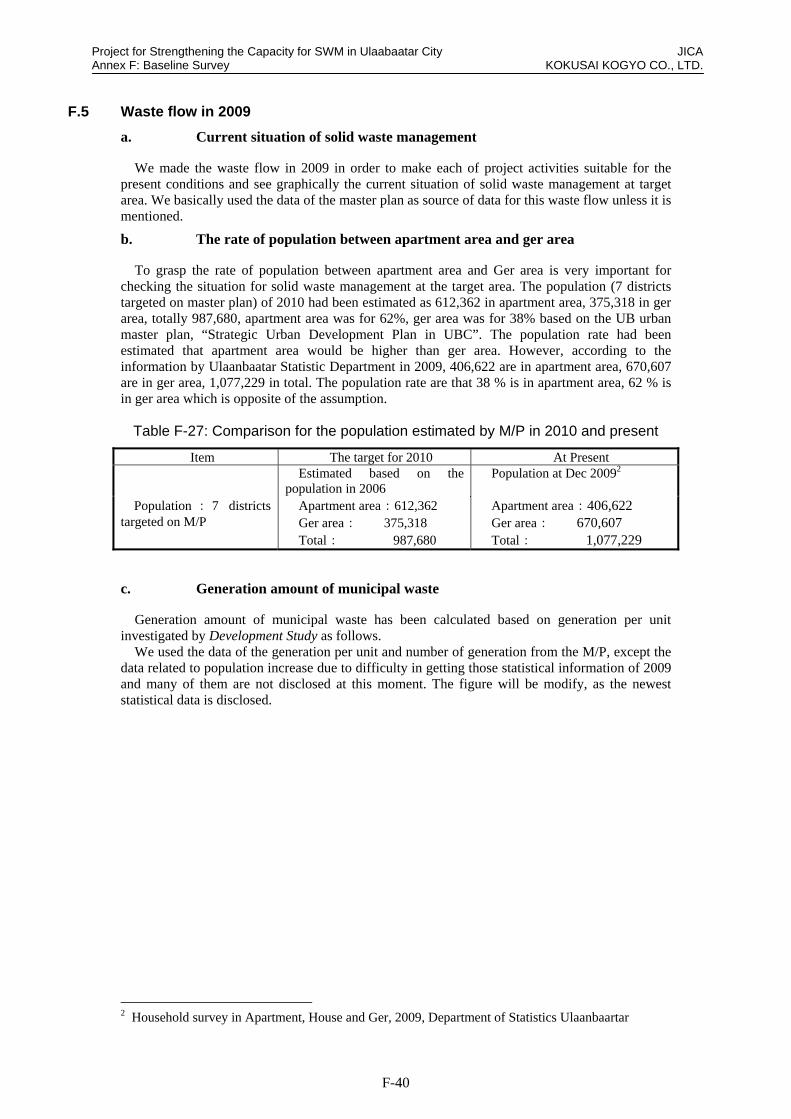
Project for Strengthening the Capacity for SWM in Ulaabaatar City JICA Annex F: Baseline Survey KOKUSAI KOGYO CO., LTD.
F-40
F.5 Waste flow in 2009
a. Current situation of solid waste management
We made the waste flow in 2009 in order to make each of project activities suitable for the present conditions and see graphically the current situation of solid waste management at target area. We basically used the data of the master plan as source of data for this waste flow unless it is mentioned.
b. The rate of population between apartment area and ger area
To grasp the rate of population between apartment area and Ger area is very important for checking the situation for solid waste management at the target area. The population (7 districts targeted on master plan) of 2010 had been estimated as 612,362 in apartment area, 375,318 in ger area, totally 987,680, apartment area was for 62%, ger area was for 38% based on the UB urban master plan, “Strategic Urban Development Plan in UBC”. The population rate had been estimated that apartment area would be higher than ger area. However, according to the information by Ulaanbaatar Statistic Department in 2009, 406,622 are in apartment area, 670,607 are in ger area, 1,077,229 in total. The population rate are that 38 % is in apartment area, 62 % is in ger area which is opposite of the assumption.
Table F-27: Comparison for the population estimated by M/P in 2010 and present
Item The target for 2010 At Present Estimated based on the
population in 2006 Population at Dec 20092
Population : 7 districts targeted on M/P
Apartment area:612,362 Ger area: 375,318 Total: 987,680
Apartment area:406,622 Ger area: 670,607 Total: 1,077,229
c. Generation amount of municipal waste
Generation amount of municipal waste has been calculated based on generation per unit investigated by Development Study as follows.
We used the data of the generation per unit and number of generation from the M/P, except the data related to population increase due to difficulty in getting those statistical information of 2009 and many of them are not disclosed at this moment. The figure will be modify, as the newest statistical data is disclosed.
2 Household survey in Apartment, House and Ger, 2009, Department of Statistics Ulaanbaartar
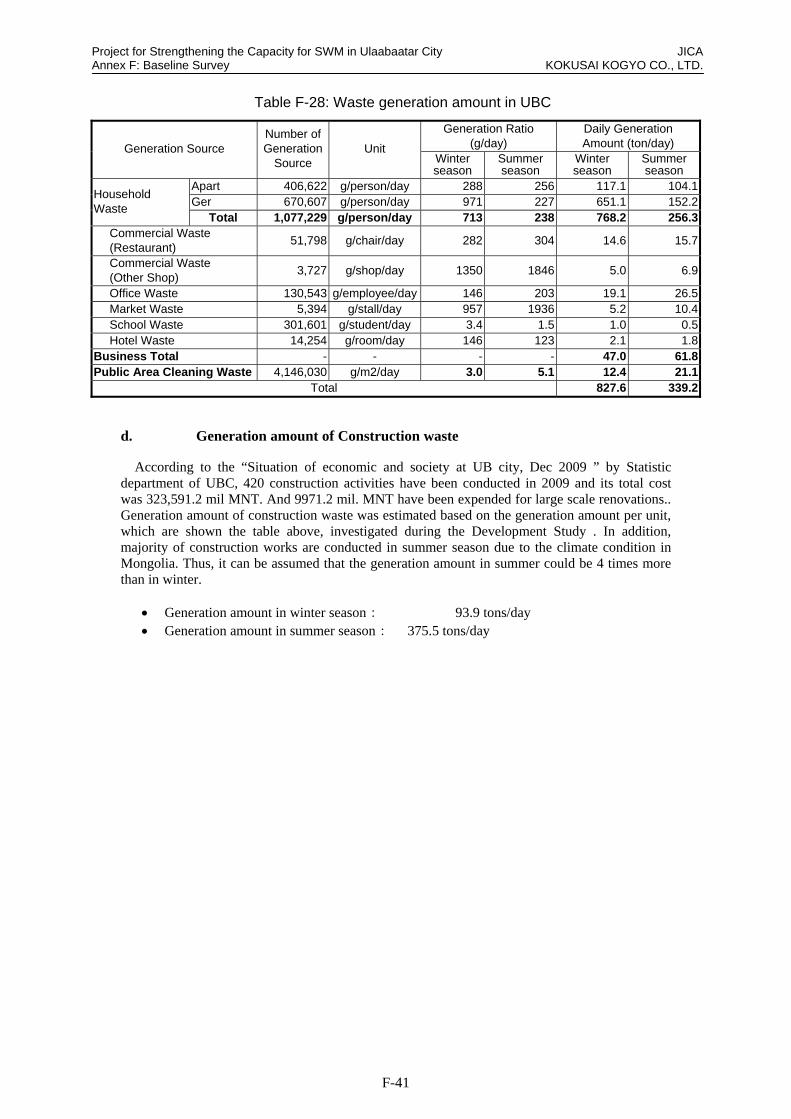
Project for Strengthening the Capacity for SWM in Ulaabaatar City JICA Annex F: Baseline Survey KOKUSAI KOGYO CO., LTD.
F-41
Table F-28: Waste generation amount in UBC
d. Generation amount of Construction waste
According to the “Situation of economic and society at UB city, Dec 2009 ” by Statistic department of UBC, 420 construction activities have been conducted in 2009 and its total cost was 323,591.2 mil MNT. And 9971.2 mil. MNT have been expended for large scale renovations.. Generation amount of construction waste was estimated based on the generation amount per unit, which are shown the table above, investigated during the Development Study . In addition, majority of construction works are conducted in summer season due to the climate condition in Mongolia. Thus, it can be assumed that the generation amount in summer could be 4 times more than in winter.
Generation amount in winter season: 93.9 tons/day Generation amount in summer season: 375.5 tons/day
Generation Ratio (g/day)
Daily Generation Amount (ton/day) Generation Source
Number of Generation
Source Unit
Winter season
Summer season
Winter season
Summer season
Apart 406,622 g/person/day 288 256 117.1 104.1Ger 670,607 g/person/day 971 227 651.1 152.2
Household Waste
Total 1,077,229 g/person/day 713 238 768.2 256.3Commercial Waste (Restaurant)
51,798 g/chair/day 282 304 14.6 15.7
Commercial Waste (Other Shop)
3,727 g/shop/day 1350 1846 5.0 6.9
Office Waste 130,543 g/employee/day 146 203 19.1 26.5Market Waste 5,394 g/stall/day 957 1936 5.2 10.4School Waste 301,601 g/student/day 3.4 1.5 1.0 0.5Hotel Waste 14,254 g/room/day 146 123 2.1 1.8
Business Total - - - - 47.0 61.8Public Area Cleaning Waste 4,146,030 g/m2/day 3.0 5.1 12.4 21.1
Total 827.6 339.2
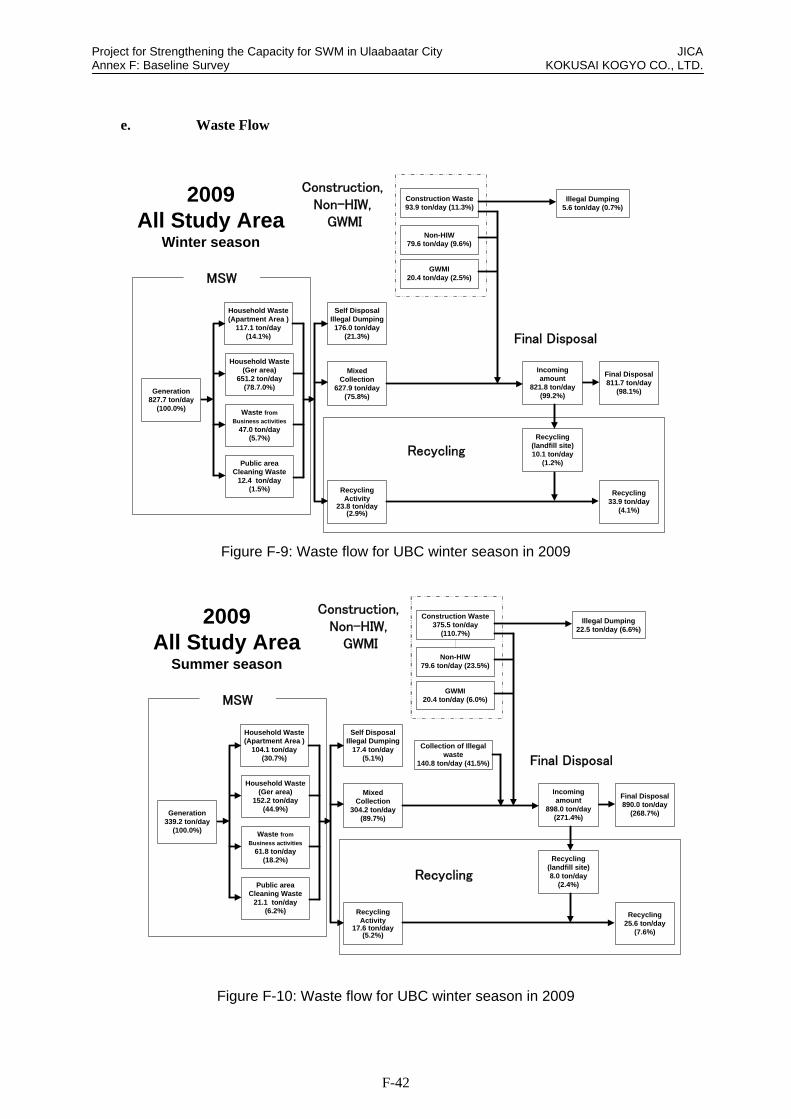
Project for Strengthening the Capacity for SWM in Ulaabaatar City JICA Annex F: Baseline Survey KOKUSAI KOGYO CO., LTD.
F-42
e. Waste Flow
Figure F-9: Waste flow for UBC winter season in 2009
Figure F-10: Waste flow for UBC winter season in 2009
Waste from
Business activities
47.0 ton/day(5.7%)
Self DisposalIllegal Dumping176.0 ton/day
(21.3%)
Recycling Activity
23.8 ton/day (2.9%)
Mixed Collection
627.9 ton/day (75.8%)
Generation827.7 ton/day
(100.0%)
Household Waste(Ger area)
651.2 ton/day(78.7.0%)
Final Disposal811.7 ton/day
(98.1%)
Recycling33.9 ton/day
(4.1%)
Public area Cleaning Waste
12.4 ton/day(1.5%)
Household Waste(Apartment Area )
117.1 ton/day(14.1%)
GWMI20.4 ton/day (2.5%)
Non-HIW79.6 ton/day (9.6%)
Construction Waste93.9 ton/day (11.3%)
Incoming amount
821.8 ton/day (99.2%)
MSW
Final Disposal
Construction,Non-HIW,
GWMI
Recycling
2009All Study Area
Winter season
Recycling (landfill site) 10.1 ton/day
(1.2%)
Illegal Dumping5.6 ton/day (0.7%)
Waste from
Business activities
61.8 ton/day(18.2%)
Self DisposalIllegal Dumping
17.4 ton/day(5.1%)
Recycling Activity
17.6 ton/day (5.2%)
Mixed Collection
304.2 ton/day (89.7%)
Generation339.2 ton/day
(100.0%)
Household Waste(Ger area)
152.2 ton/day(44.9%)
Final Disposal890.0 ton/day
(268.7%)
Recycling25.6 ton/day
(7.6%)
Public area Cleaning Waste
21.1 ton/day(6.2%)
Household Waste(Apartment Area )
104.1 ton/day(30.7%)
GWMI20.4 ton/day (6.0%)
Non-HIW79.6 ton/day (23.5%)
Construction Waste375.5 ton/day
(110.7%)
Incoming amount
898.0 ton/day (271.4%)
MSW
Final Disposal
Construction,Non-HIW,
GWMI
Recycling
2009All Study Area
Summer season
Recycling (landfill site) 8.0 ton/day
(2.4%)
Illegal Dumping22.5 ton/day (6.6%)
Collection of Illegal waste
140.8 ton/day (41.5%)

Project for Strengthening the Capacity for SWM in Ulaabaatar City JICA Annex F: Baseline Survey KOKUSAI KOGYO CO., LTD.
F-43
Table F-29: Basis and the calculation method of Waste flow
Item Basis and the calculation method
(1-1) MSW Generation
(1-2) Household Waste (Apartment Area)
(1-3) Household Waste (Ger Area) (1-4) Waste from Business Activities(1-5) Public Area Cleaning Waste
Refer to the table 2 Waste generation amount at UBC
(2-1) Self Disposal / Illegal Dumping (2-1) = (1-1)-(2-2)-(3-1)
(2-2) Mixed Collection (2-2) = (8)-((4-1)+(4-2))-(5)-(6)-(7) (3-1) Recycling Activity Calculated based on the target value of M/P (3-2) Recycling (landfill site) The record of recyclable materials took out from NEDS (3-3) Recycling (3-3) = (3-1) + (3-2) (4-1) Construction Waste Refer to “1.1.3 generation amount of construction waste ” mentioned
above (4-2) Illegal dumping amount of
Construction waste Calculated based on the target value of M/P
(5) Industrial waste (IW) Calculated based on the predicted value of M/P (6) Medical waste Calculated based on the predicted value of M/P( rate of
population) (7) Collection of Illegal Waste Wastes illegally dumped at ger area on winter season are collected in
summer season. Here, it is calculated as follows. (7) = (2-1) in summer × 0.8
(8) Incoming amount Record of the weigh bridge data at NEDS (9) Final disposal amount (9) = (8) – (3-2)

Project for Strengthening the Capacity for SWM in Ulaabaatar City JICA Annex F: Baseline Survey KOKUSAI KOGYO CO., LTD.
F-44
F.6 Opinion Survey on Waste Collection at Ger Area
a. Objective of the Survey
Under Project Design Matrix (PDM), one of the project purpose is set to be “Waste collection cover rate in Ger area is increased to ## %)
This study is conducted to identify current waste collection cover rate in Ger area by doing questionnaire survey to the residents in Ger area.
This questionnaire survey will be conducted two more time at the mid and the end of the project. Same sample will be selected and asked in future.
At the same time, collection frequency, level of collection services, fee collection rate, and other questions were asked in order to investigate current waste collection service level from the point of residents.
b. Methods of Survey
b.1 Outline of the Survey
Two Ger khoroos are selected in each District and 40 households are selected from each Khoroo. EPWMD staff distributed questionnaire sheets to the target khoroo Government and staff of Khoroo Government distributed questionnaire sheets to each household as follows.
1. Survey Methods: Distribution of Questionnaire Sheets and Collecting Answers.
2. Target: Household living at Ger Khoroos in 6 Districts
3. Number of Respondent: 480 households(HH) living in Ger Khoroo (6 Districts x 2 Khoroos x 40 HH =480 HH)
4. Target Khoroo: 2 Khoroos in 6 Districts, 12 Khoroos in total.
5. Number of Question: 12
6. Main Question: (1) Level of Waste Collection Services (2) Particular of the Respondent
b.2 Selection of Target Khoroo
Selection of Ger Khoroos was made by the EPWMD staff. Each staff has responsible Districts so, each staff select two khoroos from his/her responsible districts.
b.3 Selection of Respondent
Selection of respondent from each Khoroo was made by the Khoroo Governor and instruction to the khoroo governor was made that selection should be at random.
c. Implementation
c.1 Collection of Answers
Khoroo Government staff has collected answer sheets and data was input in the Excel Format which is prepared in advance by the JET. These Excel file has been collected by EPWMD staff and results were analyzed by EPWMD and JET.
c.2 Survey Period
Answer sheets was filled in from 3 May 2010 to 13 May 2010. It took one month to collect these data in a digital format. It took another two weeks for analyzing the results.

Project for Strengthening the Capacity for SWM in Ulaabaatar City JICA Annex F: Baseline Survey KOKUSAI KOGYO CO., LTD.
F-45
c.3 Contents of the Question
c.3.1 Frequency of the Waste Collection and Its Regularity
In this part, frequency and regularity of the waste collection services were asked. Questions are;
1. Do you receive a waste collection services or not? 2. What is the frequency of the waste collection? 3. Do you receive waste collection services regularly? 4. Do you satisfy the waste collection services? 5. What is the appropriate frequency of waste collection? 6. What is the appropriate date for waste collection? 7 What is the reason you do not receive waste collection services.
c.3.2 General Question
General question to the respondent such as,
1. Address 2. Age 3. Sex 4. Educational background
were asked.

Project for Strengthening the Capacity for SWM in Ulaabaatar City JICA Annex F: Baseline Survey KOKUSAI KOGYO CO., LTD.
F-46
Kh
oro
o
Kh
oro
o
TU
K
TU
K
EU
TU
K
CM
PU
A
TU
K
TU
T
TU
K
TUK
Kh
oro
o
Kh
oro
o
TU
K
TU
K
EU
TU
K
CM
PU
A
TU
K
TU
T
TU
K
TUK
Figure F-11: Location of Target Khoroo
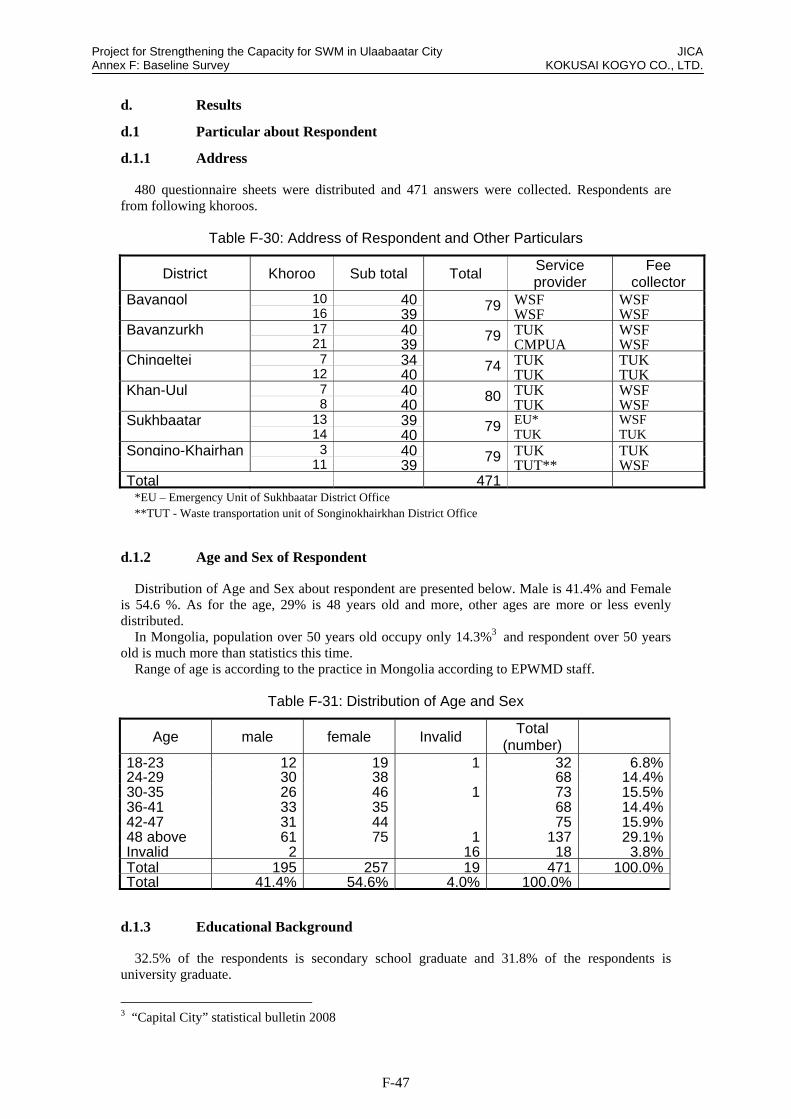
Project for Strengthening the Capacity for SWM in Ulaabaatar City JICA Annex F: Baseline Survey KOKUSAI KOGYO CO., LTD.
F-47
d. Results
d.1 Particular about Respondent
d.1.1 Address
480 questionnaire sheets were distributed and 471 answers were collected. Respondents are from following khoroos.
Table F-30: Address of Respondent and Other Particulars
District Khoroo Sub total Total Service provider
Fee collector
Bayangol 10 40 WSF WSF 16 39
79WSF WSF
Bayanzurkh 17 40 TUK WSF 21 39
79CMPUA WSF
Chingeltei 7 34 TUK TUK 12 40
74TUK TUK
Khan-Uul 7 40 TUK WSF 8 40
80TUK WSF
Sukhbaatar 13 39 EU* WSF 14 40
79TUK TUK
Songino-Khairhan 3 40 TUK TUK 11 39
79TUT** WSF
Total 471 *EU – Emergency Unit of Sukhbaatar District Office **TUT - Waste transportation unit of Songinokhairkhan District Office
d.1.2 Age and Sex of Respondent
Distribution of Age and Sex about respondent are presented below. Male is 41.4% and Female is 54.6 %. As for the age, 29% is 48 years old and more, other ages are more or less evenly distributed.
In Mongolia, population over 50 years old occupy only 14.3%3 and respondent over 50 years old is much more than statistics this time.
Range of age is according to the practice in Mongolia according to EPWMD staff.
Table F-31: Distribution of Age and Sex
Age male female Invalid Total
(number)
18-23 12 19 1 32 6.8%24-29 30 38 68 14.4%30-35 26 46 1 73 15.5%36-41 33 35 68 14.4%42-47 31 44 75 15.9%48 above 61 75 1 137 29.1%Invalid 2 16 18 3.8%Total 195 257 19 471 100.0%Total 41.4% 54.6% 4.0% 100.0%
d.1.3 Educational Background
32.5% of the respondents is secondary school graduate and 31.8% of the respondents is university graduate.
3 “Capital City” statistical bulletin 2008
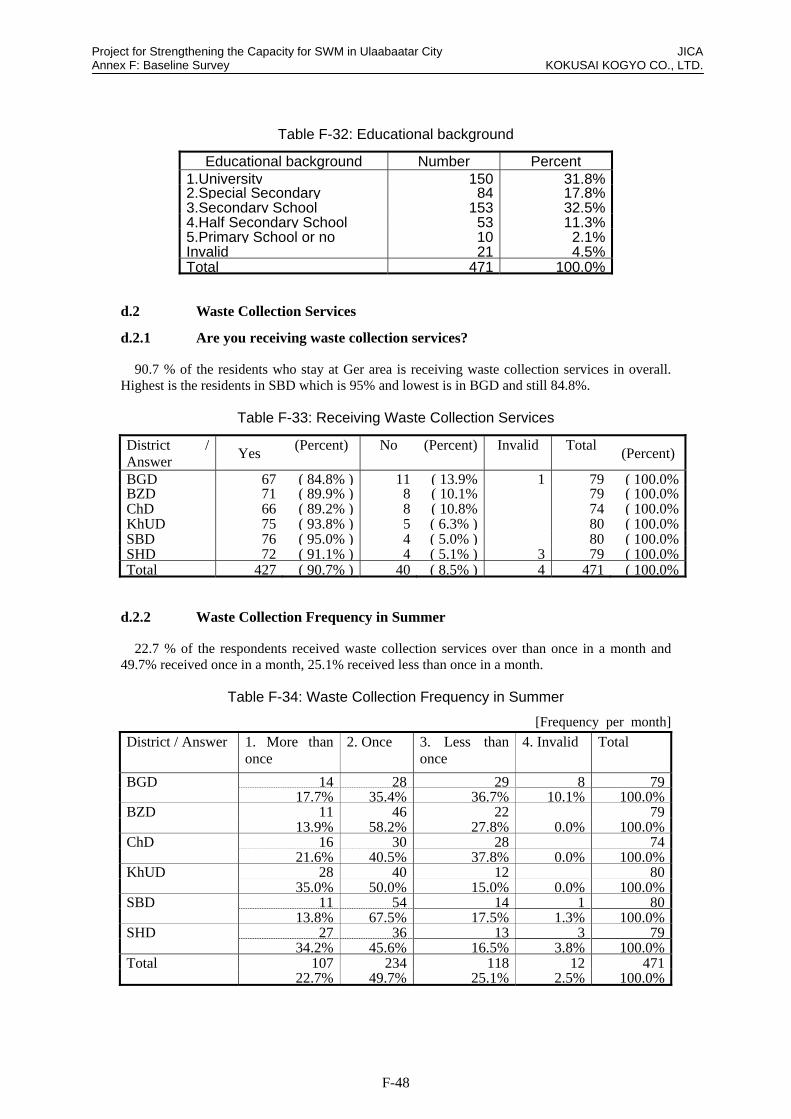
Project for Strengthening the Capacity for SWM in Ulaabaatar City JICA Annex F: Baseline Survey KOKUSAI KOGYO CO., LTD.
F-48
Table F-32: Educational background
Educational background Number Percent 1.University 150 31.8% 2.Special Secondary 84 17.8% 3.Secondary School 153 32.5% 4.Half Secondary School 53 11.3% 5.Primary School or no 10 2.1% Invalid 21 4.5% Total 471 100.0%
d.2 Waste Collection Services
d.2.1 Are you receiving waste collection services?
90.7 % of the residents who stay at Ger area is receiving waste collection services in overall. Highest is the residents in SBD which is 95% and lowest is in BGD and still 84.8%.
Table F-33: Receiving Waste Collection Services
District / Answer
Yes (Percent) No (Percent) Invalid Total
(Percent)
BGD 67 ( 84.8% ) 11 ( 13.9% 1 79 ( 100.0% BZD 71 ( 89.9% ) 8 ( 10.1% 79 ( 100.0% ChD 66 ( 89.2% ) 8 ( 10.8% 74 ( 100.0% KhUD 75 ( 93.8% ) 5 ( 6.3% ) 80 ( 100.0% SBD 76 ( 95.0% ) 4 ( 5.0% ) 80 ( 100.0% SHD 72 ( 91.1% ) 4 ( 5.1% ) 3 79 ( 100.0% Total 427 ( 90.7% ) 40 ( 8.5% ) 4 471 ( 100.0%
d.2.2 Waste Collection Frequency in Summer
22.7 % of the respondents received waste collection services over than once in a month and 49.7% received once in a month, 25.1% received less than once in a month.
Table F-34: Waste Collection Frequency in Summer
[Frequency per month]
District / Answer 1. More than once
2. Once 3. Less than once
4. Invalid Total
BGD 14 28 29 8 79 17.7% 35.4% 36.7% 10.1% 100.0%BZD 11 46 22 79 13.9% 58.2% 27.8% 0.0% 100.0%ChD 16 30 28 74 21.6% 40.5% 37.8% 0.0% 100.0%KhUD 28 40 12 80 35.0% 50.0% 15.0% 0.0% 100.0%SBD 11 54 14 1 80 13.8% 67.5% 17.5% 1.3% 100.0%SHD 27 36 13 3 79 34.2% 45.6% 16.5% 3.8% 100.0%Total 107 234 118 12 471 22.7% 49.7% 25.1% 2.5% 100.0%

Project for Strengthening the Capacity for SWM in Ulaabaatar City JICA Annex F: Baseline Survey KOKUSAI KOGYO CO., LTD.
F-49
d.2.3 Waste Collection Frequency in Winter
28.7 % of the respondents received waste collection services over than once in a month and 43.5% received once in a month, 24.0% received less than once in a month. According to the results, there is not much difference between summer and winter in terms of collection frequency.
Table F-35: Waste Collection Frequency in Winter
[Frequency per month]
District / Answer 1. More than once
2. Once 3. Less than once
4. Invalid
Total
BGD 20 22 27 10 79 25.3% 27.8% 34.2% 12.7% 100.0%BZD 21 37 20 1 79 26.6% 46.8% 25.3% 1.3% 100.0%ChD 10 32 32 74 13.5% 43.2% 43.2% 0.0% 100.0%KhUD 38 33 9 80 47.5% 41.3% 11.3% 0.0% 100.0%SBD 14 57 8 1 80 17.5% 71.3% 10.0% 1.3% 100.0%SHD 32 24 17 6 79 40.5% 30.4% 21.5% 7.6% 100.0%Total 135 205 113 18 471 28.7% 43.5% 24.0% 3.8% 100.0%
d.2.4 Regular Waste Collection
64.1% of the respondents replied that waste collection services are irregularly. In SBD, more than 50% of the respondents replied that collection services are regular, hence in ChD, merely 10.8 % of the respondents replied it is regular.
Table F-36: Regular Waste Collection
District / Answer 1. Regularly 2. Irregularly 3. Invalid Total
BGD 28 50 1 79 35.4% 63.3% 1.3% 100.0% BZD 25 54 79 31.6% 68.4% 0.0% 100.0% ChD 8 63 3 74 10.8% 85.1% 4.1% 100.0% KhUD 28 52 80 35.0% 65.0% 0.0% 100.0% SBD 42 38 80 52.5% 47.5% 0.0% 100.0% SHD 33 45 1 79 41.8% 57.0% 1.3% 100.0% Total 164 302 5 471 34.8% 64.1% 1.1% 100.0%
d.2.5 Appropriateness of Current Waste Collection Frequency
40.6 % of the respondents replied collection frequency is appropriate. Hence, 48.2 % replied it is not appropriate, 9.8% replied I do not know. 56.3% in SBD and 46.3% in KhUD replied it is appropriate, 64.9% in ChD and 63.3 % in BGD replied it is not appropriate.

Project for Strengthening the Capacity for SWM in Ulaabaatar City JICA Annex F: Baseline Survey KOKUSAI KOGYO CO., LTD.
F-50
Table F-37: Appropriateness of Current Waste Collection Frequency
District / Answer
1. Yes Appropriate
2. No not enough
3. Do not know
4. Invalid Total
BGD 19 50 8 2 79 24.1% 63.3% 10.1% 2.5% 100.0%BZD 36 37 6 79 45.6% 46.8% 7.6% 0.0% 100.0%ChD 18 48 8 74 24.3% 64.9% 10.8% 0.0% 100.0%KhUD 37 28 14 1 80 46.3% 35.0% 17.5% 1.3% 100.0%SBD 45 28 6 1 80 56.3% 35.0% 7.5% 1.3% 100.0%SHD 36 36 4 3 79 45.6% 45.6% 5.1% 3.8% 100.0%Total 191 227 46 7 471 40.6% 48.2% 9.8% 1.5% 100.0%
d.2.6 Appropriateness of Waste Collection Frequency depend on Current Service Level
Same answer was analyzed depend on current service level. 51.2 % of the respondent, who received waste collection services over than once in a month, replied that the frequency is appropriate and 48.5 % of the respondent, who received once in a month, replied that the frequency is appropriate. There are not much differences. Hence, 74% of the respondents, who received waste collection services less than once in a month, replied that the frequency is not appropriate.
Based on the results, once in a month is the level of services which most of the people think it is appropriate.
Table F-38: Appropriateness of Waste Collection Frequency depend on Current Service Level
Frequency* /Answer
1. Yes Appropriate
2. No not enough
3. Do not know
4. Invalid
Total
1. More than 62 48 9 3 121 once 51.2% 39.3% 7.4% 2.1% 100.0%2. Once 107 85 26 3 220 48.5% 38.7% 11.6% 1.1% 100.0%3. Less than once 21 86 9 1 116 18.2% 74.0% 7.4% 0.9% 100.0%Invalid 2 9 3 2 15 10.0% 60.0% 20.0% 10.0% 100.0%Total 191 227 46 7 471 40.6% 48.2% 9.8% 1.5% 100.0%
d.2.7 Desire for Frequency of Waste Collection
38.2 % of the respondents replied once in a month, and 25.3% replied once in two weeks and 21.4% replied once in three weeks.
Table F-39: Desire for Waste Collection Frequency
District / Answer
Once in a week
Once in 2 weeks
Once in 3 weeks
Once in a month
Once in 1.5 month
Once in 2 month
Invalid Total
BGD 11 25 17 23 2 1 79
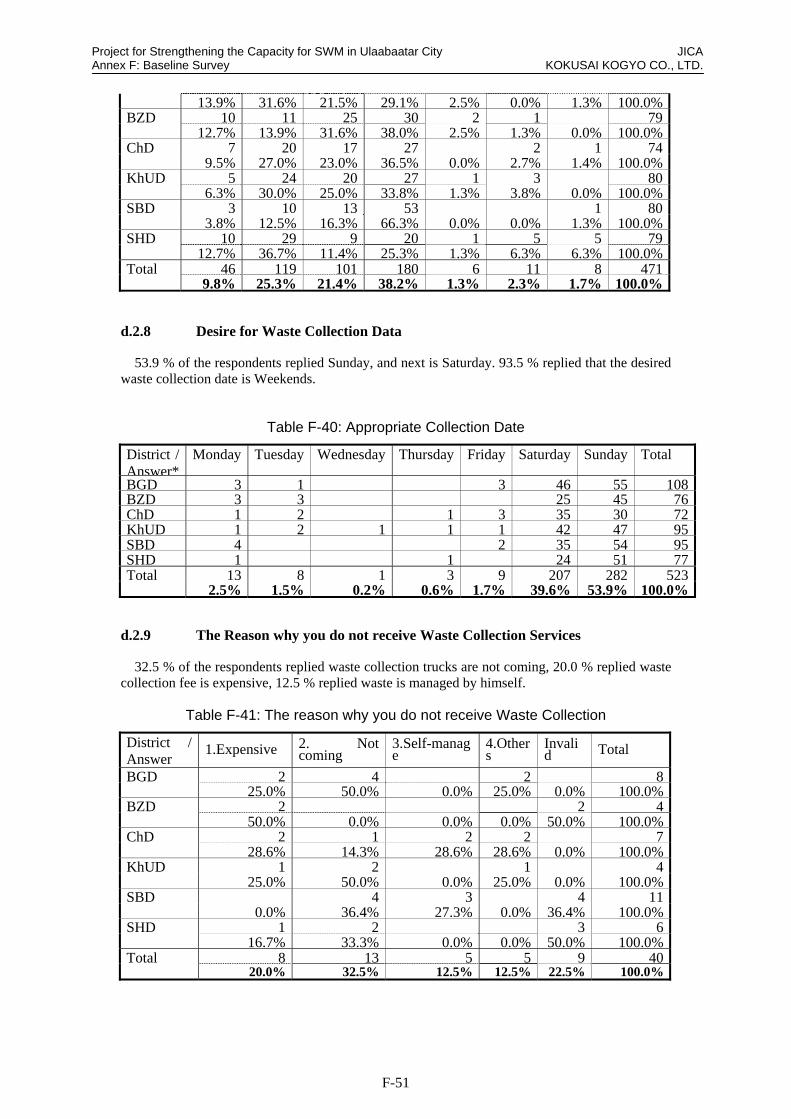
Project for Strengthening the Capacity for SWM in Ulaabaatar City JICA Annex F: Baseline Survey KOKUSAI KOGYO CO., LTD.
F-51
13.9% 31.6% 21.5% 29.1% 2.5% 0.0% 1.3% 100.0%BZD 10 11 25 30 2 1 79 12.7% 13.9% 31.6% 38.0% 2.5% 1.3% 0.0% 100.0%ChD 7 20 17 27 2 1 74 9.5% 27.0% 23.0% 36.5% 0.0% 2.7% 1.4% 100.0%KhUD 5 24 20 27 1 3 80 6.3% 30.0% 25.0% 33.8% 1.3% 3.8% 0.0% 100.0%SBD 3 10 13 53 1 80 3.8% 12.5% 16.3% 66.3% 0.0% 0.0% 1.3% 100.0%SHD 10 29 9 20 1 5 5 79 12.7% 36.7% 11.4% 25.3% 1.3% 6.3% 6.3% 100.0%Total 46 119 101 180 6 11 8 471 9.8% 25.3% 21.4% 38.2% 1.3% 2.3% 1.7% 100.0%
d.2.8 Desire for Waste Collection Data
53.9 % of the respondents replied Sunday, and next is Saturday. 93.5 % replied that the desired waste collection date is Weekends.
Table F-40: Appropriate Collection Date
District / Answer*
Monday Tuesday Wednesday Thursday Friday Saturday Sunday Total
BGD 3 1 3 46 55 108BZD 3 3 25 45 76ChD 1 2 1 3 35 30 72KhUD 1 2 1 1 1 42 47 95SBD 4 2 35 54 95SHD 1 1 24 51 77Total 13 8 1 3 9 207 282 523 2.5% 1.5% 0.2% 0.6% 1.7% 39.6% 53.9% 100.0%
d.2.9 The Reason why you do not receive Waste Collection Services
32.5 % of the respondents replied waste collection trucks are not coming, 20.0 % replied waste collection fee is expensive, 12.5 % replied waste is managed by himself.
Table F-41: The reason why you do not receive Waste Collection
District / Answer
1.Expensive 2. Not coming
3.Self-manage
4.Others
Invalid Total
BGD 2 4 2 8 25.0% 50.0% 0.0% 25.0% 0.0% 100.0%BZD 2 2 4 50.0% 0.0% 0.0% 0.0% 50.0% 100.0%ChD 2 1 2 2 7 28.6% 14.3% 28.6% 28.6% 0.0% 100.0%KhUD 1 2 1 4 25.0% 50.0% 0.0% 25.0% 0.0% 100.0%SBD 4 3 4 11 0.0% 36.4% 27.3% 0.0% 36.4% 100.0%SHD 1 2 3 6 16.7% 33.3% 0.0% 0.0% 50.0% 100.0%Total 8 13 5 5 9 40 20.0% 32.5% 12.5% 12.5% 22.5% 100.0%
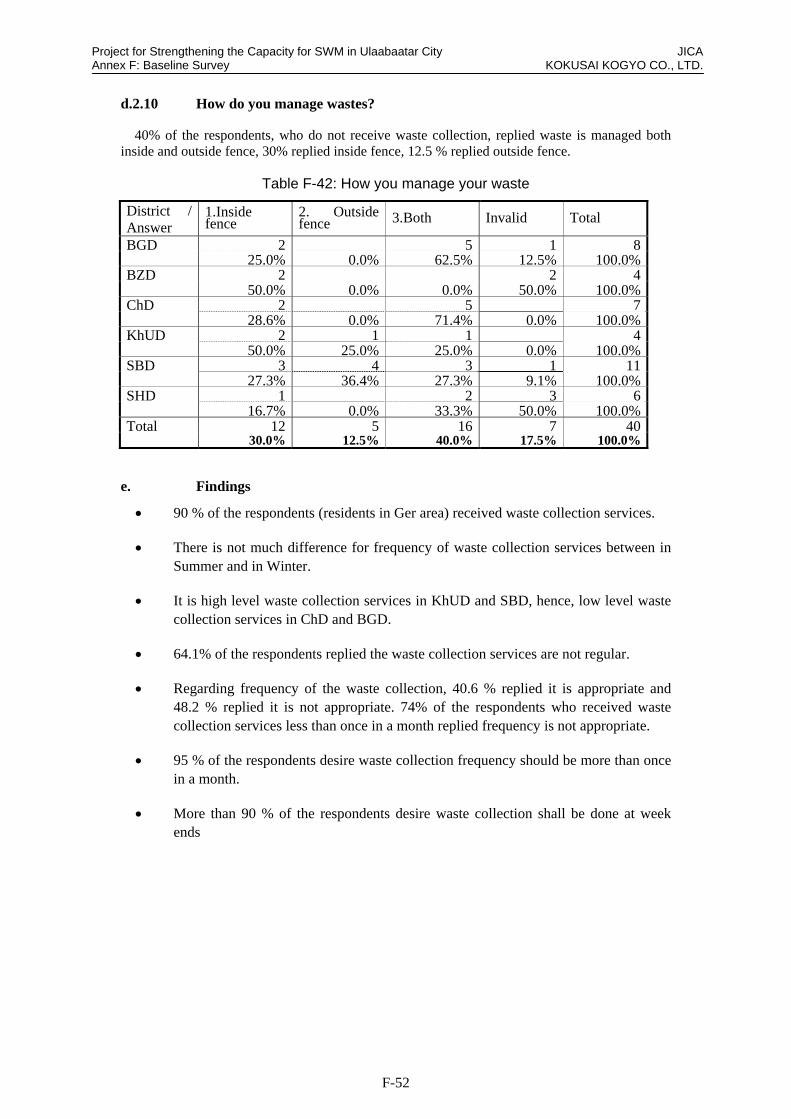
Project for Strengthening the Capacity for SWM in Ulaabaatar City JICA Annex F: Baseline Survey KOKUSAI KOGYO CO., LTD.
F-52
d.2.10 How do you manage wastes?
40% of the respondents, who do not receive waste collection, replied waste is managed both inside and outside fence, 30% replied inside fence, 12.5 % replied outside fence.
Table F-42: How you manage your waste
District / Answer
1.Inside fence
2. Outside fence 3.Both Invalid Total
BGD 2 5 1 8 25.0% 0.0% 62.5% 12.5% 100.0% BZD 2 2 4 50.0% 0.0% 0.0% 50.0% 100.0% ChD 2 5 7 28.6% 0.0% 71.4% 0.0% 100.0% KhUD 2 1 1 4 50.0% 25.0% 25.0% 0.0% 100.0% SBD 3 4 3 1 11 27.3% 36.4% 27.3% 9.1% 100.0% SHD 1 2 3 6 16.7% 0.0% 33.3% 50.0% 100.0% Total 12 5 16 7 40 30.0% 12.5% 40.0% 17.5% 100.0%
e. Findings
90 % of the respondents (residents in Ger area) received waste collection services.
There is not much difference for frequency of waste collection services between in Summer and in Winter.
It is high level waste collection services in KhUD and SBD, hence, low level waste collection services in ChD and BGD.
64.1% of the respondents replied the waste collection services are not regular.
Regarding frequency of the waste collection, 40.6 % replied it is appropriate and 48.2 % replied it is not appropriate. 74% of the respondents who received waste collection services less than once in a month replied frequency is not appropriate.
95 % of the respondents desire waste collection frequency should be more than once in a month.
More than 90 % of the respondents desire waste collection shall be done at week ends
Project for Strengthening the Capacity for SWM in Ulaabaatar City JICA Annex F: Baseline Survey KOKUSAI KOGYO CO., LTD.
F-53
F.7 Pilot Project (Waste Separation and Recycling)
F.7.1 Time & Motion Survey (Summary)
a. Objective of the Survey
The objective of the survey is to obtain basic information related to the current condition of waste collection services (waste collection routes, collection frequency and amount of wastes discharged by each type of organization) being conducted in 4 target khoroos selected for the Pilot Project on Waste Separation and Recycling in order for the JET to prepare a waste collection plan to be applied to the pilot project.
b. Methodology
b.1 Outline of the survey
1. Method: Taking records of every movement conducted by collection teams while following trucks working on waste collection.
2. Duration: 1 week
3. Survey target: Collection trucks working on waste collection in the target khoroos of the pilot project.
4. Number of the targets: Basically, 1 truck in each khoroo
5. Target areas: The khoroos #5 & #7, Sukhbaatar district and the khoroos #1 & #7, Bayanzurkh district.
6. Items of record: Specifications of vehicles, contents of activities, duration, collected amounts, collection places etc.
b.2 Implementation of the Survey
Before commencing the survey, the JET had provided the waste collecting organizations that serve the target khoroos with sufficient information and obtained their approval for and cooperation on the implementation of the survey.
Throughout the implementation, the survey staff followed the collection trucks, tracked the whole cycle of waste collection conducted each day starting with the commencement of collection until the waste is disposed at NEDS after the last collection, recorded activities conducted by the collection team onto a specific sheet (record sheet), and analyzed the current conditions of waste collection.
b.3 Duration of the Survey
The durations of the surveys implemented in each khoroo are shown in the following table. The minimum number of trips conducted in a week is 8 trips, while the maximum is 12 trips in one khoroo.
Location Duration Day off Total trip

Project for Strengthening the Capacity for SWM in Ulaabaatar City JICA Annex F: Baseline Survey KOKUSAI KOGYO CO., LTD.
F-54
Khoroo #5, SBD 7 days (23 Mar 2010 to 29 Mar, 2010) 1 day 12
Khoroo #7, SBD 7 days (15 Apr 2010 to 21 Apr 2010) 1 day 9
Khoroo #1, BZD 7 days (7 May 2010 to 13 May 2010) 1 day 11*
Khoroo #7, BZD 7 days (31 Mar 2010 to 6 Apr 2010) 2 days 8
(Note): *2 of which were conducted by a truck that belong to Tsuzuku Yume Co. Ltd, a company that was not contracted for collection in the khoroo.
b.4 Waste collection organization
The waste collection organizations are Tuzuku Yume Co. Ltd., (a private company) and the Emergency Unit (waste collection unit of Sukhbaatar district government) for the khoroos of Sukhbaatar district, while the CMPUA (a municipal company) for the khoroos of Bayanzurkh district as shown in the table below.
Location Waste collection service provider
SBD khoroo #5 Tsuzuku Yume CO.,LTD.
SBD khoroo #7 Emergency Unit under Sukhbaatar district governor (EU)
BZD khoroo #1 City Maintenance Public Utility Agency under Ulaanbaatar Mayor (CMPUA)
BZD khoroo #7 City Maintenance Public Utility Agency under Ulaanbaatar Mayor (CMPUA)
b.5 Record Sheet
The record sheet used for the survey contained 12 items. They were: each activity, starting and ending time of each activity, duration of the activity, volume of the wastes collected, rotation number of loading plate, existence of separate collection at the source, number or name of apartments, existence of dust chutes (DC) in the apartment, number of watchmen or cleaning workers, name of organizations from which waste is collected, type of the organizations and blank space for special notes.
c. Results of the Survey
c.1 Types of the Collection Vehicles
A dump truck is used for collection in khoroo #7 of SBD, while compactor trucks are used for the rest of the target khoroos. The dump truck is not appropriate for collection in apartment khoroos since waste should be compacted due to its higher discharge amount and waste loading is quite difficult due to the truck's body specifications. Therefore, loading waste onto this truck requires 2 collection workers, while 1 is sufficient for a compactor truck.
Table F-43: Specifications of the Collection Trucks
Specifications SBD, Khoroo #5 SBD, Khoroo #7 BZD, Khoroo #1 BZD, Khoroo #7
Type Compactor Dump truck Compactor Compactor
Registration No. UBZ 61-59 UNB 23-54 UBV 77-09 UBV 77-10
Year made 1997 2009 1997 1997
Volume of Body 6.5 m3 17 m3 6.24 m3 6.24 m3
Loading Capacity 3.3 tons 3.0 tons 3.8 tons 3.8 tons
Crew 1 driver, 1 worker 1 driver, 2 workers 1 driver, 1 worker 1 driver, 1 worker
Company Tsuzuku Yume Emergency Unit CMPUA CMPUA

Project for Strengthening the Capacity for SWM in Ulaabaatar City JICA Annex F: Baseline Survey KOKUSAI KOGYO CO., LTD.
F-55
SBD khoroo#5 SBD khoroo#7 BZD khoroo#1 BZD khoroo#7
c.2 Trip Hours and Amounts of Collected Wastes by Trip
Detailed information of each trip is shown in the table below. As can be seen in the table, 12 trips were conducted in SBD-5 as the maximum, while the minimum is 8 trips conducted in BZD-7. Among the average amounts of waste per trip, the maximum amount was 3,600 kg in BZD-1, while the minimum was 2,868 kg in SBD-7. As for the latter, the work efficiency was the lowest since the collection team often worked until late in the evening, even after the closure time of the NEDS, due to inconvenience of the dump truck. Therefore, the driver had to take the truck to home with the loaded waste twice during the survey.
Table F-44: Details of the trips
Trip no. Date Starting Time Ending Time Duration Amount of Waste Transported
1 3/23 8:00 11:56 3:56 3,150 kg2 3/23 11:56 17:27 5:31 3,020 kg3 3/24 7:25 11:45 4:20 2,940 kg4 3/24 11:45 18:27 6:42 3,220 kg5 3/25 7:20 12:00 4:40 2,920 kg6 3/25 12:00 17:04 5:04 3,020 kg7 3/26 7:25 12:54 5:29 3,000 kg8 3/26 12:54 19:03 6:09 2,940 kg9 3/27 8:35 13:00 4:25 2,780 kg
10 3/27 13:00 17:54 4:54 2,760 kg11 3/29 7:00 12:25 5:25 3,620 kg12 3/29 12:25 - * 3,440 kg
SB
D #
5
Total, 56:35Avg,5:08
Total,36,810 kg Avg,3,068 kg
1 4/15 8:35 15:46 7:11 2,740 kg2 4/15 15:46 21:40 5:54 2,360 kg3 4/16 8:10 16:16 8:06 3,060 kg4 4/16 16:16 22:52(09:18**) 6:36 2,300 kg5 4/17 8:50 17:31 8:41 3,080 kg6 4/19 8:05 13:44 5:39 3,390 kg7 4/19 13:44 20:27 6:43 2,440 kg8 4/20 9:25 16:50(08:15**) 7:25 2,720 kg9 4/21 7:30 18:43 11:13 3,720 kg
SB
D #
7
Total,72:36 Avg,7:29
Total,28,878 kg Avg,2,868 kg
1 5/7 8:10 11:40 3:30 3,500 kg2 5/7 11:40 16:40 5:00 3,880 kg3 5/8 8:58 12:38 3:40 3,380 kg4 5/8 12:38 18:23 5:45 3,920 kg5 5/9 9:08 12:36 3:28 2,760 kg6 5/10 9:40 12:23 2:43 3,560 kg7 5/10 12:23 18:49 6:26 3,700 kg
BZ
D #
1
8 5/11 8:15 12:29 4:14 3,680 kg
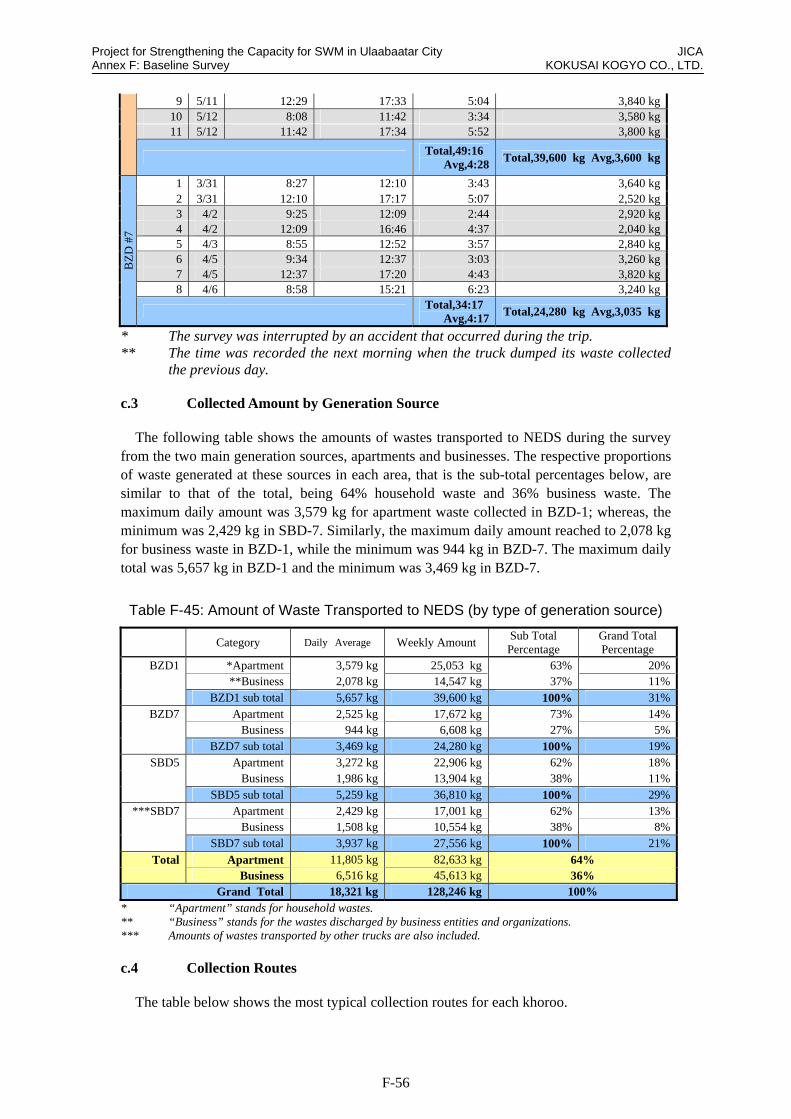
Project for Strengthening the Capacity for SWM in Ulaabaatar City JICA Annex F: Baseline Survey KOKUSAI KOGYO CO., LTD.
F-56
9 5/11 12:29 17:33 5:04 3,840 kg10 5/12 8:08 11:42 3:34 3,580 kg11 5/12 11:42 17:34 5:52 3,800 kg
Total,49:16 Avg,4:28
Total,39,600 kg Avg,3,600 kg
1 3/31 8:27 12:10 3:43 3,640 kg2 3/31 12:10 17:17 5:07 2,520 kg3 4/2 9:25 12:09 2:44 2,920 kg4 4/2 12:09 16:46 4:37 2,040 kg5 4/3 8:55 12:52 3:57 2,840 kg6 4/5 9:34 12:37 3:03 3,260 kg7 4/5 12:37 17:20 4:43 3,820 kg8 4/6 8:58 15:21 6:23 3,240 kg
BZ
D #
7
Total,34:17 Avg,4:17
Total,24,280 kg Avg,3,035 kg
* The survey was interrupted by an accident that occurred during the trip. ** The time was recorded the next morning when the truck dumped its waste collected
the previous day. c.3 Collected Amount by Generation Source
The following table shows the amounts of wastes transported to NEDS during the survey from the two main generation sources, apartments and businesses. The respective proportions of waste generated at these sources in each area, that is the sub-total percentages below, are similar to that of the total, being 64% household waste and 36% business waste. The maximum daily amount was 3,579 kg for apartment waste collected in BZD-1; whereas, the minimum was 2,429 kg in SBD-7. Similarly, the maximum daily amount reached to 2,078 kg for business waste in BZD-1, while the minimum was 944 kg in BZD-7. The maximum daily total was 5,657 kg in BZD-1 and the minimum was 3,469 kg in BZD-7.
Table F-45: Amount of Waste Transported to NEDS (by type of generation source)
Category Daily Average Weekly AmountSub Total Percentage
Grand Total Percentage
BZD1 *Apartment 3,579 kg 25,053 kg 63% 20% **Business 2,078 kg 14,547 kg 37% 11% BZD1 sub total 5,657 kg 39,600 kg 100% 31%
BZD7 Apartment 2,525 kg 17,672 kg 73% 14% Business 944 kg 6,608 kg 27% 5% BZD7 sub total 3,469 kg 24,280 kg 100% 19%
SBD5 Apartment 3,272 kg 22,906 kg 62% 18% Business 1,986 kg 13,904 kg 38% 11% SBD5 sub total 5,259 kg 36,810 kg 100% 29%
***SBD7 Apartment 2,429 kg 17,001 kg 62% 13% Business 1,508 kg 10,554 kg 38% 8% SBD7 sub total 3,937 kg 27,556 kg 100% 21%
Total Apartment 11,805 kg 82,633 kg 64% Business 6,516 kg 45,613 kg 36%
Grand Total 18,321 kg 128,246 kg 100% * “Apartment” stands for household wastes. ** “Business” stands for the wastes discharged by business entities and organizations. *** Amounts of wastes transported by other trucks are also included. c.4 Collection Routes
The table below shows the most typical collection routes for each khoroo.

Project for Strengthening the Capacity for SWM in Ulaabaatar City JICA Annex F: Baseline Survey KOKUSAI KOGYO CO., LTD.
F-57
In BZD-1, wastes from apartments without DC are collected in the mornings, and those of both apartments without DC and of businesses are collected in the afternoons every Mon, Wed and Fri. As for the rest of the days except Thur, the day-off, wastes generated by apartments with DC and specified business entities or organizations are collected.
In BZD-7, wastes discharged by apartments are collected together with those of business entities/organizations every Mon, Wed and Fri, while the waste generated at apartments with DC is collected every Tue and Sat.
Table F-46: Typical Collection Routes in BZD Khoroos
No. BZD-1 DP
TypeSchedul
e BZD-7 DP
Types Schedul
e
1 22 AP TDP yes 23 AP TDP yes 2 19, 21 AP TDP yes DP on street BS DPo yes 3 18 AP TDP yes 24 AP TDP yes 4 17a AP TDP yes 115,116,29,58 AP TDP yes 5 17 AP TDP yes 24 AP TDP yes 6 Sansar-23 AP TDP yes 30 AP TDP yes 7 20 AP ODP yes Sansar Hotel,bank,restaurant BS mixed yes 8 26a AP TDP yes DP on street BS DPo yes 9 16 AP TDP yes 31 AP TDP yes 10 14, 15 AP TDP yes DP on street BS DPo yes 11 101, 102, 103 AP TDP yes DP on street BS DPo yes 12 Anod bank BS ODP yes Shunkhlai BS TDP yes 13 27, 28 AP TDP yes DP on street BS DPo yes 14 26 AP TDP yes 37a AP Other yes 15 25 AP TDP yes 37b,38b,40,57L AP TDP yes 16 8 kiosks along the road BS TDP yes 57S AP TDP yes 17 24 AP TDP yes Auto service BS TDP yes 18 Naranbulag BS TDP yes Gerel Center BS TDP yes 19 23 AP TDP yes Taiji Hotel BS ODP yes
20 shops, barbers and supermarket
BS TDP yes 41,41a,59 AP TDP yes
21 Veni, Gun molor, New, Elsen tsag, Hotel, plus shops
BS TDP yes Buudai Hotel BS ODP yes
22 Illegally dumped behind the 52 apart.
BS DPo yes Fresh SM, MCPC BS TDP yes
23 52, 30 AP TDP yes D8,36g, church, bank, Ham factory)
BS TDP yes
24 4/1, 4/2 AP TDP yes BZD #1Hospital BS ODP yes 25 Sky shopping center BS ODP yes 38a AP ODP yes
(Note): 1. Types of the Discharge Points (DP): 1) DC: dust chute; 2) TDP: a temporary discharge
point where residents or watchmen place their wastes just before or at the same time with the arrival of collection trucks; 3) ODP: an outside discharge point where containers, fenced areas etc are arranged into which residents are allowed to discharge their wastes at anytime; 4) DPO: a discharge point where wastes are habitually open-dumped directly on the street (the figure below shows the images of each type of DPs);
2. AP: apartments, BS: business entities and organizations; 3. Schedule: shows whether wastes are collected in accordance with scheduled time
informed to the residents; and 4. The part of the table that has not been shaded represents the collection points of the 1st trip
and the shaded part shows those of the 2nd trip of the day.
Figure F-12: Image of Each Type of DPs
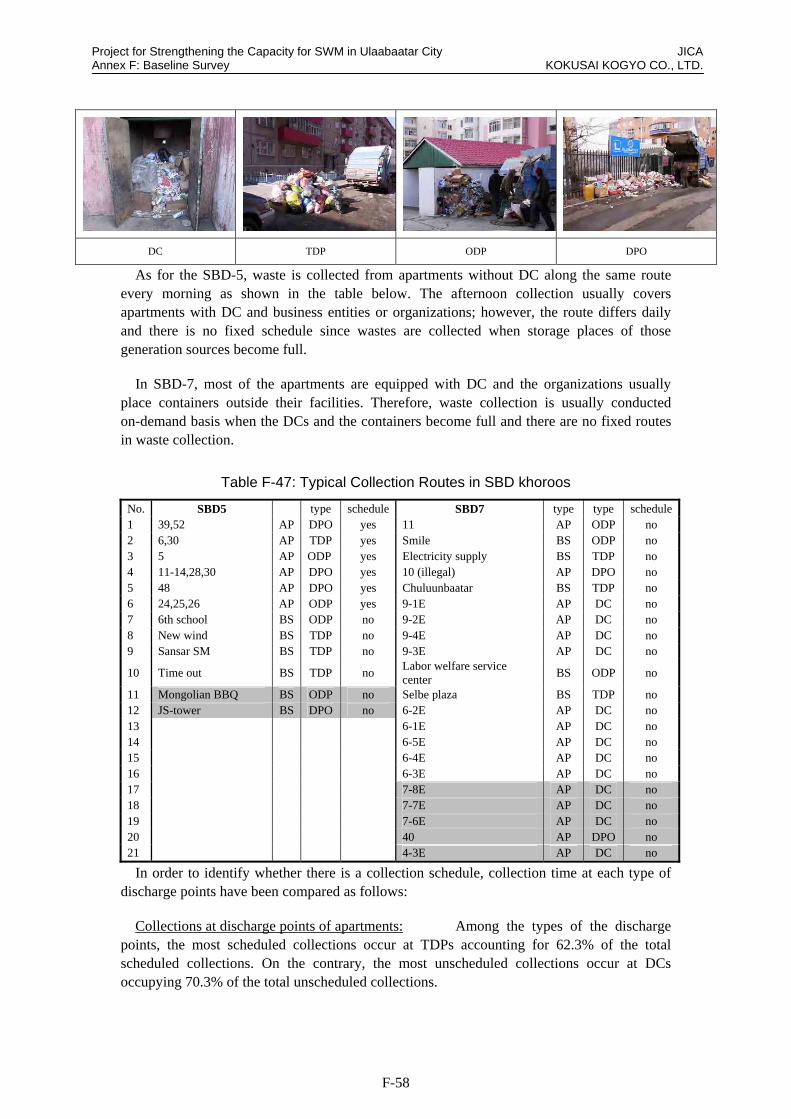
Project for Strengthening the Capacity for SWM in Ulaabaatar City JICA Annex F: Baseline Survey KOKUSAI KOGYO CO., LTD.
F-58
DC TDP ODP DPO
As for the SBD-5, waste is collected from apartments without DC along the same route every morning as shown in the table below. The afternoon collection usually covers apartments with DC and business entities or organizations; however, the route differs daily and there is no fixed schedule since wastes are collected when storage places of those generation sources become full.
In SBD-7, most of the apartments are equipped with DC and the organizations usually place containers outside their facilities. Therefore, waste collection is usually conducted on-demand basis when the DCs and the containers become full and there are no fixed routes in waste collection.
Table F-47: Typical Collection Routes in SBD khoroos
No. SBD5 type schedule SBD7 type type schedule1 39,52 AP DPO yes 11 AP ODP no 2 6,30 AP TDP yes Smile BS ODP no 3 5 AP ODP yes Electricity supply BS TDP no 4 11-14,28,30 AP DPO yes 10 (illegal) AP DPO no 5 48 AP DPO yes Chuluunbaatar BS TDP no 6 24,25,26 AP ODP yes 9-1E AP DC no 7 6th school BS ODP no 9-2E AP DC no 8 New wind BS TDP no 9-4E AP DC no 9 Sansar SM BS TDP no 9-3E AP DC no
10 Time out BS TDP no Labor welfare service center
BS ODP no
11 Mongolian BBQ BS ODP no Selbe plaza BS TDP no 12 JS-tower BS DPO no 6-2E AP DC no 13 6-1E AP DC no 14 6-5E AP DC no 15 6-4E AP DC no 16 6-3E AP DC no 17 7-8E AP DC no 18 7-7E AP DC no 19 7-6E AP DC no 20 40 AP DPO no 21 4-3E AP DC no
In order to identify whether there is a collection schedule, collection time at each type of discharge points have been compared as follows:
Collections at discharge points of apartments: Among the types of the discharge points, the most scheduled collections occur at TDPs accounting for 62.3% of the total scheduled collections. On the contrary, the most unscheduled collections occur at DCs occupying 70.3% of the total unscheduled collections.
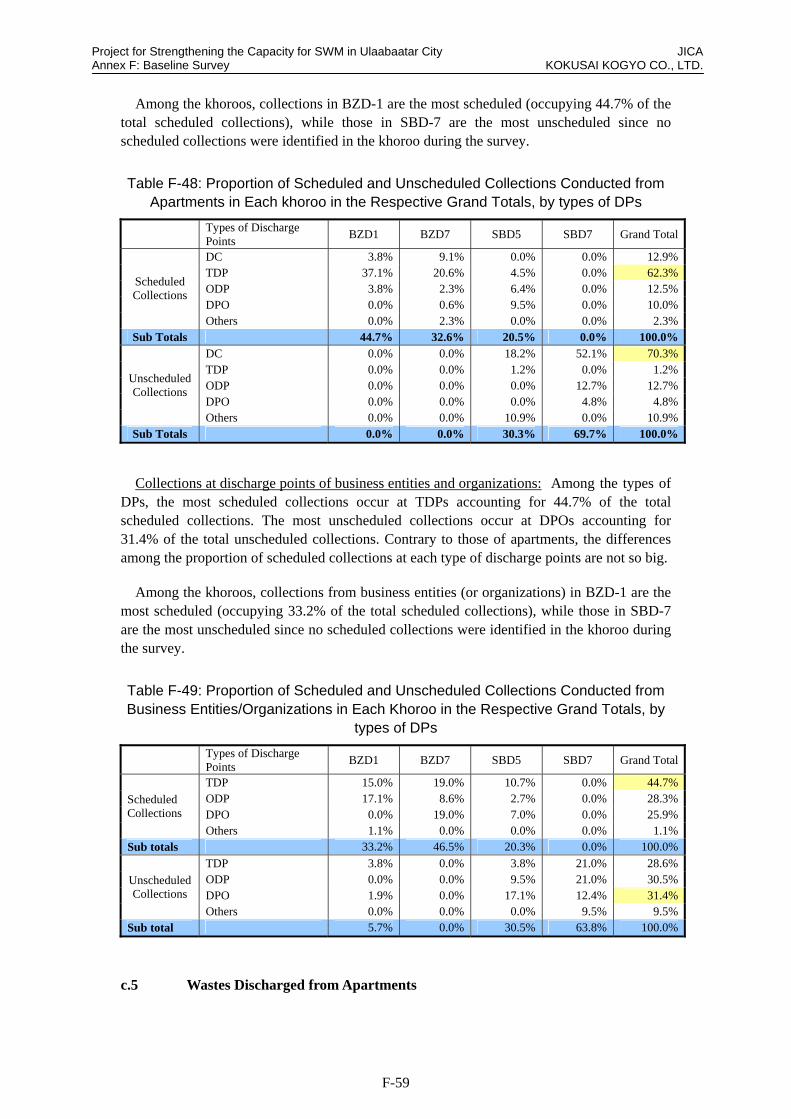
Project for Strengthening the Capacity for SWM in Ulaabaatar City JICA Annex F: Baseline Survey KOKUSAI KOGYO CO., LTD.
F-59
Among the khoroos, collections in BZD-1 are the most scheduled (occupying 44.7% of the total scheduled collections), while those in SBD-7 are the most unscheduled since no scheduled collections were identified in the khoroo during the survey.
Table F-48: Proportion of Scheduled and Unscheduled Collections Conducted from Apartments in Each khoroo in the Respective Grand Totals, by types of DPs
Types of Discharge Points
BZD1 BZD7 SBD5 SBD7 Grand Total
DC 3.8% 9.1% 0.0% 0.0% 12.9%TDP 37.1% 20.6% 4.5% 0.0% 62.3%ODP 3.8% 2.3% 6.4% 0.0% 12.5%DPO 0.0% 0.6% 9.5% 0.0% 10.0%
Scheduled Collections
Others 0.0% 2.3% 0.0% 0.0% 2.3%Sub Totals 44.7% 32.6% 20.5% 0.0% 100.0%
DC 0.0% 0.0% 18.2% 52.1% 70.3%TDP 0.0% 0.0% 1.2% 0.0% 1.2%ODP 0.0% 0.0% 0.0% 12.7% 12.7%DPO 0.0% 0.0% 0.0% 4.8% 4.8%
Unscheduled Collections
Others 0.0% 0.0% 10.9% 0.0% 10.9%Sub Totals 0.0% 0.0% 30.3% 69.7% 100.0%
Collections at discharge points of business entities and organizations: Among the types of DPs, the most scheduled collections occur at TDPs accounting for 44.7% of the total scheduled collections. The most unscheduled collections occur at DPOs accounting for 31.4% of the total unscheduled collections. Contrary to those of apartments, the differences among the proportion of scheduled collections at each type of discharge points are not so big.
Among the khoroos, collections from business entities (or organizations) in BZD-1 are the most scheduled (occupying 33.2% of the total scheduled collections), while those in SBD-7 are the most unscheduled since no scheduled collections were identified in the khoroo during the survey.
Table F-49: Proportion of Scheduled and Unscheduled Collections Conducted from Business Entities/Organizations in Each Khoroo in the Respective Grand Totals, by
types of DPs
Types of Discharge Points
BZD1 BZD7 SBD5 SBD7 Grand Total
TDP 15.0% 19.0% 10.7% 0.0% 44.7%ODP 17.1% 8.6% 2.7% 0.0% 28.3%DPO 0.0% 19.0% 7.0% 0.0% 25.9%
Scheduled Collections
Others 1.1% 0.0% 0.0% 0.0% 1.1%Sub totals 33.2% 46.5% 20.3% 0.0% 100.0%
TDP 3.8% 0.0% 3.8% 21.0% 28.6%ODP 0.0% 0.0% 9.5% 21.0% 30.5%DPO 1.9% 0.0% 17.1% 12.4% 31.4%
Unscheduled Collections
Others 0.0% 0.0% 0.0% 9.5% 9.5%Sub total 5.7% 0.0% 30.5% 63.8% 100.0%
c.5 Wastes Discharged from Apartments
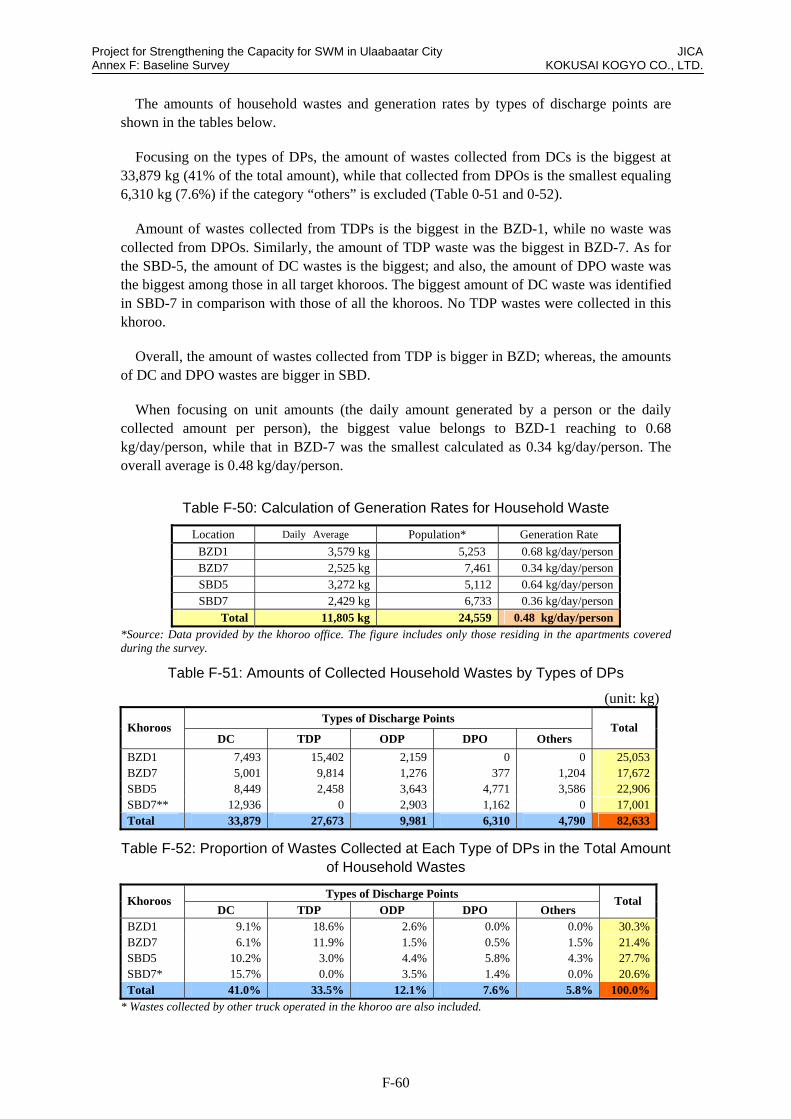
Project for Strengthening the Capacity for SWM in Ulaabaatar City JICA Annex F: Baseline Survey KOKUSAI KOGYO CO., LTD.
F-60
The amounts of household wastes and generation rates by types of discharge points are shown in the tables below.
Focusing on the types of DPs, the amount of wastes collected from DCs is the biggest at 33,879 kg (41% of the total amount), while that collected from DPOs is the smallest equaling 6,310 kg (7.6%) if the category “others” is excluded (Table 0-51 and 0-52).
Amount of wastes collected from TDPs is the biggest in the BZD-1, while no waste was collected from DPOs. Similarly, the amount of TDP waste was the biggest in BZD-7. As for the SBD-5, the amount of DC wastes is the biggest; and also, the amount of DPO waste was the biggest among those in all target khoroos. The biggest amount of DC waste was identified in SBD-7 in comparison with those of all the khoroos. No TDP wastes were collected in this khoroo.
Overall, the amount of wastes collected from TDP is bigger in BZD; whereas, the amounts of DC and DPO wastes are bigger in SBD.
When focusing on unit amounts (the daily amount generated by a person or the daily collected amount per person), the biggest value belongs to BZD-1 reaching to 0.68 kg/day/person, while that in BZD-7 was the smallest calculated as 0.34 kg/day/person. The overall average is 0.48 kg/day/person.
Table F-50: Calculation of Generation Rates for Household Waste
Location Daily Average Population* Generation Rate
BZD1 3,579 kg 5,253 0.68 kg/day/person BZD7 2,525 kg 7,461 0.34 kg/day/person SBD5 3,272 kg 5,112 0.64 kg/day/person SBD7 2,429 kg 6,733 0.36 kg/day/person
Total 11,805 kg 24,559 0.48 kg/day/person
*Source: Data provided by the khoroo office. The figure includes only those residing in the apartments covered during the survey.
Table F-51: Amounts of Collected Household Wastes by Types of DPs
(unit: kg) Types of Discharge Points
Khoroos DC TDP ODP DPO Others
Total
BZD1 7,493 15,402 2,159 0 0 25,053 BZD7 5,001 9,814 1,276 377 1,204 17,672 SBD5 8,449 2,458 3,643 4,771 3,586 22,906 SBD7** 12,936 0 2,903 1,162 0 17,001 Total 33,879 27,673 9,981 6,310 4,790 82,633
Table F-52: Proportion of Wastes Collected at Each Type of DPs in the Total Amount of Household Wastes
Types of Discharge Points Khoroos
DC TDP ODP DPO Others Total
BZD1 9.1% 18.6% 2.6% 0.0% 0.0% 30.3% BZD7 6.1% 11.9% 1.5% 0.5% 1.5% 21.4% SBD5 10.2% 3.0% 4.4% 5.8% 4.3% 27.7% SBD7* 15.7% 0.0% 3.5% 1.4% 0.0% 20.6% Total 41.0% 33.5% 12.1% 7.6% 5.8% 100.0%
* Wastes collected by other truck operated in the khoroo are also included.
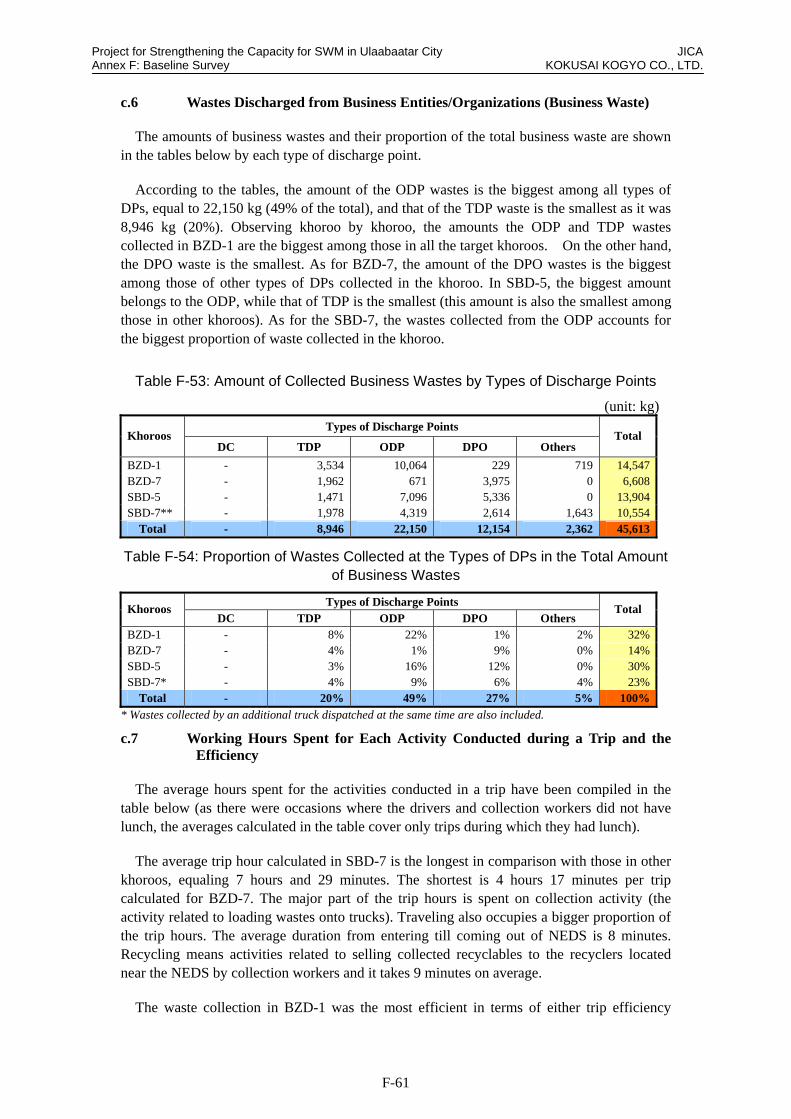
Project for Strengthening the Capacity for SWM in Ulaabaatar City JICA Annex F: Baseline Survey KOKUSAI KOGYO CO., LTD.
F-61
c.6 Wastes Discharged from Business Entities/Organizations (Business Waste)
The amounts of business wastes and their proportion of the total business waste are shown in the tables below by each type of discharge point.
According to the tables, the amount of the ODP wastes is the biggest among all types of DPs, equal to 22,150 kg (49% of the total), and that of the TDP waste is the smallest as it was 8,946 kg (20%). Observing khoroo by khoroo, the amounts the ODP and TDP wastes collected in BZD-1 are the biggest among those in all the target khoroos. On the other hand, the DPO waste is the smallest. As for BZD-7, the amount of the DPO wastes is the biggest among those of other types of DPs collected in the khoroo. In SBD-5, the biggest amount belongs to the ODP, while that of TDP is the smallest (this amount is also the smallest among those in other khoroos). As for the SBD-7, the wastes collected from the ODP accounts for the biggest proportion of waste collected in the khoroo.
Table F-53: Amount of Collected Business Wastes by Types of Discharge Points
(unit: kg) Types of Discharge Points
Khoroos DC TDP ODP DPO Others
Total
BZD-1 - 3,534 10,064 229 719 14,547 BZD-7 - 1,962 671 3,975 0 6,608 SBD-5 - 1,471 7,096 5,336 0 13,904 SBD-7** - 1,978 4,319 2,614 1,643 10,554
Total - 8,946 22,150 12,154 2,362 45,613
Table F-54: Proportion of Wastes Collected at the Types of DPs in the Total Amount of Business Wastes
Types of Discharge Points Khoroos
DC TDP ODP DPO Others Total
BZD-1 - 8% 22% 1% 2% 32% BZD-7 - 4% 1% 9% 0% 14% SBD-5 - 3% 16% 12% 0% 30% SBD-7* - 4% 9% 6% 4% 23%
Total - 20% 49% 27% 5% 100%
* Wastes collected by an additional truck dispatched at the same time are also included.
c.7 Working Hours Spent for Each Activity Conducted during a Trip and the Efficiency
The average hours spent for the activities conducted in a trip have been compiled in the table below (as there were occasions where the drivers and collection workers did not have lunch, the averages calculated in the table cover only trips during which they had lunch).
The average trip hour calculated in SBD-7 is the longest in comparison with those in other khoroos, equaling 7 hours and 29 minutes. The shortest is 4 hours 17 minutes per trip calculated for BZD-7. The major part of the trip hours is spent on collection activity (the activity related to loading wastes onto trucks). Traveling also occupies a bigger proportion of the trip hours. The average duration from entering till coming out of NEDS is 8 minutes. Recycling means activities related to selling collected recyclables to the recyclers located near the NEDS by collection workers and it takes 9 minutes on average.
The waste collection in BZD-1 was the most efficient in terms of either trip efficiency
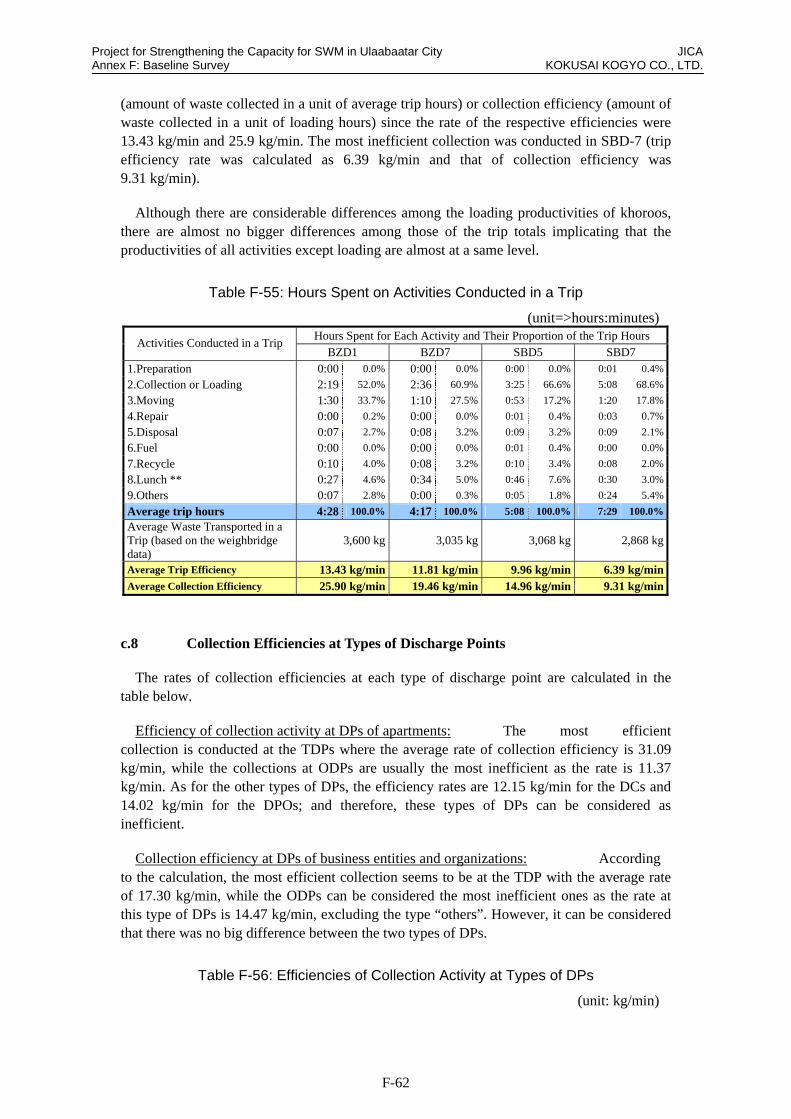
Project for Strengthening the Capacity for SWM in Ulaabaatar City JICA Annex F: Baseline Survey KOKUSAI KOGYO CO., LTD.
F-62
(amount of waste collected in a unit of average trip hours) or collection efficiency (amount of waste collected in a unit of loading hours) since the rate of the respective efficiencies were 13.43 kg/min and 25.9 kg/min. The most inefficient collection was conducted in SBD-7 (trip efficiency rate was calculated as 6.39 kg/min and that of collection efficiency was 9.31 kg/min).
Although there are considerable differences among the loading productivities of khoroos, there are almost no bigger differences among those of the trip totals implicating that the productivities of all activities except loading are almost at a same level.
Table F-55: Hours Spent on Activities Conducted in a Trip
(unit=>hours:minutes) Hours Spent for Each Activity and Their Proportion of the Trip Hours
Activities Conducted in a Trip BZD1 BZD7 SBD5 SBD7
1.Preparation 0:00 0.0% 0:00 0.0% 0:00 0.0% 0:01 0.4%
2.Collection or Loading 2:19 52.0% 2:36 60.9% 3:25 66.6% 5:08 68.6%
3.Moving 1:30 33.7% 1:10 27.5% 0:53 17.2% 1:20 17.8%
4.Repair 0:00 0.2% 0:00 0.0% 0:01 0.4% 0:03 0.7%
5.Disposal 0:07 2.7% 0:08 3.2% 0:09 3.2% 0:09 2.1%
6.Fuel 0:00 0.0% 0:00 0.0% 0:01 0.4% 0:00 0.0%
7.Recycle 0:10 4.0% 0:08 3.2% 0:10 3.4% 0:08 2.0%
8.Lunch ** 0:27 4.6% 0:34 5.0% 0:46 7.6% 0:30 3.0%
9.Others 0:07 2.8% 0:00 0.3% 0:05 1.8% 0:24 5.4%
Average trip hours 4:28 100.0% 4:17 100.0% 5:08 100.0% 7:29 100.0%
Average Waste Transported in a Trip (based on the weighbridge data)
3,600 kg 3,035 kg 3,068 kg 2,868 kg
Average Trip Efficiency 13.43 kg/min 11.81 kg/min 9.96 kg/min 6.39 kg/min Average Collection Efficiency 25.90 kg/min 19.46 kg/min 14.96 kg/min 9.31 kg/min
c.8 Collection Efficiencies at Types of Discharge Points
The rates of collection efficiencies at each type of discharge point are calculated in the table below.
Efficiency of collection activity at DPs of apartments: The most efficient collection is conducted at the TDPs where the average rate of collection efficiency is 31.09 kg/min, while the collections at ODPs are usually the most inefficient as the rate is 11.37 kg/min. As for the other types of DPs, the efficiency rates are 12.15 kg/min for the DCs and 14.02 kg/min for the DPOs; and therefore, these types of DPs can be considered as inefficient.
Collection efficiency at DPs of business entities and organizations: According to the calculation, the most efficient collection seems to be at the TDP with the average rate of 17.30 kg/min, while the ODPs can be considered the most inefficient ones as the rate at this type of DPs is 14.47 kg/min, excluding the type “others”. However, it can be considered that there was no big difference between the two types of DPs.
Table F-56: Efficiencies of Collection Activity at Types of DPs
(unit: kg/min)

Project for Strengthening the Capacity for SWM in Ulaabaatar City JICA Annex F: Baseline Survey KOKUSAI KOGYO CO., LTD.
F-63
Generation Sources Types of DPs BZD-1 BZD-7 SBD-5 SBD-7* Total DC 22.71 12.76 13.61 8.95 12.15 TDP 36.24 31.97 15.56 31.09 ODP 17.13 13.02 15.70 6.90 11.37 DPO 28.99 14.41 10.96 14.02
Apartments
Others 22.72 15.13 16.52 TDP 21.95 15.69 13.75 15.95 17.30 ODP 22.52 11.99 16.20 7.33 14.47 DPO 16.37 19.20 15.83 13.00 16.01
Business Entities and Organizations
Others 20.55 10.67 12.50
* Wastes collected by an additional truck dispatched at the same time are also included.
c.9 Recyclables Collected by Collection Workers
The amounts of recyclables collected by collection workers during waste collection and the relative earnings are compiled in the Table 0-57. According to the table, the biggest quantity of recyclables in a trip was collected in SBD-5 (57.9 kg/trip accounting for 1.7% of the amount of waste transported in a trip) and the relative earnings were 7,577 tg. The smallest amount of recyclables was collected BZD-7 (25.3 kg, which was 0.8% of the trip total and 3,035 tg).
In general, collection workers in SBD collected more recyclables in terms of their weights during a trip than those in BZD. In any of the khoroos, the earnings from the recyclables account for quite a big part of the total monthly earning by the collection workers including their salary.
Table F-57: Recyclables Collected by Collection Workers
(unit: kg) BZD1 BZD7 SBD5 SBD7
Trip No. Recyclables Total Recyclables Total Recyclables Total Recyclables Total
1 25.1 3,500 28.1 3,640 70.0 3,150 100.2 2,740 2 26.4 3,880 27.6 2,520 24.8 3,020 0.0 2,360 3 28.6 3,380 4.0 2,920 41.1 2,940 121.9 3,060 4 6.1 3,920 62.0 2,040 88.2 3,220 0.0 2,300 5 17.4 2,760 22.8 2,840 46.5 2,920 83.6 3,080 6 24.9 3,560 21.6 3,260 34.2 3,020 31.6 3,390 7 80.7 3,700 25.2 3,820 57.6 3,000 25.7 2,440 8 14.8 3,680 10.9 3,240 82.7 2,940 0.0 2,720 9 30.6 3,840 76.7 2,780 88.0 3,720
10 25.6 3,580 33.4 2,760 11 64.9 3,800 81.2 3,620 12 *- 3,440
Total 345.2 39,600 202.3 24,280 636.4 36,810 451.0 25,810 Avg (per trip) 31.4 (0.9%) 3,600 25.3 (0.8%) 3,035 57.9 (1.7%) 3,068 50.1 (1.7%) 2,868
* The survey was interrupted by an accident occurred to the target vehicle.
Table F-58: Earnings from Recyclables
Trip No. BZD1 BZD7 SBD5 SBD7 1 5,120 tg 4,740 tg 6,320 tg 11,290 tg 2 4,170 tg 4,360 tg 2,816 tg 3 5,250 tg 1,600 tg 2,830 tg 12,670 tg 4 1,090 tg 6,150 tg 8,000 tg 5 4,050 tg 5,600 tg 4,330 tg 13,770 tg 6 4,390 tg 2,800 tg 3,970 tg 6,500 tg 7 10,500 tg 3,150 tg 3,820 tg 4,080 tg

Project for Strengthening the Capacity for SWM in Ulaabaatar City JICA Annex F: Baseline Survey KOKUSAI KOGYO CO., LTD.
F-64
8 3,350 tg 1,400 tg 5,160 tg 9 5,600 tg 5,310 tg 19,885 tg
10 4,000 tg 3,510 tg 11 10,200 tg 9,540 tg 12
Total 57,720 tg 29,800 tg 55,606 tg 68,195 tg Avg (per trip) 5,247 tg/ trip 3,725 tg/ trip 5,055 tg/ trip 7,577 tg/ trip
c.10 Weighbridge Registration System at NEDS
The actual information about trucks, provided directly by the drivers or the supervising companies within this survey and that registered by the weighbridge at NEDS during the implementation of this survey, are compared in the Table 0-59.
According to the results, all the collection trucks were registered by the weighbridge system definitely; however, there was not even correct information in the records registered by the system regarding the number of khoroos where the trucks have been operating. In addition to this, the system registered the name of the company which supervises the truck 23-54 UNB as “District WSF”, but not the “Emergency Unit”, the actual supervising organization. Also, the type of the khoroo where this truck serves was recorded as ger khoroo, but not apartment khoroo.
Table F-59: Comparison of Weighbridge Records against Actual Information
Registration No. of Trucks Sources Districts Khoroos Companies
Types of Khoroos
Weighbridge Sukhbaatar Khoroo #3 "Tsuzuku yume" - /WSF/ Apartment 61-59 UBZ
Actual Sukhbaatar Khoroo #5 "Tsuzuku yume" - /WSF/ Apartment Weighbridge Sukhbaatar Khoroo #8 Sukhbaatar district WSF Ger area
23-54 UNB Actual Sukhbaatar Khoroo #7 Emergency Unit of SBD office Apartment Weighbridge Bayanzurkh Khoroo #18 CMPUA Apartment
77-09 UBV Actual Bayanzurkh Khoroo #1 CMPUA Apartment Weighbridge Bayanzurkh Khoroo #1 CMPUA Apartment
77-10 UBV Actual Bayanzurkh Khoroo #7 CMPUA Apartment
In addition to this, the average amounts of waste per trip under normal conditions were calculated for each collection truck based on the weighbridge monthly data (the data of whole month, Mar 2010 was used) and compared with those recorded throughout this survey. In the khoroo #5 of SBD, there was almost no difference between the values calculated from the monthly data and recorded during the survey. However, in khoroo #7, SBD and khoroo #7, BZD, the amount of waste transported during the survey exceeds that of normal condition. On the contrary, the amount of waste recorded during the survey is less than the average value calculated for the normal condition in khoroo #1, BZD.
Table F-60: Comparison of Amounts of Average Trip Wastes Transported in March 2010 and during This Survey
Data 61-59 UBZ
(SBD-5)
23-54 UNB
(SBD-7)
77-09 UBV
(BZD-1)
77-10 UBV
(BZD-7)
Average trip wastes transported during
this survey 3,068 kg/ trip 2,868 kg/ trip 3,600 kg/ trip 3,035 kg/ trip
Average trip wastes transported in March
2010 3,059 kg/ trip 3,610 kg/ trip 3,310 kg/ trip 3,640 kg/ trip

Project for Strengthening the Capacity for SWM in Ulaabaatar City JICA Annex F: Baseline Survey KOKUSAI KOGYO CO., LTD.
F-65
(Note): 1. The figures in the table are the trip averages calculated from all the data that belong to each category. 2. All data of both categories was measured by the same weighbridge installed at NEDS.
d. Findings
1. The proportion of the business wastes (those discharged by public organizations are also included) in the total collected amounts is about 1/3 in each target khoroo since these khoroos are located in the central UBC.
2. The collection schedule is almost fixed in BZD, while the collections in SBD can be considered as not scheduled.
3. Waste collection at TDP is often scheduled both for apartments and business entities/organizations; whereas, the most unscheduled collections occur at DCs for apartments and at DPOs for business entities/organizations.
4. Among the types of DPs, the biggest amount of waste is collected from DCs for apartments and ODPs for business entities/organizations.
5. Collection in BZD is the more efficient than that in SBD. The main reason for the inefficiency in SBD results from the most inefficient collection being conducted in khoroo #7 of the district, which, in turn, resulted from the dump truck.
6. The type of DPs where the highest rates of collection efficiency occur is the TDP for both apartments and business entities/organizations. On the contrary, the most inefficient collection occurs at the ODP for both apartments and business entities. However, there was no big difference between the same type of DPs of apartments and business entities.
7. The overall generation rate calculated from the collected amount is 0.48 kg/day/person, exceeding 0.297 kg/day/person for winter and 0.264 kg/day/person for summer, the rates calculated in the Master Plan for the year 2009.
8. The higher the rates of collection efficiency in a khoroo, the less the collectable recyclables in the khoroo for collection workers. The proportion of recyclables in the total wastes is usually 1% to 2%.
9. Among the data registered by the weighbridge system, there is either correct information or incorrect one. This is because of the out-of-date database inputted into the system at the time of installment. For example, the system fills automatically all necessary data such as khoroos of collection, types of residential areas and so on using its database for any trucks after inputting their registration numbers. As the database has not been updated since its installment, the registration does not reflect the changes in the data that have occurred until the present. Although the system registers some of data correctly for the present, these data can be changed in any time from now on. Also, vehicles are sometimes dispatched to other areas; and then, the data to be registered by the system will differ from the reality.
e. Recommendations
1. As the amount of wastes discharged by business entities and public facilities occupies 1/3 of the total waste collected in each khoroo, activities related to improvement of discharge manner and source separation should also cover these institutions during the implementation of the pilot project.
2. In order to achieve habitual separate discharge and collection by residents, punctual collection along fixed points at fixed times will be the prerequisites. However, the
Project for Strengthening the Capacity for SWM in Ulaabaatar City JICA Annex F: Baseline Survey KOKUSAI KOGYO CO., LTD.
F-66
implementation at apartments with DCs where the biggest amounts of wastes are discharged seems to remain a problem since these collections are usually unscheduled. Countermeasures such as closure of DCs should be planned and enforced during the pilot project.
3. The inefficiency of the dump truck that has been operating in one of the khoroos has been preventing the punctual collection in the khoroo. Immediate change of the truck into a compactor is preferable.
4. In the Master Plan, it was assumed that the daily waste generation rate would increase in proportion with the GPD growth, taking the value in the year 2005 as a base. Therefore, the annual growth of the daily waste generation rate per capita was projected as 5.5%. However, the GDP growth rates of Mongolia in 2007 and 2008 were considerable resulting in possible changes in residents’ lifestyles and increases in the generation rate. In order to identify the current level of waste generation rate, a waste amount survey should be conducted.
5. Data reliability of the weighbridge registration system must be ensured in such ways as introduction of data update principles as this data is essential for calculation of contract payments to be paid to waste collection organizations. In order to maintain accountability and fairness of the data, the registered data should also be provided to waste collection organizations.
6. According to the results of this survey, the TDPs are the discharge point where waste collections are conducted most efficiently. In order to expand generation sources with this type of DP for a better efficiency, the cooperation by residents and watchmen in apartments; respective staffs in charge of SWM in business entities or public organizations; and the punctual implementation in collection schedule will be the prerequisites.
7. The success in BZD resulted mainly from the efforts made by the district WSF on development of residents’ cooperation. The WSF inspectors are usually present at sites together with collection trucks throughout waste collection. One of the biggest roles of the inspectors during waste collection lay with improvement of communication between the collection team and the residents. However, the roles of SBD inspectors are limited to coming rarely to collection sites and observing work progresses. Therefore, efforts in enforcement of rules, regulations and functions of the system should be made through the inspectors of the WSFs.

Project for Strengthening the Capacity for SWM in Ulaanbaatar City JICA Section F: Baseline Survey KOKUSAI KOGYO CO., LTD.
F-67
F.8 Waste amount transported to NEDS

Project for Strengthening the Capacity for SWM in Ulaanbaatar City JICA Section F: Baseline Survey KOKUSAI KOGYO CO., LTD.
F-68

Project for Strengthening the Capacity for SWM in Ulaanbaatar City JICA Section F: Baseline Survey KOKUSAI KOGYO CO., LTD.
F-69

Section G
Activities not specified in PDM
G Output not specified in PDM.............................................................G-1
G.1 Plan of Improving Solid Waste Management in Bulgan Aimag Center
G-1
G.1.1 Background .............................................................................................G-1
G.1.2 Purpose....................................................................................................G-1
G.1.3 Current Situation of Solid Waste Management ......................................G-1
G.1.4 Improvement plan ...................................................................................G-4
G.1.5 Conclusion ............................................................................................G-11
G.2 Assistance for Tender of Waste Collection Vehicle:Technical
Specification Document................................................................... G-12
G.2.1 List ........................................................................................................G-12
G.2.2 Technical Specification Document(FOTON-chassis 5.7m3 Compactor)
G-12
G.2.3 Technical Specification Document(ISUZU-chassis 10.2m3 Compactor)
G-21
G.3 Estimation for Running Cost of RPF facility................................... G-29
G.3.1 Comparison of Estimation ....................................................................G-29

Project for Strengthening the Capacity for SWM in Ulaanbaatar City JICA Section G: Activities not specified in PDM KOKUSAI KOGYO CO., LTD.
G-1
G Activities not specified in PDM
G.1 Plan of Improving Solid Waste Management in Bulgan Aimag Center
G.1.1 Background
Currently, Ministry of Nature, Environment and Tourism (MNET) instructed each city to formulate MP of solid waste management, and allocated some budget for implementation of the plan.
The JET held workshops for formulation and implementation of SWM MP for Central Provincial Cities based on experience in Ulaanbaatar from June 28th 2011 for 3 days. Officers in charge of solid waste management were invited from 11 Aimag Centers.
At the workshop, the officers from each City requested JET to conduct site inspection and technical advices.
The JET visited 3 Aimag Center (Bulgan, Erdenet, Darkhan) for inspection of solid waste management and consulted with Governors and the persons concerned from July 4th 2011 to July 6th 2011.
The governor of Bulgan requested JET to provide technical advices and draft improvement plan for disposal site to improve the current conditions urgently. The JET drafted this plan to respond to the request.
G.1.2 Purpose
To investigate current situation of solid waste management in Bulgan city, and formulate plan for improving current situation with solving problems. Especially, final disposal site in the situation of open damping is improved to be managed disposal site without affecting surrounding environment. Improvement plan shall be feasible one with consideration of size of cities, budget and amount of wastes.
G.1.3 Current Situation of Solid Waste Management
a. Summary of Bulgan City
Bulgan city is prefectural capital, and 12,486 people (2011) live in the city. 3,746 residents live in apartment districts (30%), and 8,741 residents live in gel districts (70%). Stock farming and agriculture are main industries. There are plenty of forests.
b. Generated amount of waste in Bulgan city
There has not been investigated amount of waste in the past, so generated amount is unknown. Unit generation amount in Ulaanbaatar city (kg/day/person) is used to calculate. results are

Project for Strengthening the Capacity for SWM in Ulaanbaatar City JICA Section G: Activities not specified in PDM KOKUSAI KOGYO CO., LTD.
G-2
about 7.3ton/day.
Table G-1: Generated amount of waste in 2011
Apartment Gel Business Total
Generated amount (kg/day)
1,049 5,288 995 7,332
However, an area per gel is larger than that of Ulaanbaatar because almost all households keep livestock, so excrements of livestock are generated as a waste.
c. Collect and Transport
Collecting and transporting solid waste are operated by City Maintenance Company (Public Company) used mechanics owned by Bulgan city. Bulgan city owns following equipment.
KO440(6m3) 1
Bongo(4m3) 1
Tractor(2.4m3) 2
Figure G-1: Collect mechanics owned by Bulgan city
The amount of collection and transportation of solid waste is calculated by records of disposal site.
Table G-2: Collection and Transportation of Bulgan city (trip/month)
Month
Truck Type CapacityApr May Jun
Average Monthly
Trip
m3 trip/mth trip/mth trip/mth trip/mth
KO440 Truck 6 65 82 67 71.3
Nissan Bongo 4 88 98 172 119.3
Tractor 2.4 101 212 257 190.0
The number of trips per month is different from truck types. There is high possibility that the trucks are breakdown often. If the efficiency of trucks were set 80%, about 40m3 solid wastes were collected and transported. It is considered to collect almost all generated wastes.
Table G-3: The amount of collected and transported in Bulgan city (cubic volume/day)
Truck Type CapacityAverage Monthly
Trip
Carrying Efficiency
Monthly Collection Volume
Daily Collection Volume
m3 trip/mth % m3 m3

Project for Strengthening the Capacity for SWM in Ulaanbaatar City JICA Section G: Activities not specified in PDM KOKUSAI KOGYO CO., LTD.
G-3
KO440 Truck 6 71.3 80% 342.4 13.7
Nissan Bongo 4 119.3 80% 381.8 12.7
Tractor 2.4 190.0 80% 364.8 14.6
Total 1184.5 41.0
d. Last Disposal Site
The last disposal site is located at 4.5km southeast in Bulgan city and has been used for about 30 years. There is flat land, and flowing river from west. It needs paying attention to an outflow of leach ate.
The last disposal site has no heavy mechanics, so the waste is just dumped at enterable and flat place. The transported waste has been spread increasingly.
There is a gel beside an access road to disposal site, and number of trips is recorded. The records are composed of vehicle number, vehicle capacity, enter and exit time. The driver should sign to the record and received tickets. These tickets are proofs of payment to drivers. The payment is based on trip.
Figure G-2: The Last disposal site of Bulgan city
A recent photograph is shown below.
Sewage Treatment Plant
Final Disposal Site

Project for Strengthening the Capacity for SWM in Ulaanbaatar City JICA Section G: Activities not specified in PDM KOKUSAI KOGYO CO., LTD.
G-4
Figure G-3: The whole view seen from slope of east side
G.1.4 Improvement plan
a. Collection and Transportation
As a part of improvement plan, necessary numbers of collection vehicles are calculated by excel sheet which was used at workshop in June.
Conditions are considered as waste in apartment district is collected by compactor, and waste in gel district is collected by 6ton dump truck.
The result shows that one 8m3 compactor and two 6ton dump truck are enough. However, waste generated from apartment are small, two 6ton dump trucks are enough to collect.
Type of Truck Load
Capacity unit 2011 2012 2013 2014 2015 2016 2017 2018 2019 2020
Compactor 8m3 Nos 0.2 0.2 0.2 0.2 0.2 0.2 0.2 0.3 0.3 0.3
Dump truck 10m3 Nos 1.1 1.1 1.2 1.2 1.3 1.3 1.4 1.5 1.6 1.6
Tractors will be used to collect wastes at places where dump trucks are difficult to access.
In conclusion, current composition of collect vehicles is not necessary to be changed, and plan to procure one 6m3 dump truck is recommended to prepare for breakdown of the equipment.
b. Recycle
Priority for recycling should be place for huge amount of excrement generated from gel firstly. Excrement of live stock is recyclable as fertilizer or fuel. Reduction of discharging animal excrement should be promoted to the households in ger area.
Secondly, separation of valuables (glasses, aluminum cans, PET) at generation source should be encouraged through education to residents. PR tools made through pilot projects Ulaanbaatar city can be used with minor modification to suite the situation in the City.

Project for Strengthening the Capacity for SWM in Ulaanbaatar City JICA Section G: Activities not specified in PDM KOKUSAI KOGYO CO., LTD.
G-5
c. Final Disposal
Improvement of Final disposal site is planned with following priorities.
1.Construct a embankment dam using old wastes to set a boundary of disposal site clearly.
2.Direct collect companies to bring wastes inside embankment dam.
3.The incoming wastes shall be pushed and compacted in small area using the equipment.
4.Cover with soil in once a month.
At the first phase, big embankment dam is not necessary to construct, The area within embankment dam is just enough for the waste in 2 to 3 years. Phased extension should be carried out in order to same initial investment.
c.1 Design of Disposal Site
c.1.1 Final Disposal Amount
The final disposal amount is calculated by records of collection vehicles from April to June.
Table G-4: The amount of collect and transport in Bulgan city (m3/day)
Truck Type CapacityAverage Monthly
Trip
Carrying Efficiency
Monthly Collection Volume
Daily Collection Volume
m3 trip/mth % m3 m3
KO440 Truck 6 71.3 80% 342.4 13.7
Nissan Bongo 4 119.3 80% 381.8 12.7
Tractor 2.4 190.0 80% 364.8 14.6
Total 1184.5 41.0
There is no measuring equipment, so density and weight of wastes is unknown when wastes are brought, but the density is calculated as follows assumed 100% collection rate is achieved.
7.32 ton ÷ 41.0 m3 = 0.18 t/m3 nearly equals to 0.2 ton / m3
The amount of disposal waste of a year is
41.0 m3/day × 0.2 ton/m3 × 365 day = 2993 ton/year
It is necessary to fill in about 3,000 tons a year.
Light equipment is assumed to be used for compression. If the density were 0.5ton/m3, necessary capacity of disposal site is
3,000 ton/year ÷ 0.5 ton/m3 = 6,000 m3/year
c.1.2 Design of Size of Disposal Site

Project for Strengthening the Capacity for SWM in Ulaanbaatar City JICA Section G: Activities not specified in PDM KOKUSAI KOGYO CO., LTD.
G-6
Bulgan disposal site is located at flat place, so following disposal site is constructed. This calculation is done by excel sheet used in the workshop. The workshop participants can calculate by themselves.
Figure G-4: Shape and Size of disposal site
The size of disposal site is calculated. The Excel Sheet is used to calculate and the result is following. The necessary size of disposing for 3 years wastes is calculated, but it is possible to adjust the size depending on budget.
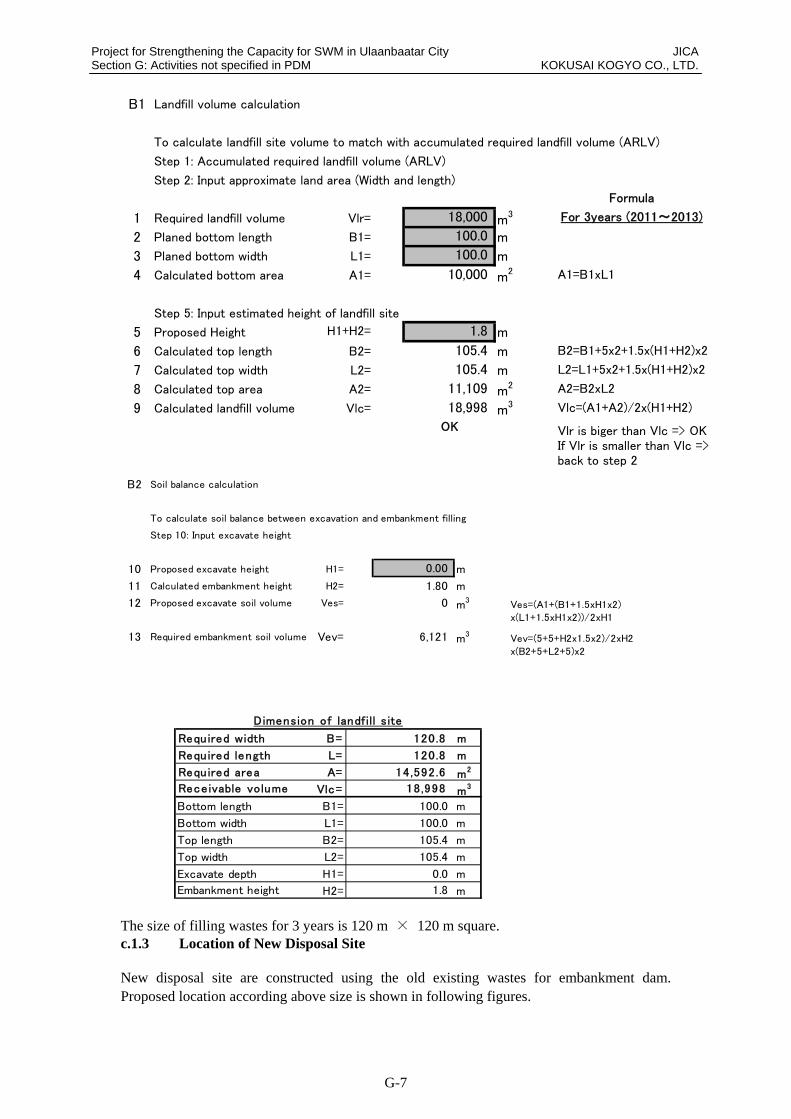
Project for Strengthening the Capacity for SWM in Ulaanbaatar City JICA Section G: Activities not specified in PDM KOKUSAI KOGYO CO., LTD.
G-7
B1 Landfill volume calculation
To calculate landfill site volume to match with accumulated required landfill volume (ARLV)
Step 1: Accumulated required landfill volume (ARLV)
Step 2: Input approximate land area (Width and length)
1 Required landfill volume Vlr= m3
2 Planed bottom length B1= m
3 Planed bottom width L1= m
4 Calculated bottom area A1= m2
Step 5: Input estimated height of landfill site
5 Proposed Height m
6 Calculated top length B2= m
7 Calculated top width L2= m
8 Calculated top area A2= m2
9 Calculated landfill volume Vlc= m3
OK Vlr is biger than Vlc => OKIf Vlr is smaller than Vlc =>back to step 2
11,109 A2=B2xL2
18,998 Vlc=(A1+A2)/2x(H1+H2)
105.4 B2=B1+5x2+1.5x(H1+H2)x2
105.4 L2=L1+5x2+1.5x(H1+H2)x2
10,000 A1=B1xL1
H1+H2= 1.8
100.0
100.0
Formula
18,000 For 3years (2011~2013)
B2 Soil balance calculation
To calculate soil balance between excavation and embankment filling
Step 10: Input excavate height
10 Proposed excavate height H1= m
11 Calculated embankment height H2= m
12 Proposed excavate soil volume Ves= m3
13 Required embankment soil volume Vev= m3
B= m
L= m
A= m2
Vlc= m3
B1= m
L1= m
B2= m
L2= m
H1= m
H2= m
Excavate depth 0.0
Embankment height 1.8
Top length 105.4
Top width 105.4
Bottom length 100.0
Bottom width 100.0
Required area 14,592.6
Receivable volume 18,998
Dimension of landf ill site
Required width 120.8
Required length 120.8
6,121 Vev=(5+5+H2x1.5x2)/2xH2x(B2+5+L2+5)x2
1.80
0 Ves=(A1+(B1+1.5xH1x2)x(L1+1.5xH1x2))/2xH1
0.00
The size of filling wastes for 3 years is 120 m × 120 m square. c.1.3 Location of New Disposal Site
New disposal site are constructed using the old existing wastes for embankment dam. Proposed location according above size is shown in following figures.
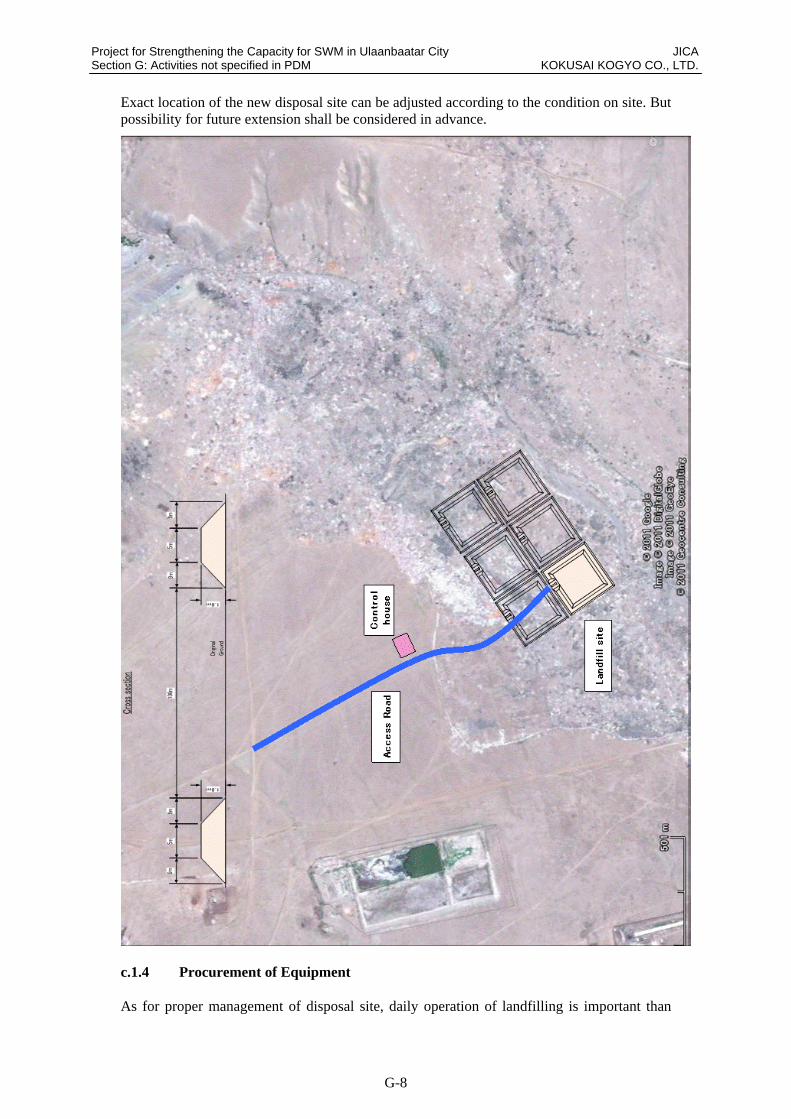
Project for Strengthening the Capacity for SWM in Ulaanbaatar City JICA Section G: Activities not specified in PDM KOKUSAI KOGYO CO., LTD.
G-8
Exact location of the new disposal site can be adjusted according to the condition on site. But possibility for future extension shall be considered in advance.
c.1.4 Procurement of Equipment
As for proper management of disposal site, daily operation of landfilling is important than

Project for Strengthening the Capacity for SWM in Ulaanbaatar City JICA Section G: Activities not specified in PDM KOKUSAI KOGYO CO., LTD.
G-9
construction of the facilities. To conduct sanitary landfill, heavy machine is necessary to push and compact wastes from collection vehicles and minimize surface area exposing to air and rain.
3 bulldozers are required to operate in UBC disposal site with daily incoming amount of wastes is over 1000 ton. However, as for Bulgan city, only less than 10tons of wastes are coming to disposal site, even one bulldozer is much more than enough to conduct landfill operation, so keeping bulldozer at disposal site permanently is not a sustainable plan.
Procurement of wheel type loader with excavator shown below is recommended .
Figure 1: Wheel type loader with Excavator
Advantages of this equipment are
1.Tire excavators are easy to move on paved roads. (Trailer is necessary in case bulldozers mobilize.)
2.Trimming of slopes, excavating and loading soil are possible by excavator function.
3.Pushing and compaction of wastes are possible by shovel function.
4.In case the machine is not needed, it can be used for cleaning up illegal dump site and repairing roads.
5.Constructing new disposal site is possible by using this machine with dump trucks.
c.1.5 Construction of Disposal Site
Construction of disposal site is operated by this equipment with dump trucks. The steps are
1.Set exact location of disposal site by survey.
2.location of embankment dam is set by survey

Project for Strengthening the Capacity for SWM in Ulaanbaatar City JICA Section G: Activities not specified in PDM KOKUSAI KOGYO CO., LTD.
G-10
3.Construct a embankment dam using this equipment and dump trucks.
4.Excavate soil inside embankment dam and this soil is used for cover embankment dam.
Theses steps shall be illustrated as follows.
c.1.6 Construction of Embankment Dam
1. Making embankment by waste
Step 1 To collect waste
Step 2 To top up waste
Step 3 To compact and trim slope
Step 4 To cover waste by soil
c.1.7 Operation of Disposal Site
Operation of disposal site can be carried out by using this machine as well. Considering incoming amount of wastes, once in a week is enough to mobilize this machine. Incoming wastes shall be pushed and compacted in a designated area and preparation for next week operation shall be done.
These steps are illustrated as follows.

Project for Strengthening the Capacity for SWM in Ulaanbaatar City JICA Section G: Activities not specified in PDM KOKUSAI KOGYO CO., LTD.
G-11
2. How to landf ill
Step 1 Unload waste into the landfill pit
Step 2 To push and compact waste once in a week
Step 3 To cover by soil and shift to next landfill pit
G.1.5 Conclusion
The Director of Nature Environment and Tourism and the Governor have high awareness of improving solid waste management. Therefore, assistance from MONET will contribute effectively. As a result, following recommendations will be made.
1.Wheel shovel with excavator shall be procured using MONET fund for improvement of solid waste management in Aimag.
2.City government shall allocate budget for operation of this equipment in order to utilize MONET fund.
3.Construction of new disposal site shall be commenced once this equipment is procured.
4.Procurement of one 6 ton dump truck will be recommended using other source of funding in order for preparation of breakdown of the trucks.
5.Priority for recycling is set for reducing discharge amount of animal excreta from ger households. Education and PR activities to the residents will be encouraged.
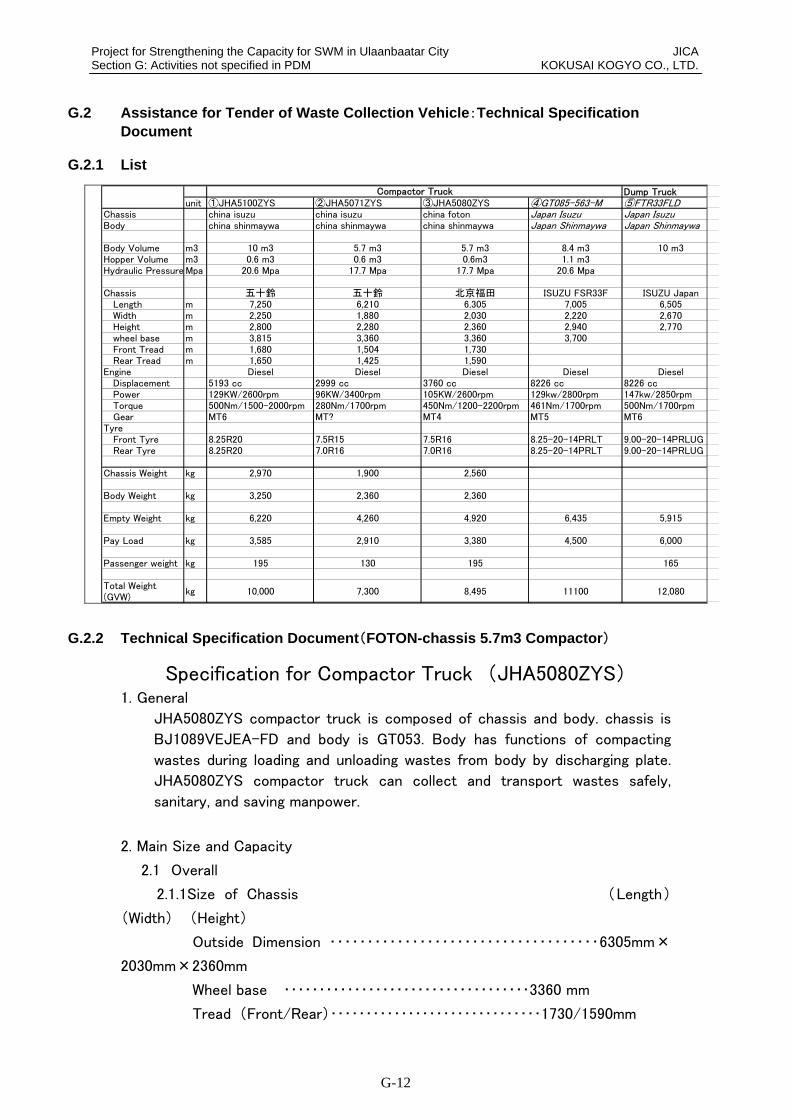
Project for Strengthening the Capacity for SWM in Ulaanbaatar City JICA Section G: Activities not specified in PDM KOKUSAI KOGYO CO., LTD.
G-12
G.2 Assistance for Tender of Waste Collection Vehicle:Technical Specification Document
G.2.1 List
Dump Truckunit ①JHA5100ZYS ②JHA5071ZYS ③JHA5080ZYS ④GT085-563-M ⑤FTR33FLD
Chassis china isuzu china isuzu china foton Japan Isuzu Japan IsuzuBody china shinmaywa china shinmaywa china shinmaywa Japan Shinmaywa Japan Shinmaywa
Body Volume m3 10 m3 5.7 m3 5.7 m3 8.4 m3 10 m3Hopper Volume m3 0.6 m3 0.6 m3 0.6m3 1.1 m3Hydraulic Pressure Mpa 20.6 Mpa 17.7 Mpa 17.7 Mpa 20.6 Mpa
Chassis 五十鈴 五十鈴 北京福田 ISUZU FSR33F ISUZU JapanLength m 7,250 6,210 6,305 7,005 6,505Width m 2,250 1,880 2,030 2,220 2,670Height m 2,800 2,280 2,360 2,940 2,770wheel base m 3,815 3,360 3,360 3,700Front Tread m 1,680 1,504 1,730Rear Tread m 1,650 1,425 1,590
Engine Diesel Diesel Diesel Diesel DieselDisplacement 5193 cc 2999 cc 3760 cc 8226 cc 8226 cc Power 129KW/2600rpm 96KW/3400rpm 105KW/2600rpm 129kw/2800rpm 147kw/2850rpmTorque 500Nm/1500-2000rpm 280Nm/1700rpm 450Nm/1200-2200rpm 461Nm/1700rpm 500Nm/1700rpmGear MT6 MT? MT4 MT5 MT6
TyreFront Tyre 8.25R20 7.5R15 7.5R16 8.25-20-14PRLT 9.00-20-14PRLUGRear Tyre 8.25R20 7.0R16 7.0R16 8.25-20-14PRLT 9.00-20-14PRLUG
Chassis Weight kg 2,970 1,900 2,560
Body Weight kg 3,250 2,360 2,360
Empty Weight kg 6,220 4,260 4,920 6,435 5,915
Pay Load kg 3,585 2,910 3,380 4,500 6,000
Passenger weight kg 195 130 195 165
Total Weight(GVW)
kg 10,000 7,300 8,495 11100 12,080
Compactor Truck
G.2.2 Technical Specification Document(FOTON-chassis 5.7m3 Compactor)
Specification for Compactor Truck (JHA5080ZYS) 1. General
JHA5080ZYS compactor truck is composed of chassis and body. chassis is
BJ1089VEJEA-FD and body is GT053. Body has functions of compacting
wastes during loading and unloading wastes from body by discharging plate.
JHA5080ZYS compactor truck can collect and transport wastes safely,
sanitary, and saving manpower.
2. Main Size and Capacity
2.1 Overall
2.1.1Size of Chassis (Length)
(Width) (Height)
Outside Dimension ・・・・・・・・・・・・・・・・・・・・・・・・・・・・・・・・・・・・6305mm×
2030mm×2360mm
Wheel base ・・・・・・・・・・・・・・・・・・・・・・・・・・・・・・・・・・・3360 mm
Tread (Front/Rear)・・・・・・・・・・・・・・・・・・・・・・・・・・・・・・1730/1590mm

Project for Strengthening the Capacity for SWM in Ulaanbaatar City JICA Section G: Activities not specified in PDM KOKUSAI KOGYO CO., LTD.
G-13
Front/Rear Overhung・・・・・・・・・・・・・・・・・・・・・・1095/1850mm
2.1.2Weight
Full Load・・・・・・・・・・・・・・・・・・・・・・・・・・・・・・・・・・・・・・・・・・・・・・・・・8495kg
Empty Load・・・・・・・・・・・・・・・・・・・・・・・・・・・・・・・・・・・・・・・・・・・・・・ 4920kg
Pay Load (Carrying Capacity)・・・・・・・・・・・・・・・・・・・・・・・・・・・・・・・・・3380kg
2.1.3Travelling
Minimum Rotation Radius・・・・・・・・・・・・・・・・・・・・・・・・・・・15 m
Lowest Clearance・・・・・・・・・・・・・・・・・・・・・・・・・・・・・・・・・180 mm
Approach angle/departure angle・・・・・・・・・・・・・・・・・・・・21/16 °
2.2 Chassis
2.2.1 Chassis
Type ・・・・・・・・・・・・・・・・・・・・・・・・・・・・・・・・・北京福田 BJ1089VEJEA-FD
(Foton)
Axle number ・・・・・・・・・・・・・・・・・・・・・・・・・・・・・・・・・2
Wheel drive ・・・・・・・・・・・・・・・・・・・・・・・・・・・・・・・・・4×2
Tire Size・・・・・・・・・・・・・・・・・・・・・・・・・・・・«轮胎规格»
Tire numbers ・・・・・・・・・・・・・・・・・・・・・・・・・・・・・・・・・6
2.2.2 Engine
Number ・・・・・・・・・・・・・・・・・・・・・・・・・・・・・・・・・ISF3.8s3141
Type ・・・・Indirect 4 cylinder, liquid cooler
Diesel Engine with Intercooler Turbo
Fuel ・・・・・・・・・・・・・・・・・・・・・・・・・・・・・・・・・Diesel
Displacement ・・・・・・・・・・・・・・・・・・・・・・・・・・・・・・・・・3760 ml
Power ・・・・・・・・・・・・・・・・・・・・・・・・・・・・・・・・・105/2600(kw/rpm)
Maximum Torque・・・・・・・・・・・・・・・・・・・・・・・・・・・・・450/1200-2200 (N
m/rpm)
2.2.3 Cabin
Color・・・・・・・・・・・・・・・・・・・・・・・・・・・・・・・・・・white
Type ・・・・・・・・・・・・・・・・・・・・・・・・・・・・・・Steel Made Single Flat Cabin
Riding Capacity・・・・・・・・・・・・・・・・・・・・・・・・・・・・・・・・・3 person
2.2.4Trasnmission
Type ・・・・・・・・・・・・・・・・・・・・・・・・・・・・・・・・・«变速器型式»
Number of Gear ・・・・・・・・・・・・・・・・・・・・・・・・・・・・・・・・・4 gears
2.2.5 Clutch
Type ・・・・・・・・・・・・・・・・・・・・・・・・・・・・・・・・・Dry Single Plate
2.2.6 Handle
Type ・・・・・・・・・・・・・・・・・・・・・・・・・・・・・・・・・Left handle
2.2.7Suspension
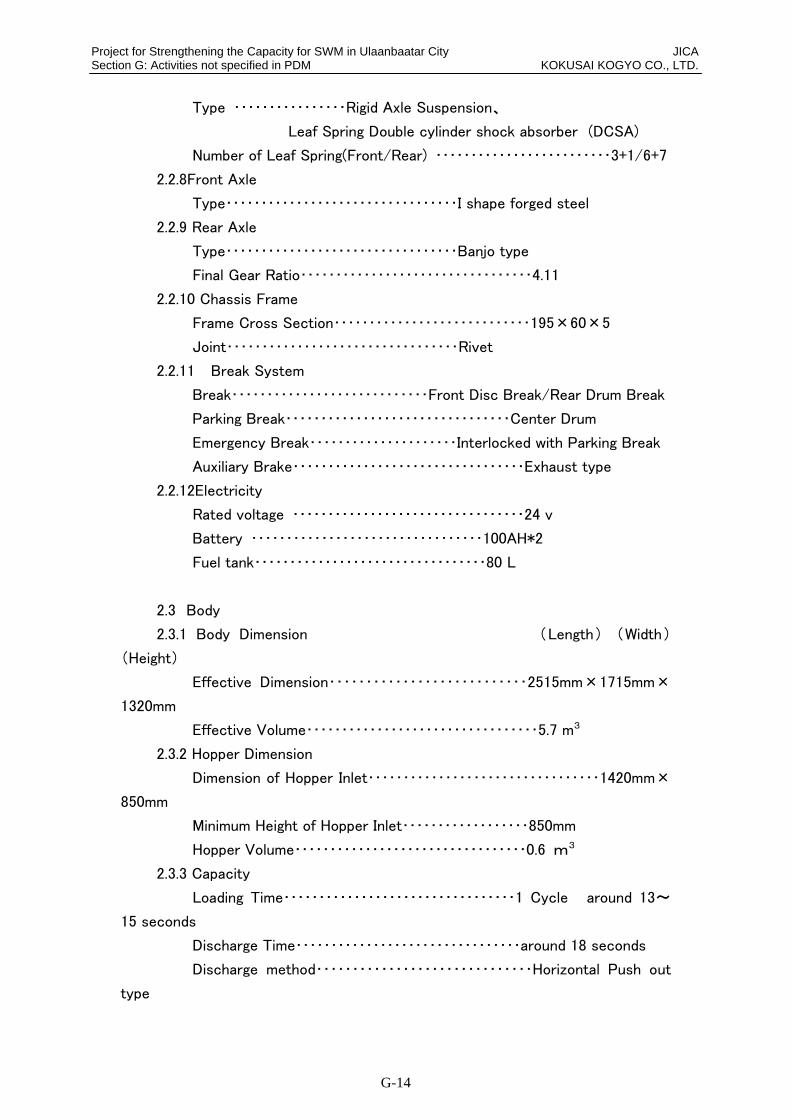
Project for Strengthening the Capacity for SWM in Ulaanbaatar City JICA Section G: Activities not specified in PDM KOKUSAI KOGYO CO., LTD.
G-14
Type ・・・・・・・・・・・・・・・・Rigid Axle Suspension、
Leaf Spring Double cylinder shock absorber (DCSA)
Number of Leaf Spring(Front/Rear) ・・・・・・・・・・・・・・・・・・・・・・・・・3+1/6+7
2.2.8Front Axle
Type・・・・・・・・・・・・・・・・・・・・・・・・・・・・・・・・・I shape forged steel
2.2.9 Rear Axle
Type・・・・・・・・・・・・・・・・・・・・・・・・・・・・・・・・・Banjo type
Final Gear Ratio・・・・・・・・・・・・・・・・・・・・・・・・・・・・・・・・・4.11
2.2.10 Chassis Frame
Frame Cross Section・・・・・・・・・・・・・・・・・・・・・・・・・・・・195×60×5
Joint・・・・・・・・・・・・・・・・・・・・・・・・・・・・・・・・・Rivet
2.2.11 Break System
Break・・・・・・・・・・・・・・・・・・・・・・・・・・・・Front Disc Break/Rear Drum Break
Parking Break・・・・・・・・・・・・・・・・・・・・・・・・・・・・・・・・Center Drum
Emergency Break・・・・・・・・・・・・・・・・・・・・・Interlocked with Parking Break
Auxiliary Brake・・・・・・・・・・・・・・・・・・・・・・・・・・・・・・・・・Exhaust type
2.2.12Electricity
Rated voltage ・・・・・・・・・・・・・・・・・・・・・・・・・・・・・・・・・24 v
Battery ・・・・・・・・・・・・・・・・・・・・・・・・・・・・・・・・・100AH*2
Fuel tank・・・・・・・・・・・・・・・・・・・・・・・・・・・・・・・・・80 L
2.3 Body
2.3.1 Body Dimension (Length) (Width)
(Height)
Effective Dimension・・・・・・・・・・・・・・・・・・・・・・・・・・・2515mm×1715mm×
1320mm
Effective Volume・・・・・・・・・・・・・・・・・・・・・・・・・・・・・・・・・5.7 m3
2.3.2 Hopper Dimension
Dimension of Hopper Inlet・・・・・・・・・・・・・・・・・・・・・・・・・・・・・・・・・1420mm×
850mm
Minimum Height of Hopper Inlet・・・・・・・・・・・・・・・・・・850mm
Hopper Volume・・・・・・・・・・・・・・・・・・・・・・・・・・・・・・・・・0.6 m3
2.3.3 Capacity
Loading Time・・・・・・・・・・・・・・・・・・・・・・・・・・・・・・・・・1 Cycle around 13~
15 seconds
Discharge Time・・・・・・・・・・・・・・・・・・・・・・・・・・・・・・・・around 18 seconds
Discharge method・・・・・・・・・・・・・・・・・・・・・・・・・・・・・・Horizontal Push out
type

Project for Strengthening the Capacity for SWM in Ulaanbaatar City JICA Section G: Activities not specified in PDM KOKUSAI KOGYO CO., LTD.
G-15
2.3.4 Hopper Volume
Hopper Volume・・・・・・・・・・・・・・・・・・・・・・・・・・・・・・around 75 L
3. Special Feature
This truck is composed of chassis and body. body is composed of body itself,
loading device, discharge plate. loading device and discharge plate are
powered by hydraulic cylinder equipped in the body and have following
features.
3.1 Pressing plate will function strongly with down, compress and up process.
Bulk wastes can be loaded with compression function.
3.2 Discharge plate inside body move towards from automatically when wastes
are loaded and compacted. Therefore, compaction of wastes loaded is efficient.
3.3 Self Rock Cylinder
Hydraulic Cylinders for Opening and Closing Hopper have special check valve
so, in case hydraulic hose is damaged, hopper should not close. It is safety
features for workers during operation.
3.4 Emergency stop device, alarm system for hopper open and close, inter rock
switch for hopper close, automatic scraping device at hopper,. are equipped and
safety operation will be secured during waste collection and washing as well.
4. Structure
4.1Loading Device
Loading will be conducted by press plate which is equipped at hopper with
hydraulic devices. Wastes are crushed and compacted by press plate and
further compacted inside the body with discharge plate.
Position of discharge plate is adjustable during loading.
4.2Unloading Device
Hopper open and close cylinder will open the hopper portion and discharge
plate push out the loaded waste to outside. This operation will be conducted
from inside cabin automatically.
4.3Hopper
Hopper is a strong structure made of steel and anti weather high tensile
steel plate is used for the place where it is possible to be rust, and anti worn
out high tensile steel plate is used for the main frame and the place where it
is possible to be wear out..
4.4 Body
It is a strong structure with anti worn out high tensile steel plate is used at
main places in order to improve anti rust performance.
4.5Hydraulic Device
Oil pump powered by PTO will push hydraulic oil through control valve to
each hydraulic cylinder and enact waste loading, open and close hopper and
discharge wastes.
Project for Strengthening the Capacity for SWM in Ulaanbaatar City JICA Section G: Activities not specified in PDM KOKUSAI KOGYO CO., LTD.
G-16
4.5.1Hydraulic Pump
Type・・・・・・・・・・・・・・・・・・・・・・・・・・・・・・・・・・・・・・・・・・Gear Pump
Standard Rotation ・・・・・・・・・・・・・・・・・・・・・・・・・・・・Around 1000 rpm
Pump Capacity ・・・・・・・・・・・・・・・・・・・・・・・・・・・・・・・・・Around 50 L/min
4.5.2Hydraulic Actuator
Press Cylinder・・・・・・・・・・・・・・・・・・・・・・・・・・・・・・・・・・・・・・double acting
cylinder
Pack Cylinder・・・・・・・・・・・・・・・・・・・・・・・・・・・・・・・・・・・・・・double acting cylinder
Rock Cylinder ・・・・・・・・・・・・・・・・・・・・・・・・・・・・・・・・・・・・・・double acting
cylinder
Lift Cylinder(self rock system)・・・・・・・・・・・・・・・・・・・・double acting cylinder
Ejection Cylinder ・・・・・・・・・・・・・・・・・・・・・・・・・・・・・・・・・・Plural stages
double acting cylinder
4.5.3 Control Valve ・・・・・・・・・・・・・・・・・・・・・・・・・・・・・・・・・・・・・・4 connection
solenoid valve
4.5.4 Maximum Pressure・・・・・・・・・・・・・・・・・・・・・・・Around17.7 MPa(Around 180
kgf/cm2)
4.5.6 Operation Device
Each cylinder will be controlled by solenoid valve through electric signals
(1)Operation Device inside Cabin
1. PTO is operated by a lever equipped inside cabin.
2. Panel Switch in the Cabin
a. Change Switch(Loading・Unloading)
b. Hopper Switch(Open・Close)
c. Discharge Plate Switch(Front・Back)
d. Discharge Switch
(2)Switch at Hopper
1. Left Rear
a. Alarm Buzzer Button to inform Driver
b. Single/Continuous Operation Button

Project for Strengthening the Capacity for SWM in Ulaanbaatar City JICA Section G: Activities not specified in PDM KOKUSAI KOGYO CO., LTD.
G-17
c. Start Button
d. Down Button(Stop Button)
e. Up Button
f. Press Plate Reverse Button
g. Emergency Stop Button
(d、e、f is for single operation)
2. Right Rear
a. Emergency Stop Button
3. Hopper blow
a. Emergency Stop Press Plate
4.5.7 Hopper Rock Device and Prevention of Waste Water Leakage Device
Body and Hopper will be automatically rocked through hooks equipped at
right and left rear. Seal packing is attached between hopper and body in
order not to leak waste water.
5. Safety Device
5.1 Solenoid check valve was equipped with hydraulic cylinder for hopper open
and close.
5.2 Protection switch for hopper closure is attached at rear body. Indication
ramp is equipped in the cabin.
5.3 Protection bar for hopper closure is equipped at the rear body.
5.4 Emergency stop bars equipped below hopper inlet.
5.5 Emergency stop button is equipped at both side of hopper inlet.
5.6 Alarm buzzer rings during open and closure of hopper.
5.7 Loading operation can not be implemented in case hopper is unrocked.
5.8 During loading operation, in case hopper is opened, loading operation is
automatically ceased.
5.9Prevention device for operation mistake
Sweep out restriction
Sweep out operation is automatically cancelled when the hopper’s opening
angle is 45 degrees or less.
5.10 Hooking confirmation ramp in cabin.

Project for Strengthening the Capacity for SWM in Ulaanbaatar City JICA Section G: Activities not specified in PDM KOKUSAI KOGYO CO., LTD.
G-18
6. Painting Body
After acid cleaning and phosphorylation treatment and surface preparation with
under splaying, urethane paint will be applied with customers request color.

Project for Strengthening the Capacity for SWM in Ulaanbaatar City JICA Section G: Activities not specified in PDM KOKUSAI KOGYO CO., LTD.
G-19
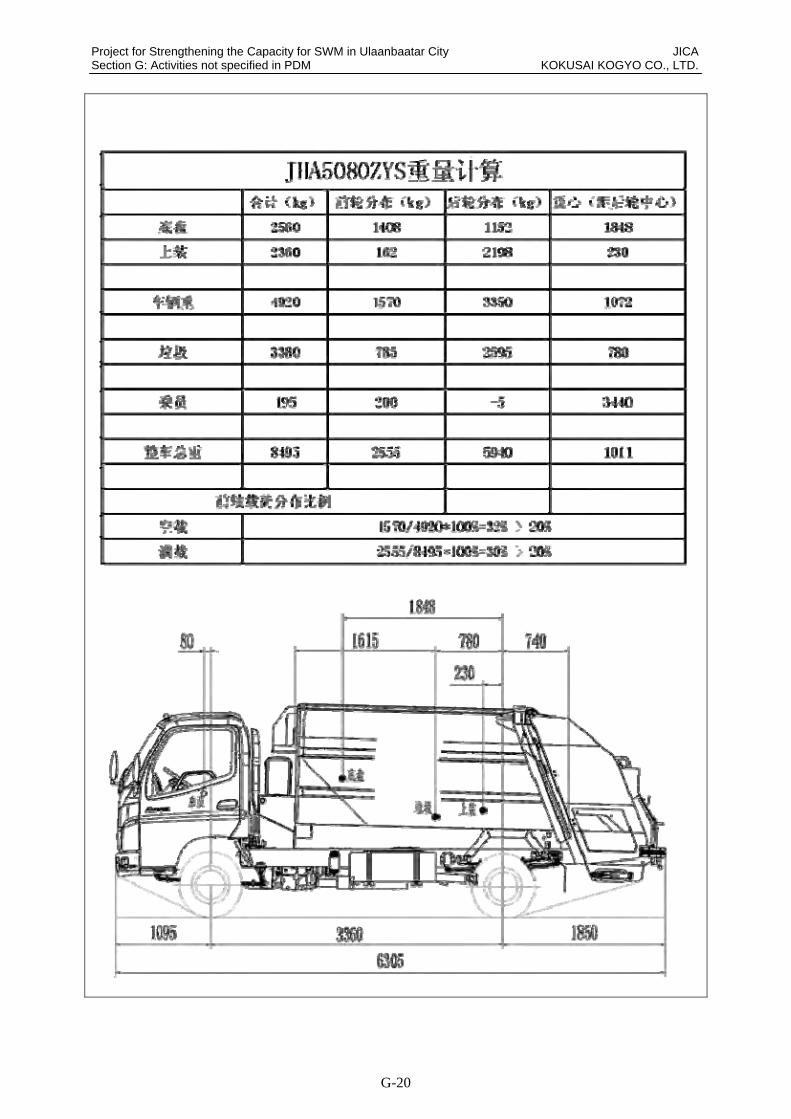
Project for Strengthening the Capacity for SWM in Ulaanbaatar City JICA Section G: Activities not specified in PDM KOKUSAI KOGYO CO., LTD.
G-20
Project for Strengthening the Capacity for SWM in Ulaanbaatar City JICA Section G: Activities not specified in PDM KOKUSAI KOGYO CO., LTD.
G-21
G.2.3 Technical Specification Document(ISUZU-chassis 10.2m3 Compactor)
Specification for Compactor Truck (JHA5100ZYS) 1. General
JHA5100ZYS compactor truck is composed of chassis and body. chassis is
QL1100TKARY and body is GT100. Body has functions of compacting wastes
during loading and unloading wastes from body by discharging plate.
JHA5100ZYS compactor truck can collect and transport wastes safely,
sanitary, and saving manpower.
2. Main Size and Capacity
2.1 Overall
2.1.1Size of Chassis (Length)
(Width) (Height)
Outside Dimension ・・・・・・・・・・・・・・・・・・・・・・・・・・・・・・・・・・・・7250mm×
2250mm×2800mm
Wheel base ・・・・・・・・・・・・・・・・・・・・・・・・・・・・・・・・・・・3815 mm
Tread (Front/Rear)・・・・・・・・・・・・・・・・・・・・・・・・・・・・・・1680/1650mm
Front/Rear Overhung・・・・・・・・・・・・・・・・・・・・・・1100/2325mm
2.1.2Weight
Full Load・・・・・・・・・・・・・・・・・・・・・・・・・・・・・・・・・・・・・・・・・・・・・・・・・10000kg
Empty Load・・・・・・・・・・・・・・・・・・・・・・・・・・・・・・・・・・・・・・・・・・・・・・ 6220kg
Pay Load (Carrying Capacity)・・・・・・・・・・・・・・・・・・・・・・・・・・・・・・・・・3585kg
2.1.3Travelling
Minimum Rotation Radius・・・・・・・・・・・・・・・・・・・・・・・・・・・15 m
Lowest Clearance・・・・・・・・・・・・・・・・・・・・・・・・・・・・・・・・・215 mm
Approach angle/departure angle・・・・・・・・・・・・・・・・・・・・21/16 °
2.2 Chassis
2.2.1 Chassis
Type ・・・・・・・・・・・・・・・・・・・・・・・・・・・・・・・・・·五十铃 QL1100TKARY
Axle number ・・・・・・・・・・・・・・・・・・・・・・・・・・・・・・・・・2
Wheel drive ・・・・・・・・・・・・・・・・・・・・・・・・・・・・・・・・・4×2
Tire Size・・・・・・・・・・・・・・・・・・・・・・・・・・・・9. 5R17. 5, 8.25-20, 8. 25R20
Tire numbers ・・・・・・・・・・・・・・・・・・・・・・・・・・・・・・・・・6
2.2.2 Engine
Number ・・・・・・・・・・・・・・・・・・・・・・・・・・・・・・・・・4HK1-TC
Type ・・・・Indirect 4 cylinder, liquid cooler, direct injection
Diesel Engine with Intercooler Turbo
Fuel ・・・・・・・・・・・・・・・・・・・・・・・・・・・・・・・・・Diesel

Project for Strengthening the Capacity for SWM in Ulaanbaatar City JICA Section G: Activities not specified in PDM KOKUSAI KOGYO CO., LTD.
G-22
Displacement ・・・・・・・・・・・・・・・・・・・・・・・・・・・・・・・・・5193 ml
Power ・・・・・・・・・・・・・・・・・・・・・・・・・・・・・・・・・129/2600(kw/rpm)
Maximum Torque・・・・・・・・・・・・・・・・・・・・・・・・・・・・・500/1500-2000 (N
m/rpm)
2.2.3 Cabin
Color・・・・・・・・・・・・・・・・・・・・・・・・・・・・・・・・・・White
Type ・・・・・・・・・・・・・・・・・・・・・・・・・・・・・・Steel Made Single Flat Cabin
Riding Capacity・・・・・・・・・・・・・・・・・・・・・・・・・・・・・・・・・3 person
2.2.4Trasnmission
Type ・・・・・・・・・・・・・・・・・・・・・・・・・・・・・・・・・«变速器型式»
Number of Gear ・・・・・・・・・・・・・・・・・・・・・・・・・・・・・・・・・.空档齿轮
2.2.5 Clutch
Type ・・・・・・・・・・・・・・・・・・・・・・・・・・・・・・・・・Hydraulic Control, 膜片弹簧,
Dry Single Plate
2.2.6 Handle
Type ・・・・・・・・・・・・・・・・・・・・・・・・・・・・・・・・・Left handle
2.2.7Suspension
Type ・・・・・・・・・・・・・・・・Rigid Axle Suspension、Leaf Spring with double
acting shock absorber
Number of Leaf Spring(Front/Rear) ・・・・・・・・・・・・・・・・・・・・・・・・・8/10+6
2.2.8Front Axle
Type・・・・・・・・・・・・・・・・・・・・・・・・・・・・・・・・・I shape forged steel, 端拳式
2.2.9 Rear Axle
Type・・・・・・・・・・・・・・・・・・・・・・・・・・・・・・・・・…整体式冲焊桥壳全浮式半
轴,螺旋伞齿轮和准双曲面
齿轮传动
Final Gear Ratio・・・・・・・・・・・・・・・・・・・・・・・・・・・・・・・・・4.1
2.2.10 Chassis Frame
Frame Cross Section・・・・・・・・・・・・・・・・・・・・・・・・・・・・216×70×6
Joint・・・・・・・・・・・・・・・・・・・・・・・・・・・・・・・・・Rivet
2.2.11 Break System
Break・・・・・・・・・・・・・・・・・・・・・・・・・・・・・・・・・・・・・Hydraulic Assist Drum
Break
Parking Break・・・・・・・・・・・・・・・・・・・・・・・・・・・・・・・・Central Drum Break
Emergency Break・・・・・・・・・・・・・・・・・・・・・Interlocked with Parking Break
Auxiliary Brake・・・・・・・・・・・・・・・・・・・・・・・・・・・・・・・・・Exhaust type
2.2.12Electricity
Rated voltage ・・・・・・・・・・・・・・・・・・・・・・・・・・・・・・・・・24 v

Project for Strengthening the Capacity for SWM in Ulaanbaatar City JICA Section G: Activities not specified in PDM KOKUSAI KOGYO CO., LTD.
G-23
Battery ・・・・・・・・・・・・・・・・・・・・・・・・・・・・・・・・・70AH*2
Fuel tank・・・・・・・・・・・・・・・・・・・・・・・・・・・・・・・・・100 L
2.3 Body
2.3.1 Body Dimension (Length) (Width)
(Height)
Effective Dimension・・・・・・・・・・・・・・・・・・・・・・・・・・・2980mm×2060mm×
1660mm
Effective Volume・・・・・・・・・・・・・・・・・・・・・・・・・・・・・・・・・10.2 m3
2.3.2 Hopper Dimension
Dimension of Hopper Inlet・・・・・・・・・・・・・・・・・・・・・・・・・・・・・・・・・1700mm×
960mm
Minimum Height of Hopper Inlet・・・・・・・・・・・・・・・・・・900mm
Hopper Volume・・・・・・・・・・・・・・・・・・・・・・・・・・・・・・・・・0.6 m3
2.3.3 Capacity
Loading Time・・・・・・・・・・・・・・・・・・・・・・・・・・・・・・・・・1 Cycle around 20
seconds
Discharge Time・・・・・・・・・・・・・・・・・・・・・・・・・・・・・・・・around 25 seconds
Discharge method・・・・・・・・・・・・・・・・・・・・・・・・・・・・・・Horizontal Push out
type
2.3.4 Hopper Volume
Hopper Volume・・・・・・・・・・・・・・・・・・・・・・・・・・・・・・around 140 L
3. Special Feature
This truck is composed of chassis and body. body is composed of body itself,
loading device, discharge plate. loading device and discharge plate are
powered by hydraulic cylinder equipped in the body and have following
features.
3.1 Pressing plate will function strongly with down, compress and up process.
Bulk wastes can be loaded with compression function.
3.2 Discharge plate inside body move towards from automatically when wastes
are loaded and compacted. Therefore, compaction of wastes loaded is efficient.
3.3 Self Rock Cylinder
Hydraulic Cylinders for Opening and Closing Hopper have special check valve
so, in case hydraulic hose is damaged, hopper should not close. It is safety
features for workers during operation.
3.4 Emergency stop device, alarm system for hopper open and close, inter rock
switch for hopper close, automatic scraping device at hopper,. are equipped and
safety operation will be secured during waste collection and washing as well.
4. Structure

Project for Strengthening the Capacity for SWM in Ulaanbaatar City JICA Section G: Activities not specified in PDM KOKUSAI KOGYO CO., LTD.
G-24
4.1Loading Device
Loading will be conducted by press plate which is equipped at hopper with
hydraulic devices. Wastes are crushed and compacted by press plate and
further compacted inside the body with discharge plate.
Position of discharge plate is adjustable during loading.
4.2Unloading Device
Hopper open and close cylinder will open the hopper portion and discharge
plate push out the loaded waste to outside. This operation will be conducted
from inside cabin automatically.
4.3Hopper
Hopper is a strong structure made of steel and anti weather high tensile
steel plate is used for the place where it is possible to be rust, and anti worn
out high tensile steel plate is used for the main frame and the place where it
is possible to be wear out..
4.4 Body
It is a strong structure with anti worn out high tensile steel plate is used at
main places in order to improve anti rust performance.
4.5Hydraulic Device
Oil pump powered by PTO will push hydraulic oil through control valve to
each hydraulic cylinder and enact waste loading, open and close hopper and
discharge wastes.
4.5.1Hydraulic Pump
Type・・・・・・・・・・・・・・・・・・・・・・・・・・・・・・・・・・・・・・・・・・Gear Pump
Standard Rotation ・・・・・・・・・・・・・・・・・・・・・・・・・・・・Around 1000 rpm
Pump Capacity ・・・・・・・・・・・・・・・・・・・・・・・・・・・・・・・・・Around 50 L/min
4.5.2Hydraulic Actuator
Press Cylinder・・・・・・・・・・・・・・・・・・・・・・・・・・・・・・・・・・・・・・double acting
cylinder
Pack Cylinder・・・・・・・・・・・・・・・・・・・・・・・・・・・・・・・・・・・・・・double acting cylinder
Rock Cylinder ・・・・・・・・・・・・・・・・・・・・・・・・・・・・・・・・・・・・・・double acting
cylinder
Lift Cylinder(self rock system)・・・・・・・・・・・・・・・・・・・・double acting cylinder
Ejection Cylinder ・・・・・・・・・・・・・・・・・・・・・・・・・・・・・・・・・・Plural stages
double acting cylinder

Project for Strengthening the Capacity for SWM in Ulaanbaatar City JICA Section G: Activities not specified in PDM KOKUSAI KOGYO CO., LTD.
G-25
4.5.3 Control Valve ・・・・・・・・・・・・・・・・・・・・・・・・・・・・・・・・・・・・・・4 connection
solenoid valve
4.5.4 Maximum Pressure・・・・・・・・・・・・・・・・・・・・・・・Around20.6 MPa(Around 210
kgf/cm2)
4.5.6 Operation Device
Each cylinder will be controlled by solenoid valve through electric signals
(1)Operation Device inside Cabin
1. PTO is operated by a lever equipped inside cabin.
2. Panel Switch in the Cabin
a. Change Switch(Loading・Unloading)
b. Hopper Switch(Open・Close)
c. Discharge Plate Switch(Front・Back)
d. Discharge Switch
(2)Switch at Hopper
1. Left Rear
a. Alarm Buzzer Button to inform Driver
b. Single/Continuous Operation Button
c. Start Button
d. Down Button(Stop Button)
e. Up Button
f. Press Plate Reverse Button
g. Emergency Stop Button
(d、e、f is for single operation)
2. Right Rear
a. Emergency Stop Button
3. Hopper blow
a. Emergency Stop Press Plate
4.5.7 Hopper Rock Device and Prevention of Waste Water Leakage Device

Project for Strengthening the Capacity for SWM in Ulaanbaatar City JICA Section G: Activities not specified in PDM KOKUSAI KOGYO CO., LTD.
G-26
Body and Hopper will be automatically rocked through hooks equipped at
right and left rear. Seal packing is attached between hopper and body in
order not to leak waste water.
5. Safety Device
5.1 Solenoid check valve was equipped with hydraulic cylinder for hopper open
and close.
5.2 Protection switch for hopper closure is attached at rear body. Indication
ramp is equipped in the cabin.
5.3 Protection bar for hopper closure is equipped at the rear body.
5.4 Emergency stop bars equipped below hopper inlet.
5.5 Emergency stop button is equipped at both side of hopper inlet.
5.6 Alarm buzzer rings during open and closure of hopper.
5.7 Loading operation can not be implemented in case hopper is unrocked.
5.8 During loading operation, in case hopper is opened, loading operation is
automatically ceased.
5.9Prevention device for operation mistake
Sweep out restriction
Sweep out operation is automatically cancelled when the hopper’s opening
angle is 45 degrees or less.
5.10 Hooking confirmation ramp in cabin.
6. Painting Body
After acid cleaning and phosphorylation treatment and surface preparation with
under splaying, urethane paint will be applied with customers request color.

Project for Strengthening the Capacity for SWM in Ulaanbaatar City JICA Section G: Activities not specified in PDM KOKUSAI KOGYO CO., LTD.
G-27

Project for Strengthening the Capacity for SWM in Ulaanbaatar City JICA Section G: Activities not specified in PDM KOKUSAI KOGYO CO., LTD.
G-28

Project for Strengthening the Capacity for SWM in Ulaanbaatar City JICA Section G: Activities not specified in PDM KOKUSAI KOGYO CO., LTD.
G-29
G.3 Estimation for Running Cost of RPF facility
G.3.1 Comparison of Estimation
a. Estimation by KOICA
KOICA Estimation
Description unit QuantityRateMNT
AmountMNT
Conditions8 hours /day operation x 300 days38 people are workingIncoming Waste: Mix collection waste fromapartmentIncoming waste amount : 80 ton/dayRPF production: 1.6 ton/dayResidue 80%
Operation Cost estimated by KOICAA Variable Cost
1 Electricity kwh 767,004 87.87 67,396,641
2 Fuel liter 18,180 1,450 26,361,000
3 Water ton 120 1,105 132,6004 Maintenance and Repair cost % 1 3,219,000,000 32,190,000 1% of Total Budget
Sub total 126,080,241B Labour Cost
1 Labor cost month 12 5,700,000 68,400,000 38p * 150,000MNT/Mth2 Other Expense % 5 68,400,000 3,420,0003 Insurance % 0.3 3,219,000,000 9,657,000
Sub total 81,477,000
Total Cost 207,557,241
Income from selling valuables for one year (300days)Glass kg 1,814,400 10 18,144,000 6,048 kg/dayCardboard kg 696,000 40 27,840,000 2,320 kg/dayPaper kg 4,363,200 30 130,896,000 14,544 kg/dayPlastic kg 2,553,600 70 178,752,000 8,512 kg/dayIron kg 306,000 30 9,180,000 1,020 kg/dayAluminium kg 143,700 450 64,665,000 479 kg/day
Sub Total 429,477,000
profit per Year 221,919,759
767004kwh/300day =2557kwh/day
Excavator, Folk Lift18180liter/300day=60liter/day
Remarks
b. Estimation by JICA
JICA EstimationOperation Cost estimated by JICA using KOICA InformationA Variable Cost
1 Electricity kwh 767,004 87.87 67,396,6412 Fuel liter 18,180 1,650 29,997,000 revise unit rate3 Water ton 120 1,105 132,6004 Maintenance and Repair cost % 1 3,219,000,000 32,190,000
Sub total 129,716,241B Labour Cost
1 Labor cost month 12 5,700,000 68,400,0002 Other Expense % 5 68,400,000 3,420,0003 Insurance % 0.3 3,219,000,000 9,657,000
Sub total 81,477,000C Residue Transportation
80ton/day x 80% =64ton/day64ton x 300 days = 19,200 ton/year10 ton dump truck ton 19,200 5,000 96,000,000
Total 307,193,241
Income from selling valuables for one year (300days)PET kg 64,800 380 24,624,000 0.27 %Colored Plastic kg 115,200 150 17,280,000 0.48 %Glass Bottle kg 525,600 40.6 21,339,360 2.19 %Iron kg 129,600 50 6,480,000 0.54 %HQ Paper kg 208,800 80 16,704,000 0.87 %Cardboard kg 1,087,200 17 18,482,400 4.53 %Bone kg 252,000 20 5,040,000 1.05 %HDPE (plastic bag) kg 24,000 200 4,800,000 0.10 %Metal kg 26,400 630 16,632,000 0.11 %
Sub Total 131,381,760
Annual Operation Cost 175,811,481
Using PP results

Section H Project Design Matrix
H Project Design Matrix ........................................................................H-1
H.1 PDM4.................................................................................................. H-1
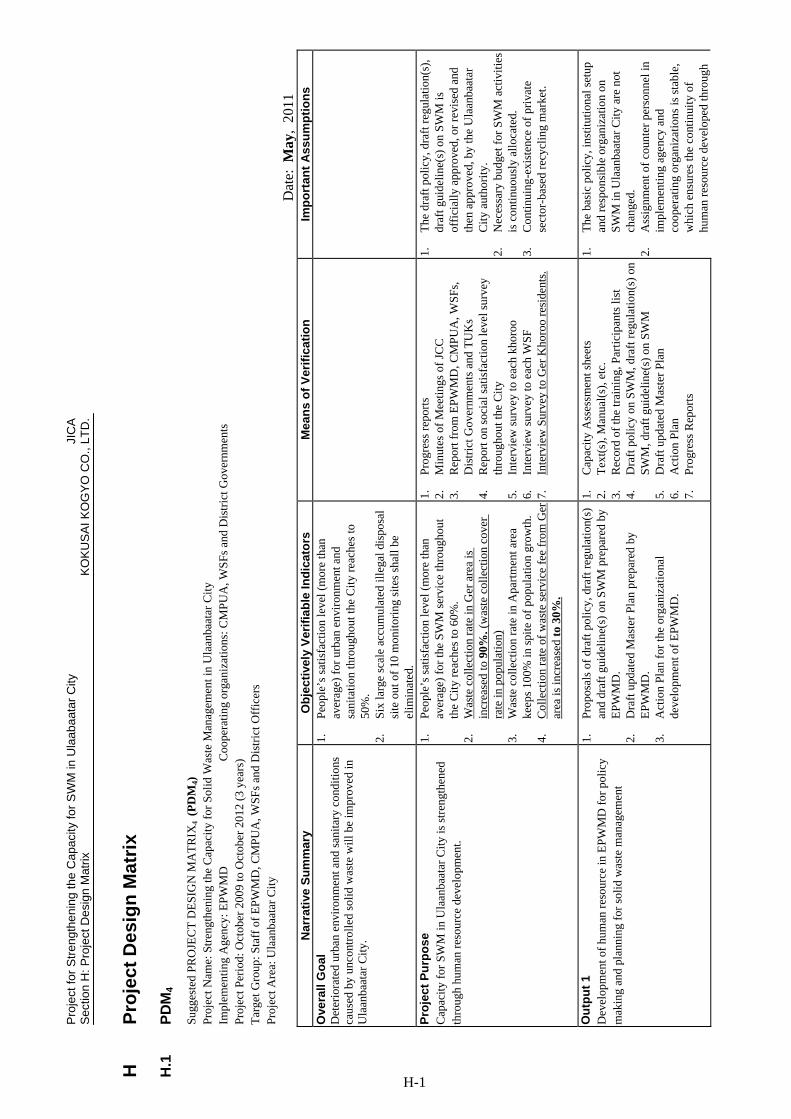
Pro
ject
for
Str
engt
heni
ng
the
Cap
acity
for
SW
M in
Ula
aba
atar
City
JI
CA
S
ectio
n H
: Pro
ject
Des
ign
Mat
rix
KO
KU
SA
I K
OG
YO
CO
., LT
D.
H-1
H
Pro
ject
Des
ign
Mat
rix
H.1
P
DM
4
Sug
gest
ed P
RO
JEC
T D
ES
IGN
MA
TR
IX4
(PD
M4)
P
roje
ct N
ame:
Str
engt
heni
ng th
e C
apac
ity
for
Sol
id W
aste
Man
agem
ent i
n U
laan
baat
ar C
ity
Impl
emen
ting
Age
ncy:
EP
WM
D
Coo
pera
ting
org
aniz
atio
ns: C
MP
UA
, WS
Fs
and
Dis
tric
t Gov
ernm
ents
P
roje
ct P
erio
d: O
ctob
er 2
009
to O
ctob
er 2
012
(3 y
ears
) T
arge
t Gro
up: S
taff
of
EP
WM
D, C
MP
UA
, WS
Fs
and
Dis
tric
t Off
icer
s P
roje
ct A
rea:
Ula
anba
atar
City
Dat
e: M
ay,
2011
N
arra
tive
Su
mm
ary
Ob
ject
ivel
y V
erif
iab
le In
dic
ato
rs
Mea
ns
of
Ver
ific
atio
n
Imp
ort
ant
Ass
um
pti
on
s O
vera
ll G
oal
D
eter
iora
ted
urba
n en
viro
nmen
t and
san
itar
y co
ndit
ions
ca
used
by
unco
ntro
lled
sol
id w
aste
wil
l be
impr
oved
in
Ula
anba
atar
City
.
1.
Peo
ple’
s sa
tisf
acti
on le
vel (
mor
e th
an
aver
age)
for
urb
an e
nvir
onm
ent a
nd
sani
tati
on th
roug
hout
the
Cit
y re
ache
s to
50
%.
2.
Six
larg
e sc
ale
accu
mul
ated
ille
gal d
ispo
sal
site
out
of
10 m
onit
orin
g si
tes
shal
l be
elim
inat
ed.
Pro
ject
Pu
rpo
se
Cap
acity
for
SW
M in
Ula
anba
atar
City
is s
tren
gthe
ned
thro
ugh
hum
an r
esou
rce
deve
lopm
ent.
1.
Peo
ple’
s sa
tisf
acti
on le
vel (
mor
e th
an
aver
age)
for
the
SW
M s
ervi
ce th
roug
hout
th
e C
ity
reac
hes
to 6
0%.
2.
Was
te c
olle
ctio
n ra
te in
Ger
are
a is
in
crea
sed
to 9
0%. (
was
te c
olle
ctio
n co
ver
rate
in p
opul
atio
n)
3.
Was
te c
olle
ctio
n ra
te in
Apa
rtm
ent a
rea
keep
s 10
0% in
spi
te o
f po
pula
tion
gro
wth
. 4.
C
olle
ctio
n ra
te o
f w
aste
ser
vice
fee
fro
m G
er
area
is in
crea
sed
to 3
0%.
1.
Pro
gres
s re
port
s 2.
M
inut
es o
f M
eeti
ngs
of J
CC
3.
R
epor
t fro
m E
PW
MD
, CM
PU
A, W
SF
s,
Dis
tric
t Gov
ernm
ents
and
TU
Ks
4.
Rep
ort o
n so
cial
sat
isfa
ctio
n le
vel s
urve
y th
roug
hout
the
Cit
y 5.
In
terv
iew
sur
vey
to e
ach
khor
oo
6.
Inte
rvie
w s
urve
y to
eac
h W
SF
7.
In
terv
iew
Sur
vey
to G
er K
horo
o re
side
nts.
1.
The
dra
ft p
olic
y, d
raft
reg
ulat
ion(
s),
draf
t gui
delin
e(s)
on
SW
M is
of
fici
ally
app
rove
d, o
r re
vise
d an
d th
en a
ppro
ved,
by
the
Ula
anba
atar
C
ity
auth
orit
y.
2.
Nec
essa
ry b
udge
t for
SW
M a
ctiv
itie
s is
con
tinu
ousl
y al
loca
ted.
3.
C
onti
nuin
g-ex
iste
nce
of p
riva
te
sect
or-b
ased
rec
ycli
ng m
arke
t.
Ou
tpu
t 1
Dev
elop
men
t of
hum
an r
esou
rce
in E
PW
MD
for
pol
icy
mak
ing
and
plan
ning
for
sol
id w
aste
man
agem
ent
1.
Pro
posa
ls o
f dr
aft p
olic
y, d
raft
reg
ulat
ion(
s)
and
draf
t gui
deli
ne(s
) on
SW
M p
repa
red
by
EPW
MD
. 2.
D
raft
upd
ated
Mas
ter
Pla
n pr
epar
ed b
y E
PWM
D.
3.
A
ctio
n P
lan
for
the
orga
niza
tion
al
deve
lopm
ent o
f E
PW
MD
.
1.
Cap
acity
Ass
essm
ent s
heet
s 2.
T
ext(
s), M
anua
l(s)
, etc
. 3.
R
ecor
d of
the
trai
ning
, Par
ticip
ants
list
4.
D
raft
pol
icy
on S
WM
, dra
ft r
egul
atio
n(s)
on
SW
M, d
raft
gui
deli
ne(s
) on
SW
M
5.
Dra
ft u
pdat
ed M
aste
r P
lan
6.
Act
ion
Pla
n 7.
P
rogr
ess
Rep
orts
1.
The
bas
ic p
olic
y, in
stit
utio
nal s
etup
an
d re
spon
sibl
e or
gani
zati
on o
n S
WM
in U
laan
baat
ar C
ity a
re n
ot
chan
ged.
2.
A
ssig
nmen
t of
coun
ter
pers
onne
l in
impl
emen
ting
age
ncy
and
coop
erat
ing
orga
niza
tions
is s
tabl
e,
whi
ch e
nsur
es th
e co
ntin
uity
of
hum
an r
esou
rce
deve
lope
d th
roug
h
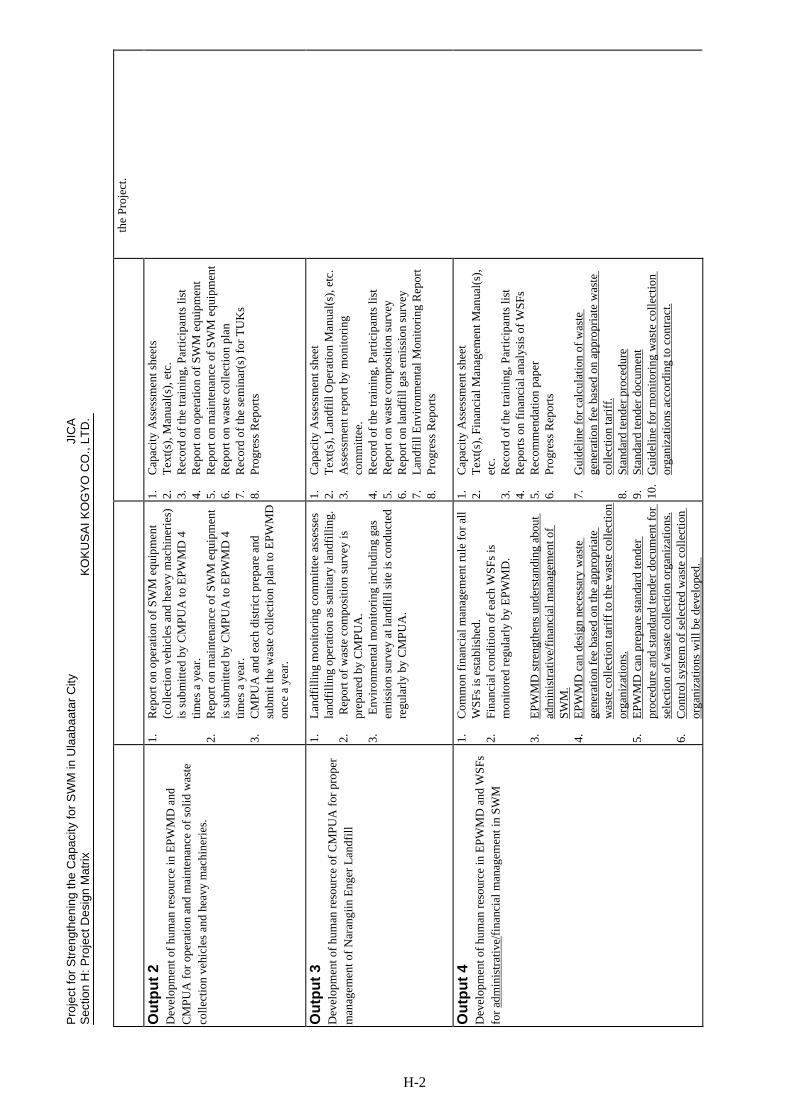
Pro
ject
for
Str
engt
heni
ng
the
Cap
acity
for
SW
M in
Ula
aba
atar
City
JI
CA
S
ectio
n H
: Pro
ject
Des
ign
Mat
rix
KO
KU
SA
I K
OG
YO
CO
., LT
D.
H-2
the
Proj
ect.
Ou
tpu
t 2
Dev
elop
men
t of
hum
an r
esou
rce
in E
PW
MD
and
C
MP
UA
for
ope
rati
on a
nd m
aint
enan
ce o
f so
lid
was
te
coll
ecti
on v
ehic
les
and
heav
y m
achi
neri
es.
1.
Rep
ort o
n op
erat
ion
of S
WM
equ
ipm
ent
(col
lect
ion
vehi
cles
and
hea
vy m
achi
neri
es)
is s
ubm
itte
d by
CM
PU
A to
EP
WM
D 4
ti
mes
a y
ear.
2.
R
epor
t on
mai
nten
ance
of
SW
M e
quip
men
t is
sub
mit
ted
by C
MP
UA
to E
PW
MD
4
tim
es a
yea
r.
3.
CM
PUA
and
eac
h di
stri
ct p
repa
re a
nd
subm
it th
e w
aste
col
lect
ion
plan
to E
PWM
D
once
a y
ear.
1.
Cap
acity
Ass
essm
ent s
heet
s 2.
T
ext(
s), M
anua
l(s)
, etc
. 3.
R
ecor
d of
the
trai
ning
, Par
ticip
ants
list
4.
R
epor
t on
oper
atio
n of
SW
M e
quip
men
t 5.
R
epor
t on
mai
nten
ance
of
SW
M e
quip
men
t6.
R
epor
t on
was
te c
olle
ctio
n pl
an
7.
Rec
ord
of th
e se
min
ar(s
) fo
r T
UK
s 8.
P
rogr
ess
Rep
orts
Ou
tpu
t 3
Dev
elop
men
t of
hum
an r
esou
rce
of C
MP
UA
for
pro
per
man
agem
ent o
f N
aran
giin
Eng
er L
andf
ill
1.
Lan
dfill
ing
mon
itor
ing
com
mit
tee
asse
sses
la
ndfi
llin
g op
erat
ion
as s
anit
ary
land
fill
ing.
2.
Rep
ort o
f w
aste
com
posi
tion
sur
vey
is
prep
ared
by
CM
PUA
. 3.
E
nvir
onm
enta
l mon
itor
ing
incl
udin
g ga
s em
issi
on s
urve
y at
land
fill
sit
e is
con
duct
ed
regu
larl
y by
CM
PU
A.
1.
Cap
acity
Ass
essm
ent s
heet
2.
T
ext(
s), L
andf
ill O
pera
tion
Man
ual(
s), e
tc.
3.
Ass
essm
ent r
epor
t by
mon
itor
ing
com
mit
tee.
4.
R
ecor
d of
the
trai
ning
, Par
ticip
ants
list
5.
R
epor
t on
was
te c
ompo
siti
on s
urve
y 6.
R
epor
t on
land
fill
gas
em
issi
on s
urve
y 7.
L
andf
ill E
nvir
onm
enta
l Mon
itor
ing
Rep
ort
8.
Pro
gres
s R
epor
ts
Ou
tpu
t 4
Dev
elop
men
t of
hum
an r
esou
rce
in E
PW
MD
and
WS
Fs
for
adm
inis
trat
ive/
fina
ncia
l man
agem
ent i
n SW
M
1.
Com
mon
fin
anci
al m
anag
emen
t rul
e fo
r al
l W
SF
s is
est
abli
shed
. 2.
F
inan
cial
con
diti
on o
f ea
ch W
SF
s is
m
onit
ored
reg
ular
ly b
y E
PW
MD
. 3.
E
PW
MD
str
engt
hens
und
erst
andi
ng a
bout
ad
min
istr
ativ
e/fi
nanc
ial m
anag
emen
t of
SWM
. 4.
E
PW
MD
can
des
ign
nece
ssar
y w
aste
ge
nera
tion
fee
bas
ed o
n th
e ap
prop
riat
e w
aste
col
lect
ion
tari
ff to
the
was
te c
olle
ctio
n or
gani
zati
ons.
5.
E
PWM
D c
an p
repa
re s
tand
ard
tend
er
proc
edur
e an
d st
anda
rd te
nder
doc
umen
t for
se
lect
ion
of w
aste
col
lect
ion
orga
niza
tion
s.6.
C
ontr
ol s
yste
m o
f se
lect
ed w
aste
col
lect
ion
orga
niza
tion
s w
ill b
e de
velo
ped.
1.
Cap
acity
Ass
essm
ent s
heet
2.
T
ext(
s), F
inan
cial
Man
agem
ent M
anua
l(s)
, et
c.
3.
Rec
ord
of th
e tr
aini
ng, P
artic
ipan
ts li
st
4.
Rep
orts
on
fina
ncia
l ana
lysi
s of
WS
Fs
5.
Rec
omm
enda
tion
pap
er
6.
Pro
gres
s R
epor
ts
7.
Gui
deli
ne f
or c
alcu
lati
on o
f w
aste
ge
nera
tion
fee
bas
ed o
n ap
prop
riat
e w
aste
co
llec
tion
tari
ff.
8.
Sta
ndar
d te
nder
pro
cedu
re
9.
Sta
ndar
d te
nder
doc
umen
t 10
. G
uide
line
for
mon
itor
ing
was
te c
olle
ctio
n or
gani
zati
ons
acco
rdin
g to
con
trac
t.

Pro
ject
for
Str
engt
heni
ng
the
Cap
acity
for
SW
M in
Ula
aba
atar
City
JI
CA
S
ectio
n H
: Pro
ject
Des
ign
Mat
rix
KO
KU
SA
I K
OG
YO
CO
., LT
D.
H-3
Ou
tpu
t 5
Dev
elop
men
t of
hum
an r
esou
rce
of E
PW
MD
and
Dis
tric
t O
ffic
ers
for
prom
otin
g pu
blic
aw
aren
ess
and
part
icip
atio
n in
SW
M.
1.
Per
sonn
el w
ho a
re in
cha
rge
of P
ubli
c A
war
enes
s in
EP
WM
D a
nd D
istr
ict o
ffic
es
are
able
to c
ondu
ct th
e pu
blic
aw
aren
ess
acti
vitie
s by
taki
ng in
itiat
ives
. 2.
Pu
blic
aw
aren
ess
cam
paig
n w
ill b
e co
nduc
ted
in 4
kho
roos
thro
ugh
PP
and
an
othe
r 4
khor
oos
by th
e C
/P.
3.
Aw
aren
ess
of r
esid
ents
on
was
te r
epar
atio
n an
d di
scha
rgin
g m
anne
r is
impr
oved
at t
he
PP
sit
es
1.
Cap
acity
Ass
essm
ent s
heet
2.
T
ext(
s), P
ubli
c A
war
enes
s C
ampa
ign
Man
ual(
s), e
tc.
3.
Rec
ord
of th
e tr
aini
ng, P
artic
ipan
t lis
t 4.
M
onit
orin
g R
epor
t on
the
pilo
t pro
ject
on
publ
ic a
war
enes
s ca
mpa
ign
5.
Rec
omm
enda
tion
pap
er
6.
Pro
gres
s R
epor
ts
7.
Inte
rvie
w s
urve
y to
the
resi
dent
s at
pil
ot
proj
ect s
ite.
Ou
tpu
t 6
Rec
omm
enda
tion
for
the
appr
opri
ate
syst
em o
f w
aste
se
para
tion
and
rec
ycli
ng in
Ula
anba
atar
Cit
y
1.
Was
te s
epar
atio
n fa
cilit
y is
exa
min
ed in
N
ED
S a
nd r
epor
t on
nece
ssar
y ex
tra
cost
, ef
fici
ency
, san
itar
y co
ndit
ions
of
sepa
rati
on
oper
atio
n is
sub
mit
ted.
2.
V
alua
ble
coll
ecto
rs (
form
er w
aste
pic
kers
) w
ill c
oope
rate
for
sor
ting
ope
ratio
n at
so
rtin
g ya
rd a
ccor
ding
to th
e m
anua
l and
gu
idel
ines
. 3.
R
ecom
men
dati
on p
aper
on
was
te s
epar
atio
n an
d re
cycl
ing
syst
em is
off
icia
lly s
ubm
itte
d to
UB
City
aut
hori
ty.
1.
Rec
ord
of th
e se
min
ar, P
artic
ipan
t lis
t 2.
M
onit
orin
g R
epor
t of
the
pilo
t pro
ject
on
was
te s
epar
atio
n an
d re
cycl
ing
in th
e la
ndfi
ll3.
R
ecom
men
dati
on p
aper
4.
P
rogr
ess
Rep
orts
Act
ivit
ies
for
Ou
tpu
t1
1-1)
JE
T (
JIC
A E
xper
t Tea
m)
asse
sses
the
base
line
ca
paci
ty o
f th
e st
aff
in n
ewly
est
abli
shed
EP
WM
D.
1-2)
JE
T p
repa
res
a tr
aini
ng p
rogr
am (
sem
inar
, w
orks
hop,
sit
e vi
sit,
etc.
) an
d tr
aini
ng m
ater
ials
(te
xt,
man
ual,
etc.
).
1-3)
The
trai
ning
pro
gram
is im
plem
ente
d by
JE
T a
nd
EPW
MD
. 1-
4) J
ET
adv
ises
EP
WM
D h
ow to
for
mul
ate
poli
cy,
regu
lati
on(s
) an
d gu
idel
ine(
s) o
f S
WM
. 1-
5) S
emin
ar o
n h
ouse
hold
haz
ardo
us w
aste
and
e-w
aste
m
anag
emen
t inv
olve
d in
urb
an w
aste
str
eam
is
orga
nize
d by
JE
T a
nd E
PW
MD
. 1-
6) E
PW
MD
con
duct
s w
aste
am
ount
sur
vey
at
gene
rati
on s
ourc
e un
der
the
assi
stan
ce o
f JE
T.
Inp
ut
<In
pu
t fr
om
JIC
A>
1.
S
hort
-ter
m E
xper
ts
(1)
Lea
der
/ Sol
id W
aste
Man
agem
ent
(2)
Ope
rati
on
&
Mai
nten
ance
of
W
aste
C
olle
ctio
n V
ehic
les
& H
eavy
Mac
hine
ries
(3
) L
andf
ill M
anag
emen
t (4
) F
inan
cial
Man
agem
ent
(5)
Pub
lic
Aw
aren
ess
(6)
Was
te S
epar
atio
n an
d R
ecyc
ling
(7
) C
oord
inat
or, i
f ne
cess
ary
2.
Equ
ipm
ent f
or w
aste
man
ual s
epar
atio
n fa
cili
ty in
land
fill
sit
e 3.
L
andf
ill g
as m
onit
or
4.
Ove
rsea
trai
ning
5.
L
ocal
cos
t for
JE
T a
ctiv
itie
s 6.
In
terp
rete
rs
Inp
ut
<In
pu
t fr
om
Mo
ng
oli
an s
ide>
1.
A
ssig
ning
C/P
per
sonn
el
2.
Bui
ldin
gs a
nd F
acili
ties
for
Proj
ect a
ctiv
ities
in
clud
ing
the
land
for
the
was
te m
anua
l se
para
tion
fac
ility
in la
ndfi
ll s
ite.
3.
Off
ice
spac
e fo
r JI
CA
exp
erts
and
mee
ting
s4.
F
acil
ities
and
ser
vice
s su
ch a
s el
ectr
icity
, ga
s, w
ater
, tel
epho
ne, i
nter
net a
cces
s an
d fu
rnit
ure
5.
Ope
rati
onal
and
rec
urre
nt c
ost f
or th
e pr
ojec
t act
ivit
ies
of th
e M
ongo
lian
sid
e
1.
EP
WM
D, C
MP
UA
and
WS
Fs
assi
gn
nece
ssar
y pe
rson
nel f
or th
e P
roje
ct
acti
vitie
s.

Pro
ject
for
Str
engt
heni
ng
the
Cap
acity
for
SW
M in
Ula
aba
atar
City
JI
CA
S
ectio
n H
: Pro
ject
Des
ign
Mat
rix
KO
KU
SA
I K
OG
YO
CO
., LT
D.
H-4
1-7)
EP
WM
D r
evie
ws
and
upda
tes
the
Mas
ter
Pla
n un
der
the
assi
stan
ce o
f JE
T.
1-8)
EPW
MD
pre
pare
s an
Act
ion
Plan
for
the
orga
niza
tion
al d
evel
opm
ent o
f E
PW
MD
und
er th
e ad
vice
of
JE
T.
Act
ivit
ies
for
Ou
tpu
t2
2-1)
JE
T a
sses
ses
the
base
line
cap
acit
y on
ope
rati
on a
nd
mai
nten
ance
of
CM
PU
A.
2-
2) J
ET
pre
pare
s a
trai
ning
pro
gram
and
trai
ning
m
ater
ials
. 2-
3) T
he tr
aini
ng p
rogr
am is
impl
emen
ted
by J
ET
, C
MP
UA
and
EP
WM
D.
2-4)
JE
T o
rgan
izes
pra
ctic
al tr
aini
ng/g
uida
nce
for
the
tech
nica
l sta
ff o
f th
e m
aint
enan
ce w
orks
hop
in
CM
PU
A.
2-5)
JE
T p
repa
res
reco
mm
enda
tion
s fo
r m
anag
emen
t sy
stem
of
mai
nten
ance
wor
ksho
p in
CM
PU
A
2-6)
CM
PU
A a
nd E
PW
MD
rev
iew
and
rec
omm
end
the
was
te c
olle
ctio
n pl
ans
of U
laan
baat
ar C
ity
unde
r th
e co
oper
atio
n of
JE
T.
2-7)
CM
PU
A a
nd E
PW
MD
org
aniz
ed s
emin
ar(s
) fo
r T
UK
s ab
out o
pera
tion
and
mai
nten
ance
of
vehi
cles
un
der
the
advi
ce o
f JE
T.
Act
ivit
ies
for
Ou
tpu
t3
3-1)
JE
T a
sses
ses
the
base
line
cap
acit
y on
land
fill
m
anag
emen
t of
CM
PU
A.
3-
2) J
ET
pre
pare
s a
trai
ning
pro
gram
and
trai
ning
m
ater
ials
incl
udin
g L
andf
ill O
pera
tion
Man
ual.
3-3)
The
trai
ning
pro
gram
is im
plem
ente
d by
JE
T a
nd
CM
PU
A.
3-4)
JE
T o
rgan
izes
pra
ctic
al tr
aini
ng/g
uida
nce
for
the
CM
PU
A's
tech
nica
l sta
ff f
or p
rope
r m
anag
emen
t of
the
Lan
dfil
l. 3-
5) W
aste
com
posi
tion
sur
vey
of la
ndfi
ll-i
ncom
ing
was
te is
con
duct
ed b
y C
MP
UA
und
er th
e co
oper
atio
n of
JE
T a
nd E
PW
MD
. 3-
6) L
andf
ill g
as e
mis
sion
sur
vey
is c
ondu
cted
by
CM
PU
A u
nder
the
coop
erat
ion
of J
ET
and
EP
WM
D.
3-7)
CM
PU
A s
umm
ariz
e th
e en
viro
nmen
tal m
onit
orin
g

Pro
ject
for
Str
engt
heni
ng
the
Cap
acity
for
SW
M in
Ula
aba
atar
City
JI
CA
S
ectio
n H
: Pro
ject
Des
ign
Mat
rix
KO
KU
SA
I K
OG
YO
CO
., LT
D.
H-5
repo
rt o
f th
e L
andf
ill u
nder
the
coop
erat
ion
of J
ET
an
d E
PW
MD
. A
ctiv
itie
s fo
r O
utp
ut4
4-
1) J
ET
ass
esse
s th
e ba
seli
ne c
apac
ity
on c
ontr
ol o
f w
aste
col
lect
ion
orga
niza
tion
s of
EP
WM
D a
nd
fina
ncia
l/ad
min
istr
ativ
e m
anag
emen
t of
WS
Fs.
. 4-
2) J
ET
pre
pare
s a
trai
ning
pro
gram
and
trai
ning
m
ater
ials
. 4-
3) T
he tr
aini
ng p
rogr
am o
n fi
nanc
ial m
anag
emen
t is
impl
emen
ted
by J
ET
and
WSF
s.
4-4)
Ana
lysi
s of
fin
anci
al s
itua
tion
of
WS
Fs
is c
ondu
cted
by
JE
T, E
PWM
D a
nd W
SFs.
4-
5) R
ecom
men
dati
ons
for
appr
opri
ate
fina
ncia
l m
anag
emen
t sys
tem
incl
udin
g re
venu
e pl
an a
re
sum
mar
ized
by
JET
and
EPW
MD
. 4-
6) E
PW
MD
and
WS
Fs
cond
uct r
ecom
men
dati
ons
unde
r th
e co
oper
atio
n of
JE
T.
4-7)
JE
T c
ondu
cts
cons
ulta
tion
s am
ong
seni
or
man
agem
ents
of
EP
WM
D a
nd C
MP
UA
on
com
preh
ensi
ve S
WM
in U
B C
ity.
4-
8) J
ET
ass
ists
EP
WM
D to
for
mul
ate
guid
elin
e fo
r ca
lcul
atio
n of
was
te g
ener
atio
n fe
e ba
sed
on
appr
opri
ate
was
te c
olle
ctio
n ta
riff
. 4-
9) J
ET
ass
ists
EP
WM
D to
pre
pare
sta
ndar
d te
nder
pr
oced
ures
to s
elec
t was
te c
olle
ctio
n or
gani
zati
ons.
4-
10)
JET
ass
ists
EP
WM
D to
pre
pare
sta
ndar
d te
nder
do
cum
ent f
or s
elec
ting
was
te c
olle
ctio
n or
gani
zati
ons.
4-11
) JE
T a
ssis
ts E
PW
MD
to p
repa
re g
uide
line
for
m
onit
orin
g w
aste
col
lect
ion
orga
niza
tion
s ba
sed
on
the
cont
ract
. 4-
12)
JET
ass
ists
EP
WM
D to
pre
pare
a w
eigh
brid
ge d
ata
man
agem
ent m
anua
l.
Act
ivit
ies
for
Ou
tpu
t5
5-1)
JE
T a
sses
ses
the
base
line
capa
city
of
EP
WM
D a
nd
Dis
tric
t Off
icer
s fo
r pr
omot
ing
publ
ic a
war
enes
s an
d pa
rtic
ipat
ion.
5-2)
JE
T p
repa
res
a tr
aini
ng p
rogr
am a
nd tr
aini
ng

Pro
ject
for
Str
engt
heni
ng
the
Cap
acity
for
SW
M in
Ula
aba
atar
City
JI
CA
S
ectio
n H
: Pro
ject
Des
ign
Mat
rix
KO
KU
SA
I K
OG
YO
CO
., LT
D.
H-6
mat
eria
ls.
5-3)
The
trai
ning
pro
gram
is im
plem
ente
d by
JE
T a
nd
Dis
tric
t Off
icer
s.
5-4)
A p
ilot
pro
ject
on
publ
ic a
war
enes
s ra
isin
g ca
mpa
ign
and
soci
al s
atis
fact
ion
leve
l sur
vey
is p
lann
ed b
y E
PWM
D a
nd D
istr
ict O
ffic
ers
unde
r th
e as
sist
ance
of
JET
. 5-
5) T
he P
ilot
Pro
ject
is im
plem
ente
d an
d m
onit
ored
by
EPW
MD
, Dis
tric
t Off
icer
s an
d JE
T.
5-6)
Rec
omm
enda
tion
s fo
r pr
omot
ing
publ
ic a
war
enes
s an
d pa
rtic
ipat
ion
are
sum
mar
ized
by
EPW
MD
, D
istr
ict O
ffic
ers
and
JET
. A
ctiv
itie
s fo
r O
utp
ut6
6-
1) S
emin
ar a
nd w
orks
hop
on w
aste
sep
arat
ion,
re
cycl
ing
and
3R (
Red
uce,
Reu
se, R
ecyc
le)
stra
tegy
is
orga
nize
d by
JE
T, E
PW
MD
and
CM
PU
A.
6-2)
A p
ilot
pro
ject
for
tria
l im
plem
enta
tion
of
was
te
sepa
rati
on a
nd r
ecyc
ling
is p
lann
ed b
y JE
T, E
PW
MD
an
d C
MP
UA
, and
a p
ilot
fac
ilit
y fo
r w
aste
man
ual
sepa
ratio
n in
land
fill
site
is c
onst
ruct
ed in
Nar
angi
in
Eng
er L
andf
ill.
6-
3) T
he P
ilot
Pro
ject
is im
plem
ente
d by
EP
WM
D,
CM
PU
A a
nd J
ET
und
er th
e pa
rtic
ipat
ion
of w
aste
pi
cker
s gr
oup.
6-
4) T
he P
ilot
Pro
ject
is m
onit
ored
and
eva
luat
ed b
y JE
T,
EP
WM
D a
nd C
MP
UA
. 6-
5) R
ecom
men
dati
ons
for
appr
opri
ate
syst
em o
f w
aste
se
para
tion
and
rec
ycli
ng a
re s
umm
ariz
ed b
y JE
T,
EP
WM
D a
nd C
MP
UA
on
the
basi
s of
the
resu
lts
of
the
Pil
ot P
roje
ct.
Pre
-co
nd
itio
ns
1.
The
EP
WM
D is
fun
ctio
nal a
s a
coor
dina
ting
age
ncy
amon
g va
riou
s or
gani
zati
ons
on S
WM
in
Ula
anba
atar
Cit
y.
2.
WS
Fs
are
coop
erat
ive
for
disc
losi
ng
the
fina
ncia
l dat
a to
the
Pro
ject
. 3.
W
aste
pic
ker
grou
p in
the
land
fill
si
te is
coo
pera
tive
to th
e P
ilot
Pr
ojec
t.
Rem
arks
:
(1)
The
des
crip
tion
s of
“O
bjec
tive
Ver
ifia
ble
Indi
cato
rs”
and
“Mea
ns o
f V
erif
icat
ion”
are
pre
lim
inar
y in
nat
ure
beca
use
thes
e w
ere
defi
ned
prio
r to
the
co
mm
ence
men
t of
the
Pro
ject
im
plem
enta
tion
. The
des
crip
tion
wil
l be
ela
bora
ted
and/
or i
ncre
men
ted
in t
he c
ours
e of
Pro
ject
im
plem
enta
tion
bas
ed
on th
e di
scus
sion
bet
wee
n JE
T a
nd M
ongo
lian
cou
nter
part
s, w
hich
sha
ll b
e ap
prov
ed b
y th
e JC
C m
eeti
ng.
(2)
Rev
ised
par
ts a
re u
nder
line
d.


