Embed Size (px)
Citation preview

GUIDELINES FOR
NUTRITION BASELINE SURVEYSIN COMMUNITIES
Table of Contents
Version 1.2
Jakarta, 1997
Rainer Gross, Arnfried Kielmann, Rolf Korte, Hans Schoeneberger, Werner Schultink.
Published under the joint auspices ofThe Southeast Asian Ministers of Education Organization (SEAMEO)Regional Tropical Medicine and Public Health Network (TROPMED)
TROPMED Central Officeand
Deutsche Gesellschaft für Technische Zusammenarbeit (GTZ) GmbHFederal Republic of Germany
"The most important resourceis always people."
Barber Conable (1988)President of the World Bank
ForewordDuring the second half of the 1980s the Deutsche Gesellschaft für Technische Zusammenarbeit (GTZ) GmbHredefined its nutrition policy within technical cooperation. The new position was published by GTZ in thedocument "Development and Nutrition." The main message of this document is that poverty alleviation is a
Part 0: Contents
http://www.nutrisurvey.de/baseline/baseline.htm (1 of 2) [13.04.2000 17:02:12]

priority in the cooperation policy of the government of the Federal Republic of Germany with developingcountries and that reduction of hunger and malnutrition is a major issue in poverty alleviation. However, verylittle is known about the effectiveness and success of reduction of malnutrition through poverty alleviation.Consequently all projects which are expected to improve the nutritional situation and reduce poverty shouldassess the nature, magnitude, causes, and groups at risk of malnutrition at the beginning of the project andafter the project has been implemented for a substantial length of time. For this purpose a standardizedmethodology for a nutritional baseline survey has been developed and tested in various projects.
These guidelines do not contain any new methods. It often refers to international standards for nutritionsurveys. For the experienced reader some information may even appear too basic and trivial. However, thecontent of the present guidelines documents the GTZ experience with nutritional baseline surveys andconsiders the repeated occurrences of different procedures, errors and failures. By ensuring quality andstandardization, it is possible to make comparisons with some of the experiences and results of nutritionsurveys from other organizations. Where standards fall short, practical experience has been used to developthe methodology.
It should be stressed that guidelines for survey techniques will never have the last word on the subject. Ratherit is important to be keep abreast of new scientific discoveries, international standardization, and practicalexperience. Therefore, all readers are encouraged to submit comments or summaries of their experiences forconsideration in future editions of the guidelines.
During the years of work, the authors have consulted numerous persons. All of them deserve an additionalexpression of gratitude for their valuable contributions. In particular, the authors thank D'Ann Finley and UrsulaGross for editing and proof reading the guidelines.
Part 0: Contents
http://www.nutrisurvey.de/baseline/baseline.htm (2 of 2) [13.04.2000 17:02:12]

Table of Contents
1. Introduction1.1 Purpose and organization of the guidelines1.2 Objective of a survey1.3 Target group of the guidelines1.4 Types of surveys1.5 Timing of a survey
2. Data collection from existing information2.1 Scientific literature2.2 Data obtained from national and international institutions2.3 Information obtained directly in the local setting2.4 Survey of structural data
3. Nutrition survey methodology3.1 Survey design3.1.1 Initial interaction with community3.1.2 Survey groups3.1.3 Cross-sectional vs. longitudinal surveys3.1.3.1 Baseline survey3.1.3.2 Follow-up survey3.1.3.3 Groups for comparison3.1.3.4 Frequency of surveys3.1.4 Sampling3.1.4.1 Sample size3.1.4.2 Implementation of sampling3.1.5 Training and supervising of survey personnel3.1.5.1 Job description of enumerators and supervisors3.1.5.2 Personnel recruitment3.1.5.3 Training of survey personnel3.1.5.4 Procedure for the collection of information in a household3.1.6 Pilot testing3.1.7 Scheduling of a survey3.1.8 Resources needed3.1.9 Questionnaires3.1.10 Ethical considerations3.2 Contents of a survey3.2.1 Information on survey organization3.2.2 Demographic data of household3.2.3 Ranking of problems by the observed household3.2.4 Socioeconomic household data3.2.5 Dietary patterns3.2.6 Nutrition intervention3.2.7 Values and norms related to gender3.2.8 Participation in social activities
Table of Contents
http://www.nutrisurvey.de/baseline/toc.htm (1 of 3) [13.04.2000 17:02:21]

3.2.9 Anthropometry3.2.9.1 Gender3.2.9.2 Age3.2.9.3 Weight3.2.9.4 Height3.2.9.5 Mid-upper arm circumference3.2.10 Morbidity information3.2.10.1 Anemia3.2.10.2 Vitamin A deficiency3.2.10.3 Iodine deficiency diseases (IDD)3.2.10.4 Diarrheal diseases3.2.10.5 Acute respiratory infections (ARI)3.2.10.6 Other infectious diseases3.2.10.7 Mortality of preschool children3.2.11 Infant nutrition3.2.11.1 Breast feeding practices3.2.11.2 Supplementary feeding and weaning practices3.2.12 Formal under-fives health services3.2.12.1 Weight monitoring3.2.12.2 Immunization3.2.13 Acceptance of a survey3.3 Reliability check
4. Analysis and interpretation of data4.1 Data analysis4.1.1 Data entry4.1.2 Plausibility check4.2 Anthropometric indices4.3 Clustering4.4 Food intake4.5 Breast feeding, supplementary feeding and weaning practices4.6 Reliability of a survey4.7 Analysis of causes and predictors4.8 Evaluation of indicators
5. Reporting of survey results5.1 Format of technical reports5.2 Considerations of style for writing the report5.3 Information for the target groups
6. Appendices6.1 Examples of questionnaires6.1.1. Example of a Community Questionnaire6.1.2. Example of a Supervisor Questionnaire6.2 List of variable codes6.3 Anthropometric reference tables6.3.1 Children6.3.2 Women6.4 Nutrient requirements6.5 Randomized number tables
Table of Contents
http://www.nutrisurvey.de/baseline/toc.htm (2 of 3) [13.04.2000 17:02:21]

6.6 Sample presentations of survey findings in technical reports6.6.1 Tables6.6.2 Figures6.7 Determination of intra- and inter-observer errors6.8 Statistical methods6.9 Addresses of national and international institutions6.10 WHO global database on child growth6.11 Construction plan for an anthropometer6.12 Literature for further study
Table of Contents
http://www.nutrisurvey.de/baseline/toc.htm (3 of 3) [13.04.2000 17:02:21]

1. IntroductionDespite all efforts undertaken both nationally and internationally, poor nutritional status is still a fundamental cause ofdisease and shortened life-span. Most people are aware that many factors are either directly or indirectly responsible forundernutrition, including insecure food supply, lack of basic education, inadequate health services, deterioratedenvironment, low income, and inadequate empowerment. The factors contributing to malnutrition vary from community tocommunity. However, poverty is nearly always an underlying factor.
To improve the nutritional status and improve living conditions in communities, it is necessary to determine thenature, magnitude and causes of malnutrition. Anthropometric indices are internationally accepted as nutrition keyindicators of populations. Additionally, they have been recommended repeatedly as a suitable key indicator for poverty aswell. The use of anthropometric indicators is based on the extensively observed phenomena that a growing child wholacks an adequate intake of food and is repeatedly ill, does not have the body height corresponding to its geneticpotential. Furthermore, inadequate food availability, caring capacity, basic education, health systems, housing andenvironmental conditions have been proven to be underlying causes of inadequate food intake and repeated episodes ofdiseases. As a result, communities that are not able to satisfy their basic needs adequately generate higher proportionsof individuals with inadequate anthropometric indices.
The quality of intervention strategies is closely linked with the quality of the assessment of the situation. Planningmethods for interventions, such as ZOPP (Objective-Oriented Project Planning), triple A (Assessment - Analysis - Action)or PMC (project management cycle), provide a structure for gathering and analyzing data that can be used subsequentlyin monitoring the impact of an intervention. Therefore, if an objective of an intervention or program/project is to raise thenutritional and living standards, appropriate and realistic indicators must be established.
Appropriate planning requires both quantitative and qualitative information. To measure the impact of nutrition-orientedprograms/projects, i.e. self-standing nutritional programs/projects and nutrition-related programs/projects, it isnecessary to collect quantitative information. Therefore, projects/programs must start with a baseline survey, and suchsurvey must be repeated periodically.
Self-standing nutrition projects/programs are directly targeted for an improvement of the nutritional situation of thepopulation. Nutrition-related programs/projects may belong to the agricultural sector (in terms of producing,processing and storing of food; food hygiene and quality control as well as regional development in rural areas), healthcare, nutritional security, urban development and urban planning. These programs/projects have objectives relatedto the particular subject, but the improvement of the nutritional situation is stated as an overall objective or positiveimpact in program/project planning. Therefore, the program/project should be evaluated as to whether its impact on thenutritional situation is positive, neutral, or negative.
1.1 Purpose and organization of the guidelinesThe purpose of the guidelines is to provide guidelines for nutrition surveys. These guidelines should serve especially
to initialize the assessment of the nutritional situation of communities,●
to assist in planning and implementing sound surveys, enabling nutrition and public health workers and specialiststo formulate appropriate nutrition policy and measures,
●
to standardize survey methods and techniques, enabling later comparison of data and results from differentsurveys, projects and countries,
●
to be used for training of nutrition and public health workers and specialists, and, ultimately●
to help to bring about an improvement of the nutritional situation of target groups.●
This guidelines does not contain any new methods but describes international standard operating procedures (SOP) fornutrition surveys. If these SOP are used, results from different organizations and projects can be compared. WhereSOPs fall short, illustrations from practical experiences of the authors will fill the gap. This guidelines can only provideguidelines for the selection of the variables to be studied; the final survey document must be adapted to the localsituation.
This document is not a text book which teaches the inexperienced reader how to organize and implement a nutritionsurvey. Certainly, there is information available in the guidelines with which some readers are very familiar. However, thepertinent chapter should be read to ensure that the survey is carried out using a consistent standardized method.
Part 1: Introduction
http://www.nutrisurvey.de/baseline/part_1.htm (1 of 4) [13.04.2000 17:02:29]

This publication has the following structure:
parts€€ ↓chapters€€ ↓sub-chapters€€ ↓sections.
1.2 Objective of a SurveyA survey is a method for collecting information directly from people. Nutrition surveys assist in the planning andimplementation of projects by providing objective data that can be used to improve the nutritional situation. The objectiveof a nutrition survey is derived from the purpose of nutrition-related projects. The survey should
monitor the improvement of the nutritional situation (project objective, overall objective, or positive impact), and/or●
guard against the worsening of the nutritional situation (negative side effect).●
General objective of a nutrition survey:
The objectives of the nutrition surveys dealt with in this guidelines are the assessment and analysis of thenutritional situation and of contributing poverty factors of risk groups and the evaluation of the
nutritional effect of a project/program on the improvement of living conditions.
The following individual activities are part of the process of a baseline survey:to initiate dialogues among all groups participating in a project (target group, non-governmental organizations,governmental authorities, donors, and project implementation personnel) concerning the living situation of thepoor,
●
to assess the needs of the poor, in particular, about their problems in daily life,●
to increase the awareness and sensitivity of the specialists involved in the project and also those responsiblefor programs designed to improve the basic need situation of the poor,
●
to reveal the nature, magnitude and severity of the nutrition- and poverty-related problems and their possiblecauses,
●
to identify the particularly affected target groups,●
to arrive at a causal model (problem tree),●
eventually to propose additional smaller in-depth surveys that are necessary to be carried out to diagnoseimportant causes of poverty problems,
●
to identify the appropriate scope of intervention for the improvement of the poverty situation,●
to identify project-defined indicators (poverty-related socioeconomic determining factors) for evaluation,●
to determine the impact of project measures on living conditions of the observed risk groups, and finally●
to obtain data for cross-sectional comparisons between the country and the project target groups.●
The objective of a baseline survey is not to undertake pure research. As the fundamental causes of malnutrition areknown, it is unnecessary to gather scientifically supportable proof of a causal relationship for a nutritional problem. Asurvey should record all possible important variables known from literature to be responsible for nutritional problems. If,for example, no statistical relationship can be identified between nutritional indicators and early weaning in a project areaunder survey due to the small sample size, the higher percentage of early weaned children should, nevertheless, beincluded in a problem tree and suitable intervention measures, e.g., nutritional advice, should be considered. Of course,these variables must be tested for their relevance no later than a pilot testing.
To illustrate this even more vividly: if, while collecting data on 500 children, only one case of eye abnormality caused byvitamin A deficiency is discovered - in which case the sampling is indisputably too small to derive a scientifically
Part 1: Introduction
http://www.nutrisurvey.de/baseline/part_1.htm (2 of 4) [13.04.2000 17:02:29]

supportable conclusion concerning this (health) problem - vitamin A deficiency should nevertheless be considered inproject planning. This potential cause-effect relationship must then be followed up in greater detail no later than duringthe first implementation phase of a project or program (orientation phase).
During the assessment of the nutritional situation of a community, a baseline survey provides information about thenutritional problems in individuals. Therefore if, for example, a child is identified as undernourished, the child must besent to the nearest available health service for further examination. Before commencing a survey, arrangements must bemade with the local health service. Many surveys have shown that both communities and health services have beenextremely cooperative in adopting such an arrangement.
The objective of a nutrition survey is not only to obtain information on the nutritional situation of a community ina survey area, but this information should be fed back to serve the needs of individuals in the community.
A nutrition survey takes place in 5 steps:Collection of available information on the nutritional situation and other demographic, socioeconomic andecological data in the survey region;
1.
Planning and preparation of the nutrition survey;2. Implementation of the nutrition survey;3. Data processing, evaluation and analysis;4. Dissemination of the results of the nutrition survey and preparation for translation into action.5.
1.3 Target group of the guidelinesAs explained before a nutrition survey has several objectives and the guidelines is a tool to reach these objectivesadequately. However, it cannot be expected that all there is to know about carrying out a survey can be taught by meansof a handbook. It is only able to set guidelines and standardize procedures. These guidelines have therefore been writtenfor an experienced community or public health nutrition specialists who possess already a basic knowledge innutritional epidemiology and practical experiences in survey technic. It is designed so that the user can extract therelevant sections corresponding to the project types, phase and needs.
The primary target group of this nutrition baseline survey guidelines is the experienced nutrition specialistwho plans, implements, and analyzes nutrition surveys.
1.4 Types of surveysThere are four types of nutrition surveys; each is important for a different type of project or a different phase of a project.
In a rapid appraisal of the nutritional situation, information on the nutritional condition of the target communityshould first be obtained during the planning phase using qualitative methods. Anthropometric data (such as heightand weight) are not recorded in this type of survey.
1.
In a rapid assessment, anthropometric data are measured to obtain information on the type of nutritionalproblems using quantitative methods. However, the sampling selection and sampling coverage do not allowquantitative conclusions to be made concerning the prevalence of nutritional problems that can be generalized fora broader population.
Both types of surveys are suitable for a pre-feasibility study for the assessment of the nutritional situation. One ofthese two types of surveys should be used for identification of the project during the planning phase.
2.
The baseline survey (for further information, see section 3.1.3.1) gathers information concerning the type,prevalence, reasons and causes of nutritional problems (see chapter 1.2).
3.
The follow-up survey assesses the impact of the project or individual project measures on the nutritional4.
Part 1: Introduction
http://www.nutrisurvey.de/baseline/part_1.htm (3 of 4) [13.04.2000 17:02:29]

condition of a community (for further information, see section 3.1.3.2).Complete nutritional baseline and follow-up surveys cover the following areas:
- Felt needs by the community- Demographic data of the households- Socioeconomic factors- Anthropometry- Signs of malnutrition and disease- Nutrition and health practices.
Complete nutritional baseline and follow-up surveys should only be considered for a self-standing nutritionproject in which the objective of the project is the improvement of the nutritional situation of a community. In
nutrition-related projects that are expected to have a positive impact on the nutritional situation or projects withpotential negative side effects resulting in the worsening of the nutritional situation, only specific nutritional
indicators should be assessed. Data on other aspects, in particular socioeconomic data, should then be taken froma project-specific baseline survey.
1.5 Timing of a surveyThe overview in Figure 1 shows how a nutrition and poverty baseline survey and a follow-up survey are integratedinto the Project Cycle.
A project starts with a project idea and ends when its main objective has been achieved. This objective, or objectivesshould be planned jointly by all involved parties including the community. The project lifetime can be subdivided intophases, such as identification, conceptualization and implementation. The baseline survey is an instrument for thedevelopment of a project strategy.
Figure 1. Project Cycle for nutrition- and poverty-oriented projects/programs
Project Phase Planning Decisions Instrument
Project idea
Project indentification ↓ Pre-feasibility study (e.g. RAN) Decision about project purpose
Poject design (conceptualization) ↓ Baseline survey and participatoryplanning (e.g. ZOPP)
Decision about projects strategy
Project implementation ↓ Follow-up survey and participatoryplanning (e.g. ZOPP)
Decision about project strategyadjustment
Project redesign andimplementation ↓ Follow-up survey and participatory
planning (e.g. ZOPP) Desired project impact
RAN: Rapid Assessment on Nutrition for Community-Based Poverty Alleviation Projects/ProgramsZOPP: Ziel-Orientierte Projekt-Plannung (objective-oriented project planning)
Part 1: Introduction
http://www.nutrisurvey.de/baseline/part_1.htm (4 of 4) [13.04.2000 17:02:29]

2. Data collection from existinginformationFor almost all countries some information is available on the nutritional situation of the population. Thisinformation should be collected before starting a nutrition survey since it
provides important information for the planning process and●
yields complementary information for analysis and interpretation of data.●
Indirect collection of information should commence during the project identification phase, or at the latest, in theorientation phase and before the planning and implementation of a baseline survey (see section 3.1.3). Threesources of information are outlined below:
Scientific literature1. Data from national literature and/or international institutions2. Nutritional information obtained directly in the local setting.3.
2.1 Scientific LiteratureLiterature searches for relevant scientific nutritional articles can be made using special computer software withCDROM or the Internet:
Current Content (Life Science),●
Medline (e.g. http://www.ncbi.nlm.nih.gov/PubMed/ ).●
Of the two, Medline is more strongly oriented toward the medical field.
The search for relevant articles requires one or several index words in the English language, for example:nutritional status, malnutrition, anemia, IDD, or xerophthalmia
in connection with a geographical region indicator, e.g.,Pakistan, Brazil, or Sahel
or an ethnic group, such asQuechua, Bantu, or casts.
The search provides the following information:the authors' names and addresses,●
the title of the scientific article,●
the literature citation (e.g., Am J Clin Nutr 1994;60:36-41.)●
and usually a synopsis of the article. Once a relevant article has been identified, the complete article can beobtained. If no library is available, the specific article can be requested by writing to the authors directly.
The quality and relevance of articles are not uniform. The following criteria should be used for evaluation:the reputation of the scientific journal●
the quality of the presentation.●
Scientific literature on nutrition surveys, in addition to other information relevant to nutrition, can be obtainedfrom scientific institutions. Annex 6.9 provides a list with some examples of scientific institutions. However, itmust be emphasized that this list is incomplete.
Part 2: Data collection from existing information
http://www.nutrisurvey.de/baseline/part_2.htm (1 of 4) [13.04.2000 17:02:36]

2.2 Data obtained from national and international institutionsInformation from published and unpublished national as well as from international institutions is availableand may complement information from scientific literature.
Multilateral and bilateral organizations can also be contacted at their respective offices in most countries,usually in the capital city.
Besides international organizations, most national agencies, such as ministries of health, agriculture,education, planning and related areas can provide valuable information. Similarly, in some countries there areministries of land reform, water resources, women's affairs, family planning and social affairs, urbandevelopment, etc. The country-specific political and bureaucratic delineations of ministries and theirsubordinate offices have to be considered.
As literature from these sources often fails to include methodology, and there is sometimes a risk of politicalinfluence on the contents of publications by government institutions, the validity of these data should becarefully reviewed.
2.3 Information obtained directly in the local settingChapters 2.1 and 2.2 have dealt with the collection of scientific and technical information based on literaturereview and to a lesser or greater degree on official statistics. However, actual experiences in everyday life canprovide valuable supplementary information about the local situation. Only with the help of many observersfrom as many different points of view as possible can precise intervention measures successfully be found. Inthis case, sociologists, anthropologists and psychologists can provide valuable insight. The explanation of thecauses of the nutritional situation of a particular community group leads to a greater understanding of theenvironmental conditions, in terms of social and cultural factors that determine the life of the communityconcerned.
Valuable information that would be difficult, if not impossible, to collect through quantitative methods, such asepidemiological techniques, can be obtained through qualitative methods, such as focus group discussions.Two examples are given below:
It is extremely difficult to establish whether there is a vitamin A deficiency in a certain area. Deficiencycan be determined only through a large random survey in which blood samples are analyzed using anexpensive assay procedure. Measurement of the prevalence of xerophthalmia (blindness caused byvitamin A deficiency) is also very difficult, and this symptom occurs only in cases of extreme vitamin Adeficiency. If there is no xerophthalmia in a region, it is still possible to find many people suffering fromvitamin A deficiency. However, information on the problem of vitamin A deficiency can be obtainedthrough discussions with the target groups, e.g., inquiring whether there are words for night blindness inthe local language,
1.
The word "kwashiorkor," used to describe symptoms of protein deficiency, originates from Ghana andmeans "the displaced child ." It is a euphemism used by village people when speaking about imminentdeath due to protein-energy-deficiency.
2.
Thus language usage provides additional indications of the picture of the nutritional situation in asociogeographic area.
In conclusion, methods of social sciences may provide very important complementary information about thenutritional situation and help to put the data gathered by natural science methods into the proper context.
2.4 Survey of structural dataBefore embarking on door-to-door interviews, relevant community structural data on the village or suburb and
Part 2: Data collection from existing information
http://www.nutrisurvey.de/baseline/part_2.htm (2 of 4) [13.04.2000 17:02:36]

region must be obtained for a nutrition survey. This is particularly important to put the results of the survey intothe proper context of the overall situation of the province or country. For example, a 20% undernutrition rate ina population can be low if the general prevalence in a country is 40%, and it can be high if the generalprevalence is only 5%. Consequently, nutritional data have to be set within the overall demographic,socioeconomic and ecological framework.
Therefore, it is necessary to obtain demographic, economic, ecological and other information, such as: Domany families migrate in or out of the survey area? Are there any unusual climatic conditions at the time of thesurvey? Is the country going through an economic crisis?
Other important structural data to consider are:
1. Growth of the Gross Domestic Product (GDP).
The GDP growth reflects a country's economic structural environment and assists in the interpretation of otherindirect indicators such as:
Agriculture (e.g., fertilizer consumption per ha of cultivated land, agricultural output).●
Education (e.g., teachers per 10,000 inhabitants, school attendance rates, % illiteracy)●
Health (e.g., doctors per 10,000 inhabitants, hospital beds per 10,000 inhabitants, infant mortality)●
2. Developments in the demographic data of a project area
Exact demographic data of the project area are necessary to identify the target group and to plan interventionmeasures. These data include if possible:
Population density (number of people/km2)●
Annual population growth (%)●
Population migration rate (%)●
Birth rate (%)●
Breakdown (%) of the population by age group (e.g., 0-5 months, 6-11 months, 1-4 years, 5-9 years,10-17 years, 18-29 years, 30-39 years, 40-49 years, 50-59 years, 60 and more years)
●
Life expectancy at birth for men and women (years)●
Infant mortality (%)●
3. Rainfall in the Project Area.
In many parts of the world, water is a limiting resource for agricultural production and living conditions.Particularly in marginal regions, rainfall patterns may differ substantially in relatively small geographical areas.Therefore, information should be collected on the amount and yearly distribution of precipitation. Inadequaterainfall can cause a precarious nutritional situation. To do this, one should begin with the survey month andthen trace back over the most recent 12 months. Rainfall measurements can generally be obtained frommeteorological institutes or agricultural agencies in the district or state capital. In certain areas, factors otherthan rainfall data, such as frost and hail, also exert an effect.
Table 1. Rainfall data in the project area
MonthAverage annual rainfallover the last 10 years
(mm)
Observed rainfallover the last 12 months
(mm)
Part 2: Data collection from existing information
http://www.nutrisurvey.de/baseline/part_2.htm (3 of 4) [13.04.2000 17:02:36]

Structural data can be sought from the statistical yearbooks at local government agencies. However, it isadvisable to ask also for data from officials in the capital city, because the data are often more readilyobtainable at the capital than in provincial areas due to centralization.
Part 2: Data collection from existing information
http://www.nutrisurvey.de/baseline/part_2.htm (4 of 4) [13.04.2000 17:02:36]

3. Nutrition survey methodology
In deciding the form and content of a nutrition survey, the social structure of the community of an area must be considered. Socialstructures between people may be built on biological, economic, political, religious and/or geographical grounds. These socialstructures are assembled by various levels. Structures are built starting with the smallest survey unit (the individual) through families,communities, etc. up to the level of the population of a country or region (see table 2).
Great differences can also be found between urban and rural areas. Although in both urban and rural areas the smallest unit is theindividual (survey level A), at the next higher level (survey level B) the social organizational structures start to differ from each another.In rural areas, the household unit is a family or extended family. In urban areas, households consist of single families or individualpersons.
The complexity of the social structure is also important. The higher the survey level, the more complex the social organizationalstructure. In addition, these structures grow even more complex with increasing numbers of people in an interdependent livingenvironment.
As shown in the following table, the quality of a higher survey unit is different from the sum of the subordinate survey units.In order to describe the quality of the whole, all levels must be described. If one wants to undertake a nutrition survey of apopulation, this principle also applies to the nutritional assessment of individuals. Not only should the sum of individualunits be assessed, but the higher structural levels must also be assessed.
Therefore, a survey must allow for the special characteristics at the level of the individual, household, and village or suburb. The sumof information on individuals alone does not provide a complete picture of a family situation, and similarly the sum of information onfamilies does not do so for villages or suburbs, etc.
Table 2. Observable characteristics related to the survey level
Surveylevel
Survey unit Examples of observablecharacteristicsRural areas Urban areas
A Individual Individual Age, size, sexB Household Household Size, income, religionC Village Suburb Electricity supply
D Valley (geographicalunit)
City/town, part of ametropolis
Health structures, typesof schools
E District (political) Metropolis Climate
Information concerning survey levels A and B has to be obtained by direct interviews and data collection from the target group.Variables concerning individuals will be described in sub-chapters 3.2.10 - 3.2.13, and those concerning households in sub-chapters3.2.1 - 3.2.9. Inquiries should be made at the appropriate agencies concerning the variables at survey levels C, D and E beforehousehold interviews are conducted. Part 2 discusses how to obtain this information.
In a nutrition survey the data collection is divided intointerviews (e.g., socioeconomic and health related questions)●
observations (e.g., socioeconomic and health related questions)●
measurements (e.g., anthropometric and biochemical data).●
Interviews must normally be carried out with the person responsible for the child. Usually this is the mother. If the mother isabsent at the time of the interview, the interview should be conducted later. Only if the mother cannot be interviewed before the surveyteam leaves the village or suburb can another adult person (e.g., grandmother, aunt, older sister, etc.) of the same household beinterviewed.
3.1. Survey design
3.1.1 Initial interactions with communityTo obtain an actual view of the nutritional situation of a target community and to lay the foundation for intervention, an essentialrequirement is that the survey is planned, carried out and evaluated only in cooperation with the community concerned.
This means that from the very beginning, a dialogue is sought with representatives of the target population. In this way the
unsaved:///Neue Seite 2.htm
http://www.nutrisurvey.de/baseline/part_31.htm (1 of 21) [13.04.2000 17:02:54]

community will be informed as to the purpose of the survey and its form and contents. Before any planning of the survey method andits contents, time and cultural requirements must first be defined. If parts of the survey cannot be carried out due to the wishes ofthe community, and therefore, some information cannot be gathered, this objection must be accepted and respected. Forexample, taking blood samples from children or asking questions concerning income is often rejected by community members.
FA basis of trust is a necessary starting point for any future
cooperation with the community and paves the way forsustainable intervention.
During, or at the latest upon completion of, a survey a dialogue must be initiated with the local population concerning the results of thesurvey. At this opportunity
the people should be informed of the results,●
their opinions on nutritional problems should be noted,●
their wishes and reservations should be considered in the formulation of intervention, and●
the potential for indigenous intervention should be identified.●
●
3.1.2 Survey groupsAn important principle in planning and evaluating a survey is to distinguish between the following community groups:
The total population, i.e., all people living in the project region.1. The target group, i.e., those people for whom and with whom the project is planned and carried out.2. The risk group, i.e., the section of the population with the worst nutritional conditions and in greatest danger of sickness anddeath from malnutrition.
A distinction has to be made between nutritional physiological risk groups and social risk groups. Physiological risk groupsare, for example, small children, school children, nursing and pregnant mothers, elderly people, and men and women whoperform physically hard work. Examples of social risk groups are the landless, low income or other groups displayingparticular forms of behavior (e.g., nutritional or health practices).
3.
The beneficiary group, i.e., those people who will benefit from the project intervention measures.4. The survey group, i.e., those persons who provide personal data relevant to nutrition (e.g., weight, height, immunization status,diarrheal diseases).
5.
Ideally, groups 2-5 are identical, thus maximizing project efficiency and optimizing the results. In reality, this is usually impossible.
During planning and evaluation the distribution of individual groups among the other groups needs to be defined. From the baselinesurvey the proportion of the risk group to the total beneficiary group can be estimated and the proportion of the beneficiary group to thetotal risk group can similarly be estimated.
This is illustrated in the following diagram:
Risk group
yes no
Beneficiarygroup
yes a b
no c d
1. Planned degree of intervention:
Proportion of total beneficiary group that is at risk = a / (a + b) * 100
With a known degree of intervention, the efficiency of the assistance provided can be determined; in other words, the proportion ofefforts that reach those who need them will be established.
2. Planned coverage of intervention:
Proportion of the total risk group that receives benefits = a / (a + c) * 100
The coverage of intervention will determine the proportion of the population at risk that will benefit from intervention.
As described earlier, a project would be overtaxed both in terms of schedule and expertise if all risk groups were to be considered in a
unsaved:///Neue Seite 2.htm
http://www.nutrisurvey.de/baseline/part_31.htm (2 of 21) [13.04.2000 17:02:54]

nutrition survey, therefore:
FThe nutrition survey methods discussed in this
publication are restricted to observations on infantsand small children up to 59 months.
The reasons for this are as follows:Latent nutritional problems influence health-related infant and child (0-59 months) mortality. The nutritional condition of this riskgroup serves therefore as an indicator of the nutritional situation of the entire target group.
1.
Additionally, the type, severity and causes of risks differ with each age group of children.In terms of nutritional physiology, the most vulnerable group is infants (0-11 months) because they do not have fullydeveloped immune systems, are changing from breast milk to plant and animal foods, and are exposed to risks ofinfection due to their increased mobility.
❍
In terms of epidemiology, the most vulnerable group is children aged from 6 to 23 months. The type and cause of therisks can also differ within this group, e.g., between the 6-11 months age group and the 18+ month age group.
❍
The direct and indirect causative factors for malnutrition based on intensive studies of this child group (0-59 months) have beenestablished. Similarly, previous experience in intervention measures can also be applied to this group.
2.
Although it is impossible to recover fully from nutrition and health related stunting after a child has reached the age of two,children older than two should be surveyed for the following reasons:
3.
acute energy deficiency problems can be easily diagnosed and treated in this age group, and❍
follow-up investigations of long-term interventions should be made after four years at the earliest because successfulnutritional intervention from infancy should have manifested itself by then. Therefore it is important to have baseline dataat the older age for comparison with the follow-up data for children who had participated in the project.
❍
The broader coverage of age groups also has the advantage that more children can be covered for a given number ofhouseholds surveyed. This produces a larger sample size without requiring extra effort to visit more households.
When the term "survey group" is used in these guidelines, it is the community group on whom the nutrition survey is being carried out(i.e., children under 5 years) and not the broader risk or beneficiary group of the project.
3.1.3 Cross-sectional vs. longitudinal surveysThe survey design needs to be tailored in a way that the maximum amount of information can be collected regarding the impact of theplanned intervention. For example, the impact of a oil palm plantation project on the nutritional situation of its smallholders/producers isstudied according to table 3.
Table 3. Survey design of nutrition surveys
LONGITUDINAL CROSS-SECTIONAL
Intervention Group Group forcomparison
Baseline survey(start of project) (A) (B)
1. Follow up survey (C) (D)2. Follow up survey (E) (F) etc. ... ...
A baseline survey at the start of the project (A) gives information about the nutritional situation of the project population. After severalyears a follow-up survey will be carried out within the same area or population (C) to study the project's impact on the nutritionalsituation. However, the comparison of the nutritional situation between (A) and (C) cannot be used alone to measure the impact of aproject because several additional factors that have changed during the time of the implementation of the project may have influencedthe nutritional situation of the population. It is difficult to attribute the project's impact to the change of the nutritional situation. If thegeneral condition of the population in the area, but not in the project, deteriorated during the intervention period, for instance due toclimatic or political factors, no change of the nutritional situation of those in the project area has to be regarded as a success becausethe nutritional status of the rest of the project's surrounding population has decreased. Therefore, it is recommended to include in thebaseline survey a population that will not be included in the project (B). Often projects are carried out in phases and start with a smallerpopulation group for a later expansion. The group of comparison (B) could be identified as a future expansion area. During thefollow-up survey the population of the group for comparison will be surveyed again (D) and this survey can be used as their baselinesurvey. After several years a follow-up survey will be carried out within the same population (F) to study the project's impact on thenutritional situation of group (D).
unsaved:///Neue Seite 2.htm
http://www.nutrisurvey.de/baseline/part_31.htm (3 of 21) [13.04.2000 17:02:54]

If no comparison group is available, the results must be analyzed with extreme caution because it is difficult to separate changes dueto the project from those independent of the project. If, for example, no improvement in the nutritional situation is observed within aspecific time, it cannot be definitely concluded that the measures have not worked. It is possible that general worsening conditionshave caused a general decline in the nutritional situation of the entire region. Under these conditions, if the original nutritional situationhas been maintained, the results have been positive. Alternatively, observed improvements in the nutritional situation may not havemuch meaning by themselves as long as they are not compared to the overall situation. It is conceivable that improvements innutritional indicators can be attributed to the general situation in the region and not to the measures undertaken in the project.
To further complicate matters, comparison groups are never fully identical to intervention groups. This problem can be reducedstatistically by studying many individuals. However, this significantly increases the cost of a survey.
It can be said that in principle:
FThe nutritional situation of the target population should
be assessed by case control studies throughperiodical surveys with comparison groups.
It has to be recognized that the assessment of the nutritional situation of population groups for the purpose of comparison may createethical problems, since no immediate actions are planned to improve their situation (see section 3.1.3.3).
There is a special type of long-term study undertaken with the same individuals over the period of the survey. This survey method canbe more economical, but in certain cases, more difficult to carry out. The primary advantage of this method is that a smaller number ofindividuals provides statistically valid results. Such a study cannot always be carried out because it is necessary to ensure that thesame individuals will be available throughout the entire study. However, at the outset of an intervention this cannot be guaranteed forsuch reasons as migration, death, etc. This type of study also raises concerns about whether the results are due to the intervention orto the repeated surveys. Experience has shown that surveys carried out without any implementation of intervention measures can leadto an improved nutritional situation for the survey group.
3.1.3.1 Baseline surveyEach nutrition-related project should start with a nutrition survey. This first (baseline) survey is much more extensive than afollow-up survey, not only because the nutritional condition of the community has to be assessed, but also the possiblecauses (such as inappropriate weaning practices or child nutrition, frequent diarrheal diseases, etc.) and important determiningfactors must be identified. Only if the causes of undernutrition are known, can sensible and equitable intervention measuresbe planned and carried out. The success of intervention can be checked and evaluated by establishing the determiningcauses of the nutritional condition. The analyses of causes and determinants will be discussed later in further details (see Chapter4.7).
Before each baseline survey there must be a comprehensive collection of background information (see part 2 of the guidelines).Because the surveys are carried out in developing countries, where it is often difficult to obtain scientific publications, literatureresearch should be conducted in advance. In addition, at least one week should be allocated for the collection and analysis ofinformation in the project country.
Most projects start with an orientation phase in which specific sector data for the project are assessed to analyze the starting situation.If during the orientation phase data are obtained which are also relevant to the nutritional baseline survey (e.g., socioeconomic data),perhaps both surveys can be combined. If the nutrition baseline survey is a part of an overall socioeconomic survey, the assessment ofsocioeconomic data can also be carried out by other persons in the survey team. Care should always be taken that the community isnot overburdened with unnecessary and redundant questions.
The relationship between the amount of information collected and the quality of the information collected is not linear. Frequently, theamount of information climbs sharply with the first few variables, but the law of diminishing returns takes effect with less and lessadditional information obtained from increasing numbers of variables. Finally a saturation point is reached and from there on lessinformation actually results from the growing number of variables. A basic underlying principle is that the patience of the intervieweeand the accuracy of the enumerator declines with increasing numbers of variables, and thus the likelihood of clean analysis andinterpretation of data is reduced. A decision must therefore be made at some point concerning the benefits in terms of information tobe derived from further variables.
Only those variables that are relevant to the objective of the survey (e.g., selection of intervention measures, determination ofintervention groups, measurement of project results) should be assessed. Therefore, not every variable that appears interestingshould be included in the survey.
F Data collection time should be limited to no more thanthree quarters of an hour spent with each family.
unsaved:///Neue Seite 2.htm
http://www.nutrisurvey.de/baseline/part_31.htm (4 of 21) [13.04.2000 17:02:54]

The timing of the baseline survey can be very important. In many rural areas there is a seasonal influence on the nutritional situationof children, because in agricultural areas the nutritional situation is often under greatest strain before the harvest season.
In urban areas a similar situation can be found with the families of employees. With incessant inflation, wages often do not increasegradually, but are only adjusted to the price of necessities after a long period. The nutritional situation is undoubtedly worse beforesuch an adjustment in wages than afterwards.
It is very informative if a survey can be carried out at a critical time such as the period before harvest, before an expected generalincrease in wages, or after a period of drastic increases in food prices. Such timing will undoubtedly bias results negatively, however, itis far better to obtain information on the situation during "bad" than during "good" times, as it is not the "good" times one needs to worryabout. Also, in an agricultural community, the period before harvest is a desirable time to carry out a baseline survey because familymembers are free from work in the fields and therefore are available to spend time participating in a survey.
As the timing of the survey depends on the progress of the project (see chapter 1.4), it is not always possible however to carry out thesurvey precisely during a critical phase.
3.1.3.2 Follow-up SurveyIf a follow-up survey for evaluation is to be carried out, the relationship between the effect of the project on the nutritional status andthe contributing poverty situation of the target group should be assessed.
A follow-up survey is faster than a baseline survey because most of the parameters, such as the survey area, the beneficiary group,the infrastructure, etc. have already been established in the baseline survey. It is also unnecessary to conduct any preliminarysampling as the questions used in earlier survey(s) should be used again. Ideally, the former survey staff will be available to conductthe follow-up survey and therefore can apply their earlier training. Consequently, only a short retraining period will be necessary.
FIt is essential that in the follow-up survey the samemethod of assessment is used as in the baseline
survey.
This means for example, variables with the same coding as in the baseline survey must be used, and that as far as possiblethe survey design (such as sampling procedure) remains constant. To achieve this, the report of the baseline survey must becarefully documented and reviewed as it must serve also as a basis of the follow-up survey..
Occasionally a project or intervention area will extend into a former comparison area. In this case the follow-up survey in the formercomparison area can also serve as the baseline survey for a future evaluation phase. A new comparison area should be found.
3.1.3.3 Groups for comparisonAs described at the beginning of this sub-chapter, when possible and ethically justifiable, comparison groups (or "control groups")should be employed in nutrition baseline surveys. A comparison group differs from the survey group only in that no project interventionmeasures have been carried out there. The comparison area should be selected so that it lies outside the influence of the activities ofthe project as much as possible.
There is an ethical aspect in comparison group surveys. Because no intervention is carried out on the comparison group theseindividuals are left with their problems for the sake of comparison. Before arriving at a survey scheme, this point has to be discussed indepth with as many project representatives as possible and decided in all seriousness.
FThe interests of individuals have priority over the accuracy
of survey implementation.
No survey without service!
This means, for example:When disease is identified in an individual, medical treatment must be provided.●
When individuals, or sections of the community, seek help to solve major problems, it must be decided whether the project cancontribute to the solution of the problem.
●
The observations made on a comparison group can in themselves constitute intervention measures and consequently the observationsno longer portray an accurate picture of the situation outside the intervention area. This influence becomes more apparent withincreased intensity of observation of the comparison group and must be considered in the interpretation of the results of the survey.
3.1.3.4 Frequency of the surveys
unsaved:///Neue Seite 2.htm
http://www.nutrisurvey.de/baseline/part_31.htm (5 of 21) [13.04.2000 17:02:54]

Determination of the frequency of surveys is a compromise between the requirements of accuracy in the M+E (monitoring andevaluation) system and the completion of the project within the deadline.
The interval between the baseline survey and the follow-up survey, as well as the frequency of the follow-up surveys, depends on:The type of problems surveyed in the risk groups,●
The type of target, risk and beneficiary groups,●
The type of intervention, and●
The expected impact and results.●
If acute malnutrition occurs due to catastrophes, direct nutritional aid is essential, and a follow-up survey must be carried out after afew weeks or months. In the case of chronic nutritional problems rooted in multiple causes and requiring long term inter-sectoraldevelopment measures, no significantly measurable changes can be expected on for at least 3-4 years, or until there is a significantimprovement of the situation underlying the nutritional problem.
3.1.4 SamplingAs a rule, it is impossible and unnecessary to investigate all members of the target community to determine the prevalence ofmalnutrition is present in the community. A representative sample is studied and the results are extrapolated to the entirecommunity. A sample is not representative if sampling systematically favors certain groups of people or makes systematic errors. Asthis can happen unknowingly, unintentionally, and is only detected during the analysis after the completion of the survey or even never,random sampling is essential. This means that all eligible persons have an equal chance to be included in the survey.
It is rare that nutritional deficiencies are evenly distributed between men and women or among age groups. When one wishes todetermine the frequency of a certain problem, one should also define and describe the groups to be investigated, whether by age,sex, place of residence or social status, etc. In the selection of a sample, this means that the sampling should only be done inthese groups.
In large survey regions it is difficult to secure that every person in the group under investigation will be equally likely to be selected aspart of the sample. To ensure this, a complete list of all inhabitants and their characteristics would be necessary. Since such a list israrely available, a solution to this problem is the division of the area into clusters (sampling units). Clusters of individuals often arisenaturally (e.g., classrooms) or they may be formed artificially (e.g., geographic clusters). The clusters are then selected at randomand within each cluster investigations are carried out on every member of the community concerned. If the cluster is still too large,further random sampling can then be done.
3.1.4.1 Sample sizeCalculation of sample size depends on the objective of the nutrition survey. If the sampling is to be done for a survey in anutrition-related project, in which the prevalence of undernutrition is to be established in a baseline survey, where specifically aimednutritional intervention is not to be undertaken, the necessary sample size for the survey of anthropometric data can be derivedusing the following formula:
n = (4 x p x (100 - p)) / 25
where: p = expected prevalence of undernutrition.
EXAMPLE:
If the prevalence of undernutrition in a survey area is estimated at 40%, the sample size (n) should be:
n = (4 x 40 x 60) / 25 = 384
In other words, the survey must be conducted on 384 individuals.
The estimated prevalence of undernutrition can be derived from literature study, data from health services, or ideally from the pilotstudy. The formula can only be used if:
estimated prevalence of undernutrition is greater than 5%, and●
the sample is representative of the whole population to be surveyed. This means that each individual, as well as eachhousehold, has an equal chance to be sampled, and the selection of either individuals or households is not affected by otherindividuals or households.
●
If clustering is used for sample selection, or the prevalence in each cluster differs because of a very low prevalence, thecalculated sample size in rural areas must be multiplied by a design factor of 2. In the urban area, however, where a farhigher heterogeneity is too be expected the design factor should be 4.
In self-standing nutrition projects, where intervention is to be undertaken, a different method is used to determine sample size. Thefollowing information must be available to ascertain the required sample size for comparison with anthropometric data in a follow-up
unsaved:///Neue Seite 2.htm
http://www.nutrisurvey.de/baseline/part_31.htm (6 of 21) [13.04.2000 17:02:54]

survey:the percentage of the comparison group and/or intervention group estimated to have nutritional problems before intervention(prevalence), and
1.
the percentage of the intervention group estimated to still have nutritional problems after intervention (prevalence).2. Estimated values for the prevalence of nutritional problems can be obtained from the literature (see part 2 of the guidelines) orpreferably from a pilot survey.
The formula used to calculate the sample size is relatively complicated and cannot be understood without an extensive knowledge ofstatistics. Sample size can more easily be determined using graphs (see the following page), based on Fleiss' illustrated calculations(Fleiss, J.L. (1981) Statistical methods for rates and proportions. Second edition, John Wiley & Sons, New York, pp 38-42).
First one looks for the exponential curve that corresponds to the expected rate of nutritional problems for the surveyed communitybefore intervention. Then on the lower horizontal axis the expected prevalence of malnutrition after intervention is identified and aperpendicular line is followed from this point to the exponential curve. From where these lines intersect one goes horizontally to the leftor right vertical axis of the graph, and one can find the respective number of persons needed for sampling. If the prevalence ofundernourished children under five is 30% before intervention and the desired goal is to halve this number, i.e., to 15%, slightly fewerthan 300 children should be investigated before and after the intervention.
Figure 2. Expected prevalence after intervention(Sample size for the comparison of proportions, a = 0.01; 1-b = 0.05!)
3.1.4.2 Implementation of samplingTwo methods are available for selecting the clusters to sample. The selection of the method depends on the availability of maps of thearea.
If the map of a rural project area shows all villages, or if the city or urban map identifies districts, the sampling can take placeusing the grid method. A grid is placed over the map, and the resulting rectangles are numbered. The rectangles should besmall enough that in only a few cases will more than one village or urban district fall within a rectangle. The specific clusters(rectangles) in which a survey is to be carried out are selected by a draw or by using a random number table (Appendix 6.5).The number of clusters (rectangles) necessary for a survey is determined by the overall sample size and the number of children
1.
unsaved:///Neue Seite 2.htm
http://www.nutrisurvey.de/baseline/part_31.htm (7 of 21) [13.04.2000 17:02:54]

estimated to live in a typical village or urban district.EXAMPLE:
If 500 children are to be surveyed and in each village there are at least 30 families with an average of 1.5 children under 6 years(i.e., 45 children/village), then 500/45 = 11 clusters must be selected. If there is more than one village or urban district within asingle rectangle, one village or urban district in that rectangle must be selected by draw. This can be done by drawing lots,throwing dice, or tossing a coin.
1 2 3 4 5 6 7 8 9 10
11 12 13 14 15 16 17 18 19 20
21 22 23 24 25 26 27 28 29 30
31 32 34 35 36 36 37 38 39 40
41 42 43 44 45 46 47 48 49 50
51 52 53 54 55 56 57 58 59 60
61 62 63 64 65 66 67 68 69 70
71 72 73 74 75 76 77 78 79 80
81 82 83 84 85 86 87 88 89 90
Another option is to construct a table listing all clusters, e.g., the urban districts or the villages in the project area. In this table,the total number of inhabitants for each cluster should be included in a column. An additional column should tabulate thecumulative number of inhabitants in the project area (see table on next page). Using literature data or pilot study data, thepercentage of the target group in the total population can be estimated.
2.
EXAMPLE:It is known that in developing countries the under-five age group of children generally makes up 18% to 22% of the totalpopulation. Consequently, the number of children in each cluster can be estimated. In the following table there are least77 inhabitants per cluster (Mayama, the least populated cluster) or at least 15 children under five years of age. If a totalof 300 children is to be surveyed, we can calculate that 20 clusters need to be surveyed, i.e., 300/15 = 20.
To decide which cluster villages should be surveyed, all villages can be assigned numbers and from these twenty can be selected atrandom. However, this does not consider the differing sizes of the clusters. Therefore, the following procedure is preferred:
EXAMPLE:
The total number of inhabitants in the survey area is divided by the selected number of clusters and the mean number of inhabitants iscalculated (In the example from table 4: 99,756/20 = 4,988). Now, a number below the mean is randomly selected from a table (e.g.,507). With this random number a series of numbers is constructed by addition of the mean to this randomly selected number andsubsequently to each sum (in the example: 507, 507 + 4,988 = 5,495; 5,495 + 4,988 = 10,483; 10,483 + 4,988 = 15,471, etc.). Usingthe second column of the cluster list (cumulative population) this series of numbers can be used to identify the villages to be surveyed,that is, all villages that against the selected cumulative number of inhabitants have the lowest difference from the numbers in theseries.
Table 4. List of communities
Cluster or Community Number ofInhabitants
Cumulative No.Inhabitants
unsaved:///Neue Seite 2.htm
http://www.nutrisurvey.de/baseline/part_31.htm (8 of 21) [13.04.2000 17:02:54]

MoutebeVoukaMissieleTofiSimba
N'ZororoMungundou SurManbanguaBoupandaYoulandzambi
BiyanbaN'ZimaMayamaMouyambaBac Louesse
BoungotoDounguilaMiangaKangaIbeni
Popo......
1 363 605 926
1 167 703
491 573
1 012 387 155
1 109 821 77
904 210
427 1 269 1 101 2 174 1 129
371 ... ...
1 363 1 968 2 894 4 061 4 764
5 255 5 828 6 840 7 227 7 382
8 491 9 312 9 389
10 293 10 503
10 910 12 199 13 300 15 474 16 603
16 974...
...
T o t a l 99 750
In our example the clusters to be surveyed are:
1. Moutebe2. N'Zororo3. Mouyamba4. Miangaetc.
After the individual clusters, i.e., urban districts or villages, are selected, the households within the clusters need to be selected. Again,either of the two methods described above can be used for selection of households.
If an accurate city map is available, in which all residential areas are shown, the grid method can be used. The size of the rectangleshould be selected so that it contains about 4-8 houses. All rectangles are numbered and the numbers of the rectangles to be sampledare selected at random. In each of these areas (rectangle) one household with at least one child will be surveyed. If individual housesare shown on the city map, the houses in the sampling area should be numbered at random and assigned numbers in sequencestarting at number 1. The survey team starts the survey at house 1. If there is no family with children under 5 years, they go on tohouse 2. If there is still no household with children under 5, the team continues to house 3 etc. When a family with at least one childunder 5 is found, the survey is completed in that area and the survey team proceeds to the next sampling area.
If there is no city map, or the map is very unreliable in showing houses, the following option can be used: a central location is chosenin the selected area (intersection, marketplace, etc.), and a coin is tossed twice, once to select north/south and once for east/west, or anumber between 1 and 4 is picked from a randomized number table (see chapter 6.5) to choose north/south and east/west. From thesame table a number can than be selected between 1 and 25, and the survey will commence at the house corresponding to thisnumber. From this house, sampling will be undertaken at the next 15 houses with children under five years. If the edge of the village isreached before there is the opportunity to visit 15 houses, one starts again in the central location to continue the investigation on thenext street in the clockwise direction. A third possibility arises if there is a list of households with children in a village, the listed childrencan then be selected by draw.
This type of sampling can be undertaken when there is a homogeneous target community. If a survey has to be undertaken with aheterogeneous community group, however, clusters representing certain population groups are the basis of selection. In this waythe specific nutritional conditions of that group can be determined. In this case, however, it is not possible to make a statement on thenutritional situation of the total population.
unsaved:///Neue Seite 2.htm
http://www.nutrisurvey.de/baseline/part_31.htm (9 of 21) [13.04.2000 17:02:54]

In rural areas village communities do not always understand why only some of their community should be surveyed. It may thereforebe necessary to conduct the survey including all families, and consequently correspondingly fewer villages will be surveyed, or moretime will be needed to complete the survey.
3.1.5 Training and supervising of survey personnelBeyond generating information on the nutritional situation, the implementation of surveys on nutritional status also has a secondimportant task. The importance of nutritional problems as a major constraint of living conditions in developing countriesshould be emphasized by involving technicians and communities.
The training of technical personnel for nutrition survey implementation carries a special importance beyond that of the survey itself.
F Adequate time and funds should be made available forplanning and implementing training.
3.1.5.1. Job description of enumerators and supervisorsThere are two distinct groups of technical personnel for conducting the survey:
enumerators and●
supervisors.●
Enumerators are in direct contact with the surveyed persons. They obtain data through interviews and measurements. For technicalreasons related to the work, two persons usually work together as a survey team. In a baseline survey carried out as part of an overallsocioeconomic survey, a third enumerator is sometimes included in the team, for example to record data on the agricultural situation.Time spent on the survey can be reduced through teamwork, and in addition the enumerators can help and check on one another.
Supervisors are responsible for the technical quality of the surveys for which either they or the survey teams under their charge areconducting. Furthermore, they function as a liaison between institutions with an interest in the survey and representatives of the targetgroups.
Knowledge of local government structures and sociocultural characteristics are prerequisites for effective coordination. Only if thesupervisor has the trust of the target groups, their representatives, and local authorities, can the survey proceed as planned. Effortsshould be made to draw survey personnel from the health sector, or from the agricultural or educational sectors. Thus, it is possible forthe respective sectors to gain greater understanding of, and motivation for intervention measures.
If the survey teams are required to investigate families in their own homes, and the families are widely scattered over the project area,the supervisors will be able to oversee only a small number of survey teams. The assignment of survey teams to a supervisor must bedone randomly. The randomized number tables can be used for this purpose (see Appendix 6.5).
A supervisor should be in charge of approximately four to nomore than six survey teams.
The duties of a supervisor include advice and control of the accuracy of the survey data.
To reduce the incidence of error, the supervisor should checkvarious measurements, such as the height and weight of thechildren, as well as check three to five answers on the survey
questionnaire of one out of every ten or fifteen families.
If differences are evident between the data collected by the supervisor and those collected by the enumerators, then obviously thecauses must be found and specific measures taken to prevent further discrepancies.
FThe supervisor should meet with all surveyors at least
once a week during the survey implementation todiscuss and exchange experiences.
It is important to maintain constant feedback with representatives of the target community about problems arising duringimplementation in order to prevent failure and friction.
The organizational structure of a survey is presented in figure 3. The survey leader should be chosen from a sector in charge of the
unsaved:///Neue Seite 2.htm
http://www.nutrisurvey.de/baseline/part_31.htm (10 of 21) [13.04.2000 17:02:54]

nutritional situation of the population in that country. This is normally the health sector. The training workshop is carried out by thesurvey leader. The survey leader is responsible for hiring the supervisors, and the supervisors for hiring the survey teams. In smallersurveys, the survey leader may be able to undertake direct supervision of the survey teams, thus eliminating one organizational level.One or two additional persons are responsible for data entry into the computer. Data entry should occur during the implementation ofthe survey. This has the following advantages:
time can be saved in the analysis of the survey;●
the quality of the questionnaires can be checked, and if necessary, the survey can be modified to avoid gathering unusabledata;
●
the completeness and accuracy of the finished forms can be rechecked, and inaccurate enumerators can be instructedaccordingly.
●
Figure 3. Organizational chart of field personnel participating in a nutrition survey
Survey Leader
↓
↓
↓Supervisor 1 Supervisor 2 Supervisor 3
↓ ↓ ↓ ↓ ↓ ↓ ↓ ↓ ↓ ↓ ↓ ↓S01S02
S03S04
S05S06
S07S08
S09S10
S11S12
S13S14
S15S16
S17S18
S19S20
S21S22
S23S24
Data entry personnel (S01 - S24: Enumerators)
3.1.5.2 Personnel recruitmentThe progress of a survey depends just as much on human qualities as on the technical qualifications of the personnel taking part in thesurvey. Completion of elementary education is a minimum requirement for an enumerator. An enumerator must have readingand writing capabilities, as well as the mastery of basic types of calculations. Previous work experience can replace theminimum formal educational requirements.
Besides education and work experience, an accurate knowledge of the local language is required. People who speak the samelanguage, know the local customs and are familiar with the problems of the target community will more easily win the confidence of thetarget groups necessary for conducting interviews. As far as possible, the enumerators should originate from the samesociogeographical and cultural area as the target groups. However, it is also possible that foreign enumerators are more accepted thanlocal interviewers. Therefore, in each survey the possibility that distinctions such as religion, ancestry, caste or sex may influence theresult of the survey has to be examined.
In all societies there are varying degrees of distinct roles for the sexes. These distinctions have to be considered in therecruitment of enumerators. As the responsibility for household nutrition generally lies with women, it is recommended thatwomen be engaged as nutritional enumerators.
Personality attributes should be considered when selecting an enumerator. Therefore, it is important to study the personalities of theenumerators during the training program to identify potential problems. In addition, potential enumerators should be assessed inrelation to the following easily recognizable attributes:
Motivation: Only a motivated enumerator will work convincingly with the target groups and win their confidence. Motivation isinfluenced by the work itself and the leadership style of the surveying organization. A positive motivation can be expected ifachievements by the enumerator are recognized by his colleagues and leaders, and also by the target groups.
●
Communication skills For a survey to be conducted successfully, the enumerators must be able to maintain communication inthe field, even under difficult conditions.
●
Reliability: The results of the interview depend on the reliability of the enumerator and on the care taken in measurements andcompletion of the questionnaires.
●
Initiative: The difficult working conditions of a survey require that an enumerator has initiative and self-reliant problem solvingabilities.
●
Willingness to learn: During the training program the future enumerator will become familiar with interview techniques,measurement techniques and forms of communication. He or she must be prepared to learn these subjects and then to applythem.
●
Physical strength: Health and a robust physical constitution are requirements for enumerators as all will work under difficultclimatic, topographical and hygienic conditions.
●
Mental health: Work in poverty stricken or abandoned rural areas can be psychologically demanding. The work requirespatience and a friendly nature as well as the ability to bear disappointments and frustrations.
●
unsaved:///Neue Seite 2.htm
http://www.nutrisurvey.de/baseline/part_31.htm (11 of 21) [13.04.2000 17:02:54]

These personal attributes are important requirements for an enumerator. Of course in practice, enumerators can rarely be found whopossess all these attributes. Nevertheless, the training period should be used as an opportunity to examine them in the enumeratorsand to prevent hiring personnel with wholly unsuitable personalities.
The requirements set for enumerators apply also to supervisors, but also additional educational qualifications should be required. Thiscould include education at a vocational school, or studies continued toward a specific goal after elementary education. Once again,successful previous work experience should be rated over formal education.
Finally, personnel engaged in a survey should also be motivated through an adequate level of remuneration.
3.1.5.3 Training of survey personnel
Enumerators must be trained intensively to carry out carefully the following tasks:anthropometric measurements,●
clinical and biochemical diagnosis,●
interviewing using predetermined wording,●
completion of the questionnaires, and●
communication with the community.●
Enumerators in a particular region or sector should receive their training together. The training should be provided by the surveyleader of the supervisors and enumerators in order to assure the standardization of the survey.
The training should stimulate interest through teaching aids. To achieve this, the following materials should be used:Charts and diagrams describing the various forms of malnutrition allow accurate and rapid transfer of information.●
Audio recordings taken during practice interviews provide the trainees with actual examples of the types of questions askedand allow detailed discussions of mistakes.
●
Enumerators should not treat the community as "second class citizens," but must see them as "partners." Without this perception,cooperation from the community will not be possible.
Patience is one of the most important qualities of an enumerator. As target groups are often not accustomed to being asked questions,interviewees can take a long time to answer, and the answers may be limited by the vocabulary of the interviewee and can be veryambiguous.
The communication between the "survey partners" will be enhanced if the enumerator looks at the interviewee with a friendlyexpression, uses encouraging words, and does not stare incessantly at the questionnaire.
Training content:
The first concern of the survey leader is to instill in the enumerators the importance of their future activities.
When the person in charge of training has made sure that the enumerators have grasped the importance of the survey for thesubsequent program or project, the next step is to make the participants aware of the inherent risks of mistakes caused by:
erroneous,●
incomplete, and●
inaccurate●
measurements and completion of questionnaires. These could significantly alter the interpretation of the situation in the region andmay result in selecting the wrong interventions. Consequently, a survey that does not reflect reality can impair the effectiveness ofassistance rendered to the target group.
To assure standardization, the individual questions on the questionnaires should be asked using a consistent predetermined wording.This can be reinforced through practice with different interview partners during training. The other enumerators and the supervisor canthen make critical observations of the dialogue and discuss its strengths and weaknesses. These exercises will introduce theenumerators to a variety of interview situations and help them to gain confidence in asking questions and in completing thequestionnaires. The amount of time needed during an average survey can be estimated by timing the practice interview session.However, in a field study, it is necessary to allow additional time for the enumerator to establish contact with the target person.
Next the anthropometric measurements and investigation methods relevant to nutritional physiology (e.g., measurement of bloodhemoglobin levels, examination for xerophthalmia and goiter) will be practiced, and the data entered on the questionnaires. At thispoint, there should be a knowledgeable person supervising the measuring in order to eliminate potential errors. Measurement of thesame person by several enumerators can help to check for uniformity of measuring results.
unsaved:///Neue Seite 2.htm
http://www.nutrisurvey.de/baseline/part_31.htm (12 of 21) [13.04.2000 17:02:55]

F Plenty of time must be made available for surveyors toreceive proper training.
A proposed schedule for the training of enumerators is shown on the next page. At the end of the training period, a pilot study must becarried out (see subchapter 3.1.6). Therefore, additional time has to be made available.
Adequate space and audiovisual materials are necessary for the training of survey teams.
Table 5. Proposed training schedule for enumerators
Day 1 Enumerators arrive, register and are briefed, etc.
Day 2
Morning:
Introductions between the enumerators and trainingpersonnel, time to become acquainted, introduction of thetraining program and discussion.
Lecture on the general concept of the project, the surveyobjectives, and the consequences for the target groups andthe entire project.
Introduction of the survey plan.Afternoon:
Introduction of the questionnaire.
Step-by-step presentation and memorization of the individualquestions (in the predetermined wording).
Interview practice in pairs with survey colleagues (e.g.,through role play) followed by discussion of positive andnegative types of behavior during the interviews.
Day 3
Morning:
Short lecture:1. Malnutrition and its consequences on the target group2. Anthropometry - what for?
Demonstration of anthropometric measurement techniquesAfternoon:
Practice with anthropometric measurement techniques.
Determination of intra- and inter-observer errors throughrepeated measurement of same individual at given intervalsby both same and different enumerators
Analysis of measurements with the enumerators, checking forerrors, and discussion of any unclear points
Day 4
Morning:
"General test" - completion of three questionnaires (includinganthropometric measurements) with different survey partners.Afternoon:
Analysis of the surveys with the enumerators, checking forerrors, and discussion of any unclear points.
Day 5Payment of daily allowances.
Departure.
3.1.5.4 Procedure for the collection of information in a household
unsaved:///Neue Seite 2.htm
http://www.nutrisurvey.de/baseline/part_31.htm (13 of 21) [13.04.2000 17:02:55]

In the training session the following items should be emphasized:When a survey team visits a household the first time, a brief introduction should be made in which the enumerators- introduce themselves with their names and the name of their professional institution,- explain the purpose and the importance of the survey, and- ask for the necessary support from the household.
●
Many questions are related to values and norms and may involve very personal matters. Therefore, the presence of anotherperson beside the enumerators and the interviewee may be distracting and responses may be altered.
●
Although it is important to stay on schedule with the survey, some interviewee may have difficulties hearing and understandingthe questions. For the sake of accuracy it is then necessary to slow the interview and repeat the questions.
●
At the end of the survey, the enumerators should ask the interviewee about their impression of the survey and should thankthem for their support.
●
3.1.6 Pilot testingShortcomings and unforeseen factors are always discovered during a survey, despite careful planning. Such unforeseeabledeficiencies can be considerably reduced by conducting a pilot survey.
Pilot testing must be conducted before any baseline survey.
The pilot survey has the following objectives:Training the enumerators.●
Testing the instruments to be used (e.g., questionnaires, measuring devices) for reliability.●
Estimating the incidence of nutritional problems in order to recheck the sample size (see section 3.1.4.1).●
Fine-tuning the scheduling and organizational planning of the main survey.●
Determining intra- and inter-observer errors, since it tells whether enumerators need more training and identifies error limits (seealso chapter 4.6 and annex 6.7).
●
Determining the mean weight of a child's clothing under circumstances where clothes cannot be removed either because ofclimate or local customs.
●
The benefits of a pilot study include:testing the variables for relevance (irrelevant variables must be deleted from the questionnaires, while new variables may beadded to the questionnaires),
●
checking the variables for cultural acceptance in the community,●
rechecking the survey type of each variable (question, observation, or measurement),●
transforming open-ended questions into closed form (creating answer categories; see sub-chapter 3.1.9),●
testing the wording of the questions (are they clearly understood by the interviewees),●
adapting the questions to the local language,●
rechecking the measuring devices, such as scales, height measuring devices, and devices for determination of blood levels, forusability and accuracy,
●
defining the time required for data collection per family in order to estimate the total time required,●
discovering and correcting possible shortcomings in the enumerators,●
training the enumerator groups and the community in organizational coordination.●
A pilot survey is conducted after the initial determination of sampling size, the drafting of the questionnaire, and the training of theenumerators. The pilot survey is the last action taken before the start of a baseline survey. It should be carried out undercircumstances as similar as possible to those under which the main survey will be carried out. In particular, the pilot survey should bedone in the same geographical area with the same population group a short time before the main survey.
A pilot survey should be conducted on about 2-5% of the households to be surveyed later. Thehouseholds recorded in the pilot study may not be re-recorded during the main survey.
unsaved:///Neue Seite 2.htm
http://www.nutrisurvey.de/baseline/part_31.htm (14 of 21) [13.04.2000 17:02:55]

After the completion of the pilot survey, a final consultation is held with the enumerators. The aim of this discussion is to clarify anyremaining obscure points and to reach an agreement on the final procedure and survey to be used.
Reproduction of the questionnaires can only take place after the final discussion on the experiencesof the pilot survey.
3.1.7 Scheduling of a surveyThe scheduling of the survey is subject to factors outside the control of the planning but which nevertheless have to be considered. Intable 6, some circumstances are listed under which a survey needs more or less time.
Table 6. Factors influencing the time needed for a survey
Less time spent on the survey More time spent on the survey
Nutrition-related project
End of the project
Follow up survey
Experienced survey team
Part of a socioeconomic survey
Family travels to the enumerator
Good transportation infrastructure
Closed village settlements and urban areas
Functioning group structures
Time schedules not interrupted for religious orcultural reasons
Self-standing nutrition project
Beginning of the project
Baseline survey
Inexperienced survey team
Isolated survey
Enumerator travels to the family
Poor transportation infrastructure
Open village settlements and nomadic settlements
Non-functioning group structures
Time schedules interrupted for religious or culturalreasons
The chronological progression of an isolated nutrition survey is presented in table 7. In this example, the schedule is based on themaximum time required for a purely nutrition project - estimated to be about 9 weeks (2 months). However, the time taken may beconsiderably less, depending on local circumstances. The search and study of literature, as well as further statistical analysis, which donot have to take place in the project area, are not included in this table.
Table 7. Example of scheduling of a baseline survey
A C T I V I T I E S1 2
W3
E4
E5
K6 7 8 9
unsaved:///Neue Seite 2.htm
http://www.nutrisurvey.de/baseline/part_31.htm (15 of 21) [13.04.2000 17:02:55]

Review of scientific literature
Review of reports from national and internationalorganizations
Preparation of the training program for theenumerators
Gathering information at local institutions andfrom local persons
Collection of structural data
Initial calculation of sampling size
Design of questionnaires
Organization of the survey
Recruitment of enumerators
Talks with target groups and representatives oflocal organizations and institutions
First test of the questionnaire
Training of the enumerators
Preliminary study and determination of the finalversion of the questionnaires (pilot study)
Final determination of the sample size
Data collection in the communities
Data entry into the computer
Initial analysis of the survey
Informing the target groups and technicalpersonnel of the survey results
More detailed analysis (analysis of causes anddeterminants)
#
#
#
#
#
#
#
#
#
#
#
#
#
#
#
#
#
#
#
#
#
#
#
#
#
#
3.1.8 Resources neededThe following list is a checklist for quick reference to see if the necessary resources are in place for a nutrition survey. No quantitiesare given, as these depend on the sample size. The resources in parentheses are not essential, but they may be needed dependingon the specific situation.
PersonnelSurvey leader●
(One supervisor per 4-5 survey teams)●
unsaved:///Neue Seite 2.htm
http://www.nutrisurvey.de/baseline/part_31.htm (16 of 21) [13.04.2000 17:02:55]

Enumerators (usually two enumerators per team)●
Driver●
2 persons for data input and correction●
Means of transportation
Equipment and suppliesFor scheduling and geographical planning, extensive map materials will be needed (maps, road maps, city maps, etc.)●
Production of the questionnaires will require the following:- Computer + printer- Paper, printing ink or tonerfor photocopying:- photocopy machine- toner, paper- Mimeographing: - mimeograph machine (!!!!!)
●
Each survey team of two should be provided with the following:- 1 weighing scale (e.g., UNIscale, UNICEF)- 1 anthropometer (length board for length measurement of infants, AHRTAG)- 1 microtoise measuring tape (UNICEF)- 1 tape for mid-upper-arm circumference measurement (UNICEF)- questionnaires- pens and pencils
●
For data processing the following will be required:- Computer and printer- Software: Nutrition Baseline software and word processing program- (statistical program, e.g., SPSS for Windows, SAS)- (graphics program, e.g., Excel, Prism,...)- Diskettes, paper and printing ink or toner.
●
If it is necessary to determine the prevalence of anemia, (refer to section 3.2.10.1 for the danger of blood transmitted infections), thefollowing equipment and materials will be required to measure hemoglobin levels:
Field photometer for hemoglobin determination (e.g. Compur, Bayer)●
Test tubes●
Batteries●
Autoclick (e.g. Boehringer)●
Disposable lancets (e.g. Boehringer)●
Receptacle for used disposable lancets●
Protective gloves (e.g. latex, rubber, plastic).●
3.1.9 QuestionnairesDespite all desires for standardization, it is necessary for each survey to develop its own questionnaire to be completed by theenumerators with data obtained from the field.
There are three distinct types of questionnaires:Questionnaire for collecting individual data1. Questionnaire for collecting household data2. Questionnaire for collecting structural data (data at community level - village or city suburb, district level, etc.)3.
In addition to these, a special questionnaire is required for supervision purposes. In the Nutrition Baseline software only thequestionnaire for individual and household data is created automatically.
Variables applying equally to individuals within a household, such as the size of the family or the amount of living space, should berecorded on a separate questionnaire for the family (household). Similarly, observable variables applying equally to all families in avillage, such a climatic data, should not be recorded on a household questionnaire, but should be entered on a questionnaire preparedfor a village or city suburb.
The questionnaires should be standardized to simplify their completion and subsequent use. For this purpose, the following rulesshould be explained on the following example of a page from a questionnaire (figure 4).
Figure 4. Example of a page from a questionnaire for a nutrition survey
unsaved:///Neue Seite 2.htm
http://www.nutrisurvey.de/baseline/part_31.htm (17 of 21) [13.04.2000 17:02:55]

Each page of a questionnaire should begin with a header that states
the name of the responsible institution,❍
the name of the survey (i.e., Nutrition survey),❍
the household number,❍
the type of questionnaire (i.e., Household, Child, Supervisor) with its page number.❍
1.
A three or four digit field for the household number should be identified at the top of the questionnaire (as part of the header).Before commencing the survey a unique household number should be assigned to each questionnaire and the assigned
2.
unsaved:///Neue Seite 2.htm
http://www.nutrisurvey.de/baseline/part_31.htm (18 of 21) [13.04.2000 17:02:55]
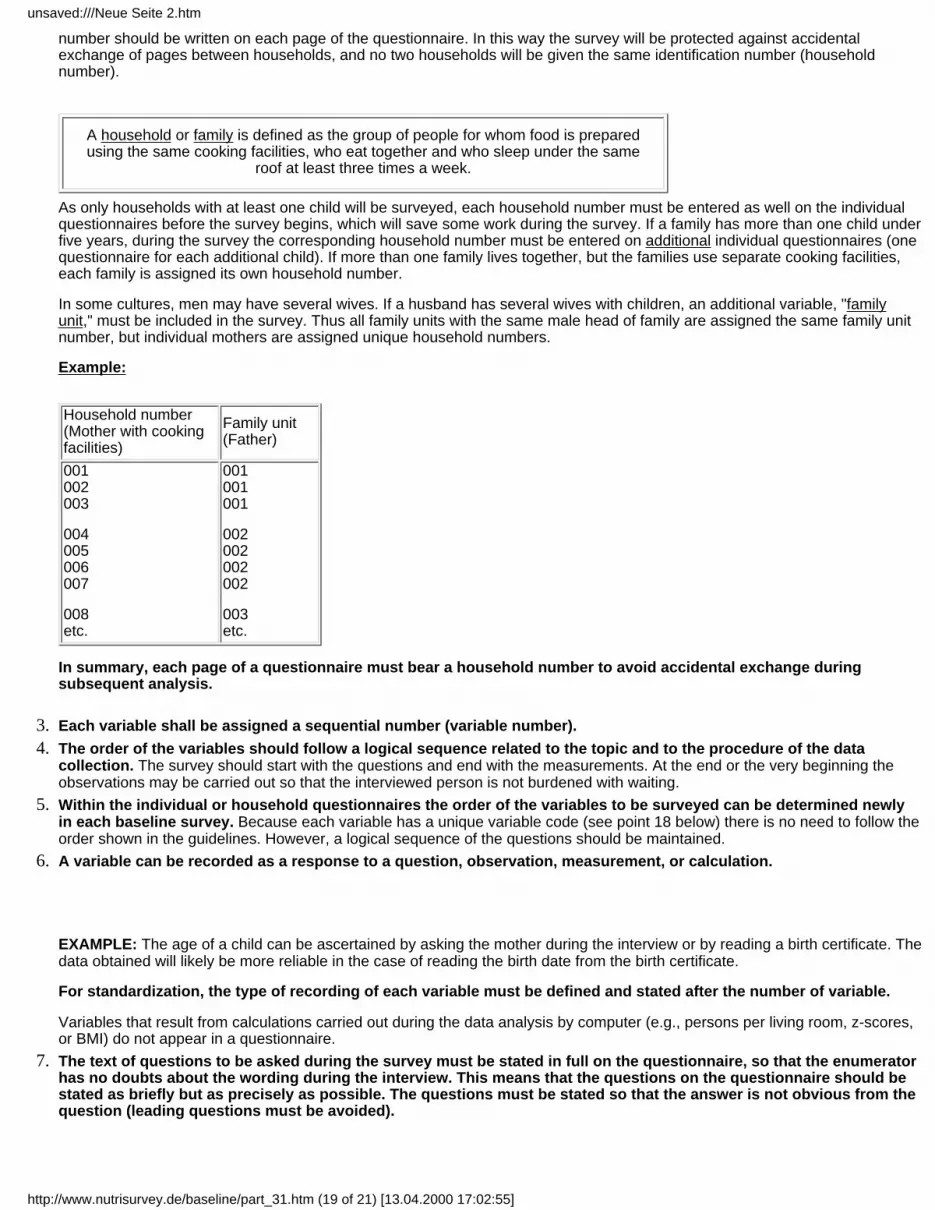
number should be written on each page of the questionnaire. In this way the survey will be protected against accidentalexchange of pages between households, and no two households will be given the same identification number (householdnumber).
A household or family is defined as the group of people for whom food is preparedusing the same cooking facilities, who eat together and who sleep under the same
roof at least three times a week.
As only households with at least one child will be surveyed, each household number must be entered as well on the individualquestionnaires before the survey begins, which will save some work during the survey. If a family has more than one child underfive years, during the survey the corresponding household number must be entered on additional individual questionnaires (onequestionnaire for each additional child). If more than one family lives together, but the families use separate cooking facilities,each family is assigned its own household number.
In some cultures, men may have several wives. If a husband has several wives with children, an additional variable, "familyunit," must be included in the survey. Thus all family units with the same male head of family are assigned the same family unitnumber, but individual mothers are assigned unique household numbers.
Example:
Household number(Mother with cookingfacilities)
Family unit(Father)
001002003
004005006007
008etc.
001001001
002002002002
003etc.
In summary, each page of a questionnaire must bear a household number to avoid accidental exchange duringsubsequent analysis. Each variable shall be assigned a sequential number (variable number).3. The order of the variables should follow a logical sequence related to the topic and to the procedure of the datacollection. The survey should start with the questions and end with the measurements. At the end or the very beginning theobservations may be carried out so that the interviewed person is not burdened with waiting.
4.
Within the individual or household questionnaires the order of the variables to be surveyed can be determined newlyin each baseline survey. Because each variable has a unique variable code (see point 18 below) there is no need to follow theorder shown in the guidelines. However, a logical sequence of the questions should be maintained.
5.
A variable can be recorded as a response to a question, observation, measurement, or calculation.
EXAMPLE: The age of a child can be ascertained by asking the mother during the interview or by reading a birth certificate. Thedata obtained will likely be more reliable in the case of reading the birth date from the birth certificate.
For standardization, the type of recording of each variable must be defined and stated after the number of variable.
Variables that result from calculations carried out during the data analysis by computer (e.g., persons per living room, z-scores,or BMI) do not appear in a questionnaire.
6.
The text of questions to be asked during the survey must be stated in full on the questionnaire, so that the enumeratorhas no doubts about the wording during the interview. This means that the questions on the questionnaire should bestated as briefly but as precisely as possible. The questions must be stated so that the answer is not obvious from thequestion (leading questions must be avoided).
7.
unsaved:///Neue Seite 2.htm
http://www.nutrisurvey.de/baseline/part_31.htm (19 of 21) [13.04.2000 17:02:55]

The local language of the target community often differs from the national language. In these cases, the questions andanswers in a questionnaire should be written in the language that the people of the target community use tocommunicate among themselves. If the questions were initially written in the national language, the quality of the translationinto the local language should be checked by reverse translation back into the national language.Questions with sociological content are easier to handle with open questions which permit greater flexibility, and there is no riskof loss of information. However, using closed questions in a survey allows for faster and more objective data collection,particularly if a survey relies on several enumerators.
With closed questions, possible answers are predetermined during the pilot study, and therefore, there is the risk of loss ofinformation. Nevertheless, using standardized questions with corresponding answer categories allows for a rapid andmeaningful analysis of the entire data set, which outweighs the disadvantages of any possible loss of information. This isparticularly true when several enumerators are used.
For these reasons, where the purpose of a nutrition survey is to identify problems and suggest solutions and not tocarry out basic research, closed questions must be used.
8.
As for the questions, all possible responses are listed on the questionnaire. The answers must not be read by theinterviewed person.
9.
The response categories for closed questions shall be coded (e.g., male = 1; female = 2). The answer categories on thequestionnaire shall be completed with the corresponding code for each question. In cases of size measurements (such asheight, age, weight) the appropriate unit (such as cm, months or kg) shall be stated on the questionnaire.
10.
On the right side of the questionnaire a field for each variable should be identified. The number of spaces in the fieldshould correspond to the maximum number of digits in the anticipated response - either a code or a measurement. Thegeneral organization of the fields on the right side of the questionnaire simplifies filling in the form and later reading the data fordata entry. Codes of responses will be entered in these fields. For example, 3 fields should be used if body height (measured incm) where the measurement is to be given to the nearest centimeter only.
11.
For ease of subsequent reading of the data, the fields should appear in vertical order as shown above, and not next toeach other.
12.
For easier data analysis, all response codes should be expressed as numbers.13. The following response code numbers should be reserved:14. 7 or 77 when an answer is given which has not been provided for in the coding, it should be recorded as "other"
8 or 88 when the interviewed person answers "I don't know," or in the case of an observation when it was notpossible to identify a clear symptom
9 or 99 when the interviewed person gives no answer or it was not possible to carry out an observation ormeasurementSeveral variables have the same responses independent where a survey will be carried out. Suggestions for responses and itscorresponding code numbers are presented in the following chapter 3.2. It is recommended to use these suggestedcodings. This would allow that several studies can be analyzed easier cross-sectionally.
15.
All response code fields must be filled in. This helps to determine whether an enumerator forgot a variable during the survey.16. There should be no additional response coding or other forms of recording during the survey, as
- this adds considerably to the workload of data entry and the later analysis, and- when several enumerators are engaged, it is impossible to maintain standardization.
However, it may be extremely valuable for the improvement of the survey procedure and the later data analysis if additional,qualitative observations are written down. For this purpose, all enumerators should have some additional sheets of paper wherenotes can be reported.
17.
Each variable must have its own, unique code name (variable code) that should consist of not more than 8 digits. Thecode name of each core variable is mentioned later in the description of the variables (a list of all variable codes usedhere is presented in Appendix 6.2). Uniform variable codes are necessary for merging the data of different surveys
e.g., Variable code: GENDER
In contrast to the individual, household and structural questionnaires, the variable codes of the supervision questionnaires canbe selected within each country since the reproducibility of the collected data should be calculated within each countryseparately.
18.
Some data needed for analysis are based on further calculation of variables. For example, the body mass index iscalculated from body stature and weight. As already mentioned, these variables do not appear in the questionnaire but will be
19.
unsaved:///Neue Seite 2.htm
http://www.nutrisurvey.de/baseline/part_31.htm (20 of 21) [13.04.2000 17:02:55]

analyzed later during data processing automatically by the Nutrition Baseline software. However, it is also necessary tostandardize the variable codes of these variables. These variables are marked in chapter 3.2 "Contents of a Survey" of theseguidelines by square brackets [ ].
If for cultural or other reasons no accurate answer can be expected, the question should be dispensed with.
It is better to obtain a lesser amount of precise information than large amountsof imprecise information.
Samples of questionnaires can be produced automatically by the Nutrition Baseline software.
3.1.10 Ethical considerationsThe implementation of surveys has ethical implications that need to be considered thoroughly as early as the planning stage. Althougha baseline survey is intended to establish the basis for interventions to improve conditions and has no scientific research component,ethical implications must be considered. Ethics are strongly associated with cultural norms and values that may differ from society tosociety; however, there are some universal issues that have to be respected.
Ethical evaluation of survey design and procedures by local professional experts and community representatives●
Efficiency of the survey- information is collected with the least burden on the expected respondent- survey expenditures are justifiable considering the resources available for later activities/ interventions- information collected does not duplicate information already available- information is wanted by communities and organizations dedicated to improving the nutritional and general basic needssituation- commitment that information is used later to improve the nutritional situation and living conditions of the target population
●
Information to all surveyed persons- honest explanation of the survey purpose and procedure- description of benefits and any risks- offer to answer all inquiries- affirmation that persons and communities are free to withdraw consent and to discontinue participation without any form ofprejudice
●
Informed consent- individual consent- community agreement
●
Privacy and confidentially of collected information- collection of information in a way that makes it impossible or at least very hard to identify the respondent- destruction of questionnaires that contain information that could be used to identify the surveyed household or persons (afterthe survey)- instruction of all personnel working with data collected in the survey about their obligation and responsibility to respect theprivacy of the respondents and the confidentiality of the data.
●
Authorship and property of a survey- all information collected and analysis carried out is available to relevant institutions of the respective country- all main contributors to the survey are listed as authors and consensus on authorship is reached during the planning stage- all contributors and supporters who are not authors are mentioned in the acknowledgment
●
unsaved:///Neue Seite 2.htm
http://www.nutrisurvey.de/baseline/part_31.htm (21 of 21) [13.04.2000 17:02:55]

3.2 Contents of a survey
The contents of a nutrition survey are arranged according to the objectives as described in Chapter 1.2. In particular, ifan objective of a project is to improve the nutritional status and living conditions, it is necessary to identify the causes ofthe nutritional problems in the population. Figure 5 shows the primary factors causing nutritional problems, all of whichare based on secondary causes. It can be observed from the problem tree that a low nutrient intake (01) and/or a highprevalence of infectious and carrier-borne diseases (02) are responsible for a poor nutritional status (0). Similarly, bothcauses result from inadequate availability of food at the household level (1), poor social relationship and caring capacity(2), inadequate health services (3) and unfavorable environmental conditions (4).
Figure 5. Causal model of malnutrition
Generally, the probability of a cause being responsible for a poor nutritional condition becomes smaller as oneprogresses more deeply into the levels of causes, and as one moves further away from the core problem. Consequently,it makes little sense merely to follow one branch of the tree down to the details (e.g., supply of nutrients at the householdlevel), if other branches remain neglected (e.g., health services or environmental conditions).
The content of the baseline survey is determined by the theoretical cause-effect-relationships of theproblem tree. Care must be taken to ensure that all problems are considered before going on to the
next lower level of causes.
part_32
http://www.nutrisurvey.de/baseline/part_32.htm (1 of 28) [13.04.2000 17:03:51]

This chapter will examine in detail the content of a nutrition survey. Nevertheless, these are only guidelines, as thepotential variables have to be examined for their relevance and necessity for each location.
The wording of the sample questions is merely one possible way to obtain the data needed for each of the surveyvariables. Obviously the development of questionnaires, the wording of questions and the selection of theanswers must consider socioeconomic and cultural realities and should sound natural in the language used.Local specialists and project staff can be of great assistance in this area.
The variables presented here are divided into two groups:
1.) Variables 1 - 40 (sub-chapters 3.2.1 - 3.2.8) that are related to the household level.
2.) Variables 41 - 82 (sub-chapters 3.2.9 - 3.2.12) that are related to the individual level.
3.2.1 Information on survey organizationEach questionnaire should begin with a cover page that helps to relate the questionnaire to the survey, the enumeratorsand the household.
1.) Household number
The household number should be filled into the questionnaire by the survey leader already before the forms aredistributed to the survey teams as they leave to the households. This ensures that all visited household have only oneunique household number.Variable code: HOUSEHNO
2.) Survey team number
The survey team number should be filled into the questionnaire by the survey team at the begin of the survey beforevisiting the households.Variable code: SURVTNO
3.) Supervisor number
In case of larger surveys in which the survey teams are coached by supervisors, the number of the correspondingsupervisor should be filled in.Variable code: SUPERVNO
4.) Date of survey
The date of survey should be filled in by the survey team before starting the data collection in the households. The dateof the survey is needed to calculate the age of the surveyed children.Variable code: SURVDATE
5.) Location of household (village, suburb)
The code of the village or suburb should be filled in before the survey team visits the households.Variable code: HSHLOCAT
3.2.2 Demographic data of householdThe demographic situation of a household is documented in a table. The table is used as an information source forseveral items. Once all relevant data have been extracted from the table, the page with the table must be destroyed toguarantee the anonymity of the respondent.
The name of each person who belongs to and is found in the household is written on the table. Although the names willnot be used afterwards, providing each name helps remind the interviewee how many persons live in the household.Based on the name list, the number of persons living in the household will be determined later.
part_32
http://www.nutrisurvey.de/baseline/part_32.htm (2 of 28) [13.04.2000 17:03:51]

In various cultural situations the number of family members is not constant and the definition of who is attached to thehousehold is different from our way of thinking. Temporary visitors in the household staying with the family may beconsidered family members. Also the father may work outside the home for several weeks at a time, and/or the childrenmay leave home when very young. Furthermore, in some societies children who are not yet baptized would not becounted.
Definition: A household includes all persons:for whom meals are prepared using the same cooking facilities and who eat together at least once a day and●
who over the last 30 days have slept at least 3 nights per week under the same roof.●
The second part of this definition may not be applicable in rural areas, as in agricultural societies other householdarrangements may exist.
The age of different household members may contribute important information about possible causes of malnutrition. Inparticular, infants from mothers who are younger than 16 or older than 40 have a higher risk of low birth weight.Furthermore, birth frequencies less than two years are also associated with a higher risk of low birth weight.
The age of children, and also of adults, is often unknown (see section 3.2.9.2). In such societies, a suitable way of askingthis question must be found, or the question must be left unanswered for all household members except the age of themother and the children under five years.
The question whether the household member has earned money during the last three months applies particularly inurban areas, as in rural areas most family members take part in agricultural work and it is difficult to distinguish betweenworking and non-working members. However, this question could be relevant for landless rural families.
No. NameFamilystatus Sex
Age(years)
Stay inthe
householdEarningmoney
1
2
3
4
5
6
7
8
9
10
11
12
13
part_32
http://www.nutrisurvey.de/baseline/part_32.htm (3 of 28) [13.04.2000 17:03:51]

14
15
16
17
18
19
20
Family status:1) Father 4) Grand parents 7) Others2) Mother 5) Aunt/uncle 9) No answer3) Children
Gender:1) Male 2) Female
Stay in household:1) Stays permanently2) Does not stay permanently, but >8 months in the household3) Does not stay permanently, but 4-8 months in the household4) Does not stay permanently, but <4 months in the household5) Moved away but sends money8) Don't know9) No answer
Earning money:1) Earned no money in the last 3 months2) Earned no regular income in the last 3 months3) Earned regular cash income in the last 3 months8) Don't know9) No answer
6.) Observation: How many persons live in the household?
Variable code: HSHMEMNOThe information is calculated from data in the household table.
7.) Observation: How many children under 5 years live in the household?
Variable code: NOCLDMEMThe information is calculated from data in the household table.
8.) Observation: Child number
Variable code: CHILDNOThe household table indicates the children under five years from whom the data for the individual questionnaire will becollected. In case that a household has more than one child younger than five years and information from all of thesechildren shall be collected, the number of individual questionnaires should be attached to the household questionnaire.Each child of this age group should be indicated with a number starting from number 1. The numbers are then filled intothe attached individual questionnaires corresponding to each child to be surveyed.
9.) Observation: Is the head of the household male or female?
part_32
http://www.nutrisurvey.de/baseline/part_32.htm (4 of 28) [13.04.2000 17:03:51]

1) Male 2) Female 9) No informationVariable code: HSHHDSEXThe information is collected from the household table.
10.) Observation: How old is the mother who lives in the household?
Variable code: AGEMOTHEThe answer is given in years and is collected from the household table.
11.) Observation: How old was the mother at the birth of the oldest child?
Variable code: AGEOLDCHThe information is calculated from data in the household table.
12.) Observation: How old was the mother at the birth of the youngest child?
Variable code: AGEYOUNGThe information is calculated from data in the household table.
13.) Observation: How many cases exist with birth spacing less than 2 years?
Variable code: BIRTHSPAThe information is calculated from data in the household table.
14.) Observation: How many household members earned money in the last 3 months?
Variable code: HSHMMNOThe information is collected from the household table.
15.) Observation: Has the mother earned money during the last 3 months?
1) Yes 2) No 9) No answerVariable code: MOTHMONEThe information is collected from the household table.
3.2.3 Ranking of problems by the observed householdOne function of the baseline survey is to assist in the identification of appropriate interventions to solve the problemsfaced by the target group. Consequently, the baseline survey should obtain a complete (holistic) description of reality. Inaddition to scientifically based observations and investigations, the perceptions of the target group are an important partof this reality.
FThe sustainability of the results of an intervention
program is drastically reduced if the opinion of targetgroups is not included in the diagnosis of the living
conditions and nutritional situation and in planning theintervention. For this reason, it is essential that the
survey reflects the viewpoint of the community.
Questions concerning nutritional and health problems should gradually move from general aspects to specifics, thusenabling the ranking of different nutritional problems to be explored. This technique also prevents the interviewer fromassuming that the interviewee has a particular nutritional problem.
The following problems can only function as examples and have to be changed according to each region. This requiresan accurate knowledge of the local area through study and reports on the experiences of others.
No generally applicable rule can be given for obtaining a general assessment of the living situation during the interview.However, it has often been shown that this question should be asked later in the interview, because at the beginning ofan interview the interviewee is often reluctant to express an opinion on these matters.
part_32
http://www.nutrisurvey.de/baseline/part_32.htm (5 of 28) [13.04.2000 17:03:51]

16.) Question: Which are the major problems in your daily life?
The respondent shall identify up to three main problems.
In rural areas:
Problems (not more than 3 items) Answers
1) No or little land2) Low yield from the land 3) Widely scattered fields 4) Little income 5) Poor living conditions 6) Disputes with neighbors 7) Educational problems for the children 8) Frequently ill 9) Little food 10) Poor or inadequate water supply 11) Inadequate energy supply (wood, electricity, etc.) 12) Other problems 13) No problems
1) Yes 2) No
In urban areas:
Problems (not more than 3 items) Answers
1) No or unclear right of residence 2) Unemployment or under-employment 3) Much time spent on getting to work 4) Little income 5) Poor living conditions 6) Disputes with neighbors 7) Educational problems for the children 8) Frequently ill 9) Little food 10) Poor or inadequate water supply 11) Inadequate energy supply (wood, electricity, etc.) 12) Other problems 13) No problems
1) Yes 2) No
Before conducting the survey the relevant answers that can be expected in the survey area must be identified.
Variable codes:1) PROBLE1 5) PROBLIVC 9) PROBFOOD2) PROBLE2 6) PROBDISP 10) PROBWATE3) PROBLE3 7) PROBEDUC 11) PROBENER4) PROBINCO 8) PROBILLN 12) PROBOTHE13) PROBNO
3.2.4 Socioeconomic household data17.) Question: Who is mainly responsible for bringing up the children?
part_32
http://www.nutrisurvey.de/baseline/part_32.htm (6 of 28) [13.04.2000 17:03:51]

1) Mother 5) Grandmother/grandfather2) Father 6) Other relative3) Both, mother and father 7) Other non-relative4) Sister/brother 9) No answerVariable code: CARERESP
18.) Question: What occupation has the head of the household mainly engaged in during the last threemonths?
1) No occupation 8) Dealer or trader2) On daily wages 9) Salesperson3) Domestic servant 10) Civil servant4) Industrial worker 11) Military or police5) Farmer 77) Other6) Fisherman 99) No answer7) CraftspersonVariable code: OCCUPACI
In urban areas, there are often strict distinctions between occupations. If the head of the household has more than oneoccupation, the occupation category with which he/she most identifies should be entered into the questionnaire.
19.) Question: Were you born in this town/city or from which part of the country did you come?
Variable code: ORIGINThis question is intended primarily for urban areas, where large ethnic and cultural differences in the community canexist due to a high migration rate. The question should also be asked in rural areas if there is a high migration rate fromother areas in the country. Before conducting the survey, the possible answers must be identified.
20.) Question: To which ethnic (or religious) community do you belong?
Variable code: ETHNIRELBefore conducting the survey the possible answers must be identified
21.) Question: How much formal education have the parents had?
1) < 3 years of schooling (illiterate )2) 3 - 5 years of schooling (can read and write)3) 5 - 11 years (attended secondary school)4) Higher education (> 11 years)Father MotherVariable code: EDUCFATH, EDUCMOTH
The UNESCO definition stipulates that a minimum of 3 years of uninterrupted schooling is required for a personto achieve a sustainable level of reading and writing ability.
22.) Question or observation: The walls of the room in which the children sleep are constructed of whatmaterial?
1) Timber 5) Pasteboard2) Mud 6) Cement/concrete3) Stone 7) Other4) Brick 9) No answerVariable code: WALLThe decision must be made before the survey whether this will be a question or an observation.
23.) Question or observation: How many bedrooms are there in the house or residence?
Variable code: NBEDROOM
24.) Calculation: How many persons on average sleep in one bedroom?
Variable code: PERSOBEDTotal household members / bedroom
part_32
http://www.nutrisurvey.de/baseline/part_32.htm (7 of 28) [13.04.2000 17:03:51]

This variable shall not appear in the questionnaire.
25.) Question: From where was the household drinking water obtained yesterday?
1) Own public water supply 5) Well/spring2) Public supply outside 6) River/canal3) Water traders 7) Other4) Rain water 9) No answerVariable code: WATER
26.) Question: Are there especially critical months when water is scare?
In which month does it start? In which month does it end?
0) No supply problem 5) May 10) October1) January 6) June 11) November2) February 7) July 12) December3) March 8) August 88) Don't know4) April 9) September 99) No answer
This information is used to fill in the chart below.
Month Answer
January
February
March
April
May
June
July
August
September
October
November
December
Answer: 1) Yes 2) No
part_32
http://www.nutrisurvey.de/baseline/part_32.htm (8 of 28) [13.04.2000 17:03:51]

Variable code: WAJANUAR, WAFEBRUA, WAMARCH, WAAPRIL, WAMAY, WAJUNE, WAJULY, WAAUGUST,WASEPTEM, WAOCTOBE, WANOVEMB, WADECEMB
27.) Question: How was sewage/human waste disposed of yesterday?
1) Connection to a public 5) River/lake sewage system 6) Sea2) Latrine 7) Other3) Garden 8) Don't know4) Field/woods 9) No answerVariable code: SEWAGE
28.) Question or observation: How was garbage/household waste disposed of yesterday?
1) Public garbage collection 2) Disposed of openly (street,..)3) Burned 4) Buried7) Other 9) No answerVariable code: GARBAGE
29.) Question or observation: What form of energy was used for cooking yesterday?
1) Electricity 2) Wood, bought3) Wood free collection 4) Wood from own property5) Petroleum 6) Dried animal manure7) Other 9) No answerVariable code: ENERCOOK
30.) Question or observation: Does the house have electricity?
1) Yes, directly from the public supply2) Yes, via a neighbor3) No7) Other9) No answerVariable code: ELECTRIC
The following questions are applicable in rural areas.
31.) Question: How large is your agricultural setting?
Variable code: FARMAREASize in hectares or local units. Experience shows that this question is not always accurately answered, as farmers areoften apprehensive that the answers will be used by government offices for other purposes (e.g., tax assessment). Inagricultural operations where a farmer raises livestock on his own land, the size of the pasturing land should also beasked.
32.) Question: What is the ownership status of the land?
1) Own land 7) Other2) Leased land 8) Don't know3) Owned and leased land 9) No answer4) Public landVariable code: LANDOWN
33.) Question: Which are the most important crops you cultivate?
The table is completed to collect information on crop cultivation. Questions are asked on the four most important staplecrops (e.g., wheat, rice, maize, potato) and their predominant use. The pilot study is used to identify the four crops andbefore the survey begins, the names and code numbers of the crops are entered in the first column. In the last columnthe number code of the predominant use is entered.
part_32
http://www.nutrisurvey.de/baseline/part_32.htm (9 of 28) [13.04.2000 17:03:51]

Cultivations Use
1) For own consumption2) For sale3) Both of approximately equal importance4) Not cultivated9) No answerVariable code: CROP1, CROP2, CROP3, CROP4Each of the four surveyed main crops needs its own variable code. It is recommended to call them:
34.) Question: Which are the most important types of livestock that you raise?
A table is completed while obtaining data on raising livestock. Questions are asked concerning the four most importantspecies of animals (e.g., buffalo, pig, goat) and their predominant uses. The pilot study is used to identify the animalspecies, and before the survey begins the animal species and code numbers are entered in the first column. Theresponse code of the predominant use is then entered in the last column.
Animal species Use
1) For own consumption2) For sale3) Both of approximately equal importance4) Not raised9) No answerVariable code: ANIMAL1, ANIMAL2, ANIMAL3, ANIMAL4Each of the four surveyed main livestock needs its own variable code. It is recommended to call them:If there are other important agricultural products in the region (i.e., fruits, vegetables, trees, shrubs, fisheries etc)additional questions should enquire about the importance of these for the household.
3.2.5 Dietary patternNutrient intake can be studied using several different methods; two commonly used ones are the weighing method andthe 24 hour recall method. In the weighing method, dietary intake is determined by calculating the net amount of foodand drink consumed for each person over a 24-hour period (the difference between the weight of the items offered to the
part_32
http://www.nutrisurvey.de/baseline/part_32.htm (10 of 28) [13.04.2000 17:03:51]

individual and the weight of the items left over). In the 24-hour recall method, specially trained interviewers ascertainwhich foods and drinks have been consumed in the last 24 hours and the amount of each item consumed.
The nutrient intake from the food and drink consumed can then be calculated using nutrient value tables or morecommonly now by using computer software packages. If the nutrient intake is compared to nutrient requirements (seechapter 6.4), it is then possible to hypothesize about the probable causes of nutritional problems. In the NutritionBaseline software optionally a quantitative Food Recall is integrated which can also be used for the weighing method andthe 24 hour recall. If the mean food intake for the mother and/or the child is entered the program calculates automaticallythe nutrient intake and the nutrient density for all nutrients which are selected in the main program.
Unfortunately, the weighing method and the 24-hour recall method are very time consuming and extensive training of thesurvey personnel is necessary. Also, in order to obtain representative data, many days of observations are required,particularly for some important nutrients (e.g., vitamin A). Additionally, the reproducibility of the data can also be affectedin other ways, such as seasonal fluctuation in the availability of foods.
After considering the advantages and disadvantages, neither the weighing method nor the 24-hour recall method shouldbe employed in this type of nutrition survey. It is much more important that the frequency of nutrient intake bedetermined. This method does not allow to obtain an exact picture of the nutrient intake, but it is possible toderive qualitative statements on the potential nutritional problems within a household.
The nutrient intake in the family can provide insight into the usual nutritional practices of the target community. Thisinformation is important if supplementary food or nutrients are necessary so that usual nutritional practices areconsidered as far as possible.
35.) Question: Which foods are eaten in your household?
Food sources Frequency ofConsumption
Staples (grains, tubers, legumes):Mixed or processed foods Snacks Meat (large livestock, e.g. cow, pig, sheep) Meat (small animals, e.g. poultry, rabbit) Fish, seafood Egg, egg products Milk, milk products Oils Plant fats Animal fats Sugars Fresh green leafy vegetables Other fresh vegetables Fruits
0) Never1) Strong seasonal fluctuations2) Monthly, once3) Monthly, more than once4) Weekly, once5) Weekly, more than once6) Daily, once7) Daily, more than once
Food items: Variable codes:
Starches (grain, tubers, legumes) STAPLE1, STAPLE2, STAPLE3, STAPLE4Pre-prepared food PREPARED, SNACKSAnimal proteins MEATLARG, MEATSMAL, FISH, EGG, MILK
part_32
http://www.nutrisurvey.de/baseline/part_32.htm (11 of 28) [13.04.2000 17:03:51]

Energy foods (fat, oil, sugar) OIL, PLANTFAT, ANIMALFT, SUGARFruits and vegetables GREENVEG, OTHERVEG, FRUITS
The following questions provide information on the seasonal nature of food supplies and nutritional status. The nutritionalcondition of rural communities can vary widely during a year, especially if agricultural production is unevenly distributedfor climatic reasons (e.g., large variations in rainfall distribution) and if storing food or earning supplementary income isnot possible.
36.) Question: Are there especially critical months for food supplies?
In which month does it start?In which month does it end?
00) No supply problem 05) May 10) October01) January 06) June 11) November02) February 07) July 12) December03) March 08) August 88) Don't know04) April 09) September 99) No answer
This information is used later to fill in the chart below.
Month Answer
January
February
March
April
May
June
July
August
September
October
November
December
Answer: 1) Yes 2) No
Variable codes: FOJANUAR, FOFEBRUA, FOMARCH, FOAPRIL, FOMAY, FOJUNE, FOJULY, FOAUGUST,
part_32
http://www.nutrisurvey.de/baseline/part_32.htm (12 of 28) [13.04.2000 17:03:51]

FOSEPTEM, FOOCTOBE, FONOVEMB, FODECEMB
3.2.6 Nutrition interventionThis group of questions should provide information on existing nutrition intervention programs and on the efficiency ofhealth services.
37.) Question: Has the household received supplementary food through a food program during the last fourweeks?
1) Yes 2) No 9) No answerVariable code: FOODAIDThis question should only be asked in regions where food assistance or feeding programs have been carried out.
38.) Question: Has one or more of the children participated in a school feeding program during the last fourweeks?
1) Yes 8) Don't know2) No 9) No answerVariable code: SCHOOLFDThis question should only be asked if a feeding program is conducted in schools.
3.2.7 Value and norms related to gender39.) Question: If you were to have another child, would you like it to be a boy or a girl?
1) Boy 8) Don't know2) Girl 9) No answer3) Boy or girl, it does not matterVariable code: GENDPREFIn some societies girls are valued less than boys, which may indicate the presence of gender discrimination.
3.2.8 Participation in social activities40.) Question: During the last 7 days, how often have you frequented a meeting with more than 5 persons?
Variable code: SOCIALIFIn some communities a poor nutritional status is caused by poor social relationships. This question should giveinformation about the social life in the community. The answer is given as frequency of participation of meetings.
3.2.9 AnthropometryThe use of anthropometric data for assessing the nutritional condition of community groups has been adoptedinternationally as a standard practice (World Health Organization (1983), Measuring Change in Nutritional Status, WHO,Geneva). This is based on the concept that an improperly nourished body is lighter or heavier than one provided withadequate nutrients. On the one hand these data can show that weight is too high or too low in relation to height, while onthe other hand they can show that the genetic potential for height has not been attained.
Anthropometric indices can be used for all members of the community, i.e., children as well as adults. Althoughanthropometric data on the total population can give information on both present and past nutritional, ecological, andoverall development status of the community under investigation, one usually focuses on the most vulnerable segmentsof the population: preschool children and, to a lesser extent, women of reproductive age.
To assess the nutritional status of preschool children, ideally both weight and height (length or stature) should bemeasured. The term length is used for children who cannot walk yet. Their height is measured lying down. One generallyrefers to stature from when children can and will stand alone, i.e. around 2 years of age onward. Without preciseinformation on age, weight by itself is of little value, as it is highly age dependent. Therefore, weight can only beinterpreted when age or height is known. When surveys are being carried out among communities, in which no records of
part_32
http://www.nutrisurvey.de/baseline/part_32.htm (13 of 28) [13.04.2000 17:03:51]

age, such as birth registration, baby welfare cards, family register, etc., are kept, it is essential that weight and height aremeasured. If height cannot be measured for the lack of a suitable instrument, mid-upper-arm-circumference (MUAC)should be measured.
If age is known, weight provides an excellent indicator of the child's nutritional status. With increasing age of the child,weight alone becomes progressively less sensitive in detecting undernutrition, since stunting, i.e., reduced linear growth,occurs with both chronically low food intakes and high (infectious) disease prevalence. A low age related weight(weight-for-age) may not necessarily spell danger, if the child is also short, suggesting chronic undernutrition whereby theweight may be physiologically adequate for the height of that given child, i.e., its body composition is "normal." There isevidence to suggest that a population with weight-for-age of 80% or more of the NCHS median shows only little if anyassociation with functional disability, provided that no nutritional deficiency such as vitamin A, iodine or iron deficiencyprevails.
A low weight-for-age may also be a reflection of temporary loss of fluid, such as resulting from diarrheal disease (DD), orof a combination of DD and undernutrition. When one carries out a cross-sectional survey, it is very difficult to assesshow much of the low weight is due to low body tissue content caused by low energy intake and how much to loss of fluid.Considering that at any given time approximately 6% of children have diarrheal disease and that as many as 20-30%, oreven more, may have suffered from a DD episode within the last seven days, the plotted weights-for-ages of a group ofpreschool children may in fact represent a somewhat grimmer situation, especially if the survey was carried out at thepeak of the diarrheal season.
Age related height (height-for-age) alone tends to be a poor indicator of nutritional status in the very young. The older thechild, the better the child reflects the combined effects of infectious disease prevalence and undernutrition on lineargrowth. Since, however, in an unhygienic environment, where multiple and repeated infectious are the rule, the child mayhave little chance to catch up on its (linear) growth deficit, height-for-age says little, if anything about the currentnutritional status and whether the child is at acute risk of disease or death from malnutrition. A low height-for-age tells usonly that in the past the child either has had less to eat than his/her physiological state required, i.e., suffered fromchronic food shortage, or has been subjected to a high infectious disease prevalence, or both. Therefore, a lowheight-for-age does not necessarily indicate a disease state. It may, for instance, indicate that growth has adaptedphysiologically to the prevailing situation, i.e., by slowing down. A small-for-age child may be perfectly healthy and havethe appropriate body composition in terms of its weight-for-height, although it appears to be malnourished both from itsweight-for-age and height-for-age.
To assess nutritional status, it is therefore necessary to find out:weight,●
height●
gender, and●
in the case of a child, age.●
3.2.9.1 Gender41.) Question or observation: Is the child a boy or a girl?
1) Boy 2) GirlVariable code: SEX
3.2.9.2 Age42.) Question or observation: When was the child born?
Variable code: BIRTHDAT Day/Month/YearIn countries in which the birth of children is registered, there is normally no difficulty in determining their age. To confirmage, in certain situations an enumerator should ask to see a baptismal or birth certificate or a clinic registration card. Ifthe exact date of birth is not known, the month of birth can be estimated from a preestablished local "calendar of events."In agrarian societies, established festivals or agricultural events (harvesting of a particular fruit, bad weather, etc.) can beused to fix points in time. In urban areas, public holidays (e.g., national holidays) or political events (e.g., elections) canalso be useful.
part_32
http://www.nutrisurvey.de/baseline/part_32.htm (14 of 28) [13.04.2000 17:03:51]

The age of a child has to be known or estimated in months inorder to calculate the anthropometric indices.
To do this, the precise age of the child on the day of the survey must be acquired. There are often problems in thisprocess, and consequently it is necessary to agree upon established international regulations for the calculation of age.
A child has fully ended the first month of his life on the first day of the following month (month 1). In the period of half amonth before and after the completion of the first month (i.e., in the case of a 30-day month, from 16 to 45 days afterbirth) the child is one month old.
If for example a child were born on February 24, 1989, the child's age would be 5 months if it were visited between July9, 1989 (9.Jul) and including August 8, 1989 (9.Aug).
As in practice errors inevitably slip into the calculation of age, it is recommended that the date of birth be asked. If thebirthdate is known the Nutrition Baseline software calculates automatically the age in months. These data can also beused to check the mother's knowledge of the age of the child.
43.) Calculation: [Age of the child]
Variable code: AGE
3.2.9.3 Weight44.) Measurement: Weight of the child (00.1 kg)
Variable code: WEIGHTThe weight of children under six years of age is usually measured with a spring scale (figure 6). The prevailing firstchoice for this is the "Salter spring scale" (Model 235 PBW). This scale can be ordered through UNICEF (stock no.:01-455-50, UNICEF Procurement and Assembly Centre (UNIPAC), UNICEF PLADS, Freeport, DK-2100 Copenhagen O,Denmark)
This scale can measure to the nearest 100 g the weight of children up to 25 kg. The child is weighed in a specially cutsack attached to the end of the spring scale. This model is light and easily transportable.
Figure 6. Spring scale for weighing small children (Salter spring scale)
Another more modern scale is the UNICEF scale model 890 produced by SECA® which is a digital, solar energyoperated scale with a range from 2 to 150 kg in graduations of 100 g. The scale can be ordered from UNICEF (stock no.:01-410-00).3 The scale is powered by long-lasting lithium batteries. These will complete at least one million weighingcycles, or 400 weighings every working day for a minimum of ten years. The batteries and the electronics are in a sealedunit to withstand better humidity, heat, and dust. Additionally, the scale has a solar cell that is used only to turn the scaleon and to tare the scale.
The advantages of this scale are the readability of the measurement and the ability to weigh infants and small childrentogether with their mothers. However, the child must weigh at least 2 kg. First, the mother is weighed alone on the scale,then the automatic tare button is pressed. The child is then weighed in the mother's arms. It is important that the motherholds the child in her arms while standing in an upright position on the scale. To ensure that the mother will remain in the
part_32
http://www.nutrisurvey.de/baseline/part_32.htm (15 of 28) [13.04.2000 17:03:51]

same position, it is recommended that the shape of two feet be drawn on the rubber mat of the scale.
The UNICEF Scale 890 is not a medically calibrated scale. It can give variations of over 100 g. Medically calibrateddigital scales are much more difficult to use and more expensive and are out of the question for use in surveys. As thesecalibrations are set in relation to measured weights, the indicated weight can be corrected by means of calculation.
The scale weighs approximately 3-4 kg and should not be stored or transported at temperature of below 0°C or above45°C and protected against excess humidity or wetness.
In preparing for weighing, the scale should be turned on by covering the solar cell for less than onesecond. The display should show 188.8 first, and then 0.0.
1.
Now the mother can step on the scale and in case the weight of the mother should be noted themeasurement can be taken from the display. Care should be taken that the solar cell is not covered bya foot or a long rope of the mother.
2.
For the weight measurement of the child the solar cell should be covered again for less than a secondwhile the mother is still standing still on the scale. The display will read again 0.0. The mother can getoff the scale the scale to get the child or the child can be handed over to the mother. In case themother gets off the scale the display shows --,-. After the mother steps back onto the scale and holdsthe baby, only the weight of the infant will be displayed.
3.
In case another baby should be weight with the same mother (or helper), the infant be handed backand another child can be weighed without taring the scale, since the weight of the adult has beenmemorized automatically. If another mother (or helper) is standing on the scale, the solar cell has tobe covered again for less than a second for taring.
4.
Note: Scales can go out of adjustment during a survey. Therefore, the scale should be checked routinely, preferably atthe beginning of each day. First, check the zero setting (the weight reading without any load applied) and then weigh abucket of a known weight filled with exactly 10 L of water.
Care should be taken that during weighing the child wears no shoes and as little clothing as possible. Sometimes,however, a child must wear certain items of clothing for climatic or cultural reasons. In these cases, the weight of theclothing should be deducted from the measured weight. The average weight of clothing worn by children should beestablished during the pilot study. The weight is recorded to the nearest 0.1 kg.
Following the procedures outlined earlier, the infant is weighed together with his/her mother. The weight of the mother,when put into relation with her height, can be a valuable additional source of information on the social situation of womenin the project area, as well as for determining the causes of malnutrition in small children. Women living in extremepoverty, underfed, frequently ill, and poorly educated, indicate a poor nutritional situation. Furthermore, underweightmothers are at high risk of giving birth to underweight babies (< 2500 g), which in turn carries a high risk of permanentpoor anthropometric data for the child.
To assess the social situation of women in the project area, it is desirable to record the weight of the mother. Theweight is recorded to the nearest 0.1 kg.
45.) Measurement: Weight of the mother (000.1 kg)
Variable code: MOWEIGHT
46.) Question: Is the mother pregnant?
0) No 5) Yes, 8 months1) Yes, 0-2 months 6) Yes, 9 months2) Yes, 3-5 months 8) Don't know3) Yes, 6 months 9) No answer4) Yes, 7 months
Variable code: PREGNANT
3.2.9.4 Height
part_32
http://www.nutrisurvey.de/baseline/part_32.htm (16 of 28) [13.04.2000 17:03:52]

47.) Measurement: Height of the child (cm).
Variable code: HEIGHT
Measurement of height (length or stature) requires somewhat more effort than that of weight. Children under two years ofage (i.e., up to and including 23 months) are measured in a lying position. For length measurements, a specializedwooden device ("anthropometer") should be made by a cabinet maker. An example of a device for this purposedeveloped by the Appropriate Health Resources and Technologies Action Group, Ltd. (AHRTAG, 85 Marylebone HighStreet, London, W1M 3DE England) for the WHO is illustrated in figure 7. Another option offers the "Rollametre" of theChild Growth Foundation (Raven Equipment Limited, Unit 4, Ford Farm Industrial Complex, Braintree Road, Dunmow,Essex, CM6 1HU, England)
In some studies mothers have refused to have the length of their children measured because they associate theanthropometer with a child's coffin. In these cases, success has been achieved by painting or pasting colorful flowers oranimals on the wooden components.
The child is placed on its back between the slanting sides. The head should be placed so that it is against the top end.The knees should be gently pushed down by a helper. The cursor is then moved toward the child until it presses softlyagainst the soles of the child's feet and the feet are at right angles to the legs. The length is then read in centimeters.
Figure 7. Anthropometer for the length measurement of children under two years of age.
If the child is over two years of age, stature is measured in a standing position. The child stands without shoes on a levelfloor. As shown in figure 8, it is recommended that during measuring the child leans with its back against a wall. The legsare placed against each other, as also are the heels. The buttocks, shoulder blades and head should rest against thewall. The child should look straight ahead so that an imaginary plane that would connect the eyes and ears are parallel tothe floor. The arms hang loosely by the sides. The best instrument for stature measurement is the microtoise. Themicrotoise has to be fixed on a straight wall precisely 2.00 m above a flat floor.
The stature measurement is taken with a Stanley-Mabo "Microtoise" that can be purchased by UNICEF (stock no.:01-144-00).3
part_32
http://www.nutrisurvey.de/baseline/part_32.htm (17 of 28) [13.04.2000 17:03:52]

A wooden rule or a measuring tape (preferable a tape made out of fiberglass) is placed against the wall.
Measuring tapes are sometimes calibrated in inches and centimeters on the same side. These can be confusing duringmeasurement.A wooden or metal right angle is employed in measuring. This instrument is placed lengthwise against the measuringtape on the wall and is pressed gently against the head so that the stature can be read on the measuring tape in cm.
Figure 8. Stature measurement for children aged two years and older.
The Z-scores of the following anthropometric indices are calculated automatically with the Nutrition Baseline software.The principle of these indices are explained in chapter 4.2.
48.) Calculation: [Z-score height-for-age]
Variable code: HFAThis variable shall not appear in the questionnaire
49.) Calculation: [Z-score weight-for-height]
Variable code: WFHThis variable shall not appear in the questionnaire
50.) Calculation: [Z-score weight-for-age]
Variable code: WFAThis variable shall not appear in the questionnaire
If the mother was weighed, her height should also be obtained. The same rules apply for measuring the height of amother as for children able to stand.
51.) Measurement: Height of the mother (cm).
Variable code: MOHEIGHT
52.) Calculation: [Body mass index of mothers]
Variable code: BMIBody weight of the mother (kg) / Body stature of the mother (m)2
This variable is calculated automatically by the Nutrition Baseline software and shall not appear in the questionnaire
part_32
http://www.nutrisurvey.de/baseline/part_32.htm (18 of 28) [13.04.2000 17:03:52]

3.2.9.5 Mid-Upper-Arm-Circumference (MUAC)For the measurement of the mid-upper-arm-circumference (MUAC) a special slotted "insertion" tape is used (figure 9).This tape can be purchased from UNICEF (stock no.: 01-456-00).
The best position for the enumerator measuring MUAC is sitting because the enumerator's eyes are at the level of themeasurement. Before the measurement the mother should remove any clothing that covers the child's left arm. Duringthe measurement the child can be held by the mother.
According to figure 10, the measurement of MUAC has to be taken at the middle of the left upper arm. Therefore, theenumerator must first identify the tip of the shoulder 1 Ç and the tip of the elbow É and mark the midpoint between thetwo tips. The child should bend its elbow to a right angle Ö. Once the tip of shoulder has been located the armcircumference "insertion" tape should be placed on the top of the tip at zero which is indicated by two arrows Ñ. Thetape should then be pulled down past the tip of the elbow and the number at the tip of the elbow should be read to thenearest centimeter Ö. The midpoint of the upper arm is determined by dividing this number by two. The midpoint shouldbe marked on the skin of the child before removing the tape from the arm Ü.
Instead of the tape a string can be used for the identification of the midpoint. After the identification of the two tips oneend of a string is fixed by one hand on the tip of the shoulder. With the other hand the string is pulled down to the tip ofthe elbow. Once the distance has been identified, the two point on the string will be brought together on the tip of theshoulder and held with the hand already holding one end of the string. The end of the doubled string is brought to themiddle arm and marks the midpoint.
For the measurement of the circumference, the left arm needs to be straightened. The tape should be wrapped aroundthe arm at the midpoint with its numbers right side up. It is important that the tape is flat around the skin á and neithertoo tight so that it notches the skin à nor too lose so that the tape looses its contact with the skin â.
When the tape is in the correct position on the arm with the correct tension, the measurement can be read to the nearest0.1 cm and recorded into the questionnaire.
53.) Measurement: MUAC of the child (00.1 cm)
Variable code: MUAC
Figure 9. Tape for the measurement of the mid-upper-arm-circumference
Figure 10. Mid-upper-arm-circumference measurement for children
part_32
http://www.nutrisurvey.de/baseline/part_32.htm (19 of 28) [13.04.2000 17:03:52]

3.2.10 Morbidity informationA child's anthropometric data reflects the overall nutritional condition. In addition the possible presence ofnutrition-related diseases with specific symptoms should be investigated (e.g., anemia, vitamin A deficiency, iodinedeficiency).
If a person is identified as ill or there is reason to suspect illness, assistance should be provided. The mother, orthe person responsible in case of illness, should be advised to visit the nearest health post or health assistant.
3.2.10.1 AnemiaOne consequence of reduced iron intake is reduced levels of red blood cells (erythrocytes) in the blood. The erythrocytesare responsible for the transportation of oxygen. The medical term for erythrocyte (Ery) deficiency is "anemia." Irondeficiency is detected by the red blood cell count or the concentration of the oxygen binding molecules of hemoglobin(Hb) in the blood.
Anemia leads to a reduced degree of physical activity in an individual and increases his/her vulnerability toinfection.
part_32
http://www.nutrisurvey.de/baseline/part_32.htm (20 of 28) [13.04.2000 17:03:52]

To diagnose iron deficiency, it is necessary to take blood. The worldwide spread of the immune-deficiency disease AIDShas brought the risk of infection by blood transmitted diseases when taking blood to the forefront of public attention.
Before deciding to take blood samples in a baseline survey, it is necessary to weigh carefully the risk ofinfection. This must be done in cooperation with the local health authorities.
If in the local setting, where safety cannot be assured, it is better to skip taking blood as the risk of infection, especiallywith HIV or hepatitis, is too high.
If the answer to any of the following questions is "no" or "don't know," blood should not be taken!Automatic finger prick is available●
Disposable lancets are available for every single individual to be sampled●
The use of disposable lancets is being supervised●
At least three pairs of water- and airtight protective (plastic or latex) gloves are available for each individual takingblood
●
Water- and airtight protective gloves are checked regularly before beginning blood sampling.●
Taking blood samples is always a critical point in a survey. It is associated with pain and crying. Most people have anatural aversion to the sight of blood. It is necessary to give a participant an understandable explanation why bloodsamples are needed.
Before taking the blood sample, the child should be kept on the lap of his/her mother or laid down and his sight turnedaway from his fingers. The blood sample should not be taken from the fingertip but from the side, as there areconsiderably more nerves in the fingertip and therefore more pain is felt at this location. An automatic finger prickapparatus should be used for the following reasons:
the risk of communicable diseases is reduced, since the lancet need not be touched after the prick,●
the velocity of prick is fast and smooth and therefore less painful,●
the depth of penetration of the lancet into the finger is more uniform and therefore the amount of confoundingtissue water is less variable.
●
In the field the Autoclix® or the newer Softclix® apparatus has proved its reliability (Boehringer Mannheim GmbH,Germany). Packages of 200 sterile lancets can be purchased.
If despite all explanations the mother refuses to allow blood to be taken, this decision must be respectedand no blood should be taken. In these cases 999 is entered into the code field.
The most exact method of measuring the hemoglobin concentration in the blood is by photometry. There are variousquick test systems for this purpose.
The Compur® Minilab 1/2/3/ Photometer Systems enables the Hb concentration and Ery content in blood to bemeasured quickly, easily and accurately in the field (Bayer Diagnostic GmbH, Weißenseestraße 101, D-81539 München,Germany). With the Minilab 1 and 2 systems concentrations of other blood constituents, such as glucose (Gluc) andbilirubin (Bili), can also be measured. Each version of the equipment has built-in programs for the methods to obtain theresults for Hb, Ery, Gluc and Bili and is calibrated by the respective Instant M End-test Cuvettes from Bayer Diagnostic +Electronic. The results are given in units and mass concentrations, which can be self-selected by the user.
The equipment is powered by either electricity (220 V - 50/60 Hz: Article No. 608925; 110 V - 50/60 Hz: Article No.608990) or heavy duty 1.5 volt batteries. The battery power supply allows field use. The value is recorded in units of g/L.
54.) Measurement: The serum hemoglobin concentration of the child. g/L
Variable code: HEMOGLCH in case of hemoglobin measurement of the child
HEMOGLMO in case of hemoglobin measurement of the mother
part_32
http://www.nutrisurvey.de/baseline/part_32.htm (21 of 28) [13.04.2000 17:03:52]

With the Minilab equipment, the Hb concentration is determined using the hemoglobin-cyanide method. To do this, theINSTANT M (40 complete tests) quick test Article No. 605749 must be used.
If the Compur rapid test is used, the Ery count can also be reported, and thus more information on the cause of anemia isobtained. Otherwise, a separate erythrocyte measurement is not recommended.
3.2.10.2 Vitamin A deficiencyThe most common vitamin deficiency in developing countries is that of vitamin A. This deficiency is responsiblefor stunted growth, greater risk of infection, various skin and eye diseases and can also lead to blindness.
Unfortunately it is currently possible to detect vitamin A deficiency at an early stage only by using expensive biochemicalanalysis techniques. These methods of analysis have no place in routine investigations. Consequently, it is necessary tobase observations on indirect indications and signs of extreme vitamin A deficiency.
Studies have shown that the existence of a commonly used word for night blindness and the extent to which it is knownin a community can indicate the presence of vitamin A deficiency. The first step is to find out whether there is a specificword for night blindness about which it is possible to ask a question.
55.) Question: Does your child stumble unusually often or have difficulties seeing or distinguishing objectsat dusk or dawn?
1) Yes 8) Don't know, not sure2) No 9) No answerVariable code: NIGHTBLI
3.2.10.3 Iodine deficiency diseases (IDD)Another far more widespread micronutrient deficiency is iodine deficiency. It can lead to retarded mentaldevelopment and cretinism.
Iodine deficiency is most easily recognized by an enlarged thyroid gland, but not every case of a enlargement can betraced to iodine deficiency. If there are many persons with swollen thyroid glands in a certain area, however, it can beconcluded that there is an endemic iodine deficiency.
Since it is difficult to diagnose enlargement of a thyroid gland in small children, mothers or older schoolchildren should bechecked for goiter in order to obtain information about the prevalence of possible iodine deficiency in the surveyed area.
56.) Observation: Does the mother have a visible enlarged thyroid gland or one that can be felt?
1) Yes, visibly enlarged (Grade 2) 8) Don't know, not sure2) Yes, palpable (Grade 1) 9) No observation made3) No (Grade 0)
The simplified classification of goiter consists of three grades:Grade 0: No (palpable or)* visible goiter.●
Grade 1*: A mass in the neck that is consistent with an enlarged thyroid that is palpable but not visible when theneck is in the normal position. It moves upward in the neck as the subject swallows. Nodular alternation(s) canoccur even when the thyroid is not visibly enlarged.
●
Grade 2: A swelling in the neck that is visible when the neck is in a normal position and is consistent with anenlarged thyroid when the neck is palpated.
●
* Mothers' thyroid should only be palpated by experienced personnel. Otherwise, thyroid gland changes should becontrolled visually.
Variable code: MOGOITRE
In several countries it has been proven that IDD disappears as a public health problem if iodization of salt is carried outadequately. Therefore, the quality of the salt is a valid, simple, indirect indicator about IDD situation in the area. The nexttwo variables are dealing with salt quality in the household.
part_32
http://www.nutrisurvey.de/baseline/part_32.htm (22 of 28) [13.04.2000 17:03:52]

57.) Observation: Could you please show me which kind of salt you use currently in cooking and as tablesalt?
1) Packaged iodized salt 3) Coarse, rock or brick salt2) Packaged salt, without label 8) Don't know, not sure about iodization 9) No observation madeVariable code: SALTYPE
The presence of iodine in salt can be easily monitored using a rapid-test kit. Details about the availability of the rapid-testkids may be obtained from UNICEF6 or local authorities of Ministry of Health. The observer places one or two drops ofthe solution on a small salt sample (one teaspoon is adequate). The intensity of the blue color which develops indicatesthe salt iodine level. However, most of the test kids can detect the presence of iodine only. The expiration date of thetest-kits should be checked.
58.) Measurement: Presence of iodine in tested sample
1) No color change 8) Don't know, not sure2) Blue color change occurs 9) No observation madeVariable code: SALTIOD
3.2.10.4 Diarrheal diseasesThe nutrient intake of a child drops off sharply during periods of diarrhea because of loss of appetite and/or vomiting. Inaddition absorption of nutrients from the digestive tract can decrease as much as 70%. Therefore, there is a directrelationship between the frequency of diarrheal diseases and undernutrition, and it is important to measure theprevalence of diarrhea.
59.) Question: During the last 24 hours did your child have more than 4 liquid stools?
1) Yes 8) Don't know, not sure2) No 9) No answerVariable code: POINTDDThe answers to this question enable the determination of point prevalence, i.e., the proportion of children sufferingdiarrheal disease at a certain point in time.
60.) Question: Has the child suffered from diarrheal disease during the last 7 days?
1) Yes 8) Don't know, not sure2) No 9) No answerVariable code: PERIODDDThe answers to this question will enable the determination of the period prevalence of diarrheal disease. The periodprevalence thus derived is not identical to the above observed point prevalence, which is the reason that specificquestions should be asked concerning both indicators. Many studies have shown that a mother's recollection dropssharply after a period of one week. Therefore, the question is not posed concerning a longer period.
3.2.10.5 Acute respiratory infections (ARI)Several studies have demonstrated a link between undernutrition and acute respiratory infections (ARI). Due to thewidespread presence of these infectious diseases it is necessary to determine their prevalence.
61.) Observation: Is the child currently suffering from running nose, cough, cold, earache, or sore throat?
1) Yes 8) Don't know, not sure2) No 9) No answerVariable code: POINTARI
The survey team should determine the response directly from the child and not by asking the mother. If the child suffersat least one of the following symptoms: common cold, earache, sore throat, cough, raspy and/or rapid breathing(breathing rate > 50 breaths per minute), acute respiratory infection is likely.
part_32
http://www.nutrisurvey.de/baseline/part_32.htm (23 of 28) [13.04.2000 17:03:52]

It is not necessary to go into any further classification of ARI. In case of any sign of disease, the child should be send tothe next health service for an adequate treatment and no therapy can and should be provided by a non-medicalenumerator.
The answers to this question enable the determination of the point prevalence of acute respiratory infections.
62.) Question: Has the child suffered from running nose, cough, cold, sore throat or earache during the last7 days?
1) Yes 8) Don't know, not sure2) No 9) No answerVariable code: PERIOARI
The answers to this question will enable the determination of the period prevalence of acute respiratory infections. Theanswer should be given by the mother.
3.2.10.6 Other infectious diseasesAs explained earlier, infectious diseases can be responsible for poor nutritional status. In developing countries, the mostprominent diseases in this area are acute respiratory infections and diarrheal diseases. In some regions measles or otherinfectious diseases such as malaria, tuberculosis, etc. are endemic and thus negatively influence the nutritional status.
In some areas special attention is needed concerning AIDS in small children. As the diseaseprogresses the child's body constantly wastes away, resulting in visibly worsening anthropometric
data.
Problems with infections in the surveyed region must be identified during the pilot study and the questions on thequestionnaire adapted to the respective problems.
The following question applicable to measles serves as an example of a supplementary question for the measurement ofperiod prevalence of infectious diseases.
63.) Question: Has the child suffered (e.g., measles) within the past year?
1) Yes 8) Don't know, not sure2) No 9) No answerVariable code: PERIODIS
3.2.10.7 Mortality of preschool childrenThe number of children that were born alive and died is a very important indicator of the general living and healthconditions of the community. Although this number is not identical with the statistics of infant or child mortality, it givesuseful indirect information about child mortality.
64.) Question: How many children have you born alive?
Of these ..... children how many are still alive today?How many of the .... children that died, died before the age of 5 years?
Variable code: CHILDDTH
It is advisable not to ask straight forward how many children died before the age of 5 years, but for the sake of clarity it isbetter to lead with several questions to the wanted information.
3.2.11 Infant nutrition
part_32
http://www.nutrisurvey.de/baseline/part_32.htm (24 of 28) [13.04.2000 17:03:52]

A common cause of nutritional deficiencies in small children can be found in inadequate infant nutrition. Improper feedingpractices during the first two years of life can lead to many functional disorders and irreversible stunting.
Because of the importance of infant nutrition to nutritional status, a nutritional baseline survey should contain a number ofquestions on this area of nutritional practices.
3.2.11.1 Breast-feeding practicesBreast-feeding is still the prevailing practice in many communities. It is known that there is no more suitable source ofnutrients for an infant up to four months of age than exclusive breast-feeding. Early weaning of babies drasticallyincreases the risk of contracting infectious diseases.
65.) Question: Have you breast-fed your child during the last 24 hours?
1) Yes 2) No 9) No answerVariable code: BREASTFE
66.) Question: If your child is not currently breast-fed, how long did you breast-feed your child?
Variable code: BREASTDU
If currently breast-fed the response is 66; if never breast-fed the response is 00. Otherwise, the response is reported inmonths.
67.) Question: Did your child receive colostrum?
1) Yes 8) Don't know2) No 9) No answerVariable code: COLOSTRU
In all cultures, a local word is used for colostrum. This term should be identified to be used for questioning. Colostrum isthe first breast milk of the mother that is fed to the child. Due to its high content of nutrients and immunoglobulins the firstmilk has a more intense color than the later breast milk. As a result, in many cultures this milk is often diluted with otherfluids or even discarded.
68.) Question: How many hours after birth did you put your baby to the breast?
1) Immediately 4) After 12 hours2) 1-4 hours 8) Don't know3) 5-12 hours 9) No answerVariable code: STARTBF
69.) Question: Did your child receive any other fluid besides breast milk during the first days after birth?
1) Yes 8) Don't know2) No 9) No answerVariable code: ADDITBF
In some cases, the newborn infant receives other fluids beside breast milk. Thus after the first hours after birth, the infanthas not yet produced larger amounts of protective enzymes and acids in the intestine and the membranes are stillvulnerable to be penetrated by larger molecules. Therefore, the administration of other fluids than colostrum during thefirst hours of life carry a high risk of infectious diseases.
70.) Question: Within the last 24 hours has your child drunk anything in addition to breast milk?
1) Yes 8) Don't know2) No 9) No answerVariable code: ADDDRINK
71.) Question: If your child receives solid food, at what age did you begin feeding the child solid food?
1) < 4 months 8) Don't know2) > 6 months 9) No answer
part_32
http://www.nutrisurvey.de/baseline/part_32.htm (25 of 28) [13.04.2000 17:03:52]

3) 4 - 6 monthsVariable code: AGESOLID
3.2.11.2 Supplementary feeding and weaning practicesBefore the survey it must be established beyond doubt that mothers are prepared to answer the following questions. Forexample, in a survey in Pakistan questions concerning types of feeding for small children were considered an affront, andthe interviewee subsequently broke off the dialogue.
72.) Question: Regardless of whether your child is breast-fed or not, how often has your child eaten anysolid food in the last 24 hours?
1) Yes 8) Don't know2) No 9) No answerVariable code: EATSOLID
The response is recorded in number of occurrences.
73.) Question: In the last 24 hours has your child eaten fruits or vegetables?
1) Yes 2) No 9) No answerVariable code: EATGREEN
74.) Question: During the past 24 hours has your child been bottle-fed?
1) Yes 2) No 9) No answerVariable code: BOTTLE
75.) Question: Regardless of whether your child is breast-fed or not, how often was your child givensomething to eat yesterday?
1) Yes 8) Don't know2) No 9) No answerVariable code: EATFREQU
3.2.12 Formal under-fives health servicesThe following questions should give some information about the accessibility and quality of formal under-fives healthservices related to nutrition.
3.2.12.1 Weight monitoringSurveying the proportion of households possessing weight monitoring cards, it should be possible to determine theeffectiveness of under-fives health services in the area of nutritional intervention.
76.) Observation: Does the mother possess a weight chart for the child?
1) Yes 2) No 9) No observation possibleVariable code: WHTCHARTThe mother should present the child's weight chart.
77.) Observation: Has the child been weighed during the first year of life at intervals of not more than 3months?
1) Yes 2) No 9) No observation possibleVariable code: WEIGHING
3.2.12.2 Immunization
part_32
http://www.nutrisurvey.de/baseline/part_32.htm (26 of 28) [13.04.2000 17:03:52]

To arrive at a second indicator for the effectiveness of under-fives health services, a survey should establish theproportion of households possessing immunization cards, and also the proportion of children immunized after the agegiven in the immunization plan.
78.) Observation: Does the mother possess an immunization record for the child?
1) Yes 2) NoVariable code: IMMUNCRD
3.2.13 Acceptance of a surveyFinally, an enumerator should ask the community members about their opinions concerning the type and formatof the survey.
In cultures in which community members are comfortable with making critical statements, the survey may be used toobtain information on the opinion of the interviewees about the implementation of the survey. Otherwise, communityopinion should be ascertained from unstructured interviews.
Valuable information can be obtained for the planning of future interventions from the evaluation of this survey. Thedegree of participation in the survey can be a useful indicator of the acceptance of a survey. If only a few people want tobe informed about the results of the survey, then only a few will be interested in participating in the planning andimplementation of the intervention. Furthermore, asking about the acceptance of the survey will instill confidence that theinstitution in charge of the nutrition survey is genuinely interested in the participation of the target community.
79.) Question: Would you be prepared to take part again in a similar survey?
1) Yes2) Only if ____________________________________________3) No, because ________________________________________Variable code: SURVPART
80.) Question: Are you interested in a discussion on the findings?
1) Yes 3) No2) Eventually 8) Don't knowVariable code: SURVDISC
If the community is inadequately organized and/or the members attend different activities, which often happens in newlydeveloped urban areas, it is advisable to ask during an interview about the most convenient time and place for a futuremeeting with members of the community.
81.) Question: Which would be for you the most opportune day of the week to receive the information aboutthe survey and to discuss it with your neighbors?
1) Monday 5) Friday2) Tuesday 6) Saturday3) Wednesday 7) Sunday4) Thursday 8) Don't knowVariable code: INFODAY
These questions on the day of the week and the time of day are only provided here as examples. It is definitely notapplicable in all cultural situations. More often, these questions must be asked in relation to normal living habits.
82.) Question: What would be the best time for the discussion with your neighbors?
1 - 24 hours 88) Don't know 99) No answerVariable code: INFOTIME
3.3 Reliability check for a survey
part_32
http://www.nutrisurvey.de/baseline/part_32.htm (27 of 28) [13.04.2000 17:03:52]

The reliability of data collection in a survey essentially depends onthe survey method●
the precision of the instruments used●
the ability of the enumerators●
the supervisor●
The preceding chapters deal with these points in detail. Nevertheless, it is only possible to assess objectively thereliability of collected data if the recorded measurements, observations and answers are compared with the actualsituation and the proportion of correct to incorrect values obtained. However, it is often difficult to ascertain the "real"situation.
In practice, a supervisor is appointed to ascertain the "real" situation in a survey. The rationale for this is that a supervisoris better trained and has more experience than the enumerators. The degree of variance in the collected data providesan indication on the reliability of data collection (for more details, see chapter 4.6.).
During the course of a survey, the supervisor collects data on the variables with the highest risk of yielding unreliableresults. The selection of these variables should be made after the pilot study (see sub-chapter 3.1.6). In all cases, thesupervisor should take measurements of height and weight so that anthropometric data can be calculated and comparedto that obtained by the survey team. An example of a questionnaire for a supervisor is presented as an appendix insub-chapter 6.1.4.
Altogether about 10% of the households visited by enumerators should be selected at random for a cross-check. Inaddition to serving the purpose of data collection for a reliability check, the cross check also provides a supervisor anexcellent opportunity to observe first hand the difficulties of the enumerators in recording data in order to be able tointroduce subsequent countermeasures during the survey.
part_32
http://www.nutrisurvey.de/baseline/part_32.htm (28 of 28) [13.04.2000 17:03:52]

4. Analysis and interpretation of data
The statistical analysis of data should take place in two stages, as shown in figure 11.
Figure 11. Overview of Data Entry and Calculation
1. Data entry, plausibility check and descriptive statistical analysis
using the Nutrition Baseline softwareInitial
analysis
In-depthanalysis
↓
2. Detailed analysisof causes and determinants
using an advanced statistic software program
For preparing the questionnaire, entering and descriptive analysis of data the Nutrition Baseline Software isrecommended. For further information please read the help in this program. The idea behind this program is to workonly with one file for preparing the questionnaire, entering and analysing the data. It is also especially designed forperforming a Nutrition Baseline survey. Compared to other procedures the computer work and possible errors arereduced.
For a more in-depth analysis of data a statistical program such as SPSS or SAS is recommended, since multivariateanalyses such as multi-factorial analysis of variance or analysis of variance with a co-variant cannot be carried outwith the Nutrition Baseline Software.
Note: One objective of nutrition surveys (see chapter 1.2) is that data should also be used for cross-sectionalcomparisons by country and measures. Consequently, data should be stored in a secure but accessible place.
An agreement has been reached with the Nutrition Unit of the WHO to professionally store the results of theanthropometric data from population-based nutritional surveys. It is highly recommended to send the results to thefollowing address using a form attached in Annex 6.10.
Nutrition UnitWHO20 Avenue AppiaCH-1211 Geneva 27Switzerland
4.1 Data analysis
4.1.1 Data entryData entry should also be carried out using the Nutrition Baseline software. This program is suitable for this purposebecause it is user-friendly and tests the entered data for its validity. The most important reason, however, is that itcan calculate, as already mentioned, anthropometric indicators and is useful for descriptive analysis.
Furthermore it is easy to export the data files into programs such as D-Base, Excel or SPSS so that the possibilityexists for switching to other computer packages later on.
For data entry first a questionnaire has to be created. These file contain the variable names, the question, the
Part 4+5: Analysis and reporting
http://www.nutrisurvey.de/baseline/part_45.htm (1 of 16) [13.04.2000 17:04:07]

description of the variable name and the possible answers. It is strongly recommended to use the variable namesprovided in this handbook
Note: It is extremely important that in each questionnaire a variable HOUSEHNO (a unique number given to eachsurveyed household) is included. This variable is the so-called "unique identifier". Furthermore, the data from thechild(ren) must contain a variable CHILDNO, which enables one to distinguish between two or more children fromthe same household.
4.1.2 Plausibility check
A plausibility check must be carried out immediately after data input in order to correct erroneous data.Despite meticulous preparation and data input, erroneous data always appears in the database. Before any furtherprocessing of raw data, the data must be checked for plausibility. In part this can be done with the Nutrition Baselinesoftware. For further information about the plausibility check in this program please read the help in this program andcheck the option sheet. The following procedures are recommended:
The frequency breakdown of all noncontinuous variables helps to identify possible errors due to inconsistencyor non-homogeneity.
1.
Reliability and consistency can be measured by comparing the data entered from the household form with thatentered from an individual form. For example, the age of the child should be the same on the household andthe individual forms.
2.
The quality of age reporting of children and/or sampling can be checked by the age frequency expressed inmonths and presented as a bar histogram (i.e., were approximately the same number of infants studied ateach age?).
3.
Comparison of data obtained by the enumerators with that obtained by the supervisors provides importantinformation about the general reliability of the survey.
4.
If unexplainable data entries are identified, these must be checked with the entries on the questionnaires. Erroneousdata in the database should then be replaced by correct data obtained from the questionnaires. If no satisfactoryexplanation for a value can be derived from the information in the questionnaires, either additional information mustbe obtained from the household, or the information must be excluded. It is better to obtain a lesser amount of correctinformation than false information.
4.2 Anthropometric indicesThe following are internationally used key indicators for determining the nutritional condition of children:
¯ Weight-for-age (wt/age),
¯ Height-for-age (ht/age),
¯ Weight-for-height (wt/ht).
A child lacking in energy or nutrients in relation to his height will not gain weight corresponding to his geneticpotential. Conversely, an overfed child will be overweight. In addition, when a child is undernourished and/or suffersrepeated infections over an extended period of time, the body growth is retarded and the genetic potential for heightwill not be reached.
In the population as a whole, there are always some individuals with unusual nutritional intakes who are heavier orlighter, or taller or shorter than others. If for example, the weight-for-height ratio for an adequately nourishedcommunity is determined, the ratio will have a biologically typical normal Gaussian distribution. Such a distributionhas been derived for the weight-for-age, height-for-age and weight-for-height indicators for children in the USA agedfrom birth to 18 years of age. Separate curves have been developed for boys and for girls. These distributions areavailable from the National Center of Health Statistics (NCHS) for use as reference data.
If the distribution of the height-for-age ratios of the surveyed community group lies to the left of the correspondingdistribution for the reference group, or if the distribution of the weight-for-height ratio lies to either side of that of the
Part 4+5: Analysis and reporting
http://www.nutrisurvey.de/baseline/part_45.htm (2 of 16) [13.04.2000 17:04:07]

reference group, there is evidence of health or nutritional problems in the surveyed child population. Often this isestimated by determining the proportion of children at or below -2 Z-score units of the NCHS reference standard (orfor weight-for-height ± 2 Z-score units). It must be kept in mind, however, that 2.3% of the children in the referencepopulation fall naturally outside 2 Z-score units of the mean.
When plotting anthropometric measurements of groups of children, it is important to determine:the proportion of those below or above the "acceptable" thresholds,1. e.g. in the case of weight-for-age, height-for-age, and weight-for-height for children under five years ofage:
below -2 Z-score or above +2 Z-score units of the NCHS reference standard ( thelater only in the case of weight-for-height)
●
in the case of mid-upper-arm-circumference (MUAC) of children:below 13.0 cm for children from 8 to 11 months●
below 13.5 cm for children from 12 to 23 months●
below 14.0 cm for children from 24 to 36 months●
in the case of body-mass-index of non-pregnant women:
below 18.5 kg/m2 and above 27.5 kg/m2❍
whether in the observed children their proportion above or below thresholds is about equal throughout the fiveyears or whether it changes perceptively for any of the age groups.
2.
The following rules-of-thumb can be used to interpret anthropometric indices in children:
1) Height-for-age
Children with a Z-score below -2 compared to the NCHS height-for-age reference are considered stunted (-2 Z-scoreis the value -2 standard deviations below the median of the reference population. By definition 2.3% of the referencepopulation is below -2 Z-score).
The proportion of stunted children relative to all children examined is a valid reflection of the prevalence of thecombination of disease prevalence and dietary inadequacy in light of physiological requirements in the wholecommunity. The proportion of "stunted" children in most developing countries usually ranges between 20% and 33%.Higher figures are indicative of an "abnormal" nutritional situation, such as may arise because of long-term civildisorders, severe and chronic food shortage, or may reflect the combination of genetic selection and an abnormalgeographic location, e.g., life in the Himalayas or the Andes.
2) Weight-for-height
Children with a weight-for-height less than -2 Z-score of the NCHS reference population are probably badlymalnourished. They are only probably so, because in the "healthy" North American reference population from whichthe NCHS standards were derived, 2.3% were found to have this weight-for-height. If one finds significantly morethan 2.3% of the children below this line, the children of the community are suffering from wasting. Since "wasting"has clearly been found to be associated with a depressed metabolism and decreased functional capacity, it is aserious sign. Wasted children experience higher mortality, probably because of reduced immune competence, fromhigher morbidity and from substantially reduced physical and mental abilities.
3) Weight-for-age
The third index used internationally as an indicator of undernutrition is the weight-for-age (wt/age) index. Mostchildren below the threshold (-2 Z-score units below the mean for NCHS standards) are undernourished, those at orabove the threshold are of normal nutritional status. This indicator combines both the ht/age and wt/ht indices. A childweighing too little for his age is too small and/or too lean (Gomez classification).
In the US reference population, the proportion of children falling below -2 Z-score units is 2.3%; however, in mostdeveloping countries in the absence of a severe food crisis the proportion is 20-40%. Higher proportions warn of a"worse-than-usual" situation.
Part 4+5: Analysis and reporting
http://www.nutrisurvey.de/baseline/part_45.htm (3 of 16) [13.04.2000 17:04:07]

It should be emphasized that these three indices are very useful for the classification of populations, butmust be interpreted with care and require additional information for the diagnosis of the nutritional status ofan individual.
4) Combination height-for-age and weight-for-height
Figure 12 presents an overview of the thresholds of malnutrition using ht/age and wt/ht indices based on theWaterlow classification.
Figure 12. Thresholds of malnutrition based on the Waterlow classification (Z-scores height-for-age andweight-for-height)
WATERLOW CLASSIFICATION SCHEME
Code Combination of indices Interpretation ofnutritional status
Height/age Weight/height
A B C D E F
normal low low low
normal high
low low
normal high high low
wasted stunted + wasted
stunted stunted + obese
obese wasted
Part 4+5: Analysis and reporting
http://www.nutrisurvey.de/baseline/part_45.htm (4 of 16) [13.04.2000 17:04:07]

wasting: lean condition due to acute nutritional and/or health problemsstuntin: reduced linear growth due to chronic nutritional and/or health problems
5) Mid-upper-arm-circumference (MUAC)
The Mid-Upper-Arm-Circumference (MUAC) is easier to measure but suffers from a higher measurement errorespecially if the investigator has little experience or takes insufficient care during measurement. MUAC may be quiteuseful to rapidly screen for severely malnourished children in emergency situations, in refugee camps, under severedrought conditions, etc, or may serve in the context of a rapid assessment of the health situation of an area. Itssensitivity, i.e. the ability of the test to detect malnutrition, is quite high if the higher threshold value (13.5 cm) is used.At this level one may, however, miss borderline cases, i.e. those moderately malnourished or at risk of becomingseverely malnourished. Raising the threshold to 14.5 cm will increase sensitivity but reduce specificity, i.e. the abilityof the test to correctly identify those not at risk. Arm circumference has the advantage that it varies relatively littlebetween one and three years of age, i.e. it is relatively age-independent, hence does not require knowledge of theprecise age, as do weight-for-age, or height-for-age. Above three years and below one year of age, especially below6 months, however, it is of limited value and should be used and interpreted only with caution.
4.3 Clustering
The forming of clusters or groups based on a variable, say age, can help to identify statistical variations or influenceson nutritional indicators.
FClustering is carried out from
functional andstatistical
viewpoints.
If clusters are to be formed, care must be taken to ensure that there is enough variation and that the number ofindividual cases in each group is roughly the same. If marital status is to be used as the basis for clustering and of alladults 42% are married, 30% single, 16% separated, 8% widowed and 4% divorced, the three smallest sample sizesare too small to build meaningful clusters since they are too small for statistical interpretation. Either these threegroups should be excluded from the statistical analysis or they should be consolidated into one group. In this examplethat would be the group of the separated + widowed + divorced = 28%. In clustering it is first necessary to carry out adescriptive statistical analysis. This is easy to do with the Nutrition Baseline Software
With some variables, the basis for clusters can easily be selected. This allows the clusters to be established from thebeginning of the project.
Variable Cluster Division
Gender
Age (Months)
Intervention
male, female
0-5, 6-11, 12-17, 18-23, 24-35, 36-47, 48-59
before, after
Once the clusters have been formed, they can then be compared statistically with respect to the nutritional indicators.An example is shown below:
Part 4+5: Analysis and reporting
http://www.nutrisurvey.de/baseline/part_45.htm (5 of 16) [13.04.2000 17:04:08]

Indicator Male (%) Female (%)
wasting
stunting
wasting + stunting
12.3
43.8
5.7
18.7
61.5
9.1
4.4 Food intake
In order to draw conclusions on the adequacy of nutrition, it is necessary to determine the individual requirements fora healthy nutrient intake. Such a relationship is, however, in practice very difficult to determine during a routine fieldsurvey because of
the difficulty of measuring the exact quantities of nutrients consumed and1. the difficulty in determining the exact nutrient requirements of individual persons (see chapter 6.4).2.
Nutrient intake can be calculated from dietary intake data, using food composition tables. When these intake data areconsidered in relation to nutrient requirements, potential nutrient deficiencies can be identified. Food compositiontables have been produced by international and regional organizations, and also in many countries.
With the Nutrition Baseline software it is possible to calculate the nutrient intake for the mother and the child but thefood weighing method or the 24-hour-recall method are not recommended as part of the surveys discussed in theseguidelines. Based on previous experience, the usability and accuracy of the findings do not justify the expenseinvolved. Therefore, only the typical food customs in a country are documented via a food frequency recall.Consequently, only qualitative conclusions concerning nutrient supply can be drawn, but it is possible toderive qualitative statements on the possible nutrition problems within a family.
Before analyzing a survey on feeding practices, inquiries should be made to the health authorities concerning thenutrient value tables used in their country.
FAO/WHO recommendations for nutrient requirements are generally used for developing countries. Chapter 6.4 inthe Appendix contains an overview of nutrient recommendations for children up to six years. However, authorities ofmany countries have published their own recommendations.
4.5 Breast-feeding, supplementary feeding, and weaning practices
A major cause of undernutrition and malnutrition in developing countries lies in improper breast-feeding,supplementary feeding, and weaning practices. The following principles are recommended:
A newborn should be given colostrum from its mother's breast immediately after birth.●
Infants should be exclusively breast-fed until the end of the fourth month. Until then supplementary feedingsare unnecessary and serve only to increase the risk of infections.
●
A child must be given supplementary feeding not later than the sixth month.●
The supplementary feeding must consider the frequency of feeding and the energy and nutrient requirementsof the child.
●
In many instances it is desirable for most infants to be breast-fed until the end of the second year of life.●
The analysis and interpretation of breast-feeding and supplementary feeding practices therefore have particularsignificance. Important breast-feeding and supplementary feeding concepts are defined in table 8.
Part 4+5: Analysis and reporting
http://www.nutrisurvey.de/baseline/part_45.htm (6 of 16) [13.04.2000 17:04:08]

Table 8. Definition of breast-feeding categories according to WHO
Category A child must begiven:
A child may be given: A child may not begiven:
Exclusivebreast-feeding
Human breast milk Medicines, vitamins,trace elements
Anything else
Predominantbreast-feeding
Mostly human breastmilk
Fluids (water, or waterbased fluids)
Anything else (includingsubstitutes for humanbreast milk)
Complementaryfeeding
Human breast milk andsemi-solid or solidfoods
Usual foods andbeverages
Bottle feeding Usual fluids or semifluidfoods from bottles withnipples
Also human breast milkfrom a bottle
The following indicators are generally used for breast-feeding, supplementary feeding, and weaning practices:
Exclusive colostrum feeding rateThe proportion of infants reported to have received exclusively colostrum during the first 12 hours after birth.
(Infants <12 months (<365 days) of age reported to have been exclusively breast-fed with colostrum in the first 12hours after birth) /(All surveyed infants <12 months (<365 days)of age)
Exclusive breast-feeding rateThe proportion of infants under 4 months of age exclusively breast-fed.
(Infants <4 months (<120 days) of age who were exclusively breast-fed in the last 24 hours) /(All surveyed infants <4 months (<120 days) of age)
Predominant breast-feeding rateThe proportion of infants under 4 months of age predominantly breast-fed.
(Infants <4 months (<120 days) of age who were predominantly breast-fed in the last 24 hours) /(All surveyed infants <4 months (<120 days) of age)
Timely, complementary feeding rateProportion of infants 6-9 months of age receiving breast milk and complementary foods
(Infants 6-9 months (180-299 days) of age receiving complementary foods in addition to breast milk in the last 24hours) /(All surveyed infants 6-9 months (180-299 days) of age)
Continued breast-feeding rate (1 year)Proportion of children 12-15 months of age who are breast-feeding
(Children 12-15 months of age breast-fed in the last 24 hours) /(All surveyed infants 12-15 months of age)
Continued breast-feeding rate (2 years)
Part 4+5: Analysis and reporting
http://www.nutrisurvey.de/baseline/part_45.htm (7 of 16) [13.04.2000 17:04:08]

Proportion of children 20-23 months of age who are breast-feeding
(Children 20-23 months of age breast-fed in the last 24 hours) /(All surveyed infants 20-23 months of age)
Bottle-feeding rateProportion of infants less than 12 months of age who are receiving any food or drink from a bottle
(Infants <12 months (<365 days) bottle-fed during the last 24 hours) /(All surveyed infants <12 months (<365 days) of age)
4.6 Reliability of a survey
There are three basic types of variables, and the method used to check the reliability of a survey depends on the typeof variables. Reliability is a measure of the repeatability or reproducibility of the results.
Variables with continuous values of measurement
For variables with continuous values, such as height, weight, or hemoglobin levels, the mean and the standarddeviation of the difference between the recorded measurements of the enumerators and the supervisor should becalculated. A small mean and small SD are desirable. In annex 6.7 an example of the calculation of an intra- and interobservation is described.
Variables with yes/no answers
For variables permitting only yes/no answers, such as the presence of goiter, anemia, or undernutrition (Z-score < 2),the inter and intra observer errors of the surveying of these variables should be calculated according to the followingoverview:
Supervisor
yes no
Enumeratoryes a bno c d
a: number of identified observations detected jointly by the enumerator and the supervisorb: number of observations not detected by the enumerator but detected by the supervisorc: number of observations detected by the enumerator but not detected by the supervisord: number of observations neither detected by the enumerator nor and the supervisor
Sensitivity of finding (proportion of true positive): a / (a + c) x 100
The sensitivity indicates the proportion of surveyed individuals actually possessing an observed attribute(undernourishment, belonging to a certain income group, etc.) who were correctly identified.
Specificity of finding (proportion of true negative): d / (b + d) x 100
The specificity indicates the proportion of surveyed individuals not possessing an observed attribute who werecorrectly identified.
Ideally, both sensitivity and specificity should be 100. The lower the value, the less precise was the surveying of thedata.
Variables allowing more than two answers
In determining the reliability of answers to questions with more than two answers, the percentage deviation betweenthe enumerators and the supervisor is calculated. The smaller the deviation, the better the survey.
Part 4+5: Analysis and reporting
http://www.nutrisurvey.de/baseline/part_45.htm (8 of 16) [13.04.2000 17:04:08]

% deviation = (Number of answers with differences between the responses obtained by enumerators and thoseobtained by the supervisor) /(Number of all answers with responses) x 100
4.7 Analysis of causes and predictors
With statistical methods it is possible to identify the relationship between the variables investigated in the survey. Ifthere is a statistically significant association between two variables, it is called a predictor. A predictor suggests acausal relationship between two variables, but does not prove that one exists.
Three goals can be achieved in the analysis of predictors.Identification of social risk groups1. Significant associations between a nutritional indicator and a socioeconomic indicator can help toidentify social risk groups, such as the landless and illiterates.
It is also possible to arrive at predictors based on observed socioeconomic data in which severalindividual predictors are included. Thus it was possible in the slums of a Brazilian city to find a higherrisk of malnutrition in young children from families who obtain their electrical power supply fromneighbors. Undoubtedly the cause of the malnutrition is not in the type of electrical power supply, andtherefore an improvement in type of electricity supply would not result in an improved nutritionalcondition for the children. Rather, there are other causal factors involved in these predictors that areresponsible for the poor nutritional conditions, such as low income and little education. Therefore,although the means of obtaining electrical power is not the cause of the malnutrition, defining thesepredictors can help the consultants to identify risk groups more quickly and at less cost. For example, inthis way families who have no electrical supply for their households can be selected for individualdiscussion on health and nutrition.Identification on indicators for monitoring2. Predictors can be helpful in identifying indicators suitable for use in monitoring the impact of interventionmeasures.Information of causal relationships3. Predictors can also provide important information regarding causal relationships and form the first stepsfor analysis of causes.Three procedures can be employed for analysis of causes:
Statistically significant relationships between variables do notautomatically provide information concerning the cause of nutritionalproblems. For this a separate analysis of causes is necessary.
1. Multiple statistical analysis of causesIn principle, in a statistical investigation of causes in order to obtain a clearer picture of a relationship,consideration should be given to the fact that a cause which cannot be eliminated has an integral part inthe relationship. A check must therefore be made as to whether the available statistical informationprovides sufficient basis to be able to assume a relationship. Therefore data of all potential confoundersmust be available. Some important tests with the related assumptions are presented in the table ofannex 6.8.
Special attention should be given to multiple regression analysis and multiple ANOVA. These mostused statistical techniques allow among others the investigator to examine the effect of one factor whileother factors in the regression equation are held constant mathematically.
2. Analyses of causes by comparison of literatureA second important source for analysis of causes is literature. A cause-effect relationship can only be
Part 4+5: Analysis and reporting
http://www.nutrisurvey.de/baseline/part_45.htm (9 of 16) [13.04.2000 17:04:08]

discussed with greater certainty, if a statistically established connection has been defined in anothersimilar situation.
3. Analysis of causes through specific investigationsThe baseline survey must commence from the viewpoint that although nutritional problems have beensolved in other locations more extensive research is needed to reveal causal relationships in thepresent location. The information gathered and relationships proposed in previous studies should becarefully considered during the planning for the baseline survey.
If there is no statistically significant relationship between variables, either no association exists or one or more of thefollowing factors may have influenced the results:
Inadequate statistical methods were used●
The sample size was too small●
Confounding factors occurred (see following overview)●
Inappropriate indicators were measured in the follow-up survey●
Intervention measures were irrelevant and unsuitable for solving the problems●
The surveyed group was not appropriately similar to the beneficiary group.●
The last three points are applicable only to follow-up surveys.
If there is a statistically significant relationship between two variables, the following questions must beconsidered:
Is the significance due to confounders or external factors?●
Is this a causal relationship?●
Which direction is the causal relationship? What is the range of the effects?●
Can the causal relationships observed in the surveyed group be extrapolated to the beneficiary groups, targetgroups and general community?
●
The following list summarizes possible confounding factors that could influence the results of a survey:
1. Differences in the survey teams and their equipmentA survey must be implemented by a several survey groups. Although the teams along with theirequipment should randomly select households for the survey, in practice the surveys by a given teamwill be limited to one geographical area to save time. Thus, differences in the results can result fromdifferent teams and equipment.
2. Changes in demographic distributionIt is possible that during the project/program segments of the population in the designated regionemigrate or immigrate. Those segments might not be representative of the general population. Anexample, they might be the poorest with the highest nutritional risk.
3. Decreases or increases in the beneficiary groupDuring the project members of the beneficiary group enter or exit. This shortens the time available forthe intervention, and the project/program measures cannot be sustained long enough to take effect.
4. Excessive representation of socioeconomic data from families with more than one child under 5 yearsMany households have more than one child under the age of 5 years. To secure the representation ofall children under five years of age and to increase the coverage of sampling, a survey has to be takenof all children in a household. If the socioeconomic data of households is used in a statisticalrelationship to the socioeconomic data of the children, the data from the families with more than onechild will be over-represented.
5. Changes in external conditionsIt is not always possible to arrange for a comparison group to evaluate the impact of interventionmeasures on the nutritional condition of a target group (see sub-chapter 3.1.3.3.). Without data from acomparison group, the interpretation of the impact of nutritional intervention based on longitudinalcomparisons of baseline and follow-up surveys can be exceedingly difficult and must be undertakenwith extreme caution, as other factors outside the control of the project/program can also have a
Part 4+5: Analysis and reporting
http://www.nutrisurvey.de/baseline/part_45.htm (10 of 16) [13.04.2000 17:04:08]

bearing on nutritional status.6. Changes in the age distribution of the surveyed group
The nutritional status of babies from zero to five months is often better than that of babies from twelve toseventeen months. If the age distribution of the examined babies is different between the baseline andfollow-up surveys, the impact of an intervention can be misrepresented.
The last two points are applicable only to follow-up surveys.
4.8 Evaluation of indicators
Nutrition surveys yield important information about the nutritional condition of an investigated population. Manyconclusions can be drawn on the type and distribution of evident nutritional problems using statistical analyses of theobserved nutritional indicators (anthropometric indices, xerophthalmia, anemia, goiter, breast-feeding practices, etc.).However, these do not provide answers about how these findings are to be interpreted if questions arise concerning
at which thresholds●
with what measures●
for which risk groups●
intervention should be undertaken.
There are no universally valid thresholds for nutritional indicators, which could then be used to decide whichmeasures to apply. If one attempted to specify a certain set of economic and health conditions, a 10% stunting rate inone part of a country might be high, while in another part of the country, or in another country, it might seem low. It istherefore necessary to establish a list of criteria that can be used to evaluate the indicators.
The following criteria should be considered when evaluating nutritional indicators:cross-sectional comparison of nutritional indicators with other parts of the country (geographicalcomparison);
●
longitudinal comparison of nutritional indicators with previous surveys (trend);●
arrangement of nutritional problems by priority with respect to general health problems;●
evaluation of the surveyed nutritional indicators by- the health and planning authorities, and- the participating population;
●
the possibilities for intervention in the survey area.●
Only by considering these criteria conclusions can be drawn about the indicators and thereby about the nutritionalsituation.
5. Reporting of survey results
5.1 Format of a technical reportA technical report should have the following structure:
Title page
Acknowledgment
Table of contents
Part 4+5: Analysis and reporting
http://www.nutrisurvey.de/baseline/part_45.htm (11 of 16) [13.04.2000 17:04:08]

0. Abstract
1. Introduction1.1 Project/program description and overall framework1.2 Nutritional situation based on previous reports1.3 Objectives of the survey
2. Methodology2.1 Population and area surveyed2.2 Study design2.3 Sampling and data collection2.4 Equipment utilized2.5 Statistical methods2.6 Sensitivity and specificity of the survey2.7 Ethical considerations
3. Results3.1 Demographic and socioeconomic data3.2 Food habits3.3 Infectious diseases3.3 Anthropometric data3.5 Nutritional deficiencies3.6 Existing intervention programs in the project/program area3.7 Predictor analysis
4. Discussion4.1 Analysis of findings4.2 Problem tree
5. Recommendations5.1 Possibilities for intervention5.2 Proposed in-depth studies5.3 Proposed indicators for monitoring and evaluation
6. List of references
7. Appendix7.1 Questionnaires utilized
The report should include the following information:
l Title page
The purpose of the title page is to present a concise statement of the subject of the survey and to identify theresponsible personnel . The title page is the "main gate" of the survey report that invites the reader to engagehim/herself to study the document. The title is the summary of the summary.
The title page should contain the following information:- Title of the report- Names of the principle enumerators and authors- Date of submission of the report- Name and address of the institution of the principle enumerators and authors
l Acknowledgment
All persons, institutions and groups that assisted in carrying out the survey and without whose support the surveywould not have been possible should be acknowledged.
l Abstract
Part 4+5: Analysis and reporting
http://www.nutrisurvey.de/baseline/part_45.htm (12 of 16) [13.04.2000 17:04:08]

The purpose of the abstract is to summarize in less than 400 words all important parts of the survey.
The abstract should- describe the general objective of the survey (justification);- describe briefly the methodology used;- report the main findings;- discuss and analyze the main results;- state the main conclusions and recommendations.
l Introduction
The purpose of the introduction is to put the survey in perspective.
The introduction includes several sections:A description of the nutritional situation is based on previous reports of investigations in the country and, ifthere are any, in the surveyed area. Both the nutritional condition of the population and the previousintervention programs should be described.
●
The project description briefly presents its objective, findings, and planned activities.●
The objectives of the survey conclude the introduction.●
l Methodology
The description of the methodology should be so complete that it would be possible to repeat the survey using thesame methodology.
This is particularly important to ensure the validity of any comparison between the baseline survey andfollow-up survey. The description of the methods used should include details of procedures that differed fromthose given in these guidelines and details of procedures for which this handbook only makes vaguerecommendations.
●
Special attention should be given to the description of sampling. The calculation of the sample size anddetails of the sampling procedure should be described. Furthermore, the equipment utilized in the surveyshould be described.
●
The methodology section should also report the sensitivity and specificity of the variables monitored by thesupervisors.
●
l Results
When describing findings, data should be presented objectively without any comment or commentary.
The following tables, arranged according to communities or urban districts, should be included in the results section:Demographic and socioeconomic data, such as:●
The number of household members❍
The number of working household members❍
The number of children under five years❍
The number of residences❍
The number of people per residence❍
The percentage of residents with electricity❍
Educational level of parents
❍
Crop land area and production of agricultural products for family's consumption and for sale
●
Prevalence of nutritional problems classified by:●
Distribution of ht/age, wt/ht, and wt/age❍
Underweight (wt/age: threshold for medium to severe malnutrition is < -2 Z-score)❍
Waterlow's classifications (ht/age: threshold for stunting is < -2 Z-score; wt/ht: threshold for wasting is <❍
Part 4+5: Analysis and reporting
http://www.nutrisurvey.de/baseline/part_45.htm (13 of 16) [13.04.2000 17:04:08]

-2 Z-score)Obesity (wt/ht: threshold for obesity is > +2 Z-score)
❍
Prevalence of medical problems, broken down by community:●
Prevalence of anemia in relation to age (threshold: for anemic children is < 110 g/L Hb and for severelyanemic children is < 95 g/L Hb)
❍
Prevalence (point prevalence and period prevalence) of diarrheal disease and acute respiratoryinfections
❍
Prevalence of fever❍
Prevalence of other infectious diseases
❍
Frequency of food consumption in the surveyed households●
The results section should contain the following diagrams:height vs. age compared to the reference group●
weight vs. height compared to the reference group●
weight vs. age compared to the reference group●
frequency of distribution of Hb concentration in the blood●
Exclusive breast-feeding rate (proportion of infants under 4 months of age exclusively breast-fed)vs age of mother
●
l Discussion
Finally, the survey results should be analyzed in the light of other findings. The discussion of the results must beseparated from their presentation. The clear separation of the presentation from the discussion of the results allowsreaders to draw their own unbiased conclusions from the survey findings.
Concrete information must be given concerning the survey goals described in the Introduction, as follows:The type and extent of the target, risk and beneficiary (intervention) groups●
The type, extent and severity of the nutritional problems●
The possible direct and indirect causes of the problems●
The interactive relationship among the possible causes (e.g., verification of the ZOPP problem tree)●
The determination of the nutritional problems of the target group with respect to normal living conditions●
l RecommendationsProposals for more extensive investigations of direct and indirect causes of malnutrition●
Proposals for appropriate and lasting nutritional intervention measures●
Proposals for simple, nutritional-relevant indicators to be used in designing a monitoring and evaluation system
●
l List of references
This section should contain a bibliography of the literature referred to in the report.
l Appendix section
The appendix section should include a copy of the actual questionnaire used in both the language of theinvestigators and the local language. The questionnaire is an important tool of a survey that has to be adapted to thelocal situation and must therefore be developed for each survey. The setting in which the data will be collected willinfluence the design and structure of the data recording form or questionnaire.
In addition, it is also possible to use the appendix section to include tables useful for clarification but too extensive forthe main section of the report.
Part 4+5: Analysis and reporting
http://www.nutrisurvey.de/baseline/part_45.htm (14 of 16) [13.04.2000 17:04:08]

5.2 Considerations of style for writing the report
Tables and figures are important tools for information transfer in reports. However, there are some rules that shouldbe considered when preparing a table or figure.
The main difference between tables and figures is that in tables information is presented in digital formwhereas in figures it is presented visually. Often visual information is easier to comprehend than digital.Therefore, the initial decision is which format is best for data presentation.
1.
Tables and figures must be self-explanatory, although they can be interpreted in the text. Each table or figureneeds a header that includes the number of the table or figure followed by the title. The table or figure numbermust be referred to in the text. Tables and figures should be numbered separately in sequence through thereport.
2.
The title of a table or figure should summarize briefly the information of the table or figure.3. Each column in a table has to have a header. The column headers should be concise so that they can bewritten horizontally. They may contain abbreviations. Tables can be laid out in several different formats, withlines separating columns, rows or headers, however, the same style should be used in all tables in the report.
4.
Immediately beneath the column heads the precise units of measurement of the data should be shown. Unitsof measurement should be written in brackets, e.g., (%) or (years). If in a table or a figure there is no room forlonger units, (e.g., number of infant deaths per 1000 live births and stillbirths), the details should be put in afootnote to the table. Footnotes should be placed beneath the lower boundary of the table. However, thefootnote should be at least two double spaced lines above the text to distinguish it clearly from the text.
5.
As a rule, tables are presented vertically on the page, although wide tables may be presented sideways(landscape). If a table is too long to fit on one page, then the table should be continued on the next page. Atthe bottom of the first page the word "continued..." should appear. The second page should begin with thewords "Table ... continued," and the column headings should be repeated. Such larger tables should probablyappear in an appendix because they will contain more detail than is necessary for the points made in the text.
6.
Various types of illustrations may accompany the report as figures, such as line drawings, graphs, maps, andphotographs. Drawings should be presented clearly with Indian ink on white paper. Graphs developed bycomputer software should be printed with ink jet or laser printers. Photographs should be printed on glossypaper.
7.
If a table or figure is taken from another publication, the source must be identified.8. Wherever percentages are to be used in tables the raw figures must similarly be provided so that the readercan both check your results as well as verify the validity of you interpretation. In the table below, andexamining only percentages, the difference in the prevalence between boys and girls is quite striking. Yet ifone had only found one more boy with goiter, the percentage would have similarly reached 50%.
9.
Table 9. Schoolchildren with visible goiter
Boys n = 4 (n) (%)
Girls n = 40 (n) (%)
Total n = 44 (n) (%)
Visible goiter 1 25 20 50 21 48
Other style considerations include:The full generic name should be used when an insect (or animal, bacterium or plant) is first mentionedanywhere in the report. Thus the mosquito would be referred to first as Anopheles hyrcanus var. sinensis, andlater as A. hyrcanus var., or A.h. sinensis, or simply A. sinensis.
●
several organisms belong to genera having the same initial letter, and confusion is therefore possible if initialsare used for them all. For example, if both Entamoeba coli and Escherichia coli are named in the same paper,it is wise to refer to both general in full throughout even at the expense of much repetition.
●
Part 4+5: Analysis and reporting
http://www.nutrisurvey.de/baseline/part_45.htm (15 of 16) [13.04.2000 17:04:08]

in general, all Latin words should be italicized.●
Names of diseases derived from proper names should not be written with initial capital letters once they havebecome generally accepted, e.g., brucellosis, bilharziasis, leishmaniasis.
●
Measurements should be expressed in metric units. Abbreviations for metric units should be written accordingto international standards.
●
5.3 Information for the target groups
Once the survey is completed, the target group should quickly be informed of the findings. The presentation andcontents should be tailored to the culture and educational level of the people.
A place and time for the meeting should be chosen so as to include as many people as possible. The questionnaireshould include a question about when and where such a meeting should be held.
The following recommendations are given concerning the presentation and discussion of the results in a community:The results should be presented by a person who has taken part in the survey and is known to the people. Heor she should be qualified in the field and thus respected (e.g., health assistant, midwife, nurse, social worker).
●
As much as possible, simple audiovisual aids should be used to present the information.●
Only essential results should be presented. Too much information confuses rather than helps.●
The results should be discussed with those of the target groups who are interested. This should lead to anexchange of views between the experts and the participants and lead to recommendations for actions.
●
Part 4+5: Analysis and reporting
http://www.nutrisurvey.de/baseline/part_45.htm (16 of 16) [13.04.2000 17:04:08]

6. Appendices
6.1. Examples of questionnairesIn nutrition baseline surveys the questionnaires are divided into community, household, individual (child) andsupervisor questionnaires. The household questionnaires are further divided into samples adapted to urban and ruralhouseholds, as there are some significant differences in socioeconomic and ecological descriptions of the two types ofcircumstances. In the Nutrition Baseline software only the questionnaires for the household and child are preparedautomatically depending on the settings in the option sheet. Samples of the other two can be found in the followingtwo chapters.
It should be emphasized here, once again, that these forms can only be used as a sample in order to becomeaccustomed to the methods for formulating questionnaires. Obviously, content and language must always beadapted to the circumstances of the survey area. Item-by-item explanations for the planning and preparation ofquestionnaires are presented in Chapter 3.2.
6.1.1. Example of a Community Questionnaire
Community
No. of Sub-Communities:
No. Inhabitants:
Major source of income:
Infrastructure, Schools:0 - Not available1 - Primary School2 - Secondary School
Health facilities:0 - Not available1 - Health post2 - Health center
Shopping facilities:
0 - None1 - Shop2 - Market3 - Kiosk (small)
Communication facilities:
1 - Postal service2 - Newspaper3 - Radio4 - Television5 - Telephon
Mass transportation means:
0 - Not available1 - Pick-up/Truck 2 - Bus/Minibus3 - Boat
Type of road:
0 - No roads available1 - Earth2 - Stone3 - Asphalt
Part 6: Appendice
http://www.nutrisurvey.de/baseline/part_6.htm (1 of 28) [13.04.2000 17:04:28]

Meeting place:
0 - None1 - Open air2 - Village Hall3 - Religious Center
Worship place:0 - None1 - Available
Sport facilities:0 - None 1 - Available
6.1.2. Example of a Supervisor questionnaire
1.) Household number
2.) Supervisor
1) A2) B3) C
3.) Survey team
1) A 7) G2) B 8) H3) C 9) I4) D 10) J5) E 11) K6) F 12) L
4.) Date of survey (day, month, year)
5.) Place of survey (village/suburb)
1) A 9) I2) B 10) J3) C 11) K4) D 12) L5) E 13) M6) F 14) N7) G 15) O8) H
6.) Question: Name of child
7.) Observation: Age of the child (months)
8.) Question: Age of the mother (years)
9.) Question: How large is your farming operation? (ha)
10.) Question: What is the ownership status of the land?1) Own land 4) Public land2) Leased land 8) Don't know3) Owned and leased land 9) No answer
11.) Question: Has your child suffered from a diarrheal disease during the last 7 days?
Part 6: Appendice
http://www.nutrisurvey.de/baseline/part_6.htm (2 of 28) [13.04.2000 17:04:28]

12.) Question: (If your child is not currently breastfed) how long did you breastfeed your child? (months)
13.) Question: How many hours after birth did you start with breast feeding?1) 1-4 hours 8) Don't know2) 5-12 hours 9) No answer3) After 12 hours
14.) Question: Did your child receive any other fluid after birth besides colostrum?1) Yes 8) Don't know2) No 9) No answer
15.) Question: Regardless of whether your child is breastfed or not, how often was your child givensomething to eat yesterday?8) Don't know9) No answer
16.) Observation: Does the child possess an immunization record?1) Yes 2) No
17.) Measurement: Weight of the child (kg)
18.) Measurement: Height of the child (cm)
19.) Measurement: Mid Upper Arm Circumference (cm)
6.2 List of variable codesThe following list gives all unique code names in alphabetic order. The variable number indicate the numbers of thevariables that are discribed in chapter 3.2. The numbers that are marked with (*) are codes that are not considered inthe forms as own variable. However, a specific code variable is given in case that these variables shall be consideredin the spreadsheet for further statistical analysis.
No. Variable Code Description
1. ADDDRINK Fluid given to child in addition to breast-milk today2. ADDITBF Fluid given to child after birth besides breast-milk3. *AGE Age of child (months)4. AGEMOTHE Actual age of mother5. AGEOLDCH Age of mother when oldest child was born6. AGESOLID Age child was first given solid foods7. AGEYOUNG Age of mother when youngest child was born8. ANIMALFT Food frequency of animal fats9. ANIMAL1 Use of animal 110. ANIMAL2 Use of animal 211. ANIMAL3 Use of animal 312. ANIMAL4 Use of animal 413. BIRTHDAT Birthdate of the child14. BIRTHSPA Number of cases with birth spacing of < 2 years15. *BMI Body mass index of mother16. BOTTLE Status of bottle-feeding of child17. BREASTDU Months child was breast-fed18. BREASTFE Current breast-feeding status19. CARERESP Identification of person who takes care of children20. CHILDDTH Preschool children mortality21. CHILDNO Child number22. COLOSTRU Child received colostrum23. CROP1 Use of crop 124. CROP2 Use of crop 225. CROP3 Use of crop 3
Part 6: Appendice
http://www.nutrisurvey.de/baseline/part_6.htm (3 of 28) [13.04.2000 17:04:28]

26. CROP4 Use of crop 427. EATFREQU Eating frequency of child per day28. EATGREEN Vegetables or fruits as supplementary feeding29. EATSOLID Solid food as supplementary feeding30. EDUCFATH Formal schooling of father31. EDUCMOTH Formal schooling of mother32. EGG Food frequency of eggs and egg products33. ELECTRIC Electricity supply of household34. ENERCOOK Kind of energy used for cooking35. ETHNIREL Ethnic or religious affiliation of mother36. FARMAREA Area of farming operation (ha)37. FISH Food frequency of fish and other seafood38. FOAPRIL Food shortage in April39. FOAUGUST Food shortage in August40. FODECEMB Food shortage in December41. FOFEBRUA Food shortage in February42. FOJANUAR Food shortage in January43. FOJUNE Food shortage in June44. FOJULY Food shortage in July45. FOMARCH Food shortage in March46. FOMAY Food shortage in May47. FONOVEMB Food shortage in November48. FOOCTOBE Food shortage in October49. FOODAID Participation on feeding program50. FOSEPTEM Food shortage in September51. FRUITS Food frequency of fruits52. GARBAGE Kind of garbage disposal53. GENDPREF Gender preference regarding the next child54. GREENVEG Food frequency of green leafy vegetables55 *HFA Height-for-age of child (z-score)56. HEIGHT Height of child (cm)57. HEMOGLCH Hemoglobin level in blood of child (g/L)58. HEMOGLMO Hemoglobin level in blood of mother (g/L)59. HSHHDSEX Gender of head of household60. HSHLOCAT Location of househould (name of village or suburb)61. HSHMEMNO Number of household members62 HSHMMNO Number of household members earning money63. HOUSEHNO Household number64. IMMUNCRD Presence of immunization record of child65. INFODAY Suggested week day for survey meeting66. INFOTIME Suggested time of day for survey meeting67. LANDOWN Ownership of land68. MEATLARG Food frequency of meat from large animals69. MEATSMAL Food frequency of meat from small animals70. MILK Food frequency of milk and milk products71. MOGOITER Goiter in mother72. MOHEIGHT Height of mother (cm)73. MOTHMONE Money earned by mother during the last 3 months74. MOWEIGHT Weight of mother (0.1 kg)75. MUAC Mid upper arm circumference76. NBEDROOM Number of bedrooms77. NIGHTBLI Nightblindness of child78. NOCLDMEM Number of members of household who are children79. OCCUPACI Occupation of head of household80. OIL Food frequency of oils81. ORIGIN Geographical origin of mother82. OTHERVEG Food frequency of other than green leafy vegetables83. PERIOARI Period prevalence of acute respiratory diseases84. PERIODDD Period prevalence of diarrheal disease of child85. PERIODIS Period prevalence of other important disease
Part 6: Appendice
http://www.nutrisurvey.de/baseline/part_6.htm (4 of 28) [13.04.2000 17:04:28]

86. *PERSOBED Number of persons per bedroom87. POINTARI Point prevalence of acute respiratory diseases88. POINTDD Point prevalence of diarrheal disease of child89. PLANTFAT Food frequency of plant fats90. PREGNANT Time of pregnancy of mother91. PREPARED Food frequency of pre-prepared, processed food92. PROBDISP Household with neighbor disputes93. PROBEDUC Household with unsatisfactory school situation94. PROBENER Household with problems of energy supply95. PROBFOOD Household with problems of food supply96. PROBILLN Household with frequent disease problems97. PROBINCO Household with too little income98. PROBLE1 Household with land tenure problems99. PROBLE2 Household with employment/yield problems100. PROBLE3 Household with time problems to get to work101. PROBLIVC Household with bad living conditions102. PROBNO Household without problems103. PROBOTHE Household with other problems104. PROBWATE Household with problems of water supply105. SALTIOD Presence of iodine in salt sample106. SALTYP Kind of salt used in cooking and as table salt107. SCHOOLFD Participation on schoolfeeding program108. SEWAGE Kind of sewage disposal109. SEX Gender of child110. SNACKS Food frequency of snacks111. SOCIALIF Participation in social meetings112. STAPLE1 Food frequency of staple food 1 (grains, tubers)113. STAPLE2 Food frequency of staple food 2 (grains, tubers)114. STAPLE3 Food frequency of staple food 3 (grains, tubers)115. STAPLE4 Food frequency of staple food 4 (grains, tubers)116. STARTBF Start of breast-feeding after birth117. SUGAR Food frequency of sugars118. SUPERVNO Supervisor119. SURVTNO Survey team number120. SURVDATE Date of the survey121. SURVDISC Interest in discussion about results of survey122. SURVPART Acceptance of survey by responder123. WAAPRIL Water shortage in April124. WAAUGUST Water shortage in August125. WADECEMB Water shortage in December126. WAFEBRUA Water shortage in February127. WAJANUAR Water shortage in January128. WAJUNE Water shortage in June129. WAJULY Water shortage in July130. WALL Material of walls of children's bedroom131. WAMARCH Water shortage in March132. WAMAY Water shortage in May133. WANOVEMB Water shortage in November134. WAOCTOBE Water shortage in October135. WASEPTEM Water shortage in September136. WATER Source of drinking water137. WEIGHING Weighing status of child138. WEIGHT Weight of child (0.1 kg)139. *WFA Weight-for-age of child (z-score)140. *WFH Weight-for-height of child (z-score)141. WHTCHART Presence of weighing chart of child
6.3 Anthropometric Reference Tables
Part 6: Appendice
http://www.nutrisurvey.de/baseline/part_6.htm (5 of 28) [13.04.2000 17:04:28]

Sometimes a nutrition survey must be made without being able to calculate anthropometric data using a personalcomputer. In this instance, one can use the age, weight and height data for a child to determine if the child is within thenormal variation of the population. These anthropometric standard values are based on the NCHS/CDC referencevalues as recommended by the WHO. Threshold values are given for stunting, wasting, and obesity. Thresholds aregiven for plus or minus two standard deviations from the reference population. In addition to values for stunting,wasting and obesity according to height, thresholds for obesity vs. age are also given.
6.3.1 Children
Thresholds for stunting (ht/age) and underweight (wt/age) in boys and girls (age : <2 years) in lying position
BOYS GIRLS
AGE(Months)
Stunting(Z-score: -2)
Height in lyingposition (cm)
Underweight(Z-score: -2)
Weight(kg)
Stunting(Z-score: -2)
Height in lyingposition (cm)
Underweight(Z-score: -2)
Weight(kg)
012345
45.949.752.955.858.360.5
2.42.93.54.14.75.3
45. 549. 052. 054. 656. 958. 9
2. 22. 83. 33. 94. 55. 0
67891011
62.464.165.767.068.369.6
5.96.46.97.27.67.9
60. 662. 263. 765. 066. 267. 5
5. 55. 96. 36. 66. 97. 2
121314151617
70.771.872.873.774.675.5
8.18.38.58.78.89.0
68. 669. 870. 871. 972. 973. 8
7. 47. 67. 88. 08. 28. 3
181920212223
76.377.177.978.979.480.2
9.19.29.49.59.79.8
74. 875. 776. 677. 478. 379. 1
8. 58. 68. 89. 09. 19. 3
Thresholds for stunting (ht/age) and underweight (wt/age) (age: 2 - 5 years) in upright position
BOYS GIRLS
Part 6: Appendice
http://www.nutrisurvey.de/baseline/part_6.htm (6 of 28) [13.04.2000 17:04:28]

AGE(Months)
Stunting(Z-score: -2)
Height inupright position
(cm)
Underweight(Z-score: -2)
Weight(kg)
Stunting(Z-score: -2)
Height inupright position
(cm)
Underweight(Z-score: -2)
Weight(kg)
242526272829
79. 279. 980. 681. 382. 082. 7
10. 110. 210. 310. 410. 510. 6
78. 078. 879. 680. 381. 081. 7
9. 49. 69. 89. 910. 110. 2
303132333435
83. 484. 184. 785. 486. 086. 7
10. 710. 911. 011. 111. 211. 3
82. 583. 283. 884. 585. 285. 8
10. 310. 510. 610. 810. 911. 0
363738394041
87. 387. 988. 689. 289. 890. 4
11. 411. 511. 711. 811. 912. 0
86. 587. 187. 788. 489. 089. 6
11. 211. 311. 411. 511. 611. 8
424344454647
91. 091. 692. 292. 793. 393. 9
12. 112. 312. 412. 512. 612. 8
90. 290. 791. 391. 992. 593. 0
11. 912. 012. 112. 212. 312. 5
484950515253
94. 495. 095. 596. 196. 697. 1
12. 913. 013. 113. 313. 413. 5
93. 594. 194. 695. 195. 696. 2
12. 612. 712. 812. 913. 013. 1
545556575859
97. 798. 298. 799. 299. 7
100. 2
13. 813. 914. 114. 214. 214. 3
96. 797. 296. 698. 198. 699. 1
13. 213. 313. 413. 513. 613. 7
Thresholds for wasting (wt/ht) and obesity (wt/ht) (length in lying position: 49 - 100 cm)
BOYS GIRLS
Part 6: Appendice
http://www.nutrisurvey.de/baseline/part_6.htm (7 of 28) [13.04.2000 17:04:28]

Height(cm)
Wasting(Z-score: -2)
Weight(kg)
Obesity(Z-score: +2)
Weight(kg)
Wasting(Z-score: -2)
Weight(kg)
Obesity(Z-score: +2)
Weight(kg)
49 2. 5 4. 2 2. 6 4. 0
5051525354
2. 52. 62. 82. 93. 1
4. 44. 64. 85. 05. 3
2. 62. 72. 83. 03. 1
4. 24. 44. 74. 95. 2
5556575859
3. 33. 53. 73. 94. 1
5. 65. 96. 16. 46. 7
3. 33. 53. 73. 94. 1
5. 45. 76. 06. 36. 6
6061626364
4. 44. 64. 95. 25. 4
7. 17. 47. 78. 08. 3
4. 34. 64. 85. 05. 3
6. 97. 27. 57. 88. 1
6566676869
5. 76. 06. 26. 56. 8
8. 79. 09. 39. 69. 9
5. 55. 86. 06. 36. 5
8. 48. 79. 09. 39. 6
7071727374
7. 07. 37. 57. 88. 0
10. 210. 510. 811. 111. 4
6. 87. 07. 27. 57. 7
9. 910. 210. 510. 711. 0
7576777879
8. 28. 48. 68. 89. 0
11. 611. 912. 112. 412. 6
7. 98. 18. 38. 58. 7
11. 211. 411. 711. 912. 1
8081828384
9. 29. 49. 69. 79. 9
12. 913. 113. 313. 513. 7
8. 89. 09. 29. 49. 6
12. 312. 612. 813. 013. 2
8586878889
10. 110. 310. 510. 610. 8
14. 014. 214. 414. 714. 9
9. 79. 910. 110. 310. 5
13. 413. 613. 914. 114. 3
Part 6: Appendice
http://www.nutrisurvey.de/baseline/part_6.htm (8 of 28) [13.04.2000 17:04:28]

9091929394
11. 011. 211. 411. 611. 9
15. 115. 315. 615. 816. 1
10. 710. 911. 111. 311. 5
14. 514. 815. 015. 315. 6
9596979899
12. 112. 312. 512. 813. 0
16. 316. 616. 817. 117. 4
11. 812. 012. 212. 512. 8
15. 916. 116. 516. 817. 1
100 13. 3 17. 7 13. 1 17. 4
Thresholds for wasting (wt/ht) and obesity (wt/ht) (stature, upright position: 75 - 127 cm)
BOYS GIRLS
Height(cm)
Wasting(Z-score: -2)
Weight(kg)
Obesity(Z-score: +2)
Weight(kg)
Wasting(Z-score: -2)
Weight(kg)
Obesity(Z-score: +2)
Weight(kg)
7576777879
7. 98. 18. 38. 58. 7
12. 712. 913. 213. 413. 6
7. 77. 98. 18. 38. 5
12. 312. 512. 713. 013. 2
8081828384
8. 99. 29. 49. 69. 7
13. 914. 114. 314. 614. 8
8. 78. 99. 19. 39. 5
13. 413. 613. 914. 114. 3
8586878889
9. 910. 110. 310. 510. 7
15. 015. 315. 515. 715. 9
9. 79. 910. 110. 310. 5
14. 614. 815. 115. 315. 6
9091929394
10. 911. 111. 311. 511. 7
16. 216. 416. 716. 917. 2
10. 710. 811. 011. 211. 4
15. 816. 116. 316. 616. 9
9596979899
11. 912. 112. 412. 612. 8
17. 417. 717. 918. 218. 5
11. 611. 812. 012. 212. 4
17. 217. 517. 818. 118. 4
Part 6: Appendice
http://www.nutrisurvey.de/baseline/part_6.htm (9 of 28) [13.04.2000 17:04:28]

100101102103104
13. 013. 213. 513. 713. 9
18. 819. 119. 419. 720. 0
12. 712. 913. 113. 313. 5
18. 719. 019. 319. 620. 0
105106107108109
14. 214. 414. 714. 915. 2
20. 420. 721. 121. 421. 8
13. 814. 014. 314. 514. 8
20. 320. 721. 021. 421. 8
110111112113114
15. 415. 716. 016. 316. 6
22. 222. 623. 123. 524. 0
15. 015. 315. 615. 916. 2
22. 222. 523. 023. 423. 8
115116117118119
16. 917. 217. 517. 918. 2
24. 424. 925. 426. 026. 5
16. 516. 817. 117. 417. 7
24. 324. 825. 325. 826. 4
120121122123124
18. 518. 919. 219. 620. 0
27. 127. 628. 228. 929. 5
18. 118. 418. 819. 119. 5
27. 027. 628. 329. 029. 7
125126127
20. 420. 721. 1
30. 230. 931. 6
19.9--
30. 5--
6.3.2 Women
Thresholds for Wasting (BMI<18.5) and Obesity (BMI>27.5)
Stature(cm)
Wasting(BMI: 18.5)Weight (kg)
Obesity(BMI: 27.5)Weight (kg)
145146147148149
38. 939. 440. 040. 541. 1
57. 858. 659. 460. 261. 1
Part 6: Appendice
http://www.nutrisurvey.de/baseline/part_6.htm (10 of 28) [13.04.2000 17:04:28]

150151152153154
41. 642. 242. 743. 343. 9
61. 962. 763. 564. 465. 2
155156157158159
44. 445. 045. 646. 247. 4
66. 166. 967. 868. 769. 5
160161162163164
47. 448. 048. 649. 249. 8
70. 471. 372. 273. 174. 0
165166167168169
50. 451. 051. 652. 252. 8
74. 975. 876. 777. 678. 5
170171172173174
53. 554. 154. 755. 456. 0
79. 580. 481. 482. 383. 3
175176177178179
56. 757. 358. 058. 659. 3
84. 285. 286. 287. 188. 1
180181182183184
59. 960. 661. 362. 062. 6
89. 190. 191. 192. 193. 1
6.4 Nutrient requirements
Nutrient requirements depend on the biological status of a person (gender, age, build, pregnancy, breastfeeding, etc.),health and nutritional conditions, physical activities and the body heat produced by the person. In addition to these,allowance must be made for external variables, such as ambient temperature and nutrient reserves, and increasedneeds under some environmental conditions - for example in order to counteract increased attacks by infections orirregular feeding.
Even if these conditions have been accurately determined, there is not always agreement at the international level.Nutritional recommendations are not consistent from one country to another. These differences are evident in thenutrient recommendations published over the last ten years.
Part 6: Appendice
http://www.nutrisurvey.de/baseline/part_6.htm (11 of 28) [13.04.2000 17:04:28]

The nutrient requirements listed on the following pages have been adapted from FAO/WHO recommendations. Theserecommendations are accepted in most developing countries.
Table 11. Average Energy and Protein Requirements of Infants and Small Children
Age weighta(kg)c Energy Requirements Protein
Requirementsb
kcal/kg kJ/kg kcal/day kJ/day g/kgc g/dayc
Months:3-66-9
9-12
78.59.5
10095
100
418397418
700810950
230034004000
1.851.651.50
131414
Years:1-22.33-5
1113.516.5
10510095
439418397
115013501550
480057006500
1.201.151.10
13.515.517.5
a Average weight for boys and girls at the mean age of the age group according to NCHS.b Based on the protein quality (amino acid content and digestibility) of eggs or milk.c Rounded to the nearest 0.05 or 0.5
World Health Organization (1985), Energy and protein requirements, Report of a Joint FAO/WHO/UNU ExpertConsultation, Technical Report Series 724, WHO, Geneva
6.5 Randomized number table
The randomized number table on the following two pages consist of the 5,000 digits zero to nine in random order.From the point of view of statistical accuracy, if such tables are used repeatedly they cannot be considered "random."However, for practical use in evaluating surveys they are quite sufficient. It is advisable to obtain a new set of randomnumbers from time to time to replace the old ones.
Statistical textbooks contain random number tables for determining random sequences. If you have such tablesavailable, these also can be used.
The digits in the tables may either be read from left to right or from top to bottom. When a row of numbers is finishedthen the next one down is taken. Similarly when using columns take the next one right. Assume that a randomlyselected number between one and five is required. Go arbitrarily to any position in the table and read right for the nextnumber between one and five. When you find such a number that is your randomly selected number. If you needanother such number then start one over from where you finished last time, no matter where in the group of digits thatmay be. If you want a number with two digits then the first digit is in the ten's place and the second in the unit's place.
Every time a new number is sought you should start immediately after the previous identified number.Therefore mark the last digit used each time with a pencil.
Table 12. Randomized numbers
0 1 2 3 4 5 6 7 8 9
0 59894 12161 60017 54948 45889 84002 53390 00386 09974 429421 36638 57682 82157 75236 15013 04478 24344 20134 03219 164222 18134 34678 81756 91082 64920 84396 86973 41828 01084 543353 08971 20750 47001 25140 82781 21128 91527 54397 37148 830534 77858 82288 15606 69731 64180 06684 59604 83386 85501 59111
5 28155 21474 24559 42851 68312 78638 07337 36209 88222 36321
Part 6: Appendice
http://www.nutrisurvey.de/baseline/part_6.htm (12 of 28) [13.04.2000 17:04:28]

6 64244 55237 79445 67676 38589 21596 69454 33332 62103 710107 84527 81383 39580 97882 34713 07567 62000 54562 99003 475278 60637 95417 01655 24389 47676 10846 51697 41868 89061 923049 67185 14448 65666 15129 98140 11435 56872 61624 75319 86429
10 84867 34444 48296 30314 46645 97312 00382 31990 19571 8755011 67726 35108 02092 28688 69855 67782 80856 44613 81416 2565212 22590 53549 53132 13576 89810 38804 12742 63263 07314 7735613 98256 69696 37975 65444 91969 15821 18313 52475 57442 4087114 96887 07346 22199 05775 38284 56418 68081 88167 57441 72314
15 41726 17042 84357 36789 87063 74298 77368 07509 20477 4442816 02478 79787 24505 04336 64329 36714 95953 99966 64670 9448217 60665 90351 47623 94771 38658 34888 61333 25702 77802 5566018 05633 69585 62760 46055 36368 64071 61925 66912 62756 6856919 23268 92767 23349 18108 97470 82625 53859 30831 57548 00430
20 75667 13924 93820 32535 71745 33648 88736 53869 94335 7307421 88723 45432 33459 09728 20055 91780 26544 40596 96749 3348822 52869 76944 33982 14236 44819 92626 63955 34411 10628 1104423 20472 60192 40431 48094 63991 69972 97926 94290 86854 2432524 27138 05002 16419 16862 38965 91742 62237 33525 05062 36222
25 01372 91112 38460 08183 54099 27957 22380 80641 00536 1837226 93123 34477 54515 71820 68076 48672 45203 52246 86073 3735527 03329 83243 40113 41306 39158 74316 78975 70461 96806 7855128 81932 57206 19496 65044 62464 85314 02335 82652 21065 9075129 57795 15755 01736 24770 53011 57617 35043 49201 60833 75054
30 71541 44832 57657 78895 58013 80311 90970 88068 67880 5231831 09450 88811 04243 20173 23783 86761 17666 44034 74815 7108432 17776 01586 41633 54126 68224 82168 26743 49436 77304 8275333 59654 06792 38986 91957 96697 33195 71024 20167 03048 6876934 48299 47003 14745 38254 19621 24271 49653 65723 17507 64233
35 80783 93479 41019 12446 65966 73456 62851 90802 86619 8030536 26589 39905 50295 52587 14356 22968 62598 39239 27332 6672537 40703 76909 23212 82165 03971 02166 18643 14031 60420 5382938 74702 66799 38493 41793 81902 88827 17551 04772 76847 6875539 66750 16069 61482 27006 33612 23763 08634 07805 68651 33737
40 61242 06100 76487 52698 89181 79142 87077 60174 62738 9412141 88168 86400 25680 03749 31223 02079 83426 75777 61584 5678142 69487 45373 65467 06945 41539 63272 12192 35054 52066 9031643 78180 88305 47987 29043 36868 98199 33931 03067 16052 7593644 36313 03238 96836 11401 12431 33405 68153 91732 60871 77374
45 41405 13690 42314 08362 76226 08231 15919 82774 43572 6270846 33185 14776 80559 08194 13535 01485 14233 94568 62409 8485347 79689 56567 08561 05145 55956 19365 47294 99096 69428 1708448 00113 02735 15268 03053 16466 75174 26704 45636 75908 9035149 68222 85394 92000 73983 76136 20113 89236 87045 82930 04874
50 62111 70722 57056 47585 00578 77467 07900 04571 15488 8324151 29928 39172 01938 39455 50717 87896 40990 83711 77947 0885152 30974 61120 76749 65525 33742 66239 67961 32244 35861 2306953 10049 04919 43742 05962 35709 77620 19039 75262 71003 8051054 16587 24521 78973 64749 05300 12098 29144 54273 54338 43210
55 70895 44988 61256 82653 85303 83948 47351 94740 66865 7857956 48472 84667 76880 00619 52843 04277 58294 56581 00253 72628
Part 6: Appendice
http://www.nutrisurvey.de/baseline/part_6.htm (13 of 28) [13.04.2000 17:04:28]

57 42529 79302 02240 79696 84366 42578 15240 67261 92166 2144458 27394 66619 67608 33847 59586 56855 86950 05393 57594 5238159 62415 83740 63241 17745 54207 27869 39010 11525 53274 84799
60 54532 44091 73936 09518 89543 58504 39431 56486 03832 6494661 78971 66966 80259 24884 06339 37323 14763 26180 20626 8757162 95032 43376 39938 20533 37634 29350 89984 68156 24941 0191963 65516 02756 61982 40975 85222 91496 08482 27210 84989 7430064 29970 10457 09977 25385 35707 01233 88818 31091 07100 49416
65 57984 18260 00511 28018 75217 03440 55231 85288 12683 6100166 63736 89304 45416 14741 36506 70550 97706 83552 18358 0256367 30916 19423 09633 53579 08788 44088 88278 02525 50545 6344968 51554 74283 76308 43434 76771 88946 26086 89791 26818 9026169 79340 81968 72766 49425 41586 51206 20675 14483 39131 47028
70 81685 11194 99495 28687 12385 03790 43830 52507 71625 8203171 66594 57141 67847 87676 48832 45372 52958 32789 09071 2685472 21445 83978 20693 78887 65156 22693 01957 89570 10880 2331173 90181 29051 28483 65332 41777 42892 14840 64637 91223 1231774 66669 35441 10416 77461 21342 68673 53101 27800 68670 15737
75 43396 48778 58343 44660 84910 80247 52922 92061 92823 8988376 89263 28259 46385 68675 79244 80185 60179 01706 19352 2059077 42769 81513 15432 39177 01788 74086 95010 32458 42006 4279578 33039 24721 14463 10998 11901 04946 10670 45655 32885 5611279 46153 53563 21084 29060 00647 81078 22411 23836 49568 98037
80 24264 62462 06936 81280 88554 63782 20191 13671 88837 5729781 92829 12186 63959 78781 08419 88129 61302 40327 43046 1713382 03871 31824 86163 47071 27718 33294 61583 07292 06049 4661583 50979 29404 46052 45405 31699 27667 29955 15782 55318 2962984 47755 17473 06336 14946 37813 45510 04863 58784 69084 12211
85 12258 74583 54811 22496 04953 92625 72800 14781 33974 6231286 46605 83284 22740 33859 64186 03284 18958 16192 57526 2237787 30395 70848 07873 65017 22859 65542 63883 49837 10588 2082088 73905 15889 75418 83779 20966 48399 68894 29540 93319 5682389 79202 07223 78401 29604 97469 27280 97388 98613 01872 55238
90 91147 39885 89998 72536 66987 57720 87624 27202 40171 6113291 21082 94493 55337 78026 33981 08379 49774 37766 98289 3485592 68775 15044 86329 70704 50754 99486 76101 93925 78272 1969793 22402 26521 77779 57262 03856 48537 72373 84189 48273 9740894 93273 84243 51177 05234 97835 96216 97046 19287 10932 09939
95 94033 66709 35126 49775 35020 63683 49408 27152 89896 0125496 08628 46815 05455 16317 23667 42309 71775 41364 21980 5314097 16929 21982 66287 88184 58914 18579 67526 10938 66656 9413898 58207 85243 45426 45711 46807 17143 24243 87845 98620 8028099 47124 77314 31839 99604 75720 95879 04290 14776 41652 44083
6.6 Sample presentations of survey findings in technical reports
The following pages give examples of the presentation of findings in technical reports. The results are presented asvividly as possible. As a rule, a technical report is also aimed at readers who are not nutritional experts. To accomplishthis, the text and presentation must be set out in such a manner that non-experts in the field are able to understand itscontents. Tables and graphs should be self-explanatory. Information in visual form in graphs can often be much more
Part 6: Appendice
http://www.nutrisurvey.de/baseline/part_6.htm (14 of 28) [13.04.2000 17:04:29]

informative and more readily understood than digital information given in tables. The following pages give someexamples of tables and graphs.
6.6.1 Tables
Table 13. Demographic and socioeconomic characteristics of two low income urban communities in Belo Horizonte,Brazil (1986).
Characteristic "Serra" "St. Lucia/VilaRita" Total
Families surveyedChildren < 6 years
Householdmembers:TotalEmployed1
Length ofresidence(years)
Living conditions:Brick houses (%)Bedrooms (n)Piped drinkingwater (%)Flushing toilets (%)Public garbagecollection (%)Electricityconnection (%)
80153
6.1±2.71.9±1.1*
12.0±9.0*
96.33.2±2.0*
45.023.316.392.5
60101
6.0±2.61.8±1.1*
8.5±7.3*
88.33.8±1.5*
76.725.016.798.3
140254
6.1±2.71.9±1.1*
10.5±9.0*
92.93.4±1.7*
58.624.316.595.0
1 Working: the number of members of the household who contribute financially to the household.* Mean and standard deviation
Table 14. Educational level of parents in the Morro Sul suburb of Rio de Janeiro (1986)
Educationallevel
Mother Father(n) (%) (n) (%)
No formaleducation(< 3 yearsschooling)3-5 yearsschooling(a)6-11 yearsschooling(b)> 11 yearseducationNo answer(c)
58
10287116-
22.1
38.632.94.22.2-
47
85948-
30
17.9
32.135.72.9-
11.4
(a) Primary schooling(b) Secondary schooling(c) Female headed households
Part 6: Appendice
http://www.nutrisurvey.de/baseline/part_6.htm (15 of 28) [13.04.2000 17:04:29]

Table 15. Prevalence of anemia among children in the two urban communities in Belo Horizonte (1986)
"Serra" "St. Lucia/VilaRita" Total children
(n) (%) (n) (%) (n) (%)Anemia(Hb <110.0 g/L)
Severeanemia(Hb < 0.95g/L)
Totalchildren
48
20
142
33.8
14.1
100.0
19
4
82
23.2
4.9
100.0
67
24
224
29.9
10.7
100.0
Table 16. Prevalence of undernutrition among children of the observed villages in West Sumatra (1994)
Village Height-for-agea Weight-for-heighta Weight-for-heightaGandoKotoBaru TBalaiGadangBadusMerapiPiliangBBatuTebalPadangLuar SLubukGadangSilayang
Allvillages
39.547.748.855.345.539.535.029.338.932.4
40.8
31.634.143.952.648.523.730.031.741.724.3
35.4
10.515.99.87.915.215.815.87.316.72.7
10.1
a Percentage of children who show a z-score lower than -2
Table 17. Relationship between anthropometric indices and age in under-five children of West Sumatra, Indonesia(1994)
Age(months)
Children(n)
Height-for-age(mean:
Z-score)Weight-for-height(mean: Z-score)
Weight-for-age(mean:
Z-score)<66-1212-1818-2424-36> 36
5466513969
108
-0.15±1.49-0.94±1.12-1.53±1.63-1.85±1.33-2.03±1.79-2.59±1.18
-0.15±1.84-0.76±1.08-0.88±1.45-1.19±1.32-0.59±1.21-0.54±1.04
-0.33±0.99-1.34±1.04-1.72±1.25-1.86±1.16-1.74±1.27-1.94±0.93
Part 6: Appendice
http://www.nutrisurvey.de/baseline/part_6.htm (16 of 28) [13.04.2000 17:04:29]

Table 18. Relationship between the presence of acute respiratory infections (ARI) and anthropometric indices inchildren under-five children of West Sumatra, Indonesia (1994)
ARI Children(n)
Height-for-age(mean: Z-score)
Weight-for-height(mean: Z-score)
YesNo
196182
-0.81±1.24a-0.44±1.40
-1.62±1.69-1.65±1.57
a p=0.003 ; corrected for village and age differences
6.6.2 Figures
Figure 13. Weight-for-height Z-scores of Indonesian children (N=168) from high-income families living in East-Jakarta(1994).
Figure 14. Frequency of body-mass-index of mothers from West-Kalimantan (1994)
Part 6: Appendice
http://www.nutrisurvey.de/baseline/part_6.htm (17 of 28) [13.04.2000 17:04:29]

6.7 Determination of intra- and inter observer errors.
Basically two types of errors can occur by taking anthropometric measurement of subjects during the survey:Occasional errors which happen at random because of wrong filling out of a form, incorrect reading of theweighing scale etc. These occasional errors sometimes can be detected afterwards because the measuredvalue does not appear to be logic or consistent with other data.
1.
Systematical errors, due to differences between measuring equipment or surveyors. These errors are oftendifficult to detect because they occur in every measurement. For example a weighing scale may underestimatea person’s weight with 0.5 kg at each measurement.
2.
Before starting the survey it is important to check whether systematic errors are likely to occur.
Therefore the quality of the equipment, and the performance of the surveyors needs to be examined. This can becarried out by using the methodology as described in the following example.
Example:
A survey which will be carried out in 15 villages plans to use 5 enumerators for weight measurements and 5 weighingscales. The 5 weighing scales and 5 enumerators should be compared, using 5-10 subjects. Weighing scales will benumbered W1 through W5, and enumerators will be numbered E1 through E5.
Part 6: Appendice
http://www.nutrisurvey.de/baseline/part_6.htm (18 of 28) [13.04.2000 17:04:29]

First, Enumerator 1 should weigh all subjects (S1- Sn) on weighing scale 1, E2 weighs all subjects on W2, E3 on W3and so forth. To ease the weighing process, the subject that has been weighed in from E1 will pass to E2, then to E3,until the last enumerator. In a second round, E1 will weigh again all subject now with W2, E2 with E3 and finally E5with E1. This process continues until all enumerators have weighed all subjects with all scales. Each enumerator fillsout the following form with the results of the weighing.
Enumerator 1
Subject W1 W2 W3 W4 W5
1 ...... kg ...... kg
2 ...... kg
3
n
The results will then be analyzed using analysis of variance (ANOVA) with weight as dependent variable, andweighing scale (1 to 5), enumerator (1 to 5), and subject (1 to n) as factors. No significant effect should exist forweighing scale and for enumerator, and there should also be no significant interaction between these two factors.
In case there will be a significant difference between weighing scales the faulty weighing scale should be identifiedand replaced. In case one of the enumerators should weigh differently from the others, the enumerators should betrained again in taking measurements.
6.8 Statistical methods
The diagram on the following page provides an overview of the most relevant statistical tests. Before selecting asuitable statistical test for analysis of data, it is necessary to first determine some of the characteristics of the data.
The more information contained in the output data, the more clearly three steps can be distinguished :Frequency: The data are of equal value (e.g. sex: male = 1, female = 2; or place of origin: South = 1, Central =2, North = 3).
1.
Ranking: The data have a rank order but the size of an interval cannot be assessed (e.g. educational level:None = 1, literate = 2, completed primary education = 3, completed secondary education = 4).
2.
Measurements: The data extend over a scale with constant intervals (e.g. height, weight, age, hemoglobinlevel).
3.
Furthermore, the data must be tested as to whether or not they fall within the normal range. Here, descriptivestatistics, such as skewness and kurtosis, are useful. Both values should lie between +2 and -2, indicating that thevalues fall with the range of normal.
Finally, the eventual selection of statistical methods depends on whether the statistics deal with only two factors (e.g.male-female, yes-no), or with more than two. Furthermore, the selection also depends on whether or not the data werecollected from the same subject (e.g. a measurement for the same individual is taken at a different time).
If these characteristics are clearly understood, the suitable statistical test can be selected from the following table.
Part 6: Appendice
http://www.nutrisurvey.de/baseline/part_6.htm (19 of 28) [13.04.2000 17:04:29]

Table 19. Important Statistical Tests
Frequency Ranking Measurement values
non-normaldistribution
normal distribution
Tests
for
2 factor
steps
independentsampling
Chi2-Test
Siegel-
Tutzey-Test
U-Test
Kolmogoroff
Smirnoff-Test
F-test
b-test
joint sampling
Tests forindications
Wilcoxon-Test
Spearman-Order CorrelationCoefficient
t-Test
Product-moment Correlation
Linear regression
Tests
for
> 2
factor
steps
independentsampling
Chi2-Test
H-test
Variance analysis
Student-Newman-Keuls-Test
joint sampling
Q-test
Friedman-Test
multiple comparison betweenWilcoxon and Wilcox
Variance analysis
Multi-various methods
For further guidance the following statistical handbook is recommended :
B.R. KirkwoodEssentials of Medical StatisticsBlackwell Scientific PublicationsOxford, London, Edinburgh
6.9 Addresses of national and international institutions
Scientific and technical institutions:Department of Health, Community Development and NutritionDeutsche Gesellschaft für Technische Zusammenarbeit GmbH (GTZ)PO Box 518065 726 EschbornGermany
Department of Human NutritionLondon School of Tropical Medicine and Hygiene.Keppel Street (Gower Street)London, WCIE 7 HTEngland
Department of Human NutritionAgriculture UniversityPostbus 81296700 EV WageningenNetherlands
Part 6: Appendice
http://www.nutrisurvey.de/baseline/part_6.htm (20 of 28) [13.04.2000 17:04:29]

Department of NutritionSchool of Hygiene and Public Health615 N. Wolfe StreetBaltimore, Maryland 21205USA.
Department of Tropical Paediatrics and International HealthLiverpool School of Tropical MedicinePembroke PlaceLiverpool, L3 SQAEngland
Division of Nutritional SciencesCornell UniversityIthaca, New York 14853-0001USA
Institute of Child HealthCentre for International Child Health30 Guilford StreetLondon, WC1N 1EHEngland
Institute of Food EconomyUniversity of KielOlshausenstr. 40D-24098 KielGermany
Instituto de Nutricion de Centro America y Panama (INCAP)Calzada Roosevelt Zona 11GuatemalaGuatemala, C.A.
International Food Policy Research Institute1776 Massachusetts Avenue, N.W.Washington, D.C. 20036USA.
Program in International NutritionDepartment of NutritionUniversity of CaliforniaDavis CA 95616 USA
SEAMEO-TROPMED Center for Community NutritionUniversity of IndonesiaJl Salemba Raya 6Jakarta 10430Indonesia
Multilateral organizations:United Nation Administration Committee on Coordination - Subcommittee on Nutrition (ACC/SCN)c/o World Health Organization20, Avenue ApplaCH-1211 Geneva 27Switzerland
Food and Agriculture Organization of the United Nations System (FAO)Food Policy and Nutritional Division,Via delle Terme di Caracalla
Part 6: Appendice
http://www.nutrisurvey.de/baseline/part_6.htm (21 of 28) [13.04.2000 17:04:29]

I - 00100 RomeItaly
and the following FAO regional sub-organizations:
Latin American regionRegional Office for Latin America and the Caribbean (RLAC)Avda. Santa Maria 6700SantiagoChile
African regionRegional Office for Africa (RAFR)PO Box 1628AccraGhana
Asian regionRegional Office for Asia and the Pacific (RAPA)Maliwan MansionPhra Atit RoadBangkok 10200Thailand
World Health Organization (WHO)Nutrition Unit20, Avenue AppiaCH-1211 Geneva 27Switzerland
and the following WHO regional sub-organizations:
American regionRegional Officer on NutritionPan-American Health Organization (PAHO)525 Twenty-Third Street, N.W.Washington, D.C. 20037-2895USA
Northern African regionRegional Nutritional AdvisorWHO/EMROP.O. Box 1517Alexandria 21511Arab Republic of Egypt
Africa, south of the SaharaRegional Nutritional AdvisorWorld Health Organization/AFRORegional Office for AfricaBoite Postale 6BrazzavilleCongo
Southern and Southeast Asian regionRegional Advisor in NutritionWorld Health OrganizationRegional Office for South East Asia
Part 6: Appendice
http://www.nutrisurvey.de/baseline/part_6.htm (22 of 28) [13.04.2000 17:04:29]

World Health HouseIndraprastha EstateMahatma Gandhi MargNew Delhi - 110 002India
Pacific regionWHO/WPROUnited Nations AvenueP.O. Box 293212115 ManillaPhilippines
European regionWHO/European Office for Europe8 ScherfigsvejDK-2100 Copenhagen 0Denmark
United Nations Children's Fund (UNICEF)UNICEF House3 United Nations PlazaNew York, N.Y. 10017USA
and its regional sub-organizations
American regionUNICEF Americas and Caribbean OfficeApartado Aereo 7555BogotaColumbia
Northern African and Middle East regionUNICEF Middle East and North Africa Regional OfficeP.O. Box 811 721AmmanJordan
Western and Central African regionUNICEF West and Central Africa Regional OfficeBoite Postale 443Abidjan 04Ivory Coast
Eastern and Southern African regionUNICEF Eastern and Southern Africa Regional OfficeP.O. Box 44145NairobiKenya
South Central Asian regionUNICEF Regional Office for South Central Asia73 Lodi EstateNew Delhi 110 003India
Southern and Eastern Asian regionUNICEF East Asia and Pakistan Regional Office
Part 6: Appendice
http://www.nutrisurvey.de/baseline/part_6.htm (23 of 28) [13.04.2000 17:04:29]

P.O. Box 2-154Bangkok 10200Thailand
World Food Programme (WFP)Via CristoforoColombo, 426I-00145 RomeItaly
United Nations Development Programme (UNDP)One New York PlazaNew York, N.Y. 10017USA
United Nations High Commissioner for Refugees (UNHCR)Center William Rappard154, Rue de LausanneCH-1202 GenevaSwitzerland
United Nations Education and Culture Organization (UNESCO)7, Place de FontenoyF-75700 ParisFrance
International Found for Agriculture Development (IFAD)Via del Serafico 107I-00142 RomeItaly
The World BankPopulation, Health and Nutrition Department1818 H Street N.W.Washington, D.C. 20433USA
and regional development banks, such as Asian Development BankP.O. Box 789ManilaPhilippines
African Development Bank01 P.O. Box 1387AbidjanIvory Coast
Bilateral Organizations:AustraliaAIDABG.P.O. Box 887Canberra A.C.T.Australia 2601
CanadaCanadian International Development Authority (CIDA)
Part 6: Appendice
http://www.nutrisurvey.de/baseline/part_6.htm (24 of 28) [13.04.2000 17:04:29]

Place du Centre200 Promenade du PortageHull, Quebec, K1A 0G4
DenmarkMinistry of Foreign AffairsQ. AsiatiskTLADSDK 1448 Copenhagen
GermanyMinistry of Economic Cooperation and DevelopmentFriedrich-Ebert-Allee 114-116D- 53113 BonnGermany
ItalyDepartment of Development CooperationMinistry of Foreign AffairsI-00100 Rom
NorwayNutritional Consultantc/o HEFARoyal Norwegian Ministry of Development CooperationP.O. Box 8142N-033 Oslo 1
SwedenSwedish International Development Agency (SIDA)Birger Jarlsgatan 61S-10525 Stockholm
The NetherlandsCoordinator of Food and NutritionMinistry of Foreign AffairsBureau DST/Pl( a)P.O. Box 20061NL-2500 EB Den Haag
United KingdomThe SecretaryOverseas Development Association (ODA)1 Stag PlaceLondon SW1 5DHEngland
United States of AmericaDirector of NutritionAgency of International Development (USAID)Department of State23 and C Street, N.W.Washington, D.C. 20001
Non-governmental organizations:American Public Health Association (APHA)Cleaning House of Infant Feeding and Maternal Nutrition1015 15th Street N.W.Washington, D.C. 20005USA
Part 6: Appendice
http://www.nutrisurvey.de/baseline/part_6.htm (25 of 28) [13.04.2000 17:04:29]

AMREFP.O. Box 30125NairobiKenya
Médecins Sans Frontières FranceDépartment Médical8, rue Saint-SabinF-7544 Paris Cedex 11France
OXFAMMedical Unit274 Banbury RoadOxford OX2 70ZEngland
Save the Children54 Wilton RoadWestport, CT 06880USA
6.10 WHO global database on child growth
Description:
Growth assessment is the best single measure for defining the health and nutritional status of children, while servingas an indirect indicator of the quality of life of entire populations. The goal of reducing, by the year 2000, severe andmoderate protein-energy malnutrition in children under five years of age by half of 1990 prevalence levels has beenendorsed in numerous international forums. The WHO Global Database on Child Growth, which is a standardizedcompilation of anthropometric data from population-based nutritional surveys conducted around the world from 1960onwards, permits monitoring progress towards achieving this goal. The aim is to describe the worldwide distribution ofchild growth failure, to provide an accurate picture of child growth as a basis for intercountry and interregionalcomparisons, and to facilitate monitoring of national, regional and global trends. The standardized presentation of databy country in the database includes: a) systematic use of the NCHS/WHO international reference population, b)display of growth retardation prevalences for preschool children, as measured by the proportion of weight-for-age(underweight), height-for-age (stunting) and weight-for-height (wasting) below -2 (moderate) and -3 (severe) standarddeviations (SD) from the median of the reference population, c) display of the prevalence of overweight, as measuredby the proportion of children with weight-for-height above +2 SD, d) display of Z-score means and SD for the threeindices, and e) stratification of the results according to age, sex, region, and rural/urban. This detailed account of dataon child malnutrition will be relevant to national authorities in planning and evaluating nutrition interventions; it will alsoserve as a baseline for child nutritional status worldwide for all who are concerned with protecting and promotingoptimal child growth. It is hoped that continual updating of the database will stimulate the gathering and sharing of newinformation, particularly in those countries and regions thus far scarcely investigated. At present the database coversover 80% of the total population of under-5-year-olds worldwide.
Source:
WHO programme information derived from population-based nutritional surveys.
Notes on usage:
Queries are received via all forms of communication. Responses are dispatched as print-outs of the relevant countrydata/references. Dissemination via WHO/LAN is being implemented.
Responsible Unit:
Please address any comments or suggestions concerning the contents to:
Part 6: Appendice
http://www.nutrisurvey.de/baseline/part_6.htm (26 of 28) [13.04.2000 17:04:29]

Nutrition UnitWHO Telephone: (+41 22) 791 332020 Avenue Appia Fax: (+41 22) 791 0746CH-1211 Geneva 27 E-mail: [email protected] [email protected]
Download File (Winword 6.0 Format)
6.11 Construction plan for an anthropometer
6.12 Literature for further study
Beaton G, Kelly A, Kevany J, Martorell R, & Mason J. Appropriate uses of child anthropometry. ACC/SCN (SOA No.7).Geneva, Switzerland, 1990.
Beghin I, Cap M, & Dujardin B. A guide to nutritional assessment. WHO. Geneva, Switzerland, 1988.
Bennet S, Woods T, Liyanange WM, & Smith DL. A simplified general method for cluster-sample surveys of health indeveloping countries. Rapp trimest statist sanit mond 1991; 44:98-106.
Cameron N. The measurement of human growth. Croom Helm Ltd., Provident House, Burrell Row, Beckenham, Kent,UK, 1984.
Center for Disease Control and Health Service Administration. Weighing and measuring children: a training manual forsupervisory personnel. Center for Disease Control, Atlanta, Georgia, USA, 1980.
Council for International Organizations of Medical Sciences (CIOMS). International guidelines for ethical review ofepidemiological studies. Geneva, Switzerland, 1991.
Fink A & Kosecoff J. How to conduct surveys. Step-by-step guide. Ninth printing. Sage Publications. Newbury Park,London, UK; New Delhi, India, 1991.
FAO. Conducting small-scale nutrition surveys. A field manual. Nutrition in Agriculture No. 5. Food and AgriulturalOrganization of the United Nations. Rome, 1990.
Fowler FJ. Survey research methods. Saga Publications. New York, USA, 1984.
Gibson RS. Principles of nutritional assessment. Oxford University Press. Oxford, New York, Tokyo, 1990.
den Hartog AP & van Staveren WA. Manual for social surveys on food habits and consumption in developingcountries. Pudoc. Wageningen, The Netherlands, 1983.
Hendrata L & Johnston M. Manual for community based under-fives weighing programme. Yayasan IndonesiaSejahtera, Jakarta, Indonesia, 1978.
Jelliffe DB. Paediatrics in the tropics. Teaching Aids at Low Costs. TALC. St. Albans, UK, 1985.
Jelliffe DB. The assessment of nutritional status of the community. WHO. Geneva, Switzerland, 1966.
Jelliffe DB. Community nutritional assessment. Oxford University Press. Oxford, New York, Tokyo, 1989.
Jennings J, Gillespie S, Mason J, Lofti M, & Scialfa T. Managing successful nutrition programmes. ACC/SCN (SOANo.8). Geneva, Switzerland, 1991.
Katz J. Sample-size implications for population-based cluster surveys of nutritional status. Am J Clin Nutr. 1995;61:155-160.
Part 6: Appendice
http://www.nutrisurvey.de/baseline/part_6.htm (27 of 28) [13.04.2000 17:04:29]

Kirkwood BR. Essentials of medical statistics. Blackwell Scientific Publications. Oxford, London, Edinburgh, UK, 1988.
List B. Ernährungsaspekte in der ländlichen Entwicklung. 2. Auflage, DSE & GTZ. Feldafing, Eschborn, Germany,1988.
Lohmann TG, Roche AF, & Martorell R. Anthropometric standardization reference manual. Abridged edition. HumanKinetics Books. Campaign, Illinois, USA, 988.
Lwanga SK & Lemeshow S. Sample size determination in health studies - a practical manual. WHO. Geneva,Switzerland, 1991.
Martorell R. Nutrition and health status indicators. LSMS Working Paper Series No. 13, The World Bank. Washington,USA, 1982.
Médecins Sans Frontières. Nutrition Guidelines. 1st edition. Paris, 1995
Morley D & Woodland M. See how they grow: monitoring child growth for appropriate health care in developingcountries. Oxford University Press. Oxford, New York, Tokyo, 1979.
Sahn DE, Lockwood R, & Scrimshaw NS. Methods for the evaluation of the impact of food and nutrition programmes.The United Nations University. Tokyo, Japan, 1984.
Scrimshaw S and Hutardo. Rapid Assessment Procedures for Nutrition and Primary Health Care. The United NationsUniversity. Tokyo, Japan, 1987.
Sichert W, Oltersdorf U, Winzen U, & Leitzmann C. Ernährungs-Erhebungs-Methoden. Schriftenreihe derErnährungsverhalten e.V., Band 4, Beiheft der Zeitschrift Ernährungs-Umschau, Umschau-Verlag. Frankfurt am Main,Germany, 1984.
Mith PG & Morrow RH. Methods for field trials of Interventions against tropical diseases: a 'toolbox.' Oxford UniversityPress. Oxford, New York, Tokyo, 1993.
Tinibu A. Weight charting and its significance in child health. University of North Carolina, African Health SchoolingInstitutions Project. Chapel Hill, USA, 1978.
United Nations. How to weigh and measure children. National Household Survey Capability Programme. New York,USA, 1986.
Vaughan JP & Morrow RH. Manual of epidemiology for district health management. WHO. Geneva, Switzerland, 1989.
Werner D. Helping health workers learn: a book of methods, aids and ideas for instructions at the village level.Hesperian Foundation. Palo Alto, USA, 1982.
World Health Organization. Growth charts and home based child's records in maternal and child health care. Anappropriate approach and reference manual for their evaluation. Geneva, Switzerland, 1978.
World Health Organization. Guidelines for training community health workers in nutrition. Publication No. 59, 2. edition.Geneva, Switzerland, 1986.
World Health Organization. Measuring change in nutritional status. Geneva, Switzerland, 1983.
World Health Organization. Training modules for household surveys on health and nutrition. Geneva, Switzerland,1988.
World Health Organization. Indicators for assessing breast-feeding practices. WHO/CDD/SER/91.14. Geneva,Switzerland, 1991.
World Health Organization. Physical status: the use and interpretation of anthropometry. Report of a WHO ExpertCommittee. WHO Technical Report Series 854. Geneva, Switzerland, 1995.
Part 6: Appendice
http://www.nutrisurvey.de/baseline/part_6.htm (28 of 28) [13.04.2000 17:04:29]