Embed Size (px)
Citation preview
SMRC 3-bin FOGO Trial Scorecard
Prepared for: Southern Metropolitan Region Council
Prepared by: Catalyse Pty Ltd
May 2018
© Copyright CATALYSE® Pty Ltd 2018
Table of Contents
Executive Summary 3
The study 7
Perceived importance and effectiveness of waste management processes 10
FOGO Trial Waste Behaviour 13
Performance of waste services during the 3-bin FOGO trial 26
Effectiveness of the FOGO Trial 32
Support for continuing the FOGO Trial 35
3-Bin FOGO Trial Communications 40
Willingness to pay for a 3 bin system 45
2
Executive Summary

Executive Summary | Overall Performance
4
Overall, the 3 bin FOGO trial appears to have been well supported.
• 1,952 residents completed a scorecard to evaluate the 3-bin FOGO Trial.
• 79% of residents would like the service to continue.
Residents are happy with FOGO and recycling bins
• 94% of residents rate weekly FOGO collections positively.
• 87% of residents rate the kitchen caddy positively
• 80% of residents rate the compostable kitchen caddy liners positively.
• 85% of residents rate fortnightly recycling collections positively.
Most make good bin choices:
• 93% choose their FOGO bin for food waste
• 97% choose their FOGO bin for garden waste
• 87% would put disposable nappies in the general waste bin (red lid)
Key messages are cutting through. The main reasons for wanting the FOGO trial to continue are that it reduces landfill, protects the
environment, increases recycling and converts more waste to compost.
32% of residents would be willing to pay for the continued provision of a FOGO bin.
• The most popular amount is $12 per year, followed by $25 per year.
• However, there is some price sensitivity. Few would be willing to pay for additional waste services, in particular a second 140L general
rubbish bin, a contribution to a community education and communications program, or a larger 240L general rubbish bin.
The main reasons for not wanting the 3-bin FOGO service to continue was that fortnightly collection of general waste is not enough, the
organics bin and the un-emptied general waste create odours, and the general waste bin is too small.
• 31% of respondents provided a low rating for the general waste collections (red lid)
• The #1suggestion for improving the 3-bin FOGO service was to introduce weekly collection of general waste bins.
In April 2018, 1,952 residents completed a survey to
evaluate community perceptions of the 3-bin Food
Organic Garden Organic (FOGO) Trial being carried
out in selected areas in the City of Melville.
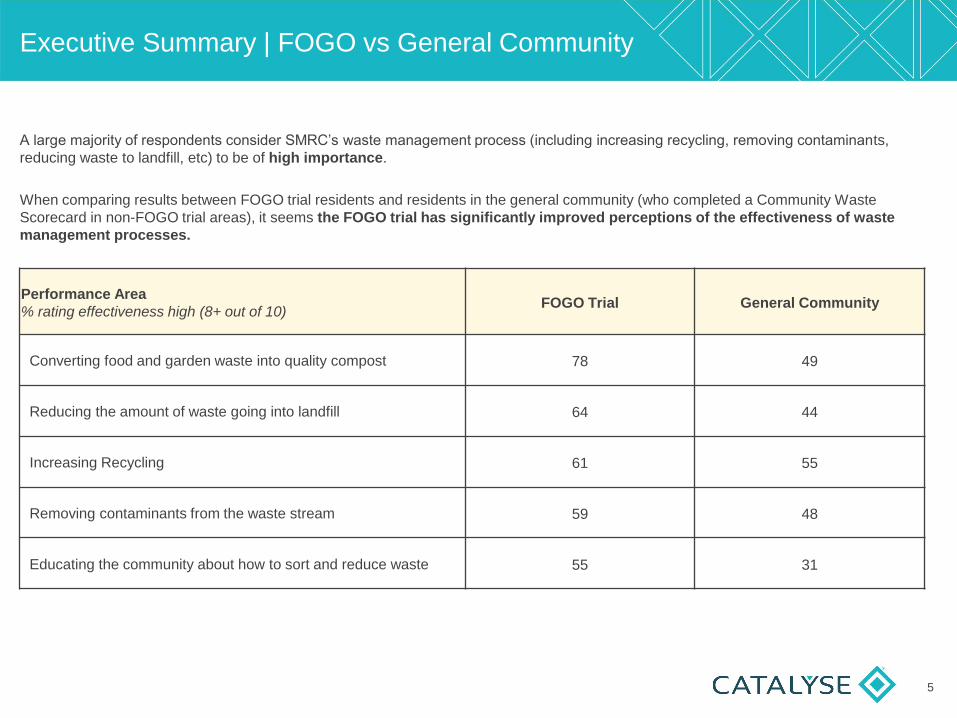
A large majority of respondents consider SMRC’s waste management process (including increasing recycling, removing contaminants,
reducing waste to landfill, etc) to be of high importance.
When comparing results between FOGO trial residents and residents in the general community (who completed a Community Waste
Scorecard in non-FOGO trial areas), it seems the FOGO trial has significantly improved perceptions of the effectiveness of waste
management processes.
Executive Summary | FOGO vs General Community
Performance Area
% rating effectiveness high (8+ out of 10) FOGO Trial General Community
Converting food and garden waste into quality compost 78 49
Reducing the amount of waste going into landfill 64 44
Increasing Recycling 61 55
Removing contaminants from the waste stream 59 48
Educating the community about how to sort and reduce waste 55 31
5

80% of residents feel that the information they received about the 3-bin FOGO trial was just right.
The 3-bin FOGO guide was perceived to be the most valuable resource, followed closely by the 3-bin FOGO waste calendar then direct
mail (i.e. letters and flyers). These resources had good reach and were highly regarded.
The main suggestions to improve communication and education were to provide a more comprehensive list of what can be recycled and
which bins to use for different items. Residents are confused about which bins to use:
• 30% use their general waste bin (red lid) for non-rinsed bottles and containers
• 18% put broken glass in their general waste bin (red lid)
• 19% put plastic bags in their recycling bin (yellow lid)
• 15% and 6% choose to put electronic waste in their general waste bin (red lid) and recycling bin (yellow lid), respectively
• 18% and 4% choose to put household batteries in their general waste bin (red lid) and recycling bin (yellow lid), respectively
Communication is needed to encourage people to reduce waste:
• Use reusable shopping bags (adoption rate = 74%)
• Put a ‘no junk mail’ sticker on their letterbox (adoption rate = 37%)
• Compost at home (adoption rate = 26%)
• Buy goods in bulk (adoption rate = 23%)
Communication will also help raise awareness about the option to upsize to a free 360L recycling bin (59% aware).
Executive Summary | Communication and Education
6
The Study
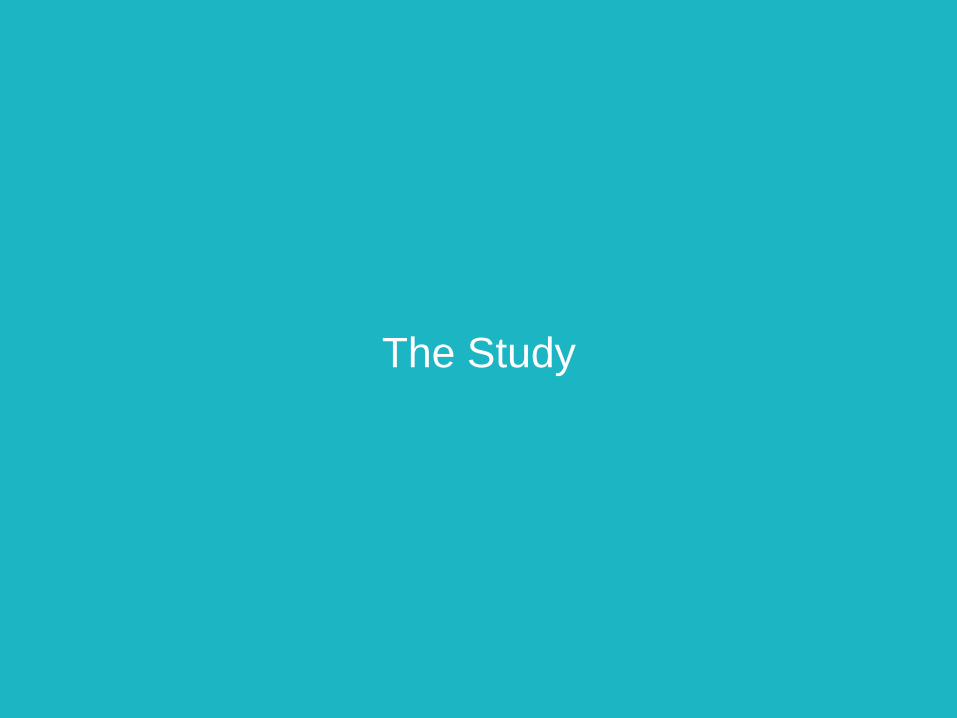
In total, 1,952 residents completed a survey, representing
a strong response rate of 30% and minimising the sampling
error to ±1.87% at the 95% confidence interval.
Data has been analysed using SPSS. Where sub-totals
add to ±1% of the parts, this is due to rounding errors to
zero decimal places.
Introduction and methodology
Image credit: http://smrc.com.au/3-bin-food-organics-garden-organics-trial/
In April 2018, the SMRC conducted a survey to evaluate community perceptions of the 3-bin Food Organic Garden Organic
(FOGO) Trial being carried out in selected areas in the City of Melville.
Surveys were mailed out to all City of Melville households in the 3-bin FOGO Trial area (n=6,698 households). Residents had
an option to complete the survey in hard copy and return using reply mail, or to submit their response online. 79% of
respondents opted to return the survey in hard copy and 21% chose to submit their response online.
8
23
10
19
26
17
1
4
84
14
21
50
7
15
2
1
1
1
Bicton
Brentwood
Bull Creek
Mt Pleasant
Willagee
Other
No response
Home owner
Renting / other
Stand-alone house onlarger lot (1000+ sqm)Stand-alone house onmedium lot (500 sqm)
Stand-alone house onsmaller lot (250-300 sqm)
Single level duplex / villa /unit
Townhouse
Apartment
Retirement / village
Other
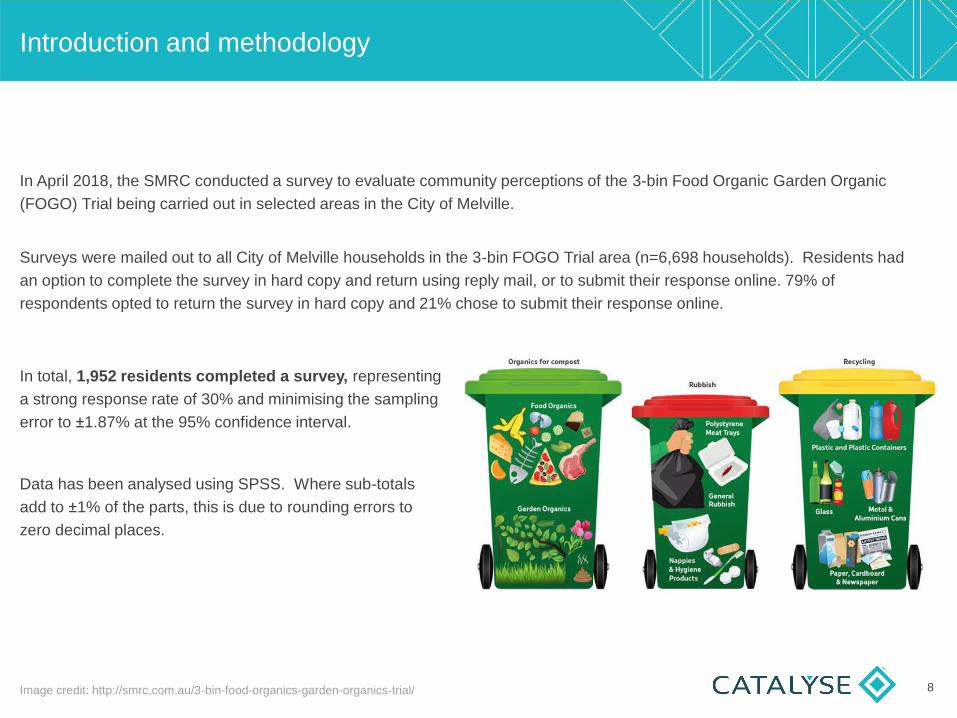
Sample Profile
33
61
5
2
16
26
33
23
14
13
10
16
56
Male
Female
Answered together
18 - 24 years
25 - 39 years
40-54 years
55-69 years
70+ years
0-5 years
6-12 years
13-17 years
18+ years
None
% of respondents
18
36
15
20
6
2
3
96
2
1
1
1
2
3
4
5
6+
No response
Survey in mail
Local councilpromotion
Family / friends
Social media(Facebook, etc)
Number of
occupants
Source of
information
Gender
Age
Age of
children
living at
home
Dwelling
Type
Suburb
Home
ownership
9
Perceived importance of
waste management processes

Importance of waste management processes
Q. How important do you think it is to:
Base: FOGO residents, excludes ‘unsure’ and ‘no response’ (n = varies) 11
FOGO trial residents believe it is very important to increase recycling, remove contaminants, reduce waste going to landfill and to
provide drop off facilities for bulky and hazardous items. This is closely followed by correctly sorting and separating waste and
community education.
Although separating garden and food waste for compost received the lowest importance rating, it is still perceived as highly
important by 78% of respondents and 81% think building W2E plants is of high importance.
90
90
89
88
85
85
81
78
8
8
8
9
11
11
15
14
2
2
3
3
4
4
4
8
Increase recycling
Remove contaminants from the waste stream, such as paintand batteries
Reduce the amount of waste going into landfill
Provide drop off facilities for bulky and hazardous items
Correctly sort and separate items so that they can berecycled
Educate the community about how to sort and reduce waste
Build ‘Waste to Energy’ plants, where waste that can’t be recycled is incinerated to produce electricity
Separate garden and food waste so that it can be convertedinto compost or mulch
High (8-10) Moderate (5-7) Low (0-4)
Waste management processes | perceived importance % of respondents
Importance of waste management processes High rating comparisons
All
respondents
Bic
ton
Bre
ntw
ood
Bull
Cre
ek
Mt
Ple
asant
Will
agee
Male
Fem
ale
18-3
9 y
ears
40-5
4 y
ears
55-6
9 y
ears
70+
years
Child
ren 0
-5
Child
ren 6
-12
Child
ren 1
3-1
7
Child
ren 1
8+
No c
hild
ren a
t hom
e
LO
TE
Dis
abili
ty
Ow
n
Rent / oth
er
Larg
e lot
Mediu
m lot
Sm
all
lot
Duple
x / v
illa /
unit
Tow
nhouse
Apart
ment
Retire
ment hom
e
1 r
esid
ent
2 r
esid
ents
3 r
esid
ents
4 r
esid
ents
5+
resid
ents
Increase recycling 90 89 92 89 89 92 86 91 90 88 91 90 90 88 86 91 90 90 82 90 90 90 89 93 90 93 79 100 91 90 89 89 90
Remove contaminants from the
waste stream 90 91 92 90 89 90 86 92 85 88 92 94 85 85 89 91 91 88 90 89 94 89 90 88 93 87 85 100 93 91 89 87 88
Reduce landfill 89 89 90 89 87 92 83 92 88 86 91 91 87 82 86 91 90 88 84 89 92 89 89 90 91 87 89 89 91 90 90 87 86
Drop off facilities for bulky and
hazardous items 88 91 92 89 86 87 86 90 86 85 91 90 85 84 86 90 89 87 84 88 90 89 87 91 92 87 79 88 89 89 88 86 88
Correctly sort and separate items for
recycling 85 83 88 85 83 87 77 88 83 80 88 88 82 80 80 86 87 85 80 84 87 83 84 86 88 89 85 100 88 86 84 83 78
Educate the community about how to
sort and reduce waste 85 84 89 86 84 87 78 89 83 81 87 90 81 81 77 87 87 85 82 85 89 84 84 88 90 82 84 89 88 86 83 84 79
‘Waste to Energy’ plants 81 79 87 82 79 83 74 84 75 76 84 88 74 78 76 82 84 79 81 81 83 80 79 80 88 88 68 100 87 82 75 79 78
Separate garden and food waste 78 76 80 79 77 79 70 81 71 71 83 86 71 71 73 80 81 78 74 78 80 79 76 80 85 80 70 78 85 79 77 74 71
Q. How important do you think it is to:
Base: FOGO residents, excludes ‘unsure’ and ‘no response’ (n = varies) 12
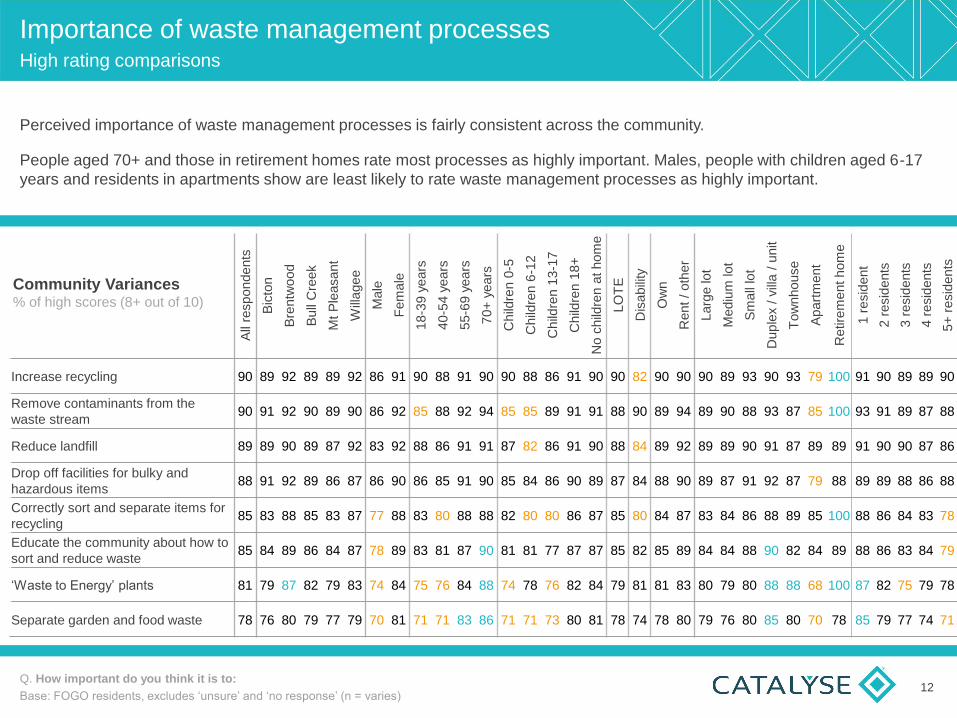
Perceived importance of waste management processes is fairly consistent across the community.
People aged 70+ and those in retirement homes rate most processes as highly important. Males, people with children aged 6-17
years and residents in apartments show are least likely to rate waste management processes as highly important.
Community Variances % of high scores (8+ out of 10)
FOGO Trial Waste Behaviour
Number and type of household bins
Q. How many of these bins do you have at your home?
Base: FOGO residents (n = 1952) 14
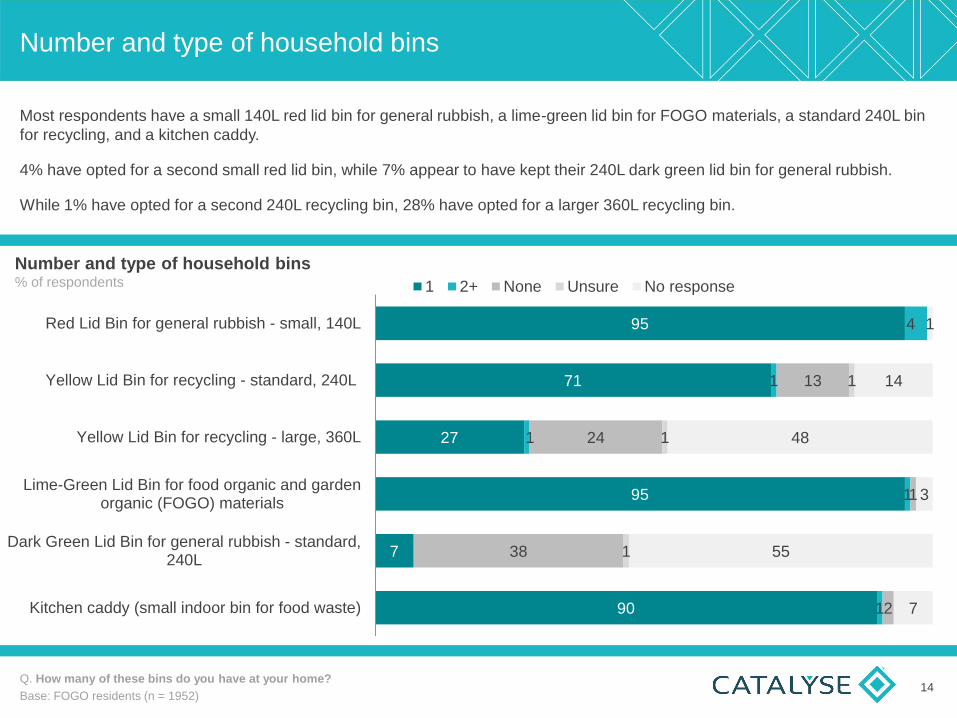
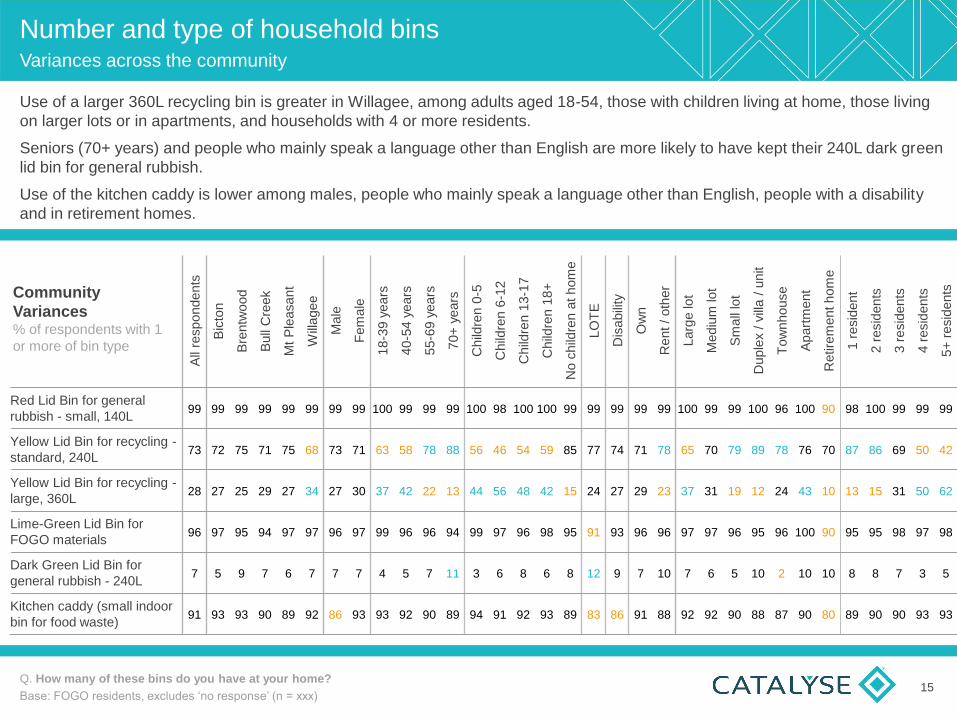
Most respondents have a small 140L red lid bin for general rubbish, a lime-green lid bin for FOGO materials, a standard 240L bin
for recycling, and a kitchen caddy.
4% have opted for a second small red lid bin, while 7% appear to have kept their 240L dark green lid bin for general rubbish.
While 1% have opted for a second 240L recycling bin, 28% have opted for a larger 360L recycling bin.
95
71
27
95
7
90
4
1
1
1
1
13
24
1
38
2
1
1
1
1
14
48
3
55
7
Red Lid Bin for general rubbish - small, 140L
Yellow Lid Bin for recycling - standard, 240L
Yellow Lid Bin for recycling - large, 360L
Lime-Green Lid Bin for food organic and gardenorganic (FOGO) materials
Dark Green Lid Bin for general rubbish - standard,240L
Kitchen caddy (small indoor bin for food waste)
1 2+ None Unsure No response
Number and type of household bins % of respondents
Number and type of household bins Variances across the community
All
respondents
Bic
ton
Bre
ntw
ood
Bull
Cre
ek
Mt
Ple
asant
Will
agee
Male
Fem
ale
18
-39 y
ears
40
-54 y
ears
55-6
9 y
ears
70+
years
Child
ren 0
-5
Child
ren 6
-12
Child
ren 1
3-1
7
Child
ren 1
8+
No c
hild
ren a
t hom
e
LO
TE
Dis
abili
ty
Ow
n
Rent / oth
er
Larg
e lot
Mediu
m lot
Sm
all
lot
Duple
x / v
illa /
unit
Tow
nhouse
Apart
ment
Retire
ment hom
e
1 r
esid
ent
2 r
esid
ents
3 r
esid
ents
4 r
esid
ents
5+
resid
ents
Red Lid Bin for general
rubbish - small, 140L 99 99 99 99 99 99 99 99 100 99 99 99 100 98 100 100 99 99 99 99 99 100 99 99 100 96 100 90 98 100 99 99 99
Yellow Lid Bin for recycling -
standard, 240L 73 72 75 71 75 68 73 71 63 58 78 88 56 46 54 59 85 77 74 71 78 65 70 79 89 78 76 70 87 86 69 50 42
Yellow Lid Bin for recycling -
large, 360L 28 27 25 29 27 34 27 30 37 42 22 13 44 56 48 42 15 24 27 29 23 37 31 19 12 24 43 10 13 15 31 50 62
Lime-Green Lid Bin for
FOGO materials 96 97 95 94 97 97 96 97 99 96 96 94 99 97 96 98 95 91 93 96 96 97 97 96 95 96 100 90 95 95 98 97 98
Dark Green Lid Bin for
general rubbish - 240L 7 5 9 7 6 7 7 7 4 5 7 11 3 6 8 6 8 12 9 7 10 7 6 5 10 2 10 10 8 8 7 3 5
Kitchen caddy (small indoor
bin for food waste) 91 93 93 90 89 92 86 93 93 92 90 89 94 91 92 93 89 83 86 91 88 92 92 90 88 87 90 80 89 90 90 93 93
Q. How many of these bins do you have at your home?
Base: FOGO residents, excludes ‘no response’ (n = xxx) 15
Use of a larger 360L recycling bin is greater in Willagee, among adults aged 18-54, those with children living at home, those living
on larger lots or in apartments, and households with 4 or more residents.
Seniors (70+ years) and people who mainly speak a language other than English are more likely to have kept their 240L dark green
lid bin for general rubbish.
Use of the kitchen caddy is lower among males, people who mainly speak a language other than English, people with a disability
and in retirement homes.
Community
Variances % of respondents with 1
or more of bin type
59
2
38
100
Awareness of free 360 litre recycling bin
16
Variances across the community % aware
Q. Were you aware residents can get a large 360 litre recycling bin free of charge as part of the 3-bin FOGO trial?
Base: FOGO residents, excludes ‘no response’ (n = 1952)
Awareness | FOGO trial free 360L recycling bin % of respondents
Aware Unaware
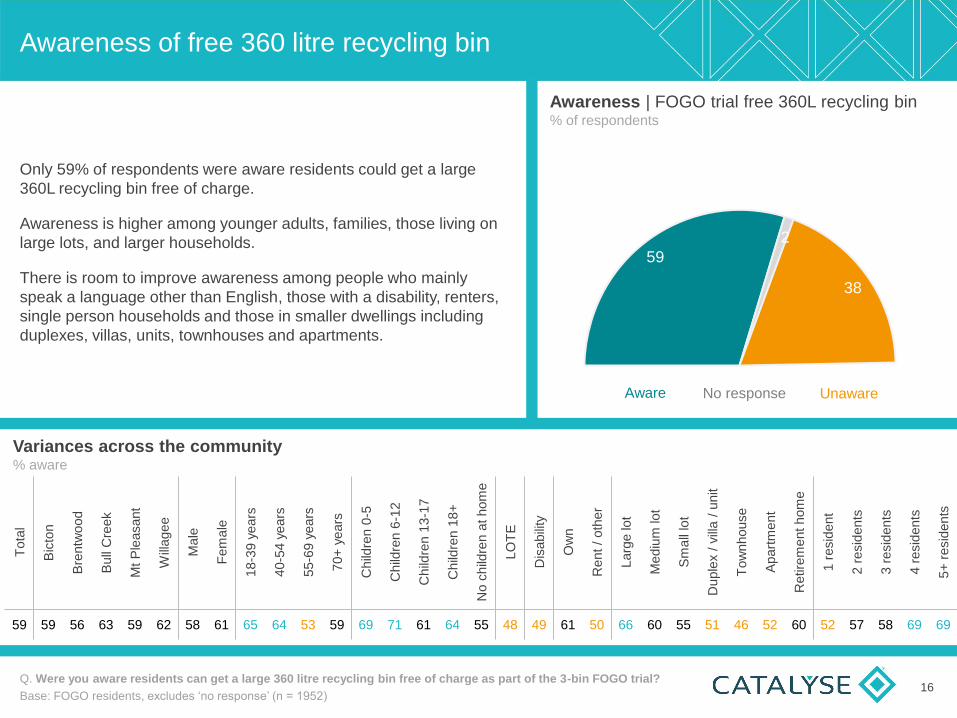
Only 59% of respondents were aware residents could get a large
360L recycling bin free of charge.
Awareness is higher among younger adults, families, those living on
large lots, and larger households.
There is room to improve awareness among people who mainly
speak a language other than English, those with a disability, renters,
single person households and those in smaller dwellings including
duplexes, villas, units, townhouses and apartments.
Tota
l
Bic
ton
Bre
ntw
ood
Bull
Cre
ek
Mt
Ple
asant
Will
agee
Male
Fem
ale
18-3
9 y
ears
40-5
4 y
ears
55-6
9 y
ears
70+
years
Child
ren 0
-5
Ch
ildre
n 6
-12
Child
ren 1
3-1
7
Child
ren 1
8+
No c
hild
ren a
t hom
e
LO
TE
Dis
abili
ty
Ow
n
Rent / oth
er
Larg
e lot
Mediu
m lot
Sm
all
lot
Duple
x / v
illa /
unit
Tow
nhouse
Apart
ment
Retire
ment hom
e
1 r
esid
ent
2 r
esid
ents
3 r
esid
ents
4 r
esid
ents
5+
resid
ents
59 59 56 63 59 62 58 61 65 64 53 59 69 71 61 64 55 48 49 61 50 66 60 55 51 46 52 60 52 57 58 69 69
No response
Waste disposal choice | food waste
17 Q. Which bins would you use for the following items?
Base: FOGO residents, excludes ‘no response’ (n = 1927)
Waste disposal choice | food waste % of respondents
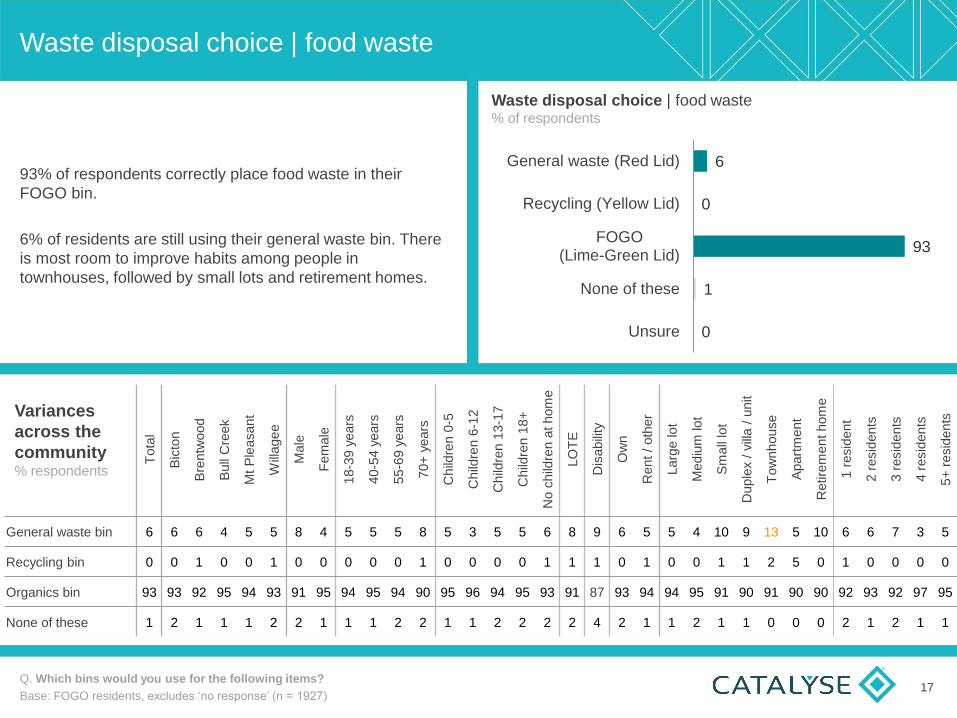
93% of respondents correctly place food waste in their
FOGO bin.
6% of residents are still using their general waste bin. There
is most room to improve habits among people in
townhouses, followed by small lots and retirement homes.
6
0
93
1
0
General waste (Red Lid)
Recycling (Yellow Lid)
FOGO(Lime-Green Lid)
None of these
Unsure
Tota
l
Bic
ton
Bre
ntw
ood
Bull
Cre
ek
Mt
Ple
asant
Will
agee
Male
Fem
ale
18-3
9 y
ears
40-5
4 y
ears
55-6
9 y
ears
70+
years
Child
ren 0
-5
Child
ren 6
-12
Child
ren 1
3-1
7
Child
ren 1
8+
No c
hild
ren a
t hom
e
LO
TE
Dis
abili
ty
Ow
n
Rent
/ oth
er
Larg
e lot
Mediu
m lot
Sm
all
lot
Duple
x / v
illa /
unit
Tow
nhouse
Apart
ment
Retire
ment hom
e
1 r
esid
ent
2 r
esid
ents
3 r
esid
ents
4 r
esid
ents
5+
resid
ents
General waste bin 6 6 6 4 5 5 8 4 5 5 5 8 5 3 5 5 6 8 9 6 5 5 4 10 9 13 5 10 6 6 7 3 5
Recycling bin 0 0 1 0 0 1 0 0 0 0 0 1 0 0 0 0 1 1 1 0 1 0 0 1 1 2 5 0 1 0 0 0 0
Organics bin 93 93 92 95 94 93 91 95 94 95 94 90 95 96 94 95 93 91 87 93 94 94 95 91 90 91 90 90 92 93 92 97 95
None of these 1 2 1 1 1 2 2 1 1 1 2 2 1 1 2 2 2 2 4 2 1 1 2 1 1 0 0 0 2 1 2 1 1
Variances
across the
community % respondents
Tota
l
Bic
ton
Bre
ntw
ood
Bull
Cre
ek
Mt
Ple
asant
Will
agee
Male
Fem
ale
18-3
9 y
ears
40-5
4 y
ears
55-6
9 y
ears
70+
years
Child
ren 0
-5
Child
ren 6
-12
Child
ren 1
3-1
7
Child
ren 1
8+
No c
hild
ren a
t hom
e
LO
TE
Dis
abili
ty
Ow
n
Rent
/ oth
er
Larg
e lot
Mediu
m lot
Sm
all
lot
Duple
x / v
illa /
unit
Tow
nhouse
Apart
ment
Retire
ment hom
e
1 r
esid
ent
2 r
esid
ents
3 r
esid
ents
4 r
esid
ents
5+
resid
ents
General waste bin 1 1 1 1 2 1 2 1 1 1 1 2 0 1 2 2 1 2 0 1 2 1 1 0 2 2 0 0 1 1 2 1 1
Recycling bin 1 1 1 1 1 2 1 1 1 1 1 3 0 1 2 0 2 3 1 1 2 1 1 3 2 0 10 0 2 2 1 0 1
Organics bin 97 97 96 97 96 97 95 98 99 97 97 95 99 98 95 96 97 95 99 97 96 96 97 97 95 100 90 100 96 96 96 98 98
None of these 1 0 1 1 1 0 1 0 0 1 1 1 0 0 1 1 1 0 0 1 0 1 1 0 0 0 0 0 1 0 1 0 1
Waste disposal choice | garden waste
18 Q. Which bins would you use for the following items?
Base: FOGO residents, excludes ‘no response’ (n = 1923)
Waste disposal choice | garden waste % of respondents
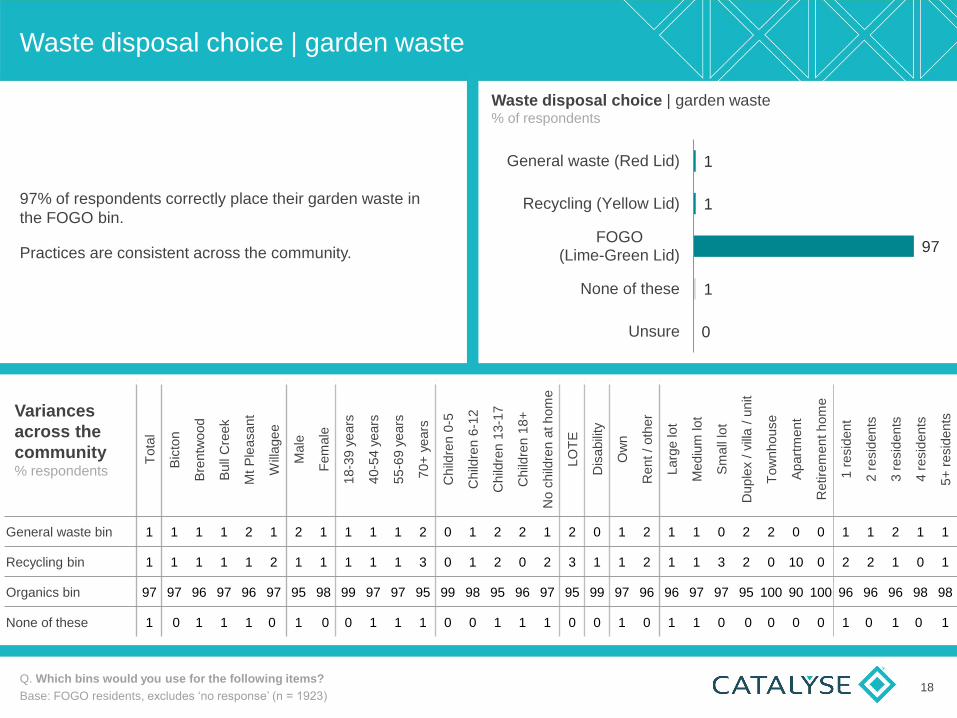
97% of respondents correctly place their garden waste in
the FOGO bin.
Practices are consistent across the community.
1
1
97
1
0
General waste (Red Lid)
Recycling (Yellow Lid)
FOGO(Lime-Green Lid)
None of these
Unsure
Variances
across the
community % respondents

Waste disposal choice | non-rinsed bottle or container
19 Q. Which bins would you use for the following items?
Base: FOGO residents, excludes ‘no response’ (n = 1876)
Waste disposal choice | non rinsed bottle or container % of respondents
61% of residents place non-rinsed bottles and containers in
their recycling bins. This is most common among
Brentwood residents and those in townhouses and
apartments.
30% of respondents are using their general waste bins;
higher among younger adults, those with primary school
aged children and in Bull Creek.
Residents who live alone appear most likely to avoid using
their kerbside bins for non-rinsed bottles and containers.
30
61
0
6
3
General waste (Red Lid)
Recycling (Yellow Lid)
FOGO(Lime-Green Lid)
None of these
Unsure
Tota
l
Bic
ton
Bre
ntw
ood
Bull
Cre
ek
Mt
Ple
asant
Will
agee
Male
Fem
ale
18-3
9 y
ears
40-5
4 y
ears
55-6
9 y
ears
70+
years
Child
ren 0
-5
Child
ren 6
-12
Child
ren 1
3-1
7
Child
ren 1
8+
No c
hild
ren a
t hom
e
LO
TE
Dis
abili
ty
Ow
n
Rent
/ oth
er
Larg
e lot
Mediu
m lot
Sm
all
lot
Duple
x / v
illa /
unit
Tow
nhouse
Apart
ment
Retire
ment hom
e
1 r
esid
ent
2 r
esid
ents
3 r
esid
ents
4 r
esid
ents
5+
resid
ents
General waste bin 30 27 24 34 32 31 28 32 36 29 29 25 31 34 30 29 29 27 31 30 31 32 30 26 31 21 19 20 26 31 31 32 32
Recycling bin 61 60 66 56 60 62 64 58 58 63 60 62 65 57 61 64 59 62 54 61 60 61 61 61 59 70 67 50 58 60 62 61 61
Organics bin 0 0 1 0 1 0 1 0 0 0 0 1 0 0 0 0 1 0 1 1 0 0 0 0 2 0 0 0 1 0 0 0 0
None of these 6 8 7 7 6 5 5 7 4 5 8 7 3 5 7 5 8 6 9 6 7 5 6 10 6 7 10 10 11 7 5 5 4
Variances
across the
community % respondents
Waste disposal choice | broken glass
20 Q. Which bins would you use for the following items?
Base: FOGO residents, excludes ‘no response’ (n = 1909)
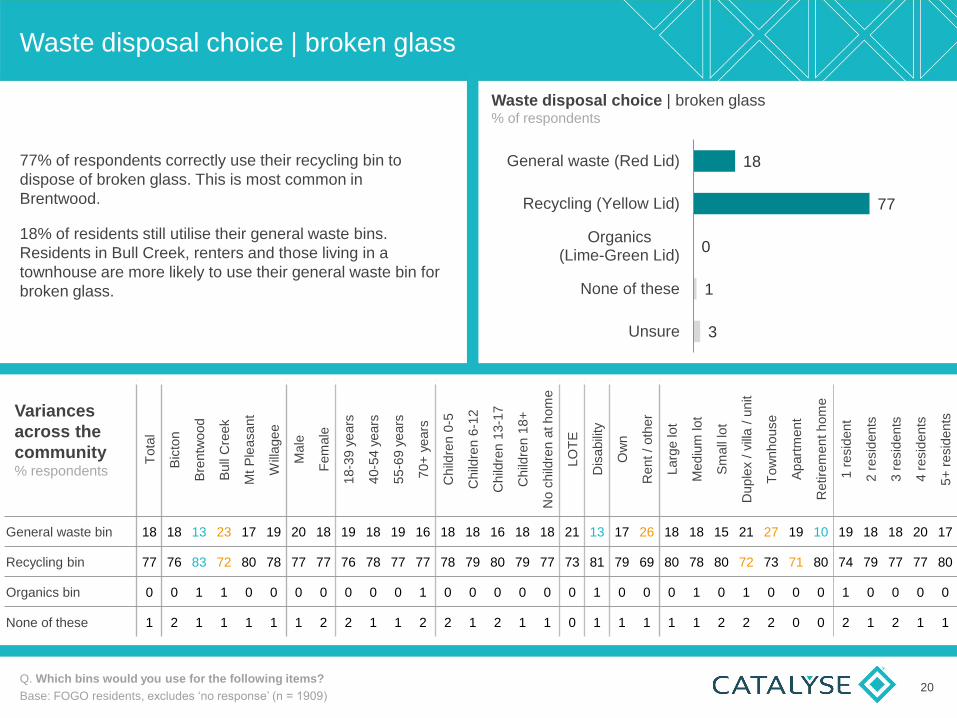
Waste disposal choice | broken glass % of respondents
77% of respondents correctly use their recycling bin to
dispose of broken glass. This is most common in
Brentwood.
18% of residents still utilise their general waste bins.
Residents in Bull Creek, renters and those living in a
townhouse are more likely to use their general waste bin for
broken glass.
18
77
0
1
3
General waste (Red Lid)
Recycling (Yellow Lid)
Organics(Lime-Green Lid)
None of these
Unsure
Tota
l
Bic
ton
Bre
ntw
ood
Bull
Cre
ek
Mt
Ple
asant
Will
agee
Male
Fem
ale
18-3
9 y
ears
40-5
4 y
ears
55-6
9 y
ears
70+
years
Child
ren 0
-5
Child
ren 6
-12
Child
ren 1
3-1
7
Child
ren 1
8+
No c
hild
ren a
t hom
e
LO
TE
Dis
abili
ty
Ow
n
Rent
/ oth
er
Larg
e lot
Mediu
m lot
Sm
all
lot
Duple
x / v
illa /
unit
Tow
nhouse
Apart
ment
Retire
ment hom
e
1 r
esid
ent
2 r
esid
ents
3 r
esid
ents
4 r
esid
ents
5+
resid
ents
General waste bin 18 18 13 23 17 19 20 18 19 18 19 16 18 18 16 18 18 21 13 17 26 18 18 15 21 27 19 10 19 18 18 20 17
Recycling bin 77 76 83 72 80 78 77 77 76 78 77 77 78 79 80 79 77 73 81 79 69 80 78 80 72 73 71 80 74 79 77 77 80
Organics bin 0 0 1 1 0 0 0 0 0 0 0 1 0 0 0 0 0 0 1 0 0 0 1 0 1 0 0 0 1 0 0 0 0
None of these 1 2 1 1 1 1 1 2 2 1 1 2 2 1 2 1 1 0 1 1 1 1 1 2 2 2 0 0 2 1 2 1 1
Variances
across the
community % respondents
Waste disposal choice | plastic bags
21 Q. Which bins would you use for the following items?
Base: FOGO residents, excludes ‘no response’ (n = 1924)
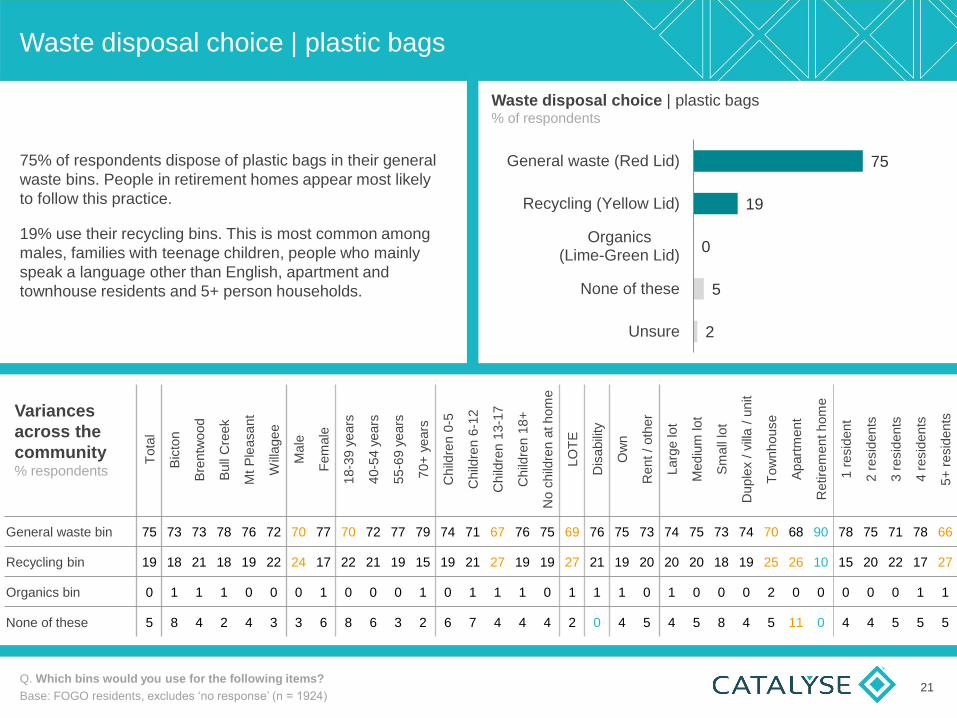
Waste disposal choice | plastic bags % of respondents
75% of respondents dispose of plastic bags in their general
waste bins. People in retirement homes appear most likely
to follow this practice.
19% use their recycling bins. This is most common among
males, families with teenage children, people who mainly
speak a language other than English, apartment and
townhouse residents and 5+ person households.
75
19
0
5
2
General waste (Red Lid)
Recycling (Yellow Lid)
Organics(Lime-Green Lid)
None of these
Unsure
Tota
l
Bic
ton
Bre
ntw
ood
Bull
Cre
ek
Mt
Ple
asant
Will
agee
Male
Fem
ale
18-3
9 y
ears
40-5
4 y
ears
55-6
9 y
ears
70+
years
Child
ren 0
-5
Child
ren 6
-12
Child
ren 1
3-1
7
Child
ren 1
8+
No c
hild
ren a
t hom
e
LO
TE
Dis
abili
ty
Ow
n
Rent
/ oth
er
Larg
e lot
Mediu
m lot
Sm
all
lot
Duple
x / v
illa /
unit
Tow
nhouse
Apart
ment
Retire
ment hom
e
1 r
esid
ent
2 r
esid
ents
3 r
esid
ents
4 r
esid
ents
5+
resid
ents
General waste bin 75 73 73 78 76 72 70 77 70 72 77 79 74 71 67 76 75 69 76 75 73 74 75 73 74 70 68 90 78 75 71 78 66
Recycling bin 19 18 21 18 19 22 24 17 22 21 19 15 19 21 27 19 19 27 21 19 20 20 20 18 19 25 26 10 15 20 22 17 27
Organics bin 0 1 1 1 0 0 0 1 0 0 0 1 0 1 1 1 0 1 1 1 0 1 0 0 0 2 0 0 0 0 0 1 1
None of these 5 8 4 2 4 3 3 6 8 6 3 2 6 7 4 4 4 2 0 4 5 4 5 8 4 5 11 0 4 4 5 5 5
Variances
across the
community % respondents
Waste disposal choice | disposable nappies
22 Q. Which bins would you use for the following items?
Base: FOGO residents, excludes ‘no response’ (n = 1898)
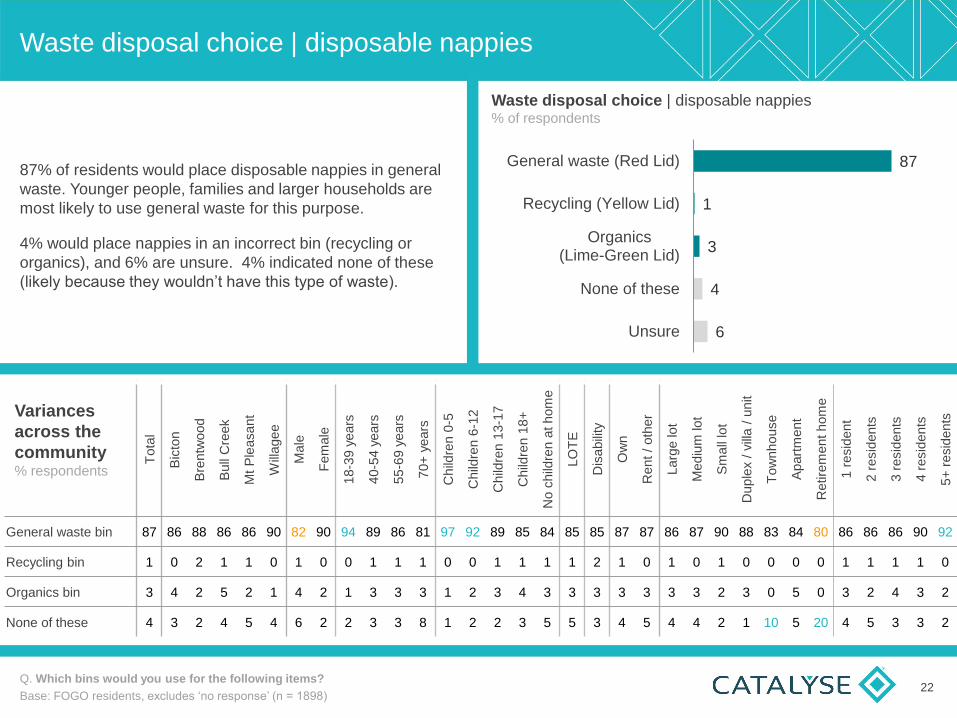
Waste disposal choice | disposable nappies % of respondents
87% of residents would place disposable nappies in general
waste. Younger people, families and larger households are
most likely to use general waste for this purpose.
4% would place nappies in an incorrect bin (recycling or
organics), and 6% are unsure. 4% indicated none of these
(likely because they wouldn’t have this type of waste).
87
1
3
4
6
General waste (Red Lid)
Recycling (Yellow Lid)
Organics(Lime-Green Lid)
None of these
Unsure
Tota
l
Bic
ton
Bre
ntw
ood
Bull
Cre
ek
Mt
Ple
asant
Will
agee
Male
Fem
ale
18-3
9 y
ears
40-5
4 y
ears
55-6
9 y
ears
70+
years
Child
ren 0
-5
Child
ren 6
-12
Child
ren 1
3-1
7
Child
ren 1
8+
No c
hild
ren a
t hom
e
LO
TE
Dis
abili
ty
Ow
n
Rent
/ oth
er
Larg
e lot
Mediu
m lot
Sm
all
lot
Duple
x / v
illa /
unit
Tow
nhouse
Apart
ment
Retire
ment hom
e
1 r
esid
ent
2 r
esid
ents
3 r
esid
ents
4 r
esid
ents
5+
resid
ents
General waste bin 87 86 88 86 86 90 82 90 94 89 86 81 97 92 89 85 84 85 85 87 87 86 87 90 88 83 84 80 86 86 86 90 92
Recycling bin 1 0 2 1 1 0 1 0 0 1 1 1 0 0 1 1 1 1 2 1 0 1 0 1 0 0 0 0 1 1 1 1 0
Organics bin 3 4 2 5 2 1 4 2 1 3 3 3 1 2 3 4 3 3 3 3 3 3 3 2 3 0 5 0 3 2 4 3 2
None of these 4 3 2 4 5 4 6 2 2 3 3 8 1 2 2 3 5 5 3 4 5 4 4 2 1 10 5 20 4 5 3 3 2
Variances
across the
community % respondents
Waste disposal choice | electronic waste (mobile phones, computers, etc.)
23 Q. Which bins would you use for the following items?
Base: FOGO residents, excludes ‘no response’ (n = 1913)
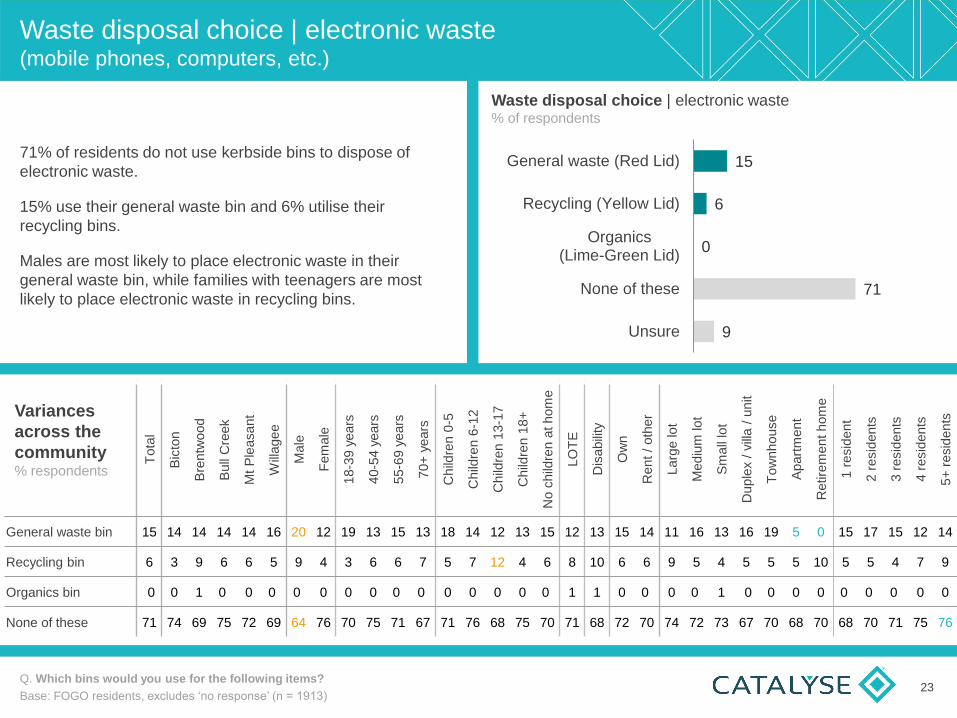
Waste disposal choice | electronic waste % of respondents
71% of residents do not use kerbside bins to dispose of
electronic waste.
15% use their general waste bin and 6% utilise their
recycling bins.
Males are most likely to place electronic waste in their
general waste bin, while families with teenagers are most
likely to place electronic waste in recycling bins.
15
6
0
71
9
General waste (Red Lid)
Recycling (Yellow Lid)
Organics(Lime-Green Lid)
None of these
Unsure
Tota
l
Bic
ton
Bre
ntw
ood
Bull
Cre
ek
Mt
Ple
asant
Will
agee
Male
Fem
ale
18-3
9 y
ears
40-5
4 y
ears
55-6
9 y
ears
70+
years
Child
ren 0
-5
Child
ren 6
-12
Child
ren 1
3-1
7
Child
ren 1
8+
No c
hild
ren a
t hom
e
LO
TE
Dis
abili
ty
Ow
n
Rent
/ oth
er
Larg
e lot
Mediu
m lot
Sm
all
lot
Duple
x / v
illa /
unit
Tow
nhouse
Apart
ment
Retire
ment hom
e
1 r
esid
ent
2 r
esid
ents
3 r
esid
ents
4 r
esid
ents
5+
resid
ents
General waste bin 15 14 14 14 14 16 20 12 19 13 15 13 18 14 12 13 15 12 13 15 14 11 16 13 16 19 5 0 15 17 15 12 14
Recycling bin 6 3 9 6 6 5 9 4 3 6 6 7 5 7 12 4 6 8 10 6 6 9 5 4 5 5 5 10 5 5 4 7 9
Organics bin 0 0 1 0 0 0 0 0 0 0 0 0 0 0 0 0 0 1 1 0 0 0 0 1 0 0 0 0 0 0 0 0 0
None of these 71 74 69 75 72 69 64 76 70 75 71 67 71 76 68 75 70 71 68 72 70 74 72 73 67 70 68 70 68 70 71 75 76
Variances
across the
community % respondents
Waste disposal choice | household batteries
24 Q. Which bins would you use for the following items?
Base: FOGO residents, excludes ‘no response’ (n = 1915)
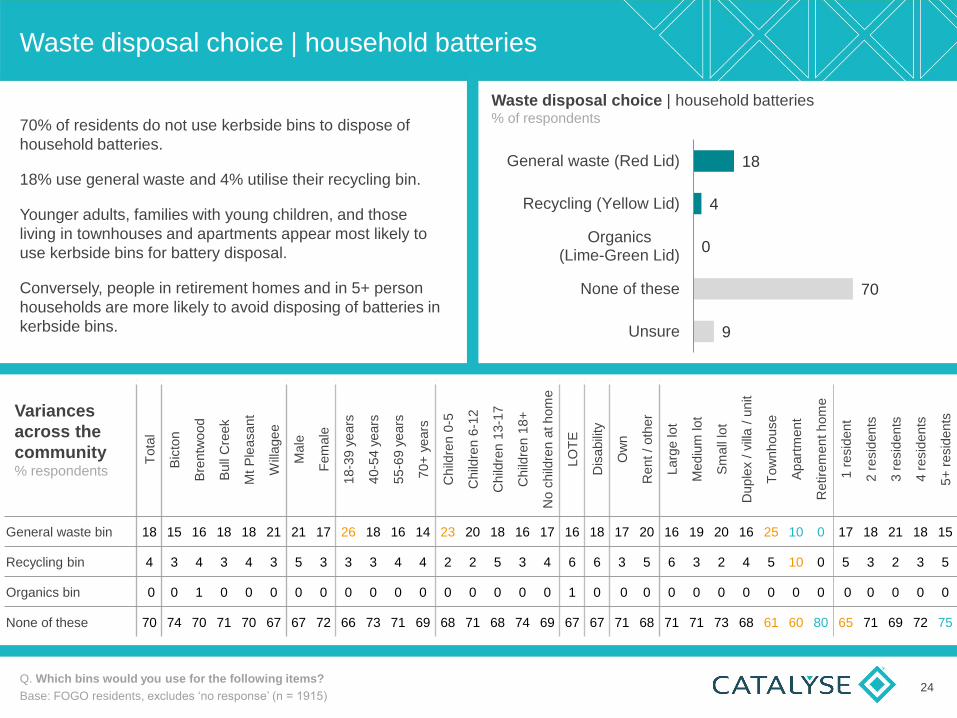
Waste disposal choice | household batteries % of respondents
70% of residents do not use kerbside bins to dispose of
household batteries.
18% use general waste and 4% utilise their recycling bin.
Younger adults, families with young children, and those
living in townhouses and apartments appear most likely to
use kerbside bins for battery disposal.
Conversely, people in retirement homes and in 5+ person
households are more likely to avoid disposing of batteries in
kerbside bins.
18
4
0
70
9
General waste (Red Lid)
Recycling (Yellow Lid)
Organics(Lime-Green Lid)
None of these
Unsure
Tota
l
Bic
ton
Bre
ntw
ood
Bull
Cre
ek
Mt
Ple
asant
Will
agee
Male
Fem
ale
18-3
9 y
ears
40-5
4 y
ears
55-6
9 y
ears
70+
years
Child
ren 0
-5
Child
ren 6
-12
Child
ren 1
3-1
7
Child
ren 1
8+
No c
hild
ren a
t hom
e
LO
TE
Dis
abili
ty
Ow
n
Rent
/ oth
er
Larg
e lot
Mediu
m lot
Sm
all
lot
Duple
x / v
illa /
unit
Tow
nhouse
Apart
ment
Retire
ment hom
e
1 r
esid
ent
2 r
esid
ents
3 r
esid
ents
4 r
esid
ents
5+
resid
ents
General waste bin 18 15 16 18 18 21 21 17 26 18 16 14 23 20 18 16 17 16 18 17 20 16 19 20 16 25 10 0 17 18 21 18 15
Recycling bin 4 3 4 3 4 3 5 3 3 3 4 4 2 2 5 3 4 6 6 3 5 6 3 2 4 5 10 0 5 3 2 3 5
Organics bin 0 0 1 0 0 0 0 0 0 0 0 0 0 0 0 0 0 1 0 0 0 0 0 0 0 0 0 0 0 0 0 0 0
None of these 70 74 70 71 70 67 67 72 66 73 71 69 68 71 68 74 69 67 67 71 68 71 71 73 68 61 60 80 65 71 69 72 75
Variances
across the
community % respondents
Efforts to reduce waste
25 Q. Which of the following steps do you take to reduce the amount of waste you produce?
Base: FOGO residents, excludes ‘no response’ (n = 1895)
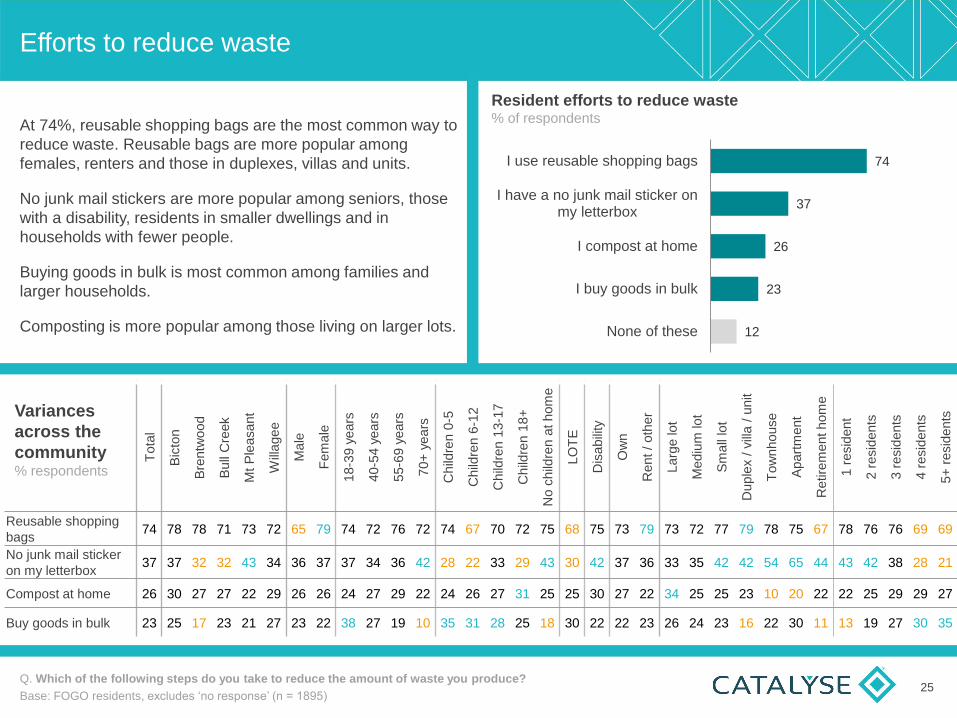
Resident efforts to reduce waste % of respondents
At 74%, reusable shopping bags are the most common way to
reduce waste. Reusable bags are more popular among
females, renters and those in duplexes, villas and units.
No junk mail stickers are more popular among seniors, those
with a disability, residents in smaller dwellings and in
households with fewer people.
Buying goods in bulk is most common among families and
larger households.
Composting is more popular among those living on larger lots.
74
37
26
23
12
I use reusable shopping bags
I have a no junk mail sticker onmy letterbox
I compost at home
I buy goods in bulk
None of these
Tota
l
Bic
ton
Bre
ntw
ood
Bull
Cre
ek
Mt
Ple
asant
Will
agee
Male
Fem
ale
18-3
9 y
ears
40-5
4 y
ears
55-6
9 y
ears
70+
years
Child
ren 0
-5
Child
ren 6
-12
Child
ren 1
3-1
7
Child
ren 1
8+
No c
hild
ren a
t hom
e
LO
TE
Dis
abili
ty
Ow
n
Rent / oth
er
Larg
e lot
Mediu
m lot
Sm
all
lot
Duple
x / v
illa /
unit
Tow
nhouse
Apart
ment
Retire
ment hom
e
1 r
esid
ent
2 r
esid
ents
3 r
esid
ents
4 r
esid
ents
5+
resid
ents
Reusable shopping
bags 74 78 78 71 73 72 65 79 74 72 76 72 74 67 70 72 75 68 75 73 79 73 72 77 79 78 75 67 78 76 76 69 69
No junk mail sticker
on my letterbox 37 37 32 32 43 34 36 37 37 34 36 42 28 22 33 29 43 30 42 37 36 33 35 42 42 54 65 44 43 42 38 28 21
Compost at home 26 30 27 27 22 29 26 26 24 27 29 22 24 26 27 31 25 25 30 27 22 34 25 25 23 10 20 22 22 25 29 29 27
Buy goods in bulk 23 25 17 23 21 27 23 22 38 27 19 10 35 31 28 25 18 30 22 22 23 26 24 23 16 22 30 11 13 19 27 30 35
Variances
across the
community % respondents
Performance of waste services
during the 3-bin FOGO trial
Fortnightly red-lid general waste collections
27
Variances across the community Performance Index Score
Q. How would you rate the following waste management services during the 3-bin FOGO Trial?
Base: FOGO residents, excludes ‘unsure’ and ‘no response’ (n = 1918)
25
23 21
13
18
100
Performance ratings % of respondents
Good Okay Excellent Poor Terrible
Positive Rating
(excellent + good + okay)
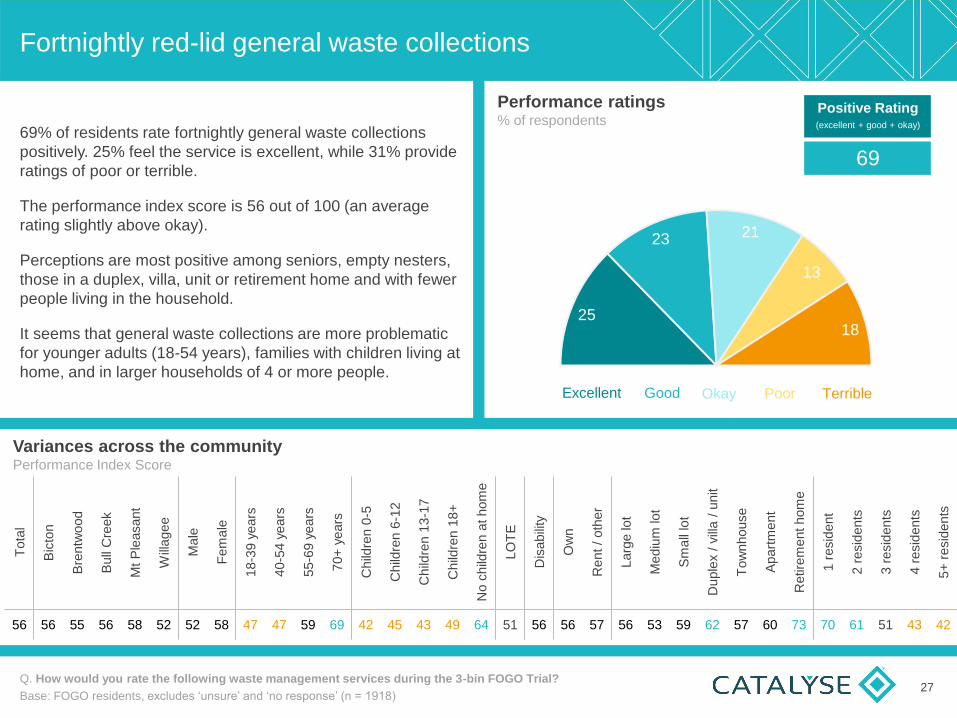
69
69% of residents rate fortnightly general waste collections
positively. 25% feel the service is excellent, while 31% provide
ratings of poor or terrible.
The performance index score is 56 out of 100 (an average
rating slightly above okay).
Perceptions are most positive among seniors, empty nesters,
those in a duplex, villa, unit or retirement home and with fewer
people living in the household.
It seems that general waste collections are more problematic
for younger adults (18-54 years), families with children living at
home, and in larger households of 4 or more people.
Tota
l
Bic
ton
Bre
ntw
ood
Bull
Cre
ek
Mt
Ple
asant
Will
agee
Male
Fem
ale
18-3
9 y
ears
40-5
4 y
ears
55-6
9 y
ears
70+
years
Child
ren 0
-5
Ch
ildre
n 6
-12
Child
ren 1
3-1
7
Child
ren 1
8+
No c
hild
ren a
t hom
e
LO
TE
Dis
abili
ty
Ow
n
Rent / oth
er
Larg
e lot
Mediu
m lot
Sm
all
lot
Duple
x / v
illa /
unit
Tow
nhouse
Apart
ment
Retire
ment hom
e
1 r
esid
ent
2 r
esid
ents
3 r
esid
ents
4 r
esid
ents
5+
resid
ents
56 56 55 56 58 52 52 58 47 47 59 69 42 45 43 49 64 51 56 56 57 56 53 59 62 57 60 73 70 61 51 43 42

Fortnightly yellow-lid recycling collections
28
Variances across the community Performance Index Score
Q. How would you rate the following waste management services during the 3-bin FOGO Trial?
Base: FOGO residents, excludes ‘unsure’ and ‘no response’ (n = 1917)
30
31
24
8
8
100
85% of residents rate fortnightly recycling collections positively.
30% feel the service is excellent.
The performance index score is 67 out of 100 (an average
rating approaching good).
Perceptions are most positive among seniors (55+), empty
nesters, those in duplex, villa, unit or retirement home and in
households of 1-2 people.
There is more room to improve perceptions among younger
adults, families and larger households of 4 or more people.
Tota
l
Bic
ton
Bre
ntw
ood
Bull
Cre
ek
Mt
Ple
asant
Will
agee
Male
Fem
ale
18-3
9 y
ears
40-5
4 y
ears
55-6
9 y
ears
70+
years
Child
ren 0
-5
Ch
ildre
n 6
-12
Child
ren 1
3-1
7
Child
ren 1
8+
No c
hild
ren a
t hom
e
LO
TE
Dis
abili
ty
Ow
n
Rent / oth
er
Larg
e lot
Mediu
m lot
Sm
all
lot
Duple
x / v
illa /
unit
Tow
nhouse
Apart
ment
Retire
ment hom
e
1 r
esid
ent
2 r
esid
ents
3 r
esid
ents
4 r
esid
ents
5+
resid
ents
67 68 64 70 68 63 65 68 58 58 72 78 57 56 55 63 73 65 69 67 67 67 65 69 73 69 65 78 77 72 64 57 54
*Variance of ±1% is due to rounding errors to zero decimal places.
Performance ratings % of respondents
Positive Rating
(excellent + good + okay)
85
Good Okay Poor Terrible Excellent
Weekly lime-green lid FOGO collections
29
Variances across the community Performance Index Score
Q. How would you rate the following waste management services during the 3-bin FOGO Trial?
Base: FOGO residents, excludes ‘unsure’ and ‘no response’ (n = 1886)
47
31
16
4 2
100
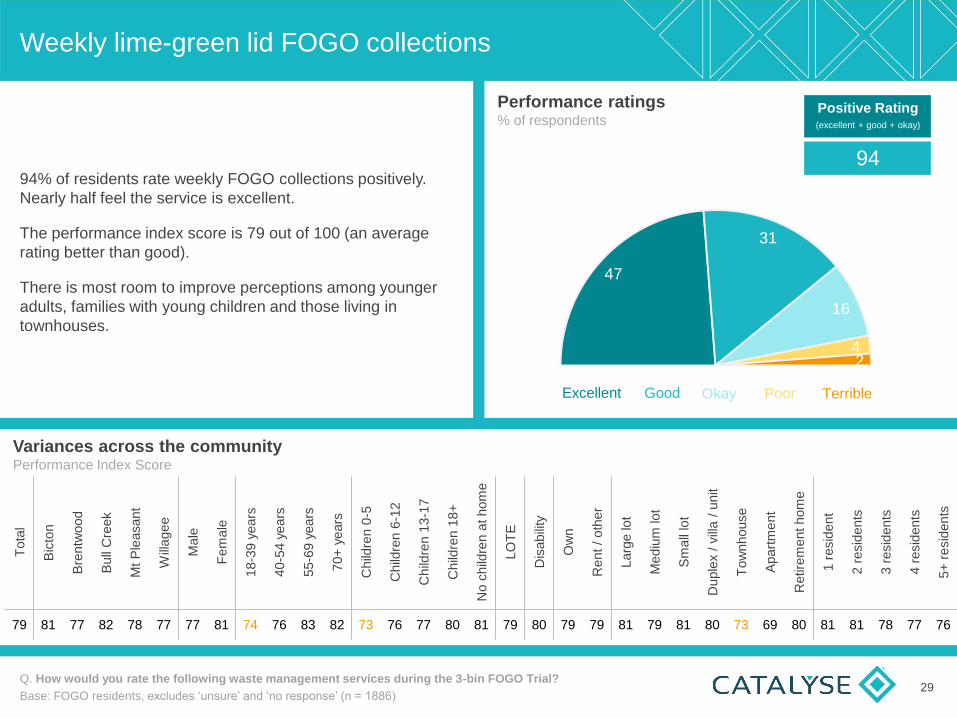
94% of residents rate weekly FOGO collections positively.
Nearly half feel the service is excellent.
The performance index score is 79 out of 100 (an average
rating better than good).
There is most room to improve perceptions among younger
adults, families with young children and those living in
townhouses.
Tota
l
Bic
ton
Bre
ntw
ood
Bull
Cre
ek
Mt
Ple
asant
Will
agee
Male
Fem
ale
18-3
9 y
ears
40-5
4 y
ears
55-6
9 y
ears
70+
years
Child
ren 0
-5
Ch
ildre
n 6
-12
Child
ren 1
3-1
7
Child
ren 1
8+
No c
hild
ren a
t hom
e
LO
TE
Dis
abili
ty
Ow
n
Rent / oth
er
Larg
e lot
Mediu
m lot
Sm
all
lot
Duple
x / v
illa /
unit
Tow
nhouse
Apart
ment
Retire
ment hom
e
1 r
esid
ent
2 r
esid
ents
3 r
esid
ents
4 r
esid
ents
5+
resid
ents
79 81 77 82 78 77 77 81 74 76 83 82 73 76 77 80 81 79 80 79 79 81 79 81 80 73 69 80 81 81 78 77 76
Performance ratings % of respondents
Positive Rating
(excellent + good + okay)
94
Good Okay Excellent Poor Terrible

Kitchen caddy (small container provided for food waste)
30
Variances across the community Performance Index Score
Q. How would you rate the following waste management services during the 3-bin FOGO Trial?
Base: FOGO residents, excludes ‘unsure’ and ‘no response’ (n = 1813)
42
25
20
5
8
100
87% of residents rate the kitchen caddy positively. 42% feel it
is excellent.
The performance index score is 72 out of 100 (an average
rating close to good).
Ratings are more positive among people aged 55-69 years,
renters and those in apartments or retirement homes.
People in townhouses are least likely to rate the caddy
positively.
Tota
l
Bic
ton
Bre
ntw
ood
Bull
Cre
ek
Mt
Ple
asant
Will
agee
Male
Fem
ale
18-3
9 y
ears
40-5
4 y
ears
55-6
9 y
ears
70+
years
Child
ren 0
-5
Ch
ildre
n 6
-12
Child
ren 1
3-1
7
Child
ren 1
8+
No c
hild
ren a
t hom
e
LO
TE
Dis
abili
ty
Ow
n
Rent / oth
er
Larg
e lot
Mediu
m lot
Sm
all
lot
Duple
x / v
illa /
unit
Tow
nhouse
Apart
ment
Retire
ment hom
e
1 r
esid
ent
2 r
esid
ents
3 r
esid
ents
4 r
esid
ents
5+
resid
ents
72 71 76 73 70 74 69 74 71 69 77 72 71 74 73 71 73 73 72 72 77 74 71 74 75 66 82 89 74 73 71 72 73
Performance ratings % of respondents
Positive Rating
(excellent + good + okay)
87
Good Okay Excellent Poor Terrible
Compostable kitchen caddy liners for food waste
31
Variances across the community Performance Index Score
Q. How would you rate the following waste management services during the 3-bin FOGO Trial?
Base: FOGO residents, excludes ‘unsure’ and ‘no response’ (n = 1809)
41
23
17
9
10
100
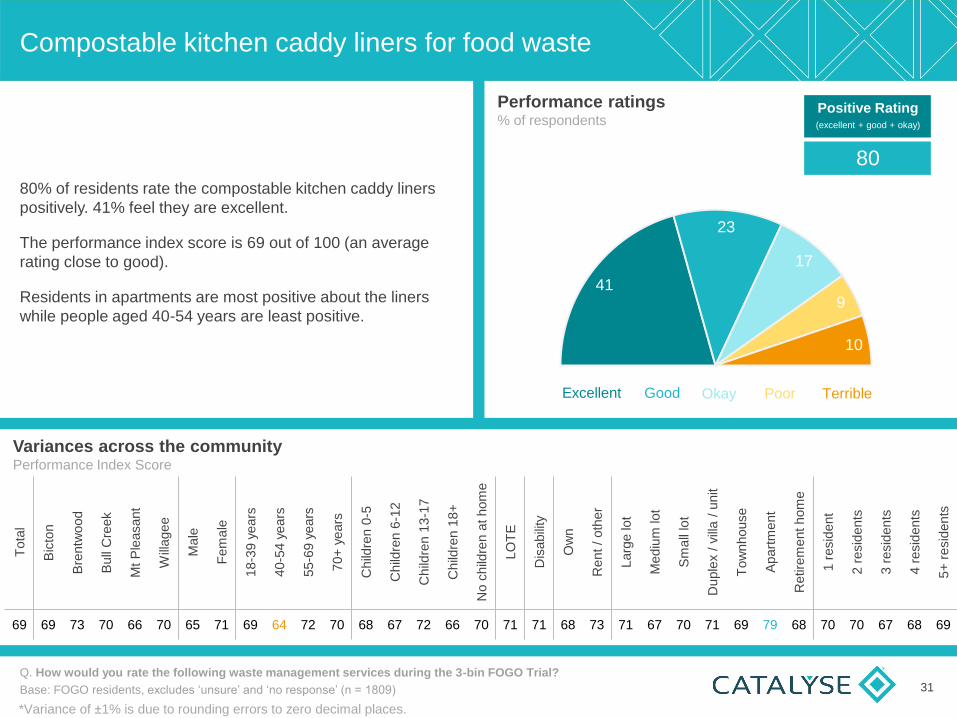
80% of residents rate the compostable kitchen caddy liners
positively. 41% feel they are excellent.
The performance index score is 69 out of 100 (an average
rating close to good).
Residents in apartments are most positive about the liners
while people aged 40-54 years are least positive.
Tota
l
Bic
ton
Bre
ntw
ood
Bull
Cre
ek
Mt
Ple
asant
Will
agee
Male
Fem
ale
18-3
9 y
ears
40-5
4 y
ears
55-6
9 y
ears
70+
years
Child
ren 0
-5
Ch
ildre
n 6
-12
Child
ren 1
3-1
7
Child
ren 1
8+
No c
hild
ren a
t hom
e
LO
TE
Dis
abili
ty
Ow
n
Rent / oth
er
Larg
e lot
Mediu
m lot
Sm
all
lot
Duple
x / v
illa /
unit
Tow
nhouse
Apart
ment
Retire
ment hom
e
1 r
esid
ent
2 r
esid
ents
3 r
esid
ents
4 r
esid
ents
5+
resid
ents
69 69 73 70 66 70 65 71 69 64 72 70 68 67 72 66 70 71 71 68 73 71 67 70 71 69 79 68 70 70 67 68 69
*Variance of ±1% is due to rounding errors to zero decimal places.
Performance ratings % of respondents
Positive Rating
(excellent + good + okay)
80
Good Okay Excellent Poor Terrible
Effectiveness of the FOGO Trial

When comparing results between FOGO trial residents and residents in the general community (who completed a Community
Waste Scorecard in non-FOGO trial areas), it seems the FOGO trial has significantly improved perceptions of the
effectiveness of waste management processes.
Across both studies there is most room to improve community education about sorting and reducing waste.
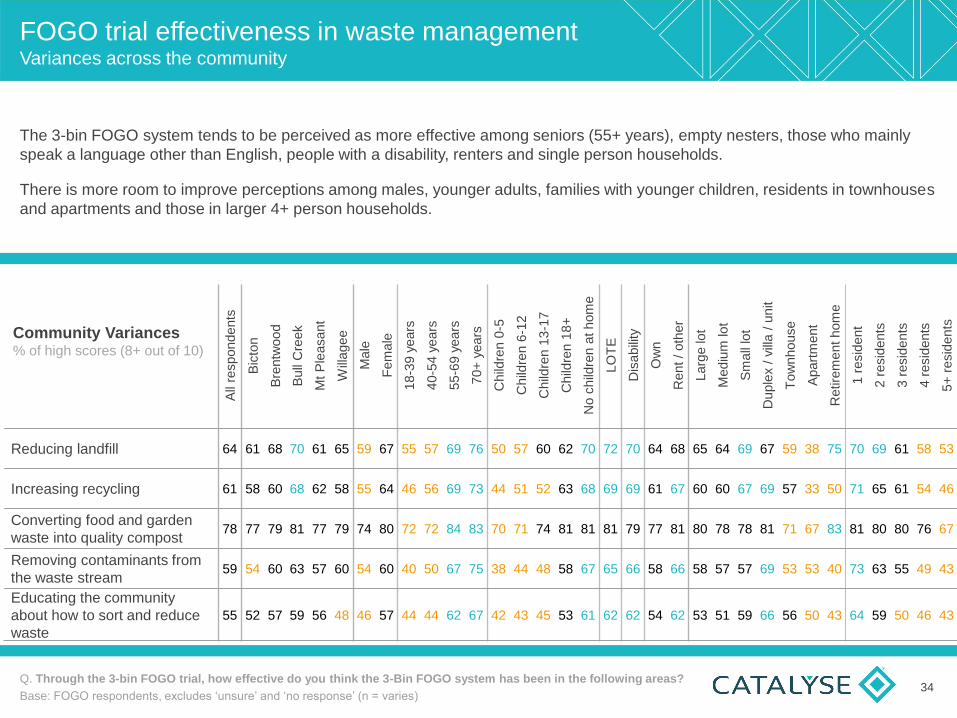
FOGO trial effectiveness in waste management
Q. Through the 3-bin FOGO trial, how effective do you think the 3-Bin FOGO system has been in the following areas?
Base: FOGO residents, excludes ‘unsure’ and ‘no response’ (n = varies)
Community Scorecard Q. How effective do you think the SMRC has been in the following areas?
78
64
61
59
55
15
26
27
29
33
7
9
12
12
12
Converting food and garden wasteinto quality compost
Reducing the amount of wastegoing into landfill
Increasing Recycling
Removing contaminants from thewaste stream
Educating the community abouthow to sort and reduce waste
High (8-10) Moderate (5-7) Low (0-4)
78 49
64 44
61 55
59 48
55 31
FOGO Trial Community
Resident comparisons % of high scores (8+ out of 10)
FOGO trial waste management | perceived effectiveness % respondents
33
FOGO trial effectiveness in waste management Variances across the community
All
respondents
Bic
ton
Bre
ntw
ood
Bull
Cre
ek
Mt
Ple
asant
Will
agee
Male
Fem
ale
18-3
9 y
ears
40-5
4 y
ears
55-6
9 y
ears
70+
years
Child
ren 0
-5
Child
ren 6
-12
Child
ren 1
3-1
7
Child
ren 1
8+
No c
hild
ren a
t hom
e
LO
TE
Dis
abili
ty
Ow
n
Rent / oth
er
Larg
e lot
Mediu
m lot
Sm
all
lot
Duple
x / v
illa /
unit
Tow
nhouse
Apart
ment
Retire
ment hom
e
1 r
esid
ent
2 r
esid
ents
3 r
esid
ents
4 r
esid
ents
5+
resid
ents
Reducing landfill 64 61 68 70 61 65 59 67 55 57 69 76 50 57 60 62 70 72 70 64 68 65 64 69 67 59 38 75 70 69 61 58 53
Increasing recycling 61 58 60 68 62 58 55 64 46 56 69 73 44 51 52 63 68 69 69 61 67 60 60 67 69 57 33 50 71 65 61 54 46
Converting food and garden
waste into quality compost 78 77 79 81 77 79 74 80 72 72 84 83 70 71 74 81 81 81 79 77 81 80 78 78 81 71 67 83 81 80 80 76 67
Removing contaminants from
the waste stream 59 54 60 63 57 60 54 60 40 50 67 75 38 44 48 58 67 65 66 58 66 58 57 57 69 53 53 40 73 63 55 49 43
Educating the community
about how to sort and reduce
waste
55 52 57 59 56 48 46 57 44 44 62 67 42 43 45 53 61 62 62 54 62 53 51 59 66 56 50 43 64 59 50 46 43
Q. Through the 3-bin FOGO trial, how effective do you think the 3-Bin FOGO system has been in the following areas?
Base: FOGO respondents, excludes ‘unsure’ and ‘no response’ (n = varies) 34
The 3-bin FOGO system tends to be perceived as more effective among seniors (55+ years), empty nesters, those who mainly
speak a language other than English, people with a disability, renters and single person households.
There is more room to improve perceptions among males, younger adults, families with younger children, residents in townhouses
and apartments and those in larger 4+ person households.
Community Variances % of high scores (8+ out of 10)
Support for continuing the FOGO Trial

Views on continuing the 3-bin FOGO service
36
Variances across the community % of respondents who would like the 3-bin FOGO service to continue
Q. Would you like the 3-bin Food Organics Garden Organics (FOGO) service to continue in your local area?
Base: FOGO residents, excludes ‘no response’ (n = 1520)
79
7
14
100
Continuing the FOGO service | community support % of respondents
Yes No
79% of residents would like the 3-bin FOGO service to
continue.
There is majority support across all community segments.
Support is highest among Brentwood residents, renters and
those in retirement homes.
Support is slightly lower among males, families with young
children, residents in apartments and 5+ person households.
Unsure
Tota
l
Bic
ton
Bre
ntw
ood
Bull
Cre
ek
Mt
Ple
asant
Will
agee
Male
Fem
ale
18-3
9 y
ears
40-5
4 y
ears
55-6
9 y
ears
70+
years
Child
ren 0
-5
Ch
ildre
n 6
-12
Child
ren 1
3-1
7
Child
ren 1
8+
No c
hild
ren a
t hom
e
LO
TE
Dis
abili
ty
Ow
n
Rent / oth
er
Larg
e lot
Mediu
m lot
Sm
all
lot
Duple
x / v
illa /
unit
Tow
nhouse
Apart
ment
Retire
ment hom
e
1 r
esid
ent
2 r
esid
ents
3 r
esid
ents
4 r
esid
ents
5+
resid
ents
79 77 84 77 76 83 72 82 76 75 82 82 72 77 76 77 81 80 78 78 86 80 78 77 81 80 67 90 80 82 81 75 71
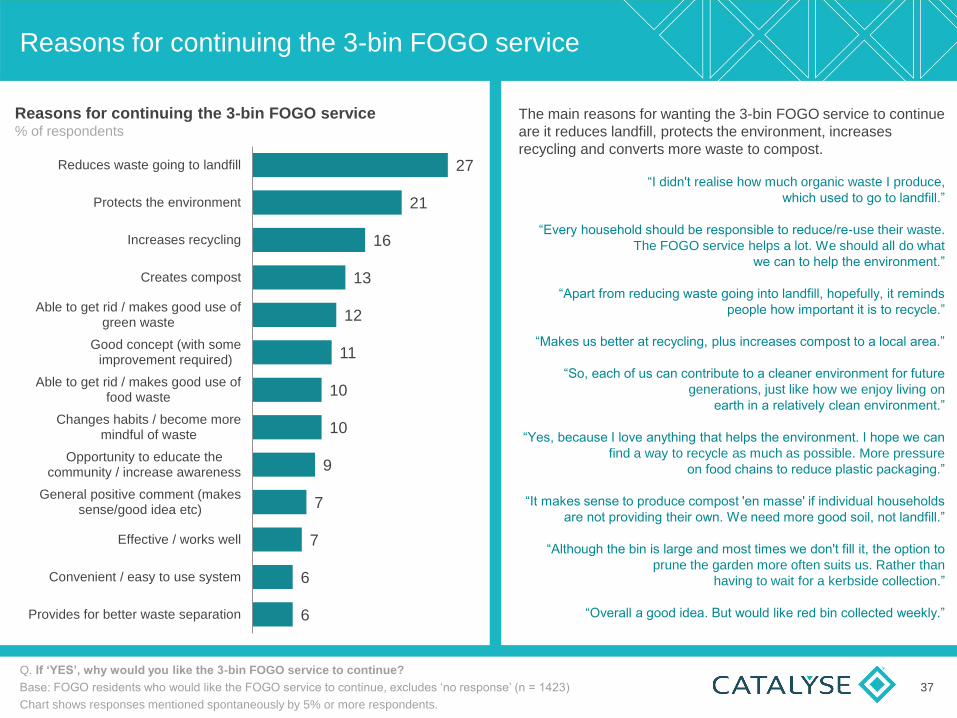
Reasons for continuing the 3-bin FOGO service
Q. If ‘YES’, why would you like the 3-bin FOGO service to continue?
Base: FOGO residents who would like the FOGO service to continue, excludes ‘no response’ (n = 1423)
Chart shows responses mentioned spontaneously by 5% or more respondents.
27
21
16
13
12
11
10
10
9
7
7
6
6
Reduces waste going to landfill
Protects the environment
Increases recycling
Creates compost
Able to get rid / makes good use ofgreen waste
Good concept (with someimprovement required)
Able to get rid / makes good use offood waste
Changes habits / become moremindful of waste
Opportunity to educate thecommunity / increase awareness
General positive comment (makessense/good idea etc)
Effective / works well
Convenient / easy to use system
Provides for better waste separation
The main reasons for wanting the 3-bin FOGO service to continue
are it reduces landfill, protects the environment, increases
recycling and converts more waste to compost.
“I didn't realise how much organic waste I produce,
which used to go to landfill.”
“Every household should be responsible to reduce/re-use their waste.
The FOGO service helps a lot. We should all do what
we can to help the environment.”
“Apart from reducing waste going into landfill, hopefully, it reminds
people how important it is to recycle.”
“Makes us better at recycling, plus increases compost to a local area.”
“So, each of us can contribute to a cleaner environment for future
generations, just like how we enjoy living on
earth in a relatively clean environment.”
“Yes, because I love anything that helps the environment. I hope we can
find a way to recycle as much as possible. More pressure
on food chains to reduce plastic packaging.”
“It makes sense to produce compost 'en masse' if individual households
are not providing their own. We need more good soil, not landfill.”
“Although the bin is large and most times we don't fill it, the option to
prune the garden more often suits us. Rather than
having to wait for a kerbside collection.”
“Overall a good idea. But would like red bin collected weekly.”
Reasons for continuing the 3-bin FOGO service % of respondents
37
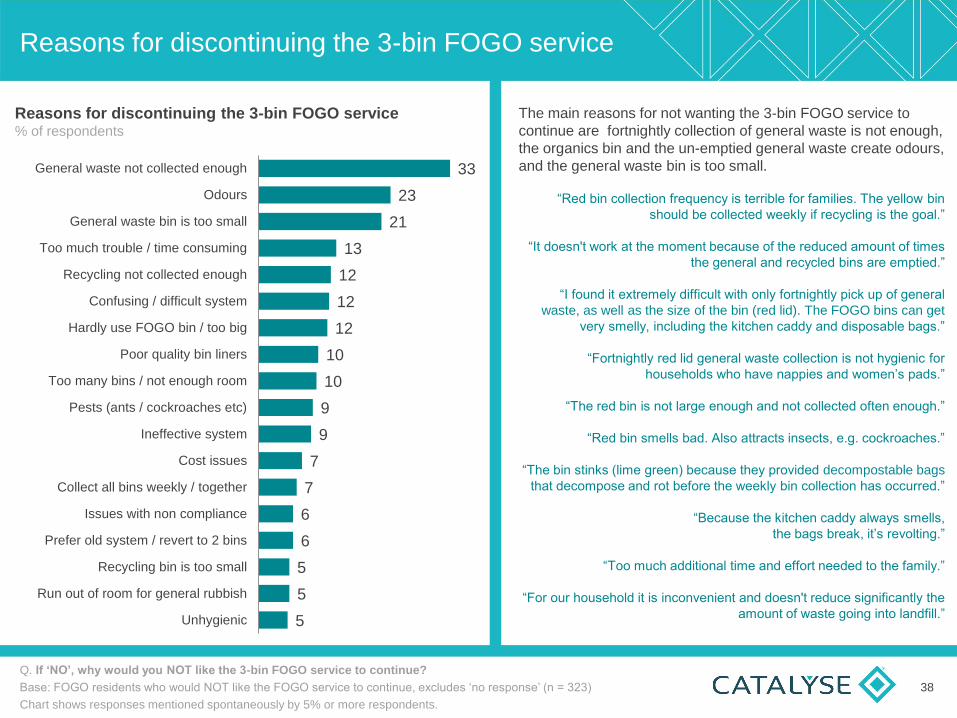
Reasons for discontinuing the 3-bin FOGO service
Q. If ‘NO’, why would you NOT like the 3-bin FOGO service to continue?
Base: FOGO residents who would NOT like the FOGO service to continue, excludes ‘no response’ (n = 323)
Chart shows responses mentioned spontaneously by 5% or more respondents.
The main reasons for not wanting the 3-bin FOGO service to
continue are fortnightly collection of general waste is not enough,
the organics bin and the un-emptied general waste create odours,
and the general waste bin is too small.
“Red bin collection frequency is terrible for families. The yellow bin
should be collected weekly if recycling is the goal.”
“It doesn't work at the moment because of the reduced amount of times
the general and recycled bins are emptied.”
“I found it extremely difficult with only fortnightly pick up of general
waste, as well as the size of the bin (red lid). The FOGO bins can get
very smelly, including the kitchen caddy and disposable bags.”
“Fortnightly red lid general waste collection is not hygienic for
households who have nappies and women’s pads.”
“The red bin is not large enough and not collected often enough.”
“Red bin smells bad. Also attracts insects, e.g. cockroaches.”
“The bin stinks (lime green) because they provided decompostable bags
that decompose and rot before the weekly bin collection has occurred.”
“Because the kitchen caddy always smells,
the bags break, it’s revolting.”
“Too much additional time and effort needed to the family.”
“For our household it is inconvenient and doesn't reduce significantly the
amount of waste going into landfill.”
Reasons for discontinuing the 3-bin FOGO service % of respondents
33
23
21
13
12
12
12
10
10
9
9
7
7
6
6
5
5
5
General waste not collected enough
Odours
General waste bin is too small
Too much trouble / time consuming
Recycling not collected enough
Confusing / difficult system
Hardly use FOGO bin / too big
Poor quality bin liners
Too many bins / not enough room
Pests (ants / cockroaches etc)
Ineffective system
Cost issues
Collect all bins weekly / together
Issues with non compliance
Prefer old system / revert to 2 bins
Recycling bin is too small
Run out of room for general rubbish
Unhygienic
38

Suggestions to improve the 3-bin FOGO service
Q. How could the 3-bin FOGO service be improved to better meet your needs?
Base: FOGO residents, excludes ‘no response’ (n = 1531)
Chart shows suggestions mentioned spontaneously by 4% or more respondents.
The main suggestion for improving the 3-bin FOGO service is to
introduce weekly collection of general waste bins.
“Increase red bin collection to weekly, preferred option, or provide larger
bin if it was to remain fortnightly. Provide larger recycling bin as ours is
often overflowing. Provide fridge magnet re scheduling of bin
collection/week.”
“Weekly red bin as the hot weather is not suitable for a fortnightly
service. Even after washing thoroughly and spraying and salting we
have had problems with maggots.”
“General waste bin should be collected weekly to avoid smell and the bin
is too small to collect general waste fortnightly.”
“Bigger red bin, weekly service for disposable nappies. Stronger kitchen
caddy bags.”
“Compost liners that seal and last a minimum of 2 weeks with
decomposting foods.”
“Stronger biobags for kitchen caddy (when filled up ready for disposing,
the bottom falls out).”
“Yellow recycling bin collected each week. We have the 360L bin and it
takes one week to fill so we always have rubbish waiting.”
“I have a large recycling bin and live on my own and I still overfill it each
week, weekly recycling again would be better.”
“I think it is excellent just the way it is. Thank you for the initiative.”
Suggestions to improve the 3-bin FOGO service % of respondents
22
14
10
10
10
8
7
6
6
4
4
4
4
4
4
4
Weekly collection of general wastebin
Larger general waste bin
Improve bin / caddy liners
Weekly collection of recycling bin
Issues with odours
Collect all bins weekly
Larger OR weekly collection ofgeneral waste
Improve information - list of items forsorting / which items go where etc
Make FOGO bin smaller
Larger recycling bin
Make it easier / clear to recycleplastics
Revert to old system
More education and assistance
Fortnightly FOGO collection
Collect other waste - batteries / e-waste / clothing etc
Issues with pests
39
3-Bin FOGO Trial Communications
Amount of information received about the FOGO trial
41
Q. Thinking about the amount of information you received about the 3-bin FOGO trial, did you feel like you got too little,
just the right amount, or too much information?
Base: FOGO residents, excludes ‘unsure’ and ‘no response’ (n = 1626)
18
80
3
100
Amount of FOGO information received % of respondents
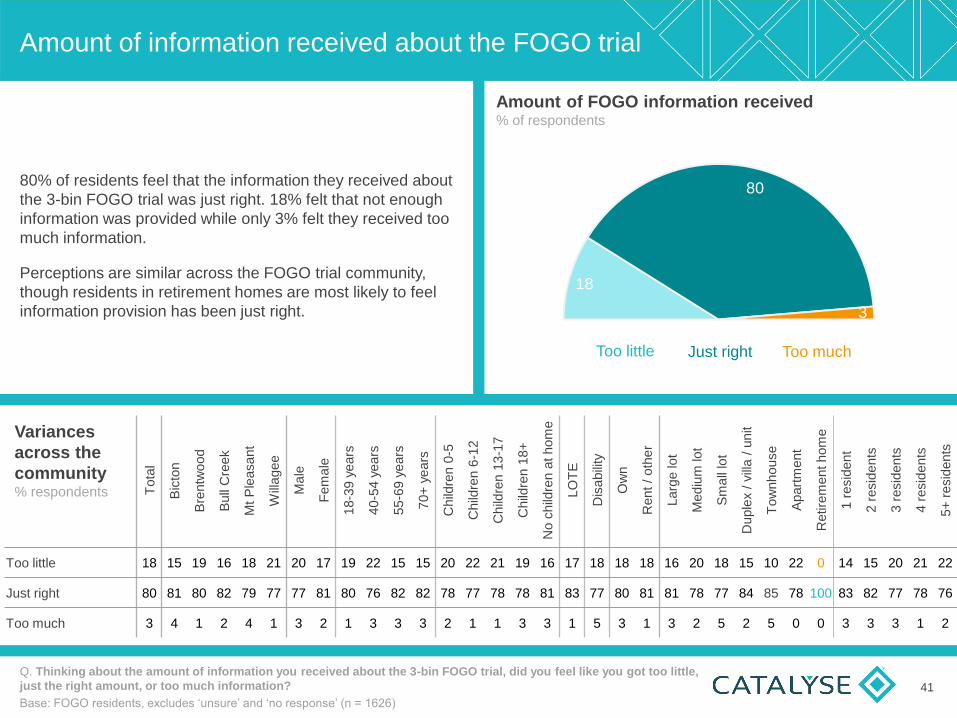
80% of residents feel that the information they received about
the 3-bin FOGO trial was just right. 18% felt that not enough
information was provided while only 3% felt they received too
much information.
Perceptions are similar across the FOGO trial community,
though residents in retirement homes are most likely to feel
information provision has been just right.
Tota
l
Bic
ton
Bre
ntw
ood
Bull
Cre
ek
Mt
Ple
asant
Will
agee
Male
Fem
ale
18-3
9 y
ears
40-5
4 y
ears
55-6
9 y
ears
70+
years
Child
ren 0
-5
Child
ren 6
-12
Child
ren 1
3-1
7
Child
ren 1
8+
No c
hild
ren a
t hom
e
LO
TE
Dis
abili
ty
Ow
n
Rent
/ oth
er
Larg
e lot
Mediu
m lot
Sm
all
lot
Duple
x / v
illa /
unit
Tow
nhouse
Apart
ment
Retire
ment hom
e
1 r
esid
ent
2 r
esid
ents
3 r
esid
ents
4 r
esid
ents
5+
resid
ents
Too little 18 15 19 16 18 21 20 17 19 22 15 15 20 22 21 19 16 17 18 18 18 16 20 18 15 10 22 0 14 15 20 21 22
Just right 80 81 80 82 79 77 77 81 80 76 82 82 78 77 78 78 81 83 77 80 81 81 78 77 84 85 78 100 83 82 77 78 76
Too much 3 4 1 2 4 1 3 2 1 3 3 3 2 1 1 3 3 1 5 3 1 3 2 5 2 5 0 0 3 3 3 1 2
Variances
across the
community % respondents
Too little Too much Just right
FOGO trial communications and resources
Q. How valuable were the following communications and resources about the 3-bin FOGO trial?
Base: FOGO residents, excludes ‘unsure’ and ‘no response’ (n = varies) 42
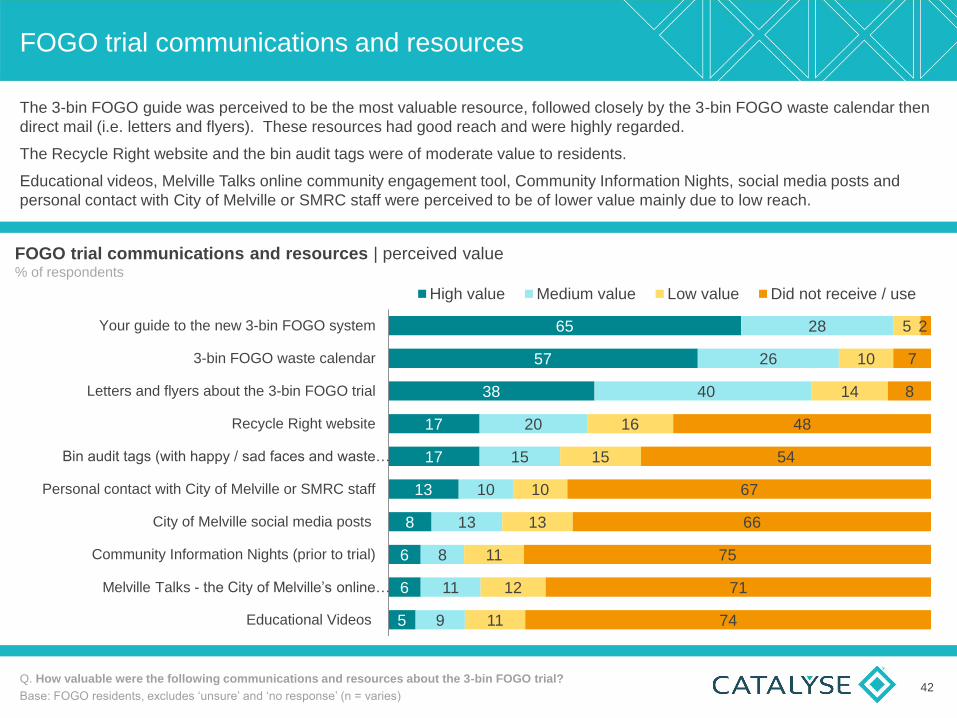
The 3-bin FOGO guide was perceived to be the most valuable resource, followed closely by the 3-bin FOGO waste calendar then
direct mail (i.e. letters and flyers). These resources had good reach and were highly regarded.
The Recycle Right website and the bin audit tags were of moderate value to residents.
Educational videos, Melville Talks online community engagement tool, Community Information Nights, social media posts and
personal contact with City of Melville or SMRC staff were perceived to be of lower value mainly due to low reach.
65
57
38
17
17
13
8
6
6
5
28
26
40
20
15
10
13
8
11
9
5
10
14
16
15
10
13
11
12
11
2
7
8
48
54
67
66
75
71
74
Your guide to the new 3-bin FOGO system
3-bin FOGO waste calendar
Letters and flyers about the 3-bin FOGO trial
Recycle Right website
Bin audit tags (with happy / sad faces and waste…
Personal contact with City of Melville or SMRC staff
City of Melville social media posts
Community Information Nights (prior to trial)
Melville Talks - the City of Melville’s online …
Educational Videos
High value Medium value Low value Did not receive / use
FOGO trial communications and resources | perceived value % of respondents
FOGO trial communications and resources Variances across the community
All
respondents
Bic
ton
Bre
ntw
ood
Bull
Cre
ek
Mt
Ple
asant
Will
agee
Male
Fem
ale
18-3
9 y
ears
40-5
4 y
ears
55-6
9 y
ears
70+
years
Child
ren 0
-5
Child
ren 6
-12
Child
ren 1
3-1
7
Child
ren 1
8+
No c
hild
ren a
t hom
e
LO
TE
Dis
abili
ty
Ow
n
Rent
/ oth
er
Larg
e lot
Mediu
m lot
Sm
all
lot
Duple
x / v
illa /
unit
Tow
nhouse
Apart
ment
Retire
ment hom
e
1 r
esid
ent
2 r
esid
ents
3 r
esid
ents
4 r
esid
ents
5+
resid
ents
Your guide to the new 3-bin FOGO
system 65 62 62 67 66 63 58 68 64 63 68 62 61 64 61 66 66 64 63 64 71 64 65 68 67 55 72 70 66 66 63 66 57
3-bin FOGO waste calendar 57 55 57 60 57 57 51 60 54 48 63 63 50 49 46 54 62 59 57 57 63 56 55 66 67 53 53 80 61 63 56 49 46
Letters and flyers about the 3-bin
FOGO trial 38 36 40 44 35 36 30 41 29 33 43 44 32 37 30 37 40 37 38 37 42 36 36 44 43 34 32 63 45 40 33 33 35
Recycle Right website 17 17 16 19 14 20 14 18 15 14 20 16 14 14 14 18 18 23 22 16 19 19 15 17 19 19 6 17 20 17 13 16 18
Bin audit tags (with happy / sad faces
and waste education tips) 17 18 18 15 11 20 14 18 15 15 17 18 15 16 15 14 18 24 20 16 23 16 15 19 18 26 17 17 19 17 14 15 17
Personal contact with City of Melville or
SMRC staff 13 12 9 16 12 18 10 16 13 15 13 13 14 14 16 15 13 12 13 13 15 14 12 17 12 12 18 13 15 11 11 14 20
City of Melville social media posts 8 7 8 9 5 14 6 9 9 8 8 8 8 7 8 9 8 12 11 7 13 7 8 7 8 15 6 25 10 6 9 9 8
Community Information Nights 6 6 6 8 5 8 5 7 4 5 7 8 4 2 6 7 8 7 8 6 9 7 5 9 8 13 6 0 10 7 6 4 4
Melville Talks - the City of Melville’s
online community engagement tool 6 3 6 7 4 9 5 6 3 6 7 5 4 6 8 7 6 8 5 5 7 7 5 5 5 5 6 14 6 6 5 6 7
Educational Videos 5 3 7 6 3 11 5 6 6 6 6 4 6 6 7 7 5 9 7 5 8 4 6 4 4 5 0 0 6 4 8 5 6
Q. How valuable were the following communications and resources about the 3-bin FOGO trial?
Base: FOGO residents, excludes ‘unsure’ and ‘no response’ (n = varies) 43
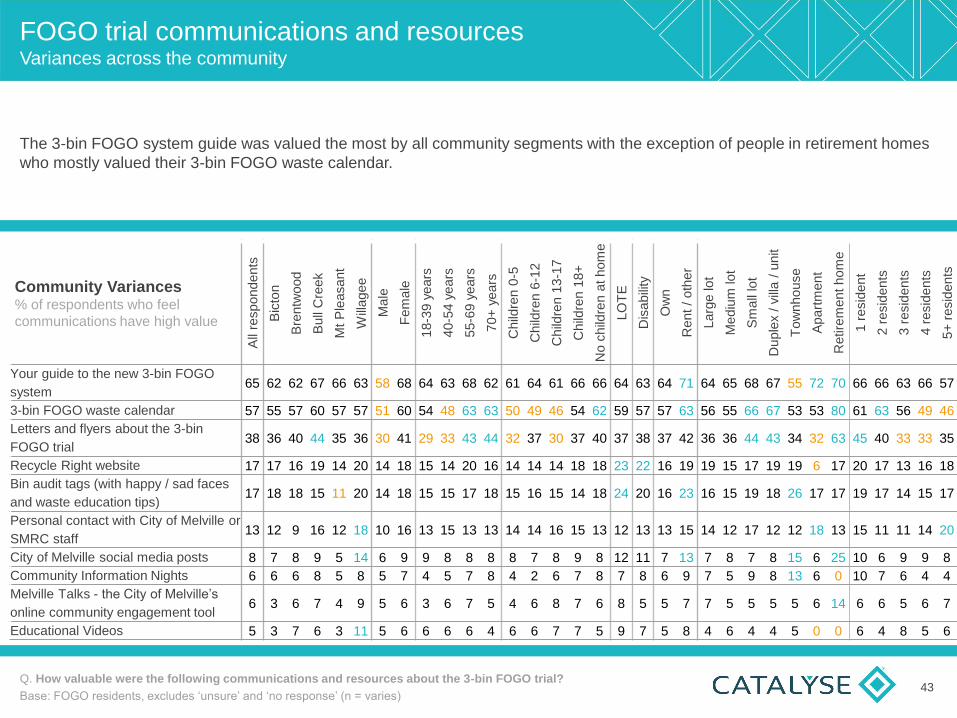
The 3-bin FOGO system guide was valued the most by all community segments with the exception of people in retirement homes
who mostly valued their 3-bin FOGO waste calendar.
Community Variances % of respondents who feel
communications have high value
Suggestions to improve communication and education
Q. How could communication and education about the 3-bin FOGO service be improved?
Base: All respondents, excludes ‘no response’ (n = 1055)
“I believe there is still a lot of confusion as to what can and cannot be
recycled. Perhaps a more detailed sheet people can put on their fridge.”
“An extensive list of what rubbish went in which bin would be handy. Also to
know how much of it is actually recycled.”
“Be clearer about what items can/can't be thrown in each respective bin.
Explain why certain items cannot be included in the recycling (or other)
bins, for example.”
“More education about what waste goes in each bin, e.g. An empty pizza
box with no food scraps vs one with food scraps - where does it go? Where
does used oil go? To landfill?”
“Perhaps more comprehensive lists. Explanations for items one might treat
incorrectly. Hard plastics, soft plastics, eggshells, used paper towels.”
“Make it succinct and easy to use and store for future reference, i.e. fridge
magnet, bin stickers etc.”
“Occasional reminders to ensure we continue to do the right thing.”
“Clear stickers on the bins highlighting key Do's and Don’t's. A visual
reference every time you are using the bin. Particularly the items that can
cause confusion, e.g. Wood.”
“In some way the need is to reach the people who have behaved as if the 3
bin FOGO Trial isn't taking place.”
“Those who are interested are going to want to use it, those who don't care
won't bother. Children can be powerful, teach more in schools.”
A full list of anonymous comments is provided in the
Community Voices database.
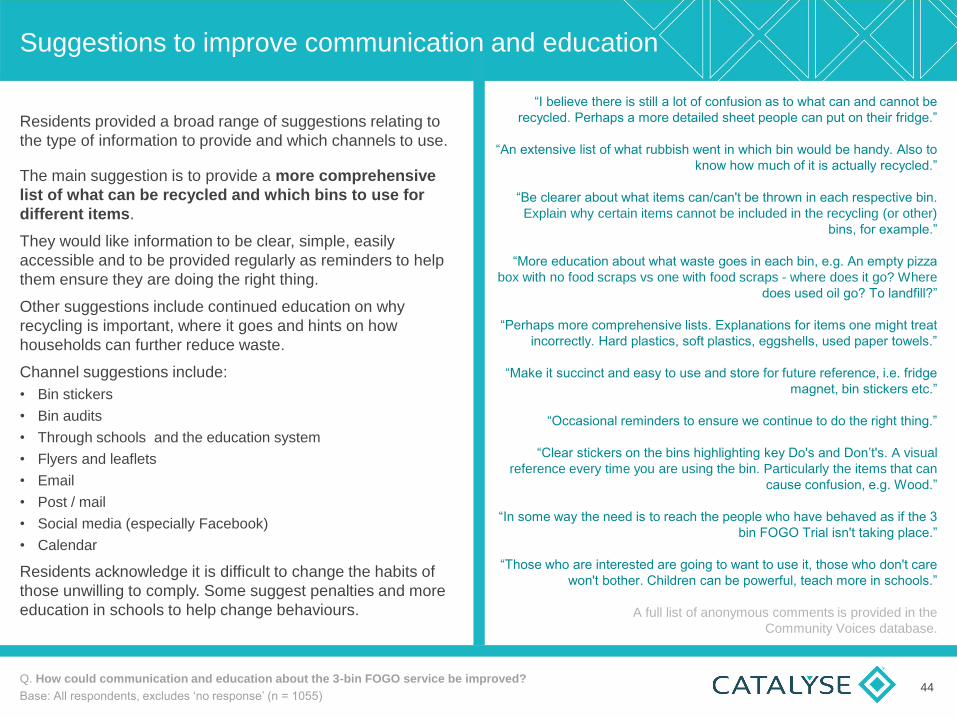
Residents provided a broad range of suggestions relating to
the type of information to provide and which channels to use.
The main suggestion is to provide a more comprehensive
list of what can be recycled and which bins to use for
different items.
They would like information to be clear, simple, easily
accessible and to be provided regularly as reminders to help
them ensure they are doing the right thing.
Other suggestions include continued education on why
recycling is important, where it goes and hints on how
households can further reduce waste.
Channel suggestions include:
• Bin stickers
• Bin audits
• Through schools and the education system
• Flyers and leaflets
• Post / mail
• Social media (especially Facebook)
• Calendar
Residents acknowledge it is difficult to change the habits of
those unwilling to comply. Some suggest penalties and more
education in schools to help change behaviours.
44
Willingness to pay for a 3 bin system
Willingness to pay for a FOGO bin
46
Q. If there was an additional cost associated with the provision of a third bin for FOGO materials, how much, if any,
would you be willing to pay per year?
Base: FOGO residents, excludes ‘unsure’ and ‘no response’ (n = 1890)
Willingness to pay extra per year for a third bin % of respondents
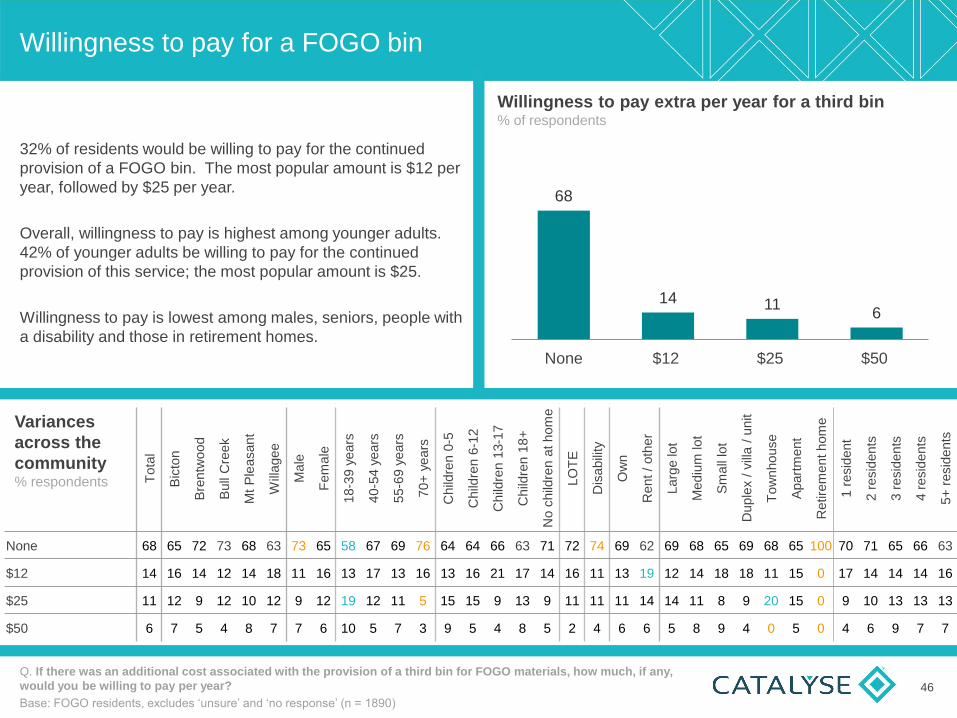
32% of residents would be willing to pay for the continued
provision of a FOGO bin. The most popular amount is $12 per
year, followed by $25 per year.
Overall, willingness to pay is highest among younger adults.
42% of younger adults be willing to pay for the continued
provision of this service; the most popular amount is $25.
Willingness to pay is lowest among males, seniors, people with
a disability and those in retirement homes.
Tota
l
Bic
ton
Bre
ntw
ood
Bull
Cre
ek
Mt
Ple
asant
Will
agee
Male
Fem
ale
18-3
9 y
ears
40-5
4 y
ears
55-6
9 y
ears
70+
years
Child
ren 0
-5
Child
ren 6
-12
Child
ren 1
3-1
7
Child
ren 1
8+
No c
hild
ren a
t hom
e
LO
TE
Dis
abili
ty
Ow
n
Rent / oth
er
Larg
e lot
Mediu
m lot
Sm
all
lot
Duple
x /
vill
a /
unit
Tow
nhouse
Apart
ment
Retire
ment hom
e
1 r
esid
ent
2 r
esid
ents
3 r
esid
ents
4 r
esid
ents
5+
resid
ents
None 68 65 72 73 68 63 73 65 58 67 69 76 64 64 66 63 71 72 74 69 62 69 68 65 69 68 65 100 70 71 65 66 63
$12 14 16 14 12 14 18 11 16 13 17 13 16 13 16 21 17 14 16 11 13 19 12 14 18 18 11 15 0 17 14 14 14 16
$25 11 12 9 12 10 12 9 12 19 12 11 5 15 15 9 13 9 11 11 11 14 14 11 8 9 20 15 0 9 10 13 13 13
$50 6 7 5 4 8 7 7 6 10 5 7 3 9 5 4 8 5 2 4 6 6 5 8 9 4 0 5 0 4 6 9 7 7
Variances
across the
community % respondents
68
14 11 6
None $12 $25 $50
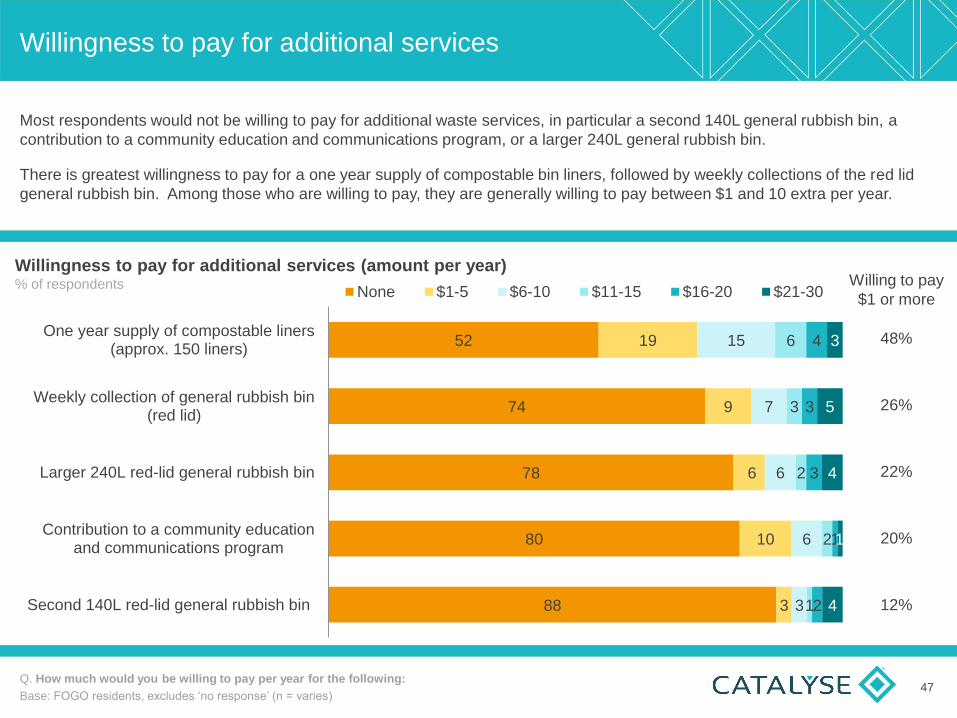
Most respondents would not be willing to pay for additional waste services, in particular a second 140L general rubbish bin, a
contribution to a community education and communications program, or a larger 240L general rubbish bin.
There is greatest willingness to pay for a one year supply of compostable bin liners, followed by weekly collections of the red lid
general rubbish bin. Among those who are willing to pay, they are generally willing to pay between $1 and 10 extra per year.
Willingness to pay for additional services
Q. How much would you be willing to pay per year for the following:
Base: FOGO residents, excludes ‘no response’ (n = varies)
52
74
78
80
88
19
9
6
10
3
15
7
6
6
3
6
3
2
2
1
4
3
3
1
2
3
5
4
1
4
One year supply of compostable liners(approx. 150 liners)
Weekly collection of general rubbish bin(red lid)
Larger 240L red-lid general rubbish bin
Contribution to a community educationand communications program
Second 140L red-lid general rubbish bin
None $1-5 $6-10 $11-15 $16-20 $21-30
Willingness to pay for additional services (amount per year) % of respondents
48%
26%
22%
20%
12%
Willing to pay
$1 or more
47
Willingness to pay for additional services Variances across the community
All
respondents
Bic
ton
Bre
ntw
ood
Bull
Cre
ek
Mt
Ple
asant
Will
agee
Male
Fem
ale
18-3
9 y
ears
40-5
4 y
ears
55-6
9 y
ears
70+
years
Child
ren 0
-5
Child
ren 6
-12
Child
ren 1
3-1
7
Child
ren 1
8+
No c
hild
ren a
t hom
e
LO
TE
Dis
abili
ty
Ow
n
Rent / oth
er
Larg
e lot
Mediu
m lot
Sm
all
lot
Duple
x / v
illa /
unit
Tow
nhouse
Apart
ment
Retire
ment hom
e
1 r
esid
ent
2 r
esid
ents
3 r
esid
ents
4 r
esid
ents
5+
resid
ents
One year supply of compostable liners
(approx. 150 liners) 48 48 45 50 49 49 43 52 57 44 49 44 51 48 45 50 48 49 39 47 57 48 48 52 48 50 45 33 49 49 49 46 53
Weekly collection of general rubbish
bin (red lid) 26 23 28 25 26 32 25 27 39 29 24 15 39 32 35 31 20 25 19 25 30 25 28 25 22 24 25 11 18 21 32 31 39
Larger 240L red-lid general rubbish bin 22 18 22 23 20 28 22 23 35 28 19 8 37 32 36 26 15 24 15 21 28 25 23 20 16 14 20 0 12 16 27 32 37
Contribution to a community education
and communications program 20 21 23 15 19 25 16 22 33 17 20 13 26 19 17 22 19 24 17 19 28 18 19 25 22 12 30 11 21 19 25 18 21
Second 140L red-lid general rubbish
bin 12 10 16 11 14 15 11 14 21 15 10 6 19 15 18 14 9 12 11 11 18 14 12 12 10 5 15 0 8 10 15 17 18
Q. How much would you be willing to pay per year for the following:
Base: FOGO residents, excludes ‘no response’ (n = varies) 48
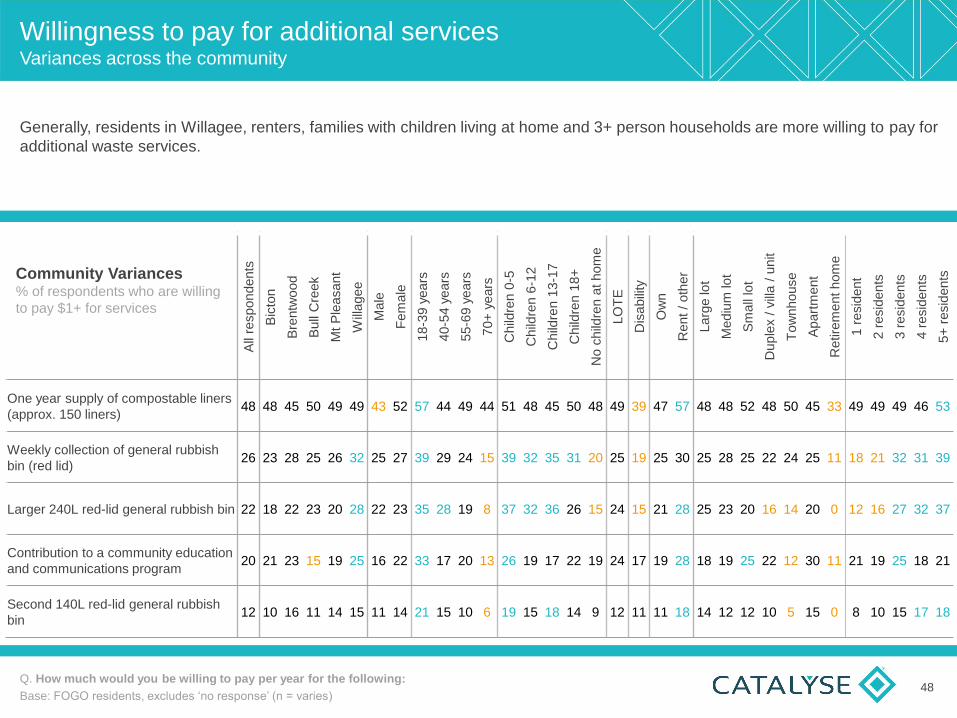
Generally, residents in Willagee, renters, families with children living at home and 3+ person households are more willing to pay for
additional waste services.
Community Variances % of respondents who are willing
to pay $1+ for services

www.catalyse.com.au
Office 3, 996 Hay Street, Perth WA 6000
PO Box 8007, Cloisters Square WA 6850
Phone +618 9226 5674
Email: [email protected]
ABN 20 108 620 855