Embed Size (px)
Citation preview
Balanced Scorecard Concept
Development: Analysis
Sergey Ivanovich Krylov
Department of Accounting, Analysis and Audit
Ural Federal University
Russian Federation
Email: [email protected]
Abstract
The author proposes theoretical and methodological aspects ofthe applied strategic analysis (ASA) as a new instrument ofthe balanced scorecard (BSC) comprehensive study of theorganization economic activity. The ASA concept has resultedfrom the further development of the BSC concept which definesa set of the analyzed indicators and the analysis sequence.Such are the main ASA objectives: comparative evaluation ofthe BSC data, diagnostics of the BSC data divergence andforecast of the BSC data. All the objectives are closely
interrelated, as every coming problem entails from theprevious one. The principle of the ASA implementation, adeduction principle, is understood as a research, firstly, ofthe general BSC indicators, then – specific ones. The basicASA applications are as follows: analysis of financial data,analysis of customers’ data, analysis of the internal businessprocesses data and analysis of the personnel training anddevelopment.
Key words: Balanced Scorecard, Applied Strategic Analysis,Comparative Assessment, Variance Diagnostics, Forecast
JEL Classification: C02, M00, M19, M41
1. Introduction
To enhance strategic management efficiency in difficultconditions of today market economy we need to improve itsinformation-analytical support, to evolve theory, methodologyand methods of the overall strategic economic activity aspectsto the level of the financial analysis being an efficientresearch instrument of the financial aspects of theorganization economic activity based on the financialindicators and described experience.One of the leads of further research is the development of thefoundations of the applied strategic analysis (ASA) concept,assuming a comprehensive research of strategic aspects of theorganization economic activity based on the balanced scorecard(BSC) and considered to facilitate strategic managementfunctions.It should be taken into consideration that the appliedstrategic analysis lacks any standard methods as it is appliedto the balanced scorecard system special for any particularorganization. Hence, The ASA methods are special as well forany particular organization. So it enables to discuss generalaspects of the methodology rather than its universalspecification.The paper treats theoretical and methodological aspects of theapplied strategic analysis concept as a research instrument ofthe financial aspects of the organization economic activity bymeans of the financial indicators of the BSC as well as other
2
aspects of the organization performance by means of otherelements of the BSC such as customer, internal business-processes, training and personnel development.
2. Literature review
The balanced scorecard concept as an analytical instrumentapplied in the field of strategic management was developed byAmerican scientists Robert Kaplan and David Norton (1992) atthe beginning of the 90s of the XX century evolving both intheir works (Kaplan & Norton, 1996, 2001, 2003, 2004, 2005,2006, 2008) and those of other scientists studying economics(Friedag & Schmidt, 2002; Horvath & Partners, 2004; Maisel,1992; Norreklit, 2000; Olve, Roy & Wetter, 2000; Rampersad,2003), and was multiply tested. At present BSC is consideredto be one of the essential instruments of the organizationmanagement system (enterprise, firm, company, and business-unit).The main reason to develop BSC was a contradiction betweencontingencies aimed at setting up wide competitiveopportunities and immobile accounting system (financialaccounting system).Balanced scorecard as a whole is implied as an aggregate ofparameters featuring an overall organization performance inup-to-date market economy. It reflects a balance to be broughtabout between short-term and long-term goals, financial andnon-financial indicators, basic and auxiliary parameters, aswell as internal and external factors of the organizationeconomic activity.The scores of the balanced system were formed depending on theoutlook and strategic goals of any particular organization andhave individual features. They represent a balance betweenexternal accounting data for the owners (shareholders) andinternal characteristics of the most significant businessprocesses, innovations, training and growth that is thebalance between the results of the organization performanceand future growth. The system comprises a combination ofobjective quantity estimated data and subjective somewhatarbitrary parameters of future growth.
3
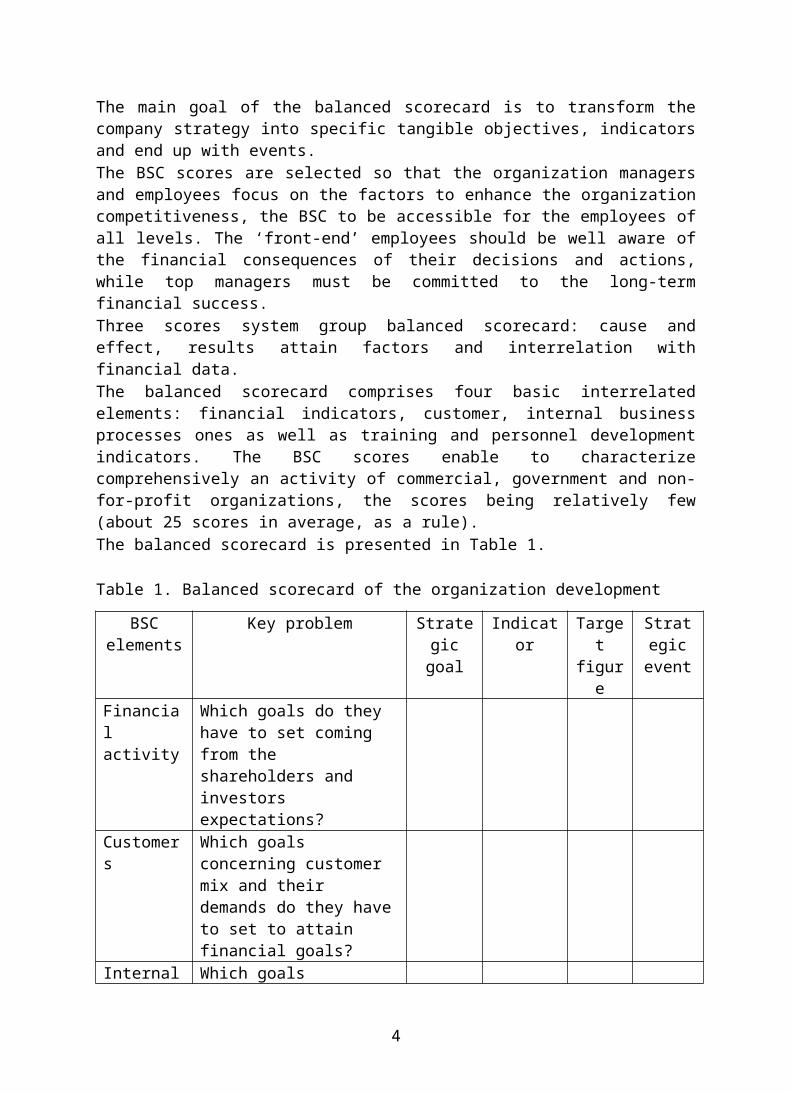
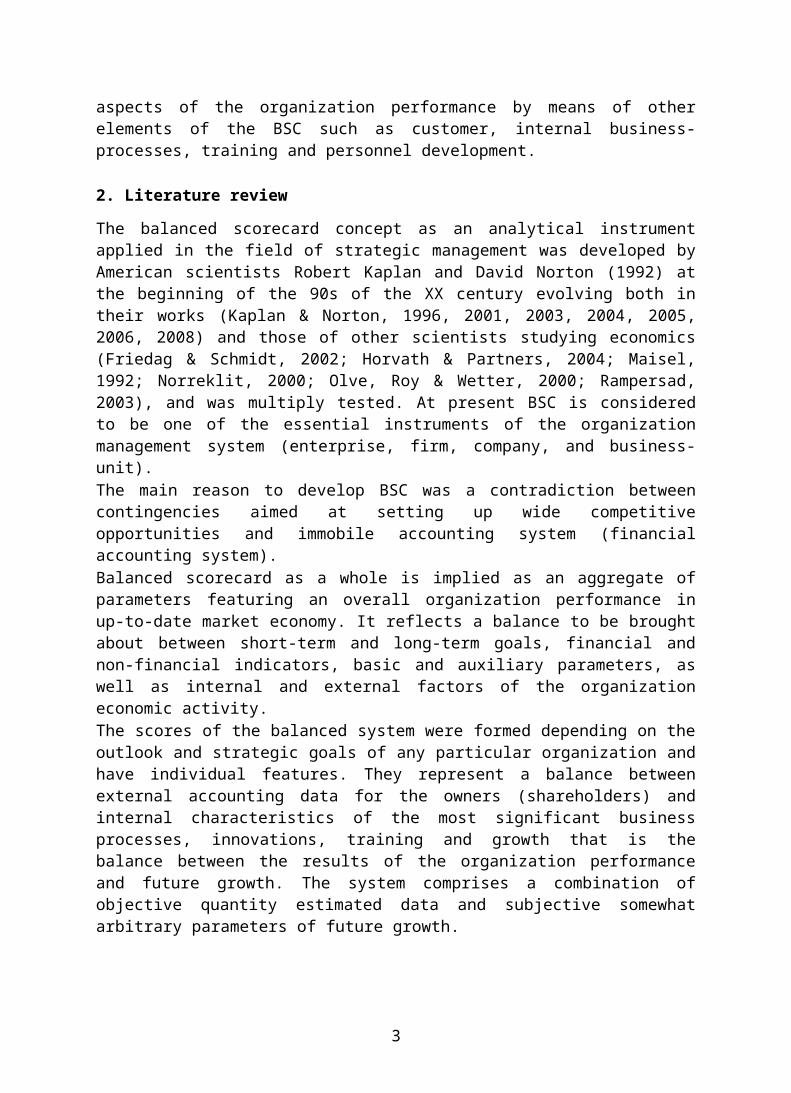
The main goal of the balanced scorecard is to transform thecompany strategy into specific tangible objectives, indicatorsand end up with events.The BSC scores are selected so that the organization managersand employees focus on the factors to enhance the organizationcompetitiveness, the BSC to be accessible for the employees ofall levels. The ‘front-end’ employees should be well aware ofthe financial consequences of their decisions and actions,while top managers must be committed to the long-termfinancial success.Three scores system group balanced scorecard: cause andeffect, results attain factors and interrelation withfinancial data.The balanced scorecard comprises four basic interrelatedelements: financial indicators, customer, internal businessprocesses ones as well as training and personnel developmentindicators. The BSC scores enable to characterizecomprehensively an activity of commercial, government and non-for-profit organizations, the scores being relatively few(about 25 scores in average, as a rule).The balanced scorecard is presented in Table 1. Table 1. Balanced scorecard of the organization development
BSCelements
Key problem Strategicgoal
Indicator
Target
figure
Strategicevent
Financial activity
Which goals do they have to set coming from the shareholders and investors expectations?
Customers
Which goals concerning customer mix and their demands do they haveto set to attain financial goals?
Internal Which goals
4
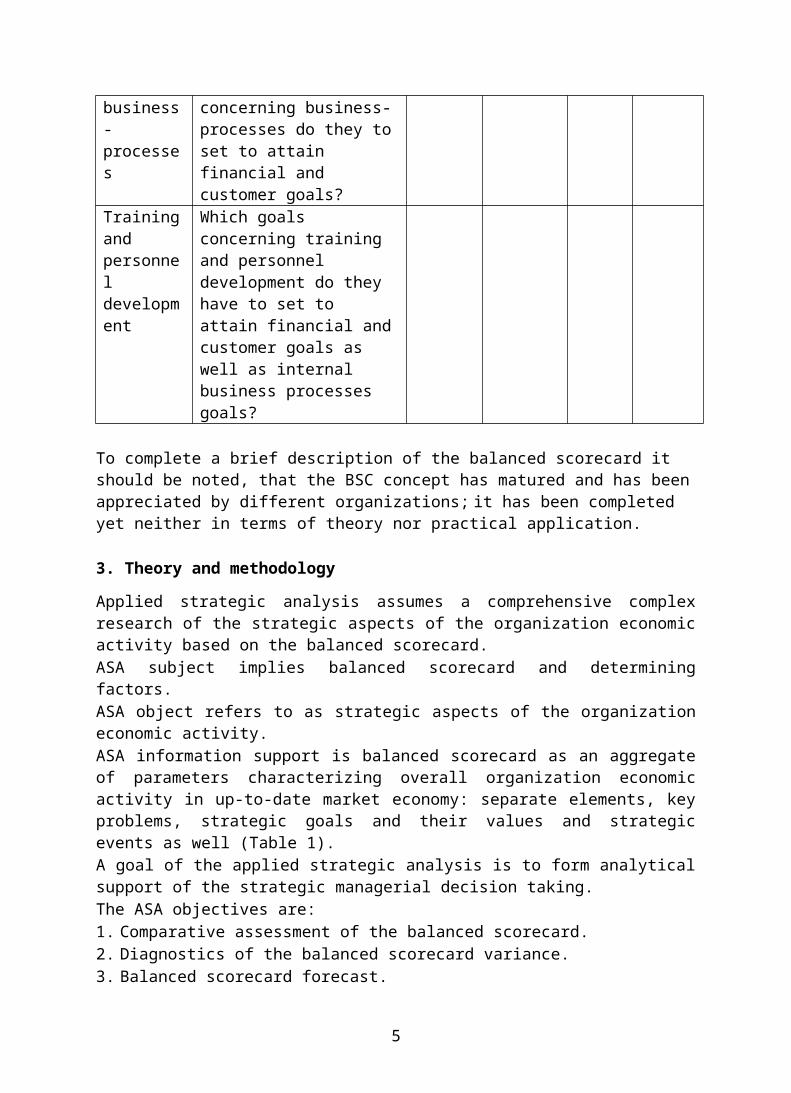
business-processes
concerning business-processes do they toset to attain financial and customer goals?
Trainingand personnel development
Which goals concerning training and personnel development do they have to set to attain financial andcustomer goals as well as internal business processes goals?
To complete a brief description of the balanced scorecard it should be noted, that the BSC concept has matured and has beenappreciated by different organizations; it has been completed yet neither in terms of theory nor practical application.
3. Theory and methodology
Applied strategic analysis assumes a comprehensive complexresearch of the strategic aspects of the organization economicactivity based on the balanced scorecard.ASA subject implies balanced scorecard and determiningfactors.ASA object refers to as strategic aspects of the organizationeconomic activity.ASA information support is balanced scorecard as an aggregateof parameters characterizing overall organization economicactivity in up-to-date market economy: separate elements, keyproblems, strategic goals and their values and strategicevents as well (Table 1).A goal of the applied strategic analysis is to form analyticalsupport of the strategic managerial decision taking.The ASA objectives are:1. Comparative assessment of the balanced scorecard.2. Diagnostics of the balanced scorecard variance.3. Balanced scorecard forecast.
5
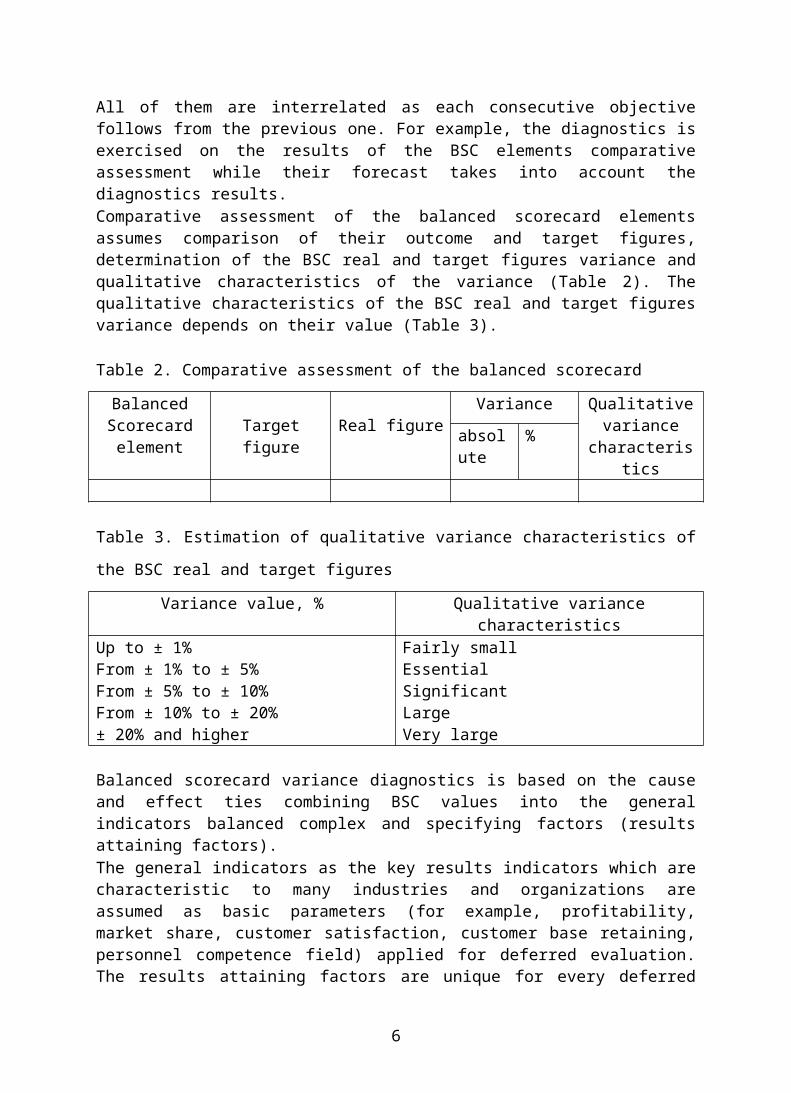
All of them are interrelated as each consecutive objectivefollows from the previous one. For example, the diagnostics isexercised on the results of the BSC elements comparativeassessment while their forecast takes into account thediagnostics results.Comparative assessment of the balanced scorecard elementsassumes comparison of their outcome and target figures,determination of the BSC real and target figures variance andqualitative characteristics of the variance (Table 2). Thequalitative characteristics of the BSC real and target figuresvariance depends on their value (Table 3).
Table 2. Comparative assessment of the balanced scorecard
BalancedScorecardelement
Targetfigure
Real figureVariance Qualitative
variancecharacteris
tics
absolute
%
Table 3. Estimation of qualitative variance characteristics of
the BSC real and target figures
Variance value, % Qualitative variancecharacteristics
Up to ± 1%From ± 1% to ± 5%From ± 5% to ± 10%From ± 10% to ± 20%± 20% and higher
Fairly smallEssentialSignificantLargeVery large
Balanced scorecard variance diagnostics is based on the causeand effect ties combining BSC values into the generalindicators balanced complex and specifying factors (resultsattaining factors).The general indicators as the key results indicators which arecharacteristic to many industries and organizations areassumed as basic parameters (for example, profitability,market share, customer satisfaction, customer base retaining,personnel competence field) applied for deferred evaluation.The results attaining factors are unique for every deferred
6
specific business-unit evaluation indicators reflecting thestrategy applied (for example, profitability financialfactors, competition market segments, specific business-unitsgoals, training and personnel development). They disclose howthe general indicators are attained. Moreover, at the earlystages the general indicators are not sufficient to estimateimplementation of the organization strategy. Vice versa, theresults attaining factors (for example, production cycle timeor faulty products percentage) with appropriate indicatorsmissing enable to improve only short-term production processesand do not reflect their impact on the customer base and,consequently, on the financial results.However, some specific BSC outcome indicators (for example,customer and internal business-processes) may be assumed asfactors defining factoring indicators variance of the moregeneral element, for example, financial element).While diagnosing the BSC indicators variance we are able tofind out the results attaining factors having impact on thegeneral or outcome BSC indicators and determine the variancevalue.The BSC factoring model comprises the outcome financial BSCindicator as final (more general) indicators and seven levelsof the defining factors:1st level factors: factorial indicators of the BSC financialelement;2nd level factors: outcome customer indicators and some outcomeindicators of the internal BSC business-processes;3rd level factors: customer factorial indicators and someoutcome indicators of the internal BSC business-processes;4th level factors: some outcome indicators of the internal BSCbusiness-processes and personnel development;5th level factors: some factorial indicators of the internalBSC business-processes and personnel development;6th level factors: some outcome indicators of the BSC trainingand personnel development element;7th level factors: some factorial indicators of the BSCtraining and personnel development element.We can push the analogy further on the five levels of thefactors defining the outcome BSC customer variance, threelevels of the factors defining the outcome BSC internalbusiness-process indicators variance, and one level of the
7
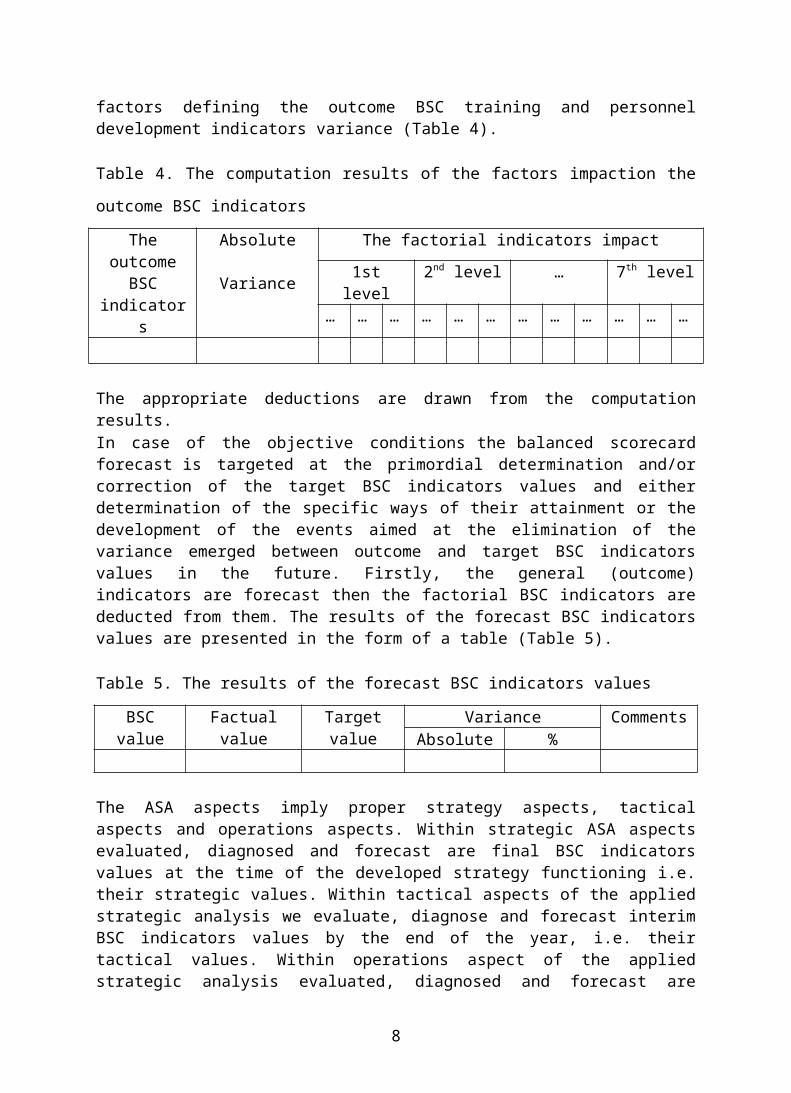
factors defining the outcome BSC training and personneldevelopment indicators variance (Table 4).
Table 4. The computation results of the factors impaction the
outcome BSC indicators
TheoutcomeBSC
indicators
Absolute
Variance
The factorial indicators impact1st
level2nd level … 7th level
… … … … … … … … … … … …
The appropriate deductions are drawn from the computationresults.In case of the objective conditions the balanced scorecardforecast is targeted at the primordial determination and/orcorrection of the target BSC indicators values and eitherdetermination of the specific ways of their attainment or thedevelopment of the events aimed at the elimination of thevariance emerged between outcome and target BSC indicatorsvalues in the future. Firstly, the general (outcome)indicators are forecast then the factorial BSC indicators arededucted from them. The results of the forecast BSC indicatorsvalues are presented in the form of a table (Table 5).
Table 5. The results of the forecast BSC indicators values
BSCvalue
Factualvalue
Targetvalue
Variance CommentsAbsolute %
The ASA aspects imply proper strategy aspects, tacticalaspects and operations aspects. Within strategic ASA aspectsevaluated, diagnosed and forecast are final BSC indicatorsvalues at the time of the developed strategy functioning i.e.their strategic values. Within tactical aspects of the appliedstrategic analysis we evaluate, diagnose and forecast interimBSC indicators values by the end of the year, i.e. theirtactical values. Within operations aspect of the appliedstrategic analysis evaluated, diagnosed and forecast are
8
interim BSC indicators values by the end of each month, i.e.their operations values.All the ASA aspects mentioned are interrelated and agreed: theresults of the analysis of the operations BSC indicatorsvalues impact on their tactical values and the results of thetactical value analysis impact on the strategic ones.The instruments of the ASA methods comprise a combination ofmethods ensuring that the analysis is carried out and itsgoals are attained. The basic ASA method may include methodsof absolute, relative and average values, comparison,grouping, graphical, table and balance methods, as well asfactoring, correlation and regression analysis.The ASA accomplishment principle, a deduction principlepresumes, firstly, an investigation of the general BSCindicators, then specific indicators. The principle definesgeneral sequence of the ASA analysis according to the followingleads:1. Analysis of financial indicators.2. Analysis of customer indicators.3. Analysis of internal business-processes indicators.4. Analysis of training and personnel development indicators.
4. Results
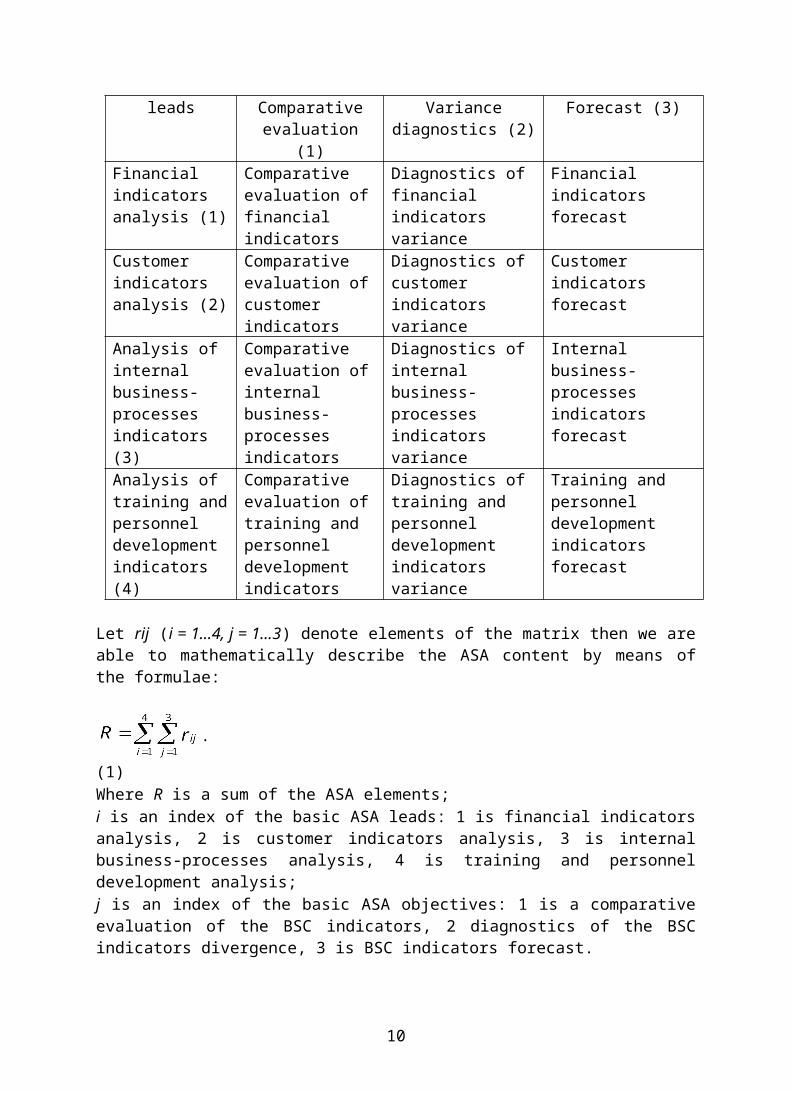
Each of the basic ASA leads, financial, customers, internalbusiness-processes as well as training and personneldevelopment is represented through the prism of its basicobjectives: evaluation, diagnostics and forecast. The ASAcommences from the comparative evaluation of the financialindicators and is completed by the forecast of training andpersonnel development.In addition, assuming “intersection points” of the basic leadsand the most significant objectives as some kind of elementswe are able to build a matrix out of the ASA elements (Table6). The author assumes that the introduced matrix (Table 6)may be considered as a matrix model respectively visualizingtheir composition and economic contents. Table 6. ASA elements matrix
Basic ASA The most significant ASA objectives
9
leads Comparativeevaluation
(1)
Variancediagnostics (2)
Forecast (3)
Financial indicators analysis (1)
Comparative evaluation offinancial indicators
Diagnostics of financial indicators variance
Financial indicators forecast
Customer indicators analysis (2)
Comparative evaluation ofcustomer indicators
Diagnostics of customer indicators variance
Customer indicators forecast
Analysis of internal business-processes indicators (3)
Comparative evaluation ofinternal business-processes indicators
Diagnostics of internal business-processes indicators variance
Internal business-processes indicators forecast
Analysis of training andpersonnel development indicators (4)
Comparative evaluation oftraining and personnel development indicators
Diagnostics of training and personnel development indicators variance
Training and personnel development indicators forecast
Let rij (i = 1…4, j = 1…3) denote elements of the matrix then we areable to mathematically describe the ASA content by means ofthe formulae:
.
(1)Where R is a sum of the ASA elements;i is an index of the basic ASA leads: 1 is financial indicatorsanalysis, 2 is customer indicators analysis, 3 is internalbusiness-processes analysis, 4 is training and personneldevelopment analysis; j is an index of the basic ASA objectives: 1 is a comparativeevaluation of the BSC indicators, 2 diagnostics of the BSCindicators divergence, 3 is BSC indicators forecast.
10
The author assumes that the introduced matrix (Table 6) andformulae (1) may be considered as matrix and mathematicalmodels respectively visualizing their composition and economiccontents.Thus, completing overall description of the applied strategicanalysis concept and contents we would like to discuss each ofits basic leads: financial indicators analysis, customerindicators analysis, internal business-processes analysis andtraining and personnel development analysis in terms of theirgoals, separate elements, examples of the indicators analyzedand brief description of the analysis performance.
4.1. Financial indicators analysis
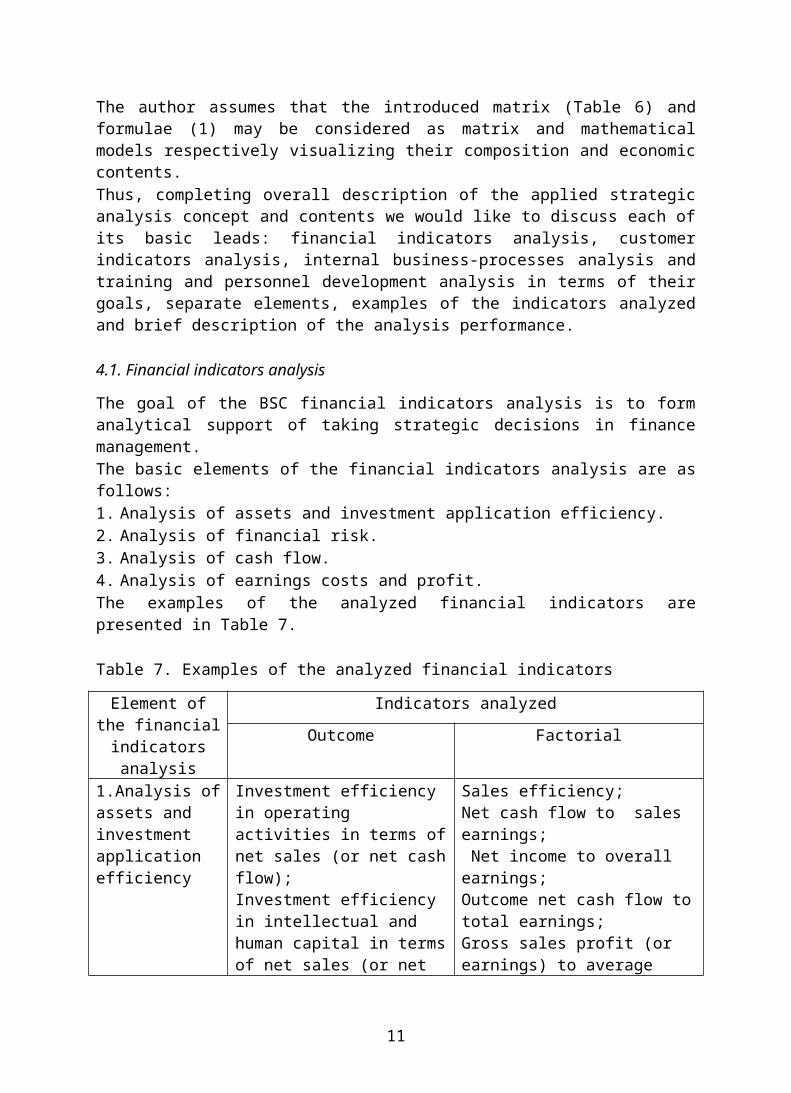
The goal of the BSC financial indicators analysis is to formanalytical support of taking strategic decisions in financemanagement.The basic elements of the financial indicators analysis are asfollows:1. Analysis of assets and investment application efficiency.2. Analysis of financial risk.3. Analysis of cash flow.4. Analysis of earnings costs and profit.The examples of the analyzed financial indicators arepresented in Table 7.
Table 7. Examples of the analyzed financial indicators
Element ofthe financialindicatorsanalysis
Indicators analyzedOutcome Factorial
1.Analysis ofassets and investment application efficiency
Investment efficiency in operating activities in terms ofnet sales (or net cashflow);Investment efficiency in intellectual and human capital in termsof net sales (or net
Sales efficiency;Net cash flow to sales earnings; Net income to overall earnings;Outcome net cash flow tototal earnings;Gross sales profit (or earnings) to average
11
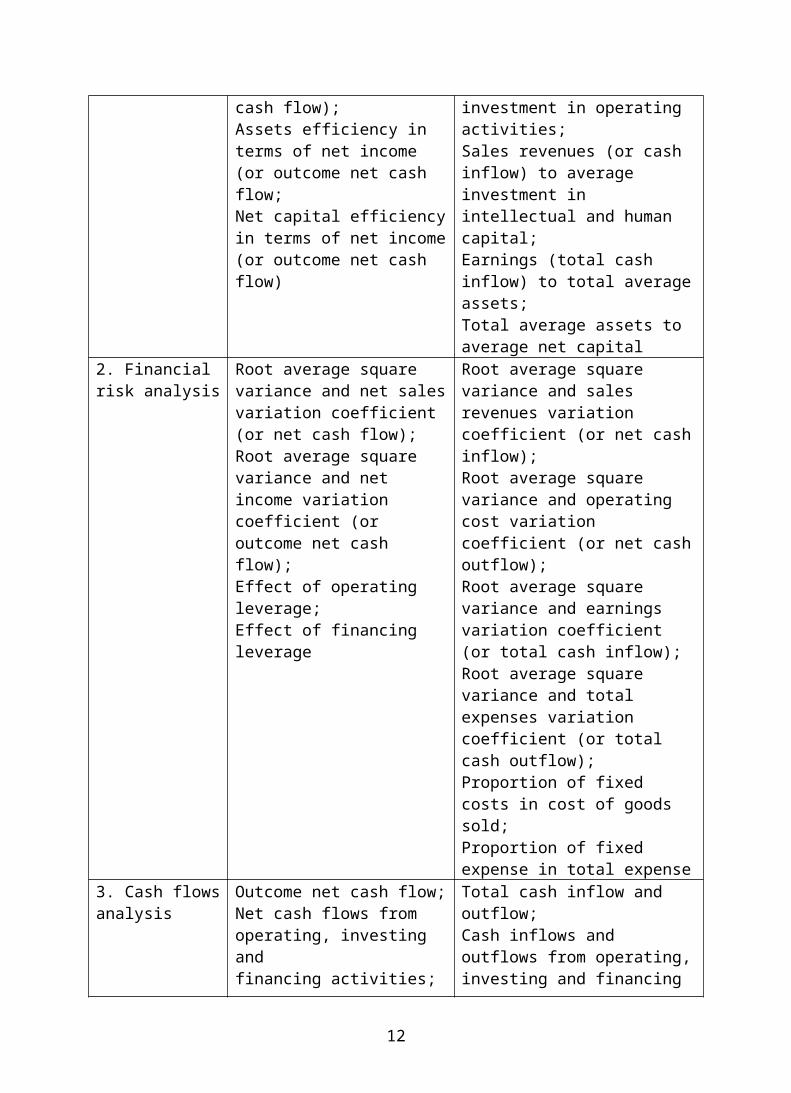
cash flow);Assets efficiency in terms of net income (or outcome net cash flow;Net capital efficiencyin terms of net income(or outcome net cash flow)
investment in operating activities;Sales revenues (or cash inflow) to average investment in intellectual and human capital;Earnings (total cash inflow) to total averageassets;Total average assets to average net capital
2. Financial risk analysis
Root average square variance and net salesvariation coefficient (or net cash flow);Root average square variance and net income variation coefficient (or outcome net cash flow);Effect of operating leverage;Effect of financing leverage
Root average square variance and sales revenues variation coefficient (or net cashinflow);Root average square variance and operating cost variation coefficient (or net cashoutflow);Root average square variance and earnings variation coefficient (or total cash inflow);Root average square variance and total expenses variation coefficient (or total cash outflow);Proportion of fixed costs in cost of goods sold;Proportion of fixed expense in total expense
3. Cash flowsanalysis
Outcome net cash flow;Net cash flows from operating, investing and financing activities;
Total cash inflow and outflow;Cash inflows and outflows from operating,investing and financing
12
Net cash flows from sales of individual products;Net cash flows from individual accounts;Net cash flows from sales of new products;Proportion of net cashflow from sales of newproducts in net cash flow from current activities
activities;Cash inflows and outflows from productionand sales of individual product range;Cash inflows and outflows from productionand sales to individual accounts;Cash inflows and outflows from productionand sales of new products
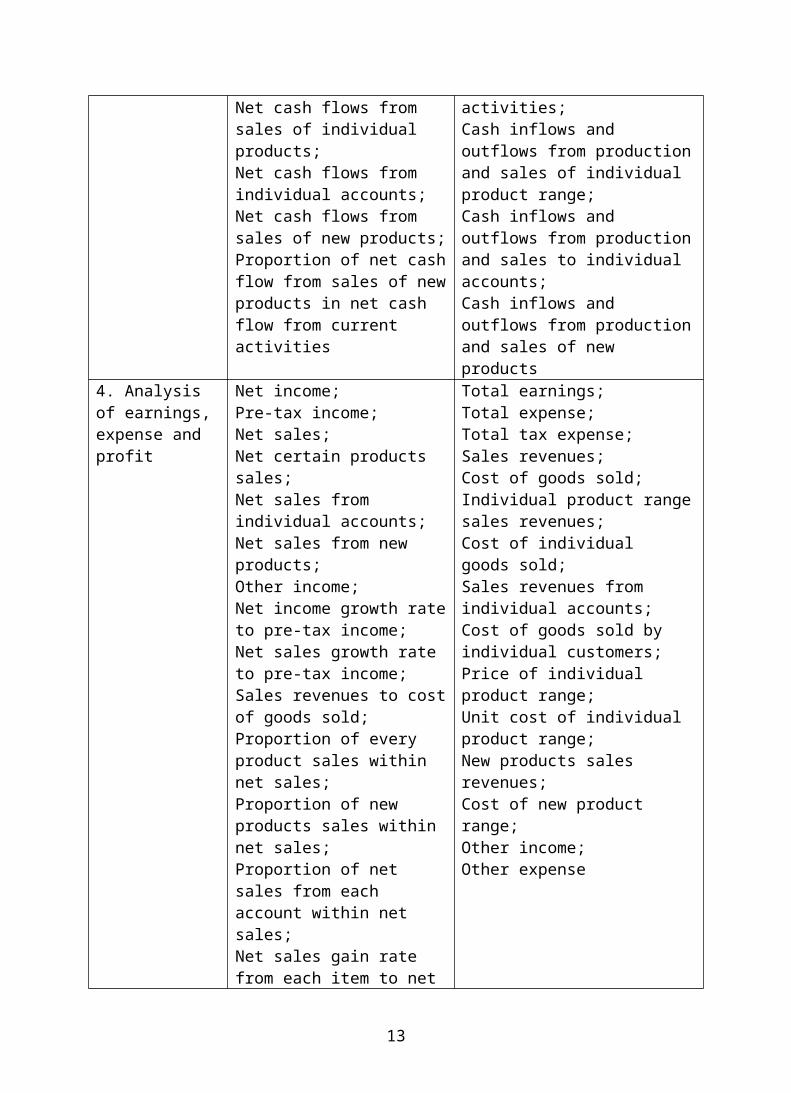
4. Analysis of earnings, expense and profit
Net income;Pre-tax income;Net sales;Net certain products sales;Net sales from individual accounts;Net sales from new products;Other income;Net income growth rateto pre-tax income;Net sales growth rate to pre-tax income;Sales revenues to costof goods sold;Proportion of every product sales within net sales;Proportion of new products sales within net sales;Proportion of net sales from each account within net sales;Net sales gain rate from each item to net
Total earnings;Total expense;Total tax expense;Sales revenues;Cost of goods sold;Individual product rangesales revenues;Cost of individual goods sold;Sales revenues from individual accounts;Cost of goods sold by individual customers;Price of individual product range;Unit cost of individual product range;New products sales revenues;Cost of new product range;Other income;Other expense
13
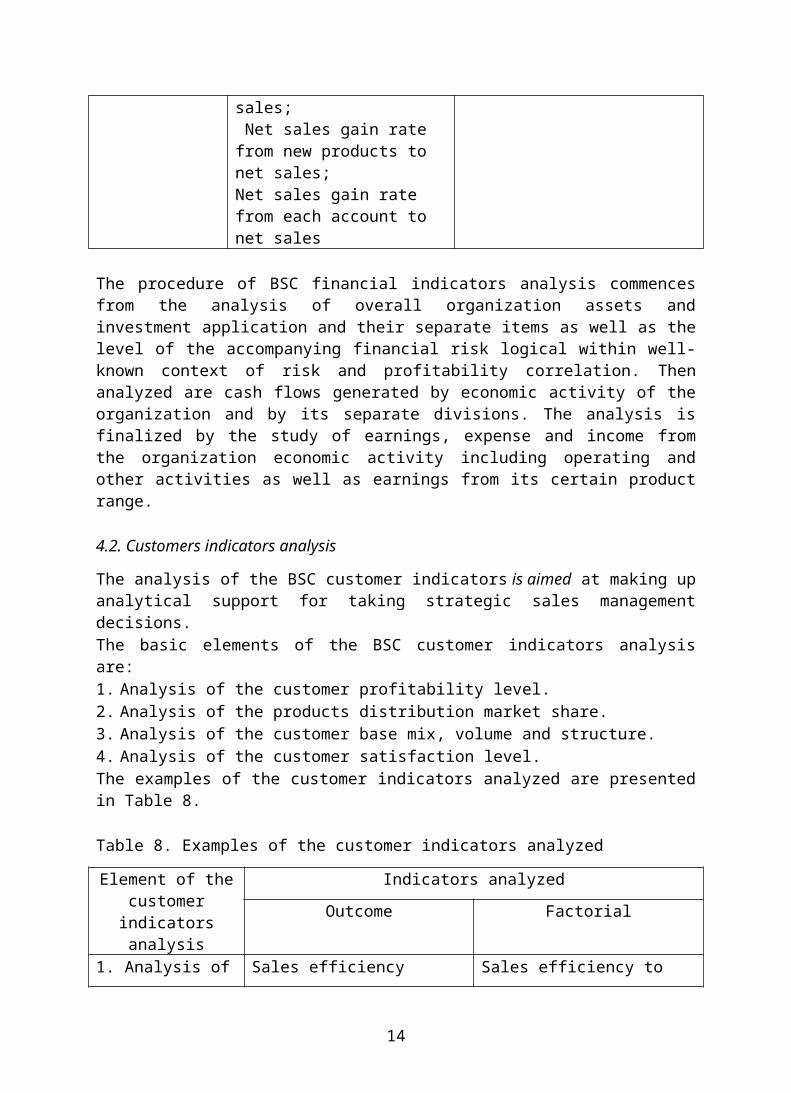
sales; Net sales gain rate from new products to net sales;Net sales gain rate from each account to net sales
The procedure of BSC financial indicators analysis commencesfrom the analysis of overall organization assets andinvestment application and their separate items as well as thelevel of the accompanying financial risk logical within well-known context of risk and profitability correlation. Thenanalyzed are cash flows generated by economic activity of theorganization and by its separate divisions. The analysis isfinalized by the study of earnings, expense and income fromthe organization economic activity including operating andother activities as well as earnings from its certain productrange.
4.2. Customers indicators analysis
The analysis of the BSC customer indicators is aimed at making upanalytical support for taking strategic sales managementdecisions.The basic elements of the BSC customer indicators analysisare:1. Analysis of the customer profitability level.2. Analysis of the products distribution market share.3. Analysis of the customer base mix, volume and structure.4. Analysis of the customer satisfaction level.The examples of the customer indicators analyzed are presentedin Table 8.
Table 8. Examples of the customer indicators analyzed
Element of thecustomer
indicatorsanalysis
Indicators analyzedOutcome Factorial
1. Analysis of Sales efficiency Sales efficiency to
14
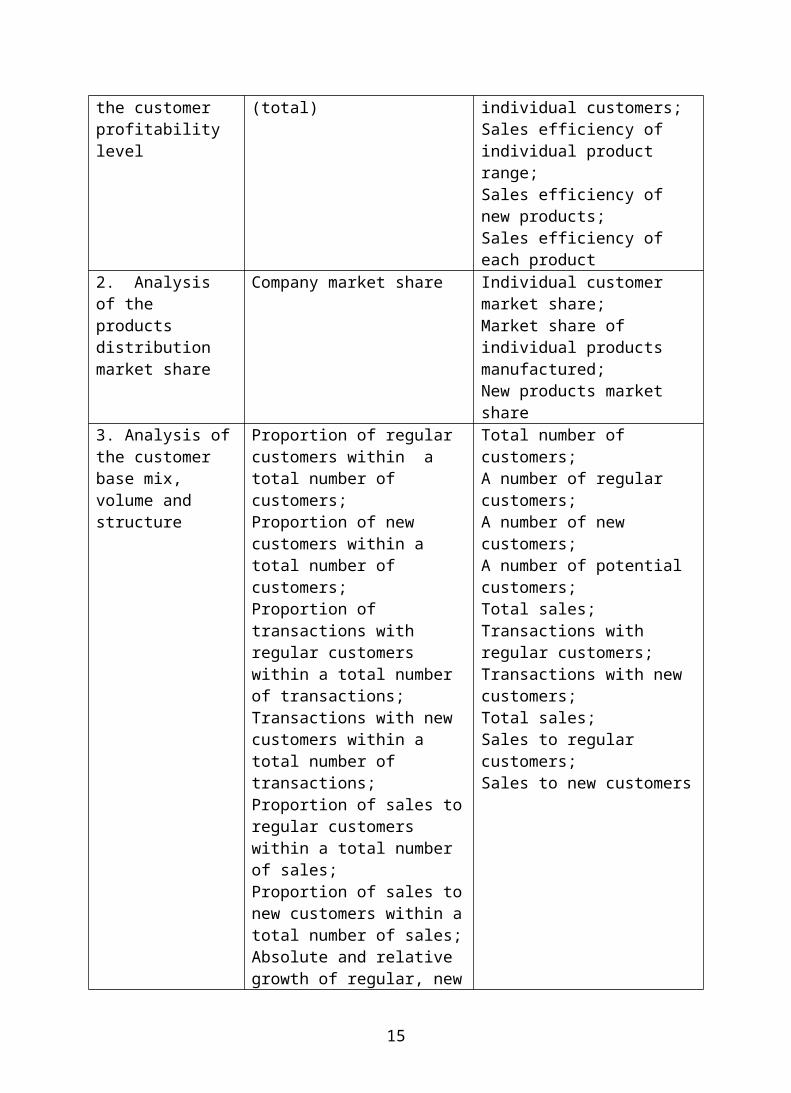
the customer profitability level
(total) individual customers;Sales efficiency of individual product range;Sales efficiency of new products;Sales efficiency of each product
2. Analysis of the products distribution market share
Company market share Individual customer market share;Market share of individual products manufactured;New products market share
3. Analysis ofthe customer base mix, volume and structure
Proportion of regular customers within a total number of customers;Proportion of new customers within a total number of customers;Proportion of transactions with regular customers within a total number of transactions;Transactions with new customers within a total number of transactions;Proportion of sales toregular customers within a total number of sales;Proportion of sales tonew customers within atotal number of sales;Absolute and relative growth of regular, new
Total number of customers;A number of regular customers;A number of new customers;A number of potential customers;Total sales; Transactions with regular customers;Transactions with new customers;Total sales;Sales to regular customers;Sales to new customers
15
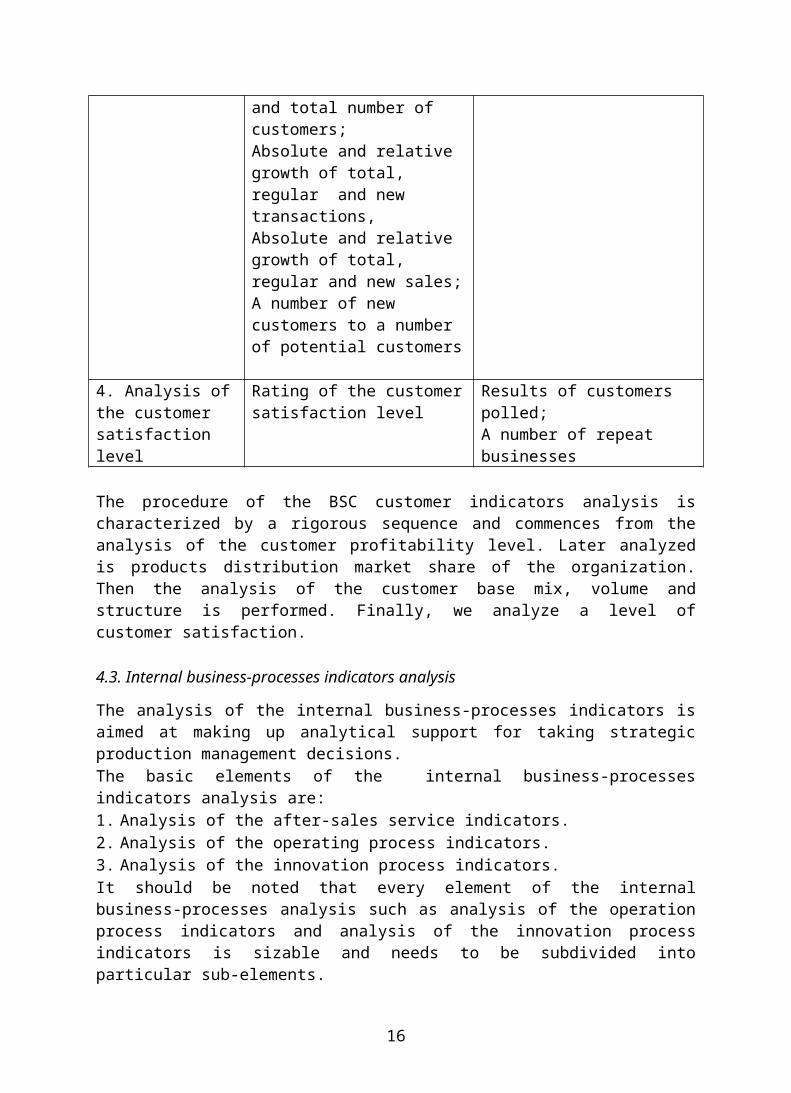
and total number of customers;Absolute and relative growth of total, regular and new transactions,Absolute and relative growth of total, regular and new sales;A number of new customers to a number of potential customers
4. Analysis ofthe customer satisfaction level
Rating of the customersatisfaction level
Results of customers polled;A number of repeat businesses
The procedure of the BSC customer indicators analysis ischaracterized by a rigorous sequence and commences from theanalysis of the customer profitability level. Later analyzedis products distribution market share of the organization.Then the analysis of the customer base mix, volume andstructure is performed. Finally, we analyze a level ofcustomer satisfaction.
4.3. Internal business-processes indicators analysis
The analysis of the internal business-processes indicators isaimed at making up analytical support for taking strategicproduction management decisions.The basic elements of the internal business-processesindicators analysis are:1. Analysis of the after-sales service indicators.2. Analysis of the operating process indicators.3. Analysis of the innovation process indicators.It should be noted that every element of the internalbusiness-processes analysis such as analysis of the operationprocess indicators and analysis of the innovation processindicators is sizable and needs to be subdivided intoparticular sub-elements.
16
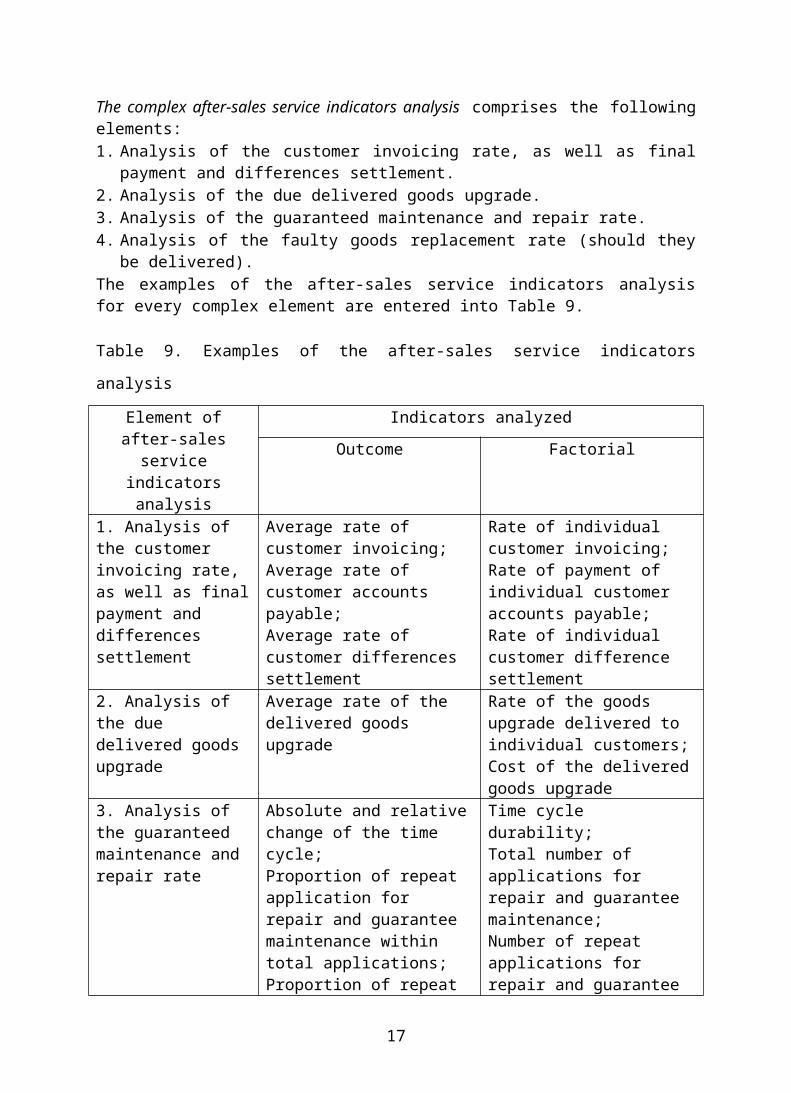
The complex after-sales service indicators analysis comprises the followingelements:1. Analysis of the customer invoicing rate, as well as final
payment and differences settlement.2. Analysis of the due delivered goods upgrade. 3. Analysis of the guaranteed maintenance and repair rate.4. Analysis of the faulty goods replacement rate (should they
be delivered).The examples of the after-sales service indicators analysisfor every complex element are entered into Table 9.
Table 9. Examples of the after-sales service indicators
analysis
Element ofafter-sales
serviceindicatorsanalysis
Indicators analyzedOutcome Factorial
1. Analysis of the customer invoicing rate, as well as finalpayment and differences settlement
Average rate of customer invoicing;Average rate of customer accounts payable;Average rate of customer differences settlement
Rate of individual customer invoicing;Rate of payment of individual customer accounts payable;Rate of individual customer difference settlement
2. Analysis of the due delivered goods upgrade
Average rate of the delivered goods upgrade
Rate of the goods upgrade delivered to individual customers;Cost of the deliveredgoods upgrade
3. Analysis of the guaranteed maintenance and repair rate
Absolute and relativechange of the time cycle;Proportion of repeat application for repair and guarantee maintenance within total applications;Proportion of repeat
Time cycle durability;Total number of applications for repair and guarantee maintenance;Number of repeat applications for repair and guarantee
17
application for shortnotice repair and maintenance
maintenance;Number of applications for; Short notice repair and guarantee maintenance
4. Analysis of the faulty goodsreplacement rate(should they be delivered)
Average rate of faulty goods replacement
Rate of faulty goods replacement to individual customers
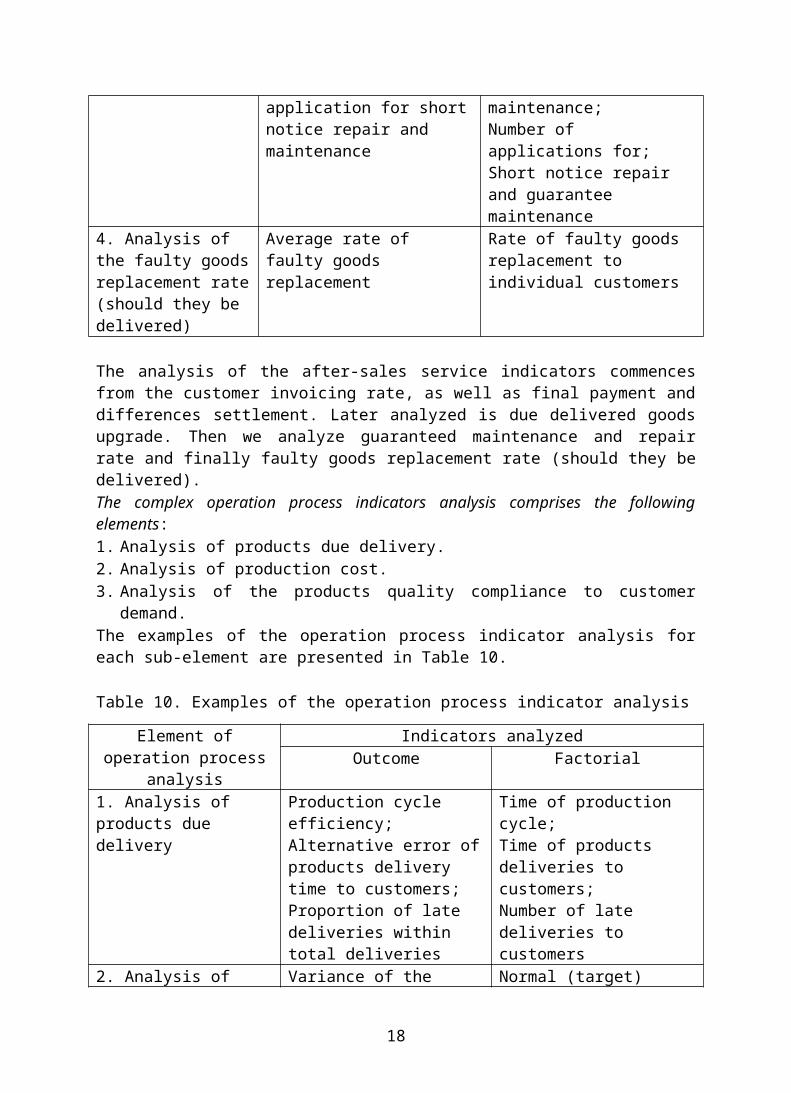
The analysis of the after-sales service indicators commencesfrom the customer invoicing rate, as well as final payment anddifferences settlement. Later analyzed is due delivered goodsupgrade. Then we analyze guaranteed maintenance and repairrate and finally faulty goods replacement rate (should they bedelivered).The complex operation process indicators analysis comprises the followingelements:1. Analysis of products due delivery.2. Analysis of production cost.3. Analysis of the products quality compliance to customer
demand.The examples of the operation process indicator analysis foreach sub-element are presented in Table 10.
Table 10. Examples of the operation process indicator analysis
Element ofoperation process
analysis
Indicators analyzedOutcome Factorial
1. Analysis of products due delivery
Production cycle efficiency;Alternative error ofproducts delivery time to customers;Proportion of late deliveries within total deliveries
Time of production cycle;Time of products deliveries to customers;Number of late deliveries to customers
2. Analysis of Variance of the Normal (target)
18
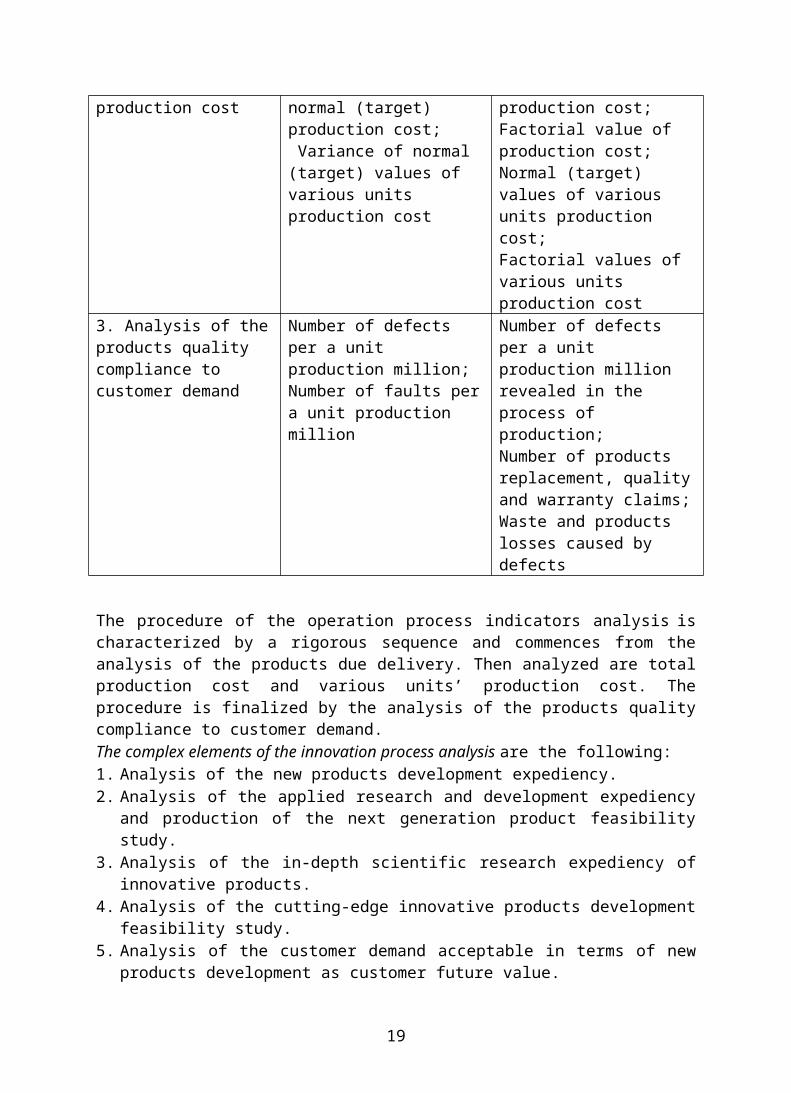
production cost normal (target) production cost; Variance of normal (target) values of various units production cost
production cost;Factorial value of production cost;Normal (target) values of various units production cost;Factorial values of various units production cost
3. Analysis of theproducts quality compliance to customer demand
Number of defects per a unit production million;Number of faults pera unit production million
Number of defects per a unit production million revealed in the process of production;Number of products replacement, qualityand warranty claims;Waste and products losses caused by defects
The procedure of the operation process indicators analysis ischaracterized by a rigorous sequence and commences from theanalysis of the products due delivery. Then analyzed are totalproduction cost and various units’ production cost. Theprocedure is finalized by the analysis of the products qualitycompliance to customer demand.The complex elements of the innovation process analysis are the following:1. Analysis of the new products development expediency.2. Analysis of the applied research and development expediency
and production of the next generation product feasibilitystudy.
3. Analysis of the in-depth scientific research expediency ofinnovative products.
4. Analysis of the cutting-edge innovative products developmentfeasibility study.
5. Analysis of the customer demand acceptable in terms of newproducts development as customer future value.
19
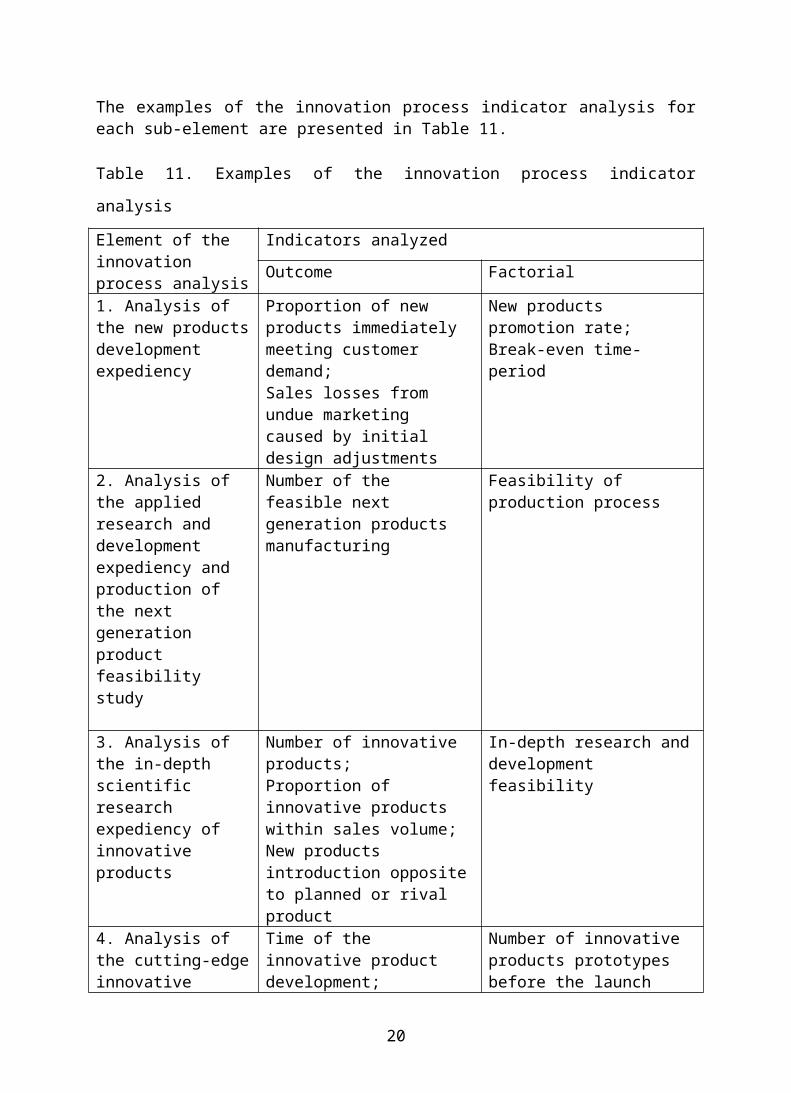
The examples of the innovation process indicator analysis foreach sub-element are presented in Table 11.
Table 11. Examples of the innovation process indicator
analysis
Element of the innovation process analysis
Indicators analyzedOutcome Factorial
1. Analysis of the new productsdevelopment expediency
Proportion of new products immediately meeting customer demand;Sales losses from undue marketing caused by initial design adjustments
New products promotion rate;Break-even time-period
2. Analysis of the applied research and development expediency and production of the next generation product feasibility study
Number of the feasible next generation products manufacturing
Feasibility of production process
3. Analysis of the in-depth scientific research expediency of innovative products
Number of innovative products;Proportion of innovative products within sales volume;New products introduction oppositeto planned or rival product
In-depth research anddevelopment feasibility
4. Analysis of the cutting-edgeinnovative
Time of the innovative product development;
Number of innovative products prototypes before the launch
20
products development feasibility study
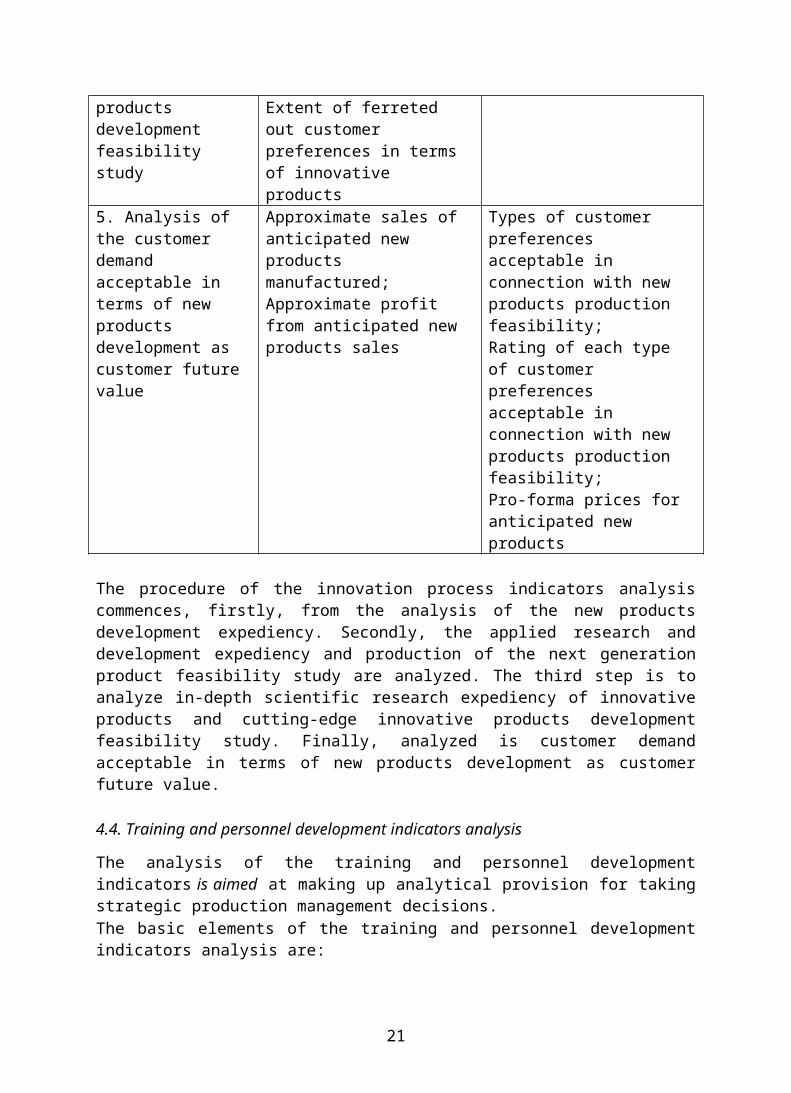
Extent of ferreted out customer preferences in terms of innovative products
5. Analysis of the customer demand acceptable in terms of new products development as customer future value
Approximate sales of anticipated new products manufactured;Approximate profit from anticipated new products sales
Types of customer preferences acceptable in connection with new products production feasibility;Rating of each type of customer preferences acceptable in connection with new products production feasibility;Pro-forma prices for anticipated new products
The procedure of the innovation process indicators analysiscommences, firstly, from the analysis of the new productsdevelopment expediency. Secondly, the applied research anddevelopment expediency and production of the next generationproduct feasibility study are analyzed. The third step is toanalyze in-depth scientific research expediency of innovativeproducts and cutting-edge innovative products developmentfeasibility study. Finally, analyzed is customer demandacceptable in terms of new products development as customerfuture value.
4.4. Training and personnel development indicators analysis
The analysis of the training and personnel developmentindicators is aimed at making up analytical provision for takingstrategic production management decisions.The basic elements of the training and personnel developmentindicators analysis are:
21
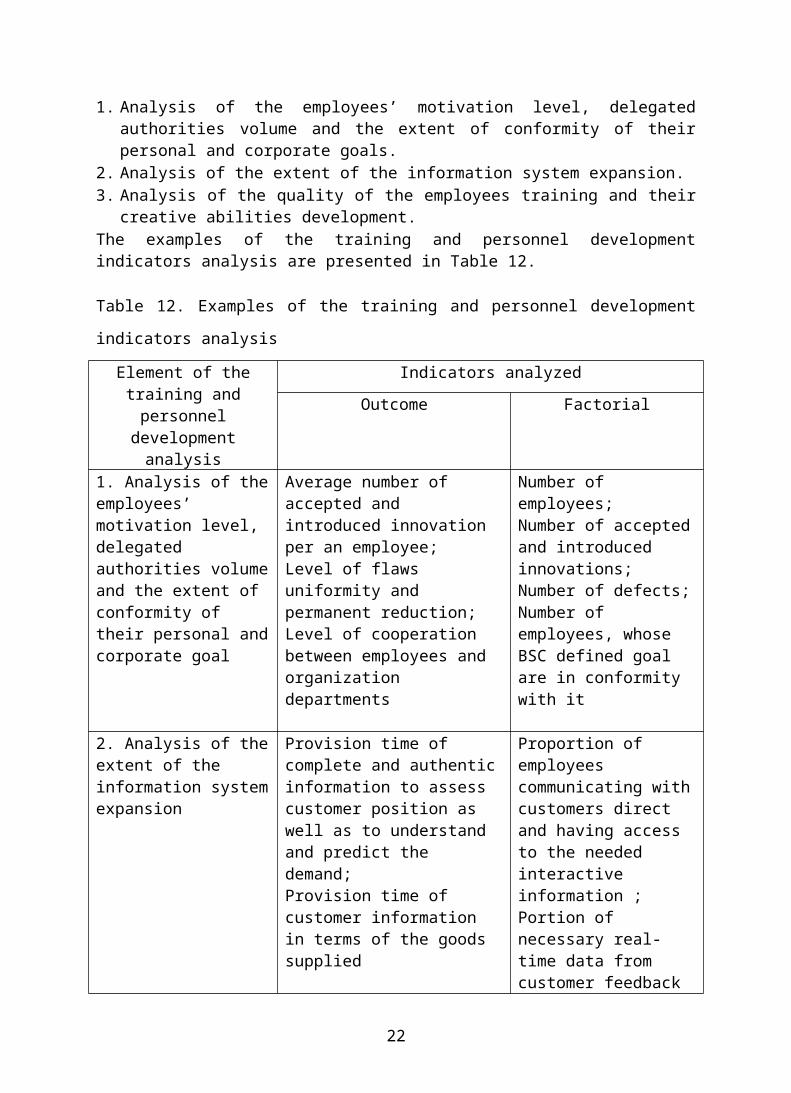
1. Analysis of the employees’ motivation level, delegatedauthorities volume and the extent of conformity of theirpersonal and corporate goals.
2. Analysis of the extent of the information system expansion.3. Analysis of the quality of the employees training and their
creative abilities development.The examples of the training and personnel developmentindicators analysis are presented in Table 12.
Table 12. Examples of the training and personnel development
indicators analysis
Element of thetraining andpersonnel
developmentanalysis
Indicators analyzedOutcome Factorial
1. Analysis of theemployees’ motivation level, delegated authorities volumeand the extent of conformity of their personal andcorporate goal
Average number of accepted and introduced innovation per an employee;Level of flaws uniformity and permanent reduction;Level of cooperation between employees and organization departments
Number of employees;Number of acceptedand introduced innovations;Number of defects;Number of employees, whose BSC defined goal are in conformity with it
2. Analysis of theextent of the information systemexpansion
Provision time of complete and authenticinformation to assess customer position as well as to understand and predict the demand;Provision time of customer information in terms of the goods supplied
Proportion of employees communicating withcustomers direct and having access to the needed interactive information ;Portion of necessary real-time data from customer feedback
22
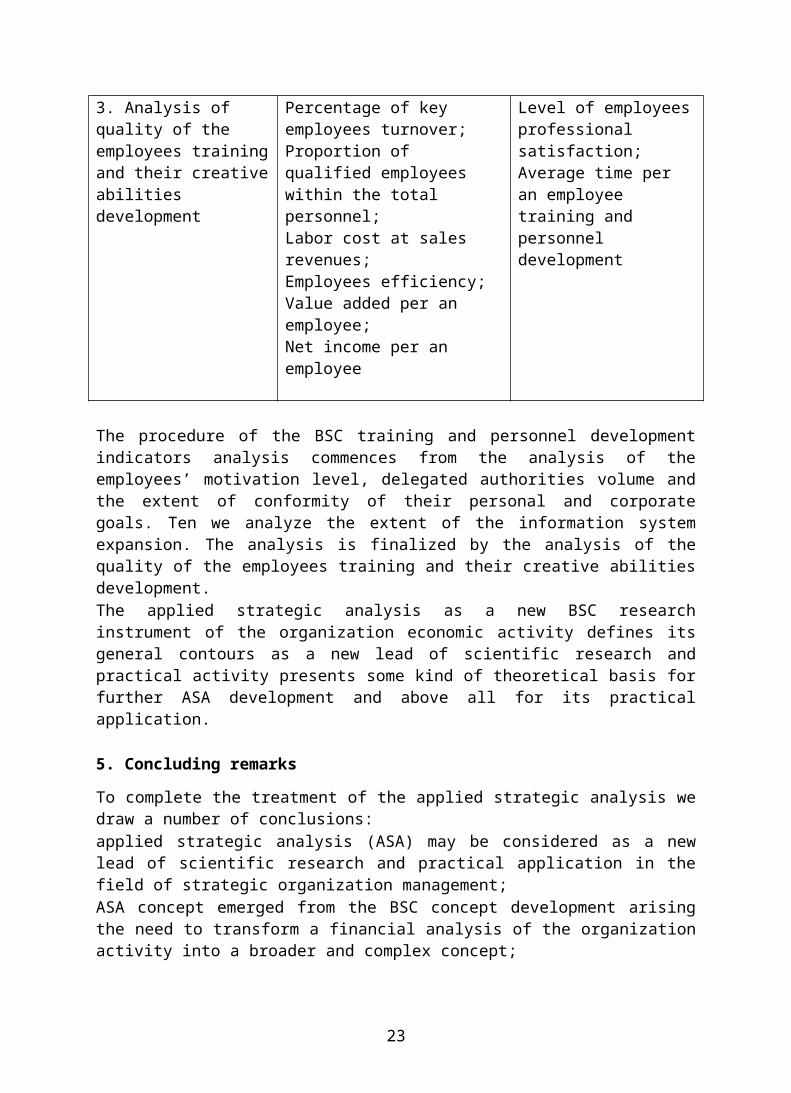
3. Analysis of quality of the employees trainingand their creativeabilities development
Percentage of key employees turnover;Proportion of qualified employees within the total personnel;Labor cost at sales revenues;Employees efficiency;Value added per an employee;Net income per an employee
Level of employeesprofessional satisfaction;Average time per an employee training and personnel development
The procedure of the BSC training and personnel developmentindicators analysis commences from the analysis of theemployees’ motivation level, delegated authorities volume andthe extent of conformity of their personal and corporategoals. Ten we analyze the extent of the information systemexpansion. The analysis is finalized by the analysis of thequality of the employees training and their creative abilitiesdevelopment.The applied strategic analysis as a new BSC researchinstrument of the organization economic activity defines itsgeneral contours as a new lead of scientific research andpractical activity presents some kind of theoretical basis forfurther ASA development and above all for its practicalapplication.
5. Concluding remarks
To complete the treatment of the applied strategic analysis wedraw a number of conclusions:applied strategic analysis (ASA) may be considered as a newlead of scientific research and practical application in thefield of strategic organization management;ASA concept emerged from the BSC concept development arisingthe need to transform a financial analysis of the organizationactivity into a broader and complex concept;
23
ASA is a BSC indicators research instrument and assumes theircomparative assessment, variance diagnostics and forecast;ASA comprises four basic leads: financial indicators analysis,customer indicators analysis, internal business-processesindicators analysis and training and personnel developmentindicators analysis;ASA concept may evolve into specific methods, economic-mathematic models and software to be practically applied.The following may be considered to be basic trends of thefurther applied strategic analysis development:further ASA development assuming its elaboration andspecification in terms of certain BSC elements;ASA methods development for different companies in differentindustries;ASA spread to include current activities, being BSCderivative;economic-mathematic models and software development enablingto apply ASA practically for organization managementprocesses.
References
Friedag, H. R., & Schmidt, W. (2002). Balanced Scorecard: Mehr als einKennzahlensystem. Berlin: Haufe Mediengruppe.Horvath & Partners. (2004). Balanced Scorecard Umzetzen. Stuttgart:Schaeffer-Poeschel Verlag GmbH. Kaplan, R. S. (2005). How the Balanced Scorecard Complementsthe McKinsey 7-s Model. Strategy and Leadership, 3( 33), 41-46.Kaplan, R. S., & Norton, D. P. (2006). Alignment. Using the BalancedScorecard to Create Corporate Sinergies. Boston: Harvard Business SchoolPress.Kaplan, R.S., & Norton, D.P. (2004). Measuring the StrategicReadiness of Intangible Assets. Harvard Business Review, 2(82), 52-63.Kaplan, R. S., & Norton, D., P. (1993). Putting the BalancedScorecard to Work. Harvard Business Review, 5( 71), 134-142.Kaplan, R. S., & Norton, D. P. (2003). Strategy Maps. Boston:Harvard Business School Press.Kaplan, R. S., & Norton, D. P. (1992). The Balanced Scorecard:Measures That Drive Performance. Harvard Business Review, 1(70), 71-79.
24
Kaplan, R.S., & Norton, D.P. (1996). The Balanced Scorecard:Translating Strategy into Action. Boston: Harvard Business SchoolPress.Kaplan, R. S. & Norton, D. P. (2008). The Execution Premium: LinkingStrategy to Operations for Competitive Advantage. Boston: HarvardBusiness School Press. Kaplan, R. S., & Norton, D. P. (2005) The Office of StrategyManagement. Harvard Business Review, 10(83), 72-80.Kaplan, R. S., & Norton, D. P. (2001). The Strategy-FocusedOrganization: How Balanced Scorecard Companies Thrive in the New CompetitiveEnvironment. Boston: Harvard Business School Press.Kaplan, R. S., & Norton, D. P. (1996). Using the BalancedScorecard as a Strategic Management System. Harvard BusinessReview, 1(74), 75-85.Kaplan, R.S., Norton D. P., & Rugelsjoen B. (2010). ManagingAlliances with the Balanced Scorecard. Harvard Business Review 1(88),114-120.Maisel, L. S. (1992). Performance Management: The BalancedScorecard Approach, Journal of Cost Management, 2(6), 47-52.Norreklit, H. (2000). The Balance on the Balanced Scorecard a Critical Analysis of Some of its Assumptions. Management Accounting Research, 1(11), 65-88. http://dx.doi.org/10.1006/mare.1999.0121Olve, N.-G., Roy, J., & Wetter, V. (2000). Performance Drivers: APractical Guide to Using the Balanced Scorecard. Chichester: John Wiley &Sons, Ltd.Rampersad, H. K. (2003). Total Performance Scorecard: RedefiningManagement to Achieve Performance with Integrity. New York, NY:Butterworth Heinemann.
25