Embed Size (px)
Citation preview

Small firm growth in a post-conflict environment:the role of human capital, institutional quality,and managerial capacities
Besnik A. Krasniqi1,2 & Muhamet Mustafa3
# Springer Science+Business Media New York 2016
Abstract Drawing on concepts from earlier theories of firm growth (Gibrat’s Law -GL, Jovanovic’s Learning Theory- JLT, Resource Based View-RBV, and InstitutionalTheory-IT) this paper empirically tests the large sets of variables as predictors of smallfirm growth that accounts for wide range of factors affecting small firm growth inKosova (human capital, institutional quality, and managerial capacities). Using datafrom a sample of 1606 entrepreneurs based on three pooled SME surveys this studycontrols for potential biases in other studies in transition economies (TEs) thatoverlooked internal factors compared to institutional factors. Findings based onProbit and Tobit models show that growth aspirations, managerial capacities andtraining are among the most significant variables associated with growth. Among theinstitutional quality variables, only corruption appears to be significant and negativelyassociated with growth. Other important factors for explaining a small firm growth arefirm size and age, and export involvement. This study contributes to literature on smallfirms growth in TEs and highlights several managerial and policy implications to fostera small firm growth.
Keywords Kosova.Transition .Small firmgrowth.Humancapital . Institutionalquality.
Managerial capacities
Int Entrep Manag JDOI 10.1007/s11365-016-0384-9
* Besnik A. [email protected]; [email protected]
Muhamet [email protected]
1 Staffordshire University, Staffordshire, UK2 University of Prishtina, Prishtina, Kosova3 Riinvest College, Prishtina, Kosova

Introduction
Although research exploring the determinants of small firm growth has attractedinterest of researchers and policymakers in order to promote policies that focus onemployment generation and economic growth (Sleuwaegen and Goedhuys 2002;Wiklund et al. 2009; Hamilton 2012; Obeng et al. 2012), there is still a need to exploreand understand this phenomenon (Wiklund et al. 2009). Despite the growing number ofstudies, (Wiklund et al. 2009; Hashi and Krasniqi 2011; Efendic et al. 2014; Naldi andDavidsson 2014; Lechner and Gudmundsson 2014) the volume of research on smallfirm growth is dominated by studies concentrated on the institutional determinants offirm growth, rather than the internal factors (i.e., the entrepreneurs’ growth aspirations,managerial capacities) and even less on the combination or linkage between the two(Smallbone and Welter 2009). In particular, literature knows very little about thecharacteristics of growing firms, which are main drivers of employment growth(Hölzl 2009). Entrepreneurs’ growth-orientation in empirical research is very importantfrom the policy angle as few small firms intent to grows, and therefore it provideslimited contribution to the economy and therefore questioning the start-up supportpolicies (Santarelli and Vivarelli 2007; Shane 2009; Doern 2011; Román et al. 2013).Studies on transition context usually overemphasis institutional environment at theexpense of the internal factors such as firm, strategy and management factors (Krasniqi2012). In addition to the institutional context which is of paramount importance, itsrelationship to the other aspects of entrepreneurship such as: the knowledge and skillspossessed by the people running a small firm is important too (Veciana and Urbano2008).
In his review of studies in small firm growthWiklund et al. (2009) notes that most ofstudies cover only a limited number of the variables that are important in explainingsmall firm growth. Research in this field is necessary to develop our understanding ofentrepreneurial activities in TEs adapting to a free market economy and, from apractical point of view, it may help entrepreneurs develop their operations by revealingopportunities and constraints in this market (Ojala and Isomäki 2011). Therefore, thispaper contributes to the transition literature by filling an important gap in understandinga small firm growth in the unique post-conflict economy of Kosova. The paperempirically tests variables as predictors of a small firm growth in a particular context,such as Kosova. Kosova is a country often regarded as an extreme and challengingenvironment for entrepreneurship, making it a ‘natural laboratory’ for entrepreneurshipresearchers (Solymossy 2005). In a broader sense, by grounding entrepreneurship innational context, we aim to contribute and value-add to the literature in understanding asmall firm growth in general (see Welter and Lasch 2008). The paper empirically testscomprehensive set of variables affecting small firm growth, such as firms characteris-tics (size, age, location, networking), human capital (training, education, experience),managerial and strategy level factors (exporting, growth aspirations, foreign ownership,separation of ownership and control) and institutional quality (unfair competition,corruption, access to finance, taxes.). The study responds to the current debateconcerning improving and refining the set of explanatory variables that have beenlimited and affect firms growth such as entrepreneurial orientation and strategicmanagement (see Wiklund et al. 2009; Parker et al. 2010; Stam 2010; Hitt et al.2011; Obeng et al. 2012; Sadler-Smith et al. 2003). From a theoretical viewpoint, the
Int Entrep Manag J
findings call for a more balanced approach between internal and external factors andsuggest application of a more integrative model of a small firm growth in TEs –overlooked in previous studies. The empirical analysis uses primary data gatheredthrough SME surveys conducted by Riinvest Institute providing information on a widerange of characteristics of the entrepreneur, the firm and its management and strategy,internal resources and the institutional environment.
The paper proceeds as follows. To begin with, we first introduce the unique featuresin this context of entrepreneurship development in Kosova. Then, theoretical literaturediscusses earlier theories of firm growth and based on these concepts derived fromtheory develops hypothesis to be tested. This follows by an explanation of the data andmethod. The next section presents the results of the determinants of a small firm growthin Kosova, for both whole sample and sample of growing firms; and the final sectionconcludes the paper.
Context: entrepreneurship and SMEs in Kosova
Specific historical and institutional context in Kosova visualizes the opportunities andthreats in development of the private sector dominated by SMEs. The developmentpath begins with so-called Bsmall economy^ during 70’s and 80’s of the last century,with a mixture of the elements of planned and market economy system within Bself-management socialism^ - a specific feature of former Yugoslavia. Private ownership ofland, farms, handicrafts, and small firms was something more pronounce in Kosova ascompared to the other TEs in CEE. The existence of private ownership, althoughlimited has played a vital role in building private sector during the period of reformingafter 1989. Massive job losses of those employed in a state and public (70 % weredismissed by Milosevic regime) heavily influenced the boom in creation of SMEsduring 1990–1993. SMEs mainly in a trade and services were born in self-employmentattempts as a gateway from difficult economic and social conditions, making a rise tonecessity-driven entrepreneurship. This period was followed by a decline in start-upsbecause of the repressive regime and deep recession because of the occupation(Riinvest 1998). During the armed conflict of 1998–1999, 92 % SMEs experiencedlosses and damages in their assets (Riinvest 2000). A period of new developmentstarted at the end of the conflict followed by the UN Administration of the Country(since June 1999) and continued after the country proclaimed its independence(February 2008).
Kosova is amongst less developed European countries with GDP per capita of 2800Euro coming from services (56 %), industry 18 %, agriculture 17 %, and construction10 %. (EU Commission 2014). Deindustrialization marked by the shrink of industryshare of GDP (47 % 1989 to 15 % during early stage of the post conflict period)influenced a heavy imbalance in the macroeconomic configuration. Trade deficitreaching about 40 % of GDP and unemployment rate above 30 % are the key problems.On the other side, macroeconomic and fiscal stability and low inflation persisted with amodest economic growth of 2–4 %. The remittances (about 14 % of GDP) and donorcontribution, especially during the emergent reconstruction phase fuelled the develop-ment of SMEs by causing high aggregate demand. Although the legal framework isalmost completed and in compliance with EU standards, the implementation and weak
Int Entrep Manag J
rule of law remains a severe problem for entrepreneurship development. The unfaircompetition remains the key barrier in doing business, according to perceptions of SMEowners and managers (Riinvest 2013b). Similar trend are reported for corruption,access to finance and taxes. However, entrepreneurs rank the employee knowledgeand managerial abilities as the lowest barriers for their operation and growth. Overall,Kosova private sector and SMEs, although fragmented and with difficulties to benefitfrom efficiency gains remains key for Kosova development as they contribute about70 % to GDP (Riinvest 2013a). The law enforcement and fair competition will remainkey challenges in establishing entrepreneurship friendly business environment inimmediate and midterm future.
Literature review
Despite an emerging body of literature on small firms growth (Davidsson et al. 2002;Wiklund et al. 2009; Yasuda 2005; Coad 2009) theories to explain and predict growthstill remain sparse (Garnsey 1998; Stam 2010), and often contradictory, urging the needfor an expansion of the current set of explanatory variables in the empirical research(Davidsson et al. 2002; Stam 2010). The following discussion takes on to bringtogether the theories of firm growth linking them with modern approaches to smallfirm growth. Earlier theories to explain the growth of small firms include the GL or theLaw of Proportionate Effect (Gibrat 1931), JLT (Jovanovic 1982), RBV (Penrose1959), and IT (North 1990).
Gibrat’ Law and Jovanovic’s Learning GL and JLT have been summarised inliterature as the size-age-growth relationship, which has become a popular theme inrecent small firm growth literature and industrial dynamics. This was motivatedoriginally by the arguments of exploitation of economies of scale discussed by neo-classical theory. The literature based on the so-called GL, maintains that a firm’s growthis independent of its size – a view that became a common wisdom in theoretical andempirical literature (Heshmati 2001). Neoclassical economics' basic assumption is thatthe optimal size is a level of production at which economies of scale are exhausted andthe average long run cost curve reaches its minimum (Carlton and Perloff 2004). In thisview, if firms behave rationally they will achieve the optimal size (minimum efficientscale - MES) and would not have an incentive to grow beyond that point. Theimplication of this theory is that small firms grow faster than larger ones until theyboth reach their optimal size or MES. Another strand of the literature, known as the‘noisy selection’ model developed by Jovanovic (1982), argues that firms learn abouttheir real efficiency over time (thus the relevance of age) and that small firms growfaster than larger firms do. In the post-entry period, firms gradually learn about theirreal cost efficiency and grow during their maturity period due to their ability to learnfrom experience diminishes; this is because of the diminishing returns to experience.Firms enter the market under the MES level and overtime grow to reach this level. Inmarkets with only negligible scale economies, the likelihood of survival is greater fornew entrants, but the opportunity to grow in post-entry period is limited by the gapbetween the MES and size of the firm (Acs and Audretsch 2001). However, the maincritiques to the industrial economics approach relates to the fact that many small firms
Int Entrep Manag J
operate in ‘relatively uncompetitive markets and partly protected local and regionalmarkets’ (O’Farrell and Hitchens 1988, p.1366). Contextualised to the transitioncontext, this critique infers that firms in TEs operate in competitive markets usuallycoupled with weakly installed institutions, thus, the assumption of competitive marketsdoes not hold. In addition, firms do not face the same cost curve and are also marked byother differences in the real world such as their ability to access inter alia managerialresources, skills technology and finance (Deakins and Freel 2003) as recognized by theresources based-view of the firm growth later.
Resource-based view Penrose’s (1959) theory of the firm growth postulates that theavailability of firm resources and knowledge determines the expansion of the firm. InPenrosean view, firms can achieve growth by the accumulation of knowledge in twoways. Firms can accumulate knowledge by learning to use the existing knowledgewithin the firms more efficiently. Alternatively, firms can use new knowledge fromexternal sources, but conditional upon internal absorbing capabilities of firms.Nevertheless, firms will be limited in terms of possibility of these growth opportunitiesbecause of the inherent rigidities of using their existing resource base, and because oftheir need to maintain coherence in their activities (Ghosh and Moran 1998). Sapienzaet al. (2004) points out that the growth of a firm is limited by the speed with which newknowledge and resources is accumulated and by its managers’ ability to quickly learnand respond to ‘accommodate the expanding scope’ of the firm’s operations. In thePenrosean view, it is not the resources itself that yield results within the firm but themanagerial capacity and their increased problem solving and competencies that may bein the form of providing productive opportunities (Garnsey 1998; Nooteboom 2009).The more resources the firm employs, the more likely it is that managers will discovernew combinations of using them in response to the new opportunities providing thebasis for persistent growth. In Penrosean view, firms engaged in the same type ofactivities, using the same technology and employees, are likely to produce differentoutput levels depending on their unique teamwork, knowledge and experiences. Eachfirm is specific in its competencies to create or acquire new knowledge, and is unique inmaking use of this knowledge differently from other firms. Therefore, the prerequisitefor firms to successfully compete in the market is their unique ability (resources) toaccess and combine resources in a distinctive way to gain competitive advantage overtheir competitors. Of course, there are disadvantages of having unique resources or aunique knowledge of operating these resources. For example, in the fast changingexternal market conditions, the firm’s performance and its competitive advantage maybe eroded if it relies heavily on certain specific specialized resources (Coad 2009).
Institutional theory Earlier theories discussed above have neglected the role of marketfailures such as imperfect information and institutional quality. Williamson (2000)posits that neo-classical economics takes institutions for granted by assuming thatlaws and courts are in place to enforce contracts and protect property rights of partiesin a transaction. The New Institutional Economics - NIE literature based on North(1990) has brought the discussion of institutions and their impact on entrepreneurshipand growth to the forefront of academic debate. The debate emerged towards theinvestigation of the role of both formal and informal institutions on entrepreneurialbehaviour (Smallbone and Welter 2009). North (1990, 2005) made a clear distinction
Int Entrep Manag J

between informal and formal institutions influencing a society’s incentive system andso how it shapes an individual’s behaviour. In particular, it is important to distinguishbetween formal institutions such as creation of new laws, procedures and other propertyrights and social institution, which are embodied in the social lives of entrepreneurs andsociety as a whole. Following NIE, a number of studies show that an unfavourableinstitutional framework has an adverse impact on entrepreneurship and small firmgrowth (Smallbone and Welter 2009; Aidis et al. 2008; Aidis and Van Praag 2007;Pissarides et al. 2003; Bartlett and Bukvič 2001; Hashi and Krasniqi 2011).Furthermore, the slow and uneven development of the institutional framework indifferent TEs has been one of the major factors explaining the divergent paths ofdevelopment, particularly the development of SMEs and entrepreneurship, in thesecountries (Frye and Zhuravskaya 2000). Therefore, the IT provides a good guidingframework because of the specific features of the institutional environment that influ-ence entrepreneurship compared with a more mature market economy (Smallbone andWelter 2006).
Hypotheses
Although important for guiding empirical research, earlier theories of firm growthcannot explain small firm growth without the inclusion of a wide range of determinantsof firm growth. The most widely used framework is based on Storey (1994a) whichincorporates firm, entrepreneur and environment. Based on Storey’s (1994a) frame-work and with authors’ extension to account for quality of institutions in TEs wediscuss main determinants classified into four groups of factors: firm, human capital,strategy and growth aspiration, and the institutional environment.
Firm
Based on GL and JLT discussed in the previous section the validity of size-age growththeories has been tested empirically by many studies, using various samples by time,sector, size, and region. These studies generally have contradicted this Law by finding anegative relationship between size, age and growth in both, TEs (Bartlett and Bukvič2001; Krasniqi 2006; Hashi and Krasniqi 2011) and developed economies (Davidssonet al. 2002; Almus 2002; Yasuda 2005). The above literature suggests that refuting GLand JLT is mainly based on ability of small and young firms to exploit economy ofscale because they are far from MES, and hence growth more than larger firms. Thus,we propose following hypotheses:
H1a: Growth is negatively associated with firm sizeH1b: Growth is negatively associated with firm age
Urban location is a factor that influences the growth of firms. Studies of agglomer-ation economies, focusing on the role of positive externalities in developed anddynamic urban areas have highlighted the important role of location for the growthof firms (Black and Henderson 1999; Alcacer and Chung 2007). They claim thatexternalities are particularly associated with knowledge spillover and the role ofurban institutions, which could lead to efficient growth. Maine et al. (2010) argue that
Int Entrep Manag J

firms may have access to some specialized resources that may not be able to developinternally, but it can be found in more urban areas. Recent theories suggest that there areincreasing returns to scale for firms in production that can be realised most effectively ifproduction is concentrated in agglomerations (see, Krugman 1991; Fujita and Thisse2002). Sleuwaegen and Goedhuys (2002) study of firm growth in Nigeria noted thatfirms located in the commercial capital of the country, were more likely to engage innetworking and subcontracting, which provided greater opportunity for growth, thanfirms located in other parts of the country. Urban resources are conducive to developfirms in developing countries. Therefore, we put the following hypothesis:
H2: growth is positively associated with urban location – resources
Many studies have explored the link between the legal form of the firm and its growth.One of the main propositions is that firms operating as limited liability companies haveshown higher rates of growth as firms founded as a limited liability have greater incentivesto peruse riskier projects compared with other counterparts and therefore they are morelikely to have higher growth than other firms (Stiglitz and Weiss 1981). Limited liabilityfirms have more credibility with both customers and banks compared to other legal types(e.g., Storey 1994b). Limited liability firms benefit from an increased reputation, whichplays a key role in accessing external finance. On the other hand, indicates the involve-ment in a higher risk than usual and signals a high-expected return but also a high-expected risk (e.g., Harhoff et al. 1998). To conclude, the legal form seems to have aninfluence on the firm’s growthwith firms operating as limited liability experiencing highergrowth rates. This, we suggest the following hypothesis:
H3: growth is positively associated with limited liability legal form
Firms can also improve their performance through networking – which ease theirgaining from external economies. Knowledge flows are among the key causes inexplaining firm growth in today’s knowledge-based economy. Evidence suggests thatfirms that belong to formal networks are more likely to report innovation and, inaddition, the growth paths of firms in a cluster lay above those of isolated firms, thatdo not belong to any networks (Beaudry and Swann 2009; Maine et al. 2010). Firmscan also benefit from other forms of networking such as membership in businessassociations. These benefits, among others, include the improved information flow,training, facilitating foreign cooperation and others (Brown et al. 2005. Particularly, thisapplies to TEs, as evidence suggest that membership in business associations, alsoseems to have a positive and significant effect on firms (Hashi and Krasniqi 2011).Therefore, our next hypothesis is formulated as follows:
H4: growth is positively associated with networking of entrepreneurs
Human capital
Many researchers in both developed and developing countries recognize the impact ofhuman capital on a firm’s growth by showing that education of employees and
Int Entrep Manag J
managers contributes to better firm performance (Kangasharju and Pekkala 2002;Macpherson and Holt 2007; see van der Sluis et al. 2005). Human capital refers tothe range of skills, knowledge and experience that facilitate growth. However, littleresearch has been conducted to measure the influence of human capital on entrepre-neurial performance and motivation in TEs (Aidis and Van Praag 2007). Haber andReichel (2007) find that human capital of the entrepreneur, especially in the form ofmanagerial skills, is the greatest contributing factor to performance. Other authors pointto the role of training as an alternative mechanism for enhancing employees andmanagers’ skills (Kirby 1990; Cosh et al. 2000). They find a positive relationshipbetween training and employment growth, especially if the training embodies the widerange of management training and human relations practices in the firm (Cosh et al.2000). Training is expected to be directly associated with growth, in particular if thefirm is involved in innovation and competes based on quality rather than simply price(Bryan 2006). Skilled employees are more productive because they have higherproblem-solving abilities, leading to greater efficiency within the firm. To sum up,firms that are strongly motivated to grow and train their workforce to facilitate thegrowth (Hallier and Butts 1999). In TEs, firms often, use training as a way tocompensate for low quality of labour, which indicates low quality of education(Krasniqi 2012). Based on the above discussion, we state following hypotheses:
H5a: Growth is positively associated with higher educationH5b: Growth is positively associated with training, of both, managers andemployees
Entrepreneur’s experience is another dimension of human capital. Several stud-ies reported a positive relationship between entrepreneurial experience and firmgrowth (Capelleras and Rabetino 2008; Lee and Tsang 2001). Beside the fact thatthat entrepreneurs’ experience is crucial for growth, how that experience developsand how it is influenced by the overall context or interactions remains unclear(Macpherson and Holt 2007). For example, in the context of TEs, pre-existingknowledge in the form of experience might not have expected positive effectsbecause as experience develops it interacts with the rapidly changing environment,therefore experience might not be a very useful guide to the entrepreneur’s futureactions. Thus, from the studies above it is shown that the firms of middle age owner/managers experience a higher growth, which leads us to following hypothesis:
H6: growth is positively associated with entrepreneur’s experience
An entrepreneurial team is fundamental to firm growth since the manage-ment of a business requires a range of skills. The synergy effects of theknowledge of founders, especially in teams with those members who havecomplementary skills (Corbett 2007). The synergy effect expands knowledge,increases managerial capabilities and in addition to the knowledge synergy thepartners may act as a signalling for potential creditors and lenders of theseriousness and economic strength of the business leading to higher growth(Schutjens and Wever 2000; Pasanen and Laukkanen 2006). Thus, the follow-ing hypothesis states:
Int Entrep Manag J
H7: Growth is positively associated with the entrepreneurial teams
Managerial capacities, strategy, and growth aspiration
The entrepreneur’s intent to grow has been the subject of a growing debate, as not allsmall firms are growth-oriented or have growth aspirations (Morrison et al. 2003;Doern 2009). Evidence suggests that individuals start and run their businesses forreasons rather than just for profit maximizing, therefore, a broader view of motives andattitudes to grow should be taken into account (Wiklund et al. 2009). Therefore, growthimplies radical changes in the business, which may hinder the owners’ goals such asindependence or ‘life style’ (Wiklund et al. 2009). Different entrepreneurs may followdifferent growth strategies and management practices; some of them, preferring toremain small and others aiming at continuous growth and operating internationally. InTEs context, this is a critical aspect to be considered as a significant share of entrepre-neurs are necessity-driven pursuing an entrepreneurial career as an employment optionto escape from unemployment making a limited contribution to economy (Early andSkaova 2000; Krasniqi 2014). Although firms may adopt various strategies for growth,the entrepreneur’s commitment to grow is the most important factor in explainingfuture growth (Wiklund et al. 2003; Mochrie et al. 2006). This reasoning suggests thefollowing hypothesis:
H8: Growth is positively associated with future growth aspiration of entrepreneurs
Export involvement is considered a growth-oriented strategy of firms. Firms in-volved in exporting may experience higher growth for at least two reasons (i) theirorientation towards new markets and market niches and (ii) their ability to learn fromtheir competitors in the areas of technology and quality. The survey of literature byTybout (2003) suggests that exporting activities have a positive effect on a firmperformance. In the earlier period of transition, there was a lack of managerial skillsand competencies because the older management practices were no longer useful tosupport growth of new enterprises. The so-called ‘learning by exporting’ enhancesinnovation, especially in firms in laggard transition economies (Salomon and Shaver2005). These spillover effects of knowledge transfer (technology, management, andexpertise) are the main reasons for their positive influence of exporting and foreignownership on firm growth. Studies from TEs such as Russia support views that foreignownership has a positive effect on firm performance (Djankov and Murrell 2002;Yudaeva et al. 2003). Foreign ownership contributes to import of advanced technolo-gies, training, and vertical technology transfers through diffusing technology, and moreimportantly, for developing countries capital investment (Taymaz and Özler 2007) andTEs (Hashi and Krasniqi 2011). All these interrelations between firms, both nationallyand internationally, can increase productive opportunities and increase the knowledgebase of the firm as postulated by the RBV. This discussion leads to followinghypotheses:
H9a: growth is positively associated with exporting statusH9b: growth is positively associated with foreign ownership
Int Entrep Manag J

As a firm grows, it faces the managerial capacity challenges such as the needfor more professional managers. Owners of the majority of small firms deal withday-to-day management. As firms start to grow and face the need for professionalmanagers, the owners’ desire to keep control over the firm and their hesitation todelegate decision-making to managers (reluctance to bring professional managers)may inhibit the growth of the firm. Small business owners are sometimes reluctantto grow even though they may face opportunities for expansion (Hart 2000).Serrasqueiro and Nunes (2008) in their study they found that in firms wheremanagement was separated from ownership, the nonowners’ objectives were morelikely to be growth-oriented, suggesting that separating management and ownershiphas a positive impact on firm growth. In developing and transitional contexts,firms have a higher concentration of ownership and control (Porta et al. 1999)despite their needs for a change from small owner-managed to a professionallyoriented firm (Shirokova et al. 2015). For example, entrepreneurs from developingand TEs’ view export markets as a risky business and that they lack knowledgeand expertise (Okpara 2009). Therefore, separating ownership from managementwill unleash growth potential of small firms in TEs. Accordingly, we hypothesizethat:
H10: growth is positively associated with higher levels of professional managers(separation of ownership and management)
Institutional quality
Drawing on IT many studies addressed small firm growth by analysing the funda-mental transformation of institutional settings in unusual and novel context oftransitional environment (Smallbone and Welter 2009; Estrin et al. 2013). Thisliterature suggests that low-level of entrepreneurship and small firms has beenattributed to weakly installed institutional environment, weak legal system, admin-istrative burden, corruption, taxes and restricted access to finance (Smallbone andWelter 2006; Estrin et al. 2013; Aidis et al. 2008). Consequently, institutionsconsisting of formal constraints, such as laws and regulation, and informal con-straints, such as conventions, codes of behaviour, norms and culture, formal andinformal elements strongly influence the goals and beliefs of individuals andorganizations. In this context, institutional factors have been used to explore newventure growth and performance in TEs (Krasniqi et al. 2008; Aidis and Mickiewicz2003; Bartlett and Bukvič 2001). Major findings in the literature point to thecomplicated and excessively regulated environment creates the incentive for entre-preneurs to evade regulations by moving partially or fully into the informal sector(Johnson et al. 2000; Shleifer and Wishny 1994). Furthermore, it also encouragesrent seeking behaviour by public officials and facilitates the development of corrup-tion. Combined, informal activities and corruption contribute to an anticompetitiveenvironment in which the market fails to allocate resources efficiently because somemarket players operate outside the law while those operating within the legal systemface the increased cost of ‘doing business’ legally. Based on this we propose thefollowing hypothesis:
Int Entrep Manag J
H11: Growth is negatively associated with higher perception of barriers of institu-tional quality (corruption, bureaucracy, high taxes, unfair competition, and accessto finance)
Methods and data
Sample and research design
This study is based on a survey responses from 1606 Kosovar entrepreneurs whocompleted questionnaires in a face-to-face interviews during December-January 2002–2003, 2003–2004, 2004–2005 (thereafter 2002, 2003 and 2004). SME surveys wereconducted by Riinvest Institute for Development Research and one of the authors had aleading role in this research project. Samples were selected randomly from the businessregister kept at the Statistical Office of Kosova and the Ministry of Trade and Industry(2005). Experienced and trained final year business students at the University ofPrishtina conducted interviews and the Riinvest research team monitored them care-fully. Respondents were key informants, mainly the owner or the general managers ofcompanies. The response rate was high with an average of 96.4 %. Excluding theseobservations might lead to sample selection bias, but in our case, this is not a concern,as the non-response rate is small (around 3.6 % of total cases) also our sample remainsrepresentative (see, Cameron and Trivedi 2005).
Pooling data The pooled data technique is used to test set of econometric models of firmgrowth. The pooled data contains information from three independent surveys from theperiod 2002, 2003 2004. An Bindependently pooled cross-section^ technique is obtainedby pooling randomly sampled cross-sections at different points in time (Wooldridge2006). The data set used in this study meets the conditions of the surveys being randomand independent of each other, using the same research instrument and identical depen-dent and independent variables in the estimations. From a statistical point of view, theindependently pooled cross sections data has several important features (Wooldridge2006). It rules out the correlation between the error terms across different observations,controls for changes overtime with the inclusion of year dummy variables, provides moreprecise estimates and more powerful diagnostic test statistics, increases the number ofobservations and, hence, has a larger sample size and more robust coefficients. This isimportant to present research which accounts for many variables which otherwise wouldbe econometrically difficult to carry out. To ensure the pure random sampling we havedeleted a few cases in which the same company was sampled more than 1 year (only 23cases). The sample includes SMEs from all regions and in all economic activities.
Descriptive statistics Descriptive statistics presented in Table A1 Appendix shows asummary of the statistics, and show that overall the mean size of the companies(measured by number of employees) in the sample are very small, around 13 em-ployees. The surveys indicates the recent origin of the private sector. Around 54 % ofthe firms are 5 years old or younger, and around 70 % of them are no more than10 years old. The overall average age of the companies in the data set is around 8 years.It is important to note that the institutional quality and structure of SMEs has not
Int Entrep Manag J
changed in Kosova, so the problem of corruption and other institutional variables is stillthe most important (BSCK 2012). This evidence suggests that although our study usesrather old data, the results and hence conclusions are coherent with the current situationof SME development in Kosova. Moreover, the results are comparable, and recom-mendations may be applied to the other TEs with similar weak institutional settings.
Growing vs. non-growing firms It is important for the purpose of empiricalestimation of the determinants of SME growth to break down the sample intogrowing and non-growing firms. As discussed, growing SMEs are more impor-tant from the policy perspective as they account for most of the new jobs andincome generation. The survey results show that during the period underconsideration (2002–04) less than a third of the firms experienced employmentgrowth (28.1 %). Comparing the share of growing versus non-growing firmsacross the years in the sample, a slightly decreasing trend of the number ofgrowing firms is noted (2002, 31; 2003, 28.4; 2004, 25.8 %). The decrease ingrowth of small firms maybe due to the decrease in the excessive aggregatedemand for goods and services following the end of the emergency reconstruc-tion phase in the aftermath of the Kosova’s War.
Model and variables
This section discusses econometric models used to estimate small firm growth.For the purposes of empirical estimations and robustness of the results variouseconometric models are employed to test against the same set of parameterssuch as probit, tobit, ordered probit regression models as well as OLS method.Based on the above discussion, the following tobit model estimates the firmgrowth equation (Greene 2003, pp. 905–926; Wooldridge 2002, p. 517–536).The general tobit model can be expressed in terms of latent variable:
y*i ¼ xiβ þ ui ð1Þ
Where yi* is the latent variable, i refers to individual firms, xi is a vector of
explanatory variables, β is the vector of parameter to be estimated, and ui is the errorterm. The assumptions of the tobit model are that the error term is normally distributed,homoscedastic with mean of zero u, u|x ~Normal(0, σ2). The tobit is given by:
yi ¼ y*i ¼ xiβ þ ui if xiβ þ ui > 00 if xiβ þ ui≤ 0
�ð2Þ
As can be seen, yi contains either zero for those firms that did not grow or apositive value for those who did grow. The model combines aspects of thebinomial probit (or logit) for yi = 0 versus yi > 0 and the regression modelE[yi|yi > 1, xi]. This means that we can observe yi through the latent variable ℓonly when it is positive (yi
* > 0) whereas the dependent variable is censored foryi* ≤ 0, therefore in our case is expressed:
Int Entrep Manag J
yi ¼ y*i ¼ xiβ þ ui if growth > 00 if nogrowth≤0
�ð3Þ
In addition, a probit model is developed in order to test the appropriateness of thetobit model. Comparing tobit and probit models allows us to assess: a) the explanatorypower of the independent variables regarding small firm growth, and b) the contribu-tion of these independent variables to growth behaviour, i.e., the probability of a firmgrowing. The following probit model is specified with the same independent variablesas in the above tobit model (Eq. 1);
P y ¼ 1jxð Þ ¼ β0 þ β1x1 þ…þ βkxk ð4Þ
where the outcome y is equal to one if the firm experiences growth in the given yearand zero otherwise; x is a vector of explanatory variables with βi as the correspondingvector of coefficients. Ordered probit model is not discussed as it is used solely forpurposes of comparison with probit and tobit models.
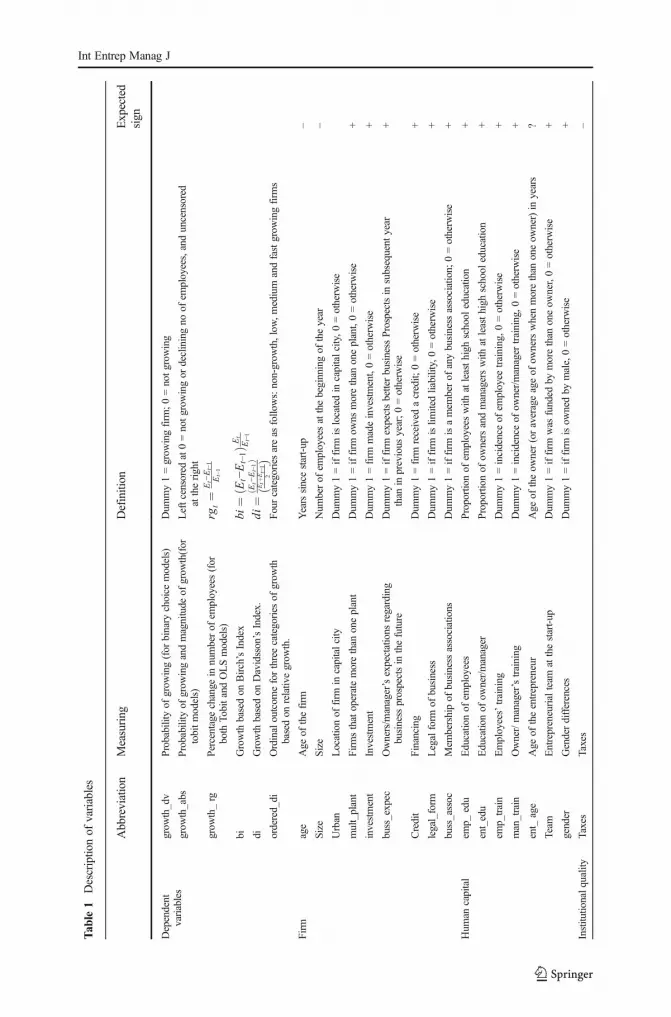
Measures of growth This study uses the employment growth which is most widelyused as an indicator in empirical studies of small firm growth in both, developed firmsand TEs (Bartlett and Bukvič 2001; Reichstein and Dahl 2004; Goddard et al. 2006;Capelleras and Rabetino 2008). In the TE context of Kosova there are more reasons toopt for employment growth. As in other TEs where firms commonly underreport theiractivities, employment growth is more reliable than other measures of firm growth(e.g., sales), because unlike sales, employment figures are less likely to beunderreported, easier to remember by entrepreneurs and also uncontaminated by pricechanges (see Brown et al. 2005; Mochrie et al. 2006; Aidis and Mickiewicz 2006).
In the empirical studies, growth is measured in absolute or relative terms. This mayhave a significant impact on the empirical results, in particular on the sign of theindependent variable of a firm’s size (Brüderl and Preisendörfer 2000). This is mainlybecause the relative measures of growth favour the small firms compared to largerfirms, while the opposite holds for an absolute measure of growth. This study usesboth, absolute and relative measures of firm growth. Absolute growth (growth_abs) issimply the increase in the number of employees during each year for growing firms andzero for non-growing firms. Relative growth (growth_rg) is measured as a percentagechange in the number of employees (Table 1). Relative growth is zero for non-growingand shrinking firms. In the probit estimation, the dependent variable (growth_dv) is adummy, equal to one for growing firms and zero otherwise. In addition to absolute andrelative measures of growth, we use other measures of firm growth too. Almus (2002)argues that using the relative growth measure will produce biased results towards smallfirms, while using absolute growth measures will lead to biased results towards largefirms. Thus, we construct two other measures of growth, Birch’s (1987) Index (bi) andDavidsson et al. (2002) Index (di). The rationale behind using these measures of growthis to test whether the findings are sensitive to specific measurements of growth (see,Ahmad and Gonnard 2007; Hölzl 2009). Formula for calculating bi and di indicatorsare presented in Table 1. bi multiplies the absolute employment growth with the relativeemployment growth to determine the employment-generation power of firms in
Int Entrep Manag J

different sizes. This measure of firm growth is not biased towards any particular size.The di growth indicator is calculated as final employment minus initial employmentdivided by average of final and initial employment. This measure, too, is not biasedtowards any particular size.
Independent variables Independent variables influencing small firm growth groupedin four categories based on research framework: firm, human capital, institutionalquality, strategy, managerial capacities and growth aspirations. Other factors includecontrol variables in each group. The precise definitions of all independent variables areprovided in Table 1.
Results and discussion
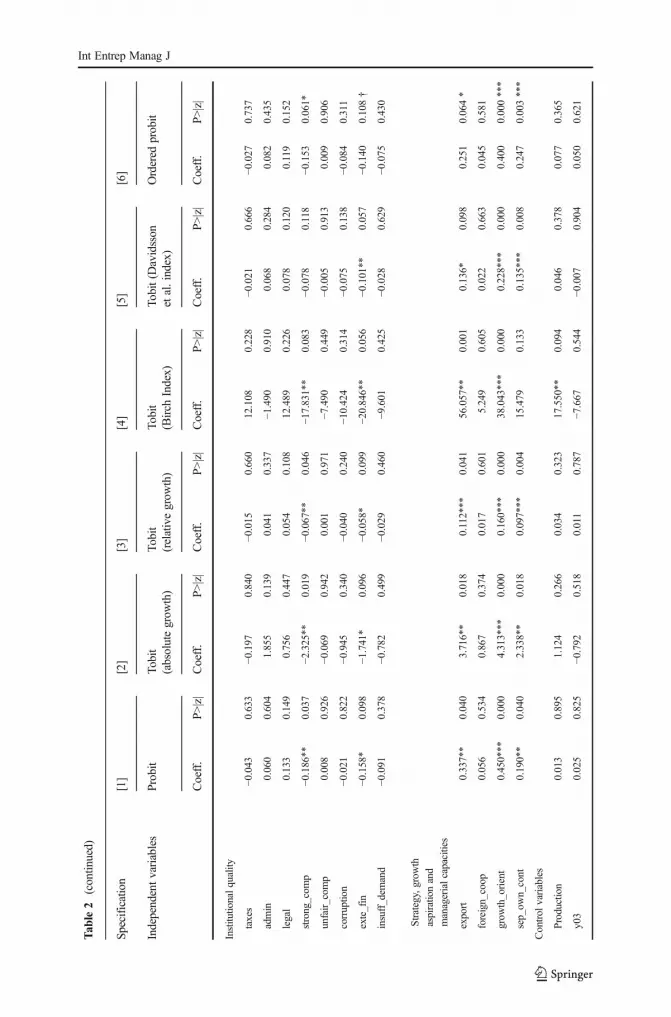
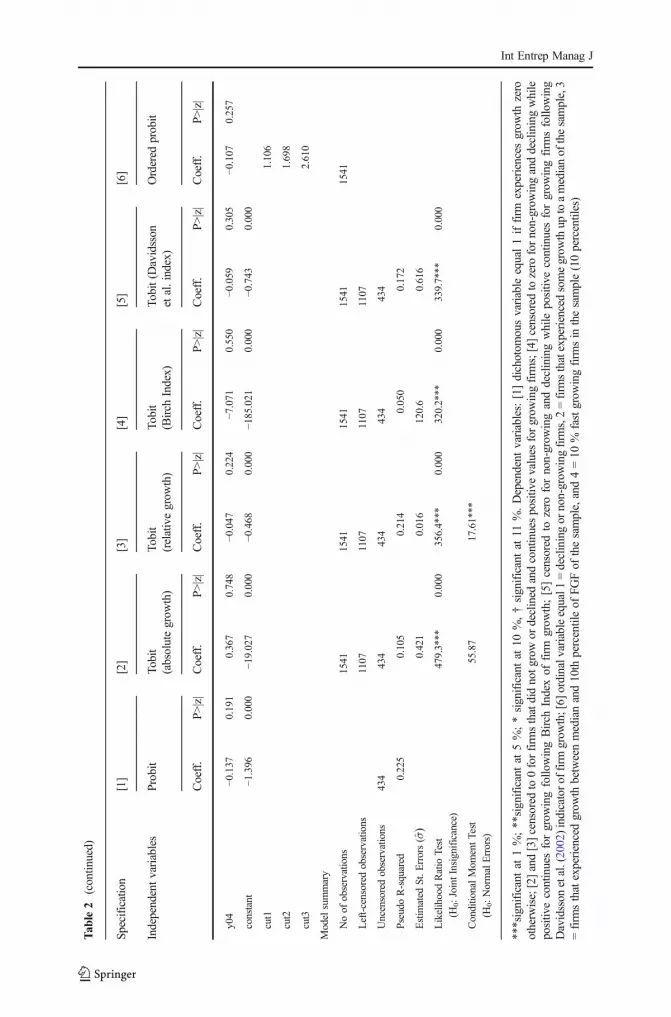
Table 2 presents the estimates of the probit, Tobit, ordered probit models of theassociation between firm growth and the characteristics of the firm, human capital,quality of institutions and strategy, managerial capacities and growth aspirations. Thefollowing discussion focuses only on the direction of the variables and their statisticalsignificance for towards the growth and comparing its consistency between all modelsused. Table 2 shows six specifications of the model. Specification [1] is the probitmodel with the dichotomous dependent variable, taking the value of 1 for growing and0 for non-growing firms. This specification will serve as a comparison check with tobitspecifications. Specifications [2] to [5] are tobit models with the dependent variable leftcensored at zero (for non-growing firms) and continuous uncensored at right takingpositive values (the growth of the number employees using different method ofcalculation). In specification [2] growth is measured in absolute terms and in specifi-cation [3] in relative terms. Specifications [4] and [5] use bi and di measures of growth.For the purposes of ensuring a robust check, we first use an alternative methodology(ordered probit specification [6]) and compare the results with those of the Tobitmodels. The dependent variable is divided into four categories: firms whose growthwas negative or zero; firms whose growth was up to a median of the sample; firmswhose growth was between the median of the sample and ten percentile fastest growingfirms; and 10 % fastest growing firms in the sample. The unconditional marginal effectsare calculated for porbit and tobit models, but we present here only tobit marginaleffects as they are of central interest in this paper and also provide more information ascompared to probit marginal effects (Table A5 in Appendix). They refer to the wholepopulation (i.e., both those that are likely to grow and those that are likely to growmore), and therefore are the effects that are most relevant for policy discussion.
Now we turn to the discussion of econometric results. Table 2 shows that the probitand tobit estimates are very similar (in terms of both sign and the level of significance)except for variables indicating the size of the firm and education of employees. Thevariable age is not statistically significant in explaining the growth of the firm in any ofthe specifications. The size of the firm is significant but does not have the expectednegative sign as postulated by JLT based on the learning theory. However, for a numberof reasons, these two variables, in order to test the validity of GL, should be interpretedwith caution here. First, in previous research, the variable size was calculated as the
Int Entrep Manag J
Tab
le1
Descriptionof
variables
Abbreviation
Measuring
Definition
Expected
sign
Dependent
variables
grow
th_dv
Probabilityof
grow
ing(for
binary
choice
models)
Dum
my1=grow
ingfirm
;0=notgrow
ing
grow
th_abs
Probabilityof
grow
ingandmagnitude
ofgrow
th(for
tobitmodels)
Leftcensored
at0=notgrow
ingor
decliningno
ofem
ployees,anduncensored
attheright
grow
th_rg
Percentagechange
innumberof
employees(for
both
TobitandOLSmodels)
rgt¼
Et−Et−1
Et−1
biGrowth
basedon
Birch’sIndex
bi¼
Et−Et−1
ðÞE
tEt−1
diGrowth
basedon
Davidsson’sIndex.
di¼
Et−Et−1
ðÞ
Etþ
Et−1
2ð
Þordered_di
Ordinaloutcom
eforthreecategories
ofgrow
thbasedon
relativ
egrow
th.
Fourcategories
areas
follows:non-grow
th,low
,medium
andfastgrow
ingfirm
s
Firm
age
Age
ofthefirm
Yearssincestart-up
–
Size
Size
Num
berof
employeesatthebeginningof
theyear
–
Urban
Locationof
firm
incapitalcity
Dum
my1=iffirm
islocatedin
capitalcity,0
=otherw
ise
mult_plant
Firmsthatoperatemorethan
oneplant
Dum
my1=iffirm
owns
morethan
oneplant,0=otherw
ise
+
investment
Investment
Dum
my1=firm
madeinvestment,0=otherw
ise
+
buss_expec
Owners/m
anager’sexpectations
regarding
business
prospectsin
thefuture
Dum
my1=iffirm
expectsbetterbusiness
Prospectsin
subsequent
year
than
inprevious
year;0=otherw
ise
+
Credit
Financing
Dum
my1=firm
received
acredit;
0=otherw
ise
+
legal_form
Legalform
ofbusiness
Dum
my1=iffirm
islim
itedliability,0=otherw
ise
+
buss_assoc
Mem
bershipof
business
associations
Dum
my1=iffirm
isamem
berof
anybusiness
association;
0=otherw
ise
+
Hum
ancapital
emp_
edu
Educationof
employees
Proportionof
employeeswith
atleasthigh
school
education
+
ent_edu
Educationof
owner/manager
Proportionof
ownersandmanagerswith
atleasthigh
school
education
+
emp_train
Employees’training
Dum
my1=incidenceof
employee
training,0
=otherw
ise
+
man_train
Owner/manager’straining
Dum
my1=incidenceof
owner/manager
training,0
=otherw
ise
+
ent_
age
Age
oftheentrepreneur
Age
oftheow
ner(oraverageageof
ownerswhenmorethan
oneow
ner)in
years
?
Team
Entrepreneurialteam
atthestart-up
Dum
my1=iffirm
was
funded
bymorethan
oneow
ner,0=otherw
ise
+
gender
Genderdifferences
Dum
my1=iffirm
isow
nedby
male,0=otherw
ise
+
Institutio
nalq
uality
Taxes
Taxes
–
Int Entrep Manag J

Tab
le1
(contin
ued)
Abbreviation
Measuring
Definition
Expected
sign
Dum
my1=ifentrepreneur
rankslevelof
taxesas
amajor
obstacleto
operation
andgrow
thof
business,0
=otherw
ise
Adm
inEffectof
administrationprocedures
and
bureaucracy
Dum
my1=ifentrepreneur
ranksadministrativeprocedures
asamajor
obstacle
tooperationandgrow
thof
business,0
=otherw
ise
unfair_com
pUnfaircompetition
Dum
my1=ifentrepreneur
ranksunfaircompetitionas
amajor
obstacleto
operation
andgrow
th0=otherw
ise
–
strong_com
pStrongcompetition
Dum
my1=ifentrepreneur
ranksstrong
competitionas
amajor
obstacleto
operation
andgrow
thof
business,0
=otherw
ise
–
exte_fin
Availabilityandconditionsof
externalfinance
Dum
my1=ifentrepreneur
ranksavailabilityandconditionsof
externalfinance
asamajor
obstacleto
operationandgrow
thof
business,0
=otherw
ise
–
Legal
Law
sandlegislation
Dum
my1=ifentrepreneur
ranksthelegalenvironm
entas
amajor
obstacleto
operation
andgrow
thof
business,0
=otherw
ise
–
Corruption
Corruption
Dum
my1=ifentrepreneur
rankscorruptionas
amajor
obstacleto
operationandgrow
thof
business,0
=otherw
ise
–
insuff_dem
and
Insufficient
demand
Dum
my1=ifentrepreneur
ranksinsufficient
demandas
amajor
obstacleto
operation
andgrow
thof
business,0
=otherw
ise
–
Strategy,g
rowth
aspiratio
nand
managerial
capacities
Export
Searching
fornew
marketsandexpansion
Dum
my1=iffirm
exports,0=otherw
ise
+
foreign_coop
Foreign
cooperation
Dum
my1=iffirm
hasperm
anentforeignpartner,0=otherw
ise
+
grow
th_orient
Planforgrow
thof
thefirm
(noof
employees)
Dum
my1=iffirm
plansto
increase
thenumberof
employeesin
thefuture,
0=otherw
ise
+
sep_ow
n_cont
Managerialcapabilitiesanddevelopm
entof
professionalmanagers
Dum
my1=ifow
nershipandmanagem
entareseparated,
0=otherw
ise
+
Control
variables
production
Productionsector
Dum
my1=iffirm
operates
prim
arily
inproductio
nsector,0
=otherw
ise;
+
services
Servicessector
Dum
my1=iffirm
operates
prim
arily
inservices,0
=otherw
ise;
+
y04
Year1
Dum
my1=for2004,0
=otherw
ise
?
y03
Year2
Dum
my1=for2003,0
=otherw
ise
?
y02
Year3
Dum
my1=for2002,0
=otherw
ise
?
Int Entrep Manag J

difference in the number of employees between the start-up year and the current year.Unfortunately, this information is not available in the Riinvest SME survey. Second,many authors use the logarithm of employment growth as the dependent variable whichin our case is impossible as we use tobit or probit models. Finally, the impact of sizeand age depend on whether the relative or absolute definition of growth is used. Themain conclusions emerging from this finding is that the association of variables sizeand age with growth is sensitive to whether the relative or absolute definition of growthis used. This is confirmed by two other tobit models (specifications [2] and [3], Table 2)and ordered probit model (specification [6] Table 2). In specification [2], the variablesize is significant and has a positive sign (when the absolute growth measure is used).In specification [3], when we use the relative growth measure for size, the variablebecomes negative, suggesting that GL does not hold.1 Results of this empirical testsuggest a nonlinear and negative relationship of size with the growth of the firm. On theother hand, age of firm is not statistically significant. In technical terms, the calculatedunconditional marginal effects indicate that there is a one-percent increase in size of thefirm decreases the percentage of growth by 0.014 %. The marginal effects for age arelow and not significant which might be because of the low firm mean age of 8 years(H1a partially supported, H1b not supported). In addition, we find that firms in the urbanlocations (capital city) are more likely to grow than other firms (H2 supported).Unconditional marginal effect show that, keeping other variables constant, transitioningfrom a non-urban firm to an urban firm increases the percentage of growth 0.55 %.However, when we split the sample by sector and size, we find that the smaller firmsand manufacturing firms exploit greater benefits from being located in the capital city(see Table 2).
These findings are in line with research on agglomeration economies, which arguethat the positive externalities enjoyed by firms operating in developed and dynamicurban areas (i.e., a larger number of consumers, better access to resources,networking,knowledge spillovers, human capital, funds, urban institutions etc.) havethe benefit of grow faster (Glaeser et al. 1992; Black and Henderson 1999). Firmslocated in urban areas are more likely to engage in networking and subcontracting,which provide greater opportunity for growth, in comparison to firms located in otherperipheral locations of the country. Firms using bank finance are more likely to growand experience higher growth compared to their counterparts. Firms that made aninvestment during the year experienced higher growth compared to those who did notinvest. The use of bank credit might influence the expansion of a firm’s activities and,in turn, will be associated with employment growth. Age does not seem to have asignificant effect on either the probability of the firm grows or the magnitude of growth– though it always has the expected sign (H1b not supported).
Human capital factors The impact of human capital (entrepreneurs, managers andemployees) on firm growth has been acknowledged by many researchers in bothdeveloped and developing countries supporting the human capital theory that greatereducation benefits the firm’s performance (Kangasharju and Pekkala 2002;Macpherson and Holt 2007; see also van der Sluis et al. 2005 for an overview of
1 We have tried quadratic terms of variable size and age but results but these variables were statisticallyinsignificant.
Int Entrep Manag J

Tab
le2
Determinantsof
smallfirm
grow
th:regression
results
ofprobit,
tobitandorderedprobitmodelsfrom
pooled
data
Specification
[1]
[2]
[3]
[4]
[5]
[6]
Independentvariables
Probit
Tobit
(absolutegrow
th)
Tobit
(relativegrow
th)
Tobit
(Birch
Index)
Tobit(D
avidsson
etal.index)
Ordered
probit
Coeff.
P>|z|
Coeff.
P>|z|
Coeff.
P>|z|
Coeff.
P>|z|
Coeff.
P>|z|
Coeff.
P>|z|
Firm size
0.003**
0.040
0.069***
0.000
lnsize
−0.056***
0.000
−0.062
0.690
−0.002**
0.017
−0.129
0.000**
lnage
−0.001
0.919
−0.044
0.449
−0.001
0.694
−0.536
0.375
−0.002
0.442
−0.039
0.375
urban
0.174***
0.061
2.512**
0.011
0.055
0.103
19.560**
0.057
0.072
0.155
0.134
0.105†
mult_plant
0.430***
0.000
3.740***
0.000
0.146***
0.000
36.011**
0.001
0.192***
0.000
0.373
0.000***
legal_form
0.011
0.907
1.194
0.220
0.006
0.855
4.191
0.681
0.004
0.936
−0.003
0.970
buss_expec
0.041
0.608
1.372
0.118
0.026
0.388
11.006
0.227
0.034
0.447
0.049
0.506
buss_assoc
0.056
0.571
0.717
0.494
0.023
0.527
−14.540
0.188
0.007
0.904
0.053
0.552
credit
0.180**
0.031
2.488***
0.005
0.068**
0.026
14.374
0.122
0.097**
0.034
0.178
0.018**
Investment
0.592***
0.000
6.045***
0.000
0.253***
0.000
56.845***
0.000
0.378***
0.000
0.612
0.000***
Hum
ancapital
gender
−0.008
0.964
0.395
0.856
−0.007
0.924
8.383
0.713
−0.035
0.741
−0.052
0.767
ent_age
−0.005
0.282
−0.031
0.501
−0.001
0.511
−0.269
0.579
−0.002
0.383
−0.002
0.534
ent_edu
0.098
0.396
1.046
0.395
0.049
0.250
18.702
0.143
0.054
0.388
0.098
0.348
emp_edu
−0.006
0.972
−3.517*
0.060
−0.045
0.470
−35.713*
0.065
−0.018
0.845
−0.067
0.663
emp_train
0.243**
0.039
4.009***
0.001
0.068
0.110
37.809***
0.003
0.077
0.223
0.183
0.079*
man_train
0.249**
0.017
2.741**
0.012
0.105***
0.005
33.643***
0.003
0.165***
0.003
0.245
0.008***
team
0.165
0.113
0.817
0.452
0.056
0.139
12.294
0.276
0.071
0.205
0.124
0.179
Int Entrep Manag J
Tab
le2
(contin
ued)
Specification
[1]
[2]
[3]
[4]
[5]
[6]
Independentvariables
Probit
Tobit
(absolutegrow
th)
Tobit
(relativegrow
th)
Tobit
(Birch
Index)
Tobit(D
avidsson
etal.index)
Ordered
probit
Coeff.
P>|z|
Coeff.
P>|z|
Coeff.
P>|z|
Coeff.
P>|z|
Coeff.
P>|z|
Coeff.
P>|z|
Institutionalquality
taxes
−0.043
0.633
−0.197
0.840
−0.015
0.660
12.108
0.228
−0.021
0.666
−0.027
0.737
admin
0.060
0.604
1.855
0.139
0.041
0.337
−1.490
0.910
0.068
0.284
0.082
0.435
legal
0.133
0.149
0.756
0.447
0.054
0.108
12.489
0.226
0.078
0.120
0.119
0.152
strong_com
p−0
.186**
0.037
−2.325**
0.019
−0.067**
0.046
−17.831**
0.083
−0.078
0.118
−0.153
0.061*
unfair_com
p0.008
0.926
−0.069
0.942
0.001
0.971
−7.490
0.449
−0.005
0.913
0.009
0.906
corruption
−0.021
0.822
−0.945
0.340
−0.040
0.240
−10.424
0.314
−0.075
0.138
−0.084
0.311
exte_fin
−0.158*
0.098
−1.741*
0.096
−0.058*
0.099
−20.846**
0.056
−0.101**
0.057
−0.140
0.108†
insuff_dem
and
−0.091
0.378
−0.782
0.499
−0.029
0.460
−9.601
0.425
−0.028
0.629
−0.075
0.430
Strategy,grow
th
aspirationand
managerialcapacities
export
0.337**
0.040
3.716**
0.018
0.112***
0.041
56.057**
0.001
0.136*
0.098
0.251
0.064*
foreign_coop
0.056
0.534
0.867
0.374
0.017
0.601
5.249
0.605
0.022
0.663
0.045
0.581
grow
th_orient
0.450***
0.000
4.313***
0.000
0.160***
0.000
38.043***
0.000
0.228***
0.000
0.400
0.000***
sep_ow
n_cont
0.190**
0.040
2.338**
0.018
0.097***
0.004
15.479
0.133
0.135***
0.008
0.247
0.003***
Control
variables
Production
0.013
0.895
1.124
0.266
0.034
0.323
17.550**
0.094
0.046
0.378
0.077
0.365
y03
0.025
0.825
−0.792
0.518
0.011
0.787
−7.667
0.544
−0.007
0.904
0.050
0.621
Int Entrep Manag J
Tab
le2
(contin
ued)
Specification
[1]
[2]
[3]
[4]
[5]
[6]
Independentvariables
Probit
Tobit
(absolutegrow
th)
Tobit
(relativegrow
th)
Tobit
(Birch
Index)
Tobit(D
avidsson
etal.index)
Ordered
probit
Coeff.
P>|z|
Coeff.
P>|z|
Coeff.
P>|z|
Coeff.
P>|z|
Coeff.
P>|z|
Coeff.
P>|z|
y04
−0.137
0.191
0.367
0.748
−0.047
0.224
−7.071
0.550
−0.059
0.305
−0.107
0.257
constant
−1.396
0.000
−19.027
0.000
−0.468
0.000
−185.021
0.000
−0.743
0.000
cut1
1.106
cut2
1.698
cut3
2.610
Modelsummary
Noof
observations
1541
1541
1541
1541
1541
Left-censored
observations
1107
1107
1107
1107
Uncensoredobservations
434
434
434
434
434
PseudoR-squared
0.225
0.105
0.214
0.050
0.172
Estim
ated
St.E
rrors( σ̂)
0.421
0.016
120.6
0.616
LikelihoodRatio
Test
(H0:JointInsignificance)
479.3***
0.000
356.4***
0.000
320.2***
0.000
339.7***
0.000
ConditionalMom
entTest
(H0:NormalErrors)
55.87
17.61***
***significant
at1%;**significantat
5%;*significantat
10%,†significantat
11%.Dependent
variables:[1]dichotom
ousvariable
equal1iffirm
experiencesgrow
thzero
otherw
ise;[2]and[3]censored
to0forfirm
sthatdidnotg
rowor
declined
andcontinuespositivevalues
forgrow
ingfirm
s;[4]censored
tozero
fornon-grow
inganddecliningwhile
positivecontinuesforgrow
ingfollo
wingBirch
Indexof
firm
grow
th;[5]censored
tozero
fornon-grow
inganddecliningwhile
positiv
econtinuesforgrow
ingfirm
sfollo
wing
Davidsson
etal.(2002)indicatorof
firm
grow
th;[6]
ordinalvariableequal1
=decliningor
non-grow
ingfirm
s,2=firm
sthatexperiencedsomegrow
thup
toamedianof
thesample,3
=firm
sthatexperiencedgrow
thbetweenmedianand10th
percentileof
FGFof
thesample,and4=10
%fastgrow
ingfirm
sin
thesample(10percentiles)
Int Entrep Manag J

these studies). In contrast to studies that found a positive relationship between educa-tion and growth of the firm (Kangasharju and Pekkala 2002; Macpherson and Holt2007; van der Sluis et al. 2005), our evidence suggests that the education of employeeshas a significant negative relationship with the growth of a firm while the educationalattainment of the entrepreneur has no significant association with growth, calling forcontextual and other interpretation frameworks (H5a not supported). The higher levelsof education of employees (university degree) is a statistically significant and nega-tively associated with growth across all specifications and definitions of growth, exceptin specification [3] when relative growth is used – which gives greater prominence tothe smaller firms in the sample. In this specification, the positive sign indicates thatfirms with a higher proportion of employees with higher education experience smallergrowth rates compared to rest of the firms in the sample (H5a not supported). Theunconditional marginal effects indicate that a one-percent increase in proportion ofemployees with university degree decreases the growth by 0.7 employees (Table A5,Tobit 1, in Appendix,). SMEs that provide on-the-job training for employees andmanagers generate, on average, 0.019 %, or 0.029 more of their growth than doSMEs that do not offer such service to their employees and managers.
Although this finding is not in line with other studies on small firm growth, it is inline with the few studies conducted in both developed and TEs. For example, Bartlettand Bukvič (2001) report similar results in their study of SMEs in Slovenia, Johnson etal. (2000) for UK SMEs operating in the service sector and Xheneti and Bartlett (2012)for Albanian SMEs. This evidence from both developed and TEs justifies the negativeeffect on employment on the ground of the over-qualification of employees generatingdissatisfaction and hence negatively affecting growth. In the context of Kosova, thedissatisfaction effect of employees and particularly highly educated employees mightbe even more pronounced considering the high unemployment rate. Under highunemployment, people generally have a limited choice about where to work. Underthese conditions, people with university degrees might end-up working in jobs they donot like or jobs that do not match their education profile. At the same time, the qualityof the education and therefore the quality of available labour in Kosova is not beneficialto the growth of SMEs in terms of the new knowledge necessary to run businesses in amarket economy. In addition, one should compare the impact of this variable with thesignificance and impact of other proxy variables for human capital in the model –training. Based on this reasoning, findings suggest the positive and statistically signif-icant association of variables suggesting management and employees’ training ongrowth (H5b supported). In line with other studies (McPherson 1996), results suggestthat firms with trained managers grow significantly faster than firms run by untrainedpeople. This may suggest that firms need to incur training costs to compensate for thelow quality of education embodied in the managers and employees’ work. About the‘legal type of business’ we find the results to be the opposite of those of Storey (1994b)and Harhoff et al. (1998) that limited liability companies experience higher growth ratesbecause they are more likely to get involved in riskier projects and therefore enjoygreater returns if they succeed (H3 not supported). The variable team is justabove the accepted statistical significance, suggesting the positive impact of theentrepreneurial team on post start-up performance because of the synergy effectof partners (H7 supported). The variable gender is not a significant indicator forfirm growth either.
Int Entrep Manag J

Institutional factors Among the institutional quality variables, ‘strong competition’and ‘external finance’ are statistically significant and are negatively associated withgrowth of the firm. (H11 partially supported). Keeping other variables constant, SMEsthat consider finance and strong competition to be a barrier, grow on average, 0.014 and0.052 % less, respectively, than SMEs that do not consider finance and strong compe-tition as a high barrier (Table A5 in Appendix).
Corruption is another dimension of the institutions, which is negatively associatedwith growth, but only for sample of growing firms only (see Table 3). The intensity ofcompetition may be perceived as a barrier by entrepreneurs because of the decrease inaggregate demand for goods and services for individual firms, which have to share themarket with an increasingly large number of other firms. As pointed out by Hay andKamshad (1994), when demand is slacking and competition is growing, economictheory does not provide a clear prediction as to whether competition has a negative orpositive impact on the firm. According to them, the negative impact of increasedcompetition may be an outcome of the capacity costs, which are mostly sunk, andlarger firms benefit from decreasing average costs. A lower level of outputs, thecompetition may cause small firms to contract or exit the market because larger firmsmight be operating on the decreasing part of the average cost curve, benefiting fromscale economies.
Strategy, managerial capacities and growth aspirations Firm growth requires both awilling attitude to exploit growth opportunities, and also the availability of suitableopportunities provided by the external environment. Only a small share of small firms isentrepreneurial and oriented toward continuous growth of their market share. Results ofthis is shown in Table A5 in the Appendix shows that exporter are more likely to grow,on average, 0.016%more than non-exporters, suggesting growth aspiring entrepreneursshould seek larger markets by exporting to other countries, in particular in a smalleconomy such as Kosova (H9a supported). This is particularly true for firms with growthambitions that operate in a small economy (Kosova being an example) where growthopportunities are limited. However, surprisingly, foreign cooperation variable does nothave a significant influence on the growth of the firm (H9b not supported).
While growth can be explained by various firm characteristics, the entrepreneur’scommitment to the growth of a firm is a most important factor (Dobbs and Hamilton2007; Mochrie et al. 2006; Heinonen et al. 2004). To operationalize this variable weused proxy as in Efendic et al. (2014), forward-looking growth orientation of the firmmeasured by ‘plans for future increases in the number of employees’. In our model, thisvariable is highly significant and has the expected positive sign, suggesting that growthaspiration is positively associated with growth (H8 supported). The unconditionalmarginal effects in Appendix show that, changing from a not growth-oriented to agrowth oriented firm increases firm growth by 0.026 % (Table A5). The results satisfyScase’s (2003) view that, especially in TEs, one should distinguish between ‘entrepre-neurship’ (growth-oriented entrepreneurs) and ‘proprietorship’ (one-person businesseswithout the aim to grow). The finding may signal that studies that do not control forgrowth aspirations of firms may have biased approach in explaining growth. Not onlyexternal but also internal factors affect small firm growth. Amongst the key internalfactors that are influencing firm growth is the entrepreneur’s willingness to grow andthe firm’s managerial capacity (Hay and Kamshad 1994). If we compare the economic
Int Entrep Manag J

and statistical significance of variables indicating growth aspiration with the coeffi-cients of variables explaining the influence of institutional factors, we find that internalfactors are more important for explaining a firm’s growth, suggesting a need for usingan ‘integrative approach’ in future empirical studies of entrepreneurship in TEs.
Finally, regarding the impact of managerial capacities on firm growth, we find thatfirms that have brought in professional managers (divorcing management from own-ership functions) are more likely to experience growth and show a greater magnitude ofgrowth. The unconditional marginal effects presented in Table A5 in Appendix showthat, change from an owner-managed to a professionally managed firm increasesgrowth by 0.026 %. (H10 supported). These findings are in line with other organiza-tional theory studies, which propose that organizations evolve through their life cyclestages. In their early phase, firms are limited in their managerial capacities and also maynot grow or wish to grow. In later stages as organizations grow more rapidly, firms needto increase the common set of managerial capabilities to overcome growth challengesin performing organizational tasks in complex external interfaces (Boeker and Wiltbank2005). Accordingly, a founder’s involvement in general management activities may bedecreasingly useful or even detrimental to a firm’s success as the firm grows. Findingssuggest that the transfer of decision-making power from owners to managers isimportant for the growth of the firm because it enhances managerial capabilities bybringing professional managers into the firm and creating conditions for growth, thushaving a positive effect on the growth.
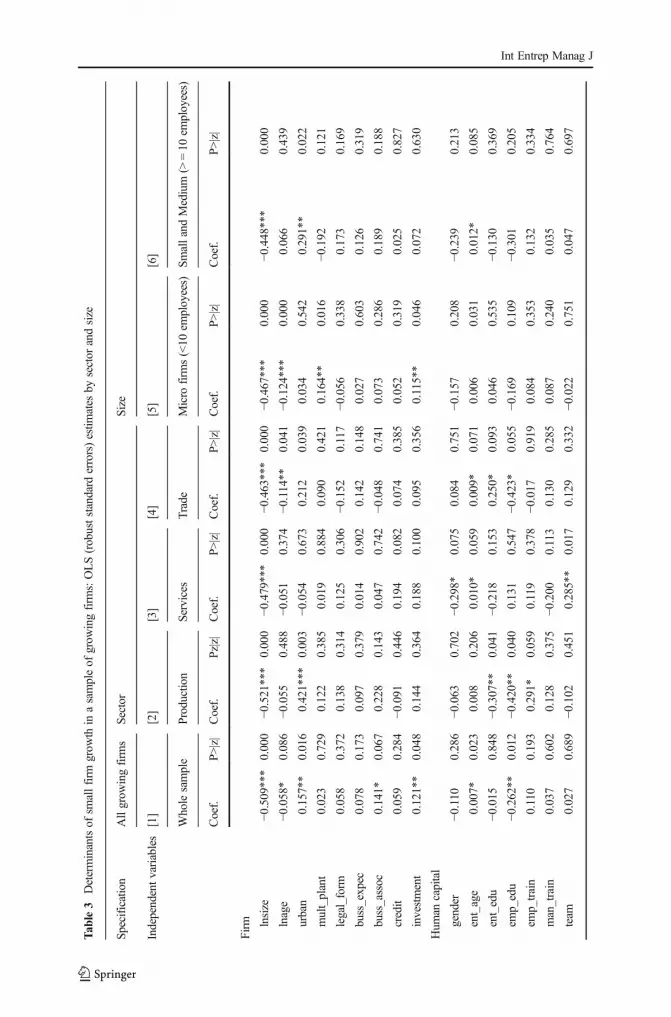
An empirical analysis of small growing firms This section aims to extend currentunderstanding of small business growth in a transitional economy by concentrating onthe subgroup of growing firms in the same dataset. We examine the impact of the samedeterminants of growth in the sample of growing firms and by conducting separateregressions for three main sectors (manufacturing, services and trade) and two sizecategories (micro and small and medium firms). Testing the relationship of the samefactors with growth of a firm within the sample of growing businesses and controlling itfor each size and sector will enable us to overcome some of the empirical drawbacks ofother studies (biased towards larger firms). Our large pooled data set gives the ability toperform this analysis because of a large number of observations.
Table 3 presents the empirical findings based on robust OLS regressions for asample of growing firms. All variables used in this model are the same as thosepresented in Table 1. Several interesting differences that can be noted in terms offindings with whole sample presented in Table 2. Firstly, in specification [1] thevariable age has a negative association with growth. Although it is expected that agewould have a negative association with growth in all sectors, the evidence shows thatthe effect of learning is more important for firms in trade compared to other sectors (H1b
partially supported). As proposed by Jovanovic’s (1982) model, the younger firmsshow higher growth rates as they have less understanding of the true cost related to theirbusiness activities and how these costs change over time. Younger firms are resource-constrained, suffer from the ‘liability of newness’, thus are more likely to make lessefficient use of slack resources than older firms because older firms have had moreopportunity to experiment with the variety of resources and select the ones that best fittheir needs (George 2005). This association is nonlinear, meaning that as firms get olderthere is a diminishing return from learning and experience. Taking into account size
Int Entrep Manag J
Tab
le3
Determinantsof
smallfirm
grow
thin
asampleof
grow
ingfirm
s:OLS(robuststandard
errors)estim
ates
bysector
andsize
Specification
Allgrow
ingfirm
sSector
Size
Independentvariables
[1]
[2]
[3]
[4]
[5]
[6]
Wholesample
Production
Services
Trade
Micro
firm
s(<10
employees)
SmallandMedium
(>=10
employees)
Coef.
P>|z|
Coef.
Pz|z|
Coef.
P>|z|
Coef.
P>|z|
Coef.
P>|z|
Coef.
P>|z|
Firm lnsize
−0.509***
0.000
−0.521***
0.000
−0.479***
0.000
−0.463***
0.000
−0.467***
0.000
−0.448***
0.000
lnage
−0.058*
0.086
−0.055
0.488
−0.051
0.374
−0.114**
0.041
−0.124***
0.000
0.066
0.439
urban
0.157**
0.016
0.421***
0.003
−0.054
0.673
0.212
0.039
0.034
0.542
0.291**
0.022
mult_plant
0.023
0.729
0.122
0.385
0.019
0.884
0.090
0.421
0.164**
0.016
−0.192
0.121
legal_form
0.058
0.372
0.138
0.314
0.125
0.306
−0.152
0.117
−0.056
0.338
0.173
0.169
buss_expec
0.078
0.173
0.097
0.379
0.014
0.902
0.142
0.148
0.027
0.603
0.126
0.319
buss_assoc
0.141*
0.067
0.228
0.143
0.047
0.742
−0.048
0.741
0.073
0.286
0.189
0.188
credit
0.059
0.284
−0.091
0.446
0.194
0.082
0.074
0.385
0.052
0.319
0.025
0.827
investment
0.121**
0.048
0.144
0.364
0.188
0.100
0.095
0.356
0.115**
0.046
0.072
0.630
Hum
ancapital
gender
−0.110
0.286
−0.063
0.702
−0.298*
0.075
0.084
0.751
−0.157
0.208
−0.239
0.213
ent_age
0.007*
0.023
0.008
0.206
0.010*
0.059
0.009*
0.071
0.006
0.031
0.012*
0.085
ent_edu
−0.015
0.848
−0.307**
0.041
−0.218
0.153
0.250*
0.093
0.046
0.535
−0.130
0.369
emp_edu
−0.262**
0.012
−0.420**
0.040
0.131
0.547
−0.423*
0.055
−0.169
0.109
−0.301
0.205
emp_train
0.110
0.193
0.291*
0.059
0.119
0.378
−0.017
0.919
0.084
0.353
0.132
0.334
man_train
0.037
0.602
0.128
0.375
−0.200
0.113
0.130
0.285
0.087
0.240
0.035
0.764
team
0.027
0.689
−0.102
0.451
0.285**
0.017
0.129
0.332
−0.022
0.751
0.047
0.697
Int Entrep Manag J

Tab
le3
(contin
ued)
Specification
Allgrow
ingfirm
sSector
Size
Independentvariables
[1]
[2]
[3]
[4]
[5]
[6]
Wholesample
Production
Services
Trade
Micro
firm
s(<10
employees)
SmallandMedium
(>=10
employees)
Coef.
P>|z|
Coef.
Pz|z|
Coef.
P>|z|
Coef.
P>|z|
Coef.
P>|z|
Coef.
P>|z|
Institutionalquality
taxes
−0.075
0.258
−0.040
0.703
−0.027
0.856
−0.062
0.512
0.008
0.891
−0.120
0.367
admin
0.073
0.430
0.073
0.613
0.305
0.120
−0.061
0.666
0.038
0.623
0.141
0.448
legal
0.028
0.661
−0.006
0.961
0.054
0.674
0.202*
0.076
0.109*
0.061
−0.034
0.789
strong_com
p−0
.037
0.583
−0.334**
0.008
−0.102
0.462
0.159
0.169
−0.036
0.534
0.017
0.913
unfair_com
p0.034
0.636
0.260*
0.078
−0.006
0.967
−0.011
0.924
0.000
0.999
0.117
0.442
corruptio
n−0
.133*
0.052
0.129
0.311
−0.259*
0.069
−0.375***
0.002
−0.151***
0.010
−0.124
0.374
exte_fin
0.016
0.825
0.200
0.170
−0.108
0.416
0.024
0.838
−0.015
0.814
0.009
0.950
insuff_dem
and
0.031
0.717
−0.004
0.973
0.079
0.652
0.117
0.323
0.031
0.658
0.047
0.841
Strategy,m
anagerialcapacity
andgrow
thaspiratio
n
export
0.219*
0.023
0.131
0.420
0.249
0.176
0.247
0.166
0.128
0.273
0.232
0.123
foreign_coop
−0.025
0.712
0.025
0.843
−0.195
0.190
−0.012
0.918
−0.052
0.401
0.013
0.919
grow
th_orient
0.053
0.426
−0.203
0.115
0.092
0.437
0.253**
0.012
0.063
0.242
0.050
0.710
sep_ow
n_cont
0.085
0.196
0.116
0.358
−0.015
0.903
0.101
0.366
0.141**
0.029
0.063
0.623
Control
variables
Productio
n0.078
0.250
0.049
0.438
0.057
0.691
y03
−0.032
0.654
−0.324*
0.046
−0.048
0.772
0.017
0.892
0.113*
0.089
−0.268*
0.070
y04
0.146*
0.050
−0.120
0.467
0.104
0.454
0.363**
0.004
0.094
0.179
0.170
0.258
Int Entrep Manag J
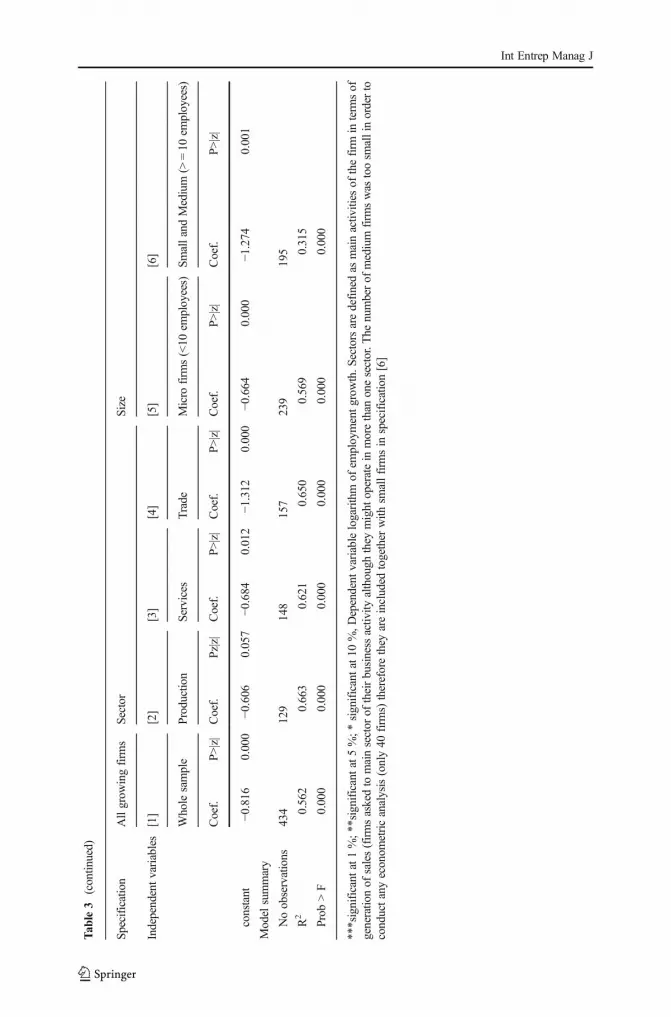
Tab
le3
(contin
ued)
Specification
Allgrow
ingfirm
sSector
Size
Independentvariables
[1]
[2]
[3]
[4]
[5]
[6]
Wholesample
Production
Services
Trade
Micro
firm
s(<10
employees)
SmallandMedium
(>=10
employees)
Coef.
P>|z|
Coef.
Pz|z|
Coef.
P>|z|
Coef.
P>|z|
Coef.
P>|z|
Coef.
P>|z|
constant
−0.816
0.000
−0.606
0.057
−0.684
0.012
−1.312
0.000
−0.664
0.000
−1.274
0.001
Modelsummary
Noobservations
434
129
148
157
239
195
R2
0.562
0.663
0.621
0.650
0.569
0.315
Prob
>F
0.000
0.000
0.000
0.000
0.000
0.000
***significant
at1%;*
*significant
at5%;*
significantat10
%,D
ependent
variablelogarithm
ofem
ploymentgrow
th.S
ectorsaredefinedas
mainactivities
ofthefirm
interm
sof
generatio
nof
sales(firmsaskedto
mainsector
oftheirbusiness
activity
although
they
might
operatein
morethan
onesector.T
henumberof
medium
firm
swas
toosm
allinorderto
conductanyeconom
etricanalysis(only40
firm
s)thereforethey
areincluded
together
with
smallfirm
sin
specification[6]
Int Entrep Manag J

cohorts in the sample, our finding suggests the high sensitivity of the sign of variablesage on growth (specifications [5] and [6] in Table 3). This may infer that after a certainsize threshold (in our case nine employees), the effect of experience gradually decreasesand becomes irrelevant. On the other hand, the size of the firm has a negativeassociation with growth across all sectors and sizes (H1a supported). As expected, inmanufacturing there is a stronger negative association of firm size with growth (H1a
supported). This finding is in line with other studies, which suggest that firms grow toreach the MES and achieve higher efficiency levels and competitiveness, and usuallylinked to larger firms and the manufacturing sector (Rodríguez et al. 2003). Indirectly,RBV acknowledged the negative association of size with growth underlying the factthat small firms need to grow in order to be able to take advantage of full resources andcapabilities. Regarding location (urban), the only observed differences are in terms ofsize and sector, showing greater benefits of large firms (small and medium compared tomicro firms in this particular case) in manufacturing, exploiting, the benefits of beinglocated in the capital city and having access to urban recourses (H2 supported). Benefitsof manufacturing firms from being located in the capital city are higher because theirtransportation costs tend to be higher than in other sectors.
Separating management and ownership has no significant association with growthamong growing firms in different sectors and sizes. This is because the majority ofthem practice some type of management delegation of authority over day-to-daymanagement, suggesting that the divorce of ownership and management has alreadyoccurred. The legal type of business is not a significant factor in explaining small firmgrowth in different sectors and for different sizes (H3 not supported). Findings partiallysupport (only for manufacturing firms, H7 partially supported), previous researchsuggesting that firms funded by an entrepreneurial team are more likely to grow fasterin comparison to those funded by an individual (Schutjens and Wever 2000). Onepossible explanation for this finding is that manufacturing firms benefit from engagingin rather larger investment projects needing large funds which are made possible by alarger group of investors, compared to their counterparts in the services and trade.
For education, findings are consistent with those in Table 2. The negative andsignificant association of the education of both owners (at best insignificant) andemployees with the growth of the firm is confirmed among growing firms as well,explained by provisions of the low quality of (H5a not supported) the labour forcestemming from low quality of education sector is not sufficient to support thegrowth of the firms. The entrepreneur’s education is negatively associated withgrowth only for firms in manufacturing, while it has a positive association with thegrowth in sample of firms in services (H5a partially supported). This finding maysuggest that the quality of education is unsuitable for entrepreneurs in manufactur-ing because manufacturing firms need more specific-skillset, compared to firmsoperating in services and trade sectors. About educated manager, managers mustuse both modern management practices as well as for vocational skills. This isconfirmed by the significance of employee’s training for firms in the manufacturingsector, suggesting that manufacturing firms demand specific skills that are noteasily obtained in the current labour market, so they choose to overcome this bytraining their employees (H5b supported). In the case of Kosova, training seems toserve as a good substitute for the poor quality of education in more technological-biased sectors like manufacturing.
Int Entrep Manag J

The institutional quality is important for the growth of firms, especially those firmsthat wish to grow. Corruption has a negative association with growth in the sample ofgrowing firms, while this did not have a significant effect on the whole sample (H11
partially supported). This finding suggests that corruption has a negative impact forhigh quality entrepreneurs, .i.e., growing firms. In terms of sector and size, the findingssuggest that growth of firms in services and trade is more negatively associated withhigh corruption perceptions while, in terms of size, smaller companies (micro) arenegatively affected by corruption, most likely because larger firms have a greater abilityto engage in corruption and might also face decreasing cost of size (in paying informalpayments). On the other hand, strong competition is an obstacle to growth. Thecompetition has increased significantly during the aftermath of the War and this hasnegatively affected small firm growth. Surprisingly, unfair competition seems to have apositive impact on firm growth in manufacturing firms, which might be an indication ofservices firms, being more able to make use of the partial informal operation ofbusinesses because of the nature of business in which they operate. Both variablesrelated to external finance, access and conditions of external finance and the use ofexternal funds (bank loans), are not statistically significant. This is completely oppositeto what we had when using the overall sample (including non-growing firms). Thisexercise shows that finance is an important factor for small business growth in general,but in terms of firms that experienced some growth, this does not seems to be a severeproblem, suggesting that small firms use their internal funds to finance their investmentprojects as found by Krasniqi (2010). Export involvement as a strategy to seek new andlarger markets is positively associated with growth and is consistent with the findings inall models and specifications (see Tables 2 and 3) when we considered the wholesample of firms, suggesting no sensitivity of the findings to the sector and firm size(H9a supported). Finally, firms that allocate resources for investment are associated withhigher growth rates generally, across all specifications and sample restrictions (growingvs. non-growing). Finally, foreign cooperation does not have an important effect on thegrowth among growing firms.
Robustness checks
Before moving to discussion of results, we will briefly explain statistical tests used tocheck the robustness of results. First, based on statistical tests, we check the appropri-ateness of the Tobit model by comparing probit and Tobit coefficients (Greene 2003, p.776; Wooldridge 2003, p. 573; Wooldridge 2006, p. 603–604).2 Findings suggest thatall our probit coefficients have the same expected sign as our Tobit estimates fromspecification 2 over the standard errors (A2 in Appendix). Greene (2003, p. 768) andWooldridge (2002, p. 534) argue that this deviance can affect coefficients, but partialeffects for E(y|x) and E(y|x, y > 0) would be the same whether the model is affected byheteroscedasticity or not, and in our model that is what we are really interested in.Second, we use the likelihood ratio test for joint significance of parameters. In all tobitspecifications, the likelihood ratio test (shown in Table 2) overwhelmingly supportedthe null hypothesis that all estimated coefficients are jointly significantly different from
2 According to Cameron and Trivedi (2005) if incomplete cases attributable to missing observations compriseno more than 5 % of the total number of cases, they will not produce biased results.
Int Entrep Manag J

zero. Third, we use the pooled data set over 3 years to look into the structural stabilityof the parameters over the three samples using the interaction dummy variable tech-nique using F-test (an alternative Chow test, see Wooldridge 2006). The results showthe null hypothesis is not rejected, suggesting the regression lines are coincidental, i.e.,both the intercept and slope coefficients are the same in the 3 years the three crosssections used in this study can be treated as a single one for purposes of econometricanalysis. Fourth, we test for normality of disturbances and investigate the problem ofcorrelation between the explanatory variables. The data show that the disturbance termis normally distributed suggesting that estimators are unbiased and consistent (Greene2003, p. 771–772). Following Greene (2003), the normality test used by the conditionalmoment test for testing the null hypothesis that the disturbances of a normal distributionshows that in tobit model the null hypothesis of normality is rejected for tobitspecification [2] but not for other tobit specifications in Table 2. Correlation ofexplanatory variables is a common problem when a large number of independentvariables are used especially in small samples (Gujarati 2003). In our tobit modelspecifications, this problem is not severe as the pooled data set is large enough for theestimation. However, we have produced the correlation matrix of explanatory variablesin order to check the magnitude of the correlation showing that correlation coefficientsare all low to one and other (Table A4 in Appendix.) and far below 0.5.3,4 Finally, theGames-Howell’s test was applied in order to check the differences between the meansof the four groups and test rejected homogeneity between groups suggesting that anordered probit can be used. Because the dataset used is cross-sectional, this study iscorrelational where we look for associations among naturally occurring variables,which is appropriate for estimating the determinants of SME growth at one point intime. As a result, we warn the reader that we report relationships analysis.
Conclusion
Drawing on various theories (GL, JLT, RBV and IT) this paper empirically tested asmall firm growth model in a particular context of Kosova, controlling the effects ofentrepreneur’s growth orientation based on three pooled SME surveys in Kosovaconducted in 2002–2004. The paper’s findings are relevant for both policymakersand owner-mangers of SMEs. In particular, the study is important to growth-oriented
3 Comparing the tobit with probit estimates is a common approach to test the appropriateness of the tobitmodel. Here we use the procedure for testing the statistical specification of the tobit model proposed byWooldridge (2006) and Greene (2003). Probit coefficients γ̂ j are compared to the ratio of the Tobit coefficients
over the standard errors of tobit estimatesβ̂ j
σ̂
� �, where β̂ j is the j of coefficients from tobit model and σ̂ their
corresponding standard errors. According to Wooldridge (2006) the tobit model holds, if the Probit estimate γ̂ j
are close to theβ̂ j
σ̂
� �ratio. However, as pointed out by Wooldridge (2006, p. 603–604):
‘These will never be identical due to sampling error, but we can check for certain problematic signs. For
example if γ̂ j is significant and negative but β̂ j is positive, the tobit model might not be appropriate. Or if γ̂ j
and β̂ j are the same sign, butβ̂ j
σ̂
��� ��� is much larger or smaller than γ̂ j
�� ��, this could also indicate a problem. We
should not worry too much about the sign changes or magnitude differences on explanatory variables.’4 (Lind et al. (2000, p.412) suggest that as a rule of thumb, for the detection of the multicollinearity problem, acorrelation coefficient smaller than 0.7 in absolute value.
Int Entrep Manag J

small business owners, as paper provides better understanding on drivers of small firmgrowth in Kosova, and also are applicable to similar transition contexts
The empirical analysis found that four groups of factors are important to explainsmall firm growth: firm related factors, human capital factors, strategy and growthaspiration and the institutional quality. Among the firm level factors, the size of thefirm, operating in more than one plant and in more than one location, and operatingin the capital city, are significant variables in explaining the firm’s growth. Variablesize was significant in the majority of specifications, but its sign was sensitive onthe choice of indicator – absolute growth measure or relative growth measuresuggesting that GL is refuted when growth is being measured in relative terms,meaning that small firms grow faster than larger firms do. Firms located in thecapital city are more likely to experience higher growth rates than other firms. Thismay suggest that firms aiming to grow should consider operating in urban locationbecause better access to resources. In addition, firms that operate in two or moreplants experience higher growth than other firms in the sample. Separating owner-ship and day-to-day management has a positive influence on the growth of the firm.This finding has implications for small firms’ owners suggesting the necessity forthe increase of managerial capacities in order to promote growth in small firms inKosova. This is critical issue for development of small firms in Kosova, havingconsidered that large number of SMEs are family based without adequate andindependent management. There is a weak relationship between the number ofowners and the growth of the firm, while no evidence was found to indicate thatfirms operating as limited liability companies grow faster than other firms, and themembership in business associations does not have an impact on growth of the firm.
Among the firm’s human capital characteristics, the most significant variables thatexplains the growth of the firm are the entrepreneurs and employees’ training.Education of the owner and manager does not have an influence on the growth ofthe firm, while the employees’ education has a negative impact. These findings pointedout the low quality of education having implication for building more market-driveneducational system in Kosova to serve the needs of private sector development in acountry. Even though it was argued that several institutional obstacles primarily impedethe growth of the SME sector in TEs, evidence provided supports only strong compe-tition, corruption and financial barriers. In particular, after we controlled the growingfirms sample, the most significant variable as a barrier to growth appeared to becorruption. Government policies should focus on creating a more competitive businessenvironment, as there is a risk that existing companies makes use of their informalnetworks and corruption to pose barriers to entry for new entrants and other competitorsthat do not make use of such informal networks for their benefits. In addition,facilitating access to external finance can promote investment and so growth of smallfirms.
The separate OLS regressions of different sectors and sizes suggest several impor-tant differences on the impact of different factors of growth. GL seems to hold moreimportance for firms in manufacturing, compared with firms in services and trade,while the JLT is more pronounced in the trade sector. Other important differences werenoted in terms of geographical location. Manufacturing firms located in the capital cityare likely to grow faster than their counterparts in services and trade. The findings alsosuggest that small and medium firms can exploit more benefits from being located in
Int Entrep Manag J

the capital city. We find that manufacturing firms also are significantly better atexploiting the benefits of being part of partnerships. Also, it seems the synergy effect,because of the expanded knowledge of founders or increased credibility, works better inmanufacturing firms (see Pasanen and Laukkanen 2006). In line with this finding, wesuggest that entrepreneurs in TEs should team up to compensate for shortages of theinstitutional settings such as access to finance. The large number of founders can alsobe used to increase managerial capacities, in TEs where as we discussed entrepreneursare more reluctant to separate ownership from management.
The education of both, owners and employees has a negative impact on a firm’sgrowth, especially in manufacturing firms, suggesting a low quality of education inKosova. We found a consistent positive impact from exporting and investing activitieson the growth of a firm. This suggests that ambitious entrepreneurs should seek largermarkets by exporting in order to achieve high growth. In terms of the businessenvironment, we did not find differences among small growing businesses – all ofthembeing constrained by corruption and strong competition. However in terms offinance, external finance has a significant negative impact on the growth for the wholesample, but it is unimportant for growing businesses, presumably signalling the use ofinternal funds by growing firms.
Taken together, this paper contributes to the literature by bringing together a broadspectrum of variables, methods and measures of growth, and applying them to a smallfirm dataset. Viewed from a theoretical perspective, the analysis suggests that internaland external factors are both important in explaining a small firm’s growth patterns.Unlike other studies in TEs that overlooked internal factors, the findings suggest thereare benefits to using an ‘integrative model’ and a ‘mixed approach’ in investigatingsmall firm growth. A key distinguishing feature of the growth of small business is abalanced alignment of the owner–managers’ intention, the abilities of the business andthe opportunity environment (Morrison et al. 2003). Viewed from a methodologicalangle, the implication for other studies in this field is that one should control thedifferent measures of growth in order to avoid methodological biases.
The design of the research was cross-sectional, limiting the researchers’ ability todeal with the causality problem. Therefore, conclusion related to some of the variablesshould be treated with caution, as they could be correlations rather than causal. Finally,as the majority of studies in the field of small business growth are based on cross-sectional data and, by implication, are limited to the explanation of growth at one pointin time. However, a firm’s growth is a process, mostly not regular, as found in studiesbased on longitudinal data (Delmar et al. 2003; Garnsey et al. 2006). On the other hand,the longitudinal studies are based on a group of surviving firms, thus limited to samplesthat are not representative of the population. The relationship between firm growth andits independent variables such as the separation of ownership and management, multi-plant operation, and investment and finance can go in both directions, hence, prone toendogeneity problem. Other independent variables are either lagged for 1 year or bytheir nature are not subject to the causality problem, because as argued by Williamson(2000) institutions change slowly. Future studies should expand on the models byincluding management related factors as well as control for growth-orientation of firms.In addition, they should focus on explaining different paths of grow by using panel dataor perhaps consider the shift from prediction of barriers to understanding (see, Doern(2009). For managerial capacities, the future research should focus on the stages of
Int Entrep Manag J
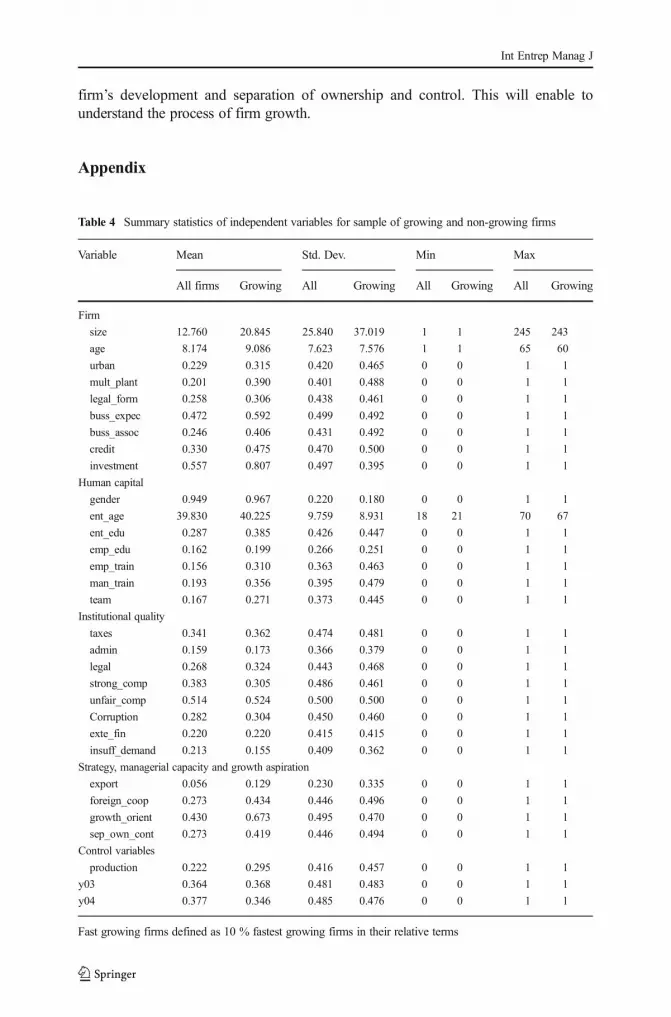
firm’s development and separation of ownership and control. This will enable tounderstand the process of firm growth.
Appendix
Table 4 Summary statistics of independent variables for sample of growing and non-growing firms
Variable Mean Std. Dev. Min Max
All firms Growing All Growing All Growing All Growing
Firm
size 12.760 20.845 25.840 37.019 1 1 245 243
age 8.174 9.086 7.623 7.576 1 1 65 60
urban 0.229 0.315 0.420 0.465 0 0 1 1
mult_plant 0.201 0.390 0.401 0.488 0 0 1 1
legal_form 0.258 0.306 0.438 0.461 0 0 1 1
buss_expec 0.472 0.592 0.499 0.492 0 0 1 1
buss_assoc 0.246 0.406 0.431 0.492 0 0 1 1
credit 0.330 0.475 0.470 0.500 0 0 1 1
investment 0.557 0.807 0.497 0.395 0 0 1 1
Human capital
gender 0.949 0.967 0.220 0.180 0 0 1 1
ent_age 39.830 40.225 9.759 8.931 18 21 70 67
ent_edu 0.287 0.385 0.426 0.447 0 0 1 1
emp_edu 0.162 0.199 0.266 0.251 0 0 1 1
emp_train 0.156 0.310 0.363 0.463 0 0 1 1
man_train 0.193 0.356 0.395 0.479 0 0 1 1
team 0.167 0.271 0.373 0.445 0 0 1 1
Institutional quality
taxes 0.341 0.362 0.474 0.481 0 0 1 1
admin 0.159 0.173 0.366 0.379 0 0 1 1
legal 0.268 0.324 0.443 0.468 0 0 1 1
strong_comp 0.383 0.305 0.486 0.461 0 0 1 1
unfair_comp 0.514 0.524 0.500 0.500 0 0 1 1
Corruption 0.282 0.304 0.450 0.460 0 0 1 1
exte_fin 0.220 0.220 0.415 0.415 0 0 1 1
insuff_demand 0.213 0.155 0.409 0.362 0 0 1 1
Strategy, managerial capacity and growth aspiration
export 0.056 0.129 0.230 0.335 0 0 1 1
foreign_coop 0.273 0.434 0.446 0.496 0 0 1 1
growth_orient 0.430 0.673 0.495 0.470 0 0 1 1
sep_own_cont 0.273 0.419 0.446 0.494 0 0 1 1
Control variables
production 0.222 0.295 0.416 0.457 0 0 1 1
y03 0.364 0.368 0.481 0.483 0 0 1 1
y04 0.377 0.346 0.485 0.476 0 0 1 1
Fast growing firms defined as 10 % fastest growing firms in their relative terms
Int Entrep Manag J

Table 5 Comparison of probit and tobit estimates
Variables Probit Tobit specification 2
Coefficient P>|z| Coefficient Coefficient/se P>|z|
Firm
lnsize 0.003** 0.040 −0.056*** −0.134 0.000
lnage −0.001 0.919 −0.001 −0.002 0.694
urban 0.174* 0.061 0.055 0.131 0.103
mult_plant 0.430*** 0.000 0.146*** 0.346 0.000
legal_form 0.011 0.907 0.006 0.015 0.855
buss_expec 0.041 0.608 0.026 0.061 0.388
buss_assoc 0.056 0.571 0.023 0.055 0.527
credit 0.180** 0.031 0.068** 0.162 0.026
investment 0.592*** 0.000 0.253*** 0.603 0.000
Human capital
gender −0.008 0.964 −0.007 −0.016 0.924
ent_age −0.005 0.282 −0.001 −0.002 0.511
ent_edu 0.098 0.396 0.049 0.116 0.250
emp_edu −0.006 0.972 −0.045 −0.107 0.470
emp_train 0.243** 0.039 0.068 0.162 0.110
man_train 0.249** 0.017 0.105*** 0.251 0.005
Team 0.165 0.113 0.056 0.132 0.139
Institutional quality factors
taxes −0.043 0.633 −0.015 −0.035 0.660
admin 0.060 0.604 0.041 0.098 0.337
legal 0.133 0.149 0.054 0.129 0.108
strong_comp −0.186** 0.037 −0.067** −0.159 0.046
unfair_comp 0.008 0.926 0.001 0.003 0.971
corruption −0.021 0.822 −0.040 −0.094 0.240
exte_fin −0.158* 0.098 −0.058* −0.139 0.099
insuff_demand −0.091 0.378 −0.029 −0.068 0.460
Strategy, managerial capacity and growth aspiration
export 0.337** 0.040 0.112*** 0.268 0.041
foreign_coop 0.056 0.534 0.017 0.042 0.601
growth_orient 0.450*** 0.000 0.160*** 0.380 0.000
sep_own_cont 0.190** 0.040 0.097*** 0.231 0.004
Control variables
Production 0.013 0.895 0.034 0.082 0.323
y03 0.025 0.825 0.011 0.027 0.787
y04 −0.137 0.191 −0.047 −0.112 0.224
constant −1.396 0.000 −0.468 −1.115 0.000
No of observations 1541 1541 1541
Pseudo R-squared 0.225 0.214 0.218
Int Entrep Manag J
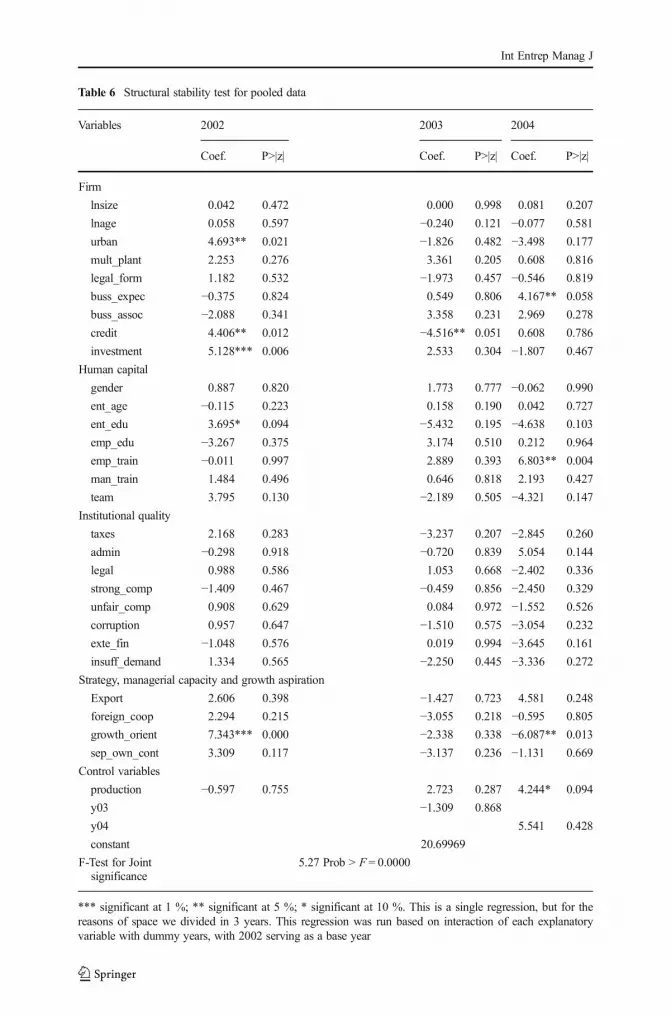
Table 6 Structural stability test for pooled data
Variables 2002 2003 2004
Coef. P>|z| Coef. P>|z| Coef. P>|z|
Firm
lnsize 0.042 0.472 0.000 0.998 0.081 0.207
lnage 0.058 0.597 −0.240 0.121 −0.077 0.581
urban 4.693** 0.021 −1.826 0.482 −3.498 0.177
mult_plant 2.253 0.276 3.361 0.205 0.608 0.816
legal_form 1.182 0.532 −1.973 0.457 −0.546 0.819
buss_expec −0.375 0.824 0.549 0.806 4.167** 0.058
buss_assoc −2.088 0.341 3.358 0.231 2.969 0.278
credit 4.406** 0.012 −4.516** 0.051 0.608 0.786
investment 5.128*** 0.006 2.533 0.304 −1.807 0.467
Human capital
gender 0.887 0.820 1.773 0.777 −0.062 0.990
ent_age −0.115 0.223 0.158 0.190 0.042 0.727
ent_edu 3.695* 0.094 −5.432 0.195 −4.638 0.103
emp_edu −3.267 0.375 3.174 0.510 0.212 0.964
emp_train −0.011 0.997 2.889 0.393 6.803** 0.004
man_train 1.484 0.496 0.646 0.818 2.193 0.427
team 3.795 0.130 −2.189 0.505 −4.321 0.147
Institutional quality
taxes 2.168 0.283 −3.237 0.207 −2.845 0.260
admin −0.298 0.918 −0.720 0.839 5.054 0.144
legal 0.988 0.586 1.053 0.668 −2.402 0.336
strong_comp −1.409 0.467 −0.459 0.856 −2.450 0.329
unfair_comp 0.908 0.629 0.084 0.972 −1.552 0.526
corruption 0.957 0.647 −1.510 0.575 −3.054 0.232
exte_fin −1.048 0.576 0.019 0.994 −3.645 0.161
insuff_demand 1.334 0.565 −2.250 0.445 −3.336 0.272
Strategy, managerial capacity and growth aspiration
Export 2.606 0.398 −1.427 0.723 4.581 0.248
foreign_coop 2.294 0.215 −3.055 0.218 −0.595 0.805
growth_orient 7.343*** 0.000 −2.338 0.338 −6.087** 0.013
sep_own_cont 3.309 0.117 −3.137 0.236 −1.131 0.669
Control variables
production −0.597 0.755 2.723 0.287 4.244* 0.094
y03 −1.309 0.868
y04 5.541 0.428
constant 20.69969
F-Test for Jointsignificance
5.27 Prob > F = 0.0000
*** significant at 1 %; ** significant at 5 %; * significant at 10 %. This is a single regression, but for thereasons of space we divided in 3 years. This regression was run based on interaction of each explanatoryvariable with dummy years, with 2002 serving as a base year
Int Entrep Manag J
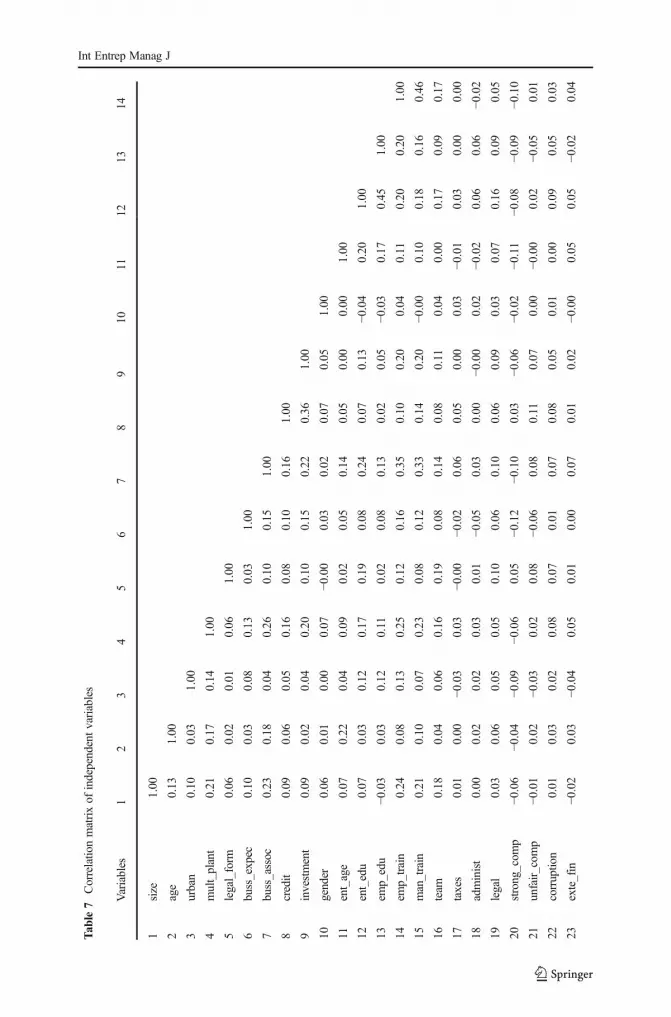
Tab
le7
Correlatio
nmatrixof
independentvariables
Variables
12
34
56
78
910
1112
1314
1size
1.00
2age
0.13
1.00
3urban
0.10
0.03
1.00
4mult_plant
0.21
0.17
0.14
1.00
5legal_form
0.06
0.02
0.01
0.06
1.00
6buss_expec
0.10
0.03
0.08
0.13
0.03
1.00
7buss_assoc
0.23
0.18
0.04
0.26
0.10
0.15
1.00
8credit
0.09
0.06
0.05
0.16
0.08
0.10
0.16
1.00
9investment
0.09
0.02
0.04
0.20
0.10
0.15
0.22
0.36
1.00
10gender
0.06
0.01
0.00
0.07
−0.00
0.03
0.02
0.07
0.05
1.00
11ent_age
0.07
0.22
0.04
0.09
0.02
0.05
0.14
0.05
0.00
0.00
1.00
12ent_edu
0.07
0.03
0.12
0.17
0.19
0.08
0.24
0.07
0.13
−0.04
0.20
1.00
13em
p_edu
−0.03
0.03
0.12
0.11
0.02
0.08
0.13
0.02
0.05
−0.03
0.17
0.45
1.00
14em
p_train
0.24
0.08
0.13
0.25
0.12
0.16
0.35
0.10
0.20
0.04
0.11
0.20
0.20
1.00
15man_train
0.21
0.10
0.07
0.23
0.08
0.12
0.33
0.14
0.20
−0.00
0.10
0.18
0.16
0.46
16team
0.18
0.04
0.06
0.16
0.19
0.08
0.14
0.08
0.11
0.04
0.00
0.17
0.09
0.17
17taxes
0.01
0.00
−0.03
0.03
−0.00
−0.02
0.06
0.05
0.00
0.03
−0.01
0.03
0.00
0.00
18administ
0.00
0.02
0.02
0.03
0.01
−0.05
0.03
0.00
−0.00
0.02
−0.02
0.06
0.06
−0.02
19legal
0.03
0.06
0.05
0.05
0.10
0.06
0.10
0.06
0.09
0.03
0.07
0.16
0.09
0.05
20strong_com
p−0
.06
−0.04
−0.09
−0.06
0.05
−0.12
−0.10
0.03
−0.06
−0.02
−0.11
−0.08
−0.09
−0.10
21unfair_com
p−0
.01
0.02
−0.03
0.02
0.08
−0.06
0.08
0.11
0.07
0.00
−0.00
0.02
−0.05
0.01
22corruption
0.01
0.03
0.02
0.08
0.07
0.01
0.07
0.08
0.05
0.01
0.00
0.09
0.05
0.03
23exte_fin
−0.02
0.03
−0.04
0.05
0.01
0.00
0.07
0.01
0.02
−0.00
0.05
0.05
−0.02
0.04
Int Entrep Manag J

Tab
le7
(contin
ued)
Variables
12
34
56
78
910
1112
1314
24insuff_dem
and
−0.08
−0.01
−0.10
−0.04
−0.02
−0.09
−0.11
−0.05
−0.09
−0.04
−0.03
−0.02
−0.07
−0.10
25export
0.12
0.09
0.03
0.15
0.05
0.08
0.21
0.12
0.13
0.03
0.05
0.10
0.05
0.21
26foreign_coop
0.12
0.07
0.12
0.25
0.11
0.11
0.25
0.14
0.21
0.03
0.07
0.18
0.11
0.27
27grow
th_orient
0.09
0.04
0.06
0.20
0.04
0.24
0.23
0.13
0.28
0.09
0.05
0.13
0.10
0.20
28sep_ow
n_cont
0.22
0.08
0.13
0.24
0.15
0.14
0.19
0.09
0.11
0.07
0.08
0.17
0.13
0.23
29productio
n0.10
0.13
−0.09
0.13
0.08
0.12
0.17
0.07
0.17
0.06
0.11
0.08
−0.01
0.06
30y03
0.14
0.06
−0.02
−0.03
−0.15
−0.02
−0.03
−0.03
−0.10
0.05
−0.01
−0.40
−0.09
0.02
31y04
−0.06
−0.06
0.02
0.04
0.16
−0.02
0.05
0.09
0.08
−0.04
0.02
0.23
0.04
0.04
1516
1718
1920
2122
2324
2526
2728
2930
31
1 2 3 4 5 6 7 8 9 10 11 12
Int Entrep Manag J

Tab
le7
(contin
ued)
1516
1718
1920
2122
2324
2526
2728
2930
31
13 14 151.00
160.15
1.00
170.07
0.03
1.00
18−0
.01
0.02
0.38
1.00
190.05
0.06
0.15
0.21
1.00
20−0
.06
−0.04
0.12
0.08
0.08
1.00
210.01
0.02
0.11
0.10
0.16
0.38
1.00
220.07
0.07
0.15
0.15
0.20
0.12
0.25
1.00
230.02
0.02
0.08
0.06
0.14
0.08
0.11
0.06
1.00
24−0
.07
−0.03
0.05
0.11
0.03
0.17
0.12
0.05
0.19
1.00
250.21
0.12
0.10
0.08
0.06
−0.01
0.06
0.04
0.01
−0.05
1.00
260.24
0.18
0.08
0.01
0.06
−0.11
0.04
0.08
0.01
−0.07
0.22
1.00
270.20
0.10
0.04
0.01
0.08
−0.03
0.02
−0.00
0.07
−0.07
0.16
0.21
1.00
280.22
0.36
0.05
0.00
0.01
−0.05
−0.02
0.06
−0.01
−0.08
0.15
0.20
0.12
1.00
290.13
0.12
0.05
0.01
0.10
−0.01
0.05
0.03
0.08
0.02
0.20
0.10
0.17
0.12
1.00
30−0
.00
−0.00
0.07
0.02
−0.11
−0.03
−0.08
−0.14
−0.03
0.03
0.02
−0.01
−0.02
0.06
−0.01
1.00
310.02
0.05
−0.00
0.05
−0.00
0.04
0.07
0.25
−0.03
0.01
−0.03
−0.01
−0.14
−0.01
−0.04
−0.60
1.00
Int Entrep Manag J

Table 8 Marginal effects of probit and tobit estimations
Variables Probit specification 1 Tobit specification 1 Tobit specification 2
Marginal effects P>|z| Marginal effects P>|z| Marginal effects P>|z|
Firm related factors
size .001** 0.041 0.014*** 0.000
age −.000 0.919
lnsize −0.014*** 0.000
lnage −0.009 0.450 0.000 0.670
urban .055* 0.069 0.543*** 0.006 0.014* 0.086
mult_plant .143*** 0.000 0.850*** 0.000 0.041*** 0.000
legal_form .003 0.907 0.247 0.204 0.002 0.855
buss_expec .012 0.608 0.275 0.116 0.007 0.377
buss_assoc .017 0.575 0.146 0.483 0.005 0.555
credit .056** 0.034 0.521*** 0.003 0.017** 0.021
Investment .177*** 0.000 1.169*** 0.000 0.061*** 0.000
Human capital factors
gender −.002 0.965 0.077 0.859 −0.002 0.930
ent_age −.001 0.282 −0.006 0.501 0.000 0.538
ent_edu .030 0.396 0.209 0.394 0.013 0.233
emp_edu −.001 0.972 −0.701** 0.060 −0.012 0.434
emp_train .079** 0.049 0.940*** 0.000 0.019* 0.074
man_train .080** 0.023 0.604*** 0.005 0.029*** 0.002
team .052 0.126 0.167 0.770 0.015 0.116
External business environment factors
taxes −.013 0.632 −0.040 0.836 −0.003 0.696
admin .018 0.609 0.401 0.109 0.010 0.331
legal .042 0.157 0.153 0.439 0.014* 0.094
strong_comp −.056** 0.034 −0.448** 0.023 −0.016* 0.052
unfair_comp .002 0.926 −0.014 0.939 0.000 0.982
corruption −.006 0.821 −0.184 0.351 −0.009 0.261
exte_fin −.047* 0.087 −0.327 0.116 −0.014 0.112
insuff_demand −.027 0.368 −0.152 0.510 −0.007 0.463
Management/strategy and entrepreneurial orientation
export .114* 0.057 0.895*** 0.004 0.033** 0.016
foreign_coop .017 0.537 0.177 0.362 0.004 0.588
growth_orient .141*** 0.000 0.898*** 0.000 0.041*** 0.000
sep_own_cont .060** 0.045 0.496** 0.012 0.026*** 0.002***
Control variables
production .003 0.895 0.232 0.249 0.009 0.289
y03 .007 0.826 −0.155 0.524 0.003 0.807
y04 −.041 0.185 0.073 0.747 −0.012 0.214
For the tobit estimation marginal effect are reported based on Unconditional Expected Value. For probitestimates, the calculation of marginal effect is specified at 1 for dummies while and at sample means for othercontinuous variables
Int Entrep Manag J
References
Acs, Z., & Audretsch, D. (2001). The Emergency of the Entrepreneurial Society, Paper presented at theInternational Award for Entrepreneurship and Small Business Research, 3 May, 2001, Stockholm.
Ahmad, N., & Gonnard, E. (2007). High growth enterprises and gazelles’, Paper prepared for theInternational Consortium on Entrepreneurship (ICE) February, 2007. Denmark: Copenhagen.
Aidis, R., & Mickiewicz, T. (2006). Entrepreneurs, expectations and business expansion: Lessons fromLithuania. Europe-Asia Studies, 58(6), 855–880.
Aidis, R., & Van Praag, M. (2007). Illegal entrepreneurship experience: does it make a difference for businessperformance and motivation? Journal of Business Venturing, 22(2), 283–310.
Aidis, R., Estrin, S., & Mickiewicz, T. (2008). Institutions and entrepreneurship development in Russia: acomparative perspective. Journal of Business Venturing, 23(6), 656–672.
Alcacer, J., & Chung, W. (2007). Location strategies and knowledge spillovers. Management Science, 53(5),760–776.
Almus, M. (2002). What characterizes a fast-growing firm? Applied Economics, 34(12), 1497–1508.Bartlett, W., & Bukvič, B. (2001). Barriers to SME growth in Slovenia. Moct–Most Economic Policy in
Transition Economies, 11(2), 177–195.Beaudry, C., & Swann, G.M.P. (2009). Firm growth in industrial clusters of the United Kingdom. Small
Business Economics, 32(4), 409–424.Birch, D.L. (1987). Job generation in America. New York: The Free Press.Black, D., & Henderson, V. (1999). A theory of urban growth. Journal of Political Economy, 107(2), 252–284.Boeker, W., &Wiltbank, R. (2005). New venture evolution and managerial capabilities. Organization Science,
16(2), 123–133.Brown, D., Earle, S., & Lup, D. (2005). What makes small firm grow? Finance, human capital, technical
assistance, and the business environment in Rumania. Economic Development and Cultural Change,54(1), 33–70.
Brüderl, J., & Preisendörfer, P. (2000). Fast growing businesses: empirical evidence from a German study.International Journal of Sociology, 30, 45–70.
Bryan, J. (2006). Training and performance in small firms. International Small Business Journal, 24(6), 635–658.
BSCK (2012). Entrepreneruship and Small Business Development in Kosova, Prishtine: Business SupportCentre Kosova.
Cameron, C.A., & Trivedi, P.K. (2005).Microeconometrics, methods and applications. New York: CambridgeUniversity Press.
Capelleras, J., & Rabetino, R. (2008). Individual, organizational and environmental determinants of new firmemployment growth: evidence from Latin America. The International Entrepreneurship and ManagementJournal, 4(1), 79–99.
Carlton, D.W., & Perloff, M.J. (2004). Modern industrial organization (4th ed.). MA: Addison–Wesley.Coad, A. (2009). The growth of firms: A survey of theories and empirical evidence. Edward Elgar Publishing.Corbett, A.C. (2007). Learning asymmetries and the discovery of entrepreneurial opportunities. Journal of
Business Venturing, 22(1), 97–118.Cosh, A.D., Hughes, A., Weeks, M. (2000). The relationship between training and employment growth in
small and medium–sized enterprises. Centre for Business Research Working Paper No. 1888, Cambridge,UK: University of Cambridge.
Davidsson, P., Kirchhoff, B., Hatemi, J.A., & Gustavsson, H. (2002). Empirical analysis of business growthfactors using Swedish data. Journal of Small Business Management, 40(4), 332–349.
Deakins, D., & Freel, M. (2003). Entrepreneurship and small firms (3rd ed.). London: McGraw-HillEducation.
Delmar, F., Davidsson, P., & Gartner, W. B. (2003). Arriving at the high-growth firm. Journal of BusinessVenturing, 18(2), 189–216.
Djankov, S., & Murrell, P. (2002). Enterprise restructuring in transition: a quantitative survey. Journal ofEconomic Literature, 40, 739–792.
Dobbs, M., & Hamilton, T.R. (2007). Small business growth: recent evidence and new directions.International Journal of Entrepreneurial Behaviour and Research, 13(5), 296–322.
Doern, R. (2009). Investigating barriers to SME growth and development in transition environments a critiqueand suggestions for developing the methodology. International Small Business Journal, 27(3), 275–305.
Int Entrep Manag J

Doern, R. (2011). Understanding how perceived barriers influence growth intentions and behaviours:Accounts from small business owner‐managers in Russia. International Journal of EntrepreneurialBehaviour and Research, 17(5), 488–514.
Earle, J., & Sakova, Z. (2000). Business start-ups or disguised unemployment? Evidence on the character ofself-employment from transition economies. Labour Economics, 7, 575–601.
Efendic, A., Mickiewicz, T., Rebmann, A. (2014). Growth aspirations and social capital: Young firms in apost-conflict environment. International Small Business Journal (forthcoming).
Estrin, S., Korosteleva, J., & Mickiewicz, T. (2013). Which institutions encourage entrepreneurial growthaspirations? Journal of Business Venturing, 28(4), 564–580.
EU Commission (2014) Staff Working Document: Kosova 2014 Progress Report, Brussels, 2014.Frye, T., & Zhuravskaya, E. (2000). Rackets, regulation, and the rule of law. The Journal of Law, Economics,
and Organization, 16(2), 478–502.Fujita, M., & Thisse, J.F. (2002). Economics of agglomeration: cities, industrial location and regional growth.
Cambridge: Cambridge University Press.Garnsey, E. (1998). A theory of the early growth of the firm. Industrial and Corporate Change, 7(3), 523–556.Garnsey, E., Stam, E., & Heffernan, P. (2006). New firm growth: exploring processes and paths. Industry and
Innovation, 13(1), 1–20.George, G. (2005). Slack resources and the performance of privately held firms. Academy of Management
Journal, 48(4), 661–676.Ghosh, S., & Moran, P. (1998). Integrated theory of the growth of the firm. London: London Business School.
[Mimeo.].Gibrat, R. (1931). Les Inégalités Économiques, Paris: Librairie du Recueil Sirey.Glaeser, E.L., Kallal, H.D., Scheinkman, J.A., & Shleifer, A. (1992). Growth in cities. Journal of Political
Economy, 100(6), 1126–1152.Goddard, J., McMillan, D., & Wilson, J.O. (2006). Do firm sizes and profit rates converge? Evidence on
Gibrat’s Law and the persistence of profits in the long run. Applied Economics, 38(3), 267–278.Greene, W. (2003). Econometric analysis (4th ed.). New Jersey: Prentice Hall.Gujarati, D. (2003). Basic econometrics (4th ed.). New York: McGraw–Hill/Irwin.Haber, S., & Reichel, A. (2007). The cumulative nature of the entrepreneurial process: the contribution of
human capital, planning and environment resources to small venture performance. Journal of BusinessVenturing, 22(1), 119–145.
Hallier, J., & Butts, S. (1999). Employers’ discovery of training: self development, employability and therhetoric of partnership. Employee Relations, 21(1), 80–94.
Hamilton, R.T. (2012). How firms grow and the influence of size and age. International Small BusinessJournal, 30(6), 611–621.
Harhoff, D., Stahl, K., & Woywode, M. (1998). Legal form, growth and exit of West German firms—empirical results for manufacturing, construction, trade and service industries. The Journal of IndustrialEconomics, 46(4), 453–488.
Hashi, I., & Krasniqi, B. (2011). Entrepreneurship and SME growth in transition: evidence from advanced andlaggard transition economies. International Journal of Entrepreneurial Behaviour and Research, 17(5),456–487.
Hart, P.E. (2000). Theories of firms’ growth and the generation of jobs. Review of Industrial Organization, 17,229–248.
Hay, M., & Kamshad, K. (1994). Small firm growth: intentions, implementation and impediments. BusinessStrategy Review, 5(3), 49–68.
Heinonen, J., Nummela, N., Pukkinen, T. (2004). To grow or not to grow? An analysis of internationallygrowth orientated Finnish SMEs, paper presented at the EIBA Annual Conference, Slovenia, 5–8December.
Heshmati, A. (2001). On the growth of micro and small firms: evidence from Sweden. Small BusinessEconomics, 17(3), 213–228.
Hitt, M. A., Ireland, R.D., Sirmon, D.G., & Trahms, C.A. (2011). Strategic entrepreneurship: creating value forindividuals, organizations and society. Academy of Management Perspectives, 25(2), 57–75.
Hölzl, W. (2009). Is the R&D behaviour of fast-growing SMEs different? Evidence from CIS III data for 16countries. Small Business Economics, 33(1), 59–75.
Johnson, S., McMillan, J., & Woodruff, C. (2000). Entrepreneurs and the ordering of institutional reform:Poland, Slovakia, Romania, Russia and Ukraine compared. Economics of Transition, 8(1), 1–36.
Johnson, S., et al. (2000). Why do firms hide? Bribes and unofficial activity after communism. Journal ofPublic Economics, 76(3), 495–520.
Jovanovic, B. (1982). Selection and evolution of industry. Econometrica, 50(3), 649–670.
Int Entrep Manag J

Kangasharju, A., & Pekkala, S. (2002). The role of education in self–employment success in Finland. Growthand Change, 33(2), 216–237.
Kirby, D. (1990). Management education and small business development: an explanatory study of smallfirms in the UK. Journal of Small Business Management, 28(4), 78–87.
Krasniqi, B. (2006). Size, age and firm growth: econometric evidence from SME sector in Kosova.International Journal of Management and Entrepreneurship, 2(1), 57–68.
Krasniqi, B. (2010). Are small firms really credit constrained?: Empirical evidence from Kosova. InternationalEntrepreneurship and Management Journal, 6(4), 459–479.
Krasniqi, B. (2012). Building an expanded small firm growth model in a transitional economy: Evidence onfast growing firms. Journal of East-West Business, 18(3), 231–273.
Krasniqi, B. (2014). Characteristics of self-employment: A refuge from unemployment or road to entrepre-neurship. Small Enterprise Research, 21(1), 33–53.
Krasniqi, B., Shiroka-Pula, J., & Kutllovci E. (2008). The determinants of entrepreneurship and small businessgrowth in Kosova: evidence from new and established firms. International Journal of Entrepreneurshipand Innovation Management, 8(3), 320–342.
Krugman, P. (1991). Increasing returns and economic geography. Journal of Political Economy, 99(3), 483–499.
Lechner, C., & Gudmundsson, S.V. (2014). Entrepreneurial orientation, firm strategy and small firm perfor-mance. International Small Business Journal, 32(1), 36–60.
Lee, D.Y., & Tsang, E.W. (2001). The effects of entrepreneurial personality, background and network activitieson venture growth. Journal of Management Studies, 38(4), 583–602.
Lind, A.D., Mason, D.R., & Marchall, G.W. (2000). Basic statistics for business and economics (3rd ed.).Boston: Irwin McGraw–Hill.
Macpherson, A., & Holt, R. (2007). Knowledge, learning and small firm growth: a systematic review of theevidence. Research Policy, 36(2), 172–192.
Maine, M.E., Shapiro, M.D., & Vining, R.A. (2010). The role of clustering in the growth of new technology–based firms. Small Business Economics, 34(2), 127–146.
McPherson, M.A. (1996). Growth of micro and small enterprises in southern Africa. Journal of DevelopmentEconomics, 48(2), 253–277.
Ministry of Trade and Industry (2005). Business register database. Prishtinë: MTI.Mochrie, R., Galloway, L., & Donnelly, E. (2006). Attitudes to growth and experience of growth among
Scottish SMEs. International Journal of Entrepreneurial Behaviour and Research, 12(1), 7–20.Morrison, A., Breen, J., & Ali, S. (2003). Small business growth: intention, ability, and opportunity. Journal of
Small Business Management, 41(4), 417–425.Naldi, L., & Davidsson, P. (2014). Entrepreneurial growth: The role of international knowledge acquisition as
moderated by firm age. Journal of Business Venturing, 29, 687–703.Nooteboom, B. (2009). A cognitive theory of the firm: Learning, governance and dynamic capabilities.
Edward Elgar Publishing.North, D.C. (1990). Institutions, institutional change and economic performance. Cambridge: Cambridge
University Press.O’Farrell, P.N., & Hitchens, D.M.W.N. (1988). Alternative theories of small-firm growth: a critical review.
Environment and Planning, 20(10), 1365–1383.Obeng, B.A., Robson, P., & Haugh, H. (2012). Strategic entrepreneurship and small firm growth in Ghana.
International Small Business Journal, 32(5), 501–524.Ojala, A., & Isomäki, H. (2011). Entrepreneurship and small businesses in Russia: a review of empirical
research. Journal of Small Business and Enterprise Development, 18(1), 97–119.Okpara, J.O. (2009). Strategic choices, export orientation and export performance of SMEs in Nigeria.
Management Decision, 47(8), 1281–1299.Parker, S., Storey, D.J., & van Witteloostuijn, A. (2010). What happens to gazelles? The importance of
dynamic management strategy. Small Business Economics, 35(2), 203–226.Pasanen, M., & Laukkanen, T. (2006). Team–managed growing SMEs: a distinct species? Management
Research News, 29(11), 684–700.Penrose, E. (1959). The theory of the growth of the firm. Oxford: Basil Blackwell.Pissarides, F., Singer, M., & Svejnar, J. (2003). Objectives and constraints of entrepreneurs: evidence from
small and medium size enterprises in Russia and Bulgaria. Journal of Comparative Economics, 31(3),503–531.
Porta, R., Lopez‐de‐Silanes, F., & Shleifer, A. (1999). Corporate ownership around the world. The Journal ofFinance, 54(2), 471–517.
Int Entrep Manag J

Reichstein, T., & Dahl, M. (2004). Are firm growth rates random? Analyzing patterns and dependencies.International Review of Applied Economics, 18(2), 225–246.
Riinvest (1998). Economic activities and democratic development of Kosova. Prishtinë: Riinvest Institute forDevelopment Research.
Riinvest (2000). Reconstruction and the development of industry in Kosova. Prishtine: Riinvest Institute forDevelopment Research.
Riinvest (2013a). A Business Perspective on Informality in Kosova, Research Report. Prishtine: RiinvestInstitute for Development Research.
Riinvest (2013b). SME Development in Kosova. Prishtinë: Riinvest Institute for Development Research.Rodríguez, A.C., Molina, M.A., Pérez, A.L.G., & Hernández, U.M. (2003). Size, age and activity sector on
the growth of the small and medium firm size. Small Business Economics, 21(3), 289–307.Román, C., Congregado, E., & Millán, J.M. (2013). Start-up incentives: entrepreneurship policy or active
labour market programme? Journal of Business Venturing, 28(1), 151–175.Sadler-Smith, E., Hampson, Y., Chaston, I., & Badger, B. (2003). Managerial behavior, entrepreneurial style,
and small firm performance. Journal of Small Business Management, 41(1), 47–67.Salomon, R.M., & Shaver, J.M. (2005). Learning by exporting: new insights from examining firm innovation.
Journal of Economics and Management Strategy, 14(2), 431–460.Santarelli, E., & Vivarelli, M. (2007). Entrepreneurship and the process of firms’ entry, survival and growth.
Industrial and Corporate Change, 16(3), 455–488.Sapienza, H.J., Parhankangas, A., & Autio, E. (2004). Knowledge relatedness and post-spin-off growth.
Journal of Business Venturing, 19(6), 809–829.Serrasqueiro, Z.S., & Nunes, P.M. (2008). Performance and size: empirical evidence from Portuguese SMEs.
Small Business Economics, 31(2), 195–217.Scase, R. (2003). Entrepreneurship and proprietorship in transition: policy implications for the SME sector. In
R. McIntyre & B. Dallago (Eds.), Small and medium enterprises in transitional economies (pp. 64–77).Hampshire: Palgrave.
Schutjens, V.A., & Wever, E. (2000). Determinants of new firm success. Papers in Regional Science, 79(2),135–159.
Shane, S. (2009). Why encouraging more people to become entrepreneurs is bad public policy. Small BusinessEconomics, 33(2), 141–149.
Shirokova, G., Vega, G., & Knatko, D. (2015). Crossing the threshold from founder management toprofessional management in Russian firms: an institutional perspective. International Journal ofEntrepreneurial Behavior and Research, 21(1), 76–106.
Shleifer, A., & Vishny, R.W. (1994). Politicians and firms. The Quarterly Journal of Economics, 995–1025.Sleuwaegen, L., & Goedhuys, M. (2002). Growth of firms in developing countries, evidence from Cote
d’Ivoire. Journal of Development Economics, 68(1), 117–135.Smallbone, D., & Welter, F. (2006). Conceptualizing entrepreneurship in a transition context. International
Journal of Entrepreneurship and Small Business, 3(2), 190–206.Smallbone, D., & Welter, F. (2009). Entrepreneurship and small business development in post-socialist
economies. London: Routledge.Solymossy, E. (2005). Entrepreneurship in extreme environments: building an expanded model. The
International Entrepreneurship and Management Journal, 1(4), 501–518.Stam, E. (2010). Growth beyond Gibrat: firm growth processes and strategies. Small Business Economics,
35(2), 129–135.Stiglitz, J., & Weiss, A. (1981). Credit rationing in markets with imperfect information. American Economic
Review, 71(3), 912–927.Storey, D. (1994a). Understanding small business sector. London: International Thomson Business Press.Storey, D.J. (1994b). The role of legal status in influencing bank financing and new firm growth. Applied
Economics, 26(2), 129–136.Tybout, J. (2003). Plant and firm–level evidence on the ‘New’ trade theories. In E. C. Kwan & J. Harrigan
(Eds.), Handbook of International Trade. Oxford: Basil Blackwell.Taymaz, E., & Özler, Ş. (2007). Foreign ownership, competition, and survival dynamics. Review of Industrial
Organization, 31(1), 23–42.van der Sluis, J., Praag, C.M., & Vijverberg, W. (2005). Entrepreneurship selection and performance: a meta–
analysis of the impact of education in less developed countries. World Bank Economic Review, 19(2),225–261.
Veciana, J.M., & Urbano, D. (2008). The institutional approach to entrepreneurship research. Introduction.International Entrepreneurship and Management Journal, 4(4), 365–379.
Int Entrep Manag J

Welter, F., & Lasch, F. (2008). Entrepreneurship research in Europe: taking stock and looking forward.Entrepreneurship: Theory and Practice, 32(2), 241–248.
Wiklund, J., Davidsson, P., & Delmar, F. (2003). What do they think and feel about growth? An expectancy–value approach to small business manager’s attitudes toward growth. Entrepreneurship: Theory andPractice, 27(3), 247–270.
Wiklund, J., Patzelt, H., & Shepherd, D. (2009). Building an integrative model of small business growth.Small Business Economics, 32(4), 351–374.
Williamson, O.E. (2000). The new institutional economics: taking stock, looking ahead. Journal of EconomicLiterature, 595–613.
Wooldridge, J. (2002). Introductory econometrics: a modern approach, Mason, OH: Thompson HigherEducation.
Wooldridge, J. (2006). Introductory econometrics: a modern approach. Mason: Thompson Higher Education.Wooldridge, J.M. (2003). Econometric analysis of cross section and panel data. MIT press.Xheneti, M., & Bartlett, W. (2012). Institutional constraints and SME growth in post-communist Albania.
Journal of Small Business and Enterprise Development, 19(4), 607–626.Yasuda, T. (2005). Firm growth, size, age and behavior in Japanese manufacturing. Small Business Economics,
24(1), 1–15.Yudaeva, K., Kozlov, K., Malentieva, N. & Ponomareva, N. (2003). Does foreign ownership matter? The
Russian experience. Economics of Transition, 11(3), 383–409.
Int Entrep Manag J


