Embed Size (px)
Citation preview

9/25/2017 Managerial Accounting
file:///Users/hannah/Downloads/Managerial-Accounting-1506381825_regexified.html 1/350
Managerial Accounting
Managerial Accounting
Developed in conjunction with Debra Porter, Tidewater Community College, www.tcc.edu
Cover photo: opensource.com,What if politicians innovated the open source way?, CC-BY, www.flickr.com/photos/library_of_congress/2162720993/

9/25/2017 Managerial Accounting
file:///Users/hannah/Downloads/Managerial-Accounting-1506381825_regexified.html 2/350
CONTENTS
Chapter 1: Nature of Managerial Accounting and CostsChapter 1 Study Plan1.1 The Role of Accounting in the Basic Management Process1.2 Characteristics of Managerial Accounting Reports1.3 Costs and Expenses1.4 Cost Classifications Used for Planning and Control1.6 The Statement of Cost of Goods ManufacturedChapter 1 Key PointsGlossaryChapter 1: Exercises
Chapter 2: Job Order Cost SystemChapter 2 Study Plan2.1 Characteristics of Job Order Costing2.2 Subsidiary Ledgers Needed for Job Order Costing2.3 Job Costing Process with Journal Entries2.4 Actual Vs. Applied Factory Overhead2.5 Under- or Over-applied Overhead2.6 Accounting in the HeadlinesChapter 2 Key PointsGlossaryChapter 2: Exercises
Chapter 3: Process Cost SystemChapter 3 Study Plan3.1 Process Costing Vs. Job Order Costing3.2 Equivalent Units (Weighted Average)3.3 Process Costing (Weighted Average)3.4 Journal Entries For the Flow of Production Costs3.5 Process Costing (FIFO Method)3.6 Process Cost Demonstration (FIFO Method)3.7 Accounting in the HeadlinesChapter 3 Key PointsGlossaryChapter 3: Exercises
Chapter 4: Activity-Based CostingChapter 4 Study Plan4.1 Activity-Based Costing and Management4.2 Activity Based-Costing Method4.3 Accounting in the HeadlinesChapter 4 Key PointsGlossaryChapter 4: Exercises
Chapter 5: Cost Behavior and Cost-Volume-Profit AnalysisChapter 5 Study Plan5.1 Cost Behavior Vs. Cost Estimation5.2 Fixed and Variable Costs5.3 Mixed Costs

9/25/2017 Managerial Accounting
file:///Users/hannah/Downloads/Managerial-Accounting-1506381825_regexified.html 3/350
5.4 Accounting in the Headlines: Costs5.5 Cost-Volume-Profit Analysis In Planning5.6 Break - Even Point for a single product5.7 Break Even Point for Multiple Products5.8 Cost-Volume-Profit Analysis Summary5.9 Accounting in the Headlines: BreakevenChapter 5 Key PointsGlossaryChapter 5: Exercises
Chapter 6: Variable and Absorption CostingChapter 6 Study Plan6.1 Absorption Costing6.2 Variable Costing6.3 Comparing Absorption and Variable CostingChapter 6 Key PointsChapter 6: Exercises
Chapter 7: BudgetingChapter 7 Study Plan7.1 Introduction to Budgeting and Budgeting Processes7.2 Master Budgets7.3 Operating Budgets7.4 Manufacturing Budgets7.5 Cash Budgets7.6 Budgeted Balance Sheet7.7 Budgeting in a Merchandising Company7.8 Other Budgeting Methods7.9 Flexible Budgets7.10 The Performance ReportGlossaryChapter 7: Exercises
Chapter 8: Standard Cost SystemsChapter 8 Study Plan8.1 The Role of Standard Costs in Management8.2 Calculations for Direct Materials and Labor8.3 Calculations for Overhead8.4 Advantages and Disadvantages of Standard Costing8.5 Variance Summary8.6 Accounting in the HeadlinesGlossaryChapter 8: Exercises
Chapter 9: Responsibility Accounting for Cost, Profit and Investment CentersChapter 9 Study Plan9.1 Types of Costs9.2 Responsibility Accounting in Management9.3 Responsibility Reports9.4 Responsibility Centers9.5 Investment Center Analysis9.6 Segmented Income Statements9.7 Accounting in the Headlines9.8 Transfer Pricing

9/25/2017 Managerial Accounting
file:///Users/hannah/Downloads/Managerial-Accounting-1506381825_regexified.html 4/350
9.9 Balanced ScorecardChapter 9 Key PointsGlossaryChapter 9: Exercises
Chapter 10: Differential Analysis (or Relevant Costs)Chapter 10 Study Plan10.1 Differential Analysis10.2 Applying Differential Analysis in Managerial Decision Making10.3 Applying Differential Analysis to Quality Decisions10.4 Accounting in the HeadlinesGlossaryChapter 10: Exercises
Chapter 11: Capital Investment AnalysisChapter 11 Study Plan11.1 Capital Investment Analysis11.2 Short Term Business Decisions11.3 Accounting in the Headlines - Payback11.4 The Capitol Rationing Process11.5 Controlling Capital Investment ExpendituresChapter 11 Key PointsGlossaryChapter 11: Exercises
Chapter 12: Financial Statement AnalysisChapter 12 Study Plan12.1 Analyzing Comparative Financial Statements12.2 Calculating Trend Percentages12.3 Common-Size Financial Statements12.4 Accounting in the Headlines12.5 Calculate Ratios That Analyze a Company's Short-Term Debt-Paying Ability12.6 Ratios That Analyze a Company's Long-Term Debt Paying Ability12.7 Ratios That Analyze a Company's Earnings Performance12.8 Ratio SummaryChapter 12: Exercises
Appendix: Service Department AllocationAllocation of Service Department CostsDirect Method of AllocationStep Method of AllocationReciprocal Method of Allocation

9/25/2017 Managerial Accounting
file:///Users/hannah/Downloads/Managerial-Accounting-1506381825_regexified.html 5/350
CHAPTER 1: NATURE OFMANAGERIAL ACCOUNTING AND
COSTS
CHAPTER 1 STUDY PLAN
Knowledge Targets
I can define the following terms as they relate to our unit:
Direct Cost Indirect Cost Prime Cost Conversion Cost
Product Cost Period Cost Direct Material Direct Labor
Overhead Raw Materials IndirectMaterials
Indirect Labor
Cost of Goods Sold Variable Cost Fixed CostCost of GoodsManufactured
FinancialAccounting
ManagerialAccounting
Goods inProcess
Finished Goods
Reasoning Targets

9/25/2017 Managerial Accounting
file:///Users/hannah/Downloads/Managerial-Accounting-1506381825_regexified.html 6/350
I can identify differences between financial and managerial accounting.I can classify costs as direct or indirect, fixed or variable, prime or conversion, and productor period.I can identify product costs as direct materials, direct labor or overhead.I can understand the flow of goods from raw materials inventory to goods in process inventoryto finished goods inventory.I can understand the difference between cost of goods manufactured and cost of goods soldin a manufacturing environment.I can prepare a manufacturing statement with cost of goods manufactured calculated.
Skill TargetsI can calculate direct materials used from raw materials inventory data.I can calculate cost of goods manufactured for a manufacturer.I can calculate cost of goods sold for a merchandiser and a manufacturer.I can prepare a manufacturing statement with cost of goods manufactured calculated.
Click Chapter 1 Plan for a printable copy.
1.1 THE ROLE OF ACCOUNTING IN THE BASICMANAGEMENT PROCESS
Managerial accounting helps managers make good decisions. Managerial accounting providesinformation about the cost of goods and services, whether a product is profitable, whether to invest ina new business venture, and how to budget. It compares actual performance to planned performanceand facilitates many other important decisions critical to the success of organizations.
The remaining chapters in this book focus on managerial accounting. This chapter provides anoverview of managerial accounting and shows how to determine the cost of a particular type ofproduct known as a job.
Watch this video online: https://youtu.be/KCyg8-zM9bA
Compare managerial accounting with �nancial accounting
Whereas financial accounting provides financial information primarily for external use, managerialaccounting information is for internal use. By reporting on the financial activities of the organization,financial accounting provides information needed by investors and creditors.
Most managerial decisions require more detailed information than that provided by external financialreports. For instance, in their external financial statements, large corporations such as GeneralElectric Company show single amounts on their balance sheets for inventory. However, managersneed more detailed information about the cost of each of several hundred products.
We show the fundamental differences between managerial and financial accounting in the chart andvideo.

9/25/2017 Managerial Accounting
file:///Users/hannah/Downloads/Managerial-Accounting-1506381825_regexified.html 7/350
Financial accounting Managerial accounting
Users External users of information – usuallyshareholders, financial analysts, and creditors
Internal users of information – usuallymanagers.
GAAP Must comply with generally acceptedaccounting principles.
NO generally accepted accountingprinciple requirements
TimePeriod Uses historical (or past) data. May use estimates of the future for
budgeting and decision making.
Detailpresented
Presents summary data, costs, revenues, andprofits.
More detailed data are presentedabout product.
Watch this video online: https://youtu.be/Ep7DqVxFHaY
Accountants currently face a big challenge: designing information systems that provide information formultiple purposes. Some people at lower levels in the organization need detailed information, but notthe big picture provided by a company’s income statement. However, managers at top levels need tosee the big picture.
All of you will use accounting information in your careers. Therefore, you need to know enough aboutaccounting to get the information you need for decision making.
Managerial accountants face many choices involving ethics. For example, managers are responsiblefor achieving financial targets such as net income. Managers who fail to achieve these targets maylose their jobs. If a division or company is having trouble achieving financial performance targets,managers may be tempted to manipulate the accounting numbers.
In its Standards of Ethical Conduct for Management Accountants, the Institute of ManagementAccountants (IMA) states that management accountants have an obligation to maintain the highestlevels of ethical conduct by maintaining professional competency, refraining from disclosingconfidential information, and maintaining integrity and objectivity in their work.[1]
The standards recommend that people faced with ethical conflicts follow the company’s establishedpolicies that deal with such conflicts. If the policies do not resolve the conflict, accountants shouldconsider discussing the matter with their superiors, potentially going as high as the audit committee ofthe board of directors. In extreme cases, the accountants may have no alternative but to resign.
Licensing & Attributions
CC licensed content, Shared previously
Accounting Principles: A Business Perspective. . Authored by: James Don Edwards, University of Georgia & Roger H. Hermanson, Georgia State University.. Provided by: Endeavour InternationalCorporation. Project: The Global Text Project. License: CC BY: Attribution
All rights reserved content
Introduction to Managerial Accounting. Authored by: Education Unlocked. Located at: https://youtu.be/KCyg8-zM9bA. License: All Rights Reserved. License Terms: Standard YouTube LicenseFinancial Accounting vs Managerial Accounting. Authored by: Education Unlocked. Located at: https://youtu.be/Ep7DqVxFHaY. License: All Rights Reserved. License Terms: Standard YouTube License
1.2 CHARACTERISTICS OF MANAGERIALACCOUNTING REPORTS

9/25/2017 Managerial Accounting
file:///Users/hannah/Downloads/Managerial-Accounting-1506381825_regexified.html 8/350
Financial reporting by manufacturing companies
Many of you will work in manufacturing companies or provide services for them. Others will work inretail or service organizations that do business with manufacturers. This section will help youunderstand how manufacturing companies work and how to read both their internal and externalfinancial statements.
Assume you own a bicycle store and purchase bicycles and accessories to sell to customers. Todetermine your profitability, you would subtract the cost of bicycles and accessories from your grosssales as cost of goods sold. However, if you owned the manufacturing company that made thebicycles, you would base your cost of goods sold on the cost of manufacturing those bicycles.Accounting for manufacturing costs is more complex than accounting for costs of merchandisepurchased that is ready for sale.
Perhaps the most important accounting difference between merchandisers and manufacturers relatesto the differences in the nature of their activities. A merchandiser purchases finished goods ready tobe sold. On the other hand, a manufacturer must purchase raw materials and use productionequipment and employee labor to transform the raw materials into finished products.
Thus, while a merchandiser has only one type of inventory—merchandise available for sale—amanufacturer has three types—unprocessed materials, partially complete work in process, and ready-for-sale finished goods. Instead of one inventory account, three different inventory accounts arenecessary to show the cost of inventory in various stages of production. Looking at Exhibit 2, you cansee how the inventory cost flows differ between manufacturing and merchandising companies.
We compare a manufacturer’s cost of goods sold section of the income statement to that samesection of the merchandiser’s income statement in the chart below. There are two major differences inthese cost of goods sold sections: (1) goods ready to be sold are referred to as merchandiseinventory by a merchandiser and finished goods inventory by a manufacturer, and (2) the net cost ofpurchases for a merchandiser is equivalent to the cost of goods manufactured by a manufacturer.
Merchandiser Manufacturer
Cost of goods sold: Cost of goods sold:
Merchandise inventory, Beginning $ 25,000 Finished goods inventory, Beginning $ 50,000
Net cost of purchases 165,000 Cost of goods manufactured
1,100,000
Cost of goods available for sale $ 190,000 Cost of goods available for sale $1,150,000
Merchandise inventory, Ending 30,000 Finished goods inventory, Ending 60,000
Cost of goods sold $ 160,000 Cost of goods sold $1,090,000
Unlike a merchandiser’s balance sheet that reports a single inventory amount, the balance sheet for amanufacturer typically shows materials, work in process, and finished goods inventories separately.

9/25/2017 Managerial Accounting
file:///Users/hannah/Downloads/Managerial-Accounting-1506381825_regexified.html 9/350
The video and chart will explain these concepts further.
Watch this video online: https://youtu.be/78_uE_b896U
Account AccountType Description
Raw MaterialsInventory
CurrentAsset
all materials to be used in production (including direct andindirect materials)
Work in ProcessInventory
CurrentAsset
Direct Material + Direct Labor + Overhead applied to itemsstarted but not completed
Finished GoodsInventory
CurrentAsset
Direct Material + Direct Labor + Overhead applied to itemscompleted BUT not sold
Cost of goods sold Expense Direct Material + Direct Labor + Overhead applied to itemscompleted AND sold
The next section will explain the different cost types of direct materials, direct labor and overhead.Licensing & Attributions
CC licensed content, Shared previously
Accounting Principles: A Business Perspective.. Authored by: James Don Edwards, University of Georgia & Roger H. Hermanson, Georgia State University.. Provided by: Endeavour InternationalCorporation. Project: The Global Text Project.. License: CC BY: Attribution
All rights reserved content
Raw Materials, Work in Process, and Finished Goods Inventory (Managerial Accounting Tutorial #23) . Authored by: Note Pirate. Located at: https://youtu.be/78_uE_b896U. License: All Rights Reserved.License Terms: Standard YouTube License
1.3 COSTS AND EXPENSES
Merchandiser and manufacturer accounting: Di�erences in cost concepts
Cost is a financial measure of the resources used or given up to achieve a stated purpose. Productcosts are the costs a company assigns to units produced. Product costs are the costs of making aproduct, such as an automobile; the cost of making and serving a meal in a restaurant; or the cost ofteaching a class in a university.
Manufacturing companies use the most complex product costing methods. To ensure that youunderstand how and why product costing is done in manufacturing companies, we use manymanufacturing company examples. However, since many of you could have careers in service ormerchandising companies, we also use nonmanufacturing examples.
In manufacturing companies, a product’s cost is made up of three cost elements: direct material costs,direct labor costs, and manufacturing overhead costs.
Watch this video online: https://youtu.be/4eUdwWNNkYU
Direct materials

9/25/2017 Managerial Accounting
file:///Users/hannah/Downloads/Managerial-Accounting-1506381825_regexified.html 10/350
Materials are unprocessed items used in the manufacturing process. Direct materials are thosematerials used only in making the product and are clearly and easily traceable to a particular product.For example, iron ore is a direct material to a steel company because the iron ore is clearly traceableto the finished product, steel. In turn, steel becomes a direct material to an automobile manufacturer.
Some materials (such as glue and thread used in manufacturing furniture) may become part of thefinished product, but tracing those materials to a particular product would require more effort than issensible. Such materials, called indirect materials or supplies, are included in manufacturingoverhead. Indirect materials are materials used in the manufacture of a product that cannot, or will notfor practical reasons, be traced directly to the product being manufactured. Indirect materials are partof overhead, which we will discuss later.
Direct labor
Direct labor costs include the labor costs of all employees actually working on materials to convertthem into finished goods. As with direct material costs, direct labor costs of a product include onlythose labor costs clearly traceable to, or readily identifiable with, the finished product. The wages paidto a construction worker, a pizza delivery driver, and an assembler in an electronics company areexamples of direct labor.
Many employees receive fringe benefits—employers pay for payroll taxes, pension costs, and paidvacations. These fringe benefit costs can significantly increase the direct labor hourly wage rate.Some companies treat fringe benefit costs as direct labor. Other companies include fringe benefitcosts in overhead if they can be traced to the product only with great difficulty and effort.
Firms account for some labor costs (for example, wages of materials handlers, custodial workers, andsupervisors) as indirect labor because the expense of tracing these costs to products would be toogreat. These indirect labor costs are part of overhead. Indirect labor consists of the cost of labor thatcannot, or will not for practical reasons, be traced to the products being manufactured.
Overhead
In a manufacturing company, overhead is generally called manufacturing overhead. (You may alsosee other names for manufacturing overhead, such as factory overhead, factory indirect costs, orfactory burden.) Service companies use service overhead, and construction companies useconstruction overhead. Any of these companies may just use the term overhead rather thanspecifying it as manufacturing overhead, service overhead, or construction overhead. Some peopleconfuse overhead with selling and administrative costs. Overhead is part of making the good orproviding the service, whereas selling costs result from sales activity and administrative costs resultfrom running the business.
In general, overhead refers to all costs of making the product or providing the service except thoseclassified as direct materials or direct labor. (Some service organizations have direct labor but notdirect materials.) In manufacturing companies, manufacturing overhead includes all manufacturingcosts except those accounted for as direct materials and direct labor. Manufacturing overhead costsare manufacturing costs that must be incurred but that cannot or will not be traced directly to specificunits produced. In addition to indirect materials and indirect labor, manufacturing overhead includesdepreciation and maintenance on machines and factory utility costs. Look at the following for moreexamples of manufacturing overhead costs.
Indirect labor including: Repairs and maintenance on factory buildings and equipment
Janitors in factory buildings Payroll taxes and fringe benefits for manufacturing employees
Supervisors in factory buildings Depreciation on factory buildings and equipment

9/25/2017 Managerial Accounting
file:///Users/hannah/Downloads/Managerial-Accounting-1506381825_regexified.html 11/350
Materials storeroom personnel Insurance and taxes on factory property and inventories
Cost accountant salary Utilities for factory buildings
Indirect materials including:
Oil
Nails
Selling expenses
Selling expenses are costs incurred to obtain customer orders and get the finished product in thecustomers’ possession. Advertising, market research, sales salaries and commissions, and deliveryand storage of finished goods are selling costs. The costs of delivery and storage of finished goodsare selling costs because they are incurred after production has been completed. Therefore, the costsof storing materials are part of manufacturing overhead, whereas the costs of storing finished goodsare a part of selling costs. Remember that retailers, wholesalers, manufacturers, and serviceorganizations all have selling costs.
Administrative expenses
Administrative expenses are nonmanufacturing costs that include the costs of top administrativefunctions and various staff departments such as accounting, data processing, and personnel.Executive salaries, clerical salaries, office expenses, office rent, donations, research anddevelopment costs, and legal costs are administrative costs. As with selling costs, all organizationshave administrative costs.
Product Costs vs Period Expenses
Companies also classify costs as product costs and period costs. Product costs are the costsincurred in making products. These costs include the costs of direct materials, direct labor, andmanufacturing overhead.
Period expenses are closely related to periods of time rather than units of products. For this reason,firms expense (deduct from revenues) period costs in the period in which they are incurred.Accountants treat all selling and administrative expenses as period costs for external financialreporting.
To illustrate, assume a company pays its sales manager a fixed salary. Even though the manager maybe working on projects to benefit the company in future accounting periods, it expenses the salesmanager’s salary in the period incurred because the expense cannot be traced to the production of aspecific product.
Watch this video online: https://youtu.be/sfKgR0uuMaM
In summary, product costs (direct materials, direct labor and overhead) are not expensed until theitem is sold when the product costs are recorded as cost of goods sold. Period costs are selling andadministrative expenses, not related to creating a product, that are shown in the income statementalong with cost of goods sold.

9/25/2017 Managerial Accounting
file:///Users/hannah/Downloads/Managerial-Accounting-1506381825_regexified.html 12/350
Licensing & Attributions
CC licensed content, Shared previously
Accounting Principles: A Business Perspective.. Authored by: James Don Edwards, University of Georgia & Roger H. Hermanson, Georgia State University.. Provided by: Endeavour InternationalCorporation. Project: The Global Text Project.. License: CC BY: Attribution
All rights reserved content
Manufacturing Costs (Direct Materials, Labor, Manufacturing Overhead) and Product and Period Costs. . Authored by: Note Pirate. Located at: https://youtu.be/4eUdwWNNkYU. License: All RightsReserved. License Terms: Standard YouTube License17 -- Product Costs Versus Period Costs . Authored by: Larry Walther. Located at: https://youtu.be/sfKgR0uuMaM. License: All Rights Reserved. License Terms: Standard YouTube License
1.4 COST CLASSIFICATIONS USED FORPLANNING AND CONTROL
In this course, we will cover many cost classifications useful for planning and control. We willintroduce the basic concepts behind these classifications but you will use them (and get in greaterdepth) in other chapters.
1. Fixed vs Variable Costs.
A fixed cost remains the same in total but changes per unit. Fixed costs examples include yourmonthly rent, salaried employees, straight-line depreciation as these amounts do not change basedon volume. A variable cost remains the same per unit but changes in total. Variable costexamples include sales commissions, hourly workers, units-of-production method depreciation asthese amounts will change based on total volume but the amount charged per unit does not change.
Watch this video online: https://youtu.be/RIYN2F6fW2Y
2. Direct vs Indirect Costs.
A direct cost is an amount that can be traced to a specific department, process or job. Direct costscan be product costs like direct materials or direct labor or they can be period costs like anaccountant’s salary would be traced to the accounting department. Indirect costs is an amount thatcannot be traced to a specific department, process or job. These costs are typically allocated (orestimated) to the departments, processes or jobs using those items. Indirect costs can be productcosts like overhead or period costs like an IT employee’s salary to the sales department. The salesdepartment needs the services provided by IT and the IT employee’s time would be an indirectexpense to the sales department.
Here is a video that provides a real world example of the differences between direct and indirect costs(focus on the first 2 minutes of the video):
Watch this video online: https://youtu.be/NTEwMcXZ-0o
3. Controllable vs Non-controllable Costs.
When evaluating the performance of an executive or manager under managerial accounting, it ishelpful to recognize that some costs and expenses may be out of the control of that manager orexecutive. One example is the the manager’s salary. The manager has no control over his ownsalary and has no power to change or stay within the budget for the salary. Controllable costs are

9/25/2017 Managerial Accounting
file:///Users/hannah/Downloads/Managerial-Accounting-1506381825_regexified.html 13/350
things the executive, manager, or department even can control or change. If the executive, manageror department cannot change or control the cost, it is an uncontrollable cost. An example of anuncontrollable cost would be an allocation of administrative expenses to each job or department.
Watch this video online: https://youtu.be/HKJjov8i3RU
4. Differential Costs including Sunk and Opportunity Costs.
Differential Costs represent the difference between two alternatives. We will analyze what is relevantto our decision making including any opportunity costs. Opportunity costs are what you give up bychoosing one alternative over another (think about what you are giving up by taking this course —what else could you be doing?). Sunk costs are not relevant for decision making as the cost cannotbe recovered at a later date. Watch this video to get a better idea of these concepts.
Watch this video online: https://youtu.be/ZtATVI1OeyoLicensing & Attributions
All rights reserved content
Fixed and Variable Costs (Managerial Accounting Tutorial #3) NotePirate NotePirate . Authored by: Note Pirate. Located at: https://youtu.be/RIYN2F6fW2Y. License: All Rights Reserved. License Terms:Standard YouTube LicenseDirect & Indirect Costs. Authored by: Andromedia Productions. Located at: https://youtu.be/NTEwMcXZ-0o. License: All Rights Reserved. License Terms: Standard YouTube LicenseControllable and Uncontrollable costs . Authored by: Rutgers Accounting Web. Located at: https://youtu.be/HKJjov8i3RU. License: All Rights Reserved. License Terms: Standard YouTube LicenseDi�erential Analysis - Concepts. Authored by: Christy Lynch Chauvin. Located at: https://youtu.be/ZtATVI1Oeyo. License: Public Domain: No Known Copyright
1.6 THE STATEMENT OF COST OF GOODSMANUFACTURED
The statement of cost of goods manufactured supports the cost of goods sold figure on the incomestatement. The two most important numbers on this statement are the total manufacturing cost andthe cost of goods manufactured. Be careful not to confuse the terms total manufacturing cost and costof goods manufactured with each other or with the cost of goods sold.
Total Manufacturing Cost includes the costs of all resources put into production during the period(meaning, the direct materials, direct labor and overhead applied). Cost of goods manufacturedconsists of the cost of all goods completed during the period. It includes total manufacturing costs plusthe beginning work in process inventory minus the ending work in process inventory. Cost of goodssold are the costs of all goods SOLD during the period and includes the cost of goods manufacturedplus the beginning finished goods inventory minus the ending finished goods inventory. Cost of goodssold is reported as an expense on the income statements and is the only time product costs areexpensed. This chart will summarize the formulas you will need:
DirectMaterialsUsed
Beginning Raw Materials Inventory + Raw Material Purchases – Ending RawMaterials Inventory – Indirect Materials Used
TotalManufacturingCost
Direct Materials + Direct Labor + Overhead applied

9/25/2017 Managerial Accounting
file:///Users/hannah/Downloads/Managerial-Accounting-1506381825_regexified.html 14/350
Cost of GoodsManufactured
Total Manufacturing Cost (Direct Materials + Direct Labor + Overhead applied) +Beginning Work In Process Inventory – Ending Work in Process Inventory
Cost of GoodsSold
Beginning Finished Goods Inventory + Cost of Goods Manufactured – EndingFinished Goods Inventory
Watch this video online: https://youtu.be/Ycezt5Hu06M
NoteLook at the following example. Farside Manufacturing makes calendars and books. Theschedule (or statement) of cost of goods manufactured follows:
Farside Manufacturing Company
Statement of cost of goods manufactured
For the year ended December 31
Direct Materials Used:
Raw Materials inventory, January 1 $40,000
Raw Materials purchases 480,000
Less: Raw Materials inventory, December 31 30,000
Raw Materials used $490,000
Less: Indirect Materials Used $0
Direct Materials Used $490,000
Direct labor 380,000
Manufacturing overhead:
Indirect labor $120,000
Maintenance and repairs expense 60,000
Factory utilities expense 10,000
Depreciation expense – factory building 20,000
Depreciation expense – factory equipment 30,000
Other expense – factory 20,000
Total manufacturing overhead 260,000
Total Manufacturing Cost $1,130,000
Add: Work in process inventory, January 1 30,000
Less: Work in process inventory, December 31 -60,000
Cost of goods manufactured $1,100,000

9/25/2017 Managerial Accounting
file:///Users/hannah/Downloads/Managerial-Accounting-1506381825_regexified.html 15/350
Note how the statement shows the costs incurred for direct materials, direct labor, and manufacturingoverhead. The statement totals these three costs for total manufacturing cost during the period. Whenadding beginning work in process inventory and deducting ending work in process inventory from thetotal manufacturing cost, we obtain cost of goods manufactured or completed. Cost of goods solddoes not appear on the cost of goods manufactured statement but on the income statement.
To make the manufacturer’s income statement more understandable to readers of the financialstatements, accountants do not show all of the details that appear in the cost of goods manufacturedstatement. Next, we show the income statement for Farside Manufacturing Company. Notice therelationship of the statement of cost of goods manufactured to the income statement.
The cost of goods manufactured appears in the cost of goods sold section of the income statement.The cost of goods manufactured is in the same place that purchases would be presented on amerchandiser’s income statement. We add cost of goods manufactured to beginning finished goodsinventory to derive cost of goods available for sale. This is similar to the merchandiser who presentspurchases added to beginning merchandise to derive goods available for sale.
Farside Manufacturing Company
Income statement
For the year ended December 31
Sales $1,800,000
Cost of goods sold:
Finished goods inventory, January 1 $50,000
Cost of goods manufactured 1,100,000
Cost of goods available for sale $1,150,000
Less: Finished goods inventory, December 31 60,000
Cost of goods sold 1,090,000
Gross margin (Sales – Cost of goods sold) $710,000
Operating expenses:
Selling expenses $300,000
Administrative expenses 200,000
Total operating expenses 500,000
Income from operations $210,000
Note: Cost of goods available for sale represents all items completed and read to sell during theperiod. It is calculated as beginning finished goods inventory + cost of goods manufactured from thestatement of cost of goods manufactured. Income from operations is calculated as Gross Margin(also called Gross Profit) – total operating expenses.

9/25/2017 Managerial Accounting
file:///Users/hannah/Downloads/Managerial-Accounting-1506381825_regexified.html 16/350
Licensing & Attributions
CC licensed content, Shared previously
Accounting Principles: A Business Perspective.. Authored by: James Don Edwards, University of Georgia & Roger H. Hermanson, Georgia State University.. Provided by: Endeavour InternationalCorporation. Project: The Global Text Project.. License: CC BY: Attribution
All rights reserved content
How to Prepare a Cost of Goods Manufactured Statement (Managerial Accounting Tutorial #24) . Authored by: Note Pirate. Located at: https://youtu.be/Ycezt5Hu06M. License: CC BY: Attribution
CHAPTER 1 KEY POINTS
Chapter 1 Takeaway
These are the key points you should know for Chapter 1
1. Managerial accounting is designed for decision making within the company. Managerialaccounting uses more projections and estimates than seen in financial accounting. The focus iswithin the company and is often applied to specific jobs, process, products or departments.
2. Manufacturing Costs include:
Direct Materials — materials can be directly traced to a product or jobDirect Labor — labor can be directly traced to a product or jobOverhead — materials, labor, or other costs related to a product or job BUT cannot be directlytraced to a specific product or job (hint: look for keywords like Indirect, Factory, or Manufacturingwithin the costs)
3. Prime Costs are all DIRECT manufacturing costs and include direct material and direct labor.
4. Conversion Costs are defined as any cost used to convert a raw material to a finished good andinclude direct labor and overhead
NOTE: Direct labor is considered BOTH a prime and a conversion cost
5. Direct Materials Used can be calculated using Raw Materials Inventory:
Beg. Raw Materials Inventory
+ Raw Material Purchases
– End. Raw Materials Inventory
= Raw Materials Used
– Indirect Materials (typically given in problems)
= DIRECT MATERIALS USED
6. Cost of Goods Manufactured is the cost of jobs, processes, or products that are finished. Weneed to transfer this cost to finished goods inventory and OUT of work in process inventory. We

9/25/2017 Managerial Accounting
file:///Users/hannah/Downloads/Managerial-Accounting-1506381825_regexified.html 17/350
will use Direct Materials USED in this calculation which is different from material purchases (seeabove formula for getting direct materials used) .
Cost of Goods Manufactured is calculated as:
Direct Materials Used
+ Direct Labor
+ Overhead Applied
=Total Manufacturing Costs
+ Beg. Work in Process Inventory
– End. Work in Process Inventory
= COST OF GOODS MANUFACTURED
7. Cost of Goods Sold represents the TOTAL COST of a finished product, job, or process and isrecorded as an expense ONLY when it is sold. Cost of goods sold is calculated as:
Beg. Finished Goods Inventory
+ Cost of Goods Manufactured
– End. Finished Goods Inventory
= COST OF GOODS SOLD
8. Gross Profit (or Gross Margin) is calculated as Sales – Cost of Goods Sold and does not includeany selling, general or administrative costs. Net Income includes ALL expenses and is calculatedas Sales – cost of goods sold, selling, general and administrative costs.
Click Chapter 1 Key points for a printable copy.
GLOSSARY
GLOSSARY
Administrative costs Costs of managing the organization, including the costs of top administrativefunctions and various staff departments such as accounting, data processing, and personnel.
Cost A financial measure of the resources used or given up to achieve a stated purpose.
9/25/2017 Managerial Accounting
file:///Users/hannah/Downloads/Managerial-Accounting-1506381825_regexified.html 18/350
Cost driver Activity or transaction that causes costs to be incurred. Machine-hours can be a costdriver for costs of energy to run machines, for example.
Cost of goods manufactured Consists of the total costs of all goods completed during the period;includes cost to manufacture plus beginning work in process inventory minus ending work in processinventory
Cost of goods sold Cost of goods manufactured plus the beginning finished goods inventory minusthe ending finished goods inventory.
Cost to manufacture (or manufacturing costs) Includes the direct materials, direct labor, andmanufacturing overhead incurred during the period.
Direct labor Labor costs of all employees actually working on materials to convert them to finishedgoods. Direct labor costs are directly traced to particular products in contrast to indirect labor costs.
Direct materials Materials that are used only in making the product and are clearly and easilytraceable to a particular product.
Finished goods Completed manufactured products ready to be sold. Finished Goods Inventory is thetitle of an inventory account maintained for such products.
Indirect labor The cost of labor that cannot, or will not for practical reasons, be traced to the goodsbeing produced or the services being provided.
Indirect materials Materials used in making a product that cannot, or will not for practical reasons, betraced directly to particular products.
Managerial accounting Managerial accounting information is intended for internal use. The purposeis to generate information managers can use to make good decisions.
Manufacturing overhead All manufacturing costs except for those costs accounted for as directmaterials and direct labor.
Materials Unprocessed items used in the manufacturing process typically stored in Raw MaterialsInventory.
Overhead All costs of making goods or providing services except for those costs classified as directmaterials and direct labor. See manufacturing overhead for overhead in manufacturing companies.
Period costs Costs related more closely to periods of time than to products produced. Period costscannot be traced directly to the manufacture of a specific product; they are expensed in the period inwhich they are incurred.
Predetermined overhead rate Calculated by dividing estimated total overhead costs for a period bythe expected level of activity, such as total expected machine-hours or total expected direct labor-hours for the period.
Product costs Costs a company assigns to units produced. In manufacturing companies, these costsare direct materials, direct labor, and manufacturing overhead. In service companies that have nomaterials, these costs are direct labor and overhead.
Selling costs Costs incurred to obtain customer orders and distribute the finished product to thecustomer.

9/25/2017 Managerial Accounting
file:///Users/hannah/Downloads/Managerial-Accounting-1506381825_regexified.html 19/350
Statement of cost of goods manufactured An accounting report showing the cost to manufactureand the cost of goods manufactured.
Work in process Partially manufactured products; a Work in Process Inventory account is maintainedfor such products.
CHAPTER 1: EXERCISES
SHORT ANSWER QUESTIONS, EXERCISES AND PROBLEMS
Questions
➢ What are the major differences between managerial and financial accounting?
➢ Identify the three elements of cost incurred in manufacturing a product and indicate thedistinguishing characteristics of each.
➢ Why might a company claim that the total cost of employing a person is $15.30 per hour when theemployee’s wage rate is $10.50 per hour? How should this difference be classified and why?
➢ Why are certain costs referred to as period costs? What are the major types of period costsincurred by a manufacturer?
➢ Explain why the income statement of a manufacturing company differs from the income statementof a merchandising company.
➢ What is the general content of a statement of cost of goods manufactured? What is its relationshipto the income statement?
➢ Real world question Assume Domino’s Pizza is considering offering a new product—a 6-inch(15.24 cm) pizza. Why would it matter if Domino’s Pizza knows how much it costs to produce anddeliver this 6-inch (15.24 cm) pizza?
➢ Real world question Why is it becoming more important that the managers of hospitalsunderstand their product costs? Exercises
Exercise A The following costs are incurred by an electrical appliance manufacturer. Classify thesecosts as direct materials, direct labor, manufacturing overhead, selling, or administrative.
1. President’s salary.2. Cost of electrical wire used in making appliances.3. Cost of janitorial supplies (the janitors work in the factory).4. Wages of assembly-line workers.5. Cost of promotional displays.6. Assembly-line supervisor’s salary.7. Cost accountant’s salary (the accountant works in the factory).8. Cost of cleaner used to clean appliances when they are completed.9. Cost of aluminum used for toasters.

9/25/2017 Managerial Accounting
file:///Users/hannah/Downloads/Managerial-Accounting-1506381825_regexified.html 20/350
10. Cost of market research survey.
Exercise B Classify the costs listed in the previous exercise as either product costs or period costs.
Exercise C Gore Company makes products for sporting events. The following data are for the yearended December 31:
Materials inventory, January 1 $ 45,000
Materials inventory, December 31 65,000
Materials purchases 175,000
Direct labor 225,000
Work in process inventory, January 1 30,000
Work in process inventory, December 31 40,000
Manufacturing overhead 130,000
Finished goods inventory, January 1 80,000
Finished goods inventory, December 31 140,000
Prepare a Cost of Goods Manufactured Statement and compute the cost of goods sold.
Problem A Total Block, Inc., is considering a new sunscreen packet that contains a skin wipe withsunscreen on it. These would be particularly useful for people who do not want to carry a bottle ofsunscreen, according to Sunspot’s marketing manager. Classify the following costs of this newproduct as direct materials, direct labor, manufacturing overhead, selling, or administrative.
1. President’s salary.2. Packages used to hold the skin wipes.3. Cleaning materials used to clean the skin wipe packages.4. Wages of workers who package the product.5. Cost of advertising the product.6. The salary of the supervisor of the workers who package the product.7. Cost accountant’s salary (the accountant works in the factory).8. Cost of a market research survey.9. Sales commissions paid as a percent of sales.
10. Depreciation of administrative office building.
Problem B Classify the costs listed in the previous problem as either product costs or period costs.
Problem C Good Vibrations, Inc., produces videotapes of musical performances. A newly hiredexecutive of the company has asked you to sort through the records and prepare a statement of thecompany’s cost of goods manufactured. You find the following data from records prepared by GoodVibrations, Inc., for the year ended December 31:
Inventories:
Beginning direct materials inventory, January 1 $ 6,000
Ending direct materials inventory, December 31 10,500
Beginning work in process inventory, January 1 10,000

9/25/2017 Managerial Accounting
file:///Users/hannah/Downloads/Managerial-Accounting-1506381825_regexified.html 21/350
Ending work in process inventory, December 31 9,500
Materials purchases 50,000
Direct labor 40,000
Indirect labor 15,000
Factory utilities expense 7,000
Factory supplies expense 5,000
Depreciation expense – factory building 14,000
Depreciation expense – Factory Equipment 10,500
Other manufacturing overhead 25,000
You also learn that beginning Finished Goods Inventory on January 1, was $20,000 and endingFinished Goods Inventory on December 31, was $5,000. Sales for the year were $400,000. Sellingexpenses were $50,000 and administrative expenses were $75,000.
1. Prepare a statement of cost of goods manufactured for Good Vibrations, Inc., for the year endedDecember 31.
2. Prepare an income statement for Good Vibrations, Inc., for the year ended December 31.
Alternate problems
Alternate problem A Pocket Umbrella, Inc., is considering producing a new type of umbrella. Thisnew pocket-sized umbrella would fit into a coat pocket or purse. Classify the following costs of thisnew product as direct materials, direct labor, manufacturing overhead, selling, or administrative.
1. Cost of advertising the product.2. Fabric used to make the umbrellas.3. Maintenance of cutting machines used to cut the umbrella fabric so it will fit the umbrella frame.4. Wages of workers who assemble the product.5. President’s salary.6. The salary of the supervisor of the people who assemble the product.7. Wages of the product tester who stands in a shower to make sure the umbrellas do not leak.8. Cost of market research survey.9. Salary of the company’s sales managers.
10. Depreciation of administrative office building.
Alternate problem B Classify the costs listed in Alternate problem A as either product costs or periodcosts.
Alternate problem C Presley Manufacturing Company is a producer of music compact discs (CDs)and tapes. The following account balances are for the year ended December 31
Administrative expenses $ 60,000
Depreciation expense – Manufacturing equipment 50,000
Direct labor 468,000
Manufacturing supplies expense 40,000

9/25/2017 Managerial Accounting
file:///Users/hannah/Downloads/Managerial-Accounting-1506381825_regexified.html 22/350
Indirect labor 36,000
Beginning inventories, January 1:
Direct materials 14,000
Work in process 20,000
Finished goods 128,000
Ending inventories, December 31
Direct materials 44,000
Work in process 56,000
Finished goods 92,000
Direct materials purchases 216,000
Rent expense – Factory 28,000
Sales 1,400,000
Selling expense 72,000
Other manufacturing overhead 126,000
1. Prepare a statement of cost of goods manufactured for Presley Manufacturing Company for theyear.
2. Prepare an income statement for the year ended December 31.
Beyond the numbers—Critical thinking
Business decision case A Companies often do work on a cost-reimbursement basis. That is,Company B reimburses Company A for the cost of doing work for Company B. Suppose yourcompany has a contract that calls for reimbursement of direct materials and direct labor, but notoverhead. Following are costs that various organizations incur; they fall into three categories: directmaterials (DM), direct labor (DL), or overhead (OH).
Glue used to attach labels to bottles containing a patented medicine.
Compressed air used in operating paint sprayers for Student Painters, a company that paints housesand apartments.
Insurance on a factory building and equipment.
A production department supervisor’s salary.
Rent on factory machinery.
Iron ore in a steel mill.
Oil, gasoline, and grease for forklift trucks in a manufacturing company’s warehouse.
Services of painters in building construction.
Cutting oils used in machining operations.

9/25/2017 Managerial Accounting
file:///Users/hannah/Downloads/Managerial-Accounting-1506381825_regexified.html 23/350
Cost of paper towels in a factory employees’ washroom.
Payroll taxes and fringe benefits related to direct labor.
The plant electricians’ salaries.
Crude oil to an oil refinery.
Copy editor’s salary in a book publishing company.
1. Classify each of these items as direct materials, direct labor, or overhead.2. Assume your classifications could be challenged in a court case. Indicate to your attorneys which
of your answers for part a might be successfully disputed by the opposing attorneys. In whichanswers are you completely confident?
Writing assignment B Refer to Presley Manufacturing company, Alt Problem C. Assume the newlyhired executive is a whiz at marketing, but a person whose eyes glaze over at the sight of a number.The executive wants you to explain the financial results for the year in words. Essentially, assume theexecutive has not seen the financial statements prepared. What would you say to convey themessage in the financial statements? Keep it short—less than 100 words.Using the Internet—Aview of the real world
Visit the website for a high technology company, such as HP, Intel Corporation, or IBM, and locate itsannual report. Review the annual report to gain a general understanding of the company’s primarybusiness segments and products. Write a report addressing the following questions based on yourresearch. What products or services are provided by the company? How does the financialinformation provided in the annual report (focus on the income statement) differ from financialinformation used for managerial accounting purposes? As a manager making business decisionswithin the company, what additional information would you need? (Remember that the incomestatement may be referred to using different terminology such as statement of earnings or statementof operations.)
Company Website
Hewlett Packard Http://www.hp.com
Intel Corporation Http://www.intel.com
IBM Http://www.ibm.com
Visit the following website for Wells Fargo (a financial institution) and locate its annual report:
http://www.wellsfargo.com
Review the annual report to gain a general understanding of the company’s primary businesssegments and products. Write a report addressing the following questions based on your research.What products or services are provided by the company? How does the financial information providedin the annual report (focus on the income statement) differ from financial information used formanagerial accounting purposes? As a manager making business decisions within the company, whatadditional information would you need? (Remember that the income statement may be referred tousing different terminology such as statement of earnings or statement of operations.)
Visit the following website for Home Depot (a retail organization) and locate its annual report:
http://www.homedepot.com

9/25/2017 Managerial Accounting
file:///Users/hannah/Downloads/Managerial-Accounting-1506381825_regexified.html 24/350
Review the annual report to gain a general understanding of the company’s primary businesssegments and products. Write a report addressing the following questions based on your research.What products or services are provided by the company? How does the financial information providedin the annual report (focus on the income statement) differ from financial information used formanagerial accounting purposes? As a manager making business decisions within the company, whatadditional information would you need? (Remember that the income statement may be referred tousing different terminology such as statement of earnings or statement of operations.)
1. [1]See Standards of Ethical Conduct for Management Accountants (Montvale, N.J.: Institute ofManagement Accountants, June 1, 1983.)
Licensing & Attributions
CC licensed content, Shared previously
Accounting Principles: A Business Perspective. Authored by: James Don Edwards, University of Georgia & Roger H. Hermanson, Georgia State University. Provided by: Endeavour International Corporation.Project: The Global Text Project. License: CC BY: Attribution

9/25/2017 Managerial Accounting
file:///Users/hannah/Downloads/Managerial-Accounting-1506381825_regexified.html 25/350
CHAPTER 2: JOB ORDER COSTSYSTEM
CHAPTER 2 STUDY PLAN
Study Plan: Job Costing
Knowledge Targets
I can define the following terms as they relate to our unit:
Applied Overhead Goods (or work) inprocess Finished Goods Job Costing
Allocation Base Cost driver Cost of goods sold Under-appliedOverhead
Predeterminedoverhead rate Cost of Goods Sold Cost of Goods
Manufactured Over-appliedOverhead
Gross Margin (orProfit) Direct materials Direct Labor Actual Overhead
Reasoning TargetsI can identify job costs as direct materials, direct labor and overhead.I can track job costs from raw materials to goods in process to finished goods and cost ofgoods sold.I can identify accounts to use in recording the flow of job costs.I can identify the allocation base used in calculating predetermined overhead rate.I can identify the difference between actual overhead and applied overhead.I can determine under- or over-applied overhead.I can understand a manufacturing statement with cost of goods manufactured calculated.
Skill TargetsI can prepare and post journal entries for job costing from raw materials to cost of goods sold.

9/25/2017 Managerial Accounting
file:///Users/hannah/Downloads/Managerial-Accounting-1506381825_regexified.html 26/350
I can calculate the predetermined overhead rate for a company.I can calculate the amount of applied overhead using the predetermined overhead rate.I can calculate the amount of under- or over-applied overhead using applied overhead andactual overhead.I can compute the total cost of a job and determine the job’s gross margin.I can prepare a manufacturing statement, schedule of cost of goods sold, and incomestatement for job costing.
Click Job Cost Study Plan for a printable copy.
2.1 CHARACTERISTICS OF JOB ORDERCOSTING
The general cost accumulation model
In general, companies match the flow of costs to the physical flow of products through the productionprocess. They place materials received from suppliers in the materials storeroom and record the costof those materials when purchasing them to raw materials inventory. As they are needed forproduction, the materials move from the materials storeroom (raw materials inventory) to theproduction departments with their cost as shown below.
During production, the materials processed by workers and machines become partially manufacturedproducts. At any time during production, these partially manufactured products are collectively knownas work in process (or goods in process). For example, if accountants compute the inventory whenthe company has partially finished products at the end of the year, this inventory is work in processinventory.
Completed products are finished goods. When the products are completed and transferred to thefinished goods storeroom, the company removes their costs from Work in Process Inventory andassigns them to Finished Goods Inventory. As the goods are sold, the company transfers relatedcosts from Finished Goods Inventory to Cost of Goods Sold.
The accounting flow of costs follows the physical flow of the manufacturing process in mostcompanies. In this chapter and the next, we assume costs follow the physical flow of products.Indiscussing product costing, we described how accountants and managers assign costs to products.

9/25/2017 Managerial Accounting
file:///Users/hannah/Downloads/Managerial-Accounting-1506381825_regexified.html 27/350
Recall that products can be either goods or services, so this discussion applies to service andmerchandising companies as well as to manufacturing companies.
Watch this video online: https://youtu.be/Uw_52M9GLbg
What kinds of companies would use job costing? The chart below shows how various companieschoose different accounting systems, depending on their products. First, companies producingindividual, unique products known as jobs use job costing (also called job order costing). Companiessuch as construction companies and consulting firms, produce jobs and use job costing.
Type of production Accounting system Type of product
Job shop Job costing Customized
Hospital, custom home builder,consulting firm
Batch production Mostly job costing Several differentproducts
Furniture manufacturer, winery
Repetitive manufacturing Mostly process costing(operations) Few new products
Computer manufacturer, bicyclemanufacturer
Continuous flow processing Process costing Standardized
Oil refinery, paint manufacturer
Second, some companies, like furniture manufacturers, produce batches of products. They produceall of the components of a single product (e.g. coffee tables) in one batch. They would then producethe components of another product (e.g. dining room sets) in a new batch. (Some university foodservice companies prepare meals this way.) Companies such as these use job costing methods toaccumulate the cost of each batch.
The last two types of production in use process costing methods described in another chapter, so wegive just a brief overview here. Repetitive manufacturing lends itself to the use of automatedequipment that minimizes the amount of manual material handling. Automobile assembly plants,bicycle assembly plants, and computer assembly plants use repetitive manufacturing.
Continuous flow processing is the opposite of job shops. Companies using this process continuouslymass-produce a single, homogeneous product. Companies might use process cost systems inmanufacturing paint, grinding flour, and refining oil.
Licensing & Attributions
CC licensed content, Shared previously
Accounting Principles: A Business Perspective. Authored by: James Don Edwards, University of Georgia & Roger H. Hermanson, Georgia State University. Provided by: Endeavour International Corporation.Project: The Global Text Project. License: CC BY: Attribution
All rights reserved content
Job Order Costing. Authored by: Education Unlocked. Located at: https://youtu.be/Uw_52M9GLbg. License: All Rights Reserved. License Terms: Standard YouTube License

9/25/2017 Managerial Accounting
file:///Users/hannah/Downloads/Managerial-Accounting-1506381825_regexified.html 28/350
2.2 SUBSIDIARY LEDGERS NEEDED FOR JOBORDER COSTING
If you remember from your financial accounting class, a subsidiary ledger is a secondary ledger thatprovides the details of a control account. A control account is a summarized account balance to makeviewing financial statements easier. Accounts Receivable is an example of a control account. Weshow the amount owed to use by customers in total on the balance sheet and do not list an accountsreceivable for each customer on the balance sheet (could you imagine the length of that report?). Wehave a subsidiary ledger for each customer so we can determine who owes us money and who haspaid. The total of the items in the subsidiary ledger must match the balance reported in the controlaccount.
This concept relates to job costing because we have 3 main inventory accounts control accounts: Raw Materials Inventory, Work in Process Inventory, and Finished Goods Inventory. Raw Materialsinventory is used to store the costs of materials purchased but not yet used in production. Thesubsidiary ledger would contain details of the individual raw material components.
Work in Process Inventory is used when we have started but not completed a job and include all jobcosts including any costs from the previous period and costs added this period include directmaterials, direct labor and applied overhead. The subsidiary ledger consists of the job cost sheet(remember the video from the previous page?) showing all the direct materials, direct labor, andoverhead costs applied to a job. The total of all jobs still in process will equal the balance of Work inProcess Inventory.
Finished Goods Inventory is used when we finish a job and before we sell it. We move the total jobcost of the job from Work in Process Inventory to Finished Goods Inventory. The subsidiary ledgerwill the be for each job showing its full job cost until the item is sold.
2.3 JOB COSTING PROCESS WITH JOURNALENTRIES
Job costing
A job cost system (job costing) accumulates costs incurred according to the individual jobs.Companies generally use job cost systems when they can identify separate products or when theyproduce goods to meet a customer’s particular needs.
Who uses job costing? Examples include home builders who design specific houses for eachcustomer and accumulate the costs separately for each job, and caterers who accumulate the costs ofeach banquet separately. Consulting, law, and public accounting firms use job costing to measure the

9/25/2017 Managerial Accounting
file:///Users/hannah/Downloads/Managerial-Accounting-1506381825_regexified.html 29/350
costs of serving each client. Motion pictures, printing, and other industries where unique jobs areproduced use job costing. Hospitals also use job costing to determine the cost of each patient’s care.
We will use the following flow chart to help us record the transactions in job costing (click job cost flowfor a printable version complete with journal entry examples):
In a journal entry, we will do entries for each letter labeled in the chart — where the arrow is pointingTO is our debit and where the arrow is coming FROM is our credit. Here is a video discussion of jobcost journal entries and then we will do an example.
Watch this video online: https://youtu.be/Ut_2r-hvfXA
Example
Assume Creative Printers is a company run by a group of students who use desktop publishing toproduce specialty books and instruction manuals. Creative Printers uses job costing. Creative Printerskeeps track of the time and materials (mostly paper) used on each job.
The company compares the cost of each job with the revenue received to be sure the jobs areprofitable. Sometimes the company learns that certain jobs are too costly considering the prices theycan charge. For example, Creative Printers recently learned that cookbooks were not profitable. Onthe other hand, printing instruction manuals was quite profitable, so the company has focused moreon the instruction manual market. To illustrate a job costing system, this section describes thetransactions for the month of July for Creative Printers.
On July 1, Creative Printers had these beginning inventories:
Materials inventory (or Raw Materials Inventory) $20,000
Work in process inventory
(Job No. 106: direct materials, $4,200;direct labor, $5,000; and overhead, $4,000)
13,200
Finished goods inventory (Job No. 105) 5,500
Creative Printing had completed Job No. 105, a set of gardening books, but had not shipped them tothe customer as of June 30. Additional information regarding July transactions follows:
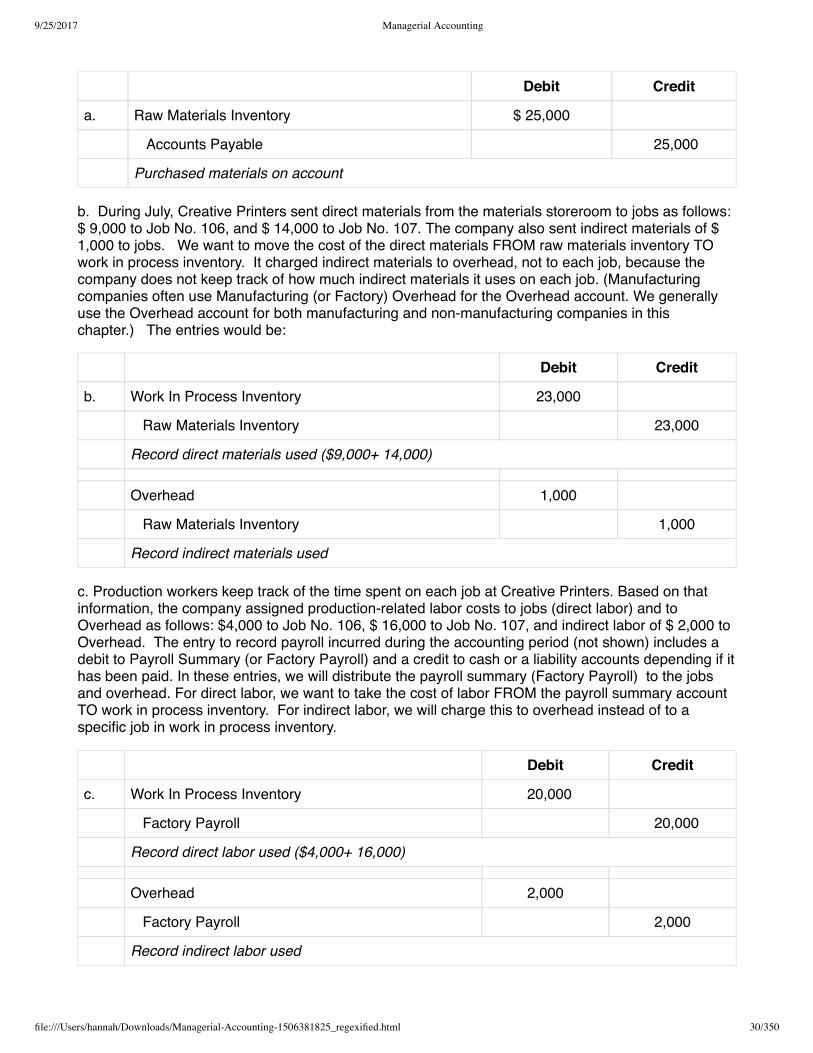
a. During July, Creative Printers purchased $ 25,000 of materials on account. This purchase includedboth direct materials, such as paper, and indirect materials, such as printing supplies and computersupplies. The journal entry required would be:
9/25/2017 Managerial Accounting
file:///Users/hannah/Downloads/Managerial-Accounting-1506381825_regexified.html 30/350
Debit Credit
a. Raw Materials Inventory $ 25,000
Accounts Payable 25,000
Purchased materials on account
b. During July, Creative Printers sent direct materials from the materials storeroom to jobs as follows:$ 9,000 to Job No. 106, and $ 14,000 to Job No. 107. The company also sent indirect materials of $1,000 to jobs. We want to move the cost of the direct materials FROM raw materials inventory TOwork in process inventory. It charged indirect materials to overhead, not to each job, because thecompany does not keep track of how much indirect materials it uses on each job. (Manufacturingcompanies often use Manufacturing (or Factory) Overhead for the Overhead account. We generallyuse the Overhead account for both manufacturing and non-manufacturing companies in thischapter.) The entries would be:
Debit Credit
b. Work In Process Inventory 23,000
Raw Materials Inventory 23,000
Record direct materials used ($9,000+ 14,000)
Overhead 1,000
Raw Materials Inventory 1,000
Record indirect materials used
c. Production workers keep track of the time spent on each job at Creative Printers. Based on thatinformation, the company assigned production-related labor costs to jobs (direct labor) and toOverhead as follows: $4,000 to Job No. 106, $ 16,000 to Job No. 107, and indirect labor of $ 2,000 toOverhead. The entry to record payroll incurred during the accounting period (not shown) includes adebit to Payroll Summary (or Factory Payroll) and a credit to cash or a liability accounts depending if ithas been paid. In these entries, we will distribute the payroll summary (Factory Payroll) to the jobsand overhead. For direct labor, we want to take the cost of labor FROM the payroll summary accountTO work in process inventory. For indirect labor, we will charge this to overhead instead of to aspecific job in work in process inventory.
Debit Credit
c. Work In Process Inventory 20,000
Factory Payroll 20,000
Record direct labor used ($4,000+ 16,000)
Overhead 2,000
Factory Payroll 2,000
Record indirect labor used

9/25/2017 Managerial Accounting
file:///Users/hannah/Downloads/Managerial-Accounting-1506381825_regexified.html 31/350
d. The company assigns overhead to each job on the basis of the machine-hours each job uses. Overhead is assigned to a job at the rate of $ 2 per machine-hour used on the job. Job 16 had 875machine-hours so we would charge overhead of $1,750 (850 machine-hours x $2 per machine-hour). Job 17 had 4,050 machine-hours so overhead would be $8,100 (4,050 machine-hours x $2). Thejournal entry to apply or assign overhead to the jobs would be to move the cost FROM overhead TOwork in process inventory.
Debit Credit
d. Work In Process Inventory 9,850
Overhead 9,850
Record overhead applied ($1,750+ 8,100)
The complete job cost sheets for Jobs 106 and 107 would appear as below:
Job: 106 107
Beginning Work in Process $13,200 0
Added this period:
Direct Materials 9,000 14,000
Direct Labor 4,000 16,000
Overhead applied 1,750 8,100
Total Job Costs $ 27,950 $ 38,100
e. Job No. 106 was completed. The total job cost of Job 106 is $27,950 for the total work done onthe job, including costs in beginning Work in Process Inventory on July 1 and costs added during July.This entry records the completion of Job 106 by moving the total cost FROM work in processinventory TO finished goods inventory.
Debit Credit
e. Finished Goods Inventory 27,950
Work In Process Inventory 27,950
Record completion of Job 16
(Beg. WIP $13,200 + DM 9,000 + DL 4,000 + OH 1,750)
f. Job No. 105 was sold on account in July for $ 9,000. This transaction would require 2 entries: onefor the sales and customer side and one for the company’s actual cost (remember, you do not wantthese to be the same amount. You want to charge customers MORE than it cost you to make aprofit). Since this was sold on account, we know that means accounts receivable. The cost of Job105 can be found in the beginning inventory for finished goods inventory.
Debit Credit
f. Accounts Receivable 9,000

9/25/2017 Managerial Accounting
file:///Users/hannah/Downloads/Managerial-Accounting-1506381825_regexified.html 32/350
Sales 9,000
Record sale of Job 105 for $9,000 on account
Cost of goods sold 5,500
Finished Goods Inventory 5,500
Record total cost of Job 105 now sold
g. The company applied overhead to the jobs in entry (d) based on a predetermined overhead rate.Many of the actual overhead costs are not known until the end of the month or later. For example, thecompany would not receive its utility bill for July until sometime in August. In addition to the indirectmaterials and indirect labor recorded in entries (b) and (c), Creative Printers incurred these otheroverhead costs for July:
Machinery repairs and maintenance $1,500
Utilities, including energy costs to run machines 1,000
Depreciation of building and machines 2,500
Other overhead 1,800
Total overhead incurred in July, other than indirect materials and indirect labor $6,800
To prepare the journal entry, we debit the Overhead account for the actual costs. Then we creditAccounts Payable for the machinery repairs and maintenance, utilities, and other overhead. (Weassume an outside contractor does the maintenance and repairs.) The amount is $ 4,300 ($ 3,500 + $1,000 + $ 1,800). And, finally we credit Accumulated Depreciation for $ 2,500. Here is the journalentry to record the actual overhead:
Debit Credit
g. Overhead 6,800
Accounts Payable 4,300
Accum. Depreciation 2,500
Record actual overhead costs incurred
If we posted each of these journal entries, you will find the ending balances of the inventory accountsto be:
Raw Materials Inventory $21,000
(20,000 + 25,000 – 23,000 – 1,000)
Work in Process Inventory $38,100
(Total costs of Job 17)
Finished Goods Inventory $27,950

9/25/2017 Managerial Accounting
file:///Users/hannah/Downloads/Managerial-Accounting-1506381825_regexified.html 33/350
(Total cost of Job 16)
Notice, Job 105 has been moved from Finished Goods Inventory since it was sold and is nowreported as an expense called Cost of Goods Sold. Also, did you notice that actual overhead came to$9,800 ($1,000 indirect materials + $2,000 indirect labor + $6,800 other overhead from transaction g)but we applied $9,850 in overhead to the jobs in transaction d? Whenever we use an estimateinstead of actual numbers, it should be expected that an adjustment is needed. We will discuss thedifference between actual and applied overhead and how we handle the differences in the nextsections.
Managers would use the preceding cost information for several purposes: First, they would comparethe actual costs of the job with expected costs, both as the work is being done and after the job hasbeen completed. Later chapters discuss the role of managerial accounting in performance evaluation.
Second, managers would assess the profitability of jobs. For example, Job 105 had revenue of USD9,000 and costs of USD 5,500.Third, managers would compare actual overhead on the left side of theOverhead account, with the overhead applied to jobs on the right side. If the actual overhead exceedsthe applied overhead, they may wish to learn why the actual overhead is so high. Also, they may askthe accountants to increase the overhead applied to jobs to give them a better idea of the cost of jobs.If the actual is less than the applied overhead, they may ask the accountants to reduce the overheadapplied to jobs.
Licensing & Attributions
CC licensed content, Shared previously
Accounting Principles: A Business Perspective.. Authored by: James Don Edwards, University of Georgia & Roger H. Hermanson, Georgia State University.. Provided by: Endeavour InternationalCorporation. Project: The Global Text Project.. License: CC BY: Attribution
All rights reserved content
Management Accounting Job Order Journal Entries (Managerial Accounting Tutorial #25) . Authored by: Note Pirate. Located at: https://youtu.be/Ut_2r-hvfXA. License: All Rights Reserved. License Terms:Standard YouTube License
2.4 ACTUAL VS. APPLIED FACTORYOVERHEAD
By definition, overhead cannot be traced directly to jobs. Most company use a predeterminedoverhead rate (or estimated rate) instead of actual overhead for the following reasons:
•A company usually does not incur overhead costs uniformly throughout the year. For example,heating costs are greater during winter months. However, allocating more overhead costs to a jobproduced in the winter compared to one produced in the summer may serve no useful purpose.
•Some overhead costs, like factory building depreciation, are fixed costs. If the volume of goodsproduced varies from month to month, the actual rate varies from month to month, even though thetotal cost is constant from month to month. The predetermined rate, on the other hand, is constantfrom month to month.

9/25/2017 Managerial Accounting
file:///Users/hannah/Downloads/Managerial-Accounting-1506381825_regexified.html 34/350
•Predetermined rates make it possible for companies to estimate job costs sooner. Using apredetermined rate, companies can assign overhead costs to production when they assign directmaterials and direct labor costs. Without a predetermined rate, companies do not know the costs ofproduction until the end of the month or even later when bills arrive. For example, the electric bill forJuly will probably not arrive until August. If Creative Printers had used actual overhead, the companywould not have determined the costs of its July work until August. It is better to have a good estimateof costs when doing the work instead of waiting a long time for only a slightly more accurate number.
Predetermined overhead rates
Predetermined overhead rates are used to apply overhead to jobs until we have all the actual costsavailable. To create the rate, we use cost drivers to assign overhead to jobs. A cost driver is ameasure of activities, such as machine-hours, that is the cause of costs. To assign overhead to jobs,the cost driver should be the cause of the overhead costs, or at least be reasonably associated withthe overhead costs. Just as automobile mileage is a good cost driver for measuring the cause ofgasoline consumption, machine-hours is a measure of what causes energy costs. By assigningenergy costs to jobs based on the number of machine-minutes or hours the job uses, we have a prettygood idea of the energy costs required to produce the job.
Watch this video online: https://youtu.be/qrnTwV2zbPM
Most manufacturing and service organizations use predetermined rates.
To calculate a predetermined overhead rate, a company divides the estimated total overhead costsfor a period by an estimated base (or expected level of activity). This activity could be total expectedmachine-hours, total expected direct labor-hours, or total expected direct labor cost for the period.Companies set predetermined overhead rates at the beginning of the year in which they will usethem. This formula computes a predetermined rate:
Predetermined Overhead Rate (POHR) =Estimated Overhead
Estimated Base
Notice how the predetermined rate is based on ESTIMATED overhead and the ESTIMATED base orlevel of activity. To apply overhead, we will use the actual amount of the base or level of activity x thepredetermined overhead rate. Again, to apply overhead use this formula:
AppliedOverhead
= Actual amount ofbase x POHR
To demonstrate, assume the accountants at Creative Printers estimated overhead related to machineusage to be $ 120,000 for the year and estimated the machine usage for the year to be 60,000machine-hours. Thus, the predetermined overhead rate would be calculated as follows:
Predetermined Overhead Rate(POHR) =
EstimatedOverhead = $120,000 = $2 per machine
hour
Estimated Base 60,000 machinehours
If we want to apply overhead to jobs. Job 106 had 875 machine hours and Job 107 had 4,050machine hours. The calculation for actual overhead for each job would be:

9/25/2017 Managerial Accounting
file:///Users/hannah/Downloads/Managerial-Accounting-1506381825_regexified.html 35/350
Job ACTUAL machine hours POHR Overhead applied
106 875 x $2 $ 1,750
107 4050 x $2 8,100
Total Overhead applied $ 9,850
Actual Overhead
Actual Overhead costs are the true costs incurred and typically include things like indirect materials,indirect labor, factory supplies used, factory insurance, factory depreciation, factory maintenance andrepairs, factory taxes, etc. Actual overhead costs are any indirect costs related to completing the jobor making a product. Next, we look at how we correct our records when the actual and our applied (orestimated) overhead do not match (which they almost never match!).
2.5 UNDER- OR OVER-APPLIED OVERHEAD
Since we will be using the concept of the predetermined overhead rate many times during thesemester, lets review what it means again.
Watch this video online: https://youtu.be/orjRQjE_ZqE
We know overhead is applied using estimated or budgeted overhead and a base. Actual overheadcosts may be different and we will not have all of those costs until late in the year. Estimated may beclose but is rarely accurate with what really happens, so the result is Over-applied or Under-appliedOverhead. At the end of the year, we will compare the applied overhead to the actual overhead and ifapplied overhead is GREATER than actual overhead, overhead is over-applied. If applied overheadis less than actual overhead, overhead is under-applied. But how do we correct it?
Watch this video online: https://youtu.be/FkS_mbt7f6k
Example – Creative Printers
We learned, in the previous pages, that Creative Printers had applied overhead to Jobs 106 and 107for a total amount of $9,850. Actual overhead was $9,800 from indirect materials $1,000, indirectlabor of $2,000 and other overhead of $6,800. If we compare applied overhead $9,850 and actualoverhead $9,000, we see a difference of $50 over-applied since the applied amount is greater thanthe actual overhead. Companies generally transfer the balance of the Overhead account to Cost ofGoods Sold at the end of the accounting period. Some companies do this monthly; others do itquarterly or annually. The journal entry to transfer Creative Printers’ overhead balance to Cost ofGoods Sold for the month of July is as follows:
Debit Credit
Overhead 50
Cost of goods sold 50

9/25/2017 Managerial Accounting
file:///Users/hannah/Downloads/Managerial-Accounting-1506381825_regexified.html 36/350
To record over-applied overhead.
Why does the previous entry reduce the Cost of Goods Sold by $50? The overhead cost applied tothe jobs was too high—it was overapplied. Thus, the cost of jobs was overstated or we charged tomuch cost to jobs. Although those jobs are still in Work in Process or Finished Goods Inventory,companies usually adjust the Cost of Goods Sold account instead of each inventory account.Adjusting each inventory account for a small overhead adjustment is usually not a good use ofmanagerial and accounting time and effort. All jobs appear in Cost of Goods Sold sooner or later, socompanies simply adjust Cost of Goods Sold instead of the inventory accounts.
If applied overhead was less than actual overhead, we have under-applied overhead or not chargedenough cost. The entry to correct under-applied overhead, using cost of goods sold, would be (XXrepresents the amount of under-applied overheard or the difference between applied and actualoverhead):
Debit Credit
Cost of goods sold XX
Overhead XX
To record under-applied overhead.
In this book, we assume companies transfer overhead balances to Cost of Goods Sold. We leave themore complicated procedure of allocating overhead balances to inventory accounts to textbooks oncost accounting.
Licensing & Attributions
CC licensed content, Shared previously
Accounting Principles: A Business Perspective.. Authored by: James Don Edwards, University of Georgia & Roger H. Hermanson, Georgia State University.. Provided by: Endeavour InternationalCorporation. Project: The Global Text Project. License: CC BY: Attribution
All rights reserved content
Predetermined Overhead Rate and Overhead Applied (Managerial Accounting Tutorial #26). Authored by: Note Pirate. Located at: https://youtu.be/orjRQjE_ZqE. License: All Rights Reserved. LicenseTerms: Standard YouTube LicenseUnderapplied or Overapplied Manufacturing Overhead (how to dispose of it) . Authored by: Education Unlocked. Located at: https://youtu.be/FkS_mbt7f6k. License: All Rights Reserved. License Terms:Standard YouTube License
2.6 ACCOUNTING IN THE HEADLINES
Would a Pizza Studio franchisee need to use job-costing or process costing for its made-to-order pizzas?Pizza Studio is a relatively new pizza chain that takes the made-to-order model used by Chipotle and Subway and applies it to pizzas. Ata counter, customers order their pizzas with exactly the crust, sauce,

9/25/2017 Managerial Accounting
file:///Users/hannah/Downloads/Managerial-Accounting-1506381825_regexified.html 37/350
cheese, and toppings they want – and then watch as the pizza travelsthrough a conveyor-belt oven, being blasted with 150 degree heat, andthen see it emerge two minutes later, hot and bubbling.
Pizza Studio has many choices for pizzas. In addition to traditional,crust choices include whole grain & flax seed, rosemary herb, andfirecracker. Sauces include tomato blend, basil pesto, tangy BBQ,spicy buffalo, and others. Cheese selections include mozzarella, fetaand goat cheese. Pizza Studio offers a wide variety of unlimitedtoppings: minced garlic, artichoke hearts, Kalamata olives, zucchini,Jamaican jerk seasoning, and caramelized onions are a sampling ofthe toppings available. Describe Pizza Studio process here.
The price of each pizza is $7.99.
Pizza Studio was founded in 2012 and has nearly 25 locations, with additional locations planned to beadded throughout 2015. It has several franchise operators; most of Pizza Studio’s growth is projectedto be through the opening of new franchise locations.
Questions
1. Does an individual Pizza Studio franchise operator need to decide whether to use a job-costingsystem or a process costing system for the pizzas it sells? Why or why not?
2. Assume that Pizza Studio pizzas are extremely popular and Pizza Studio decides to expand intolocal grocery stores with frozen Pizza Studio pizzas. Do you think Pizza Studios would use moreof a job-costing system or a process-costing system for the pizzas it produces for grocery stores?Explain.
Licensing & Attributions
CC licensed content, Speci�c attribution
Would a Pizza Studio franchisee need to use job-costing or process costing for its made-to-order pizzas?. Authored by: Dr. Wendy Tietz, CPA, CMA, CGMA. Located at:http://www.accountingintheheadlines.com. License: CC BY-NC: Attribution-NonCommercial
CHAPTER 2 KEY POINTS
Job Costing Key Points
Here is some basic information you need to know about these accounts:
Account AccountType
FinancialStatement
Increaseswith
Decreaseswith
Raw Materials Inventory Asset Balance Sheet Debit Credit
Work in Process (or goods in process)Inventory Asset Balance Sheet Debit Credit
Finished Goods Inventory Asset Balance Sheet Debit Credit

9/25/2017 Managerial Accounting
file:///Users/hannah/Downloads/Managerial-Accounting-1506381825_regexified.html 38/350
Cost of Goods Sold Expense IncomeStatement
Debit Credit
Sales Revenue IncomeStatement Credit Debit
Factory Payroll and Factory Overhead are temporary accounts that act like assets/expenses meaningDebit will increase and Credit will decrease. Both accounts are zeroed out at the end of the period sothey will not appear on a financial statement.
Job costs include the TOTAL costs incurred for direct materials, direct labor and overhead. Directmaterials can be traced to a specific job. Direct labor hours and dollars can be traced to a specific job.Overhead are indirect costs that cannot be traced to a specific job and include things like indirectmaterials, indirect labor, factory utilities, factory depreciation, factory rent, etc.
When a job is started, the costs (direct materials, direct labor, and applied overhead) go into Work inProcess or Goods in Process Inventory. When the job is finished, the job cost gets transferred toFinished Goods Inventory and is removed from Work in process inventory.
A predetermined overhead rate can be established to budget overhead expenses to jobs. Thepredetermined overhead rate is used to APPLY overhead costs to jobs in Work in Process Inventory.The predetermined overhead rate (POHR) can be based on anything the company chooses – directlabor dollars, direct labor hours, machine hours, jobs finished, etc. The most common we will see isdirect labor.
The formula for calculating the predetermined overhead rate is:
ESTIMATED OVERHEAD
ESTIMATED BASE
with the base being whatever is decided upon (again, examples include direct labor, machine hours,etc.).
Actual overhead costs are recorded in the Factory overhead account. Applied overhead uses thePredetermined Overhead Rate and applies the overhead to jobs in Work in Process Inventory bytaking the ACTUAL amount of the BASE x the Predetermined Overhead Rate. At the end of theperiod, the actual overhead costs (debits to factory overhead) are compared to the applied overheadcosts (credits to factory overhead) to make sure they agree – which they won’t since applied is anestimate. You will need to do an adjusting entry to Cost of Goods Sold to make the Factory Overheadaccount zero. If applied overhead (credits) are more than the actual overhead (debits), overhead isOVER-applied. If applied overhead is less than actual overhead, overhead is UNDER-applied.
Click Job Costing Key Points for a printable copy.
GLOSSARY
GLOSSARY

9/25/2017 Managerial Accounting
file:///Users/hannah/Downloads/Managerial-Accounting-1506381825_regexified.html 39/350
Actual overhead rate Total actual manufacturingoverhead divided by total actual manufacturingactivity.
Cost A financial measure of the resources used or given up to achieve a stated purpose.
Cost driver Activity or transaction that causes costs to be incurred. Machine-hours can be a costdriver for costs of energy to run machines, for example.
Cost of goods manufactured Consists of the total costs of all goods completed during the period;includes cost to manufacture plus beginning work in process inventory minus ending work inprocess inventory
Cost of goods sold Cost of goods manufactured plus the beginning finished goods inventoryminus the ending finished goods inventory.
Cost to manufacture (or total manufacturing cost) Includes the direct materials, direct labor, andmanufacturing overhead incurred during the period.
Direct labor Labor costs of all employees actually working on materials to convert them to finishedgoods. Direct labor costs are directly traced to particular products in contrast to indirect labor costs.
Direct materials Materials that are used only in making the product and are clearly and easilytraceable to a particular product.
Finished goods Completed manufactured products ready to be sold. Finished Goods Inventory isthe title of an inventory account maintained for such products.
Indirect labor The cost of labor that cannot, or will not for practical reasons, be traced to the goodsbeing produced or the services being provided.
Indirect materials Materials used in making a product that cannot, or will not for practical reasons,be traced directly to particular products.
Job cost system (job costing) A manufacturing cost system that accumulates costs incurred toproduce a product according to individual jobs, such as a building, a consulting job, or a batch of100 computer desks.
Manufacturing overhead All manufacturing costs except for those costs accounted for as directmaterials and direct labor.
Materials Unprocessed items used in the manufacturing process.
Overapplied (overabsorbed) overhead The amount by which the overhead applied to productionexceeds the actual overhead costs incurred in that same period.
Overhead All costs of making goods or providing services except for those costs classified asdirect materials and direct labor. See manufacturing overhead for overhead in manufacturingcompanies.
Period costs Costs related more closely to periods of time than to products produced. Period costscannot be traced directly to the manufacture of a specific product; they are expensed in the periodin which they are incurred.
Predetermined overhead rate Calculated by dividing estimated total overhead costs for a periodby the expected level of activity, such as total expected machine-hours or total expected direct

9/25/2017 Managerial Accounting
file:///Users/hannah/Downloads/Managerial-Accounting-1506381825_regexified.html 40/350
labor-hours for the period.
Product costs Costs a company assigns to units produced. In manufacturing companies, thesecosts are direct materials, direct labor, and manufacturing overhead. In service companies thathave no materials, these costs are direct labor and overhead.
Statement of cost of goods manufactured An accounting report showing the cost to manufactureand the cost of goods manufactured.
Underapplied (underabsorbed) overhead The amount by which actual overhead costs incurred ina period exceed the overhead applied to production in that period.
Work in process Partially manufactured products; a Work in Process Inventory account ismaintained for such products.
Licensing & Attributions
CC licensed content, Shared previously
Accounting Principles: A Business Perspective. Authored by: James Don Edwards, University of Georgia & Roger H. Hermanson, Georgia State University. Provided by: Endeavour International Corporation.Project: The Global Text Project. License: CC BY: Attribution
CHAPTER 2: EXERCISES
SHORT ANSWER QUESTIONS, EXERCISES AND PROBLEMS
Questions
➢ What are the major differences between managerial and financial accounting?
➢ Identify the three elements of cost incurred in manufacturing a product and indicate thedistinguishing characteristics of each.
➢ Why might a company claim that the total cost of employing a person is $15.30 per hour when theemployee’s wage rate is $10.50 per hour? How should this difference be classified and why?
➢ Why are certain costs referred to as period costs? What are the major types of period costsincurred by a manufacturer?
➢ Explain why the income statement of a manufacturing company differs from the income statementof a merchandising company.
➢ What is the general content of a statement of cost of goods manufactured? What is its relationshipto the income statement?
➢ What is the relationship between cost flows in the accounts and the flow of physical productsthrough a factory?
➢ Define a job cost system and give an example of a situation in which it can be used.

9/25/2017 Managerial Accounting
file:///Users/hannah/Downloads/Managerial-Accounting-1506381825_regexified.html 41/350
➢ What are the major reasons for using predetermined manufacturing overhead rates?
➢ What is the formula for computing a predetermined overhead rate? If the expected level of activityin a production center is 50,000 machine-hours and the estimated overhead costs are $750,000, whatis the predetermined overhead rate? Show the calculation.
➢ What is underapplied and overapplied overhead? What type of balance does each have in theOverhead account?
➢ Direct materials were issued to the following jobs: Material A was issued to Job No. 101, $2,000;Job No. 102, $1,000; and Job No. 103, $5,000. Material B was issued to Job No. 101, $5,000; JobNo. 102, $2,000; and Job No. 103, $3,000. A total of $3,000 in indirect materials was issued to alljobs.
➢ Record the direct and indirect materials issued in journal entry form.
➢ Real world question Assume Domino’s Pizza is considering offering a new product—a 6-inch(15.24 cm) pizza. Why would it matter if Domino’s Pizza knows how much it costs to produce anddeliver this 6-inch (15.24 cm) pizza?
➢ Real world question Why is it becoming more important that the managers of hospitalsunderstand their product costs?
➢ Real world question Besides law firms and public accounting firms, name three serviceorganizations that produce individual jobs and would use job costing.
Exercises
Exercise A The following costs are incurred by an electrical appliance manufacturer. Classify thesecosts as direct materials, direct labor, manufacturing overhead, selling, or administrative.
1. President’s salary.2. Cost of electrical wire used in making appliances.3. Cost of janitorial supplies (the janitors work in the factory).4. Wages of assembly-line workers.5. Cost of promotional displays.6. Assembly-line supervisor’s salary.7. Cost accountant’s salary (the accountant works in the factory).8. Cost of cleaner used to clean appliances when they are completed.9. Cost of aluminum used for toasters.
10. Cost of market research survey.
Exercise B Classify the costs listed in the previous exercise as either product costs or period costs.
Exercise C Gore Company makes products for sporting events. The following data are for the yearended 2010 December 31:
Materials inventory, 2010 January 1 $ 45,000
Materials inventory, 2010 December 31 65,000
Materials purchases 175,000
Direct labor 225,000
Work in process inventory, 2010 January 1 30,000

9/25/2017 Managerial Accounting
file:///Users/hannah/Downloads/Managerial-Accounting-1506381825_regexified.html 42/350
Work in process inventory, 2010 December 31 40,000
Manufacturing overhead 130,000
Finished goods inventory, 2010 January 1 80,000
Finished goods inventory, 2010 December 31 140,000
Prepare a Cost of Goods Manufactured Statement and compute the cost of goods sold.
Exercise D In June, Sierra Company worked only on Job No. 100 and completed it on June 30. Therewere no prior costs accumulated on Job No. 100 before June 1. During the month, the companypurchased and used $10,800 of direct materials, used 2,000 machine-hours, and incurred $19,200 ofdirect labor costs. Assuming manufacturing overhead is applied at the rate of $12 per machine-hour,what is the total cost of Job No. 100? Prepare journal entries to assign the materials, labor, andmanufacturing overhead costs to production and to record the transfer of Job No. 100 to FinishedGoods Inventory.
Exercise E At the end of the second week in March, Job No. 710 has an accumulated total cost of$37,800. In the third week, $9,000 of direct materials were used on Job 710, 300 hours of direct laborwere charged to the job at $40 per hour, and manufacturing overhead was applied on the basis of $40per machine-hour for overhead. Job No. 710 was the only job worked on in the third week. It was alsocompleted in the third week. Job No. 710 used 160 machine-hours during the third week in March.Compute the cost of Job No. 710, and give the journal entry required to record its completion andtransfer to Finished Goods Inventory.
Exercise F Different companies use different bases in computing their predetermined overhead rates.From the following estimated data, compute the predetermined rate to be used by each company:
Company
Paper Rock Scissors
Machine-hours 100,000 210,000 125,000
Direct labor-hours 50,000 48,000 39,000
Direct labor cost $800,000 $735,000 $410,000
Manufacturing overhead cost $400,000 $432,000 $375,000
Basis for determining predetermined overhead rate:
Company Basis
Paper Direct labor cost
Rock Direct labor-hours
Scissors Machine-hours
Exercise G Refer to the previous exercise. Assume the actual hours and cost data were:
Actual Paper Rock Scissors

9/25/2017 Managerial Accounting
file:///Users/hannah/Downloads/Managerial-Accounting-1506381825_regexified.html 43/350
Manufacturing overhead $450,000 $400,000 $375,000
Direct labor cost $850,000 $700,000 $400,000
Direct labor-hours 45,000 46,000 38,000
Machine-hours 105,000 200,000 130,000
1. Compute overapplied or underapplied overhead for each company.2. Prepare journal entries to transfer overapplied or underapplied overhead to Cost of Goods Sold
for each company.
Exercise H Ernest Peat Consultants uses a job cost system and had the following activity duringDecember:
There were no jobs in beginning Work in Process or Finished Goods Inventory.
Three jobs were started: No. 222, 223, and 224. Job No. 222 was completed and the customer wasbilled for $10,000 on account. Job No. 223 was completed and in Finished Goods Inventory awaitingbilling to the client at the end of the month. Job No. 224 was still in process at month-end.
Direct labor costs incurred for:
Job No. 222 200 hours @ $21/hour
Job No. 223 300 hours @ $18/hour
Job No. 224 120 hours @ $17/hour
Assume overhead is applied at the rate of $10 per labor-hour.
Actual overhead was $6,400. (The credit part of the journal entry is to Accounts Payable.
Prepare journal entries to record the preceding data, as well as the transfer of underapplied oroverapplied overhead to Cost of Goods Sold.
Problem A Total Block, Inc., is considering a new sunscreen packet that contains a skin wipe withsunscreen on it. These would be particularly useful for people who do not want to carry a bottle ofsunscreen, according to Sunspot’s marketing manager. Classify the following costs of this newproduct as direct materials, direct labor, manufacturing overhead, selling, or administrative.
1. President’s salary.2. Packages used to hold the skin wipes.3. Cleaning materials used to clean the skin wipe packages.4. Wages of workers who package the product.5. Cost of advertising the product.6. The salary of the supervisor of the workers who package the product.7. Cost accountant’s salary (the accountant works in the factory).8. Cost of a market research survey.9. Sales commissions paid as a percent of sales.
10. Depreciation of administrative office building.
Problem B Classify the costs listed in the previous problem as either product costs or period costs.
Problem C Good Vibrations, Inc., produces videotapes of musical performances. A newly hiredexecutive of the company has asked you to sort through the records and prepare a statement of the

9/25/2017 Managerial Accounting
file:///Users/hannah/Downloads/Managerial-Accounting-1506381825_regexified.html 44/350
company’s cost of goods manufactured. You find the following data from records prepared by GoodVibrations, Inc., for the year ended 2009 December 31:
Inventories:
Beginning direct materials inventory, 2009 January 1 $ 6,000
Ending direct materials inventory, 2009 December 31 10,500
Beginning work in process inventory, 2009 January 1 10,000
Ending work in process inventory, 2009 December 31 9,500
Materials purchases 50,000
Direct labor 40,000
Indirect labor 15,000
Factory utilities expense 7,000
Factory supplies expense 5,000
Depreciation expense – factory building 14,000
Depreciation expense – Factory Equipment 10,500
Other manufacturing overhead 25,000
You also learn that beginning Finished Goods Inventory on 2009 January 1, was $20,000 and endingFinished Goods Inventory on 2009 December 31, was $5,000. Sales for the year were $400,000.Selling expenses were $50,000 and administrative expenses were $75,000.
1. Prepare a statement of cost of goods manufactured for Good Vibrations, Inc., for the year ended2009 December 31.
2. Prepare an income statement for Good Vibrations, Inc., for the year ended 2009 December 31.
Problem D Log Cabin Homes, Inc., uses a job cost system to account for its jobs, which areprefabricated houses. As of January 1, its records showed inventories as follows:
Materials and supplies $100,000
Work in process (Job Nos. 22 and 23) 180,000
Finished goods (Job No. 21) 140,000
The work in process inventory consisted of two jobs:
Job No. Direct
materials
Direct
labor
Manufacturing
overheadTotal
22 $36,000 $40,000 $20,000 $ 96,000
23 40,000 28,000 16,000 84,000
$180,000

9/25/2017 Managerial Accounting
file:///Users/hannah/Downloads/Managerial-Accounting-1506381825_regexified.html 45/350
Cost and sales data:
a. Materials purchased on account, $400,000.
b. Direct materials used: Job No. 22, $60,000; Job No. 23, $120,000; Job No. 24, $180,000.
c. Indirect materials used, $10,000.
d. Direct labor costs: Job No. 22, $100,000; Job No. 23, $200,000; and Job No. 24, $80,000.
e. Indirect labor costs, $80,000.
f. Overhead is assigned to jobs at $100 per machine-hour. Job No. 22 used 500 machine-hours, JobNo. 23 used 1,000 machine-hours, and Job No. 24 used 300 machine-hours in January.
g. Job No. 22 and 23 were completed and transferred to Finished Goods Inventory.
h. Job No. 21 and 22 were sold on account for $1,200,000, total.
i. Manufacturing overhead costs incurred, other than indirect materials and indirect labor, weredepreciation, $60,000, and heat, light, power, miscellaneous, $30,000 (to be paid next month).
Required:
1. Calculate the Job Cost for each job.2. Prepare journal entries to assign each cost for each cost and sales data item.3. Calculate the ending balance in Raw Materials Inventory, Work in Process Inventory, Finished
Goods Inventory, and Cost of Goods Sold.4. Assuming selling and administrative expenses were $100,000, prepare a multi-step income
statement.
Problem E Green Thumb Landscaping Company uses a job cost system. As of January 1, its recordsshowed the following inventory balances:
Materials (shrubs, trees, etc.) $ 13,500
Work in process 25,800
Finished goods (Job No. 211) 30,000
The work in process inventory consisted of two jobs:
Job No. Direct
Materials
Direct
Labor
Manufacturing
OverheadTotal
212 10 Downing St. $4,500 $ 6,000 $2,400 $12,900
213 1010 Wilshire Blvd. 5,100 4,800 3,000 12,900
$9,600 $10,800 $5,400 $25,800
Here are data for the company for January:

9/25/2017 Managerial Accounting
file:///Users/hannah/Downloads/Managerial-Accounting-1506381825_regexified.html 46/350
Materials purchased, $48,000.
Landscaping direct labor costs: direct labor to Job No. 212, $12,000; to Job No. 213, $24,000; and toJob No. 214, $36,000. Indirect labor, $30,000.
Direct materials used: direct materials for Job No. 212, $7,800; for Job No. 213, $14,400; and for JobNo. 214, $24,000. Supplies (indirect materials) used amounted to $1,200.
Overhead is assigned to jobs at $3 per labor-hour, with 8,000 labor-hours to Job 212 and 2,000 labor-hours each to Jobs 213 and 214.
Jobs 212 and 213 were completed and in Finished Goods Inventory at the end of January.
Sales revenues for January were $45,000; cost of goods sold was $30,000 for Job No. 211 that wasin Finished Goods Inventory on 2010 January 1.
Overhead costs incurred other than indirect labor and indirect materials were depreciation, $3,000,and utilities, fuel, and miscellaneous, $3,000.
1. Prepare journal entries to record the preceding transactions, including the transfer ofunderapplied or overapplied overhead to Cost of Goods Sold.
2. Assuming selling and administrative expenses were $10,000, prepare an income statement forJanuary.
Problem F Speedy Delivery, Inc., transports computer equipment for various computermanufacturers. Speedy applies overhead to jobs using a predetermined overhead rate based on truckmiles. Estimated data for 2010 are:
Estimated truck miles 20 million
Estimated overhead for hauling operations
(equivalent to manufacturing overhead)$12 million
1. Compute the predetermined overhead rate per mile.2. Assume that in 2010, actual manufacturing overhead for hauling operations amounted to $15
million, and 24 million truck miles were driven. Compute the amount of underapplied oroverapplied manufacturing overhead for 2010.
3. Prepare the journal entry to transfer underapplied or overapplied overhead to Cost of GoodsSold.
Alternate problemsAlternate problem A Pocket Umbrella, Inc., is considering producing a new typeof umbrella. This new pocket-sized umbrella would fit into a coat pocket or purse. Classify thefollowing costs of this new product as direct materials, direct labor, manufacturing overhead, selling,or administrative.
1. Cost of advertising the product.2. Fabric used to make the umbrellas.3. Maintenance of cutting machines used to cut the umbrella fabric so it will fit the umbrella frame.4. Wages of workers who assemble the product.5. President’s salary.6. The salary of the supervisor of the people who assemble the product.7. Wages of the product tester who stands in a shower to make sure the umbrellas do not leak.8. Cost of market research survey.

9/25/2017 Managerial Accounting
file:///Users/hannah/Downloads/Managerial-Accounting-1506381825_regexified.html 47/350
9. Salary of the company’s sales managers.10. Depreciation of administrative office building.
Alternate problem B Classify the costs listed in Alternate problem A as either product costs or periodcosts.
Alternate problem C Presley Manufacturing Company is a producer of music compact discs (CDs)and tapes. The following account balances are for the year ended 2009 December 31
Administrative expenses $ 60,000
Depreciation expense – Manufacturing equipment 50,000
Direct labor 468,000
Manufacturing supplies expense 40,000
Indirect labor 36,000
Beginning inventories, 2009 January 1:
Direct materials 14,000
Work in process 20,000
Finished goods 128,000
Ending inventories, 2009 December 31
Direct materials 44,000
Work in process 56,000
Finished goods 92,000
Direct materials purchases 216,000
Rent expense – Factory 28,000
Sales 1,400,000
Selling expense 72,000
Other manufacturing overhead 126,000
1. Prepare a statement of cost of goods manufactured for Presley Manufacturing Company for2009.
2. Prepare an income statement for the year ended 2009 December 31.
Alternate problem D Cathy’s Catering Company uses a job cost system. Its activities in November2010, the first month of operations, were as follows:
Job
First-rate
University
Active life
home
Precocious
School

9/25/2017 Managerial Accounting
file:///Users/hannah/Downloads/Managerial-Accounting-1506381825_regexified.html 48/350
Direct materials cost (food) $54,000 $36,000 $81,000
Direct labor cost $45,000 $40,500 $54,000
Labor-hours 2,900 3,500 3,800
The company applies overhead at a rate of $16 per labor-hour. It completed all jobs in November. Thetotal revenue for the three jobs was $400,000. The actual overhead for the month was $160,000, ofwhich $120,000 should be credited to Accounts Payable and $40,000 should be credited toAccumulated Depreciation.
Prepare journal entries to record the costs of jobs and to record the transfer of completed jobs toFinished Goods Inventory and to Cost of Goods Sold. Transfer any underapplied or overappliedoverhead to Cost of Goods Sold. The company had no beginning or ending inventories.
Alternate problem E Sullivan Company applied overhead to production using a predeterminedoverhead rate based on machine-hours. Budgeted data for 2010 are:
Budgeted machine-hours 75,000
Budgeted manufacturing overhead $870,000
1. Compute the predetermined overhead rate.2. Assume that in 2010, actual manufacturing overhead amounted to $997,500, and 86,000
machine-hours were used. Compute the amount of underapplied or overapplied manufacturingoverhead for 2010.
3. Prepare the journal entry to transfer underapplied or overapplied overhead to Cost of GoodsSold.
Beyond the numbers—Critical thinking
Business decision case A Companies often do work on a cost-reimbursement basis. That is,Company B reimburses Company A for the cost of doing work for Company B. Suppose yourcompany has a contract that calls for reimbursement of direct materials and direct labor, but notoverhead. Following are costs that various organizations incur; they fall into three categories: directmaterials (DM), direct labor (DL), or overhead (OH).
Glue used to attach labels to bottles containing a patented medicine.
Compressed air used in operating paint sprayers for Student Painters, a company that paints housesand apartments.
Insurance on a factory building and equipment.
A production department supervisor’s salary.
Rent on factory machinery.
Iron ore in a steel mill.
Oil, gasoline, and grease for forklift trucks in a manufacturing company’s warehouse.
Services of painters in building construction.
Cutting oils used in machining operations.

9/25/2017 Managerial Accounting
file:///Users/hannah/Downloads/Managerial-Accounting-1506381825_regexified.html 49/350
Cost of paper towels in a factory employees’ washroom.
Payroll taxes and fringe benefits related to direct labor.
The plant electricians’ salaries.
Crude oil to an oil refinery.
Copy editor’s salary in a book publishing company.
1. Classify each of these items as direct materials, direct labor, or overhead.2. Assume your classifications could be challenged in a court case. Indicate to your attorneys which
of your answers for part a might be successfully disputed by the opposing attorneys. In whichanswers are you completely confident?
Business decision case B Quality Painters, Inc., uses a job cost system. As of 2010 January 1, itsrecords showed the following inventory balances:
Materials $ 7,000
Work in process 50,000
Finished goods 0
The work in process inventory consisted of two jobs:
Job No. Direct
Materials
Direct
LaborOverhead Total
100 Community housing $ 9,000 $12,000 $ 4,000 $25,000
101 Regal apartments 10,000 9,000 6,000 25,000
$19,000 $21,000 $10,00 $50,000
Here are data for the company for January:
Materials purchased, $90,000.
Direct labor costs: direct labor to Job No. 100, $20,000; to Job No. 101, $48,000; and to Job No. 102(a new job), $50,000. Indirect labor, $10,000.
Direct materials used: direct materials for Job No. 100, $15,600; for Job No. 101, $28,800; and for JobNo. 102, $48,000. Supplies (indirect materials) used amounted to $4,000.
Overhead is assigned to jobs at $5 per labor-hour, with 1,000 labor-hours to Job 100 and 2,000 labor-hours each to Jobs 101 and 102.
All three jobs were completed in January.
Sales revenues for January were $350,000 for the three jobs.
Overhead costs incurred other than indirect labor and indirect materials were depreciation, $6,000,and utilities, fuel, and miscellaneous, $6,000.

9/25/2017 Managerial Accounting
file:///Users/hannah/Downloads/Managerial-Accounting-1506381825_regexified.html 50/350
Management is concerned about the relationship between costs incurred on jobs and the costsexpected to be incurred, and has asked for your help. Here are the expected total costs (directmaterials, direct labor, and overhead) for the three jobs:
Job 100 $ 60,000
Job 101 120,000
Job 102 130,000
These cost estimates cover the entire job, including both costs in beginning Work in ProcessInventory and costs incurred during January.
1. Compare the costs incurred on each job, including the costs in beginning Work in ProcessInventory and costs incurred during January with the expected costs. Is the company keeping itscosts below the expected costs for each job?
2. Prepare an income statement for January 2010 assuming selling and administrative expenses forJanuary were $50,000. Don’t forget to transfer any underapplied or overapplied overhead balanceto Cost of Goods Sold.
3. Is the company profitable (that is, showing net income greater than zero)? What suggestions canyou make for management to help increase the company’s net income?
Ethics case Suzie Garcia, an accountant for a consulting firm, had just received the monthly costreports for the two jobs she supervises: one for Arrow Space, Inc., and one for the US government.She immediately called her boss after reading the figures for the Arrow Space job.
“We are going to be way over budget on the Arrow Space contract,” she informed her boss. “The jobis only about three-fourths complete, but we have spent all the money that we had budgeted for theentire job.”
“You had better watch these job costs more carefully in the future,” her boss advised. “Meanwhile,charge the rest of the costs needed to complete the Arrow Space job to your US government job. Thegovernment will not notice the extra costs. Besides, we get reimbursed for costs on the governmentjob, so we will not lose any money on this problem you have with the Arrow Space contract.”
What should Suzie do? Does it matter that Suzie’s company is reimbursed for costs on the USgovernment contract? Explain.
Group project A In teams of two or three students, interview in person or by speakerphone, abusinessperson in your community who uses job costing (for example, businesses that producecustom products such as homes, signs, or landscape design, or business consultants). Ask how thisperson assigns costs to products and how this information affects business decisions. Keep in mindthat many businesspeople use terms other than job costing and manufacturing overhead. Be flexiblewith your use of accounting terminology in this interview. Each team should write a memorandum tothe instructor summarizing the results of the interview. Information contained in the memo shouldinclude:
Date:
To:
From:
Subject:

9/25/2017 Managerial Accounting
file:///Users/hannah/Downloads/Managerial-Accounting-1506381825_regexified.html 51/350
Content of the memo must include the name and title of the person interviewed, name of thecompany, date of the interview, examples of the use of accounting information for decision making,and any other pertinent information.
Group project B In teams of two or three students, interview the manager of a campus print shop ora print shop in the area about how the company bids on prospective jobs. Does it use cost informationfrom former jobs that are similar to prospective ones, for example? Does it have a specialist in costestimation who estimates the costs of prospective jobs? Each team should write a memorandum tothe instructor summarizing the results of the interview. Information contained in the memo shouldinclude:
Date:
To:
From:
Subject:
Content of the memo must include the name and title of the person interviewed, name of thecompany, date of the interview, and information responding to the questions above.
Using the Internet—A view of the real world
Visit the website for a high technology company, such as HP, Intel Corporation, or IBM, and locate itsannual report. Review the annual report to gain a general understanding of the company’s primarybusiness segments and products. Write a report addressing the following questions based on yourresearch. What products or services are provided by the company? How does the financialinformation provided in the annual report (focus on the income statement) differ from financialinformation used for managerial accounting purposes? As a manager making business decisionswithin the company, what additional information would you need? (Remember that the incomestatement may be referred to using different terminology such as statement of earnings or statementof operations.)
Company Website
Hewlett Packard Http://www.hp.com
Intel Corporation Http://www.intel.com
IBM Http://www.ibm.com
Visit the following website for Wells Fargo (a financial institution) and locate its annual report:
http://www.wellsfargo.com
Review the annual report to gain a general understanding of the company’s primary businesssegments and products. Write a report addressing the following questions based on your research.What products or services are provided by the company? How does the financial information providedin the annual report (focus on the income statement) differ from financial information used formanagerial accounting purposes? As a manager making business decisions within the company, whatadditional information would you need? (Remember that the income statement may be referred tousing different terminology such as statement of earnings or statement of operations.)
Visit the following website for Home Depot (a retail organization) and locate its annual report:

9/25/2017 Managerial Accounting
file:///Users/hannah/Downloads/Managerial-Accounting-1506381825_regexified.html 52/350
http://www.homedepot.com
Review the annual report to gain a general understanding of the company’s primary businesssegments and products. Write a report addressing the following questions based on your research.What products or services are provided by the company? How does the financial information providedin the annual report (focus on the income statement) differ from financial information used formanagerial accounting purposes? As a manager making business decisions within the company, whatadditional information would you need? (Remember that the income statement may be referred tousing different terminology such as statement of earnings or statement of operations.)
1. [1]See Standards of Ethical Conduct for Management Accountants (Montvale, N.J.: Institute ofManagement Accountants, June 1, 1983.)
Licensing & Attributions
CC licensed content, Shared previously
Accounting Principles: A Business Perspective. Authored by: James Don Edwards, University of Georgia & Roger H. Hermanson, Georgia State University. Provided by: Endeavour International Corporation.Project: The Global Text Project. License: CC BY: Attribution
9/25/2017 Managerial Accounting
file:///Users/hannah/Downloads/Managerial-Accounting-1506381825_regexified.html 53/350
CHAPTER 3: PROCESS COSTSYSTEM
CHAPTER 3 STUDY PLAN
Study Plan: Process Costing
Knowledge Targets
I can define the following terms as they relate to our unit:
Process Costing Equivalent Units
Conversion Cost
Predetermined overheadrate
Weighted Averagemethod
Cost of GoodsManufactured
Cost perEquivalent Unit
Goods completed andtransferred out
Ending goods (or work)in process
Process costsummary
PercentComplete Goods started
Reasoning TargetsI can identify the difference between process costing and job costing.I can identify costs in process costing as direct materials, direct labor, and overhead.I can understand the difference between beginning and ending balances in work in processinventory.I can track process costs from raw materials to goods in process to finished goods and cost ofgoods sold.I can identify accounts to use in recording the flow of process costing.I can determine the percent complete for direct materials and conversion costs.I can understand equivalent units of production and how it is used in process costing.
9/25/2017 Managerial Accounting
file:///Users/hannah/Downloads/Managerial-Accounting-1506381825_regexified.html 54/350
I can determine the ending balance in goods in process inventory.I can understand a process cost summary report.
Skill TargetsI can prepare and post journal entries for process costing from raw materials to cost of goodssold.I can calculate the equivalent units for direct materials, direct labor and overhead using theweighted average method.I can calculate the cost per equivalent unit using the weighted average method.I can calculate the amount of cost to assign to goods completed and transferred out (alsoknown as cost of goods manufactured) using equivalent units and cost per equivalent unit.I can calculate the amount of cost to assign to ending goods in process inventory usingequivalent units and cost per equivalent unit.I can prepare a process cost summary report under the weighted average method.
Click Process Cost Study Plan for a printable copy.
Nature of a process cost system
Many businesses produce large quantities of a single product or similar products. Pepsi-Cola makessoft drinks, Exxon Mobil produces oil, and Kellogg Company produces breakfast cereals on acontinuous basis over long periods. For these kinds of products, companies do not have separatejobs. Instead, production is an ongoing process.
Watch this video online: https://youtu.be/F6RzLSSKlZM
Job costing and process costing have important similarities:Both job and process cost systems have the same goal: to determine the cost of products.Both job and process cost systems have the same cost flows. Accountants record production inseparate accounts for materials inventory, labor, and overhead. Then, they transfer the costs to aWork in Process Inventory account.Both job and process cost systems use predetermined overhead rates to apply overhead.
Job costing and process costing systems also have their significant differences:Types of products produced. Companies that use job costing work on many different jobs withdifferent production requirements during each period. Companies that use process costingproduce a single product, either on a continuous basis or for long periods. All the products thatthe company produces under process costing are the same.Cost accumulation procedures. Job costing accumulates costs by individual jobs. Process costingaccumulates costs by process or department.Work in Process Inventory accounts. Job cost systems have one Work in Process Inventoryaccount for each job. Process cost systems have a Work in Process Inventory account for eachdepartment or process.

9/25/2017 Managerial Accounting
file:///Users/hannah/Downloads/Managerial-Accounting-1506381825_regexified.html 55/350
Aprocess cost system (process costing) accumulates costs incurred to produce a productaccording to the processes or departments a product goes through on its way to completion.Companies making paint, gasoline, steel, rubber, plastic, and similar products using process costing.In these types of operations, accountants must accumulate costs for each process or departmentinvolved in making the product. As an example, view this How’s It Made video.
Watch this video online: https://youtu.be/zrzKih5rqD0
Can you imagine having to determine the cost of making just ONE lego when we can make 1.7 millionlegos per hour? Cost accountants have to do this. They will use process costing! Accountantscompute the cost per unit by first accumulating costs for the entire period (usually a month) for eachprocess or department. Second, they divide the accumulated costs by the number of units produced(tons, pounds, gallons, or feet) in that process or department.
The next picture shows the cost flows in a process cost system that processes the products in aspecified sequential order. That is, the production and processing of products begin in Department A.From Department A, products go to Department B. Department B inputs direct materials and furtherprocesses the products. Then Department B transfers the products to Finished Goods Inventory.
There are two methods for using process costs: Weighted Average and FIFO (First In First Out). Each method uses equivalent units and cost per equivalent units but calculates them just a littledifferently.
Licensing & Attributions
CC licensed content, Shared previously
Accounting Principles: A Business Perspective.. Authored by: James Don Edwards, University of Georgia & Roger H. Hermanson, Georgia State University.. Provided by: Endeavour InternationalCorporation. Project: The Global Text Project. License: CC BY: Attribution
All rights reserved content
Job Order Costing vs Process Costing. Authored by: Education Unlocked. Located at: https://youtu.be/F6RzLSSKlZM. License: All Rights Reserved. License Terms: Standard YouTube LicenseHow It's Made Lego. Authored by: How Is Made. Located at: https://youtu.be/zrzKih5rqD0. License: All Rights Reserved. License Terms: Standard YouTube License
3.2 EQUIVALENT UNITS (WEIGHTEDAVERAGE)

9/25/2017 Managerial Accounting
file:///Users/hannah/Downloads/Managerial-Accounting-1506381825_regexified.html 56/350
Essentially, the concept of equivalent units involves expressing a given number of partiallycompleted units as a smaller number of fully completed units. We do this because it is easier toaccount for whole units then parts of a unit. We are adding together partially completed units to makea whole unit. For example, if we have 3 units 1/3 of the way complete, we can add them together tomake 1 equivalent unit (1/3 + 1/3 + 1/3). We can make this calculation easier by multiplying the unitsby a percentage of complete.
For example, if we bring 1,000 units to a 40 % state of completion, this is equivalent to 400 units(1,000 x 40%) that are 100% complete. Accountants base this concept on the supposition that acompany must incur approximately the same amount of costs to bring 1,000 units to a 40% level ofcompletion as it would to complete 400 units.
Here is a diagram of the concept of equivalent units. As you examine the diagram, think of the amountof water in the glasses as costs that the company has already incurred.
Now, watch the video for another example.
Watch this video online: https://youtu.be/IMhBXeb0IsY
Units in Beg. Work in Process Units Completed and Transferred
+ Units Started this period + Units in End. Work in Process
= Total Units = Total Units
The total units in each column must agree with one another. This formula explains how many unitswe had to work with (including units in beginning work in process + units started this period) and whathappened to those units (units completed or units remain in work in process inventory since there arenot complete).
Under the weighted average method, equivalent units are calculated based on 2 things: unitscompleted and transferred out and units in ending work in process inventory.
Units completed and transferred are finished units and will always be 100% complete for equivalentunit calculations for direct materials, direct labor and overhead. For units in ending work in process,we would take the units unfinished x a percent complete. The percent complete can be different fordirect materials, direct labor or overhead.
Example – Jax Company
Assume that Jax Company manufactures and sells a chemical product used to clean kitchen countersand sinks. The company processes the product in two departments. Department A crushes powdersand blends the basic materials. Department B packages the product and transfers it to finishedgoods. We will look at equivalent units for Department B. The June production data for Department Bis:
Department B

9/25/2017 Managerial Accounting
file:///Users/hannah/Downloads/Managerial-Accounting-1506381825_regexified.html 57/350
Beginning work in process -0-
Units started this period 11,000
Units completed and transferred 9,000
Ending work in process units 2,000
Direct materials $ 1,100
Direct labor $ 2,880
Applied overhead $ 8,880
The physical flow of units shows:
Units in Beg. WIP -0- Units Completed and Transferred 9,000
Units Started this period 11,000 Units in End. WIP 2,000
Total Units 11,000 = Total Units 11,000
The beginning step in computing Department B’s equivalent units for Jax Company is determining thestage of completion of the 2,000 unfinished units (remember units completed and transferred arealways 100% complete). In Department B, the ending units may be in different stages of completionregarding the materials, labor, and overhead costs. Assume that Department B adds all materials atthe beginning of the production process. Then ending inventory would be 100% complete as tomaterials since we received all materials at the beginning of the process.
Accountants often assume that units are at the same stage of completion for both labor and overhead.Accountants call the combined labor and overhead costs conversion costs. Conversion costs arethose costs incurred to convert raw materials into the final product (meaning, direct labor andoverhead).
Let us assume that, on average, the 2,000 units in ending inventory are 40% complete as toconversion costs. This means that Department B transferred out 9,000 units fully completed andbrought 2,000 units to a 40% completion state. Department B now has an equivalent of 800 fullycompleted units remaining in inventory (800 = 2,000 X 40 per cent).
The equivalent units for materials, labor and overhead would be calculated as:
Materials Conversion Costs
Units Completed and Transferred 9,000 9,000
(9,000 x 100% complete)
Units in Ending WIP
Materials (2,000 x 100% complete) 2,000
Conversion Cost (2,000 x 40% complete) 800
Total Equivalent Units 11,000 9,800
Total equivalent units for each cost element (materials, conversion cost) is calculated as:

9/25/2017 Managerial Accounting
file:///Users/hannah/Downloads/Managerial-Accounting-1506381825_regexified.html 58/350
Equivalent units = Units completed + (Units in ending inventory X percent complete)
The key to equivalent units is determining the percent complete, especially for materials can beconfusing. Common terms you will see when determine ending work in process percent complete:
Description % Complete
Materials added at the beginning of the process 100% complete for materials
Materials added evenly through out the process Use % complete for ending WIP
Materials added at the end of the process 0% complete for materials
Licensing & Attributions
CC licensed content, Shared previously
Accounting Principles: A Business Perspective.. Authored by: James Don Edwards, University of Georgia & Roger H. Hermanson, Georgia State University.. Provided by: Endeavour InternationalCorporation. Project: The Global Text Project.. License: CC BY: Attribution
All rights reserved content
20-- The Concept of Equivalent Units of Production. Authored by: Larry Walther. Located at: https://youtu.be/IMhBXeb0IsY. License: All Rights Reserved. License Terms: Standard YouTube License
3.3 PROCESS COSTING (WEIGHTEDAVERAGE)
Process Costing consists of the following steps:
1. Physical flow of units2. Equivalent Units of Production3. Cost per Equivalent Unit4. Assign Costs to Units completed and Ending work in process inventory5. Reconcile Costs
Keep in mind, there are no Generally Accepted Accounting Principles (GAAP) that mandate how wemust do a process cost report. We will focus on the calculations involved and show you an exampleof a process cost summary report but know there are several ways to present the information, but thecalculations are all the same.
In the previous page, we discussed the physical flow of units (step 1) and how to calculate equivalentunits of production (step 2) under the weighted average method. We will continue the discussionunder the weighted average method and calculate a cost per equivalent unit.
Step 3: Cost per Equivalent Unit
The formula we will use is notice we are primarily using the dollar costs and not units for this section(except we will use TOTAL equivalent units we calculated in the previous section):
Beg. Work in Process Costs
+ Costs added this period

9/25/2017 Managerial Accounting
file:///Users/hannah/Downloads/Managerial-Accounting-1506381825_regexified.html 59/350
= Total Costs
÷ Total Equivalent Units
= Cost per Equivalent Units
We will calculate a cost per equivalent unit for each cost element (direct materials and conversioncosts (or direct labor and overhead).
Watch this video online: https://youtu.be/Txv05196CWs
Example – Jax Company
To continue with our previous example, we were given the following information:
The June production and cost data for Jax Company are:
Department B
Beginning work in process -0-
Units started this period 11,000
Units completed and transferred 9,000
Ending work in process units 2,000
Direct materials cost $ 1,100
Direct labor cost $ 2,880
Applied overhead cost $ 8,880
We calculated total equivalent units of 11,000 units for materials and 9,800 for conversion.
To calculate cost per equivalent unit by taking the total costs (both beginning work in process andcosts added this period) and divide by the total equivalent units.
Materials Conversion
Beg. Work in Process Costs -0- -0-
+ Costs added this period $ 1,100 $ 11,760
(Conv. Cost = DL $2,880 + OH $8,880)
= Total Costs $ 1,100 $ 11,760
÷ Total Equivalent Units 11,000 9,800
= Cost per Equivalent Units $ 0.10 $ 1.20
In this example, beginning work in process is zero. This will not always be the case. The problem willprovide the information related to beginning work in process inventory costs and units.
Step 4: Assign Costs

9/25/2017 Managerial Accounting
file:///Users/hannah/Downloads/Managerial-Accounting-1506381825_regexified.html 60/350
In this next section, we will combine the equivalent units (from step 2) and the cost per equivalentunits (step 3) to assign costs to units completed and transferred out (also called cost of goodsmanufactured) and costs of units remaining ending work in process inventory. The basic formula toassign costs is:
Equivalent Units per cost element
(direct materials, conversion)
x cost per equivalent unit for cost element
(direct materials, conversion)
Using the example company, Jax Company, we have the following information:
Materials Conversion Costs
Units Completed and Transferred 9,000 9,000
Units in Ending WIP 2,000 800
Total Equivalent Units 11,000 9,800
Cost per Equivalent Units $ 0.10 $ 1.20
We would assign costs as follows:
Cost assigned to units completed and transferred
Direct Materials (9,000 equiv units x $0.10) $ 900
Conversion (9,000 equiv units x $1.20) 10,800
Total cost assigned to units completed $ 11,700
Cost assigned to ending work in process
Direct Materials (2,000 equiv units x $0.10) 200
Conversion (800 equiv units x $1.20) 960
Total cost assigned to ending work in process inventory $ 1,160
For costs of units completed and transferred, we take the equivalent units for units completed xcost per equivalent unit. We do the same of ending work in process but using the equivalent unitsfor ending work in process.
Step 5: Cost Reconciliation
Finally, we can check our work. We want to make sure that we have assigned all the costs frombeginning work in process and costs incurred or added this period to units completed and transferredand ending work in process inventory.
First, we need to know our total costs for the period (or total costs to account for) by adding beginningwork in process costs to the costs incurred or added this period. Then, we compare the total to thecost assignment in step 4 for units completed and transferred and ending work in process to get totalunits accounted for. Both totals should agree.

9/25/2017 Managerial Accounting
file:///Users/hannah/Downloads/Managerial-Accounting-1506381825_regexified.html 61/350
For Jax Company, the cost reconciliation would be:
Beg. Work in Process Cost -0-
+ Costs added this period $ 12,860
($1,100 DM + $2,880 DL + $8,880 OH)
= Total costs to account for $ 12,860
Cost assigned to units completed and transferred (from step 4 above) $ 11,700
+ Cost assigned to ending work in process inventory (from step 4 above) 1,160
= Total costs accounted for $ 12,860
The full process cost report can be found by clicking Jax_process cost).
Licensing & Attributions
CC licensed content, Shared previously
Accounting Principles: A Business Perspective.. Authored by: James Don Edwards, University of Georgia & Roger H. Hermanson, Georgia State University.. Provided by: Endeavour InternationalCorporation. Project: The Global Text Project.. License: CC BY: Attribution
All rights reserved content
Cost Per Equivalent Unit (weighted average method) . Authored by: Education Unlocked. Located at: https://youtu.be/Txv05196CWs. License: All Rights Reserved. License Terms: Standard YouTube License
3.4 JOURNAL ENTRIES FOR THE FLOW OFPRODUCTION COSTS
The journal entries for the flow of production costs are the same with process and job costing. Thecost flow is as follows:
The corresponding journal entries to the letters in the flow chart are:
Journal Entries by account flow (see referenced letter)
Ref Account / Description Debit Credit

9/25/2017 Managerial Accounting
file:///Users/hannah/Downloads/Managerial-Accounting-1506381825_regexified.html 62/350
a Raw Materials Inventory X
Cash or Accounts Payable X
Purchased raw materials inventory
b Factory Payroll X
Wages Payable X
Record wages earned but unpaid
c These are examples of some of the entries you may record:
Manufacturing Overhead X
Accumulated Depreciation X
Record depreciation on factory equipment
Manufacturing Overhead X
Cash X
Record factory rent paid with cash
Manufacturing Overhead X
Accounts Payable X
Record factory supplies purchased on credit
d Work in Process Inventory X
Raw Materials Inventory X
Record Direct Materials Used
e Manufacturing Overhead X
Raw Materials Inventory X
Record INDIRECT materials used
f Work in Process Inventory X

9/25/2017 Managerial Accounting
file:///Users/hannah/Downloads/Managerial-Accounting-1506381825_regexified.html 63/350
Factory Payroll X
Record Direct Labor
g Manufacturing Overhead X
Factory Payroll X
Record INDIRECT labor
h Work in Process Inventory X
Manufacturing Overhead X
Record Overhead APPLIED to production
i Finished Goods Inventory X
Work in Process Inventory X
Record jobs or goods completed (cost of goods manufactured)
j Cost of goods sold X
Finished Goods Inventory X
Record cost of jobs or goods completed AND sold
For a printable view click job cost flow.
3.5 PROCESS COSTING (FIFO METHOD)
Another acceptable method for determining unit cost under process costing is the first-in, first-out(FIFO) cost method. Under the FIFO method, we assume any units that were not completed lastperiod (beginning work in process) are finished before anything else is started. The following tableshows the differences between the weighted average method and the FIFO cost method:
Weighted Average FIFO
UnitsCompletedandtransferredout:
Total units completed thisperiod
Total units finished from beginning work in process +units started and completed this period

9/25/2017 Managerial Accounting
file:///Users/hannah/Downloads/Managerial-Accounting-1506381825_regexified.html 64/350
EquivalentUnitsbased on:
Units completed this period +Units in Ending Work inProcess
Units from Beg. Work in Process completed + unitsstarted and completed + units in Ending Work inProcess
Cost perEquivalentUnit basedon:
Beg. Work in Process Costs+ Costs added this period Costs added this period only
Assigncostsusing:
Equivalent Units x Cost perEquivalent Units for Unitscompleted and units inending Work in Process
Beg. Work in Process Costs + Equivalent Units x costper equivalent unit for units finished from Beg. Work InProcess, Units started and completed and units inEnd. Work In Process
We will look at each item individually as we discuss the steps of process costing. Under eithermethod, weighted average or FIFO, process costing consists of 5 steps:
1. Physical Flow of Units2. Equivalent Units3. Cost per Equivalent Unit4. Assign Costs to Units Completed and Ending Work in Process Inventory5. Reconcile Costs
Physical Flow of Units
The physical flow of units is as follows under the weighted average method:
Units in Beg. WIP Units Completed and Transferred
+ Units Started this period + Units in End. WIP
= Total Units = Total Units
This is altered just slightly under the FIFO method as we must separate the items in units completedinto Units Completed from beginning work in process and Units started and completed this periodsince under FIFO, we must finish anything from beginning work in process before we start somethingnew. Under the FIFO, we the physical flow of units would be documented as:
Units in Beg. WIP Units Completed and Transferred:
+ Units Started this period Beg. Work in Process Units Completed
= Total Units + Units started and Completed this period
= Units completed and transferred
+ Units in End. WIP
= Total Units
Just as in the weighted average method, the 2 Total Units figures must agree!
Equivalent Units of Production

9/25/2017 Managerial Accounting
file:///Users/hannah/Downloads/Managerial-Accounting-1506381825_regexified.html 65/350
Under the FIFO method, we will calculate equivalent units for 3 things: Units completed frombeginning work in process, units started and completed this period and units remaining in ending workin process. This video will discuss the differences between the Weighted Average and FIFO methodsfor equivalent units (if you are comfortable with the weighted average method, skip to minute 4:06 tobegin the discussion on the FIFO method).
Watch this video online: https://youtu.be/nETeUa0Bts4
Equivalent units for the period will be calculated as follows under FIFO (keep in mind, you may havedifferent percent complete for materials, labor and overhead):
1. Units from beginning work in process: you want to complete this units, so how much MOREeffort will be needed to finish these units. You will calculate this as beginning work in processunits x (100% – given % complete) to calculate the amount of additional work necessary to makethe unit 100% complete.
2. Units started and completed this period: take the units x 100% complete since they were startedand completed they have received all of their materials, labor and overhead and will not receiveany more since they are finished.
3. Units in Ending work in process: just like with the weighted average method, we will take theending work in process units x a given % complete.
To illustrate the computation of equivalent units under the FIFO method, assume the following facts(for simplicity we are using just one percent complete for materials, labor and overhead):
Beginning work in process inventory 3,000 units, 40% complete
Units started this period 10,000 units
Ending work in process inventory 5,000 units, 20% complete
The physical flow of units would be (calculate units started and completed as units started 10,000 –units in ending work in process 5,000):
Units in Beg. WIP 3,000 Units Completed and Transferred:
Units Started this period 10,000 Units from Beg. WIP 3,000
Total Units 13,000 Units started and completed 5,000 (10,000 – 5,000)
Total Units completed and txfr 8,000
Units in End. WIP 5,000
Total Units 13,000
The equivalent production for the period would be:
Units from beginning WIP [3,000 units x (100% – 40% complete)] 1,800
Units started and completed 5,000 units x 100% complete 5,000
Units in ending WIP 5,000 units x 20% complete 1,000
Total Equivalent Units 7,800

9/25/2017 Managerial Accounting
file:///Users/hannah/Downloads/Managerial-Accounting-1506381825_regexified.html 66/350
Cost per Equivalent Unit
Under the weighted average method, we use beginning work in process costs AND costs added thisperiod. Under the FIFO method, we will only use the costs added this period. This video will explainthe differences between the two approaches.
Watch this video online: https://youtu.be/P_Nwchc_pcs
The formula we will use for calculating cost per equivalent unit under the FIFO Method is:
Current Costs added this period
÷ Total Equivalent Units
= Cost per Equivalent Units
Assign Costs
When we assign costs to units completed and transferred and units remaining in ending work inprocess under the FIFO method, we need the following items:
1. Costs from beginning work in process: these were the costs we started the period with or theunfinished items from the previous period (no calculation required — just bring over the costsfrom beginning work in process). Remember, under FIFO, these are finished first so their costsmust be passed along to completed units.
2. Costs to complete beginning work in process: you will take the Equivalent units calculated forcompleting beginning work in process x the cost per equivalent unit. You will do this for materials,labor and overhead (or for conversion costs which is the both direct labor and overhead).
3. Costs of units started and completed: you will take the equivalent units calculated for unitsstarted and completed x the cost per equivalent unit for materials, labor and overhead (orconversion).
4. The sum of these 3 will be the cost of units completed and transferred which is also known ascost of goods manufactured. This amount is transferred to the next department or to finishedgoods and out of work in process for the units completed this period.
5. Cost of units remaining in ending work in process: you will take the ending work in processequivalent units x the cost per equivalent unit for materials, labor and overhead (or conversion)just as we did under the weighed average method. This amount rolls over to be the next period’sbeginning work in process inventory.
This video will provide a demonstration of cost assignment under the FIFO method.
Watch this video online: https://youtu.be/y1TLRSL9Yjo
Reconcile Costs
Finally, something is the same under FIFO and Weighted Average.
We want to make sure that we have assigned all the costs from beginning work in process and costsincurred or added this period to units completed and transferred and ending work in processinventory.
First, we need to know our total costs for the period (or total costs to account for) by adding beginningwork in process costs to the costs incurred or added this period. Then, we compare the total to thecost assignment in step 4 for units completed and transferred and ending work in process to get totalunits accounted for. Both totals should agree.

9/25/2017 Managerial Accounting
file:///Users/hannah/Downloads/Managerial-Accounting-1506381825_regexified.html 67/350
The cost reconciliation would be:
Beg. Work in Process Cost
+ Costs added this period
= Total costs to account for
Cost assigned to units completed and transferred
+ Cost assigned to ending work in process inventory
= Total costs accounted for
In the next page, we will do a demonstration problem of the FIFO method for process costing.
Licensing & Attributions
All rights reserved content
Equivalent Units. Authored by: Linda Williams. License: All Rights Reserved. License Terms: Standard YouTube LicenseCost Per Equivalent Unit-- FIFO Method vs. Weighted-average Method . Authored by: Education Unlocked. Located at: https://youtu.be/P_Nwchc_pcs. License: All Rights Reserved. License Terms: StandardYouTube LicenseCost Per Equivalent Unit, FIFO Method, Part 2 (Applying Costs) . Authored by: Education Unlocked. Located at: https://youtu.be/y1TLRSL9Yjo. License: All Rights Reserved. License Terms: Standard YouTubeLicense
3.6 PROCESS COST DEMONSTRATION (FIFOMETHOD)
To illustrate more completely the operation of the FIFO process cost method, we use an example ofthe month of June production costs for a company’s Department B. Department B adds materials onlyat the beginning of processing. The May 31 inventory in Department B (June’s beginning work inprocess) consists of 2,000 units that are fully complete as to materials and 60% complete as toconversion. Beginning work in process inventory has accumulated costs of $6,180.
The following costs were added in June: Direct materials issued $ 1,300; direct labor $ 7,200; and manufacturing overhead applied $ 6,000. The units for the period were:
Beginning work in process inventory 2,000 units
Units started this period 10,000 units
Ending work in process inventory 3,000 units
Ending work in process inventory was 1/3 complete as to conversion costs.
Step 1: Physical Flow of Units
For the physical flow of units, we calculate units started AND completed this period as Units started10,000 – units remaining in ending work in process 3,000 = 7,000 units.

9/25/2017 Managerial Accounting
file:///Users/hannah/Downloads/Managerial-Accounting-1506381825_regexified.html 68/350
Units in Beg. WIP 2,000 Units Completed and Transferred:
Units Started this period 10,000 Units from Beg. WIP 2,000
Total Units 12,000 Units started and completed 7,000 (10,000 – 3,000)
Total Units completed and txfr 9,000
Units in End. WIP 3,000
Total Units 12,000
Step 2: Equivalent Units of Production
We are concerned with the right side of our physical flow of units. We must first FINISH beginningwork in process, add units started and completed and units remaining in ending work in process. Beginning work in process is fully complete for materials (or 100% complete) and 60% complete forconversion so to complete these units we will need NO (or 0%) materials and 40% of conversion(100% – 60%). Units started and completed are always 100% complete for materials, labor andoverhead! Ending work in process is 1/3 complete for conversion costs, but what about materials? The problem information reads “Department B adds materials only at the beginning of processing” which means we receive all (or 100%) of the materials at the beginning of the process and endingwork in process will be fully complete for materials.
Materials Conversion Costs
Units from beginningWIP 0 800
[ 2,000 units x (100% – 100%complete)]
[ 2,000 units x (100% – 60%complete)]
Units started andcompleted 7,000 7,000
(7,000 units x 100% complete)
Units in ending WIP 3,000 1,000
(3,000 units x 100% complete) (3,000 units x 1/3 complete)
Total EquivalentUnits 10,000 8,800
Step 3: Cost per Equivalent Units
Under FIFO, we are only interested in the current period costs which is June for this example. Conversion costs are direct labor $7,200 + overhead $6,000.
Materials Conversion Costs
Current Costs added this period $ 1,300 $ 13,200 (7,200 + 6,000)
÷ Total Equivalent Units 10,000 8,800
= Cost per Equivalent Unit $ 0.13 $ 1.50

9/25/2017 Managerial Accounting
file:///Users/hannah/Downloads/Managerial-Accounting-1506381825_regexified.html 69/350
Step 4: Assign Costs to Units Completed and Ending Work in Process Inventory
Under FIFO, remember to bring over the costs of beginning work in process first, then multiply theindividual equivalent units calculated in step 2 (not the total equivalent units) by the cost perequivalent unit from step 3.
Cost assigned to units completed and transferred out:
Cost of beginning work in process inventory $6,180
Cost to complete beginning work in process inventory
Materials (0 equivalent units) $0
Conversion (800 equiv units x $1.50) $1,200
$1,200
Cost of units started and completed
Materials (7,000 equiv units x $0.13) $910
Conversion (7,000 equiv units x $1.50) $10,500
$11,410
Total cost of units completed and transferred $18,790
Cost assigned to ending work in process inventory:
Materials (3,000 equiv units x $0.13) $390
Conversion (1,000 equiv units x $1.50) $1,500
Total cost of units remaining in ending work in process inventory $1,890
Step 5: Reconcile Costs
Here is our chance to check our work. Total costs to account for should always equal what wasassigned in total costs accounted for.
Cost of beginning work in process $6,180
Costs added in June $14,500 (1,300 DM + 7,200 DL + 6,000 OH)
Total costs to account for $20,680
Costs assigned to units completed $18,790 (from step 4 above)
Costs assigned to ending work in process $1,890 (from step 4 above)
Total costs accounted for $20,680

9/25/2017 Managerial Accounting
file:///Users/hannah/Downloads/Managerial-Accounting-1506381825_regexified.html 70/350
Licensing & Attributions
CC licensed content, Shared previously
Accounting Principles: A Business Perspective. Authored by: James Don Edwards, University of Georgia & Roger H. Hermanson, Georgia State University. Provided by: Endeavour International Corporation.Project: The Global Text Project. License: CC BY: Attribution
3.7 ACCOUNTING IN THE HEADLINES
Would job order costing or process costing be usedby the Smarties Candy Company?Smarties come in six flavors: white (orange crème), yellow(pineapple), pink (cherry), green (strawberry), purple (grape),and orange (orange). Smarties are gluten free and vegan andhave 25 calories per roll of 15 candies. The main ingredient inSmarties is dextrose, a form of sugar.The Smarties CandyCompany, founded in 1949, makes its Smarties candy in a NewJersey plant. Its founder bought gunpowder pellet machinesafter World War I and repurposed them to make the tablet-shaped candies. Smarties are made by color in large batchesand then dumped together to be sorted by machines into rollsand packs.
Three granddaughters of the original founder of Smarties now run the company and have beenworking to improve efficiency. Their chief mechanic designed a faster candy press and a new wrappermachine. Previously, 125 Smarties rolls could be wrapped per minute; now 200 rolls can be wrappedper minute.
Smarties are produced 24 hours a day. (You can see a short video clip about Smarties and theproduction process at http://www.fyi.tv/shows/food-factory-usa/videos/these-women-have-business-smarties .) The Smarties Candy Company has its one main product that is likely to account for most of its sales,but recently it has introduced Smarties ‘n creme, which are tablets that are about the size of a quarterand have a flavor burst that is half fruit (strawberry, blueberry, raspberry, peach, or orange) and halfcream (dairy-free.)
Questions
1. Give an example of each of the following types of costs at the Smarties Candy Company:Direct materialDirect laborManufacturing overheadSelling and administrative expense
2. Assume that only Smarties candies are made in the New Jersey plant. Do you think the SmartiesCandy Company is likely to use job order costing or process costing? Explain.
3. If the New Jersey plant begins to produce Smarties ‘n creme in addition to Smarties candy rolls,would this change be likely to whether the company uses job order costing or process costing?

9/25/2017 Managerial Accounting
file:///Users/hannah/Downloads/Managerial-Accounting-1506381825_regexified.html 71/350
Why or why not?
Licensing & Attributions
CC licensed content, Speci�c attribution
Would job order costing or process costing be used by the Smarties Candy Company?. Authored by: Dr. Wendy Tietz, CPA, CMA, CGMA . Located at: http://www.accountingintheheadlines.com. License: CCBY-NC: Attribution-NonCommercial
All rights reserved content
These Women Have Business Smart(ie)s. Authored by: A&E Networks. Located at: http://www.fyi.tv/shows/food-factory-usa/season-1/episode-14/these-women-have-business-smarties. License: All RightsReserved
CHAPTER 3 KEY POINTS
Process Costing Key Points
Process costing is used for mass production – high volumes of standardized product. This makescosting difficult due to the sheer volume of product we are producing and the fact that each productuses a small amount of materials, labor and overhead. Process costing is done in a 5-step Process.
Step 1: Cost accumulation
This section lists all dollar costs in Beginning work in process and adds the costs added during theperiod to get your Total Costs to Account For.
Step 2: Physical Flow of Units
In this section, we document how many units we had to work on and then disclose what happened tothose units – were they finished or not. The calculation is:
Beginning work in process units + units started this period = Units completed and transferred +Ending work in process units
Step 3: Equivalent Units – Weighted Average
Equivalent units is the process of adding partially completed units together to make whole units sinceit is easier to calculate with whole numbers. Under the weighted average method, we use only theUnits completed and transferred and Ending work in process units from Step 2. You will calculatedequivalent units for direct materials, direct labor and overhead. The calculation for equivalent units is:
Units completed and transferred x 100% percent complete
Plus Ending work in process units x percent complete
= Total Equivalent Units

9/25/2017 Managerial Accounting
file:///Users/hannah/Downloads/Managerial-Accounting-1506381825_regexified.html 72/350
Note: Ending work in process percent complete can be different for direct materials, direct labor, oroverhead. Materials added at the beginning means 100% complete since it has received all itsmaterials. Materials or conversion costs added evenly means use the percent complete given.Remember, conversion costs means direct labor and overhead.
Step 4: Cost per Equivalent Unit – Weighted Average
We add the total costs incurred during the process including beginning work in process and divide bythe Total Equivalent Units calculated in Step 3. The formula is applied to direct materials, direct laborand overhead individually (or sometimes just direct materials and conversion costs). The calculationis:
Cost of Beginning work in process inventory + costs added this period
Total Equivalent Units
Step 5: Assign and Reconcile Costs
In this section, you will use the equivalent units calculated in Step 3 and multiply by the cost perequivalent unit calculated in Step 4. You will do this beginning with units completed and transferredand apply the costs to direct material first, then conversion costs. The result of this step is Cost ofGoods Manufactured. The calculations look like this:
Cost assigned to units completed
Direct Materials (equivalent units for direct materials units completed in step 3 x direct material costper equivalent unit in step 4)
+ Conversion Costs (equivalent units for conversion cost units completed in step 3 x conversion costper equivalent unit in step 4).
= Total Costs transferred out (or Cost of Goods Manufactured)
Now, repeat the process using your equivalent units calculated based on Ending Work in Process.
Cost assigned to ending work in process
Direct Materials (equivalent units for direct materials for ending work in process in step 3 x directmaterial cost per equivalent unit in step 4)
+ Conversion Costs (equivalent units for conversion cost for ending work in process in step 3 xconversion cost per equivalent unit in step 4).
= Total Costs assigned to Ending Work in Process
Finally, you complete the reconciliation by adding your Total Costs Transferred Out and Total costsassigned to Ending Work in Process to get your Total Costs Accounted For. This should match thecost totals in Step 1.

9/25/2017 Managerial Accounting
file:///Users/hannah/Downloads/Managerial-Accounting-1506381825_regexified.html 73/350
Click Process Costing Key Points for a printable copy.
GLOSSARY
GLOSSARY
Average cost (or weighted average) method A method of computing equivalent units where thenumber of equivalent units for each cost element equals the number of units transferred out plus thenumber of equivalent units of that cost element in the ending inventory.
Conversion costs Costs of converting raw materials into the final product. Direct labor plusoverhead.
Equivalent units A method of expressing a given number of partially completed units as a smallernumber of fully completed units; for example, bringing 1,000 units to a 75 per cent level of completionis the equivalent of bringing 750 units to a 100 per cent level of completion.
First-in, first-out (FIFO) method A method of determining unit cost. This method computesequivalent units by adding equivalent units of work needed to complete the units in beginninginventory, work done on units started and completed during the period, and work done on partiallycompleted units in ending inventory.
Job cost system (job costing) A manufacturing cost system that accumulates costs incurred toproduce a product according to individual jobs.
Process cost system (process costing) A manufacturing cost system that accumulates costsincurred to produce a product according to the processes or departments a product goes through onits way to completion.
Production cost report A report that shows both the flow of units and the flow of costs through aprocessing center. It also shows how accountants divide these costs between the cost of unitscompleted and transferred out and the cost of units still in the processing center’s ending inventory.
Transferred-in costs Costs associated with physical units that were accumulated in previousprocessing centers.
Licensing & Attributions
CC licensed content, Shared previously
Accounting Principles: A Business Perspective. Authored by: James Don Edwards, University of Georgia & Roger H. Hermanson, Georgia State University. Provided by: Endeavour International Corporation.Project: The Global Text Project. License: CC BY: Attribution
CHAPTER 3: EXERCISES

9/25/2017 Managerial Accounting
file:///Users/hannah/Downloads/Managerial-Accounting-1506381825_regexified.html 74/350
Short Answer Questions, Exercises, and Problems
Short-Answer Questions➢ Define process costing and describe the types of companies that use process costing.➢ How does a process cost system differ from a job costing system?➢ Would a lumber mill use process or job costing?➢ What is meant by the term equivalent units? Ofwhat use is the computation of the numbers of equivalent units of production?➢ Distinguish between the number of units completed and transferred during a period and theequivalent units for the same period.➢ Under what circumstances would the number of equivalentunits of materials differ from the number of equivalent units of labor and overhead in the samedepartment in the same period? Under what circumstances would they be the same?➢ Whentransferring goods from one department to another, which accounts require journal entries?➢ Unitsare usually assumed to be at the same stage of completion for both labor and overhead. What is thereason for this assumption?
➢ What is the basic information conveyed by a production cost report?
➢ What are the four steps in preparing a production cost report?
➢ What is meant by average cost procedure? What other two cost flow assumptions could be used?
➢ Would an automobile plant that makes specialty race cars use job costing or process costing?Would an automobile plant that makes all terrain vehicles use job costing or process costing? Explainyour answer.
➢ Show the differences between computing equivalent units of production using the average costmethod and FIFO cost method (Appendix 19A).
➢ Real world question Does The Coca-Cola Company use a process cost system or a job costingsystem in its bottling plants? Why?
➢ Real world question Name five companies that probably use process costing.
Exercises
Exercise A Using the average cost method, compute the equivalent units of production in each of thefollowing cases:
1. Units started in production during the month, 72,000; units completed and transferred, 52,800;and units in process at the end of the month (100% complete as to materials; 60% complete as toconversion), 19,200. (There was no beginning inventory.)
2. Units in process at the beginning of the month (100% complete as to materials; 30% complete asto conversion), 12,000; units started during the month, 48,000; and units in process at the end ofthe month (100% complete as to materials; 40% complete as to conversion), 24,000.
Exercise B In Department C, materials are added at the beginning of the process. There were 1,000units in beginning inventory, 10,000 units were started during the month, and 7,000 units werecompleted and transferred to finished goods inventory. The ending inventory in Department C in Junewas 40% complete as to conversion costs. Under the average cost method, what are the equivalentunits of production for materials and conversion?

9/25/2017 Managerial Accounting
file:///Users/hannah/Downloads/Managerial-Accounting-1506381825_regexified.html 75/350
Exercise C In Department D, materials are added uniformly throughout processing. The beginninginventory was considered 80% complete, as was the ending inventory. Assume that there were 6,000units in the beginning inventory and 20,000 in the ending inventory, and that 80,000 units werecompleted and transferred out of Department D. What are the equivalent units for the period using theaverage cost method?
Exercise D If in the previous exercise the total costs charged to the department amounted to$960,000, including the $48,000 cost of the beginning inventory, what is the cost of the unitscompleted and transferred out?
Exercise E The following data relate to Work in Process—Department C, in which all materials areadded at the start of processing:
Work in process – Department C: Inventory, March 1:
Materials cost (1,200 pounds; 100% complete) $7,020
Conversion cost (20% complete) 1,804
Costs incurred this period:
Direct materials used (9,000 pounds) $36,330
Direct labor 10,880
Overhead 17,820
Inventory, March 31
Materials cost (1,800 pounds, 100% complete) ?
Conversion cost (1,800 pounds, 80% complete) ?
Pounds of product transferred out: 8,400
Using these data, compute:
1. The unit cost per equivalent unit for materials and conversion (use the average cost method).2. The cost of the product transferred out.
Problems
Problem A The following data refer to a production center of Sipp-Fizz, a soft drink bottler:
Work in process inventory, August 1, 4,000 units (units equal 12-bottle cases):
Direct materials $12,000
Direct labor 6,120
Manufacturing overhead applied 8,000
$26,120
Units started in August 12,000
Costs incurred in August:

9/25/2017 Managerial Accounting
file:///Users/hannah/Downloads/Managerial-Accounting-1506381825_regexified.html 76/350
Direct materials $36,000
Direct labor 48,000
Manufacturing overhead applied 60,000
The beginning inventory was 100% complete for materials and 50% complete for conversion costs.
The ending inventory on August 31 consisted of 6,000 units (100% complete for materials, 70%complete for conversion costs).
Compute the following:
1. Number of units completed and transferred to finished goods inventory.2. The equivalent units of production for materials and conversion costs using the average cost
method.3. Cost per equivalent unit for materials and conversion costs.4. Cost of units completed and transferred.5. Cost of ending inventory.
Problem B The following information relates to Aromatic Company for its line of perfume products forthe month ended March 31:
Units in beginning inventory (units equal cases of product) 2,700
Cost of units in beginning inventory:
Materials $40,500
Conversion $ 18,900
Units placed in production 54,000
Cost incurred during current period:
Materials $239,598
Conversion $215,310
Units remaining in ending inventory
(100% complete as to materials, 60% complete as to conversion)3,000
Prepare a production cost report for the month ended March 31, using the average cost method.
Problem C Shine Company uses a process cost system to account for the costs incurred in makingits single product, a hair conditioner. This product is processed in Department A and then inDepartment B. Materials are added in both departments. Production for May was as follows:
Department A Department B
Units started or transferred in 200,000 160,000
Units completed and transferred out 160,000 120,000
Stage of completion of May 31 inventory:

9/25/2017 Managerial Accounting
file:///Users/hannah/Downloads/Managerial-Accounting-1506381825_regexified.html 77/350
Materials 100% 80%
Conversion 50% 40%
Costs incurred this month:
Direct materials costs $200,000 $304,000
Conversion costs $540,000 $272,000
There was no May 1 inventory in either department.
1. Prepare a production cost report for Department A in May.2. Prepare a production cost report for Department B in May.
Problem D A bottling company bottles soft drinks using a process cost system. Following are costand production data for the mixing department for June:
UnitsMaterials
costs
Conversion
costs
Inventory, June 1 56,000 $11,620 $16,240
Placed in production in June 133,000 29,960 41,720
Inventory, June 30 63,000 ? ?
The June 30 inventory was 100% complete as to materials and 30% complete as to conversion.
Prepare a production cost report for the month ended June 30 using the average cost method.
Problem E Refer to the facts given in the previous problem. Assume the beginning inventory on June1 was 100% complete as to materials and 25% complete as to conversion.
1. Prepare a production cost report for the month ended June 30, using FIFO. Round unit costs tothe nearest cent.
2. Why are ending inventory amounts different than those for the previous problem?
Alternate problems
Alternate problem A Pure Aqua Company is a producer of flavored mineral water. These data are forits March production:
Work in process inventory, March 1, 3,000 (units equal cases):
Direct materials $12,600
Direct labor 6,000
Manufacturing overhead (1,500 machine-hours at $6 per machine-hours) 9,000
$27,600
Units started in March 9,000
Costs incurred in March:

9/25/2017 Managerial Accounting
file:///Users/hannah/Downloads/Managerial-Accounting-1506381825_regexified.html 78/350
Direct materials $36,360
Direct labor 55,200
Manufacturing overhead applied (13,800 machine-hours) ?
The ending inventory consisted of 4,500 units (100% complete as to materials, 60% complete as toconversion).
Compute the following:
1. Number of units completed and transferred to finished goods inventory.2. The equivalent units of production for materials and conversion costs using the average cost
method.3. Cost per equivalent unit for materials and conversion costs.4. Cost of units completed and transferred.5. Cost of ending inventory.
Alternate problem B The following data pertain to a production center of Sunbelt Company, a makerof sunscreen products:
UnitsMaterials
costs
Conversion
costs
Inventory, October 1 70,000 $12,000 $16,000
Placed in production in October 200,000 20,400 18,200
Inventory, October 31 100,000 ? ?
The October 31 inventory was 100% complete as to materials and 20% complete as to conversioncosts.
Prepare a production cost report for the month ended October 31, using the average cost method.
Alternate problem C Healthbar Company produces a health food and determines product costsusing a process cost system. The product is moved through two departments, mixing and bottling.Production and cost data for the bottling department in August follow.
Work in process, August 1 (30,000 pints):
Costs transferred in $30,000
Materials costs 15,000
Conversion costs 9,000
Costs incurred in August:
Transferred in (100,000 pints) $100,000
Materials costs 50,000
Conversion costs 39,300

9/25/2017 Managerial Accounting
file:///Users/hannah/Downloads/Managerial-Accounting-1506381825_regexified.html 79/350
All materials are added at the beginning of the bottling process. Ending inventory consists of 25,000pints, 100% complete as to materials and 40% complete as to conversion.
Prepare a production cost report for August using the average cost method.
Beyond the numbers—Critical thinking
Business decision case A Bicycles Plus, Inc., produces bicycles. While the company has developeda per unit cost, it has not been able to break down its costs in each of its three departments: frames,assembling, and finishing. Karol Ring, the production manager, has been concerned with costoverruns during July in the frames department, which produces the bicycle frames.
On July 1, the frames department had 6,000 units in its work in process inventory. These units were100% complete as to materials and 40% complete as to conversion. The department had incurred$12,000 in materials costs and $90,000 in conversion costs in processing these 6,000 units.
The department handled 30,000 units during the month, including the 6,000 units in beginninginventory on July 1. At the end of the month, the department’s work in process included 3,600 unitsthat were 100% complete as to materials and 30% complete as to conversion. The month’s costswere allocated on the number of units processed during the month as follows:
Materials Conversion
Costs $60,000 $300,216
Units handled during month 30,000 30,000
Cost per unit $ 2 $ 10
The $12 per unit cost was assigned in a way that resulted in the following costs:
Beginning work
in process
Work started
and completed
Ending work
in process
Cost per unit incurred during the month:
Units 6,000 20,400 3,600
Cost per unit $12 $12 $12
Ring realized that this per unit cost is incorrect and asks you to develop a better method of computingthese costs for the month ended July 31.
1. How would you recommend that July’s costs be assigned to the units produced?How would thisdiffer from the present method?
2. To justify your recommendation, recalculate July’s costs using your recommendation. Presentyour analysis in a production cost report.
Ethics case – Writing experience B Steve Yung works in the inventory control group at a companythat produces stone-washed jeans. A good friend manages the Stitching Department at the samecompany. At the end of a recent month, Yung reviewed the Stitching Department’s production costreport and found the department had no beginning Work in Process Inventory, had started 27,000pairs of jeans, and had produced only 24,000 pairs. That leaves 3,000 pairs in ending inventory, Yungthought, that is a lot of jeans they did not finish.

9/25/2017 Managerial Accounting
file:///Users/hannah/Downloads/Managerial-Accounting-1506381825_regexified.html 80/350
Later, Yung visited his friend who managed the Stitching Department. “Why all the ending inventory?”he asked.
“One of the new workers set several machines wrong, and the stitching was bad on 2,400 pairs,” themanager replied. “We set those aside, and we will fix them when we have some free time. The other600 pairs are complete now, and have been transferred out. Our entire operation was slower becauseof the machine problem.”
“Company policy is to send all defective products to the Rework Department. They can fix the jeans.That is their job,” Yung said.
“No way!” exclaimed the Stitching Department manager. “We would all be in trouble if plantmanagement finds out. The worker who messed up would probably be fired. I do not want that. This isour little problem, and we will take care of it.”
1. What should Yung do?2. Would your answer change if Yung learned that the Stitching Department had fixed the jeans and
sent them on to the next department?
Financial analysis C Suppose a bottling company made an error in estimating the stage ofcompletion of its work in process inventory. Suppose the costs in beginning inventory and the coststransferred in were correct, but the company overstated the stage of completion for both materials andconversion costs in ending Work in Process Inventory causing ending Work in Process Inventory to be$100,000 too high. The beginning and ending Finished Goods Inventory amounts are correct. Whateffect would this error have on the company’s last year’s financial statements?
Group project D In groups of 3 or 4 students, write a paper on the topic, “How scientific is theallocation of joint costs to products?” Prepare the paper on a computer and prepare and edit severaldrafts before turning in the final paper. Use examples to demonstrate your points.
Group project E In teams of two or three students, interview the manager of a grocery store. What isthe cost of spoilage in the vegetable and fruit section as a percentage of the total cost of goods sold?Does the manager differentiate between normal and abnormal spoilage? If so, provide someexamples. Each team should write a memorandum to the instructor summarizing the results of theinterview. Information contained in the memo should include:
Date:
To:
From:
Subject:
Content of the memo must include the name and title of the person interviewed, name of thecompany, and information responding to the questions above.
Group project F In teams of two or three students, interview the manager of a fast food restaurantsuch as McDonald’s. What is the cost of spoilage as a percentage of the total cost of goods sold?Does the manager differentiate between normal and abnormal spoilage? If so, provide someexamples. Each team should write a memorandum to the instructor summarizing the results of theinterview. Information contained in the memo should include:
Date:

9/25/2017 Managerial Accounting
file:///Users/hannah/Downloads/Managerial-Accounting-1506381825_regexified.html 81/350
To:
From:
Subject:
Content of the memo must include the name and title of the person interviewed, name of thecompany, and information responding to the questions above.
Using the Internet—A view of the real world
Using the Internet as a research tool, describe the conversion activities (or processes) involved inproducing oil or oil-related products. Your description should include examples of raw materials usedas inputs, production activities required to convert inputs into products, and resulting outputs (finishedgoods). Write your report in the form of a memorandum. The heading of the memorandum shouldcontain the date, to whom it is written, from whom, and the subject matter. Be sure to attach yourresearch materials obtained from the Internet to the memorandum.
Using the Internet as a research tool, describe the conversion activities (or processes) involved inproducing milk or milk-related products. Your description should include examples of raw materialsused as inputs, production activities required to convert inputs into products, and resulting outputs(finished goods). Write your report in the form of a memorandum. The heading of the memorandumshould contain the date, to whom it is written, from whom, and the subject matter. Be sure to attachyour research materials obtained from the Internet to the memorandum.
Comprehensive review problem
The Compack Company assembles personal computers. Personal computers go through severaldepartments where sub assemblies are unpacked and checked, the circuit board is attached, theproduct is tested and repaired if defective, and the computers are packed carefully for shipping. Eachorder is treated as a job, and the entire job is shipped at once. The company keeps track of costs byjob and calculates the equivalent stage of completion for each job based on machine-hours.
Although the company has grown rapidly, it has yet to show a profit. You have been called in as aconsultant. Management believes some jobs are profitable and others are not, but it is not clear whichare profitable. The accounting system is almost nonexistent; however, you piece together thefollowing information for April:
Production:
1. Completed Job No. 101.2. Started and completed Job No. 102.3. Started Job No. 103.
Inventory values:
1. Work in process inventory:
March 31: Job No. 101
Direct materials $60,000
Direct labor 9,600
Overhead 14,400
April 30: Job No. 103

9/25/2017 Managerial Accounting
file:///Users/hannah/Downloads/Managerial-Accounting-1506381825_regexified.html 82/350
Direct materials $45,000
Direct labor 10,400
Overhead 15,600
1. Job No. 101 was exactly one-half finished in direct labor-hours and machine-hours at thebeginning of April, and Job No. 103 was exactly one-half complete in direct labor-hours andmachine-hours at the end of April. However, all of the direct materials necessary to do the entirejob were charged to each job as soon as the job was started.
2. There were no direct materials inventories or finished goods inventories at either March 31 orApril 30.
Manufacturing overhead is applied at $30 per machine-hour. The company used 1,600 machine-hours during April, 480 machine-hours on Job 101 and 600 machine-hours on Job 102. Theactual overhead for the month of April was $50,000.Cost of goods sold (before adjustment for over applied or under applied overhead):
Job No. 101:
Materials $60,000
Labor ?
Overhead ?
Total ?
Job No. 102:
Materials ?
Labor ?
Overhead ?
Total ?
Overhead was applied to jobs using the predetermined rate of $30 per machine-hour. The samerate had been used since the company began operations. Over- or under applied overhead isdebited or credited to Cost of Goods Sold.All direct materials were purchased on account. Direct materials purchased in April amounted to$150,000.Direct labor costs charged to jobs in April were $32,000. All labor costs were the same rate perhour for April for all laborers.
1. Compute the cost of each job, whether in inventory or sold.2. Show the transactions in journal entry form. Use a separate Work in Process Inventory account
for each job.3. Prepare an income statement for April assuming revenue was $250,000 and selling and
administrative expenses were $60,000.4. [1]For example, a survey of oil refineries indicated that seven of the nine companies did not
allocate joint costs. See K. Slater and C. Wooton, A Study of Joint and By-Product Costing in theU.K. (Reprint, London: Chartered Institute of Management Accountants, 1988), p. 110.
9/25/2017 Managerial Accounting
file:///Users/hannah/Downloads/Managerial-Accounting-1506381825_regexified.html 83/350
Licensing & Attributions
CC licensed content, Shared previously
Accounting Principles: A Business Perspective. Authored by: James Don Edwards, University of Georgia & Roger H. Hermanson, Georgia State University. Provided by: Endeavour International Corporation.Project: The Global Text Project. License: CC BY: Attribution
9/25/2017 Managerial Accounting
file:///Users/hannah/Downloads/Managerial-Accounting-1506381825_regexified.html 84/350
CHAPTER 4: ACTIVITY-BASEDCOSTING
CHAPTER 4 STUDY PLAN
Study Plan: Activity Based Costing
Knowledge Targets
I can define the following terms as they relate to our unit:
Cost Driver Cost Pool
Product Margin Activity Based Costing
Customer Margin Activity Rate Plantwide rate
Departmental rate
Allocation Base Cost per Unit
Reasoning TargetsI can explain the use of cost pools in activity based costing.I can analyze the product margin of a product when using activity based costing and plantwideallocation.I can understand the difference between plantwide rate, departmental rate, and activity basedcosting activity rate.I can analyze the customer margin of a product using activity based costing.
Skill Targets

9/25/2017 Managerial Accounting
file:///Users/hannah/Downloads/Managerial-Accounting-1506381825_regexified.html 85/350
I can calculate activity rates for activity cost pools.I can calculate the product margin using a traditional costing system and activity basedcosting.I can allocate overhead using activity based costing activity rates.I can allocate overhead using plantwide rates and departmental rates.I can calculate the total cost of a department, job, product, or process using activity basedcosting.
Click ABC Costing study plan for a printable copy.
4.1 ACTIVITY-BASED COSTING ANDMANAGEMENT
Activity-based costing and management
Suppose you go to a movie theater that has five screens showing five different movies. Jerome Justinworks for the movie theater selling tickets for all five movies. Suppose management wants to knowthe cost of selling tickets per movie and asks you to assign Justin’s wages to each of the five movies.How would you assign his wages?
You could simply divide Justin’s wages by the number of movies and allocate 20% (1/5 = 20%) of hissalary to each movie. Or you could figure out how many tickets he sold to each movie, and allocatehis wages on the basis of ticket sales. For example, if 50% of the ticket sales were for Avatar, youmight allocate 50% of Justin’s wages to Avatar. You probably also could think of additional ways toallocate Justin’s wages. No matter how we allocate Justin’s wages, his wages would not be directlytraceable to one of the movies if he sold tickets for all five movies. In short, the allocation of Justin’swages to a particular movie is at least somewhat arbitrary because alternative methods could allocatedifferent amounts of Justin’s wages to each movie. Justin’s wages would be indirect costs to thedifferent movies because his wages could not be directly assigned to any one of the movies.
By definition, the allocation of indirect costs is at least somewhat arbitrary. Nevertheless, accountantshave discovered that they can improve the ways costs are assigned, such as to movies in this case,by using activity-based costing.
Activity-based costing is a costing method that assigns indirect costs to activities and to theproducts based on each product’s use of activities. Activity-based costing is based on the premise:Products consume activities; activities consume resources.
Activity-based costing identifies the activities generating costs and assigns costs to those activities.Take the earlier Justin example. By focusing on Justin’s activities, management could learn whatcaused costs and find ways to improve Justin’s efficiency. Suppose that by studying Justin’s activities,management learns he spends 40% of his time answering questions about movies, 40% of his timeselling tickets, and 20% doing nothing. Based on this information, management could think aboutbetter ways to use Justin’s time. By improving their signs and posting information about the movies,management could reassign Justin to other tasks.
9/25/2017 Managerial Accounting
file:///Users/hannah/Downloads/Managerial-Accounting-1506381825_regexified.html 86/350
Closely related to activity-based costing is the notion of activity-based management (ABM). Usingactivity-based management, managers identify which activities consume resources. The focus is thento effectively manage costly activities with the goal of reducing costs and improving quality. ConsiderJustin and the movie theater again. Using activity-based management, managers would identify whatJustin did with his time and perhaps find ways to help him become more efficient.
Let’s look at a company that makes clothing. The product does not cost less under one system oranother. Our problem is that no cost system measures costs perfectly. We are able to trace somecosts directly to the product. For example, we are pretty accurate in measuring the cost of denim,which is a direct material, in each of our shirts, pants, jackets, and so forth.
Activity-based costing and management
Suppose you go to a movie theater that has five screens showing five different movies. Jerome Justinworks for the movie theater selling tickets for all five movies. Suppose management wants to knowthe cost of selling tickets per movie and asks you to assign Justin’s wages to each of the five movies.How would you assign his wages?
You could simply divide Justin’s wages by the number of movies and allocate 20 per cent of his salaryto each movie. Or you could figure out how many tickets he sold to each movie, and allocate hiswages on the basis of ticket sales. For example, if 50 per cent ofthe ticket sales were for Avatar, youmight allocate 50 per cent of Justin’s wages to Avatar. You probably also could think of additionalways to allocate Justin’s wages. No matter how we allocate Justin’s wages, his wages would not bedirectly traceable to one of the movies if he sold tickets for all five movies. In short, the allocation ofJustin’s wages to a particular movie is at least somewhat arbitrary because alternative methods couldallocate different amounts of Justin’s wages to each movie. Justin’s wages would be indirect costs tothe different movies because his wages could not be directly assigned to any one of the movies.
By definition, the allocation of indirect costs is at least somewhat arbitrary. Nevertheless, accountantshave discovered that they can improve the ways costs are assigned, such as to movies in this case,by using activity-based costing.
Activity-based costing is a costing method that assigns indirect costs to activities and to theproducts based on each product’s use of activities. Activity-based costing is based on the premise:Products consume activities; activities consume resources.
Numerous companies, such as HP, Caterpillar, and IBM, have implemented activity-based costing.Activity-based costing (ABC) has revealed startling information in these companies. For example,after installing new costing methods, one well-known company found that one of its products, aprinted circuit board, was generating negative margins of 46 per cent.
Activity-based costing identifies the activities generating costs and assigns costs to those activities.Take the earlier Justin example. By focusing on Justin’s activities, management could learn whatcaused costs and find ways to improve Justin’s efficiency. Suppose that by studying Justin’s activities,management learns he spends 40 per cent of his time answering questions about movies, 40 per centof his time selling tickets, and 20 per cent doing nothing. Based on this information, managementcould think about better ways to use Justin’s time. By improving their signs and posting informationabout the movies, management could reassign Justin to other tasks.
Closely related to activity-based costing is the notion of activity-based management (ABM). Usingactivity-based management, managers identify which activities consume resources. The focus is thento effectively manage costly activities with the goal of reducing costs and improving quality. Consider

9/25/2017 Managerial Accounting
file:///Users/hannah/Downloads/Managerial-Accounting-1506381825_regexified.html 87/350
Justin and the movie theater again. Using activity-based management, managers would identify whatJustin did with his time and perhaps find ways to help him become more efficient.
Let’s illustrate by looking at a textile company that makes jeans. We will use this company as a basisto demonstrates important issues about the difficulty with traditional cost allocation methods and theadvantages of activity-based costing.
The product does not cost less under one system or another. Our problem is that no cost systemmeasures costs perfectly. We are able to trace some costs directly to the product. For example, weare pretty accurate in measuring the cost of denim, which is a direct material, in each of our shirts,pants, jackets, and so forth.
Overhead costs are another matter. Overhead includes costs like electricity to run machines andsalaries of product designers and inspectors. All these costs are allocated to products. We knowquality control inspectors cost money, but we do not know how much of that cost is caused by aparticular jacket or pair of pants. So we make some assumptions about the relation between productsand overhead costs. For example, we typically allocate overhead based on machine-hours required tostitch and fasten snaps. While that is probably a reasonable way to allocate the costs of electricity torun machines, its not a desirable way to allocate the cost of quality control inspectors.
overhead allocation is somewhat arbitrary (it is based on an estimate only), how will activity-basedcosting help?
Activity-based costing provides more accurate information because we can identify which activitiescause costs, and we can determine the cost of the activity. Activity-based costing identifies andmeasures the costs of performing the activities that go into a product much better than traditional costmethods. For example, if a particular jacket requires 10 inspections for a production run of 1,000jackets, we figure out the cost of those inspections and assign that cost to the production run for thisparticular jacket.
But exactly how would activity-based costing help us cut production costs?
Once we identify activities that cause costs, we can eliminate or modify costly activities. For example,if we find that a jacket requires too many costly inspections, we could redesign the jacket to reducethe need for inspections. Our current cost system allocates all overhead costs, including inspectioncosts, to products based on machine-hours. We really do not know how much it costs to make aninspection and how much inspection cost is required by each product.
Because activity-based costing provides more information, it takes more time than traditional costsystems. New accounting methods sound great in theory, but there must be enough benefit fromimproved management decisions to justify the additional work required to provide numbers.
Key points about activity-based costing:
1. The allocation of indirect costs is at least somewhat arbitrary, even using sophisticatedaccounting methods.
2. Activity-based costing provides more detailed measures of costs than traditional allocationmethods.
3. Activity-based costing can help marketing people by providing more accurate product costnumbers for decisions about pricing and which unprofitable products the company shouldeliminate.
4. Production also benefits because activity-based costing provides better information about thecost of each activity. In practice, ABC helps managers identify cost-causing activities. To managecosts, production managers learn to manage the activities that cause costs.

9/25/2017 Managerial Accounting
file:///Users/hannah/Downloads/Managerial-Accounting-1506381825_regexified.html 88/350
5. Activity-based costing provides more information about product costs than traditional methods butrequires more record-keeping. Managers must decide whether the benefits or improved decisionsjustify the additional record-keeping cost.
6. Installing activity-based costing requires teamwork among accountants, production managers,marketing managers, and other nonaccounting people.
Next, we discuss the methods used for activity-based costing and illustrate them with an example.
4.2 ACTIVITY BASED-COSTING METHOD
Traditional Costing method
In a traditional costing method, we calculate one plantwide allocation rate or we could calculate anoverhead allocation rate for each department. We have a three step process:
Step 1: Determine the basis for allocating overhead or indirect costs. These can be anything acompany decides but most common are direct labor cost, direct labor hours, direct material usage ormachine hours.
Step 2: Calculated a predetermined overhead rate using estimates. This is typically calculated at theend of the year to be used during the following year. The formula we use for this is:
Predetermined Overhead Rate (POHR) = Estimated Overhead
Estimated Base (or cost driver)
Step 3: Apply overhead throughout the period using the actual amount of our base and thepredetermined overhead rate (POHR) calculated in step 2. We calculate this as:
Applied Overhead = Actual amount of base x POHR
This video will discuss the differences between the traditional costing method and activity basedcosting.
Watch this video online: https://youtu.be/aDycx2hJ6tg
Traditional costing method example
Assume High Challenge Company makes two products, touring bicycles and mountain bicycles. Thetouring bicycles product line is a high-volume line, while the mountain bicycle is a low-volume,specialized product.
High Challenge Company allocated manufacturing overhead costs to the two products for the monthof January. Department A had estimated overhead of $2,000,000 and used 20,000 machine hours. High Challenge has decided to allocate overhead on the basis of machine hours.
The predetermined overhead rate of $100 per machine hour is calculated as:

9/25/2017 Managerial Accounting
file:///Users/hannah/Downloads/Managerial-Accounting-1506381825_regexified.html 89/350
Predetermined Overhead Rate (POHR)=
Estimated Overhead $2,000,000
Estimated Base (or costdriver) 20,000 machine hours
At the end of January, High Challenge had used 1,500 machine hours for the Touring bicycleproduct line and 500 machine hours for the Mountain bicycle product line. Overhead would beallocated to each product as follows (use the POHR calculated above at $100 per machine hour):
Touring Bicycle Mountain Bicycle
$150,000 $50,000
(1,500 machine hours x $100 per hour) (500 machine hours x $100 per hour)
Methods used for activity-based costing
Activity-based costing requires accountants to use the following four steps:
1. Identify the activities that consume resources and assign costs to those activities. Purchasingmaterials would be an activity, for example.
2. Identify the cost drivers associated with each activity. A cost driver is an activity or transaction thatcauses costs to be incurred. For the purchasing materials activity, the cost drivers could be thenumber of orders placed or the number of items ordered. Each activity could have multiple costdrivers.
3. Compute a cost rate per cost driver unit. The cost driver rate could be the cost per purchaseorder, for example.
4. Assign costs to products by multiplying the cost driver rate times the volume of cost driver unitsconsumed by the product. For example, the cost per purchase order times the number of ordersrequired for Product A for the month of December would measure the cost of the purchasingactivity for Product A for December.
The next section describes these four steps.
Step 1 is often the most interesting and challenging part of the exercise. This step requires people tounderstand all of the activities required to make the product. Imagine the activities involved in makinga simple product like a pizza—ordering, receiving and inspecting materials, making the dough, puttingon the ingredients, baking, and so forth. Or imagine the activities involved in making a complexproduct such as an automobile or computer.
One of the lessons of activity-based costing has been that the more complex the business, the higherthe indirect costs. Imagine that each month you produce 100,000 gallons of vanilla ice cream andyour friend produces 100,000 gallons of 39 different flavors of ice cream. Further, assume your icecream is sold only in one liter containers, while your friend sells ice cream in various containers. Yourfriend has more complicated ordering, storage, product testing (one of the more desirable jobs,nevertheless), and packing in containers. Your friend has more machine setups, too. Presumably, youcan set the machinery to one setting to obtain the desired product quality and taste. Your friend has toset the machines each time a new flavor is produced. Although both of you produce the same totalvolume of ice cream, it is not hard to imagine that your friend’s overhead costs would be considerablyhigher.
In Step 2, we identify the cost drivers. In the table below, we present several examples of the costdrivers companies use. Most cost drivers are related to either the volume of production or to the

9/25/2017 Managerial Accounting
file:///Users/hannah/Downloads/Managerial-Accounting-1506381825_regexified.html 90/350
complexity of the production or marketing process.
Cost driver Cost of assigned cost driverMiles driven Automobile costsMachine-hours Electricity to run machinesCustomersserved Overhead in a bankFlight hours Airplane maintenance costsNumber ofcustomers Selling costs
In deciding which cost drivers to use, managers consider these three factors:Causal relation. Choosing a cost driver that causes the cost is ideal. For example, supposestudents in biology classes are messier than students in history classes. As a result, theuniversity does more maintenance per square foot in biology classrooms and labs than in historyclassrooms. Further, it is possible to keep track of the time maintenance people spend cleaningclassrooms and labs. The university could assign maintenance costs based on the time spent inhistory classrooms and in biology classrooms and labs, respectively, to the history and biologydepartments.Benefits received. Choose a cost driver so costs are assigned in proportion to benefits received.For example, if the physics department in a university benefits more from the university’ssupercomputer than the German department does, the university should select a cost driver thatrecognizes such differences in benefits. The cost driver could be the number of faculty and/orstudents in each department who use the computer.Reasonableness. Some costs that cannot be linked to products based on causality or benefitsreceived are assigned on the basis of reasonableness.
For step 3, we need to calculate the activity rates. These are calculated using the same formula forpredetermined overhead rate (POHR) that we used for traditional costing. In general, predeterminedrates for allocating indirect costs to products are computed as follows:
Predetermined Overhead Rate (POHR) = Estimated Overhead
Estimated Base (or cost driver)
This formula applies to all indirect costs, whether manufacturing overhead, administrative costs,distribution costs, selling costs, or any other indirect cost.
In Step 4, we first define the notion of an activity center. An activity center is a unit of theorganization that performs some activity. For example, the costs of setting up machines would beassigned to the activity center that sets up machines. This means that each activity has associatedcosts. When the cost driver is the number of inspections, for example, the company must keep trackof the cost of inspections.
Workers and machines perform activities on each product as it is produced. Accountants allocatecosts to products by multiplying each activity’s indirect cost rate by the volume of activity used inmaking the product. The formula we will use for each activity is:
Applied Overhead = Actual amount of activity cost driver x activity POHR
Activity-based costing example

9/25/2017 Managerial Accounting
file:///Users/hannah/Downloads/Managerial-Accounting-1506381825_regexified.html 91/350
Assume High Challenge Company makes two products, touring bicycles and mountain bicycles. Thetouring bicycles product line is a high-volume line, while the mountain bicycle is a low-volume,specialized product.
In using activity-based costing, the company identified four activities that were important cost driversand a cost driver used to allocate overhead. These activities were (1) purchasing materials, (2) settingup machines when a new product was started, (3) inspecting products, and (4) operating machines.
Accountants estimated the overhead and the volume of events for each activity. For example,management estimated the company would purchase 100,000 pieces of materials that would requireoverhead costs of $200,000 for the year. These overhead costs included salaries of people topurchase, inspect, and store materials. Setting up machines for a new product would need 400 setupsand overhead of $800,000. The company would have 4,000 inspections and overhead of $400,000. Finally, running machines would cost $600,000 for 20,000 machine hours.
These estimates were made last year and will be used during all of the current year. In practice,companies most frequently set rates for the entire year, although some set rates for shorter periods,such as a quarter.
Look at the overhead rates computed for the four activities in the table below. Note that the totaloverhead for current year is $2,000,000 using activity-based costing, just as it was using a traditionalcosting method. The total amount of overhead should be the same whether using activity-basedcosting or traditional methods of cost allocation to products. The primary difference between activity-based costing and the traditional allocation methods is the amount of detail; particularly, the number ofactivities used to assign overhead costs to products. Traditional allocation uses just one activity, suchas machine-hours. Activity-based costing used four activities in this case. In practice, companiesusing activity-based costing generally use more than four activities because more than four activitiesare important. We used four to keep the illustration as simple as possible.
The activity cost rates (predetermined overhead rates) are calculated as follows:
Activity Cost Driver(activity)
OverheadCost Estimated Units Rate
PurchasingMaterials Pieces of materials $ 200,000 100,000 pieces $ 2 per piece
Machine Setups Machine setups 800,000 400 setups 2,000 per setup
Inspections Inspection hours 400,000 4,000 inspect.hours 100 per inspect.
hour
Running Machine Machine hours 600,000 20,000 mach.Hours 30 per machine
hour
Total Overhead $ 2,000,000
For January, the High Challenge Company has the following information about the actual number ofcost driver units for each of the two products:
Touring Mountain
Purchasing Materials 6,000 pieces 4,000 pieces
Machine Setups 10 setups 30 setups

9/25/2017 Managerial Accounting
file:///Users/hannah/Downloads/Managerial-Accounting-1506381825_regexified.html 92/350
Inspections 200 hours 200 hours
Running Machine 1,500 hours 1,500 hours
Multiplying the actual activity events for each product times the predetermined rates computed earlierresulted in the overhead allocated to the two products:
Touring Mountain
PurchasingMaterials
$12,000
(6,000 pieces x $2 perpiece) $ 8,000 (4,000 pieces x $2 per
piece)
Machine Setups 20,000 (10 setups x $2,000 persetup) 60,000 (30 setups x $2,000 per
setup)
Inspections 20,000 (200 hours x $100 per hour) 20,000 (200 hours x $100 per hour)
Running Machine 45,000 (1,500 hours x $30 perhour) 15,000 (500 hours x $30 per hour)
Total Overhead $97,000
$103,000
Now we can compare the overhead allocated to the two product lines using the traditional method andactivity-based costing, as follows:
Touringbicycles
Mountainbicycles
Traditionalmethod $150,000$50,000Activity-basedcosting
97,000 103,000
Notice how the total overhead for the month of January is the same at $200,000 but the amountallocated to each product is different.
Analysis More overhead is allocated to the lower volume mountain bicycles using activity-basedcosting. The mountain bicycles are allocated more overhead per unit primarily because activity-basedcosting recognizes the need for more setups for mountain bicycles and for as many inspection hoursfor the more specialized mountain bicycles as for the higher volume touring bicycles. By failing toassign costs to all of the activities, touring bicycles were subsidizing mountain bicycles. Manycompanies have found themselves in similar situations. Activity-based costing has revealed that low-volume, specialized products have been the cause of greater costs than managers had realized.
Here is a video example of activity based costing:
Watch this video online: https://youtu.be/0m0Ob81nd9g

9/25/2017 Managerial Accounting
file:///Users/hannah/Downloads/Managerial-Accounting-1506381825_regexified.html 93/350
Licensing & Attributions
All rights reserved content
Activity Based Costing vs. Traditional Costing. Authored by: Education Unlocked. Located at: https://youtu.be/aDycx2hJ6tg. License: All Rights Reserved. License Terms: Standard YouTube LicenseActivity Based Costing Systems for Overhead (Managerial Accounting Tutorial #28) . Authored by: Note Pirate. Located at: https://youtu.be/0m0Ob81nd9g. License: All Rights Reserved. License Terms:Standard YouTube License
4.3 ACCOUNTING IN THE HEADLINES
What are potential cost drivers for an ABC system atVirgin America?After several years of losses, Virgin America recently announced that it anticipates a profit for 2013.Although the company is expecting a profit for 2013, it still is not out of the woods. Critics have calledfor greater cost control at Virgin America.
The following table contains selected financial and other data for Virgin America for 2012.
Virgin America
Selected financial data
For Twelve Months Ended December 31, 2012
Partial income statement: (000s omitted)
Operating revenues $ 1,332,837
Other expenses:
Aircraft fuel 537,501
Aircraft rent 221,275
Wages and salaries 176,216
Aircraft maintenance 74,459
Landing fees 110,165
Sales and marketing 107,136
Guest services 50,448
Depreciation 11,260
Other 76,110

9/25/2017 Managerial Accounting
file:///Users/hannah/Downloads/Managerial-Accounting-1506381825_regexified.html 94/350
Total operating expenses $ 1,364,570
Operating income/loss $ (31,733)
Selected data:
Available seat miles (millions) 12,545
Departures 56,362
Aircraft in service 51
Guests (thousands) 6,219
Load factor (% of seats filled) 79.0%
Fuel gallons consumed (thousands) 161,404
Financial data source here.
Questions
1. For each of the expenses listed in the income statement, select a cost driver from the driverslisted under “Selected data.” Provide rationale for your choice of each of the drivers.
2. Are there any expenses you would group together into a single pool? Why or why not?3. How could Virgin America use these cost pools and activity-based costing information internally?
Licensing & Attributions
CC licensed content, Speci�c attribution
What are potential cost drivers for an ABC system at Virgin America?. Authored by: Dr. Wendy Tietz, CPA, CMA, CGMA. Located at: http://www.accountingintheheadlines.com. License: CC BY-NC:Attribution-NonCommercial
CHAPTER 4 KEY POINTS
Activity-Based Costing Takeaways
In this chapter we reviewed/learned 3 ways of allocating overhead. We will use the formula forPredetermined Overhead Rate (POHR) you have already learned.
Plantwide Overhead
Plantwide Overhead allocation means the company uses just one allocation rate (POHR) for theentire company. The rate is calculated as:
Total Overhead for company
Total Base for company

9/25/2017 Managerial Accounting
file:///Users/hannah/Downloads/Managerial-Accounting-1506381825_regexified.html 95/350
The base is typically direct labor but it doesn’t have to be – it can be anything the company decides.To apply overhead, you will take the ACTUAL amount of whatever base was selected for adepartment, product, job, etc. and multiply by the Plantwide POHR.
Departmental Overhead
Departmental Overhead allocation means the each department selects a different BASE to be used toallocate overhead. The rate is calculated as:
Total Departmental Overhead
Total Departmental Base chosen by Department
The base can be anything the department decides but it will use the DEPARTMENT costs only andnot total costs. You can have different rates for every department you choose.
To apply overhead, you will take the ACTUAL amount of whatever base was selected for adepartment and multiply by the Department POHR for that department.
Activity Based Overhead
In Activity-Based Overhead allocation, the company’s overhead is divided into cost activities. Thesecosts have a cost driver which is the object that causes the cost to increase or decrease. A cost poolis where costs that have the same cost drivers are added together to make on activity. Each activitywill have its own overhead allocation rate (POHR). The rate is calculated as:
TOTAL Overhead for the cost pool or activity
TOTAL cost driver quantity (or base)
The base or cost driver can be anything but the rate is based on TOTAL amounts for that activity. Youwill have different rates for every activity or cost pool.
To apply overhead, you will take the ACTUAL amount of whatever base or cost driver for the job,product or department you are assigning overhead to (not TOTAL here just the specific amount for theoverhead you are applying) and multiply by the Activity–based POHR for that activity.
Click ABC Takeways for a printable copy.
GLOSSARY
GLOSSARY

9/25/2017 Managerial Accounting
file:///Users/hannah/Downloads/Managerial-Accounting-1506381825_regexified.html 96/350
Activity-based costing A costing method that first assigns costs to activities, then assigns costs toproducts based on their consumption of activities.
Activity center An activity center is a unit of the organization that performs some activity.
Cost driver A cost driver is an activity or transaction that causes costs to be incurred.
CHAPTER 4: EXERCISES
Questions
➢ A company’s performance measure is the number of customer complaints. Why would thecompany measure the number of customer complaints?
➢ A company’s performance measure is the percentage of time that machines are not working. Whywould the company measure the percentage of time that the machines are not working?
➢ What is the difference between activity-based costing and activity-based management?
➢ Activity-based costing methods use four steps in computing a product’s cost. What are thesesteps?
➢ “Activity-based costing is great for manufacturing plants, but does not really address the needs ofthe service sector.” Do you agree with this statement? Explain.
➢ What is a cost driver? Give three examples.
➢ The vice president of marketing wonders how products can cost less under one cost system thanunder another. How would you respond to her question “Are not costs cut-and-dried?”
➢ A drawback to activity-based costing is that it requires more record-keeping and extensiveteamwork between all departments. What are the potential benefits of a more detailed product costsystem?
➢ Give three criteria for choosing cost drivers for allocating costs to products.
➢ “Activity-based costing is for accountants and production managers. I plan to be a marketingspecialist so ABC will not help me.” Do you agree with this statement? Explain.
➢ Observe the workings of a food service or coffee house. What activities are being performed? Giveexamples of some cost drivers that cause the cost of those activities. (For example, cooking food isan activity; the number of meals could be a cost driver for the cooking activity.)
➢ Observe the workings of a bank, credit union, or savings and loan institution. What activities arebeing performed? Give examples of some cost drivers that cause the cost of those activities. (Forexample, opening checking accounts is an activity; the number of accounts opened could be a costdriver for the opening accounts activity.)

9/25/2017 Managerial Accounting
file:///Users/hannah/Downloads/Managerial-Accounting-1506381825_regexified.html 97/350
➢ Activity-based costing assigns costs to activities that consume resources and to the productsbased on each product’s use of activities. What is a benefit of this approach compared to a traditionalapproach that allocates costs to products based on the machine-hours used to produce the product?
Exercises
Exercise A Quality Sound Corporation produces two types of compact discs (CDs), one is to installon touring bicycles and the other is a high-grade product for home and car use. The touring bicycles’CDs are designed for durability rather than accurate sound reproduction. The company only recentlybegan producing the high-grade disc. Management believes the accounting system may not beaccurately allocating costs to products.
Management asked you to investigate the cost allocation problem. You found that manufacturingoverhead is currently assigned based on the direct labor costs in the products. For your investigation,you are using data from last year. Last year’s manufacturing overhead was $440,000 based onproduction of 320,000 touring bicycle CDs and 100,000 high-grade CDs. Direct labor and directmaterials costs were as follows:
Touring
bicycle
High
gradeTotal
Directlabor $180,000$60,000$240,000Materials120,000 112,000 232,000
Management believes three activities cause overhead costs. The cost drivers and related costs foryour analysis are as follows:
Activity Level
Costdrivers
Costassigned
Touring
bicycle
High
gradeTotal
Number ofproductionruns
$200,000 40 10 50
Qualitytestsperformed
180,000 12 18 30
Shippingordersprocessed
60,000 100 50 150
Totaloverhead $440,000
1. How much of the overhead would be assigned to each product if the three cost drivers are usedto allocate overhead? What would be the cost per unit (including materials, labor, and overhead)for each product if overhead is assigned to products using the three cost drivers?
2. How much of the overhead would be assigned to each product if direct labor costs had been usedas the basis for allocating overhead to each product? What would be the cost per unit (includingmaterials, labor, and overhead) for each product if overhead is allocated to products using directlabor cost as the allocation base?

9/25/2017 Managerial Accounting
file:///Users/hannah/Downloads/Managerial-Accounting-1506381825_regexified.html 98/350
Exercise E Landscape, Inc., is a lawn and garden service. The company originally specialized inserving small residential clients; recently it has started contracting for work on larger office buildinggrounds.
Employees worked a total of 10,000 hours last year, 6,500 on residential jobs and 3,500 oncommercial jobs. Wages amounted to $10 per hour for all work done. Materials used are included inoverhead and called supplies. All overhead is allocated on the basis of labor-hours worked, which isalso the basis for customer charges. Landscape, Inc., can charge $30 per hour for residential workbut, because of greater competition for commercial accounts, only $20 per hour for commercial work.
1. Using labor-hours as the basis for allocating overhead, what was the gross margin (revenuesminus labor and overhead expense) for (1) commercial and (2) residential service? Assumeoverhead was $50,000.
2. Overhead consists of transportation, lawn mowing and landscaping equipment costs,depreciation on equipment, supplies, fuels, and maintenance. These costs can be traced to thefollowing activities:
Activity LevelActivity Cost
driver Cost CommercialResidential
TransportationClientsserved $10,00015 45
Equipmentcosts:
Fuel,maintenance,
depreciation
Equipmenthours 25,000 3,000 2,000
SuppliesSquareyardsservicedper year
15,000 100,000 50,000
Totaloverhead $50,000
Recalculate gross margin for commercial and residential services based on these cost driver bases.
1. Would you advise Landscape, Inc., to drop either the residential or commercial service based onyour analysis? Explain.
Problems
Problem A C & W Corporation manufactures travel clocks and watches. Overhead costs are currentlyallocated using direct labor-hours, but the controller has recommended using an activity-basedcosting system based on the following data:
ActivityLevelActivity Cost
driver Cost Travelclocks Watches
Productionsetup Setups $100,00020 30Materialhandling
Parts 30,000 24 36

9/25/2017 Managerial Accounting
file:///Users/hannah/Downloads/Managerial-Accounting-1506381825_regexified.html 99/350
andrequisitionPackagingandshipping
Unitsshipped60,000 80,000 120,000
Totaloverhead $190,000
1. Compute the amount of total overhead allocated to each of the products under activity-basedcosting.
2. Compute the amount of total overhead allocated to each product using labor-hours as theallocation base. Assume labor-hours required to assemble each unit are .5 per travel clock and1.0 per watch, and that 80,000 travel clocks and 120,000 watches were produced.
3. Should the company follow the controller’s recommendations?
Problem B Sunshield Company makes three types of sunglasses: Nerds, Stars, and Fashions.Sunshield presently allocates overhead to products using a rate based on direct labor-hours. Aconsultant recommended that Sunshield switch to activity-based costing. Management decided togive ABC a try and identified the following activities, cost drivers, and costs for a typical year for eachactivity center. Use this information to compute the overhead rates for each cost driver.
Activity Recommended
cost driverCosts
Costdriver
unitsProductionsetup Production runs $ 30,000 100Orderprocessing Orders 50,000 200
Materialshandling
Pounds of
materials used20,000 8,000
Equipmentdepreciation
andmaintenance
Machine-hours 60,000 10,000
Qualitymanagement Inspections 50,000 40Packing andshipping Units shipped 40,000 20,000Totaloverhead $250,000
In addition, there are 2,500 direct labor-hours in a typical year.
Assume the following activities occurred in February of 2011:
Nerds Stars FashionsUnits produced 1,000 500 400Direct $4,000 $2,500$2,000

9/25/2017 Managerial Accounting
file:///Users/hannah/Downloads/Managerial-Accounting-1506381825_regexified.html 100/350
materials costsDirect labor-hours 100 100 89Orders 8 8 4Productionruns 2 4 8Pounds ofmaterial 400 200 200Machine-hours 500 300 300Inspections 2 2 2Units shipped 1,000 500 300
Direct labor costs are $15 per hour.
1. Compute an overhead allocation rate (1) for each of the cost drivers recommended by theconsultant and (2) for direct labor.
2. Management wants to compare the product costs using ABC and the traditional method for themonth of February. Compute the production costs for each product for February using directlabor-hours as the allocation base. (Note: Production costs are direct materials, direct labor, andoverhead.)
3. To derive product costs under ABC, compute the production costs for each product for Februaryusing the cost drivers recommended by the consultant.
4. Management has seen your numbers and wants to know how you account for the discrepancybetween the product costs using direct labor-hours as the allocation base and using activity-based costing. Write a brief response to management.
Problem C Filmworks Photography offers two types of services, student portraits and family portraits.Last year, Filmworks had the following costs and revenues:
FilmworksPhotographyIncomestatementDeluxe Family Total
Revenue $180,000 $200,000$380,000Directmaterials 25,000 25,000 50,000Direct labor 90,000 60,000 150,000Indirect costs:Administration——- ———- 25,000Productionsetup ——- ———- 50,000Qualitycontrol ——- ———- 25,000Marketing ——- ———- 20,000Operatingprofit $60,000
Filmworks Photography currently uses labor costs to allocate all overhead, but management isconsidering implementing an activity-based costing system. After interviewing the sales andproduction staff, management decides to allocate administrative costs on the basis of direct laborcosts and to use the following bases to allocate the remaining overhead:

9/25/2017 Managerial Accounting
file:///Users/hannah/Downloads/Managerial-Accounting-1506381825_regexified.html 101/350
Costdriver Units
Activity Cost driver StudentFamilyProductionsetup Photo sessions 150 250Qualitycontrol
Customerinspections 300 200
Marketing Advertisements60 40
1. Complete the income statement using these activity bases.2. Write a report describing how management might use activity-based costing to reduce costs.3. Restate the income statement for Filmworks Photography using direct labor costs as the only
overhead allocation base.4. Write a report to management stating why product line profits differ using activity-based costing
compared to the traditional approach. Indicate whether the activity-based costing methodprovides more accurate information and why (if you believe it does provide more accurateinformation). Indicate in your report how the use of labor-based overhead allocation could resultin Filmworks Photography management making suboptimal decisions.
Alternate problems
Alternate problem A The manager of Rafting Excursions uses activity-based costing to compute thecosts of her raft trips. Each raft holds six paying customers and a guide. She offers two types of rafttrips, a three-day float trip for beginners, and a three-day white-water trip for seasoned rafters. Thebreakdown of costs is as follows:
Activities (withcost drivers)
Costs perfloat trip
Costs perwhite-water trip
Advertising (trips) $430 $430Permit to use theriver (trips) 60 100Equipment use(trips, people)
40 + 10 perperson
80 + $16 perperson
Insurance (trips) 150 300Paying guide(trips, guides)
600 perguide 800 per guide
Food (people) 120 perperson 120 per person
1. Compute the cost of a 28-person (including guides) float trip with four rafts and four guides.2. Compute the cost of a 28-person (including guides) white-water trip with four rafts and four
guides.3. How much should the manager charge each customer if she wants to cover her costs?
Alternate problem B Shoe Express, Inc., manufactures two types of shoes, B-Ball and Marathon.The B-Ball shoe has a complex design that uses gel-filled compartments to provide support. TheMarathon shoe is simpler to manufacture and uses conventional foam padding. Last year, ShoeExpress had the following revenues and costs:
ShoeExpress,Inc.

9/25/2017 Managerial Accounting
file:///Users/hannah/Downloads/Managerial-Accounting-1506381825_regexified.html 102/350
IncomeStatementB-Ball MarathonTotal
Revenue $390,000 $368,000 $758,000Directmaterials 110,000 100,000 210,000Direct labor 80,000 40,000 120,000Indirect costs:Administration——– ——— 40,000Productionsetup ——— ——— 90,000
——— ———Qualitycontrol ——— ——— 60,000Advertising ———- ——— 120,000Net incomebefore taxes $118,000
Shoe Express currently uses labor costs to allocate all overhead, but management is consideringimplementing an activity-based costing system. After interviewing the sales and production staff,management decides to allocate administrative costs on the basis of direct labor costs, but to use thefollowing bases to allocate the remaining overhead:
ActivityLevelActivity Cost drivers B-ball MarathonProductionsetup
Productionruns 20 20
Qualitycontrol Inspections 40 20AdvertisingAdvertisements12 48
1. Complete the income statement using these activity bases.2. Write a brief report indicating how management could use activity-based costing to reduce costs.3. Restate the income statement for Shoe Express, Inc., using direct labor costs as the only
overhead allocation base.4. Write a report to management stating why product line profits differ using activity-based costing
compared to the traditional approach. Indicate whether the activity-based costing methodprovides more accurate information and why (if you believe it does provide more accurateinformation). Indicate in your report how the use of labor-based overhead allocation could resultin Shoe Express management making suboptimal decisions.
Beyond the numbers—Critical thinking
Business decision case A Many companies recognize that their cost systems are inadequate fortoday’s global market. Managers in companies selling multiple products are making important productdecisions based on distorted cost information.
Write a short paper describing the benefits management should expect from implementing activity-based costing.
Business decision case B A company that makes Halloween costumes is considering using just-in-time purchasing and production methods. Write a short paper describing the problems this companymight face in using just-in-time.

9/25/2017 Managerial Accounting
file:///Users/hannah/Downloads/Managerial-Accounting-1506381825_regexified.html 103/350
Business decision case C Managers at Texas Instruments developed these four cost-of-qualitycategories: prevention costs, appraisal costs, internal failure costs, and external failure costs. Give anexample of a cost for each of these four categories. Would minimizing the sum of these four costsassure high-quality products? Why or why not? Write a short paper summarizing your analysis.
Group project D The chapter listed the following six important points to remember about activity-based costing. Following each point are the comments of a cynic in italics. After forming six groups,discuss one of these points in each group. How would you respond to the cynic’s comments? (It isokay to agree; even cynics have good points to make.) Choose one group member to report yourgroup’s response to the class.
The allocation of indirect costs is at least somewhat arbitrary, even using sophisticatedaccounting methods. (“This means no method gives you a true cost; all are arbitrary. So why goto the trouble of implementing ABC?”)Activity-based costing provides more detailed measures of costs than traditional allocationmethods. (“Who needs more detail? Life is already too complicated“.)Activity-based costing can help marketing people by providing more accurate product costnumbers for decisions about pricing and which unprofitable products the company shouldeliminate. (“Why should accountants want to help marketing people?”)Production also benefits because activity-based costing provides better information about thecost of each activity. In practice, ABC helps managers identify cost causing activities. To managecosts, production managers learn to manage the activities that cause costs. (“If production peopleknow their jobs, they do not need help from accountants“.)Activity-based costing provides more information about product costs than traditional methods butrequires more record-keeping. Managers must decide whether the benefits of improved decisionsjustify the additional record-keeping cost. (“ABC sounds like a lot of work. Why bother?“)Installing activity-based costing requires teamwork among accountants, production managers,marketing managers, and other nonaccounting people. (“You will never get these people to worktogether. Accountants and marketing people? You have got to be kidding!”)
Group project E Form a group of three or four students and assume you are hired as businessconsultants for each of the cases below. Respond to each of the comments made in case 1 and case2. Your response should assume you are talking directly to the CEO. State whether you agree ordisagree with the statement and justify your response. (Hint: Consider the potential costs and benefitsassociated with each case.)
Case 1 Your group is meeting with the CEO of a relatively small company that produces one model ofbicycles. After lengthy discussion regarding the company’s costing system, the CEO makes thefollowing statement: “From what I have seen at other companies lately, activity-based costing is thewave of the future. Everyone, including us, should drop existing cost systems and adopt ABC!”
Case 2 Your group is meeting with the CEO of a relatively large company that produces hundreds ofexpensive custom computers. After lengthy discussion regarding the company’s costing system, theCEO makes the following statement: “From what I have seen at other companies lately, activity-basedcosting is the wave of the future. Everyone, including us, should drop existing cost systems and adoptABC!”
Group project F In teams of two or three, interview the manager of a retail (or wholesale) store suchas a music store, an automobile parts store, or the parts department of an appliance dealership. Askthe manager how items are ordered to replace those sold. For example, does he or she order basedon observing inventory levels or place an order each time a customer buys an item? Does he or sheappear to use just-in-time inventory? Write a memorandum to the instructor summarizing the resultsof the interview. Information contained in the memo should include:
Date:

9/25/2017 Managerial Accounting
file:///Users/hannah/Downloads/Managerial-Accounting-1506381825_regexified.html 104/350
To:
From:
Subject:
Content of the memo must include the name and title of the person interviewed, name of thecompany, date of the interview, and the results of the interview.
Group project G In teams of two or three, observe an organization of your choice—wholesale, retail,or service. Give examples of warning and diagnostic signals the organization uses. How could it usecontrol charts, Pareto charts, and cause-and-effect analysis?
Using the Internet—A view of the real world
The Malcolm Baldrige National Quality Award is awarded to companies meeting certain qualitystandards and criteria. This award is issued annually by the National Institute of Standards andTechnology (NIST). Visit the following website:
http://www.baldrige.nist.gov
Click on “Criteria and their Impact”. What criteria are used as a basis for making awards toapplicants? Click on “Winners Showcase”. Who were the most recent winners of the Baldrige Award?What products or services do these companies provide?
Based on the results of the previous Internet project, perform an Internet search to find at least onerecent Baldrige Award winning company. Does the company provide information on the Internet aboutbeing the recipient of the award? If so, write a report summarizing this information. If not, search for arecent award winner that does provide this information, and write a report summarizing theinformation provided.
1. [1]“Texas Instruments: Cost of Quality (A)” (Boston: Harvard Business School, Case 9-189-029).
1. [2]Based on R. S. Kaplan and D. P. Norton, “Using the Balanced Scorecard as a StrategicManagement System,” Harvard Business Review, January-February 1996.

9/25/2017 Managerial Accounting
file:///Users/hannah/Downloads/Managerial-Accounting-1506381825_regexified.html 105/350
CHAPTER 5: COST BEHAVIOR ANDCOST-VOLUME-PROFIT ANALYSIS
CHAPTER 5 STUDY PLAN
Study Plan: Cost-Volume-Pro�t (CVP) Analysis
Knowledge Targets
I can define the following terms as they relate to our unit:
Contribution margin Fixed Costs Variable Costs Profit
Break even point Margin of safety Targeted Income Contribution margin ratio
Reasoning TargetsI can identify costs as fixed or variable.I can explain how changes in volume affect contribution margin.I can explain the significance of margin of safety.I can explain the importance of calculating break even point.
Skill TargetsI can calculate contribution margin and contribution margin ratio.I can determine the break even point in units and dollars.I can calculate the level of sales necessary to achieve a targeted income or profit.
Click CVP Study Plan for a printable copy.
5.1 COST BEHAVIOR VS. COST ESTIMATION
Cost behavior patterns

9/25/2017 Managerial Accounting
file:///Users/hannah/Downloads/Managerial-Accounting-1506381825_regexified.html 106/350
There are four basic cost behavior patterns: fixed, variable, mixed (semivariable), and step whichgraphically would appear as below.
The relevant range is the range of production or sales volume over which the assumptions about costbehavior are valid. Often, we describe them as time-related costs.
Watch this video online: https://youtu.be/KCpRAgs-yMw
A graph depicting the relevant range would look like this:
Fixed costs remain constant (in total) over some relevant range of output. Depreciation, insurance,property taxes, and administrative salaries are examples of fixed costs. Recall that so-called fixedcosts are fixed in the short run but not necessarily in the long run.
For example, a local high-tech company did not lay off employees during a recent decrease inbusiness volume because the management did not want to hire and train new people when businesspicked up again. Management treated direct labor as a fixed cost in this situation. Although volumedecreased, direct labor costs remained fixed.
In contrast to fixed costs, variable costs vary (in total) directly with changes in volume of production orsales. In particular, total variable costs change as total volume changes. If pizza production increasesfrom 100 10-inch pizzas to 200 10-inch pizzas per day, the amount of dough required per day to make10-inch pizzas would double. The dough is a variable cost of pizza production. Direct materials andsales commissions are variable costs.
Direct labor is a variable cost in many cases. If the total direct labor cost increases as the volume ofoutput increases and decreases as volume decreases, direct labor is a variable cost. Piecework payis an excellent example of direct labor as a variable cost. In addition, direct labor is frequently avariable cost for workers paid on an hourly basis, as the volume of output increases, more workersare hired. However, sometimes the nature of the work or management policy does not allow directlabor to change as volume changes and direct labor can be a fixed cost.
Mixed costs have both fixed and variable characteristics. A mixed cost contains a fixed portion of costincurred even when the facility is idle, and a variable portion that increases directly with volume.Electricity is an example of a mixed cost. A company must incur a certain cost for basic electricalservice. As the company increases its volume of activity, it runs more machines and runs them longer.The firm also may extend its hours of operation. As activity increases, so does the cost of electricity.
Managers usually separate mixed costs into their fixed and variable components for decision-makingpurposes. They include the fixed portion of mixed costs with other fixed costs, while assuming the
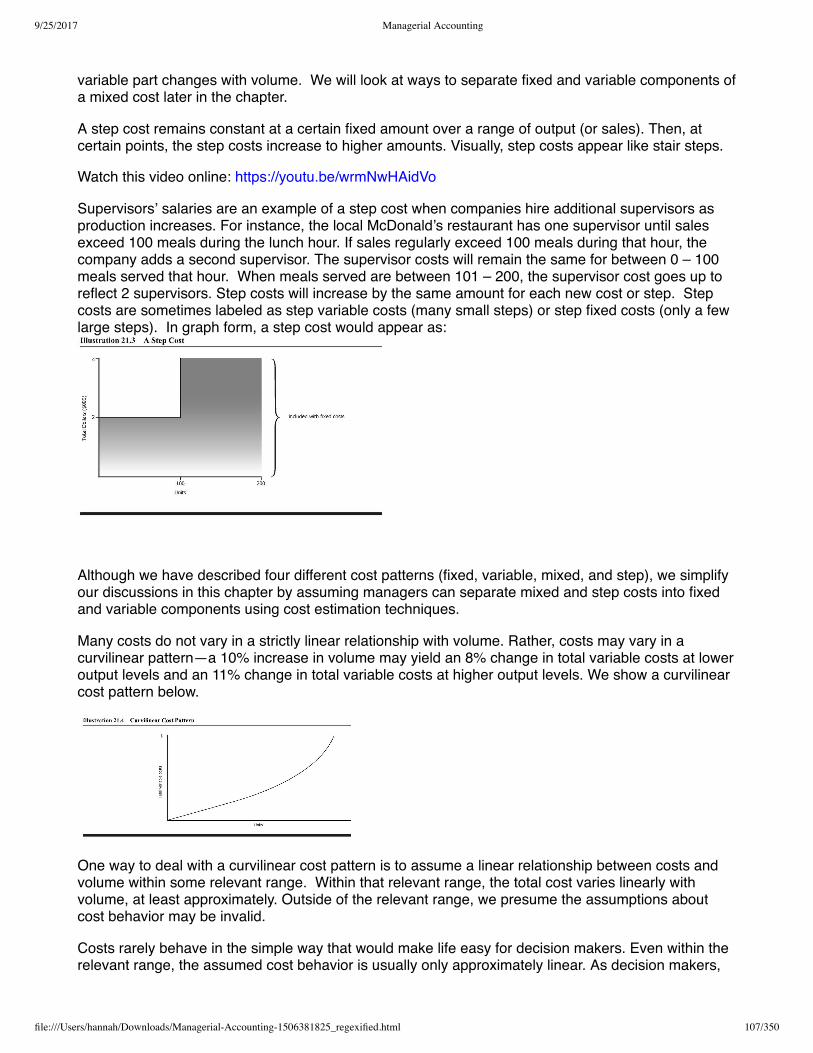
9/25/2017 Managerial Accounting
file:///Users/hannah/Downloads/Managerial-Accounting-1506381825_regexified.html 107/350
variable part changes with volume. We will look at ways to separate fixed and variable components ofa mixed cost later in the chapter.
A step cost remains constant at a certain fixed amount over a range of output (or sales). Then, atcertain points, the step costs increase to higher amounts. Visually, step costs appear like stair steps.
Watch this video online: https://youtu.be/wrmNwHAidVo
Supervisors’ salaries are an example of a step cost when companies hire additional supervisors asproduction increases. For instance, the local McDonald’s restaurant has one supervisor until salesexceed 100 meals during the lunch hour. If sales regularly exceed 100 meals during that hour, thecompany adds a second supervisor. The supervisor costs will remain the same for between 0 – 100meals served that hour. When meals served are between 101 – 200, the supervisor cost goes up toreflect 2 supervisors. Step costs will increase by the same amount for each new cost or step. Stepcosts are sometimes labeled as step variable costs (many small steps) or step fixed costs (only a fewlarge steps). In graph form, a step cost would appear as:
Although we have described four different cost patterns (fixed, variable, mixed, and step), we simplifyour discussions in this chapter by assuming managers can separate mixed and step costs into fixedand variable components using cost estimation techniques.
Many costs do not vary in a strictly linear relationship with volume. Rather, costs may vary in acurvilinear pattern—a 10% increase in volume may yield an 8% change in total variable costs at loweroutput levels and an 11% change in total variable costs at higher output levels. We show a curvilinearcost pattern below.
One way to deal with a curvilinear cost pattern is to assume a linear relationship between costs andvolume within some relevant range. Within that relevant range, the total cost varies linearly withvolume, at least approximately. Outside of the relevant range, we presume the assumptions aboutcost behavior may be invalid.
Costs rarely behave in the simple way that would make life easy for decision makers. Even within therelevant range, the assumed cost behavior is usually only approximately linear. As decision makers,

9/25/2017 Managerial Accounting
file:///Users/hannah/Downloads/Managerial-Accounting-1506381825_regexified.html 108/350
we have to live with the fact that cost estimates are not as precise as physical or engineeringmeasurements.
Licensing & Attributions
CC licensed content, Shared previously
Accounting Principles: A Business Perspective.. Authored by: James Don Edwards, University of Georgia & Roger H. Hermanson, Georgia State University.. Provided by: Endeavour InternationalCorporation. Project: The Global Text Project. License: CC BY: Attribution
All rights reserved content
What is the Relevant Range (Managerial Accounting Tutorial #4). Authored by: Note Pirate. Located at: https://youtu.be/KCpRAgs-yMw. License: All Rights Reserved. License Terms: Standard YouTubeLicenseStep Variable Costs. Authored by: Education Unlocked. Located at: https://youtu.be/wrmNwHAidVo. License: All Rights Reserved. License Terms: Standard YouTube License
5.2 FIXED AND VARIABLE COSTS
Fixed Costs
Fixed costs remain in TOTAL but change per unit based on the actual amount of production. Hereis a video to discuss these concepts.
Watch this video online: https://youtu.be/Ah7EggKApHY
Examples of fixed costs include monthly rent, mortgage or car payments, employee salary,depreciation calculated under straight-line method, and insurance.
Variable Costs
Variable Costs remain the same PER UNIT but CHANGE in total. Watch this video for anotherexplanation:
Watch this video online: https://youtu.be/0Nmvjvhdex8
Variable costs for a manufacturer would include things like direct labor of hourly workers, other wageemployees, direct materials, applied overhead, sales commissions, and depreciation under units ofproduction method.
Licensing & Attributions
All rights reserved content
Variable Costs. Authored by: Education Unlocked. Located at: https://youtu.be/0Nmvjvhdex8. License: All Rights Reserved. License Terms: Standard YouTube LicenseFixed Costs. Authored by: Education Unlocked. Located at: https://youtu.be/Ah7EggKApHY. License: All Rights Reserved. License Terms: Standard YouTube License
5.3 MIXED COSTS

9/25/2017 Managerial Accounting
file:///Users/hannah/Downloads/Managerial-Accounting-1506381825_regexified.html 109/350
Mixed costs are costs that contain a portion of both fixed and variable costs. Common examplesinclude utilities and even your cell phone! You may be charged a fixed amount each month for datausage or text messages allowed but when you exceed your limit, you are charged a set amount(variable cost) based on each text message or gigabyte of data you use over your limit.
Watch this video online: https://youtu.be/mRi01CYooDA
A mixed cost would look like this in a graph:
Next, we will look at how we can estimate the fixed and variable portions of a mixed cost foraccounting analysis.
Licensing & Attributions
All rights reserved content
What are Mixed Costs? (Managerial Accounting Tutorial #5). Authored by: Note Pirate. Located at: https://youtu.be/mRi01CYooDA. License: All Rights Reserved. License Terms: Standard YouTube License
5.4 ACCOUNTING IN THE HEADLINES: COSTS
Are the costs of owning a car �xed, variable,or mixed?According to a recent news article in the Wall Street Journal(“Mercedes or Ford, It Costs a Lot More Than You Think,” WallStreet Journal, Sunday Journal, March 15, 2014), the averageconsumer spends more than $760 a month on his/her vehicle andrelated expenses.
Purchase price of the car Finance charges on car loan Gas Oil changes Routine maintenance Tires

9/25/2017 Managerial Accounting
file:///Users/hannah/Downloads/Managerial-Accounting-1506381825_regexified.html 110/350
Insurance License plate/registration SiriusXM Radio subscription cost Car washes Garage/parking Parking tickets Speeding tickets Value of car owner’s time spent commuting
Questions
1. Which of the costs above would most likely be variable with respect to the number of milesthe car owner drives?
2. Which of the costs above would most likely be fixed with respect to the number of miles thecar owner drives?
3. Which of the costs above would most likely be mixed with respect to the number of miles thecar owner drives?
Licensing & Attributions
CC licensed content, Speci�c attribution
Are the costs of owning a car �xed, variable, or mixed?. Authored by: Dr. Wendy Tietz, CPA, CMA, CGMA . Located at: http://www.accountingintheheadlines.com. License: CC BY-NC: Attribution-NonCommercial
5.5 COST-VOLUME-PROFIT ANALYSIS INPLANNING
Cost-volume-pro�t (CVP) analysis
Companies use cost-volume-profit (CVP) analysis (also called break-even analysis) to determinewhat affects changes in their selling prices, costs, and/or volume will have on profits in the short run.A careful and accurate cost-volume-profit (CVP) analysis requires knowledge of costs and their fixedor variable behavior as volume changes.
A cost-volume-profit chart is a graph that shows the relationships among sales, costs, volume, andprofit. Look at illustration below. The illustration shows a cost-volume-profit chart for VideoProductions, a company that produces DVDs. Each DVD sells for $20. The variable cost per DVD is$12, and the fixed costs per month are $ 40,000.

9/25/2017 Managerial Accounting
file:///Users/hannah/Downloads/Managerial-Accounting-1506381825_regexified.html 111/350
The total cost line represents the fixed costs of $40,000 plus $12 per unit. Thus, if Video Productionsproduces and sells 6,000 DVDs, the company’s total costs are $112,000, made up of $40,000 fixedcosts and $ 72,000 total variable costs ($ 72,000 = $ 12 per unit X 6,000 units produced and sold).
The total revenue line shows how revenue increases as volume increases. Total revenue is $ 120,000for sales of 6,000 tapes ($ 20 per unit X 6,000 units sold). In the chart, we demonstrate the effect ofvolume on revenue, costs, and net income, for a particular price, variable cost per unit, and fixed costper period.
At each volume, one can estimate the company’s profit or loss. For example, at a volume of 6,000units, the profit is $8,000. We can find the net income either by constructing an income statement orusing the profit equation. The contribution margin income statement gives the following results for avolume of 6,000 units:
Revenue $120,000Less: variablecosts 72,000Contributionmargin $ 48,000Less: Fixedcosts 40,000Net income $ 8,000
We have introduced a new term in this income statement—the contribution margin. The contributionmargin is the amount by which revenue exceeds the variable costs of producing that revenue. Wecan calculate it on a per unit or total sales volume basis. On a per unit basis, the contribution marginfor Video Productions is $8 (the selling price of $20 minus the variable cost per unit of $ 12).
Contribution Margin = Sales – Variable Cost
The contribution margin indicates the amount of money remaining after the company covers itsvariable costs. This remainder contributes to the coverage of fixed costs and to net income. In VideoProduction’s income statement, the $ 48,000 contribution margin covers the $ 40,000 fixed costs andleaves $ 8,000 in net income.
You can also calculate a contribution margin ratio by using the following formula:
Contribution Margin RATIO = Sales – Variable Cost
Sales
Watch this video to see more about contribution margin and how it can be used in business.
Watch this video online: https://youtu.be/pm6Eo9qiUIY
Profit equation The profit equation is just like the income statement, except it presents the analysis ina slightly different form. According to the profit equation:
Net income = Revenue – Total variable costs – Fixed costs
For Video Productions, the profit equation looks like this:

9/25/2017 Managerial Accounting
file:///Users/hannah/Downloads/Managerial-Accounting-1506381825_regexified.html 112/350
Net income = $ 120,000 − $ 72,000 − $ 40,000 Net income = $ 8,000
The CVP chart above shows cost data for Video Productions in a relevant range of output from 500 to10,000 units. Recall the relevant range is the range of production or sales volume over which thebasic cost behavior assumptions hold true. For volumes outside these ranges, costs behavedifferently and alter the assumed relationships. For example, if Video Productions produced and soldmore than 10,000 units per month, it might be necessary to increase plant capacity (thus incurringadditional fixed costs) or to work extra shifts (thus incurring overtime charges and other inefficiencies).In either case, the assumed cost relationships would no longer be valid.
The contribution margin income statement is used quite frequently since it separates fixed andvariable costs to allow a company to see what it can directly change and what it cannot change. Thisvideo will give you an example of the why and how to do a contribution margin income statement.
Watch this video online: https://youtu.be/fyAEVKCSjcI
Licensing & Attributions
CC licensed content, Shared previously
Accounting Principles: A Business Perspective.. Authored by: James Don Edwards, University of Georgia & Roger H. Hermanson, Georgia State University.. Provided by: Endeavour InternationalCorporation. Project: The Global Text Project. License: CC BY: Attribution
All rights reserved content
Investopedia Video: Contribution Margin . Authored by: Investopedia. Located at: https://youtu.be/pm6Eo9qiUIY. License: All Rights Reserved. License Terms: Standard YouTube LicenseContribution Margin Income Statement. Authored by: Krisitin Ingram. Located at: https://youtu.be/fyAEVKCSjcI. License: All Rights Reserved. License Terms: Standard YouTube License
5.6 BREAK - EVEN POINT FOR A SINGLEPRODUCT
Finding the break-even point
A company breaks even for a given period when sales revenue and costs charged to that period areequal. Thus, the break-even point is that level of operations at which a company realizes no netincome or loss.
A company may express a break-even point in dollars of sales revenue or number of units producedor sold. No matter how a company expresses its break-even point, it is still the point of zero income orloss. To illustrate the calculation of a break-even point watch the following video and then we will workwith the previous company, Video Productions.
Watch this video online: https://youtu.be/94lrvPlG9P4
Before we can begin, we need two things from the previous page: Contribution Margin per unit andContribution Margin RATIO. These formulas are:
Contribution Margin per unit = Sales Price – Variable Cost per Unit

9/25/2017 Managerial Accounting
file:///Users/hannah/Downloads/Managerial-Accounting-1506381825_regexified.html 113/350
Contribution Margin Ratio =Contribution margin (Sales – Variable Cost)
Sales
Break-even in units
Recall that Video Productions produces DVDs selling for $20 per unit. Fixed costs per period total$40,000, while variable cost is $12 per unit. We compute the break-even point in units as:
BE Units = Fixed Costs
Contribution Margin per unit
Video Productions contribution margin per unit is $ 8 ($ 20 selling price per unit – $ 12 variable costper unit). The break even point in units would be calculated as:
BE Units =Fixed Costs $40,000
= 5,000 unitsContribution Margin per unit $8
The result tells us that Video Productions breaks even at a volume of 5,000 units per month. We canprove that to be true by computing the revenue and total costs at a volume of 5,000 units. Revenue =(5,000 units X $20 sales price per unit) $100,000. Total costs = $100,000 ($40,000 fixed costs +$60,000 variable costs calculated as $12 per unit X 5,000 units).
Look at the cost-volume-profit chart and note that the revenue and total cost lines cross at 5,000 units—the break-even point. Video Productions has net income at volumes greater than 5,000, but it haslosses at volumes less than 5,000 units.
Break-even in sales dollars Companies frequently think of volume in sales dollars instead of units.For a company such as GM that makes Cadillacs and certain small components, it makes no sense tothink of a break-even point in units. GM breaks even in sales dollars.
The formula to compute the break-even point in sales dollars looks a lot like the formula to computethe break-even in units, except we divide fixed costs by the contribution margin ratio instead of thecontribution margin per unit.
The contribution margin ratio expresses the contribution margin as a percentage of sales. To calculatethis ratio, divide the contribution margin per unit by the selling price per unit, or total contributionmargin by total revenues. Video Production’s contribution margin ratio is:
Contribution Margin Ratio = Contribution margin $8 = 0.4 or 40%

9/25/2017 Managerial Accounting
file:///Users/hannah/Downloads/Managerial-Accounting-1506381825_regexified.html 114/350
Sales $20
Or, referring to the income statement in which Video Productions had a total contribution margin of$48,000 on revenues of $ 120,000, we compute the contribution margin ratio as contribution margin$48,000 / Revenues $120,000 = 0.40 or 40%.
That is, for each dollar of sales, there is a $ 0.40 left over after variable costs to contribute to coveringfixed costs and generating net income.
Using this contribution margin ratio, we calculate Video Production’s break-even point in sales dollarsas:
BE in Sales Dollars =Fixed Costs $40,000
= $100,000Contribution Margin RATIO 0.40
The break-even volume of sales is $ 100,000 (can also be calculated as break even point in units5,000 units x sales price $ 20 per unit). At this level of sales, fixed costs plus variable costs equalsales revenue, as shown here:
Revenue $ 100,000 (5,000 units x $20 per unit)
Less:variablecosts
60,000 (5,000 units x $12 per unit)
Contributionmargin 40,000 (100,000 – 60,000)
Less: Fixedcosts 40,000
Net Income $ 0
Margin of Safety
If a company’s current sales are more than its break-even point, it has a margin of safety equal tocurrent sales minus break-even sales. The margin of safety is the amount by which sales candecrease before the company incurs a loss. For example, assume Video Productions currently hassales of $120,000 and its break-even sales are $ 100,000. The margin of safety is $ 20,000,computed as follows:
Margin of safety = Current sales – Break even sales
Margin of safety = $ 120,000 – $ 100,000 = $ 20,000
Sometimes people express the margin of safety as a percentage, called the margin of safety rate orjust margin of safety percentage. The margin of safety rate is equal to
Marginof
Safety
Current Sales – Break even Sales
Current Sales

9/25/2017 Managerial Accounting
file:///Users/hannah/Downloads/Managerial-Accounting-1506381825_regexified.html 115/350
Percent=
Using the data just presented, we compute the margin of safety rate is $20,000 / 120,000 = 16.67 %
This means that sales volume could drop by 16.67 percent before the company would incur a loss.
Targeted Profit or Income
You can also use this same type of analysis to determine how many sales units or sales dollars youwould need to make a specific profit (very helpful!). The good news is you have already learned thebasic formula, we are just changing it slightly. The formulas we will need are:
Units at Target Profit =Fixed Costs + Target Income
Contribution Margin per unit
Sales Dollars for Target Profit = Fixed Costs + Target Income
Contribution Margin RATIO
These look familiar (or they should!). These are the same formulas we used for break even analysisbut this time we have added target income. If you think about it, it IS the same formula because atbreak even our target income is ZERO.
Watch this video online: https://youtu.be/4U60Ya5ysMU
Let’s look at another example. The management of a major airline wishes to know how many seatsmust be sold on Flight 529 to make $8,000 in profit. To solve this problem, management must identifyand separate costs into fixed and variable categories.
The fixed costs of Flight 529 are the same regardless of the number of seats filled. Fixed costsinclude the fuel required to fly the plane and crew (with no passengers) to its destination; depreciationon the plane used on the flight; and salaries of required crew members, gate attendants, andmaintenance and refueling personnel. Fixed costs are $12,000.
The variable costs vary directly with the number of passengers. Variable costs include snacks andbeverages provided to passengers, baggage handling costs, and the cost of the additional fuelrequired to fly the plane with passengers to its destination. Management would express each variablecost on a per passenger basis. Variable costs are $25 per passenger.
Tickets are sold for $125 each. The contribution margin is $100 ($125 sales – $25 variable) and thecontribution margin ratio is 80% ($100 contribution margin /$125 sales). We can calculate the unitsand sales dollar required to make $8,000 in profit by:
Units at Target Profit=
Fixed Costs + TargetIncome
= 12,000 +8,000
=$20,000 = 200
ticketsContribution Margin per unit $100 $100
The sales dollars required could be calculated as break even units of 200 tickets x $125 sales priceper ticket = $25,000 or by using the following formula:

9/25/2017 Managerial Accounting
file:///Users/hannah/Downloads/Managerial-Accounting-1506381825_regexified.html 116/350
Sales Dollars for TargetProfit =
Fixed Costs + TargetIncome =
12,000 + 8,000= $20,000 =
$25,000Contribution Margin RATIO 0.80 0.80
Management can also use its knowledge of cost-volume-profit relationships to determine whether toincrease sales promotion costs in an effort to increase sales volume or to accept an order at a lower-than-usual price. In general, the careful study of cost behavior helps management plan future coursesof action.
Licensing & Attributions
CC licensed content, Shared previously
Accounting Principles: A Business Perspective.. Authored by: James Don Edwards, University of Georgia & Roger H. Hermanson, Georgia State University.. Provided by: Endeavour InternationalCorporation. Project: The Global Text Project.. License: CC BY: Attribution
All rights reserved content
Cost Volume Pro�t Analysis (CVP): calculating the Break Even Point . Authored by: Education Unlocked. Located at: https://youtu.be/Nw2IioaF6Lc. License: All Rights Reserved. License Terms: StandardYouTube LicenseCost Volume Pro�t Analysis (CVP): Target Net Income . Authored by: Education Unlocked. Located at: https://youtu.be/4U60Ya5ysMU. License: All Rights Reserved. License Terms: Standard YouTubeLicense
5.7 BREAK EVEN POINT FOR MULTIPLEPRODUCTS
Although you are likely to use cost-volume-profit analysis for a single product, you will more frequentlyuse it in multi-product situations. The easiest way to use cost-volume-profit analysis for a multi-product company is to use dollars of sales as the volume measure. For CVP purposes, a multi-product company must assume a given product mix or sales mix. Product (or sales) mix refers to theproportion of the company’s total sales for each type of product sold.
To illustrate the computation of the break-even point for Wonderfood, a multi-product company thatmakes three types of cereal, assume the following historical data (percent is a percentage of sale, foreach product, take the amount / sales and multiply by 100 to get the percentage):
Product 1 Product 2 Product 3 Total
Amount Percent Amount Percent Amount Percent Amount Percent
Sales 60,000 100%
30,000 100% 10,000 100%
100,000 100%
Less:variablecosts
40,000 67%
16,000 53% 4,000 40%
60,000 60%
Contributionmargin
20,000 33%
14,000 47% 6,000 60%
40,000 40%
We use the data in the total columns to compute the break-even point. The contribution margin ratiois 40% (total contribution margin $40,000/total sales $ 100,000). Assuming the product mix remains

9/25/2017 Managerial Accounting
file:///Users/hannah/Downloads/Managerial-Accounting-1506381825_regexified.html 117/350
constant and fixed costs for the company are $50,000, break-even sales are $125,000, computed asfollows:
BE in Sales Dollars =Fixed Costs $50,000
= $ 125,000Contribution Margin RATIO 0.40
[To check our answer: ($ 125,000 break even sales X 0.40 contribution margin ratio) – $ 50,000 fixedcosts = $ 0 net income.]
Here is a video example:
Watch this video online: https://youtu.be/QsNAp26mFPI
Since what we found in our example for Wonderfood is a total, we need to determine how much saleswould be needed by each product to break even. To find the three product sales totals, we multiplytotal sales dollars by the percent of product (or sales) mix for each of the three products. The productmix for products 1, 2, and 3 is 60:30:10, respectively. That is, out of the $ 100,000 total sales, therewere sales of $ 60,000 for product 1, $ 30,000 for product 2, and $ 10,000 for product 3. An easy wayto calculate product or sales mix is to divide each product’s sales by total sales like in the followingtable:
Sales Sales Mix
Product 1 60,000 60% (60,000 / 100,000)
Product 2 30,000 30% (30,000 / 100,000)
Product 3 10,000 10% (10,000 / 100,000)
Total Sales 100,000 100%
We can calculate the amount each product needs to sell by multiplying the total break even salesrequired x the sales mix for each product. This is calculated as:
Sales Mix Sales at Break even
Product1 60% $ 75,000 (125,000 x 60%)
Product2 30% 37,500 (125,000 x 30%)
Product3 10% 12,500 (125,000 x 10%)
TotalSales 100% 125,000
Be aware! Predicting sales mix can be extremely different. If we know we need $125,000 in sales tobreak even but the sales mix is different from what we budgeted, the numbers will appear quitedifferent (as you should have noticed in the video). If the sales mix is different from our estimate, thebreak even point will not be the same.

9/25/2017 Managerial Accounting
file:///Users/hannah/Downloads/Managerial-Accounting-1506381825_regexified.html 118/350
Licensing & Attributions
CC licensed content, Shared previously
Accounting Principles: A Business Perspective.. Authored by: James Don Edwards, University of Georgia & Roger H. Hermanson, Georgia State University.. Provided by: Endeavour InternationalCorporation. Project: The Global Text Project.. License: CC BY: Attribution
All rights reserved content
acct 2102 Lofty Inc multi product break even CLASS ACTIVITY . Authored by: Carol Sargent. Located at: https://youtu.be/QsNAp26mFPI. License: All Rights Reserved. License Terms: Standard YouTubeLicense
5.8 COST-VOLUME-PROFIT ANALYSISSUMMARY
Assumptions made in cost-volume-pro�t analysis
To summarize, the most important assumptions underlying CVP analysis are:
•Selling price, variable cost per unit, and total fixed costs remain constant through the relevant range.This means that a company can sell more or fewer units at the same price and that the company hasno change in technical efficiency as volume changes.
•In multi-product situations, the product mix is known in advance.
•Costs can be accurately classified into their fixed and variable portions.
Critics may call these assumptions unrealistic in many situations, but they greatly simplify theanalysis.
CVP Graph
This video review the components of the CVP Chart or graph.
Watch this video online: https://youtu.be/Ei8SFrqZiag

9/25/2017 Managerial Accounting
file:///Users/hannah/Downloads/Managerial-Accounting-1506381825_regexified.html 119/350
Licensing & Attributions
CC licensed content, Shared previously
Accounting Principles: A Business Perspective.. Authored by: James Don Edwards, University of Georgia & Roger H. Hermanson, Georgia State University.. Provided by: Endeavour InternationalCorporation. Project: The Global Text Project.. License: CC BY: Attribution
All rights reserved content
Lesson FA-20-050 - Clip 12 - CVP Graph - Part 2 - Breakeven, Pro�ts, Losses, and MoS - 3:10 . Authored by: evideolearner. Located at: https://youtu.be/Ei8SFrqZiag. License: All Rights Reserved. LicenseTerms: Standard YouTube License
5.9 ACCOUNTING IN THE HEADLINES:BREAKEVEN
What happens to the breakeven point when SportsIllustrated lays o� all six sta� photographers anduses freelancers instead?Sports Illustrated announced in late January 2015 that it wouldbe laying off all six of its staff photographers. Instead, it will beusing freelance photographers around the world. SportsIllustrated is one of 90 magazines owned by Time Inc. (TIME). Published 56 times a year, Sports Illustrated is read by over 23million people each week.
Questions
1. What type of cost would staff photographers be for Sports Illustrated (fixed, variable, or mixed)?2. What type of cost would the freelance photographers be for Sports Illustrated?3. What is likely to happen to the breakeven point for Sports Illustrated due to the switch to using
freelance photographers?4. What are some disadvantages to Sports Illustrated’s decision to outsource its photography?
Licensing & Attributions
CC licensed content, Speci�c attribution
What happens to the breakeven point when Sports Illustrated lays o� all six sta� photographers and uses freelancers instead?. Authored by: Dr. Wendy Tietz, CPA, CMA, CGMA. Located at:http://www.accountingintheheadlines.com. License: CC BY: Attribution
CHAPTER 5 KEY POINTS

9/25/2017 Managerial Accounting
file:///Users/hannah/Downloads/Managerial-Accounting-1506381825_regexified.html 120/350
CVP Key Takeaways
Fixed Cost stays the same in total but varies per unit.
Variable Costs stay the same per unit but vary in total.
To calculate cost per unit (this works for any type of cost per unit):
Cost (make sure to use the correct cost)
Units produced
Contribution Margin is Sales – Variable Cost (contribution margin per unit is Sales price per unit –Variable cost per unit).
Contribution Margin RATIO is: Contribution Margin per unit / Sales Price per unit
You can find the breakeven point IN UNITS or the units necessary at any income level using the sameformula:
Fixed Costs + Target Income
Contribution Margin per unit
Note: At breakeven, your target income is ZERO.
You can calculate breakeven point in SALES DOLLARS or Sales necessary to achieve a specificamount of income in 2 ways:
1. Fixed Costs + Target Income
Contribution Margin RATIO
Note: At breakeven, your target income is ZERO.
2. OR, an alternative method is to take your breakeven point in UNITS x sales price per unit.
Contribution Margin Income Statement assumes all costs can be classified as either Fixed or VariableCosts. The basic structure is:
Sales
– Variable Costs
9/25/2017 Managerial Accounting
file:///Users/hannah/Downloads/Managerial-Accounting-1506381825_regexified.html 121/350
= Contribution Margin (Sales – Variable Costs)
– Fixed Costs
=Net Income (Contribution Margin – Fixed Costs)
Click CVP Key Takeaways for a printable copy.
GLOSSARY
GLOSSARY
Break-even point That level of operations at which revenues for a period are equal to the costsassigned to that period so there is no net income or loss.
Contribution margin The amount by which revenue exceeds the variable costs of producing thatrevenue. The contribution margin per unit is the selling price minus the variable cost per unit.
Contribution margin ratio Contribution margin per unit divided by selling price per unit, or totalcontribution margin divided by total revenues.
Cost-volume-profit (CVP) analysis An analysis of the effect that any changes in a company’sselling prices, costs, and/or volume will have on income (profits) in the short run. Also called break-even analysis.
Cost-volume-profit (CVP) chart A graph that shows the relationships among sales, volume, costs,and net income or loss.
Fixed costs Costs that remain constant (in total) over some relevant range of output.
High-low method A method used in dividing mixed costs into their fixed and variable portions. Thehigh plot and low plot of actual costs are used to draw a line representing a total mixed cost.
Margin of safety Amount by which sales can decrease before a loss is incurred.
Margin of safety rate Margin of safety expressed as a percentage, which equals (Current sales –Break-even sales)/Current sales.
Mixed cost Contains a fixed portion of cost incurred even when the plant is completely idle and avariable portion that increases directly with production volume.
Product mix The proportion of the company’s total sales attributable to each type of product sold.
Profit equation The equation is Net income = Revenue – Total variable costs – Fixed costs.
Relevant range The range of production or sales volume over which the assumptions about costbehavior are valid.

9/25/2017 Managerial Accounting
file:///Users/hannah/Downloads/Managerial-Accounting-1506381825_regexified.html 122/350
Scatter diagram A diagram that shows plots of actual costs incurred for various levels of activity; itis used in dividing mixed costs into their fixed and variable portions.
Short run The time during which a company’s management cannot change the effects of certainpast decisions; often determined to be one year or less. In the short run, many costs are assumedto be fixed and unchangeable.
Step cost A cost that remains constant at a certain fixed amount over a range of output (or sales)but then keeps increasing to a higher amount at certain points.
Variable costs Costs that vary (in total) directly with changes in the volume of production or sales.
*Some terms listed in earlier chapters are repeated here for your convenience.
Licensing & Attributions
CC licensed content, Shared previously
Accounting Principles: A Business Perspective. Authored by: James Don Edwards, University of Georgia & Roger H. Hermanson, Georgia State University. Provided by: Endeavour International Corporation.Project: The Global Text Project. License: CC BY: Attribution
CHAPTER 5: EXERCISES
Short-Answer Questions, Exercises, and Problems
Short-Answer Questions➢ Name and describe four cost behavior patterns.➢ Describe two methods of determining the fixed and variable components of mixed costs.➢ What is meant by the term break-even point?➢ What are two ways in which the break-even point can be expressed?➢ What is the relevant range?➢ What is the formula for calculating the break-even point in sales revenue?➢ What formula is used to solve for the break-even point in units?➢ How can the break-even formula be altered to calculate the number of units that must be sold toachieve a desired level of income?➢ Why might a business wish to lower its break-even point? How would it go about lowering thebreak-even point?➢ What effect would you expect the mechanization and automation of production processes tohave on the break-even point?➢ Real world question Assume your college is considering hiring a lecturer to teach a specialclass in communication skills. Identify at least two costs that college administrators might considerin deciding whether to hire the lecturer and add the class.➢ Real world question Two enterprising students are considering renting space and opening aclass video recording service. They would hire camera operators to record large introductoryclasses. The students taking the classes would be charged a fee to rent and view the video on theirlaptops or smart phones. Identify as many costs of this business as you can and indicate whichwould be variable and which would be fixed.ExercisesExercise A Name and match the types of cost behavior with the appropriate diagrambelow:Exercise B Research Inc., performs laboratory tests. Use the high-low method to determine

9/25/2017 Managerial Accounting
file:///Users/hannah/Downloads/Managerial-Accounting-1506381825_regexified.html 123/350
the fixed and variable components of a mixed cost, given the following observations:
Volume (number of tests) Total cost
4,800 $6,000
19,200 9,600
Exercise C Compute the break-even point in sales dollars if fixed costs are $200,000 and the totalcontribution margin is 20% of revenue.
Exercise D Barney Company makes and sells stuffed animals. One product, Michael Bears, sellsfor $28 per bear. Michael Bears have fixed costs of $100,000 per month and a variable cost of $12per bear. How many Michael Bears must be produced and sold each month to break even?
Exercise E Peter Garcia Meza is considering buying a company if it will break even or earn netincome on revenues of $80,000 per month. The company that Peter is considering sells each unit itproduces for $5. Use the following cost data to compute the variable cost per unit and the fixed costfor the period. Calculate the break-even point in sales dollars. Should Peter buy this company?
Volume (units) Cost
8,000 $70,000
68,000 190,000
Exercise F Never Late Delivery currently delivers packages for $9 each. The variable cost is $3 perpackage, and fixed costs are $60,000 per month. Compute the break-even point in both salesdollars and units under each of the following independent assumptions. Comment on why thebreak-even points are different.
1. The costs and selling price are as just given.2. Fixed costs are increased to $75,000.3. Selling price is increased by 10%. (Fixed costs are $60,000.)4. Variable cost is increased to $4.50 per unit. (Fixed costs are $60,000 and selling price is $9.)
Exercise G Best Eastern Motel is a regional motel chain. Its rooms rent for $100 per night, onaverage. The variable cost is $40 a room per night. Fixed costs are $5,000,000 per year. Thecompany currently rents 200,000 units per year, with each unit defined as one room for one night.Should this company undertake an advertising campaign resulting in a $500,000 increase in fixedcosts per year, no change in variable cost per unit, and a 10% increase in revenue (resulting froman increase in the number of rooms rented)? What is the margin of safety before and after thecampaign?
Exercise H Fall-For-Fun Company sells three products. Last year’s sales were $600,000 forparachutes, $800,000 for hang gliders, and $200,000 for bungee jumping harnesses. Variable costswere: parachutes, $400,000; hang gliders, $700,000; and bungee jumping harnesses, $100,000.Fixed costs were $240,000. Find (a) the break-even point in sales dollars and (b) the margin ofsafety.
Exercise I Early Horizons Day Care Center has fixed costs of $300,000 per year and variable costsof $10 per child per day. If it charges $25 a child per day, what will be its break-even pointexpressed in dollars of revenue? How much revenue would be required for Early Horizons DayCare to earn $100,000 net income per year?

9/25/2017 Managerial Accounting
file:///Users/hannah/Downloads/Managerial-Accounting-1506381825_regexified.html 124/350
Problems
Problem A Assume the local franchise of Togorio Sandwich Company assigns you the task ofestimating total maintenance cost on its delivery vehicles. This cost is a mixed cost. You receive thefollowing data from past months:
Month Units Costs
March 8,000 $14,000
April 10,000 14,960
May 9,000 15,200
June 11,000 15,920
July 10,000 15,920
August 13,000 16,880
September 14,000 18,080
October 18,000 19,280
November 20,000 21,200
1. Using the high-low method, determine the total amount of fixed costs and the amount ofvariable cost per unit. Draw the cost line.
2. Prepare a scatter diagram, plot the actual costs, and visually fit a linear cost line to the points.Estimate the amount of total fixed costs and the amount of variable cost per unit.
Problem B
1. Using the preceding graph, label the relevant range, total costs, fixed costs, break-even point,and profit and loss areas.
2. At 8,000 units, what are the variable costs, fixed costs, sales, and contribution margin amountsin dollars?
3. At 8,000 units, is there net income or loss? How much?
Problem C The management of Bootleg Company wants to know the break-even point for its newline hiking boots under each of the following independent assumptions. The selling price is $50 pairof boots unless otherwise stated. (Each pair of boots is one unit.)
1. Fixed costs are $300,000; variable cost is $30 per unit.2. Fixed costs are $300,000; variable cost is $20 per unit.3. Fixed costs are $250,000; variable cost is $20 per unit.4. Fixed costs are $250,000; selling price is $40; and variable cost is $30 per unit.
Compute the break-even point in units and sales dollars for each of the four independent case.
Problem D Refer to the previous problem. Bootleg Company’s sales are $1,100,000. Determinethe margin (safety in dollars for cases (a) through (d).
Problem E Using the data in the Bootleg Company problem (a through d), determine the level ofsales dollars required achieve a net income of $125,000.

9/25/2017 Managerial Accounting
file:///Users/hannah/Downloads/Managerial-Accounting-1506381825_regexified.html 125/350
Problem F Bikes Unlimited, Inc., sells three types of bicycles. It has fixed costs of $258,000 permonth. The sales and variable costs of these products for April follow:
Bikes
Racing Mountain Touring
Sales $1,00,000 $1,500,000 $2,500,000
Variable costs 700,000 900,000 1,250,000
Compute the break-even point in sales dollars.
Problem G a. Assume that fixed costs of Celtics Company are $180,000 per year, variable cost is$12 per unit, and selling price is $30 per unit. Determine the break-even point in sales dollars.
1. Hawks Corporation breaks even when its sales amount to $89,600,000. In 2010, its sales were$14,400,000, and its variable costs amounted to $5,760,000. Determine the amount of its fixedcosts.
2. The sales of Niners Corporation last year amounted to $20,000,000, its variable costs were$6,000,000, and its fixed costs were $4,000,000. At what level of sales dollars would the NinersCorporation break even?
3. What would have been the net income of the Niners Corporation in part (c), if sales volume hadbeen 10% higher but selling prices had remained unchanged?
4. What would have been the net income of the Niners Corporation in part (c), if variable costshad been 10% lower?
5. What would have been the net income of the Niners Corporation in part (c), if fixed costs hadbeen 10% lower?
6. Determine the break-even point in sales dollars for the Niners Corporation on the basis of thedata given in (e) and then in (f).
Answer each of the preceding questions.
Problem H After graduating from college, M. J. Orth started a company that produced cookbooks.After three years, Orth decided to analyze how well the company was doing. He discovered thecompany has fixed costs of $1,200,000 per year, variable cost of $14.40 per cookbook (onaverage), and a selling price of $26.90 per cookbook (on average).
How many units (that is, cookbooks) must be sold to break even? How many units will the companyhave to sell to earn $48,000?
Problem I The operating results for two companies follow:
Sierra Olympias
Sales (20,000) units $1,920,000 $1,920,000
Variable costs 480,000 1,056,000
Contribution margin 1,440,000 864,000
Fixed costs 960,000 384,00
Net income 480,000 480,000

9/25/2017 Managerial Accounting
file:///Users/hannah/Downloads/Managerial-Accounting-1506381825_regexified.html 126/350
1. Prepare a cost-volume-profit chart for Sierra Company, indicating the break-even point, thecontribution margin, and the areas of income and losses.
2. Compute the break-even point of both companies in sales dollars and units.3. Assume that without changes in selling price, the sales of each company decline by 10%.
Prepare income statements similar to the preceding statements for both companies.
Problem J Soundoff, Inc., a leading manufacturer of electronic equipment, decided to analyze theprofitability of its new portable compact disc (CD) players. On the CD player line, the companyincurred $2,520,000 of fixed costs per month while selling 20,000 units at $600 each. Variable costwas $240 per unit.
Recently, a new machine used in the production of CD players has become available; it is moreefficient than the machine currently being used. The new machine would reduce the company’svariable costs by 20%, and leasing it would increase fixed costs by $96,000 per year.
1. Compute the break-even point in units assuming use of the old machine.2. Compute the break-even point in units assuming use of the new machine.3. Assuming that total sales remain at $12,000,000 and that the new machine is leased, compute
the expected net income.4. Should the new machine be leased? Why?
Problem K Surething CD Company reports sales of $720,000, variable costs of $432,000, andfixed costs of $108,000. If the company spends $72,000 on a sales promotion campaign, itestimates that sales will be increased by $270,000.
Determine whether the sales promotion campaign should be undertaken. Provide calculations.
Alternate problems
Alternate problem A Hear Right Company has identified certain variable and fixed costs in itsproduction of hearing aids. Management wants you to divide one of its mixed costs into its fixed andvariable portions. Here are the data for this cost:
Month Units Costs
January 20,800 $57,600
February 20,000 54,000
March 22,000 58,500
April 25,600 57,600
May 28,400 58,500
June 30,000 62,100
July 32,800 63,900
August 35,600 68,400
September 37,600 72,000
October 40,000 77,400
1. Using the high-low method, determine the total amount of fixed costs and the amount ofvariable cost per unit. Draw the cost line.

9/25/2017 Managerial Accounting
file:///Users/hannah/Downloads/Managerial-Accounting-1506381825_regexified.html 127/350
2. Prepare a scatter diagram, plot the actual costs, and visually fit a linear cost line to the points.Estimate the amount of total fixed costs and the variable cost per unit.
Alternate problem B
1. Using the preceding graph, label the relevant range, total costs, fixed costs, break-even point,and profit and loss areas.
2. At 18,000 units, what would sales revenue, total costs, fixed and variable costs be?3. At 18,000 units, would there be a profit or loss? How much?
Alternate problem C Jefferson Company has a plant capacity of 100,000 units, at which levelvariable costs are $720,000. Fixed costs are expected to be $432,000. Each unit of product sells for$12.
1. Determine the company’s break-even point in sales dollars and units.2. At what level of sales dollars would the company earn net income of $144,000?3. If the selling price were raised to $14.40 per unit, at what level of sales dollars would the
company earn $144,000?
Alternate problem D a. Determine the break-even point in sales dollars and units for CowboysCompany that has fixed costs of $63,000, variable cost of $24.50 per unit, and a selling price of$35.00 per unit.
1. Wildcats Company breaks even when sales are $280,000. In March, sales were $670,000, andvariable costs were $536,000. Compute the amount of fixed costs.
2. Hoosiers Company had sales in June of $84,000; variable costs of $46,200; and fixed costs of$50,400. At what level of sales, in dollars, would the company break even?
3. What would the break-even point in sales dollars have been in (c) if variable costs had been10% higher?
4. What would the break-even point in sales dollars have been in (c) if fixed costs had been 10%higher?
5. Compute the break-even point in sales dollars for Hoosiers Company in (c) under theassumptions of (d) and (e) together.
Answer each of the preceding questions.
Alternate problem E See Right Company makes contact lenses. The company has a plantcapacity of 200,000 units. Variable costs are $4,000,000 at 100% capacity. Fixed costs are$2,000,000 per year, but this is true only between 50,000 and 200,000 units.
1. Prepare a cost-volume-profit chart for See Right Company assuming it sells its product for $40each. Indicate on the chart the relevant range, break-even point, and the areas of net incomeand losses.
2. Compute the break-even point in units.3. How many units would have to be sold to earn $200,000 per year?
Alternate problem F Mr Feelds Cookies has fixed costs of $360,000 per year. It sells three typesof cookies. The cost and revenue data for these products follow:
Cookies
Cream cake Goo fill Sweet tooth
Sales $64,000 $95,0000 $131,000
Variable costs 38,400 55,100 66,000

9/25/2017 Managerial Accounting
file:///Users/hannah/Downloads/Managerial-Accounting-1506381825_regexified.html 128/350
Compute the break-even point in sales dollars.
Beyond the numbers—Critical thinking
Business decision case A Quality Furniture Company is operating at almost 100% of capacity.The company expects sales to increase by 25% in 2011. To satisfy the demand for its product, thecompany is considering two alternatives: The first alternative would increase fixed costs by 15% butnot affect variable costs. The second alternative would not affect fixed costs but increase variablecosts to 60% of the selling price of the company’s product.
This is Quality Furniture Company’s condensed income statement for 2010:
Sales $3,600,000
Costs:
Variable $1,620,000
Fixed 330,000 1,950,000
Income before taxes $1,650,000
1. Determine the break-even point in sales dollars for 2011 under each of the alternatives.2. Determine projected income for 2011 under each of the alternatives.3. Which alternative would you recommend? Why?
Business decision case B When the Weidkamp Company’s plant is completely idle, fixed costsamount to $720,000. When the plant operates at levels of 50% of capacity or less, its fixed costsare $840,000; at levels more than 50% of capacity, its fixed costs are $1,200,000. The company’svariable costs at full capacity (100,000 units) amount to $1,800,000.
1. Assuming that the company’s product sells for $60 per unit, what is the company’s break-evenpoint in sales dollars?
2. Using only the data given, at what level of sales would it be more economical to close thefactory than to operate it? In other words, at what level would operating losses approximate thelosses incurred if the factory closed down completely?
3. Assume that Weidkamp Company is operating at 50% of its capacity and decides to reduce theselling price from $60 per unit to $36 per unit to increase sales. At what percentage of capacitymust the company operate to break even at the reduced sales price?
Business decision case C Monroe Company has recently been awarded a contract to sell 25,000units of its product to the federal government. Monroe manufactures the components of the productrather than purchasing them. When the news of the contract was released to the public, PresidentMary Monroe, received a call from the president of the McLean Corporation, Carl Cahn. Cahnoffered to sell Monroe 25,000 units of a needed component, Part J, for $15.00 each. After receivingthe offer, Monroe calls you into her office and asks you to recommend whether to accept or rejectCahn’s offer.
You go to the company’s records and obtain the following information concerning the production ofPart J.
Costs at current production

9/25/2017 Managerial Accounting
file:///Users/hannah/Downloads/Managerial-Accounting-1506381825_regexified.html 129/350
level (200,000 units)
Direct labor $1,248,000
Direct materials 576,000
Manufacturing overhead 600,000
Total cost $2,424,000
You calculate the unit cost of Part J to be $12.12 or ($2,424,000/200,000). But you suspect that thisunit cost may not hold true at all production levels. To find out, you consult the production manager.She tells you that to meet the increased production needs, equipment would have to be rented andthe production workers would work some overtime. She estimates the machine rental to be $60,000and the total overtime premiums to be $108,000. She provides you with the following information:
Costs at current production
level (225,000 units)
Direct labor $1,404,000
Direct materials 648,000
Manufacturing overhead
(including equipmental rental and overtime premiums)828,000
Total cost $2,880,000
The production manager advises you to reject Cahn’s offer, since the unit cost of Part J would beonly $12.80 or ($2,880,000/225,000 units) with the additional costs of equipment rental andovertime premiums. This amount still is less than the $15.00 that Cahn would charge. Undecided,you return to your office to consider the matter further.
1. Using the high-low method, compute the variable cost portion of manufacturing overhead.(Remember that the costs of equipment rental and overtime premiums are included inmanufacturing overhead. Subtract these amounts before performing the calculation).
2. Compute the total costs to manufacture the additional units of Part J. (Note: include overtimepremiums as a part of direct labor.)
3. Compute the unit cost to manufacture the additional units of Part J.4. Write a report recommending that Monroe accept or reject Cahn’s offer.
Business decision case D Refer to the “A broader perspective: Major television networks arefinding it harder to break even” discussion of cost-volume-profit analysis for television networks.Write a memo to your instructor describing how the networks can reduce their break-even points.
Group project E In teams of two or three students, develop a cost-volume-profit equation for a newbusiness that you might start. Examples of such businesses are a portable espresso bar, a pizzastand, a campus movie theater, a package delivery service, a campus-to-airport limousine service,and a T-shirt printing business.
Your equation should be in the form: Profits = (Price per unit X Volume) – (Variable cost per unit XVolume) – Fixed costs per period. Pick a period of time, say one month, and project the unit price,
9/25/2017 Managerial Accounting
file:///Users/hannah/Downloads/Managerial-Accounting-1506381825_regexified.html 130/350
volume, unit variable cost, and fixed costs for the period. From this information, you will be able toestimate the profits—or losses—for the period. Select one spokesperson for your team to tell theclass about your proposed business and its profits or losses. Good luck, and have fun.
Group project F Refer to “A broader perspective: Even colleges use CVP” discussion of how cost-volume-profit analysis is used by colleges. In teams of two or three students, write a memo to yourinstructor defining step costs and explain why the step costs identified in the case are classified assuch. Also include in your memo how the school might lower its break-even point.
Group project G In teams of two or three students, address the following questions:Why would a company consider increasing automation and decreasing the use of labor if theresult would be an increase in the break-even point?Would an increase in automation increase fixed costs over the short-run, long-run, or both?
Write a memo to your instructor that addresses both questions. Be sure to explain your answers.
Using the Internet—A view of the real world
Visit the website for Intel Corporation, a high technology manufacturing company.
http://www.intel.com
Go to the company’s most recent financial statements and review the consolidated statement ofincome. What additional information, if any, would you need to perform cost-volume-profit analysis?Why is this information excluded from Intel’s income statement?
Visit the website for Wal-Mart Corporation, a retail company.
http://www.walmart.com
Go to the company’s most recent financial statements and review the statement of income. Whatadditional information, if any, would you need to perform cost-volume-profit analysis? Why is thisinformation excluded from Wal-Mart Corporation’s income statement?
level (225,000 units)Direct labor$1,404,000Direct materials648,000
Manufacturing overhead
(including equipmental rental and overtime premiums)
828,000Total cost$2,880,000
The production manager advises you to reject Cahn’s offer, since the unit cost of Part J would be only$12.80 or ($2,880,000/225,000 units) with the additional costs of equipment rental and overtimepremiums. This amount still is less than the $15.00 that Cahn would charge. Undecided, you return toyour office to consider the matter further.
1. Using the high-low method, compute the variable cost portion of manufacturing overhead.(Remember that the costs of equipment rental and overtime premiums are included inmanufacturing overhead. Subtract these amounts before performing the calculation).
2. Compute the total costs to manufacture the additional units of Part J. (Note: include overtimepremiums as a part of direct labor.)
3. Compute the unit cost to manufacture the additional units of Part J.

9/25/2017 Managerial Accounting
file:///Users/hannah/Downloads/Managerial-Accounting-1506381825_regexified.html 131/350
4. Write a report recommending that Monroe accept or reject Cahn’s offer.
Licensing & Attributions
CC licensed content, Shared previously
Accounting Principles: A Business Perspective. Authored by: James Don Edwards, University of Georgia & Roger H. Hermanson, Georgia State University. Provided by: Endeavour International Corporation.Project: The Global Text Project. License: CC BY: Attribution
9/25/2017 Managerial Accounting
file:///Users/hannah/Downloads/Managerial-Accounting-1506381825_regexified.html 132/350
CHAPTER 6: VARIABLE ANDABSORPTION COSTING
CHAPTER 6 STUDY PLAN
Study Plan: Variable Costing & Performance Reporting
Knowledge Targets
I can define the following terms as they relate to our unit:
Absorptioncosting
Variablecosting Fixed Costs Variable Costs
Segment SegmentMargin
Segmented IncomeStatement
Contribution Margin IncomeStatement
Traceable Cost Commoncost Cost per unit Net Income
Reasoning TargetsI can identify costs as fixed or variable.I can explain the difference between variable costing and absorption costing.I can analyze and explain the difference in net income under variable costing and absorptioncosting.I can determine the profitability of each segment in a segmented income statement.
Skill TargetsI can calculate cost per unit under variable costing.I can calculate cost per unit under absorption costing.I can prepare income statements using variable costing and absorption costing.I can prepare a segmented income statement.
Click Variable Costing for a printable copy.

9/25/2017 Managerial Accounting
file:///Users/hannah/Downloads/Managerial-Accounting-1506381825_regexified.html 133/350
6.1 ABSORPTION COSTING
Absorption costing, also called full costing, is what you are used to under Generally AcceptedAccounting Principles. Under absorption costing, companies treat all manufacturing costs, includingboth fixed and variable manufacturing costs, as product costs. Remember, total variable costs changeproportionately with changes in total activity, while fixed costs do not change as activity levels change.These variable manufacturing costs are usually made up of direct materials, variable manufacturingoverhead, and direct labor. The product costs (or cost of goods sold) would include direct materials,direct labor and overhead. The period costs would include selling, general and administrative costs.
Watch this video online: https://youtu.be/5RcNPp1_stU
The following diagram explains the cost flow for product and period costs.
The product cost, under absorption costing, would be calculated as:
Direct Materials
+ Direct Labor
+ Variable Overhead
+ Fixed Overhead
= Total Product Cost
You can calculate a cost per unit by taking the total product costs / total units PRODUCED. Yes, youwill calculate a fixed overhead cost per unit as well even though we know fixed costs do not change intotal but they do change per unit. We will assign a cost per unit for accounting reasons. When weprepare the income statement, we will use the multi-step income statement format.
Watch this video online: https://youtu.be/YBWrDtBuRkA
We will not get as complicated in our multi-step income statement as the video example but it shouldhave provided a refresher from what you should have learning in financial accounting. For ourpurpose, the absorption income statement will contain:
Sales
– Cost of Goods Sold
= Gross Profit
Operating Expenses:

9/25/2017 Managerial Accounting
file:///Users/hannah/Downloads/Managerial-Accounting-1506381825_regexified.html 134/350
Selling Expenses
+ General and Admin. Expenses
= Total Expenses
= Net Operating Income
Gross Profit is also referred to as gross margin. Net operating income is Gross Profit – TotalOperating Expenses and is also called Income before taxes. Let’s look at an example:
Bradley Company had the following information for May:Direct materials $13,000Direct labor $15,000Variable overhead $5,000Fixed overhead $6,000Fixed selling expenses $15,000Variable selling expenses $0.20 per unitAdministrative expenses $12,00010,000 units produced9,000 units sold (1,000 remain in ending finished goods inventory)Sales price $8 per unit
First, we need to calculate the absorption product cost per unit:
Direct Materials $ 13,000
+ Direct Labor $ 15,000
+ Variable Overhead $ 5,000
+ Fixed Overhead $ 6,000
= Total Product Cost $39,000
÷ Total Units Produced ÷ 10,000
= Product cost per unit $ 3.90
Next, we can use the product cost per unit to create the absorption income statement. We will usethe UNITS SOLD on the income statement (and not units produced) to determine sales, cost of goodssold and any other variable period costs.
Bradley Company
Income Statement (absorption)
For Month Ended May
Sales (9,000 x $8 per unit) $ 72,000
– Cost of Goods Sold (9,000 x $3.90 per unit) 35,100
= Gross Profit 36,900

9/25/2017 Managerial Accounting
file:///Users/hannah/Downloads/Managerial-Accounting-1506381825_regexified.html 135/350
Operating Expenses:
Selling Expenses (15,000 fixed + variable 0.20 x 9,000 unitssold)
16,800
+ General and Admin. Expenses 12,000
= Total Expenses 28,800
= Net Operating Income $8,100
Remember the following under absorption costing:Typically used for financial reporting (GAAP)ALL manufacturing costs are included in the cost (direct materials, direct labor, fixed and variableoverhead)Can be misleading as some costs are not affected by productsFixed manufacturing overhead costs are applied to units PRODUCED and not just unit soldIncome statement shows Sales – Cost of Goods sold = Gross Margin (or Gross Profit) –Operating Expenses = Net Income and is based on the number of units SOLD.
Licensing & Attributions
CC licensed content, Shared previously
Accounting Principles: A Business Perspective.. Authored by: James Don Edwards, University of Georgia & Roger H. Hermanson, Georgia State University.. Provided by: Endeavour InternationalCorporation. Project: The Global Text Project. License: CC BY: Attribution
All rights reserved content
Period Costs. Authored by: Education Unlocked. Located at: https://youtu.be/5RcNPp1_stU. License: All Rights Reserved. License Terms: Standard YouTube LicensePrepare a Multiple Step Income Statement (Financial Accounting Tutorial #32) . Authored by: Note Pirate. Located at: https://youtu.be/YBWrDtBuRkA. License: All Rights Reserved. License Terms: StandardYouTube License
6.2 VARIABLE COSTING
Variable costing (also known as direct costing) treats all fixed manufacturing costs as period costs tobe charged to expense in the period received. Under variable costing, companies treat only variablemanufacturing costs as product costs. The logic behind this expensing of fixed manufacturing costs isthat the company would incur such costs whether a plant was in production or idle. Therefore, thesefixed costs do not specifically relate to the manufacture of products. The following video explains theconcepts in variable costing:
Watch this video online: https://youtu.be/kfJqYGQOLes
Product costs, under variable costing, includes the VARIABLE costs only like direct materials, directlabor and variable overhead. Fixed overhead would not be included as a product cost! We calculateproduct cost per unit as:
Direct Materials

9/25/2017 Managerial Accounting
file:///Users/hannah/Downloads/Managerial-Accounting-1506381825_regexified.html 136/350
+ Direct Labor
+ Variable Overhead
= Total Product Cost
÷ Total Units Produced
= Product cost per unit
The income statement we will use in not Generally Accepted Accounting Principles so is not typicallyincluded in published financial statements outside the company. This contribution margin incomestatement would be used for internal purposes only. You should remember, the contribution marginincome statement separates variable costs and fixed costs (whether product or period does notmatter) and calculates a contribution margin (this is sales – variable costs). Now, let’s continue withour example Bradley Company.
Bradley Company had the following information for May:Direct materials $13,000Direct labor $15,000Variable overhead $5,000Fixed overhead $6,000Fixed selling expenses $15,000Variable selling expenses $0.20 per unitAdministrative expenses $12,00010,000 units produced9,000 units sold (1,000 remain in ending finished goods inventory)Sales price $8 per unit
First, we will calculate the variable cost product cost per unit:
Direct Materials $ 13,000
+ Direct Labor $ 15,000
+ Variable Overhead $ 5,000
= Total Product Cost $ 33,000
÷ Total Units Produced ÷ 10,000
= Product cost per unit $ 3.30
Next, we calculate the contribution margin format income statement under variable costing:
Bradley Company
Income Statement (variable)
For Month Ended May
Sales (9,000 x $8 per unit) $ 72,000
Variable Costs:
Cost of goods sold (9,000 x $3.30 per unit) 29,700

9/25/2017 Managerial Accounting
file:///Users/hannah/Downloads/Managerial-Accounting-1506381825_regexified.html 137/350
Selling expenses (9,000 x $0.20 per unit) 1,800
Total variable costs 31,500
Contribution Margin 40,500
Fixed Costs:
Fixed overhead (fixed portion only) 6,000
Selling expenses (fixed portion only) 15,000
Administrative expenses 12,000
Total Fixed expenses 33,000
Net Operating Income $ 7,500
In variable costing, it is important to remember:ONLY includes variable costs meaning costs that increase with volumeDoes not include FIXED costs as volume levels do not change these costs (fixed costs treated asperiod costs not product costs)Can provide more accurate information for decision makers as costs are better tied to productionlevelsCan be applied to ALL costs and not just product costs.Uses Contribution Margin Income Statement showing Sales – VARIABLE expenses =Contribution Margin – Fixed Expenses = Net Income and is based on the number of units SOLD.
Licensing & Attributions
CC licensed content, Shared previously
Accounting Principles: A Business Perspective.. Authored by: James Don Edwards, University of Georgia & Roger H. Hermanson, Georgia State University.. Provided by: Endeavour InternationalCorporation. Project: The Global Text Project.. License: CC BY: Attribution
All rights reserved content
Variable Costing (the Variable Costing method in Managerial Accounting) . Authored by: Education Unlocked. Located at: https://youtu.be/kfJqYGQOLes. License: All Rights Reserved. License Terms:Standard YouTube License
6.3 COMPARING ABSORPTION ANDVARIABLE COSTING
In comparing the two income statements for Bradley, we notice that the cost of goods sold underabsorption is $3.90 per unit and $3.30 per unit under variable costing. The income reported undereach statement is off by $600 because of this difference ($8,100 under absorption and $7,500 undervariable). Let’s review how these costs were calculated:
Absorption Variable
Direct Materials $13,000 $13,000
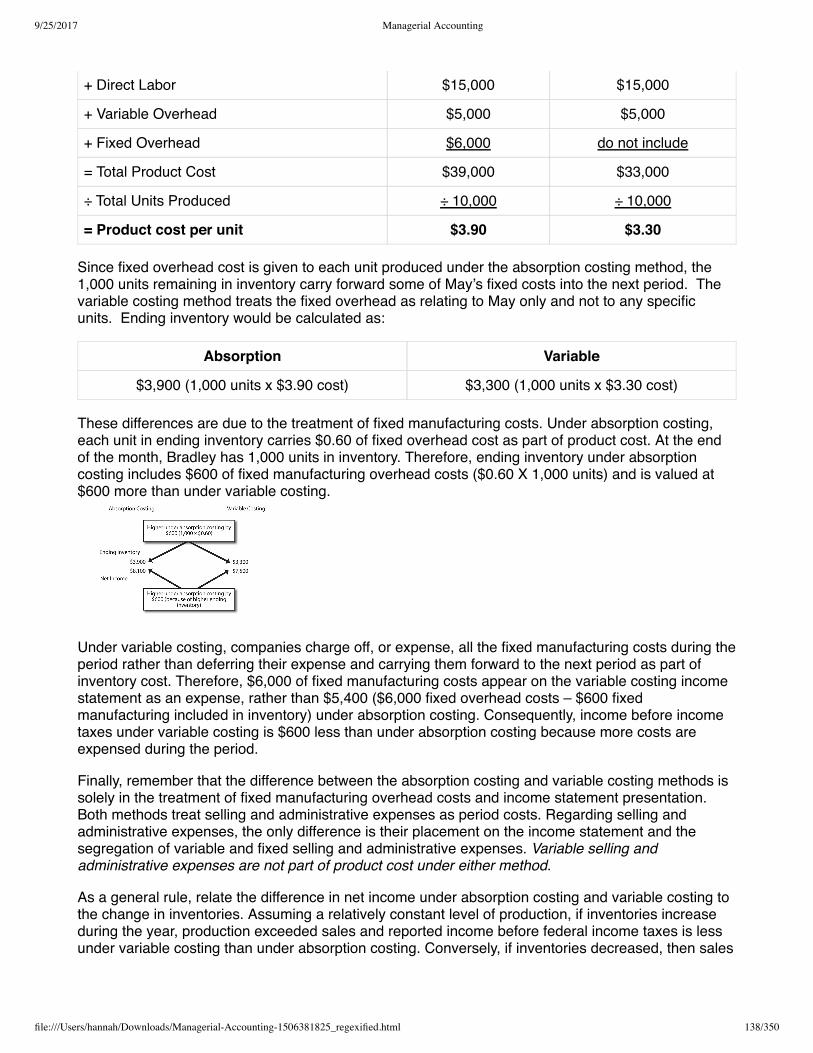
9/25/2017 Managerial Accounting
file:///Users/hannah/Downloads/Managerial-Accounting-1506381825_regexified.html 138/350
+ Direct Labor $15,000 $15,000
+ Variable Overhead $5,000 $5,000
+ Fixed Overhead $6,000 do not include
= Total Product Cost $39,000 $33,000
÷ Total Units Produced ÷ 10,000 ÷ 10,000
= Product cost per unit $3.90 $3.30
Since fixed overhead cost is given to each unit produced under the absorption costing method, the1,000 units remaining in inventory carry forward some of May’s fixed costs into the next period. Thevariable costing method treats the fixed overhead as relating to May only and not to any specificunits. Ending inventory would be calculated as:
Absorption Variable
$3,900 (1,000 units x $3.90 cost) $3,300 (1,000 units x $3.30 cost)
These differences are due to the treatment of fixed manufacturing costs. Under absorption costing,each unit in ending inventory carries $0.60 of fixed overhead cost as part of product cost. At the endof the month, Bradley has 1,000 units in inventory. Therefore, ending inventory under absorptioncosting includes $600 of fixed manufacturing overhead costs ($0.60 X 1,000 units) and is valued at$600 more than under variable costing.
Under variable costing, companies charge off, or expense, all the fixed manufacturing costs during theperiod rather than deferring their expense and carrying them forward to the next period as part ofinventory cost. Therefore, $6,000 of fixed manufacturing costs appear on the variable costing incomestatement as an expense, rather than $5,400 ($6,000 fixed overhead costs – $600 fixedmanufacturing included in inventory) under absorption costing. Consequently, income before incometaxes under variable costing is $600 less than under absorption costing because more costs areexpensed during the period.
Finally, remember that the difference between the absorption costing and variable costing methods issolely in the treatment of fixed manufacturing overhead costs and income statement presentation.Both methods treat selling and administrative expenses as period costs. Regarding selling andadministrative expenses, the only difference is their placement on the income statement and thesegregation of variable and fixed selling and administrative expenses. Variable selling andadministrative expenses are not part of product cost under either method.
As a general rule, relate the difference in net income under absorption costing and variable costing tothe change in inventories. Assuming a relatively constant level of production, if inventories increaseduring the year, production exceeded sales and reported income before federal income taxes is lessunder variable costing than under absorption costing. Conversely, if inventories decreased, then sales

9/25/2017 Managerial Accounting
file:///Users/hannah/Downloads/Managerial-Accounting-1506381825_regexified.html 139/350
exceeded production, and income before income taxes is larger under variable costing than underabsorption costing.
Variable costing is not currently acceptable for income measurement or inventory valuation in externalfinancial statements that must comply with generally accepted accounting principles (GAAP) in theUnited States. However, managers often use variable costing for internal company reports. Here is avideo comparing the two methods:
Watch this video online: https://youtu.be/oSH77AHIYQc
SUMMARY
1. Product costs are calculated differently under each method:
Absorption Variable
Direct Materials Include Include
Direct Labor Include Include
Overhead:
Variable Overhead Include Include
Fixed Overhead Include DO NOT include
Total Product Costs Sum sum
÷ Total Units Produced ÷ Total Units Produced ÷ Total Units Produced
Product Cost per Unit = Cost per unit = Cost per unit
2. Income statement formats are different under each method (both use units sold for variableexpenses):
Absorption uses standard GAAP income statement of Sales – Cost of Goods Sold = Gross Profit– Operating Expenses = Net Operating IncomeVariable uses a contribution margin income statement of Sales – Variable Costs = ContributionMargin – Fixed Expenses = Net Operating Income
3. Net income on the two reports can be different if units produced do not equal units sold.
Licensing & Attributions
CC licensed content, Shared previously
Accounting Principles: A Business Perspective.. Authored by: James Don Edwards, University of Georgia & Roger H. Hermanson, Georgia State University.. Provided by: Endeavour InternationalCorporation. Project: The Global Text Project.. License: CC BY: Attribution
All rights reserved content
Absorption vs. Contribution Approach using Income Statements (Managerial Tutorial #30) . Authored by: Note Pirate. Located at: https://youtu.be/oSH77AHIYQc. License: Public Domain: No KnownCopyright. License Terms: Standard YouTube License
CHAPTER 6 KEY POINTS
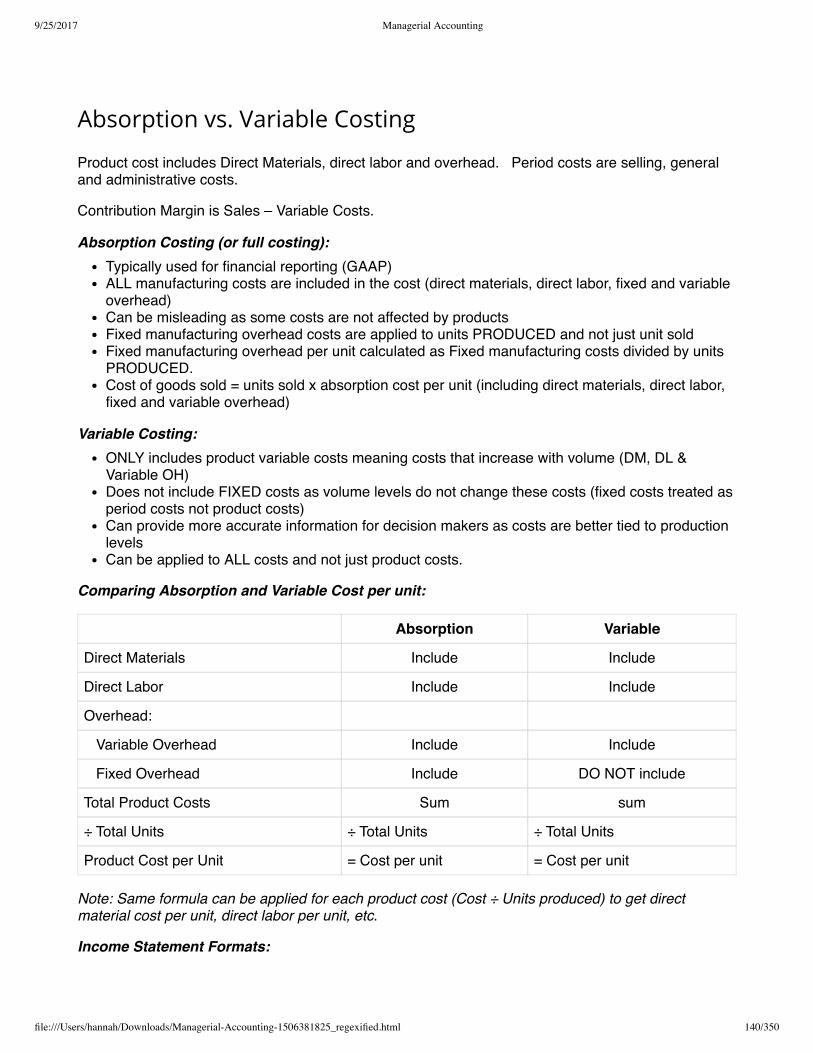
9/25/2017 Managerial Accounting
file:///Users/hannah/Downloads/Managerial-Accounting-1506381825_regexified.html 140/350
Absorption vs. Variable Costing
Product cost includes Direct Materials, direct labor and overhead. Period costs are selling, generaland administrative costs.
Contribution Margin is Sales – Variable Costs.
Absorption Costing (or full costing):Typically used for financial reporting (GAAP)ALL manufacturing costs are included in the cost (direct materials, direct labor, fixed and variableoverhead)Can be misleading as some costs are not affected by productsFixed manufacturing overhead costs are applied to units PRODUCED and not just unit soldFixed manufacturing overhead per unit calculated as Fixed manufacturing costs divided by unitsPRODUCED.Cost of goods sold = units sold x absorption cost per unit (including direct materials, direct labor,fixed and variable overhead)
Variable Costing:ONLY includes product variable costs meaning costs that increase with volume (DM, DL &Variable OH)Does not include FIXED costs as volume levels do not change these costs (fixed costs treated asperiod costs not product costs)Can provide more accurate information for decision makers as costs are better tied to productionlevelsCan be applied to ALL costs and not just product costs.
Comparing Absorption and Variable Cost per unit:
Absorption Variable
Direct Materials Include Include
Direct Labor Include Include
Overhead:
Variable Overhead Include Include
Fixed Overhead Include DO NOT include
Total Product Costs Sum sum
÷ Total Units ÷ Total Units ÷ Total Units
Product Cost per Unit = Cost per unit = Cost per unit
Note: Same formula can be applied for each product cost (Cost ÷ Units produced) to get directmaterial cost per unit, direct labor per unit, etc.
Income Statement Formats:

9/25/2017 Managerial Accounting
file:///Users/hannah/Downloads/Managerial-Accounting-1506381825_regexified.html 141/350
Absorption Costing – this is your standard income statement showing Sales – Cost of Goods sold= Gross Margin (or Gross Profit) – Operating Expenses = Net Income and cost of goods sold isbased on the number of units SOLD x absorption cost per unit.Variable Costing – this is a Contribution Margin Income Statement showing Sales – VARIABLEexpenses = Contribution Margin – Fixed Expenses = Net Income and variable expenses arebased on number of units sold x variable cost per unit.Net income on the two reports can be different if units produced do not equal units sold.
Click Absorption Variable Key Takeaway for a printable copy.
CHAPTER 6: EXERCISES
Questions
➢ Explain the absorption costing method.
➢ Explain the variable costing method.
➢ Discuss the differences between variable and absorption costing.
➢ When is it appropriate to use variable or absorption costing in financial reporting?
➢ Under what specific circumstances would you expect net income to be larger under variablecosting than under absorption costing? What is the reason for this difference?
Exercise I The following data relate to Socks Company for the year ended 2013 December 31:
Cost of production:
Direct materials (variable) $360,000
Direct labor (variable) 504,000
Manufacturing overhead:
Variable 180,000
Fixed 360,000
Sales commissions (variable) 108,000
Sales salaries (fixed) 72,000
Administrative expenses (fixed) 144,000

9/25/2017 Managerial Accounting
file:///Users/hannah/Downloads/Managerial-Accounting-1506381825_regexified.html 142/350
Units produced 150,000
Units sold (at $18 each) 120,000
Beginning inventory, 2013 January 1 -0
There were no beginning inventories. Assume direct materials and direct labor are variable costs.Prepare two income statements—a variable costing income statement and an absorption costingincome statement.
Problem G Costner Company uses an absorption costing system in accounting for the single productit manufactures. The following selected data are for the year
The company produced 12,000 units and sold 10,000 units. Direct materials and direct labor arevariable costs. One unit of direct material goes into each unit of finished goods. Overhead rates arebased on a volume of 12,000 units and are $1.08 and $1.44 per unit for variable and fixed overhead,respectively. The ending inventory is the 2,000 units of finished goods on hand at the end of 2013.There was no inventory at the beginning of 2013.
1. Calculate production cost per unit under variable and absorption costing.2. Prepare an income statement for 2013 under variable costing.3. Prepare an income statement for 2013 under absorption costing.4. Explain the reason for the difference in net income between b and c.
Licensing & Attributions
CC licensed content, Shared previously
Accounting Principles: A Business Perspective. Authored by: James Don Edwards, University of Georgia & Roger H. Hermanson, Georgia State University. Provided by: Endeavour International Corporation.Project: The Global Text Project. License: CC BY: Attribution

9/25/2017 Managerial Accounting
file:///Users/hannah/Downloads/Managerial-Accounting-1506381825_regexified.html 143/350
CHAPTER 7: BUDGETING
CHAPTER 7 STUDY PLAN
Knowledge Targets
I can define the following terms as they relate to our unit:
Budget Planning Budget Flexible Budget Cash Budget
Master Budget Activity Variance Revenue Variance Spending Variance
Fixed Cost Variable Cost Standard Cost Standard Hours
Standard Price Variance Quantity Variance Efficiency Variance
Rate Variance Price Variance Materials Labor
Variable Overhead Fixed Overhead Selling expense Administrative expense
Reasoning TargetsI can understand the difference between a planning budget and a flexible budget.I can identify costs as fixed cost or variable cost.I can understand the purpose of using a budget for businesses.I can analyze differences between budget and actual and explain possible reasons for thevariances.I can analyze and explain labor rate and efficiency variances.I can analyze and explain material price and quantity variances.I can understand the use of standards (including cost, hours or price) for budgeting andanalysis.
Skill TargetsI can prepare a sales and production budget (or purchases budget for merchandiser).I can prepare a selling and administrative expense budget.I can prepare a cash budget including schedules of receivables and payables.I can prepare a budgeted income statement and budgeted balance sheet.

9/25/2017 Managerial Accounting
file:///Users/hannah/Downloads/Managerial-Accounting-1506381825_regexified.html 144/350
I can prepare a master budget including budgets for sales, purchases, selling and administrativeexpenses, cash, income statement and balance sheet.I can prepare a flexible budget based on the actual level of production.I can prepare a flexible budget performance report analyzing difference between budget andactual.I can calculate variances for materials and labor.
Click Budgeting Study Plan for a printable copy.
7.1 INTRODUCTION TO BUDGETING ANDBUDGETING PROCESSES
The budget—For planning and control
Time and money are scarce resources to all individuals and organizations; the efficient and effectiveuse of these resources requires planning. Planning alone, however, is insufficient. Control is alsonecessary to ensure that plans actually are carried out. A budget is a tool that managers use to planand control the use of scarce resources. A budget is a plan showing the company’s objectives andhow management intends to acquire and use resources to attain those objectives.
Watch this video online: https://youtu.be/pCwLhz0ltlE
Companies, nonprofit organizations, and governmental units use many different types of budgets.Responsibility budgets are designed to judge the performance of an individual segment or manager.Capital budgets evaluate long-term capital projects such as the addition of equipment or the relocationof a plant. This chapter examines the master budget, which consists of a planned operating budgetand a financial budget. The planned operating budget helps to plan future earnings and results in aprojected income statement. The financial budget helps management plan the financing of assetsand results in a projected balance sheet.
The budgeting process involves planning for future profitability because earning a reasonable returnon resources used is a primary company objective. A company must devise some method to deal withthe uncertainty of the future. A company that does no planning whatsoever chooses to deal with thefuture by default and can react to events only as they occur. Most businesses, however, devise ablueprint for the actions they will take given the foreseeable events that may occur.
A budget: (1) shows management’s operating plans for the coming periods; (2) formalizesmanagement’s plans in quantitative terms; (3) forces all levels of management to think ahead,anticipate results, and take action to remedy possible poor results; and (4) may motivate individuals tostrive to achieve stated goals.
Companies can use budget-to-actual comparisons to evaluate individual performance. For instance,the standard variable cost of producing a personal computer at IBM is a budget figure. This figure canbe compared with the actual cost of producing personal computers to help evaluate the performanceof the personal computer production managers and employees who produce personal computers. Wewill do this type of comparison in a later chapter.

9/25/2017 Managerial Accounting
file:///Users/hannah/Downloads/Managerial-Accounting-1506381825_regexified.html 145/350
Many other benefits result from the preparation and use of budgets. For example: (1) businesses canbetter coordinate their activities; (2) managers become aware of other managers’ plans; (3)employees become more cost conscious and try to conserve resources; (4) the company reviews itsorganization plan and changes it when necessary; and (5) managers foster a vision that otherwisemight not be developed.
The planning process that results in a formal budget provides an opportunity for various levels ofmanagement to think through and commit future plans to writing. In addition, a properly preparedbudget allows management to follow the management-by-exception principle by devoting attention toresults that deviate significantly from planned levels. For all these reasons, a budget must clearlyreflect the expected results.
Failing to budget because of the uncertainty of the future is a poor excuse for not budgeting. In fact,the less stable the conditions, the more necessary and desirable is budgeting, although the processbecomes more difficult. Obviously, stable operating conditions permit greater reliance on pastexperience as a basis for budgeting. Remember, however, that budgets involve more than acompany’s past results. Budgets also consider a company’s future plans and express expectedactivities. As a result, budgeted performance is more useful than past performance as a basis forjudging actual results.
A budget should describe management’s assumptions relating to: (1) the state of the economy overthe planning horizon; (2) plans for adding, deleting, or changing product lines; (3) the nature of theindustry’s competition; and (4) the effects of existing or possible government regulations. If theseassumptions change during the budget period, management should analyze the effects of thechanges and include this in an evaluation of performance based on actual results.
Budgets are quantitative plans for the future. However, they are based mainly on past experienceadjusted for future expectations. Thus, accounting data related to the past play an important part inbudget preparation. The accounting system and the budget are closely related. The details of thebudget must agree with the company’s ledger accounts. In turn, the accounts must be designed toprovide the appropriate information for preparing the budget, financial statements, and interimfinancial reports to facilitate operational control.
Management should frequently compare accounting data with budgeted projections during the budgetperiod and investigate any differences. Budgeting, however, is not a substitute for good management.Instead, the budget is an important tool of managerial control. Managers make decisions in budgetpreparation that serve as a plan of action.
The period covered by a budget varies according to the nature of the specific activity involved. Cashbudgets may cover a week or a month; sales and production budgets may cover a month, a quarter,or a year; and the general operating budget may cover a quarter or a year.
Budgeting involves the coordination of financial and nonfinancial planning to satisfy organizationalgoals and objectives. No foolproof method exists for preparing an effective budget. However, budgetmakers should carefully consider the conditions that follow:
Top management support All management levels must be aware of the budget’s importance tothe company and must know that the budget has top management’s support. Top management,then, must clearly state long-range goals and broad objectives. These goals and objectives mustbe communicated throughout the organization. Long-range goals include the expected quality ofproducts or services, growth rates in sales and earnings, and percentage-of-market targets.Overemphasis on the mechanics of the budgeting process should be avoided.Participation in goal setting Management uses budgets to show how it intends to acquire anduse resources to achieve the company’s long-range goals. Employees are more likely to strivetoward organizational goals if they participate in setting them and in preparing budgets. Often,

9/25/2017 Managerial Accounting
file:///Users/hannah/Downloads/Managerial-Accounting-1506381825_regexified.html 146/350
employees have significant information that could help in preparing a meaningful budget. Also,employees may be motivated to perform their own functions within budget constraints if they arecommitted to achieving organizational goals.Communicating results People should be promptly and clearly informed of their progress.Effective communication implies (1) timeliness, (2) reasonable accuracy, and (3) improvedunderstanding. Managers should effectively communicate results so employees can make anynecessary adjustments in their performance.Flexibility If significant basic assumptions underlying the budget change during the year, theplanned operating budget should be restated. For control purposes, after the actual level ofoperations is known, the actual revenues and expenses can be compared to expectedperformance at that level of operations.Follow-up Budget follow-up and data feedback are part of the control aspect of budgetarycontrol. Since the budgets are dealing with projections and estimates for future operating resultsand financial positions, managers must continuously check their budgets and correct them ifnecessary. Often management uses performance reports as a follow-up tool to compare actualresults with budgeted results.
The term budget has negative connotations for many employees. Often in the past, management hasimposed a budget from the top without considering the opinions and feelings of the personnelaffected. Such a dictatorial process may result in resistance to the budget. A number of reasons mayunderlie such resistance, including lack of understanding of the process, concern for status, and anexpectation of increased pressure to perform. Employees may believe that the performanceevaluation method is unfair or that the goals are unrealistic and unattainable. They may lackconfidence in the way accounting figures are generated or may prefer a less formal communicationand evaluation system. Often these fears are completely unfounded, but if employees believe theseproblems exist, it is difficult to accomplish the objectives of budgeting.
Problems encountered with such imposed budgets have led accountants and management to adoptparticipatory budgeting. Participatory budgeting means that all levels of management responsiblefor actual performance actively participate in setting operating goals for the coming period. Managersand other employees are more likely to understand, accept, and pursue goals when they are involvedin formulating them.
Within a participatory budgeting process, accountants should be compilers or coordinators of thebudget, not preparers. They should be on hand during the preparation process to present and explainsignificant financial data. Accountants must identify the relevant cost data that enables management’sobjectives to be quantified in dollars. Accountants are responsible for designing meaningful budgetreports. Also, accountants must continually strive to make the accounting system more responsive tomanagerial needs. That responsiveness, in turn, increases confidence in the accounting system.
Although many companies have used participatory budgeting successfully, it does not always work.Studies have shown that in many organizations, participation in the budget formulation failed to makeemployees more motivated to achieve budgeted goals. Whether or not participation works dependson management’s leadership style, the attitudes of employees, and the organization’s size andstructure. Participation is not the answer to all the problems of budget preparation. However, it is oneway to achieve better results in organizations that are receptive to the philosophy of participation.
Licensing & Attributions
CC licensed content, Shared previously
Accounting Principles: A Business Perspective. Authored by: James Don Edwards, University of Georgia & Roger H. Hermanson, Georgia State University. Provided by: Endeavour International Corporation.Project: The Global Text Project. License: CC BY: Attribution
All rights reserved content
Introduction to Budgeting (Managerial Accounting) . Authored by: Education Unlocked. Located at: https://youtu.be/pCwLhz0ltlE. License: All Rights Reserved. License Terms: Standard YouTube License

9/25/2017 Managerial Accounting
file:///Users/hannah/Downloads/Managerial-Accounting-1506381825_regexified.html 147/350
A master budget consists of a projected income statement (planned operating budget) and aprojected balance sheet (financial budget) showing the organization’s objectives and proposed waysof attaining them. In diagram below, we depict a flowchart of the financial planning process that youcan use as an overview of the elements in a master budget. The remainder of this chapter describeshow a company prepares a master budget. We emphasize the master budget because of its primeimportance to financial planning and control in a business entity.
The budgeting process starts with management’s plans and objectives for the next period. Theseplans take into consideration various policy decisions concerning selling price, distribution network,advertising expenditures, and environmental influences from which the company forecasts its salesfor the period (in units by product or product line). Managers arrive at the sales budget in dollars bymultiplying sales units times sales price per unit. They use expected production, sales volume, andinventory policy to project cost of goods sold. Next, managers project operating expenses such asselling and administrative expenses.
This chapter cannot cover all areas of budgeting in detail—entire books have been written onbudgeting. However, the following video provides an overview of a budgeting procedure that manysuccessful companies have used.
Watch this video online: https://youtu.be/n0iddr99fD4
We begin the budget process by discussing the planned operating budget or projected incomestatement.
The projected balance sheet, or financial budget, depends on many items in the projected incomestatement. Thus, the logical starting point in preparing a master budget is the projected incomestatement, or planned operating budget. However, since the planned operating budget shows the neteffect of many interrelated activities, management must prepare several supporting budgets (sales,production, and purchases, to name a few) before preparing the planned operating budget. Theprocess begins with the sales budget.
Licensing & Attributions
CC licensed content, Shared previously
Accounting Principles: A Business Perspective. Authored by: James Don Edwards, University of Georgia & Roger H. Hermanson, Georgia State University. Provided by: Endeavour International Corporation.Project: The Global Text Project. License: CC BY: Attribution
All rights reserved content
The Master Budget (Managerial Accounting Tutorial #38) . Authored by: Note Pirate. Located at: https://youtu.be/n0iddr99fD4. License: All Rights Reserved. License Terms: Standard YouTube License
7.3 OPERATING BUDGETS

9/25/2017 Managerial Accounting
file:///Users/hannah/Downloads/Managerial-Accounting-1506381825_regexified.html 148/350
In this Operating Budget section, we will discuss the following budgets:
1. Sales Budget2. Production Budget3. Cost of Goods Sold Budget4. Selling and Administrative Expense Budget5. Income Statement
Sales budget The cornerstone of the budgeting process is the sales budget because the usefulnessof the entire operating budget depends on it. The sales budget involves estimating or forecasting howmuch demand exists for a company’s goods and then determining if a realistic, attainable profit can beachieved based on this demand. Sales forecasting can involve either formal or informal techniques, orboth. The video below illustrates a sales budget (watch the first 4 minutes of the video only for thesales budget).
Watch this video online: https://youtu.be/frCX_bsFsao
Formal sales forecasting techniques often involve the use of statistical tools. For example, to predictsales for the coming period, management may use economic indicators (or variables) such as thegross national product or gross national personal income, and other variables such as populationgrowth, per capita income, new construction, and population migration.
To use economic indicators to forecast sales, a relationship must exist between the indicators (calledindependent variables) and the sales that are being forecast (called the dependent variable). Thenmanagement can use statistical techniques to predict sales based on the economic indicators.
Management often supplements formal techniques with informal sales forecasting techniques such asintuition or judgment. In some instances, management modifies sales projections using formaltechniques based on other changes in the environment. Examples include the effect on sales of anychanges in the expected level of advertising expenditures, the entry of new competitors, and/or theaddition or elimination of products or sales territories. In other instances, companies do not use anyformal techniques. Instead, sales managers and salespersons estimate how much they can sell.Managers then add up the estimates to arrive at total estimated sales for the period.
Usually, the sales manager is responsible for the sales budget and prepares it in units and then indollars by multiplying the units by their selling price. The sales budget in units is the basis of theremaining budgets that support the operating budget.
We will be illustrating the step-by-step preparation of a master budget for Leed Company, whichmanufactures low-priced running shoes. Most companies develop the sales budget in units and salesdollars because the remaining budgets will use both sales units and sales dollars.
To illustrate this step, assume that Leed’s management forecasts sales for the year at 100,000 units(each pair of shoes is one unit). Quarterly sales are expected to be 15,000, 40,000, 20,000, and25,000 units, reflecting higher demand for shoes in the late spring and again around Christmas. Theselling price for each pair of shoes forecasted at $40. Leed’s sales budget would be prepared as byshowing the sales unit for each quarter x budgeted sales price to get the sales in dollars. The totalsfor the year are added from each quarter.
Leed Company
Sales Budget
Qtr 1 Qtr 2 Qtr 3 Qtr 4 YEAR

9/25/2017 Managerial Accounting
file:///Users/hannah/Downloads/Managerial-Accounting-1506381825_regexified.html 149/350
Sales in Units 15,000 40,000 20,000 25,000 100,000
Budgeted price x $40 x $40 x $40 x $40
Sales in Dollars $600,000 $1,600,000 $800,000 $1,000,000 $4,000,000
Production budget The production budget considers the units in the sales budget and thecompany’s inventory policy. Managers develop the production budget in units and then in dollars.Determining production volume is an important task. Companies should schedule production carefullyto maintain certain minimum quantities of inventory while avoiding excessive inventory accumulation.The principal objective of the production budget is to coordinate the production and sale of goods interms of time and quantity.
Companies using a just-in-time inventory system need to closely coordinate purchasing, sales, andproduction. In general, maintaining high inventory levels allows for more flexibility in coordinatingpurchases, sales, and production. However, businesses must compare the convenience of carryinginventory with the cost of carrying inventory; for example, they must consider storage costs and theopportunity cost of funds tied up in inventory. Watch this video for an example of how to create aproduction budget.
Watch this video online: https://youtu.be/YwIUeaFkOS8
Firms often subdivide the production budget into budgets for materials, labor, and manufacturingoverhead, which we will discuss in the manufacturing budgets. Usually materials, labor, and someelements of manufacturing overhead vary directly with production within a given relevant range ofproduction. Fixed manufacturing overhead costs do not vary directly with production but are constantin total within a relevant range of production. To determine fixed manufacturing overhead costsaccurately, management must determine the relevant range for the expected level of operations.
For our example company, Leed Company, we assume the company’s policy is to maintain 40% ofnext quarters sales in ending inventory. Finished goods inventory on January 1 is 10,000 units (Note: You should be given this information but if you do not have the beginning inventory, you can assumethe company followed the same ending inventory policy. This means, you can calculate beginningfinished goods inventory as Quarter 1 sales x 40% since we can assume the company followed thispolicy and the ending inventory of 4th quarter last year is the beginning inventory of this year). Weanticipate the December 31 ending inventory to be 6,000 units. From these data, we can prepare theschedule of planned production using the Sales budget as our starting place.
Leed Company
Production Budget
Qtr 1 Qtr 2 Qtr 3 Qtr 4 YEAR
Sales in Units 15,000 40,000 20,000 25,000
100,000
Add: Desired EndingInventory 16,000 8,000 10,000 6,000 6,000
(Next Qtr Sales x 40%) (40,000 x40%)
(20,000 x40%)
(25,000 x40%) (given)
Total Units Needed 31,000 48,000 30,000 31,000
106,000

9/25/2017 Managerial Accounting
file:///Users/hannah/Downloads/Managerial-Accounting-1506381825_regexified.html 150/350
Less: Beginning Inventory 10,000 16,000 8,000 10,000 10,000
Units to be Produced 21,000 32,000 22,000 21,000 96,000
Important things to note:
1. Desired ending inventory is calculated as next quarter sales units x 40% in Leed’s case since thecompany policy is to maintain 40% of next quarters sales in ending inventory.
2. Quarter 4 ending inventory is the same number used for ending inventory for the year.3. Quarter 1 beginning inventory is the same number used for beginning inventory for the year.4. Quarter 2 beginning inventory is quarter 1’s ending inventory since the balance rolls over the to
next period. This means, quarter 3 beginning inventory is quarter 2’s ending inventory andquarter 4 beginning inventory is quarter 3’s ending inventory.
5. Inventory refers to Finished Goods Inventory for a manufacturer.
For a merchandiser, this budget would be called a Purchases Budget and would show how manyunits we would need to purchase for each quarter. The inventory in this case would refer tomerchandise inventory. You can see an example of a purchases budget in the Budgets for aMerchandiser section later in this chapter.
Cost of Goods Sold budget The cost of goods sold budget establishes the forecast for the inventoryexpense and is usually on of the largest expenses on an income statement. A cost of goods soldbudget would not be necessary for a service company since they do not sell a product. Managementmust now prepare a schedule to forecast cost of goods sold, the next major amount in the plannedoperating budget. We need to understand the costs for making the product. Leed Company has thefollowing costs:
Direct Materials $ 10 per unit
Direct Labor $ 6 per unit
Variable Overhead $ 0.75 per unit
Fixed Overhead $75,000 per quarter
The cost of goods sold budget would use the sales budget in units. We will take each of our variablecosts (direct materials, direct labor and variable overhead) x budgeted sales units. The cost of goodssold budget would look like:
Leed Company
Cost of Goods Sold Budget
Qtr 1 Qtr 2 Qtr 3 Qtr 4 YEAR
Sales in Units 15,000 40,000 20,000 25,000 100,000
Direct Materials ($10 per unit) $150,000 $400,000 $200,000 $250,000 $1,000,000
Direct Labor ($6 per unit) 90,000 240,000 120,000 150,000 600,000
Variable Overhead ($0.75 per unit) 11,250 30,000 15,000 18,750 75,000
Fixed Overhead 75,000 75,000 75,000 75,000 300,000
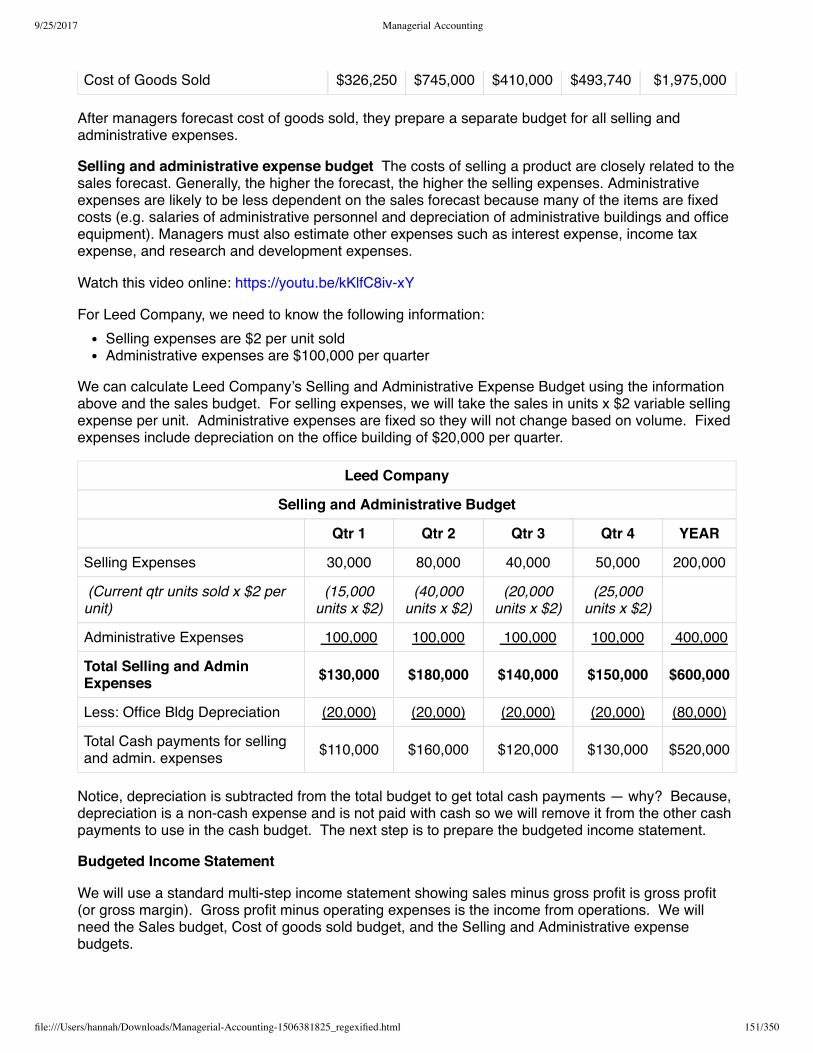
9/25/2017 Managerial Accounting
file:///Users/hannah/Downloads/Managerial-Accounting-1506381825_regexified.html 151/350
Cost of Goods Sold $326,250 $745,000 $410,000 $493,740 $1,975,000
After managers forecast cost of goods sold, they prepare a separate budget for all selling andadministrative expenses.
Selling and administrative expense budget The costs of selling a product are closely related to thesales forecast. Generally, the higher the forecast, the higher the selling expenses. Administrativeexpenses are likely to be less dependent on the sales forecast because many of the items are fixedcosts (e.g. salaries of administrative personnel and depreciation of administrative buildings and officeequipment). Managers must also estimate other expenses such as interest expense, income taxexpense, and research and development expenses.
Watch this video online: https://youtu.be/kKlfC8iv-xY
For Leed Company, we need to know the following information:Selling expenses are $2 per unit soldAdministrative expenses are $100,000 per quarter
We can calculate Leed Company’s Selling and Administrative Expense Budget using the informationabove and the sales budget. For selling expenses, we will take the sales in units x $2 variable sellingexpense per unit. Administrative expenses are fixed so they will not change based on volume. Fixedexpenses include depreciation on the office building of $20,000 per quarter.
Leed Company
Selling and Administrative Budget
Qtr 1 Qtr 2 Qtr 3 Qtr 4 YEAR
Selling Expenses 30,000 80,000 40,000 50,000 200,000
(Current qtr units sold x $2 perunit)
(15,000units x $2)
(40,000units x $2)
(20,000units x $2)
(25,000units x $2)
Administrative Expenses 100,000 100,000 100,000 100,000 400,000
Total Selling and AdminExpenses $130,000 $180,000 $140,000 $150,000 $600,000
Less: Office Bldg Depreciation (20,000) (20,000) (20,000) (20,000) (80,000)
Total Cash payments for sellingand admin. expenses $110,000 $160,000 $120,000 $130,000 $520,000
Notice, depreciation is subtracted from the total budget to get total cash payments — why? Because,depreciation is a non-cash expense and is not paid with cash so we will remove it from the other cashpayments to use in the cash budget. The next step is to prepare the budgeted income statement.
Budgeted Income Statement
We will use a standard multi-step income statement showing sales minus gross profit is gross profit(or gross margin). Gross profit minus operating expenses is the income from operations. We willneed the Sales budget, Cost of goods sold budget, and the Selling and Administrative expensebudgets.

9/25/2017 Managerial Accounting
file:///Users/hannah/Downloads/Managerial-Accounting-1506381825_regexified.html 152/350
Watch this video online: https://youtu.be/l5BBOZHhfjM
We will use the information from the sales budget, cost of goods sold budget, and selling andadministrative expense budget. Note: Remember, to use the full budget amount for selling andadministrative expenses and not the cash payments amount. Leed Company pays a 40% income taxrate (multiply income from operations x 40% for each quarter).
Leed Company
Budgeted Income Statement
Qtr 1 Qtr 2 Qtr 3 Qtr 4 YEAR
Sales (in dollars) $600,000 1,600,000 800,000 1,000,000 4,000,000 from Salesbudget
Less: Cost of goodssold 326,250 745,000 410,000 493,750 1,975,000
from Cost ofGoods Soldbudget
Gross Profit 273,750 855,000 390,000 506,250 2,025,000 (Sales – Costof good sold)
Operating Expenses:
Selling Expenses 30,000 80,000 40,000 50,000 200,000 from Sellingand Adminbudget
AdministrativeExpenses 100,000 100,000 100,000 100,000 400,000
Income fromoperations $143,750 675,000 250,000 356,250 $1,425,000
(Gross Profit –Selling andAdminexpense)
Less: Income taxexpense (40%) 57,500 270,000 100,000 142,500 570,000
Net Income $86,250 $405,000 $150,000 $213,750 $855,000
We look look at the manufacturing budgets and cash budget next.Licensing & Attributions
CC licensed content, Shared previously
Accounting Principles: A Business Perspective. Authored by: James Don Edwards, University of Georgia & Roger H. Hermanson, Georgia State University. Provided by: Endeavour International Corporation.Project: The Global Text Project. License: CC BY: Attribution
All rights reserved content
The Production Budget. Authored by: Education Unlocked. Located at: https://youtu.be/YwIUeaFkOS8. License: All Rights Reserved. License Terms: Standard YouTube LicenseThe Sales Budget. Authored by: Education Unlocked. Located at: https://youtu.be/frCX_bsFsao. License: All Rights Reserved. License Terms: Standard YouTube LicenseOperating Expenses (Selling and Administrative) Budget . Authored by: Kristin Ingram. Located at: https://youtu.be/kKlfC8iv-xY. License: All Rights Reserved. License Terms: Standard YouTube LicenseManagerial Accounting: Budgeted Income Statement . Authored by: Prof Alldredge. Located at: https://youtu.be/l5BBOZHhfjM. License: CC BY: Attribution
7.4 MANUFACTURING BUDGETS

9/25/2017 Managerial Accounting
file:///Users/hannah/Downloads/Managerial-Accounting-1506381825_regexified.html 153/350
In a manufacturing company, you will have a budget for all of your manufacturing costs includingDirect Materials, Direct Labor and Overhead. Each cost will have their own budget. You will need theinformation from the Sales and Production budgets to complete these 3 budgets.
Materials Budget
The materials budget (or materials purchases budget) is used to plan how much raw materials weneed to have available to meet budgeted production. This budget is prepare similarly to theproduction budget as the company must decide how much raw materials inventory they want to haveon hand at the end of each quarter. This is typically determined as a percent of next quarter’smaterial needs. In a materials budget, we will deal with units first and then add the budgeted costnear the end. We also need to know how many direct materials are needed for each unit.
Watch this video online: https://youtu.be/jgN_E4qlkI4
For Leed Company, our budgeted cost is $2 per pound. We need 5 pounds of materials for eachunit. We want to maintain 25% of next quarter’s production needs in ending inventory. Beginning rawmaterials inventory was 20,000 pounds (at $2 per pound) and we are expecting ending raw materialsinventory to be 30,000 pounds.
Leed Company
Materials Purchases Budget
Qtr 1 Qtr 2 Qtr 3 Qtr 4 YEAR
Units to be produced (from productionbudget)
21,000
32,000
22,000
21,000
96,000
x lbs. of materials required per unit x 5 lb. x 5 lb. x 5 lb. x 5 lb
Pounds of materials required forproduction 105,000 160,000 110,000 105,000 480,000
Add: Desired Ending Inventory 40,000 27,500 26,250 30,000 30,000
Total Material Needed 145,000 187,500 136,250 135,000 510,000
Less: Beginning Inventory (20,000) (40,000) (27,500) (26,250) (20,000)
Material to be Purchased (in lbs) 125,000 147,500 108,750 108,750 460,000
x $2 cost per pound x $ 2 x $ 2 x $ 2 x $ 2
Total Material to be Purchased (in $) $250,000 $295,000 $217,500 $217,500 $980,000
Just like with the production budget, please note the following items:Ending inventory is calculated as NEXT quarter’s production needs x 25% for all but quarter 4.Quarter 4 ending inventory is the same as the ending inventory for the year and was given in theexample.Beginning inventory refers to the previous quarters ending inventory for all quarters exceptquarter 1. For quarter 1, beginning raw materials was given in the problem and should also bethe beginning inventory for the YEAR. If beginning inventory is not provided, assume thecompany followed the same inventory policy last year and multiply Quarter 1 pounds of materialsneeded x percent provided for ending inventory.

9/25/2017 Managerial Accounting
file:///Users/hannah/Downloads/Managerial-Accounting-1506381825_regexified.html 154/350
Quarter 2 beginning is quarter 1 ending inventory. Quarter 3 beginning is quarter 2 endinginventory and quarter 4 beginning is quarter 3 ending inventory.
The total material to be purchased will be used later in the cash disbursement section of the CASHbudget.
Direct Labor Budget
The direct labor budget is a very easy one. We need to know the units required from the productionbudget. Next, we need to know how many direct labor hours it takes to complete one unit and thecost per labor hour. Using this information, we can determine how many direct labor hours arerequired to meet the budgeted level of production. We will take the production units x direct labor perunit to get the number of direct labor hours. Finally, we will take the direct labor hours x the rate perhour.
Watch this video online: https://youtu.be/sqUuV_Y5TYM
For Leed Company, each unit requires 0.5 hours of direct labor and the hourly rate is $12 per hour. The direct labor budget would be:
Leed Company
Direct Labor Budget
Qtr 1 Qtr 2 Qtr 3 Qtr 4 YEAR
Units to be produced 21,000 32,000 22,000 21,000 96,000
x 0.5 DL hour per unit x 0.5 hr x 0.5 hr x 0.5 hr x 0.5 hr
Direct Labor Hours Required 10,500 16,000 11,000 10,500 48,000
x $12 per hour x $12 x $12 x $12 x $12
Budgeted direct labor dollars $126,000 $192,000 $132,000 $126,000 $576,000
The budgeted direct labor dollar amount will be used later in the cash disbursement section of theCASH budget.
Manufacturing Overhead Budget
The final budget for manufacturing is the manufacturing overhead budget. The manufacturingoverhead budget is prepare depending on how the company allocates overhead. The company canchoose to allocate overhead using one predetermined overhead rate, departmental rates or usingactivity-based costing. Further, the company can choose to separate the fixed and variable overheadcosts and assign costs to overhead using only the variable overhead.
Watch this video online: https://youtu.be/nb9SoL8M5AU
Leed Company has decided to allocate variable overhead on the basis of $1.50 per direct laborhour and fixed overhead is $75,000 per quarter. Depreciation on the factory machinery of $10,000per quarter is included in the fixed overhead.
Leed Company
Mfg. Overhead Budget

9/25/2017 Managerial Accounting
file:///Users/hannah/Downloads/Managerial-Accounting-1506381825_regexified.html 155/350
Qtr 1 Qtr 2 Qtr 3 Qtr 4 YEAR
Budgeted direct labor hours (from direct laborbudget) 10,500 16,000 11,000 10,500 48,000
x Variable OH per unit x $1.50 x $1.50 x $1.50 x $1.50
Variable Overhead Cost $15,750 $24,000 $16,500 $15,750 $72,000
Fixed Overhead Cost 75,000 75,000 75,000 75,000 300,000
Total Overhead Cost $90,750 $99,000 $91,500 $90,750 $372,000
Less: Depreciation on Factory Machinery (10,000) (10,000) (10,000) (10,000) (40,000)
Total Cash payments for mfg overhead $80,750 $89,000 $81,500 $80,750 $332,000
We will use the information from the overhead budget in the cash disbursement section of the cashbudget.
Licensing & Attributions
All rights reserved content
Direct Materials Budget, Part 1. Authored by: Kristin Ingram. Located at: https://youtu.be/jgN_E4qlkI4. License: All Rights Reserved. License Terms: Standard YouTube LicenseDirect labor Budget. Authored by: Kristin Ingram. Located at: https://youtu.be/sqUuV_Y5TYM. License: All Rights Reserved. License Terms: Standard YouTube LicenseOverhead budget. Authored by: Kristin Ingram. Located at: https://youtu.be/nb9SoL8M5AU. License: All Rights Reserved. License Terms: Standard YouTube License
7.5 CASH BUDGETS
Cash budget After the preceding analyses have been prepared, sufficient information is available toprepare the cash budget and compute the balance in the Cash account for each quarter. Preparing acash budget requires information about cash receipts and cash disbursements from all the otheroperating budget schedules.
Watch this video online: https://youtu.be/HT0c22HF5hA
Cash receipts We can prepare the cash receipts schedule based on how the company expects tocollect on sales. We know, from past experience, how much of our sales are cash sales and howmuch are credit sales. We also can analyze past accounts receivable to determine when credit salesare typically paid.
Watch this video online: https://youtu.be/iYlBGkEBb_E
Leed Company has determined that all sales are on credit and they do not have any cash sales. Forthe credit sales, experience tells Leed they will collect 60% of sales in the quarter of the sale and theremaining 40% is collected the quarter after the sale (yes, we understand collecting 100% is unlikelybut Leed chooses to budget for 100% collection). Accounts Receivable at the beginning of the year is$200,000 and is expected to be collected in the 1st Quarter. Leed Company prepares thefollowing schedule of planned cash receipts:
Leed Company

9/25/2017 Managerial Accounting
file:///Users/hannah/Downloads/Managerial-Accounting-1506381825_regexified.html 156/350
Schedule of Cash Receipts
Qtr 1 Qtr 2 Qtr 3 Qtr 4
Budgeted Sales $600,000 $1,600,000 $800,000 $1,000,000
Cash receipts, current quarter (60% xquarter sales) 360,000 960,000 480,000 600,000
(600,000 x60%)
(1,600,000x 60%)
(800,000 x60%)
(1,000,000 x60%)
Cash receipts, from previous qtr (40% xprevious quarter sales) 200,000** 240,000 640,000 320,000
(600,000 x40%)
(1.600,000x 40%)
(800,000 x40%)
Total Cash Collections from Sales $560,000 $1,200,000 $1,120,000 $920,000
** Cash receipts from previous quarter for Quarter 1 comes from the beginning balance in AccountsReceivable.
We can calculate the ENDING balance of Accounts Receivable for the budgeted balance sheet bytaking the 4th Quarter sales $1,000,000 x 40% to be received in 1st Quarter of the next year as$400,000. In addition to cash receipts, we also need to understand how we plan to make our cashpayments or disbursements.
Cash disbursements Companies need cash to pay for purchases, wages, rent, interest, incometaxes, cash dividends, and most other expenses. We can obtain the amount of each cashdisbursement from other budgets or schedules.
This video discusses the purchases budget for a merchandiser but if you begin at minute 9 it will pickup with the cash disbursement schedule example.
Leed Company is a manufacturing company and will need to use the information from the materialspurchases budget first. Leed Company makes all material purchases on credit. Leed Company willpay for material purchases 80% in the quarter of purchase and 20% in the quarter after thepurchase. Accounts Payable at the beginning of the year is $80,000 and will be paid in the 1stQuarter. We will calculate cash payments for material purchases as shown in the following table.
Qtr 1 Qtr 2 Qtr 3 Qtr 4
Budgeted Material Purchases $250,000 $295,000 $217,500 $217,500
Cash payments, current quarter(80%) $200,000 $236,000 $174,000 $174,000
(250,000 x80%)
(295,000 x80%)
(217,500 x80%)
(217,500 x80%)
Cash payments, from previous qtr(20%) 80,000** 50,000 59,000 43,500
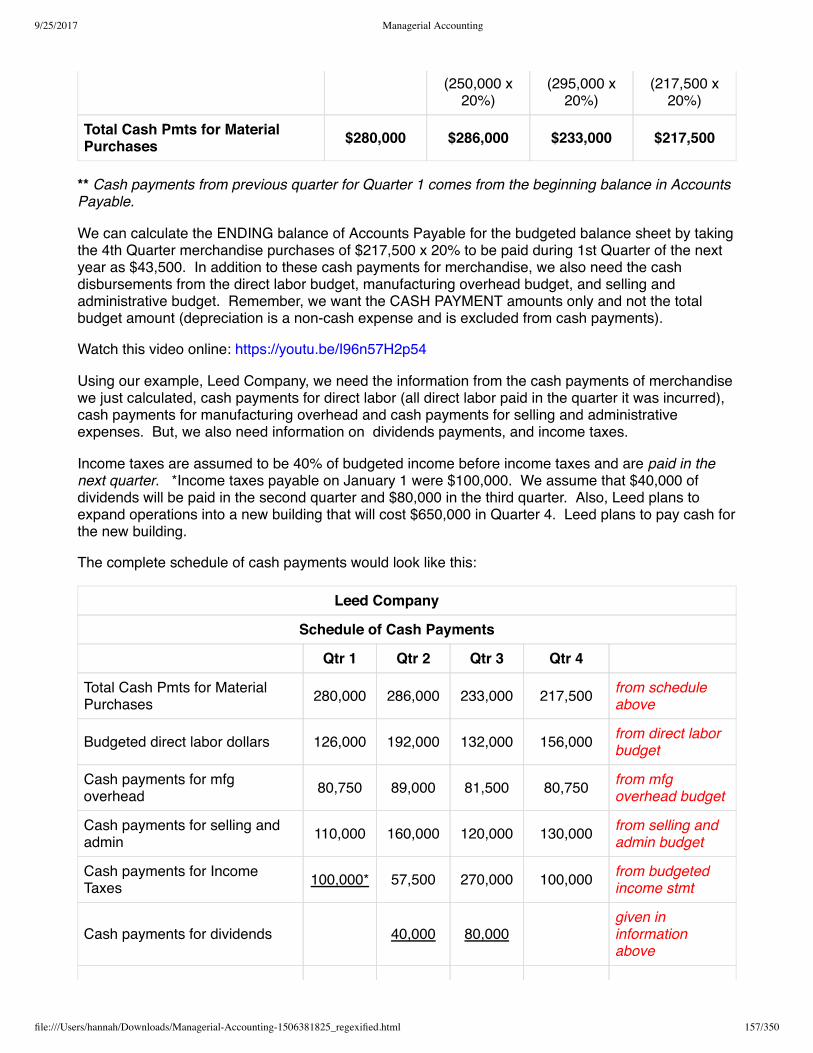
9/25/2017 Managerial Accounting
file:///Users/hannah/Downloads/Managerial-Accounting-1506381825_regexified.html 157/350
(250,000 x20%)
(295,000 x20%)
(217,500 x20%)
Total Cash Pmts for MaterialPurchases $280,000 $286,000 $233,000 $217,500
** Cash payments from previous quarter for Quarter 1 comes from the beginning balance in AccountsPayable.
We can calculate the ENDING balance of Accounts Payable for the budgeted balance sheet by takingthe 4th Quarter merchandise purchases of $217,500 x 20% to be paid during 1st Quarter of the nextyear as $43,500. In addition to these cash payments for merchandise, we also need the cashdisbursements from the direct labor budget, manufacturing overhead budget, and selling andadministrative budget. Remember, we want the CASH PAYMENT amounts only and not the totalbudget amount (depreciation is a non-cash expense and is excluded from cash payments).
Watch this video online: https://youtu.be/I96n57H2p54
Using our example, Leed Company, we need the information from the cash payments of merchandisewe just calculated, cash payments for direct labor (all direct labor paid in the quarter it was incurred),cash payments for manufacturing overhead and cash payments for selling and administrativeexpenses. But, we also need information on dividends payments, and income taxes.
Income taxes are assumed to be 40% of budgeted income before income taxes and are paid in thenext quarter. *Income taxes payable on January 1 were $100,000. We assume that $40,000 ofdividends will be paid in the second quarter and $80,000 in the third quarter. Also, Leed plans toexpand operations into a new building that will cost $650,000 in Quarter 4. Leed plans to pay cash forthe new building.
The complete schedule of cash payments would look like this:
Leed Company
Schedule of Cash Payments
Qtr 1 Qtr 2 Qtr 3 Qtr 4
Total Cash Pmts for MaterialPurchases 280,000 286,000 233,000 217,500 from schedule
above
Budgeted direct labor dollars 126,000 192,000 132,000 156,000 from direct laborbudget
Cash payments for mfgoverhead 80,750 89,000 81,500 80,750 from mfg
overhead budget
Cash payments for selling andadmin 110,000 160,000 120,000 130,000 from selling and
admin budget
Cash payments for IncomeTaxes 100,000* 57,500 270,000 100,000 from budgeted
income stmt
Cash payments for dividends 40,000 80,000given ininformationabove

9/25/2017 Managerial Accounting
file:///Users/hannah/Downloads/Managerial-Accounting-1506381825_regexified.html 158/350
Cash payment for new building 650,000 given ininformationabove
Total Cash Payments $696,750 $824,500 $916,500 $1,304,250
Now let’s put it all together in the complete cash budget. The cash budget is a plan indicatingexpected inflows and outflows of cash. At the simplest form, a Cash budget is:
Beginning Cash Balance
Add: Cash Receipts
Cash Available
Subtract: Cash Payments
Budgeted Ending Cash Balance
We can make it a little more complicated by adding financing considerations. The cash budget helpsmanagement to decide whether enough cash will be available for short-term needs. If a company’scash budget indicates a cash shortage at a certain date, the company may need to borrow money ona short-term basis. If the company’s cash budget indicates a cash excess, the company may wish toinvest the extra funds for short periods to earn interest rather than leave the cash idle. Knowing inadvance that a possible cash shortage or excess may occur allows management sufficient time toplan for such occurrences and avoid a cash crisis.
Watch this video online: https://youtu.be/9j48YgH2VfA
To illustrate, we will complete the cash budget for Leed Company. On January 1, Leed Company’scash balance was $130,000. We will calculate the cash budget for each quarter using the informationfrom the schedules on this page. We will get our cash receipts from the Schedule of Cash Receiptsand the cash disbursements (or payments) from the Schedule of Cash Payments.
Important: The ending cash balance of one quarter is the beginning cash balance of the nextquarter!
Leed Company
Cash Budget
Qtr 1 Qtr 2 Qtr 3 Qtr 4
Beginning Cash Balance $130,000 $21,250 $408,750 $612,250
Add: Cash Receipts (see Schedule of CashReceipts) $560,000 $1,200,000 $1,120,000 $920,000
Cash Available $690,000 $1,266,250 $1,573,750 $1,577,250
Less: Cash Payments (see Schedule of CashPayments) $696,750 $824,500 $916,500 $1304,250
Budgeted Ending Cash Balance -$6,750 $368,750 $572,250 $188,000
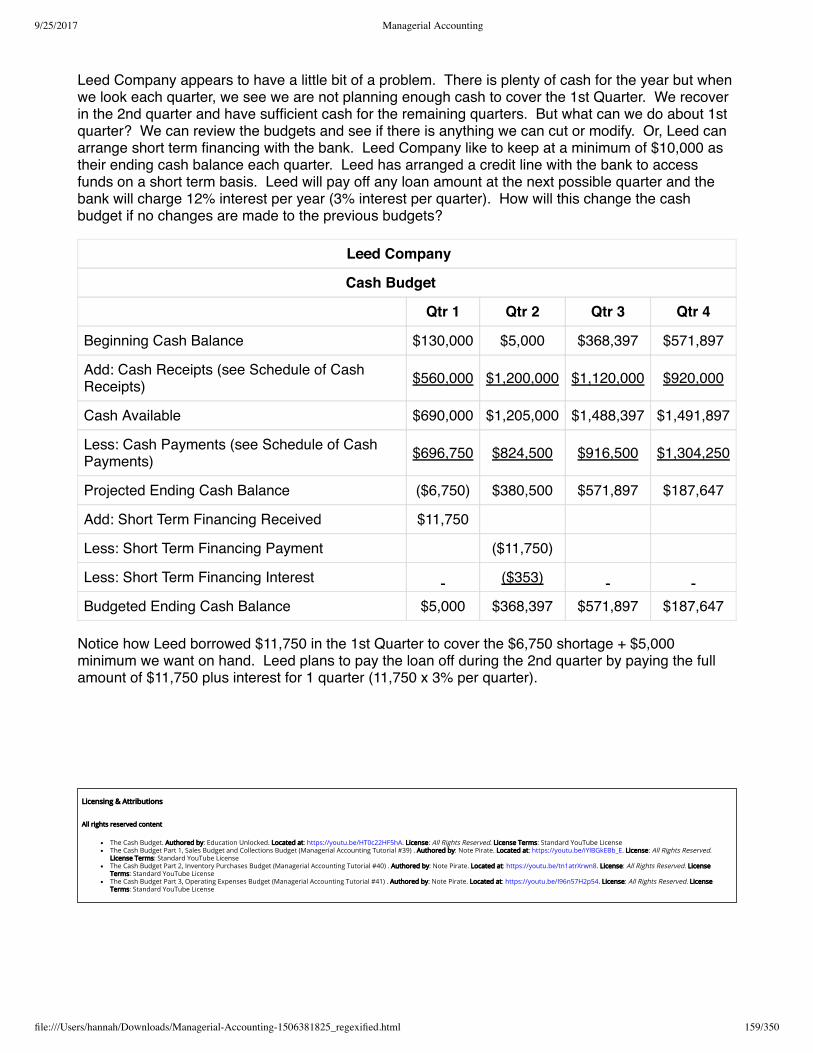
9/25/2017 Managerial Accounting
file:///Users/hannah/Downloads/Managerial-Accounting-1506381825_regexified.html 159/350
Leed Company appears to have a little bit of a problem. There is plenty of cash for the year but whenwe look each quarter, we see we are not planning enough cash to cover the 1st Quarter. We recoverin the 2nd quarter and have sufficient cash for the remaining quarters. But what can we do about 1stquarter? We can review the budgets and see if there is anything we can cut or modify. Or, Leed canarrange short term financing with the bank. Leed Company like to keep at a minimum of $10,000 astheir ending cash balance each quarter. Leed has arranged a credit line with the bank to accessfunds on a short term basis. Leed will pay off any loan amount at the next possible quarter and thebank will charge 12% interest per year (3% interest per quarter). How will this change the cashbudget if no changes are made to the previous budgets?
Leed Company
Cash Budget
Qtr 1 Qtr 2 Qtr 3 Qtr 4
Beginning Cash Balance $130,000 $5,000 $368,397 $571,897
Add: Cash Receipts (see Schedule of CashReceipts) $560,000 $1,200,000 $1,120,000 $920,000
Cash Available $690,000 $1,205,000 $1,488,397 $1,491,897
Less: Cash Payments (see Schedule of CashPayments) $696,750 $824,500 $916,500 $1,304,250
Projected Ending Cash Balance ($6,750) $380,500 $571,897 $187,647
Add: Short Term Financing Received $11,750
Less: Short Term Financing Payment ($11,750)
Less: Short Term Financing Interest ($353)
Budgeted Ending Cash Balance $5,000 $368,397 $571,897 $187,647
Notice how Leed borrowed $11,750 in the 1st Quarter to cover the $6,750 shortage + $5,000minimum we want on hand. Leed plans to pay the loan off during the 2nd quarter by paying the fullamount of $11,750 plus interest for 1 quarter (11,750 x 3% per quarter).
Licensing & Attributions
All rights reserved content
The Cash Budget. Authored by: Education Unlocked. Located at: https://youtu.be/HT0c22HF5hA. License: All Rights Reserved. License Terms: Standard YouTube LicenseThe Cash Budget Part 1, Sales Budget and Collections Budget (Managerial Accounting Tutorial #39) . Authored by: Note Pirate. Located at: https://youtu.be/iYlBGkEBb_E. License: All Rights Reserved.License Terms: Standard YouTube LicenseThe Cash Budget Part 2, Inventory Purchases Budget (Managerial Accounting Tutorial #40) . Authored by: Note Pirate. Located at: https://youtu.be/tn1atrXrwn8. License: All Rights Reserved. LicenseTerms: Standard YouTube LicenseThe Cash Budget Part 3, Operating Expenses Budget (Managerial Accounting Tutorial #41) . Authored by: Note Pirate. Located at: https://youtu.be/I96n57H2p54. License: All Rights Reserved. LicenseTerms: Standard YouTube License

9/25/2017 Managerial Accounting
file:///Users/hannah/Downloads/Managerial-Accounting-1506381825_regexified.html 160/350
7.6 BUDGETED BALANCE SHEET
Preparing a projected balance sheet, or financial budget, involves analyzing every balance sheetaccount. The beginning balance for each account is the amount on the balance sheet prepared at theend of the preceding period. Then, managers consider the effects of any planned activities on eachaccount. Many accounts are affected by items appearing in the operating budget and by either cashinflows or outflows. Cash inflows and outflows usually appear in a cash budget discussed later in thechapter.
The complexities encountered in preparing the financial budget often require the preparation ofdetailed schedules. These schedules analyze such things as planned accounts receivable collectionsand balances, planned material purchases, planned inventories, changes in all accounts affected byoperating costs, and the amount of federal income taxes payable. Dividend policy, inventory policy,financing policy and constraints, credit policy, and planned capital expenditures also affect theamounts in the financial budget. This video will give you an overview of the budgeted balance sheetprocess (the first 3 minutes reviews the entire master budget process).
Watch this video online: https://youtu.be/6DuTf1NSRf0
Now that Leed’s management has prepared the operating budget (or projected income statement), itcan prepare its financial budget. Remember that the financial budget is a projected balance sheet.
To prepare a projected balance sheet, Leed’s management must analyze each balance sheetaccount. Managers take the beginning balance from the balance sheet at the end of the precedingperiod (remember, ending balances of one period are the beginning balances of the next period). Look at Leed Company’s balance sheet as of December 31 last year. Management must consider theeffects of planned activities on these balances. Many accounts are affected by items in the plannedoperating budget, by cash inflows and outflows, and by policy decisions. Management uses theplanned operating budgets and cash budget to prepare the project balance sheet for this year.
Leed Company
Balance sheet
December 31 (last year)
Assets
Current assets:
Cash $130,000
Accounts receivable 200,000
Inventories:
Materials $40,000
Finished goods 130,000 170,000
Total current assets $500,000

9/25/2017 Managerial Accounting
file:///Users/hannah/Downloads/Managerial-Accounting-1506381825_regexified.html 161/350
Property, plant, and equipment:
Land $60,000
Buildings $1,000,000
Less: accumulated depreciation 400,000 600,000
Factory Equipment $600,000
Less: accumulated depreciation 180,000 420,000
Total property, plant, and equipment $1,080,000
Total assets $1,580,000
Liabilities and stockholders‘ equity
Current liabilities:
Accounts payable $80,000
Income taxes payable 100,000
Total current liabilities $180,000
Stockholders’ equity:
Common stock (100,000 shares of $10 par value) $1,000,000
Retained earnings 400,000
Total stockholders’ equity $1,400,000
Total liabilities and stockholders’ equity $1,580,000
We will look at each account and determine the new budgeted balances based on the previousschedules.
Cash
We can get the ending cash balance from the Ending Cash balance in the cash budget. The endingcash balance is $188,000.
Accounts Receivable
The balance in Accounts Receivable represents credit sales that have not been collected during theyear. This would be 40% of Quarter 4 sales of $1,000,000 or $400,000 to be collected during the 1stquarter of the next year.
Inventory
For a manufacturer like Leed Company, there are two inventory accounts: Raw Materials inventoryand Finished Goods inventory. Raw Materials inventory will come from the materials purchasesbudget using desired ending inventory for quarter 4 or the year x cost per material. For LeedCompany, there were 30,000 lbs of materials for ending inventory x $2 per lb of material = $60,000. For Finished Goods inventory, we will use the desired ending inventory units from the productionbudget x production cost per unit. For Leed Company, the production cost is $20.50 per unit including
9/25/2017 Managerial Accounting
file:///Users/hannah/Downloads/Managerial-Accounting-1506381825_regexified.html 162/350
direct materials, direct labor, variable and fixed overhead. The ending balance in finished goodsinventory is calculate as 6,000 units x $20.50 per unit or $123,000.
For a merchandising company, you would use the quarter 4 or year Ending merchandise inventoryunits x the cost per unit.
Property, Plant and Equipment
This section will look at the balances from the previous year and add any depreciation and additionalpurchases for the year. Property, Plant and Equipment (also called Fixed Assets) refer to long termassets used in the business including land, equipment, machinery, buildings, etc. Depreciation isapplied to all of these items except for land, which is not depreciated.
For Leed Company, there were no changes to the Land account so the balance will remain at$60,000. Leed purchased a new building for $650,000 in the 4th quarter so the new building balanceis $1,650,000 ($1,000,000 last year + 650,000 new building). According to the selling andadministration expense budget, we had depreciation on the office building of $80,000 so we will addthis to the existing balance from the previous year to get a new balance of $480,000 ($400,000 prioryear + $80,000 current year depreciation). We are not planning on buying any new equipment thisyear. The equipment balance will remain the same at $600,000. According to the manufacturingoverhead budget, we planned $40,000 of factory equipment depreciation this year. The new balancefor equipment accumulated depreciation is $220,000 ($180,000 prior year + $40,000 current yeardepreciation).
Current Liabilities
Current Liabilities are liabilities we expect to pay in the next year. Accounts Payable is determinedusing the purchases budget (material purchases for a manufacturer or inventory purchase budget fora merchandiser) and the schedule of cash payments.
Leed Company budgets purchase payments as 80% in the quarter of purchase and 20% in thequarter after the purchase. We can calculate Leed’s ending accounts payable by looking at theQuarter 4 material purchases of $217,500 x 20% to be paid in the first quarter of next year for$43,500.
Income taxes are typically paid in the quarter after they were calculated or during the first quarter ofthe next year. For Leed Company, income taxes are paid in the quarter after they were calculated. We can determine the budgeted income tax amount from the budgeted income statement. In quarter4, Leed Company plans income taxes of $142,500 to be paid in the first quarter of the following yearmaking this the ending balance for Income Taxes Payable.
Stockholder’s Equity
Stockholder’s Equity is comprised of common stock and retained earnings. Common stockrepresents ownership in the company. Retained Earnings is the earnings of the company over timeminus any dividends paid.
Leed Company did not have any new issues of common stock so the ending common stock balancewill remain the same as $1,000,000. For retained earnings, we will need to calculate the endingbalance using the following formula:
Beginning Retained Earnings + Net Income – Dividends = Ending Retained Earnings
Beginning retained earnings comes from the balance of last year’s balance sheet of $400,000. NetIncome comes from the budgeted income statement for the year of $855,000. Dividends can be

9/25/2017 Managerial Accounting
file:///Users/hannah/Downloads/Managerial-Accounting-1506381825_regexified.html 163/350
determined from the schedule of cash payments which shows $120,000 paid this year. EndingRetained Earnings is $1,135,000 ($400,000 + 855,000 – 120,000).
The full budgeted balance sheet will look like this:
Leed Company
Budgeted Balance sheet
December 31
Assets
Current assets:
Cash 188,000
Accounts receivable 400,000
Inventories:
Materials 60,000
Finished goods 123,000 183,000
Total current assets 771,000
Property, plant, and equipment:
Land 60,000
Buildings 1,650,000
Less: accumulated depreciation 480,000 1,170,000
Factory Equipment 600,000
Less: accumulated depreciation 220,000 380,000
Total property, plant, and equipment 1,550,000
Total assets 2,321,000
Liabilities and stockholders‘ equity
Current liabilities:
Accounts payable 43,500
Income taxes payable 142,500
Total current liabilities 186,000
Stockholders’ equity:
Common stock (100,000 shares of $10 par value) 1,000,000
Retained earnings 1,135,000
Total stockholders’ equity 2,135,000

9/25/2017 Managerial Accounting
file:///Users/hannah/Downloads/Managerial-Accounting-1506381825_regexified.html 164/350
Total liabilities and stockholders’ equity 2,321,000
The preparation of Leed’s financial budgeted balance sheet completes the master budget.Management now has information to help appraise the policies it has adopted before implementingthem. If the master budget shows the results of these policies to be unsatisfactory, the company canchange its policies before serious problems arise.
7.7 BUDGETING IN A MERCHANDISINGCOMPANY
Budgeting in merchandising companies
Budget preparation for merchandising companies and service companies is similar to budgeting formanufacturing companies. A service or merchandising company will not have a production budget ordirect material budget and may not have a direct labor or overhead budget. The largest difference issince we do not have a production or materials purchase budget, we still need to know how muchinventory we need to buy for a merchandiser. The merchandise purchases budget is similar to theproduction budget. The purchases budget can be done in units or in total dollars. Typically, thepurchases budget is done in dollars and will use a cost of goods sold percentage to determine thecost of inventory sales. Remember, cost of goods sold is literally the cost of the inventory we are nowselling and should be less than what we can sell it. This section discusses budgeting inmerchandising companies.
Watch this video online: https://youtu.be/7xs1BPfpRk4
Throughout this chapter, we have focused on budgeting in a manufacturing company. Supposemanagers in a retail merchandising business, such as a dress shop or a furniture store, prepare abudget. In this case, the company prepares a purchases budget instead of a production budget. Tocompute the purchases for each quarter, management must estimate the cost of the goods to be soldduring the quarter and the inventory required at the end of the quarter.
Suppose Strobel Furniture Company prepared a sales budget showing sales of $30,000 in the firstquarter, $80,000 in the second quarter, $50,000 in the third quarter and $40,000 in the fourth quarter.Assume the company maintains sufficient inventory to cover one-half of the next quarter’s sales. Costof goods sold is 55% of sales. The ending merchandise inventory this year is expected to be $11,000.The purchases budget can now be prepared. We need the following information:
Sales, from the Sales budgetCost of goods sold percentage (can also be shown as gross margin or gross profit percent whichwould be subtracted from 100 to get the cost of goods sold percent)Desired ending inventory policyBeginning inventory balance (if not provided, you can follow the same ending inventory policy andapply to first quarter sales.) Remember, beginning inventory of one quarter is the endinginventory of the previous quarter.

9/25/2017 Managerial Accounting
file:///Users/hannah/Downloads/Managerial-Accounting-1506381825_regexified.html 165/350
Strobel’s merchandise inventory budget would look like:
Strobel Furniture Company
Merchandise Purchases Budget
Qtr 1 Qtr 2 Qtr 3 Qtr 4
SALES (in dollars) $30,000 $80,000 $50,000 $90,000
Cost of goods sold (Sales x 55%) $16,500 $44,000 $27,500 $49,500
Add: Desired ending inventory (1/2 of next quarter’scost of goods sold) $22,000 $13,750 $24,750 $11,000
Total inventory needs $38,500 $57,750 $52,250 $60,500
Less: Beginning merchandise inventory ($8,250) ($22,000) ($13,750) ($24,750)
Budgeted Purchases (in dollars) $30,250 $35,750 $38,500 $35,750
Important items to now:Sales is used in the calculation for cost of goods sold but is not part of the budget itself.Cost of goods sold takes the Sales dollars x 55% cost of goods sold percentage.Desired ending inventory is next quarter’s cost of goods sold x 50% or divided by 2. For fourthquarter, the information is given in the example problem.Beginning inventory equals the ending inventory of the previous quarter for all except for firstquarter. For first quarter, we assume the same rules were followed for ending inventory in theprevious year so we can calculate as first quarter cost of goods sold $16,500 / 2.
Strobel can now use the information in its purchases budget to prepare the cost of goods sold sectionof the budgeted income statement, to prepare cash disbursements schedules, and to prepare theinventory and accounts payable amounts in the financial budget.
Licensing & Attributions
All rights reserved content
Purchases Budget with Example Calculations - Accounting video. Authored by: Brian Routh TheAccountingDr. Located at: https://youtu.be/7xs1BPfpRk4. License: All Rights Reserved. License Terms:Standard YouTube License
7.8 OTHER BUDGETING METHODS
Budgeting in service companies

9/25/2017 Managerial Accounting
file:///Users/hannah/Downloads/Managerial-Accounting-1506381825_regexified.html 166/350
The concepts discussed in this chapter are equally applicable to service companies. Service firmshave service revenues and operating expenses that must be budgeted. Projected income statementsand balance sheets can be prepared for service companies and are typically based on pastperformance.
Watch this video online: https://youtu.be/IuL0dWfd7Jk
To illustrate, assume Windy Weather Company wants to make the following changes this year to lastyear’s results:
1. Sales will increase 5%2. Sales commissions will remain the same at 10% of sales3. Sales and administrative salaries will increase 3%4. Supplies, rent and miscellaneous expenses will remain the same.5. Income taxes will be 30% of net income.
The budgeted income statement for this year would be:
Windy Weather Company
Budgeted Income Statement
Last Year BUDGET Calculation
Sales $450,000 $472,500 450,000 + (450,000 x 5%)
Less Expenses: heading only – no entry
Sales Commissions $45,000 $49,500 472,500 x 10%
Sales Salaries $50,000 $51,500 $50,000 + (50,000 x 3%)
Administrative Salaries $75,000 $77,250 $75,000 + (75,000 x 3%)
Supplies Expense $5,000 $5,000 no change
Rent Expense $120,000 $120,000 no change
Miscellaneous Expense $15,000 $15,000 no change
Total Expenses $310,000 $318,250 sum of all expenses
Income from operations $140,000 $154,250 Sales 450,000 – Expenses 318,250
Less: Income Tax (30%) ($42,000) ($46,275) Inc. from operations x 30%
Net Income $98,000 $107,975 Inc. from operations – income tax
Zero-Based Budgeting
An alternative to the traditional budget is zero-based budgeting.
Watch this video online: https://youtu.be/t0KLvsvShsk
Zero-base budgeting became popular in the 1970s, particularly when President Jimmy Cartersupported it for state and federal governmental units. It has received less attention since then.

9/25/2017 Managerial Accounting
file:///Users/hannah/Downloads/Managerial-Accounting-1506381825_regexified.html 167/350
Under zero-base budgeting, managers in a company start each year with zero budget levels andmust justify every dollar that appears in the budget. Managers do not assume any costs incurred inprevious years should be incurred this year. Each manager prepares decision packages that describethe nature and cost of tasks that can be performed by that unit and the consequences of notperforming each task. Top organization officials rank the decision packages and approve those thatthey believe are most worthy. A major drawback to the use of this concept is the massive amounts ofpaperwork and time needed to prepare and rank decision packages, especially in large organizations.
Accounting in the Headlines
Why is Campbell Soup Company using zero-based budgeting?Consumers are increasingly distrusting “Big Food,” and CampbellSoup Company (CPB) is working to counter the effects of thattrend by offering more healthy or natural alternatives. Forexample, Campbell’s recently introduced a new line of organicsoups, Campbell’s® Organics, and acquired both Bolthouse Farmsjuices and Plum Organics baby food.
In addition to expanding its healthier and more natural productlines, Campbell’s has also announced it will be implementing zero-based budgeting. It expects to save $200 million off its expected annual costs of close to $7 billion.
Questions
1. What is “zero-based budgeting”?2. How does Campbell’s expect that it will save $200 million by using zero-based budgeting?3. What are some potential drawbacks to Campbell’s from its use of zero-based budgeting?
Final Thoughts
For the final thoughts on budgeting, it might be helpful to rethink about how we create budgets, whocreates them and what motivation the person might have for the budget figures. This video discussesthe difference between participating and traditional budgeting.
Watch this video online: https://youtu.be/m-uWeIy-whQ
Licensing & Attributions
CC licensed content, Speci�c attribution
Why is Campbell Soup Company using zero-based budgeting?. Authored by: Dr. Wendy Tietz, CPA, CMA, CGMA . Located at: http://www.accountingintheheadlines.com. License: CC BY-NC: Attribution-NonCommercial
All rights reserved content
What is Zero-Based Budgeting (ZBB)?. Authored by: Stroud International. Located at: https://youtu.be/t0KLvsvShsk. License: All Rights Reserved. License Terms: Standard YouTube LicenseParticipative Budgeting vs. Traditional Budgeting . Authored by: Education Unlocked. Located at: https://youtu.be/m-uWeIy-whQ. License: All Rights Reserved. License Terms: Standard YouTube LicenseHow to Build a Basic Financial Projection - Business Finance . Authored by: Gateway CFO Solutions. Located at: https://youtu.be/IuL0dWfd7Jk. License: All Rights Reserved. License Terms: StandardYouTube License

9/25/2017 Managerial Accounting
file:///Users/hannah/Downloads/Managerial-Accounting-1506381825_regexified.html 168/350
7.9 FLEXIBLE BUDGETS
Early in the chapter, you learned that a budget should be adjusted for changes in assumptions orvariations in the level of operations. Managers use a technique known as flexible budgeting to dealwith budgetary adjustments. A flexible operating budget is a special kind of budget that providesdetailed information about budgeted expenses (and revenues) at various levels of output.
Watch this video online: https://youtu.be/JHVaey2WdPE
Leed Company’s manufacturing overhead cost budget at 70% capacity is shown below. Leed canproduce 25,000 units in a 3 month period or a quarter, which represents 100% of capacity.
Leed Company
Manufacturing Overhead Cost
3-month Budget
Supplies $1,400
Power 7,000
Insurance 4,200
Maintenance 4,900
Depreciation 18,000
Supervision 57,000
Total Overhead Costs $92,500
Units Produced (70% capacity) 17,500
To keep the example simple, we assume that the first four costs are strictly variable and we willcalculate a budget per unit for these costs. On the other hand, the last two costs, depreciation andsupervision, are fixed costs and are assumed to be constant over the entire relevant range of activitymeaning they do not change based on volume. The table below shows the calculations for unitsproduced at 70% capacity and calculates the variable cost per unit for all variable costs.
Variable Fixed Calculation
Unitsproduced
17,500units
(25,00 unitsx 70%
capacity)
Supplies $1,400 $0.08($1,400 /17,500units)

9/25/2017 Managerial Accounting
file:///Users/hannah/Downloads/Managerial-Accounting-1506381825_regexified.html 169/350
Power 7,000
$0.40 ($7,000 /17,500units)
Insurance 4,200 $0.24
($4,200 /17,500units)
Maintenance 4,900 $0.28
($4,900 /17,500units)
Depreciation 18,000 $18,000
Nocalculation– fixed cost
Supervision 57,000 $57,000
Nocalculation– fixed cost
Now that we know the variable costs per unit. we can calculate the flexible budget for any level ofactivity using these figures. Leed Company prepares a flexible budget for 70%, 80%, 90% and 100%capacity. Notice how the variable costs change with volume but the fixed costs remain the same.
Leed Company Flexible Budget for Mfg Overhead
70%capacity
80%capacity
90%capacity
100%capacity
Volume (inunits)
(25,000 units xcapacity %)
17,500
20,000
22,250
25,000
Variable Fixed
Supplies $0.08 $1,400 $1,600 $1,780 $2,000
(17,500units x$0.08)
(20,000units x$0.08)
(22,250units x$0.08)
(25,000units x$0.08)
Power $0.40 7,000 8,000 8,900 10,000
(17,500units x$0.40)
(20,000units x$0.40)
(22,250units x$0.40)
(25,000units x$0.40)
Insurance $0.24 4,200 4,800 5,340 6,000
(17,500units x$0.24)
(20,000units x$0.24)
(22,250units x$0.24)
(25,000units x$0.24)
Maintenance $0.28 4,900 5,600 6,230 7,000
(17,500 (20,000 (22,250 (25,000

9/25/2017 Managerial Accounting
file:///Users/hannah/Downloads/Managerial-Accounting-1506381825_regexified.html 170/350
units x$0.24)
units x$0.24)
units x$0.24)
units x$0.24)
Depreciation $18,000 18,000 18,000 18,000 18,000
Supervision $57,000 57,000 57,000 57,000 57,000
Total MfgOverhead $92,500 $95,000 $97,250 $100,000
A flexible budget can be prepared for any level of activity. The advantage to a flexible budget is wecan create a budget based on the ACTUAL level of production to give us a clearer picture of ourresults by comparing the flexible budget to actual results. This analysis would compare the actuallevel of activity so volume variances are not a factor and management can focus on the costvariances only. We will discuss this analysis next in the performance report.
Licensing & Attributions
All rights reserved content
Flexible Budgeting. Authored by: Education Unlocked. Located at: https://youtu.be/JHVaey2WdPE. License: All Rights Reserved. License Terms: Standard YouTube License
7.10 THE PERFORMANCE REPORT
Flexible Budget A flexible budget is a budget prepared using the ACTUAL level of productioninstead of the budgeted activity. The difference between actual costs incurred and the flexible budgetamount for that same level of operations is called a budget variance. Budget variances can indicatea department’s or company’s degree of efficiency, since they emerge from a comparison of what waswith what should have been. The performance report shows the budget variance for each line item.
A flexible budget allows volume differences to be removed from the analysis since we are using thesame actual level of activity for both budget and actual. How can we do this? We will need todetermine the budgeted variable cost per unit for each variable cost. Budgeted fixed costs wouldremain the same because they do not change based on volume.
Watch this video online: https://youtu.be/DFD2E5sO6k0
To illustrate the computation of budget variances, assume that Leed’s management prepared anoverhead budget based on an expected volume of 100% capacity, or 25,000 units. At this level ofproduction, the budgeted amount for supplies is a variable cost at $0.08 per unit for a total of $2,000(25,000 units x $0.08). By the end of the period, Leed has used $1,900 of supplies. Our firstimpression is that a favorable variance of $100 exists ($1,900 actual amount is less than the $2,000budget amount).
However, if Leed’s actual production for the period was only 22,500 units (90% of capacity), thecompany would have an unfavorable variance of $100. Why? Because at 90% capacity of 22,500units, the flexible operating budget for supplies would be $1,800 (22,500 units x $0.08). The $1900actual supplies used is $100 more than the flexible budget amount of $1,800. Consequently, itappears that Leed used supplies inefficiently.

9/25/2017 Managerial Accounting
file:///Users/hannah/Downloads/Managerial-Accounting-1506381825_regexified.html 171/350
To give another example using the data in Exhibit 6, Leed’s management may have budgetedmaintenance at USD 5,600 for a given period assuming the company planned to produce 20,000 units(80 per cent of operating capacity). However, Leed’s actual maintenance costs may have been USD6,200 for the period. This result does not necessarily mean that Leed had an unfavorable variance ofUSD 600. The variance depends on actual production volume.
Assume once again that Leed actually produced 22,500 units during the period. The company hadbudgeted maintenance costs at USD 6,300 for that level of production. Therefore, there would actuallybe a favorable variance of USD 100 (USD 6,300 – USD 6,200).
Flexible budgets often show budgeted amounts for every 10 per cent change in the level ofoperations, such as at the 70 per cent, 80 per cent, 90 per cent, and 100 per cent levels of capacity.However, actual production may fall between the levels shown in the flexible budget. If so, thecompany can find the budgeted amounts at that level of operations using the following formula:
Budgeted amount = Budgeted fixed portion of costs + [Budgeted variable portion of cost per unit XActual units of output]
Flexible operating budget and budget variances illustrated As stated earlier, a flexible operatingbudget provides detailed information about budgeted expenses at various levels of activity. The mainadvantage of using a flexible operating budget along with a planned operating budget is thatmanagement can appraise performance on two levels. First, management can compare the actualresults with the planned operating budget, which enables management to analyze the deviation ofactual output from expected output. Second, given the actual level of operations, management cancompare actual costs at actual volume with budgeted costs at actual volume. The use of flexibleoperating budgets gives a valid basis for comparison when actual production or sales volume differsfrom expectations.
Using the data from Exhibit 3, Exhibit 7 and Exhibit 8, present Leed’s detailed planned operatingbudget and flexible operating budget for the quarter ended 2010 March 31. The planned operatingbudget was based on a sales forecast of 20,000 units and a production forecast of 25,000 units.Exhibit 7 and Exhibit 8 show actual sales of 19,000 units and actual production of 25,000 units. (As istypically the case, the budgeted and actual amounts are not equal.) The actual selling price was USD20 per unit, the same price that management had forecasted.
Leed Company Comparison ofplanned operatingbudget and actualresults
For quarter ended2010 March 31
Plannedbudget Actual
Sales (budgeted20,000 units, actual19,000 units)
$400,000$380,000
Cost of goods sold: Beginning finishedgoods inventory $130,000$130,000 Cost of goodsmanufactured (25,000units):

9/25/2017 Managerial Accounting
file:///Users/hannah/Downloads/Managerial-Accounting-1506381825_regexified.html 172/350
Direct materials $ 50,000 $ 62,500 Direct labor 150,000 143,750 Variablemanufacturingoverhead
25,000 31,250
Fixed manufacturingoverhead 75,000 75,000 Cost of goodsmanufactured $300,000$312,500 Cost of goodsavailable for sale $430,000$442,500 Ending finishedgoods inventory 180,000 200,000 Cost of goods sold $250,000$242,500Gross margin $150,000$137,500Selling andadministrativeexpenses: Variable $ 40,000 $ 28,500 Fixed 100,000 95,000 Total selling andadministrativeexpenses
$140,000 $123,500
Income before incometaxes $ 10,000 $ 14,000 Deduct: Estimatedincome taxes (40%) 4,000 5,600Net income $ 6,000 $ 8,400
Exhibit 7: Leed Company: Comparison of planned operating budget and actual results
In Exhibit 7 we compare the actual results with the planned operating budget. Comparison of actualresults with the planned operating budget yields some useful information because it shows whereactual performance deviated from planned performance. For example, sales were 1,000 units lowerthan expected, sales revenue was USD 20,000 less than expected, gross margin was USD 12,500less than expected, and net income was USD 2,400 more than expected.
The comparison of actual results with the planned operating budget does not provide a basis forevaluating whether or not management performed efficiently at the actual level of operations. Forexample, in Exhibit 7, the cost of goods sold was USD 7,500 less than expected. The meaning of thisdifference is not clear, however, because the actual cost of goods sold relates to the 19,000 unitsactually sold, while the planned cost of goods sold relates to the 20,000 units expected.
A company makes a valid analysis of expense controls by comparing actual results with a flexibleoperating budget based on the levels of sales and production that actually occurred. Exhibit 8 showsthe comparison of Leed’s flexible operating budget with the actual results. Note that the flexiblebudget in Exhibit 8 is made up of several pieces. The flexible budget amounts for sales revenue andselling and administrative expenses come from a flexible sales budget (not shown) for 19,000 units ofsales.
Leed Company

9/25/2017 Managerial Accounting
file:///Users/hannah/Downloads/Managerial-Accounting-1506381825_regexified.html 173/350
Comparison offlexible operatingbudget andactual results
For quarterended 2010March 31
Flexiblebudget Actual
Budgetvarianceover(under)
Sales (19,000units)
$380,000
$380,000 $ -0-
Cost of goodssold: Beginningfinished goodsinventory
$130,000
$130,000 $ -0-
Cost of goodsmanufactured(25,000 units): Direct materials $ 50,000 $ 62,500 $
(12,500) Direct labor 150,000 143,750 (6,250) Variablemanufacturingoverhead
25,000 31,250 6,250
Fixedmanufacturingoverhead
75,000 75,000 -0-
Cost of goodsmanufactured) $300,000$312,500$ 12,500 Cost of goodsavailable for sale $430,000$442,500$ 12,500 Ending finishedgoods inventory 192,000 200,000 8,000 Cost of goodssold (19,000 units) $238,000$242,500$ 4,500
Gross margin $142,000
$137,500 $ (4,500)
Selling andadministrativeexpenses: Variable $ 38,000 $ 28,500 $ (9,500) Fixed 100,000 95,000 (5,000) Total sellingand administrativeexpenses
$138,000$123,500$(14,500)
Income beforeincome taxes $ 4,000 $ 14,000 $ 10,000 Deduct: 1,600 5,600 4,000
9/25/2017 Managerial Accounting
file:///Users/hannah/Downloads/Managerial-Accounting-1506381825_regexified.html 174/350
estimated taxes(40%)Net income $ 2,400 $ 8,400 $ 6,000
Exhibit 8: Leed Company: Comparison of flexible operating budget and actual results
In comparisons such as these, if the number of units produced is equal to the number sold, manycompanies do not show their beginning and ending inventories in their flexible operating budgets.Instead, the flexible operating budget may show the number of units actually sold multiplied by thebudgeted unit cost of direct materials, direct labor, and manufacturing overhead. This budget alsoshows actual costs for direct materials, direct labor, and manufacturing overhead for the number ofunits sold.
The comparison of the actual results with the flexible operating budget (Exhibit 8) reveals someinefficiencies for items in the cost of goods manufactured section. For instance, direct materials andvariable overhead costs were considerably higher than expected. Direct labor costs, on the otherhand, were somewhat lower than expected. Both variable and fixed selling and administrativeexpenses were lower than expected. Net income was USD 6,000 more than expected at a sales levelof 19,000 units.
Licensing & Attributions
All rights reserved content
Variance Analysis, Master (Static), Flexible and Actual Budgets (Managerial Accounting Tutorial #43) . Authored by: Note Pirate. Located at: https://youtu.be/DFD2E5sO6k0. License: All Rights Reserved.License Terms: Standard YouTube License
GLOSSARY
GLOSSARY
Budget A plan showing a company’s objectives and proposed ways of attaining the objectives.Major types of budgets are (1) master budget, (2) responsibility budget, and (3) capital budget.
Budgeting The coordination of financial and nonfinancial planning to satisfy an organization’sgoals.
Budget variance The difference between an actual cost incurred (or revenue earned) at a certainlevel of operations and the budgeted amount for the same level of operations.
Cash budget A plan indicating expected inflows (receipts) and outflows (disbursements) of cash; ithelps management decide whether enough cash will be available for short-term needs.
Financial budget The projected balance sheet portion of a master budget.
Fixed costs Costs that are unaffected in total by the relative level of production or sales.
Flexible operating budget A special budget that provides detailed information about budgetedexpenses (and revenues) at various levels of output.

9/25/2017 Managerial Accounting
file:///Users/hannah/Downloads/Managerial-Accounting-1506381825_regexified.html 175/350
Just-in-time inventory system Provides that goods are produced and delivered just in time to besold.
Master budget The projected income statement (planned operating budget) and projected balancesheet (financial budget) showing the organization’s objectives and proposed ways of attaining them;includes supporting budgets for various items in the master budget; also called master profit plan.The master budget is the overall plan of the enterprise and ideally consists of all of the varioussegmental budgets.
Participatory budgeting A method of preparing the budget that includes the participation of alllevels of management responsible for actual performance.
Planned operating budget The projected income statement portion of a master budget.
Production budget A budget that takes into account the units in the sales budget and thecompany’s inventory policy.
Variable costs Costs that vary in total directly with production or sales and are a constant dollaramount per unit of output over different levels of output or sales.
Zero-base budgeting Managers in a company start each year with zero budget levels and mustjustify every dollar that will appear in the budget.
CHAPTER 7: EXERCISES
Short-Answer Questions, Problems, and Exercises
Short-Answer Questions➢ What are three purposes of budgeting?➢ What are the purposes of a master, planned operating, and financial budget?➢ How does the management by exception concept relate to budgeting?➢ What are five basic principles which, if followed, should improve the probability of preparing ameaningful budget? Why is each important?➢ What is the difference between an imposed budget and a participatory budget?➢ Define and explain a budget variance.➢ What are the two major budgets in the master budget? Which should be prepared first? Why?➢ Distinguish between a master budget and a responsibility budget.➢ The budget established at the beginning of a given period carried an item for supplies expense inthe amount of $40,000. At the end of the period, the supplies used amounted to $44,000. Can it beconcluded from these data that there was an inefficient use of supplies or that care was not exercisedin purchasing the supplies?➢ Management must make certain assumptions about the business environment when preparing abudget. What areas should be considered?➢ Why is budgeted performance better than past performance as a basis for judging actual results?➢ Describe the concepts of just-in-time inventory systems and zero-base budgeting.➢ Real world question Refer to the financial statements for a publicly traded company. An industryanalyst has asked you to forecast sales for each of the next five years (after the current year).

9/25/2017 Managerial Accounting
file:///Users/hannah/Downloads/Managerial-Accounting-1506381825_regexified.html 176/350
Assume sales increase each year by the same percentage. That is, the percentage increase for nextyear is expected to be the same as it was last year. What is your estimate of sales in each of the nextfive years?➢ Real world question Refer to your forecasts of sales for the company in the previous question.Evaluate the simple forecasting method you were asked to use in that question. What additionalfactors should be used in forecasting sales?➢ Real world question Do you think the sales for a particular grocery store in your neighborhood willgo up, go down, or stay the same next year compared to this year? Give your answer in sales volume,then give it in sales dollars.➢ Real world question The text refers to the benefits of participation in budgeting. Assume yourcollege bookstore is preparing a budget for next year and wants to include employees in thebudgeting process. Give examples of the people who should be included and state what informationthey could provide.ExercisesExercise A Hike n’ Run Company has decided to produce 288,000 pairs of socks at a uniform ratethroughout 2010. The sales department of Hike n’ Run has estimated sales for 2010 according to thefollowing schedule:
Sales of pairs of socks
First quarter 76,800
Second quarter 62,400
Third quarter 72,000
Fourth quarter 100,800
Total for 2007 312,000
Assume the 2009 December 31, inventory is estimated to be 38,400 pairs of socks. Prepare aschedule of planned sales and production for the first two quarters of 2010.
Exercise B DePaul Company projects sales of 25,000 units during May at $6 per unit. Productioncosts are $1.80 per unit. Variable selling and administrative expenses are $0.60 per unit; fixed sellingand administrative expenses are $60,000. Compute the budgeted income before income taxes.
Exercise C Skaters Plus Company plans to sell 90,000 skateboards next quarter at a price of $36 perunit. Production costs are $14.40 per unit. Selling and administrative expenses are: variable, $7.20per unit; and fixed, $604,800 per quarter. What are the budgeted earnings for next quarter? (Do notconsider federal income taxes.)
Exercise D Duke Corporation considers materials and labor to be completely variable costs.Expected production for the year is 50,000 units. At that level of production, direct materials cost isbudgeted at $198,000, and direct labor cost is budgeted at $450,000. Prepare a flexible budget formaterials and labor for possible production levels of 52,500, 60,000, and 67,500 units of product.
Exercise E Assume that in the previous exercise the actual production was 60,000 units, materialscost was $247,000, and labor cost was $510,000. What are the budget variances?
Exercise F Fixed production costs for Alexia Company are budgeted at $576,000, assuming 40,000units of production. Actual sales for the period were 35,000 units, while actual production was 40,000units. Actual fixed costs used in computing cost of goods sold amounted to $504,000. What is thebudget variance?

9/25/2017 Managerial Accounting
file:///Users/hannah/Downloads/Managerial-Accounting-1506381825_regexified.html 177/350
Exercise G The shoe department of Noardstone’s Department Store has prepared a sales budget forApril calling for a sales volume of $75,000. The department expects to begin in April with a $50,000inventory and to end the month with an $42,500 inventory. Its cost of goods sold averages 70% ofsales.
Prepare a purchases budget for the department showing the amount of goods to be purchased duringApril.
Problems
Problem A Joyce Corporation prepares monthly operating and financial budgets. The operatingbudgets for June and July are based on the following data:
Units produced Units sold
June 400,000 360,000
July 360,000 400,000
All sales are at $30 per unit. Direct materials, direct labor, and variable manufacturing overhead areestimated at $3, $6, and $3 per unit, respectively. Total fixed manufacturing overhead is budgeted at$1,080,000 per month. Selling and administrative expenses are budgeted at $1,200,000 plus 10% ofsales, while federal income taxes are budgeted at 40% of income before federal income taxes. Theinventory at June 1 consists of 200,000 units with a cost of $17.10 each.
1. Prepare monthly budget estimates of cost of goods sold assuming that FIFO inventory procedureis used.
2. Prepare planned operating budgets for June and July.
Problem B The computation of operating income for Frisco Company for 2008 follows:
Sales $1,800,000
Cost of goods manufactured and sold:
Direct materials $360,000
Direct labor 240,000
Variable manufacturing overhead 120,000
Fixed manufacturing overhead 240,000 960,000
Gross margin $ 840,000
Selling expenses:
Variable $132,000
Fixed 168,000 300,000
Administrative expenses:
Variable $156,000
Fixed 192,000 348,000
Net operating income $ 192,000

9/25/2017 Managerial Accounting
file:///Users/hannah/Downloads/Managerial-Accounting-1506381825_regexified.html 178/350
An operating budget is prepared for 2009 with sales forecasted at a 25% increase in volume. Directmaterials, direct labor, and all costs labeled as variable are completely variable. Fixed costs areexpected to continue except for a $24,000 increase in fixed administrative costs. Actual operatingdata for 2009 are:
Sales $2,160,000
Direct materials 444,000
Direct labor 288,000
Variable manufacturing overhead 148,800
Fixed manufacturing overhead 246,000
Variable selling expenses 186,000
Fixed selling expenses 157,200
Variable administrative expenses 198,000
Fixed administrative expenses 218,200
1. Prepare a budget report comparing the 2009 planned operating budget with actual 2009 data.2. Prepare a budget report that would be useful in appraising the performance of the various
persons charged with responsibility to provide satisfactory income. (Hint: Prepare budget data ona flexible basis and use the percentage by which sales were actually experienced.)
3. Comment on the differences revealed by the two reports.
Problem C Use the following data to prepare a planned operating budget for Hi-Lo Company for theyear ending 2009 December 31:
Plant capacity 100,000 units
Expected sales volume 90,000 units
Expected production 90,000 units
Actual production 90,000 units
Forecasted selling price $ 12,00 per unit
Actual selling price $ 13,50 per unit
Manufacturing costs:
Variable (per unit):
Direct materials $3.60
Direct labor $1.50
Manufacturing overhead $2.25
Fixed manufacturing overhead $108,000
Selling and administrative expenses:

9/25/2017 Managerial Accounting
file:///Users/hannah/Downloads/Managerial-Accounting-1506381825_regexified.html 179/350
Variable (per unit) $1.20
Fixed $60,000
Assume no beginning or ending inventory. Federal income taxes are budgeted at 40% of incomebefore federal income taxes.
The actual operating data for the year ending 2009 December 31, follow:
Sales $1,080,000
Cost of goods sold:
Direct materials $337,500
Direct labor 135,000
Variable manufacturing overhead 202,500
Fixed manufacturing overhead 108,000
Total $783,000
Less: Ending inventory ($783,000 x 10/90) 87,000 696,000
Gross margin $384,000
Selling expenses:
Variable 102,000
Fixed 72,000 174,000
Income before federal income taxes $210,000
Deduct: Federal income taxes at 40% 84,000
Net income $126,000
1. Prepare a planned operating budget for the year ended 2009 December 31, for part (1).2. Using a flexible operating budget, analyze the efficiency of operations and comment on the
company’s sales policy for part (2).
Problem D Kim Company wants you to prepare a flexible budget for selling and administrativeexpenses. The general manager and the sales manager have met with all the department heads, whoprovided the following information regarding selling and administrative expenses:
The company presently employs 30 full-time salespersons with a base of $3,600 each per month pluscommissions and 10 full-time salespersons with a salary of $6,000 each per month plus commissions.In addition, the company employs nine regional sales managers with a salary of $21,600 per month,none of whom is entitled to any commissions.
If sales volume exceeds $80 million per year, the company must hire four more salespersons, each ata salary of $3,600 per month plus commissions.
Sales commissions are either 10% or 5% of the selling price, depending on the product sold.Typically, a 10% commission applies on 60% of sales, and a 5% commission applies on the remaining40% of sales.

9/25/2017 Managerial Accounting
file:///Users/hannah/Downloads/Managerial-Accounting-1506381825_regexified.html 180/350
Salespersons’ travel allowances average $1,500 per month per salesperson (excluding managers).
Advertising expenses average $150,000 per month plus 3% of sales.
Selling supplies expense is estimated at 1% of sales.
Administrative salaries are $300,000 per month.
Other administrative expenses include the following:
Rent—$48,000 per month
Office supplies—2% of sales
Other administrative expenses (telephone, etc.)—$12,000 per month
Prepare a flexible budget for selling and administrative expenses for sales volume of $36 million, $48million, and $60 million per year.
Problem E Galaxy Lighting Company manufactures and sells lighting fixtures. Estimated sales for thenext three months are:
September $350,000
October 500,000
November 400,000
Sales for August were $400,000. All sales are on account. Galaxy Lighting Company estimates that60% of the accounts receivable are collected in the month of sale with the remaining 40% collectedthe following month. The units sell for $30 each. The cash balance for September 1 is $100,000.
Generally, 60% of purchases are due and payable in the month of purchase with the remainder duethe following month. Purchase cost per unit for materials is $18. The company maintains an end-of-the-month inventory of 1,000 units plus 10% of next month’s unit sales.
Prepare a cash receipts schedule for September and October and a purchases budget for August,September, and October.
Problem F Refer to the previous problem. In addition to the information given, selling andadministrative expenses paid in cash are $120,000 per month.
Prepare a monthly cash budget for September and October for Galaxy Lighting Company.
Alternate problems
Alternate problem A Cougars Company prepares monthly operating and financial budgets.Estimates of sales in units are made for each month. Production is scheduled at a level high enoughto take care of current needs and to carry into each month one-half of the next month’s unit sales.Direct materials, direct labor, and variable manufacturing overhead are estimated at $12, $6, and $4per unit, respectively. Total fixed manufacturing overhead is budgeted at $480,000 per month. Salesfor April, May, June, and July 2009 are estimated at 100,000, 120,000, 160,000, and 120,000 units.The inventory at 2009 April 1, consists of 50,000 units with a cost of $28.80 per unit.
9. Prepare a schedule showing the budgeted production in units for April, May, and June 2009.

9/25/2017 Managerial Accounting
file:///Users/hannah/Downloads/Managerial-Accounting-1506381825_regexified.html 181/350
10. Prepare a schedule showing the budgeted cost of goods sold for the same three monthsassuming that the FIFO method is used for inventories.
Alternate problem B Following is a summary of operating data of Bugs Company for the year 2008:
Sales $ 7,00,000
Cost of goods manufactured and sold:
Direct materials $1,200,000
Direct labor 1,100,000
Variable manufacturing overhead 300,000
Fixed manufacturing overhead 800,000 3,400,000
Gross margin $ 3,600,000
Selling expenses:
Variable $ 300,000
Fixed 400,000 700,000
2,900,000
General and administrative expenses:
Variable $ 100,000
Fixed 1,200,000 1,300,000
Net operating income $ 1,600,000
Sales volume for 2009 is budgeted at 90% of 2008 sales volume. Prices are not expected to change.The 2009 budget amounts for the various other costs and expenses differ from those reported in 2008only for the expected volume change in the variable items. Actual operating data for 2009 follow:
Sales $5,800,000
Direct materials 1,300,000
Direct labor 1,100,000
Variable manufacturing overhead 300,000
Fixed manufacturing overhead 780,000
Variable selling expenses 270,000
Fixed selling expenses 290,000
Variable administrative expenses 110,000
Fixed administrative expenses 1,100,000
1. Prepare a budget report comparing the planned operating budget for 2009 with the actual resultsfor that year.
9/25/2017 Managerial Accounting
file:///Users/hannah/Downloads/Managerial-Accounting-1506381825_regexified.html 182/350
2. Prepare a budget report that would be useful in pinpointing responsibility for the poor showing in2009. (Hint: Prepare a flexible operating budget.)
Alternate problem C Use the following data for Andrea Company in preparing its 2009 plannedoperating budget:
Plant capacity 500,000 units
Expected sales volume 450,000 units
Expected production 500,000 units
Forecasted selling price $72 per unit
Variable manufacturing costs per unit:
Direct materials $ 27.00
Direct labor 9.00
Manufacturing overhead 6.00
Fixed manufacturing overhead per period $900,000
Selling and administrative expenses:
Variable (per unit) $ 3.00
Fixed (per period) $ 750,000
Assume no beginning inventory. Federal income taxes are budgeted at 40% of income before incometaxes.
The actual results for Andrea Company for the year ended 2009 December 31, follow. (Note: Theactual sales price was $80 per unit. Actual unit production was equal to actual unit sales.)
Sales (500,000 units @ $80 per unit) $40,000,000
Cost of goods sold:
Direct materials $12,000,000
Direct labor 4,400,000
Variable manufacturing overhead 4,000,000
Fixed manufacturing overhead 1,000,000 21,400,000
Gross margin $18,600,000
Selling and administrative expenses:
Variable $ 1,400,000
Fixed 800,000 2,200,000
Income before federal income taxes $16,400,000
Deduct: Federal income taxes 6,560,000

9/25/2017 Managerial Accounting
file:///Users/hannah/Downloads/Managerial-Accounting-1506381825_regexified.html 183/350
Net income $ 9,840,000
1. Prepare a planned operating budget for the year ended 2009 December 31, for (1).2. Using a flexible operating budget, analyze the efficiency of operations. Comment on the results of
2009 and on the company’s sales policy in (2).
Alternate problem D Rocklin Company gathered the following budget information for the quarterending 2009 September 30:
Sales $540,000
Purchases 450,000
Salaries and wages 194,000
Rent 10,000
Supplies 8,000
Insurance 2,000
Other cash expenses 12,000
A cash balance of $36,000 is planned for July 1. Accounts receivable are expected to be $60,000 onJuly 1. All but one-half of 1% of the July 1 Accounts Receivable balance will be collected in thequarter ending September 30. The company’s sales collection pattern is 95% in the quarter of saleand 5% in the quarter after sale. Accounts payable will be $30,000 on July 1 and will be paid duringthe coming quarter. The company’s purchases payment pattern is 75% in the quarter of purchase and25% in the quarter after purchase. Expenses are paid in the quarter in which they are incurred.
Prepare a cash budget for the quarter ending 2009 September 30.
Beyond the numbers—Critical thinking
Business decision case A Golden State Company has applied at a local bank for a short-term loanof $150,000 starting on 2009 October 1. The bank’s loan officer has requested a cash budget from thecompany for the quarter ending 2009 December 31. The following information is needed to preparethe cash budget:
Sales $600,000
Purchases 350,000
Salaries and wages to be paid 125,000
Rent payments 7,000
Supplies (payments for) 4,500
Insurance payments 1,500
Other cash payments 22,000
A cash balance of $24,000 is planned for October 1. Accounts receivable are expected to be $48,000on October 1. All of these accounts will be collected in the quarter ending December 31. In general,sales are collected as follows: 90% in the quarter of sale, and 10% in the quarter after sale. Accounts

9/25/2017 Managerial Accounting
file:///Users/hannah/Downloads/Managerial-Accounting-1506381825_regexified.html 184/350
payable will be $480,000 on October 1 and will be paid during the quarter ending December 31. Allpurchases are paid in the quarter after purchase.
1. Prepare a cash budget for the quarter ending 2009 December 31. Assume that the $150,000 loanwill be made on October 1 and will be repaid with interest at 10% on December 31.
2. Will the company be able to repay the loan on December 31? If the company desires a minimumcash balance of $18,000, will the company be able to repay the loan as planned?
Ethics case B The state of California, USA faced large budget deficits. Meanwhile, officials in aparticular community college district were looking for ways to spend the money that had beenbudgeted for the district. The community college was entering the last three months of the fiscal yearwith excess funds because the area had experienced a mild winter resulting in lower than usualutilities and maintenance costs.
At a budget meeting, one official commented, “You know what will happen if we do not spend all of ourbudget. The state will claim we do not need as much money next year. What happens if we have ahard winter next year? We will need every cent we can get!”
The community college’s accounting manager commented, “We are legally entitled to spend all of themoney this year that has been budgeted to us. I am concerned about the memorandum that wereceived requesting that we cut expenditures wherever possible to help reduce the state’s deficit.”
The first official responded, “That deficit is the state’s problem, not ours. We would not have a deficitin the first place if the state administrators were able to estimate taxes and do a better job ofbudgeting. Let us deal with our problems and let them deal with theirs!”
Write a response from the point of view of the taxpayers of the state of California. Should thecommunity college spend all of the money that had been budgeted for it?
Broader perspective C Refer to the Broader perspective, “Planning in a changing environment”.Describe and evaluate Verizon Communications, Inc.’s new approach to planning. How would youadvise company management to communicate the company’s values and plans to employees?
Group project D In groups of three, develop a budget for an organization that publishes financialstatements, such as The Coca-Cola Company or Maytag Corporation. Your budget should includethree different types of projected income statements for the coming month, quarter, or year. Thesethree income statements should be for optimistic, pessimistic, and expected scenarios. Collect ordevelop as much information as possible to prepare the budget. For example, to prepare a budgetedincome statement for a publicly traded company such as Coca-Cola, look at previous annual reportsand collect whatever additional information you can from news reports. Be sure to state theassumptions used in preparing the budget in a memorandum you write as a team. The heading of thememorandum should contain the date, to whom it is written, from whom, and the subject matter. Donot forget to include the three different projected income statements.
Group project E The chief executive officer (CEO) of Rigid Plastics Corporation remarked to acolleague, “I do not understand why other companies waste so much time in the budgeting process. Iset our company goals, and everyone strives to meet them. What is wrong with that approach?” Ingroups of two or three students, write a memorandum to your instructor stating whether you agreewith this comment or not and explain why. The heading of the memorandum should contain the date,to whom it is written, from whom, and the subject matter.
Group project F Multigoal Corporation has established a bonus plan for its employees. An employeereceives a bonus if his or her department meets or is below the cost levels specified in the annualbudget plan. If the department’s costs exceed the budget, its employees earn no bonus. In groups oftwo or three students, write a memorandum to your instructor stating the problems that might arise

9/25/2017 Managerial Accounting
file:///Users/hannah/Downloads/Managerial-Accounting-1506381825_regexified.html 185/350
with this bonus plan. The heading of the memorandum should contain the date, to whom it is written,from whom, and the subject matter.
Using the Internet—A view of the real world
Visit the website for a high technology company that provides recent annual reports. Examplesinclude Intel Corporation, IBM, and Dell. Develop a budgeted income statement (operating budget) forthe coming year and include three categories for optimistic, pessimistic, and expected scenarios.Collect or develop as much information as possible to prepare the budget. For example, look atprevious annual reports and collect whatever additional information you can from news reports. Besure to state the assumptions used in preparing the budget in a memorandum. The heading of thememorandum should contain the date, to whom it is written, from whom, and the subject matter. Donot forget to include the three different projected income statements.
Visit the website for a retail company that provides recent annual reports. Develop a budgeted incomestatement (operating budget) for the coming year and include three categories for optimistic,pessimistic, and expected scenarios. Collect or develop as much information as possible to preparethe budget. For example, look at previous annual reports and collect whatever additional informationyou can from news reports. Be sure to state the assumptions used in preparing the budget in amemorandum. The heading of the memorandum should contain the date, to whom it is written, fromwhom, and the subject matter. Do not forget to include the three different projected incomestatements.
Comprehensive problems
Wimerick Corporation prepares annual budgets by quarters. The company’s post-closing trial balanceas of 2010 December 31, is as follows:
Debits Credits
Cash $138,000
Accounts receivable 360,000
Allowance for uncollectible accounts $ 12,000
Inventories 156,000
Prepaid expenses 12,000
Furniture and equipment 180,000
Accumulated depreciation – Furniture and equipment 12,000
Accounts payable 120,000
Accrued liabilities payable 36,000
Notes payable, 5% (due 2008) 480,000
Capital stock 300,000
Retained earnings (deficit) 114,000
$960,000 $960,000

9/25/2017 Managerial Accounting
file:///Users/hannah/Downloads/Managerial-Accounting-1506381825_regexified.html 186/350
All of the capital stock of the company was recently acquired by Juan Jackson. After the purchase,Jackson loaned substantial sums of money to the corporation, which still owes him $480,000 on a 5%note. There are no accrued federal income taxes payable, but future earnings will be subject toincome taxation.
Jackson is anxious to withdraw $120,000 from the corporation (as a payment on the note payable tohim) but will not do so if it reduces the corporation’s cash balance below $120,000. Thus, he is quiteinterested in the budgets for the quarter ending 2011 March 31.
Sales for the coming quarter ending 2011 March 31, are forecasted at $1,200,000; for the followingquarter they are forecasted at $1,500,000. All sales are priced to yield a gross margin of 40%.Inventory is to be maintained on hand at the end of any quarter in an amount equal to 20% of thegoods to be sold in the next quarter. All sales are on account, and 95% of the 2010 December 31,receivables plus 70% of the current quarter’s sales will be collected during the quarter ending 2011March 31.
Selling expenses are budgeted at $48,000 plus 6% of sales; $24,000 will be incurred on account,$66,000 accrued, $27,000 from expiration of prepaid rent and prepaid insurance, and $3,000 fromallocated depreciation.
Purchasing expenses are budgeted at $34,800 plus 5% of purchases for the quarter; $9,000 will beincurred on account, $48,000 accrued, $13,800 from expired prepaid expenses, and $1,200 fromallocated depreciation.
Administrative expenses are budgeted at $42,000 plus 2% of sales; $3,000 will be incurred onaccount, $36,000 accrued, $13,200 from expired prepayments, and $1,800 from allocateddepreciation. Uncollectible accounts are estimated at 1% of sales.
Interest accrues at 5% annually on the notes payable and is credited to Accrued Liabilities Payable.
All of the beginning balances in Accounts Payable and Accrued Liabilities Payable, plus 80% of thecurrent credits to Accounts Payable, and all but $30,000 of the current accrued liabilities will be paidduring the quarter. An $18,000 insurance premium is to be paid prior to March 31, and a full year’srent of $144,000 is due on January 2.
Federal income taxes are budgeted at 40% of the income before federal income taxes. The taxesshould be accrued, and no payments are due in the first quarter.
1. Prepare a planned operating budget for the quarter ending 2011 March 31, including supportingschedules for planned purchases and operating expenses.
2. Prepare a financial budget for 2011 March 31. Supporting schedules should be included that (1)analyze accounts credited for purchases and operating expenses, (2) show planned accountsreceivable collections and balance, and (3) show planned cash flows and cash balance.
3. Will Jackson be able to collect the $120,000 on his note?
Davis Corporation is a rapidly expanding company. The company’s post-closing balance as of 2010December 31, is as follows:
Davis corporation
Post-closing trial balance
2010 December 31
Debits Credits

9/25/2017 Managerial Accounting
file:///Users/hannah/Downloads/Managerial-Accounting-1506381825_regexified.html 187/350
Cash $240,000
Accounts receivable 480,000
Allowance for uncollectible accounts $ 36,000
Inventories 600,000
Prepaid expenses 72,000
Land 600,000
Buildings and equipment 1,800,000
Accumulated depreciation – Buildings and equipment 240,000
Accounts payable 360,000
Accrued liabilities payable (including income taxes) 240,000
Capital stock 2,400,000
Retained earnings 516,000
$3,792,000 $3,792,000
Sales in the last quarter of 2010 amounted to $2,400,000 and are projected at $3,000,000 and$4,800,000 for the first two quarters of 2011. This expansion has created a need for cash.Management is especially concerned about the probable cash balance of 2011 March 31, since apayment of $360,000 for some new equipment must be made on delivery on April 2. The current cashbalance of $240,000 is considered to be the minimum workable balance.
Purchases, all on account, are to be scheduled so that the inventory at the end of any quarter is equalto one-third of the goods expected to be sold in the coming quarter. Cost of goods sold averages 60%of sales.
Selling expenses are budgeted at $120,000 plus 8% of sales; $24,000 is expected to be incurred onaccount, $288,000 accrued, $33,600 from expired prepayments, and $14,400 from allocateddepreciation.
Purchasing expenses are budgeted at $84,000 plus 5% of purchases; $12,000 will be incurred onaccount, $156,000 accrued, $13,200 from expired prepayments, and $10,800 from allocateddepreciation.
Administrative expenses are budgeted at $150,000 plus 3% of sales; $24,000 will be incurred onaccount, $132,000 accrued, $13,200 from expired prepayments, and $10,800 from allocateddepreciation.
Federal income taxes are budgeted at 40% of income before federal income taxes and are recordedas accrued liabilities. Payments on these taxes are included in the payments on accrued liabilitiesdiscussed in item 6.
All 2010 December 31, accounts payable plus 80% of current credits to this account will be paid in thefirst quarter. All of the 2010 December 31, accrued liabilities payable (except for $72,000) will be paidin the first quarter. Of the current quarter’s accrued liabilities, all but $288,000 will be paid during thefirst quarter.

9/25/2017 Managerial Accounting
file:///Users/hannah/Downloads/Managerial-Accounting-1506381825_regexified.html 188/350
Cash outlays for various expenses normally prepaid will amount to $96,000 during the quarter.
All sales are made on account; 80% of the sales are collected in the quarter in which made, and all ofthe remaining sales are collected in the following quarter, except for 2% which is never collected. TheAllowance for Uncollectible Accounts account shows the estimated amount of accounts receivable at2010 December 31, arising from 2010 sales that will not be collected.
1. Prepare an operating budget for the quarter ending 2011 March 31. Supporting schedules forplanned purchases and operating expenses should be included.
2. Prepare a financial budget for 2011 March 31. Include supporting schedules that (1) analyzeaccounts credited for purchases and expenses, (2) show planned cash flows and cash balance,and (3) show planned collections of accounts receivable and the accounts receivable balance.
3. Will sufficient cash be on hand April 2 to pay for the new equipment?

9/25/2017 Managerial Accounting
file:///Users/hannah/Downloads/Managerial-Accounting-1506381825_regexified.html 189/350
CHAPTER 8: STANDARD COSTSYSTEMS
CHAPTER 8 STUDY PLAN
Knowledge Targets
I can define the following terms as they relate to our unit:
Budget Planning Budget Flexible Budget Cash Budget
Master Budget Activity Variance Revenue Variance Spending Variance
Fixed Cost Variable Cost Standard Cost Standard Hours
Standard Price Variance Quantity Variance Efficiency Variance
Rate Variance Price Variance Materials Labor
Variable Overhead Fixed Overhead Selling expense Administrative expense
Reasoning TargetsI can understand the difference between a planning budget and a flexible budget.I can identify costs as fixed cost or variable cost.I can understand the purpose of using a budget for businesses.I can analyze differences between budget and actual and explain possible reasons for thevariances.I can analyze and explain labor rate and efficiency variances.I can analyze and explain material price and quantity variances.I can understand the use of standards (including cost, hours or price) for budgeting andanalysis.
Skill TargetsI can prepare a sales and production budget (or purchases budget for merchandiser).I can prepare a selling and administrative expense budget.I can prepare a cash budget including schedules of receivables and payables.I can prepare a budgeted income statement and budgeted balance sheet.I can prepare a master budget including budgets for sales, purchases, selling and administrativeexpenses, cash, income statement and balance sheet.

9/25/2017 Managerial Accounting
file:///Users/hannah/Downloads/Managerial-Accounting-1506381825_regexified.html 190/350
I can prepare a flexible budget based on the actual level of production.I can prepare a flexible budget performance report analyzing difference between budget andactual.I can calculate variances for materials and labor.
Click Budgeting Study Plan for a printable copy.
8.1 THE ROLE OF STANDARD COSTS INMANAGEMENT
Uses of standard costs
Whenever you have set goals that you have sought to achieve, these goals could have been calledstandards. Periodically, you might measure your actual performance against these standards andanalyze the differences to see how close you are to your goal. Similarly, management sets goals,such as standard costs, and compares actual costs with these goals to identify possible problems.
This section begins with a discussion of the nature of standard costs. Next, we explain how managersuse standard costs to establish budgets. Then we describe how management uses the concept ofmanagement by exception to investigate variances from standards. We also explain settingstandards and how management decides whether to use ideal or practical standards. The sectioncloses with a discussion of the other uses of standard costs.
Watch this video online: https://youtu.be/KTeY4TBh5nA
Nature of standard costs
A standard cost is a carefully predetermined measure of what a cost should be under statedconditions. Standard costs are not only estimates of what costs will be but also goals to be achieved.When standards are properly set, their achievement represents a reasonably efficient level ofperformance.
Usually, effective standards are the result of engineering studies and of time and motion studiesundertaken to determine the amounts of materials, labor, and other services required to produce aproduct. Also considered in setting standards are general economic conditions because theseconditions affect the cost of materials and other services that must be purchased by a manufacturingcompany.
Watch this video online: https://youtu.be/QDKP7u1VVqE
Manufacturing companies determine the standard cost of each unit of product by establishing thestandard cost of direct materials, direct labor, and manufacturing overhead necessary to produce thatunit. Determining the standard cost of direct materials and direct labor is less complicated thandetermining the standard cost of manufacturing overhead.

9/25/2017 Managerial Accounting
file:///Users/hannah/Downloads/Managerial-Accounting-1506381825_regexified.html 191/350
The standard direct materials cost per unit of a product consists of the standard amount of materialrequired to produce the unit multiplied by the standard price of the material. You must distinguishbetween the terms standard price and standard cost. Standard price usually refers to the price perunit of inputs into the production process, such as the price per pound of raw materials.
Standard cost, however, is the standard quantity of an input required per unit of output times thestandard price per unit of that input. For example, if the standard price of cloth is $ 3 per yard and thestandard quantity of material required to produce a dress is 3 yards, the standard direct materials costof the dress is 3 yards x $ 3 per yard = $ 9. Similarly, a company computes the standard direct laborcost per unit for a product as the standard number of hours needed to produce one unit multiplied bythe standard labor or wage rate per hour.
Standard manufacturing overhead cost To find the standard manufacturing overhead cost of a unit,use the following steps. First, determine the expected level of output for the year. This level of outputis called the standard level of output. Second, determine the total budgeted manufacturingoverhead cost at the standard level of output. The total budgeted overhead cost includes both fixedand variable components. Total fixed cost is the same at every level of output within a relevant range.Total variable overhead varies in direct proportion to the number of units produced. Third, compute thestandard manufacturing overhead cost per unit by dividing the total budgeted manufacturing overheadcost at the standard level of output by the standard level of output. The result is standard overheadcost (or rate) per unit of output.
The formula to compute the standard overhead cost per unit is:
Total Budgeted Manufacturing OH at standard level / standard level of output
Sometimes accountants find the standard overhead rate per unit of input, such as direct labor-hourinstead of per unit. To find the standard overhead cost per unit, multiply the direct labor-hours per unittimes the standard overhead cost per direct labor-hour. For instance, if the standard overhead costsper direct labor-hour is $ 5 and the standard number of direct labor-hours is two hours per unit, thestandard overhead cost per unit is $ 5 x 2 hours = $ 10.
As discussed in the previously, budgets are formal written plans that represent management’splanned actions in the future and the impacts of these actions on the business. As a business incursactual expenses and revenues, management compares them with the budgeted amounts. To controloperations, management investigates any differences between the actual and budgeted amounts andtakes corrective action.
When management compares actual expenses and revenues with budgeted expenses and revenues,differences—called variances—are likely to occur. The responsibility of management is to investigatesignificant variances. Obviously, management must determine when a variance is significant. Thisprocess of focusing on only the most significant variances is known as management by exception.The process of management by exception enables management to concentrate its efforts on thosevariances that could have a big effect on the company, ignoring those variances that are notsignificant.
In developing standards, management must consider the assumed conditions under which thesestandards can be met. Standards generally fall into two groups—ideal and practical.
A company attains ideal standards under the best circumstances—with no machinery problems orworker problems. The company can attain these unrealistic standards only when it has highly efficient,skilled workers who are working at their best effort throughout the entire period needed to completethe job.

9/25/2017 Managerial Accounting
file:///Users/hannah/Downloads/Managerial-Accounting-1506381825_regexified.html 192/350
Practical standards are strict but attainable standards that have allowances made for machineryproblems and rest periods for workers. Companies can meet these standards if average workers areefficient at their work. These standards are generally used in planning.
Generally, management does not use ideal standards because ideal standards do not allow fornormal repairs to machinery or rest periods for workers. A company rarely runs its operations underideal conditions. Since planning under ideal standards is unrealistic, managers rarely use idealstandards in budgeting. Instead, management uses practical standards in planning because thesestandards are more realistic, allowing for machinery repairs and rest periods for workers. Anyvariances that result when practical standards are used indicate abnormal or unusual problems.
In addition to developing budgets, companies use standard costs in evaluating management’sperformance, evaluating workers’ performance, and setting appropriate selling prices.
Firms evaluate management’s and workers’ performances through the use of a budget. Whenmanagement compares actual results with budgeted amounts, it can see how well it is performing itsown duties and managing its employees. Management also can evaluate workers based on how wellthey performed relative to the budgeted amounts pertaining to the activities they performed.
Standard costs are useful in setting selling prices. The budget shows the expected expenses incurredby the business. By considering these expenses, management can determine how much to charge fora product so that it can produce the desired net income. As the business actually incurs theseexpenses, management determines if the selling prices set are still reasonable and, when necessary,considers some price adjustments after taking competition into account.
Licensing & Attributions
CC licensed content, Shared previously
Accounting Principles: A Business Perspective.. Authored by: James Don Edwards, University of Georgia & Roger H. Hermanson, Georgia State University.. Provided by: Endeavour InternationalCorporation. Project: The Global Text Project. License: CC BY: Attribution
All rights reserved content
Standard Cost versus Actual Cost: Which is Best?. Authored by: Cost Matters. Located at: https://youtu.be/KTeY4TBh5nA. License: All Rights Reserved. License Terms: Standard YouTube LicenseStandard Cost: Which Costs To Use As A Standard? . Authored by: Cost Matters. Located at: https://youtu.be/QDKP7u1VVqE. License: All Rights Reserved. License Terms: Standard YouTube License
8.2 CALCULATIONS FOR DIRECT MATERIALSAND LABOR
Computing variances
As stated earlier, standard costs represent goals. Standard cost is the amount a cost should be undera given set of circumstances. The accounting records also contain information about actual costs.
The amount by which actual cost differs from standard cost is called a variance. When actual costsare less than the standard cost, a cost variance is favorable. When actual costs exceed the standardcosts, a cost variance is unfavorable. Do not automatically equate favorable and unfavorablevariances with good and bad. You must base such an appraisal on the causes of the variance.

9/25/2017 Managerial Accounting
file:///Users/hannah/Downloads/Managerial-Accounting-1506381825_regexified.html 193/350
The following section explains how to compute the dollar amount of variances, a process calledisolating variances, using data for Beta Company. Beta manufactures and sells a single product, eachunit of which has the following standard costs:
Materials – 5 sheetsat $6 $30Direct labor – 2hours at $10 20Manufacturingoverhead – 2 directlabor hours at $5
10
Total standard costper unit $60
We present additional data regarding the production activities of the company as needed.
The standard materials cost of any product is simply the standard quantity of materials that should beused multiplied by the standard price that should be paid for those materials. Actual costs may differfrom standard costs for materials because the price paid for the materials and/or the quantity ofmaterials used varied from the standard amounts management had set. These two factors areaccounted for by isolating two variances for materials—a price variance and a usage variance.
Accountants isolate these two materials variances for three reasons. First, different individuals may beresponsible for each variance—a purchasing agent for the price variance and a production managerfor the usage variance. Second, materials might not be purchased and used in the same period. Thevariance associated with the purchase should be isolated in the period of purchase, and the varianceassociated with usage should be isolated in the period of use. As a general rule, the sooner avariance can be isolated, the greater its value in cost control. Third, it is unlikely that a single materialsvariance—the difference between the standard cost and the actual cost of the materials used—wouldbe of any real value to management for effective cost control. A single variance would not showmanagement what caused the difference, or one variance might simply offset another and make thetotal difference appear to be immaterial.
Watch this video online: https://youtu.be/-e32TQdCjDg
Materials price variance In a manufacturing company, the purchasing and accounting departmentsusually set a standard price for materials meeting certain engineering specifications. They considerfactors such as market conditions, vendors’ quoted prices, and the optimum size of a purchase orderwhen setting a standard price. A materials price variance (MPV) occurs when a company pays ahigher or lower price than the standard price set for materials. Materials price variance is thedifference between actual price paid (AP) and standard price allowed (SP) multiplied by the actualquantity of materials purchased (AQ). In equation form, the materials price variance can be done intwo ways:
Materials price variance = (Actual price – Standard price) x Actual quantity purchased
OR
Materials price variance = (Actual price x Actual quantity purchased) – (Standard price x Actualquantity purchased)
To illustrate, assume that a new supplier entered the market enabling Beta Company to purchase60,000 sheets of material at a price of $ 5.90 each. Since the standard price set by management is $6 per sheet, the materials price variance is computed as:

9/25/2017 Managerial Accounting
file:///Users/hannah/Downloads/Managerial-Accounting-1506381825_regexified.html 194/350
Materials price variance= (Actual price – Standard price) x Actual quantity purchased
= ($5.90 – $6.00) x 60,000 sheets of material
= (-0.10) x 60,000 sheets = -6,000 which means $6,000 favorable
OR
Materials price variance = (Actual price x Actual quantity purchased) – (Standard price x Actualquantity purchased)
= ($5.90 x 60,000) – ($6.00 x 60,000 sheets of material)
= $345,000 – $360,000 = -6,000 which means $6,000 favorable
The materials price variance of $ 6,000 is considered favorable since the materials were acquired fora price less than the standard price. If the actual price had exceeded the standard price, the variancewould be unfavorable because the costs incurred would have exceeded the standard price. We donot show variances with a negative or positive but at the absolute value with favorable orunfavorable specified.
Materials usage variance Because the standard quantity of materials used in making a product islargely a matter of physical requirements or product specifications, usually the engineeringdepartment sets it. But if the quality of materials used varies with price, the accounting and purchasingdepartments may perform special studies to find the right quality.
The materials usage variance occurs when more or less than the standard amount of materials isused to produce a product or complete a process. The variance shows only differences from thestandard quantity caused by the quantity of materials used; it does not include any effect of variancesin price. Thus, the materials usage variance is :
Materials usage variance = (Actual qty – Standard qty allowed) x Standard price
OR
Materials price variance = (Actual Qty x Standard price) – (Standard Qty x Standard price)
To illustrate, assume that Beta Company used 55,500 sheets of material to produce 11,000 units of aproduct for which the standard quantity allowed is 55,000 sheets (5 sheets per unit allowed x 11,000units actually produced). Since the standard price of the material is $ 6 per sheet, the materials usagevariance of $ 3,000 would be computed as follows:
Materials usage variance = (Actual qty – Standard qty allowed) x Standard price
= (55,500 actual sheets – 55,000 allowed sheets) x $6 per sheet
= 500 sheets x $6 per sheet
= $ 3,000 which means $3,000 unfavorable variance
OR
Materials price variance = (Actual Qty x Standard price) – (Standard Qty x Standard price)
= (55,500 actual sheets x $6) – (55,000 allowed sheets x $6 per sheet)

9/25/2017 Managerial Accounting
file:///Users/hannah/Downloads/Managerial-Accounting-1506381825_regexified.html 195/350
= $333,000 – 330,000
= $ 3,000 which means $3,000 unfavorable variance
The variance is unfavorable because more materials were used than the standard quantity allowed tocomplete the job. If the standard quantity allowed had exceeded the quantity actually used, thematerials usage variance would have been favorable.
Determine whether a variance is favorable or unfavorable by reliance on reason or logic. If morematerials were used than the standard quantity, or if a price greater than the standard price was paid,the variance is unfavorable. If the reverse is true, the variance is favorable.
The standard labor cost of any product is equal to the standard quantity of labor time allowedmultiplied by the wage rate that should be paid for this time. Here again, it follows that the actual laborcost may differ from standard labor cost because of the wages paid for labor, the quantity of laborused, or both. Thus, two labor variances exist—a rate variance and an efficiency variance.
Watch this video online: https://youtu.be/zNriZz-zCec
Labor rate variance The labor rate variance occurs when the average rate of pay is higher or lowerthan the standard cost to produce a product or complete a process. The labor rate variance is similarto the materials price variance.
To compute the labor rate variance, we use the actual direct labor-hour rate paid (AR), the standarddirect labor-hour rate allowed (SR) and the actual hours of direct labor services worked (AH). It canalso be calculated in either of the following ways:
Labor rate variance= (Actual rate – Standard rate) x Actual hours worked
OR
Labor rate variance = (Actual rate x actual hours worked) – (Standard rate x actual hoursworked)
To continue the Beta example, assume that the direct labor payroll of the company consisted of22,200 hours at a total cost of $ 233,100 (an average actual hourly rate of $ 10.50). Becausemanagement has set a standard direct labor-hour rate of $ 10 per hour, the labor rate variance is:
Labor rate variance = (Actual rate – Standard rate) x Actual hours worked
= ($10.50 actual rate – $10 per hour standard) x 22,200 actual hours
= $ 0.50 x 22,200
= $ 11,100 or $11,100 unfavorable variance
OR
Labor rate variance = (Actual rate x actual hours worked) – (Standard rate x actual hours worked)
= ($10.50 actual rate x 22,200 hours) – ($10 per hour standard x 22,200 actual hours)
= $ 233,100 – $ 222,000
= $ 11,100 or $11,100 unfavorable variance

9/25/2017 Managerial Accounting
file:///Users/hannah/Downloads/Managerial-Accounting-1506381825_regexified.html 196/350
The variance is positive and unfavorable because the actual rate paid exceeded the standard rateallowed. If the reverse were true, the variance would be favorable.
Labor efficiency variance Usually, the company’s engineering department sets the standard amountof direct labor-hours needed to complete a product. Engineers may base the direct labor-hoursstandard on time and motion studies or on bargaining with the employees’ union. The laborefficiency variance occurs when employees use more or less than the standard amount of directlabor-hours to produce a product or complete a process. The labor efficiency variance is similar to thematerials usage variance.
To compute the labor efficiency variance, we will use the actual direct labor-hours worked (AH), thestandard direct labor-hours allowed (SH), and the standard direct labor-hour rate per hour (SR) ineither of the following ways:
Labor efficiency variance= (Actual DL hours – Standard DL hours) x Standard DL rate per hour
OR
Labor efficiency variance = (Actual DL hours x Std Rate) – (Std DL hours x Std Rate)
To illustrate, assume that the 22,200 hours of direct labor-hours worked by Beta Company employeesresulted in 11,000 units of production. Assume these units have a standard direct labor-hours of22,000 hours (11,000 units at 2 hour unit). Since the standard direct labor rate is $ 10 per hour, thelabor efficiency variance is $ 2,000, computed as follows:
Labor efficiency variance= (Actual hours worked – Standard hours allowed) x Standard rate
= (22,200 actual DL hours x 22,000 standard DL hours) x $10 per hour
= 200 hours x $10
= $ 2,000 unfavorable variance
OR
Labor efficiency variance= (Actual DL hours x Std Rate) – (Std DL hours x Std Rate)
= (22,200 actual DL hours x $10 per hour) – x (22,000 standard DL hours x $10 per hour)
= $222,000 – 220,000
= $ 2,000 unfavorable variance
The variance is unfavorable since more hours than the standard number of hours were required tocomplete the period’s production. If the reverse were true, the variance would be favorable.
The unfavorable labor rate variance is not necessarily caused by paying employees more wages thanthey are entitled to receive. More probable reasons are either that more highly skilled employees withhigher wage rates worked on production than originally anticipated, or that employee wage ratesincreased after the standard was developed and the standard was not revised. Favorable ratevariances, on the other hand, could be caused by using less-skilled, cheaper labor in the productionprocess. Typically, the hours of labor employed are more likely to be under management’s controlthan the rates that are paid. For this reason, labor efficiency variances are generally watched moreclosely than labor rate variances.

9/25/2017 Managerial Accounting
file:///Users/hannah/Downloads/Managerial-Accounting-1506381825_regexified.html 197/350
Summary of labor variances The accuracy of the two labor variances can be checked by comparingtheir sum with the difference between actual and standard labor cost for a period. In the BetaCompany illustration, this difference was:
Actual laborcost incurred(22,200 hoursx $10.50)
$233,100
Standard laborcost allowed(22,000 hoursx $10)
220,000
Total laborvariance(unfavorable)
$ 13,100
This $13,100 unfavorable variance is made up of two labor variances:
Labor ratevariance(22,200 x$0.50)
$11,100unfavorable
Laborefficiencyvariance(200 x$10)
2,000unfavorable
Total laborvariance(11,100 U+ 2,000 U)
$ 13,100Unfavorable
Since both the rate and efficiency variances are unfavorable, we would add them together to get theTOTAL labor variance. If we had one favorable and one unfavorable variance, we would subtract thenumbers.
Still unsure about material and labor variances, watch this Note Pirate video to help.
Watch this video online: https://youtu.be/DFD2E5sO6k0Licensing & Attributions
CC licensed content, Shared previously
Accounting Principles: A Business Perspective. Authored by: James Don Edwards, University of Georgia & Roger H. Hermanson, Georgia State University. Provided by: Endeavour International Corporation.Project: The Global Text Project . License: CC BY: Attribution
All rights reserved content
Direct Materials Variances. Authored by: Education Unlocked. Located at: https://youtu.be/-e32TQdCjDg. License: All Rights Reserved. License Terms: Standard YouTube LicenseDirect Labor Variance. Authored by: Education Unlocked. Located at: https://youtu.be/zNriZz-zCec. License: All Rights Reserved. License Terms: Standard YouTube LicenseVariance Analysis, Master (Static), Flexible and Actual Budgets (Managerial Accounting Tutorial #43) . Authored by: Note Pirate. Located at: https://youtu.be/DFD2E5sO6k0. License: All Rights Reserved.License Terms: Standard YouTube License
8.3 CALCULATIONS FOR OVERHEAD

9/25/2017 Managerial Accounting
file:///Users/hannah/Downloads/Managerial-Accounting-1506381825_regexified.html 198/350
In a standard cost system, accountants apply the manufacturing overhead to the goods producedusing a standard overhead rate. They set the rate prior to the start of the period by dividing thebudgeted manufacturing overhead cost by a standard level of output or activity. Total budgetedmanufacturing overhead varies at different levels of standard output, but since some overhead costsare fixed, total budgeted manufacturing overhead does not vary in direct proportion with output.
Managers use a flexible budget to isolate overhead variances and to set the standard overhead rate.Flexible budgets show the budgeted amount of manufacturing overhead for various levels of output.
Look at Beta Company’s flexible budget below. Note that Beta’s flexible budget shows the variableand fixed manufacturing overhead costs expected to be incurred at three levels of activity: 9,000 units,10,000 units, and 11,000 units. For product costing purposes, Beta must estimate the expected levelof activity in advance and set a rate based on that level. The level chosen is called the standardvolume of output. This standard volume of output (or activity) may be expressed in terms of any of theactivity bases used in setting standard overhead rates. These activity bases include percentage ofcapacity, units of output machine-hours, and direct labor-hours, among others. Machine-hours arebudgeted at 2 machine-hours per product. In our example, standard volume is assumed to be 10,000units produced. Management expects to use 20,000 machine-hours of services. These will be usedas our budgeted amounts.
BetaCompany Flexible manuf. overhead budget
Machine-hours 18,000 20,000 22,000Units of output 9,000 10,000 11,000Variableoverhead:
Indirectmaterials $7,200 $8,000 $8,800
Power 9,000 10,000 11,000 Royalties 1,800 2,000 2,200 Other 18,000 20,000 22,000 Total variableoverhead $36,000 $40,000 $44,000
Fixed overhead:
Insurance $4,000 $4,000 $4,000 Property taxes 6,000 6,000 6,000 Depreciation 20,000 20,000 20,000 Other 30,000 30,000 30,000 Total fixedoverhead $60,000 $60,000 $60,000Total Overhead(variable + fixed ) $96,000 $100,000$104,000
Standardoverhead rate($100,000/20,000hours)
$5

9/25/2017 Managerial Accounting
file:///Users/hannah/Downloads/Managerial-Accounting-1506381825_regexified.html 199/350
Assume that Beta applies manufacturing overhead using a rate based on machine-hours. Accordingto the flexible manufacturing overhead budget, the expected manufacturing overhead cost at thestandard volume (20,000 machine-hours) is $ 100,000, so the standard overhead rate is $ 5 permachine-hour ($100,000/20,000 machine-hours).
Knowing the separate rates for variable and fixed overhead is useful for decision making. We will beusing the company’s expected volume of 10,000 units. The variable overhead rate is $ 2 permachine hour ($ 40,000 variable OH/20,000 hours), and the fixed overhead rate is $ 3 per hour ($60,000/20,000 hours). If the expected volume had been 18,000 machine-hours, the standardoverhead rate would have been $ 5.33 ($96,000/18,000 hours). If the standard volume had been22,000 machine-hours, the standard overhead rate would have been $ 4.73 ($104,000/22,000 hours).
Note that the difference in rates is due solely to dividing fixed overhead by a different number ofmachine-hours. That is, the variable overhead cost per unit stays constant ($ 2 per machine-hour)regardless of the number of units expected to be produced, and only the fixed overhead cost per unitchanges. Since fixed overhead does not change per unit, we will separate the fixed and variableoverhead for variance analysis.
Continuing with the Beta Company illustration, assume that the company incurred $ 108,000 of actualmanufacturing overhead costs ($46,000 in variable OH and $62,000 in fixed OH) in a period duringwhich 11,000 units of product were produced. The actual costs would be debited to ManufacturingOverhead and credited to a variety of accounts such as Accounts Payable, AccumulatedDepreciation, Prepaid Insurance, Property Taxes Payable, and so on. According to the flexible budget,the standard number of machine-hours allowed for 11,000 units of production is 22,000 hours.Therefore, $ 110,000 of manufacturing overhead is applied to production ($ 5 per machine-hour times22,000 hours) by debiting Work in Process Inventory and crediting Manufacturing Overhead for $110,000.
These show that manufacturing overhead has been overapplied to production by the $ 2,000($110,000 applied OH – $108,000 actual OH). Because of its fixed component, manufacturingoverhead tends to be over applied when actual production is greater than standard production. Now,we will separate the variable and fixed components for analysis.
Variable Overhead Variances
Although various complex computations can be made for overhead variances, we use a simpleapproach in this text. In this approach, known as the two-variance approach to variable overheadvariances, we calculate only two variances—a variable overhead spending variance and a variableoverhead efficiency variance.
Watch this video online: https://youtu.be/fKPDFk69Hrk
Variable Overhead Spending Variance The variable overhead spending variance shows in oneamount how economically overhead services were purchased and how efficiently they were used.This overhead spending variance is similar to a price variance for materials or labor. We compare theVariable OH rate for budget and actual using the actual amount of our variable overhead base(machine-hours, direct labor dollars, direct labor hours, etc.)
Variable OH Spending Variance = (Actual Variable OH per base – Std Variable OH per base) xActual OH base
OR

9/25/2017 Managerial Accounting
file:///Users/hannah/Downloads/Managerial-Accounting-1506381825_regexified.html 200/350
Variable OH Spending Variance = (Actual OH base x Actual Variable OH per base) – (Actual OHbase x Std Variable OH per base)
For Beta Company, overhead is applied based on machine hours. The Variable OH rate per machinehour is $2 (calculated above) and actual variable overhead was $46,000 for 22,000 actual machinehours giving an actual rate of $2.0909 rounded ($46,000 / 22,000 actual machine hours). We cancalculate the variable OH spending variance using either of these two methods below:
Variable OH Spending Variance = (Actual Variable OH per base – Std Variable OH per base) x ActualOH base
= ($2.0909 per machine hour – $2.00 per machine hour) x 22,000 actual machine hours
= $0.0909 x 22,000 machine hours
= $2,000 (rounded) Unfavorable
OR
Variable OH Spending Variance = (Actual OH base x Actual Variable OH per base) – (Actual OH basex Std Variable OH per base)
= $46,000 actual variable OH – (22,000 actual machine hours x $2 standard OH per machine hour)
= $46,000 – 44,000
= $2,000 unfavorable
The variance is unfavorable because actual variable overhead costs were $46,000, while according tothe flexible budget for 11,000 units, they should have been $44,000 meaning Beta spent more onvariable overhead than they had planned.Variable Overhead Efficiency Variance The variableefficiency overhead variance is caused by producing at a level other than that used in setting thestandard overhead application rate. The variable OH efficiency variance shows whether plant assetsproduced more or fewer units than expected.
Variable OH Efficiency Variance = (Actual OH base – Std OH base) x Standard Variable OH perbase
OR
Variable OH Efficiency Variance = (Actual OH base x Std Variable OH per base) – (Std OH basex Std Variable OH per base)
For Beta Company, the Variable OH rate per machine hour is $2 (calculated above) and actualvariable overhead was $46,000 for 22,000 actual machine hours. Management expected to use20,000 hours for 10,000 units produced. We can calculate the variable OH spending variance usingeither of these two methods below:
Variable OH Efficiency Variance = (Actual OH base – Std OH base) x Standard Variable OH per base
= (22,000 actual machine hours – 20,000 standard machine hours ) x $2 per machine hour
= 2,000 machine hours x $2 per machine hour
= $4,000 unfavorable

9/25/2017 Managerial Accounting
file:///Users/hannah/Downloads/Managerial-Accounting-1506381825_regexified.html 201/350
OR
Variable OH Efficiency Variance = (Actual OH base x Std Variable OH per base) – (Std OH base x StdVariable OH per base)
= (22,000 actual hours x $2 per machine hour) – (20,000 standard hours x $2 per machine hour)
= $44,000 – 40,000
= $4,000 unfavorable
The efficiency variance is unfavorable because we used more machine hours than we had budgeted. Of course, this is because we produced 11,000 units when the budget planned for 10,000 units.
Fixed Overhead Variance
Because fixed overhead is not constant on a per unit basis, any deviation from planned productioncauses the overhead application rate to be incorrect. We can calculate a fixed overhead variance bycomparing:
Fixed Overhead variance = Actual fixed overhead – Budgeted fixed overhead
In the Beta Company illustration, the budgeted fixed overhead was $60,000 (notice the level ofproduction does not matter since fixed costs remain the same regardless of volume) and the actualfixed costs were $62,000.
Fixed Overhead variance = Actual fixed overhead – Budgeted fixed overhead
= $62,000 actual fixed – $60,000 budgeted fixed
= $2,000 unfavorable variance
This variance is unfavorable since we spent more on fixed costs than we had planned.
Summary of overhead variances To easily determine the accuracy of the overhead variances, Betawould compare the sum of the variances with the difference between the costs of actualmanufacturing overhead and budgeted manufacturing overhead. For Beta Company, the differencebetween actual and budgeted overhead (budget is based on the expected level of volume of 10,000units) was:
Actual manufacturingoverhead incurred
$108,000
Budgeted overhead (at10,000 units) 100,000Total overhead variance(unfavorable) $ 8,000
This difference is made up of the following overhead variances:
Variable OH SpendingVariance $ 2,000 UVariable OH EfficiencyVariance $ 4,000 UFixed OH Variance $ 2,000 UTotal overhead variance $8,000

9/25/2017 Managerial Accounting
file:///Users/hannah/Downloads/Managerial-Accounting-1506381825_regexified.html 202/350
(2,000 U + 4,000 U +2,000 U)
Unfavorable
The unfavorable spending variance is because we had more variable cost per unit than budgeted. The efficiency variance is unfavorable because we spent more machine hours than budgetedbecause we produced more units. We spent more on fixed costs than we had anticipated.
Licensing & Attributions
CC licensed content, Shared previously
Accounting Principles: A Business Perspective.. Authored by: James Don Edwards, University of Georgia & Roger H. Hermanson, Georgia State University.. Provided by: Endeavour InternationalCorporation. Project: The Global Text Project.. License: CC BY: Attribution
All rights reserved content
Cost Accounting 15: Overhead Variance Analysis . Authored by: AccountingED. Located at: https://youtu.be/fKPDFk69Hrk. License: All Rights Reserved. License Terms: Standard YouTube License
8.4 ADVANTAGES AND DISADVANTAGES OFSTANDARD COSTING
Advantages and disadvantages of using standard costs
Five of the benefits that result from a business using a standard cost system are:Improved cost control.More useful information for managerial planning and decision making.More reasonable and easier inventory measurements.Cost savings in record-keeping.Possible reductions in production costs.
Improved cost control Companies can gain greater cost control by setting standards for each type ofcost incurred and then highlighting exceptions or variances—instances where things did not go asplanned. Variances provide a starting point for judging the effectiveness of managers in controlling thecosts for which they are held responsible.
Assume, for example, that in a production center, actual direct materials costs of $ 52,015 exceededstandard costs by $ 6,015. Knowing that actual direct materials costs exceeded standard costs by $6,015 is more useful than merely knowing the actual direct materials costs amounted to $ 52,015.Now the firm can investigate the cause of the excess of actual costs over standard costs and takeaction.
Further investigation should reveal whether the exception or variance was caused by the inefficientuse of materials or resulted from higher prices due to inflation or inefficient purchasing. In either case,the standard cost system acts as an early warning system by highlighting a potential hazard formanagement.
More useful information for managerial planning and decision making When managementdevelops appropriate cost standards and succeeds in controlling production costs, future actual costs

9/25/2017 Managerial Accounting
file:///Users/hannah/Downloads/Managerial-Accounting-1506381825_regexified.html 203/350
should be close to the standard. As a result, management can use standard costs in preparing moreaccurate budgets and in estimating costs for bidding on jobs. A standard cost system can be valuablefor top management in planning and decision making.
More reasonable and easier inventory measurements A standard cost system provides easierinventory valuation than an actual cost system. Under an actual cost system, unit costs for batches ofidentical products may differ widely. For example, this variation can occur because of a machinemalfunction during the production of a given batch that increases the labor and overhead charged tothat batch. Under a standard cost system, the company would not include such unusual costs ininventory. Rather, it would charge these excess costs to variance accounts after comparing actualcosts to standard costs.
Thus, in a standard cost system, a company assumes that all units of a given product producedduring a particular time period have the same unit cost. Logically, identical physical units produced ina given time period should be recorded at the same cost.
Cost savings in record-keeping Although a standard cost system may seem to require moredetailed record-keeping during the accounting period than an actual cost system, the reverse is true.For example, a system that accumulates only actual costs shows cost flows between inventoryaccounts and eventually into cost of goods sold. It records these varying amounts of actual unit coststhat must be calculated during the period. In a standard cost system, a company shows the cost flowsbetween inventory accounts and into cost of goods sold at consistent standard amounts during theperiod. It needs no special calculations to determine actual unit costs during the period. Instead,companies may print standard cost sheets in advance showing standard quantities and standard unitcosts for the materials, labor, and overhead needed to produce a certain product.
Possible reductions in production costs A standard cost system may lead to cost savings. The useof standard costs may cause employees to become more cost conscious and to seek improvedmethods of completing their tasks. Only when employees become active in reducing costs cancompanies really become successful in cost control.
Three of the disadvantages that result from a business using standard costs are:Controversial materiality limits for variances.Nonreporting of certain variances.Low morale for some workers.
Controversial materiality limits for variances Determining the materiality limits of the variancesmay be controversial. The management of each business has the responsibility for determining whatconstitutes a material or unusual variance. Because materiality involves individual judgment, manyproblems or conflicts may arise in setting materiality limits.
Nonreporting of certain variances Workers do not always report all exceptions or variances. Ifmanagement only investigates unusual variances, workers may not report negative exceptions to thebudget or may try to minimize these exceptions to conceal inefficiency. Workers who succeed inhiding variances diminish the effectiveness of budgeting.
Low morale for some workers The management by exception approach focuses on the unusualvariances. Management often focuses on unfavorable variances while ignoring favorable variances.Workers might believe that poor performance gets attention while good performance is ignored. As aresult, the morale of these workers may suffer.

9/25/2017 Managerial Accounting
file:///Users/hannah/Downloads/Managerial-Accounting-1506381825_regexified.html 204/350
Licensing & Attributions
CC licensed content, Shared previously
Accounting Principles: A Business Perspective. Authored by: James Don Edwards, University of Georgia & Roger H. Hermanson, Georgia State University. Provided by: Endeavour International Corporation.Project: The Global Text Project. License: CC BY: Attribution
8.5 VARIANCE SUMMARY
See below for a summary of the six variances from standard discussed in this chapter.
Materials price variance =(Actual price – Standard price) x Actual quantity purchased OR
(Actual Price x Actual Qty purch) – (Standard Price x Actual Quantitypurchased)
Materials usage variance =(Actual quantity used – Standard quantity allowed) x Standard priceOR
(Actual qty used x Standard price) – (Standard Qty allowed xStandard price)
Labor rate variance =(Actual rate – standard rate) x Actual hours worked OR
(Actual rate x Actual hours worked) – (Standard rate x Actual hoursworked)
Labor efficiency variance =(Actual hours worked – standard hours allowed) x Standard rate OR
(Actual hours worked x Standard Rate) – (Standard hours allowed xStandard Rate)
Variable OH Spendingvariance =
(Actual variable OH rate – standard variable OH rate) x Actual OHbase OR
(Actual variable OH rate x Actual OH base) – (Std variable OH rate xActual OH base)
Variable OH Efficiencyvariance =
(Actual OH base – standard OH base) x Standard variable OH rateOR
(Actual OH base x Standard variable OH rate) – (Std OH base x Stdvariable OH rate)
Fixed OH variance = Actual fixed overhead – Budgeted fixed overhead

9/25/2017 Managerial Accounting
file:///Users/hannah/Downloads/Managerial-Accounting-1506381825_regexified.html 205/350
Remember, variances are expressed at the absolute values meaning we do not show negative orpositive numbers. We express variances in terms of FAVORABLE or UNFAVORABLE and negative isnot always bad or unfavorable and positive is not always good or favorable.
Keep these in mind:When actual materials are more than standard (or budgeted), we have an UNFAVORABLEvariance.When actual materials are less than the standard, we have a FAVORABLE variance.Same rule applies for direct labor. If actual direct labor (either hours or dollars) is more than thestandard, we have an UNFAVORABLE variance. A FAVORABLE variance occurs when actualdirect labor is less than the standard.
Accounting in the Headlines
How will the increasing cost of chocolate impact Hershey’s variances?
The price of chocolate had been predicted to increase rapidly beginning in late 2013 and continue into2014, according to the Wall Street Journal. The price increase is due to multiple factors, including ashortage of cocoa beans and an increase in demand by consumers.
Although the demand for all chocolate has been increasing, consumer tastes have been graduallyshifting towards dark chocolate because of its purported health benefits. Dark chocolate uses morecocoa beans per ounce than milk chocolate.
So what does the predicted price increase mean for companies that use chocolate and/or cocoabeans?
Questions
1. The Hershey Company produces several products that use chocolate and/or cocoa beans. Whichof the following variances for Hershey’s chocolate products are likely to be impacted by the projectedprice increase in the cost of chocolate? Explain your answer.
a. Direct material price varianceb. Direct material quantity variancec. Direct labor rate varianced. Direct labor efficiency variance
2. Hershey’s Special Dark Mildly Sweet Chocolate Bar and Hershey’s Milk Chocolate with AlmondsBar both weigh 1.45 ounces. Which bar’s variances are more likely to be impacted by the increase inthe cost of chocolate? Explain your reasoning.
3. Since The Hershey Company’s management knows that the price of chocolate is likely to increase,it might revise one or more of its standards. Which standard(s) would be impacted? What would bethe benefit of revising the standard(s) before the end of the reporting period?
Licensing & Attributions
CC licensed content, Shared previously
Accounting Principles: A Business Perspective.. Authored by: James Don Edwards, University of Georgia & Roger H. Hermanson, Georgia State University.. Provided by: Endeavour InternationalCorporation. Project: The Global Text Project.. License: CC BY: Attribution
CC licensed content, Speci�c attribution
How will the increasing cost of chocolate impact Hersheyu2019s variances?. Authored by: Dr. Wendy Tietz, CPA, CMA, CGMA. Located at: http://www.accountingintheheadlines.com. License: CC BY-NC:Attribution-NonCommercial

9/25/2017 Managerial Accounting
file:///Users/hannah/Downloads/Managerial-Accounting-1506381825_regexified.html 206/350
8.6 ACCOUNTING IN THE HEADLINES
How will cost standards be impacted at PEZ CandyInc. by the rising cost of sugar and labor?PEZ Candy Inc. produces the popular small candy that isdispensed in collectible flip-top dispensers. PEZ candy wasinvented as a breath mint in Vienna, Austria, in 1927. The namePEZ is derived from “pfefferminz” which is the word for peppermintin German.
In the United States, PEZ candies are produced in a factory inConnecticut since 1973. The PEZ candies are made from about95% sugar, which makes the PEZ product cost particularlysensitive to changes in the cost of sugar. The cost of sugar in theUnited States has been significantly increasing over the past year, due in least at part, to preliminarytariffs imposed by the U.S. government on Mexican sugar. In addition, the cost of labor has beenincreasing due to increases in the minimum wage in the U.S. For these reasons, PEZ expects toraise its prices in 2015.
Questions
1. What cost standards will most likely be adjusted at PEZ for the rising costs? When do you thinkthese standard adjustments will be made?
2. If the related cost standard is not adjusted, what variance(s) will be impacted by the rising cost ofsugar? What department would typically be responsible for explaining this variance(s)?
3. If the related cost standard is not adjusted, what variance(s) will be impacted by the rising cost oflabor? What department would typically be responsible for explaining this variance(s)?
Licensing & Attributions
CC licensed content, Speci�c attribution
How will cost standards be impacted at PEZ Candy Inc. by the rising cost of sugar and labor?. Authored by: Dr. Wendy Tietz, CPA, CMA, CGMA . Located at: http://www.accountingintheheadlines.com.License: CC BY: Attribution
GLOSSARY
GLOSSARY
Budgets Formal written plans that represent management’s planned actions in the future and theimpacts of these actions on the business.

9/25/2017 Managerial Accounting
file:///Users/hannah/Downloads/Managerial-Accounting-1506381825_regexified.html 207/350
Flexible budget A budget that shows the budgeted amount of manufacturing overhead for variouslevels of output; used in isolating overhead variances and setting standard overhead rates.
Ideal standards Standards that can be attained under the best circumstances—that is, with nomachinery problems or worker problems. These unrealistic standards can only be met when thecompany has highly efficient, skilled workers who are working at their best effort throughout theentire period needed to complete the job.
Fixed overhead variance A variance from standard caused by using more or less than thestandard amount of fixed overhead costs to produce a product or complete a process; computed asActual fixed overhead – Budgeted fixed overhead.
Labor efficiency variance (LEV) A variance from standard caused by using more or less than thestandard amount of direct labor-hours to produce a product or complete a process; computed as(Actual hours worked – Standard hours allowed) x Standard rate per hour.
Labor rate variance (LRV) A variance from standard caused by paying a higher or lower averagerate of pay than the standard cost to produce a product or complete a process; computed as(Actual rate -Standard rate) x Actual hours worked.
Management by exception The process where management only investigates those variancesthat are unusually favorable or unfavorable or that have a material effect on the company.
Materials price variance (MPV) A variance from standard caused by paying a higher or lowerprice than the standard for materials purchased; computed as (Actual price – Standard price) xActual quantity purchased.
Materials usage variance (MUV) A variance from standard caused by using more or less than thestandard amount of materials to produce a product or complete a process; computed as (Actualquantity used – Standard quantity allowed) x Standard price.Overhead Base The overhead base is how overhead is applied to a product and is typically basedon direct labor hours, direct labor dollars or machine hours.Practical standards Standards that are strict but attainable. Allowances are made for machineryproblems and rest periods for workers. These standards are generally used in planning.
Standard cost A carefully predetermined measure of what a cost should be under statedconditions.
Standard level of output A carefully predetermined measure of what the expected level of outputshould be for a specified period of time, usually one year.
Variance A deviation of actual costs from standard costs; may be favorable or unfavorable. That is,actual costs may be less than or more than standard costs. Variances may relate to materials,labor, or manufacturing overhead.
Variable Overhead Spending variance (VOHSV) A variance from standard caused by incurringmore actual variable overhead than the standard variable overhead cost to produce a product orcomplete a process; computed as (Actual variable OH rate -Standard variable OH rate) x Actualamount of base.
Variable Overhead Efficiency variance (VOHEV) A variance from standard caused by using moreor less than the standard amount of overhead application base to produce a product or complete aprocess; computed as (Actual OH base – Standard OH base) x Standard variable OH rate perbase.

9/25/2017 Managerial Accounting
file:///Users/hannah/Downloads/Managerial-Accounting-1506381825_regexified.html 208/350
Licensing & Attributions
CC licensed content, Shared previously
Accounting Principles: A Business Perspective. Authored by: James Don Edwards, University of Georgia & Roger H. Hermanson, Georgia State University. Provided by: Endeavour International Corporation.Project: The Global Text Project. License: CC BY: Attribution
CHAPTER 8: EXERCISES
Short-Answer Questions
➢ Is a standard cost an estimated cost? What is the primary objective of employing standard costs ina cost system?
➢ What is a budget?
➢ What is the difference between ideal and practical standards? Which standard generally is used inplanning?
➢ What is meant by the term management by exception?
➢ What are some advantages of using standard costs? What are some disadvantages?
➢ Describe how the materials price and usage variances would be computed from the following data:
➢ Standard—1 unit of material at $20 per unit. Purchased—1,200 units of material at $20.30; used—990 units. Production—1,000 units of finished goods.
➢ When might a given company have a substantial favorable materials price variance and asubstantial unfavorable materials usage variance?
➢ What is the usual cause of a favorable or unfavorable labor rate variance? What other laborvariance is isolated in a standard cost system? Of the two variances, which is more likely to be underthe control of management? Explain.
➢ Identify the type of variance indicated by each of the following situations and indicate whether it isfavorable or unfavorable:
The cutting department of a company during the week ending July 15 cut 12 size-Scogged wheels out of three sheets of 12-inch high-tempered steel. Usually three wheelsof such size are cut out of each sheet.A company purchased and installed an expensive new cutting machine to handleexpanding orders. This purchase and the related depreciation had not been anticipatedwhen the overhead was budgeted.Edwards, the band saw operator, was on vacation last week. Lands took her place for thenormal 40-hour week. Edwards’ wage rate is $12 per hour, while Lands’ is $10 per hour.Production was at capacity last week and the week before.
➢ Theoretically, how would an accountant dispose of variances from standard? How does anaccountant typically dispose of variances?
➢ Why are variances typically isolated as soon as possible?

9/25/2017 Managerial Accounting
file:///Users/hannah/Downloads/Managerial-Accounting-1506381825_regexified.html 209/350
➢ Is it correct to consider favorable variances as always being desirable? Explain.
➢ How does the use of standard costs permit the application of the principle of management byexception?
➢ How do standards help in controlling production costs?
➢ Real world question Imagine you are making and selling pizzas for Domino’s Pizza. How wouldyou set standards for one pizza to be made and delivered?
Exercises
Exercise A During July, the cutting department completed 8,000 units of a product that had astandard materials cost of 2 square feet per unit at $2.40 per square foot. The actual materialspurchased consisted of 16,400 square feet at $2.20 per square foot, for a total cost of $36,080. Theactual material used this period was 16,160 square feet. Compute the materials price and usagevariances. Indicate whether each is favorable or unfavorable.
Direct materials – 4pounds at $5 perpound
$20
Direct labor – 3hours at $6 per hour18Manufacturingoverhead – 150% ofdirect labor
27
$65
Exercise B Whitewater’s purchasing agent took advantage of a special offer from one of its suppliersto purchase 44,000 pounds of material at $4.10 per pound. Assume 5,500 units were produced and34,100 pounds of material were used. Compute the variances for materials. Comment on thepurchasing agent’s decision to take the special offer.
Exercise C Compute the labor variances in the following situation:
Actual direct laborpayroll (51,600 hoursat $18)
$928,800
Standard direct laborallowed per unit, 4.20hours at $19.20
80.64
Production for month(in units) 10,000
Exercise D Blackman Company manufactures a product that has a standard direct labor cost of fourhours per unit at $24 per hour. In producing 6,000 units, the foreman used a different crew than usual,which resulted in a total labor cost of $26 per hour for 22,000 hours. Compute the labor variances andcomment on the foreman’s decision to use a different crew.
Exercise E The following data relates to the manufacturing activities of Strauss Company for the firstquarter of the current year:
Standardactivity (in
30,000

9/25/2017 Managerial Accounting
file:///Users/hannah/Downloads/Managerial-Accounting-1506381825_regexified.html 210/350
units)Actualproduction(units)
24,000
Budgetedfixedmanufacturingoverhead
$36,000
Variableoverhead rate(per unit)
$ 4.00
Actual fixedmanufacturingoverhead
$37,200
Actualvariablemanufacturingoverhead
$88,800
Compute the variable overhead spending variance, variable overhead efficiency variance and thefixed overhead variance. (Assume overhead is applied based on units produced.)
Exercise F Assume that the actual production in the previous exercise was 26,000 units rather than24,000. What was the variable overhead efficiency variance?
Problems
Problem A A product has a standard materials usage and cost of 4 pounds per unit at $7.00 perpound. During the month, 2,400 pounds of materials were purchased at $7.30 per pound. Productionfor the month totaled 550 units requiring 2,100 pounds of materials.
Compute the materials variances.
Problem B During December, a department completed 2,500 units of a product that has a standardmaterials usage and cost of 1.2 square feet per unit at $0.48 per square foot. The actual materialused consisted of 3,050 square feet at an actual cost of $2,664.48. The actual purchase of thismaterial amounted to 4,500 square feet at a total cost of $3,931.20.
Prepare journal entries (a) for the purchase of the materials and (b) for the issuance of materials toproduction.
Problem C Martin Company makes plastic garbage bags. One box of bags requires one hour ofdirect labor at an hourly rate of $6. The company produced 200,000 boxes of bags using 208,000hours of direct labor at a total cost of $1,144,000.
Compute the labor variances.
Problem D The finishing department of Mozart Company produced 25,000 units during November.The standard number of direct labor-hours per unit is two hours. The standard rate per hour is $37.80.During the month, 51,250 direct labor-hours were worked at a cost of $1,742,500.
Compute labor variances.

9/25/2017 Managerial Accounting
file:///Users/hannah/Downloads/Managerial-Accounting-1506381825_regexified.html 211/350
Problem E The standard amount of output for the Chicago plant of Worldworth Company is 50,000units per month. Overhead is applied based on units produced. The flexible budget of the month formanufacturing overhead allows $180,000 for fixed overhead and $4.80 per unit of output for variableoverhead. Actual overhead for the month consisted of $181,440 of fixed overhead; the actual variableoverhead follows.
Compute the overhead variances variance assuming the following actual production in units andactual variable overhead in dollars:
400. 37,500 and $182,400.401. 55,000 and $270,480.
Problem F Based on a standard volume of output of 96,000 units per month, the standard cost of theproduct manufactured by Tahoe Company consists of:
Direct materials(0.25 pounds x $8per pound)
$2.00
Direct labor (0.5hours x $7.60 perhour)
3.80
Variablemanufacturingoverhead
2.50
Fixedmanufacturingoverhead($144,000 in total)
1.50
Total $9.80
A total of 25,200 pounds of materials was purchased at $8.40 per pound. During May, 98,400 unitswere produced with the following costs:
Direct materialsused (24,000pounds at $8.40)
$201,600
Direct labor(50,000 hours at$7.80)
390,000
Variablemanufacturingoverhead
249,000
Fixedmanufacturingoverhead
145,000
Compute the materials price and usage variances, the labor rate and efficiency variances, and theoverhead budget and volume variances. (Overhead is applied based on units produced.)
Alternate problems
Alternate problem A The following data apply to Roseanne Company for August, when 2,500 unitswere produced:

9/25/2017 Managerial Accounting
file:///Users/hannah/Downloads/Managerial-Accounting-1506381825_regexified.html 212/350
Materials used: 16,000 pounds
standard materials per unit: 6 pounds at 5 per pound
Materials purchased: 24,000 pounds at$4.80 per pound
Direct labor: 5,800 hours at a total cost of $69,600
Standard labor per unit: 2 hours at $11 per hour.
1. Compute the materials and labor variances.2. Prepare journal entries to record the transactions involving these variances.
Alternate problem B During April, Shakespeare Company produced 15,000 units of a product calledCreative. Creative has a standard materials cost of two pieces per unit at $8 per piece. The actualmaterials used consisted of 30,000 pieces at a cost of $230,000. Actual purchases of the materialsamounted to 40,000 pieces at a cost of $300,000.
Compute the two materials variances.
Alternate problem C Some of the records of Gonzaga Company’s repair and maintenance divisionwere accidentally shredded. Salvaged records indicate that actual direct labor-hours for the periodwere 2,000 hours. The total labor variance was $6,000, favorable. The standard labor rate was $7 perdirect labor-hour, and the labor rate variance was $2,000, unfavorable.
Compute the actual direct labor rate per hour and prepare the journal entry to record the labor rateand the labor efficiency variances.
Alternate problem D All Fixed Overhead Company computes its overhead rate based on a standardlevel of output of 20,000 units. Fixed manufacturing overhead for the current year is budgeted at$30,000. Actual fixed manufacturing overhead for the current year was $31,000. Overhead is appliedbased on units produced.
Compute the amount of overhead volume variance for the year under each of the followingassumptions regarding actual output:
1. 12,500 units.2. 22,500 units.
Beyond the numbers—Critical thinking
Business decision case A Turn to the Sun City Company exercise in this chapter. For each of thevariances listed, give a possible reason for its existence.
Business decision case B Diane La Hoya, the president of the Rebokk Company, has a problemthat does not involve substantial dollar amounts but does involve the important question ofresponsibility for variances from standard costs. She has just received the following report:
Standard materials at standardprice for the actual production inMay
$9,000
Unfavorable materials pricevariance($3.60 – $3.00) x 3,450 pounds 2,070Unfavorable materials usage

9/25/2017 Managerial Accounting
file:///Users/hannah/Downloads/Managerial-Accounting-1506381825_regexified.html 213/350
variance(3,450 – 3,000 pounds) x $3 1,350Total actual materials cost for themonth of May(3,450 pounds at $3.60 perpound) $12,420
La Hoya has discussed the unfavorable price variance with Jim Montel, the purchasing officer. Montelagrees that under the circumstances he should be held responsible for most of the materials pricevariance. But he objects to the inclusion of $270 (450 pounds of excess materials used at $0.60 perpound). This, he argues, is the responsibility of the production department. If the productiondepartment had not been so inefficient in the use of materials, he would not have had to purchase theextra 450 pounds.
On the other hand, Ken Kechum, the production manager, agrees that he is basically responsible forthe excess quantity of materials used. But, he does not agree that the materials usage varianceshould be revised to include the $270 of unfavorable price variance on the excess materials used.“That is Jim’s responsibility,” he says.
La Hoya now turns to you for help. Specifically, she wants you to tell her:
1. Who is responsible for the $270 in dispute?2. If responsibility cannot be clearly assigned, how should the accounting department categorize the
variance (price or usage)? Why?3. Are there likely to be other circumstances where materials variances cannot be considered the
responsibility of the manager most closely involved with them? Explain.
Prepare written answers to the three questions La Hoya asked.
A broader perspective C Refer to “A broader perspective: Quality management and Balridge award”.The Baldrige Award has been criticized for fostering a winner-versus-loser mentality, instead ofencouraging every organization to improve its quality. Further, the award has been criticized forgrading on the curve by awarding companies that are the best in US industry but still do not competewell against foreign competition.
Write a response to each of these criticisms of the Baldrige Award.
Group project D Many workers hate standards. Some people claim standards reduce morale andproductivity. Others believe standards are necessary to motivate people. Based on your ownexperience in school or on a job, what do you think?
In groups of three, choose an organization or business to use as an example. List all the possiblestandards you could set for this organization or business. Then decide whether your group favorssetting standards. If the group does, decide who should set each of the standards on your list. If thegroup does not favor standards, discuss your reasons. Choose one member to report for your groupto the class.
Group project E The chief executive officer (CEO) of Tax Preparation Services, Incorporated,remarked to a colleague, “Establishing standard costs and performing variance analysis is only usefulfor companies with inventories. As a service organization, how could we possibly benefit fromimplementing such a system?” In groups of two or three students, write a memorandum to yourinstructor stating whether you agree with this comment or not and explain why. The heading of thememorandum should contain the date, to whom it is written, from whom, and the subject matter.
9/25/2017 Managerial Accounting
file:///Users/hannah/Downloads/Managerial-Accounting-1506381825_regexified.html 214/350
Group project F The controller of Plastics Manufacturing, Incorporated, states: “Let us figure thematerials price variances when the materials are used rather than at the time of purchase. This waywe can prepare the price and usage variances at the same time and directly link the price variance toproduction.” In groups of two or three students, write a memorandum to your instructor statingwhether you agree with this suggestion or not and explain why. The heading of the memorandumshould contain the date, to whom it is written, from whom, and the subject matter.
Using the Internet—A view of the real world
Using any Internet search engine enter “standard costs” (be sure to include the quotation marks).Select an article that directly discusses standard costs and print a copy of the article. You areencouraged (but not required) to find an article that answers some of the following questions: When isthe use of standard costing appropriate? How do certain industries use standard costing? How arestandard costs established? How do standard costs help management in production?
Write a memorandum to your instructor summarizing the key points of the article. The heading of thememorandum should contain the date, to whom it is written, from whom, and the subject matter. Besure to include a copy of the article used for this assignment.
Using any Internet search engine select one of the new terms at the end of the chapter and perform akey word search. Be sure to include quotation marks (for example: “Management by exception”).Select an article that directly discusses the new term used and print a copy of the article. Write amemorandum to your instructor summarizing the key points of the article. The heading of thememorandum should contain the date, to whom it is written, from whom, and the subject matter. Besure to include a copy of the article used for this assignment.
Licensing & Attributions
CC licensed content, Shared previously
Accounting Principles: A Business Perspective. Authored by: James Don Edwards, University of Georgia & Roger H. Hermanson, Georgia State University. Provided by: Endeavour International Corporation.Project: The Global Text Project. License: CC BY: Attribution

9/25/2017 Managerial Accounting
file:///Users/hannah/Downloads/Managerial-Accounting-1506381825_regexified.html 215/350
CHAPTER 9: RESPONSIBILITYACCOUNTING FOR COST, PROFIT
AND INVESTMENT CENTERS
CHAPTER 9 STUDY PLAN
Study Plan: Performance Measurement
Knowledge Targets
I can define the following terms as they relate to our unit:
Decentralized Profit Center Cost Center Investment Center
Return onInvestment Operating Assets Margin Balanced Scorecard
Turnover Residual Income Rate of Return Operating Income
Wait Time Value-added Throughput Time Economic ValueAdded
Non-value added Delivery CycleTime
Manufacturing CycleTime
Reasoning TargetsI can understand the difference between profit center, cost center and investment centers.I can understand the meaning of delivery cycle time, throughput time and manufacturingcycle efficiency.I can understand how to use a balanced scorecard.I can analyze projects or departments using return on investment and residual income.
Skill TargetsI can calculate return on investment, margin and turnover for a company.I can calculate residual income for a company.I can compute delivery cycle time, throughput time and manufacturing cycle efficiency.

9/25/2017 Managerial Accounting
file:///Users/hannah/Downloads/Managerial-Accounting-1506381825_regexified.html 216/350
I can construct a balanced scorecard.
9.1 TYPES OF COSTS
Product vs. Period Cost
A product cost is any cost related to creating a product and can be a direct or indirect cost. The keyword is CREATING a product. Product costs are typically direct materials, direct labor andmanufacturing overhead. These costs are not expensed until the product is actually sold, then it isreported as cost of goods sold on the income statement.
A period cost is NOT related to creating the product. These are costs necessary for the product to besold or accounted for but not for actually making the product. A period cost is typically selling, generaland administrative costs expensed on the income statement when it is incurred.
Watch this video online: https://youtu.be/rbSABuSKVpQ
Direct vs. Indirect Cost
A direct cost is a cost that can be directly tied or traced to a specific unit, department or process. Examples of a direct cost include direct materials, direct labor, sales salaries to the sales department,accounting dept salaries to the accounting department, etc.
An indirect cost is a cost that cannot be directly traced to a specific unit, department or process. Examples include manufacturing overhead, executive staff salaries, and even the InformationTechnology department salaries to all other departments.
Watch this video online: https://youtu.be/3SEv1_dl86I
Licensing & Attributions
All rights reserved content
Authored by: Education Unlocked. Provided by: Direct vs. Indirect Costs . Located at: https://youtu.be/3SEv1_dl86I. License: All Rights Reserved. License Terms: Standard YouTube LicenseManagerial Accounting: Product vs Period Costs. Authored by: Prof Alldredge. Located at: https://youtu.be/rbSABuSKVpQ. License: All Rights Reserved. License Terms: Standard YouTube License
9.2 RESPONSIBILITY ACCOUNTING INMANAGEMENT
Responsibility accounting

9/25/2017 Managerial Accounting
file:///Users/hannah/Downloads/Managerial-Accounting-1506381825_regexified.html 217/350
The term responsibility accounting refers to an accounting system that collects, summarizes, andreports accounting data relating to the responsibilities of individual managers. A responsibilityaccounting system provides information to evaluate each manager on the revenue and expense itemsover which that manager has primary control (authority to influence).
A responsibility accounting report contains those items controllable by the responsible manager.When both controllable and uncontrollable items are included in the report, accountants should clearlyseparate the categories. The identification of controllable items is a fundamental task in responsibilityaccounting and reporting.
To implement responsibility accounting in a company, the business entity must be organized so thatresponsibility is assignable to individual managers. The various company managers and their lines ofauthority (and the resulting levels of responsibility) should be fully defined. The organizationchart below demonstrates lines of authority and responsibility that could be used as a basis forresponsibility reporting.
To identify the items over which each manager has control, the lines of authority should follow aspecified path. For example, in the picture above we show that a department supervisor may report toa store manager, who reports to the vice president of operations, who reports to the president. Thepresident is ultimately responsible to stockholders or their elected representatives, the board ofdirectors. In a sense, the president is responsible for all revenue and expense items of the company,since at the presidential level all items are controllable over some period. The president often carriesthe title, Chief Executive Officer (CEO) and usually delegates authority to lower level managers sinceone person cannot keep fully informed of the day-to-day operating details of all areas of the business.
The manager’s level in the organization also affects those items over which that manager has control.The president is usually considered a first-level manager. Managers (usually vice presidents) whoreport directly to the president are second-level managers. Notice on the organization chart thatindividuals at a specific management level are on a horizontal line across the chart. Not all managersat that level, however, necessarily have equal authority and responsibility. The degree of a manager’sauthority varies from company to company.
While the president may delegate much decision-making power, some revenue and expense itemsremain exclusively under the president’s control. For example, in some companies, large capital (plantand equipment) expenditures may be approved only by the president. Therefore, depreciation,property taxes, and other related expenses should not be designated as a store manager’sresponsibility since these costs are not primarily under that manager’s control.
The controllability criterion is crucial to the content of performance reports for each manager. Forexample, at the department supervisor level, perhaps only direct materials and direct labor costcontrol are appropriate for measuring performance. A plant manager, however, has the authority tomake decisions regarding many other costs not controllable at the supervisory level, such as the

9/25/2017 Managerial Accounting
file:///Users/hannah/Downloads/Managerial-Accounting-1506381825_regexified.html 218/350
salaries of department supervisors. These other costs would be included in the performanceevaluation of the store manager, not the supervisor.
Watch this short video to further explain the concept of responsibility accounting and to give you apreview of the rest of the chapter.
Watch this video online: https://youtu.be/EsS0socI3I4
Decentralization is the dispersion of decision-making authority among individuals at lower levels ofthe organization. In other words, the extent of decentralization refers to the degree of control thatsegment managers have over the revenues, expenses, and assets of their segments. When asegment manager has control over these elements, the investment center concept can be applied tothe segment. Thus, the more decentralized the decision making is in an organization, the moreapplicable is the investment center concept to the segments of the company. The more centralizedthe decision making is, the more likely responsibility centers are to be established as expensecenters.
Some advantages of decentralized decision making are:Managing segments trains managers for high-level positions in the company. The added authorityand responsibility also represent job enlargement and often increase job satisfaction andmotivation.Top management can be more removed from day-to-day decision making at lower levels of thecompany and can manage by exception. When top management is not involved with routineproblem solving, it can devote more time to long-range planning and to the company’s mostsignificant problem areas.Decisions can be made at the point where problems arise. It is often difficult for top managers tomake appropriate decisions on a timely basis when they are not intimately involved with theproblem they are trying to solve.Since decentralization permits the use of the investment center concept, performance evaluationcriteria such as ROI and residual income (to be explained later) can be used.
Licensing & Attributions
All rights reserved content
Part 1 of Responsibility Accounting, Operational Performance Measures, and the Balanced Scorecard . Authored by: Maxwell Katzman . Located at: https://youtu.be/EsS0socI3I4. License: All RightsReserved. License Terms: Standard YouTube License
9.3 RESPONSIBILITY REPORTS
Responsibility reports
Responsibility accounting provides reports to different levels of management. The amount of detailvaries depending on the manager’s level in the organization. A performance report to a departmentmanager of a retail store would include actual and budgeted dollar amounts of all revenue andexpense items under that supervisor’s control. The report issued to the store manager would showonly totals from all the department supervisors’ performance reports and any additional items underthe store manager’s control, such as the store’s administrative expenses. The report to the company’spresident includes summary totals of all the stores’ performance levels plus any additional itemsunder the president’s control. In effect, the president’s report should include all revenue and expense

9/25/2017 Managerial Accounting
file:///Users/hannah/Downloads/Managerial-Accounting-1506381825_regexified.html 219/350
items in summary form because the president is responsible for controlling the profitability of theentire company.
Management by exception is the principle that upper level management does not need to examineoperating details at lower levels unless there appears to be a problem. As businesses becomeincreasingly complex, accountants have found it necessary to filter and condense accounting data sothat these data may be analyzed quickly. Most executives do not have time to study detailedaccounting reports and search for problem areas. Reporting only summary totals highlights any areasneeding attention and makes the most efficient use of the executive’s time.
The condensation of data in successive levels of management reports is justified on the basis that theappropriate manager will take the necessary corrective action. Thus, specific performance detailsneed not be reported to superiors.
For example, if sales personnel costs have been excessively high in a particular department, thatdepartmental manager should find and correct the cause of the problem. When the store managerquestions the unfavorable budget variance of the department, the departmental supervisor can informthe store manager that corrective action was taken. Hence, it is not necessary to report to any higherauthority that a particular department within one of the stores is not operating satisfactorily becausethe matter has already been resolved. Alternatively, if a manager’s entire store has been performingpoorly, summary totals reported to the vice president of operations discloses this situation, and aninvestigation of the store manager’s problems may be indicated.
Watch this video online: https://youtu.be/7y_9UCV95d4
In preparing responsibility accounting reports, companies use two basic methods to handle revenueor expense items. In the first approach, only those items over which a manager has direct control areincluded in the responsibility report for that management level. Any revenue and expense items thatcannot be directly controlled are not included. The second approach is to include all revenue andexpense items that can be traced directly or allocated indirectly to a particular manager, whether ornot they are controllable. This second method represents a full-cost approach, which means all costsof a given area are disclosed in a single report. When this approach is used, care must be taken toseparate controllable from noncontrollable items to differentiate those items for which a manager canand should be held responsible.
For accounting reports to be of maximum benefit, they must be timely. That is, accountants shouldprepare reports as soon as possible after the end of the performance measurement period. Timelyreporting allows prompt corrective action to be taken. When reports are delayed excessively, they losetheir effectiveness as control devices. For example, a report on the previous month’s operations thatis not received until the end of the current month is virtually useless for analyzing poor performanceareas and taking corrective action.
Companies also should issue reports regularly so that managers can spot trends. Then, appropriatemanagement action can be initiated before major problems occur. Regular reporting allows managersto rely on reports and become familiar with their contents.
Firms should make the format of their responsibility reports relatively simple and easy to read.Confusing terminology should be avoided. Where appropriate, expressing results in physical unitsmay be more familiar and understandable to some managers. To assist management in quicklyspotting budget variances, companies can report both budgeted (expected) and actual amounts. Abudget variance is the difference between the budgeted and actual amounts of an item. Becausevariances highlight problem areas (exceptions), they are helpful in applying the management-by-exception principle. To help management evaluate performance to date, responsibility reports ofteninclude both a current period and year-to-date analysis.
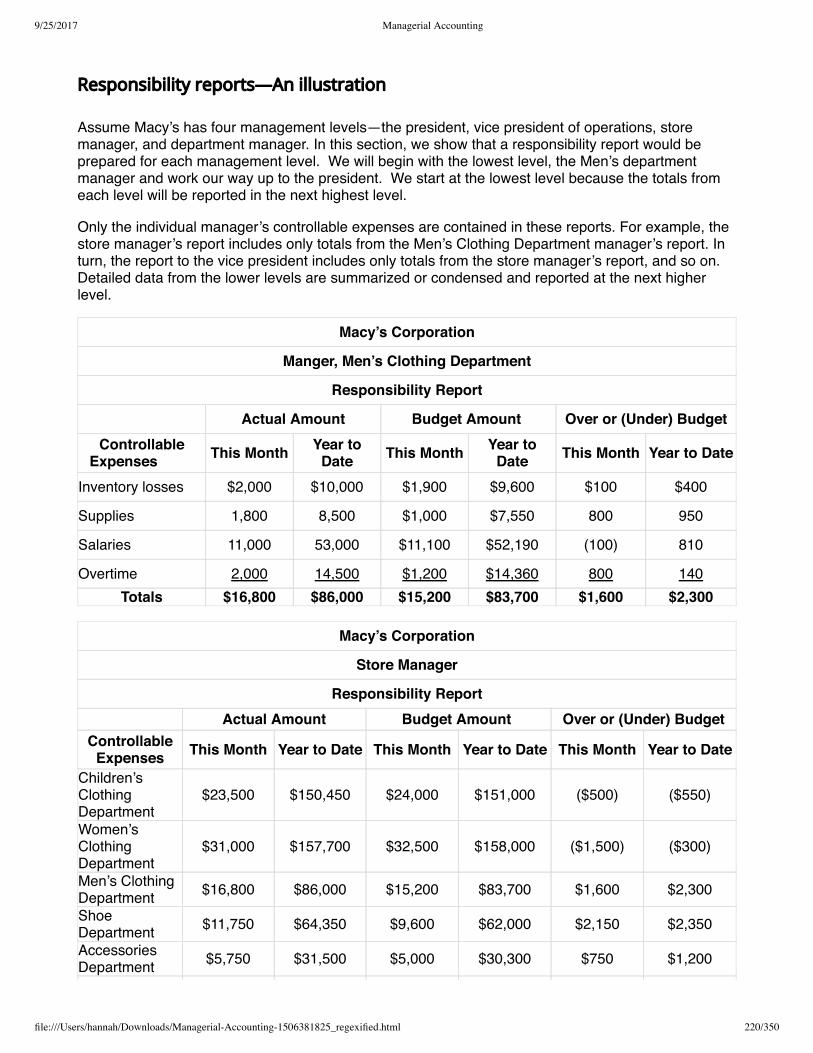
9/25/2017 Managerial Accounting
file:///Users/hannah/Downloads/Managerial-Accounting-1506381825_regexified.html 220/350
Responsibility reports—An illustration
Assume Macy’s has four management levels—the president, vice president of operations, storemanager, and department manager. In this section, we show that a responsibility report would beprepared for each management level. We will begin with the lowest level, the Men’s departmentmanager and work our way up to the president. We start at the lowest level because the totals fromeach level will be reported in the next highest level.
Only the individual manager’s controllable expenses are contained in these reports. For example, thestore manager’s report includes only totals from the Men’s Clothing Department manager’s report. Inturn, the report to the vice president includes only totals from the store manager’s report, and so on.Detailed data from the lower levels are summarized or condensed and reported at the next higherlevel.
Macy’s Corporation
Manger, Men’s Clothing Department
Responsibility Report
Actual Amount Budget Amount Over or (Under) BudgetControllable
Expenses This Month Year toDate This Month Year to
Date This Month Year to Date
Inventory losses $2,000 $10,000 $1,900 $9,600 $100 $400
Supplies 1,800 8,500 $1,000 $7,550 800 950
Salaries 11,000 53,000 $11,100 $52,190 (100) 810
Overtime 2,000 14,500 $1,200 $14,360 800 140Totals $16,800 $86,000 $15,200 $83,700 $1,600 $2,300
Macy’s Corporation
Store Manager
Responsibility ReportActual Amount Budget Amount Over or (Under) Budget
ControllableExpenses This Month Year to Date This Month Year to Date This Month Year to Date
Children’sClothingDepartment
$23,500 $150,450 $24,000 $151,000 ($500) ($550)
Women’sClothingDepartment
$31,000 $157,700 $32,500 $158,000 ($1,500) ($300)
Men’s ClothingDepartment $16,800 $86,000 $15,200 $83,700 $1,600 $2,300ShoeDepartment $11,750 $64,350 $9,600 $62,000 $2,150 $2,350AccessoriesDepartment $5,750 $31,500 $5,000 $30,300 $750 $1,200

9/25/2017 Managerial Accounting
file:///Users/hannah/Downloads/Managerial-Accounting-1506381825_regexified.html 221/350
Totals 88,800 490,000 $86,300 $485,000 2,500 5,000
You can see that at each level, more and more costs become controllable. Also, the companyintroduces controllable costs not included on lower level reports into the reports for levels 3, 2, and 1.The only store cost not included at the store manager’s level is the store manager’s salary because itis noncontrollable by that store manager. It is, however, controllable by the store manager’ssupervisor, the vice president of operations.
Macy’s Corporation
Vice President of Operations Responsibility ReportActual Amount Budget Amount Over or (Under) Budget
ControllableExpenses This Month Year to
Date This Month Year toDate This Month Year to
DateVice president’soffice expense $2,840 $9,500 $3,340 $17,500 ($500) ($8,000)
Store manager 88,800 490,000 $86,300 $485,000 2,500 5,000Purchasing 5,300 32,500 $4,300 $30,500 1,000 2,000
Receiving 4,700 33,000 $1,700 $24,000 3,000 9,000Salaries of storemanagers andheads ofpurchasing andreceiving
27,000 135,000 $27,000 $135,000 -0- -0-
Totals $128,640 $700,000 $122,640 $692,000 $6,000 $8,000
Macy’s Corporation
President’s Responsibility Report
Actual Amount Budget Amount Over or (Under)Budget
Controllable Expenses ThisMonth
Year toDate
ThisMonth
Year toDate
ThisMonth
Year toDate
President’s office expense $11,000 $55,000 $10,000 $53,000 $1,000 $2,000Vice president of operations 128,640 700,000 122,640 692,000 6,000 8,000Vice president of marketing 18,700 119,000 $14,700 $111,000 4,000 8,000
Vice president of finance 14,000 115,000 $6,000 $106,000 8,000 9,000
Vice presidents’ salaries 29,000 145,000 $29,000 $145,000 -0- -0-
Totals $201,340 $1,134,000 $182,340 $1,107,000 $19,000 $27,000
Based on an analysis of these reports, the Men’s Clothing Department manager probably would takeimmediate action to see why supplies and overtime were significantly over budget this month. Thestore manager may ask the department manager what the problems were and whether they are nowunder control. The vice president may ask the same question of the store manager. The president

9/25/2017 Managerial Accounting
file:///Users/hannah/Downloads/Managerial-Accounting-1506381825_regexified.html 222/350
may ask each vice president why the budget was exceeded this month and what corrective action hasbeen taken.
Licensing & Attributions
All rights reserved content
Lesson FA-20-150 - Clip 03 - Responsibility Reporting Formats - 08:07 . Authored by: evideolearner. Located at: https://youtu.be/7y_9UCV95d4?t=53s. License: All Rights Reserved. License Terms: StandardYouTube License
9.4 RESPONSIBILITY CENTERS
A segment is a fairly autonomous unit or division of a company defined according to function orproduct line. Traditionally, owners have organized their companies along functional lines. Thesegments or departments organized along functional lines perform a specified function such asmarketing, finance, purchasing, production, or shipping. Recently, large companies have tended toorganize segments according to product lines such as an electrical products division, shoedepartment, or food division.
A responsibility center is a segment of an organization for which a particular executive isresponsible. There are three types of responsibility centers—expense (or cost) centers, profit centers,and investment centers. In designing a responsibility accounting system, management must examinethe characteristics of each segment and the extent of the responsible manager’s authority. Care mustbe taken to ensure that the basis for evaluating the performance of an expense center, profit center, orinvestment center matches the characteristics of the segment and the authority of the segment’smanager. The following sections of the chapter discuss the characteristics of each of these centersand the appropriate bases for evaluating the performance of each type.
Watch this video online: https://youtu.be/N84VVslVctU
An expense center is a responsibility center incurring only expense items and producing no directrevenue from the sale of goods or services. Examples of expense centers are service centers (e.g.the maintenance department or accounting department) or intermediate production facilities thatproduce parts for assembly into a finished product. Managers of expense centers are held responsibleonly for specified expense items.
The appropriate goal of an expense center is the long-run minimization of expenses. Short-runminimization of expenses may not be appropriate. For example, a production supervisor couldeliminate maintenance costs for a short time, but in the long run, total costs might be higher due tomore frequent machine breakdowns.
Aprofit center is a responsibility center having both revenues and expenses. Because segmentalearnings equal segmental revenues minus related expenses, the manager must be able to controlboth of these categories. The manager must have the authority to control selling price, sales volume,and all reported expense items. To properly evaluate performance, the manager must have authorityover all of these measured items. Controllable profits of a segment result from deducting theexpenses under a manager’s control from revenues under that manager’s control.
Closely related to the profit center concept is an investment center. An investment center is aresponsibility center having revenues, expenses, and an appropriate investment base. When a firmevaluates an investment center, it looks at the rate of return it can earn on its investment base.

9/25/2017 Managerial Accounting
file:///Users/hannah/Downloads/Managerial-Accounting-1506381825_regexified.html 223/350
Typical investment centers are large, autonomous segments of large companies. The centers areoften separated from one another by location, types of products, functions, and/or necessarymanagement skills. Segments such as these often seem to be separate companies to an outsideobserver. But the investment center concept can be applied even in relatively small companies inwhich the segment managers have control over the revenues, expenses, and assets of theirsegments.
Licensing & Attributions
All rights reserved content
Types of Responsibility Centers. Authored by: Rutgers Accounting Web. Located at: https://youtu.be/N84VVslVctU. License: All Rights Reserved. License Terms: Standard YouTube License
9.5 INVESTMENT CENTER ANALYSIS
Two evaluation bases that include the concept of investment base in the analysis are ROI (return oninvestment) and RI (residual income).
Return on Investment (ROI)
A segment that has a large amount of assets usually earns more in an absolute sense than asegment that has a small amount of assets. Therefore, a firm cannot use absolute amounts ofsegmental income to compare the performance of different segments. To measure the relativeeffectiveness of segments, a company might use return on investment (ROI), which calculates thereturn (income) as a percentage of the assets employed (investment). The formula for ROI is:
ROI = Segment Income
Investment Base
For example, a segment that earns $500,000 on an investment base of $5,000,000 has an ROI of10% ($500,000 /$5,000,000). Return on investment is reported as a percentage. The return oninvestments means how much income do we generate for every dollar of investment. In this example,ROI was 10% which means the company earns 10 cents on every $1 of investment. To illustrate thedifference between using absolute amounts and using percentages in evaluating a segment’sperformance, consider the data in the table below for a company with three segments.
Segment A Segment B Segment C Total
(a) Income $250,000 $1,000,000 $500,000 $1,750,000
(b) Investment 2,500,000 5,000,000 2,000,000 9,500,000
Return on investment (a) ÷ (b) 10% 20% 25% 18.42%
When using absolute dollars of income to evaluate performance, Segment B appears to be doingtwice as well as Segment C. However, using ROI to evaluate the segments indicates that Segment Cis really performing the best (25%), Segment B is next (20%), and Segment A is performing the worst(10%). Therefore, ROI is a more useful indicator of the relative performance of segments thanabsolute income.

9/25/2017 Managerial Accounting
file:///Users/hannah/Downloads/Managerial-Accounting-1506381825_regexified.html 224/350
This video will summarize the return on investment concept. Focus on the first 3 steps listed in thevideo.
Watch this video online: https://youtu.be/7fB-3Xh2IXg
Determining the investment base to be used in the ROI calculation is a tricky matter. Normally, theassets available for use by the division make up its investment base. But accountants disagree onwhether depreciable assets should be included in the ROI calculation at original cost, original costless accumulated depreciation, or current replacement cost. Original cost is the price paid to acquirethe assets. Original cost less accumulated depreciation is the book value of the assets—theamount paid less total depreciation taken. Current replacement cost is the cost of replacing thepresent assets with similar assets in the same condition as those now in use. A different rate of returnresults from each of these measures. Therefore, management must select and agree on anappropriate measure of investment base prior to making ROI calculations or interdivisioncomparisons.
Each of the valuation bases has merits and drawbacks, as we discuss next. First, cost lessaccumulated depreciation is probably the most widely used valuation base and is easily determined.Because of the many types of depreciation methods, comparisons between segments or companiesmay be difficult. Also, as book value decreases, a constant income results in a steadily increasing ROIeven though the segment’s performance is unchanged. Second, the use of original cost eliminates theproblem of decreasing book value but has its own drawback. The cost of old assets is much less thanan investment in new assets, so a segment with old assets can earn less than a segment with newassets and realize a higher ROI. Third, current replacement cost is difficult to use becausereplacement cost figures often are not available, but this base does eliminate some of the problemscaused by the other two methods. Whichever valuation basis is adopted, all ROI calculations that areto be used for comparative purposes should be made consistently.
Although ROI appears to be a quite simple and straightforward computation, there are severalalternative methods for making the calculation. These alternatives focus on what is meant by incomeand investment. The table below shows various definitions and applicable situations for each type ofcomputation.
Situation Definition of Income Definition ofInvestment
1. Evaluation of the earning power ofthe company. Do not use for segmentsor segment managers due to inclusionof non controllable expenses.
Net income of the company.*Total assets
of thecompany.†
2. Evaluation of rate of incomecontribution of segment. Do not use forsegment managers due to inclusion ofnon controllable expenses.
Contribution to indirect expenses.
Assetsdirectly used
by andidentified withthe segment.
3. Evaluation of income performanceof segment manager.
Controllable income. Begin withcontribution to indirect expenses andeliminate any revenues and directexpenses not under the control of thesegment manager.
Assets underthe control ofthe segmentmanager.

9/25/2017 Managerial Accounting
file:///Users/hannah/Downloads/Managerial-Accounting-1506381825_regexified.html 225/350
* Often net operating income is used; this term is defined as income before interest and taxes.
† Operating assets are often used in the calculation. This definition excludes assets not used innormal operations.
Even after the investment base is defined, problems may still remain because many segmentmanagers have limited control over some of the items included in the investment base of theirsegment. For instance, top-level management often makes capital expenditure decisions for majorstore assets rather than allowing the segment managers to do so. Therefore, the segment managermay have little control over the store assets used by the segment. Another problem area may be thecompany’s centralized credit and collection department. The segment manager may have little or nocontrol over the amount of accounts receivable included as segment assets because the managercannot change the credit-granting or collection policies of the company.
Usually these problems are overcome when managers realize that if all segments are treated in thesame manner, the inclusion of noncontrollable items in the investment base may have negligibleeffects. Then, comparisons of the ROI for all segments are based on a consistent treatment of items.To avoid adverse reactions or decreased motivation, segment managers must agree to this treatment.
Expanded form of ROI computation
The ROI formula breaks into two component parts:
ROI =Income
xSales
Sales Turnover
The first part of the formula, Income/Sales, is called margin or return on sales. The margin refers tothe percentage relationship of income or profits to sales. This percentage shows the number of centsof profit generated by each dollar of sales. The second part of the formula, Sales/Investment, is calledturnover. Turnover shows the number of dollars of sales generated by each dollar of investment.Turnover measures how effectively each dollar of assets was used.
A manager can increase ROI in the following three ways.
1. By concentrating on increasing the profit margin while holding turnover constant: Pursuing thisstrategy means keeping selling prices constant and making every effort to increase efficiency andthereby reduce expenses.
2. By concentrating on increasing turnover by reducing the investment in assets while holdingincome and sales constant: For example, working capital could be decreased, thereby reducingthe investment in assets.
3. By taking actions that affect both margin and turnover: For example, disposing of nonproductivedepreciable assets would decrease investment while also increasing income (through thereduction of depreciation expense). Thus, both margin and turnover would increase. Anadvertising campaign would probably increase sales and income. Turnover would increase, andmargin might increase or decrease depending on the relative amounts of the increases in incomeand sales.
Residual Income
When a company uses ROI to evaluate performance, managers have incentives to focus on theaverage returns from their segments’ assets. However, the company’s best interest is served ifmanagers also focus on the marginal returns.

9/25/2017 Managerial Accounting
file:///Users/hannah/Downloads/Managerial-Accounting-1506381825_regexified.html 226/350
Residual income (RI) is defined as the amount of income a segment has in excess of the segment’sinvestment base times its cost of capital percentage. Each company based on debt costs establishesits cost of capital coverage and desired returns to stockholders. The formula for residual income (RI)is:
RI = Income − (Investment x Cost of capital percentage)
When a company uses RI to evaluate performance, the segment rated as the best is the segment withthe greatest amount of RI rather than the one with the highest ROI.
Watch this video online: https://youtu.be/47Hf4M1I6gk
Critics of the RI method complain that larger segments are likely to have the highest RI. In a givensituation, it may be advisable to look at both ROI and RI in assessing performance or to scale RI forsize.
A manager tends to make choices that improve the segment’s performance. The challenge is to selectevaluation bases for segments that result in managers making choices that benefit the entirecompany. When performance is evaluated using RI, choices that improve a segment’s performanceare more likely also to improve the entire company’s performance.
When calculating RI for a segment, the income and investment definitions are contribution to indirectexpenses and assets directly used by and identified with the segment. When calculating RI for amanager of a segment, the income and investment definitions should be income controllable by themanager and assets under the control of the segment manager.
In evaluating the performance of a segment or a segment manager, comparisons should be madewith (1) the current budget, (2) other segments or managers within the company, (3) past performanceof that segment or manager, and (4) similar segments or managers in other companies. Considerationmust be given to factors such as general economic conditions and market conditions for the productbeing produced. A superior segment in Company A may be considered superior because it is earninga return of 12%, which is above similar segments in other companies but below other segments inCompany A. However, segments in Company A may be more profitable because of market conditionsand the nature of the company’s products rather than because of the performance of the segmentmanagers. Top management must use careful judgment whenever performance is evaluated.
To illustrate, assume the manager of Segment 3 below has an opportunity to take on a projectinvolving an investment of $100,000 that is estimated to return $22,000, or 22%, on the investmentwith an income of $22,000. Since the segment’s ROI is currently 25%, or $250,000/$1,000,000, themanager may decide to reject the project because accepting the project will cause the segment’s ROIto decline. Suppose however, from the company’s point of view, all projects earning greater than a10%return should be accepted, even if they are lower than a particular segment’s ROI.
Before acceptance of the project by Segment 3, the amounts are as follows:
Segment 1 Segment 2 Segment 3
a. Income $ 100,000 $ 500,000 $ 250,000
b. Investment 1,000,000 2,500,000 1,000,000
c. Cost of capital 10% 10% 10%
d. Desired minimum income (b) x (c) $ 100,000 $ 250,000 $ 100,000
e. Residual Income (RI) [a – d] -0- 250,000 150,000

9/25/2017 Managerial Accounting
file:///Users/hannah/Downloads/Managerial-Accounting-1506381825_regexified.html 227/350
If Segment 3 accepts the new project, the Residual Income (RI) would be calculated as:
Segment 3
a. Income $272,000
b. Investment 1,100,000
c. Cost of capital x 10%
d. Desired minimum income (b) x (c) $ 110,000
e. Residual Income (RI) [a – d] 162,000
The project opportunity for Segment 3 could earn in excess of the desired minimum ROI of 10%. Infact, the project generates RI of $12,000 more for the segment. If RI were applied as the basis forevaluating segmental performance, the manager of Segment 3 would accept the project becausedoing so would improve the segment’s performance. That choice would also be beneficial to the entirecompany.
Licensing & Attributions
All rights reserved content
How to Calculate ROI (Return on Investment). Authored by: Howcast. Located at: https://youtu.be/7fB-3Xh2IXg. License: All Rights Reserved. License Terms: Standard YouTube License23 - Measures of Residual Income. Authored by: Larry Walther. Located at: https://youtu.be/47Hf4M1I6gk. License: All Rights Reserved. License Terms: Standard YouTube License
9.6 SEGMENTED INCOME STATEMENTS
Concepts used in segmental analysis
To understand segmental analysis, you need to know about the concepts of variable cost, fixed cost,direct cost, indirect cost, net income of a segment, and contribution to indirect expenses. Next, wedescribe each concept.
Costs may be either directly or indirectly related to a particular cost object. A cost object is asegment, product, or other item for which costs may be accumulated. In other words, a cost is notdirect or indirect in and of itself. It is only direct or indirect in relation to a given cost object.
A direct cost (expense) is specifically traceable to a given cost object. An indirect cost (expense) isnot traceable to a given cost object but has been allocated to it. Accountants can designate aparticular cost (expense) as direct or indirect by reference to a given cost object. Thus, a cost that isdirect to one cost object may be indirect to another. For instance, the salary of a segment managermay be a direct cost of a given manufacturing segment but an indirect cost of one of the productsmanufactured by that segment. In this example, the segment and the product are two distinct costobjects.
Because a direct cost is traceable to a cost object, the cost is likely to be eliminated if the cost objectis eliminated. For instance, if the plastics segment of a business closes down, the salary of the

9/25/2017 Managerial Accounting
file:///Users/hannah/Downloads/Managerial-Accounting-1506381825_regexified.html 228/350
manager of that segment probably is eliminated. Sometimes a direct cost would remain even if thecost object were eliminated, but this is the exception rather than the rule.
An indirect cost is not traceable to a particular cost object; therefore, it only becomes an expense ofthe cost object through an allocation process. For example, consider the depreciation expense on thecompany headquarters building that is allocated to each segment of the company. The depreciationexpense is a direct cost for the company headquarters, but it is an indirect cost to each segment. If asegment of the company is eliminated, the indirect cost for depreciation assigned to that segmentdoes not disappear; the cost is simply allocated among the remaining segments. In a given situation,it may be possible to identify an indirect cost that would be eliminated if the cost object wereeliminated, but this would be the exception to the general rule.
Because the direct costs of a segment are clearly identified with that segment, these costs are oftencontrollable by the segment manager. In contrast, indirect costs become segment costs only throughallocation; therefore, most indirect costs are noncontrollable by the segment manager. Be careful,however, not to equate direct costs with controllable costs. For example, the salary of a segmentmanager may be direct to that segment and yet is noncontrollable by that manager becausemanagers cannot specify their own salaries.
When preparing internal reports on the performance of segments of a company, management oftenfinds it is important to classify expenses as fixed or variable and as direct or indirect to the segment.These classifications may be more useful to management than the traditional classifications of cost ofgoods sold, operating expenses, and nonoperating expenses that are used for external reporting inthe company’s financial statements. As a result, many companies prepare an income statement forinternal use with the format shown below.
Indirect Expenses not allocated to Segments
Segment A Segment B TotalSales $2,500,000 $1,500,000 $4,000,000Less: Variable expenses 700,000 650,000 1,350,000Contribution margin $1,800,000 $850,000 $2,650,000Less: Direct fixed expenses 450,000 550,000 1,000,000Contribution to indirectexpenses $1,350,000 $300,000 $1,650,000
Less: Indirect fixed expenses 600,000Net income $1,050,000
This format is called the contribution margin format for an income statement because it shows thecontribution margin. Contribution margin is defined as sales revenue less variable expenses.Notice that all variable expenses are direct expenses of the segment. The second subtotal in thecontribution margin format income statement is the segment’s contribution to indirect expenses.Contribution to indirect expenses is defined as sales revenue less all direct expenses of thesegment (both variable direct expenses and fixed direct expenses). The final total in the incomestatement is segmental net income, defined as segmental revenues less all expenses (directexpenses and allocated indirect expenses).
Earlier we stated that the performance of a profit center is evaluated on the basis of the segment’sprofits. It is tempting to use segmental net income to make this evaluation since total net income isused to evaluate the performance of the entire company. The problem with using segmental netincome to evaluate performance is that segmental net income includes certain indirect expenses thathave been allocated to the segment but are not directly related to it or its operations. Because

9/25/2017 Managerial Accounting
file:///Users/hannah/Downloads/Managerial-Accounting-1506381825_regexified.html 229/350
segmental contribution to indirect expenses includes only revenues and expenses directly related tothe segment, this amount is often more appropriate for evaluation purposes.
To stress the importance of a segment’s contribution to indirect expenses, many companies prefer thecontribution margin income statement format. Notice how the indirect fixed costs are not allocated toindividual segments. Indirect fixed expenses appear only in the total column for the computation of netincome for the entire company. The computation for each segment stops with the segment’scontribution to indirect expenses; this is the appropriate figure to use for evaluating the earningsperformance of a segment. Only for the company as a whole is net income (revenues minus allexpenses) computed; this is, of course, the appropriate figure to use for evaluating the company as awhole.
Arbitrary allocations of indirect fixed expenses As stated earlier, indirect fixed expenses, such asdepreciation on the corporate administration building or on the computer facility maintained atcompany headquarters, can only be allocated to segments on some arbitrary basis. The two basicguidelines for allocating indirect fixed expenses are by the benefit received and by the responsibilityfor the incurrence of the expense.
Accountants can make an allocation on the basis of benefit received for certain indirect expenses. Forinstance, assume the entire company used a corporate computer for a total of 10,000 hours. If it used4,000 hours, Segment K could be charged (allocated) with 40 per cent of the computer’s depreciationfor the period because it received 40 per cent of the total benefits for the period.
For certain other indirect expenses, accountants base allocation on responsibility for incurrence. Forinstance, assume that Segment M contracts with a magazine to run an advertisement benefitingSegment M and various other segments of the company. Some companies would allocate the entirecost of the advertisement to Segment M because it was responsible for incurring the advertisingexpense.
To further illustrate the allocation of indirect expenses based on a measure of benefit or responsibilityfor incurrence, assume that Daily Company operates two segments, X and Y. It allocates the followingindirect expenses to its two segments using the designated allocation bases:
Expense Allocation BaseAdministrative office building occupancy expense, $ 50,000 Net salesInsurance expense, $ 35,000 Cost of segmental plant assetsGeneral administrative expenses, $ 40,000 Number of employees
The following additional data are provided:
Segment X Segment Y TotalNet sales $400,000 $500,000 $900,000Segmental plant assets $250,000 $400,000 $650,000Number of employees 50 80 130
The following expense allocation schedule shows the allocation of indirect expenses:
Segment X Segment Y TotalAdministrative officebuilding occupancyexpense
$22,222 $27,778 $50,000
[(400,000 / 900,000) x $50,000 ] [(500,000 /900,000) x

9/25/2017 Managerial Accounting
file:///Users/hannah/Downloads/Managerial-Accounting-1506381825_regexified.html 230/350
$50,000]Insurance expense 13,462 21,538 35,000
[(250,000/650,000) x $35,000][(400,000 /650,000) x$35,000]
General administrativeexpenses 15,385 24,615 40,000
[(50 / 130) x $40,000] [(80 / 130) x$40,000]
When it uses neither benefit nor responsibility to allocate indirect fixed expenses, a company mustfind some other reasonable, but arbitrary, basis. Often, for lack of a better approach, a firm mayallocate indirect expenses based on net sales. For instance, if Segment X’s net sales were 60% oftotal company sales, then 60% of the indirect expenses would be allocated to Segment X. Allocatingexpenses based on sales is not recommended because it reduces the incentive of a segmentmanager to increase sales because this would result in more indirect expenses being allocated to thatsegment.
9.7 ACCOUNTING IN THE HEADLINES
How should the cost of national advertising by WholeFoods impact the performance report (and segmentmargin) for each store?Whole Foods Market, Inc., is a supermarket chain based in Austin, Texas, with 381stores in the US (it also has stores in the UK and Canada.) Whole Foodsspecializes in natural and organic food and has annual sales of $13 billion.
In October 2014, Whole Foods rolled out its first national advertising campaign inthe United States. This advertising campaign is centered on the slogan “Valuesmatter,” and is estimated to have a cost of $20 million. The advertising will be on TV, in print, andonline.
Questions
1. Would each of Whole Foods’ stores be considered to be a cost center, a revenue center, a profitcenter, or an investment center?
2. Assume that Whole Foods prepares performance reports for each of its stores. Would you expectto see a portion of the national advertising campaign cost in each store’s segment margin? Whyor why not?
3. Assume now that the advertising campaign turns out to be quite successful because it increasesWhole Foods’ visibility and results in increased sales across all stores in the U.S. Should the U.S.store managers be evaluated on the variance between the budgeted national advertising costsand the actual national advertising costs? Why or why not?

9/25/2017 Managerial Accounting
file:///Users/hannah/Downloads/Managerial-Accounting-1506381825_regexified.html 231/350
Licensing & Attributions
CC licensed content, Speci�c attribution
How should the cost of national advertising by Whole Foods impact the performance report (and segment margin) for each store?. Authored by: Dr. Wendy Tietz, CPA, CMA, CGMA. Located at:http://www.accountingintheheadlines.com. License: CC BY: Attribution
9.8 TRANSFER PRICING
Transfer prices
Profit centers and investment centers inside companies often exchange products with each other. ThePontiac, Buick, and other divisions of General Motors buy and sell automobile parts from each other,for example. No market exchange takes place, so the company sets transfer prices that representrevenue to the selling division and costs to the buying division.
A transfer price is an artificial price used when goods or services are transferred from one segmentto another segment within the same company. Accountants record the transfer price as a revenue ofthe producing segment and as a cost, or expense, of the receiving segment. Usually no cash actuallychanges hands between the segments. Instead, the transfer price is an internal accountingtransaction.
Watch this video online: https://youtu.be/0aB6L6kajCY
Segments are generally evaluated based on some measure of profitability. The transfer price isimportant because it affects the profitability of the buying and selling segments. The higher thetransfer price, the better for the seller. The lower the transfer price, the better for the buyer.
Ideally, a transfer price provides incentives for segment managers to make decisions not only in theirbest interests but also in the interests of the entire company. For example, if the selling segment cansell everything it produces for $100 per unit, the buying segment should pay the market price of $100per unit. A seller with excess capacity, however, should be willing to transfer a product to the buyingsegment for any price at or above the differential cost of producing and transferring the product to thebuying segment (typically all variable costs).
In practice, companies mostly base transfer prices on (1) the market price of the product, (2) the costof the product, or (3) some amount negotiated by the buying and selling segment managers.
Licensing & Attributions
All rights reserved content
Pricing - 6 Transfer Pricing. Authored by: Susan Crosson. Located at: https://youtu.be/0aB6L6kajCY. License: All Rights Reserved. License Terms: Standard YouTube License
9.9 BALANCED SCORECARD
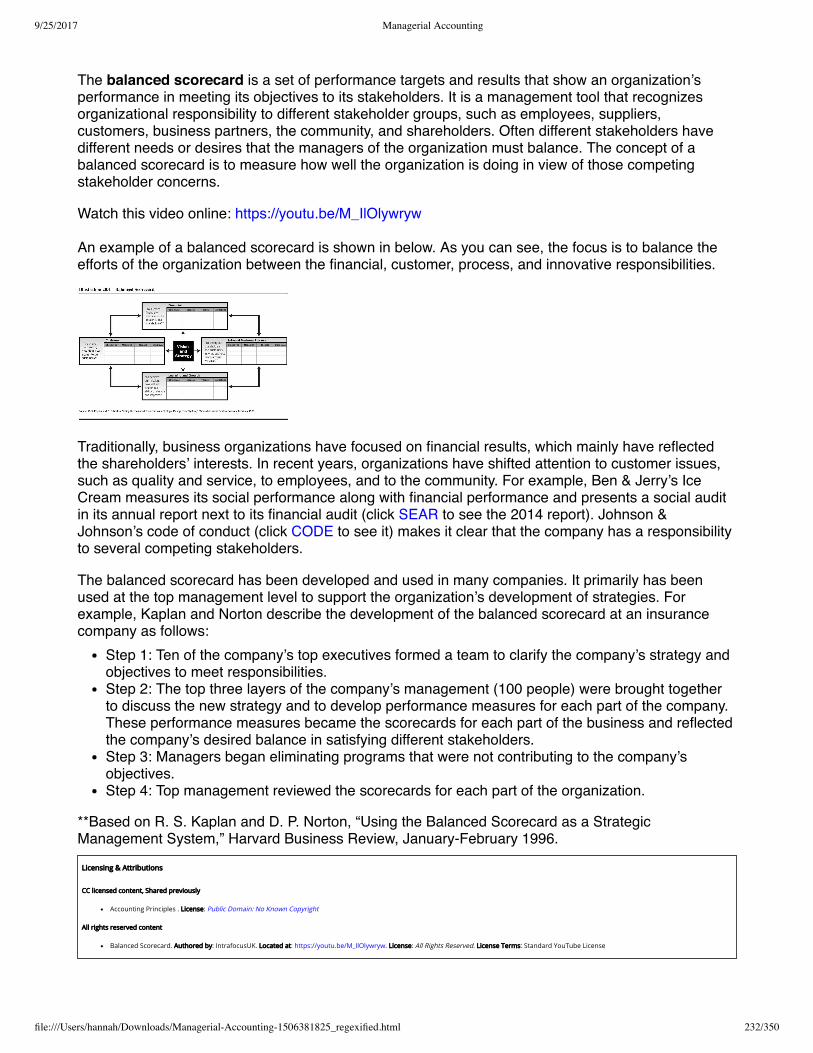
9/25/2017 Managerial Accounting
file:///Users/hannah/Downloads/Managerial-Accounting-1506381825_regexified.html 232/350
The balanced scorecard is a set of performance targets and results that show an organization’sperformance in meeting its objectives to its stakeholders. It is a management tool that recognizesorganizational responsibility to different stakeholder groups, such as employees, suppliers,customers, business partners, the community, and shareholders. Often different stakeholders havedifferent needs or desires that the managers of the organization must balance. The concept of abalanced scorecard is to measure how well the organization is doing in view of those competingstakeholder concerns.
Watch this video online: https://youtu.be/M_IlOlywryw
An example of a balanced scorecard is shown in below. As you can see, the focus is to balance theefforts of the organization between the financial, customer, process, and innovative responsibilities.
Traditionally, business organizations have focused on financial results, which mainly have reflectedthe shareholders’ interests. In recent years, organizations have shifted attention to customer issues,such as quality and service, to employees, and to the community. For example, Ben & Jerry’s IceCream measures its social performance along with financial performance and presents a social auditin its annual report next to its financial audit (click SEAR to see the 2014 report). Johnson &Johnson’s code of conduct (click CODE to see it) makes it clear that the company has a responsibilityto several competing stakeholders.
The balanced scorecard has been developed and used in many companies. It primarily has beenused at the top management level to support the organization’s development of strategies. Forexample, Kaplan and Norton describe the development of the balanced scorecard at an insurancecompany as follows:
Step 1: Ten of the company’s top executives formed a team to clarify the company’s strategy andobjectives to meet responsibilities.Step 2: The top three layers of the company’s management (100 people) were brought togetherto discuss the new strategy and to develop performance measures for each part of the company.These performance measures became the scorecards for each part of the business and reflectedthe company’s desired balance in satisfying different stakeholders.Step 3: Managers began eliminating programs that were not contributing to the company’sobjectives.Step 4: Top management reviewed the scorecards for each part of the organization.
**Based on R. S. Kaplan and D. P. Norton, “Using the Balanced Scorecard as a StrategicManagement System,” Harvard Business Review, January-February 1996.
Licensing & Attributions
CC licensed content, Shared previously
Accounting Principles . License: Public Domain: No Known Copyright
All rights reserved content
Balanced Scorecard. Authored by: IntrafocusUK. Located at: https://youtu.be/M_IlOlywryw. License: All Rights Reserved. License Terms: Standard YouTube License

9/25/2017 Managerial Accounting
file:///Users/hannah/Downloads/Managerial-Accounting-1506381825_regexified.html 233/350
CHAPTER 9 KEY POINTS
Key Takeaways – Performance Measurement
Managers and Department heads should be evaluated based on CONTROLLABLE costs orthings that they can alter.
Indirect costs from other departments can be allocated using whatever base the company haddecided upon. The basic formula is Indirect Department Cost / Total Base to get our allocationrate. Then take the number of actual base used by the current department x allocation rate.
Direct costs are costs that can be directly traced to a segment, department or product and can beeither fixed or variable.
Contribution to Indirect expenses by a segment is used to determine the amount of money thesegments gives towards indirect (and often uncontrollable) expenses. It is calculated asContribution Margin (Sales – Variable expenses) – direct fixed expenses.
Return on Investment is calculated as Income / Investment Base. Return on investment tells youhow many cents are earned in income for every dollar of investment base.
Return on Investment can also be calculated as Margin (Income / Sales) x Turnover (Sales /Investment)
Residual Income uses a Cost of Capital set by the company to establish the minimum income orreturn an investment should have. Residual Income is the difference between segment incomeand minimum income and can be positive or negative. (Negative would be bad as this would fallbelow our desired minimum income)
To calculate minimum required income: Investment base x cost of capital
To calculate residual income: Segment Income – Minimum required income
Click Key Takeaways for a printable copy.
GLOSSARY
GLOSSARY
Budget variance The difference between the budgeted and actual amounts of an item.
Contribution margin Sales revenues less variable expenses.

9/25/2017 Managerial Accounting
file:///Users/hannah/Downloads/Managerial-Accounting-1506381825_regexified.html 234/350
Contribution margin format An income statement format that shows the contribution margin (SalesVariable expenses) for a segment.
Contribution to indirect expenses Sales revenue less all direct expenses of the segment.
Controllable profits of a segment Profit of a segment when expenses under a manager’s controlare deducted from revenues under that manager’s control.
Cost object A segment, product, or other item for which costs may be accumulated.
Current replacement cost The cost of replacing the present assets with similar assets in the samecondition as those now in use.
Decentralization The dispersion of decision-making authority among individuals at lower levels of theorganization.
Direct cost (expense) A cost that is specifically traceable to a given cost object.
Expense center A responsibility center incurring only expense items and producing no direct revenuefrom the sale of goods or services. Examples include the accounting department and the maintenancedepartment.
Indirect cost (expense) A cost that is not traceable to a given cost object but has been allocated to it.
Investment center A responsibility center having revenues, expenses, and an appropriate investmentbase.
Management by exception The principle that upper level management does not need to examineoperating details at lower levels unless there appears to be a problem (an exception).
Margin (as used in ROI) The percentage relationship of income (or profits) to sales.
Original cost The price paid to acquire an asset.
Original cost less accumulated depreciation The book value of an asset—the amount paid lesstotal depreciation taken.
Profit center A responsibility center having both revenues and expenses.
Residual income (RI), Economic Value Added The amount of income a segment has in excess of theinvestment base times the cost of capital percentage. Residual income is equal to
.
Responsibility accounting Refers to an accounting system that collects, summarizes, and reportsaccounting data relating to the responsibility of the individual managers. A responsibility accountingsystem provides information to evaluate each manager on revenue and expense items over whichthat manager has primary control.
Responsibility center A segment of an organization for which a particular executive is responsible.
Return on investment (ROI) Calculates the return (income) as a percentage of the assets employed(investment).
−
Margin = IncomeSales
Income − (Investment × Cost of capital percentage)
Return on investment = or ×Income Income Sales

9/25/2017 Managerial Accounting
file:///Users/hannah/Downloads/Managerial-Accounting-1506381825_regexified.html 235/350
Segment A fairly autonomous unit or division of a company defined according to function or productline.
Segmental net income The final total in the income statement; segmental revenues less allexpenses (direct expenses and allocated indirect expenses).
Transfer price An artificial price used when goods or services are transferred from one segment toanother segment within the same company.
Turnover (as used in ROI) The number of dollars of sales generated by each dollar of investment.
CHAPTER 9: EXERCISES
Short-Answer Questions, Exercises, and Problems
Short-Answer Questions
What is the fundamental principle of responsibility accounting?List five important factors that should be considered in designing reports for a responsibilityaccounting system.How soon should accounting reports be prepared after the end of the performancemeasurement period? Explain.Name and describe three types of responsibility centers.Describe a segment of a business enterprise that is best treated as an expense center. Listfour indirect expenses that may be allocated to such an expense center.Compare and contrast an expense center and an investment center.What purpose is served by setting transfer prices?What is the advantage of using investment centers as a basis for performance evaluation?Which categories of items must a segment manager have control over for the investmentcenter concept to be applicable?What is the connection between the extent of decentralization and the investment centerconcept?Give some of the advantages of decentralization.Differentiate between a direct cost and an indirect cost of a segment. What happens to thesecategories if the segment to which they are related is eliminated?Is it possible for a cost to be direct to one cost object and indirect to another cost object?Explain.Describe some of the methods by which indirect expenses are allocated to a segment.Give the general formula for return on investment (ROI). What are its two components?
Return on investment = or ×IncomeInvestment
IncomeSales
SalesInvestment
Turnover = SalesInvestment

9/25/2017 Managerial Accounting
file:///Users/hannah/Downloads/Managerial-Accounting-1506381825_regexified.html 236/350
Give the three sets of definitions for income and investment that can be used in ROIcalculations, and explain when each set is applicable.Give the various valuation bases that can be used for plant assets in investment centercalculations. Discuss some of the advantages and disadvantages of these methods.In what way is the use of the residual income (RI) concept superior to the use of ROI?How is residual income (RI) determined?If the RI for segment manager A is $50,000 while the RI for segment manager B is $100,000,does this necessarily mean that B is a better manager than A? Explain.Real world question Refer to the annual report of a publicly traded company. Which of thecompany’s geographic regions performed better? Explain.(Based on Appendix) Briefly discuss the two methods of allocating service department costs.
Exercises
Exercise A The following information refers to the inspection department of a chemicalpackaging plant for September:
Amount Over or (Under)Budget
Supplies $54,000 $ (10,800)
Repairs and maintenance 270,000 21,600
Overtime paid to inspectors 108,000 10,800
Salary of inspection department manager 32,400 (5,400)
Salary of plant manager 43,200 -0-
Allocation of company accounting costs 32,400 10,800
Allocation of building depreciation to the inspectiondepartment 21,600 (5,400)
Using this information, prepare a responsibility report for the manager of the inspectiondepartment for September. Include those items for which you think the inspection departmentmanager would be held responsible.
Exercise B Present the following information for the Hardware Division of ABC ComputerCompany,
Sales $ 1,400,000

9/25/2017 Managerial Accounting
file:///Users/hannah/Downloads/Managerial-Accounting-1506381825_regexified.html 237/350
Variable selling and administrative expenses 100,000
Fixed direct manufacturing expenses 35,000
Fixed indirect manufacturing expenses 56,000
Variable manufacturing expenses 400,000
Fixed direct selling and administrative expenses 175,000
Fixed indirect selling and administrative expenses 28,000
Exercise C Given the following data, prepare a schedule that shows contribution margin,contribution to indirect expenses, and net income of the Sharks Division of Hockey, Inc.:
Direct fixed expenses $ 324,000
Indirect fixed expenses 259,200
Sales 2,100,000
Variable expenses 1,500,000
What would be the effect on the company income if the segment were eliminated?
Exercise D Three segments (A, B, and C) of Trump Enterprises have net sales of $300,000,$150,000, and $50,000, respectively. A decision is made to allocate the pool of $25,000 ofadministrative overhead expenses of the home office to the segments, using net sales as thebasis for allocation.
a. How much of the $25,000 should be allocated to each segment?
b. If Segment C is eliminated, how much of the $25,000 will be allocated to A and B?
Exercise E Two segments (Mountain Bike and Road Bike) showed the following data for themost recent year:
Mountain bike Road bike
Contribution to indirect expenses $ 840,000 $ 504,000
Assets directly used by and identified with the segment 2,520,000 2,184,000
Sales 3,360,000 6,720,000
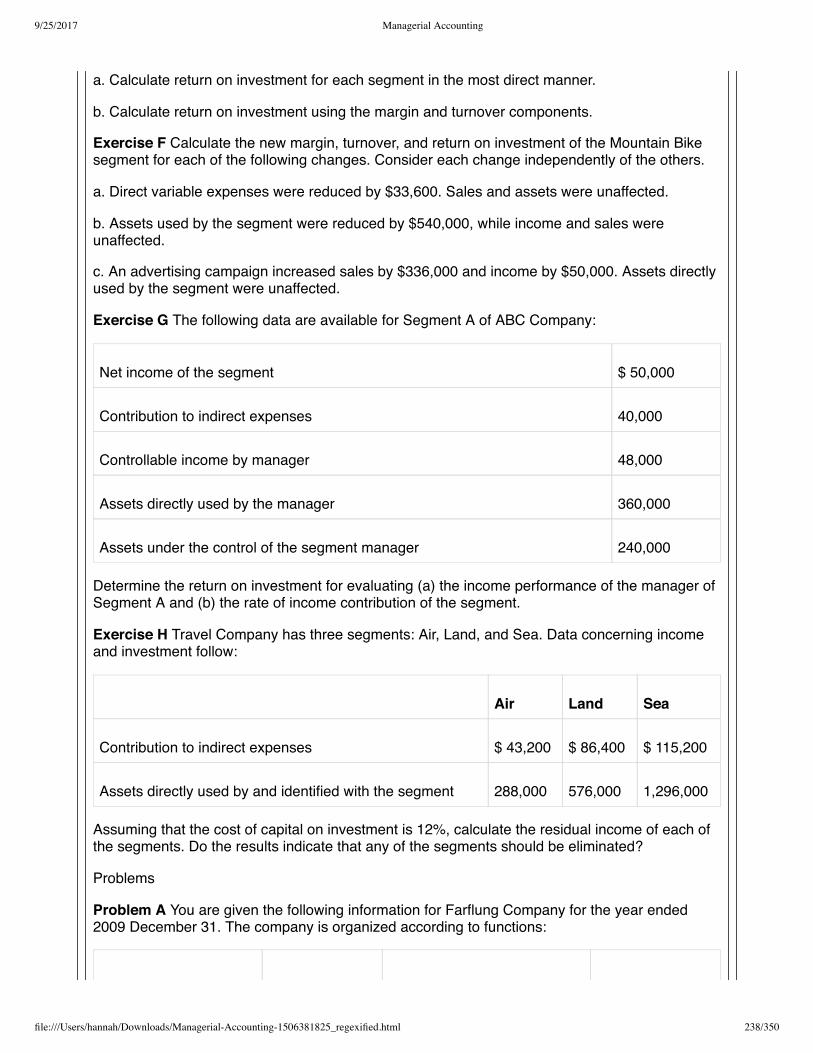
9/25/2017 Managerial Accounting
file:///Users/hannah/Downloads/Managerial-Accounting-1506381825_regexified.html 238/350
a. Calculate return on investment for each segment in the most direct manner.
b. Calculate return on investment using the margin and turnover components.
Exercise F Calculate the new margin, turnover, and return on investment of the Mountain Bikesegment for each of the following changes. Consider each change independently of the others.
a. Direct variable expenses were reduced by $33,600. Sales and assets were unaffected.
b. Assets used by the segment were reduced by $540,000, while income and sales wereunaffected.
c. An advertising campaign increased sales by $336,000 and income by $50,000. Assets directlyused by the segment were unaffected.
Exercise G The following data are available for Segment A of ABC Company:
Net income of the segment $ 50,000
Contribution to indirect expenses 40,000
Controllable income by manager 48,000
Assets directly used by the manager 360,000
Assets under the control of the segment manager 240,000
Determine the return on investment for evaluating (a) the income performance of the manager ofSegment A and (b) the rate of income contribution of the segment.
Exercise H Travel Company has three segments: Air, Land, and Sea. Data concerning incomeand investment follow:
Air Land Sea
Contribution to indirect expenses $ 43,200 $ 86,400 $ 115,200
Assets directly used by and identified with the segment 288,000 576,000 1,296,000
Assuming that the cost of capital on investment is 12%, calculate the residual income of each ofthe segments. Do the results indicate that any of the segments should be eliminated?
Problems
Problem A You are given the following information for Farflung Company for the year ended2009 December 31. The company is organized according to functions:

9/25/2017 Managerial Accounting
file:///Users/hannah/Downloads/Managerial-Accounting-1506381825_regexified.html 239/350
Plant Manager Vice President OfManufacturing
President
Controllable expenses Budget Actual Budget Actual Budget Actual
Office expense $ 7,200 $9,600 $ 12,000 $ 16,800 $
24,000$16,800
Printing 19,200 16,800
Paging 2,400 2,160
Binding 4,800 4,800
Purchasing 24,000 26,400
Receiving 12,000 14,400
Inspection 19,200 16,800
Vice president ofmarketing 192,000 168,000
Controller 144,000 120,000
Treasurer 96,000 72,000
Vice president ofpersonnel 48,000 72,000
Prepare the responsibility accounting reports for the three levels of management—plantmanager, vice president of manufacturing, and president.
Problem B Joey Bauer Corporation has production plants in Sacramento, Dallas, and Seattle.Following is a summary of the results for past year:
Plant Revenues Expenses Investment base (gross assets)
Sacramento $ 450,000 $ 225,000 $ 4,500,000
Dallas 450,000 180,000 3,375,000

9/25/2017 Managerial Accounting
file:///Users/hannah/Downloads/Managerial-Accounting-1506381825_regexified.html 240/350
Seattle 675,000 247,500 7,200,000
a. If the plants are treated as profit centers, which plant manager appears to have done the bestjob?
b. If the plants are treated as investment centers, which plant manager appears to have done thebest job? (Assume the plant managers are evaluated by return on investment on gross assets.)
c. Do the results of profit center analysis and investment center analysis give different findings? Ifso, why?
Problem C Quinn Company allocates all of its home office expenses to its two segments, A andB. Allocations are based on the following selected expense account balances and additionaldata:
Expenses (allocation bases)
Home office building expense (net sales) $76,800
Buying expense (net purchases) 67,200
Uncollectible accounts (net sales) 8,000
Depreciation of home office equipment (net sales) 21,120
Advertising expense (indirect, allocated on basis of relative amounts of directadvertising) 86,400
Insurance expense (relative amounts of equipment plus average inventory indepartment) 23,040
Segment A Segment B Total
Purchases (net) $ 243,200 $ 76,800 $ 320,000
Sales (net) 512,000 128,000 640,000
Equipment (cost) 96,000 64,000 160,000
Advertising (cost) 25,600 12,800 38,400
Average inventory 160,000 64,000 224,000

9/25/2017 Managerial Accounting
file:///Users/hannah/Downloads/Managerial-Accounting-1506381825_regexified.html 241/350
a. Prepare a schedule showing the amounts of each type of expense allocable to Segments Xand Y using these data and bases of allocation.
b. Evaluate and criticize these allocation bases.
Problem D Allentown, Inc., is a company with two segments, X and Y. Its revenues andexpenses for 2009 follow:
Segment X Segment Y Total
Net sales $ 96,000 $ 144,000 $ 240,000
Direct expenses:*
Cost of goods sold 45,000 99,000 144,000
Selling 13,680 7,200 20,880
Administrative:
Uncollectible accounts 3,000 1,800 4,800
Insurance 2,400 1,200 3,600
Interest 480 240 720
Indirect expenses (all fixed):
Selling 18,000
Administrative 25,200
* All the direct expenses are variable except insurance and interest, which are fixed.
a. Prepare a schedule showing the contribution margin, the contribution to indirect expenses ofeach segment, and net income for the company as a whole. Do not allocate indirect expenses tothe segments.
b. Assume that indirect selling expenses are to be allocated on the basis of net sales and thatindirect administrative expenses are to be allocated on the basis of direct administrativeexpenses. Prepare a statement (starting with the contribution to indirect expenses) that showsthe net income of each segment.
c. Comment on the appropriateness of the income amounts shown in parts (a) and (b) fordetermining the income contribution of the segments.

9/25/2017 Managerial Accounting
file:///Users/hannah/Downloads/Managerial-Accounting-1506381825_regexified.html 242/350
Problem E The following data pertain to the operating revenues and expenses for Golden StateCompany for 2009:
Los Angeles
(LA) Segment
San Francisco
(SF) SegmentTotal
Sales $ 180,000 $ 360,000 $ 540,000
Variable expenses 96,000 240,000 336,000
Direct fixed expenses 24,000 30,000 54,000
Indirect fixed expenses 72,000
Regarding the company’s total operating assets of $900,000, the following facts exist:
Los Angeles
Segment
San Francisco
Segment
Assets directly used by and identified with the segment $ 180,000 $ 360,000
a. Prepare a statement showing the contribution margin of each segment, the contribution toindirect expenses of each segment, and the total income of Golden State Company.
b. Determine the return on investment for evaluating (1) the earning power of the entire companyand (2) the performance of each segment.
c. Comment on the results of part (b).
Problem F Shaq Company operates with three segments, Louisiana, Orlando, and LA. Dataregarding these segments follow:
Louisiana
segment
Orlando
segment
LA
segment
Contribution to indirect expenses $ 324,000 $ 180,000 $ 144,000
Assets directly used and identified with the segment 1,800,000 1,440,000 720,000
a. Calculate the return on investment for each segment. Rank them from highest to lowest.
b. Assume the cost of capital is 12% for a segment. Calculate residual income for each segment.Rank them from highest to lowest.

9/25/2017 Managerial Accounting
file:///Users/hannah/Downloads/Managerial-Accounting-1506381825_regexified.html 243/350
c. Repeat (b), but assume the cost of capital is 17% for a segment. Rank them from highest tolowest.
d. Comment on the rankings achieved.
Problem G The manager of the Winston Company faced the following data for the year 2009:
Contribution to indirect expenses $ 1,800,000
Assets directly used by and identified with the segment 22,500,000
Sales 36,000,000
a. Determine the margin, turnover, and return on investment for the segment in 2009.
b. Determine the effect on margin, turnover, and return on investment of the segment in 2010 ifeach of the following changes were to occur. Consider each change separately and assume thatany items not specifically mentioned remain the same as in 2009:
A campaign to control costs resulted in $180,000 of reduced expenses.
Certain nonproductive assets were eliminated. As a result, investment decreased by $900,000,and expenses decreased by $72,000.
An advertising campaign resulted in increasing sales by $3,600,000, cost of goods sold by$2,700,000, and advertising expense by $540,000.
An investment was made in productive assets costing $900,000. As a result, sales increased by$360,000, and expenses increased by $54,000.
Problem H For the year ended 2009 December 31, Fore Company reported the followinginformation for the company as a whole and for the sports segment of Fore Corporation:
Sports Segment
Fore
company
Woods
Project
Irons
ProjectTotal
Sales $12,000,000 $1,350,000 $600,000 $1,950,000
Income 1,125,000 300,000 37,500 337,500
Investment 4,500,000 900,000 105,000 1,005,000
Fore Company anticipates that these relationships (return on investment, margin, and turnover)will hold true for the upcoming year. The sports segment is faced with the possibility of adding anew project in 2010, with the following projected data:

9/25/2017 Managerial Accounting
file:///Users/hannah/Downloads/Managerial-Accounting-1506381825_regexified.html 244/350
Putters
Project
Sales $450,000
Income 52,500
Investment 187,500
a. Determine the return on investment for Fore Company, for the sports segment, and for theWoods and Irons projects separately for the year ended 2009 December 31.
b. Using this information, determine the effect of adding the Putters project on the sportssegment’s return on investment. What problem may be encountered?
Using the data provided in the previous problem, determine the residual income (1) for all threeprojects and (2) for the sports segment with and without the Putters project, if the cost of capitalis 25%. What is the effect on the sport segment’s residual income if the Putter project is added?How does this result compare with your answer to the previous problem?
Alternate problems
Alternate problem A Swiss Corporation has three production plants (X, Y, and Z). Following is asummary of the results for January 2009:
Plant Revenues Expenses
Investment
Base
(gross assets)
X $ 720,000 $ 300,000 $ 1,440,000
Y 960,000 180,000 1,920,000
Z 5,040,000 1,920,000 13,200,000
a. If the plants are treated as profit centers, which plant manager appears to have done the bestjob?
b. If the plants are treated as investment centers, which plant manager appears to have done thebest job? (Assume the plant managers are evaluated by return on investment.)
c. Do the results of profit center analysis and investment center analysis give different findings? Ifso, why?
Alternate problem B Easy Loans, Inc., allocates expenses and revenues to the two segmentsthat it operates. Easy Loans extends credit to customers under a revolving charge plan whereby

9/25/2017 Managerial Accounting
file:///Users/hannah/Downloads/Managerial-Accounting-1506381825_regexified.html 245/350
all account balances not paid within 30 days are charged interest at the rate of 11/2% per month.
Following are selected revenue and expense accounts and some additional data needed tocomplete the allocation of the one revenue amount and the expenses.
Revenue and Expenses (allocation bases)
Revolving charge service revenue (net sales) $600,000
Home office building occupancy expense (net sales) 45,000
Buying expenses (net purchases) 150,000
General administrative expenses (number of employees in
department)75,000
Insurance expense (relative average inventory plus cost
of equipment and fixtures in each department)18,000
Depreciation expense on home office equipment (net sales) 30,000
High Risk
Segment
Low Risk
SegmentTotal
Number of employees 3 7 10
Net sales $ 300,000 $ 600,000 $ 900,000
Net purchases 240,000 360,000 600,000
Averaging inventory 60,000 120,000 180,000
Cost of equipment fixtures 90,000 180,000 270,000
a. Prepare a schedule showing allocation of these items to the High and Low Risk segments.
b. Do you think these are good allocation bases? Why or why not?
Alternate problem C Student Painters, Inc., operates two segments, interior and exterior. Therevenue and expense data for 2009 follow:
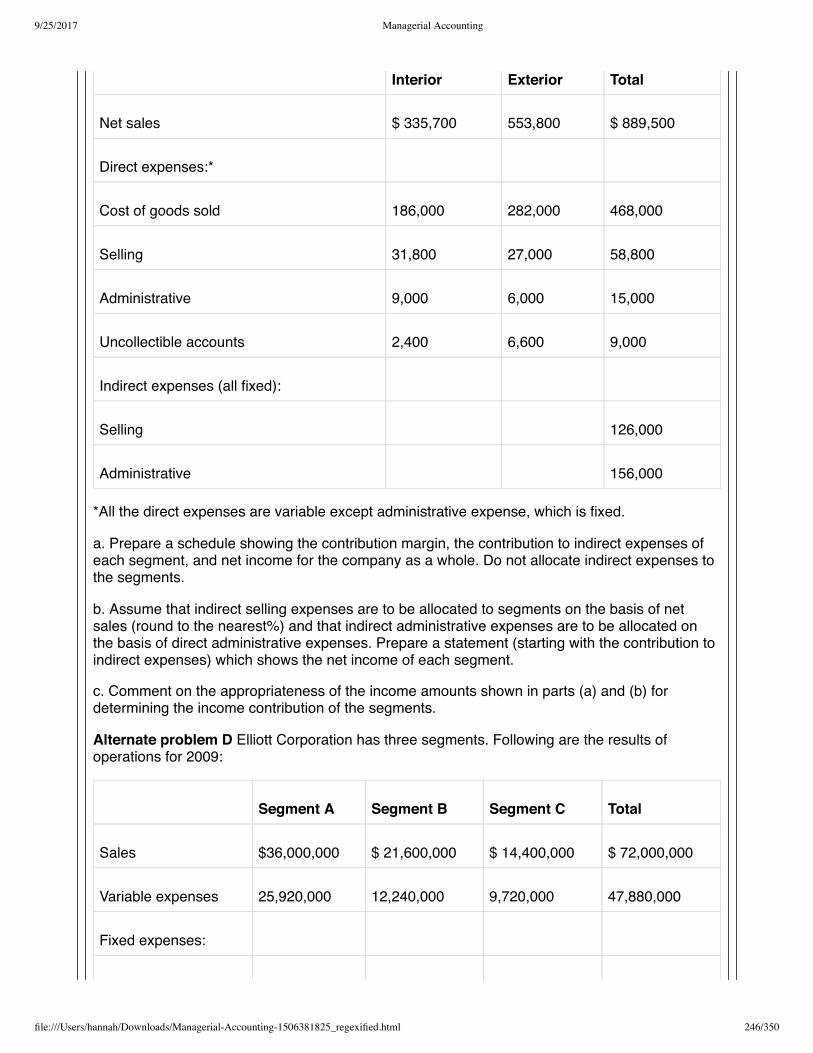
9/25/2017 Managerial Accounting
file:///Users/hannah/Downloads/Managerial-Accounting-1506381825_regexified.html 246/350
Interior Exterior Total
Net sales $ 335,700 553,800 $ 889,500
Direct expenses:*
Cost of goods sold 186,000 282,000 468,000
Selling 31,800 27,000 58,800
Administrative 9,000 6,000 15,000
Uncollectible accounts 2,400 6,600 9,000
Indirect expenses (all fixed):
Selling 126,000
Administrative 156,000
*All the direct expenses are variable except administrative expense, which is fixed.
a. Prepare a schedule showing the contribution margin, the contribution to indirect expenses ofeach segment, and net income for the company as a whole. Do not allocate indirect expenses tothe segments.
b. Assume that indirect selling expenses are to be allocated to segments on the basis of netsales (round to the nearest%) and that indirect administrative expenses are to be allocated onthe basis of direct administrative expenses. Prepare a statement (starting with the contribution toindirect expenses) which shows the net income of each segment.
c. Comment on the appropriateness of the income amounts shown in parts (a) and (b) fordetermining the income contribution of the segments.
Alternate problem D Elliott Corporation has three segments. Following are the results ofoperations for 2009:
Segment A Segment B Segment C Total
Sales $36,000,000 $ 21,600,000 $ 14,400,000 $ 72,000,000
Variable expenses 25,920,000 12,240,000 9,720,000 47,880,000
Fixed expenses:

9/25/2017 Managerial Accounting
file:///Users/hannah/Downloads/Managerial-Accounting-1506381825_regexified.html 247/350
Direct 5,040,000 1,800,000 720,000 7,560,000
Indirect 3,600,000
For the company’s total operating assets of $100,800,000, the following facts exist:
Segment A Segment B Segment C
Assets directly used by and
identified with the segment$ 50,400,000 $ 28,800,000 $ 14,400,000
a. Prepare a statement (in thousands of dollars) showing the contribution margin, the contributionto indirect expenses for each segment, and the total income of the Elliott Corporation.
b. Determine the return on investment for evaluating (1) the performance of the entire companyand (2) performance of each segment.
c. Comment on the results of part (a).
Alternative problem E Goodwin Company has three segments, 1,2, and 3. Data regardingthese segments follow:
Segment 1 Segment 2 Segment 3
Contribution to indirect expenses $ 432,000 $ 208,800 $ 72,000
Assets directly used by and identified
with the segment3,600,000 1,440,000 360,000
a. Calculate the return on investment for each segment. Rank them from highest to lowest.
b. Assume the cost of capital is 10% for a segment. Calculate the residual income for eachsegment. Rank them from highest to lowest.
c. Repeat (b), but assume the desired cost of capital is 14%. Rank the segments from highest tolowest.
d. Comment on the rankings achieved.
Beyond the numbers—Critical thinking
Business decision case A Texas Company manufactures skateboards. Because the company’sbusiness is seasonal, between August and December skilled manufacturing employees are laidoff. To improve morale, the financial vice president suggested that 10 employees not be laid off inthe future. Instead, she suggested that they work in general labor from August to December butstill be paid their manufacturing wages of $10 per hour. General labor personnel earn $6.60 per

9/25/2017 Managerial Accounting
file:///Users/hannah/Downloads/Managerial-Accounting-1506381825_regexified.html 248/350
hour. What are the implications of this plan for the assignment of costs to the various segmentsof the business?
Business decision case B Piero Company builds new homes. Sarah Richards is in charge ofthe construction department. Among other responsibilities, Sarah hires and supervises thecarpenters and other workers who build the homes. Piero Company does not do its ownfoundation work. The construction of foundations is done by subcontractors hired by Leslie Larueof the procurement department.
To start the development of a 500-home community, Larue hired Dire Company to build thefoundations for the homes. On the day construction was to begin, Dire Company went out ofbusiness. Consequently, construction was delayed six weeks while Larue hired a newsubcontractor. Which department should be charged with the cost of the delay in construction?Why?
Business decision case C Ken Silva is the supervisor of Department 103 of Laguna Company.The annual budget for Silva’s department is as follows:
Annual budget for Department 103
Small tools $ 6,750
Set up 7,500
Direct labor 8,250
Direct materials 15,000
Supplies 3,750
Supervision 22,500
Property taxes 3,750
Property insurance 750
Depreciation, machinery 1,500
Depreciation, building 1,500
Total $ 71,250
Silva’s salary of $15,000 is included in supervision. The remaining $7,500 in supervision is thesalary of the assistant supervisor directly responsible to Silva. Identify the budget items that Silvacontrols.

9/25/2017 Managerial Accounting
file:///Users/hannah/Downloads/Managerial-Accounting-1506381825_regexified.html 249/350
Broader perspective – Writing experience D Refer to “A broader perspective: Employeebuyouts”. Write a brief report explaining the effects of employee buyouts on employee motivation.
Group project E Macrofast Software, Inc., faces stiff competition in selling its products.Macrofast’s top management feels considerable pressure from the company’s stockholders toincrease earnings.
Mac Washington, the vice president of marketing at the company’s Production Software Division,received a memorandum from top management that said, in effect, “Increase your division’searnings or look for a new job”.
Washington could think of only one way to increase earnings by the end of the year. TheProduction Software Division had several installations that should be completed early thefollowing year, probably in February or March. For each of those jobs, he asked the customers tosign a Completed Installation document stating the job was completed to the customer’ssatisfaction. He did this because Macrofast’s accounting department would record the revenuefrom the job when it received the Completed Installation document.
Several customers signed Completed Installation documents even though the jobs were notcomplete because Washington gave them a personally signed letter stating the CompletionInstallation document was not legally binding.
The scheme initially worked. Revenues were prematurely recorded for these jobs, sales andearnings for the year were up, Macrofast’s top management was delighted with the results, andWashington was rewarded with a large bonus and a promotion to a vice presidency at corporateheadquarters.
The following June, a staff accountant discovered the scheme when a customer called tocomplain that he was being billed for a job that was not yet completed. When the accountantproduced the customer’s Completed Installation document, the customer produced Washington’sletter saying the document was not binding. The accountant did some detective work andunearthed the scheme. When she presented the results to her supervisor, the supervisor said,“This practice is unfortunate and is against company policy. But what is done is done. Do notworry about last year’s financial statements. Just be sure it does not happen again.”
a. In teams of four, discuss what the staff accountant should do.
b. Then, decide how your solution would change if all jobs had been completed to the customers’satisfaction.
c. As a team, write a memorandum to your instructor describing your solutions. The heading ofthe memo should contain the date, to whom it is written, from whom, and the subject matter.
Group project F Bleak Prospects, Inc., found that its market share was slipping. Divisionmanagers were encouraged to maximize ROI and made decisions consistent with that goal.Nonetheless, there were frequent customer complaints, with resulting loss of business. Moreover,Bleak depended on an established product line and was unable to find new products forexpansion while its competitors seemed to be able to generate new products almost yearly. Whatwould you suggest Bleak Prospects’ management do to improve the situation? In groups of twoor three students, write a memorandum to your instructor addressing this question. The headingof the memorandum should contain the date, to whom it is written, from whom, and the subjectmatter.
Group project G Management of Division A is evaluated based on residual income measures.The division can either rent or buy a certain asset. Will the performance evaluation technique

9/25/2017 Managerial Accounting
file:///Users/hannah/Downloads/Managerial-Accounting-1506381825_regexified.html 250/350
have an impact on the rent-or-buy decision? Why or why not? In groups or three students, write amemorandum to your instructor addressing this question. The heading of the memorandumshould contain the date, to whom it is written, from whom, and the subject matter.
Using the Internet—A view of the real world
Visit the website for PepsiCo, Incorporated.
http://www.pepsico.com
Go to the company’s most recent annual report. Compare the performance of PepsiCo’s threebusiness segments: (1) beverages, (2) snack foods, and (3) restaurants. (You will find businesssegment information in the notes to the financial statements.) Which business segment had themost operating profits? Which business performed better using ROI, profit margin, and assetturnover as the performance measures? Use end-of-year “identifiable assets” to measureinvestment, “operating profits” to measure income, and “net sales” to measure sales. Be sure tosubmit a copy of PepsiCo’s business segment information from the annual report.
Visit the website for PepsiCo, Incorporated.
http://www.pepsico.com
Go to the company’s most recent annual report. Using financial information for the most recentyear, which of the company’s geographic areas had the highest ROI? (You will find businesssegment information in the notes to the financial statements, including geographic segments.)Use end-of-year “identifiable assets” to measure investment, “operating profits” to measureincome, and “net sales” to measure sales. Be sure to submit a copy of PepsiCo’s businesssegment information from the annual report.

9/25/2017 Managerial Accounting
file:///Users/hannah/Downloads/Managerial-Accounting-1506381825_regexified.html 251/350
CHAPTER 10: DIFFERENTIALANALYSIS (OR RELEVANT COSTS)
CHAPTER 10 STUDY PLAN
Study Plan: Relevant Costing for Managers
Knowledge Targets
I can define the following terms as they relate to our unit:
Avoidable Cost Constraint Make or Buy Differential Cost
Differential Revenue Joint Product Joint Cost Opportunity Cost
Sunk Cost Relevant Benefit Relevant Cost Sells or Process further
Special Order Split Off Point Constrained Resource
Reasoning TargetsI can identify costs as relevant, avoidable, opportunity or sunk cost.I can classify costs as relevant or not relevant.I can determine value and use of a constrained resource.
Skill TargetsI can prepare an analysis showing if a product line or business segment should be dropped oradded.I can prepare make or buy analysis.I can prepare analysis showing whether a special order should be accepted or rejected.I can prepare an analysis showing whether a joint product should be sold at the split off pointor processed further.
Click Relevant Costs for a printable copy.

9/25/2017 Managerial Accounting
file:///Users/hannah/Downloads/Managerial-Accounting-1506381825_regexified.html 252/350
10.1 DIFFERENTIAL ANALYSIS
Di�erential analysis
Differential analysis involves analyzing the different costs and benefits that would arise fromalternative solutions to a particular problem. Relevant revenues or costs in a given situation arefuture revenues or costs that differ depending on the alternative course of action selected.Differential revenue is the difference in revenues between two alternatives. Differential cost orexpense is the difference between the amounts of relevant costs for two alternatives.[1]
Future costs that do not differ between alternatives are irrelevant and may be ignored since they affectboth alternatives similarly. Past costs, also known as sunk costs, are not relevant in decision makingbecause they have already been incurred; therefore, these costs cannot be changed no matter whichalternative is selected.
For certain decisions, revenues do not differ between alternatives. Under those circumstances,management should select the alternative with the least cost. In other situations, costs do not differbetween alternatives. Accordingly, management should select the alternative that results in the largestrevenue. Many times both future costs and revenues differ between alternatives. In these situations,the management should select the alternative that results in the greatest positive difference betweenfuture revenues and expenses (costs).
To illustrate relevant, differential, and sunk costs, assume that Joanna Bennett invested $400 in a tillerso she could till gardens to earn $1,500 during the summer. Not long afterward, Bennett was offered ajob at a horse stable feeding horses and cleaning stalls for $1,200 for the summer. The costs that shewould incur in tilling are $100 for transportation and $150 for supplies. The costs she would incur atthe horse stable are $100 for transportation and $50 for supplies. If Bennett works at the stable, shewould still have the tiller, which she could loan to her parents and friends at no charge.
The tiller cost of $400 is not relevant to the decision because it is a sunk cost. The transportation costof $100 is also not relevant because it is the same for both alternatives. These costs and revenuesare relevant (note: differential means difference):
Performing tillingservice
Working at horsestable Differential
Revenues $1,500 $1,200 $300
Costs 150 50 100
Net benefit in favor of tillingservice $200
Based on this differential analysis, Joanna Bennett should perform her tilling service rather than workat the stable. Of course, this analysis considers only cash flows; nonmonetary considerations, such asher love for horses, could sway the decision.
Watch this video online: https://youtu.be/ZtATVI1Oeyo

9/25/2017 Managerial Accounting
file:///Users/hannah/Downloads/Managerial-Accounting-1506381825_regexified.html 253/350
In many situations, total variable costs differ between alternatives while total fixed costs do not. Forexample, suppose you are deciding between taking the bus to work or driving your car on a particularday. The differential costs of driving a car to work or taking the bus would involve only the variablecosts of driving the car versus the variable costs of taking the bus.
Suppose the decision is whether to drive your car to work every day for a year versus taking the busfor a year. If you bought a second car for commuting, certain costs such as insurance and an autolicense that are fixed costs of owning a car would be differential costs for this particular decision.
Before studying the applications of differential analysis, you must realize that opportunity costs arealso relevant in choosing between alternatives. An opportunity cost is the potential benefit that isforgone by not following the next best alternative course of action. For example, assume that the twobest uses of a plot of land are as a mobile home park (annual income of $100,000) and as a golfdriving range (annual income of $60,000). The opportunity cost of using the land as a mobile homepark is $60,000, while the opportunity cost of using the land as a driving range is $100,000.
Companies do not record opportunity costs in the accounting records because they are the costs ofnot following a certain alternative. Thus, opportunity costs are not transactions that occurred but thatdid not occur. However, opportunity cost is a relevant cost in many decisions because it represents areal sacrifice when one alternative is chosen instead of another.
In the next section, we will look at examples of differential analysis.
Licensing & Attributions
All rights reserved content
Di�erential Analysis - Concepts. Authored by: Christy Lynch Chauvin. Located at: https://youtu.be/ZtATVI1Oeyo. License: All Rights Reserved. License Terms: Standard YouTube License
10.2 APPLYING DIFFERENTIAL ANALYSIS INMANAGERIAL DECISION MAKING
Applications of differential analysis
To illustrate the application of differential analysis to specific decision problems, we consider fivedecisions:
1. setting prices of products;2. accepting or rejecting special orders;3. adding or eliminating products, segments, or customers;4. processing or selling joint products; and5. deciding whether to make products or buy them.
Although these five decisions are not the only applications of differential analysis, they representtypical short-term business decisions using differential analysis. Our discussion ignores income taxes.
Pricing Decisions

9/25/2017 Managerial Accounting
file:///Users/hannah/Downloads/Managerial-Accounting-1506381825_regexified.html 254/350
When applying differential analysis to pricing decisions, each possible price for a given productrepresents an alternative course of action. The sales revenues for each alternative and the costs thatdiffer between alternatives are the relevant amounts in these decisions. Total fixed costs often remainthe same between pricing alternatives and, if so, may be ignored. In selecting a price for a product,the goal is to select the price at which total future revenues exceed total future costs by the greatestamount, thus maximizing income.
A high price is not necessarily the price that maximizes income. The product may have manysubstitutes. If a company sets a high price, the number of units sold may decline substantially ascustomers switch to lower-priced competitive products. Thus, in the maximization of income, theexpected volume of sales at each price is as important as the contribution margin per unit of productsold. In making any pricing decision, management should seek the combination of price and volumethat produces the largest total contribution margin. This combination is often difficult to identify in anactual situation because management may have to estimate the number of units that can be sold ateach price.
For example, assume that a company selling fried chicken in the New York market estimates productdemand for its large bucket of chicken for a particular period to be:
Choice Demand
1 15,000 units at $6 per unit
2 12,000 units at $7 per unit
3 10,000 units at $8 per unit
4 7,000 units at $9 per unit
The company’s fixed costs of $20,000 per year are not affected by the different volume alternatives.Variable costs are $5 per unit. What price should be set for the product? Based on the calculationsshown in the table below, the company should select a price of $8 per unit because choice (3) resultsin the greatest total contribution margin and net income. In the short run, maximizing total contributionmargin maximizes profits.
Choice SalesPrice
– Var. Cost=
Contribution
margin per unitx
Number
of units =
Total
margin
Fixed
costs
Net
income(loss)
1 $6 $5 $1 15,000 $15,000 $20,000 $(5,000)
2 $7 $5 2 12,000 24,000 20,000 4,000
3 $8 $5 3 10,000 30,000 20,000 10,000
4 $9 $5 4 7,000 28,000 20,000 8,000
Accept or Reject Special Orders
Sometimes management has an opportunity to sell its product in two or more markets at two or moredifferent prices. Movie theaters, for example, sell tickets at discount prices to particular groups ofpeople—children, students, and senior citizens. Differential analysis can determine whethercompanies should sell their products at prices below regular levels.

9/25/2017 Managerial Accounting
file:///Users/hannah/Downloads/Managerial-Accounting-1506381825_regexified.html 255/350
Watch this video online: https://youtu.be/0vDqSCMXoa0
Good business management requires keeping the cost of idleness at a minimum. When operating atless than full capacity, management should seek additional business. Management may decide toaccept such additional business at prices lower than average unit costs if the differential revenuesfrom the additional business exceed the differential costs. By accepting special orders at a discount,businesses can keep people employed that they would otherwise lay off.
To illustrate, assume Rios Company produces and sells a single product with a variable cost of $8 perunit. Annual capacity is 10,000 units, and annual fixed costs total $48,000. The selling price is $20 perunit and production and sales are budgeted at 5,000 units. Thus, budgeted income before incometaxes is $12,000, as shown below.
Rios company
Income statement
For the period ending May 31
Revenue (5,000 units at $20) $100,000
Variable costs:
Direct materials cost ($4 per unit) $20,000
Labor ($1 per unit) 5,000
Overhead ($2 per unit) 10,000
Marketing and administrative costs ($1 per unit) 5,000
Total variable costs ($8 per unit) $40,000
Fixed costs:
Overhead $28,000
Marketing and administrative costs 20,000
Total fixed costs 48,000
Total costs ($17.60 per unit) 88,000
Net income $12,000
Assume the company receives an order from a foreign distributor for 3,000 units at $10 per unit.This $10 price is not only half of the regular selling price per unit, but also less than the $17.60average cost per unit ($88,000/5,000 units). However, the $10 price offered exceeds the variable costper unit by $2. If the company accepts the order, net income increases to $18,000.
Revenue would increase to $130,000 with the special order. Each of the variable costs increases intotal by 60% because total volume increases by 60% (3,000 units in the special order/5,000 unitsregularly produced). The revised income statement would appear as follows:
Rios company
Income statement (with Special Order)

9/25/2017 Managerial Accounting
file:///Users/hannah/Downloads/Managerial-Accounting-1506381825_regexified.html 256/350
For the period ending May 31
Revenue (5,000 units at $20 + 3,000 units at $10) $130,000
Variable costs:
Direct materials cost ($4) $32,000
Labor ($1) 8,000
Overhead ($2) 16,000
Marketing and administrative costs ($1) 8,000
Total variable costs ($8 per unit) $64,000
Fixed costs:
Manufacturing overhead $28,000
Marketing and administrative costs 20,000
Total fixed costs 48,000
Total costs ($14 per unit) 112,000
Net income $18,000
Note that the fixed costs do not increase with the special order. Because the special order does notincrease the fixed costs, the special order’s revenues need only cover its variable costs.
If Rios Company continues to operate at 50% capacity (producing 5,000 units without the specialorder) it would generate income of only $12,000. By accepting the special order, net income increasesby $6,000 ($18,000 net income with special order – $12,000 net income without special order).
Differential analysis would provide the following calculations:
Accept
order
Reject
orderDifferential
Revenues $130,000 $100,000 $30,000
Costs 112,000 88,000 24,000
Net benefit of accepting order $6,000
Variable costs set a floor for the selling price in special-order situations. Even if the price exceedsvariable costs only slightly, the additional business increases net income, assuming fixed costs do notchange. However, pricing just above variable costs of special-order business often brings only short-term increases in net income. In the long run, companies must cover all of their costs, not just thevariable costs.
Adding or Eliminating
Periodically, management has to decide whether to add or eliminate certain products, segments, orcustomers. If you have watched a store or a plant open or close in your area, you have seen the

9/25/2017 Managerial Accounting
file:///Users/hannah/Downloads/Managerial-Accounting-1506381825_regexified.html 257/350
results of these decisions. Differential analysis is useful in this decision making because a company’sincome statement does not automatically associate costs with certain products, segments, orcustomers. Thus, companies must reclassify costs as those that the action would change and thosethat it would not change.
https://youtu.be/w7Ve8__NtPY
If companies add or eliminate products, they usually increase or decrease variable costs. The fixedcosts may change, but not in many cases. Management bases decisions to add or eliminate productsonly on the differential items; that is, the costs and revenues that change.
To illustrate, assume that the Campus Bookstore is considering eliminating its art suppliesdepartment. If the bookstore dropped the art supplies department, it would lose revenues of $100,000annually. The bookstore’s management assigns costs of $110,000 ($80,000 variable and $30,000fixed) to the art supplies department. Therefore, art supplies has an apparent annual loss of $10,000($100,000 revenue minus $110,000 costs). But careful cost analysis reveals that if the art suppliesdepartment were dropped, the reduction in costs would be only $80,000 variable costs directly relatedto the art supplies department and the $30,000 fixed costs are general bookstore fixed costs allocatedto the art supplies department. These fixed costs would continue to be incurred and would not besaved by closing the art supplies department. Look at the differential analysis below.
Art Supplies Department
Keep Close Differential
Revenues $100,000 $-0- $100,000
Variable costs 80,000 -0- 80,000
Fixed costs 30,000 30,000 -0-
Net benefit of keeping art supplies department $ 20,000
Note that the art supplies department has been contributing $20,000 ($100,000 revenues – $80,000variable costs) annually toward covering the fixed costs of the business. Consequently, its eliminationcould be a costly mistake unless there is a more profitable use for the vacated facilities.
If the company has a profitable alternative use for the vacated facilities, the potential income from thatalternative represents an opportunity cost of retaining the product, segment, or customer. Assume, forexample, that the bookstore could use the facilities currently occupied by the art supplies departmentto open a new department to display and sell personal computers, printers, and software. This newdepartment would contribute $35,000 to the bookstore’s income.
The relevant costs in the decision to retain the art supplies department are $115,000 ($80,000 ofvariable manufacturing costs and $35,000 of opportunity cost of not opening a new department), whilethe relevant revenues are still $100,000. Therefore, the bookstore has a net disadvantage in keepingthe art supplies department because it loses $15,000 compared to the computer department.
Art Supplies PCs Differential
Revenues $100,000
Variable costs -80,000
Additional Income $20,000 35,000 $15,000

9/25/2017 Managerial Accounting
file:///Users/hannah/Downloads/Managerial-Accounting-1506381825_regexified.html 258/350
Sell or Process Further
Sometimes two or more products result from a common raw material or production process; theseproducts are called joint products. Companies can process these products further or sell them intheir current condition. For instance, when Chevron refines crude oil, it produces a wide variety offuels, solvents, lubricants, and residual petrochemicals.
Management can use differential analysis to decide whether to process a joint product further or tosell it in its present condition. Joint costs are those costs incurred up to the point where the jointproducts split off from each other. These costs are sunk costs and are not considered when decidingwhether to process a joint product further before selling it or to sell it in its condition at the split-offpoint.
Watch this video online: https://youtu.be/dcRj7cb3FVo
The following example illustrates the issue of whether to process or sell joint products. Assume thatPacific Paper, Inc., produces two paper products, A and B, from a common manufacturing process.Each of the products could either be sold in its present form or processed further and sold at a higherprice. Data for both products follow:
Product Selling price per unit atsplit-off point
Cost per unit of furtherprocessing
Selling price per unit afterfurther processing
A $10 $6 $21
B 12 7 18
The differential revenues and costs of further processing of the two products are as follows:
Product Different revenue offurther processing
Differential cost offurther processing
Net advantage (disadvantage) offurther processing
A $11 $6 $5
B 6 7 (1)
Based on this analysis, Pacific Paper should process product A further to increase income by $5 perunit sold. The company should not process product B further because that would decrease incomeby $1 per unit sold.
Companies use this same form of differential analysis to decide whether they should discard their by-products or process them further. By-products are additional products resulting from the productionof a main product and generally have a small market value compared to the main product. Sometimescompanies consider by-products to be waste materials. For example, the bark from trees cut intolumber is a by-product of lumber production. Although a by-product, companies convert this bark intofuel or landscaping material. When the differential revenue of further processing exceeds thedifferential cost, firms should do further processing. As concerns increase about the effects of wasteon the environment, companies find more and more waste materials that can be converted into by-products.
Make or Buy
Managers also apply differential analysis to make-or-buy decisions. A make-or-buy decision occurswhen management must decide whether to make or purchase a part or material used in

9/25/2017 Managerial Accounting
file:///Users/hannah/Downloads/Managerial-Accounting-1506381825_regexified.html 259/350
manufacturing another product. Management must compare the price paid for a part with theadditional costs incurred to manufacture the part. When most of the manufacturing costs are fixed andwould exist in any case, it is likely to be more economical to make the part rather than buy it.
Watch this video online: https://youtu.be/FWWvPPx4rTQ
To illustrate the application of differential analysis to make-or-buy decisions, assume that Small MotorCompany manufactures a part costing $6 for use in its toy automobile engines. Cost components are:materials, $3.00; labor, $1.50; fixed overhead costs, $1.05; and variable overhead costs, $0.45. Smallcould purchase the part for $5.25. Fixed overhead would presumably continue even if the part werepurchased. The added costs (variable costs only) of manufacturing amount to $4.95 ($3.00 DM +$1.50 DL + $0.45 Variable OH). This amount is 30 cents per unit less than the purchase price of thepart. Therefore, manufacturing the part should be continued as shown in the following analysis:
Make Buy Differential
Variable Costs $4.95 $5.25 $0.30
Net advantage of making $0.30
In make-or-buy decisions, management also should consider the opportunity cost of not utilizing thespace for some other purpose. In the previous example, if the opportunity costs of not using thisspace in its best alternative use is more than 30 cents per unit times the number of units produced,the part should be purchased.
In some manufacturing situations, firms avoid a portion of fixed costs by buying from an outsidesource. For example, suppose eliminating a part would reduce production so that a supervisor’ssalary could be saved. In such a situation, firms should treat these fixed costs the same as variablecosts in the analysis because they would be relevant costs.
Sometimes the cost to manufacture may be only slightly less than the cost of purchasing the part ormaterial. Then management should place considerable weight on other factors such as thecompetency of existing personnel to undertake manufacturing the part or material, the availability ofworking capital, and the cost of any loans that may be necessary.
Licensing & Attributions
All rights reserved content
Management Product & Pricing Decisions: Special Order; Incremental Analysis - Accounting video. Authored by: Brian Routh TheAccountingDr. Located at: https://youtu.be/0vDqSCMXoa0. License: AllRights Reserved. License Terms: Standard YouTube License72 Management Accounting Decision Making Add or Delete Product Line . Authored by: MLI247. Located at: https://youtu.be/w7Ve8__NtPY. License: All Rights Reserved. License Terms: Standard YouTubeLicenseDi�erential Analysis - Joint Products Sell or Process Further. Authored by: Christy Lynch Chauvin. Located at: https://youtu.be/dcRj7cb3FVo. License: All Rights Reserved. License Terms: Standard YouTubeLicenseManagement Accounting 17: Make or Buy Decisions . Authored by: AccountingED. Located at: https://youtu.be/FWWvPPx4rTQ. License: All Rights Reserved. License Terms: Standard YouTube License
10.3 APPLYING DIFFERENTIAL ANALYSIS TOQUALITY DECISIONS
Applying di�erential analysis to quality

9/25/2017 Managerial Accounting
file:///Users/hannah/Downloads/Managerial-Accounting-1506381825_regexified.html 260/350
High quality is essential to success in a competitive environment. Therefore, companies usedifferential analysis to make decisions about the quality of their products.
Assume Erie Waters produces bottled water. The variable cost of a case (12 one-liter bottles) is asfollows:
Water and bottles $2.00
Inspection and rework costs 1.00
All other variable costs 3.00
Total variable cost per case $6.00
In addition, the company has $150,000 of fixed costs per year.
The company inspects the product at various stages. When inspectors find the water is belowstandard or the bottles have defects, production workers replace the water and/or the bottles. Thecost of inspecting the product and replacing water and/or bottles averages $1.00 per case, and isshown as inspection and rework costs.
Management of Erie Waters is concerned about product quality. Despite the inspection just noted,management has learned that dissatisfied customers are switching to competitive products.Management is considering purchasing a high-quality water product. This product would increasewater and bottle costs to $2.50 per case while decreasing inspection and rework costs to $0.40 percase. All other variable costs would remain at $3.00 per case. Erie Waters would sell this waterfor $8.00 per case.
If the high-quality water is purchased, Erie Waters expects to sell 100,000 cases of water this yearat $8.00 per case. If Erie continues to use the current low-quality water, the company expects to sell90,000 cases of water this year at $8.00 per case. Fixed costs are $150,000 per year whether thecompany buys high-quality water or low-quality water. Should Erie Waters buy the high-quality water?We compare the two alternatives below.
Low-quality water (90,000cases)
High-quality water
(100,000 cases)
Revenue at $8.00 per case $ 720,000 $ 800,000
Water and bottles at $2.00 per case for
low quality and $2.50 per case for
high quality
(180,000)
[90,000 cases x $2.00]
(250,000)
[100,000 cases x$2.50]
Inspection and rework at $1.00 percase
for low quality and $0.40 per case forhigh
quality
(90,000)
[90,000 cases x $1.00]
(40,000)
[100,000 cases x$0.40]

9/25/2017 Managerial Accounting
file:///Users/hannah/Downloads/Managerial-Accounting-1506381825_regexified.html 261/350
All other variable costs at $3.00 percase (270,000)
[90,000 cases x $3]
(300,000)
[100,000 cases x $3]
Fixed costs (150,000) (150,000)
Net income $ 30,000 $ 60,000
Erie Waters should purchase the high-quality water because it increases net income from $30,000to $60,000 per year. In addition, a high-quality product improves the company’s prospects formaintaining or even increasing its market share in years to come. Many companies have learned thehard way that letting quality slip creates a bad reputation that is hard to overcome.
10.4 ACCOUNTING IN THE HEADLINES
Should Apple Country Orchards sell Granny Smithapples or make cider from those apples? Apple Country Orchards in Idalou, Texas, has 6,000 apple treesand offers 30 varieties of apples. The orchard is 29 years old andallows customers to pick their own apples or to purchase pre-picked apples. In addition to apples and apple picking, the orchardoffers hayrides, lunch, pumpkins, and a variety of other items.
Apple Country Orchards makes cider from several different applevarieties. One of the varieties used to make cider is the GrannySmith apple, which is known for its ability to be easily preserved in storage for up to a year and for itshigh antioxidant activity.
Assume that Apple Country Orchards sells Granny Smith apples for $0.90 per pound. One gallon offresh-pressed cider at Apple Country Orchards sells for $8. (On average, ten pounds of Granny Smithapples yield one gallon of fresh-pressed cider.)
Questions
1. Do you need to know the cost per pound that Apple Country Orchards uses for its Granny Smithapples to be able to decide if the Granny Smith apples should be sold as is (as raw apples) orprocessed further into cider, pie, turnovers, or any other apple product? Why or why not?
2. From a purely quantitative standpoint, should Apple Country Orchards sell raw Granny Smithapples or process those apples further into apple cider? Support your answer with calculations.
3. Assume that it is financially advantageous to sell raw apples rather than process them further intocider. What qualitative factors might influence Apple Country Orchards’ decision to offer fresh-pressed cider?
9/25/2017 Managerial Accounting
file:///Users/hannah/Downloads/Managerial-Accounting-1506381825_regexified.html 262/350
Licensing & Attributions
CC licensed content, Speci�c attribution
Should Apple Country Orchards sell Granny Smith apples or make cider from those apples?. Authored by: Dr. Wendy Tietz, CPA, CMA, CGMA. Located at: http://www.accountingintheheadlines.com.License: CC BY: Attribution
GLOSSARY
GLOSSARY
By-products Additional products resulting from the production of a main product. By-productsgenerally have a small market value compared to the main product.
Committed fixed costs Costs relating to the basic facilities and organizational structure that acompany must have to continue operations.
Differential analysis An analysis of the different costs and benefits that would arise fromalternative solutions to a particular problem.
Differential cost or expense The difference between the amounts of relevant costs for twoalternatives.
Differential revenue The difference between the amounts of relevant revenues for twoalternatives.
Discretionary fixed costs Fixed costs subject to management control from year to year; anexample is advertising expense.
Joint costs Those production costs incurred up to the point where the joint products split off fromeach other.
Joint products Two or more products resulting from a common raw material or production process.
Make-or-buy decision A decision concerning whether to manufacture or purchase a part ormaterial used in manufacturing another product.
Opportunity cost The potential benefit that is forgone from not following the next best alternativecourse of action.
Relevant revenues or costs Revenues or costs that will differ in the future depending on whichalternative course of action is selected.
Sunk costs Past costs that are not relevant in decision making because they have already beenincurred.

9/25/2017 Managerial Accounting
file:///Users/hannah/Downloads/Managerial-Accounting-1506381825_regexified.html 263/350
CHAPTER 10: EXERCISES
Short-Answer Questions, Exercises, and Problems
Questions➢ Identify types of decisions that can be made using differential analysis.➢ What is a committed fixed cost? Give some examples.➢ What is a discretionary fixed cost? Give some examples.➢ Give an example of a fixed cost that might be considered committed for one company anddiscretionary for another.➢ What is the disadvantage of a company having all committed fixed costs? Explain.➢ What is an opportunity cost? Give some examples.➢ What essential feature distinguishes the contribution margin income statement from the traditionalincome statement?➢ Real world question Give an example of a make-or-buy decision that you have made or someoneyou know has made.➢ Real world question Give an example in which your campus bookstore replaces one of itsdepartments with another it currently does not have. (For example, it stops selling magazines andstarts selling cameras.) What revenues and costs would be differential?➢ Real world question Assume that McDonald’s, of McDonald’s fast-food restaurants, currently buysits french fries from agricultural growers and food processors. In doing so, McDonald’s has decided tobuy the materials for its french fries instead of “make” them. (Assume that making french friesincludes growing the potatoes.) What factors would go into McDonald’s decision to buy instead ofmake french fries?➢ Real world question Suppose that Wal-Mart, one of the fastest growingcompanies in the world, were to close one of its stores. Which differential revenues and costs wouldbe affected by that decision?ExercisesExercise A The following data are for Paso Robles Companyfor the year ended 2009 December 31:
Costs:
Direct material $ 90,000
Direct labor 130,000
Manufacturing overhead:
Variable 45,000
Fixed 90,000
Sales commissions (variable) 25,000
Sales salaries (fixed) 20,000
Administrative expenses (fixed) 35,000
Selling price per unit $ 10
Units produced and sold 60,000

9/25/2017 Managerial Accounting
file:///Users/hannah/Downloads/Managerial-Accounting-1506381825_regexified.html 264/350
Assume direct materials and direct labor are variable costs. Prepare a contribution margin incomestatement and a traditional income statement.
Exercise B Assume you had invested $1,000 in a lawn mower to set up a lawn mowing business forthe summer. During the first week, you could choose either to mow the grounds at a housingdevelopment for $1,400 or to help paint a garage for $1,360. Each job would take one week. Youcannot do both. You would incur additional costs of $160 for lawn mowing and $80 for garagepainting. These costs include $60 under each alternative for transportation to the job. Prepare aschedule showing the net benefit or advantage of selecting one alternative over the other.
Exercise C The marketing department of Specialty Coffees estimates the following monthly demandfor espresso in these four price-quantity relationships:
Demand
1 9,000 cups at $1.00 per cup
2 8,000 cups at $1.25 per cup
3 6,000 cups at $1.50 per cup
4 4,000 cups at $1.75 per cup
The fixed costs of $3,000 per month are not affected by the different price-volume alternatives.Variable costs are $0.25 per cup. What price should Specialty Coffees set for espresso?
Exercise D Viking Corporation is operating at 80% of capacity, which means it produces 8,000 units.Variable cost is $100 per unit. Wholesaler Y offers to buy 2,000 additional units at $120 per unit.Wholesaler Z proposes to buy 1,500 additional units at $140 per unit. Which offer, if either, shouldViking Corporation accept? Fixed costs are not affected by accepting either offer.
Exercise E Analysis of Hair Care Company’s citrus hair conditioner reveals that it is losing $5,000annually. The company sells 5,000 units of citrus hair conditioner each year at $10 per unit. Variablecosts are $6 per unit. None of the company’s fixed costs would be saved if the citrus hair conditionerwere eliminated. What would be the increase or decrease in company net income if citrus haircondition were eliminated?
Exercise F The luggage department of Sampson Company has revenues of $1,000,000; variableexpenses of $250,000; direct fixed costs of $500,000; and allocated, indirect fixed costs of $300,000in an average year. If the company eliminates this department, what would be the effect on netincome?
Exercise G Raiders Company manufactures two joint products. At the split-off point, they have salesvalues of:
Product 1 $18 per unit
Product 2 12 per unit
After further processing, the company can sell them for $36 and $16, respectively. Product 1 costs$12 per unit to process further and Product 2 costs $8 to process further. Should further processingbe done on either or both of these products? Why or why not?
Exercise H Gopherit Corporation currently is manufacturing 40,000 units per year of a part used in itsfinal product. The cost of producing this part is $50 per unit. The variable portion of this cost consists

9/25/2017 Managerial Accounting
file:///Users/hannah/Downloads/Managerial-Accounting-1506381825_regexified.html 265/350
of direct materials of $25, direct labor of $15, and variable manufacturing overhead of $3. Thecompany could earn $100,000 per year from the space now used to manufacture this part. Assumingequal quality and availability, what is the maximum price per unit that Gopherit Corporation should payto buy the part rather than make it? (The total fixed costs would not be affected by this decision.)
Exercise I Ortez Company buys strawberries and produces strawberry jam. The variable cost of acase of strawberry jam is as follows:
Materials (strawberries and jars) $10.00
Inspection and rework costs 4.00
All other variable costs 8.00
Total variable cost per case $22.00
In addition, the company has $1,000,000 of fixed costs per year.
The company inspects the product at various stages. The cost of inspecting the product and replacingjam and/or jars averages $4.00 per case, shown as in the inspection and rework costs.
Management is considering purchasing high-quality strawberries. This would increase materials coststo $12.00 per case, while decreasing inspection and rework costs to $2.00 per case. All other costswould remain at $8.00 per case for variable costs and $1,000,000 for fixed costs whether or not thehigh-quality strawberries were purchased. Ortez’s jam sells for $40 per case. If the high-qualitystrawberries were purchased, the company could sell 100,000 cases of jam this year at $40 per case.If the company continued to use the current low-quality berries, it could sell 80,000 cases of jam thisyear at $40 per case.
Should Ortez purchase the high-quality strawberries?
Problems
Problem A Montonya Company has the following selected data for the current year:
Sales (10,000 units) $90,000
Direct materials 30,000
Direct labor costs 10,000
Variable manufacturing overhead 3,500
Fixed manufacturing overhead 7,500
Variable selling and administrative expenses 2,500
Fixed selling and administrative expenses 15,000
The company produced and sold 10,000 units. Direct materials and direct labor are variable costs.
1. Prepare an income statement for the current year using the contribution margin format.2. Prepare an income statement for the current year using the traditional format.3. What additional information do you learn from the contribution margin format?

9/25/2017 Managerial Accounting
file:///Users/hannah/Downloads/Managerial-Accounting-1506381825_regexified.html 266/350
Problem B Pick-Me-Up Company is introducing a new coffee in its stores and must decide what priceto set for the coffee beans. An estimated demand schedule for the product follows:
Price One-pound units demanded
$ 5 80,000
6 72,000
7 56,000
8 48,000
9 36,000
10 30,000
Estimated costs follow:
Variable manufacturing costs $2 per unit
Fixed manufacturing costs $40,000 per year
Variable selling and administrative costs $1 per unit
Fixed selling and administrative costs $20,000 per year
1. Prepare a schedule showing management the total revenue, total cost, and total profit or loss foreach selling price.
2. Which price do you recommend to the management of Pick-Me-Up? Explain your answer.
Problem C Ocean View Company operates tour boats. Its predicted operations for the year are asfollows:
Sales (1,000 tours per year) $400,000
Costs:
Variable $250 per tour
Fixed $100,000 per year
The company has received a request to offer 100 tours for $300 each. Ocean View has plenty ofcapacity to do these tours in addition to its regular business. Doing these tours would not affect thecompany’s regular sales or its fixed costs.
1. Should the company do the special tours for $300 per tour?2. What is the effect of the decision on the company’s operating profit?
Problem D Following are sales and other operating data for the three products made and sold byRanger Company:
Product
A B C Total

9/25/2017 Managerial Accounting
file:///Users/hannah/Downloads/Managerial-Accounting-1506381825_regexified.html 267/350
Sales $ 600,000 $ 300,000 $ 200,000 $ 1,100,000
Manufacturing costs:
Fixed $ 60,000 $ 20,000 $ 60,000 $ 140,000
Variable 280,000 220,000 100,000 600,000
Selling and administrative expenses:
Fixed 20,000 20,000 12,000 52,000
Variable 40,000 20,000 30,000 90,000
Total costs $ 400,000 $ 280,000 $ 202,000 $ 882,000
Net income $ 200,000 $ 20,000 $ (2,000) $ 218,000
In view of the net loss for Product C, Ranger’s management is considering dropping that product. Allvariable costs are direct costs and would be eliminated if Product C were dropped. Fixed costs areindirect costs; no fixed costs would be eliminated. Assume that the space used to produce Product Cwould be left idle.
Would you recommend the elimination of Product C? Give supporting computations.
Problem E Sierra Lumber Company produces lumber. The company has two grades of lumber at thesplit-off point, A and B. Grade A sells for $4 per board foot and Grade B sells for $2 per board foot.This lumber is suitable for framing and most exterior work but not for the interior of buildings. Eithergrade can be further processed to make it suitable for interior work at a cost of $1.20 per board foot.After this further processing, the firm can sell Grade A lumber for $5.50 per board foot and Grade Bfor $3.00 per board foot.
Would you recommend the company sell the lumber at the split-off point or process it further to makeit suitable for interior work? Explain and give supporting computations.
Problem F Skate-Right Company, a skateboard manufacturer, is currently operating at 60% capacityand producing about 8,000 units a year. To use more capacity, the manager has been considering theresearch and development department’s suggestion that the company manufacture its own wheels.
Currently the company purchases wheels from a supplier at a unit price of $20. (Each unit is a set ofwheels for a skateboard.) Estimates show the company can manufacture its own wheels at $10 fordirect materials costs and $4 for direct labor cost per unit. The variable factory overhead is $1 perunit. The company’s accountants would probably allocate another $6 per unit to the wheels.
1. Should Skate-Right make or buy the wheels?2. Suppose Skate-Right could rent out the factory space needed to make the wheels for $30,000 a
month. How would this affect your decision in (a), if at all?
Problem G Quality Calc, Inc., purchases calculator components and assembles them into handheldcalculators. The variable cost of one Model A-25 is as follows:
Materials $10
Inspection and rework costs 2
All other variable costs 5

9/25/2017 Managerial Accounting
file:///Users/hannah/Downloads/Managerial-Accounting-1506381825_regexified.html 268/350
Total variable cost per case $17
In addition, this product incurs $5,000,000 of fixed costs per year.
The company inspects the product at various stages. The cost of inspecting the product and replacingcomponents averages $2 per calculator, shown as the inspection and rework costs.
Management is considering purchasing better components that would both increase quality andexpand the calculator’s capacity. These new components would increase materials costs to $12.50per calculator, but would decrease inspection and rework costs to $1.50 per calculator. All othervariables cost would remain at $5 per calculator. Fixed costs would remain at $5,000,000 per year.
Quality Calc currently sells each A-25 calculator for $25 at a volume of 1 million calculators per year.Management believes it can increase the price of the calculator (which would now be called the A-25STAR) to $30 per calculator because of its increased capability. Sales volume would remain at 1million calculators per year for the improved A-25 STAR. Should Quality Calc purchase the bettercomponents?
Alternate problems
Alternate problem A The following data are for Nets Company for the current year:
Sales (20,000 units) $750,000
Direct materials 270,000
Direct labor cost 90,000
Variable manufacturing overhead 27,000
Fixed manufacturing overhead 36,000
Variable selling and administrative expenses 45,000
Fixed selling and administrative expenses 150,000
The company produced and sold 20,000 units.
1. Prepare an income statement for the current year using the contribution margin format.2. Prepare an income statement for the current year using the traditional format.3. What additional information does the contribution margin format provide compared to the
traditional format?
Alternate problem B The Havana Company is introducing a new product and must decide its price.An estimated demand schedule for the product is as follows:
Price Units demanded
$ 5 20,000
6 18,000
7 14,000
8 12,000
9 9,000

9/25/2017 Managerial Accounting
file:///Users/hannah/Downloads/Managerial-Accounting-1506381825_regexified.html 269/350
10 8,000
Estimated costs are as follows:
Variable manufacturing costs $2.20 per unit
Fixed manufacturing costs $20,000 per year
Variable selling and administrative costs $1.00 per unit
Fixed selling and administrative costs $5,000 per year
1. Prepare a schedule showing the total revenue, total cost, and total profit or loss for each sellingprice.
2. Which price should Havana select? Explain.
Alternate problem C Following are sales and other operating data for the three products made andsold by Marine Enterprises:
Product
A B C Total
Sales $150,000 $90,000 $240,000 $480,000
Manufacturing costs:
Fixed $ 15,000 $25,000 $ 30,000 $ 70,000
Variable 120,000 35,000 134,000 289,000
Selling and administrative expenses:
Fixed 5,000 30,000 10,000 45,000
Variable 2,500 5,000 6,000 13,500
Total costs $142,500 $95,000 $180,000 $417,500
Net income (loss) $ 7,500 $(5,000) $ 60,000 $ 62,500
In view of the net loss shown for Product B, company management is considering dropping thatproduct. All variable costs are direct costs and would be eliminated if Product B were dropped; allfixed costs are indirect costs and would not be eliminated. Assume that the space used to produceProduct B would be left idle.
Would you recommend the elimination of Product B? Give supporting computations.
Alternate problem D Sailboard Enterprises, a wind sailing board manufacturer, is currently operatingat 70% capacity and producing about 20,000 units a year. To use more capacity, the manager hasbeen considering the research and development department’s suggestion that Sailboard manufactureits own sails. Currently Sailboard purchases sails from a supplier at a unit price of $100. Estimatesshow that Sailboard can manufacture its own sails for a $40 direct materials cost and a $32 directlabor cost per unit. The variable factory overhead is $8 per sail. The company’s accountants wouldallocate fixed manufacturing overhead of $30 per sail to the sail production.

9/25/2017 Managerial Accounting
file:///Users/hannah/Downloads/Managerial-Accounting-1506381825_regexified.html 270/350
1. Should Sailboard Enterprises make or buy the sails?2. Suppose that Sailboard Enterprises could rent out the part of the factory that would otherwise be
used for sail manufacturing for $8,000 a month. How would this affect the decision in (a)?
Alternate problem E Cool-Snacks Company produces and sells ice cream for ice cream shops.Management is considering purchasing better ingredients. The variable cost of producing a gallon ofice cream is as follows:
Materials (cream, containers, etc.) $1.40
Inspection and replacement costs .40
All other variable costs .70
Total variable cost per gallon $2.50
In addition, the company has $1,000,000 of fixed costs per year.
The company inspects the product at various stages. The cost of inspecting the product and replacingice cream averages $0.40 per gallon, shown as the inspection and replacement costs.
Management is considering purchasing high-quality ingredients, in particular, high-quality dairyproducts. These high-quality ingredients would increase materials costs to $1.80 per gallon, but woulddecrease inspection and replacement costs to $0.30 per gallon. All other costs would remain at $0.70per gallon for variable costs and $1,000,000 for fixed costs whether or not the high-quality ingredientsare purchased. If the high-quality ingredients are purchased, the company expects to sell 1,200,000gallons of ice cream this year at $4 per gallon. If the company continues to use the current low-qualityingredients, the company expects to sell 1,000,000 gallons of ice cream at $3.50 per gallon. ShouldCool-Snacks Company buy the high-quality ingredients for its ice cream?
Beyond the numbers—Critical thinking
Business decision case A Prior to 2011, Starks Wholesalers Company had not kept departmentincome statements. To achieve better management control, the company decided to installdepartment-by-department accounts. At the end of 2011, the new accounts showed that although as awhole the business was profitable, the dry goods department had a substantial loss. The followingincome statement for the dry goods department reports on operations for 2011:
Starks wholesalers company
Dry goods department
Partial income statement for 2011
Sales $1,200,000
Cost of goods sold 800,000
Gross margin $ 400,000
Costs:
Payroll, direct labor, and supervision $120,000
Commissions of sales staff a 60,000
Rent b 40,000

9/25/2017 Managerial Accounting
file:///Users/hannah/Downloads/Managerial-Accounting-1506381825_regexified.html 271/350
Insurance on inventory 20,000
Depreciation c 80,000
Administration and general office d 80,000
Interest for inventory carrying costs e 10,000
Total costs 410,000
Net income (loss) $ (10,000)
A All sales staff are compensated on straight commission on sales.
B Rent charged to departments on a square-foot basis. The company rents an entire building, and thedry goods department occupies 15% of the building.
C Depreciation is 8.5% of the cost of the departmental equipment.
D Allocated on basis of departmental sales as a fraction of total company sales.
D Based on average inventory quantity multiplied by the company’s borrowing rate for three-monthloans.
Analysis of these results has led management to suggest closing the dry goods department. Membersof the management team agree that keeping the dry goods department is not essential to maintaininggood customer relations and supporting the rest of the company’s business. In other words,eliminating the dry goods department is expected to have no effect on the amount of business doneby the other departments.
Prepare a written report recommending whether or not Starks should close the dry goods department.Explain why. State your assumptions.
Business decision case B After working for a software company for several years, Chris and Terryquit their jobs and set up their own consulting firm called C & T Software, Inc. Major customersinclude corporate, professional, and government organizations that are setting up informationnetworks.
The cost per billable hour of service at the company’s normal volume of 3,000 billable hours permonth follows. (A billable hour is one hour billed to a client.)
Average cost per hour billed to client:
Variable labor – consultants $50
Variable overhead, including supplies and clerical support 20
Fixed overhead, including allowance for unbilled hours 80
$150
Marketing and administrative costs per billable hour (all fixed) 40
Total hourly cost $190

9/25/2017 Managerial Accounting
file:///Users/hannah/Downloads/Managerial-Accounting-1506381825_regexified.html 272/350
Treat each of the following questions independently. Unless given otherwise, the regular fee per houris $200.
1. How many hours must the firm bill per month to break even? (You may need to refer to Chapter21 to answer this question.)
2. Market research estimates that a fee increase to $250 per hour would decrease monthly volumeto 2,000 hours. The accounting department estimates that fixed overhead costs would be $120per hour, while variable cost per hour would remain unchanged. What effect would a fee increasehave on profits?
3. Assume C & T Software is operating at its normal volume of 3,000 hours per month. It hasreceived a special request from one of its long-time customers to provide services on a special-order basis. Because of the long-term nature of the contract (four months) and the magnitude(1,000 hours per month), the customer believes a fee reduction is in order. C & T Software has acapacity limitation of 4,000 hours per month. Fixed costs would not change if the firm accepts thespecial order. What is the lowest fee C & T Software would be willing to charge?
Business decision case C Refer to “A broader perspective: Differential analysis in sports”. In amemorandum to your instructor identify which costs and revenues you think would be differential for asports team acquiring a major star like Bonds. The heading of the memorandum should contain thedate, to whom it is written, from whom, and the subject matter.
Group project D In teams of two or three students, visit a local department store and imagine thetypes of costs that it would save if it closed a significant department (for example, the housewaresdepartment). List the types of costs that would be saved, but do not attempt to assign numbers tothose costs. For example, would rent be saved? Would security be saved? What about taxes oninventories? Consider the effects of closing the department on the people who work there. As a team,write a memorandum describing the costs saved and the effects of closing a department in a localdepartment store. The heading of the memorandum should contain the date, to whom it is written,from whom, and the subject matter.
Group project E A manager in your organization just received a special order at a price that is “belowcost”. The manager points to the document and says, “These are the kinds of orders that will get youin trouble. Every sale must bear its share of the full costs of running the business. If we sell below ourfull cost, we will be out of business in no time.” In groups of two or three students, write amemorandum to your instructor stating whether you agree with this comment or not and explain why.The heading of the memorandum should contain the date, to whom it is written, from whom, and thesubject matter.
Group project F Form a group of two or three students. Assume you are considering driving to aweekend resort for a quick break from school. What are the differential costs of operating your car forthe drive? Write a memorandum to your instructor addressing this question. The heading of thememorandum should contain the date, to whom it is written, from whom, and the subject matter.
Using the Internet—A view of the real world
Visit the website for Intel Corporation, a high technology manufacturing company.
http:/www.intel.com
Go to the company’s most recent financial statements and review the consolidated statement ofincome. Looking at the most recent year on the statement of income, assume 70% of the cost of salesare variable costs and the remaining 30% are fixed costs. Furthermore, assume all other costs andexpenses (research and development, marketing, general and administrative, interest, taxes, etc.) are60% variable and 40% fixed. Prepare an income statement using the contribution margin format. Be

9/25/2017 Managerial Accounting
file:///Users/hannah/Downloads/Managerial-Accounting-1506381825_regexified.html 273/350
sure to submit a copy of Intel’s consolidated statement of income with the contribution margin incomestatement.
Visit the following website for Wal-Mart, a retail company.
http:/www.walmart.com
Go to the company’s most recent financial statements and review the statement of income. Looking atthe most recent year on the statement of income, assume 45% of the cost of sales are variable costsand the remaining 55% are fixed costs. Furthermore, assume all other costs and expenses (researchand development, marketing, general and administrative, interest, taxes, etc.) are 30% variable and70% fixed. Prepare an income statement using the contribution margin format. Be sure to submitacopy of Wal-Mart’s income statement with the contribution margin income statement.
9/25/2017 Managerial Accounting
file:///Users/hannah/Downloads/Managerial-Accounting-1506381825_regexified.html 274/350
CHAPTER 11: CAPITAL INVESTMENTANALYSIS
CHAPTER 11 STUDY PLAN
Knowledge Targets
I can define the following terms as they relate to our unit:
Payback period Investment Cash Flows Net Cash Flow
Capital Budgeting Cost of Capital Rate of return Time value of money
Reasoning TargetsI can determine the payback period for an investment.I can rank investment projects in order of preference using payback period and rate of return.I can understand the time value of money.
Skill TargetsI can calculate the payback period for an investment.I can evaluate investments using payback period and rate of return.I can compute the rate of return for an investment.I can evaluate investment projects with uncertain cash flows.
Click Capital Budget for a printable copy.
11.1 CAPITAL INVESTMENT ANALYSIS
Capital budgeting
Capital budgeting is the process of considering alternative capital projects and selecting thosealternatives that provide the most profitable return on available funds, within the framework of

9/25/2017 Managerial Accounting
file:///Users/hannah/Downloads/Managerial-Accounting-1506381825_regexified.html 275/350
company goals and objectives. A capital project is any available alternative to purchase, build, lease,or renovate buildings, equipment, or other long-range major items of property. The alternativeselected usually involves large sums of money and brings about a large increase in fixed costs for anumber of years in the future. Once a company builds a plant or undertakes some other capitalexpenditure, its future plans are less flexible.
Watch this video online: https://youtu.be/kFyZkXHit_A
Poor capital-budgeting decisions can be costly because of the large sums of money and relativelylong periods involved. If a poor capital budgeting decision is implemented, the company can lose all orpart of the funds originally invested in the project and not realize the expected benefits. In addition,other actions taken within the company regarding the project, such as finding suppliers of rawmaterials, are wasted if the capital-budgeting decision must be revoked. Poor capital-budgetingdecisions may also harm the company’s competitive position because the company does not have themost efficient productive assets needed to compete in world markets.
Investment of funds in a poor alternative can create other problems as well. Workers hired for theproject might be laid off if the project fails, creating morale and unemployment problems. Many of thefixed costs still remain even if a plant is closed or not producing. For instance, advertising effortswould be wasted, and stock prices could be affected by the decline in income.
On the other hand, failure to invest enough funds in a good project also can be costly. Ford’s Mustangis an excellent example of this problem. At the time of the original capital-budgeting decision, if Fordhad correctly estimated the Mustang’s popularity, the company would have expended more funds onthe project. Because of an undercommitment of funds, Ford found itself short on production capacity,which caused lost and postponed sales of the automobile.
Finally, the amount of funds available for investment is limited. Thus, once a company makes a capitalinvestment decision, alternative investment opportunities are normally lost. The benefits or returns lostby rejecting the best alternative investment are the opportunity cost of a given project.
For all these reasons, companies must be very careful in their analysis of capital projects. Capitalexpenditures do not occur as often as ordinary expenditures such as payroll or inventory purchasesbut involve substantial sums of money that are then committed for a long period. Therefore, themeans by which companies evaluate capital expenditure decisions should be much more formal anddetailed than would be necessary for ordinary purchase decisions.
Project selection: A general view
Making capital-budgeting decisions involves analyzing cash inflows and outflows. This section showsyou how to calculate the benefits and costs used in capital-budgeting decisions. Because money hasa time value, these benefits and costs are adjusted for time under the last two methods covered in thechapter.
Money received today is worth more than the same amount of money received at a future date, suchas a year from now. This principle is known as the time value of money. Money has time valuebecause of investment opportunities, not because of inflation. For example, $100 today is worth morethan $100 to be received one year from today because the $100 received today, once invested, growsto some amount greater than $100 in one year. Future value and present value concepts areextremely important in assessing the desirability of long-term investments (capital budgeting).
The net cash inflow (as used in capital budgeting) is the net cash benefit expected from a project ina period. The net cash inflow is the difference between the periodic cash inflows and the periodic cash

9/25/2017 Managerial Accounting
file:///Users/hannah/Downloads/Managerial-Accounting-1506381825_regexified.html 276/350
outflows for a proposed project.
Asset acquisition Assume, for example, that a company is considering the purchase of newequipment for $120,000. The equipment is expected (1) to have a useful life of 15 years and nosalvage value, and (2) to produce cash inflows (revenue) of $75,000 per year and cash outflows(costs) of $50,000 per year. Ignoring depreciation and taxes, the annual net cash inflow is computedas follows:
Cash inflows $75,000Cash outflows 50,000
Net cashinflow $ 25,000
Depreciation and taxes The computation of the net income usually includes the effects ofdepreciation and taxes. Although depreciation does not involve a cash outflow, it is deductible inarriving at federal taxable income. Therefore depreciation is subtracted to get net income but is notincluded in the cash flow since it does not involve cash. Income tax expense is based on net incomeand not net cash flow. To calculate income taxes, we use the following formula:
Income before taxes x tax rate = income tax expense
Keep in mind, you will use the income tax expense amount calculated under both the net income andnet cash flow since income tax is a cash expense.
Using the data in the previous example and assuming straight-line depreciation of $8,000 per yearand a 40% tax rate. Now, considering taxes and depreciation, we compute the annual net income andnet cash inflow from the $120,000 of equipment as follows:
Changein netincome
Change incash flow
Cash inflows $ 75,000 $75,000Cash outflows 50,000 50,000Net cash inflowbefore taxes $25,000 $25,000
Depreciation 8,000Income beforeincome taxes $17,000
Deduct: Incometax(17,000 x40%)
-6,800 -6,800
Net incomeafter taxes $10,200
Net cash inflow(after taxes) $18,200
Notice how depreciation of $8,000 is NOT included in the net cash inflow because it is a non-cashexpense. Also note, the income taxes expense calculated under net income is the same amountreported under the net cash inflow since we have to pay income tax based on net income in cash.

9/25/2017 Managerial Accounting
file:///Users/hannah/Downloads/Managerial-Accounting-1506381825_regexified.html 277/350
Asset replacement Sometimes a company must decide whether or not it should replace existingplant assets. Such replacement decisions often occur when faster and more efficient machinery andequipment appear on the market.
The computation of the net cash inflow is more complex for a replacement decision than for anacquisition decision because cash inflows and outflows for two items (the asset being replaced andthe new asset) must be considered. To illustrate, assume that a company operates two machinespurchased four years ago at a cost of $18,000 each. The estimated useful life of each machine is 12years (with no salvage value). Each machine will produce 40,000 units of product per year. Theannual cash operating expenses (labor, repairs, etc.) for the two machines together total $14,000.After the old machines have been used for four years, a new machine becomes available. The newmachine can be acquired for $28,000 and has an estimated useful life of eight years (with no salvagevalue). The new machine produces 60,000 units annually and entails annual cash operating expensesof $10,000. The $4,000 reduction in operating expenses ($14,000 for old machines – $10,000 for thenew machine) is a $4,000 increase in net cash inflow (savings) before taxes.
The firm would pay $28,000 in the first year to acquire the new machine. In addition to this initialoutlay, the annual net cash inflow from replacement is computed as follows:
Using these data, the following display shows how you can use this formula to find the net cash flowafter taxes:
Change in Annual Cash Expenses: Net Cash Flow
Old Machines 14,000
New Machine 10,000
Annual net cash savings before taxes 4,000
x 40% income tax EXPENSE – 1,600
(4,000 x 40%)
Annual net cash inflow after tax 2,400 2,400
Annual Depreciation:
Old Machines 3,000
New Machine 3,500
Additional Annual Depreciation Expense 500
x 40% income tax expense SAVED + 200 + 200
(500 x 40%)
Annual net cash inflow after tax 2,600
(2,400 annual net cash inflow + 200 tax savings from depreciation)
Remember, depreciation is a non-cash expense so it will not change net cash BUT it will changeincome tax expense as it is reported for net income.
Notice that these figures concentrated only on the differences in costs for each of the two alternatives.Two other items also are relevant to the decision. First, the purchase of the new machine creates a
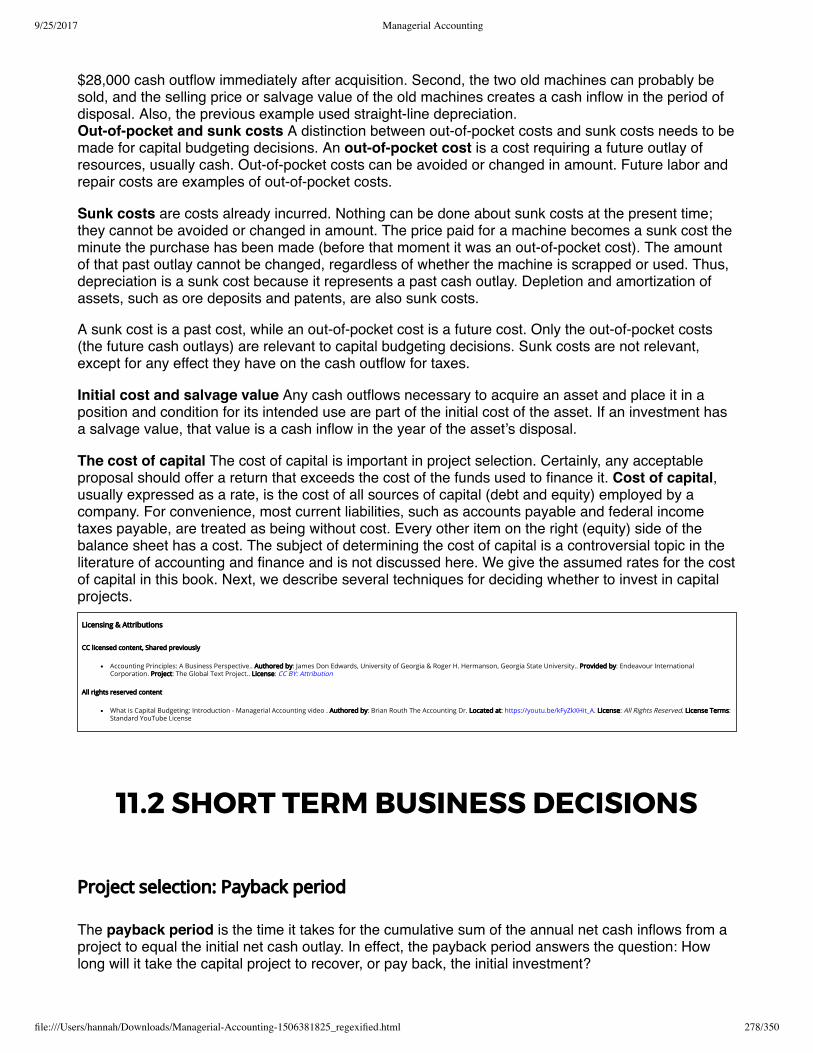
9/25/2017 Managerial Accounting
file:///Users/hannah/Downloads/Managerial-Accounting-1506381825_regexified.html 278/350
$28,000 cash outflow immediately after acquisition. Second, the two old machines can probably besold, and the selling price or salvage value of the old machines creates a cash inflow in the period ofdisposal. Also, the previous example used straight-line depreciation. Out-of-pocket and sunk costs A distinction between out-of-pocket costs and sunk costs needs to bemade for capital budgeting decisions. An out-of-pocket cost is a cost requiring a future outlay ofresources, usually cash. Out-of-pocket costs can be avoided or changed in amount. Future labor andrepair costs are examples of out-of-pocket costs.
Sunk costs are costs already incurred. Nothing can be done about sunk costs at the present time;they cannot be avoided or changed in amount. The price paid for a machine becomes a sunk cost theminute the purchase has been made (before that moment it was an out-of-pocket cost). The amountof that past outlay cannot be changed, regardless of whether the machine is scrapped or used. Thus,depreciation is a sunk cost because it represents a past cash outlay. Depletion and amortization ofassets, such as ore deposits and patents, are also sunk costs.
A sunk cost is a past cost, while an out-of-pocket cost is a future cost. Only the out-of-pocket costs(the future cash outlays) are relevant to capital budgeting decisions. Sunk costs are not relevant,except for any effect they have on the cash outflow for taxes.
Initial cost and salvage value Any cash outflows necessary to acquire an asset and place it in aposition and condition for its intended use are part of the initial cost of the asset. If an investment hasa salvage value, that value is a cash inflow in the year of the asset’s disposal.
The cost of capital The cost of capital is important in project selection. Certainly, any acceptableproposal should offer a return that exceeds the cost of the funds used to finance it. Cost of capital,usually expressed as a rate, is the cost of all sources of capital (debt and equity) employed by acompany. For convenience, most current liabilities, such as accounts payable and federal incometaxes payable, are treated as being without cost. Every other item on the right (equity) side of thebalance sheet has a cost. The subject of determining the cost of capital is a controversial topic in theliterature of accounting and finance and is not discussed here. We give the assumed rates for the costof capital in this book. Next, we describe several techniques for deciding whether to invest in capitalprojects.
Licensing & Attributions
CC licensed content, Shared previously
Accounting Principles: A Business Perspective.. Authored by: James Don Edwards, University of Georgia & Roger H. Hermanson, Georgia State University.. Provided by: Endeavour InternationalCorporation. Project: The Global Text Project.. License: CC BY: Attribution
All rights reserved content
What is Capital Budgeting: Introduction - Managerial Accounting video . Authored by: Brian Routh The Accounting Dr. Located at: https://youtu.be/kFyZkXHit_A. License: All Rights Reserved. License Terms:Standard YouTube License
11.2 SHORT TERM BUSINESS DECISIONS
Project selection: Payback period
The payback period is the time it takes for the cumulative sum of the annual net cash inflows from aproject to equal the initial net cash outlay. In effect, the payback period answers the question: Howlong will it take the capital project to recover, or pay back, the initial investment?

9/25/2017 Managerial Accounting
file:///Users/hannah/Downloads/Managerial-Accounting-1506381825_regexified.html 279/350
Watch this video online: https://youtu.be/YX4NoZN8YWU
If the net cash inflows each year are a constant amount, the formula for the payback period is:
Payback period = Initial cash outlay
Annual net cash inflow (benefit)
For the two assets discussed in the previous section, you can compute the payback period as follows.The purchase of the $120,000 equipment creates an annual net cash inflow after taxes of $18,200, sothe payback period is 6.6 years, computed as follows:
Payback period =Initial cash outlay = 120,000
= 6.6 years (rounded)Annual net cash inflow (benefit) 18,200
The payback period for the replacement machine with a $28,000 cash outflow in the first year and anannual net cash inflow of $2,600, is 10.8 years, computed as follows:
Payback period =Initial cash outlay = 28,000
= 10.8 years (rounded)Annual net cash inflow (benefit) 2,600
Remember that the payback period indicates how long it will take the machine to pay for itself. Thereplacement machine being considered has a payback period of 10.8 years but a useful life of only 8years. Therefore, because the investment cannot pay for itself within its useful life, the companyshould not purchase a new machine to replace the two old machines.
In each of the previous examples, the projected net cash inflow per year was uniform. When theannual returns are uneven, companies use a cumulative calculation to determine the payback period,as shown in the following situation.
Neil Company is considering a capital investment project that costs $40,000 and is expected to last 10years. The projected annual net cash inflows are:
Year Investment Annual netcash inflow
Cumulativenet cashinflows
0 $ 40,000 —– —1 — $ 8,00 $ 8,0002 — 6,000 14,0003 — 7,000 21,0004 —- 5,000 26,0005 — 8,000 34,0006 — 6,000 40,0007 — 3,000 43,0008 — 2,000 45,00010 — 1,000 49,000

9/25/2017 Managerial Accounting
file:///Users/hannah/Downloads/Managerial-Accounting-1506381825_regexified.html 280/350
The payback period in this example is six years, the time it takes to recover the $40,000 originalinvestment as show in the cumulative net cash inflows of year 6.
When using payback period analysis to evaluate investment proposals, management may choose oneof these rules to decide on project selection:
Select the investments with the shortest payback periods.Select only those investments that have a payback period of less than a specified number ofyears.
Both decision rules focus on the rapid return of invested capital. If capital can be recovered rapidly, afirm can invest it in other projects, thereby generating more cash inflows or profits.
Some managers use payback period analysis in capital budgeting decisions due to its simplicity.However, this type of analysis has two important limitations:
Payback period analysis ignores the time period beyond the payback period. For example,assume Allen Company is considering two alternative investments; each requires an initial outlayof $30,000. Proposal Y returns $6,000 per year for five years, while proposal Z returns $5,000 peryear for eight years. The payback period for Y is five years ($30,000/$6,000) and for Z is sixyears ($30,000/$5,000). But, if the goal is to maximize income, proposal Z should be selectedrather than proposal Y, even though Z has a longer payback period. This is because Z returns atotal of $40,000 ($5,000 per year x 8 years), while Y simply recovers the initial $30,000 ($6,000per year for 5 years) outlay.Payback analysis also ignores the time value of money. For example, assume the following netcash inflows are expected in the first three years from two capital projects:
Net CashInflows
Project A ProjectB
Firstyear $ 15,000 $ 9,000
Secondyear 12,000 12,000
Thirdyear 9,000 15,000
Total $ 36,000 $36,000
Assume that both projects have the same net cash inflow each year beyond the third year. If the costof each project is $36,000, each has a payback period of three years. But common sense indicatesthat the projects are not equal because money has time value and can be reinvested to increaseincome. Because larger amounts of cash are received earlier under Project A, it is the preferableproject.
Project selection: Unadjusted rate of return or Accounting rate of return
Another method of evaluating investment projects that you are likely to encounter in practice is theaccounting (or unadjusted) rate of return method. To compute the accounting rate of return, youwill need to know 2 things:
1. Annual income after taxes; and

9/25/2017 Managerial Accounting
file:///Users/hannah/Downloads/Managerial-Accounting-1506381825_regexified.html 281/350
2. Average amount of the investment in the project. The average investment is the (Beginningbalance + Ending balance)/2. If the ending balance is zero (as we assume), the averageinvestment equals the original cash investment divided by 2.
The formula for the unadjusted (or Accounting) rate of return is:
Rate of Return =Average annual income after taxes
Average amount of investment
Notice that this calculation uses annual income rather than net cash inflow.[1]
Watch this video online: https://youtu.be/-E5Z1-0NUmk
To illustrate the use of the unadjusted rate of return, assume Thomas Company is considering twocapital project proposals, each having a useful life of three years. The company does not haveenough funds to undertake both projects. Information relating to the projects follows:
Averageannual
Before-taxAverage
Proposal Initialcost
SalvageValue
Net cashinflow
Annualdepreciation
1 $76,000 $ 4,000 $ 45,000 $ 24,000
2 95,000 5,000 55,000 30,000
Assuming a 40% tax rate, Thomas Company can determine the unadjusted rate of return for eachproject as follows:
Proposal1
Proposal2
Average investment:(original outlay +Salvage value)/2
(1) $ 40,000 $ 50,000
(76,000 +4,000) / 2
(95,000 +5,000) / 2
Annual net cashinflow (before incometaxes)
$ 45,000 $ 55,000
Less: Annualdepreciation – 24,000 – 30,000
Annual income(before income taxes) $ 21,000 $ 25,000
Deduct: Income taxesat 40% – 8,400 – 10,000
Average annual netincome frominvestment
(2) $ 12,600 $ 15,000

9/25/2017 Managerial Accounting
file:///Users/hannah/Downloads/Managerial-Accounting-1506381825_regexified.html 282/350
Rate of return (2)/(1) 31.5% 30%(12,600 /40,000)
(15,000 /50,000)
From these calculations, if Thomas Company makes an investment decision solely on the basis of theunadjusted rate of return, it would select Proposal 1 since it has a higher rate.
Sometimes companies receive information on the average annual after-tax net cash inflow. Averageannual after-tax net cash inflow is equal to annual before-tax cash inflow minus taxes. Giventhis information, the firms could deduct the depreciation to arrive at average net income. For instance,for Proposal 2, Thomas Company would compute average net income as follows:
After-tax net cashinflow($55,000-$10,000)
$45,000
Less: Depreciation –30,000
Average net income $15,000
The unadjusted rate of return, like payback period analysis, has several limitations:The length of time over which the return is earned is not considered.The rate allows a sunk cost, depreciation, to enter into the calculation. Since depreciation can becalculated in so many different ways, the rate of return can be manipulated by simply changingthe method of depreciation used for the project.The timing of cash flows is not considered. Thus, the time value of money is ignored.
Unlike the two project selection methods just illustrated, the remaining two methods—net presentvalue and time-adjusted rate of return—take into account the time value of money in the analysis. Inboth of these methods, we assume that all net cash inflows occur at the end of the year. Often used incapital budgeting analysis, this assumption makes the calculation of present values less complicatedthan if we assume the cash flows occurred at some other time.
Licensing & Attributions
CC licensed content, Shared previously
Accounting Principles: A Business Perspective.. Authored by: James Don Edwards, University of Georgia & Roger H. Hermanson, Georgia State University.. Provided by: Endeavour InternationalCorporation. Project: The Global Text Project. License: CC BY: Attribution
All rights reserved content
The Payback Method. Authored by: Education Unlocked. Located at: https://youtu.be/YX4NoZN8YWU. License: All Rights Reserved. License Terms: Stanard YouTube LicenseAverage Accounting Rate of Return CFA-Course.com . Authored by: cfa-course.com. Located at: https://youtu.be/-E5Z1-0NUmk. License: All Rights Reserved. License Terms: Standard YouTube License
11.3 ACCOUNTING IN THE HEADLINES -PAYBACK

9/25/2017 Managerial Accounting
file:///Users/hannah/Downloads/Managerial-Accounting-1506381825_regexified.html 283/350
Should you rent a cable modem from Time WarnerCable or buy one?When you have internet service from Time Warner Cable, you willneed a cable modem. Time Warner will rent you a modem for$5.99 per month. Alternatively, you could purchase your owncable modem. For example, you could purchase the MotorolaSurfboard SB6121 cable modem from Amazon for $79.99.
Questions
1. What is the payback period (in months) if you decide to purchase the Motorola Surfboard SB6121cable modem?
2. What are the advantages to renting a cable modem from Time Warner?3. What are the advantages to buying a cable model from Time Warner?
Licensing & Attributions
CC licensed content, Speci�c attribution
Should you rent a cable modem from Time Warner Cable or buy one?. Authored by: Dr. Wendy Tietz, CPA, CMA, CGMA. Located at: http://www.accountingintheheadlines.com. License: CC BY-NC:Attribution-NonCommercial
11.4 THE CAPITOL RATIONING PROCESS
Investments in working capital
An investment in a capital asset usually must be supported by an investment in working capital, suchas accounts receivable and inventory. For example, companies often invest in a capital projectexpecting to increase sales. Increased sales usually bring about an increase in accounts receivablefrom customers and an increase in inventory to support the higher sales level. The increases incurrent assets—accounts receivable and inventory—are investments in working capital that usuallyare recovered in full at the end of a capital project’s life. Such working capital investments should beconsidered in capital-budgeting decisions.
To illustrate, assume that a company is considering a capital project involving a $50,000 investment inmachinery and a $40,000 investment in working capital. The machine, which will produce a newproduct, has an estimated useful life of eight years and no salvage value. The annual cash inflows(before taxes) are estimated at $25,000, with annual cash outflows (before taxes) of $5,000. Theannual net cash inflow from the project is computed as follows (assuming straight-line depreciationand a 40% tax rate):
Cash inflows $ 25,000
Cash outflows 5,000
Net cash inflow before taxes $ 20,000

9/25/2017 Managerial Accounting
file:///Users/hannah/Downloads/Managerial-Accounting-1506381825_regexified.html 284/350
Less: 40% Income Tax Expense (20,000 x 40%) – 8,000
Net cash inflow after taxes (ignoring depreciation) (1) $ 12,000
Depreciation expense ($ 50,000/8 years) $ 6,250
Income tax rate x 40%
Depreciation tax savings (2) $ 2,500
Annual net cash inflow, years 1-8 (1) + (2) $ 14,500
The annual net cash inflow from the machine is $14,500 each year for eight years. However, theworking capital investment must be considered. The investment of $40,000 in working capital at thestart of the project is an additional outlay that must be made when the project is started. The $40,000would be tied up every year until the project is finished, or in this case, until the end of the life of themachine. At that point, the working capital would be released, and the $40,000 could be used forother investments. Therefore, the $40,000 is a cash outlay at the start of the project and a cash inflowat the end of the project.
The net present value of the project is computed as follows (assuming a 14% minimum desired rate ofreturn):
Net cash inflow, years 1-8 ($14,500 x 4.63886) $67,263
Recovery of investment in working capital ($40,000 x 0.35056) 14,022
Present value of net cash inflows $81,285
Initial cash outlay ($50,000 + $40,000) 90,000
Net present value $(8,715)
The discount factor for the cash inflows, 4.63886, comes from Table 2 in the Appendix at the end ofthe book, because the cash inflows in this example are a series of equal payments—an annuity. Therecovery of the investment in working capital is assumed to represent a single lump sum received atthe end of the project’s life. As such, it is discounted using a factor (0.35056) that comes from Table 1in the Appendix.
The investment is not acceptable because it has a negative net present value. If the working capitalinvestment had been ignored, the proposal would have had a rather large positive net present valueof $17,263 ($67,263 net cash inflow – $50,000 initial cost). Thus, it should be obvious thatinvestments in working capital must be considered if correct capital-budgeting decisions are to bemade.
Licensing & Attributions
CC licensed content, Shared previously
Accounting Principles: A Business Perspective. Authored by: James Don Edwards, University of Georgia & Roger H. Hermanson, Georgia State University. Provided by: Endeavour International Corporation.Project: The Global Text Project. License: CC BY: Attribution

9/25/2017 Managerial Accounting
file:///Users/hannah/Downloads/Managerial-Accounting-1506381825_regexified.html 285/350
11.5 CONTROLLING CAPITAL INVESTMENTEXPENDITURES
During the budget process, a company should prepare a capital expenditures budget. This budgetmay affect the cash budget, the budgeted income statement and the budgeted balance sheet so itshould be prepared before these final budgets are prepared.
Watch this video online: https://youtu.be/0wWEJ-x-R2g
The capital expenditure budget should not if the capital projects will be paid with cash or with aliability. We will need this information to budget for depreciation on the capital projects as well as thecash payments in the cash budget.
Licensing & Attributions
CC licensed content, Shared previously
Accounting Principles: A Business Perspective.. Authored by: James Don Edwards, University of Georgia & Roger H. Hermanson, Georgia State University.. Provided by: Endeavour InternationalCorporation. Project: The Global Text Project.. License: CC BY: Attribution
All rights reserved content
Managerial Accounting: Capital Expenditure Budget. Authored by: Prof Alldredge. Located at: https://youtu.be/0wWEJ-x-R2g. License: All Rights Reserved. License Terms: Standard YouTube License
CHAPTER 11 KEY POINTS
Key Takeaways – Capital Budgeting
Capital Budgeting looks at the purchase of long term plant assets or investments.
Capital Budgeting can use simple techniques that do not take the present value of $1 intoaccount (remember, a dollar is not worth the same as it was 20 years ago).
Payback period provides you with an idea of how long it will take to earn back the money youpaid for the asset. It is calculated as Cost of Investment / Net Cash Flow
Net Cash Flow refers to the after-tax net income of a company with any non-cash expensesadded back in (like Depreciation).
Accounting Rate of Return provides you with an idea of how many cents of after-tax net incomeyou earn of every dollar of your investment. It is calculated as after-tax net income / averageinvestment.

9/25/2017 Managerial Accounting
file:///Users/hannah/Downloads/Managerial-Accounting-1506381825_regexified.html 286/350
Average Investment for the rate of return is calculated as the Beginning Book Value (or Cost ofinvestment) + Salvage value (or Ending book value) divided by 2
Click capital budget key points for a printable copy.
GLOSSARY
GLOSSARY
Annuity A series of equal cash inflows.
Capital budgeting The process of considering alternative capital projects and selecting thosealternatives that provide the most profitable return on available funds, within the framework ofcompany goals and objectives.
Capital project Any available alternative to purchase, build, lease, or renovate equipment, buildings,property, or other long-term assets.
Cost of capital The cost of all sources of capital (debt and equity) employed by a company.
Initial cost of an asset Any cash outflows necessary to acquire an asset and place it in a positionand condition for its intended use.
Net cash inflow The periodic cash inflows from a project less the periodic cash outflows related tothe project.
Net present value A project selection technique that discounts all expected after-tax cash inflows andoutflows from the proposed investment to their present values using the company’s minimum rate ofreturn as a discount rate. If the amount obtained by this process exceeds or equals the investmentamount, the proposal is considered acceptable for further consideration.
Opportunity cost The benefits or returns lost by rejecting the best alternative investment.
Out-of-pocket cost A cost requiring a future outlay of resources, usually cash.
Payback period The period of time it takes for the cumulative sum of the annual net cash inflowsfrom a project to equal the initial net cash outlay.
Profitability index The ratio of the present value of the expected net cash inflows (after taxes)divided by the initial cash outlay (or present value of cash outlays if future outlays are required).
Sunk costs Costs that have already been incurred. Nothing can be done about sunk costs at thepresent time; they cannot be avoided or changed in amount.
Time-adjusted rate of return A project selection technique that finds a rate of return that will equatethe present value of future expected net cash inflows (after taxes) from an investment with the cost ofthe investment; also called internal rate of return.

9/25/2017 Managerial Accounting
file:///Users/hannah/Downloads/Managerial-Accounting-1506381825_regexified.html 287/350
Unadjusted (or accounting) rate of return The rate of return computed by dividing average annualincome after taxes from a project by the average amount of the investment.
CHAPTER 11: EXERCISES
Short-Answer Questions, Exercises, and Problems
Short-Answer QuestionsHow do capital expenditures differ from ordinary expenditures?What effects can capital-budgeting decisions have on a company?What effect does depreciation have on cash flow?Give an example of an out-of-pocket cost and a sunk cost by describing a situation in whichboth are encountered.A machine is being considered for purchase. The salesperson attempting to sell the machinesays that it will pay for itself in five years. What is meant by this statement?Discuss the limitations of the payback period method.What is the profitability index, and of what value is it?What is the time-adjusted rate of return on a capital investment?What role does the cost of capital play in the time-adjusted rate of return method and in the netpresent value method?What is the purpose of a postaudit? When should a postaudit be performed?A friend who knows nothing about the concepts in this chapter is considering purchasing ahouse for rental to students. In just a few words, what would you tell your friend to think aboutin making this decision?
Exercises
Exercise A Diane Manufacturing Company is considering investing $600,000 in new equipmentwith an estimated useful life of 10 years and no salvage value. The equipment is expected toproduce $240,000 in cash inflows and $160,000 in cash outflows annually. The company usesstraight-line depreciation, and has a 40% tax rate. Determine the annual estimated net income andnet cash inflow.
Exercise B Zen Manufacturing Company is considering replacing a four-year-old machine with anew, advanced model. The old machine was purchased for $60,000, has an estimated useful life of10 years with no salvage value, and has annual maintenance costs of $15,000. The new machinewould cost $45,000, but annual maintenance costs would be only $6,000. The new machine wouldhave an estimated useful life of 10 years with no salvage value. Using straight-line depreciation andan assumed 40% tax rate, compute the additional annual cash inflow if the old machine is replaced.
Exercise C Given the following annual costs, compute the payback period for the new machine ifits initial cost is $420,000.
Old machine New machine

9/25/2017 Managerial Accounting
file:///Users/hannah/Downloads/Managerial-Accounting-1506381825_regexified.html 288/350
Depreciation $ 18,000 $ 42,000
Labor 72,000 63,000
Repairs 21,000 4,500
Other costs 12,000 3,600
$ 123,000 $ 113,100
Exercise D Jefferson Company is considering investing $33,000 in a new machine. The machine isexpected to last five years and to have a salvage value of $8,000. Annual before-tax net cash inflowfrom the machine is expected to be $7,000. Calculate the unadjusted rate of return. The income taxrate is 40%.
Exercise E Compute the profitability index for each of the following two proposals assuming thedesired minimum rate of return is 20%. Based on the profitability indexes, which proposal is better?
Proposal 1 Proposal 2
Initial cash outlay $ 16,000 $ 10,300
Net cash inflow (after taxes):
First year 10,000 6,000
Second year 9,000 6,000
Third year 6,000 4,000
Fourth year -0- 2,500
Exercise F Ross Company is considering three alternative investment proposals. Using thefollowing information, rank the proposals in order of desirability using the payback period method.
Proposal
A B C
Initial outlay $ 360,000 $ 360,000 $ 360,000
Net cash inflow (after taxes):
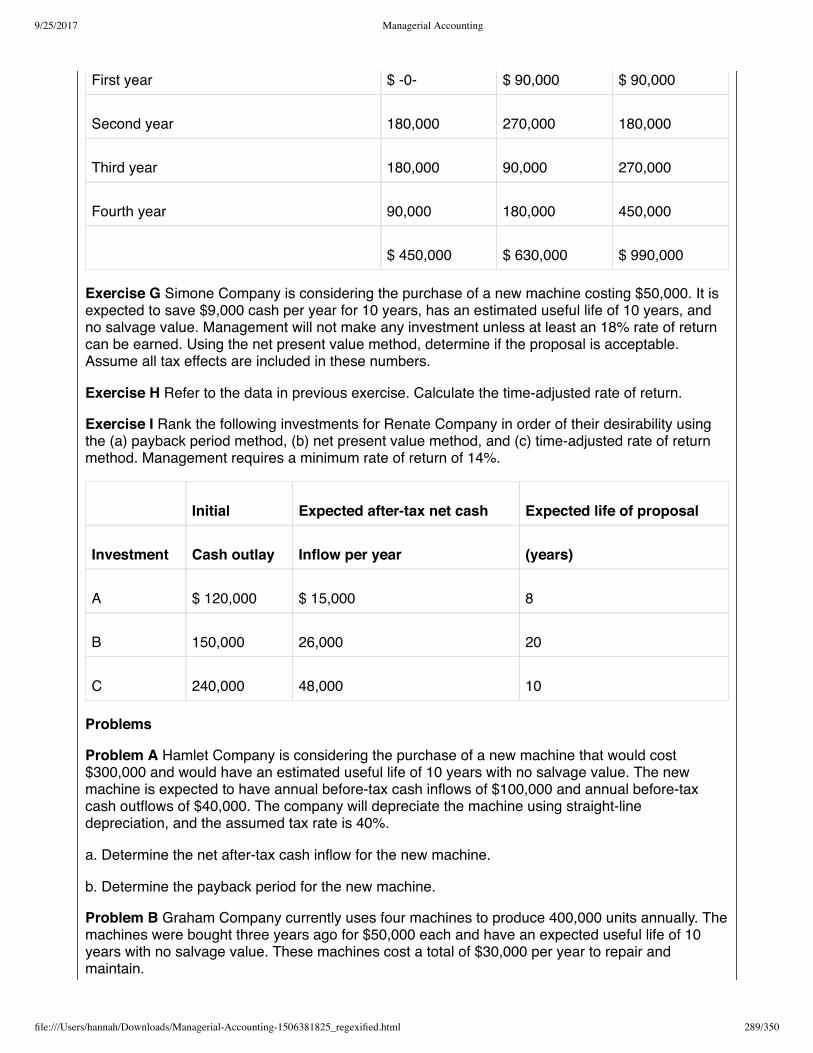
9/25/2017 Managerial Accounting
file:///Users/hannah/Downloads/Managerial-Accounting-1506381825_regexified.html 289/350
First year $ -0- $ 90,000 $ 90,000
Second year 180,000 270,000 180,000
Third year 180,000 90,000 270,000
Fourth year 90,000 180,000 450,000
$ 450,000 $ 630,000 $ 990,000
Exercise G Simone Company is considering the purchase of a new machine costing $50,000. It isexpected to save $9,000 cash per year for 10 years, has an estimated useful life of 10 years, andno salvage value. Management will not make any investment unless at least an 18% rate of returncan be earned. Using the net present value method, determine if the proposal is acceptable.Assume all tax effects are included in these numbers.
Exercise H Refer to the data in previous exercise. Calculate the time-adjusted rate of return.
Exercise I Rank the following investments for Renate Company in order of their desirability usingthe (a) payback period method, (b) net present value method, and (c) time-adjusted rate of returnmethod. Management requires a minimum rate of return of 14%.
Initial Expected after-tax net cash Expected life of proposal
Investment Cash outlay Inflow per year (years)
A $ 120,000 $ 15,000 8
B 150,000 26,000 20
C 240,000 48,000 10
Problems
Problem A Hamlet Company is considering the purchase of a new machine that would cost$300,000 and would have an estimated useful life of 10 years with no salvage value. The newmachine is expected to have annual before-tax cash inflows of $100,000 and annual before-taxcash outflows of $40,000. The company will depreciate the machine using straight-linedepreciation, and the assumed tax rate is 40%.
a. Determine the net after-tax cash inflow for the new machine.
b. Determine the payback period for the new machine.
Problem B Graham Company currently uses four machines to produce 400,000 units annually. Themachines were bought three years ago for $50,000 each and have an expected useful life of 10years with no salvage value. These machines cost a total of $30,000 per year to repair andmaintain.

9/25/2017 Managerial Accounting
file:///Users/hannah/Downloads/Managerial-Accounting-1506381825_regexified.html 290/350
The company is considering replacing the four machines with one technologically superior machinecapable of producing 400,000 units annually by itself. The machine would cost $140,000 and havean estimated useful life of seven years with no salvage value. Annual repair and maintenance costsare estimated at $14,000.
Assuming straight-line depreciation and a 40% tax rate, determine the annual additional after-taxnet cash inflow if the new machine is acquired.
Problem C Macro Company owns five machines that it uses in its manufacturing operations. Eachof the machines was purchased four years ago at a cost of $120,000. Each machine has anestimated life of 10 years with no expected salvage value. A new machine has become available.One new machine has the same productive capacity as the five old machines combined; it canproduce 800,000 units each year. The new machine will cost $648,000, is estimated to last sixyears, and will have a salvage value of $72,000. A trade-in allowance of $24,000 is available foreach of the old machines. These are the operating costs per unit:
Five old Machines New Machines
Repairs $ 0.6796 $ 0.0856
Depreciation 0.1500 0.2400
Power 0.1890 0.1036
Other operating costs 0.1620 0.0496
$ 1.1806 $ 0.4788
Ignore federal income taxes. Use the payback period method for (a) and (b).
a. Do you recommend replacing the old machines? Support your answer with computations.Disregard all factors except those reflected in the data just given.
b. If the old machines were already fully depreciated, would your answer be different? Why?
c. Using the net present value method with a discount rate of 20%, present a schedule showingwhether or not the new machine should be acquired.
Problem D Span Fruit Company has used a particular canning machine for several years. Themachine has a zero salvage value. The company is considering buying a technologically improvedmachine at a cost of $232,000. The new machine will save $50,000 per year after taxes in cashoperating costs. If the company decides not to buy the new machine, it can use the old machine foran indefinite time by incurring heavy repair costs. The new machine would have an estimateduseful life of eight years.
a. Compute the time-adjusted rate of return for the new machine.
b. Management thinks the estimated useful life of the new machine may be more or less than eightyears. Compute the time-adjusted rate of return for the new machine if its useful life is (1) 5 yearsand (2) 12 years, instead of 8 years.
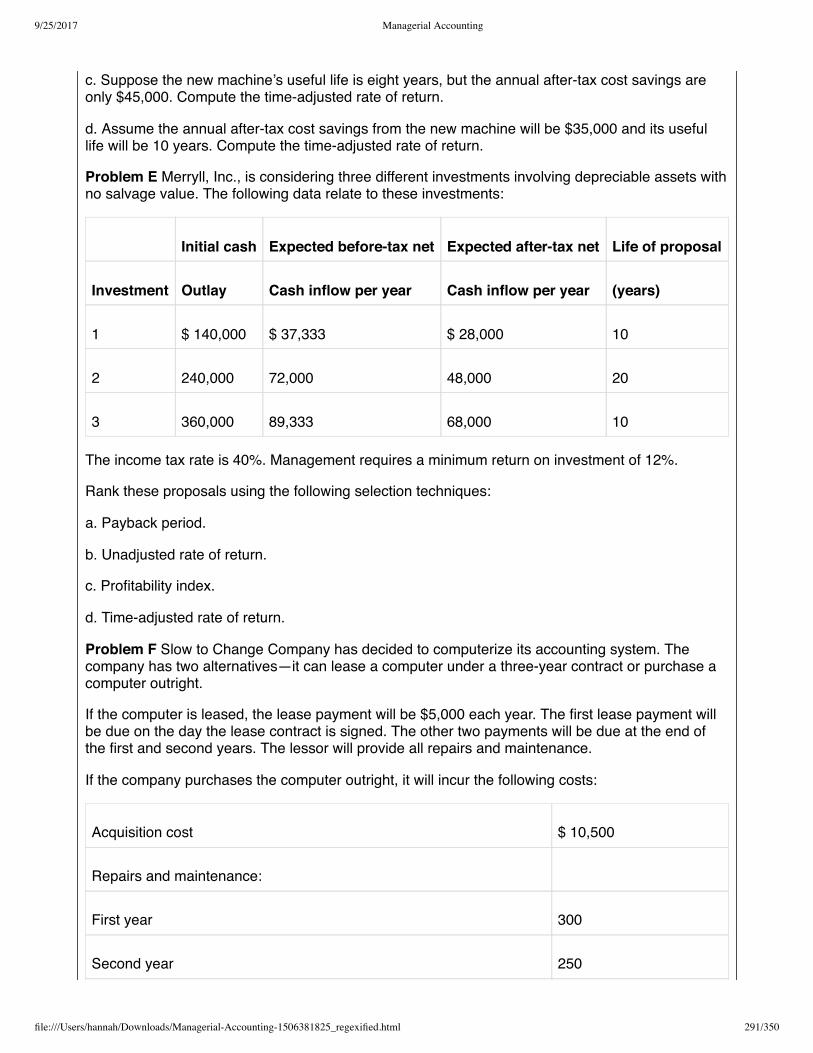
9/25/2017 Managerial Accounting
file:///Users/hannah/Downloads/Managerial-Accounting-1506381825_regexified.html 291/350
c. Suppose the new machine’s useful life is eight years, but the annual after-tax cost savings areonly $45,000. Compute the time-adjusted rate of return.
d. Assume the annual after-tax cost savings from the new machine will be $35,000 and its usefullife will be 10 years. Compute the time-adjusted rate of return.
Problem E Merryll, Inc., is considering three different investments involving depreciable assets withno salvage value. The following data relate to these investments:
Initial cash Expected before-tax net Expected after-tax net Life of proposal
Investment Outlay Cash inflow per year Cash inflow per year (years)
1 $ 140,000 $ 37,333 $ 28,000 10
2 240,000 72,000 48,000 20
3 360,000 89,333 68,000 10
The income tax rate is 40%. Management requires a minimum return on investment of 12%.
Rank these proposals using the following selection techniques:
a. Payback period.
b. Unadjusted rate of return.
c. Profitability index.
d. Time-adjusted rate of return.
Problem F Slow to Change Company has decided to computerize its accounting system. Thecompany has two alternatives—it can lease a computer under a three-year contract or purchase acomputer outright.
If the computer is leased, the lease payment will be $5,000 each year. The first lease payment willbe due on the day the lease contract is signed. The other two payments will be due at the end ofthe first and second years. The lessor will provide all repairs and maintenance.
If the company purchases the computer outright, it will incur the following costs:
Acquisition cost $ 10,500
Repairs and maintenance:
First year 300
Second year 250

9/25/2017 Managerial Accounting
file:///Users/hannah/Downloads/Managerial-Accounting-1506381825_regexified.html 292/350
Third year 350
The computer is expected to have only a three-year useful life because of obsolescence andtechnological advancements. The computer will have no salvage value and be depreciated on adouble-declining-balance basis. Slow to Change Company’s cost of capital is 16%.
a. Calculate the net present value of out-of-pocket costs for the lease alternative.
b. Calculate the net present value of out-of-pocket costs for the purchase alternative.
c. Do you recommend that the company purchase or lease the machine?
Problem G Van Gogh Sports Company is trying to decide whether to add tennis equipment to itsexisting line of football, baseball, and basketball equipment. Market research studies and costanalyses have provided the following information:
Van Gogh will need additional machinery and equipment to manufacture the tennis equipment. Themachines and equipment will cost $450,000, have an estimated 10-year useful life, and have a$10,000 salvage value.
Sales of tennis equipment for the next 10 years have been projected as follows:
Years Sales in dollars
1 $ 75,000
2 112,500
3 168,750
4 187,500
5 206,250
6 – 10 (each year) 225,000
Variable costs are 60% of selling price, and fixed costs (including straight-line depreciation) will total$88,500 per year.
The company must advertise its new product line to gain rapid entry into the market. Its advertisingcampaign costs will be:
Years Annual advertising cost
1 – 3 $ 75,000

9/25/2017 Managerial Accounting
file:///Users/hannah/Downloads/Managerial-Accounting-1506381825_regexified.html 293/350
4 – 10 37,500
The company requires a 14% minimum rate of return on investments.
Using the net present value method, decide whether or not Van Gogh Sports Company should addthe tennis equipment to its line of products. (Ignore federal income taxes.) Round to the nearestdollar.
Problem H Jordan Company is considering purchasing new equipment costing $2,400,000. Jordanestimates that the useful life of the equipment will be five years and that it will have a salvage valueof $600,000. The company uses straight-line depreciation. The new equipment is expected to havea net cash inflow (before taxes) of $258,000 annually. Assume that the tax rate is 40% and thatmanagement requires a minimum return of 14%.
Using the net present value method, determine whether the equipment is an acceptableinvestment.
Problem I Penny Company has an opportunity to sell some equipment for $40,000. Such a sale willresult in a tax-deductible loss of $4,000. If the equipment is not sold, it is expected to produce netcash inflows after taxes of $8,000 for the next 10 years. After 10 years, the equipment can be soldfor its book value of $4,000. Assume a 40% federal income tax rate.
Management currently has other opportunities that will yield 18%. Using the net present valuemethod, show whether the company should sell the equipment. Prepare a schedule to support yourconclusion.
Alternate problems
Alternate problem A Mark’s Manufacturing Company is currently using three machines that itbought seven years ago to manufacture its product. Each machine produces 10,000 units annually.Each machine originally cost $25,500 and has an estimated useful life of 17 years with no salvagevalue.
The new assistant manager of Mark’s Manufacturing Company suggests that the company replacethe three old machines with two technically superior machines for $22,500 each. Each newmachine would produce 15,000 units annually and would have an estimated useful life of 10 yearswith no salvage value.
The new assistant manager points out that the cost of maintaining the new machines would bemuch lower. Each old machine costs $2,500 per year to maintain; each new machine would costonly $1,500 a year to maintain.
Compute the increase in after-tax annual net cash inflow that would result from replacing the oldmachines; use straight-line depreciation and an assumed tax rate of 40%.
Alternate problem B Fed Extra Company is considering replacing 10 of its delivery vans thatoriginally cost $30,000 each; depreciation of $18,750 has already been taken on each van. Thevans were originally estimated to have useful lives of eight years and no salvage value. Each vantravels an average of 150,000 miles per year. The 10 new vans, if purchased, will cost $36,000each. Each van will be driven 150,000 miles per year and will have no salvage value at the end ofits three-year estimated useful life. A trade-in allowance of $3,000 is available for each of the oldvans. Following is a comparison of costs of operation per mile:

9/25/2017 Managerial Accounting
file:///Users/hannah/Downloads/Managerial-Accounting-1506381825_regexified.html 294/350
Old vans New vans
Fuel, lubricants, etc. $ 0.152 $ 0.119
Tires 0.067 0.067
Repairs 0.110 0.087
Depreciation 0.025 0.080
Other operating costs 0.051 0.043
Operating costs per mile $ 0.405 $ 0.396
Use the payback period method for (a) and (b).
a. Do you recommend replacing the old vans? Support your answer with computations anddisregard all factors not related to the preceding data.
b. If the old vans were already fully depreciated, would your answer be different? Why?
c. Assume that all cost flows for operating costs fall at the end of each year and that 18% is anappropriate rate for discounting purposes. Using the net present value method, present a scheduleshowing whether or not the new vans should be acquired.
Alternate problem C Mesa Company has been using an old-fashioned computer for many years.The computer has no salvage value. The company is considering buying a computer system at acost of $35,000. The new computer system will save $7,000 per year after taxes in cash (includingtax effects of depreciation). If the company decides not to buy the new computer system, it can usethe old one for an indefinite time. The new computer system will have an estimated useful life of 10years.
a. Compute the time-adjusted rate of return for the new computer system.
b. The company is uncertain about the new computer system’s 10-year useful life. Compute thetime-adjusted rate of return for the new computer system if its useful life is (1) 6 years and (2) 15years, instead of 10 years.
c. Suppose the computer system has a useful life of 10 years, but the annual after-tax cost savingsare only $4,500. Compute the time-adjusted rate of return.
d. Assume the annual after-tax cost savings will be $7,500 and the useful life will be eight years.Compute the time-adjusted rate of return.
Alternate problem D Ott’s Fresh Produce Company has always purchased its trucks outright andsold them after three years. The company is ready to sell its present fleet of trucks and is trying todecide whether it should continue to purchase trucks or whether it should lease trucks. If the trucksare purchased, the company will incur the following costs:
Costs per fleet

9/25/2017 Managerial Accounting
file:///Users/hannah/Downloads/Managerial-Accounting-1506381825_regexified.html 295/350
Acquisition cost $ 312,000
Repairs:
First year 3,600
Second year 6,600
Third year 9,000
Other annual costs 9,600
At the end of three years, the trucks could be sold for a total of $96,000. Another fleet of truckswould then be purchased. The costs just listed, including the same acquisition cost, also would beincurred with respect to the second fleet of trucks. The second fleet also could be sold for $96,000at the end of three years.
If the company leases the trucks, the lease contract will run for six years. One fleet of trucks will beprovided immediately, and a second fleet of trucks will be provided at the end of three years. Thecompany will pay $126,000 per year under the lease contract. The first lease payment will be dueon the day the lease contract is signed. The lessor bears the cost of all repairs.
Using the net present value method, determine if the company should buy or lease the trucks.Assume the company’s cost of capital is 18%. (Ignore federal income taxes.)
Beyond the numbers—Critical thinking
Business decision case A Lloyd’s Company wishes to invest $750,000 in capital projects thathave a minimum expected rate of return of 14%. The company is evaluating five proposals.Acceptance of one proposal does not preclude acceptance of any of the other proposals. Thecompany’s criterion is to select proposals that meet its 14% minimum required rate of return. Therelevant information related to the five proposals is as follows:
Initial cash Expected after-tax net Expected life of
Investment Outlay Cash inflow per year Proposal (years)
A $ 150,000 $ 45,000 5
B 300,000 60,000 8
C 375,000 82,500 10
D 450,000 78,000 12

9/25/2017 Managerial Accounting
file:///Users/hannah/Downloads/Managerial-Accounting-1506381825_regexified.html 296/350
E 150,000 31,500 10
a. Compute the net present value of each of the five proposals.
b. Which projects should be undertaken? Why? Rank them in order of desirability.
Business decision case B Slick Company is considering a capital project involving a $225,000investment in machinery and a $45,000 investment in working capital. The machine has anexpected useful life of 10 years and no salvage value. The annual cash inflows (before taxes) areestimated at $90,000 with annual cash outflows (before taxes) of $30,000. The company usesstraight-line depreciation. Assume the federal income tax rate is 40%.
The company’s new accountant computed the net present value of the project using a minimumrequired rate of return of 16% (the company’s cost of capital). The accountant’s computationsfollow:
Cash inflows $ 90,000
Cash outflows 30,000
Net cash inflow $ 60,000
Present value of net cash at 16% X 4.833
Present value of net cash inflow $283,980
Initial cash outlay 225,000
Net present value $ 64,980
a. Are the accountant’s computations correct? If not, compute the correct net present value.
b. Is this capital project acceptable to the company? Why or why not?
An accounting perspective – Writing experience C Refer to “An accounting perspective:Business insight”. Write a brief paper explaining why managers in Japan might use lower measuresof the cost of capital than US managers.
Ethics case – Writing experience D Rebecca Peters just learned that First Bank’s investmentreview committee rejected her pet project, a new computerized method of storing data that wouldenable customers to have instant access to their bank records. Peters’ software consulting firmspecializes in working with financial institutions. This project for First Bank was her first as projectmanager.
Following up, Peters learned that First Bank’s investment review committee liked the idea but werenot convinced that the new software’s financial benefits would justify the cost of the software. Whenshe told a colleague about the rejection at First Bank, the colleague said, “Why not tell thecommittee this software will increase the bank’s profits? After we installed the software in the bank

9/25/2017 Managerial Accounting
file:///Users/hannah/Downloads/Managerial-Accounting-1506381825_regexified.html 297/350
in Indianapolis, Indiana, USA their profits increased substantially. We even have data from thatbank that you could present.”
Peters thought about the suggestion. She knew First Bank would be pleased with the software ifthey installed it, and she wanted to make the sale. She also knew that the situation in Indianapolis,Indiana, USA was different; profits there had increased primarily because of other software that hadreduced the bank’s operating costs.
What should Rebecca Peters do? Write her a letter telling what you would do.
Group assignment E For summer employment, a friend is considering investing in a coffee standon a busy street near office buildings. Being unfamiliar with the concepts in this chapter, your frienddoes not know how to make the decision. In teams of four, help your friend get started by providinga framework and questions that your friend should answer. (For example, how much will theinvestment be? How much are the estimated cash flows from sales?) Prepare a memorandum fromthe group to your instructor; list your questions and suggestions for your friend. In the heading,include the date, to whom it is written, from whom, and the subject matter.
Group project F You have the option of choosing between two projects with equal total cash flowsover five years but different annual cash flows. In groups of two or three students, determine whichproject should be selected for investment. Write a memorandum to your instructor addressing thisissue. Be sure to provide examples to reinforce your answer. The heading of the memorandumshould contain the date, to whom it is written, from whom, and the subject matter.
Group project G A manager comments to her superior, “There is no need to perform a postaudit.The project was justified based on our initial projections and we were given the green light toproceed. It has been a year since we started the project, a postaudit would be a waste of time.” Ingroups of two or three students, respond to this comment. Do you agree? Do you disagree? If thismanager is right, why bother with a postaudit? Write a memorandum to your instructor addressingthese questions. The heading of the memorandum should contain the date, to whom it is written,from whom, and the subject matter.
Using the Internet—A view of the real world
Using any Internet search engine enter “budgeting” . Select an article that directly discussesbudgeting in an organization or industry and print a copy of the article. You are encouraged (but notrequired) to find an article that answers some of the following questions: What is the purpose ofbudgeting? How are budgets developed? How is budgeting used to motivate employees? Howmight budgeting create ethical dilemmas?
Write a memorandum to your instructor summarizing the key points of the article. The heading ofthe memorandum should contain the date, to whom it is written, from whom, and the subject matter.Be sure to include a copy of the article used for this assignment.
Using any Internet search engine select one of the new terms at the end of the chapter and performa key word search. Be sure to include quotation marks (for example: “Payback period”). Select anarticle that directly discusses the new term used, and print a copy of the article. Write amemorandum to your instructor summarizing the key points of the article. The heading of thememorandum should contain the date, to whom it is written, from whom, and the subject matter. Besure to include a copy of the article used for this assignment.

9/25/2017 Managerial Accounting
file:///Users/hannah/Downloads/Managerial-Accounting-1506381825_regexified.html 298/350
CHAPTER 12: FINANCIALSTATEMENT ANALYSIS
CHAPTER 12 STUDY PLAN
Study Plan: Financial Statement Analysis
Knowledge Targets
I can define the following terms as they relate to our unit:
Net Income Retained Earnings Horizontal Analysis
Vertical Analysis Ratio Analysis Trend Percents
Current Assets Current Liabilities Average Inventory
Average Accounts Receivable Percent of change Dollar amount of change
Reasoning Targets
I can understand the use of horizontal analysis, vertical analysis and ratio analysis
to evaluate company performance.
I can analyze and explain the trends of a company using horizontal analysis.
I can analyze and explain a company’s financial statements using vertical analysis.
I can analyze and explain a company’s financial performance using ratio analysis.
Skill Targets
I can calculate dollar amount of change and percentage of change for accounts on the financialstatements using horizontal analysis.

9/25/2017 Managerial Accounting
file:///Users/hannah/Downloads/Managerial-Accounting-1506381825_regexified.html 299/350
I can calculate trend percentages for horizontal analysis.
I can calculate the common-size percentages using vertical analysis.
I can calculate ratios used in ratio analysis.
Click Fin Stmt Analysis for a printable copy.
12.1 ANALYZING COMPARATIVE FINANCIALSTATEMENTS
This chapter discusses several common methods of analyzing and relating the data in financialstatements and, as a result, gaining a clear picture of the solvency and profitability of a company.Internally, management analyzes a company’s financial statements as do external investors, creditors,and regulatory agencies. Although these users have different immediate goals, their overall objectivein financial statement analysis is the same—to make predictions about an organization as an aid indecision making.
Watch this video online: https://youtu.be/8DmChanpSmw
Objectives of �nancial statement analysis
Management’s analysis of financial statements primarily relates to parts of the company. Using thisapproach, management can plan, evaluate, and control operations within the company. Managementobtains any information it wants about the company’s operations by requesting special-purposereports. It uses this information to make difficult decisions, such as which employees to lay off andwhen to expand operations. Our primary focus in this chapter, however, is not on the special reportsaccountants prepare for management. Rather, it is on the information needs of persons outside thefirm.
Investors, creditors, and regulatory agencies generally focus their analysis of financial statements onthe company as a whole. Since they cannot request special-purpose reports, external users must relyon the general-purpose financial statements that companies publish. These statements include abalance sheet, an income statement, a statement of stockholders’ equity, a statement of cash flows,and the explanatory notes that accompany the financial statements.
Financial statement analysis consists of applying analytical tools and techniques to financialstatements and other relevant data to obtain useful information. This information reveals significantrelationships between data and trends in those data that assess the company’s past performance andcurrent financial position. The information shows the results or consequences of prior managementdecisions. In addition, analysts use the information to make predictions that may have a direct effecton decisions made by users of financial statements.
Comparative financial statements present the same company’s financial statements for one or twosuccessive periods in side-by-side columns. The calculation of dollar changes or percentage changes

9/25/2017 Managerial Accounting
file:///Users/hannah/Downloads/Managerial-Accounting-1506381825_regexified.html 300/350
in the statement items or totals is horizontal analysis. This analysis detects changes in a company’sperformance and highlights trends.
The good news is you have already been performing the first part of horizontal analysis withoutrealizing it when you were preparing the statement of cash flows. Horizontal analysis consists of 2things:
Dollar amount of change (calculated as Current Year amount – Previous Year amount)Percentage of change (calculated as Dollar amount of change / previous year amount)
Horizontal analysis is called horizontal because we look at one account at a time across time. Wecan perform this type of analysis on the balance sheet or the income statement. Let’s look at thisvideo followed by another example.
Watch this video online: https://youtu.be/x_ltrzpz4Ew
The comparative financial statements of Synotech, Inc., will serve as a basis for an example ofhorizontal analysis and vertical analysis of a balance sheet and a statement of income and retainedearnings. Recall that horizontal analysis calculates changes in comparative statement items or totals. Here is an example of Synotech, Inc. current asset section (in millions) of the balance sheet withhorizontal analysis performed:
2015 2014 Increase (or Decrease) Percent of Change
Current assets:
Cash $ 298.00 $ 250.50 $ 47.50 19.0%
Marketable securities 71.30 57.50 $ 13.80 24.0%
Receivables, net 1,277.30 1,340.30 $ (63.00) -4.7%
Inventories 924.80 929.80 $ (5.00) -0.5%
Other current assets 275.30 254.30 $ 21.00 8.3%
Total current assets $ 2,846.70 $ 2,832.40 $ 14.30 0.5%
What does this tell us? Notice total current assets have increased $ 14.3 million, consisting largely ofincreases in cash, marketable securities, and other current assets despite a $63.0 million decrease innet receivables.
Next, study Column (4), which expresses as a percentage the dollar change in Column (3).Frequently, these percentage increases are more informative than absolute amounts, as illustrated bythe current asset changes. The percentages reveal that current assets increased .5% which if wecompared this to current liabilities would give us an idea if the company could pay their debt in thefuture.
Studying the percentages on the balance sheet could lead to several other observations. Forinstance, if there was a 6.9% decrease in long-term debt indicates that interest charges will be lowerin the future, having a positive effect on future net income. An increase in retained earnings could bea sign of increased dividends in the future; in addition, the increase in cash of 19% could support thisconclusion.

9/25/2017 Managerial Accounting
file:///Users/hannah/Downloads/Managerial-Accounting-1506381825_regexified.html 301/350
Licensing & Attributions
CC licensed content, Shared previously
Accounting Principles: A Business Perspective. Authored by: James Don Edwards, University of Georgia & Roger H. Hermanson, Georgia State University. Provided by: Endeavour International Corporation.Project: The Global Text Project. License: CC BY: Attribution
All rights reserved content
What is Financial Statement Analysis? - Accounting Video. Authored by: Brian Routh TheAccountingDr. Located at: https://youtu.be/8DmChanpSmw. License: All Rights Reserved. License Terms: StandardYouTube LicenseWhat is Financial Statement Analysis: Horizontal Analysis? - Accounting video . Authored by: Brian Routh TheAccountingDr. Located at: https://youtu.be/x_ltrzpz4Ew. License: All Rights Reserved. LicenseTerms: Standard YouTube License
12.2 CALCULATING TREND PERCENTAGES
Trend percentages are similar to horizontal analysis except that comparisons are made to a selectedbase year or period. Trend percentages are useful for comparing financial statements over severalyears because they disclose changes and trends occurring through time.
Watch this video online: https://youtu.be/SUr-ZzFBGcQ
Trend percentages, also referred to as index numbers, help you to compare financial information overtime to a base year or period. You can calculate trend percentages by:
Selecting a base year or period.Assigning a weight of 100% to the amounts appearing on the base-year financial statements.Expressing the corresponding amounts on the other years’ financial statements as a percentageof base-year or period amounts. Compute the percentages by Analysis year amount / baseyear amount and then multiplying the result by 100 to get a percentage.
The following information for Synotech illustrates the calculation of trend percentages:
(USD millions) 20Y3 20Y4 20Y5
Net sales $9,105.50 $10,029.80 $10,498.80
Cost of goods sold 4,696.00 5,223.70 5,341.30
Gross profit $4,409.50 $4,806.10 $5,157.50
Operating expenses 3,353.60 4,369.90 4,012.00
Income before income taxes $1,055.90 $436.20 $1,145.50
We will calculate the trend percentages using 2ox3 as the base year and everything in 20Y3 will be100%. For Net Sales in 20×4, take $10,029.80 from 20Y4 / 9,105.50 from base year 20Y3 andmultiply by 100 to get 119.6%. For Net Sales in 20Y5, take $10,498.80 from 20Y5 / 9,105.50 frombase year 20Y3 and multiply by 100 to get 115.3%. The same process continues for each accountusing the amount for each account in the base year 20Y3. The trend analysis would look like this(calculations added beside each column):
20Y3 20Y4 20Y5

9/25/2017 Managerial Accounting
file:///Users/hannah/Downloads/Managerial-Accounting-1506381825_regexified.html 302/350
Net sales 100.00% 119.20%($10,029.80
115.30%($10,498.80
$9,105.50) $9,105.50)
Cost of goods sold 100 111.2(5,223.70
113.7(5,341.30
4,696.00) 4,696.00)
Gross profit 100 109($4,806.10
117($5,157.50
$4,409.50) $4,409.50)
Operating expenses 100 130.3(4,369.90
119.6(4,012.00
3,353.60) 3,353.60)
Income before income taxes 100 41.3($436.20
108.5($1,145.50
$1,055.90) $1,055.90)
These trend percentages indicate the changes taking place in the organization and highlight thedirection of these changes. For instance, the percentage of sales is increasing each year compared tothe base year. Cost of goods sold increased at a lower rate than net sales in 20Y3 and 20Y5, causinggross profit to increase at a higher rate than net sales. Operating expenses in 20Y4 increased due tothe provision for restructured operations, causing a significant decrease in income before incometaxes. Percentages provide clues to an analyst about which items need further investigation oranalysis. In reviewing trend percentages, a financial statement user should pay close attention to thetrends in related items, such as the cost of goods sold in relation to sales. Trend analysis that shows aconstantly declining gross margin (profit) rate may be a signal that future net income will decrease.
As useful as trend percentages are, they have one drawback. Expressing changes as percentages isusually straightforward as long as the amount in the base year or period is positive—that is, not zeroor negative. Analysts cannot express a $30,000 increase in notes receivable as a percentage if theincrease is from zero last year to $30,000 this year (remember, you cannot divide by zero). Nor canthey express an increase from a loss last year of – $10,000 to income this year of $20,000 in arealistic percentage term.
Proper analysis does not stop with the calculation of increases and decreases in amounts orpercentages over several years. Such changes generally indicate areas worthy of further investigationand are merely clues that may lead to significant findings. Accurate predictions depend on manyfactors, including economic and political conditions; management’s plans regarding new products,plant expansion, and promotional outlays; and the expected activities of competitors. Consideringthese factors along with horizontal analysis, vertical analysis, and trend analysis should provide areasonable basis for predicting future performance.
Licensing & Attributions
CC licensed content, Shared previously
Accounting Principles: A Business Perspective. Authored by: James Don Edwards, University of Georgia & Roger H. Hermanson, Georgia State University. Provided by: Endeavour International Corporation.Project: The Global Text Project. License: CC BY: Attribution
All rights reserved content
What is Financial Statement Analysis: Trend Analysis? - Accounting video . Authored by: Brian Routh TheAccountingDr. Located at: https://youtu.be/SUr-ZzFBGcQ. License: All Rights Reserved. LicenseTerms: Standard YouTube License

9/25/2017 Managerial Accounting
file:///Users/hannah/Downloads/Managerial-Accounting-1506381825_regexified.html 303/350
12.3 COMMON-SIZE FINANCIALSTATEMENTS
Analysts also use vertical analysis of a single financial statement, such as an income statement.Vertical analysis consists of the study of a single financial statement in which each item is expressedas a percentage of a significant total. Vertical analysis is especially helpful in analyzing incomestatement data such as the percentage of cost of goods sold to sales. Where horizontal analysislooked at one account at a time, vertical analysis will look at one YEAR at a time.
Financial statements that show only percentages and no absolute dollar amounts are common-sizestatements. All percentage figures in a common-size balance sheet are percentages of totalassets while all the items in a common-size income statement are percentages of net sales. Theuse of common-size statements facilitates vertical analysis of a company’s financial statements.
Watch this video online: https://youtu.be/OT1BVZPNfks
The calculation for common-size percentages is: (Amount / Base amount) and multiply by 100 to get apercentage. Remember, on the balance sheet the base is total assets and on the income statementthe base is net sales. The video showed an example using the balance sheet so we will look atSynotech, Inc.’s income statement with common-size percentages (calculations provided in lastcolumn).
Synotech, Inc.
Income Statement
For year ended December 31
Net Sales $10,498.8 100.0%( 10,498.8
10,498.8 )
Cost of goods sold 5,341.3 50.9%( 5,341.3
10,498.8 )
Gross profit 5,157.5 49.1%( 5,157.5
10,498.8 )
Selling, general and admin expenses 3,662.5 34.9%( 3,662.5
10,498.8 )
Other expense, net 112.6 1.1%( 112.6
10,498.8 )
Interest expense 236.9 2.3%( 236.9
10,498.8 )

9/25/2017 Managerial Accounting
file:///Users/hannah/Downloads/Managerial-Accounting-1506381825_regexified.html 304/350
Income before taxes 1145.5 10.9% ( 1,145.5
10,498.8 )
Income tax expense 383.5 3.7%( 383.5
10,498.8 )
Net Income 762 7.3%( 762
10,498.8 )
What does this common-size percentage tell you about the company? Since we use net sales as thebase on the income statement, it tells us how every dollar of net sales is spent by the company. ForSynotech, Inc., approximately 51 cents of every sales dollar is used by cost of goods sold and 49cents of every sales dollar is left in gross profit to cover remaining expenses. Of the 49 centsremaining, almost 35 cents is used by operating expenses (selling, general and administrative), 1 centby other and 2 cents in interest. We earn almost 11 cents of net income before taxes and over 7cents in net income after taxes on every sales dollar. This is a little easier to understand than thelarger numbers showing Synotech earned $762 million dollars.
The same process would apply on the balance sheet but the base is total assets. The common-sizepercentages on the balance sheet explain how our assets are allocated OR how much of every dollarin assets we owe to others (liabilities) and to owners (equity). Many computerized accountingsystems automatically calculate common-size percentages on financial statements.
Licensing & Attributions
CC licensed content, Shared previously
Accounting Principles: A Business Perspective. Authored by: James Don Edwards, University of Georgia & Roger H. Hermanson, Georgia State University. Provided by: Endeavour International Corporation.Project: The Global Text Project. License: CC BY: Attribution
All rights reserved content
Financial Statement Analysis: Vertical Analysis - Financial Accounting video . Authored by: Brian Routh TheAccountingDr. Located at: https://youtu.be/OT1BVZPNfks. License: All Rights Reserved. LicenseTerms: Standard YouTube License
12.4 ACCOUNTING IN THE HEADLINES
How can a common-size income statement helpanalysis of Pandora’s results of operations in 2015compared to 2014?Pandora Internet Radio by Pandora Media (P) is a streamingmusic service. Its free advertising-supported radio service wasfirst launched in 2005. Pandora users streamed 20.03 billionhours of internet radio during 2014. In December 2014, therewere 81.5 million active users of Pandora, making it the largest

9/25/2017 Managerial Accounting
file:///Users/hannah/Downloads/Managerial-Accounting-1506381825_regexified.html 305/350
streaming music service currently. Pandora has a database ofover 1,000,000 songs from over 125,000 artists.
Pandora offers its streaming music through two services:
1. Free Service: This option allows the listener access to themusic by including advertisements.
2. Pandora One: This option is a paid subscription modelwithout any advertisements; it also allows users to havemore daily skips and longer listening times.
While Pandora currently has plenty of cash from its investors, it has yet to generate a profit since itsinception. Pandora is facing increasing competition from sources such as Apple Music (approximately6.5 million subscribers in 2015), Spotify (approximately 20 million paid subscribers in 2015), and otherstreaming services. In addition, Pandora’s costs in some areas are increasing.
Pandora recently released its earnings for the third quarter of 2015. Earnings were less thanexpected by investors and Pandora’s stock price fell sharply. At the end of this posting, excerpts fromPandora’s statement of operations is provided, both in dollars and in common-size formats. Use thoseexcerpts to answer the questions.
Questions
1. Using the statement of operations excerpt in dollars, what can you say about how Pandora isdoing in the third quarter of 2015 compared to the third quarter of 2014? What can you say abouthow Pandora is doing for the nine months ended September 2015 compared to September2014? Can you tell if the rate of increase is greater for revenues or expenses from 2014 to 2015? Why or why not?
2. Using the statement of operations excerpt in dollars again, why is the loss from operations largerin 2015 than in 2014?
3. Using the common-size statement of operations excerpt, what can you say about how Pandora isdoing in the third quarter of 2015 compared to the third quarter of 2014? What can you say abouthow Pandora is doing for the nine months ended September 2015 compared to September2014? Is the rate of increase is greater for revenues or expenses from 2014 to 2015?
4. Using the common-size statement of operations excerpt again, why is the loss from operationslarger in 2015 than in 2014? Also, what can you say about the mix of advertising revenue versussubscription revenue?
5. Which statement (dollars versus common-size) is more useful for analyzing the financialperformance of Pandora in this case? Explain.
Licensing & Attributions
CC licensed content, Speci�c attribution
How can a common-size income statement help analysis of Pandorau2019s results of operations in 2015 compared to 2014?. Authored by: Dr. Wendy Tietz, CPA, CMA, CGMA . Located at:http://www.accountingintheheadlines.com. License: CC BY-NC: Attribution-NonCommercial
12.5 CALCULATE RATIOS THAT ANALYZE ACOMPANY'S SHORT-TERM DEBT-PAYING
ABILITY

9/25/2017 Managerial Accounting
file:///Users/hannah/Downloads/Managerial-Accounting-1506381825_regexified.html 306/350
Ratios are expressions of logical relationships between items in the financial statements of a singleperiod. Analysts can compute many ratios from the same set of financial statements. A ratio can showa relationship between two items on the same financial statement or between two items on differentfinancial statements (e.g. balance sheet and income statement). The only limiting factor in choosingratios is the requirement that the items used to construct a ratio have a logical relationship to oneanother.
Ratio analysis
Logical relationships exist between certain accounts or items in a company’s financial statements.These accounts may appear on the same statement or on two different statements. We set up thedollar amounts of the related accounts or items in fraction form called ratios. These ratios include: (1)liquidity ratios; (2) equity, or long-term solvency, ratios; (3) profitability tests; and (4) market tests.
Liquidity ratios indicate a company’s short-term debt-paying ability. Thus, these ratios show interestedparties the company’s capacity to meet maturing current liabilities.
Watch this video online: https://youtu.be/AD2VPUacKTM
Current (or working capital) ratio Working capital is the excess of current assets over currentliabilities. The ratio that relates current assets to current liabilities is the current (or working capital)ratio. The current ratio indicates the ability of a company to pay its current liabilities from currentassets and, thus, shows the strength of the company’s working capital position. You calculate thecurrent ratio by:
Current Assets
Current Liabilities
The ratio is usually stated as a number of dollars of current assets available to pay every dollar ofcurrent liabilities (although the dollar signs usually are omitted). Thus, for Synotech, when currentassets totaled $2,846.7 million and current liabilities totaled $2,285.2 million, the ratio is 1.25:1 (or1.25 to 1), meaning that the company has $1.25 of current assets available to pay every $1.00 ofcurrent liabilities.
Short-term creditors are particularly interested in the current ratio since the conversion of inventoriesand accounts receivable into cash is the primary source from which the company obtains the cash topay short-term creditors. Long-term creditors are also interested in the current ratio because acompany that is unable to pay short-term debts may be forced into bankruptcy. For this reason, manybond indentures, or contracts, contain a provision requiring that the borrower maintain at least acertain minimum current ratio. A company can increase its current ratio by issuing long-term debt orcapital stock or by selling noncurrent assets.
A company must guard against a current ratio that is too high, especially if caused by idle cash, slow-paying customers, and/or slow-moving inventory. Decreased net income can result when too muchcapital that could be used profitably elsewhere is tied up in current assets.
Acid-test (quick) ratio The current ratio is not the only measure of a company’s short-term debt-paying ability. Another measure, called the acid-test (quick) ratio, is the ratio of quick assets (cash,marketable securities, and net receivables) to current liabilities. Analysts exclude inventories and

9/25/2017 Managerial Accounting
file:///Users/hannah/Downloads/Managerial-Accounting-1506381825_regexified.html 307/350
prepaid expenses from current assets to compute quick assets because they might not be readilyconvertible into cash. The formula for the acid-test ratio is:
Cash + Short-term investments + net current receivables
Current Liabilities
Short-term creditors are particularly interested in this ratio, which relates the pool of cash andimmediate cash inflows to immediate cash outflows. In deciding whether the acid-test ratio issatisfactory, investors consider the quality of the marketable securities and receivables. Anaccumulation of poor-quality marketable securities or receivables, or both, could cause an acid-testratio to appear deceptively favorable. When referring to marketable securities, poor quality meanssecurities likely to generate losses when sold. Poor-quality receivables may be uncollectible or notcollectible until long past due.
Since inventory and accounts receivable are a large part of a company’s current assets, it is importantto understand the company’s ability to collect from their customers and the company’s efficiency inbuying and selling inventory.
Watch this video online: https://youtu.be/g432Yyb8-aw
Accounts receivable turnover Turnover is the relationship between the amount of an asset andsome measure of its use. Accounts receivable turnover is the number of times per year that theaverage amount of receivables is collected. To calculate this ratio:
Net Sales
AVERAGE Accounts receivable, net
Net accounts receivable is accounts receivable after deducting the allowance for uncollectibleaccounts. Calculate average accounts receivable by taking the beginning balance in accountsreceivable (or ending amount from the previous year) + the ending balance of the current year anddivide by 2.
The accounts receivable turnover ratio provides an indication of how quickly the company collectsreceivables. For Synotech, Inc., we have the following information:
Net Sales $ 10,498.80
Accounts Receivable, Net
January 1 $ 1,340.30
December 31 1,277.30
We first need to calculate average accounts receivable. Jan 1 accounts receivable $1,340.30 + Dec31 Accounts receivable $1,277.30 = $2,617.60 / 2 gives us average accounts receivable of$1,308.80. We calculate the AR Turnover of 8.02 times:
Net Sales $10,498.80

9/25/2017 Managerial Accounting
file:///Users/hannah/Downloads/Managerial-Accounting-1506381825_regexified.html 308/350
Avg. Accts Receivable = $1,308.80
The accounts receivable turnover ratio indicates Synotech collected, or turned over, its accountsreceivable slightly more than eight times. The ratio is better understood and more easily comparedwith a company’s credit terms if we convert it into a number of days, as is illustrated in the next ratio.
Number of days’ sales in accounts receivable The number of days’ sales in accountsreceivable ratio is also called the average collection period for accounts receivable. Calculate it asfollows:
Avg Accounts Receivable x 365 days
Net Sales
We use a 365 days in a year for this calculation. Notice we are using Average accounts receivablehere as well, but it can also be calculated with ending accounts receivable instead. Still usingSynotech, Inc.’s information from above, we calculate 45.5 or 46 days from:
Avg. Accts Receivable = $1,308.80 x 365 Days
Net Sales $10,498.80
It can also be calculated as (365 days / AR Turnover). This ratio tells us it takes 46 days to collect onaccounts receivable. Standard credit terms are 30 days but 46 days is not too bad.
What about how a company handles inventory? We can prepare similar ratios for inventory turnoverand number of days’ sales in inventory.
Inventory turnover A company’s inventory turnover ratio shows the number of times its averageinventory is sold during a period. You can calculateinventory turnover as follows:
Cost of Goods Sold
Average Inventory
When comparing an income statement item and a balance sheet item, measure both in comparabledollars. Notice that we measure the numerator and denominator in cost rather than sales dollars.(Earlier, when calculating accounts receivable turnover, we measured both numerator anddenominator in sales dollars.) We will calculate average inventory by taking the beginning inventory+ ending inventory and divide by 2. Let’s look at the following information for Synotech, Inc.:
Cost of goods sold $ 5,341.30
Inventory
January 1 $ 929.80
December 31 924.80
We first calculate average inventory as Jan 1 inventory $929.80 + Dec 31 inventory $924.80 = totalinventory of $1,854.60 and divide by 2 for average inventory of $927.30. Next, we calculate inventory

9/25/2017 Managerial Accounting
file:///Users/hannah/Downloads/Managerial-Accounting-1506381825_regexified.html 309/350
turnover:
Cost of Goods Sold = $5,341.30
Average Inventory $927.30
Synotech was able to sell average inventory 5.76 times during the year. This ratio can better beunderstood by looking at the number of days’ sales in inventory. Calculated as 365 days / inventoryturnover or by this formula:
Average Inventory x 365 days
Cost of goods sold
We will calculate Synotech’s number of days in inventory using average inventory (but can also becalculated using ending inventory) of 63.4 or just 63 days as follows:
Average Inventory $1,854.60 x 365 Days
Cost of Goods Sold $5,341.30
This means it takes 63 days to sell our inventory. This is a very useful ratio to determine how quicklya company’s inventory moves through the company.
Other things being equal, a manager who maintains the highest inventory turnover ratio (and lowestnumber of days) is the most efficient. Yet, other things are not always equal. For example, a companythat achieves a high inventory turnover ratio by keeping extremely small inventories on hand mayincur larger ordering costs, lose quantity discounts, and lose sales due to lack of adequate inventory.In attempting to earn satisfactory income, management must balance the costs of inventory storageand obsolescence and the cost of tying up funds in inventory against possible losses of sales andother costs associated with keeping too little inventory on hand.
Licensing & Attributions
CC licensed content, Shared previously
Accounting Principles: A Business Perspective. Authored by: James Don Edwards, University of Georgia & Roger H. Hermanson, Georgia State University. Provided by: Endeavour International Corporation.Project: The Global Text Project. License: CC BY: Attribution
All rights reserved content
Financial Statement Analysis: Ability to Pay Current Liabilities - Accounting video . Authored by: Brian Routh TheAccountingDr. Located at: https://youtu.be/AD2VPUacKTM. License: All Rights Reserved.License Terms: Standard YouTube LicenseFinancial Statement Analysis: Ability to Sell Inventory and Collect Receivables - Accounting video . Authored by: Brian Routh TheAccountingDr. Located at: https://youtu.be/g432Yyb8-aw. License: All RightsReserved. License Terms: Standard YouTube License
12.6 RATIOS THAT ANALYZE A COMPANY'SLONG-TERM DEBT PAYING ABILITY
Creditors are interested to know if a company can pay its long-term debts. There are several ratioswe use for this as demonstrated in the video:

9/25/2017 Managerial Accounting
file:///Users/hannah/Downloads/Managerial-Accounting-1506381825_regexified.html 310/350
Watch this video online: https://youtu.be/OZEK8uPQuqI
Debt ratio The debt ratio measures how much we owe in total liabilities for every dollar in total assetswe have. This is a good overall ratio to tell creditors or investors if we have enough assets to coverour debt. The ratio is calculated as:
Total Liabilities
Total Assets
Total Liabilities $7,041.00
Total Assets $9,481.80
Times interest earned ratio Creditors, especially long-term creditors, want to know whether aborrower can meet its required interest payments when these payments come due. The timesinterest earned ratio, or interest coverage ratio, is an indication of such an ability. It is computed asfollows:
Income from operations (IBIT)
Interest expense
The ratio is a rough comparison of cash inflows from operations with cash outflows for interestexpense. Income before interest and taxes (IBIT) is the numerator because there would be no incometaxes if interest expense is equal to or greater than IBIT. (To find income before interest and taxes,take net income from continuing operations and add back the net interest expense and taxes.)Analysts disagree on whether the denominator should be (1) only interest expense on long-term debt,(2) total interest expense, or (3) net interest expense. We will use net interest expense in theSynotech illustration.
For Synotech, the net interest expense is $236.9 million. With an IBIT of $1,382.4 million, the timesinterest earned ratio is 5.84, calculated as:
Income from operations $1,382.40
Interest expense $236.90
The company earned enough during the period to pay its interest expense almost 6 times over.
Low or negative interest coverage ratios suggest that the borrower could default on required interestpayments. A company is not likely to continue interest payments over many periods if it fails to earnenough income to cover them. On the other hand, interest coverage of 5 to 10 times or more suggeststhat the company is not likely to default on interest payments.
Licensing & Attributions
CC licensed content, Shared previously
Accounting Principles: A Business Perspective. Authored by: James Don Edwards, University of Georgia & Roger H. Hermanson, Georgia State University. Provided by: Endeavour International Corporation.Project: The Global Text Project . License: CC BY: Attribution
All rights reserved content
Financial Statement Analysis: Ability to Pay Long-Term Debt - Accounting video. Authored by: Brian Routh TheAccountingDr. Located at: https://youtu.be/OZEK8uPQuqI. License: All Rights Reserved.License Terms: Standard YouTube License

9/25/2017 Managerial Accounting
file:///Users/hannah/Downloads/Managerial-Accounting-1506381825_regexified.html 311/350
12.7 RATIOS THAT ANALYZE A COMPANY'SEARNINGS PERFORMANCE
Equity, or long-term solvency, ratios show the relationship between debt and equity financing in acompany.
Equity (stockholders’ equity) ratio The two basic sources of assets in a business are owners(stockholders) and creditors; the combined interests of the two groups are total equities. In ratioanalysis, however, the term equity generally refers only to stockholders’ equity. Thus, the equity(stockholders’ equity) ratio indicates the proportion of total assets (or total liabilities and equity)provided by stockholders (owners) on any given date. The formula for the equity ratio is:
Total Stockholder’s Equity
Total Assets (or Total Liabilities & Equity)
Notice how we can use either Total Assests or Total Liabilities and Equity as the denominator, why? Because of the accounting equation — Assets = Liabilities + Equity. This calculation should lookfamiliar as this is the same calculation we would have done in a vertical analysis (common-sizepercentages). Synotech’s liabilities and stockholders’ equity follow. The company’s equity ratioincreased from 22.0% in 20Y4 to 25.7% in 20Y5. The information below shows that stockholdersincreased their proportionate equity in the company’s assets due largely to the retention of earnings(which increases retained earnings).
20Y5 December31 20Y4 December
31
(USD millions) Amount % Amount %
Current liabilities $2,285.2 24.1% $2,103.8 22.9%
Long-term liabilities 4,755.8 50.2 5,051.3 55.1
Total liabilities $7,041.0 74.3 $7,155.1 78.0
Total stockholders’ equity 2,440.8 25.7 2,015.7 22.0
Total liabilities & equity (equal to totalassets) $9,481.8 100% $9,170.8 100.0%
The equity ratio must be interpreted carefully. From a creditor’s point of view, a high proportion ofstockholders’ equity is desirable. A high equity ratio indicates the existence of a large protective bufferfor creditors in the event a company suffers a loss. However, from an owner’s point of view, a highproportion of stockholders’ equity may or may not be desirable. If the business can use borrowedfunds to generate income in excess of the net after-tax cost of the interest on such funds, a lowerpercentage of stockholders’ equity may be desirable.

9/25/2017 Managerial Accounting
file:///Users/hannah/Downloads/Managerial-Accounting-1506381825_regexified.html 312/350
We should point out, however, that too low a percentage of stockholders’ equity (too much debt) hasits dangers. Financial leverage magnifies losses per share as well as Earnings Per Share (EPS) sincethere are fewer shares of stock over which to spread the losses. A period of business recession mayresult in operating losses and shrinkage in the value of assets, such as receivables and inventory,which in turn may lead to an inability to meet fixed payments for interest and principal on the debt. Asa result, the company may be forced into liquidation, and the stockholders could lose their entireinvestments.
Stockholders’ equity to debt (debt to equity) ratio Analysts express the relative equities of ownersand creditors in several ways. To say that creditors held a 74.3% interest in the assets of Synotech(remember the debt ratio from the previous section?) on 20Y5 December 31, is equivalent to sayingstockholders held a 25.7% interest. Another way of expressing this relationship is the stockholders’equity to debt ratio:
Total Stockholder’s Equity
Total Liabilities
Such a ratio for Synotech would be 0.28:1 (or $2,015.7 million/$7,155.1 million) on 20Y4 December31, and 0.35:1 (or $2,440.8 million/$7,041.0 million) on 20Y5 December 31. This ratio is often invertedand called the debt to equity ratio. Some analysts use only long-term debt rather than total debt incalculating these ratios. These analysts do not consider short-term debt to be part of the capitalstructure since it is paid within one year.
Profitability is an important measure of a company’s operating success. Generally, we are concernedwith two areas when judging profitability: (1) relationships on the income statement that indicate acompany’s ability to recover costs and expenses, and (2) relationships of income to various balancesheet measures that indicate the company’s relative ability to earn income on assets employed. Eachof the following ratios utilizes one of these relationships.
Watch this video online: https://youtu.be/aEZWbQznr_U
Return on average common stockholders’ equity From the stockholders’ point of view, animportant measure of the income-producing ability of a company is the relationship of return onaverage common stockholders’ equity, also called rate of return on average common stockholders’equity, or simply the return on equity (ROE). Although stockholders are interested in the ratio ofoperating income to operating assets as a measure of management’s efficient use of assets, they areeven more interested in the return the company earns on each dollar of stockholders’ equity. Theformula for return on average common stockholders’ equity if no preferred stock is outstanding is:
Net Income – preferred dividends
AVERAGE common stockholder’s equity
When a company has preferred stock outstanding, the numerator of this ratio becomes net incomeminus the annual preferred dividends. Synotech has preferred stock outstanding. The ratios for thecompany follow. Total common stockholders’ equity on January 1 was $ 1,531.5 million and onDecember 31 $1,969.6. Net income for the year was $762 million and preferred dividends were $25.7million. NOTE: Common stockholder’s equity is Total stockholder’s equity – par value of preferredstock. We calculate average common stockholders equity by taking Jan 1 $1,531.50 + Dec 31$1,969.60 and dividing by 2 to get $1,750.55 million. The return on average stockholder’s equitycalculation would be:

9/25/2017 Managerial Accounting
file:///Users/hannah/Downloads/Managerial-Accounting-1506381825_regexified.html 313/350
Net Income – preferred dividends = $ 762 – $25.7
AVERAGE common stockholder’s equity $1,750.55
The ratio would be 42.06% which indicates that for each dollar of capital invested by a commonstockholder, the company earned approximately 42 cents. Earnings per share of common stock Probably the measure used most widely to appraise acompany’s operations is earnings per share (EPS) of common stock. The formula for EPS is:
Earnings available to common stockholders
weighted average common shares outstanding
The financial press regularly publishes actual and forecasted EPS amounts for publicly tradedcorporations, together with period-to-period comparisons. The Accounting Principles Board noted thesignificance attached to EPS by requiring that such amounts be reported on the face of the incomestatement.[2] (Unit 14 illustrated how earnings per share should be presented on the incomestatement.)
The calculation of EPS may be fairly simple or highly complex depending on a corporation’s capitalstructure. A company has a simple capital structure if it has no outstanding securities (e.g. convertiblebonds, convertible preferred stocks, warrants, or options) that can be exchanged for common stock. Ifa company has such securities outstanding, it has a complex capital structure. Discussion of EPS fora corporation with a complex capital structure is beyond the scope of this text.
The amount of earnings available to common stockholders is equal to net income minus the currentyear’s preferred dividends, whether such dividends have been declared or not.
Determining the weighted-average number of common shares The denominator in the EPSfraction is the weighted-average number of common shares outstanding for the period. If the numberof common shares outstanding did not change during the period, the weighted-average number ofcommon shares outstanding would, of course, be the number of common shares outstanding at theend of the period.
To illustrate, the balance in the Common Stock account of Synotech is $219.9 million on December31. The common stock had a $1.20 par value. Assuming no common shares were issued orredeemed during the year, the weighted-average number of common shares outstanding would be183.2 million (or $219.9 million common stock account balance /$1.20 par value per share).(Normally, common treasury stock reacquired and reissued are also included in the calculation of theweighted-average number of common shares outstanding. We ignore treasury stock transactions tosimplify the illustrations.) The EPS in this example would be $4.02 per share calculated as:
Earnings available to commonstockholders =
Net Income – preferred dividends=
$762 –$25.7 = 736.3
weighted average common sharesoutstanding
Common stock account balance /par value
$219.9 /$1.20
183.25shares
If the number of common shares changed during the period, such a change increases or decreasesthe capital invested in the company and should affect earnings available to stockholders. To computethe weighted-average number of common shares outstanding, we weight the change in the number of

9/25/2017 Managerial Accounting
file:///Users/hannah/Downloads/Managerial-Accounting-1506381825_regexified.html 314/350
common shares by the portion of the year that those shares were outstanding. Shares areoutstanding only during those periods that the related capital investment is available to produceincome.
To illustrate, assume that during Synotech’s began the year with 171.5 million shares outstanding. Assume that the company issued 9.5 million shares on April 1, and 2.2 million shares on October 1.The computation of the weighted-average number of common shares outstanding would be:
171.5 million shares x 1 year 171.500 million
9.5 million shares x ¾ year (April – December or 9/12) 7.125 million
2.2 million shares x ¼ year (October – December or 3/12) 0.550
Weighted-average number of common shares outstanding 179.175 million
The EPS in this example would be $4.11 per share calculated as:
Earnings available to commonstockholders =
Net Income – preferreddividends =
$ 762 – $25.7= 736.3
weighted average common sharesoutstanding 171.5 + 7.125 + 0.55 179.175
shares 179.18
EPS and stock dividends or splits Increases in shares outstanding as a result of a stock dividend orstock split do not require weighting for fractional periods. Such shares do not increase the capitalinvested in the business and, therefore, do not affect income. All that is required is to restate all priorcalculations of EPS using the increased number of shares. For example, assume a company reportedEPS for the year as $1.20 (or $120,000/100,000 shares) and earned $120,000 of net income duringthe year. The only change in common stock was a two-for-one stock split on December 1, whichdoubled the shares outstanding to 200,000. The firm would restate EPS as $0.60(or $120,000/200,000 shares).
Watch this video online: https://youtu.be/hDR7fRKwXu8
Price-earnings ratio The price-earnings ratio measures the value of the stock in relation to itsselling or market price typically on the New York Stock Exchange. The formula to compute the price-earnings ratio is:
Market price per common share
Earnings per share
Assume Synotech has common stock with an EPS of $5.03 and that the quoted market price of thestock on the New York Stock Exchange is $110.70. Investors would say that this stock is selling at 22times earnings, or at a multiple of 22 calculated as:
Market price per common share = $110.70
Earnings per share $5.03
These investors might have a specific multiple in mind that indicates whether the stock is underpricedor overpriced. Different investors have different estimates of the proper price-earnings ratio for a given

9/25/2017 Managerial Accounting
file:///Users/hannah/Downloads/Managerial-Accounting-1506381825_regexified.html 315/350
stock and also different estimates of the future earnings prospects of the company. These differentestimates may cause one investor to sell stock at a particular price and another investor to buy at thatprice.
Dividend yield on common stock The dividend paid per share of common stock is also of muchinterest to common stockholders. The dividend yield on common stock is calculated as:
Annual cash dividend per share
Market price per share
For example, Synotech’s December 31 common stock market price was $110.70 per share. Synotechpaid cash dividends per share of $1.80. The company’s dividend yield on common stock is 1.6%calculated as:
Annual cash dividend per share = $1.80
Market price per share $110.70
The dividend yield tells investors the company pays 1.6% of the market price in cash dividends. Through the use of dividend yield rates, we can compare different stocks having different annualdividends and different market prices.
Final considerations in financial statement analysis
Standing alone, a single financial ratio may not be informative. Investors gain greater insight bycomputing and analyzing several related ratios for a company. Financial analysis relies heavily oninformed judgment. As guides to aid comparison, percentages and ratios are useful in uncoveringpotential strengths and weaknesses. However, the financial analyst should seek the basic causesbehind changes and established trends.
Analysts must be sure that their comparisons are valid—especially when the comparisons are ofitems for different periods or different companies. They must follow consistent accounting practices ifvalid interperiod comparisons are to be made. Comparable intercompany comparisons are moredifficult to secure. Accountants cannot do much more than disclose the fact that one company is usingFIFO and another is using LIFO for inventory and cost of goods sold computations. Such a disclosurealerts analysts that intercompany comparisons of inventory turnover ratios, for example, may not becomparable.
Also, when comparing a company’s ratios to industry averages provided by an external source suchas Dun & Bradstreet, the analyst should calculate the company’s ratios in the same manner as thereporting service. Thus, if Dun & Bradstreet uses net sales (rather than cost of goods sold) tocompute inventory turnover, so should the analyst. Net sales is sometimes preferable because allcompanies do not compute and report cost of goods sold amounts in the same manner.
Facts and conditions not disclosed by the financial statements may, however, affect theirinterpretation. A single important event may have been largely responsible for a given relationship.For example, competitors may put a new product on the market, making it necessary for the companyunder study to reduce the selling price of a product suddenly rendered obsolete. Such an event wouldseverely affect the percentage of gross margin to net sales. Yet there may be little chance that suchan event will happen again.
Analysts must consider general business conditions within the industry of the company under study. Acorporation’s downward trend in earnings, for example, is less alarming if the industry trend or the

9/25/2017 Managerial Accounting
file:///Users/hannah/Downloads/Managerial-Accounting-1506381825_regexified.html 316/350
general economic trend is also downward.
Investors also need to consider the seasonal nature of some businesses. If the balance sheet daterepresents the seasonal peak in the volume of business, for example, the ratio of current assets tocurrent liabilities may be much lower than if the balance sheet date is in a season of low activity.
Potential investors should consider the market risk associated with the prospective investment. Theycan determine market risk by comparing the changes in the price of a stock in relation to the changesin the average price of all stocks.
Potential investors should realize that acquiring the ability to make informed judgments is a longprocess and does not occur overnight. Using ratios and percentages without considering theunderlying causes may lead to incorrect conclusions.
Relationships between financial statement items also become more meaningful when standards areavailable for comparison. Comparisons with standards provide a starting point for the analyst’sthinking and lead to further investigation and, ultimately, to conclusions and business decisions. Suchstandards consist of (1) those in the analyst’s own mind as a result of experience and observations,(2) those provided by the records of past performance and financial position of the business understudy, and (3) those provided about other enterprises. Examples of the third standard are dataavailable through trade associations, universities, research organizations (such as Dun & Bradstreetand Robert Morris Associates), and governmental units (such as the Federal Trade Commission).
In financial statement analysis, remember that standards for comparison vary by industry, andfinancial analysis must be carried out with knowledge of specific industry characteristics. For example,a wholesale grocery company would have large inventories available to be shipped to retailers and arelatively small investment in property, plant, and equipment, while an electric utility company wouldhave no merchandise inventory (except for repair parts) and a large investment in property, plant, andequipment.
Even within an industry, variations may exist. Acceptable current ratios, gross margin percentages,debt to equity ratios, and other relationships vary widely depending on unique conditions within anindustry. Therefore, it is important to know the industry to make comparisons that have real meaning.
Licensing & Attributions
CC licensed content, Shared previously
Accounting Principles: A Business Perspective. Authored by: James Don Edwards, University of Georgia & Roger H. Hermanson, Georgia State University. Provided by: Endeavour International Corporation.Project: The Global Text Project . License: CC BY: Attribution
All rights reserved content
Financial Statement Analysis: Measuring Pro�tability, cont'd - Accounting video . Authored by: BrianRouth TheAccountingDr. Located at: https://youtu.be/aEZWbQznr_U. License: All Rights Reserved.License Terms: Standard YouTube LicenseFinancial Statement Analysis: Analyzing Stock Investments - Accounting video . Authored by: Brian Routh TheAccountingDr. Located at: https://youtu.be/hDR7fRKwXu8. License: All Rights Reserved.License Terms: Standard YouTube License
12.8 RATIO SUMMARY
Type Ratio Formula Significance
Liquidity Ratios

9/25/2017 Managerial Accounting
file:///Users/hannah/Downloads/Managerial-Accounting-1506381825_regexified.html 317/350
WorkingCapital
Current Assets – Current Liabilities Amount of current assets left over afterpaying liabilities
Current ratio Current Assets
Current Liabilities
Test of debt-paying ability – how much dowe have available for every $1 ofliabilities.
Acid-test(quick) Ratio
Quick Assets (Cash + MarketableSecurities + net receivables)
Current Liabilities
Test of immediate debt-paying ability –how much cash do we have availableimmediately to pay debt
Cash flowliquidity ratio
(Cash + Marketable securities + Cashflow from operating activities)
Current Liabilities
Test of short-term, debt paying ability
AccountsReceivableTurnover
Net credit sales (or net sales)
Average Accounts Receivable
**Avg Accounts Receivable iscalculated as (beg. or last year’saccounts receivable + current year endAccounts receivable) / 2
Test of quality of accounts receivable –how many times have we collected avgaccts receivable
Days SalesUncollected
Accts Receivable, Net x 365 days
Net Sales
**Accts Receivable, Net meansAccounts Receivable – Allowance fordoubtful or uncollectible accounts.
How many days it takes to collect onaccounts receivable
InventoryTurnover
Cost of Goods Sold
Average Inventory
**Avg Inventory is calculated as (beg. orlast year’s inventory + current year endinventory) / 2
Test of management efficiency – howmany times we have sold avg. inventory
Days Salesin Inventory
Ending Inventory x 365 days
Cost of Goods SoldHow many days it takes to sell inventory
Total AssetTurnover Net Sales
Average Total Assets
How many times we have been able tosell the amount equal to avg total assets.Tests whether the volume of business isadequate.

9/25/2017 Managerial Accounting
file:///Users/hannah/Downloads/Managerial-Accounting-1506381825_regexified.html 318/350
**Avg Total Assets is calculated as(beg. or last year’s total assets +current year end total assets) / 2
Equity (or Solvency) Ratios
Debt Ratio Total Liabilities
Total Assets
How much we owe in liabilities for every$1 in assets.
Equity (orStockholder’sEquity) Ratio
Total Equity
Total Assets
How much equity we have for every $1 inassets.
Debt toEquity Ratio
Total Liabilities
Total Equity
How much we owe in liabilities for every$1 of equity.
Stockholder’sEquity to DebtRatio
Total Equity
Total Liabilities
How much equity we have to cover $1 inliabilities.
Profitability Ratios
Profit MarginRatio
Net Income
Net Sales
How much NET income we generatefrom every dollar of sales.
Gross MarginRatio
Net sales – Cost of goods sold
Net Sales
How much gross profit is earned on everydollar of sales (also known as markup)
Return ontotal assets
Net Income
Average Total Assets
**Avg Total Assets is calculated as(beg. or last year’s total assets +current year end total assets) / 2
How many times we have earned backaverage total assets from net income.
Return oncommonstockholder’sequity
Net Income – Preferred dividends
Average common stockholder’s equity
How much net income was generatedfrom every dollar of common stockinvested.
BasicEarnings perShare (EPS)
Net Income – Preferred Dividends
Weighted Avg common sharesoutstanding
How much net income generate on everyshare of common stock
Market Prospects

9/25/2017 Managerial Accounting
file:///Users/hannah/Downloads/Managerial-Accounting-1506381825_regexified.html 319/350
Price-earnings ratio Market price per common share
Earnings per share
How much the market price is for everydollar of earnings per share
Dividendyield
Annual cash dividends per share
Market price per share
How much dividends you receive basedon every dollar of market price per share.
Click ratio summary for a printable copy.
Licensing & Attributions
CC licensed content, Shared previously
Accounting Principles: A Business Perspective. Authored by: James Don Edwards, University of Georgia & Roger H. Hermanson, Georgia State University. Provided by: Endeavour International Corporation.Project: The Global Text Projectt. License: CC BY: Attribution
CHAPTER 12: EXERCISES
QUESTIONS, EXERCISES AND PROBLEMS
Questions➢ What are the major sources of financial information for publicly owned corporations?➢ The higher the accounts receivable turnover rate, the better off the company is. Do you agree?Why?➢ Can you think of a situation where the current ratio is very misleading as an indicator of short-term, debt-paying ability? Does the acid-test ratio offer a remedy to the situation you havedescribed? Describe a situation where the acid-test ratio does not suffice either.➢ Before the Marvin Company issued $20,000 of long-term notes (due more than a year from thedate of issue) in exchange for a like amount of accounts payable, its current ratio was 2:1 and itsacid-test ratio was 1:1. Will this transaction increase, decrease, or have no effect on the currentratio and acid-test ratio? What would be the effect on the equity ratio?➢ Through the use ofturnover rates, explain why a firm might seek to increase the volume of its sales even though suchan increase can be secured only at reduced prices.➢ Indicate which of the relationships illustratedin the chapter would be best to judge:
The short-term debt-paying ability of the firm.The overall efficiency of the firm without regard to the sources of assets.The return to owners (stockholders) of a corporation.The safety of long-term creditors’ interest.The safety of preferred stockholders’ dividends.
➢ Indicate how each of the following ratios or measures is calculated:Payout ratio.Earnings per share of common stock.Price-earnings ratio.Earnings yield on common stock.Dividend yield on preferred stock.

9/25/2017 Managerial Accounting
file:///Users/hannah/Downloads/Managerial-Accounting-1506381825_regexified.html 320/350
Times interest earned.Times preferred dividends earned.Return on average common stockholders’ equity.Cash flow margin.
➢ How is the rate of return on operating assets determined? Is it possible for two companies withoperating margins of 5 per cent and 1 per cent, respectively, to both have a rate of return of 20 percent on operating assets? How?
➢ Cite some of the possible deficiencies in accounting information, especially regarding its use inanalyzing a particular company over a 10-year period.
Exercises
Exercise A Income statement data for Boston Company for 2009 and 2010 follow:
2009 2010
Net sales $2,610,000 $1,936,000
Cost of goods sold 1,829,600 1,256,400
Selling expenses 396,800 350,000
Administrative expenses 234,800 198,400
Federal income taxes 57,600 54,000
Prepare a horizontal and vertical analysis of the income data in a form similar to Exhibit 2.Comment on the results of this analysis.
Exercise B A company engaged in the following three independent transactions:Merchandise purchased on account, $2,400,000.Machinery purchased for cash, $2,400,000.Capital stock issued for cash, $2,400,000.
1. Compute the current ratio after each of these transactions assuming current assets were$3,200,000 and the current ratio was 1:1 before the transactions occurred.
2. Repeat part (a) assuming the current ratio was 2:1.3. Repeat part (a) assuming the current ratio was 1:2.
Exercise C A company has sales of $3,680,000 per year. Its average net accounts receivablebalance is $920,000.
1. What is the average number of days accounts receivable are outstanding?2. By how much would the capital invested in accounts receivable be reduced if the turnover
could be increased to 6 without a loss of sales?
Exercise D Columbia Corporation had the following selected financial data for 2009 December 31:Net cash provided by operating activities
Net sales $1,800,000
Cost of goods sold 1,080,000
Operating expenses 315,000

9/25/2017 Managerial Accounting
file:///Users/hannah/Downloads/Managerial-Accounting-1506381825_regexified.html 321/350
Net income 195,000
Total assets 1,000,000
Net cash provided by operating activities 25,000
Compute the cash flow margin.
Exercise E From the following partial income statement, calculate the inventory turnover for theperiod.
$2,028,000 1,294,800 $ 733,200 327,600 $ 405,600
Net sales
Cost of goods sold:
Beginning inventory $ 234,000
Purchases 1,236,000
Cost of goods available for sale $1,560,000
Less: Ending inventory 265,200
Cost of goods sold
Gross margin
Operating expenses
Net operating income
Exercise F Eastern, Inc., had net sales of $3,520,000, gross margin of $1,496,000, and operatingexpenses of $904,000. Total assets (all operating) were $3,080,000. Compute Eastern’s rate ofreturn on operating assets.
Exercise G Nelson Company began the year 2010 with total stockholders’ equity of $2,400,000. Itsnet income for 2010 was $640,000, and $106,800 of dividends were declared. Compute the rate ofreturn on average stockholders’ equity for 2010. No preferred stock was outstanding.
Exercise H Rogers Company had 60,000 shares of common stock outstanding on 2010 January 1.On 2010 April 1, it issued 20,000 additional shares for cash. The amount of earnings available forcommon stockholders for 2010 was $600,000. What amount of EPS of common stock should thecompany report?
Exercise I Smith Company started 2011 with 800,000 shares of common stock outstanding. OnMarch 31, it issued 96,000 shares for cash, and on September 30, it purchased 80,000 shares of itsown stock for cash. Compute the weighted-average number of common shares outstanding for theyear.
Exercise J A company reported EPS of $2 (or ) for 2009, ending the year with 1,200,000 sharesoutstanding. In 2010, the company earned net income of $7,680,000, issued 320,000 shares ofcommon stock for cash on September 30, and distributed a 100 per cent stock dividend on 2010December 31. Compute EPS for 2010, and compute the adjusted earnings per share for 2009 thatwould be shown in the 2010 annual report.

9/25/2017 Managerial Accounting
file:///Users/hannah/Downloads/Managerial-Accounting-1506381825_regexified.html 322/350
Exercise K A company paid interest of $32,000, incurred federal income taxes of $88,000, and hadnet income (after taxes) of $112,000. How many times was interest earned?
Exercise L John Company had 20,000 shares of $600 par value, 8 per cent preferred stockoutstanding. Net income after taxes was $5,760,000. The market price per share was $720.
1. How many times were the preferred dividends earned?2. What was the dividend yield on the preferred stock assuming the regular preferred dividends
were declared and paid?
Exercise M A company had 80,000 weighted-average number of shares of $320 par valuecommon stock outstanding. The amount of earnings available to common stockholders was$800,000. Current market price per share is $720. Compute the EPS and the price-earnings ratio.
Problems
Problem A Loom’s comparative statements of income and retained earnings for 2010 and 2009 aregiven below.
Loom
Consolidated statement of earnings
For the years ended 2010 December 31, and 2009
($thousands, except per data share)
December31
(1) (2)
2010 2009
Net sales $2,403,100
$2,297,800
Cost of sales 1,885,700 1,651,300
Gross earnings $ 517,400 $ 646,500
Selling, general and administrative expenses 429,700 376,300
Goodwill amortization 37,300 35,200
Impairment write down of goodwill 158,500 0
Operating earnings (loss) $(108,100) $235,000
Interest expense (116,900) (95,400)
Other expense-net (21,700) (6,100)
Earnings (loss) before income tax (benefit) expense, extraordinary itemand cumulative effect of change in accounting principles
$(246,700) $133,500
Income tax (benefit) expense (19,400) 73,200

9/25/2017 Managerial Accounting
file:///Users/hannah/Downloads/Managerial-Accounting-1506381825_regexified.html 323/350
Earnings (loss) before cumulative effect of change in account principles $(227,300)
$60,300
Cumulative effect of change in accounting principles:
Pre-operating costs (5,200) 0
Net earnings (loss) $(232,500) $60,300
Retained earnings, January 1 680,600 620,300
$ 448,100 $680,600
Dividends 0 0
Retained earnings, December 31 $ 448,100 $680,600
Loom
consolidated balance sheet
As of 2010 December 31, and 2009
($thousands)
December31
(1) (2)
2010 2009
Assets
Current assets
Cash and cash equivalents $ 26,500 $ 49,400
Notes and accounts receivable (less allowance for possible losses of$26,600,000 and $20,700,000, respectively) 261,000 295,600
Inventories
Finished goods 522,300 496,200
Work in process 132,400 141,500
Materials and supplies 44,800 39,100
Other 72,800 54,800
Total current assets $1,059,800
$1,076,600
Property, plant, and equipment
Land $ 20,100 $ 19,300

9/25/2017 Managerial Accounting
file:///Users/hannah/Downloads/Managerial-Accounting-1506381825_regexified.html 324/350
Buildings, structures and improvements 486,400 435,600
Machinery and equipment 1,076,600 1,041,300
Construction in progress 24,200 35,200
Total property, plant and equipment $1,607,300
$1,531,400
Less accumulated depreciation 578,900 473,200
Net property, plant and equipment $1,028,400
$1,058,200
Other assets
Goodwill (less accumulated amortization of $257,800,000 and$242,400,000, respectively). $ 771,100 $ 965,800
Other 60,200 62,900
Total other assets $831,300 $1,028,700
Total assets $2,919,500
$3,163,500
Liabilities and stockholders’ equity
Current liabilities
Current maturities of long-term debt $ 14,600 $ 23,100
Trade accounts payable 60,100 113,300
Accrued insurance obligations 38,800 23,600
Accrued advertising and promotion 23,800 23,400
Interest payable 16,000 18,300
Accrued payroll and vacation pay 15,300 33,100
Accrued pension 11,300 19,800
Other accounts payable and accrued expenses 123,900 77,200
Total current liabilities $ 303,800 $ 331,800
Noncurrent liabilities
Long-term debt 1,427,200 1,440,200
Net deferred income taxes 0 43,400
Other 292,900 222,300
Total noncurrent liabilities $1,720,000
$1,705,900
Total liabilities $ $
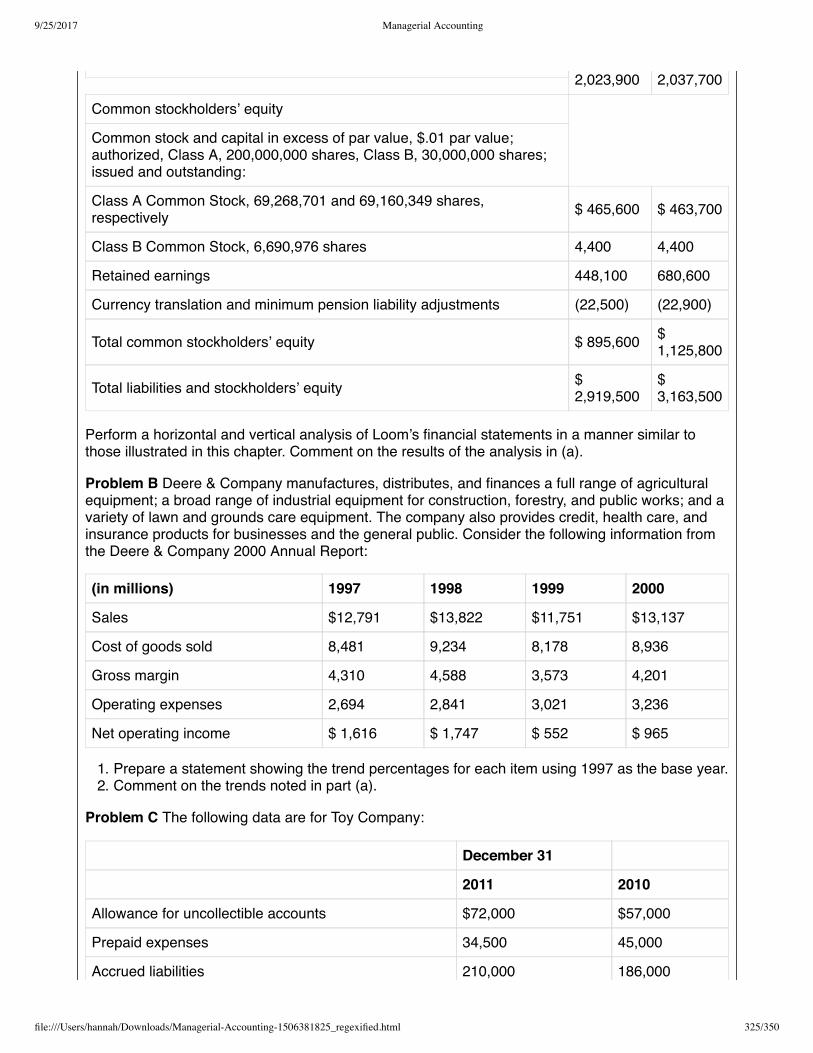
9/25/2017 Managerial Accounting
file:///Users/hannah/Downloads/Managerial-Accounting-1506381825_regexified.html 325/350
2,023,900 2,037,700
Common stockholders’ equity
Common stock and capital in excess of par value, $.01 par value;authorized, Class A, 200,000,000 shares, Class B, 30,000,000 shares;issued and outstanding:
Class A Common Stock, 69,268,701 and 69,160,349 shares,respectively $ 465,600 $ 463,700
Class B Common Stock, 6,690,976 shares 4,400 4,400
Retained earnings 448,100 680,600
Currency translation and minimum pension liability adjustments (22,500) (22,900)
Total common stockholders’ equity $ 895,600 $1,125,800
Total liabilities and stockholders’ equity $2,919,500
$3,163,500
Perform a horizontal and vertical analysis of Loom’s financial statements in a manner similar tothose illustrated in this chapter. Comment on the results of the analysis in (a).
Problem B Deere & Company manufactures, distributes, and finances a full range of agriculturalequipment; a broad range of industrial equipment for construction, forestry, and public works; and avariety of lawn and grounds care equipment. The company also provides credit, health care, andinsurance products for businesses and the general public. Consider the following information fromthe Deere & Company 2000 Annual Report:
(in millions) 1997 1998 1999 2000
Sales $12,791 $13,822 $11,751 $13,137
Cost of goods sold 8,481 9,234 8,178 8,936
Gross margin 4,310 4,588 3,573 4,201
Operating expenses 2,694 2,841 3,021 3,236
Net operating income $ 1,616 $ 1,747 $ 552 $ 965
1. Prepare a statement showing the trend percentages for each item using 1997 as the base year.2. Comment on the trends noted in part (a).
Problem C The following data are for Toy Company:
December 31
2011 2010
Allowance for uncollectible accounts $72,000 $57,000
Prepaid expenses 34,500 45,000
Accrued liabilities 210,000 186,000

9/25/2017 Managerial Accounting
file:///Users/hannah/Downloads/Managerial-Accounting-1506381825_regexified.html 326/350
Cash in Bank A 1,095,000 975,000
Wages payable -0- 37,500
Accounts payable 714,000 585,000
Merchandise inventory 1,342,500 1,437,000
Bonds payable, due in 2005 615,000 594,000
Marketable securities 217,500 147,000
Notes payable (due in six months) 300,000 195,000
Accounts receivable 907,500 870,000
Cash flow from operating activities 192,000 180,000
1. Compute the amount of working capital at both year-end dates.2. Compute the current ratio at both year-end dates.3. Compute the acid-test ratio at both year-end dates.4. Compute the cash flow liquidity ratio at both year-end dates.5. Comment briefly on the company’s short-term financial position.
Problem D On 2011 December 31, Energy Company’s current ratio was 3:1 before the followingtransactions were completed:
Purchased merchandise on account.Paid a cash dividend declared on 2011 November 15.Sold equipment for cash.Temporarily invested cash in trading securities.Sold obsolete merchandise for cash (at a loss).Issued 10-year bonds for cash.Wrote off goodwill to retained earnings.Paid cash for inventory.Purchased land for cash.Returned merchandise that had not been paid for.Wrote off an account receivable as uncollectible. Uncollectible amount is less than the balancein the Allowance for Uncollectible Accounts.Accepted a 90-day note from a customer in settlement of customer’s account receivable.Declared a stock dividend on common stock.
Consider each transaction independently of all the others.
1. Indicate whether the amount of working capital will increase, decrease, or be unaffected byeach of the transactions.
2. Indicate whether the current ratio will increase, decrease, or be unaffected by each of thetransactions.
Problem E Digital Company has net operating income of $500,000 and operating assets of$2,000,000.
Its net sales are $4,000,000.
The accountant for the company computes the rate of return on operating assets after computingthe operating margin and the turnover of operating assets.

9/25/2017 Managerial Accounting
file:///Users/hannah/Downloads/Managerial-Accounting-1506381825_regexified.html 327/350
1. Show the computations the accountant made.2. Indicate whether the operating margin and turnover increase or decrease after each of the
following changes. Then determine what the actual rate of return on operating assets would be.The events are not interrelated; consider each separately, starting from the original earningpower position. No other changes occurred.
(a)Sales increased by $160,000. There was no change in the amount of operating income and nochange in operating assets.
(b)Management found some cost savings in the manufacturing process. The amount of reduction inoperating expenses was $40,000. The savings resulted from the use of less materials tomanufacture the same quantity of goods. As a result, average inventory was $16,000 lower than itotherwise would have been. Operating income was not affected by the reduction in inventory.
(c) The company invested $80,000 of cash (received on accounts receivable) in a plot of land itplans to use in the future (a nonoperating asset); income was not affected.
(d)The federal income tax rate increased and caused income tax expense to increase by $20,000.The taxes have not yet been paid.
(e)The company issued bonds and used the proceeds to buy $400,000 of machinery to be used inthe business. Interest payments are $20,000 per year. Net operating income increased by $100,000(net sales did not change).
Problem F Polaroid Corporation designs, manufactures, and markets worldwide instantphotographic cameras and films, electronic imaging recording devices, conventional films, and lightpolarizing filters and lenses. The following information is for Polaroid:
(in millions) 2000 1999
Net sales $13,994 $14,089
Income before interest and taxes 2,310 2,251
Net income 1,407 1,392
Interest expense 178 142
Stockholders’ equity (on 1998 December 31, $3,988) 3,428 3,912
Common stock, par value $1, December 31 978 978
Compute the following for both 2000 and 1999. Then compare and comment.
1. EPS of common stock.2. Net income to net sales.3. Net income to average common stockholders’ equity.4. Times interest earned ratio.
Problem G The Walt Disney Company operates several ranges of products from theme parks andresorts to broadcasting and other creative content. The following balance sheet and supplementarydata are for The Walt Disney Company for 2000.
The Walt Disney Company
Consolidated balance sheet

9/25/2017 Managerial Accounting
file:///Users/hannah/Downloads/Managerial-Accounting-1506381825_regexified.html 328/350
For 2000 September 30
($millions)
$ 842 3,599 702 1,162 1,258 $7,563 5,339 2,270 1,995 597 16,117 1,428 $25,027 $5,161 2,502 739 $ 8,402 6,959 2,833 2,377 356 $45,027
Assets
Cash and cash equivalents
Receivables
Inventories
Film and television costs
Other
Total current costs
Film and television costs
Investments
Theme parks, resorts, and other property, at cost
Attractions, buildings, and equipment $16,160
Accumulated depreciation (6,892)
9,718
Project in process
Land
Intangibles assets, net
Other assets
Total assets
Liabilities and stockholders’ equity
Accounts payable and accrued liabilities
Current portion of borrowing
Unearned royalties
Total current liabilities
Borrowings
Deferred income taxes
Other long-term liabilities
Minority interest

9/25/2017 Managerial Accounting
file:///Users/hannah/Downloads/Managerial-Accounting-1506381825_regexified.html 329/350
Common shareholders’ equity
Common shares ($.01 par value) $12,101
Retained earnings 12,767
Cumulative translation and other adjustments (28)
Treasury shares (740) 24,100
Total liabilities and stockholders’ equity
Net income, $920.Income before interest and taxes, $3,231.Cost of goods sold, $21,321.Net sales, $25,402.Inventory on 1999 September 30, $796.Total interest expense for the year, $598.
Calculate the following ratios and show your computations. For calculations normally involvingaverages, such as average stockholders’ equity, use year-end amounts unless the necessaryinformation is provided.
1. Current ratio.2. Net income to average common stockholders’ equity.3. Inventory turnover.4. Number of days’ sales in accounts receivable (assume 365 days in 2000).5. EPS of common stock (ignore treasury stock).6. Times interest earned ratio.7. Equity ratio.8. Net income to net sales.9. Total assets turnover.
10. Acid-test ratio.
Problem H Cooper Company currently uses the FIFO method to account for its inventory but isconsidering a switch to LIFO before the books are closed for the year. Selected data for the yearare:
Merchandise inventory, January 1 $1,430,000
Current assets 3,603,600
Total assets (operating) 5,720,000
Cost of goods sold (FIFO) 2,230,800
Merchandise inventory, December 31 (LIFO) 1,544,400
Merchandise inventory, December 31 (FIFO) 1,887,600
Current liabilities 1,144,000
Net sales 3,832,400
Operating expenses 915,200

9/25/2017 Managerial Accounting
file:///Users/hannah/Downloads/Managerial-Accounting-1506381825_regexified.html 330/350
1. Compute the current ratio, inventory turnover ratio, and rate of return on operating assetsassuming the company continues using FIFO.
2. Repeat part (a) assuming the company adjusts its accounts to the LIFO inventory method.
Alternate problems
Alternate problem A Steel Corporation’s comparative statements of income and retained earningsand consolidated balance sheet for 2010 and 2009 follow:
Steel Corporation
Consolidated statement of Earnings
For the years ended 2010 December 31, 2009
(USD thousands)
December 31
(1) (2)
2010 2009
Net sales $4,876.5 $4,819.4
Costs and expenses:
Cost of sales $4,202.8 $4,287.3
Depreciation 284.0 261.1
Estimated restructuring losses 111.8 137.4
Total costs $4,598.6 $4,685.8
Income from operations $268.9 $ 133.6
Financing income (expense):
Interest and other income 7.7 7.1
Interest and other financing costs (60.0) (46.2)
Loss before income taxes and cumulative effect of changes in accounting $ 216.6 $ 94.5
Benefit (provision) for income taxes (37.0) (14.0)
Net earning (loss) $ 179.6 $ 80.5
Retained earnings, January 1 (859.4) (939.9)
$ (679.8) $ (859.4)
Dividends 0.0 0.0
Retained earnings, December 31 $ (679.8) (859.4)
Steel Corporation

9/25/2017 Managerial Accounting
file:///Users/hannah/Downloads/Managerial-Accounting-1506381825_regexified.html 331/350
Consolidated balance sheet
As of 2010 December 31, and 2009
December 31
(1) (2)
2010 2009
Assets
Current Assets
Cash and cash equivalents $ 180.0 $ 159.5
Receivables 374.6 519.5
Total $ 554.6 $ 679.0
Inventories
Raw materials and supplies $ 335.5 $ 331.9
Finished and semifinished products 604.9 534.9
Contract work in process less billings of $10.9 and $2.3 17.8 16.1
Total inventories $ 958.2 $ 882.9
Other current assets $ 13.0 $ 7.2
Total current assets $ 1,525.8 $1,569.1
Property, plant and equipment less accumulated depreciation of $4329.5and $4167.8 $ 2,714.2 $
2,759.3
Investments and miscellaneous assets 112.3 124.2
Deferred income tax asset – net 885.0 903.2
Intangible asset – Pensions 463.0 426.6
Total assets $ 5,700.3 $5,782.4
Liabilities and stockholders’ equity
Current liabilities
Accounts payable $ 381.4 $ 387.0
Accrued employment costs 208.0 165.8
Postretirement benefits other than pensions 150.0 138.0
Accrued taxes 72.4 67.6
Debt and capital lease obligations 91.5 88.9

9/25/2017 Managerial Accounting
file:///Users/hannah/Downloads/Managerial-Accounting-1506381825_regexified.html 332/350
Other current liabilities 146.3 163.9
Total current liabilities $ 1,049.6 $1,011.2
Pension liability $ 1,115.0 $1,117.1
Postretirement benefits other than pensions 1,415.0 1,441.4
Long-term debt and capital lease obligations 546.8 668.4
Other 335.6 388.5
Total noncurrent liabilities $ 3,412.4 #3,615.4
Total liabilities $ 4,462.0 $4,626.6
Common stockholders’ equity
Preferred stock – at $1 per share par value (aggregate liquidationpreference of $481.2); Authorized 20,000,000 shares $ 11.6 $ 11.6
Preference stock – at $1 per share par value (aggregate liquidationpreference of $88.2); Authorized 20,000,000 shares 2.6 2.6
Common stock – at $1 per share par value/Authorized 250,000,000 and150,000,000 shares; Issued 112,699,869 and 111,882,276 shares 112.7 111.9
Held in treasury, 1,992,189 and 1,996,715 shares at cost (59.4) (59.5)
Additional paid-in capital 1,850.6 1,948.6
Accumulated deficit (679.8) (859.4)
Total common stockholders’ equity $ 1,238.3 $1,155.8
Total liabilities and stockholders’ equity $ 5,700.3 $5,782.4
2. Perform a horizontal and vertical analysis of Steel’s financial statements in a manner similar toExhibit 1 and Exhibit 2.
3. Comment on the results obtained in part (a).
Alternate problem B Ford Motor Company is the world’s second-largest producer of cars andtrucks and ranks among the largest providers of financial services in the United States. Thefollowing information pertains to Ford: (in millions)
(in millions) 1998 1999 2000
Sales $118.017 $135,073 $141,230
Cost of goods sold 104,616 118,985 126,120
Gross margin $ 13,401 $ 16,088 $ 15,110
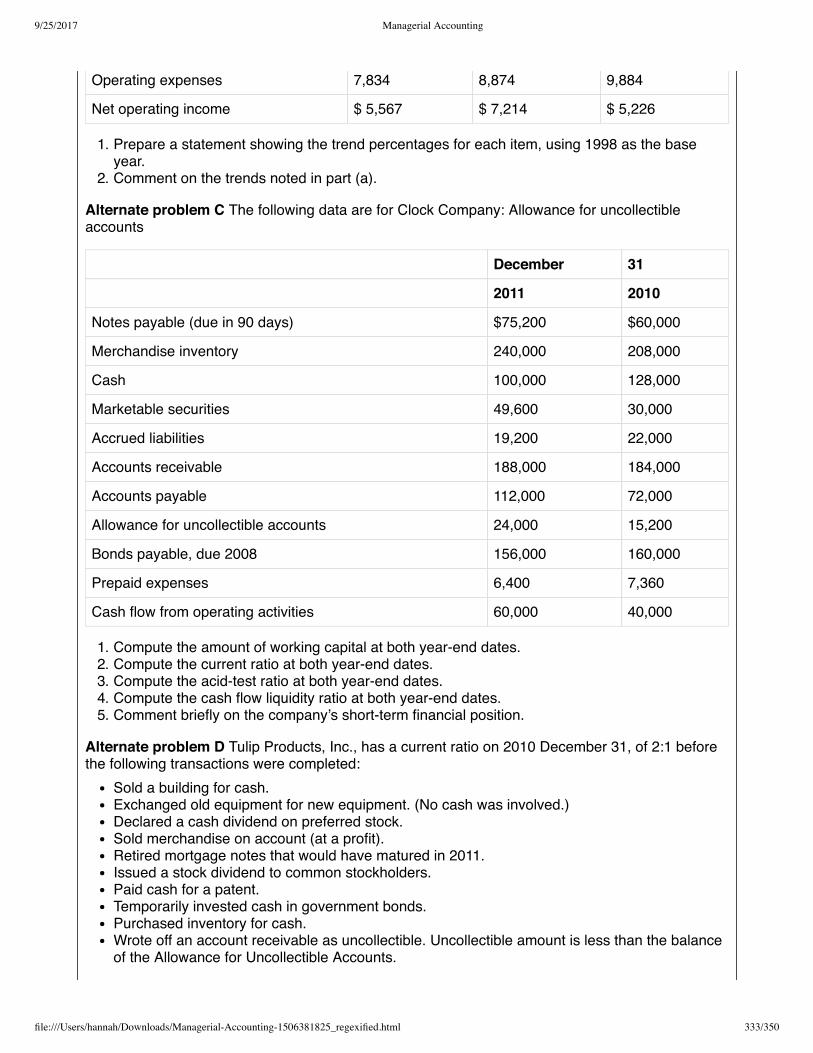
9/25/2017 Managerial Accounting
file:///Users/hannah/Downloads/Managerial-Accounting-1506381825_regexified.html 333/350
Operating expenses 7,834 8,874 9,884
Net operating income $ 5,567 $ 7,214 $ 5,226
1. Prepare a statement showing the trend percentages for each item, using 1998 as the baseyear.
2. Comment on the trends noted in part (a).
Alternate problem C The following data are for Clock Company: Allowance for uncollectibleaccounts
December 31
2011 2010
Notes payable (due in 90 days) $75,200 $60,000
Merchandise inventory 240,000 208,000
Cash 100,000 128,000
Marketable securities 49,600 30,000
Accrued liabilities 19,200 22,000
Accounts receivable 188,000 184,000
Accounts payable 112,000 72,000
Allowance for uncollectible accounts 24,000 15,200
Bonds payable, due 2008 156,000 160,000
Prepaid expenses 6,400 7,360
Cash flow from operating activities 60,000 40,000
1. Compute the amount of working capital at both year-end dates.2. Compute the current ratio at both year-end dates.3. Compute the acid-test ratio at both year-end dates.4. Compute the cash flow liquidity ratio at both year-end dates.5. Comment briefly on the company’s short-term financial position.
Alternate problem D Tulip Products, Inc., has a current ratio on 2010 December 31, of 2:1 beforethe following transactions were completed:
Sold a building for cash.Exchanged old equipment for new equipment. (No cash was involved.)Declared a cash dividend on preferred stock.Sold merchandise on account (at a profit).Retired mortgage notes that would have matured in 2011.Issued a stock dividend to common stockholders.Paid cash for a patent.Temporarily invested cash in government bonds.Purchased inventory for cash.Wrote off an account receivable as uncollectible. Uncollectible amount is less than the balanceof the Allowance for Uncollectible Accounts.

9/25/2017 Managerial Accounting
file:///Users/hannah/Downloads/Managerial-Accounting-1506381825_regexified.html 334/350
Paid the cash dividend on preferred stock that was declared earlier.Purchased a computer and gave a two-year promissory note.Collected accounts receivable.Borrowed from the bank on a 120-day promissory note.Discounted a customer’s note. Interest expense was involved.
Consider each transaction independently of all the others.
1. Indicate whether the amount of working capital will increase, decrease, or be unaffected byeach of the transactions.
2. Indicate whether the current ratio will increase, decrease, or be unaffected by each of thetransactions.
Alternate problem E The following selected data are for three companies:
Operating
Assets
Net Operating
Income
Net
Sales
Company 1 $ 1,404,000 $ 187,200 $ 2,059,200
Company 2 8,424,000 608,400 18,720,000
Company 3 37,440,000 4,914,000 35,100,000
1. Determine the operating margin, turnover of operating assets, and rate of return on operatingassets for each company.
2. In the subsequent year, the following changes took place (no other changes occurred):
Company 1 bought some new machinery at a cost of $156,000. Net operating income increased by$12,480 as a result of an increase in sales of $249,600.
Company 2 sold some equipment it was using that was relatively unproductive. The book value ofthe equipment sold was $624,000. As a result of the sale of the equipment, sales declined by$312,000, and operating income declined by $6,240.
Company 3 purchased some new retail outlets at a cost of $6,240,000. As a result, sales increasedby $9,360,000, and operating income increased by $499,200.
Which company has the largest absolute change in:
1. Operating margin ratio?2. Turnover of operating assets?3. Rate of return on operating assets?
Which one realized the largest dollar change in operating income? Explain this change inrelation to the changes in the rate of return on operating assets.
Alternate problem F One of the largest spice companies in the world, McCormick & Company,Inc., produces a diverse array of specialty foods. The following information is for McCormick &Company, Inc.:
2000 1999
($thousands)

9/25/2017 Managerial Accounting
file:///Users/hannah/Downloads/Managerial-Accounting-1506381825_regexified.html 335/350
Net sales $2,123,500 $2,006,900
Income before interest and taxes 225,700 174,700
Net income 137,500 98,500
Interest expense 39,700 32,400
Stockholders’ equity 359,300 382,400
Common stock, no par value, November 30 175,300 173,800
Assume average common shares outstanding for 2000 and 1999 are 69,600 and 72,000 (inthousands), respectively.
Compute the following for both 2000 and 1999. Then compare and comment. Assumestockholders’ equity for 1998 was $388,100.
1. EPS of common stock.2. Net income to net sales.3. Return on average common stockholders’ equity.4. Times interest earned ratio.
Alternate problem G Parametric Technology Corporation is in the CAD/CAM/CAE industry and isthe top supplier of software tools used to automate a manufacturing company. The followingconsolidated balance sheet and supplementary data are for Parametric for 2003:
Parametric Technology Corporation
Consolidated balance sheet
For 2003 September 30 (in thousands)
Assets
Current assets
Cash and cash equivalents $ 325,872
Short-term investments 22,969
Accounts receivable, net of allowances for doubtful account of $6,270 183,804
Other current assets 95,788
Total current assets $ 628,433
Marketable investments 26,300
Property and equipment, net 66,879
Other assets 203,271
Total assets $ 924,883
Liabilities and stockholders‘ equity
Current liabilities

9/25/2017 Managerial Accounting
file:///Users/hannah/Downloads/Managerial-Accounting-1506381825_regexified.html 336/350
Accounts payable and accrued expenses $ 77,144
Accrued compensation 52,112
Deferred revenue 231,495
Income taxes 1,601
Total currents liabilities $ 362,352
Other liabilities 33,989
Stockholders’ equity
Preferred stock, $.01 par value; 5,000 shares authorized; none issued
Common stock, $.01 par value; 500,000 shares authorized; 276,053 (2000) and272,277 (1999) shares issued 2,761
Additional paid-in capital 1,641,513
Foreign currency translation adjustment (12,629)
Accumulated deficit (1,036,456)
Treasury stock, at cost, 6,456 (2000) and 2,113 (1999) shares (66,647)
Total liabilities and stockholders’ equity $ 924,883
Net loss, ($3,980).Loss before interest and taxes, ($4,700).Cost of goods sold, $244,984.Net sales, $928,414.Total interest expense for the year, $367.Weighted-average number of shares outstanding, 273,081.
Calculate the following ratios and show your computations. For calculations normally involvingaverages, such as average accounts receivable or average stockholders’ equity, use year-endamounts if the information is not available to use averages.
1. Current ratio.2. Net income to average common stockholders’ equity.3. Number of days’ sales in accounts receivable (assume 365 days in 2003).4. EPS of common stock.5. Times interest earned ratio.6. Equity ratio.7. Net income to net sales.8. Total assets turnover.9. Acid-test ratio.
Alternate problem H Paper Company is considering switching from the FIFO method to the LIFOmethod of accounting for its inventory before it closes its books for the year. The January 1merchandise inventory was $864,000. Following are data compiled from the adjusted trial balanceat the end of the year:
Merchandise inventory, December 31 (FIFO) $1,008,000

9/25/2017 Managerial Accounting
file:///Users/hannah/Downloads/Managerial-Accounting-1506381825_regexified.html 337/350
Current liabilities 720,000
Net sales 2,520,000
Operating expenses 774,000
Current assets 1,890,000
Total assets (operating) 2,880,000
Cost of goods sold 1,458,000
If the switch to LIFO takes place, the December 31 merchandise inventory would be $900,000.
1. Compute the current ratio, inventory turnover ratio, and rate of return on operating assetsassuming the company continues using FIFO.
2. Repeat (a) assuming the company adjusts its accounts to the LIFO inventory method.
Beyond the numbers – Critical thinking
Business decision case A The comparative balance sheets of the Darling Corporation for 2011December 31, and 2010 follow:
Darling Corporation
Comparative balance sheets
2011 December 31, and 2010
($millions)
2011 2010
Assets
Cash $ 480,000 $ 96,000
Accounts receivable, net 86,400 115,200
Merchandise inventory 384,000 403,200
Plant and equipment, net 268,800 288,000
Total assets $ 1,219,200 $902,400
Liabilities and stockholders’ equity
Accounts payable $ 96,000 $ 96,000
Common stock 672,000 672,000
Retained earnings 451,200 134,400
Total liabilities and stockholders’ equity $1,219,200 $902,400
Based on your review of the comparative balance sheets, determine the following:
1. What was the net income for 2011 assuming there were no dividend payments?2. What was the primary source of the large increase in the cash balance from 2010 to 2011?

9/25/2017 Managerial Accounting
file:///Users/hannah/Downloads/Managerial-Accounting-1506381825_regexified.html 338/350
3. What are the two main sources of assets for Darling Corporation?4. What other comparisons and procedures would you use to complete the analysis of the
balance sheet?
Business decision case B As Miller Manufacturing Company’s internal auditor, you are reviewingthe company’s credit policy. The following information is from Miller’s annual reports for 2008, 2009,2010, and 2011:
2008 2009 2010 2011
Nets accounts receivable $ 1,080,000 $ 2,160,000 $ 2,700,000 $ 3,600,000
Net sales 10,800,000 13,950,000 17,100,000 19,800,000
Management has asked you to calculate and analyze the following in your report:
1. If cash sales account for 30 per cent of all sales and credit terms are always 1/10, n/60,determine all turnover ratios possible and the number of days’ sales in accounts receivable atall possible dates. (The number of days’ sales in accounts receivable should be based on year-end accounts receivable and net credit sales.)
2. How effective is the company’s credit policy?
Business decision case C Wendy Prince has consulted you about the possibility of investing inone of three companies (Apple, Inc., Baker Company, or Cookie Corp.) by buying its commonstock. The companies’ investment shares are selling at about the same price. The long-term capitalstructures of the companies alternatives are as follows:
$2,400,000 $2,400,000
Apple,
Inc.
Baker
Company
Cookie
Corp.
Bonds with a 10% interest rate
Preferred stock with an 8% dividend rate
Common stock, $10 par value $4,800,000 2,400,000 2,400,000
Retained earnings 384,000 384,000 384,000
Total long-term equity $5,184,000 $5,184,000 $5,184,000
Number of common shares outstanding 480,000 240,000 240,000
Prince has already consulted two investment advisers. One adviser believes that each of thecompanies will earn $300,000 per year before interest and taxes. The other adviser believes thateach company will earn about $960,000 per year before interest and taxes. Prince has asked youto write a report covering these points:
1. Compute each of the following, using the estimates made by the first and second advisers.
(a)Earnings available for common stockholders assuming a 40 per cent tax rate.
(b)EPS of common stock.

9/25/2017 Managerial Accounting
file:///Users/hannah/Downloads/Managerial-Accounting-1506381825_regexified.html 339/350
(c) Rate of return on total stockholders’ equity.
1. Which stock should Prince select if she believes the first adviser?2. Are the stockholders as a group (common and preferred) better off with or without the use of
long-term debt in the companies?
Annual Report analysis D The following selected financial data excerpted from the annual reportof Appliance Corporation represents the summary information which management presented forinterested parties to review:
Appliance Corporation
Selected Financial Data
($thousands except per share data)
2010 2009 2008 2007 2006
Net sales $3,049,524 $3,372,515 $2,987,054 $3,041,223 $2,970,626
Cost of sales 2,250,616 2,496,065 2,262,942 2,339,406 2,254,221
Income taxes 74,800 90,200 38,600 15,900 44,400
Income (loss) from continuingoperations (14,996) 151,137 51,270 (8,254) 79,017
Per cent of income (loss) fromcontinuing operations to netsales
(0.5%) 4.5% 1.7% (0.3%) 2.7%
Income (loss) from continuingoperations per share $ (0.14) 1.42 0.48 (0.08) $ 0.75
Dividends paid per share 0.515 0.50 0.50 0.50 0.50
Average shares outstanding (inthousands) 107,062 106,795 106,252 106,077 105,761
Working capital $ 543,431 $ 595,703 $ 406,181 $452,626 $ 509,025
Depreciation of property, plantand equipment 102,572 110,044 102,459 94,032 83,352
Additions to property, plant andequipment 152,912 84,136 99,300 129,891 143,372
Total assets 2,125,066 2,504,327 2,469,498 2,501,490 2,535,068
Long-term debt 536,579 663,205 724,65 789,232 809,480
Total debt to capitalization 45.9% 50.7% 60.0% 58.7% 45.9%
Shareowners’ equity per shareof common stock $ 6.05 $ 6.82 $ 5.50 $ 9.50
1. As a creditor, what do you believe management’s objectives should be? Which of thepreceding items of information would assist a creditor in judging management’s performance?

9/25/2017 Managerial Accounting
file:///Users/hannah/Downloads/Managerial-Accounting-1506381825_regexified.html 340/350
2. As an investor, what do you believe management’s objectives should be? Which of thepreceding items of information would assist an investor in judging management’s performance?
3. What other information might be considered useful?
Group project E Choose a company the class wants to know more about and obtain its annualreport. In groups of two or three students, calculate either the liquidity, equity, profitability, or markettest ratios. Each group should select a spokesperson to tell the rest of the class the results of thegroup’s calculations. Finally, the class should decide whether or not to invest in the corporationbased on the ratios they calculated.
Group project F In a group of two or three students, go to the library and attempt to locate Dun &Bradstreet’s Industry Norms and Key Business Ratios. You may have to ask the reference librarianfor assistance to see if this item is available at your institution. If it is not available at your institution,ask if it is available through an interlibrary loan. (Obviously, if you cannot obtain this item, youcannot do this project.) Then select and obtain the latest annual report of a company of your choice.Determine the company’s SIC Code (a code that indicates the industry in which that companyoperates). SIC Codes for specific companies are available on COMPACT DISCLOSURE, anelectronic source that may be available at your library. As an alternative, you could call thecompany’s home office to inquire about its SIC Code. The annual report often contains thecompany’s phone number. From the annual report, determine various ratios for the company, suchas the current ratio, debt to equity ratio, and net income to net sales. Then compare these ratios tothe industry norms for the company’s SIC Code as given in the Dun & Bradstreet source. Write areport to your instructor summarizing the results of your investigation.
Group project G In a group of two or three students, obtain the annual report of a company of yourchoice Identify the major sections of the annual report and the order in which they appear. Wouldyou recommend the order be changed to emphasize the most useful and important information? Ifso, how? Then describe some specific useful information in each section. Comment on yourperceptions of the credibility that a reader of the annual report could reasonably assign to eachsection of the report. For instance, if such a discussion appears in the annual report you select,would you assign high credibility to everything that appears in the Letter to Stockholders regardingthe company’s future prospects? Write a report to your instructor summarizing the results of yourinvestigation.
Using the Internet—A view of the real world
Visit the following website for Eastman Kodak Company:
http://www.kodak.com
By following choices on the screen, locate the income statements and balance sheets for the latesttwo years. Calculate all of the ratios illustrated in the chapter for which the data are available.Compare the ratios to those shown for Synotech as presented in the chapter. Write a report to yourinstructor showing your calculations and comment on the results of your comparison of the twocompanies.
Visit the following website for General Electric Company:
http://www.ge.com
By following choices on the screen, locate the income statements and balance sheets for the latesttwo years. Calculate all of the ratios illustrated in the chapter for which the data are available.Compare the ratios to those shown for Synotech as presented in the chapter. Write a report to yourinstructor showing your calculations and comment on the results of your comparison of the twocompanies.

9/25/2017 Managerial Accounting
file:///Users/hannah/Downloads/Managerial-Accounting-1506381825_regexified.html 341/350
Answers to self-test
True-false
True. Financial statement analysis consists of applying analytical tools and techniques to financialstatements and other relevant data to obtain useful information.
False. Horizontal analysis provides useful information about the changes in a company’sperformance over several periods by analyzing comparative financial statements of the samecompany for two or more successive periods.
False. Common-size statements show only percentage figures, such as percentages of total assetsand percentages of net sales.
True. Liquidity ratios such as the current ratio and acid-test ratio indicate a company’s short-termdebt-paying ability.
True. The accrual net income shown on the income statement is not cash basis income and doesnot indicate cash flows.
True. Analysts must use comparable data when making comparisons of items for different periodsor different companies.
Multiple-choice
1. b. Current assets: $136,000 + $64,000 + $184,000 + $244,000 + $12,000 = $640,000
Current liabilities: $256,000 + $64,000 = $320,000
Current ratio:
1. c. Quick assets:
$136,000 + $64,000 + $184,000 = $384,000
Current liabilities:
256,000 + $64,000 = $320,000
Acid-test ratio:
1. Net sales:
$4,620,000
Average accounts receivable:
Accounts receivable turnover:
1. Cost of goods sold:
$3,360,000
Average inventory:
Inventory turnover:

9/25/2017 Managerial Accounting
file:///Users/hannah/Downloads/Managerial-Accounting-1506381825_regexified.html 342/350
1. Income before interest and taxes, $720,000
Interest on bonds, 192,000
Times interest earned ratio: $720,000/$192,000 = 3.75 times
Licensing & Attributions
CC licensed content, Shared previously
Accounting Principles: A Business Perspective. Authored by: James Don Edwards, University of Georgia & Roger H. Hermanson, Georgia State University. Provided by: Endeavour International Corporation.Project: The Global Text Project . License: CC BY: Attribution

9/25/2017 Managerial Accounting
file:///Users/hannah/Downloads/Managerial-Accounting-1506381825_regexified.html 343/350
APPENDIX: SERVICE DEPARTMENTALLOCATION
ALLOCATION OF SERVICE DEPARTMENTCOSTS
Throughout this text, we have emphasized cost allocations only in the operating departments of acompany. These operating departments perform the primary purpose of the company—to producegoods and services for consumers. Examples of operating departments are the assemblydepartments of manufacturing firms and the departments in hotels that take and confirm reservations.
The costs of service departments are allocated to the operating departments because they exist tosupport the operating departments. Examples of service departments are maintenance,administration, cafeterias, laundries, and receiving. Service departments aid multiple productiondepartments at the same time, and accountants must allocate and account for all of these costs. It iscrucial that these service department costs be allocated to the operating departments so that thecosts of conducting business in the operating departments are clearly and accurately reflected.
Accountants allocate service department costs using some type of base. When the companies’managers choose bases to use, they consider such criteria as the types of services provided, thebenefits received, and the fairness of the allocation method. Examples of bases used to allocateservice department costs are number of employees, machine-hours, direct labor-hours, squarefootage, and electricity usage.
There are three methods for allocating service department costs:The first method, the direct method, is the simplest of the three. The direct method allocates costsof each of the service departments to each operating department based on each department’sshare of the allocation base. Services used by other service departments are ignored.The second method of allocating service department costs is the step method. This methodallocates service costs to the operating departments and other service departments in asequential process. The sequence of allocation generally starts with the service department thathas incurred the greatest costs. After this department’s costs have been allocated, the servicedepartment with the next highest costs has its costs allocated, and so forth until the service department with the lowestcosts has had its costs allocated. Costs are not allocated back to a department that has alreadyhad all of its costs allocated.The third method is the most complicated but also the most accurate. The reciprocal methodallocates services department costs to operating departments and other service departments.

9/25/2017 Managerial Accounting
file:///Users/hannah/Downloads/Managerial-Accounting-1506381825_regexified.html 344/350
Under the reciprocal cost, the relationship between service departments is recognized and cost isallocated to and from each service department for services provided.
Next, we will look at each method.Licensing & Attributions
CC licensed content, Shared previously
Accounting Principles: A Business Perspective. Authored by: James Don Edwards, University of Georgia & Roger H. Hermanson, Georgia State University. Provided by: Endeavour International Corporation.Project: The Global Text Project. License: CC BY: Attribution
DIRECT METHOD OF ALLOCATION
The direct method allocates costs of each of the service departments to each operating departmentbased on each department’s share of the allocation base. Services used by other service departmentsare ignored. This means the direct method does not recognize service performed by other servicedepartments. For example, if Service Department A uses some of Service Department B’s services,these services would be ignored in the cost allocation process. Because these services are notallocated to other service departments, some accountants believe the direct method is not accurate.
Watch this video online: https://youtu.be/LxrmRNNW1PI
Let’s look at another example. A company has 2 service departments, Maintenance andAdministration, and 2 operating departments (Department 1 and 2 for simplicity). The costs of themaintenance department are allocated based on the machine-hours used. For the administration department, the cost allocation is based on the number of employees. The followinginformation is provided:
Service Dept Operating Dept
Maintenance Administration 1 2
Costs $8,000 $4,000 $32,000 $36,000
Machine-hours used 1,000 2,000 1,500 2,500
Number of Employees 100 200 250 150
Remember how we calculate predetermined overhead rates? We will need that same formula again. The formula to calculate the allocation rate will be slightly modified for service department cost but willbe:
Service Dept Cost
TOTAL Cost Driver (operating depts only)
Notice, we use the operating department cost drivers only since we are allocating the servicedepartment cost to operating departments only and not to another service department. Maintenance
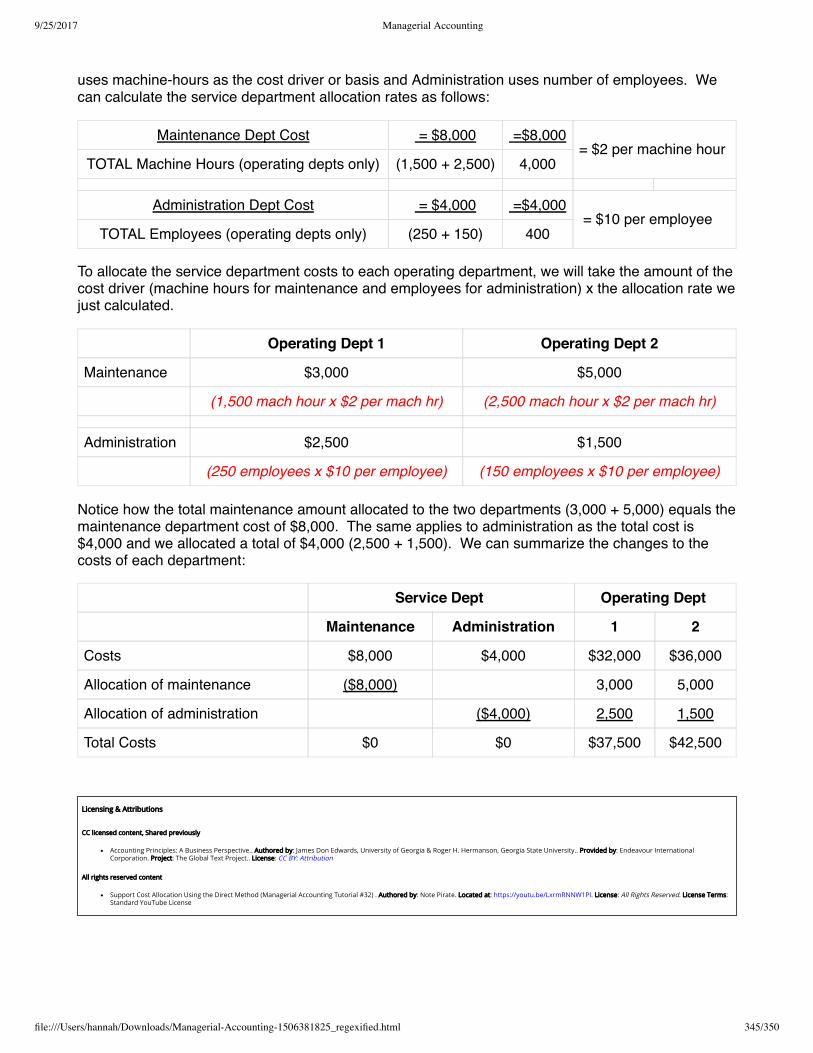
9/25/2017 Managerial Accounting
file:///Users/hannah/Downloads/Managerial-Accounting-1506381825_regexified.html 345/350
uses machine-hours as the cost driver or basis and Administration uses number of employees. Wecan calculate the service department allocation rates as follows:
Maintenance Dept Cost = $8,000 =$8,000= $2 per machine hour
TOTAL Machine Hours (operating depts only) (1,500 + 2,500) 4,000
Administration Dept Cost = $4,000 =$4,000 = $10 per employee
TOTAL Employees (operating depts only) (250 + 150) 400
To allocate the service department costs to each operating department, we will take the amount of thecost driver (machine hours for maintenance and employees for administration) x the allocation rate wejust calculated.
Operating Dept 1 Operating Dept 2
Maintenance $3,000 $5,000
(1,500 mach hour x $2 per mach hr) (2,500 mach hour x $2 per mach hr)
Administration $2,500 $1,500
(250 employees x $10 per employee) (150 employees x $10 per employee)
Notice how the total maintenance amount allocated to the two departments (3,000 + 5,000) equals themaintenance department cost of $8,000. The same applies to administration as the total cost is$4,000 and we allocated a total of $4,000 (2,500 + 1,500). We can summarize the changes to thecosts of each department:
Service Dept Operating Dept
Maintenance Administration 1 2
Costs $8,000 $4,000 $32,000 $36,000
Allocation of maintenance ($8,000) 3,000 5,000
Allocation of administration ($4,000) 2,500 1,500
Total Costs $0 $0 $37,500 $42,500
Licensing & Attributions
CC licensed content, Shared previously
Accounting Principles: A Business Perspective.. Authored by: James Don Edwards, University of Georgia & Roger H. Hermanson, Georgia State University.. Provided by: Endeavour InternationalCorporation. Project: The Global Text Project.. License: CC BY: Attribution
All rights reserved content
Support Cost Allocation Using the Direct Method (Managerial Accounting Tutorial #32) . Authored by: Note Pirate. Located at: https://youtu.be/LxrmRNNW1PI. License: All Rights Reserved. License Terms:Standard YouTube License

9/25/2017 Managerial Accounting
file:///Users/hannah/Downloads/Managerial-Accounting-1506381825_regexified.html 346/350
STEP METHOD OF ALLOCATION
The second method of allocating service department costs is the step method. This method allocatesservice costs to the operating departments and other service departments in a sequential process.The sequence of allocation generally starts with the service department that has incurred the greatestcosts. After this department’s costs have been allocated, the service department with the next highestcosts has its costs allocated, and so forth until the service department with the lowest costs has hadits costs allocated. Costs are not allocated back to a department that has already had all of its costsallocated.
Watch this video online: https://youtu.be/oUk3f9SWFKU
For this example, we will use the same data as before which was:
Service Dept Operating Dept
Maintenance Administration 1 2
Costs $8,000 $4,000 $32,000 $36,000
Machine-hours used 1,000 2,000 1,500 2,500
Number of Employees 100 200 250 150
In the step method, we typically begin with the highest service cost first. We will start withMaintenance and allocate the cost to all remaining operating AND service departments(administration, operating dept 1 and operating dept 2). When calculating the allocation rate, wenever use the service department cost driver itself (so do not use the maintenance machine hoursused).
Maintenance Cost = $8,000 =$8,000 = $1.3333 per machine
hourMachine Hours (all butmaintenance)
(2,000 + 1,500 +2,500) 6,000
We would allocate maintenance to Administration, Operating Departments 1 and 2 using the machinehours for each department x the maintenance rate per machine hour (round final answer to nearestdollar).
Admin Oper. Dept 1 Oper. Dept 2
Maintenance 2,667 2,000 3,333
(2,000 MH x 1.333) (1,500 MH x 1.3333) (2,500 MH x 1.3333)
Next, we would allocate the administration department. The total administration cost has changedsince we have the original department costs of $4,000 + maintenance cost allocated above of $2,667making the new administration cost $6,667. Administration will be allocated based on number of

9/25/2017 Managerial Accounting
file:///Users/hannah/Downloads/Managerial-Accounting-1506381825_regexified.html 347/350
employees. We will use the operating departments only since we have already allocate all ofmaintenance costs and there are no other service departments.
Administration Cost = $6,667 =$6,667= $16.6675 per employee
Employees (operating depts only) (250 + 150) 400
We would allocate administration to the operating departments only by taking each departmentnumber of employees x the administration rate per employee (round final answer to nearest dollar).
Oper. Dept 1 Oper. Dept 2
Administration 4,167 2,500
(250 employees x 16.6675) (150 employees x 16.6675)
The final cost allocation would appear as follows:
Service Dept Operating Dept
Maintenance Administration 1 2
Costs $8,000 $4,000 $32,000 $36,000
Maintenance cost allocated ($8,000) 2,667 2,000 3,333
Administration cost allocated ($6,667) 4,167 2,500
Total Costs $0 $0 $38,167 $41,833
Remember, the step method recognizes a one-way relationship between service departments andonce the service department cost has been allocated out to other departments, we do not go backand give additional costs to that department.
Licensing & Attributions
CC licensed content, Shared previously
Accounting Principles: A Business Perspective.. Authored by: James Don Edwards, University of Georgia & Roger H. Hermanson, Georgia State University.. Provided by: Endeavour InternationalCorporation. Project: The Global Text Project.. License: CC BY: Attribution
All rights reserved content
Support Cost Allocation using Step Down Method (Managerial Accounting Tutorial #33) . Authored by: Note Pirate. Located at: https://youtu.be/oUk3f9SWFKU. License: All Rights Reserved. License Terms:Standard YouTube License
RECIPROCAL METHOD OF ALLOCATION
The final method, is the reciprocal method. Although it is the most accurate, it is also the mostcomplicated. In the reciprocal method, the relationship between the service departments is

9/25/2017 Managerial Accounting
file:///Users/hannah/Downloads/Managerial-Accounting-1506381825_regexified.html 348/350
recognized. This means service department costs are allocated to and from the other servicedepartments.
Watch this video online: https://youtu.be/NB0zsaPC4MI
We can break the process up into 3 steps so we can make sense of the process. To demonstrate, wewill use the same basic data:
Service Dept Operating Dept
Maintenance Administration 1 2
Costs $8,000 $4,000 $32,000 $36,000
Machine-hours used 1,000 2,000 1,500 2,500
Number of Employees 100 200 250 150
Step 1: Determine allocation bases
Just like you would for direct or step,we need to calculate the allocation base EXCEPT the only thingyou are excluding is the department cost you are trying to allocate — ALL other departments areincluded. We can calculate the allocation base amount for each service department as follows:
Maintenance Dept Administration Dept
Mach Hrs % ofTotal Employees % of Total
Maintenance –
–
100 20.00% (100/500)
Administration 2,000 2/6** (2,000/6,000)
–
–
Dept 1 1,500 25% (1,500/6,000)
250 50.00% (250/500)
Dept 2 2,500 2.5/6** (2,500/6,000)
150 30.00% (150/500)
Total 6,000 100%
500 100.00%
**since these numbers do not come out evenly, we keep them in the fraction form and only round thefinal answer to the nearest dollar.
Step 2: Setup the formulas.
Since maintenance costs are allocated to administration and administration cost is allocated tomaintenance — things get interesting. You will need to determine the TOTAL cost being allocated toboth the Administration and Maintenance Departments first.
(a) Total Maintenance cost = Maintenance department cost + cost allocated to maintenance fromadministration.

9/25/2017 Managerial Accounting
file:///Users/hannah/Downloads/Managerial-Accounting-1506381825_regexified.html 349/350
(b) Total Administration cost = Administration department cost + cost allocated to administration frommaintenance.
We will work with the administration cost formula in (b) first:
Total Administration cost = Administration department cost + cost allocated to administration frommaintenance. From step 1, we know the cost allocation to administration from maintenance is (2/6 xtotal maintenance cost). We still do not know what total maintenance cost but we can plug in this newformula.
Total Administration cost = $ 4,000 administration department cost + (2/6 x total maintenance cost)
We can insert the formula from (a) for total maintenance cost into the total administration cost formula(b) as follows:
Total Administration cost = $4,000 admin department cost + [2/6 x (Maintenance department cost +cost allocated to maintenance from administration) ]
We can see from step 1 that administration cost is allocated to maintenance as total administrationcost x 20%. Adding this to our formula, we now have:
Total Administration cost = $4,000 admin department cost + [2/6 x ($8,000 Maintenance departmentcost + (total admin cost x 20%) ) ]
Using algebra, we can assign Total Administration Cost a variable of A giving the formula:
A = 4,000 + [ 2/6 x ($8,000 + 0.20)A]
A = 4,000 + (2/6 x 8,000) + (2/6 x 0.20A)
A = 4,000 + 2,666.67 + 0.067A — rounded
A = 6,666.67 + 0.067A
1.0A – 0.067A = 6,666.67
0.933A = 6,666.67
A or total administration cost = $7,145 rounded
Total maintenance cost can be calculated as $8,000 department cost + $1,429 (7,145 x 20%)allocated from administration for a total of $9,429.
Step 3: Show cost allocations
Now that you have the TOTAL Cost of Maintenance and Personnel, it is time to allocate it using theTotal Cost amounts from Step 2 and the percents from Step 1.
Service Dept Operating Dept
Maintenance Administration 1 2
Costs $8,000 $4,000 $32,000 $36,000
Maintenance costs allocated -9,429 3,143 2,357 3,929
(9,429 x 2/6) (9,429 x 25%) (,9429 x 2.5/6)

9/25/2017 Managerial Accounting
file:///Users/hannah/Downloads/Managerial-Accounting-1506381825_regexified.html 350/350
Administration costs allocated 1,429 -7,145 3,572.50 2,143.50
(7,145 x 20%) (7,145 x 50%) (7,145 x 30%)
Total costs $0 ($2)** $37,930 $42,073
** difference due to rounding in calculations.
Licensing & Attributions
All rights reserved content
Support Cost Allocation Using Reciprocal Method (Managerial Accounting Tutorial #34) . Authored by: Note Pirate. Located at: https://youtu.be/NB0zsaPC4MI. License: All Rights Reserved. License Terms:Standard YouTube License


