Embed Size (px)
Citation preview
Case Studies
2013
Managerial Accounting 547
Study Package Number: 313419 Credits: 25 Pre-requisite: Nil
Curtin Business School School of Accounting
Managerial Accounting 547 – Case Studies 2013
2
ASM Lithography
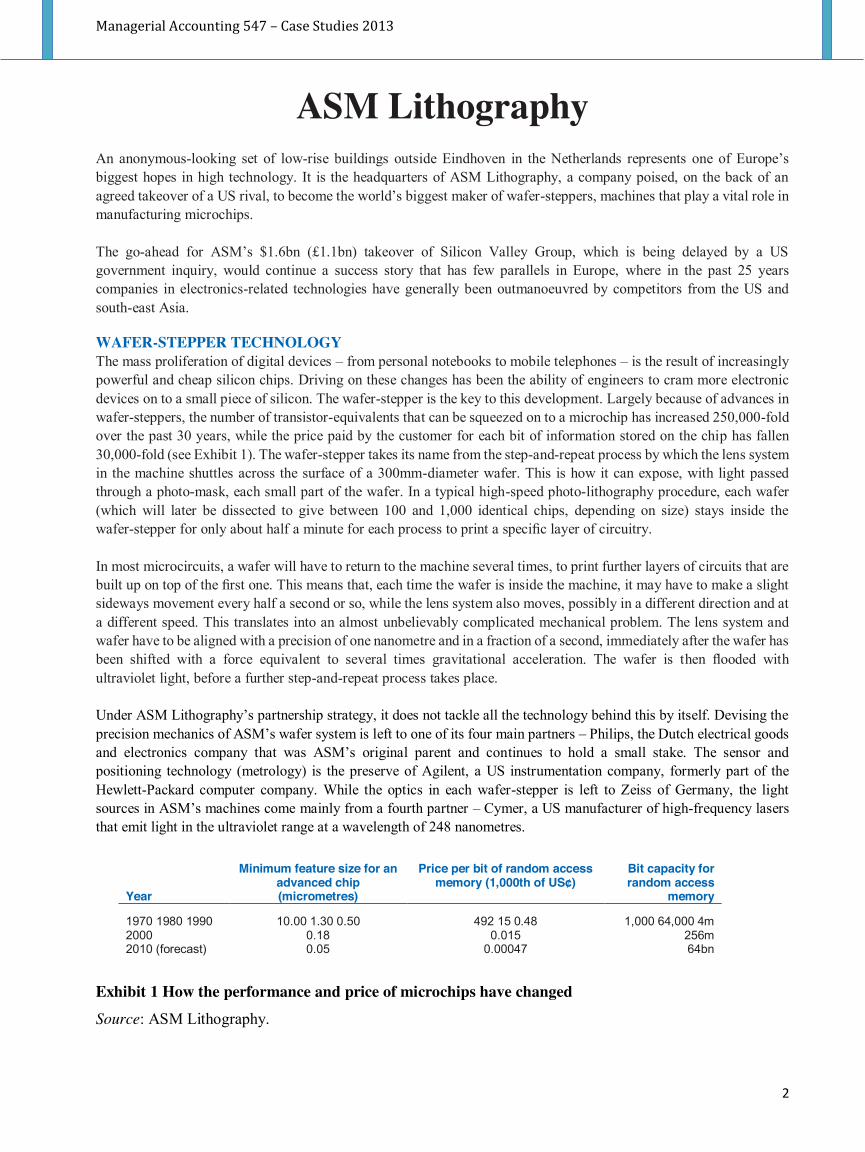
An anonymous-looking set of low-rise buildings outside Eindhoven in the Netherlands represents one of Europe’s biggest hopes in high technology. It is the headquarters of ASM Lithography, a company poised, on the back of an agreed takeover of a US rival, to become the world’s biggest maker of wafer-steppers, machines that play a vital role in manufacturing microchips. The go-ahead for ASM’s $1.6bn (£1.1bn) takeover of Silicon Valley Group, which is being delayed by a US government inquiry, would continue a success story that has few parallels in Europe, where in the past 25 years companies in electronics-related technologies have generally been outmanoeuvred by competitors from the US and south-east Asia. WAFER-STEPPER TECHNOLOGY The mass proliferation of digital devices – from personal notebooks to mobile telephones – is the result of increasingly powerful and cheap silicon chips. Driving on these changes has been the ability of engineers to cram more electronic devices on to a small piece of silicon. The wafer-stepper is the key to this development. Largely because of advances in wafer-steppers, the number of transistor-equivalents that can be squeezed on to a microchip has increased 250,000-fold over the past 30 years, while the price paid by the customer for each bit of information stored on the chip has fallen 30,000-fold (see Exhibit 1). The wafer-stepper takes its name from the step-and-repeat process by which the lens system in the machine shuttles across the surface of a 300mm-diameter wafer. This is how it can expose, with light passed through a photo-mask, each small part of the wafer. In a typical high-speed photo-lithography procedure, each wafer (which will later be dissected to give between 100 and 1,000 identical chips, depending on size) stays inside the wafer-stepper for only about half a minute for each process to print a specific layer of circuitry. In most microcircuits, a wafer will have to return to the machine several times, to print further layers of circuits that are built up on top of the first one. This means that, each time the wafer is inside the machine, it may have to make a slight sideways movement every half a second or so, while the lens system also moves, possibly in a different direction and at a different speed. This translates into an almost unbelievably complicated mechanical problem. The lens system and wafer have to be aligned with a precision of one nanometre and in a fraction of a second, immediately after the wafer has been shifted with a force equivalent to several times gravitational acceleration. The wafer is then flooded with ultraviolet light, before a further step-and-repeat process takes place. Under ASM Lithography’s partnership strategy, it does not tackle all the technology behind this by itself. Devising the precision mechanics of ASM’s wafer system is left to one of its four main partners – Philips, the Dutch electrical goods and electronics company that was ASM’s original parent and continues to hold a small stake. The sensor and positioning technology (metrology) is the preserve of Agilent, a US instrumentation company, formerly part of the Hewlett-Packard computer company. While the optics in each wafer-stepper is left to Zeiss of Germany, the light sources in ASM’s machines come mainly from a fourth partner – Cymer, a US manufacturer of high-frequency lasers that emit light in the ultraviolet range at a wavelength of 248 nanometres. Exhibit 1 How the performance and price of microchips have changed
Source: ASM Lithography.
Year
Minimum feature size for an advanced chip (micrometres)
Price per bit of random access memory (1,000th of US¢)
Bit capacity for random access
memory
1970 1980 1990 10.00 1.30 0.50 492 15 0.48 1,000 64,000 4m 2000 0.18 0.015 256m 2010 (forecast) 0.05 0.00047 64bn
Managerial Accounting 547 – Case Studies 2013
3
ASM AND WAFER STEPPERS Behind ASM’s success is the brain-box model: an approach apparent in other areas of high-tech manufacturing. It involves the company maintaining strong links with customers and retaining a crucial role in technology development while leaving to partner businesses much of the manufacturing and design of subcomponents. Incongruously, an important contributor to ASM making this strategy work in the microelectronics age turns out to be a 155-year-old German business steeped in the mechanical engineering principles of the nineteenth century. Carl Zeiss, a large, privately owned optics group, is the Dutch company’s sole supplier of the complex lens systems that are an essential part of its machines and account for about a quarter of its manufactured costs. Costing up to $10m and weighing about 15 tonnes, wafer-steppers are among the most complicated machines on earth. They use optics, precision engineering and lasers to define with mind-boggling precision the dimensions of integrated circuits. ‘Just about everything we do involves technologies at the limits of human capability,’ says Doug Dunn, ASM’s chief executive. Worldwide sales of wafer-steppers – also called silicon lithography machines – last year came to nearly $6bn. The machines radiate ultraviolet light through a lens system and photographic mask. The light rays print (using a photoresist) complicated patterns on to silicon wafers in which the lines are about 0.15 micrometres thick. The lines define the positions of transistors – of which tens of millions, assuming the lithographic patterns are fine enough, can be positioned through manufacturing steps on to a thumbnail-sized chip. Because the accuracy and operating efficiency of wafer-steppers are vital to microchip production, the companies that make them influence the global $1,500bn-a-year electronics business. Wafer-stepper manufacture is dominated by four companies, accounting for more than 95 per cent of world sales. With a market share estimated at 34 per cent, ASM is number two behind Nikon of Japan, with 37 per cent. But through the deal announced last October to buy Silicon Valley Group – now in number four position – ASM is due to become the world leader, with a share of more than 40 per cent, roughly twice as much as Canon of Japan. The deal is being delayed by an investigation into whether US national security would be endangered by allowing foreign control of Tinsley, a small subsidiary of Silicon Valley Group. As well as making lenses for lithography applications, Tinsley produces optical systems for surveillance satellites, including those operated by the US Defense Department. The results of the inquiry are expected in late April or early May (2001). Assuming the deal goes through – and ASM is hopeful, saying it is ready to guarantee to the US government that the availability of Tinsley’s technology will not be compromised – ASM hopes it can build on its position to take more than 50 per cent of the world market within a few years. The company remains confident about the longer-term prospects, in spite of warnings in March that profits would be hit this year by the expected slowdown in investment in the $200bn-a-year microchip industry. ASM’S DEVELOPMENT ASM’s strong run started only relatively recently. Formed in 1984 as a unit of Philips, the Dutch electronics company, it was spun out as a quoted company in 1995. Since then, revenues have risen fivefold to £2.2bn (£1.35bn) last year – with sales outside the Netherlands accounting for 85 per cent of itsrevenues. The company has more than doubled its market share in wafer-steppers since the early 1990s, when its US and Japanese competitors were in the ascendancy. ASM’s story underlines that in high technology, early movers do not necessarily end up strongest. Microchip lithography was invented by Perkin-Elmer, a US instrumentation business, which brought out its first machine in 1973. The machines defined lines 4 micrometres thick, making their resolving power roughly one-twenty-fifth of today’s systems. In the mid-1980s, GCA, a US company, was dominant in wafer-steppers, having entered the business in 1976. But both companies lost their lead in the 1990s to Nikon (which introduced its first machine in 1980) and Canon. A key to this was that the Japanese companies offered superior lens systems to the US competitors (both of which later quit the
Managerial Accounting 547 – Case Studies 2013
4
wafer-stepper business). Both Nikon and Canon had in-house optics technologies, developed as a result of their respective backgrounds in cameras and office equipment. It is in this context that the ASM/Zeiss partnership, which started in the late 1980s, has been vital. The durability of this partnership – and the world-class optics technology that Zeiss provides – has been crucial to ASM’s success. Zeiss, whose centre for semiconductor optics technology is at its headquarters in Oberkochen, a small town near Stuttgart, employs several hundred people who work solely for ASM. They make lens stacks: 1-metre-tall systems of up to 30 lenses, each ground, sometimes with ion beams, to immense accuracy. The lens stacks are at the heart of each wafer-stepper, making sure the radiation is directed on to the wafers with the required precision. The nature of the link with Zeiss has caused some heart-searching at ASM. Mr Dunn, an Englishman who took the top job at ASM in January 2000 after a career in the electronics industry with Plessey, Motorola and Philips, says it is ‘risky’ to have just one supplier for such a critical sub-component – ‘but we don’t have any other choice’. Such is the rarefied nature of this technology, Mr Dunn explains, that it would be virtually impossible to have a back-up supplier that could provide the same quality as Zeiss. Also, by guaranteeing to Zeiss that it will buy lenses from no one else, ASM has made the importance of the link transparent, which Mr Dunn thinks spurs the German company to greater effort on its behalf. ‘We fight a lot but underneath we have a good relationship’, he says. ASM has three other critical partnerships, as a result of which, under its brain-box strategy, it can divert most of its energies into machine development, marketing and building up links with customers, leaving in-depth technical know-how in the area of precision mechanics, metrology and light sources to others. Of ASM’s 4,300 employees (a figure that has increased by 2,000 in the past two years and of which 1,000 are based outside the Netherlands), nearly one in three works in research and development – a field that accounted for 10.8 per cent of sales last year. A similar number is in marketing or customer support, liaising with the big semiconductor companies that are the company’s customers. Only about 800 work in manufacturing – and of these only half are traditional manufacturing and assembly workers, with the rest involved in buying subcomponents or organising shipments of finished goods. ASM’S FUTURE CHALLENGES Mr Dunn says that one of his biggest challenges is to make sure that the spirit of the company – where the average age is only 32 – is kept at the same high pitch as during these years of rapid high growth. Meanwhile, he says that – assuming his US deal is approved and he is left, in effect, with just two competitors – he cannot afford to relax. He says: ‘Every day when I wake up I am paranoid about what the Japanese are doing.’ The next few years, Mr Dunn intimates, are unlikely to be easy for ASM – even if its record in building up a rare European strength in high technology is second to none.
Managerial Accounting 547 – Case Studies 2013
5
Glamour Plastics Glamour Plastics Pty Ltd manufactures plastic kitchenware at its Castle Hill factory. Its manufacturing equipment consists of large plastic extrusion machines that were purchased 15 years ago. Glamour Plastics produces in small production runs, and although the machine is old, it is reliable. The company’s products are much sought after by specialty gift stores and up-market department stores such as David Jones. It also sells its products to Saks of Fifth Avenue in New York. While Glamour Plastics has many products, among the most popular is the Puchi salad bowl and servers. This product is made of clear plastic with gold specks, and competes very favourably with the latest Italian salad bowls. Glamour Plastics has just begun its first benchmarking activity. It has subscribed to an international benchmarking group that provides benchmarking data specifically tailored to different industries. The benchmarking data supplied by the agency, relating to the plastics industry, include product cost per kilogram of finished product; cycle time; reject rate; and direct labour and raw material costs per kilogram of product. The manufacturing manager, Pascale Grinwald, suspects that the benchmark data must relate to the famous Speedy Plastics, renowned as the world’s best plastics manufacturer. This company is a mass-producer of multi-coloured lunch boxes and picnic cutlery, and uses high-speed, computer-controlled plastic extrusion machines. The management accountant of Glamour Plastics, Bruce Hogan, has prepared a report comparing the performance of Glamour Plastics with the benchmark data:
Pascale is concerned about the size of some of the performance gaps between Glamour Plastics’ measures and best practice, and has asked Bruce to investigate.
Performance measure Glamour Plastics Benchmark data
Product cost per kilogram of product $85 $66
Direct labour per kilogram of product $20 $10
Raw material cost per kilogram of product $45 $10
Cycle time per 100 units 60 minutes 15 minutes
Reject rate 2% 3%
Managerial Accounting 547 – Case Studies 2013
6
Topps International Ltd
TOPPS INTERNATIONAL LTD, 1995 Topps International Ltd has been operating since 1977 and is a subsidiary of a US-owned multinational company, the Topps Company Inc. Topps is an international marketer of entertainment products – principally collectable trading cards, confectionery, and sticker and album collections – and was founded in 1938. Topps created Bazooka bubblegum in 1947 and marketed the first baseball cards in 1951. Nowadays, Topps is a major player in the children’s entertainment business on the European market and describes its business as the marketing and distribution of fashion items for the children’s market. Hence, Topps is not a typical manufacturing company. Some of the most famous products on which Topps success has been built, the Bazooka chewing gums and the Push-Pops lollipops, have now become household names. Topps has also become famous for adding an entertainment component to its confectionery products in the shape of ‘Casper the friendly ghost’ toy containers, containing gum or sweets. Recently, Topps has been particularly successful with its purchase of the rights to make Pokémon-branded products, including the sale of stickers and albums. The emphasis of its business has changed substantially over the years from a heavily manufacturing perspective to an approach based more on the trade of goods imported from the Far East. By 1995, 20 per cent of its products were manufactured locally, the remainder being imported from China, Thailand and other countries. This represented a significant shift from the position even five years earlier when less than 20 per cent of products were imported. This switch in business emphasis allowed sales growth to mushroom with corresponding increases in the import/export activities. The product life cycle of some of the products was extremely short so the company needed to react quickly to change, emphasising the company’s requirement for accurate information that was readily available. This acceleration of the business flows was aggravated by the rapid development of the new trading element of Topps’ business. Topps products were distributed out of three warehouses – Cork (Ireland), Liverpool (UK) and Rotterdam (Holland). The Cork plant stored the products manufactured in Cork while the Rotterdam depot stored imported products and the Liverpool depot maintained stocks required to serve the UK market. All activities were managed from Cork1
with outside companies providing warehousing and distribution facilities at both external locations. The UK was the biggest market and a team of sales representatives handled sales to multiple stores and wholesalers. Ireland and the rest of Europe were serviced through distributors in each country. Products were sold mainly on a sale or return basis, making it vital that returns were identified quickly and resold within the life cycle where possible. Sales campaigns were not launched simultaneously in all countries and regions so it was often possible to pass unsold products on to another, less saturated market. Identifying the critical success factors for Topps in 1995 Topps’ business success revolved around making correct management decisions quickly. Information technology (IT) supported the vital provision of rapid, accurate information on which to base these decisions. Spreadsheets were used extensively (on a limited number of PCs used in the company) to create mini profit and loss accounts representing scenario analyses on specific markets or for specific products and to identify windows of opportunity aimed at maximising the rotation of stock. The main business tools centred on the strategic plan and operational budgets derived therefrom which were based on a number of spreadsheet models developed in a PC-based software package. The majority of information was gathered manually and the non-strategic data processing services (payroll, invoicing, inventory control, and other nonstrategic transactions processing systems) were provided by software supplied by an external supplier. Both the software and the computer used to run it were completely obsolete – Topps was the final customer using these services, which were becoming increasingly expensive and unreliable. Management at Topps had repeatedly complained to its parent company about the failure of their largely manual systems, but each time clearance to purchase a new system was requested, it was refused by headquarters (in New York). Topps’ management realised that too much replication and duplication was taking place and that a fully integrated financial, manufacturing and distribution system was required to both:
support the basic business processes, and automate basic flows of information.
A more reliable information basis was required to speed up the reporting processes across the organisation. A need for the capability of downloading all required information from a central system into existing information systems was 1 While three separate locations existed, all activities were processed through the Cork offices.
Managerial Accounting 547 – Case Studies 2013
7
identified to improve and make the production of crucial management reports more reliable. Such an approach would require the implementation of a network of PCs to enable data collection and screen enquiries throughout the different business functions (new hardware), selection and implementation of appropriate financial, distribution and manufacturing modules (new software), and staff training. In March 1995, Topps International Ltd again attempted to purchase such an integrated software package that would cover the financial, distribution and manufacturing aspects of their business. The business was growing rapidly across all European markets and it was also looking to expand into a number of South American countries. It had been mainly a manufacturing organisation, but 75 per cent of its turnover was now coming from trading in goods produced by Far East suppliers. The most significant problem for Topps was identified as the lack of online stock control for key personnel as the basic computerised stock system used tracked only goods manufactured and stored in Cork. There were also occasional failures to meet shipping deadlines because of paperwork delays. The robustness of the cash flow was compromised by the lack of control of debtors’ balances and invoice due dates. In addition, there were also problems with reporting to the US headquarters due to the unavailability of information on territory and product profitability. Compliance with requirements for regular monthly and quarterly reports on EU movements of goods was slow. As described by the then financial controller, the company was vulnerable in the shipping, credit-control and treasury departments. He concluded that too much information was contained in employees’ heads rather than in the company’s information systems. Reports that were written at this time pointed out that hiring extra staff would not solve these problems and that the availability of a fully integrated system of the enterprise resource planning type would be required (see, for example, the Consultants’ Report in the Appendix). In addition to this operational data layer, a powerful report generation application would also be required to generate better quality managerial reporting. At the time, a number of potential failures were threatening:
Sales order processing required attention as it was feared that Topps might begin to lose a significant portion of the ever-growing business due to orders not being met on time or not being processed at all.
Invoicing is always a crucial element of a business, but Topps’ management sometimes had no clear idea how much had been shipped to a particular customer. In fact, some shipping deadlines were not met due to paperwork delays.
Convincing HQ Over twenty months of time and effort (in tendering, and development) was involved in the process that culminated in the selection of the required ERP system and the local software vendor who was to supply it. Consultants had argued that local support would be a significant asset during the implementation phase as people in Topps had little experience with large computer systems (there were no full-time IT personnel in Topps at the time). The next step in the process was to commit the money to this investment of roughly £180,000 and the signs were good when the IT director at HQ responded favourably to the request and agreed with the conclusions of the final report he had been sent. Topps’ parent company then purchased Merlin Publishing, a UK-based company similar in size to Topps but operating in the complementary children’s entertainment market (e.g. the production of stickers of players in the English premiership and other major European soccer leagues). Due to uncertainties regarding the sharing of business between Topps and Merlin and the relations to be developed between the two companies, HQ decided, again, to block the ERP investment in Topps. Following a number of meetings with equivalent personnel in Merlin, a new strand of reports was sent to HQ to indicate how the systems in both Topps and Merlin could operate and the processes that could be shared between the two companies. A joint report signed by Topps and Merlin was even sent to the US to emphasise the support that Merlin were ready to give Topps in its implementation of the system selected. A further series of negotiations took place but the project was put on hold while a global IT strategy for Topps was developed by the IT director at HQ. More than two years after the first reports had been written and sent to the US about the weaknesses of the systems in Topps, nothing had been done and the manual systems were still holding on. A computerised system for Topps International had never seemed so far away. In a final attempt to demonstrate that there were no managerial grounds for postponing the commitment of Topps to the purchase of a system (software and hardware) another report was sent to HQ. The report emphasised that a global IT strategy for the company made little sense as no truly shared processes requiring integration of computer systems had been identified either between Ireland and the US or between Topps and Merlin (the computing cultures differed significantly as Merlin had full-time IT personnel and a networked IT infrastructure with its international subsidiaries; no such common processes existed between Merlin and Topps – no consolidation of financial information was required;;
Managerial Accounting 547 – Case Studies 2013
8
finally, using a UK-based supplier of software services would lead to significant cost increases in IT provision). Compatibility of each organisation’s systems would, however, be required to enable the smooth exchange of information, and for example, reports on the performance of various Topps and Merlin products. In addition, the implementation of a global strategy meant that Topps would have to sacrifice the possibility of using local support for the software, an added – and potentially very costly – difficulty for a company without full-time resident IT expertise. This report was to change the minds of managers in the parent company. In mid-December 1995, news from HQ indicated that management should start implementing the decision to purchase an integrated computer system covering the financial and distribution activities. Before the end of January, the cabling had been put in place and system installation began in earnest. ERP teething troubles following implementation Management at Topps found that committing to a solution was not the only important aspect of the decision making in relation to deciding to implement its ERP system. Actual implementation involved enacting the choices made on the basis of management expertise and consultants’ advice, and raised new issues and fresh questions which were overlooked or ignored throughout the previous stages. Such difficulties have frequently been reported in the management of ERP projects around the world. More specifically, there were problems with the support provided by the system for the manufacturing operations of Topps’ business. ERP systems are an extension of the materials requirement planning (MRP) systems of the 1970s and most of them are based on some MRP logic. This means that companies should have an MRP-organised factory before they can implement an ERP system that also supports their manufacturing. At the time, Topps had reduced its manufacturing to a small number of products (most originating in the Far East) but the factory floor had never been MRP-oriented. In fact, there had never been any just-in-time requirement in the factory and it was not known how useful it would be to switch to MRP at that stage. This issue was increasingly relevant as the manufacturing operations of Topps’ activities were being phased out. As a result, ‘workarounds’ had to be implemented at the interface between the ERP and the manufacturing activities. Workarounds were portions of business processes that had to be ‘invented’ in the computer system and in reality to ensure that the ERP software could be used even though it did not exactly match the way activities were carried out. Developing the workarounds was not likely to compromise the success of the ERP implementation because the products being made in the factory represented a very small fraction of Topps’ turnover but it did take some time that had not been planned for. There were also problems with the lack of familiarity of Topps’ staff with the software. Such problems are very common with enterprise-wide software such as ERP and most companies who implement them find themselves on a steep learning curve from the moment their new system goes live. No amount of training is ever going to provide staff with the confidence needed to use their ERP to its full extent from the outset. Thus, even though training was quite extensive, it took a while before staff became accustomed to the new ways of doing business through the ERP system. Topps’ business, like any other, includes a certain level of idiosyncrasy and, in the ERP area, software providers can never become so familiar with a company that they would be able to anticipate every detail of the business processes. Some are replaced by new processes suggested by the package, but some remain and require workarounds that take a while to establish and to integrate into day-to-day routines. After a few weeks, staff became more comfortable with their systems, and after a few months, they became true experts at exploiting the functionality of their ERP software to develop Topps’ business. Another problem that arose was that of data migration, which is also common with ERP systems. ERP systems are organised around very large databases that contain all the data required for the systems to operate properly and to link up with other information systems the company may have decided to keep. These data must often be uploaded from previous systems (which is referred to as migration). This applies to the more stable data a business uses, such as bills of material (describing the recipe of the company’s products), customer data, but also some much needed transactional information such as invoicing data, sales data and any other accounting-based data. In the case of Topps, the previous system was an obsolete integrated package running on an even more archaic computer. The data proved difficult to extract on account of the lack of flexibility of the old system. Also, the data did not always have the proper level of detail, as modern ERP systems offer far greater depths of information and far more schemes to classify and organise data. Thus, a substantial amount of manual data entry was originally required before the system could go live. After a few months, however, it became clear to the managers in Topps that their ERP system was a sound investment and that the benefits obtained in terms of inventory management and acceleration of business processes would far outweigh these initial teething problems.
Managerial Accounting 547 – Case Studies 2013
9
Using the ERP system – January 2001 According to the financial controller in 2001, the ERP project had been very useful and positive from the first year of its implementation and Topps had progressed in leaps and bounds in terms of its information systems. Before the implementation of the ERP system, production of the complete month’s end results took two weeks and even then did not allow managers to drill down into products, geographical areas and activities with any flexibility. This time had been halved after the implementation of the ERP system and the system also enabled managers to investigate sales figures to a much greater level of detail, drilling down into each market and each product far more accurately than ever before. The main strength of the ERP system was that it provided managers with the full set of live data regarding the inventory and shipment elements of the business, whereas managers used to rely on suppliers to establish accurate quantities shipped. The sales function, by contrast, was not improved to the same exent, but the purchase of an additional software package (called Adaytum™) enabled managers to achieve significant improvements in this area. This added flexibility in understanding the business and controlling the flows of goods had been achieved despite enormous growth of sales from IR£20m in 1996 to over IR£50m in 2000. The greatest advantage of the ERP system identified was how it allowed managers to control stocks, sales volumes and quality control in a way that was never possible before. Slow-moving lines were exposed, quality problems could be traced down to specific consignments and first-in first-out stock movements could be strictly enforced. Such was the accuracy of the ERP system that managers in Ireland could tell operators in the Rotterdam warehouse which cases should be shipped first and the exact location (or bin number) where they were located in the warehouse. In practice, however, they did not need to do so because the Rotterdam operators had a separate system which tallied with Topps’ ERP system. A new project is currently under way which will enable staff in the Liverpool and Rotterdam facilities to access Topps’ ERP system remotely through its e-business module so as to increase the integration of the companies and reduce the extent of duplication of work. These represented very significant improvement from a quality control point of view because the appearance of sweets disimproves over time (even though they are extremely slow to perish) and become impossible to sell. Since the implementation of the ERP system, products no longer had to be destroyed on a regular basis. As far as reporting was concerned the ERP package was not initially sufficient to cater for Topps’ needs. Even though all the required information was available, the report generation capabilities of the system were not sufficiently flexible. This problem was solved in 2000 by the purchase of the additional package (Adaytum
TM
) which used the data contained in the ERP system to provide the drill-down and reporting capabilities required by Topps’ managers. Reports could then be produced on every single line or item sold by Topps and customer profitability analyses could be carried out to an extent never possible before. At this point, the ERP system could cater for all the actual orders and the Adaytum software could handle the forecasting and planning of demand. These two key sources of data could then be aggregated to produce the overall plan for the company.
Case Appendix: Topps International Ltd2
CONSULTANTS’ REPORT (1995) Goals of information system implementation for Topps As an introduction, it should be acknowledged that Topps is currently a healthy organisation with a clear management structure and a very good knowledge of its market. This does not mean, however, that the performance of Topps could not be improved significantly. Topps possesses a combination of up-to-date managerial thinking but rather out-dated administration. It is therefore certain that the introduction of state-of-the art computing in Topps could have a significantly positive impact on the performance of the business and create a more reliable administration of the organisation as a whole, especially given the recent increases in the volume of transactions dealt with by Topps International Ltd. Additional benefits arising from such an introduction could include:
an advance towards ISO certification (and the potential resulting benefits);; freeing of manpower for either higher-level analytical tasks or improved customer service; an administrative system less reliant on individuals, thereby providing more permanent and consistent
long-run company operations. Given that Topps’ business success revolves around making correct management decisions quickly, it is important that information technology (IT) is applied more efficiently to provide the rapid, accurate information on which to base these 2
The issues described in this report are expanded in Adam and Doherty, 2000.
Managerial Accounting 547 – Case Studies 2013
10
decisions. This occurs to a degree with the extensive use of spreadsheets but these are not centrally available and sometimes are not preserved for reuse such that substantial duplication of work arises. Reports take more time to produce than they should and the standard of presentation suffers as a result. Time better spent in utilising the information creatively and efficiently to exploit opportunities and be aware of threats is currently spent on gathering basic information. Required systems for Topps As an initial step, the application of a modern software package would substantially improve the quality of managerial reports. However, from the investigations carried out, excessive replication and duplication of work (e.g. data entry) also need to be addressed. A fully integrated financial and distribution system would support both the basic business processes carried out at Topps and automate the basic flows of information within the organisation. All modules of the system need not be implemented simultaneously and a phased approach to implementation should suffice, once commitment to implement all modules in the medium term is established. Enterprise resource planning systems Such a system may be classified as an enterprise resource planning (ERP) system which is an integrated enterprise-wide software package designed to support the key functional areas of the organisation. ERP systems have inherent strengths and weaknesses, and are therefore better suited to certain types of organisations and certain circumstances. Management at Topps should, therefore, understand the inherent trade-offs of an ERP system before they make any decision regarding the potential appropriateness of the ERP concept for their organisation. While many consultants and media reports are prompt to emphasise the benefits of ERP implementations, the key issue resides in understanding the specific needs of an organisation and the business model best suited to its operations. The added difficulty in ERP projects is that few companies, if any, could possibly contemplate developing such vast applications in-house. For the majority of companies, the decision to implement ERP functionalities will mean buying a software package from one of the major suppliers on the ERP market 3 .
The software selection phase is not straightforward and managers must understand what ERP packages are on offer, how they differ, and what is at stake in selecting one ERP over another. Each ERP package uses a business model as an underlying framework and can be quite different relative to competitors’ products in terms of how they operate or the business processes they support. The problem for Topps’ management is that not all business models fit all organisations and the cost of failing to recognise the relationship between the nature of one’s business and the ERP system to be purchased can be very high indeed. Quite literally, selecting the right software package, i.e. the right blueprint for one’s organisation, is a critical failure factor in ERP projects. An analysis of the strengths and weakness of ERP systems can help managers facing such decisions. Strengths and weaknesses of ERP systems The case for ERP systems In many ways ERP systems represent the implementation of a managerial dream of unifying and centralising (or at least under one name) all the information systems required by the firm in one single system. Most notably, ERP systems support the recording of all business transactions from purchase orders to sales orders and the scheduling and monitoring of manufacturing activities. Most ERP systems are based on an inventory control module that records the movements of goods in and out of the company which makes them particularly suited to organisations seeking to rationalise their internal processes and obtain higher performance from their operations. ERP systems provide employees within organisations with a common language and a common pool of data. At a practical level, ERP systems have very beneficial effects that remove the need for often disparate and unreliable end-user applications, operating and reporting procedures can be standardised and some of the key processes of the firm (e.g. order acquisition and processing or inventory control) can be optimised. In addition, these systems offer high levels of portability and reasonable flexibility in adapting to the requirements of specific organisations. One of the key strengths of ERP systems is that they are built on top of a relational database4
which enables a reliable and rapid circulation of the data between the modules and eliminates the need for multiple data entry. Thus, ERP systems simplify, accelerate and automate much of the data transfers that must take place in organisations to guarantee the proper execution of operational tasks. The relational database underlying an ERP can be quite large, depending on
3 For example, SAP, Baan, JD Edwards, Peoplesoft, Oracle or MFG/PRO. 4 A relational database is a collection of items organised as a set of formally described tables from which data can be accessed or reassembled in many different ways without having to reorganise the database tables.
Managerial Accounting 547 – Case Studies 2013
11
company and operational complexity (some SAP applications implemented are reported to have in excess of one thousand different tables). Currently, the case for ERP systems seems compelling and the development of more powerful and user-friendly platforms makes it now possible to integrate many large systems in a way that was not possible up to very recently. This is clear from the fact that Microsoft spent 10 months and $25m replacing 33 existing systems in 26 sites with ERP systems. Managers in Microsoft claim to save $18m annually as a result and Bill Gates reportedly expressed great satisfaction with the system. Microsoft had reportedly grown so fast that it could not keep up with itself – the number of applications developed to support the company’s operations and their lack of integration meant that information systems staff had lost control over the complexity of the systems they administered. Moving to a single ERP architecture enabled better linkages between business areas as well as with suppliers and customers. The case against ERP systems The strengths of ERP packages are matched by the high level of risk associated with ERP projects. ERP projects are complex and require the reliance on many different types of expertise often sourced outside the organisation. Consultants often advise managers to undertake some degree of re-engineering of key processes before acquiring ERP systems and this adds to the complexity and political character of the projects. There is empirical evidence of the dangers inherent in such vast projects5.
These difficulties have led to some researchers taking a negative view of ERP systems. Some researchers argue that the current interest in ERP in the business community is justified more by political reasons than by sound managerial reasoning. Relevant surveys show low levels of satisfaction of firms having implemented ERP systems, with 45 per cent of firms perceiving no improvements whatever from implementation and 43 per cent claiming that no cycle reduction had been obtained. The difficulty inherent in ERP implementations is largely due to the fact that organisations implementing them should typically only hold on to 20 per cent of their previous applications. But the extensive replacement of previous systems may be a requirement if the major benefits of ERP implementation – greater integration of functional areas and, in the case of multinational firms, greater co-ordination between entities and between sites – are to be obtained. The consequence of this ‘clean slate’ approach is that organisations find it virtually impossible to revert to their pre-ERP situation and, in any case, their investment either cannot be recouped or generates very low returns. Finally, there is anecdotal evidence that many companies were pushed into ERP projects by the much-publicised fears of what might have happened to legacy systems during the year 2000 change. Conclusions for Topps These arguments paint a very mixed picture of the potential of ERP packages which may be portrayed as silver bullets as often as villains. The message to be taken from the potential strengths and weaknesses of ERP systems for Topps’ management is that they would be well advised to conduct a detailed analysis of proposed benefits and costs of their ERP system prior to going down the implementation road to ensure that the system can appropriately meet the organisational requirements. Of vital importance in this process is the consideration of the business strategy needs of Topps and the specific improvements that an enterprise-wide integrated software package can provide. Articles consulted to support report Adam, F. and Doherty, P. (2000) ‘Do ERP implementations have to be lengthy? Lessons from Irish SMEs’, 5th Conference of the Information and
Management Association, Montpellier, France, November. Bancroft, N. (1996) Implementing SAP/R3: How to introduce a large system into a large organisation, Manning/Prentice Hall, London, UK. Bingi, P., Sharma, M. and Godla, J. (1999) ‘Critical issues affecting an ERP implementation’, Information Systems Management, Summer, 7–14. Forrest, P. (1999) ‘Les ERP à l’épreuve de l’organisation’, Systèmes d’Information et Management, 4(4), 71–90. Kalatoka, R. and Robinson, M. (1999) E-business – Roadmap to success, Addison-Wesley, Reading, MA. Rowe, F. (1999) ‘Cohérence, Intégration informationnelle et changement: esquisse d’un programme de recherche à partir des Progiciels Intégrés
de Gestion’, Systèmes d’Information et Management, 4(4), 3–20. Wood, T. and Caldas, M. (2000) Stripping the ‘big brother’: unveiling the backstage of the ERP fad,
http://www.gv.br/prof_alunos/thomaz/ingles/paper5.htm. White, B., Clark, D. and Ascarely, S. (1997) ‘Program of pain’, Wall Street Journal, 14 March 6.
5 Kalatoka and Robinson (1999) detail the case of Foxmayer which went bankrupt in 1996 after three years of unsuccessful implementation of SAP – suing SAP’s US subsidiary and Arthur Andersen in the process. This is illustrative of what can happen to the largest organisations when ERP implementations go wrong.
Managerial Accounting 547 – Case Studies 2013
12
Irish Ports THE INTERNATIONAL TREND TOWARDS PORT REFORM The tendency to reform the operational and institutional structures of ports is a matter of strategic interest within the maritime sector internationally. Ports are critical nodes which facilitate trade flows and, to a lesser extent, tourism flows. In turn, their operational efficiency can have a considerable impact upon the wider economy. Alfred Baird of Napier University in Scotland described the four different models of port administration which are in place variously in different countries and these are shown in Exhibit 1.
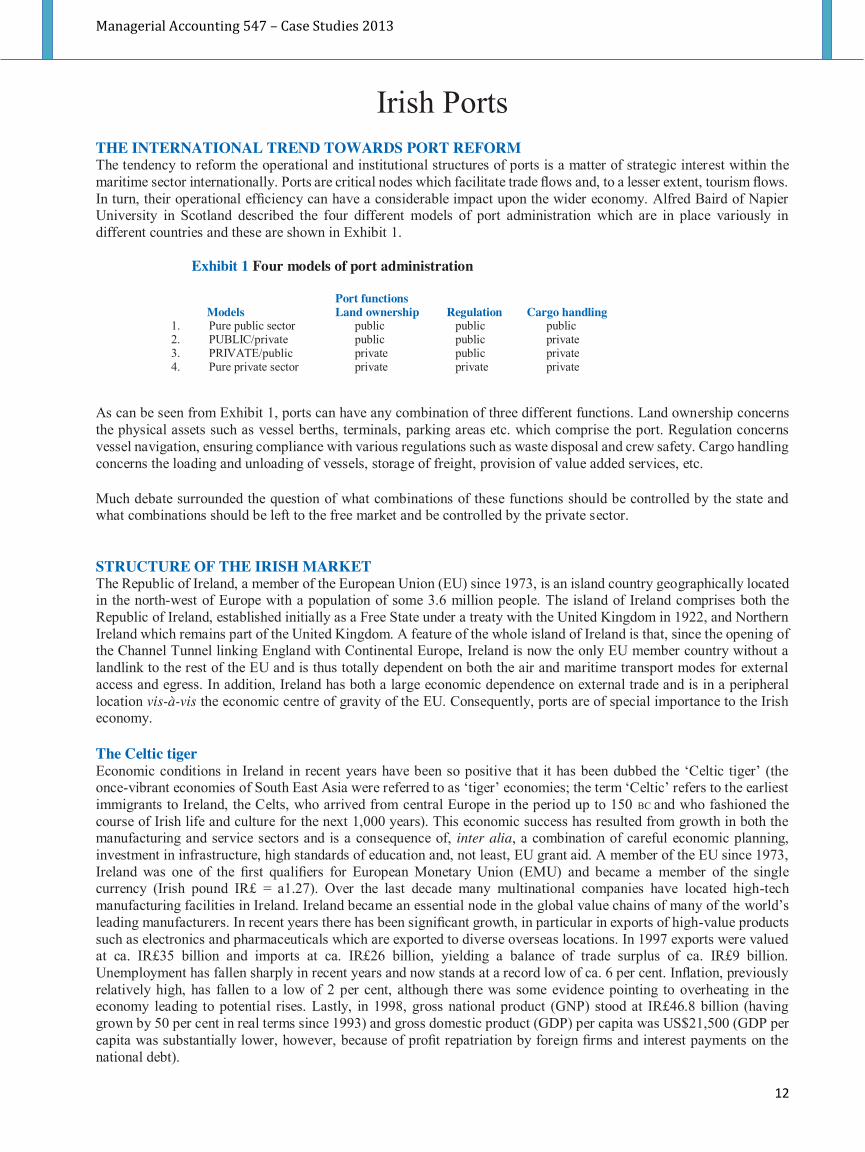
Exhibit 1 Four models of port administration
Port functions Models Land ownership Regulation Cargo handling
1. Pure public sector public public public 2. PUBLIC/private public public private 3. PRIVATE/public private public private 4. Pure private sector private private private
As can be seen from Exhibit 1, ports can have any combination of three different functions. Land ownership concerns the physical assets such as vessel berths, terminals, parking areas etc. which comprise the port. Regulation concerns vessel navigation, ensuring compliance with various regulations such as waste disposal and crew safety. Cargo handling concerns the loading and unloading of vessels, storage of freight, provision of value added services, etc. Much debate surrounded the question of what combinations of these functions should be controlled by the state and what combinations should be left to the free market and be controlled by the private sector. STRUCTURE OF THE IRISH MARKET The Republic of Ireland, a member of the European Union (EU) since 1973, is an island country geographically located in the north-west of Europe with a population of some 3.6 million people. The island of Ireland comprises both the Republic of Ireland, established initially as a Free State under a treaty with the United Kingdom in 1922, and Northern Ireland which remains part of the United Kingdom. A feature of the whole island of Ireland is that, since the opening of the Channel Tunnel linking England with Continental Europe, Ireland is now the only EU member country without a landlink to the rest of the EU and is thus totally dependent on both the air and maritime transport modes for external access and egress. In addition, Ireland has both a large economic dependence on external trade and is in a peripheral location vis-à-vis the economic centre of gravity of the EU. Consequently, ports are of special importance to the Irish economy. The Celtic tiger Economic conditions in Ireland in recent years have been so positive that it has been dubbed the ‘Celtic tiger’ (the once-vibrant economies of South East Asia were referred to as ‘tiger’ economies;; the term ‘Celtic’ refers to the earliest immigrants to Ireland, the Celts, who arrived from central Europe in the period up to 150 BC and who fashioned the course of Irish life and culture for the next 1,000 years). This economic success has resulted from growth in both the manufacturing and service sectors and is a consequence of, inter alia, a combination of careful economic planning, investment in infrastructure, high standards of education and, not least, EU grant aid. A member of the EU since 1973, Ireland was one of the first qualifiers for European Monetary Union (EMU) and became a member of the single currency (Irish pound IR£ = a1.27). Over the last decade many multinational companies have located high-tech manufacturing facilities in Ireland. Ireland became an essential node in the global value chains of many of the world’s leading manufacturers. In recent years there has been significant growth, in particular in exports of high-value products such as electronics and pharmaceuticals which are exported to diverse overseas locations. In 1997 exports were valued at ca. IR£35 billion and imports at ca. IR£26 billion, yielding a balance of trade surplus of ca. IR£9 billion. Unemployment has fallen sharply in recent years and now stands at a record low of ca. 6 per cent. Inflation, previously relatively high, has fallen to a low of 2 per cent, although there was some evidence pointing to overheating in the economy leading to potential rises. Lastly, in 1998, gross national product (GNP) stood at IR£46.8 billion (having grown by 50 per cent in real terms since 1993) and gross domestic product (GDP) per capita was US$21,500 (GDP per capita was substantially lower, however, because of profit repatriation by foreign firms and interest payments on the national debt).
Managerial Accounting 547 – Case Studies 2013
13
Ireland’s maritime past and present Ireland has been influenced by maritime trade since the arrival of the Celts from central Europe in the period up to 150 BC. The next major influx of settlers were the Viking warriors who arrived by sea (mostly from Scandinavia) in the ninth and tenth centuries and built fortified settlements, including one at the mouth of the River Liffey, thus giving birth to what is now Dublin, Ireland’s capital city, and establishing it as a centre for maritime trade. The next wave of settlers were the Normans in 1169, thus effectively beginning some 800 years of association between England and Ireland. This then was to define the basis for the development of Ireland’s maritime trade which revolved largely around shipping between England/Wales and Ireland. Unlike the great maritime nations such as England, France, Spain and Portugal, Ireland was not to have a large maritime fleet and thus did not participate in overseas conquests and empire building. Indeed the domination of maritime trade by flows between Ireland and England was to continue up to and even beyond Ireland’s independence from the British Empire in the twentieth century. The twentieth century saw Ireland increasingly engage in international trade, particularly since joining the EEC in 1973, and with it a growth in maritime transportation occurred.
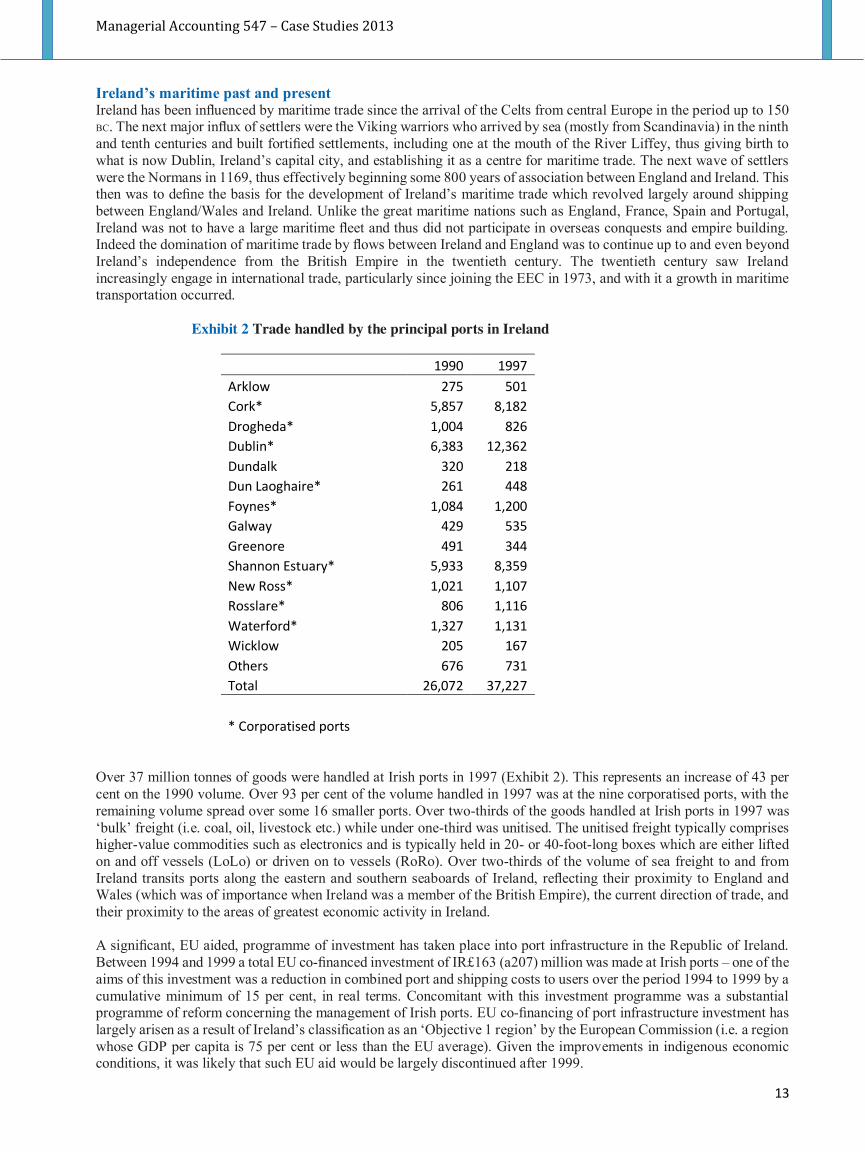
Exhibit 2 Trade handled by the principal ports in Ireland
1990 1997 Arklow 275 501 Cork* 5,857 8,182 Drogheda* 1,004 826 Dublin* 6,383 12,362 Dundalk 320 218 Dun Laoghaire* 261 448 Foynes* 1,084 1,200 Galway 429 535 Greenore 491 344 Shannon Estuary* 5,933 8,359 New Ross* 1,021 1,107 Rosslare* 806 1,116 Waterford* 1,327 1,131 Wicklow 205 167 Others 676 731 Total 26,072 37,227 * Corporatised ports
Over 37 million tonnes of goods were handled at Irish ports in 1997 (Exhibit 2). This represents an increase of 43 per cent on the 1990 volume. Over 93 per cent of the volume handled in 1997 was at the nine corporatised ports, with the remaining volume spread over some 16 smaller ports. Over two-thirds of the goods handled at Irish ports in 1997 was ‘bulk’ freight (i.e. coal, oil, livestock etc.) while under one-third was unitised. The unitised freight typically comprises higher-value commodities such as electronics and is typically held in 20- or 40-foot-long boxes which are either lifted on and off vessels (LoLo) or driven on to vessels (RoRo). Over two-thirds of the volume of sea freight to and from Ireland transits ports along the eastern and southern seaboards of Ireland, reflecting their proximity to England and Wales (which was of importance when Ireland was a member of the British Empire), the current direction of trade, and their proximity to the areas of greatest economic activity in Ireland. A significant, EU aided, programme of investment has taken place into port infrastructure in the Republic of Ireland. Between 1994 and 1999 a total EU co-financed investment of IR£163 (a207) million was made at Irish ports – one of the aims of this investment was a reduction in combined port and shipping costs to users over the period 1994 to 1999 by a cumulative minimum of 15 per cent, in real terms. Concomitant with this investment programme was a substantial programme of reform concerning the management of Irish ports. EU co-financing of port infrastructure investment has largely arisen as a result of Ireland’s classification as an ‘Objective 1 region’ by the European Commission (i.e. a region whose GDP per capita is 75 per cent or less than the EU average). Given the improvements in indigenous economic conditions, it was likely that such EU aid would be largely discontinued after 1999.
Managerial Accounting 547 – Case Studies 2013
14
Many of the ferry companies in the Irish market who carry RoRo freight also carry passengers. Between four and five million passengers travel on RoRo ferries between Britain and Ireland each year, while in contrast over eight million travel by air; a relatively small number (approximately three hundred thousand) travel on ferries between Ireland and France. Deregulation in the air transport market has led to considerable growth in this sector and the ferry companies now face stiff competition from the air mode. One major cloud on the horizon of the passenger travel market was the intended abolition of duty-free sales in late June 1999. GOVERNMENT POLICY Together with the investment programme in port infrastructure there has been a substantial programme of reform concerning the management of Irish ports. Irish ports had been governed by relatively old legislation, namely the Harbours Acts 1946–1976. A government-appointed Review Group was established in 1991 to review the policy and legislation governing commercial ports in Ireland. The Review Group was chaired by Patrick Murphy, a highly successful Irish industrialist, and comprised eight other members who represented the various stakeholders’ interests. The Review Group’s report noted that ‘Ireland’s ports have been severely constrained in their ability to respond commercially because of the restricted legislation under which they operate’. Prior ministerial approval was, for example, required for matters such as setting rates and charges, borrowing money, carrying out harbour improvements, and acquiring and disposing of property. The Review Group considered four alternative structures for Irish ports in order to bring about greater commercialisation:
privatisation; amalgamation/regionalisation of ports; a national seaports company, on the model of Aer Rianta (the state-owned company which operated
Ireland’s three main airports);; separate state companies to operate individual ports on a commercial footing (i.e. the state remains the
sole shareholder). The Review Group recommended that commercial state companies should be set up to manage twelve key (in effect the largest) Irish ports. Consequently the Harbours Act 1996 was passed with the purpose of ‘freeing Ireland’s key ports from direct Departmental control and giving them the commercial freedom they need to be able to operate as modern, customer-oriented service industries’. In March 1997 the first eight ports (see Exhibit 3) out of a planned twelve ports were corporatised and vested as commercial harbour companies (previously they were known as harbour authorities). The port of Waterford was subsequently corporatised in January 1999. There were a number of reasons for the delay in corporatising Waterford, which included the port’s largest customer going out of business, storm damage to two cranes (key assets in any ports infrastructure and which are not possible to replace over a short period), and an outstanding loan from the European Investment Bank (EIB). It was intended to corporatise a further three ports (Arklow, Dundalk and Wicklow) but this did not subsequently happen. PROGRESS TO DATE The government department responsible for the ports sector, the Department of the Marine and Natural Resources, was committed to enhancing the effectiveness of Irish maritime transport infrastructure and services, especially in the context of the critical role which maritime transport played in Ireland’s geographically peripheral island economy. The Department in their strategy statement for the period 1998–2000 stressed that sea transport and port services must be efficient, adequate, responsive and competitive. Dr Michael Woods TD, the Minister for Marine and Natural Resources, stated at a national ports conference in late 1998 that ‘freeing up our key ports from direct state control gave them the commercial freedom to operate as modern, customer-oriented service industries, while tightening up accountability for operational and financial procedures’. Dr Woods, a noted scientist and long-serving politician, was regarded by his peers as a hard-working minister (he also served as Minister for the Marine in a previous government) who achieved results, aided and abetted by a new breed of astute and commercially focused civil servants. By mid-1999 the corporatised ports were enjoying significant successes, buoyed up by very healthy domestic economic conditions. Whether these ports would have been as successful had economic conditions not been so good was a moot point. Many of the ports had made strides to becoming much more commercially focused and began to explore other value-adding and non-core commercial activities. Areas of business being developed included the development of marinas, industrial parks, transhipment facilities, car park developments, and the cruise liner business. A number of ports also introduced leading-edge navigation technologies for vessels (VTIMS) using their ports and also introduced quality standards. In addition, the corporatised ports submitted five-year development plans to the Department of the Marine and Natural Resources. Invariably, it would take some time for matters to settle and for the ports to further develop and prosper under their new status.
Managerial Accounting 547 – Case Studies 2013
15
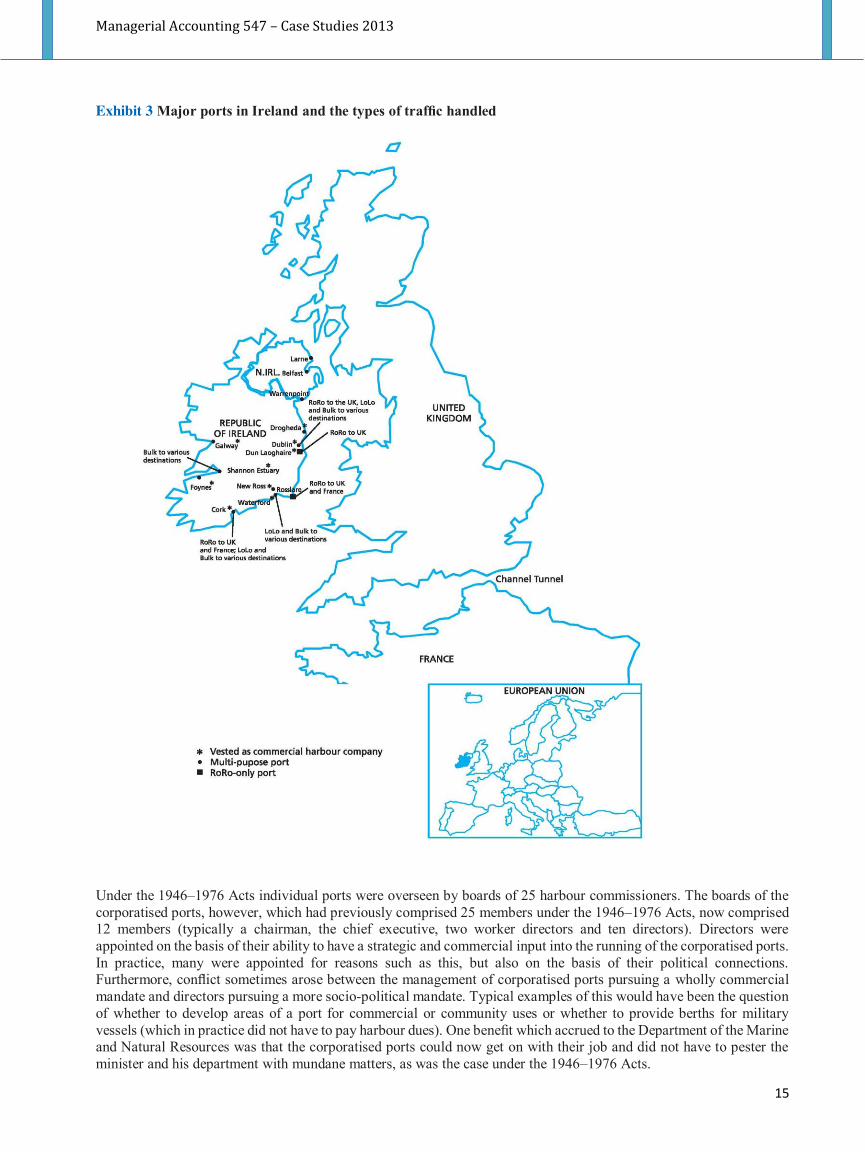
Exhibit 3 Major ports in Ireland and the types of traffic handled
Under the 1946–1976 Acts individual ports were overseen by boards of 25 harbour commissioners. The boards of the corporatised ports, however, which had previously comprised 25 members under the 1946–1976 Acts, now comprised 12 members (typically a chairman, the chief executive, two worker directors and ten directors). Directors were appointed on the basis of their ability to have a strategic and commercial input into the running of the corporatised ports. In practice, many were appointed for reasons such as this, but also on the basis of their political connections. Furthermore, conflict sometimes arose between the management of corporatised ports pursuing a wholly commercial mandate and directors pursuing a more socio-political mandate. Typical examples of this would have been the question of whether to develop areas of a port for commercial or community uses or whether to provide berths for military vessels (which in practice did not have to pay harbour dues). One benefit which accrued to the Department of the Marine and Natural Resources was that the corporatised ports could now get on with their job and did not have to pester the minister and his department with mundane matters, as was the case under the 1946–1976 Acts.
Managerial Accounting 547 – Case Studies 2013
16
The corporatised ports did, however, inherit certain difficulties with their change of status. Many port employees had been guaranteed that there would be no threat to their jobs. Pensions provisions were complex and in some instances lacking. The new corporatised ports had to deal with certain restrictive work practices and other issues such the results of a lack of investment in staff training over previous years. In addition, the corporatised ports were expected to be cognisant of various externalities which might affect the many varied stakeholder groups. Issues which arose here included noise pollution from cargo handling disturbing local communities, marine engineering works affecting aquaculture developments and fishing interests, and the introduction of new services disturbing marine leisure users. Confusion also arose over ownership of the foreshore (i.e. that part of the shore between the high- and low-tide marks) which was governed by very dated legislation, namely the 1933 Foreshore Act. Finally, difficulties with surface transport access (primarily congestion) also affected some ports. ISSUES FOR THE FUTURE It had been intended to corporatise a further three ports (Arklow, Dundalk and Wicklow) but this did not happen. In addition, the question arose in the late 1990s as to what should be done with the thirteen other smaller ports. This combined group of sixteen ports still operated under the rather dated 1946–1976 Harbours Acts. Exhibit 2 illustrated the relatively small volumes handled by these ports. In effect, policy makers had six options, which were not mutually exclusive, to choose from with regard to the future of these ports, namely:
1. Allow the status quo to remain and make small legislative changes as necessary to the 1946–1976 Acts (this would of course involve these ports still being quite dependent upon the Department of the Marine and Natural Resources).
2. Corporatise the ports under the 1996 Harbours Act as was done with the nine larger ports (one pragmatic issue which would have to be addressed was board remuneration: the chairman of a corporatised port received an annual fee of IR£4,000 and each director received IR£2,500; some of the smaller ports had annual revenues below IR£100,000 and could not afford such a structure. It should be noted that fees payable to directors under the 1946–1976 Acts were insignificant in comparison).
3. Transfer ownership of ports to local authorities. 4. Sell ports to the largest customer (in some instances the bulk of the traffic through the smaller ports was derived
from one large customer). 5. Develop the ports jointly with the private sector on a public–private partnership (PPP) basis – there were
precedents elsewhere in Ireland for such an undertaking (e.g. toll roads etc.). 6. Stipulate that mergers or alliances are made between different combinations of ports.
Key aspects of whatever strategy would be chosen included ensuring that public expenditure would be kept to a minimum, and also ensuring that traffic would not merely be displaced from one small port to another, but instead that real growth would occur and would be of benefit to the port hinterland and the wider economy. Furthermore, policy makers also decided that they would review progress under the Harbours Act 1996 with regard to the nine corporatised ports by completing statutory audits on these ports in March 2000. References Baird, A. (1995) Privatisation of trust ports in the UK: review and analysis of the first sales. Transport Policy, 2 (2) 135–143. Mangan, J. and Hannigan, K. (eds), (2000) Logistics and Transport in a Fast Growing Economy, Blackhall Publishing, Dublin. The following websites are recommended for further information concerning the Irish economy: Irish Government (with links to Government departments) www.irlgov.ie Irish Economic and Social Research Institute www.esri.ie Irish Central Statistics Office www.cso.ie Irish Industrial Development Authority www.idaireland.com Economic Review and Outlook 2000, Department of Finance, Dublin, available at www.irlgov.ie/finance/econ2000.pdf The Irish Times (daily newspaper with various links) www.ireland.com
Managerial Accounting 547 – Case Studies 2013
17
The Royal Hotel Introduction It is said that the difference between an Irish summer and Irish winter is that in summer the rain is warm! Recalling this, Pascal Burke smiled as the rain drops gathered on and lazily meandered down the window pane outside. It was mid-afternoon but the dark, heavy rain clouds outside necessitated the use of desk lamps for those working indoors. Pascal had not expected to be at his desk this Friday afternoon. Indeed, Pascal had not expected to be at his desk at this time! He should have been on holiday. He had just finished his MBA degree, as a full-time student and had graduated near the top of his class and had been voted by his fellow students as ‘the person most likely to be famous’. While the award was made slightly tongue in cheek, Pascal, nevertheless, took it seriously. Pascal took most things seriously - especially work. On leaving school, seven years earlier, he studied for and earned a degree in hotel management. His father owned a hotel in a provincial town in Ireland in which Pascal spent most of his school holidays working. He developed a keen interest in the hospitality industry and his decision to study hotel management was a logical progression from his schoolboy times. His studies were a combination of theory and practice and he acquired good experience both within Ireland and Europe. On graduation, he joined the Smith Group which was a family run hotel chain in Ireland. It was a private company, unlike Irish publicly quoted hotel chains of Jurys Hotel Group plc or Ryan Hotels plc. After three years he had progressed as far as he could and felt it was time to broaden his horizons. A full-time MBA offered the greatest challenge and opportunity. After one year of study his perspective had been considerably expanded and changed. He enjoyed his time studying in Dublin and looked forward, after a brief holiday, to a job search in the area of promoting the Irish tourism industry to the European market. However, it was not to be after the recent phone call from his mother ... The scenario A few days earlier his mother had phoned to convey the bad news of his father's heart attack. Thankfully it was not fatal and his father, even at sixty years of age, was expected to make a full recovery in due course. In the meanwhile, the hotel was effectively without a manager, so Pascal promised to return home immediately to try to sort things out. Before he left for home he phoned his girlfriend to apologize for the cancellation of their holiday. It was a ‘special offer’ holiday so he didn't lose too much money - he didn't have much money to lose. The Royal Hotel is situated in a provincial town on the east coast of Ireland, about an hour's drive from the capital city, Dublin. The town is situated in what the tourist brochures describe as ‘the Garden of Ireland’. The hotel is an ideal location for exploring the Dublin/Wicklow mountains. The hotel is only a short distance from the sea although only a few of the town's hardy souls swam during summer months. Rather, walking along the sea front with the invigorating ocean air was the preferred option for many. The town had a population of about 5,000. This population, coupled with a significant hinterland and number of tourists, provided a reasonable trade for the other three hotels in the immediate vicinity. The Royal, like the three other hotels in the locality, is a fifty-bedroom, two-star hotel and can be described as being in the mid-price range. Each guest room is comfortable, includes a telephone and most have a private bathroom. With its traditional Irish pub - named the ‘Lady Gray’ after a rather notorious inhabitant of the town during the previous century - together with the restaurant and function room, the Royal Hotel offers the cost-conscious guest excellent value and good food. Unlike the other hotels, the Royal Hotel was situated in the town. A few years ago, most of its gardens were replaced by tarmac in order to provide ample parking space for its patrons. Thus, its physical scope for expansion was restricted and any proposed developments to the hotel were likely to encounter resistance from local residents and the planning authorities. Some immediate problems and issues currently occupied Pascal's mind. Over the past few days he had introduced himself to employees as the acting General Manager of the hotel. He had also read or at least glanced at all the correspondence and reports on this father’s desk. The one that interested him the most was the summarized management accounts for the year ended 31 October 1996 (Table 1). Although it was only mid-October, Pascal had asked the hotel accountant, Pat Doyle, to prepare them for the past year, including projections for the last weeks in October. Pat Doyle was not a qualified accountant and his role in the hotel was effectively that of bookkeeper. He operated, with a good degree of accuracy, debtors and creditors ledgers, the payroll function, and prepared bank reconciliation statements. He was also responsible for tax compliance of the hotel, mainly the operation of VAT and the deduction of payroll tax under the PAYE system.
Managerial Accounting 547 – Case Studies 2013
18
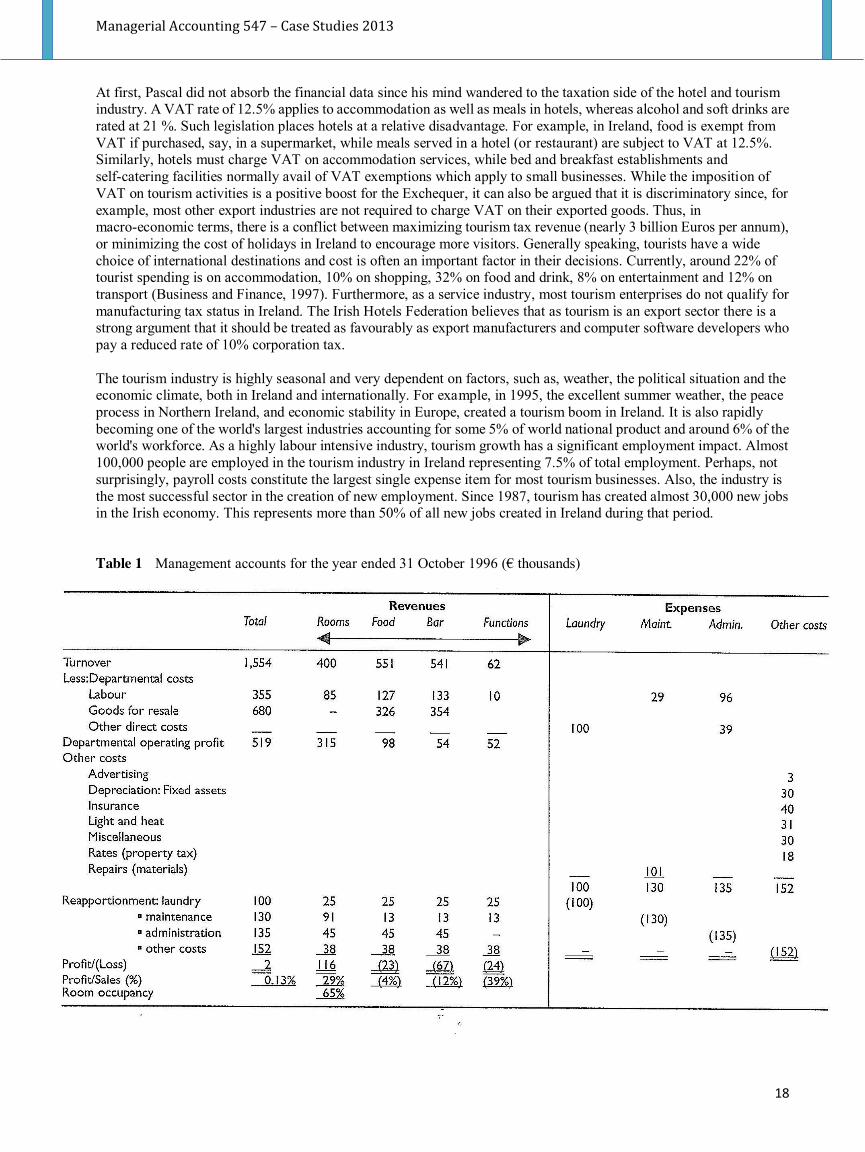
At first, Pascal did not absorb the financial data since his mind wandered to the taxation side of the hotel and tourism industry. A VAT rate of 12.5% applies to accommodation as well as meals in hotels, whereas alcohol and soft drinks are rated at 21 %. Such legislation places hotels at a relative disadvantage. For example, in Ireland, food is exempt from VAT if purchased, say, in a supermarket, while meals served in a hotel (or restaurant) are subject to VAT at 12.5%. Similarly, hotels must charge VAT on accommodation services, while bed and breakfast establishments and self-catering facilities normally avail of VAT exemptions which apply to small businesses. While the imposition of VAT on tourism activities is a positive boost for the Exchequer, it can also be argued that it is discriminatory since, for example, most other export industries are not required to charge VAT on their exported goods. Thus, in macro-economic terms, there is a conflict between maximizing tourism tax revenue (nearly 3 billion Euros per annum), or minimizing the cost of holidays in Ireland to encourage more visitors. Generally speaking, tourists have a wide choice of international destinations and cost is often an important factor in their decisions. Currently, around 22% of tourist spending is on accommodation, 10% on shopping, 32% on food and drink, 8% on entertainment and 12% on transport (Business and Finance, 1997). Furthermore, as a service industry, most tourism enterprises do not qualify for manufacturing tax status in Ireland. The Irish Hotels Federation believes that as tourism is an export sector there is a strong argument that it should be treated as favourably as export manufacturers and computer software developers who pay a reduced rate of 10% corporation tax. The tourism industry is highly seasonal and very dependent on factors, such as, weather, the political situation and the economic climate, both in Ireland and internationally. For example, in 1995, the excellent summer weather, the peace process in Northern Ireland, and economic stability in Europe, created a tourism boom in Ireland. It is also rapidly becoming one of the world's largest industries accounting for some 5% of world national product and around 6% of the world's workforce. As a highly labour intensive industry, tourism growth has a significant employment impact. Almost 100,000 people are employed in the tourism industry in Ireland representing 7.5% of total employment. Perhaps, not surprisingly, payroll costs constitute the largest single expense item for most tourism businesses. Also, the industry is the most successful sector in the creation of new employment. Since 1987, tourism has created almost 30,000 new jobs in the Irish economy. This represents more than 50% of all new jobs created in Ireland during that period. Table 1 Management accounts for the year ended 31 October 1996 (€ thousands)
Managerial Accounting 547 – Case Studies 2013
19
Generally speaking, the current worldwide trend away from sun destinations and towards cultural and activity-based holidays has proved to be very beneficial to the Irish tourism industry. Recognizing this, the National Development Plan 1994-1999, sets three key targets for the tourism sector. It aims to increase foreign tourist revenue by about 1.5 billion Euros, to increase visitor numbers to Ireland by 1.7 million and to create 35,000 new jobs in tourism. Indeed, the Irish Tourism Board (Bord Fáilte, 1994) hoped to attract 4.4 million visitors per annum to Ireland by 1999. The climate for development of the tourism industry in Ireland is ideal at present. For example, government funds are available under the National Development Plan and there have been recent beneficial changes in tax legislation. Tax incentives are particularly important to the hotel and tourism industries, because of low profit margins and volatile earnings. The most pervasive and attractive tax incentives were introduced by the 1995 Finance Act. The government's objective for the scheme is 'to revitalise and update the tourist amenities and facilities in the resort areas designated'. The pilot scheme is exclusively targeting seaside resorts and the scheme has hence become known as the ‘seaside resorts scheme’, but the Finance Act does not refer to the scheme being specifically for seaside resorts. The incentives available for resort areas include (a) accelerated capital allowances, (b) double rent allowances and (c) relief for expenditure on certain rented residential accommodation. In addition, financial support is increasingly available from banks and financial institutions, and the industry itself is experiencing the effects of growing maturity and independence (Ernst and Young/AIB, 1995). However, Pascal realized that the hotel sector is as vulnerable to painful shakeout as any other industry. He remembered that in the US and UK during the 1980s there was a huge increase in the supply of hotel rooms followed by a dramatic contraction in demand. Declining tourism numbers were certainly a factor. In the UK alone, hundreds of hotels became insolvent in the early 1990s. Resale values of hotels collapsed. Pascal's thoughts returned to the summarized management accounts prepared by Pat Doyle (Table 1). Pascal was slightly amused that what were referred to as the ‘management accounts’, were so simple but they made grim and surprising reading. The hotel reported a profit of only 2,000 Euros for the year. Clearly, the overall profitability of the hotel would have to be improved. In his father's temporary absence this would be Pascal's responsibility and he intended to upgrade the hotel to three-star status. However, this aspiration would require significant expenditure to ensure that all guest rooms had a private bathroom with a bath and/or shower. Table d'hôte and a la carte menus would be introduced to provide a high standard of cuisine in relaxed surroundings. In general, the Royal Hotel would need to offer a range of services to satisfy the cost-conscious client. Closing down the hotel for the forthcoming winter season might allow some changes to be made. Another alternative would be to sell the hotel as a going concern. Either way the decision would require clear and unambiguous thinking and this was what Pascal was resolved to do. But, first he had to get a better overall picture of the situation. The management accounts had been prepared to conform with the Uniform System of Accounts for Hotels. The Uniform System originated in the USA and was first published in 1926. It sets out recommendations on how particular transactions should be dealt with in accounting terms. Results of hotels are reported in a particular way, using standard formats, and are therefore comparable with results of other hotels. One of the main principles of the Uniform System is that results are reported by each department of the hotel, in line with the traditional organization structure which is found in most hotel operations. All expenses that are attributable to (and controllable by) a particular department are allocated against the revenue of that department to arrive at a departmental operating profit. The allocation of revenues and costs enables the General Manager to allocate responsibility for results to individual department heads who can directly influence, and be accountable for, the results of their department. For management accounting purposes, the Royal Hotel operated four departments, i.e. Rooms, Food (Restaurant), Bar and a Function Room which generated rental income for weddings, social and other functions, including business meetings. Any revenues generated by such functions from food or bar sales were directly attributed to their respective departments. This function room, tastefully decorated, offers a much-needed facility for local business and commercial clients. It can accommodate up to 200 guests in total. The various cost headings used in the management accounts were relatively straightforward and self-explanatory. The bulk of cost items (excluding the direct costs of the four revenue departments) were charged to one of four cost headings, i.e. Laundry (which was an externally purchased rather than in-house service), Maintenance, Administration and Other Costs. In turn, these costs were reapportioned by Pat Doyle to the four revenue departments as follows:
Cost item Basis ofre-apportiomnent Laundry • Equally to all four departments. Maintenance • Space occupied by four departments i.e. 7/10; 1/10; 1/10; 1/10, Administration • Equally between three departments. Other costs • Equally between four departments.
Managerial Accounting 547 – Case Studies 2013
20
The resulting net profit figures indicated that rooms were the only profitable section in the hotel. They returned a profit of 116,000 Euros after all expenses. To Pascal’s surprise, the Restaurant, Bar and Function Room all reported losses for the year of 23,000 Euros, 67,000 Euros and 24,000 Euros respectively. It was easy for anyone to see that the hotel would find it difficult to remain profitable in future years unless costs could be controlled and unless overall turnover and occupancy levels could be significantly expanded. What were the good features of the situation, Pascal asked himself? For one thing, the hotel had no borrowings and its long-term finance was represented entirely by shareholders’ funds of some 750,000 Euros. The hotel was carried at a book-value of 600,000 Euros but its current market value was considerably in excess of this figure. In addition, the hotel was in excellent condition as evidenced by spending in excess of 100,000 Euros on maintenance during the previous year. His father, Pascal always remembered, would never compromise on quality - either in terms of physical appearance or level of service. As a result, the hotel enjoyed a reasonable reputation for good fare in the town. Staff morale was high and nobody could remember any formal industrial dispute of any consequence in the establishment in recent years. The decision In the gathering gloom of the evening, Pascal turned his thoughts towards two possible alternatives - to close the hotel down for the winter season or to keep it open and try to improve things. Either way, a decision needed to be made quickly. In some ways, closing down the hotel for the six winter months (and re-opening in May) was the easy option and should be a significant cost saver. Closing down would result in significant cost savings on laundry, maintenance and administration costs. However, staff would have to be notified, so that they could make other arrangements, although he did not know employment law in this area. Also, he would have to notify patrons, who had made advance bookings, that the hotel was closing down during the winter months. Confirmed bookings (for rooms and various functions) for the forthcoming winter season currently ran at a level of 150,000 Euros. Such trade could easily be transferred to nearby establishments. On average, 25% commission would be received for such referrals. This, he had confirmed, on an informal basis, with James Dunne, the owner and general manager for the Bay Hotel, just two miles away. Pascal and James knew each other - a familiarity extending back to school days together. In current times they kept in touch with a round of golf on the nearby course every few months. Since the illness of Pascal's father, James had been in regular telephone contact offering to ‘assist’ in any way possible. As an alternative, Pascal considered staying open for the winter months. From his student days he still retained some good contacts in the advertising industry. They should be able to advise him how to spend an additional 15,000 Euros about 1 % of annual turnover -promoting the hotel. He was confident that this would allow the hotel to achieve a 50% occupancy level during the winter months. Taking last year as a whole, the hotel operated at a 65% occupancy level. This would normally fall to 40% during the winter season (1 November - 30 April). Anyone in the hotel industry knew that overall room occupancy was a critical factor in determining overall profitability. Pascal realized that very serious thought should be given to the various cost and revenue elements in the financial planning process. Apart from the additional advertising spend, he anticipated that some of his operating costs were ‘fixed’ in the sense that they would be incurred regardless of the level of activity (i.e. room occupancy) and covered a twelve month rather than a six month period. He anticipated that any possible increase in the level of fixed costs would be so marginal in the context of total costs incurred that they could be ignored for computation purposes in the initial draft of his calculations. He realized that his preliminary cost analysis would be a little unscientific and imperfect. He wanted to get a ‘first draft’ ready in a format that would be suitable for spreadsheet purposes. This would allow him to change his assumptions about the next six months and to, instantaneously, see the immediate financial impact. He was confident that he could get a fairly good picture of the various financial implications. The option to stay open would have to be financially viable. Pascal realized that financial planning could not realistically take place in a vacuum. There were many external factors to be considered, such as, the existence and level of competition. Pascal had received the 1996 copy of the Irish Hotel Industry Survey (Horwath Bastow Charleton, 1996). This survey represents useful guidelines (rather than standards) for comparing the operating results of hotels in different classifications (e.g. mid-price, luxury, etc.), Region (e.g. Midlands & East) and size (number of rooms). Pascal was interested in other hotels in the Midlands & East Region and also those hotels in the mid-price range.
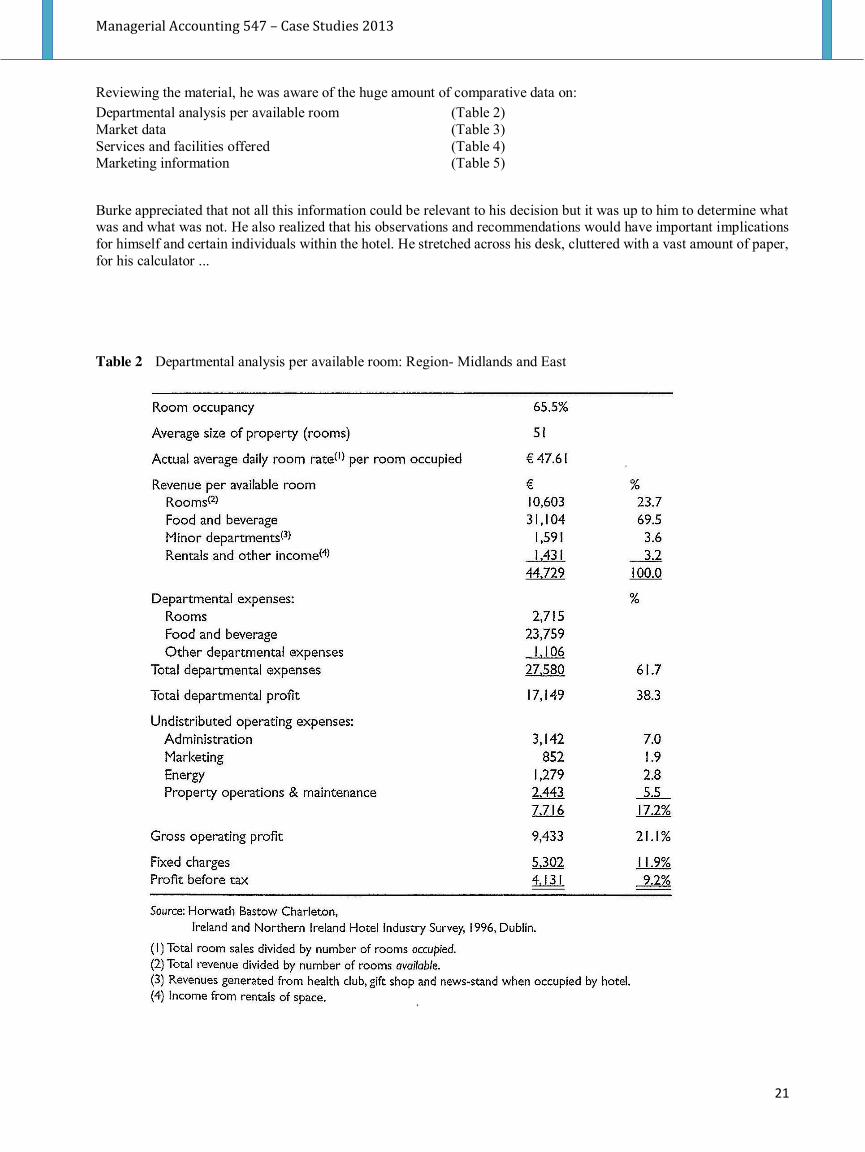
Managerial Accounting 547 – Case Studies 2013
21
Reviewing the material, he was aware of the huge amount of comparative data on:
Burke appreciated that not all this information could be relevant to his decision but it was up to him to determine what was and what was not. He also realized that his observations and recommendations would have important implications for himself and certain individuals within the hotel. He stretched across his desk, cluttered with a vast amount of paper, for his calculator ... Table 2 Departmental analysis per available room: Region- Midlands and East
Departmental analysis per available room (Table 2) Market data (Table 3) Services and facilities offered (Table 4) Marketing information (Table 5)
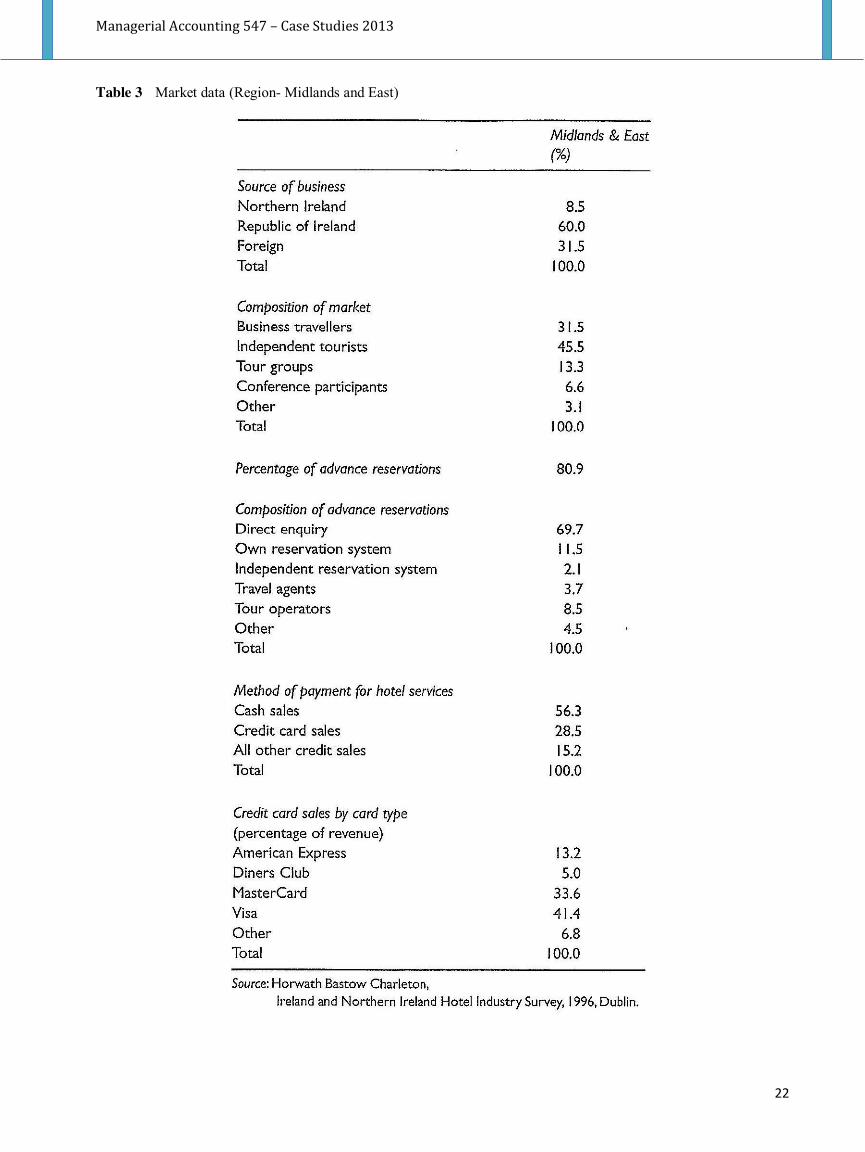
Managerial Accounting 547 – Case Studies 2013
22
Table 3 Market data (Region- Midlands and East)
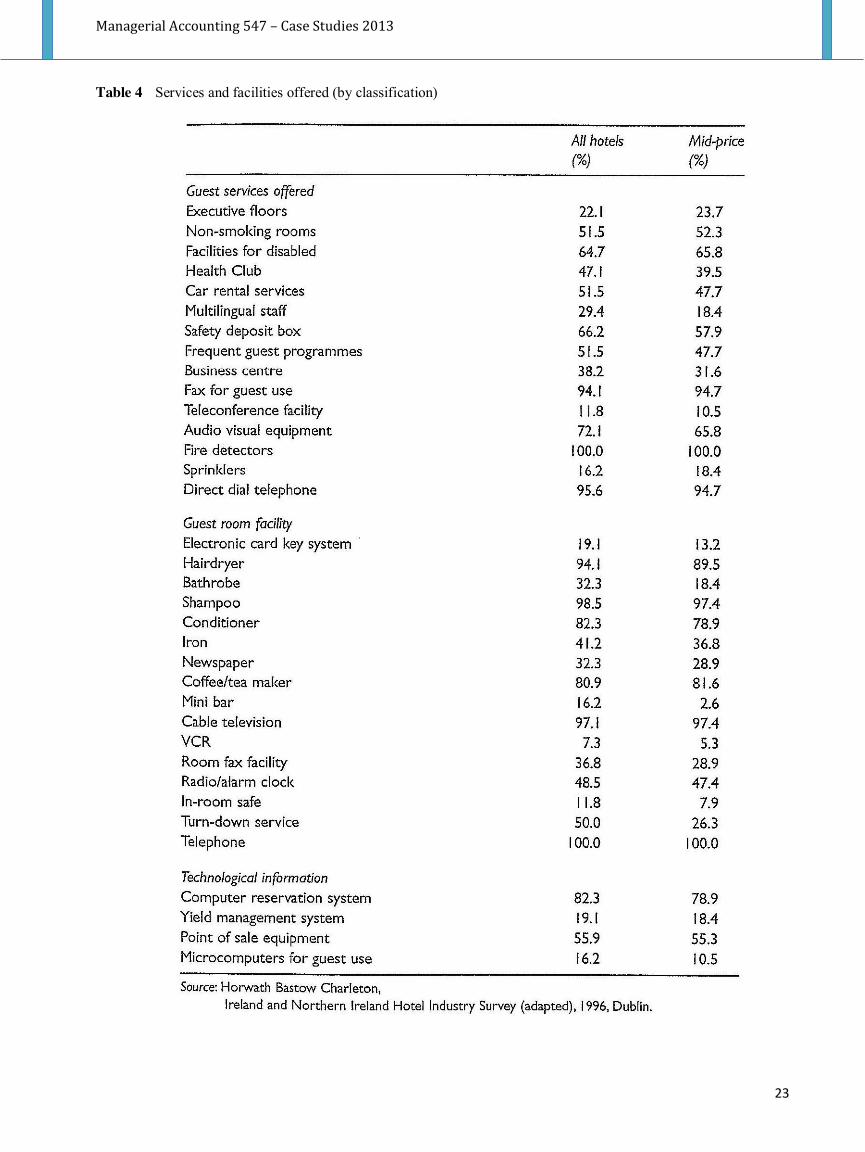
Managerial Accounting 547 – Case Studies 2013
23
Table 4 Services and facilities offered (by classification)
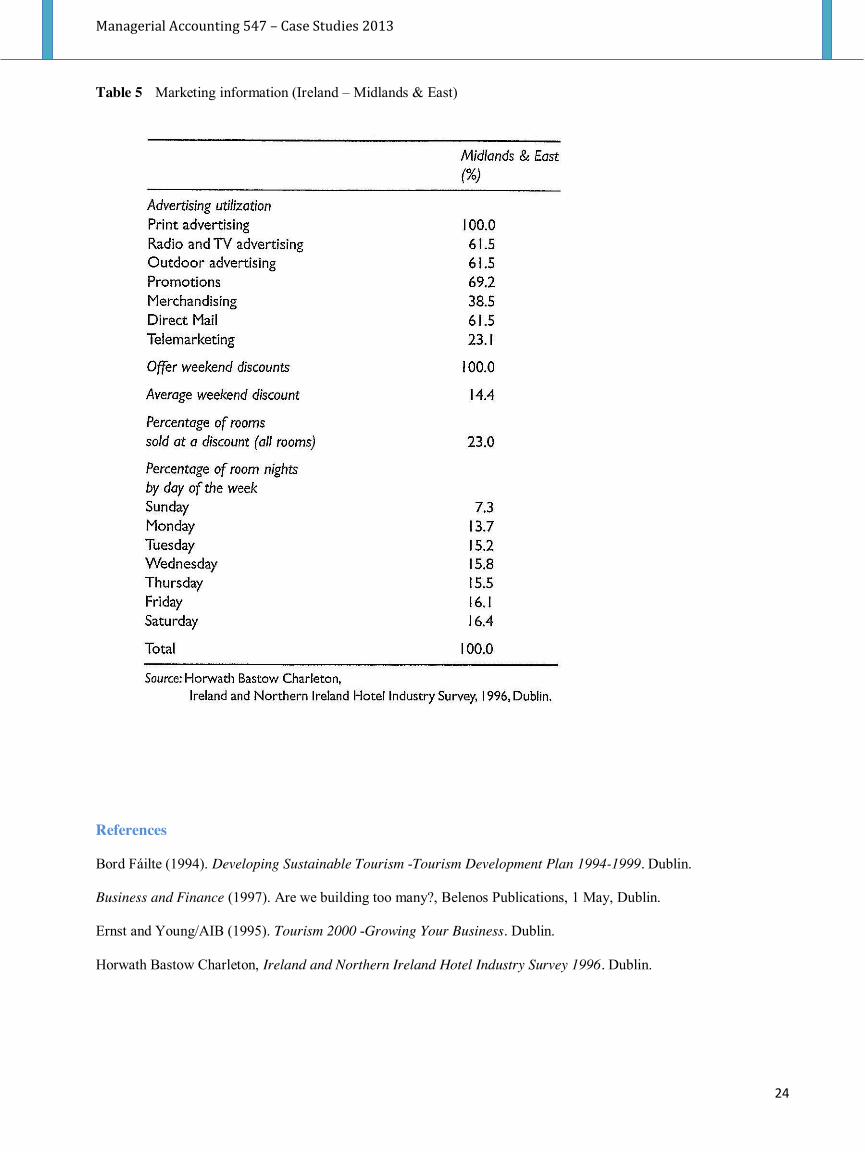
Managerial Accounting 547 – Case Studies 2013
24
Table 5 Marketing information (Ireland – Midlands & East)
References Bord Fáilte (1994). Developing Sustainable Tourism -Tourism Development Plan 1994-1999. Dublin. Business and Finance (1997). Are we building too many?, Belenos Publications, 1 May, Dublin. Ernst and Young/AIB (1995). Tourism 2000 -Growing Your Business. Dublin. Horwath Bastow Charleton, Ireland and Northern Ireland Hotel Industry Survey 1996. Dublin.
Managerial Accounting 547 – Case Studies 2013
25
BIRCH PAPER COMPANY
“If I were to price these boxes any lower than $480 a thousand, “said James Brunner, manager of Birch Paper Company’s Thompson Division, “I’d be countermanding my order of last month for our salesmen to stop shaving their bids and to bid full-cost quotations. I’ve been trying for weeks to improve the quality of our business, and if I turn around now and accept this job at $430 or $450 or something less that $480, I’ll be tearing down this program I’ve been working so hard to build up. The division can’t very well show profit by putting in bids that don’t even cover a fair share of overhead costs, let alone give us a profit.”
Birch Paper Company was a medium-sized, partly integrated paper company, producing white and kraft papers and paperboard. A portion of its paperboard output was converted into corrugated boxes by the Thompson Division, which also printed and coloured the outside surface of the boxes, Including Thompson, the company had four producing divisions and timberland division, which supplied part of the company’s pulp requirements. For several years, each division had been judged independently on the basis of its profit and return on investment. Top management had been working to gain effective results from a policy of decentralizing responsibility and authority for all decisions except those relating to overall company policy. The company’s top officials believed that in the past few years the concept of decentralization had been applied successfully and that the company’s profits and competitive position definitely had improved. The Northern Division had designed a special display box for one of its papers in conjunction with the Thompson Division, which was equipped to make the box. Thompson’s staff for package design and development spent several months perfecting the design, production methods, and materials to be used. Because of the unusual colour and shape, these were far from standard. According to an agreement between the two divisions, the Thompson Division was reimbursed by the Northern Division for the cost of its design and development work.. When all the specifications were prepared, the Northern Division asked for bids on the box from the Thompson Division and from two outside companies. Each division manager was normally free to buy from whatever supplier he wished, and even on sales within the company, divisions were expected to meet the going market price if they wanted the business. During this period, the profit margins of such converters as the Thompson Division were being squeezed. Thompson as did many other similar converters, bought its paperboard, and its function was to print, cut, and shape it into boxes. Though it bought most of its materials form other Birch divisions, most of Thompson’s sales were made to outside customers. If Thompson got the order from Northern, it probably would buy its linerboard and corrugating medium from the Southern Division of Birch. The walls of a corrugated box consist of outside and inside sheets of linerboard sandwiching the fluted corrugating medium. About 70 percent of Thompson’s out-of-pocket cost of $400 for the order represented the cost of linerboard and corrugating medium. Though Southern had been running below capacity and had excess inventory, it quoted the market price, which had not noticeably weakened as a result of the over-supply. Its out-of-pocket costs on both liner and corrugating medium were about 60 percent of the selling price. The Northern Division received bids on the boxes of $480 and thousand from the Thompson Division, $430 a thousand from West Paper Company, and $432 a thousand from Eire Papers, Ltd. Eire Papers offered to buy from Birch the outside linerboard with the special printing already on it, but would be supplied by the Southern Division at a price equivalent of $90 a thousand boxes, and it sould be printed for $30 a thousand by the Thompson Division. Of the $30, about $25 would be out-of-pocket costs.
Managerial Accounting 547 – Case Studies 2013
26
Since this situation appeared to be a little unusual, William Kenton, manager of the Northern Division, discussed the wide discrepancy of bids with Birch’s commercial vice president. He told the vice president: “We sell in a very competitive market, where higher costs cannot be passed on. How can we be expected to show a decent profit and return on investment if we have to buy our supplies at more than 10 percent over the going market?” Knowing that Mr Brunner on occasion in the past few months had been unable to operate the Thompson Division at capacity, it seemed odd to the vice president that Mr Brunner would add the full 20 percent overhead and profit charge to his out-of pocket costs. When he was asked about this, Mr Brunner’s answer was the statement that appears at the beginning of the case. He went on to say that having done the developmental work on the box, and having received no profit on that, he felt entitled to a good mark-up on the production of the box itself. The vice president explored further the cost structures of the various divisions. He remembered a comment that the controller had made at a meeting the week before to the effect that costs which were variable for one division could be largely fixed for the company as a whole. He knew that in the absence of specific orders from top management Mr Kenton would accept the lowest bid, which was that of the West Paper Company for $430. However, it would be possible for top management to order the acceptance of another bid if the situation warranted such action. And though the volume represented by the transactions in question was less that 5 percent of the volume of any of the divisions involved, other transactions would conceivably raise similar problems later.
Managerial Accounting 547 – Case Studies 2013
27
Accountants for the Public Interest (API) Accountants for the Public Interest (API) is a national organization that provides volunteer accounting services through a network of affiliated accounting organizations. API’s Board meets three times per year, often at the offices of an international accounting firm in either New York City or Washington DC. The BOD is comprised of CPAs, accounting professors, and a representative from the nonprofit sector. Agendas for Board meetings include both strategic and operational items, with funding for operations and programs being an issue that is discussed at each meeting of the Board. The need for performance measures is currently being discussed by API’s Board. In recent years, API at the national level and affiliates at the local level have been very successful in mobilizing accounting volunteers to provide support to small nonprofit organizations. API affiliates respond to requests from nonprofits for volunteers to provide services such as financial planning and improving accounting system design. The number of affiliates increased significantly in the 1990s, which the BOD viewed as an indicator of success. Small businesses and individuals who are unable to pay for accounting or tax services are also served. At the national level, API promotes and publicizes volunteerism through the Journal of Accountancy and similar professional journals. API has created an awareness of the types of pro bono services available from affiliates and the benefits of such services to the community. API has published several guides that provide useful accounting and audit information to small nonprofit organizations and volunteer accountants. API’s activities and accomplishments are frequently recognized in the national press, and API has a reputation as a good nonprofit organization. Much of API’s growth and success has been attributed to Mildred E. MacVicar, the organization’s now-retired Executive Director. A typical nonprofit organization client has a mission dedicated to meeting health or welfare community needs, such as serving disabled adults, mentally retarded children, and fighting drug abuse. The small nonprofit’s annual budget is often in the range $20,000–$50,000. The executive director in charge of administering the client organization typically has no accounting training, and a volunteer, also with no accounting training, generally maintains the organization’s financial records. All nonprofit organizations with a 501 (C)(3) tax-exempt status must file an annual information return with the Internal Revenue Service. Nonprofit organizations are regulated at the state level and may be required to file audited or reviewed financial statements with a state agency. Filing requirements usually depend on size as measured by revenues or contributions. Small nonprofit organizations often have difficulty getting the books ready for audit, especially the first audit. API affiliates are independent nonprofit accounting organizations that provide support primarily to small local nonprofit organizations. For example, API affiliates provide short-term accounting services, such as setting up an accounting system, preparing Form 990, and educating the nonprofit organization’s personnel on accounting matters. Affiliates also offer seminars on various nonprofit accounting and financial management issues at no charge or for a very low fee. Affiliates distribute API publications to their clients, and some publish their own materials for nonprofit organizations. Most affiliates offer pro bono tax services to low-income people, and some affiliates do this exclusively. Several API affiliates are support centers, offering accounting, tax, and a wide range of consultation services to the nonprofit community. API is interested in attracting additional support centers as affiliates. Two state CPA societies have affiliated and a few others have discussed affiliation. In recent years, affiliates reported that 6000 volunteers served approximately 40,000 individuals and organizations. The type of support that API provides to affiliates includes consultation, publications, continuing education, and publicity. The process of reexamining API’s mission statement and strategic plan was an important topic at the January 1996 BOD meeting, where a committee recommended that the following be the organization’s mission statement:
To enhance and increase the availability of pro bono accounting services to organizations and individuals who otherwise would not have access to needed professional assistance; and, to improve the image of the accounting professional.
This statement was a revision to the existing mission statement, with the major proposed change being to include the word increase so as to emphasize growth in volunteer accounting services. The growth issue was debated extensively at the BOD meeting. A second change to the mission statement was to add ‘‘to improve the image of the accounting professional’’, which the BOD committee felt would result from providing more pro bono accounting services. The
Managerial Accounting 547 – Case Studies 2013
28
committee also presented goals to accomplish this mission, which can be summarized as to design, identify and support public service accounting organization structures, to promote volunteer accounting services, and to acquire resources necessary to provide pro bono accounting services. One question raised during the strategic planning session was how many affiliate organizations could be supported with the current level of resources. This was an important issue for API’s recently hired executive director because API was a small nonprofit organization. In recent years, API’s staff was usually comprised of only one to three people, who were very busy. In 1995, the API Board approved a pilot student chapter affiliate program — Accounting Students for the Public Interest (ASPI). An ASPI chapter could be a student organization that exists as a separate group or the chapter could be incor-porated as part of an accounting society or Beta Alpha Psi organization. The BOD recognized that encouraging students to use their accounting knowledge and skills for community service would provide them with valuable experience and potentially increase volunteerism among these future accounting professionals. Although instilling a spirit of volunteerism in a future generation of accounting professionals was viewed as having long-term benefits, API had made only minor efforts to promote ASPI. Due to limited resources, the BOD was content to gain experience with a ‘‘pilot’’ ASPI chapter before making a major effort to implement this program on a larger scale. Educators on API’s board noted an increased interest in service learning and felt that the timing was good for implementing the student chapter program. While API could devote a small amount of resources toward promoting ASPI chapters and supporting their operations with structure, publications, and consultation, the Board believed that outside funding was needed to implement the program. Funding is usually the most important issue for a small nonprofit organization’s board of directors, and API is no exception. Because of profit pressures on potential donors and the discretionary nature of contributions, API’s BOD is concerned about maintaining or increasing funding from CPA firms and corporations. API’s funding from CPA firms is a significant portion of revenues. CPA firm fund-raising is on a national or regional headquarters level because of concerns about not impairing an affiliate’s chances of raising funds on a local level. The BOD is concerned about the implications that changes taking place in the accounting profession could have for fund-raising. Mergers have reduced the number of national accounting and auditing firms, which are the organizations that provided a substantial portion of API’s unrestricted funds in recent years. These firms were also moving away from an accounting and auditing identity and toward becoming more broad-based professional services firms, a change that might diminish the firms’ interest in funding an accounting organization like API. During her tenure as API Executive Director, Mildred MacVicar was successful in obtaining funding for various API initiatives from several major foundations. These foundation grants were restricted funds that could only be used for the purpose designated in the funding proposal. The BOD wanted to continue with similar initiatives and was concerned that competition for funding from foundations was becoming much more intense. In this environment, API needed an influential contact person associated with each potential foundation source to have a reasonable chance of getting funding. In past years, many successful funding efforts could be attributed to a BOD member’s personal contacts. Thus, having influential people on the BOD is an important ingredient to successful fund-raising. Sale of publications has been an important source of unrestricted revenues in recent years. API’s formula for publications has been to obtain foundation funding for writing the publication and distributing approximately 5000 copies to a target group of nonprofit organizations. Additional copies are printed and sold at prices ranging from $7.50 to $20.00. These publications vary from 50 to 100 pages in length. Publication sales are typically very strong during the first 6 months of availability. For the year ended 13 December 1995, there was a fund balance reduction of $22,552 as compared with a budgeted increase of $18,880, and revenues and expenses were reported as $177,454 and $200,006, respectively. A major reason for the variance was that a budgeted foundation grant for printing and distributing a publication was not received in 1995, although API was optimistic that the grant would be received in 1996. For 1996, API had a balanced budget of $219,300, which was approved at the BOD annual meeting in October 1995. However, revenues were lower than expected and the reported fund balance for 1996 was reduced approximately $13,000. The trend toward lower revenues continued in 1997 and 1998, although in 1999 API published a new guide and revisions of two best-selling publications to boost revenue. The BOD was very concerned about controlling costs. Payroll expenses were approximately 65% and office related expenses 20% of total expenses for the 1997 budget. In 1998, the API seized the opportunity to join a nonprofit
Managerial Accounting 547 – Case Studies 2013
29
community on a university campus. This move to a better environment resulted in significantly reduced office expenses for 1998. It also provided the opportunity to use low cost or volunteer student workers instead of paid staff. This enabled API to operate on a much lower budget than prior years. Budget versus actual data for the current month and year-to date is reported at all BOD meetings. In past years, most of monthly budgeted revenue and expense amounts were calculated by dividing the annual budget amount by 12. Large unfavorable variances were discussed, and the Executive Director responded to questions. The BOD paid considerable attention to unfavorable variances for contributions and other revenue sources. A frequent explanation for contribution variances was the tendency for end of year giving by large donors. At least once per year there was a discussion of BOD contributions. During this discussion, the president conveyed the expectation that BOD members donate both time and money. Audited financial statements were available approximately 6 months after fiscal year end and were discussed at the fall BOD meeting. Other information provided at all BOD meetings was a two-page report by each API staff person that listed their major activities since the last BOD meeting. Between BOD meetings, the executive director, president, and treasurer monitored budget variances. Another funding issue was whether API should commit resources to significantly increase funding by acquiring new members. Membership ($40 annual dues) had varied from 120 to 200 members in recent years. During one discussion of membership, the executive director stated that the average annual cost of serving a member is $6.
Managerial Accounting 547 – Case Studies 2013
30
Island Wheels Ltd Island Wheels Ltd is a bicycle manufacturer based in New Zealand. Over the last fifteen years, bicycle manufacturers from Taiwan and Korea have been able to price their bicycles below those of the Island Wheels products, but the company has managed to retain its market share due to the poor quality of the imported bicycles. Recently, things have changed. The quality of the imported bicycles has improved and Island Wheels have had to reduce prices in order to retain its market share. The managing director, John Rower, is concerned about the viability of the business at these lower prices and has asked the accountant, Heidi West, to investigate the problem. West’s initial investigation indicates that the lower prices cannot be sustained in the longer term, as they do not cover the costs of manufacture, let alone contribute to the company’s selling and administrative costs. She looks for possible reductions. The company has always had a reputation for high quality, but West feels that there are substantial costs incurred in attaining this level of quality. She knows that there are extensive quality inspection checks throughout the production process and that many employees spend part of their time reworking defective parts. She has also noticed the buckets full of scrapped parts and components spread throughout the factory. These costs are not recorded separately in the existing accounting system. West asks Rower to support the development of a cost of quality system. Rower: What do you mean a system that records the costs of poor quality! Our bikes are among the best in
terms of quality! West: I know that John, and we know what it costs to make our bikes, but we’ve got no idea how much of
that cost is related to ensuring quality. I think the cost of quality here is very high. What if it’s a third of manufacturing costs? And what if we could reduce it without compromising our quality? We could keep our prices down and still make a good profit.
Rower: Okay Heidi. Give your cost of quality system a try, though I don’t see how it will help. Everybody knows that good quality costs money. Even if we do find out our cost of quality, I don’t see how it will help us reduce it.
West: John, good quality doesn’t seem to cost money in Taiwan and Korea. Their prices haven’t gone up, even though their quality has. You’ll soon see that understanding quality costs can help you to reduce them and to improve quality at the same time.
Over the next six months, West identifies the following costs of quality:
Cost of replacement bikes provided under warranty, $5,000. Cost of bikes returned by customers and scrapped, $5,000. Sales commissions on faulty bikes returned by customers, $500. Contribution margin forgone on bikes returned by customers, $1,000. Rework on defective wheels, $8,000. Quality inspection in the goods receiving area, $15,000. Quality inspections during processing, $23,000. Laboratory testing of bikes and components, $13,000. Contribution margin foregone on lost future bike sales, $5,000. Engineering costs to correct production line quality problems, $15,000. Lost contribution on machine downtime during correction of product line quality problems, $25,000. Operating an X-ray machine to detect faulty welds, $15,000. Cost of repairs under warranty, $1,000. Cost of rewelding faulty joints discovered during processing, $19,000. Cost of quality training programs, $3,000. Inspection of bikes put into finished goods warehouse, $16,000. Cost of faulty components that are scrapped, $4,000. Cost of faulty bikes that are scrapped after finished goods inspection, $10,000.
During this period, total manufacturing costs were $600,000.
Managerial Accounting 547 – Case Studies 2013
31
Tsinghua Tongfang Co. Ltd.
If Tsinghua Tongfang can keep its pace of development as it does now ... it will make one hundred ten millionaires and 1,000 millionaires within a period of at most three to five years6.
Historically, the vast majority of the corporations in the People's Republic of China used bureaucratic forms of control characterized by, for example, centralization of authority, subjective performance evaluations and, if any, only relatively small performance-based incentives. However, as China adapted to its new socialist market economy and competition in the global economy, Chinese corporations were changing their control systems rapidly. They were decentralizing their operations, developing more formal performance evaluation systems, and providing larger performance-related incentives. Still, subjective performance evaluations remained common and heavily weighted in many Chinese corporations in the early 21st century. Tsinghua Tongfang Co. Ltd. (THTF), one of China's most successful high-tech companies, was different. A young company, it had a relatively well developed and objective performance measurement, evaluation, and incentive system. Significant bonuses were offered to most of the company's management-level employees based on performance measured in terms of return on investment (ROI). THTF managers were generally pleased with their measurement/incentive system, although they knew that the system would have to evolve over time, as Meilan Han (chief financial officer) explained:
We've taken a conservative approach that is designed to prevent failures. We worry that if we have failures, we can ruin the reputation of the company and Tsinghua University [the company's largest shareholder]. Our conservative approach has been very successful. But as we continue to grow, it is inevitable that our systems will have to change.
One change that the company's managers were hoping to make as soon as possible was to add stock options to the compensation packages of at least some employees, if and when the Chinese government legalized their use. COMPANY BACKGROUND THTF, headquartered in Beijing, was one of China's leading high technology companies7. In 2002, the company's sales revenue was about 5.5 billion yuan8, 50% derived from the sale of computer products (e.g. personal computers and components), 31 % from network, software, and systems integration products, and 19% from resource and environmental engineering and facilities products (e.g. energy economization systems, pollution control systems, large-scale container inspection systems). Net income in 2002 was 184 million yuan. Exhibit 1 presents a five-year summary of financial data. THTF was created through the consolidation of ten enterprises owned by Tsinghua University. Tsinghua University was widely regarded as being China's premiere engineering-oriented university ("the MIT of China"). The association with Tsinghua University provided THTF with a reputation for high technology and high quality, which made its products easier to sell. THTF was particularly proud of its highly educated employees, many of whom had earned degrees in technical fields. Among its approximately 1,200 employees, 22% had masters degrees and 66% had bachelors degrees. Company brochures described THTF's philosophy as follows:
Today's THTF is the successful combination of applying human and capital market resources to high technology. Tomorrow it will stand firmly as a world leader in developing technology and serving society with innovative products and services.
6 "Bring Hundred Multimillionaires in Tsinghua Tongfang," People's Daily, August 1,2000. 7 A China Securities/Asian Commerce survey of the "Top 50 Highest Development Potential Chinese Companies." Ranked THTF #6 (SINO-US Weekly, June 20, 2000). 8 yuan = US$0.I23.
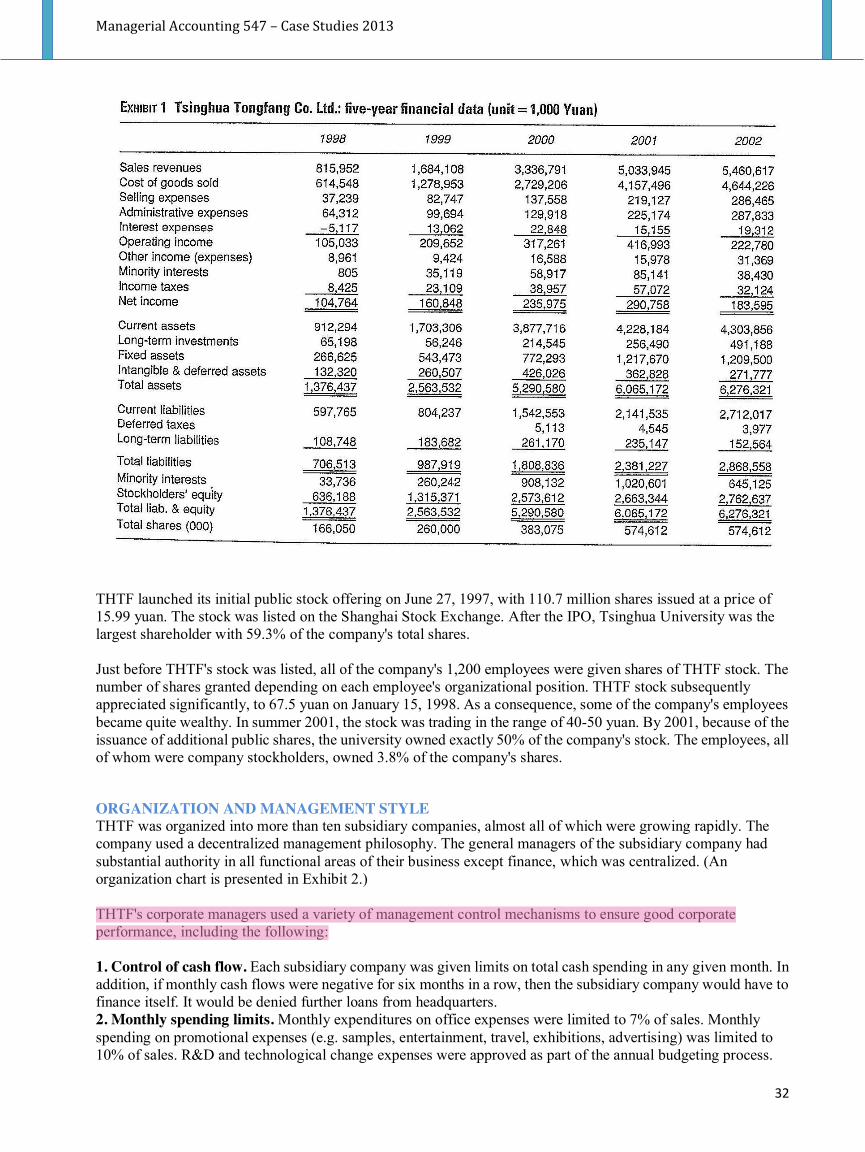
Managerial Accounting 547 – Case Studies 2013
32
THTF launched its initial public stock offering on June 27, 1997, with 110.7 million shares issued at a price of 15.99 yuan. The stock was listed on the Shanghai Stock Exchange. After the IPO, Tsinghua University was the largest shareholder with 59.3% of the company's total shares. Just before THTF's stock was listed, all of the company's 1,200 employees were given shares of THTF stock. The number of shares granted depending on each employee's organizational position. THTF stock subsequently appreciated significantly, to 67.5 yuan on January 15, 1998. As a consequence, some of the company's employees became quite wealthy. In summer 2001, the stock was trading in the range of 40-50 yuan. By 2001, because of the issuance of additional public shares, the university owned exactly 50% of the company's stock. The employees, all of whom were company stockholders, owned 3.8% of the company's shares. ORGANIZATION AND MANAGEMENT STYLE THTF was organized into more than ten subsidiary companies, almost all of which were growing rapidly. The company used a decentralized management philosophy. The general managers of the subsidiary company had substantial authority in all functional areas of their business except finance, which was centralized. (An organization chart is presented in Exhibit 2.) THTF's corporate managers used a variety of management control mechanisms to ensure good corporate performance, including the following: 1. Control of cash flow. Each subsidiary company was given limits on total cash spending in any given month. In addition, if monthly cash flows were negative for six months in a row, then the subsidiary company would have to finance itself. It would be denied further loans from headquarters. 2. Monthly spending limits. Monthly expenditures on office expenses were limited to 7% of sales. Monthly spending on promotional expenses (e.g. samples, entertainment, travel, exhibitions, advertising) was limited to 10% of sales. R&D and technological change expenses were approved as part of the annual budgeting process.
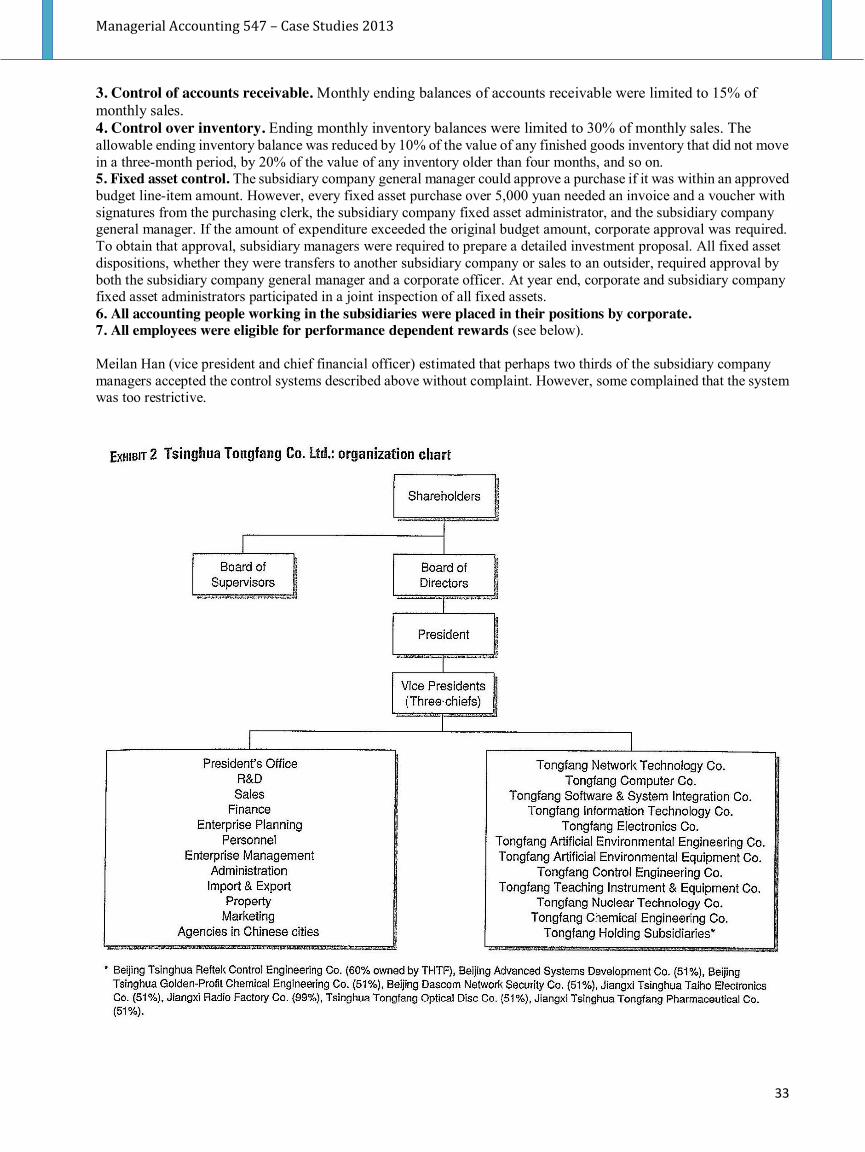
Managerial Accounting 547 – Case Studies 2013
33
3. Control of accounts receivable. Monthly ending balances of accounts receivable were limited to 15% of monthly sales. 4. Control over inventory. Ending monthly inventory balances were limited to 30% of monthly sales. The allowable ending inventory balance was reduced by 10% of the value of any finished goods inventory that did not move in a three-month period, by 20% of the value of any inventory older than four months, and so on. 5. Fixed asset control. The subsidiary company general manager could approve a purchase if it was within an approved budget line-item amount. However, every fixed asset purchase over 5,000 yuan needed an invoice and a voucher with signatures from the purchasing clerk, the subsidiary company fixed asset administrator, and the subsidiary company general manager. If the amount of expenditure exceeded the original budget amount, corporate approval was required. To obtain that approval, subsidiary managers were required to prepare a detailed investment proposal. All fixed asset dispositions, whether they were transfers to another subsidiary company or sales to an outsider, required approval by both the subsidiary company general manager and a corporate officer. At year end, corporate and subsidiary company fixed asset administrators participated in a joint inspection of all fixed assets. 6. All accounting people working in the subsidiaries were placed in their positions by corporate. 7. All employees were eligible for performance dependent rewards (see below). Meilan Han (vice president and chief financial officer) estimated that perhaps two thirds of the subsidiary company managers accepted the control systems described above without complaint. However, some complained that the system was too restrictive.
Managerial Accounting 547 – Case Studies 2013
34
PERFORMANCE EVALUATION SYSTEM In 1998, THTF implemented a formal individual employee performance evaluation system consisting of three parts: self evaluation (20%), peer evaluation (20%), and direct superior's evaluation (60%). Each part of the evaluation was based on judgments in each of the following areas: 1. Performance: efficiency, effectiveness, and output quality. 2. Dedication: commitment, work attitude, and self motivation. 3. Obedience to superiors and cooperation with others. 4. Knowledge: technical and managerial skills, experience, and demonstration of competence. 5. Discipline: attendance, adherence to company rules and regulations, and good moral character. Twice per year (in July and January), each rater assigned scores for each criterion on a 20–point scale with the following guidelines:
Excellent (a score of 17-20) Good (13-16) Adequate (9-12) Need improvement (5-8) Unacceptable (1-4)
For both the self evaluation and the direct superior's evaluation, the rater had to explain in writing the reasons for assigning a specific score for each criterion. After completing the self evaluation form, each employee also had to write down a plan for improvement in the next half year. For the peer evaluation, each employee evaluated his/her immediate superior, colleagues, and subordinates. Typically employees rated five to 20 people, depending on the specific position the employee held. INCENTIVE SYSTEM The compensation packages for all employees included some performance-dependent elements. For example, for a subsidiary general manager, the average total annual compensation was comprised of approximately 30% base salary, 40% "discretionary bonus," and 30% formula bonus. Salary increases were based on the semi-annual performance evaluations described above. About 50% of the importance weighting was placed on performance. The other criteria were weighted approximately equally. The discretionary bonus was “almost guaranteed”. While it could be withheld under exceptional circumstances, it never had been withheld at THTF. Thus, it was like another component of salary, and it increased proportionally with increases in base salary. The performance-dependent bonuses for all subsidiary company employees were based on subsidiary company results - return on investment (ROI) and “excess profit” - as is shown in Table l. Excess profit was defined as actual profit less profit based on target ROI. Performance targets were set to be challenging-but-achievable. Since most of the subsidiary companies operated in highly uncertain markets, their performances as compared to targets varied. In a typical year approximately two (of the 10) subsidiary companies would not achieve the ROI target level. One would be at or near the target. The other seven would exceed the target, and some would do so by a wide margin. The function shown in Table 1 defined the size of the bonus pool to be allocated among subsidiary company personnel. Subsidiary general managers decided how to allocate the pool to individual employees. Corporate managers did not prescribe a policy for making these allocations, but they did reserve the right to exercise some judgment to “smooth out” the allocations of bonuses. In recent years, the highest bonus given to any individual totalled 70% of that person's total compensation. Bonuses for corporate-level managers and staff were based on corporate ROI performance, using a similar performance/reward function. In addition to this bonus plan, THTF conducted an annual employee vote to select the top 1 % “Star Employees” and the top 5% “Excellent Employees”. (Managers were not eligible.) These employees had the opportunity to get additional bonuses, promotions, overseas study opportunities, and new share issues.
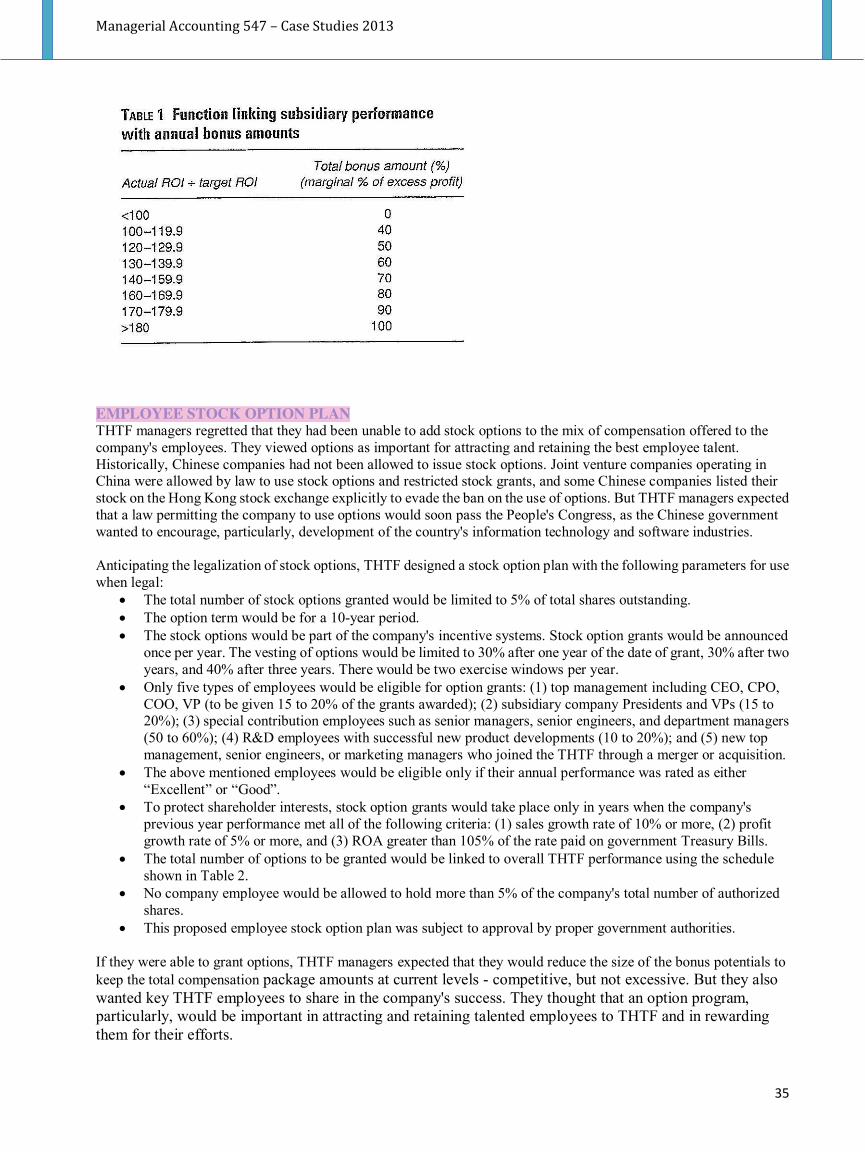
Managerial Accounting 547 – Case Studies 2013
35
EMPLOYEE STOCK OPTION PLAN THTF managers regretted that they had been unable to add stock options to the mix of compensation offered to the company's employees. They viewed options as important for attracting and retaining the best employee talent. Historically, Chinese companies had not been allowed to issue stock options. Joint venture companies operating in China were allowed by law to use stock options and restricted stock grants, and some Chinese companies listed their stock on the Hong Kong stock exchange explicitly to evade the ban on the use of options. But THTF managers expected that a law permitting the company to use options would soon pass the People's Congress, as the Chinese government wanted to encourage, particularly, development of the country's information technology and software industries. Anticipating the legalization of stock options, THTF designed a stock option plan with the following parameters for use when legal:
The total number of stock options granted would be limited to 5% of total shares outstanding. The option term would be for a 10-year period. The stock options would be part of the company's incentive systems. Stock option grants would be announced
once per year. The vesting of options would be limited to 30% after one year of the date of grant, 30% after two years, and 40% after three years. There would be two exercise windows per year.
Only five types of employees would be eligible for option grants: (1) top management including CEO, CPO, COO, VP (to be given 15 to 20% of the grants awarded); (2) subsidiary company Presidents and VPs (15 to 20%); (3) special contribution employees such as senior managers, senior engineers, and department managers (50 to 60%); (4) R&D employees with successful new product developments (10 to 20%); and (5) new top management, senior engineers, or marketing managers who joined the THTF through a merger or acquisition.
The above mentioned employees would be eligible only if their annual performance was rated as either “Excellent” or “Good”.
To protect shareholder interests, stock option grants would take place only in years when the company's previous year performance met all of the following criteria: (1) sales growth rate of 10% or more, (2) profit growth rate of 5% or more, and (3) ROA greater than 105% of the rate paid on government Treasury Bills.
The total number of options to be granted would be linked to overall THTF performance using the schedule shown in Table 2.
No company employee would be allowed to hold more than 5% of the company's total number of authorized shares.
This proposed employee stock option plan was subject to approval by proper government authorities. If they were able to grant options, THTF managers expected that they would reduce the size of the bonus potentials to keep the total compensation package amounts at current levels - competitive, but not excessive. But they also wanted key THTF employees to share in the company's success. They thought that an option program, particularly, would be important in attracting and retaining talented employees to THTF and in rewarding them for their efforts.

Managerial Accounting 547 – Case Studies 2013
36
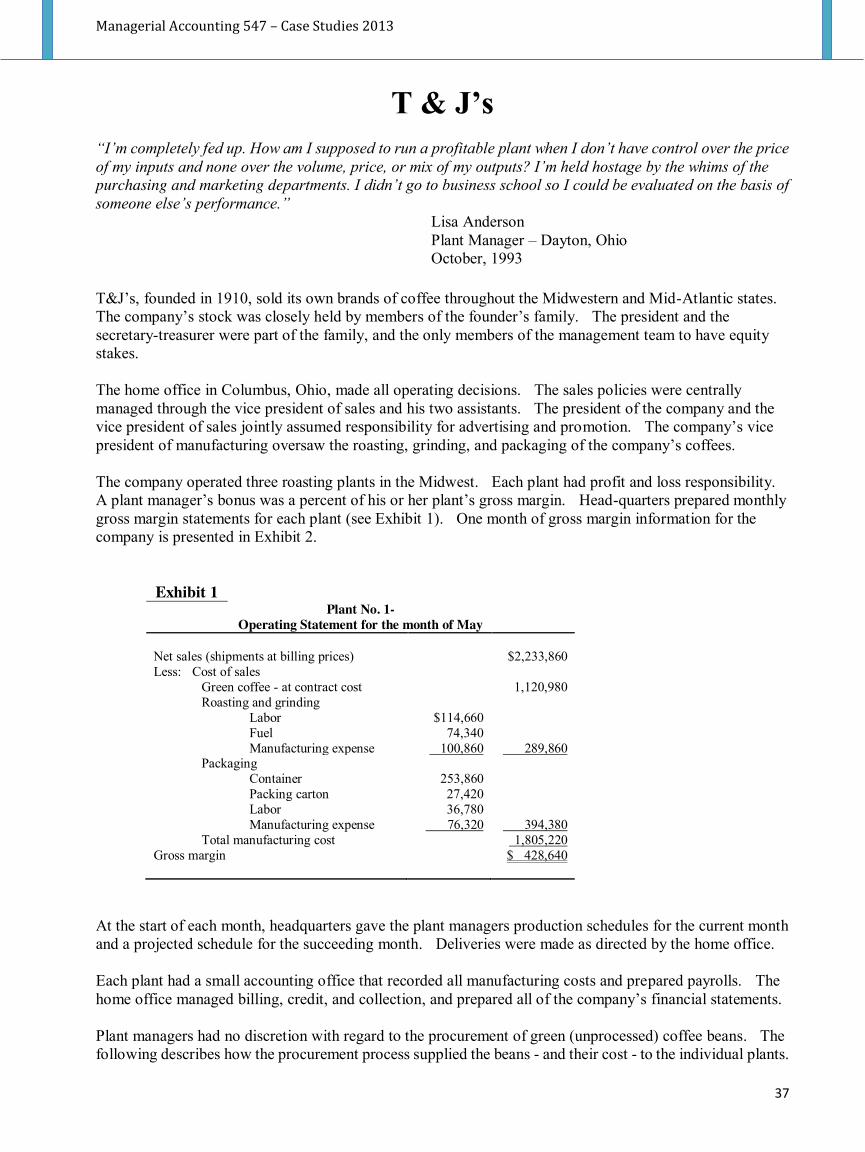
Managerial Accounting 547 – Case Studies 2013
37
T & J’s “I’m completely fed up. How am I supposed to run a profitable plant when I don’t have control over the price of my inputs and none over the volume, price, or mix of my outputs? I’m held hostage by the whims of the purchasing and marketing departments. I didn’t go to business school so I could be evaluated on the basis of someone else’s performance.”
Lisa Anderson Plant Manager – Dayton, Ohio October, 1993
T&J’s, founded in 1910, sold its own brands of coffee throughout the Midwestern and Mid-Atlantic states. The company’s stock was closely held by members of the founder’s family. The president and the secretary-treasurer were part of the family, and the only members of the management team to have equity stakes. The home office in Columbus, Ohio, made all operating decisions. The sales policies were centrally managed through the vice president of sales and his two assistants. The president of the company and the vice president of sales jointly assumed responsibility for advertising and promotion. The company’s vice president of manufacturing oversaw the roasting, grinding, and packaging of the company’s coffees. The company operated three roasting plants in the Midwest. Each plant had profit and loss responsibility. A plant manager’s bonus was a percent of his or her plant’s gross margin. Head-quarters prepared monthly gross margin statements for each plant (see Exhibit 1). One month of gross margin information for the company is presented in Exhibit 2.
Exhibit 1 Plant No. 1-
Operating Statement for the month of May Net sales (shipments at billing prices) $2,233,860 Less: Cost of sales Green coffee - at contract cost 1,120,980 Roasting and grinding Labor $114,660 Fuel 74,340 Manufacturing expense 100,860 289,860 Packaging Container 253,860 Packing carton 27,420 Labor 36,780 Manufacturing expense 76,320 394,380 Total manufacturing cost 1,805,220 Gross margin $ 428,640
At the start of each month, headquarters gave the plant managers production schedules for the current month and a projected schedule for the succeeding month. Deliveries were made as directed by the home office. Each plant had a small accounting office that recorded all manufacturing costs and prepared payrolls. The home office managed billing, credit, and collection, and prepared all of the company’s financial statements. Plant managers had no discretion with regard to the procurement of green (unprocessed) coffee beans. The following describes how the procurement process supplied the beans - and their cost - to the individual plants.
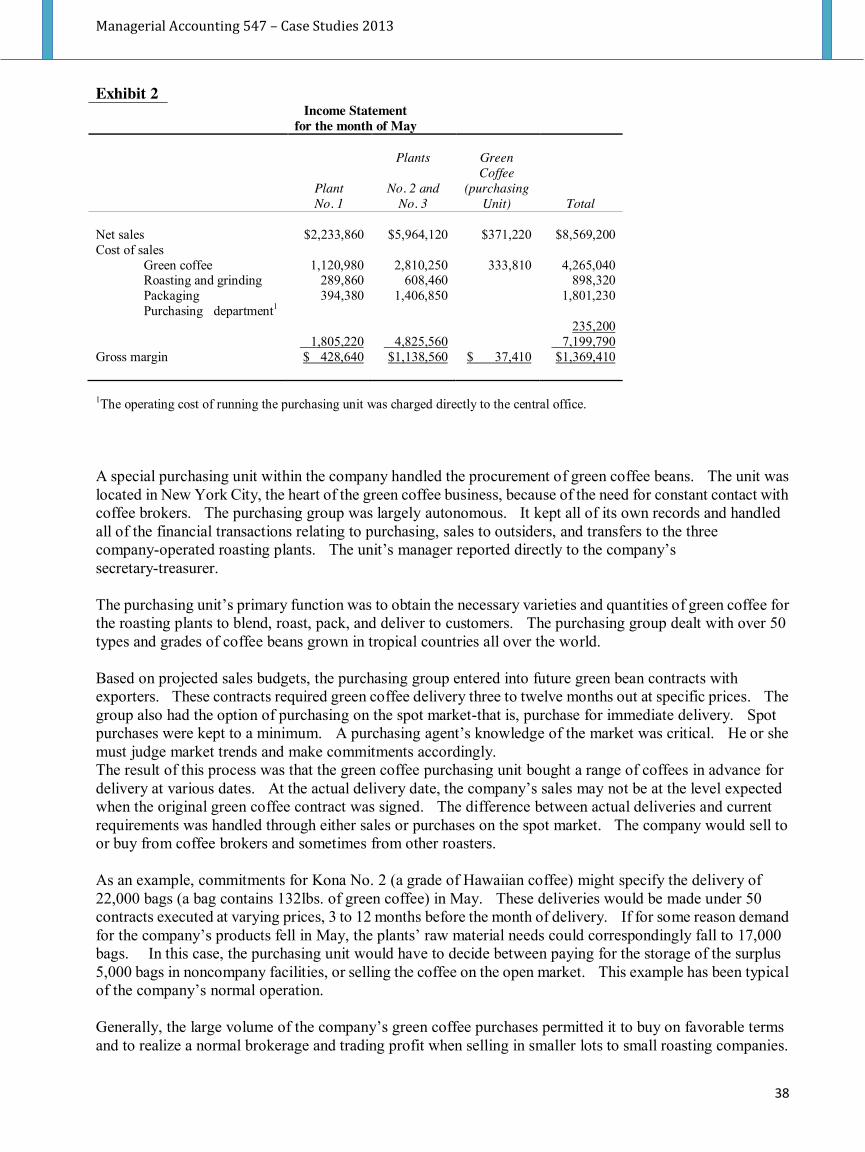
Managerial Accounting 547 – Case Studies 2013
38
Exhibit 2 Income Statement
for the month of May
Plants Green Coffee
Plant No. 2 and (purchasing No. 1 No. 3 Unit) Total
Net sales $2,233,860 $5,964,120 $371,220 $8,569,200 Cost of sales Green coffee 1,120,980 2,810,250 333,810 4,265,040 Roasting and grinding 289,860 608,460 898,320 Packaging 394,380 1,406,850 1,801,230 Purchasing department1
235,200 1,805,220 4,825,560 7,199,790 Gross margin $ 428,640 $1,138,560 $ 37,410 $1,369,410
1The operating cost of running the purchasing unit was charged directly to the central office. A special purchasing unit within the company handled the procurement of green coffee beans. The unit was located in New York City, the heart of the green coffee business, because of the need for constant contact with coffee brokers. The purchasing group was largely autonomous. It kept all of its own records and handled all of the financial transactions relating to purchasing, sales to outsiders, and transfers to the three company-operated roasting plants. The unit’s manager reported directly to the company’s secretary-treasurer. The purchasing unit’s primary function was to obtain the necessary varieties and quantities of green coffee for the roasting plants to blend, roast, pack, and deliver to customers. The purchasing group dealt with over 50 types and grades of coffee beans grown in tropical countries all over the world. Based on projected sales budgets, the purchasing group entered into future green bean contracts with exporters. These contracts required green coffee delivery three to twelve months out at specific prices. The group also had the option of purchasing on the spot market-that is, purchase for immediate delivery. Spot purchases were kept to a minimum. A purchasing agent’s knowledge of the market was critical. He or she must judge market trends and make commitments accordingly. The result of this process was that the green coffee purchasing unit bought a range of coffees in advance for delivery at various dates. At the actual delivery date, the company’s sales may not be at the level expected when the original green coffee contract was signed. The difference between actual deliveries and current requirements was handled through either sales or purchases on the spot market. The company would sell to or buy from coffee brokers and sometimes from other roasters. As an example, commitments for Kona No. 2 (a grade of Hawaiian coffee) might specify the delivery of 22,000 bags (a bag contains 132lbs. of green coffee) in May. These deliveries would be made under 50 contracts executed at varying prices, 3 to 12 months before the month of delivery. If for some reason demand for the company’s products fell in May, the plants’ raw material needs could correspondingly fall to 17,000 bags. In this case, the purchasing unit would have to decide between paying for the storage of the surplus 5,000 bags in noncompany facilities, or selling the coffee on the open market. This example has been typical of the company’s normal operation. Generally, the large volume of the company’s green coffee purchases permitted it to buy on favorable terms and to realize a normal brokerage and trading profit when selling in smaller lots to small roasting companies.
Managerial Accounting 547 – Case Studies 2013
39
Hence, the usual policy was to make purchase commitments based on maximum potential plant requirements and sell the surplus on the spot market. In accounting for coffee purchases, a separate cost record was maintained for each contract. This record was charged with payments for coffee purchased, with shipping charges, import expenses, and similar items. With these charges, the purchasing group computed for each contract a net cost per bag. Thus the 50 deliveries of Kona No. 2 cited in the example would come into inventory at 50 different costs. The established policy was to treat each contract on an individual basis. When green coffee was shipped to a plant, a charge was made for the cost represented by the contracts that covered that particular shipment of coffee. There was no element of profit or loss associated with this transfer. When the company sold green coffee on the open market, the sales were likewise costed on a specific contract basis with a resulting profit or loss on the transaction. The operating cost of running the purchasing unit was charged to the central office. The cost was recorded as an element in the general corporate overhead. For the past several years, the plant managers have been dissatisfied with the method of computing gross margin (as evident form the quote at the beginning of the case). Their complaints finally led to the president requesting that the controller study the whole method of reporting the results of plant operations and the purchasing group. As part of evaluating the control system, the controller assembled the data on the coffee industry (see the Appendix to the case).
APPENDIX NOTE ON COFFEE The Commodity Prior to reaching its final form in grocery stores as ground (percolator) or soluble (instant), coffee is referred to by buyers and sellers as “green coffee”. This refers to the green beans that are picked from the coffee trees. There are two types of coffee beans, arabica and robusta. Arabica is the coffee favored by American consumers and is grown primarily in South America. Its flavour is not as strong as that of the robusta variety. Robusta coffee’s major grower is the Ivory Coast. Not only is its flavour stronger than arabica’s, but it is also favored by processors in the production of instant coffee. Thus, with the increased demand for instant coffee, there has been a concomitant growth in relative demand for robusta beans. The Suppliers Coffee is generally grown in tropical regions. Brazil has been the largest producer and has supplied between 20 to 30 percent of the world’s green coffee. Other large exporting countries include Colombia, Indonesia, the Ivory Coast, and Mexico. Coffee is harvested somewhere in the world during almost every month of the year. For example, Brazil’s main harvesting season is April-September; Colombia’s is October-March; and the Ivory Coast harvests from November-April. The Buyers The United States has been the world’s largest single importer of coffee. It buys most of its coffee from Brazil and Colombia. Europe is second, purchasing a little less than half of all coffee exported. Buyers fall into two categories: roasters and brokers. Roasters include the large food processing companies such as Philip Morris (which acquired General Foods including its Maxwell House business), P & G and Nestle, as well as regional and local coffee companies. The large players purchase their coffee supplies directly from the growers. Their financial strength has allowed them to generally negotiate favorable terms with the growers. The larger purchasers are also able to inventory coffee stock in order to protect themselves against future price increases.
Managerial Accounting 547 – Case Studies 2013
40
The smaller coffee processors have normally bought their coffee from brokers. A broker is either a trade firm or a “pure” broker. Trade firms actually purchase the coffee from the country of origin and then sell it to a food processor. Pure brokers never actually take title to the coffee. They merely match buyer and seller in the marketplace. Trade firms generally finance their transactions via second loans from commercial banks. The banks generally allow a creditworthy company to borrow between 80 to 90 percent of the market value (based on the spot price) of the coffee purchased. The loan is secured with the title to the coffee, which is given to the bank until the trade firms sells the coffee to end users. The trade firm then pays down its loan and takes the remainder of the sale as profit. It is important to note that the coffee business is a relationship business for buyers whether they are large or small. The development of strong relationships with the growers is important in maintaining a steady supply of coffee. While it is true that coffee is a commodity product and the supply and demand of coffee depends on price, one cannot fly down to Colombia and expect to easily buy a million bags of coffee. Growers want to deal with buyers they can trust and vice versa. The buyer may be from a large food processing company or a small New York City brokerage, but one can be sure that he or she has spent a great deal of time cultivating a relationship. A strong relationship provides two things; information on the coffee market, and an inside track on a grower’s crop. This is especially important if a roaster needs a certain type of coffee (e.g., Colombian mild) to maintain a standard blend of ground coffee to keep consumers drinking “to the last drop”. Factors Affecting Price Weather, specifically frost and drought, is the most important factor affecting production and hence price for western hemisphere coffees. The commodity sections in most major newspapers will often carry stories concerning the effect of weather on harvests. Eastern hemisphere coffee producing countries’ crops are most often damaged by insects. The level of coffee inventories in major producing and consuming countries is another important market consideration. Actual or threatened dock strikes may cause a buildup of coffee stocks at a part of exit. Marketing policies of various exporting countries will also affect prices. On the consumer side, high retail prices or concerns about health can reduce consumptions, which in turn may exert downward pressure on prices. The Futures Market Futures markets for coffee exist in New York, London and Paris. In New York, coffee futures are traded on the Coffee, Sugar and Cocoa Exchange. There is considerable uncertainty in predicting prices and availability of green coffee beans. Thus, the normal use of the coffee futures market is to set up a hedge to protect one’s inventory position against price fluctuations. A hedge is commonly defined as the establishment of a position in the futures market approximately equal to, but in the opposite direction of, a commitment in the cash market (also known as the physical or actual commodity). Only two percent of all futures contracts result in actual delivery of coffee beans. The majority of contracts are closed out by purchasing a contract on the opposite direction or selling one’s own contract. For example, one who owns an inventory of coffee establishes a short position in the futures market. This position will offset a drop in the value of one’s inventory due to a decline in coffee prices. The short position obligates the holder to sell coffee at a predetermined price at some future date. If, in the future, coffee prices drop, the short position will increase in value because the holder has locked in a higher sales price. This will offset the decline in value of the actual coffee inventory. It is virtually impossible to set up a perfect hedge position due to imperfections between the physical and futures markets, but the markets do provide protection to the value of one’s inventory. Hedging also allows the coffee merchant to obtain credit from banks. Banks will seldom lend money to the holder of a commodity who has not attempted to properly hedge his or her position. Coffee Consumption Trends Per capita coffee consumption has declined precipitously since 1965. Exhibit 3 shows U.S. liquid consumption in several drink categories. While overall coffee consumption has declined, specialty premium and gourmet coffees have bucked this trend and have been selling well. Gourmet coffee sales alone have climbed from approximately $500 million in 1987 to $780 million in 1992. During this period, total coffee sales have moved from $6.3 billion to only $6.8 billion. These specialty brands have attracted new coffee drinkers that are younger and more affluent than the coffee drinkers of 30
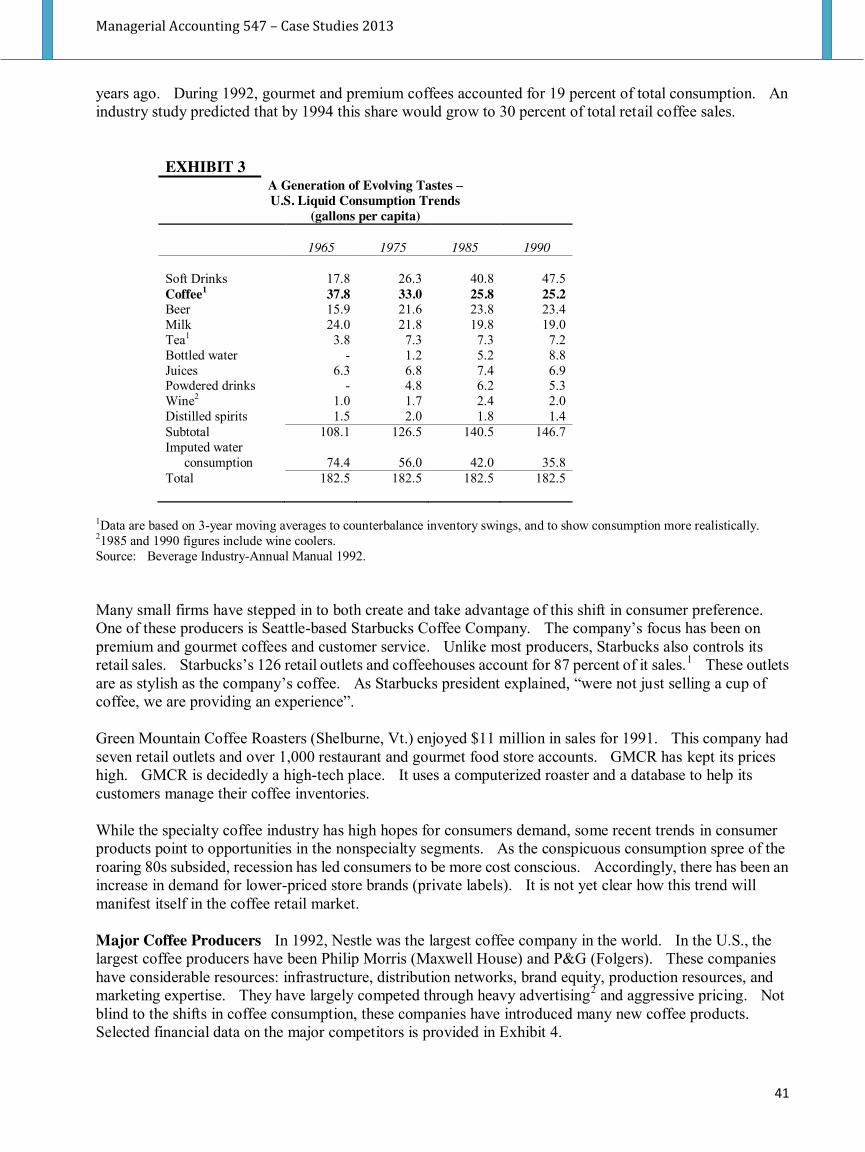
Managerial Accounting 547 – Case Studies 2013
41
years ago. During 1992, gourmet and premium coffees accounted for 19 percent of total consumption. An industry study predicted that by 1994 this share would grow to 30 percent of total retail coffee sales.
EXHIBIT 3 A Generation of Evolving Tastes – U.S. Liquid Consumption Trends
(gallons per capita) 1965 1975 1985 1990
Soft Drinks 17.8 26.3 40.8 47.5 Coffee1 37.8 33.0 25.8 25.2 Beer 15.9 21.6 23.8 23.4 Milk 24.0 21.8 19.8 19.0 Tea1 3.8 7.3 7.3 7.2 Bottled water - 1.2 5.2 8.8 Juices 6.3 6.8 7.4 6.9 Powdered drinks - 4.8 6.2 5.3 Wine2 1.0 1.7 2.4 2.0 Distilled spirits 1.5 2.0 1.8 1.4 Subtotal 108.1 126.5 140.5 146.7 Imputed water consumption 74.4 56.0 42.0 35.8 Total 182.5 182.5 182.5 182.5
1Data are based on 3-year moving averages to counterbalance inventory swings, and to show consumption more realistically. 21985 and 1990 figures include wine coolers. Source: Beverage Industry-Annual Manual 1992. Many small firms have stepped in to both create and take advantage of this shift in consumer preference. One of these producers is Seattle-based Starbucks Coffee Company. The company’s focus has been on premium and gourmet coffees and customer service. Unlike most producers, Starbucks also controls its retail sales. Starbucks’s 126 retail outlets and coffeehouses account for 87 percent of it sales.1 These outlets are as stylish as the company’s coffee. As Starbucks president explained, “were not just selling a cup of coffee, we are providing an experience”. Green Mountain Coffee Roasters (Shelburne, Vt.) enjoyed $11 million in sales for 1991. This company had seven retail outlets and over 1,000 restaurant and gourmet food store accounts. GMCR has kept its prices high. GMCR is decidedly a high-tech place. It uses a computerized roaster and a database to help its customers manage their coffee inventories. While the specialty coffee industry has high hopes for consumers demand, some recent trends in consumer products point to opportunities in the nonspecialty segments. As the conspicuous consumption spree of the roaring 80s subsided, recession has led consumers to be more cost conscious. Accordingly, there has been an increase in demand for lower-priced store brands (private labels). It is not yet clear how this trend will manifest itself in the coffee retail market. Major Coffee Producers In 1992, Nestle was the largest coffee company in the world. In the U.S., the largest coffee producers have been Philip Morris (Maxwell House) and P&G (Folgers). These companies have considerable resources: infrastructure, distribution networks, brand equity, production resources, and marketing expertise. They have largely competed through heavy advertising2 and aggressive pricing. Not blind to the shifts in coffee consumption, these companies have introduced many new coffee products. Selected financial data on the major competitors is provided in Exhibit 4.
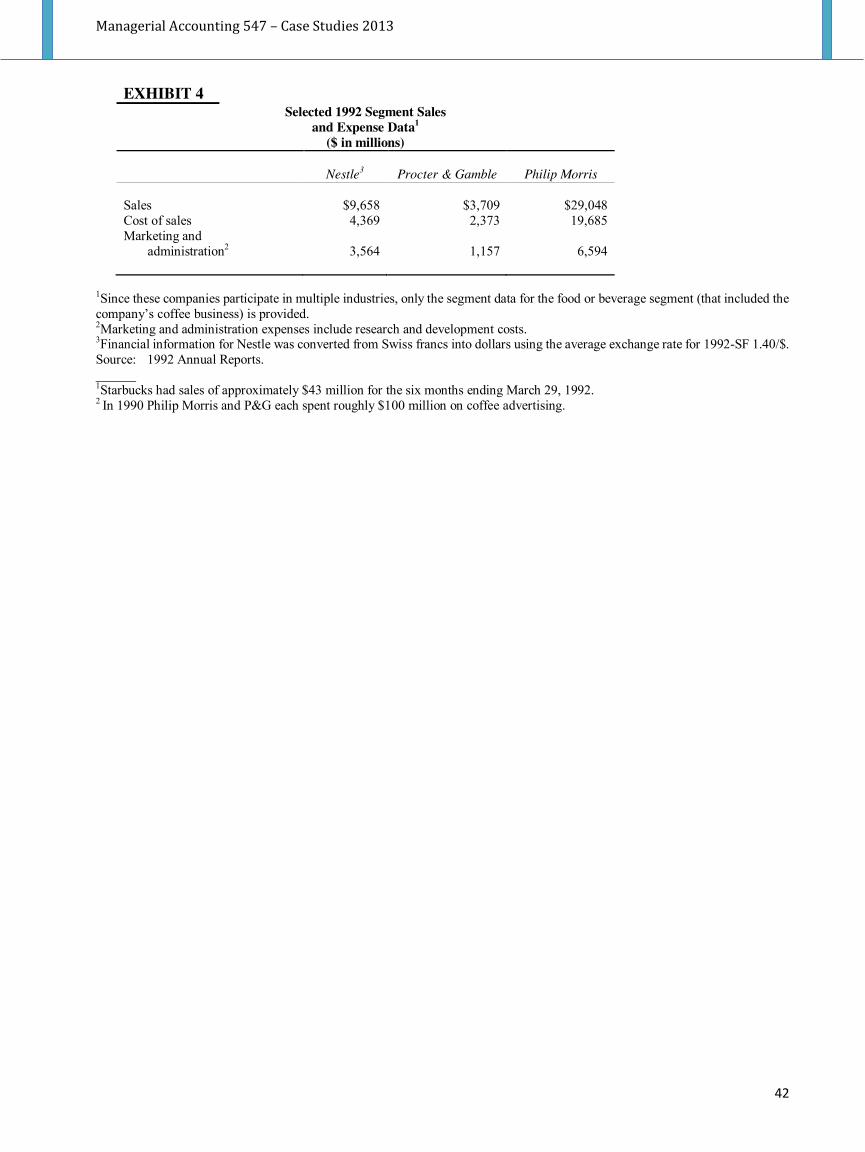
Managerial Accounting 547 – Case Studies 2013
42
EXHIBIT 4 Selected 1992 Segment Sales
and Expense Data1 ($ in millions)
Nestle3 Procter & Gamble Philip Morris
Sales $9,658 $3,709 $29,048 Cost of sales 4,369 2,373 19,685 Marketing and administration2 3,564 1,157 6,594
1Since these companies participate in multiple industries, only the segment data for the food or beverage segment (that included the company’s coffee business) is provided. 2Marketing and administration expenses include research and development costs. 3Financial information for Nestle was converted from Swiss francs into dollars using the average exchange rate for 1992-SF 1.40/$. Source: 1992 Annual Reports. ______ 1Starbucks had sales of approximately $43 million for the six months ending March 29, 1992. 2 In 1990 Philip Morris and P&G each spent roughly $100 million on coffee advertising.
Managerial Accounting 547 – Case Studies 2013
43
WealthWise Insurance
WealthWise Insurance has recently set up an internal information system to improve social and environmental
practices within the company. The company has its head office in Brisbane and offices in all capital cities and every
regional city with a population of more than 50,000 people. One of the underlying principles of the company is to be
socially and environmentally responsible. This principle has been in place for many years, dating back to the firm’s
founder, Jeanette Dai, who felt that she would like to contribute to society rather than simply maximising profits.
The company is a major contributor to charities, particularly those that focus on the homeless and the poor. It actively
promotes environmental management in all of the company operations. It sponsors a program that provides
scholarships to disadvantaged students to allow them to attend university, and it is proud to offer employment in the
company to long-term unemployed and the poor. Each year it publishes a sustainability report that summarises its
achievements across each area of performance.
Over time, these activities have become a marketing strength of WealthWise. The social and environmental stance
taken by the company has attracted many customers to the company. Listed on the Australian Stock Exchange in
2001, the company has also become a preferred investment of ethical and green investment funds.
The mission statement of WealthWise states that it will aim to:
Support employees in achieving their personal and career goals.
Act in a socially responsible way when dealing with insurance clients and the general community.
Promote a better social and physical environment for the world.
However, the current chief executive officer, Sylvia Trott, thinks that the firm has become complacent and is resting
on its past achievements. She is concerned that the firm has built up a reputation for good social and environmental
practices but is not ‘walking the talk’. There is some level of discontent among employees about the way that
management treats staff, and this is impacting on employee satisfaction. There have also been negative reports in the
media of its treatment of businesses in Phuket and Langkawi that were damaged in the December 2004 tsunami. The
reports claim that the company has tried to minimise amounts paid to these businesses by strictly applying clauses in
the insurance contracts that cover earthquake damage but not flood damage.
In 2004, the company’s net profit rose by 15 per cent to $173 million on an asset base of $1235 million. This is the
third consecutive year of increased profits. Earnings per share were 62 cents, and the market value was $5.40 per
share. The board is concerned that WealthWise makes a loss on its insurance business, while its investments yield a
strong return and are the main reason for the increase in profitability. Its investment portfolio includes shares in BHP
Billiton, Qantas, Telstra and James Hardie Industries.
Managerial Accounting 547 – Case Studies 2013
44
The board adopts a sustainability approach to viewing its performance and uses the following key performance
indicators to assess company performance:
Financial:
Net profit
Gross insurance premiums
Return on investment
Economic indicators:
Policy, practices and spending on local suppliers
Procedures for hiring local staff
Development projects primarily for public benefit
Social indicators:
Employee satisfaction ratings
Percentage of women in the top three tiers of management
Number of indigenous employees
Customers’ ethical ranking of sales staff
Number of staff hired who were previously unemployed teenagers
Environmental indicators:
Tonnes of paper recycled per annum
Percentage reduction in electricity usage
Litres of fuel per dollar of sales


