Embed Size (px)
Citation preview
Intake: March 2013
[email protected] Assignment for Managerial Finance Page 1 of 29
MASTER OF BUSINESS ADMINISTRATION
INTERNATIONAL PROGRAM
SEMESTER 2 – 2013
ANALYSIS THE FINNANCIAL STATEMENT OF INVESTMENT COMMERCE
FISHERIES CORPORATION - ICF
Lecturer: Dr. Phan Dinh Nguyen
Student Name: Nguyen Manh Ha
ID No: 15030
MBAOUM0313 - Class K08A
Intake: March 2013
[email protected] Assignment for Managerial Finance Page 2 of 29
Preface:
My heart is filled with very gratitude to my dear teacher who inspire and instruct me
how to do research and conduct a case study for how analysing the financial statement of the
ICF Corporation that listed in Hochiminh City’s Stock Exchange. These studies have
revealed the application for analysis any type of businesses, organizations on the financial
market. The fact that the financial statement is very important and the manager of any
business requires a flow of information to make informed, intelligent decisions affecting the
success or failure of its operations. Investors need statements to analyze investment potential
Banks require financial statements to decide whether or not to loan money, and/ or many
companies need statements to ascertain the risk involved in doing business with their
customers and suppliers
I highly appreciate the efforts of Dr. Phan Dinh Nguyen who guided and gave me a
chance to do this assignment.
I also would like to express my thanks to all my friends & ICF Corporation helped
me with very useful information so that I could accomplish this assignment.
I hope that my analysis would serve as a ready reckoned document for students,
research scholars using as a reference source.
With very best regards.
Nguyen Manh Ha
Intake: March 2013
[email protected] Assignment for Managerial Finance Page 3 of 29
Table of contents
I. Introduction
II. General introduction of Incomfish
III. Analysis of financial statements
IV. Conclusion and policy implications
References
Intake: March 2013
[email protected] Assignment for Managerial Finance Page 4 of 29
I. INTRODUCTION
1. BUSINESS PROFILE
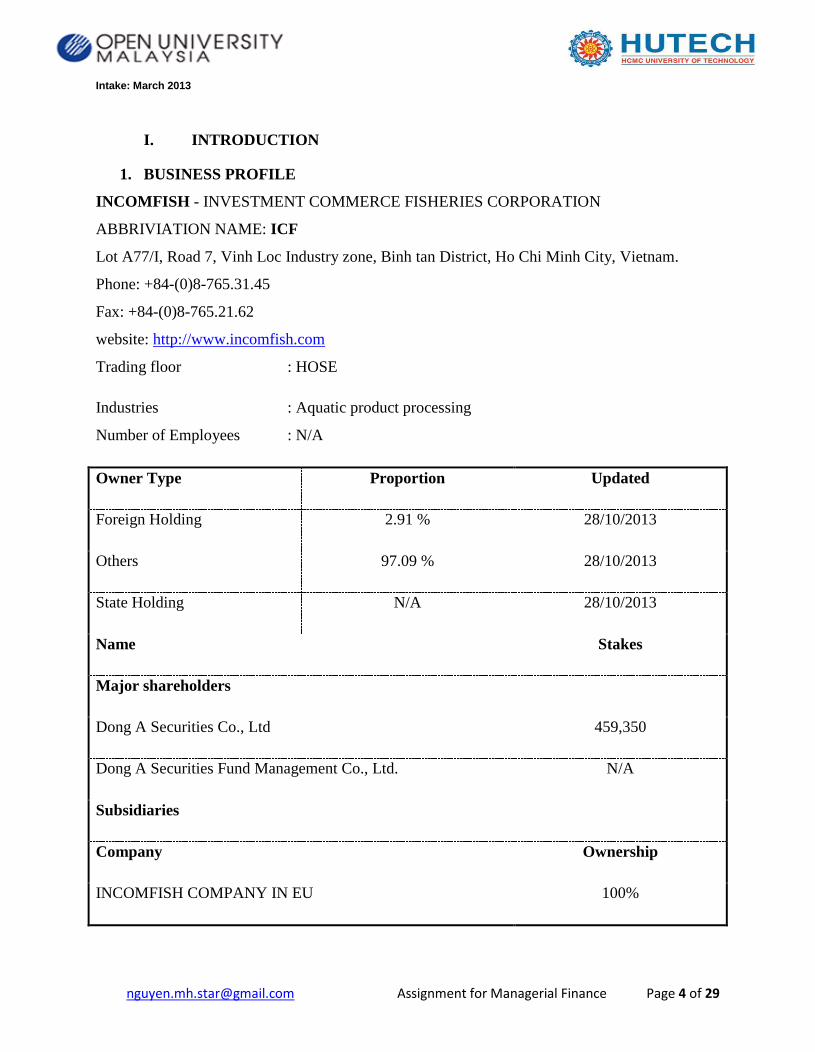
INCOMFISH - INVESTMENT COMMERCE FISHERIES CORPORATION
ABBRIVIATION NAME: ICF
Lot A77/I, Road 7, Vinh Loc Industry zone, Binh tan District, Ho Chi Minh City, Vietnam.
Phone: +84-(0)8-765.31.45
Fax: +84-(0)8-765.21.62
website: http://www.incomfish.com
Trading floor : HOSE
Industries : Aquatic product processing
Number of Employees : N/A
Owner Type Proportion Updated
Foreign Holding 2.91 % 28/10/2013
Others 97.09 % 28/10/2013
State Holding N/A 28/10/2013
Name Stakes
Major shareholders
Dong A Securities Co., Ltd 459,350
Dong A Securities Fund Management Co., Ltd. N/A
Subsidiaries
Company Ownership
INCOMFISH COMPANY IN EU 100%
Intake: March 2013
[email protected] Assignment for Managerial Finance Page 5 of 29
INCOMFISH COMPANY IN NORTHERN AMERICA 100%
II. GENERAL INTRODUCTION OF INCOMFISH
1. Corporate History
1st Sep1999: Established with the initial chartered capital of VND10 billion
2001: Constructing Seafood Product Processing Manufactory in Vinh Loc industrial park
– Ho Chi Minh City
June 2006: Completing to build Seafood Product Processing Manufactory with the
capacity of 6,500 tons/ year
Increasing its chartered capital to VND118 billion
29/11/2006: Listed on Hose
03/2011: The chartered capital is VND128.07 billion
2. Scopes of Business
Cultivating sea animals
Processing and preserving seafood products and others
Supplying services relating to sea animals as collecting, transporting fresh sea animals,
providing foods, creating fish or shrimp breeds
Processing and preserving meat, products from meat, vegetables and products from
vegetables.
Others under business license
3. Development Strategies
Good quality is the main principle to develop company. Thus, it always increases the role
of quality management to meet higher consumers’ demand on quality.
Keeping diversifying products and market, the company plans to build infrastructures of
industrial parks, congealment manufactory according the economic and social
incorporation programs between Ho Chi Minh City and Dong Thap province from 2007
to 2010.
4. Company Ability
Intake: March 2013
[email protected] Assignment for Managerial Finance Page 6 of 29
Investment Commerce Fisheries Joint Stock Company was established in 1999 and started
operating in 2003. The company mainly produces seafood products (3 main types: fish, shrimp
and processing foodstuff). Company’s products are mainly exported (above 95%) to the US,
Japan and EU. The main manufactory of company located in an area of 21,000 m2 has a capacity
of 1500 tons per year. Moreover, the company has a system of cold storages with capacity of
2,500 ton and applies technology of conveyor belt and sewage disposal system. Especially,
company’s products are permitted to export to Japan without inspections.
5. Company Position
Incomfish applies quality management system as HACCP, BRC (Brittish Retail
Consortium), ISO 9001:2000, IFS (International Food Standard), ACC (Aquaculture
Certificate Council), MSC (Marine Stewardships Council) to guarantee high standard of
quality and food safety. Besides, in 2008, the company was granted SA 8000 (Social
Accountability) by TUV NORD
Their products directly entered EU market, Japan, US and some high demanding markets.
6. Major Projects
Project of congealment manufactory in Dong Thap province: this company invested VND
66,240,000,000 in the manufactory with capacity of 150 tons/ year. It will be put into
operation in July 2009.
Making contributions to establish Incomfish Company in the US and EU with the
investment capital of VND29.16 billion. Investing USD2 million on equipments and
machines of Incomfish Company. It will officially operate in 5/2009.
Project of office building in No.32, Mac Dinh Chi, 1st District, Ho Chi Minh City. The
company contributed VND39.6 billion in this project with Saga Trading &Service Co.
Ltd
Project of building infrastructures of Industrial group in Dong Thap province. Incomfish
mobilized VND250 billion. It will begin executing in 2009.
Project of real estate in Linh Xuan ward, Thu Duc District, HCM city. The company
contributed VND48 billion in this project with Vega Trading &Service Co. Ltd
7. Company Prospects
The manufactory is equipped with modern machines and advanced technology.
The company’s products are evaluated as good quality and safety
Diversifying material resources in domestic and overseas sources to reduce risks about
Intake: March 2013
[email protected] Assignment for Managerial Finance Page 7 of 29
harvest.
Stable international processing products
More business opportunities and risk when Vietnam become an official member of WTO
The products have highly competitive capability and high value addition. Thus, these
products are brought directly to supermarkets in Japan and EU.
8. Business Risks
Lack of capital: it is difficult for company to mobilize capital to meet their operation
costs.
Increase in material price
Competition: highly fierce competition in this industry
Influences from anti-dumping lawsuits: the company is under pressure from anti-dumping
lawsuits as catfish (in 2003) and frozen shrimps (in 2004) which the US applied to 6
export countries including Vietnam.
Diversify similar products
It is difficult to recruit employees
III. ANALYSIS OF FINANCIAL STATEMENTS
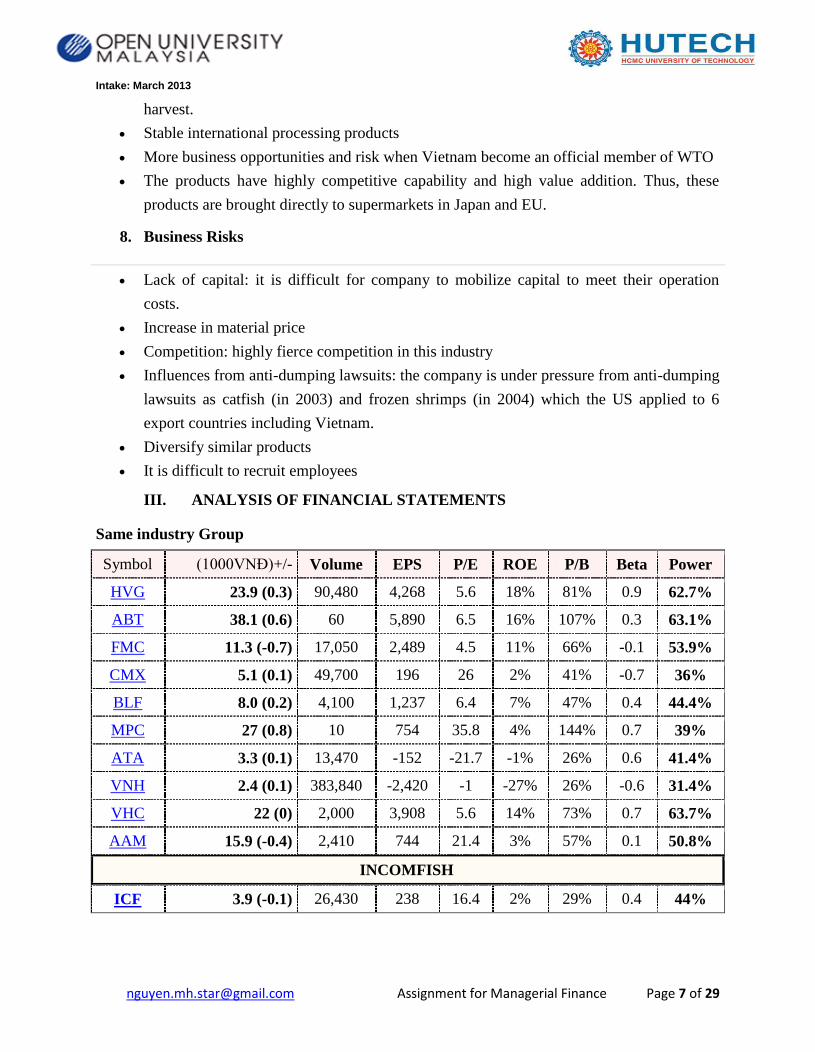
Same industry Group
Symbol (1000VNĐ)+/- Volume EPS P/E ROE P/B Beta Power
HVG 23.9 (0.3) 90,480 4,268 5.6 18% 81% 0.9 62.7%
ABT 38.1 (0.6) 60 5,890 6.5 16% 107% 0.3 63.1%
FMC 11.3 (-0.7) 17,050 2,489 4.5 11% 66% -0.1 53.9%
CMX 5.1 (0.1) 49,700 196 26 2% 41% -0.7 36%
BLF 8.0 (0.2) 4,100 1,237 6.4 7% 47% 0.4 44.4%
MPC 27 (0.8) 10 754 35.8 4% 144% 0.7 39%
ATA 3.3 (0.1) 13,470 -152 -21.7 -1% 26% 0.6 41.4%
VNH 2.4 (0.1) 383,840 -2,420 -1 -27% 26% -0.6 31.4%
VHC 22 (0) 2,000 3,908 5.6 14% 73% 0.7 63.7%
AAM 15.9 (-0.4) 2,410 744 21.4 3% 57% 0.1 50.8%
INCOMFISH
ICF 3.9 (-0.1) 26,430 238 16.4 2% 29% 0.4 44%
Intake: March 2013
[email protected] Assignment for Managerial Finance Page 8 of 29
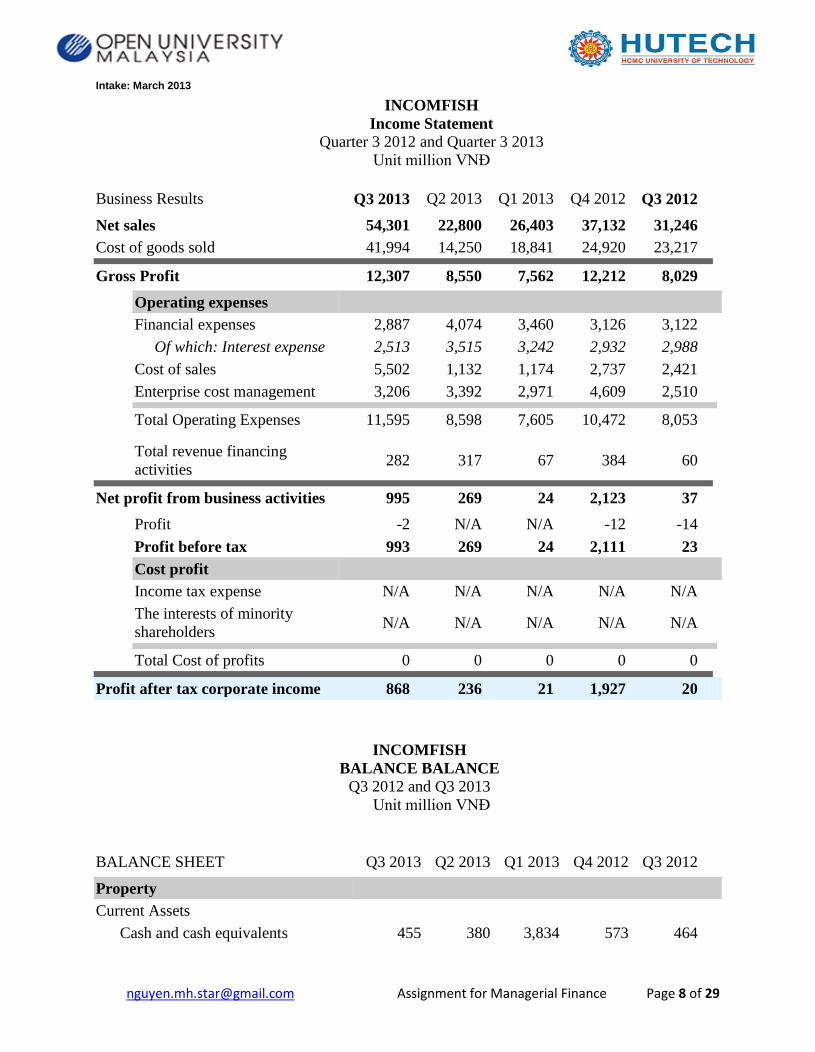
INCOMFISH
Income Statement
Quarter 3 2012 and Quarter 3 2013
Unit million VNĐ
Business Results Q3 2013 Q2 2013 Q1 2013 Q4 2012 Q3 2012
Net sales 54,301 22,800 26,403 37,132 31,246
Cost of goods sold 41,994 14,250 18,841 24,920 23,217
Gross Profit 12,307 8,550 7,562 12,212 8,029
Operating expenses
Financial expenses 2,887 4,074 3,460 3,126 3,122
Of which: Interest expense 2,513 3,515 3,242 2,932 2,988
Cost of sales 5,502 1,132 1,174 2,737 2,421
Enterprise cost management 3,206 3,392 2,971 4,609 2,510
Total Operating Expenses 11,595 8,598 7,605 10,472 8,053
Total revenue financing
activities 282 317 67 384 60
Net profit from business activities 995 269 24 2,123 37
Profit -2 N/A N/A -12 -14
Profit before tax 993 269 24 2,111 23
Cost profit
Income tax expense N/A N/A N/A N/A N/A
The interests of minority
shareholders N/A N/A N/A N/A N/A
Total Cost of profits 0 0 0 0 0
Profit after tax corporate income 868 236 21 1,927 20
INCOMFISH
BALANCE BALANCE
Q3 2012 and Q3 2013
Unit million VNĐ
BALANCE SHEET Q3 2013 Q2 2013 Q1 2013 Q4 2012 Q3 2012
Property
Current Assets
Cash and cash equivalents 455 380 3,834 573 464
Intake: March 2013
[email protected] Assignment for Managerial Finance Page 9 of 29
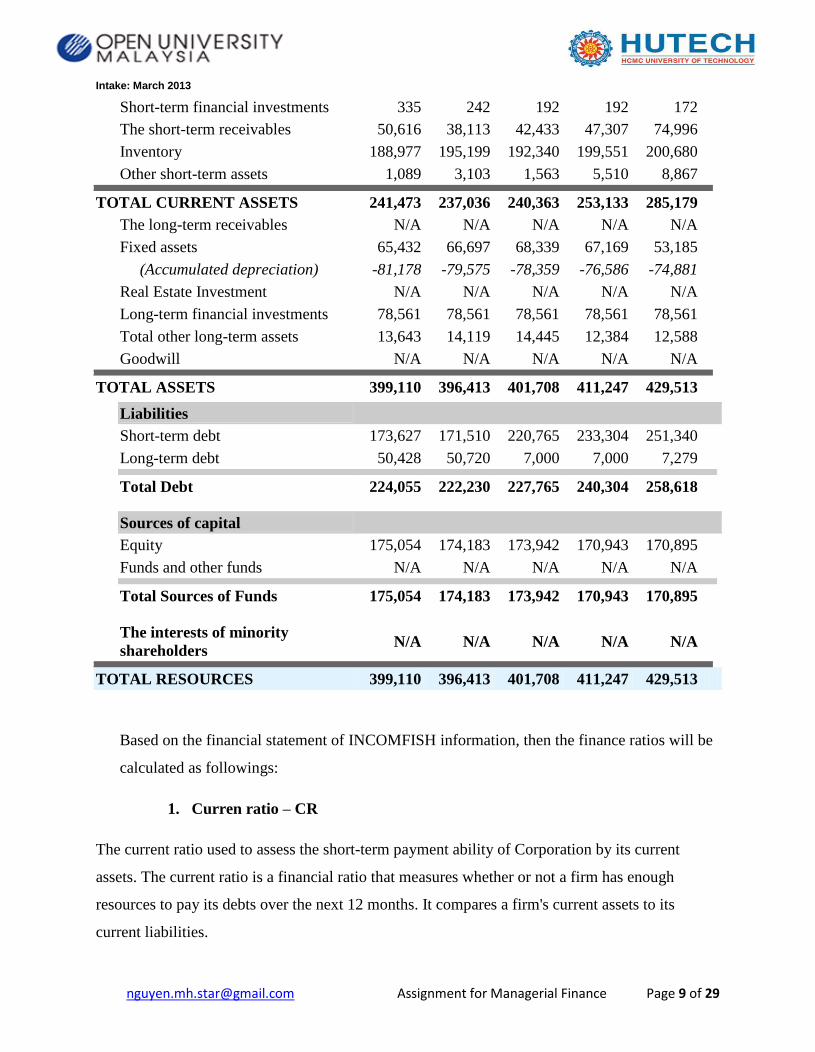
Short-term financial investments 335 242 192 192 172
The short-term receivables 50,616 38,113 42,433 47,307 74,996
Inventory 188,977 195,199 192,340 199,551 200,680
Other short-term assets 1,089 3,103 1,563 5,510 8,867
TOTAL CURRENT ASSETS 241,473 237,036 240,363 253,133 285,179
The long-term receivables N/A N/A N/A N/A N/A
Fixed assets 65,432 66,697 68,339 67,169 53,185
(Accumulated depreciation) -81,178 -79,575 -78,359 -76,586 -74,881
Real Estate Investment N/A N/A N/A N/A N/A
Long-term financial investments 78,561 78,561 78,561 78,561 78,561
Total other long-term assets 13,643 14,119 14,445 12,384 12,588
Goodwill N/A N/A N/A N/A N/A
TOTAL ASSETS 399,110 396,413 401,708 411,247 429,513
Liabilities
Short-term debt 173,627 171,510 220,765 233,304 251,340
Long-term debt 50,428 50,720 7,000 7,000 7,279
Total Debt 224,055 222,230 227,765 240,304 258,618
Sources of capital
Equity 175,054 174,183 173,942 170,943 170,895
Funds and other funds N/A N/A N/A N/A N/A
Total Sources of Funds 175,054 174,183 173,942 170,943 170,895
The interests of minority
shareholders N/A N/A N/A N/A N/A
TOTAL RESOURCES 399,110 396,413 401,708 411,247 429,513
Based on the financial statement of INCOMFISH information, then the finance ratios will be
calculated as followings:
1. Curren ratio – CR
The current ratio used to assess the short-term payment ability of Corporation by its current
assets. The current ratio is a financial ratio that measures whether or not a firm has enough
resources to pay its debts over the next 12 months. It compares a firm's current assets to its
current liabilities.
Intake: March 2013
[email protected] Assignment for Managerial Finance Page 10 of 29
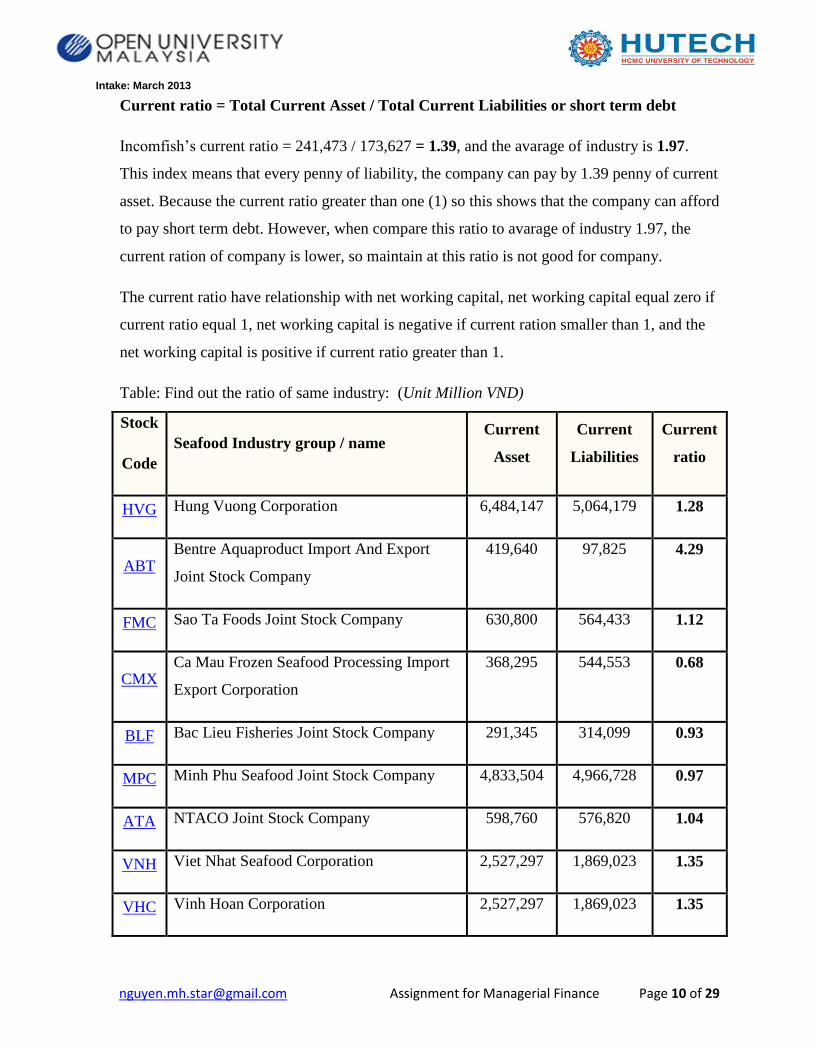
Current ratio = Total Current Asset / Total Current Liabilities or short term debt
Incomfish’s current ratio = 241,473 / 173,627 = 1.39, and the avarage of industry is 1.97.
This index means that every penny of liability, the company can pay by 1.39 penny of current
asset. Because the current ratio greater than one (1) so this shows that the company can afford
to pay short term debt. However, when compare this ratio to avarage of industry 1.97, the
current ration of company is lower, so maintain at this ratio is not good for company.
The current ratio have relationship with net working capital, net working capital equal zero if
current ratio equal 1, net working capital is negative if current ration smaller than 1, and the
net working capital is positive if current ratio greater than 1.
Table: Find out the ratio of same industry: (Unit Million VND)
Stock
Code
Seafood Industry group / name Current
Asset
Current
Liabilities
Current
ratio
HVG Hung Vuong Corporation 6,484,147 5,064,179 1.28
ABT Bentre Aquaproduct Import And Export
Joint Stock Company
419,640 97,825 4.29
FMC Sao Ta Foods Joint Stock Company 630,800 564,433 1.12
CMX Ca Mau Frozen Seafood Processing Import
Export Corporation
368,295 544,553 0.68
BLF Bac Lieu Fisheries Joint Stock Company 291,345 314,099 0.93
MPC Minh Phu Seafood Joint Stock Company 4,833,504 4,966,728 0.97
ATA NTACO Joint Stock Company 598,760 576,820 1.04
VNH Viet Nhat Seafood Corporation 2,527,297 1,869,023 1.35
VHC Vinh Hoan Corporation 2,527,297 1,869,023 1.35
Intake: March 2013
[email protected] Assignment for Managerial Finance Page 11 of 29
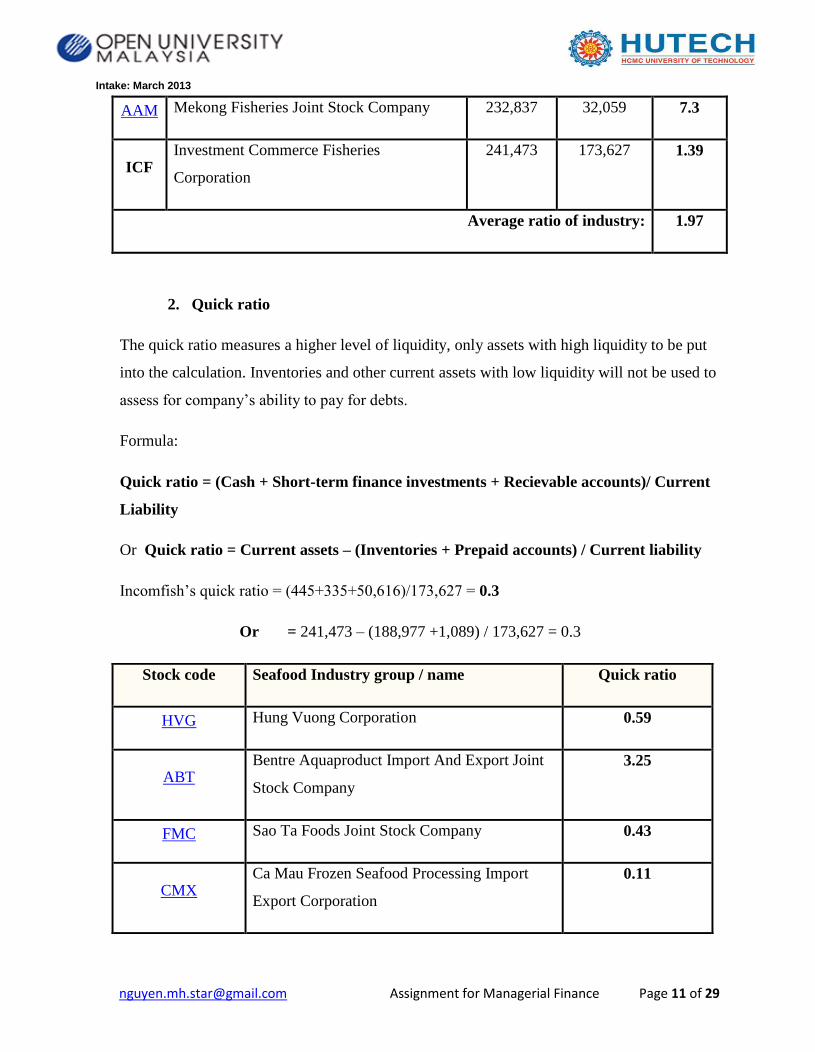
AAM Mekong Fisheries Joint Stock Company 232,837 32,059 7.3
ICF Investment Commerce Fisheries
Corporation
241,473 173,627 1.39
Average ratio of industry: 1.97
2. Quick ratio
The quick ratio measures a higher level of liquidity, only assets with high liquidity to be put
into the calculation. Inventories and other current assets with low liquidity will not be used to
assess for company’s ability to pay for debts.
Formula:
Quick ratio = (Cash + Short-term finance investments + Recievable accounts)/ Current
Liability
Or Quick ratio = Current assets – (Inventories + Prepaid accounts) / Current liability
Incomfish’s quick ratio = (445+335+50,616)/173,627 = 0.3
Or = 241,473 – (188,977 +1,089) / 173,627 = 0.3
Stock code Seafood Industry group / name Quick ratio
HVG Hung Vuong Corporation 0.59
ABT Bentre Aquaproduct Import And Export Joint
Stock Company
3.25
FMC Sao Ta Foods Joint Stock Company 0.43
CMX Ca Mau Frozen Seafood Processing Import
Export Corporation
0.11
Intake: March 2013
[email protected] Assignment for Managerial Finance Page 12 of 29
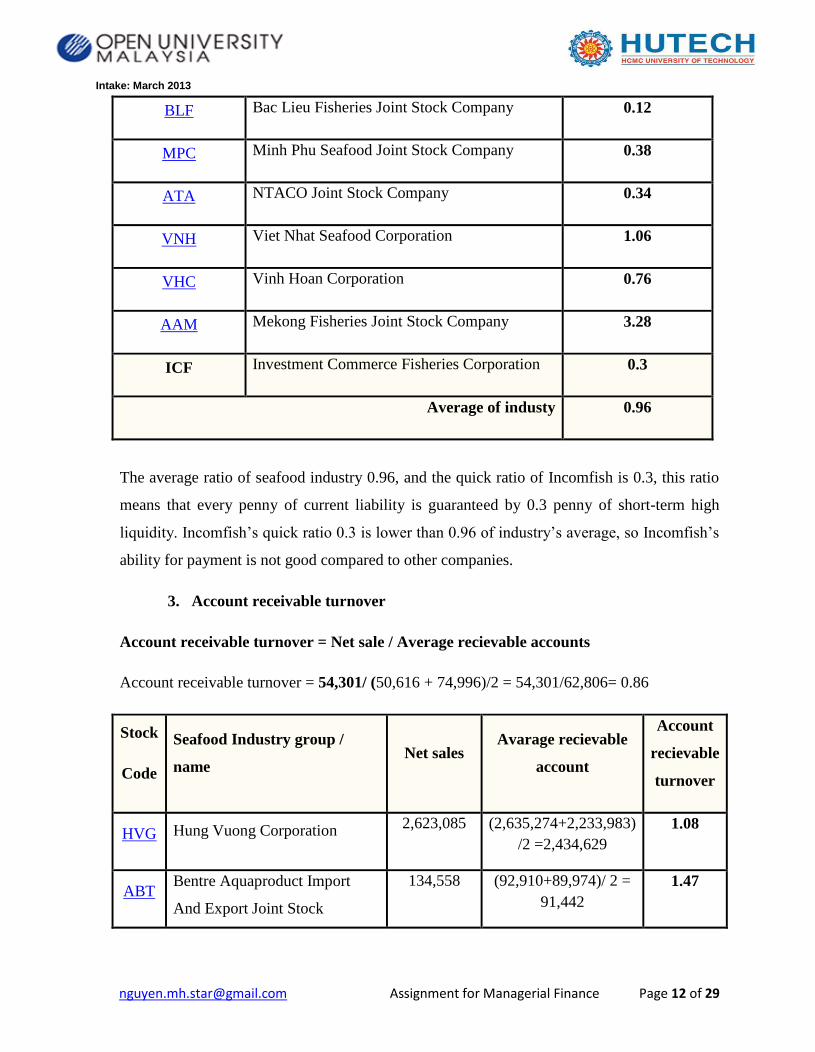
BLF Bac Lieu Fisheries Joint Stock Company 0.12
MPC Minh Phu Seafood Joint Stock Company 0.38
ATA NTACO Joint Stock Company 0.34
VNH Viet Nhat Seafood Corporation 1.06
VHC Vinh Hoan Corporation 0.76
AAM Mekong Fisheries Joint Stock Company 3.28
ICF Investment Commerce Fisheries Corporation 0.3
Average of industy 0.96
The average ratio of seafood industry 0.96, and the quick ratio of Incomfish is 0.3, this ratio
means that every penny of current liability is guaranteed by 0.3 penny of short-term high
liquidity. Incomfish’s quick ratio 0.3 is lower than 0.96 of industry’s average, so Incomfish’s
ability for payment is not good compared to other companies.
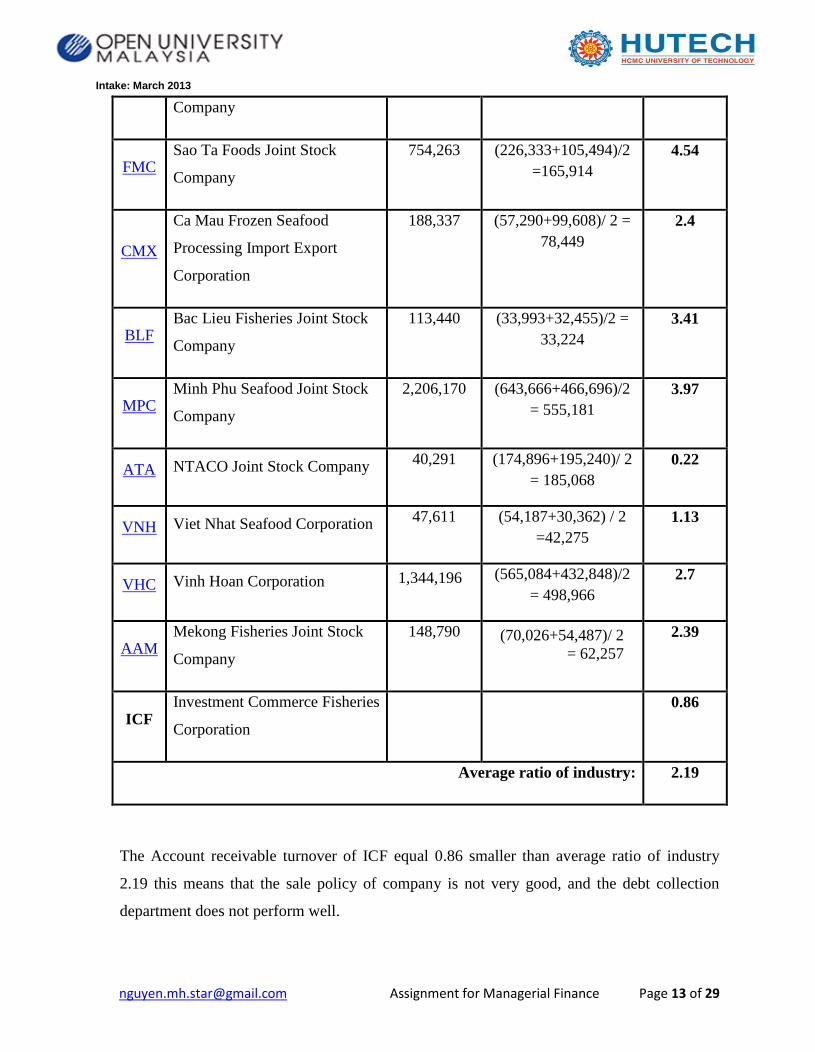
3. Account receivable turnover
Account receivable turnover = Net sale / Average recievable accounts
Account receivable turnover = 54,301/ (50,616 + 74,996)/2 = 54,301/62,806= 0.86
Stock
Code
Seafood Industry group /
name Net sales
Avarage recievable
account
Account
recievable
turnover
HVG Hung Vuong Corporation 2,623,085 (2,635,274+2,233,983)
/2 =2,434,629
1.08
ABT Bentre Aquaproduct Import
And Export Joint Stock
134,558 (92,910+89,974)/ 2 =
91,442
1.47
Intake: March 2013
[email protected] Assignment for Managerial Finance Page 13 of 29
Company
FMC Sao Ta Foods Joint Stock
Company
754,263 (226,333+105,494)/2
=165,914
4.54
CMX
Ca Mau Frozen Seafood
Processing Import Export
Corporation
188,337 (57,290+99,608)/ 2 =
78,449
2.4
BLF Bac Lieu Fisheries Joint Stock
Company
113,440 (33,993+32,455)/2 =
33,224
3.41
MPC Minh Phu Seafood Joint Stock
Company
2,206,170 (643,666+466,696)/2
= 555,181
3.97
ATA NTACO Joint Stock Company 40,291 (174,896+195,240)/ 2
= 185,068
0.22
VNH Viet Nhat Seafood Corporation 47,611 (54,187+30,362) / 2
=42,275
1.13
VHC Vinh Hoan Corporation 1,344,196
(565,084+432,848)/2
= 498,966
2.7
AAM Mekong Fisheries Joint Stock
Company
148,790 (70,026+54,487)/ 2
= 62,257
2.39
ICF Investment Commerce Fisheries
Corporation
0.86
Average ratio of industry: 2.19
The Account receivable turnover of ICF equal 0.86 smaller than average ratio of industry
2.19 this means that the sale policy of company is not very good, and the debt collection
department does not perform well.
Intake: March 2013
[email protected] Assignment for Managerial Finance Page 14 of 29
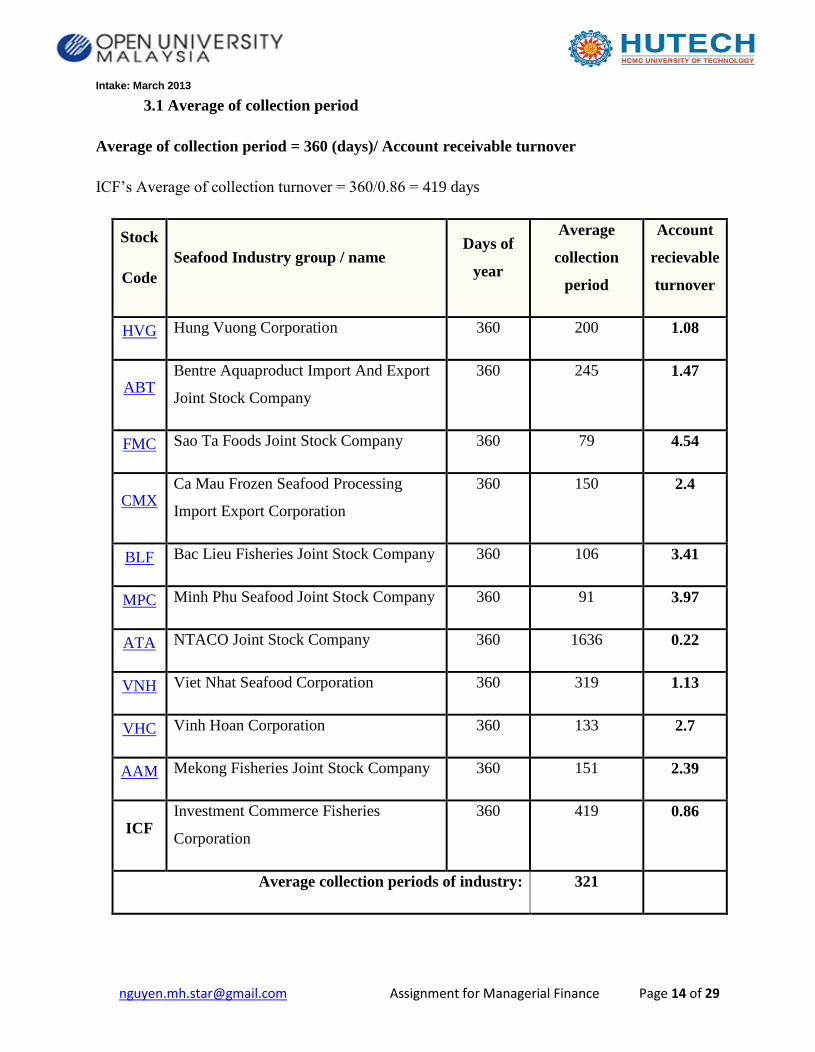
3.1 Average of collection period
Average of collection period = 360 (days)/ Account receivable turnover
ICF’s Average of collection turnover = 360/0.86 = 419 days
Stock
Code
Seafood Industry group / name Days of
year
Average
collection
period
Account
recievable
turnover
HVG Hung Vuong Corporation 360 200 1.08
ABT Bentre Aquaproduct Import And Export
Joint Stock Company
360 245 1.47
FMC Sao Ta Foods Joint Stock Company 360 79 4.54
CMX Ca Mau Frozen Seafood Processing
Import Export Corporation
360 150 2.4
BLF Bac Lieu Fisheries Joint Stock Company 360 106 3.41
MPC Minh Phu Seafood Joint Stock Company 360 91 3.97
ATA NTACO Joint Stock Company 360 1636 0.22
VNH Viet Nhat Seafood Corporation 360 319 1.13
VHC Vinh Hoan Corporation 360 133 2.7
AAM Mekong Fisheries Joint Stock Company 360 151 2.39
ICF Investment Commerce Fisheries
Corporation
360 419 0.86
Average collection periods of industry: 321
Intake: March 2013
[email protected] Assignment for Managerial Finance Page 15 of 29
The Average collection of ICF is 419 days bigger than the average collection period of industry
321days. This analysis show that the company’s collection period too large, and aslo show that
revenue of company is not good, or too small compare to the account receivable, if company
there is no sale policy to increase revenue then it will short of money to investment or
reinvestment.
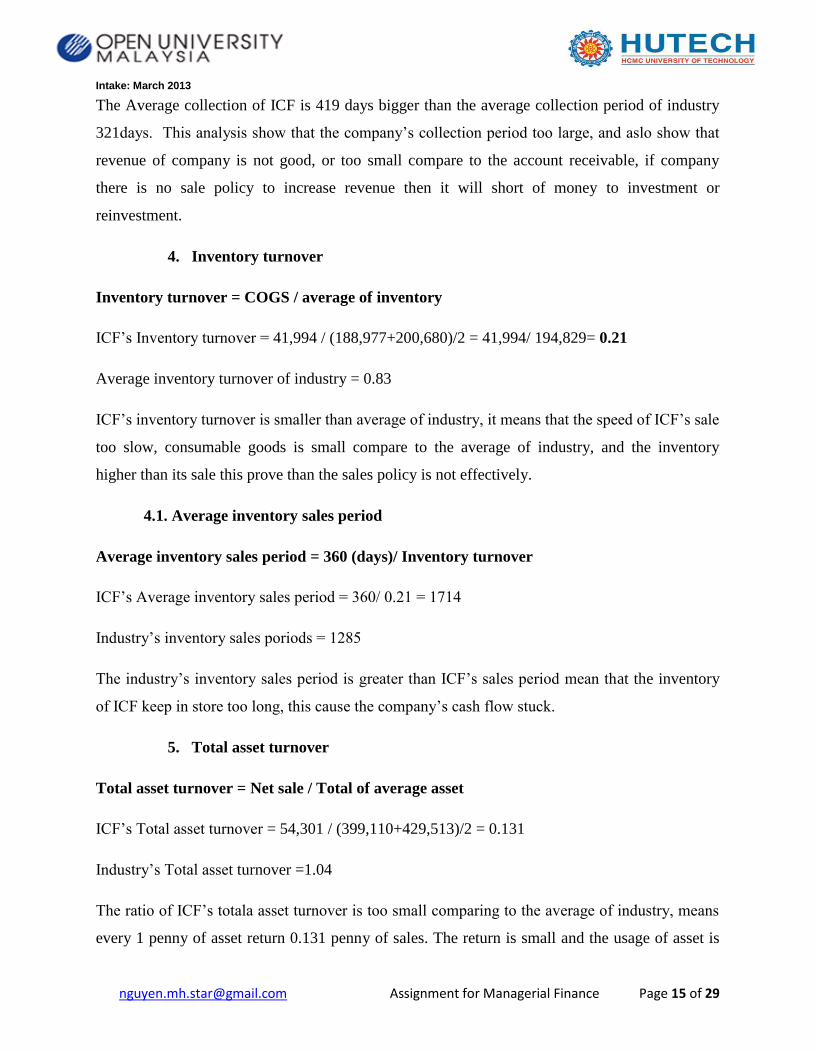
4. Inventory turnover
Inventory turnover = COGS / average of inventory
ICF’s Inventory turnover = 41,994 / (188,977+200,680)/2 = 41,994/ 194,829= 0.21
Average inventory turnover of industry = 0.83
ICF’s inventory turnover is smaller than average of industry, it means that the speed of ICF’s sale
too slow, consumable goods is small compare to the average of industry, and the inventory
higher than its sale this prove than the sales policy is not effectively.
4.1. Average inventory sales period
Average inventory sales period = 360 (days)/ Inventory turnover
ICF’s Average inventory sales period = 360/ 0.21 = 1714
Industry’s inventory sales poriods = 1285
The industry’s inventory sales period is greater than ICF’s sales period mean that the inventory
of ICF keep in store too long, this cause the company’s cash flow stuck.
5. Total asset turnover
Total asset turnover = Net sale / Total of average asset
ICF’s Total asset turnover = 54,301 / (399,110+429,513)/2 = 0.131
Industry’s Total asset turnover =1.04
The ratio of ICF’s totala asset turnover is too small comparing to the average of industry, means
every 1 penny of asset return 0.131 penny of sales. The return is small and the usage of asset is
Intake: March 2013
[email protected] Assignment for Managerial Finance Page 16 of 29
not efficiency.
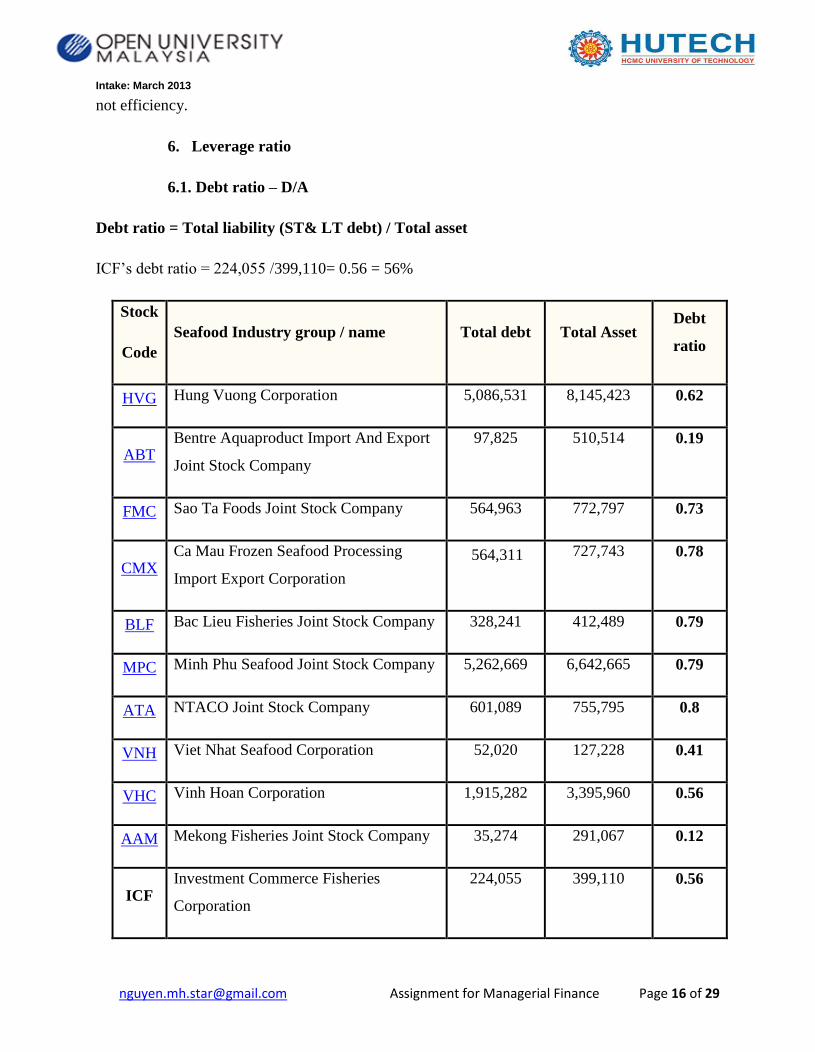
6. Leverage ratio
6.1. Debt ratio – D/A
Debt ratio = Total liability (ST& LT debt) / Total asset
ICF’s debt ratio = 224,055 /399,110= 0.56 = 56%
Stock
Code
Seafood Industry group / name Total debt Total Asset Debt
ratio
HVG Hung Vuong Corporation 5,086,531 8,145,423 0.62
ABT Bentre Aquaproduct Import And Export
Joint Stock Company
97,825 510,514 0.19
FMC Sao Ta Foods Joint Stock Company 564,963 772,797 0.73
CMX Ca Mau Frozen Seafood Processing
Import Export Corporation
564,311
727,743 0.78
BLF Bac Lieu Fisheries Joint Stock Company 328,241 412,489 0.79
MPC Minh Phu Seafood Joint Stock Company 5,262,669 6,642,665 0.79
ATA NTACO Joint Stock Company 601,089 755,795 0.8
VNH Viet Nhat Seafood Corporation 52,020 127,228 0.41
VHC Vinh Hoan Corporation 1,915,282 3,395,960 0.56
AAM Mekong Fisheries Joint Stock Company 35,274 291,067 0.12
ICF Investment Commerce Fisheries
Corporation
224,055 399,110 0.56
Intake: March 2013
[email protected] Assignment for Managerial Finance Page 17 of 29
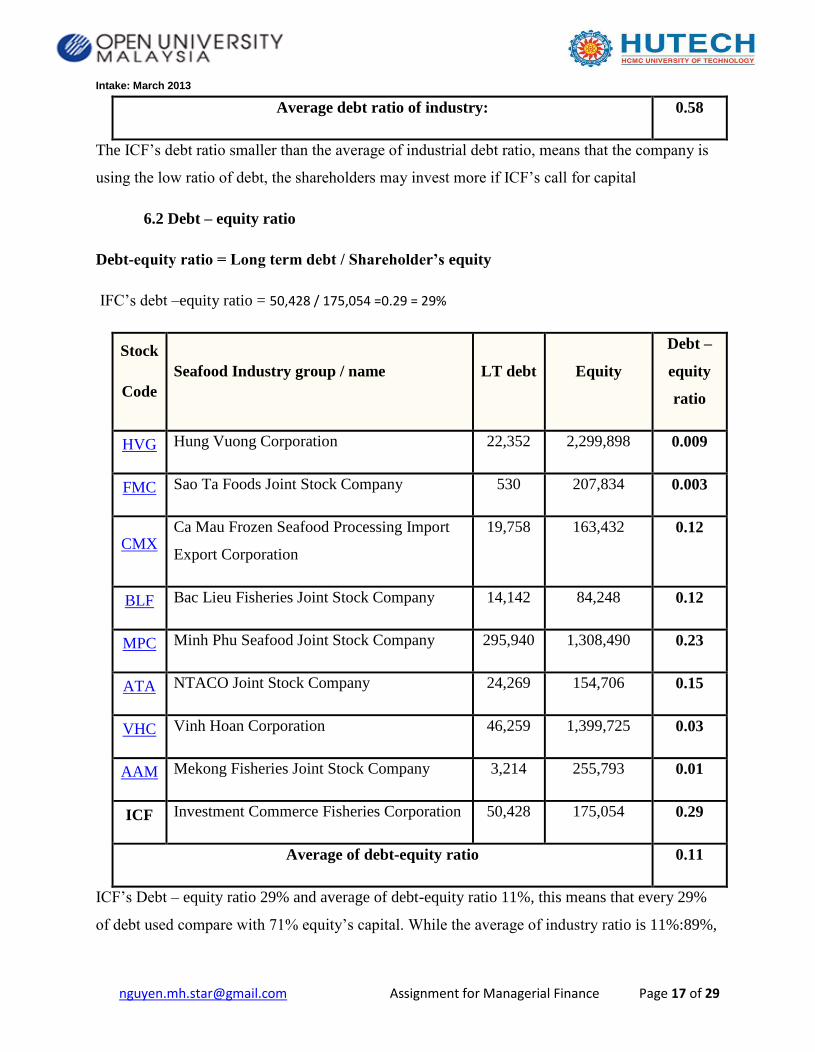
Average debt ratio of industry: 0.58
The ICF’s debt ratio smaller than the average of industrial debt ratio, means that the company is
using the low ratio of debt, the shareholders may invest more if ICF’s call for capital
6.2 Debt – equity ratio
Debt-equity ratio = Long term debt / Shareholder’s equity
IFC’s debt –equity ratio = 50,428 / 175,054 =0.29 = 29%
Stock
Code
Seafood Industry group / name LT debt Equity
Debt –
equity
ratio
HVG Hung Vuong Corporation 22,352 2,299,898 0.009
FMC Sao Ta Foods Joint Stock Company 530 207,834 0.003
CMX Ca Mau Frozen Seafood Processing Import
Export Corporation
19,758 163,432 0.12
BLF Bac Lieu Fisheries Joint Stock Company 14,142 84,248 0.12
MPC Minh Phu Seafood Joint Stock Company 295,940 1,308,490 0.23
ATA NTACO Joint Stock Company 24,269 154,706 0.15
VHC Vinh Hoan Corporation 46,259 1,399,725 0.03
AAM Mekong Fisheries Joint Stock Company 3,214 255,793 0.01
ICF Investment Commerce Fisheries Corporation 50,428 175,054 0.29
Average of debt-equity ratio 0.11
ICF’s Debt – equity ratio 29% and average of debt-equity ratio 11%, this means that every 29%
of debt used compare with 71% equity’s capital. While the average of industry ratio is 11%:89%,
Intake: March 2013
[email protected] Assignment for Managerial Finance Page 18 of 29
ICF’s debt ratio higher than the industry, ICF denpendent on dept higher than the company in the
same industry.
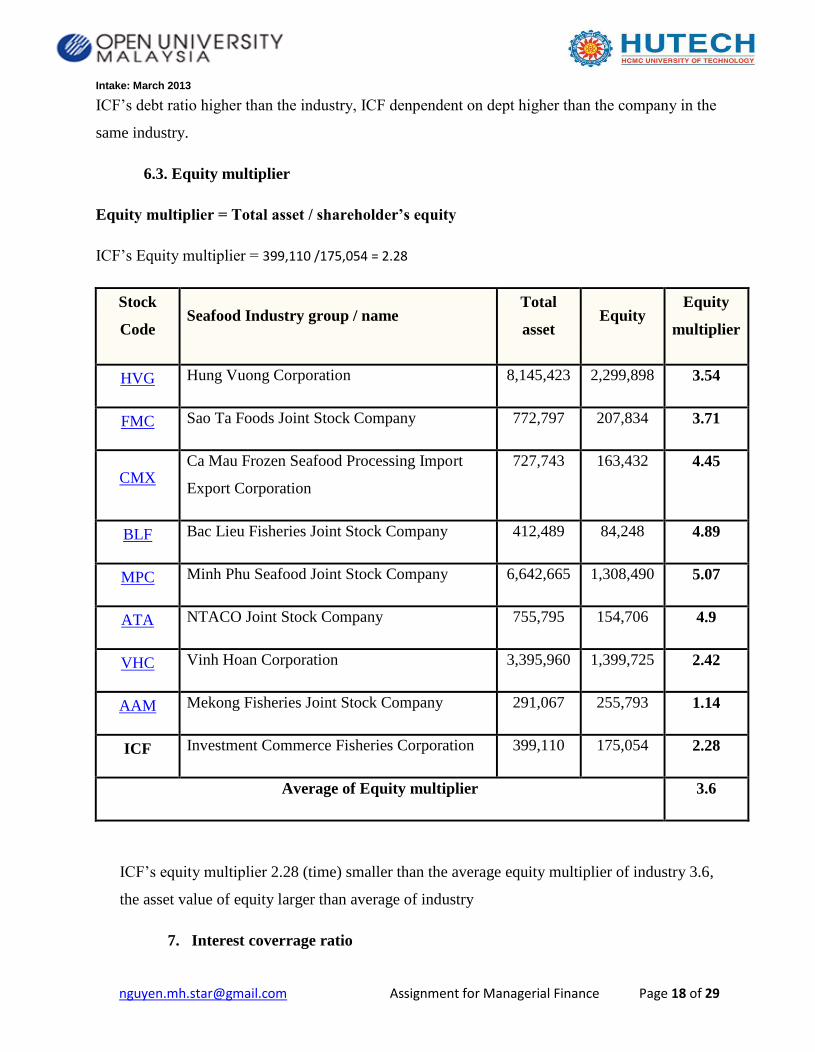
6.3. Equity multiplier
Equity multiplier = Total asset / shareholder’s equity
ICF’s Equity multiplier = 399,110 /175,054 = 2.28
Stock
Code Seafood Industry group / name
Total
asset Equity
Equity
multiplier
HVG Hung Vuong Corporation 8,145,423 2,299,898 3.54
FMC Sao Ta Foods Joint Stock Company 772,797 207,834 3.71
CMX Ca Mau Frozen Seafood Processing Import
Export Corporation
727,743 163,432 4.45
BLF Bac Lieu Fisheries Joint Stock Company 412,489 84,248 4.89
MPC Minh Phu Seafood Joint Stock Company 6,642,665 1,308,490 5.07
ATA NTACO Joint Stock Company 755,795 154,706 4.9
VHC Vinh Hoan Corporation 3,395,960 1,399,725 2.42
AAM Mekong Fisheries Joint Stock Company 291,067 255,793 1.14
ICF Investment Commerce Fisheries Corporation 399,110 175,054 2.28
Average of Equity multiplier 3.6
ICF’s equity multiplier 2.28 (time) smaller than the average equity multiplier of industry 3.6,
the asset value of equity larger than average of industry
7. Interest coverrage ratio
Intake: March 2013
[email protected] Assignment for Managerial Finance Page 19 of 29
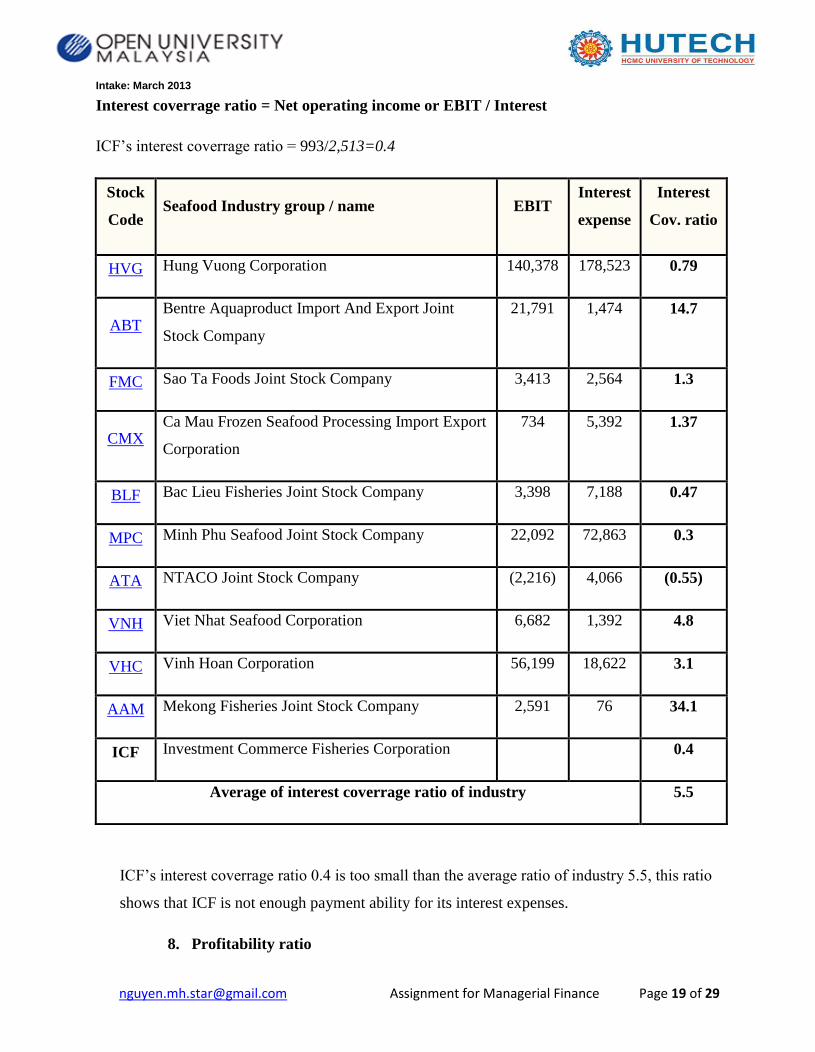
Interest coverrage ratio = Net operating income or EBIT / Interest
ICF’s interest coverrage ratio = 993/2,513=0.4
Stock
Code Seafood Industry group / name EBIT
Interest
expense
Interest
Cov. ratio
HVG Hung Vuong Corporation 140,378 178,523 0.79
ABT Bentre Aquaproduct Import And Export Joint
Stock Company
21,791 1,474 14.7
FMC Sao Ta Foods Joint Stock Company 3,413 2,564 1.3
CMX Ca Mau Frozen Seafood Processing Import Export
Corporation
734 5,392 1.37
BLF Bac Lieu Fisheries Joint Stock Company 3,398 7,188 0.47
MPC Minh Phu Seafood Joint Stock Company 22,092 72,863 0.3
ATA NTACO Joint Stock Company (2,216) 4,066 (0.55)
VNH Viet Nhat Seafood Corporation 6,682 1,392 4.8
VHC Vinh Hoan Corporation 56,199 18,622 3.1
AAM Mekong Fisheries Joint Stock Company 2,591 76 34.1
ICF Investment Commerce Fisheries Corporation 0.4
Average of interest coverrage ratio of industry 5.5
ICF’s interest coverrage ratio 0.4 is too small than the average ratio of industry 5.5, this ratio
shows that ICF is not enough payment ability for its interest expenses.
8. Profitability ratio
Intake: March 2013
[email protected] Assignment for Managerial Finance Page 20 of 29
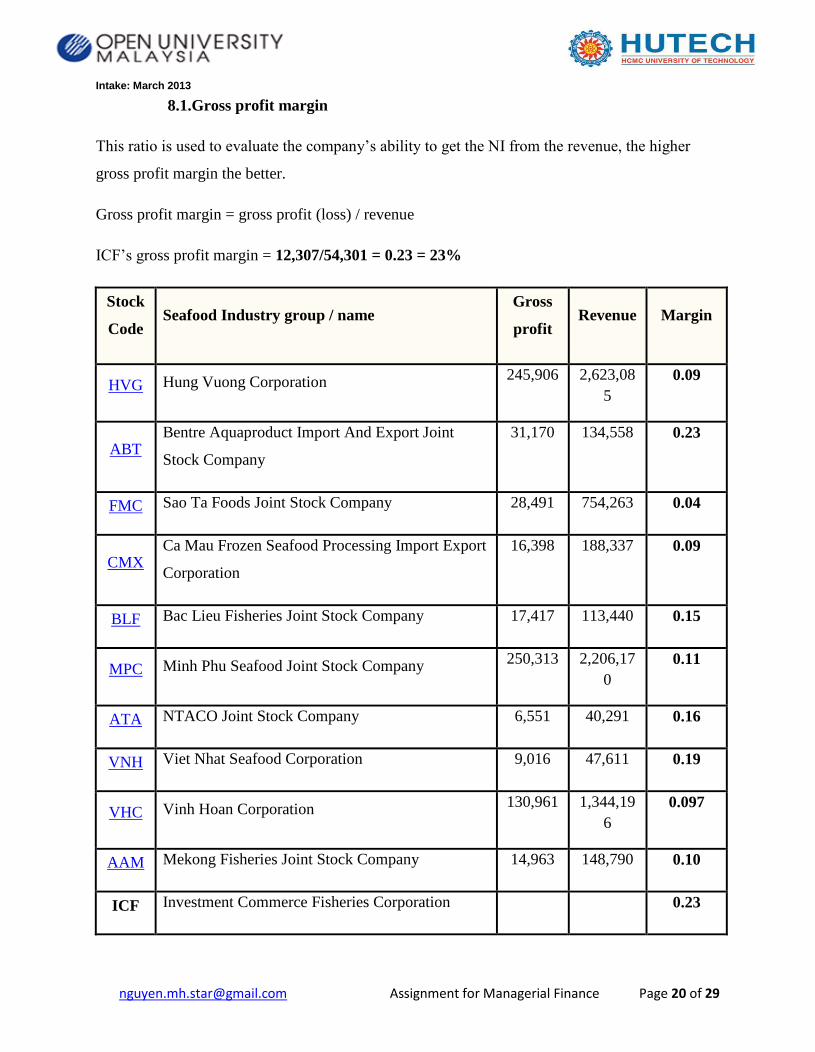
8.1.Gross profit margin
This ratio is used to evaluate the company’s ability to get the NI from the revenue, the higher
gross profit margin the better.
Gross profit margin = gross profit (loss) / revenue
ICF’s gross profit margin = 12,307/54,301 = 0.23 = 23%
Stock
Code Seafood Industry group / name
Gross
profit Revenue Margin
HVG Hung Vuong Corporation 245,906 2,623,08
5
0.09
ABT Bentre Aquaproduct Import And Export Joint
Stock Company
31,170 134,558 0.23
FMC Sao Ta Foods Joint Stock Company 28,491 754,263 0.04
CMX Ca Mau Frozen Seafood Processing Import Export
Corporation
16,398 188,337 0.09
BLF Bac Lieu Fisheries Joint Stock Company 17,417 113,440 0.15
MPC Minh Phu Seafood Joint Stock Company 250,313 2,206,17
0
0.11
ATA NTACO Joint Stock Company 6,551 40,291 0.16
VNH Viet Nhat Seafood Corporation 9,016 47,611 0.19
VHC Vinh Hoan Corporation 130,961 1,344,19
6
0.097
AAM Mekong Fisheries Joint Stock Company 14,963 148,790 0.10
ICF Investment Commerce Fisheries Corporation 0.23
Intake: March 2013
[email protected] Assignment for Managerial Finance Page 21 of 29
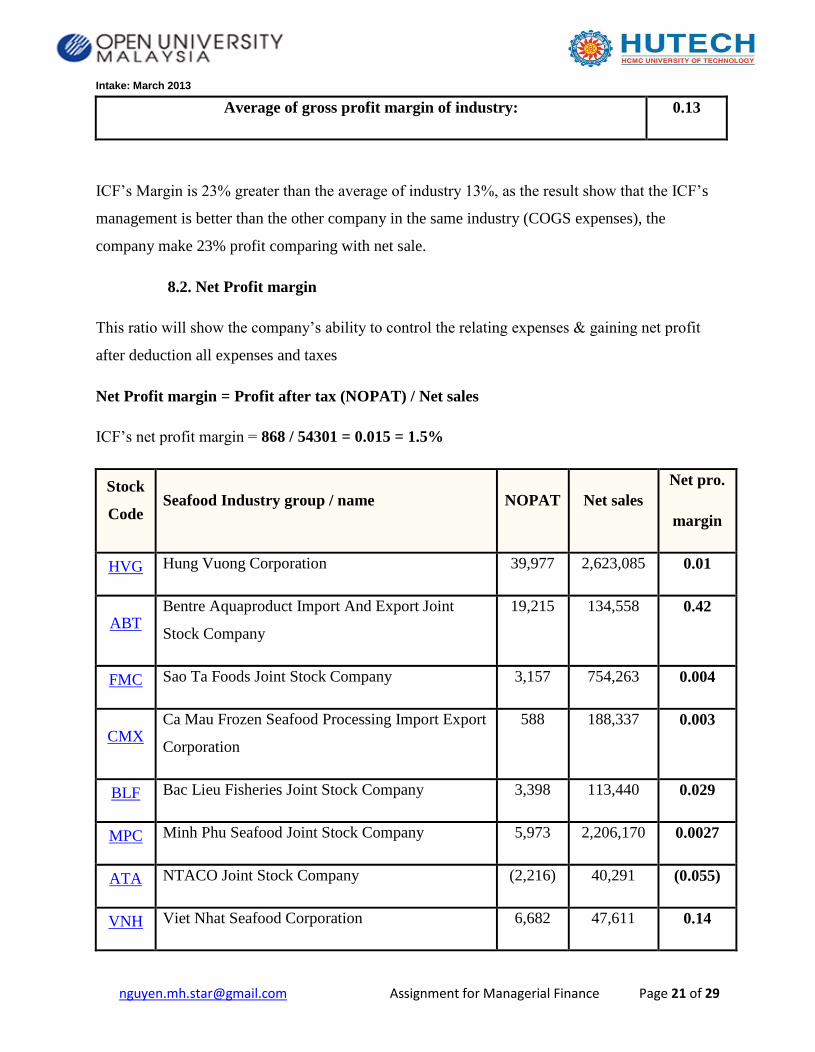
Average of gross profit margin of industry: 0.13
ICF’s Margin is 23% greater than the average of industry 13%, as the result show that the ICF’s
management is better than the other company in the same industry (COGS expenses), the
company make 23% profit comparing with net sale.
8.2. Net Profit margin
This ratio will show the company’s ability to control the relating expenses & gaining net profit
after deduction all expenses and taxes
Net Profit margin = Profit after tax (NOPAT) / Net sales
ICF’s net profit margin = 868 / 54301 = 0.015 = 1.5%
Stock
Code Seafood Industry group / name NOPAT Net sales
Net pro.
margin
HVG Hung Vuong Corporation 39,977 2,623,085 0.01
ABT Bentre Aquaproduct Import And Export Joint
Stock Company
19,215 134,558 0.42
FMC Sao Ta Foods Joint Stock Company 3,157 754,263 0.004
CMX Ca Mau Frozen Seafood Processing Import Export
Corporation
588 188,337 0.003
BLF Bac Lieu Fisheries Joint Stock Company 3,398 113,440 0.029
MPC Minh Phu Seafood Joint Stock Company 5,973 2,206,170 0.0027
ATA NTACO Joint Stock Company (2,216) 40,291 (0.055)
VNH Viet Nhat Seafood Corporation 6,682 47,611 0.14
Intake: March 2013
[email protected] Assignment for Managerial Finance Page 22 of 29
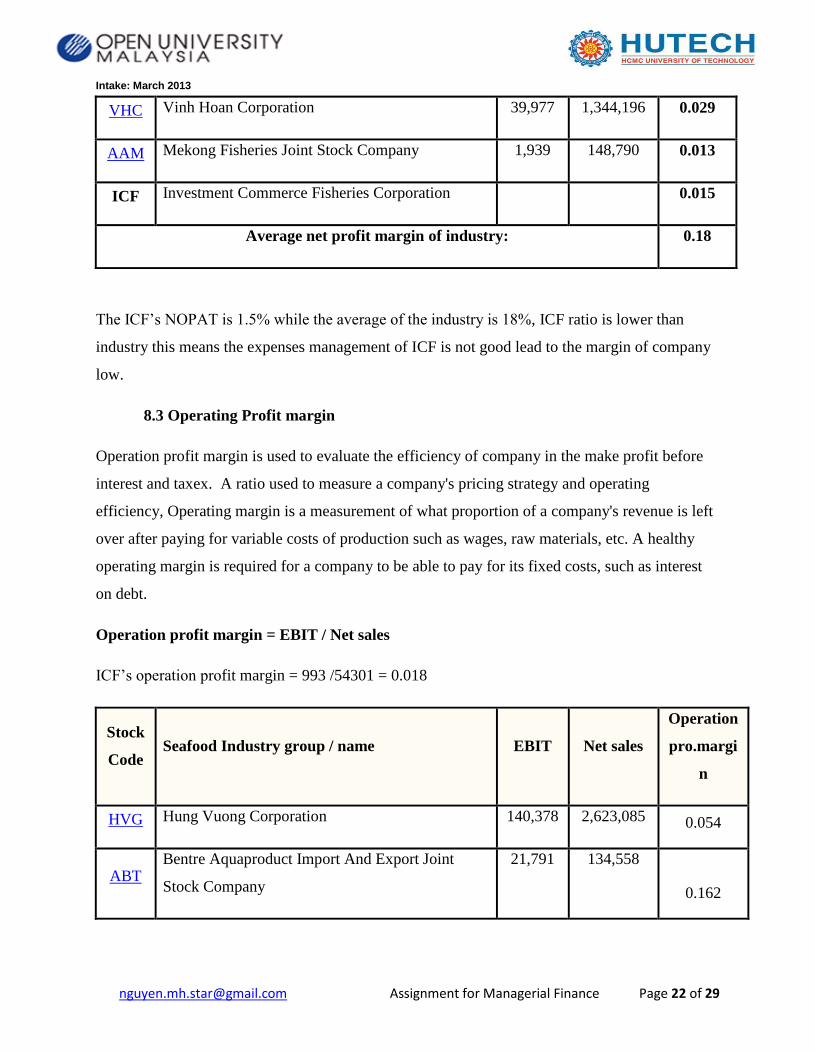
VHC Vinh Hoan Corporation 39,977 1,344,196 0.029
AAM Mekong Fisheries Joint Stock Company 1,939 148,790 0.013
ICF Investment Commerce Fisheries Corporation 0.015
Average net profit margin of industry: 0.18
The ICF’s NOPAT is 1.5% while the average of the industry is 18%, ICF ratio is lower than
industry this means the expenses management of ICF is not good lead to the margin of company
low.
8.3 Operating Profit margin
Operation profit margin is used to evaluate the efficiency of company in the make profit before
interest and taxex. A ratio used to measure a company's pricing strategy and operating
efficiency, Operating margin is a measurement of what proportion of a company's revenue is left
over after paying for variable costs of production such as wages, raw materials, etc. A healthy
operating margin is required for a company to be able to pay for its fixed costs, such as interest
on debt.
Operation profit margin = EBIT / Net sales
ICF’s operation profit margin = 993 /54301 = 0.018
Stock
Code Seafood Industry group / name EBIT Net sales
Operation
pro.margi
n
HVG Hung Vuong Corporation 140,378 2,623,085 0.054
ABT Bentre Aquaproduct Import And Export Joint
Stock Company
21,791 134,558
0.162
Intake: March 2013
[email protected] Assignment for Managerial Finance Page 23 of 29
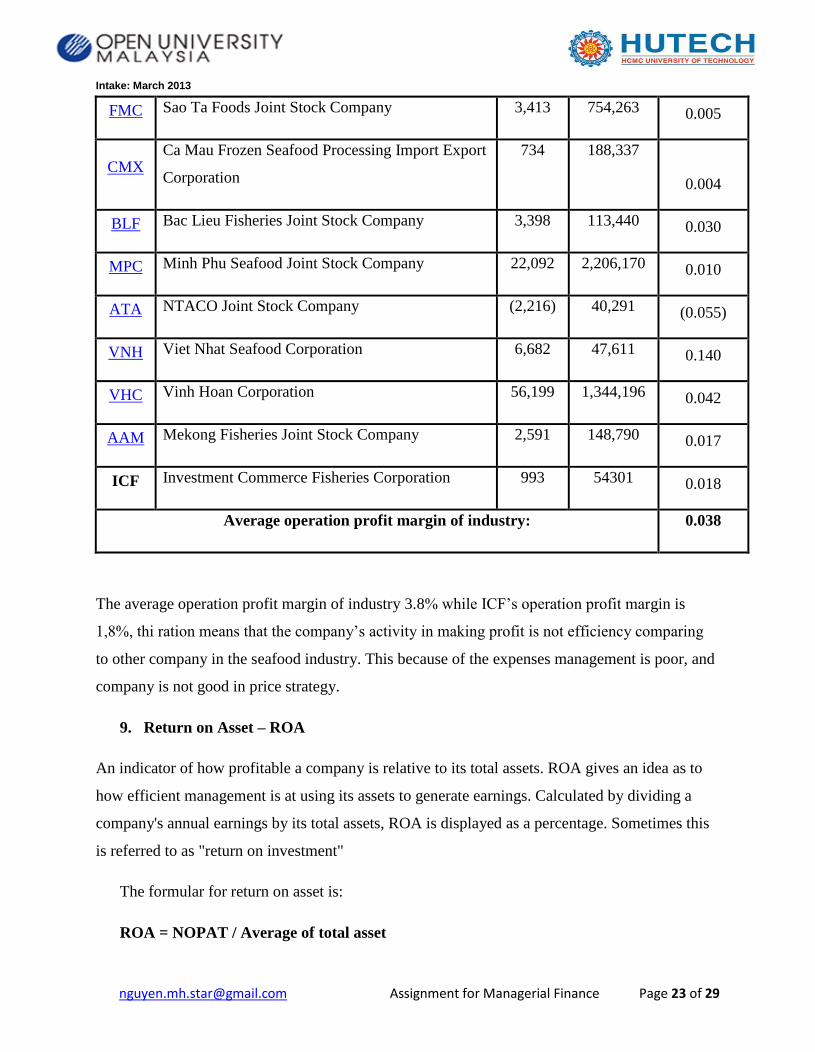
FMC Sao Ta Foods Joint Stock Company 3,413 754,263 0.005
CMX Ca Mau Frozen Seafood Processing Import Export
Corporation
734 188,337
0.004
BLF Bac Lieu Fisheries Joint Stock Company 3,398 113,440 0.030
MPC Minh Phu Seafood Joint Stock Company 22,092 2,206,170 0.010
ATA NTACO Joint Stock Company (2,216) 40,291 (0.055)
VNH Viet Nhat Seafood Corporation 6,682 47,611 0.140
VHC Vinh Hoan Corporation 56,199 1,344,196 0.042
AAM Mekong Fisheries Joint Stock Company 2,591 148,790 0.017
ICF Investment Commerce Fisheries Corporation 993 54301 0.018
Average operation profit margin of industry: 0.038
The average operation profit margin of industry 3.8% while ICF’s operation profit margin is
1,8%, thi ration means that the company’s activity in making profit is not efficiency comparing
to other company in the seafood industry. This because of the expenses management is poor, and
company is not good in price strategy.
9. Return on Asset – ROA
An indicator of how profitable a company is relative to its total assets. ROA gives an idea as to
how efficient management is at using its assets to generate earnings. Calculated by dividing a
company's annual earnings by its total assets, ROA is displayed as a percentage. Sometimes this
is referred to as "return on investment"
The formular for return on asset is:
ROA = NOPAT / Average of total asset
Intake: March 2013
[email protected] Assignment for Managerial Finance Page 24 of 29
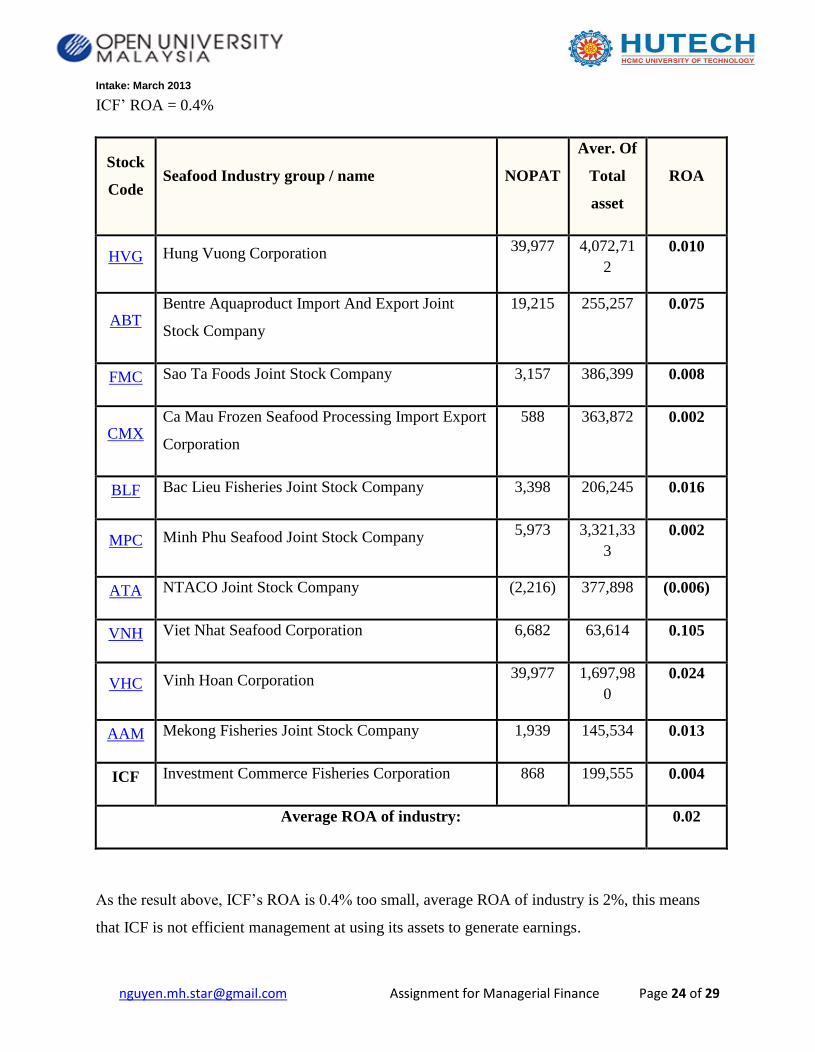
ICF’ ROA = 0.4%
Stock
Code Seafood Industry group / name NOPAT
Aver. Of
Total
asset
ROA
HVG Hung Vuong Corporation 39,977 4,072,71
2
0.010
ABT Bentre Aquaproduct Import And Export Joint
Stock Company
19,215 255,257 0.075
FMC Sao Ta Foods Joint Stock Company 3,157 386,399 0.008
CMX Ca Mau Frozen Seafood Processing Import Export
Corporation
588 363,872 0.002
BLF Bac Lieu Fisheries Joint Stock Company 3,398 206,245 0.016
MPC Minh Phu Seafood Joint Stock Company 5,973 3,321,33
3
0.002
ATA NTACO Joint Stock Company (2,216) 377,898 (0.006)
VNH Viet Nhat Seafood Corporation 6,682 63,614 0.105
VHC Vinh Hoan Corporation 39,977 1,697,98
0
0.024
AAM Mekong Fisheries Joint Stock Company 1,939 145,534 0.013
ICF Investment Commerce Fisheries Corporation 868 199,555 0.004
Average ROA of industry: 0.02
As the result above, ICF’s ROA is 0.4% too small, average ROA of industry is 2%, this means
that ICF is not efficient management at using its assets to generate earnings.
Intake: March 2013
[email protected] Assignment for Managerial Finance Page 25 of 29
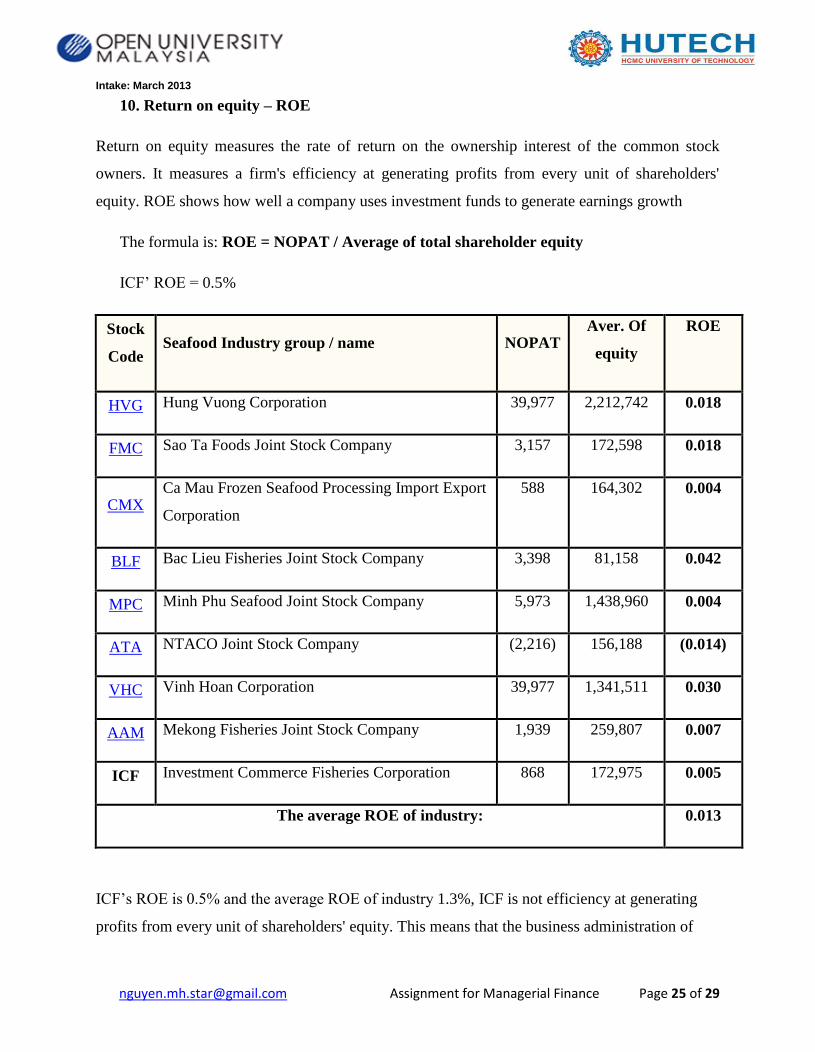
10. Return on equity – ROE
Return on equity measures the rate of return on the ownership interest of the common stock
owners. It measures a firm's efficiency at generating profits from every unit of shareholders'
equity. ROE shows how well a company uses investment funds to generate earnings growth
The formula is: ROE = NOPAT / Average of total shareholder equity
ICF’ ROE = 0.5%
Stock
Code Seafood Industry group / name NOPAT
Aver. Of
equity
ROE
HVG Hung Vuong Corporation 39,977 2,212,742 0.018
FMC Sao Ta Foods Joint Stock Company 3,157 172,598 0.018
CMX Ca Mau Frozen Seafood Processing Import Export
Corporation
588 164,302 0.004
BLF Bac Lieu Fisheries Joint Stock Company 3,398 81,158 0.042
MPC Minh Phu Seafood Joint Stock Company 5,973 1,438,960 0.004
ATA NTACO Joint Stock Company (2,216) 156,188 (0.014)
VHC Vinh Hoan Corporation 39,977 1,341,511 0.030
AAM Mekong Fisheries Joint Stock Company 1,939 259,807 0.007
ICF Investment Commerce Fisheries Corporation 868 172,975 0.005
The average ROE of industry: 0.013
ICF’s ROE is 0.5% and the average ROE of industry 1.3%, ICF is not efficiency at generating
profits from every unit of shareholders' equity. This means that the business administration of
Intake: March 2013
[email protected] Assignment for Managerial Finance Page 26 of 29
IFC is not better than the other company in seafood industry.
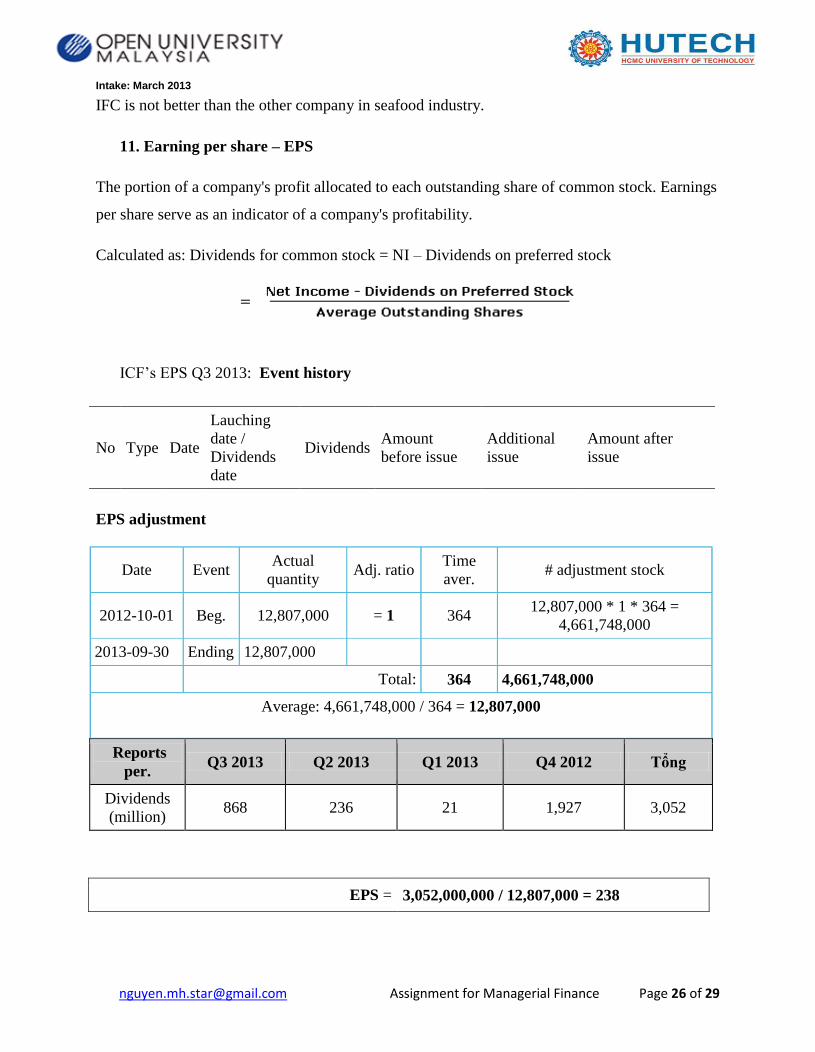
11. Earning per share – EPS
The portion of a company's profit allocated to each outstanding share of common stock. Earnings
per share serve as an indicator of a company's profitability.
Calculated as: Dividends for common stock = NI – Dividends on preferred stock
ICF’s EPS Q3 2013: Event history
No Type Date
Lauching
date /
Dividends
date
Dividends Amount
before issue
Additional
issue
Amount after
issue
EPS adjustment
Date Event Actual
quantity Adj. ratio
Time
aver. # adjustment stock
2012-10-01 Beg. 12,807,000 = 1 364 12,807,000 * 1 * 364 =
4,661,748,000
2013-09-30 Ending 12,807,000
Total: 364 4,661,748,000
Average: 4,661,748,000 / 364 = 12,807,000
Reports
per. Q3 2013 Q2 2013 Q1 2013 Q4 2012 Tổng
Dividends
(million) 868 236 21 1,927 3,052
EPS = 3,052,000,000 / 12,807,000 = 238
Intake: March 2013
[email protected] Assignment for Managerial Finance Page 27 of 29
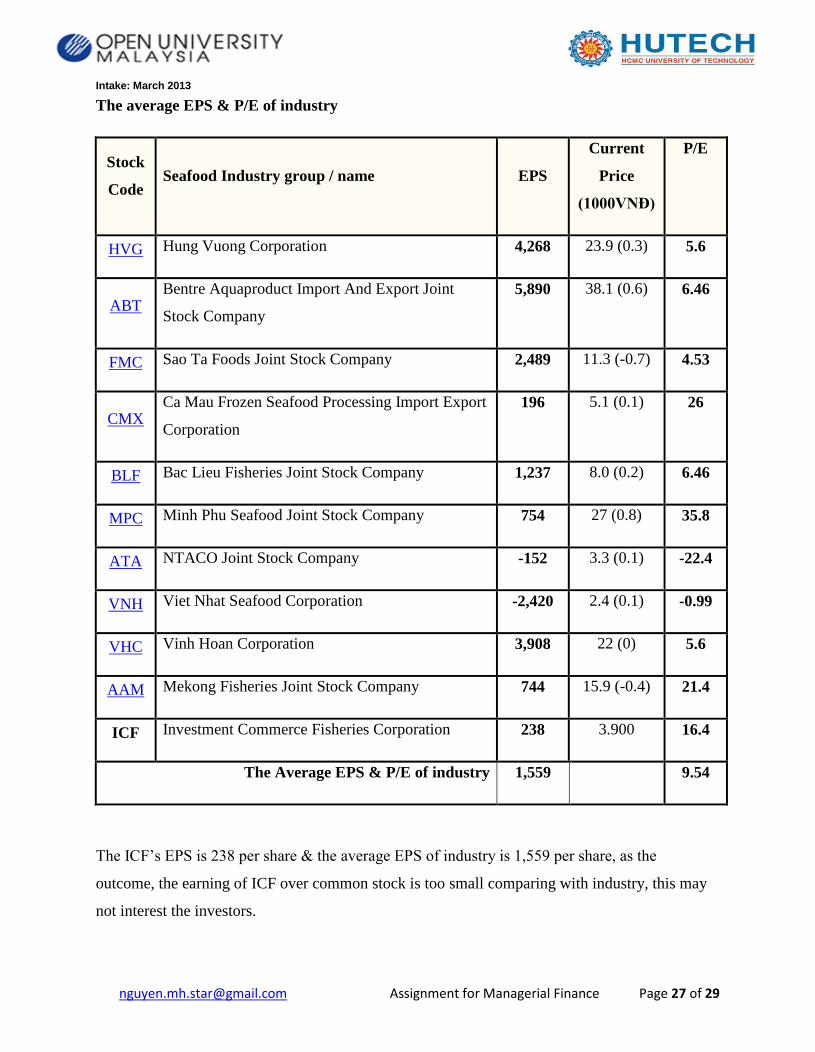
The average EPS & P/E of industry
Stock
Code Seafood Industry group / name EPS
Current
Price
(1000VNĐ)
P/E
HVG Hung Vuong Corporation 4,268 23.9 (0.3) 5.6
ABT Bentre Aquaproduct Import And Export Joint
Stock Company
5,890 38.1 (0.6) 6.46
FMC Sao Ta Foods Joint Stock Company 2,489 11.3 (-0.7) 4.53
CMX Ca Mau Frozen Seafood Processing Import Export
Corporation
196 5.1 (0.1) 26
BLF Bac Lieu Fisheries Joint Stock Company 1,237 8.0 (0.2) 6.46
MPC Minh Phu Seafood Joint Stock Company 754 27 (0.8) 35.8
ATA NTACO Joint Stock Company -152 3.3 (0.1) -22.4
VNH Viet Nhat Seafood Corporation -2,420 2.4 (0.1) -0.99
VHC Vinh Hoan Corporation 3,908 22 (0) 5.6
AAM Mekong Fisheries Joint Stock Company 744 15.9 (-0.4) 21.4
ICF Investment Commerce Fisheries Corporation 238 3.900 16.4
The Average EPS & P/E of industry 1,559 9.54
The ICF’s EPS is 238 per share & the average EPS of industry is 1,559 per share, as the
outcome, the earning of ICF over common stock is too small comparing with industry, this may
not interest the investors.
Intake: March 2013
[email protected] Assignment for Managerial Finance Page 28 of 29
12. Price earning ratio – P/E
The price-to-earnings ratio, or P–E ratio, or P/E ratio, is an equity valuation multiple. It is
defined as market price per share divided by annual earnings per share.
P/E =Current price / EPS
ICF’s P/E = 3900/238 = 16.4
The average P/E of industry is 9.54
As the outcome above, the investor may accept to pay 16.4 times for every share of ICF higher
than other company in the same industry (9.54 times).
IV. CONCLUSION AND POLICY IMPLICATIONS
Based on the analysis of ICF, I have my conclution about the company business situation; ICF
have not built the stable exporting market yet, ICF is heavily influenced by the anti-dumping
lawsuit seafood export to the U.S market. ICF also have been not maintaining the stability export
to other major market such as Japan & EU market.
ICF is not completely proactive about the raw materials, purchased power dependent on directly
purchases and/or imported. All the above elements & factors lead to the revenue and profits over
the years are low, and the other reason is due to the processing plants not operating at full
capacity leading to costly inefficiencis & increasing costs.
This analysis is generated & performed based on the financial statement of Incomfish company
and other truth sources, however I do not guarantee that all information & database is completely
sufficient and/or arcurately 100 percent, so this analysis purpose for case study & reference
source for whom intending to invest into this security.
Intake: March 2013
[email protected] Assignment for Managerial Finance Page 29 of 29
References sources:
Lecture of Dr. Phan Dinh Nguyen Faculty of Accounting, Banking and Finance, HUTECH
University
Financial Management Theory and Practice, authors Eugene F. Brigham University of Florida,
Michael C. Ehrharrdt University of Tennessee.
http://www.cophieu68.vn/profilesymbol.php?id=icf
http://s.cafef.vn/hose/ICF-cong-ty-co-phan-dau-tu-thuong-mai-thuy-san.chn
http://www.vcbs.com.vn/en/Research/Company.aspx?subTab=2&stock_symbol=ICF
http://www.dnb.com/customer-service/understanding-financial-statements.html


