Embed Size (px)
Citation preview

MARINE ECOLOGY PROGRESS SERIESMar Ecol Prog Ser
Vol. 357: 301–311, 2008doi: 10.3354/meps07325
Published April 7
INTRODUCTION
Many seabird and commercial fish species dependdirectly on pelagic zooplankton. Therefore, seasonalchanges in zooplankton availability will have profoundeffects on the distribution and abundance of these con-sumers. Annual mean zooplankton abundance in thesurface layer in Aleutian Archipelago waters is pre-dicted to be the highest in the Northern Hemisphere(Nakata et al. 2004). Not surprisingly then, aggre-gations of planktivorous seabirds in waters of theAleutian Archipelago are of global significance.
In contrast to the considerable amounts of informa-tion available on the distribution of zooplankton, fish,and seabirds in Aleutian waters during spring andsummer (Hunt et al. 1998, Byrd et al. 2005, Coyle 2005,
Jahncke et al. 2005, Logerwell et al. 2005), little isknown about Aleutian zooplankton or seabird distribu-tion and abundance patterns in winter. The physicalprocesses bringing plankton onto the continental shelfduring summer (Hunt et al. 1998) are probably stillactive over the winter, since current flows do not showmajor changes between winter and summer (Overlandet al. 1994). However, the large Neocalanus spp. cope-pods, which dominate the mesozooplankton fauna ofthe central and western Aleutians (Coyle 2005) and areimportant prey for seabirds (Hunt et al. 1998, Jahnckeet al. 2005), overwinter in diapause after descending toa depth of >250 m (Miller & Clemons 1988), wherethey are unavailable to seabirds.
Euphausiids form large aggregations and are impor-tant prey of commercially valuable fish, marine mam-
© Inter-Research 2008 · www.int-res.com*Email: [email protected]
Seasonal and distributional patterns of seabirdsalong the Aleutian Archipelago
Martin Renner1,*, George L. Hunt Jr.1, John F. Piatt2, G. Vernon Byrd3
1School of Aquatic and Fishery Sciences, University of Washington, Box 355020, Seattle, Washington 98195, USA2Alaska Science Center, U. S. Geological Survey, 1011 E. Tudor Rd, Anchorage, Alaska 99503, USA
3Alaska Maritime National Wildlife Refuge, 95 Sterling Highway, Suite 1, Homer, Alaska 99603, USA
ABSTRACT: The Aleutian Archipelago is of global importance to seabirds during the northern sum-mer, but little is known about seabird use of these waters during winter. We compare summer andwinter abundances of seabirds around 3 islands: Buldir in the western, Kasatochi in the central, andAiktak in the eastern Aleutians. The density of combined seabird biomass in nearshore marinewaters was higher in summer than in winter at Buldir and Kasatochi, but was higher in winter atAiktak, despite the departure of abundant migratory species. Comparing foraging guilds, we foundthat only piscivores increased at the western and central sites in winter, whereas at the eastern siteseveral planktivorous species increased as well. The only planktivore remaining in winter at thecentral and western sites in densities comparable to summer densities was whiskered auklet Aethiapygmaea. Crested auklet Aethia cristatella and thick-billed murre Uria lomvia showed the greatestproportional winter increase at the eastern site. The seasonal patterns of the seabird communitiessuggest a winter breakdown of the copepod-based food web in the central and western parts of thearchipelago, and a system that remains rich in euphausiids in the eastern Aleutians. We suggest thatin winter crested auklets take the trophic role that short-tailed shearwaters Puffinus tenuirostrisoccupy during summer. We hypothesize that advection of euphausiids in the Aleutian North SlopeCurrent is important for supporting the high biomass of planktivores that occupy the Unimak Passregion on a year-round basis.
KEY WORDS: Aleutian North Slope Current · Euphausiids · Indicator species · Seabird biomass
Resale or republication not permitted without written consent of the publisher
Mar Ecol Prog Ser 357: 301–311, 2008
mals, and seabirds (Tanasichuk 1999, Jahncke et al.2005). Adult euphausiid stages come to the sea surfaceprimarily at night and descend to depths >100 m duringthe day, but upwelling waters can flush them to the sur-face, making them available to seabirds during the day(Coyle et al. 1992, Hunt et al. 1998, Ladd et al. 2005).
Major habitat features characterizing waters ofthe Aleutian Archipelago are bottom topography andcurrent systems. Synthesizing the information onoceanography, plankton, fish, and seabirds, Piatt &Springer (2007) identified 3 major eco-regions alongthe Aleutian Islands, with boundaries around SamalgaPass (Hunt & Stabeno 2005) and Amchitka Pass(Logerwell et al. 2005). Recent seabird surveys havebeen conducted in nearshore waters in both summerand winter at sites in each of these eco-regions (east-ern, central, and western Aleutians), and these providea basis for comparing geographic differences in sea-sonal bird assemblages. Seabird distribution is likely tobe driven by prey availability, particularly in winterwhen the birds are not constrained by having to returnto a breeding site.
Here, we evaluate the seasonal differences in thebiomass of piscivorous and planktivorous seabirds inthese broadly distinct oceanographic regions in theAleutians, using seabirds as indicators of differences inmarine food webs. We expect that the differences infood webs would be reflected in changes in seabird
species composition and biomass. Furthermore, ifSamalga Pass is a distinctive ecological boundary(Hunt & Stabeno 2005), we predict that the central andwestern Aleutian sites would be similar and distinctfrom the eastern Aleutian site. We draw inferencesconcerning the availability of plankton fauna in theregion during winter, and hypothesize as to why theseasonal changes in the avifauna of the eastern Aleu-tians should differ so markedly from the patterns seenin the central and western Aleutians.
MATERIALS AND METHODS
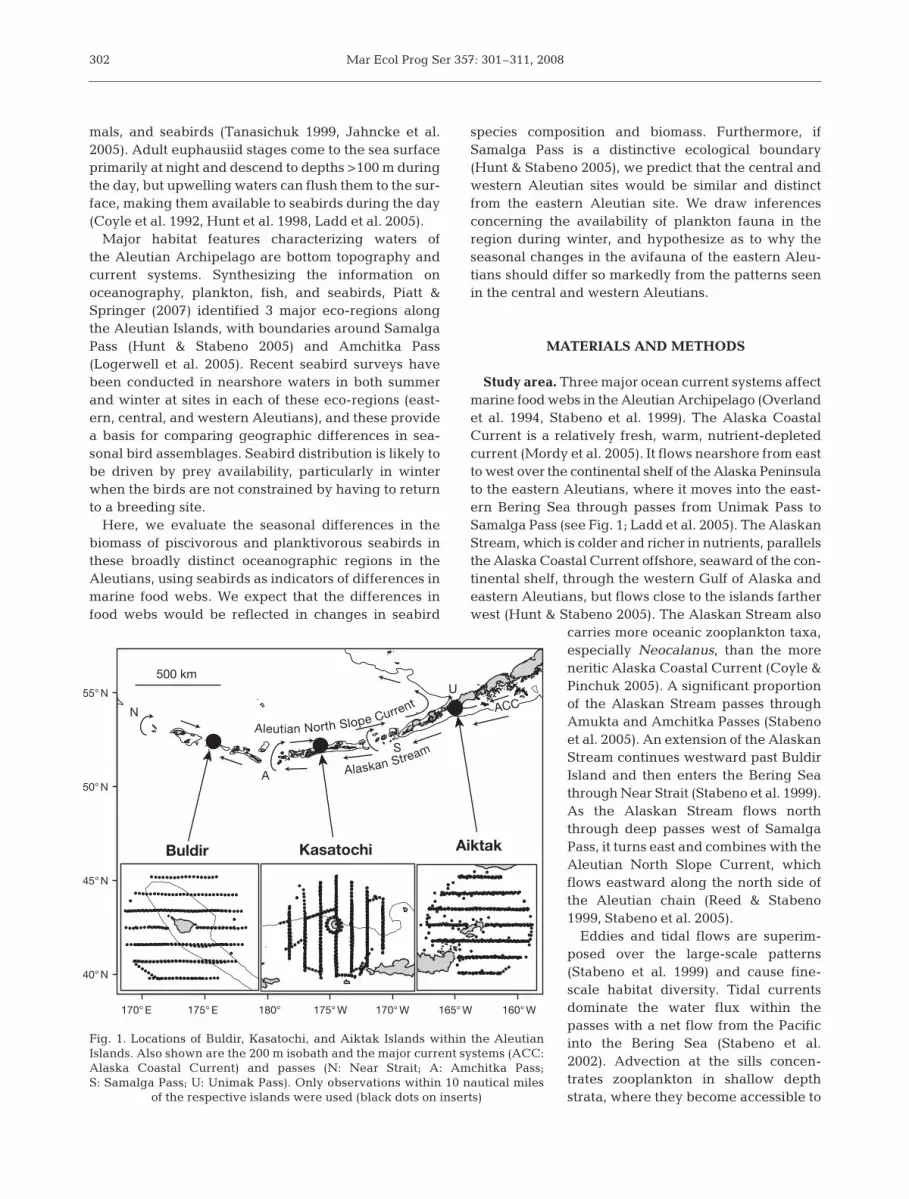
Study area. Three major ocean current systems affectmarine food webs in the Aleutian Archipelago (Overlandet al. 1994, Stabeno et al. 1999). The Alaska CoastalCurrent is a relatively fresh, warm, nutrient-depletedcurrent (Mordy et al. 2005). It flows nearshore from eastto west over the continental shelf of the Alaska Peninsulato the eastern Aleutians, where it moves into the east-ern Bering Sea through passes from Unimak Pass toSamalga Pass (see Fig. 1; Ladd et al. 2005). The AlaskanStream, which is colder and richer in nutrients, parallelsthe Alaska Coastal Current offshore, seaward of the con-tinental shelf, through the western Gulf of Alaska andeastern Aleutians, but flows close to the islands fartherwest (Hunt & Stabeno 2005). The Alaskan Stream also
carries more oceanic zooplankton taxa,especially Neocalanus, than the moreneritic Alaska Coastal Current (Coyle &Pinchuk 2005). A significant proportionof the Alaskan Stream passes throughAmukta and Amchitka Passes (Stabenoet al. 2005). An extension of the AlaskanStream continues westward past BuldirIsland and then enters the Bering Seathrough Near Strait (Stabeno et al. 1999).As the Alaskan Stream flows norththrough deep passes west of SamalgaPass, it turns east and combines with theAleutian North Slope Current, whichflows eastward along the north side ofthe Aleutian chain (Reed & Stabeno1999, Stabeno et al. 2005).
Eddies and tidal flows are superim-posed over the large-scale patterns(Stabeno et al. 1999) and cause fine-scale habitat diversity. Tidal currentsdominate the water flux within thepasses with a net flow from the Pacificinto the Bering Sea (Stabeno et al.2002). Advection at the sills concen-trates zooplankton in shallow depthstrata, where they become accessible to
302
170° E 175° E 180° 175° W 170° W 165° W
S
160° W
40° N
45° N
50° N
55° N
Buldir Kasatochi Aiktak
ACCN
A
U
500 km
Aleutian North Slope Current
Alaskan Stream
Fig. 1. Locations of Buldir, Kasatochi, and Aiktak Islands within the AleutianIslands. Also shown are the 200 m isobath and the major current systems (ACC:Alaska Coastal Current) and passes (N: Near Strait; A: Amchitka Pass;S: Samalga Pass; U: Unimak Pass). Only observations within 10 nautical miles
of the respective islands were used (black dots on inserts)

Renner et al.: Aleutian seabird seasonality
seabirds (Hunt et al. 1998). This mechanism is particu-larly effective in shallow passes (Jahncke et al. 2005,Ladd et al. 2005). For some seabird species, colony dis-tribution too is related to proximity to passes (Byrd etal. 2005). Sea temperatures are another major charac-teristic of marine habitats, but there are no clear spatialtrends in sea surface temperature within Aleutianwaters (Luchin et al. 1999).
Samalga Pass, in the eastern Aleutian Archipelago,marks an important transition in the Aleutian Archi-pelago ecosystem, with strong differences in bathy-metry, meteorology, zooplankton, fish, benthic fauna,and avifauna to the east and west of there (Hunt &Stabeno 2005). Eastern passes are less saline andwarmer than the central passes, suggesting a moreneritic environment in the east (Coyle 2005). Similarly,zooplankton species composition changes from domi-nantly neritic genera in the east to mostly oceanicgenera in the west (Coyle 2005). During the breedingseason, planktivorous seabirds, such as auklets andstorm-petrels that feed on small plankton, are moreabundant in the western and central than in the east-ern Aleutians (Byrd et al. 2005). In contrast, species,such as tufted puffins Fratercula cirrhata, that forageon larger prey, have bigger colonies in the easternAleutians (Hunt & Stabeno 2005). The respective influ-ence of the neritic Alaska Coastal Current in the east-ern passes and the more oceanic Alaskan Stream in the
central Aleutians is believed to be responsible for thispattern (Coyle 2005, Hunt & Stabeno 2005).
Field methods. We compared the summer and winterat-sea distribution of seabirds around 3 major seabirdcolonies: Buldir Island (52.35° N, 175.93° E) in the west-ern Aleutians, Kasatochi Island (52.17° N, 175.51° W) inthe central Aleutians, and Aiktak Island (54.19° N,164.89° W) in the eastern Aleutian Islands (Fig. 1). Theseislands are of similar size, free of introduced predators,support major seabird colonies (Byrd et al. 2005), and areall part of a network of seabird monitoring sites withinthe Alaska Maritime National Wildlife Refuge.
As part of the Seabird, Marine Mammal, Oceano-graphic Coordinated Investigation (SMMOCI) project,we conducted ship-based surveys of birds at sea be-tween 1995 and 2003. Each site was visited at leastonce in summer and winter (Table 1). Seabirds werecounted during daylight hours from the flying bridge(8 m above the sea surface) of the MV ‘Tiglax’ on par-allel transects (Fig. 1) using a strip transect method andsnapshots for flying birds (Tasker et al. 1984). Transectwidth was 150 m to each side (for a combined widthof 300 m), but was occasionally narrowed if visibil-ity was poor. Two observers, one on each side, countedbirds and relayed their observations to a third personwho entered the data into a computer. The softwareattached a time and GPS position to each observationand recorded the vessel’s position every 15 s.
303
Species Buldir Kasatochi Aiktakcode Summer Winter Summer Winter Summer Winter
1998 1998 1996 1997 2003 1998 1999 1995 1996 1998 1997 1998 1999
DensityCRAU 18.0 0.6 111.0 102.3 35.6 0.0 0.0 0.0 0.0 0.0 217.1 168.4 187.3LEAU 10.7 0.9 11.2 444.3 27.8 0.3 0.0 0.0 0.0 0.1 0.0 0.0 0.0WHAU 10.8 24.2 9.0 18.9 26.7 1.5 2.8 13.5 4.5 5.9 248.7 63.7 92.2STSH 82.4 0.1 17.5 0.1 2.8 0.0 0.0 132.3 347.2 4.9 0.0 0.0 0.0NOFU 17.5 3.0 2.7 74.7 23.9 22.1 69.1 63.2 48.0 17.2 0.4 0.4 24.8COMU 0.5 1.0 0.6 0.7 0.3 0.6 0.3 4.1 4.1 5.5 131.5 37.9 139.2TUPU 14.2 0.0 8.7 6.3 10.8 0.0 0.0 70.2 53.9 45.7 0.0 0.0 0.0TBMU 6.5 0.1 1.6 1.5 1.1 0.0 0.0 0.3 0.2 0.9 70.9 16.6 66.2GWGU 4.5 12.6 2.9 1.8 2.6 7.7 21.2 3.2 2.7 2.3 3.7 3.0 6.6ANMU 0.6 0.0 0.0 1.7 0.0 0.0 0.0 9.9 16.2 15.5 0.0 0.0 0.6FTSP 17.1 0.0 0.2 5.7 0.1 0.0 0.0 0.2 1.5 3.9 0.0 0.0 0.0BLKI 7.1 0.8 0.1 0.5 0.2 1.4 4.2 0.7 0.0 0.0 2.9 2.3 9.5LAAL 3.1 0.7 1.1 0.5 0.4 0.0 7.3 0.0 0.0 0.6 0.0 0.1 0.8PAAU 7.3 0.0 1.1 1.2 2.4 0.0 0.0 0.1 0.0 0.0 1.2 0.0 0.0PECO 0.0 0.8 0.0 0.1 0.1 2.0 0.3 0.0 0.0 0.0 1.3 1.0 4.4HOPU 3.0 0.0 0.1 0.2 0.5 0.1 0.0 0.8 0.7 1.6 0.0 0.0 0.2REPH 0.3 0.0 0.1 0.0 3.5 0.0 0.0 2.0 0.0 0.0 0.0 0.0 0.0CAAU 0.0 0.0 0.0 0.0 3.9 0.0 0.0 0.3 0.0 0.0 0.0 0.0 0.0RFCO 0.1 0.4 0.0 0.0 0.0 0.7 0.1 0.0 0.0 0.1 0.3 0.4 1.4SOSH 0.0 0.0 0.0 0.0 0.0 0.0 0.0 1.5 3.9 0.0 0.0 0.0 0.0
Area 59.2 42.8 52.9 48.0 47.5 52.7 27.7 128.1 29.7 59.3 52.3 50.7 27.0
Table 1. Year, location, seabird densities (birds km–2) of the most common species, and total areas surveyed (km2) of summer andwinter cruises. Summer cruises were conducted in July and early August; winter cruises, in March. Species are sorted by overall
average density. See Appendix 1 for species codes

Mar Ecol Prog Ser 357: 301–311, 2008
Data analysis. Individual observations were binnedinto 3 km-long sections. At 10 knots, 3 km is covered inclose to 10 min, which is a standard interval in pelagicseabird surveys (Tasker et al. 1984). Section lengthwas calculated along the trackline, allowing for curvi-linear sections. To avoid spuriously high density esti-mates, terminal sections shorter than 1.5 km wereadded to the previous 3 km section. To keep surveyscomparable, we restricted the analysis to the smallestarea covered by all surveys (a circle of 10 nauticalmiles [18.5 km] radius around each site).
Bird numbers were converted to bird biomass, usingmass data from del Hoyo et al. (1992, 1996). This wasnecessary to compare individuals of different specieson the same scale and has the advantage of beingclosely linked to metabolic rate. We used the meanwhere several mass values were available. Finally, wecalculated average bird biomass density (kg km–2) foreach species, for each given site and season. To takevarying section size into account, we weighted themean by the section area. Due to the strongly skeweddistributions characteristic for avian at-sea densitydata, ANOVA was not a suitable tool to investigateinterannual variability. Instead, we plotted the firstmajor axes of a detrended correspondence analysis foreach survey.
Several of the relevant species are difficult to iden-tify in the field to species level under less than idealconditions. Thus, 9.4% of birds were identified togenus level only. We assumed unidentified individualsof similar and common species pairs to be distributedbetween the species pairs at the same ratios as theidentified birds at each site and season, and allocatedthem to the identified birds at the appropriate ratio. Weexcluded species that were recorded, but do not foragein the ocean, such as waders or raptors. This left 35species in the dataset (see Appendix 1). We assignedeach species to 1 of 3 foraging guilds (planktivore, pis-civore, or mixed diets) based on information in ‘Birds ofNorth America’ accounts (Poole & Gill 2007) as aguide. We used sources as close to our study sites aspossible and considered both direct methods andstable isotope studies. To classify a species, we onlyconsidered adult diet. While this can differ from chickdiet, the time to fledging is only a small fraction out ofthe total lifespan for all species considered here.
We were interested in the differences in biologicaldiversity between sites and seasons, so we first deter-mined the species richness (i.e. the number of species)per site and season. We then calculated the speciesdiversity; species diversity also takes the abundance ofeach species into account. If 2 sites have the samenumber of species, the site with the more even distrib-ution of species abundances is regarded as morediverse. We used the diversity index Shannon’s H,
which is the negative sum of the product of the propor-tion of each species and the natural logarithm of thatproportion:
(1)
where S is the number of species (richness) and p is theproportion of each species’ abundance. Shannon’sequitability (or evenness) is calculated by:
(2)
Shannon’s H can take values from 1 to lnS. Shannon’sequitability EH can range from >0 (small values indi-cating dominant species) to 1 (all species at the sameabundance).
All 90% confidence intervals (CI, 0.05 and 0.95 per-centiles) were calculated by bootstrapping with 5000replicates. For the bootstrap, we pooled data from allyears and used the 3 km sections as the sampling unit.Calculations were performed in R (R DevelopmentCore Team 2007), with the packages geoR and sp.
RESULTS
Seabird biomass
There were significant differences in mean at-seabiomass densities of seabirds (all species combined)among our 3 study areas (non-overlapping confi-dence intervals; Fig. 2). In both seasons, bird biomassdensity was highest around Aiktak. In summer, thebiomass density of seabirds was higher at Aiktakthan at Kasatochi or Buldir (Fig. 2). Mean seabirdbiomass density greatly decreased from summer towinter in nearshore waters at the western and cen-tral Aleutian sites, but not at the eastern site, wherewe observed a slight increase in biomass density (by
EH
HH
SH = =max ln
H p pi ii
S
= −=
∑ ln1
304
Fig. 2. Average seabird biomass densities by sites and seasons.Error bars are 90% confidence intervals calculated from 5000
bootstrap replicates

Renner et al.: Aleutian seabird seasonality
41% reaching 246 kg km–2). Furthermore, at Aiktak,the winter seabird biomass density was 5 to 10 timesgreater than the winter densities at the western sites.
Interannual variability
The large-scale differences in biomass and speciescomposition (see below) between sites and seasonswere consistent across years (Table 1). Expressed inthe first major axes of a detrended correspondenceanalysis (eigenvalues 0.70 and 0.31, respectively),observed interannual variation was greater in summer(Aiktak and Kasatochi) than in winter (Fig. 3). While
our sample size was small (up to 3 yr site–1 andseason–1), the convex hulls of site–season groups forthe 2 major axes did not overlap, but each occupied adistinct space within the space of the first major axes.This indicates that the variations observed betweensites and seasons were large in comparison to inter-annual variation (Fig. 3).
Species composition
Seasonal changes in biomass were the result ofchanges in species composition, as well as changes indensity. For example, the most significant contributorsto combined bird biomass during summer at all siteswere migratory species, which were not recorded dur-ing winter (Fig. 4). These included short-tailed shear-waters Puffinus tenuirostris (STSH) at Buldir (45% oftotal bird biomass) and Aiktak (46%), and crested auk-lets Aethia cristatella (CRAU) at Kasatochi (27%). Insummer, tufted puffins (TUPU) were also large contrib-utors to seabird biomass at all sites (8 to 25%).
After the northern summer, many species of seabirds(including shearwaters breeding in the SouthernHemisphere) left nearshore waters in the region. Whilecomparatively few birds remained at the western sitesduring winter, the loss of biomass through the depar-ture of breeding birds and migrants was more thancompensated for at Aiktak by the influx of winteringcommon and thick-billed murres Uria aalge (COMU)and U. lomvia (TBMU), respectively, and high num-bers of crested auklets (Fig. 4). Two of these specieswere rare or absent around Aiktak during summer.
There also might have been a local concentration ofwhiskered auklets Aethia pygmaea (WHAU) near Aik-
305
DCA1
DC
A2
−1 0 1 2
−1
0
1
2
As
As
AsAw
Aw
Aw
Bs
Bw
Ks
Ks
Ks
Kw Kw
Fig. 3. Detrended correspondence analysis (DCA) of eachseabird survey showing interannual and inter-site variation ofthe first major axes DCA1 and DCA2. B: Buldir; K: Kasatochi;A: Aiktak; s: summer; w: winter. The lines connect surveys at
the same site and season, but in different years
LAAL
NOFU
STSH
PECORFCO
GWGU
COMU
TBMU
CRAU
LEAUWHAU
TUPU
Buldir
0.0
0.5
1.0
1.5
2.0
LAAL
NOFU
STSH
PECORFCO
GWGU
COMU
TBMU
CRAU
LEAU
WHAU
TUPU
Kasatochi
0.0 0.5 1.0 1.5 2.0
Winter log density
LAAL
NOFU
STSH
PECORFCO
GWGUCOMU
TBMU
CRAULEAU
WHAU
TUPU
Aiktak
0.0 0.5 1.0 1.5 2.0
Su
mm
er
log
den
sity
planktivores
piscivores
mixed diet
0.0 0.5 1.0 1.5 2.0
Fig. 4. Comparison of summer and winter bird biomass densities [log10(density + 1)] within 10 nautical miles of Buldir, Kasatochi, andAiktak. Species below the diagonal line were more abundant in winter than in summer. Error bars are 90% confidence intervals
based on 5000 bootstrap replicates. Rare species were plotted, but not labeled. See Appendix 1 for species codes

Mar Ecol Prog Ser 357: 301–311, 2008
tak in winter (Fig. 4). Murres and crested auklets werethe most important species around Aiktak in winter (43and 22% of total bird biomass, respectively), whereasthe primary species present at Kasatochi and Buldir inwinter were glaucous-winged gulls Larus glaucescens(GWGU, 24 and 55%) and northern fulmars Fulmarusglacialis (NOFU, 1 and 54%). Whiskered auklets werethe only species of Aethia auklets that remained atKasatochi and Buldir from the large summer multi-species assemblage of auklets. At all sites, glaucous-winged gulls increased during winter.
To examine the seasonal patterns of abundance by dif-ferent foraging guilds, we plotted the log ratio of winterto summer densities of each species (Fig. 5). Since thesummer–winter patterns at Buldir and Kasatochi weresimilar to each other, and differed from the pattern atAiktak, we averaged seabird densities at Buldir andKasatochi (hereafter referred to as ‘western sites’).
Two marked patterns were apparent (Figs. 4 & 5): (1)all species that increased at the western sites in winter(above the horizontal dashed line) also increased atAiktak (right of the vertical dashed line) and (2) all ofthese species were piscivorous. The only planktivorous
species encountered at the western sites at densitiescomparable to their summer densities was thewhiskered auklet. By contrast, the lower right quad-rant of Fig. 5 was almost entirely populated by plank-tivorous species (the only exceptions are close to theedges, their 90% CI reaching out of the quadrant). Ofthese, crested auklet, thick-billed murre, and parakeetauklet Aethia psittacula (PAAU) were the farthest fromthe dashed lines, indicating that these species showedthe strongest opposing seasonal trends between theeastern and central/western sites.
At Aiktak, short-tailed shearwaters in summer, andmurres and crested auklets in winter, aggregated oversimilar bathymetric features on the side of a sill to thenorth of the island (Fig. 6a–c). We found murres alsoover the sill itself. By comparison, a common piscivo-rous species (glaucous-winged gull; Fig. 6d) was foundin deeper water, and a species feeding on squid andfish (tufted puffin; Fig. 6e; diet in Unimak Pass accord-ing to LGL Alaska Research Associates, Inc. 1991) inshallower waters, than short-tailed shearwaters orcrested auklets.
Diversity
Species diversity reflected a similar pattern in whichthe seasonal changes at Aiktak differed from thatobserved at the other locations (Table 2). While speciesrichness declined from summer to winter at all sites (by15 to 18%), Aiktak (which had lower summer diversitythan the other sites) was the only site at which thediversity did not decrease from summer to winter. AtAiktak, the loss of richness was compensated by a neardoubling of species equitability EH (0.048 to 0.093),which was not reflected at the other sites. The diversityat Aiktak in summer was similar to the diversity at theother sites and seasons, because the lowest equitabilityobserved was offset by the greatest species richnesswithin the set.
DISCUSSION
We found remarkable differences in seasonal pat-terns of species composition of the seabird communi-ties in the nearshore marine waters of an easternAleutian site and sites in the central and western Aleu-tians. These patterns were stable across several years.In summer, seabird biomass density and speciesrichness were highest at the eastern site. From summerto winter, seabird biomass density and richnessdeclined (sometimes dramatically) in the 2 westernsites, while biomass density increased at the easternsite (Fig. 2, Table 2).
306
Aiktak (log10 winter/summer ratio)
Bu
ldir a
nd
Kasato
ch
i (lo
g1
0 w
inte
r/su
mm
er
ratio
)
planktivores
piscivores
mixed diet
−∞ −2 −1 0 1 2 ∞
−∞
−2
−1
0
1
∞
LAALNOFU
SOSH
STSH
PECO
RFCO
GWGU
BLKI
RLKI
COMU
TBMU
PIGUANMU
PAAU
CRAULEAU
WHAU
HOPU
TUPU
EastDecrease in winter Increase in winter
West
Decre
ase in w
inte
rIn
cre
ase in w
inte
r
Fig. 5. Ratios of winter to summer abundance of seabirdsaround Buldir and Kasatochi (western and central Aleutians,combined) and Aiktak (eastern Aleutians, Unimak Pass). Spe-cies in the upper right and lower left quadrants show thesame seasonal trends at both eastern and western sites (upperright quadrant: winter increase; lower left quadrant: winterdecrease), species in the upper left and lower right quadrantsshow opposing seasonal trends between sites. ∞ values: spe-cies absent during summer; –∞ values: species absent duringwinter. Error bars are 90% confidence intervals based on5000 bootstrap replicates. See Appendix 1 for species codes

Renner et al.: Aleutian seabird seasonality 307
50
60
70
80
40
10
3020
50
70
60
40
10
3020
50
70
60
40
10
3020
50
70
60
40
10
3020
50
70
60
40
10
3020
50
70
60
40
10
3020
50
70
60
165 164.9 164.8 164.7 164.6 164.5
a b
c d
e
Ugamak Strait
Unimak Pass
f
Aiktak
Ugamak
54.05
54.1
54.15
54.2
54.25
54.3
54.35
54.05
54.1
54.15
54.2
54.25
54.3
54.35
54.05
54.1
54.15
54.2
54.25
54.3
54.35
54.4° N
54.4° N
54.4° N
165.1° W 165 164.9 164.8 164.7 164.6 164.5165.1° W
Fig. 6. (a) Puffinus tenuirostris, (b) Aethia cristatella, (c) Uria lomvia, (d) Larus glaucescens, and (e) Fratercula cirrhata distribu-tion around Aiktak Island. See Panel f for place names. Summer distribution is shown for P. tenuirostris and F. cirrhata; winter dis-tribution, for all other species. Dots represent relative densities for each species, i.e. the largest dot matches the greatest density
measured for each species. Small crosses indicate survey effort, showing where the species was not recorded

Mar Ecol Prog Ser 357: 301–311, 2008
These patterns are consistent with Samalga Passmarking a major ecological boundary (Hunt & Stabeno2005). There were differences in the within-season spe-cies composition between Buldir and Kasatochi (Fig. 3),as can be expected when dividing the Aleutian Archi-pelago into 3 eco-zones (Piatt & Springer 2007). How-ever, these differences between the 2 western siteswere small compared to those found between the west-ern site and the eastern sites. The broad inter-seasonalpatterns in bird biomass density, dominant foragingguilds and diversity are shared between the 2 westernsites and contrast sharply with the eastern site.
Auklets and shearwaters
At Aiktak Island, the close spatial match in the loca-tion of crested auklet and murre aggregations in win-ter and short-tailed shearwater flocks in summer(Fig. 6) suggests that these species exploit the samefood source, albeit at different seasons, and that similarmechanisms concentrate the prey in near-surfacewaters, where they are available to the birds. Thysa-noessa euphausiids have been identified as an impor-tant prey of short-tailed shearwaters, murres, and bothcrested and whiskered auklets, including in the Uni-mak Pass region in both summer and winter (LGLAlaska Research Associates, Inc. 1991, Jahncke et al.2005). Presumably, tidal fluxes advect euphausiids tothe surface when passing over the sill in Ugamak Strait(Fig. 6f), a mechanism similar to that found at theDelarof Islands (Hunt et al. 1998) and at the PribilofIslands (Coyle et al. 1992).
No least and only a few crested auklets breed in theAleutians east of Koniuji Island (30 km east of Kasa-tochi Island; Stephensen & Irons 2003, Byrd et al.2005). Stephensen & Irons (2003) suggested that thisabsence of breeding auklets might be due to a lack ofbreeding sites created through recent volcanic activity.However, auklets can breed successfully in cliffcrevices and under beach boulders, so there is appar-
ently suitable nesting habitat in theeastern Aleutians. For example, leastand crested auklets often share breed-ing habitat with whiskered auklets(Byrd & Williams 1993), which areabundant throughout the eastern Aleu-tians (Williams et al. 2003).
Least auklets specialize on oceanicNeocalanus copepods (Russell et al.1999), which might not be available insufficient densities in the eastern Aleu-tians (Coyle 2005). Crested auklets,however, prey more on larger euphau-siids (Russell et al. 1999), which are
abundant in the eastern Aleutians (LGL AlaskaResearch Associates, Inc. 1991, Coyle 2005). Whileshort-tailed shearwaters are found throughout theAleutians, mega-flocks numbering into the millionshave only been documented from the eastern Aleu-tians (Gibson & Byrd 2007), where the species feedslargely on euphausiids (Jahncke et al. 2005). Shear-water feeding behavior is disruptive to other species(Hoffman et al. 1981), and thus interference competi-tion from shearwaters could be a contributor to the lackof crested auklet colonies in the eastern Aleutians.Crested auklets occupy this foraging niche in thewinter, when short-tailed shearwaters breed in theSouthern Hemisphere.
Hunt et al. (2005) described the seasonal patterns ofbirds from the Gulf of Alaska, where some of the cur-rents affecting Aleutian waters originate; patternsquite similar to what we observed in the Unimak Passarea, with seabird biomass density higher in winterthan during summer. The cause of the higher winterdensity in the Gulf of Alaska was the influx of sea-ducks. Although we also noted a winter increase ofseaducks around Aiktak (as did LGL Alaska ResearchAssociates, Inc. 1991), this group of birds did not con-tribute much to the overall bird biomass there (Fig. 4).Also, our transects might have been too far offshore todetect the main concentrations of ducks in winter. Sim-ilar to our results at Aiktak, the abundance of murresand planktivorous auklets over the Gulf of Alaskabasin increased greatly in winter (Hunt et al. 2005).
Euphausiids at Unimak Pass
Within the Unimak Pass area around Aiktak, Thysa-noessa euphausiids were the main prey of murres andauklets in winter (LGL Alaska Research Associates,Inc. 1991). In contrast to copepods that diapause atdepth in winter (Miller & Clemons 1988), in the Uni-mak Pass region, euphausiids remain active in near-surface waters, and dominate the mesozooplankton
308
Site Season S H EH
Buldir Summer 23 (20) 1.95 1.71–2.15 0.085 0.077–0.101Winter 15 1.60 1.33–1.78 0.107 0.093–0.130
Kasatochi Summer 24 (13) 1.90 1.77–1.99 0.079 0.075–0.088Winter 14 1.32 1.21–1.40 0.094 0.089–0.114
Aiktak Summer 29 (12) 1.40 1.31–1.47 0.048 0.046–0.055Winter 16 1.49 1.39–1.58 0.093 0.088–0.106
Table 2. Seabird species richness (S, number of species; number of species breed-ing on the islands in parentheses), diversity, and equitability (EH, evenness) insummer and winter. Shannon’s H and equitability EH are displayed with therespective 90% confidence intervals, calculated from 5000 bootstrap replicates

Renner et al.: Aleutian seabird seasonality
fauna in winter (LGL Alaska Research Associates, Inc.1991). Euphausiids are thus available to seabirdsaround Unimak Pass throughout the year. Given thestrong contrast in seasonal trends of planktivorousseabirds between the central and western sites com-pared to the trends at Aiktak, we postulate that, inwinter, euphausiids do not occur in the central andwestern sites in densities as high as those at Aiktak.
It is not known why there is this apparent east–westdifference in the winter availability of euphausiids toseabirds in the Aleutians. One possible hypothesis isthat the euphausiids in the Unimak Pass region areadvected there from the Aleutian North Slope Current,and thus probably originate in the Gulf of Alaska, hav-ing been carried to the Bering Sea by the AlaskanStream as it flows northward through Amukta andAmchitka Passes (Stabeno et al. 2005). Such a scenariowould help to explain why most of the large aggrega-tions of foraging shearwaters in summer and of murresand crested auklets in winter are on the north sideof the eastern Aleutian Archipelago (LGL AlaskaResearch Associates, Inc. 1991, Jahncke et al. 2005,Ladd et al. 2005). It is also consistent with the observa-tion that, east of Samalga Pass, the diets of PacificOcean perch Sebastes alutus, walleye pollock Thera-gra chalcogramma and Atka mackerel Pleurogrammusmonopterygius are dominated by euphausiids (50 to90% occurrence), whereas, west of Samalga Pass,euphausiids occur less frequently in the diets of thesefish (<50%) and copepods and myctophids become thedominant prey items (Logerwell et al. 2005).
Foraging guilds
In the western and central Aleutian Islands, all of theseabird species that occurred at significantly higherbiomass densities in winter than in summer were pisci-vores (Fig. 5). The classification of seabirds into plank-tivores and piscivores is somewhat artificial. Manyspecies can switch their diet, e.g. from predominantlyplankton to fish. However, the most extreme casesdriving the pattern in Fig. 5 are relatively specializedforagers (piscivores: cormorants, gulls; planktivores:crested auklet, parakeet auklet). Given this gradient ofpiscivores (high western log10 winter/summer ratio) toplanktivores (low western log10 winter/summer ratio)we can examine where species pairs with a more inter-mediate diet are found.
Bill morphology and actual diet samples suggest thatthick-billed murres Uria lomvia are more plankti-vorous than common murres U. aalge (Ainley et al.2002), even though both fish and invertebrates havebeen found as the predominant diet in each murre spe-cies (Ainley et al. 2002). In our study, the seasonal dis-
tribution patterns of thick-billed murres match those ofother planktivores, but those of common murres havecloser resemblance with species of an intermediatediet (Fig. 5), suggesting a dietary specialization as pre-dicted from bill morphology.
Whiskered auklets Aethia pygmaea were the onlyAethia auklet species and the only plankton specialistto remain in the western and central Aleutians in win-ter at densities similar to those found during summer(Fig. 5). Whiskered auklets differ from their congenersin remaining near the breeding sites throughout theyear and roosting on land at night (Byrd & Williams1993). During summer, their diet is more diverse(greater Shannon’s H) than that of other Aethia auklets(G. Fraser pers. comm.). The species might thereforebe more flexible than its congeners in exploiting differ-ent resources when their preferred prey becomesscarce. This dietary flexibility might allow the speciesto occupy a much wider range within the AleutianArchipelago than least and crested auklets (A. pusillaand A. cristatella, respectively; Williams et al. 2003). Inwinter, whiskered auklets in the Unimak Pass regionconsumed mainly euphausiids (LGL Alaska ResearchAssociates, Inc. 1991). It is unknown what prey theyuse in winter farther west in the Aleutians, wherewhiskered auklets maintain high winter densities eventhough euphausiids appear to be less common.
CONCLUSIONS
We found that at all sites, the main piscivorousseabirds increased in winter, whereas, with the excep-tion of whiskered auklets, planktivorous seabird speciesdeclined at the sites in the central and western AleutianIslands. In contrast, at the eastern Aleutian site close toUnimak Pass, planktivorous seabird biomass increasedsignificantly, despite the departure of summer visitorssuch as short-tailed shearwaters. From this we infer thatthe large copepod species and euphausiids that supportmost central and western Aleutian planktivores insummer were not available in winter. In contrast, eupha-usiids apparently remain abundant in the vicinity ofUnimak Pass all winter, supporting a large seabird bio-mass. Existing data on winter diets and availability ofzooplankton in the central and western Aleutians areinadequate to address how whiskered auklets meettheir trophic requirement in winter there.
Euphausiids are an important component of the dietsof many commercially important fish species, includ-ing walleye pollock. The presence of high numbersof wintering, euphausiid-dependent seabirds in thevicinity of the north end of Unimak Pass suggests thatconcentrations of euphausiids there must be extraordi-narily high in winter as well as in summer. There is a
309

Mar Ecol Prog Ser 357: 301–311, 2008
need to understand the mechanisms responsible forthese large aggregations of euphausiids and the envi-ronmental conditions that might affect their availabil-ity to the fish, seabirds, and marine mammals thatdepend on them.
Acknowledgements. We thank R. Merrick and K. Chumbleyfrom the National Marine Mammal Lab for sharing their datafrom the winter cruises that were an essential component ofthe present paper. D. Dragoo and J. Williams did much of theheavy lifting in the field to keep this project running. Weextend our appreciation to the captain and crew of the MV‘Tiglax’ for making this vessel a safe and dependable workingplatform. D. Dragoo, K. Morgan, H. Renner, and 4 anonymousreviewers provided comments on earlier drafts, whichimproved this manuscript. Funding came from the U.S. Geo-logical Survey and Alaska Maritime National Wildlife Refuge.M.R. thanks the COASST lab for their hospitality and J. Par-rish for her advice and help in numerous ways.
LITERATURE CITED
Ainley DG, Nettleship DN, Carter HR, Storey AE (2002) Com-mon murre (Uria aalge). In: Poole A, Gill F (eds) Birds ofNorth America, No. 666. The Birds of North America, Inc.,Philadelphia, PA, p 1–44
Byrd GV, Williams JC (1993) Whiskered auklet (Aethia pyg-maea). In: Poole A, Gill F (eds) The birds of North Amer-ica, No 76. The Academy of Natural Sciences of Phila-delphia and the American Ornithologists’ Union,Washington, DC, p 1–12
Byrd GV, Renner HM, Renner M (2005) Distribution patternsand population trends of breeding seabirds in the AleutianIslands. Fish Oceanogr 14(Suppl 1):139–159
Coyle KO (2005) Zooplankton distribution, abundance andbiomass relative to water masses in eastern and centralAleutian Island passes. Fish Oceanogr 14(Suppl 1):77–92
Coyle KO, Pinchuk A (2005) Seasonal cross-shelf distribu-tion of major zooplankton taxa on the northern Gulf ofAlaska shelf relative to water mass properties, speciesdepth preferences and vertical migration behaviour.Deep-Sea Res II 52:217–245
Coyle KO, Hunt GL Jr, Decker MB, Weingartner TJ (1992)Murre foraging, epibenthic sound scattering and tidaladvection over a shoal near St. George Island, Bering Sea.Mar Ecol Prog Ser 83:1–14
del Hoyo J, Elliott A, Sargatal J (eds) (1992) Handbook of thebirds of the world, Vol 1. Ostrich to ducks. Lynx Edicions,Barcelona
del Hoyo J, Elliott A, Sargatal J (eds) (1996) Handbook of thebirds of the world, Vol 3. Hoatzin to auks. Lynx Edicions,Barcelona
Gibson DD, Byrd GV (2007) Birds of the Aleutian Islands,Alaska. In: Causey D (ed) Series in ornithology, No. 1.Nuttall Ornithological Club and American Ornithologists’Union, Cambridge, MA, p 1–351
Hoffman W, Heinemann D, Wiens JA (1981) The ecology ofseabird feeding flocks in Alaska. Auk 98:437–456
Hunt GL Jr, Stabeno PJ (2005) Oceanography and ecology ofthe Aleutian Archipelago: spatial and temporal variation.Fish Oceanogr 14(Suppl 1):292–306
Hunt GL Jr, Russell RW, Coyle KO, Weingartner T (1998)Comparative foraging ecology of planktivorous auklets inrelation to ocean physics and prey availability. Mar EcolProg Ser 167:241–259
Hunt GL Jr, Drew GS, Jahncke J, Piatt JF (2005) Prey con-sumption and energy transfer by marine birds in the Gulfof Alaska. Deep-Sea Res II 52:781–797
Jahncke J, Coyle KO, Hunt GL Jr (2005) Seabird distribution,abundance and diets in the eastern and central AleutianIslands. Fish Oceanogr 14(Suppl 1):160–177
Ladd C, Jahncke J, Hunt GL Jr, Coyle KO, Stabeno PJ (2005)Hydrographic features and seabird foraging in Aleutianpasses. Fish Oceanogr 14(Suppl 1):178–195
LGL Alaska Research Associates, Inc. (1991) Marine birdsand mammals of the Unimak Pass Area: abundance, habi-tat use and vulnerability. MMS Contract 14-35-0001-30564 (formerly NOAA/OCSEAP RU 689), OCS StudyMMS 91-0038, 4175 Tudor Centre Drive, Suite 101,Anchorage, AK 99508
Logerwell EA, Aydin K, Barbeaux S, Brown E, and others(2005) Geographic patterns in the demersal ichthyofaunaof the Aleutian Islands. Fish Oceanogr 14(Suppl 1):93–112
Luchin VA, Menovshchikov VA, Lavrentiev VM, Reed RK(1999) Thermohaline structure and water masses in theBering Sea. In: Loughlin TR, Ohtani K (eds) Dynamics ofthe Bering Sea. University of Alaska Sea Grant, AK-SG-99-03, Fairbanks, AK, p 61–91
Miller CB, Clemons MJ (1988) Revised life history analysis forlarge grazing copepods in the subarctic Pacific Ocean.Prog Oceanogr 20:293–313
Mordy CW, Stabeno PJ, Ladd C, Zeeman S, Wisegarver DP,Salo SA, Hunt GL Jr (2005) Nutrients and primary produc-tion along the eastern Aleutian Island Archipelago. FishOceanogr 14(Suppl 1):55–76
Nakata K, Doi T, Taguchi K, Aoki S (2004) Characterization ofocean productivity using a new physical–biological cou-pled ocean model. In: Shiyomi M, Kawahata H, Hiroshi K,Tsuda A, Awaya Y (eds) Global environmental change inthe ocean and on land. Terrapub, Tokyo, p 1–44
Overland JE, Spillane MC, Hurlburt HE, Wallcraft AJ (1994)A numerical study of the circulation of the Bering Seabasin and exchange with the North Pacific Ocean. J PhysOceanogr 24:736–758
Piatt JF, Springer AM (2007) Marine ecoregions of Alaska. In:Spies RB (ed) Long-term ecological change in the northernGulf of Alaska. Elsevier, Amsterdam, p 522–526
Poole A, Gill F (eds) (2007) The birds of North America online.Cornell Lab of Ornithology and American Ornithologists’Union. Available at http://bna.birds.cornell.edu/, accessed3 April 2007
R Development Core Team (2007) R: a language and environ-ment for statistical computing. R Foundation for StatisticalComputing, Vienna. Available at www.R-project.org,accessed 27 April 2007
Reed RK, Stabeno PJ (1999) The Aleutian North Slope Cur-rent. In: Loughlin TR, Ohtani K (eds) Dynamics of theBering Sea. University of Alaska Sea Grant, AK-SG-99-03,Fairbanks, AK, p 177–191
Russell RW, Harrison NM, Hunt GL Jr (1999) Foraging at afront: hydrography, zooplankton, and avian planktivory inthe northern Bering Sea. Mar Ecol Prog Ser 182:77–93
Stabeno PJ, Schumacher JD, Ohtani K (1999) The physicaloceanography of the Bering Sea. In: Loughlin TR, OhtaniK (eds) Dynamics of the Bering Sea. University of AlaskaSea Grant, AK-SG-99-03, Fairbanks, AK, p 1–28
Stabeno PJ, Reed R, Napp JM (2002) Transport through Uni-mak Pass, Alaska. Deep-Sea Res 49(Part II):5919–5930
Stabeno PJ, Kachel DG, Kachel N, Sullivan ME (2005) Obser-vations from moorings in the Aleutian passes: temperature,salinity and transport. Fish Oceanogr 14(Suppl 1):39–54
310

Renner et al.: Aleutian seabird seasonality
Stephensen SW, Irons DB (2003) Comparison of colonialbreeding seabirds in the eastern Bering Sea and Gulf ofAlaska. Mar Ornithol 31:167–173
Tanasichuk RW (1999) Interannual variation in the availabil-ity and utilization of euphausiids as prey for Pacific hake(Merluccius productus) along the south-west coast of Van-couver Island. Fish Oceanogr 8:150–156
Tasker ML, Jones PH, Dixon T, Blake BF (1984) Countingseabirds at sea from ships: a review of methods employedand a suggestion for a standardized approach. Auk 101:567–577
Williams JC, Byrd GV, Konyukhov NB (2003) Whiskered auk-let Aethia pygmaea, foxes, humans and how to right awrong. Mar Ornithol 31:175–180
311
Code Latin name Common name Mass (g)
Phoebastria nigripes Black-footed albatross 3300
LAAL Phoebastria immutabilis Laysan albatross 2550
NOFU Fulmarus glacialis Northern fulmar 768
SOSH Puffinus griseus Sooty shearwater 814
STSH Puffinus tenuirostris Short-tailed shearwater 640Pterodroma inexpectata Mottled petrel 344
FTSP Oceanodroma furcata Fork-tailed storm-petrel 59Oceanodroma leucorhoa Leach’s storm-petrel 45Phalacrocorax auritus Double-crested cormorant 1885
PECO Phalacrocorax pelagicus Pelagic cormorant 1956
RFCO Phalacrocorax urile Red-faced cormorant 2098Histrionicus histrionicus Harlequin duck 625Somateria mollissima Common eider 1980
REPH Phalaropus fulicarius Red phalarope 57Phalaropus lobatus Red-necked phalarope 35Stercorarius pomarinus Pomarine jaeger 750Stercorarius longicaudus Long-tailed jaeger 270Larus hyperboreus Glaucous gull 1445
GWGU Larus glaucescens Glaucous-winged gull 1075
BLKI Rissa tridactyla Black-legged kittiwake 408Rissa brevirostris Red-legged kittiwake 395Xema sabini Sabine’s gull 180
COMU Uria aalge Common murre 1000
TBMU Uria lomvia Thick-billed murre 1000
PIGU Cepphus columba Pigeon guillemot 500Brachyramphus marmoratus Marbled murrelet 220
ANMU Synthliboramphus antiquus Ancient murrelet 206
CAAU Ptychoramphus aleuticus Cassin’s auklet 175
PAAU Aethia psittacula Parakeet auklet 297
CRAU Aethia cristatella Crested auklet 260
LEAU Aethia pusilla Least auklet 85
WHAU Aethia pygmaea Whiskered auklet 116Cerorhinca monocerata Rhinoceros auklet 533
HOPU Fratercula corniculata Horned puffin 532
TUPU Fratercula cirrhata Tufted puffin 773
Appendix 1. Bird species abbreviations (where used; in systematic order),Latin and common names, and average mass values of species encountered
during the surveys (mass values from del Hoyo et al. 1992, 1996)
Editorial responsibility: Otto Kinne,Oldendorf/Luhe, Germany
Submitted: May 29, 2007; Accepted: November 5, 2007Proofs received from author(s): March 21, 2008


