Embed Size (px)
Citation preview

Econ. Innov. New Techn., 2005, Vol. 14(3), April, pp. 213–223
R&D INVESTMENT AND INTERNAL FINANCE:THE CASH FLOW EFFECT
CARTER BLOCH∗
The Danish Centre for Studies in Research and Research Policy, University of Aarhus,Finlandsgade 4, 8200 Aarhus N., Denmark
(Received 24 February 2004; Revised 22 September 2004; In final form 4 October 2004)
This paper investigates the cash flow effect on R&D investments for firms in Denmark. Evidence is found that internalfunds are important in explaining R&D investments, indicating that R&D investment decisions are affected by creditmarket imperfections. Cash flow sensitivities are larger both for smaller firms and for firms with low debt relative toassets. Furthermore, this effect is also present after controlling for cash flow’s potential role as a predictor of futureprofitability.
Keywords: R&D; Cash flow; Internal finance; Financial constraints; Credit market imperfections
JEL Classification: G32; O32
INTRODUCTION
It is often argued that there is too little investment in R&D. An important reason for this isthat much of the ideas and knowledge created by R&D is non-rival; its use by one firm doesnot preclude its use by another. Firms may then be unable to fully appropriate the gains fromtheir investments, which then leads to underinvestment. However, there may also be anotherreason why firms’ R&D investment is suboptimal. The nature of R&D investments may affectthe access to and the cost of external funding.
According to the Miller–Modigliani (Modigliani and Miller, 1958) theorem, optimallevels of investment should be indifferent to capital structure. However, economic theoryon information problems offers a number of reasons why this may not be the case.
R&D, as with other types of investments, may be characterized by problems of asymmetricinformation.1 The firm has better information on the likelihood of success and the nature ofthe project than the investor. The investor may then have difficulties in determining whichprojects are most promising. Furthermore, reducing information problems in this case is prob-lematic since firms are reluctant to provide more information on their research due to strategicconsiderations.
∗ Tel.: (45) 8942 2398; Fax: (45) 8942 2399; E-mail: [email protected] Classical references are Akerlof (1970) and Stiglitz and Weiss (1981).
ISSN 1043-8599 print; ISSN 1476-8364 online © 2005 Taylor & Francis Group LtdDOI: 10.1080/1043859042000312710

214 C. BLOCH
Myers and Majluf (1984) argue that managers’inside information on the value of investmentprojects will make them reluctant to seek external finance, instead relying on internal funds.
As with other types of investment, external financing of R&D also creates problems of moralhazard;2 due to limited liability, firms may be willing to take on greater risk than otherwisewhen projects are financed by external funds. These problems are potentially greater for R&D,given that R&D is very difficult to collateralize.
An extensive literature3 has examined the presence of financial constraints on investmentin fixed capital, most often by examining whether cash flow affects investment. Theories oncredit market imperfections show that firms’ net worth may affect both the access to and thecost of external financing. Cash flow functions both as a proxy for firms’ net worth and as ameasure of their internal funds available for investment.
A smaller number of papers4 have also considered the role of cash flow on R&D investment.R&D and fixed capital investments differ in a number of important ways. First, since a largeportion of R&D expenditure is wages and salaries, and the output is mainly knowledge andideas, R&D is difficult to collateralize. Second, much of the knowledge created is tacit; thefirm’s knowledge base sits with its researchers, and in order to maintain it, the firm must keeptheir staff employed. This implies that there are high adjustment costs for R&D, which alsomotivates the smoothing of R&D spending. Third, the returns to R&D investment are muchmore uncertain for investments in fixed capital.
The majority of work in this area has been on US data. However, consideration of theseissues in other countries is interesting both in its own right and also in comparison with USresults. Financial systems and relationships between firms and banks may vary considerablyfrom country to country.
In terms of broad characteristics, the Danish financial system resembles most the ContinentalEuropean model, in which banks have the central role in providing financing for businesses.5
The stock market, although having grown both in size and importance in recent years, is stillrelatively small in Denmark. Bonds issued by the government and mortgage credit institutionsare the most dominant type of financial assets in Denmark, though the issuance of bonds byprivate businesses is very limited. By far the most prevalent form of financing for firms is bankloans.
Though, there are important differences between the Danish financial system and universalbanking systems in, e.g., Germany. In particular, legal regulations for financial institutionsgreatly restrict the influence that banks may have on firms.6 Thus, the close relationshipsbetween banks and firms that are encountered in other bank-based systems are absent. Onthe basis of this, it may be expected that credit market imperfections are more prevalent inDenmark than in other bank-based systems.
The objective of this paper is to investigate the cash flow effect on R&D investments inDanish firms. This is done by examining two issues. The first is whether there is a relationshipbetween cash flow and R&D investments. If firm borrowing is subject to financial imperfec-tions, then R&D expenditures will be dependent on firms’ own cash flow. Thus, cash flow’sability to explain R&D investments may provide evidence of financial imperfections.
The second issue involves isolating the effects of credit market imperfections from demandshifts, or changes in investment opportunities. For example, cash flow may also functionas an indicator of future profitability (for example, an increase in cash flow may generate
2 See, e.g. Holmstrom and Tirole (1997) and Townsend (1979).3 Examples are Fazzari et al. (1988), Gilchrist and Himmelberg (1995).4 Among them, Hao and Jaffe (1993), Himmelberg and Petersen (1994), Hall (1992), Mulkay et al. (2001), Boughaes
et al. (2003). A review of literature on the financing of R&D can be found in Hall (2002).5 See, e.g. Østrup (1994) and Andersen et al. (2001).6 See, e.g. Østrup (1994).

R&D INVESTMENT AND INTERNAL FINANCE 215
expectations of greater profits in the future), which suggests that cash flow may help explainR&D investments simply because it forecasts future earnings, and not due to financialconstraints.
This second issue is addressed in two ways. First, following Fazzari et al. (1988) and Haoand Jaffe (1993), subsets of the sample are examined that, a priori, are considered more likelyto be subject to financial constraints. If cash flow effects are stronger for these subsets, thenthis provides evidence that at least part of cash flow effects on R&D investment are due tocredit market imperfections.
Second, both sales and an empirical measure of Tobin’s Q are used to control for demandeffects. In addition, using a simplified approach based on that used to examine capitalinvestment in Gilchrist and Himmelberg (1995), an estimate of expected future profitabi-lity, ‘Expected Q’, controlling for, among other things, cash flow’s predictive power for futureearnings is constructed. This makes it possible to distinguish between the two interpretations.A finding that cash flow still helps to explain R&D investments after controlling for its abilityto forecast future earnings provides strong evidence of a cash flow effect due to credit marketimperfections.
These questions are examined using a panel of Danish firms listed on the Copenhagen StockExchange. The dataset draws on a comprehensive database compiled by the Danish Centrefor Studies in Research and Research Policy on R&D activities for Danish firms from 1989to 2001. This R&D data has then been combined with accounting and stock market data forall non-financial firms listed on the Copenhagen Stock Exchange.7
The cash flow approach for measuring credit market imperfections has been the subjectof criticism, most notably by Kaplan and Zingales.8 Among the most important of these arefirst, that subgroups should not be fixed over the entire period since financial constraints maynot be binding in all periods. Related to this is the problem of endogeneity; whether financialconstraints are binding will influence sample selection criteria. Second, Kaplan and Zingalesargue that there is no solid theoretical argument for a monotonic relationship between cashflow and investment. For example, financially distressed firms are likely to have lower cashflow sensitivities.
This paper uses a priori classifications of firms (i.e. fixed subgroups) for the followingreason. Although it may well be the case that financial constraints are not always binding,there is good reason to believe that credit market imperfections may affect firms’ behavioreven when they are not binding. A forward-looking firm will try to avoid costly adjustmentto its investments as a result of financial constraints and may maintain a buffer stock of cashand other liquid assets. In this way, credit market imperfections may be equally relevant bothwhen constraints are actually binding and when they are not. Furthermore, by this reasoning,the endogeneity problem is not an issue, as this rests on the argument that subgroups should beallowed to vary over time (i.e. selected according to whether constraints are actually binding).
The paper also considers the issue of financially distressed firms and monotonicity empir-ically, and does not find this to be a problem for the data here, since there are only a smallnumber of distressed firm observations in the sample,9 and the removal of these firms fromthe sample does not have a significant effect on the results.10
7 Annual account data are from the Account Database from the Copenhagen Business School. Stock market datais obtained from the Danish Stock Database from the Center of Analytical Finance at the Aarhus School of Business.A more detailed description of the R&D data is given in the appendix.
8 See Kaplan and Zingales (1997, 2000) and the reply to their arguments in Fazzari et al. (2000). Schiantarelli(1996) and Hubbard (1998) contain general discussions of a number of the methodological issues concerning creditmarket imperfections and investment.
9 A firm was considered distressed if it had either a negative or very low cash flow to assets ratio.10 These changes are not reported in the paper, though they can be obtained from the author.

216 C. BLOCH
If is found that in general, cash flow has a positive, significant effect on R&D investments.Furthermore, when subsets are considered that, a priori, are more likely to be subject to creditmarket imperfections, this effect is stronger (i.e. the coefficient on cash flow increases). Thisis the case, both when comparing small and large firms and when comparing firms with lowand high levels of debt. A bootstrapping exercise provides support that differences in coeffi-cient estimates for these subsets are statistically significant. In addition, when Expected Q isused instead of Tobin’s Q in the regressions, cash flow still has a significant effect on R&Dinvestments, in particular for small and low debt firms. These results give a strong indicationboth of the presence of a cash flow effect on R&D, and that it reflects the presence of creditmarket imperfections.
THE MODEL
The empirical model that will be used in this paper is
RDit
TAit
= β0 + β1Qit + β2CFit
TAit
+ β3Sit
TAit
+ eit (1)
where RDit is R&D investment for firm i in period t , TA is the book value of total assets, Q
is an empirical proxy of Tobin’s Q, CF is cash flow,11 S is sales and e is an error term. I use astandard empirical measure of Tobin’s Q, defined as the ratio of the market value to the bookvalue of the firm’s total assets.12 Q and TA are values at the beginning of the period, whereasCF, RD and S are values during the period. As indicated by Eq. (1), cash flow, sales and R&Dare normalized by total assets.
As noted above, the finding that firms’ cash flow helps explain R&D investment can beinterpreted in two ways:
• The effect of cash flow on R&D investment is due to firms’limited access to external finance.• R&D investment’s positive association with cash flow is not due to credit market imper-
fections, but is instead due to cash flow’s role as a predictor of firms’ investmentopportunities.
Hence, having found a ‘cash flow effect,’ it is equally important to identify the role of cashflow in affecting R&D investment.
The inclusion of an empirical measure of Tobin’s Q is designed to capture the effect ofinvestment opportunities; given that Tobin’s Q theoretically is, under certain conditions, asufficient statistic13 for the profitability of investment, any additional effects of cash flow aftercontrolling for Q are argued to be due to financial constraints.
Adjustment costs and other factor specific characteristics imply that investments in fixedcapital, working capital and R&D may respond to changes in different ways. And, in efforts toequate expected marginal returns, investment decisions for each factor may interact. Althoughthe Tobin’s Q model has mainly been used to model fixed investment,14 empirical measuresof Tobin’s Q function as an indicator of the value of all assets and thus can be used to controlfor demand effects for both fixed and R&D investment.
11 Cash flow is defined as operating income before R&D expenditures, plus liquid assets.12 More precisely, Q is calculated as the market value of equity plus the book value of long-term debt, divided by
the book value of total assets.13 That is, average Q, which empirical approximations are a proxy of, is equal to marginal Q. See Hayashi (1982).14 Though, see Himmelberg and Petersen (1994).

R&D INVESTMENT AND INTERNAL FINANCE 217
There may also be concerns on the quality of empirical approximations of Tobin’s Q. Fora number of factors, such as imperfect competition, result of Hayashi (1982) may not hold,resulting in a wedge between marginal and average Q. In addition, if empirical measures are apoor proxy of the theoretical measure of Q, then cash flow effects can be argued to supplementthe empirical measure of Q as a predictor of future investment opportunities.
This issue is addressed in the following ways.The addition of sales to the model is intended tocapture the wedge between average and marginal Q.15 In addition, as noted earlier subsamplesof the dataset are examined to determine whether cash flow effects are stronger for firms that,a priori, are considered likely to be subject to credit market imperfections. In order to examinethe significance of coefficient differences among subsets, the author employs a bootstrappingprocedure to estimate the sampling variance of coefficient estimates which are used to testwhether cash flow coefficients are different.16 A low empirical p-value provides support thatthe observed differences are in fact significant.
In order to address potential shortcomings in the empirical measure of Q, the expectedvalue of Q17 is estimated using cash flow, sales, and other variables. If cash flow still affectsR&D investment after controlling for its effect on expectations of future profitability, then thisprovides further evidence of a cash flow effect on R&D investment.
THE DATA
The dataset comprises non-financial firms listed on the Copenhagen Stock Exchange over theperiod, 1989–2001. In all, between 250 and 300 firms are listed on the stock market, with atotal market capitalization of DKK 738 billion (approximately EUR 100 billion) at end-2001,which is equivalent to ∼55% of Denmark’s GDP in 2001.18 R&D expenditures among publiclytraded firms in Denmark have increased steadily over the period, more than doubling.19
In order to focus on firms that are active in research and development, only firms withaverage R&D expenditures >1% of the book value of total assets are included. This yields anunbalanced panel consisting of 63 firms with a total of 390 observations.
The impact of credit market imperfections on R&D investments may vary from sectorto sector. Concerning firms’ innovative activities, there may be a number of characteristicsthat are specific to individual sectors,20 such as the degree of uncertainty for R&D invest-ments, time lags between research and final products, the share of basic vs. applied R&D andappropriability. These factors may play a significant role in affecting firms’ access to externalfinancing.
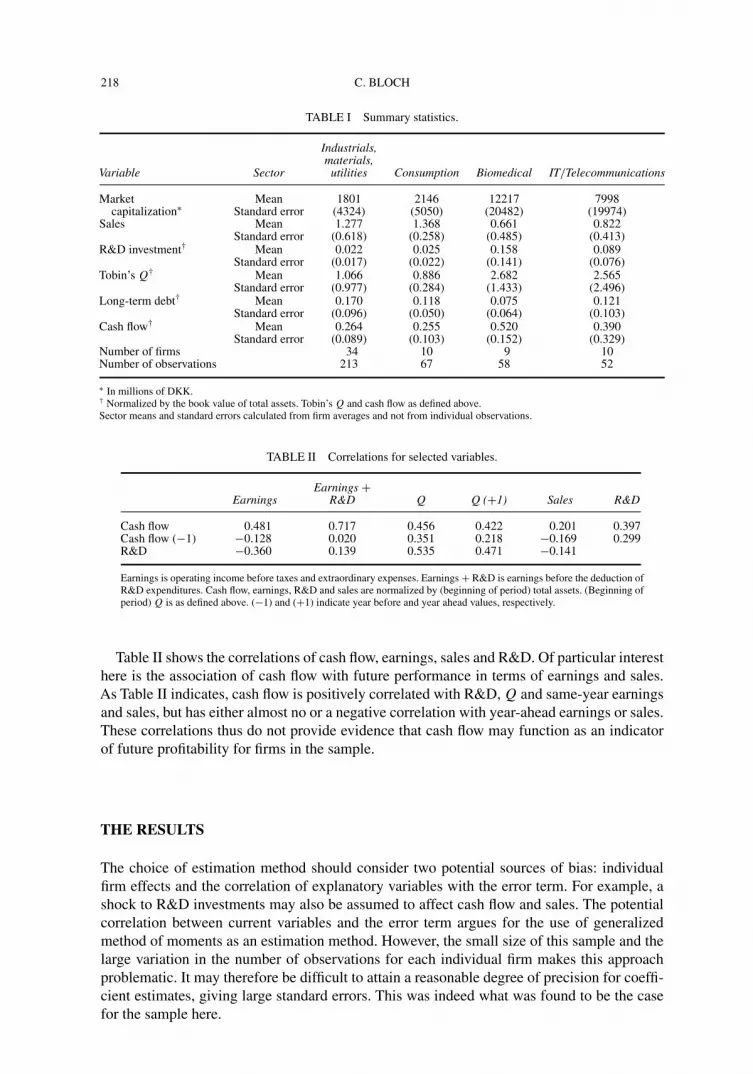
Table I shows some summary statistics for the sample. Here, firms are classified by sec-tor according to the General Industry Classification System.21 One can see that mean R&Dintensities are much higher for Biomedicals and IT/Telecommunications, as are mean valuesfor Tobin’s Q and cash flow ratios. Though, there is very large variation in values within eachsector.
15 See, e.g. Fazzari et al. (1988) and Hubbard (1998).16 See also Cleary (1999).17 That is, the expected value of Q in period t + 1 based on information in period t .18 As a reference, the market capitalization of the NYSE (source: NYSE’s web site) was slightly higher than
US GDP in 2001 (GDP data from OECD).19 R&D among firms listed on the CSE amounts to a little under half of total private sector R&D in Denmark,
which was DKK 21.9 billion. See Danish Centre for Studies in Research and Research Policy (2003).20 See, e.g. Malerba and Orsenigo (1997).21 Where, due to the number of observations, some sectors have been combined [industrials (20), materials
(15) and utilities (55); consumer discretionary (25) and consumer staples (30); information technology (45) andtelecommunications (50)].
218 C. BLOCH
TABLE I Summary statistics.
Industrials,materials,
Variable Sector utilities Consumption Biomedical IT/Telecommunications
Market Mean 1801 2146 12217 7998capitalization∗ Standard error (4324) (5050) (20482) (19974)
Sales Mean 1.277 1.368 0.661 0.822Standard error (0.618) (0.258) (0.485) (0.413)
R&D investment† Mean 0.022 0.025 0.158 0.089Standard error (0.017) (0.022) (0.141) (0.076)
Tobin’s Q† Mean 1.066 0.886 2.682 2.565Standard error (0.977) (0.284) (1.433) (2.496)
Long-term debt† Mean 0.170 0.118 0.075 0.121Standard error (0.096) (0.050) (0.064) (0.103)
Cash flow† Mean 0.264 0.255 0.520 0.390Standard error (0.089) (0.103) (0.152) (0.329)
Number of firms 34 10 9 10Number of observations 213 67 58 52
∗ In millions of DKK.† Normalized by the book value of total assets. Tobin’s Q and cash flow as defined above.Sector means and standard errors calculated from firm averages and not from individual observations.
TABLE II Correlations for selected variables.
Earnings +Earnings R&D Q Q (+1) Sales R&D
Cash flow 0.481 0.717 0.456 0.422 0.201 0.397Cash flow (−1) −0.128 0.020 0.351 0.218 −0.169 0.299R&D −0.360 0.139 0.535 0.471 −0.141
Earnings is operating income before taxes and extraordinary expenses. Earnings + R&D is earnings before the deduction ofR&D expenditures. Cash flow, earnings, R&D and sales are normalized by (beginning of period) total assets. (Beginning ofperiod) Q is as defined above. (−1) and (+1) indicate year before and year ahead values, respectively.
Table II shows the correlations of cash flow, earnings, sales and R&D. Of particular interesthere is the association of cash flow with future performance in terms of earnings and sales.As Table II indicates, cash flow is positively correlated with R&D, Q and same-year earningsand sales, but has either almost no or a negative correlation with year-ahead earnings or sales.These correlations thus do not provide evidence that cash flow may function as an indicatorof future profitability for firms in the sample.
THE RESULTS
The choice of estimation method should consider two potential sources of bias: individualfirm effects and the correlation of explanatory variables with the error term. For example, ashock to R&D investments may also be assumed to affect cash flow and sales. The potentialcorrelation between current variables and the error term argues for the use of generalizedmethod of moments as an estimation method. However, the small size of this sample and thelarge variation in the number of observations for each individual firm makes this approachproblematic. It may therefore be difficult to attain a reasonable degree of precision for coeffi-cient estimates, giving large standard errors. This was indeed what was found to be the casefor the sample here.
R&D INVESTMENT AND INTERNAL FINANCE 219
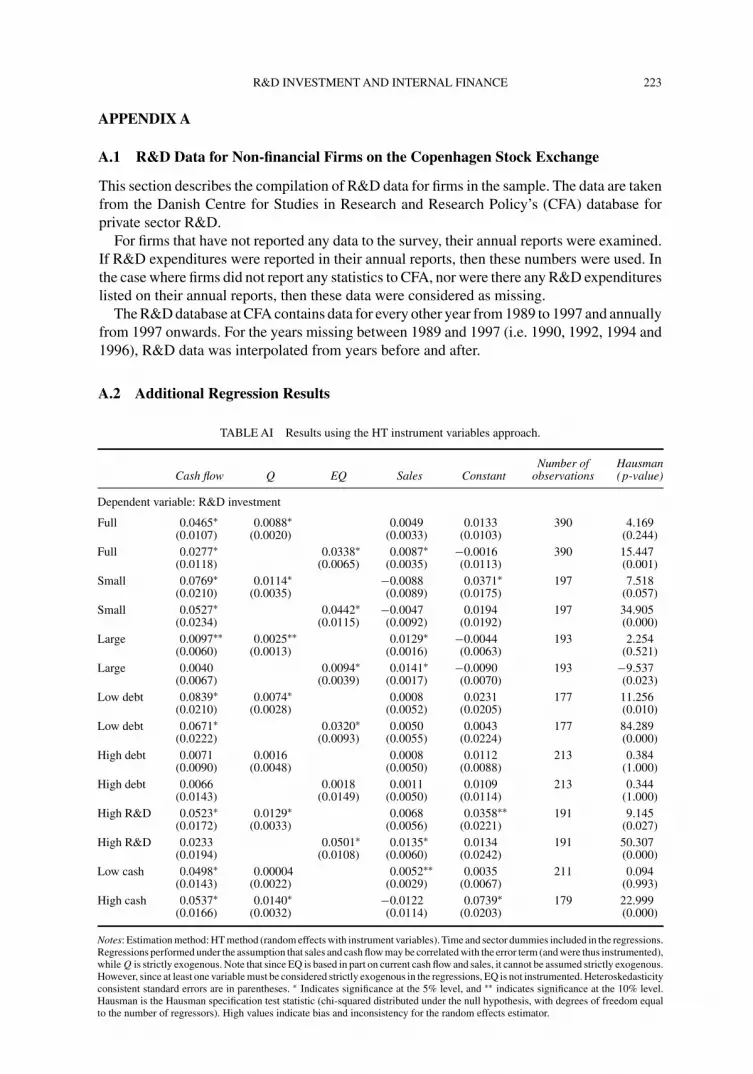
This paper will instead focus on results using a fixed effects estimation method.22 This allowsfor individual firm effects, but does not control for potential bias with the explanatory variables.As a control, the model was also estimated using the Hausman–Taylor (HT) instrumentalvariables approach.23 The advantages of the HT approach relative to a fixed effects modelare that it captures within firm variation and it allows the examination of sector effects. Themain disadvantage is that if there are substantial individual firm effects, it may product biasedand inconsistent estimates. The Hausman specification test provides a method for assessingwhether this bias exists.24 The results from the HT approach were fairly similar to those withfixed effects, giving an indication that the fixed effects estimates are fairly reliable. Resultsusing the HT approach are included in the appendix for comparison.
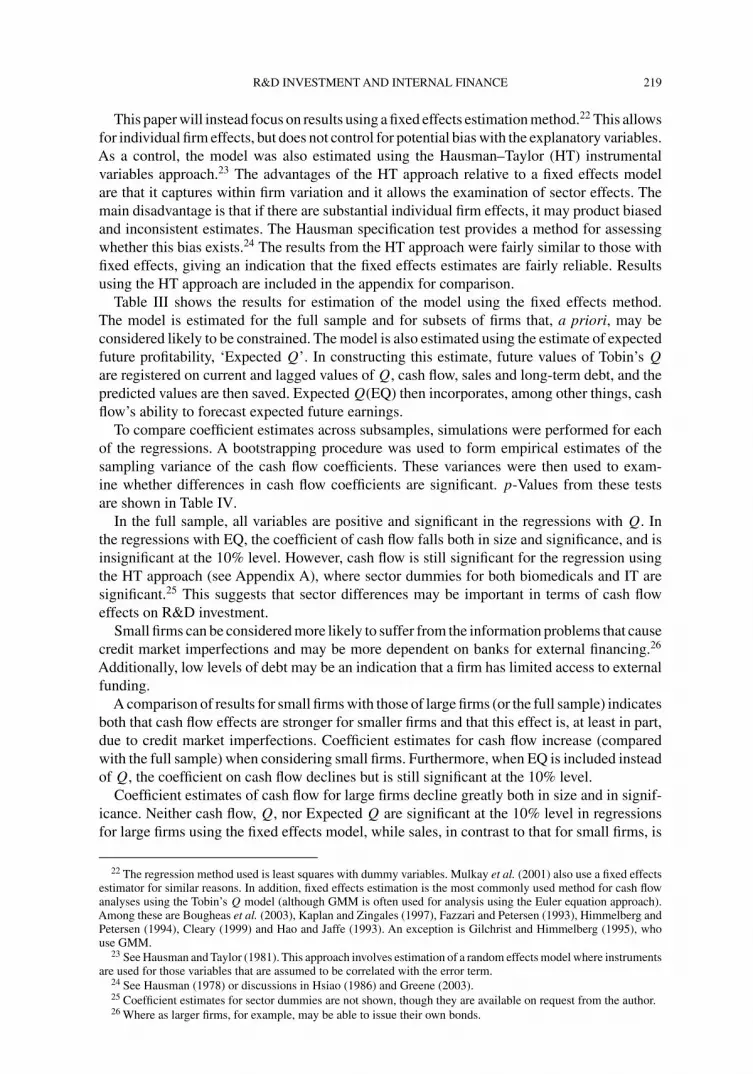
Table III shows the results for estimation of the model using the fixed effects method.The model is estimated for the full sample and for subsets of firms that, a priori, may beconsidered likely to be constrained. The model is also estimated using the estimate of expectedfuture profitability, ‘Expected Q’. In constructing this estimate, future values of Tobin’s Q
are registered on current and lagged values of Q, cash flow, sales and long-term debt, and thepredicted values are then saved. Expected Q(EQ) then incorporates, among other things, cashflow’s ability to forecast expected future earnings.
To compare coefficient estimates across subsamples, simulations were performed for eachof the regressions. A bootstrapping procedure was used to form empirical estimates of thesampling variance of the cash flow coefficients. These variances were then used to exam-ine whether differences in cash flow coefficients are significant. p-Values from these testsare shown in Table IV.
In the full sample, all variables are positive and significant in the regressions with Q. Inthe regressions with EQ, the coefficient of cash flow falls both in size and significance, and isinsignificant at the 10% level. However, cash flow is still significant for the regression usingthe HT approach (see Appendix A), where sector dummies for both biomedicals and IT aresignificant.25 This suggests that sector differences may be important in terms of cash floweffects on R&D investment.
Small firms can be considered more likely to suffer from the information problems that causecredit market imperfections and may be more dependent on banks for external financing.26
Additionally, low levels of debt may be an indication that a firm has limited access to externalfunding.
A comparison of results for small firms with those of large firms (or the full sample) indicatesboth that cash flow effects are stronger for smaller firms and that this effect is, at least in part,due to credit market imperfections. Coefficient estimates for cash flow increase (comparedwith the full sample) when considering small firms. Furthermore, when EQ is included insteadof Q, the coefficient on cash flow declines but is still significant at the 10% level.
Coefficient estimates of cash flow for large firms decline greatly both in size and in signif-icance. Neither cash flow, Q, nor Expected Q are significant at the 10% level in regressionsfor large firms using the fixed effects model, while sales, in contrast to that for small firms, is
22 The regression method used is least squares with dummy variables. Mulkay et al. (2001) also use a fixed effectsestimator for similar reasons. In addition, fixed effects estimation is the most commonly used method for cash flowanalyses using the Tobin’s Q model (although GMM is often used for analysis using the Euler equation approach).Among these are Bougheas et al. (2003), Kaplan and Zingales (1997), Fazzari and Petersen (1993), Himmelberg andPetersen (1994), Cleary (1999) and Hao and Jaffe (1993). An exception is Gilchrist and Himmelberg (1995), whouse GMM.
23 See Hausman and Taylor (1981). This approach involves estimation of a random effects model where instrumentsare used for those variables that are assumed to be correlated with the error term.
24 See Hausman (1978) or discussions in Hsiao (1986) and Greene (2003).25 Coefficient estimates for sector dummies are not shown, though they are available on request from the author.26 Where as larger firms, for example, may be able to issue their own bonds.

220 C. BLOCH
TABLE III Regression results.
Number ofCash flow Q EQ Sales Constant observations df (adj) R2
Dependent variable: R&D investment
Full 0.0330∗ 0.0056∗ 0.0081∗ 0.014∗ 390 315 0.828(0.0109) (0.0021) (0.0034) (0.0046)
Full 0.0179 0.0230∗ 0.0111∗ 0.0075 390 315 0.831(0.0120) (0.0065) (0.0035) (0.0081)
Small 0.0692∗ 0.0091∗ −0.0026 0.0241∗ 197 150 0.822(0.0221) (0.0038) (0.0091) (0.0112)
Small 0.0439∗∗ 0.0369∗ 0.0013 −0.0028 197 150 0.826(0.0240) (0.0115) (0.0091) (0.0157)
Large 0.0070 0.0012 0.0135∗ 0.0095∗ 193 153 0.890(0.0061) (0.0014) (0.0017) (0.0025)
Large 0.0040 0.0048 0.0142∗ 0.0052 193 153 0.890(0.0068) (0.0041) (0.0018) (0.0052)
Low debt 0.0570∗ 0.0051∗∗ 0.0065 0.0202∗ 177 134 0.833(0.0215) (0.0030) (0.0054) (0.0083)
Low debt 0.0381∗∗ 0.0255∗ 0.0105∗∗ −0.0061 177 134 0.838(0.0225) (0.0091) (0.0056) (0.0140)
High debt 0.0098 0.0030 −0.0024 0.0231∗ 213 169 0.724(0.0092) (0.0049) (0.0050) (0.0065)
High debt 0.0148 −0.0042 −0.0026 0.0287∗ 213 169 0.723(0.0136) (0.0134) (0.0051) (0.0122)
High R&D 0.0359∗ 0.0099∗ 0.0112∗∗ 0.0270∗ 191 147 0.807(0.0174) (0.0035) (0.0057) (0.0083)
High R&D 0.0067 0.0417∗ 0.0177∗ −0.0157 191 147 0.816(0.0193) (0.0105) (0.0060) (0.0158)
Low cash 0.0506∗ −0.0006 0.0050 0.0099∗ 211 168 0.728(0.0150) (0.0025) (0.0036) (0.0036)
High cash 0.0331∗ 0.0095∗ 0.0042 0.0224∗∗ 179 135 0.835(0.0164) (0.0034) (0.0122) (0.0136)
Notes: Estimation method: fixed effects (least squares with dummy variables), using both firm and time dummies (coefficients forfixed effects not shown). Heteroskedasticity consistent standard errors are in parentheses. ∗ Indicates significance at the 5% level, and∗∗ indicates significance at the 10% level. EQ is Expected Q in the next period, based on current values of cash flow, sales, long-termdebt, and Q. Cash flow, R&D investment and sales are normalized by the book value of total assets. Full is the entire sample. Small isall firms with average sales less than one billion DKK. Low debt consists of firms with average long-term debt (relative to total assets)less than the sample median. High (low) cash are firms with average cash flow ratios greater (less) than the sample median value. HighR&D is firms with an average R&D to Sales ratio greater than median.
TABLE IV Empirical p-values for differences in cash flow coefficients.
Small Small Low debt Low debt Low cash High R&DRegressions minus minus minus minus minus minusincluding large full high debt full high cash low R&D
Q 9.533(0.000) 5.105(0.000) 9.540(0.000) 4.341(0.000) 0.324(0.373) 1.498(0.068)EQ 5.000(0.000) 3.073(0.001) 4.198(0.000) 3.286(0.000) 5.194(0.000) 0.034(0.487)
Notes: ‘Q’ and ‘EQ’ indicate regressions using Tobin’s Q and Expected Q, respectively. Shown are t-statistics for differences in cashflow coefficients for subsamples, e.g. ‘small minus large’ is the difference between the cash flow coefficient for small firms and that forlarge firms. Statistics are t-distributed with 198 degrees of freedom. p-Values in parentheses indicate the probability that coefficientdifferences are less than or equal to zero (i.e. a low p-value indicates the difference is positive and significant). Statistics are based onbootstrapping exercise with 100 replications, where an empirical sampling variance is estimated.
highly significant. Though using HT estimations, which account for sector differences, bothQ and EQ are significant.27 Empirical p-values from Table IV indicate that the differencebetween coefficient estimates for cash flow is significant both between small and large firms,and between small firms and the full sample.
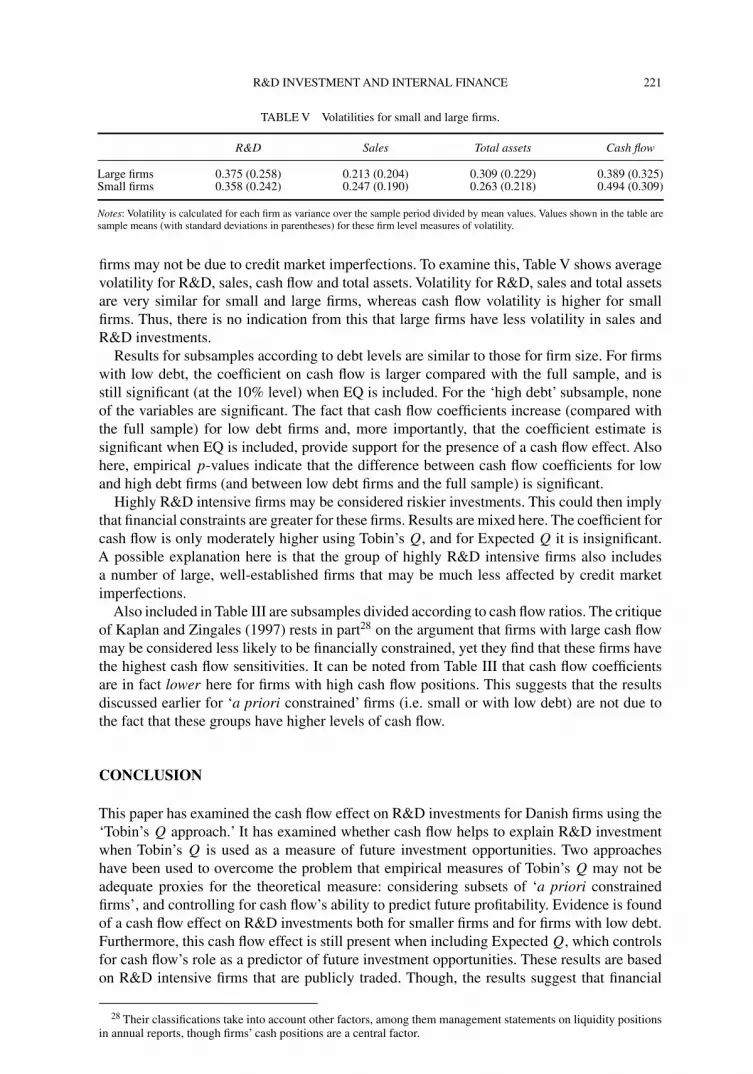
A potential explanation for lower cash flow sensitivities for large firms is that if these firmsexperience less volatility in sales and R&D investment, then R&D may be relatively lesssensitive to changes in cash flow. This would imply that larger cash flow coefficients for small
27 See Table AI.
R&D INVESTMENT AND INTERNAL FINANCE 221
TABLE V Volatilities for small and large firms.
R&D Sales Total assets Cash flow
Large firms 0.375 (0.258) 0.213 (0.204) 0.309 (0.229) 0.389 (0.325)Small firms 0.358 (0.242) 0.247 (0.190) 0.263 (0.218) 0.494 (0.309)
Notes: Volatility is calculated for each firm as variance over the sample period divided by mean values. Values shown in the table aresample means (with standard deviations in parentheses) for these firm level measures of volatility.
firms may not be due to credit market imperfections. To examine this, Table V shows averagevolatility for R&D, sales, cash flow and total assets. Volatility for R&D, sales and total assetsare very similar for small and large firms, whereas cash flow volatility is higher for smallfirms. Thus, there is no indication from this that large firms have less volatility in sales andR&D investments.
Results for subsamples according to debt levels are similar to those for firm size. For firmswith low debt, the coefficient on cash flow is larger compared with the full sample, and isstill significant (at the 10% level) when EQ is included. For the ‘high debt’ subsample, noneof the variables are significant. The fact that cash flow coefficients increase (compared withthe full sample) for low debt firms and, more importantly, that the coefficient estimate issignificant when EQ is included, provide support for the presence of a cash flow effect. Alsohere, empirical p-values indicate that the difference between cash flow coefficients for lowand high debt firms (and between low debt firms and the full sample) is significant.
Highly R&D intensive firms may be considered riskier investments. This could then implythat financial constraints are greater for these firms. Results are mixed here. The coefficient forcash flow is only moderately higher using Tobin’s Q, and for Expected Q it is insignificant.A possible explanation here is that the group of highly R&D intensive firms also includesa number of large, well-established firms that may be much less affected by credit marketimperfections.
Also included in Table III are subsamples divided according to cash flow ratios. The critiqueof Kaplan and Zingales (1997) rests in part28 on the argument that firms with large cash flowmay be considered less likely to be financially constrained, yet they find that these firms havethe highest cash flow sensitivities. It can be noted from Table III that cash flow coefficientsare in fact lower here for firms with high cash flow positions. This suggests that the resultsdiscussed earlier for ‘a priori constrained’ firms (i.e. small or with low debt) are not due tothe fact that these groups have higher levels of cash flow.
CONCLUSION
This paper has examined the cash flow effect on R&D investments for Danish firms using the‘Tobin’s Q approach.’ It has examined whether cash flow helps to explain R&D investmentwhen Tobin’s Q is used as a measure of future investment opportunities. Two approacheshave been used to overcome the problem that empirical measures of Tobin’s Q may not beadequate proxies for the theoretical measure: considering subsets of ‘a priori constrainedfirms’, and controlling for cash flow’s ability to predict future profitability. Evidence is foundof a cash flow effect on R&D investments both for smaller firms and for firms with low debt.Furthermore, this cash flow effect is still present when including Expected Q, which controlsfor cash flow’s role as a predictor of future investment opportunities. These results are basedon R&D intensive firms that are publicly traded. Though, the results suggest that financial
28 Their classifications take into account other factors, among them management statements on liquidity positionsin annual reports, though firms’ cash positions are a central factor.

222 C. BLOCH
restrictions may be even greater for smaller firms. These results are also qualitatively similarto studies using US data. However, owing to the fact that model specifications are not thesame, a straightforward comparison of quantitative estimates is not fully feasible.
Acknowledgements
Comments from Ebbe Graversen, the editor and two anonymous referees are gratefullyacknowledged.
References
Akerlof, G.A. (1970) The Market for ‘Lemons’: Quality, Uncertainty, and the Market Mechanism. Quarterly Journalof Economics, 84, 488–500.
Andersen, T.M., Dalum, B., Linderoth, H., Smith, V. and Westergård-Nielsen, N. (2001) The Danish Economy: AnInternational Perspective. DJØF Publishing: Copenhagen.
Bougheas, S., Gorg, H. and Strobl, E. (2003) Is R&D Financially Constrained? Theory and Evidence from IrishManufacturing. Review of Industrial Organization, 22, 159–174.
Cleary, S. (1999) The Relationship Between Firm Investment and Financial Status. The Journal of Finance, 54,673–692.
Danish Centre for Studies in Research and Research Policy (2003a) R&D Statistics 2001: Research and Developmentin the Private Sector (in Danish).
Fazzari, S. and Petersen, B.C. (1993) Working Capital and Fixed Investment: New Evidence on Financing Constraints.Rand Journal of Economics, 24, 328–342.
Fazzari, S.R. Hubbard, G. and Petersen, B.C. (1988) Financing Constraints and Corporate Investment. BrookingsPapers on Economic Activity, 1, 141–195.
Fazzari, S.R. Hubbard, G. and Petersen, B.C. (2000) Investment–Cash Flow Sensitivities are Useful: A Comment onKaplan and Zingales. Quarterly Journal of Economics, 115, 695–705.
Gilchrist, S. and Himmelberg, C.P. (1995) Evidence on the Role of Cash Flow for Investment. Journal of MonetaryEconomics, 36, 541–572.
Greene, W. (2003) Econometric Analysis, 5th ed. Prentice Hall Englewood Cliffs: New Jersey.Hall, B. (1992) Investment and Research and Development and the Firm Level: Does the Source of Financing Matter?
Working Paper 4906, NBER.Hall, B. (2002) The Financing of Research and Development. Oxford Review of Economic Policy, 18, 35–51.Hao, K.Y. and Jaffe, A.B. (1993) Effect of Liquidity on Firms’ R&D Spending. Economics of Innovation and New
Technology, 2, 275–282.Hausman, J.A. (1978) Specification Tests in Econometrics. Econometrica, 46, 1251–1271.Hausman, J.A. and Taylor, W.E. (1981) Panel Data and Unobservable Individual Effects. Econometrica, 49,
1377–1398.Hayashi, F. (1982) Tobin’s Marginal q and Average q: A Neoclassical Interpretation. Econometrica, 50, 215–224.Himmelberg, C.P. and Petersen, B.C. (1994) R&D and Internal Finance: A Panel Study of Small Firms in High-Tech
Industries. The Review of Economics and Statistics, 76, 38–51.Holmstrom, B. and Tirole, J. (1997) Financial Intermediation, Loanable Funds, and the Real Sector. Quarterly Journal
of Economics, 112, 663–691.Hsiao, C. (1986) Analysis of Panel Data. Cambridge University Press: Cambridge.Hubbard, R.G. (1998) Capital–Market Imperfections and Investment. Journal of Economic Literature, 36, 193–225.Kaplan, S.N. and Zingales, L. (1997) Do Investment–Cash Flow Sensitivities Provide Useful Measures of Financing
Constraints? The Quarterly Journal of Economics, 112, 169–215.Kaplan, S.N. and Zingales, L. (2000) Investment–Cash Flow Sensitivities are Not Valid Measures of Financing
Constraints. The Quarterly Journal of Economics, 115, 707–712.Malerba, F. and Orsenigo, L. (1997) Technological Regimes and Sectoral Patterns of Innovative Activities. Industrial
and Corporate Change, 6, 83–117.Modigliani, F. and Miller, M.H. (1958) The Cost of Capital, Corporation Finance and the Theory of Investment.
American Economic Review, 48, 261–297.Mulkay, B., Hall, B.H. and Mairesse, J. (2001) Firm Level Investment and R&D in France and the United States. In
Herrmann, Heinz and Rolf Strauch (eds) Investing Today for the World of Tomorrow. Springer-Verlag.Myers, S.C. and Majluf, N.S. (1984) Corporate Financing and Investment Decisions when Firms have Information
that Investors Do Not. Journal of Financial Economics, 13, 187–221.Østrup, F. (1994) The Financial System in Denmark (in Danish). Institute of Finance, Copenhagen Business School.Schiantarelli, F. (1996) Financial Constraints and Investment: Methodological Issues and International Evidence.
Oxford Review of Economic Policy, 12, 70–89.Stiglitz, J.E. and Weiss, A. (1981) Credit Rationing in Markets with Imperfect Information. American Economic
Review, 71, 393–410.Townsend, R. (1979) Optimal Contracts and Financial Markets with Costly State Verification. Journal of Economic
Theory, 21, 265–293.
R&D INVESTMENT AND INTERNAL FINANCE 223
APPENDIX A
A.1 R&D Data for Non-financial Firms on the Copenhagen Stock Exchange
This section describes the compilation of R&D data for firms in the sample. The data are takenfrom the Danish Centre for Studies in Research and Research Policy’s (CFA) database forprivate sector R&D.
For firms that have not reported any data to the survey, their annual reports were examined.If R&D expenditures were reported in their annual reports, then these numbers were used. Inthe case where firms did not report any statistics to CFA, nor were there any R&D expenditureslisted on their annual reports, then these data were considered as missing.
The R&D database at CFA contains data for every other year from 1989 to 1997 and annuallyfrom 1997 onwards. For the years missing between 1989 and 1997 (i.e. 1990, 1992, 1994 and1996), R&D data was interpolated from years before and after.
A.2 Additional Regression Results
TABLE AI Results using the HT instrument variables approach.
Number of HausmanCash flow Q EQ Sales Constant observations (p-value)
Dependent variable: R&D investment
Full 0.0465∗ 0.0088∗ 0.0049 0.0133 390 4.169(0.0107) (0.0020) (0.0033) (0.0103) (0.244)
Full 0.0277∗ 0.0338∗ 0.0087∗ −0.0016 390 15.447(0.0118) (0.0065) (0.0035) (0.0113) (0.001)
Small 0.0769∗ 0.0114∗ −0.0088 0.0371∗ 197 7.518(0.0210) (0.0035) (0.0089) (0.0175) (0.057)
Small 0.0527∗ 0.0442∗ −0.0047 0.0194 197 34.905(0.0234) (0.0115) (0.0092) (0.0192) (0.000)
Large 0.0097∗∗ 0.0025∗∗ 0.0129∗ −0.0044 193 2.254(0.0060) (0.0013) (0.0016) (0.0063) (0.521)
Large 0.0040 0.0094∗ 0.0141∗ −0.0090 193 −9.537(0.0067) (0.0039) (0.0017) (0.0070) (0.023)
Low debt 0.0839∗ 0.0074∗ 0.0008 0.0231 177 11.256(0.0210) (0.0028) (0.0052) (0.0205) (0.010)
Low debt 0.0671∗ 0.0320∗ 0.0050 0.0043 177 84.289(0.0222) (0.0093) (0.0055) (0.0224) (0.000)
High debt 0.0071 0.0016 0.0008 0.0112 213 0.384(0.0090) (0.0048) (0.0050) (0.0088) (1.000)
High debt 0.0066 0.0018 0.0011 0.0109 213 0.344(0.0143) (0.0149) (0.0050) (0.0114) (1.000)
High R&D 0.0523∗ 0.0129∗ 0.0068 0.0358∗∗ 191 9.145(0.0172) (0.0033) (0.0056) (0.0221) (0.027)
High R&D 0.0233 0.0501∗ 0.0135∗ 0.0134 191 50.307(0.0194) (0.0108) (0.0060) (0.0242) (0.000)
Low cash 0.0498∗ 0.00004 0.0052∗∗ 0.0035 211 0.094(0.0143) (0.0022) (0.0029) (0.0067) (0.993)
High cash 0.0537∗ 0.0140∗ −0.0122 0.0739∗ 179 22.999(0.0166) (0.0032) (0.0114) (0.0203) (0.000)
Notes: Estimation method: HT method (random effects with instrument variables). Time and sector dummies included in the regressions.Regressions performed under the assumption that sales and cash flow may be correlated with the error term (and were thus instrumented),while Q is strictly exogenous. Note that since EQ is based in part on current cash flow and sales, it cannot be assumed strictly exogenous.However, since at least one variable must be considered strictly exogenous in the regressions, EQ is not instrumented. Heteroskedasticityconsistent standard errors are in parentheses. ∗ Indicates significance at the 5% level, and ∗∗ indicates significance at the 10% level.Hausman is the Hausman specification test statistic (chi-squared distributed under the null hypothesis, with degrees of freedom equalto the number of regressors). High values indicate bias and inconsistency for the random effects estimator.