Embed Size (px)
Citation preview
CHAPTER-I
INTRODUCTION
1
INTRODUCTION TO FINANCIAL
MANAGEMENT INTRODUCTION:
Financial Management in the small firm is
characterized, in many different cases, by the need to
confront a somewhat different set of problems and
opportunities than those confronted by a large
corporation. One immediate and obvious difference is
that a majority of smaller firms do not normally have
the opportunity to publicly sell issues of stocks or
bonds in order to raise funds. The owner-manager of a
smaller firm must rely primarily on trade credit, bank
financing, lease financing, and personal equity to
finance the business. One therefore faces a much more
severely restricted set of financing alternatives than
2
those faced by the financial vice president or treasurer
of a large corporation
The business manager must continually be alert to
changes in working capital accounts, the cause of these
changes and the implications of these changes for the
financial health of the company.
MEANING OF FINANCIAL MANAGEMENT
Financial management is the most specialized branch of
the general management, which is related to the
procurement of finance and its efficient utilization for
the achievement of a common goal., for example the
analysis required for a long-term investment decision
such as the purchase of heavy machinery or the
evaluation of lease-buy alternatives, is essentially the
same regardless of the size of the firm.
DEFINITIONS
3
Financial management is an area of financial
decision making, harmonizing individual motives and
enterprise goals.
--- Weston and Birg.
Finance management is the application of the planning
and control function to the finance functions.
--- Howard and Upon.
Financial management is the operational activity of a
business that is responsible for obtaining and
effectively utilizing the funds necessary for efficient
operations.
--- Joseph and Massie.
NATURE OF FINANCIAL MANAGEMENT
The finance functions are acquisitions of funds and
efficient use of available resources. The managerial
4
activity of the financial management is concerned with
the planning and controlling of the firm’s financial
resources. Finance in the modern business world is
lifeblood of the business economy. Every business
transaction is directly of indirectly connected with the
finance. The financial management is concentrated on
three major aspects,
FINANCIAL MANAGEMENT
1.Investment Decision
2.Financing Decision
3.Dividend Decision
INVESTMENT DECISION
It relates to the allocation of capital
are involve to decision to commit funds to long-term
assets which would yield benefits in future. It is one
very significant aspect is the task of measuring the
5
prospective profitability of new investments future
benefits are difficult to measure and cannot be
predicted with continuity because of the uncertain
future capital budgeting involves risk
FINANCING DECISION
Broadly a finance manager must declare when, where
and how to acquire funds to meet the firms investments
needs. The finance manager must strive to obtain the
best financing mix or optimum capital structure of this
firm. The use of debt affects the return and rise of
shareholders. It may increase the return of the equity
funds. A proper balance will have to be struck between
rises and retain.
DIVIDEND DECISION
The finance manager must decide whether the firm
should distribute all profits or certain term or
distribute a portion and retain the balance. The
dividend policy should be determined in terms of its
impact on the market value of the firms share.
6
SCOPE OF FINANCIAL MANAGEMENT
Finance plays an important role in the progress of the
business in keeps the enterprise dynamic.
1. Successful promotion depends upon Financial
Administration,
2. Smooth running of an Enterprise,
3. Determinant of business success,
4. Measure of performance,
5. Focal point of decision making.
FUNCTIONS OF FINANCIAL MANAGEMENT
EXECUTIVE FINANCE FUNCTIONS:
Financial Forecasting
Establishing asset management policies
Allocation of net profit
Cash flow and requirements
Dividing upon borrowing policy
Negotiations for new outside financing
Checking upon financial performance
7
Profit maximization
Wealth maximization
RESPONSIBILTIES OF FINANCIAL MANAGEMENT
Financial planning
Rising of necessary funds
Controlling the use of funds
Other Responsibilities
FIELD OF STUDY
Cash flow Management & Analysis in SVG
COOPERATIVE SUGARS LTD
Due to Globalization of the Industries, the need
for establishing the Industries have grown consequently.
In general the Individual how much wealthy he might be,
cannot fund the entire project cost and he have to
necessarily look for outside financial resources for the
project. In addition to the project cost, funds have to
8
be arranged to meet the cash flow requirements for the
project. Cash flow is the capital required for day-to-
day management of the business and in accounting terms
it represents excess of current assets over the current
liabilities. In other words we can say that is the cash
required to run the daily activities. However, in day-
to-day operations, the factors of uncertainty and risk
play a great role and accordingly the entrepreneur will
have to depend on different sources of finance.
The basic financial statements, i.e., the balance sheet
and profit and loss account or income statement of
business, reveal the net effect of the various
transactions on the operational and financial position
of the company. The balance sheet gives a summary of the
assets and liabilities of an undertaking at a particular
point of time. It reveals the financial status of the
company. The assets side of a balance sheet shows the
deployment of resources of an undertaking while the
liabilities side indicates its obligations, i.e., the
manner in which these resources were obtained. The
9
profit and loss account reflects the results of the
business operations for a period of time. It contains a
summary of expenses incurred and the revenue realized in
an accounting period. Both of these statements provide
the essential basic information on the financial
activities of a business, but their usefulness is
limited for analysis and planning purposes. The balance
sheet gives a static view of the resources (liabilities)
of a business and the uses (assets) to which these
resources have been put at a certain point of time. It
does not disclose the causes for changes in the assets
and liabilities between two different points of time.
The profit and loss account, in a general way, indicates
the resources provided by operations. But there are many
transactions that take place in an undertaking and which
do not operate through profit and loss account.
Thus, another statement has to be
prepared to show the change in the assets and
liabilities from the end of one period of time to the
end of another period of time. The statement is called a
10
statement of changes in Financial Position or a Cash
flow Statement.
The Cash flow Statement is a statement,
which shows the movement of cash and is a report of
financial operations of the business undertaking. It
indicates various means by which cash were obtained
during a particular period and the ways in which these
cash were employed. In simple words, it is a statement
of sources and applications of cash
NEED FOR STUDY:
Financial statement analyses enable a firm to the
dimension into account. It facilities the management
to know where the firms financial position is
improving are determination on over the years.
Cash flow statements are a needful tool for the
management planning and forecasting and controlling.
Financial statement analysis indicates the overall
profitability of the firm. It ensures a fair return to
11
its owners and secures optimum utilization of the
firm’s assets.
It is also helpful in forewarning the corporate
sickness and helps the managements to take corrective
action.
There is a need to prepare analysis for estimating the
cash flow requirements of an organization.
OBJECTIVES OF THE STUDY:
To study the analysis of cash management in the
organization.
To study the safety level of cash in the
organization.
To analyze the sources and application
To suggest suitable measures for better
performance.
METHODOLOGY:
12
Data can be collected from two sources Primary and
secondary. Classified on the basis of purpose of
collection of sources.
Primary Data: Primary data are those collected
specially for the research situation at hand. It is the
firm harm information that researches get from various
sources like respondents, analogous and research
experiments. The primary data will be collected from
personal interview of employees in the organization.
Secondary Data: Secondary data are already published
data collected for some purpose from officials at a
given point to time. The secondary data will be
collected from annual reports, books, journals etc.
LIMITATIONS:
The study of availability of bank finance for the
working capital requirement is an ocean and fund of
experience of lifetime and hence it is in adequate
to cover the entire aspects of the study
13
I have limited the study to the facts obtaining in
the company where I am being employed. Working
Capital Management and dependency on banking
finance is one of the biggest problems faced by the
company
The problems faced by the company are similar to
that of other organizations. The company can
express its problems and request the banks to
provide for the finance enable them to meet its
financial requirements. It can only request the
banks but however it cannot compel the banks to
provide any financial assistance in the regular
course of business. This is a major limitation of
the study
In addition, I have also covered the
recommendations of the Tan don Committee Report as
well as Chore Committee Report released by the
Reserve Bank of India on the subject of Working
capital Management
14
A study is also made on the recommendations made by
Dehejia Committee on the subject
SIGNIFICANCE:
Today the term “Management of cash flow” has been
acquired greatest importance in the Indian scenario.
Either it may be manufacturing Industry or a service
Industry. In this connection, many of the organizations
fail due to poor maintenance of cash flow management.
Gross cash flow and net cash flow .Net cash flow refers
to the difference between current assets and current
liabilities
A positive net cash flow arises when current assets
exceed current liabilities. A negative cash flow occurs
when current liabilities are in excess of current
assets. The investment in current assets should be just
adequate not more not more not less to the needs of the
business firm. Excessive investment in current assets
should be avoided, because it impairs the firms
profitability as idle investment earns nothing, on the
15
other hand, inadequate amount of cash flow can threaten
the solvency of the firm, it is fails to meet its
current obligations. It should be realized that the cash
flow needs of the firm might be fluctuating with
changing business activity. The management should be too
prompt to initiate on action and correct the imbalances.
A negative cash flow and excessive liquidity are
also bad. It may be due to mismanagement of current
assets. Therefore prompt and timely action should be
taken by the management to improve and correct the
unbalance in the liquidity position of the firm. Every
firm should have minimum amount of net cash flow which
is permanent after liberalization role of the cash flow
is improved.
16

CHAPTER -II
INDUSTRY PROFILE
17
AN OVERVIEW OF INDIAN SUGAR INDUSTRY
India has been known as the original home of
sugarcane and sugar. Indians knew the art of making
sugar since the 4th century. However the advent of
modern sugar industry in India dates back to mid
1930’s when a few vacuum pan units were established in
the sub-tropical belts of Uttar Pradesh and Bihar.
Until the mid 50’s the sugar industry was almost
wholly confined to the states of Uttar Pradesh and
Bihar. After late fifties or early sixties the industry
dispersed into Southern India, Western India and other
parts of Northern India.
India is the largest consumer and second largest
producer of sugar in the world. The sufficient and
well distributed monsoon rains, rapid population
growth and substantial increases in sugar production
capacity have combined to make India the largest
consumer and second largest producer of sugar in the
world.
18
The Indian sugar industry has not only achieved
the singular distinction of being one of the largest
producer of white plantation crystal sugar in the world
but has also turned out to be a massive enterprise of
gigantic dimensions. With over 450 sugar factories
located throughout the country, the sugar industry is
amongst the largest agro processing industries, with
an annual turnover of Rs 150 billions. It plays a
major role in rural development and its importance for
India stretches far beyond the role of a sweetener
supplier.
The sugar factories located in various parts of
the country work for development of rural areas by
mobilizing rural resources and generating employment,
transport and communication facilities. Over 45
farmers, their dependants and a large mass of
agricultural labor are involved in sugarcane
cultivation, harvesting and ancillary activities
constituting 7.5% of the rural population. The sugar
19
industry employs over 0.5 million skilled and
unskilled workmen, mostly from the rural areas.
Since the beginning of planning , sugar industry
operated under a policy of partial control in 1950-
51 and 1951-52 , followed by a continuous period of
six years of decontrol between 1952-53 to 1957-58.
This policy was followed under the pragmatic leadership
of the Minister of Food, Shri. Rafi Ahmed Kidwai.
However, with his departure, the perception of decontrol
was lost.
After alternating between control and
decontrol , the government adopted the policy of
partial decontrol in 1967-68, which has since been
the ministry of government policy except for two
short periods of decontrol in the 1970’s .Under the
policy, the government procures 40% of production
at controlled prices based on the Statutory Minimum
Price for sugarcane, for supply through the Public
Distribution System and the balance 60% is
allowed to be sold by the mills in free market
20
subject the monthly release mechanism. The details
of past government policies for sugar industry are
provided in annexure1.
The levy quota for sugar mills has been brought
down from the peak levels of 70% in 1968-69 to the
present levels of40% as a gradual process of
deregulation of sugar industry.
The number of operating sugar mills in the
country has increased from 29 in sugar year (sy)
1930-31 to 412 by SY 1996-97 ( sugar year= October
1st t o September 30th ). The addition in number of
mills was added between 1970 and 1980 to increase
the number of operating units to 300. The development
of industry in the past is as given in table below.
The average capacity of the sugar mills in the
industry has considerably moved up from just 644 ton per
day in SY 1930-31 to 2656 ton per day. But still the
growth in the Indian sugar industry was driven by
horizontal growth ( increase in number of units)
21
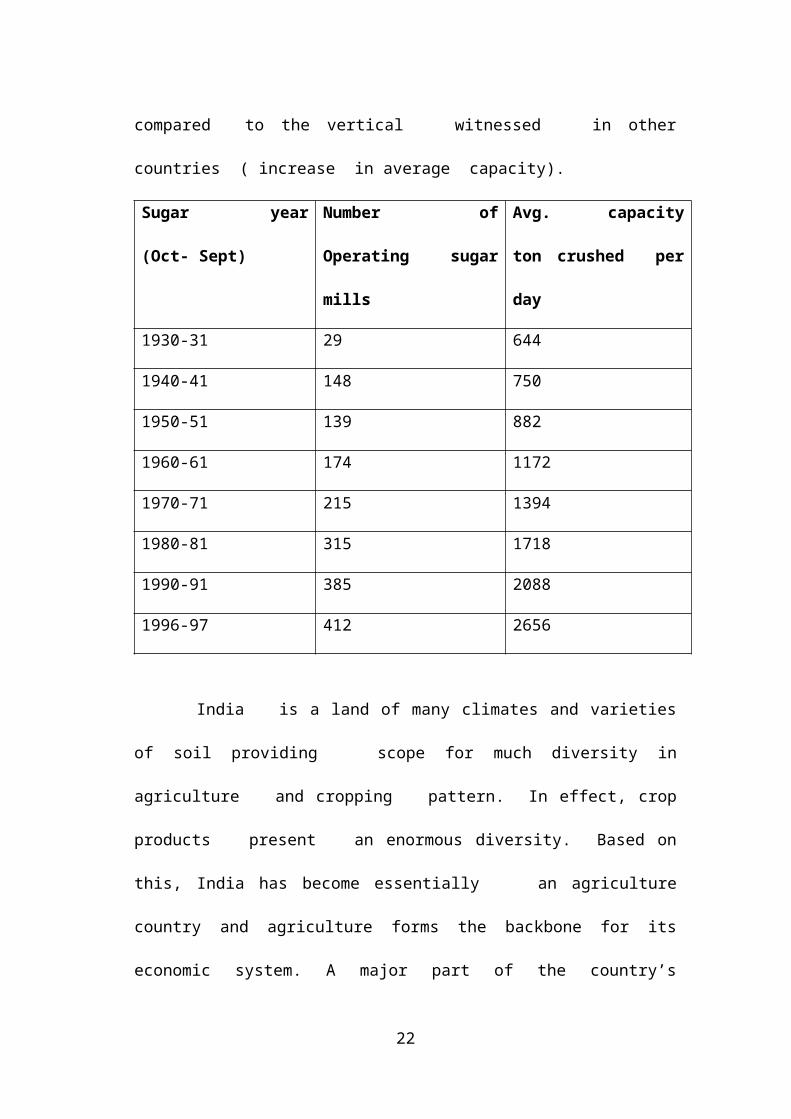
compared to the vertical witnessed in other
countries ( increase in average capacity).
Sugar year
(Oct- Sept)
Number of
Operating sugar
mills
Avg. capacity
ton crushed per
day
1930-31 29 644
1940-41 148 750
1950-51 139 882
1960-61 174 1172
1970-71 215 1394
1980-81 315 1718
1990-91 385 2088
1996-97 412 2656
India is a land of many climates and varieties
of soil providing scope for much diversity in
agriculture and cropping pattern. In effect, crop
products present an enormous diversity. Based on
this, India has become essentially an agriculture
country and agriculture forms the backbone for its
economic system. A major part of the country’s
22
populations depends directly or indirectly for
sustenance on agriculture. Agricultural sector has
been given top priority in order to feed it’s ever -
growing population. This sector also provides
necessary raw material for the principal food
manufacturing industries. Further, this sector
provides a substantial portion of country’s exports
and hence this sector has become an important foreign
exchange earner. Agriculture is the main occupation for
a major part of population until a few years ago. In
recent years, there has been a tremendous progress
in the field of industrial establishments and soon
this sector has become the backbone for the present
day economic development of the country.
Currently, India is self- sufficient in a large
number of consumer goods and has reached to a
stage that it is able to export a variety of
manufactured or processed goods to different
countries in Asia , Africa, and Europe.
23
India is in outstanding position in the
world with regard to many agricultural products such
as tea, sugar cane , millets, rice , jute , etc. Of
these, sugar cane is important as a non- food grain
crop. It is an industrial crop, because it is used as
a non-food grain crop. It is an industrial crop, because
it is used as raw material in sugar industry. India is
producing more than 2900 lakhs tones of sugar cane. The
principal sugar cane producing states are Uttar
Pradesh , Madhya Pradesh, Maharastra , Tamil Nadu ,
Andhra Pradesh , Bihar, Haryana and Punjab. Sugar is
also grown in other states such as Orissa, Assam,
Gujarat, West Bengal etc. Uttar Pradesh alone produce
37% of total sugar cane produced in the country
every year .In Andhra Pradesh , sugar can is
cultivated in the districts of Srikakulam,
Vizianagaram, Vizag , East Godavari, West Godavari,
Kurnool, Anantapur, Nizamabad, Chitoor, Cuddapah,
Guntur, and Adilabad. Altogether 2 lakh hectors of
land is under sugarcane cultivation in the entire
24
State of Andhra Pradesh. The total annual production
touches 140 lakh tons in Andhra Pradesh alone.
Sugarcane is a tropical plant (Saccharin
officinarum) that is able to grow over a prolonged
season. It thrives well under the temperature ranging
from 25-30 C and under the rainfall ranging from
100-500cm. Under warm humid conditions it can
continue its growth unless terminated by flowering.
However, its height is strongly influenced by the
age of the crop and season. Temperatures above 50
C arrest its growth, those below 20 C slow it down
markedly and severe frost proves fatal. Sugarcane
is a Kharif crop planted between December and
February period. About 10-12 month gestation
period is required for the harvest of sugarcane
crop. Different varieties have been developed over
a period of time and they are being classified into
early varieties, mid varieties and late varieties.
The early varieties reach maturity at the age of 10th
month, mid variety at 11th month and late variety
25
at the 12th or 13th month. Earlier planting of sugarcane
in the season gives higher yields and better
quality cane, the late plantings apart from
giving lower yields are usually badly attacked
by the shoot borer which caused gaps in the
stand of sugarcane and setback to the plant growth.
Since crops planted in different months ripen in
succession, by a suitable adjustments of planning,
the necessary areas in different seasons, and a
planned supply of cane to the factory, a
satisfactory recovery of sugar in factories can be
ensured over a reasonably long crushing season.
It is important note that the harvested sugarcane
should be crushed within 24 hours for getting
good quality sugar. Sugarcane is a heavy feeder. A70 -
ton crop removes from the soil 85-110 kgs of
nitrogen.180-330 kgs of phosphoric acid, 60-90 kgs
of potash and 70-80 kgs of calcium. Adequate manuring
therefore is essential for sustaining high yields. At
26
present, only 10% of sugarcane crop is manured and in
most cases inadequately.
Sugar factories in India are classified based
on their cane crushing capacity per day.
Small Up to 1500 tones
Medium 1501to 3000tones
Large 3001 to above tones
Today the sugar industry is the third largest
industry in the country and ranks next to the
iron steel, and cotton industries. The area
under sugar cultivation in India is larger
than in any other country in the world, but the
average yield per acre is low. Until recently
India depended on imports of cheap foreign sugar,
but with the increase of domestic production, India
could not only achieve self – sufficiency in sugar but
also has surplus for export.
India has a record production of 8.4 million tones in
1981-82 and record earning of Rs. 800 Crores in 1975-
76 by exporting. Sugar industry in India is playing an
27
important role in the economic development of the
country. The by-products find value as raw material
in other industries such as distilleries.
History:
The discovery of sugarcane, from which sugar as it
is known today, is derived dates back unknown thousands
of years. It is thought to have originated in New
Guinea, and was spread along routes to Southeast Asia
and India. The process known for creating sugar, by
pressing out the juice and then boiling in into
crystals, was developed in India around 5000 BC. Its
cultivation was not introduced into Europe until the
middle-ages, when it was brought to Spain by Arabs.
Columbus took the plant, dearly held, to the West
28
Indies, where it began to thrive in a most favorable
climate.
It was not until the eighteenth century that
sugarcane cultivation was began in the United States,
where it was planted in the southern climate of New
Orleans. The very first refinery was built in New York
City 1690; the industry was established by the 1830s.
Earlier attempts to create a successful industry in the
U.S. did not fare well; from the late 1830s, when the
first factory was built. Until 1872, sugar factories
closed down almost as quickly as they had opened. It was
1872 before a factory, built in California, was finally
able to successfully produce sugar in a profitable
manner. At the end of that century, more than thirty
factories were in operation in the D.S.Sugar (sucrose)
is a carbohydrate that occurs naturally in every fruit
and vegetables. It is a major product of photosynthesis,
the process by which plants transform the sun’s energy
into food. Sugar occurs in greatest quantities in
sugarcane and sugar beets from which it is separated for
29
commercial use. The natural sugar stored in the cane
stalk or beet root is separated from rest of the plant
material through a process known as refining Beet sugar
processing is similar, but it is done in one continuous
process without the raw sugar stage. The sugar beets are
washed, sliced and soaked in hot water to separate the
sugar -contain juice from the beet fiber. The sugar-
laden juice is then purified, filtered, concentrated and
dried in a series of steps similar to cane sugar
processing.
For the sugar industry, capacity utilization is
conceptually different from that applicable to
industries in general. It depends on three crucial
factors the actual number of ton of sugarcane crushed in
a day, the recovery rate which generally depends on the
quality of the cane and actual length of the crushing
season.
Since cane is not transported to any great extent,
the quality of the cane that a factory receives depends
on its location and is outside its control. The length
30
of the crushing season also depends upon location with
the maximum sugarcane in India is used to make sugar,
khandsari or Gur.
However, sugar products produced worldwide are
divided into four basic categories: granulated, brown,
liquid sugar and invert sugar. Granulated: granulated
sugar is the pure crystalline sucrose. It can be
classified into seven types of sugar based on the
crystal size. Most of these are used only by food
processors and professional bakers. Each crystal size
provides unique functional characteristics that make the
sugar appropriate for the food processor’s special need.
Mission & Values:
Mission
31
To build entrepreneurial organizations that makes a
difference to society through creation of value.
Values
Humility
We value intellectual modesty and dislike false
pride and arrogance
Entrepreneurship
We seek opportunities – they are everywhere
Teamwork and Relationships
Going beyond the individual – encouraging boundary
less behavior
Deliver the promise, we value a deep sense of
responsibility and self discipline, to meet and
surpass on commitments made.
Learning
Nurturing active curiosity – to question, share,
and improve
32
Social responsibility
Anticipating and meeting relevant and emerging
needs of society and,
DEVELOPMENT – AGRICULTURE:
Just after India attained freedom, 50yeears ago,
Indian governments’ first and immediate concern was food
production. In the words of the first Prime Minister of
India – “Everything can wait, agriculture can not”. The
words expressed common concern as population was growing
at a much faster rate than food production.
That the country became self sufficient in food
grains was a demonstration of unprecedented
collaboration between policy makers, administration,
scientist and response of farmers. To give further
boost Farmer was provided incentive by way of an
attractive support price and disposal mechanism by way
of procurement of the food grains by the Government
Agencies.The agricultural thrust continued in other
agriculture commercial crops as we like oil seeds, sugar
33
cane where Government. appointed technology missions and
where India became self sufficient from a net importer.
In sugar, it became an exporter, exporting as much as
1Million Tones in 1995-96. Today India has made a place
for itself in the world agricultural map where it enjoys
a prominent position with rest of the world.
ISSUES RELATING TO SUGAR INDUSTRY
Central government measure Licensing:
Sugar Industry is a schedule industry under
Industrial Development regulation Act requiring
License to manufacturer.
o Gestation period has been reduced from 3 years
to 1 year.
Minimum capacity of a new sugar mill is 2500 TCD
and expandable up to 5000TCD.
34
Minimum distance between 2 sugar mills is now 15
kms- which used to be 40 km.
Cane availability is now not so critical
requirement.
Government gives incentives where in new mills can
sell up to 100% of the sugar in free market against
60% of existing mills – Government has also
announced such incentive for expansion up to 5000
TCD.
The impact has been horizontal growth – causing
cane shortage – higher per unit processing cost
etc.,
PRODUCTION MONITORING:
The sugar (control) Order 1966- regulates the
production- sale of sugar- stock limit. It also
prescribed standard of quality – to which sugar must
conform at the time of delivery.
SUGAR CANE PRICING:
Sugar cane (control) Order 1966- was issued to
promote sugar industry and to ensure fair deal to cane
35
growers by fixings minimum price payable by sugar mills
Act provided cane price fixation basis 50%profit
sharing. Not enforced in some states where such state
fix its own price.
SUGAR SUPPLIES FOR PUBLIC DISTRIBUTION:
The Levy Sugar Supply (control) Order 1979 was
issued empowering the Government. To direct sugar mills
to supply levy sugar to authorized persons /
organization etc., at a price fixed for the season.
DUAL SUGAR PRICING POLICY:
Under the provision of the Sugar Control Order,
Govt has been regulating the sugar supplies for
distribution under PDS and free market. Several times in
the past, industry has gone through complete control or
partial control to complete decontrol and back to
partial control.
Under the current policy 10% of the sugar
produced is to be delivered by mills, for public
distribution, at a price fixed from season to season.
Balance 90% can be sold in the free market as per
36
quantity decided by government. on month-to-month basis
for each mill. Also mill has to sell minimum 47.5% in
the first fortnight and 52.5 in second.
QUALITY / PACKAGING:
Governed by Indian Standards. Grade 31, 30, 29, and
packaging only in 100 kgs jute bags. Consumer packs
allowed in 1, 2, 5 kg in any packaging. Exports packing
can be in 50 Kg and in any packaging material and so
also imports.
STATE GOVERNMENT REGULATIONS:
Over and above the central government control,
each state government enforces it sown regulatory
measures to protect the state / farmers. Following are
some typical controls in the state of Uttar Pradesh,
which are there in other states in some form or other.
RESTRICTION ON SUGAR CANE PURCHASE ORDER, 1966
This order provides for restriction on purchase of
sugarcane by producers. It also provides for permits for
purchase of sugarcane by a khandsari manufacturer
holding a license.
37
SUGAR CANE CESS ACT, 1956
This Act has been promulgated for imposition of
cess on cane sold to a sugar factory. At present the
rate of cess is Rs. 140 PMT on sugar, which is collected
at the time of delivery of sugar.
SUGAR CANE (PURCHASE TAX) ACT, 1961:
This Act proposes to impose a tax on the purchase of
sugarcane by the owner of a sugar factory. A sugar
factory is not allowed to remove any sugar until
Purchase tax has been paid thereupon. At present the
rate of Purchase Tax is Rs. 220 MT on sugar.
SUGAR CANE (REGULATION OF SUPPLY & PURCHASE)
ACT, 1953
This Act regulated the supply and purchase of sugarcane
required for use in a sugar factory, khandsari unit and
for manufacture of gur, it provides for:
Declaration of reserved area / assigned area for
the purpose of supply of cane to sugar factory.
38
Speedy payment of the price of cane (action for
delays)
Cane purchase by mill through cane grower’s Co-
operative Societies.
Payment of commission to cane grower’s Co-
operative societies.
Power to declare some cane unsuitable for sugar
mills.
SUGAR CANE (SUPPLY& PURCHASE) ORDER, 1954
It provides for rules and regulations governing
purchase of cane in a reserved area /assigned area
and purchase for cane at cane purchasing centers
within the reserved area of a sugar factory
MOLASSES CONTROL ORDER
39
While the central Government has decontrolled the
molasses, the State Governments, had imposed its
regulations like:
Ban on interstate movement
Restriction on end use i.e. Sale to a specific
consumer.
Ratio of control fixed rate and free market
rate.
Also specify consumers who will get a control
price.
SUGAR- DISTRIBUTION AND TRADING PRACTICES
Under the dual pricing policy government
announces from time to time portion of the sugar that
can be sold in the free market and what is to be
supplied at the fixed price under the public
distribution system called levy sugar.
LEVY SUGAR SALES/ DISTRIBUTION SYSTEM
Currently, 40% of production (effectively due to
non- levy unit 33%). Quantity for distribution per month
40
fixed unit per kg/ family etc. Varies basis additional
requirement arising due to important festivals.
Food Ministry issues allocation of various food
departments/ corporations. Such departments approach
individual mills to lift the sugar and for onwards
supply to various public distribution system (ration
shops) appointed by the State Government.
MARKET MAKING
The Indian sugar industry is worth 25000 crore and
lies only with Brazil for the position of the world’s
leading sugar producer. Currently, about 4 million
hectares of land in India is under sugarcane cultivation
with an average yield of 70 tones per hectare. The
cumulative production during October 2002 – May 2003
stood at 19.65 million tones -- 8.6% higher than the
output during the corresponding sugar production is
likely to continue at these high levels into next
year, given that the returns to farmers are higher in
sugarcane than in other crops, in spite of the delay in
payments for cane arrears.
41
SUGAR PRICES
The Indian sugar industry operates under a dual
pricing system for its sugar output. These are levy
prices and free market prices.
Levy prices- the government procures 10% of the
sugar for the public distribution system (PDS) at a
subsidized price called the “levy price”, which varies
from region to region. The government announces PDS
sugar prices based on levy sugar prices fixed by it and
the subsidy is provided through budgetary system.
FREE MARKET PRICES
The remaining 90% of the production by sugar
mills can be sold in the open market, but only up to
a fixed quantity as decided by the government for
each factory each month(monthly release quotas),
based on the demand – supply situation in the
country.
During October 2002 to June 2003, the average price
of free Market sugar was Rs. 12050 per tons as
compared to Rs. 14130 per tons during the corresponding
42
period of 2001-02. This implies a steep 14.7% falls as
against a nominal 2.2% decline recorded in the
corresponding period of 2001-02. The March, April
and May 2003 prices witnessed a year – on- year fall
of 18% , 16% and 16% respectively. May 2003 was
the fifteenth consecutive month that registered a
price fall. Sugar prices dropped to these low levels due
to the dumping of sugar in the open market by the mills.
SUGARCANE PRICES
Each Year, The Government of India declares a
Statutory Minimum Price (SMP) for cane. In some states,
such as Punjab, Haryana, and Uttar Pradesh the sugar
mills have to pay the effective State Advised Price
(SAP) for the sugarcane, which is 20-25% above the
minimum support price (MSP.). The successive increase
in cane prices in the past years has translated into
an abnormally high cost for the production of sugar,
now estimated at $ 270- 280 per tone, in addition to
causing the current supply glut in sugarcane and
sugar.
43
SUGAR EXPORTS
The huge amount of standing sugar stocks has
forced the Indian Government to encourage exports by
offering a reimbursement of the cost of surface
transport of exportable sugar from factories to ports.
(As agreed in July 2002) and an ocean freight subsidy of
Rs. 350 per tones. The benefits also include a state
subsidy on exports and an exemption from levy
obligations on the quantity of sugar exported.
The exports in2001-02 were 1.06 million tones,
while in 2002-03 (October –May) the figures have so
far reached 1.43 million tones. The export for 2002-03,
total, is estimated at 2 million tones. The prices
received by exporters for world market sales are
unlikely to improve in the near future. The world sugar
output in 2002-03 is expected to be, at 143.1 million
tons ( September –August) from 138.2 million tons
last year, and the current structure of the world
white sugar futures suggested that prices will
44
continue to be under pressure for the coming
year.
IMPORTS
Sugar imports are negligible in India as there is a
high customs duty of 60% plus a countervailing duty of
RS. 850 per tons. In addition, the governments’ policy
is to subject imported sugar to a levy requirement and
market release quotas, while tightening the norms for
duty- free import against re- exports.
SUGAR PRODUCTION
sugar cane and sugar beet are the two main crops
that contribute approximately 56% and 44%
respectively of the total sugar production in the
world. Sugar cane is the main source of sugar
production in India and holds a prominent position as
a cash crop. Sugar cane is a crop of the tropics while
sugar beet is essentially a crop of temperature regions.
Sugar is pure sucrose in solid crystalline form. It is
an essential commodity and has innumerable uses. It is
45
the common sweetener. One cannot ignore the use of sugar
in the daily life as the day starts with coffee or tea.
Sugar is used in the preparation of many sweets, bakery,
confectioneries, soft drinks, chocolate industries, etc.
It means that it has wide importance domestically and
industrially. Sugar has highest place in the indigenous
market and also in the export sector. Sugar is being
exported to USA, Canada, UK, Malaysia, Sri Lanka, and
Middle East countries.
Sugar industry is one of the important industries
in India. Among the agro- based industries, textile
industry is the first and foremost important industry
and the second most important industry is the sugar
industry. India stands second in the production of
sugar in the world. India has more than 396 sugar
factories. Overall, the sugar industry provided
employment to 2.5lakh people, which include skilled and
unskilled workers. Further, it sustains over 2.5 crore
agriculturists and their families. The sugar industry is
largely confined to the northern part of the country,
46
especially in Uttar Pradesh and Bihar, this parties
regarded as sugar, belt. In recent years, sugar
industries have come up in the states of
Maharashtra, Andhra Pradesh, West Bengal , tamilnadu ,
Punjab , etc. sugar industries are developed as co-
operative sector industries.
With sugar cane crushing in sugar factories,
the main product obtained is crystal sugar. Along with
it, the by- products, namely, bagasse, molasses, and
filter cake are also obtained. The by – products find
value as raw material in other industries. The biogas is
used as fuel to heat boilers for power production. The
molasses are widely used in distillery industries.
Like any other manufacturing industry, sugar
industry is also responsible for the release of
pollutants, which degrades the local a real environment.
Although no serious health hazards are associated with
pollutants from the sugar industry, over a period of
time, pollution may cause health problems to living
organisms including man. Apart from this, there are some
47
occupational health problems among sugar factory
workers, which will be detailed in the pages to follow
at the appropriate place. Nevertheless the pollution
problems associated with sugar production from sugar
cane is not that serious when compared to those
associated with other industries..
48
CHAPTER-III
COMPANY PROFILE
49
SRI VIJAYA RAMA GAJAPATHI CO- OPERATIVE
SUGAR LTD
This sugar factory is situated in
Bhimasinghi of vizianagaram district. It was
established in the year1960 and production began in
1976 it was established with a view encourage the
nearby sugar cane farmers for growing sugar cane in
their crop fields and also to better their economic
welfare. The factor has a jurisdiction of 601 villages
distributed in 20 mandals out of which only 9 mandals
supply sugar cane for the production of sugar by this
factory, sugarcane is cultivated in 9,908 hectors .The
total sugarcane production from this land amounts to
1, 90,000 metric tons per year .Out of this 25,000
metric tons of sugarcane are kept aside for raising
50
the new crop in the subsequent season and the
remaining 1, 65,000 tons of sugar cane are crushed to
produce sugar by the factory. The factory has an
installed capacity of 1,250 tons of sugar cane per
day. The factory operated from November /December to
may/June and produces 1, 70,250 quintals of sugar from
the total supply of sugar cane (1, 65,000 metric tons)
during this period.
Location:
The factory is situated in Jami mandal,
which is 11kms from vizianagaram. This factory is
provided with good transport facilities like road and
railway station. Korukonda is the nearest railway
station. This is just 4 kms from the plant. About
140days is the optimum crushing duration. Since the
wet weather up to November and sever drought and high
day temperatures in summer months of may restrict
economics of crushing. The cane crush is estimated
about 35,000 M.T per month. Main raw material used in
51
sugar cane only with in the capacity of the plant of
1250 m tones of cane per day.
Objectives of the organization:
The objects of the society shall
be to promote the economic interests on members by
encouraging proper development of agricultural
industries on co-operative lines and through co-
operative principles with a view to ensure to the
agriculturists ,with special attention to and
performance to small farmers as far as possible ,the
advantages of scientific.
Agricultural production and the benefits large
scale industries and for the said purpose it shall be
competent to the society.
To purchase from members or non-members sugarcane
and or other raw materials and also to undertake
cultivation of sugarcane.
To construct or take on rent go downs at the place
of manufacture as well as outside for storage and
sale of the products.
52
To do all other things incidental to or necessary
for the establishment and running of the factory.
To process and sell sugar and other by-products
produced.
To undertake measures for the development of
sugarcane including supply of seed , fertilizer
agricultural implements, irrigation facilities and
other production requirements including
agricultural credit and to provide technical advice
on improved cultivation methods .
To hire or purchase land for the purpose of
undertaking research and to take necessary measures
to disseminate knowledge to members.
To purchase or take on hire tractors, boring sets
and other agricultural implements and hire them to
members.
To issue loans to members for productive and other
similar purposes.
SUGAR CANE YIELD AND CRUSHING:
53
Under the jurisdiction of the
sugar factory, different varieties of sugar cane are
advocated for cultivation. They include early
varieties, mid varieties and late varieties. The early
varieties are co6907, 85A261, 87A298, 88A189, 86V96,
91V83, the mid varieties are co7805, 86A146, 88A162,
90a272, and late varieties are co7219, co7706. Out of
these varieties, early varieties yield quality sugar
cane and quality sugar after crushing. Different
varieties, especially, the mid and the late varieties
are advocated by the factory management for sugar cane
cultivation in order to get a continuous supply of
sugar cane during the operation period of the factory.
The sugar cane growers are largely small and marginal
farmers. The average holding of the land by and
individual farmer ranges from 0.5-2acres. Over 8,000
farmers are involved in sugar cane cultivation under
the jurisdiction of factory.
In order to draw sugarcane for crushing, the
factory conducts pre-harvest survey one month before
54
starting of crushing season. Taking into
consideration the entire sugarcane area, the area is
divided into four groups on the basis of the month,
the variety and ration / plant, etc., early varieties
are surveyed and grouped accordingly to know the
maturity of the crop. Once the pre-harvest survey of
the early varieties of sugarcane is completed and
based on the results of the survey, the factory
management then recommends took the farmers to harvest
the crop. After the harvest of early varieties of
sugarcane and subsequent crushing of the same at the
factory, the mid and the late varieties of sugarcane
and harvested and crushed in succession.
At the factory, 160 skilled and
unskilled workers are engaged for crushing and for the
production of sugar during the entire period of
factory operation. Further, the factory management
engages additional number of seasonal workers as daily
wage laborers (unskilled). Apart from this, 300
55
employees are engaged in Administration, Accounts, and
Agriculture and Engineering sections of the factory.
1. Raw materials:
Raw materials are those basic input materials that
are converted into finished product through the
manufacturing process.
2. Working in progress:
This includes those materials, which have been
committed to production process but have not yet been
completed.
3. Finished goods:
These are completed products a waiting sale .they are
the final output of the production process in a
manufacturing firm. The level of three kinds of
inventories differs depending on the nature of business.
A manufacturing firm will have substantially high level
of the finished goods inventories are no raw material
and work in progress inventory
56
PROCESS OF SUGAR PRODUCTION:
Sugar cane and sugar beet is the main crops
that contribute approximately 56% and 44% respectively
of the total sugar production in the world. Sugar cane
is the main source of sugar production in India and
holds a prominent position as a cash crop. Sugar cane
is a crop of the tropics while sugar beet is
essentially a crop of temperate regions. Sugar cane
from the fields is brought to the factory through
Lorries, tractors, and bullock carts. Sugar cane of
5 to 6 feet length is unloaded into the cane
trolleys and weighted in the automatic electric
weighing bridges and convey the trolled to the
tilting tables by the pushers, sugar cane is
unloaded into the cane carried by trunk tilting
system. Cash is prepared to 80-85% broken cells
with the help of two sets of cane canvas and
shredder, this process is called cane preparation.
In this process of manufacturing of white sugar
there are six stages. They are:
57
Juice Extraction
Juice Clarification
Evaporation
Crystallization
Centrifugation
Grading and Bagging
Packaging
Manuring
transporting
JUICE EXTRACTION:
The juice will be heated to 70 C
and then So2 gas and milk of lime are added. The
sulphited juice will be further heated to 105 C to 108C
in juice heater. Adding magnafloc to this hot
juice fed to the clarifiers helps in quicker
settling of muds in evaporators.
JUICE CLARIFICATION
This muddy juice is mixed with bagacillo and
fed to the vacuum filters.
58
EVAPORATION
Filtered juice will be sent back to the
process and the filter cake will be sent out. Filter
cake is a by- product with which we can make waxes
and can be used as manure to the cane fields.
The clear juice is sent to the
evaporators in which 75% of the water is
evaporated and syrup at around 60 brick is sent
to the pan floor through syrup sulphites in
which So2 will be added.
CRYSTALLIZATION:
The syrup is boiled in the pans till we get the
required size of crystal formation and masscults will
be allowed into the crystallizes for cooling and
exhaustion. After the masscults is
Cooled to the required level, it is sent to the
pug mills where the masscults is reheated for
better mobility.
CENTRIFUGATION
59
The masscults, is a mixture of sugar crystals and
molasses is sent from the pug mills to the centrifugals,
where the sugar and molasses are separated. The
molasses will then be sent to distillery, for the
manufacture of rectified spirits. If there is no
distillery they will send the molasses to private
parties.
The final molasses is a by- product of
sugar industry that can be used as raw materials
for distillery and for making cattle feed etc.
The sugar from centrifugals is dried and cooled
while passing through the hoppers to bucket
elevators.
GRADING AND BAGGING
Sugar is graded according to its crystal
sizes and stored in the bins. The sugar will be
bagged through automatic weighers, stitched and stored
in the god owns through belt conveyors and
stackers.
60
Different varieties of sugar cane are advocated for
cultivation. They include early varieties, mid
varieties and late varieties.
1. Avoiding losses of sales:
If a firm maintains adequate inventories it can
avoid losses on account of losing the customers for non-
supply of goods in time.
2. Reducing order cost:
The variable cost associated with individual order
e.g. Typing, checking, approving, mailing etc. can be
reduced if a firm places a few larger rather than
numerous small order.
61
CHAPTER-IV
CASH FLOW
ANALYSIS
62
CASH FLOW ANALYSIS
THE CO-OPERATIVE SUGARS Ltd, BHIMASINGI:
Procedure for preparing for cash flow statement
Cash flow statement is a method by which we
study changes in the financial position of a business
enterprise between beginning and ending financial statements
dates. Hence, the cash flow statement is prepared by
comparing two balance sheets and with the helps of such
other information derived from the accounts as may be
needed. Broadly speaking, the preparation of a cash flow
statement consists of two pans:
1.Statement or Schedule of changes in cash flow
63
Cash flow means the excess of current assets
over current liabilities. Statement of changes in cash flow
is prepared to show the changes in the cash flow between the
two balance sheet dates. This statement is prepared with
the help of current assets and current liabilities derived
from the two balance sheets.
CASH FLOW =CURRENT ASSETS-CURRENT LIABILITIES.
2. Statement of sources and applications of cash
(I) an increase in current assets increases cash
flow.
(ii) A decrease in current assets decrease,
cash flow
(iii) An increase in current liabilities
decreases cash flow
(iv) A decrease in current liabilities
increases cash flow
The change in the amount of any current asset or current
liability in the current balance sheet as compared to that
of the previous balance sheet either results in increase or
64
decrease in cash flow. The difference is recorded for each
individual current asset and current liability. In case a
current asset in the current period is more than in the
previous period, the effects an increase in cash flow and it
is recorded in the increase column. But if a current
liability in the current period is more than in the previous
period, the effect is decrease in cash flow and it is
recorded in the decrease column or vice versa. The total
increase and the total decrease are compared and the
difference shows the net increase or net decrease in cash
flow It is worth nothing that schedule of changes in cash
flow is prepared only from current assets and current
liabilities and the other information is not of any use for
preparing this statement. A typical form of statement or
schedule of changes in cash flow is as follows:
MANAGEMENT OF CASH
Theoretical aspects of cash management
65
One of the main tasks of financial management is to
hoard and maintain adequate, but not excessive cash
position. Cash is an obvious and inescapable in sufficient
doses according to needs on a continuing basis. Cash is also
the major and much awaited output or result of the companies
operations and there is the need for effective plan to
deploy these liquid resources to utmost productive use.
A company that is growing fast and every turning out
hand some profits may be continuously faced with a state of
production. So finding adequate funds for operation needs is
an unending pre-occupation for the company’s finance manager
in adequacy of cash, even for short period is source of
trouble for most enterprise. It is not wise to have a lot
of cash which is idle, cash is not and earning assets.
It is the duty of the finance manager to provide
adequate cash to all segments of the organization .The has
also to ensure that no funds are blocked in idle cash since
this involve cost in terms of interest to the business a
66
sound cash management schemes, maintain the balance between
the objective of liquidity and cash.
The term cash with reference to cash management is used
in the sense it includes coins, currency notes, cheques,
bank drafts held by within in the banks. In broader sense,
it also include near cash, assets such as marketable
securities and time deposits with bank.
Motives for holding cash:
LORD Keynes, the noted economist has attributed 3 motives
for holding cash.
The transaction motive
The precautionary motive
The speculative motive
The transaction motive
The transaction motive arises from the need for
ready funds to make payment falling due in the ordinary
course of day to day business .Such as payments for
67
purchase, pay for wages, payment of operating expenses and
payment of these and dividends .The aim of cash management
to ensure functioning of day to day business by judicious
direction of the operation of the operating and contractual
payment are promptly.
Precautionary motive
The precautionary motive comes from the closer to keep
a cash caution or buffer to meet un expected contingencies
the degree of precautionary will normally bear an inverse
relationship to the degree of predictability of cash flows
of the business. As a matter abundant caution many companies
have learnt the art of establishing and maintaining good
lasting link with progressive banking institution .Thus,
having a ready borrowing power, the firm can release
available cash resources for remunerative applications.
Speculative motive
The speculative motive covers instances were the
intention is to hold cash to be able to take advantage of68
shifts insecurity prices, rising from changes in interest
and other factors .Thus it is not a common feature of
corporate financial management except in case of finance and
installment companies.
Cash management concern with the management, the cash
flows into and out of the organization. Management of cash
flows with in the firm and management of cash and balances
held by the firm at point of time.
Objective of cash management:
There are two basic objectives of the cash management
To meet the cash disbursement need as per the payment
schedule
To minimize the amount locked up as cash balance
As a matter of fact both the objectives are mutually
contradictory and therefore it is challenge task for the69
finance manager to reconcile them and to have the best in
process.
Meeting cash disbursement
The first basic objective of cash management is to meet
the payment schedule. In other words, the firm should have
sufficient cash to meet the various requirements of the firm
at different time periods. The business has to make payment
for purchase activity may come to grinding half, if the
payment schedule is not maintain cash has therefore been
aptly described as the” oil to lubricate the ever turning
wheels of business, without it the process grinds to a
stop”.
Permanent/Long-term working capital
Permanent working capital should be financial in such a way
that the enterprise may have its uninterrupted use for
sufficiently longer periods.
The sources of long-term working capital are
70
1. Shares: A company can issue various type of shares as
equity shares, preference shares and deferred shares.
Equity shares do not have any fixed commitment,
preference shares have a fixed rate and deferred shares
cannot be issued by a public company.
2. Debentures: Debenture holders are to be paid a fixed
rate of interest. The debentures may be of various
kinds such as simple, naked or unsecured debentures,
secured or mortgaged debentures, redeemable,
irredeemable debentures, convertible, non-convertible
debentures. Interests on debentures have to be paid on
certain predetermined intervals at fixed rate and also
debentures get priority on repayment at the time of
liquidation.
3. Public Deposits: Public deposits are the fixed deposits
accepted by a business enterprise directly from the
public. Public deposits have advantages such as very
simple and convenient source of finance, taxation
benefits, trading on equity, inexpensive source of
finance but non-banking concerns cannot borrow by way71
public deposits more than 25% of its paid up capital
and free reserves.
4. Pouching Back of Profits : This means the reinvestment
by a concern of its surplus earnings in its business.
This method has a number of advantages as it is the
cheapest, no need to keep securities; it ensures stable
dividend policy and gains confidence of the public.
But excessive report may lead to monopolies, over
capitalization and speculation, etc.
5. Long from Financial Institutions: Financial institution
such as commercial Bank, life insurance corporation
(LIC), Industrial Financial Corporation of India
(IFCI), Industrial Development Bank of India (IDBI) etc
provide short-term, medium-term and long-term loans.
Interest is charged at a fixed rate and repayment
should be done by way of installments.
6. Temporary/short-term working capital: Some amount of
working capital may be required to meet the seasonal
demands and rise in prices, strikes etc. this
72
proportion of working capital given rise to temporary
or variable working capital.
The sources of short-term working capital are:
a). Commercial banks: The major portion of working
capital loans are provided by commercial banks through a
wide variety of loans tailored to meet the specific
requirements of a concern.
The different forms for providing loans and advances are:
a. Loans
b. Cash credits
c. Overdrafts
d. Purchasing and discounting of bills
b) Indigenous Bankers: Private money-lenders and other
country bankers used to be only source of finance prior to
the establishment of commercial banks. But even today some
business sources have to depend upon indigenous bankers for
obtaining loans to meet their working capital requirements.
c) Trade Credits: Trade credit arrangements of a concern
with its suppliers an important source of short-term73
finance. The main advantages of this source are; it is very
convenient method of finance, flexible but this method
charges high prices and loss of cash discount.
d) Installment Credit: This is another method by which the
assets are purchased and the possession of goods is taken
immediately but the payment is made in installments over a
predetermined period of time.
e) Advances: Some business houses get advances from their
customers and agents against orders and this source of
finance for them and it is also a cheaper source
Minimizing funds locked up as cash balances
The second basic object of cash management is to
minimize the amount locked up as cash balances. In the
process of minimizing cash balances the financial manager is
confronted with to conflicting aspects.
A higher cash balance ensures proper presents with all
it advantages. But this will result in a large balance of
cash remaining idle low level of cash balance may result in
failure of the firm to meet the payment schedule the74
financial manager should therefore, try to have an optimum
amount of cash balance keep above facts in view.
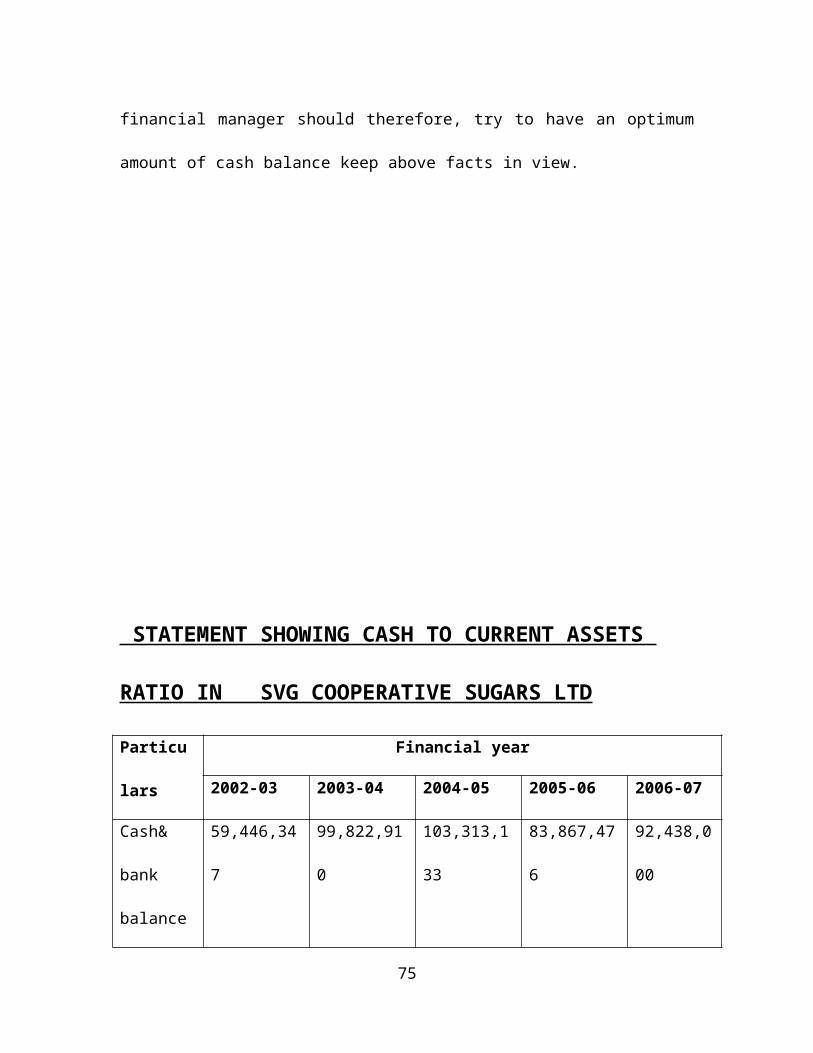
STATEMENT SHOWING CASH TO CURRENT ASSETS
RATIO IN SVG COOPERATIVE SUGARS LTD
Particu
lars
Financial year
2002-03 2003-04 2004-05 2005-06 2006-07
Cash&
bank
balance
59,446,34
7
99,822,91
0
103,313,1
33
83,867,47
6
92,438,0
00
75
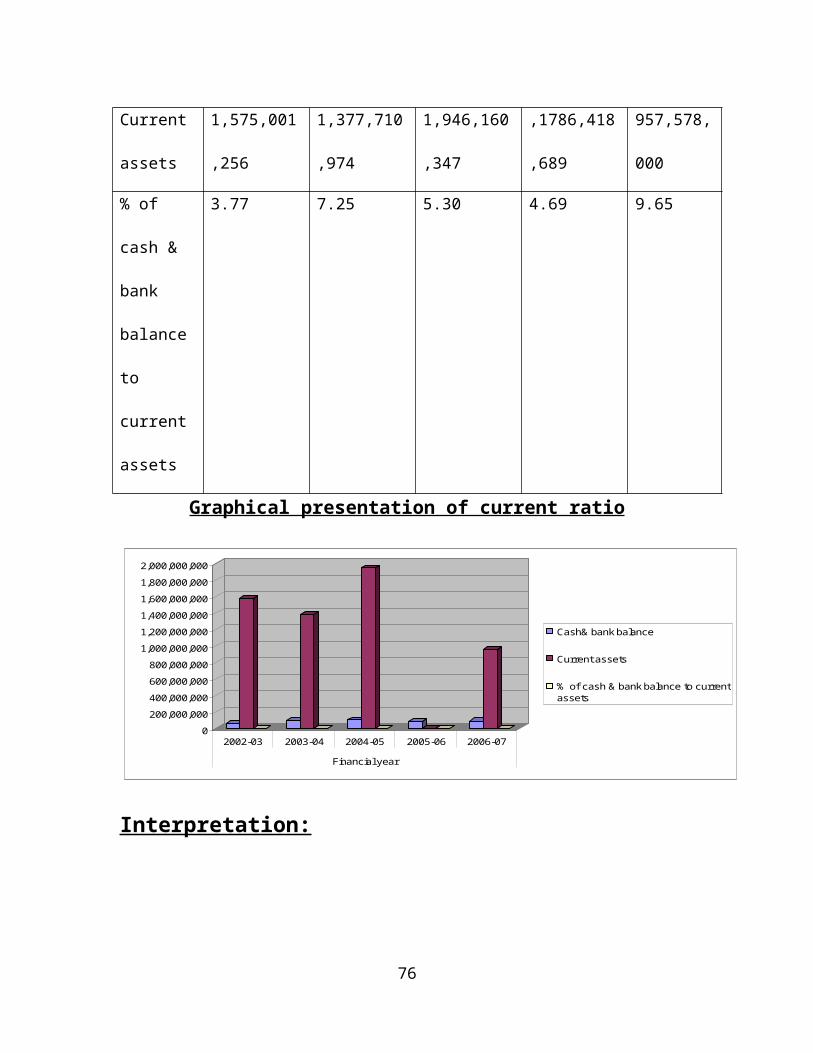
Current
assets
1,575,001
,256
1,377,710
,974
1,946,160
,347
,1786,418
,689
957,578,
000
% of
cash &
bank
balance
to
current
assets
3.77 7.25 5.30 4.69 9.65
Graphical presentation of current ratio
0200,000,000400,000,000600,000,000800,000,000
1,000,000,0001,200,000,0001,400,000,0001,600,000,0001,800,000,0002,000,000,000
2002-03 2003-04 2004-05 2005-06 2006-07
Financial year
Cash& bank balance
Current assets
% of cash & bank balance to currentassets
Interpretation:
76
Cash to current assets ratio indicates what % of
current assets in the form of cash. It should be kept as
low as possible because by it self does not yield profit.
The above table presents the percentage of cash and
bank balances to current assets in SVG COOPERATIVE SUGARS
LTD the cash bank balances as percentage of total firm
assets the percentages decreased from 4.58% to 3.77% for
years 2001-02 to 2002-03 .the next year means 2003-04 it is
increased from 3.77% to 7.25% it is decreased 5.30%, 2006
and its decreased 5.30% to 4.69% in 2005-06 due to decreased
in cash sales.
STATEMENT SHOWING CASH & BANK BALANCE TO CURRENT
LIABILITIES IN SVG COOPERATIVE SUGARS LTD
Particula
rs
Financial year
2002-03 2003-04 2004-05 2005-06 2006-07
Cash&
bank
balance
59,446,34
7
99,822,91
0
103,313,1
33
83,867,47
6
92,438,00
0
77
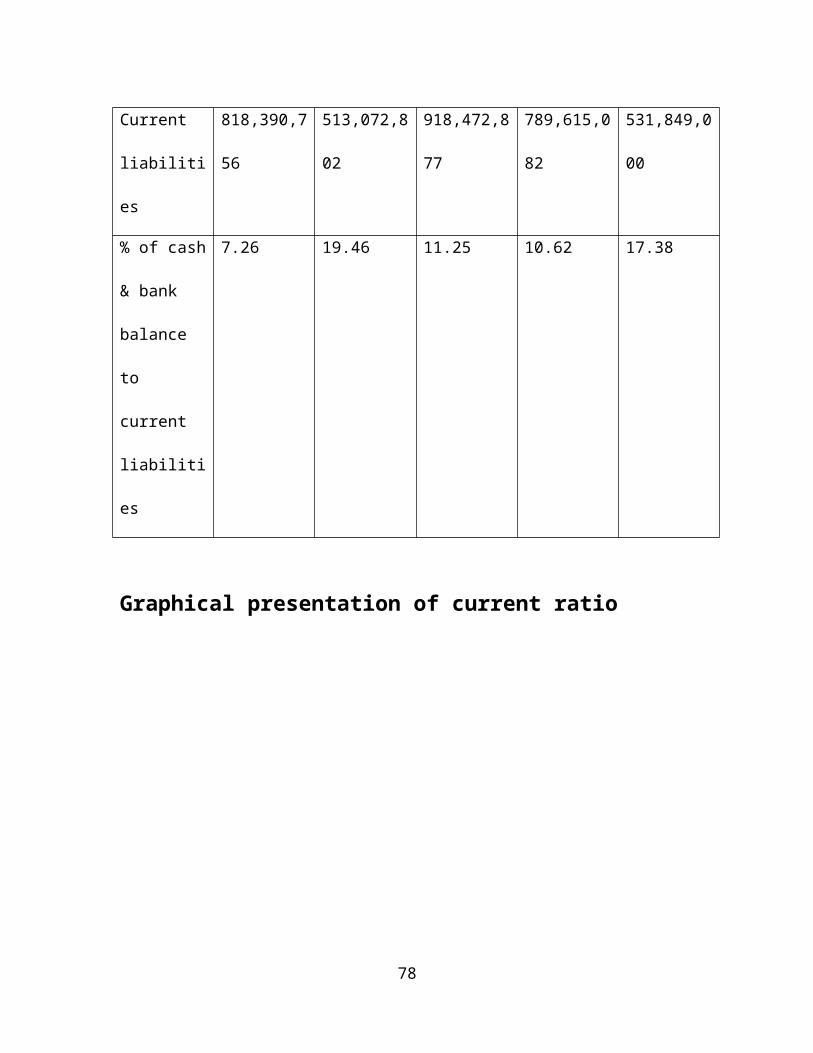
Current
liabiliti
es
818,390,7
56
513,072,8
02
918,472,8
77
789,615,0
82
531,849,0
00
% of cash
& bank
balance
to
current
liabiliti
es
7.26 19.46 11.25 10.62 17.38
Graphical presentation of current ratio
78
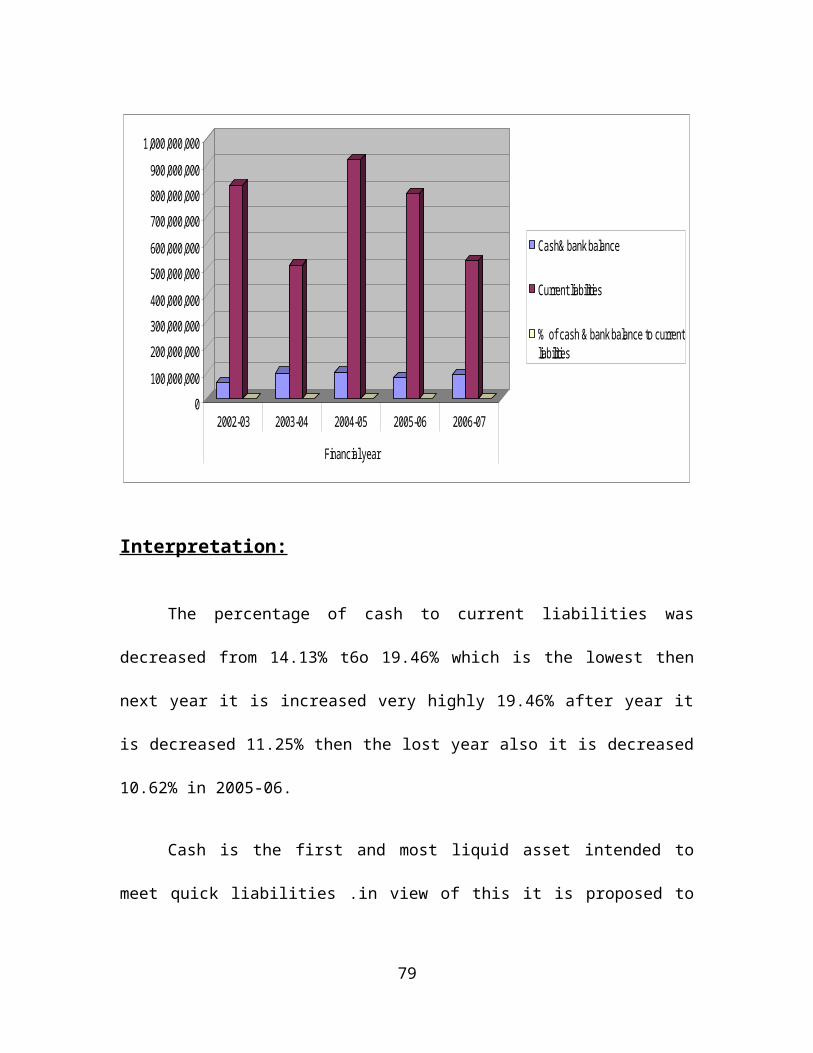
0100,000,000200,000,000300,000,000400,000,000500,000,000600,000,000700,000,000800,000,000900,000,000
1,000,000,000
2002-03 2003-04 2004-05 2005-06 2006-07
Financial year
Cash& bank balance
Current liabilities
% of cash & bank balance to currentliabilities
Interpretation:
The percentage of cash to current liabilities was
decreased from 14.13% t6o 19.46% which is the lowest then
next year it is increased very highly 19.46% after year it
is decreased 11.25% then the lost year also it is decreased
10.62% in 2005-06.
Cash is the first and most liquid asset intended to
meet quick liabilities .in view of this it is proposed to
79
compare the trends in cash holding with the trend in the
quick liabilities.
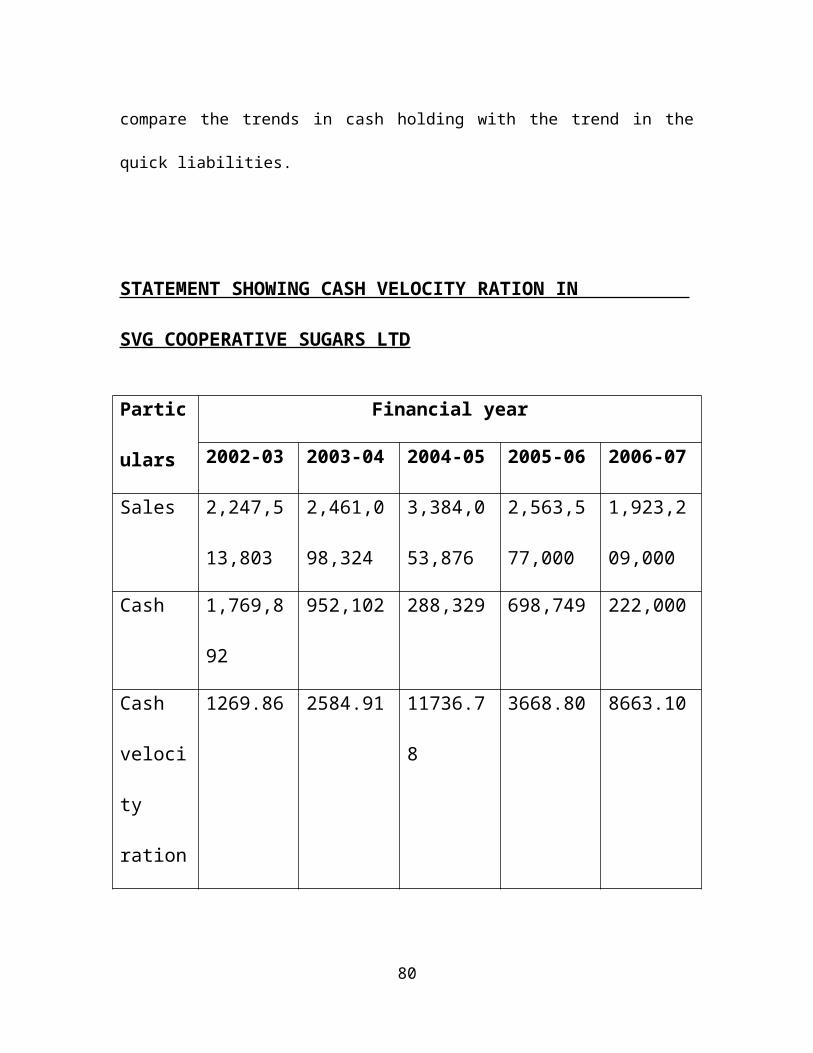
STATEMENT SHOWING CASH VELOCITY RATION IN
SVG COOPERATIVE SUGARS LTD
Partic
ulars
Financial year
2002-03 2003-04 2004-05 2005-06 2006-07
Sales 2,247,5
13,803
2,461,0
98,324
3,384,0
53,876
2,563,5
77,000
1,923,2
09,000
Cash 1,769,8
92
952,102 288,329 698,749 222,000
Cash
veloci
ty
ration
1269.86 2584.91 11736.7
8
3668.80 8663.10
80
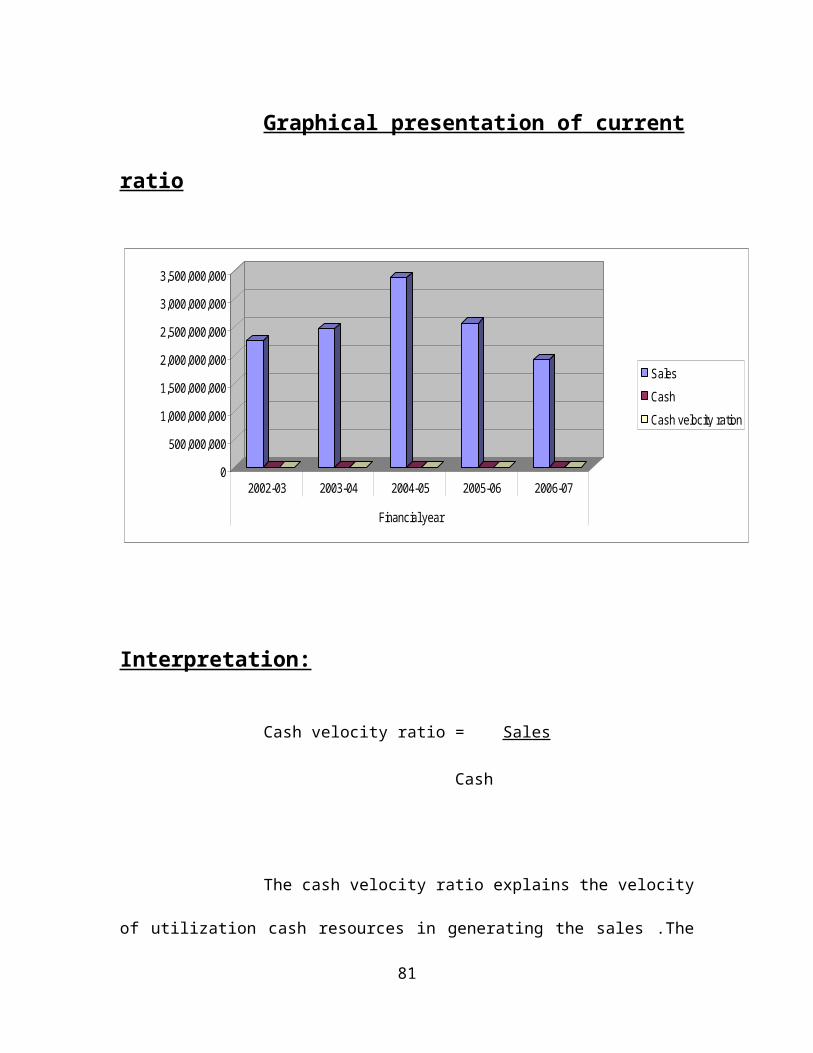
Graphical presentation of current
ratio
0
500,000,000
1,000,000,000
1,500,000,000
2,000,000,000
2,500,000,000
3,000,000,000
3,500,000,000
2002-03 2003-04 2004-05 2005-06 2006-07
Financial year
SalesCashCash velocity ration
Interpretation:
Cash velocity ratio = Sales
Cash
The cash velocity ratio explains the velocity
of utilization cash resources in generating the sales .The
81
high cash velocity is desirable but at the same time it
adversely effects the short term liquidity position of the
business unit .In the year 2004-2005 generation of rupees
3,384,053,876 of sales .
The company having only 2,88,329 worth of cash
resources with the merge cash balances .The sample unit is
unable to discharge its liabilities so that there is high
average payment period when the company is following a too
liberal credit policy .It is adversely effective the cash
position.
THE MANAGEMENT OF FIXED ASSETS AND CURRENT ASSETS
DIFFER UN THREE IMPORTANT WAYS
1. In managing fixed assets the three factors is very
important that is why discounting compounding play a very
important role in any capital budgeting decision. But
because the time frames of current assets is only of
money it less significant in the management of current
assets.
82
2. The liquidity positions of firm’s dependent on the
investment in current assets then more then better where
as the role of fixed as for as liquidity is concerned
reliable.
Any short run immediate need of the company whether it be
used for cash or adjustments to fluctuation in safes can be
made only through adjustments. The level of the various
components of the current assets. The calls for efficient
management of current assets which from part of management
of working capital.
CURRENT ASSETS:
The term current assets refers to those assets which in
the ordinary course of business will be turned into cash
with in one year
The major current assets of cash marketable securities
account receivable and inventories close securities of the
above table no: 1 shows that
83
In the three years of 2004-05, 2006-07, 2007-08&2008-09
the study period inventories from major portion in the
current assets of the enterprise.
In the two years of 2005-06 & 2006-07 the study period
debtors form major portion in the C.A of the
enterprise.
There is some up & down in cash & bank balance from
2004-05 to 2008-09.totally it is increases from 9, 98,
22,910 to 6, 68, 73,000.
There is decrease in inventories from 40,55,03,124 to
26,88,47,000 the portion of inventories as percentage
of total current assets declined from 53.62% to 29.33%
and after that it is increased finally 56.76% in 2007-
08
There is an decrease debtors from 2004-05 to 2006-07
due to credit sales increased on that period after
2007-2008 it is decreases every year due to credit
sales decrease on that period.
Average collection period:
84
This ratio indicates the extent to which the debts have
been collected in time .it gives the average debt collection
period. The ratio is very helpful to the leaders. Because it
explains to them whether their borrowers are collection
money with in a reasonable time and increase in the
collection money with in a reasonable time an increase in
the period will result in greater blockage of funds in
debtors.
The ratio may be calculated by the following formula:
Average Collection Period = Average book debtors X
365 days
Sales
Closing Balance of P&L A/c or retained earnings has given in
the Balance sheet.
Add: On Fund and Non-operating items which have been already
debited to P&L A/c.
SL.NO. DESCRI
PTION
AMOUNT
85
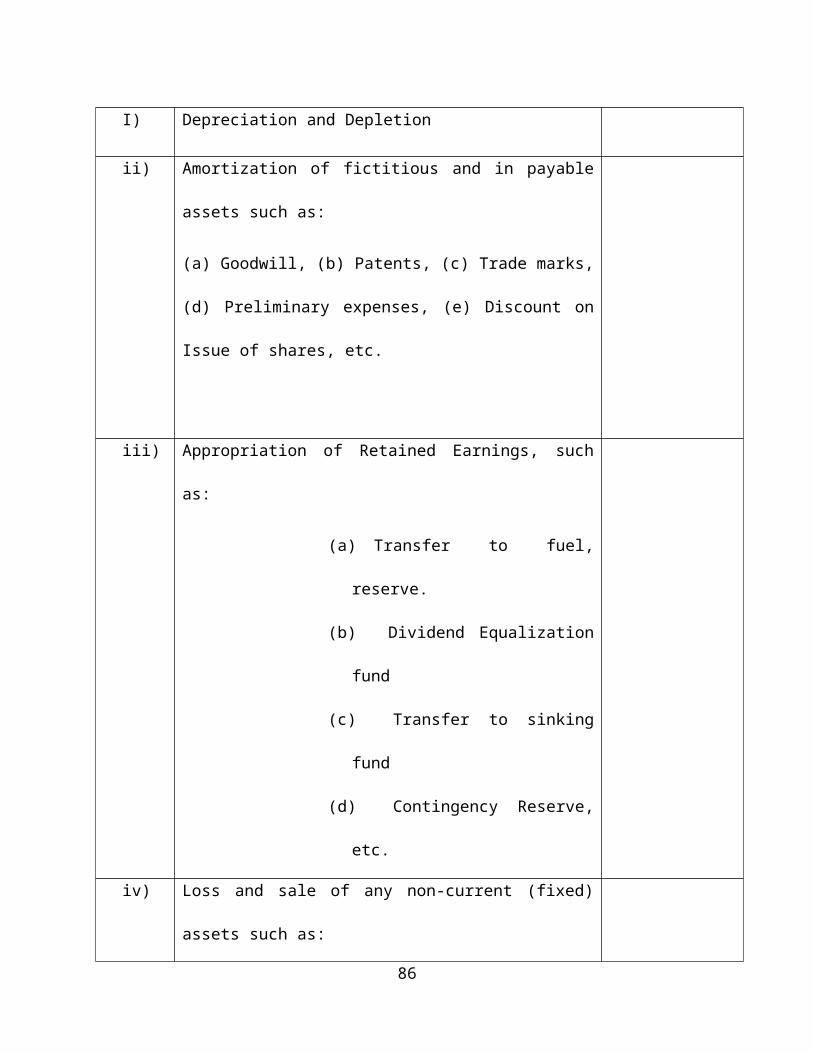
I) Depreciation and Depletion
ii) Amortization of fictitious and in payable
assets such as:
(a) Goodwill, (b) Patents, (c) Trade marks,
(d) Preliminary expenses, (e) Discount on
Issue of shares, etc.
iii) Appropriation of Retained Earnings, such
as:
(a) Transfer to fuel,
reserve.
(b) Dividend Equalization
fund
(c) Transfer to sinking
fund
(d) Contingency Reserve,
etc.
iv) Loss and sale of any non-current (fixed)
assets such as:
86
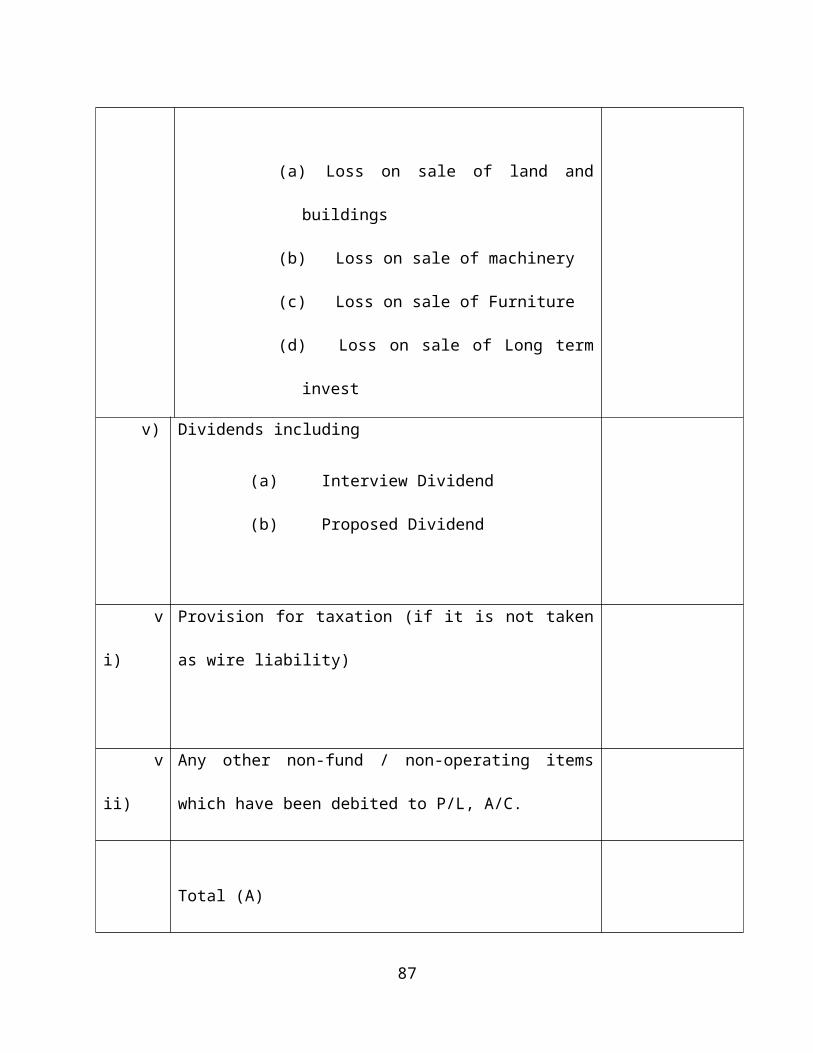
(a) Loss on sale of land and
buildings
(b) Loss on sale of machinery
(c) Loss on sale of Furniture
(d) Loss on sale of Long term
invest
v) Dividends including
(a) Interview Dividend
(b) Proposed Dividend
v
i)
Provision for taxation (if it is not taken
as wire liability)
v
ii)
Any other non-fund / non-operating items
which have been debited to P/L, A/C.
Total (A)
87
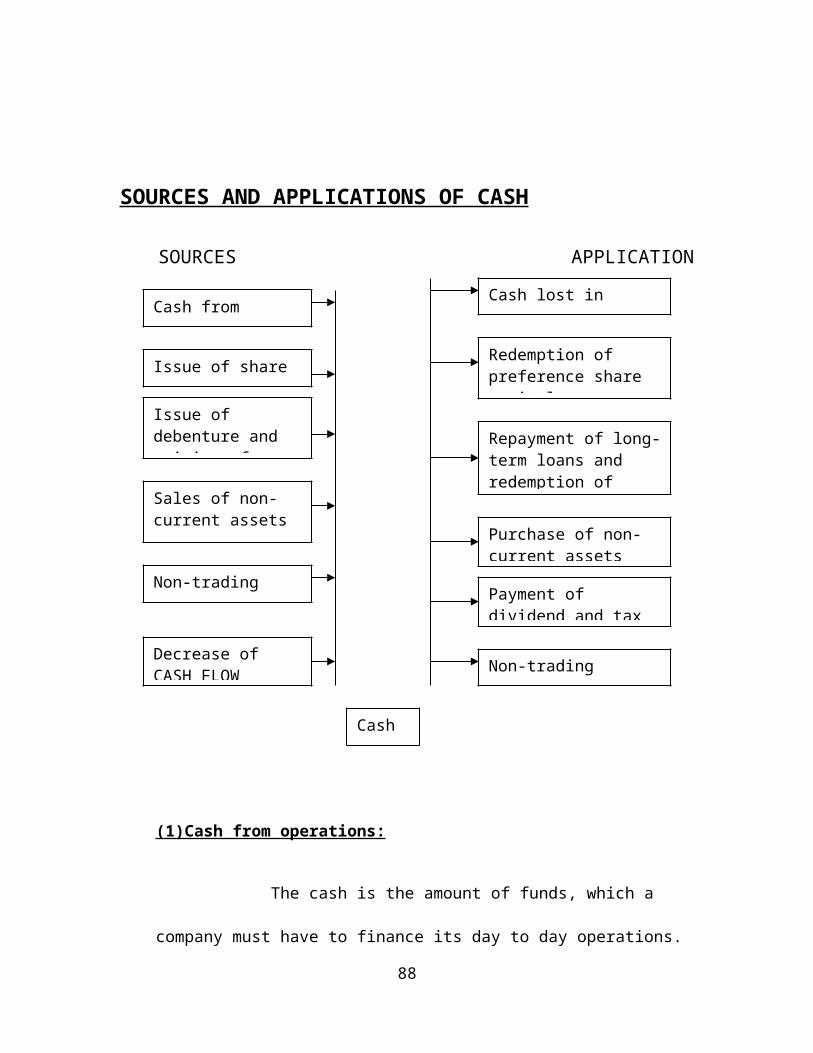
SOURCES AND APPLICATIONS OF CASH
SOURCES APPLICATION
(1)Cash from operations:
The cash is the amount of funds, which a
company must have to finance its day to day operations.
88
Cash from operations
Issue of share capitalIssue of debenture and raising of
Sales of non-current assets
Non-trading receipts Payment of
dividend and tax
Purchase of non-current assets
Repayment of long-term loans and redemption of
Redemption of preference share capital
Cash lost in operations
Decrease of CASH FLOW Non-trading
payment
Cash
It can also be regarded as that operation of the
Companies total capital which is employed in short term
operations. It can take the form of cash near cash and
other assets are stock of raw material and suppliers
needed for manufacturing. Stock of finished goods a
waiting sale, semi-process items or components that will
soon emerges as final products. Sundry debtors spending
collection against credit sales and short term
investment if any.
The current assets are those assets which can be converted
into cash within a short period of time, generally not
exceeding one year without diminution in the value of assets
and include cash, bank, marketable securities inventory of
raw material, semi-finished goods and finished goods.
Debtors, bills receivable and prepaid expenses
(2) Issue of share capital:
If during the year there is any increase in the
share capital, whether preference or equity, it means
capital has been raised during the year. Issue of shares is
89
a source of cash, as it constitutes inflow of cash. Even the
calls received from partly paid shares constitute an inflow
of cash. It should also be remembered that it is the net
proceeds from the issue of share capital, which amounts to a
source of cash and hence in case shares are issued at
premium, even the amount of premium collected shall become a
source of cash. The same is true when shares are issued at
discount; kit will not be the nominal value of shares but
the actual realization after deduction discount that shall
amount to inflow of cash. But sometimes shares are issued
otherwise than in cash the following rules must be followed:
i. Issue of shares or making of partly paid shares is
fully paid out of accumulated profits in tile form/of
bonus shares is not a source of cash.
ii. Issues of shares for consideration other than current
assets such as against purchase of land, machines, and
etc. does not amount to inflow of cash.
90
iii. Conversion of debentures or loans into shares also does
not amount to inflow of cash. In all the three cases
mentioned above, both the
iv. Amounts involved are non-current and do not involve any
current assets or cash.
(3) Issue of Debentures and Raising of Loans, etc.
Issue of debentures or rising of loans (long-term),
whether secured or unsecured results in the flow of cash
into the business. The inflow of cash is the; actual
proceeds from the issue of such debentures or rising of
loans, i.e., including the amount of premium or excluding
discount, if any. However, loans rose for consideration
other than a current asset, such as for purchase of
building, will not constitute inflow of cash because in
that case the accounts involved are only fixed or non-
current.
91
(4) Sale of Fixed (non-current) Assets and Long-term
or Trade investments .
When any fixed or non –current asset like land, building,
plant and Machinery, furniture, long-term investments etc.
Are sold it “C411- 1 racts cash and becomes a source of
cash. However, it must be remembered that if one fixed
asset is exchanged for another fixed asset, it does not
constitute an inflow of cash because no current assets
are involved.
(5) Non-Trading receipts.
Any non-trading receipt like dividend received, refund flax;
rent received, etc. also increases cash and is treated as a
sources of cash because such an income is not included in
the cash from operations.
(6) Decrease in cash flow
92
If the cash flow decreases during the current period as
compared to the previous period, it means that there has
been a release of cash from cash flow and it constitutes a
source of fund
APPLICATION OR USES OF CASH
1) Cash lost in operations.
Some times the result of trading in a certain year
is a loss and some cash are lost during that period in
trading operations 1 such loss of cash in trading amounts
to an outflow of cash and is treated as an application of
cash.
2) Redemption of preference share capital.
If during the year any preference shares are
redeemed, it will result in the outflow of cash and is
taken as an application of cash. When the shares are
redeemed at premium or discount, it is the net amount
paid (including premium or excluding discount, as the
93
case may be). However, if shares are redeemed in
exchanges of some other type of shares or debentures, it
does not constitute an outflow of cash as no current
account is involved in that case.
3) Repayment of loans or redemption of debentures, etc.
In the same way as redemption of preference share
capital, redemption of debentures or repayments of loans
also constitute an application of cash
4) Purchase of any non-current or fixed asset:
When any fixed or non-current asset like
land, building, plant and machinery, furniture, long-term
investments, etc. are purchased, cash outflow from the
business. However, if fixed assets are purchased for a
consideration of issue of shares or debentures or if some
94
fixed asset is exchanged for another, it does of involve
any cash and hence not an application of cash.
5) Payment of dividends and tax.
Payment of dividends and tax are also
applications of cash. It is the actual payment of
dividend (may be interim dividend) and tax, which should
be taken as an outflow of cash and not the mere
declaration of dividend or creating of a provision for
taxation.
6) Any other non - trading payment.
Any payment or expense not related to the
trading operations of file business amounts to outflow of
cash and is taken as an application of cash. The examples
could be drawings in case of sole trader or partnership
firms, loss of cash, etc. ). However, if shares are
redeemed in exchanges of some other type of shares or
debentures, it does not constitute an outflow of cash as
no current account is involved in that case.95
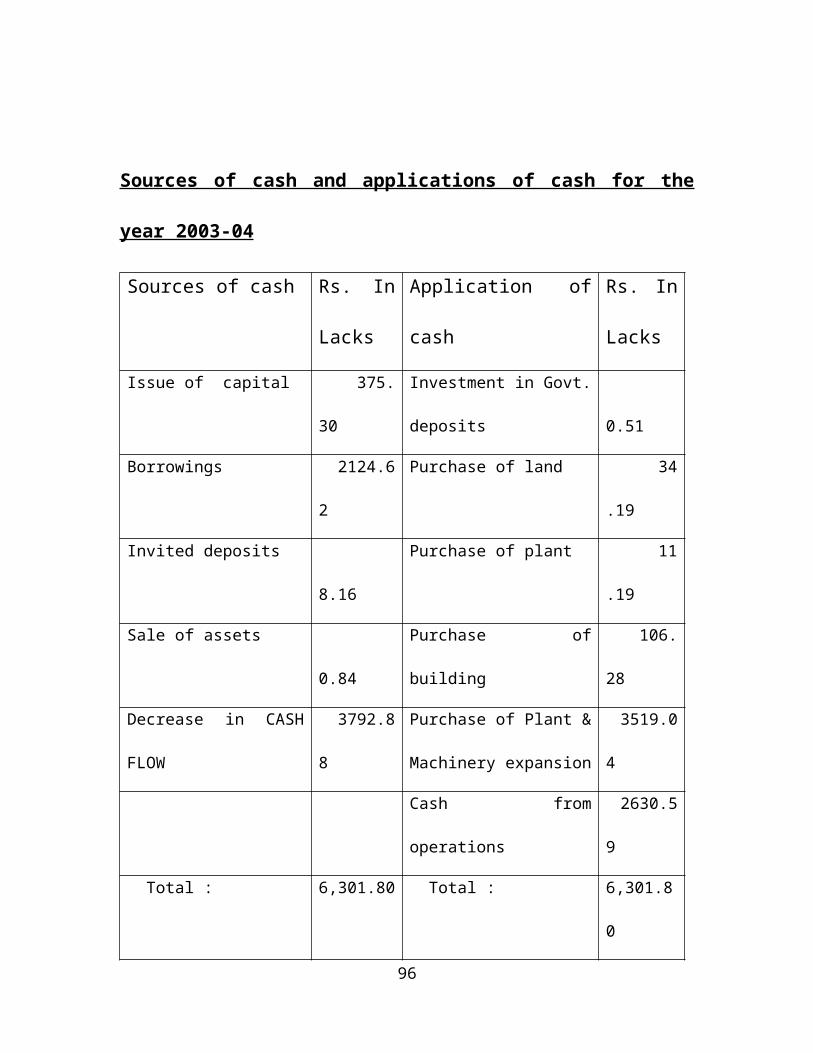
Sources of cash and applications of cash for the
year 2003-04
Sources of cash Rs. In
Lacks
Application of
cash
Rs. In
Lacks
Issue of capital 375.
30
Investment in Govt.
deposits
0.51
Borrowings 2124.6
2
Purchase of land 34
.19
Invited deposits
8.16
Purchase of plant 11
.19
Sale of assets
0.84
Purchase of
building
106.
28
Decrease in CASH
FLOW
3792.8
8
Purchase of Plant &
Machinery expansion
3519.0
4
Cash from
operations
2630.5
9
Total : 6,301.80 Total : 6,301.8
0
96
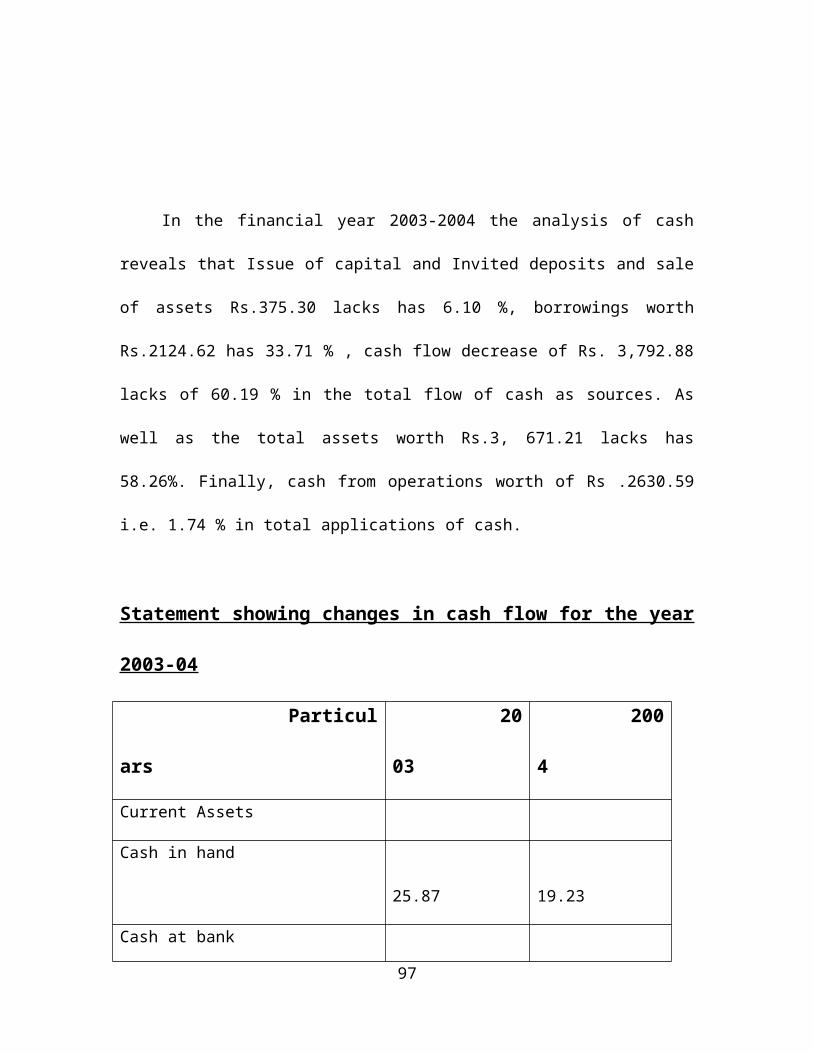
In the financial year 2003-2004 the analysis of cash
reveals that Issue of capital and Invited deposits and sale
of assets Rs.375.30 lacks has 6.10 %, borrowings worth
Rs.2124.62 has 33.71 % , cash flow decrease of Rs. 3,792.88
lacks of 60.19 % in the total flow of cash as sources. As
well as the total assets worth Rs.3, 671.21 lacks has
58.26%. Finally, cash from operations worth of Rs .2630.59
i.e. 1.74 % in total applications of cash.
Statement showing changes in cash flow for the year
2003-04
Particul
ars
20
03
200
4
Current Assets
Cash in hand
25.87
19.23
Cash at bank
97
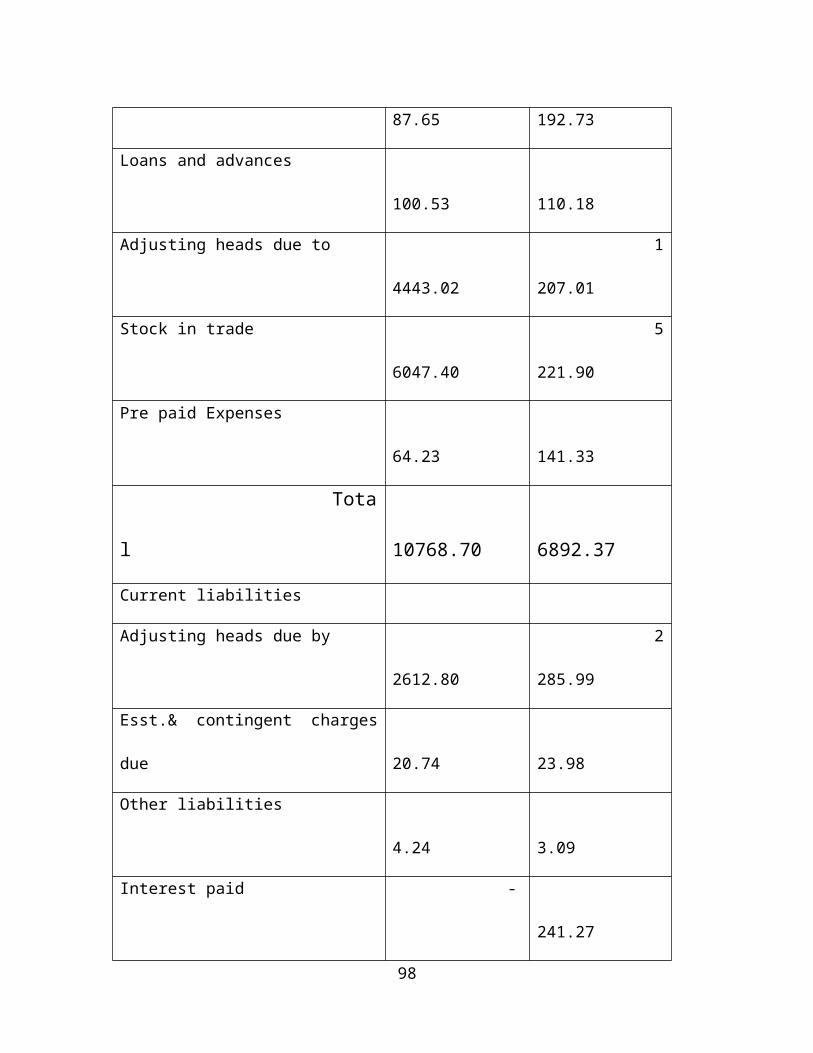
87.65 192.73
Loans and advances
100.53
110.18
Adjusting heads due to
4443.02
1
207.01
Stock in trade
6047.40
5
221.90
Pre paid Expenses
64.23
141.33
Tota
l
10768.70
6892.37
Current liabilities
Adjusting heads due by
2612.80
2
285.99
Esst.& contingent charges
due
20.74
23.98
Other liabilities
4.24
3.09
Interest paid -
241.27
98
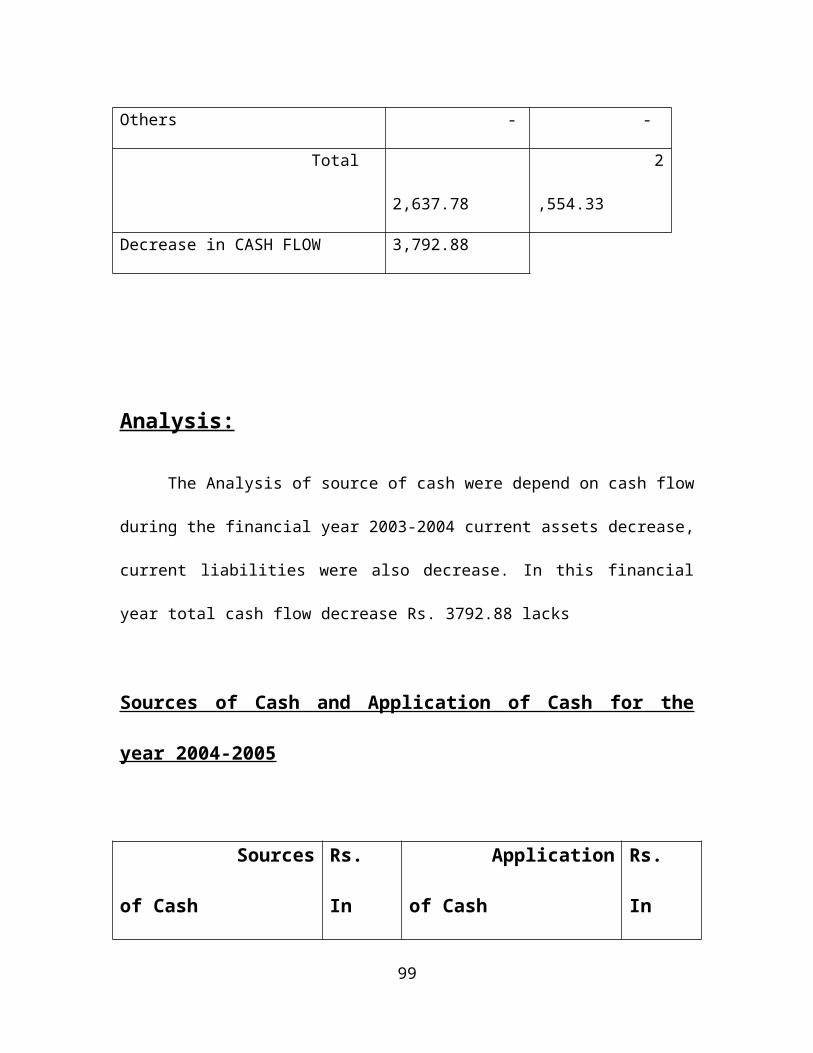
Others - -
Total
2,637.78
2
,554.33
Decrease in CASH FLOW 3,792.88
Analysis:
The Analysis of source of cash were depend on cash flow
during the financial year 2003-2004 current assets decrease,
current liabilities were also decrease. In this financial
year total cash flow decrease Rs. 3792.88 lacks
Sources of Cash and Application of Cash for the
year 2004-2005
Sources
of Cash
Rs.
In
Application
of Cash
Rs.
In
99
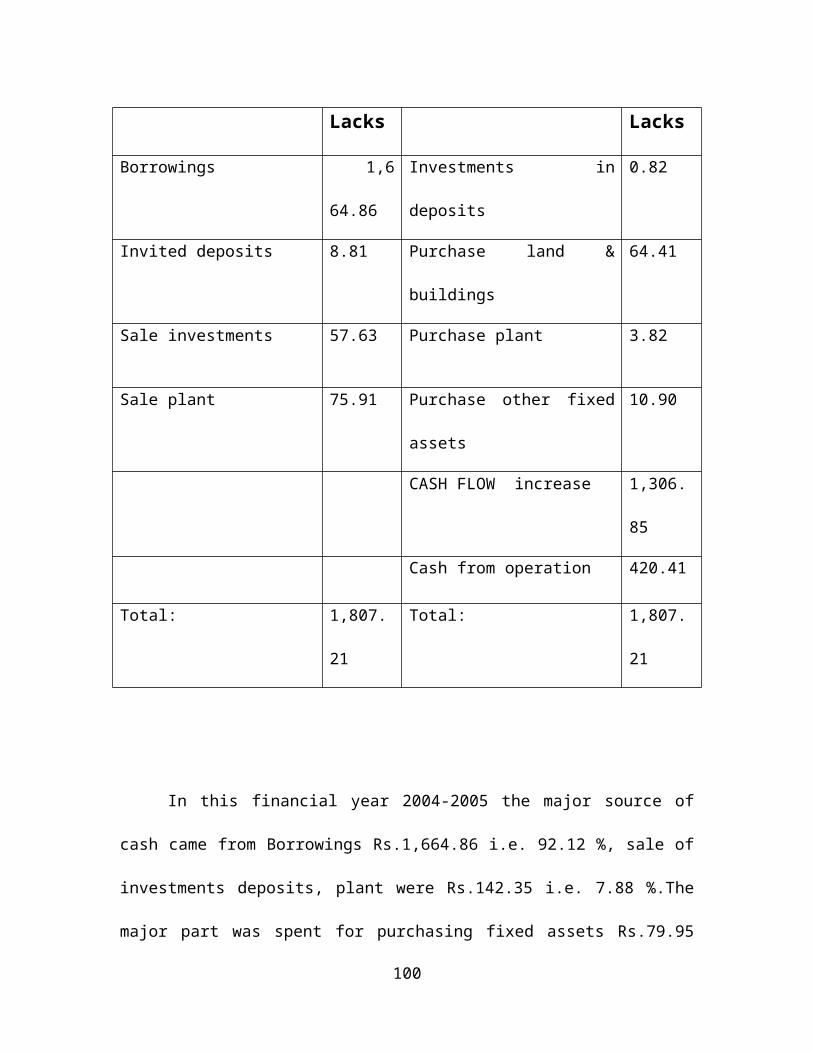
Lacks Lacks
Borrowings 1,6
64.86
Investments in
deposits
0.82
Invited deposits 8.81 Purchase land &
buildings
64.41
Sale investments 57.63 Purchase plant 3.82
Sale plant 75.91 Purchase other fixed
assets
10.90
CASH FLOW increase 1,306.
85
Cash from operation 420.41
Total: 1,807.
21
Total: 1,807.
21
In this financial year 2004-2005 the major source of
cash came from Borrowings Rs.1,664.86 i.e. 92.12 %, sale of
investments deposits, plant were Rs.142.35 i.e. 7.88 %.The
major part was spent for purchasing fixed assets Rs.79.95
100
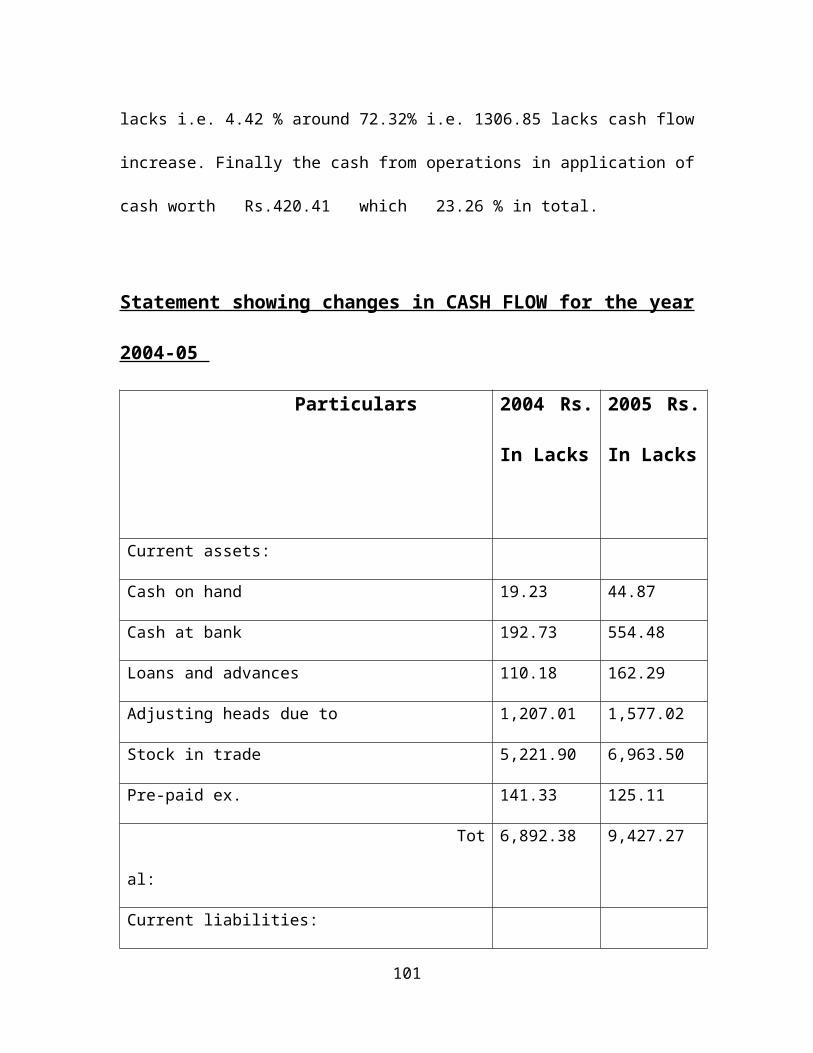
lacks i.e. 4.42 % around 72.32% i.e. 1306.85 lacks cash flow
increase. Finally the cash from operations in application of
cash worth Rs.420.41 which 23.26 % in total.
Statement showing changes in CASH FLOW for the year
2004-05
Particulars 2004 Rs.
In Lacks
2005 Rs.
In Lacks
Current assets:
Cash on hand 19.23 44.87
Cash at bank 192.73 554.48
Loans and advances 110.18 162.29
Adjusting heads due to 1,207.01 1,577.02
Stock in trade 5,221.90 6,963.50
Pre-paid ex. 141.33 125.11
Tot
al:
6,892.38 9,427.27
Current liabilities:
101
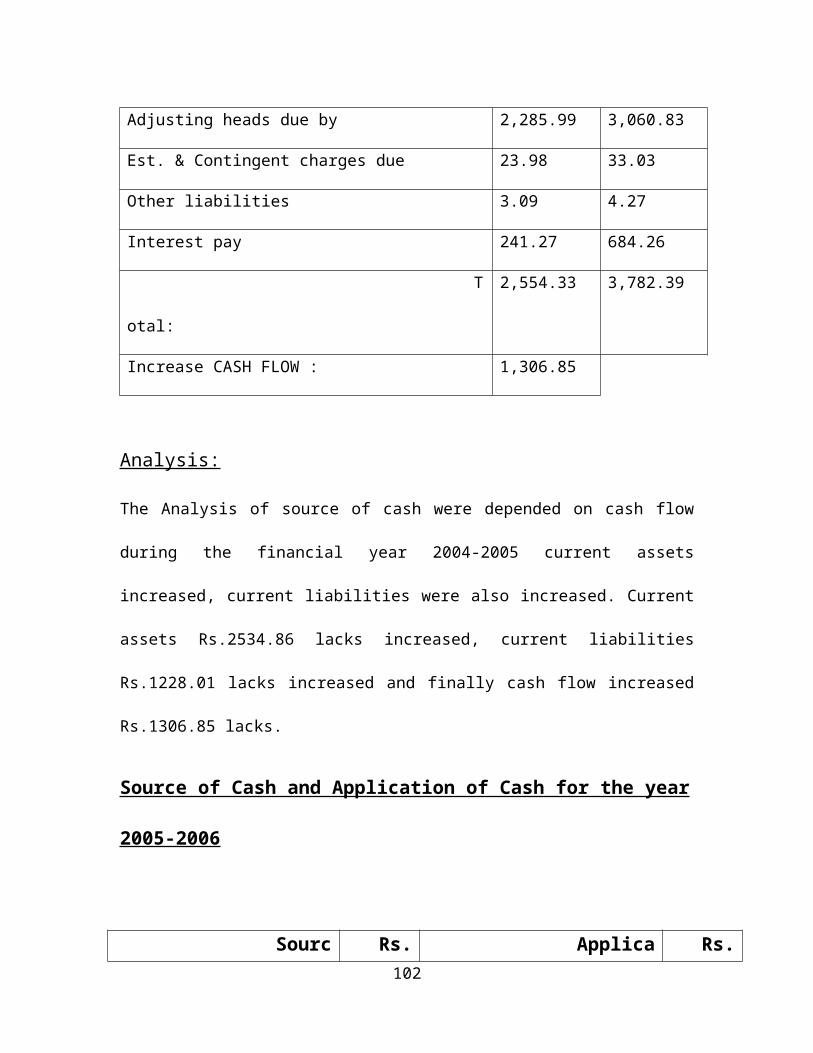
Adjusting heads due by 2,285.99 3,060.83
Est. & Contingent charges due 23.98 33.03
Other liabilities 3.09 4.27
Interest pay 241.27 684.26
T
otal:
2,554.33 3,782.39
Increase CASH FLOW : 1,306.85
Analysis:
The Analysis of source of cash were depended on cash flow
during the financial year 2004-2005 current assets
increased, current liabilities were also increased. Current
assets Rs.2534.86 lacks increased, current liabilities
Rs.1228.01 lacks increased and finally cash flow increased
Rs.1306.85 lacks.
Source of Cash and Application of Cash for the year
2005-2006
Sourc Rs. Applica Rs.102
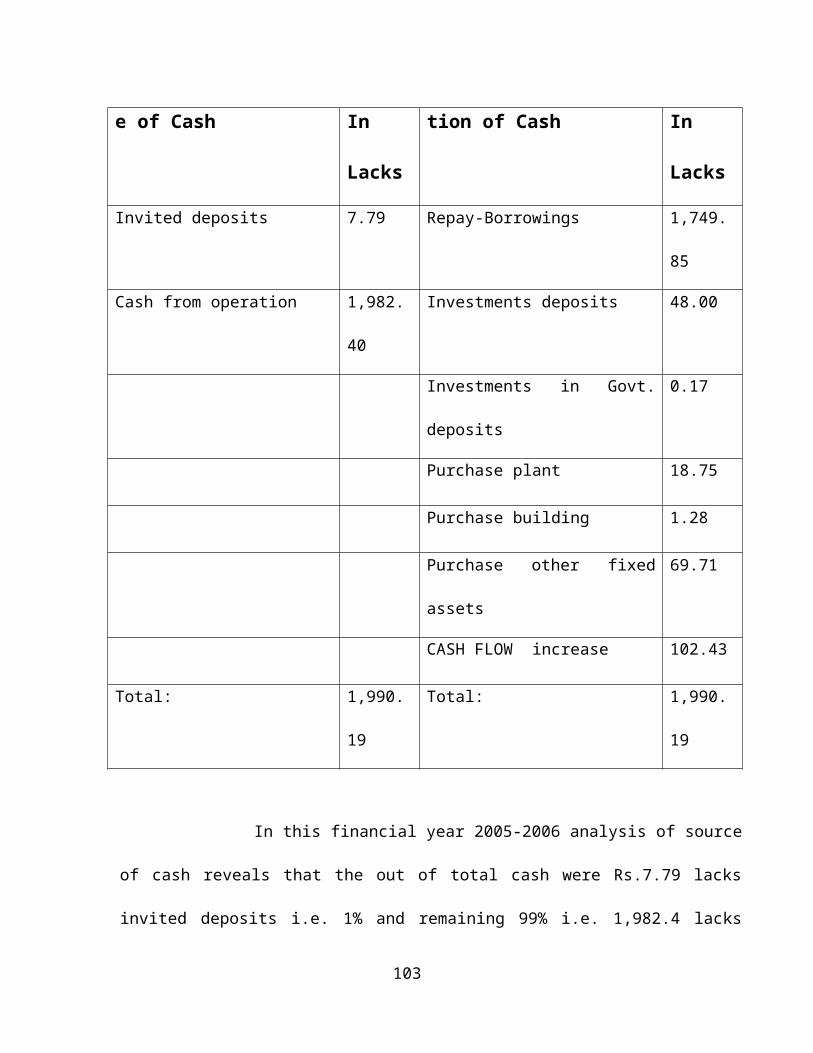
e of Cash In
Lacks
tion of Cash In
Lacks
Invited deposits 7.79 Repay-Borrowings 1,749.
85
Cash from operation 1,982.
40
Investments deposits 48.00
Investments in Govt.
deposits
0.17
Purchase plant 18.75
Purchase building 1.28
Purchase other fixed
assets
69.71
CASH FLOW increase 102.43
Total: 1,990.
19
Total: 1,990.
19
In this financial year 2005-2006 analysis of source
of cash reveals that the out of total cash were Rs.7.79 lacks
invited deposits i.e. 1% and remaining 99% i.e. 1,982.4 lacks
103
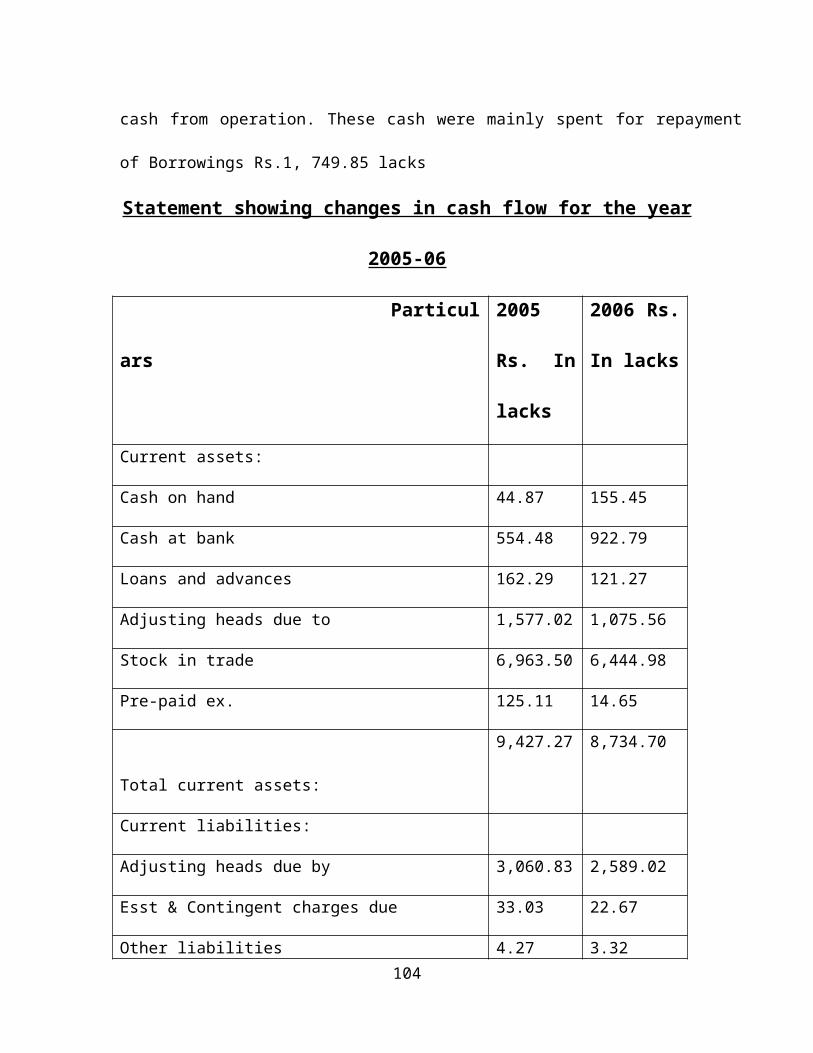
cash from operation. These cash were mainly spent for repayment
of Borrowings Rs.1, 749.85 lacks
Statement showing changes in cash flow for the year
2005-06
Particul
ars
2005
Rs. In
lacks
2006 Rs.
In lacks
Current assets:
Cash on hand 44.87 155.45
Cash at bank 554.48 922.79
Loans and advances 162.29 121.27
Adjusting heads due to 1,577.02 1,075.56
Stock in trade 6,963.50 6,444.98
Pre-paid ex. 125.11 14.65
Total current assets:
9,427.27 8,734.70
Current liabilities:
Adjusting heads due by 3,060.83 2,589.02
Esst & Contingent charges due 33.03 22.67
Other liabilities 4.27 3.32104
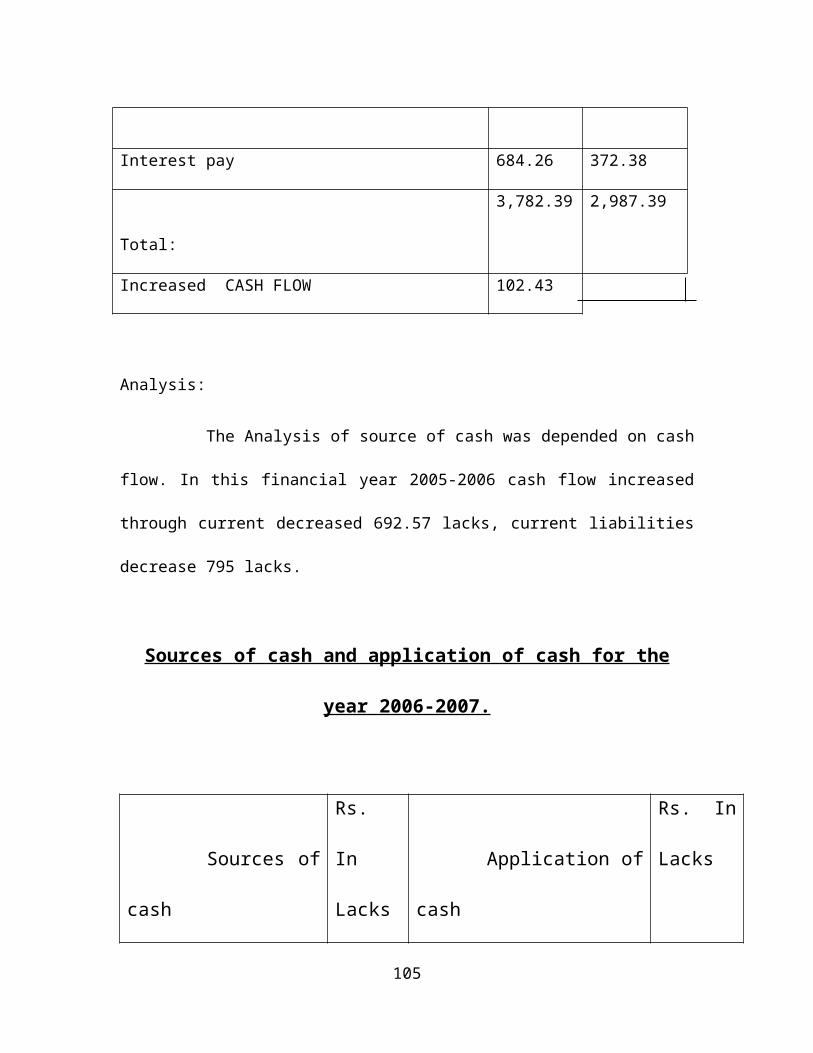
Interest pay 684.26 372.38
Total:
3,782.39 2,987.39
Increased CASH FLOW 102.43
Analysis:
The Analysis of source of cash was depended on cash
flow. In this financial year 2005-2006 cash flow increased
through current decreased 692.57 lacks, current liabilities
decrease 795 lacks.
Sources of cash and application of cash for the
year 2006-2007.
Sources of
cash
Rs.
In
Lacks
Application of
cash
Rs. In
Lacks
105
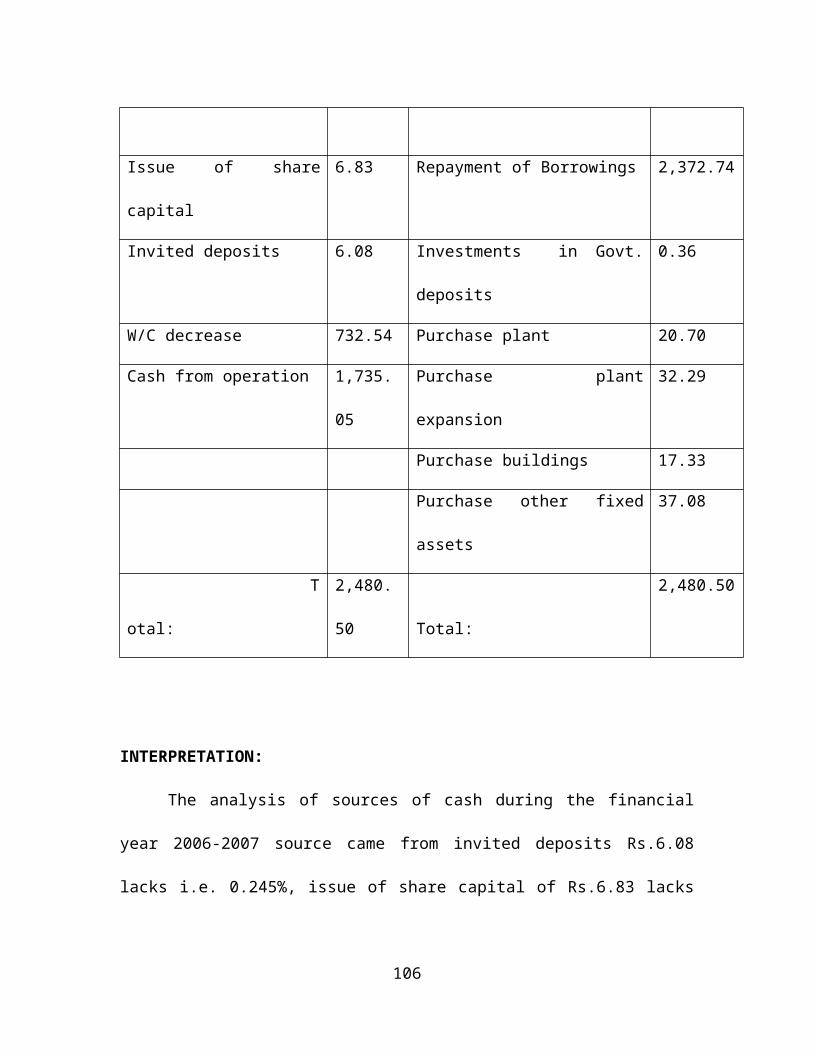
Issue of share
capital
6.83 Repayment of Borrowings 2,372.74
Invited deposits 6.08 Investments in Govt.
deposits
0.36
W/C decrease 732.54 Purchase plant 20.70
Cash from operation 1,735.
05
Purchase plant
expansion
32.29
Purchase buildings 17.33
Purchase other fixed
assets
37.08
T
otal:
2,480.
50
Total:
2,480.50
INTERPRETATION:
The analysis of sources of cash during the financial
year 2006-2007 source came from invited deposits Rs.6.08
lacks i.e. 0.245%, issue of share capital of Rs.6.83 lacks
106
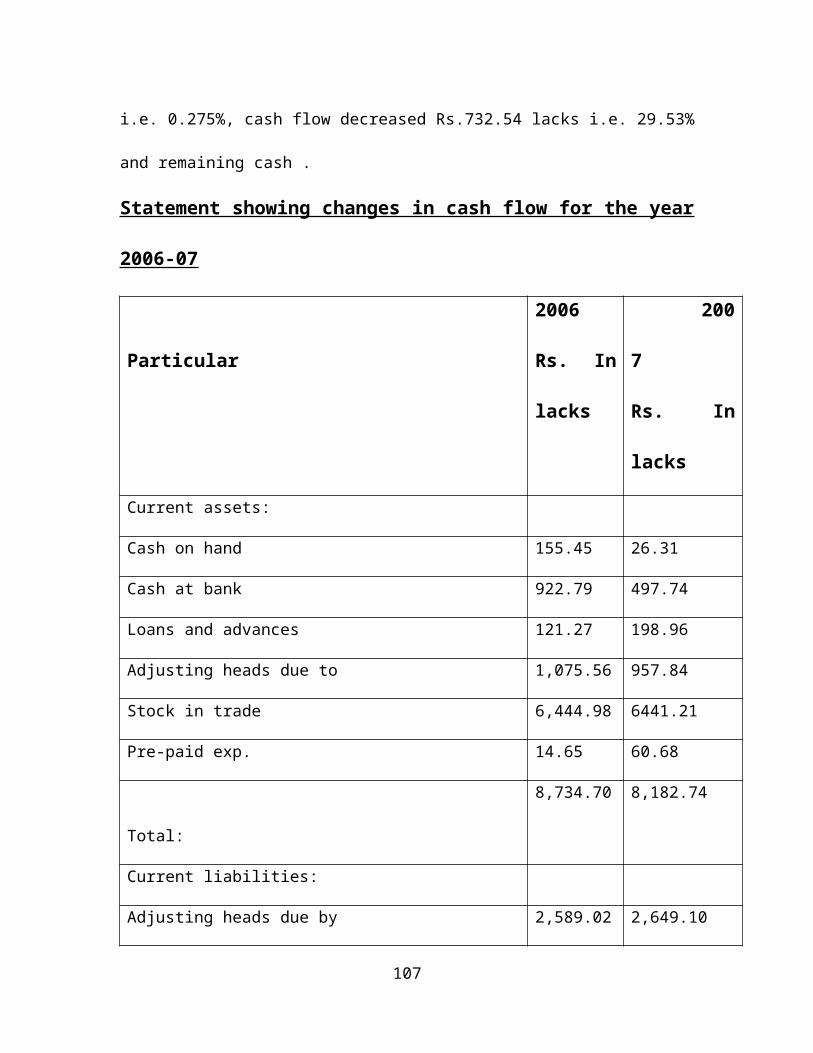
i.e. 0.275%, cash flow decreased Rs.732.54 lacks i.e. 29.53%
and remaining cash .
Statement showing changes in cash flow for the year
2006-07
Particular
2006
Rs. In
lacks
200
7
Rs. In
lacks
Current assets:
Cash on hand 155.45 26.31
Cash at bank 922.79 497.74
Loans and advances 121.27 198.96
Adjusting heads due to 1,075.56 957.84
Stock in trade 6,444.98 6441.21
Pre-paid exp. 14.65 60.68
Total:
8,734.70 8,182.74
Current liabilities:
Adjusting heads due by 2,589.02 2,649.10
107
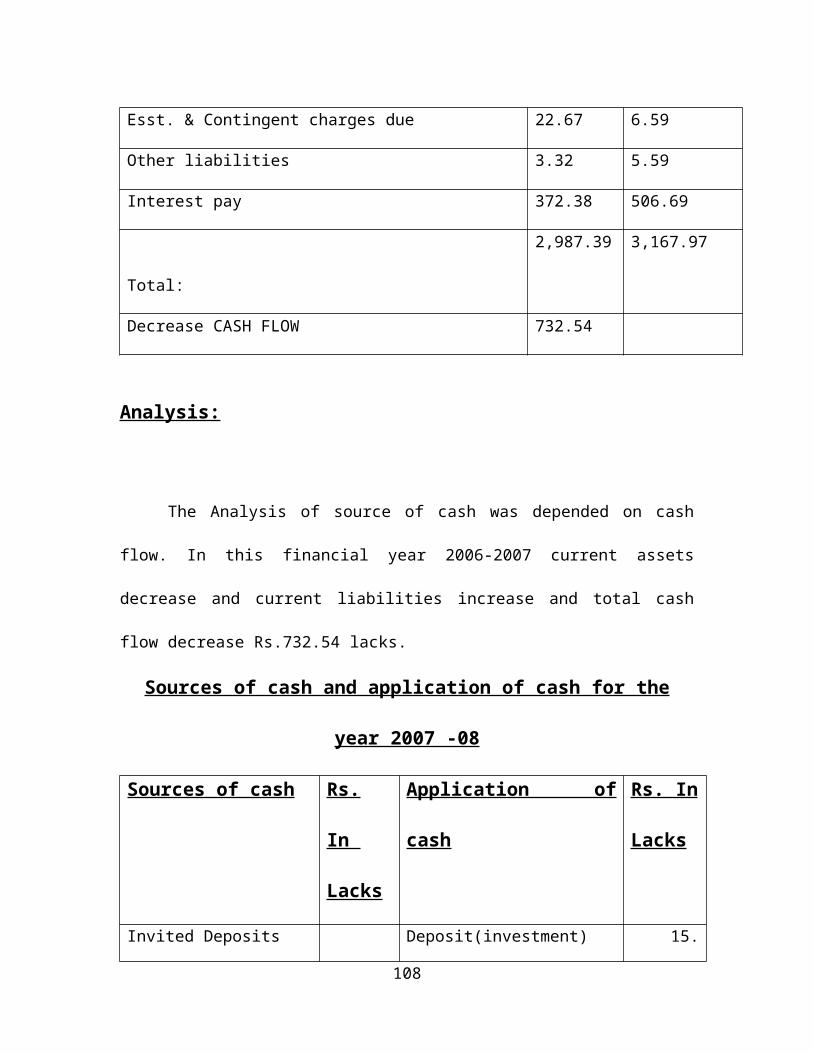
Esst. & Contingent charges due 22.67 6.59
Other liabilities 3.32 5.59
Interest pay 372.38 506.69
Total:
2,987.39 3,167.97
Decrease CASH FLOW 732.54
Analysis:
The Analysis of source of cash was depended on cash
flow. In this financial year 2006-2007 current assets
decrease and current liabilities increase and total cash
flow decrease Rs.732.54 lacks.
Sources of cash and application of cash for the
year 2007 -08
Sources of cash Rs.
In
Lacks
Application of
cash
Rs. In
Lacks
Invited Deposits Deposit(investment) 15.
108
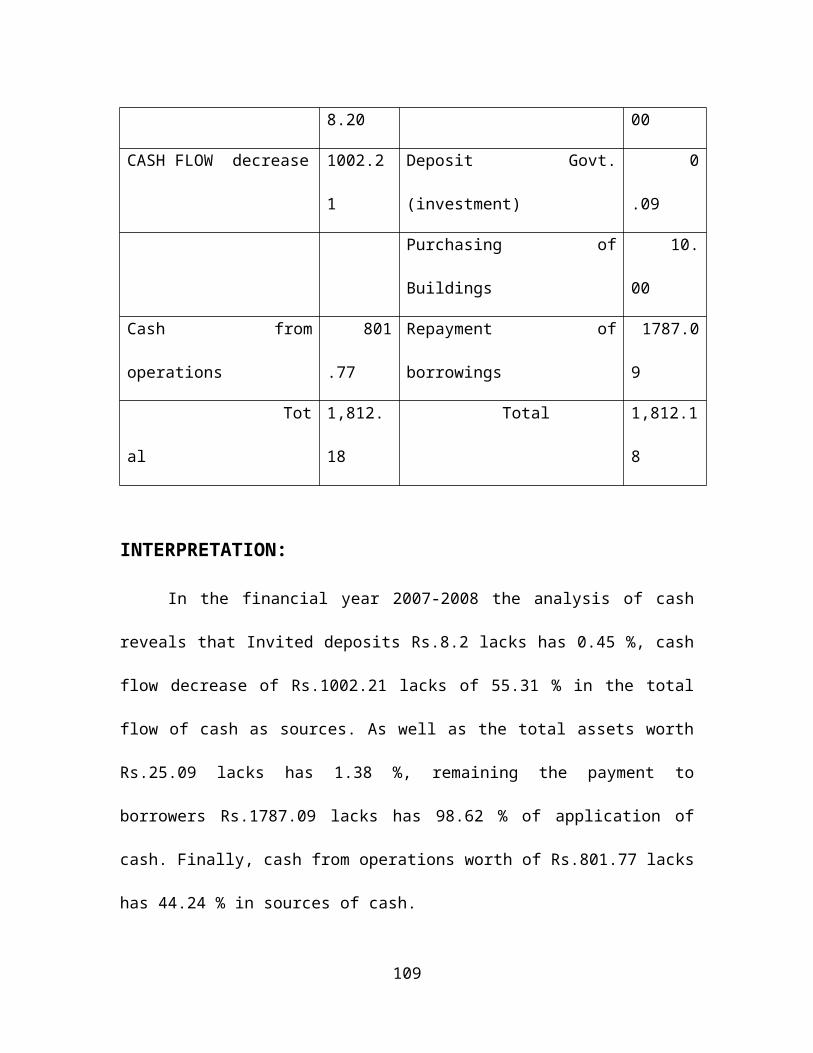
8.20 00
CASH FLOW decrease 1002.2
1
Deposit Govt.
(investment)
0
.09
Purchasing of
Buildings
10.
00
Cash from
operations
801
.77
Repayment of
borrowings
1787.0
9
Tot
al
1,812.
18
Total 1,812.1
8
INTERPRETATION:
In the financial year 2007-2008 the analysis of cash
reveals that Invited deposits Rs.8.2 lacks has 0.45 %, cash
flow decrease of Rs.1002.21 lacks of 55.31 % in the total
flow of cash as sources. As well as the total assets worth
Rs.25.09 lacks has 1.38 %, remaining the payment to
borrowers Rs.1787.09 lacks has 98.62 % of application of
cash. Finally, cash from operations worth of Rs.801.77 lacks
has 44.24 % in sources of cash.
109
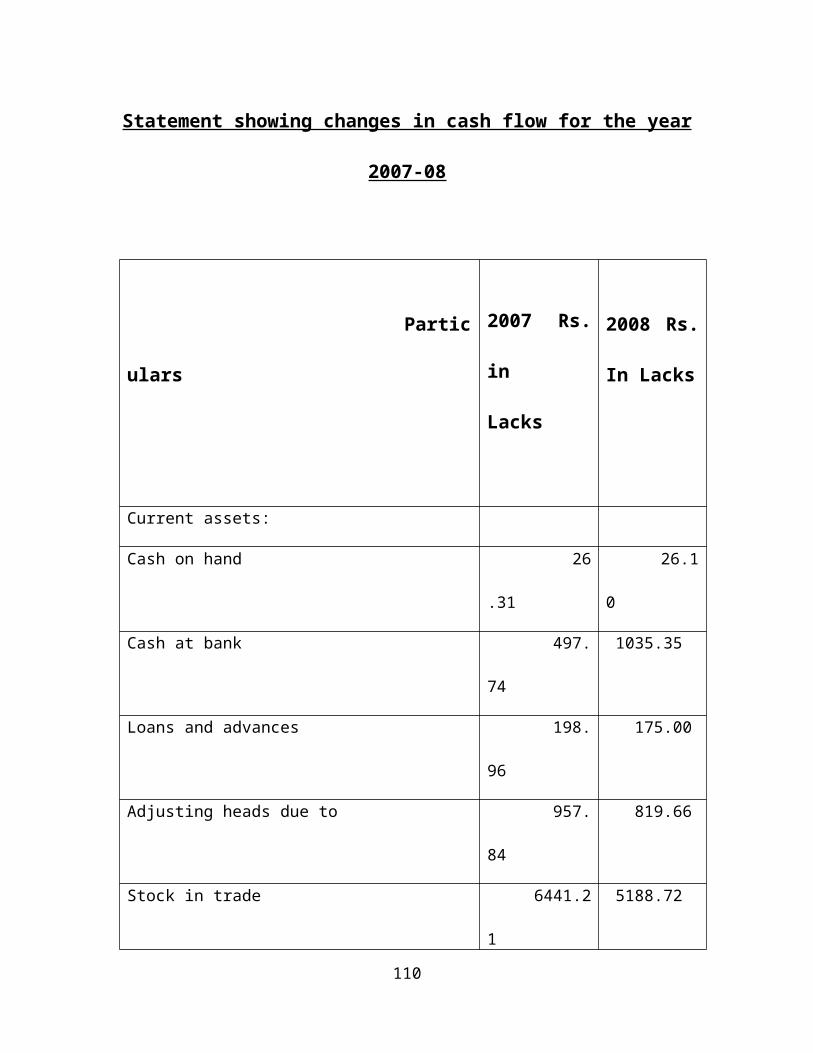
Statement showing changes in cash flow for the year
2007-08
Partic
ulars
2007 Rs.
in
Lacks
2008 Rs.
In Lacks
Current assets:
Cash on hand 26
.31
26.1
0
Cash at bank 497.
74
1035.35
Loans and advances 198.
96
175.00
Adjusting heads due to 957.
84
819.66
Stock in trade 6441.2
1
5188.72
110
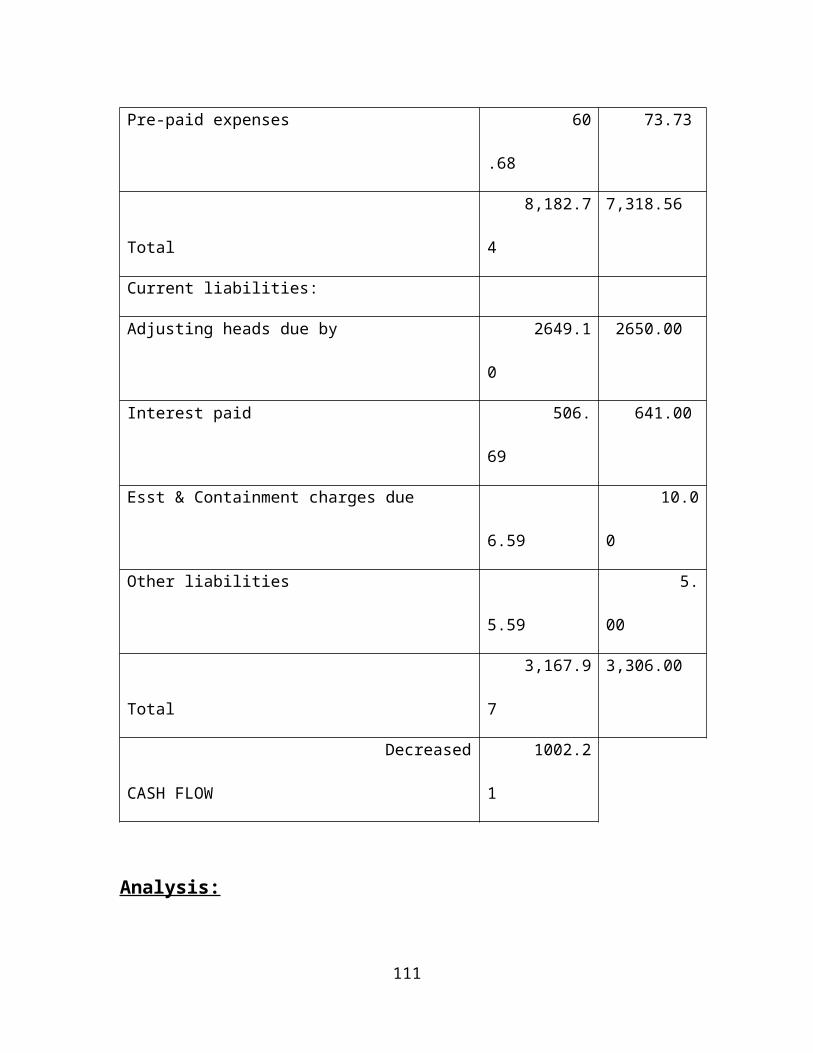
Pre-paid expenses 60
.68
73.73
Total
8,182.7
4
7,318.56
Current liabilities:
Adjusting heads due by 2649.1
0
2650.00
Interest paid 506.
69
641.00
Esst & Containment charges due
6.59
10.0
0
Other liabilities
5.59
5.
00
Total
3,167.9
7
3,306.00
Decreased
CASH FLOW
1002.2
1
Analysis:
111
The analysis of source of cash was on cash flow. The
financial year 2006-2007 current assets decreased and
current liabilities increased .In this year current assets
864.18 lacks decreased ,current liabilities 138.03 increased
and finally w/c decrease 1002.21 lacks.
MANAGEMENT OF RECIVABLE
Theoretical aspects
Receivables to total current assets ratio
Sundry debtors ratio
Average collection period
Brief theoretical aspects of receivables management
The well known form of trade credit is book also
referred to as debtors, outstanding and account receivables,
when a seller extended credit to a buyer mutual trust is
implicit in the transaction. The has three dimensions first
it embraces and element of risk, which needs to be
assessed .cash transaction covering immediate payment in
exchange for goods and services is totally risk112
less .Secondly it is based on economic value, the economic
value in good posses to the buyers currently in return for
an equipment economic value currently expected from him
latter, third, it implies futurity .The payment for value
received arrases at future date.
From the point of view of the seller, accounts receivable or
trade creditors represents a claim or an asset .In the
present day economy, credit stands out as a prominent per
force .Some view it is a type of business finance.
Granting credit has the effect of diverting financial
resources and this gives rise to the need for supplemental
financial assistance from banks of other sources to sustain
credit sales. This is the basis for the reference to the
investment in receivables.
Account receivables constitute a significant portion of
the total current assets of the business next inventories
they are a direct consequence of trade credit which has
become an essential marketing tool in modern business.
113
When a firm sells goods or services on credit the
payment are postponed to future dates receivables is to
maximize the acceleration of the collection process.
Accounts of funds should be and important consideration
in determining the company’s life. A firm cans economies of
the amount of funds tied up in receivable by adopting a
number of policies.
Objectives of receivables management
Primarily, receivable management should sustain and
promote the Turin corporate goals of liquidity and
profitability for this the credit policies, procedure and
practices have to be so tuned as to:
Obtain the optimum value of sales for a given period
Marinating proper control over the quantum of
investment in receivables
Exercise control over the cost of credit and collection
credit policy has close relevance to pricing strategy as
114
also the volume of business transacted in many given period.
Well administration credit can provide a good push to sales
and services as an effective tool for sales promotion it can
win new customers and keep them as profitable credit
accounts.
Scope of receivables management
Funds locked up in accounts receivables have
opportunity costs. Excessive tie up in outstand will amount
to denial of funds for more remunerative alternative uses.
The level of receivables is influenced by external
factors such as industry convention as to term of sale,
impact of changes in general level of business activity on
the volume of credit sales and other seasonal factors. While
these external influences may defy control there are host of
internal controllable factors that deserve attention. These
cover credit policies norms pertaining to granting of credit
determination of credit limits, policies and procedure
relating to collection of outstanding.
115
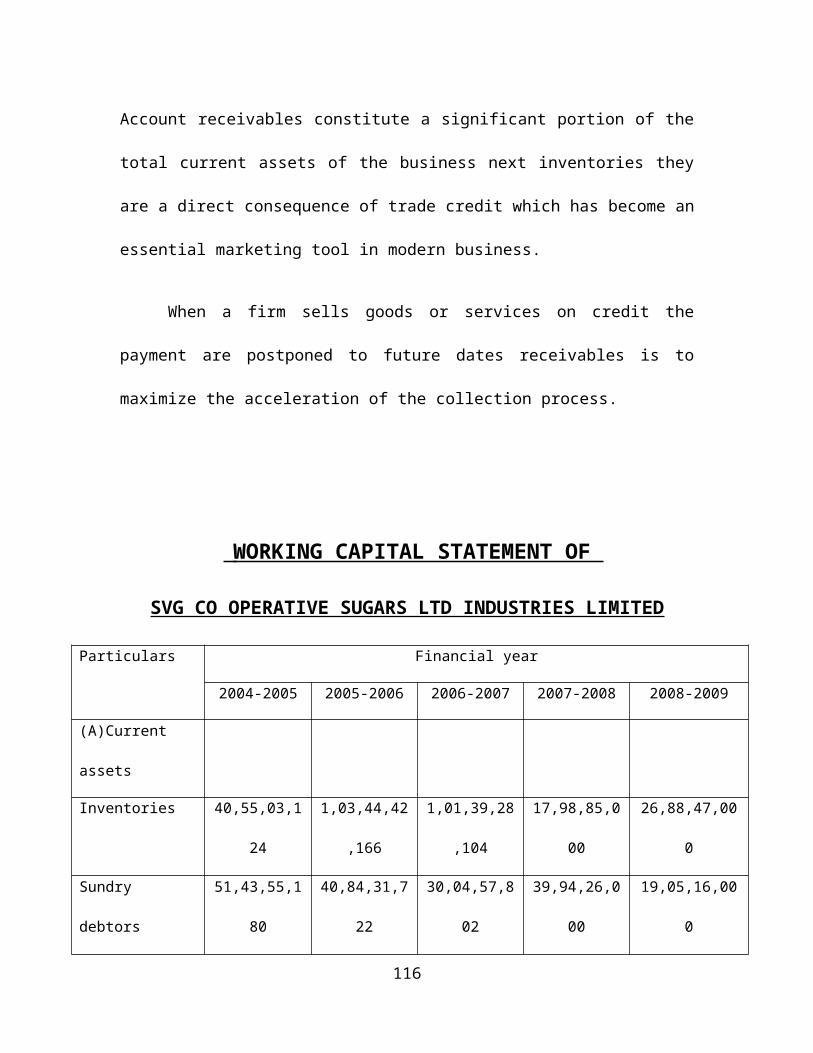
Account receivables constitute a significant portion of the
total current assets of the business next inventories they
are a direct consequence of trade credit which has become an
essential marketing tool in modern business.
When a firm sells goods or services on credit the
payment are postponed to future dates receivables is to
maximize the acceleration of the collection process.
WORKING CAPITAL STATEMENT OF
SVG CO OPERATIVE SUGARS LTD INDUSTRIES LIMITED
Particulars Financial year
2004-2005 2005-2006 2006-2007 2007-2008 2008-2009
(A)Current
assets
Inventories 40,55,03,1
24
1,03,44,42
,166
1,01,39,28
,104
17,98,85,0
00
26,88,47,00
0
Sundry
debtors
51,43,55,1
80
40,84,31,7
22
30,04,57,8
02
39,94,26,0
00
19,05,16,00
0
116
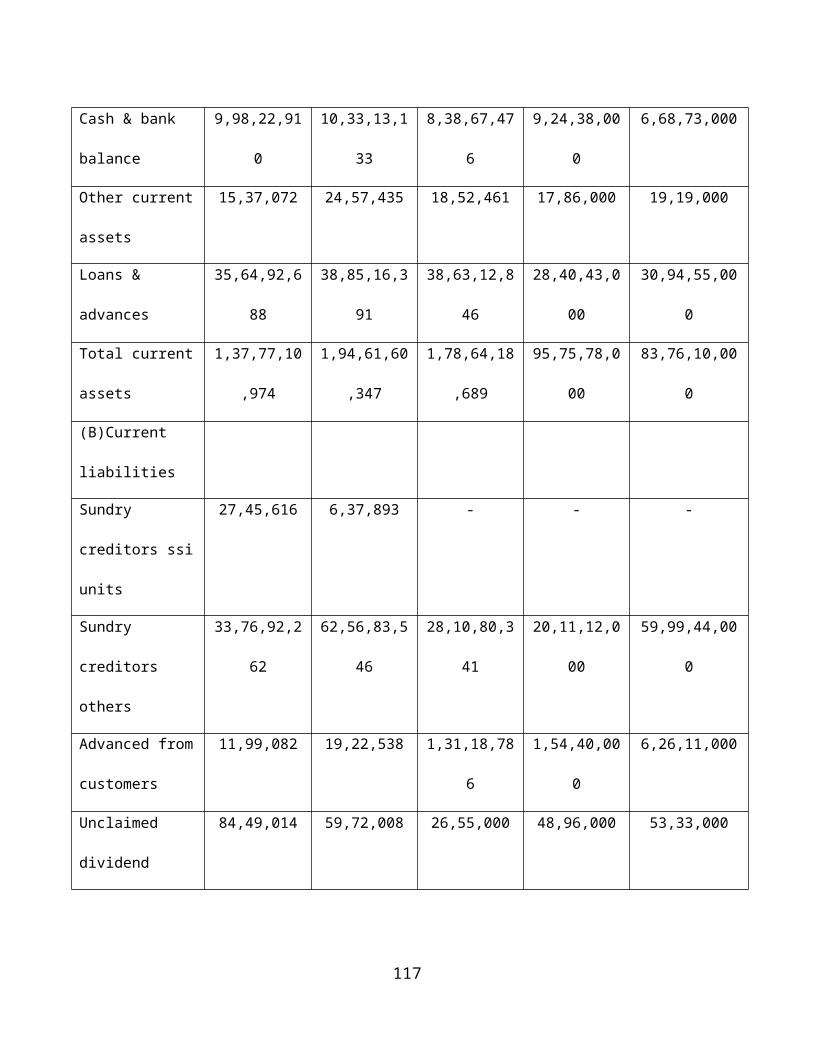
Cash & bank
balance
9,98,22,91
0
10,33,13,1
33
8,38,67,47
6
9,24,38,00
0
6,68,73,000
Other current
assets
15,37,072 24,57,435 18,52,461 17,86,000 19,19,000
Loans &
advances
35,64,92,6
88
38,85,16,3
91
38,63,12,8
46
28,40,43,0
00
30,94,55,00
0
Total current
assets
1,37,77,10
,974
1,94,61,60
,347
1,78,64,18
,689
95,75,78,0
00
83,76,10,00
0
(B)Current
liabilities
Sundry
creditors ssi
units
27,45,616 6,37,893 - - -
Sundry
creditors
others
33,76,92,2
62
62,56,83,5
46
28,10,80,3
41
20,11,12,0
00
59,99,44,00
0
Advanced from
customers
11,99,082 19,22,538 1,31,18,78
6
1,54,40,00
0
6,26,11,000
Unclaimed
dividend
84,49,014 59,72,008 26,55,000 48,96,000 53,33,000
117
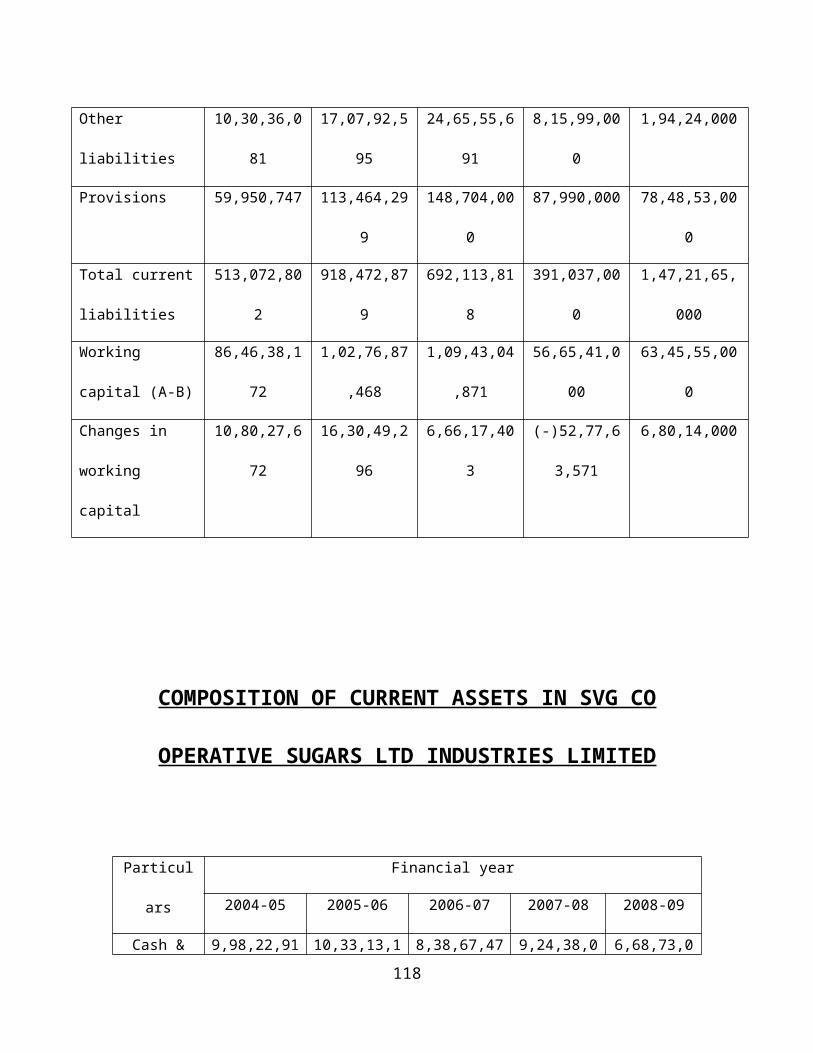
Other
liabilities
10,30,36,0
81
17,07,92,5
95
24,65,55,6
91
8,15,99,00
0
1,94,24,000
Provisions 59,950,747 113,464,29
9
148,704,00
0
87,990,000 78,48,53,00
0
Total current
liabilities
513,072,80
2
918,472,87
9
692,113,81
8
391,037,00
0
1,47,21,65,
000
Working
capital (A-B)
86,46,38,1
72
1,02,76,87
,468
1,09,43,04
,871
56,65,41,0
00
63,45,55,00
0
Changes in
working
capital
10,80,27,6
72
16,30,49,2
96
6,66,17,40
3
(-)52,77,6
3,571
6,80,14,000
COMPOSITION OF CURRENT ASSETS IN SVG CO
OPERATIVE SUGARS LTD INDUSTRIES LIMITED
Particul
ars
Financial year
2004-05 2005-06 2006-07 2007-08 2008-09
Cash & 9,98,22,91 10,33,13,1 8,38,67,47 9,24,38,0 6,68,73,0118
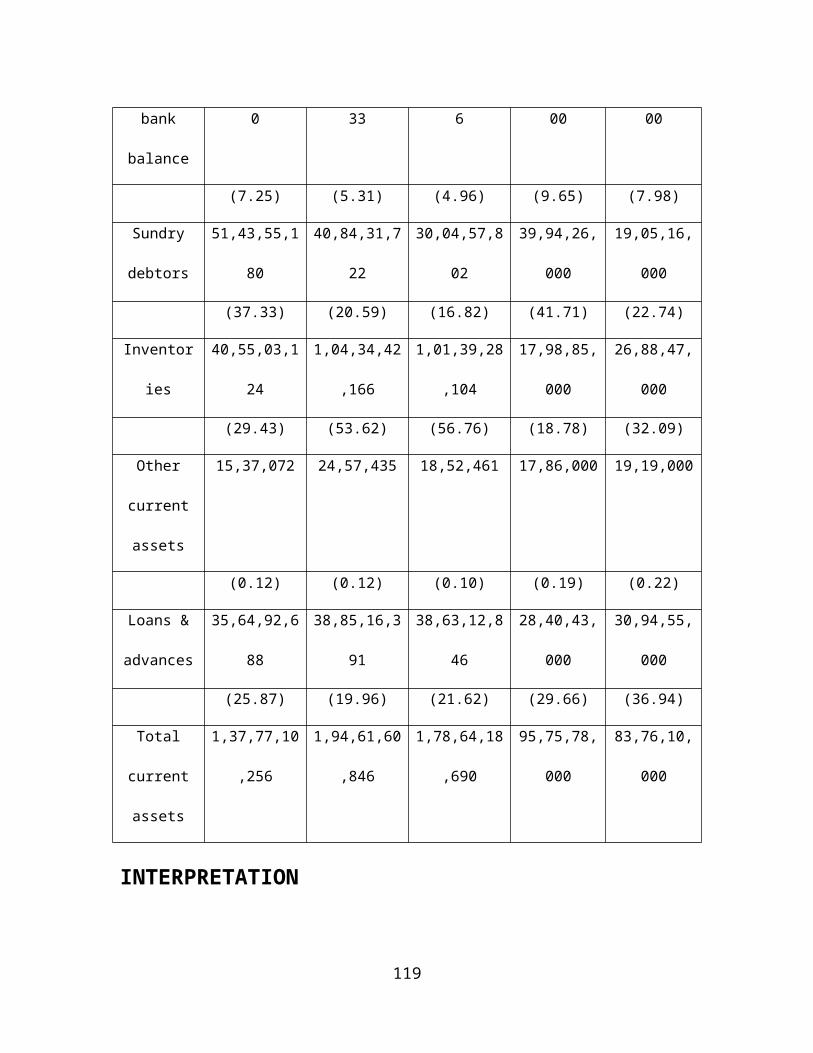
bank
balance
0 33 6 00 00
(7.25) (5.31) (4.96) (9.65) (7.98)
Sundry
debtors
51,43,55,1
80
40,84,31,7
22
30,04,57,8
02
39,94,26,
000
19,05,16,
000
(37.33) (20.59) (16.82) (41.71) (22.74)
Inventor
ies
40,55,03,1
24
1,04,34,42
,166
1,01,39,28
,104
17,98,85,
000
26,88,47,
000
(29.43) (53.62) (56.76) (18.78) (32.09)
Other
current
assets
15,37,072 24,57,435 18,52,461 17,86,000 19,19,000
(0.12) (0.12) (0.10) (0.19) (0.22)
Loans &
advances
35,64,92,6
88
38,85,16,3
91
38,63,12,8
46
28,40,43,
000
30,94,55,
000
(25.87) (19.96) (21.62) (29.66) (36.94)
Total
current
assets
1,37,77,10
,256
1,94,61,60
,846
1,78,64,18
,690
95,75,78,
000
83,76,10,
000
INTERPRETATION
119
By observing the above statement the working capital in
2004-05is 1,37,77,10,256 it is in 2006-07 is 1,78,64,18,690
and it is in 2007-08 is 95,75,78,000it is decreases
83,76,10,000 in 2004-05 it is increases to 18,027672 in
2005-06 it is also increases16,30,49,672 in 2005-06 and it
is current assets decreases in 2005-06and 2006-07. it refers
to those assets which in ordinary business can be converted
in to cash with in the accounting year 2005-06,2006-07,2007-
08.
STATEMENT OF CURRENT RATIO SVG CO OPERATIVE
SUGARS LTD INDUSTRIES LIMITED
Particu Financial year
120
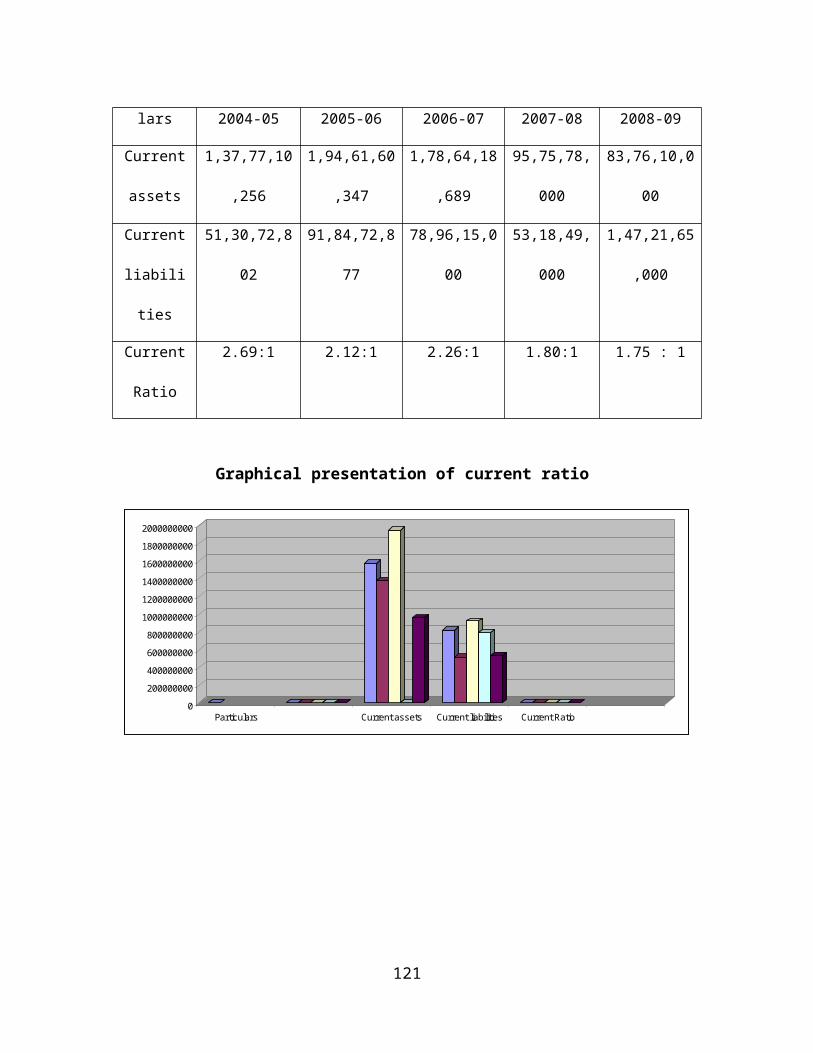
lars 2004-05 2005-06 2006-07 2007-08 2008-09
Current
assets
1,37,77,10
,256
1,94,61,60
,347
1,78,64,18
,689
95,75,78,
000
83,76,10,0
00
Current
liabili
ties
51,30,72,8
02
91,84,72,8
77
78,96,15,0
00
53,18,49,
000
1,47,21,65
,000
Current
Ratio
2.69:1 2.12:1 2.26:1 1.80:1 1.75 : 1
Graphical presentation of current ratio
0200000000400000000600000000800000000100000000012000000001400000000160000000018000000002000000000
Particulars Current assets Current liabilities Current Ratio
121
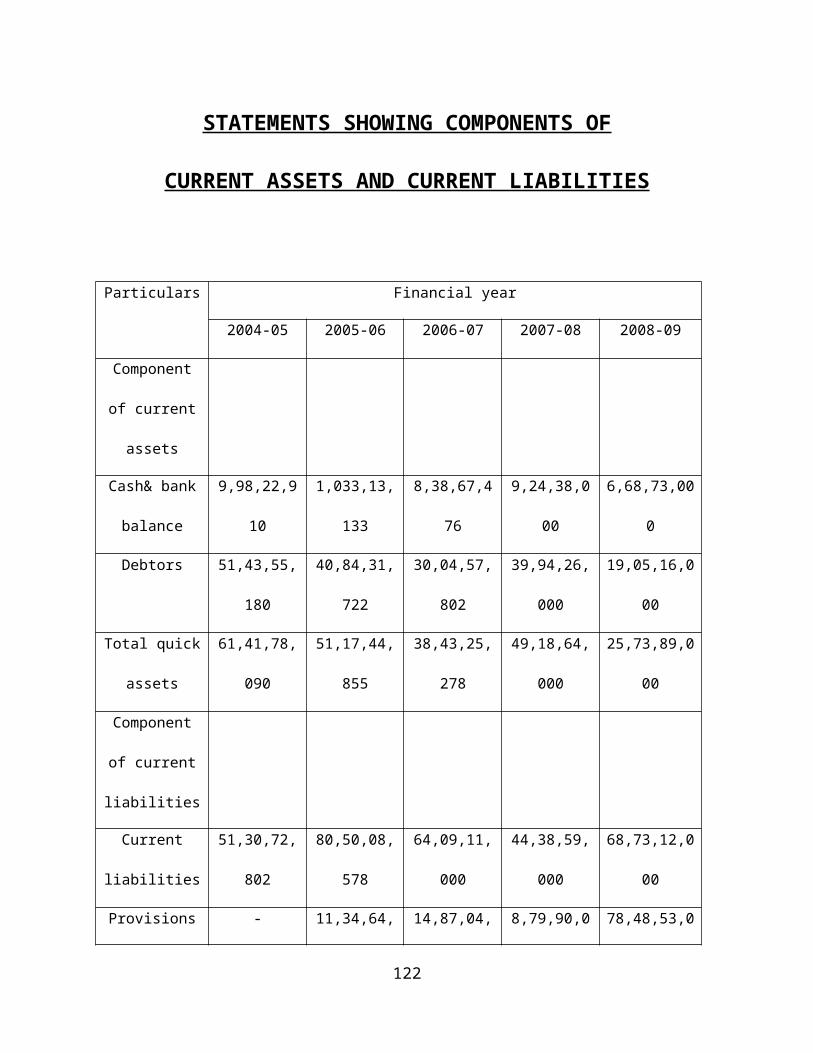
STATEMENTS SHOWING COMPONENTS OF
CURRENT ASSETS AND CURRENT LIABILITIES
Particulars Financial year
2004-05 2005-06 2006-07 2007-08 2008-09
Component
of current
assets
Cash& bank
balance
9,98,22,9
10
1,033,13,
133
8,38,67,4
76
9,24,38,0
00
6,68,73,00
0
Debtors 51,43,55,
180
40,84,31,
722
30,04,57,
802
39,94,26,
000
19,05,16,0
00
Total quick
assets
61,41,78,
090
51,17,44,
855
38,43,25,
278
49,18,64,
000
25,73,89,0
00
Component
of current
liabilities
Current
liabilities
51,30,72,
802
80,50,08,
578
64,09,11,
000
44,38,59,
000
68,73,12,0
00
Provisions - 11,34,64, 14,87,04, 8,79,90,0 78,48,53,0
122
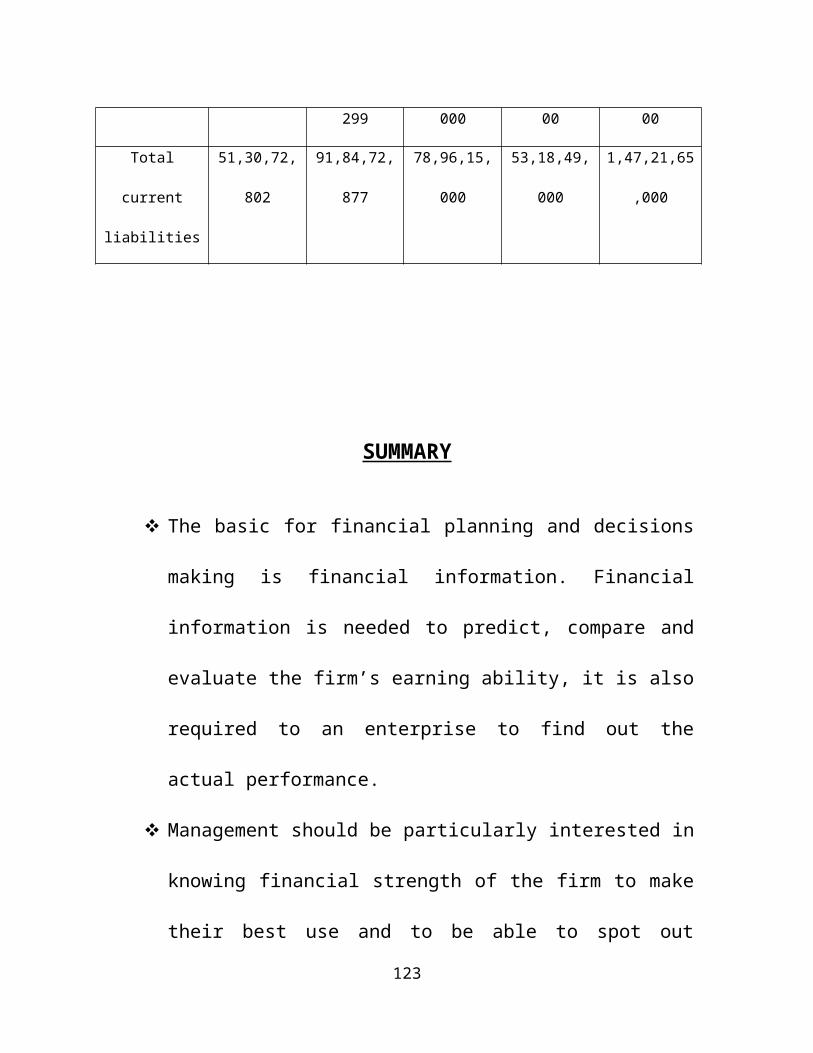
299 000 00 00
Total
current
liabilities
51,30,72,
802
91,84,72,
877
78,96,15,
000
53,18,49,
000
1,47,21,65
,000
SUMMARY
The basic for financial planning and decisions
making is financial information. Financial
information is needed to predict, compare and
evaluate the firm’s earning ability, it is also
required to an enterprise to find out the
actual performance.
Management should be particularly interested in
knowing financial strength of the firm to make
their best use and to be able to spot out
123
financial weakness of the firm to take suitable
corrective actions thus financial analysis is
the starting point of making plans before using
any forecasting & planning procedure.
Financial analysis is the process of
identifying the finance strength & weakness of
the firm by properly establishing relationship
between the items of the balance sheet and
profit and loss account.
India has been known as the original homes of
sugar and sugarcane Indian mythology supports
the above face as is contains some legends
showing the origin of sugar cane. .
Sugar industry continues to play a dominant
role in the economy of other states as
sugarcane is one of the important commercial
crops, the installed capacity of the sugar
124
factories in the state is 54000 tones of cane
crushing per day (TCD).
CHAPTER-V
FINDINGS & SUGGESTION
125
FINDINGS , SUGGESTION &CONCLUSION
CONCLUSION:
Cash flow analysis an important aspect in financial
management of every organization cash flow analysis is
required on fund based activities of the organization.
The Vizianagaram co-operative sugars limited, also
requires cash flow for carrying on its activities like
any organization. The accounts offices of the
organization maintain this.
126
The firm pledge its goods to the Visakhapatnam district
co-operative central bank, and gets cash credit limit
for getting its cash flow funded
The firm was the cash flow for lending to the
farmers, sanctioning fertilizers loans and other loans
for carrying on the production of sugar cane. It also
invest in some other current assets in invest in stock
as it should get order from the government selling in
sugar.
It needs cash flow for paying its current liabilities
like interest over due, sugarcane payments etc.,
The firm cash flow management policy is very optimum as it
need not keep any cash in advance for making payments (or)
need not keep any surplus cash available ideally as it can
with draw or deposit cash when ever required from the bank.
SUGGESTIONS
1. Cash in hand and bank is very high which does not carry
any interest resulting in opportunity cost of interest
lost for having not been invested some where else. It
127
is suggested that the money at the disposal of the
company should be sufficient to meet the requirements
exactly at the right time only, but it should not be
unproductively maintained on hand or bank for too long
a period in advance of the date of requirement.
2. Stock in trade is very high. So it is better to
dispose the stock immediately. Stock accumulation
result increased ware housing cost, risk of damage
obsolescence of stock etc., besides blocking up to cash
flow
3. The management has to see the dispose the stock which
is present in books for quite a long time since three
years.
4. The company should clearly define and establish
suitable credit policies in respect of both sales and
members.
5. It is suggested the company adopts the suitable system
of cash budgeting, receivables management and inventory
management.
128
6. The company is advised have the concept of cash flow
management.
7. It suggested the company should established reasonable
basis for estimating the future cash flow requirements.
8. The company identify its inventory as a show moving
items, fast moving items or long moving items, to their
after the management may consider steps that are
necessary for the disposal of non moving items at the
earliest.
9. The company may also go for “ABC analysis” in order to
efficiently manage their inventory.
FINDINGS
There is an increase in assets in the organization for
2004-05 then the assets in the organization are
decreased from 2006 to 2009. This indicated the
financial performance of the organization is not
satisfactory
129
It is found that the company has got sufficient gross
profit having margin of 39% in the year 2006-07. But
the gross profit position declined slightly in the year
2008-09.
The total income and net worth were growing at a low
rate in 2006-07. yet there are wide fluctuations in the
ratio during the period which is not good for the
company in the long run.
The leverage position of the company is almost
comfortable.
The total assets turnover ratio of the company is also
not satisfactory.
BIBLIOGRAPHY
130
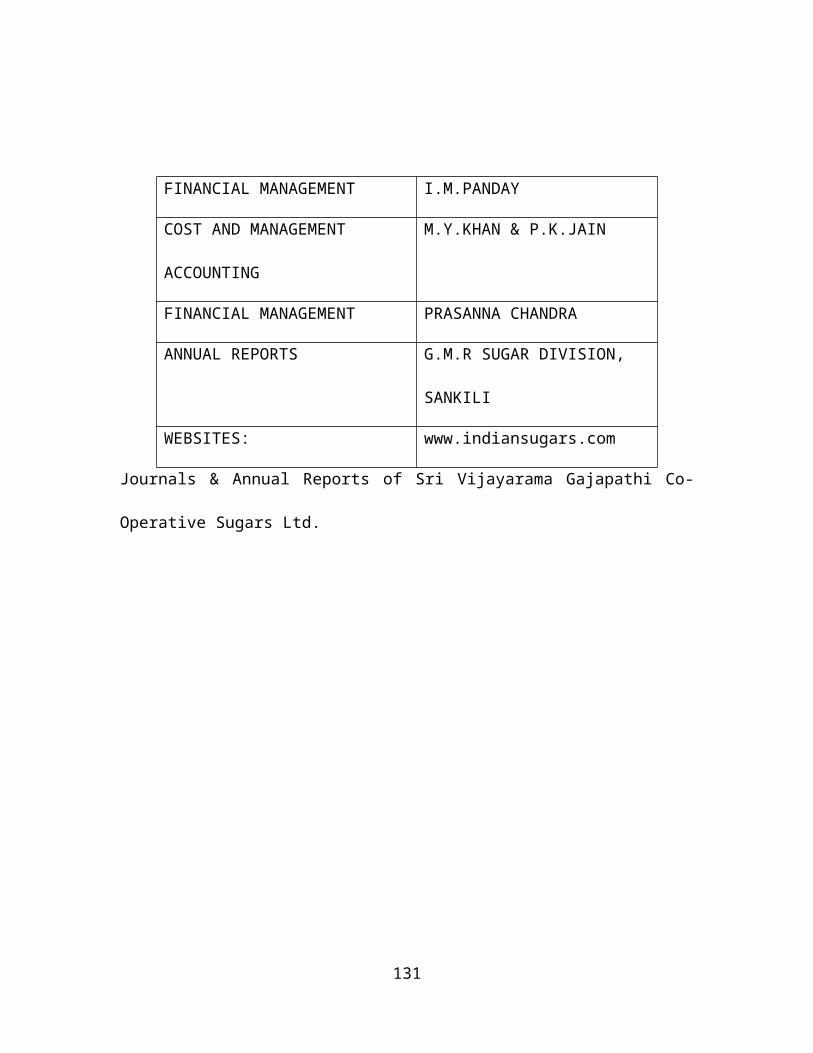
Journals & Annual Reports of Sri Vijayarama Gajapathi Co-
Operative Sugars Ltd.
131
FINANCIAL MANAGEMENT I.M.PANDAY
COST AND MANAGEMENT
ACCOUNTING
M.Y.KHAN & P.K.JAIN
FINANCIAL MANAGEMENT PRASANNA CHANDRA
ANNUAL REPORTS G.M.R SUGAR DIVISION,
SANKILI
WEBSITES: www.indiansugars.com

‘
132