Embed Size (px)
Citation preview


Cash Flow Forecasting

Essential Capital Markets
Books in the series:
Cash Flow Forecasting
Corporate Valuation
Credit Risk Management
Finance of International Trade
Mergers and Acquisitions
Portfolio Management in Practice
Introduction to Project Finance
Syndicated Lending

Cash Flow
Forecasting
Edited by
Andrew Fight
AMSTERDAM • BOSTON • HEIDELBERG • LONDON • NEW YORK • OXFORD
PARIS • SAN DIEGO • SAN FRANCISCO • SINGAPORE • SYDNEY • TOKYO
Butterworth-Heinemann is an imprint of Elsevier

Butterworth-Heinemann is an imprint of Elsevier
Linacre House, Jordan Hill, Oxford OX2 8DP
30 Corporate Drive, Suite 400, Burlington, MA 01803
First published 2006
Copyright © 2006, Andrew Fight. All rights reserved.
Note
The materials contained in this book remain the copyrighted intellectual
property of Andrew Fight, are destined for use in his consulting activities,
and are to be clearly identified as copyrighted to him.
Andrew Fight has asserted his right under the Copyrights, Designs, and
Patents Act 1988, to be identified as author of this work, and confirms
that he retains ownership of the intellectual property and rights
to use these materials in his training courses and consulting activities.
No part of this publication may be reproduced in any material form
(including photocopying or storing in any medium by electronic means
and whether or not transiently or incidentally to some other use of this
publication) without the written permission of the copyright holder
except in accordance with the provisions of the Copyright, Designs and
Patents Act 1998 or under the terms of a licence issued by the Copyright
Licensing Agency Ltd, 90 Tottenham Court Road, London, England W1T 4LP.
Applications for the copyright holder’s written permission to reproduce
any part of this publication should be addressed to the publisher.
Permissions may be sought directly from Elsevier’s Science
and Technology Rights Department in Oxford, UK: phone: (�44) (0) 1865 843830;
fax: (�44) (0) 1865 853333; e-mail: [email protected]. You may
also complete your request on-line via the Elsevier homepage (http://www.elsevier.com),
by selecting ‘Customer Support’ and then ‘Obtaining Permissions’.
British Library Cataloguing in Publication Data
A catalogue record for this book is available from the British Library
Library of Congress Cataloging in Publication Data Control Number: 2005923901
ISBN-13: 978-0-7506-6136-2
ISBN-10: 0-7506-6136-4
Composition by Charon Tec Pvt. Ltd, Chennai, India
www.charontec.com
Printed and bound in Great Britain
06 07 08 09 10 11 10 9 8 7 6 5 4 3 2 1
For information on all Butterworth-Heinemann publications
visit our website at http://books.elsevier.com

Contents
Preface ix
1 Overview of cash flow forecasting 1
Introduction 1
What is a healthy cash flow? 3
What are the uses of cash flow forecasting? 6
2 Summary of financial statements 8
Introduction 8
The annual report and accounts 10
The profit and loss account 33
Problems with financial statements and auditors 35
Conclusion 38
3 Factors impacting financial performance 41
Introduction 41
Strategic analysis – the external environment 42
Strategic analysis – the value chain 46
Management 49
Profitability and performance 50
Asset management 54
Capital structure 58
Cash flow 63
Cash flow forecasting 66
Corporate failure 70
4 Cash flow forecasting of financial statements 76
Why cash flow analysis? 76
Purpose of projections 79
Historical performance and variable input analysis 81
Profit and loss statement projections 86
Balance sheet projections 109
Assets 112
Liabilities 119
Completed AmaOS forecasted balance sheet 131
Cash flow projections 134
Cash flow ratio analysis 144
Sensitivity analysis 146
Protection and control in term lending 150
Conclusion 153
Chapter self-test 155
Chapter self-test answers 158
5 Cash flow forecasting of project finance 160
Introduction 160
Cash flow forecasting 163
Conclusion 171
6 Pro forma forecasts using AMADEUS electronic databases 172
Appendices 185
1 Credit rating agency rating scales 186
2 Country risk criteria 189
3 Summary of lending types 199
4 Complete AmaOS spreadsheet 200
Suggested reading 209
Glossary 210
Profitability indicators 237
Turnover and efficiency indicators 238
Contentsvi

Financial position indicators 239
Cash flow terms 240
Cash ratios 240
Index 243
Contents vii

This page intentionally left blank

Preface
Welcome to this book on cash flow forecasting.
This book is presented in six chapters, each of which treats a specific
aspect of cash flow forecasting. The individual chapters cover the following
topics:
■ Overview of cash flow forecasting
■ Summary of financial statements
■ Factors impacting financial performance
■ Cash flow forecasting of financial statements
■ Cash flow forecasting of project finance
■ Pro forma forecasts using Amadeus electronic databases.
It also includes appendices, suggested reading, and a glossary.
This book aims to explain the background and raison d’être of cash flow
forecasting as one of the techniques used in the capital markets to provide
finance to companies, multinational corporations and large-scale projects.
Since most large loans and project financings are structured with a view
to syndication in the international capital markets, cash flow forecasting
also offers the possibility of structuring financings to satisfy the particu-
lar pricing, size and tenor appetites of the market.

It is suggested that this book be read in conjunction with the Syndicated
Lending and Introduction to Project Finance books in this series, thereby
linking the structuring of the cash flow forecasting facility to the
marketing issues involved in loan syndication.
For newcomers to credit and financial analysis, the Credit Risk Management
book in this series sets the analytical groundwork for understanding the
concepts in Cash Flow Forecasting.
We hope that this book Cash Flow Forecasting, in the Essential Capital
Markets Series, will be informative and instructional, and an indispens-
able and practical aid to persons seeking to understand this important
area of banking.
Andrew Fight
www.andrewfight.com
Prefacex

Chapter 1
Overview of cash flowforecasting
Introduction
What is cash flow forecasting? The term features prominently in the
press, more specifically with respect to infrastructure, and public and
private venture capital needs. The press often refers to huge projects
such as building infrastructure projects like highways, the Eurotunnel,
metro systems or airports. It is a technique that has been used to raise
huge amounts of capital and promises to continue to do so, in both
developed and developing countries, for the foreseeable future.
Cash flow forecasting, however, is also useful for more mundane applica-
tions. In many countries, the SME sector can account for as much as 40–50
per cent of economic activity. Small and medium-sized enterprises often
require access to growth capital during their expansion phase, and the
greatest single problem facing SMEs in an expansion role is insufficient
liquidity. It is unfortunate that in many countries the SME sector is over-
looked in the quest for more lucrative, albeit higher-risk, credit scenarios.
National economic growth can also be fostered by the growth in the eco-
nomic activity of SMEs, and it is therefore important to understand the
techniques that can be used to provide funding to this sector. It is crucial for
potential lenders to understand the financial situation, liquidity and cash
flow situation of SMEs in order optimally to practise good lending principles.
This book on cash flow forecasting will therefore explore some of the
mechanisms used in preparing cash flow forecasts, with a view to using
them for sensitivity analysis and designing appropriate financial struc-
tures and loan covenants to protect the bank’s position in an adverse
environment. Accordingly, this book will touch upon a number of issues
en passant, such as the interrelations between items in a standard set of
company accounts, ratio analysis, projection methodologies, debt runoff
schedules, loan documentation, and the drafting of effective financial
covenants in order to illustrate how to use the projections usefully.
The purpose of cash flow projections after all is not to construct elab-
orate mathematical models or predict the future, but rather to identify
potential weaknesses in a given credit situation and point the way to
adopt measures to enhance, correct or protect the bank’s exposure.
Understanding the key risks and practical applications of cash flow fore-
casting and how it differs from other financing techniques is critical to
all the major players in large capital projects (such as commercial and
investment bankers), but also other players in lending situations (such as
project finance, general contractors, subcontractors, insurance com-
panies, suppliers and customers). All these participants will participate
into an interlocking financing structure with mutual and multiple inter-
dependencies.
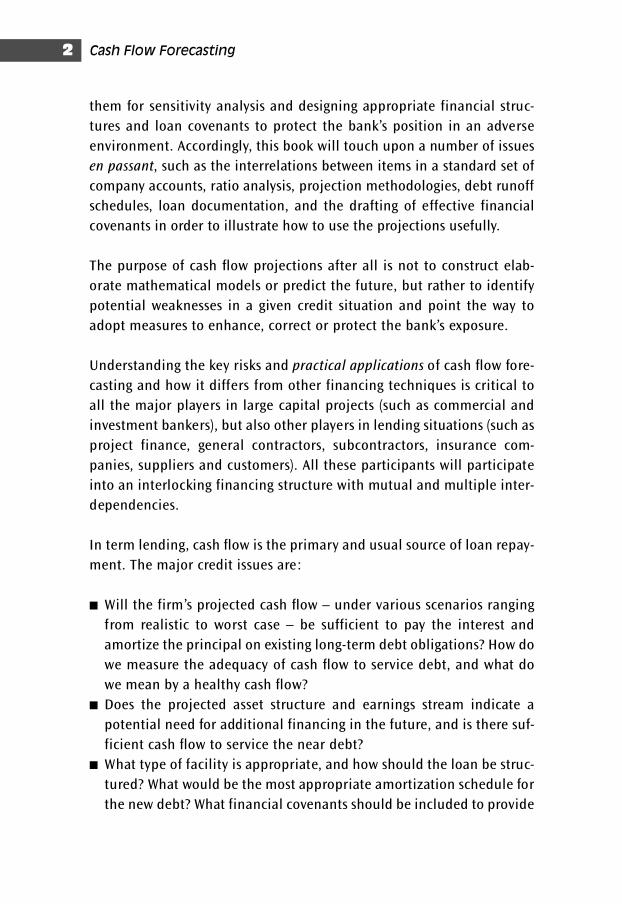
In term lending, cash flow is the primary and usual source of loan repay-
ment. The major credit issues are:
■ Will the firm’s projected cash flow – under various scenarios ranging
from realistic to worst case – be sufficient to pay the interest and
amortize the principal on existing long-term debt obligations? How do
we measure the adequacy of cash flow to service debt, and what do
we mean by a healthy cash flow?
■ Does the projected asset structure and earnings stream indicate a
potential need for additional financing in the future, and is there suf-
ficient cash flow to service the near debt?
■ What type of facility is appropriate, and how should the loan be struc-
tured? What would be the most appropriate amortization schedule for
the new debt? What financial covenants should be included to provide
Cash Flow Forecasting2

the bank sufficient protection against loss – that is, to preserve and
control the cash flow and overall financial strength of the firm?
In the following sections we will explore each of these issues, beginning
with a discussion of how to determine the relative ‘health’ and debt-
servicing ability of a cash flow.
What is a healthy cash flow?
In term lending, we look to future cash flow for loan repayment. The
objective of an analysis of cash flow as the primary repayment source is
to ensure there will be sufficient cash to meet financing payments.
Before considering future cash flow and determining its adequacy, it is
useful to look at historical cash flow and pose the question: what con-
stitutes a healthy cash flow? Whether a particular cash flow is healthy
depends not only on the present financial condition of the company, but
also on how it achieved its present position and the external and internal
conditions it faces.
Consider Examples 1.1–1.5
Overview of cash flow forecasting 3
Example 1.1
A company in the mature phase of its life cycle, where there is no
expectation of continued growth, exhibits the following characteristics:
■ earnings retained can finance permanent working investment
■ cash ‘throw-off ’ from depreciation (that is, the non-cash charge of
depreciation on the income statement) is sufficient to maintain
fixed assets
■ the firm can pay down its short-term borrowings without riding
the trade and without refinancing at the seasonal low point by
borrowing from another bank
■ there is sufficient cash to amortize existing long-term debt and
pay dividends.
Here, the firm has a healthy cash flow.
Cash Flow Forecasting4
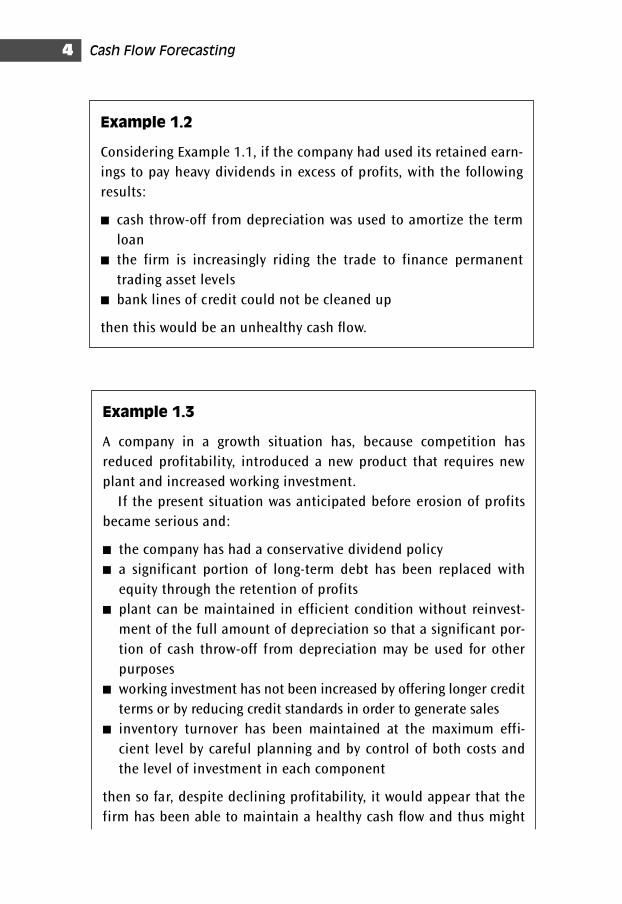
Example 1.2
Considering Example 1.1, if the company had used its retained earn-
ings to pay heavy dividends in excess of profits, with the following
results:
■ cash throw-off from depreciation was used to amortize the term
loan
■ the firm is increasingly riding the trade to finance permanent
trading asset levels
■ bank lines of credit could not be cleaned up
then this would be an unhealthy cash flow.
Example 1.3
A company in a growth situation has, because competition has
reduced profitability, introduced a new product that requires new
plant and increased working investment.
If the present situation was anticipated before erosion of profits
became serious and:
■ the company has had a conservative dividend policy
■ a significant portion of long-term debt has been replaced with
equity through the retention of profits
■ plant can be maintained in efficient condition without reinvest-
ment of the full amount of depreciation so that a significant por-
tion of cash throw-off from depreciation may be used for other
purposes
■ working investment has not been increased by offering longer credit
terms or by reducing credit standards in order to generate sales
■ inventory turnover has been maintained at the maximum effi-
cient level by careful planning and by control of both costs and
the level of investment in each component
then so far, despite declining profitability, it would appear that the
firm has been able to maintain a healthy cash flow and thus might
Overview of cash flow forecasting 5
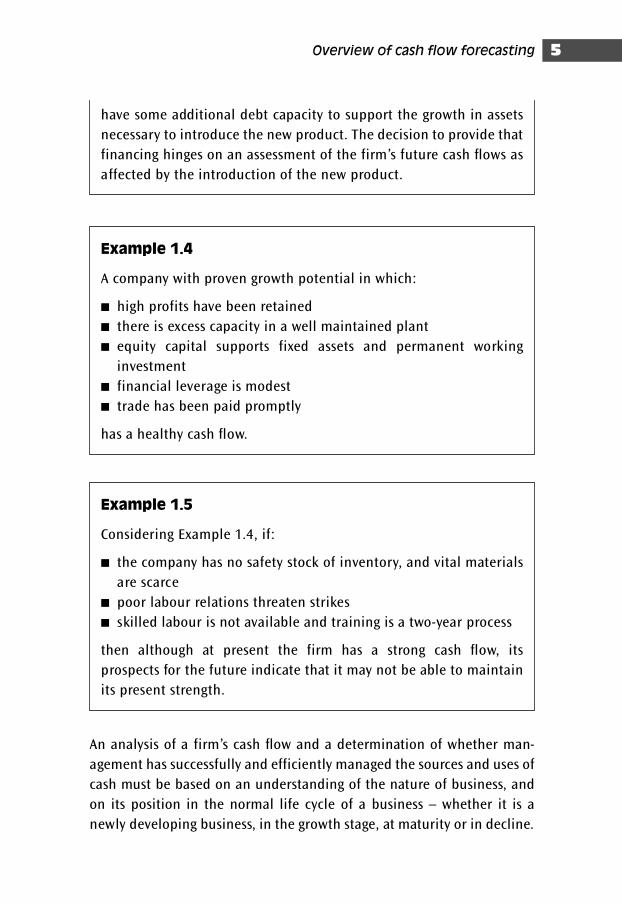
Example 1.4
A company with proven growth potential in which:
■ high profits have been retained
■ there is excess capacity in a well maintained plant
■ equity capital supports fixed assets and permanent working
investment
■ financial leverage is modest
■ trade has been paid promptly
has a healthy cash flow.
have some additional debt capacity to support the growth in assets
necessary to introduce the new product. The decision to provide that
financing hinges on an assessment of the firm’s future cash flows as
affected by the introduction of the new product.
Example 1.5
Considering Example 1.4, if:
■ the company has no safety stock of inventory, and vital materials
are scarce
■ poor labour relations threaten strikes
■ skilled labour is not available and training is a two-year process
then although at present the firm has a strong cash flow, its
prospects for the future indicate that it may not be able to maintain
its present strength.
An analysis of a firm’s cash flow and a determination of whether man-
agement has successfully and efficiently managed the sources and uses of
cash must be based on an understanding of the nature of business, and
on its position in the normal life cycle of a business – whether it is a
newly developing business, in the growth stage, at maturity or in decline.
As a basic proposition, however, the bank as a creditor defines a healthy
cash flow as one in which net cash inflow from the normal operations of
the firm is sufficient to cover both financing payments and the mainten-
ance of the quality and efficiency of its assets. Depending on where the
firm is in its business life cycle, the bank would also like to see some per-
centage of the growth in assets (increasing working investment and gross
plant expenditure) covered by internally generated funds.
Analysis of cash flow concentrates, then, on the debt servicing ability of
the firm. By isolating, in a firm’s cash flow, an amount of cash available
for debt servicing, however, it is important to remember that:
■ this is not an identifiable pool of cash earmarked solely for debt ser-
vicing, and
■ from the corporation’s point of view there may be a number of other
needs equally urgent and necessary to ensure solvency of the business
that are competing for the limited cash available.
Analysis of cash flow, then, cannot merely isolate debt capacity but must
also consider all the factors producing major changes in cash inflows
and outflows. The primary hazard of too much debt compared to cash
generated is the risk of insolvency, and debt servicing is given top prior-
ity as far as the bank is concerned. However, all decisions involving cash
outflows vital to the survival of the firm need to be considered when
evaluating cash solvency.
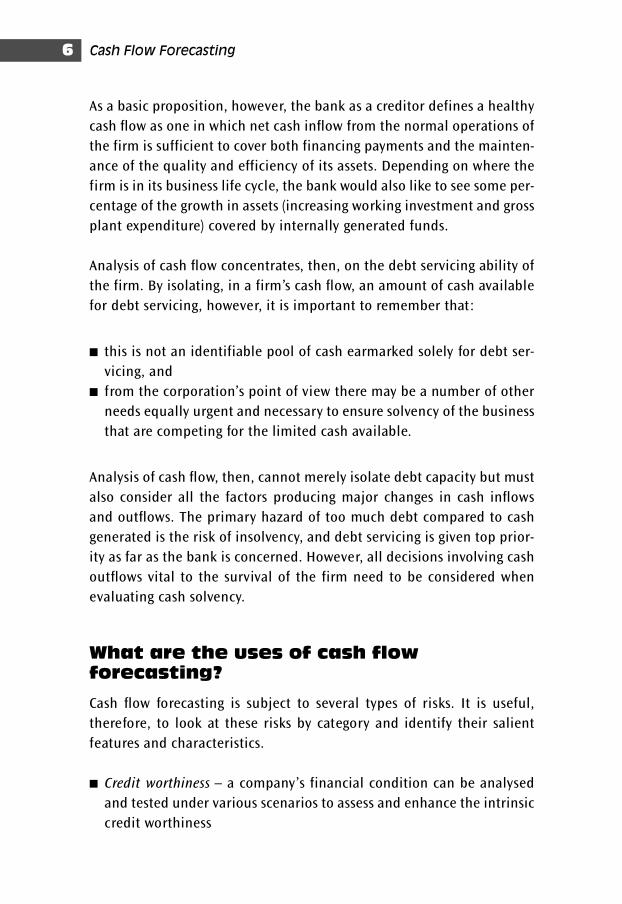
What are the uses of cash flow
forecasting?
Cash flow forecasting is subject to several types of risks. It is useful,
therefore, to look at these risks by category and identify their salient
features and characteristics.
■ Credit worthiness – a company’s financial condition can be analysed
and tested under various scenarios to assess and enhance the intrinsic
credit worthiness
Cash Flow Forecasting6
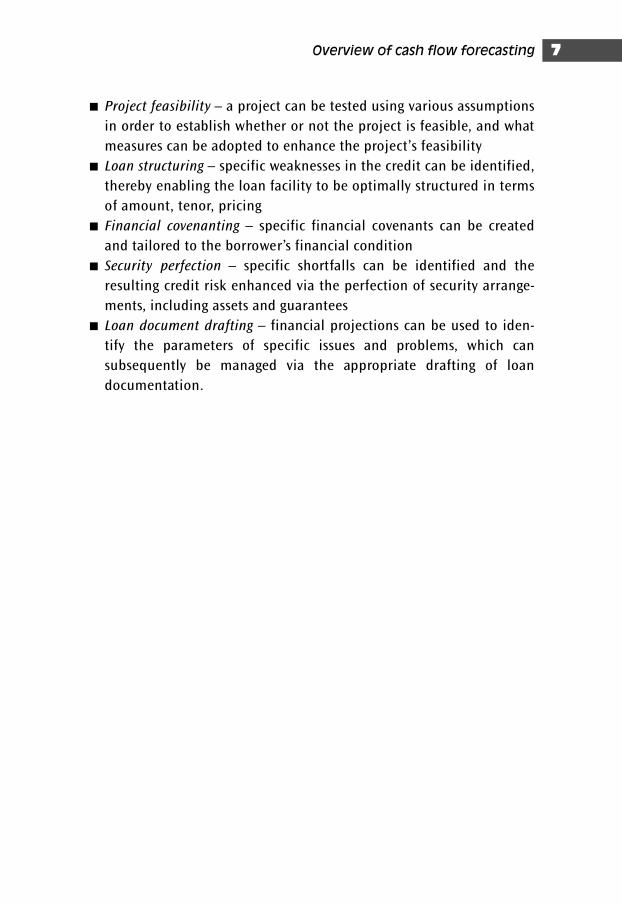
■ Project feasibility – a project can be tested using various assumptions
in order to establish whether or not the project is feasible, and what
measures can be adopted to enhance the project’s feasibility
■ Loan structuring – specific weaknesses in the credit can be identified,
thereby enabling the loan facility to be optimally structured in terms
of amount, tenor, pricing
■ Financial covenanting – specific financial covenants can be created
and tailored to the borrower’s financial condition
■ Security perfection – specific shortfalls can be identified and the
resulting credit risk enhanced via the perfection of security arrange-
ments, including assets and guarantees
■ Loan document drafting – financial projections can be used to iden-
tify the parameters of specific issues and problems, which can
subsequently be managed via the appropriate drafting of loan
documentation.
Overview of cash flow forecasting 7
Chapter 2
Summary of financialstatements
Introduction
This is not a treatise on financial analysis, but rather a consideration of
the interrelations existing between the various components of the bal-
ance sheet and income statement and financial ratios which it is essen-
tial to understand in the preparation of cash flow forecasting.
In particular, we are concerned with the interrelationships existing between
the income statement, balance sheet, and various financial ratios summa-
rizing their interrelationships, and which can be manipulated with ‘cash
drivers’ to project key accounts.
We therefore touch upon these topics as they relate to the manipula-
tions required in effecting financial analysis.
The accounting process is divided into two basic elements, recording
and reporting of financial information. The emergence of the large-scale
limited liability company has been the single most important factor
stimulating the need for financial reports. The larger and more complex
the company, the more remote the management can become from day-to-
day operations, and the more reliant they have to become on account-
ing information. In addition, the company that borrows money will need
to demonstrate its financial solidity to its bankers, and financial state-
ments are used by bankers and others as part of the basis for lending
decisions.
In recent years, there has been recognition that there may be a large
number of different parties with a legitimate interest in a company’s
performance:
■ the equity investors – existing and potential shareholders
■ the loan creditors – including existing and potential holders of deben-
tures and loan stock, and providers of short-term unsecured loans and
finance
■ the company’s bankers
■ the company’s employees
■ the analysts/advisers – this will include financial analysts and journal-
ists, economists, researchers, stockbrokers etc.
■ customers, trade creditors and suppliers
■ tax authorities, supervisory bodies, local authorities
■ the general public – including taxpayers, consumers, political parties,
and consumer and environmental groups.
Each of the groups will have a common interest in the financial statements
of a company, but will use the information as the basis for different types
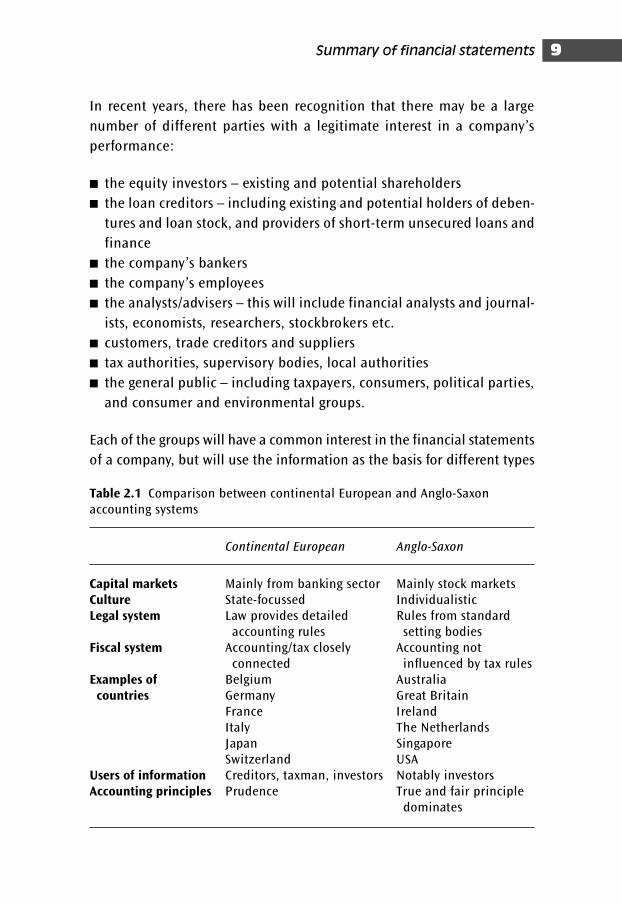
Table 2.1 Comparison between continental European and Anglo-Saxonaccounting systems
Continental European Anglo-Saxon
Capital markets Mainly from banking sector Mainly stock marketsCulture State-focussed IndividualisticLegal system Law provides detailed Rules from standard
accounting rules setting bodiesFiscal system Accounting/tax closely Accounting not
connected influenced by tax rulesExamples of Belgium Australiacountries Germany Great Britain
France IrelandItaly The NetherlandsJapan SingaporeSwitzerland USA
Users of information Creditors, taxman, investors Notably investorsAccounting principles Prudence True and fair principle
dominates
Summary of financial statements 9
of decisions. There are differences in the amount of financial information
made available to each of these groups, caused by different legal require-
ments and the company’s management decisions as to what they wish to
make available.
The annual report and accounts
The publication of an annual report and accounts by a company suppos-
edly provides its shareholders and others with a means to keep them-
selves informed on the activities and financial position of the company.
The style and content of the annual report and accounts will vary from
company to company, depending on the directors’ design ideas and the
financial resources available for the printing and designing of the report.
Many companies will use their report and accounts as a marketing tool.
However, there is a minimum amount of information that the law requires
a company to print in the report and accounts. These requirements include
four basic components:
1 The directors’ report
2 A report by the company’s auditors
3 A balance sheet and a profit and loss account
4 A statement of accounting policies and notes to the accounts.
Companies that are listed on the London Stock Exchange have to also pro-
duce a half-yearly interim report, and their annual report and accounts
have to contain more information than do those of unlisted companies.
Under the Companies Acts, directors have a legal responsibility to prepare
and publish accounts that give a ‘true and fair’ view of their company’s
financial affairs. The legal requirements currently in force are contained
within the Companies Acts 1985 and 1989.
With reference to the Company’s Act, the accounts must be delivered to
the Registrar within a time limit fixed by reference to its accounting year
end. The limit for a public company is seven months from its accounting
year end. The Stock Exchange requires listed companies to issue an annual
report within six months of the date of their financial year end.
Cash Flow Forecasting10
Summary of financial statements 11
Companies are also required to file with the Registrar the following
information:
■ copies of their Memorandum and Articles of Association, and details of
subsequent changes
■ the address of their registered office, and the place at which the com-
pany’s registers are kept (e.g. a rented bedsit at Land’s End)
■ details of the company’s share capital and debentures
■ details of each mortgage and charge on the assets of the company
■ a list of the directors and secretary, and any changes.
Statements of standard accounting practice, and
financial reporting standards
There are various methods available for valuing and accounting for the
different business assets (what the company owns) and liabilities (what
the company owes). It is important that the company should state which
policies have been employed, in order to enable the reader correctly to
interpret the company’s financial statements. The way a company’s assets
are valued can have a direct impact on profits. In the UK, accounting
regulations operate under a specific regime:
The Accounting Standards Committee (ASC) was set up in 1970, and issued
25 Statements of Standard Accounting Practice (SSAP).
The Accounting Standards Board replaced the ASC in 1990. The ASB adopted
all of the SSAP, and in addition have been issuing further accounting stand-
ards, which are known as Financial Reporting Standards (FRS).
SSAP and FRS are guidelines for the production of company financial
statements by accountants and the company, and some of their recom-
mendations have been incorporated into the Companies Acts and have
the force of law.
SSAP2 relates to the disclosure of accounting policies. It aims to ensure
that companies prepare their accounts in accordance with certain fun-
damental accounting ‘concepts’, which it specifies. Companies report
which accounting ‘policies’ they have chosen from the accounting bases
available for the purpose of valuing the assets and liabilities that appear
in their accounts.
Company accounts are based on the following four premises:
1 The going concern concept. This assumes that the company will con-
tinue in business for the foreseeable future. The main effect of this
assumption is that the liquidation value of fixed assets (which may be
significantly different from the book value) may be ignored.
2 The accruals (or matching) concept. This requires that the revenues be
matched with related expenses when measuring profit, and that rev-
enues and expenses be included in the profit and loss account as they
are earned and incurred rather than when they are received and paid.
3 The consistency concept. This requires the company to use the same
accounting policies for valuing similar assets both within the account-
ing period and during consecutive accounting periods.
4 The prudency concept. This states that companies should not antici-
pate profits, but requires them to provide for all foreseeable losses.
‘Accounting policies’ is the term used to describe the accounting methods
chosen by a particular company for the purposes of valuing assets and
liabilities. The main provisions of SSAP2 are given statutory backing by
the Companies Act 1985. The accounting policies on which a company’s
accounts are based are shown at the beginning of the notes to the
accounts, and typically will include the basis of accounting for:
■ sales
■ deferred taxation
■ depreciation of fixed assets
■ investment grants
■ research and development
■ stocks and work in progress
■ extraordinary items
■ translation of foreign currencies.
There are at least three important points of interaction between the
profit and loss account and the balance sheet where if abnormal
Cash Flow Forecasting12
accounting policies are used they can materially alter the company’s
reported profits:
1 Valuation of stock – the higher the value at the end of the accounting
period, the lower the cost of goods sold and therefore the higher the
profit.
2 Depreciation – the lower the charge for depreciation in the accounting
period, the higher the book value of assets carried forward and the
higher the reported profits.
3 Capitalizing expenditure – all expenditure incurred by the company
must either add to the total asset value in the balance sheet or be
charged in the profit and loss account. Any amounts that can be capit-
alized will increase profits directly, as this would otherwise be a charge
against profits. There will be an increased profit today against future
years, when the higher capital value of fixed assets will require a higher
depreciation charge and therefore reduce profits. Items that are some-
times capitalized include research and development costs, interest incur-
red on projects during construction, and start-up costs (e.g. advertising
and promotional costs associated with launching a new product).
Consequences of fraudulent manipulation of accounts
If the company overstates its profits in the accounting period, it may be
difficult to sustain them in the future. Once a company starts to cook the
books, it becomes even more necessary to continue to do so in future.
Such practices are euphemistically known as ‘creative accounting’,
although a more accurate description is manipulating the accounts or
fraudulent accounting. It is sad to say that to carry this deception off,
two parties need to play the game – the company and the company’s
auditors. Often the company’s auditors participate in the deception
since they feel they must please the client in order to keep the lucrative
accounting business, as well as to be considered for even more lucrative
consulting services! Accountants failing to please the client obviously
will not be selected for lucrative consulting assignments. Hence the
entire process of the auditing of financial statements by auditors could
be considered to be compromised by commercial conflicts of interest.
Summary of financial statements 13
Industry sources have admitted as much, saying that the accounting pro-
fession has lost its credibility and reliability and is in a state of dysfunc-
tion. Useful additional reading on this is provided by Accounting for
Growth, by Terry Smith (see Suggested Reading).
The auditors’ report
Every company is required to appoint at each of their annual general
meetings an auditor to hold office from the date of that meeting until the
next annual general meeting. This will usually be a firm of accountants.
The Companies Act 1985 made it an offence for a director or company
secretary of a company to give false or misleading statements to their
auditors.
The auditors are required to report to the shareholders of the company
whether, in their opinion, the balance sheet, profit and loss and other
financial statements have been properly prepared in accordance with
legislation, and whether these give a true and fair view of the profitability
and state of affairs of the company. If the auditors feel that the accounts
have not been properly prepared, that the records do not accord with
fact and/or they have not been able to obtain all the information that
they need in order to give an informed opinion, they must state this in
their report; this is known as qualifying the audit report.
It is important to note that the auditors’ report does not certify the accur-
acy of the accounts, but expresses the opinion that the accounts show a
true and fair view of the company.
An auditors’ report should contain a clear expression of opinion on a
company’s financial statements. The opinion will be unqualified (i.e. every-
thing appears to be in order as laid down by the Institute of Chartered
Accountants Audit Policies) or qualified.
A qualified opinion is expressed by the auditors when either there is a
limitation on the scope of the auditors examination of the company’s
Cash Flow Forecasting14
accounts and affairs, or the auditor disagrees with the way a matter has
been treated or disclosed in the financial statements.
An adverse opinion is expressed by the auditors if their disagreement
with the company is so material or pervasive that they feel that the com-
pany’s accounts are seriously misleading and do not give a true and fair
view of the company’s situation.
A disclaimer of opinion is expressed by the auditors when the possible
effect of a limitation on the scope of the audit is so material that the
auditors have been unable to obtain sufficient material to support or
express any opinion on the financial statements.
Fundamental uncertainty is where an inherent uncertainty exists which
in the auditors’ opinion is fundamental and is adequately accounted for
and disclosed in the accounts. Here, auditors will include an explana-
tory paragraph in their report, making it clear that their opinion is not
qualified by this.
The balance sheet
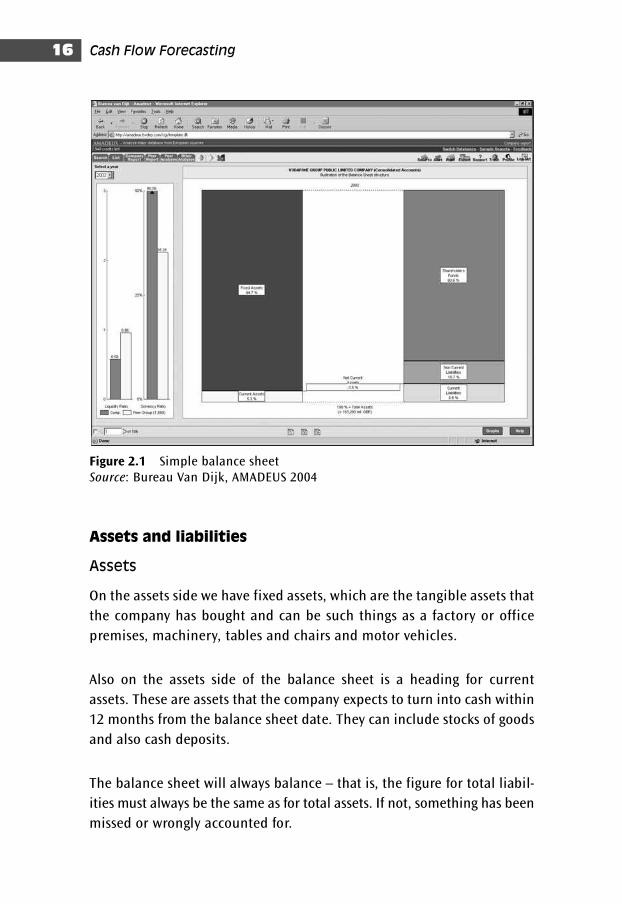
The balance sheet (see Figure 2.1) is one of the basic components of the
company’s report and accounts. It is a statement of the assets (what the
company owns) and liabilities (what the company owes) of a company at
the close of business on a stated date – ‘the balance sheet date’ .
The balance sheet shows:
■ how cash is invested in the business
■ how the assets are balanced with the liabilities
■ how the company is financed.
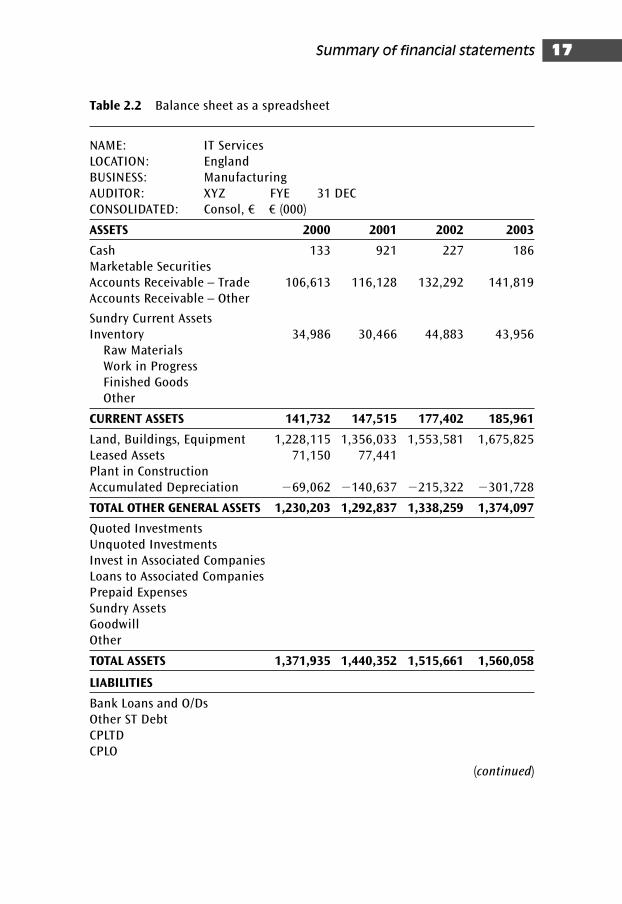
Table 2.2 provides an example of the balance sheet as you are likely
to encounter it in a ‘spreadsheet’. Spreadsheets recast heterogeneous
company account presentations into a standardized format to facilitate
analysis and manipulation by analysts into forecasting models and peer
group analysis.
Summary of financial statements 15
Cash Flow Forecasting16
Assets and liabilities
Assets
On the assets side we have fixed assets, which are the tangible assets that
the company has bought and can be such things as a factory or office
premises, machinery, tables and chairs and motor vehicles.
Also on the assets side of the balance sheet is a heading for current
assets. These are assets that the company expects to turn into cash within
12 months from the balance sheet date. They can include stocks of goods
and also cash deposits.
The balance sheet will always balance – that is, the figure for total liabil-
ities must always be the same as for total assets. If not, something has been
missed or wrongly accounted for.
Figure 2.1 Simple balance sheetSource: Bureau Van Dijk, AMADEUS 2004
Summary of financial statements 17
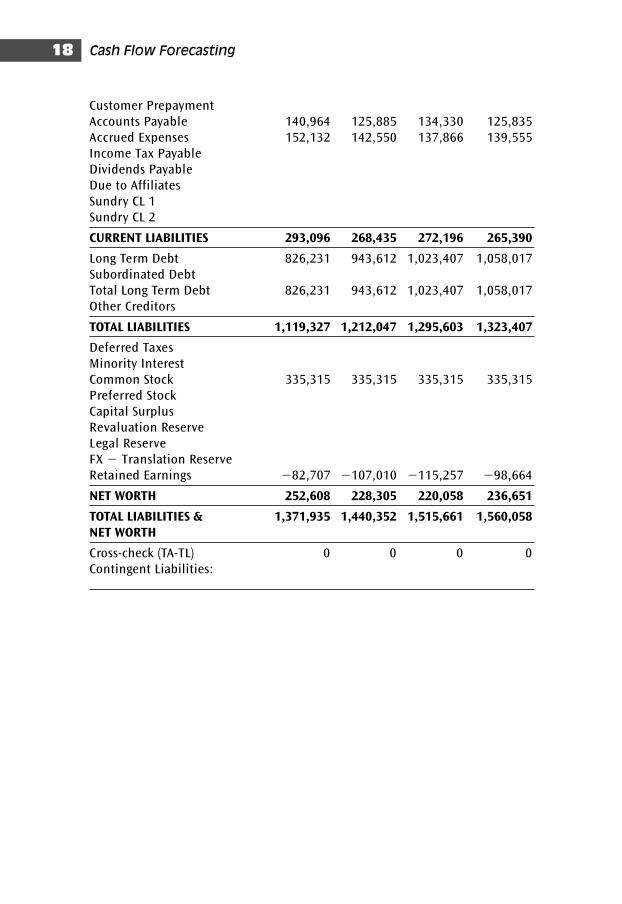
Table 2.2 Balance sheet as a spreadsheet
NAME: IT ServicesLOCATION: EnglandBUSINESS: ManufacturingAUDITOR: XYZ FYE 31 DECCONSOLIDATED: Consol, € € (000)
ASSETS 2000 2001 2002 2003
Cash 133 921 227 186Marketable SecuritiesAccounts Receivable – Trade 106,613 116,128 132,292 141,819Accounts Receivable – Other
Sundry Current AssetsInventory 34,986 30,466 44,883 43,956
Raw MaterialsWork in ProgressFinished GoodsOther
CURRENT ASSETS 141,732 147,515 177,402 185,961
Land, Buildings, Equipment 1,228,115 1,356,033 1,553,581 1,675,825Leased Assets 71,150 77,441Plant in ConstructionAccumulated Depreciation �69,062 �140,637 �215,322 �301,728
TOTAL OTHER GENERAL ASSETS 1,230,203 1,292,837 1,338,259 1,374,097
Quoted InvestmentsUnquoted InvestmentsInvest in Associated CompaniesLoans to Associated CompaniesPrepaid ExpensesSundry AssetsGoodwillOther
TOTAL ASSETS 1,371,935 1,440,352 1,515,661 1,560,058
LIABILITIES
Bank Loans and O/DsOther ST DebtCPLTDCPLO
(continued)
Cash Flow Forecasting18
Customer PrepaymentAccounts Payable 140,964 125,885 134,330 125,835Accrued Expenses 152,132 142,550 137,866 139,555Income Tax PayableDividends PayableDue to AffiliatesSundry CL 1Sundry CL 2
CURRENT LIABILITIES 293,096 268,435 272,196 265,390
Long Term Debt 826,231 943,612 1,023,407 1,058,017Subordinated DebtTotal Long Term Debt 826,231 943,612 1,023,407 1,058,017Other Creditors
TOTAL LIABILITIES 1,119,327 1,212,047 1,295,603 1,323,407
Deferred TaxesMinority InterestCommon Stock 335,315 335,315 335,315 335,315Preferred StockCapital SurplusRevaluation ReserveLegal ReserveFX � Translation ReserveRetained Earnings �82,707 �107,010 �115,257 �98,664
NET WORTH 252,608 228,305 220,058 236,651
TOTAL LIABILITIES & 1,371,935 1,440,352 1,515,661 1,560,058NET WORTH
Cross-check (TA-TL) 0 0 0 0Contingent Liabilities:
Summary of financial statements 19
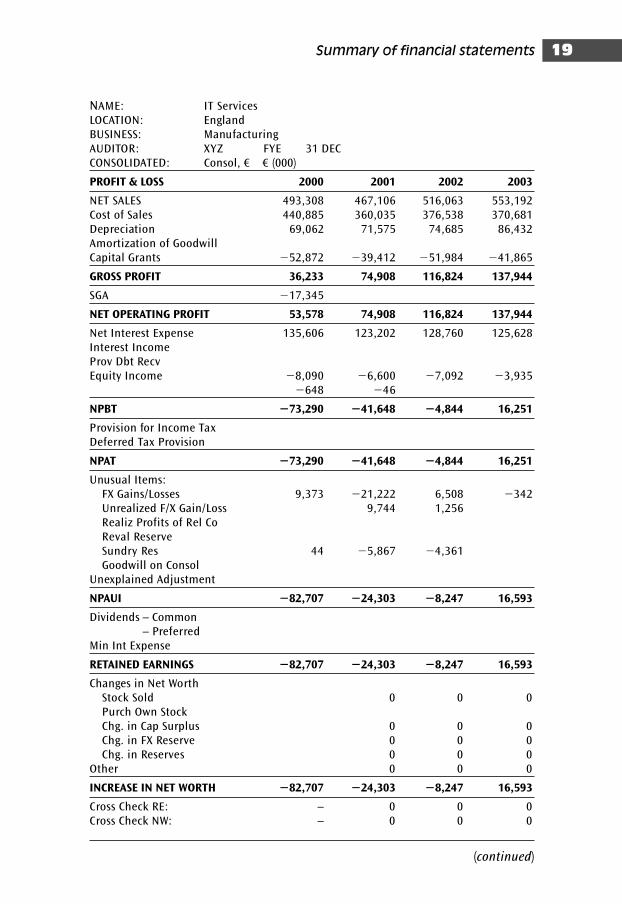
NAME: IT ServicesLOCATION: EnglandBUSINESS: ManufacturingAUDITOR: XYZ FYE 31 DECCONSOLIDATED: Consol, € € (000)
PROFIT & LOSS 2000 2001 2002 2003
NET SALES 493,308 467,106 516,063 553,192Cost of Sales 440,885 360,035 376,538 370,681Depreciation 69,062 71,575 74,685 86,432Amortization of GoodwillCapital Grants �52,872 �39,412 �51,984 �41,865
GROSS PROFIT 36,233 74,908 116,824 137,944
SGA �17,345
NET OPERATING PROFIT 53,578 74,908 116,824 137,944
Net Interest Expense 135,606 123,202 128,760 125,628Interest IncomeProv Dbt RecvEquity Income �8,090 �6,600 �7,092 �3,935
�648 �46
NPBT �73,290 �41,648 �4,844 16,251
Provision for Income TaxDeferred Tax Provision
NPAT �73,290 �41,648 �4,844 16,251
Unusual Items:FX Gains/Losses 9,373 �21,222 6,508 �342Unrealized F/X Gain/Loss 9,744 1,256Realiz Profits of Rel CoReval ReserveSundry Res 44 �5,867 �4,361Goodwill on Consol
Unexplained Adjustment
NPAUI �82,707 �24,303 �8,247 16,593
Dividends – Common– Preferred
Min Int Expense
RETAINED EARNINGS �82,707 �24,303 �8,247 16,593
Changes in Net WorthStock Sold 0 0 0Purch Own StockChg. in Cap Surplus 0 0 0Chg. in FX Reserve 0 0 0Chg. in Reserves 0 0 0
Other 0 0 0
INCREASE IN NET WORTH �82,707 �24,303 �8,247 16,593
Cross Check RE: – 0 0 0Cross Check NW: – 0 0 0
(continued)
Cash Flow Forecasting20
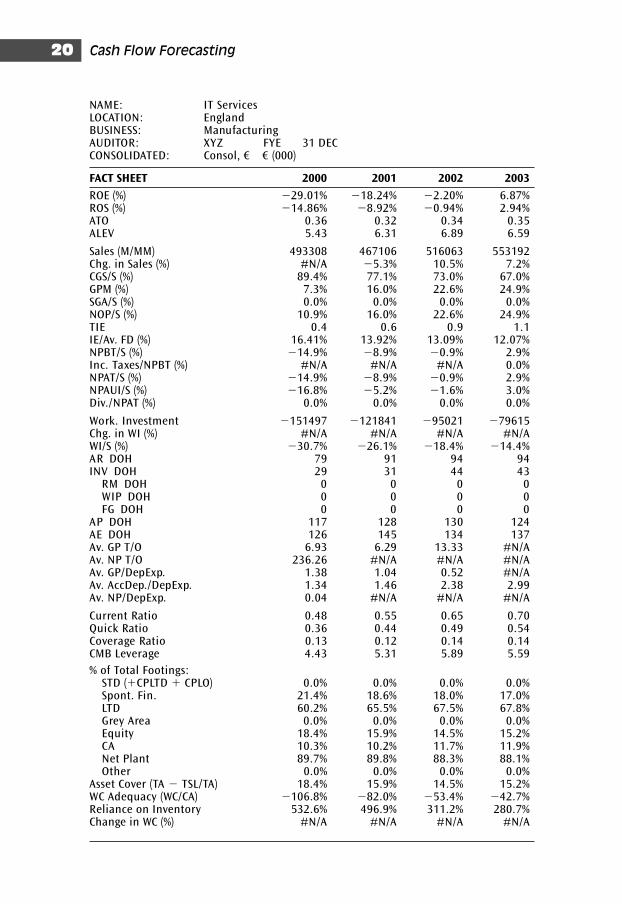
NAME: IT ServicesLOCATION: EnglandBUSINESS: ManufacturingAUDITOR: XYZ FYE 31 DECCONSOLIDATED: Consol, € € (000)
FACT SHEET 2000 2001 2002 2003
ROE (%) �29.01% �18.24% �2.20% 6.87%ROS (%) �14.86% �8.92% �0.94% 2.94%ATO 0.36 0.32 0.34 0.35ALEV 5.43 6.31 6.89 6.59
Sales (M/MM) 493308 467106 516063 553192Chg. in Sales (%) #N/A �5.3% 10.5% 7.2%CGS/S (%) 89.4% 77.1% 73.0% 67.0%GPM (%) 7.3% 16.0% 22.6% 24.9%SGA/S (%) 0.0% 0.0% 0.0% 0.0%NOP/S (%) 10.9% 16.0% 22.6% 24.9%TIE 0.4 0.6 0.9 1.1IE/Av. FD (%) 16.41% 13.92% 13.09% 12.07%NPBT/S (%) �14.9% �8.9% �0.9% 2.9%Inc. Taxes/NPBT (%) #N/A #N/A #N/A 0.0%NPAT/S (%) �14.9% �8.9% �0.9% 2.9%NPAUI/S (%) �16.8% �5.2% �1.6% 3.0%Div./NPAT (%) 0.0% 0.0% 0.0% 0.0%
Work. Investment �151497 �121841 �95021 �79615Chg. in WI (%) #N/A #N/A #N/A #N/AWI/S (%) �30.7% �26.1% �18.4% �14.4%AR DOH 79 91 94 94INV DOH 29 31 44 43
RM DOH 0 0 0 0WIP DOH 0 0 0 0FG DOH 0 0 0 0
AP DOH 117 128 130 124AE DOH 126 145 134 137Av. GP T/O 6.93 6.29 13.33 #N/AAv. NP T/O 236.26 #N/A #N/A #N/AAv. GP/DepExp. 1.38 1.04 0.52 #N/AAv. AccDep./DepExp. 1.34 1.46 2.38 2.99Av. NP/DepExp. 0.04 #N/A #N/A #N/A
Current Ratio 0.48 0.55 0.65 0.70Quick Ratio 0.36 0.44 0.49 0.54Coverage Ratio 0.13 0.12 0.14 0.14CMB Leverage 4.43 5.31 5.89 5.59
% of Total Footings:STD (�CPLTD � CPLO) 0.0% 0.0% 0.0% 0.0%Spont. Fin. 21.4% 18.6% 18.0% 17.0%LTD 60.2% 65.5% 67.5% 67.8%Grey Area 0.0% 0.0% 0.0% 0.0%Equity 18.4% 15.9% 14.5% 15.2%CA 10.3% 10.2% 11.7% 11.9%Net Plant 89.7% 89.8% 88.3% 88.1%Other 0.0% 0.0% 0.0% 0.0%
Asset Cover (TA � TSL/TA) 18.4% 15.9% 14.5% 15.2%WC Adequacy (WC/CA) �106.8% �82.0% �53.4% �42.7%Reliance on Inventory 532.6% 496.9% 311.2% 280.7%Change in WC (%) #N/A #N/A #N/A #N/A
Summary of financial statements 21
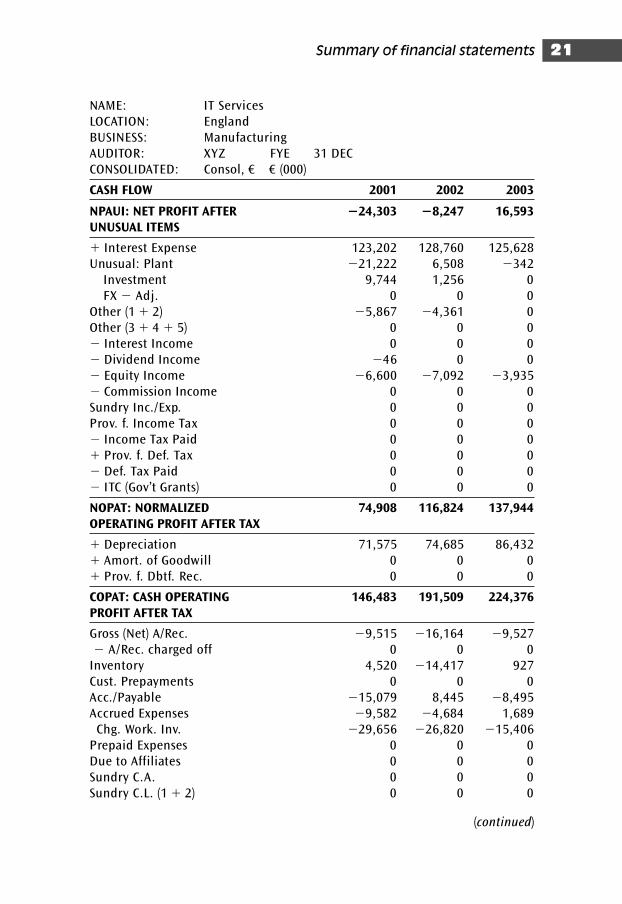
NAME: IT ServicesLOCATION: EnglandBUSINESS: ManufacturingAUDITOR: XYZ FYE 31 DECCONSOLIDATED: Consol, € € (000)
CASH FLOW 2001 2002 2003
NPAUI: NET PROFIT AFTER �24,303 �8,247 16,593UNUSUAL ITEMS
� Interest Expense 123,202 128,760 125,628Unusual: Plant �21,222 6,508 �342
Investment 9,744 1,256 0FX � Adj. 0 0 0
Other (1 � 2) �5,867 �4,361 0Other (3 � 4 � 5) 0 0 0� Interest Income 0 0 0� Dividend Income �46 0 0� Equity Income �6,600 �7,092 �3,935� Commission Income 0 0 0Sundry Inc./Exp. 0 0 0Prov. f. Income Tax 0 0 0� Income Tax Paid 0 0 0� Prov. f. Def. Tax 0 0 0� Def. Tax Paid 0 0 0� ITC (Gov’t Grants) 0 0 0
NOPAT: NORMALIZED 74,908 116,824 137,944OPERATING PROFIT AFTER TAX
� Depreciation 71,575 74,685 86,432� Amort. of Goodwill 0 0 0� Prov. f. Dbtf. Rec. 0 0 0
COPAT: CASH OPERATING 146,483 191,509 224,376PROFIT AFTER TAX
Gross (Net) A/Rec. �9,515 �16,164 �9,527� A/Rec. charged off 0 0 0
Inventory 4,520 �14,417 927Cust. Prepayments 0 0 0Acc./Payable �15,079 8,445 �8,495Accrued Expenses �9,582 �4,684 1,689
Chg. Work. Inv. �29,656 �26,820 �15,406Prepaid Expenses 0 0 0Due to Affiliates 0 0 0Sundry C.A. 0 0 0Sundry C.L. (1 � 2) 0 0 0
(continued)
Cash Flow Forecasting22
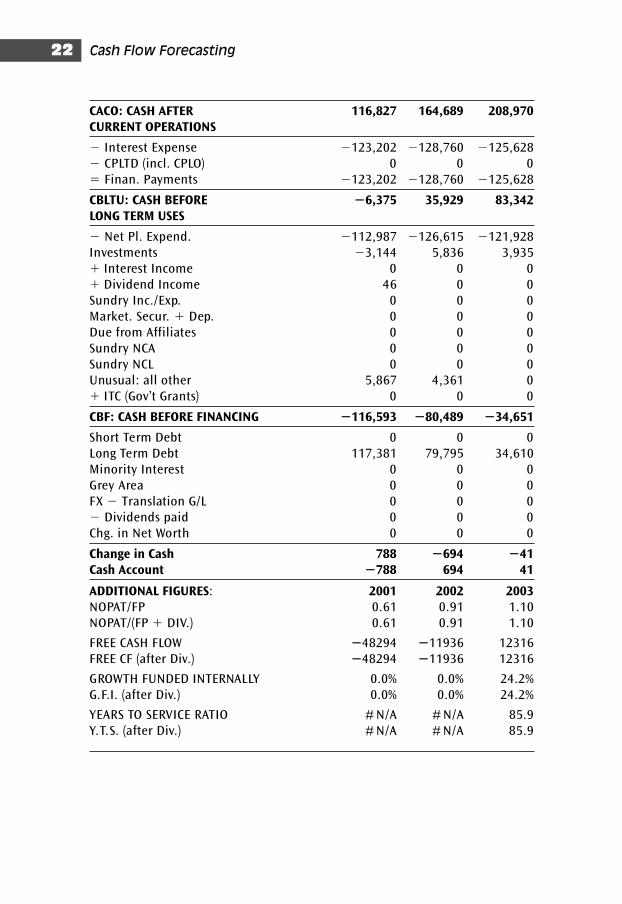
CACO: CASH AFTER 116,827 164,689 208,970CURRENT OPERATIONS
� Interest Expense �123,202 �128,760 �125,628� CPLTD (incl. CPLO) 0 0 0� Finan. Payments �123,202 �128,760 �125,628
CBLTU: CASH BEFORE �6,375 35,929 83,342LONG TERM USES
� Net Pl. Expend. �112,987 �126,615 �121,928Investments �3,144 5,836 3,935� Interest Income 0 0 0� Dividend Income 46 0 0Sundry Inc./Exp. 0 0 0Market. Secur. � Dep. 0 0 0Due from Affiliates 0 0 0Sundry NCA 0 0 0Sundry NCL 0 0 0Unusual: all other 5,867 4,361 0� ITC (Gov’t Grants) 0 0 0
CBF: CASH BEFORE FINANCING �116,593 �80,489 �34,651
Short Term Debt 0 0 0Long Term Debt 117,381 79,795 34,610Minority Interest 0 0 0Grey Area 0 0 0FX � Translation G/L 0 0 0� Dividends paid 0 0 0Chg. in Net Worth 0 0 0
Change in Cash 788 �694 �41Cash Account �788 694 41
ADDITIONAL FIGURES: 2001 2002 2003NOPAT/FP 0.61 0.91 1.10NOPAT/(FP � DIV.) 0.61 0.91 1.10
FREE CASH FLOW �48294 �11936 12316FREE CF (after Div.) �48294 �11936 12316
GROWTH FUNDED INTERNALLY 0.0% 0.0% 24.2%G.F.I. (after Div.) 0.0% 0.0% 24.2%
YEARS TO SERVICE RATIO # N/A # N/A 85.9Y.T.S. (after Div.) # N/A # N/A 85.9
Summary of financial statements 23
Liabilities
On the liabilities side, we have a breakdown of the funding sources of
the company.
When a company is formed, its members subscribe for shares – that is,
they give money to the company in return for certificates which state that
they own a certain percentage of the company. For example, in our simple
balance sheet there is a figure of € 335,315 shown as share capital. The
cash raised by issuing these shares will be used in the business to buy fixed
assets, such as an office or factory for the company’s operations, machin-
ery and motor cars, and to buy stock ready to start trading.
The share capital may not in itself be enough to pay all of the company’s
initial costs and to enable it to start trading. In our example balance
sheet, there is a liability headed ‘overdraft’ .
The directors have negotiated credit terms with the suppliers of their raw
materials and stock – i.e. the suppliers do not require immediate payment
and become creditors of the company. To recap, creditors are people to
whom the company owes money.
Therefore, on the liabilities side of the balance sheet we have:
■ Share capital, put into the business by the shareholders
■ Creditors, to whom the company owes money
■ An overdraft facility representing money owed to the bank by the
company.
Summary
We have taken a brief look at the assets and liabilities side of our simple
balance sheet. We can summarize the balance sheet, as depicted in the
preceding spreadsheet, as follows:
■ Fixed assets show capital (funds) that is tied up on a long-term basis,
i.e. assets that are not quickly and easily realizable. Tangible assets are
the assets used in the operation of the business, and may include land,
Cash Flow Forecasting24
buildings, plant and machinery. Intangible assets may comprise good-
will, patents and licences, rights, monopolies, contracts and databases.
■ Current assets can be readily converted into cash within a short period,
normally one year.
■ Stocks – reported profits are affected by the valuation a company places
on its stock, as high value produces high profits. Accountants therefore
insist that stocks are valued at the lower of cost or net realizable value.
■ Current liabilities are debts due for payment in less than one year.
These include bank overdrafts and payment to suppliers, and expiring
loans.
■ Long-term liabilities are debts that need not be repaid within one year.
These may include bank loans and mortgages.
■ Called up share capital represents the number of shares that have been
issued by a company. (If trading ceased, any money left over after settle-
ment of all of the company’s other liabilities would be distributed
amongst the shareholders pro rata according to the number of shares
that each of them holds.)
■ Share premium is the difference between the nominal (face) value of
a share and the amount at which it is offered for sale to shareholders.
Successful companies issue shares at a premium to their nominal value.
■ Revaluation reserve – assets valued, such as land, may actually be
worth more than their original cost. The difference between these two
figures is the revaluation reserve – it is not profit that the company
has actually realized in cash terms, and therefore is not distributable
to shareholders.
■ Profit and loss account figure. This is the sum total of profits accumu-
lated by the business and retained for use in the growth and expan-
sion of the business.
■ Shareholders’ funds is the owner’s equity.
■ Notes – several of the figures given in the balance sheet will be
explained in more detail in the notes that appear towards the end of
the accounts.
Debtors
Debtors (also known as accounts receivable) are a current asset, and rep-
resent amounts owed to the company. The balance sheet formats as
Summary of financial statements 25
prescribed in the Companies Act 1985 require the company to split their
debtors figure into the following categories:
■ Trade debtors – debts owed to the company arising from sale of goods
to customers of the company on credit terms.
■ Amounts owed by group companies – these amounts will represent
inter-group trading activities, i.e. sums owed to the company by its
parent company (if it is not itself the parent company), fellow sub-
sidiaries or subsidiaries of its own.
■ Amounts owed by companies and other institutions in which the com-
pany has a participating interest – that is, debts owed to the company
by institution(s) in which the company has a holding of 20% or more of
that institution’s shares.
■ Other debtors – for example, debts due to the company from the sale
of fixed assets or investments.
■ Prepayments and accrued income – for example, rent and rates paid by
the company in advance.
Most companies will show a single figure for debtors in their balance
sheet, but then break down the various categories in the notes section of
their accounts.
Companies will have different debtor profiles. Supermarket chains will
have very little showing in their accounts in the way of debtors, as most of
their sales will be for cash; any debtors shown in their accounts are likely
to be non-trade or prepayments. Other companies may conduct most or
all of their trade on credit terms, and will have large debtor balances.
Some key questions to ask about debtors include:
■ Customer concentration – is there too much reliance on one cus-
tomer, or on one major industry? What would be the consequences to
the company if it was to lose a major client? Unfortunately, in some
instances the company will grant credit to a customer only to find that
payment is not forthcoming.
■ What is the age pattern of the debtors? Are some very old debts?
■ Is there adequate provision for bad and doubtful debts?
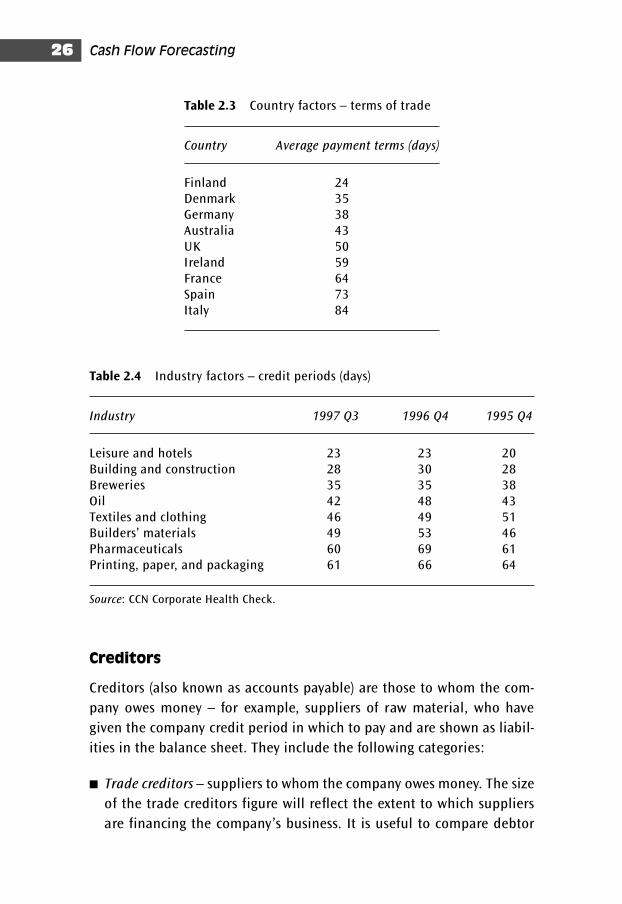
■ What is the company’s credit granting policy (see Tables 2.3 and 2.4)?
Cash Flow Forecasting26
Creditors
Creditors (also known as accounts payable) are those to whom the com-
pany owes money – for example, suppliers of raw material, who have
given the company credit period in which to pay and are shown as liabil-
ities in the balance sheet. They include the following categories:
■ Trade creditors – suppliers to whom the company owes money. The size
of the trade creditors figure will reflect the extent to which suppliers
are financing the company’s business. It is useful to compare debtor
Table 2.3 Country factors – terms of trade
Country Average payment terms (days)
Finland 24Denmark 35Germany 38Australia 43UK 50Ireland 59France 64Spain 73Italy 84
Table 2.4 Industry factors – credit periods (days)
Industry 1997 Q3 1996 Q4 1995 Q4
Leisure and hotels 23 23 20Building and construction 28 30 28Breweries 35 35 38Oil 42 48 43Textiles and clothing 46 49 51Builders’ materials 49 53 46Pharmaceuticals 60 69 61Printing, paper, and packaging 61 66 64
Source: CCN Corporate Health Check.
Summary of financial statements 27
and creditor days to see if there is any serious imbalance between
them. For example, if the company’s credit period is 30 days then it is
paying its bills in a 30-day period, but at the same time if it is giving
100 days’ credit this could produce very serious cash flow problems for
the company, and indicate a serious deficiency in the company’s debt
collection procedures – and very possibly bad debts.
■ Debenture (secured) loans – when a company wishes to issue loan cap-
ital, it can offer the lender some specific security on the loan. If it does
so, the loan is called a debenture, or debenture stock.
■ Bank loans and overdrafts.
■ Payments received on account – e.g. deposits from customers paid
in advance for work which the company is undertaking or will
undertake.
■ Bills of exchange payable – a way of raising short-term capital for the
company. A bill of exchange is used to finance the sale of goods
when the seller wishes to obtain payment at the time the goods are
despatched to the buyer, and the buyer wants to defer payment until
the goods are received (or later). A bill of exchange payable in a com-
pany’s creditors would indicate that the company has purchased goods
and has accepted a bill of exchange acknowledging its debt to the
supplier and promising to pay at some future time.
■ Amounts owed to group companies – amounts owed to institutions in
which the company has a participating interest.
■ Other creditors – including tax and social security, which are shown
separately.
■ Accruals – apportionments of a known future liability in respect of a
service which the company has already partly received.
■ Deferred income – money received by or due to the company, which
has not yet been earned.
■ Dividends proposed – although the company cannot pay proposed divi-
dends until they have been approved at the Annual General Meeting,
these are always shown as a liability.
Stock and work in progress
Traditionally companies have shown stocks as a single figure under cur-
rent assets, described as ‘stocks’ or ‘inventories’ or ‘stocks and work in
Cash Flow Forecasting28
progress’. However, whichever term is used it covers three very different
classes of assets:
1 Raw materials – components, consumables (such as paint and oil) used
in the making of a product
2 Work in progress – items in the process of being turned from raw materi-
als into the finished product
3 Finished goods – those either complete or purchased for resale.
The accurate valuation of stock on a consistent basis is crucially import-
ant to the company, because quite small variations can have a signifi-
cant effect on the profits it reports. There are three main problems in
valuing stock:
1 The price to be used if an item has been supplied during the year at
varying prices
2 The value that is added to the item during the manufacturing process
3 Assessment of what the net realizable value of the items will be.
There are a number of different methods used to put a value on stock,
of which the following are examples of the most commonly used:
■ First-in-first-out (FIFO). This method of stock pricing assumes for
accounting purposes that the stock has been used in the order in which
it was received by the company. Therefore, if there have been price
rises the stock which has not been used will probably be that which was
purchased by the company at the higher price, and it can be valued
accordingly.
■ Average or weighted average price. Where a company receives a num-
ber of stock deliveries during an accounting period at different prices,
the average price, or weighted average price, will be used.
■ Standard price. Some businesses will employ a standard cost system.
They predetermine for each item that they manufacture the price that
should be paid for material, wages and so on. Materials issued from
store are priced at a standard cost, as are work in progress and fin-
ished goods. Any variances from standard are written off as operating
losses (or profits) at the time they occur. As long as the standard price
fairly represents the average cost of the material in stock, it can be
used for accounting purposes.
Summary of financial statements 29
Borrowing as shown in a company’s accounts
A company’s borrowings will broadly fall into three categories:
1 Debentures and unsecured loan stock and bonds, which can be bought
and sold in the same way as shares in a company, and can be held by
the general public
2 Loans from financial institutions
3 Bank overdrafts.
The former two categories of borrowings are shown separately in the bal-
ance sheet, and in the notes to the accounts there will be descriptions of
the terms under which each loan is repayable, the rates of interest applic-
able on each loan, and whether they are secured or unsecured. The bank
overdraft is shown under the current liabilities heading in the balance
sheet, although this only tells us the balance utilized – not the full extent
of the facility available to the company from the bank.
The amount that a company can borrow may be limited by the following:
■ The company’s borrowing powers as limited by its Articles of Asso-
ciation (the internal rules upon which the directors run the company,
which are filed with the Registrar of Companies when the company is
first established)
■ Restrictions imposed by existing borrowings – terms of existing loan
agreements may preclude the company from borrowing further
■ The lender’s requirement for capital and income cover
■ The lender’s general opinion of the company and its overall borrow-
ing position.
Banking facilities
There are three main methods by which a company can borrow money
from a bank:
1 Overdrawing its current account against an agreed overdraft facility. Bank
advances on the overdraft are technically repayable upon demand by
Cash Flow Forecasting30
the bank, and can leave the company vulnerable to increases in interest
rates. However, they are a simple method by which to fund day-to-day
working capital requirements, and the balance overdrawn is shown
under current liabilities in the company’s balance sheet.
2 Bank loans. These are shown in the balance sheet under two head-
ings; one in current liabilities, which shows the amount of principal
due to be repaid under bank loans within the next 12 months (CPLTD
or current portion of long-term debt), and the balance under long-
term liabilities, which shows the amount due to be repaid after
12 months.
3 Bills of exchange under an Acceptance Credit facility. The primary pur-
pose of the bill of exchange as a funding instrument is to finance the
sale of goods when the seller or exporter wishes to obtain payment at
the time the goods are despatched, and the buyer or importer wants to
defer payment until the goods arrive, or later. In these circumstances,
company A, the supplier of the goods to company B, will draw up a bill
of exchange for the goods which company B will accept as representing
the debt to company A which is payable at some future time.
Fixed assets
The Companies Act 1985 requires fixed assets to be set out in the balance
sheet under three headings:
1 Intangible fixed assets, which will include such items as patents and
trademarks, brand names, goodwill, concessions, and capitalized
development costs. ‘Goodwill’ is the amount by which the value of a
business as a whole exceeds the balance sheet value of its individual
assets less liabilities. It is normally only recognized in the accounts of
a company when it acquires another business, and it relates to the
amount that the purchasing company has paid for the company being
purchased over and above its balance sheet value.
2 Tangible fixed assets, which are assets with a long working life that have
not been bought by the company for resale purposes in the ordinary
course of their business, but for the purposes (directly or indirectly) of
revenue generation. They will include items such as machinery on
which the company’s product is made, land on which the head office
Summary of financial statements 31
or factories are based, buildings such as the offices and factories, and
motor vehicles (lorries, sales representatives cars etc.).
3 Investments, which fall into four categories:
■ Investment in subsidiary companies.
■ Investment in associated undertakings.
■ Participating interests (these are interests held by the company on
a long-term basis to secure a contribution to its activities by the
exercise of control or influence over another party or parties). This
would involve a holding of 20% or more of the shares of another
institution. A participating interest becomes an interest in an asso-
ciated undertaking if the company exercises a significant degree of
influence over the operating and financial policy of the company in
which it has a participating interest.
■ Other investments, which are share holdings in other companies
that are none of the above, but which the company feels is a good
investment for it and will bring a good return.
Depreciation
This is a measure of the loss of value of an asset due to use, the passage
of time and obsolescence (obsolescence is particularly a problem in the
field of high technology, such as computers and electronic equipment).
This includes the amortization of fixed assets that have a pre-determined
future life, and the depletion of wasting assets.
Factors affecting the depreciation of an asset will include the original cost
of the asset, the estimated life of the asset, the method of depreciation
calculation used, and the likely residual value. Depreciation methods
include straight line, reducing balance, and the sum of digits. Straight line
is the most commonly used method.
Book value
Traditionally, fixed assets are shown in the balance sheet at cost less
aggregate depreciation to date – this is known as the net book value.
This is not in any sense a true valuation of the worth of the asset today;
it will require a professional valuation under today’s market constraints.
Cash Flow Forecasting32
Authorized and issued share capital
When a company is formed, the authorized share capital and the nom-
inal value of its shares are written into the company’s Memorandum of
Association. Both the authorized and the issued share capital are shown in
the company’s accounts.
There are several different types of share capital, which carry different
levels of risk dependent upon where they would rank for distribution
in the event of liquidation of the company. The types of share capital, in
ascending order of risk, are:
■ Preference (or non-equity) shares. Preference shares earn a fixed rate
of dividend, which is normally payable half-yearly, but preference
shareholders have no right of legal redress against the directors of the
company if they decide that no preference dividend should be paid.
However, if no preference dividend is paid for an accounting period,
then no other share dividend can be declared for the accounting
period concerned. Varieties of preference shares can include one or a
combination of the following features.
■ Convertible shares, where shareholders have the option of converting
their preference shares into ordinary shares within a given period of
time (the conversion period).
■ Ordinary shares, which comprise the main part of the share capital of
a company. Ordinary shareholders are entitled to vote at the com-
pany’s general meetings, giving them a say in company decisions –
including the appointment of directors. They are entitled to the profits
of the company that remain after tax and preference dividends have
been deducted.
■ Deferred shares form a class of share on which a dividend is not
payable until ordinary shareholders’ dividends have reached a certain
level, or until the deferred shares have themselves been converted into
ordinary shares.
■ Warrants to subscribe for shares are transferable options granted by
the company to purchase new shares from the company at a given
price, called the ‘exercise price’. The warrant is exercisable only during
a specified time period, called the ‘exercise period’.
Summary of financial statements 33
Reserves
Reserves can arise via:
■ accumulation of profits, from trading and from the sale of assets
■ issue of shares at a premium, i.e. at more than their nominal value
■ issue of warrants
■ upward revaluation of assets
■ acquisition of assets at below their balance sheet value.
Reserves can be reduced by losses, share issue and share redemption
expenses, revaluation expenses, revaluation deficits, and the writing off
of goodwill.
The Companies Act 1985 requires reserves to be shown under three main
headings:
1 Share premium account – when shares are issued at a premium over
their nominal value, the premium element must be credited to the
share premium account. The share premium account has to be shown
separately on the balance sheet, and may not be paid out to share-
holders except on liquidation or under a capital reduction scheme.
2 Revaluation reserve (unrealized profits) – the surplus (or shortfall) on
the revaluation of assets should be credited (or debited) to a separate
reserve, the revaluation reserve.
3 Other reserves prohibited from distribution by the company’s memoran-
dum articles include capital redemption reserves. Shares may be
redeemed or purchased by a company out of distributable profits or out
of the proceeds of a new issue of shares. Where redemption or purchase
is out of distributable profits, an amount equal to the amount by which
the company’s share capital is diminished must be set aside by the com-
pany in a reserve called the capital redemption reserve. This is shown
separately under ‘Other reserves’.
The profit and loss account
The profit and loss account is also one of the basic components of the
company’s report and accounts. It is a record of the trading activities of
a company for a given period of time. This period is called the account-
ing period, and is normally a year. The balance sheet is always drawn up
on the last day of the company’s accounting period.
The profit and loss account:
■ compares revenue for the year against the cost of goods sold and other
expenses, disclosing the profit or loss made
■ measures the current performance of the business and shows turnover
and expenses
■ reveals the pre-tax profit or loss figure, which is an important pointer
to the overall efficiency of the company.
The profit and loss account will show three things; how the profit (or
loss) was earned, how much was taken in taxation, and what happened
to the profit (or loss) after taxation was deducted.
Turnover
This is the amount derived from the provision of goods and services
falling within the company’s ordinary activities, after deduction of trade
discounts and before addition of VAT and other sales-based taxes.
Under the Companies Act, the following information must also be given
by the company relating to its turnover:
■ If the company has carried on two or more classes of business during
the year that, in the directors’ opinion, differ substantially from each
other, it should describe the classes of business and split out each
businesses’ turnover and pre-tax profits
■ If in the accounting period the company supplied goods and services
to different geographical markets, the amount of turnover attribut-
able to each market should also be stated.
SSAP 25 requires companies which have two or more classes of busi-
ness or which operate in two or more different geographical markets
to report separately each market’s turnover, pre-tax profits and net
assets.
Cash Flow Forecasting34
Summary of financial statements 35
To summarize, the profit and loss account performs three functions:
1 It shows how much profit has been earned by the company, and
whether this is sufficient to cover the dividends and to provide for
expansion of the business
2 It explains how the reported balance of profit was computed
3 It shows how the reported profit has been distributed and what has
been retained.
Problems with financial statements
and auditors
It is important to note that there are several difficulties in using the
information in a company’s financial statements:
■ There is no complete and comprehensive set of accounting standards.
For example, in the same industry a transaction can be presented in
several ways, all in accordance with FRS. The analyst should be aware
of the way a company is presenting its accounts.
■ Financial statements represent the work of two parties – the direc-
tors/management, and the auditors – with differing interests. There
will be differences of opinion that must be reconciled to the satisfac-
tion of both parties.
■ Published financial statements are prepared for a wide audience. In
addition to the shareholders, the annual report is targeted towards
institutional investors, analysts, employees and the public.
■ Accounting involves approximations – for example, it is difficult to
value assets such as partially finished ‘work in progress’, or provisions
for bad or doubtful debts.
■ There are different methods of valuing assets. Current assets such as
receivables, less provisions for doubtful debts, are often estimates.
Likewise, stock/inventories can be valued in a number of different
ways – LIFO (Last In, First Out), FIFO (First In, First Out), WACC (weighted
average cost method), etc.
■ In accounting, there are honest differences of opinion. There are also
ambiguities that enable companies to manipulate accounts and mis-
represent the true and fair state of their company, and often the
Cash Flow Forecasting36
auditors collude with the company in signing off on financial state-
ments known to be misleading if not outright fraudulent. The analyst
should be aware that these exist, and that accounting in recent years
has become unreliable. This is not only a breakdown in accounting
practice, but indeed goes to the very heart of the ethos of accounting.
■ Accounting terminology can vary. For example, income statement, profit
and loss statement, statement of income and retained earnings and
operating statement are all different ways of referring to the same
statement; stock can be called inventory, and debtors either receivables
or accounts receivable. It is important to be familiar with the general
characteristics of the accounting language.
■ Accounting has evolved by convention and tradition over time, and
that there are many anomalies and differences of opinion in the prac-
tice. Accounting attempts to quantify the approximate and, at times,
unquantifiable.
To this traditional list must be added the impact of new developments
witnessed in the USA with Enron (merely the first of a baker’s dozen of
scandals), and in the EU with Parmalat.
Financial statements are hardly likely to explain fraudulent activities,
how or why (for example) a company has several offshore special purpose
vehicles (SPVs), and whether these are part of the company’s business
operations or speculative – indeed illegal – structures designed to evade
regulation and taxation laws. The names of the Enron SPVs tell us some-
thing about the mentalities of the executives who set them up. Some of
the partnerships were named after characters from Star Wars, such as
Chewbacca (Chewco) and Jedi (Joint Energy Development Investments).
Others were called Braveheart, Raptor, Porcupine and Condor.
What is surprising in these developments is the banality of the decep-
tion. It seems that a great many other companies are doing the same
thing, and not only in the USA – as the Parmalat saga testifies.
This begs a host of questions: Why did Enron’s accountants and lawyers
approve of these activities? Why did Parmalat’s auditors not see the 5 bil-
lion euro ‘hole’ in the company’s accounts for 10 years? Incompetence
Summary of financial statements 37
seems too tame an accusation to level at repeated audit teams over a
decade. The word ‘corruption’ comes to mind.
Wall Street is now ridden with fears that other companies have overstated
earnings because of similarly misleading accounting practices that were
devised by the major accounting and law firms. The SEC is investigating
Global Crossing. The stocks of companies such as Worldcom, Reliant Ser-
vices, the Irish drug firm Elan, and even General Electric have been falling
in price for fear they will have to restate earnings as scrutiny of corporate
books increases.
The former chief accountant of the SEC, Lynn Turner, estimates that
investors have seen company stock prices fall by $200 billion as earnings
have been restated because of what were deemed accounting errors. He
finds the number of companies that have had to restate earnings has
doubled since 1997 (‘Accounting in crisis’, Business Week, 28 January
2002). Similarly, economists at the Levy Forecasting Center in Chappaqua,
New York, believe that profits nationwide may be overstated on average
by 20%.
Such developments render the traditional task of financial analysis effect-
ively obsolete, and new, perhaps more intuitive and judgmental or psy-
chological elements may have to be factored into the analytical process
given the dearth of reliable quantifiable data.
The sad fact is that the accounting profession has proven itself to be
more concerned about fostering a ‘positive and dynamic can-do spirit’
within its bright young things in order to chase business and feed itself
into more lucrative consulting business, than in applying accounting
principles effectively. The result is that the accounting profession, as
well as the financial statements it audits, has lost all credibility and the
word ‘Andersen’ has become a joke. The exorcizing of government, the
deregulation and the emancipation of ‘limits’ on business are the very
forces that will undermine its credibility and expose the foundations of
financial statements for all to see.
The Powers Report is especially harsh on Arthur Andersen. It states that
Andersen ‘did not communicate the essence of the transactions in a
Cash Flow Forecasting38
sufficiently clear fashion to enable a reader of the financial statements
to understand what was going on’. The Powers Report also finds that
Andersen had an integral part as consultants in creating the Raptor part-
nerships, earning nearly $6 million in fees on these and related partner-
ships alone.
The basic question arising from the Enron scandal is whether accounting
statements can be required to reflect the true economic condition of the
companies. In many companies, including Enron, there was at best a
pretence of this, and often not even that. Perhaps the best overall
reform, as Partnoy (1999) suggests, might be to adopt legislation to make
corporations, their officers and their directors legally liable should the
general requirement that disclosure must reflect the economic reality of
a company be violated. Treasury Secretary O’Neill has proposed that
executives should not be allowed to have insurance to cover any such
liability, but few believe the White House will support his rather off-the-
cuff proposal.
It is therefore important to bear these realities in mind when number-
crunching a spreadsheet, and wondering about the true significance
behind a change in an inventory turnover ratio from 57 to 64 days or the
speed-up in days’ receivables from 37 to 34 days.
Conclusion
The purpose of company financial information is to enable effective credit
decisions to be made, so that costly lending errors can be avoided. It is
important therefore that information is reliable. Consider the essential
information that is obtained directly from members of senior management,
such as the CEO or finance director. How reliable is this information?
In Enron, for example, the Senior Manager was Kenneth Lay and the
Finance Director was Jeffrey Skilling, who in his testimony to Congress suf-
fered from an acute loss of memory most atypical of a normal CFOs per-
formance (he repeated ‘I do not recall’ 28 times during his testimony).
Despite the fact that 27 Enron managers have been charged with fraud and
9 have pleaded guilty, Lay and Skilling have yet (as of February 2004) to be
Summary of financial statements 39
brought into court on charges related to Enron’s implosion (Houston
Chronicle, 13 February 2004). In Europe, such CEOs have included Asil Nadir
(following the collapse in the 1990s of the publicly quoted company Polly
Peck Plc) and Ruiz-Mateus of Spain. Following the collapse of Polly Peck,
Nadir sought refuge in the illegitimate state of Turkish North Cyprus, from
where he cannot be extradited for having perpetrated corporate fraud in
the UK.1 Likewise, Ruiz-Mateus absconded to Argentina while the Spanish
government combed over the ashes of the collapsed RUMASA group.2
In Italy, Parmalat hid a 15 billion euro ‘hole’ in its accounts from its
auditors for 10 years by providing a forged photocopy of a deposit cer-
tificate with the pasted-on logo of an offshore subsidiary of a US bank.3
It begs the question, what sort of audit guidelines did the company have
in its audit procedures manual, and were they being followed or not?
It is normal to consider how accurate such information is likely to be
both during a best-case scenario (inflating corporate performance to
please share and rating analysts) and in a worst-case scenario (hiding the
fraud). Moreover, it is worth considering whether the company’s audit-
ors are colluding in the fraud in an effort to retain profitable business
and indeed sell more profitable ‘consulting’ business (for example,
many of the fraudulent mechanisms present in Enron were designed by
Andersen, its auditors, and the supporting documentary evidence was
destroyed by Andersen after it received a subpoena from the Securities
and Exchange Commission).4
1 Asil Nadir, the Polly Peck tycoon who fled to northern Cyprus in 1993 to avoid charges involv-ing theft totalling £34 m, yesterday astonished friends, Turkish politicians and the seriousfraud office by pledging to return to Britain to clear his name. (Nils Pratley, The Guardian, 3 September 2003)2 Peter Gooch, Valencia Life Magazine.3 The Commission’s complaint, filed in the US District Court in the Southern District of NewYork, alleges that Parmalat engaged in one of the largest and most brazen corporate financialfrauds in history (SEC Litigation Release No. 18527, 30 December 2003). After fraudulently cer-tifying 8 billion euros ($10 billion) in assets in their company’s balance sheet, Parmalat enteredbankruptcy protection last week and founder and former CEO Calisto Tanzi fled the country. Hesubsequently returned and was immediately detained by police. The scandal and its aftermathcontinue to unfold, and Parmalat is being called ‘the Europe Enron’ for its massive fraud andillegal business practices (see the forged deposit certificate in Annex 6.1 to the Release.4 FT.Com, Q&A: ‘Enron finds itself in a Washington circus’, Adrian Michaels, Gerard Baker andPeter Thal Larsen, 13 February 2002.
Cash Flow Forecasting40
Since it is impossible to certify all accounts as having been properly
audited, prudency dictates that these audited statements be considered
as failing to satisfy the requirements of mission-critical reliability.
These audit shortcomings have further knock-on effects, not only on the
quality of financial statements but also on the relevance of credit ratings
issued by the credit rating agencies, since they rely on them for issuing
such ratings and cheerfully admit that they do not question the validity
of accounting statements since this is the auditor’s job.5
5 ‘When asked by Committee staff whether they considered as a qualitative factor in theiranalysis whether the company was engaging in aggressive accounting, the agencies indicatedthat they rely on the auditors’ work. This was consistent with their testimony at the hearing. Inthe Committee staff interviews, the credit rating analysts resisted staff’s suggestion that a com-pany’s accounting methods should be part of their analysis, because even when financial state-ments comply with Generally Accepted Accounting Principles (GAAP), they nevertheless maynot present all the information an investor would want to know, or all the information a creditrater would want to know. This is troubling, because the fact that a company may be using theflexibility of GAAP to hide problems should be a consideration, particularly if the credit raterstake a long-term view’ (Financial Oversight of Enron: The SEC and Private-Sector WatchdogsReport of the Staff to the Senate Committee on Governmental Affairs; 8 October 2002).
Chapter 3
Factors impactingfinancial performance
Introduction
Corporate credit analysis provides an overall assessment of the credit-
worthiness of a company, and is used for a variety of commercial and
financial purposes. It is needed prior to accepting a financial risk on the
ability of a company to satisfy its obligations in the future.
That risk may exist in a variety of forms. It is important to understand
that the credit process is not limited to the examination of financial
measures. Proper assessment requires a broader framework, involving a
thorough review of business fundamentals, including judgements about
the company’s competitive position and evaluation of management and
its strategies. Clearly such judgements are highly subjective indeed; sub-
jectivity is at the basis of every credit decision.
Yet many of these factors will have a direct impact on the key variables
used in building financial projections. It is therefore useful to consider
the macroeconomic risk factors that can affect the key variables driving
a business.
While these factors are subjective and non-numerical, familiarity with
their characteristics and likely impact on financial statements and future
performance is essential if financial projections are to be rooted in reality.
Table 3.1 summarizes the critical risk factors to be taken into account in
an overall assessment of creditworthiness. The business risk factors
clearly impact on the output symptoms of profitability balance sheet
strength and cash flow.
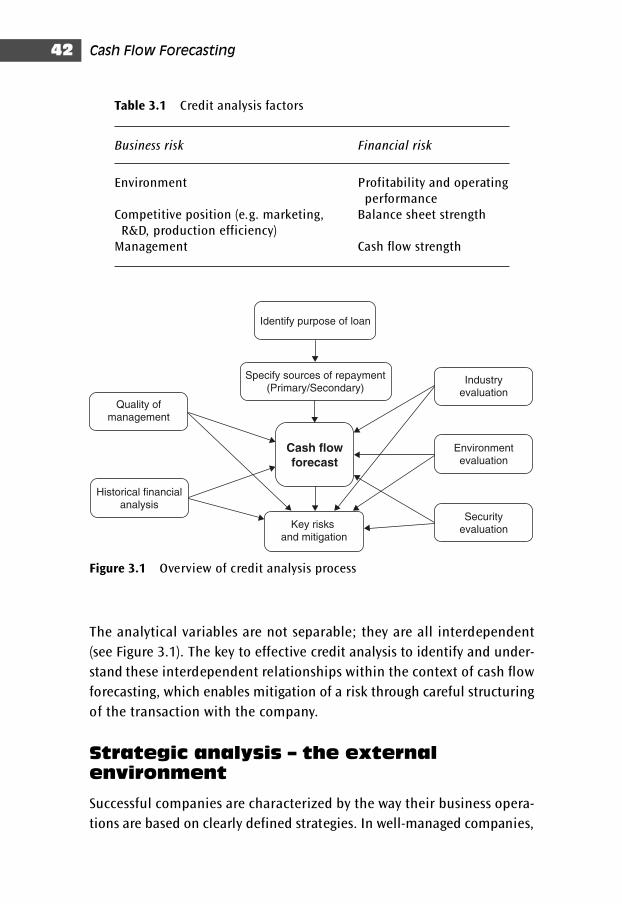
The analytical variables are not separable; they are all interdependent
(see Figure 3.1). The key to effective credit analysis to identify and under-
stand these interdependent relationships within the context of cash flow
forecasting, which enables mitigation of a risk through careful structuring
of the transaction with the company.
Strategic analysis – the external
environment
Successful companies are characterized by the way their business opera-
tions are based on clearly defined strategies. In well-managed companies,
Cash Flow Forecasting42
Table 3.1 Credit analysis factors
Business risk Financial risk
Environment Profitability and operatingperformance
Competitive position (e.g. marketing, Balance sheet strengthR&D, production efficiency)
Management Cash flow strength
Quality ofmanagement
Historical financialanalysis
Identify purpose of loan
Specify sources of repayment(Primary/Secondary)
Key risks and mitigation
Industryevaluation
Environmentevaluation
Securityevaluation
Cash flow
forecast
Figure 3.1 Overview of credit analysis process
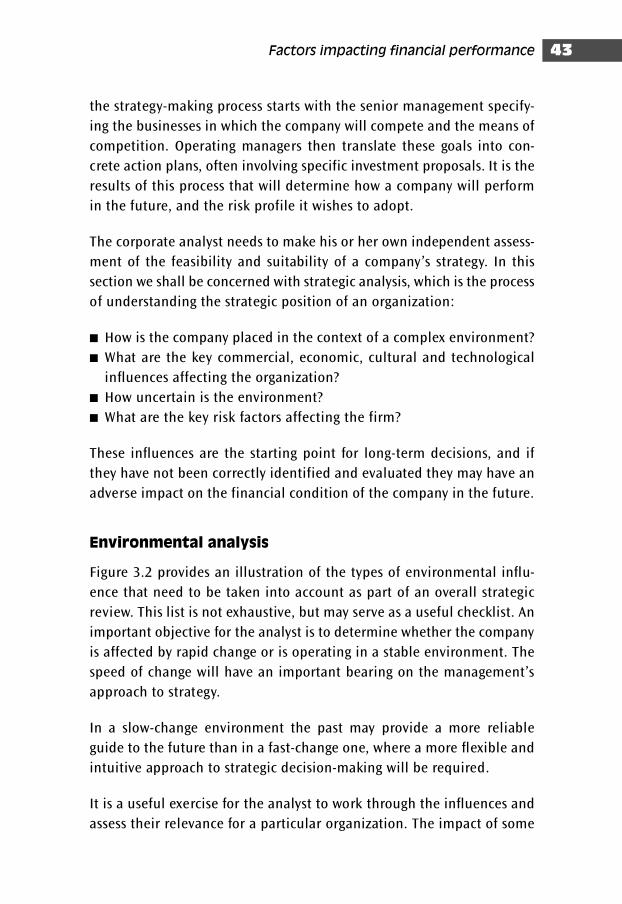
the strategy-making process starts with the senior management specify-
ing the businesses in which the company will compete and the means of
competition. Operating managers then translate these goals into con-
crete action plans, often involving specific investment proposals. It is the
results of this process that will determine how a company will perform
in the future, and the risk profile it wishes to adopt.
The corporate analyst needs to make his or her own independent assess-
ment of the feasibility and suitability of a company’s strategy. In this
section we shall be concerned with strategic analysis, which is the process
of understanding the strategic position of an organization:
■ How is the company placed in the context of a complex environment?
■ What are the key commercial, economic, cultural and technological
influences affecting the organization?
■ How uncertain is the environment?
■ What are the key risk factors affecting the firm?
These influences are the starting point for long-term decisions, and if
they have not been correctly identified and evaluated they may have an
adverse impact on the financial condition of the company in the future.
Environmental analysis
Figure 3.2 provides an illustration of the types of environmental influ-
ence that need to be taken into account as part of an overall strategic
review. This list is not exhaustive, but may serve as a useful checklist. An
important objective for the analyst is to determine whether the company
is affected by rapid change or is operating in a stable environment. The
speed of change will have an important bearing on the management’s
approach to strategy.
In a slow-change environment the past may provide a more reliable
guide to the future than in a fast-change one, where a more flexible and
intuitive approach to strategic decision-making will be required.
It is a useful exercise for the analyst to work through the influences and
assess their relevance for a particular organization. The impact of some
Factors impacting financial performance 43
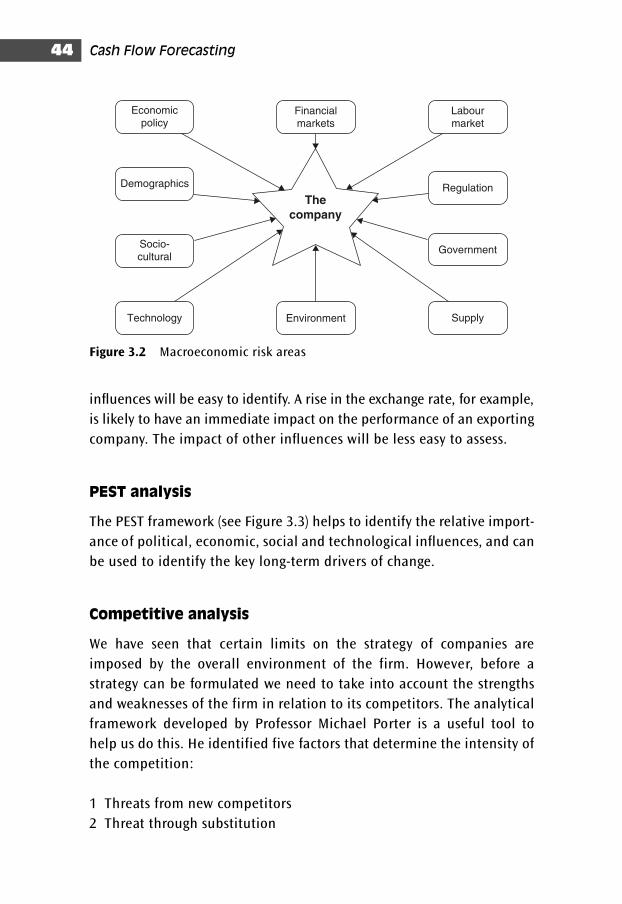
influences will be easy to identify. A rise in the exchange rate, for example,
is likely to have an immediate impact on the performance of an exporting
company. The impact of other influences will be less easy to assess.
PEST analysis
The PEST framework (see Figure 3.3) helps to identify the relative import-
ance of political, economic, social and technological influences, and can
be used to identify the key long-term drivers of change.
Competitive analysis
We have seen that certain limits on the strategy of companies are
imposed by the overall environment of the firm. However, before a
strategy can be formulated we need to take into account the strengths
and weaknesses of the firm in relation to its competitors. The analytical
framework developed by Professor Michael Porter is a useful tool to
help us do this. He identified five factors that determine the intensity of
the competition:
1 Threats from new competitors
2 Threat through substitution
Cash Flow Forecasting44
Economicpolicy
Demographics
Socio-cultural
Technology
Financialmarkets
Environment
Labourmarket
Government
Supply
The
company
Regulation
Figure 3.2 Macroeconomic risk areas
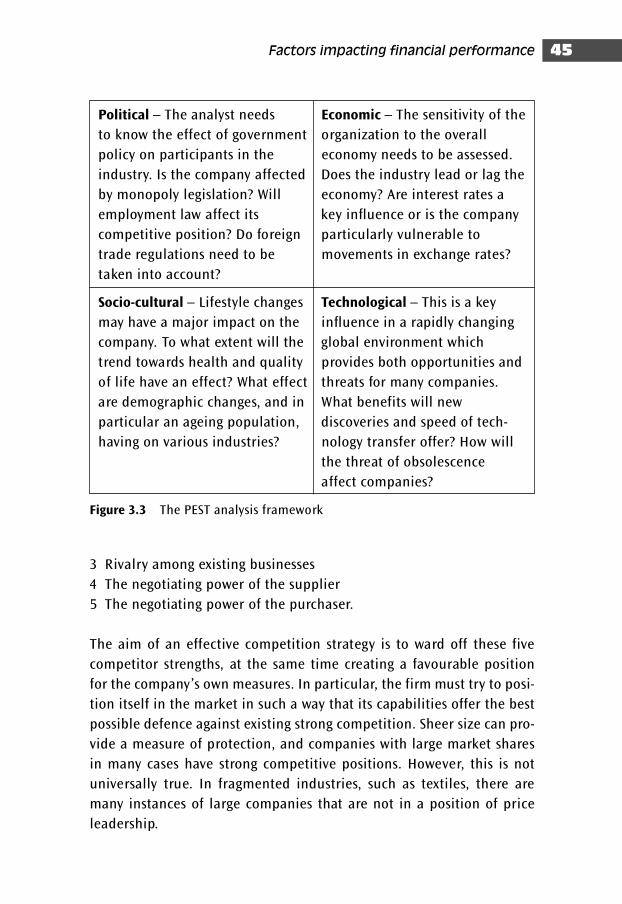
3 Rivalry among existing businesses
4 The negotiating power of the supplier
5 The negotiating power of the purchaser.
The aim of an effective competition strategy is to ward off these five
competitor strengths, at the same time creating a favourable position
for the company’s own measures. In particular, the firm must try to posi-
tion itself in the market in such a way that its capabilities offer the best
possible defence against existing strong competition. Sheer size can pro-
vide a measure of protection, and companies with large market shares
in many cases have strong competitive positions. However, this is not
universally true. In fragmented industries, such as textiles, there are
many instances of large companies that are not in a position of price
leadership.
Factors impacting financial performance 45
Political – The analyst needs Economic – The sensitivity of the
to know the effect of government organization to the overall
policy on participants in the economy needs to be assessed.
industry. Is the company affected Does the industry lead or lag the
by monopoly legislation? Will economy? Are interest rates a
employment law affect its key influence or is the company
competitive position? Do foreign particularly vulnerable to
trade regulations need to be movements in exchange rates?
taken into account?
Socio-cultural – Lifestyle changes Technological – This is a key
may have a major impact on the influence in a rapidly changing
company. To what extent will the global environment which
trend towards health and quality provides both opportunities and
of life have an effect? What effect threats for many companies.
are demographic changes, and in What benefits will new
particular an ageing population, discoveries and speed of tech-
having on various industries? nology transfer offer? How will
the threat of obsolescence
affect companies?
Figure 3.3 The PEST analysis framework
Cash Flow Forecasting46
The basis on which a company competes will determine which factors
need to be analysed in depth.
Table 3.2 sets out the credit factors for the paper industry. The issues
that are critical for this industry will be different from the factors affect-
ing, say, an electronics distribution company. However, there will always
be certain risk factors, such as reliance on one product, which need to
be considered for all types of company.
Strategic analysis – the value chain
The next stage in strategic analysis is to identify whether the company
has the resources to meet the demands of the environment and the com-
petitive market outlined in the previous section. Value chain analysis is
often used by corporate strategists to identify areas where a firm can
seek to achieve competitive advantage. It involves assessing the capability
of an organization at various levels of detail, and the separate activities
it undertakes in designing, producing, selling and delivering its services.
Figure 3.4 provides an illustration of the value chain, which shows that
value is added through five primary activities:
1 Inbound logistics are the receiving, storing and distributing of the
inputs
2 Operations include machining, packaging, assembly and testing
3 Outbound logistics are the collection, storage and distribution of the
product to the customer
4 Marketing and sales are promotion and selling activities
5 Services are installation, after-sales service, repairs and product support.
The support activities are then combined with the primary activities to
form a matrix of separate activities. The support activities are:
■ procurement, which involves acquiring goods and services to support
each stage of the value chain
■ technology development, which includes know how, product design,
process development and information systems
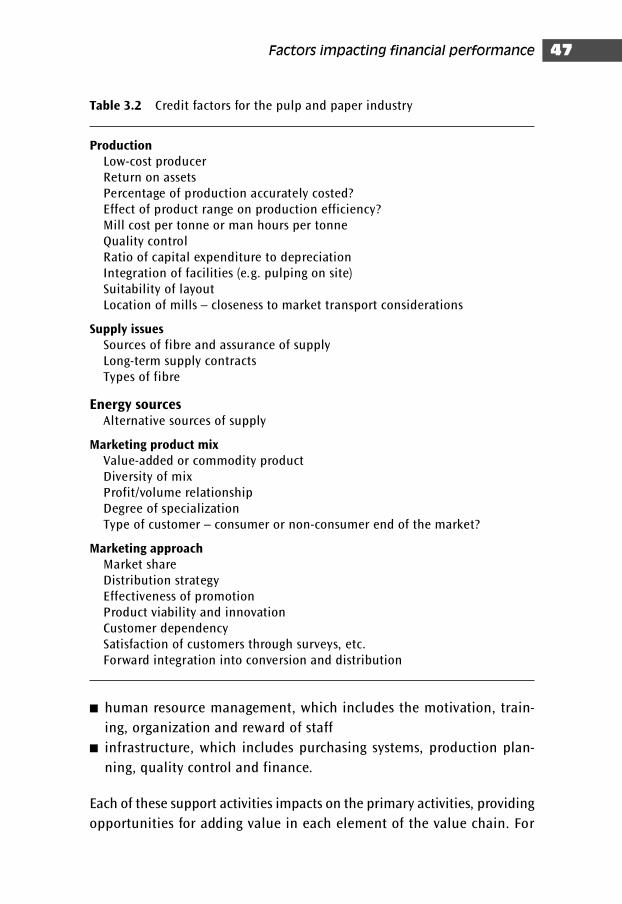
Factors impacting financial performance 47
Table 3.2 Credit factors for the pulp and paper industry
ProductionLow-cost producerReturn on assetsPercentage of production accurately costed?Effect of product range on production efficiency?Mill cost per tonne or man hours per tonneQuality controlRatio of capital expenditure to depreciationIntegration of facilities (e.g. pulping on site)Suitability of layoutLocation of mills – closeness to market transport considerations
Supply issuesSources of fibre and assurance of supplyLong-term supply contractsTypes of fibre
Energy sourcesAlternative sources of supply
Marketing product mixValue-added or commodity productDiversity of mixProfit/volume relationshipDegree of specializationType of customer – consumer or non-consumer end of the market?
Marketing approachMarket shareDistribution strategyEffectiveness of promotionProduct viability and innovationCustomer dependencySatisfaction of customers through surveys, etc.Forward integration into conversion and distribution
■ human resource management, which includes the motivation, train-
ing, organization and reward of staff
■ infrastructure, which includes purchasing systems, production plan-
ning, quality control and finance.
Each of these support activities impacts on the primary activities, providing
opportunities for adding value in each element of the value chain. For
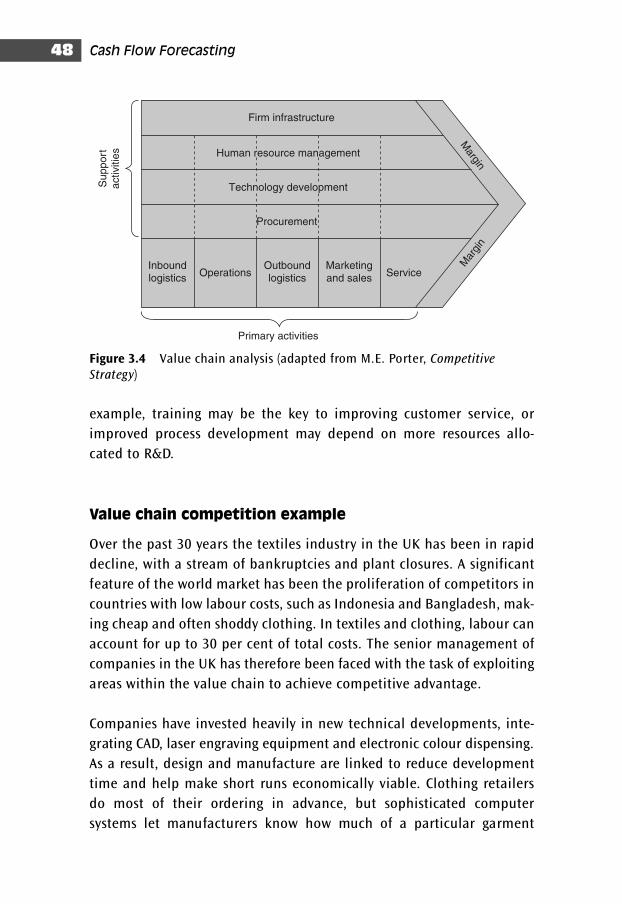
example, training may be the key to improving customer service, or
improved process development may depend on more resources allo-
cated to R&D.
Value chain competition example
Over the past 30 years the textiles industry in the UK has been in rapid
decline, with a stream of bankruptcies and plant closures. A significant
feature of the world market has been the proliferation of competitors in
countries with low labour costs, such as Indonesia and Bangladesh, mak-
ing cheap and often shoddy clothing. In textiles and clothing, labour can
account for up to 30 per cent of total costs. The senior management of
companies in the UK has therefore been faced with the task of exploiting
areas within the value chain to achieve competitive advantage.
Companies have invested heavily in new technical developments, inte-
grating CAD, laser engraving equipment and electronic colour dispensing.
As a result, design and manufacture are linked to reduce development
time and help make short runs economically viable. Clothing retailers
do most of their ordering in advance, but sophisticated computer
systems let manufacturers know how much of a particular garment
Cash Flow Forecasting48
Support
activitie
sFirm infrastructure
Margin
Mar
gin
Inboundlogistics
Outboundlogistics
OperationsMarketingand sales
Service
Primary activities
Human resource management
Technology development
Procurement
Figure 3.4 Value chain analysis (adapted from M.E. Porter, Competitive
Strategy)
has been sold as soon as customers log it past the cash till. This signal
allows them both to send new stock to the customer promptly and to
divert their own production to whatever lines are selling well. In the
high-cost economies the textile companies need to play to their
strengths, and by using this technology and their proximity to the mar-
ket they are able to counter the threat from competitors abroad with
lower labour costs.
Management
Insufficient attention is often paid to the quality of management in a
corporate credit analysis. However, corporate failure has on many occa-
sions been ascribed to poor management, and it is therefore a critical
risk area which needs to be assessed carefully.
A list of areas that must be explored includes:
■ Integrity. Is company management fundamentally honest? How will-
ing are managers to share information? How open do you think they
will be if the company is confronted with problems? How long has
management been known to us?
■ Stability. How stable has the management team been? Is any conflict
that exists at senior level constructive? Is there an autocratic style of
management? Is succession planning a relevant issue? Does manage-
ment have depth?
■ Skills. Does the management team have the necessary skills for problem-
solving and decision-making? Is it good at uncovering problems and
identifying opportunities?
■ Management style. What sort of management style is used? Is it partici-
pative or more prescriptive? What motivates management on a per-
sonal basis? Is it power, greed, status, money, or none of these?
■ Experience. How long have the managers been in the industry? Is the
experience relevant? Has the management team successfully negoti-
ated a cyclical downturn? What has been the team’s attitude to risk?
Are members purely interested in short-term gain? Are they finan-
cially astute? What is the organizational recognition of the finance
function?
Factors impacting financial performance 49
Profitability and performance
The aim in this section is to analyse financial statements for the purpose
of evaluating performance. Profitability is a critical determinant of credit-
worthiness, since a company generating high profit margins will have a
stronger ability to generate equity capital internally and attract it externally.
Performance measurement is much more an art than a science, and
requires the use of imagination and judgement rather than relying on a
given set of rules. There is no single measure of performance that will
provide us with a straightforward answer on corporate credit risk. We
need to use several measures, each of which may prompt the analyst to
ask more searching questions.
Return on equity
One of the most well-known measures of financial performance is the
return on equity (ROE), which measures the efficiency with which the firm
employs owners’ capital. It represents the percentage to owners on their
investment in the firm. It is a useful starting point for analysis, and has great
value for the analyst when broken down into its principal components:
ROE � earnings/shareholders’ equity
ROE � (earnings/sales)*(sales/assets)*(assets/shareholders’ equity)
or, expressed differently,
ROE � profit margin*asset turnover*financial leverage
This formula demonstrates that company management can control and
improve the return on equity in three different ways – by:
1 Squeezing more earnings out of each currency unit of sales
2 Generating more sales out of the assets employed in the company
3 Managing the amount of debt used to finance the assets.
Table 3.3 shows the breakdown of return on equity for a number of differ-
ent types of company, and demonstrates that there are many different
Cash Flow Forecasting50
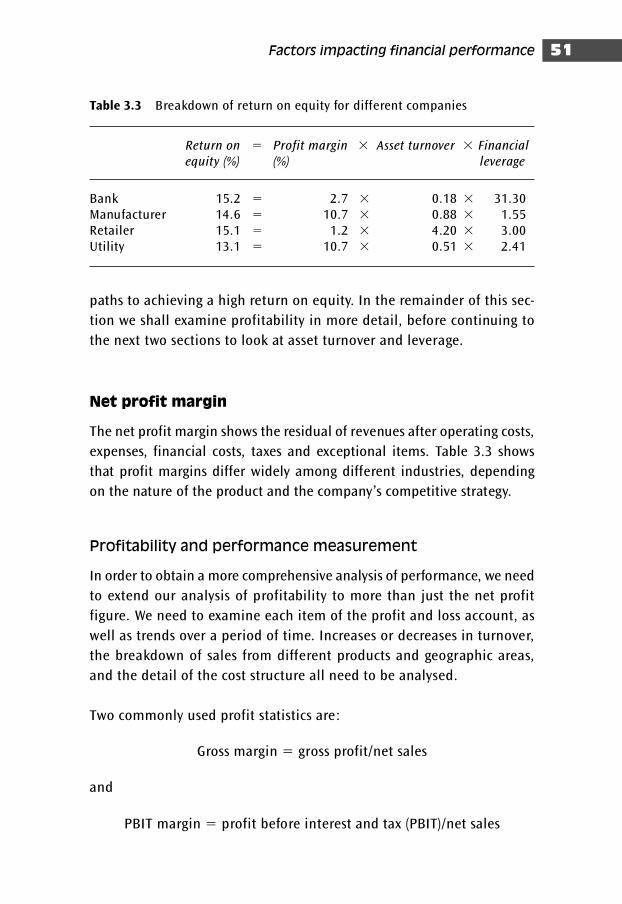
paths to achieving a high return on equity. In the remainder of this sec-
tion we shall examine profitability in more detail, before continuing to
the next two sections to look at asset turnover and leverage.
Net profit margin
The net profit margin shows the residual of revenues after operating costs,
expenses, financial costs, taxes and exceptional items. Table 3.3 shows
that profit margins differ widely among different industries, depending
on the nature of the product and the company’s competitive strategy.
Profitability and performance measurement
In order to obtain a more comprehensive analysis of performance, we need
to extend our analysis of profitability to more than just the net profit
figure. We need to examine each item of the profit and loss account, as
well as trends over a period of time. Increases or decreases in turnover,
the breakdown of sales from different products and geographic areas,
and the detail of the cost structure all need to be analysed.
Two commonly used profit statistics are:
Gross margin � gross profit/net sales
and
PBIT margin � profit before interest and tax (PBIT)/net sales
Factors impacting financial performance 51
Table 3.3 Breakdown of return on equity for different companies
Return on � Profit margin � Asset turnover � Financial
equity (%) (%) leverage
Bank 15.2 � 2.7 � 0.18 � 31.30Manufacturer 14.6 � 10.7 � 0.88 � 1.55Retailer 15.1 � 1.2 � 4.20 � 3.00Utility 13.1 � 10.7 � 0.51 � 2.41
The gross margin reflects the relationship of cost, volume and prices in
the production or purchase of goods. It is often regarded as the ‘raw
profit’, and highlights the basic operating efficiency of a company.
The PBIT margin is favoured by many analysts because it not only iden-
tifies operating efficiency but also takes into account administrative
efficiency. It does not, however, take into consideration the level of debt
or the tax liability that the company is carrying.
The profit margin and asset turnover relationship
The profit margin and asset turnover tend to vary inversely. A leading
UK specialist plastics processing company, for example, has an asset
turnover ratio of less than one. This is because it requires a heavy invest-
ment in assets, particularly plant and machinery, to add value to the raw
materials. As a result, it is able to produce a specialized final product
that commands high profit margins.
A food retailer, on the other hand, adds little to product value, and will
consequently have low profit margins and high asset turnover.
It should be apparent, therefore, that a company with a high profit mar-
gin is not necessarily better than a low-margin company. It all depends
on the combined effect of the profit margin and the asset turnover.
Reliability of financial information
We have looked at various techniques for analysing corporate perform-
ance, but we still have to establish the quality and reliability of the
information on which we are basing our analysis. We have seen many
examples internationally of companies that apparently were in good
financial condition but then collapsed within a short period of reporting
good results.
However, if the analyst had carried out a detailed examination of the
company, it would have been possible in most cases to have detected
signs of impending disaster. The majority of these signs would have
Cash Flow Forecasting52
needed ferreting out of the notes. In recent years the presentation of
accounts has been improved, and they have now become more rigorous
and robust than in the late 1980s.
We must nevertheless not lose sight of the fact that financial managers,
particularly of quoted companies, are going to want to present their
accounts in the best possible light, and will use the ingenuity of their
advisers to do this.
The analyst needs to bear in mind, therefore, that any ‘creative account-
ing’ will dishonestly attempt to inflate reported profits, and in particu-
lar earnings per share, and also to report profits at the expense of the
balance sheet. This may result in profits being reported without an
equivalent amount of cash being generated. Cash is ultimately more
important than profits, since it is cash that pays interest and dividends.
The lack of it causes companies to fail.
Accounting quality is a critical issue in corporate analysis. It is important
to know that ratios derived from financial statements can be used accur-
ately to measure a company’s performance, and that there is a common
frame of reference to assist with comparative analysis. Accounting issues
to be reviewed include:
■ Valuation of assets. Financial statements are prepared after judgements
of valuation have been made by a company’s auditors. This is most
apparent with fixed assets and stock, so it is important that there is con-
sistent valuation to avoid distortions to the profit and loss and balance
sheets. The closing stock value is particularly important, because even
small changes in the value can have a large impact on corporate profits.
■ Capitalization of interest. Some companies, particularly in the real
estate and retail sector, will add the interest charges into the cost of
assets when they are borrowing money to finance a major building
project. This will protect the profit and loss in the short run, although
profits will be affected by a higher depreciation charge in the future.
The analyst should make adjustments for capitalized interest when
calculating the company’s interest cover, a key ratio for determining
creditworthiness (see Asset management, below).
Factors impacting financial performance 53
■ Contingent liabilities. Contingent liabilities are liabilities that may
become concrete in the future. They are specified in a company’s annual
report, but are usually tucked away at the end of the notes. For some
companies they have become potentially disastrous. Examples of con-
tingent liabilities are guarantees of subsidiary borrowings, performance
bonds and discounted bills.
■ Depreciation. Changes in depreciation methods have often been used
as a way of manipulating profitability. These changes can be particularly
hard to identify because they do not count as a change in accounting
policy, and therefore do not have to be noted as a change in the
accounting policy notes.
■ Ratio analysis. Despite the difficulties of interpretation referred to
above, financial statements offer much valuable information to the ana-
lyst. Ratio analysis is widely used, and this technique can reveal much
about a company and its operations. However, we should remember that
the appropriate value for ratios is dependent on a company’s specific cir-
cumstances, and that comparing ratios to rules of thumb has little value.
Comparing a company’s ratios to industry ratios provides a useful indi-
cator as to how the company is performing against its peer group. How-
ever, most companies have their own special differentiating factors, which
results in some ratios deviating from industry norms.
Another useful method to evaluate ratios is trend analysis. Ratios should
be calculated for a company over several years, and note taken of how
they change over time. Trend analysis eliminates company and industry
differences, enabling the analyst to make more accurate assessments of
corporate creditworthiness and its change over time. Such pedestrian
analytical methods in a volatile economic environment of hire and fire,
merge and divest may, however, be limited in effectiveness.
Asset management
Asset turnover and liquidity
We saw in the previous section that the asset turnover of a company is
to some extent determined by a company’s products and industry sector.
Cash Flow Forecasting54
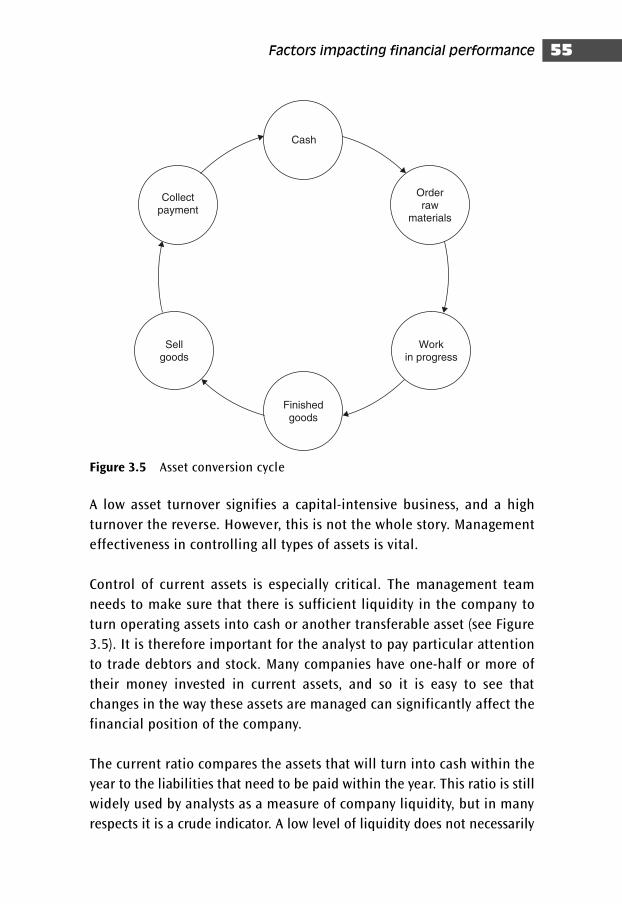
A low asset turnover signifies a capital-intensive business, and a high
turnover the reverse. However, this is not the whole story. Management
effectiveness in controlling all types of assets is vital.
Control of current assets is especially critical. The management team
needs to make sure that there is sufficient liquidity in the company to
turn operating assets into cash or another transferable asset (see Figure
3.5). It is therefore important for the analyst to pay particular attention
to trade debtors and stock. Many companies have one-half or more of
their money invested in current assets, and so it is easy to see that
changes in the way these assets are managed can significantly affect the
financial position of the company.
The current ratio compares the assets that will turn into cash within the
year to the liabilities that need to be paid within the year. This ratio is still
widely used by analysts as a measure of company liquidity, but in many
respects it is a crude indicator. A low level of liquidity does not necessarily
Factors impacting financial performance 55
Workin progress
Finishedgoods
Sellgoods
Cash
Orderraw
materials
Collectpayment
Figure 3.5 Asset conversion cycle
mean that the company is high risk, and may even be evidence of effi-
cient financial management. Conversely, a high liquidity ratio tells us
nothing about the quality of the assets and whether, for example,
debtors are liquid within a month, or perhaps a year. It is therefore neces-
sary to delve deeper and analyse each type of asset individually. This, in
turn, will improve our understanding of how a company’s operating
decisions can have a favourable impact on the company’s ROE.
When we are measuring working capital efficiency, we are often com-
paring the firm’s investment in an asset to sales (or a closely related figure).
If a company’s stock has risen over time, this could be due to the fact
that sales have risen and stock has risen in line with this increase.
Alternatively, management may have been less efficient in its control of
stock and allowed an undesirable build-up. The ratio distinguishes
between changes triggered by sales increases and other, perhaps less
favourable, causes. Several different measures of working capital effi-
ciency are shown below.
Stock turnover
The stock turnover ratio, also known as inventory turnover is defined as:
Inventory turnover � cost of goods sold/inventory
A stock turn of, say, two times means that an average item of stock turns
over twice per year – or, put differently, the average item sits in stock for
six months. It should be noted that the number of days a firm holds
stock varies between industries, and will also depend on the types of
stock-management techniques (such as just-in-time) that are in place.
Several alternative definitions of the stock turnover ratio exist, includ-
ing sales divided by stock. The analyst should ensure that a consistent
approach is adopted at all times. If sales are used as the numerator, the
stock turnover ratio will differ significantly, especially in the case of
companies with high gross profit margins. Costs of goods sold is more
appropriate than sales, because sales include a profit mark-up which
does not apply to stock.
Cash Flow Forecasting56
Collection period
The collection period provides information about a company’s debtors’
management, and is defined as:
Collection period � trade debtors/credit sales per day
If all sales are on credit, we can use net sales in place of credit sales.
Credit sales per day is defined as credit sales for the accounting period
divided by the number of days in the accounting period. This ratio
reveals a great deal about a company’s credit policy and the efficiency
with which it can collect money from its customers. A long collection
period may also indicate an inferior quality product that requires better
credit terms than its competitors to increase its appeal. The collection
periods for various industries in the UK are shown in Table 2.4.
Payment period
The payment period is simply the collection period applied to creditors:
Payment period � trade creditors/credit purchases per day
Average payment periods vary considerably from industry to industry,
and it is often the case that industries with long stock-holding and
debtor periods have longer payment periods. It is also useful to consider
this ratio in the context of a Five Forces competitive analysis, and see
what the result tells us about the relative bargaining power between
company and supplier.
Net working assets to sales and overtrading
Once an analysis on an item-by-item basis has been carried out, it is very
useful to have a picture of the size of a company’s total investment in
working capital. Net working assets to sales is calculated as:
Net working assets/sales � (stocks � debtors � creditors)/sales
This ratio is useful in determining how much cash will be required by a
company during a growth phase, and is a useful ratio (as we shall see) for
forecasting purposes. It may, in fact, underestimate the real need,
because debtors and stock tend to grow faster than sales, especially at
times of rapid growth.
Factors impacting financial performance 57
Some companies will have high net working assets to sales ratios simply
because this reflects the type of industry they are in. However, when this
ratio is high compared to a peer group, it may provide a signal to cred-
itors that the financial condition of the company is deteriorating. This is
particularly common with small companies whose fast-growth strategies
are over-ambitious. Many of these firms pursue risky financial policies
as part of the overall strategic objectives of the firm.
An example from the electronics distribution industry shows why the
analyst needs to give careful consideration to the issues facing rapidly
growing sales-oriented companies. This company increased its sales
from €10.6 million to €18.1 million in one year, with operating profits
rising from €117,000 to €545,000. At the same time short-term debt rose
from €450,000 to nearly €3 million. A detailed financial analysis showed
that the company had a net working assets to sales ratio of 0.47. This was
a clear case of a firm with working capital investment exceeding the
ability to generate funds internally.
The next stage of analysis is to examine each working capital component
on an item-by-item basis. Is stock being managed adequately? Are debtors
at a satisfactory level?
There is a tendency for companies that experience rapid sales growth to
enter a debt spiral in order to fund their operational capital require-
ments. In other words, the company is growing too fast and sales are too
high for the financial resources of the company. This condition of over-
trading represents a big risk to creditors, and immediate remedial action
is required by management doing one or more of the following:
■ reducing the level of business activity
■ increasing the capital base
■ maintaining tight control over working capital.
Capital structure
Financial leverage
Financial leverage is the substitution of debt for equity in company
financing. It is the third lever available to company management to
Cash Flow Forecasting58
improve the return on equity. However, this is not to say that the use of
debt will always result in an improved return for shareholders. During
the 1980s, debt and leverage were seen as an expression of manage-
ment’s efforts to boost shareholders’ returns. Even hard-headed finance
managers and executives were afflicted by the fashion for borrowing
funds on a highly leveraged basis. However, the arrival of the recession
at the end of the boom period led to the discrediting of leveraged finan-
cing and a need to shore up balance sheets through new equity issues.
So what is the optimal balance between debt and equity? Academics
have been labouring over this question for many years, and this has
resulted in the publication of many papers on the subject and in hours
of deliberation at conferences.
One of the theories at the forefront is Professor Myers’ static trade-off
theory, which emphasizes the tax advantages for a company in borrow-
ing. At a certain level, however, the costs of the risks inherent in indebt-
edness become so significant as to outweigh the tax gains, and further
borrowing pushes the firm towards bankruptcy.
One of the problems of applying the theory is that, in practice, most
companies are neither on the brink of collapse nor sitting on a cash
mountain. There is a large intermediate range where there is very little
evidence that finance managers make an effort to move along the curve
to any given debt/equity mix.
In reality, capital adequacy is much more dependent upon the quality
and reliability of cash flows than on any particular debt ratio. It may
vary substantially according to the nature of the firm, its assets, the
industry and the economic environment. Table 3.4 shows borrowing
ratios across various sectors in the US and UK.
Apart from the differences in the levels of absolute gearing between the
two countries, it is noticeable that construction and property – two of
the industries that might be expected to be exposed to high levels of
market risk – have gearing levels above those of the utility companies.
The figures do not appear to support the commonsense viewpoint that
Factors impacting financial performance 59
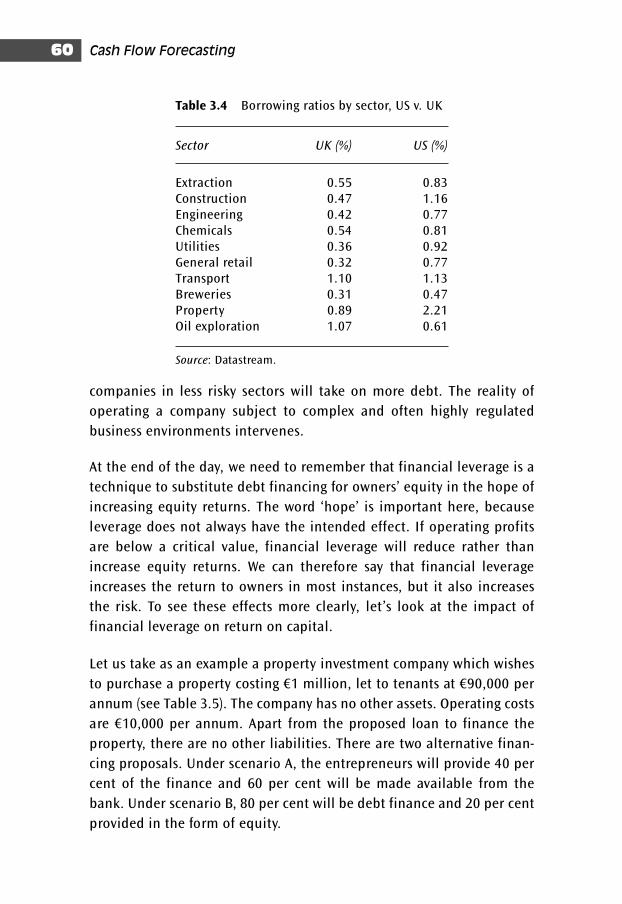
companies in less risky sectors will take on more debt. The reality of
operating a company subject to complex and often highly regulated
business environments intervenes.
At the end of the day, we need to remember that financial leverage is a
technique to substitute debt financing for owners’ equity in the hope of
increasing equity returns. The word ‘hope’ is important here, because
leverage does not always have the intended effect. If operating profits
are below a critical value, financial leverage will reduce rather than
increase equity returns. We can therefore say that financial leverage
increases the return to owners in most instances, but it also increases
the risk. To see these effects more clearly, let’s look at the impact of
financial leverage on return on capital.
Let us take as an example a property investment company which wishes
to purchase a property costing €1 million, let to tenants at €90,000 per
annum (see Table 3.5). The company has no other assets. Operating costs
are €10,000 per annum. Apart from the proposed loan to finance the
property, there are no other liabilities. There are two alternative finan-
cing proposals. Under scenario A, the entrepreneurs will provide 40 per
cent of the finance and 60 per cent will be made available from the
bank. Under scenario B, 80 per cent will be debt finance and 20 per cent
provided in the form of equity.
Cash Flow Forecasting60
Table 3.4 Borrowing ratios by sector, US v. UK
Sector UK (%) US (%)
Extraction 0.55 0.83Construction 0.47 1.16Engineering 0.42 0.77Chemicals 0.54 0.81Utilities 0.36 0.92General retail 0.32 0.77Transport 1.10 1.13Breweries 0.31 0.47Property 0.89 2.21Oil exploration 1.07 0.61
Source: Datastream.
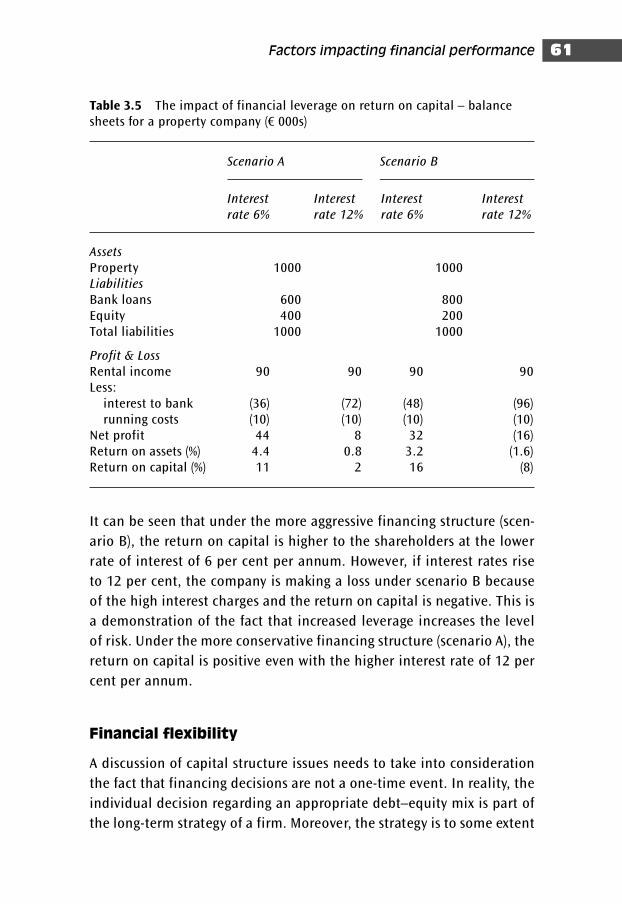
It can be seen that under the more aggressive financing structure (scen-
ario B), the return on capital is higher to the shareholders at the lower
rate of interest of 6 per cent per annum. However, if interest rates rise
to 12 per cent, the company is making a loss under scenario B because
of the high interest charges and the return on capital is negative. This is
a demonstration of the fact that increased leverage increases the level
of risk. Under the more conservative financing structure (scenario A), the
return on capital is positive even with the higher interest rate of 12 per
cent per annum.
Financial flexibility
A discussion of capital structure issues needs to take into consideration
the fact that financing decisions are not a one-time event. In reality, the
individual decision regarding an appropriate debt–equity mix is part of
the long-term strategy of a firm. Moreover, the strategy is to some extent
Factors impacting financial performance 61
Table 3.5 The impact of financial leverage on return on capital – balancesheets for a property company (€ 000s)
Scenario A Scenario B
Interest Interest Interest Interest
rate 6% rate 12% rate 6% rate 12%
Assets
Property 1000 1000Liabilities
Bank loans 600 800Equity 400 200Total liabilities 1000 1000
Profit & Loss
Rental income 90 90 90 90Less:
interest to bank (36) (72) (48) (96)running costs (10) (10) (10) (10)
Net profit 44 8 32 (16)Return on assets (%) 4.4 0.8 3.2 (1.6)Return on capital (%) 11 2 16 (8)
determined by the ease with which a company has access to the capital
markets over time (remember that the financial markets were listed as a
key environmental influence earlier in this chapter).
Financial flexibility is concerned with the ability of a company to refi-
nance its debt through other financial institutions or the capital mar-
kets. For example, if a company has reached its debt capacity, its only
external financing option may be the equity market. However, if for any
reason the raising of funds through the equity market is unattractive, or
not feasible, a company may find itself unable to raise funds to pursue
the company’s future strategy. There may be an argument, therefore, for
raising funds from shareholders while the opportunity is available, so
leaving the company with greater flexibility to refinance its obligations
or raise new debt in the future.
Interest cover
The first test of earnings quality is the firm’s ability to pay interest over
time. Analysts are interested in the ability of the firm to service debt not
just in the short term but also for the whole period that the risk is out-
standing. Interest cover is calculated as profit before interest and tax,
divided by interest payable. Analysts look for profits that are a consistently
high multiple of interest as a sign of health. If the firm has an interest
multiple of 10, it is able to pay its interest 10 times over – or see profits
fall to one-tenth of the current level before interest servicing is at risk.
Table 3.6 sets out some of the key ratio medians for US industrial com-
panies by rating category. These are among some of the key ratios used
by Standard & Poor, a leading credit agency in analysing credit strength.
The rating agencies are careful to point out that ratios are helpful in
determining a company’s position relative to rating categories. They are
not intended to be hurdles. Furthermore, as ratings need to be valid
over the whole business cycle, ratios of a particular firm at any point in
the cycle may not appear to be in line with its assigned debt ratings.
The medians are constantly being affected by changing economic and
environmental factors. However, Table 3.6 shows the importance of
Cash Flow Forecasting62
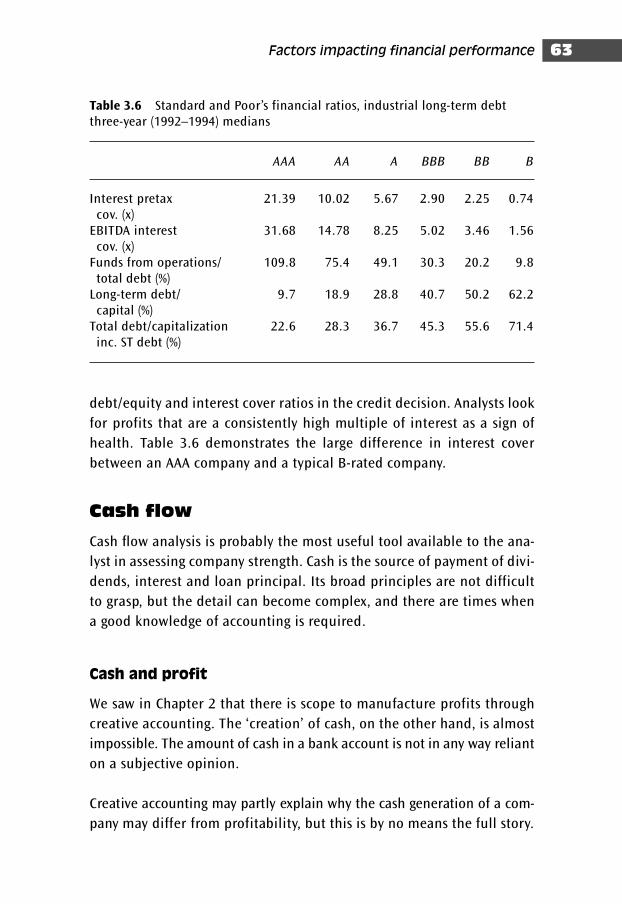
debt/equity and interest cover ratios in the credit decision. Analysts look
for profits that are a consistently high multiple of interest as a sign of
health. Table 3.6 demonstrates the large difference in interest cover
between an AAA company and a typical B-rated company.
Cash flow
Cash flow analysis is probably the most useful tool available to the ana-
lyst in assessing company strength. Cash is the source of payment of divi-
dends, interest and loan principal. Its broad principles are not difficult
to grasp, but the detail can become complex, and there are times when
a good knowledge of accounting is required.
Cash and profit
We saw in Chapter 2 that there is scope to manufacture profits through
creative accounting. The ‘creation’ of cash, on the other hand, is almost
impossible. The amount of cash in a bank account is not in any way reliant
on a subjective opinion.
Creative accounting may partly explain why the cash generation of a com-
pany may differ from profitability, but this is by no means the full story.
Factors impacting financial performance 63
Table 3.6 Standard and Poor’s financial ratios, industrial long-term debtthree-year (1992–1994) medians
AAA AA A BBB BB B
Interest pretax 21.39 10.02 5.67 2.90 2.25 0.74cov. (x)
EBITDA interest 31.68 14.78 8.25 5.02 3.46 1.56cov. (x)
Funds from operations/ 109.8 75.4 49.1 30.3 20.2 9.8total debt (%)
Long-term debt/ 9.7 18.9 28.8 40.7 50.2 62.2capital (%)
Total debt/capitalization 22.6 28.3 36.7 45.3 55.6 71.4inc. ST debt (%)
There are many other reasons why cash and profit will differ, and these
are examined below.
Let us start by considering a sale made by a company to one of its cus-
tomers. If the sale is for cash, then cash realization and income realization
happen at the same time. If it is a credit sale, then the sale is recognized
as income when the invoice is raised and the corresponding contra-entry
is a debit to debtors. When the customer pays after, say, 60 days, debtors
are credited and the cash account is debited for the relevant amount. Over
the course of the year a company is going to have many such transactions,
and the net position may be as follows at the year end:
Debtors at beginning of year €150,000Debtors at end of year €250,000Profit and loss – sales €1,000,000
Armed with this information we are able to determine the amount of cash
inflow over the year in respect of sales, to take into account the timing dif-
ferences that affect cash flow. We must first take the sales figure and adjust
it by the change in debtors from the beginning to the end of the year.
Cash inflow due � sales � debtors at period � debtors at
to sales beginning period end
The cash inflow due to sales is therefore €1,000,000 � (€150,000 �
€250,000) � €900,000. In other words, if debtors increase, the change
in debtors is subtracted from sales, and if debtors decrease, the change
is added to sales.
We can see that items on the profit and loss statement have a correspond-
ing category on the balance sheet to account for the timing differences
between income/expense recognition and cash receipt/expenditure. We
can therefore devise a more generic formula as a method of calculating
cash flow from the profit and loss and differences in balance sheet items:
Cash flow � (decrease in assets) OR (increase in assets) OR
(increase in liabilities) OR (decrease in liabilities)
� (credits to P/L) OR (debits to P/KL)
If the resulting cash flow is positive, it is an inflow (i.e. a source). If the
resultant cash flow is negative, it is an outflow.
Cash Flow Forecasting64
It will now be clear that cash flow statements do not provide any new
information, but are simply a reformulation of information provided
elsewhere. However, it is still important for an analyst to be able to
derive his or her own cash flow statement from a profit and loss and bal-
ance sheet. First, not all accounting standards bodies require a cash flow
statement to be prepared and, even in countries where they are a require-
ment, exceptions do apply. Secondly, there is no better way for an analyst
to get to grips with the financial fundamentals of a company than to
draw up his or her own cash flow statements.
Operational cash flow
The operational cash flow is the cash flow associated with the company
in its normal course of business. This represents the powerhouse of the
company, and is the ‘quality’ cash flow to which the analyst needs to pay
particular attention.
The activity format normally begins with the operating profit shown on
the profit and loss for the relevant financial period. The Financial
Reporting Standard requires a note (usually tucked away at the end of
the annual report!) reconciling operating profit to the cash flow from
operating activities. The most important components of this note are oper-
ating profit, depreciation and changes in working capital. Depreciation is a
non-cash item, and therefore the annual charge needs to be added back in
the cash flow statement. Also, because cash flow analysis is about cash real-
ization, not income realization using accrual accounting, we need to make
the adjustments for working capital explained earlier:
■ Returns on investments and servicing of finance. These consist princi-
pally of priority outflows in respect of interest paid, dividends paid
and the interest element of finance leases.
■ Taxation. This shows the amount of tax actually paid, and often dif-
fers substantially from the amount shown on the profit and loss state-
ment. This is because of the effect of advanced corporation tax, and
because tax is normally charged in one year and paid in the next.
■ Investing activities. This includes sales and disposals of fixed assets
and acquisitions.
Factors impacting financial performance 65
■ Financing activities. This shows the cash flows from external sources of
finance, including lenders and equity providers.
■ Net movement in cash and short-term investments. This is the final cal-
culation, and the analyst should ensure that the results reconcile from
the balance sheet and cash flow.
■ Cash flow analysis. It is an important principle of lending that each loan
should have two independent sources of repayment (primary and sec-
ondary). The capacity to repay through cash generation (as opposed to
a third-party guarantee) requires analysis in three different areas:
(1) operational cash flow strength and the funds generated from the sale
of goods and services in the day-to-day operations; (2) financial flexi-
bility, which, as we have seen, is the ability of a company to refinance
its debt through alternative sources of finance; and (3) operational flexi-
bility, which is the ability of a company to raise cash through the liquid-
ation of an asset or make operational changes to increase cash flow.
Our analysis can be strengthened by considering not only the overall
amount of the cash flow but also the sources and uses of the cash. This
can be done effectively by breaking down the cash inflows and outflows
as depicted in Figure 3.6.
This will give a picture of the relative sources and uses of cash, and
should be followed by a secondary phase of analysis which concentrates
on issues such as the quality of the acquisitions and the effect on the
underlying business of asset disposals.
It is also important to consider multi-period cash flows. A company that
shows a steady and stable earnings stream in profit terms is likely to be
a better credit than one where the aggregate earnings over a number of
years are the same but which suffers volatility from year to year. The
same is true for cash flow. We need to bear in mind that although cash
flow analysis is the key tool for the creditor, the timing of cash flows is
often irregular and they lack the smoothing effect of accruals.
Cash flow forecasting
To this point we have looked at past and present performance, evaluat-
ing existing financial statements. It is now time to look to the future.
Cash Flow Forecasting66
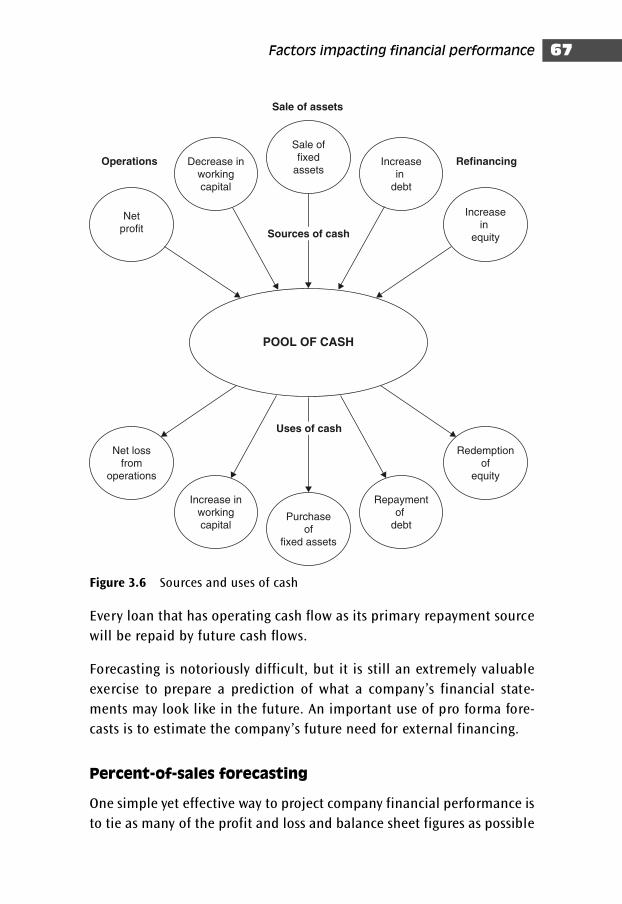
Every loan that has operating cash flow as its primary repayment source
will be repaid by future cash flows.
Forecasting is notoriously difficult, but it is still an extremely valuable
exercise to prepare a prediction of what a company’s financial state-
ments may look like in the future. An important use of pro forma fore-
casts is to estimate the company’s future need for external financing.
Percent-of-sales forecasting
One simple yet effective way to project company financial performance is
to tie as many of the profit and loss and balance sheet figures as possible
Factors impacting financial performance 67
Netprofit
Increase inworkingcapital
Decrease inworkingcapital
Purchaseof
fixed assets
Net lossfrom
operations
Sale offixed
assets
Redemptionof
equity
Repaymentof
debt
Increasein
equity
Increasein
debt
Operations
Sale of assets
Refinancing
POOL OF CASH
Uses of cash
Sources of cash
Figure 3.6 Sources and uses of cash
to future sales. The rationale for this approach is the tendency (which we
examined earlier) for P&L items and most current assets and current
liabilities to vary directly with sales.
For example, if stock on the balance sheet has historically been about 24
per cent of sales and next year’s sales are forecast to be €10 million, we
would expect inventories to be approximately €2.4 million. This will not
be true for all of the entries in a company’s financial statements, and it
will be necessary to make independent forecasts of items, such as cap-
ital expenditure, which are not directly linked to sales. Nonetheless, the
percent-of-sales method does provide a powerful forecasting tool when
combined with accurate sales forecasts and careful extrapolation of past
trends. The input variables usually include:
■ sales growth
■ operating margin
■ interest rates
■ depreciation
■ dividend payout rates
■ capital expenditure
■ working capital activity ratios
■ increases in equity
■ changes in long-term debt
■ tax rates.
These are the cash drivers that will determine not only the shape of the
balance sheet and profit and loss statement, but also the cash flow. By
assigning a value to each one of these variables, an analyst can prepare
an integrated financial forecast that will show the cash demands of the
company in the future. Management may help either by providing the
cash flow forecasts or by giving their views on operational issues, which
will aid the analyst in making assumptions.
However, always remember that company forecasts are going to tend to
paint an optimistic future and certainly will not be predicting failure. In
most cases analysts should regard management forecasts as a best-case
scenario, and significant changes in the assumptions for the cash drivers
must be made to reflect a less favourable scenario.
Cash Flow Forecasting68
Forecasting methodology
Many corporate analysts have PC-based spreadsheet software adapted
for forecasting clients’ financial performance. This saves a great deal of
time and allows ‘what if’ analysis, permitting the analyst to adjust the
variables to show different scenarios. Some lending situations are so com-
plex and specific in nature (such as the building of the Eurotunnel, or a
metro, a gold mine or an oil field project) that customized spreadsheets
enabling the incorporation of key variable inputs will be required. We
analyse such a spreadsheet in Chapter 5.
With a properly constructed forecasting model, the analyst will be able
to prepare an integrated financial projection of this company by attach-
ing values to the cash drivers for each year of the forecast period. The
historical values and the ratio analysis will assist the analyst with this task.
PC-based systems have many advantages, but the analyst must use fore-
casting models with care:
■ It is important to identify the really critical variables. Is there one
driver to which a company is particularly sensitive? Has there been cor-
rect identification of how a company will react to an increase in sales?
■ The interrelationship between the variables must be considered. Can,
for example, an improvement in the stock to sales ratio be achieved
without an investment in a stock control system, i.e. a capital expend-
iture item?
■ The forecasts should be consistent with company strategy the envir-
onment and historic performance.
■ Computer printouts tend to be ‘believable’, but it is important to
remember that all forecasts are only as good as the assumptions.
Furthermore, it is necessary to remember that uncertainty increases
with time.
Sustainable growth
We have seen that when companies are growing, they consume cash.
Debtors and stock consume cash at a faster rate than growth in creditors
Factors impacting financial performance 69
can support the growth of the company. The net working assets to sales
ratio, which we referred to earlier, provides a useful indicator of how
much cash a company will require to support a certain level of growth.
A typical manufacturing company may require an investment of 30
pence in working capital to fund every extra pound of sales.
The sustainable growth rate is the rate at which a company can grow
without increasing its leverage, provided that it maintains:
■ the dividend payout ratio
■ after tax profit margins
■ net working asset activity ratios
■ the sales/fixed asset ratio.
The sustainable growth rate is given by the following formula:
Sustainable growth � P(1 � d)/(1 � D) (NWA � FA)
� P(1 � d)/(1 � D)
where
P � after tax profit margin/sales
d � dividend payout ratio
D � bank debt/bank debt plus equity
NWA � net working assets/sales
FA � fixed assets/sales.
The analyst needs to use his or her knowledge of the company to estimate
whether sales growth in excess of the sustainable rate is going to be of
concern. Sometimes this may be perfectly acceptable for a period of, say,
two years, given the strategy of the company. At other times, it may be a
sign that the company is heading for a debt spiral.
Corporate failure
We noted earlier that there have been a number of corporate failures in
recent years which have happened soon after accounts have been pre-
pared showing the company to be in an apparently sound financial con-
dition. However, close scrutiny of the financial statements, particularly
Cash Flow Forecasting70
the notes, would have revealed weaknesses which would have served as
a warning for creditors to protect any exposure that they may have had
to the company.
This serves to emphasize the importance of early identification of prob-
lems. The earlier the difficulties are spotted, the greater the opportunities
for remedial action.
Reasons for failure
Several ostensibly amusing checklists have been compiled regarding
warning signals of poor management. The most common causes of
corporate failure are:
1 Autocratic chief executive (Maxwell, Nadir, Conrad Black)
2 Weak board of directors (Maxwell, Nadir, Conrad Black)
3 Combined role of chairman and chief executive
4 Fraud and corruption in accounting practices (Maxwell, Nadir, Conrad
Black, Parmalat)
5 Lack of senior management experience in the company’s industry
(RUMASA)
6 Management neglect of the core business activity
7 Cyclical decline in demand which expose company weaknesses
with regard to the environment, management controls and capital
structure.
The New York Times suggests a more up-to-date list of perks.1
Factors impacting financial performance 71
1 ‘Haircuts. Shower curtains. Parking reimbursements. Country club memberships. Use of cor-porate jets … James Follo, the chief financial officer of Martha Stewart Living Omnimedia,testified that Ms Stewart had asked the company to reimburse her $17,000 annually for herweekend driver as well as for trips to her hairdresser, coffee and other items. The trial ofL. Dennis Kozlowski and Mark H. Swartz, two former top executives at Tyco International, amanufacturing conglomerate, has revealed that Tyco paid an array of their expenses includ-ing tuition to private schools for Mr Swartz’s three children and $1 million for a birthday partyin Sardinia for Mr Kozlowski’s wife. And then there was the infamous $6,000 shower curtainand a $15,000 umbrella stand. In 2002, a filing in the divorce of John F. Welch Jr, the formerchairman of General Electric, disclosed that G.E. was paying for a Manhattan apartment, NewYork Knicks tickets and other benefits for him even after he retired. He later agreed to give upmany of the perks.’ (Alex Berenson, ‘From coffee to jets, perks for executives come out incourt, New York Times, 22 February 2004.)
Most company problems allegedly arise due to the combination of the
above. For example, Maxwell exhibited points (1) and (2); similarly,
RUMASA showed (1), (2) and (5),2 Crédit Lyonnais (1) and (5), etc.
It is unfortunate that this heirarchization of causes in classic business lit-
erature omits to mention the most recent cause of corporate failure –
criminal fraud, as witnessed with the managements of BCCI, Enron,
Worldcom, Parmalat, Barings, or the defunct auditor Andersen, who
signed off on Enron’s accounts (and shredded evidence to the same), to
name a few.
None of these collapses are due to classic analytical explanations such as
‘mature product cycle’, ‘poor working capital’, ‘entry of new competi-
tors’ or ‘business cycle’. These collapses are due to greed and fraud per-
petrated by two actors – management and auditors. Note that these are
only the companies that have collapsed … what other surprises do top
management and the auditors have waiting for us? When significant
numbers of corporations are restating their profits downwards, this is
suggestive of general rather than episodic breakdowns.
Recent research
Research was carried out by a leading firm of stockbrokers, County
NatWest WoodMac (now NatWest Markets), into corporate failure during
the early 1990s. The key conclusions were as follows:
■ Fast, aggressive expansion, whether organic or by acquisition, is a
likely precursor to problems. If also accompanied by a sharp rise in
debt, particularly short-term borrowings, this should be viewed as
very worrying.
■ Dominant personalities are often connected with the companies that
have foundered. Where there is a combined chairman/chief execu-
tive, often reinforced with a large shareholding, the extent of his or
her influence is unchecked. Companies tend to be run like personal
Cash Flow Forecasting72
2A summary of the RUMASA and Crédit Lyonnais collapses features in Andrew Fight’sUnderstanding International Bank Risk, published by John Wiley & Sons (2004).
playthings, with the use of corporate jets to entertain friends
(Kowalski of Tyco, Conrad Black of Hollinger International, Ladreit de
Lacharriére of Fimalac/Fitch). Boardroom ‘strife’ should also be viewed
as a leading indicator of trouble.
■ ‘Hype’ often comes before a fall.
Failure prediction models
Credit analysis should adopt a holistic approach which relies on a com-
bination of ratio analysis, cash flow strength and non-financial variables.
Some academics have conducted empirical research to see whether
there is any one group of ratios that can be a more reliable guide to pre-
dicting corporate failure than others.
Edward Altman in the USA developed the ‘Altman Bankruptcy Predictor’.
Credit-scoring techniques such as the Altman Bankruptcy Predictor (also
called solvency analysis) use an offshoot of classic ratio analysis known as
multiple discriminant analysis (MDA). MDA simply takes two populations,
failed and non-failed corporations, and compares (discriminates between)
the two population groups. Altman takes five well-known ratios expressed
as decimals, multiplies each one by a weighted coefficient, and then totals
them up into a ‘Z score’. Z scores are then assembled for industries and
compiled into a database classified according to SIC industry codes schemes.
The five ratios look at liquidity, profitability, leverage, solvency and
activity:
■ X1 � working capital/total assets
■ X2 � retained earnings/total assets
■ X3 � earnings before interest and taxes/total assets
■ X4 � market value equity/book value of total liabilities
■ XS � sales/total assets.
A company Z score is then referred to a bell curve (calculated from the
totality of the sample universe depicting the overall parameters of cor-
porate failure) to situate that particular company’s probability of failure
within the bell curve.
Factors impacting financial performance 73
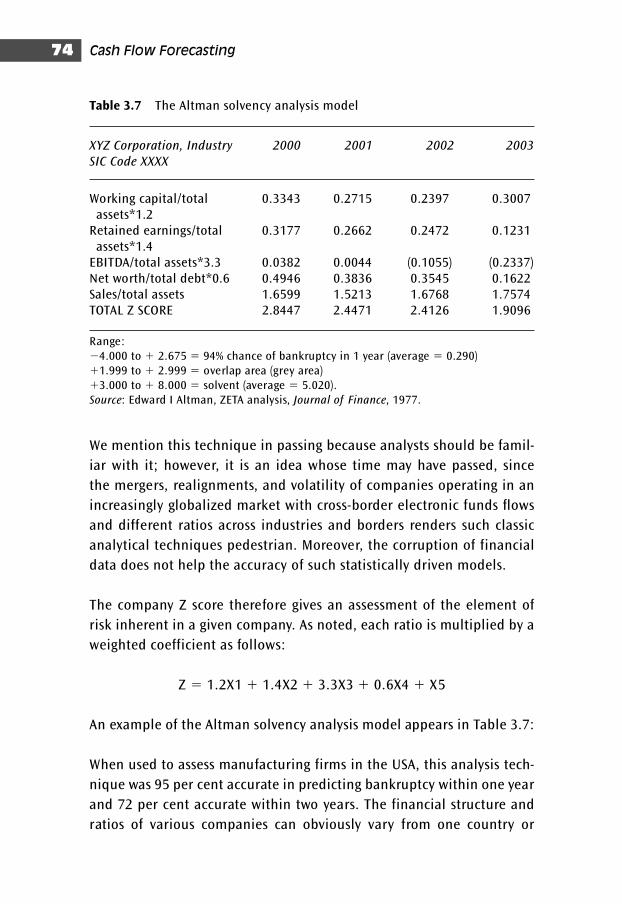
Cash Flow Forecasting74
We mention this technique in passing because analysts should be famil-
iar with it; however, it is an idea whose time may have passed, since
the mergers, realignments, and volatility of companies operating in an
increasingly globalized market with cross-border electronic funds flows
and different ratios across industries and borders renders such classic
analytical techniques pedestrian. Moreover, the corruption of financial
data does not help the accuracy of such statistically driven models.
The company Z score therefore gives an assessment of the element of
risk inherent in a given company. As noted, each ratio is multiplied by a
weighted coefficient as follows:
Z � 1.2X1 � 1.4X2 � 3.3X3 � 0.6X4 � X5
An example of the Altman solvency analysis model appears in Table 3.7:
When used to assess manufacturing firms in the USA, this analysis tech-
nique was 95 per cent accurate in predicting bankruptcy within one year
and 72 per cent accurate within two years. The financial structure and
ratios of various companies can obviously vary from one country or
Table 3.7 The Altman solvency analysis model
XYZ Corporation, Industry 2000 2001 2002 2003
SIC Code XXXX
Working capital/total 0.3343 0.2715 0.2397 0.3007assets*1.2
Retained earnings/total 0.3177 0.2662 0.2472 0.1231assets*1.4
EBITDA/total assets*3.3 0.0382 0.0044 (0.1055) (0.2337)Net worth/total debt*0.6 0.4946 0.3836 0.3545 0.1622Sales/total assets 1.6599 1.5213 1.6768 1.7574TOTAL Z SCORE 2.8447 2.4471 2.4126 1.9096
Range:
�4.000 to � 2.675 � 94% chance of bankruptcy in 1 year (average � 0.290)
�1.999 to � 2.999 � overlap area (grey area)
�3.000 to � 8.000 � solvent (average � 5.020).
Source: Edward I Altman, ZETA analysis, Journal of Finance, 1977.
Factors impacting financial performance 75
industry to another, and the use of such techniques must therefore take
these factors into account when being interpreted. Although it is tempt-
ing to adjust the model in order to conform with conditions peculiar to
a given country, this can affect the accuracy of the model’s forecasting.
A variation on the Altman model, called the Syspas system, has been
developed in the UK by Professor Richard Taffler from City University. As
with the Altman system, Syspas looks at companies’ financial ratios and
scores them on a weighted combination. The approach is founded on
multiple discriminant analysis: company performance needs to be
assessed on a combination of ratios. The model has achieved country-
specific effectiveness in predicting some of the recent corporate casual-
ties in the UK. As with the Altman model, however, applying this model
in an international context is somewhat more problematical.
The difficulty in adopting purely quantitative methods is that they rely
on accounting data, which recent financial scandals have indicated are
often corrupted and therefore unreliable for basing a financial analysis
on. Therefore, whilst more subjective, a holistic approach can be a more
likely assessment of failure provided financial analysts undertaking the
analysis are proactive in their thinking and well structured in their argu-
mentation, rather than seeking easy pre-digested formulae that will
absolve them of engaging in assuming personal responsibility for their
financial analysis.
Chapter 4
Cash flow forecasting offinancial statements
Why cash flow analysis?
Banks lend cash to their clients, collect interest in cash, and require debt
repayment in cash. Nothing else, just cash.
Term lending is typically to finance a company’s medium- to long-term
needs (five to seven years). Very often the loan is to purchase an asset
which is expected to generate future cash flow and contribute towards
the repayment of the loan. The assets being financed by the facility, such
as plant or equipment, are usually expected to produce other assets,
which, via manufacturing and sale, will generate sufficient cash to repay
the loan. The fixed asset being financed is therefore not expected to be
converted to cash to repay the loan. Rather, profits produced by the new
equipment are the source of cash used to repay the loan. This is a long-
term (multi-year) process.
Traditional bank credit analysis, however, typically resides in a balance
sheet ratio analysis based on the borrower’s historic financial state-
ments. Classic balance sheet ratio analysis is useful in assessing the bor-
rower’s ‘cushion’ available to bank creditors in a bankruptcy scenario.
However, no responsible banker is going to justify a credit proposal with
the rationale that there is an adequate cushion of assets available in a
bankruptcy. For one thing, there are too many legal and other variables
which will make the likelihood of repayment in such a scenario uncer-
tain – assets may be located in juridically unenforceable countries, or
the attendant legal costs may be high.
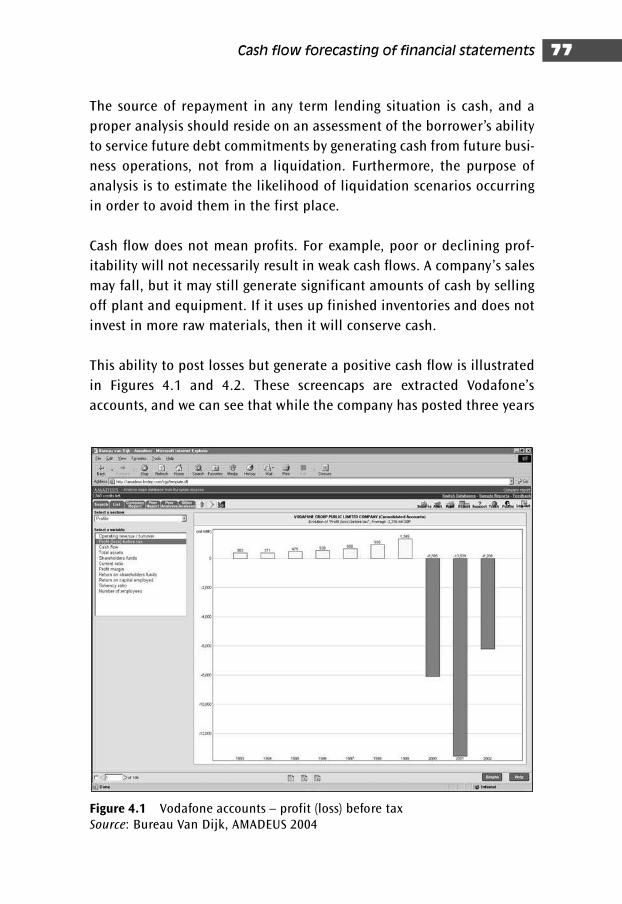
Cash flow forecasting of financial statements 77
The source of repayment in any term lending situation is cash, and a
proper analysis should reside on an assessment of the borrower’s ability
to service future debt commitments by generating cash from future busi-
ness operations, not from a liquidation. Furthermore, the purpose of
analysis is to estimate the likelihood of liquidation scenarios occurring
in order to avoid them in the first place.
Cash flow does not mean profits. For example, poor or declining prof-
itability will not necessarily result in weak cash flows. A company’s sales
may fall, but it may still generate significant amounts of cash by selling
off plant and equipment. If it uses up finished inventories and does not
invest in more raw materials, then it will conserve cash.
This ability to post losses but generate a positive cash flow is illustrated
in Figures 4.1 and 4.2. These screencaps are extracted Vodafone’s
accounts, and we can see that while the company has posted three years
Figure 4.1 Vodafone accounts – profit (loss) before taxSource: Bureau Van Dijk, AMADEUS 2004
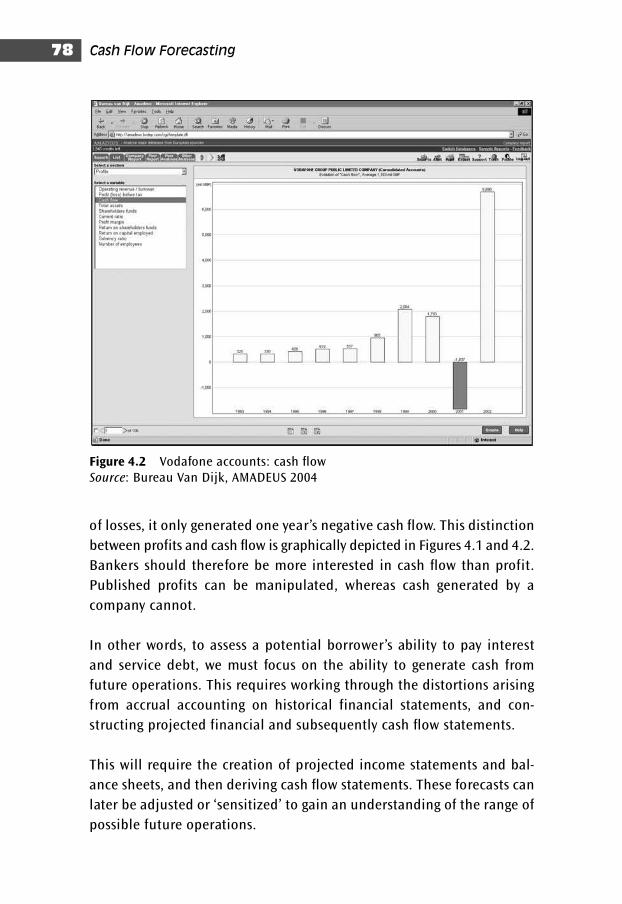
Cash Flow Forecasting78
of losses, it only generated one year’s negative cash flow. This distinction
between profits and cash flow is graphically depicted in Figures 4.1 and 4.2.
Bankers should therefore be more interested in cash flow than profit.
Published profits can be manipulated, whereas cash generated by a
company cannot.
In other words, to assess a potential borrower’s ability to pay interest
and service debt, we must focus on the ability to generate cash from
future operations. This requires working through the distortions arising
from accrual accounting on historical financial statements, and con-
structing projected financial and subsequently cash flow statements.
This will require the creation of projected income statements and bal-
ance sheets, and then deriving cash flow statements. These forecasts can
later be adjusted or ‘sensitized’ to gain an understanding of the range of
possible future operations.
Figure 4.2 Vodafone accounts: cash flow Source: Bureau Van Dijk, AMADEUS 2004
To be able to pay all its debts as they become due, a company must be
continually generating cash. This can only be done through:
■ cash flow from operations
■ sale of assets
■ refinancing.
To assess the company’s ability to generate cash in any of the above
three areas, the company’s capacity must be reviewed in three different
areas:
1 NOCF – the ability to service debt through cash flows
2 Financial flexibility – the ability to raise new debt or equity
3 Operational flexibility – the ability to raise cash through asset disposals.
For financial projections, we shall be concerned with constructing oper-
ational cash flow models in order to better assess the company’s oper-
ational characteristics in these areas. This chapter shall therefore explore
how to use already analysed historical financial statements to construct
financial and cash flow projections.
Finally, we will show how to use the results of such an analysis to pro-
duce a concise, logical, and effective credit assessment to evaluate the
servicing of existing debt as well as structure future debt commitments.
Purpose of projections
Financial projection techniques are intended to enhance the under-
standing of a company and its lending situation. They are not intended
to replace common sense or provide quick and ready answers. In add-
ition to using the techniques outlined in this book, any good analyst will
be alert to any other ‘warning signals’, which may or may not be quan-
tifiable but may be useful signposts in the path of inquiry.
The objective of projections is to make a reasonable forecast of a firm’s
future performance and probable financial condition that will allow
Cash flow forecasting of financial statements 79
Cash Flow Forecasting80
you, as the analyst, to answer questions such as:
■ Will the firm be able to pay back its current debt obligations out of
future cash flow?
■ How much additional financing will the firm need to finance its future
growth?
■ What is the firm’s future debt capacity? What is the maximum amount
of debt that can be serviced out of cash flow, given the firm’s other
needs, such as working capital, plant expenditures, etc.?
■ What are the available shrinkage margins in the projected cash flow?
How much can sales revenues, profit margins, and cash flow shrink
before payback is in jeopardy?
■ Will the firm be too highly leveraged as a result of increased debt
resulting from growth?
■ Given the above, how should the loan be structured? What kind of
repayment schedule should be set up for the new debt?
■ What forms of protection and control need to be included in the
loan agreement in order to afford maximum safety for the bank’s
money?
Financial projections will enable you to assess factors such as the true
purpose of a facility – whether it is appropriate for the purpose being
considered (project finance, expansion, acquisition, debt refinancing) or
whether it is for non-specific purposes (a warning signal) – to identify the
term lending risks, and gauge the likelihood of repayment.
Financial projections can also have other uses: often companies need to
restructure their debt profile for a variety of valid reasons. Financial pro-
jections will enable an assessment of the problems being considered, and
identify the most appropriate repayment schedule in terms of the com-
pany’s future cash flow (i.e. bullet, repayment, or interest servicing only).
Finally, in order to protect the bank’s loans, projections can give an idea
of sensitive areas in which the company may be vulnerable. In such cases,
you may wish to include certain financial covenants in order to ensure
the borrower operates within a certain set of constraints, in order to
protect the facility.
Cash flow forecasting of financial statements 81
After you have spread (ideally) three years of historical financial state-
ments and stepped back to think about them, the first step in setting the
groundwork for the tedious process of constructing projected cash flows
is to construct projected financial statements: profit and loss, and then
balance sheet statements.
In this chapter we will be looking at the financial statements of a ficti-
tious company – AmaOS (Automated Management Operating Systems), a
manufacturer of computer components and networking solutions. We
will be working off accounts that have been cast into a standardized for-
mat known as a spreadsheet, and using those spreadsheets to build
financial and cash flow projections.
Historical performance and variable
input analysis
Historical analysis is the starting point for projecting a firm’s future per-
formance and financial condition. Analysing a firm’s past performance
and operations provides a basis for projecting a firm’s performance
under future conditions. The most important element for you to bear in
mind when undertaking an historical financial analysis for building pro-
jections is to identify the key variables influencing the company, since it
is this ‘variable input analysis’ that is your main tool in building the
financial projections.
If, in historical analysis, you have been able to determine what has prob-
ably caused the demonstrated results, and if you have some information
about future conditions provided by statistical organizations, industry
projections or company plans, you can begin to make assumptions as to
what future events may occur and how these events will affect the firm’s
future performance.
Financial statements over a minimum of three (and preferably five)
years provide an opportunity to examine a variety of causes and effects
in a firm’s historical performance. The analysis of the firm’s historical
operations, performance and financial condition will help you to form
reasonable assumptions about what is likely to happen in the future.
Before beginning projections, you should summarize your analysis of
the company’s performance in the following areas:
■ Is the company operationally healthy?
■ Is the company financially strong, or too highly leveraged?
■ Are markets growing, stable or shrinking?
■ How is the company situated amongst its competitors?
■ A summary of present financial condition and existing cash flow
■ Strength and weaknesses in management, industry position, nature of
products and attendant risks, economic cyclicality
■ Management performance as an influencing variable
■ Operating risks
■ Historical spreadsheets.
This book assumes that you are familiar with the mechanics of spreading
historical financial statements (such as the historical figures for AmaOS),
and that you already have a set to use for projections. Understanding
spreadsheets is essential if you are to use them in preparing projections.
Defining the initial assumptions
The value of any set of projections revolves around the reasonableness
of the underlying assumptions used in preparing them, and their whole
credibility resides on this plain fact. Consequently, it is useful to remem-
ber a few golden rules on projected cash flows:
■ Projections are sales driven. It is crucial to qualify the projection
assumptions. Regardless of whether the projections are prepared by
the customer or the analyst, without qualifying the assumptions on
which they are based, they next to worthless.
■ Customers may produce certain scenarios – for example, best case, most
likely and worst case. Taking the customers’ most likely scenario, you
should play devil’s advocate to their reasonableness and, where
necessary, make adjustments. (If you want empirical evidence of cus-
tomer optimism, ask any experienced banker if a customer has ever
projected failure!)
Cash Flow Forecasting82
■ The bank must protect itself against a downside. Once projections have
been prepared, adjustments (also known as ‘sensitivity analysis’) must
be made to reflect a reasonable worst-case scenario. The bank must
then ensure that it will be adequately protected in such a scenario.
■ Don’t get lost in the numbers; projections are not reality. Rather, step
back and see if the projections make sense. Are the company’s fore-
casts of 12 per cent annual growth in a mature industry characterized
by over capacity realistic?
Often, in a term lending situation the borrower and/or agent bank may
provide forecasted rates of sales growth. These may be perfectly adequate
to construct forecasts on, but you, as analyst, will at least want to exam-
ine the assumptions underlying the growth rates in order to be satisfied
that these assumptions are realistic. You can also make your own assump-
tions and then check them out with the customer in a marketing call.
Procedure for constructing projections
Projections are sales driven – in other words, company performance is
linked to the inflow of money into the company. The projection of other
income statement and balance sheet accounts is related, directly or indi-
rectly, to the projected sales level. Sales level is, for example, a main
determinant of asset growth – the higher the sales, the higher the work-
ing investment needed to support the sales.
There are two sources of financing:
1 Profits earned and retained in the business
2 Outside financing, either through increased equity (such as through
the issuance of stock) or increased debt.
The process of creating a pro forma income statement and balance sheet
can be broadly summarized as determining:
■ probable sales revenue and related income statement expense items
■ probable total asset growth and corresponding liability growth
Cash flow forecasting of financial statements 83
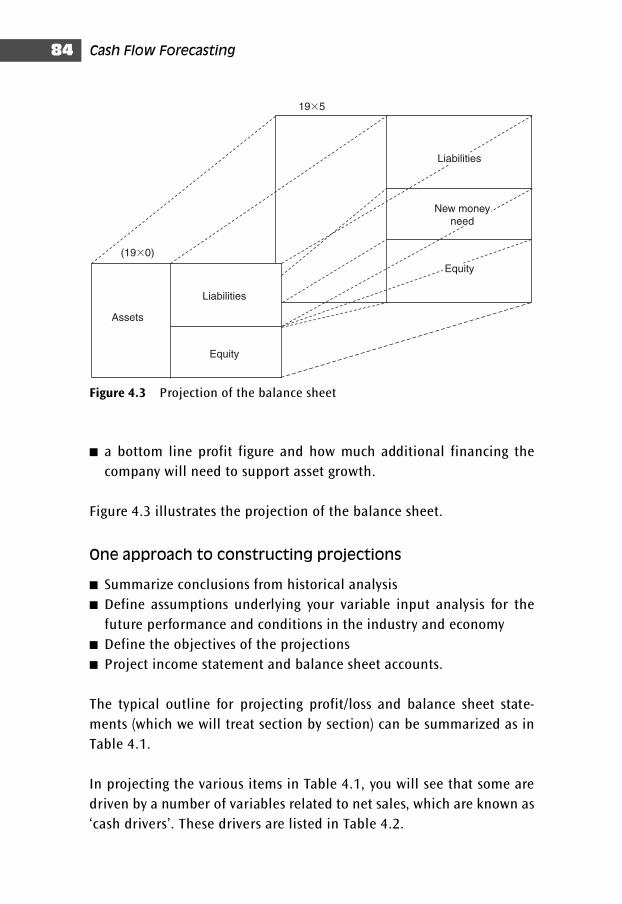
Cash Flow Forecasting84
■ a bottom line profit figure and how much additional financing the
company will need to support asset growth.
Figure 4.3 illustrates the projection of the balance sheet.
One approach to constructing projections
■ Summarize conclusions from historical analysis
■ Define assumptions underlying your variable input analysis for the
future performance and conditions in the industry and economy
■ Define the objectives of the projections
■ Project income statement and balance sheet accounts.
The typical outline for projecting profit/loss and balance sheet state-
ments (which we will treat section by section) can be summarized as in
Table 4.1.
In projecting the various items in Table 4.1, you will see that some are
driven by a number of variables related to net sales, which are known as
‘cash drivers’. These drivers are listed in Table 4.2.
19�5
(19�0)
Assets
Liabilities
Equity
Liabilities
Equity
New moneyneed
Figure 4.3 Projection of the balance sheet
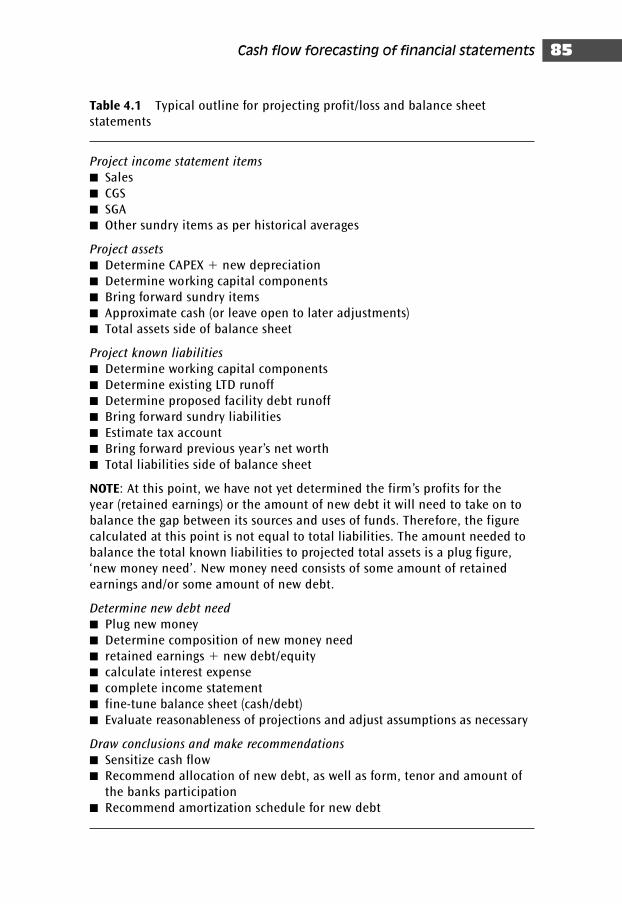
Cash flow forecasting of financial statements 85
Table 4.1 Typical outline for projecting profit/loss and balance sheet statements
Project income statement items
■ Sales■ CGS■ SGA■ Other sundry items as per historical averages
Project assets
■ Determine CAPEX � new depreciation■ Determine working capital components■ Bring forward sundry items■ Approximate cash (or leave open to later adjustments)■ Total assets side of balance sheet
Project known liabilities
■ Determine working capital components■ Determine existing LTD runoff■ Determine proposed facility debt runoff■ Bring forward sundry liabilities■ Estimate tax account■ Bring forward previous year’s net worth■ Total liabilities side of balance sheet
NOTE: At this point, we have not yet determined the firm’s profits for the year (retained earnings) or the amount of new debt it will need to take on tobalance the gap between its sources and uses of funds. Therefore, the figurecalculated at this point is not equal to total liabilities. The amount needed tobalance the total known liabilities to projected total assets is a plug figure,‘new money need’. New money need consists of some amount of retainedearnings and/or some amount of new debt.
Determine new debt need
■ Plug new money■ Determine composition of new money need■ retained earnings � new debt/equity■ calculate interest expense■ complete income statement■ fine-tune balance sheet (cash/debt)■ Evaluate reasonableness of projections and adjust assumptions as necessary
Draw conclusions and make recommendations
■ Sensitize cash flow■ Recommend allocation of new debt, as well as form, tenor and amount of
the banks participation■ Recommend amortization schedule for new debt
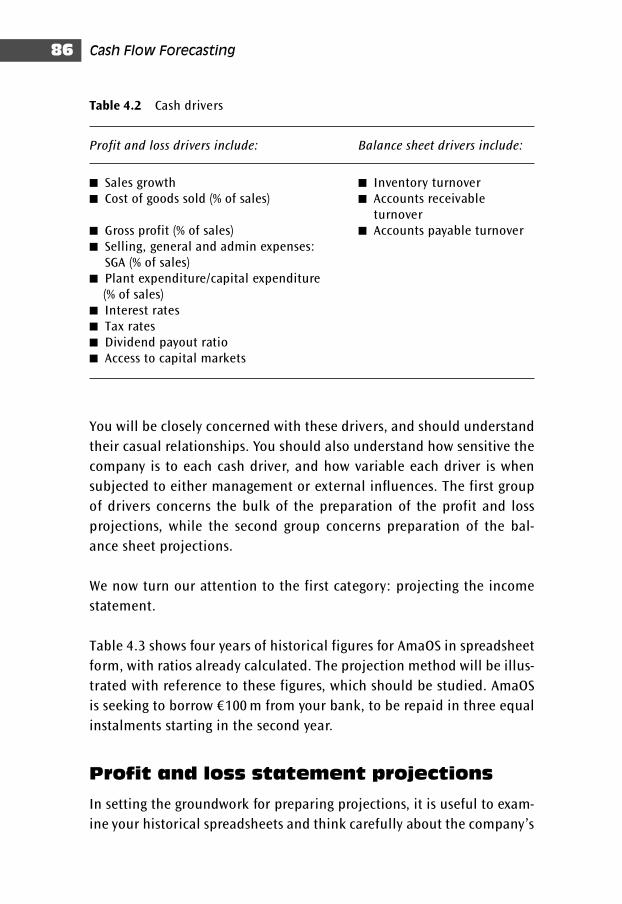
Cash Flow Forecasting86
You will be closely concerned with these drivers, and should understand
their casual relationships. You should also understand how sensitive the
company is to each cash driver, and how variable each driver is when
subjected to either management or external influences. The first group
of drivers concerns the bulk of the preparation of the profit and loss
projections, while the second group concerns preparation of the bal-
ance sheet projections.
We now turn our attention to the first category: projecting the income
statement.
Table 4.3 shows four years of historical figures for AmaOS in spreadsheet
form, with ratios already calculated. The projection method will be illus-
trated with reference to these figures, which should be studied. AmaOS
is seeking to borrow €100 m from your bank, to be repaid in three equal
instalments starting in the second year.
Profit and loss statement projections
In setting the groundwork for preparing projections, it is useful to exam-
ine your historical spreadsheets and think carefully about the company’s
Table 4.2 Cash drivers
Profit and loss drivers include: Balance sheet drivers include:
■ Sales growth ■ Inventory turnover■ Cost of goods sold (% of sales) ■ Accounts receivable
turnover■ Gross profit (% of sales) ■ Accounts payable turnover■ Selling, general and admin expenses:
SGA (% of sales)■ Plant expenditure/capital expenditure
(% of sales)■ Interest rates■ Tax rates■ Dividend payout ratio■ Access to capital markets
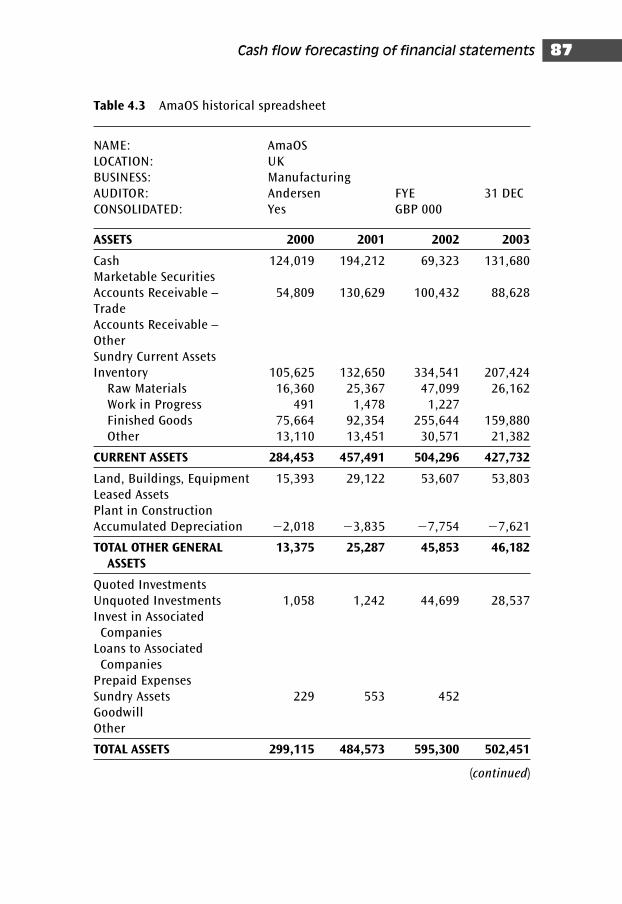
Cash flow forecasting of financial statements 87
Table 4.3 AmaOS historical spreadsheet
NAME: AmaOSLOCATION: UKBUSINESS: ManufacturingAUDITOR: Andersen FYE 31 DECCONSOLIDATED: Yes GBP 000
ASSETS 2000 2001 2002 2003
Cash 124,019 194,212 69,323 131,680Marketable SecuritiesAccounts Receivable – 54,809 130,629 100,432 88,628TradeAccounts Receivable – OtherSundry Current AssetsInventory 105,625 132,650 334,541 207,424
Raw Materials 16,360 25,367 47,099 26,162Work in Progress 491 1,478 1,227Finished Goods 75,664 92,354 255,644 159,880Other 13,110 13,451 30,571 21,382
CURRENT ASSETS 284,453 457,491 504,296 427,732
Land, Buildings, Equipment 15,393 29,122 53,607 53,803Leased AssetsPlant in ConstructionAccumulated Depreciation �2,018 �3,835 �7,754 �7,621
TOTAL OTHER GENERAL 13,375 25,287 45,853 46,182ASSETS
Quoted InvestmentsUnquoted Investments 1,058 1,242 44,699 28,537Invest in Associated
CompaniesLoans to Associated
CompaniesPrepaid ExpensesSundry Assets 229 553 452GoodwillOther
TOTAL ASSETS 299,115 484,573 595,300 502,451
(continued)
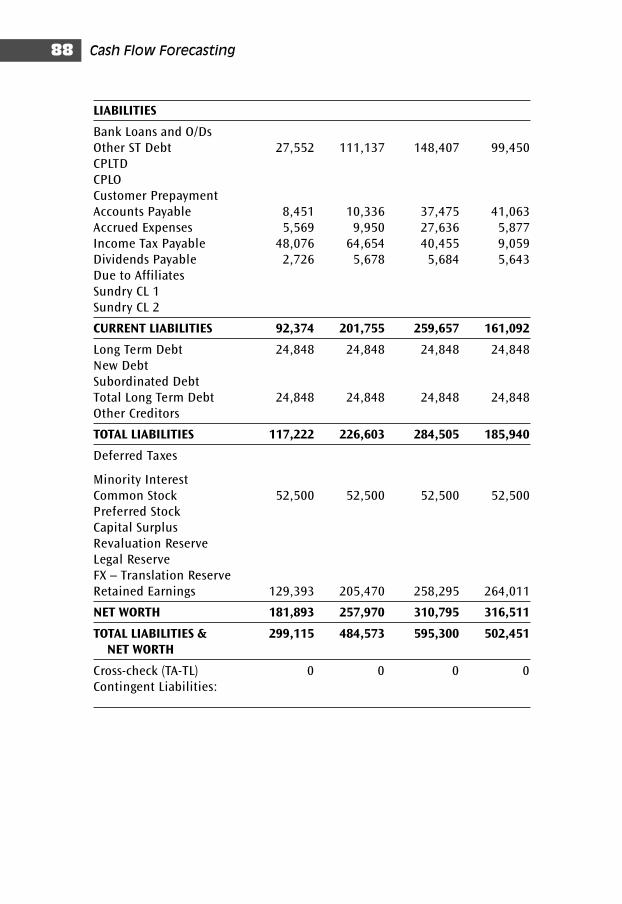
Cash Flow Forecasting88
LIABILITIES
Bank Loans and O/DsOther ST Debt 27,552 111,137 148,407 99,450CPLTDCPLOCustomer PrepaymentAccounts Payable 8,451 10,336 37,475 41,063Accrued Expenses 5,569 9,950 27,636 5,877Income Tax Payable 48,076 64,654 40,455 9,059Dividends Payable 2,726 5,678 5,684 5,643Due to AffiliatesSundry CL 1Sundry CL 2
CURRENT LIABILITIES 92,374 201,755 259,657 161,092
Long Term Debt 24,848 24,848 24,848 24,848New DebtSubordinated DebtTotal Long Term Debt 24,848 24,848 24,848 24,848Other Creditors
TOTAL LIABILITIES 117,222 226,603 284,505 185,940
Deferred Taxes
Minority InterestCommon Stock 52,500 52,500 52,500 52,500Preferred StockCapital SurplusRevaluation ReserveLegal ReserveFX – Translation ReserveRetained Earnings 129,393 205,470 258,295 264,011
NET WORTH 181,893 257,970 310,795 316,511
TOTAL LIABILITIES & 299,115 484,573 595,300 502,451NET WORTH
Cross-check (TA-TL) 0 0 0 0Contingent Liabilities:
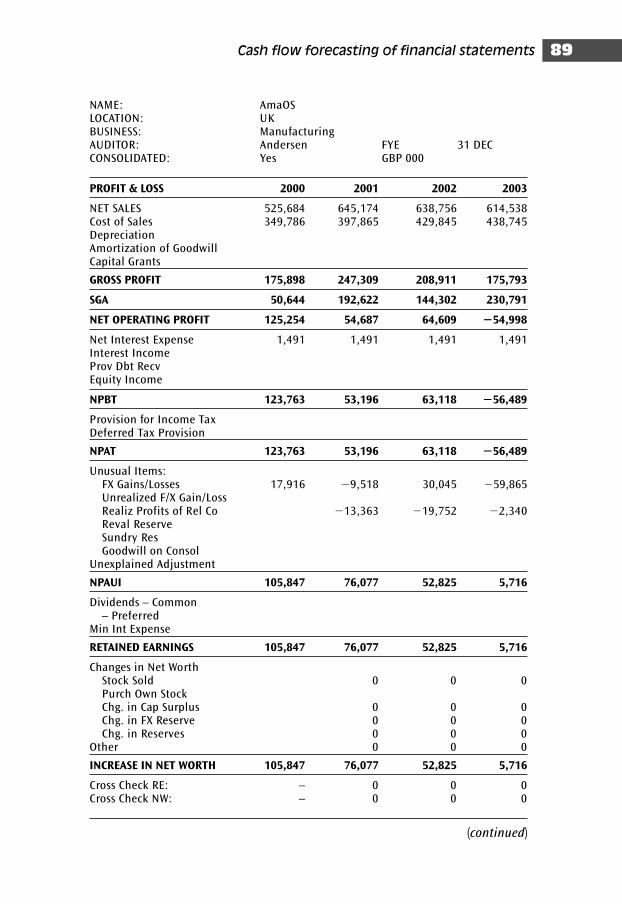
Cash flow forecasting of financial statements 89
NAME: AmaOSLOCATION: UKBUSINESS: ManufacturingAUDITOR: Andersen FYE 31 DECCONSOLIDATED: Yes GBP 000
PROFIT & LOSS 2000 2001 2002 2003
NET SALES 525,684 645,174 638,756 614,538Cost of Sales 349,786 397,865 429,845 438,745DepreciationAmortization of GoodwillCapital Grants
GROSS PROFIT 175,898 247,309 208,911 175,793
SGA 50,644 192,622 144,302 230,791
NET OPERATING PROFIT 125,254 54,687 64,609 �54,998
Net Interest Expense 1,491 1,491 1,491 1,491Interest IncomeProv Dbt RecvEquity Income
NPBT 123,763 53,196 63,118 �56,489
Provision for Income TaxDeferred Tax Provision
NPAT 123,763 53,196 63,118 �56,489
Unusual Items:FX Gains/Losses 17,916 �9,518 30,045 �59,865Unrealized F/X Gain/LossRealiz Profits of Rel Co �13,363 �19,752 �2,340Reval ReserveSundry ResGoodwill on Consol
Unexplained Adjustment
NPAUI 105,847 76,077 52,825 5,716
Dividends – Common– Preferred
Min Int Expense
RETAINED EARNINGS 105,847 76,077 52,825 5,716
Changes in Net WorthStock Sold 0 0 0Purch Own StockChg. in Cap Surplus 0 0 0Chg. in FX Reserve 0 0 0Chg. in Reserves 0 0 0
Other 0 0 0
INCREASE IN NET WORTH 105,847 76,077 52,825 5,716
Cross Check RE: – 0 0 0Cross Check NW: – 0 0 0
(continued)
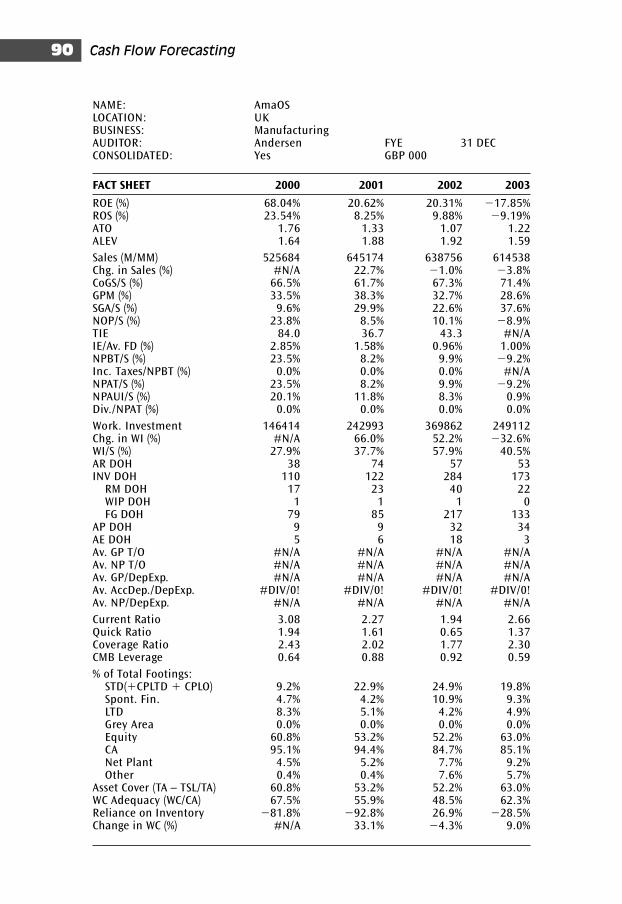
Cash Flow Forecasting90
NAME: AmaOSLOCATION: UKBUSINESS: ManufacturingAUDITOR: Andersen FYE 31 DECCONSOLIDATED: Yes GBP 000
FACT SHEET 2000 2001 2002 2003
ROE (%) 68.04% 20.62% 20.31% �17.85%ROS (%) 23.54% 8.25% 9.88% �9.19%ATO 1.76 1.33 1.07 1.22ALEV 1.64 1.88 1.92 1.59
Sales (M/MM) 525684 645174 638756 614538Chg. in Sales (%) #N/A 22.7% �1.0% �3.8%CoGS/S (%) 66.5% 61.7% 67.3% 71.4%GPM (%) 33.5% 38.3% 32.7% 28.6%SGA/S (%) 9.6% 29.9% 22.6% 37.6%NOP/S (%) 23.8% 8.5% 10.1% �8.9%TIE 84.0 36.7 43.3 #N/AIE/Av. FD (%) 2.85% 1.58% 0.96% 1.00%NPBT/S (%) 23.5% 8.2% 9.9% �9.2%Inc. Taxes/NPBT (%) 0.0% 0.0% 0.0% #N/ANPAT/S (%) 23.5% 8.2% 9.9% �9.2%NPAUI/S (%) 20.1% 11.8% 8.3% 0.9%Div./NPAT (%) 0.0% 0.0% 0.0% 0.0%
Work. Investment 146414 242993 369862 249112Chg. in WI (%) #N/A 66.0% 52.2% �32.6%WI/S (%) 27.9% 37.7% 57.9% 40.5%AR DOH 38 74 57 53INV DOH 110 122 284 173
RM DOH 17 23 40 22WIP DOH 1 1 1 0FG DOH 79 85 217 133
AP DOH 9 9 32 34AE DOH 5 6 18 3Av. GP T/O #N/A #N/A #N/A #N/AAv. NP T/O #N/A #N/A #N/A #N/AAv. GP/DepExp. #N/A #N/A #N/A #N/AAv. AccDep./DepExp. #DIV/0! #DIV/0! #DIV/0! #DIV/0!Av. NP/DepExp. #N/A #N/A #N/A #N/A
Current Ratio 3.08 2.27 1.94 2.66Quick Ratio 1.94 1.61 0.65 1.37Coverage Ratio 2.43 2.02 1.77 2.30CMB Leverage 0.64 0.88 0.92 0.59
% of Total Footings:STD(�CPLTD � CPLO) 9.2% 22.9% 24.9% 19.8%Spont. Fin. 4.7% 4.2% 10.9% 9.3%LTD 8.3% 5.1% 4.2% 4.9%Grey Area 0.0% 0.0% 0.0% 0.0%Equity 60.8% 53.2% 52.2% 63.0%CA 95.1% 94.4% 84.7% 85.1%Net Plant 4.5% 5.2% 7.7% 9.2%Other 0.4% 0.4% 7.6% 5.7%
Asset Cover (TA – TSL/TA) 60.8% 53.2% 52.2% 63.0%WC Adequacy (WC/CA) 67.5% 55.9% 48.5% 62.3%Reliance on Inventory �81.8% �92.8% 26.9% �28.5%Change in WC (%) #N/A 33.1% �4.3% 9.0%
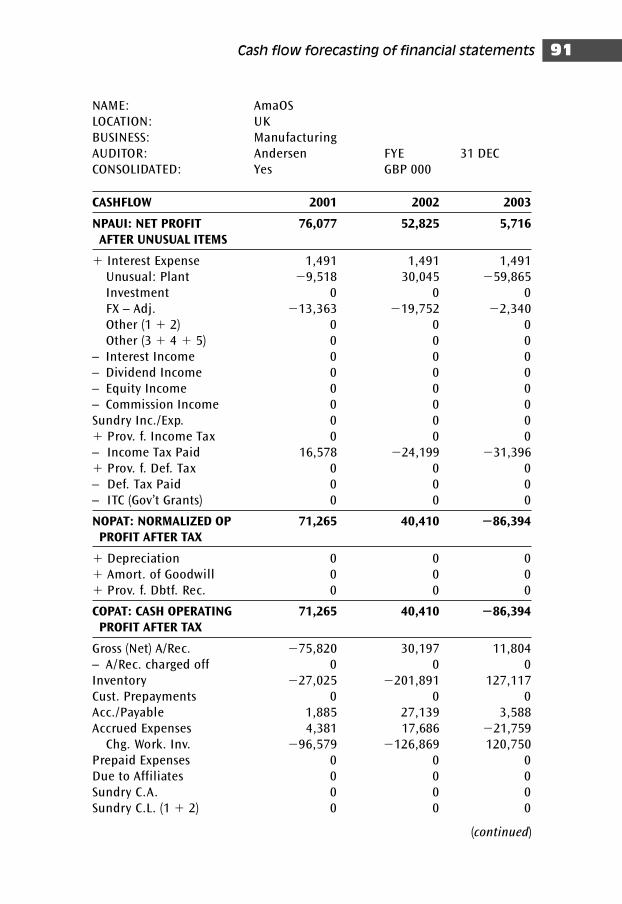
Cash flow forecasting of financial statements 91
NAME: AmaOSLOCATION: UKBUSINESS: ManufacturingAUDITOR: Andersen FYE 31 DECCONSOLIDATED: Yes GBP 000
CASHFLOW 2001 2002 2003
NPAUI: NET PROFIT 76,077 52,825 5,716AFTER UNUSUAL ITEMS
� Interest Expense 1,491 1,491 1,491Unusual: Plant �9,518 30,045 �59,865Investment 0 0 0FX – Adj. �13,363 �19,752 �2,340Other (1 � 2) 0 0 0Other (3 � 4 � 5) 0 0 0
– Interest Income 0 0 0– Dividend Income 0 0 0– Equity Income 0 0 0– Commission Income 0 0 0Sundry Inc./Exp. 0 0 0� Prov. f. Income Tax 0 0 0– Income Tax Paid 16,578 �24,199 �31,396� Prov. f. Def. Tax 0 0 0– Def. Tax Paid 0 0 0– ITC (Gov’t Grants) 0 0 0
NOPAT: NORMALIZED OP 71,265 40,410 �86,394PROFIT AFTER TAX
� Depreciation 0 0 0� Amort. of Goodwill 0 0 0� Prov. f. Dbtf. Rec. 0 0 0
COPAT: CASH OPERATING 71,265 40,410 �86,394PROFIT AFTER TAX
Gross (Net) A/Rec. �75,820 30,197 11,804– A/Rec. charged off 0 0 0Inventory �27,025 �201,891 127,117Cust. Prepayments 0 0 0Acc./Payable 1,885 27,139 3,588Accrued Expenses 4,381 17,686 �21,759
Chg. Work. Inv. �96,579 �126,869 120,750Prepaid Expenses 0 0 0Due to Affiliates 0 0 0Sundry C.A. 0 0 0Sundry C.L. (1 � 2) 0 0 0
(continued)
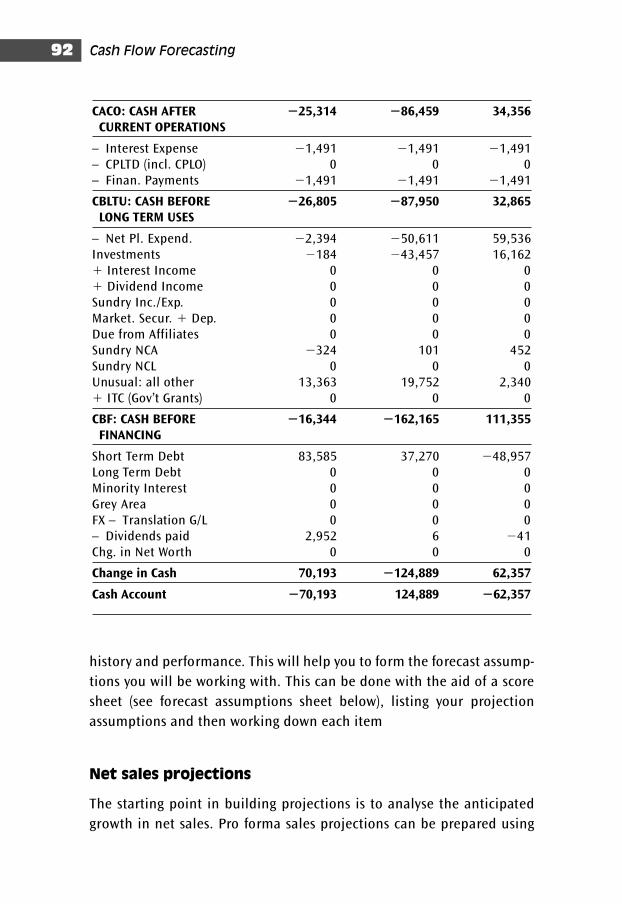
Cash Flow Forecasting92
CACO: CASH AFTER �25,314 �86,459 34,356CURRENT OPERATIONS
– Interest Expense �1,491 �1,491 �1,491– CPLTD (incl. CPLO) 0 0 0– Finan. Payments �1,491 �1,491 �1,491
CBLTU: CASH BEFORE �26,805 �87,950 32,865LONG TERM USES
– Net Pl. Expend. �2,394 �50,611 59,536Investments �184 �43,457 16,162� Interest Income 0 0 0� Dividend Income 0 0 0Sundry Inc./Exp. 0 0 0Market. Secur. � Dep. 0 0 0Due from Affiliates 0 0 0Sundry NCA �324 101 452Sundry NCL 0 0 0Unusual: all other 13,363 19,752 2,340� ITC (Gov’t Grants) 0 0 0
CBF: CASH BEFORE �16,344 �162,165 111,355FINANCING
Short Term Debt 83,585 37,270 �48,957Long Term Debt 0 0 0Minority Interest 0 0 0Grey Area 0 0 0FX – Translation G/L 0 0 0– Dividends paid 2,952 6 �41Chg. in Net Worth 0 0 0
Change in Cash 70,193 �124,889 62,357
Cash Account �70,193 124,889 �62,357
history and performance. This will help you to form the forecast assump-
tions you will be working with. This can be done with the aid of a score
sheet (see forecast assumptions sheet below), listing your projection
assumptions and then working down each item
Net sales projections
The starting point in building projections is to analyse the anticipated
growth in net sales. Pro forma sales projections can be prepared using
Cash flow forecasting of financial statements 93
the most basic assumptions (e.g. ‘flat 8.5 per cent growth in net sales per
annum’) ranging up to more detailed variants such as subdividing the
company’s various operations into either geographic or product lines
and forecasting each division’s performance (including acquisition/
disposal/capital expenditures) to arrive at an overall total.
Likewise, other models may factor in several variables such as fluctuat-
ing prices of the goods delivered plus the operating capacity of the pro-
duction stream. For example, production may be at 90 per cent of
capacity and the price at €70 per unit, or production may fall to 75 per cent
of capacity but the market price rise to €110 per unit.
These assumptions may be further refined by factoring in expected infla-
tion rates and economic growth or recession rates. Such economic data
are available from sources such as the Central Statistical Office in the
UK, or publications produced by banks or industry groups covering the
economy in their home countries. Sales forecasts may also be provided
by the company in its annual report or facility information memorandum.
It is important to break down the identifiable variables affecting the
net sales figure over time accurately, so that key or vulnerable elements
can be identified and individually manipulated. This is why often the
net sales projections may be calculated in a stand-alone matrix specifi-
cally designed for this purpose. A detailed process of reflection is neces-
sary to arrive at a reasonable estimate of net sales, since all other items
will be derived (directly or indirectly) from this figure. Such a matrix
for a manufacturing company with several product lines is depicted in
Table 4.4.
Sales projections present the greatest analytical challenge, since this
account encompasses the greatest number of variables and unknowns.
The company’s own forecast of sales, sometimes included in the annual
report, can provide a starting point for projecting sales, but the com-
pany’s projections should always be tested against the analyst’s own
assumptions and understanding of the problems that confront the com-
pany and that may affect its success in meeting its goals.
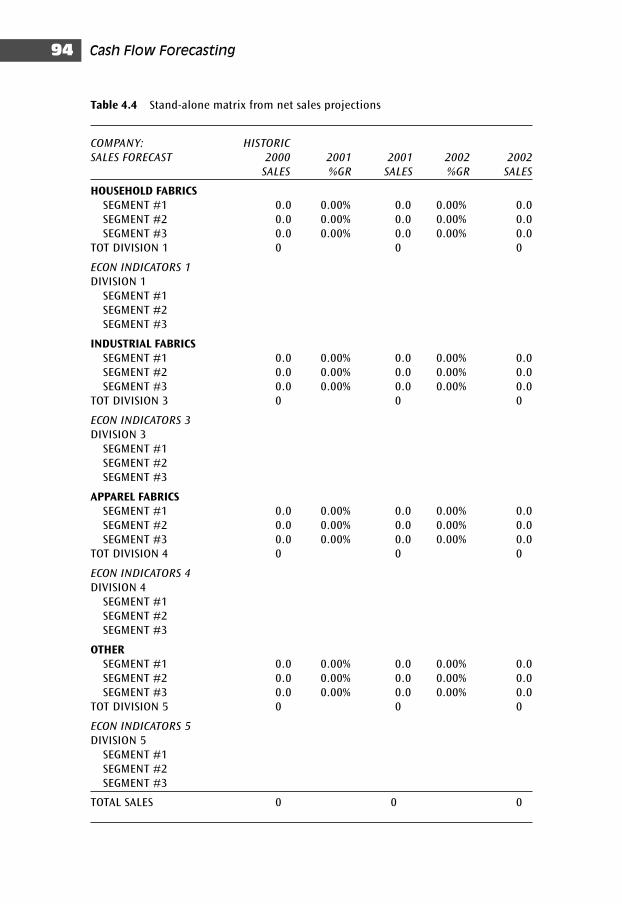
Cash Flow Forecasting94
Table 4.4 Stand-alone matrix from net sales projections
COMPANY: HISTORIC
SALES FORECAST 2000 2001 2001 2002 2002
SALES %GR SALES %GR SALES
HOUSEHOLD FABRICSSEGMENT #1 0.0 0.00% 0.0 0.00% 0.0SEGMENT #2 0.0 0.00% 0.0 0.00% 0.0SEGMENT #3 0.0 0.00% 0.0 0.00% 0.0
TOT DIVISION 1 0 0 0
ECON INDICATORS 1
DIVISION 1SEGMENT #1SEGMENT #2SEGMENT #3
INDUSTRIAL FABRICSSEGMENT #1 0.0 0.00% 0.0 0.00% 0.0SEGMENT #2 0.0 0.00% 0.0 0.00% 0.0SEGMENT #3 0.0 0.00% 0.0 0.00% 0.0
TOT DIVISION 3 0 0 0
ECON INDICATORS 3
DIVISION 3SEGMENT #1SEGMENT #2SEGMENT #3
APPAREL FABRICSSEGMENT #1 0.0 0.00% 0.0 0.00% 0.0SEGMENT #2 0.0 0.00% 0.0 0.00% 0.0SEGMENT #3 0.0 0.00% 0.0 0.00% 0.0
TOT DIVISION 4 0 0 0
ECON INDICATORS 4
DIVISION 4SEGMENT #1SEGMENT #2SEGMENT #3
OTHERSEGMENT #1 0.0 0.00% 0.0 0.00% 0.0SEGMENT #2 0.0 0.00% 0.0 0.00% 0.0SEGMENT #3 0.0 0.00% 0.0 0.00% 0.0
TOT DIVISION 5 0 0 0
ECON INDICATORS 5
DIVISION 5SEGMENT #1SEGMENT #2SEGMENT #3
TOTAL SALES 0 0 0
Cash flow forecasting of financial statements 95
There is no one way to approach sales projections; however, these broad
areas should be considered for each product line:
■ What are the future economic conditions affecting the company likely
to be?
■ What is the industry outlook, and what are the demand factors in the
company’s line of business? Are there problems with sources of sup-
ply, competition, over- or under-capacity, consumer demand, etc.?
■ How has the company historically performed under various economic
conditions? What have been the major influences on sales?
■ What are the company’s identifiable strategies with respect to its
product lines?
The problem in making sales projections is seldom too few data, but
rather too many. This means the analyst needs to understand the under-
lying fundamentals of the company’s past sales performance and out-
look for the industry and economy, be able to make reasonable
assumptions about the variables most likely to impact future perform-
ance, and eliminate extraneous variables.
Determining the probable future level of sales is ultimately a matter of
judgement, estimate and approximation.
There are two broad methods of projecting net sales:
1 Evaluating the volume and price components of sales revenue for
each separate product line, determining those factors that are likely
to influence future volume and price levels, and estimating a total
probable dollar sales figure
2 Relating the firm’s past sales performance to overall conditions in the
industry or economy, obtaining forecasts of future industry or eco-
nomic conditions, and deriving a figure for projected sales.
We will look more closely at these two approaches.
Evaluating volume and pricing components
The dollar sales figure is a function of the volume of goods sold or ser-
vices rendered and the price the company is able to obtain for these
goods or services.
Cash Flow Forecasting96
Factors to consider when determining the probable future volume of
sales for each product line include the following:
■ Health of the market. Is the company’s product one that will be in
demand in the future, or is it a product for which demand is decreas-
ing? Is the product subject to unforeseen changes in consumer taste?
■ Production capacity. At what percentage of total capacity is the firm
now operating, and how much additional volume can it generate with
its current capacity? If increased volume depends on increased cap-
acity, how quickly can new capacity be put on?
■ Competitive conditions. What is the company’s position with regard to
its competitors? Does the company have a competitive edge, and can
it maintain its market share? Can its markets be expanded? Are there
substitute products that will inhibit volume growth or trigger volume
declines?
■ General economy. Who are the consumers of the company’s product?
Is the product sold to distributors, wholesalers, retailers, or company-
owned stores or outlets? Which factors can affect their demand for the
product – economic, fashion, geographic, cyclicality?
■ Cost flexibility. Can the company pass off increased costs to the con-
sumer? Does the company’s product enjoy brand-name identification
advantages that make it possible to increase prices without diminish-
ing demand, or does the company have a reputation for quality or
service that makes price relatively unimportant – is the company’s
product one that is in short supply but high demand?
The number of factors that could affect a company’s sales volume and
product price is almost limitless, but a knowledge of the economic,
market and industry conditions, the nature of the business and the char-
acteristics of the company’s asset conversion cycle will assist you
in limiting the number of factors that will have a major impact on the
company being analysed.
Relating a firm’s performance to industry
and economic conditions
Historical analysis may sometimes indicate a relationship between
a firm’s sales level and conditions in the industry and economy.
Cash flow forecasting of financial statements 97
Specifically, a relationship might be found to exist between sales and
some other variable, such as total industry sales or certain economic
indicators. When a forecast of the other variable is available, the pro-
jected sales figure can be derived. Some examples will illustrate:
■ Sales projections by market share. In some cases it may be appropriate
to project sales by market share. The first step in this method is to
analyse the company’s historic market share. Has it been growing,
stable, shrinking?
■ Sales projections in relation to economic indicators. Historical analysis
may sometimes indicate a relationship between sales and certain eco-
nomic indicators. For example, we may observe for a particular
company:
Sales Index of
industrial
production
20X1 4.3 10020X2 4.6 20020X3 4.9 30020X4 5.2 40020X5 5.5 500
When such a relationship has been observed to exist historically, it
may sometimes be used as a basis to determine a projected sales figure,
provided we have an estimate for the future value of the other variable –
in this case, the index of industrial production.
This technique uses a method of calculation known as linear regression.
It is important, however, to realize that linear regression is effective
typically when dealing with large population samples – for example, of
several hundred data points (e.g. voter registration patterns linked to
income). Using linear regression techniques to project corporate data
where the variables are relatively limited in number (five years) can
often lead to misleading results, since individual extraneous events can
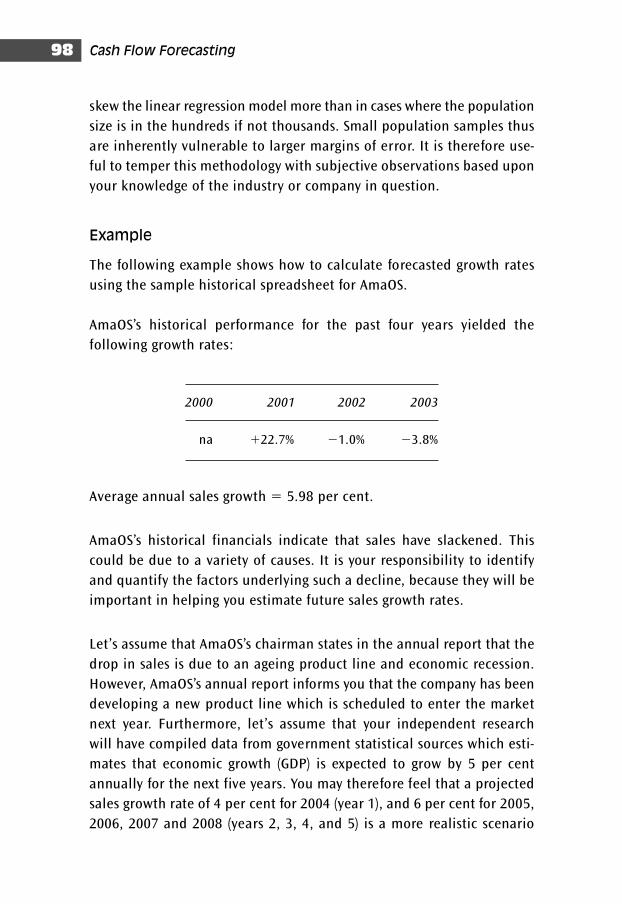
Cash Flow Forecasting98
skew the linear regression model more than in cases where the population
size is in the hundreds if not thousands. Small population samples thus
are inherently vulnerable to larger margins of error. It is therefore use-
ful to temper this methodology with subjective observations based upon
your knowledge of the industry or company in question.
Example
The following example shows how to calculate forecasted growth rates
using the sample historical spreadsheet for AmaOS.
AmaOS’s historical performance for the past four years yielded the
following growth rates:
2000 2001 2002 2003
na �22.7% �1.0% �3.8%
Average annual sales growth � 5.98 per cent.
AmaOS’s historical financials indicate that sales have slackened. This
could be due to a variety of causes. It is your responsibility to identify
and quantify the factors underlying such a decline, because they will be
important in helping you estimate future sales growth rates.
Let’s assume that AmaOS’s chairman states in the annual report that the
drop in sales is due to an ageing product line and economic recession.
However, AmaOS’s annual report informs you that the company has been
developing a new product line which is scheduled to enter the market
next year. Furthermore, let’s assume that your independent research
will have compiled data from government statistical sources which esti-
mates that economic growth (GDP) is expected to grow by 5 per cent
annually for the next five years. You may therefore feel that a projected
sales growth rate of 4 per cent for 2004 (year 1), and 6 per cent for 2005,
2006, 2007 and 2008 (years 2, 3, 4, and 5) is a more realistic scenario

Cash flow forecasting of financial statements 99
than the straight-line average figure of 5.98 (which moreover factored in
the exceptional 22.7 per cent increase in net sales for 2001).
The sales forecast assumptions worksheet figures should therefore read
as follows:
2004 2005 2006 2007 2008
Net sales:€614,538 €639,120 €677,467 €718,115 €761,202 €806,874
Last actual 4% growth 6% growth 6% growth 6% growth 6% growthyear
You will have worked out these figures from a combination of historical
data plus factors that you have estimated. In preparing forecasts, it is
important to summarize the assumptions used and include them with
the forecasts in order to enable the reader to understand the underlying
assumptions.
Next, select and check the factors that you think are relevant to the
industry in which the company being analysed operates. The essential
issue is to arrive at a forecasted rate of growth that you feel is realistic.
Completing the profit and loss projections
Once you have established pro forma net sales growth forecasts and pro-
jected them over the number of years being considered (usually five,
although this can be longer), then constructing projected profit and loss
statements, at least to the net operating profit level, is a relatively
straightforward operation.
The usual starting point is to take an historical average of the various
cash drivers from the historical profit and loss statement, namely:
■ cost of goods sold
■ gross profit
■ SGA, and
■ operating profit
Cash Flow Forecasting100
and calculate them as an average percentage of net sales in the histor-
ical income statement spread. These percentages are then used in
conjunction with the pro forma net sales forecasts to calculate their
expected value in the projected income statements.
This technique should be applied to operational items which arise as a
consequence of the activity generated by sales in the company’s income
statements.
Some factors, however, may not necessarily be linked to the company’s
historical sales activity, and will require specialized treatment. Cost of
goods sold may require adjustments for anticipated changes, such as the
availability of a key raw material used in the operational process.
Another example is if the proposed facility is to acquire a company or
operation that is operating with higher than average costs, or will
generate additional costs following absorption into the company; these
should also be factored in. It is the task of you, as the analyst, to identify
such pertinent factors and understand how they can affect the drivers.
Cost of goods sold/gross margin projections
Cost of goods sold (CGS) is a function of sales. One logical technique used
to project cost of goods sold is therefore to calculate a CGS/sales ratio,
based on the historical relationship of cost of goods sold to sales (� any
other assumptions or factors that may affect the ratio in the future). The
historical average ratio of CGS/sales can be then applied to the projected
sales figure to yield a projected cost of goods sold figure:
Projected CGS � projected sales*(historical CGS/sales ratio)
To further refine the projected CGS/sales ratio, the analyst looks at the
major components of cost of goods sold (such as raw materials, labour,
overhead) and can then consider factors that have determined the cost
level of each of these in the past and that may affect them in the future.
Reasonable assumptions about what may happen in the future can then
be made.
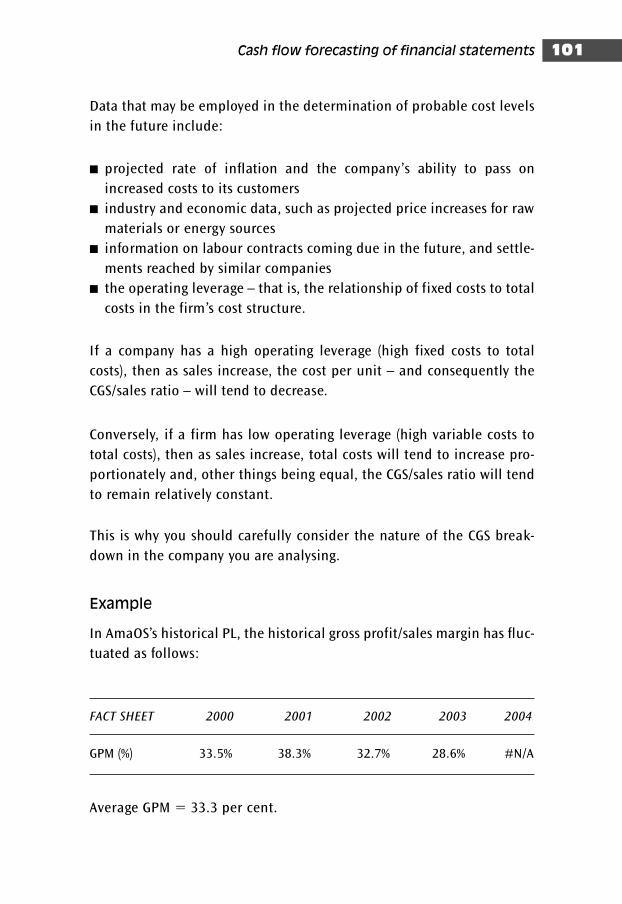
Cash flow forecasting of financial statements 101
Data that may be employed in the determination of probable cost levels
in the future include:
■ projected rate of inflation and the company’s ability to pass on
increased costs to its customers
■ industry and economic data, such as projected price increases for raw
materials or energy sources
■ information on labour contracts coming due in the future, and settle-
ments reached by similar companies
■ the operating leverage – that is, the relationship of fixed costs to total
costs in the firm’s cost structure.
If a company has a high operating leverage (high fixed costs to total
costs), then as sales increase, the cost per unit – and consequently the
CGS/sales ratio – will tend to decrease.
Conversely, if a firm has low operating leverage (high variable costs to
total costs), then as sales increase, total costs will tend to increase pro-
portionately and, other things being equal, the CGS/sales ratio will tend
to remain relatively constant.
This is why you should carefully consider the nature of the CGS break-
down in the company you are analysing.
Example
In AmaOS’s historical PL, the historical gross profit/sales margin has fluc-
tuated as follows:
FACT SHEET 2000 2001 2002 2003 2004
GPM (%) 33.5% 38.3% 32.7% 28.6% #N/A
Average GPM � 33.3 per cent.
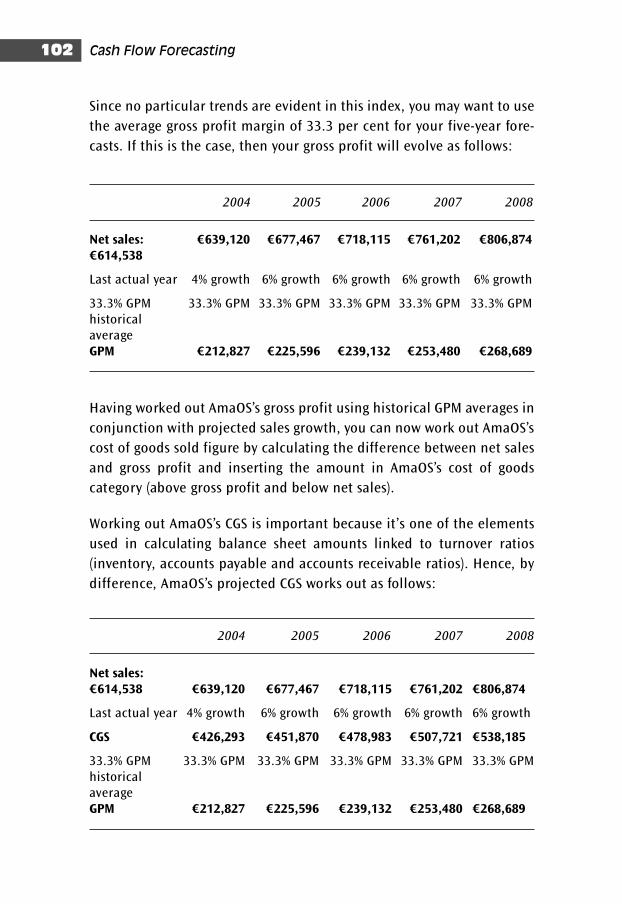
Cash Flow Forecasting102
Since no particular trends are evident in this index, you may want to use
the average gross profit margin of 33.3 per cent for your five-year fore-
casts. If this is the case, then your gross profit will evolve as follows:
2004 2005 2006 2007 2008
Net sales: €639,120 €677,467 €718,115 €761,202 €806,874€614,538
Last actual year 4% growth 6% growth 6% growth 6% growth 6% growth
33.3% GPM 33.3% GPM 33.3% GPM 33.3% GPM 33.3% GPM 33.3% GPMhistorical averageGPM €212,827 €225,596 €239,132 €253,480 €268,689
Having worked out AmaOS’s gross profit using historical GPM averages in
conjunction with projected sales growth, you can now work out AmaOS’s
cost of goods sold figure by calculating the difference between net sales
and gross profit and inserting the amount in AmaOS’s cost of goods
category (above gross profit and below net sales).
Working out AmaOS’s CGS is important because it’s one of the elements
used in calculating balance sheet amounts linked to turnover ratios
(inventory, accounts payable and accounts receivable ratios). Hence, by
difference, AmaOS’s projected CGS works out as follows:
2004 2005 2006 2007 2008
Net sales:€614,538 €639,120 €677,467 €718,115 €761,202 €806,874
Last actual year 4% growth 6% growth 6% growth 6% growth 6% growth
CGS €426,293 €451,870 €478,983 €507,721 €538,185
33.3% GPM 33.3% GPM 33.3% GPM 33.3% GPM 33.3% GPM 33.3% GPMhistorical averageGPM €212,827 €225,596 €239,132 €253,480 €268,689
Selling, general and administrative expense (SGA)
The technique for projecting the SGA account is similar to that for other
sales-driven expense items in the P&L statement. This involves examin-
ing historic trends in the SGA/sales ratio and selecting a projected ratio
that can then be applied to the projected sales figure to determine pro-
jected SGA expenses in cash terms. Alternatively, you can establish SGA
by projecting operating profit (as with gross profit) and then work back-
wards to establish SGA.
The former approach is, however, preferable, as a number of factors can
affect SGA, and analysis should include conditions that may cause a rise
or fall in this account. For example, if AmaOS intends to achieve sales
growth by expanding into new markets, it is likely that there will be an
increase in selling expenses typically associated with ‘start-up costs’
(salaries, commissions, advertising, legal, and consulting fees).
Depending on the type of company, SGA may or may not be critical. SGA
will be more important for retail stores than for a manufacturer. Other
companies may spend on advertising or R&D (which will probably be cut
back in a recession, since they fall under management control). You
should understand the nature of the company you are analysing, and
adjust these figures accordingly.
Operating profit
As with net sales and gross margin, forecasting expense items from
gross profit on down to operating profit (SGA, depreciation, other expenses)
follows a similar process. To determine operating profit, you can
either:
■ calculate SGA as in the preceding paragraph and subsequently derive
operating profit, or
■ calculate the historical operating profit average and then work out
the various expense items above operating profit and below gross
profit by calculating the difference between the two.
Cash flow forecasting of financial statements 103
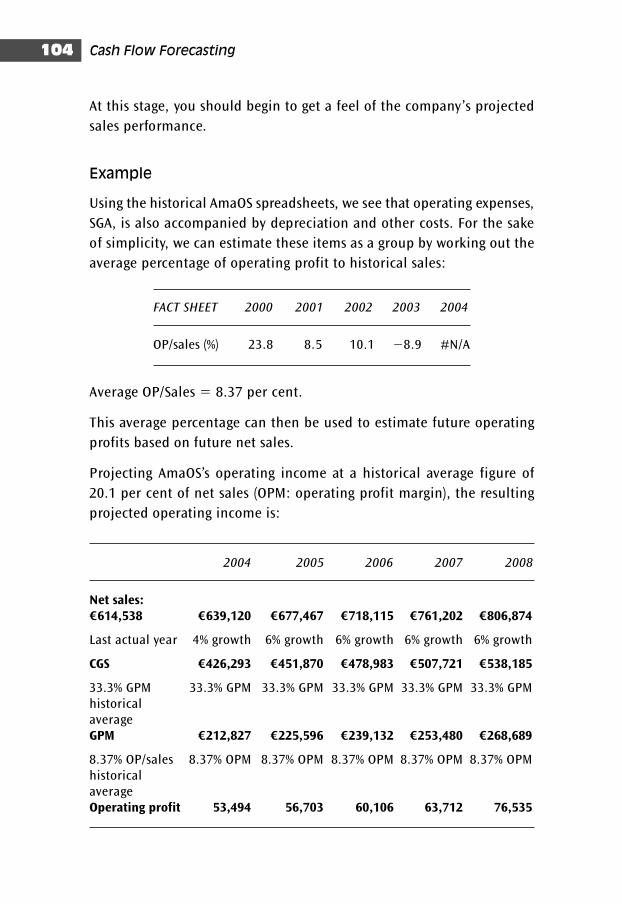
Cash Flow Forecasting104
At this stage, you should begin to get a feel of the company’s projected
sales performance.
Example
Using the historical AmaOS spreadsheets, we see that operating expenses,
SGA, is also accompanied by depreciation and other costs. For the sake
of simplicity, we can estimate these items as a group by working out the
average percentage of operating profit to historical sales:
FACT SHEET 2000 2001 2002 2003 2004
OP/sales (%) 23.8 8.5 10.1 �8.9 #N/A
Average OP/Sales � 8.37 per cent.
This average percentage can then be used to estimate future operating
profits based on future net sales.
Projecting AmaOS’s operating income at a historical average figure of
20.1 per cent of net sales (OPM: operating profit margin), the resulting
projected operating income is:
2004 2005 2006 2007 2008
Net sales:€614,538 €639,120 €677,467 €718,115 €761,202 €806,874
Last actual year 4% growth 6% growth 6% growth 6% growth 6% growth
CGS €426,293 €451,870 €478,983 €507,721 €538,185
33.3% GPM 33.3% GPM 33.3% GPM 33.3% GPM 33.3% GPM 33.3% GPMhistorical averageGPM €212,827 €225,596 €239,132 €253,480 €268,689
8.37% OP/sales 8.37% OPM 8.37% OPM 8.37% OPM 8.37% OPM 8.37% OPMhistorical averageOperating profit 53,494 56,703 60,106 63,712 76,535
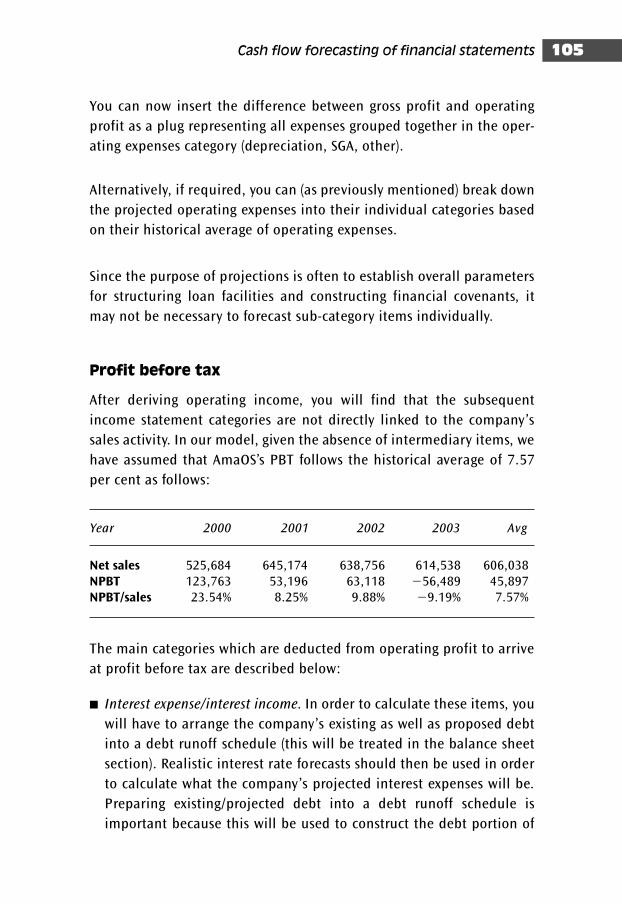
You can now insert the difference between gross profit and operating
profit as a plug representing all expenses grouped together in the oper-
ating expenses category (depreciation, SGA, other).
Alternatively, if required, you can (as previously mentioned) break down
the projected operating expenses into their individual categories based
on their historical average of operating expenses.
Since the purpose of projections is often to establish overall parameters
for structuring loan facilities and constructing financial covenants, it
may not be necessary to forecast sub-category items individually.
Profit before tax
After deriving operating income, you will find that the subsequent
income statement categories are not directly linked to the company’s
sales activity. In our model, given the absence of intermediary items, we
have assumed that AmaOS’s PBT follows the historical average of 7.57
per cent as follows:
Year 2000 2001 2002 2003 Avg
Net sales 525,684 645,174 638,756 614,538 606,038NPBT 123,763 53,196 63,118 �56,489 45,897NPBT/sales 23.54% 8.25% 9.88% �9.19% 7.57%
The main categories which are deducted from operating profit to arrive
at profit before tax are described below:
■ Interest expense/interest income. In order to calculate these items, you
will have to arrange the company’s existing as well as proposed debt
into a debt runoff schedule (this will be treated in the balance sheet
section). Realistic interest rate forecasts should then be used in order
to calculate what the company’s projected interest expenses will be.
Preparing existing/projected debt into a debt runoff schedule is
important because this will be used to construct the debt portion of
Cash flow forecasting of financial statements 105
the liabilities section of the balance sheet. You should therefore leave
this area blank until you have completed the new debt calculations
for the balance sheet, and then return to the profit and loss statement
to complete the interest expense section.
■ Extraordinary items. While by definition ‘extraordinary and unpre-
dictable’, extraordinary items should be included when required. These
items are not linked to sales driven activity; however, they can have a
significant impact on the company’s cash flow and you should therefore
attempt to identify and quantify them. For example, is the company
expecting to sell (asset strip?) or buy any operating units as part of the
organization plan which your term lending facility is destined to
finance, and are losses or gains expected to arise as a consequence? You
should try to gain an understanding of the company’s future plans if
possible, in order to factor such variables into your forecasts.
Once you have determined profit before tax, most likely based on his-
torical averages and then accordingly adjusting back for interest
expense and extraordinaries, you will want to arrive at your profit after
tax figure. This will require projecting taxes and dividends, which are
treated as follows:
■ Taxation. Taxation rates should be forecasted; you can use the stand-
ard rates in effect in the country in which the company is operating.
For companies with operations in several countries, it may be prefer-
able to calculate a flat historical average of taxation as a function of
profit before tax (as in the example PL statement), and apply this aver-
age percentage against the projected profit before tax figure to arrive
as a projected tax figure.
■ Dividends. Dividends will impact the level of retained earnings, which
will follow through to net worth and affect the company’s require-
ment for new financing. Therefore, you should attempt to estimate
the expected level of dividends and funds available to be ploughed
back into retained earnings in order to arrive at an estimated retained
earnings figure for each of the projected periods. To arrive at this esti-
mate, work out the average historical ratio of dividends to profit after
tax (known as the dividend payout ratio), and, as in the case of tax-
ation above, deduct it from profit before tax in order to obtain your
projected net profits.
Cash Flow Forecasting106
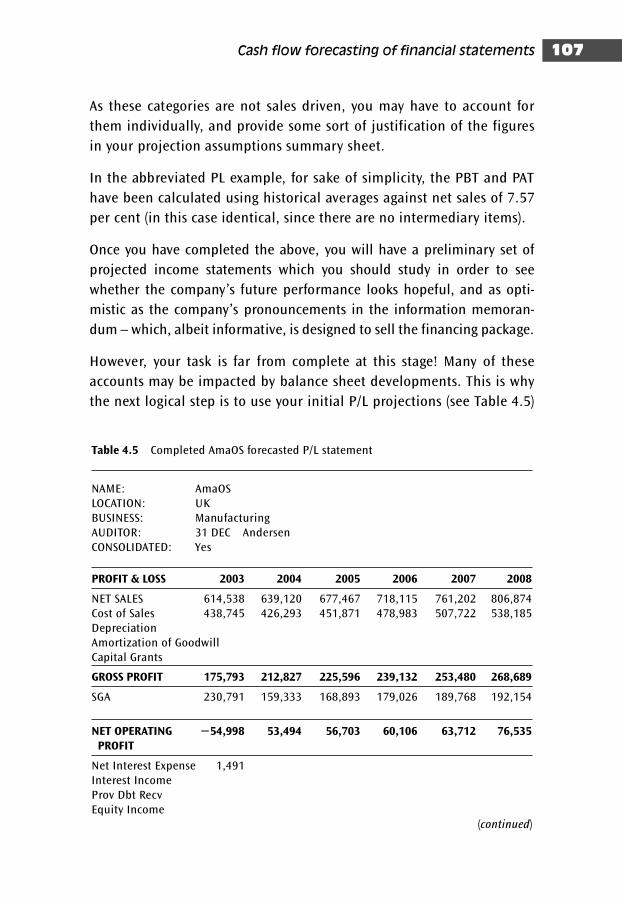
Cash flow forecasting of financial statements 107
As these categories are not sales driven, you may have to account for
them individually, and provide some sort of justification of the figures
in your projection assumptions summary sheet.
In the abbreviated PL example, for sake of simplicity, the PBT and PAT
have been calculated using historical averages against net sales of 7.57
per cent (in this case identical, since there are no intermediary items).
Once you have completed the above, you will have a preliminary set of
projected income statements which you should study in order to see
whether the company’s future performance looks hopeful, and as opti-
mistic as the company’s pronouncements in the information memoran-
dum – which, albeit informative, is designed to sell the financing package.
However, your task is far from complete at this stage! Many of these
accounts may be impacted by balance sheet developments. This is why
the next logical step is to use your initial P/L projections (see Table 4.5)
Table 4.5 Completed AmaOS forecasted P/L statement
NAME: AmaOS
LOCATION: UK
BUSINESS: Manufacturing
AUDITOR: 31 DEC Andersen
CONSOLIDATED: Yes
PROFIT & LOSS 2003 2004 2005 2006 2007 2008
NET SALES 614,538 639,120 677,467 718,115 761,202 806,874
Cost of Sales 438,745 426,293 451,871 478,983 507,722 538,185
Depreciation
Amortization of Goodwill
Capital Grants
GROSS PROFIT 175,793 212,827 225,596 239,132 253,480 268,689
SGA 230,791 159,333 168,893 179,026 189,768 192,154
NET OPERATING �54,998 53,494 56,703 60,106 63,712 76,535PROFIT
Net Interest Expense 1,491
Interest Income
Prov Dbt Recv
Equity Income
(continued)
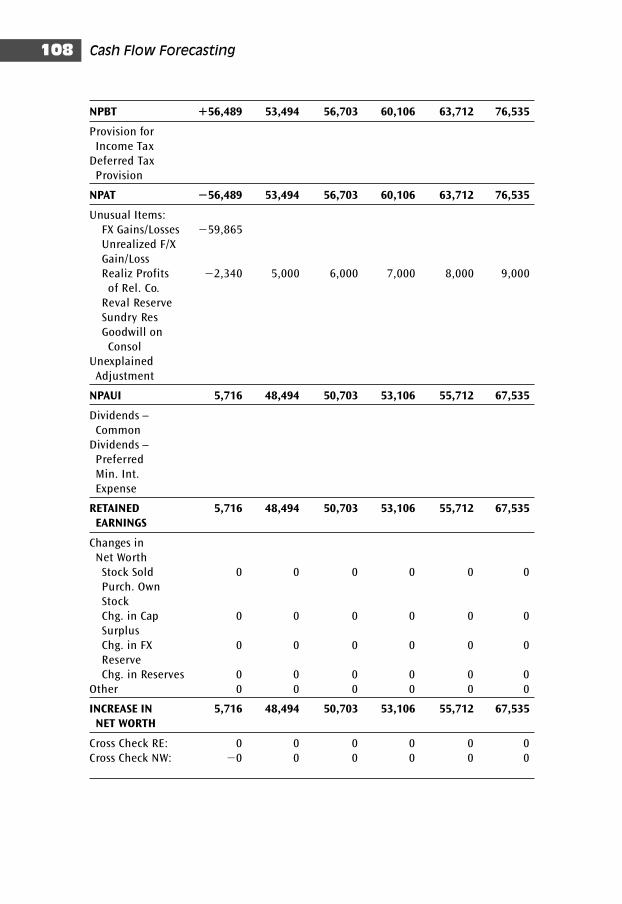
Cash Flow Forecasting108
NPBT �56,489 53,494 56,703 60,106 63,712 76,535
Provision for
Income Tax
Deferred Tax
Provision
NPAT �56,489 53,494 56,703 60,106 63,712 76,535
Unusual Items:
FX Gains/Losses �59,865
Unrealized F/X
Gain/Loss
Realiz Profits �2,340 5,000 6,000 7,000 8,000 9,000
of Rel. Co.
Reval Reserve
Sundry Res
Goodwill on
Consol
Unexplained
Adjustment
NPAUI 5,716 48,494 50,703 53,106 55,712 67,535
Dividends –
Common
Dividends –
Preferred
Min. Int.
Expense
RETAINED 5,716 48,494 50,703 53,106 55,712 67,535EARNINGS
Changes in
Net Worth
Stock Sold 0 0 0 0 0 0
Purch. Own
Stock
Chg. in Cap 0 0 0 0 0 0
Surplus
Chg. in FX 0 0 0 0 0 0
Reserve
Chg. in Reserves 0 0 0 0 0 0
Other 0 0 0 0 0 0
INCREASE IN 5,716 48,494 50,703 53,106 55,712 67,535NET WORTH
Cross Check RE: 0 0 0 0 0 0
Cross Check NW: �0 0 0 0 0 0
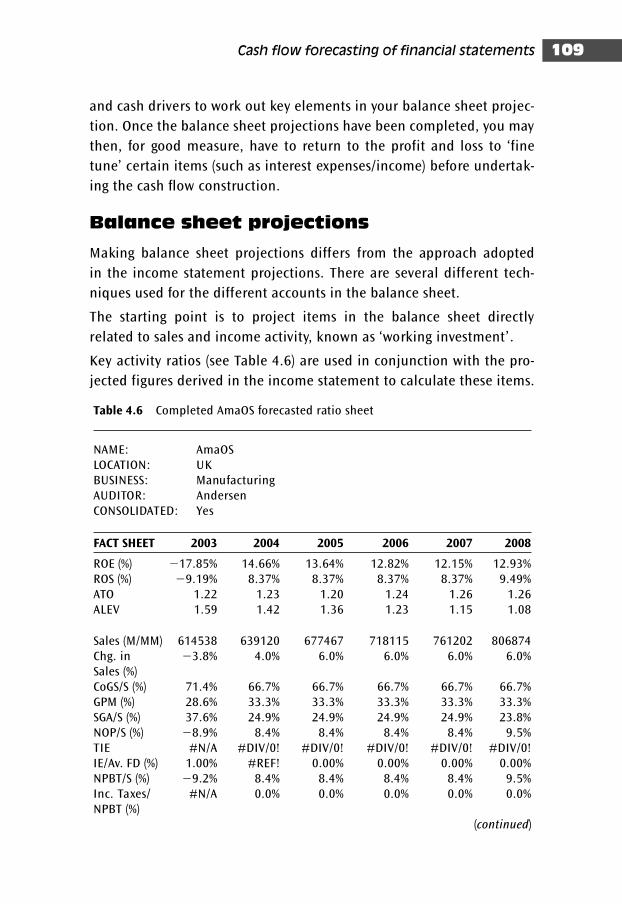
and cash drivers to work out key elements in your balance sheet projec-
tion. Once the balance sheet projections have been completed, you may
then, for good measure, have to return to the profit and loss to ‘fine
tune’ certain items (such as interest expenses/income) before undertak-
ing the cash flow construction.
Balance sheet projections
Making balance sheet projections differs from the approach adopted
in the income statement projections. There are several different tech-
niques used for the different accounts in the balance sheet.
The starting point is to project items in the balance sheet directly
related to sales and income activity, known as ‘working investment’ .
Key activity ratios (see Table 4.6) are used in conjunction with the pro-
jected figures derived in the income statement to calculate these items.
Cash flow forecasting of financial statements 109
Table 4.6 Completed AmaOS forecasted ratio sheet
NAME: AmaOSLOCATION: UKBUSINESS: ManufacturingAUDITOR: AndersenCONSOLIDATED: Yes
FACT SHEET 2003 2004 2005 2006 2007 2008
ROE (%) �17.85% 14.66% 13.64% 12.82% 12.15% 12.93%ROS (%) �9.19% 8.37% 8.37% 8.37% 8.37% 9.49%ATO 1.22 1.23 1.20 1.24 1.26 1.26ALEV 1.59 1.42 1.36 1.23 1.15 1.08
Sales (M/MM) 614538 639120 677467 718115 761202 806874Chg. in �3.8% 4.0% 6.0% 6.0% 6.0% 6.0%Sales (%)CoGS/S (%) 71.4% 66.7% 66.7% 66.7% 66.7% 66.7%GPM (%) 28.6% 33.3% 33.3% 33.3% 33.3% 33.3%SGA/S (%) 37.6% 24.9% 24.9% 24.9% 24.9% 23.8%NOP/S (%) �8.9% 8.4% 8.4% 8.4% 8.4% 9.5%TIE #N/A #DIV/0! #DIV/0! #DIV/0! #DIV/0! #DIV/0!IE/Av. FD (%) 1.00% #REF! 0.00% 0.00% 0.00% 0.00%NPBT/S (%) �9.2% 8.4% 8.4% 8.4% 8.4% 9.5%Inc. Taxes/ #N/A 0.0% 0.0% 0.0% 0.0% 0.0%NPBT (%)
(continued)
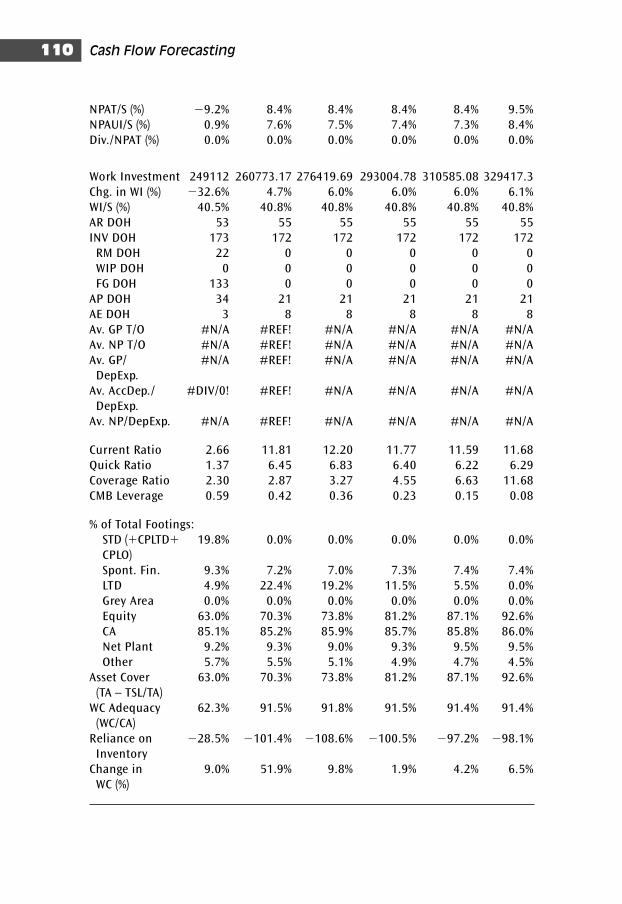
Cash Flow Forecasting110
NPAT/S (%) �9.2% 8.4% 8.4% 8.4% 8.4% 9.5%NPAUI/S (%) 0.9% 7.6% 7.5% 7.4% 7.3% 8.4%Div./NPAT (%) 0.0% 0.0% 0.0% 0.0% 0.0% 0.0%
Work Investment 249112 260773.17 276419.69 293004.78 310585.08 329417.3Chg. in WI (%) �32.6% 4.7% 6.0% 6.0% 6.0% 6.1%WI/S (%) 40.5% 40.8% 40.8% 40.8% 40.8% 40.8%AR DOH 53 55 55 55 55 55INV DOH 173 172 172 172 172 172
RM DOH 22 0 0 0 0 0WIP DOH 0 0 0 0 0 0FG DOH 133 0 0 0 0 0
AP DOH 34 21 21 21 21 21AE DOH 3 8 8 8 8 8Av. GP T/O #N/A #REF! #N/A #N/A #N/A #N/AAv. NP T/O #N/A #REF! #N/A #N/A #N/A #N/AAv. GP/ #N/A #REF! #N/A #N/A #N/A #N/A
DepExp.Av. AccDep./ #DIV/0! #REF! #N/A #N/A #N/A #N/A
DepExp.Av. NP/DepExp. #N/A #REF! #N/A #N/A #N/A #N/A
Current Ratio 2.66 11.81 12.20 11.77 11.59 11.68Quick Ratio 1.37 6.45 6.83 6.40 6.22 6.29Coverage Ratio 2.30 2.87 3.27 4.55 6.63 11.68CMB Leverage 0.59 0.42 0.36 0.23 0.15 0.08
% of Total Footings:STD (�CPLTD� 19.8% 0.0% 0.0% 0.0% 0.0% 0.0%CPLO)Spont. Fin. 9.3% 7.2% 7.0% 7.3% 7.4% 7.4%LTD 4.9% 22.4% 19.2% 11.5% 5.5% 0.0%Grey Area 0.0% 0.0% 0.0% 0.0% 0.0% 0.0%Equity 63.0% 70.3% 73.8% 81.2% 87.1% 92.6%CA 85.1% 85.2% 85.9% 85.7% 85.8% 86.0%Net Plant 9.2% 9.3% 9.0% 9.3% 9.5% 9.5%Other 5.7% 5.5% 5.1% 4.9% 4.7% 4.5%
Asset Cover 63.0% 70.3% 73.8% 81.2% 87.1% 92.6%(TA – TSL/TA)
WC Adequacy 62.3% 91.5% 91.8% 91.5% 91.4% 91.4%(WC/CA)
Reliance on �28.5% �101.4% �108.6% �100.5% �97.2% �98.1%Inventory
Change in 9.0% 51.9% 9.8% 1.9% 4.2% 6.5%WC (%)
Cash flow forecasting of financial statements 111
For items such as cash and marketable securities, an average percentage
approach of total assets or a ‘plug’ figure in conjunction with ‘new
money need’ (calculated using debt runoff schedules and projected
assets after all other balance sheet calculations are completed) can be
used.
For the liabilities side of the balance sheet, you should first determine
the known quantities. This will include items linked to sales (accounts
payable). For items such as debt, debt runoff schedules incorporating
the company’s existing debt runoff schedules (provided in the com-
pany’s accounts), and the debt runoff schedule of the proposed term
lending facility should be prepared. Other items can be brought forward
on a historical average basis (e.g. tax accounts).
For net worth projections, you will rely on a combination of projected
retained earnings and expected equity injections. Finally, you will have
to balance assets with liabilities: this will require calculating the com-
pany’s ‘new money need’: a ‘plug’ figure which can be used in conjunc-
tion with the cash/marketable securities caption (after all other balance
sheet calculations are completed).
You should note that a substantial number of the accounts that you will
be projecting are sales driven, and will be calculated using sales driven
ratios. Hence, in addition to using projection assumptions and the pro-
jected profit and loss statement you will be making extensive use of the
ratio sheet, which is based on your historical spreadsheets. You should
be familiar with the ratio sheet and aware of how the various ratios are
calculated, since you will be manipulating them in order to construct
your projections.
We shall examine each of these areas on a case-by-case basis in further
detail below.
A depiction of a balance sheet exhibiting a typical growth scenario can
be seen in Figure 4.4.
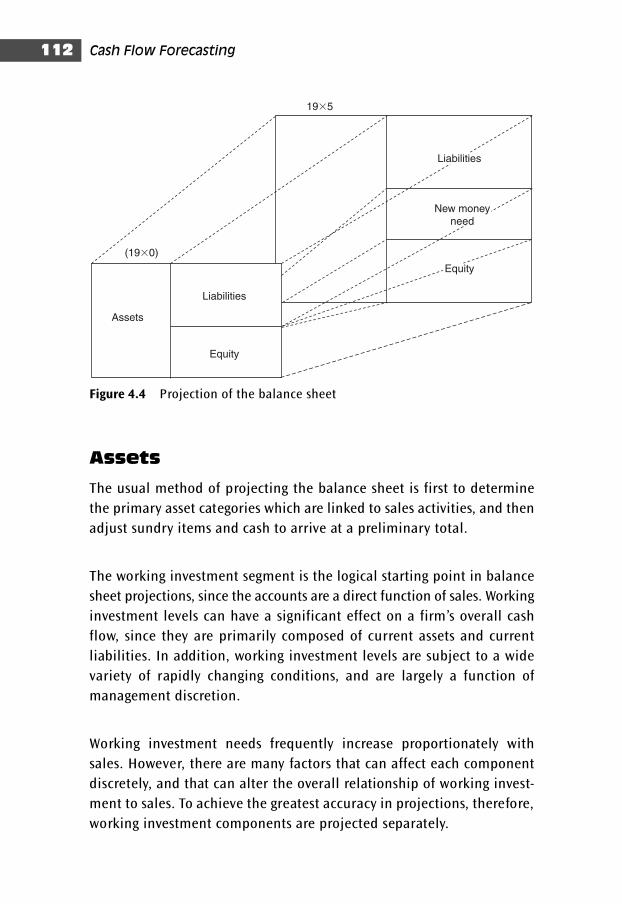
Cash Flow Forecasting112
19�5
(19�0)
Assets
Liabilities
Equity
Liabilities
Equity
New moneyneed
Figure 4.4 Projection of the balance sheet
Assets
The usual method of projecting the balance sheet is first to determine
the primary asset categories which are linked to sales activities, and then
adjust sundry items and cash to arrive at a preliminary total.
The working investment segment is the logical starting point in balance
sheet projections, since the accounts are a direct function of sales. Working
investment levels can have a significant effect on a firm’s overall cash
flow, since they are primarily composed of current assets and current
liabilities. In addition, working investment levels are subject to a wide
variety of rapidly changing conditions, and are largely a function of
management discretion.
Working investment needs frequently increase proportionately with
sales. However, there are many factors that can affect each component
discretely, and that can alter the overall relationship of working invest-
ment to sales. To achieve the greatest accuracy in projections, therefore,
working investment components are projected separately.
Cash flow forecasting of financial statements 113
The technique usually applied in forecasting the working investment
components is as follows.
1 Examine the historical turnover ratios on the ratio sheet of the spread-
sheet, the relationship of the working investment components to sales (or
cost of goods sold), and determine the causes for these historical ratios:
■ Sales/accounts receivable � Accounts receivable turnover
■ CGS/inventory � inventory turnover
■ CGS/accounts payable � accounts payable turnover
■ CGS/accrued expenses � accrued expenses turnover.
2 Decide on a turnover ratio that reflects your reasonable assumptions
about what is likely to happen in the future to alter these ratios.
Overall factors to consider include the following:
■ Historical trends – have the turnover ratios been relatively stable,
or have they Fluctuated?
■ Projected economic conditions – what stage in the economic cycle
do the projections represent, and how will the firm likely react to
the economic conditions? (For example, in a recession a firm may
liquidate inventory in anticipation of continued slowdown.)
■ Sales assumptions – working investment projections should reflect
the assumptions on which sales have been projected. For example,
sales increases resulting from the anticipated introduction of a new
product line will usually be accompanied by an increase in the
working investment accounts.
■ Factors affecting individual working investment components – factors
to consider when evaluating the individual working investment
components include accounts receivable (changes in selling
terms as a means of meeting competition or extending markets);
inventory (accounting methods – LIFO, FIFO – purchase commit-
ments, availability of supply, price of raw materials); accounts
payable (changes in term of trade, ability to ride trade, purchase
commitments); and accrued expenses (ability to cut back on work-
force or overhead, changes in the cost structure for labour or
overhead).
3 Calculate the dollar value of each working investment account by
applying the projected turnover rate for the account to the projected
sales (or cost of goods sold) figure.
Cash Flow Forecasting114
4 Check the reasonableness of the projected figures: (this means that
the accuracy of the aforementioned is not certain and may need sub-
jectively to be overridden).
Fixed assets, capital expenditure and depreciation
Depending on the type of company (capital intensive aircraft manu-
facturer), this forms one of the most important asset categories.
Projections of the level of plant expenditures are based on three
considerations:
1 Management’s plans for plant expenditure. A company will often pro-
vide information on anticipated capital expenditures and operating
capacities in its annual report. The amount and purpose of plant
expenditures must be consistent with the assumptions on which sales
projections have been made, and with the conclusions from historical
analysis of the plant account.
2 Historical analysis of plant. Historical analysis of the plant account
can provide information on the age, adequacy, capacity, utilization
and efficiency of existing plant, and can assist the analyst in assessing
the reasonableness of management’s plans for plant expenditures.
3 Sales assumptions. The levels of sales and plant are inter-related.
Although plant does not usually vary directly with sales, for a variety
of reasons (accounting conventions, management decisions as to use-
ful life, over- or under-capacity utilization, construction start-up time,
and the fact that sales are in relatively current dollars and plant in
older dollars), plant projections must be consistent with assumptions
used to project sales. Important here is the aforementioned distinc-
tion between price and volume increases in sales. A sales increase
attributable wholly to price requires no additional capacity. If there is
a historical relationship between the level of sales and plant/machin-
ery, the fixed asset turnover ratio may be helpful.
Example
Let us consider sales/net fixed assets (for simplicity’s sake, net fixed
assets excludes depreciation).
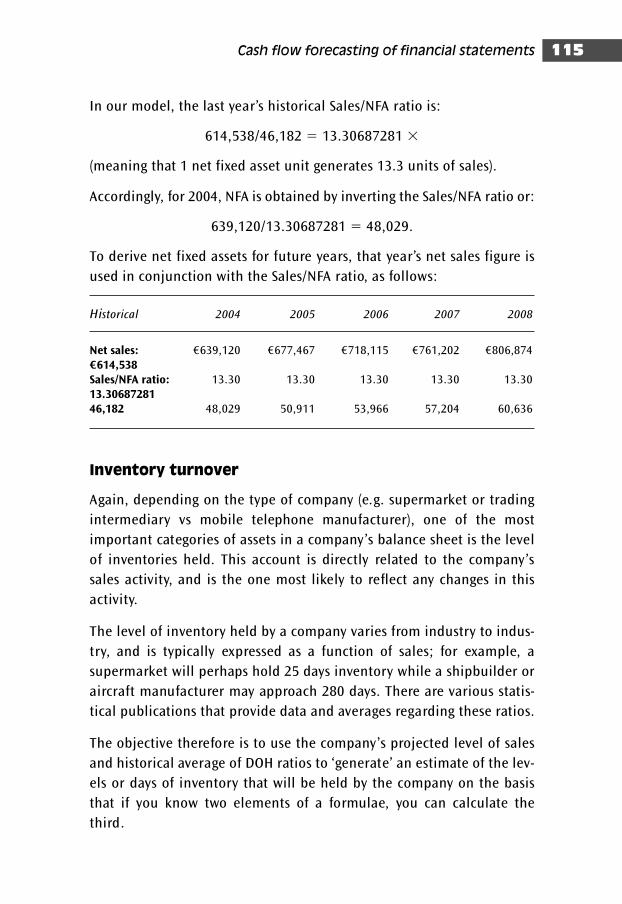
Cash flow forecasting of financial statements 115
In our model, the last year’s historical Sales/NFA ratio is:
614,538/46,182 � 13.30687281 �
(meaning that 1 net fixed asset unit generates 13.3 units of sales).
Accordingly, for 2004, NFA is obtained by inverting the Sales/NFA ratio or:
639,120/13.30687281 � 48,029.
To derive net fixed assets for future years, that year’s net sales figure is
used in conjunction with the Sales/NFA ratio, as follows:
Historical 2004 2005 2006 2007 2008
Net sales: €639,120 €677,467 €718,115 €761,202 €806,874
€614,538Sales/NFA ratio: 13.30 13.30 13.30 13.30 13.30
13.3068728146,182 48,029 50,911 53,966 57,204 60,636
Inventory turnover
Again, depending on the type of company (e.g. supermarket or trading
intermediary vs mobile telephone manufacturer), one of the most
important categories of assets in a company’s balance sheet is the level
of inventories held. This account is directly related to the company’s
sales activity, and is the one most likely to reflect any changes in this
activity.
The level of inventory held by a company varies from industry to indus-
try, and is typically expressed as a function of sales; for example, a
supermarket will perhaps hold 25 days inventory while a shipbuilder or
aircraft manufacturer may approach 280 days. There are various statis-
tical publications that provide data and averages regarding these ratios.
The objective therefore is to use the company’s projected level of sales
and historical average of DOH ratios to ‘generate’ an estimate of the lev-
els or days of inventory that will be held by the company on the basis
that if you know two elements of a formulae, you can calculate the
third.
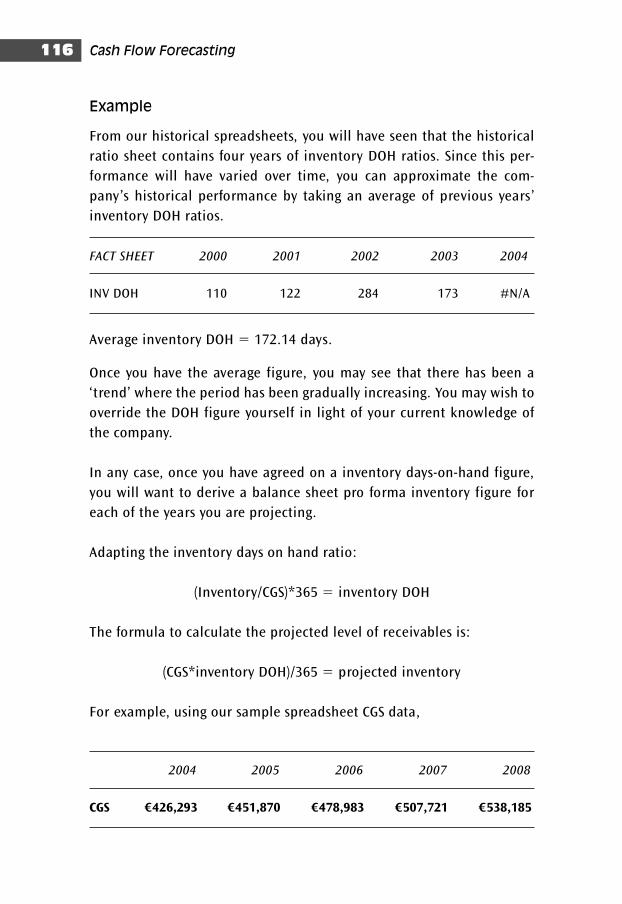
Cash Flow Forecasting116
Example
From our historical spreadsheets, you will have seen that the historical
ratio sheet contains four years of inventory DOH ratios. Since this per-
formance will have varied over time, you can approximate the com-
pany’s historical performance by taking an average of previous years’
inventory DOH ratios.
FACT SHEET 2000 2001 2002 2003 2004
INV DOH 110 122 284 173 #N/A
Average inventory DOH � 172.14 days.
Once you have the average figure, you may see that there has been a
‘trend’ where the period has been gradually increasing. You may wish to
override the DOH figure yourself in light of your current knowledge of
the company.
In any case, once you have agreed on a inventory days-on-hand figure,
you will want to derive a balance sheet pro forma inventory figure for
each of the years you are projecting.
Adapting the inventory days on hand ratio:
(Inventory/CGS)*365 � inventory DOH
The formula to calculate the projected level of receivables is:
(CGS*inventory DOH)/365 � projected inventory
For example, using our sample spreadsheet CGS data,
2004 2005 2006 2007 2008
CGS €426,293 €451,870 €478,983 €507,721 €538,185
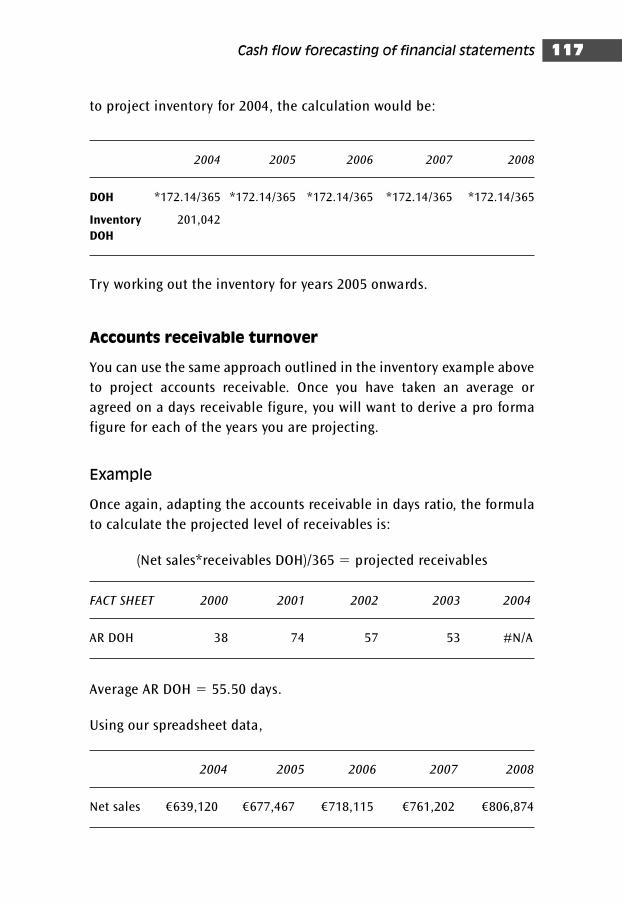
Cash flow forecasting of financial statements 117
to project inventory for 2004, the calculation would be:
2004 2005 2006 2007 2008
DOH *172.14/365 *172.14/365 *172.14/365 *172.14/365 *172.14/365
Inventory 201,042
DOH
Try working out the inventory for years 2005 onwards.
Accounts receivable turnover
You can use the same approach outlined in the inventory example above
to project accounts receivable. Once you have taken an average or
agreed on a days receivable figure, you will want to derive a pro forma
figure for each of the years you are projecting.
Example
Once again, adapting the accounts receivable in days ratio, the formula
to calculate the projected level of receivables is:
(Net sales*receivables DOH)/365 � projected receivables
FACT SHEET 2000 2001 2002 2003 2004
AR DOH 38 74 57 53 #N/A
Average AR DOH � 55.50 days.
Using our spreadsheet data,
2004 2005 2006 2007 2008
Net sales €639,120 €677,467 €718,115 €761,202 €806,874
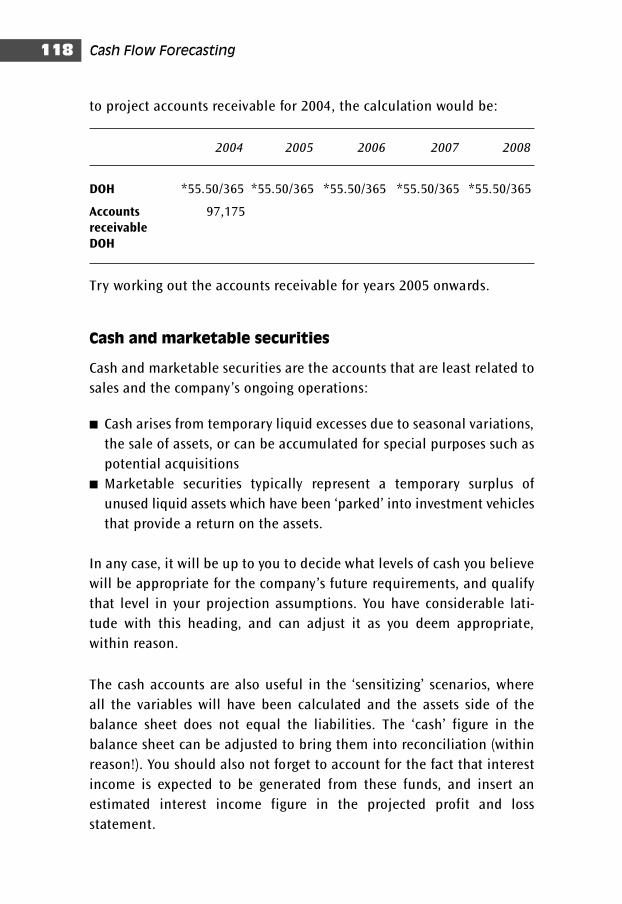
Cash Flow Forecasting118
to project accounts receivable for 2004, the calculation would be:
2004 2005 2006 2007 2008
DOH *55.50/365 *55.50/365 *55.50/365 *55.50/365 *55.50/365
Accounts 97,175receivable DOH
Try working out the accounts receivable for years 2005 onwards.
Cash and marketable securities
Cash and marketable securities are the accounts that are least related to
sales and the company’s ongoing operations:
■ Cash arises from temporary liquid excesses due to seasonal variations,
the sale of assets, or can be accumulated for special purposes such as
potential acquisitions
■ Marketable securities typically represent a temporary surplus of
unused liquid assets which have been ‘parked’ into investment vehicles
that provide a return on the assets.
In any case, it will be up to you to decide what levels of cash you believe
will be appropriate for the company’s future requirements, and qualify
that level in your projection assumptions. You have considerable lati-
tude with this heading, and can adjust it as you deem appropriate,
within reason.
The cash accounts are also useful in the ‘sensitizing’ scenarios, where
all the variables will have been calculated and the assets side of the
balance sheet does not equal the liabilities. The ‘cash’ figure in the
balance sheet can be adjusted to bring them into reconciliation (within
reason!). You should also not forget to account for the fact that interest
income is expected to be generated from these funds, and insert an
estimated interest income figure in the projected profit and loss
statement.
Cash flow forecasting of financial statements 119
Example
In our sample worksheet, the company’s sales growth is rather low. As
we discussed, companies in a low sales growth scenario typically have
strong liquidity. This, coupled with the new €100 million facility, means
that the company’s new money need is non-existent. In fact the com-
pany uses the facility to reduce its current liabilities, thereby strength-
ening its working capital position generates a cash surplus. Accordingly,
after having worked out all the asset categories whose amounts are
linked to the PL statement, a plug figure will eventually be inserted in
the cash figure to balance the accounts.
As you sensitize for various scenarios (prepayment of debt, purchase of
fixed assets), you will find that the relevant adjustments will occur in
this category.
Liabilities
Once you have completed projecting the main asset categories, you must
turn to the liabilities side to determine how this activity is going to be
funded.
As with some of the asset categories, some of the liability accounts can
be determined from net sales and the profit and loss account. This
would include accounts payable and taxes. Other items such as debt can
be worked out from historical data, as well as the facility you may be
assessing in your credit proposal. Future injections of net worth may be
disclosed or included.
Other accounts, however, will require some assessment: retained earn-
ings and new money need. We discuss each of these categories in further
detail below.
Current liabilities
Current liabilities typically include short-term funding facilities (over-
drafts) and accounts payable. To project future overdrafts is not really
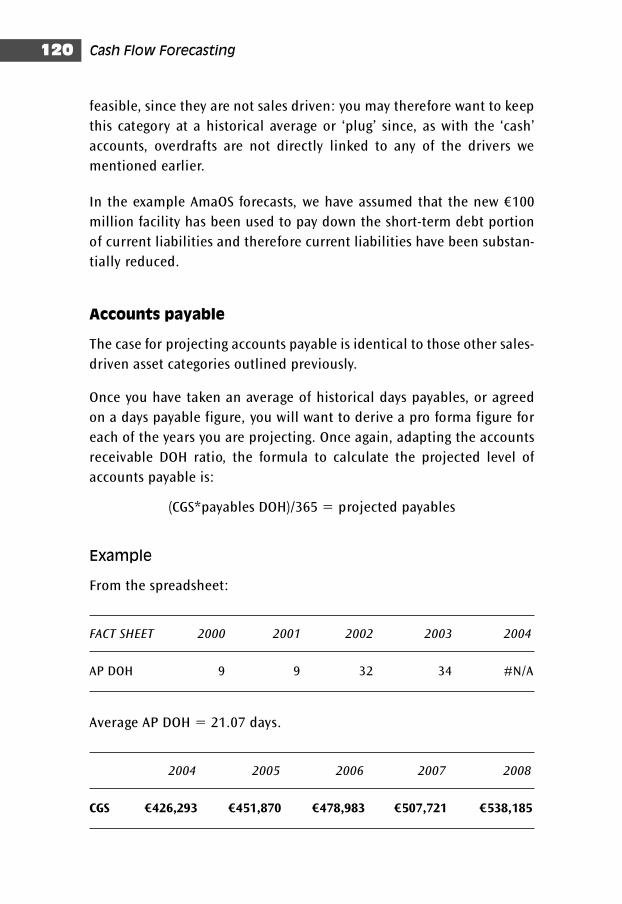
Cash Flow Forecasting120
feasible, since they are not sales driven: you may therefore want to keep
this category at a historical average or ‘plug’ since, as with the ‘cash’
accounts, overdrafts are not directly linked to any of the drivers we
mentioned earlier.
In the example AmaOS forecasts, we have assumed that the new €100
million facility has been used to pay down the short-term debt portion
of current liabilities and therefore current liabilities have been substan-
tially reduced.
Accounts payable
The case for projecting accounts payable is identical to those other sales-
driven asset categories outlined previously.
Once you have taken an average of historical days payables, or agreed
on a days payable figure, you will want to derive a pro forma figure for
each of the years you are projecting. Once again, adapting the accounts
receivable DOH ratio, the formula to calculate the projected level of
accounts payable is:
(CGS*payables DOH)/365 � projected payables
Example
From the spreadsheet:
FACT SHEET 2000 2001 2002 2003 2004
AP DOH 9 9 32 34 #N/A
Average AP DOH � 21.07 days.
2004 2005 2006 2007 2008
CGS €426,293 €451,870 €478,983 €507,721 €538,185
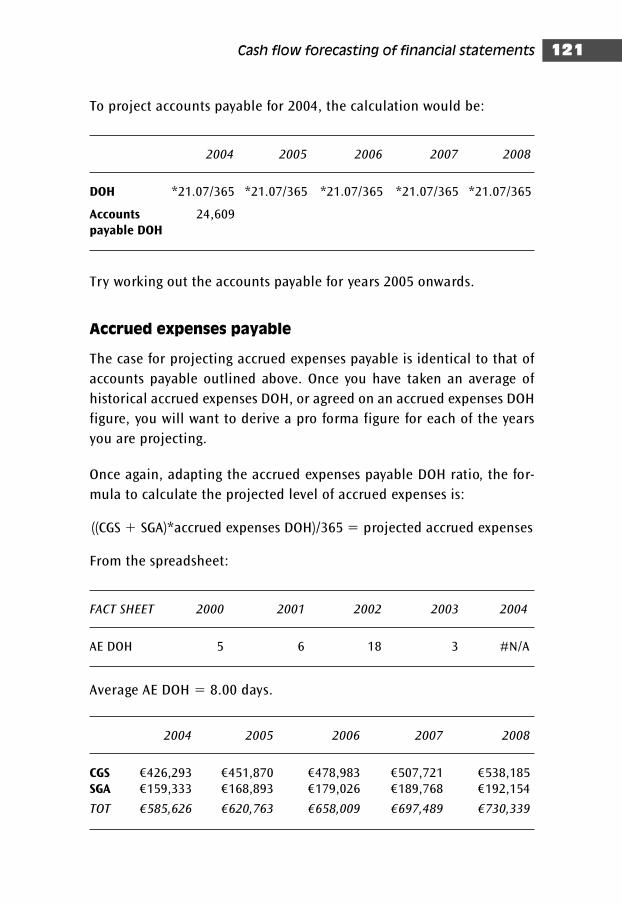
Cash flow forecasting of financial statements 121
To project accounts payable for 2004, the calculation would be:
2004 2005 2006 2007 2008
DOH *21.07/365 *21.07/365 *21.07/365 *21.07/365 *21.07/365
Accounts 24,609payable DOH
Try working out the accounts payable for years 2005 onwards.
Accrued expenses payable
The case for projecting accrued expenses payable is identical to that of
accounts payable outlined above. Once you have taken an average of
historical accrued expenses DOH, or agreed on an accrued expenses DOH
figure, you will want to derive a pro forma figure for each of the years
you are projecting.
Once again, adapting the accrued expenses payable DOH ratio, the for-
mula to calculate the projected level of accrued expenses is:
((CGS � SGA)*accrued expenses DOH)/365 � projected accrued expenses
From the spreadsheet:
FACT SHEET 2000 2001 2002 2003 2004
AE DOH 5 6 18 3 #N/A
Average AE DOH � 8.00 days.
2004 2005 2006 2007 2008
CGS €426,293 €451,870 €478,983 €507,721 €538,185SGA €159,333 €168,893 €179,026 €189,768 €192,154
TOT €585,626 €620,763 €658,009 €697,489 €730,339
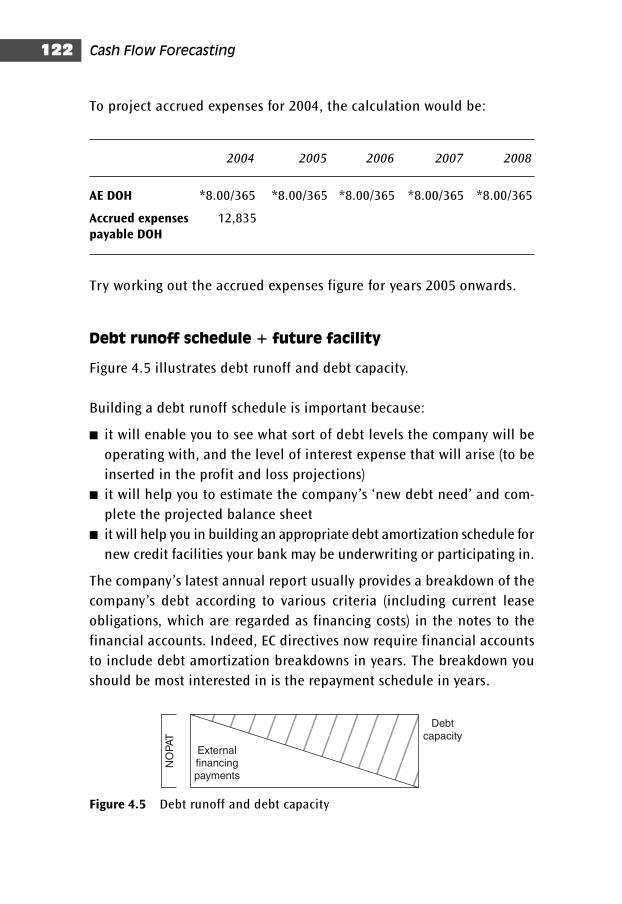
Cash Flow Forecasting122
To project accrued expenses for 2004, the calculation would be:
2004 2005 2006 2007 2008
AE DOH *8.00/365 *8.00/365 *8.00/365 *8.00/365 *8.00/365
Accrued expenses 12,835payable DOH
Try working out the accrued expenses figure for years 2005 onwards.
Debt runoff schedule � future facility
Figure 4.5 illustrates debt runoff and debt capacity.
Building a debt runoff schedule is important because:
■ it will enable you to see what sort of debt levels the company will be
operating with, and the level of interest expense that will arise (to be
inserted in the profit and loss projections)
■ it will help you to estimate the company’s ‘new debt need’ and com-
plete the projected balance sheet
■ it will help you in building an appropriate debt amortization schedule for
new credit facilities your bank may be underwriting or participating in.
The company’s latest annual report usually provides a breakdown of the
company’s debt according to various criteria (including current lease
obligations, which are regarded as financing costs) in the notes to the
financial accounts. Indeed, EC directives now require financial accounts
to include debt amortization breakdowns in years. The breakdown you
should be most interested in is the repayment schedule in years.
NO
PAT
Externalfinancingpayments
Debtcapacity
Figure 4.5 Debt runoff and debt capacity
Cash flow forecasting of financial statements 123
Example
Let’s assume that AmaOS’s debt repayment schedule in the notes to the
financial statements in its 2003 annual report shows that existing long-
term debt (€24.848 million) is fully repaid in three years, with one-third
being repaid each year. You can therefore include this in the debt runoff
table under ‘existing debt’ and reduce it by one-third in 2004 (to €16.494
million), by one third in 2005 (to €8.247 million) and by one-third in
2006 (to €0), the final year. The debt runoff table at this stage should
show how the company’s debt is reduced (see Table 4.7).
Since you are most likely building these forecasts in order to gauge the
appropriateness of a term lending facility whose terms and conditions
you will have been provided with, you will also want to include the new
facility in the table. Let’s assume AmaOS’s 2004 €100 million loan facil-
ity is repayable one-third in 2005, one-third in 2006 and one-third in
2007. This means that if the loan is granted in 2004, your new facility
will show €100 million for 2004 and 2005, €66 million in 2006, €33 million
in 2007, and €0 million in 2008.
You should arrange AmaOS’s debt runoff in a format such as Table 4.7.
The table should include the company’s existing debt as well as
proposed term debt facility (which forms the subject of the credit analy-
sis). The runoff schedule should cover the life of the projections, and
should then be totalled up to show the company’s projected outstanding
levels of debt. The total should then be inserted in the long-term debt
portion of the forecasted balance sheet, and shown to run off accord-
ingly. This can either be included as a single category or kept as two
separate debt items for additional clarity when you insert them in the
projected balance sheet: existing debt runoff and new debt runoff.
You will also want to estimate the interest expense the company will
incur on this total debt (using a forecasted interest rate, 9 per cent in
Table 4.7) at the bottom of the debt maturity table, since this figure will
be later be inserted in the company’s PL statement under the ‘interest
expense’ category.
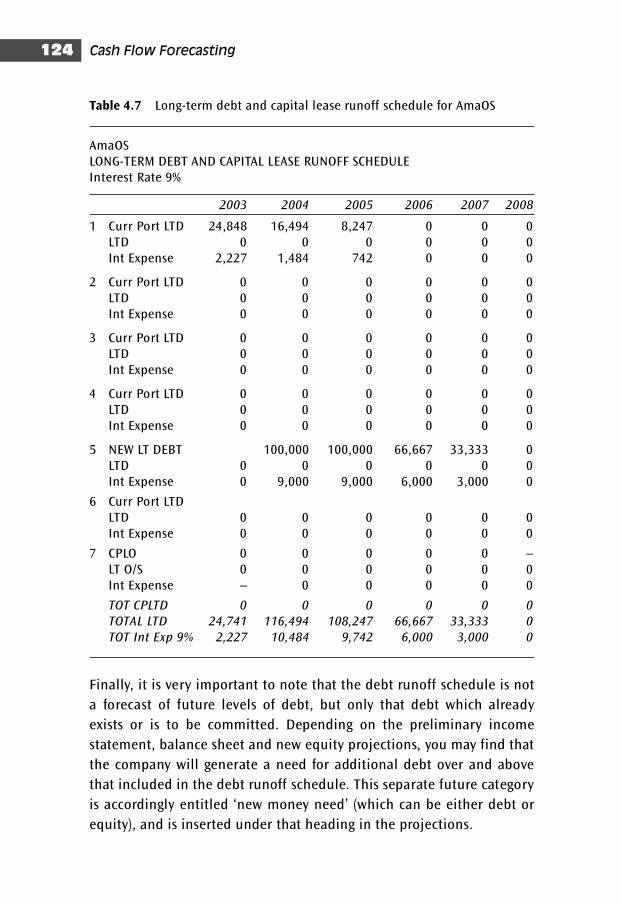
Cash Flow Forecasting124
Finally, it is very important to note that the debt runoff schedule is not
a forecast of future levels of debt, but only that debt which already
exists or is to be committed. Depending on the preliminary income
statement, balance sheet and new equity projections, you may find that
the company will generate a need for additional debt over and above
that included in the debt runoff schedule. This separate future category
is accordingly entitled ‘new money need’ (which can be either debt or
equity), and is inserted under that heading in the projections.
Table 4.7 Long-term debt and capital lease runoff schedule for AmaOS
AmaOSLONG-TERM DEBT AND CAPITAL LEASE RUNOFF SCHEDULEInterest Rate 9%
2003 2004 2005 2006 2007 2008
1 Curr Port LTD 24,848 16,494 8,247 0 0 0LTD 0 0 0 0 0 0Int Expense 2,227 1,484 742 0 0 0
2 Curr Port LTD 0 0 0 0 0 0LTD 0 0 0 0 0 0Int Expense 0 0 0 0 0 0
3 Curr Port LTD 0 0 0 0 0 0LTD 0 0 0 0 0 0Int Expense 0 0 0 0 0 0
4 Curr Port LTD 0 0 0 0 0 0LTD 0 0 0 0 0 0Int Expense 0 0 0 0 0 0
5 NEW LT DEBT 100,000 100,000 66,667 33,333 0LTD 0 0 0 0 0 0Int Expense 0 9,000 9,000 6,000 3,000 0
6 Curr Port LTDLTD 0 0 0 0 0 0Int Expense 0 0 0 0 0 0
7 CPLO 0 0 0 0 0 –LT O/S 0 0 0 0 0 0Int Expense – 0 0 0 0 0
TOT CPLTD 0 0 0 0 0 0
TOTAL LTD 24,741 116,494 108,247 66,667 33,333 0
TOT Int Exp 9% 2,227 10,484 9,742 6,000 3,000 0
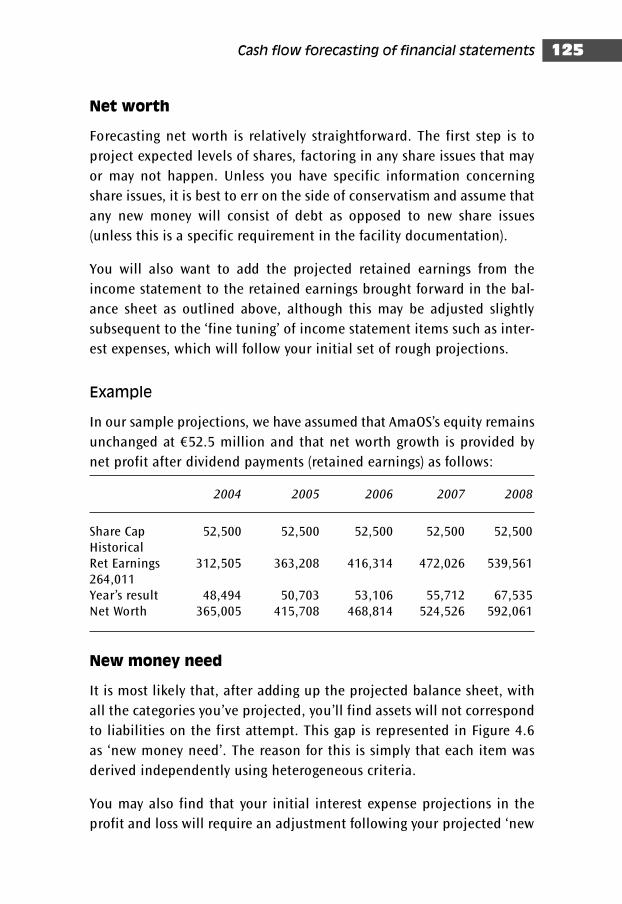
Cash flow forecasting of financial statements 125
Net worth
Forecasting net worth is relatively straightforward. The first step is to
project expected levels of shares, factoring in any share issues that may
or may not happen. Unless you have specific information concerning
share issues, it is best to err on the side of conservatism and assume that
any new money will consist of debt as opposed to new share issues
(unless this is a specific requirement in the facility documentation).
You will also want to add the projected retained earnings from the
income statement to the retained earnings brought forward in the bal-
ance sheet as outlined above, although this may be adjusted slightly
subsequent to the ‘fine tuning’ of income statement items such as inter-
est expenses, which will follow your initial set of rough projections.
Example
In our sample projections, we have assumed that AmaOS’s equity remains
unchanged at €52.5 million and that net worth growth is provided by
net profit after dividend payments (retained earnings) as follows:
2004 2005 2006 2007 2008
Share Cap 52,500 52,500 52,500 52,500 52,500HistoricalRet Earnings 312,505 363,208 416,314 472,026 539,561264,011Year’s result 48,494 50,703 53,106 55,712 67,535Net Worth 365,005 415,708 468,814 524,526 592,061
New money need
It is most likely that, after adding up the projected balance sheet, with
all the categories you’ve projected, you’ll find assets will not correspond
to liabilities on the first attempt. This gap is represented in Figure 4.6
as ‘new money need’. The reason for this is simply that each item was
derived independently using heterogeneous criteria.
You may also find that your initial interest expense projections in the
profit and loss will require an adjustment following your projected ‘new
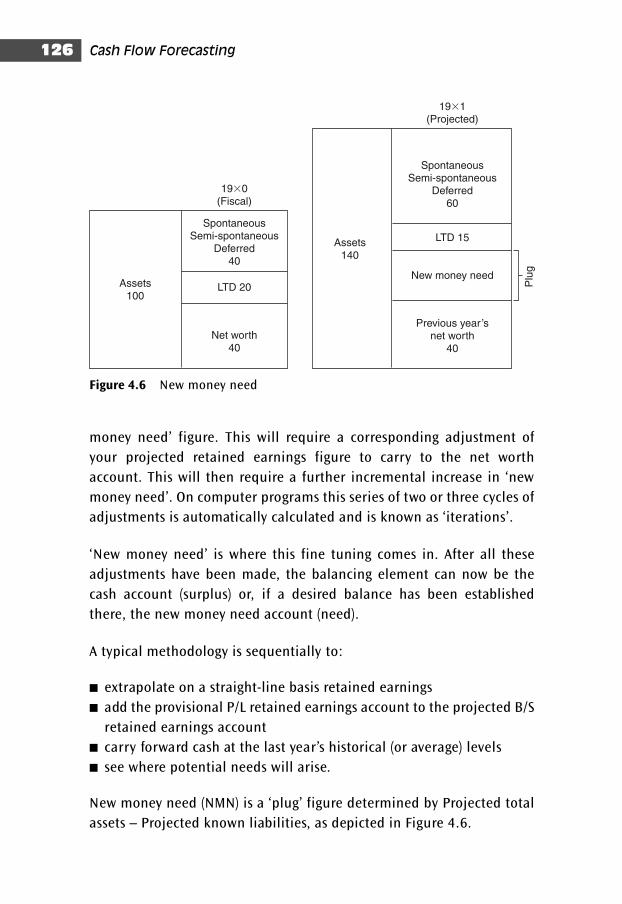
money need’ figure. This will require a corresponding adjustment of
your projected retained earnings figure to carry to the net worth
account. This will then require a further incremental increase in ‘new
money need’. On computer programs this series of two or three cycles of
adjustments is automatically calculated and is known as ‘iterations’.
‘New money need’ is where this fine tuning comes in. After all these
adjustments have been made, the balancing element can now be the
cash account (surplus) or, if a desired balance has been established
there, the new money need account (need).
A typical methodology is sequentially to:
■ extrapolate on a straight-line basis retained earnings
■ add the provisional P/L retained earnings account to the projected B/S
retained earnings account
■ carry forward cash at the last year’s historical (or average) levels
■ see where potential needs will arise.
New money need (NMN) is a ‘plug’ figure determined by Projected total
assets – Projected known liabilities, as depicted in Figure 4.6.
Cash Flow Forecasting126
19�0(Fiscal)
Assets100
LTD 20
SpontaneousSemi-spontaneous
Deferred40
Net worth40
19�1(Projected)
Assets140
LTD 15
New money need
SpontaneousSemi-spontaneous
Deferred60
Previous year ’snet worth
40
Plu
g
Figure 4.6 New money need
Cash flow forecasting of financial statements 127
Note that new money need, which is the gap between projected total
assets and projected liabilities, will also include the amounts by which
the original debt will have been amortized (see Figure 4.6).
(In our example spreadsheet, there is no new money need since the €100
million new money facility is being used to pay down current liabilities
and thereby strengthen the company’s working capital position.)
The picture is thus completed by inserting the new money need plug fig-
ure, which will equalize the assets and liabilities. This figure can be positive
or negative, depending on the funds flows assumed. A ‘positive cash bal-
ance’ (or a ‘negative new money need’) will represent an excess of funds
over the forecast needs, while a negative cash balance or positive accounts
payable balance will indicate the need for obtaining additional funds.
Various sources of cash to service debt
The cash flow diagram in Chapter 3, Figure 3.6, illustrates that new
money need can be obtained from various sources.
If operating profit is not sufficient to meet financing payments,
alternative sources of cash may be available. However, if insufficient
profitability is the major problem with the cash flow, these alterna-
tive sources of cash will be merely short-term palliatives.
■ Sources of equity and intercompany debt. If the firm is closely
held, or is a parent or subsidiary of a stronger firm with a vested
interest in the firm’s financial well-being, equity or debt injec-
tions may be available in times of cash flow difficulties.
■ Refinancing and restructuring. As interest rates have increased
over the years, many companies have committed to short-term
debt, betting that rates would drop. Firms are often willing to refi-
nance to stretch out loan amortization schedules over a longer
term, thus reducing financing payments. The company may also
have unused lines of credit that could be drawn down to pay cur-
rent portions of long-term debt on a temporary basis. The tenor of
the debt, however, may be due to other factors, such as high
leverage that has prevented access to long-term markets.
(continued)
Cash Flow Forecasting128
Fine tuning the ultimate amount of new money need is done by a
process of estimation. There are four steps:
1 Estimate retained earnings and new debt
2 Calculate interest expense on new debt
3 Complete income statement based on interest expense estimates
4 Fine tune initial estimate of retained earnings and repeat above
three steps.
Finally, you should step back a while and think about your ‘new debt
need’ figure. While you may have a ‘plug’ figure which balances your
■ Cash and marketable securities. Some firms hold cash and/or mar-
ketable securities above what might be needed to meet seasonal
needs, and these may sometimes be liquidated as an alternate
source of cash. Companies frequently build up these accounts in
periods of high earnings in anticipation of poor periods or periods
of heavy expenditures, such as for the building of a plant.
■ Working investment. Permanent working investment can often be
reduced by tightening inventory controls or receivables collec-
tions, thus releasing cash to be used for other purposes. Must a
base stock of inventory, for example, be maintained at existing
levels? Can sales terms be accelerated, or can the firm obtain bet-
ter terms from its suppliers? In addition, a one-time infusion of
cash can sometimes be obtained by selling a group of receivables
to a factor.
■ Fixed asset investments. Another option sometimes available to a
firm is the sale and leaseback of fixed assets providing a one-time
source of cash. The firm may have other assets or investments of
value that can be sold without restricting the firm’s operating
capacity.
■ Dividends. Although firms may be unwilling to cut off entirely the
payment of dividends, they may be willing to pay them out at a
lower level. Other methods of ‘tightening the belt’ include delay-
ing plant expenditures or discontinuing unprofitable operations.
Knowledge of the firm’s operations is essential in order to identify
such sources.
Cash flow forecasting of financial statements 129
projections and appears reasonable, you will want to consider what this
actually represents.
Obviously, it represents new debt obtained from other banks. Is this in
itself a reasonable assumption? Will the company be able to fund itself
via the capital markets without any difficulties? Does this tally with say
the company’s credit rating? Although your projections may indicate
that the company can operate in a state of equilibrium, perhaps the
indicators will be negative and the company will not be able to obtain
new debt for a variety of reasons. You should therefore think carefully
about what this ‘new debt need’ figure represents, and the likelihood of
obtaining it without any undue difficulties.
Amortization schedule for new debt
Once the pro forma accounts and cash flow have been completed and
new money need estimated for five projected years, the analyst can use
‘sensitivity analysis’ to test the upper and lower boundaries of the firm’s
probable future debt capacity.
This basically means playing with input variables such as sales, expenses,
interest rates, currency rates, debt amortization schedules, etc. The idea
is to see which of these variables can have the most adverse impact on
the company’s financial condition, so that appropriate measures or con-
trol mechanisms can be structured.
This will also require defining the composition of new money need, as
the manner in which this is broken down will have an impact on the
company’s balance sheet structure, funding costs and risk profile. It
does not make sense, for example, to allocate the entirety of a com-
pany’s new money need to debt if this weakens the company’s capital
structure to the point that it cannot service its debt, violates its financial
covenants or net worth covenants, or weakens its credit rating.
This is why sensitivity analysis and the breakdown of new money need
may result in the bank imposing certain conditions on the borrower,
Cash Flow Forecasting130
such as minimum net worth covenants, or commitments for future
capital increases via various vehicles such as long-term debt, private
placements, mezzanine finance, etc.
The allocation of new debt thus requires an analysis of the firm’s pro-
jected cash flow. The technique usually employed is first to review the
major projected sources and uses of cash on a cumulative basis. For
example, if the new debt is being used to finance plant, the need is
long term.
The tenor of the need is, in fact, probably longer than the bank would
be willing to finance. In such a case, a revolving credit with takeout from
a private placement would be one possible financing package.
In general, the issues that should be considered in structuring new
money need can be summarized as follows:
■ Debt servicing ability must be considered. The analyst must judge
whether the additional financing payments, particularly CPLTD, that
would result from the particular financing vehicle can be covered by
the firm’s cash flow and dividends.
■ Tenor matching may indicate an appropriate allocation of new debt
need. In general, the tenor of the asset being financed should match
the tenor of the financing vehicle.
■ The timing of the financing need is another consideration. For
example, a revolving credit may be appropriate for a financing need
that fluctuates throughout the year or the five-year period, while a
standby term loan may be suited to finance construction that will be
completed in stages.
■ Flexibility in repayment is also important. If, for example, the firm’s
projected cash flow indicates flexibility in its ability to repay a loan, a
revolving credit may be more appropriate than a term loan.
■ The firm’s historical preference in choosing financing vehicles should
be reviewed, and may indicate the type of financing that should be
recommended (e.g. a company may prefer debt in order to avoid
share issues and the spectre of hostile takeovers).
■ The financial leverage resulting from the new debt taken on should be
considered. An increase in debt may result in a capital structure that
Cash flow forecasting of financial statements 131
is too highly leveraged to provide the bank sufficient protection
against loss.
■ Previous loan covenants should also be considered – it would be coun-
terproductive to impose conditions that would cause the borrower to
default on previous loan commitments.
Along with determining the composition of new debt there is the need
to determine an appropriate amortization schedule which is reasonable
in relation to the firm’s projected cash flow. This is to ensure that the
recommended amortization schedule:
■ is consistent with other requirements such as liquidity
■ does not cause the company to violate existing financial covenants
■ provides a comfortable margin of free cash flow or unused debt
capacity to absorb unforeseen adverse circumstances.
As new debt amortizes, several things can happen to the company’s pro-
jected financial statements:
■ The CPLTD from the runoff of the new debt will increase the total
CPLTD shown in the financing payments section of the cash flow. The
new debt should be structured so as to start amortizing only when the
firm can pay it back, and not before.
■ Total liabilities will not change (other things remaining equal), but
current liabilities will increase by the amount of the CPLTD associated
with new debt running off.
■ Ratios and other measures linked to current liabilities will change
whilst ratios that vary with total liabilities (such as the leverage ratio)
will remain the same.
The implication of these changes is that a firm’s liquidity will be affected
as new debt runs off. This is why it is important to consider these effects
when structuring lending facilities.
Completed AmaOS forecasted balance
sheet
Table 4.8 is the completed AmaOS forecasted balance sheet.
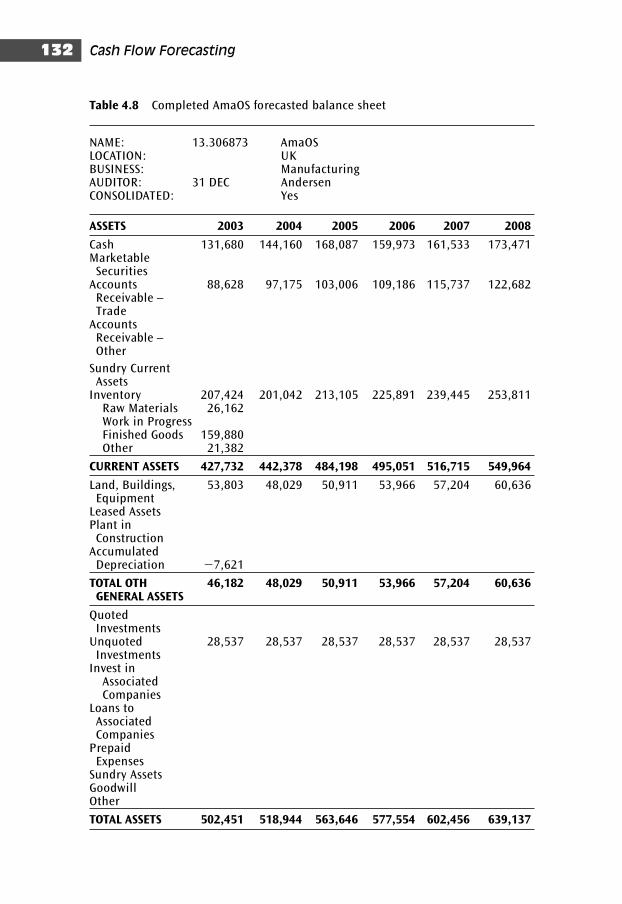
Cash Flow Forecasting132
Table 4.8 Completed AmaOS forecasted balance sheet
NAME: 13.306873 AmaOSLOCATION: UKBUSINESS: ManufacturingAUDITOR: 31 DEC AndersenCONSOLIDATED: Yes
ASSETS 2003 2004 2005 2006 2007 2008
Cash 131,680 144,160 168,087 159,973 161,533 173,471Marketable
SecuritiesAccounts 88,628 97,175 103,006 109,186 115,737 122,682
Receivable –Trade
Accounts Receivable – Other
Sundry Current Assets
Inventory 207,424 201,042 213,105 225,891 239,445 253,811Raw Materials 26,162Work in ProgressFinished Goods 159,880Other 21,382
CURRENT ASSETS 427,732 442,378 484,198 495,051 516,715 549,964
Land, Buildings, 53,803 48,029 50,911 53,966 57,204 60,636Equipment
Leased AssetsPlant in
ConstructionAccumulated
Depreciation �7,621
TOTAL OTH 46,182 48,029 50,911 53,966 57,204 60,636GENERAL ASSETS
Quoted Investments
Unquoted 28,537 28,537 28,537 28,537 28,537 28,537Investments
Invest in Associated Companies
Loans to Associated Companies
Prepaid Expenses
Sundry AssetsGoodwillOther
TOTAL ASSETS 502,451 518,944 563,646 577,554 602,456 639,137
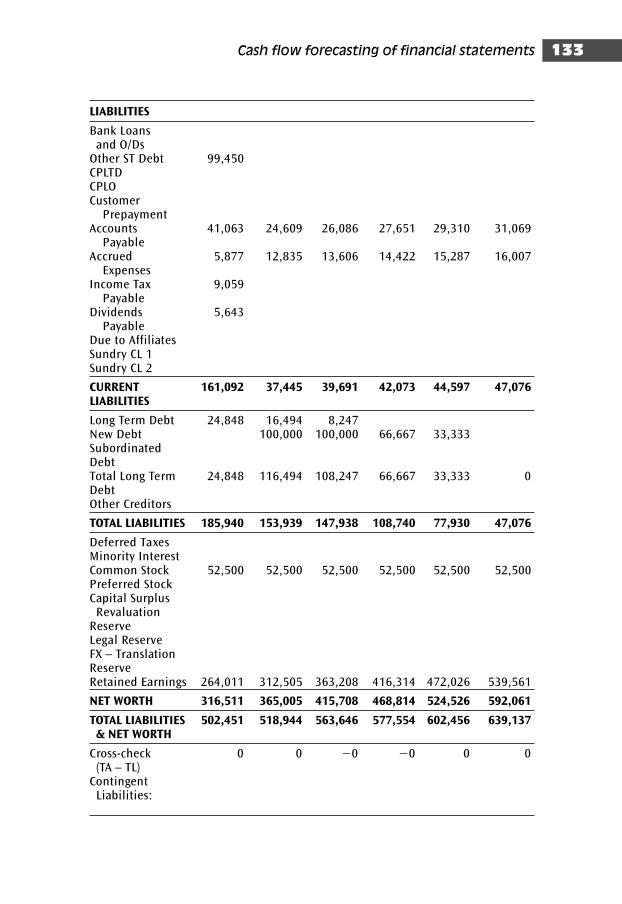
Cash flow forecasting of financial statements 133
LIABILITIES
Bank Loans and O/Ds
Other ST Debt 99,450CPLTDCPLOCustomer
PrepaymentAccounts 41,063 24,609 26,086 27,651 29,310 31,069
PayableAccrued 5,877 12,835 13,606 14,422 15,287 16,007
ExpensesIncome Tax 9,059
PayableDividends 5,643
PayableDue to AffiliatesSundry CL 1Sundry CL 2
CURRENT 161,092 37,445 39,691 42,073 44,597 47,076LIABILITIES
Long Term Debt 24,848 16,494 8,247New Debt 100,000 100,000 66,667 33,333Subordinated DebtTotal Long Term 24,848 116,494 108,247 66,667 33,333 0DebtOther Creditors
TOTAL LIABILITIES 185,940 153,939 147,938 108,740 77,930 47,076
Deferred TaxesMinority InterestCommon Stock 52,500 52,500 52,500 52,500 52,500 52,500Preferred StockCapital Surplus
Revaluation ReserveLegal ReserveFX – Translation ReserveRetained Earnings 264,011 312,505 363,208 416,314 472,026 539,561
NET WORTH 316,511 365,005 415,708 468,814 524,526 592,061
TOTAL LIABILITIES 502,451 518,944 563,646 577,554 602,456 639,137& NET WORTH
Cross-check 0 0 �0 �0 0 0(TA – TL)
Contingent Liabilities:
Cash Flow Forecasting134
Cash flow projections
Now that we’ve completed our balance sheet and income statement
forecasts, we can turn to analysing the spreadsheet generated cash flow
forecasts to gain an understanding of how the anticipated scenario will
impact on the company’s expected performance, see whether the com-
pany will have sufficient cash flow to service and amortize new and
existing debt, and establish whether the proposed repayment schedule
is appropriate.
There are several formats that can be devised for cash flow projections.
The cash flow statement for AmaOS (see Table 4.9) is a typical sample. It
should be noted that there is no standardized method of calculating
cash flows, and that analysts can use differing models.
Construction and evaluation of future cash flow model
Cash flows can be constructed in several ways, from the simple to the
more time consuming. We will consider a relatively time-consuming model
which appears in the AmaOS spreadsheets in order to gain a clear under-
standing of the underlying principles of the typical computer-generated
cash flow model.
Once these principles are understood, producing various sensitized scen-
arios by changing some of the underlying assumptions will have the
advantages of the speed of the computer model coupled with an under-
standing of the underlying principles.
The first step in constructing a cash flow is to identify sources and uses
of funds, as these phrases are commonly used by companies.
Remember that an increase in assets represents a USE of cash and will
therefore be a cash outflow (i.e. NEGATIVE), while an increase in liabil-
ities represents a SOURCE of cash or funding and will therefore be a cash
inflow (i.e. POSITIVE). For clarity, negative figures in the cash flow
should be in �parenthesis�.
Examples of sources and uses appear in Table 4.10.
These inflows and outflows are depicted in Chapter 3, Figure 3.6.
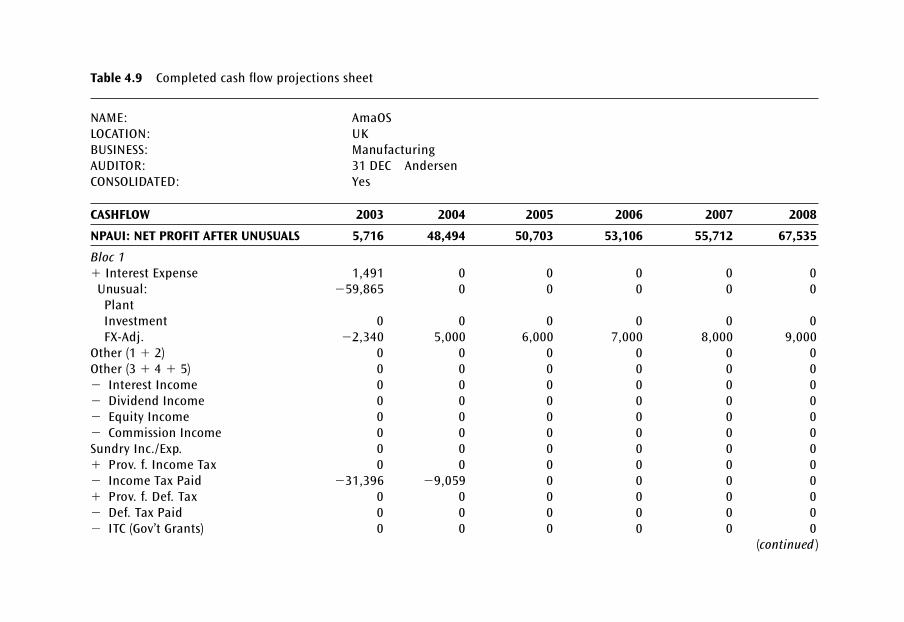
Table 4.9 Completed cash flow projections sheet
NAME: AmaOSLOCATION: UKBUSINESS: ManufacturingAUDITOR: 31 DEC AndersenCONSOLIDATED: Yes
CASHFLOW 2003 2004 2005 2006 2007 2008
NPAUI: NET PROFIT AFTER UNUSUALS 5,716 48,494 50,703 53,106 55,712 67,535
Bloc 1
� Interest Expense 1,491 0 0 0 0 0Unusual: �59,865 0 0 0 0 0
PlantInvestment 0 0 0 0 0 0FX-Adj. �2,340 5,000 6,000 7,000 8,000 9,000
Other (1 � 2) 0 0 0 0 0 0Other (3 � 4 � 5) 0 0 0 0 0 0� Interest Income 0 0 0 0 0 0� Dividend Income 0 0 0 0 0 0� Equity Income 0 0 0 0 0 0� Commission Income 0 0 0 0 0 0Sundry Inc./Exp. 0 0 0 0 0 0� Prov. f. Income Tax 0 0 0 0 0 0� Income Tax Paid �31,396 �9,059 0 0 0 0� Prov. f. Def. Tax 0 0 0 0 0 0� Def. Tax Paid 0 0 0 0 0 0� ITC (Gov’t Grants) 0 0 0 0 0 0
(continued )
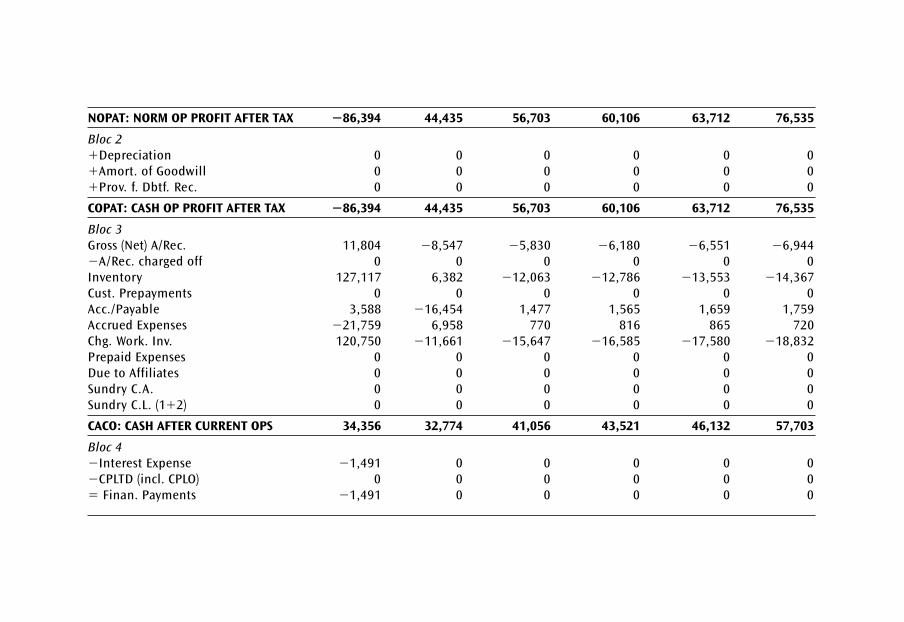
NOPAT: NORM OP PROFIT AFTER TAX �86,394 44,435 56,703 60,106 63,712 76,535
Bloc 2
�Depreciation 0 0 0 0 0 0�Amort. of Goodwill 0 0 0 0 0 0�Prov. f. Dbtf. Rec. 0 0 0 0 0 0
COPAT: CASH OP PROFIT AFTER TAX �86,394 44,435 56,703 60,106 63,712 76,535
Bloc 3
Gross (Net) A/Rec. 11,804 �8,547 �5,830 �6,180 �6,551 �6,944�A/Rec. charged off 0 0 0 0 0 0Inventory 127,117 6,382 �12,063 �12,786 �13,553 �14,367Cust. Prepayments 0 0 0 0 0 0Acc./Payable 3,588 �16,454 1,477 1,565 1,659 1,759Accrued Expenses �21,759 6,958 770 816 865 720Chg. Work. Inv. 120,750 �11,661 �15,647 �16,585 �17,580 �18,832Prepaid Expenses 0 0 0 0 0 0Due to Affiliates 0 0 0 0 0 0Sundry C.A. 0 0 0 0 0 0Sundry C.L. (1�2) 0 0 0 0 0 0
CACO: CASH AFTER CURRENT OPS 34,356 32,774 41,056 43,521 46,132 57,703
Bloc 4
�Interest Expense �1,491 0 0 0 0 0�CPLTD (incl. CPLO) 0 0 0 0 0 0� Finan. Payments �1,491 0 0 0 0 0
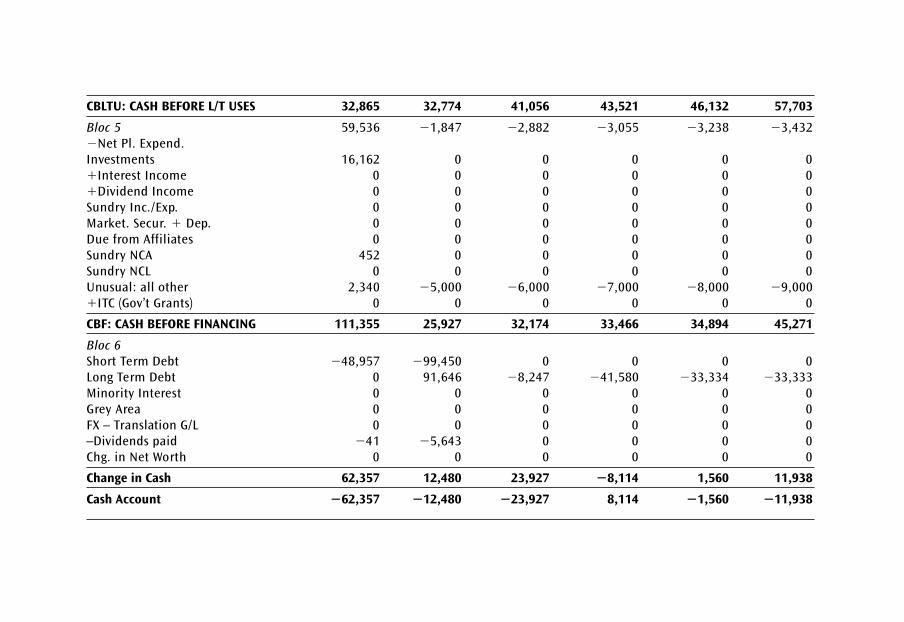
CBLTU: CASH BEFORE L/T USES 32,865 32,774 41,056 43,521 46,132 57,703
Bloc 5 59,536 �1,847 �2,882 �3,055 �3,238 �3,432�Net Pl. Expend.Investments 16,162 0 0 0 0 0�Interest Income 0 0 0 0 0 0�Dividend Income 0 0 0 0 0 0Sundry Inc./Exp. 0 0 0 0 0 0Market. Secur. � Dep. 0 0 0 0 0 0Due from Affiliates 0 0 0 0 0 0Sundry NCA 452 0 0 0 0 0Sundry NCL 0 0 0 0 0 0Unusual: all other 2,340 �5,000 �6,000 �7,000 �8,000 �9,000�ITC (Gov’t Grants) 0 0 0 0 0 0
CBF: CASH BEFORE FINANCING 111,355 25,927 32,174 33,466 34,894 45,271
Bloc 6
Short Term Debt �48,957 �99,450 0 0 0 0Long Term Debt 0 91,646 �8,247 �41,580 �33,334 �33,333Minority Interest 0 0 0 0 0 0Grey Area 0 0 0 0 0 0FX – Translation G/L 0 0 0 0 0 0–Dividends paid �41 �5,643 0 0 0 0Chg. in Net Worth 0 0 0 0 0 0
Change in Cash 62,357 12,480 23,927 �8,114 1,560 11,938
Cash Account �62,357 �12,480 �23,927 8,114 �1,560 �11,938
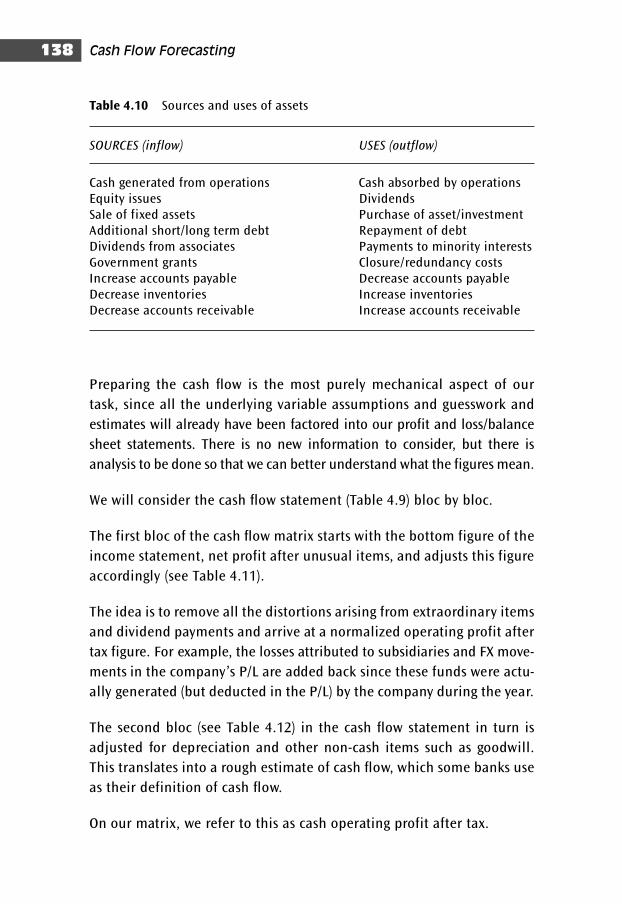
Cash Flow Forecasting138
Preparing the cash flow is the most purely mechanical aspect of our
task, since all the underlying variable assumptions and guesswork and
estimates will already have been factored into our profit and loss/balance
sheet statements. There is no new information to consider, but there is
analysis to be done so that we can better understand what the figures mean.
We will consider the cash flow statement (Table 4.9) bloc by bloc.
The first bloc of the cash flow matrix starts with the bottom figure of the
income statement, net profit after unusual items, and adjusts this figure
accordingly (see Table 4.11).
The idea is to remove all the distortions arising from extraordinary items
and dividend payments and arrive at a normalized operating profit after
tax figure. For example, the losses attributed to subsidiaries and FX move-
ments in the company’s P/L are added back since these funds were actu-
ally generated (but deducted in the P/L) by the company during the year.
The second bloc (see Table 4.12) in the cash flow statement in turn is
adjusted for depreciation and other non-cash items such as goodwill.
This translates into a rough estimate of cash flow, which some banks use
as their definition of cash flow.
On our matrix, we refer to this as cash operating profit after tax.
Table 4.10 Sources and uses of assets
SOURCES (inflow) USES (outflow)
Cash generated from operations Cash absorbed by operationsEquity issues DividendsSale of fixed assets Purchase of asset/investmentAdditional short/long term debt Repayment of debtDividends from associates Payments to minority interestsGovernment grants Closure/redundancy costsIncrease accounts payable Decrease accounts payableDecrease inventories Increase inventoriesDecrease accounts receivable Increase accounts receivable
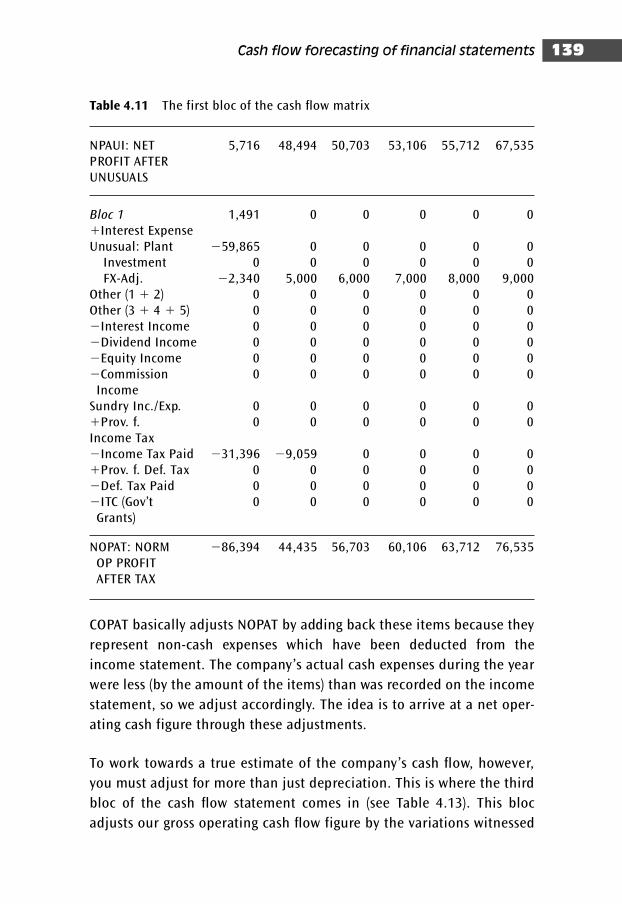
Cash flow forecasting of financial statements 139
COPAT basically adjusts NOPAT by adding back these items because they
represent non-cash expenses which have been deducted from the
income statement. The company’s actual cash expenses during the year
were less (by the amount of the items) than was recorded on the income
statement, so we adjust accordingly. The idea is to arrive at a net oper-
ating cash figure through these adjustments.
To work towards a true estimate of the company’s cash flow, however,
you must adjust for more than just depreciation. This is where the third
bloc of the cash flow statement comes in (see Table 4.13). This bloc
adjusts our gross operating cash flow figure by the variations witnessed
Table 4.11 The first bloc of the cash flow matrix
NPAUI: NET 5,716 48,494 50,703 53,106 55,712 67,535PROFIT AFTER UNUSUALS
Bloc 1 1,491 0 0 0 0 0�Interest ExpenseUnusual: Plant �59,865 0 0 0 0 0
Investment 0 0 0 0 0 0FX-Adj. �2,340 5,000 6,000 7,000 8,000 9,000
Other (1 � 2) 0 0 0 0 0 0Other (3 � 4 � 5) 0 0 0 0 0 0�Interest Income 0 0 0 0 0 0�Dividend Income 0 0 0 0 0 0�Equity Income 0 0 0 0 0 0�Commission 0 0 0 0 0 0
IncomeSundry Inc./Exp. 0 0 0 0 0 0�Prov. f. 0 0 0 0 0 0Income Tax�Income Tax Paid �31,396 �9,059 0 0 0 0�Prov. f. Def. Tax 0 0 0 0 0 0�Def. Tax Paid 0 0 0 0 0 0�ITC (Gov’t 0 0 0 0 0 0
Grants)
NOPAT: NORM �86,394 44,435 56,703 60,106 63,712 76,535OP PROFIT AFTER TAX
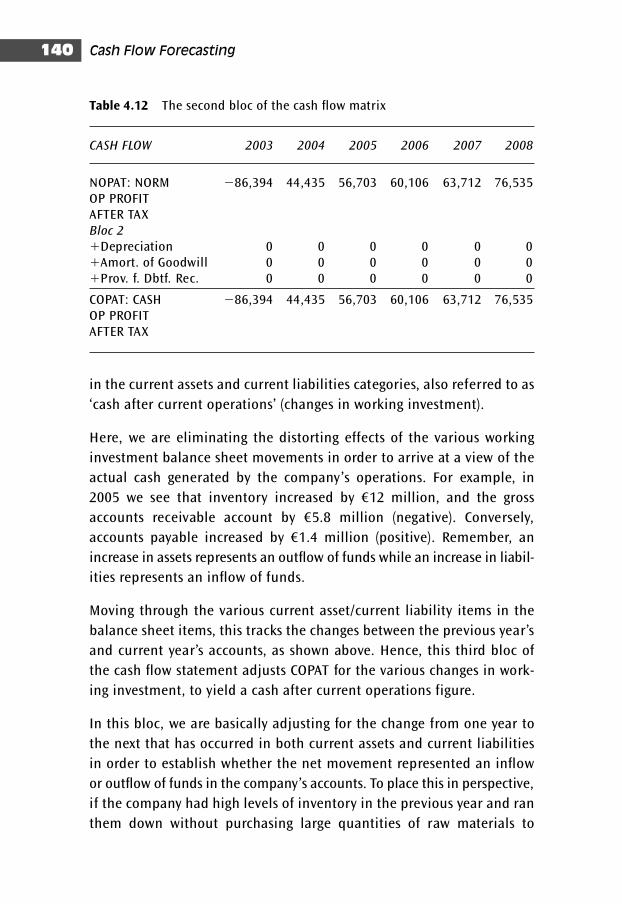
Cash Flow Forecasting140
Table 4.12 The second bloc of the cash flow matrix
CASH FLOW 2003 2004 2005 2006 2007 2008
NOPAT: NORM �86,394 44,435 56,703 60,106 63,712 76,535OP PROFIT AFTER TAXBloc 2
�Depreciation 0 0 0 0 0 0�Amort. of Goodwill 0 0 0 0 0 0�Prov. f. Dbtf. Rec. 0 0 0 0 0 0
COPAT: CASH �86,394 44,435 56,703 60,106 63,712 76,535OP PROFIT AFTER TAX
in the current assets and current liabilities categories, also referred to as
‘cash after current operations’ (changes in working investment).
Here, we are eliminating the distorting effects of the various working
investment balance sheet movements in order to arrive at a view of the
actual cash generated by the company’s operations. For example, in
2005 we see that inventory increased by €12 million, and the gross
accounts receivable account by €5.8 million (negative). Conversely,
accounts payable increased by €1.4 million (positive). Remember, an
increase in assets represents an outflow of funds while an increase in liabil-
ities represents an inflow of funds.
Moving through the various current asset/current liability items in the
balance sheet items, this tracks the changes between the previous year’s
and current year’s accounts, as shown above. Hence, this third bloc of
the cash flow statement adjusts COPAT for the various changes in work-
ing investment, to yield a cash after current operations figure.
In this bloc, we are basically adjusting for the change from one year to
the next that has occurred in both current assets and current liabilities
in order to establish whether the net movement represented an inflow
or outflow of funds in the company’s accounts. To place this in perspective,
if the company had high levels of inventory in the previous year and ran
them down without purchasing large quantities of raw materials to
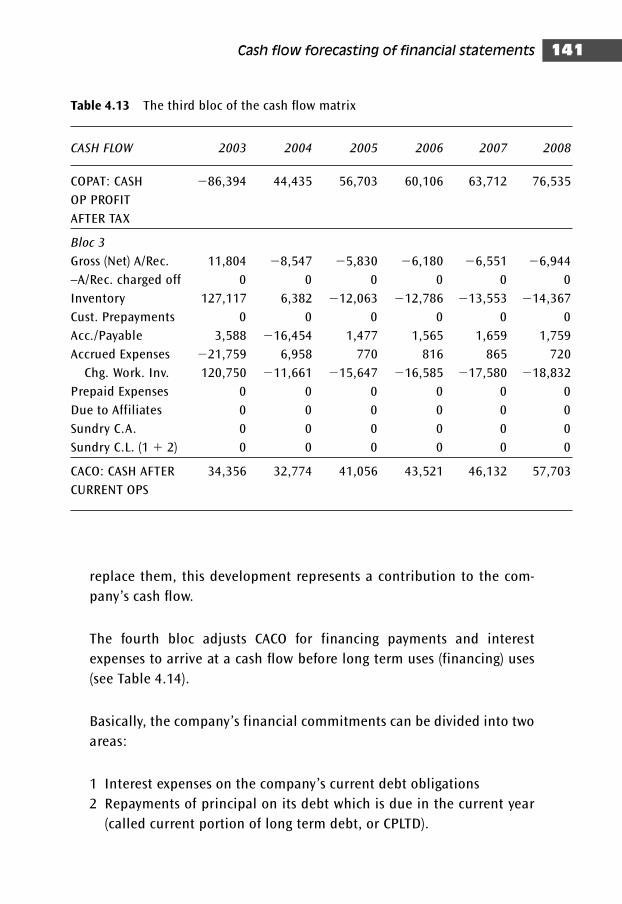
Cash flow forecasting of financial statements 141
replace them, this development represents a contribution to the com-
pany’s cash flow.
The fourth bloc adjusts CACO for financing payments and interest
expenses to arrive at a cash flow before long term uses (financing) uses
(see Table 4.14).
Basically, the company’s financial commitments can be divided into two
areas:
1 Interest expenses on the company’s current debt obligations
2 Repayments of principal on its debt which is due in the current year
(called current portion of long term debt, or CPLTD).
Table 4.13 The third bloc of the cash flow matrix
CASH FLOW 2003 2004 2005 2006 2007 2008
COPAT: CASH �86,394 44,435 56,703 60,106 63,712 76,535
OP PROFIT
AFTER TAX
Bloc 3
Gross (Net) A/Rec. 11,804 �8,547 �5,830 �6,180 �6,551 �6,944
–A/Rec. charged off 0 0 0 0 0 0
Inventory 127,117 6,382 �12,063 �12,786 �13,553 �14,367
Cust. Prepayments 0 0 0 0 0 0
Acc./Payable 3,588 �16,454 1,477 1,565 1,659 1,759
Accrued Expenses �21,759 6,958 770 816 865 720
Chg. Work. Inv. 120,750 �11,661 �15,647 �16,585 �17,580 �18,832
Prepaid Expenses 0 0 0 0 0 0
Due to Affiliates 0 0 0 0 0 0
Sundry C.A. 0 0 0 0 0 0
Sundry C.L. (1 � 2) 0 0 0 0 0 0
CACO: CASH AFTER 34,356 32,774 41,056 43,521 46,132 57,703
CURRENT OPS
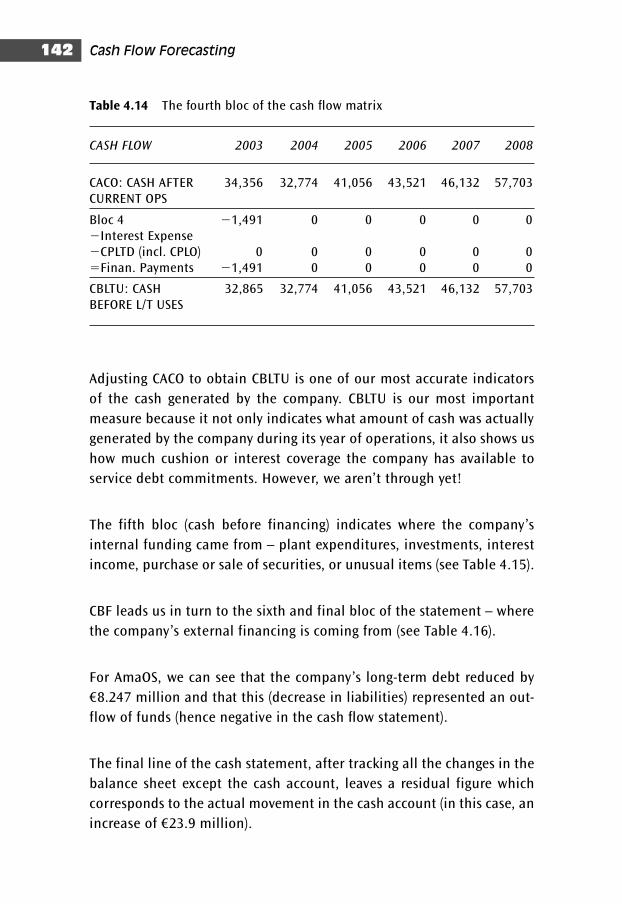
Cash Flow Forecasting142
Table 4.14 The fourth bloc of the cash flow matrix
CASH FLOW 2003 2004 2005 2006 2007 2008
CACO: CASH AFTER 34,356 32,774 41,056 43,521 46,132 57,703CURRENT OPS
Bloc 4 �1,491 0 0 0 0 0�Interest Expense�CPLTD (incl. CPLO) 0 0 0 0 0 0�Finan. Payments �1,491 0 0 0 0 0
CBLTU: CASH 32,865 32,774 41,056 43,521 46,132 57,703BEFORE L/T USES
Adjusting CACO to obtain CBLTU is one of our most accurate indicators
of the cash generated by the company. CBLTU is our most important
measure because it not only indicates what amount of cash was actually
generated by the company during its year of operations, it also shows us
how much cushion or interest coverage the company has available to
service debt commitments. However, we aren’t through yet!
The fifth bloc (cash before financing) indicates where the company’s
internal funding came from – plant expenditures, investments, interest
income, purchase or sale of securities, or unusual items (see Table 4.15).
CBF leads us in turn to the sixth and final bloc of the statement – where
the company’s external financing is coming from (see Table 4.16).
For AmaOS, we can see that the company’s long-term debt reduced by
€8.247 million and that this (decrease in liabilities) represented an out-
flow of funds (hence negative in the cash flow statement).
The final line of the cash statement, after tracking all the changes in the
balance sheet except the cash account, leaves a residual figure which
corresponds to the actual movement in the cash account (in this case, an
increase of €23.9 million).
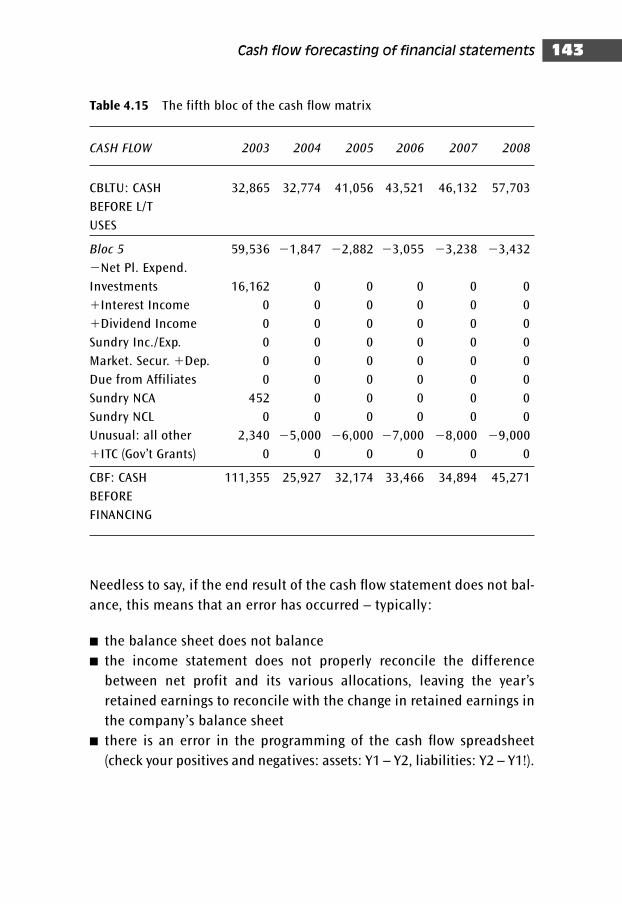
Cash flow forecasting of financial statements 143
Needless to say, if the end result of the cash flow statement does not bal-
ance, this means that an error has occurred – typically:
■ the balance sheet does not balance
■ the income statement does not properly reconcile the difference
between net profit and its various allocations, leaving the year’s
retained earnings to reconcile with the change in retained earnings in
the company’s balance sheet
■ there is an error in the programming of the cash flow spreadsheet
(check your positives and negatives: assets: Y1 – Y2, liabilities: Y2 – Y1!).
Table 4.15 The fifth bloc of the cash flow matrix
CASH FLOW 2003 2004 2005 2006 2007 2008
CBLTU: CASH 32,865 32,774 41,056 43,521 46,132 57,703
BEFORE L/T
USES
Bloc 5 59,536 �1,847 �2,882 �3,055 �3,238 �3,432
�Net Pl. Expend.
Investments 16,162 0 0 0 0 0
�Interest Income 0 0 0 0 0 0
�Dividend Income 0 0 0 0 0 0
Sundry Inc./Exp. 0 0 0 0 0 0
Market. Secur. �Dep. 0 0 0 0 0 0
Due from Affiliates 0 0 0 0 0 0
Sundry NCA 452 0 0 0 0 0
Sundry NCL 0 0 0 0 0 0
Unusual: all other 2,340 �5,000 �6,000 �7,000 �8,000 �9,000
�ITC (Gov’t Grants) 0 0 0 0 0 0
CBF: CASH 111,355 25,927 32,174 33,466 34,894 45,271
BEFORE
FINANCING
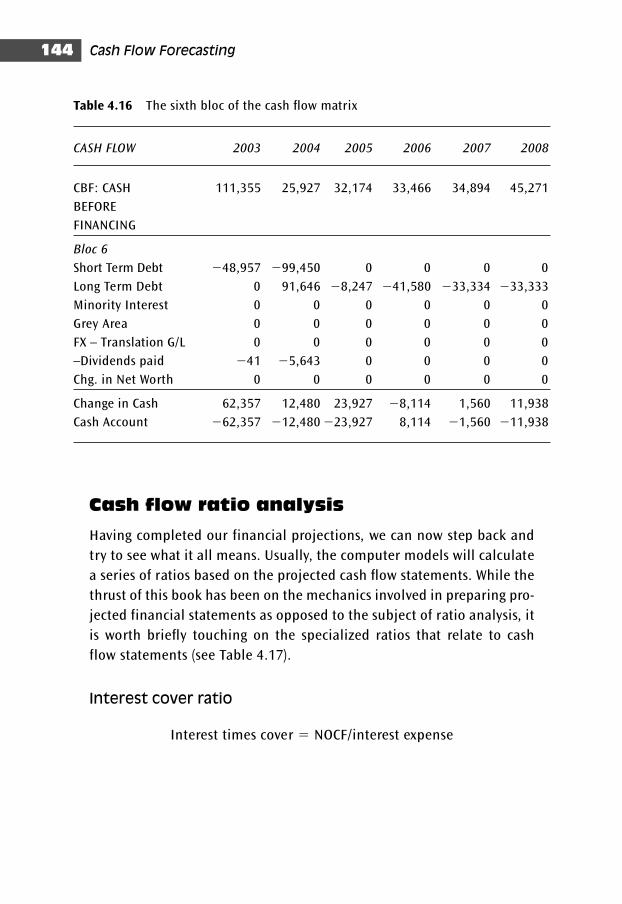
Cash Flow Forecasting144
Table 4.16 The sixth bloc of the cash flow matrix
CASH FLOW 2003 2004 2005 2006 2007 2008
CBF: CASH 111,355 25,927 32,174 33,466 34,894 45,271
BEFORE
FINANCING
Bloc 6
Short Term Debt �48,957 �99,450 0 0 0 0
Long Term Debt 0 91,646 �8,247 �41,580 �33,334 �33,333
Minority Interest 0 0 0 0 0 0
Grey Area 0 0 0 0 0 0
FX – Translation G/L 0 0 0 0 0 0
–Dividends paid �41 �5,643 0 0 0 0
Chg. in Net Worth 0 0 0 0 0 0
Change in Cash 62,357 12,480 23,927 �8,114 1,560 11,938
Cash Account �62,357 �12,480 �23,927 8,114 �1,560 �11,938
Cash flow ratio analysis
Having completed our financial projections, we can now step back and
try to see what it all means. Usually, the computer models will calculate
a series of ratios based on the projected cash flow statements. While the
thrust of this book has been on the mechanics involved in preparing pro-
jected financial statements as opposed to the subject of ratio analysis, it
is worth briefly touching on the specialized ratios that relate to cash
flow statements (see Table 4.17).
Interest cover ratio
Interest times cover � NOCF/interest expense
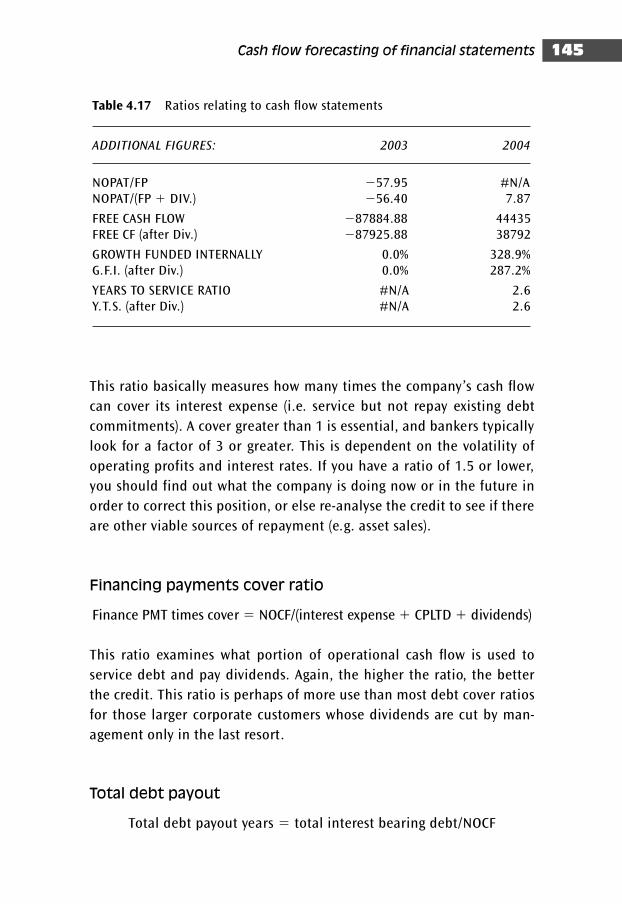
Cash flow forecasting of financial statements 145
This ratio basically measures how many times the company’s cash flow
can cover its interest expense (i.e. service but not repay existing debt
commitments). A cover greater than 1 is essential, and bankers typically
look for a factor of 3 or greater. This is dependent on the volatility of
operating profits and interest rates. If you have a ratio of 1.5 or lower,
you should find out what the company is doing now or in the future in
order to correct this position, or else re-analyse the credit to see if there
are other viable sources of repayment (e.g. asset sales).
Financing payments cover ratio
Finance PMT times cover � NOCF/(interest expense � CPLTD � dividends)
This ratio examines what portion of operational cash flow is used to
service debt and pay dividends. Again, the higher the ratio, the better
the credit. This ratio is perhaps of more use than most debt cover ratios
for those larger corporate customers whose dividends are cut by man-
agement only in the last resort.
Total debt payout
Total debt payout years � total interest bearing debt/NOCF
Table 4.17 Ratios relating to cash flow statements
ADDITIONAL FIGURES: 2003 2004
NOPAT/FP �57.95 #N/ANOPAT/(FP � DIV.) �56.40 7.87
FREE CASH FLOW �87884.88 44435FREE CF (after Div.) �87925.88 38792
GROWTH FUNDED INTERNALLY 0.0% 328.9%G.F.I. (after Div.) 0.0% 287.2%
YEARS TO SERVICE RATIO #N/A 2.6Y.T.S. (after Div.) #N/A 2.6
Cash Flow Forecasting146
This ratio helps to give a feel for the company’s ability to repay debt on
current (historic) cash flow performance. It is particularly useful when com-
pared to a company’s debt repayment schedule. (European Community
companies must note in their accounts how much debt matures in one
year, two years, and three to five years.)
Long term debt payout
LT debt payout years � total interest bearing LTD/NOCF
This ratio is similar to the previous one. It assumes, however, that the
short-term debt in current liabilities, although only committed one year
at a time, is evergreen in nature. The banks making the commitments
might view the situation differently!
When looking at the number of years, it is important to relate it to the
expected life of the assets that are generating the cash flow: if the pay-
out is within five years, this would be conservative for a property invest-
ment company but not for a service company with minimal fixed assets.
Debt service ratio
DSR � NOCF/(ST debt � CPLTD � interest expense)
This is the real test of whether a company can service its debt assuming the
bankers call in all short-term borrowings, as well as measuring whether cash
flow covers interest expense and the amortizing portion of long-term debt.
The bank’s control over such types of lending will reside on establishing
financial covenants and conditions on the borrower to ensure that the
lender retains some element of control on the borrower should the
financial condition deteriorate. This topic will be treated in a subse-
quent section.
Sensitivity analysis
We are now ready to put into use the concepts we have been exploring.
Some words of caution should, however, be expressed at this point. All
of the forecasting methods described up to here are based on the initial

Cash flow forecasting of financial statements 147
assumptions we have made. The assumptions necessary to make fore-
casts are often made, with substantial uncertainty, on the basis of:
■ historical relationships (to the extent that it is reasonable to expect
the future to be the same as the past)
■ management forecasts (to the extent that there are not obvious forces
biasing management)
■ industry data (not overly useful, as there typically exists a wide range
of diverse companies within an industry)
■ common sense.
Although you may not know which variables the results are most sensi-
tive to, you may have an idea. If these variables can be isolated, not only
can the area of concern be isolated but also, and just as importantly, the
extent to which the expected results would be affected by changes in
these variables can be established.
This can be accomplished by running a series of new forecasts in which
all the original assumptions except one are held constant. This is known
as a ‘sensitivity analysis’. In such an analysis, each of the variables can
be changed individually to determine which are of crucial importance.
For example, you may not be convinced by the company’s sales projec-
tions and may want to change them, or you may decide that cost of
goods sold will rise, as will debt or interest expenses, and want to ‘sen-
sitize’ the forecasts accordingly.
You may also want to see how much of a sales downturn and for how
long would be required before a company started to violate its financial
covenants and erode its net worth, position in order to assess what sort
of worst-case scenario the company could survive.
With computer forecasting models you can test these changes within a
matter of minutes, and generate infinite variations such as ‘base line’
(neutral), ‘downside’, ‘expensive debt’, ‘equity injection’, ‘Rasta Dub Mix’,
‘Party House Mix’ or which ever mix your credit committee prefers.
Figures 4.7–4.11 obviously depict the linear nature of the extrapolated
statements. Reality, of course, is anything but linear.
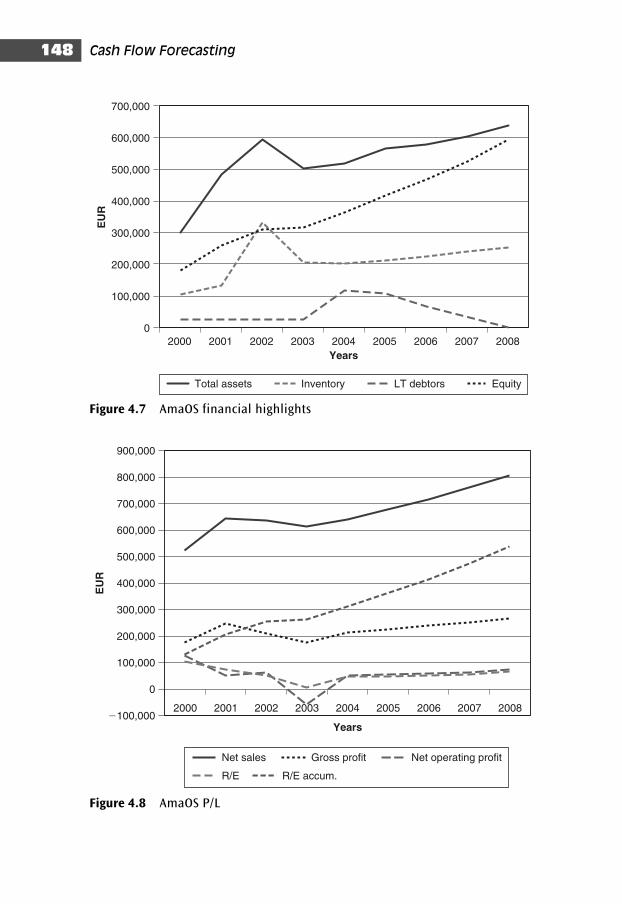
Cash Flow Forecasting148
0
100,000
200,000
300,000
400,000
500,000
600,000
700,000
2000 2001 2002 2003 2004 2005 2006 2007 2008
Years
EU
R
Total assets Inventory LT debtors Equity
Figure 4.7 AmaOS financial highlights
�100,000
0
100,000
200,000
300,000
400,000
500,000
600,000
700,000
800,000
900,000
2000 2001 2002 2003 2004 2005 2006 2007 2008
Years
EU
R
Net sales Gross profit Net operating profit
R/E R/E accum.
Figure 4.8 AmaOS P/L
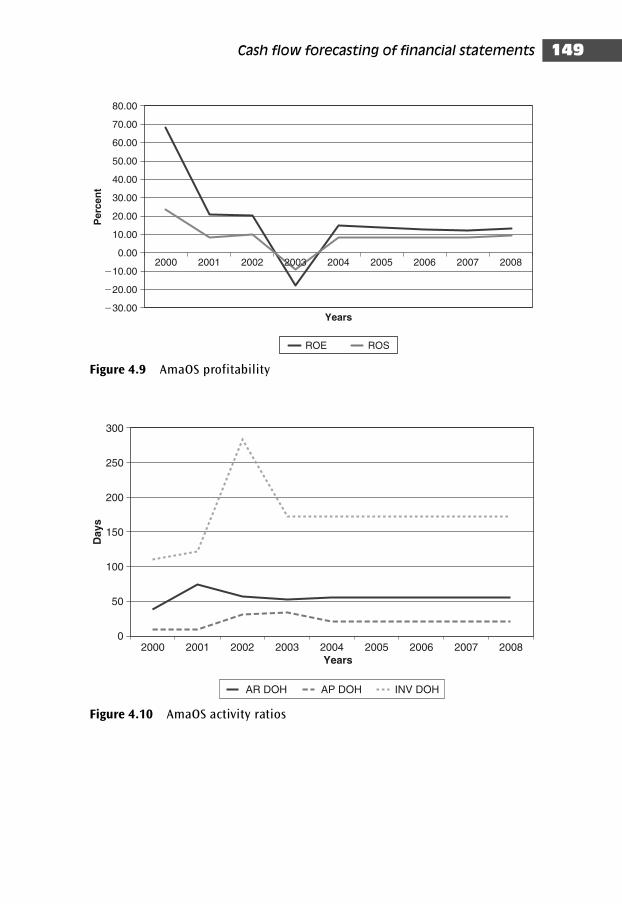
Cash flow forecasting of financial statements 149
�30.00
�20.00
�10.00
0.00
10.00
20.00
30.00
40.00
50.00
60.00
70.00
80.00
2000 2001 2002 2003 2004 2005 2006 2007 2008
Years
ROE ROS
Perc
en
t
Figure 4.9 AmaOS profitability
0
50
100
150
200
250
300
Years
Days
AR DOH AP DOH INV DOH
2000 2001 2002 2003 2004 2005 2006 2007 2008
Figure 4.10 AmaOS activity ratios
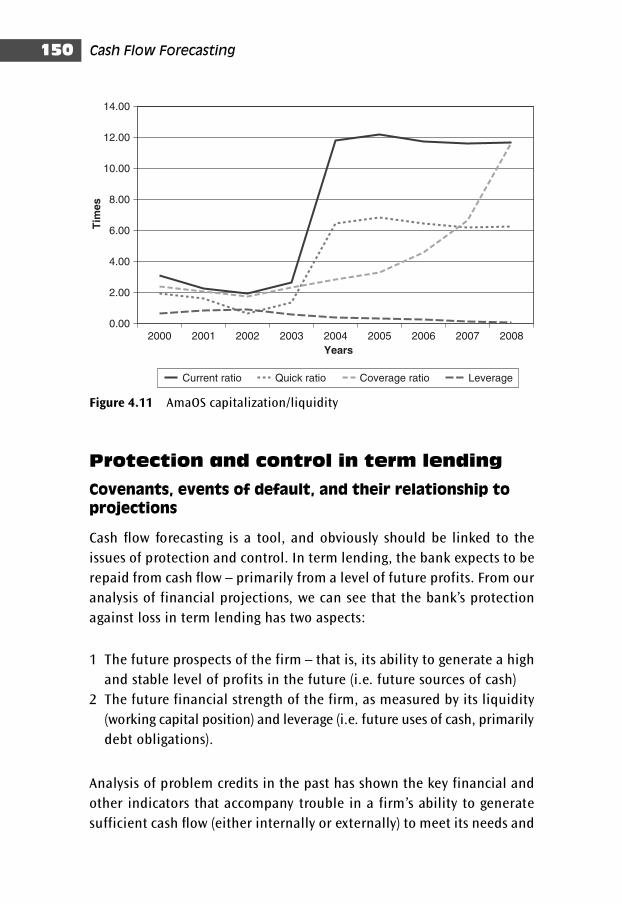
Cash Flow Forecasting150
0.00
2.00
4.00
6.00
8.00
10.00
12.00
14.00
Years
Tim
es
Current ratio Quick ratio Coverage ratio Leverage
2000 2001 2002 2003 2004 2005 2006 2007 2008
Figure 4.11 AmaOS capitalization/liquidity
Protection and control in term lending
Covenants, events of default, and their relationship to
projections
Cash flow forecasting is a tool, and obviously should be linked to the
issues of protection and control. In term lending, the bank expects to be
repaid from cash flow – primarily from a level of future profits. From our
analysis of financial projections, we can see that the bank’s protection
against loss in term lending has two aspects:
1 The future prospects of the firm – that is, its ability to generate a high
and stable level of profits in the future (i.e. future sources of cash)
2 The future financial strength of the firm, as measured by its liquidity
(working capital position) and leverage (i.e. future uses of cash, primarily
debt obligations).
Analysis of problem credits in the past has shown the key financial and
other indicators that accompany trouble in a firm’s ability to generate
sufficient cash flow (either internally or externally) to meet its needs and
Cash flow forecasting of financial statements 151
ensure its solvency include the following:
■ inadequate working capital
■ a sharp fall in the market value of a company’s stock, reflecting the
market’s perception of the company’s future cash flow
■ low or negative retained earnings in relation to assets
■ an unexpected change in ‘corporate objectives’ or ‘business profile’ ,
such as in introducing new products or divisions
■ vulnerability to economic cycles from debt heavy balance sheets or
high fixed cost operations
■ debt repayment schedules inappropriate in relation to cash flow.
In order to protect against loss and to control the source of repayment,
loan agreements are drawn up in order to define and govern the conditions
surrounding and affecting the proposed loan. Loan documentation in itself
could form the subject of an entire book. We shall however, touch briefly
on aspects that relate specifically to the company’s financial condition and
ability to generate cash flow sufficient to service debt commitments.
The first requirement is to ensure that the debt amortization schedules
which have been set up in the loan agreement are appropriate in terms
of the firm’s projected cash flow. The second is to verify that financial
covenants, which are designed to preserve and control the firm’s
cash flow and its financial strength, have been included in the loan
documentation.
Financial covenants are conditions which define the framework of the
financial plan agreed upon by the company and the bank. Drafting this
framework is typically a process of negotiation, and the degree of pro-
tection which is obtained through such negotiations can vary and is
often imperfect. Indeed, some companies may vigorously resist the
inclusion of such covenants. We briefly cover the main types below:
■ Primary covenants include factors that have a direct impact on the
company’s financial statements. These include limitation of future
debt (including contingent liabilities), prohibition of new secured
debt or obligations which will rank ahead of the proposed term loan
Cash Flow Forecasting152
(‘negative pledge’), provision for a minimum level of working capital,
and provision for a minimum level of net worth. Such limits can either
be defined in absolute ($/*) or ratio terms. Requirements for the company
to provide audited financial statements on a regular basis in order to
verify the above should also be included in the loan agreement.
■ Secondary covenants include aspects related to the company’s man-
agement and ongoing operations. These can include prohibition on
the sale of subsidiaries or assets, limitations in the prepayment of
other debt, prohibitions on mergers or consolidations without con-
sent of the lenders, limitations in investments or capital expend-
itures, and limitations in dividends. Conversely, rather than limiting
dividend payments, ‘ratcheting’ clauses requiring minimal annual
increases in net worth may be included.
In assessing the future loan facility, it will be necessary to test the
covenants that have been included in the loan agreement and see how
they hold up against the projections you will have prepared. You may
want to sensitize your forecasts for a downside scenario to see whether
the proposed covenants will enable the banks to take action to protect
their loan before it becomes too late to arrest the company’s financial
deterioration.
Finally, there are ‘events of default’. These establish conditions under
which the lending bank has the right to accelerate repayment of the
loan. This right to accelerate is rarely used, but typically gives the
lenders the control to renegotiate lending terms or take other steps in
order to protect the loan before it is too late. The events of default that
we are concerned with refer specifically to breaching (failing to meet)
financial covenants. Often, lenders may temporarily breach covenants;
in these cases, waivers are typically requested from (and granted by) the
banks.
While loan covenant issues are not directly related to the mechanics of
cash flow projections and analysis, the final projections you will have
prepared will naturally be held up against those covenants to see how
effective they are. It is therefore a good idea to have addressed these
issues in the event you are questioned on them.
Conclusion
What confidence can you have in forecasts? A frank answer is ‘not very
much’, although there are a number of factors that could qualify that
answer. That, however, is partially beside the point. The main value of
forecasts to the analyst is not necessarily diminished by the fact that
they may be perceived not to be completely airtight. It is easy for critics
to look at a given forecast and shoot holes in it on the basis that there
are bound to be certain assumptions that will not hold true.
Furthermore, the greater the number of assumptions and the further
into the future they go, the more sceptical the observer becomes – for
the possible scenarios are literally limitless.
Too often, bankers ascribe too much meaning to such forecasts. To
recap, projections are useful:
■ to evaluate appropriateness of proposed term lending
■ in constructing covenants/facility structure
■ as a tool in ultimate credit decision
■ as tools in problem loan restructuring.
They are not meant to predict the future, but can be useful in helping to
reach an informed decision.
It should also be noted that the exponential effect on straight-line scen-
arios means that a small variation in Year 1 assumptions, extrapolated
through to Year 5, may result in completely ridiculous balance sheet
structures necessitating manual ‘nip and tuck’ overrides, thus making a
mockery of the exercise of carefully selecting input variables. If this is the
case, you should backtrack and ensure that you are making the proper
assumptions, or at least develop convincing answers to the probing
questions your credit committee will no doubt relish subjecting you to.
Analysts and rating analysts traditionally harp on about the ‘quality of
cash flow’, which basically considers that a company which can report a
‘steady and consistent earnings stream’ is a ‘better credit’ than one
whose aggregate earnings over a number of years is the same but which
suffers volatility from year to year.
Cash flow forecasting of financial statements 153
Cash Flow Forecasting154
While this sounds wonderful in theory, in an era of mergers, acquisi-
tions, divestitures, and permanent restructurings, as well as layoffs and
outsourcing, harping on the virtues of stable cash flow today seems as
pedestrian as advocates of historical ratio analysis were considered to
be by aficionados of cash flow analysis in the 1980s. A look at the
Vodafone cash flow provides ample evidence of this.
Moreover, the plethora of accounting scandals in 2003 and acknowl-
edgement by industry gurus that the accounting profession has regressed
to exercises of profit inflation, obfuscation, legerdemain, dysfunction
and fraud means that the foundation of your analytical work –
published accounts – may in themselves be unreliable.
To adopt a well known maxim of computer programming: ‘GIGO’ (Garbage
In, Garbage Out) means that it is absolutely essential that you, the ana-
lyst, be able to understand the underlying quality of the information
you are incorporating into your financial projections model and accord-
ingly understand the inherent shortcomings of the data as well as the
projection model.
Indeed, the main value of projections may not be as a forecasting tool
but as a due diligence tool to ensure, in the event your bank is sued for
negligence, that ‘prudent lending principles’ using ‘established financial
analysis techniques’ were ‘diligently adhered to’, and that the finger of
blame can thus move on, during the witch hunt, to the auditors of the
company’s financial statements!
Finally, while the use of sophisticated software packages which produce
forecasts save time, you should understand how they work. You don’t
have to be a computer programmer, but you should at least know
whether, for example, if you lower or raise debt in a company’s balance
sheet, will the changes arising in interest expenses be calculated by the
model and accordingly inserted in the profit and loss statement or not?
Another example is a case where you base the level of accounts receiv-
able on sales. If you decide to change the sales growth assumption, do
you have to adjust accounts receivable accordingly on the balance sheet,
or does the computer model do so automatically?
While computer models are accurate and save time, you should at least
understand how the model works so that you are able to answer any
trick questions your enemies in the credit committee may throw at you.
Cash flow forecasting of financial statements 155
Chapter self-test
1. Projections are useful for:
(a) Predicting future company performance
(b) Identifying a company’s sensitive financial areas
(c) Predicting bankruptcy
(d) Identifying potential financial problems
(e) Giving clues to a company’s ability to repay debt
2. A company is expected to repay a large loan in semi annual
instalments over a period of five years. The expected source of
repayment would normally be:
(a) The company’s levels of cash
(b) The company’s finished goods in inventory
(c) Accounts payable
(d) Interest income
(e) Cash flow from operations
3. What is the importance of net worth in cash flow analysis?
(a) It indicates the company’s ability to repay a loan
(b) It indicates financial strength
(c) It is used in calculating gearing
(d) It indicates management effectiveness
(e) None of the above
4. CF analysis differs from profit analysis in that:
(a) It is harder to predict
(b) Profit can be positive while CF can be negative, meaning the
company may experience debt repayment problems
(c) It is more precise than profit analysis
(d) It can be used to predict gearing
(e) It accounts for funds flows other than profit
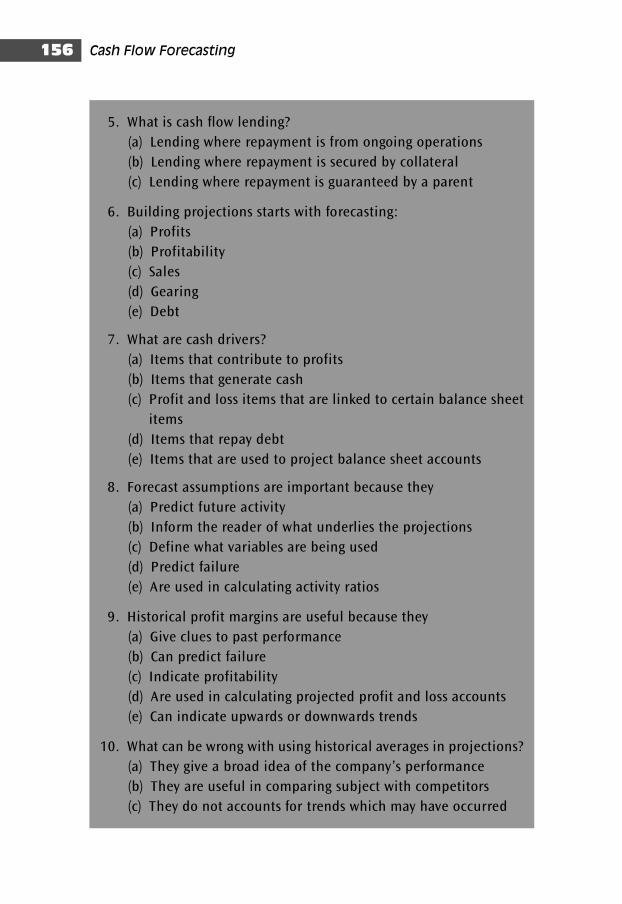
Cash Flow Forecasting156
5. What is cash flow lending?
(a) Lending where repayment is from ongoing operations
(b) Lending where repayment is secured by collateral
(c) Lending where repayment is guaranteed by a parent
6. Building projections starts with forecasting:
(a) Profits
(b) Profitability
(c) Sales
(d) Gearing
(e) Debt
7. What are cash drivers?
(a) Items that contribute to profits
(b) Items that generate cash
(c) Profit and loss items that are linked to certain balance sheet
items
(d) Items that repay debt
(e) Items that are used to project balance sheet accounts
8. Forecast assumptions are important because they
(a) Predict future activity
(b) Inform the reader of what underlies the projections
(c) Define what variables are being used
(d) Predict failure
(e) Are used in calculating activity ratios
9. Historical profit margins are useful because they
(a) Give clues to past performance
(b) Can predict failure
(c) Indicate profitability
(d) Are used in calculating projected profit and loss accounts
(e) Can indicate upwards or downwards trends
10. What can be wrong with using historical averages in projections?
(a) They give a broad idea of the company’s performance
(b) They are useful in comparing subject with competitors
(c) They do not accounts for trends which may have occurred
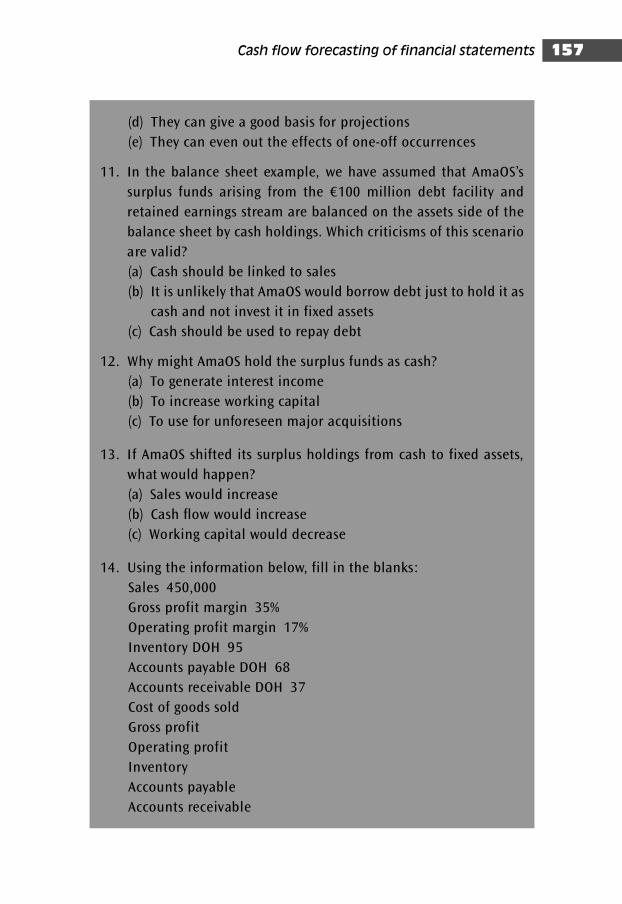
Cash flow forecasting of financial statements 157
(d) They can give a good basis for projections
(e) They can even out the effects of one-off occurrences
11. In the balance sheet example, we have assumed that AmaOS’s
surplus funds arising from the €100 million debt facility and
retained earnings stream are balanced on the assets side of the
balance sheet by cash holdings. Which criticisms of this scenario
are valid?
(a) Cash should be linked to sales
(b) It is unlikely that AmaOS would borrow debt just to hold it as
cash and not invest it in fixed assets
(c) Cash should be used to repay debt
12. Why might AmaOS hold the surplus funds as cash?
(a) To generate interest income
(b) To increase working capital
(c) To use for unforeseen major acquisitions
13. If AmaOS shifted its surplus holdings from cash to fixed assets,
what would happen?
(a) Sales would increase
(b) Cash flow would increase
(c) Working capital would decrease
14. Using the information below, fill in the blanks:
Sales 450,000
Gross profit margin 35%
Operating profit margin 17%
Inventory DOH 95
Accounts payable DOH 68
Accounts receivable DOH 37
Cost of goods sold
Gross profit
Operating profit
Inventory
Accounts payable
Accounts receivable
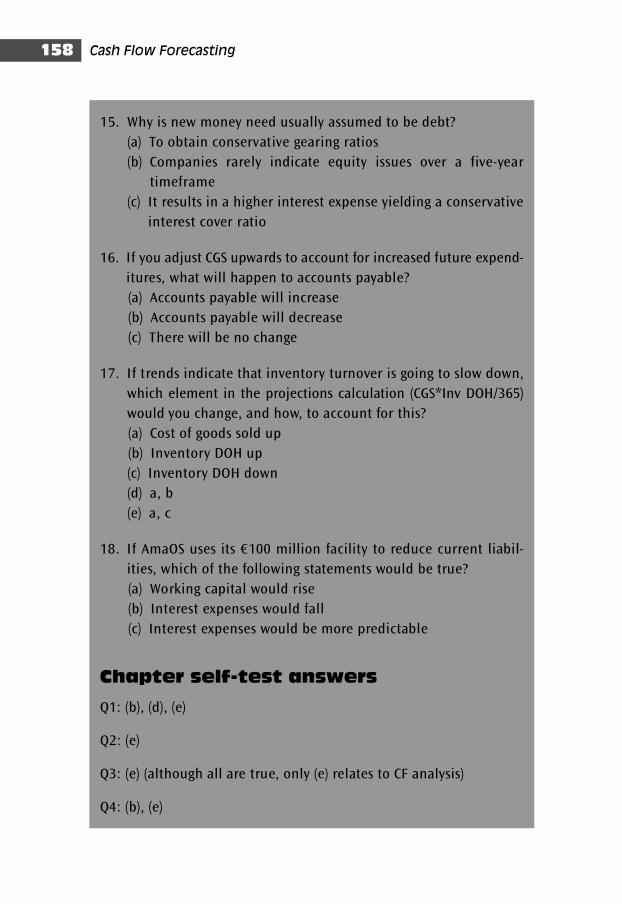
Cash Flow Forecasting158
15. Why is new money need usually assumed to be debt?
(a) To obtain conservative gearing ratios
(b) Companies rarely indicate equity issues over a five-year
timeframe
(c) It results in a higher interest expense yielding a conservative
interest cover ratio
16. If you adjust CGS upwards to account for increased future expend-
itures, what will happen to accounts payable?
(a) Accounts payable will increase
(b) Accounts payable will decrease
(c) There will be no change
17. If trends indicate that inventory turnover is going to slow down,
which element in the projections calculation (CGS*Inv DOH/365)
would you change, and how, to account for this?
(a) Cost of goods sold up
(b) Inventory DOH up
(c) Inventory DOH down
(d) a, b
(e) a, c
18. If AmaOS uses its €100 million facility to reduce current liabil-
ities, which of the following statements would be true?
(a) Working capital would rise
(b) Interest expenses would fall
(c) Interest expenses would be more predictable
Chapter self-test answers
Q1: (b), (d), (e)
Q2: (e)
Q3: (e) (although all are true, only (e) relates to CF analysis)
Q4: (b), (e)
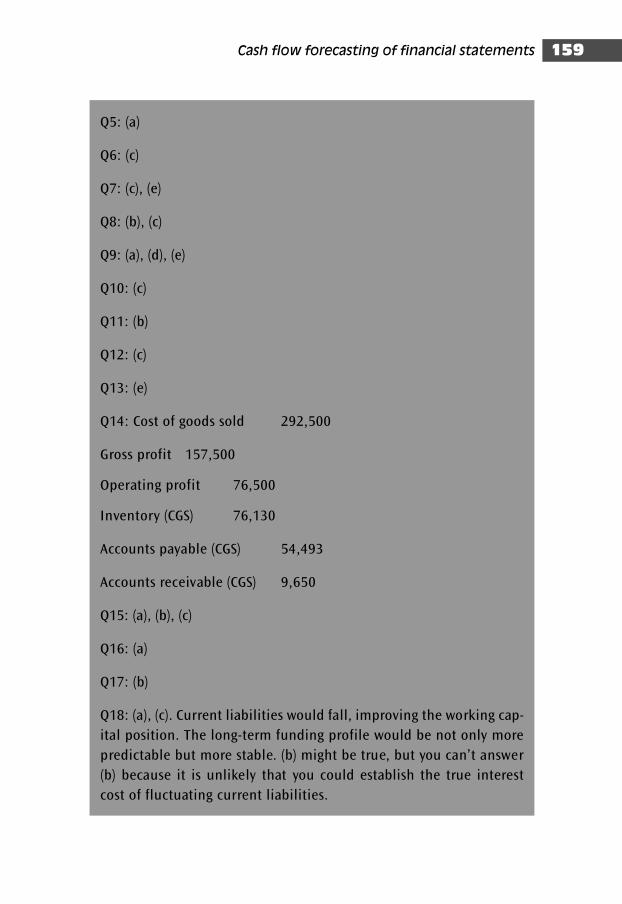
Cash flow forecasting of financial statements 159
Q5: (a)
Q6: (c)
Q7: (c), (e)
Q8: (b), (c)
Q9: (a), (d), (e)
Q10: (c)
Q11: (b)
Q12: (c)
Q13: (e)
Q14: Cost of goods sold 292,500
Gross profit 157,500
Operating profit 76,500
Inventory (CGS) 76,130
Accounts payable (CGS) 54,493
Accounts receivable (CGS) 9,650
Q15: (a), (b), (c)
Q16: (a)
Q17: (b)
Q18: (a), (c). Current liabilities would fall, improving the working cap-
ital position. The long-term funding profile would be not only more
predictable but more stable. (b) might be true, but you can’t answer
(b) because it is unlikely that you could establish the true interest
cost of fluctuating current liabilities.
Chapter 5
Cash flow forecasting ofproject finance
Introduction
In the previous section we looked at how to build projected financial
statements based on historical financial statements, and in turn use the
cash flow statement generated by the spreadsheet to undertake an
analysis about the borrower’s future ability to repay credit facilities. This
exercise in turn entailed mastering various supporting component tech-
niques such as net sales projections, historical averages of ratios, manip-
ulating ratios, constructing debt runoff schedules, and making assumptions
about allocation of new money needs. All this is useful when looking at
a company with a historical track record.
There are other scenarios, however, that require cash flow projection
techniques – for example, a merger of two companies, or the case of cre-
ating a special purpose vehicle to build a large-scale construction pro-
ject such as a metro system, airport, road or dam. Here we are also
interested in the use of projections, for example in understanding the
future condition of an entity that a lender may be presently considering
extending finance to. In this case, the key importance in preparing pro-
jections is not only to assess the inherent credit risk but also how to
enhance that risk due to judicious structuring of the financing facility
and identification of negotiating points to enhance that security further.
The underlying data and focus of this analysis will therefore be quite
unlike that in the preceding chapter, and the analytical and construction
techniques will be significantly different.
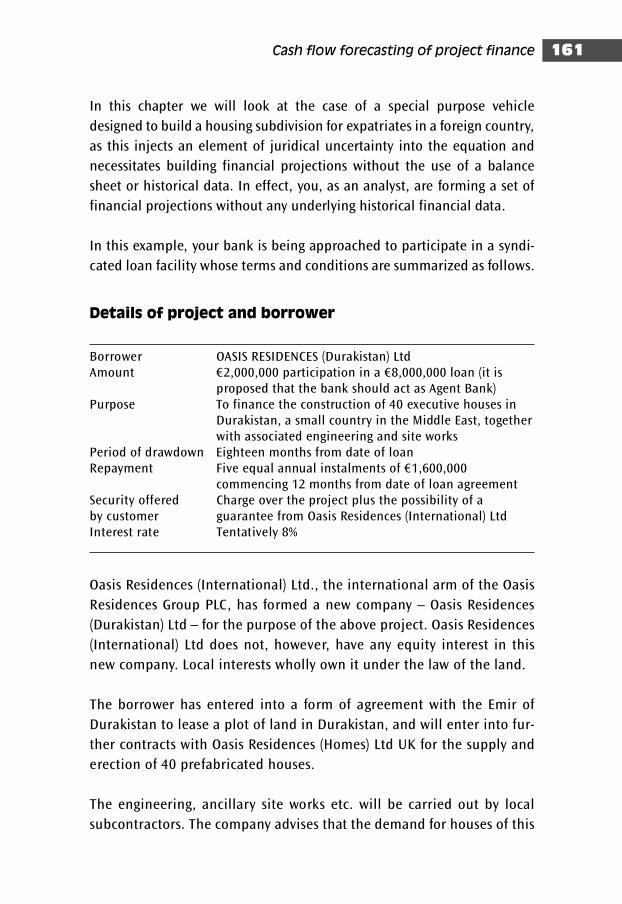
In this chapter we will look at the case of a special purpose vehicle
designed to build a housing subdivision for expatriates in a foreign country,
as this injects an element of juridical uncertainty into the equation and
necessitates building financial projections without the use of a balance
sheet or historical data. In effect, you, as an analyst, are forming a set of
financial projections without any underlying historical financial data.
In this example, your bank is being approached to participate in a syndi-
cated loan facility whose terms and conditions are summarized as follows.
Details of project and borrower
Borrower OASIS RESIDENCES (Durakistan) LtdAmount €2,000,000 participation in a €8,000,000 loan (it is
proposed that the bank should act as Agent Bank)Purpose To finance the construction of 40 executive houses in
Durakistan, a small country in the Middle East, togetherwith associated engineering and site works
Period of drawdown Eighteen months from date of loanRepayment Five equal annual instalments of €1,600,000
commencing 12 months from date of loan agreementSecurity offered Charge over the project plus the possibility of a by customer guarantee from Oasis Residences (International) LtdInterest rate Tentatively 8%
Oasis Residences (International) Ltd., the international arm of the Oasis
Residences Group PLC, has formed a new company – Oasis Residences
(Durakistan) Ltd – for the purpose of the above project. Oasis Residences
(International) Ltd does not, however, have any equity interest in this
new company. Local interests wholly own it under the law of the land.
The borrower has entered into a form of agreement with the Emir of
Durakistan to lease a plot of land in Durakistan, and will enter into fur-
ther contracts with Oasis Residences (Homes) Ltd UK for the supply and
erection of 40 prefabricated houses.
The engineering, ancillary site works etc. will be carried out by local
subcontractors. The company advises that the demand for houses of this
Cash flow forecasting of project finance 161

nature from international companies operating in Durakistan for their
expatriate staff is strong. In view of the serious shortage of accommodation
in the area, no difficulty is foreseen in letting the houses; in fact, a number
of Letters of Intent to lease the houses are already being negotiated.
Repayment of the loan will come from the rental income, after deduc-
tion of overheads, payments under the Head Lease, etc.
The Oasis Residences Group is a good customer of the bank, but the
bank’s General Management Committee has recommended that further
exposure should be on a secured basis only. The legal opinion and cash
flow have been obtained, and extracts are reproduced here.
The following legal opinion has been received from the bank’s lawyer:
The ‘Head Lease’ of the land constitutes an agreement whereby the
use of the land, and all proceeds there from, are granted by the lessor
to Oasis Residences (Durakistan) Ltd for a period of ten years. Oasis
Residences (Durakistan) Ltd have an obligation under the agreement
to complete the housing project up to local building standards within
period of two years at a cost of not less than €8 million. This is to
ensure sufficient expenditure in Durakistan and on the project. If it
does not comply with this obligation within the specified two years,
the lessor has the right to terminate the agreement and reclaim the
land. At the end of the ten-year lease period, ownership of the land,
the housing and all proceeds there from revert to the lessor.
This is necessarily a rather artificial agreement when considered in
the light of the whole transaction, and we feel that we should add
the following general comments. The Law of the State of Durakistan
relating to the business of contracts of works requires that all com-
panies must either be wholly owned by a Durakistani national or be
granted a Durakistani decree of exemption before it can operate
in this field. At the present the authorities are not issuing such
decrees, and so the majority of construction companies are operat-
ing by supplying a Durakistani company with management and
expert construction advice. In practice, this means that their pos-
ition is exactly the same as set out in the agreement. This fact is fully
Cash Flow Forecasting162

Cash flow forecasting of project finance 163
accepted by the authorities, who have never interfered with or ques-
tioned this practice as it is appreciated that such expertise is neces-
sary, but at the same time the ultimate responsibility or the works
remain with a Durakistani as required by the relevant legislation. In
this case, the authorities are less likely to investigate this work as it is
not their practice to interfere in an individual Durakistani’s affairs.
In conclusion, therefore, we would comment that, although some
vestige of doubt must remain as such practice has never been brought
before the commercial court and has not been directly approved in
all the circumstances, we consider that in practice this is a satisfac-
tory arrangement.
The agent bank has provided summary financial statements for the project.
Cash flow forecasting
Step one
Before committing to financing, you are asked to identify the major risks
of the project. In particular:
■ what questions would you ask about the assumed cash flow figures
(see Table 5.1)?
■ what relevant general points can be made?
Observations
■ No rental increases or variable testing have been factored into the model
■ No occupancy rates or variable testing have been factored into the
model
■ There is no segregation of operational and financial expenses
■ There is no variable testing of interest expenses
■ There is no ability to calculate financial rations
■ First indications indicate a weak (negative) cash flow, but it is difficult
to see this in terms of total cash inflows
■ This is basically a rudimentary and poorly designed set of projections,
although there is enough information present to undertake a more
thorough analysis.
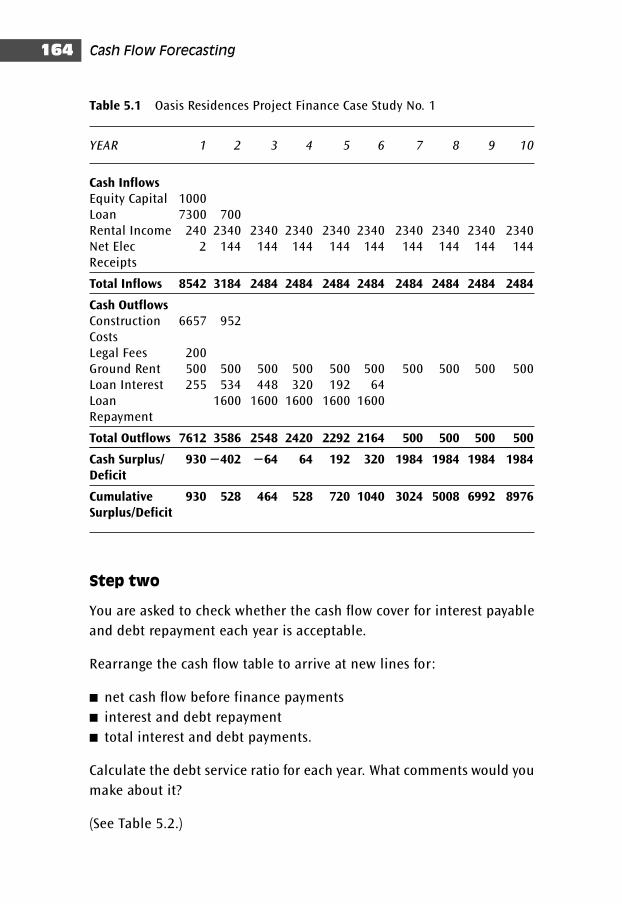
Cash Flow Forecasting164
Step two
You are asked to check whether the cash flow cover for interest payable
and debt repayment each year is acceptable.
Rearrange the cash flow table to arrive at new lines for:
■ net cash flow before finance payments
■ interest and debt repayment
■ total interest and debt payments.
Calculate the debt service ratio for each year. What comments would you
make about it?
(See Table 5.2.)
Table 5.1 Oasis Residences Project Finance Case Study No. 1
YEAR 1 2 3 4 5 6 7 8 9 10
Cash InflowsEquity Capital 1000Loan 7300 700Rental Income 240 2340 2340 2340 2340 2340 2340 2340 2340 2340Net Elec 2 144 144 144 144 144 144 144 144 144Receipts
Total Inflows 8542 3184 2484 2484 2484 2484 2484 2484 2484 2484
Cash OutflowsConstruction 6657 952CostsLegal Fees 200Ground Rent 500 500 500 500 500 500 500 500 500 500Loan Interest 255 534 448 320 192 64Loan 1600 1600 1600 1600 1600Repayment
Total Outflows 7612 3586 2548 2420 2292 2164 500 500 500 500
Cash Surplus/ 930 �402 �64 64 192 320 1984 1984 1984 1984Deficit
Cumulative 930 528 464 528 720 1040 3024 5008 6992 8976Surplus/Deficit
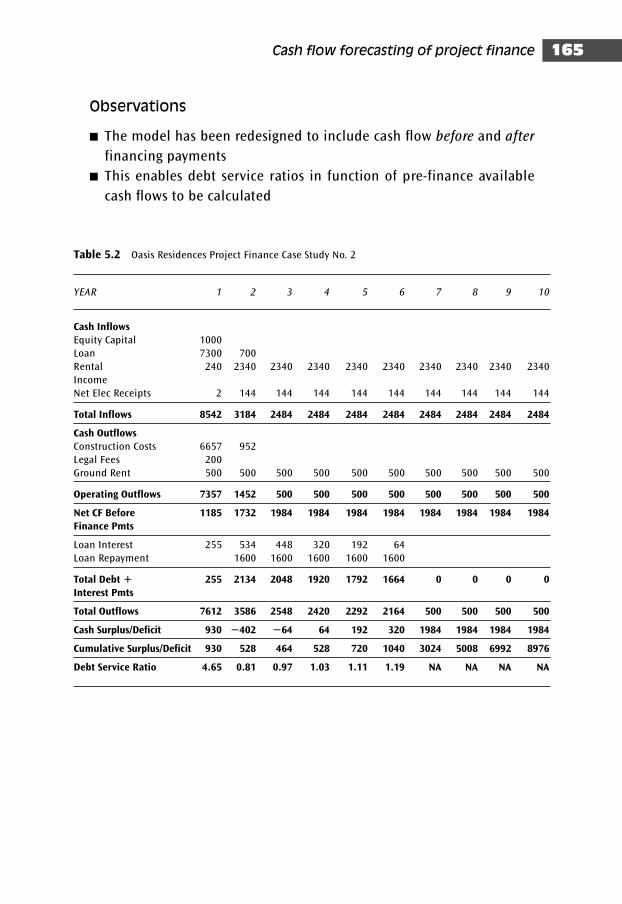
Cash flow forecasting of project finance 165
Observations
■ The model has been redesigned to include cash flow before and after
financing payments
■ This enables debt service ratios in function of pre-finance available
cash flows to be calculated
Table 5.2 Oasis Residences Project Finance Case Study No. 2
YEAR 1 2 3 4 5 6 7 8 9 10
Cash Inflows
Equity Capital 1000
Loan 7300 700
Rental 240 2340 2340 2340 2340 2340 2340 2340 2340 2340
Income
Net Elec Receipts 2 144 144 144 144 144 144 144 144 144
Total Inflows 8542 3184 2484 2484 2484 2484 2484 2484 2484 2484
Cash Outflows
Construction Costs 6657 952
Legal Fees 200
Ground Rent 500 500 500 500 500 500 500 500 500 500
Operating Outflows 7357 1452 500 500 500 500 500 500 500 500
Net CF Before 1185 1732 1984 1984 1984 1984 1984 1984 1984 1984
Finance Pmts
Loan Interest 255 534 448 320 192 64
Loan Repayment 1600 1600 1600 1600 1600
Total Debt � 255 2134 2048 1920 1792 1664 0 0 0 0
Interest Pmts
Total Outflows 7612 3586 2548 2420 2292 2164 500 500 500 500
Cash Surplus/Deficit 930 �402 �64 64 192 320 1984 1984 1984 1984
Cumulative Surplus/Deficit 930 528 464 528 720 1040 3024 5008 6992 8976
Debt Service Ratio 4.65 0.81 0.97 1.03 1.11 1.19 NA NA NA NA
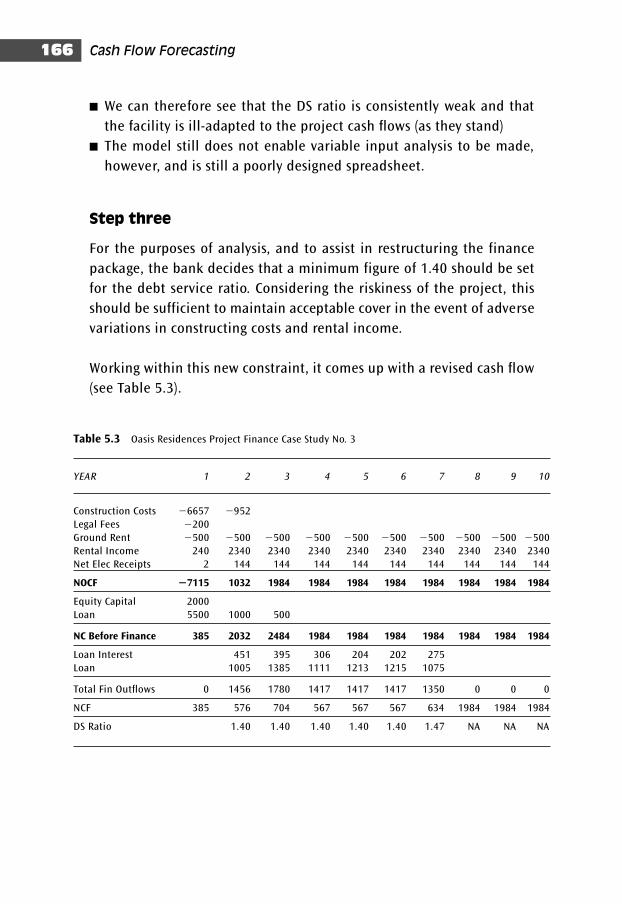
Cash Flow Forecasting166
■ We can therefore see that the DS ratio is consistently weak and that
the facility is ill-adapted to the project cash flows (as they stand)
■ The model still does not enable variable input analysis to be made,
however, and is still a poorly designed spreadsheet.
Step three
For the purposes of analysis, and to assist in restructuring the finance
package, the bank decides that a minimum figure of 1.40 should be set
for the debt service ratio. Considering the riskiness of the project, this
should be sufficient to maintain acceptable cover in the event of adverse
variations in constructing costs and rental income.
Working within this new constraint, it comes up with a revised cash flow
(see Table 5.3).
Table 5.3 Oasis Residences Project Finance Case Study No. 3
YEAR 1 2 3 4 5 6 7 8 9 10
Construction Costs �6657 �952
Legal Fees �200
Ground Rent �500 �500 �500 �500 �500 �500 �500 �500 �500 �500
Rental Income 240 2340 2340 2340 2340 2340 2340 2340 2340 2340
Net Elec Receipts 2 144 144 144 144 144 144 144 144 144
NOCF �7115 1032 1984 1984 1984 1984 1984 1984 1984 1984
Equity Capital 2000
Loan 5500 1000 500
NC Before Finance 385 2032 2484 1984 1984 1984 1984 1984 1984 1984
Loan Interest 451 395 306 204 202 275
Loan 1005 1385 1111 1213 1215 1075
Total Fin Outflows 0 1456 1780 1417 1417 1417 1350 0 0 0
NCF 385 576 704 567 567 567 634 1984 1984 1984
DS Ratio 1.40 1.40 1.40 1.40 1.40 1.47 NA NA NA
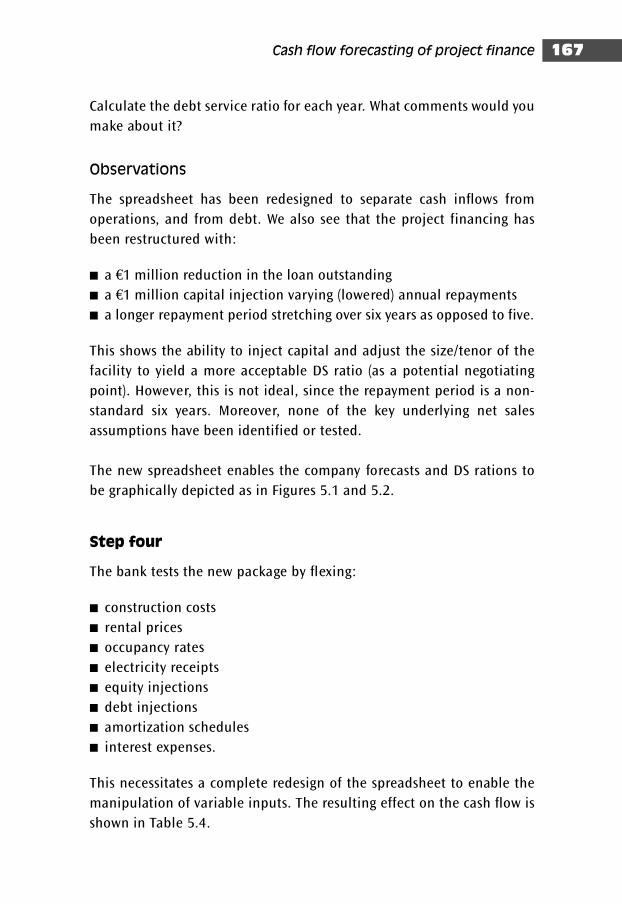
Cash flow forecasting of project finance 167
Calculate the debt service ratio for each year. What comments would you
make about it?
Observations
The spreadsheet has been redesigned to separate cash inflows from
operations, and from debt. We also see that the project financing has
been restructured with:
■ a €1 million reduction in the loan outstanding
■ a €1 million capital injection varying (lowered) annual repayments
■ a longer repayment period stretching over six years as opposed to five.
This shows the ability to inject capital and adjust the size/tenor of the
facility to yield a more acceptable DS ratio (as a potential negotiating
point). However, this is not ideal, since the repayment period is a non-
standard six years. Moreover, none of the key underlying net sales
assumptions have been identified or tested.
The new spreadsheet enables the company forecasts and DS rations to
be graphically depicted as in Figures 5.1 and 5.2.
Step four
The bank tests the new package by flexing:
■ construction costs
■ rental prices
■ occupancy rates
■ electricity receipts
■ equity injections
■ debt injections
■ amortization schedules
■ interest expenses.
This necessitates a complete redesign of the spreadsheet to enable the
manipulation of variable inputs. The resulting effect on the cash flow is
shown in Table 5.4.
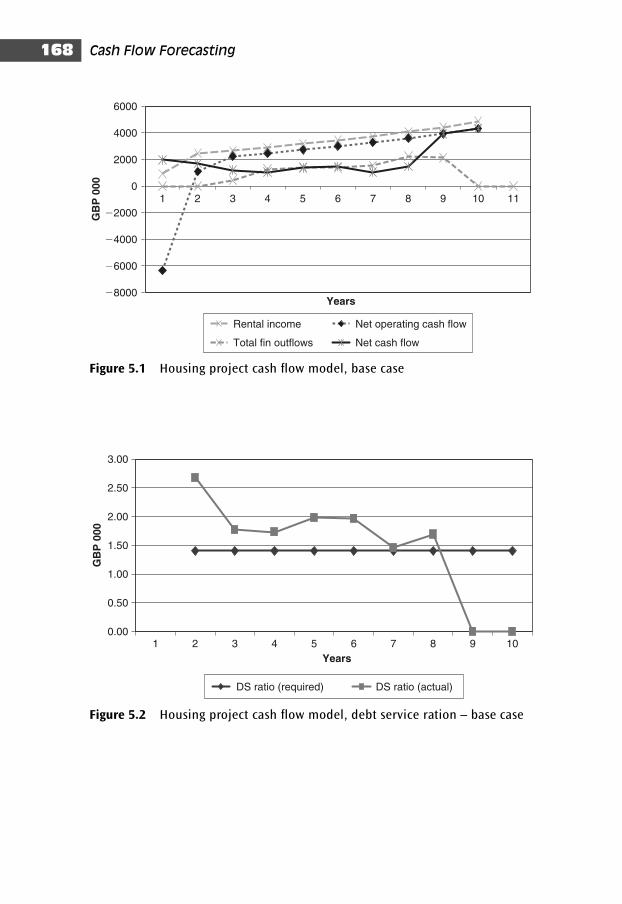
Cash Flow Forecasting168
�8000
�6000
�4000
�2000
0
2000
4000
6000
1 3 4 5 6 7 8 9 10 11
Years
GB
P 0
00
Rental income Net operating cash flow
Total fin outflows Net cash flow
2
Figure 5.1 Housing project cash flow model, base case
0.00
0.50
1.00
1.50
2.00
2.50
3.00
1 9 10
Years
GB
P 0
00
DS ratio (required) DS ratio (actual)
2 3 4 5 6 7 8
Figure 5.2 Housing project cash flow model, debt service ration – base case
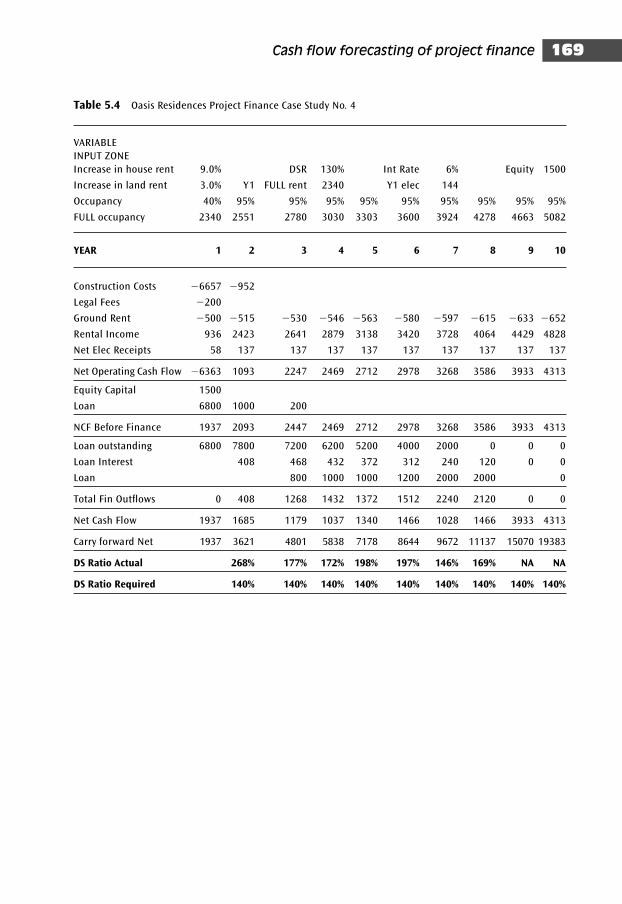
Cash flow forecasting of project finance 169
Table 5.4 Oasis Residences Project Finance Case Study No. 4
VARIABLE
INPUT ZONE
Increase in house rent 9.0% DSR 130% Int Rate 6% Equity 1500
Increase in land rent 3.0% Y1 FULL rent 2340 Y1 elec 144
Occupancy 40% 95% 95% 95% 95% 95% 95% 95% 95% 95%
FULL occupancy 2340 2551 2780 3030 3303 3600 3924 4278 4663 5082
YEAR 1 2 3 4 5 6 7 8 9 10
Construction Costs �6657 �952
Legal Fees �200
Ground Rent �500 �515 �530 �546 �563 �580 �597 �615 �633 �652
Rental Income 936 2423 2641 2879 3138 3420 3728 4064 4429 4828
Net Elec Receipts 58 137 137 137 137 137 137 137 137 137
Net Operating Cash Flow �6363 1093 2247 2469 2712 2978 3268 3586 3933 4313
Equity Capital 1500
Loan 6800 1000 200
NCF Before Finance 1937 2093 2447 2469 2712 2978 3268 3586 3933 4313
Loan outstanding 6800 7800 7200 6200 5200 4000 2000 0 0 0
Loan Interest 408 468 432 372 312 240 120 0 0
Loan 800 1000 1000 1200 2000 2000 0
Total Fin Outflows 0 408 1268 1432 1372 1512 2240 2120 0 0
Net Cash Flow 1937 1685 1179 1037 1340 1466 1028 1466 3933 4313
Carry forward Net 1937 3621 4801 5838 7178 8644 9672 11137 15070 19383
DS Ratio Actual 268% 177% 172% 198% 197% 146% 169% NA NA
DS Ratio Required 140% 140% 140% 140% 140% 140% 140% 140% 140%
Comment on the impact on the bank and on shareholders. Are any
further measures needed?
Observation
It is obvious that the earlier three spreadsheets were poorly designed
and did not enable a proper sensitivity analysis to be made. Accordingly,
the final spreadsheet has been completely redesigned with the following
innovations:
■ All input variables are colour-coded to the appropriate area of the
spreadsheet.
■ All input variables are grouped at the top of the spreadsheet in a
‘dashboard format’ so that individual variables can be changed and
the net effect seen in the spreadsheet.
■ Key financial indicators are linked to graphs that provide a clear view
of the project cash flow dynamics.
■ Rental income in the previous models exhibited no increases for ten
years! The new spreadsheet sensitizes the rental income stream to
two key elements – rental increases and occupancy rates.
■ The occupancy rates can therefore build up more slowly and rental
increases be phased in over time. This has a dramatic effect on project
cash flow and the profits accumulated during the ten-year timeframe.
■ Electricity receipts are linked the occupancy rates.
■ Land rent is subject to an annual increase.
■ Equity can be adjusted.
■ Outstanding debt is subject to variable interest rate changes.
Such a model enables the identification of all key variables and adop-
tion of measures to improve the security of the facility, such as:
■ negotiating rent increases in the tenancy contracts
■ obtaining bloc commitments from company rentals
■ planning and identifying potential vacancies
■ understanding how much discount can be offered without excessively
adverse impact on project cash flows
Cash Flow Forecasting170
■ the advantages in setting up an escrow account in order to monitor
cash flows and hold portions of the accumulated surplus as security to
compensate for the legal ambiguity of property rights in Durakistan.
The end result is that it is possible to construct a cash flow model where
the FP ratio is entirely adequate. The next step of course is negotiating a
facility which is accepted by the borrower and is sufficiently well struc-
tured to meet with interest in the syndication marketplace.
Conclusion
This project finance forecasting model illustrates several key points:
1 The need to be able to construct projections when no financial state-
ments are available
2 The need to identify key project variables
3 The need to select the appropriate indices to measure performance
4 The need to consider carefully the above two points in designing a
spreadsheet that incorporates all relevant elements of the project and
enables the manipulation and testing of key variables.
Cash flow forecasting of project finance 171
Chapter 6
Pro forma forecastsusing AMADEUSelectronic databases
Subscription services via the Internet provide information on nearly
anything anybody might need. Such information can be particularly
useful to see what a company has been doing since its last published
annual report. For example, a company could have changed its corporate
structure, dismissed certain members of management, sold or acquired a
subsidiary, entered into an alliance or cooperative agreement with a com-
petitor to market or distribute a product, or availed itself of the services
of a rival bank in closing a transaction.
One such on-line database is AMADEUS. AMADEUS (Analyse MAjor
Database from EUropean Sources) is a comprehensive, pan-European
database containing financial information on 7 million public and
private companies in 38 European countries. It combines data from over
30 information providers (IPs). AMADEUS is a modular product; you can
choose the level of coverage that you require – the top 250,000 com-
panies, the top 1.5 million, or all companies. AMADEUS is available on
CD/DVD-ROM, as an intranet feed and on the Internet.
AMADEUS is exclusive to BvDEP and its information providers, and is not
available via any other platform. BvDEP identifies the best source of
information in each country and applies strict inclusion criteria to
prevent any bias in coverage.
Pro forma forecasts using AMADEUS electronic databases 173
A standard company report includes:
■ twenty-two balance sheet items
■ twenty-five profit and loss account items
■ twenty-six ratios
■ descriptive information, including trade description and activity codes
(NACE 1, NAICS or US SIC can be used across the database)
■ ownership information, which is researched by BvD’s own team of
consultants
■ Reuters’ news, security and price information
■ links to an executive report with integral graphs
■ a report comparing the financials of the company’s default peer group.
In addition to the existing ratios you can also create your own, which you
can display in the reports and also use in your searches and analyses.
Each company is part of a default peer group based on its activity codes,
and integral graphs illustrate its position in this peer group. A company
tree diagram instantly illustrates the structure of the group.
The advantage of AMADEUS is that it provides the ability to undertake peer
group analysis. Typically it comes to the fore when there is a wealth of data
to work with. The financial ratios calculated on the spreadsheet can be
compared with published data, such as lists of industry standard ratios.
The problem here is that you do not know how the spreadsheets and
resulting calculations from the published sources have been arrived at,
which would render comparison between the published work and the
analysts’ spreadsheet meaningful.
The screencap in Figure 6.1 illustrates the company search mechanism.
Such on-line databases are rapidly supplanting traditional paper-based
annual reports and idiosyncratic and heterogeneous spreadsheet models.
The on-line database can be accessed by web browser, and reports con-
verted into exportable RTF or XL format for subsequent manipulation.
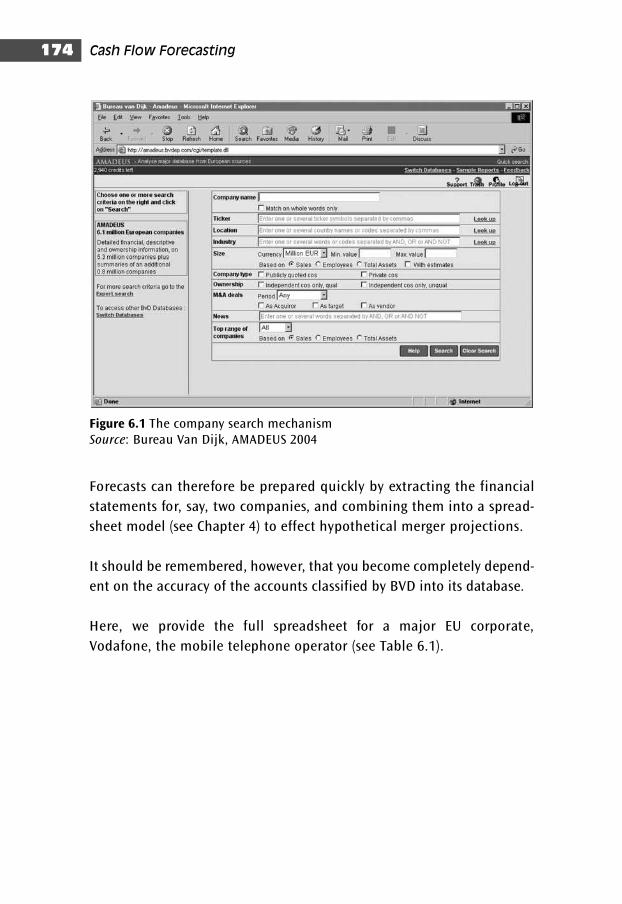
Cash Flow Forecasting174
Forecasts can therefore be prepared quickly by extracting the financial
statements for, say, two companies, and combining them into a spread-
sheet model (see Chapter 4) to effect hypothetical merger projections.
It should be remembered, however, that you become completely depend-
ent on the accuracy of the accounts classified by BVD into its database.
Here, we provide the full spreadsheet for a major EU corporate,
Vodafone, the mobile telephone operator (see Table 6.1).
Figure 6.1 The company search mechanismSource: Bureau Van Dijk, AMADEUS 2004
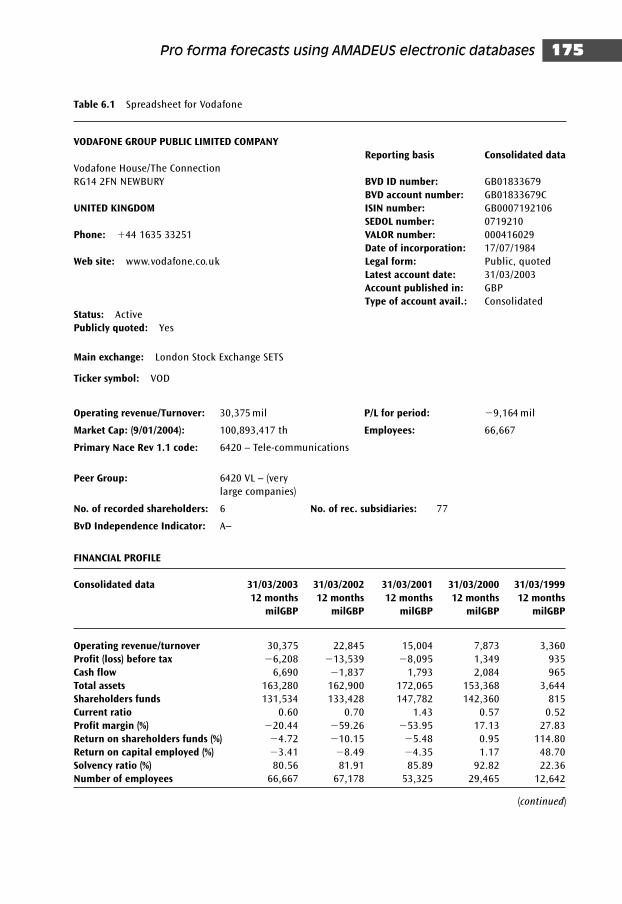
Pro forma forecasts using AMADEUS electronic databases 175
Table 6.1 Spreadsheet for Vodafone
VODAFONE GROUP PUBLIC LIMITED COMPANY
Reporting basis Consolidated data
Vodafone House/The Connection
RG14 2FN NEWBURY BVD ID number: GB01833679
BVD account number: GB01833679C
UNITED KINGDOM ISIN number: GB0007192106
SEDOL number: 0719210
Phone: �44 1635 33251 VALOR number: 000416029
Date of incorporation: 17/07/1984
Web site: www.vodafone.co.uk Legal form: Public, quoted
Latest account date: 31/03/2003
Account published in: GBP
Type of account avail.: Consolidated
Status: Active
Publicly quoted: Yes
Main exchange: London Stock Exchange SETS
Ticker symbol: VOD
Operating revenue/Turnover: 30,375 mil P/L for period: �9,164 mil
Market Cap: (9/01/2004): 100,893,417 th Employees: 66,667
Primary Nace Rev 1.1 code: 6420 – Tele-communications
Peer Group: 6420 VL – (very
large companies)
No. of recorded shareholders: 6 No. of rec. subsidiaries: 77
BvD Independence Indicator: A–
FINANCIAL PROFILE
Consolidated data 31/03/2003 31/03/2002 31/03/2001 31/03/2000 31/03/1999
12 months 12 months 12 months 12 months 12 months
milGBP milGBP milGBP milGBP milGBP
Operating revenue/turnover 30,375 22,845 15,004 7,873 3,360
Profit (loss) before tax �6,208 �13,539 �8,095 1,349 935
Cash flow 6,690 �1,837 1,793 2,084 965
Total assets 163,280 162,900 172,065 153,368 3,644
Shareholders funds 131,534 133,428 147,782 142,360 815
Current ratio 0.60 0.70 1.43 0.57 0.52
Profit margin (%) �20.44 �59.26 �53.95 17.13 27.83
Return on shareholders funds (%) �4.72 �10.15 �5.48 0.95 114.80
Return on capital employed (%) �3.41 �8.49 �4.35 1.17 48.70
Solvency ratio (%) 80.56 81.91 85.89 92.82 22.36
Number of employees 66,667 67,178 53,325 29,465 12,642
(continued)
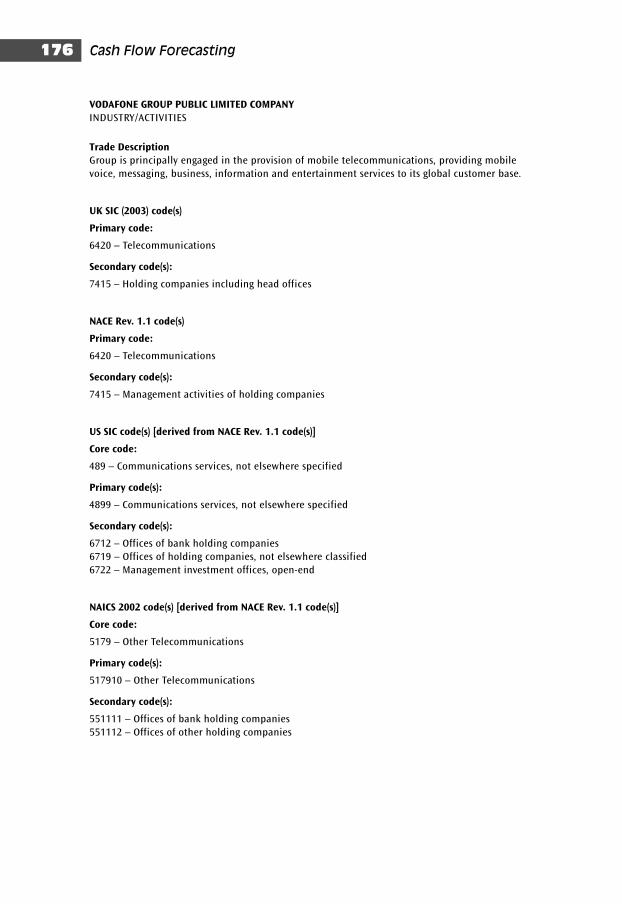
Cash Flow Forecasting176
VODAFONE GROUP PUBLIC LIMITED COMPANY
INDUSTRY/ACTIVITIES
Trade Description
Group is principally engaged in the provision of mobile telecommunications, providing mobile
voice, messaging, business, information and entertainment services to its global customer base.
UK SIC (2003) code(s)
Primary code:
6420 – Telecommunications
Secondary code(s):
7415 – Holding companies including head offices
NACE Rev. 1.1 code(s)
Primary code:
6420 – Telecommunications
Secondary code(s):
7415 – Management activities of holding companies
US SIC code(s) [derived from NACE Rev. 1.1 code(s)]
Core code:
489 – Communications services, not elsewhere specified
Primary code(s):
4899 – Communications services, not elsewhere specified
Secondary code(s):
6712 – Offices of bank holding companies
6719 – Offices of holding companies, not elsewhere classified
6722 – Management investment offices, open-end
NAICS 2002 code(s) [derived from NACE Rev. 1.1 code(s)]
Core code:
5179 – Other Telecommunications
Primary code(s):
517910 – Other Telecommunications
Secondary code(s):
551111 – Offices of bank holding companies
551112 – Offices of other holding companies
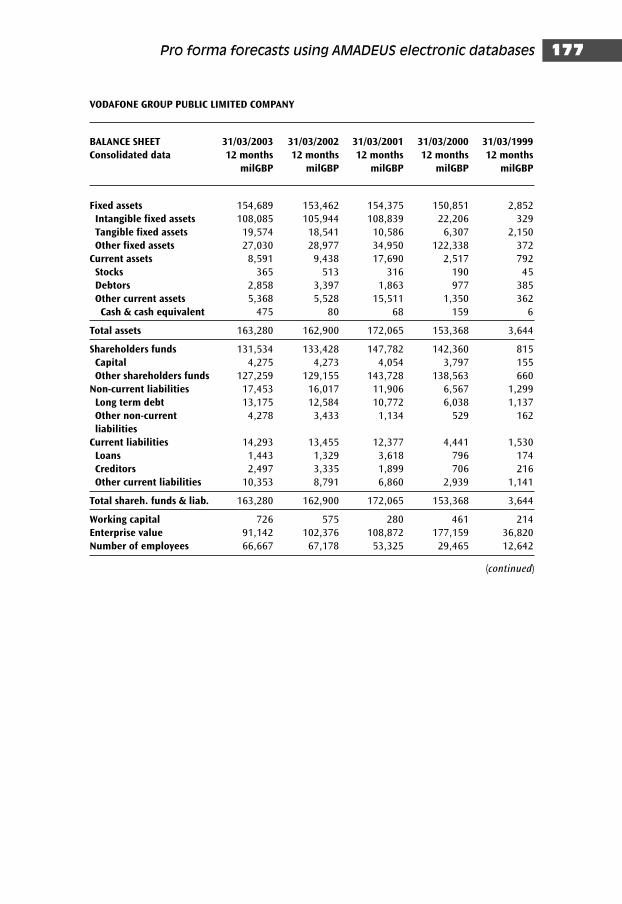
Pro forma forecasts using AMADEUS electronic databases 177
VODAFONE GROUP PUBLIC LIMITED COMPANY
BALANCE SHEET 31/03/2003 31/03/2002 31/03/2001 31/03/2000 31/03/1999
Consolidated data 12 months 12 months 12 months 12 months 12 months
milGBP milGBP milGBP milGBP milGBP
Fixed assets 154,689 153,462 154,375 150,851 2,852
Intangible fixed assets 108,085 105,944 108,839 22,206 329
Tangible fixed assets 19,574 18,541 10,586 6,307 2,150
Other fixed assets 27,030 28,977 34,950 122,338 372
Current assets 8,591 9,438 17,690 2,517 792
Stocks 365 513 316 190 45
Debtors 2,858 3,397 1,863 977 385
Other current assets 5,368 5,528 15,511 1,350 362
Cash & cash equivalent 475 80 68 159 6
Total assets 163,280 162,900 172,065 153,368 3,644
Shareholders funds 131,534 133,428 147,782 142,360 815
Capital 4,275 4,273 4,054 3,797 155
Other shareholders funds 127,259 129,155 143,728 138,563 660
Non-current liabilities 17,453 16,017 11,906 6,567 1,299
Long term debt 13,175 12,584 10,772 6,038 1,137
Other non-current 4,278 3,433 1,134 529 162
liabilities
Current liabilities 14,293 13,455 12,377 4,441 1,530
Loans 1,443 1,329 3,618 796 174
Creditors 2,497 3,335 1,899 706 216
Other current liabilities 10,353 8,791 6,860 2,939 1,141
Total shareh. funds & liab. 163,280 162,900 172,065 153,368 3,644
Working capital 726 575 280 461 214
Enterprise value 91,142 102,376 108,872 177,159 36,820
Number of employees 66,667 67,178 53,325 29,465 12,642
(continued)
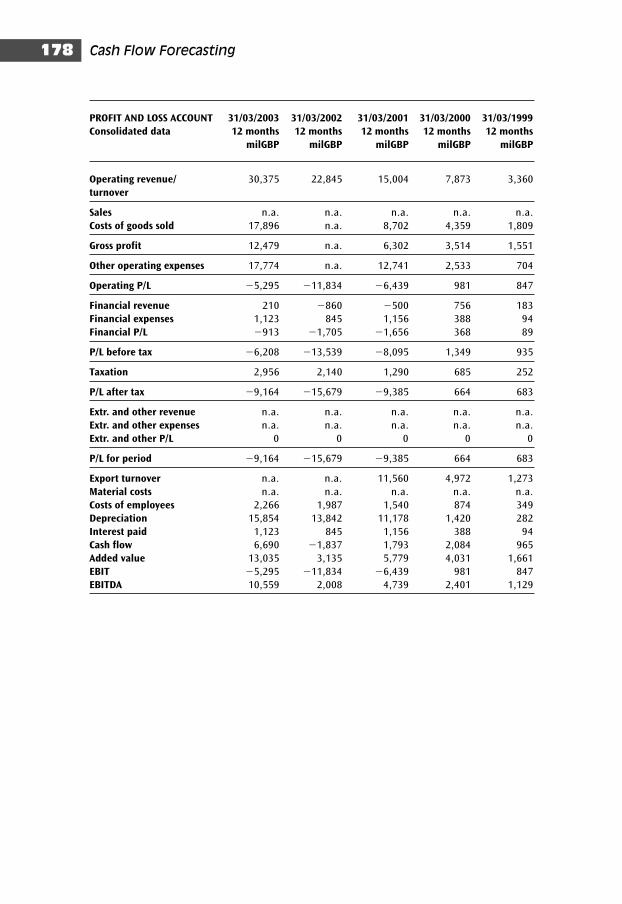
PROFIT AND LOSS ACCOUNT 31/03/2003 31/03/2002 31/03/2001 31/03/2000 31/03/1999
Consolidated data 12 months 12 months 12 months 12 months 12 months
milGBP milGBP milGBP milGBP milGBP
Operating revenue/ 30,375 22,845 15,004 7,873 3,360
turnover
Sales n.a. n.a. n.a. n.a. n.a.
Costs of goods sold 17,896 n.a. 8,702 4,359 1,809
Gross profit 12,479 n.a. 6,302 3,514 1,551
Other operating expenses 17,774 n.a. 12,741 2,533 704
Operating P/L �5,295 �11,834 �6,439 981 847
Financial revenue 210 �860 �500 756 183
Financial expenses 1,123 845 1,156 388 94
Financial P/L �913 �1,705 �1,656 368 89
P/L before tax �6,208 �13,539 �8,095 1,349 935
Taxation 2,956 2,140 1,290 685 252
P/L after tax �9,164 �15,679 �9,385 664 683
Extr. and other revenue n.a. n.a. n.a. n.a. n.a.
Extr. and other expenses n.a. n.a. n.a. n.a. n.a.
Extr. and other P/L 0 0 0 0 0
P/L for period �9,164 �15,679 �9,385 664 683
Export turnover n.a. n.a. 11,560 4,972 1,273
Material costs n.a. n.a. n.a. n.a. n.a.
Costs of employees 2,266 1,987 1,540 874 349
Depreciation 15,854 13,842 11,178 1,420 282
Interest paid 1,123 845 1,156 388 94
Cash flow 6,690 �1,837 1,793 2,084 965
Added value 13,035 3,135 5,779 4,031 1,661
EBIT �5,295 �11,834 �6,439 981 847
EBITDA 10,559 2,008 4,739 2,401 1,129
Cash Flow Forecasting178
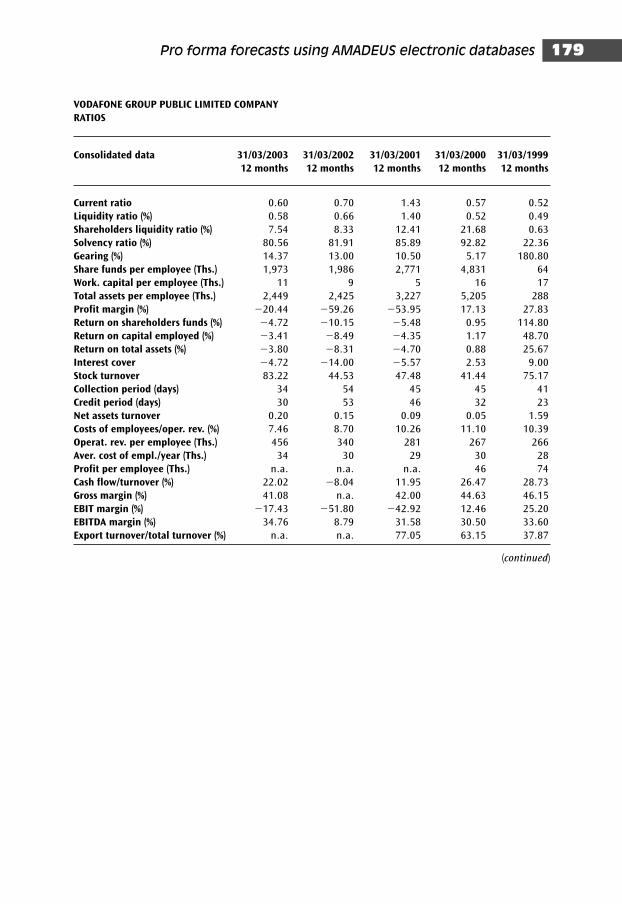
VODAFONE GROUP PUBLIC LIMITED COMPANY
RATIOS
Consolidated data 31/03/2003 31/03/2002 31/03/2001 31/03/2000 31/03/1999
12 months 12 months 12 months 12 months 12 months
Current ratio 0.60 0.70 1.43 0.57 0.52
Liquidity ratio (%) 0.58 0.66 1.40 0.52 0.49
Shareholders liquidity ratio (%) 7.54 8.33 12.41 21.68 0.63
Solvency ratio (%) 80.56 81.91 85.89 92.82 22.36
Gearing (%) 14.37 13.00 10.50 5.17 180.80
Share funds per employee (Ths.) 1,973 1,986 2,771 4,831 64
Work. capital per employee (Ths.) 11 9 5 16 17
Total assets per employee (Ths.) 2,449 2,425 3,227 5,205 288
Profit margin (%) �20.44 �59.26 �53.95 17.13 27.83
Return on shareholders funds (%) �4.72 �10.15 �5.48 0.95 114.80
Return on capital employed (%) �3.41 �8.49 �4.35 1.17 48.70
Return on total assets (%) �3.80 �8.31 �4.70 0.88 25.67
Interest cover �4.72 �14.00 �5.57 2.53 9.00
Stock turnover 83.22 44.53 47.48 41.44 75.17
Collection period (days) 34 54 45 45 41
Credit period (days) 30 53 46 32 23
Net assets turnover 0.20 0.15 0.09 0.05 1.59
Costs of employees/oper. rev. (%) 7.46 8.70 10.26 11.10 10.39
Operat. rev. per employee (Ths.) 456 340 281 267 266
Aver. cost of empl./year (Ths.) 34 30 29 30 28
Profit per employee (Ths.) n.a. n.a. n.a. 46 74
Cash flow/turnover (%) 22.02 �8.04 11.95 26.47 28.73
Gross margin (%) 41.08 n.a. 42.00 44.63 46.15
EBIT margin (%) �17.43 �51.80 �42.92 12.46 25.20
EBITDA margin (%) 34.76 8.79 31.58 30.50 33.60
Export turnover/total turnover (%) n.a. n.a. 77.05 63.15 37.87
(continued)
Pro forma forecasts using AMADEUS electronic databases 179

VODAFONE GROUP PUBLIC LIMITED COMPANY
BOARD MEMBERS AND OFFICERS
Name Function
Peter Bamford Director
Michael Boskin Director
Alec Broers Director
John Buchanan Director
Vittorio Colao Director
Thomas Geitner Director
Paul Hazen Director
Julian Horn-Smith Director
Penny Hughes Director
Kenneth Hydon Director
Ian Maclaurin Director
Arun Sarin Director
David Scholey Director
Jurgen Schrempp Director
Luc Vandevelde Director
Stephen Scott Company Secretary
Auditors
Deloitte & Touche
Cash Flow Forecasting180
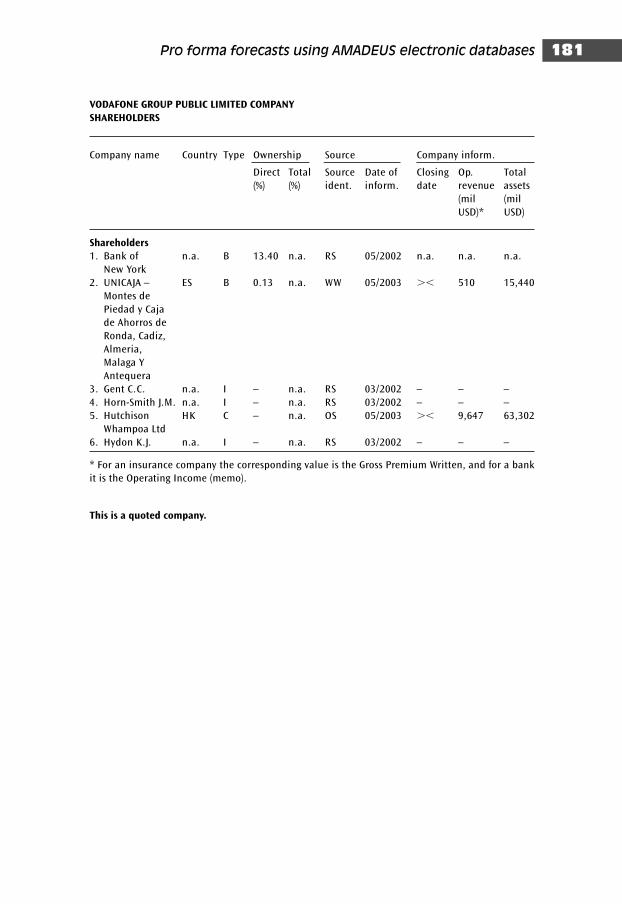
Pro forma forecasts using AMADEUS electronic databases 181
VODAFONE GROUP PUBLIC LIMITED COMPANY
SHAREHOLDERS
Company name Country Type Ownership Source Company inform.
Direct Total Source Date of Closing Op. Total
(%) (%) ident. inform. date revenue assets
(mil (mil
USD)* USD)
Shareholders
1. Bank of n.a. B 13.40 n.a. RS 05/2002 n.a. n.a. n.a.
New York
2. UNICAJA – ES B 0.13 n.a. WW 05/2003 �� 510 15,440
Montes de
Piedad y Caja
de Ahorros de
Ronda, Cadiz,
Almeria,
Malaga Y
Antequera
3. Gent C.C. n.a. I – n.a. RS 03/2002 – – –
4. Horn-Smith J.M. n.a. I – n.a. RS 03/2002 – – –
5. Hutchison HK C – n.a. OS 05/2003 �� 9,647 63,302
Whampoa Ltd
6. Hydon K.J. n.a. I – n.a. RS 03/2002 – – –
* For an insurance company the corresponding value is the Gross Premium Written, and for a bank
it is the Operating Income (memo).
This is a quoted company.
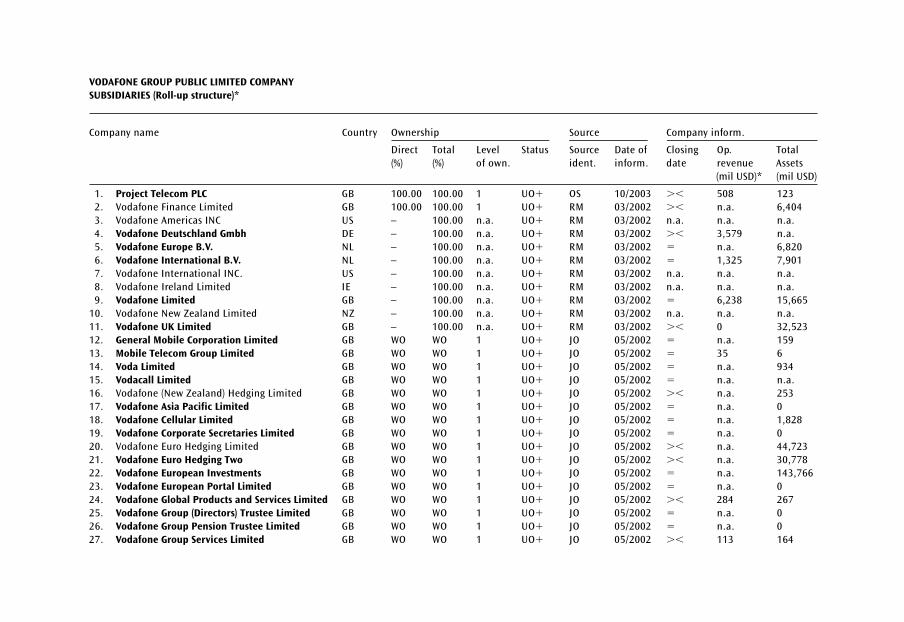
VODAFONE GROUP PUBLIC LIMITED COMPANY
SUBSIDIARIES (Roll-up structure)*
Company name Country Ownership Source Company inform.
Direct Total Level Status Source Date of Closing Op. Total
(%) (%) of own. ident. inform. date revenue Assets
(mil USD)* (mil USD)
1. Project Telecom PLC GB 100.00 100.00 1 UO� OS 10/2003 �� 508 123
2. Vodafone Finance Limited GB 100.00 100.00 1 UO� RM 03/2002 �� n.a. 6,404
3. Vodafone Americas INC US – 100.00 n.a. UO� RM 03/2002 n.a. n.a. n.a.
4. Vodafone Deutschland Gmbh DE – 100.00 n.a. UO� RM 03/2002 �� 3,579 n.a.
5. Vodafone Europe B.V. NL – 100.00 n.a. UO� RM 03/2002 � n.a. 6,820
6. Vodafone International B.V. NL – 100.00 n.a. UO� RM 03/2002 � 1,325 7,901
7. Vodafone International INC. US – 100.00 n.a. UO� RM 03/2002 n.a. n.a. n.a.
8. Vodafone Ireland Limited IE – 100.00 n.a. UO� RM 03/2002 n.a. n.a. n.a.
9. Vodafone Limited GB – 100.00 n.a. UO� RM 03/2002 � 6,238 15,665
10. Vodafone New Zealand Limited NZ – 100.00 n.a. UO� RM 03/2002 n.a. n.a. n.a.
11. Vodafone UK Limited GB – 100.00 n.a. UO� RM 03/2002 �� 0 32,523
12. General Mobile Corporation Limited GB WO WO 1 UO� JO 05/2002 � n.a. 159
13. Mobile Telecom Group Limited GB WO WO 1 UO� JO 05/2002 � 35 6
14. Voda Limited GB WO WO 1 UO� JO 05/2002 � n.a. 934
15. Vodacall Limited GB WO WO 1 UO� JO 05/2002 � n.a. n.a.
16. Vodafone (New Zealand) Hedging Limited GB WO WO 1 UO� JO 05/2002 �� n.a. 253
17. Vodafone Asia Pacific Limited GB WO WO 1 UO� JO 05/2002 � n.a. 0
18. Vodafone Cellular Limited GB WO WO 1 UO� JO 05/2002 � n.a. 1,828
19. Vodafone Corporate Secretaries Limited GB WO WO 1 UO� JO 05/2002 � n.a. 0
20. Vodafone Euro Hedging Limited GB WO WO 1 UO� JO 05/2002 �� n.a. 44,723
21. Vodafone Euro Hedging Two GB WO WO 1 UO� JO 05/2002 �� n.a. 30,778
22. Vodafone European Investments GB WO WO 1 UO� JO 05/2002 � n.a. 143,766
23. Vodafone European Portal Limited GB WO WO 1 UO� JO 05/2002 � n.a. 0
24. Vodafone Global Products and Services Limited GB WO WO 1 UO� JO 05/2002 �� 284 267
25. Vodafone Group (Directors) Trustee Limited GB WO WO 1 UO� JO 05/2002 � n.a. 0
26. Vodafone Group Pension Trustee Limited GB WO WO 1 UO� JO 05/2002 � n.a. 0
27. Vodafone Group Services Limited GB WO WO 1 UO� JO 05/2002 �� 113 164
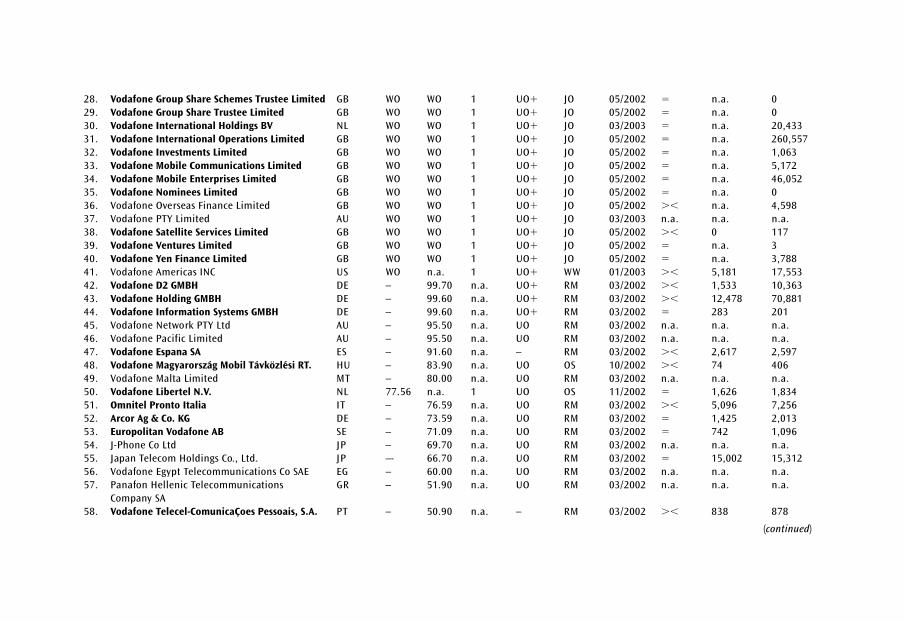
28. Vodafone Group Share Schemes Trustee Limited GB WO WO 1 UO� JO 05/2002 � n.a. 0
29. Vodafone Group Share Trustee Limited GB WO WO 1 UO� JO 05/2002 � n.a. 0
30. Vodafone International Holdings BV NL WO WO 1 UO� JO 03/2003 � n.a. 20,433
31. Vodafone International Operations Limited GB WO WO 1 UO� JO 05/2002 � n.a. 260,557
32. Vodafone Investments Limited GB WO WO 1 UO� JO 05/2002 � n.a. 1,063
33. Vodafone Mobile Communications Limited GB WO WO 1 UO� JO 05/2002 � n.a. 5,172
34. Vodafone Mobile Enterprises Limited GB WO WO 1 UO� JO 05/2002 � n.a. 46,052
35. Vodafone Nominees Limited GB WO WO 1 UO� JO 05/2002 � n.a. 0
36. Vodafone Overseas Finance Limited GB WO WO 1 UO� JO 05/2002 �� n.a. 4,598
37. Vodafone PTY Limited AU WO WO 1 UO� JO 03/2003 n.a. n.a. n.a.
38. Vodafone Satellite Services Limited GB WO WO 1 UO� JO 05/2002 �� 0 117
39. Vodafone Ventures Limited GB WO WO 1 UO� JO 05/2002 � n.a. 3
40. Vodafone Yen Finance Limited GB WO WO 1 UO� JO 05/2002 � n.a. 3,788
41. Vodafone Americas INC US WO n.a. 1 UO� WW 01/2003 �� 5,181 17,553
42. Vodafone D2 GMBH DE – 99.70 n.a. UO� RM 03/2002 �� 1,533 10,363
43. Vodafone Holding GMBH DE – 99.60 n.a. UO� RM 03/2002 �� 12,478 70,881
44. Vodafone Information Systems GMBH DE – 99.60 n.a. UO� RM 03/2002 � 283 201
45. Vodafone Network PTY Ltd AU – 95.50 n.a. UO RM 03/2002 n.a. n.a. n.a.
46. Vodafone Pacific Limited AU – 95.50 n.a. UO RM 03/2002 n.a. n.a. n.a.
47. Vodafone Espana SA ES – 91.60 n.a. – RM 03/2002 �� 2,617 2,597
48. Vodafone Magyarország Mobil Távközlési RT. HU – 83.90 n.a. UO OS 10/2002 �� 74 406
49. Vodafone Malta Limited MT – 80.00 n.a. UO RM 03/2002 n.a. n.a. n.a.
50. Vodafone Libertel N.V. NL 77.56 n.a. 1 UO OS 11/2002 � 1,626 1,834
51. Omnitel Pronto Italia IT – 76.59 n.a. UO RM 03/2002 �� 5,096 7,256
52. Arcor Ag & Co. KG DE – 73.59 n.a. UO RM 03/2002 � 1,425 2,013
53. Europolitan Vodafone AB SE – 71.09 n.a. UO RM 03/2002 � 742 1,096
54. J-Phone Co Ltd JP – 69.70 n.a. UO RM 03/2002 n.a. n.a. n.a.
55. Japan Telecom Holdings Co., Ltd. JP –- 66.70 n.a. UO RM 03/2002 � 15,002 15,312
56. Vodafone Egypt Telecommunications Co SAE EG – 60.00 n.a. UO RM 03/2002 n.a. n.a. n.a.
57. Panafon Hellenic Telecommunications GR – 51.90 n.a. UO RM 03/2002 n.a. n.a. n.a.
Company SA
58. Vodafone Telecel-ComunicaÇoes Pessoais, S.A. PT – 50.90 n.a. – RM 03/2002 �� 838 878
(continued)
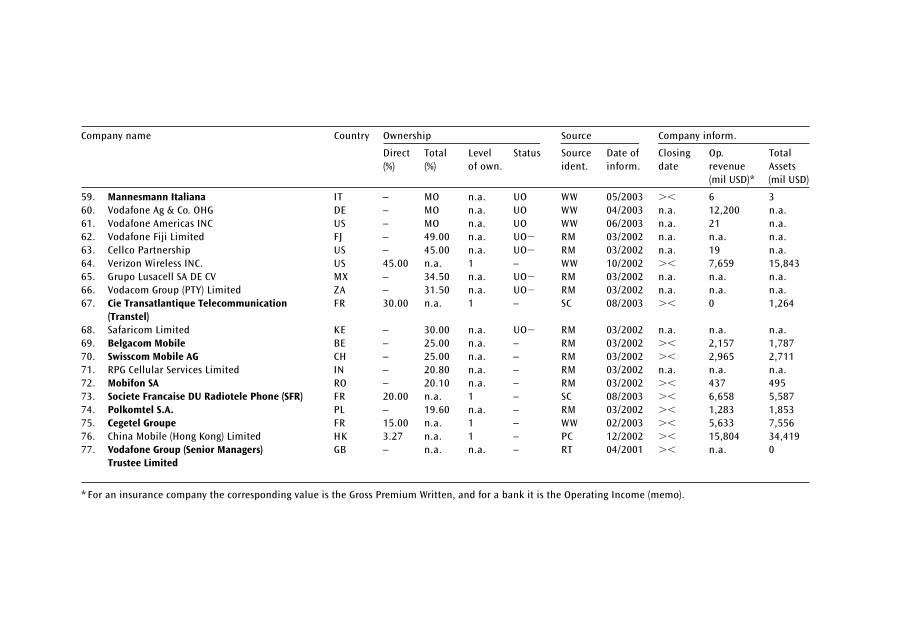
Company name Country Ownership Source Company inform.
Direct Total Level Status Source Date of Closing Op. Total
(%) (%) of own. ident. inform. date revenue Assets
(mil USD)* (mil USD)
59. Mannesmann Italiana IT – MO n.a. UO WW 05/2003 �� 6 3
60. Vodafone Ag & Co. OHG DE – MO n.a. UO WW 04/2003 n.a. 12,200 n.a.
61. Vodafone Americas INC US – MO n.a. UO WW 06/2003 n.a. 21 n.a.
62. Vodafone Fiji Limited FJ – 49.00 n.a. UO� RM 03/2002 n.a. n.a. n.a.
63. Cellco Partnership US – 45.00 n.a. UO� RM 03/2002 n.a. 19 n.a.
64. Verizon Wireless INC. US 45.00 n.a. 1 – WW 10/2002 �� 7,659 15,843
65. Grupo Lusacell SA DE CV MX – 34.50 n.a. UO� RM 03/2002 n.a. n.a. n.a.
66. Vodacom Group (PTY) Limited ZA – 31.50 n.a. UO� RM 03/2002 n.a. n.a. n.a.
67. Cie Transatlantique Telecommunication FR 30.00 n.a. 1 – SC 08/2003 �� 0 1,264
(Transtel)
68. Safaricom Limited KE – 30.00 n.a. UO� RM 03/2002 n.a. n.a. n.a.
69. Belgacom Mobile BE – 25.00 n.a. – RM 03/2002 �� 2,157 1,787
70. Swisscom Mobile AG CH – 25.00 n.a. – RM 03/2002 �� 2,965 2,711
71. RPG Cellular Services Limited IN – 20.80 n.a. – RM 03/2002 n.a. n.a. n.a.
72. Mobifon SA RO – 20.10 n.a. – RM 03/2002 �� 437 495
73. Societe Francaise DU Radiotele Phone (SFR) FR 20.00 n.a. 1 – SC 08/2003 �� 6,658 5,587
74. Polkomtel S.A. PL – 19.60 n.a. – RM 03/2002 �� 1,283 1,853
75. Cegetel Groupe FR 15.00 n.a. 1 – WW 02/2003 �� 5,633 7,556
76. China Mobile (Hong Kong) Limited HK 3.27 n.a. 1 – PC 12/2002 �� 15,804 34,419
77. Vodafone Group (Senior Managers) GB – n.a. n.a. – RT 04/2001 �� n.a. 0
Trustee Limited
* For an insurance company the corresponding value is the Gross Premium Written, and for a bank it is the Operating Income (memo).

Appendices

Appendix 1: Credit rating agency rating
scales
Moody’s Issuer Rating Symbols
Aaa Issuers rated Aaa offer exceptional financial security. While the creditworthiness of these entities is likely to change, such changes ascan be visualized are most unlikely to impair their fundamentally strongposition.
Aa Issuers rated Aa offer excellent financial security. Together with the Aaagroup, they constitute what are generally known as high-grade entities.They are rated lower than Aaa-rated entities because long-term risks appear somewhat larger.
A Issuers rated A offer good financial security. However elements may bepresent which suggest a susceptibility to impairment sometime in thefuture.
Baa Issuers rated Baa offer adequate financial security. However, certainprotective elements may be lacking or may be unreliable over any greatperiod of time.
Ba Issuers rated Ba offer questionable financial security. Often the abilityof these entities to meet obligations may be moderate and not well safe-guarded in the future.
B Issuers rated B offer poor financial security. Assurance of payment ofobligations over any long period of time is small.
Caa Issuers rated Caa offer very poor financial security. They may be indefault on their obligations or there may be present elements ofdanger with respect to punctual payment of obligations.
Ca Issuers rated Ca offer extremely poor financial security. Such entities areoften in default on their obligations or have other marked shortcomings.
C Issuers rated C are the lowest-rated class of entity, are usually in defaulton their obligations, and potential recovery values are low.
Note: Moody’s applies numerical modifiers 1, 2, and 3 in each generic rating category
from Aa to Caa. The modifier 1 indicates that the issuer is in the higher end of its letter
rating category; the modifier 2 indicates a mid-range ranking; the modifier 3 indicates
that the issuer is in the lower end of the letter ranking category.
Source: Moody’s Investor Service.
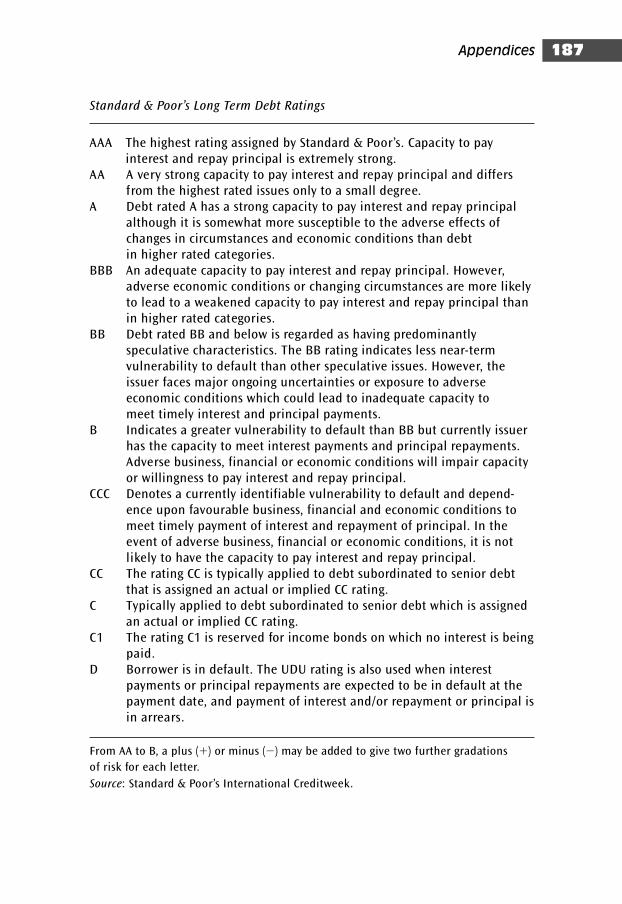
Standard & Poor’s Long Term Debt Ratings
AAA The highest rating assigned by Standard & Poor’s. Capacity to pay interest and repay principal is extremely strong.
AA A very strong capacity to pay interest and repay principal and differsfrom the highest rated issues only to a small degree.
A Debt rated A has a strong capacity to pay interest and repay principalalthough it is somewhat more susceptible to the adverse effects ofchanges in circumstances and economic conditions than debt in higher rated categories.
BBB An adequate capacity to pay interest and repay principal. However,adverse economic conditions or changing circumstances are more likelyto lead to a weakened capacity to pay interest and repay principal thanin higher rated categories.
BB Debt rated BB and below is regarded as having predominantly speculative characteristics. The BB rating indicates less near-term vulnerability to default than other speculative issues. However, theissuer faces major ongoing uncertainties or exposure to adverse economic conditions which could lead to inadequate capacity to meet timely interest and principal payments.
B Indicates a greater vulnerability to default than BB but currently issuerhas the capacity to meet interest payments and principal repayments.Adverse business, financial or economic conditions will impair capacityor willingness to pay interest and repay principal.
CCC Denotes a currently identifiable vulnerability to default and depend-ence upon favourable business, financial and economic conditions tomeet timely payment of interest and repayment of principal. In theevent of adverse business, financial or economic conditions, it is notlikely to have the capacity to pay interest and repay principal.
CC The rating CC is typically applied to debt subordinated to senior debtthat is assigned an actual or implied CC rating.
C Typically applied to debt subordinated to senior debt which is assignedan actual or implied CC rating.
C1 The rating C1 is reserved for income bonds on which no interest is beingpaid.
D Borrower is in default. The UDU rating is also used when interest payments or principal repayments are expected to be in default at thepayment date, and payment of interest and/or repayment or principal isin arrears.
From AA to B, a plus (�) or minus (�) may be added to give two further gradations
of risk for each letter.
Source: Standard & Poor’s International Creditweek.
Appendices 187

Standard & Poor’s Short Term Commercial Paper Debt Ratings
A1 The degree of safety regarding timely payment is either overwhelming orvery strong. Those issues determined to possess overwhelming safetycharacteristics are denoted with a plus (�) designation.
A2 Capacity for timely payment is strong. However, the relative degree ofsafety is not as high as for issues rated A1.
A3 A satisfactory capacity for timely payment, though somewhat more vulnerable to the adverse effects of changes in circumstances than obligations carrying the higher designations.
B Only an adequate capacity for timely payment. However, such capacitymay be damaged by changing conditions or short-term adversities.
C Doubtful capacity for payment.D Issue is either in default or is expected to be in default upon maturity.
Source: Standard & Poor’s International Creditweek.
Cash Flow Forecasting188
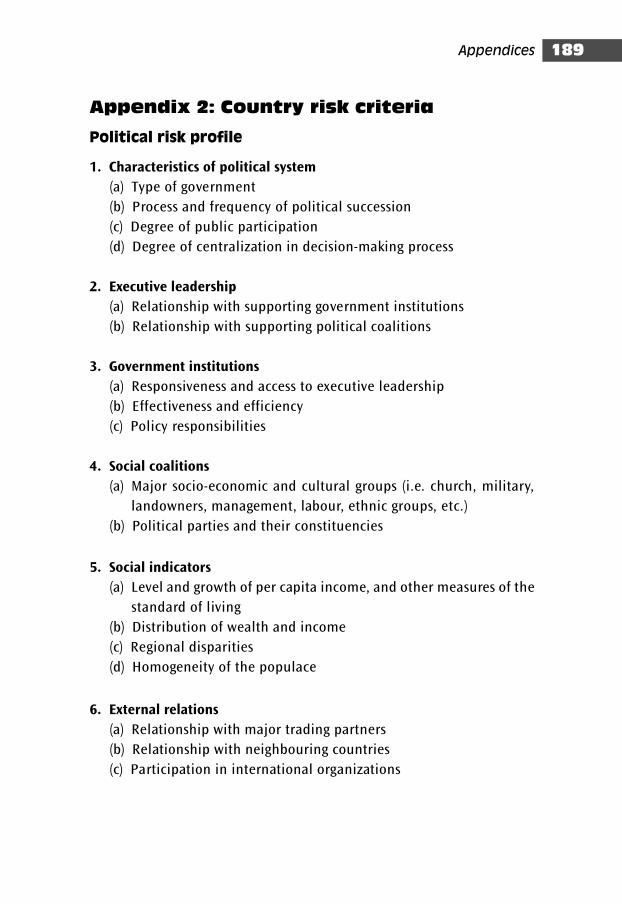
Appendix 2: Country risk criteria
Political risk profile
1. Characteristics of political system
(a) Type of government
(b) Process and frequency of political succession
(c) Degree of public participation
(d) Degree of centralization in decision-making process
2. Executive leadership
(a) Relationship with supporting government institutions
(b) Relationship with supporting political coalitions
3. Government institutions
(a) Responsiveness and access to executive leadership
(b) Effectiveness and efficiency
(c) Policy responsibilities
4. Social coalitions
(a) Major socio-economic and cultural groups (i.e. church, military,
landowners, management, labour, ethnic groups, etc.)
(b) Political parties and their constituencies
5. Social indicators
(a) Level and growth of per capita income, and other measures of the
standard of living
(b) Distribution of wealth and income
(c) Regional disparities
(d) Homogeneity of the populace
6. External relations
(a) Relationship with major trading partners
(b) Relationship with neighbouring countries
(c) Participation in international organizations
Appendices 189
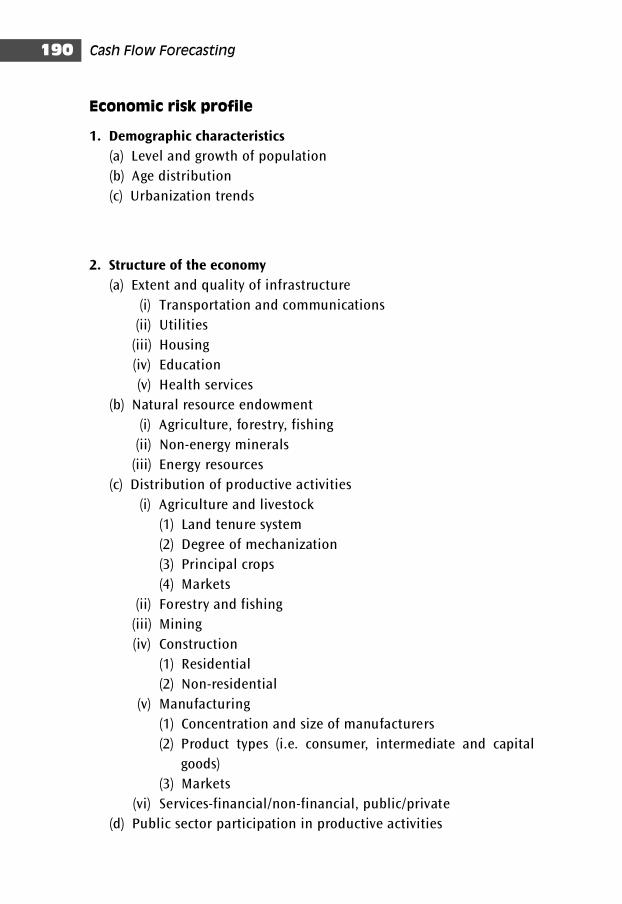
Economic risk profile
1. Demographic characteristics
(a) Level and growth of population
(b) Age distribution
(c) Urbanization trends
2. Structure of the economy
(a) Extent and quality of infrastructure
(i) Transportation and communications
(ii) Utilities
(iii) Housing
(iv) Education
(v) Health services
(b) Natural resource endowment
(i) Agriculture, forestry, fishing
(ii) Non-energy minerals
(iii) Energy resources
(c) Distribution of productive activities
(i) Agriculture and livestock
(1) Land tenure system
(2) Degree of mechanization
(3) Principal crops
(4) Markets
(ii) Forestry and fishing
(iii) Mining
(iv) Construction
(1) Residential
(2) Non-residential
(v) Manufacturing
(1) Concentration and size of manufacturers
(2) Product types (i.e. consumer, intermediate and capital
goods)
(3) Markets
(vi) Services-financial/non-financial, public/private
(d) Public sector participation in productive activities
Cash Flow Forecasting190
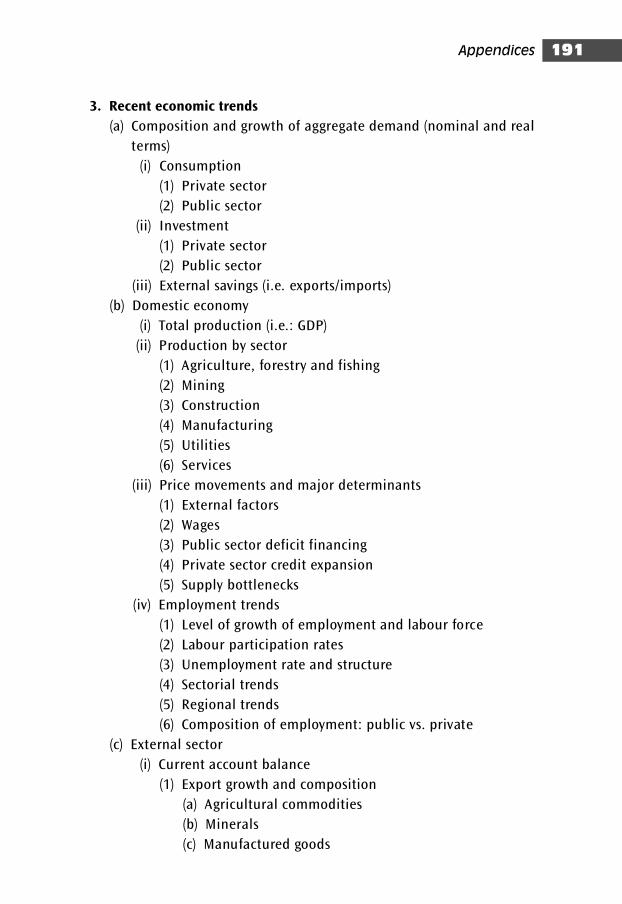
3. Recent economic trends
(a) Composition and growth of aggregate demand (nominal and real
terms)
(i) Consumption
(1) Private sector
(2) Public sector
(ii) Investment
(1) Private sector
(2) Public sector
(iii) External savings (i.e. exports/imports)
(b) Domestic economy
(i) Total production (i.e.: GDP)
(ii) Production by sector
(1) Agriculture, forestry and fishing
(2) Mining
(3) Construction
(4) Manufacturing
(5) Utilities
(6) Services
(iii) Price movements and major determinants
(1) External factors
(2) Wages
(3) Public sector deficit financing
(4) Private sector credit expansion
(5) Supply bottlenecks
(iv) Employment trends
(1) Level of growth of employment and labour force
(2) Labour participation rates
(3) Unemployment rate and structure
(4) Sectorial trends
(5) Regional trends
(6) Composition of employment: public vs. private
(c) External sector
(i) Current account balance
(1) Export growth and composition
(a) Agricultural commodities
(b) Minerals
(c) Manufactured goods
Appendices 191
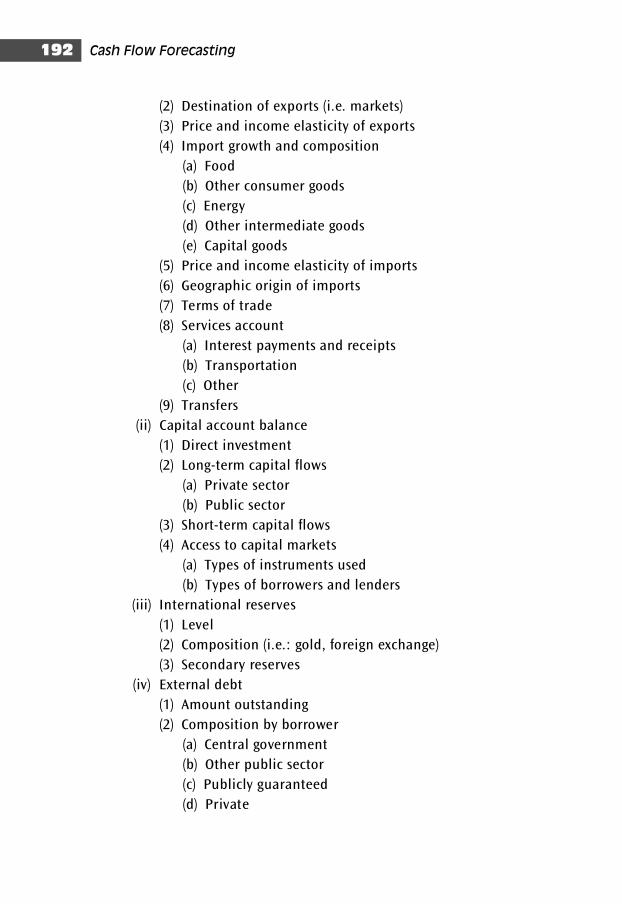
(2) Destination of exports (i.e. markets)
(3) Price and income elasticity of exports
(4) Import growth and composition
(a) Food
(b) Other consumer goods
(c) Energy
(d) Other intermediate goods
(e) Capital goods
(5) Price and income elasticity of imports
(6) Geographic origin of imports
(7) Terms of trade
(8) Services account
(a) Interest payments and receipts
(b) Transportation
(c) Other
(9) Transfers
(ii) Capital account balance
(1) Direct investment
(2) Long-term capital flows
(a) Private sector
(b) Public sector
(3) Short-term capital flows
(4) Access to capital markets
(a) Types of instruments used
(b) Types of borrowers and lenders
(iii) International reserves
(1) Level
(2) Composition (i.e.: gold, foreign exchange)
(3) Secondary reserves
(iv) External debt
(1) Amount outstanding
(2) Composition by borrower
(a) Central government
(b) Other public sector
(c) Publicly guaranteed
(d) Private
Cash Flow Forecasting192
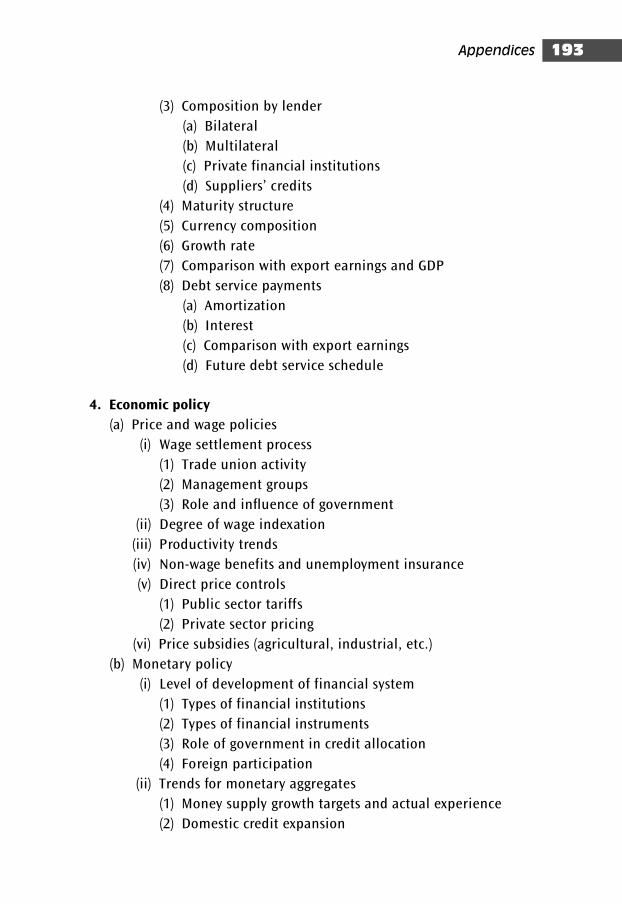
(3) Composition by lender
(a) Bilateral
(b) Multilateral
(c) Private financial institutions
(d) Suppliers’ credits
(4) Maturity structure
(5) Currency composition
(6) Growth rate
(7) Comparison with export earnings and GDP
(8) Debt service payments
(a) Amortization
(b) Interest
(c) Comparison with export earnings
(d) Future debt service schedule
4. Economic policy
(a) Price and wage policies
(i) Wage settlement process
(1) Trade union activity
(2) Management groups
(3) Role and influence of government
(ii) Degree of wage indexation
(iii) Productivity trends
(iv) Non-wage benefits and unemployment insurance
(v) Direct price controls
(1) Public sector tariffs
(2) Private sector pricing
(vi) Price subsidies (agricultural, industrial, etc.)
(b) Monetary policy
(i) Level of development of financial system
(1) Types of financial institutions
(2) Types of financial instruments
(3) Role of government in credit allocation
(4) Foreign participation
(ii) Trends for monetary aggregates
(1) Money supply growth targets and actual experience
(2) Domestic credit expansion
Appendices 193
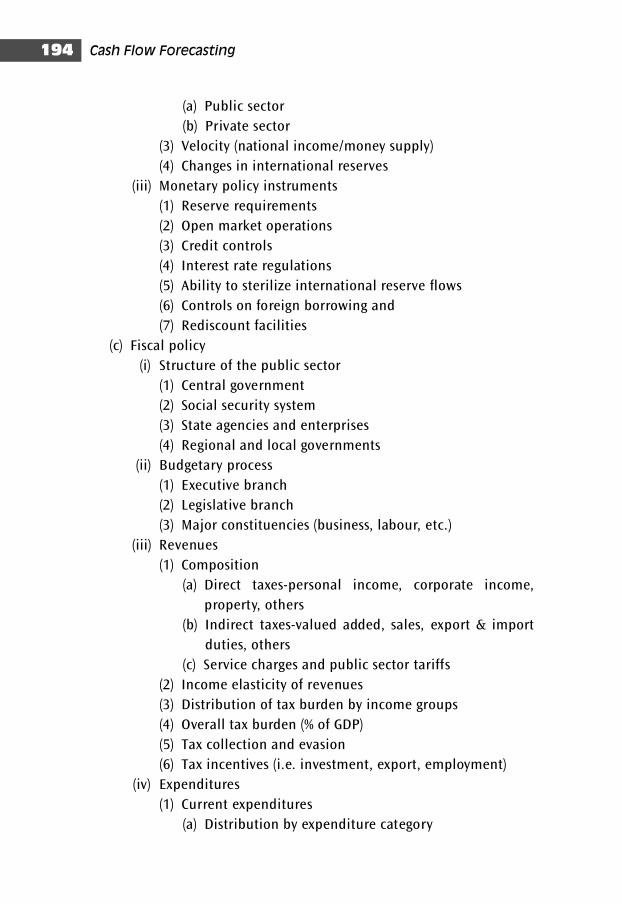
(a) Public sector
(b) Private sector
(3) Velocity (national income/money supply)
(4) Changes in international reserves
(iii) Monetary policy instruments
(1) Reserve requirements
(2) Open market operations
(3) Credit controls
(4) Interest rate regulations
(5) Ability to sterilize international reserve flows
(6) Controls on foreign borrowing and
(7) Rediscount facilities
(c) Fiscal policy
(i) Structure of the public sector
(1) Central government
(2) Social security system
(3) State agencies and enterprises
(4) Regional and local governments
(ii) Budgetary process
(1) Executive branch
(2) Legislative branch
(3) Major constituencies (business, labour, etc.)
(iii) Revenues
(1) Composition
(a) Direct taxes-personal income, corporate income,
property, others
(b) Indirect taxes-valued added, sales, export & import
duties, others
(c) Service charges and public sector tariffs
(2) Income elasticity of revenues
(3) Distribution of tax burden by income groups
(4) Overall tax burden (% of GDP)
(5) Tax collection and evasion
(6) Tax incentives (i.e. investment, export, employment)
(iv) Expenditures
(1) Current expenditures
(a) Distribution by expenditure category
Cash Flow Forecasting194
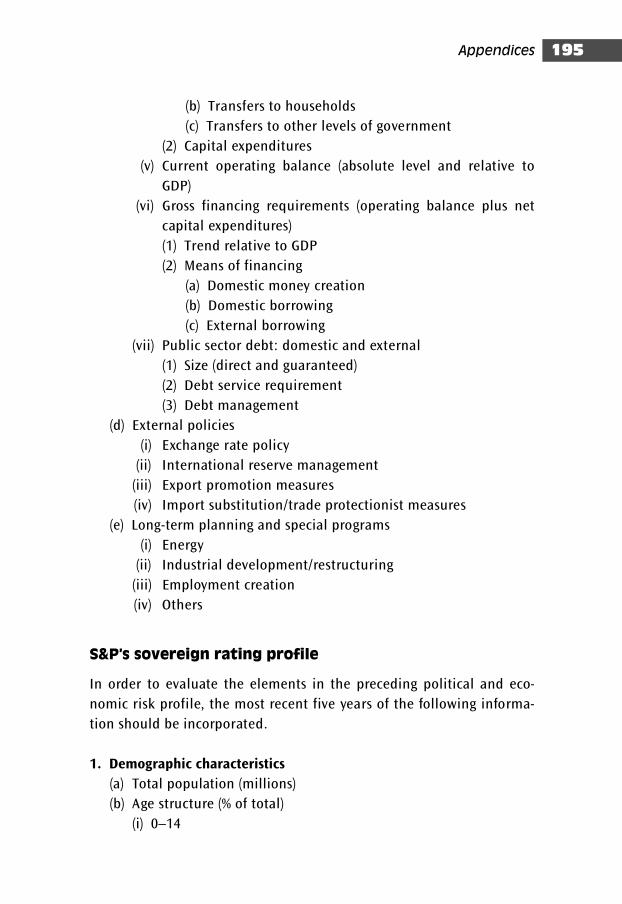
(b) Transfers to households
(c) Transfers to other levels of government
(2) Capital expenditures
(v) Current operating balance (absolute level and relative to
GDP)
(vi) Gross financing requirements (operating balance plus net
capital expenditures)
(1) Trend relative to GDP
(2) Means of financing
(a) Domestic money creation
(b) Domestic borrowing
(c) External borrowing
(vii) Public sector debt: domestic and external
(1) Size (direct and guaranteed)
(2) Debt service requirement
(3) Debt management
(d) External policies
(i) Exchange rate policy
(ii) International reserve management
(iii) Export promotion measures
(iv) Import substitution/trade protectionist measures
(e) Long-term planning and special programs
(i) Energy
(ii) Industrial development/restructuring
(iii) Employment creation
(iv) Others
S&P’s sovereign rating profile
In order to evaluate the elements in the preceding political and eco-
nomic risk profile, the most recent five years of the following informa-
tion should be incorporated.
1. Demographic characteristics
(a) Total population (millions)
(b) Age structure (% of total)
(i) 0–14
Appendices 195
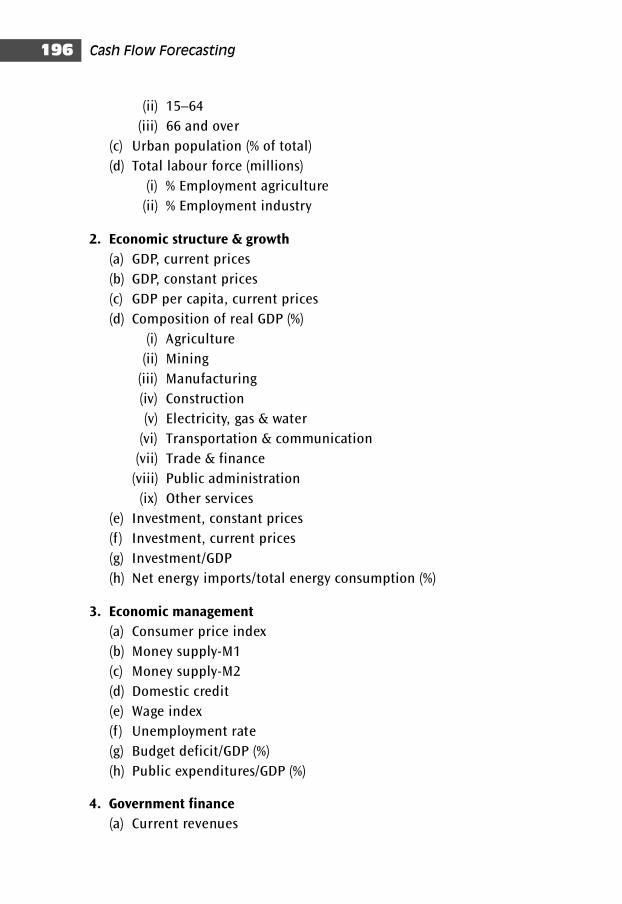
(ii) 15–64
(iii) 66 and over
(c) Urban population (% of total)
(d) Total labour force (millions)
(i) % Employment agriculture
(ii) % Employment industry
2. Economic structure & growth
(a) GDP, current prices
(b) GDP, constant prices
(c) GDP per capita, current prices
(d) Composition of real GDP (%)
(i) Agriculture
(ii) Mining
(iii) Manufacturing
(iv) Construction
(v) Electricity, gas & water
(vi) Transportation & communication
(vii) Trade & finance
(viii) Public administration
(ix) Other services
(e) Investment, constant prices
(f ) Investment, current prices
(g) Investment/GDP
(h) Net energy imports/total energy consumption (%)
3. Economic management
(a) Consumer price index
(b) Money supply-M1
(c) Money supply-M2
(d) Domestic credit
(e) Wage index
(f ) Unemployment rate
(g) Budget deficit/GDP (%)
(h) Public expenditures/GDP (%)
4. Government finance
(a) Current revenues
Cash Flow Forecasting196
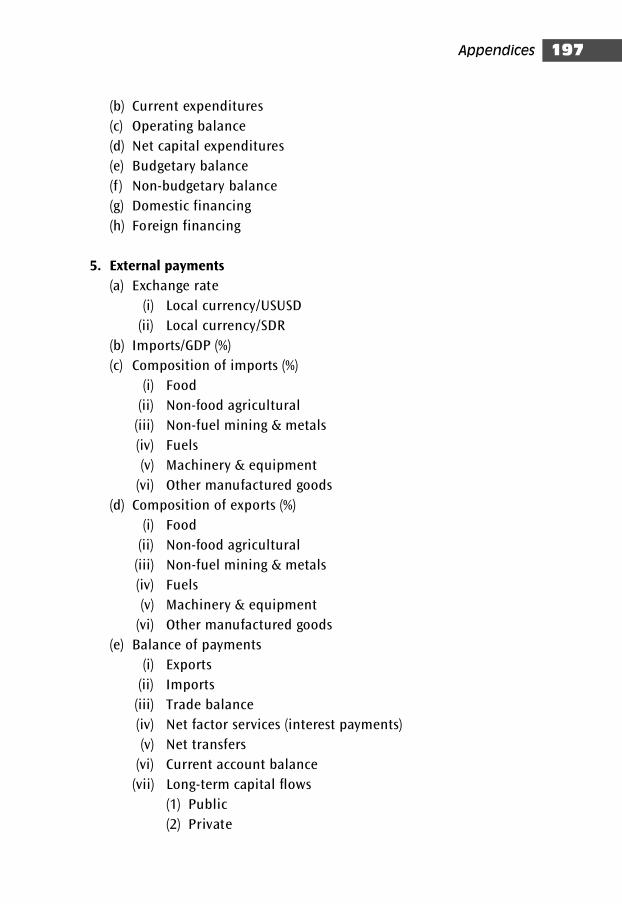
(b) Current expenditures
(c) Operating balance
(d) Net capital expenditures
(e) Budgetary balance
(f ) Non-budgetary balance
(g) Domestic financing
(h) Foreign financing
5. External payments
(a) Exchange rate
(i) Local currency/USUSD
(ii) Local currency/SDR
(b) Imports/GDP (%)
(c) Composition of imports (%)
(i) Food
(ii) Non-food agricultural
(iii) Non-fuel mining & metals
(iv) Fuels
(v) Machinery & equipment
(vi) Other manufactured goods
(d) Composition of exports (%)
(i) Food
(ii) Non-food agricultural
(iii) Non-fuel mining & metals
(iv) Fuels
(v) Machinery & equipment
(vi) Other manufactured goods
(e) Balance of payments
(i) Exports
(ii) Imports
(iii) Trade balance
(iv) Net factor services (interest payments)
(v) Net transfers
(vi) Current account balance
(vii) Long-term capital flows
(1) Public
(2) Private
Appendices 197
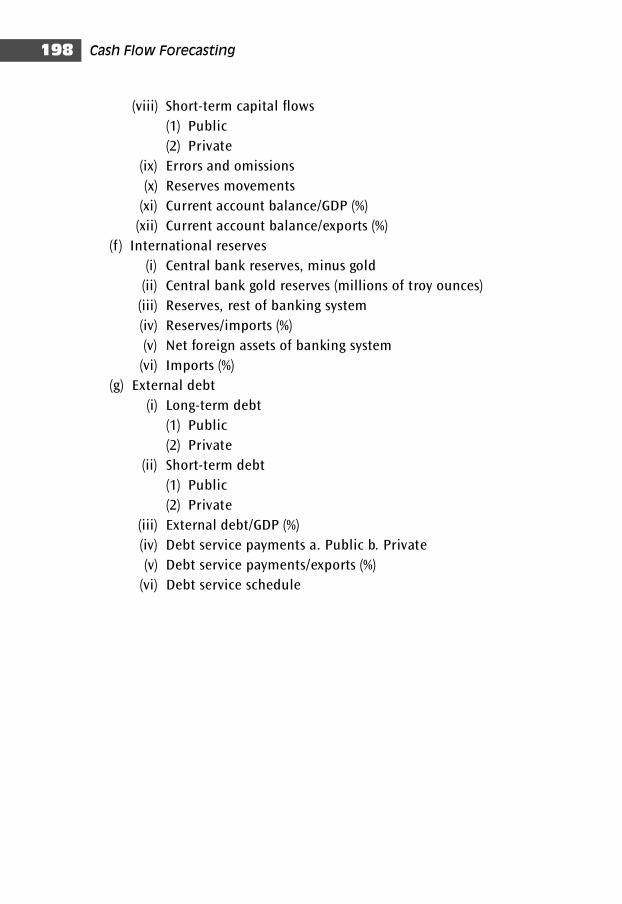
(viii) Short-term capital flows
(1) Public
(2) Private
(ix) Errors and omissions
(x) Reserves movements
(xi) Current account balance/GDP (%)
(xii) Current account balance/exports (%)
(f ) International reserves
(i) Central bank reserves, minus gold
(ii) Central bank gold reserves (millions of troy ounces)
(iii) Reserves, rest of banking system
(iv) Reserves/imports (%)
(v) Net foreign assets of banking system
(vi) Imports (%)
(g) External debt
(i) Long-term debt
(1) Public
(2) Private
(ii) Short-term debt
(1) Public
(2) Private
(iii) External debt/GDP (%)
(iv) Debt service payments a. Public b. Private
(v) Debt service payments/exports (%)
(vi) Debt service schedule
Cash Flow Forecasting198
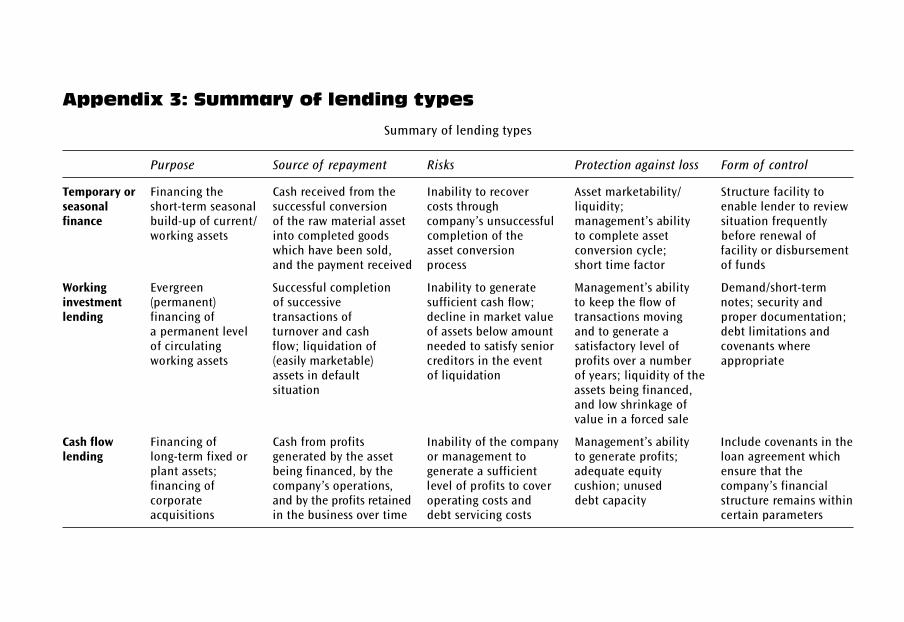
Appendix 3: Summary of lending types
Summary of lending types
Purpose Source of repayment Risks Protection against loss Form of control
Temporary or Financing the Cash received from the Inability to recover Asset marketability/ Structure facility to seasonal short-term seasonal successful conversion costs through liquidity; enable lender to reviewfinance build-up of current/ of the raw material asset company’s unsuccessful management’s ability situation frequently
working assets into completed goods completion of the to complete asset before renewal ofwhich have been sold, asset conversion conversion cycle; facility or disbursementand the payment received process short time factor of funds
Working Evergreen Successful completion Inability to generate Management’s ability Demand/short-term investment (permanent) of successive sufficient cash flow; to keep the flow of notes; security and lending financing of transactions of decline in market value transactions moving proper documentation;
a permanent level turnover and cash of assets below amount and to generate a debt limitations and of circulating flow; liquidation of needed to satisfy senior satisfactory level of covenants where working assets (easily marketable) creditors in the event profits over a number appropriate
assets in default of liquidation of years; liquidity of thesituation assets being financed,
and low shrinkage ofvalue in a forced sale
Cash flow Financing of Cash from profits Inability of the company Management’s ability Include covenants in thelending long-term fixed or generated by the asset or management to to generate profits; loan agreement which
plant assets; being financed, by the generate a sufficient adequate equity ensure that the financing of company’s operations, level of profits to cover cushion; unused company’s financial corporate and by the profits retained operating costs and debt capacity structure remains withinacquisitions in the business over time debt servicing costs certain parameters
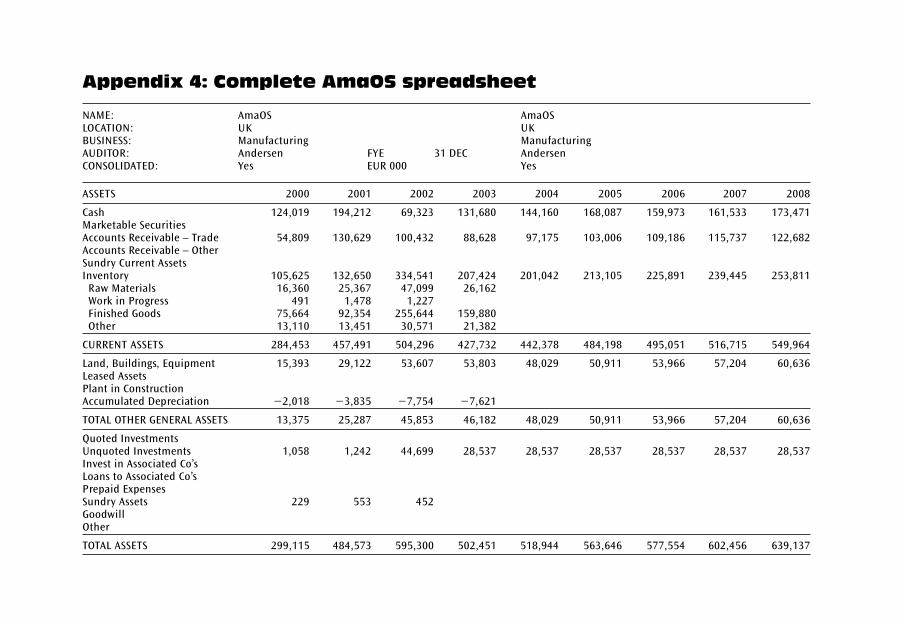
Appendix 4: Complete AmaOS spreadsheet
NAME: AmaOS AmaOSLOCATION: UK UKBUSINESS: Manufacturing ManufacturingAUDITOR: Andersen FYE 31 DEC AndersenCONSOLIDATED: Yes EUR 000 Yes
ASSETS 2000 2001 2002 2003 2004 2005 2006 2007 2008
Cash 124,019 194,212 69,323 131,680 144,160 168,087 159,973 161,533 173,471Marketable SecuritiesAccounts Receivable – Trade 54,809 130,629 100,432 88,628 97,175 103,006 109,186 115,737 122,682Accounts Receivable – OtherSundry Current AssetsInventory 105,625 132,650 334,541 207,424 201,042 213,105 225,891 239,445 253,811
Raw Materials 16,360 25,367 47,099 26,162Work in Progress 491 1,478 1,227Finished Goods 75,664 92,354 255,644 159,880Other 13,110 13,451 30,571 21,382
CURRENT ASSETS 284,453 457,491 504,296 427,732 442,378 484,198 495,051 516,715 549,964
Land, Buildings, Equipment 15,393 29,122 53,607 53,803 48,029 50,911 53,966 57,204 60,636Leased AssetsPlant in ConstructionAccumulated Depreciation �2,018 �3,835 �7,754 �7,621
TOTAL OTHER GENERAL ASSETS 13,375 25,287 45,853 46,182 48,029 50,911 53,966 57,204 60,636
Quoted InvestmentsUnquoted Investments 1,058 1,242 44,699 28,537 28,537 28,537 28,537 28,537 28,537Invest in Associated Co’sLoans to Associated Co’sPrepaid ExpensesSundry Assets 229 553 452GoodwillOther
TOTAL ASSETS 299,115 484,573 595,300 502,451 518,944 563,646 577,554 602,456 639,137
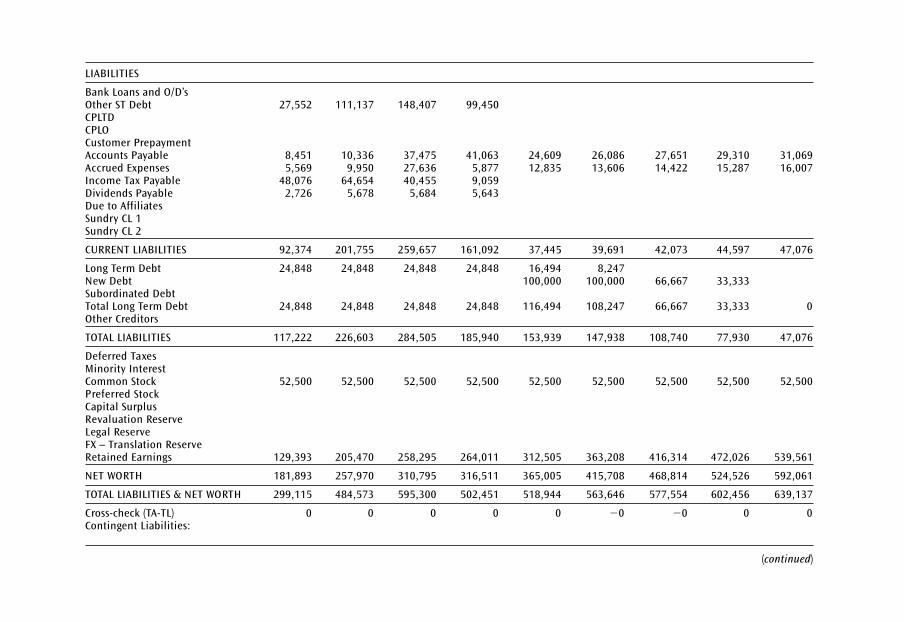
LIABILITIES
Bank Loans and O/D’sOther ST Debt 27,552 111,137 148,407 99,450CPLTDCPLOCustomer PrepaymentAccounts Payable 8,451 10,336 37,475 41,063 24,609 26,086 27,651 29,310 31,069Accrued Expenses 5,569 9,950 27,636 5,877 12,835 13,606 14,422 15,287 16,007Income Tax Payable 48,076 64,654 40,455 9,059Dividends Payable 2,726 5,678 5,684 5,643Due to AffiliatesSundry CL 1Sundry CL 2
CURRENT LIABILITIES 92,374 201,755 259,657 161,092 37,445 39,691 42,073 44,597 47,076
Long Term Debt 24,848 24,848 24,848 24,848 16,494 8,247New Debt 100,000 100,000 66,667 33,333Subordinated DebtTotal Long Term Debt 24,848 24,848 24,848 24,848 116,494 108,247 66,667 33,333 0Other Creditors
TOTAL LIABILITIES 117,222 226,603 284,505 185,940 153,939 147,938 108,740 77,930 47,076
Deferred TaxesMinority InterestCommon Stock 52,500 52,500 52,500 52,500 52,500 52,500 52,500 52,500 52,500Preferred StockCapital SurplusRevaluation ReserveLegal ReserveFX – Translation ReserveRetained Earnings 129,393 205,470 258,295 264,011 312,505 363,208 416,314 472,026 539,561
NET WORTH 181,893 257,970 310,795 316,511 365,005 415,708 468,814 524,526 592,061
TOTAL LIABILITIES & NET WORTH 299,115 484,573 595,300 502,451 518,944 563,646 577,554 602,456 639,137
Cross-check (TA-TL) 0 0 0 0 0 �0 �0 0 0Contingent Liabilities:
(continued)
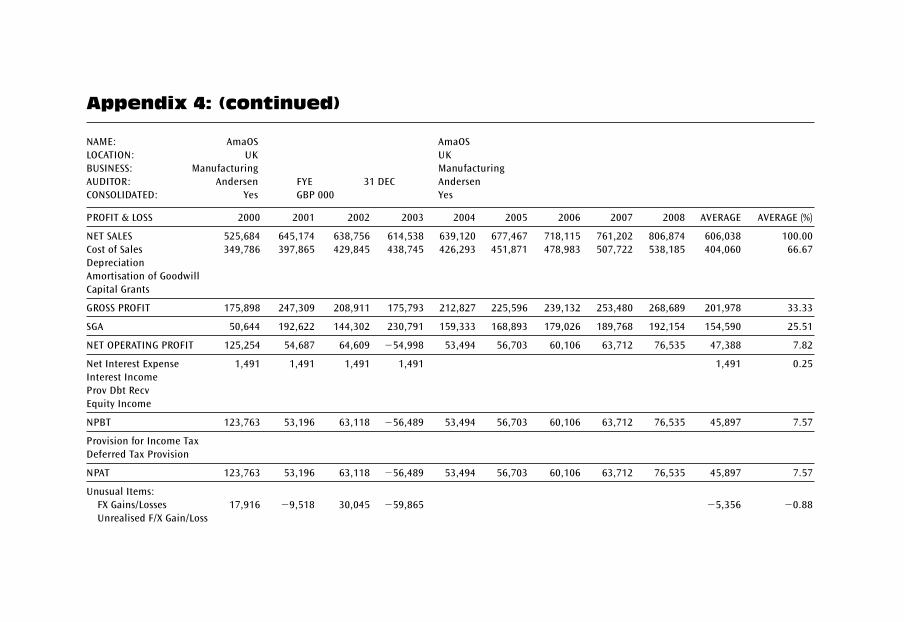
Appendix 4: (continued)
NAME: AmaOS AmaOS
LOCATION: UK UK
BUSINESS: Manufacturing Manufacturing
AUDITOR: Andersen FYE 31 DEC Andersen
CONSOLIDATED: Yes GBP 000 Yes
PROFIT & LOSS 2000 2001 2002 2003 2004 2005 2006 2007 2008 AVERAGE AVERAGE (%)
NET SALES 525,684 645,174 638,756 614,538 639,120 677,467 718,115 761,202 806,874 606,038 100.00
Cost of Sales 349,786 397,865 429,845 438,745 426,293 451,871 478,983 507,722 538,185 404,060 66.67
Depreciation
Amortisation of Goodwill
Capital Grants
GROSS PROFIT 175,898 247,309 208,911 175,793 212,827 225,596 239,132 253,480 268,689 201,978 33.33
SGA 50,644 192,622 144,302 230,791 159,333 168,893 179,026 189,768 192,154 154,590 25.51
NET OPERATING PROFIT 125,254 54,687 64,609 �54,998 53,494 56,703 60,106 63,712 76,535 47,388 7.82
Net Interest Expense 1,491 1,491 1,491 1,491 1,491 0.25
Interest Income
Prov Dbt Recv
Equity Income
NPBT 123,763 53,196 63,118 �56,489 53,494 56,703 60,106 63,712 76,535 45,897 7.57
Provision for Income Tax
Deferred Tax Provision
NPAT 123,763 53,196 63,118 �56,489 53,494 56,703 60,106 63,712 76,535 45,897 7.57
Unusual Items:
FX Gains/Losses 17,916 �9,518 30,045 �59,865 �5,356 �0.88
Unrealised F/X Gain/Loss
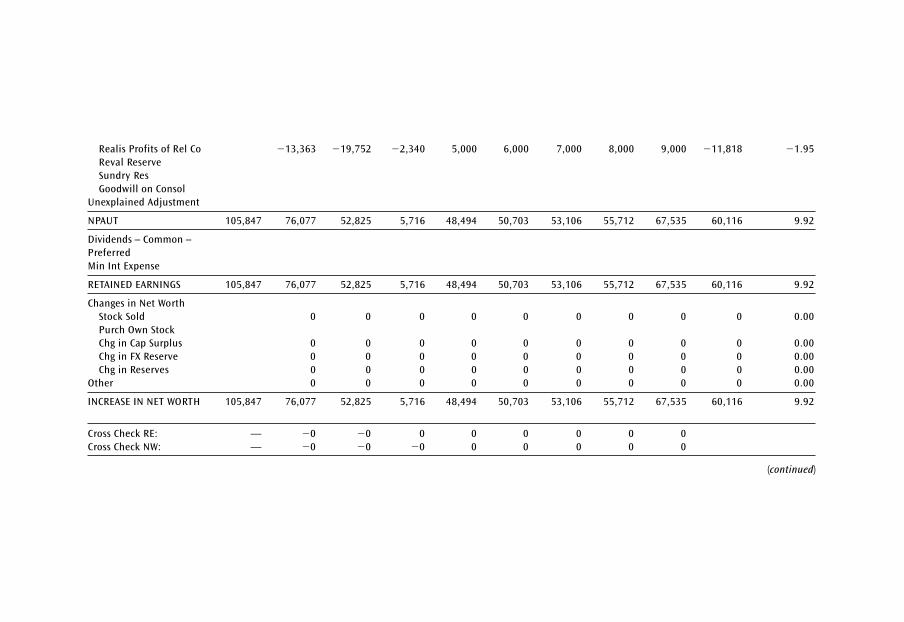
Realis Profits of Rel Co �13,363 �19,752 �2,340 5,000 6,000 7,000 8,000 9,000 �11,818 �1.95
Reval Reserve
Sundry Res
Goodwill on Consol
Unexplained Adjustment
NPAUT 105,847 76,077 52,825 5,716 48,494 50,703 53,106 55,712 67,535 60,116 9.92
Dividends – Common –
Preferred
Min Int Expense
RETAINED EARNINGS 105,847 76,077 52,825 5,716 48,494 50,703 53,106 55,712 67,535 60,116 9.92
Changes in Net Worth
Stock Sold 0 0 0 0 0 0 0 0 0 0.00
Purch Own Stock
Chg in Cap Surplus 0 0 0 0 0 0 0 0 0 0.00
Chg in FX Reserve 0 0 0 0 0 0 0 0 0 0.00
Chg in Reserves 0 0 0 0 0 0 0 0 0 0.00
Other 0 0 0 0 0 0 0 0 0 0.00
INCREASE IN NET WORTH 105,847 76,077 52,825 5,716 48,494 50,703 53,106 55,712 67,535 60,116 9.92
Cross Check RE: — �0 �0 0 0 0 0 0 0
Cross Check NW: — �0 �0 �0 0 0 0 0 0
(continued)
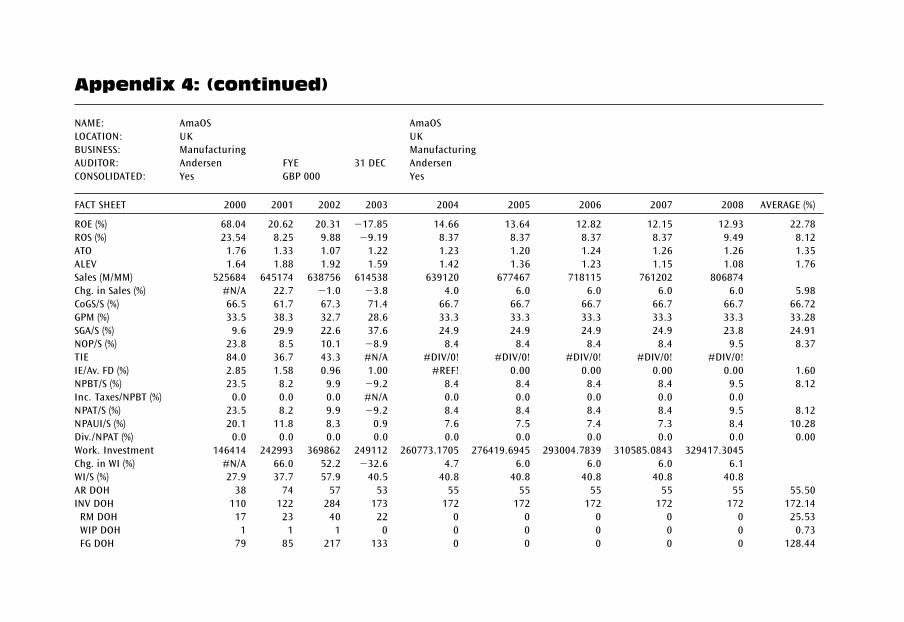
Appendix 4: (continued)
NAME: AmaOS AmaOS
LOCATION: UK UK
BUSINESS: Manufacturing Manufacturing
AUDITOR: Andersen FYE 31 DEC Andersen
CONSOLIDATED: Yes GBP 000 Yes
FACT SHEET 2000 2001 2002 2003 2004 2005 2006 2007 2008 AVERAGE (%)
ROE (%) 68.04 20.62 20.31 �17.85 14.66 13.64 12.82 12.15 12.93 22.78
ROS (%) 23.54 8.25 9.88 �9.19 8.37 8.37 8.37 8.37 9.49 8.12
ATO 1.76 1.33 1.07 1.22 1.23 1.20 1.24 1.26 1.26 1.35
ALEV 1.64 1.88 1.92 1.59 1.42 1.36 1.23 1.15 1.08 1.76
Sales (M/MM) 525684 645174 638756 614538 639120 677467 718115 761202 806874
Chg. in Sales (%) #N/A 22.7 �1.0 �3.8 4.0 6.0 6.0 6.0 6.0 5.98
CoGS/S (%) 66.5 61.7 67.3 71.4 66.7 66.7 66.7 66.7 66.7 66.72
GPM (%) 33.5 38.3 32.7 28.6 33.3 33.3 33.3 33.3 33.3 33.28
SGA/S (%) 9.6 29.9 22.6 37.6 24.9 24.9 24.9 24.9 23.8 24.91
NOP/S (%) 23.8 8.5 10.1 �8.9 8.4 8.4 8.4 8.4 9.5 8.37
TIE 84.0 36.7 43.3 #N/A #DIV/0! #DIV/0! #DIV/0! #DIV/0! #DIV/0!
IE/Av. FD (%) 2.85 1.58 0.96 1.00 #REF! 0.00 0.00 0.00 0.00 1.60
NPBT/S (%) 23.5 8.2 9.9 �9.2 8.4 8.4 8.4 8.4 9.5 8.12
Inc. Taxes/NPBT (%) 0.0 0.0 0.0 #N/A 0.0 0.0 0.0 0.0 0.0
NPAT/S (%) 23.5 8.2 9.9 �9.2 8.4 8.4 8.4 8.4 9.5 8.12
NPAUI/S (%) 20.1 11.8 8.3 0.9 7.6 7.5 7.4 7.3 8.4 10.28
Div./NPAT (%) 0.0 0.0 0.0 0.0 0.0 0.0 0.0 0.0 0.0 0.00
Work. Investment 146414 242993 369862 249112 260773.1705 276419.6945 293004.7839 310585.0843 329417.3045
Chg. in WI (%) #N/A 66.0 52.2 �32.6 4.7 6.0 6.0 6.0 6.1
WI/S (%) 27.9 37.7 57.9 40.5 40.8 40.8 40.8 40.8 40.8
AR DOH 38 74 57 53 55 55 55 55 55 55.50
INV DOH 110 122 284 173 172 172 172 172 172 172.14
RM DOH 17 23 40 22 0 0 0 0 0 25.53
WIP DOH 1 1 1 0 0 0 0 0 0 0.73
FG DOH 79 85 217 133 0 0 0 0 0 128.44
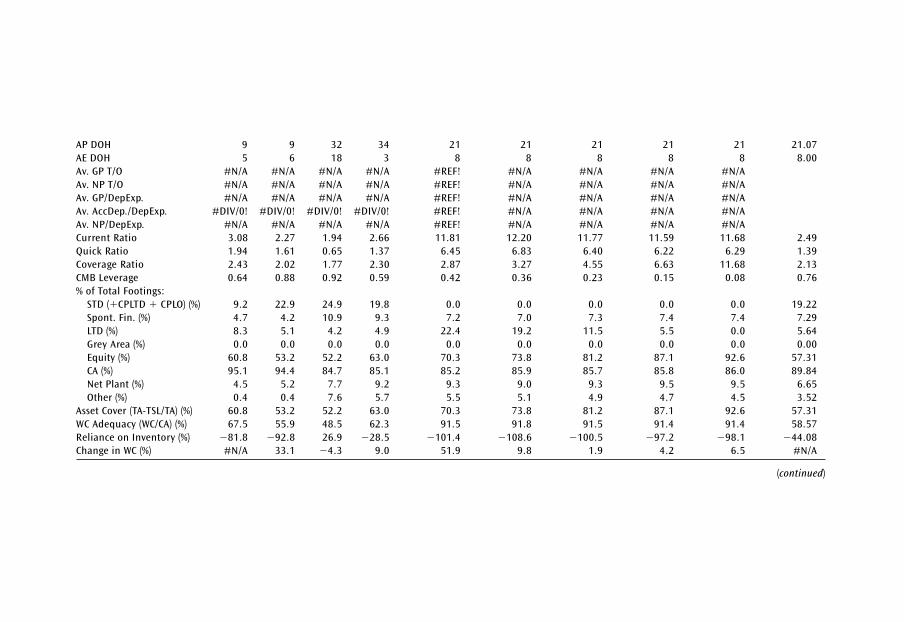
AP DOH 9 9 32 34 21 21 21 21 21 21.07
AE DOH 5 6 18 3 8 8 8 8 8 8.00
Av. GP T/O #N/A #N/A #N/A #N/A #REF! #N/A #N/A #N/A #N/A
Av. NP T/O #N/A #N/A #N/A #N/A #REF! #N/A #N/A #N/A #N/A
Av. GP/DepExp. #N/A #N/A #N/A #N/A #REF! #N/A #N/A #N/A #N/A
Av. AccDep./DepExp. #DIV/0! #DIV/0! #DIV/0! #DIV/0! #REF! #N/A #N/A #N/A #N/A
Av. NP/DepExp. #N/A #N/A #N/A #N/A #REF! #N/A #N/A #N/A #N/A
Current Ratio 3.08 2.27 1.94 2.66 11.81 12.20 11.77 11.59 11.68 2.49
Quick Ratio 1.94 1.61 0.65 1.37 6.45 6.83 6.40 6.22 6.29 1.39
Coverage Ratio 2.43 2.02 1.77 2.30 2.87 3.27 4.55 6.63 11.68 2.13
CMB Leverage 0.64 0.88 0.92 0.59 0.42 0.36 0.23 0.15 0.08 0.76
% of Total Footings:
STD (�CPLTD � CPLO) (%) 9.2 22.9 24.9 19.8 0.0 0.0 0.0 0.0 0.0 19.22
Spont. Fin. (%) 4.7 4.2 10.9 9.3 7.2 7.0 7.3 7.4 7.4 7.29
LTD (%) 8.3 5.1 4.2 4.9 22.4 19.2 11.5 5.5 0.0 5.64
Grey Area (%) 0.0 0.0 0.0 0.0 0.0 0.0 0.0 0.0 0.0 0.00
Equity (%) 60.8 53.2 52.2 63.0 70.3 73.8 81.2 87.1 92.6 57.31
CA (%) 95.1 94.4 84.7 85.1 85.2 85.9 85.7 85.8 86.0 89.84
Net Plant (%) 4.5 5.2 7.7 9.2 9.3 9.0 9.3 9.5 9.5 6.65
Other (%) 0.4 0.4 7.6 5.7 5.5 5.1 4.9 4.7 4.5 3.52
Asset Cover (TA-TSL/TA) (%) 60.8 53.2 52.2 63.0 70.3 73.8 81.2 87.1 92.6 57.31
WC Adequacy (WC/CA) (%) 67.5 55.9 48.5 62.3 91.5 91.8 91.5 91.4 91.4 58.57
Reliance on Inventory (%) �81.8 �92.8 26.9 �28.5 �101.4 �108.6 �100.5 �97.2 �98.1 �44.08
Change in WC (%) #N/A 33.1 �4.3 9.0 51.9 9.8 1.9 4.2 6.5 #N/A
(continued)
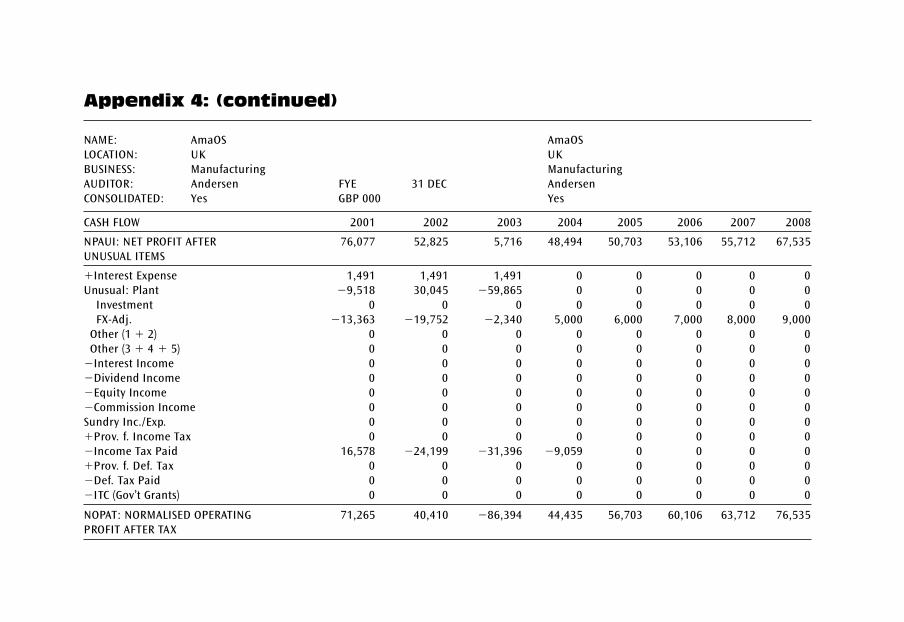
Appendix 4: (continued)
NAME: AmaOS AmaOS
LOCATION: UK UK
BUSINESS: Manufacturing Manufacturing
AUDITOR: Andersen FYE 31 DEC Andersen
CONSOLIDATED: Yes GBP 000 Yes
CASH FLOW 2001 2002 2003 2004 2005 2006 2007 2008
NPAUI: NET PROFIT AFTER 76,077 52,825 5,716 48,494 50,703 53,106 55,712 67,535
UNUSUAL ITEMS
�Interest Expense 1,491 1,491 1,491 0 0 0 0 0
Unusual: Plant �9,518 30,045 �59,865 0 0 0 0 0
Investment 0 0 0 0 0 0 0 0
FX-Adj. �13,363 �19,752 �2,340 5,000 6,000 7,000 8,000 9,000
Other (1 � 2) 0 0 0 0 0 0 0 0
Other (3 � 4 � 5) 0 0 0 0 0 0 0 0
�Interest Income 0 0 0 0 0 0 0 0
�Dividend Income 0 0 0 0 0 0 0 0
�Equity Income 0 0 0 0 0 0 0 0
�Commission Income 0 0 0 0 0 0 0 0
Sundry Inc./Exp. 0 0 0 0 0 0 0 0
�Prov. f. Income Tax 0 0 0 0 0 0 0 0
�Income Tax Paid 16,578 �24,199 �31,396 �9,059 0 0 0 0
�Prov. f. Def. Tax 0 0 0 0 0 0 0 0
�Def. Tax Paid 0 0 0 0 0 0 0 0
�ITC (Gov’t Grants) 0 0 0 0 0 0 0 0
NOPAT: NORMALISED OPERATING 71,265 40,410 �86,394 44,435 56,703 60,106 63,712 76,535
PROFIT AFTER TAX
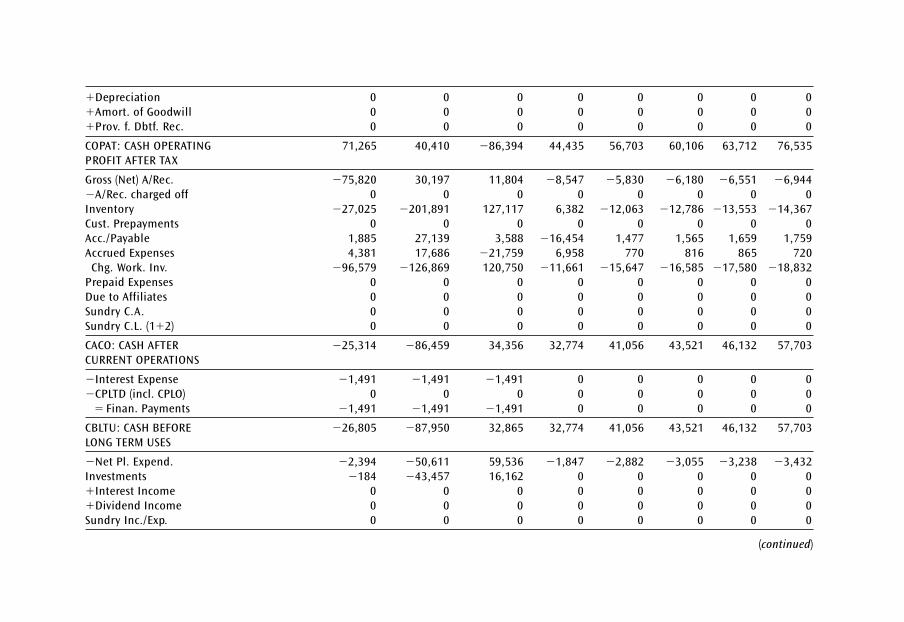
�Depreciation 0 0 0 0 0 0 0 0
�Amort. of Goodwill 0 0 0 0 0 0 0 0
�Prov. f. Dbtf. Rec. 0 0 0 0 0 0 0 0
COPAT: CASH OPERATING 71,265 40,410 �86,394 44,435 56,703 60,106 63,712 76,535
PROFIT AFTER TAX
Gross (Net) A/Rec. �75,820 30,197 11,804 �8,547 �5,830 �6,180 �6,551 �6,944
�A/Rec. charged off 0 0 0 0 0 0 0 0
Inventory �27,025 �201,891 127,117 6,382 �12,063 �12,786 �13,553 �14,367
Cust. Prepayments 0 0 0 0 0 0 0 0
Acc./Payable 1,885 27,139 3,588 �16,454 1,477 1,565 1,659 1,759
Accrued Expenses 4,381 17,686 �21,759 6,958 770 816 865 720
Chg. Work. Inv. �96,579 �126,869 120,750 �11,661 �15,647 �16,585 �17,580 �18,832
Prepaid Expenses 0 0 0 0 0 0 0 0
Due to Affiliates 0 0 0 0 0 0 0 0
Sundry C.A. 0 0 0 0 0 0 0 0Sundry C.L. (1�2) 0 0 0 0 0 0 0 0
CACO: CASH AFTER �25,314 �86,459 34,356 32,774 41,056 43,521 46,132 57,703
CURRENT OPERATIONS
�Interest Expense �1,491 �1,491 �1,491 0 0 0 0 0
�CPLTD (incl. CPLO) 0 0 0 0 0 0 0 0
� Finan. Payments �1,491 �1,491 �1,491 0 0 0 0 0
CBLTU: CASH BEFORE �26,805 �87,950 32,865 32,774 41,056 43,521 46,132 57,703
LONG TERM USES
�Net Pl. Expend. �2,394 �50,611 59,536 �1,847 �2,882 �3,055 �3,238 �3,432
Investments �184 �43,457 16,162 0 0 0 0 0
�Interest Income 0 0 0 0 0 0 0 0
�Dividend Income 0 0 0 0 0 0 0 0
Sundry Inc./Exp. 0 0 0 0 0 0 0 0
(continued)
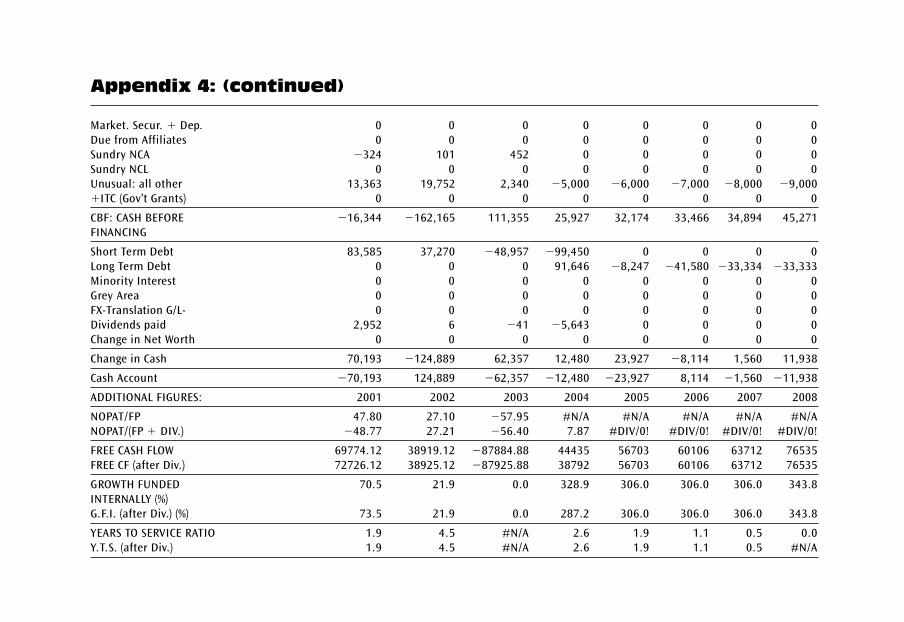
Appendix 4: (continued)
Market. Secur. � Dep. 0 0 0 0 0 0 0 0
Due from Affiliates 0 0 0 0 0 0 0 0
Sundry NCA �324 101 452 0 0 0 0 0
Sundry NCL 0 0 0 0 0 0 0 0
Unusual: all other 13,363 19,752 2,340 �5,000 �6,000 �7,000 �8,000 �9,000
�ITC (Gov’t Grants) 0 0 0 0 0 0 0 0
CBF: CASH BEFORE �16,344 �162,165 111,355 25,927 32,174 33,466 34,894 45,271
FINANCING
Short Term Debt 83,585 37,270 �48,957 �99,450 0 0 0 0
Long Term Debt 0 0 0 91,646 �8,247 �41,580 �33,334 �33,333
Minority Interest 0 0 0 0 0 0 0 0
Grey Area 0 0 0 0 0 0 0 0
FX-Translation G/L- 0 0 0 0 0 0 0 0
Dividends paid 2,952 6 �41 �5,643 0 0 0 0
Change in Net Worth 0 0 0 0 0 0 0 0
Change in Cash 70,193 �124,889 62,357 12,480 23,927 �8,114 1,560 11,938
Cash Account �70,193 124,889 �62,357 �12,480 �23,927 8,114 �1,560 �11,938
ADDITIONAL FIGURES: 2001 2002 2003 2004 2005 2006 2007 2008
NOPAT/FP 47.80 27.10 �57.95 #N/A #N/A #N/A #N/A #N/A
NOPAT/(FP � DIV.) �48.77 27.21 �56.40 7.87 #DIV/0! #DIV/0! #DIV/0! #DIV/0!
FREE CASH FLOW 69774.12 38919.12 �87884.88 44435 56703 60106 63712 76535
FREE CF (after Div.) 72726.12 38925.12 �87925.88 38792 56703 60106 63712 76535
GROWTH FUNDED 70.5 21.9 0.0 328.9 306.0 306.0 306.0 343.8
INTERNALLY (%)
G.F.I. (after Div.) (%) 73.5 21.9 0.0 287.2 306.0 306.0 306.0 343.8
YEARS TO SERVICE RATIO 1.9 4.5 #N/A 2.6 1.9 1.1 0.5 0.0
Y.T.S. (after Div.) 1.9 4.5 #N/A 2.6 1.9 1.1 0.5 #N/A

Suggested reading
Brett, M. (2003) How to Read the Financial Pages. Century Business
Books.
Fight, A. (2004). Credit Risk Management. Elsevier.
Fight, A. (2004). Project Finance. Elsevier.
Fight, A. (2004). Syndicated Lending. Elsevier.
Fight, A. (2004). Understanding International Bank Risk. Elsevier.
Fridson, M. (1995). Financial Statement Analysis, 2nd edn. Wiley.
Griffiths, I. (1995). New Creative Accounting. Macmillan.
Holmes, G. and Dunham, R. (1994). Beyond The Balance Sheet. Woodhead-
Faulkner.
Holmes, G. and Sugden, A. (1996). Interpreting Company Reports and
Accounts, 5th edn. Prentice Hall.
Hussey, R. (1999). A Dictionary of Accounting. Oxford University Press.
McKenzie, W. (1994). Understanding and Interpreting Company Accounts.
FT Pitman Publishing.
Nobes, C. (2001). Pocket Accounting. Penguin Group.
Partnoy, F. (1999). The Siskel and Ebert of financial markets: two
thumbs down for the credit rating agencies. Washington University
Law Quarterly, 77, 619–712.
Plewa, F. and Friedlob, G. (1994). Understanding Cash Flow. John Wiley.
Smith, T. (1996). Accounting for Growth. Century Business.
Stott, J. R. (2003). Teach Yourself Basic Accounting. Hodder and Stoughton.
Whitehead, G. (1998). Book-keeping and Accounting. Pitman Publishing.
Glossary
Acceleration After a default, the loan is fully due and payable.
Repayments are accelerated to the present.
Account party In a commercial letter of credit, the party instructing the
bank to open a letter of credit and on whose behalf the bank agrees
to make payment.
Accounting period The period of activity which the accounts reflect
(e.g. a year, six months, etc.).
Accounts payable (Payables or Creditors) Amounts owed to suppliers
for goods or services received.
Accounts receivable (Receivables or Debtors) Amounts owed by cus-
tomers or buyers as a result of a sale of goods, or the performance of
a service.
Accruals Allowing for income or costs when they are incurred and not
when they are either received or paid out.
Accrued interest Interest earned but not collected.
Acid test (Quick ratio) The relationship between the current assets
which may be quickly converted into cash (excluding stock) and cur-
rent liabilities – i.e. current assets, less inventories divided by current
liabilities.
ADB Asian Development Bank.
Ad valorem Off the gross or stated value, usually a percentage.
Advance agent A loan drawdown is advanced by the funder.
After tax cash flow Total cash generated by the project annually,
defined as profit after-tax plus depreciation.
Aged analysis A form of reporting based on the time a financial item
has been outstanding, commonly used for receivables and payables.
Agent The bank charged with administering the project financing.
Generic: a party appointed to act on behalf of a principal entity/person.
Glossary 211
Agent banks The banks that arrange the financing on behalf of a cor-
porate borrower. Usually, the banks commit to underwrite the whole
amount if they are unable to fully place the deal. Typically, however,
the place the bulk of the facility, and retain a portion on their books
for themselves.
All-in rate Interest rate which includes margin, commitment Fees,
up-front fees.
Amortization The technique of writing-off an asset over a period of time.
Amortization Reduction of capital or up-front expenses (capitalized) over
time, often an equal amount p.a. Sometimes describes Repayments.
Amortization The process of paying off an amount gradually by spread-
ing the payments over several years.
Amortization (depreciation) A process of establishing an expense in
respect of assets (normally fixed assets) over a number of accounting
periods to reflect the value of an asset over its economic life.
Annual report The company’s annual accounts, audit statement, and
narrative account of the year at hand. Presentations vary considerably.
Annuity The sum of principal and interest is equal for each period.
Arbitrage Take advantage of discrepancies in price or yields in differ-
ent markets.
Arrangement fees For their efforts in arranging the deal, agent banks
collect arrangement fees. These fees are attractive because they rep-
resent revenues that do not have to be generated by the balance
sheet, which is subject to capital adequacy ratios.
Arranger The senior tier of a syndication. This implies the entity that
agreed and negotiated the cash flow forecasting structure. Also refers
to the bank/underwriter entitled to syndicate the loan/bond issue.
Articles of association This document is drawn up by the company
when it is formed and lays down the internal rules by which the direct-
ors will run the company.
Asset Something a company or person owns or has use of, and which is
expected to be of economic benefit.
Asset The physical project and its associated contracts, rights, and
interests of every kind, in the present or future, which can be valued
or used to repay debt.
Asset-backed securities Securities collateralized by a pool of assets.
The process of creating securities backed by assets is referred to as
asset securitization.
Cash Flow Forecasting212
Assets Resources or legal rights owned by the business. These may be
physical (e.g. a building) or contractual (e.g. a receivable).
Assets Any item owned by a company or individual that can be given a
monetary value and used if necessary to pay debts. There are many
kinds of assets, described by terms like current assets and fixed assets.
Asset turnover ratio A broad measure of asset efficiency, defined as
net sales divided by total assets.
Assignment Grant of the right to step in to the position of a party to a
contract or legal agreement.
Associate company A company which is more than 20 per cent owned
by another company. A company will take onto its own profit and loss
account its share of the associate’s profits or losses.
Audit A process of examination of financial statements and the under-
lying accounting. An independent audit will provide a systematic inves-
tigation of the accounting systems and controls to ensure compliance
with prescribed accounting and auditing standards.
Audit An official examination and checking of a company’s accounts
by an independent accountant called an auditor, to certify that the
accounts (as presented by the directors) comply with the law, and in
their opinion give a true and fair view of the company’s affairs.
Auditors Accountants who certify that the company’s accounts have
been reviewed in accordance with FRS (Financial Reporting Standards
for the UK – see below) and note the findings of their inquiry.
Authorized signatories Persons authorized to sign on behalf of the
company borrowing the money. Specimen signatures are usually in
a booklet provided by the company. It is the bank’s (i.e. analyst’s)
responsibility to verify this: if the signatory is not authorized, the
company does not have to pay the money back.
Availability The project financing is available for drawdown. A period
prior to financial close may also be included.
Available cash flow Total cash sources less total cash uses before pay-
ment of debt service.
Average life Average for all repayments, usually weighted by amounts
outstanding.
Avoided cost The capital and expense that would otherwise have to be
spent if the project did not proceed.
Balance sheet A statement reflecting the financial position at a specific
moment in time.
Glossary 213
Balance sheet The accounts which show assets, liabilities, net worth/
shareholders’ equity.
Balloon payment A large single repayment.
BAR Builders’ All Risk, a standard construction insurance.
Barter The physical form of countertrade.
Basis point (bp) One hundred bp equals 1 percentage point.
Bearer Bond The Bond certificate is itself. Negotiable. (It is not recorded
as being owned by any particular Investor.)
Best efforts A very high standard of undertaking, nevertheless excus-
able in the event of force majeure or failure to execute the matter in
question after trying to do so on a sustained, dedicated basis.
BI Business interruption insurance available once the project is in
business.
Bid bond A small percentage (1–3 per cent) of the tender contract
price is established as a bid ‘performance’ bond. Once the contract is
awarded, bid bonds are refunded to the losers.
Blocked currency Due to inconvertibility, or transfer risk, a currency
cannot be moved out of the country.
Bond The paper evidence of a legal promise by the issuer to pay the
investor on the declared terms. Bond are usually negotiable. Bonds are
customarily longer term, say 5–25 years. Short-term bonds are usually
referred to as notes.
BOO Build Own Operate (and Maintain).
Book runner The arranger or bank extending the invitations for a syn-
dication and tallying final take.
Borrower risk Risks pertaining to the company, including manage-
ment, profitability, non-performance, and bankruptcy: all factors relat-
ing to the borrower.
BOT Build Own Transfer, where the project is transferred back to the
party granting the concession. The transfer may be for value or at no
cost.
Break even The reduction of a cash flow forecasting net cash flow to
zero by changing an input variable such as price or costs.
Broker A party which brings together sponsors, finance, or insurances
but is not acting as a principal.
Builders-All Risk The standard insurance package during construction.
Bullet A one-time repayment, often after no/little amortization of the
loan. A balloon.
Cash Flow Forecasting214
Bullet repayment A loan whose interest is payable at intervals agreed in
the loan agreement, and whose principal is repayable in a lump sum
at final maturity. The source of repayment is usually a new facility
that is put into place.
Buy-back A promise to repurchase unsold production. Alternatively, a
promise to repay a financial obligation.
Buydown A once-off payment out of LDs to reflect cash flow losses from
sustained underperformance. Often used to ‘buy’ down the cash flow
forecasting loan.
Buyer credit Financing provided to a buyer to pay for the supply of
goods or services usually by an exporting country or the supplier
company.
Call An option to buy a security or commodity for a set price at a given
time in the future.
Call option A contract sold for a price that gives the holder the right to
buy from the writer of the option, over a specified period, a specified
property or amount of securities at a specified price.
Cap A ceiling on an interest or FX rate through a swap, options, or by
agreement.
Capex Capital expenditures usually by way of direct investment.
Capital Money invested in the business by its owners.
Capital & reserves (Shareholders’ funds/net worth) The value the
owners have invested in the business. This is represented by share
capital and reserves.
Capitalized interest Prior to completion, the convention is to capital-
ize interest into the project financing – i.e. to borrow to pay interest.
See IDC.
Capital markets A broad term to include tradable debt, securities and
equity as distinct from private markets or banks.
Cash flow The inflow and outflow of cash through a company. It is used
to describe the cash needed to finance operating expenses and other
obligations.
Cash flow The generation of cash by a project.
Cash flow forecast Estimation of expected cash flow used to alert man-
agement to future cash shortages and surpluses.
CDC Commonwealth Development Corp – a British development finance
institute.
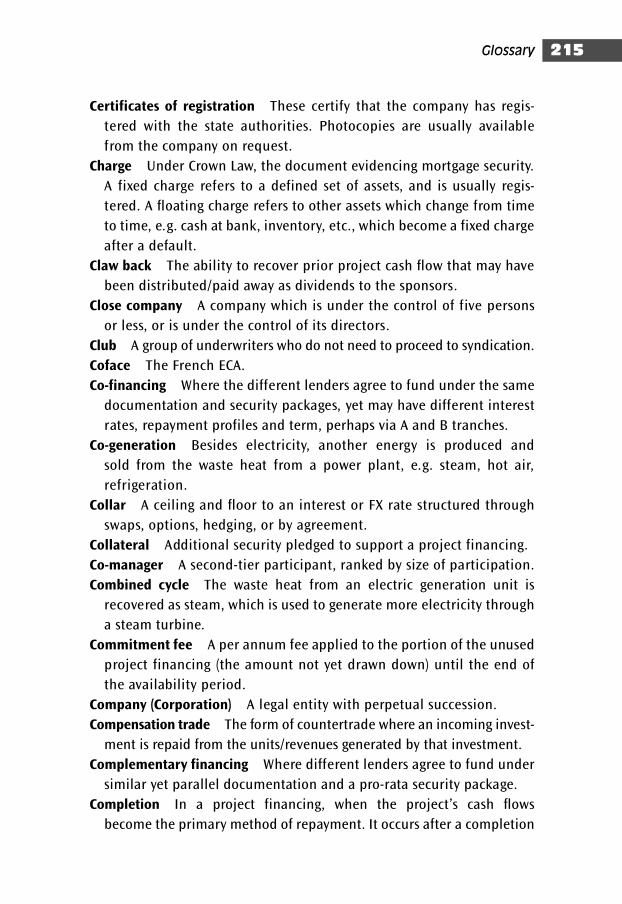
Certificates of registration These certify that the company has regis-
tered with the state authorities. Photocopies are usually available
from the company on request.
Charge Under Crown Law, the document evidencing mortgage security.
A fixed charge refers to a defined set of assets, and is usually regis-
tered. A floating charge refers to other assets which change from time
to time, e.g. cash at bank, inventory, etc., which become a fixed charge
after a default.
Claw back The ability to recover prior project cash flow that may have
been distributed/paid away as dividends to the sponsors.
Close company A company which is under the control of five persons
or less, or is under the control of its directors.
Club A group of underwriters who do not need to proceed to syndication.
Coface The French ECA.
Co-financing Where the different lenders agree to fund under the same
documentation and security packages, yet may have different interest
rates, repayment profiles and term, perhaps via A and B tranches.
Co-generation Besides electricity, another energy is produced and
sold from the waste heat from a power plant, e.g. steam, hot air,
refrigeration.
Collar A ceiling and floor to an interest or FX rate structured through
swaps, options, hedging, or by agreement.
Collateral Additional security pledged to support a project financing.
Co-manager A second-tier participant, ranked by size of participation.
Combined cycle The waste heat from an electric generation unit is
recovered as steam, which is used to generate more electricity through
a steam turbine.
Commitment fee A per annum fee applied to the portion of the unused
project financing (the amount not yet drawn down) until the end of
the availability period.
Company (Corporation) A legal entity with perpetual succession.
Compensation trade The form of countertrade where an incoming invest-
ment is repaid from the units/revenues generated by that investment.
Complementary financing Where different lenders agree to fund under
similar yet parallel documentation and a pro-rata security package.
Completion In a project financing, when the project’s cash flows
become the primary method of repayment. It occurs after a completion
Glossary 215
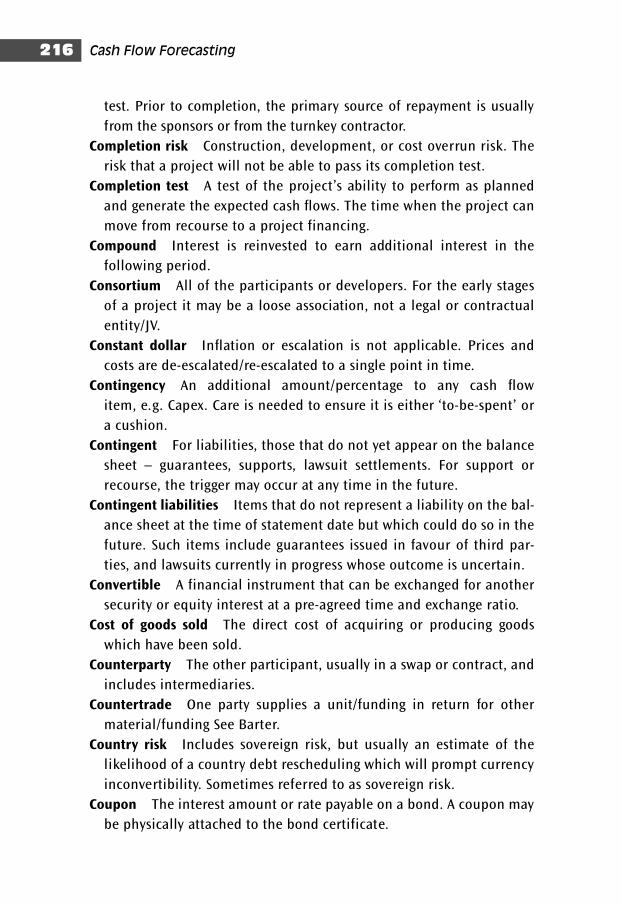
test. Prior to completion, the primary source of repayment is usually
from the sponsors or from the turnkey contractor.
Completion risk Construction, development, or cost overrun risk. The
risk that a project will not be able to pass its completion test.
Completion test A test of the project’s ability to perform as planned
and generate the expected cash flows. The time when the project can
move from recourse to a project financing.
Compound Interest is reinvested to earn additional interest in the
following period.
Consortium All of the participants or developers. For the early stages
of a project it may be a loose association, not a legal or contractual
entity/JV.
Constant dollar Inflation or escalation is not applicable. Prices and
costs are de-escalated/re-escalated to a single point in time.
Contingency An additional amount/percentage to any cash flow
item, e.g. Capex. Care is needed to ensure it is either ‘to-be-spent’ or
a cushion.
Contingent For liabilities, those that do not yet appear on the balance
sheet – guarantees, supports, lawsuit settlements. For support or
recourse, the trigger may occur at any time in the future.
Contingent liabilities Items that do not represent a liability on the bal-
ance sheet at the time of statement date but which could do so in the
future. Such items include guarantees issued in favour of third par-
ties, and lawsuits currently in progress whose outcome is uncertain.
Convertible A financial instrument that can be exchanged for another
security or equity interest at a pre-agreed time and exchange ratio.
Cost of goods sold The direct cost of acquiring or producing goods
which have been sold.
Counterparty The other participant, usually in a swap or contract, and
includes intermediaries.
Countertrade One party supplies a unit/funding in return for other
material/funding See Barter.
Country risk Includes sovereign risk, but usually an estimate of the
likelihood of a country debt rescheduling which will prompt currency
inconvertibility. Sometimes referred to as sovereign risk.
Coupon The interest amount or rate payable on a bond. A coupon may
be physically attached to the bond certificate.
Cash Flow Forecasting216
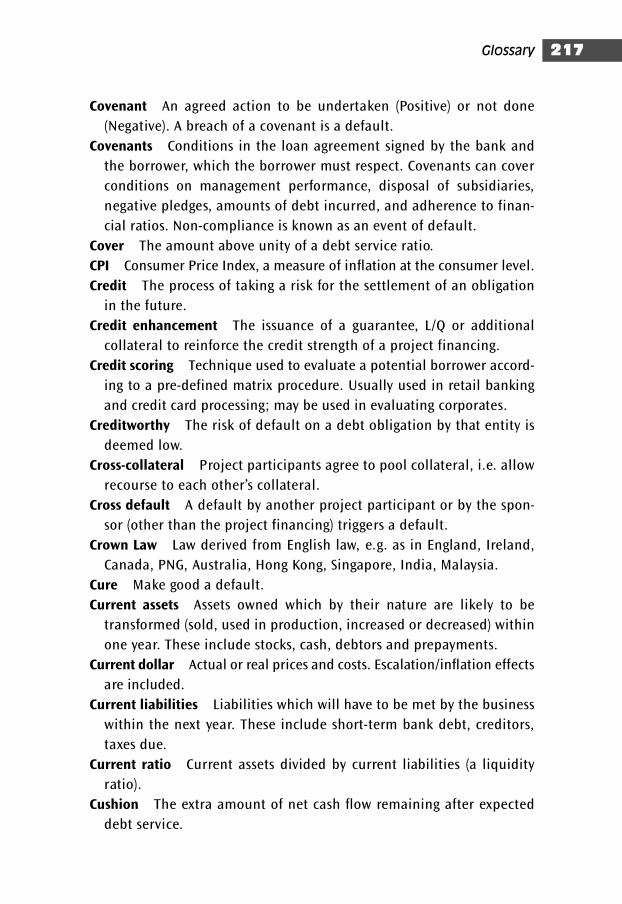
Covenant An agreed action to be undertaken (Positive) or not done
(Negative). A breach of a covenant is a default.
Covenants Conditions in the loan agreement signed by the bank and
the borrower, which the borrower must respect. Covenants can cover
conditions on management performance, disposal of subsidiaries,
negative pledges, amounts of debt incurred, and adherence to finan-
cial ratios. Non-compliance is known as an event of default.
Cover The amount above unity of a debt service ratio.
CPI Consumer Price Index, a measure of inflation at the consumer level.
Credit The process of taking a risk for the settlement of an obligation
in the future.
Credit enhancement The issuance of a guarantee, L/Q or additional
collateral to reinforce the credit strength of a project financing.
Credit scoring Technique used to evaluate a potential borrower accord-
ing to a pre-defined matrix procedure. Usually used in retail banking
and credit card processing; may be used in evaluating corporates.
Creditworthy The risk of default on a debt obligation by that entity is
deemed low.
Cross-collateral Project participants agree to pool collateral, i.e. allow
recourse to each other’s collateral.
Cross default A default by another project participant or by the spon-
sor (other than the project financing) triggers a default.
Crown Law Law derived from English law, e.g. as in England, Ireland,
Canada, PNG, Australia, Hong Kong, Singapore, India, Malaysia.
Cure Make good a default.
Current assets Assets owned which by their nature are likely to be
transformed (sold, used in production, increased or decreased) within
one year. These include stocks, cash, debtors and prepayments.
Current dollar Actual or real prices and costs. Escalation/inflation effects
are included.
Current liabilities Liabilities which will have to be met by the business
within the next year. These include short-term bank debt, creditors,
taxes due.
Current ratio Current assets divided by current liabilities (a liquidity
ratio).
Cushion The extra amount of net cash flow remaining after expected
debt service.
Glossary 217
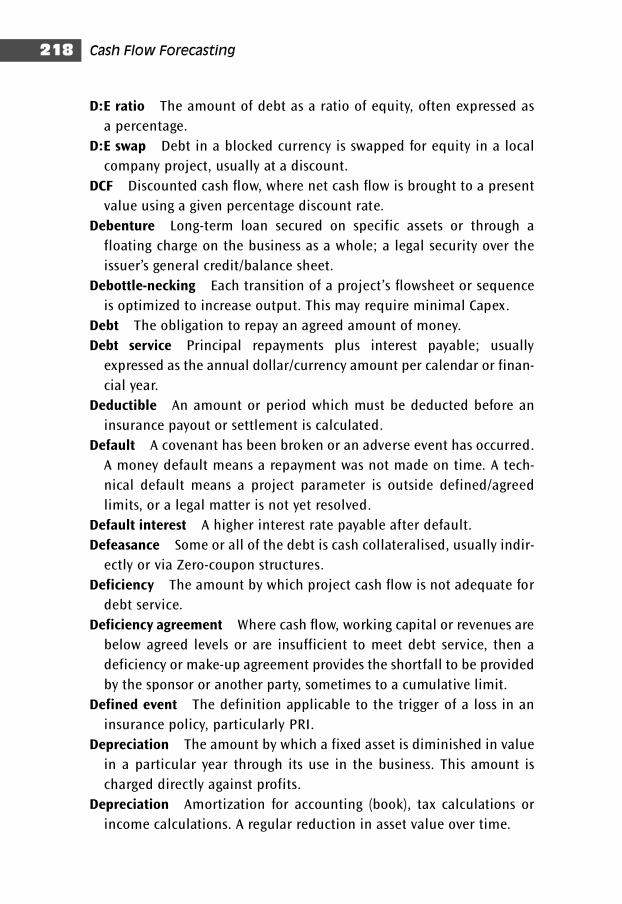
D:E ratio The amount of debt as a ratio of equity, often expressed as
a percentage.
D:E swap Debt in a blocked currency is swapped for equity in a local
company project, usually at a discount.
DCF Discounted cash flow, where net cash flow is brought to a present
value using a given percentage discount rate.
Debenture Long-term loan secured on specific assets or through a
floating charge on the business as a whole; a legal security over the
issuer’s general credit/balance sheet.
Debottle-necking Each transition of a project’s flowsheet or sequence
is optimized to increase output. This may require minimal Capex.
Debt The obligation to repay an agreed amount of money.
Debt service Principal repayments plus interest payable; usually
expressed as the annual dollar/currency amount per calendar or finan-
cial year.
Deductible An amount or period which must be deducted before an
insurance payout or settlement is calculated.
Default A covenant has been broken or an adverse event has occurred.
A money default means a repayment was not made on time. A tech-
nical default means a project parameter is outside defined/agreed
limits, or a legal matter is not yet resolved.
Default interest A higher interest rate payable after default.
Defeasance Some or all of the debt is cash collateralised, usually indir-
ectly or via Zero-coupon structures.
Deficiency The amount by which project cash flow is not adequate for
debt service.
Deficiency agreement Where cash flow, working capital or revenues are
below agreed levels or are insufficient to meet debt service, then a
deficiency or make-up agreement provides the shortfall to be provided
by the sponsor or another party, sometimes to a cumulative limit.
Defined event The definition applicable to the trigger of a loss in an
insurance policy, particularly PRI.
Depreciation The amount by which a fixed asset is diminished in value
in a particular year through its use in the business. This amount is
charged directly against profits.
Depreciation Amortization for accounting (book), tax calculations or
income calculations. A regular reduction in asset value over time.
Cash Flow Forecasting218
Derivative A financial instrument based on an underlying contract or
funding, such as a swap, option or hedge.
Devaluation Either a formal reduction in the FX rate or one gradually
occurring according to FX market forces.
DIS Delay-in-start-up insurances which can cover all non-site force
majeures, change in a law and contingent contractor liability (efficacy).
Sometimes called advanced loss-of-profits insurances or advanced busi-
ness interruption insurance.
Discount rate The annual percentage applied to NPV or PV calcula-
tions (and is often the all-in interest rate or the interest rate plus
margin for project financing). The discount rate may be the WACC.
Dividend The payment or distribution by a business to its sharehold-
ers; the amount paid out per share, usually once or twice a year, by a
company from its profits as decided by the board of directors.
Documentation Anything (such as certificates of registration, loan
agreements, guarantees, etc.) relating to the legal agreements and
guarantees governing the facility extended to the borrower.
Documentation risk The risk of non-repayment due to a defect in the
loan agreement or security arrangements. This can arise due to faulty
drafting, mitigating circumstances, juridically non-enforceable and
faulty collateral, or guarantees which have expired and not been
renewed. The analyst is not expected to assess legal issues, but is
expected to obtain legal opinions when necessary and note them in the
credit analysis.
Double dip Tax depreciation is accessed in two countries concurrently.
Drawdown The borrower obtains some of the project financing, usu-
ally progressively according to construction expenditures plus IDC.
Drop-dead A fee payable when the underlying transaction does not
proceed.
DSCR Debt service cover ratio; usually annual.
DTI Department of Trade and Industry. It is a valuable source of infor-
mation on companies and many business matters in the UK and abroad.
Earnings Net income, net profit.
EBIT Earnings before interest and taxes.
EBIT DA Earnings before interest and tax, depreciation and amortization.
EBRD European Bank for Reconstruction and Development targeted at
Eastern Europe and the former Soviet Union, an MIA.
Glossary 219
ECA Export credit agency established by a country to finance its
national’s goods, investment and services. They often offer PRI.
ECGD Export Credit Guarantee Dept., the UK ECA.
EDC Export Development Corp., Canada’s ECA.
EFIC Export Finance Insurance Corp., Australia’s ECA.
EIS Environmental impact statement, which may have been subject to
public comment.
Engineering risk Design risk. The impact on project cash flow from
deficiencies in design or engineering.
Environmental risk Economic or administrative consequence of slow
or catastrophic environmental pollution.
Equity The owners equity in the company is a residual interest, a claim
on the assets not required to meet the claims of lenders and creditors.
Equity will comprise the amounts originally contributed by the own-
ers, along with profits from previous years which have not been
distributed by way of dividend.
Equity In a project financing, the cash or assets contributed by the
sponsors. For accounting, it is the net worth (or total assets) minus
liabilities.
Equity In the context of credit analysis, this refers to the net value of
all assets after deduction of all charges. Also known as share capital or
shareholder’s funds.
Equity kicker A share of ownership interest in a company, project or
property, or a potential ownership in them. The kicker may take the
form of stock, warrants, purchase options, percentage of profits, or
percentage of ownership.
Escrow Where documents or money accounts are put beyond the reach
of the parties.
Eurobonds Bonds issued in any currency and commonly listed in
Luxembourg. They cannot be traded in the USA. Eurobonds are often
Bearer Bonds.
Eurodollar € deposited with banks outside the USA.
Events of default A covenant in the loan agreement which the borrower
failed to meet, enabling the bank to call the loan in for prepayment.
Such events can range from the Channel tunnel boring failing to reach
mile 12.75 on 25 October, to mailing an annual report to the lending
bank three days late.
Cash Flow Forecasting220
Evergreen facility A facility that automatically renews itself unless the
borrower or lender gives notice to cancel.
Execute Formal signing of documentation. To implement an action
required under the documentation.
Expropriation The state has taken over a company or project, implying
compensation will be paid. Nationalization. Creeping expropriation
occurs when a government squeezes a project by taxes, regulation,
access or changes in law.
Factoring Selling of invoices to raise cash. Debts of various kinds are
put together and sold to banks or corporate treasurers. A term used in
international trade.
Fee A fixed amount or a percentage of an underwriting or principal.
Final take The final participation.
Finance lease The lessor receives lease payments to cover its ownership
costs. The lessee is responsible for maintenance, insurance, and taxes.
Some finance leases are conditional sales or hire purchase agreements.
Financial close When the documentation has been executed and con-
ditions precedent have been satisfied or waived. Drawdowns are now
permissible.
Financial year end The close of the year accounts (FYE).
Financing agreements The documents which provide the project
financing and sponsor support for the project as defined in the project
contracts.
Fiscal year-end The end of the tax year as defined by the tax authorities.
Fixed assets Assets owned which by their nature are not likely to be
transformed (sold, used in production, increased or decreased) within
one year. These include land and buildings, plant and machinery fix-
tures and fittings.
Fixed cost Operating cost which does not vary per unit of output.
Fixed rate Interest rate that is fixed for a defined period.
Float See IPO.
Floating charge Security, in the form of a range of assets, which is
given by the company for a loan.
Floating rate Interest rate that is reset periodically, usually every
couple of months or sometimes daily.
Floor A level which an interest rate or currency is structured not to go
below.
Glossary 221
Force majeure Events outside the control of the parties. These events
are acts of man, nature, governments/regulators, or impersonal events.
Contract performance is forgiven or extended by the period of force
majeure.
Foreign exchange The conversion of one currency into another.
Forex FX, Foreign exchange.
Forward contract Forwards. An agreement to exchange currency or
interest obligations in the future. For tradable commodities or secur-
ities, an agreement to buy or sell at a future date.
FRNs Floating rate notes, where the interest is reset by a panel or by
reference to a market floating rate.
FRS/SSAP Financial Reporting Standard/Statement of Standard Account-
ing Practices. A set of standardized guidelines and procedures which
have become mandatory for directors in the UK for all company
accounts.
Full recourse No matter what risk event occurs, the borrower or its
guarantors guarantee to repay the debt. By definition, this is not a
project financing unless the borrower’s sole asset is the project.
Funding risk he impact on project cash flow from higher funding costs
or lack of availability of funds. Interest risk.
Funds Value used in a business (includes cash, credit, capital).
Futures These are formal agreements to purchase a given item in
the future at a price agreed today. The practice began in Chicago in
the nineteenth century and centred around the agricultural market,
but records show that it was common in Holland and Japan in the
sixteenth century. The purpose is to hedge against price changes.
Futures market A market where forward contracts can be traded
before their maturity.
FX Foreign exchange.
FX rate One currency unit expressed in terms of another. Foreign
exchange rate.
FX risk The effect on project cash flow or debt service from a move-
ment in the FX rate for revenue, costs, or debt service.
Gas turbine Electricity generation by way of a turbine from burning
natural gas or liquid fuels.
Gearing This is a ratio that sums up the financial standing of a com-
pany. It is obtained by dividing the total interest bearing debt by the
Cash Flow Forecasting222
Glossary 223
shareholders’ funds. The higher the number, the greater the risk. A
company that has a large proportion of its permanent capital from
debt is referred to as being highly geared.
General partner The partner with unlimited liability.
Goodwill The amount paid in excess of book value on the balance
sheet, usually for intangible assets such as trademarks or licences.
Grace After a default, days of grace may be stated within which the
cure is effected. A period when interest or principal is not yet payable,
usually a period after start-up/commissioning/completion in a project
financing.
Gross margin Sales revenue minus cost of goods sold.
GSM Global System for Mobiles, a mobile phone standard.
Guarantee Usually an undertaking by a third party to assume the debts
of the borrower in the event of default. A common situation with
parent/affiliate lending arrangements. Guarantees can and do expire,
and the analyst should ensure in the credit review that they are either
still valid, or have been renewed.
Guarantor A party who will guarantee repayment or performance of a
covenant.
Heat rate The amount of fuel required to generate a kilowatt hr
(kwh) of electricity, usually expressed as an energy value such as
kilojoules (kJ).
Hedge To take a forward contract or option to effect an anticipated
change in a currency, commodity, interest rate or security, so that gains
or losses are offset.
Hell-or-high-water An absolute commitment, with no contractual defence.
Hermes The trade finance agency for Germany.
Hire purchase The user of the asset is entitled to purchase the asset
according to a pre-agreed method. The user may be the owner for tax
purposes.
Holding company Company which holds, directly or indirectly, more
than 50 per cent of a subsidiary company, or controls the composition
of the board of directors.
Hurdle rate A minimum IRR.
IFC International Finance Corporation, the private enterprise arm of
the World Bank.
Illiquid Not easily traded or not readily converted to cash.
Cash Flow Forecasting224
Incipient default Potential default.
Income Operating cash flows less overheads and depreciation, either
before tax (BT) or after tax (AT). Earnings.
Inconvertibility Where a local currency cannot be exchanged for
another currency. Often includes transfer risk.
Indemnity A legal obligation to cover a liability, however arising.
Indexed rate An interest rate linked to an index, usually the CPI.
Information memorandum An information circular which the borrow-
ing company and agent banks will prepare providing information
relating to the company and its borrowing requirements, and which is
circulated to interested parties during a loan syndication.
Infrastructure risk The impact on project cash flows from infrastruc-
ture problems. Sometimes labelled transportation risk.
Institutions Insurance companies, pension funds, trusts, foundations,
mutual funds, funds managers, bank investment departments.
Instrument A financial tool. Sometimes a discrete type of funding or a
security.
Intangible assets Assets which are neither physical nor financial (e.g.
goodwill, licences, trademarks).
Interest rate The percentage payable to the lender calculated at an
annual rate on the principal. May be all-in.
Interest risk The impact on project cash flow from higher interest costs
or lack of availability of funds. Funding risk.
Intermediary An entity standing between parties to funding or a swap.
An intermediary may be at risk.
Inventory Finished goods, raw materials or work in process.
Inverse order Applied to the periodic repayment schedule, and means
from the end, expected maturity. ‘Current order’ means the next peri-
odic principal repayment.
Investment bank The US term for a merchant bank.
Investment grade For a rating, the rating level above which institu-
tional investors have been authorized to invest.
Investor/creditor community Entities which provide funds to com-
panies. Investors buy shares in the company (equity), while creditors
lend money to companies (debt).
IPO An initial public offering of shares. A float.
IPP Independent power plant, a BOO development.
Glossary 225
IRR The discount rate to make the NPV zero. Multiple IRRs occur math-
ematically if the periodic cash flows change sign more than once.
Islamic loan Interest cannot be charged. Rather, the loan is struc-
tured using discounts, sale/lease, profit participation, or repurchase
agreements.
Iterations The number of times circular references in a spreadsheet
are recalculated before the calculation reaches an (approximated)
acceptable degree of accuracy (interest expenses calculated on pro-
jected debt, projected debt based on the final P � L result which
depends on interest expense, etc. …). Computers perform such labori-
ous calculations instantly.
Joint venture (JV) The legal means of dividing the project’s equity
either by shareholdings in a company (incorporated JV) or by way of a
contract (unincorporated JV).
Junk A high-yield bond of speculative grade.
L/C Letter of credit, a guarantee to pay limited to an amount and time
triggered by defined events or exchange of agreed documents. Used
for credit enhancement.
Latent default A potential default that may have always been present
but unidentified.
Lawsuits Items which do not appear on the balance sheet but can have a
financial impact on the company. Also considered as ‘contingent liabil-
ities’, these should be explained in the notes to the financial statements.
LDs Liquidated damages. The amount payable for delays and sub-
standard performance under a construction, equipment supply, or
0 & M contract.
Lead arranger The senior tier of arranger.
Lead bank A senior bank involved in the negotiations for a project
financing. Subordinate to an arranger.
Lead manager Senior tier of lender in a loan syndication.
League tables A ranking of lenders and advisers according to the
underwriting, final take, or number of cash flow forecasting loans or
advisory mandates.
Lease The owner of an asset (lessor) agrees to receive lease payments/
rentals from the user (lessee), usually at a fixed rental level. The
lessor/owner takes the benefit of depreciation as a tax deduction. Its
primary security is the asset.
Lease rate The equivalent interest rate calculated from a stream of
lease payments.
Lease term The life of a lease including any renewal options.
Legal risk A risk that a defect in the documentation will affect cash
flow or debt service.
Lending risk Risks relating to lender, including legal enforceability,
documentation, interest rates, etc. The risks the bank is getting into
by putting the loan into place.
Lessee The user who pays lease rentals to the owner/lessor.
Lessor The owner of a leased asset.
Leverage 1. This is the American term for gearing. 2. In the UK this
is the same as gearing, with the addition of non-interest bearing
external debt.
Leveraged lease A lessor borrows to finance a leased asset. Recourse
may be limited to the lease rentals or the asset.
Liability Obligation of a company to make payment for goods or
services already received.
Liability The obligation to repay a defined amount or to perform a service.
LIBOR London Interbank Offered Rate, often quoted as a 1-, 3-,
6-month rate for €.
Lien A legal security interest in an asset.
Limited recourse Under certain conditions (legal or financial), there is
access to the sponsor’s credit or other legal security for repayment
(besides the project’s cash flows). There is usually recourse in the event
of fraud or misrepresentation/non-disclosure. Thus non-recourse is
better described as ‘limited-recourse’.
Liquid Easily traded or converted to cash.
Liquidation The process of disposal or sale of the project or project
assets with the proceeds used to repay the project financing.
Liquidation Selling off the company’s assets to satisfy creditors during a
winding up. The main risk in a liquidation is asset shrinkage – whether
the assets being liquidated can fetch a market value sufficient to satisfy
all the creditors.
Liquidity The pool of accessible funds, either in cash or in assets that
may be converted rapidly into cash to meet immediate debts.
Liquidity The ability to convert current assets into cash to meet
current liabilities when they fall due.
Cash Flow Forecasting226
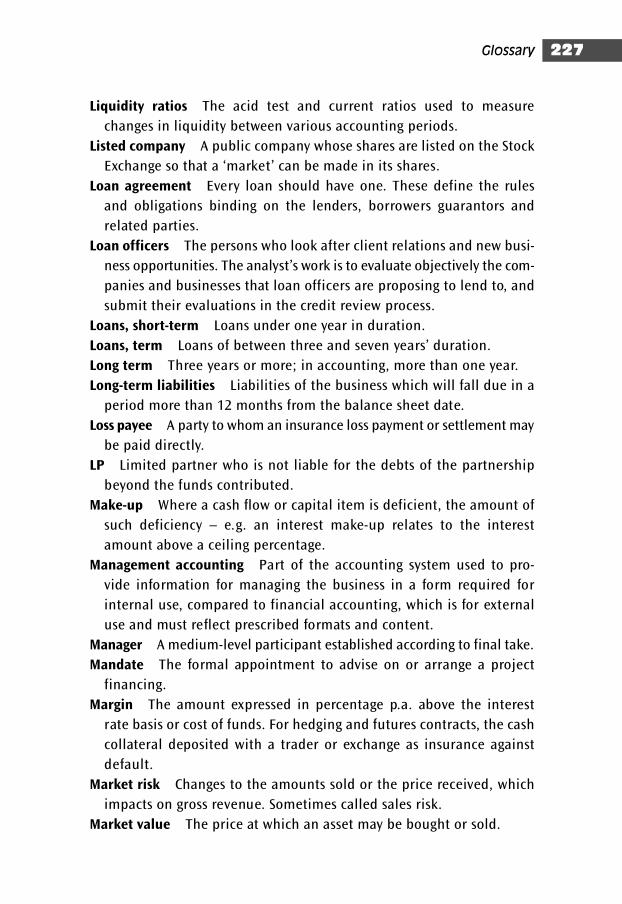
Liquidity ratios The acid test and current ratios used to measure
changes in liquidity between various accounting periods.
Listed company A public company whose shares are listed on the Stock
Exchange so that a ‘market’ can be made in its shares.
Loan agreement Every loan should have one. These define the rules
and obligations binding on the lenders, borrowers guarantors and
related parties.
Loan officers The persons who look after client relations and new busi-
ness opportunities. The analyst’s work is to evaluate objectively the com-
panies and businesses that loan officers are proposing to lend to, and
submit their evaluations in the credit review process.
Loans, short-term Loans under one year in duration.
Loans, term Loans of between three and seven years’ duration.
Long term Three years or more; in accounting, more than one year.
Long-term liabilities Liabilities of the business which will fall due in a
period more than 12 months from the balance sheet date.
Loss payee A party to whom an insurance loss payment or settlement may
be paid directly.
LP Limited partner who is not liable for the debts of the partnership
beyond the funds contributed.
Make-up Where a cash flow or capital item is deficient, the amount of
such deficiency – e.g. an interest make-up relates to the interest
amount above a ceiling percentage.
Management accounting Part of the accounting system used to pro-
vide information for managing the business in a form required for
internal use, compared to financial accounting, which is for external
use and must reflect prescribed formats and content.
Manager A medium-level participant established according to final take.
Mandate The formal appointment to advise on or arrange a project
financing.
Margin The amount expressed in percentage p.a. above the interest
rate basis or cost of funds. For hedging and futures contracts, the cash
collateral deposited with a trader or exchange as insurance against
default.
Market risk Changes to the amounts sold or the price received, which
impacts on gross revenue. Sometimes called sales risk.
Market value The price at which an asset may be bought or sold.
Glossary 227
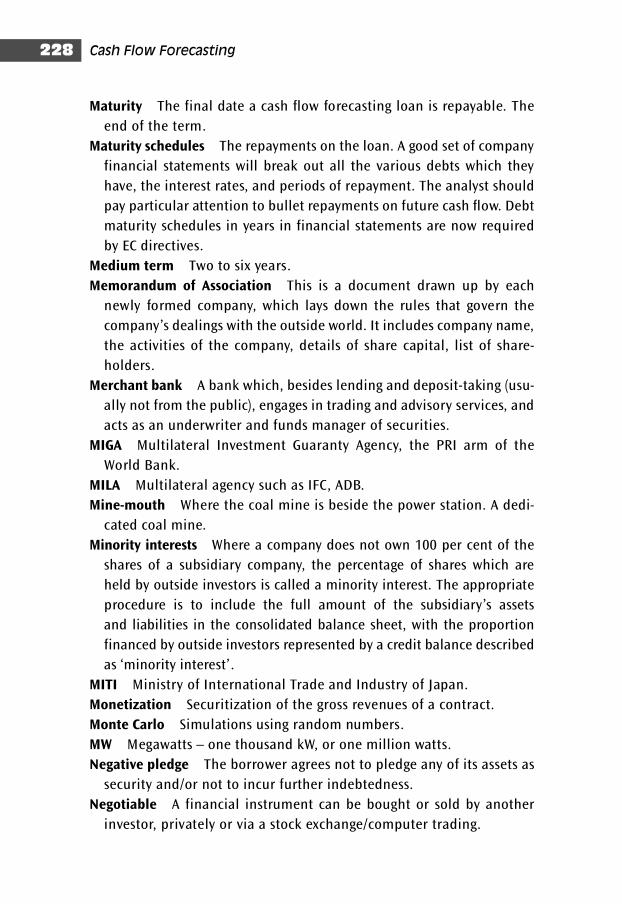
Maturity The final date a cash flow forecasting loan is repayable. The
end of the term.
Maturity schedules The repayments on the loan. A good set of company
financial statements will break out all the various debts which they
have, the interest rates, and periods of repayment. The analyst should
pay particular attention to bullet repayments on future cash flow. Debt
maturity schedules in years in financial statements are now required
by EC directives.
Medium term Two to six years.
Memorandum of Association This is a document drawn up by each
newly formed company, which lays down the rules that govern the
company’s dealings with the outside world. It includes company name,
the activities of the company, details of share capital, list of share-
holders.
Merchant bank A bank which, besides lending and deposit-taking (usu-
ally not from the public), engages in trading and advisory services, and
acts as an underwriter and funds manager of securities.
MIGA Multilateral Investment Guaranty Agency, the PRI arm of the
World Bank.
MILA Multilateral agency such as IFC, ADB.
Mine-mouth Where the coal mine is beside the power station. A dedi-
cated coal mine.
Minority interests Where a company does not own 100 per cent of the
shares of a subsidiary company, the percentage of shares which are
held by outside investors is called a minority interest. The appropriate
procedure is to include the full amount of the subsidiary’s assets
and liabilities in the consolidated balance sheet, with the proportion
financed by outside investors represented by a credit balance described
as ‘minority interest’.
MITI Ministry of International Trade and Industry of Japan.
Monetization Securitization of the gross revenues of a contract.
Monte Carlo Simulations using random numbers.
MW Megawatts – one thousand kW, or one million watts.
Negative pledge The borrower agrees not to pledge any of its assets as
security and/or not to incur further indebtedness.
Negotiable A financial instrument can be bought or sold by another
investor, privately or via a stock exchange/computer trading.
Cash Flow Forecasting228
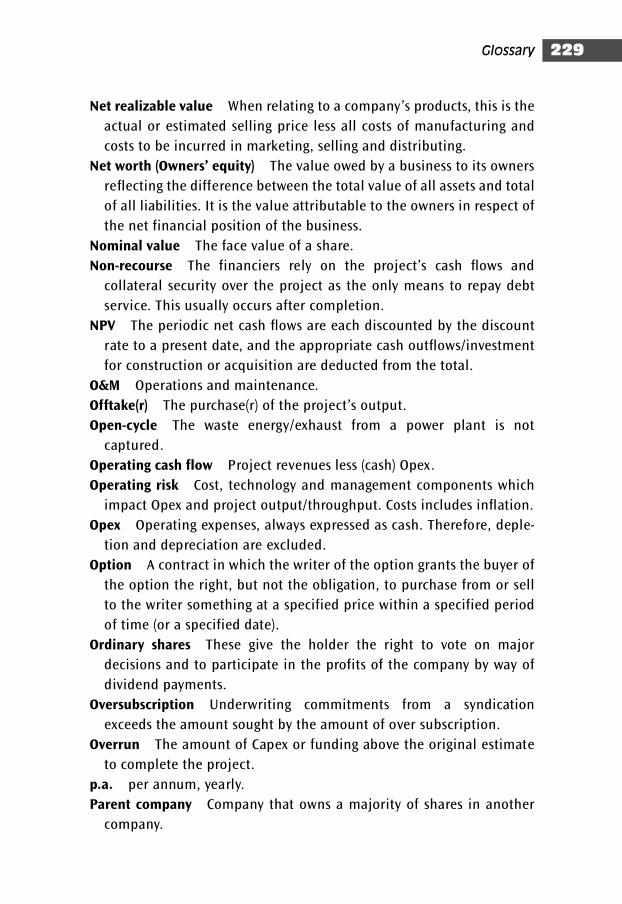
Net realizable value When relating to a company’s products, this is the
actual or estimated selling price less all costs of manufacturing and
costs to be incurred in marketing, selling and distributing.
Net worth (Owners’ equity) The value owed by a business to its owners
reflecting the difference between the total value of all assets and total
of all liabilities. It is the value attributable to the owners in respect of
the net financial position of the business.
Nominal value The face value of a share.
Non-recourse The financiers rely on the project’s cash flows and
collateral security over the project as the only means to repay debt
service. This usually occurs after completion.
NPV The periodic net cash flows are each discounted by the discount
rate to a present date, and the appropriate cash outflows/investment
for construction or acquisition are deducted from the total.
O&M Operations and maintenance.
Offtake(r) The purchase(r) of the project’s output.
Open-cycle The waste energy/exhaust from a power plant is not
captured.
Operating cash flow Project revenues less (cash) Opex.
Operating risk Cost, technology and management components which
impact Opex and project output/throughput. Costs includes inflation.
Opex Operating expenses, always expressed as cash. Therefore, deple-
tion and depreciation are excluded.
Option A contract in which the writer of the option grants the buyer of
the option the right, but not the obligation, to purchase from or sell
to the writer something at a specified price within a specified period
of time (or a specified date).
Ordinary shares These give the holder the right to vote on major
decisions and to participate in the profits of the company by way of
dividend payments.
Oversubscription Underwriting commitments from a syndication
exceeds the amount sought by the amount of over subscription.
Overrun The amount of Capex or funding above the original estimate
to complete the project.
p.a. per annum, yearly.
Parent company Company that owns a majority of shares in another
company.
Glossary 229
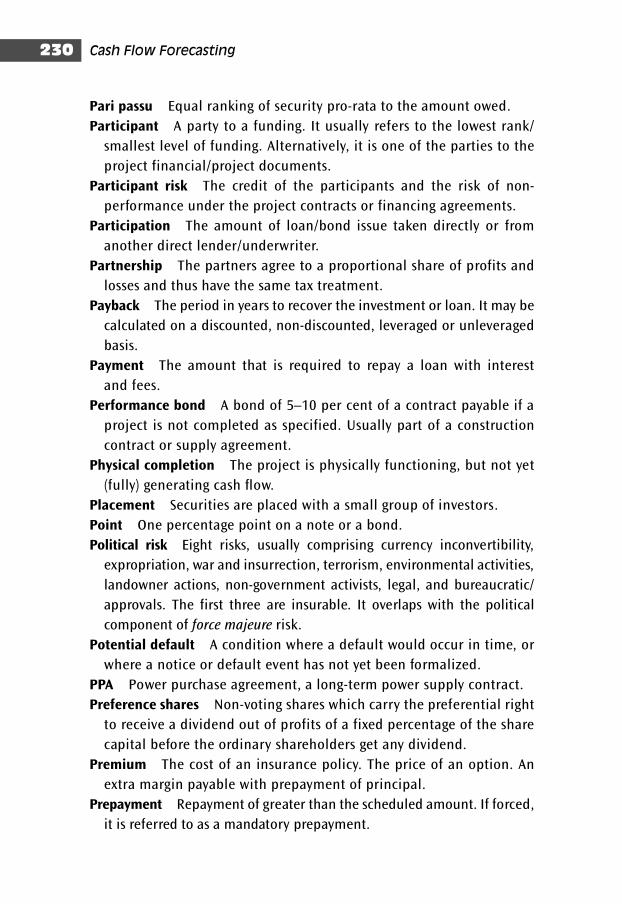
Pari passu Equal ranking of security pro-rata to the amount owed.
Participant A party to a funding. It usually refers to the lowest rank/
smallest level of funding. Alternatively, it is one of the parties to the
project financial/project documents.
Participant risk The credit of the participants and the risk of non-
performance under the project contracts or financing agreements.
Participation The amount of loan/bond issue taken directly or from
another direct lender/underwriter.
Partnership The partners agree to a proportional share of profits and
losses and thus have the same tax treatment.
Payback The period in years to recover the investment or loan. It may be
calculated on a discounted, non-discounted, leveraged or unleveraged
basis.
Payment The amount that is required to repay a loan with interest
and fees.
Performance bond A bond of 5–10 per cent of a contract payable if a
project is not completed as specified. Usually part of a construction
contract or supply agreement.
Physical completion The project is physically functioning, but not yet
(fully) generating cash flow.
Placement Securities are placed with a small group of investors.
Point One percentage point on a note or a bond.
Political risk Eight risks, usually comprising currency inconvertibility,
expropriation, war and insurrection, terrorism, environmental activities,
landowner actions, non-government activists, legal, and bureaucratic/
approvals. The first three are insurable. It overlaps with the political
component of force majeure risk.
Potential default A condition where a default would occur in time, or
where a notice or default event has not yet been formalized.
PPA Power purchase agreement, a long-term power supply contract.
Preference shares Non-voting shares which carry the preferential right
to receive a dividend out of profits of a fixed percentage of the share
capital before the ordinary shareholders get any dividend.
Premium The cost of an insurance policy. The price of an option. An
extra margin payable with prepayment of principal.
Prepayment Repayment of greater than the scheduled amount. If forced,
it is referred to as a mandatory prepayment.
Cash Flow Forecasting230
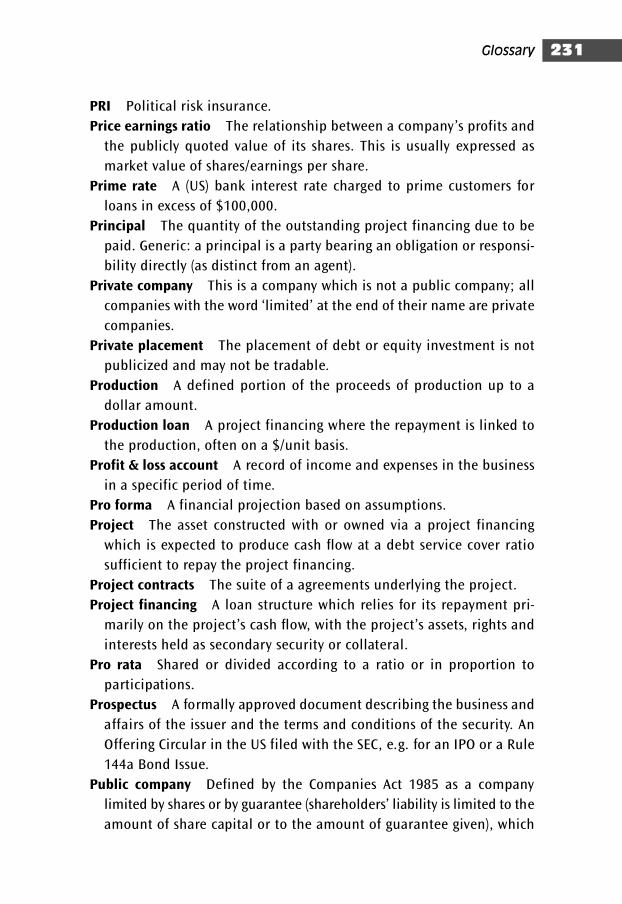
PRI Political risk insurance.
Price earnings ratio The relationship between a company’s profits and
the publicly quoted value of its shares. This is usually expressed as
market value of shares/earnings per share.
Prime rate A (US) bank interest rate charged to prime customers for
loans in excess of $100,000.
Principal The quantity of the outstanding project financing due to be
paid. Generic: a principal is a party bearing an obligation or responsi-
bility directly (as distinct from an agent).
Private company This is a company which is not a public company; all
companies with the word ‘limited’ at the end of their name are private
companies.
Private placement The placement of debt or equity investment is not
publicized and may not be tradable.
Production A defined portion of the proceeds of production up to a
dollar amount.
Production loan A project financing where the repayment is linked to
the production, often on a $/unit basis.
Profit & loss account A record of income and expenses in the business
in a specific period of time.
Pro forma A financial projection based on assumptions.
Project The asset constructed with or owned via a project financing
which is expected to produce cash flow at a debt service cover ratio
sufficient to repay the project financing.
Project contracts The suite of a agreements underlying the project.
Project financing A loan structure which relies for its repayment pri-
marily on the project’s cash flow, with the project’s assets, rights and
interests held as secondary security or collateral.
Pro rata Shared or divided according to a ratio or in proportion to
participations.
Prospectus A formally approved document describing the business and
affairs of the issuer and the terms and conditions of the security. An
Offering Circular in the US filed with the SEC, e.g. for an IPO or a Rule
144a Bond Issue.
Public company Defined by the Companies Act 1985 as a company
limited by shares or by guarantee (shareholders’ liability is limited to the
amount of share capital or to the amount of guarantee given), which
Glossary 231
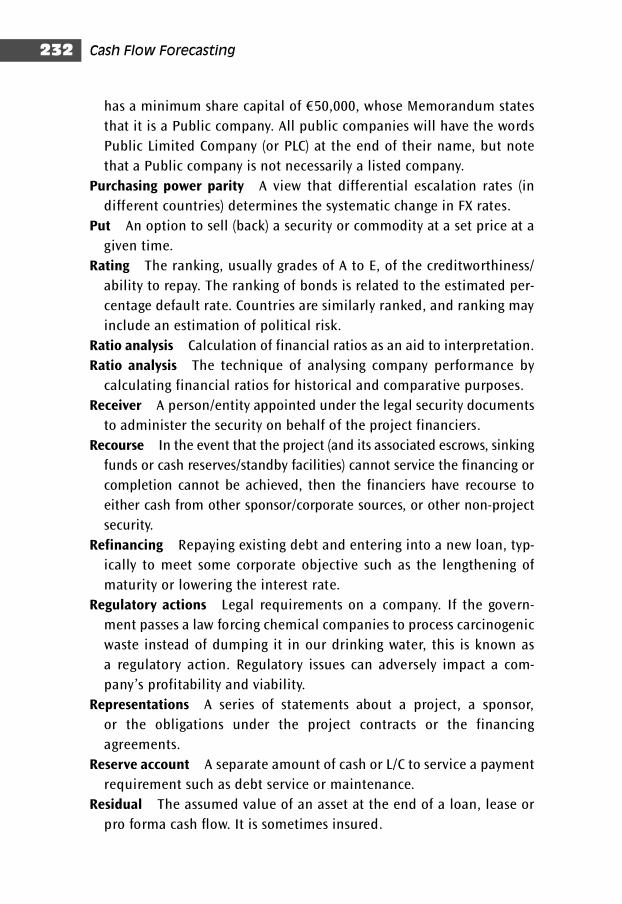
has a minimum share capital of €50,000, whose Memorandum states
that it is a Public company. All public companies will have the words
Public Limited Company (or PLC) at the end of their name, but note
that a Public company is not necessarily a listed company.
Purchasing power parity A view that differential escalation rates (in
different countries) determines the systematic change in FX rates.
Put An option to sell (back) a security or commodity at a set price at a
given time.
Rating The ranking, usually grades of A to E, of the creditworthiness/
ability to repay. The ranking of bonds is related to the estimated per-
centage default rate. Countries are similarly ranked, and ranking may
include an estimation of political risk.
Ratio analysis Calculation of financial ratios as an aid to interpretation.
Ratio analysis The technique of analysing company performance by
calculating financial ratios for historical and comparative purposes.
Receiver A person/entity appointed under the legal security documents
to administer the security on behalf of the project financiers.
Recourse In the event that the project (and its associated escrows, sinking
funds or cash reserves/standby facilities) cannot service the financing or
completion cannot be achieved, then the financiers have recourse to
either cash from other sponsor/corporate sources, or other non-project
security.
Refinancing Repaying existing debt and entering into a new loan, typ-
ically to meet some corporate objective such as the lengthening of
maturity or lowering the interest rate.
Regulatory actions Legal requirements on a company. If the govern-
ment passes a law forcing chemical companies to process carcinogenic
waste instead of dumping it in our drinking water, this is known as
a regulatory action. Regulatory issues can adversely impact a com-
pany’s profitability and viability.
Representations A series of statements about a project, a sponsor,
or the obligations under the project contracts or the financing
agreements.
Reserve account A separate amount of cash or L/C to service a payment
requirement such as debt service or maintenance.
Residual The assumed value of an asset at the end of a loan, lease or
pro forma cash flow. It is sometimes insured.
Cash Flow Forecasting232
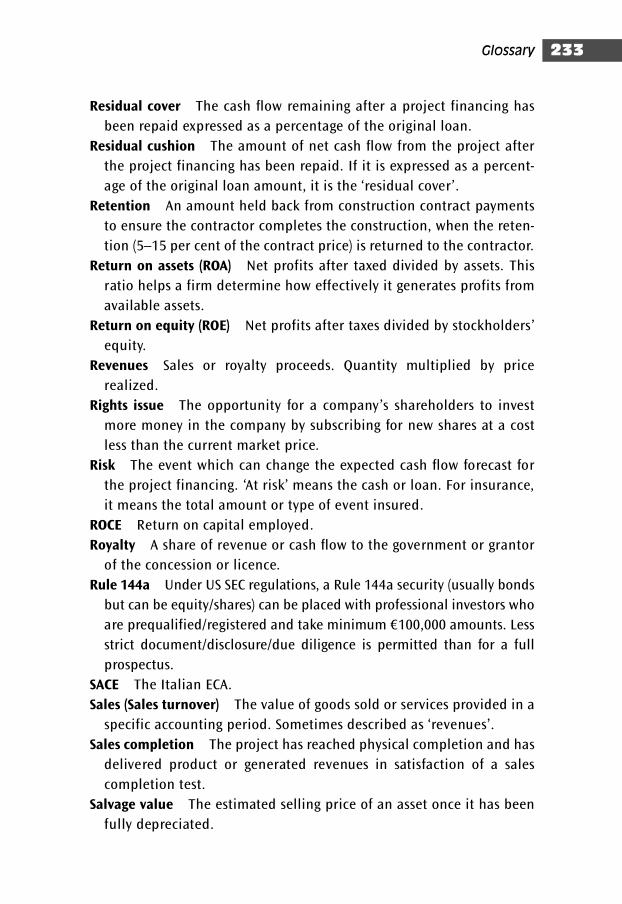
Residual cover The cash flow remaining after a project financing has
been repaid expressed as a percentage of the original loan.
Residual cushion The amount of net cash flow from the project after
the project financing has been repaid. If it is expressed as a percent-
age of the original loan amount, it is the ‘residual cover’.
Retention An amount held back from construction contract payments
to ensure the contractor completes the construction, when the reten-
tion (5–15 per cent of the contract price) is returned to the contractor.
Return on assets (ROA) Net profits after taxed divided by assets. This
ratio helps a firm determine how effectively it generates profits from
available assets.
Return on equity (ROE) Net profits after taxes divided by stockholders’
equity.
Revenues Sales or royalty proceeds. Quantity multiplied by price
realized.
Rights issue The opportunity for a company’s shareholders to invest
more money in the company by subscribing for new shares at a cost
less than the current market price.
Risk The event which can change the expected cash flow forecast for
the project financing. ‘At risk’ means the cash or loan. For insurance,
it means the total amount or type of event insured.
ROCE Return on capital employed.
Royalty A share of revenue or cash flow to the government or grantor
of the concession or licence.
Rule 144a Under US SEC regulations, a Rule 144a security (usually bonds
but can be equity/shares) can be placed with professional investors who
are prequalified/registered and take minimum €100,000 amounts. Less
strict document/disclosure/due diligence is permitted than for a full
prospectus.
SACE The Italian ECA.
Sales (Sales turnover) The value of goods sold or services provided in a
specific accounting period. Sometimes described as ‘revenues’.
Sales completion The project has reached physical completion and has
delivered product or generated revenues in satisfaction of a sales
completion test.
Salvage value The estimated selling price of an asset once it has been
fully depreciated.
Glossary 233
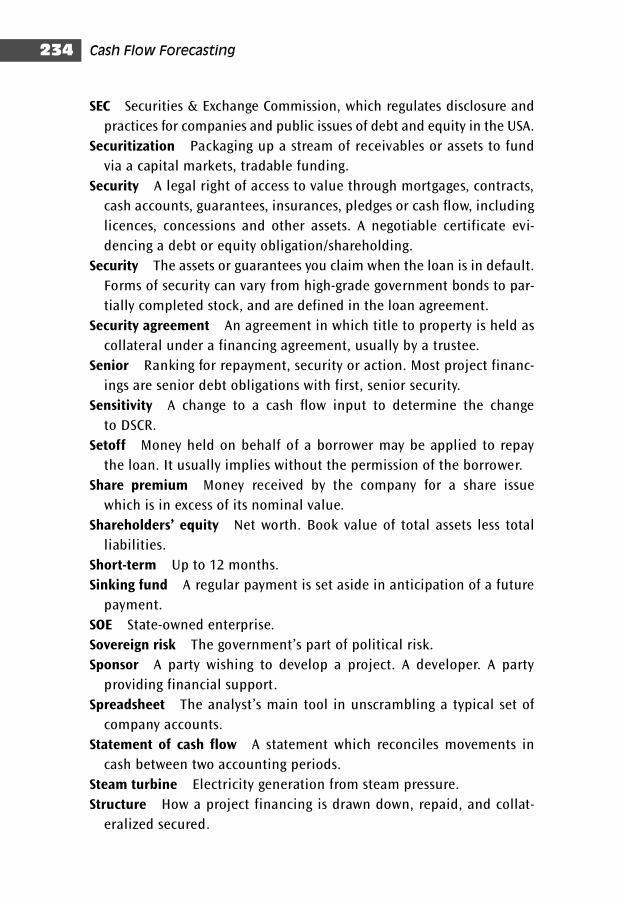
SEC Securities & Exchange Commission, which regulates disclosure and
practices for companies and public issues of debt and equity in the USA.
Securitization Packaging up a stream of receivables or assets to fund
via a capital markets, tradable funding.
Security A legal right of access to value through mortgages, contracts,
cash accounts, guarantees, insurances, pledges or cash flow, including
licences, concessions and other assets. A negotiable certificate evi-
dencing a debt or equity obligation/shareholding.
Security The assets or guarantees you claim when the loan is in default.
Forms of security can vary from high-grade government bonds to par-
tially completed stock, and are defined in the loan agreement.
Security agreement An agreement in which title to property is held as
collateral under a financing agreement, usually by a trustee.
Senior Ranking for repayment, security or action. Most project financ-
ings are senior debt obligations with first, senior security.
Sensitivity A change to a cash flow input to determine the change
to DSCR.
Setoff Money held on behalf of a borrower may be applied to repay
the loan. It usually implies without the permission of the borrower.
Share premium Money received by the company for a share issue
which is in excess of its nominal value.
Shareholders’ equity Net worth. Book value of total assets less total
liabilities.
Short-term Up to 12 months.
Sinking fund A regular payment is set aside in anticipation of a future
payment.
SOE State-owned enterprise.
Sovereign risk The government’s part of political risk.
Sponsor A party wishing to develop a project. A developer. A party
providing financial support.
Spreadsheet The analyst’s main tool in unscrambling a typical set of
company accounts.
Statement of cash flow A statement which reconciles movements in
cash between two accounting periods.
Steam turbine Electricity generation from steam pressure.
Structure How a project financing is drawn down, repaid, and collat-
eralized secured.
Cash Flow Forecasting234
Glossary 235
Subordinated The subordinated party accepts a lower priority of repay-
ment and/or security than senior debt.
Subsidiary company A company in which all of its share capital is
owned by another company.
Sunk costs Capital already spent.
Supplier credit The supplier of goods or services agrees to deferred
repayment terms.
Supply risk The raw materials or input to a project change from those
assumed/projected. For a resources production project, this is called
reserves risk.
Swap An exchange of the basis of obligations to repay principal, inter-
est or currency. For interest-rate swaps (floating to fixed), the under-
lying principal may not be exchanged.
Sweep All available cash flow is used for debt service.
Syndication The selling of a cash flow forecasting to a group of prospect-
ive participants, the syndicate.
Tail The remaining reserves after the project financing has been repaid.
Sometimes means the residual.
Take-and-pay If the project’s output is deliverable and can be taken, it
will be paid for.
Take-or-pay In the event the project’s output is not taken, payment
must be made whether or not the output is deliverable.
Takeout A financing to refinance or take out another e.g. construction
loan.
Tangible assets Assets which have a tangible, real or ascertainable value.
Tangible net worth The value attributable to shareholders when real-
istic (tangible) values are applied to the calculation of net worth.
Tenor The number of years a loan is outstanding. The term.
Term The loan life or tenor; the period to a loan’s maturity. Generic:
A condition attached.
Throughput A throughput agreement is a hell-or-high-water contract
to put and pay for material through a facility. Force majeure gives no
relief.
TNW Total net worth.
Tolling A contract to process or convert a raw material into a saleable
or finished product. The tolling contract does not require the
purchase of the raw material or the sale of the output.
Tombstone An advertisement listing the sponsor, amount funded, par-
ticipants, and key roles.
Tranche A separate portion of a project financing, perhaps with dif-
ferent financiers, margins and term.
Transfer risk Currency cannot be sent out of the country, usually due
to Central Bank restrictions or a national debt rescheduling.
Trustee An independent or nominated third party who administers
corporate or financial arrangements.
Turnkey The construction of a project to meet a standard or the com-
pletion test where it is ready to produce cash flow. Turnkey contracts
usually have LDs and retentions.
Turnover The gross revenue net of VAT which the company has earned
from providing goods/services to customers.
Underwriting The commitment to fund is not contingent on syndication.
Unsecured The financier has no security, merely the obligation/under-
taking to repay.
Unwind To reverse a swap or hedge.
WACC Weighted Average Cost of Capital calculated from the returns on
interest rates payable on the different components of a company’s or
a project’s deemed capital structure.
Well A drill hole in the petroleum industry.
Withholding A tax on interest, royalty, or dividend payments, usually
those paid overseas. It may be deducted at source.
Working capital The amount of short-term funds available to a busi-
ness to perform its normal trading operations. Usually defined as the
difference between current assets and current liabilities.
Working capital Cash required to fund inventories and accounts receiv-
able. Accounting definition is current assets less current liabilities. It
is recovered entirely when the project ceases.
Workout The project financiers are responding to work out a potential
problem or have arranged to take over the operation after a default
to attempt to rehabilitate the cash flow generating capacity of the
project.
World Bank An MILA based in Washington DC. The international bank
for reconstruction and development. Usually involved in government-
related deals.
Yield The financial return, usually expressed as a percentage p.a.
Cash Flow Forecasting236
Zero coupon No interest is paid. A bond or note is issued at a discount,
which is calculated to yield a compound interest equivalent return.
Profitability indicators
Cost of goods sold (CGS) The cost of the raw materials and resources
used in the manufacturing process, both in their composition (wood
for paper manufacturing) as well as in other manufacturing related
resources (chemicals, electricity).
Dividend payout ratio The ratio of dividends paid out as a percentage
of net profits, useful in calculating the level of retained earnings.
Gross profit (GP) Net sales revenue minus cost of goods sold � gross
profit.
Gross profit margin (GPM) This is the company’s gross profit expressed as
a percentage of net sales. This index is useful to see whether the com-
pany’s sales activity is generating more or less profits. Historical average
gross profit margins, in conjunction with projected future sales, are also
useful in projecting future cost of goods sold and gross profits.
Net margins Percentage of each sales pound remaining after all oper-
ating expenses and taxes have paid: net income divided by net sales.
Profit The amount of funds available after satisfying preceding expenses.
In descending order in the profit and loss statement, we are concerned
with several types of profit: gross profit, operating profit, profit before
interest and taxes, and net profit.
Profitability Measures the amount of profit generated in relation to
net sales. If your sales double and profits rise by only 20 per cent, you
will have increased your profits but your profitability will have taken
a sharp downturn.
Retained earnings (R/E) The amount of a company’s profits which are
transferred to net worth after payment of dividends to the company’s
shareholders. From our projections viewpoint this item is important,
as it contributes to growth in net worth and maintaining adequate
leverage.
Return on assets (ROA) Percentage return on each pound of assets
employed: net income divided by total assets.
Return on equity (ROE) Percentage return on each pound of equity
employed: net income divided by net worth adjusted for intangibles.
Glossary 237
Selling, general and administrative expenses (SGA) These are expenses
arising from the company’s ongoing operations in completing the
manufacturing process.
SGA as a percent of sales Percent of each sales pound used for selling,
general and administrative expense: SGA divided by net sales.
Turnover and efficiency indicators
Accounts payable in days Accounts payable/sales*365. This is another
index linked to sales activity. Also known as supplier credit, this ratio
measures the extent to which the company avails itself of credit from
its suppliers. While modest levels are to be expected, undue variations
can be indicative of liquidity problems in the company.
Accounts receivable in days Total accounts receivable/sales*365. Also
known as the collection period, this ratio measures how long it takes
the company to collect payments from its clients. This activity is
linked to sales activity, but can vary for other reasons such as inad-
equate collection procedures.
Asset to sales (ATO) The ratio of assets to net sales, also known as asset
turnover (ATO). This ratio basically measures how many units of sales a
company is able to generate in terms of its balance sheet size. A com-
pany which is able to generate more sales then a competitor with a
similar-sized balance sheet is more ‘asset efficient’. Asset efficiency
should not be confused with profitability, however: an asset-efficient
company may generate a loss, unlike its less asset-efficient competitor,
due to other variables (rising operating costs, loss on sale of sub, etc.).
Inventory in days Total inventory/sales*365. Inventory levels are
directly linked to sales: if the company is keeping inventory longer than
in previous years, this can be an indication of inadequate inventory
controls (raw materials) or slow sales (finished goods). From the Land of
The Rising Sun comes the vogue concept of ‘just-in-time’ inventory,
which attempts to minimize levels of inventory held to the bare min-
imum (hours), as inventory represents financial resources lying idle.
Easier said than done, though, if your business is located in a country
prone to transport strikes.
Net plant to sales (NP/S) Net plant/sales. This ratio measures the
amount of net plant needed to support each unit of sales. NP/S is a
Cash Flow Forecasting238
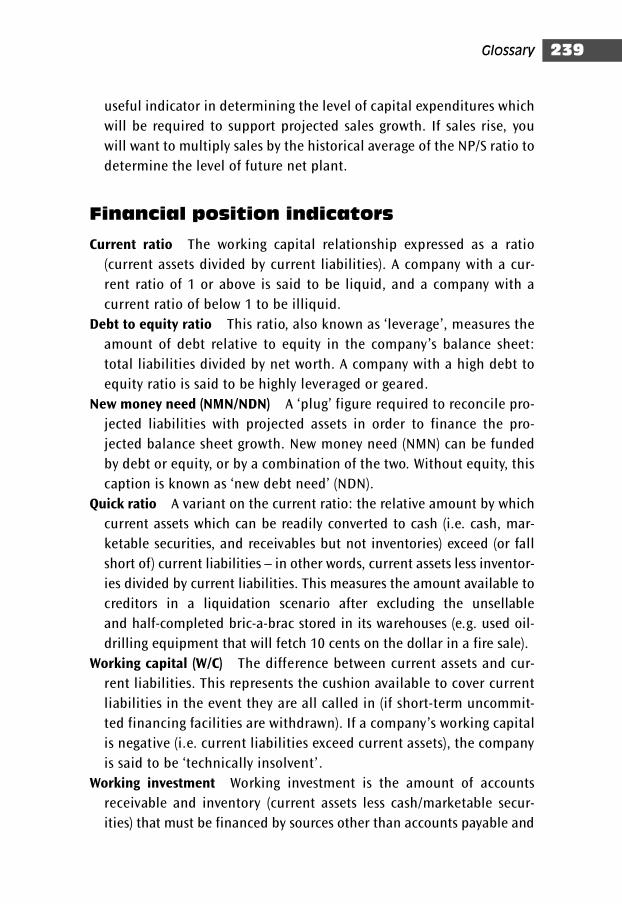
useful indicator in determining the level of capital expenditures which
will be required to support projected sales growth. If sales rise, you
will want to multiply sales by the historical average of the NP/S ratio to
determine the level of future net plant.
Financial position indicators
Current ratio The working capital relationship expressed as a ratio
(current assets divided by current liabilities). A company with a cur-
rent ratio of 1 or above is said to be liquid, and a company with a
current ratio of below 1 to be illiquid.
Debt to equity ratio This ratio, also known as ‘leverage’, measures the
amount of debt relative to equity in the company’s balance sheet:
total liabilities divided by net worth. A company with a high debt to
equity ratio is said to be highly leveraged or geared.
New money need (NMN/NDN) A ‘plug’ figure required to reconcile pro-
jected liabilities with projected assets in order to finance the pro-
jected balance sheet growth. New money need (NMN) can be funded
by debt or equity, or by a combination of the two. Without equity, this
caption is known as ‘new debt need’ (NDN).
Quick ratio A variant on the current ratio: the relative amount by which
current assets which can be readily converted to cash (i.e. cash, mar-
ketable securities, and receivables but not inventories) exceed (or fall
short of) current liabilities – in other words, current assets less inventor-
ies divided by current liabilities. This measures the amount available to
creditors in a liquidation scenario after excluding the unsellable
and half-completed bric-a-brac stored in its warehouses (e.g. used oil-
drilling equipment that will fetch 10 cents on the dollar in a fire sale).
Working capital (W/C) The difference between current assets and cur-
rent liabilities. This represents the cushion available to cover current
liabilities in the event they are all called in (if short-term uncommit-
ted financing facilities are withdrawn). If a company’s working capital
is negative (i.e. current liabilities exceed current assets), the company
is said to be ‘technically insolvent’ .
Working investment Working investment is the amount of accounts
receivable and inventory (current assets less cash/marketable secur-
ities) that must be financed by sources other than accounts payable and
Glossary 239
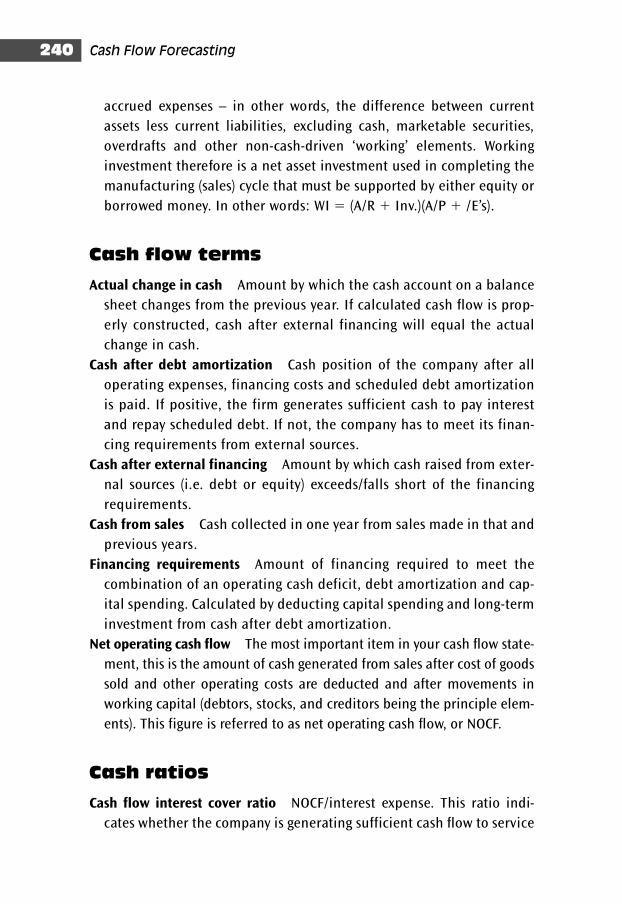
accrued expenses – in other words, the difference between current
assets less current liabilities, excluding cash, marketable securities,
overdrafts and other non-cash-driven ‘working’ elements. Working
investment therefore is a net asset investment used in completing the
manufacturing (sales) cycle that must be supported by either equity or
borrowed money. In other words: WI � (A/R � Inv.)(A/P � /E’s).
Cash flow terms
Actual change in cash Amount by which the cash account on a balance
sheet changes from the previous year. If calculated cash flow is prop-
erly constructed, cash after external financing will equal the actual
change in cash.
Cash after debt amortization Cash position of the company after all
operating expenses, financing costs and scheduled debt amortization
is paid. If positive, the firm generates sufficient cash to pay interest
and repay scheduled debt. If not, the company has to meet its finan-
cing requirements from external sources.
Cash after external financing Amount by which cash raised from exter-
nal sources (i.e. debt or equity) exceeds/falls short of the financing
requirements.
Cash from sales Cash collected in one year from sales made in that and
previous years.
Financing requirements Amount of financing required to meet the
combination of an operating cash deficit, debt amortization and cap-
ital spending. Calculated by deducting capital spending and long-term
investment from cash after debt amortization.
Net operating cash flow The most important item in your cash flow state-
ment, this is the amount of cash generated from sales after cost of goods
sold and other operating costs are deducted and after movements in
working capital (debtors, stocks, and creditors being the principle elem-
ents). This figure is referred to as net operating cash flow, or NOCF.
Cash ratios
Cash flow interest cover ratio NOCF/interest expense. This ratio indi-
cates whether the company is generating sufficient cash flow to service
Cash Flow Forecasting240

Glossary 241
(not repay) its debt commitments. If the ratio is below 1, the company
is unable to service the interest, let alone repayment on its debt, and
may be in serious difficulties.
Financing payments cover ratio NOCF/(interest expenses, dividends (or
withdrawals), scheduled debt amortization and lease payments). This
ratio indicates if the firm generates sufficient cash from operations to
meet financing costs and amortize scheduled debt. If this ratio is
greater than 1, the firm is able to pay financing costs and repay debt
as scheduled. If the ratio is less than 1, the firm is not able to do so.
Total debt payout ratio (years) Total interest-bearing debt/NOCF. This
ratio basically tells you how many years it will take the company to
repay its current levels of debt.

This page intentionally left blank
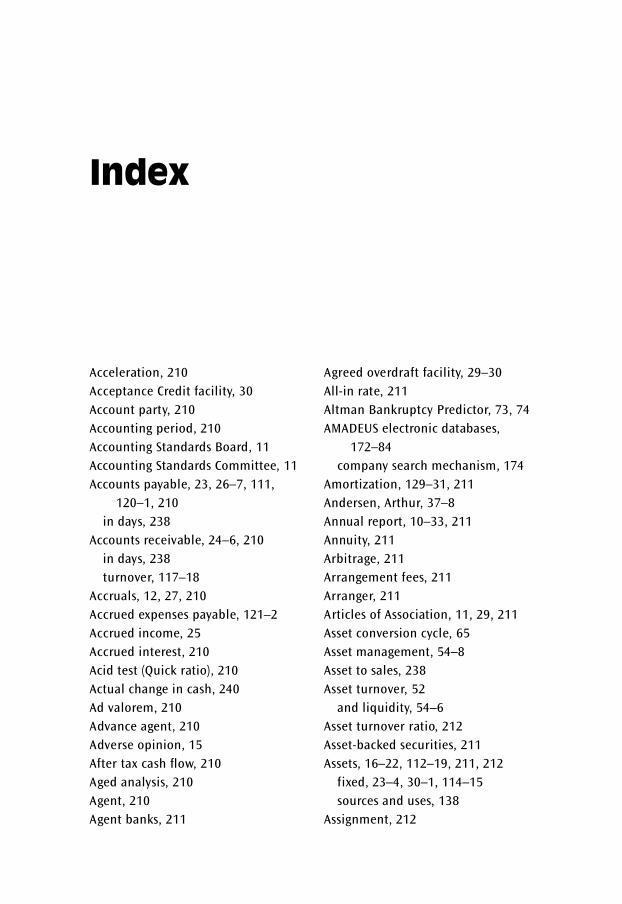
Acceleration, 210
Acceptance Credit facility, 30
Account party, 210
Accounting period, 210
Accounting Standards Board, 11
Accounting Standards Committee, 11
Accounts payable, 23, 26–7, 111,
120–1, 210
in days, 238
Accounts receivable, 24–6, 210
in days, 238
turnover, 117–18
Accruals, 12, 27, 210
Accrued expenses payable, 121–2
Accrued income, 25
Accrued interest, 210
Acid test (Quick ratio), 210
Actual change in cash, 240
Ad valorem, 210
Advance agent, 210
Adverse opinion, 15
After tax cash flow, 210
Aged analysis, 210
Agent, 210
Agent banks, 211
Agreed overdraft facility, 29–30
All-in rate, 211
Altman Bankruptcy Predictor, 73, 74
AMADEUS electronic databases,
172–84
company search mechanism, 174
Amortization, 129–31, 211
Andersen, Arthur, 37–8
Annual report, 10–33, 211
Annuity, 211
Arbitrage, 211
Arrangement fees, 211
Arranger, 211
Articles of Association, 11, 29, 211
Asset conversion cycle, 65
Asset management, 54–8
Asset to sales, 238
Asset turnover, 52
and liquidity, 54–6
Asset turnover ratio, 212
Asset-backed securities, 211
Assets, 16–22, 112–19, 211, 212
fixed, 23–4, 30–1, 114–15
sources and uses, 138
Assignment, 212
Index
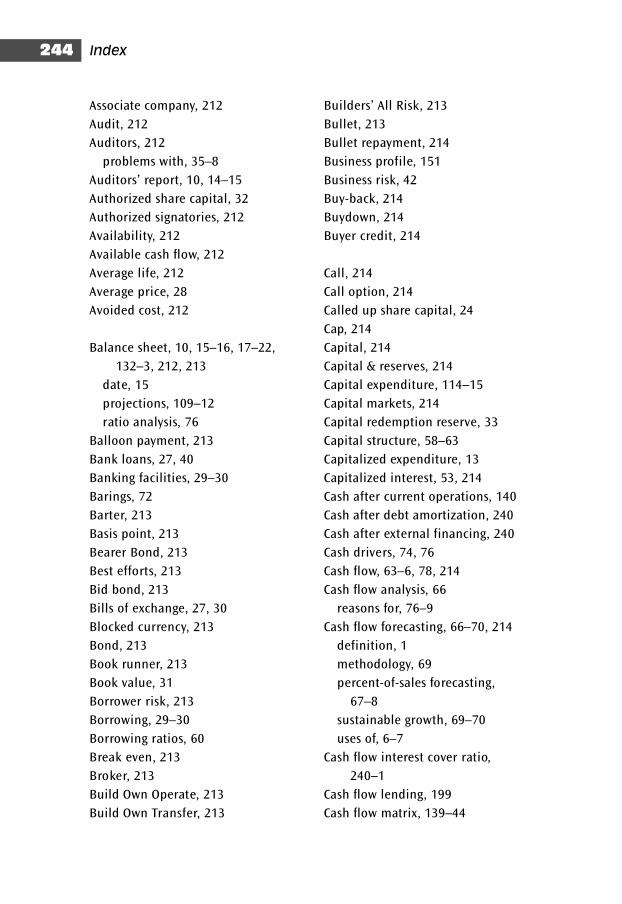
Associate company, 212
Audit, 212
Auditors, 212
problems with, 35–8
Auditors’ report, 10, 14–15
Authorized share capital, 32
Authorized signatories, 212
Availability, 212
Available cash flow, 212
Average life, 212
Average price, 28
Avoided cost, 212
Balance sheet, 10, 15–16, 17–22,
132–3, 212, 213
date, 15
projections, 109–12
ratio analysis, 76
Balloon payment, 213
Bank loans, 27, 40
Banking facilities, 29–30
Barings, 72
Barter, 213
Basis point, 213
Bearer Bond, 213
Best efforts, 213
Bid bond, 213
Bills of exchange, 27, 30
Blocked currency, 213
Bond, 213
Book runner, 213
Book value, 31
Borrower risk, 213
Borrowing, 29–30
Borrowing ratios, 60
Break even, 213
Broker, 213
Build Own Operate, 213
Build Own Transfer, 213
Builders’ All Risk, 213
Bullet, 213
Bullet repayment, 214
Business profile, 151
Business risk, 42
Buy-back, 214
Buydown, 214
Buyer credit, 214
Call, 214
Call option, 214
Called up share capital, 24
Cap, 214
Capital, 214
Capital & reserves, 214
Capital expenditure, 114–15
Capital markets, 214
Capital redemption reserve, 33
Capital structure, 58–63
Capitalized expenditure, 13
Capitalized interest, 53, 214
Cash after current operations, 140
Cash after debt amortization, 240
Cash after external financing, 240
Cash drivers, 74, 76
Cash flow, 63–6, 78, 214
Cash flow analysis, 66
reasons for, 76–9
Cash flow forecasting, 66–70, 214
definition, 1
methodology, 69
percent-of-sales forecasting,
67–8
sustainable growth, 69–70
uses of, 6–7
Cash flow interest cover ratio,
240–1
Cash flow lending, 199
Cash flow matrix, 139–44
Index244
Cash flow projections, 134–44
Cash flow ratio analysis, 144–6
Cash from sales, 240
Cash and marketable securities,
118–19, 128
Cash and profit, 63–5
Certificates of registration, 215
Charge, 215
Claw back, 215
Close company, 215
Club, 215
Co-financing, 215
Co-generation, 215
Co-manager, 215
Coface, 215
Collar, 215
Collateral, 215
Collection period, 57
Combined cycle, 215
Commitment fee, 215
Companies Acts (1985, 1989), 10,
12, 14
Compensation trade, 215
Competitive analysis, 44–6
Competitive conditions, 96
Complementary financing, 215
Completion, 215
Completion risk, 216
Completion test, 216
Compound, 216
Conrad Black, 71
Consistency, 12
Consortium, 216
Constant dollar, 216
Consumer Price Index, 217
Contingency, 216
Contingent liabilities, 54, 216
Convertible shares, 32, 216
Corporate credit analysis, 41
Corporate failure, 70–5
failure prediction models,
73–5
reasons for failure, 71–2
Corporate objectives, 151
Cost flexibility, 96
Cost of goods sold, 100–2, 216, 237
Counterparty, 216
Countertrade, 216
Country risk, 189–98, 216
economic risk profile, 190–5
political risk profile, 189
S&P’s sovereign rating profile,
195–8
Coupon, 216
Covenant, 217
Cover, 217
Creative accounting, 13–14
Credit, 217
Credit analysis, 42
Credit enhancement, 217
Credit factors, 47
Credit period, 26
Credit rating agency rating scales,
186–8
Credit scoring, 217
Credit worthiness, 6
Creditors see Accounts payable
Creditworthy, 217
Cross default, 217
Cross-collateral, 217
Crown Law, 217
Cure, 217
Current assets, 24, 217
Current dollar, 217
Current liabilities, 24, 119–20,
217
Current ratio, 217, 239
Cushion, 217
Index 245
D:E ratio, 218
D:E swap, 218
Debenture (secured) loans, 27, 218
Debentures, 29, 218
Debottle-necking, 218
Debt, 111, 218
capacity, 122
intercompany, 127
Debt runoff schedule, 111, 122–4
Debt service cover ratio, 146, 219
Debt servicing, 6, 130, 218
Debt to equity ratio, 239
Debtors see Accounts receivable
Deductible, 218
Default, 218
Default interest, 218
Defeasance, 218
Deferred income, 27
Deferred shares, 32
Deficiency, 218
Deficiency agreement, 218
Defined event, 218
Delay-in-start-up insurances, 219
Department of Trade and Industry, 219
Depreciation, 3, 13, 31, 54, 114–15,
218
Derivative, 219
Devaluation, 219
Directors’ report, 10
Disclaimer of opinion, 15
Discount rate, 219
Discounted cash flow, 218
Dividend payout ratio, 237
Dividends, 27, 106, 128, 219
Documentation, 219
Documentation risk, 219
Double dip, 219
Drawdown, 219
Drop-dead, 219
Earnings, 219
Earnings before interest and taxes,
219
Economic risk profile, 190–5
Engineering risk, 220
Enron, 36–8, 72
Environmental analysis, 43–4
Environmental impact statement,
220
Environmental risk, 220
Equity, 220
Equity investors, 9
Equity kicker, 220
Escrow, 220
Eurobonds, 220
Eurodollar, 220
European accounting systems, 9
European Bank for Reconstruction
and Development, 219
Events of default, 152, 220
Evergreen facility, 221
Execute, 221
Exercise period, 32
Exercise price, 32
Experience, 49
Export credit agency, 220
Export Credit Guarantee Department,
220
Export Development Corporation,
220
Export Finance Insurance
Corporation, 220
Expropriation, 221
External environment, 42–6
Extraordinary items, 106
Factoring, 221
Failure prediction models, 73–5
Fee, 221
Index246
Final take, 221
Finance lease, 221
Financial close, 221
Financial covenants, 8, 151–2
Financial flexibility, 61–2
Financial information, 52–4
Financial leverage, 58–61, 62
Financial performance, 41–75
Financial position indicators, 239–40
Financial projections, 79–81, 83–6
Financial reporting standards,
11–14, 222
Financial risk, 41, 42
Financial statements, 8–40, 76–159
annual report and accounts, 10–33
problems with, 35–8
profit and loss account, 10, 33–5
Financial year end, 221
Financing activities, 66
Financing agreements, 221
Financing payments cover ratio, 145,
241
Financing requirements, 240
Finished goods, 28
First-in-first-out (FIFO), 28, 35
Fiscal year-end, 221
Fixed asset investments, 128
Fixed assets, 23–4, 30–1, 114–15, 221
Fixed cost, 101, 151, 221
Fixed rate, 32, 221
Floating charge, 215, 218, 221
Floating rate, 221
Floating rate notes, 222
Floor, 221
Force majeure, 222
Foreign exchange, 222
Forward contract, 222
Fraudulent manipulation of
accounts, 13–14
Full recourse, 222
Fundamental uncertainty, 15
Funding risk, 222
Funds, 222
Future cash flow model, 134–44
Futures, 222
Futures market, 222
Gas turbine, 222
Gearing, 222
General partner, 223
Going concern, 12
Goodwill, 223
Grace, 223
Gross margin, 51, 52, 100–2, 223
Gross profit, 237
Gross profit margin, 237
GSM, 223
Guarantee, 223
Guarantor, 223
Healthy cash flow, 3–6
Heat rate, 223
Hedge, 223
Hell-or-high-water, 223
Hermes, 223
Hire purchase, 223
Historical analysis, 81–6
Holding company, 223
Hurdle rate, 223
Illiquidity, 223
Inbound logistics, 55
Incipient default, 224
Income, 224
Inconvertibility, 224
Indemnity, 224
Indexed rate, 224
Information memorandum, 224
Index 247
Infrastructure risk, 224
Institutions, 224
Instrument, 224
Intangible assets, 30, 224
Integrity, 49
Intercompany debt, 127
Interest cover, 62–3, 144–5
Interest expense, 105–6
Interest income, 105–6
Interest rate, 224
Interest risk, 224
Intermediary, 224
International Finance Corporation,
223
Inventory, 27, 224
in days, 238
turnover, 56, 115–17
Inverse order, 224
Investing activities, 65
Investment, 31
Investment bank, 224
Investment grade, 224
Investor/creditor community, 224
Islamic loan, 225
Issue share capital, 32
Iterations, 126, 225
Joint venture, 225
Junk, 225
Key activity ratios, 109–10
Last-in-first-out (LIFO), 35
Latent default, 225
Lawsuits, 225
Lay, Kenneth, 38
Lead arranger, 225
Lead manager, 225
League tables, 225
Lease, 225
Lease rate, 226
Lease term, 226
Legal risk, 226
Lending risk, 226
Lending types, 199
Lessee, 226
Lessor, 226
Letter of credit, 225
Leverage, 226
Leveraged lease, 226
Liability, 23, 119–31, 226
Lien, 226
Limited partner, 227
Limited recourse, 226
Liquidated damages, 225
Liquidation, 226
Liquidity, 64–6, 226
Liquidity ratios, 227
Listed company, 227
Loan agreement, 227
Loan creditors, 9
Loan document drafting, 8
Loan officers, 227
Loan repayment, 2
Loan structuring, 8
Loans, 227
London Interbank Offered Rate,
226
Long-term debt payout, 146
Long-term liabilities, 24, 227
Loss payee, 227
Macroeconomic risk areas, 44
Make-up, 227
Management accounting, 227
Management style, 49
Mandate, 227
Margin, 227
Index248
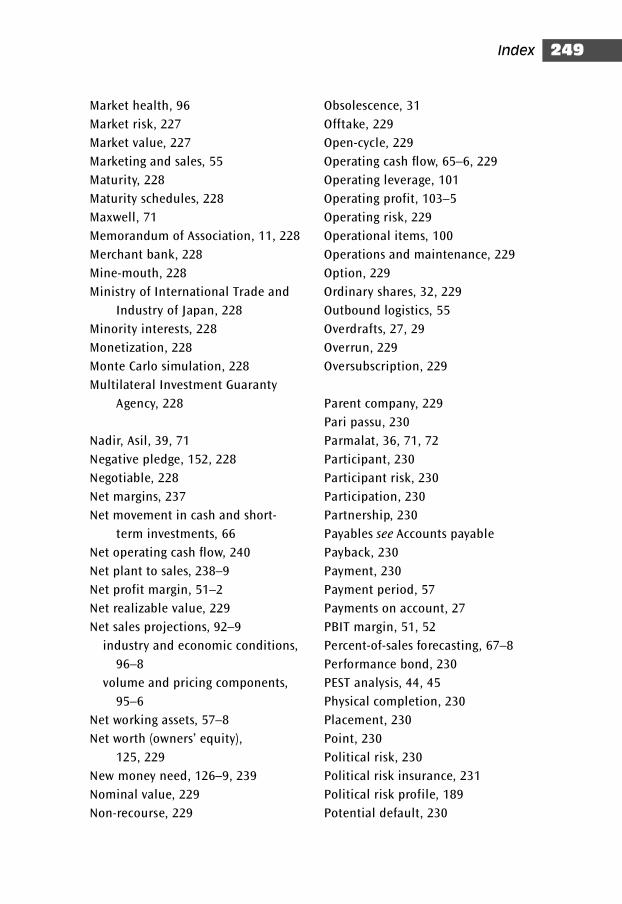
Market health, 96
Market risk, 227
Market value, 227
Marketing and sales, 55
Maturity, 228
Maturity schedules, 228
Maxwell, 71
Memorandum of Association, 11, 228
Merchant bank, 228
Mine-mouth, 228
Ministry of International Trade and
Industry of Japan, 228
Minority interests, 228
Monetization, 228
Monte Carlo simulation, 228
Multilateral Investment Guaranty
Agency, 228
Nadir, Asil, 39, 71
Negative pledge, 152, 228
Negotiable, 228
Net margins, 237
Net movement in cash and short-
term investments, 66
Net operating cash flow, 240
Net plant to sales, 238–9
Net profit margin, 51–2
Net realizable value, 229
Net sales projections, 92–9
industry and economic conditions,
96–8
volume and pricing components,
95–6
Net working assets, 57–8
Net worth (owners’ equity),
125, 229
New money need, 126–9, 239
Nominal value, 229
Non-recourse, 229
Obsolescence, 31
Offtake, 229
Open-cycle, 229
Operating cash flow, 65–6, 229
Operating leverage, 101
Operating profit, 103–5
Operating risk, 229
Operational items, 100
Operations and maintenance, 229
Option, 229
Ordinary shares, 32, 229
Outbound logistics, 55
Overdrafts, 27, 29
Overrun, 229
Oversubscription, 229
Parent company, 229
Pari passu, 230
Parmalat, 36, 71, 72
Participant, 230
Participant risk, 230
Participation, 230
Partnership, 230
Payables see Accounts payable
Payback, 230
Payment, 230
Payment period, 57
Payments on account, 27
PBIT margin, 51, 52
Percent-of-sales forecasting, 67–8
Performance bond, 230
PEST analysis, 44, 45
Physical completion, 230
Placement, 230
Point, 230
Political risk, 230
Political risk insurance, 231
Political risk profile, 189
Potential default, 230
Index 249
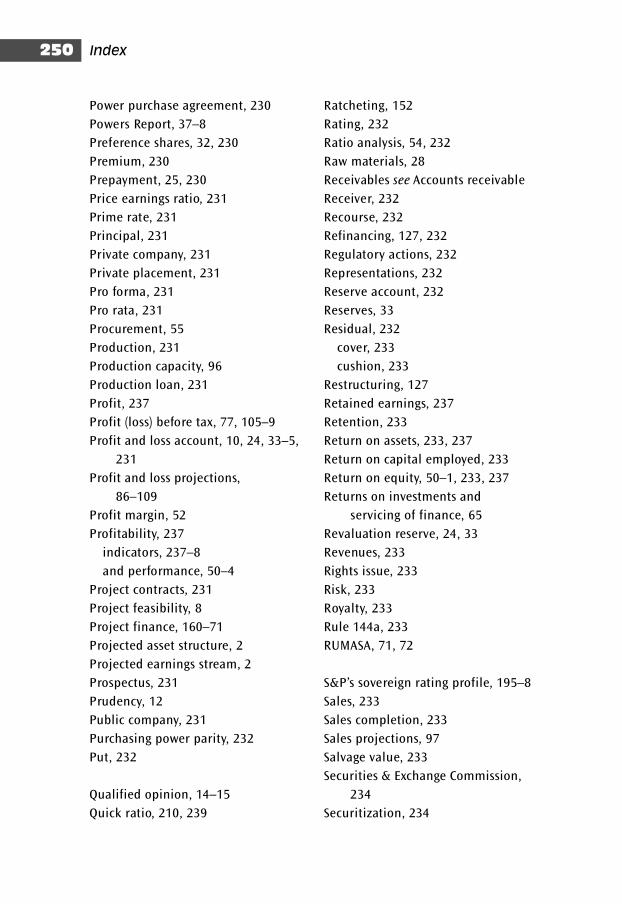
Power purchase agreement, 230
Powers Report, 37–8
Preference shares, 32, 230
Premium, 230
Prepayment, 25, 230
Price earnings ratio, 231
Prime rate, 231
Principal, 231
Private company, 231
Private placement, 231
Pro forma, 231
Pro rata, 231
Procurement, 55
Production, 231
Production capacity, 96
Production loan, 231
Profit, 237
Profit (loss) before tax, 77, 105–9
Profit and loss account, 10, 24, 33–5,
231
Profit and loss projections,
86–109
Profit margin, 52
Profitability, 237
indicators, 237–8
and performance, 50–4
Project contracts, 231
Project feasibility, 8
Project finance, 160–71
Projected asset structure, 2
Projected earnings stream, 2
Prospectus, 231
Prudency, 12
Public company, 231
Purchasing power parity, 232
Put, 232
Qualified opinion, 14–15
Quick ratio, 210, 239
Ratcheting, 152
Rating, 232
Ratio analysis, 54, 232
Raw materials, 28
Receivables see Accounts receivable
Receiver, 232
Recourse, 232
Refinancing, 127, 232
Regulatory actions, 232
Representations, 232
Reserve account, 232
Reserves, 33
Residual, 232
cover, 233
cushion, 233
Restructuring, 127
Retained earnings, 237
Retention, 233
Return on assets, 233, 237
Return on capital employed, 233
Return on equity, 50–1, 233, 237
Returns on investments and
servicing of finance, 65
Revaluation reserve, 24, 33
Revenues, 233
Rights issue, 233
Risk, 233
Royalty, 233
Rule 144a, 233
RUMASA, 71, 72
S&P’s sovereign rating profile, 195–8
Sales, 233
Sales completion, 233
Sales projections, 97
Salvage value, 233
Securities & Exchange Commission,
234
Securitization, 234
Index250
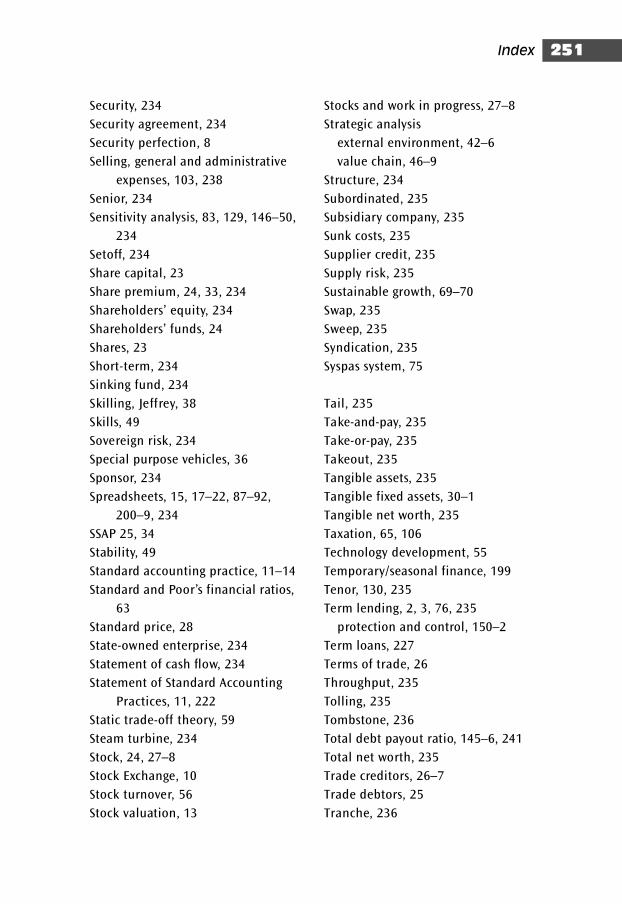
Security, 234
Security agreement, 234
Security perfection, 8
Selling, general and administrative
expenses, 103, 238
Senior, 234
Sensitivity analysis, 83, 129, 146–50,
234
Setoff, 234
Share capital, 23
Share premium, 24, 33, 234
Shareholders’ equity, 234
Shareholders’ funds, 24
Shares, 23
Short-term, 234
Sinking fund, 234
Skilling, Jeffrey, 38
Skills, 49
Sovereign risk, 234
Special purpose vehicles, 36
Sponsor, 234
Spreadsheets, 15, 17–22, 87–92,
200–9, 234
SSAP 25, 34
Stability, 49
Standard accounting practice, 11–14
Standard and Poor’s financial ratios,
63
Standard price, 28
State-owned enterprise, 234
Statement of cash flow, 234
Statement of Standard Accounting
Practices, 11, 222
Static trade-off theory, 59
Steam turbine, 234
Stock, 24, 27–8
Stock Exchange, 10
Stock turnover, 56
Stock valuation, 13
Stocks and work in progress, 27–8
Strategic analysis
external environment, 42–6
value chain, 46–9
Structure, 234
Subordinated, 235
Subsidiary company, 235
Sunk costs, 235
Supplier credit, 235
Supply risk, 235
Sustainable growth, 69–70
Swap, 235
Sweep, 235
Syndication, 235
Syspas system, 75
Tail, 235
Take-and-pay, 235
Take-or-pay, 235
Takeout, 235
Tangible assets, 235
Tangible fixed assets, 30–1
Tangible net worth, 235
Taxation, 65, 106
Technology development, 55
Temporary/seasonal finance, 199
Tenor, 130, 235
Term lending, 2, 3, 76, 235
protection and control, 150–2
Term loans, 227
Terms of trade, 26
Throughput, 235
Tolling, 235
Tombstone, 236
Total debt payout ratio, 145–6, 241
Total net worth, 235
Trade creditors, 26–7
Trade debtors, 25
Tranche, 236
Index 251
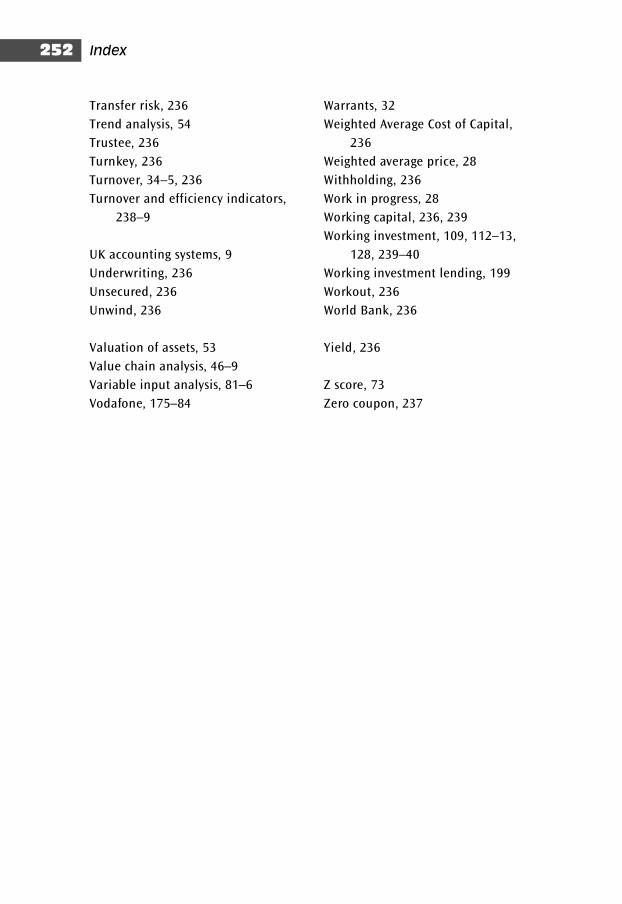
Transfer risk, 236
Trend analysis, 54
Trustee, 236
Turnkey, 236
Turnover, 34–5, 236
Turnover and efficiency indicators,
238–9
UK accounting systems, 9
Underwriting, 236
Unsecured, 236
Unwind, 236
Valuation of assets, 53
Value chain analysis, 46–9
Variable input analysis, 81–6
Vodafone, 175–84
Warrants, 32
Weighted Average Cost of Capital,
236
Weighted average price, 28
Withholding, 236
Work in progress, 28
Working capital, 236, 239
Working investment, 109, 112–13,
128, 239–40
Working investment lending, 199
Workout, 236
World Bank, 236
Yield, 236
Z score, 73
Zero coupon, 237
Index252


