Embed Size (px)
Citation preview
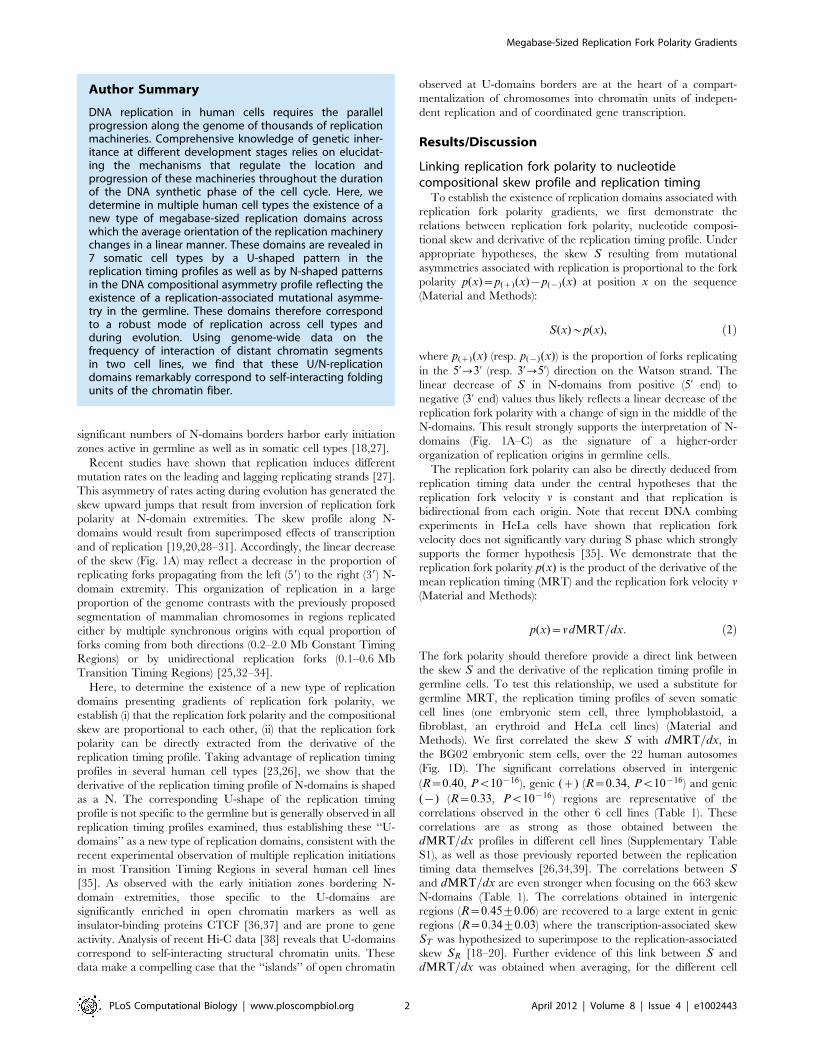
Replication Fork Polarity Gradients Revealed byMegabase-Sized U-Shaped Replication Timing Domainsin Human Cell LinesAntoine Baker1,2,3, Benjamin Audit1,2,3, Chun-Long Chen4, Benoit Moindrot1,2, Antoine Leleu1,2,
Guillaume Guilbaud5¤, Aurelien Rappailles5, Cedric Vaillant1,2,3, Arach Goldar6, Fabien Mongelard1,2,7,
Yves d’Aubenton-Carafa4, Olivier Hyrien5, Claude Thermes4, Alain Arneodo1,2,3*
1 Universite de Lyon, Lyon, France, 2 Laboratoire Joliot-Curie, CNRS, Ecole Normale Superieure de Lyon, Lyon, France, 3 Laboratoire de Physique, CNRS, Ecole Normale
Superieure de Lyon, Lyon, France, 4 Centre de Genetique Moleculaire UPR 3404, CNRS, Gif-sur-Yvette, France, 5 Institut de Biologie de l’Ecole Normale Superieure, CNRS
UMR8197, Inserm U1024, Paris, France, 6 Commissariat a l’energie atomique, iBiTecS, Gif-sur-Yvette, France, 7 Laboratoire de Biologie Moleculaire de la Cellule, CNRS, Ecole
Normale Superieure de Lyon, Lyon, France
Abstract
In higher eukaryotes, replication program specification in different cell types remains to be fully understood. We show forseven human cell lines that about half of the genome is divided in domains that display a characteristic U-shapedreplication timing profile with early initiation zones at borders and late replication at centers. Significant overlap is observedbetween U-domains of different cell lines and also with germline replication domains exhibiting a N-shaped nucleotidecompositional skew. From the demonstration that the average fork polarity is directly reflected by both the compositionalskew and the derivative of the replication timing profile, we argue that the fact that this derivative displays a N-shape in U-domains sustains the existence of large-scale gradients of replication fork polarity in somatic and germline cells. Analysis ofchromatin interaction (Hi-C) and chromatin marker data reveals that U-domains correspond to high-order chromatinstructural units. We discuss possible models for replication origin activation within U/N-domains. The compartmentalizationof the genome into replication U/N-domains provides new insights on the organization of the replication program in thehuman genome.
Citation: Baker A, Audit B, Chen C-L, Moindrot B, Leleu A, et al. (2012) Replication Fork Polarity Gradients Revealed by Megabase-Sized U-Shaped ReplicationTiming Domains in Human Cell Lines. PLoS Comput Biol 8(4): e1002443. doi:10.1371/journal.pcbi.1002443
Editor: William Stafford Noble, University of Washington, United States of America
Received November 30, 2011; Accepted February 9, 2012; Published April 5, 2012
Copyright: � 2012 Baker et al. This is an open-access article distributed under the terms of the Creative Commons Attribution License, which permitsunrestricted use, distribution, and reproduction in any medium, provided the original author and source are credited.
Funding: This work was supported by the Centre National de la Recherche Scientifique (CNRS), Agence Nationale de la Recherche under project REFOPOL (ANR10 BLAN 1615 01), and by grants from the Fondation pour la Recherche Medicale (equipe labelisee), the ARC and the Ligue contre le Cancer (Comite de Paris) toO.H. A.R was supported by the ANR NT05-3_41825 and by a fellowship from the Conseil Regional d’Ile de France (DIM STEM-Pole), G.G. was supported by theMinistere de l’Education Nationale de l’Enseignement Superieur et de la Recherche, and by the Association pour la Recherche sur le Cancer. The funders had norole in study design, data collection and analysis, decision to publish, or preparation of the manuscript.
Competing Interests: The authors have declared that no competing interests exist.
* E-mail: [email protected]
¤ Current address: Medical Research Council Laboratory of Molecular Biology, Cambridge, United Kingdom
Introduction
Comprehensive knowledge of genetic inheritance at different
development stages relies on elucidating the mechanisms that
regulate the DNA spatio-temporal replication program and its
possible conservation during evolution [1]. In multi-cellular
organisms, there is no clear consensus sequence where initiation
may occur [2,3]. Instead epigenetic mechanisms may take part in
the spatial and temporal control of replication initiation in higher
eukaryotes in relation with gene expression [4–9]. For many years,
understanding the determinants that specify replication origins has
been hampered by the small number (approximately 30) of well-
established replication origins in the human genome and more
generally in mammalian genomes [1,7,10]. Recently, nascent
DNA strands synthesized at origins were purified by various
methods [11–14] to map a few hundreds putative origins in 1% of
the human genome. For unclear reasons, the concordance
between the different studies is very low (from v5% to v25%)
[12–15]. In a completely different approach to map replication
origins, previous in silico analyses of the nucleotide compositional
skew S~(T{A)=(TzA)z(G{C)=(GzC) of the human
genome showed that the sign of S abruptly changed from ({)to (z) when crossing known replication initiation sites. This
allowed us to predict putative origins at more than a thousand sites
of S sign inversion (S-jumps) along the human genome [16,17].
Further analyses of S patterns identified 663 megabase-sized N-
domains whose skew profile displays a N-like shape (Fig. 1A), with
two abrupt S-jumps bordering a DNA segment whose skew
linearly decreases between the two jumps [16–21]. Skew N-
domains have a mean length of 1:2+0:6 Mb and cover 29.2% of
the human genome. The initiation zones predicted at N-domains
borders would be specified by an open chromatin structure
favorable to early replication initiation and permissive to
transcription [21,22]. The determination of HeLa replication
timing profile [23] and the analysis of available timing profiles in
several human cell lines [24–26] allowed us to confirm that
PLoS Computational Biology | www.ploscompbiol.org 1 April 2012 | Volume 8 | Issue 4 | e1002443
significant numbers of N-domains borders harbor early initiation
zones active in germline as well as in somatic cell types [18,27].
Recent studies have shown that replication induces different
mutation rates on the leading and lagging replicating strands [27].
This asymmetry of rates acting during evolution has generated the
skew upward jumps that result from inversion of replication fork
polarity at N-domain extremities. The skew profile along N-
domains would result from superimposed effects of transcription
and of replication [19,20,28–31]. Accordingly, the linear decrease
of the skew (Fig. 1A) may reflect a decrease in the proportion of
replicating forks propagating from the left (59) to the right (39) N-
domain extremity. This organization of replication in a large
proportion of the genome contrasts with the previously proposed
segmentation of mammalian chromosomes in regions replicated
either by multiple synchronous origins with equal proportion of
forks coming from both directions (0.2–2.0 Mb Constant Timing
Regions) or by unidirectional replication forks (0.1–0.6 Mb
Transition Timing Regions) [25,32–34].
Here, to determine the existence of a new type of replication
domains presenting gradients of replication fork polarity, we
establish (i) that the replication fork polarity and the compositional
skew are proportional to each other, (ii) that the replication fork
polarity can be directly extracted from the derivative of the
replication timing profile. Taking advantage of replication timing
profiles in several human cell types [23,26], we show that the
derivative of the replication timing profile of N-domains is shaped
as a N. The corresponding U-shape of the replication timing
profile is not specific to the germline but is generally observed in all
replication timing profiles examined, thus establishing these ‘‘U-
domains’’ as a new type of replication domains, consistent with the
recent experimental observation of multiple replication initiations
in most Transition Timing Regions in several human cell lines
[35]. As observed with the early initiation zones bordering N-
domain extremities, those specific to the U-domains are
significantly enriched in open chromatin markers as well as
insulator-binding proteins CTCF [36,37] and are prone to gene
activity. Analysis of recent Hi-C data [38] reveals that U-domains
correspond to self-interacting structural chromatin units. These
data make a compelling case that the ‘‘islands’’ of open chromatin
observed at U-domains borders are at the heart of a compart-
mentalization of chromosomes into chromatin units of indepen-
dent replication and of coordinated gene transcription.
Results/Discussion
Linking replication fork polarity to nucleotidecompositional skew profile and replication timing
To establish the existence of replication domains associated with
replication fork polarity gradients, we first demonstrate the
relations between replication fork polarity, nucleotide composi-
tional skew and derivative of the replication timing profile. Under
appropriate hypotheses, the skew S resulting from mutational
asymmetries associated with replication is proportional to the fork
polarity p(x)~p(z)(x){p({)(x) at position x on the sequence
(Material and Methods):
S(x)*p(x), ð1Þ
where p(z)(x) (resp. p({)(x)) is the proportion of forks replicating
in the 5’?3’ (resp. 3’?5’) direction on the Watson strand. The
linear decrease of S in N-domains from positive (5’ end) to
negative (3’ end) values thus likely reflects a linear decrease of the
replication fork polarity with a change of sign in the middle of the
N-domains. This result strongly supports the interpretation of N-
domains (Fig. 1A–C) as the signature of a higher-order
organization of replication origins in germline cells.
The replication fork polarity can also be directly deduced from
replication timing data under the central hypotheses that the
replication fork velocity v is constant and that replication is
bidirectional from each origin. Note that recent DNA combing
experiments in HeLa cells have shown that replication fork
velocity does not significantly vary during S phase which strongly
supports the former hypothesis [35]. We demonstrate that the
replication fork polarity p(x) is the product of the derivative of the
mean replication timing (MRT) and the replication fork velocity v(Material and Methods):
p(x)~vdMRT=dx: ð2Þ
The fork polarity should therefore provide a direct link between
the skew S and the derivative of the replication timing profile in
germline cells. To test this relationship, we used a substitute for
germline MRT, the replication timing profiles of seven somatic
cell lines (one embryonic stem cell, three lymphoblastoid, a
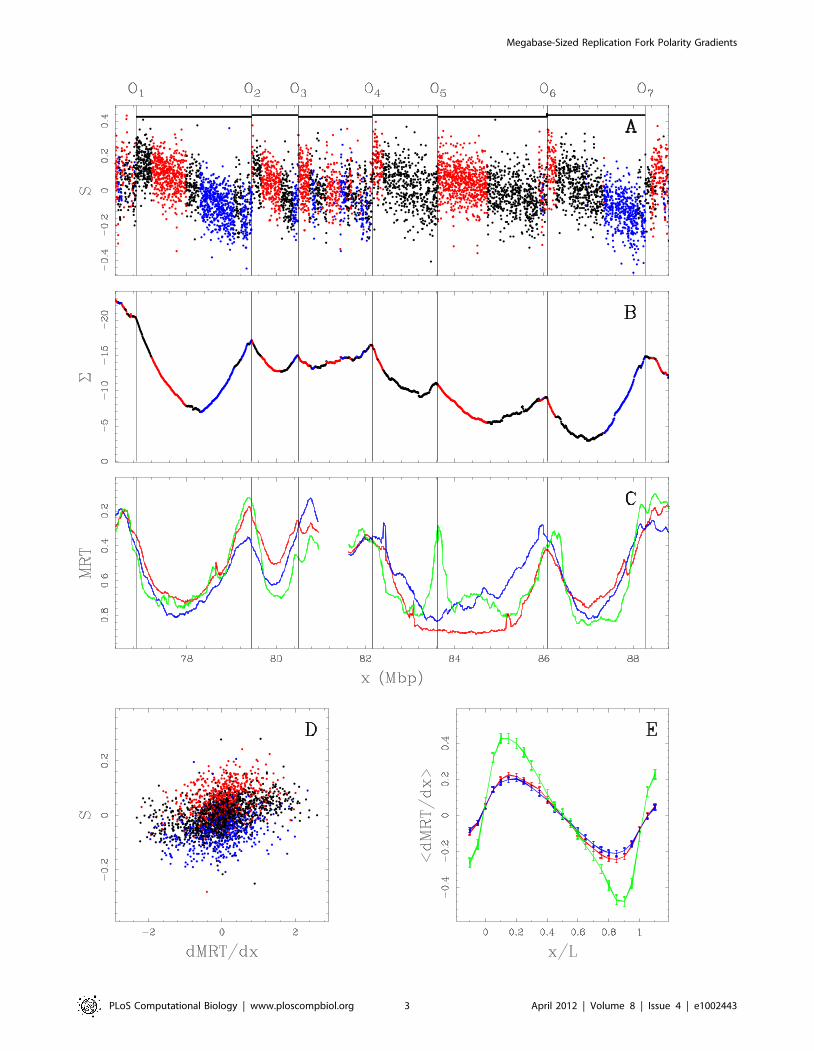
fibroblast, an erythroid and HeLa cell lines) (Material and
Methods). We first correlated the skew S with dMRT=dx, in
the BG02 embryonic stem cells, over the 22 human autosomes
(Fig. 1D). The significant correlations observed in intergenic
(R~0:40, Pv10{16), genic (z) (R~0:34, Pv10{16) and genic
({) (R~0:33, Pv10{16) regions are representative of the
correlations observed in the other 6 cell lines (Table 1). These
correlations are as strong as those obtained between the
dMRT=dx profiles in different cell lines (Supplementary Table
S1), as well as those previously reported between the replication
timing data themselves [26,34,39]. The correlations between Sand dMRT=dx are even stronger when focusing on the 663 skew
N-domains (Table 1). The correlations obtained in intergenic
regions (R~0:45+0:06) are recovered to a large extent in genic
regions (R~0:34+0:03) where the transcription-associated skew
ST was hypothesized to superimpose to the replication-associated
skew SR [18–20]. Further evidence of this link between S and
dMRT=dx was obtained when averaging, for the different cell
Author Summary
DNA replication in human cells requires the parallelprogression along the genome of thousands of replicationmachineries. Comprehensive knowledge of genetic inher-itance at different development stages relies on elucidat-ing the mechanisms that regulate the location andprogression of these machineries throughout the durationof the DNA synthetic phase of the cell cycle. Here, wedetermine in multiple human cell types the existence of anew type of megabase-sized replication domains acrosswhich the average orientation of the replication machinerychanges in a linear manner. These domains are revealed in7 somatic cell types by a U-shaped pattern in thereplication timing profiles as well as by N-shaped patternsin the DNA compositional asymmetry profile reflecting theexistence of a replication-associated mutational asymme-try in the germline. These domains therefore correspondto a robust mode of replication across cell types andduring evolution. Using genome-wide data on thefrequency of interaction of distant chromatin segmentsin two cell lines, we find that these U/N-replicationdomains remarkably correspond to self-interacting foldingunits of the chromatin fiber.
Megabase-Sized Replication Fork Polarity Gradients
PLoS Computational Biology | www.ploscompbiol.org 2 April 2012 | Volume 8 | Issue 4 | e1002443
Megabase-Sized Replication Fork Polarity Gradients
PLoS Computational Biology | www.ploscompbiol.org 3 April 2012 | Volume 8 | Issue 4 | e1002443
lines, the dMRT=dx profiles inside the 663 skew N-domains after
rescaling their length to unity (Fig. 1E). These mean profiles are
shaped as a N, suggesting that some properties of the germline
replication program associated with the pattern of replication fork
polarity are shared by somatic cells.
Replication timing U-domains are robustly observed inhuman cell lines
According to Equations (1) and (2), the integration of the skew Sis expected to generate a profile rather similar to the replication
timing profile. In segments of linearly changing skew, the
integrated S function is thus expected to show a parabolic profile.
The integrated S function when estimated by the cumulative skew
S (Fig. 1B) along N-domains of a 11.4 Mb long fragment of
human chromosome 10, indeed displays a U-shaped (parabolic)
profile likely corresponding the replication timing profile in the
germline. Remarkably, the 6 N-domains effectively correspond to
successive genome regions where the MRT in the BG02
embryonic stem cells is U-shaped (Fig. 1C). The 7 putative
initiation zones (O1 to O7) corresponding to upward S-jumps
(Fig. 1A), co-locate (up to the *100 kb resolution) with MRT
local extrema which supports that they are highly active in BG02.
These initiation zones can present cell specificity as exemplified by
the putative replication origin O5 which is inactive (or late) in both
the K562 erythroid and GM06990 lymphoblastoid cell lines
(Fig. 1C) resulting in domain ‘‘consolidation’’ [40]. Two
neighboring U-domains (½O4,O5� and ½O5,O6�) in BG02 merged
into a larger U-domain in the K562 and GM06990 cell lines. Note
that the other 3 N-domains (½O1,O2�,½O2,O3�, and ½O6,O7�) are
replication timing U-domains common to BG02, K562 and
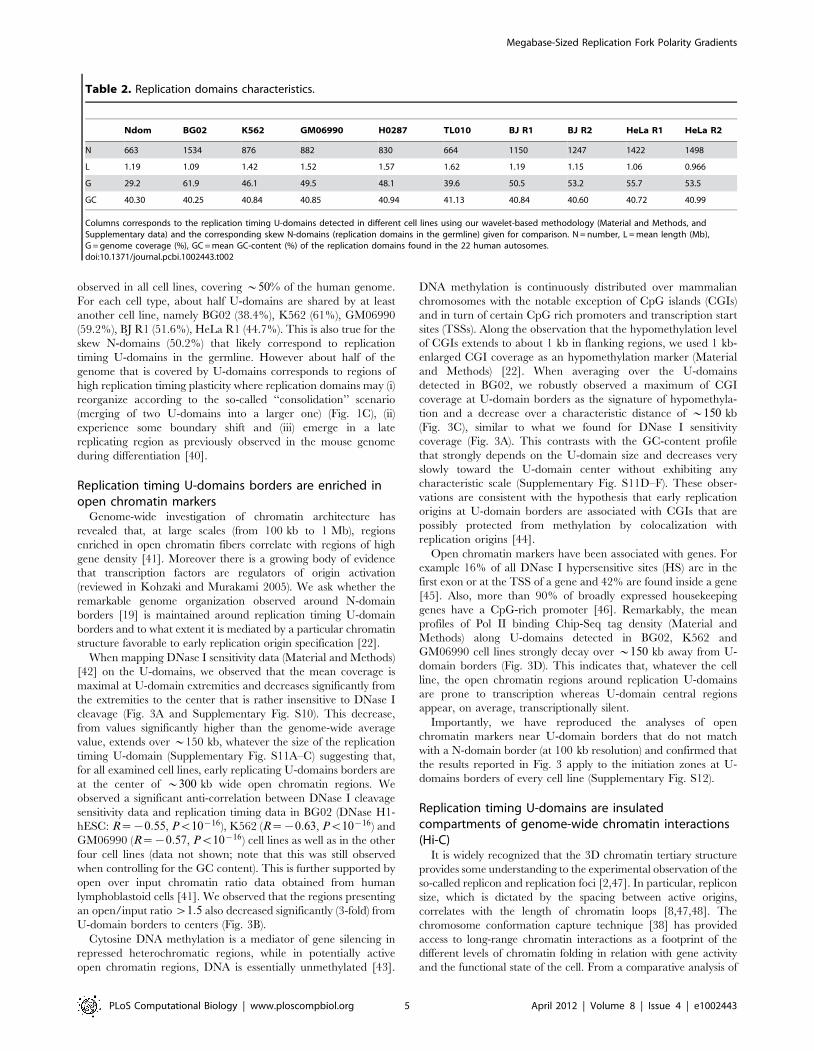
GM06990. To detect U-domains in replication timing profiles at
genome scale, we developed a wavelet-based method (Material
and Methods, and Supplementary Text S1) which allowed us to
identify in the 7 human cell lines from 664 (TL010) up to 1534
(BG02) U-domains of mean size ranging from 0.966 Mb (HeLa
R2) up to 1.62 Mb (TL010) and covering from 39.6% (TL010) to
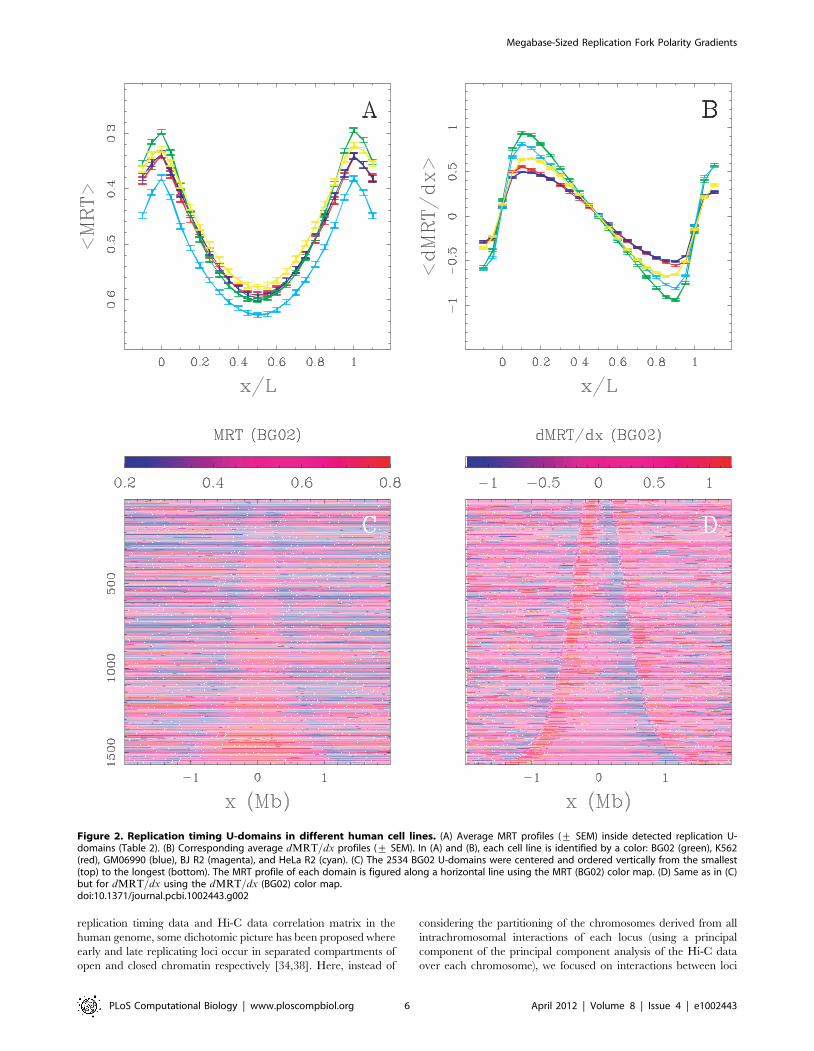
61.9% (BG02) of the genome (Table 2). For each cell line, the
average MRT profile of U-domains has an expected parabolic
shape (Fig. 2A) representative of individual U-domains (Fig. 2C
and Supplementary Figs. S1A–S9A). Inside the U-domains, the
derivative dMRT=dx is N-shaped (Fig. 2D and Supplementary
Figs. S1B–S9B) like the skew profile inside N-domains (Supple-
mentary Figs. S1F–S9F). When rescaling the size of each U-
domains to unity for a given cell line, these profiles superimpose
onto a common N-shaped curve well approximated by the average
dMRT=dx profile (Fig. 2B).
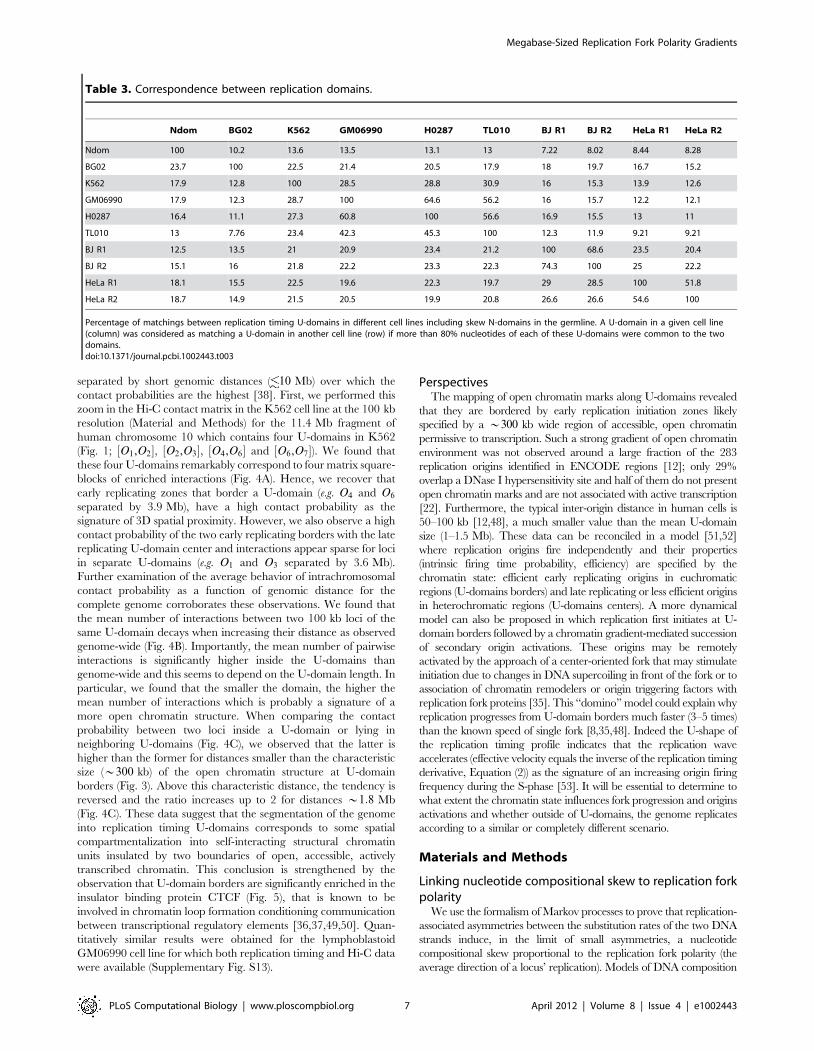
To determine the amounts of U-domains conserved in different
cell types, we computed for each cell type pair the mutual covering
of the corresponding sets of U-domains (two U-domains are shared
by two different cell lines if each domain covers more than 80% of
the other domain (Table 3)). Taking as reference the matching
obtained for the two BJ (68.6% and 74.3%) and HeLa (51.8% and
54.6%) cell replicates, the matchings between the other cell lines
were statistically significant and comparable (from 40% to 65% for
the mutual covering of lymphoblastoid cell lines). The number of
U-domain shared by cell type pairs were all significantly larger
than the number expected by chance (Pv10{3, Supplementary
Table S2). For example BG02 shares 197 and 189 U-domains with
K562 and GM06990 respectively, when only 45 and 46 are
expected by chance (Supplementary Table S3). This corresponds
to a significant proportion (*20%) of the U-domains of the
individual cell lines (Table 3), as compared to the matchings (*; 5%)
expected by chance (Supplementary Table S4). A significant
percentage of N-domains correspond to U-domains (e.g. from
12.5% in BJ R1 up to 23.7% in BG02). This explains that when
representing the MRT profile of BG02 instead of the skew S,
along the set of N-domains ordered according to their size, we can
recognize the edges of many N-domains (Supplementary Figs.
S1D–S9D). The same observation can be made when comparing
the dMRT=dx profiles (Supplementary Figs. S1E–S9E) to the
corresponding skew profiles (Supplementary Fig. S1F). Note that
the N-domains match only 7{14% of the U-domains of various
cell lines due to the very stringent N-domain selection criteria
[19,20] that yielded only 663 N-domains (29.2% of the genome) as
compared to much larger U-domain numbers (*50% of the
genome; Table 2). Replication timing U-domains are robustly
Figure 1. Comparing skew S~T{A
TzAz
G{C
GzCand mean replication timing (MRT). (A) S profile along a 11.4 Mb long fragment of human
chromosome 10 that contains 6 skew N-domains (horizontal black bars) bordered by 7 putative replication origins O1 to O7 . Each dot corresponds to
the skew calculated for a window of 1 kb of repeat-masked sequence. The colors correspond to intergenic (black), (z) genes (red) and ({) genes
(blue). (B) Corresponding cumulative skew profile S obtained by cumulative addition of S-values along the sequence. (C) MRT profiles from early, 0 to
late, 1 for BG02 (green), K562 (red) and GM06990 (blue) cell lines. (D) Correlations between S and dMRT=dx, in BG02 (100 kb windows) along the 22human autosomes; colors as in (A); the corresponding Pearson correlations are given in Table 1. (E) Average dMRT=dx profiles (+ SEM) in the 663skew N-domains after rescaling their length L to unity; colors as in (C).doi:10.1371/journal.pcbi.1002443.g001
Table 1. Compostional skew and derivative of the replication timing profile correlate.
R BG02 K562 GM06990 H0287 TL010 BJ R1 BJ R2 HeLa R1 HeLa R2
GW (z) 0.34 0.36 0.35 0.34 0.33 0.31 0.30 0.33 0.29
GW (i) 0.40 0.45 0.42 0.41 0.41 0.35 0.36 0.32 0.28
GW ({) 0.33 0.37 0.34 0.35 0.34 0.33 0.32 0.34 0.29
Ndom (z) 0.36 0.43 0.42 0.42 0.41 0.32 0.32 0.38 0.35
Ndom (i) 0.45 0.50 0.48 0.48 0.47 0.38 0.39 0.35 0.29
Ndom ({) 0.35 0.44 0.44 0.43 0.41 0.40 0.39 0.40 0.35
Pearson correlation (R values) between the skew S and dMRT=dx, from different cell lines (Material and Methods). S and dMRT=dx were calculated in non-overlapping 100 kb windows genome wide (GW) and in the 663 skews N-domains (Ndom). Each 100 kb window was classed as intergenic (i), genic (z) or genic ({) bymajority rule. All p-values are v10{16 .doi:10.1371/journal.pcbi.1002443.t001
Megabase-Sized Replication Fork Polarity Gradients
PLoS Computational Biology | www.ploscompbiol.org 4 April 2012 | Volume 8 | Issue 4 | e1002443
observed in all cell lines, covering *50% of the human genome.
For each cell type, about half U-domains are shared by at least
another cell line, namely BG02 (38.4%), K562 (61%), GM06990
(59.2%), BJ R1 (51.6%), HeLa R1 (44.7%). This is also true for the
skew N-domains (50.2%) that likely correspond to replication
timing U-domains in the germline. However about half of the
genome that is covered by U-domains corresponds to regions of
high replication timing plasticity where replication domains may (i)
reorganize according to the so-called ‘‘consolidation’’ scenario
(merging of two U-domains into a larger one) (Fig. 1C), (ii)
experience some boundary shift and (iii) emerge in a late
replicating region as previously observed in the mouse genome
during differentiation [40].
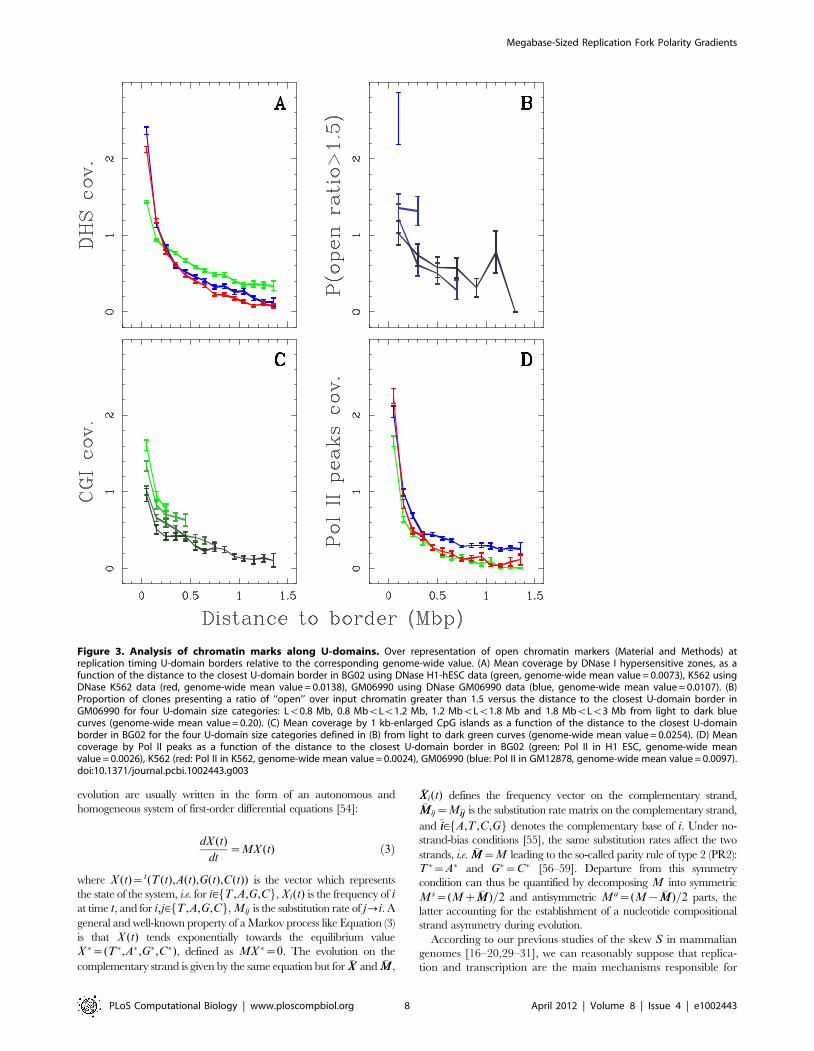
Replication timing U-domains borders are enriched inopen chromatin markers
Genome-wide investigation of chromatin architecture has
revealed that, at large scales (from 100 kb to 1 Mb), regions
enriched in open chromatin fibers correlate with regions of high
gene density [41]. Moreover there is a growing body of evidence
that transcription factors are regulators of origin activation
(reviewed in Kohzaki and Murakami 2005). We ask whether the
remarkable genome organization observed around N-domain
borders [19] is maintained around replication timing U-domain
borders and to what extent it is mediated by a particular chromatin
structure favorable to early replication origin specification [22].
When mapping DNase I sensitivity data (Material and Methods)
[42] on the U-domains, we observed that the mean coverage is
maximal at U-domain extremities and decreases significantly from
the extremities to the center that is rather insensitive to DNase I
cleavage (Fig. 3A and Supplementary Fig. S10). This decrease,
from values significantly higher than the genome-wide average
value, extends over *150 kb, whatever the size of the replication
timing U-domain (Supplementary Fig. S11A–C) suggesting that,
for all examined cell lines, early replicating U-domains borders are
at the center of *300 kb wide open chromatin regions. We
observed a significant anti-correlation between DNase I cleavage
sensitivity data and replication timing data in BG02 (DNase H1-
hESC: R~{0:55, Pv10{16), K562 (R~{0:63, Pv10{16) and
GM06990 (R~{0:57, Pv10{16) cell lines as well as in the other
four cell lines (data not shown; note that this was still observed
when controlling for the GC content). This is further supported by
open over input chromatin ratio data obtained from human
lymphoblastoid cells [41]. We observed that the regions presenting
an open/input ratio w1:5 also decreased significantly (3-fold) from
U-domain borders to centers (Fig. 3B).
Cytosine DNA methylation is a mediator of gene silencing in
repressed heterochromatic regions, while in potentially active
open chromatin regions, DNA is essentially unmethylated [43].
DNA methylation is continuously distributed over mammalian
chromosomes with the notable exception of CpG islands (CGIs)
and in turn of certain CpG rich promoters and transcription start
sites (TSSs). Along the observation that the hypomethylation level
of CGIs extends to about 1 kb in flanking regions, we used 1 kb-
enlarged CGI coverage as an hypomethylation marker (Material
and Methods) [22]. When averaging over the U-domains
detected in BG02, we robustly observed a maximum of CGI
coverage at U-domain borders as the signature of hypomethyla-
tion and a decrease over a characteristic distance of *150 kb
(Fig. 3C), similar to what we found for DNase I sensitivity
coverage (Fig. 3A). This contrasts with the GC-content profile
that strongly depends on the U-domain size and decreases very
slowly toward the U-domain center without exhibiting any
characteristic scale (Supplementary Fig. S11D–F). These obser-
vations are consistent with the hypothesis that early replication
origins at U-domain borders are associated with CGIs that are
possibly protected from methylation by colocalization with
replication origins [44].
Open chromatin markers have been associated with genes. For
example 16% of all DNase I hypersensitive sites (HS) are in the
first exon or at the TSS of a gene and 42% are found inside a gene
[45]. Also, more than 90% of broadly expressed housekeeping
genes have a CpG-rich promoter [46]. Remarkably, the mean
profiles of Pol II binding Chip-Seq tag density (Material and
Methods) along U-domains detected in BG02, K562 and
GM06990 cell lines strongly decay over *150 kb away from U-
domain borders (Fig. 3D). This indicates that, whatever the cell
line, the open chromatin regions around replication U-domains
are prone to transcription whereas U-domain central regions
appear, on average, transcriptionally silent.
Importantly, we have reproduced the analyses of open
chromatin markers near U-domain borders that do not match
with a N-domain border (at 100 kb resolution) and confirmed that
the results reported in Fig. 3 apply to the initiation zones at U-
domains borders of every cell line (Supplementary Fig. S12).
Replication timing U-domains are insulatedcompartments of genome-wide chromatin interactions(Hi-C)
It is widely recognized that the 3D chromatin tertiary structure
provides some understanding to the experimental observation of the
so-called replicon and replication foci [2,47]. In particular, replicon
size, which is dictated by the spacing between active origins,
correlates with the length of chromatin loops [8,47,48]. The
chromosome conformation capture technique [38] has provided
access to long-range chromatin interactions as a footprint of the
different levels of chromatin folding in relation with gene activity
and the functional state of the cell. From a comparative analysis of
Table 2. Replication domains characteristics.
Ndom BG02 K562 GM06990 H0287 TL010 BJ R1 BJ R2 HeLa R1 HeLa R2
N 663 1534 876 882 830 664 1150 1247 1422 1498
L 1.19 1.09 1.42 1.52 1.57 1.62 1.19 1.15 1.06 0.966
G 29.2 61.9 46.1 49.5 48.1 39.6 50.5 53.2 55.7 53.5
GC 40.30 40.25 40.84 40.85 40.94 41.13 40.84 40.60 40.72 40.99
Columns corresponds to the replication timing U-domains detected in different cell lines using our wavelet-based methodology (Material and Methods, andSupplementary data) and the corresponding skew N-domains (replication domains in the germline) given for comparison. N = number, L = mean length (Mb),G = genome coverage (%), GC = mean GC-content (%) of the replication domains found in the 22 human autosomes.doi:10.1371/journal.pcbi.1002443.t002
Megabase-Sized Replication Fork Polarity Gradients
PLoS Computational Biology | www.ploscompbiol.org 5 April 2012 | Volume 8 | Issue 4 | e1002443
replication timing data and Hi-C data correlation matrix in the
human genome, some dichotomic picture has been proposed where
early and late replicating loci occur in separated compartments of
open and closed chromatin respectively [34,38]. Here, instead of
considering the partitioning of the chromosomes derived from all
intrachromosomal interactions of each locus (using a principal
component of the principal component analysis of the Hi-C data
over each chromosome), we focused on interactions between loci
Figure 2. Replication timing U-domains in different human cell lines. (A) Average MRT profiles (+ SEM) inside detected replication U-domains (Table 2). (B) Corresponding average dMRT=dx profiles (+ SEM). In (A) and (B), each cell line is identified by a color: BG02 (green), K562(red), GM06990 (blue), BJ R2 (magenta), and HeLa R2 (cyan). (C) The 2534 BG02 U-domains were centered and ordered vertically from the smallest(top) to the longest (bottom). The MRT profile of each domain is figured along a horizontal line using the MRT (BG02) color map. (D) Same as in (C)but for dMRT=dx using the dMRT=dx (BG02) color map.doi:10.1371/journal.pcbi.1002443.g002
Megabase-Sized Replication Fork Polarity Gradients
PLoS Computational Biology | www.ploscompbiol.org 6 April 2012 | Volume 8 | Issue 4 | e1002443
separated by short genomic distances ( 10 Mb) over which the
contact probabilities are the highest [38]. First, we performed this
zoom in the Hi-C contact matrix in the K562 cell line at the 100 kb
resolution (Material and Methods) for the 11.4 Mb fragment of
human chromosome 10 which contains four U-domains in K562
(Fig. 1; ½O1,O2�, ½O2,O3�, ½O4,O6� and ½O6,O7�). We found that
these four U-domains remarkably correspond to four matrix square-
blocks of enriched interactions (Fig. 4A). Hence, we recover that
early replicating zones that border a U-domain (e.g. O4 and O6
separated by 3.9 Mb), have a high contact probability as the
signature of 3D spatial proximity. However, we also observe a high
contact probability of the two early replicating borders with the late
replicating U-domain center and interactions appear sparse for loci
in separate U-domains (e.g. O1 and O3 separated by 3.6 Mb).
Further examination of the average behavior of intrachromosomal
contact probability as a function of genomic distance for the
complete genome corroborates these observations. We found that
the mean number of interactions between two 100 kb loci of the
same U-domain decays when increasing their distance as observed
genome-wide (Fig. 4B). Importantly, the mean number of pairwise
interactions is significantly higher inside the U-domains than
genome-wide and this seems to depend on the U-domain length. In
particular, we found that the smaller the domain, the higher the
mean number of interactions which is probably a signature of a
more open chromatin structure. When comparing the contact
probability between two loci inside a U-domain or lying in
neighboring U-domains (Fig. 4C), we observed that the latter is
higher than the former for distances smaller than the characteristic
size (*300 kb) of the open chromatin structure at U-domain
borders (Fig. 3). Above this characteristic distance, the tendency is
reversed and the ratio increases up to 2 for distances *1:8 Mb
(Fig. 4C). These data suggest that the segmentation of the genome
into replication timing U-domains corresponds to some spatial
compartmentalization into self-interacting structural chromatin
units insulated by two boundaries of open, accessible, actively
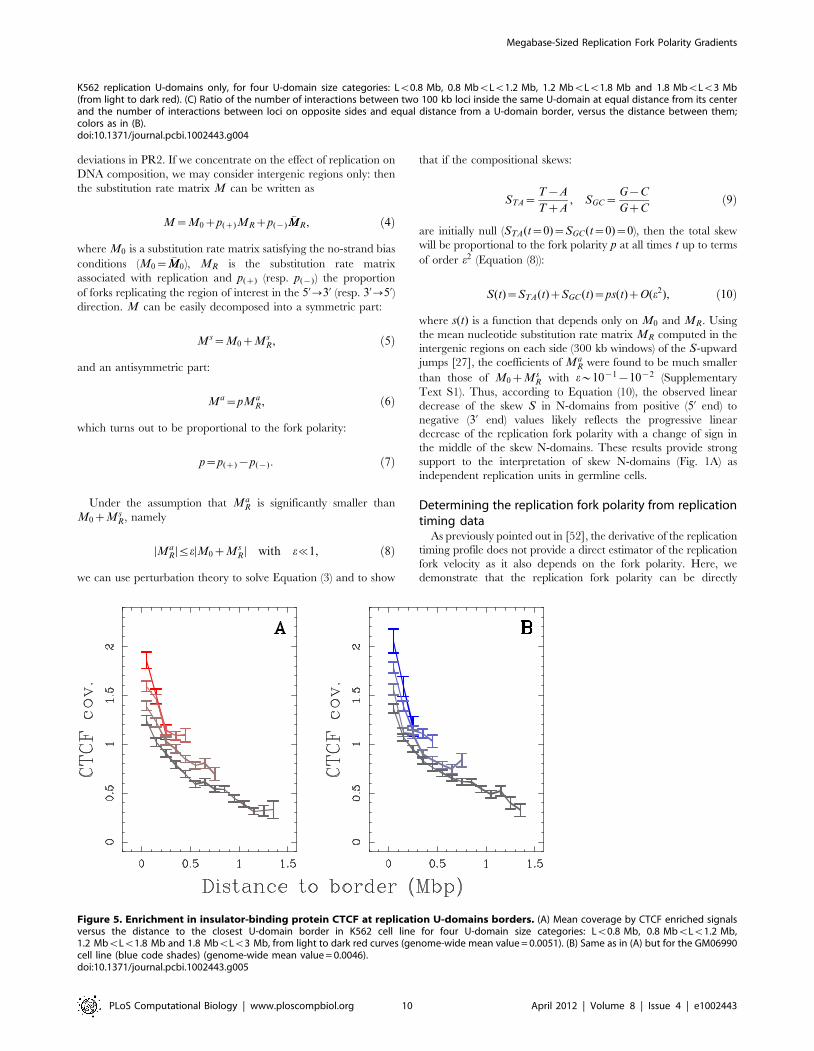
transcribed chromatin. This conclusion is strengthened by the
observation that U-domain borders are significantly enriched in the
insulator binding protein CTCF (Fig. 5), that is known to be
involved in chromatin loop formation conditioning communication
between transcriptional regulatory elements [36,37,49,50]. Quan-
titatively similar results were obtained for the lymphoblastoid
GM06990 cell line for which both replication timing and Hi-C data
were available (Supplementary Fig. S13).
PerspectivesThe mapping of open chromatin marks along U-domains revealed
that they are bordered by early replication initiation zones likely
specified by a *300 kb wide region of accessible, open chromatin
permissive to transcription. Such a strong gradient of open chromatin
environment was not observed around a large fraction of the 283
replication origins identified in ENCODE regions [12]; only 29%
overlap a DNase I hypersensitivity site and half of them do not present
open chromatin marks and are not associated with active transcription
[22]. Furthermore, the typical inter-origin distance in human cells is
50–100 kb [12,48], a much smaller value than the mean U-domain
size (1–1.5 Mb). These data can be reconciled in a model [51,52]
where replication origins fire independently and their properties
(intrinsic firing time probability, efficiency) are specified by the
chromatin state: efficient early replicating origins in euchromatic
regions (U-domains borders) and late replicating or less efficient origins
in heterochromatic regions (U-domains centers). A more dynamical
model can also be proposed in which replication first initiates at U-
domain borders followed by a chromatin gradient-mediated succession
of secondary origin activations. These origins may be remotely
activated by the approach of a center-oriented fork that may stimulate
initiation due to changes in DNA supercoiling in front of the fork or to
association of chromatin remodelers or origin triggering factors with
replication fork proteins [35]. This ‘‘domino’’ model could explain why
replication progresses from U-domain borders much faster (3–5 times)
than the known speed of single fork [8,35,48]. Indeed the U-shape of
the replication timing profile indicates that the replication wave
accelerates (effective velocity equals the inverse of the replication timing
derivative, Equation (2)) as the signature of an increasing origin firing
frequency during the S-phase [53]. It will be essential to determine to
what extent the chromatin state influences fork progression and origins
activations and whether outside of U-domains, the genome replicates
according to a similar or completely different scenario.
Materials and Methods
Linking nucleotide compositional skew to replication forkpolarity
We use the formalism of Markov processes to prove that replication-
associated asymmetries between the substitution rates of the two DNA
strands induce, in the limit of small asymmetries, a nucleotide
compositional skew proportional to the replication fork polarity (the
average direction of a locus’ replication). Models of DNA composition
Table 3. Correspondence between replication domains.
Ndom BG02 K562 GM06990 H0287 TL010 BJ R1 BJ R2 HeLa R1 HeLa R2
Ndom 100 10.2 13.6 13.5 13.1 13 7.22 8.02 8.44 8.28
BG02 23.7 100 22.5 21.4 20.5 17.9 18 19.7 16.7 15.2
K562 17.9 12.8 100 28.5 28.8 30.9 16 15.3 13.9 12.6
GM06990 17.9 12.3 28.7 100 64.6 56.2 16 15.7 12.2 12.1
H0287 16.4 11.1 27.3 60.8 100 56.6 16.9 15.5 13 11
TL010 13 7.76 23.4 42.3 45.3 100 12.3 11.9 9.21 9.21
BJ R1 12.5 13.5 21 20.9 23.4 21.2 100 68.6 23.5 20.4
BJ R2 15.1 16 21.8 22.2 23.3 22.3 74.3 100 25 22.2
HeLa R1 18.1 15.5 22.5 19.6 22.3 19.7 29 28.5 100 51.8
HeLa R2 18.7 14.9 21.5 20.5 19.9 20.8 26.6 26.6 54.6 100
Percentage of matchings between replication timing U-domains in different cell lines including skew N-domains in the germline. A U-domain in a given cell line(column) was considered as matching a U-domain in another cell line (row) if more than 80% nucleotides of each of these U-domains were common to the twodomains.doi:10.1371/journal.pcbi.1002443.t003
Megabase-Sized Replication Fork Polarity Gradients
PLoS Computational Biology | www.ploscompbiol.org 7 April 2012 | Volume 8 | Issue 4 | e1002443
evolution are usually written in the form of an autonomous and
homogeneous system of first-order differential equations [54]:
dX (t)
dt~MX (t) ð3Þ
where X (t)~t(T(t),A(t),G(t),C(t)) is the vector which represents
the state of the system, i.e. for i[fT ,A,G,Cg, Xi(t) is the frequency of i
at time t, and for i,j[fT ,A,G,Cg, Mij is the substitution rate of j?i. A
general and well-known property of a Markov process like Equation (3)
is that X (t) tends exponentially towards the equilibrium value
X �~(T�,A�,G�,C�), defined as MX �~0. The evolution on the
complementary strand is given by the same equation but for �XX and �MM,
�XXi(t) defines the frequency vector on the complementary strand,�MMij~M�ii�jj is the substitution rate matrix on the complementary strand,
and �ii[fA,T ,C,Gg denotes the complementary base of i. Under no-
strand-bias conditions [55], the same substitution rates affect the two
strands, i.e. �MM~M leading to the so-called parity rule of type 2 (PR2):
T�~A� and G�~C� [56–59]. Departure from this symmetry
condition can thus be quantified by decomposing M into symmetric
Ms~(Mz �MM)=2 and antisymmetric Ma~(M{ �MM)=2 parts, the
latter accounting for the establishment of a nucleotide compositional
strand asymmetry during evolution.
According to our previous studies of the skew S in mammalian
genomes [16–20,29–31], we can reasonably suppose that replica-
tion and transcription are the main mechanisms responsible for
Figure 3. Analysis of chromatin marks along U-domains. Over representation of open chromatin markers (Material and Methods) atreplication timing U-domain borders relative to the corresponding genome-wide value. (A) Mean coverage by DNase I hypersensitive zones, as afunction of the distance to the closest U-domain border in BG02 using DNase H1-hESC data (green, genome-wide mean value = 0.0073), K562 usingDNase K562 data (red, genome-wide mean value = 0.0138), GM06990 using DNase GM06990 data (blue, genome-wide mean value = 0.0107). (B)Proportion of clones presenting a ratio of ‘‘open’’ over input chromatin greater than 1.5 versus the distance to the closest U-domain border inGM06990 for four U-domain size categories: Lv0.8 Mb, 0.8 MbvLv1.2 Mb, 1.2 MbvLv1.8 Mb and 1.8 MbvLv3 Mb from light to dark bluecurves (genome-wide mean value = 0.20). (C) Mean coverage by 1 kb-enlarged CpG islands as a function of the distance to the closest U-domainborder in BG02 for the four U-domain size categories defined in (B) from light to dark green curves (genome-wide mean value = 0.0254). (D) Meancoverage by Pol II peaks as a function of the distance to the closest U-domain border in BG02 (green: Pol II in H1 ESC, genome-wide meanvalue = 0.0026), K562 (red: Pol II in K562, genome-wide mean value = 0.0024), GM06990 (blue: Pol II in GM12878, genome-wide mean value = 0.0097).doi:10.1371/journal.pcbi.1002443.g003
Megabase-Sized Replication Fork Polarity Gradients
PLoS Computational Biology | www.ploscompbiol.org 8 April 2012 | Volume 8 | Issue 4 | e1002443
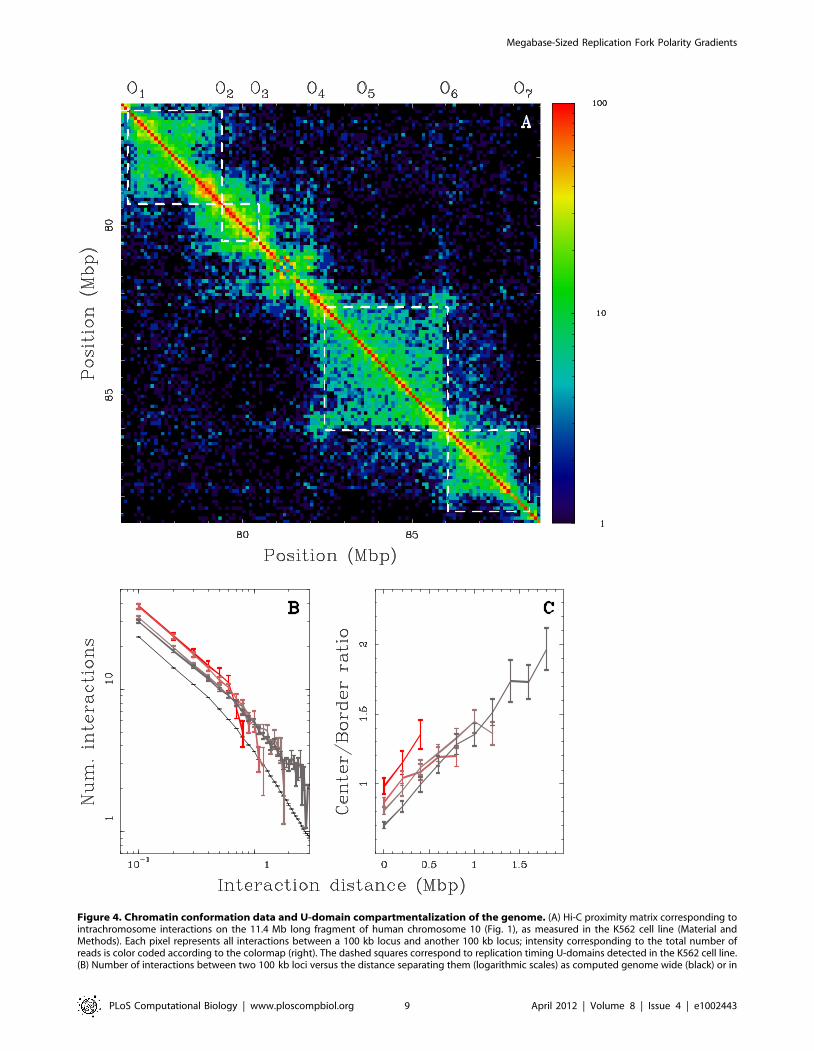
Figure 4. Chromatin conformation data and U-domain compartmentalization of the genome. (A) Hi-C proximity matrix corresponding tointrachromosome interactions on the 11.4 Mb long fragment of human chromosome 10 (Fig. 1), as measured in the K562 cell line (Material andMethods). Each pixel represents all interactions between a 100 kb locus and another 100 kb locus; intensity corresponding to the total number ofreads is color coded according to the colormap (right). The dashed squares correspond to replication timing U-domains detected in the K562 cell line.(B) Number of interactions between two 100 kb loci versus the distance separating them (logarithmic scales) as computed genome wide (black) or in
Megabase-Sized Replication Fork Polarity Gradients
PLoS Computational Biology | www.ploscompbiol.org 9 April 2012 | Volume 8 | Issue 4 | e1002443
deviations in PR2. If we concentrate on the effect of replication on
DNA composition, we may consider intergenic regions only: then
the substitution rate matrix M can be written as
M~M0zp(z)MRzp({)�MMR, ð4Þ
where M0 is a substitution rate matrix satisfying the no-strand bias
conditions (M0~ �MM0), MR is the substitution rate matrix
associated with replication and p(z) (resp. p({)) the proportion
of forks replicating the region of interest in the 5’?3’ (resp. 3’?5’)direction. M can be easily decomposed into a symmetric part:
Ms~M0zMsR, ð5Þ
and an antisymmetric part:
Ma~pMaR, ð6Þ
which turns out to be proportional to the fork polarity:
p~p(z){p({): ð7Þ
Under the assumption that MaR is significantly smaller than
M0zMsR, namely
DMaRDƒeDM0zMs
RD with e%1, ð8Þ
we can use perturbation theory to solve Equation (3) and to show
that if the compositional skews:
STA~T{A
TzA, SGC~
G{C
GzCð9Þ
are initially null (STA(t~0)~SGC(t~0)~0), then the total skew
will be proportional to the fork polarity p at all times t up to terms
of order e2 (Equation (8)):
S(t)~STA(t)zSGC(t)~ps(t)zO(e2), ð10Þ
where s(t) is a function that depends only on M0 and MR. Using
the mean nucleotide substitution rate matrix MR computed in the
intergenic regions on each side (300 kb windows) of the S-upward
jumps [27], the coefficients of MaR were found to be much smaller
than those of M0zMsR with e*10{1{10{2 (Supplementary
Text S1). Thus, according to Equation (10), the observed linear
decrease of the skew S in N-domains from positive (5’ end) to
negative (3’ end) values likely reflects the progressive linear
decrease of the replication fork polarity with a change of sign in
the middle of the skew N-domains. These results provide strong
support to the interpretation of skew N-domains (Fig. 1A) as
independent replication units in germline cells.
Determining the replication fork polarity from replicationtiming data
As previously pointed out in [52], the derivative of the replication
timing profile does not provide a direct estimator of the replication
fork velocity as it also depends on the fork polarity. Here, we
demonstrate that the replication fork polarity can be directly
K562 replication U-domains only, for four U-domain size categories: Lv0.8 Mb, 0.8 MbvLv1.2 Mb, 1.2 MbvLv1.8 Mb and 1.8 MbvLv3 Mb(from light to dark red). (C) Ratio of the number of interactions between two 100 kb loci inside the same U-domain at equal distance from its centerand the number of interactions between loci on opposite sides and equal distance from a U-domain border, versus the distance between them;colors as in (B).doi:10.1371/journal.pcbi.1002443.g004
Figure 5. Enrichment in insulator-binding protein CTCF at replication U-domains borders. (A) Mean coverage by CTCF enriched signalsversus the distance to the closest U-domain border in K562 cell line for four U-domain size categories: Lv0.8 Mb, 0.8 MbvLv1.2 Mb,1.2 MbvLv1.8 Mb and 1.8 MbvLv3 Mb, from light to dark red curves (genome-wide mean value = 0.0051). (B) Same as in (A) but for the GM06990cell line (blue code shades) (genome-wide mean value = 0.0046).doi:10.1371/journal.pcbi.1002443.g005
Megabase-Sized Replication Fork Polarity Gradients
PLoS Computational Biology | www.ploscompbiol.org 10 April 2012 | Volume 8 | Issue 4 | e1002443
deduced from replication timing data under the central hypothesis
that the replication fork speed v is constant and that replication is
bidirectional from each origin. For a given cell cycle, let n be the
number of activated origins, x1v � � �vxn their positions along the
genome and t1, � � � ,tn their initiation times. Then the configuration
C~O1 � � �On~(x1,t1) � � � (xn,tn) (where and when the origins of
replication fire during the S-phase) completely specifies the spatio-
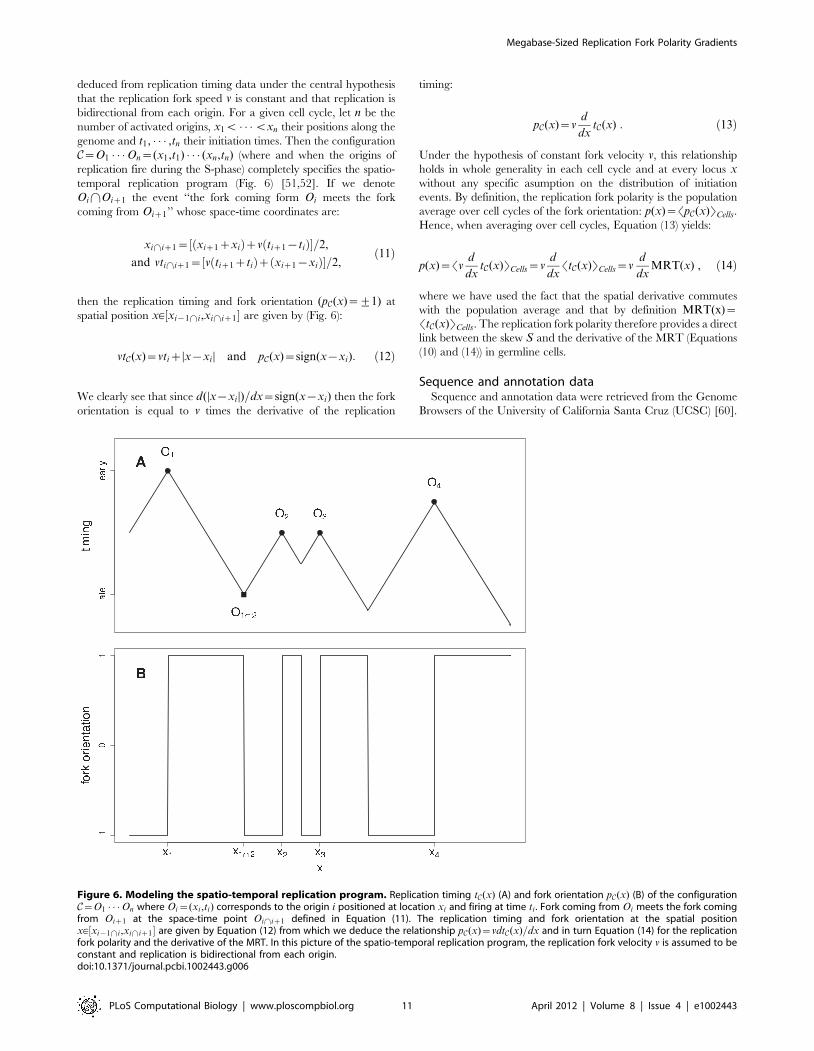
temporal replication program (Fig. 6) [51,52]. If we denote
Oi\Oiz1 the event ‘‘the fork coming form Oi meets the fork
coming from Oiz1’’ whose space-time coordinates are:
xi\iz1~ xiz1zxið Þzv tiz1{tið Þ½ �=2,
and vti\iz1~ v tiz1ztið Þz xiz1{xið Þ½ �=2,ð11Þ
then the replication timing and fork orientation (pC(x)~+1) at
spatial position x[½xi{1\i,xi\iz1� are given by (Fig. 6):
vtC(x)~vtizDx{xi D and pC(x)~sign(x{xi): ð12Þ
We clearly see that since d(Dx{xi D)=dx~sign(x{xi) then the fork
orientation is equal to v times the derivative of the replication
timing:
pC(x)~vd
dxtC(x) : ð13Þ
Under the hypothesis of constant fork velocity v, this relationship
holds in whole generality in each cell cycle and at every locus xwithout any specific asumption on the distribution of initiation
events. By definition, the replication fork polarity is the population
average over cell cycles of the fork orientation: p(x)~SpC(x)TCells.
Hence, when averaging over cell cycles, Equation (13) yields:
p(x)~Svd
dxtC(x)TCells~v
d
dxStC(x)TCells~v
d
dxMRT(x) , ð14Þ
where we have used the fact that the spatial derivative commutes
with the population average and that by definition MRT(x)~StC(x)TCells. The replication fork polarity therefore provides a direct
link between the skew S and the derivative of the MRT (Equations
(10) and (14)) in germline cells.
Sequence and annotation dataSequence and annotation data were retrieved from the Genome
Browsers of the University of California Santa Cruz (UCSC) [60].
Figure 6. Modeling the spatio-temporal replication program. Replication timing tC(x) (A) and fork orientation pC(x) (B) of the configurationC~O1 � � �On where Oi~(xi ,ti) corresponds to the origin i positioned at location xi and firing at time ti . Fork coming from Oi meets the fork comingfrom Oiz1 at the space-time point Oi\iz1 defined in Equation (11). The replication timing and fork orientation at the spatial positionx[½xi{1\i,xi\iz1� are given by Equation (12) from which we deduce the relationship pC(x)~vdtC(x)=dx and in turn Equation (14) for the replicationfork polarity and the derivative of the MRT. In this picture of the spatio-temporal replication program, the replication fork velocity v is assumed to beconstant and replication is bidirectional from each origin.doi:10.1371/journal.pcbi.1002443.g006
Megabase-Sized Replication Fork Polarity Gradients
PLoS Computational Biology | www.ploscompbiol.org 11 April 2012 | Volume 8 | Issue 4 | e1002443
Analyses were performed using the human genome assembly of
March 2006 (NCBI36 or hg18). As human gene coordinates, we
used the UCSC Known Genes table. When several genes presenting
the same orientation overlapped, they were merged into one gene
whose coordinates corresponded to the union of all the overlapping
gene coordinates, resulting in 23818 distinct genes. We used CpG
islands (CGIs) annotation provided in UCSC table ‘‘cpgIslandExt’’.
Replication N-domainsThe coordinates of the 678 human replication N-domains for
assembly NCBI35/hg17 were obtained from the authors [19] and
mapped using LiftOver to hg18 coordinates; we kept only the 663
N-domains that had the same size after conversion.
Determining mean replication timing profilesWe determined the mean replication timing profiles along the
complete human genome using Repli-Seq data [23,26] (Supple-
mentary Text S1, and Supplementary Fig. S14). For embryonic
stem cell line (BG02), three lymphoblastoid cell lines (GM06990,
H0287, TL010), a fibroblast cell line (BJ, replicates R1 and R2),
and erythroid K562 cell line, Repli-Seq tags for 6 FACS fractions
were downloaded from the NCBI SRA website (Studies accession:
SPR0013933) [26]. For the HeLa cell line we computed the mean
replication timing (MRT) instead of computing the S50 (median
replication timing) as in [23].
Detection of U-domains along mean replication timingprofiles
We developed a segmentation method of the MRT profile into U-
domains based on the continuous wavelet transform. This method
amounts to perform objective (U-) pattern recognition in 1D signals
where the U-motif is picked out from the background signal
variations (Supplementary Text S1, and Supplementary Fig. S15).
Correlation analysisFor the analysis of correlations, we reported the Pearson’s
product moment correlation coefficient R and the associated P-
value for no association (R~0). All statistical computations were
performed using the R software (http://www.r-project.org/).
DNase I hypersensitive site dataWe used the DNaseI sensitivity measured genome-wide [42].
Data corresponding to Release 3 (Jan 2010) of the ENCODE UW
DNaseI HS track, were downloaded from the UCSC FTP site:
ftp://hgdownload.cse.ucsc.edu/goldenPath/hg18/encodeDCC/
wgEncodeUwDnaseSeq/.
We plotted the coverage by DNase Hypersentive Sites (DHSs)
identified as signal peaks at a false discovery rate threshold of 0.5%
within hypersensitive zones delineated using the HotSpot
algorithm (‘‘wgEncodeUwDnaseSeqPeaks’’ tables). When several
replicates were available, data were merged.
Genome-wide maps of Pol II and CTCF bindingWe used ChIP-seq data using antibody for Pol II and CTCF
from Release 3 (Mar 2010) of the ENCODE Open Chromatin
track [11,61]. Data were downloaded from the UCSC FTP site:
ftp://hgdownload.cse.ucsc.edu/goldenPath/hg18/encodeDCC/
wgEncodeChromatinMap.
We plotted coverage by regions of enriched signal in ChIP
experiments, called based on signals created using F-Seq [62]
(‘‘wgEncodeUtaChIPseqPeaks’’ tables). Significant regions were
determined at an approximately 95% sensitivity level. We always
used the most recent version of data.
Whole genome chromatin conformation dataWe used the spatial proximity maps of the human genome
generated using Hi-C method [38]. We downloaded 100 kb
resolution maps for GM06990 and K562 cell lines from the GEO
web site (GSE18199_binned_heatmaps): http://www.ncbi.nlm.
nih.gov/geo/query/acc.cgi?acc = GSE18199.
Chromatin fiber density dataOpen over input chromatin ratio data from human lympho-
bastoid cells were obtained from the authors [41].
Data availabilityCoordinates of N-domains and U-domains in the investi-
gated 7 cell lines can be downloaded from: http://perso.ens-
lyon.fr/benjamin.audit/ReplicationDomainsPLoSComputBiol
2012/.
Supporting Information
Figure S1 The 1534 replication timing U-domains detected in
BG02 embryonic stem cells were centered and ordered vertically
from the smallest (top) to the largest (bottom) : the MRT (A),
dMRT/dx (B), and skew S (C) profiles of each domain are figured
along a horizontal line using the corresponding color maps. Same
representation of the MRT (D), dMRT/dx (E), and S (F) profiles
in the 663 skew N-domains.
(PDF)
Figure S2 Same as in Supplementary Fig. S1 but for the
erythroid K562 cell line (876 replication timing U-domains).
(PDF)
Figure S3 Same as in Supplementary Fig. S1 but for the
lymphoblastoid GM06990 cell line (882 replication timing U-domains).
(PDF)
Figure S4 Same as in Supplementary Fig. S1 but for the
lymphoblastoid H0287 cell line (830 replication timing U-domains).
(PDF)
Figure S5 Same as in Supplementary Fig. S1 but for the
lymphoblastoid TL010 cell line (664 replication timing U-domains).
(PDF)
Figure S6 Same as in Supplementary Fig. S1 but for the
fibroblast BJ cell line (Replicate experiment 1 : 1150 replication
timing U-domains).
(PDF)
Figure S7 Same as in Supplementary Fig. S1 but for the
fibroblast BJ cell line (Replicate experiment 2 : 1247 replication
timing U-domains).
(PDF)
Figure S8 Same as in Supplementary Fig. S1 but for the HeLa cell
line (Replicate experiment 1 : 1422 replication timing U-domains).
(PDF)
Figure S9 Same as in Supplementary Fig. S1 but for the HeLa
cell line (Replicate experiment 2 : 1498 replication timing U-
domains).
(PDF)
Figure S10 Mean coverage (relative to the genome average) by
DNase I hypersensitive zones, as a function of the distance to the
closest U-domain border in H0287 (blue solid line : DNase
GM06990, genome-wide mean value = 0.0107), in TL010 (blue
dashed line : DNase GM06990, genome-wide mean val-
Megabase-Sized Replication Fork Polarity Gradients
PLoS Computational Biology | www.ploscompbiol.org 12 April 2012 | Volume 8 | Issue 4 | e1002443
ue = 0.0107), in BJ R1 (light blue solid line : DNase BJtert,
genome-wide mean value = 0.0164), in BJ R2 (light blue dashed
line : DNase BJtert, genome-wide mean value = 0.0164), in HeLa
R1 (magenta solid line : DNase HeLa S3, genome-wide mean
value = 0.0136), in HeLa R2 (magenta dashed line : DNase HeLa
S3, genome-wide mean value = 0.0136).
(PDF)
Figure S11 Mean coverage (relative to the genome average) of
DNase I hypersensitive zones (A–C) and GC content (D–F) as a
function of the distance to the closest U-domain border in K562 (A,D),
GM06990 (B,E) and BG02 (C,F), for four U-domain size categories :
Lv0.8 Mb, 0.8 MbvLv1.2 Mb, 1.2 MbvLv1.8 Mb and
1.8 MbvLv3 Mb from light to dark curves.
(PDF)
Figure S12 Same analysis as in Fig. 3 but restricted to
replication timing U-domain borders that do not colocate within
100 kb with a N-domain border.
(PDF)
Figure S13 (A) S~T{A
TzAz
G{C
GzCprofile along a 23 Mb long
fragment of human chromosome 5 that contains 5 detected skew
N-domains (black horizontal bars). Each dot corresponds to the
skew calculated for a window of 1 kb of repeat-masked
sequence. The colors correspond to intergenic (black), (z)genes (red) and ({) genes (blue). (B) MRT profile from
GM06990 cell line (blue curve); the vertical dashed blue lines
correspond to the edges of 10 detected replication timing U-
domains (horizontal blue bars). (C) Hi-C proximity matrix
corresponding to intrachromosome interactions on the corre-
sponding 23 Mb long fragment of human chromosome 5, as
measured in the GM06990 cell line (Methods). Each pixel
represents all interactions between a 100 kb locus and another
100 kb locus; intensity corresponding to the total number of
reads is color coded according to the colormap (right). The
dashed squares correspond to the 10 detected U-domains. (D)
Number of interactions between two 100 kb loci versus the
distance separating them (logarithmic scales) as computed
genome wide (black) or in replication U-domains only, for four
U-domain size categories : Lv0.8 Mb, 0.8 MbvLv1.2 Mb,
1.2 MbvLv1.8 Mb and 1.8 MbvLv3 Mb (from light to
dark blue). (E) Ratio of the number of interactions between two
100 kb loci that are inside the same U-domain at equal distance
from its center and the number of interactions between loci in
different U-domains at equal distance from a U-domain border,
versus the distance between them (logarithmic scales); the color
coding is the same as in (D). The number of interactions per pair
of 100 kb loci corresponds to averaging over the 882 U-domains
detected in the GM06990 cell line (Table 2).
(PDF)
Figure S14 (A) Normalized tag densities on a 25 Mb long
fragment of chromosome 10, for the GM06990 cell line, and the
corresponding computed MRT (white line). (B) ‘‘Denoised’’
normalized tag densities on the same genomic fragment and the
corresponding MRT (white line). In (A) and (B) the tag densities
for each S-phase fraction (G1–G2) are color coded using the color
map situed at the top. (C) Comparison on the same genomic
fragment of the MRT computed on the normalized tag densities
(cyan line) and the MRT computed on the ‘‘denoised’’
normalized tag densities (blue line). (D) Probability density
function (P.d.f.) of the genome-wide distribution of the normal-
ized tag densities for each S-phase fraction from G1 to G2 from
bottom to top (black histogram). The mode m of the distribution
is given by the red bar, the threshold 4m used for denoising is
given by the green bar.
(PDF)
Figure S15 (A) MRT profile obtained in K562 cell line along a
11.4 Mbp long segment of human chromosome 10. (B) Space-
scale representation of second-order variations for the MRT
profile presented in (A); TMRTg(2) (Equation (S7)) values are color
coded using green (resp. orange) shades for negative (resp. positive)
curvature (note that MRT axis is going downwards). Horizontal
dashed line marks scale 300 kb used to detect regions of
preferential replication initiation (vertical lines). Pairs of horizontal
bars delineate the scale range where strong negative curvature is
expected for parabolic U-shaped MRT profile. Regions delineated
by two successive regions of preferential replication initiation are
kept as U-domain if TMRTg(2) ƒ{0:04 at their midpoint for some
scale value in this range.
(PDF)
Table S1 Pearson correlation (R values) of the derivative of
MRT, dMRT/dx, between different pairs of human cell lines
(Methods). dMRT/dx was calculated in non-overlapping 100 kb
windows over the 22 human autosomes. All p-values are v10{16.
(PDF)
Table S2 Number of matchings between replication timing U-
domains in different pairs of cell lines including skew N-domains in
the germline. A U-domain in a given cell line (column) was
considered as matching a U-domain in another cell line (row) if
more than 80% nucleotides of each of these U-domains were
common to the two domains.
(PDF)
Table S3 Number of matchings between randomly re-posi-
tioned replication timing U-domains in different pairs of cell lines
including skew N-domains in the germline (1000 simulations were
used to obtain the mean values). A U-domain in a given cell line
(column) was considered as matching a U-domain in another cell
line (row) if more than 80% nucleotides of each of these U-
domains were common to the two domains.
(PDF)
Table S4 Percentage of matchings between randomly re-
positioned replication timing U-domains in different pairs of cell
lines including skew N-domains in the germline (1000 simulations
were used to obtain the mean values). A U-domain in a given cell
line (column) was considered as matching a U-domain in another
cell line (row) if more than 80% nucleotides of each of these U-
domains were common to the two domains.
(PDF)
Text S1 Supplementary methods: (i) Substitution rate matrix
associated to replication (ii) Determination of mean replication
timing profiles from experimental data and (iii) Detection of U-
domains along mean replication timing profiles.
(PDF)
Acknowledgments
We thank M. Silvain for help in mapping Repli-Seq data.
Author Contributions
Conceived and designed the experiments: AB BA CT AA. Performed the
experiments: AB BA CLC AA. Analyzed the data: AB BA CLC BM AL
GG AR CV AG FM YA OH CT AA. Contributed reagents/materials/
analysis tools: AB BA CLC BM AL GG AR CV AG FM YA OH CT AA.
Wrote the paper: CT AA.
Megabase-Sized Replication Fork Polarity Gradients
PLoS Computational Biology | www.ploscompbiol.org 13 April 2012 | Volume 8 | Issue 4 | e1002443
References
1. Gilbert DM (2010) Evaluating genome-scale approaches to eukaryotic DNAreplication. Nat Rev Genet 11: 673–684.
2. Berezney R, Dubey DD, Huberman JA (2000) Heterogeneity of eukaryoticreplicons, replicon clusters, and replication foci. Chromosoma 108: 471–484.
3. Bell SP, Dutta A (2002) DNA replication in eukaryotic cells. Annu Rev Biochem71: 333–374.
4. Bogan JA, Natale DA, Depamphilis ML (2000) Initiation of eukaryotic DNA
replication: conservative or liberal? J Cell Physiol 184: 139–150.5. Mechali M (2001) DNA replication origins: from sequence specificity to
epigenetics. Nat Rev Genet 2: 640–645.6. McNairn AJ, Gilbert DM (2003) Epigenomic replication: linking epigenetics to
DNA replication. Bioessays 25: 647–656.
7. Aladjem MI (2007) Replication in context: dynamic regulation of DNAreplication patterns in metazoans. Nat Rev Genet 8: 588–600.
8. Courbet S, Gay S, Arnoult N, Wronka G, Anglana M, et al. (2008) Replicationfork movement sets chromatin loop size and origin choice in mammalian cells.
Nature 455: 557–560.
9. Mechali M (2010) Eukaryotic DNA replication origins: many choices forappropriate answers. Nat Rev Mol Cell Biol 11: 728–738.
10. Hamlin JL, Mesner LD, Lar O, Torres R, Chodaparambil SV, et al. (2008) Arevisionist replicon model for higher eukaryotic genomes. J Cell Biochem 105:
321–329.11. The ENCODE Project Consortium (2007) Identification and analysis of
functional elements in 1% of the human genome by the ENCODE pilot
project. Nature 447: 799–816.12. Cadoret JC, Meisch F, Hassan-Zadeh V, Luyten I, Guillet C, et al. (2008)
Genome-wide studies highlight indirect links between human replication originsand gene regulation. Proc Natl Acad Sci U S A 105: 15837–15842.
13. Karnani N, Taylor CM, Dutta A (2009) Microarray analysis of DNA replication
timing. Methods Mol Biol 556: 191–203.14. Mesner LD, Valsakumar V, Karnani N, Dutta A, Hamlin JL, et al. (2011)
Bubble-chip analysis of human origin distributions demonstrates on a genomicscale significant clustering into zones and significant association with
transcription. Genome Res 21: 377–389.15. Hamlin JL, Mesner LD, Dijkwel PA (2010) A winding road to origin discovery.
Chromosome Res 18: 45–61.
16. Brodie of Brodie EB, Nicolay S, Touchon M, Audit B, d’Aubenton-Carafa Y,et al. (2005) From DNA sequence analysis to modeling replication in the human
genome. Phys Rev Lett 94: 248103.17. Touchon M, Nicolay S, Audit B, Brodie of Brodie EB, d’Aubenton-Carafa Y,
et al. (2005) Replication-associated strand asymmetries in mammalian genomes:
toward detection of replication origins. Proc Natl Acad Sci U S A 102:9836–9841.
18. Audit B, Nicolay S, Huvet M, Touchon M, d’Aubenton Carafa Y, et al. (2007)DNA replication timing data corroborate in silico human replication origin
predictions. Phys Rev Lett 99: 248102.19. Huvet M, Nicolay S, Touchon M, Audit B, d’Aubenton-Carafa Y, et al. (2007)
Human gene organization driven by the coordination of replication and
transcription. Genome Res 17: 1278–1285.20. Baker A, Nicolay S, Zaghloul L, d’Aubenton-Carafa Y, Thermes C, et al. (2010)
Wavelet-based method to disentangle transcription- and replication- associatedstrand asymmetries in mammalian genomes. Appl Comput Harmon Annal 28:
150–170.
21. Arneodo A, Vaillant C, Audit B, Argoul F, d’Aubenton Carafa Y, et al. (2011)Multi-scale coding of genomic information: From DNA sequence to genome
structure and function. Phys Rep 498: 45–188.22. Audit B, Zaghloul L, Vaillant C, Chevereau G, d’Aubenton Carafa Y, et al.
(2009) Open chromatin encoded in DNA sequence is the signature of ‘master’replication origins in human cells. Nucleic Acids Res 37: 6064–6075.
23. Chen CL, Rappailles A, Duquenne L, Huvet M, Guilbaud G, et al. (2010)
Impact of replication timing on non-CpG and CpG substitution rates inmammalian genomes. Genome Res 20: 447–457.
24. Woodfine K, Beare DM, Ichimura K, Debernardi S, Mungall AJ, et al. (2005)Replication timing of human chromosome 6. Cell Cycle 4: 172–176.
25. Desprat R, Thierry-Mieg D, Lailler N, Lajugie J, Schildkraut C, et al. (2009)
Predictable dynamic program of timing of DNA replication in human cells.Genome Res 19: 2288–2299.
26. Hansen RS, Thomas S, Sandstrom R, Canfield TK, Thurman RE, et al. (2010)Sequencing newly replicated DNA reveals widespread plasticity in human
replication timing. Proc Natl Acad Sci U S A 107: 139–144.
27. Chen CL, Duquenne L, Audit B, Guilbaud G, Rappailles A, et al. (2011)Replication-associated mutational asymmetry in the human genome. Mol Biol
Evol 28: 2327–2337.28. Green P, Ewing B, Miller W, Thomas PJ, Green ED (2003) Transcription-
associated mutational asymmetry in mammalian evolution. Nat Genet 33:514–517.
29. Touchon M, Nicolay S, Arneodo A, d’Aubenton-Carafa Y, Thermes C (2003)
Transcription-coupled TA and GC strand asymmetries in the human genome.FEBS Lett 555: 579–582.
30. Touchon M, Arneodo A, d’Aubenton-Carafa Y, Thermes C (2004) Transcrip-tion-coupled and splicing-coupled strand asymmetries in eukaryotic genomes.
Nucleic Acids Res 32: 4969–4978.
31. Nicolay S, Brodie of Brodie EB, Touchon M, Audit B, d’Aubenton-Carafa Y,
et al. (2007) Bifractality of human DNA strand-asymmetry profiles results from
transcription. Phys Rev E 75: 032902.
32. Farkash-Amar S, Lipson D, Polten A, Goren A, Helmstetter C, et al. (2008)
Global organization of replication time zones of the mouse genome. Genome
Res 18: 1562–1570.
33. Hiratani I, Ryba T, Itoh M, Yokochi T, Schwaiger M, et al. (2008) Global
reorganization of repli- cation domains during embryonic stem cell differenti-
ation. PLoS Biol 6: e245.
34. Ryba T, Hiratani I, Lu J, Itoh M, Kulik M, et al. (2010) Evolutionarily
conserved replication timing profiles predict long-range chromatin interactions
and distinguish closely related cell types. Genome Res 20: 761–770.
35. Guilbaud G, Rappailles A, Baker A, Chen CL, Arneodo A, et al. (2011)
Evidence for sequential and increasing activation of replication origins along
replication timing gradients in the human genome. PLoS Comput Biol 7:
e1002322.
36. Phillips JE, Corces VG (2009) CTCF: master weaver of the genome. Cell 137:
1194–1211.
37. Ohlsson R, Lobanenkov V, Klenova E (2010) Does CTCF mediate between
nuclear organization and gene expression? Bioessays 32: 37–50.
38. Lieberman-Aiden E, van Berkum NL, Williams L, Imakaev M, Ragoczy T, et al.
(2009) Comprehensive mapping of long-range interactions reveals folding
principles of the human genome. Science 326: 289–293.
39. Yaffe E, Farkash-Amar S, Polten A, Yakhini Z, Tanay A, et al. (2010)
Comparative analysis of DNA replication timing reveals conserved large-scale
chromosomal architecture. PLoS Genet 6: e1001011.
40. Hiratani I, Ryba T, Itoh M, Rathjen J, Kulik M, et al. (2010) Genome-wide
dynamics of replication timing revealed by in vitro models of mouse
embryogenesis. Genome Res 20: 155–169.
41. Gilbert N, Boyle S, Fiegler H, Woodfine K, Carter NP, et al. (2004) Chromatin
architecture of the human genome: gene-rich domains are enriched in open
chromatin fibers. Cell 118: 555–566.
42. Sabo PJ, Kuehn MS, Thurman R, Johnson BE, Johnson EM, et al. (2006)
Genome-scale mapping of DNase I sensitivity in vivo using tiling DNA
microarrays. Nat Methods 3: 511–518.
43. Suzuki MM, Bird A (2008) DNA methylation landscapes: provocative insights
from epigenomics. Nat Rev Genet 9: 465–476.
44. Antequera F, Bird A (1999) CpG islands as genomic footprints of promoters that
are associated with replication origins. Curr Biol 9: R661–R667.
45. Boyle AP, Davis S, Shulha HP, Meltzer P, Margulies EH, et al. (2008) High-
resolution mapping and characterization of open chromatin across the genome.
Cell 132: 311–322.
46. Ponger L, Duret L, Mouchiroud D (2001) Determinants of CpG islands:
expression in early embryo and isochore structure. Genome Res 11: 1854–1860.
47. Buongiorno-Nardelli M, Micheli G, Carri MT, Marilley M (1982) A relationship
between replicon size and supercoiled loop domains in the eukaryotic genome.
Nature 298: 100–102.
48. Conti C, Sacca B, Herrick J, Lalou C, Pommier Y, et al. (2007) Replication fork
velocities at adjacent replication origins are coordinately modified during DNA
replication in human cells. Mol Biol Cell 18: 3059–3067.
49. Hou C, Dale R, Dean A (2010) Cell type speci_city of chromatin organization
mediated by CTCF and cohesin. Proc Natl Acad Sci U S A 107: 3651–3656.
50. Handoko L, Xu H, Li G, Ngan CY, Chew E, et al. (2011) CTCF-mediated
functional chromatin interactome in pluripotent cells. Nat Genet 43: 630–638.
51. Yang SCH, Rhind N, Bechhoefer J (2010) Modeling genome-wide replication
kinetics reveals a mechanism for regulation of replication timing. Mol Syst Biol
6: 404.
52. de Moura APS, Retkute R, Hawkins M, Nieduszynski CA (2010) Mathematical
modelling of whole chromosome replication. Nucleic Acids Res 38: 5623–5633.
53. Goldar A, Marsolier-Kergoat MC, Hyrien O (2009) Universal temporal profile
of replication origin activation in eukaryotes. PLoS One 4: e5899.
54. Li WH (1997) Molecular Evolution. Sunderland, Mass.: Sinauer.
55. Sueoka N (1995) Intrastrand parity rules of DNA base composition and usage
biases of synonymous codons. J Mol Evol 40: 318–325 (erratum in idib 42:373).
56. Chargaff E (1951) Structure and function of nucleic acids as cell constituents.
Fed Proc 10: 654–659.
57. Rudner R, Karkas JD, Chargaff E (1968) Separation of B. subtilis DNA into
complementary strands. 3. Direct analysis. Proc Natl Acad Sci U S A 60:
921–922.
58. Fickett JW, Torney DC, Wolf DR (1992) Base compositional structure of
genomes. Genomics 13: 1056–1064.
59. Lobry JR (1995) Properties of a general model of DNA evolution under no-
strand-bias conditions. J Mol Evol 40: 326–330.
60. Karolchik D, Baertsch R, Diekhans M, Furey TS, Hinrichs A, et al. (2003) The
UCSC genome browser database. Nucleic Acids Res 31: 51–54.
61. Bhinge AA, Kim J, Euskirchen GM, Snyder M, Iyer VR (2007) Mapping the
chromosomal targets of STAT1 by sequence tag analysis of genomic enrichment
(STAGE). Genome Res 17: 910–916.
62. Boyle AP, Guinney J, Crawford GE, Furey TS (2008) F-Seq: a feature density
estimator for high-throughput sequence tags. Bioinformatics 24: 2537–2538.
Megabase-Sized Replication Fork Polarity Gradients
PLoS Computational Biology | www.ploscompbiol.org 14 April 2012 | Volume 8 | Issue 4 | e1002443