Embed Size (px)
Citation preview
Utah State University Utah State University
DigitalCommons@USU DigitalCommons@USU
Undergraduate Honors Capstone Projects Honors Program
5-2015
Right Hand Fork Pedestrian Bridge Final Report Right Hand Fork Pedestrian Bridge Final Report
Ren Gibbons Utah State University
Follow this and additional works at: https://digitalcommons.usu.edu/honors
Part of the Civil and Environmental Engineering Commons
Recommended Citation Recommended Citation Gibbons, Ren, "Right Hand Fork Pedestrian Bridge Final Report" (2015). Undergraduate Honors Capstone Projects. 561. https://digitalcommons.usu.edu/honors/561
This Thesis is brought to you for free and open access by the Honors Program at DigitalCommons@USU. It has been accepted for inclusion in Undergraduate Honors Capstone Projects by an authorized administrator of DigitalCommons@USU. For more information, please contact [email protected].
RIGHT HAND FORK PEDESTRIAN BRIDGE FINAL REPORT
by
Ren Gibbons
Thesis submitted in partial fulfillment of the requirements for the degree
of Bachelor's of Science
HONORS IN UNIVERSITY STUDIES WITH DEPARTMENTAL HONORS
in
Civil Engineering in the Department of Civil and Environmental Engineering
Approved:
v 1 nes1strt:6)ect Aav1sor Dr. Marc Maguire
Departmental Honors Advisor Dr. V. Dean Adams
Director of Honors Program Dr. Kris Miller
UT AH ST A TE UNIVERSITY Logan, UT
Spring 2015

RIGHT HAND FORK PEDESTRIAN BRIDGE FINAL REPORT
Prepared by
Stream Spanners
Stetson Bassett Kedric Curtis Dexter Fisher Ren Gibbons
Jeff Lundgreen
For the Logan Ranger District Uinta-Wasatch -Cache National Forests
A report submitted to fulfill requirements for the CEE 4880 Design Ill course.
Faculty Advisor : Dr. Marc Maguire , Ph.D.
External Advisors : Mark Anderson , S.E., P.E.
UTAH STATE UNIVERSITY College of Civil and Environmental Engineering
Mentor Contact Information
Role (External
Address
PE, client, Last Name, First Name, Phone number(s) Faculty Credential (PE, EIT, PhD, etc.),
Advisor, Position, Organization Email etc.)
ENGR 229, Utah State University
Faculty Logan, UT 84321 Maguire , Marc, Ph.D. (435) 797-2932 Advisor Assistant Professor Utah State University
2331 Rulon White Blvd
External Anderson , Mark, S.E., P.E. Ogden, UT 84404
PE Civil Engineer (801) 452-6699 Steel Concepts
marka@steel-concepts .com
Client nla
2

Team Member Roles
This table lists each team member in alphabetical order and their responsibility or function on the team. Function and spec ialties include disc ipline, CEE specialty , and function such as team leader, scheduler , records keeper, etc. This is used to demonstrate the multidisciplinary nature of the project.
Function or specialty on team Last name First name
Environmental Bassett Stetson Coordinator/Hydroloqical Expert CAD Expert/Hydraulic Expert Curtis Kedric
Record Keeper/Hydraulic Expert Fisher Dexter
Team Leader/Structural Expert Gibbons Ren
Cost Evaluator/Gantt Chart Lundgreen Jeff Expert/Structural Evaluator
3
EXECUTIVE SUMMARY
Right Hand Fork is a tributary canyon whose stream enters the Logan River nine miles east of the mouth of Logan Canyon near Logan, Utah. The access bridge to a popular recreational area, the Hobbit Caves, was damaged in 2011 by flooding . We propose that a new bridge be designed and constructed for the Forest Service to replace the current structure to ensure public safety and minimize environmental impact. We plan to use a longer bridge span that will situate the abutments higher on the stream bank and reduce possible water damage during flood events . Bridge costs will be minimized and will meet required construction and aesthetic standards required by the Forest Service .
The current bridge is a 15-foot timber span placed on existing earth footings. High runoff discharges in 2011 caused the northern earth abutment to shear and settle due to scour. The bridge span now sags at approximately 20°. While still usable , the bridge 's structural integrity has been compromised , and the footing will presumably continue to settle until the bridge fails . Figure 1 shows the extent of the damage done to the bridge .
Figure 1. The condition of the existing bridge .
We have completed a topographical survey and hydrological report to determine the best location for the structure to prevent future water damage. We performed structural analysis and design for a safe and cost-effective replacement pedestrian bridge. We independently prepared a steel bridge and a timber bridge design . The preferred alternative for structural materials is a 40-ft timber glulam girder span and Gabion foundations . We propose that construction will begin as early as fall 2015. We also propose biannual inspections beginning once construction is complete to ensure proper maintenance and a 50-year life as required by the Forest Service .
4
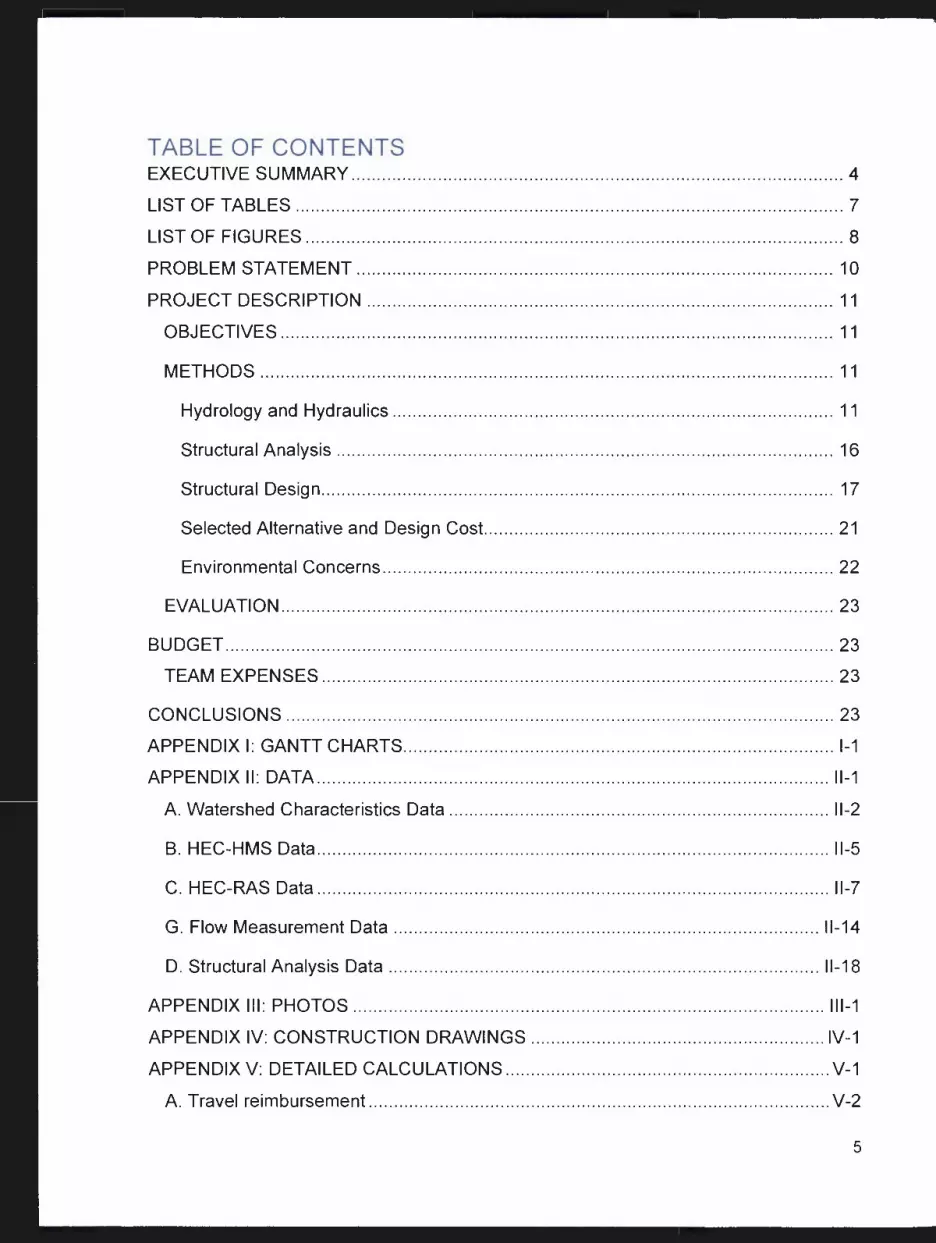
TABLE OF CONTENTS EXECUTIVE SUMMARY ........................ ................. ................ ......... ....................... ........ 4
LIST OF TABLES ......................... ......................... .................. ........... ............... ............ .. 7
LIST OF FIGURES ................ ......................................... ...................... ........................... 8
PROBLEM STATEMENT ........ ............................. ......................... .................. .............. 10
PROJECT DESCRIPTION ..................... ......... ................................... ........................... 11
OBJECTIVES ............. ..... ........... .............................. ............................ .................. .... 11
METHODS .............. ....................... ...................... .......... ............................... ............. 11
Hydrology and Hydraulics ............ .......... ............. .......... ............... ........................... 11
Structural Analysis .......... ............... ................ ................. ..................... .............. ..... 16
Structural Design ..................... .................... .............. ................... .................. ......... 17
Selected Alternative and Design Cost. ............. ........ .............................................. . 21
Environmental Concerns ...................... ........ ............................ ........................... .... 22
EVALUATION ............................. ......... .................. ........ .............................. ............ ... 23
BUDGET .......................... ..................... ............... ........... ....... ........................................ 23
TEAM EXPENSES ........................ .............. ........................................................... .... 23
CONCLUSIONS ............ ........... ................. ........... ......... ............. .................... ............ ... 23
APPENDIX I: GANTT CHARTS ........ ........ .......................... ........ ......................... .......... 1-1
APPENDIX II: DATA ............................. .................................... ........................... ......... 11-1
A. Watershed Characteristics Data .......... ............................ ................ ............... ...... 11-2
B. HEC-HMS Data .................... ....................... ......... .......... ............. ............... ...... ..... 11-5
C. HEC-RAS Data .......................................................... .................................. ......... 11-7
G. Flow Measurement Data ............................. .......... ............................... .......... .... 11-14
D. Structural Analysis Data ....... .............................................................................. 11-18
APPENDIX Ill : PHOTOS .............. ............ ......... ......................................... ...... ........... 111-1
APPENDIX IV: CONSTRUCTION DRAWINGS .............. ............ ................... ............. IV-1
APPENDIX V: DETAILED CALCULATIONS ...................... ............ ......................... ..... V-1
A. Travel reimbursement ........... ...... ................................................................ ......... . V-2
5
B. Bridge Costs .............................. ......... .................................................... .......... .... V-2
C. Calculation of Weighted Curve Numbers ............................. ................................ . V-3
D. Structural Analysis ................ ............. ...... .................................... ............... .......... V-4
E. Structural Design ............... ................ ......................... .............. ............ ....... ....... V-13
F. Foundation Design ................................................................ .............................. V-31
APPENDIX VI : SPECIAL SUMMARY DOCUMENTATION ................................ ....... Vlll-1
CHANGES AS PER PROFESSIONAL MENTOR'S RECOMMENDATIONS .... Vlll-2
CONSTRAINTS CONSIDERATIONS SUMMARY .......... ................. .................... .. Vlll-2
HEALTH AND SAFETY ........................... .................. ................ ......................... Vlll-2
CONSTRUCTIBILITY ................. .......... ............................. ............ ................... ... Vlll -2
ENVIRONMENTAL ............................... .............. ....... ............... .......................... Vlll-3
SOCIAL .............. ......................... .......................... .................................. ........... . Vlll-3
SUSTAINABILITY ........ ..................... ....................................... .................. ......... Vlll -3
ENGINEERING TOOLS SUMMARY ............... ....................... .............................. .. Vlll -3
PROFESSIONAL RESPONSIBILITY AND CONDUCT SUMMARY ...................... Vlll-4
POTENTIAL RISKS ............... ............... .............................. ............ .................... Vlll -5
ASPECTS TO BE REVIEWED BY PROFESSIONALS ...................................... Vlll-5
rnl\lnl 1rT ()I= PR() 11:::rT 1\/1.61\1.6~1=1\,11=1\IT \/Il l_~ '-''-'1 'IL.,1'--''-' I '-'1 I I '- '-'VL-'--' I IVI I \I 'I/ \ '-"'L.. I YIL.. l 'II•• • •• • • ••• ••••• • ••• •• • ••• ••••••• ••••• • • • •• •• • •••• • ••• • • • V 111 - V
6
LIST OF TABLES
Table 1. Basin Characteristics ....................................................................................... 12
Table 2. Watershed Variables Used in HEC-HMS ........................................................ 12
Table 3. Flow Measurements from Logan River and Right Hand Fork .... ..................... 15
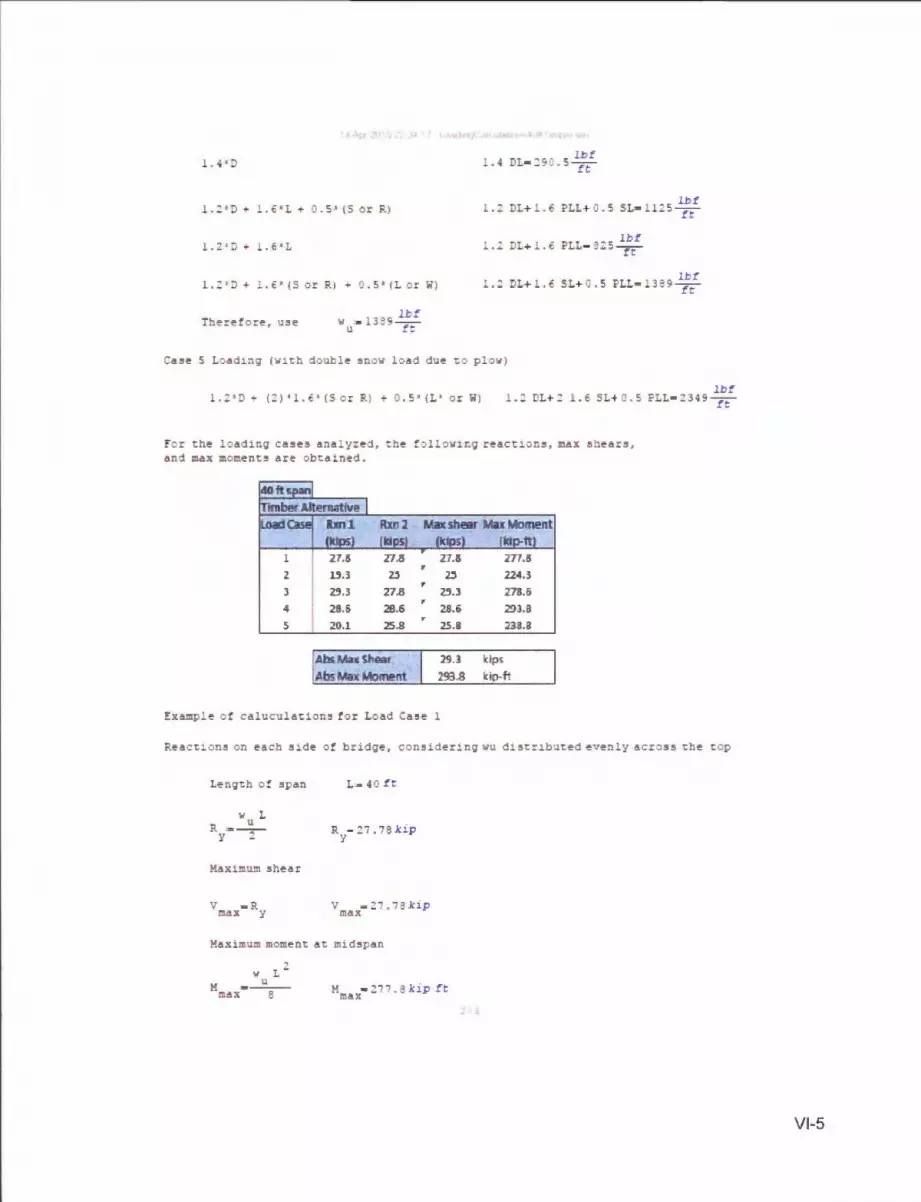
Table 4: Tabulated shears and reactions from load cases used for design . ................. 17
Table 5: Material costs of timber bridge ......................................................................... 22
Table 6. Proposed Gantt chart for fall 2014 and spring 2015 .......................................... 2
Table 7. Gantt chart for fall 2014 .................................... ................................................. 3
Table 8. Gantt chart for spring 2015 ................................................................................ 4
Table 9. Land Cover Type and Possible Curve Numbers ............................................... 3
Table 10. Results of Soils Samples .................................. ............................................... 3
Table 11. Detailed Results from 24-hr Simulation of 100-yr 12-hr Storm ............ ........... . 5
Table 12. Detailed Results for station 11 +26.61 ............. ...................... ........................... 8
Table 13. Detailed Results for station 10+80.25 .............. ............................................... . 9
Table 14. Detailed Results for station 10+76.68 ................. ................................... ........ 10
Table 15. Detailed Results for station 10+57.28 ............................................................ 11
Table 16. Detailed Results for station 10+4 7.41 ........................................................... . 12
Table 17. Detailed Results for station 10+02.94 ............................................................ 13
Table 18. Profile Summary ........... ................................................................................. 14
Table 19: Bridge cost estimates .... .................................................................................. 2
Table 20. Engineering Tools Summary ................................ ........................................... 3
Table 21. Expected Professional Standards used in Design .............................. ............. 4
Table 22. Expected Identification Number and Name of Government Regulations ........ 4
7
LIST OF FIGURES
Figure 1. The condition of the existing bridge .................................................................. 4
Figure 2. Right Hand Fork Location (courtesy of Google Maps) . .................. ................ 10
Figure 3. Current Bridge location (courtesy of Google Maps) . .................. .................... 10
Figure 4. Precipitation and peak flow for 100-yr 12-hr storm ..................................... .... 13
Figure 5. 100-year flood plain ................................................... ..................................... 14
Figure 6: Location of the proposed bridge ..... .......................................................... ...... 16
Figure 7. Glued-laminated stringer bridge design used by the Forest Service .......... .... 19
Figure 8. Watershed delineation from USGS Streamstats . ............................................. 3
Figure 9. Basin model for HEC-HMS model. ......................................................... .......... 5
Figure 10. Geometry map for HEC-RAS model ............................................................... 7
Figure 11. Cross section for station 11 +26.61 ................................................................. 7
Figure 12. Cross section for station 10+80.25 ................................ ...................... ........... 8
Figure 13. Cross section for station 1 0+ 76.68 ......................... .............. .......................... 9
Figure 14. Cross section for station 10+57.28 ............................................................... 10
Figure 15. Cross section for station 10+4 7.41 ... ................ .................... ................. ....... 11
r ·1- · ·-- "'C, c-oss sect=-- L-- _,._,.;_n 1 0+0" 94 12 r !:JUltj 10 . I IUII IUI :Slc::ILIUI L. . . ............................ .. .. .... ........ .. ..... .... ...... .
Figure 17. Water surface profile for 100-yr 12-hr storm ............................ ..................... 13
Figure 18. Free Body Diagram, Shear Diagram, Moment Diagram for Load Case 1 .... 19
Figure 19. Free Body Diagram, Shear Diagram, Moment Diagram for Load Case 2 .... 20
Figure 20. Free Body Diagram, Shear Diagram, Moment Diagram for Load Case 3 .... 21
Figure 21. Free Body Diagram, Shear Diagram, Moment Diagram for Load Case 4 .... 22
Figure 22. Free Body Diagram, Shear Diagram, Moment Diagram for Load Case 5 .... 23
Figure 23. Fish barrier ..... ......................... ............... ...................................................... .. 2
8

Figure 24. Possible bridge location ...................................... .................. ............ .............. 2
Figure 25. View of current bridge ...... ............. ...................................... ............................ 3
Figure 26. Footing shear failure .... ..................... ........................... ............................. ...... 3
Figure 27. View of Stream Bed Conditions ......................................... ................. ............ 4
Figure 28 . Surveying Equipment ..................................................... ................................ 4
9
PROBLEM STATEMENT
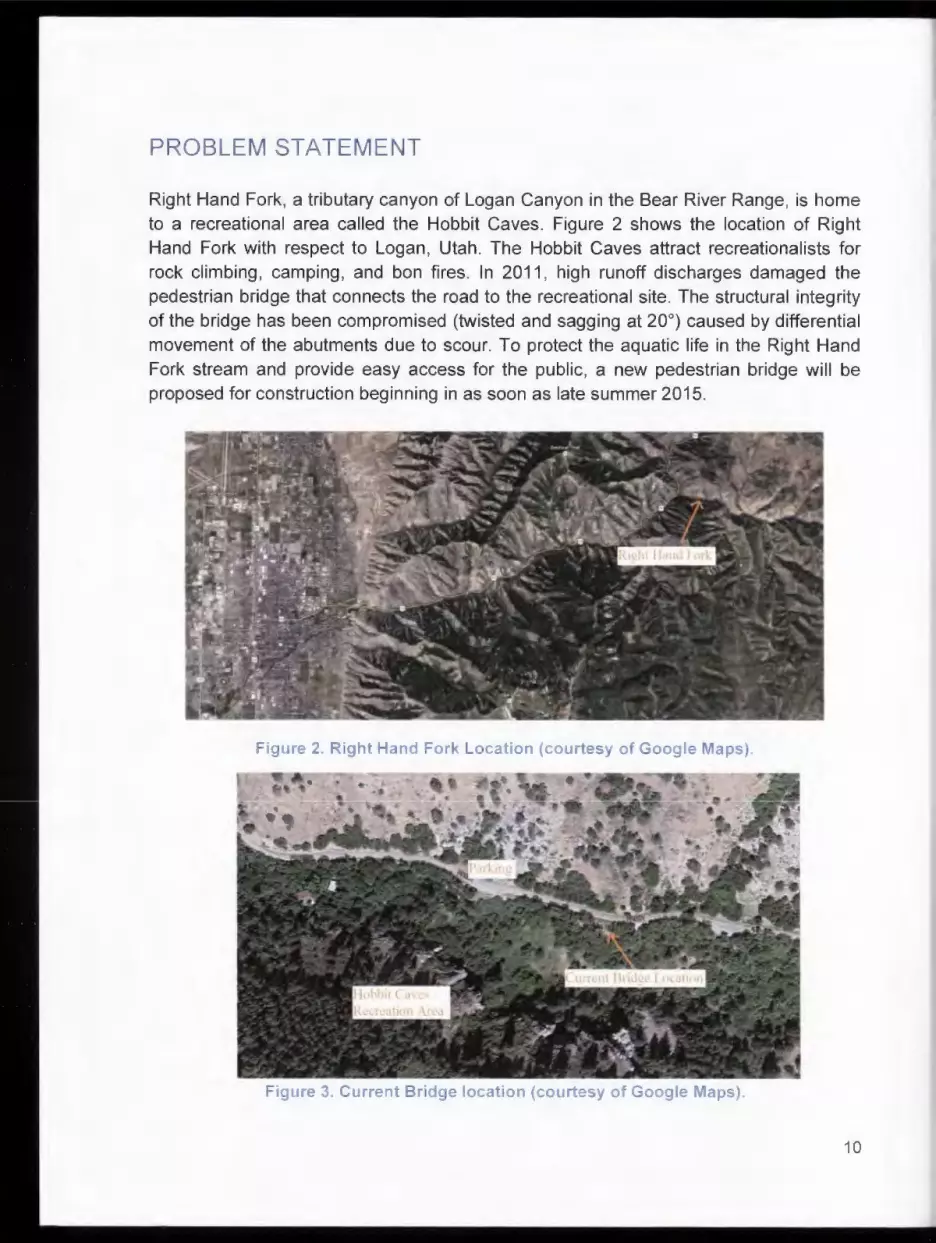
Right Hand Fork, a tributary canyon of Logan Canyon in the Bear River Range, is home to a recreational area called the Hobbit Caves . Figure 2 shows the location of Right Hand Fork with respect to Logan, Utah. The Hobbit Caves attract recreationalists for rock climbing , camping, and bon fires . In 2011, high runoff discharges damaged the pedestrian bridge that connects the road to the recreational site. The structural integrity of the bridge has been compromised (twisted and sagging at 20°) caused by differential movement of the abutments due to scour. To protect the aquatic life in the Right Hand Fork stream and provide easy access for the public, a new pedestrian bridge will be proposed for construction beginning in as soon as late summer 2015.
Figure 2. Right Hand Fork Location (courtesy of Google Maps).
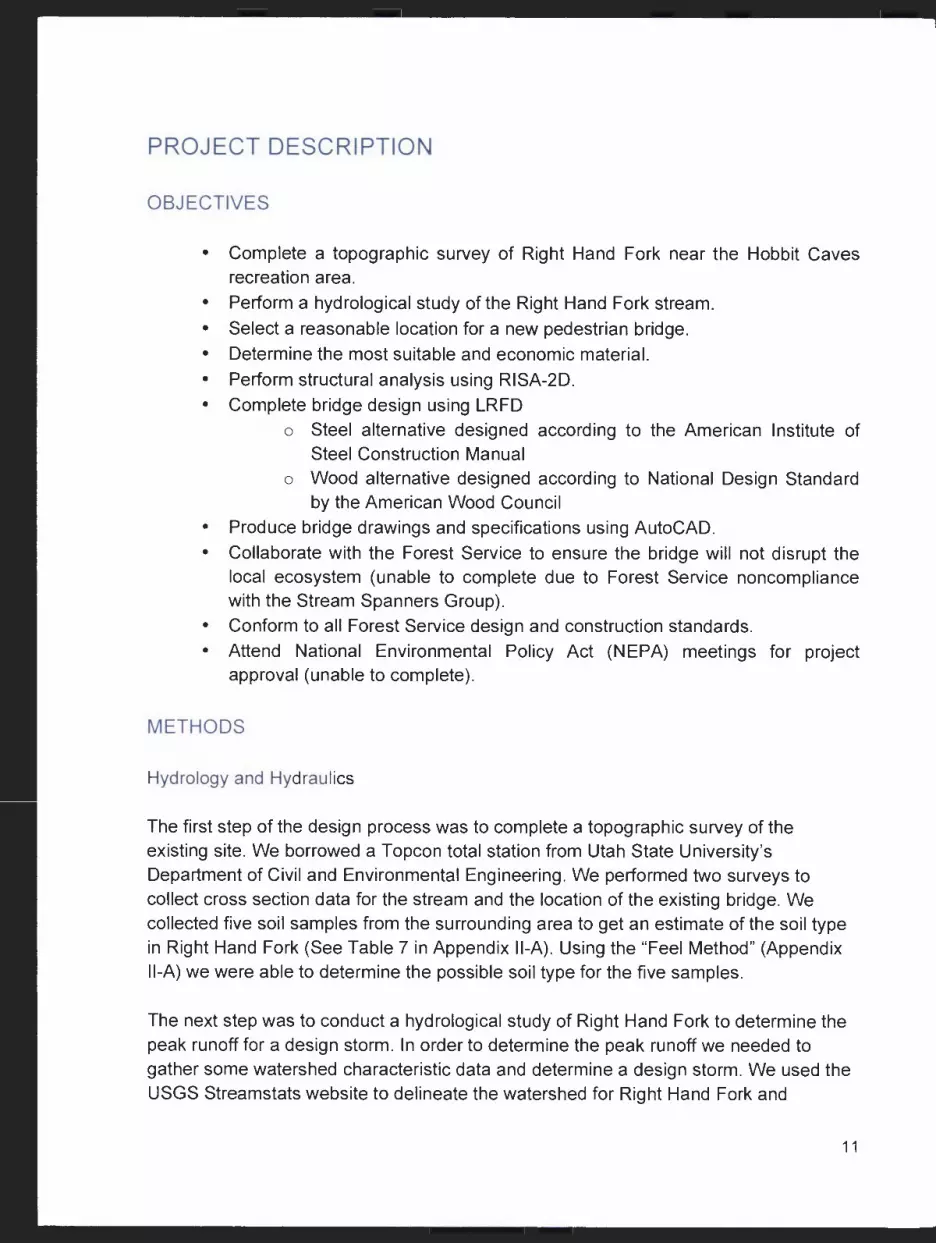
Figure 3. Current Bridge location (courtesy of Google Maps) .
10
PROJECT DESCRIPTION
OBJECTIVES
• Complete a topographic survey of Right Hand Fork near the Hobbit Caves recreation area.
• Perform a hydrological study of the Right Hand Fork stream. • Select a reasonable location for a new pedestrian bridge . • Determine the most suitable and economic material. • Perform structural analysis using RISA-2D. • Complete bridge design using LRFD
o Steel alternative designed according to the American Institute of Steel Construction Manual
o Wood alternative designed according to National Design Standard by the American Wood Council
• Produce bridge drawings and specifications using AutoCAD . • Collaborate with the Forest Service to ensure the bridge will not disrupt the
local ecosystem (unable to complete due to Forest Service noncompliance with the Stream Spanners Group).
• Conform to all Forest Service design and construction standards . • Attend National Environmental Policy Act (NEPA) meetings for project
approval (unable to complete) .
METHODS
Hydrology and Hydraulics
The first step of the design process was to complete a topographic survey of the existing site. We borrowed a Topcon total station from Utah State University 's Department of Civil and Environmental Engineering . We performed two surveys to collect cross section data for the stream and the location of the existing bridge. We collected five soil samples from the surrounding area to get an estimate of the soil type in Right Hand Fork (See Table 7 in Appendix II-A). Using the "Feel Method" (Appendix II-A) we were able to determine the possible soil type for the five samples .
The next step was to conduct a hydrological study of Right Hand Fork to determine the peak runoff for a design storm. In order to determine the peak runoff we needed to gather some watershed characteristic data and determine a design storm. We used the USGS Streamstats website to delineate the watershed for Right Hand Fork and
11
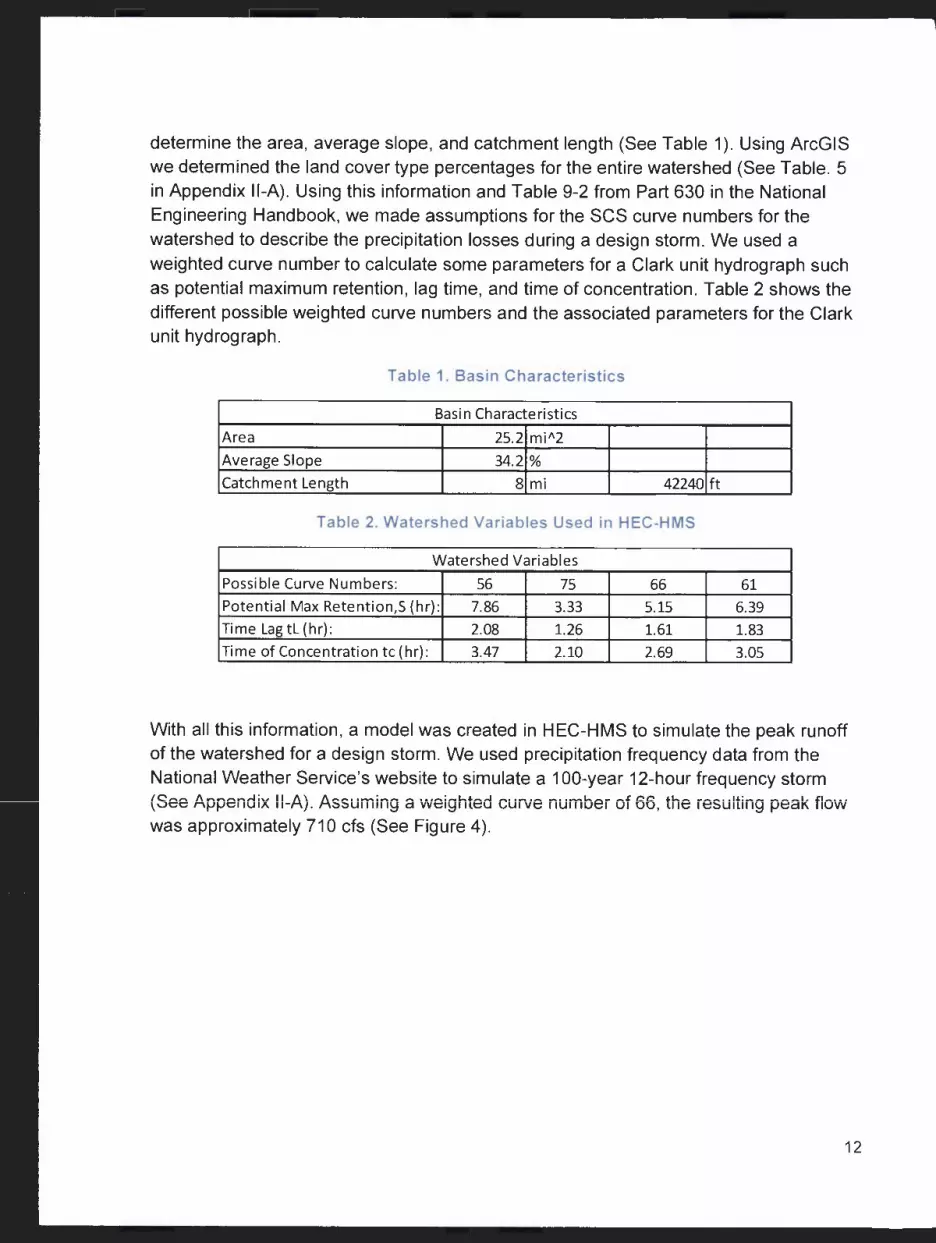
determine the area, average slope, and catchment length (See Table 1 ). Using ArcGIS we determined the land cover type percentages for the entire watershed (See Table . 5 in Appendix II-A). Using this information and Table 9-2 from Part 630 in the National Engineering Handbook , we made assumptions for the SCS curve numbers for the watershed to describe the precipitation losses during a design storm. We used a weighted curve number to calculate some parameters for a Clark unit hydrograph such as potential maximum retention , lag time , and time of concentration. Table 2 shows the different possible weighted curve numbers and the associated parameters for the Clark unit hydrograph .
Table 1. Basin Characteristics
Basin Characteristics
Area 25.2 mi"2
Average Slope 34.2 %
Catchment Length 8 mi 42240 ft
Table 2. Watershed Variables Used in HEC-HMS
Watershed Variables
Possible Curve Numbers : 56 75 66 61 Potential Max Retention ,S (hr) : 7.86 3.33 5.15 6.39 Time Lag tL (hr) : 2.08 1.26 1.61 1.83 Time of Concentr at ion t c (hr) : 3.47 2.10 2.69 3.05
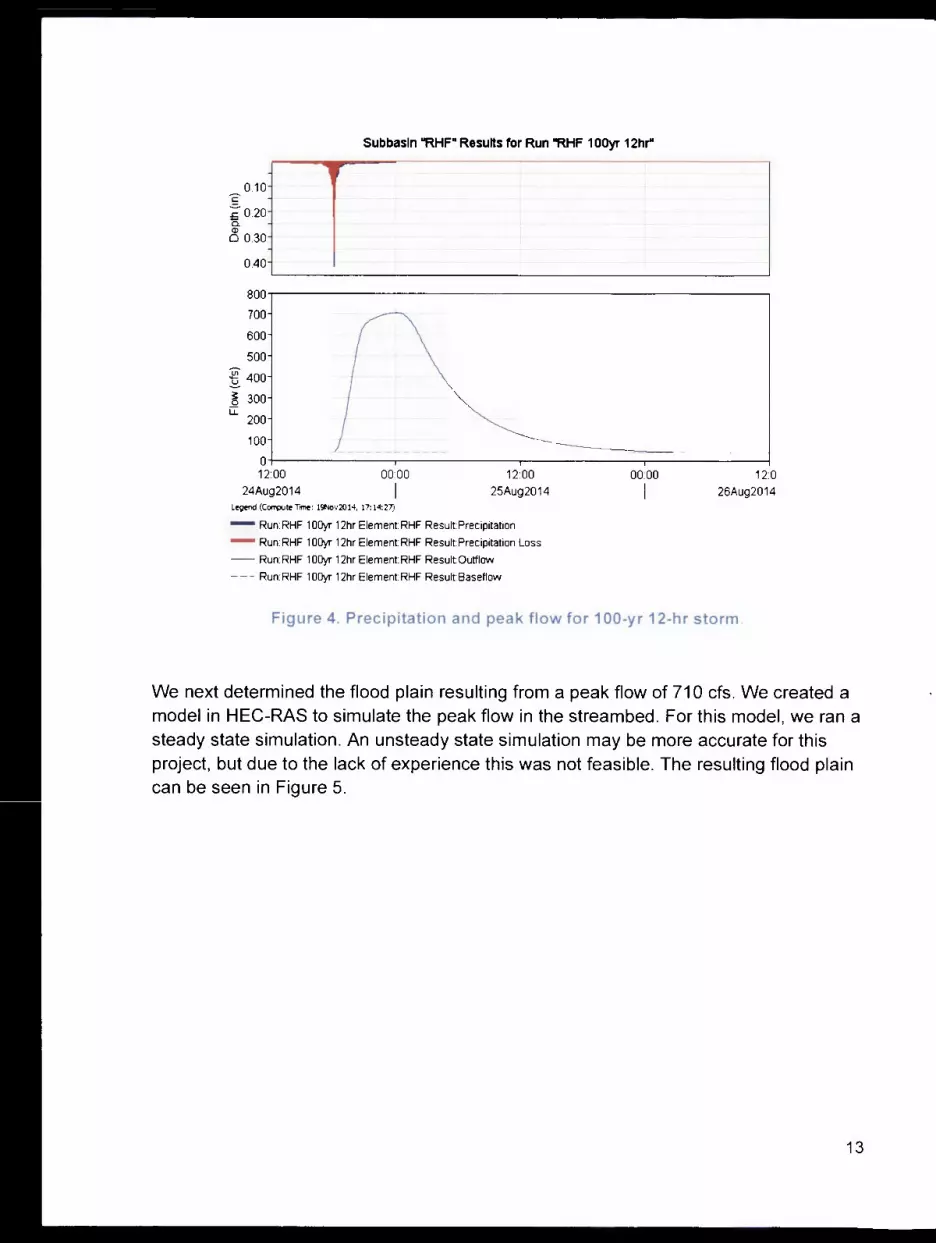
With all this information , a model was created in HEC-HMS to simulate the peak runoff of the watershed for a design storm. We used precipitation frequency data from the National Weather Service 's website to simulate a 100-year 12-hour frequency storm (See Appendix II-A). Assuming a weighted curve number of 66, the resulting peak flow was approximately 710 cfs (See Figure 4) .
12
Subbasln "RHF" Results for Run "RHF 1 0Oyr 12hr"
l r 0.10
'2 i0 .20 a. Q)
o 0.30
040
800
700
600
500
~ 400
~ 300 u::
200
100
0 12:00 0000 12:00
24Aug2014 I 25Aug2014 L<Qend (Compute Trne: 19Nov2014, 17: 14:27)
- Run:RHF 1 O()yr 12hr ElementRHF Result Precipitation
- Run:RHF 100yr 12hr ElementRHF Result:Precipitation Loss
- Run: RHF 1 O()yr 12hr Element RHF Result: Outflow
--- Run:RHF 100yr 12hr ElementRHF ResultBaseflow
00:00
I 120
26Aug2014
Figure 4. Precipitation and peak flow for 100-yr 12-hr storm .
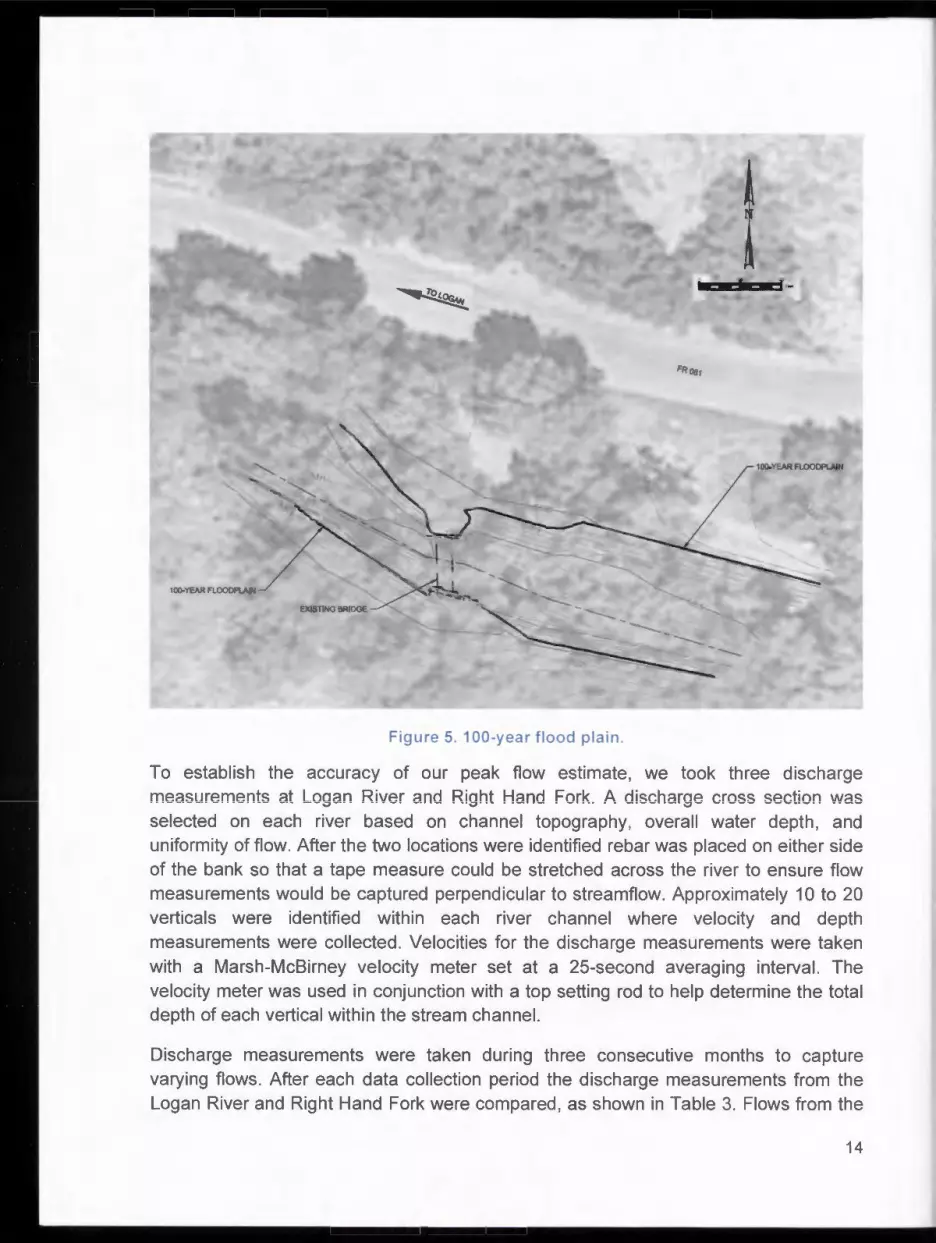
We next determined the flood plain resulting from a peak flow of 710 cfs. We created a model in HEC-RAS to simulate the peak flow in the streambed . For this model , we ran a steady state simulation . An unsteady state simulation may be more accurate for this project, but due to the lack of experience this was not feasible . The resulting flood plain can be seen in Figure 5.
13
1 "'EAR FlOOOPLAIN
IIJC>YEAR FLOOOPI.AlN
Figure 5. 100-year flood plain .
To establish the accuracy of our peak flow estimate , we took three discharge measurements at Logan River and Right Hand Fork. A discharge cross section was selected on each river based on channel topography , overall water depth , and uniformity of flow . After the two locations were identified rebar was placed on either side of the bank so that a tape measure could be stretched across the river to ensure flow measurements would be captured perpendicular to streamflow . Approximately 10 to 20 verticals were identified within each river channel where velocity and depth measurements were collected. Velocities for the discharge measurements were taken with a Marsh-McBirney velocity meter set at a 25-second averaging interval. The velocity meter was used in conjunction with a top setting rod to help determine the total depth of each vertical within the stream channel.
Discharge measurements were taken during three consecutive months to capture varying flows . After each data collection period the discharge measurements from the Logan River and Right Hand Fork were compared , as shown in Table 3. Flows from the
14
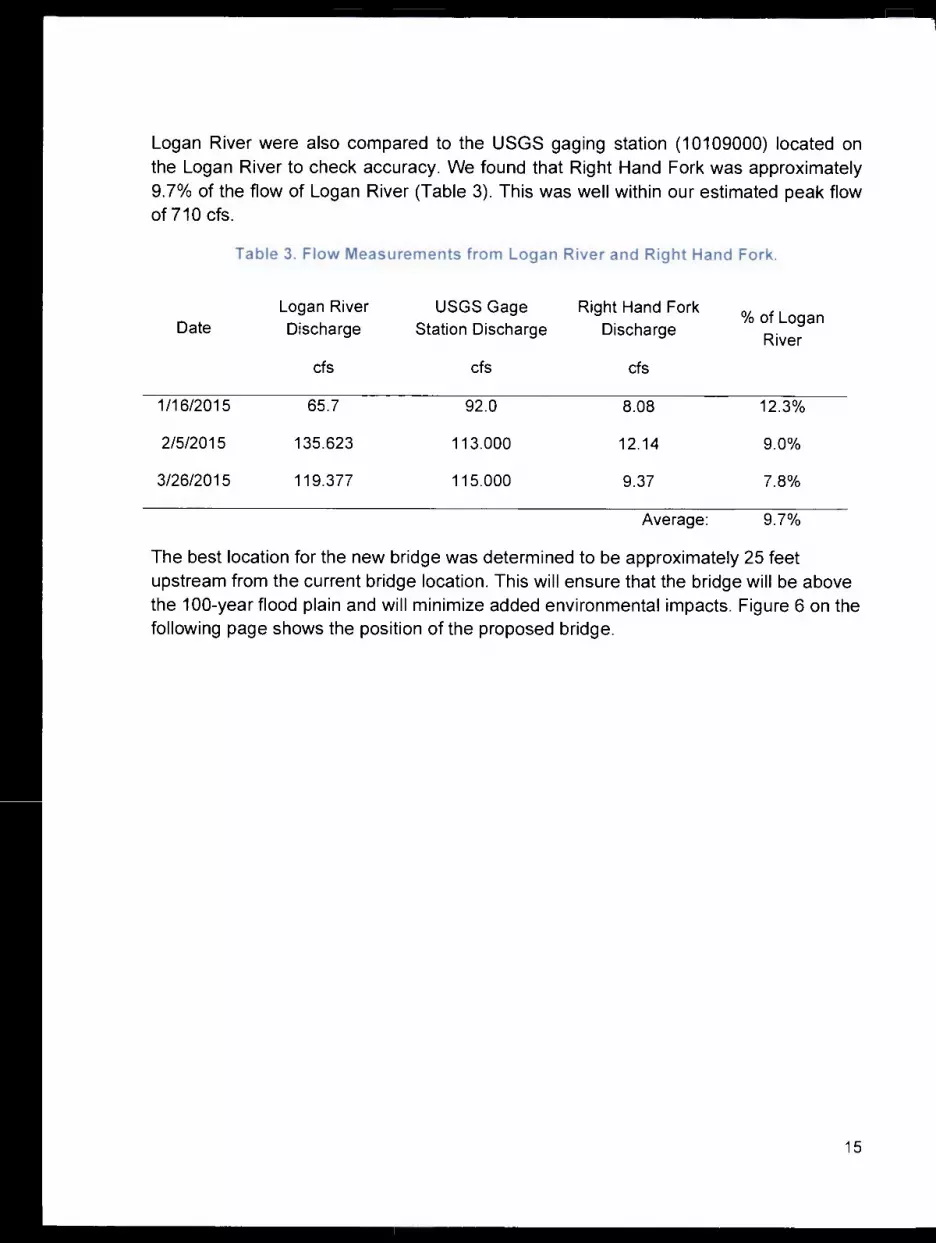
Logan River were also compared to the USGS gaging station (10109000) located on the Logan River to check accuracy . We found that Right Hand Fork was approximately 9.7% of the flow of Logan River (Table 3). This was well within our estimated peak flow of 710 cfs.
Date
1/16/2015
2/5/2015
3/26/2015
Table 3. Flow Measurements from Logan River and Right Hand Fork .
Logan River USGS Gage Discharge Station Discharge
cfs cfs
65.7 92.0
135.623 113.000
119.377 115.000
Right Hand Fork Discharge
cfs
8.08
12.14
9.37
Average :
%of Logan River
12.3%
9.0%
7.8%
9.7%
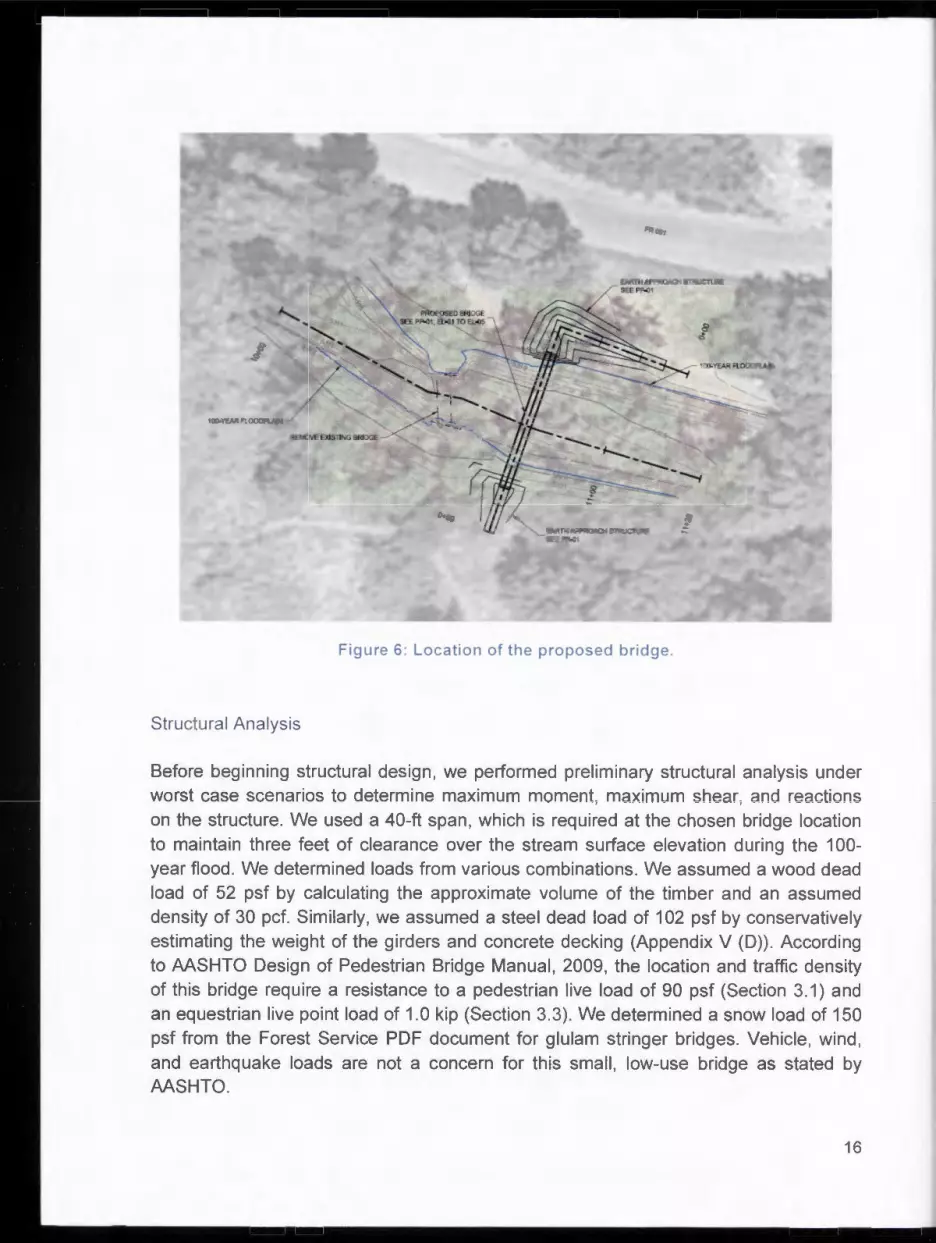
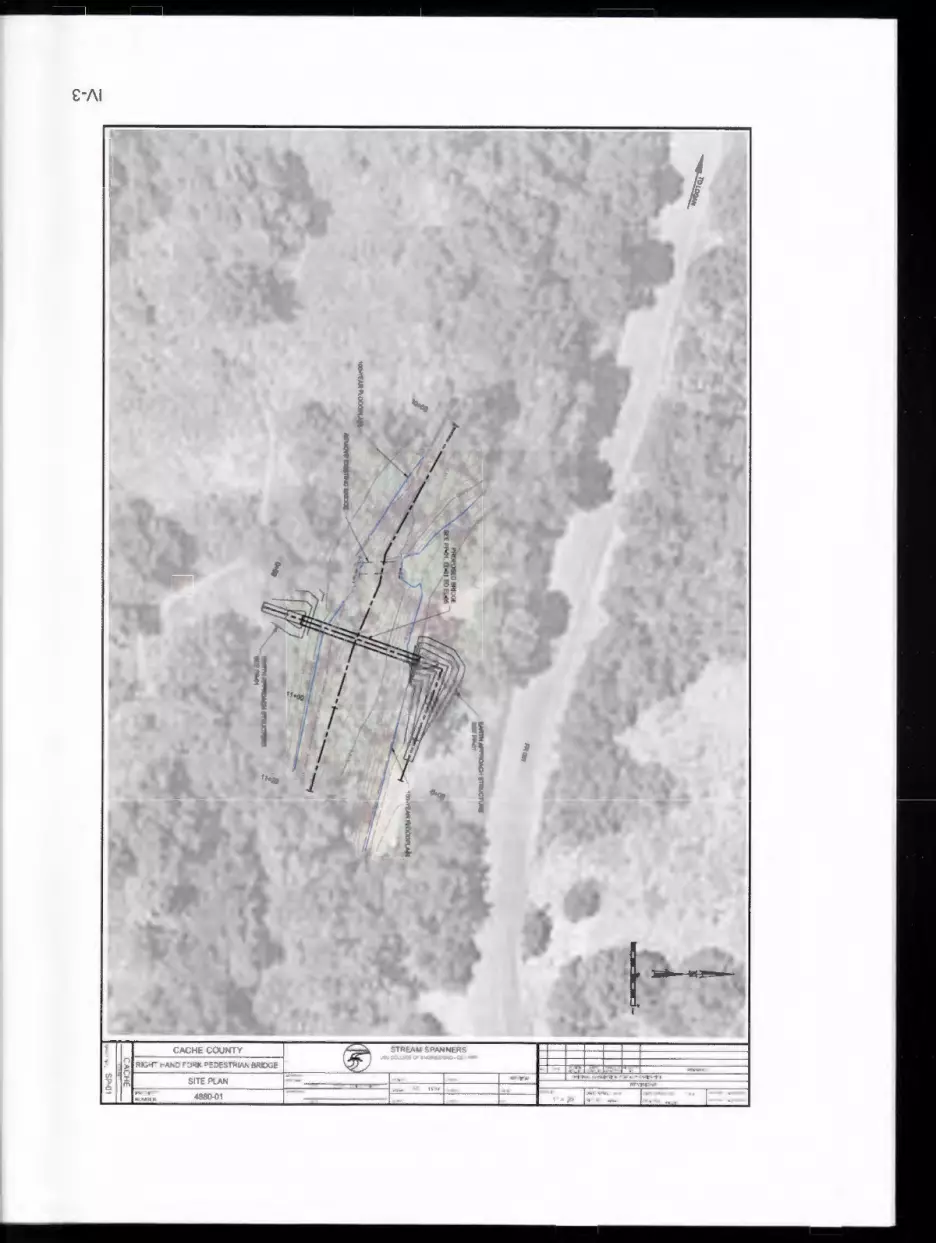
The best location for the new bridge was determined to be approximately 25 feet upstream from the current bridge location . This will ensure that the bridge will be above the 100-year flood plain and will minimize added environmental impacts . Figure 6 on the following page shows the position of the proposed bridge.
15
' 'l'tAR
Figure 6: Location of the proposed bridge .
Structural Analysis
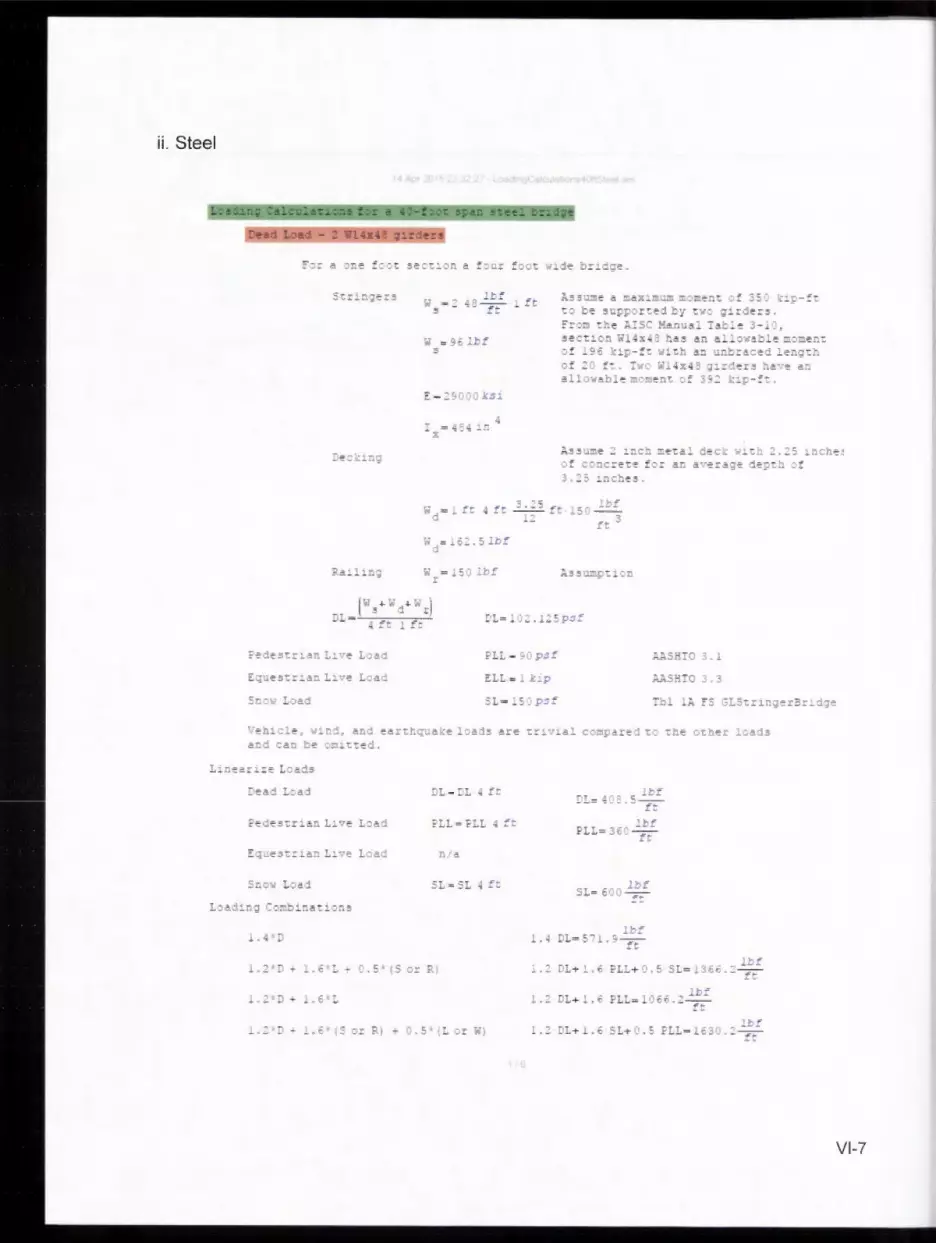
Before beginning structural design , we performed preliminary structural analysis under worst case scenarios to determine maximum moment , maximum shear , and reactions on the structure . We used a 40-ft span, which is required at the chosen bridge location to maintain three feet of clearance over the stream surface elevation during the 100-year flood. We determined loads from various combinations. We assumed a wood dead load of 52 psf by calculating the approximate volume of the timber and an assumed density of 30 pcf. Similarly, we assumed a steel dead load of 102 psf by conservatively estimating the weight of the girders and concrete decking (Appendix V (D)). According to AASHTO Design of Pedestrian Bridge Manual , 2009, the location and traffic density of this bridge require a resistance to a pedestrian live load of 90 psf (Section 3.1) and an equestrian live point load of 1.0 kip (Section 3.3). We determined a snow load of 150 psf from the Forest Service PDF document for glulam stringer bridges . Vehicle, wind , and earthquake loads are not a concern for this small, low-use bridge as stated by AASHTO .
16
With these loads determined, we used LRFD loading combinations to find maximum bending moments and shear to identify the approximate member sizes required for the span used in design . Shear and moment diagrams and tabulated shear and moment diagrams are located in Appendix II (D).
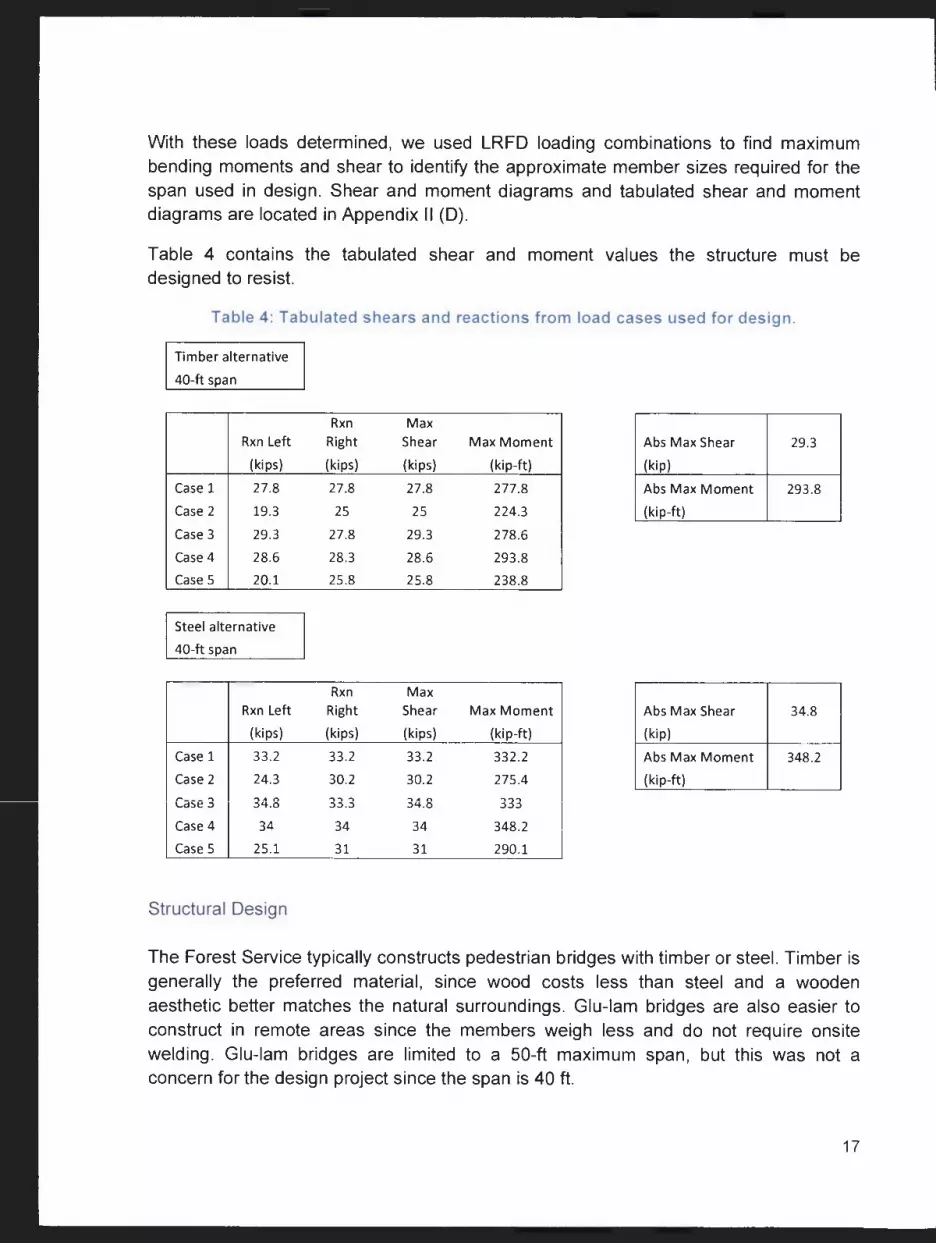
Table 4 contains the tabulated shear and moment values the structure must be designed to resist.
Table 4 : Tabulated shears and reactions from load cases used for design .
Timber alternative
40-ft span
Rxn Left
(kips)
Case 1 27.8
Case 2 19.3
Case 3 29.3
Case 4 28.6
Case 5 20.1
Steel alternative
40-ft span
Rxn Left
(kips)
Case 1 33 .2
Case 2 24.3
r"'---.., 34.8 \...d:.t: :>
Case 4 34
Case 5 25.1
Structural Design
Rxn Right
(kips)
27.8
25
27.8
28.3
25.8
Rxn Right
(kips)
33.2
30.2 ...... :>:>. :>
34
31
Max Shear Max Moment Abs Max Shear 29.3
(kips) (kip-ft) (kip)
27.8 277 .8 Abs Max Moment 293.8
25 224 .3 (kip-ft)
29.3 278 .6
28.6 293 .8
25.8 238 .8
Max Shear Max Moment Abs Max Shear 34.8
(kips) (kip-ft) (kip)
33.2 332 .2 Abs Max Moment 348 .2
30.2 275 .4 (kip-ft) -, A 0 333 :><+.O
34 348 .2
31 290 .1
The Forest Service typically constructs pedestrian bridges with timber or steel. Timber is generally the preferred material, since wood costs less than steel and a wooden aesthetic better matches the natural surroundings. Glu-lam bridges are also easier to construct in remote areas since the members weigh less and do not require onsite welding . Glu-lam bridges are limited to a 50-ft maximum span, but this was not a concern for the design project since the span is 40 ft.
17
We independently prepared a steel bridge alternative and a wood bridge alternative and compared the resulting costs .
Steel Design
Refer to construction drawings in Appendix V.
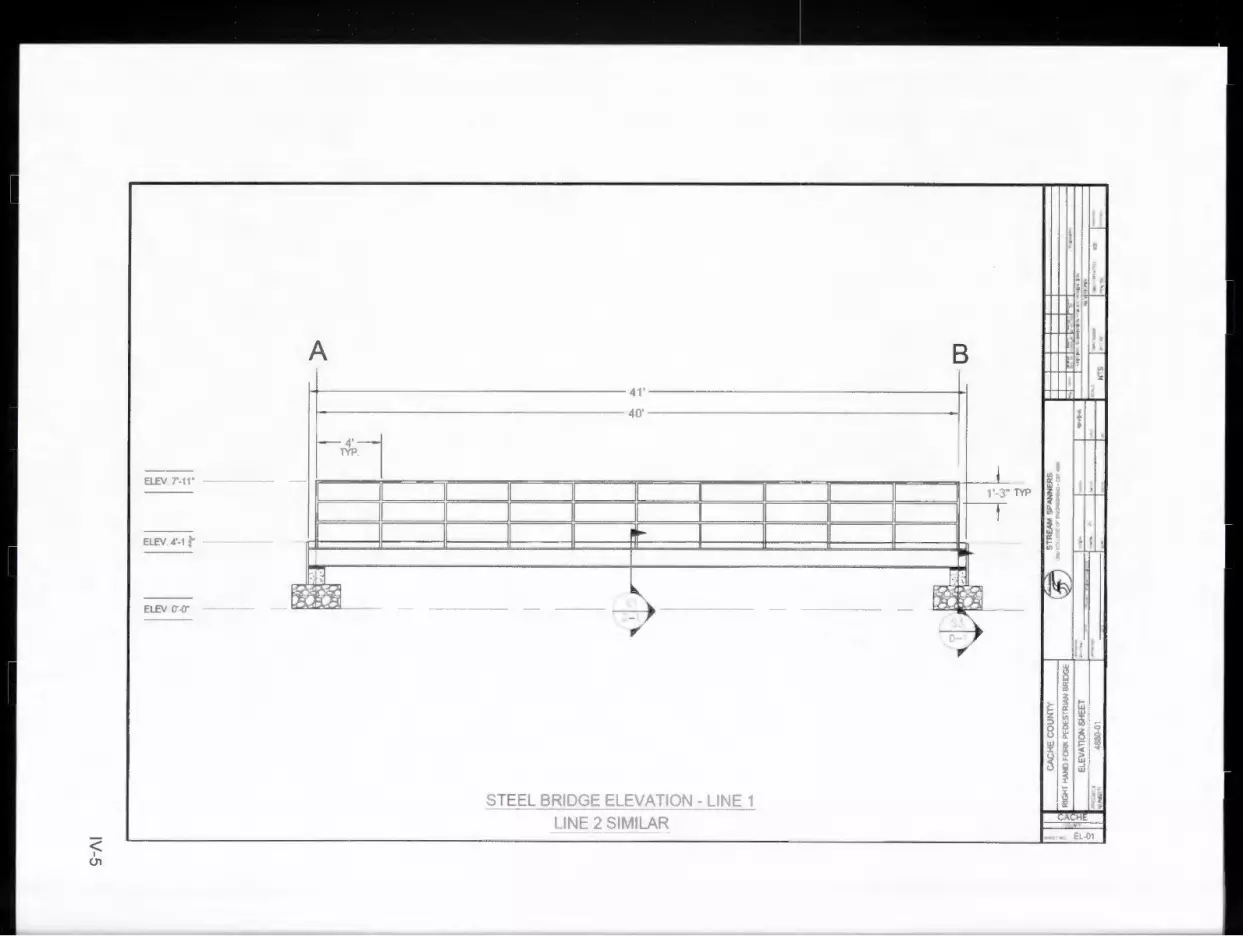
We used the American Institute of Steel Construction (AISC) Manual as a guide for ou r design guideline for the steel bridge. We first completed the girder design by selecting an adequate member to resist the required moment from Table 3-10 in the AISC Manual. We then verified the adequacy of the shear capacity using the AISC Specification Chapter G equations. Finally , we checked deflections to satisfy serviceability limit states. According to AASHTO regulation for pedestrian bridges , the maximum deflection due to live loads cannot exceed U360 where L is the span length (Dead + live load limit states are not required for pedestrian bridges) . After iterating through several sections , we determined two W14x61 girders are adequate for the bridge with a single brace at the mid-span (See Appendix V(E.ii)) .
Next , we designed the handrails . According to Forest Service guidelines , a pedestrian only use bridge must have a 42-inch high handrail , which must also be able to withstand a 200 lb lateral point load and support a distributed load of 50 lb/ft along the entire length of the structure . The handrail must also have a vertical bar spacing of no more than 19 inches. We designed a vertical handrail support post every 4 feet and a vertical spacing of 15 inches for horizontal members . The bars are to be A36 steel , 1" diameter , and 0.25" thickness. Since the loading is perpendicular to the welding axis Chapter J of the AISC Specification allows a 50% increase in capacity . We checked tensile capacity of the base material and the strength of weld and determine a ¼" fillet weld is adequate (See Appendix V(E.ii) .
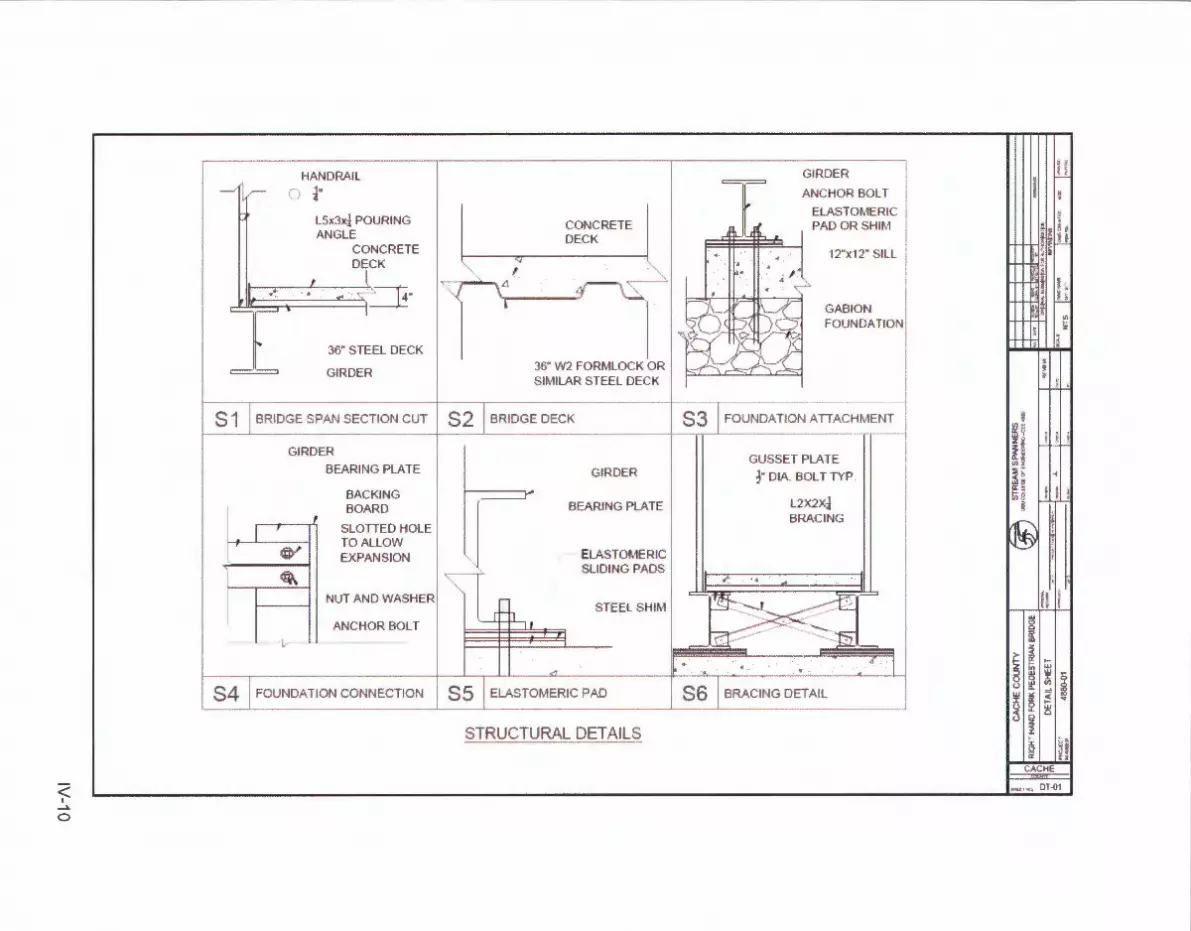
The vv1alking surface shall consist of a 2" metal deck vvith 2" of concrete for a 4" equivalent depth slab. The slab will be longitudinally flanked by two L5x3x1/4 " angles to contain the concrete when poured .
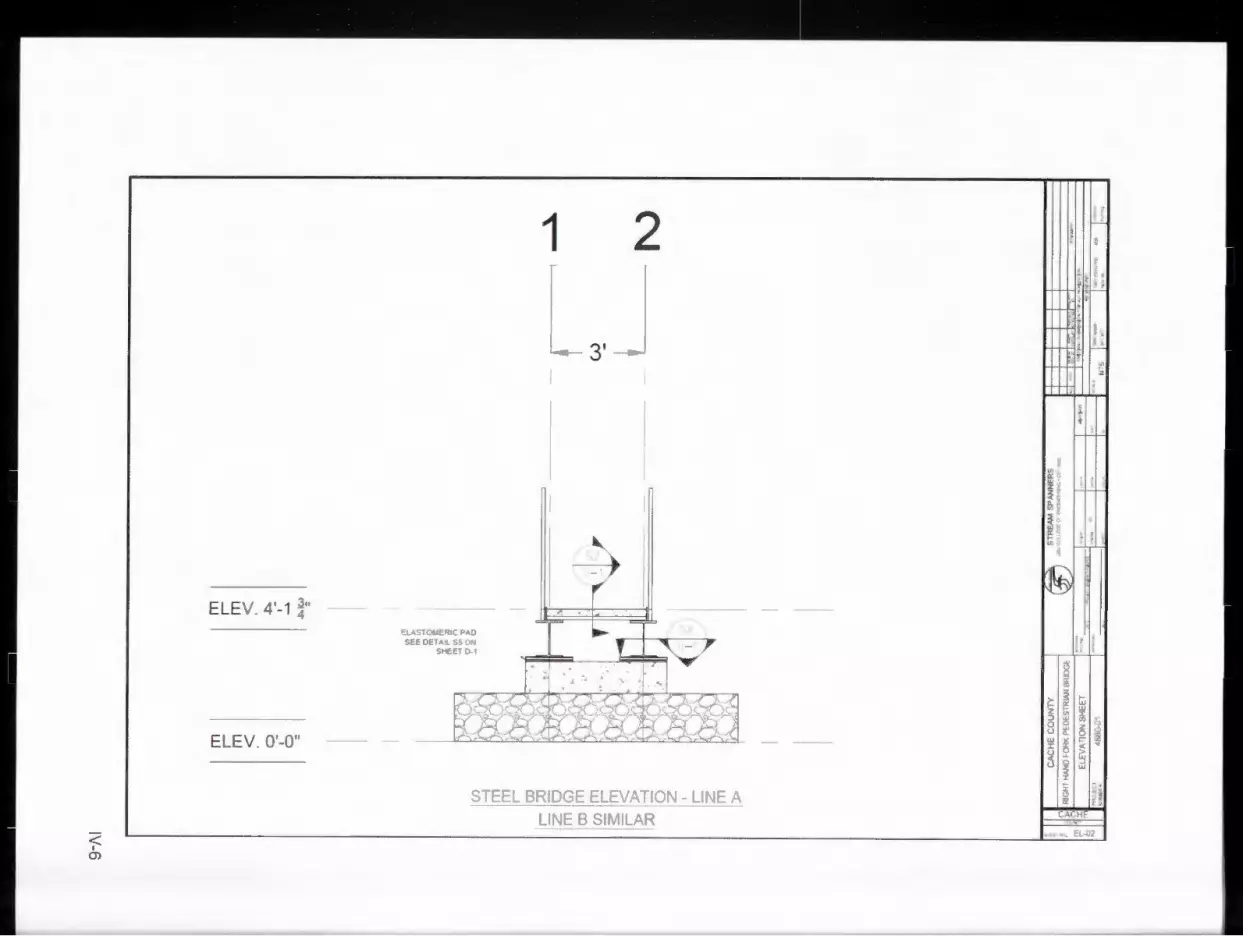
We accounted for axial thermal expansion of the steel girders by designing elastomeric pads to support the girder at one end. We used a 50-durometer Elastomeric Isolator system by Kinetics Noise Control. First , we determined the extent of thermal expansion/contraction expected from temperature variation , which we calculated using the coefficient of thermal expansion of steel. With a maximum temperature differential of 80°F from room temperature , we calculated a deflection of 0.257 in. Using two ¼" thick elastomeric pads separated by a steel shim allows for 0.3 in of lateral movement. We next checked the allowable vertical bearing pressure on the pads. To avoid exceeding the allowable pressure , we specified that each girder must bear on an A36 steel plate of
18
dimensions 12"x18"x1 /4", which will rest directly on top of the elastomeric pads . (See Appendix V(E.ii)).
Wood Design
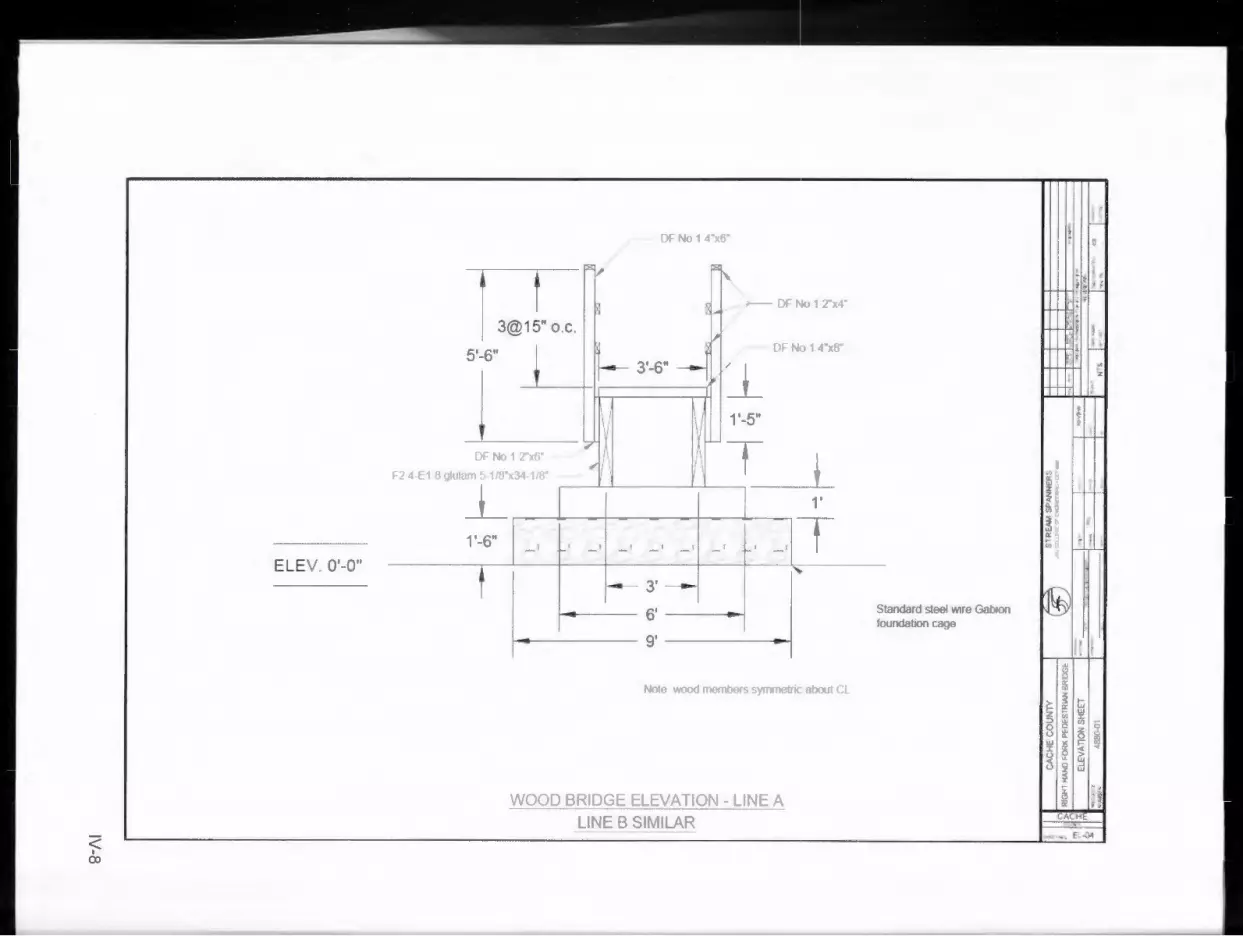
Refer to construction drawings in Appendix V.
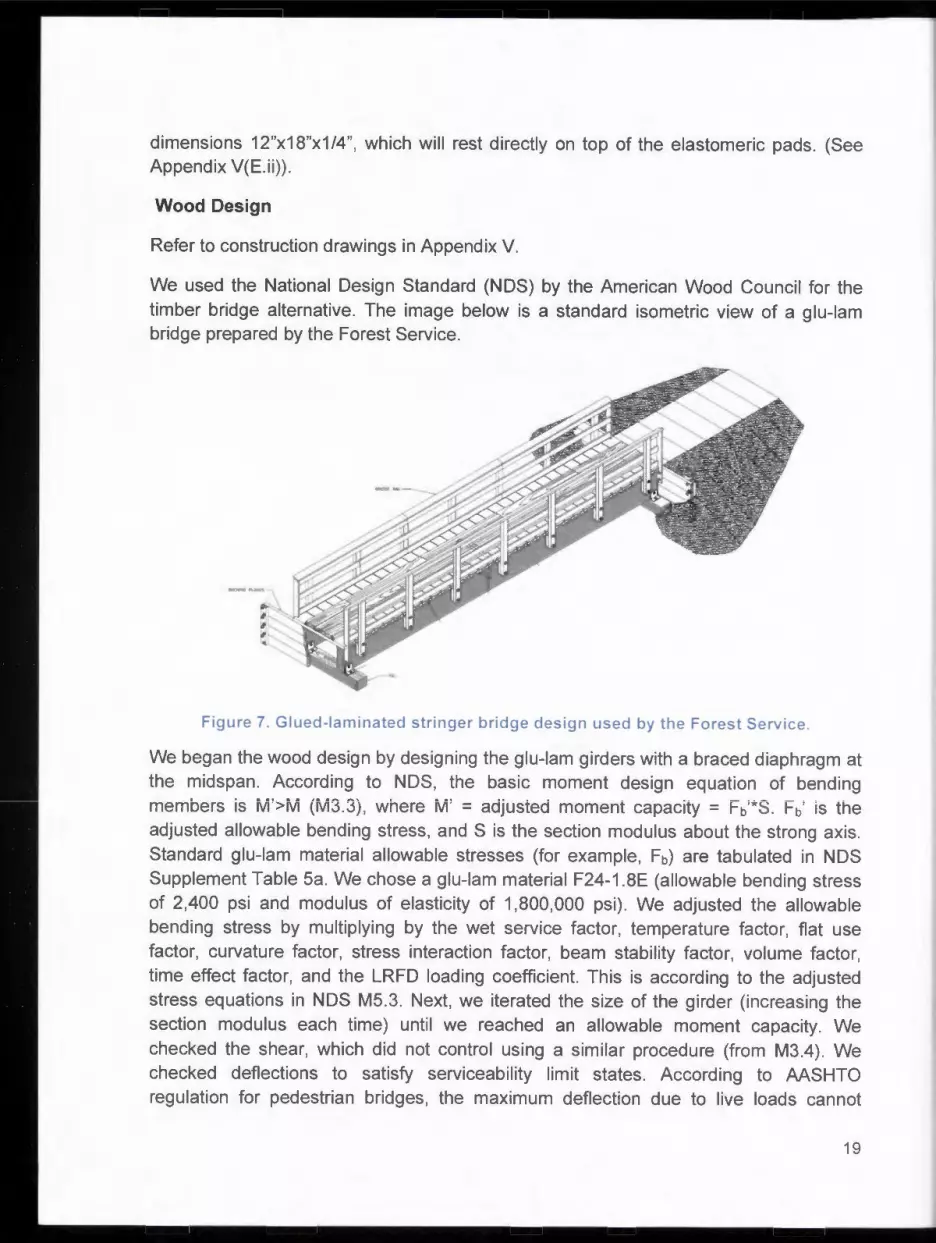
We used the National Design Standard (NOS) by the American Wood Council for the timber bridge alternative. The image below is a standard isometric view of a glu-lam bridge prepared by the Forest Service .
Figure 7. Glued-laminated stringer bridge design used by the Forest Service .
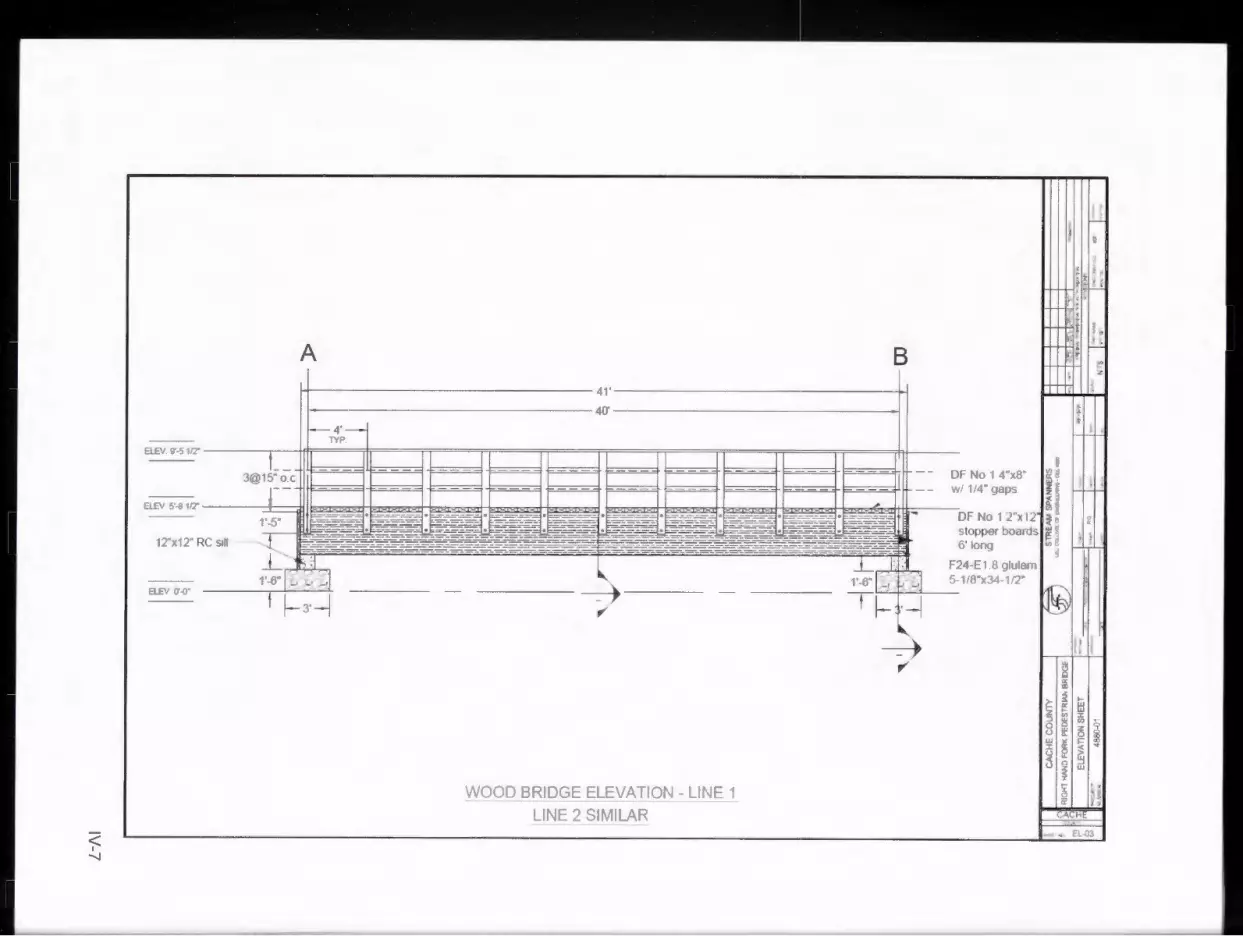
We began the wood design by designing the glu-lam girders with a braced diaphragm at the midspan . According to NOS, the basic moment design equation of bending members is ivi'>ivi (ivi3.3), where M' = adjusted moment capacity = Fb'*S . Fb' is the adjusted allowable bending stress, and S is the section modulus about the strong axis . Standard glu-lam material allowable stresses (for example , Fb) are tabulated in NOS Supplement Table 5a. We chose a glu-lam material F24-1.8E (allowable bending stress of 2,400 psi and modulus of elasticity of 1,800,000 psi) . We adjusted the allowable bending stress by multiplying by the wet service factor, temperature factor, flat use factor, curvature factor , stress interaction factor, beam stability factor, volume factor , time effect factor, and the LRFD loading coefficient. This is according to the adjusted stress equations in NOS M5.3 . Next, we iterated the size of the girder (increasing the section modulus each time) until we reached an allowable moment capacity. We checked the shear, which did not control using a similar procedure (from M3.4) . We checked deflections to satisfy serviceability limit states . According to AASHTO regulation for pedestrian bridges , the maximum deflection due to live loads cannot
19
exceed U360 (Dead + live load limit states are not required for pedestrian bridges) . Finally, we checked for allowable bearing stress of the girders at the support . We determined that two 5-1/8x34-1/2" F2.4-1.8E glu-lam girders are adequate from the bridge (See Appendix V(Ei)).
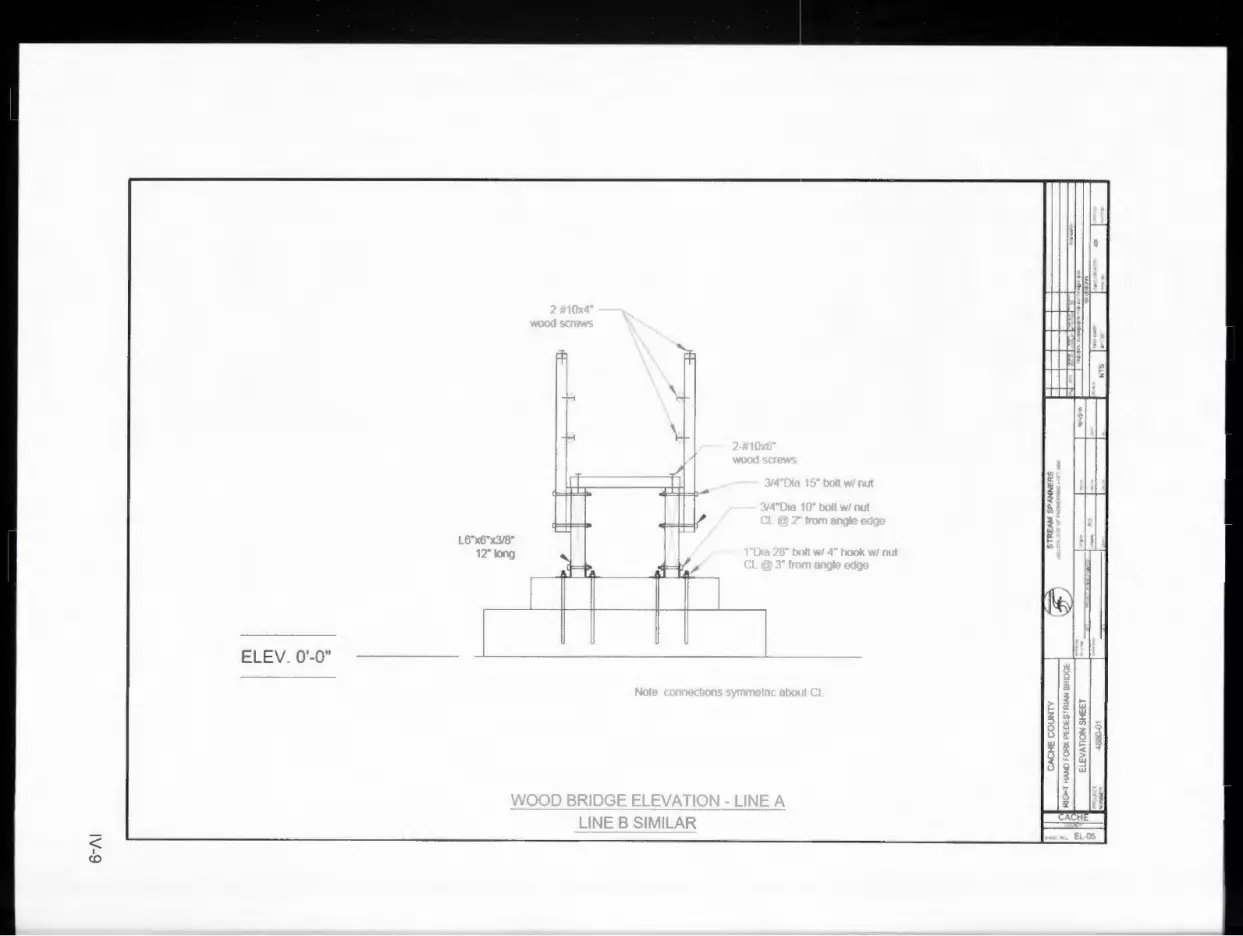
Next, we designed the timber handrails from rough sawn lumber. We used the same lateral loading as specified in the steel design: a point load of 200 lb or a distributed load of 50 lb/ft. We used the same spacing as the steel bridge: vertical posts at 4' on center , horizontal posts at 15" on center . The design considerations were similar to the girder design ; we adjusted tabulated allowable bending and shear stresses (NOS Supplement Table 4A) for usage conditions and compared the resulting shear and moment capacities to the design shear and moments. We determined 4"x6" rough sawn posts connected normal to the weak axis are adequate (See Appendix V(Ei)).
The deck is to consist of 3'-6" long 4"x8" rough sawn members attached directly to the glu-lam girders perpendicular to the length of span with ¼" gaps between each member.
The handrail and decking connections support negligible load compared to the capacity of the fasteners we designed , so we did not perform detailed calculations for the bolts and wood screws . Each vertical handrail post is connected to the girder with two ¾"-16" long bolts separate from the girder by a 2"x6" block. The horizontal handrail components and the decking members are attached with #1 0x4" wood screws or #1 0x6" wood screws depending on the width of the side member .
Cost Analysis
The total material cost of the steel alternative (excluding foundations , earthwork , and construction costs) is $9,420 .64. The wood alternative was less expensive at $7,173.05.
Foundation Design
Refer to construction drawings in Appendix V.
We next designed the foundation for the bridge. The soil had to be analyzed to find the allowable soil bearing pressure . We were unable to perform a triaxial shear test to determine soil strength , but we assumed a sandy soil with a friction angle of 35° and no cohesion , according to local soil conditions . We performed a bearing capacity analysis using the "Bearing Capacity of Foundations on Top of a Slope" method described in 4.6 of Principles of Foundation Engineering (Seventh Edition) by Braja Das. We used this technique since the pads will sit near the top of the river banks.
We found the bearing capacity of the soil using a method for continuous foundations on top of a slope to be 2,960 psf for the critical side (side opposite the road). The
20
dimensions of the footing are 9 ft by 3 ft , which we approximate as continuous . Continuous footings can only displace loads in the perpendicular direction , but a square or rectangular footing can displace loads in all directions and therefore would have more capacity than a continuous footing . This makes the analysis of a 9 ft by 3 ft rectangular pad conservative and acceptable . We used conservative soil properties described above to find a bearing capacity . We used the buoyant unit weight of the soil to simulate the water table at the base of the foundation which occurs during flooding . With these conservative assumptions, we obtained an acceptable ultimate bearing pressure factor of safety of 2.2, comparing the soil's bearing capacity to pressure due to the maximum footing reaction from loading the bridge (See Appendix V(F)) . We plan to use a standard Gabion foundation which uses a steel wire cage filled with stone cobbles . A 12"x12" concrete sill beam will sit on top of each foundation pad, and the girders will bear on and connect to the concrete sill. This inexpensive and easy-to -construct alternative will cost $950 for both foundation pads .
We also designed an earth approach structure for the bridge to satisfy ABA accessibility standards . The bridge must be wheel chair assessable , with no approach slope exceeding 12: 1. The required slope on the roadway side of the bridge is 42 ', which is too long for a straight slope , so we designed a 90° bend in the earthworks to provide the needed ramp length . The soil must be well compacted , and natural grass will be permitted to grow on the side slopes to reduce erosion. We estimate that 39 yd"3 of earth fill will be needed to construct the ramp , costing approximately $2,100.
Selected Alternative and Design Cost
We selected a timber alternative for the bridge at Right Hand Fork for three primary reasons .
1. Cost - The timber alternative costs $7,173.05, which is significantly less than the steel alternative cost at $9,420.64 .
2. Ease of construction - The timber bridge will be easier to construct since the materials are lighter weight and easier to move to semi-inaccessible locations. Wood does not require any difficult onsite welding or a waiting time for concrete to cure.
3. Aesthetics - The natural finish of a timber bridge better matches the natural aesthetic desired by the Forest Service in remote locations .
The costs of the individual components are listed below. A more detailed cost estimate is located in Appendix V(B).
21
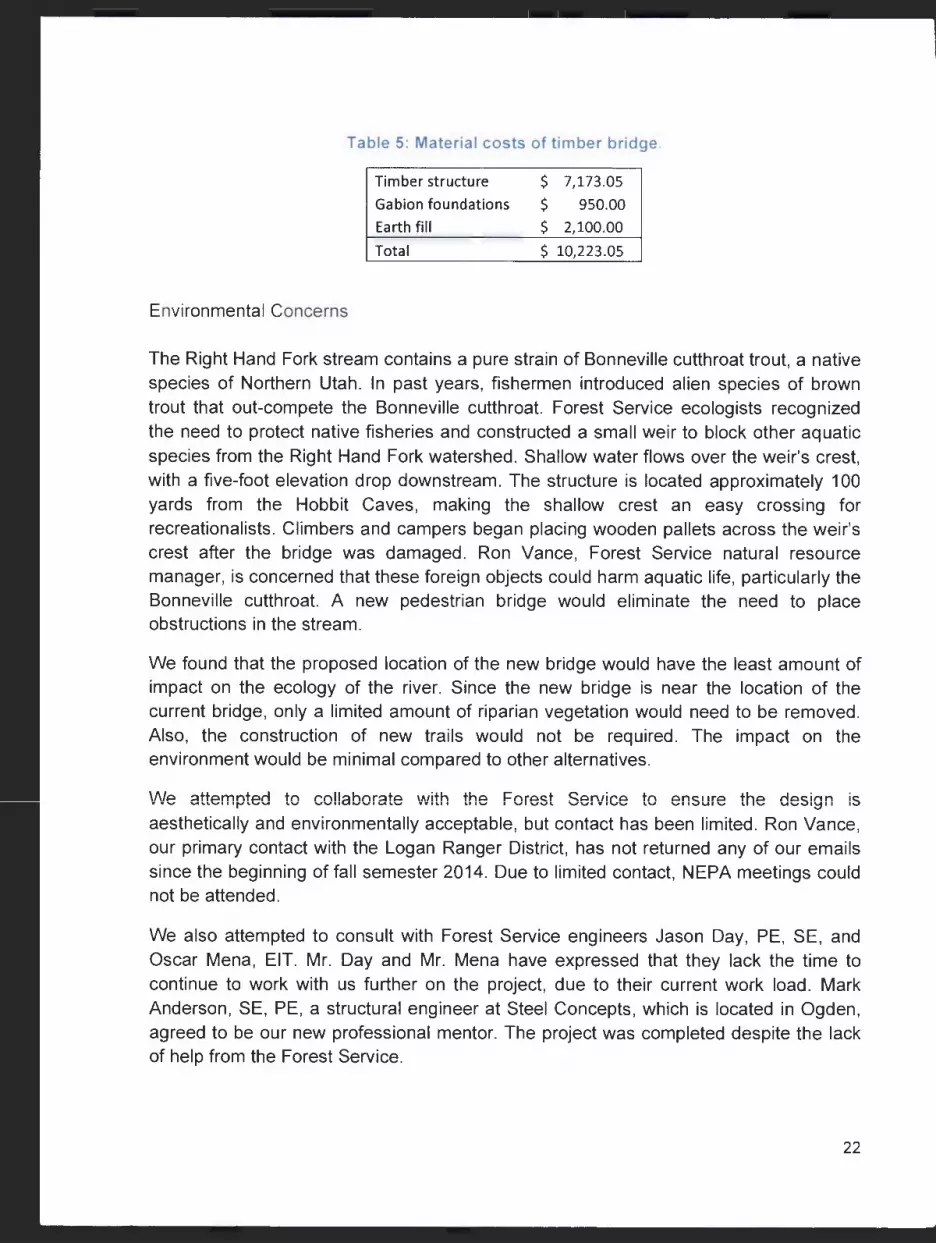
Table 5: Material costs of timber bridge .
Environmental Concerns
Timber structure
Gabion foundations
Earth fill
Total
$ 7,173.05
$ 950 .00
$ 2,100.00
$ 10,223 .05
The Right Hand Fork stream contains a pure strain of Bonneville cutthroat trout, a native species of Northern Utah. In past years, fishermen introduced alien species of brown trout that out-compete the Bonneville cutthroat. Forest Service ecologists recognized the need to protect native fisheries and constructed a small weir to block other aquatic species from the Right Hand Fork watershed. Shallow water flows over the weir's crest , with a five-foot elevation drop downstream . The structure is located approximately 100 yards from the Hobbit Caves , making the shallow crest an easy crossing for recreationalists . Climbers and campers began placing wooden pallets across the weir 's crest after the bridge was damaged . Ron Vance, Forest Service natural resource manager , is concerned that these foreign objects could harm aquatic life, particularly the Bonneville cutthroat. A new pedestrian bridge would eliminate the need to place obstructions in the stream .
We found that the proposed location of the new bridge would have the least amount of impact on the ecology of the river . Since the new bridge is near the location of the current bridge, only a limited amount of riparian vegetation would need to be removed . Also , the construction of new trails would not be required. The impact on the environment would be minimal compared to other alternatives .
\/Ve attempted to collaborate \111ith the Forest Service to ensure the design is aesthetically and environmentally acceptable , but contact has been limited. Ron Vance , our primary contact with the Logan Ranger District, has not returned any of our emails since the beginning of fall semester 2014. Due to limited contact , NEPA meetings could not be attended.
We also attempted to consult with Forest Service engineers Jason Day, PE, SE, and Oscar Mena, EIT. Mr. Day and Mr. Mena have expressed that they lack the time to continue to work with us further on the project , due to their current work load. Mark Anderson , SE, PE, a structural engineer at Steel Concepts , which is located in Ogden , agreed to be our new professional mentor . The project was completed despite the lack of help from the Forest Service .
22

EVALUATION
The Right Hand Fork trail bridge will be built due to the failure of the previous bridge. We are using appropriate LRFD and AASHTO design codes to design a more sustainable structure than the current bridge . All design work and surveys will be subject to evaluations. The evaluations include:
• Purchase of proper materials to guarantee that the new bridge can withstand weather conditions .
• Maximum recorded flow rates of the Right Hand Fork creek to determine the height of the bridge span above the river .
• Appropriate location to provide easy access to the public and protection to the ecosystem. It is essential that the bridge be visible from the parking area so recreationalists can see it.
• Annual maintenance requirements for normal wear and tear .
Evaluations of the bridge design will be made by our team and the Forest Service . The bridge will have a 50-year design life.
BUDGET
TEAM EXPENSES
According the Internal Revenue System (IRS), the "standard mileage rates for the use of a car" shall be reimbursed at 56 cents per mile driven for business purposes. Therefore , the total travel reimbursement is currently $100 .80 (See Appendix 13.4). All equipment used for the project has been rented for free.
CONCLUSIONS
Right Hand Fork is a beautiful Forest Service area near Logan Canyon that draws crowds to recreational sites . The Hobbit Caves are a recreational site in Right Hand Fork, accessible by a pedestrian bridge, but flooding in 2011 damaged the bridge's abutments . Recreationalists now stack wooden pallets in the creek as an alternative access to the visibly damaged structure . We propose to construct a new bridge with a 50-year service life.
Right Hand Fork is home to the Bonneville cutthroat trout , which is on the Utah Sensitive Species list. Forest Service ecologists feel that it is important to protect the trout by reducing foreign objects (pallets , etc.) in the stream.
23

The proposed trail bridge project will greatly benefit the public using the area and the local wildlife . The structure will be safer than the current damaged bridge and provide wheelchair accessibility. A new bridge will also promote a positive image of the Forest Service, compared to the sagging bridge that currently spans the creek .
24

APPENDIX I: GANTT CHARTS
1-1
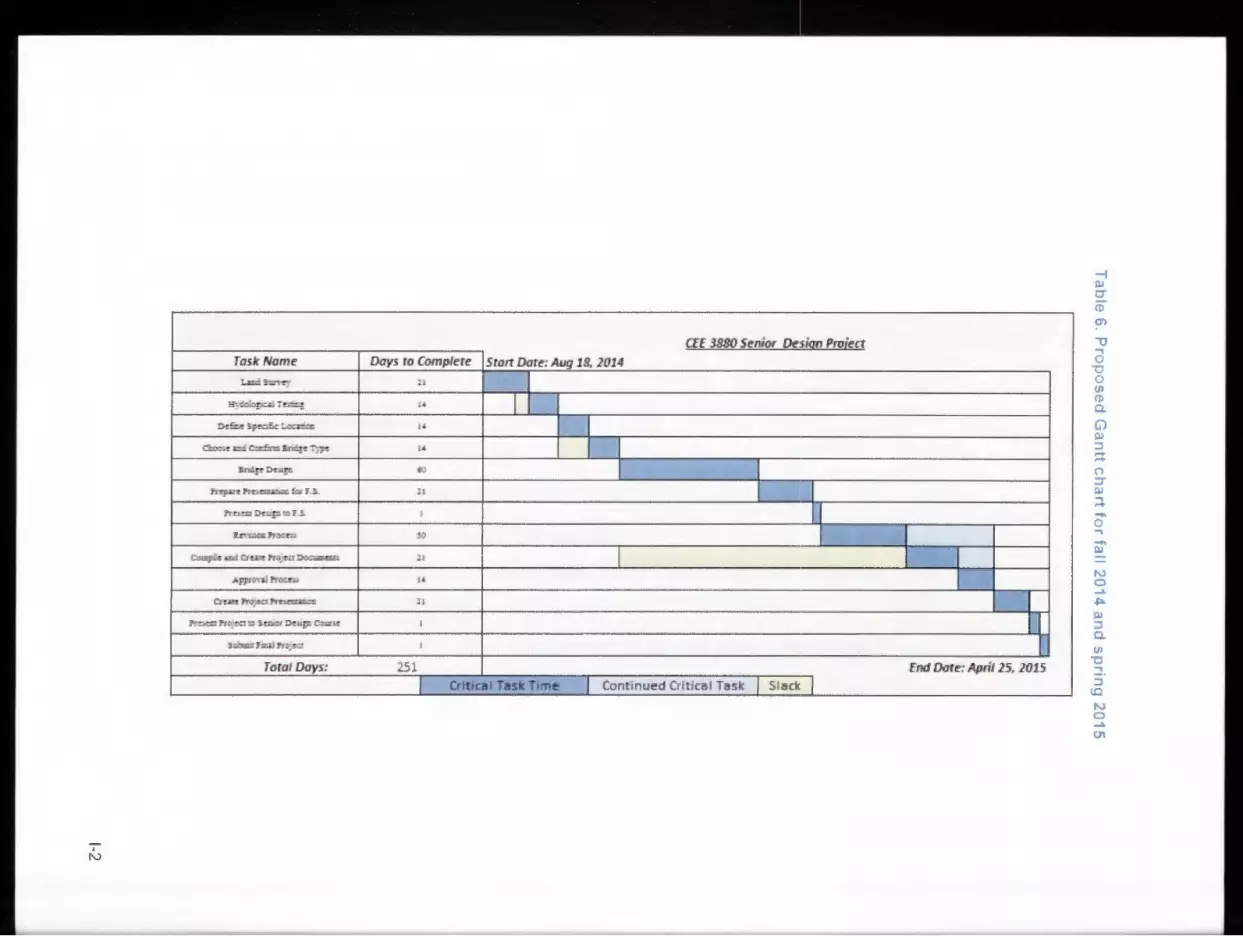
Task Name
Lw!I ''
R; ;>:' T~ _;
De&: spea& t.o:=
d,oo,. Clcmf:rm ;• ~r-
::E:rx:!;e o-~~
l'ropu • :Pro.= b T
1"I - !%: "0,-_;;j!Jl ~ T ~
I. Pro:m
ComJl:l• o~~ .,,~~=i I>oci:m:u:i
J..yyta..· :Pr .
er~ "~Pro;- :Pr~;~
,r~;::m J"ro;~~ •:, !,c, I>e.u;z, = · ~ J J'r~~.:J
Total Days:
I N
CEE 3880 Senior De:iign Project
Days to Complete Start Date: Aug 18, 2014
21 I 14 I I 14 I 14 I I ~, I I 21 I II I
:0
I I S4
I
I
I
251
I Critic a l Task Time I Cont inu e d Crit ica l Task I Slack
I I
End Date : Apri l 25, 2015
-i ni er (P
~ "'O .... 0 -0 0 C/l Cl) a. G) ni ::l --(') :T ni .... --0 .... -ni
"' 0 ..... .i:,.
ni ::l a. C/l -0 .... ::l
(0
"' 0 ..... 0,

I (.,J
September 014 October 014 ovember 2014
29 5 1 19 26 3 0 24 3 14
:and Survey
Create I utoC D Model
ydrologi al 1esting
December 2014 ,January 2015 February 2015
28 5 12 19 26 2 9 16 23 30 6 3 "
Senior 9es1gn Fall 2014
_,....__ De me Spec1 1c L~cation/Hydrology
Preliminary Design
Choose and Con 1rm Bridge Typ
Bridge Q sign
1
Continu7 Design
J Signed lnttrim Report Due to Dr t 1aguire
[;" Final lnte1nn Report Due in Clas~
-i llJ CT co ~
G) llJ ::::, ::: (')
::r llJ -, ...... -0 -, -llJ

January 2015 February 2015
29 5 12 19 26 2 9 16 23
I
A
March 2015 pril 2015 May 2015
2 9 16 23 30 6 13 20 2 4 11 18 25
7enior D sign Spring
Design
, S condary Flo; nalysis
Btge oe$ign I
Firali e D sign (Post Ht1dro Report)
Re is1on . recess
Project 01cumen ation
Create Prrsentation
Present I Final1 e tinal Report
Subml to d 1sors
~- ~ubmit ;
-I Q)
CT co 0)
G) Q)
::i ,-+ ,-+
n :,Q) -, ,-+ -0 -,
C/l "C -,
::i (D
"' 0 .... 0,

APPENDIX II: DATA
11-1

A. Watershed Characteristics Data
Point precipitation frequency estimates (inches)
NOAA Atlas 14 Volume 1 Version 5
Data type : Precipitation depth
Time series type : Partial duration
Project area : Southwest
Location name : Logan, Utah, US*
Station Name: -
Latitude : 41.7804°
Longitude : -111.6357°
Elevation: 5316 ft*
* source: Google Maps
PRECIPITATION FREQUENCY ESTIMATES
by duration for ARI: 1 2 5 10 25 so 100 200
5-min : 0.12 0.15 0.2 0.26 0.34 0.41 0.49 0.59 10-min : 0.18 0.23 0.31 0.39 0.51 0.62 0.75 0.9
15-min : 0.22 0.28 0.39 0.48 0.63 0.77 0.93 1.11 30-min : 0.3 0.38 0.52 0.65 0.85 1.03 1.25 1.49 60-min : 0.37 0.47 0.65 0.8 1.05 1.28 1.54 1.85 2-hr : 0 .48 0.61 0.8 0.97 1.24 1.49 1.78 2.12
3-hr: 0 .57 0.72 0.91 1.09 1.36 1.61 1.9 2.22 6-hr : 0.8 0.99 1.22 1.43 1.73 1.99 2.27 2.6
12-hr: 1.07 1.32 1.61 1.87 2.25 2.55 2.87 3.22 24-hr : 1.43 1.76 2.15 2.47 2.93 3.3 3.68 4.08
2-day : 1.7 2.1 2.55 2.94 3.48 3.91 4.37 4.84
3-day : 1.9 2.34 2.85 3.29 3.9 4.39 4.9 5.44 4-day : 2.09 2.58 3.16 3.65 4.33 4.87 5.44 6.04
7-day : 2.61 3.23 3.96 4.57 5.43 6.1 6.81 7.55
10-day : 2.99 3.7 4.54 5.22 6.15 6.87 7.62 8.39
20-day : 4 4.95 5.98 6.79 7.86 8.66 9.47 10.27
30-day : 4 .89 6.04 7.27 8.25 9.55 10.54 11.53 12.51 45-day : 6.17 7.6 9.06 10.2 11.69 12.79 13.89 14.96
60-day : 7.28 8.97 10.62 11.87 13.45 14.6 15.71 16.79
Date/time (GMT): Thu Sep 11 00:01 :20 2014
pyRunTime : 0.0587310791016
Figure 8. Watershed delineation from USGS Streamstats .
Table 9. Land Cover Type and Possible Curve Numbers Count Land Cover Type Percent Soil Cond Possible CN Soil Cond Possible CN Soil Cond Possible CN Soil Cond
179 Developed, Open Space 0 41682 Decid uous Forest 58 Fair-B 48 73 Fai r-C 57 Fair-C 10246 Evergreen Fore st 14 Fair -B 58 77 Fair-C 73 Fair -C
74 Mixed Fore st 0 20167 Shrub/Scrub 28 Fair -B 71 77 Fair-C 81 Fair -C
11 Herbaceuou s 0 19 Hay/Pa st u re 0 19 Woody Wetland s 0
Curve numbers were determined using Table 9-2 from chapter 9 in the National Engineering Handbook .
Table 10. Results of Soils Samples
Location
N w Soil Sample Soil Type
41.77987 111.63484 1 Silty Clay/Silty Clay loam
41.78009 111.62418 2 Sandy Loam
41.76808 111.62001 3 Loam/ sandy clay loam
41.77497 111.60947 4 Sandy Clay loam/Sandy loam
41.77331 111.60789 5 Sandy Clay/ Sandy Clay loam
Possible Cl\
57
73
63
11-3
The results from the soil samples were used to determine the hydrologic soil group and soil condition for the curve numbers .
Determining Soll Texture by the "Feel Method"
Place apprmrnately ere lalJle&poDn ci sea 11 palm. Alld wats a esq> at a i.oo and IUEad Ille Id ID break dcJMI al a~tes . SOI la at l1e proper coraslency 'Mll!fl ~ am ffllde, Ilka mcxst JUIY.
Doe& &01 remstn In a blll Wl91 squeezecJ7
YE
NO .
Place ball ar &Oii ~ ll'Uoo and~ . ger1ly pu&lllng l1e SOI wtltl lte tunt>, worttlg It upward lnlo a rbol. Fam a dbbon ii 1r1bm 111Cknl!s& and Wleltll. NIDW Ire l'llllml lo emerge Sid ellmd Offl' 1111! tcrennger, bleaklng llllln own wei!fL
Doe& Ire SCI tJnn a ltltllln7
YES
Does Ire set nae a weak rllbon 11!55 than 1'10ngbelllre trea01g7
~weta &ITIIIII pn:fl " &01 In pun or l18nd and rub wttt1 ltlretrlger .
Doe&h&Oll!el _., 1J111y7
NO
..... [E]OMf'( NO SANO
0 .1~- c·
NO
NO .
Does Ille SOIi malle a medUn l'llllml 1' ID 'Z' 10ngtJelbre~7
YES
8a!s&l\1llly we a &ITIIIII pn:11 or &OIi in palm or Ilana 111111 rut> wtltl !ore~ .
Doe& Ille SOIi feel --, 1J111Y7
NO
TH lln CS.lllllelllon C = COSISe MC = lillldEnmt, CDsn;e M =Mecl-F = Ane
Md d!y SOI ID 508k up --YES
1&11eao11toowen ..... ~ _______ .. 0 -~- L_J
NO • Does ll1e 9DI malle a stroog ltltXln T or longerllelllre ~1
YES
ED:8&&1W!fywela 5lll811 pn:fl 0( aol In pam ci nana 1n1 ru1> WIil llrallga' .
Doe& ll1e 5(ll feel very gr1tty7
NO
Doe&h&Cll!a _., &mOOll17
NO
Nelher grllllne55 nor &ITIODlllllB6& predlllnlnates .
Doe& the salt feel _., amootn7 ~~
0 ~1=-~ IG Does Ille 5(ll feel very smooll7
NO 1=-~ pn!dOllllnale&
S8nd Pllfllde size SlloLfd be estlmaled {'tely line , 11'1e, mec1-. coan;e) fllr lrle&e lexlur1!6. lnclMdllal grains ar ~ san1 are rn ¥1Slllle wlnOut rn8!J111C8Uon afll there Iii a grtly reeurg ID a WI)' small &affllll8 grtuld IJetween Ille 1eeln. sane 11'18 sand panldes may t>e )J5t 'IISl>te. Meclsafll parleles are easly ¥!slllle . EX3llple6 or~ Size~ wnae one Sile hi ~~ lh! sano, lllE liSR!y IDam, iiiooiy ~sand.
cay pen:mtage range.
~ tram: nwn, steven J., 1<a111as 5tlte unrventty, 1979 Jour. AQronomy ecrucatton.
11-4

B. HEC-HMS Data
Figure 9. Basin model for HEC-HMS model.
Table 11. Detailed Results from 24-hr Simulation of 100-yr 12-hr Storm
Date Time Precip Loss (IN) Excess Direct Flow Baseflow Total Flow (IN) (IN) (CFS) (CFS) (CFS)
24-Aug-14 12:00 0 40 40
24-Aug-14 12:30 0.04 0.04 0 0 40 40
24-Aug-14 13:00 0.04 0.04 0 0 40 40
24-Aug-14 13:30 0.05 0.05 0 0 40 40 '°'IA/\ .. -,4A 14:00 0.05 0.05 0 0 40 40 L't-MUy- I'+
24-Aug-14 14:30 0.05 0.05 0 0 40 40
24-Aug-14 15:00 0.06 0.06 0 0 40 40
24-Aug-14 15:30 0.05 0.05 0 0 40 40
24-Aug-14 16:00 0.06 0.06 0 0 40 40
24-Aug-14 16:30 0.07 0.07 0 0 40 40
24-Aug-14 17:00 0.06 0.06 0 0 40 40
24-Aug-14 17:30 0.11 0.11 0 0 40 40
24-Aug-14 18:00 0.33 0.33 0 0 40 40
24-Aug-14 18:30 1.04 0.88 0.16 27 .8 40 67.8
24-Aug-14 19:00 0.15 0.1 0.05 111.7 40 151.7
24-Aug-14 19:30 0.07 0.05 0.02 243.6 40 283 .6
24-Aug-14 20:00 0.08 0.05 0.03 392.4 40 432.4
11-5

24-Aug-14 20 :30 0.06 0.04 0.02 521.6 40 561 .6
24-Aug-14 21 :00 0.06 0.03 0.02 599.2 40 639.2
24-Aug-14 21:30 0.06 0.04 0.02 629 .9 40 669.9
24-Aug-14 22 :00 0.06 0.03 0.02 645.2 40 685 .2
24-Aug-14 22:30 0.05 0.03 0.02 656 .3 40 696 .3
24-Aug-14 23:00 0.05 0.03 0.02 664.5 40 704 .5
24-Aug-14 23:30 0.05 0.03 0.02 670 .2 40 710 .2
25-Aug-14 0:00 0.04 0.02 0.02 673 40 713
25-Aug-14 0:30 0 0 0 669 .3 40 709 .3
25-Aug-14 1 :00 0 0 0 654 .5 40 694 .5
25-Aug-14 1 :30 0 0 0 626 .2 40 666 .2
25-Aug-14 2:00 0 0 0 585.6 40 625 .6
25-Aug-14 2:30 0 0 0 537.4 40 577.4
25-Aug-14 3:00 0 0 0 488.4 40 528.4
25-Aug-14 3:30 0 0 0 443 .1 40 483.1
25-Aug-14 4:00 0 0 0 402 .1 40 442.1
25-Aug-14 4:30 0 0 0 364.9 40 404 .9
25-Aug-14 5:00 0 0 0 331.1 40 371.1
25-Aug-14 5:30 0 0 0 300.4 40 340.4
25-Aug-14 6:00 0 0 0 272 .6 40 312.6
25-Aug-14 6:30 0 0 0 247.4 40 287.4
25-Aug-14 7:00 0 0 0 224.5 40 264.5
25-Aug-14 7:30 0 0 0 203.7 40 243.7
25-Aug-14 8:00 0 0 0 184.8 40 224 .8
25-Aug-14 8:30 0 0 0 167.7 40 207 .7
25-Aug-14 9:00 0 0 0 152.2 40 192.2
25-Aug-14 9:30 0 0 0 138.1 40 178.1
25-Aug-14 10:00 0 0 0 125.3 40 165.3 "")C: /\,.,. "1 A 10:30 " " " 113.7 40 153.7 £;J-/"\U\:r I '-t u u u
25-Aug-14 11 :00 0 0 0 103.2 40 143.2
25-Aug-14 11 :30 0 0 0 93.6 40 133.6
25-Aug-14 12:00 0 0 0 85 40 125
C. HEC-RAS Data
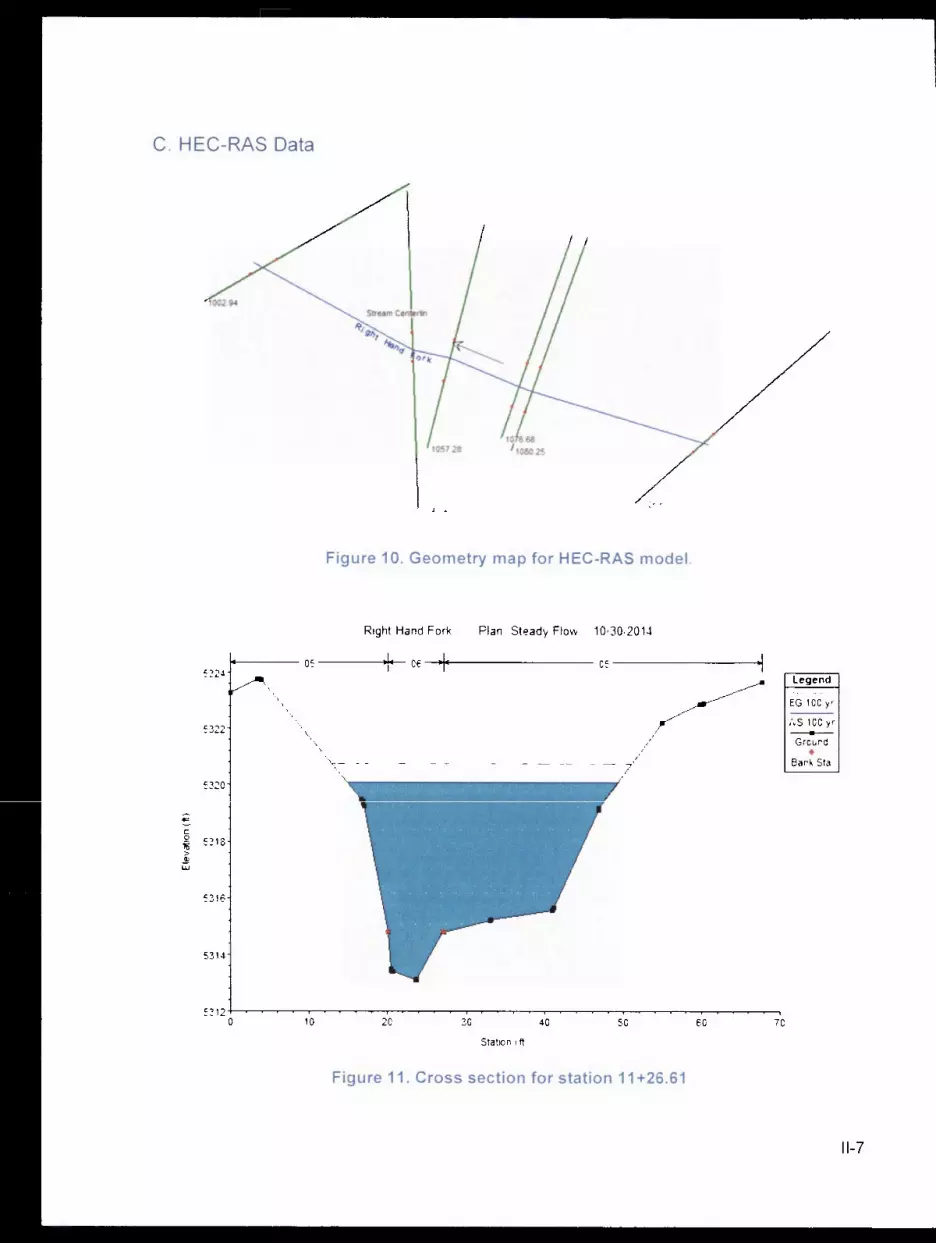
Figure 10. Geometry map for HEC-RAS model.
Right Hand Fork Plan Steady Flow 10/30/2014
1+---- 05 ----- os ----------- os --------~ 5324
5322
5320
e C 0 5318 15 > .!! UJ
5316
5314
5312+-~~~~~~~~-r-~~~~~~~~~~~~~-r-~~~~~~~~~
0 10 20 30 40 50 60 70
Statoon (ft)
Figure 11. Cross section for station 11 +26.61
Legend
EG 100yr
WS 100y r --+--Ground
• Bank Sta
11-7
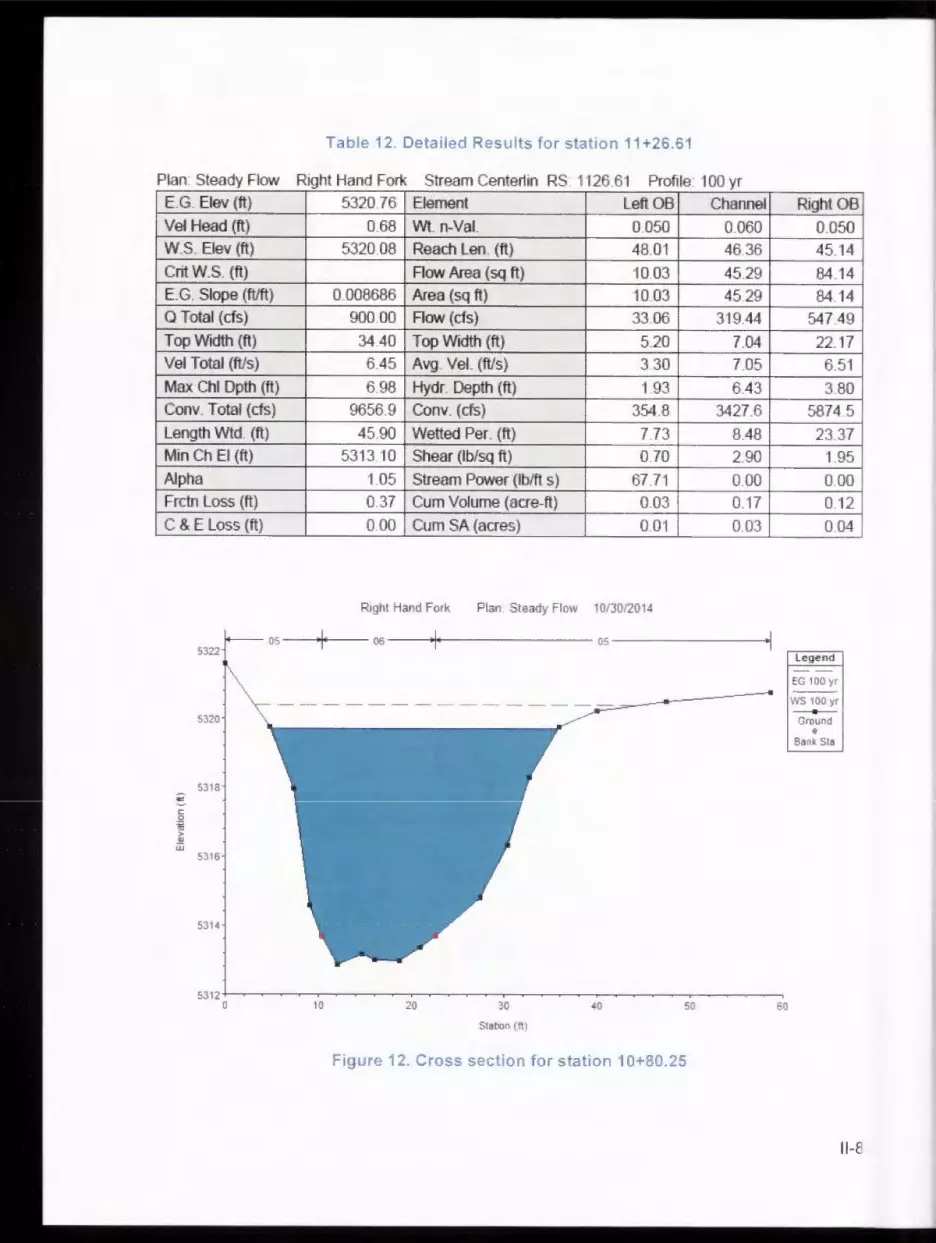
Table 12. Detailed Results for station 11 +26 .61
Plan: Steady Flow Right Hand Fork Stream Centertin RS. 1126.61 Profile: 100 yr E.G. Elev (ft) 5320.76 Element Left OB Channel Vel Head (ft) 0.68 Wt. n-Val. 0.050 0.060 W.S. Elev (ft) 5320.08 Reach Len. (ft) 48.01 46.36 CritW .S. (ft) Flow Area (sq ft) 10.03 45.29 E.G. Slope (ft/ft) 0.008686 Area (sq ft) 10.03 45.29 a Total (cfs) 900.00 Flow (cfs) 33.06 319.44 Top Width (ft) 34.40 Top Width (ft) 5.20 7.04 Vel Total (ft/s) 6.45 Avg. Vel. (ft/s) 3.30 7.05 Max Chi Dpth (ft) 6.98 Hydr. Depth (ft) 1.93 6.43 Conv. Total (cfs) 9656.9 Conv. (cfs) 354.8 3427.6 Length Wtd. (ft) 45.90 Wetted Per. (ft) 7.73 8.48 Min Ch El (ft) 5313.10 Shear (lb/sq ft) 0.70 2.90 Alpha 1.05 Stream Power (lb/ft s) 67.71 0.00 Frctn Loss (ft) 0.37 Cum Volume (acre-ft) 0.03 0.17 C & E Loss (ft) 0.00 Cum SA (acres) 0.01 0.03
Right Hand Fork Plan Steady Flow 10/30/2014
05 --1--- 00----------- 05 --------+1 5322
5320
5318
"" C 0
16 > .!! UJ
5316
5314
5312 +--~~---r--r---~.---.~---r--r---.--~~~---r--r---~,---,~---r----.---, 0 10 20 30
Stat10n (ft)
40 so
Figure 12. Cross section for station 10+80 .25
€0
Right OB
0.050 45.14
84.14 84.14
547.49
22.17 6.51
3.80 5874.5
23.37 1.95
0.00 012
0.04
Legend
EG 100 yr
WS 100 yr --+-Ground
• Bank Sta
11-8
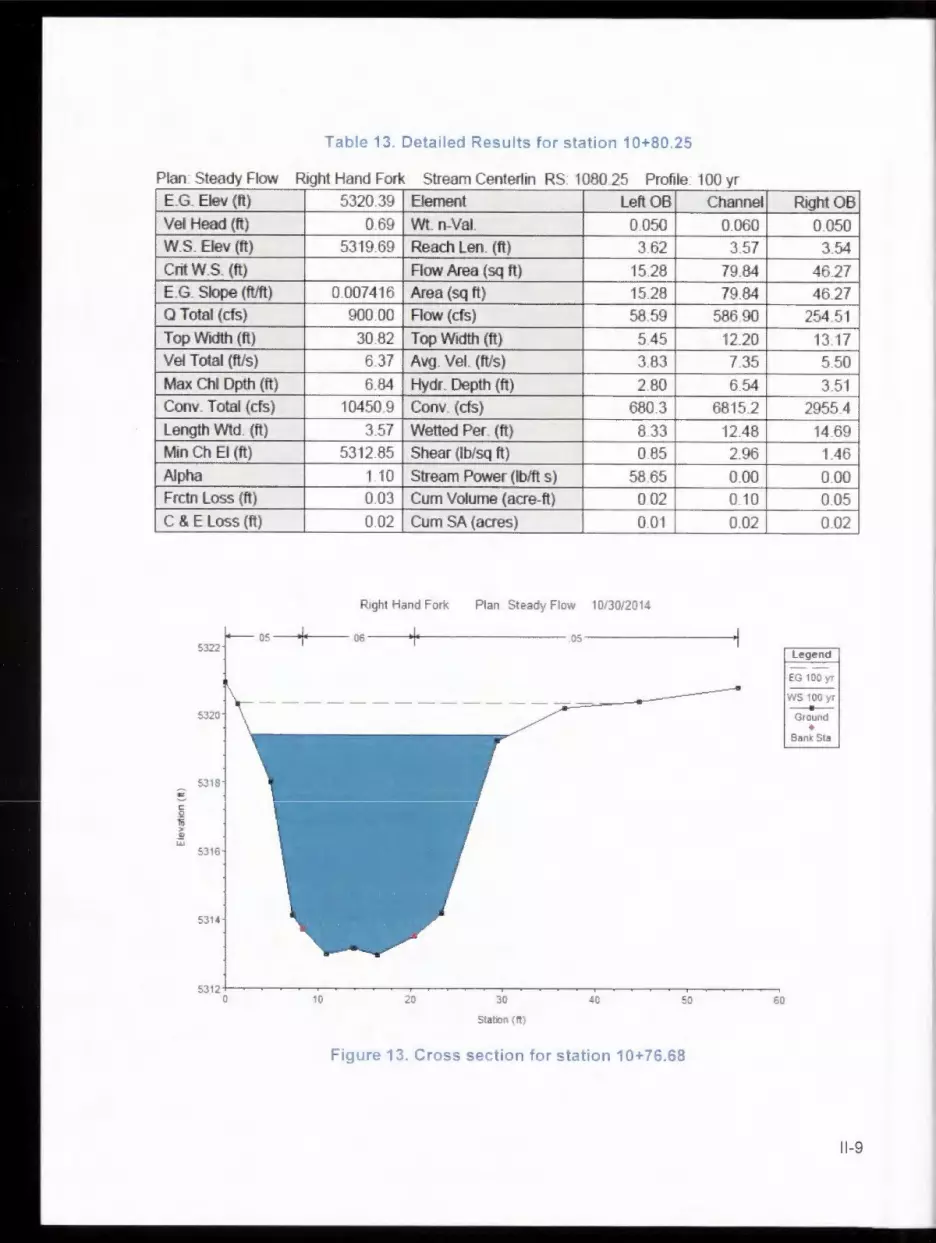
Table 13. Detailed Results for station 10+80 .25
Plan: Steady Flow Right Hand Fork Stream Center1in RS: 1080 25 Profile: 100 yr E.G. Elev (ft) 5320.39 Element Left OB Channel
Vel Head (ft) 0.69 wt . n-Val. 0.050 0.060 W.S. Elev (ft) 5319.69 Reach Len. (ft) 3.62 3.57
Crit W.S. (ft) Row Area (sq ft) 15.28 79.84 E.G. Slope (ft/ft) 0.007416 Area (sq ft) 15.28 79.84 a Total (cfs) 900.00 Row (cfs) 58.59 586.90
Top Width (ft) 30.82 Top Width (ft) 5.45 12.20 Vel Total (ft/s) 6.37 Avg. Vel. (ft/s) 3.83 7.35
Max Chi Dpth (ft) 6.84 Hydr. Depth (ft) 2.80 6.54 Conv. Total (cfs) 10450.9 Conv. (cfs) 680.3 6815.2
Length Wtd. (ft) 3.57 Wetted Per. (ft) 8 33 12.48 Min Ch El (ft) 5312.85 Shear (lb/sq ft) 0.85 2.96
Alpha 1.10 Stream Power (lb/ft s) 58.65 0.00 Frctn Loss (ft) 0.03 Cum Volume (acre-ft) 0 02 0.10
C & E Loss (ft) 0.02 Cum SA (acres) 0.01 0.02
Right Hand Fork Plan Steady Flow 10/30/2014
05 ------ os--------- 05 -------+1 5322
5320
5318 € C 0
i > .!! UJ
5316
5314
5312-t--~~~----,-~~~--T~~~~..--~~~----.-~~~....--.~~----,---.---, 0 10 20 30
Stat10n (ft )
40 50
Figure 13. Cross section for station 10+76 .68
60
Right OB
0.050
3.54
46 .27
46 .27
254.51
13.17
5.50
3.51
2955 .4
14.69
1.46
0.00
0.05
0.02
Legend
EG 100 yr
WS 100 yr --+--Ground
♦
Bank Sta
11-9
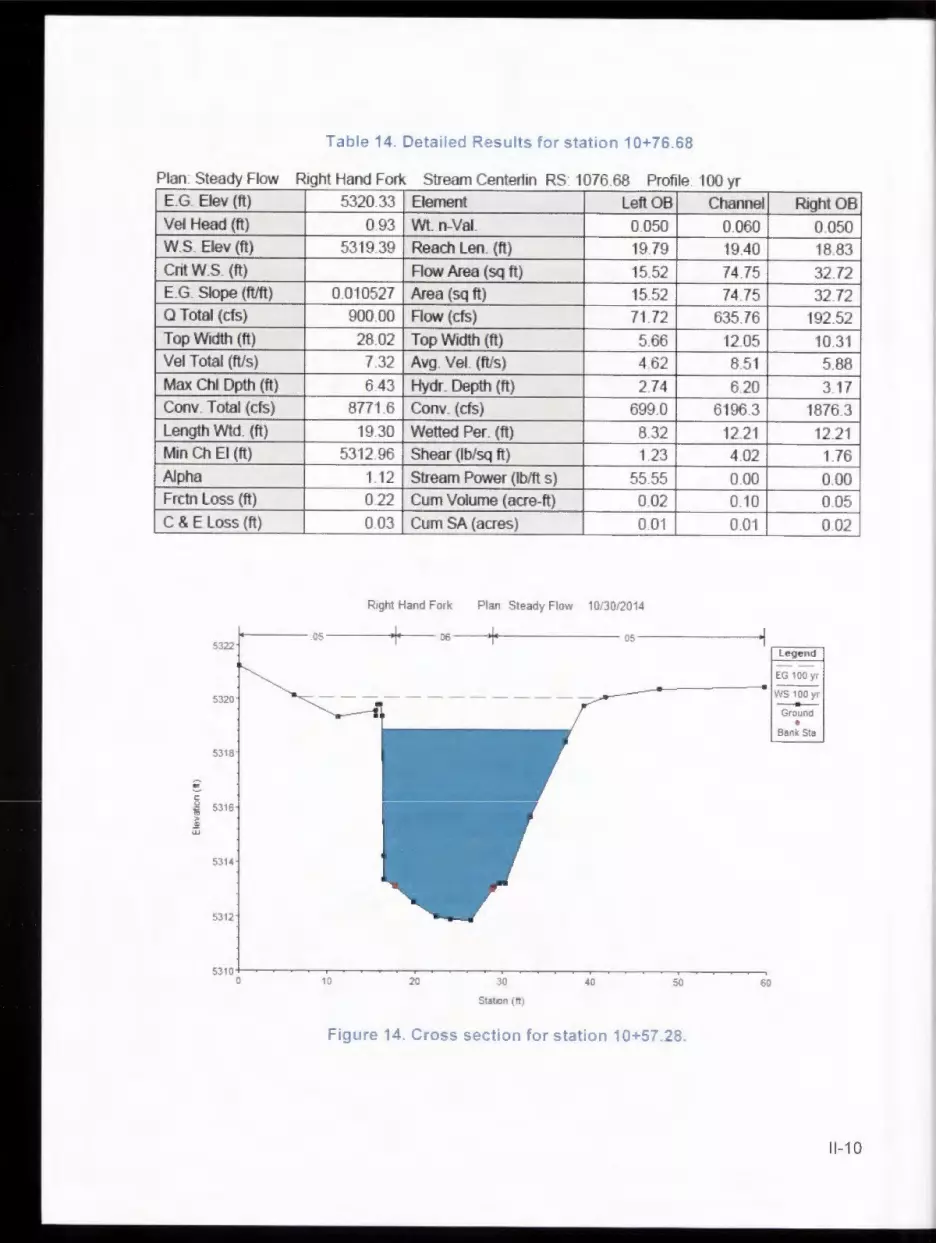
Table 14 . Detailed Results for station 10+76 .68
Plan: Steady Flow Right Hand Fork Stream Center1in RS: 1076 .68 Profile : 100 yr E.G. Elev (ft) 5320 .33 Element Left OB Channel Right OB Vel Head (ft) 0.93 Wt . n-Val . 0.050 0.060 0.050 W.S. Elev (ft) 5319 .39 Reach Len. (ft) 19.79 19.40 18.83 Crit W .S. (ft) Flow Area (sq ft) 15.52 74.75 32 .72 E.G. Slope (ft/ft) 0.010527 Area {sq ft} 15.52 74.75 32 .72 Q Total (cfs) 900 .00 Flow (cfs) 71.72 635 .76 192.52 Top Width (ft) 28.02 Top Width {ft) 5.66 12.05 10.31 Vel Total {ft/s) 7.32 Avg . Vel. {ft/s) 4 .62 8.51 5.88 Max Chi Dpth (ft) 6.43 Hydr. Depth (ft) 2.74 6.20 3.17 Conv . Total ( cfs) 8771 .6 Conv . (cfs) 699 .0 6196 .3 1876 .3 Length Wtd . (ft) 19.30 Wetted Per. (ft) 8.32 12.21 12.21 Min Ch El {ft) 5312 .96 Shear (lb/sq ft} 1.23 4.02 1.76 Alpha 1.12 Stream Power (lb/ft s) 55.55 0.00 0.00 Frctn Loss (ft} 0 .22 Cum Volume (acre-ft) 0 .02 0.10 0.05 C & E Loss (ft) 0.03 Cum SA (acres) 0 01 0.01 0.02
Right Hand Fork Plan Steady Flow 10/30/2014
- --05-- -------- os- _.,.. - - ----os- -- - -~ 5322
legend
5320
EG 100 yr
- --- --- -- WS 100 yr
~
5 1ij > .!1 w
5318
5316
5314
5312
5310+--~-~-~~~~-~~~--~~~-~~~~-~ 0 10 20 30
Station {ft)
40 so
Figure 14 . Cross section for stat ion 10+57 .28 .
60
--Ground •
Bank Sta
11-10
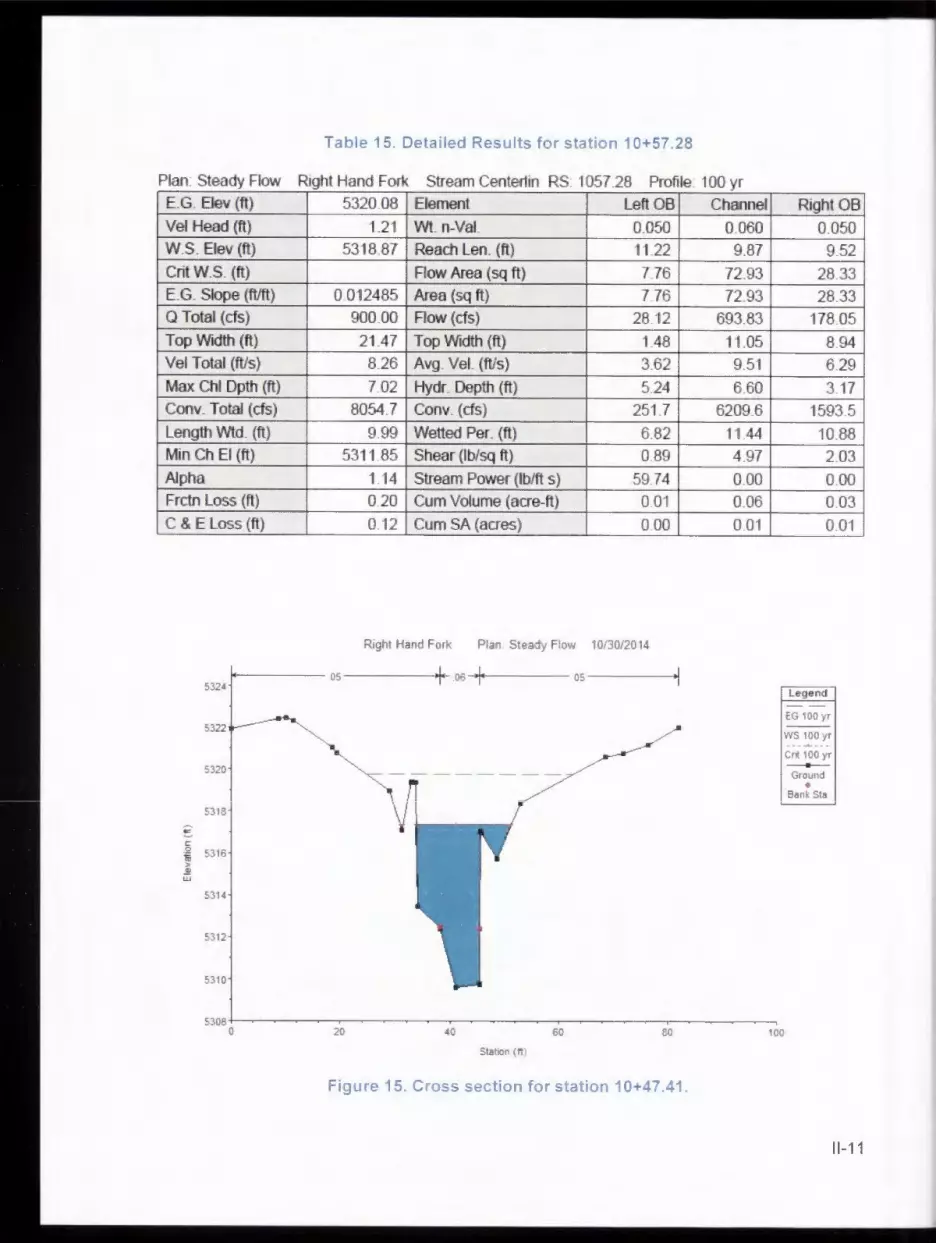
Table 15 . Detailed Results for station 10+57 .28
Plan: Steady Flow Right Hand Fork Stream Center1in RS: 1057.28 Profile : 100 yr E.G. Elev (ft) 5320 .08 Element Left OB Channel
Vel Head (ft) 1.21 Wt . n-Val. 0.050 0.060 W.S. Elev (ft) 5318 .87 Reach Len. (ft) 11.22 9.87
Crit W.S. (ft) Flow Area (sq ft) 7.76 72.93 E.G. Slope (ft/ft) 0.012485 Area (sq ft) 7.76 72.93 a Total (cfs) 900 .00 Row (ds) 28.12 693 .83
Top Width (ft) 21.47 Top Width (ft) 1.48 11.05 Vel Total (ft/s) 8.26 Avg . Vel. (ft/s) 3.62 9.51
Max Chi Dpth (ft) 7.02 Hydr. Depth (ft) 5.24 6.60 Conv . Total (cfs) 8054 .7 Conv . (ds) 251.7 6209 .6
Length Wtd . (ft) 9.99 Wetted Per. (ft) 6.82 11.44 Min Ch El (ft) 5311 .85 Shear (lb/sq ft) 0.89 4 .97
Alpha 1.14 Stream Power (lb/ft s) 59 74 0.00 Frctn loss (ft) 0.20 Cum Volume (acre-ft) 0.01 0.06
C & E loss (ft) 0.12 Cum SA (acres) 000 0.01
Right Hand Fork Plan Steady Flow 10/30/2014
--- -- 05 ------- os-------- 05 -----5324
5322
5320
5318
!:-C 0 5316 t5 > .!! w
5314
5312
5310
5308 0 20 40 60 80
Station ( ft )
Figure 15 . Cross section for station 10+47 .41 .
Right OB
0.050
9.52
28.33
28.33
178.05
8.94
6.29
3.17
1593 .5
10.88
2.03
0.00
0.03
0.01
Legend
EG 100 yr
WS 100 yr
Cnt 100 yr --+--
100
Ground •
Bank Sta
11-11
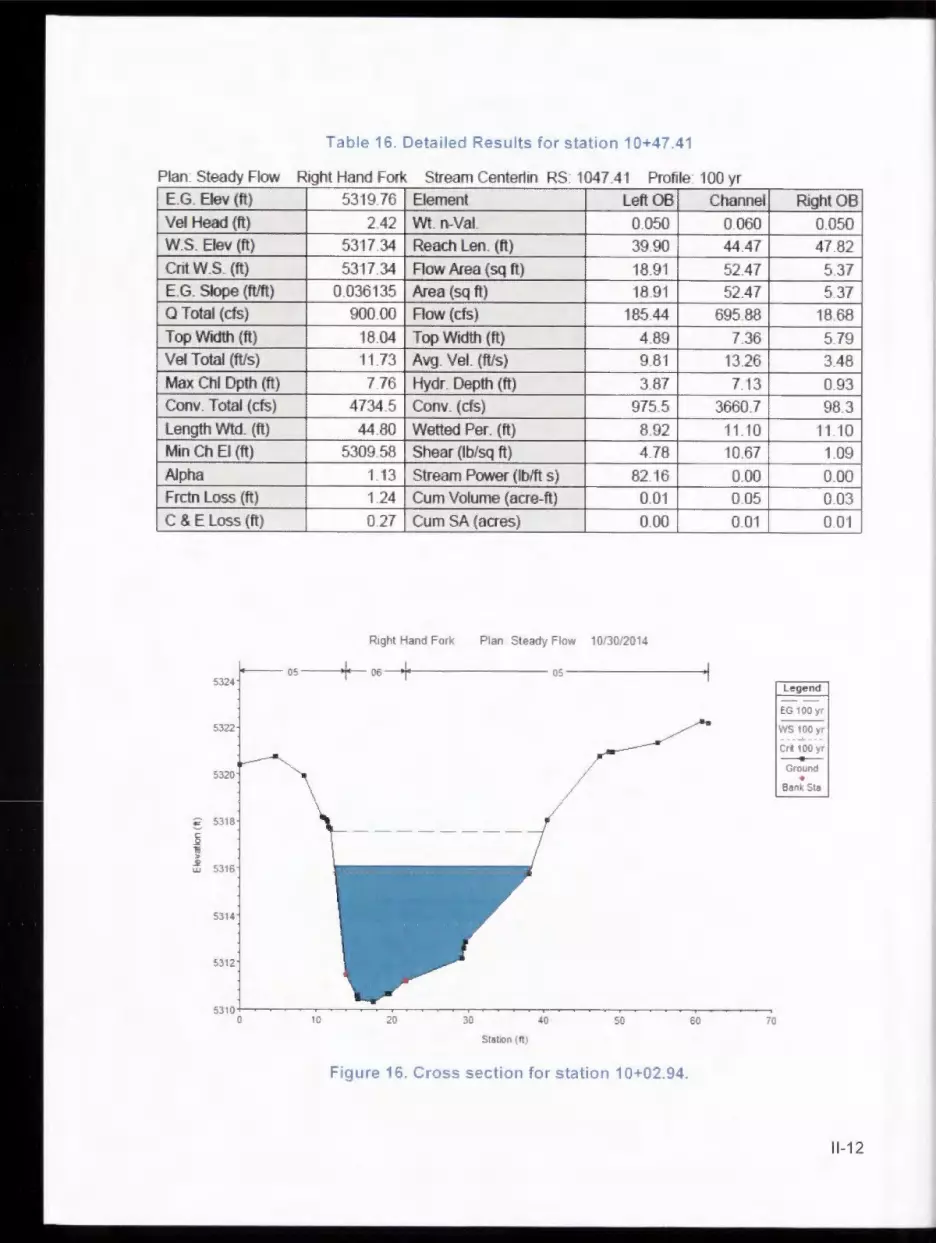
Table 16 . Detailed Results for station 10+47 .41
Plan: Steady Flow Right Hand Fork Stream Center1in RS: 1047.41 Profile : 100 yr
E.G. Elev (ft) 5319 .76 Element left OB Channel
Vel Head (ft) 2.42 Wt . n-Val. 0.050 0.060 W.S. Elev (ft) 5317 .34 Reach Len. (ft) 39.90 44.47
Crit W.S. (ft) 5317.34 Flow Area (sq ft) 18.91 52.47 E.G. Slope (ft/ft) 0.036135 Area (sq ft) 18.91 52.47 Q Total (ds) 900 .00 Flow (cfs) 185.44 695.88
Top Width (ft) 18.04 Top Width (ft) 4.89 7.36 Vel Total (ft/s) 11.73 Avg . Vel. (fVs) 9.81 13.26
Max Chi Dpth (ft) 7.76 Hydr. Depth (ft) 3.87 7.13 Conv. Total (cfs) 4734 .5 Conv . (ds) 975.5 3660.7
Length Wtd . (ft) 44.80 Wetted Per. (ft) 8.92 11.10 Min Ch El (ft) 5309 .58 Shear (lb/sq ft) 4.78 10.67
Alpha 1.13 Stream Power (lb/ft s) 82.16 0.00 Frctn Loss (ft) 1.24 Cum Volume (acre-ft) 0.01 0.05
C & E Loss (ft) 0.27 Cum SA (acres) 0.00 0.01
Right Hand Fork Plan Steady Flow 10/30/2014
05 ----os-i---------05------ ~ 5324
5322
5320
€ 5318 C .2 t;; > .!!
5316 w
5314
5312
5310 0 10 20 30 40 50 60
Stat10n ( II )
Figure 16 . Cross section for station 10+02.94 .
70
Right OB
0.050
47.82
5.37
5.37
18.68
5.79
3.48
0.93
98.3
11.10
1.09
0.00
0.03
0.01
legend
EG 100 yr
WS 100y r
Crt 100 yr ---Ground •
Bank Sta
11-12

Table 17. Detailed Results for station 10+02.94
Plan: Steady Flow Right Hand Fork Stream Center1in RS: 1002.94 Profile: 100 yr E.G. Elev (ft) 5317.58 Element Left OB Channel Right OB Vel Head (ft) 1.51 Wt. n-Val. 0.050 0.060 0.050 W.S. Elev (ft) 5316.07 Reach Len. (ft) CritW .S. (ft) 5315.83 Flow Area (sq ft) 3.36 42.30 49.05 E.G. Slope (ft/ft) 0.022008 Area (sq ft) 3.36 42.30 49.05 Q Total (cfs) 900.00 Flow (cfs) 11.65 461.13 427.22 Top Width (ft) 25.93 Top Width (ft) 1.46 7.84 16.62 Vel Total (ft/s) 9.50 Avg. Vel. (ft/s) 3.47 10.90 8.71 Max Chi Dpth (ft) 5.77 Hydr. Depth (ft) 2.30 5.40 2.95 Conv. Total (cfs) 6066.7 Conv. (cfs) 78.5 3108.4 2879.8 Length Wtd. (ft) Wetted Per. (ft) 4.82 8.28 17.66 Min Ch El (ft) 5310.30 Shear (lb/sq ft) 0.96 7.02 3.82 Alpha 1.07 Stream Power (lb/ft s) 61.66 0.00 0.00 Frctn Loss (ft) Cum Volume (acre-ft) C & E Loss (ft) Cum SA (acres)
Right Hand Fork Plan Steady Flow 10/30/2014 Right Hand Forlc Stream Centerlin
5322 Legend
------ ---- ---- EG 100 yr
5320 WS 100 yr
Cr4 100 yr
5318 Ground
"" S316 C 0
t6 > .!! 5314 w
5312
5310
5308 0 20 40 60 80 100 120 140
Malll Channel Distance (fl)
Figure 17. Water surface profile for 100-yr 12-hr storm.
11-13
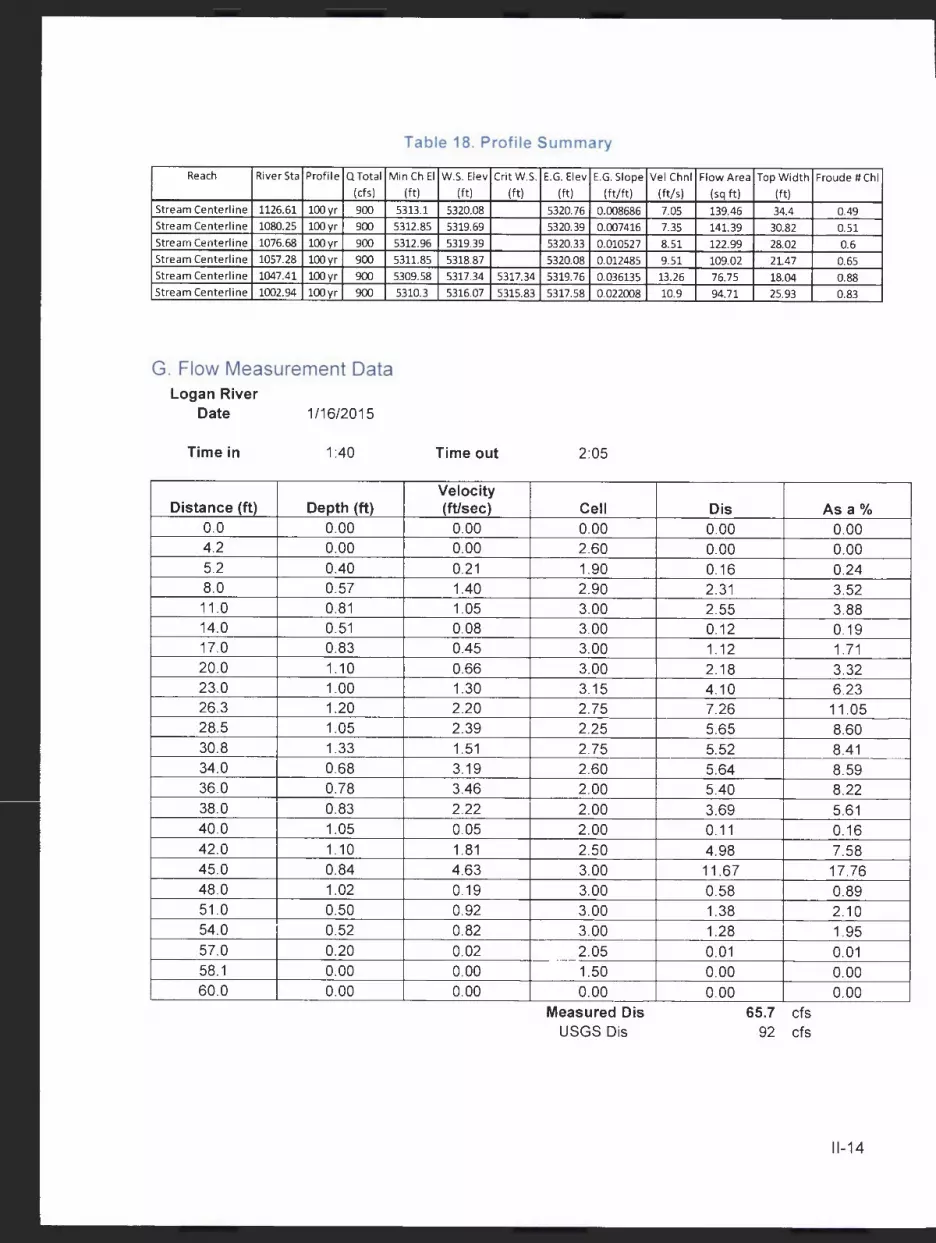
Table 18. Profile Summary
Reach River Sta Profile Q Total Min Ch El
(cfs) (ft)
Stream Centerline 1126.61 lOOyr 900 5313.1 Stream Centerline 1080.25 lOOyr 900 5312.85 Stream Centerline 1076.68 lOOyr 900 5312.96 Stream Centerline 1057.28 lOOyr 900 5311.85 Stream Centerline 1047.41 lOOyr 900 5309.58 Stream Centerline 1002.94 lOOyr 900 5310.3
G. Flow Measurement Data Logan River
Date
Time in
Distance (ft) 0.0 4.2 5.2 8.0 11.0 14.0 17.0 20.0 23.0 26.3 28.5 30.8 34.0 36.0 38.0 40 .0 42 .0 45 .0 48.0 51.0 54.0 57.0 58.1 60 .0
1/16/2015
1 :40
Depth (ft) 0.00 0.00 0.40 0.57 0.81 0.51 0.83 1.10 1.00 1.20 1.05 1.33 0.68 0.78 0.83 1.05 1.10 0.84 1.02 0.50 0.52 0.20 0.00 0.00
W.S. Elev Crit W.S.
(ft) (ft)
5320.08
5319.69
5319.39
5318.87
5317.34 5317.34 5316.07 5315.83
Time out
Velocity (fUsec)
0.00 0.00 0.21 1.40 1.05 0.08 0.45 0.66 1.30 2.20 2.39 1.51 3.19 3.46 2.22 0.05 1.81 4.63 0.19 0.92 0.82 0.02 0.00 0.00
E.G. Elev E.G. Slope
(ft) ( ft/ft)
5320.76 0.008686 5320.39 0.007416
5320.33 0.010527 5320.08 0.012485 5319.76 0.036135 5317.58 0.022008
2:05
Cell 0.00 2.60 1.90 2.90 3.00 3.00 3.00 3.00 3.15 2.75 2.25 2.75 2.60 2.00 2.00 2.00 2.50 3.00 3.00 3.00 3.00 2.05 1.50 0.00
Measured Dis USGS Dis
Vel Chnl
(ft/s)
7.05
7.35
8.51
9.51
13.26
10.9
Flow Area Top Width
(sq ft)
139.46
141.39
122.99 109.02
76.75
94.71
Dis 0.00 0.00 0.16 2.31 2.55 0.12 1.12 2.18 4.10 7.26 5.65 5.52 5.64 5.40 3.69 0.11 4.98 11.67 0.58 1.38 1.28 0.01 0.00 0.00
(ft)
34.4
30.82
28.02
21.47
18.04 25.93
65.7 cfs 92 cfs
Froude # Chi
0.49
0.51
0.6
0.65
0.88
0.83
Asa% 0.00 0.00 0.24 3.52 3.88 0.19 1. 71 3.32 6.23 11.05 8.60 8.41 8.59 8.22 5.61 0.16 7.58 17.76 0.89 2.10 1.95 0.01 0.00 0.00
11-14
Logan River Date
Time in
Distance (ft) 3.3 4 .2 5.2 8 11 14 17 20 23
26.3 28 .5 30.8 34 36 38 40 42 45 48 51 54 57
58.5
60
2/5/2015
4:50
Depth (ft) 0
0.59 0.59 0.79 1.05 0.20 1.00 1.22 1.17 1.68 1.30 1.50 0.93 1.33 1.13 0.77 1.41 1.25 1.30 0.80 0.99 0.50 0.00 0.00
Time out
Velocity (fUsec)
0 0.23 0.29 1.42 2.21 1.38 0.54 0.95 1.88 2.73 4 .19 2.86 3.69 3.88 2.63 4.31 2.17 4 .99 1.65 0.57 3.04 0.37 0.00 0.00
5:20
Cell
0.95 1.90 2 .90 3.00 3.00 3.00 3.00 3.15 2.75 2.25 2.75 2.60 2.00 2.00 2.00 2.50 3.00 3.00 3.00 3.00 2 .25 1.50 0.00
Measured Dis USGS Dis
Dis
0.129 0.325 3.253 6 .962 0.828 1.620 3.477 6.929 12.613 12.256 11.798 8.922 10.321 5.944 6 .637 7.649 18.713 6.435 1.368 9.029 0.416 0.000 0.000
135.623 cfs 113 cfs
Asa%
0.20 0.49 4.95 10.60 1.26 2.47 5.29 10.55 19.20 18.66 17.96 13.58 15.71 9.05 10.10 11.64 28.49 9.80 208 13.74 0.63 0.00 0.00
11-15
Logan River Date
Time in
Distance (ft)
3.4 4.2 5.2 8 11 14
17 20 23
26.3 28.5 30.8 34 36 38 40 42 45 48 51 54 57
58.5 60
3/26/2015
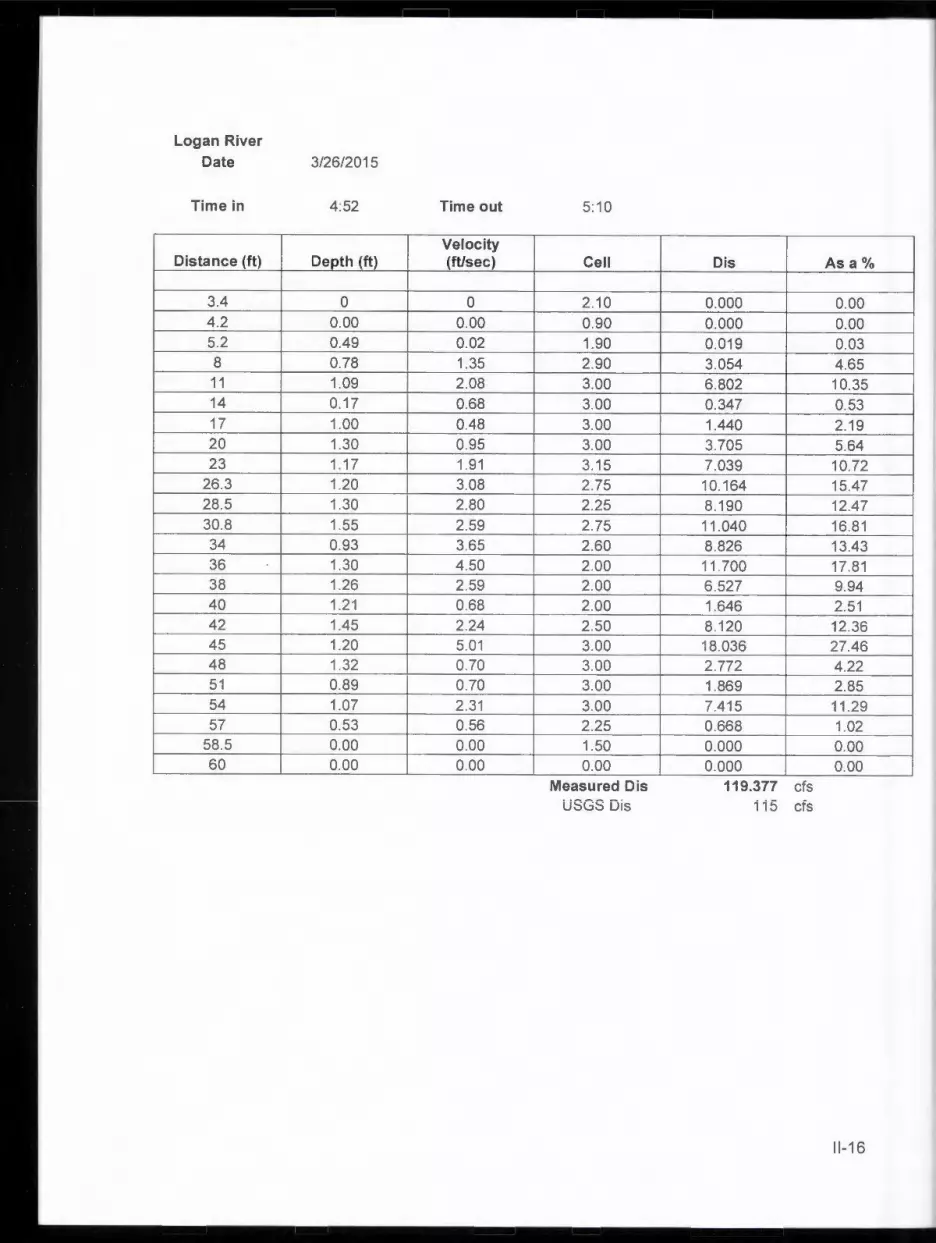
4 :52
Depth (ft)
0 0.00 0.49 0.78 1.09 0.17 1.00 1.30 1.17 1.20 1.30 1.55 0.93 1.30 1.26 1.21 1.45 1.20 1.32 0.89 1.07 0.53 0.00 0.00
Time out
Velocity (ft/sec)
0 0.00 0.02 1.35 2.08 0.68 0.48 0.95 1.91 3.08 2.80 2.59 3.65 4.50 2.59 0.68 2.24 5.01 0.70 0.70 2.31 0.56 0.00 0.00
5:10
Cell
2.10 0.90 1.90 2.90 3.00 3.00
3.00 3.00 3.15 2.75 2.25 2.75 2.60 2.00 2.00 2.00 2.50 3.00 3.00 3.00 3.00 2.25 1.50 0.00
Measured Dis USGS Dis
Dis
0.000
0.000 0.019 3.054 6.802 0.347 1.440 3.705 7.039 10.164 8.190 11.040 8.826 11.700 6.527 1.646 8.120 18.036 2.772 1.869 7.415 0.668 0.000 0.000
119.377 cfs 115 cfs
Asa%
0.00 0.00 0.03 4.65 10.35 0.53 2.19 5.64 10.72 15.47 12.47 16.81 13.43 17.81 9.94 2.51 12.36 27.46 4.22 2.85 11.29 1.02 0.00 0.00
11-16

Right Hand Fork
Date 1/15/2015
Time in
Distance (ft) 0.0 1.2 1.6 2.8 4.0
5.2 6.2 7.0 7.7 8.5 9.7 10.8 11.8 13.1 15.0
Right Hand Fork
5:28
Depth (ft) 0.00 0.00 0.15 0.53 0.68 0.53 0.34 0.59 0.58 0.61 0.50 0.39 0.22 0.00 0.00
Date 2/5/2015
Time in 5:38
Distance (ft) Depth (ft) 0
1.2 0.00 1.6 0.32 2.8 0.70 4 0.90
5.2 0.70 6.2 0.47 7 0.70
7.7 0.70 8.5 0.66 9.7 0.60 10.8 0.51 11.8 0.37 13.1 0.10 13.4 0.00 14 0.00
Time out
Velocity (ft/sec)
0.00 0.00 0.46 1.40 1.73 1.13 1.56 2.28 2.23 1.65 1.79 1.26 0.22 0.00 0.00
Time out
Velocity (ft/sec)
0.00
0.85 2.19 2.24 1.81 2.46 1.62 2.00 1.76 1.86 1.11 0.64 0.24 0.00 0.00
5:40
Cell Dis Asa% 0.00 0.00 0.00 0.80 0.00 0.00 0.80 0.06 0.68 1.20 0.89 11.02 1.20 1.41 17.47 1.10 0.66 8.15 0.90 0.48 5.91 0.75 1.01 12.49 0.75 0.97 12.01 1.00 1.01 12.46 1.15 1.03 12.74 1.05 0.52 6.39 1.15 0.06 0.69 1.60 0.00 0.00 0.00 0.00 0.00
Measured Dis 8.1 cfs
5:57
Cell Dis Asa%
0.80 0.000 0.00 0.80 0.218 2.69 1.20 1.840 22 .77 1.20 2.419 29.94 1.10 1.394 17.25 0.90 1.041 12.88 0.75 0.851 10.53 0.75 1.050 13.00 1.00 1.162 14.38 1.15 1.283 15.88 1.05 0.594 7.36 1.15 0.272 3.37 0.80 0.019 0.24 0.45 0.000 0.00 0.00 0.000 0.00
Measured Dis 12.142 cfs
11-17
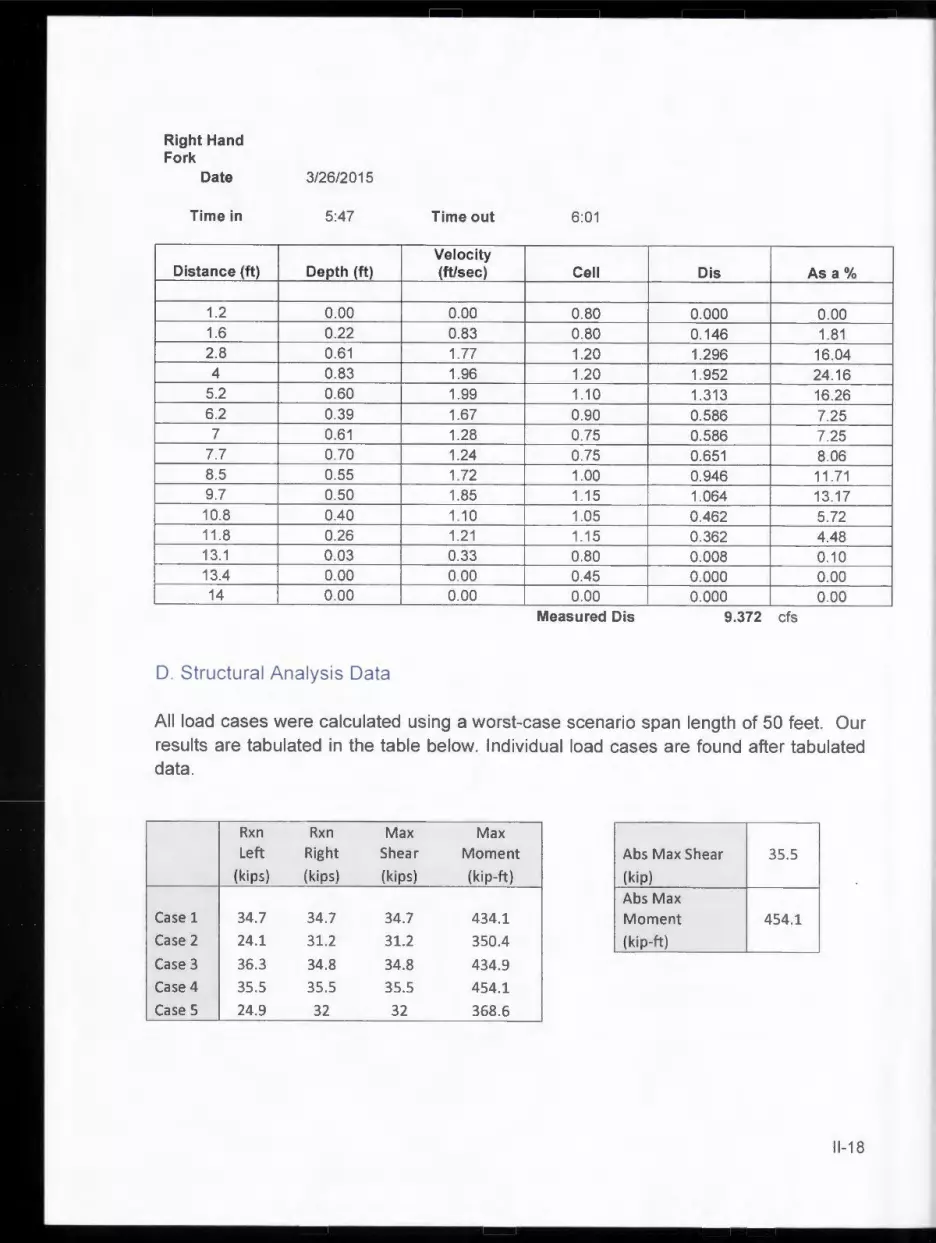
Right Hand Fork
Date
Time in
Distance (ft)
1.2 1.6 2.8 4
5.2 6.2 7
7.7 8.5 9.7 10.8 11.8 13.1 13.4 14
3/26/2015
5:47
Depth (ft)
0.00 0.22 0 .61 0 .83 0.60 0.39 0.61 0.70 0.55 0.50 0.40 0.26 0.03 0.00 0.00
D. Structural Analysis Data
Time out
Velocity (ft/sec)
0.00 0.83 1.77 1.96 1.99 1.67 1.28 1.24 1.72 1.85 1.10 1.21 0.33 0.00 0.00
6:01
Cell Dis Asa%
0.80 0.000 0.00 0.80 0.146 1.81 1.20 1.296 16.04 1.20 1.952 24 .16 1.10 1.313 16.26 0.90 0.586 7.25 0.75 0.586 7.25 0.75 0.651 8.06 1.00 0.946 11.71 1.15 1.064 13.17 1.05 0.462 5.72 1.15 0.362 4.48 0.80 0.008 0.10 0.45 0.000 0.00 0.00 0.000 0.00
Measured Dis 9.372 cfs
All load cases were calculated using a worst-case scenario span length of 50 feet. Our results are tabulated in the table below . Individual load cases are found after tabulated data .
Rxn Rxn Max Max Left Right Shear Moment Abs Max Shear 35.5
(kips) (kips) (kips) (kip-ft) (kip)
Abs Max Case 1 34.7 34.7 34.7 434 .1 Moment 454 .1
Case 2 24.1 31.2 31.2 350 .4 (kip-ft)
Case 3 36.3 34.8 34.8 434 .9
Case 4 35.5 35.5 35.5 454.1
Case 5 24.9 32 32 368.6
11-18
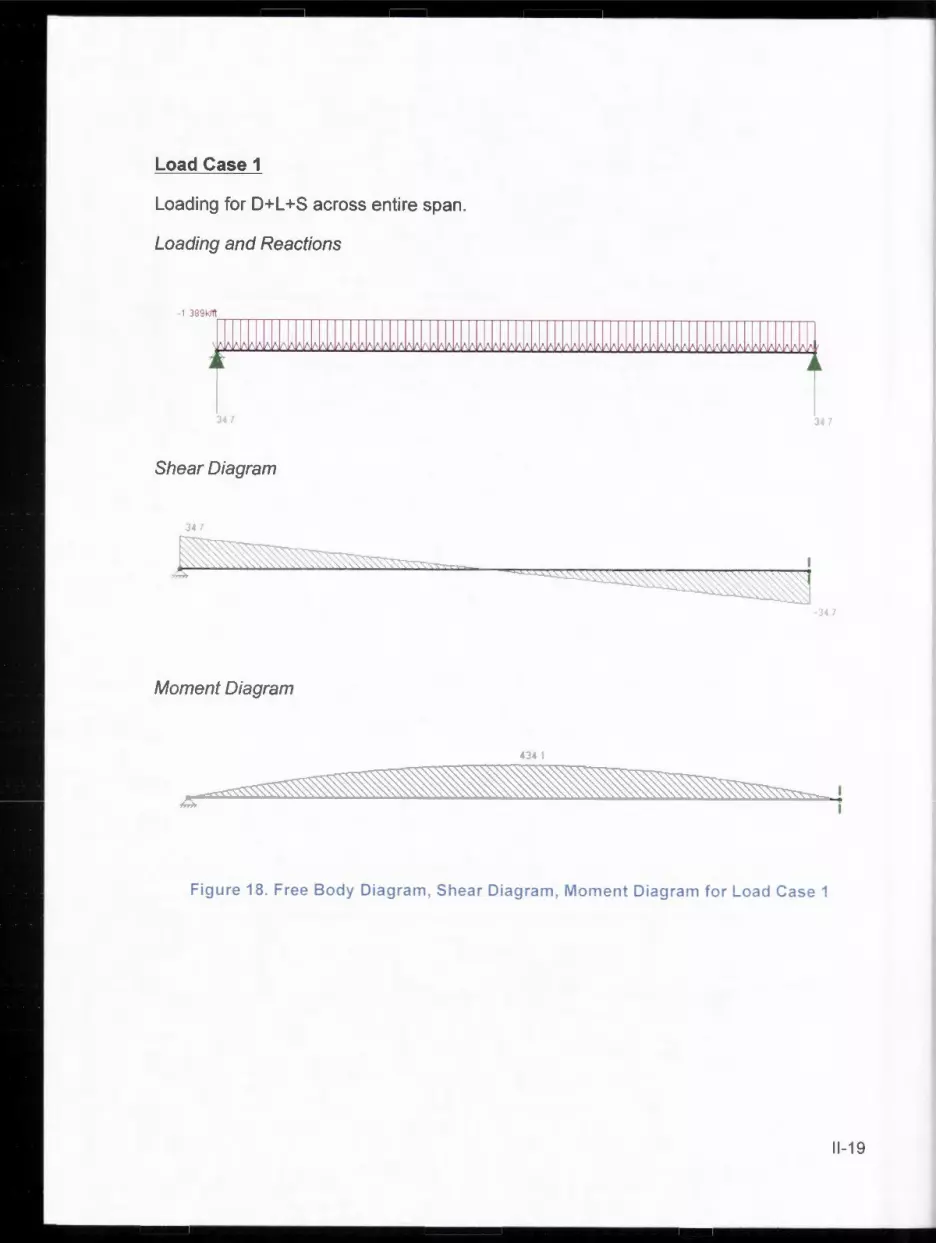
Load Case 1
Loading for D+L +S across entire span.
Loading and Reactions
34 7
Shear Diagram
347
I ~
Moment Diagram
434 1
347
.34 7
Figure 18. Free Body Diagram, Shear Diagram, Moment Diagram for Load Case 1
11-19

Load Case 2
Loading for D+L on half of span and D+L +S on other half .
Loading and reactions
24 1
Shear Diagram
24 1
Moment Diagram
350 4
31 2
-31 2
Figure 19. Free Body Diagram , Shear Diagram , Moment Diagram for Load Case 2
11-20
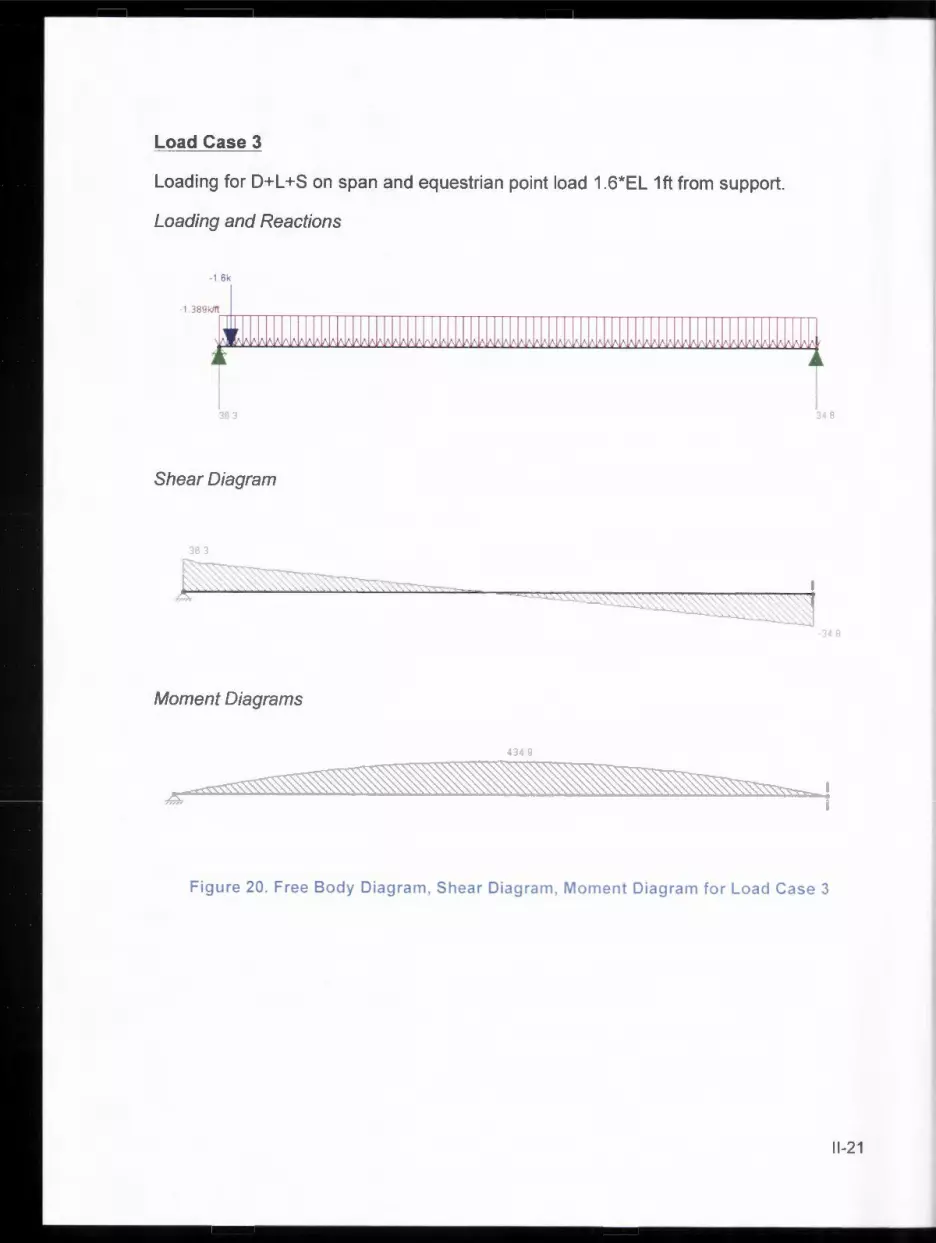
Load Case 3
Loading for D+L +Son span and equestrian point load 1.6*EL 1ft from support.
Loading and Reactions
-1 6k
36 3
Shear Diagram
36 3
~ /4
Moment Diagrams
434 9
34 A
- l4 8
Figure 20. Free Body Diagram , Shear Diagram , Moment Diagram for Load Case 3
11-21

Load Case 4
Loading for D+L +Son span and equestrian point load 1.6*EL at CL.
Loading and Reactions
35 5
Shear Diagram
35 5
Moment Diagram
-1 6k
454 1
Figure 21. Free Body Diagram , Shear Diagram , Moment Diagram for Load Case 4
35 5
11-22
Load Case 5
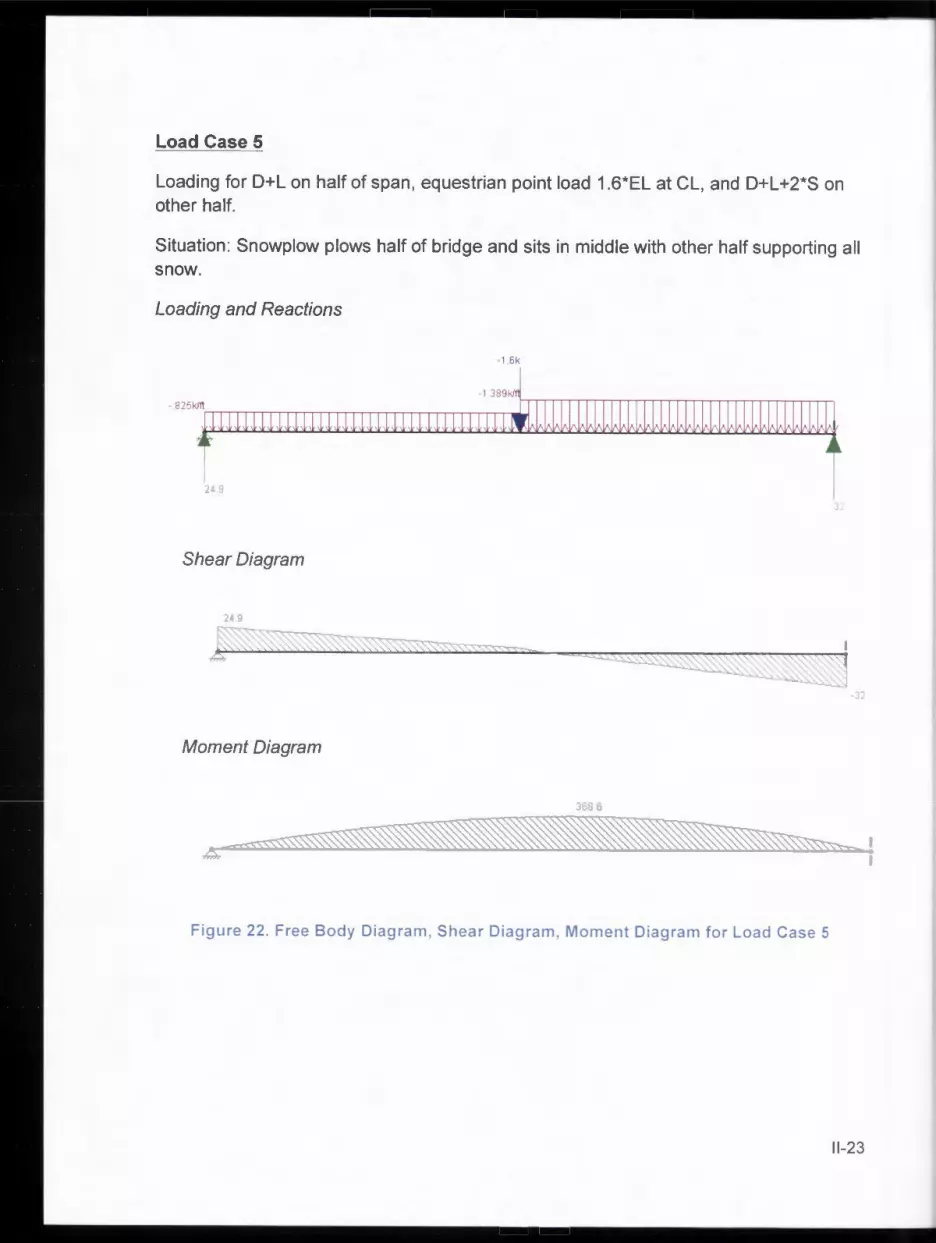
Loading for D+L on half of span , equestrian point load 1.6*EL at CL, and D+L +2*S on other half .
Situation : Snowplow plows half of bridge and sits in middle with other half supporting all snow.
Loading and Reactions
-1 6k
I
24 9
32
Shear Diagram
20
r:0~' ~ 32
Moment Diagram
368 6
Figure 22. Free Body Diagram , Shear Diagram, Moment Diagram for Load Case 5
11-23

APPENDIX Ill : PHOTOS
111-1
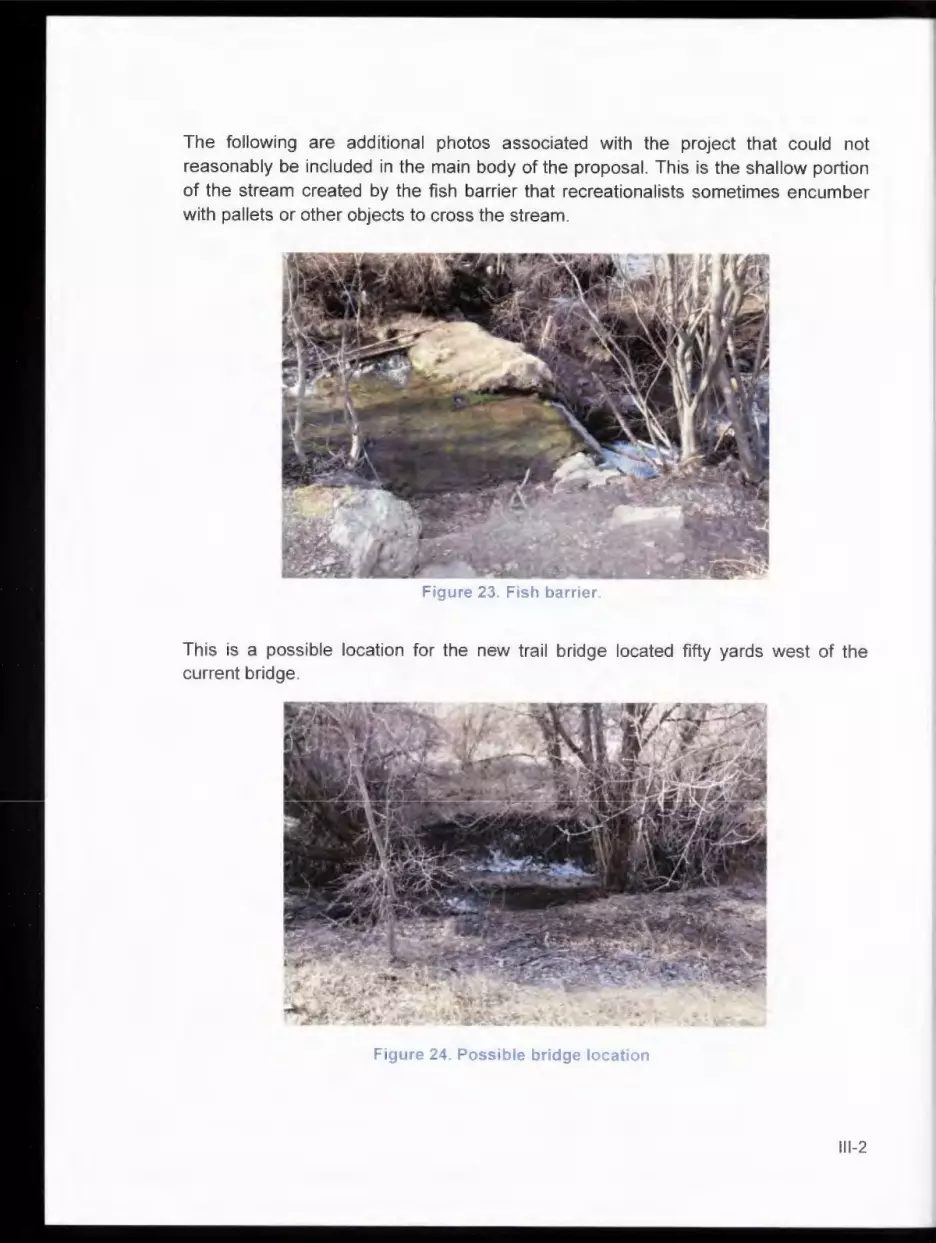
The following are additional photos associated with the project that could not reasonably be included in the main body of the proposal. This is the shallow portion of the stream created by the fish barrier that recreationalists sometimes encumber with pallets or other objects to cross the stream.
Figure 23. Fish barrier .
This is a possible location for the new trail bridge located fifty yards west of the current bridge .
Figure 24. Possible bridge location
111-2
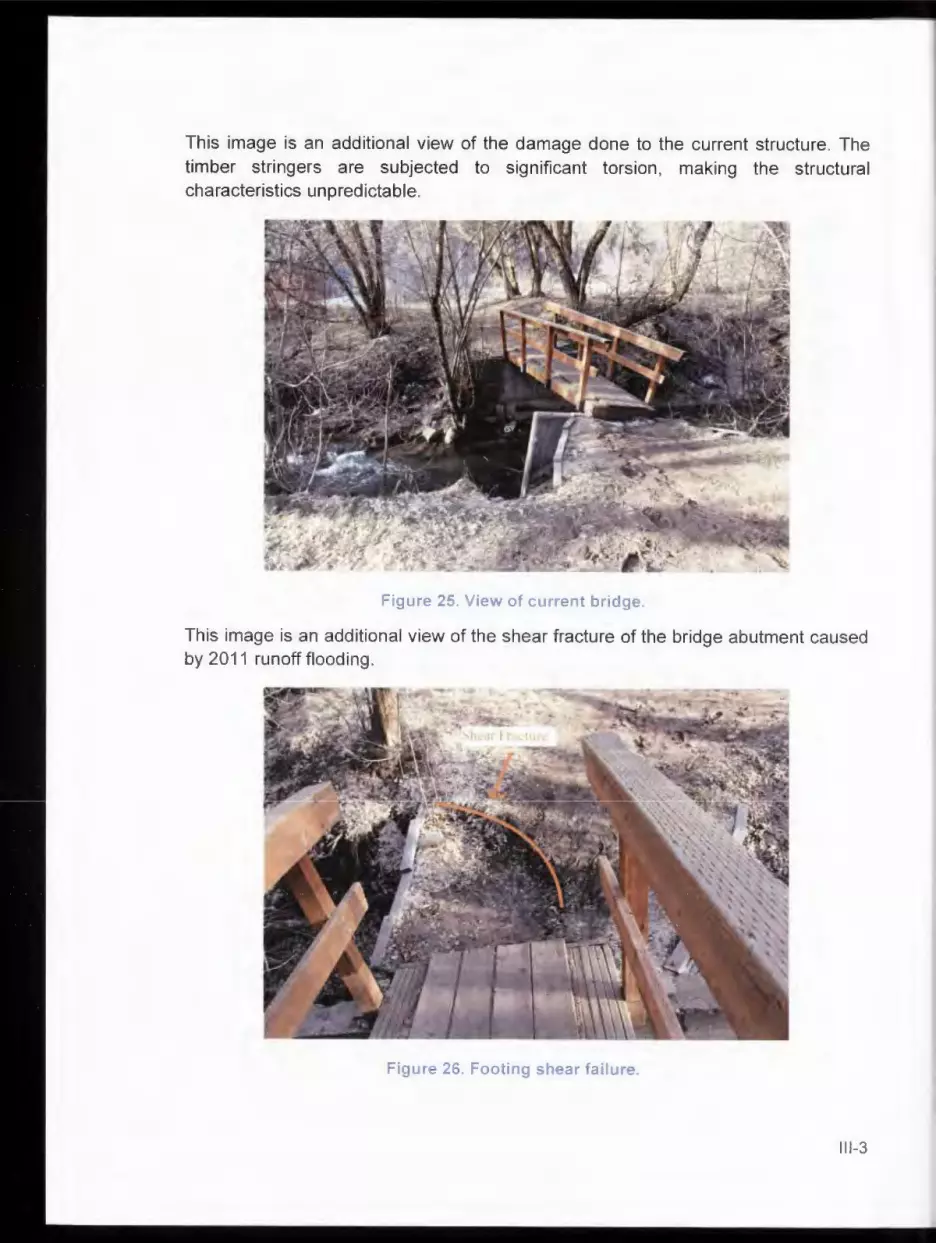
This image is an additional view of the damage done to the current structure . The timber stringers are subjected to significant torsion, making the structural characteristics unpredictable .
Figure 25. View of current bridge .
This image is an additional view of the shear fracture of the bridge abutment caused by 2011 runoff flooding .
Figure 26. Footing shear failure .
111-3

This image is a sample of the stream bed condition of the site. This was helpful in determining an appropriate Manning 's coefficient.
Figure 27. View of Stream Bed Conditions
A Total Station was used to determine the topography of the river.
Figure 28. Surveying Equipment
111-4

APPENDIX IV: CONSTRUCTION DRAWINGS
IV-I
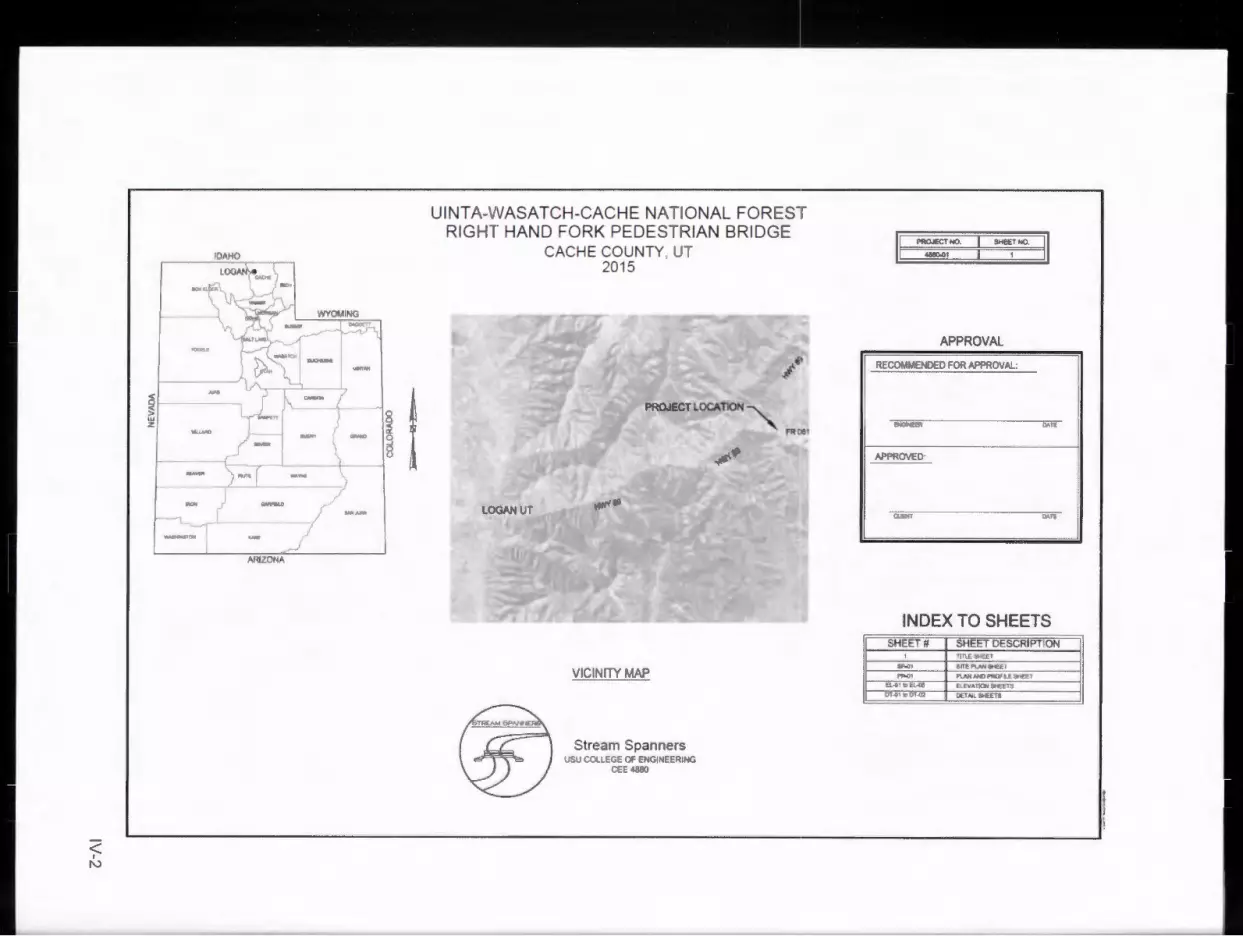
UINTA-WASATCH-CACHE NATIONAL FOREST RIGHT HAND FORK PEDESTRIAN BRIDG E
CACHE COUNTY, UT 2015
PROJECT LOCATION"'
VICINITY MAP
Stream Spanners USU COLLEGE OF ENGINEERING
CEE 4880
FRCl81
II ~NO . SHEET NO. II
APPROVAL
RECOMMENDED FOR Af'PROVAL:
APPROVED·
INDEX TO SHEETS SHEET# SHEET DESCRIPTION
' Tit\£~
""'" I ITE PUN SHE.Et
"""' P\MN#JPHOF U9&T El.~ 1 1>EL-0S ELEVATION 9HEl:TS OT~ 1 1)0 T'1l2 DET~L SHEETS
£-/\I
I
(
ji : 1 I
;I li .,
'¾,
-1 ,, } / :j · • /, f "' '.3 I . . ' i· ; ! A'· I I -_ ii ' / r! - ~ , ~ ·1
,,... 1 _:/. ·I . ~- 1 "
l CACHE COUNTY
~ I ~ RIGK"" I-ANO FORK P: OESIBIJ\N BRIDGE
;g ffi SITE PLAN
- ~~ 4880-01
~ ~
A
ELEVT-1 1" ---
~ 4• 1 TYP
--II II
I II II ELEV 4'-1 f II II
" "
:{8 . -
ELEV 0'-0" (p R "'!: -
< I (J'1
41'
40'
II II II I II II II I II II +-- I " " .
--
STEEL BRIDGE ELEVATION - LINE 1
LINE 2 SIMILAR
II II II "
-
B
i
I II l'-3" TY p
II I --r II "
I::; -~~ ~
LP ;:r ~ -
➔
ELEV. 4'-1 ¾"
ELEV. 0'-0" -- -
< I 0)
ELASTOMERlC PAD SEE DETAIL SS Otl
SHEET 0-1
STEEL BRIDGE ELEVATION - LINE A LINE B SIMILAR
12"x12" RC s111
ELEY 0'-0"
< I -..,J
A B !-+---------- --------- 41'------------------
,------------- ------40' ------------------ - ,
-4'-T'fP
WOOD BRIDGE ELEVATION - LINE 1
LINE 2 SIMILAR
s 0: .,
~ ! z I-:::, "' 0 w (.) 11. w V r ~ ~ (.) 0
~
· !
i
~ ~ & ~ , i ~
'i,
'
! t
r:
Ill :,: (I)
i ..: 0
~ w
ELE V. 0'-0 "
~ OJ
t 3@15" O.C.
5'-6"
t
OF No 1 2""xli""
F2 4 EI 8 glulam ~ l/8"x34 1 '8'
OF No 1 4"x6"
CE:!/ is, ~ ~~
;-- OF fllo 1 2"x4"
~ j Of No 1 4"x!J"
-3'-6 " - j_ lo
J_ ....------1-----+------.----+--___,_______,
_, T t 1'
1 '-6" _, I- '
_ , t- '
--3 ' --
6' --- --i
9' ------ -
Nole wood members symrnetnc: aboul Cl
WOOD BRIDGE ELEVATION - LINE A LINE B SIMILAR
Standard steel wire Gabton foundatJOn cage
. ,_ I , J
~ <I)
ffi/ .....:~~ z l ~;
lh i · ~ er,
I .... ,; . <l>c• 1-.C
1
CA HI
a-.. ·,,.-_;, EL-04
ELEV. 0'-0"
L6"x6"x3/8" 12" long
2 #10x4" wood SCfflWS
2 # 10x6· wood screws
3/4"Dto I 5" bolt w/ nut
3/4"D10 10" bolt w/ nut CL @ 2 from ongle edge
1"Ota 78" bolt w/ 4" hook w/ nut CL @ 3" from ongle edge
Note connectJons symmetnc obout CL
WOOD BRIDGE ELEVATION - LINE A LINE B SIMILAR
HANDRAIL
0 ¾" L5x3xj POURING ANGLE
CONCRETE DECK
36" STEEL DECK
GIRDER
CONCRETE DECK
36" W2 FORMLOCK OR SIMILAR STEEL DECK
$ 1 BRIDGE SPAN SECT ION CUT S2 BRIDGE DECK
I
GIRDER
j ,
4¥
~
.
BEARING PLATE
BACKING BOARD
SLOTTED HOLE TO ALLOW EXPANSION
NUT AND WASHER
ANCHOR BOLT
GIRDER
BEARING PLATE
ELASTOMER IC SLIDING PADS
STEEL SHIM
S4 FOUNDATION CONNECTION S5 ELASTOMERIC PAD
STRUCTURAL DETAILS
GIRDER » I L
ANCHOR BOLT
ELASTOMERIC 5 PAD OR SHIM h
H 12"x12" SILL
GABION FOUNDATION
f ' • •
S3 FOUNDATION ATTACHMENT I ,~ i i !
GUSSET PLATE ii ~- DIA. BOLT TYP . :Ii~ ◄
L2X2X¾ Ii t I i
~ BRACING
01
S6 BRACING DETAIL
-=- 1..:r. DT-01

12•x12· Concrete s111
==, -------------
1 .__________,1'-6"
- 3·
1"Dto rod 32" long w/ 4" bend
Gab10n Foundation
l W~BION FOUNDATION
OF No 1 2"x4" 3-#10x4" wood screws 4-#10x4" wood screws
glu-lom girder
Simpson connecuon
W2j WOOO ABUTMENT BACKING 1 W3rPHRAM
STRUCTURAL DETAILS
; ~
' ::1~ W' z i ' . ~· ~1
!~ "' . l t; j
~ ! tu 2 en ::::, ~ w
i .1:
8 d:' <I)
"' " ~ I ~ t., u <(
~ u ,. -

APPENDIX V : DETAILED CALCULATIONS
Vl-1

A . Travel reimbursement
Cost per mile = $0.56/mile
Miles to date = 9 trips*20 miles = 180 miles
B. Bridge Costs
Steel Option:
Member:
Bridge Girders:
Handrail: Perimeter Angle:
Bracing Angle:
Concrete Deck:
Anchor Bolts:
Decking:
Wood Option:
Member:
Bridge Girders:
Decking:
Posts:
Railing:
Hardware:
Hardware 2:
Current Reimbursement = cost per mile * miles
= $0.56 * 180 = $100. 80
Table 19: Bridge cost estimates.
Number/Length: I Pricing: I Weight/Area/Vol:
$ per 2 W14x61@ 41 0.75 pound 5002
2@ 40 $ 58.00 per foot NA $ per
2 L5x3xl/4@ 41 0.75 pound 574
$ per 2 L5x3xl/4@ 10 0.75 pound 140
$ 4" x 3.5' Slab @ 41 100.00 peryd"3 1.77
$ 16@ 2 6.00 per piece NA
3.5 $ 14 pieces@ II 1.50 per ft"2 147
Number/Length: I Pricing: I :eight/Area/Lengt
2 - 36" Glulam @ 41 $ 40.00 per foot 82
$ 62 4x8@ 3.5 8.50 per foot 217
22 - 4x6 Posts $ @ 5 6.25 per foot 110
$ 4 2x4 Rails@ 41 2.25 per foot 164
44 3/4" Bolts@ 16 $ 12.90 per piece 44
$ 10 3/4" Bolts@ 10 7.35 per piece 10
I Cost I $
3,751.50 $
4,640.00
$ 430.50
$ 105.00
$ 177.14
$ 96.00
$ 220.50
I :,420.64 I
I Cost
$ 3,280.00
$ 1,844.50
$ 687.50
$ 369.00
$ 567.60
$ 73.50
Vl-2

Screws 132 Screws@
Screws 2: 248 screws@
Angle 6x6x3/8@
Anchor Bolts: 16@
I General Costs:
Item:
Concrete Sill: 1xlx4 .S
Earth Fill: $150 delivery
Gabion Found : $100 per Cage
Total for Each Option :
Steel :
Wood :
$ 12,603.98 $ 10,356 .38
4 $ 12.15
6 $ 17.75 $
8 1.75
$ 2 6.00
I Pricing :
$100
$50
$SO
C . Calculation of Weighted Curve Numbers
per SO
per SO
per lb
per piece
peryd"3
peryd"3
peryd"3
3
6
64
$ 36.45
$ 106.50
$ 112.00
$ NA 96.00
1~7_\ _7_3-.0-5-,
I Cost:
$ 0.167 33.33
$ 39 2,100 .00
$ 6 1,050.00
I :,183 .33
Given: 58% of watershed has a curve number of 57, 14% of watershed has a curve number of 73, and 28% of the watershed has a curve number of 81.
58% * 57 + 14% * 73 + 28% * 81 CN = lOOo/o = 66
Vl-3
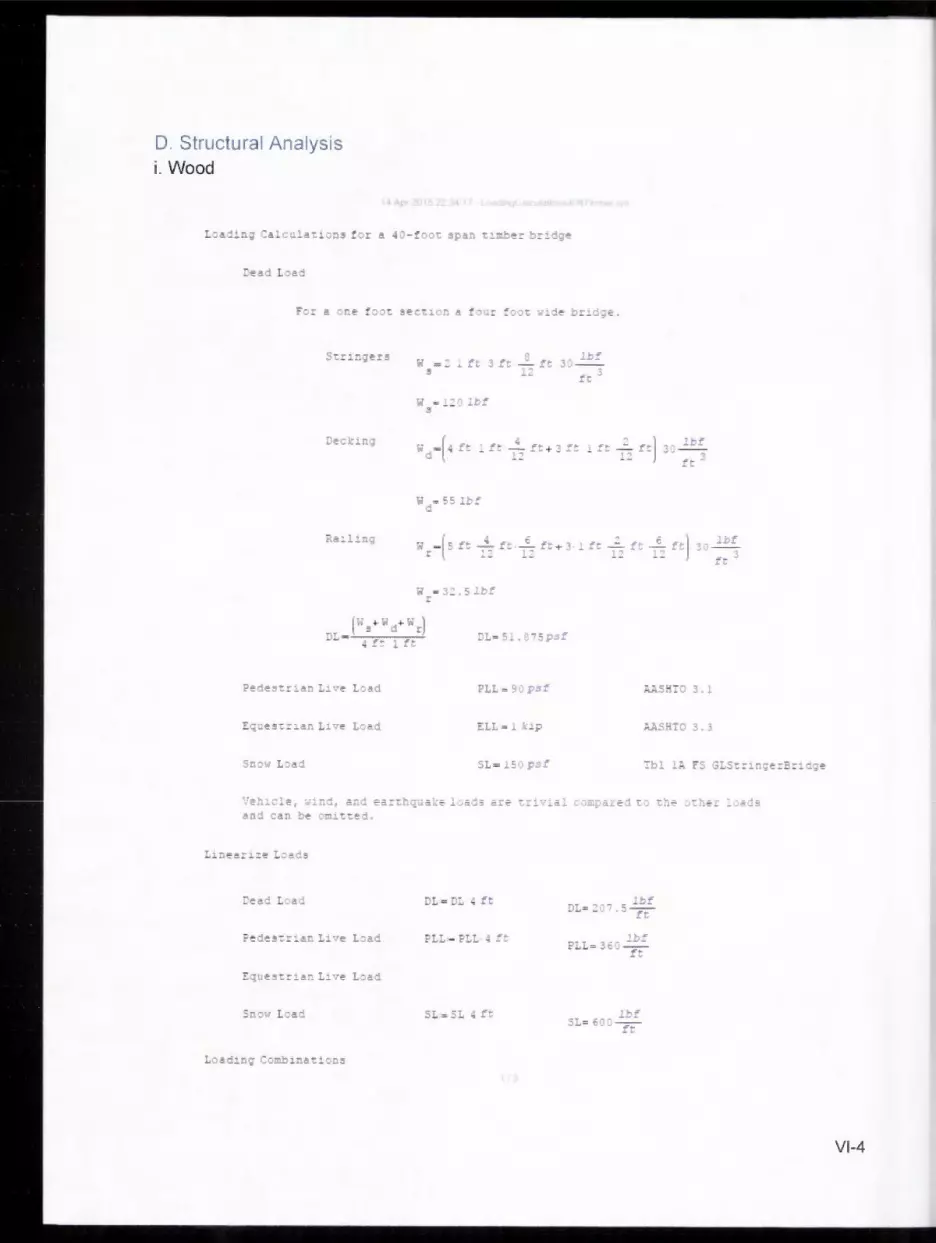
D. Structural Analysis i. Wood
S-::.ri:i gers w _: l ft 3 :t -=--ft 3: lJ::f s !: ft 3
.. f:
Ra1ling w -[s fc - ft . ,<·_ tc + 3 r 1:
"s ... wd ... wr) L- .; f: ft
?e :le s -::.r : an L1· ·e L: a d
Sn ,w L~ad
? LL = 9:psf
ELL=_ kip
SL=_ S:psf
:_, n] 3 : lbf
ft 3
;..:;.s HI O 3. l
AASHI O 3.3
~-,."eh:c!e, -,,;1:1d, and ea.:t.hqu--~ e l:.a.j- ar c ~=:·-:a! c:mi:ar = .:1 tJ
and c a n b e ;m :t t e d .
_ea d L:ad L = L ~ f:
PLL ,- ?L L· ft
:'.qu e s t r : an Li v e L a d
Snww L J a d SL= SL 4 ft
Vl-4
l. 4 ' 0
1.: •o + .6 • L + o.s • (S or R>
1.2 '0 + l. 6 • L
1.2 • 0 + 1.6 ' (S o r R) + o.s • (L o r W)
There f o re, u se w ,. 13 89 lbf u ft
1. 2 DL+ l.6 PLL+ 0 .5 SL- 1125 1:t
lb!° 1.: DL+ 1. 6 SL+ 0 • 5 PLL - 13 8 9 Et
Ca!le 5 Loading (wi th double !lnow l oad du e c o pl ow)
1.2 • 0 + (2 ) •1.e • (S o r R) + o.s • (L ' o r W) lbf
1. : DL+-1 1.6 SL-+0 .5 PLL - 2349 Et
Fo r the l oading cas e s analyzed, th e f oll owir.g r e acti ons , max !lbears, and max moment:!I are obtained.
MalC shear Mu Moment
l
2
3
4
5
2 7.S 27J!,
1' .3 2-l
2' .3 VJ3
28 .6 28.6
20.1 25.8
AbsMaicShaar Abs Max Moment
r
r
.
~ 27.S
~
2' .3
28.6
25 .8
29.3
293.8
Example o f ca l ucu l ati on!I f o r Load Case l
(Id ft 277 .S
224.3
27S .6
293.B
238.8
kips
kip-ft
Rea c ti ons on each side o f bridge, c on!lidering wu d1!lt:r1b ute d ev enly acr o !l!I the t op
Length o f !lpan
w L R , __ u_ y 2
Maxi mum !lhear
V = R max y
L,= 40 ft
R - 27.7 8 Jcip y
Maxim um moment: at: midspan
w 12
M __ u __
max 8 M - 277. 8 kip ft max
Vl-5

11. Steel
ft
X
A.ss w:,.e a max ~o:i."D. :r.:Joen:. :- : 3 5 : £:: ~-.::. t .: be :supi::r ::e:l J:::,, :..i: gird er :,. f::: :r. t:ie ;.:sc Manua Tab e 3 -_ J, .se ct ::.cn W x; ~ :t:.d.3 an a:::· .. a:,le :r.:::ie n : :,!' 19€ ,:ip-f: -.. :.t h an ·.mb ::a::-: d len:;i t h
f :o f t. : .,,: \E4x 3 :;i::.::de r.s !1.a·· e an all: l'.,ab e Clt!!ler.t :; f 39'.: k :i:;-:t.
A.s.sUJ:le:: :.n cl'. oeta: :le e.: ;; :. t!:l :.:5 ::.:ichec, J !' c::nc ::ete : :,:: ar. a--erage: d ,;,pth
= ' •· · lbf r - ~.
PLL - ~ J psf
ELL s : kip
SL - Sj psf
3.'.:5 l.:'lChe -,.
;;.:..:,n o 3.3
: b : ~ f5 GLSt::1r.ger3=:d;e
'i eh:. c: e, ·••:::i:l, and ea:: hquate l:ad-, are tr1··:al compar e d t: ::!'le :the= ::a:l.s cr.d ca:1 b : ::in tte d.
rL - rL
PLL = ?LL
n / a
SL= SL
. 5 • (S . )
.:•~ - _ ,,; (3 r . ) t : .S '( L:irW )
~ - .! ii i:,.. lbf -- - - -- ·- ft
lbf . 4 DL= 5 ~ • 9 ft
l.: L+ . € PL + J. 5 SL= __ ... lt ·~
3 C C, • - ---;-;:--
' L+ • € l.,. ~ lbf' LL= !)Ct, . ... ~=
l.:: L+ . € SL+ IJ. 5 PL1 = , ~ lbf' 03-- -~
Vl-7

'• L 'J
y
Hax1 ct•.1.,: shea=
-- R max '/
E:. L= l. c k1p
·; - 3: .c•; klp max
Ma x1m.1:n :n:cte:11; at m1j.,pan
- CLt- : : . c s:.+ : . 5
. eaci;i~ns c.r: each side , : br : dge, c,ns ! de r _:i;i ;;u d 1stc=:bu:ce:i e··enl y ac::-,·ss the c,p ar:j a . >tip e q·.1estr1an loa:i a: the midspar ..
:.engtch :i f span L - q: f:
max 'j , z 33.4 kip
max
Vl-8
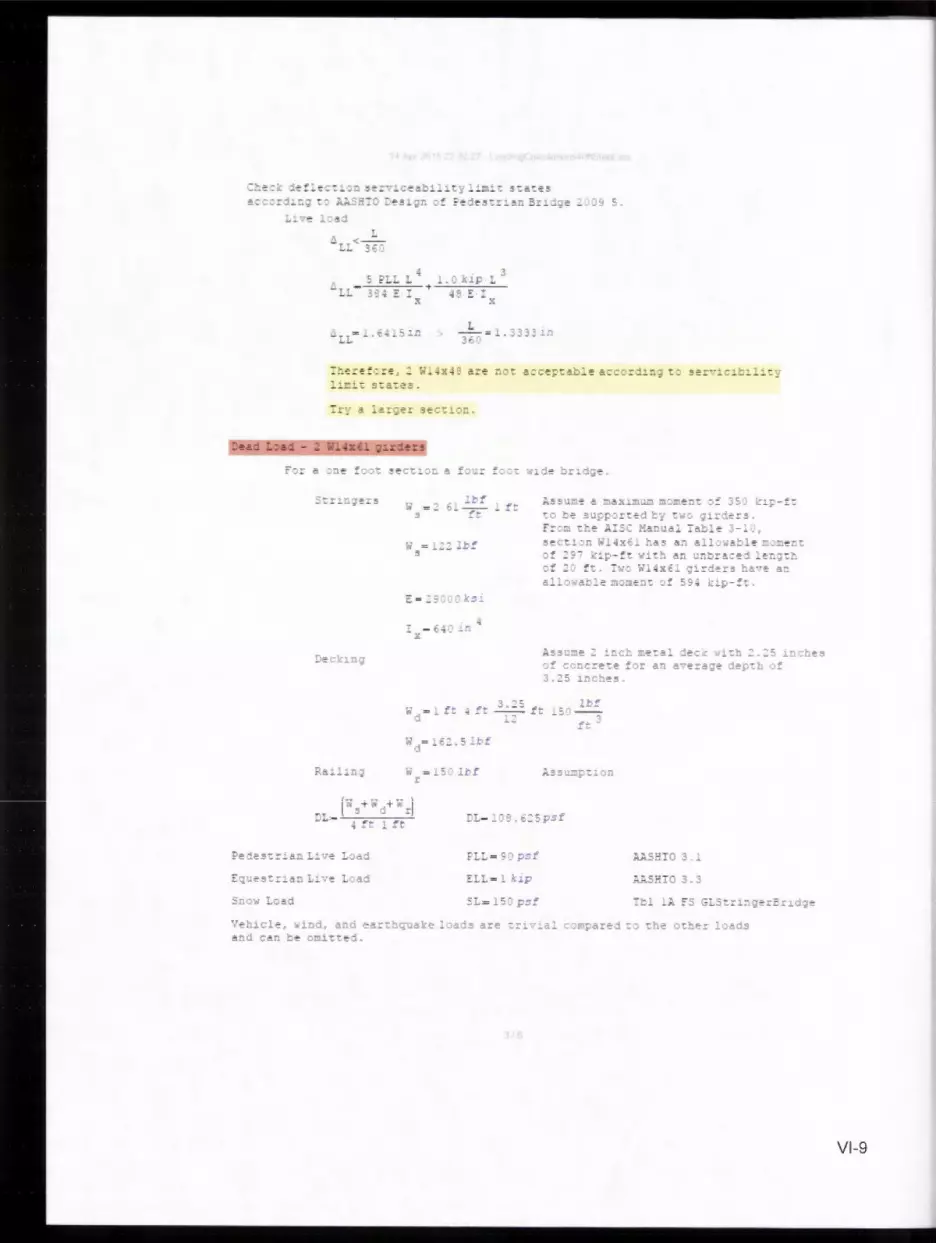
:r.':c:C d;'!.:.~ :::.1: 0 s ~=··i. cedb1:~t:l :i m1t sta:.es ~-:::rj:.:i;. ::: ;._' -:: : :e.,1;.r-. :-:: ?ejes::r1~ :-: 3rlC:'Je :, ,:" 5 .
S:io;; :. ;ad
.:l. < - -LL H •:
'"LL 5 PLL - 3~' - , -
1. .:
I X
.. kip L 3
-t 3 -- -X
. 3333 .l./J
: r.-e-=e! : =~ f : w: ~x ~~ a.re nc ~ acc ~;:t ab :-: acc:rd 1:11 -c:.. s er ··1c 1~ : :.1~7 l1=i.:. s -:e :.es .
fc ;.ssume a :nax::.mun :r.::n e n:: : : 35,) 1-:ii: -: t ::o be supi:orted b7 tw: gird;; :::s. F= ~o ~he ~IS H¾c~al : ab :e -~ C, sec:::.:n W x€_ ha11 dn a:1:;·.,4ble o:m er.:: J! :9- k:p -:~ w1 ~ ~ an unbra:ed :e ng~t
: : ,:, ::: . : -.. : Wl4xcl girder, ha· ·,e an a :l Jwab:e mo:ne:it o f 59~ k1p- ::: .
~ .s!!lume: inch mecal ·:!ecii: ·•1:h :.:s :nche!I j f c~ncrete ::= an ave=age de~~h ~= 3.:s nches.
3.:s, 5 .. lb~ \old =_ fc .J ~:; - -- - .. c _ .
n3
W =- 5:lbf' r
PLL = 9: . psf'
:C:LL = kip
SL = 15: psf'
USHTO 3. _
:USHTO 3. 3
·,ehicle, •••1nd, and ear :iquake _ ; ad3 are ::riv 41 c :.rnpared o ::he o ther l ::.ads dnd Cdn b e ~rn1::::ed.
Vl-9
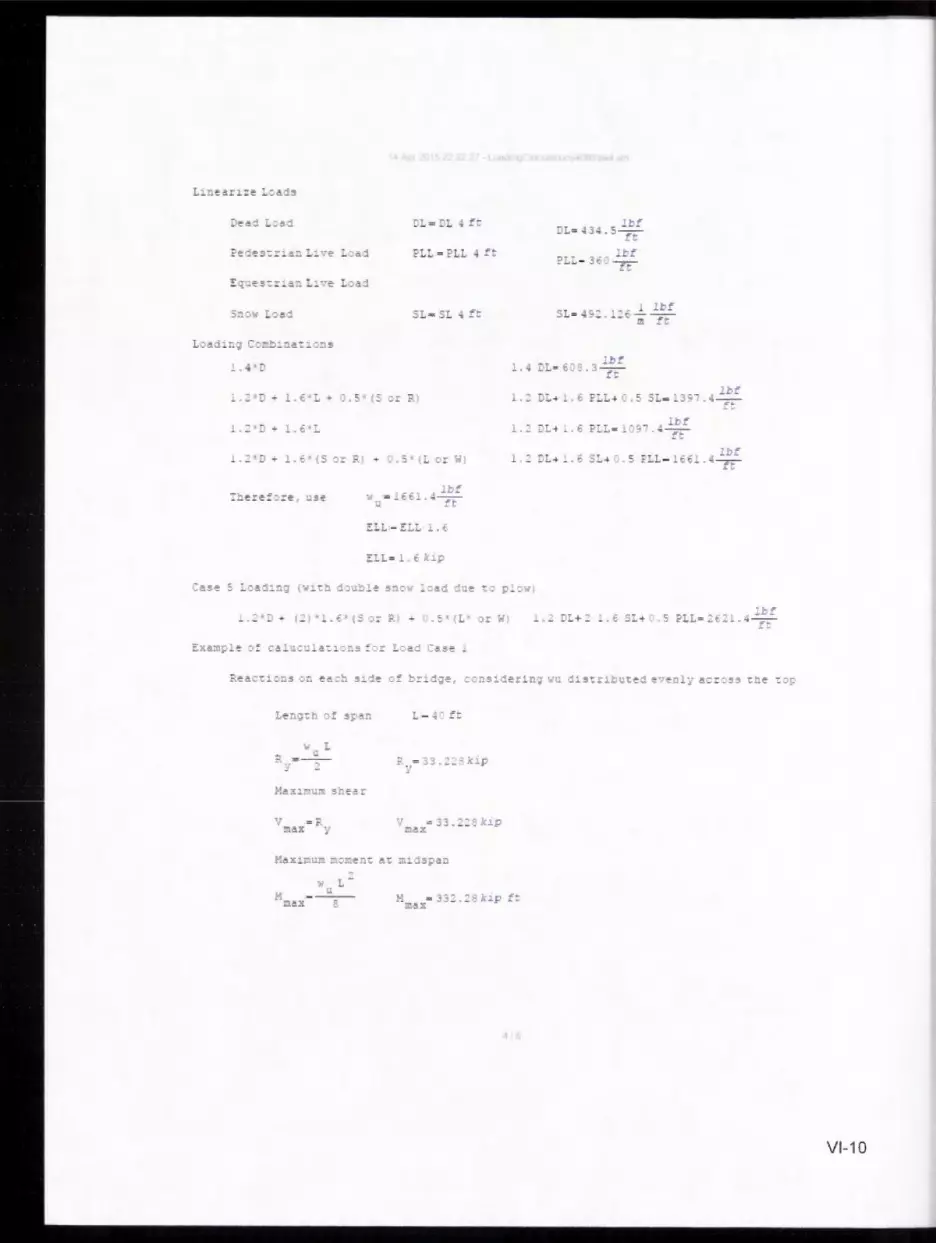
Deaj :. :aj
L e ngth :,f ~i:ar.
?LL = ?LL f:;,
.SL= SL ~ fC
• lbf · · 7c
:t .. = 33. :: 3 kip ,
11ax~mu:n ::i:..:men::. at rn:d:span
'b' L = 43~. 5 -f.-
"L . lbf ~ L- 3c ... ft
• _ ,, 0 3
lbf - - e, - . Tt'"
.., :+ . i P:.L_.. -: . S Sl = 3~~ . .; 1~ .. f •~
• DL+ : .... £
Vl-10

?ea c -:: :n3 J:'l ea ch sije : ! br~dge, c.::ns1der1ng ·••l dis::::-1::n.;;;ej e ··en::,• a::rcs3 the c;p a:1d a _ . J - ··:p e:, u estr:a :i :ad a t he m.:dspa:i .
.,, L l-1 =- ~-· __ .._ :'.LL L
e:tax : -l
•:~ e ek de ~lect.1 ... n :,-r··1c e b1 1 "J l:m.it .s :,f ?e:ie.:1tr:an 3::-idges :0: 9 5.
5 FLL L 3
. J kip +---~--~~ E :
X
-1
-= l.3333J.n 315)
:heel.: she r c ap c1::y cc,::rd1ng o ;u se M nual pee Chap::er G (Sh ea:- )
• - :r:aximum shear ·,n h a - 1:i p pJ : nt =ad a c c1n ;i :- fr .m - h e supp:irt .
F = SC ks1 .,.
he = 3,J . q .,,
., - - . ; kip max
Vl-11
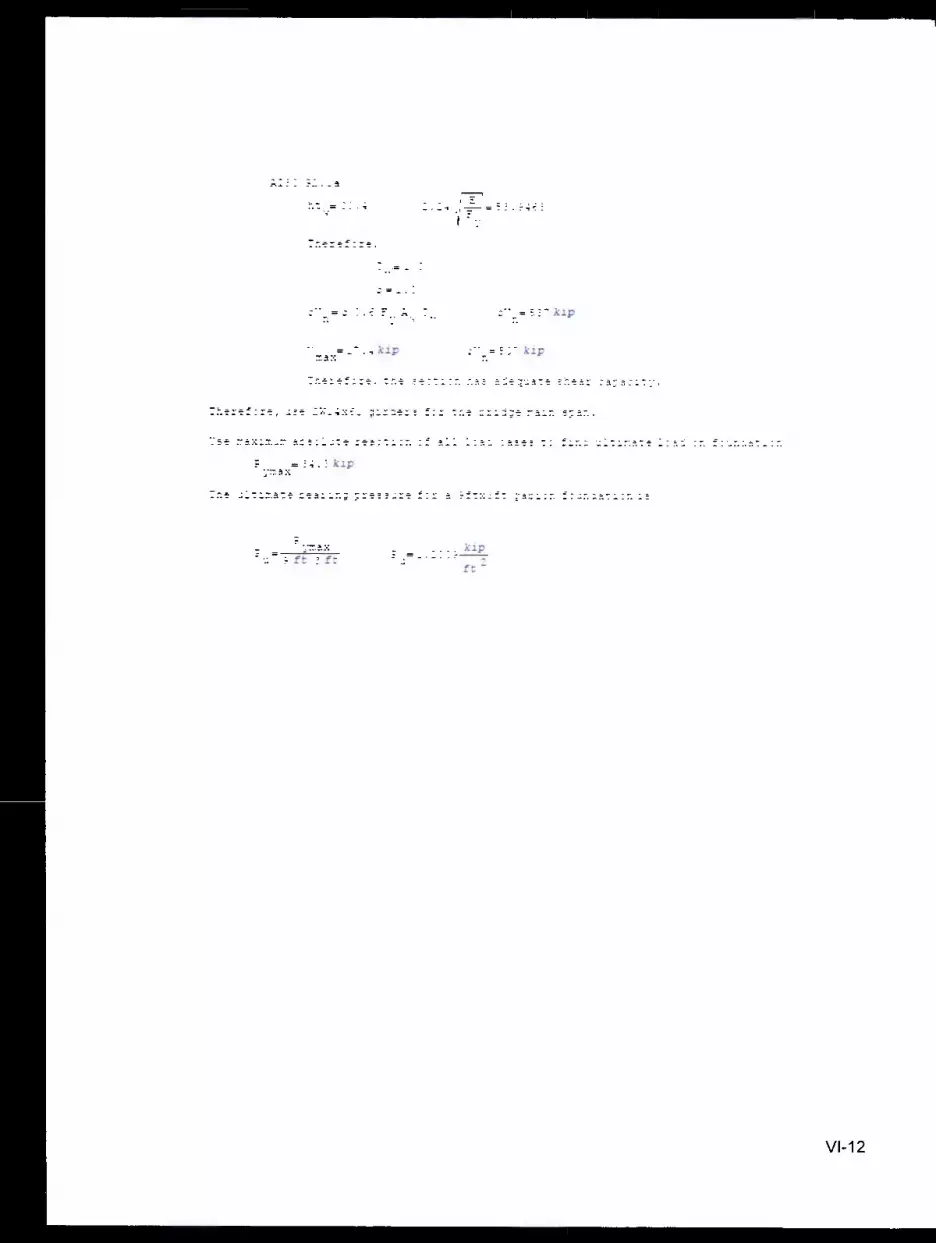
- u
V :r.ax
S ft 3 :fc
=.: . .,
k.1p
Vl -12
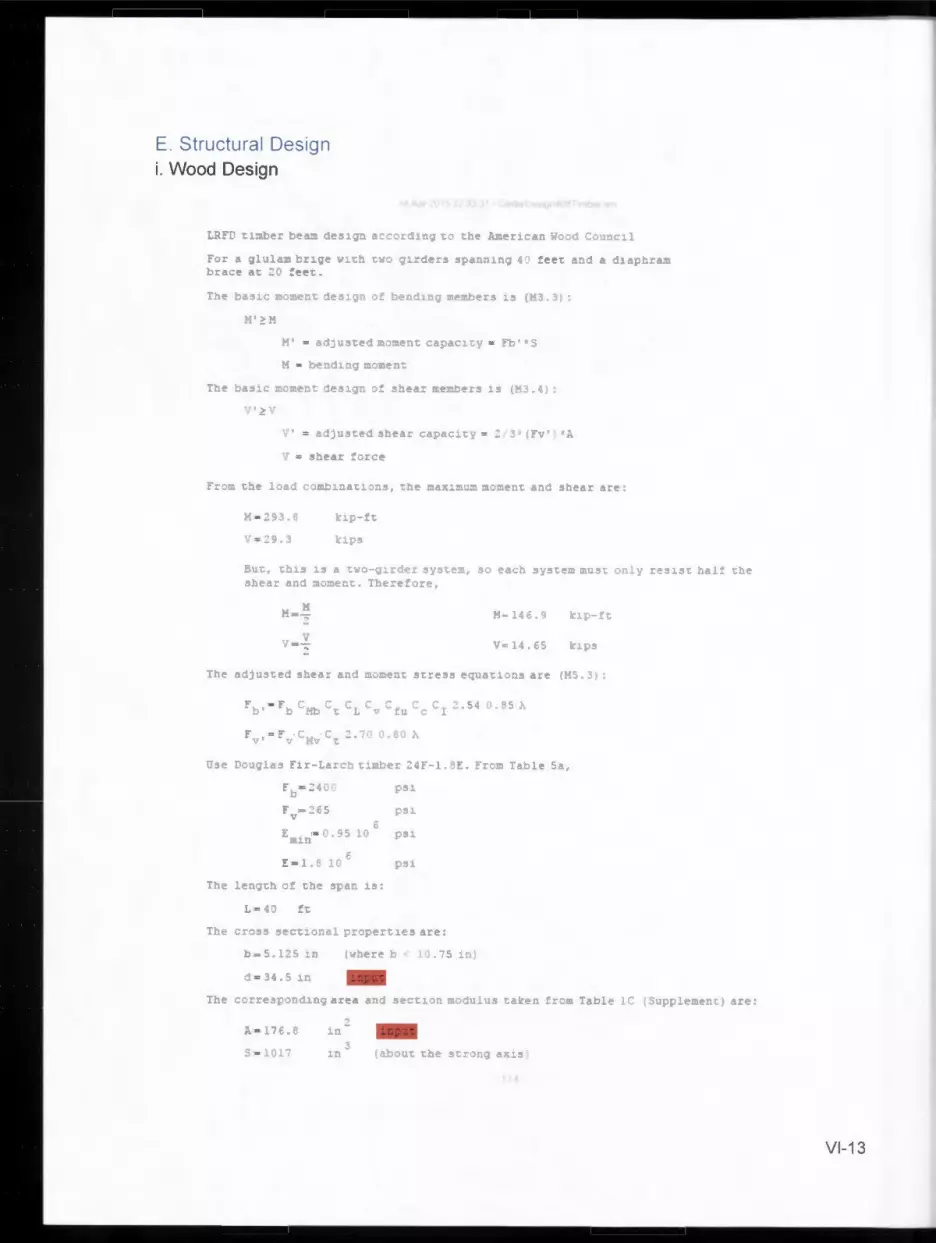
E. Structural Design i. Wood Design
:":>r a .. _u :~ b =:. g,e ~:.:.:"l cw: ~ := :ie= ~ ~J:.¼~ :tl nJ .; :1 : e~'t c1:-id a .j :a rh =a :n b ra =e a~ ~O ~ee~ .
be n:1::ig :nenb e rs 1s {~3.3 1
: b' •s
l.:J.j:5
Euc., th.:.s 1s a ·.-:i- ;i:r der S'./St eo, s o ea c h syst e:r. must cnl · r e sist ha :: tl: e 51:.ea r anj :r.:::l=r: :.. : he =e:: :1re,
Use r.:iu,l a s f1r-:. a r cl: :.1:rb e ::: f- . 3:'. . f r::n Tabl e Sa,
_ = 0 .9 5 C l. n
£ . e :c
The l e ng t h J: t he :,p a n 1s:
L =
ps :
Th e cr:is s s e c ti Jr.a : i:r :p e r c:e s ar e:
('whe r e b _ J . ~5 in )
d = 3 ~. 5 in -The co ::r es p c nd1:1;i r ea a nd s e c :.1 ,:n :r.odu us t a l:e n f ro:r . :a bl e !C (Supi:l e :r.e nq , ~~ -
e. e : n -(ab ou t th e s cr ong ax S I
Vl-13

!G:r ders re i::a ce ct s uch t r. :; 1 H.3.-::.:.~r. Jj 1nt s are r.~r1: ~nta~
==- :. J 3 :;re!ls 1n :;era c :;1 : n : a c :. J r (5. 3 . ~ ) :
r
l.'.! ) E m1.n
R -a
L a nd C
-There: :ire,
FbE [ +~] f bst:ar +-_---
C - ~. 9
r bstar . 9
1 z:. ) ,; 1 e u
Vl-14
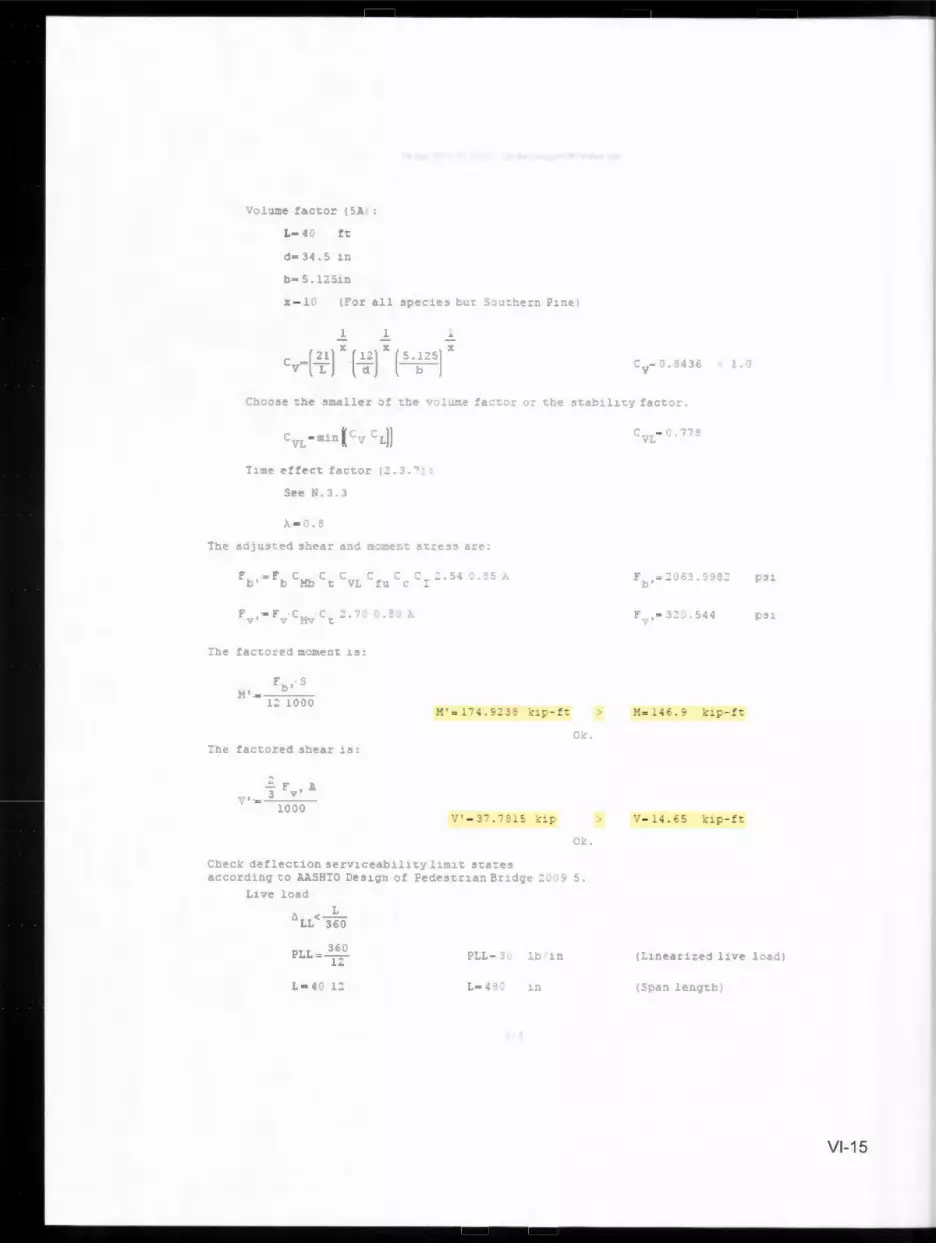
--d= 3.;. 5 in
:o= s. 1:sin
..::. ..::.
~he~k de : ec1:1:m 5e=·· :.ceab:.:.1:.:, • ~i.:r.:.:. :,:.a:.es acc:i=dir.gto AASHIO Des:.gn :: Pe:ies1:r:a:13=1dge : :: ,. 5.
L: ··e l Ja:i
PLL - 3: ~b _ .,
= .. ,= 3: : . 5-l
'), V- 4.65 k ip - ft
( pan ler.g.:r. )
Vl-15
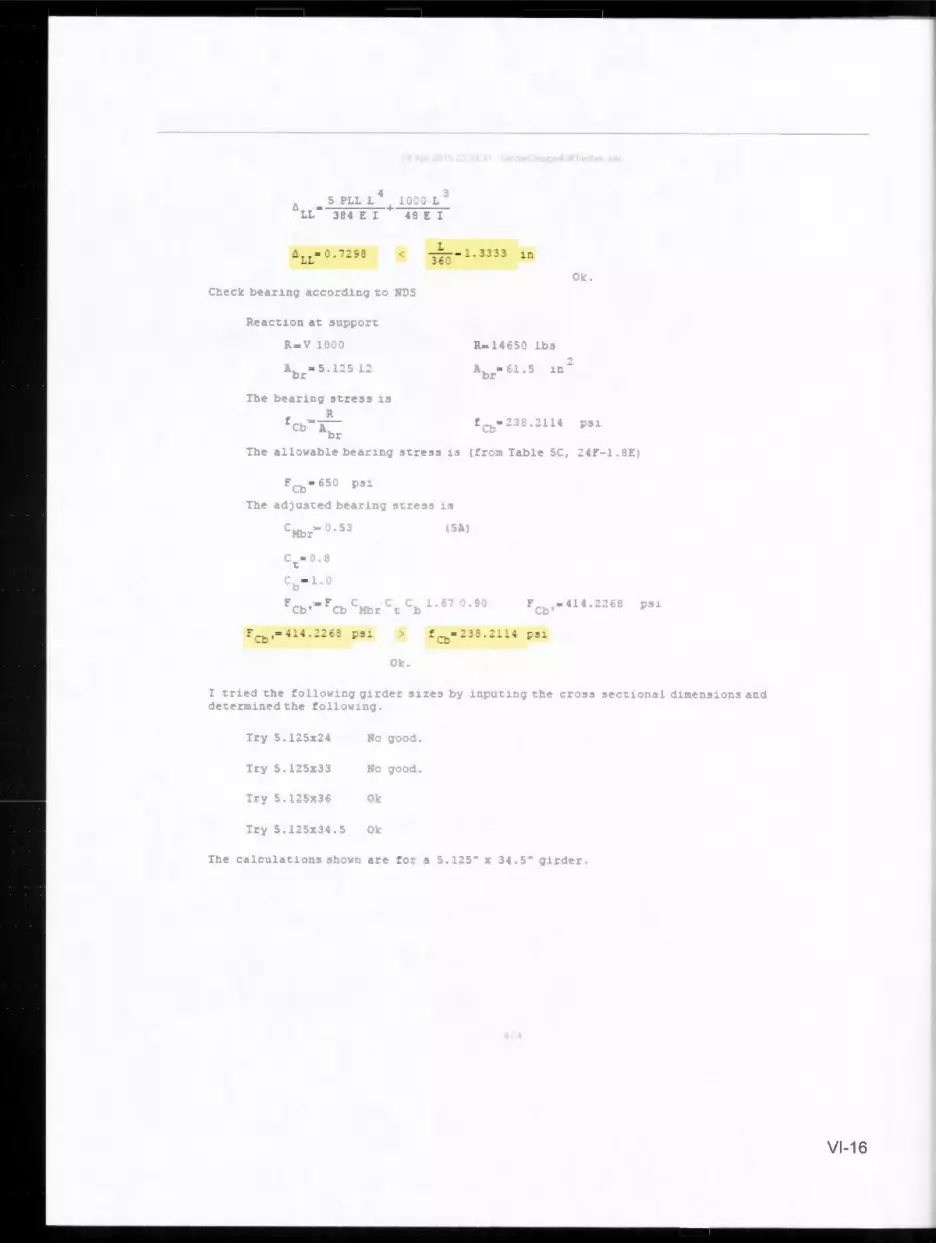
: JO
f Cb = -:;-'=-n b ::-
!. :, : : L 3
~: : I
= 14€ : lbs
OJ.:.
Th e al Y-'d bl e b ea.r:.:i;; 3.;re3:5 :.3 ( : =:m I b! e 5 , :4 : -1 . 9 '.::)
F Cb = ,; - : t= !!l
Th e adjU!!te::I bea.::-1.n;i s-:=es5 : s
b'
Cb = l. C
F Cb' =: :::b C:-!b = :'t :b
.. ... f p:,i
r1.e d he f :;llY,nn;; ;i :.::-de::- s ::e s by ini:uc:.ng :he c r :,33 se~:1.nal d1:r. e r.:1l::r.s and dete=:r:ine d ch.e ! :>l! :i• ~r..g.
Try 5. :sx:4 N:> ,;p:d.
Tr y 5. '.:5x33 I!: , g ,::id.
T::-y s. 1:sxJ~ I,,;
Try 5.l:5x 34.5 OI:
Vl-16
V = P
V'.2:'"-
b : in
d - c :n
L: 5 . 5 in
lb-:n
lb
Vl-17
A - _ 9. :s 1.r..
3 S= :c.:3 ir.
: ,:,·- 1. 3
>.- J . e : he aj:us:ed :t:e ::i::! r.g a~j s:t:ea !l':r e 33e! a:::,;,:
~ '· - :'b' S
.. , =3 ...... ;:,,
o··
Vl-18

ii. Steel Desi n
w 5
lbf' e~ tt Assume a max : cu:n :t : men: :)~ 3c: ~ : ~ -:-: c2 be :,upporced by w:: g1r::ier:,. f r o:n the ;u se M nual ab e 3- _ , secti on w x~: has an a:l:: ;;able :i::,men:: : f !. SC I:ip -: c ·,.:.: : h a:i '..lr.b=ac: i l~:-1~:.!": :,f : o : c. : -.o l,L~x 3 girde r s ha··e an all ""'able mcment o !' 3~: kli:; -!' t.
~s:sUI:te : :.net rn.e: a : deck ·1t:. t.h : . :s : !:.::'.le! :f c::nc=ete ~,r an a·.·e::a~e depth
Sn JW Load
3.: · inches.
L= : :: . ... :sps.f
PLL - ,1) psf
EL L = ! kip
SL = S Jps f
;.).S:iTO 3. 3
Tbl A f S GLSt=inger3=ictge
·,'el::.cle, •,1:.nd, ar.d ea= : l:c,-.iake l: a::13 a=e tr:, ··ia : c:,mpared t: the the= _ :,ads and can be c:i::.tted.
:L - r L
?LL = ?: L
r. a
SL = SL
l.
l.: ' _ .,. l. € l - J. 5 {S :;= .
.6 (Sn.) • :.s•(L:.rW)
ft
, ..
ft _L _" lbf ~ = t, /.iJ --:;::-:-
lbf - • 4 LL = 5 ° . 9 fr;
L+ l . € PLL+ ) . S SL=
DL+ l. € t>LL 1' •• ~ lb:-· - . = .c;c. _ft
l . : L+ l . 6 SL+ . S ?L:= 6 3: . : -:t
Vl-19
-- R cax ·1
. ., L -u
!-lr:iax =-- ., -
E:.:. = EL:. 1. 6
React::::._, ::,r. eacl: .5:d': :, ! br1d-;7e , o:i, : der :n -;; ·,;u di.,-:;r : bu-:ed e··enly ac=~.,., -::1.e t;i; ar.d a l. ': - l:1.p eq: :.ie.5tr 1.a:1 J a d a-: the ml.d-'P n.
·= R , = 33.rn k1p nax q max
Maxu:i,i:r. m,me:1t at midspan
M - 34:::.)4klpft r:iax
Vl-20
cr.ec.ti: d.efl~ :-:..:.':rJ .se=··1.c':'.a.:.1.::.-:~, :.1.=i.r.: s:a:.es ac..::r:3 : ~~ t: ;.;.sr:: : -e31i1: ::! =-=j =;:1:=:.a :i. 3r: .:.;-:- : J:~ S.
5 ~ LL - .; -t
LL - 3: . E - - -X X
:'he=-::: ,re,: w:.:x~~ a.=-= r.::. a:ce~tab:e a-::c.:ir11ng c:. .3er··1c1b :.:.1-:.· 11::11:. ~:..¼:.e!I.
Ra: ing
;..ssi;r:1~ a It:ax:.:nun :c.:m~n: : : 35: k:i:- :t :;: be s:1i:i::r:ed b·· t·o1: girders. Fr :o : he ~I SC Ma~ua : ab:e 3 -! -:, sec :.:. :.n ;;~.;xC! ~as a:i a: -·,_iable c:m e r.~ :,~ :"" l: : i;:-~: « .:. : !l an unbrac e d :e n~ : !: : : : : ::.. : •11:, ~14xC. 91.=der~ hape an a:.1:,wab:e c.~:ni:=nt -:.f 5~~ l:1.::--!t. .
Ass1:r:1e : inch me:a l deck w1 th : . :s inches :.: c;nc=e:~e : ,= an a··erage- de~ l":. :; : 3. :s :nches.
::.L- _ ::. c:Spsf
?LL = ~-: psf
C:LL= k.:.p
A).SH: 3. l
A..l\.SH:O 3. 3
·;ehicle, ,nnd, a:id ear-: h:iual:e _ :ad are -:r1.,:al c:r:1i:,a::ed t the :>ther l:iads and c an be ~rnit: e d.
Vl-21
Lir.ear::e LJacls
Jead : :,ad i:'L = uL ~ f t
?LL =. Ll.
L ,ad:nQ Ccmb::.:iat : :ns
- l.o'L - :·.s• (Se r R1
:.:: •J - l.€ I S . ) - :.S•(L: :: WJ
: here : :,re, use
Length : span
w u
y
Maximum sl: e ar
V max y
Max:mu:r. :r.:me:i:: at :r.::.ds:i:;a:i
w L-11max- ~ 11 = 33'.: .: 9klp
max
lb f •
4 ft
Vl-22

::'eac:.::.n.s ::i e ::J: 5 : :le ; .: br : ::!;ie, c::n51:ier1:1g ;.rJ d1s :.=1 butect e ·· e n ::· a.::r:sl! te -c::;;, a:i d a . - ··:i;: eq u estr:a:i ~:c:l at the :r.:ds.i::a:i.
'Ii '.l ::1: =--+--.. i ... .. ?-__ = 3L:::>k:p ,
C!"le ci.: ::!e!le "t :. :r. se:-··_ceab1:1t• l1c1t sta e s cc:,rd1r:7 :.: ~:. .: ;i: Ces1:,:1 :,! Pe:!e.,tr:.ai:: 3r1 dg es :::; 5.
S Pll L ~ _ . J kip : 3
t-------.: 9 t. -
X
. 3333.ln
Check st.ear cai;:ac1:.· acc~rd1ng c:, ;.: sc Manua Spec Chapter G (Shear)
- 3~. e kl.p max - :r.ax1mum .,hear w th a -ki;:: i;::::it : :ad ac:.::ig !t fr om the sui;:port.
' -
f = 5 1:ksi 'j
A = l7.9ln -·,;
ht = 3 J. ·,;
max
Vl-23
? u
h :: = 3:. ; ',/
r-;:,
: • : 4 .. ,' =-=- = 5; . ~ ..,_ € 3 I -
Vl-24

:c :i:t:3t a:!I: :Ce ab le:: w:.: !ls :a::ij a: : : ::; p. :.o : .ad at !lupi;:-:r:!I :r a d.1s cr:.::: ·.::e d : :iad :•!' s : : b f:. al:n~ : !l e '::::ltire s:r-.:c:i.:r : .
L = 4 0 (!t.
[ : __ be] w = so ..
s = l J ( r:umber .:i: :,upp:rt.3 )
2001 b ►
Concrete
-"- Handrail
Steel Deck _,;'
Girder
Vl-25
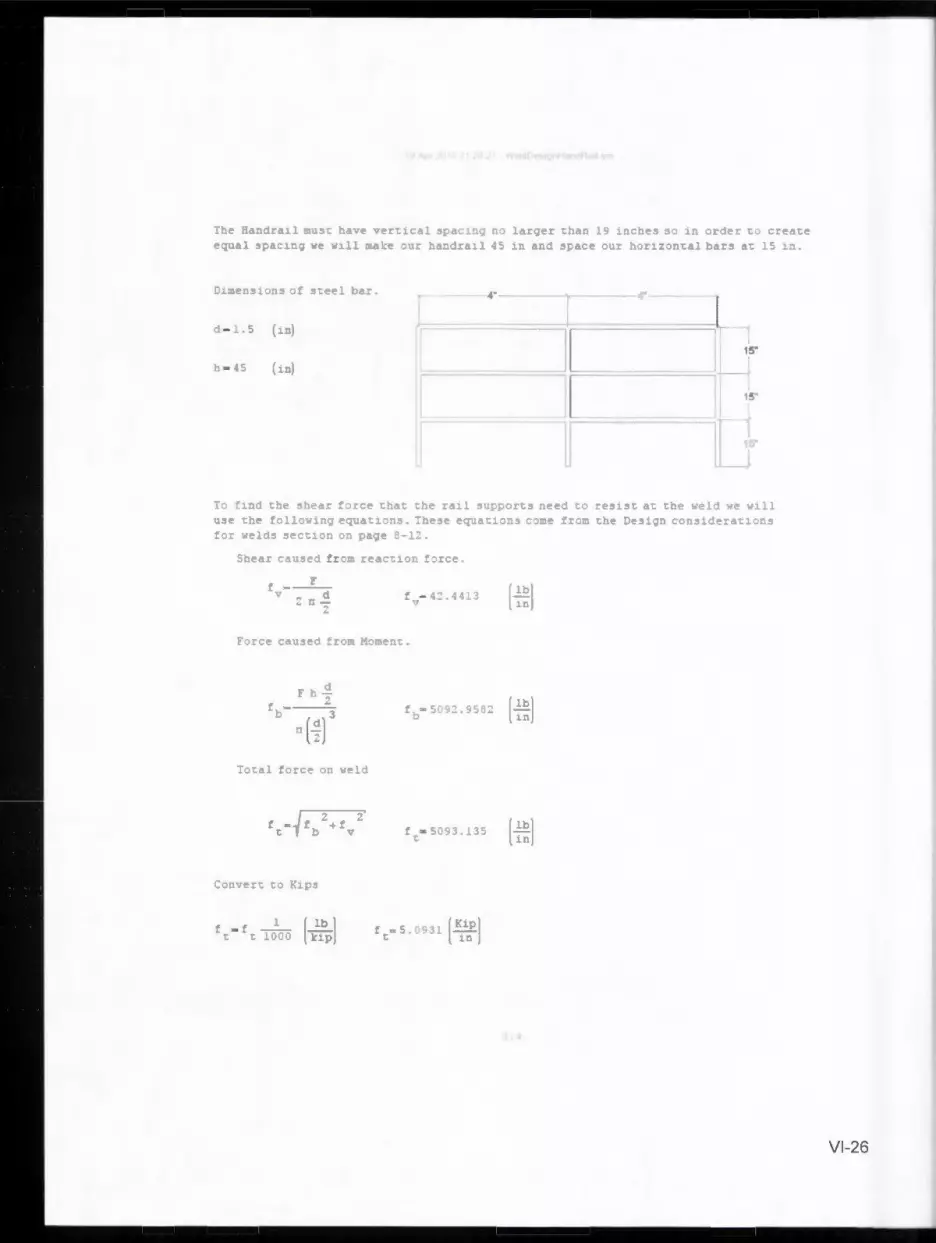
: :ie :I nd=a:: rr:1;st ha·•e -e=7.ica:. si:a c ::i;i :i::: la=qe= than 9 in ch es s:. 1n o =:i-er :; ) c =eac-e e qua : si:a:::::i;i we -.r:ll :r.al:e :u= l:a:ij=aJ..l ;5 1r: a:i:i si:ace ):J h.r :::n::al ba:::i at: ::c : :i.
4"
15"
h = S ( ir:) ----,
15"
] 15"
_ .., ~1 r.d t he stear !::r =e that: chc r:J.:l siq:-pJrcs r.eed :.c =es1st. a~ the •·e: d we ·"':_:l u3 e the ~ Jl ::·,; ::i;i eq:ia::J..::1:, . T!:e.,e e~ ua:1:n., c:me !r :!:I the :es1 ;ir. c:n .,1:i-e=a::::::s ~ ~ r ~e~ ds sec~1~n :n ~aJ e ~--: .
~ _ __ F __
:1 I:-:;-
[ lb] l!l
Vl-26
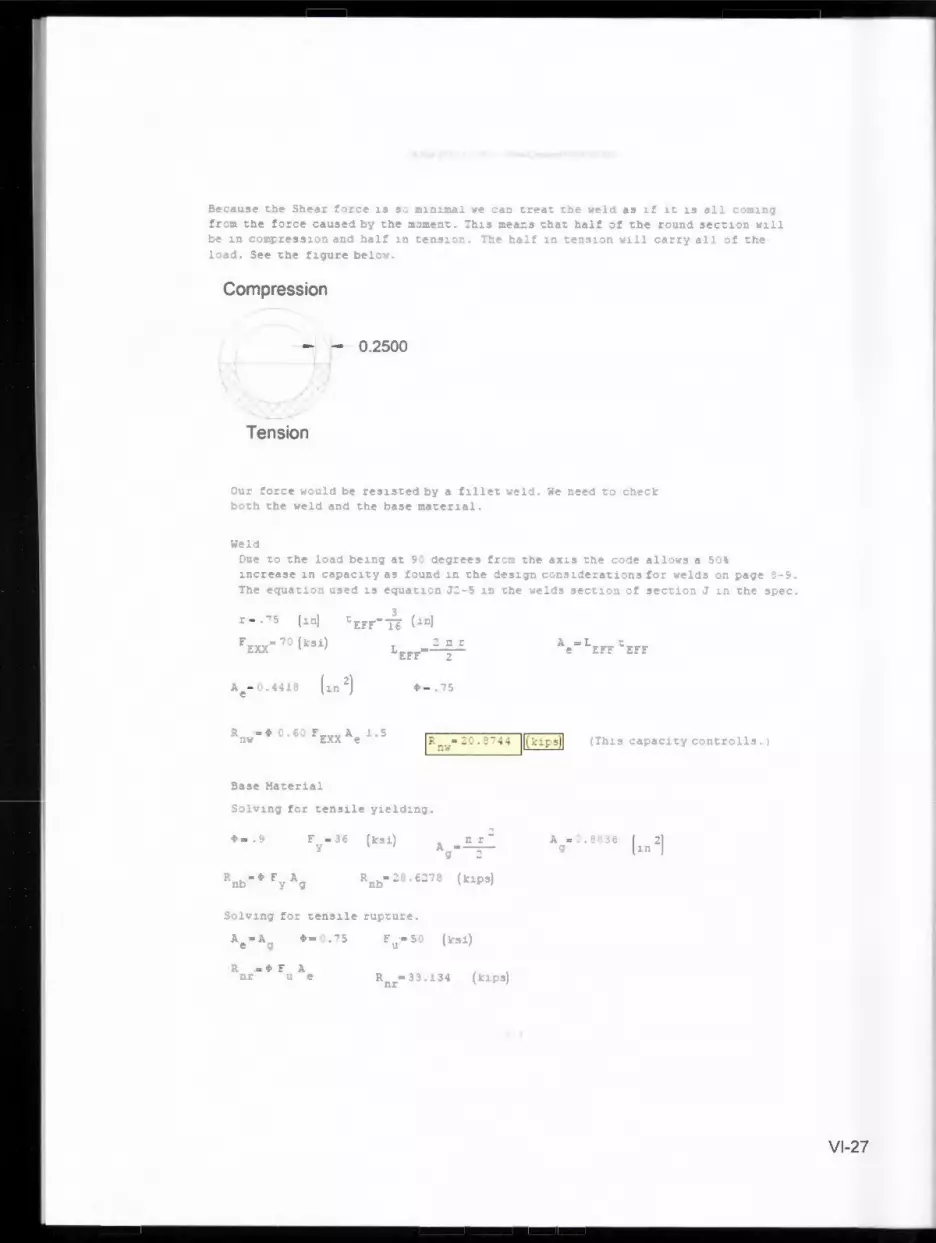
! r:ci. t he ! ::c e cau!l e d b7 th e :r.:c -en:.. : :-:1~ ::i~a :-.~ -:=.a.: ?-.a.l : :: t.h e : jt:. :"ld .s,ec :.:::~ .; :: be n C)~f:: !'1:-33:.:n ar:.d ~d:: : :i ten : :r-.. : :--.e ~.::.:~ !::l :.~ ::.31 :•:, ·.-al: carr:· _ l : : th~ : :ad. See the ~ gure b e :··.
Compression
0.2500
Tension
0:.1:: !::: c e ;; : ulj be res:ste d b:; :. ~i::e t ,, e: j. ii -;; J".ee d ~:ch the vel d ~j t he bas e =dte:::a:.
W-;;~j
J ue c c t he l~ad be:~1 at 9: de1ree s ~r=~ tte ax:s t h e c~d e all Jws d 5 ) \ 1n -=rea3 e : n capac1:.~ -· a~ ! :ur:j :.:i : e ~e~:g:-i c:r.:.! : j era~1::,.5 !:r we: 1s : , :1 J:d'J':' ~- ~. : te equa~:.:n '.J~ed :.s e: r.1at: : :n ;:-s ::-. he ·..:':'.:d.s se::t::~ : ! se:;:.1.Jn: !.n : t-: s~ec .
(: r.J
( l:s i)
3dse Mat erial
• nb = 9 F y ;,..g
·= 9 n:: F
u ;,..
3 t :::F:- --=-z (: n]
L - •• --=--=--=- -
.. r
- ·= 5 ~ u ( ksi )
R = 33. 3-l nr
n -----
Vl-27

r.« ~ L,-:-:- =
ri. - J. S ?9 e
Okay us e
(in)
==---- t __ _ e .:.:: i:.t:
Vl-28

Wi d th o f c,:, n c re:t':: inl::.:
R R max r.iax
0 =---=---b "b b s b
- 6
a :::9.3 :nax
R R max l J)(
max
R :nax
b = s
l:: C
Vl-29

f:i.nj the c ::::.;::i.::a: ·,;:.C: r.,
The 1 · "CJ= c:o. e 1.n - 3-i r: s.::r.1~==s, and l~ in :s c -set~ :c.3 ir.. The::::: Jr : , use ~ads:: : d:.~ e osi:ns:
l. O
Vl-30
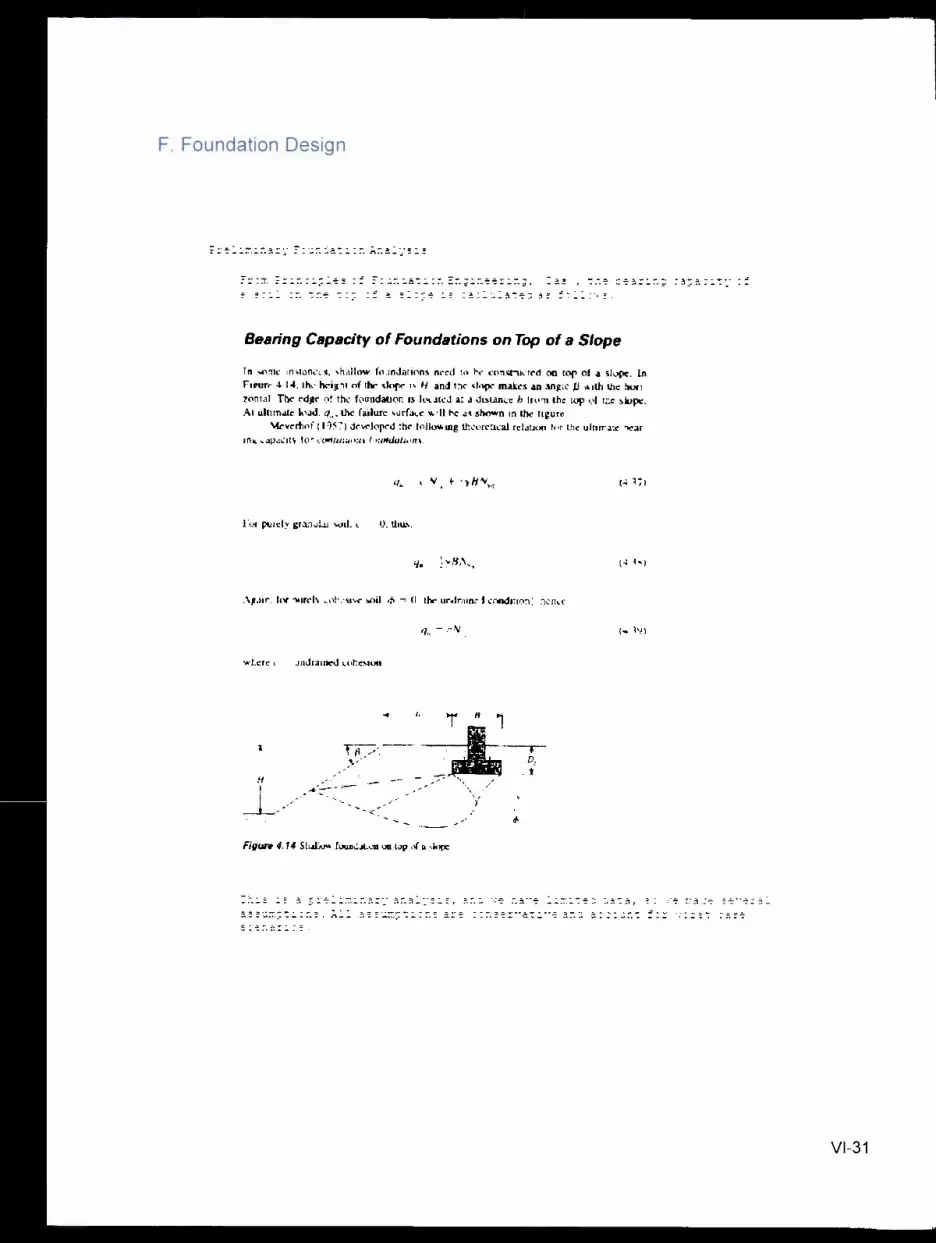
F. Foundation Design
:'r::c. :=1nc:p es :::: ";:ur.dat.1:in ~:"J.g1neer:.r.q, r:as ), :.!':.e bea= :.n~ :apac:t.·· a .5 :i: en tl':e ;; ,:;p : a s :i;;:ce :.5 ca.c : ·.1la :;ej a.5 : 1 :·.s.
Bearing Capacity of Foundations on Top of a Slope
ln m m, tonccs. shall ow foundatio n . need to h<,. cnn. 1n1crcd on top of a slope . In F1Vurr 4 14, the hei ght of the dope 1 · H aml the lope make s an an gle fj 1th the hon z:ontal. Tbc edge the fou ndati on i localed at a d~t.an c b fro the top or the slope. At ulti rnatc load , q., th<, failure surface ... ~11 be ~ shown tn the fii;ure .
¼vcm of ( 19 ) developed the follow wg th al n:lauoo for lh< ultimate hear 1n capac ity for cu,i t,nu ow fm md atwn, .
Foe purely granul.ir ii. < 0. lbw. .
q. jyH,
iain. for re l coh c i,c soil, ,t, = 0 \ lh<-undra ined cond mon) ; hen
when: c = u11dra.iocJ cuhc:s10,L
Figun 4. 14 SwaJJ,,,.. fow1dlll1..., un top r/ a •k,pe
D ' I
(4 l7)
(4 IK)
< 39)
Th is is a i;:;re i::u:iar· analysis, r.d ·,ie l:a··e :i:i::ted da :;a, s:i ·,1e ma;:e se··eral assu:i:pti:ins. ;.11 assumpci:ins are CO!l!lervati·:e a:id acc· ·.1nt : ·r ..,crsc case scenar:os.
Vl-31

[
Slope d :.mens1 :ms: b
s
b = 5 . 55 b·= 5
ft
: h e u l:.:. m4~e b earir.g c a ~a::1t.·i :r. :.!le 5:1.: !!I ca::u:a:. e j as ;·,;s
(s ee hand dr a . :.n;; :, f ele·"at:. ·n ··1e w ~:,r estimat.ed d1:te n3 1cr. a 1
( ass,;.me t he s :,1: is ;::ir e l1 ;;r nu :a ::- n:! c' ==< 1
rl..,.su:ne t.he • a:.er table =:.ses ~= h e l:::.t:o : ! t.he ! :~ndat : :~ . : here!':re, U-' C ~he buJy a n t u :11:. ,1e1g:it o f s:i: : :r ca : c:i la:.:. n;; :Oear1n;; cap a c :t" ,
Y ' ·= Y - Y ',I
v' = s:. e pc ~
Vl-32
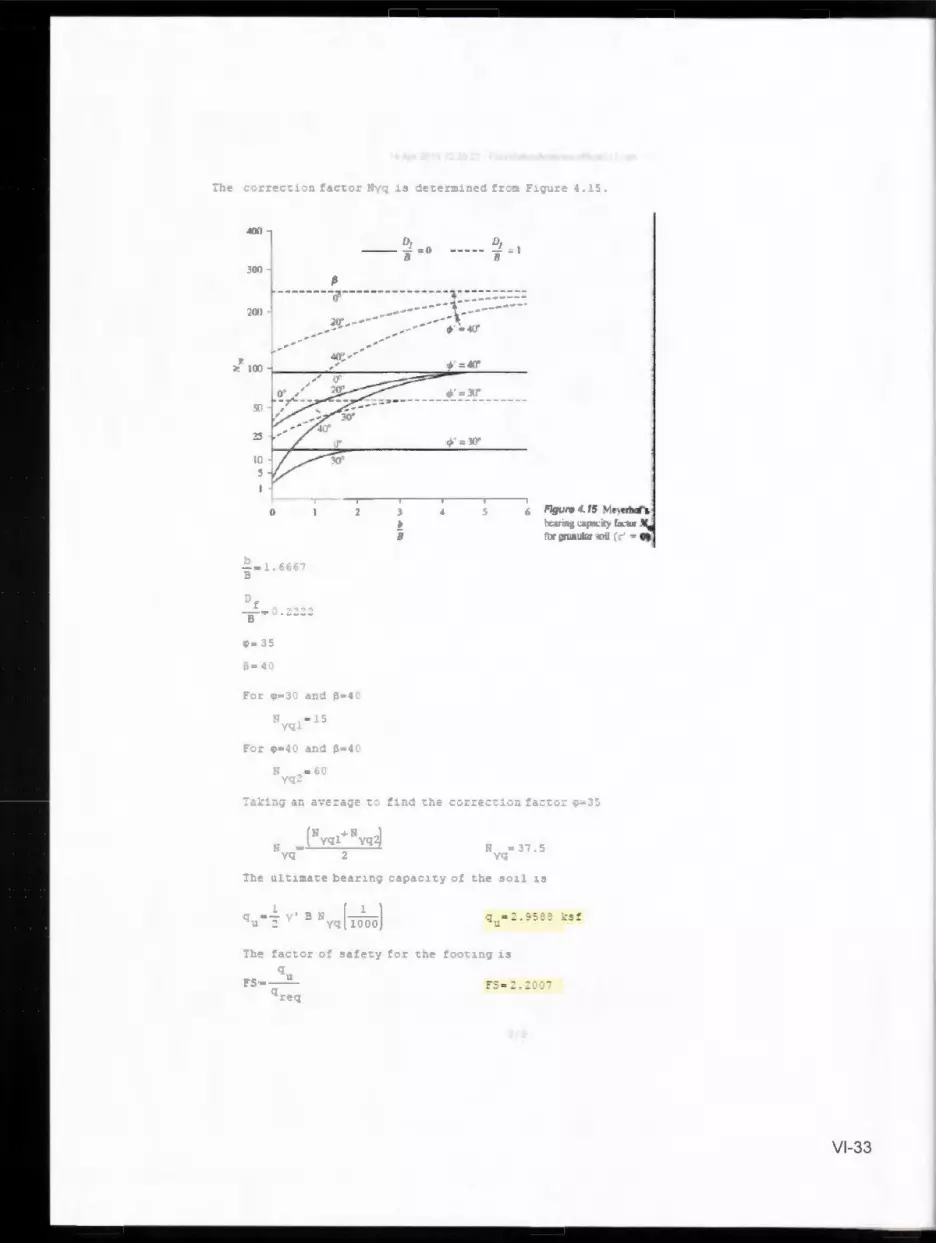
b B
0
- - .......... ----=---.. ----
= 35
1
~ B
v, n - 1
6 Flgvr• 4 15 Me~ ~ ~ L&JD-it) ft.LIO
1
f i,nnutar '!0 1I ( c' ~ .,
--------· -- ,. ____ _ \.,\J -.l~ \..."- .1. .JL. _ a,_\,..; ..
. , = r . s yq
The ul t !l:1a.te b -ea.r: ng c a.pa.c : r;,y :f t he 5 · : i ~
The ~a.c : J= : f 5a.fet · ~ ~ r t he f o~:: ng l5
qu : S·=-
q re q
Vl-33
L = -I. •-3 • - -
yq
~ss urne r.e ,1ater ca b e r:3e bu~yan ~ un :~ ~ei g. ~ ~! s::
V ' = V - Y ',/
b = S . 55 ft
(see ban d dra,11ng : : ele·· c1. .. n v 1e ·,; : :, r es cirna ted d :::iens: :,n s )
s.sw:i e the sJi: l !
i:urely g r nu: r anc C' = :)
~: ~: :~ =~ : f ~~e ~:ur.ja ~i ~n. : he=e ! ~r e, us e the :a::i.::a -:::.n;i l::ea rir.g c ai:a c :;; y.
Vl-34
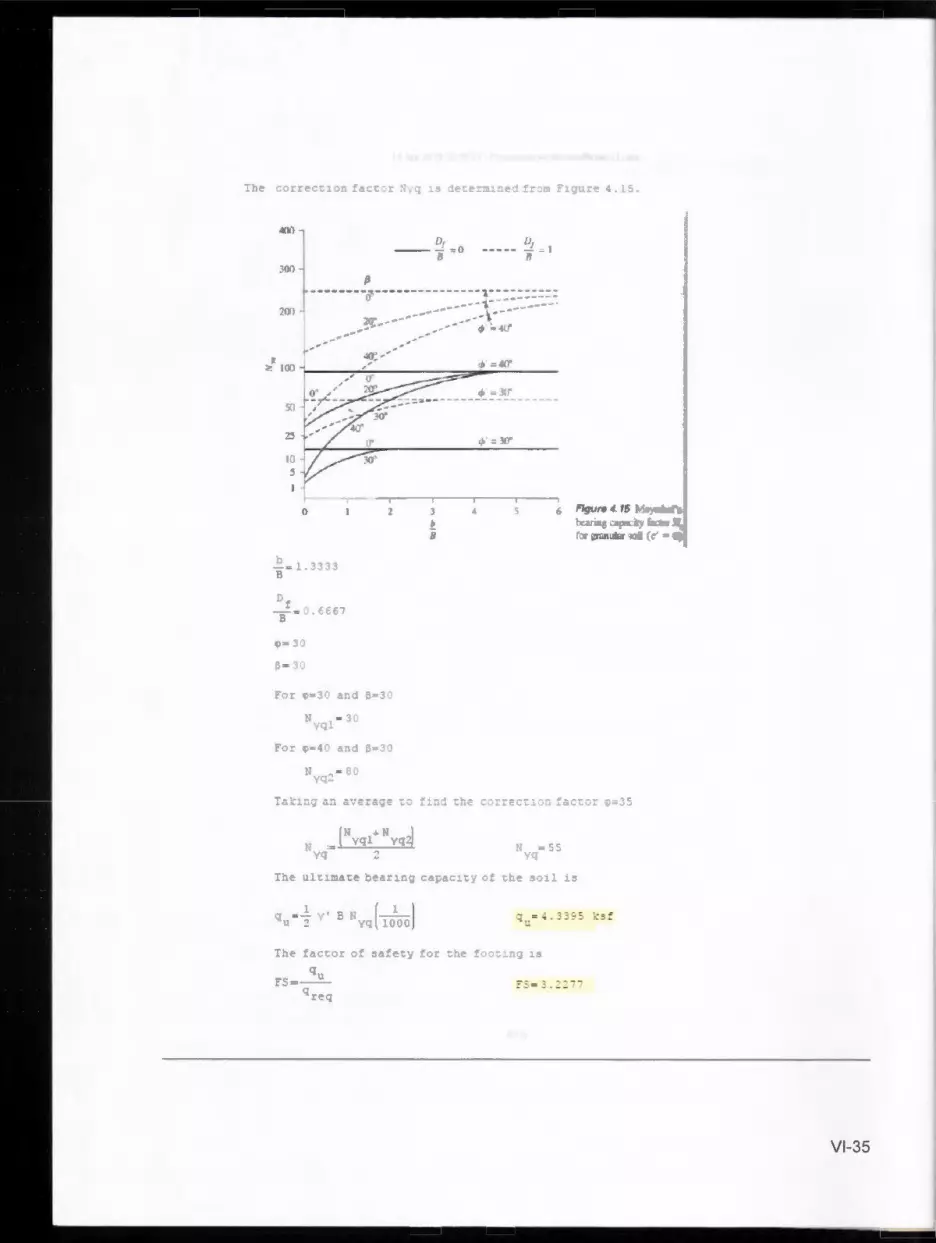
0
. 33 33
&
~ - - - ----=-= ._ • CC.C-O
,rq
F~r • J and a=JG
o, --n =O
3 b 8
6 Figure 4 15 Me}tdlat'I ~"" l"-ic) C -1u1
f ilJllJlular cioil (( ~ ..
.33~ 5
Vl-35

APPENDIX VI : SPECIAL SUMMARY DOCUMENTATION
Vlll-1
CHANGES AS PER PROFESSIONAL MENTOR 'S RECOMMENDATIONS
• Our professional mentor, Mark Anderson, is an S.E. and a P.E. We added S.E. to his titles throughout the document.
• In the problem statement, we more appropriately stated the beginning of the construction period "as soon as late summer 2015 ," rather than our previous statement of "will be constructed beginning in late summer 2015."
• We included the values of the bearing capacity (7500 psf) of the soil in the "Foundation Design" section .
• Under "Evaluation," we explicitly stated that we are using LRFD and AASHTO standards for the new structure.
CONSTRAINTS CONSIDERATIONS SUMMARY
HEAL TH AND SAFETY
The current condition of the pedestrian bridge at Right Hand Fork poses risks to pedestrian users. Stream crossings with pallets are also dangerous . The requirements placed on the new bridge will promote safe crossings . The location of the new bridge will be surveyed to provide easy access to the general public . It will be built with materials designed to withstand designated AASHTO LRFD loadings and various adverse weather conditions . The bridge will be built at a suitable height above the river to prevent abutment erosion . The structure will also be accessible to offer safe crossing for individuals with physical disabilities. During the construction phase, all workers will follow Occupational Safety and Health Administration (OSHA) standards . This will ensure a safe work environment that will help avoid accidents.
CONSTRUCTIBILITY
The Right Hand Fork pedestrian bridge is a relatively small structure with a braced , two girder design. Access to the northern side of the stream is unobstructed, since the bank is adjacent to the dirt road. Machine access to the southern bank will prove more difficult since the stream banks are quite steep . Therefore , a Gabion foundation design is suitable for this location since it can easily be installed without the use of heavy machine equipment. Each glu-lam girder weighs approximately 1750 lbs, which is reasonable for a crew of ten workers to place across the stream . Therefore , no crane will be needed. The rest of the timber materials are quite easy to manipulate and move with one or two workers . A dump truck will be required to haul the earth fill , but the crew will be able to place and compact the fill with shovels and a compactor onsite .
Vlll-2

Construction should not take longer than two weeks , nor require more than five to ten workers .
ENVIRONMENTAL
Protection of native plant and animal life in Right Hand Fork is the primary environmental constraint. Also , protection of water quality and stability were considered in the design. Construction will not require heavy equipment that could harm the ecosystem. We considered multiple locations for the bridge to ensure the protection of native wildlife while meeting accessibility requirements . The proposed location will not destroy any trees, and approximately 1,500 ft2 of grassy slope will be removed to allow for the foundations and the earth approach structure. The bridge will allow the public to cross the stream without disturbing the Bonneville cutthroat trout's habitat.
SOCIAL
Accessibility is the primary social constraint. In order to meet this constraint , the bridge design meets ABA accessibility standards . This mandates that the bridge must have a minimum 3-ft width , and the proposed design has a 3.5-ft width . Also , the bridge must be wheelchair accessible , and approach ramps must not exceed a slope of 1: 12, which we designed in the earth approach structure . Therefore , the bridge meets ABA requirements .
SUSTAINABILITY
The foundation design of the structure is resistant to scour since we placed the abutments higher on the stream bank. The bridge has a standard 50-year service life that will not likely be damaged during future flooding events since the design provides 3 feet of clearance above the 100-yr 12-hr storm water level. The bridge will be constructed out of timber to meet these constraints . A hydrological study provided the necessary knowledge of the required height of the bridge span.
ENGINEERING TOOLS SUMMARY
Table 20. Engineering Tools Summary
Software Name Version Manufacturer HEC-HMS 4.0 US Army Corps of Engineers AutoCAD Civil 30 19.1 Autodesk , Inc. SMathStudio 0.97.5346
Vlll-3

Excel 15.0 Microsoft MATLAB 8.1 MathWorks, Inc. RISA-2D 12 RISA Technologies, LLC HEC-RAS 4.1 US Army Corps of Engineers ArcGIS 10.2 ESRI
PROFESSIONAL RESPONSIBILITY AND CONDUCT SUMMARY
Table 21. Expected Professional Standards used in Design
Organization Number Name American Society of Civil 7-10 Minimum Design Loads for Engineers , ASCE Buildings and Other Structures American Association of State 5tn Edition, Bridge Design Specifications Highway and Transportation 2013 Officials , AASHTO American Institute of Steel 14tn Steel Construction Manual Construction National Design Specification 2012 Wood Design Manual
Natural Resources Part 630 National Engineering Conservation Service Handbook
Table 22. Expected Identification Number and Name of Government Regulations
Organization Number Name
Architectural Barriers Act , ABA 401 Accessible Routes
Forest Service Trail 7.4 Technical Provisions Accessibility Guidelines , FSTAG
Vlll -4
POTENTIAL RISKS
WATER DAMAGE
There is a possibility of water damage on the structure during high runoff seasons as evidenced by the abutment failure of the current bridge in 2011. For this reason, we will design the new bridge with a longer deck span, which will place the abutments at a higher elevation that will not choke the stream's flow. Additionally, Forest Service regulations require that all bridge spans have a three foot clearance over the 100-year flood water level.
EXCEEDING DESIGN LOADS
There exists an improbability of actual loads on the bridge exceed factored design loads, causing structural damage. These circumstances are unlikely since the design will satisfy safety codes for loading . AASHTO loading for wind, snow, and earthquake loads will be considered. The majority of the traffic loads (humans) will be small compared to capacity. The design will also safely support the weight of A TVs if misused .
VANDALISM
The Hobbit Caves are in a fairly remote location and somewhat infrequently visited . Remote areas can attract delinquent behavior. Therefore, vandalism is a potential risk the bridge faces .
ASPECTS TO BE REVIEWED BY PROFESSIONALS
ENVIRONMENTAL IMPACT
We will attend NEPA meetings to consult with Forest Service professionals about environmental impacts associated with the design. Specifically, ecologists will assess the impact to the Bonneville cutthroat trout strain and any trees that need to be removed.
Vlll-5
STRUCTURAL SOUNDNESS
Forest Service engineers Jason Day and Oscar Mena will assist us in the bridge design process . Their expertise will help ensure the bridge is properly designed according to Forest Service, ASCE, MSHTO , and ABA standards. Finally, Dr. Marc Maguire, structural engineering professor and our faculty advisor, will review all designs before the project is finalized.
FLOOD PLAIN
Due to the lack of experience in modeling watersheds, many assumptions were made in determining the 100-year flood plain. Therefore, it is important the results from HECHMS and HEC-RAS should be doubled checked to ensure the bridge will be above the flood plain.
CONDUCT OF PROJECT MANAGEMENT
SCHEDULING
Ren Gibbons will create and oversee the team's scheduling . The schedule will be structured to meet all deadlines required for the Senior Design course and the Forest Service . We will follow the Gantt charts created for the project.
DECISION MAKING
Major decision making will be done as a group during face-to-face meetings. Minor decisions may be proposed by a group member via email if other members do not object.
RESOLVING DISPUTES
Disputes will be resolved by the team's dispute resolver , Kedric Curtis. Persistent disputes will be discussed during group meetings and each side will express their opinion . Reasonable action will then be taken by the group under Kedric's lead.
CHECKING RES UL TS
Redundant verification of each team member 's contribution is required. Any research, studies, or design work completed by any individual will be checked by at least one
Vlll-6

other group member . Next, these results will be reviewed by our professional mentor and faculty advisor .
ENSURE A QUALITY PRODUCT
Ensuring a quality product is the result of the previously mentioned four points of Conduct of Project Management. If these regulations are kept, we will be confident that our bridge design for Right Hand Fork will be effective and economically feasible .
Vlll -7


