Embed Size (px)
Citation preview
This article appeared in a journal published by Elsevier. The attachedcopy is furnished to the author for internal non-commercial researchand education use, including for instruction at the authors institution
and sharing with colleagues.
Other uses, including reproduction and distribution, or selling orlicensing copies, or posting to personal, institutional or third party
websites are prohibited.
In most cases authors are permitted to post their version of thearticle (e.g. in Word or Tex form) to their personal website orinstitutional repository. Authors requiring further information
regarding Elsevier’s archiving and manuscript policies areencouraged to visit:
http://www.elsevier.com/copyright
Author's personal copy
Removal of remazol black B textile dye from aqueous solution by adsorption
Natali F. Cardoso, Rodrigo B. Pinto, Eder C. Lima ⁎, Tatiana Calvete, Camila V. Amavisca, Betina Royer,Marta L. Cunha, Thais H.M. Fernandes, Isis S. PintoInstitute of Chemistry, Federal University of Rio Grande do Sul, UFRGS, Av. Bento Gonçalves 9500, Caixa Postal 15003, CEP 91501-970, Porto Alegre, RS, Brazil
a b s t r a c ta r t i c l e i n f o
Article history:Received 9 April 2010Received in revised form 12 August 2010Accepted 18 October 2010Available online 24 November 2010
Keywords:AdsorptionActivated carbonRemazol black BNonlinear isotherm fittingAdsorption kineticsAdsorption thermodynamics
Brazilian pine-fruit shells (Araucaria angustifolia) in natural form and as activated carbon were tested asadsorbents for the removal of remazol black B (RB) textile dye from aqueous effluents. The effects of shakingtime, adsorbent dosage and pH on the adsorption capacity were studied. RB uptake was favorable at pH valuesranging from 2.0 to 2.5 and from 2.0 to 7.0 for the biosorbent and the activated carbon, respectively. Thecontact time required to obtain the equilibrium using the biosorbent and the activated carbon was 12 and 4 hat 298 K, respectively. The fractionary-order kinetic model provided the best fit to experimental datacompared with other models. Equilibrium data were better fit to the Sips isothermmodel using the biosorbentas well as the activated carbon. The enthalpy and entropy of adsorption of RB were obtained from adsorptionexperiments ranging from 298 to 323 K. Simulated dyehouse effluents were used to check the applicability ofthe proposed adsorbents for effluent treatment.
© 2010 Elsevier B.V. All rights reserved.
1. Introduction
Dyes are one of the most important hazardous species found inindustrial effluents which needs to be treated, because its presence inwater bodies reduces light penetration, precluding the photosynthesisof aqueous flora [1,2], besides of being aesthetically objectionable fordrinking and other purposes. Also, dyes can cause allergy, dermatitis,skin irritation and also provoke cancer and mutation in humans [3,4].
Dyes are a kind of organic compound with a complex aromaticmolecular structure that can bring bright and firm color to othermaterials. However, the complex aromatic molecular structures ofdyes make themmore stable and more difficult to biodegrade [5]. Themost efficient method for the removal of synthetic dyes from aqueouseffluents is the adsorption procedure [6–9]. This process transfers thedye species from the water effluent to a solid phase thereby keepingthe effluent volume to aminimum [9,10]. Subsequently, the adsorbentcan be regenerated or stored in a dry placewithout direct contact withthe environment [9,10].
Activated carbon is the most employed adsorbent for toxic speciesremoval from aqueous effluents because of well-developed porestructures and a high internal surface area that leads to its excellentadsorption properties [11–13]. Besides these physical characteristics,the adsorption capacity is also dependent on the source of organicmaterial employed for the production of the activated carbon [11–13],
as well as the experimental conditions employed in the activationprocesses [12].
Activated carbon can be prepared using a variety of chemical [13]and physical [14] activation methods and in some cases using acombination of both types of methods [15]. Chemical activation is theprocess where the carbon precursor material is firstly treated withaqueous solutions of dehydrating agents such as H3PO4, ZnCl2, H2SO4,and KOH. Afterwards, the carbon material is dried at 373–393 K toeliminate the water. In a subsequent step, the chemically treatedcarbon material is heated between 673 and 1073 K under nitrogenatmosphere [12,16]. The physical activation consists of a thermaltreatment of previously carbonized material with suitable oxidizinggases, such as air at temperatures in the 623–823 K range or 1073–1373 K using steam and/or carbon dioxide [12,14].
In recent years, a considerable number of studies have focused onlow cost alternative materials for the production of activated carbonsfrom agricultural wastes such as, peach stone [13], cherry stones[11,17], coconut shell [14,18,19], vine shoots [20], cassava pell [21],walnut shell [21], coffee bean husk [21], corn cob [21] rice husk [21],pecan shell [21] and sugar cane bagasse [21].
In a previous paper [22] it was proposed, the use of Brazilian pine-fruit shell (Araucaria angustifolia syn. Araucaria brasiliensis) as aprecursor for the preparation the activated carbon material (AC-PW).This adsorbent was very efficient to remove the Procion Red MX 3Breactive dye from aqueous solutions, showing elevated sorptioncapacity. Due to its remarkable results for removal of a reactive dyefrom aqueous solutions, in this work, Brazilian pine-fruit shell wasutilized again, in natural form (PW) as well as the activated carbonmaterial (AC-PW). These adsorbents were successfully used to
Desalination 269 (2011) 92–103
⁎ Corresponding author. Tel.: +55 51 3308 7175; fax: +55 51 3308 7304.E-mail addresses: [email protected], [email protected] (E.C. Lima).
0011-9164/$ – see front matter © 2010 Elsevier B.V. All rights reserved.doi:10.1016/j.desal.2010.10.047
Contents lists available at ScienceDirect
Desalination
j ourna l homepage: www.e lsev ie r.com/ locate /desa l
Author's personal copy
remove the remazol black B textile dye (RB) from aqueous solutions.Equilibrium, kinetic and thermodynamic data of the adsorptionprocess of the dye onto these adsorbents were investigated. Theadsorbents were also tested for treatment of a simulated dyehouseeffluent.
2. Materials and methods
2.1. Solutions and reagents
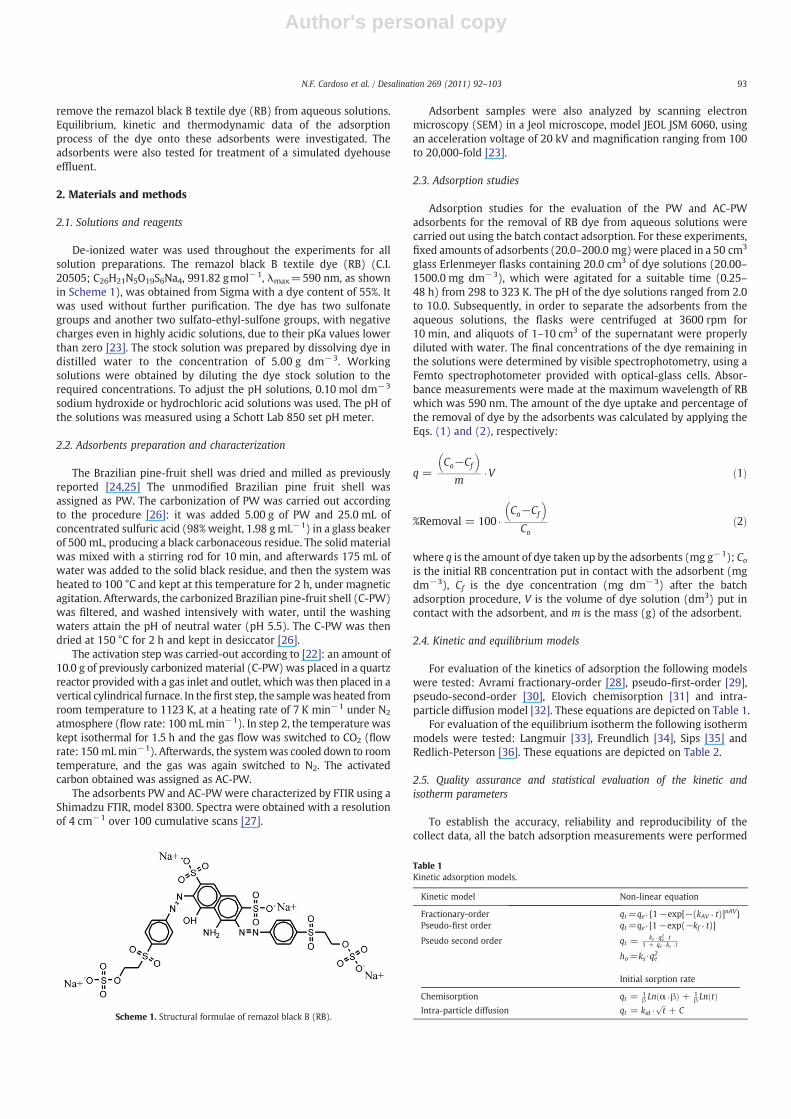
De-ionized water was used throughout the experiments for allsolution preparations. The remazol black B textile dye (RB) (C.I.20505; C26H21N5O19S6Na4, 991.82 gmol−1, λmax=590 nm, as shownin Scheme 1), was obtained from Sigma with a dye content of 55%. Itwas used without further purification. The dye has two sulfonategroups and another two sulfato-ethyl-sulfone groups, with negativecharges even in highly acidic solutions, due to their pKa values lowerthan zero [23]. The stock solution was prepared by dissolving dye indistilled water to the concentration of 5.00 g dm−3. Workingsolutions were obtained by diluting the dye stock solution to therequired concentrations. To adjust the pH solutions, 0.10 mol dm−3
sodium hydroxide or hydrochloric acid solutions was used. The pH ofthe solutions was measured using a Schott Lab 850 set pH meter.
2.2. Adsorbents preparation and characterization
The Brazilian pine-fruit shell was dried and milled as previouslyreported [24,25] The unmodified Brazilian pine fruit shell wasassigned as PW. The carbonization of PW was carried out accordingto the procedure [26]: it was added 5.00 g of PW and 25.0 mL ofconcentrated sulfuric acid (98%weight, 1.98 gmL−1) in a glass beakerof 500 mL, producing a black carbonaceous residue. The solid materialwas mixed with a stirring rod for 10 min, and afterwards 175 mL ofwater was added to the solid black residue, and then the system washeated to 100 °C and kept at this temperature for 2 h, under magneticagitation. Afterwards, the carbonized Brazilian pine-fruit shell (C-PW)was filtered, and washed intensively with water, until the washingwaters attain the pH of neutral water (pH 5.5). The C-PW was thendried at 150 °C for 2 h and kept in desiccator [26].
The activation step was carried-out according to [22]: an amount of10.0 g of previously carbonized material (C-PW) was placed in a quartzreactor provided with a gas inlet and outlet, whichwas then placed in avertical cylindrical furnace. In thefirst step, the samplewas heated fromroom temperature to 1123 K, at a heating rate of 7 K min−1 under N2
atmosphere (flow rate: 100 mLmin−1). In step 2, the temperature waskept isothermal for 1.5 h and the gas flow was switched to CO2 (flowrate: 150 mLmin−1). Afterwards, the systemwas cooled down to roomtemperature, and the gas was again switched to N2. The activatedcarbon obtained was assigned as AC-PW.
The adsorbents PW and AC-PWwere characterized by FTIR using aShimadzu FTIR, model 8300. Spectra were obtained with a resolutionof 4 cm−1 over 100 cumulative scans [27].
Adsorbent samples were also analyzed by scanning electronmicroscopy (SEM) in a Jeol microscope, model JEOL JSM 6060, usingan acceleration voltage of 20 kV and magnification ranging from 100to 20,000-fold [23].
2.3. Adsorption studies
Adsorption studies for the evaluation of the PW and AC-PWadsorbents for the removal of RB dye from aqueous solutions werecarried out using the batch contact adsorption. For these experiments,fixed amounts of adsorbents (20.0–200.0 mg)were placed in a 50 cm3
glass Erlenmeyer flasks containing 20.0 cm3 of dye solutions (20.00–1500.0 mg dm−3), which were agitated for a suitable time (0.25–48 h) from 298 to 323 K. The pH of the dye solutions ranged from 2.0to 10.0. Subsequently, in order to separate the adsorbents from theaqueous solutions, the flasks were centrifuged at 3600 rpm for10 min, and aliquots of 1–10 cm3 of the supernatant were properlydiluted with water. The final concentrations of the dye remaining inthe solutions were determined by visible spectrophotometry, using aFemto spectrophotometer provided with optical-glass cells. Absor-bance measurements were made at the maximum wavelength of RBwhich was 590 nm. The amount of the dye uptake and percentage ofthe removal of dye by the adsorbents was calculated by applying theEqs. (1) and (2), respectively:
q =Co−Cf
� �m d V ð1Þ
%Removal = 100dCo−Cf
� �Co
ð2Þ
where q is the amount of dye taken up by the adsorbents (mg g−1); Cois the initial RB concentration put in contact with the adsorbent (mgdm−3), Cf is the dye concentration (mg dm−3) after the batchadsorption procedure, V is the volume of dye solution (dm3) put incontact with the adsorbent, and m is the mass (g) of the adsorbent.
2.4. Kinetic and equilibrium models
For evaluation of the kinetics of adsorption the following modelswere tested: Avrami fractionary-order [28], pseudo-first-order [29],pseudo-second-order [30], Elovich chemisorption [31] and intra-particle diffusion model [32]. These equations are depicted on Table 1.
For evaluation of the equilibrium isotherm the following isothermmodels were tested: Langmuir [33], Freundlich [34], Sips [35] andRedlich-Peterson [36]. These equations are depicted on Table 2.
2.5. Quality assurance and statistical evaluation of the kinetic andisotherm parameters
To establish the accuracy, reliability and reproducibility of thecollect data, all the batch adsorption measurements were performed
Scheme 1. Structural formulae of remazol black B (RB).
Table 1Kinetic adsorption models.
Kinetic model Non-linear equation
Fractionary-order qt=qe . {1−exp[−(kAV . t)]nAV}Pseudo-first order qt=qe . [1−exp(−kf . t)]
Pseudo second order qt =ks d q2e d t
1 + qe d ks d t
ho=ks ∙qe2
Initial sorption rate
Chemisorption qt = 1β Ln αd βð Þ + 1
β Ln tð ÞIntra-particle diffusion qt = kidd
ffiffit
p+ C
93N.F. Cardoso et al. / Desalination 269 (2011) 92–103
Author's personal copy
in triplicate [37]. Blanks were run in parallel and they were correctedwhen necessary [37].
All dye solutionswere stored in glass flasks, whichwere cleaned bysoaking in 1.4 mol dm−3 HNO3 for 24 h [38], rinsing five times withde-ionized water and dried and stored in a flow hood.
For analytical calibration standard solutions with concentrationsranging from 1.00 to 10.0 mg dm−3 RB dye were employed, runningagainst a blank solution of water adjusted in a suitable pH. The linearanalytical calibrations of the curves were furnished by the software ofthe Femto spectrometer. The detection limit of the method, obtainedwith signal/noise ratio of 3 [39] was 0.14 mg dm−3. All the analyticalmeasurements were performed in triplicate, and the precision of thestandards was better than 3% (n=3). For checking the accuracy of theRB dye sample solutions during the spectrophotometric measure-ments, a standard containing RB dye at 5.00 mg dm−3 was employedas quality control at each five determinations [40].
The kinetic and equilibrium models were fitted by employing anonlinear method, with successive interactions calculated by themethod of Levenberg–Marquardt and also interactions calculated bythe Simplex method, using the nonlinear fitting facilities of thesoftware Microcal Origin 7.0. In addition, the models were alsoevaluated by adjusted determination factor (R2adj), as well as by anerror function (Ferror) [41], which measures the differences in theamount of dye taken up by the adsorbent predicted by themodels andthe actual q measured experimentally. The R2adj and Ferror are givenbelow, respectively:
R2adj = 1−
∑n
iqi; exp−qmodel
� �2∑n
iqi; exp−qexp� �2
0BBB@
1CCCAd
n−1n−p
� �ð3Þ
Ferror %ð Þ = 100x
ffiffiffiffiffiffiffiffiffiffiffiffiffiffiffiffiffiffiffiffiffiffiffiffiffiffiffiffiffiffiffiffiffiffiffiffiffiffiffiffiffiffiffiffiffiffiffiffiffiffiffiffiffiffiffiffiffiffiffiffiffiffiffiffiffiffiffiffi∑n
i
qi; exp−qi;model
qi; exp
!2
d1
n−p
� �vuut ð4Þ
where qi, model is the value of q predicted by the fitted model and qi, exp.is the value of q measured experimentally, qexp is the average of qexperimentally measured, n is the number of experiments performed,and p is the number of parameter of the fitted model.
2.6. Simulated dyehouse effluent
Two synthetic dyehouse effluents containing four representativereactive dyes plus one direct dye used for coloring fibers and theircorresponding auxiliary chemicals were prepared in two different pHvalues, using a mixture of different dyes most often applied to textilefibers industries. According to the practical information obtained froma dyehouse, typically 20% of the reactive dyes and 100% of the dyebathauxiliaries remain in the spent dyebath, and its composition suffer a5–30-fold dilution during subsequentwashing and rinsing stages [22].The concentrations of the dyes and auxiliary chemicals selected toimitate the exhausted dyebath are given in Table 3.
3. Results and discussion
3.1. Characterization of the adsorbents
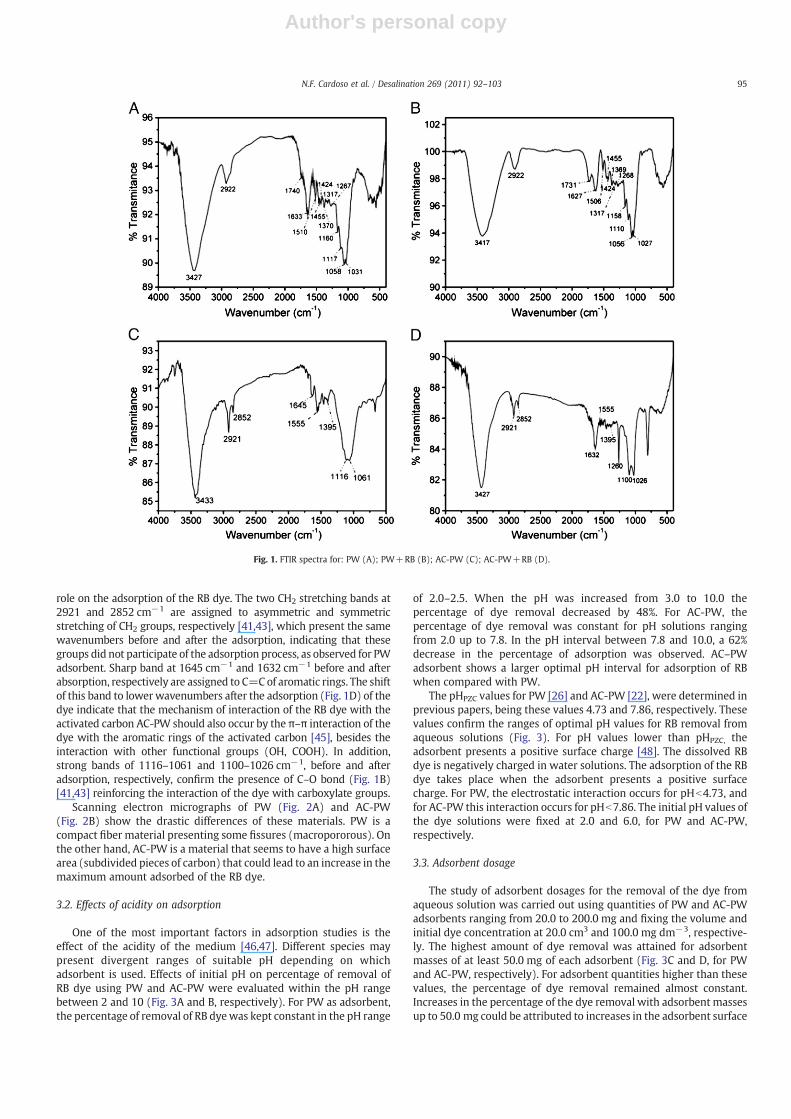
FTIR technique was used to examine the surface groups ofadsorbents (PW and AC-PW) and to identify the groups responsiblefor dye adsorption. Infrared spectra of the adsorbents and dye-loadedadsorbent samples, before and after the adsorption process, wererecorded in the range 4000–400 cm−1 (Fig. 1). As previouslyobserved for a fly ash adsorbent [42] after the adsorption procedure,the functional groups that interacted with the dye suffered a shift tolower wavenumbers.
Fig. 1A and B shows the FTIR vibrational spectra of the Brazilian-pine fruit shell (PW) before the adsorption and loaded with the dyeRB (PW+RB) after the adsorption, respectively. The intense absorp-tion bands at 3427 and 3417 cm−1 are assigned to O–H bondstretching, before and after adsorption, respectively [37,43,44]. TheCH2 stretching band at 2922 cm−1 are assigned to asymmetricstretching of CH2 groups [41,43] which present the same wavenum-bers before and after the adsorption, indicating that these groups didnot participate in the adsorption process. Small bands at 1740 and1731 cm−1, before and after absorption, respectively, are assigned tocarbonyl groups of carboxylic acid [43,44]. Sharp intense peaksobserved at 1633 and 1627 cm−1, before and after absorption,respectively, are assigned to the aromatic C=C ring stretch [43,44].In addition, there are several small bands and shoulders in the rangeof 1510–1424 cm−1 that are assigned to ring modes of the aromaticrings [43]. Thewavenumbers of these bandswere practically the samebefore and after the adsorption procedure. Small bands ranging from1160–1031 cm−1 and 1158–1027 cm−1 before and after adsorption,respectively, are assigned to C–O stretching vibrations of lignin[43,44]. FTIR results indicate that the interaction of the dye with thePW adsorbent should occur with the O–H bonds of phenols andcarboxylate groups.
The activation process to produce activated carbon from Brazilianpine fruit-shell (AC-PW) decreased the amount of vibrational bandswhen compared to PW adsorbent (Fig. 1C), evidenced by the fact thatsome of the FTIR bands disappear from the spectrum. This indicates thatthe oxidation and activation processes for the production of AC-PWwere efficient and lead to the oxidation of the functional groups of thestarting material, as already observed by the FTIR spectra of cherrystones activated byKOH [17]. Absorption bands at 3433 and 3427 cm−1
are assigned to O–H bond stretching, before (Fig. 1C) and afteradsorption (Fig. 1D), respectively [43], indicating that this group plays a
Table 2Isotherm models.
Isotherm model Equation
Langmuir qe = Q max d KL d Ce1 + KL d Ce
Freundlich qe=KF ⋅Ce1/nF
Sips qe = Q max d Ks d C1=nse
1 + Ks d C1=nse
Redlich−Peterson qe = KRP d Ce
1 + aRP d Cgewhere 0≤g≤1
Table 3Chemical composition of the simulated dyehouse effluents.
Dye λ (nm) Concentration (mg dm−3)
Reactive dyesRemazol Black B 598 50 50Basilen Red E−B 535 10 10Everzol BrilliantOrange3R 493 10 10Reactive Red 194 505 10 10
Direct dyesDirect Yellow 4 403 10 10
Auxiliary chemical
Na2SO4 100 100NaCl 100 100Na2CO3 25 25CH3COONa 50 50CH3COOH 12.0 900pH 2.0a 5.8
a pH of the solution adjusted with 0.10 mol dm−3 HCl.
94 N.F. Cardoso et al. / Desalination 269 (2011) 92–103
Author's personal copy
role on the adsorption of the RB dye. The two CH2 stretching bands at2921 and 2852 cm−1 are assigned to asymmetric and symmetricstretching of CH2 groups, respectively [41,43], which present the samewavenumbers before and after the adsorption, indicating that thesegroups did not participate of the adsorption process, as observed for PWadsorbent. Sharp band at 1645 cm−1 and 1632 cm−1 before and afterabsorption, respectively are assigned to C=C of aromatic rings. The shiftof this band to lower wavenumbers after the adsorption (Fig. 1D) of thedye indicate that the mechanism of interaction of the RB dye with theactivated carbon AC-PW should also occur by the π–π interaction of thedye with the aromatic rings of the activated carbon [45], besides theinteraction with other functional groups (OH, COOH). In addition,strong bands of 1116–1061 and 1100–1026 cm−1, before and afteradsorption, respectively, confirm the presence of C–O bond (Fig. 1B)[41,43] reinforcing the interaction of the dye with carboxylate groups.
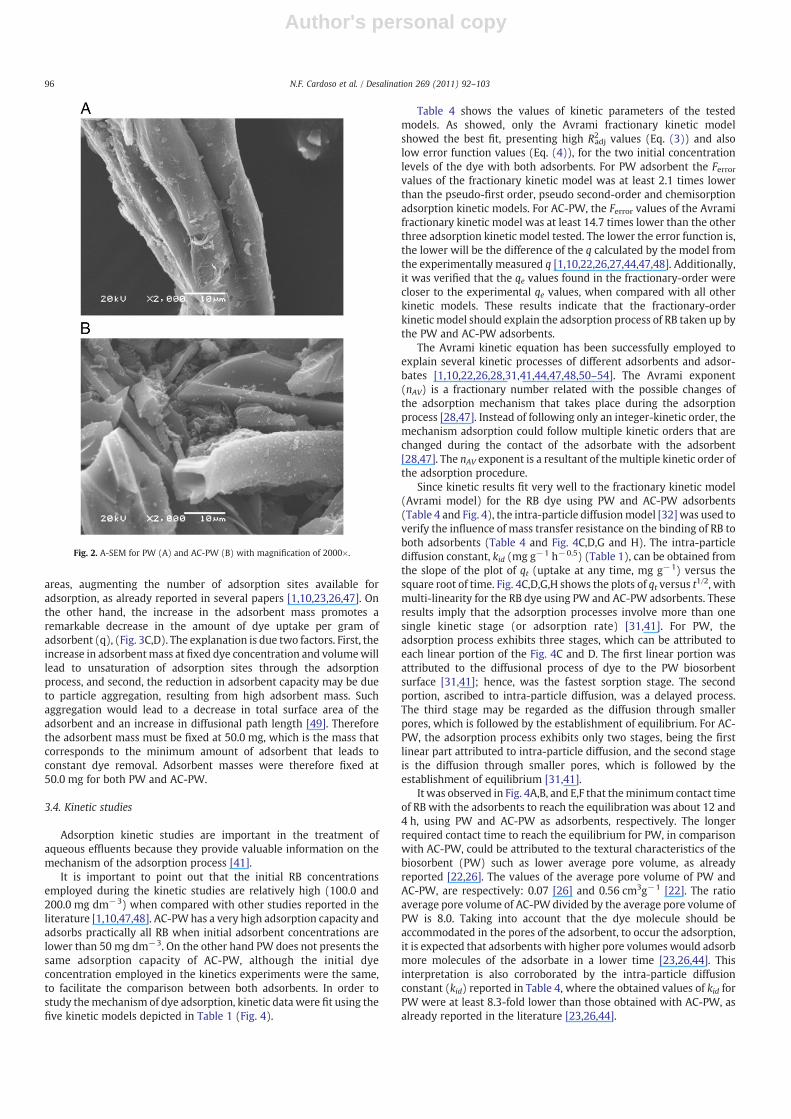
Scanning electron micrographs of PW (Fig. 2A) and AC-PW(Fig. 2B) show the drastic differences of these materials. PW is acompact fiber material presenting some fissures (macropororous). Onthe other hand, AC-PW is a material that seems to have a high surfacearea (subdivided pieces of carbon) that could lead to an increase in themaximum amount adsorbed of the RB dye.
3.2. Effects of acidity on adsorption
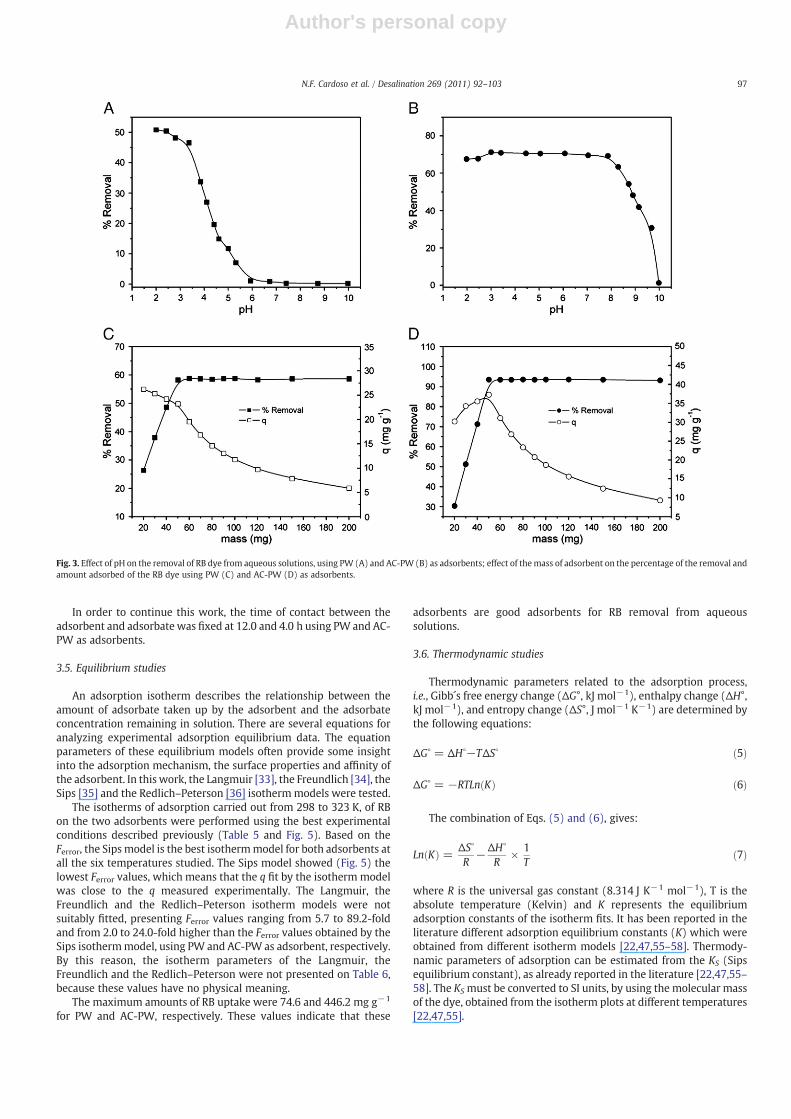
One of the most important factors in adsorption studies is theeffect of the acidity of the medium [46,47]. Different species maypresent divergent ranges of suitable pH depending on whichadsorbent is used. Effects of initial pH on percentage of removal ofRB dye using PW and AC-PW were evaluated within the pH rangebetween 2 and 10 (Fig. 3A and B, respectively). For PW as adsorbent,the percentage of removal of RB dyewas kept constant in the pH range
of 2.0–2.5. When the pH was increased from 3.0 to 10.0 thepercentage of dye removal decreased by 48%. For AC-PW, thepercentage of dye removal was constant for pH solutions rangingfrom 2.0 up to 7.8. In the pH interval between 7.8 and 10.0, a 62%decrease in the percentage of adsorption was observed. AC–PWadsorbent shows a larger optimal pH interval for adsorption of RBwhen compared with PW.
The pHPZC values for PW [26] and AC-PW [22], were determined inprevious papers, being these values 4.73 and 7.86, respectively. Thesevalues confirm the ranges of optimal pH values for RB removal fromaqueous solutions (Fig. 3). For pH values lower than pHPZC, theadsorbent presents a positive surface charge [48]. The dissolved RBdye is negatively charged in water solutions. The adsorption of the RBdye takes place when the adsorbent presents a positive surfacecharge. For PW, the electrostatic interaction occurs for pHb4.73, andfor AC-PW this interaction occurs for pHb7.86. The initial pH values ofthe dye solutions were fixed at 2.0 and 6.0, for PW and AC-PW,respectively.
3.3. Adsorbent dosage
The study of adsorbent dosages for the removal of the dye fromaqueous solution was carried out using quantities of PW and AC-PWadsorbents ranging from 20.0 to 200.0 mg and fixing the volume andinitial dye concentration at 20.0 cm3 and 100.0 mg dm−3, respective-ly. The highest amount of dye removal was attained for adsorbentmasses of at least 50.0 mg of each adsorbent (Fig. 3C and D, for PWand AC-PW, respectively). For adsorbent quantities higher than thesevalues, the percentage of dye removal remained almost constant.Increases in the percentage of the dye removal with adsorbent massesup to 50.0 mg could be attributed to increases in the adsorbent surface
Fig. 1. FTIR spectra for: PW (A); PW+RB (B); AC-PW (C); AC-PW+RB (D).
95N.F. Cardoso et al. / Desalination 269 (2011) 92–103
Author's personal copy
areas, augmenting the number of adsorption sites available foradsorption, as already reported in several papers [1,10,23,26,47]. Onthe other hand, the increase in the adsorbent mass promotes aremarkable decrease in the amount of dye uptake per gram ofadsorbent (q), (Fig. 3C,D). The explanation is due two factors. First, theincrease in adsorbentmass at fixed dye concentration and volumewilllead to unsaturation of adsorption sites through the adsorptionprocess, and second, the reduction in adsorbent capacity may be dueto particle aggregation, resulting from high adsorbent mass. Suchaggregation would lead to a decrease in total surface area of theadsorbent and an increase in diffusional path length [49]. Thereforethe adsorbent mass must be fixed at 50.0 mg, which is the mass thatcorresponds to the minimum amount of adsorbent that leads toconstant dye removal. Adsorbent masses were therefore fixed at50.0 mg for both PW and AC-PW.
3.4. Kinetic studies
Adsorption kinetic studies are important in the treatment ofaqueous effluents because they provide valuable information on themechanism of the adsorption process [41].
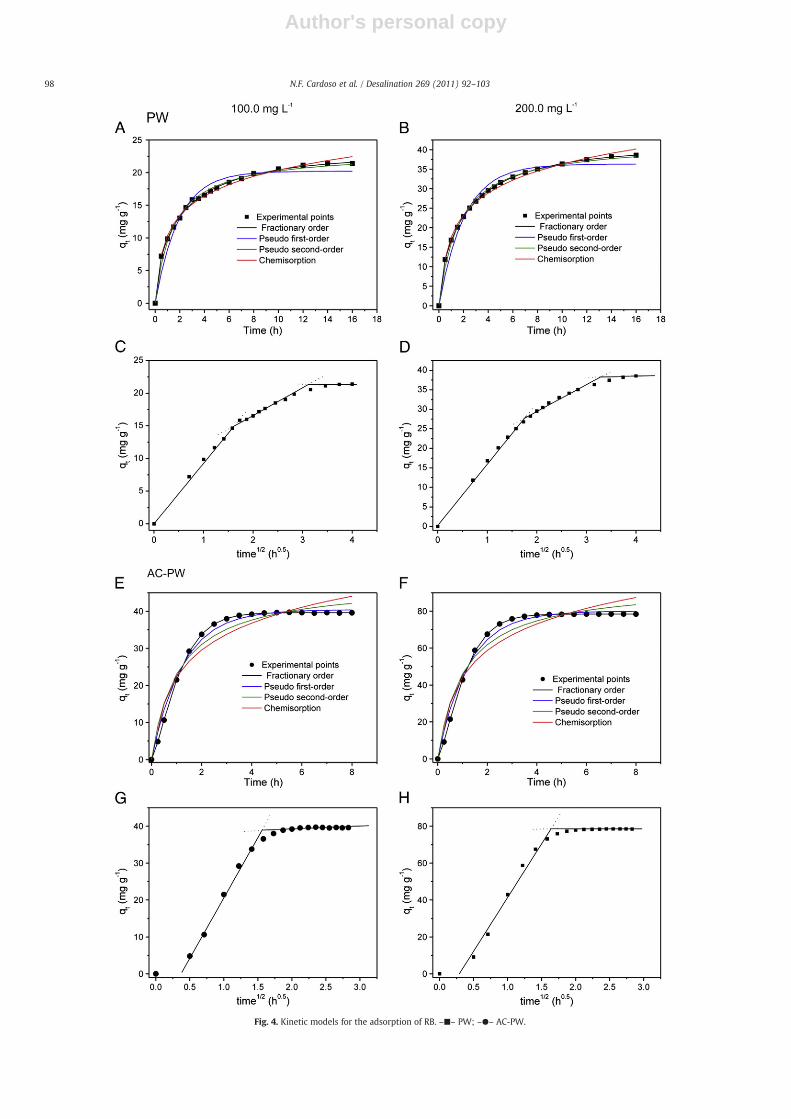
It is important to point out that the initial RB concentrationsemployed during the kinetic studies are relatively high (100.0 and200.0 mg dm−3) when compared with other studies reported in theliterature [1,10,47,48]. AC-PWhas a very high adsorption capacity andadsorbs practically all RB when initial adsorbent concentrations arelower than 50 mg dm−3. On the other hand PW does not presents thesame adsorption capacity of AC-PW, although the initial dyeconcentration employed in the kinetics experiments were the same,to facilitate the comparison between both adsorbents. In order tostudy themechanism of dye adsorption, kinetic data were fit using thefive kinetic models depicted in Table 1 (Fig. 4).
Table 4 shows the values of kinetic parameters of the testedmodels. As showed, only the Avrami fractionary kinetic modelshowed the best fit, presenting high R2adj values (Eq. (3)) and alsolow error function values (Eq. (4)), for the two initial concentrationlevels of the dye with both adsorbents. For PW adsorbent the Ferrorvalues of the fractionary kinetic model was at least 2.1 times lowerthan the pseudo-first order, pseudo second-order and chemisorptionadsorption kinetic models. For AC-PW, the Ferror values of the Avramifractionary kinetic model was at least 14.7 times lower than the otherthree adsorption kinetic model tested. The lower the error function is,the lower will be the difference of the q calculated by the model fromthe experimentally measured q [1,10,22,26,27,44,47,48]. Additionally,it was verified that the qe values found in the fractionary-order werecloser to the experimental qe values, when compared with all otherkinetic models. These results indicate that the fractionary-orderkinetic model should explain the adsorption process of RB taken up bythe PW and AC-PW adsorbents.
The Avrami kinetic equation has been successfully employed toexplain several kinetic processes of different adsorbents and adsor-bates [1,10,22,26,28,31,41,44,47,48,50–54]. The Avrami exponent(nAV) is a fractionary number related with the possible changes ofthe adsorption mechanism that takes place during the adsorptionprocess [28,47]. Instead of following only an integer-kinetic order, themechanism adsorption could follow multiple kinetic orders that arechanged during the contact of the adsorbate with the adsorbent[28,47]. The nAV exponent is a resultant of themultiple kinetic order ofthe adsorption procedure.
Since kinetic results fit very well to the fractionary kinetic model(Avrami model) for the RB dye using PW and AC-PW adsorbents(Table 4 and Fig. 4), the intra-particle diffusionmodel [32] was used toverify the influence of mass transfer resistance on the binding of RB toboth adsorbents (Table 4 and Fig. 4C,D,G and H). The intra-particlediffusion constant, kid (mg g−1 h−0.5) (Table 1), can be obtained fromthe slope of the plot of qt (uptake at any time, mg g−1) versus thesquare root of time. Fig. 4C,D,G,H shows the plots of qt versus t1/2, withmulti-linearity for the RB dye using PW and AC-PW adsorbents. Theseresults imply that the adsorption processes involve more than onesingle kinetic stage (or adsorption rate) [31,41]. For PW, theadsorption process exhibits three stages, which can be attributed toeach linear portion of the Fig. 4C and D. The first linear portion wasattributed to the diffusional process of dye to the PW biosorbentsurface [31,41]; hence, was the fastest sorption stage. The secondportion, ascribed to intra-particle diffusion, was a delayed process.The third stage may be regarded as the diffusion through smallerpores, which is followed by the establishment of equilibrium. For AC-PW, the adsorption process exhibits only two stages, being the firstlinear part attributed to intra-particle diffusion, and the second stageis the diffusion through smaller pores, which is followed by theestablishment of equilibrium [31,41].
It was observed in Fig. 4A,B, and E,F that theminimum contact timeof RB with the adsorbents to reach the equilibration was about 12 and4 h, using PW and AC-PW as adsorbents, respectively. The longerrequired contact time to reach the equilibrium for PW, in comparisonwith AC-PW, could be attributed to the textural characteristics of thebiosorbent (PW) such as lower average pore volume, as alreadyreported [22,26]. The values of the average pore volume of PW andAC-PW, are respectively: 0.07 [26] and 0.56 cm3g−1 [22]. The ratioaverage pore volume of AC-PWdivided by the average pore volume ofPW is 8.0. Taking into account that the dye molecule should beaccommodated in the pores of the adsorbent, to occur the adsorption,it is expected that adsorbents with higher pore volumes would adsorbmore molecules of the adsorbate in a lower time [23,26,44]. Thisinterpretation is also corroborated by the intra-particle diffusionconstant (kid) reported in Table 4, where the obtained values of kid forPW were at least 8.3-fold lower than those obtained with AC-PW, asalready reported in the literature [23,26,44].
Fig. 2. A-SEM for PW (A) and AC-PW (B) with magnification of 2000×.
96 N.F. Cardoso et al. / Desalination 269 (2011) 92–103
Author's personal copy
In order to continue this work, the time of contact between theadsorbent and adsorbate was fixed at 12.0 and 4.0 h using PW and AC-PW as adsorbents.
3.5. Equilibrium studies
An adsorption isotherm describes the relationship between theamount of adsorbate taken up by the adsorbent and the adsorbateconcentration remaining in solution. There are several equations foranalyzing experimental adsorption equilibrium data. The equationparameters of these equilibrium models often provide some insightinto the adsorption mechanism, the surface properties and affinity ofthe adsorbent. In this work, the Langmuir [33], the Freundlich [34], theSips [35] and the Redlich–Peterson [36] isothermmodels were tested.
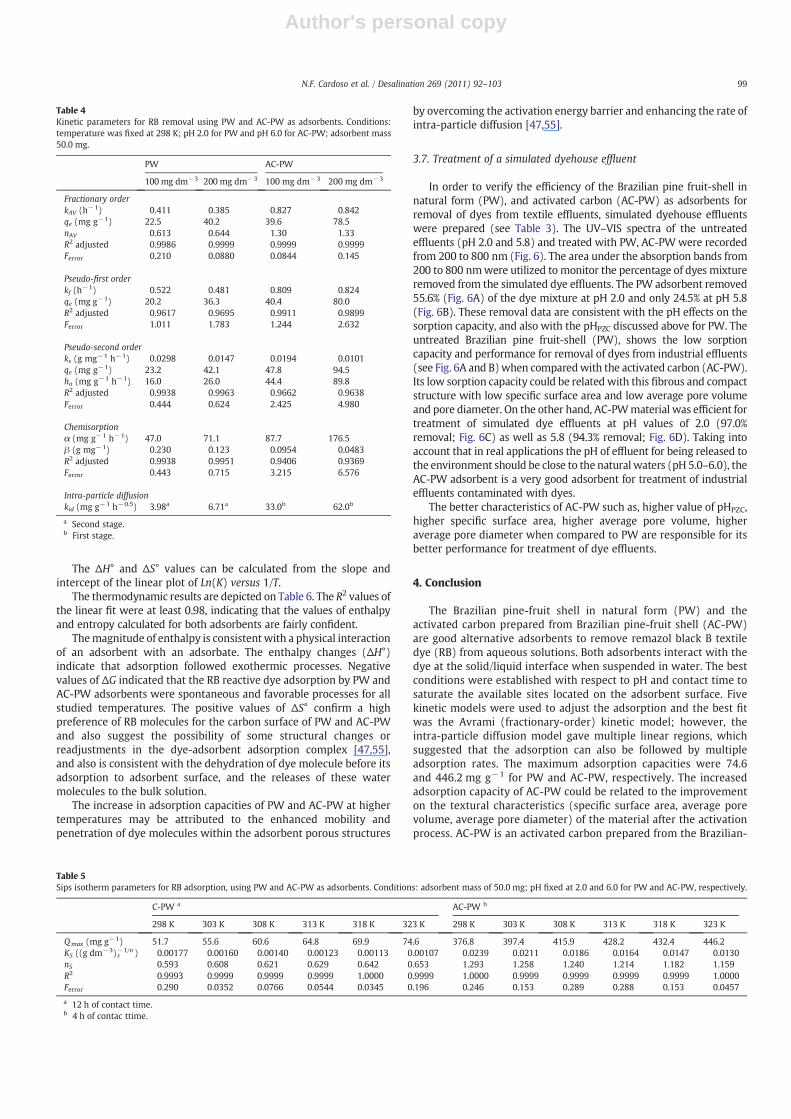
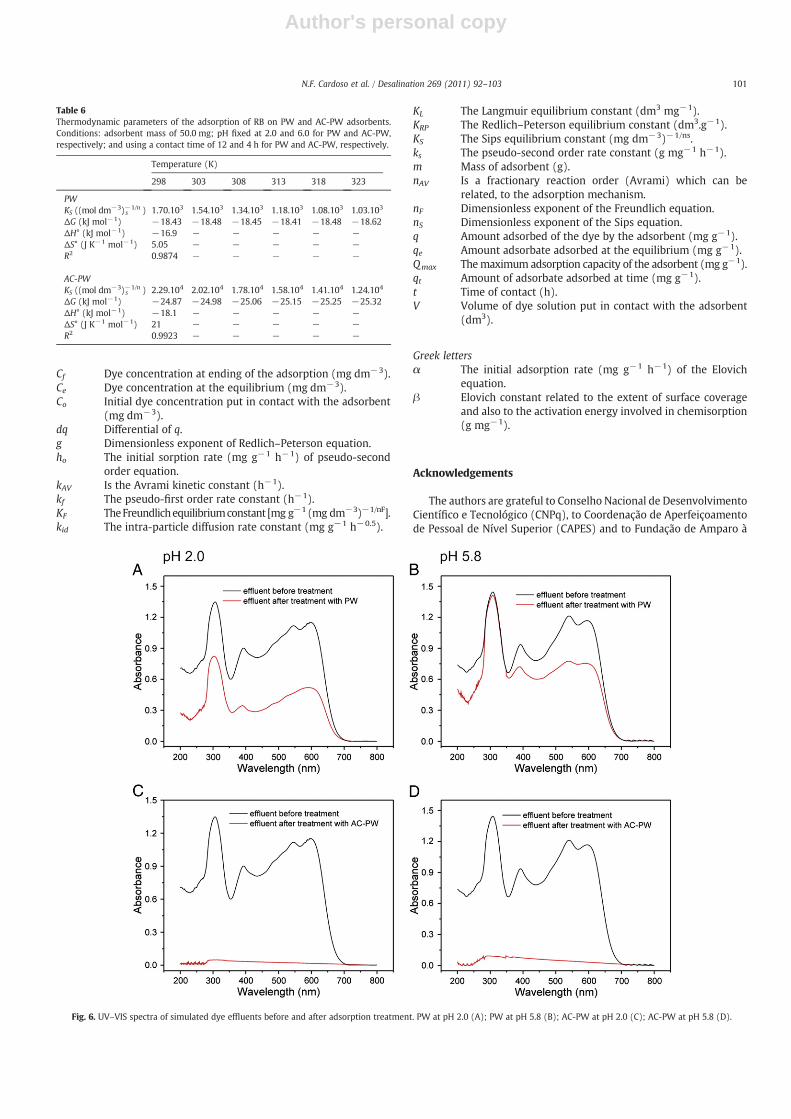
The isotherms of adsorption carried out from 298 to 323 K, of RBon the two adsorbents were performed using the best experimentalconditions described previously (Table 5 and Fig. 5). Based on theFerror, the Sips model is the best isothermmodel for both adsorbents atall the six temperatures studied. The Sips model showed (Fig. 5) thelowest Ferror values, which means that the q fit by the isotherm modelwas close to the q measured experimentally. The Langmuir, theFreundlich and the Redlich–Peterson isotherm models were notsuitably fitted, presenting Ferror values ranging from 5.7 to 89.2-foldand from 2.0 to 24.0-fold higher than the Ferror values obtained by theSips isothermmodel, using PW and AC-PW as adsorbent, respectively.By this reason, the isotherm parameters of the Langmuir, theFreundlich and the Redlich–Peterson were not presented on Table 6,because these values have no physical meaning.
The maximum amounts of RB uptake were 74.6 and 446.2 mg g−1
for PW and AC-PW, respectively. These values indicate that these
adsorbents are good adsorbents for RB removal from aqueoussolutions.
3.6. Thermodynamic studies
Thermodynamic parameters related to the adsorption process,i.e., Gibb´s free energy change (ΔG°, kJ mol−1), enthalpy change (ΔH°,kJ mol−1), and entropy change (ΔS°, J mol−1 K−1) are determined bythe following equations:
ΔG° = ΔH°−TΔS° ð5Þ
ΔG° = −RTLn Kð Þ ð6Þ
The combination of Eqs. (5) and (6), gives:
Ln Kð Þ = ΔS°
R−ΔH°
R×
1T
ð7Þ
where R is the universal gas constant (8.314 J K−1 mol−1), T is theabsolute temperature (Kelvin) and K represents the equilibriumadsorption constants of the isotherm fits. It has been reported in theliterature different adsorption equilibrium constants (K) which wereobtained from different isotherm models [22,47,55–58]. Thermody-namic parameters of adsorption can be estimated from the KS (Sipsequilibrium constant), as already reported in the literature [22,47,55–58]. The KS must be converted to SI units, by using the molecular massof the dye, obtained from the isotherm plots at different temperatures[22,47,55].
Fig. 3. Effect of pH on the removal of RB dye from aqueous solutions, using PW (A) and AC-PW (B) as adsorbents; effect of themass of adsorbent on the percentage of the removal andamount adsorbed of the RB dye using PW (C) and AC-PW (D) as adsorbents.
97N.F. Cardoso et al. / Desalination 269 (2011) 92–103
Author's personal copy
Fig. 4. Kinetic models for the adsorption of RB. –■– PW; –●– AC-PW.
98 N.F. Cardoso et al. / Desalination 269 (2011) 92–103
Author's personal copy
The ΔH° and ΔS° values can be calculated from the slope andintercept of the linear plot of Ln(K) versus 1/T.
The thermodynamic results are depicted on Table 6. The R2 values ofthe linear fit were at least 0.98, indicating that the values of enthalpyand entropy calculated for both adsorbents are fairly confident.
Themagnitude of enthalpy is consistent with a physical interactionof an adsorbent with an adsorbate. The enthalpy changes (ΔH°)indicate that adsorption followed exothermic processes. Negativevalues of ΔG indicated that the RB reactive dye adsorption by PW andAC-PW adsorbents were spontaneous and favorable processes for allstudied temperatures. The positive values of ΔS° confirm a highpreference of RB molecules for the carbon surface of PW and AC-PWand also suggest the possibility of some structural changes orreadjustments in the dye-adsorbent adsorption complex [47,55],and also is consistent with the dehydration of dye molecule before itsadsorption to adsorbent surface, and the releases of these watermolecules to the bulk solution.
The increase in adsorption capacities of PW and AC-PW at highertemperatures may be attributed to the enhanced mobility andpenetration of dye molecules within the adsorbent porous structures
by overcoming the activation energy barrier and enhancing the rate ofintra-particle diffusion [47,55].
3.7. Treatment of a simulated dyehouse effluent
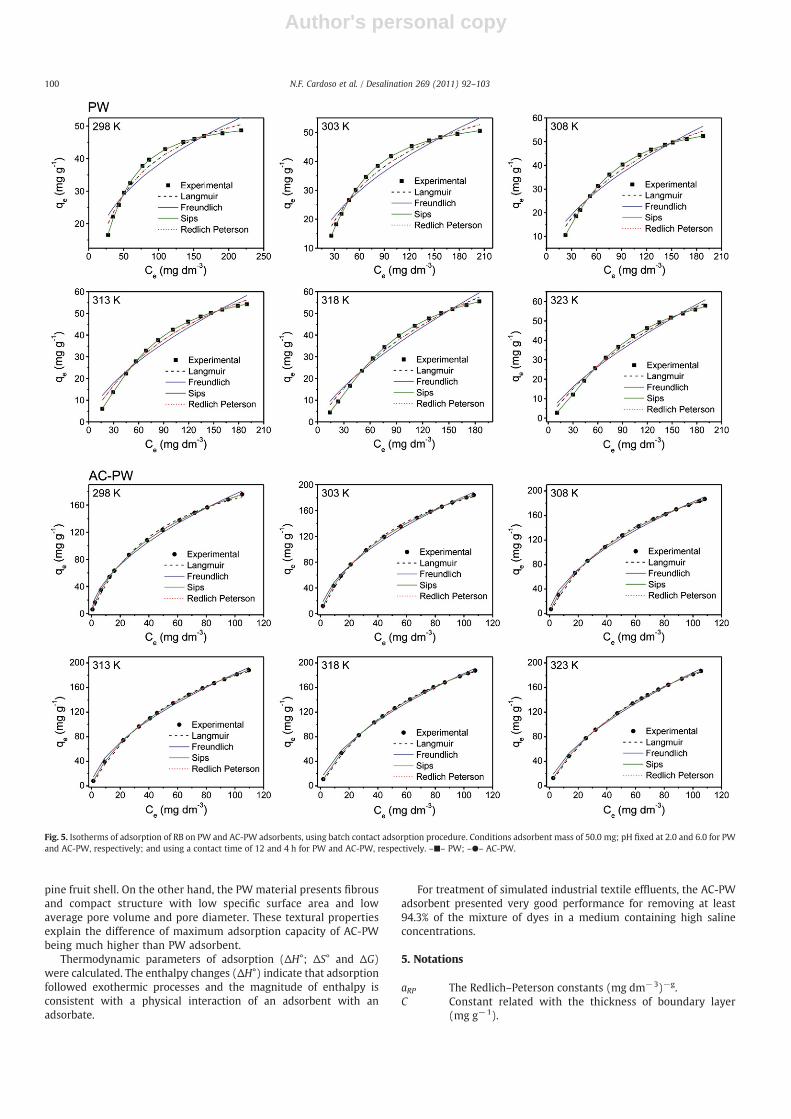
In order to verify the efficiency of the Brazilian pine fruit-shell innatural form (PW), and activated carbon (AC-PW) as adsorbents forremoval of dyes from textile effluents, simulated dyehouse effluentswere prepared (see Table 3). The UV–VIS spectra of the untreatedeffluents (pH 2.0 and 5.8) and treated with PW, AC-PW were recordedfrom 200 to 800 nm (Fig. 6). The area under the absorption bands from200 to 800 nmwere utilized to monitor the percentage of dyes mixtureremoved from the simulated dye effluents. The PW adsorbent removed55.6% (Fig. 6A) of the dye mixture at pH 2.0 and only 24.5% at pH 5.8(Fig. 6B). These removal data are consistent with the pH effects on thesorption capacity, and also with the pHPZC discussed above for PW. Theuntreated Brazilian pine fruit-shell (PW), shows the low sorptioncapacity and performance for removal of dyes from industrial effluents(see Fig. 6A and B)when comparedwith the activated carbon (AC-PW).Its low sorption capacity could be related with this fibrous and compactstructure with low specific surface area and low average pore volumeand pore diameter. On the other hand, AC-PWmaterial was efficient fortreatment of simulated dye effluents at pH values of 2.0 (97.0%removal; Fig. 6C) as well as 5.8 (94.3% removal; Fig. 6D). Taking intoaccount that in real applications the pH of effluent for being released tothe environment should be close to the natural waters (pH 5.0–6.0), theAC-PW adsorbent is a very good adsorbent for treatment of industrialeffluents contaminated with dyes.
The better characteristics of AC-PW such as, higher value of pHPZC,higher specific surface area, higher average pore volume, higheraverage pore diameter when compared to PW are responsible for itsbetter performance for treatment of dye effluents.
4. Conclusion
The Brazilian pine-fruit shell in natural form (PW) and theactivated carbon prepared from Brazilian pine-fruit shell (AC-PW)are good alternative adsorbents to remove remazol black B textiledye (RB) from aqueous solutions. Both adsorbents interact with thedye at the solid/liquid interface when suspended in water. The bestconditions were established with respect to pH and contact time tosaturate the available sites located on the adsorbent surface. Fivekinetic models were used to adjust the adsorption and the best fitwas the Avrami (fractionary-order) kinetic model; however, theintra-particle diffusion model gave multiple linear regions, whichsuggested that the adsorption can also be followed by multipleadsorption rates. The maximum adsorption capacities were 74.6and 446.2 mg g−1 for PW and AC-PW, respectively. The increasedadsorption capacity of AC-PW could be related to the improvementon the textural characteristics (specific surface area, average porevolume, average pore diameter) of the material after the activationprocess. AC-PW is an activated carbon prepared from the Brazilian-
Table 4Kinetic parameters for RB removal using PW and AC-PW as adsorbents. Conditions:temperature was fixed at 298 K; pH 2.0 for PW and pH 6.0 for AC-PW; adsorbent mass50.0 mg.
PW AC-PW
100 mg dm−3 200 mg dm−3 100 mg dm−3 200 mg dm−3
Fractionary orderkAV (h−1) 0.411 0.385 0.827 0.842qe (mg g−1) 22.5 40.2 39.6 78.5nAV 0.613 0.644 1.30 1.33R2 adjusted 0.9986 0.9999 0.9999 0.9999Ferror 0.210 0.0880 0.0844 0.145
Pseudo-first orderkf (h−1) 0.522 0.481 0.809 0.824qe (mg g−1) 20.2 36.3 40.4 80.0R2 adjusted 0.9617 0.9695 0.9911 0.9899Ferror 1.011 1.783 1.244 2.632
Pseudo-second orderks (g mg−1 h−1) 0.0298 0.0147 0.0194 0.0101qe (mg g−1) 23.2 42.1 47.8 94.5ho (mg g−1 h−1) 16.0 26.0 44.4 89.8R2 adjusted 0.9938 0.9963 0.9662 0.9638Ferror 0.444 0.624 2.425 4.980
Chemisorptionα (mg g−1 h−1) 47.0 71.1 87.7 176.5β (g mg−1) 0.230 0.123 0.0954 0.0483R2 adjusted 0.9938 0.9951 0.9406 0.9369Ferror 0.443 0.715 3.215 6.576
Intra-particle diffusionkid (mg g−1 h−0.5) 3.98a 6.71a 33.0b 62.0b
a Second stage.b First stage.
Table 5Sips isotherm parameters for RB adsorption, using PW and AC-PW as adsorbents. Conditions: adsorbent mass of 50.0 mg; pH fixed at 2.0 and 6.0 for PW and AC-PW, respectively.
C-PW a AC-PW b
298 K 303 K 308 K 313 K 318 K 323 K 298 K 303 K 308 K 313 K 318 K 323 K
Qmax (mg g−1) 51.7 55.6 60.6 64.8 69.9 74.6 376.8 397.4 415.9 428.2 432.4 446.2KS ((g dm−3)−1/n
s ) 0.00177 0.00160 0.00140 0.00123 0.00113 0.00107 0.0239 0.0211 0.0186 0.0164 0.0147 0.0130nS 0.593 0.608 0.621 0.629 0.642 0.653 1.293 1.258 1.240 1.214 1.182 1.159R2 0.9993 0.9999 0.9999 0.9999 1.0000 0.9999 1.0000 0.9999 0.9999 0.9999 0.9999 1.0000Ferror 0.290 0.0352 0.0766 0.0544 0.0345 0.196 0.246 0.153 0.289 0.288 0.153 0.0457
a 12 h of contact time.b 4 h of contac ttime.
99N.F. Cardoso et al. / Desalination 269 (2011) 92–103
Author's personal copy
pine fruit shell. On the other hand, the PW material presents fibrousand compact structure with low specific surface area and lowaverage pore volume and pore diameter. These textural propertiesexplain the difference of maximum adsorption capacity of AC-PWbeing much higher than PW adsorbent.
Thermodynamic parameters of adsorption (ΔH°; ΔS° and ΔG)were calculated. The enthalpy changes (ΔH°) indicate that adsorptionfollowed exothermic processes and the magnitude of enthalpy isconsistent with a physical interaction of an adsorbent with anadsorbate.
For treatment of simulated industrial textile effluents, the AC-PWadsorbent presented very good performance for removing at least94.3% of the mixture of dyes in a medium containing high salineconcentrations.
5. Notations
aRP The Redlich–Peterson constants (mg dm−3)−g.C Constant related with the thickness of boundary layer
(mg g−1).
Fig. 5. Isotherms of adsorption of RB on PW and AC-PW adsorbents, using batch contact adsorption procedure. Conditions adsorbent mass of 50.0 mg; pH fixed at 2.0 and 6.0 for PWand AC-PW, respectively; and using a contact time of 12 and 4 h for PW and AC-PW, respectively. –■– PW; –●– AC-PW.
100 N.F. Cardoso et al. / Desalination 269 (2011) 92–103
Author's personal copy
Cf Dye concentration at ending of the adsorption (mg dm−3).Ce Dye concentration at the equilibrium (mg dm−3).Co Initial dye concentration put in contact with the adsorbent
(mg dm−3).dq Differential of q.g Dimensionless exponent of Redlich–Peterson equation.ho The initial sorption rate (mg g−1 h−1) of pseudo-second
order equation.kAV Is the Avrami kinetic constant (h−1).kf The pseudo-first order rate constant (h−1).KF TheFreundlichequilibriumconstant [mg g−1 (mg dm−3)−1/nF].kid The intra-particle diffusion rate constant (mg g−1 h−0.5).
KL The Langmuir equilibrium constant (dm3 mg−1).KRP The Redlich–Peterson equilibrium constant (dm3.g−1).KS The Sips equilibrium constant (mg dm−3)−1/ns.ks The pseudo-second order rate constant (g mg−1 h−1).m Mass of adsorbent (g).nAV Is a fractionary reaction order (Avrami) which can be
related, to the adsorption mechanism.nF Dimensionless exponent of the Freundlich equation.nS Dimensionless exponent of the Sips equation.q Amount adsorbed of the dye by the adsorbent (mg g−1).qe Amount adsorbate adsorbed at the equilibrium (mg g−1).Qmax Themaximum adsorption capacity of the adsorbent (mg g−1).qt Amount of adsorbate adsorbed at time (mg g−1).t Time of contact (h).V Volume of dye solution put in contact with the adsorbent
(dm3).
Greek lettersα The initial adsorption rate (mg g−1 h−1) of the Elovich
equation.β Elovich constant related to the extent of surface coverage
and also to the activation energy involved in chemisorption(g mg−1).
Acknowledgements
The authors are grateful to Conselho Nacional de DesenvolvimentoCientífico e Tecnológico (CNPq), to Coordenação de Aperfeiçoamentode Pessoal de Nível Superior (CAPES) and to Fundação de Amparo à
Fig. 6. UV–VIS spectra of simulated dye effluents before and after adsorption treatment. PW at pH 2.0 (A); PW at pH 5.8 (B); AC-PW at pH 2.0 (C); AC-PW at pH 5.8 (D).
Table 6Thermodynamic parameters of the adsorption of RB on PW and AC-PW adsorbents.Conditions: adsorbent mass of 50.0 mg; pH fixed at 2.0 and 6.0 for PW and AC-PW,respectively; and using a contact time of 12 and 4 h for PW and AC-PW, respectively.
Temperature (K)
298 303 308 313 318 323
PWKS ((mol dm−3)−1/n
s ) 1.70.103 1.54.103 1.34.103 1.18.103 1.08.103 1.03.103
ΔG (kJ mol−1) −18.43 −18.48 −18.45 −18.41 −18.48 −18.62ΔH° (kJ mol−1) −16.9 − − − − −ΔS° (J K−1 mol−1) 5.05 − − − − −R2 0.9874 − − − − −
AC-PWKS ((mol dm−3)−1/n
s ) 2.29.104 2.02.104 1.78.104 1.58.104 1.41.104 1.24.104
ΔG (kJ mol−1) −24.87 −24.98 −25.06 −25.15 −25.25 −25.32ΔH° (kJ mol−1) −18.1 − − − − −ΔS° (J K−1 mol−1) 21 − − − − −R2 0.9923 − − − − −
101N.F. Cardoso et al. / Desalination 269 (2011) 92–103
Author's personal copy
Pesquisa do Estado do Rio Grande do Sul (FAPERGS) for the financialsupport and fellowships. We are also grateful to Centro deMicroscopia Eletrônica (CME-UFRGS) for the use of the SEMmicroscope.
References
[1] B. Royer, N.F. Cardoso, E.C. Lima, T.R. Macedo, C. Airoldi, A useful organofunctio-nalized layered silicate for textile dye removal, Journal of Hazardous Materials181 (2010) 366–374.
[2] Y.S. Al-Degs, M.I. El-Barghouthi, A.H. El-Sheikh, G.M.Walker, Effect of solution pH,ionic strength, and temperature on adsorption behavior of reactive dyes onactivated carbon, Dyes and Pigments 77 (2008) 16–23.
[3] R.O.A. de Lima, A.P. Bazo, D.M.F. Salvadori, C.M. Rech, D.P. Oliveira, G.A.Umbuzeiro, Mutagenic and carcinogenic potential of a textile azo dye processingplant effluent that impacts a drinking water source, Mutation Research, GeneticToxicology and Environmental Mutagenesis 626 (2007) 53–60.
[4] H.S. Rosenkranz, S.L. Cunningham, R. Mermelstein, A.R. Cunningham, Thechallenge of testing chemicals for potential carcinogenicity using multipleshort-term assays: an analysis of a proposed test battery for hair dyes, MutationResearch, Genetic Toxicology and Environmental Mutagenesis 633 (2007) 55–66.
[5] B. Kayan, B. Gözmen, M. Demirel, A.M. Gizir, Degradation of acid red 97 dye inaqueous medium using wet oxidation and electro-Fenton techniques, Journal ofHazardous Materials 177 (2010) 95–102.
[6] B. Royer, E.C. Lima, N.F. Cardoso, T. Calvete, R.E. Bruns, Statistical design ofexperiments for optimization of batch adsorption conditions for removal ofreactive red 194 textile dye from aqueous effluents, Chemical EngineeringCommunications 197 (2010) 775–790.
[7] J.J.M. Órfão, A.I.M. Silva, J.C.V. Pereira, S.A. Barata, I.M. Fonseca, P.C.C. Faria, M.F.R.Pereira, Adsorption of a reactive dye on chemically modified activated carbons–influence of pH, Journal of Colloid and Interface Science 296 (2006) 480–489.
[8] S. Rosa, M.C.M. Laranjeira, H.G. Riela, V.T. Fávere, Cross-linked quaternary chitosanas an adsorbent for the removal of the reactive dye from aqueous solutions,Journal of Hazardous Materials 155 (2008) 253–260.
[9] F.A. Pavan, Y. Gushikem, A.S. Mazzocato, S.L.P. Dias, E.C. Lima, Statistical design ofexperiments as a tool for optimizing the batch conditions to methylene bluebiosorption on yellow passion fruit and mandarin peels, Dyes and Pigments 72(2007) 256–266.
[10] B. Royer, N.F. Cardoso, E.C. Lima, T.R. Macedo, C. Airoldi, Sodic and acidiccrystalline lamellar magadiite adsorbents for removal of methylene blue fromaqueous solutions. Kinetic and equilibrium studies, Separation Science andTechnology 45 (2010) 129–141.
[11] M. Olivares-Marín, V. Del-Prete, E. Garcia-Moruno, C. Fernández-González, A.Macías-García, V. Gómez-Serrano, The development of an activated carbon fromcherry stones and its use in the removal of ochratoxin A from red wine, FoodControl 20 (2009) 298–303.
[12] H. Marsh, F.R. Reinoso, Activated Carbon, Elsevier, Amsterdam, 2006.[13] A.A. Attia, B.S. Girgis, N.A. Fathy, Removal of methylene blue by carbons derived
from peach stones by H3PO4 activation: batch and column studies, Dyes andPigments 76 (2008) 282–289.
[14] W. Li, K. Yang, J. Peng, L. Zhang, S. Guo, H. Xia, Effects of carbonizationtemperatures on characteristics of porosity in coconut shell chars and activatedcarbons derived from carbonized coconut shell chars, Industrial Crops andProducts 28 (2008) 190–198.
[15] A.S. Albero, J.S. Albero, A.S. Escribano, F.R. Reinoso, Ethanol removal usingactivated carbon: effect of porous structure and surface chemistry, Microporousand Mesoporous Materials 120 (2009) 62–68.
[16] P.C.C. Faria, J.J.M. Orfão, J.L. Figueiredo, M.F.R. Pereira, Adsorption of aromaticcompounds from the biodegradation of azo dyes on activated carbon, AppliedSurface Science 254 (2008) 3497–3503.
[17] M. Olivares-Marín, C. Fernández-González, A. Macías-García, V. Gómez-Serrano,Preparation of activated carbons from cherry stones by activation with potassiumhydroxide, Applied Surface Science 252 (2006) 5980–5983.
[18] I.A.W. Tan, A.L. Ahmad, B.H. Hameed, Adsorption of basic dye on high-surface-areaactivated carbon prepared from coconut husk: equilibrium, kinetic andthermodynamic studies, Journal of Hazardous Materials 154 (2008) 337–346.
[19] F.S. Vieira, A.R. Cestari, I.F. Gimenez, N.L.V. Carreño, L.S. Barreto, Kinetic andcalorimetric study of the adsorption of dyes on mesoporous activated carbonprepared from coconut coir dust, Journal of Colloid and Interface Science 298(2006) 515–522.
[20] B. Corcho-Corral, M. Olivares-Marín, C. Fernandez-Gonzalez, V. Gomez-Serrano, A.Macıas-Garcıa, Preparation and textural characterisation of activated carbon fromvine shoots (Vitis vinifera) by H3PO4-chemical activation, Applied Surface Science252 (2006) 5961–5966.
[21] J.M. Dias, M.C.M. Alvim-Ferraz, M.F. Almeida, J. Rivera-Utrilla, M. Sánchez-Polo,Waste materials for activated carbon preparation and its use in aqueous-phasetreatment: a review, Journal of Environmental Management 85 (2007) 833–846.
[22] T. Calvete, E.C. Lima, N.F. Cardoso, S.L.P. Dias, F.A. Pavan, Application of carbonadsorbents prepared from the Brazilian-pine fruit shell for removal of Procion RedMX 3B from aqueous solution – kinetic, equilibrium, and thermodynamic studies,Chemical Engineering Journal 155 (2009) 627–636.
[23] E.C. Lima, B. Royer, J.C.P. Vaghetti, N.M. Simon, B.M. da Cunha, F.A. Pavan, E.V.Benvenutti, R.C. Veses, C. Airoldi, Application of Brazilian-pine fruit coat as a
biosorbent to removal of reactive red 194 textile dye fromaqueous solution. Kineticsand equilibrium study, Journal of Hazardous Materials 155 (2008) 536–550.
[24] J.L. Brasil, R.R. Ev, C.D. Milcharek, L.C. Martins, F.A. Pavan, A.A. dos Santos Jr., S.L.P.Dias, J. Dupont, C.P.Z. Noreña, E.C. Lima, Statistical Design of Experiments as a toolfor optimizing the batch conditions to Cr(VI) biosorption on Araucaria angustifoliawastes, Journal of Hazardous Materials 133 (2006) 143–153.
[25] E.C. Lima, B. Royer, J.C.P. Vaghetti, J.L. Brasil, N.M. Simon, A.A. dos Santos Jr., F.A.Pavan, S.L.P. Dias, E.V. Benvenutti, E.A. da Silva, Adsorption of Cu(II) on Araucariaangustifolia wastes: determination of the optimal conditions by statistic design ofexperiments, Journal of Hazardous Materials 140 (2007) 211–220.
[26] B. Royer, N.F. Cardoso, E.C. Lima, J.C.P. Vaghetti, N.M. Simon, T. Calvete, R.C. Veses,Applications of Brazilian-pine fruit shell in natural and carbonized forms asadsorbents to removal of methylene blue from aqueous solutions – kinetic andequilibrium study, Journal of Hazardous Materials 164 (2009) 1213–1222.
[27] R.A. Jacques, R. Bernardi, M. Caovila, E.C. Lima, F.A. Pavan, J.C.P. Vaghetti, C. Airoldi,Removal of Cu(II), Fe(III) and Cr(III) from aqueous solution by aniline graftedsilica gel, Separation Science and Technology 42 (2007) 591–609.
[28] E.C.N. Lopes, F.S.C. dos Anjos, E.F.S. Vieira, A.R. Cestari, An alternative Avramiequation to evaluate kinetic parameters of the interaction of Hg(II) with thinchitosan membranes, Journal of Colloid and Interface Science 263 (2003)542–547.
[29] S. Largegren, About the theory of so-called adsorption of soluble substances,Kungliga Suensk Vetenskapsakademiens Handlingar 241 (1898) 1–39.
[30] G. Blanachard, M. Maunaye, G. Martin, Removal of heavy metals from waters bymeans of natural zeolites, Water Research 18 (1984) 1501–1507.
[31] J.C.P. Vaghetti, E.C. Lima, B. Royer, B.M. da Cunha, N.F. Cardoso, J.L. Brasil, S.L.P.Dias, Pecan nutshell as biosorbent to remove Cu(II), Mn(II) and Pb(II) fromaqueous solutions, Journal of Hazardous Materials 162 (2009) 270–280.
[32] W.J. Weber Jr., J.C. Morris, Kinetics of adsorption on carbon from solution, Journalof Sanitary Engineering Division of American Society of Civil Engineering 89(1963) 31–59.
[33] I. Langmuir, The adsorption of gases on plane surfaces of glass, mica and platinum,Journal of the American Chemical Society 40 (1918) 1361–1403.
[34] H.M.F. Freundlich, Über die adsorption in lösungen, Zeitschrift für PhysikalischeChemie (Leipzig) 57A (1906) 385–470.
[35] R. Sips, On the structure of a catalyst surface, The Journal of Chemical Physics 16(1948) 490–495.
[36] O. Redlich, D.L. Peterson, A useful adsorption isotherm, The Journal of ChemicalPhysics 63 (1959) 1024–1027.
[37] J.C.P. Vaghetti, E.C. Lima, B. Royer, J.L. Brasil, B.M. da Cunha, N.M. Simon, N.F.Cardoso, C.P.Z. Noreña, Application of Brazilian-pine fruit coat as a biosorbent toremoval of Cr(VI) from aqueous solution. Kinetics and equilibrium study,Biochemical Engineering Journal 42 (2008) 67–76.
[38] E.C. Lima, F. Barbosa Jr., F.J. Krug, A. Tavares, Copper determination in biologicalmaterials by ETAAS using W-Rh permanent modifier, Talanta 57 (2002) 177–186.
[39] E.C. Lima, P.G. Fenga, J.R. Romero, W.F. de Giovani, Electrochemical behaviour of[Ru(4, 4'-Me2bpy)2(PPh3)(H2O)](ClO4)2 in homogeneous solution and incor-porated into carbon paste electrodes. Application to oxidation of benzyliccompounds, Polyhedron 17 (1998) 313–318.
[40] E.C. Lima, F.J. Krug, J.A. Nóbrega, A.R.A. Nogueira, Determination of ytterbium inanimal faeces by tungsten coil electrothermal atomic absorption spectrometry,Talanta 47 (1998) 613–623.
[41] J.C.P. Vaghetti, E.C. Lima, B. Royer, N.F. Cardoso, B. Martins, T. Calvete, Pecannutshell as biosorbent to remove toxic metals from aqueous solution, SeparationScience and Technology 44 (2009) 615–644.
[42] S. Kara, C. Aydiner, E. Demirbas, M. Kobya, N. Dizge, Modeling the effects ofadsorbent dose and particle size on the adsorption of reactive textile dyes by flyash, Desalination 212 (2007) 282–293.
[43] B. Smith, Infrared spectral Interpretation – a systematic approach, CRC Press, BocaRaton, 1999.
[44] T. Calvete, E.C. Lima, N.F. Cardoso, J.C.P. Vaghetti, S.L.P. Dias, F.A. Pavan, Applicationof carbon adsorbents prepared from Brazilian-pine fruit shell for the removal ofreactive orange 16 from aqueous solution: Kinetic, equilibrium, and thermody-namic studies, Journal of Environmental Management 91 (2010) 1695–1706.
[45] W. Zhang, Z. Xu, B. Pan, C. Hong, K. Jia, P. Jiang, Q. Zhang, B. Pan, Equilibrium andheat of adsorption of diethyl phthalate on heterogeneous adsorbents, Journal ofColloid and Interface Science 325 (2008) 41–47.
[46] N.T. Abdel-Ghani, A.K. Hegazy, G.A. El-Chaghaby, E.C. Lima, Factorial experimentaldesign for biosorption of iron and zinc using Typha domingensis phytomass,Desalination 249 (2009) 343–347.
[47] D.S.F. Gay, T.H.M. Fernandes, C.V. Amavisca, N.F. Cardoso, E.V. Benvenutti, T.M.H.Costa, E.C. Lima, Silica grafted with a silsesquioxane containing the positivelycharged 1, 4-diazoniabicyclo[2.2.2]octane group used as adsorbent for anionic dyeremoval, Desalination 258 (2010) 128–135.
[48] B. Royer, N.F. Cardoso, E.C. Lima, V.S.O. Ruiz, T.R. Macedo, C. Airoldi, Organo-functionalized kenyaite for dye removal from aqueous solution, Journal of Colloidand Interface Science 336 (2009) 398–405.
[49] N.A. Oladoja, A.K. Akinlabi, Congo red biosorption on palm kernel seed coat,Industrial and Engineering Chemistry Research 48 (2009) 6188–6196.
[50] A.R. Cestari, E.F.S. Vieira, G.S. Vieira, L.E. Almeida, The removal of anionic dyesfrom aqueous solutions in the presence of anionic surfactant using aminopro-pylsilica–a kinetic study, Journal of Hazardous Materials 138 (2006) 133–141.
[51] E.F.S. Vieira, A.R. Cestari, E.C.N. Lopes, L.S. Barreto, G.S. Lázaro, L.E. Almeida,Determination of kinetic parameters from isothermal calorimetry for interactionprocesses of pyrimethamine with chitosan derivatives, Reactive and FunctionalPolymers 67 (2007) 820–827.
102 N.F. Cardoso et al. / Desalination 269 (2011) 92–103

Author's personal copy
[52] G. Bascialla, A.E. Regazzoni, Immobilization of anionic dyes by intercalation intohydrotalcite, Colloids and Surfaces, A: Physicochemical and Engineering Aspects328 (2008) 34–39.
[53] C.E. Zubieta, P.V. Messina, C. Luengo, M. Dennehy, O. Pieroni, P.C. Schulz, Reactivedyes remotion by porous TiO2-chitosan materials, Journal of Hazardous Materials152 (2008) 765–777.
[54] R. Serna-Guerrero, A. Sayari, Modeling adsorption of CO2 on amine-functionalizedmesoporous silica. 2: kinetics and breakthrough curves, Chemical EngineeringJournal 161 (2010) 182–190.
[55] P. Leechart,W. Nakbanpote, P. Thiravetyan, 912–920, Application of ‘waste’wood-shaving bottom ash for adsorption of azo reactive dye, Journal of EnvironmentalManagement 90 (2009) 912–920.
[56] M.S. Bilgili, Adsorption of 4-chlorophenol from aqueous solutions by xad-4 resin:isotherm, kinetic, and thermodynamic analysis, Journal of Hazardous Materials137 (2006) 157–164.
[57] S. Nethajia, A. Sivasamya, G. Thennarasu, S. Saravanan, Adsorption of MalachiteGreen dye onto activated carbon derived from Borassus aethiopum flowerbiomass, Journal of Hazardous Materials 181 (2010) 271–280.
[58] V.K. Gupta, R. Jain, S. Malathi, A. Nayak, Adsorption–desorption studies ofindigocarmine from industrial effluents by using deoiled mustard and itscomparison with charcoal, Journal of Colloid and Interface Science 348 (2010)628–633.
103N.F. Cardoso et al. / Desalination 269 (2011) 92–103


