Embed Size (px)
Citation preview

WEEKLY MARKET OUTLOOK
APRIL 15, 2021
CAPITAL MARKETS RESEARCH
Moody’s Analytics markets and distributes all Moody’s Capital Markets Research, Inc. materials. Moody’s Capital Markets Research, Inc. is a subsidiary of Moody’s Corporation. Moody’s Analytics does not provide investment advisory services or products. For further detail, please see the last page.
Record-High Systemic Leverage Limits Upside for Benchmark Interest Rates
Credit Markets Review and Outlook by John Lonski Record-High Systemic Leverage Limits Upside for Benchmark Interest Rates
» FULL STORY PAGE 2
The Week Ahead We preview economic reports and forecasts from the U.S., Europe and Asia/Pacific regions.
» FULL STORY PAGE 6
The Long View Full updated stories and key credit market metrics: Investment-grade bond issuance has slowed, but high-yield offerings maintain an above-trend pace.
» FULL STORY PAGE 12
Ratings Round-Up Upgrades Account for 85% of U.S. Rating Changes and All Reported Debt
» FULL STORY PAGE 15
Market Data Credit spreads, CDS movers, issuance.
» FULL STORY PAGE 18
Moody’s Capital Markets Research recent publications Links to commentaries on: Inflation, GDP, Treasury yields, rising prices, stimulus, core profits, yield spreads, virus, Congress, misery, issuance boom, default rate, volatility, credit quality, record savings rates, demographic change, high tech, complacency, Fed intervention, speculation, risk, credit stress, optimism, corporate credit, leverage, VIX.
» FULL STORY PAGE 23
Credit Spreads
Investment Grade: Year-end 2021’s average investment grade bond spread may top its recent 94 basis points. High Yield: A composite high-yield spread may exceed its recent 324 bp by year-end 2021.
Defaults US HY default rate: According to Moody's Investors Service, the U.S.' trailing 12-month high-yield default rate jumped from March 2020’s 4.9% to March 2021’s 7.5% and may average only 4.1% for 2021’s final quarter, according to Moody’s Investors Service.
Issuance For 2019’s offerings of US$-denominated corporate bonds, IG bond issuance rose 2.6% to $1.309 trillion, while high-yield bond issuance surged by 58% to $440 billion. In 2020, US$-denominated corporate bond issuance soared 54% for IG to a record $2.012 trillion, while high-yield advanced 30% to a record-high $570 billion. For 2021, US$-denominated corporate bond offerings may decline 24% (to $1.524 trillion) for IG and dip 1% (to $563 billion) for high-yield, where both forecasts top their respective annual averages for the five years ended 2020 of $1.494 trillion for IG and $410 billion for high-yield.
Moody’s Analytics Research
Weekly Market Outlook Contributors: Moody's Analytics/New York: John Lonski Chief Capital Markets Economist 1.212.553.7144 [email protected] Yukyung Choi Quantitative Research Moody's Analytics/Asia-Pacific: Katrina Ell Economist Shahana Mukherjee Economist Moody's Analytics/Europe: Ross Cioffi Economist Moody’s Analytics/U.S.: Mark Zandi Chief Economist Michael Ferlez Economist
Editor Reid Kanaley
Click here for Moody’s Credit Outlook, our sister publication containing Moody’s rating agency analysis of recent news events, summaries of recent rating changes, and summaries of recent research.
Contact: [email protected]
CAPITAL MARKETS RESEARCH
2 APRIL 15, 2021 CAPITAL MARKETS RESEARCH / MARKET OUTLOOK / MOODYS.COM
Credit Markets Review and Outlook
Credit Markets Review and Outlook By John Lonski, Chief Capital Markets Economist, Moody’s Capital Markets Research
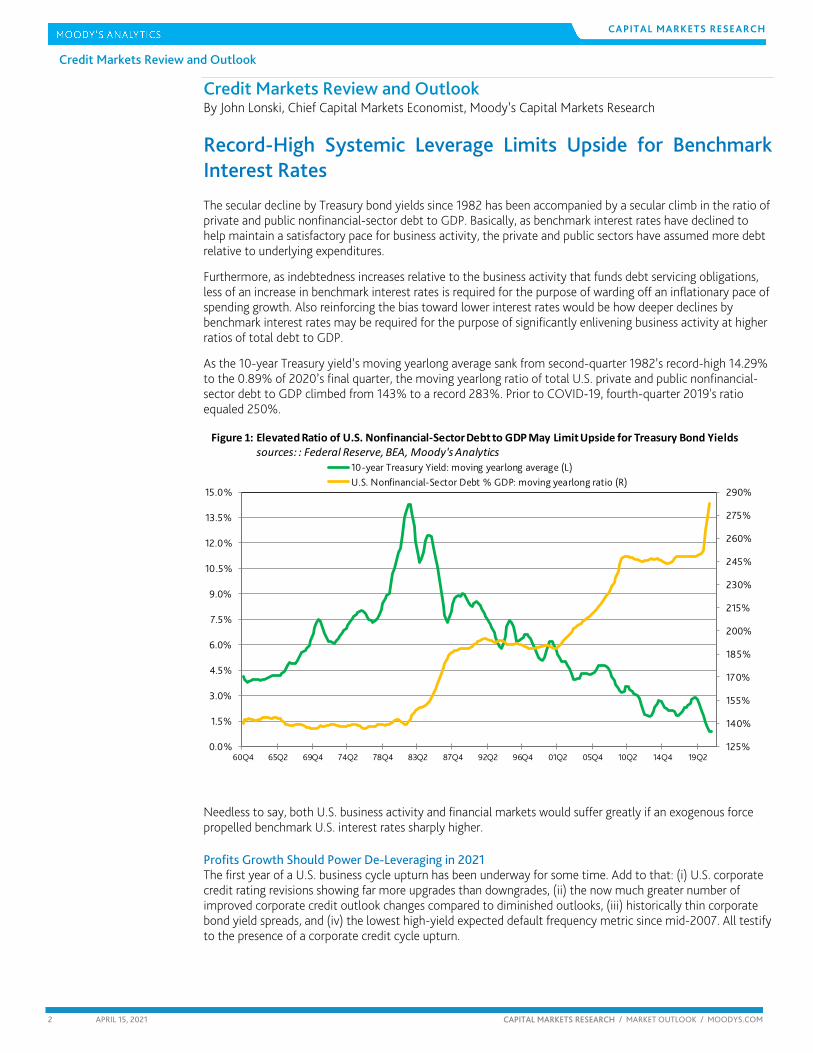
Record-High Systemic Leverage Limits Upside for Benchmark Interest Rates The secular decline by Treasury bond yields since 1982 has been accompanied by a secular climb in the ratio of private and public nonfinancial-sector debt to GDP. Basically, as benchmark interest rates have declined to help maintain a satisfactory pace for business activity, the private and public sectors have assumed more debt relative to underlying expenditures.
Furthermore, as indebtedness increases relative to the business activity that funds debt servicing obligations, less of an increase in benchmark interest rates is required for the purpose of warding off an inflationary pace of spending growth. Also reinforcing the bias toward lower interest rates would be how deeper declines by benchmark interest rates may be required for the purpose of significantly enlivening business activity at higher ratios of total debt to GDP.
As the 10-year Treasury yield’s moving yearlong average sank from second-quarter 1982’s record-high 14.29% to the 0.89% of 2020’s final quarter, the moving yearlong ratio of total U.S. private and public nonfinancial-sector debt to GDP climbed from 143% to a record 283%. Prior to COVID-19, fourth-quarter 2019's ratio equaled 250%.
Needless to say, both U.S. business activity and financial markets would suffer greatly if an exogenous force propelled benchmark U.S. interest rates sharply higher.
Profits Growth Should Power De-Leveraging in 2021 The first year of a U.S. business cycle upturn has been underway for some time. Add to that: (i) U.S. corporate credit rating revisions showing far more upgrades than downgrades, (ii) the now much greater number of improved corporate credit outlook changes compared to diminished outlooks, (iii) historically thin corporate bond yield spreads, and (iv) the lowest high-yield expected default frequency metric since mid-2007. All testify to the presence of a corporate credit cycle upturn.
125%
140%
155%
170%
185%
200%
215%
230%
245%
260%
275%
290%
60Q4 65Q2 69Q4 74Q2 78Q4 83Q2 87Q4 92Q2 96Q4 01Q2 05Q4 10Q2 14Q4 19Q20.0%
1.5%
3.0%
4.5%
6.0%
7.5%
9.0%
10.5%
12.0%
13.5%
15.0%
10-year Treasury Yield: moving yearlong average (L)U.S. Nonfinancial-Sector Debt % GDP: moving yearlong ratio (R)
Figure 1: Elevated Ratio of U.S. Nonfinancial-Sector Debt to GDP May Limit Upside for Treasury Bond Yieldssources: : Federal Reserve, BEA, Moody's Analytics
CAPITAL MARKETS RESEARCH
3 APRIL 15, 2021 CAPITAL MARKETS RESEARCH / MARKET OUTLOOK / MOODYS.COM
Credit Markets Review and Outlook
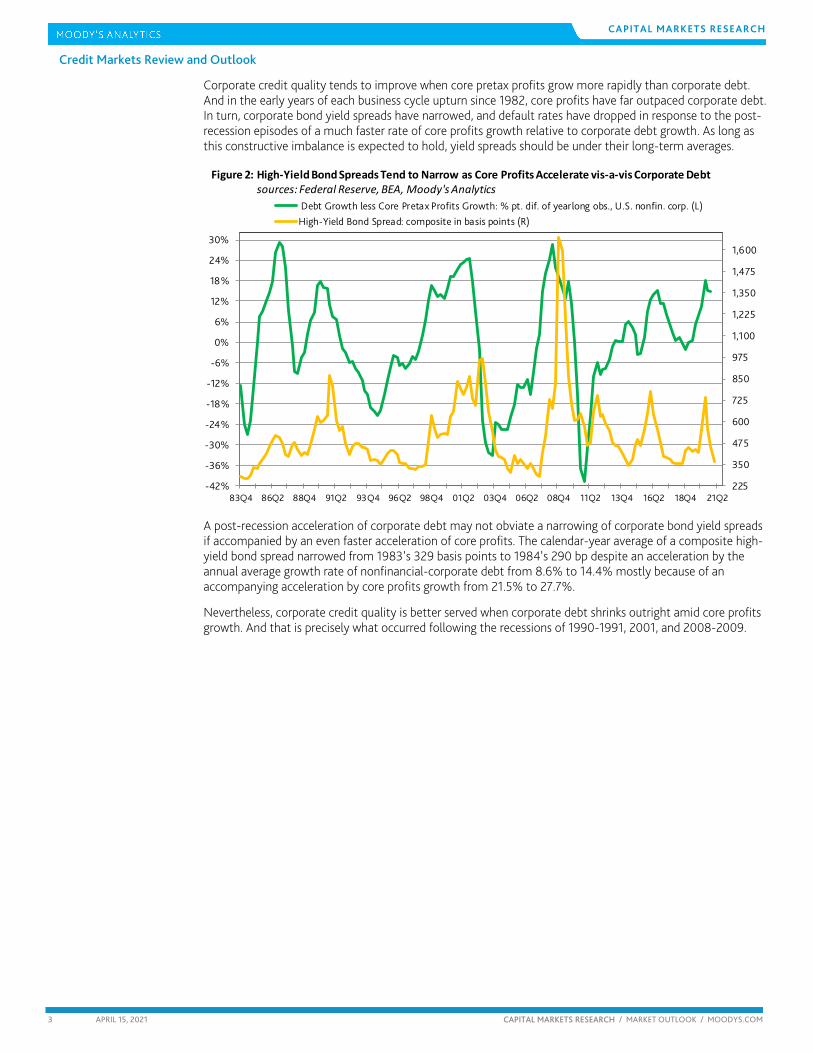
Corporate credit quality tends to improve when core pretax profits grow more rapidly than corporate debt. And in the early years of each business cycle upturn since 1982, core profits have far outpaced corporate debt. In turn, corporate bond yield spreads have narrowed, and default rates have dropped in response to the post-recession episodes of a much faster rate of core profits growth relative to corporate debt growth. As long as this constructive imbalance is expected to hold, yield spreads should be under their long-term averages.
A post-recession acceleration of corporate debt may not obviate a narrowing of corporate bond yield spreads if accompanied by an even faster acceleration of core profits. The calendar-year average of a composite high-yield bond spread narrowed from 1983’s 329 basis points to 1984’s 290 bp despite an acceleration by the annual average growth rate of nonfinancial-corporate debt from 8.6% to 14.4% mostly because of an accompanying acceleration by core profits growth from 21.5% to 27.7%.
Nevertheless, corporate credit quality is better served when corporate debt shrinks outright amid core profits growth. And that is precisely what occurred following the recessions of 1990-1991, 2001, and 2008-2009.
225
350
475
600
725
850
975
1,100
1,225
1,350
1,475
1,600
83Q4 86Q2 88Q4 91Q2 93Q4 96Q2 98Q4 01Q2 03Q4 06Q2 08Q4 11Q2 13Q4 16Q2 18Q4 21Q2-42%
-36%
-30%
-24%
-18%
-12%
-6%
0%
6%
12%
18%
24%
30%
Debt Growth less Core Pretax Profits Growth: % pt. dif. of yearlong obs., U.S. nonfin. corp. (L)High-Yield Bond Spread: composite in basis points (R)
Figure 2: High-Yield Bond Spreads Tend to Narrow as Core Profits Accelerate vis-a-vis Corporate Debtsources: Federal Reserve, BEA, Moody's Analytics

CAPITAL MARKETS RESEARCH
4 APRIL 15, 2021 CAPITAL MARKETS RESEARCH / MARKET OUTLOOK / MOODYS.COM
Credit Markets Review and Outlook
However, the expansion of nonfinancial-corporate debt is likely to continue during the early years of the unfolding business cycle upturn largely in response to extraordinarily low corporate borrowing costs and the sense that monetary and fiscal policy will do whatever is necessary to extend the upturn until full employment takes hold. Because of the release of pent-up demand and the application of massive monetary and fiscal stimuli, the credit market is confident that a disruptive contraction of core profits will be avoided for some time. Thus, today’s historically narrow corporate bond yield spreads may persist for some time.
As inferred from FactSet consensus expectations of at least a 20% annual advance by 2021’s S&P 500 earnings per share, both corporate earnings and cash flows should significantly outpace corporate debt and by doing so enhance corporate credit quality in 2021.
Homebuyer Mortgage Applications Have Yet to Signal Boom for Housing’s Peak Selling Season Seasonally adjusted retail sales soared 9.8% monthly to a new record high in March. Not only were March retail sales up 27.7% from March 2020’s COVID-19 depressed pace, they also expanded at a blistering 9.9% average annualized pace from March 2019’s tally. Reason to believe that a brisk pace of retail sales will be maintained was inferred from the deep drop by initial state unemployment claims from April 3’s 769,000 first-time filings to April 10’s 576,000.
Nevertheless, you would never know that it is housing’s peak spring selling season according to April 9’s third straight week-to-week decline by the Mortgage Bankers Association’s index of mortgage applications for the purchase of a home. The average of the four-weeks-ended April 9 showed that homebuyer mortgage applications were a considerable 14.3% under their latest peak moving four-week average of the span-ended January 29.
Flat-to-lower homebuyer mortgage applications suggest that the consensus may have overestimated 2021’s pace for home sales. The surprisingly muted pace of homebuyer mortgage applications might partly be ascribed to higher mortgage yields. After bottoming at the 2.96% of the span-ended January 1, 2021, the moving four-week average of the MBA’s effective 30-year mortgage yield has since risen to 3.44% as of the span-ended April 9.
A possible loss of anticipated credit-sensitive expenditures to higher interest rates partly explains why the recent 1.55% 10-year Treasury yield is under March 31’s current cycle-high of 1.74%. More than inflation expectations determine Treasury bond yields.
According to some, under-appreciated geopolitical and pandemic risks help to explain the odd juxtaposition of lower Treasury bond yields amid very upbeat outlooks for business activity and corporate earnings.
10088Q4 90Q4 92Q4 94Q4 96Q4 98Q4 00Q4 02Q4 04Q4 06Q4 08Q4 10Q4 12Q4 14Q4 16Q4 18Q4 20Q4
-22.0%
-16.5%
-11.0%
-5.5%
0.0%
5.5%
11.0%
16.5%
22.0%
27.5%
33.0%
Recessions are shaded, actual & predictedNonfinancial-Corporate DebtNonfinancial-Corporate Core Pretax Profits
Figure 3: Forthcoming Surge by Core Pretax Profits May Double Corporate Debt Growthyy % changes of yr. long obs.sources: Federal Reserve, BEA, NBER, Moody's Analytics

CAPITAL MARKETS RESEARCH
5 APRIL 15, 2021 CAPITAL MARKETS RESEARCH / MARKET OUTLOOK / MOODYS.COM
Credit Markets Review and Outlook
Supposedly, increased foreign buying of U.S. Treasury bonds is responsible for the unexpected drop by benchmark bond yields.
Elevated construction costs may weigh on new home sales. The most heavily traded lumber futures contract set a new record high on April 14. Compared with its COVID-19 suppressed reading of a year earlier, lumber futures are up by a staggering 277% year-to-year.
In order to eliminate the downward bias now implicit to many year-to-year comparisons, current prices and levels of business activity might be measured off of their levels of two years back. But even this approach shows an 89% average annualized advance by lumber futures over the past two years.
Energy costs are up sharply year-to-year, but down compared to two years back Depending on the time frame, the price of WTI crude oil may or may not exhibit very rapid growth.
April 14’s price of WTI crude oil soared higher by 178% yearly. However, in order to limit the downward bias emanating from the COVID-19 recession of a year earlier, the price of WTI crude oil incurred a far different looking 1% average annualized decline over the past 24 months.
In a similar manner, April 14’s price of the most heavily trade gasoline futures contract went from being up 201% year-to-year to a 1% average annualized rise compared to 24-months back.
Thank you and Farewell It was nearly 36 years ago that I penned my first weekly commentary for what was then Moody’s Bond Survey. Since I’ll be moving on, this is my final installment. I would like to thank my editors and production staff for their assistance over the years and Moody’s management for this opportunity. And, of course, I’m grateful to you readers for using your valuable time to see what I had to say. For the employees of Moody’s Corporation and you readers, I predict the best is yet to come. By the way, I’m not vanishing and can be reached via LinkedIn.
The Week Ahead
CAPITAL MARKETS RESEARCH
6 APRIL 15, 2021 CAPITAL MARKETS RESEARCH / MARKET OUTLOOK / MOODYS.COM
The Week Ahead – U.S., Europe, Asia-Pacific THE U.S. By Mark Zandi, Chief Economist of Moody’s Analytics
Shifting Into Overdrive
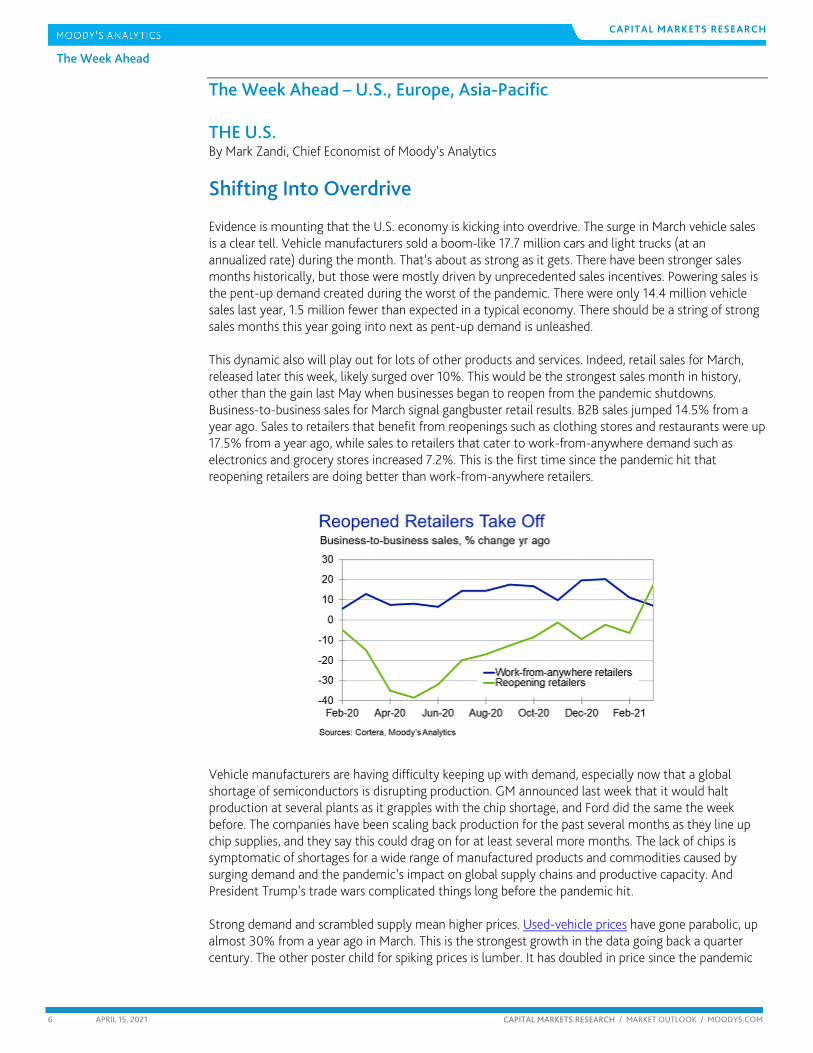
Evidence is mounting that the U.S. economy is kicking into overdrive. The surge in March vehicle sales is a clear tell. Vehicle manufacturers sold a boom-like 17.7 million cars and light trucks (at an annualized rate) during the month. That’s about as strong as it gets. There have been stronger sales months historically, but those were mostly driven by unprecedented sales incentives. Powering sales is the pent-up demand created during the worst of the pandemic. There were only 14.4 million vehicle sales last year, 1.5 million fewer than expected in a typical economy. There should be a string of strong sales months this year going into next as pent-up demand is unleashed. This dynamic also will play out for lots of other products and services. Indeed, retail sales for March, released later this week, likely surged over 10%. This would be the strongest sales month in history, other than the gain last May when businesses began to reopen from the pandemic shutdowns. Business-to-business sales for March signal gangbuster retail results. B2B sales jumped 14.5% from a year ago. Sales to retailers that benefit from reopenings such as clothing stores and restaurants were up 17.5% from a year ago, while sales to retailers that cater to work-from-anywhere demand such as electronics and grocery stores increased 7.2%. This is the first time since the pandemic hit that reopening retailers are doing better than work-from-anywhere retailers.
Vehicle manufacturers are having difficulty keeping up with demand, especially now that a global shortage of semiconductors is disrupting production. GM announced last week that it would halt production at several plants as it grapples with the chip shortage, and Ford did the same the week before. The companies have been scaling back production for the past several months as they line up chip supplies, and they say this could drag on for at least several more months. The lack of chips is symptomatic of shortages for a wide range of manufactured products and commodities caused by surging demand and the pandemic’s impact on global supply chains and productive capacity. And President Trump’s trade wars complicated things long before the pandemic hit. Strong demand and scrambled supply mean higher prices. Used-vehicle prices have gone parabolic, up almost 30% from a year ago in March. This is the strongest growth in the data going back a quarter century. The other poster child for spiking prices is lumber. It has doubled in price since the pandemic
The Week Ahead
CAPITAL MARKETS RESEARCH
7 APRIL 15, 2021 CAPITAL MARKETS RESEARCH / MARKET OUTLOOK / MOODYS.COM
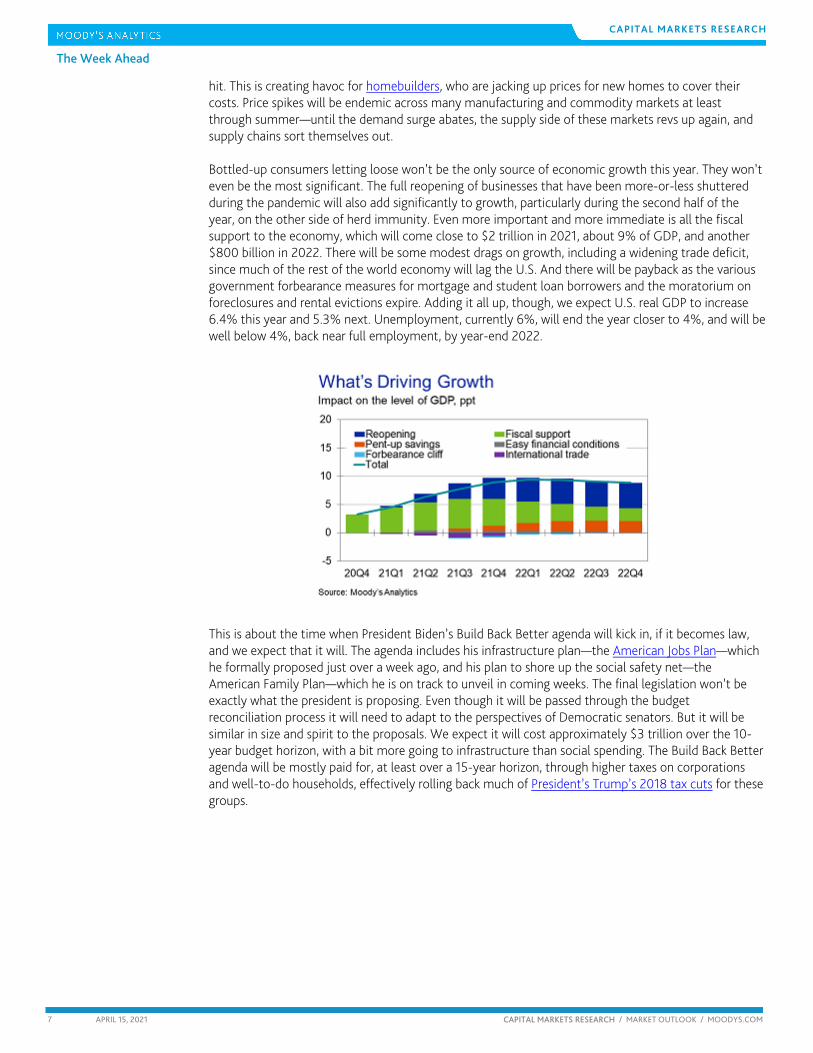
hit. This is creating havoc for homebuilders, who are jacking up prices for new homes to cover their costs. Price spikes will be endemic across many manufacturing and commodity markets at least through summer—until the demand surge abates, the supply side of these markets revs up again, and supply chains sort themselves out. Bottled-up consumers letting loose won’t be the only source of economic growth this year. They won’t even be the most significant. The full reopening of businesses that have been more-or-less shuttered during the pandemic will also add significantly to growth, particularly during the second half of the year, on the other side of herd immunity. Even more important and more immediate is all the fiscal support to the economy, which will come close to $2 trillion in 2021, about 9% of GDP, and another $800 billion in 2022. There will be some modest drags on growth, including a widening trade deficit, since much of the rest of the world economy will lag the U.S. And there will be payback as the various government forbearance measures for mortgage and student loan borrowers and the moratorium on foreclosures and rental evictions expire. Adding it all up, though, we expect U.S. real GDP to increase 6.4% this year and 5.3% next. Unemployment, currently 6%, will end the year closer to 4%, and will be well below 4%, back near full employment, by year-end 2022.
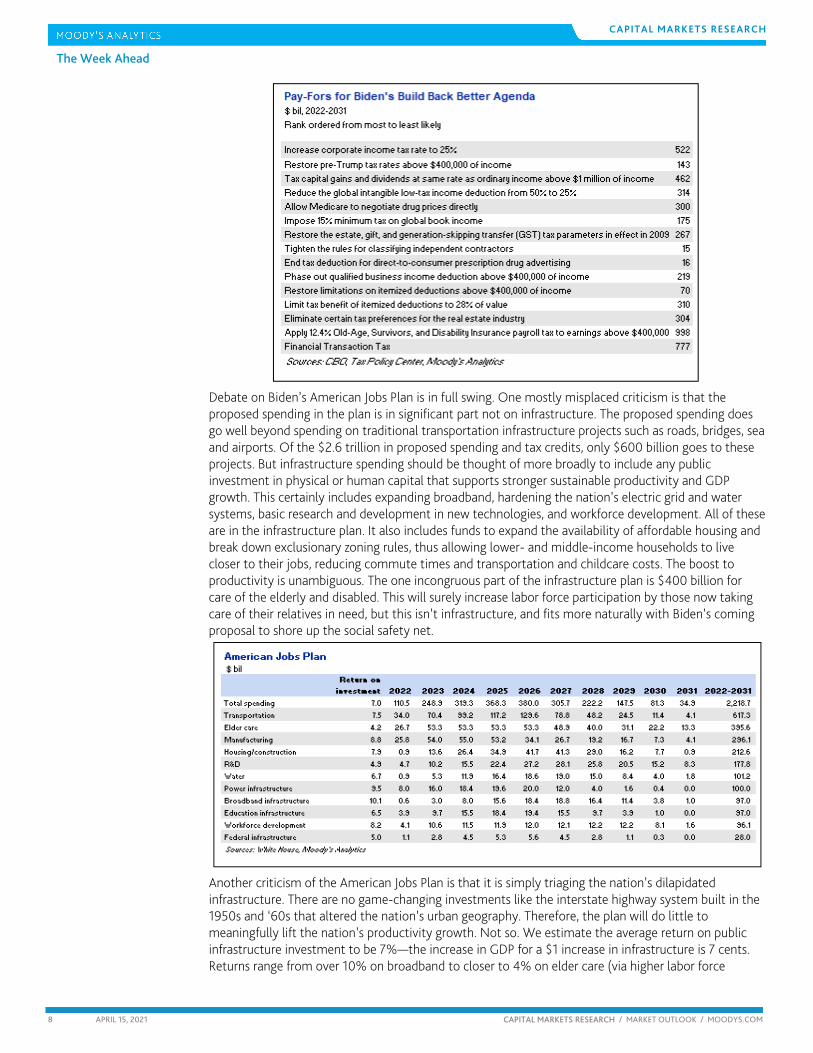
This is about the time when President Biden’s Build Back Better agenda will kick in, if it becomes law, and we expect that it will. The agenda includes his infrastructure plan—the American Jobs Plan—which he formally proposed just over a week ago, and his plan to shore up the social safety net—the American Family Plan—which he is on track to unveil in coming weeks. The final legislation won’t be exactly what the president is proposing. Even though it will be passed through the budget reconciliation process it will need to adapt to the perspectives of Democratic senators. But it will be similar in size and spirit to the proposals. We expect it will cost approximately $3 trillion over the 10-year budget horizon, with a bit more going to infrastructure than social spending. The Build Back Better agenda will be mostly paid for, at least over a 15-year horizon, through higher taxes on corporations and well-to-do households, effectively rolling back much of President’s Trump’s 2018 tax cuts for these groups.
The Week Ahead
CAPITAL MARKETS RESEARCH
8 APRIL 15, 2021 CAPITAL MARKETS RESEARCH / MARKET OUTLOOK / MOODYS.COM
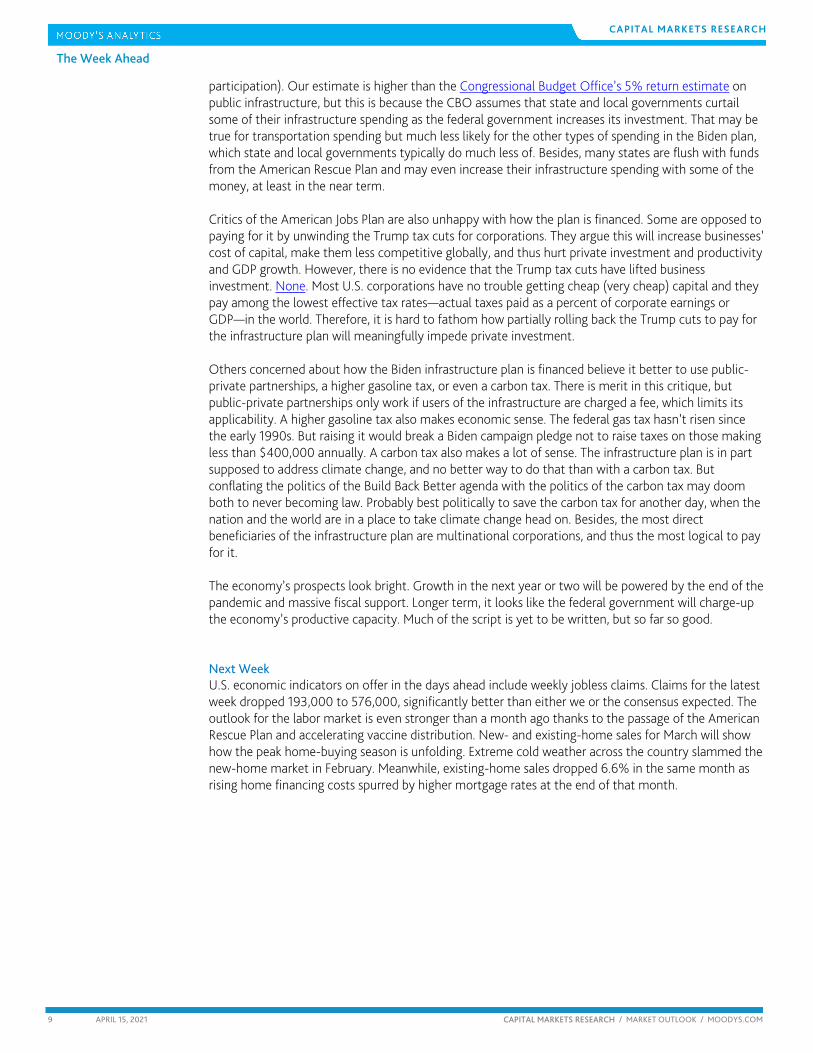
Debate on Biden’s American Jobs Plan is in full swing. One mostly misplaced criticism is that the proposed spending in the plan is in significant part not on infrastructure. The proposed spending does go well beyond spending on traditional transportation infrastructure projects such as roads, bridges, sea and airports. Of the $2.6 trillion in proposed spending and tax credits, only $600 billion goes to these projects. But infrastructure spending should be thought of more broadly to include any public investment in physical or human capital that supports stronger sustainable productivity and GDP growth. This certainly includes expanding broadband, hardening the nation’s electric grid and water systems, basic research and development in new technologies, and workforce development. All of these are in the infrastructure plan. It also includes funds to expand the availability of affordable housing and break down exclusionary zoning rules, thus allowing lower- and middle-income households to live closer to their jobs, reducing commute times and transportation and childcare costs. The boost to productivity is unambiguous. The one incongruous part of the infrastructure plan is $400 billion for care of the elderly and disabled. This will surely increase labor force participation by those now taking care of their relatives in need, but this isn’t infrastructure, and fits more naturally with Biden’s coming proposal to shore up the social safety net.
Another criticism of the American Jobs Plan is that it is simply triaging the nation’s dilapidated infrastructure. There are no game-changing investments like the interstate highway system built in the 1950s and ‘60s that altered the nation’s urban geography. Therefore, the plan will do little to meaningfully lift the nation’s productivity growth. Not so. We estimate the average return on public infrastructure investment to be 7%—the increase in GDP for a $1 increase in infrastructure is 7 cents. Returns range from over 10% on broadband to closer to 4% on elder care (via higher labor force
The Week Ahead
CAPITAL MARKETS RESEARCH
9 APRIL 15, 2021 CAPITAL MARKETS RESEARCH / MARKET OUTLOOK / MOODYS.COM
participation). Our estimate is higher than the Congressional Budget Office’s 5% return estimate on public infrastructure, but this is because the CBO assumes that state and local governments curtail some of their infrastructure spending as the federal government increases its investment. That may be true for transportation spending but much less likely for the other types of spending in the Biden plan, which state and local governments typically do much less of. Besides, many states are flush with funds from the American Rescue Plan and may even increase their infrastructure spending with some of the money, at least in the near term. Critics of the American Jobs Plan are also unhappy with how the plan is financed. Some are opposed to paying for it by unwinding the Trump tax cuts for corporations. They argue this will increase businesses’ cost of capital, make them less competitive globally, and thus hurt private investment and productivity and GDP growth. However, there is no evidence that the Trump tax cuts have lifted business investment. None. Most U.S. corporations have no trouble getting cheap (very cheap) capital and they pay among the lowest effective tax rates—actual taxes paid as a percent of corporate earnings or GDP—in the world. Therefore, it is hard to fathom how partially rolling back the Trump cuts to pay for the infrastructure plan will meaningfully impede private investment. Others concerned about how the Biden infrastructure plan is financed believe it better to use public-private partnerships, a higher gasoline tax, or even a carbon tax. There is merit in this critique, but public-private partnerships only work if users of the infrastructure are charged a fee, which limits its applicability. A higher gasoline tax also makes economic sense. The federal gas tax hasn’t risen since the early 1990s. But raising it would break a Biden campaign pledge not to raise taxes on those making less than $400,000 annually. A carbon tax also makes a lot of sense. The infrastructure plan is in part supposed to address climate change, and no better way to do that than with a carbon tax. But conflating the politics of the Build Back Better agenda with the politics of the carbon tax may doom both to never becoming law. Probably best politically to save the carbon tax for another day, when the nation and the world are in a place to take climate change head on. Besides, the most direct beneficiaries of the infrastructure plan are multinational corporations, and thus the most logical to pay for it. The economy’s prospects look bright. Growth in the next year or two will be powered by the end of the pandemic and massive fiscal support. Longer term, it looks like the federal government will charge-up the economy’s productive capacity. Much of the script is yet to be written, but so far so good.
Next Week U.S. economic indicators on offer in the days ahead include weekly jobless claims. Claims for the latest week dropped 193,000 to 576,000, significantly better than either we or the consensus expected. The outlook for the labor market is even stronger than a month ago thanks to the passage of the American Rescue Plan and accelerating vaccine distribution. New- and existing-home sales for March will show how the peak home-buying season is unfolding. Extreme cold weather across the country slammed the new-home market in February. Meanwhile, existing-home sales dropped 6.6% in the same month as rising home financing costs spurred by higher mortgage rates at the end of that month.
The Week Ahead
CAPITAL MARKETS RESEARCH
10 APRIL 15, 2021 CAPITAL MARKETS RESEARCH / MARKET OUTLOOK / MOODYS.COM
EUROPE By Ross Cioffi of Moody’s Analytics
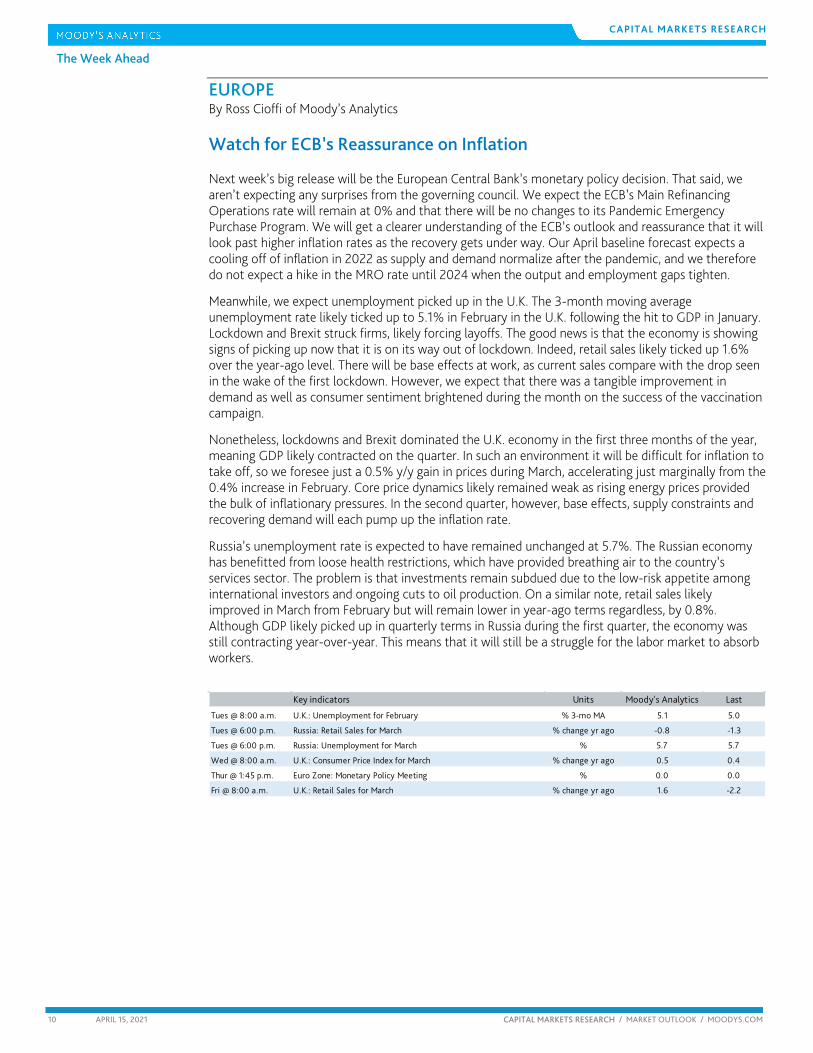
Watch for ECB’s Reassurance on Inflation Next week’s big release will be the European Central Bank’s monetary policy decision. That said, we aren’t expecting any surprises from the governing council. We expect the ECB’s Main Refinancing Operations rate will remain at 0% and that there will be no changes to its Pandemic Emergency Purchase Program. We will get a clearer understanding of the ECB’s outlook and reassurance that it will look past higher inflation rates as the recovery gets under way. Our April baseline forecast expects a cooling off of inflation in 2022 as supply and demand normalize after the pandemic, and we therefore do not expect a hike in the MRO rate until 2024 when the output and employment gaps tighten.
Meanwhile, we expect unemployment picked up in the U.K. The 3-month moving average unemployment rate likely ticked up to 5.1% in February in the U.K. following the hit to GDP in January. Lockdown and Brexit struck firms, likely forcing layoffs. The good news is that the economy is showing signs of picking up now that it is on its way out of lockdown. Indeed, retail sales likely ticked up 1.6% over the year-ago level. There will be base effects at work, as current sales compare with the drop seen in the wake of the first lockdown. However, we expect that there was a tangible improvement in demand as well as consumer sentiment brightened during the month on the success of the vaccination campaign.
Nonetheless, lockdowns and Brexit dominated the U.K. economy in the first three months of the year, meaning GDP likely contracted on the quarter. In such an environment it will be difficult for inflation to take off, so we foresee just a 0.5% y/y gain in prices during March, accelerating just marginally from the 0.4% increase in February. Core price dynamics likely remained weak as rising energy prices provided the bulk of inflationary pressures. In the second quarter, however, base effects, supply constraints and recovering demand will each pump up the inflation rate.
Russia’s unemployment rate is expected to have remained unchanged at 5.7%. The Russian economy has benefitted from loose health restrictions, which have provided breathing air to the country’s services sector. The problem is that investments remain subdued due to the low-risk appetite among international investors and ongoing cuts to oil production. On a similar note, retail sales likely improved in March from February but will remain lower in year-ago terms regardless, by 0.8%. Although GDP likely picked up in quarterly terms in Russia during the first quarter, the economy was still contracting year-over-year. This means that it will still be a struggle for the labor market to absorb workers.
Key indicators Units Moody's Analytics Last
Tues @ 8:00 a.m. U.K.: Unemployment for February % 3-mo MA 5.1 5.0
Tues @ 6:00 p.m. Russia: Retail Sales for March % change yr ago -0.8 -1.3
Tues @ 6:00 p.m. Russia: Unemployment for March % 5.7 5.7
Wed @ 8:00 a.m. U.K.: Consumer Price Index for March % change yr ago 0.5 0.4
Thur @ 1:45 p.m. Euro Zone: Monetary Policy Meeting % 0.0 0.0
Fri @ 8:00 a.m. U.K.: Retail Sales for March % change yr ago 1.6 -2.2
The Week Ahead
CAPITAL MARKETS RESEARCH
11 APRIL 15, 2021 CAPITAL MARKETS RESEARCH / MARKET OUTLOOK / MOODYS.COM
Asia-Pacific By Shahana Mukherjee of Moody’s Analytics
Japan’s trade surplus continues to grow
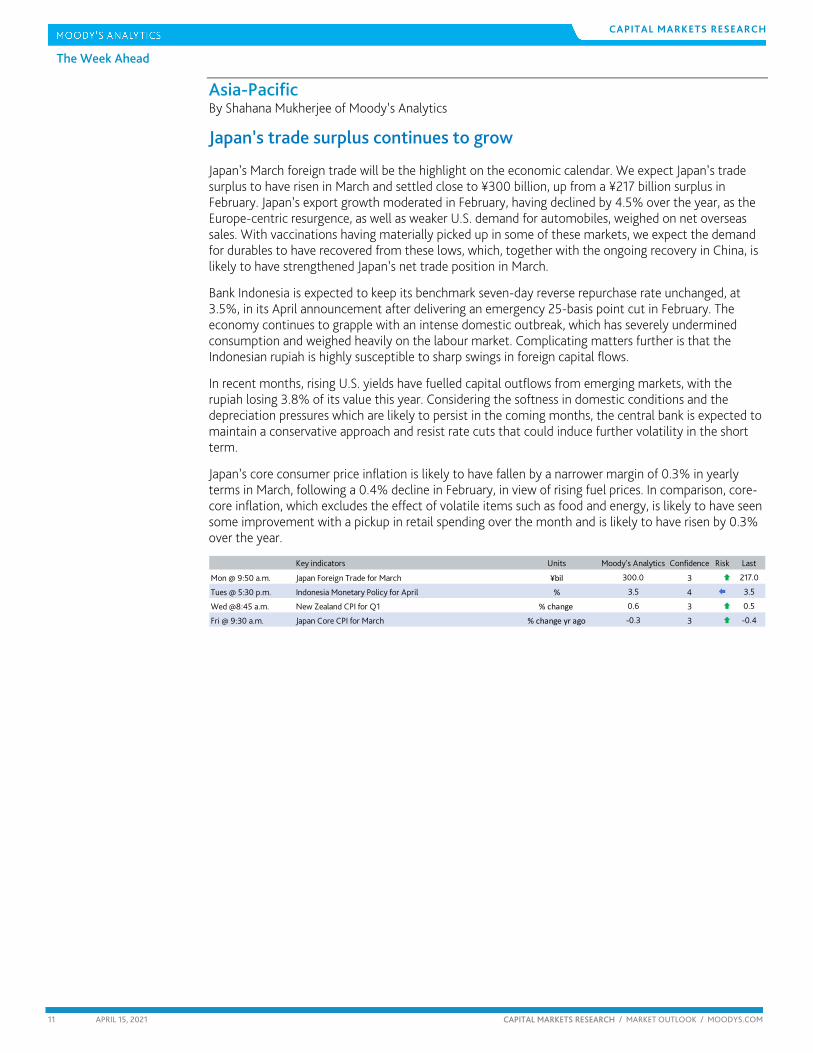
Japan’s March foreign trade will be the highlight on the economic calendar. We expect Japan’s trade surplus to have risen in March and settled close to ¥300 billion, up from a ¥217 billion surplus in February. Japan’s export growth moderated in February, having declined by 4.5% over the year, as the Europe-centric resurgence, as well as weaker U.S. demand for automobiles, weighed on net overseas sales. With vaccinations having materially picked up in some of these markets, we expect the demand for durables to have recovered from these lows, which, together with the ongoing recovery in China, is likely to have strengthened Japan’s net trade position in March.
Bank Indonesia is expected to keep its benchmark seven-day reverse repurchase rate unchanged, at 3.5%, in its April announcement after delivering an emergency 25-basis point cut in February. The economy continues to grapple with an intense domestic outbreak, which has severely undermined consumption and weighed heavily on the labour market. Complicating matters further is that the Indonesian rupiah is highly susceptible to sharp swings in foreign capital flows.
In recent months, rising U.S. yields have fuelled capital outflows from emerging markets, with the rupiah losing 3.8% of its value this year. Considering the softness in domestic conditions and the depreciation pressures which are likely to persist in the coming months, the central bank is expected to maintain a conservative approach and resist rate cuts that could induce further volatility in the short term.
Japan’s core consumer price inflation is likely to have fallen by a narrower margin of 0.3% in yearly terms in March, following a 0.4% decline in February, in view of rising fuel prices. In comparison, core-core inflation, which excludes the effect of volatile items such as food and energy, is likely to have seen some improvement with a pickup in retail spending over the month and is likely to have risen by 0.3% over the year.
Key indicators Units Moody's Analytics Confidence Risk Last
Mon @ 9:50 a.m. Japan Foreign Trade for March ¥bil 300.0 3 217.0
Tues @ 5:30 p.m. Indonesia Monetary Policy for April % 3.5 4 3.5
Wed @8:45 a.m. New Zealand CPI for Q1 % change 0.6 3 0.5
Fri @ 9:30 a.m. Japan Core CPI for March % change yr ago -0.3 3 -0.4

12 APRIL 15, 2021 CAPITAL MARKETS RESEARCH / MARKET OUTLOOK / MOODYS.COM
CAPITAL MARKETS RESEARCH The Long View
d The Long View Investment-grade bond issuance has slowed, but high-yield offerings maintain an above-trend pace. By John Lonski, Chief Capital Markets Economist, Moody’s Capital Markets Research April 15, 2021
CREDIT SPREADS As measured by Moody's long-term average corporate bond yield, the recent investment grade corporate bond yield spread of 94 basis points was less than its 116 basis-point median of the 30 years ended 2019. This spread may be no wider than 105 bp by year-end 2021.
The recent composite high-yield bond spread of 324 bp approximates what is suggested by the accompanying long-term Baa industrial company bond yield spread of 134 bp but is much narrower than what might be inferred from the recent VIX of 16.8 points. The latter has been historically associated with a 475-bp midpoint for a composite high-yield bond spread.
DEFAULTS March 2021’s U.S. high-yield default rate of 7.5% was up from March 2020’s 4.9%. The recent average high-yield EDF metric of 1.9% portend a less-than-3% default rate by 2021’s final quarter.
U.S. CORPORATE BOND ISSUANCE First-quarter 2020’s worldwide offerings of corporate bonds revealed annual advances of 14% for IG and 19% for high-yield, wherein US$-denominated offerings increased 45% for IG and grew 12% for high yield.
Second-quarter 2020’s worldwide offerings of corporate bonds revealed annual surges of 69% for IG and 32% for high-yield, wherein US$-denominated offerings increased 142% for IG and grew 45% for high yield.
Third-quarter 2020’s worldwide offerings of corporate bonds revealed an annual decline of 6% for IG and an annual advance of 44% for high-yield, wherein US$-denominated offerings increased 12% for IG and soared upward 56% for high yield.
Fourth-quarter 2020’s worldwide offerings of corporate bonds revealed an annual decline of 3% for IG and an annual advance of 8% for high-yield, wherein US$-denominated offerings increased 16% for IG and 11% for high yield.
First-quarter 2021’s worldwide offerings of corporate bonds revealed an annual decline of 4% for IG and an annual advance of 57% for high-yield, wherein US$-denominated offerings sank 9% for IG and advanced 64% for high yield.
For 2019, worldwide corporate bond offerings grew 5.8% annually (to $2.456 trillion) for IG and advanced 51.6% for high yield (to $570 billion). The annual percent increases for 2020’s worldwide corporate bond offerings are 19.7% (to $2.940 trillion) for IG and 23.9% (to $706 billion) for high yield. The expected annual declines for 2021’s worldwide rated corporate bond issuance are 17% for investment-grade and 2% for high-yield.
U.S. ECONOMIC OUTLOOK Unacceptably high unemployment and other low rates of resource utilization will rein in Treasury bond yields. A now-rising global economy, as well as forthcoming fiscal and monetary stimulus suggest the upper bound for the 10-year Treasury yield will be 2%. The corporate credit market has priced in the widespread distribution of a COVID-19 vaccine by mid-2021.
13 APRIL 15, 2021 CAPITAL MARKETS RESEARCH / MARKET OUTLOOK / MOODYS.COM
CAPITAL MARKETS RESEARCH The Long View
d Europe By Ross Cioffi of Moody’s Analytics April 15, 2021
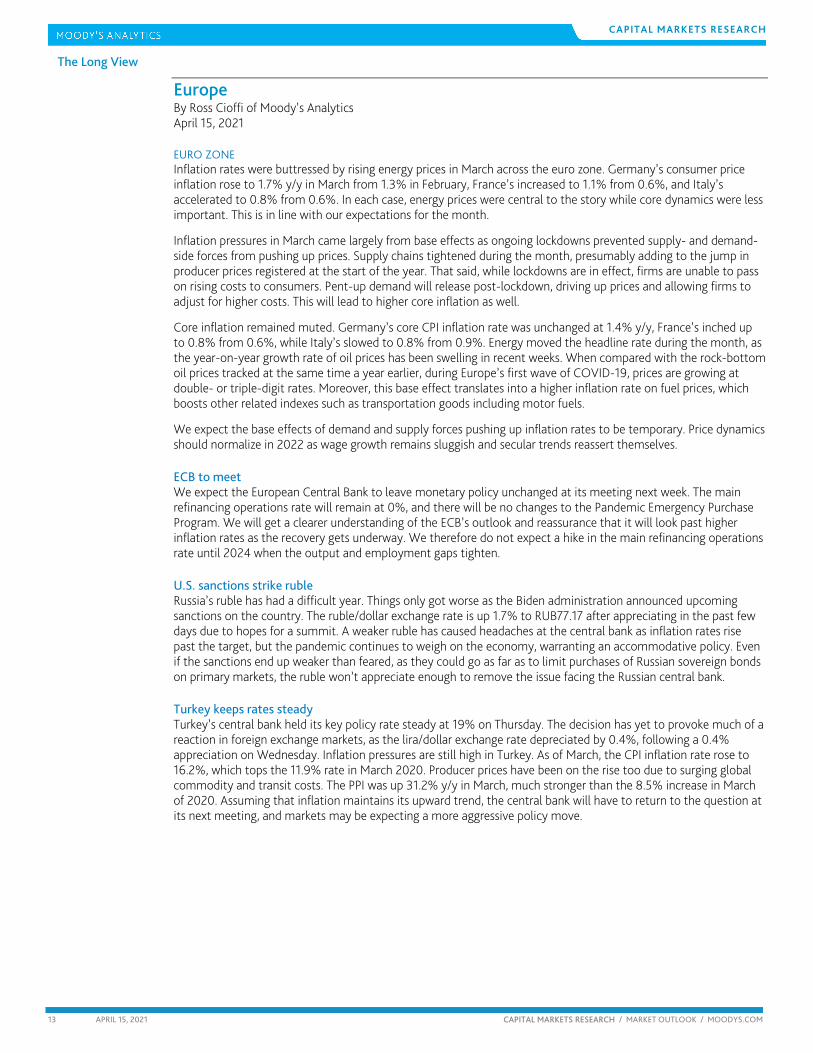
EURO ZONE Inflation rates were buttressed by rising energy prices in March across the euro zone. Germany’s consumer price inflation rose to 1.7% y/y in March from 1.3% in February, France’s increased to 1.1% from 0.6%, and Italy’s accelerated to 0.8% from 0.6%. In each case, energy prices were central to the story while core dynamics were less important. This is in line with our expectations for the month.
Inflation pressures in March came largely from base effects as ongoing lockdowns prevented supply- and demand-side forces from pushing up prices. Supply chains tightened during the month, presumably adding to the jump in producer prices registered at the start of the year. That said, while lockdowns are in effect, firms are unable to pass on rising costs to consumers. Pent-up demand will release post-lockdown, driving up prices and allowing firms to adjust for higher costs. This will lead to higher core inflation as well.
Core inflation remained muted. Germany’s core CPI inflation rate was unchanged at 1.4% y/y, France’s inched up to 0.8% from 0.6%, while Italy’s slowed to 0.8% from 0.9%. Energy moved the headline rate during the month, as the year-on-year growth rate of oil prices has been swelling in recent weeks. When compared with the rock-bottom oil prices tracked at the same time a year earlier, during Europe’s first wave of COVID-19, prices are growing at double- or triple-digit rates. Moreover, this base effect translates into a higher inflation rate on fuel prices, which boosts other related indexes such as transportation goods including motor fuels.
We expect the base effects of demand and supply forces pushing up inflation rates to be temporary. Price dynamics should normalize in 2022 as wage growth remains sluggish and secular trends reassert themselves.
ECB to meet We expect the European Central Bank to leave monetary policy unchanged at its meeting next week. The main refinancing operations rate will remain at 0%, and there will be no changes to the Pandemic Emergency Purchase Program. We will get a clearer understanding of the ECB’s outlook and reassurance that it will look past higher inflation rates as the recovery gets underway. We therefore do not expect a hike in the main refinancing operations rate until 2024 when the output and employment gaps tighten.
U.S. sanctions strike ruble Russia’s ruble has had a difficult year. Things only got worse as the Biden administration announced upcoming sanctions on the country. The ruble/dollar exchange rate is up 1.7% to RUB77.17 after appreciating in the past few days due to hopes for a summit. A weaker ruble has caused headaches at the central bank as inflation rates rise past the target, but the pandemic continues to weigh on the economy, warranting an accommodative policy. Even if the sanctions end up weaker than feared, as they could go as far as to limit purchases of Russian sovereign bonds on primary markets, the ruble won’t appreciate enough to remove the issue facing the Russian central bank.
Turkey keeps rates steady Turkey’s central bank held its key policy rate steady at 19% on Thursday. The decision has yet to provoke much of a reaction in foreign exchange markets, as the lira/dollar exchange rate depreciated by 0.4%, following a 0.4% appreciation on Wednesday. Inflation pressures are still high in Turkey. As of March, the CPI inflation rate rose to 16.2%, which tops the 11.9% rate in March 2020. Producer prices have been on the rise too due to surging global commodity and transit costs. The PPI was up 31.2% y/y in March, much stronger than the 8.5% increase in March of 2020. Assuming that inflation maintains its upward trend, the central bank will have to return to the question at its next meeting, and markets may be expecting a more aggressive policy move.
14 APRIL 15, 2021 CAPITAL MARKETS RESEARCH / MARKET OUTLOOK / MOODYS.COM
CAPITAL MARKETS RESEARCH The Long View
d Asia Pacific By Shahana Mukherjee of Moody’s Analytics April 15, 2021
SINGAPORE Singapore’s economy sustained the rebound over the March quarter, as advanced estimates pegged seasonally adjusted GDP growth at 2% in quarterly terms, building on the 3.8% increase in the prior quarter. This translated into a yearly increase of 0.2% and marked a turnaround from the 2.8% contraction over the December quarter, and exceeded our expectations of a 0.5% decline for this period.
The impressive performance was led by significant gains in manufacturing and construction, which grew by 7.6% and 8.4% over the quarter, respectively. The highly trade-reliant economy has continued to benefit from the surging overseas demand for electronics, precision engineering equipment, and biomedical products, of which the total production more than offsets declines in transport engineering and other manufactured goods. Not surprisingly, growth outcomes remained unfavourable for some services industries, with accommodation and food services declining by 1.4% over the quarter, after some normalization during the second half of 2020. Indeed, among services, accommodation and food and the wholesale and retail sectors remained the most acutely impacted by the COVID-19 restrictions, with output contracting by 12.8% and 9.5% through 2020.
Looking ahead, the near-term prospects for Singapore are improving. While authorities have successfully contained the localized outbreak and are ensuring a well-paced vaccination rollout necessary to support the domestic rebound, a meaningful revival in global manufacturing is likely to further strengthen its external position, particularly in the second half of 2021. For Singapore, however, a sustainable recovery rests crucially on the resumption of international travel. The scope for this will be moderated by the course of the pandemic, but the increased possibility of limited travel agreements with select countries can become an important first step in breaking away from the long pause that has weighed heavily on its tourism-exposed industries.
Despite the record 5.4% contraction in 2020, Singapore’s economy has fared better through the COVID-19 crisis relative to several of its Asian counterparts, thanks to effective containment and the substantial resources mobilized to cushion the fallout. But the COVID-19-related uncertainties still loom and could disrupt the revival, if restrictions are renewed. For now, assuming that no new domestic outbreak emerges, vaccinations proceed uninterrupted, and overseas demand continues to revive, we look for GDP to grow by 5.2% in 2021, a touch more conservative than the Monetary Authority of Singapore’s expectations of growth likely to exceed the upper limit of its 4% to 6% forecast range in 2021.
15 APRIL 15, 2021 CAPITAL MARKETS RESEARCH / MARKET OUTLOOK / MOODYS.COM
CAPITAL MARKETS RESEARCH Ratings Round-Up
Ratings Round-Up
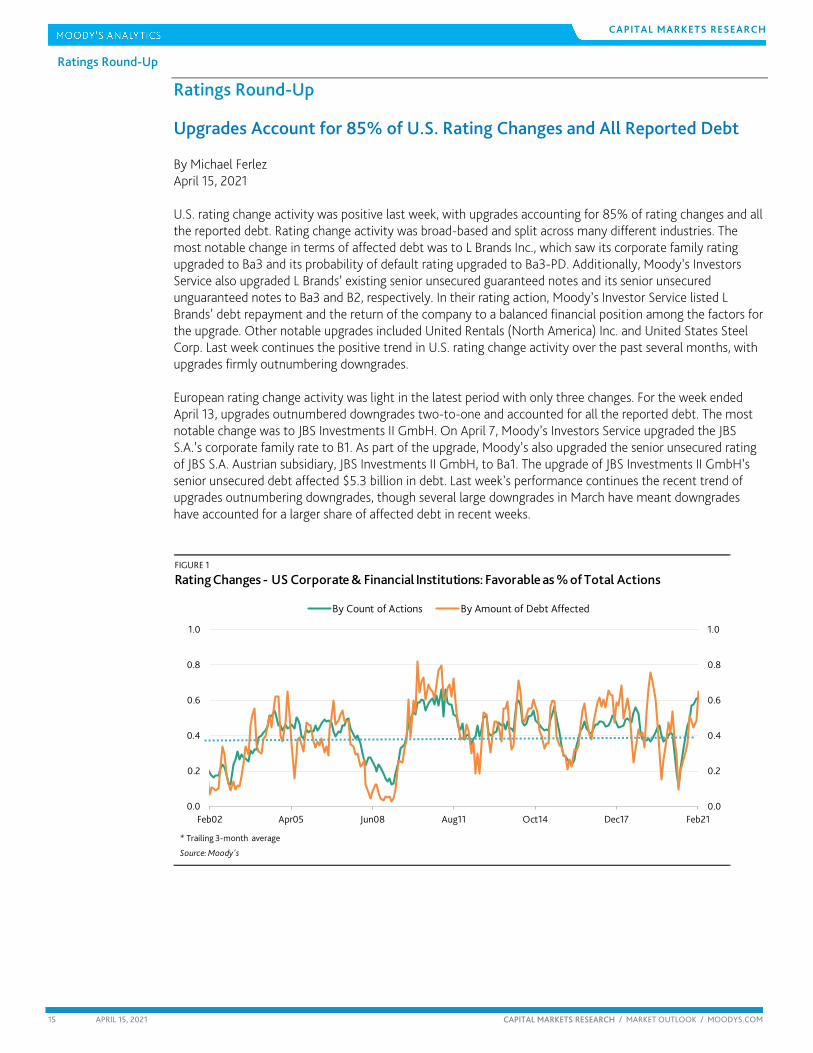
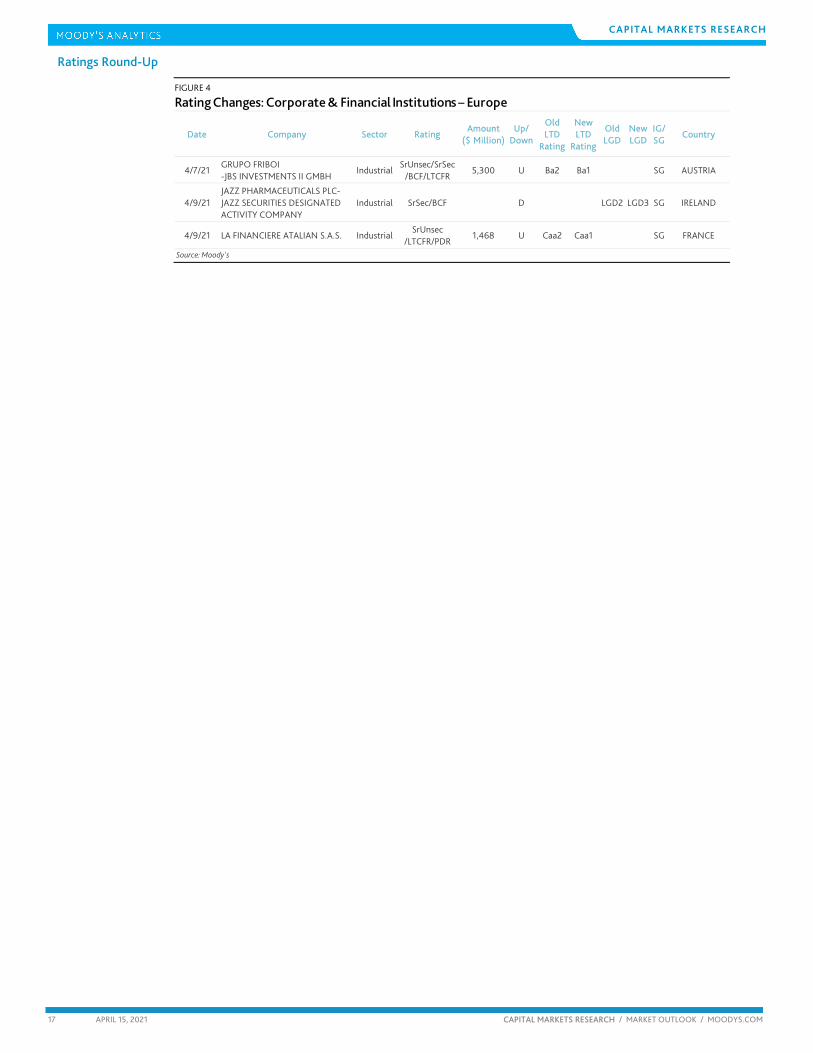
Upgrades Account for 85% of U.S. Rating Changes and All Reported Debt By Michael Ferlez April 15, 2021 U.S. rating change activity was positive last week, with upgrades accounting for 85% of rating changes and all the reported debt. Rating change activity was broad-based and split across many different industries. The most notable change in terms of affected debt was to L Brands Inc., which saw its corporate family rating upgraded to Ba3 and its probability of default rating upgraded to Ba3-PD. Additionally, Moody’s Investors Service also upgraded L Brands’ existing senior unsecured guaranteed notes and its senior unsecured unguaranteed notes to Ba3 and B2, respectively. In their rating action, Moody’s Investor Service listed L Brands’ debt repayment and the return of the company to a balanced financial position among the factors for the upgrade. Other notable upgrades included United Rentals (North America) Inc. and United States Steel Corp. Last week continues the positive trend in U.S. rating change activity over the past several months, with upgrades firmly outnumbering downgrades. European rating change activity was light in the latest period with only three changes. For the week ended April 13, upgrades outnumbered downgrades two-to-one and accounted for all the reported debt. The most notable change was to JBS Investments II GmbH. On April 7, Moody’s Investors Service upgraded the JBS S.A.’s corporate family rate to B1. As part of the upgrade, Moody’s also upgraded the senior unsecured rating of JBS S.A. Austrian subsidiary, JBS Investments II GmbH, to Ba1. The upgrade of JBS Investments II GmbH’s senior unsecured debt affected $5.3 billion in debt. Last week’s performance continues the recent trend of upgrades outnumbering downgrades, though several large downgrades in March have meant downgrades have accounted for a larger share of affected debt in recent weeks.
FIGURE 1
Rating Changes - US Corporate & Financial Institutions: Favorable as % of Total Actions
0.0
0.2
0.4
0.6
0.8
1.0
0.0
0.2
0.4
0.6
0.8
1.0
Feb02 Apr05 Jun08 Aug11 Oct14 Dec17 Feb21
By Count of Actions By Amount of Debt Affected
* Trailing 3-month average
Source: Moody's
16 APRIL 15, 2021 CAPITAL MARKETS RESEARCH / MARKET OUTLOOK / MOODYS.COM
CAPITAL MARKETS RESEARCH Ratings Round-Up
FIGURE 2
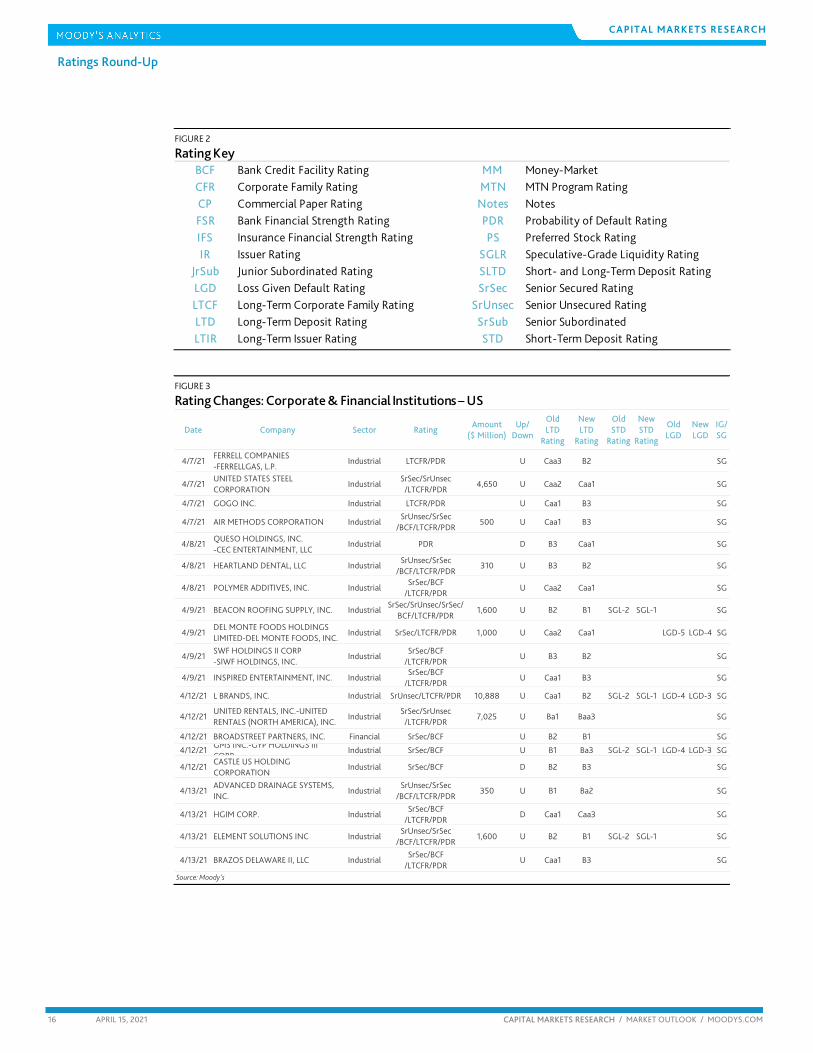
Rating Key
BCF Bank Credit Facility Rating MM Money-MarketCFR Corporate Family Rating MTN MTN Program RatingCP Commercial Paper Rating Notes NotesFSR Bank Financial Strength Rating PDR Probability of Default RatingIFS Insurance Financial Strength Rating PS Preferred Stock RatingIR Issuer Rating SGLR Speculative-Grade Liquidity Rating
JrSub Junior Subordinated Rating SLTD Short- and Long-Term Deposit RatingLGD Loss Given Default Rating SrSec Senior Secured Rating LTCF Long-Term Corporate Family Rating SrUnsec Senior Unsecured Rating LTD Long-Term Deposit Rating SrSub Senior SubordinatedLTIR Long-Term Issuer Rating STD Short-Term Deposit Rating
FIGURE 3
Rating Changes: Corporate & Financial Institutions – US
Date Company Sector RatingAmount
($ Million)Up/
Down
Old LTD
Rating
New LTD
Rating
Old STD
Rating
New STD
Rating
Old LGD
New LGD
IG/SG
4/7/21FERRELL COMPANIES -FERRELLGAS, L.P.
Industrial LTCFR/PDR U Caa3 B2 SG
4/7/21UNITED STATES STEEL CORPORATION
IndustrialSrSec/SrUnsec
/LTCFR/PDR4,650 U Caa2 Caa1 SG
4/7/21 GOGO INC. Industrial LTCFR/PDR U Caa1 B3 SG
4/7/21 AIR METHODS CORPORATION IndustrialSrUnsec/SrSec
/BCF/LTCFR/PDR500 U Caa1 B3 SG
4/8/21QUESO HOLDINGS, INC. -CEC ENTERTAINMENT, LLC
Industrial PDR D B3 Caa1 SG
4/8/21 HEARTLAND DENTAL, LLC IndustrialSrUnsec/SrSec
/BCF/LTCFR/PDR310 U B3 B2 SG
4/8/21 POLYMER ADDITIVES, INC. IndustrialSrSec/BCF
/LTCFR/PDRU Caa2 Caa1 SG
4/9/21 BEACON ROOFING SUPPLY, INC. IndustrialSrSec/SrUnsec/SrSec/
BCF/LTCFR/PDR1,600 U B2 B1 SGL-2 SGL-1 SG
4/9/21DEL MONTE FOODS HOLDINGS LIMITED-DEL MONTE FOODS, INC.
Industrial SrSec/LTCFR/PDR 1,000 U Caa2 Caa1 LGD-5 LGD-4 SG
4/9/21SWF HOLDINGS II CORP -SIWF HOLDINGS, INC.
IndustrialSrSec/BCF
/LTCFR/PDRU B3 B2 SG
4/9/21 INSPIRED ENTERTAINMENT, INC. IndustrialSrSec/BCF
/LTCFR/PDRU Caa1 B3 SG
4/12/21 L BRANDS, INC. Industrial SrUnsec/LTCFR/PDR 10,888 U Caa1 B2 SGL-2 SGL-1 LGD-4 LGD-3 SG
4/12/21UNITED RENTALS, INC.-UNITED RENTALS (NORTH AMERICA), INC.
IndustrialSrSec/SrUnsec
/LTCFR/PDR7,025 U Ba1 Baa3 SG
4/12/21 BROADSTREET PARTNERS, INC. Financial SrSec/BCF U B2 B1 SG
4/12/21GMS INC.-GYP HOLDINGS III CORP
Industrial SrSec/BCF U B1 Ba3 SGL-2 SGL-1 LGD-4 LGD-3 SG
4/12/21CASTLE US HOLDING CORPORATION
Industrial SrSec/BCF D B2 B3 SG
4/13/21ADVANCED DRAINAGE SYSTEMS, INC.
IndustrialSrUnsec/SrSec
/BCF/LTCFR/PDR350 U B1 Ba2 SG
4/13/21 HGIM CORP. IndustrialSrSec/BCF
/LTCFR/PDRD Caa1 Caa3 SG
4/13/21 ELEMENT SOLUTIONS INC IndustrialSrUnsec/SrSec
/BCF/LTCFR/PDR1,600 U B2 B1 SGL-2 SGL-1 SG
4/13/21 BRAZOS DELAWARE II, LLC IndustrialSrSec/BCF
/LTCFR/PDRU Caa1 B3 SG
Source: Moody's
17 APRIL 15, 2021 CAPITAL MARKETS RESEARCH / MARKET OUTLOOK / MOODYS.COM
CAPITAL MARKETS RESEARCH Ratings Round-Up
FIGURE 4
Rating Changes: Corporate & Financial Institutions – Europe
Date Company Sector RatingAmount
($ Million)Up/
Down
Old LTD
Rating
New LTD
Rating
Old LGD
New LGD
IG/SG
Country
4/7/21GRUPO FRIBOI -JBS INVESTMENTS II GMBH
IndustrialSrUnsec/SrSec
/BCF/LTCFR5,300 U Ba2 Ba1 SG AUSTRIA
4/9/21JAZZ PHARMACEUTICALS PLC-JAZZ SECURITIES DESIGNATED ACTIVITY COMPANY
Industrial SrSec/BCF D LGD2 LGD3 SG IRELAND
4/9/21 LA FINANCIERE ATALIAN S.A.S. IndustrialSrUnsec
/LTCFR/PDR1,468 U Caa2 Caa1 SG FRANCE
Source: Moody's
18 APRIL 15, 2021 CAPITAL MARKETS RESEARCH / MARKET OUTLOOK / MOODYS.COM
CAPITAL MARKETS RESEARCH
Market Data
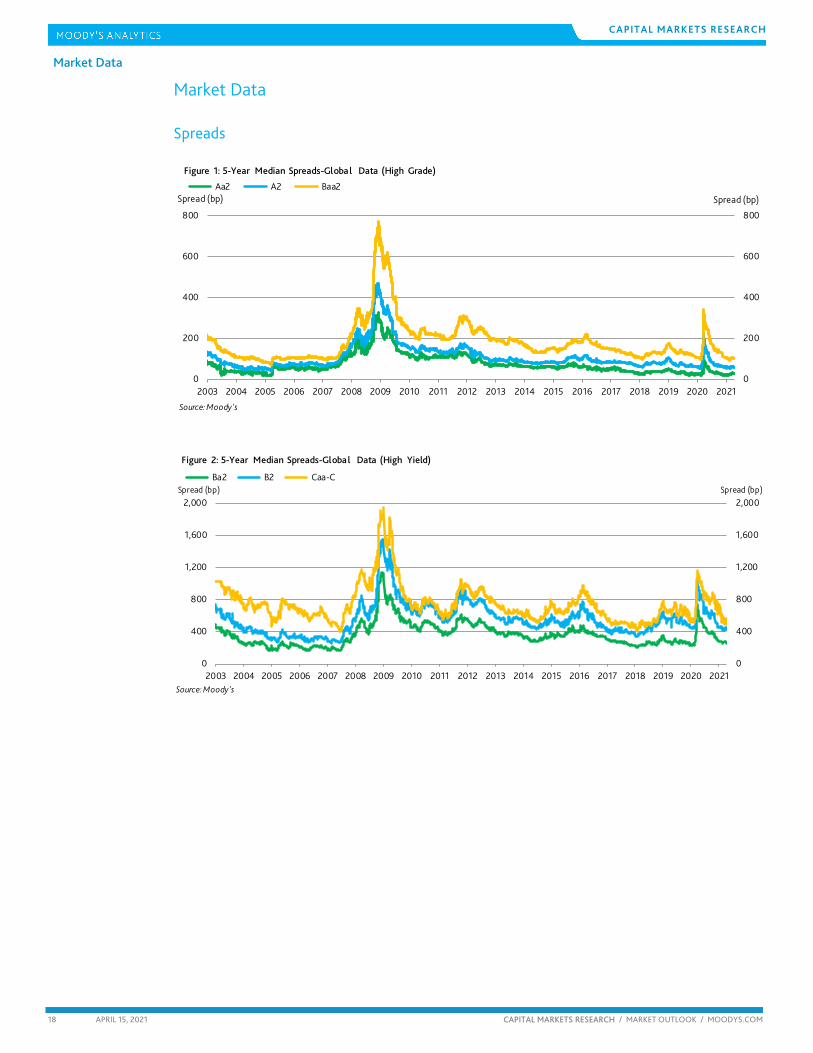
Market Data Spreads
0
200
400
600
800
0
200
400
600
800
2003 2004 2005 2006 2007 2008 2009 2010 2011 2012 2013 2014 2015 2016 2017 2018 2019 2020 2021
Spread (bp) Spread (bp) Aa2 A2 Baa2
Source: Moody's
Figure 1: 5-Year Median Spreads-Global Data (High Grade)
0
400
800
1,200
1,600
2,000
0
400
800
1,200
1,600
2,000
2003 2004 2005 2006 2007 2008 2009 2010 2011 2012 2013 2014 2015 2016 2017 2018 2019 2020 2021
Spread (bp) Spread (bp) Ba2 B2 Caa-C
Source: Moody's
Figure 2: 5-Year Median Spreads-Global Data (High Yield)

19 APRIL 15, 2021 CAPITAL MARKETS RESEARCH / MARKET OUTLOOK / MOODYS.COM
CAPITAL MARKETS RESEARCH
Market Data
CDS Movers
CDS Implied Rating Rises
Issuer Apr. 14 Apr. 7 Senior RatingsIllinois Tool Works Inc. A1 Baa2 A2Univision Communications Inc. B2 Caa1 Caa2Texas Instruments, Incorporated A2 Baa1 A1JPMorgan Chase & Co. A2 A3 A2Citigroup Inc. Baa1 Baa2 A3Bank of America Corporation A2 A3 A2Wells Fargo & Company Baa1 Baa2 A2Morgan Stanley Baa1 Baa2 A1Verizon Communications Inc. Baa1 Baa2 Baa1John Deere Capital Corporation A2 A3 A2
CDS Implied Rating DeclinesIssuer Apr. 14 Apr. 7 Senior RatingsRepublic Services, Inc. Baa2 A3 Baa2Alliant Energy Corporation Baa2 A3 Baa2Toyota Motor Credit Corporation A1 Aa3 A1Microsoft Corporation Aa3 Aa2 AaaMcDonald's Corporation Aa3 Aa2 Baa1CVS Health Corporation A3 A2 Baa2Walmart Inc. Aa3 Aa2 Aa2PepsiCo, Inc. A2 A1 A1Caterpillar Financial Services Corporation A2 A1 A3Coca-Cola Company (The) A1 Aa3 A1
CDS Spread IncreasesIssuer Senior Ratings Apr. 14 Apr. 7 Spread DiffService Corporation International Ba3 174 148 26Rite Aid Corporation Caa3 711 687 24Tenet Healthcare Corporation Caa1 323 301 23United States Steel Corporation Caa1 405 382 22Commercial Metals Company Ba2 301 284 18Meritor, Inc. B1 228 213 16K. Hovnanian Enterprises, Inc. Caa3 601 587 15NRG Energy, Inc. Ba2 166 153 13Travel + Leisure Co. B1 150 137 13Meritage Homes Corporation Ba1 173 160 13
CDS Spread DecreasesIssuer Senior Ratings Apr. 14 Apr. 7 Spread DiffTalen Energy Supply, LLC B3 1,147 1,237 -91American Airlines Group Inc. Caa1 771 822 -51R.R. Donnelley & Sons Company B3 511 556 -46Univision Communications Inc. Caa2 304 344 -40Illinois Tool Works Inc. A2 35 63 -28Nabors Industries, Inc. Caa2 1,056 1,083 -27Royal Caribbean Cruises Ltd. B2 352 373 -21Dish DBS Corporation B2 393 406 -13L Brands, Inc. Ba3 152 162 -11Avient Corporation Ba3 173 184 -11
Source: Moody's, CMA
CDS Spreads
CDS Implied Ratings
CDS Implied Ratings
CDS Spreads
Figure 3. CDS Movers - US (April 7, 2021 – April 14, 2021)
20 APRIL 15, 2021 CAPITAL MARKETS RESEARCH / MARKET OUTLOOK / MOODYS.COM
CAPITAL MARKETS RESEARCH
Market Data
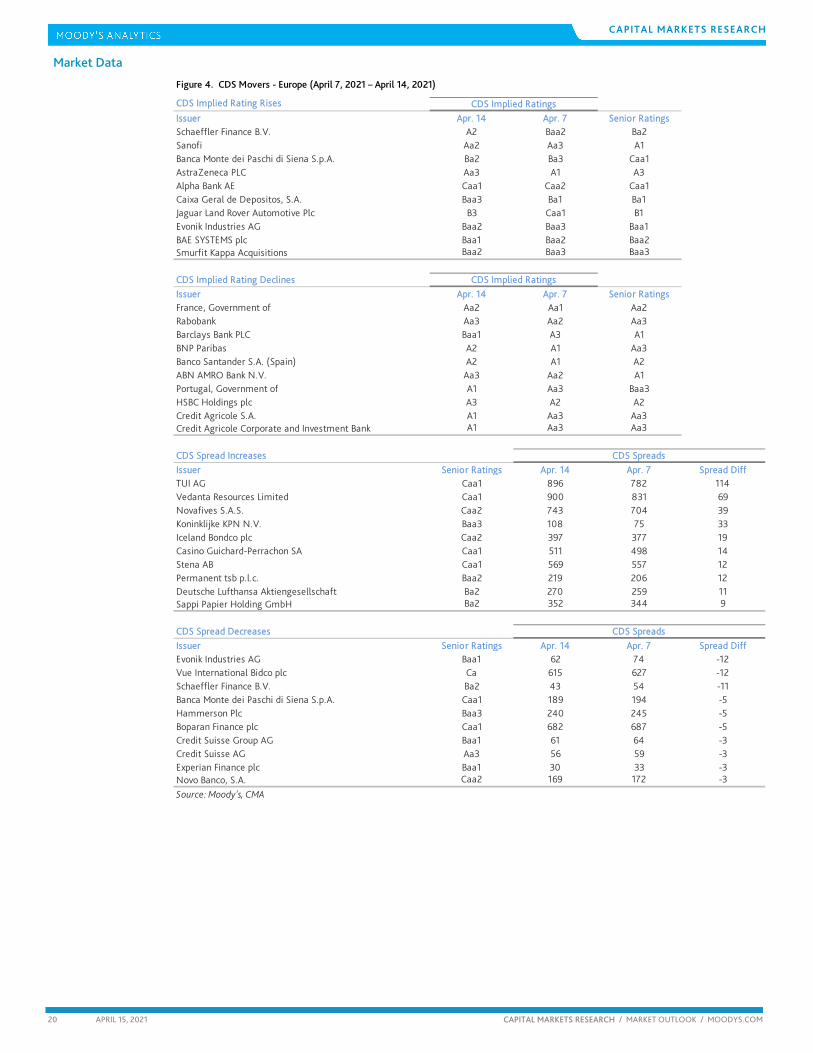
CDS Implied Rating Rises
Issuer Apr. 14 Apr. 7 Senior RatingsSchaeffler Finance B.V. A2 Baa2 Ba2Sanofi Aa2 Aa3 A1Banca Monte dei Paschi di Siena S.p.A. Ba2 Ba3 Caa1AstraZeneca PLC Aa3 A1 A3Alpha Bank AE Caa1 Caa2 Caa1Caixa Geral de Depositos, S.A. Baa3 Ba1 Ba1Jaguar Land Rover Automotive Plc B3 Caa1 B1Evonik Industries AG Baa2 Baa3 Baa1BAE SYSTEMS plc Baa1 Baa2 Baa2Smurfit Kappa Acquisitions Baa2 Baa3 Baa3
CDS Implied Rating DeclinesIssuer Apr. 14 Apr. 7 Senior RatingsFrance, Government of Aa2 Aa1 Aa2Rabobank Aa3 Aa2 Aa3Barclays Bank PLC Baa1 A3 A1BNP Paribas A2 A1 Aa3Banco Santander S.A. (Spain) A2 A1 A2ABN AMRO Bank N.V. Aa3 Aa2 A1Portugal, Government of A1 Aa3 Baa3HSBC Holdings plc A3 A2 A2Credit Agricole S.A. A1 Aa3 Aa3Credit Agricole Corporate and Investment Bank A1 Aa3 Aa3
CDS Spread IncreasesIssuer Senior Ratings Apr. 14 Apr. 7 Spread DiffTUI AG Caa1 896 782 114Vedanta Resources Limited Caa1 900 831 69Novafives S.A.S. Caa2 743 704 39Koninklijke KPN N.V. Baa3 108 75 33Iceland Bondco plc Caa2 397 377 19Casino Guichard-Perrachon SA Caa1 511 498 14Stena AB Caa1 569 557 12Permanent tsb p.l.c. Baa2 219 206 12Deutsche Lufthansa Aktiengesellschaft Ba2 270 259 11Sappi Papier Holding GmbH Ba2 352 344 9
CDS Spread DecreasesIssuer Senior Ratings Apr. 14 Apr. 7 Spread DiffEvonik Industries AG Baa1 62 74 -12Vue International Bidco plc Ca 615 627 -12Schaeffler Finance B.V. Ba2 43 54 -11Banca Monte dei Paschi di Siena S.p.A. Caa1 189 194 -5Hammerson Plc Baa3 240 245 -5Boparan Finance plc Caa1 682 687 -5Credit Suisse Group AG Baa1 61 64 -3Credit Suisse AG Aa3 56 59 -3Experian Finance plc Baa1 30 33 -3Novo Banco, S.A. Caa2 169 172 -3
Source: Moody's, CMA
CDS Spreads
CDS Implied Ratings
CDS Implied Ratings
CDS Spreads
Figure 4. CDS Movers - Europe (April 7, 2021 – April 14, 2021)
21 APRIL 15, 2021 CAPITAL MARKETS RESEARCH / MARKET OUTLOOK / MOODYS.COM
CAPITAL MARKETS RESEARCH
Market Data
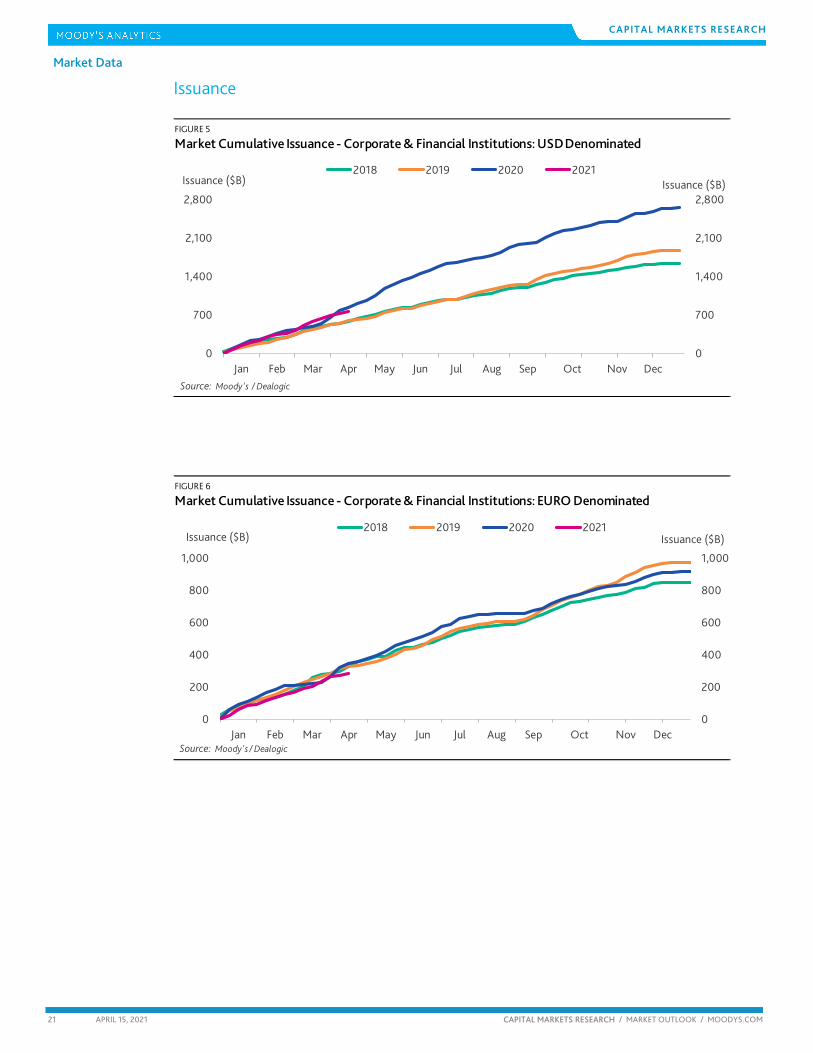
Issuance
FIGURE 5
Market Cumulative Issuance - Corporate & Financial Institutions: USD Denominated
0
700
1,400
2,100
2,800
0
700
1,400
2,100
2,800
Jan Feb Mar Apr May Jun Jul Aug Sep Oct Nov Dec
Issuance ($B) Issuance ($B)2018 2019 2020 2021
Source: Moody's / Dealogic
FIGURE 6
Market Cumulative Issuance - Corporate & Financial Institutions: EURO Denominated
0
200
400
600
800
1,000
0
200
400
600
800
1,000
Jan Feb Mar Apr May Jun Jul Aug Sep Oct Nov Dec
Issuance ($B) Issuance ($B)2018 2019 2020 2021
Source: Moody's / Dealogic
22 APRIL 15, 2021 CAPITAL MARKETS RESEARCH / MARKET OUTLOOK / MOODYS.COM
CAPITAL MARKETS RESEARCH
Market Data
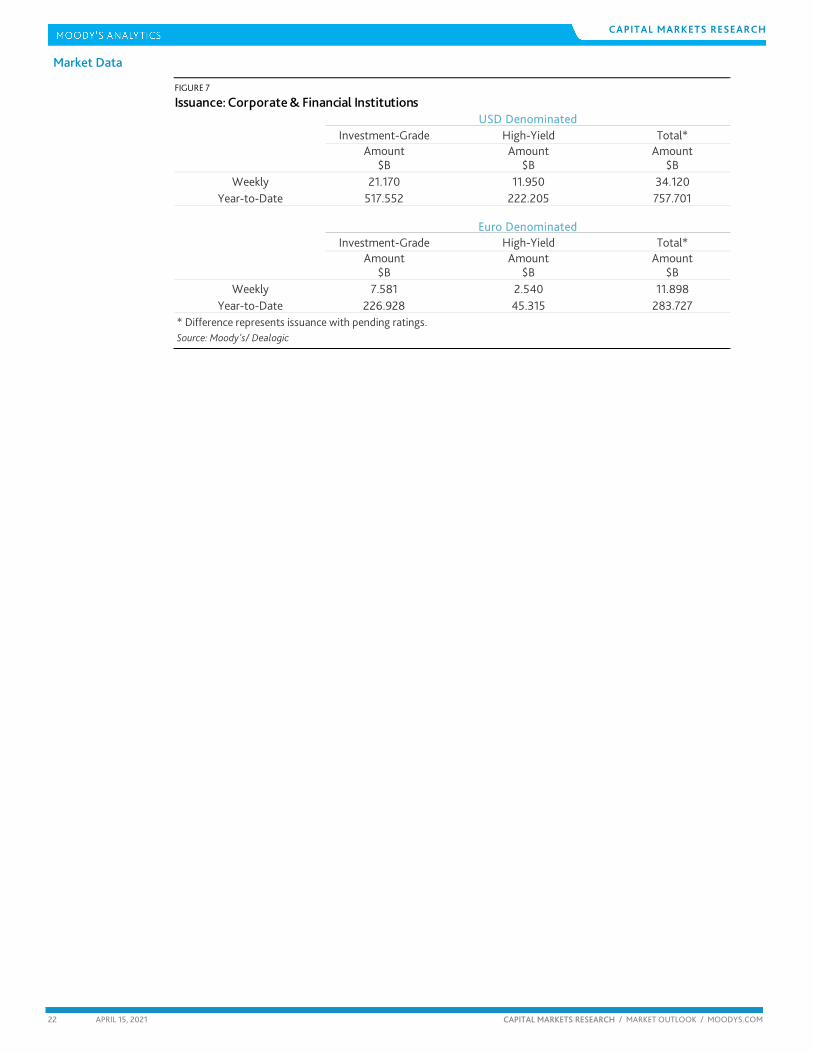
FIGURE 7
Issuance: Corporate & Financial Institutions
Investment-Grade High-Yield Total*Amount Amount Amount
$B $B $BWeekly 21.170 11.950 34.120
Year-to-Date 517.552 222.205 757.701
Investment-Grade High-Yield Total*Amount Amount Amount
$B $B $BWeekly 7.581 2.540 11.898
Year-to-Date 226.928 45.315 283.727* Difference represents issuance with pending ratings.Source: Moody's/ Dealogic
USD Denominated
Euro Denominated

23 APRIL 15, 2021 CAPITAL MARKETS RESEARCH / MARKET OUTLOOK / MOODYS.COM
CAPITAL MARKETS RESEARCH
Moody’s Capital Markets Research recent publications
Replay of the Inflationary 1970s Is Unlikely (Capital Market Research)
Real GDP Growth’s Biggest Improvement since 1950 May Power 2021’s Profits Growth (Capital Market Research)
Positive Outlook for Corporate Earnings Favors Narrower Credit Spreads (Capital Market Research)
Moody’s Analytics EDF-Based Bond Valuation Model Version 2.0
Stocks and High-Yield Performed Well Amid Prior Upturns by Treasury Bond Yields (Capital Market Research)
Quality Bonds Retreat as Leveraged Loans Shine (Capital Market Research)
Too Much of a Good Thing? (Capital Market Research)
Fast Declining EDF Favors Thinner High-Yield Bond Spread (Capital Market Research)
Prices Rise Here, There and Everywhere (Capital Market Research)
Investment-Grade Bond Offerings to Slow from 2020’s Torrid Pace (Capital Market Research)
Not All Debt Is Equal (Capital Market Research)
Market Value of U.S. Common Stock Soars to Record-High 185% of GDP (Capital Market Research)
Stimulatory Monetary and Fiscal Policies Enhance Corporate Credit Outlook (Capital Market Research)
Financial Markets Have Largely Priced-In 2021’s Positive Outlook (Capital Market Research)
Core Profits and U.S. Equities Set New Record Highs (Capital Market Research)
Operating Leverage May Help to Narrow Yield Spreads in 2021 (Capital Market Research)
Resurgent COVID-19 Threatens Corporate Credit’s Improved Trend (Capital Market Research)
Split Congress Sparks Rallies by Equities, Corporates and Treasuries (Capital Market Research)
Credit Disputes Equities Gloom (Capital Market Research)
Corporate Cash Outruns Corporate Debt (Capital Market Research)
Profits Give Direction to Downgrades and Defaults (Capital Market Research)
Markets Sense an Upturn Despite Pockets of Profound Misery (Capital Market Research)
Record-High Bond Issuance Aids Nascent Upturn (Capital Market Research)
Corporate Bond Issuance Boom May Steady Credit Quality, On Balance (Capital Market Research)
Markets, Bankers and Analysts Differ on 2021’s Default Rate (Capital Market Research)
Corporate Credit Mostly Unfazed by Equity Volatility (Capital Market Research)
Record August for Bond Issuance May Aid Credit Quality (Capital Market Research)
Fed Policy Shift Bodes Well for Corporate Credit (Capital Markets Research)
Markets Avoid Great Recession’s Calamities (Capital Markets Research)
Liquidity Surge Hints of More Upside Surprises (Capital Markets Research)
Unprecedented Stimulus Lessens the Blow from Real GDP’s Record Dive (Capital Markets Research)
Ultra-Low Bond Yields Buoy Corporate Borrowing (Capital Markets Research)
Record-High Savings Rate and Ample Liquidity May Fund an Upside Surprise (Capital Markets Research)
Unprecedented Demographic Change Will Shape Credit Markets Through 2030 (Capital Markets Research)

24 APRIL 15, 2021 CAPITAL MARKETS RESEARCH / MARKET OUTLOOK / MOODYS.COM
CAPITAL MARKETS RESEARCH
To order reprints of this report (100 copies minimum), please call 212.553.1658.
Report Number: 1278630 Contact Us
Editor Reid Kanaley [email protected]
Americas: 1.212.553.4399
Europe: +44 (0) 20.7772.5588
Asia: 813.5408.4131
25 APRIL 15, 2021 CAPITAL MARKETS RESEARCH / MARKET OUTLOOK / MOODYS.COM
CAPITAL MARKETS RESEARCH
© 2021 Moody’s Corporation, Moody’s Investors Service, Inc., Moody’s Analytics, Inc. and/or their licensors and affiliates (collectively, “MOODY’S”). All rights reserved.
CREDIT RATINGS ISSUED BY MOODY'S CREDIT RATINGS AFFILIATES ARE THEIR CURRENT OPINIONS OF THE RELATIVE FUTURE CREDIT RISK OF ENTITIES, CREDIT COMMITMENTS, OR DEBT OR DEBT-LIKE SECURITIES, AND MATERIALS, PRODUCTS, SERVICES AND INFORMATION PUBLISHED BY MOODY’S (COLLECTIVELY, “PUBLICATIONS”) MAY INCLUDE SUCH CURRENT OPINIONS. MOODY’S DEFINES CREDIT RISK AS THE RISK THAT AN ENTITY MAY NOT MEET ITS CONTRACTUAL FINANCIAL OBLIGATIONS AS THEY COME DUE AND ANY ESTIMATED FINANCIAL LOSS IN THE EVENT OF DEFAULT OR IMPAIRMENT. SEE APPLICABLE MOODY’S RATING SYMBOLS AND DEFINITIONS PUBLICATION FOR INFORMATION ON THE TYPES OF CONTRACTUAL FINANCIAL OBLIGATIONS ADDRESSED BY MOODY’S CREDIT RATINGS. CREDIT RATINGS DO NOT ADDRESS ANY OTHER RISK, INCLUDING BUT NOT LIMITED TO: LIQUIDITY RISK, MARKET VALUE RISK, OR PRICE VOLATILITY. CREDIT RATINGS, NON-CREDIT ASSESSMENTS (“ASSESSMENTS”), AND OTHER OPINIONS INCLUDED IN MOODY’S PUBLICATIONS ARE NOT STATEMENTS OF CURRENT OR HISTORICAL FACT. MOODY’S PUBLICATIONS MAY ALSO INCLUDE QUANTITATIVE MODEL-BASED ESTIMATES OF CREDIT RISK AND RELATED OPINIONS OR COMMENTARY PUBLISHED BY MOODY’S ANALYTICS, INC. AND/OR ITS AFFILIATES. MOODY’S CREDIT RATINGS, ASSESSMENTS, OTHER OPINIONS AND PUBLICATIONS DO NOT CONSTITUTE OR PROVIDE INVESTMENT OR FINANCIAL ADVICE, AND MOODY’S CREDIT RATINGS, ASSESSMENTS, OTHER OPINIONS AND PUBLICATIONS ARE NOT AND DO NOT PROVIDE RECOMMENDATIONS TO PURCHASE, SELL, OR HOLD PARTICULAR SECURITIES. MOODY’S CREDIT RATINGS, ASSESSMENTS, OTHER OPINIONS AND PUBLICATIONS DO NOT COMMENT ON THE SUITABILITY OF AN INVESTMENT FOR ANY PARTICULAR INVESTOR. MOODY’S ISSUES ITS CREDIT RATINGS, ASSESSMENTS AND OTHER OPINIONS AND PUBLISHES ITS PUBLICATIONS WITH THE EXPECTATION AND UNDERSTANDING THAT EACH INVESTOR WILL, WITH DUE CARE, MAKE ITS OWN STUDY AND EVALUATION OF EACH SECURITY THAT IS UNDER CONSIDERATION FOR PURCHASE, HOLDING, OR SALE. MOODY’S CREDIT RATINGS, ASSESSMENTS, OTHER OPINIONS, AND PUBLICATIONS ARE NOT INTENDED FOR USE BY RETAIL INVESTORS AND IT WOULD BE RECKLESS AND INAPPROPRIATE FOR RETAIL INVESTORS TO USE MOODY’S CREDIT RATINGS OR MOODY’S PUBLICATIONS WHEN MAKING AN INVESTMENT DECISION. IF IN DOUBT YOU SHOULD CONTACT YOUR FINANCIAL OR OTHER PROFESSIONAL ADVISER.
ALL INFORMATION CONTAINED HEREIN IS PROTECTED BY LAW, INCLUDING BUT NOT LIMITED TO, COPYRIGHT LAW, AND NONE OF SUCH INFORMATION MAY BE COPIED OR OTHERWISE REPRODUCED, REPACKAGED, FURTHER TRANSMITTED, TRANSFERRED, DISSEMINATED, REDISTRIBUTED OR RESOLD, OR STORED FOR SUBSEQUENT USE FOR ANY SUCH PURPOSE, IN WHOLE OR IN PART, IN ANY FORM OR MANNER OR BY ANY MEANS WHATSOEVER, BY ANY PERSON WITHOUT MOODY’S PRIOR WRITTEN CONSENT.
MOOD’S CREDIT RATINGS, ASSESSMENTS, OR OTHER OPINIONS AND PUBLICATIONS ARE NOT INTENDED FOR USE BY ANY PERSON AS A BENCHMARK AS THAT TERM IS DEFINED FOR REGULATORY PURPOSES AND MUST NOT BE USED IN ANY WAY THAT COULD RESULT IN THEM BEING CONSIDERED A BENCHMARK.
All information contained herein is obtained by MOODY’S from sources believed by it to be accurate and reliable. Because of the possibility of human or mechanical error as well as other factors, however, all information contained herein is provided “AS IS” without warranty of any kind. MOODY'S adopts all necessary measures so that the information it uses in assigning a credit rating is of sufficient quality and from sources MOODY'S considers to be reliable including, when appropriate, independent third-party sources. However, MOODY’S is not an auditor and cannot in every instance independently verify or validate information received in the rating process or in preparing the Moody’s publications.
To the extent permitted by law, MOODY’S and its directors, officers, employees, agents, representatives, licensors and suppliers disclaim liability to any person or entity for any indirect, special, consequential, or incidental losses or damages whatsoever arising from or in connection with the information contained herein or the use of or inability to use any such information, even if MOODY’S or any of its directors, officers, employees, agents, representatives, licensors or suppliers is advised in advance of the possibility of such losses or damages, including but not limited to: (a) any loss of present or prospective profits or (b) any loss or damage arising where the relevant financial instrument is not the subject of a particular credit rating assigned by MOODY’S.
To the extent permitted by law, MOODY’S and its directors, officers, employees, agents, representatives, licensors and suppliers disclaim liability for any direct or compensatory losses or damages caused to any person or entity, including but not limited to by any negligence (but excluding fraud, willful misconduct or any other type of liability that, for the avoidance of doubt, by law cannot be excluded) on the part of, or any contingency within or beyond the control of, MOODY’S or any of its directors, officers, employees, agents, representatives, licensors or suppliers, arising from or in connection with the information contained herein or the use of or inability to use any such information.
NO WARRANTY, EXPRESS OR IMPLIED, AS TO THE ACCURACY, TIMELINESS, COMPLETENESS, MERCHANTABILITY OR FITNESS FOR ANY PARTICULAR PURPOSE OF ANY CREDIT RATING OR OTHER OPINION OR INFORMATION IS GIVEN OR MADE BY MOODY’S IN ANY FORM OR MANNER WHATSOEVER.
Moody’s Investors Service, Inc., a wholly-owned credit rating agency subsidiary of Moody’s Corporation (“MCO”), hereby discloses that most issuers of debt securities (including corporate and municipal bonds, debentures, notes and commercial paper) and preferred stock rated by Moody’s Investors Service, Inc. have, prior to assignment of any rating, agreed to pay to Moody’s Investors Service, Inc. for ratings opinions and services rendered by it fees ranging from $1,000 to approximately $5,000,000. MCO and MIS also maintain policies and procedures to address the independence of MIS’s ratings and rating processes. Information regarding certain affiliations that may exist between directors of MCO and rated entities, and between entities who hold ratings from MIS and have also publicly reported to the SEC an ownership interest in MCO of more than 5%, is posted annually at www.moodys.com under the heading “Investor Relations — Corporate Governance — Director and Shareholder Affiliation Policy.”
Additional terms for Australia only: Any publication into Australia of this document is pursuant to the Australian Financial Services License of MOODY’S affiliate, Moody’s Investors Service Pty Limited ABN 61 003 399 657AFSL 336969 and/or Moody’s Analytics Australia Pty Ltd ABN 94 105 136 972 AFSL 383569 (as applicable). This document is intended to be provided only to “wholesale clients” within the meaning of section 761G of the Corporations Act 2001. By continuing to access this document from within Australia, you represent to MOODY’S that you are, or are accessing the document as a representative of, a “wholesale client” and that neither you nor the entity you represent will directly or indirectly disseminate this document or its contents to “retail clients” within the meaning of section 761G of the Corporations Act 2001. MOODY’S credit rating is an opinion as to the creditworthiness of a debt obligation of the issuer, not on the equity securities of the issuer or any form of security that is available to retail investors.
Additional terms for Japan only: Moody's Japan K.K. (“MJKK”) is a wholly owned credit rating agency subsidiary of Moody's Group Japan G.K., which is wholly owned by Moody’s Overseas Holdings Inc., a wholly owned subsidiary of MCO. Moody’s SF Japan K.K. (“MSFJ”) is a wholly owned credit rating agency subsidiary of MJKK. MSFJ is not a Nationally Recognized Statistical Rating Organization (“NRSRO”). Therefore, credit ratings assigned by MSFJ are Non-NRSRO Credit Ratings. Non-NRSRO Credit Ratings are assigned by an entity that is not a NRSRO and, consequently, the rated obligation will not qualify for certain types of treatment under U.S. laws. MJKK and MSFJ are credit rating agencies registered with the Japan Financial Services Agency and their registration numbers are FSA Commissioner (Ratings) No. 2 and 3 respectively.
MJKK or MSFJ (as applicable) hereby disclose that most issuers of debt securities (including corporate and municipal bonds, debentures, notes and commercial paper) and preferred stock rated by MJKK or MSFJ (as applicable) have, prior to assignment of any rating, agreed to pay to MJKK or MSFJ (as applicable) for ratings opinions and services rendered by its fees ranging from JPY125,000 to approximately JPY550,000,000.
MJKK and MSFJ also maintain policies and procedures to address Japanese regulatory requirements.
For Publications Issued by Moody’s Capital Markets Research, Inc. only:
The statements contained in this research report are based solely upon the opinions of Moody’s Capital Markets Research, Inc. and the data and information available to the authors at the time of publication of this report. There is no assurance that any predicted results will actually occur. Past performance is no guarantee of future results.
The analysis in this report has not been made available to any issuer prior to publication.
When making an investment decision, investors should use additional sources of information and consult with their investment advisor. Investing in securities involves certain risks including possible fluctuations in investment return and loss of principal. Investing in bonds presents additional risks, including changes in interest rates and credit risk.
Moody's Capital Markets Research, Inc., is a subsidiary of MCO. Please note that Moody’s Analytics, Inc., an affiliate of Moody’s Capital Markets Research, Inc. and a subsidiary of MCO, provides a wide range of research and analytical products and services to corporations and participants in the financial markets. Customers of Moody’s Analytics, Inc. may include companies mentioned in this report. Please be advised that a conflict may exist and that any investment decisions you make are your own responsibility. The Moody’s Analytics logo is used on certain Moody’s Capital Markets Research, Inc. products for marketing purposes only. Moody’s Analytics, Inc. is a separate company from Moody’s Capital Markets Research, Inc.