Embed Size (px)
Citation preview

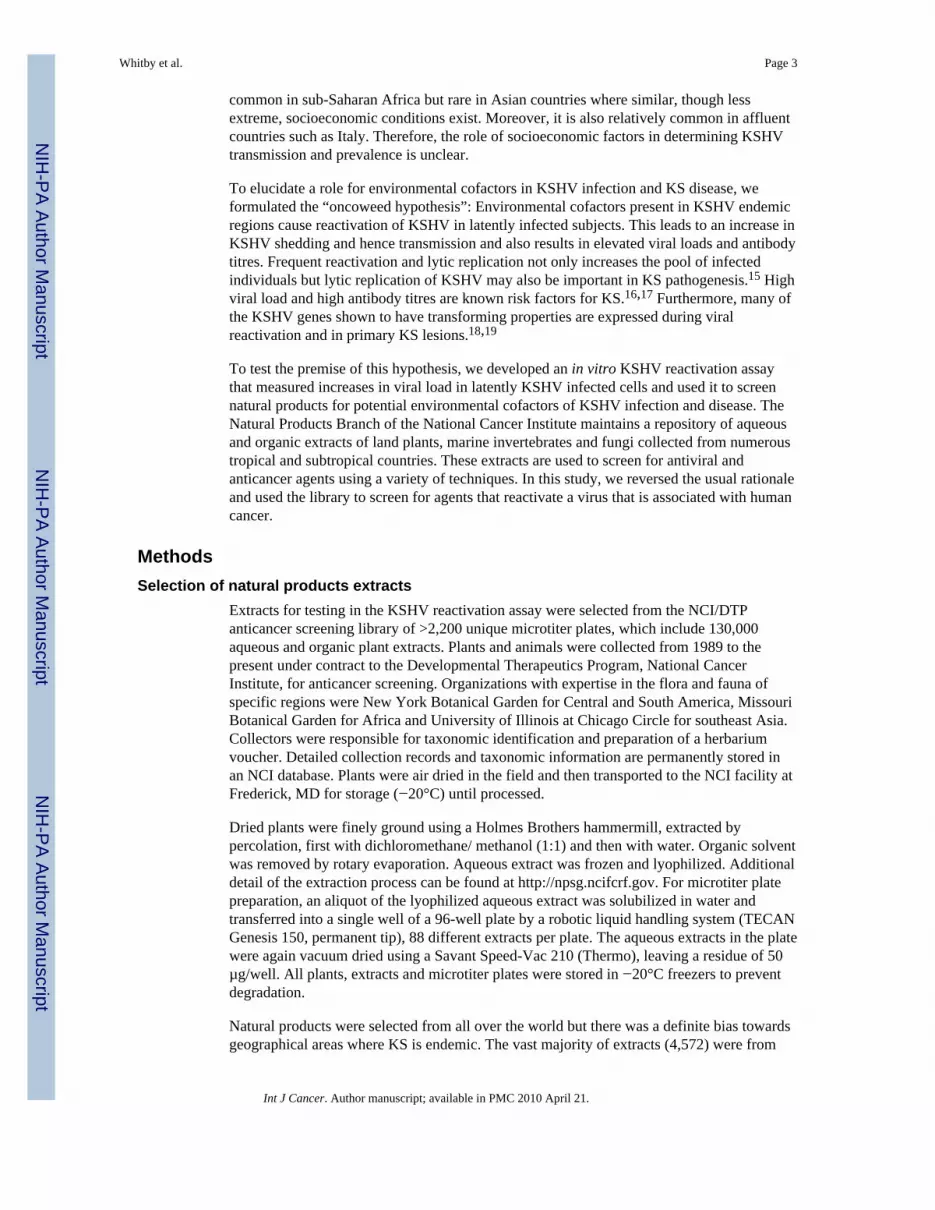
Reactivation of Kaposi’s sarcoma-associated herpesvirus bynatural products from Kaposi’s sarcoma endemic regions
Denise Whitby1,*, Vickie A. Marshall1, Rachel K. Bagni1, Wendell J. Miley1, Thomas G.McCloud2, Rebecca Hines-Boykin3, James J. Goedert4, Betty A. Conde1, KunioNagashima5, Judy Mikovits6, Dirk P. Dittmer7, and David J. Newman81Viral Epidemiology Section, AIDS Vaccine Program, SAIC-Frederick, NCI-Frederick, Frederick,MD2Natural Products Support Group, SAIC-Frederick, NCI-Frederick, Frederick, MD3Department of Microbiology and Immunology, University of Oklahoma Health Sciences Center,Oklahoma City, OK4Division of Cancer Epidemiology and Genetics, National Cancer Institute, Bethesda, MD5Image Analysis Laboratory, Research Technology Program, SAIC-Frederick, NCI-Frederick,Frederick, MD6Laboratory of Antiviral Drug Mechanisms, SAIC-Frederick, NCI-Frederick, Frederick, MD7Department of Microbiology and Immunology, Lineberger Comprehensive Cancer Center,University of North Carolina at Chapel Hill, Chapel Hill, NC8Natural Products Branch, NCI-Frederick, Frederick, MD
AbstractKaposi’s sarcoma (KS) and its causative agent, Kaposi’s sarcoma associated herpesvirus (KSHV/HHV-8), a gamma2 herpesvirus, have distinctive geographical distributions that are largelyunexplained. We propose the “oncoweed” hypothesis to explain these differences, namely thatenvironmental cofactors present in KS endemic regions cause frequent reactivation of KSHV ininfected subjects, leading to increased viral shedding and transmission leading to increasedprevalence of KSHV infection as well as high viral load levels and antibody titers. Reactivationalso plays a role in the pathogenesis of KSHV-associated malignancies. To test this hypothesis, weemployed an in vitro KSHV reactivation assay that measured increases in KSHV viral load inKSHV infected primary effusion lymphoma (PEL) cells and screened aqueous natural productextracts from KS endemic regions. Of 4,842 extracts from 38 countries, 184 (5%) caused KSHVreactivation. Extracts that caused reactivation came from a wide variety of plant families, andextracts from Africa, where KSHV is highly prevalent, caused the greatest level of reactivation.Time course experiments were performed using 28 extracts that caused the highest levels ofreactivation. The specificity of the effects on viral replication was examined using transcriptionalprofiling of all viral mRNAs. The array data indicated that the natural extracts caused an orderedcascade of lytic replication similar to that seen after induction with synthetic activators. These invitro data provide support for the “oncoweed” hypothesis by demonstrating basic biologicalplausibility.
© 2006 Wiley-Liss, Inc.*Correspondence to: Viral Epidemiology Section, AIDS Vaccine Program, SAIC-Frederick, NCI-Frederick, Frederick, MD, 21702,USA. [email protected].
NIH Public AccessAuthor ManuscriptInt J Cancer. Author manuscript; available in PMC 2010 April 21.
Published in final edited form as:Int J Cancer. 2007 January 15; 120(2): 321–328. doi:10.1002/ijc.22205.
NIH
-PA Author Manuscript
NIH
-PA Author Manuscript
NIH
-PA Author Manuscript

KeywordsKaposi’s sarcoma associated herpesvirus; natural products; reactivation
Much has been learned about the epidemiology and pathogenesis of Kaposi’s sarcoma (KS)since the discovery in 1994 of the causative agent, Kaposi’s sarcoma-associated Herpesvirus(KSHV), also known as Human Herpesvirus 8.1 The striking geographical differences inincidence of classic KS and the equally striking differences in incidence of AIDS KS,according to HIV risk group, can be partially explained by differences in the prevalence ofKSHV. Prior to the AIDS epidemic, KS was most common in sub-Saharan Africa andMediterranean countries but was rare in the US and northern Europe.2,3 Even now, in theUS and Northern Europe, KS is rarely seen in patients who acquire HIV via blood productsor heterosexual sex, but it is common in homosexual men.4
The prevalence of KSHV infection also shows considerable variation geographically andbetween HIV risk groups, largely mirroring the variations seen in the incidence of KS.Prevalence is high in sub-Saharan Africa and some Mediterranean countries and low in mostnorthern European and Asian populations.5 In Italy, the incidence of KS is higher in thesouth than in the centre and north of the peninsula. The prevalence of KSHV accords withthis geographical distribution.6 There are exceptions to this general rule, however. Forinstance, the high prevalence of KSHV in The Gambia where the incidence of KS is low isstriking.7 The high prevalence of KSHV in South American Amerindians is also surprising.Although KS has not been reported in Amerindians, it is possible that this may be due tolack of ascertainment because of poor access to health care and the low life expectancyamong these populations.8,9 In the US and Europe, KSHV is rare in the general populationbut relatively common in homosexual men, explaining the high risk of KS in HIV infectedhomosexual men.
Although the variation in the incidence of KS disease can thus be partially explained bydifferences in KSHV prevalence, no explanation exists for the variation in KSHVprevalence, since like other herpesviruses, KSHV is known to have coevolved with thehuman species.10 Variation in viral prevalence may be due to host genetic or environmentalrisk factors. Host genetic factors likely play an important part in the elevated risk for KS inelderly men of Jewish descent, since the prevalence of KSHV is not elevated in thispopulation.11 Similarly, KS risk is 10-fold higher in transplant recipients from Saudi Arabiathan from other areas, despite a modest KSHV prevalence in this population.12 In theseinstances, the high risk of KS is likely due to a genetically determined increased risk ofdisease amongst infected subjects.
We believe that environmental risk factors are more important than genetic predispositionsin determining the variation in KSHV prevalence and KS risk in many areas andpopulations. Although KSHV prevalence is high in Africa, it is not elevated in subjects ofAfrican descent living in the Caribbean.13,14 In a study of STD clinic attendees in London,we found a high prevalence of KSHV in subjects born in Africa but not in those whoseparents were born in Africa, suggesting that a single generation in a non-Africanenvironment is sufficient to reduce prevalence.14 Conversely, the prevalence of KSHV inSouth African blood donors of Northern European descent is 10% (Whitby and Sitas,unpublished data), compared with estimates of 1–2% in Northern European blood donorsliving in Northern Europe.
Unlike other viruses, such as Hepatitis B virus, the relationship between socioeconomicfactors such as household crowding and KSHV prevalence is inconsistent. KSHV is
Whitby et al. Page 2
Int J Cancer. Author manuscript; available in PMC 2010 April 21.
NIH
-PA Author Manuscript
NIH
-PA Author Manuscript
NIH
-PA Author Manuscript
common in sub-Saharan Africa but rare in Asian countries where similar, though lessextreme, socioeconomic conditions exist. Moreover, it is also relatively common in affluentcountries such as Italy. Therefore, the role of socioeconomic factors in determining KSHVtransmission and prevalence is unclear.
To elucidate a role for environmental cofactors in KSHV infection and KS disease, weformulated the “oncoweed hypothesis”: Environmental cofactors present in KSHV endemicregions cause reactivation of KSHV in latently infected subjects. This leads to an increase inKSHV shedding and hence transmission and also results in elevated viral loads and antibodytitres. Frequent reactivation and lytic replication not only increases the pool of infectedindividuals but lytic replication of KSHV may also be important in KS pathogenesis.15 Highviral load and high antibody titres are known risk factors for KS.16,17 Furthermore, many ofthe KSHV genes shown to have transforming properties are expressed during viralreactivation and in primary KS lesions.18,19
To test the premise of this hypothesis, we developed an in vitro KSHV reactivation assaythat measured increases in viral load in latently KSHV infected cells and used it to screennatural products for potential environmental cofactors of KSHV infection and disease. TheNatural Products Branch of the National Cancer Institute maintains a repository of aqueousand organic extracts of land plants, marine invertebrates and fungi collected from numeroustropical and subtropical countries. These extracts are used to screen for antiviral andanticancer agents using a variety of techniques. In this study, we reversed the usual rationaleand used the library to screen for agents that reactivate a virus that is associated with humancancer.
MethodsSelection of natural products extracts
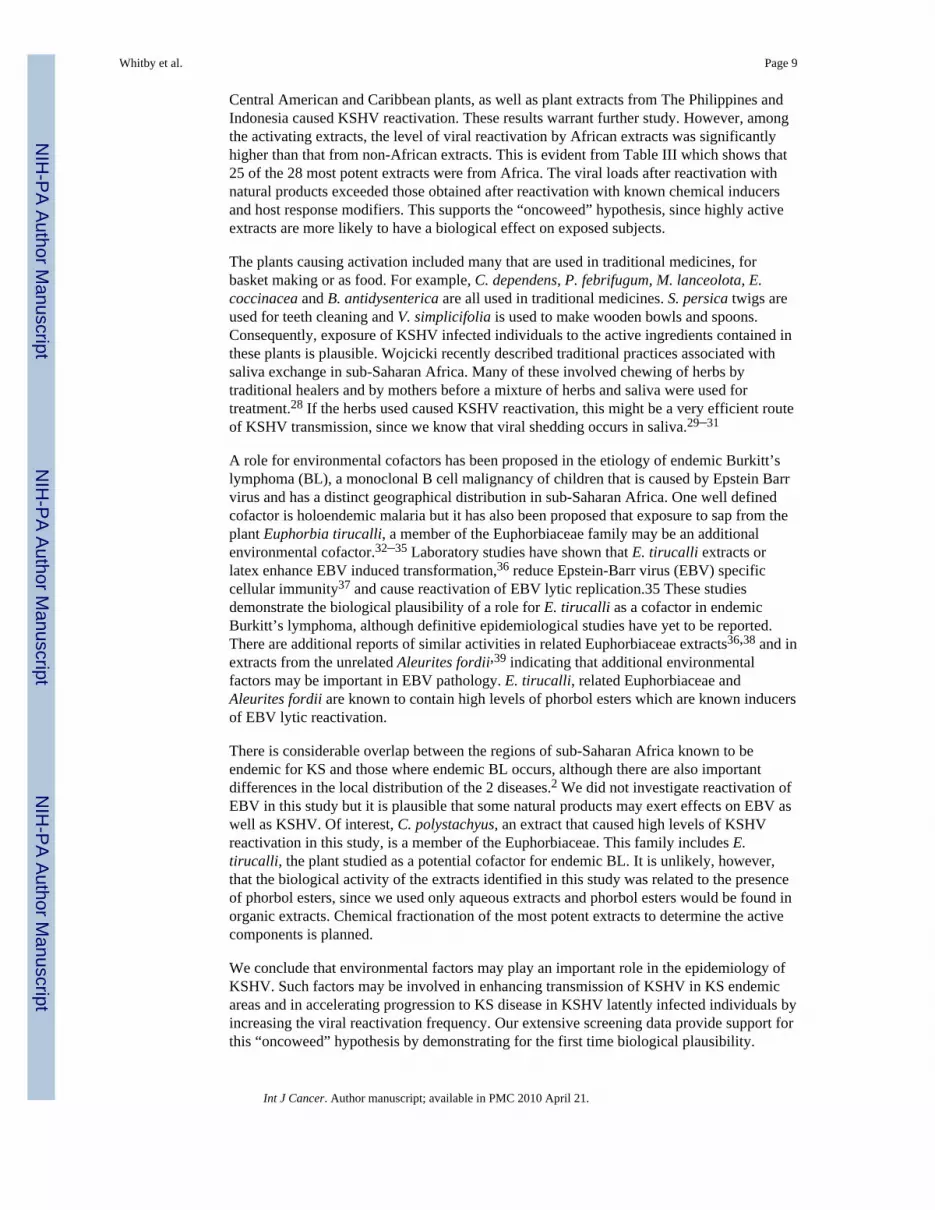
Extracts for testing in the KSHV reactivation assay were selected from the NCI/DTPanticancer screening library of >2,200 unique microtiter plates, which include 130,000aqueous and organic plant extracts. Plants and animals were collected from 1989 to thepresent under contract to the Developmental Therapeutics Program, National CancerInstitute, for anticancer screening. Organizations with expertise in the flora and fauna ofspecific regions were New York Botanical Garden for Central and South America, MissouriBotanical Garden for Africa and University of Illinois at Chicago Circle for southeast Asia.Collectors were responsible for taxonomic identification and preparation of a herbariumvoucher. Detailed collection records and taxonomic information are permanently stored inan NCI database. Plants were air dried in the field and then transported to the NCI facility atFrederick, MD for storage (−20°C) until processed.
Dried plants were finely ground using a Holmes Brothers hammermill, extracted bypercolation, first with dichloromethane/ methanol (1:1) and then with water. Organic solventwas removed by rotary evaporation. Aqueous extract was frozen and lyophilized. Additionaldetail of the extraction process can be found at http://npsg.ncifcrf.gov. For microtiter platepreparation, an aliquot of the lyophilized aqueous extract was solubilized in water andtransferred into a single well of a 96-well plate by a robotic liquid handling system (TECANGenesis 150, permanent tip), 88 different extracts per plate. The aqueous extracts in the platewere again vacuum dried using a Savant Speed-Vac 210 (Thermo), leaving a residue of 50µg/well. All plants, extracts and microtiter plates were stored in −20°C freezers to preventdegradation.
Natural products were selected from all over the world but there was a definite bias towardsgeographical areas where KS is endemic. The vast majority of extracts (4,572) were from
Whitby et al. Page 3
Int J Cancer. Author manuscript; available in PMC 2010 April 21.
NIH
-PA Author Manuscript
NIH
-PA Author Manuscript
NIH
-PA Author Manuscript

land plants, but extracts were included from 86 marine plants, 97 marine animals and 87fungi. More than 50% of extracts selected were from African countries including Cameroon,Central Africa Republic, Gabon, Ghana, Madagascar and Tanzania. The remaining extractswere selected as being representative of the rest of the world, including regions where KS israre. Plants were not selected by family or genus but rather represented a wide variety ofgroups. Extracts known to be highly toxic to cells in tissue culture (based upon previousanticancer testing) were excluded. Organic and aqueous extracts were available butscreening was restricted to aqueous extracts, since aqueous components of plants were mostlikely to be present as environmental exposures. Aqueous extracts that caused greater than25% growth inhibition in a panel of 60 transformed cell lines at a concentration of 100 µg/ml were also excluded.
KSHV quantitative PCR assayWe developed a KSHV quantitative real time PCR assay based on Applied Biosystems(ABI) technology. The KSHV genomic sequence used for assay design was GenBank recordU75698 derived from the BC-1 cell line.20 Primers and probe were designed to target theKSHV K6 gene region, viral macrophage inflammatory protein α (v-mip-α), using GeneRunner software (Version 3.00, Hastings Software) according to ABI guidelines. Theselected primers and probe sequence are as follows:
K6-10F: 5′-CGCCTAATAGCTGCTGCTACGG-3′ (nt 27330-27309)
K6-10R: 5′-TGCATCAGCTGCCTAACCCAG-3′ (nt 27159–27179)
p-K6-10: 5′-FAM-CACCCACCGCCCGTCCAAATTC-TAMRA-3′ (nt 27298-27277)
The primers and probe were synthesized and HPLC purified by Operon (Alameda, CA). Theoptimized KSHV K6 master mix consisted of 3 mM magnesium chloride, 0.05% EIAreagent grade gelatin (Sigma, St. Louis, MO), 0.01% Tween 20 (Sigma, St. Louis, MO), 200µM each dATP, dCTP, dGTP, 400 µM dUTP, 1 µM forward and reverse primers, 200 nMprobe, 0.1 U/µl AmpErase uracil-N-glycosylase and 1.25 U/µl AmpliTaq Gold polymerasein TaqMan buffer A (TaqMan PCR Core Reagents kit, Applied Biosystems, Foster City,CA). PCR reactions contained 40 µl of master mix and 10 µl of test material for a finalvolume of 50 µl. The cycling conditions were 2 min hold at 50°C, 95°C hold for 10 min and45 cycles performed at 95°C for 15 sec, 55°C for 30 sec and an annealing step of 60°C for 1min. All assays were performed using an ABI Prism 7700 automated detection system thatcaptured and analyzed the data using the Sequence Detection System software version 1.6.
A 500-bp fragment of the KSHV K6 gene, which includes the 176-bp fragment amplified bythe TaqMan primers, was cloned and used to prepare a plasmid based standard. The standardcurve was prepared by making 10-fold serial dilutions ranging from 10 to 100 copies in TEbuffer (nuclease-free 0.1 M Tris-EDTA buffer (Invitrogen, Carlsbad, CA)) containing 0.1µg/ml of human placental DNA (Sigma, St. Louis, MO). The Sequence Detection softwareperforms a linear regression and plots the standard curve. The KSHV K6 standard curve hasa least-squares regression (R2) value of greater than 0.97, which reflects titration accuracy.The slope of the standard curve is indicative of 90–97% PCR efficiency and the Y interceptvalue is consistent with one copy template input. The estimated viral copy numbers for testsamples are determined by interpolation of the sample Ct value onto the K6 standard curve.The lower limit of detection was 3 copies of KSHV genomic DNA per PCR. In practice, theKSHV K6 assay sensitivity is 1 copy of KSHV per 1 million cell equivalents in clinicalsamples.
Whitby et al. Page 4
Int J Cancer. Author manuscript; available in PMC 2010 April 21.
NIH
-PA Author Manuscript
NIH
-PA Author Manuscript
NIH
-PA Author Manuscript

KSHV reactivation screenLyophilized aqueous extracts were provided at a concentration of 50 µg per well in 96-wellplates. BCP-1 cells21 latently infected with KSHV were added at a concentration of 2.5 ×10⁵ cells per well and incubated for 3 days at 37°C, 5% CO2 in RPMI (Invitrogen)supplemented with 20% FBS (Hyclone, Logan, UT). A 96-well plate of uninduced BCP-1cells served as the negative control and another plate of BCP-1 cells, induced with 0.3 mMsodium butyrate, was used as the positive control.
DNA was extracted using either the Qiagen QiAmp 96-well blood extraction kit, (Qiagen,Valencia CA) or Puregene 96-well kit (Gentra Systems, Minneapolis, MN). Real-timequantitative PCR assays were performed for KSHV K6 and the cell quantitation marker,ERV-3, as described above and previously.22,23 Viral load was calculated and expressed asthe number of copies per 105 cells.
BCP-1 cells, like all PEL cell lines, undergo spontaneous reactivation and up to 5% of cellswill be undergoing lytic infection at any time. Differences in KSHV viral load after 72 hrwere used to classify the extracts as activators, inactive or suppressors. A reduction in viralload compared with the uninduced (negative control) cells therefore suggests that lyticreplication is being inhibited, whereas increased viral load is indicative of reactivation.Extracts were considered activators if the log10 KSHV viral load was 2 standard deviationsgreater than the mean of the viral load in the sodium butyrate stimulated (positive control)cells (log10 KSHV copies = 7.77). The mean log10 viral load in the sodium butyrate inducedcells was 7.05 (geometric mean = 1.12 × 10⁷ KSHV copies/10 cells with a standarddeviation of 0.36 log10 KSHV copies/ 105 compared with 7.03 (geometric mean = 1.07 ×10⁷ KSHV copies/105 cells) with a standard deviation of 0.23 log10 KSHV copies/105 in theuninduced (negative control) BCP-1 cells. Extracts were considered inhibitory if the viralload was greater than 2 standard deviations less than the log10 mean of the uninduced BCP-1cells (log10 KSHV copies = 6.57). All remaining extracts were classified as either inactive orindeterminate. Comparisons between African and non-African extracts were made using theLikelihood Ratio χ2 test.
Time course experimentsWe selected the 28 extracts that showed the most potent activity for follow-up experiments.These extracts produced viral loads of >9 logs in the initial screen. Replicate natural productplates were created using the same concentration (50 µg/well) of extracts. BCP-1 cells wereadded to each well at a concentration of 2.5 × 10⁵ cells in 200 µl of RPMI 1640 (Invitrogen,Carlsbad, CA) supplemented with 20% FBS (Hyclone, Logan, UT). Plates were incubated at37°C, 5% CO2 for 1 to 4 days. One plate was harvested each day for 4 consecutive days.From each well, 100 µl was added to 1 ml of Trizol (Invitrogen, Carlsbad, CA) and frozen at−80°C for later RNA extraction. DNA was extracted from the remaining 100 µl using theQiAmp 96-well blood extraction kit (Qiagen, Valencia, CA), according to themanufacturer’s instructions. Real-time quantitative PCR assays were performed for KSHVK6 as described earlier and the cell quantitation marker ERV-3 as previously described.22,23Viral load was calculated and expressed as KSHV copies per 104 cells.
Negative controls consisted of unstimulated BCP-1 cells and positive controls were BCP-1cells stimulated with a gradient of sodium butyrate concentrations ranging from 3 to 100nM. The KSHV viral load estimates for each extract were normalized by subtracting theaverage of the negative control (unstimulated BCP-1) viral copy number and dividing by thecorresponding 100 nM sodium butyrate positive control copy number for each day. The datameasure the effect greater than that of butyrate and were thus expressed as standard sodiumbutyrate units.
Whitby et al. Page 5
Int J Cancer. Author manuscript; available in PMC 2010 April 21.
NIH
-PA Author Manuscript
NIH
-PA Author Manuscript
NIH
-PA Author Manuscript

Real-time PCR based KSHV viral gene expression arrayRNA was isolated from 106 cells using RNAzol (Tel-Test, Friendswood, Texas) aspreviously described,19 and reverse-transcribed using Superscript-II reverse transcriptase(Invitrogen, Carlsbad, CA), according to the manufacturers’ recommendations. The cDNAwas diluted to a final volume of 600 µl in distilled water and stored at −80°C The KSHVreal-time QPCR array and analysis have been previously described.18 The final QPCRreaction contained 2.5 µl of primer mix (final concentration 166 nM), 7.5 µl of 2× SYBRPCR mix (Applied Biosystems, Foster City, CA) and 5 µl of cDNA.
Viral CT values obtained by real-time QPCR were normalized to gapdh according to dCT =CT (viral mRNA) – CT (gapdh). The dCT values were imported into ArrayMiner v5.2(Optimal Design, Brussels, Belgium) and clustered based on standard correlation metric.Fold induction was calculated by ddCT method (fold = 1.7 exp(dCTmock-Maximum(dCTinduced)).
Western blotting for K8.1 A/B viral glycoproteinsSupernatants from untreated BCP-1 cells and cells stimulated for 96 hr with extracts from C.dependens, E. coccinea, C. polystachyus and D.fragrans (top activators identified in screen)were filtered and then concentrated through a 20% sucrose gradient at 17,000 rpm, 4°C for 2hr. Virus was resuspended in 300 µl (concentrated 100× original volume). Isolated KSHV(1.5 µl) from each condition was subjected to electrophoresis in a 7% Tris-Acetatepolyacrylamide gel (Invitrogen, Carlsbad, CA) under reducing conditions. After transfer toImmobilon-P PVDF membrane (Millipore, Billerica, MA), the blot was probed with mouseanti-K8.1A/B (Advanced Biotechnologies, Columbia, MD), washed and probed with goatanti-mouse secondary antibody (Invitrogen, Carlsbad, CA). Chemiluminescence usingImmunstar HRP (Biorad, Hercules, CA) was detected on Lumi-Film (Roche, Indianapolis,IN).
Electron microscopyPreparation of cultured cells for EM ultrastructural analysis was described previously.24
Briefly, BCP-1 cells stimulated for 96 hr with extracts from C. dependens, E. coccinea, C.polystachyus and D. fragrans as well as 0.3 mM sodium butyrate (about 1 × 10⁶/ ml) werecentrifuged at 100g, supernatant aspirated and gently overlaid with 2% glutaraldehyde incacodylate buffer (0.1 M, pH. 7.4) followed by post fixation in 1% osmium in same buffer.The cell pellet was stained en bloc in 0.5% uranyl acetate in acetate buffer (0.1 M, pH 4.0),dehydrated in graded ethanol and propylene oxide and infiltrated in an equal volume ofepoxy resin and propylene oxide overnight. The sample was embedded in epoxy resin andcured for 48 hr in 60°C The cured block was thin-sectioned, stained in uranyl acetate andlead citrate and examined with an EM equipped with a digital camera and operated at 75 kV.
ResultsA total of 4,842 extracts from 38 countries were tested for their ability to induce KSHVreactivation in BCP-1 cells. Most were from land plants but extracts from 86 marine plants,97 marine animals and 87 species of fungi were included. Usable results were obtained from3,703 extracts. A total of 2,958 extracts were inactive, 561 reduced levels of spontaneousKSHV replication and 184 (5.0%) induced viral reactivation above the level of sodiumbutyrate, which is the most potent chemical inducer of KSHV reactivation. The degree ofviral reactivation by natural products was significantly higher than that obtained by hostbiological response modifiers such as interferon-gamma.25,26
Whitby et al. Page 6
Int J Cancer. Author manuscript; available in PMC 2010 April 21.
NIH
-PA Author Manuscript
NIH
-PA Author Manuscript
NIH
-PA Author Manuscript

More than half (2,477) of the extracts with usable results were from African land plants and126 (5.1%) of these were activators, compared with 58 (4.7%) from other or unknowngeographical regions (Table I). Activators included 3 marine plants, 1 marine animal and 1fungal extract.
Using likelihood ratio χ2 tests, African plants were more likely to cause reactivation thannon-African plants (p = 0.024: likelihood ratio χ2 = 7.442, 2 df). Of the activating extracts,the magnitude of activation was greater for those from Africa (log10 mean = 8.41) comparedwith those from elsewhere (log10 mean = 8.21, p = 0.044, t-test). These associations wereonly weakly statistically significant. There were no activators from Europe or Asia, althoughonly a small number of extracts from these regions were tested. Somewhat surprisingly, theproportion of extracts from Central America and the Caribbean and from The Philippinesand Indonesia causing reactivation was higher than for African plants (5.6% and 7.2%,respectively vs. 5.1%), although the numbers of extracts were relatively small.
Viral activators belonged to a wide variety of plant families (Table II), although consistentwith sampling based only on geography; for many families only a few extracts were tested.For example, 2 out of 3 samples from the Hypericaceae and 3 out of 7 samples from thePittosporaceae were classified as activators. Between 7 and 15% of the extracts from theAcanthaceae, Boraginaceae, Celastraceae, Leguminosae, Rutaceae and Solanaceae wereclassified as activators compared with 5% or less for other families. The 28 natural productsthat had the highest reactivation levels in the screening experiment are listed in Table III,along with the family to which they belong, country of origin and the induced KSHV levelexpressed as log10 KSHV copies per 105 cells.
Apparent inhibition of KSHV replication was observed with 555 extracts (15%).Theseextracts included 525 land plants, 11 marine plants, 9 marine animals and 10 fungi. Weconsidered it unlikely that these extracts were specifically inhibiting KSHV replication.More likely, the reduction in KSHV load that was observed with these extracts was probablycaused by toxic effects of the extracts specific to BCP-1 cells, even though we had excludedextracts known to cause cytotoxicity in other cell lines. Some of these extracts may causespecific inhibition of KSHV replication but, since this was not the focus of this study, wedid not attempt to characterize these further, with the exception of 3 extracts selected for theviral transcription array experiment.
We further characterized the dynamics of reactivation by retesting the 28 most potentextracts from the initial screen in a 4-day time course experiment over 4 days. Using the K6real-time quantitative PCR assay, we confirmed the initial screening results for 22 of theextracts by showing KSHV viral load increases over time (Fig. 1). To further elucidate themechanism of reactivation, RNA was extracted from duplicate cell pellets for viral geneexpression analysis using a previously reported viral array18 that queries the entire KSHVtranscriptome by real time quantitative PCR. Four extracts causing high levels ofreactivation, Dracaena fragrans, Chasmanthera dependens, Cleistanthus polystachyus andEmilia coccinea, were chosen for RNA analysis as well as 3 causing apparent inhibition:Uvaria angalensia, Keetia carmichailli and Garcinia species.
No mRNAs could be isolated from pellets in experiments using extracts, U. angolensia andGarcinia species, which caused apparent inhibition, consistent with our assumption that thenatural product extract killed the cells early on. The other results fell into 2 categories; E.coccinea, C. dependens and D. fragrans caused only minimal changes in levels of 3different cellular mRNAs over time, suggesting that the extract did not affect cell viability orbasic cellular transcription (Fig. 2a). In contrast, extracts from K. carmichailli and C.polystachyus caused a rapid decrease in cellular mRNA levels between 24 and 48 hr post
Whitby et al. Page 7
Int J Cancer. Author manuscript; available in PMC 2010 April 21.
NIH
-PA Author Manuscript
NIH
-PA Author Manuscript
NIH
-PA Author Manuscript

exposure, suggesting a deleterious effect on viability or down regulation of basic cellulartranscription. On the basis if this result, we normalized all data to the level of gapdh for eachsample at each time point.
To determine whether the extracts were specifically causing KSHV reactivation, we firstquantified the levels of 2 early viral mRNAs: K14 and ORF57 (Fig. 2b). All 3 of the extractscausing apparent decrease of KSHV replication exhibited significant signs of cellulartoxicity. We were therefore unable to demonstrate any specific effects on KSHV replicationby these extracts. In contrast, for extracts causing activation, E. coccinea, C. polystachyus,C. dependens and D. fragrans, the 2 viral mRNAs showed a different pattern than thecellular mRNAs. Levels for K14 and ORF57 increased over time up to and beyond the levelof gapdh, which is indicative of KSHV lytic reactivation. By comparison, the 2 cellularmRNAs, c-myc and actin showed little or no change, indicating that the effect was specificfor viral transcripts. Table IV shows fold induction relative to mock treated cells for selectedmRNAs, representing the different kinetic classes of genes. All classes were induced relativeto mock treatment.
To evaluate the effects of E. coccinea, C. polystachyus, C. dependens and D. fragransextracts on all KSHV mRNAs, we performed cluster analysis of the viral array data asshown in Figure 3. Most KSHV mRNAs were induced upon exposure to the naturalproducts and with similar kinetics, as shown by the gradual shift from blue (low levels) toblack (median level) to red (high levels) over time. This suggested that the transcriptionalchanges were the result of an ordered cascade of lytic reactivation rather than activation ofrandom viral promoters by the extract. The RNA transcription data indicate that theincreases in viral load observed with our real time PCR assay are a consequence of specificviral reactivation as a result of exposure to the natural product extracts.
To determine whether viral reactivation by natural products resulted in virion production, wefiltered and concentrated supernatants from untreated BCP-1 cells and cells treated with C.dependens, E. coccinea, C. polystachyus and D. fragrans for 96 hr. Immunoblotting of theKSHV late-lytic viral protein K8.1 A/B detected the expected 68–72 kDa broad band ofvirion-associated glycoprotein27 in samples from cells exposed to the 4 extracts, suggestingnatural product reactivation induced a full lytic cycle of the virus (Fig. 4).K8.1 was notdetected in the supernatant from the untreated BCP-1 cells. Cells from this experiment wereprocessed for electron microscopy. Immature and mature virions were present in cellstreated with all 4 extracts as well as the positive control. Representative virions are shown inFigure 5.
DiscussionWe have demonstrated that aqueous extracts of natural products collected from Africancountries known to have a high prevalence of KSHV infection and endemic KS can causereactivation of KSHV in latently infected PEL cells. This supports the “oncoweed”hypothesis by providing a biological mechanism that may help to explain geographicvariations in KSHV reactivation rates. Higher reactivation rates may explain higherprevalence, viral loads and transmission frequency in KS endemic regions.
Some caution must be applied to the interpretation of these data. The plants in the NCIrepository were not collected to be representative of the flora of specific geographical areasbut were selected for possibly having therapeutic potential against common cancers. Fewextracts were available from regions with very low KSHV prevalence. The percentage ofextracts inducing activation was only slightly higher if they were collected from Africanversus non African countries. In addition, a surprisingly high proportion of extracts from
Whitby et al. Page 8
Int J Cancer. Author manuscript; available in PMC 2010 April 21.
NIH
-PA Author Manuscript
NIH
-PA Author Manuscript
NIH
-PA Author Manuscript
Central American and Caribbean plants, as well as plant extracts from The Philippines andIndonesia caused KSHV reactivation. These results warrant further study. However, amongthe activating extracts, the level of viral reactivation by African extracts was significantlyhigher than that from non-African extracts. This is evident from Table III which shows that25 of the 28 most potent extracts were from Africa. The viral loads after reactivation withnatural products exceeded those obtained after reactivation with known chemical inducersand host response modifiers. This supports the “oncoweed” hypothesis, since highly activeextracts are more likely to have a biological effect on exposed subjects.
The plants causing activation included many that are used in traditional medicines, forbasket making or as food. For example, C. dependens, P. febrifugum, M. lanceolota, E.coccinacea and B. antidysenterica are all used in traditional medicines. S. persica twigs areused for teeth cleaning and V. simplicifolia is used to make wooden bowls and spoons.Consequently, exposure of KSHV infected individuals to the active ingredients contained inthese plants is plausible. Wojcicki recently described traditional practices associated withsaliva exchange in sub-Saharan Africa. Many of these involved chewing of herbs bytraditional healers and by mothers before a mixture of herbs and saliva were used fortreatment.28 If the herbs used caused KSHV reactivation, this might be a very efficient routeof KSHV transmission, since we know that viral shedding occurs in saliva.29–31
A role for environmental cofactors has been proposed in the etiology of endemic Burkitt’slymphoma (BL), a monoclonal B cell malignancy of children that is caused by Epstein Barrvirus and has a distinct geographical distribution in sub-Saharan Africa. One well definedcofactor is holoendemic malaria but it has also been proposed that exposure to sap from theplant Euphorbia tirucalli, a member of the Euphorbiaceae family may be an additionalenvironmental cofactor.32–35 Laboratory studies have shown that E. tirucalli extracts orlatex enhance EBV induced transformation,36 reduce Epstein-Barr virus (EBV) specificcellular immunity37 and cause reactivation of EBV lytic replication.35 These studiesdemonstrate the biological plausibility of a role for E. tirucalli as a cofactor in endemicBurkitt’s lymphoma, although definitive epidemiological studies have yet to be reported.There are additional reports of similar activities in related Euphorbiaceae extracts36,38 and inextracts from the unrelated Aleurites fordii,39 indicating that additional environmentalfactors may be important in EBV pathology. E. tirucalli, related Euphorbiaceae andAleurites fordii are known to contain high levels of phorbol esters which are known inducersof EBV lytic reactivation.
There is considerable overlap between the regions of sub-Saharan Africa known to beendemic for KS and those where endemic BL occurs, although there are also importantdifferences in the local distribution of the 2 diseases.2 We did not investigate reactivation ofEBV in this study but it is plausible that some natural products may exert effects on EBV aswell as KSHV. Of interest, C. polystachyus, an extract that caused high levels of KSHVreactivation in this study, is a member of the Euphorbiaceae. This family includes E.tirucalli, the plant studied as a potential cofactor for endemic BL. It is unlikely, however,that the biological activity of the extracts identified in this study was related to the presenceof phorbol esters, since we used only aqueous extracts and phorbol esters would be found inorganic extracts. Chemical fractionation of the most potent extracts to determine the activecomponents is planned.
We conclude that environmental factors may play an important role in the epidemiology ofKSHV. Such factors may be involved in enhancing transmission of KSHV in KS endemicareas and in accelerating progression to KS disease in KSHV latently infected individuals byincreasing the viral reactivation frequency. Our extensive screening data provide support forthis “oncoweed” hypothesis by demonstrating for the first time biological plausibility.
Whitby et al. Page 9
Int J Cancer. Author manuscript; available in PMC 2010 April 21.
NIH
-PA Author Manuscript
NIH
-PA Author Manuscript
NIH
-PA Author Manuscript

Further epidemiological and laboratory studies are needed to fully understand the role ofenvironmental cofactors in KSHV infection and disease.
AcknowledgmentsThis project has been funded in part with federal funds from the National Cancer Institute, National Institutes ofHealth, under contract N01-CO-12400. This study was funded in part with federal funds from the NationalInstitutes of Health to D.P.D. We thank Mr. Robert Shoemaker for helpful discussions, Mr. John Britt for help withnatural products, Mr. Jason de la Cruz for help with electron microscopy, Mr. Doug Powell for help with statisticsand Mr. Thomas Parks for help with figures.
Research funded by: National Cancer Institute, NIH; Contract number: NO1-CO-12400; Grant sponsor: NationalInstitutes of Health; Grant number: CA109232; Grant sponsor: Intramural Research Program, NIH.
References1. Chang Y, Cesarman E, Pessin MS, Lee F, Culpepper J, Knowles DM, Moore PS. Identification of
herpesvirus-like DNA sequences in AIDS-associated Kaposi’s sarcoma. Science 1994;266:1865–1869. [PubMed: 7997879]
2. Cook-Mozaffari P, Newton R, Beral V, Burkitt DP. The geographical distribution of Kaposi’ssarcoma and of lymphomas in Africa before the AIDS epidemic. Br J Cancer 1998;78:1521–1528.[PubMed: 9836488]
3. Franceschi S, Geddes M. Epidemiology of classic Kaposi’s sarcoma, with special reference tomediterranean population. Tumori 1995;81:308–314. [PubMed: 8804445]
4. Beral V, Peterman TA, Berkelman RL, Jaffe HW. Kaposi’s sarcoma among persons with AIDS: asexually transmitted infection? Lancet 1990;335:123–128. [PubMed: 1967430]
5. Whitby D, Boshoff C. Kaposi’s sarcoma herpesvirus as a new paradigm for virus-inducedoncogenesis. Curr Opin Oncol 1998;10:405–412. [PubMed: 9800110]
6. Whitby D, Luppi M, Barozzi P, Boshoff C, Weiss RA, Torelli G. Human herpesvirus 8seroprevalence in blood donors and lymphoma patients from different regions of Italy. J NatlCancer Inst 1998;90:395–397. [PubMed: 9498490]
7. Ariyoshi K, Schim van der Loeff M, Cook P, Whitby D, Corrah T, Jaffar S, Cham F, Sabally S,O’Donovan D, Weiss RA, Schulz TF, Whittle H. Kaposi’s sarcoma in the Gambia, West Africa isless frequent in human immunodeficiency virus type 2 than in human immunodeficiency virus type1 infection despite a high prevalence of human herpesvirus 8. J Hum Virol 1998;1:193–199.[PubMed: 10195242]
8. Biggar RJ, Whitby D, Marshall V, Linhares AC, Black F. Human herpesvirus 8 in BrazilianAmerindians: a hyperendemic population with a new subtype. J Infect Dis 2000;181:1562–1568.[PubMed: 10823754]
9. Whitby D, Marshall VA, Bagni RK, Wang CD, Gamache CJ, Guzman JR, Kron M, Ebbesen P,Biggar RJ. Genotypic characterization of Kaposi’s sarcoma-associated herpesvirus in asymptomaticinfected subjects from isolated populations. J Gen Virol 2004;85((Part 1)):155–163. [PubMed:14718630]
10. McGeoch DJ, Davison AJ. The descent of human herpesvirus 8. Semin Cancer Biol 1999;9:201–209. [PubMed: 10343071]
11. Engels EA, Clark E, Aledort LM, Goedert JJ, Whitby D. Kaposi’s sarcoma-associated herpesvirusinfection in elderly Jews and non-Jews from New York City. Int J Epidemiol 2002;31:946–950.[PubMed: 12435765]
12. Almuneef M, Nimjee S, Khoshnood K, Miller G, Rigsby MO. Prevalence of antibodies to humanherpesvirus 8 (HHV-8) in Saudi Arabian patients with and without renal failure. Transplantation2001;71:1120–1124. [PubMed: 11374413]
13. Ablashi D, Chatlynne L, Cooper H, Thomas D, Yadav M, Norhanom AW, Chandana AK,Churdboonchart V, Kulpradist SA, Patnaik M, Liegmann K, Masood R, et al. Seroprevalence ofhuman herpesvirus-8 (HHV-8) in countries of Southeast Asia compared to the USA, the Caribbeanand Africa. Br J Cancer 1999;81:893–897. [PubMed: 10555764]
Whitby et al. Page 10
Int J Cancer. Author manuscript; available in PMC 2010 April 21.
NIH
-PA Author Manuscript
NIH
-PA Author Manuscript
NIH
-PA Author Manuscript

14. Smith NA, Sabin CA, Gopal R, Bourboulia D, Labbet W, Boshoff C, Barlow D, Band B, PetersBS, de Ruiter A, Brown DW, Weiss RA, et al. Serologic evidence of human herpesvirus 8transmission by homosexual but not heterosexual sex. J Infect Dis 1999;180:600–606. [PubMed:10438345]
15. Grundhoff A, Ganem D. Inefficient establishment of KSHV latency suggests an additional role forcontinued lytic replication in Kaposi sarcoma pathogenesis. J Clin Invest 2004;113:124–136.[PubMed: 14702116]
16. Engels EA, Biggar RJ, Marshall VA, Walters MA, Gamache CJ, Whitby D, Goedert JJ. Detectionand quantification of Kaposi’s sarcoma-associated herpesvirus to predict AIDS-associatedKaposi’s sarcoma. AIDS 2003;17:1847–1851. [PubMed: 12891072]
17. Sitas F, Carrara H, Beral V, Newton R, Reeves G, Bull D, Jentsch U, Pacella-Norman R,Bourboulia D, Whitby D, Boshoff C, Weiss R. Antibodies against human herpesvirus 8 in blackSouth African patients with cancer. N Engl J Med 1999;340:1863–1871. [PubMed: 10369849]
18. Fakhari FD, Dittmer DP. Charting latency transcripts in Kaposi’s sarcoma-associated herpesvirusby whole-genome real-time quantitative PCR. J Virol 2002;76:6213–6223. [PubMed: 12021355]
19. Dittmer DP. Transcription profile of Kaposi’s sarcoma-associated herpesvirus in primary Kaposi’ssarcoma lesions as determined by realtime PCR arrays. Cancer Res 2003;63:2010–2015.[PubMed: 12727810]
20. Russo JJ, Bohenzky RA, Chien MC, Chen J, Yan M, Maddalena D, Parry JP, Peruzzi D, EdelmanIS, Chang Y, Moore PS. Nucleotide sequence of the Kaposi sarcoma-associated herpesvirus(HHV8). Proc Natl Acad Sci USA 1996;93:14862–14867. [PubMed: 8962146]
21. Boshoff C, Gao SJ, Healy LE, Matthews S, Thomas AJ, Coignet L, Warnke RA, Strauchen JA,Matutes E, Kamel OW, Moore PS, Weiss RA, et al. Establishing a KSHV+ cell line (BCP-1) fromperipheral blood and characterizing its growth in Nod/SCID mice. Blood 1998;91:1671–1679.[PubMed: 9473233]
22. de Sanjose S, Marshall V, Sola J, Palacio V, Almirall R, Goedert JJ, Bosch FX, Whitby D.Prevalence of Kaposi’s sarcoma-associated herpesvirus infection in sex workers and women fromthe general population in Spain. Int J Cancer 2002;98:155–158. [PubMed: 11857400]
23. Yuan CC, Miley W, Waters D. A quantification of human cells using an ERV-3 real time PCRassay. J Virol Methods 2001;91:109–117. [PubMed: 11164492]
24. Gonda MA, Aaronson SA, Ellmore N, Zeve VH, Nagashima K. Ultrastructural studies of surfacefeatures of human normal and tumor cells in tissue culture by scanning and transmission electronmicroscopy. J Natl Cancer Inst 1976;56:245–263. [PubMed: 1255758]
25. Chang J, Renne R, Dittmer D, Ganem D. Inflammatory cytokines and the reactivation of Kaposi’ssarcoma- associated herpesvirus lytic replication. Virology 2000;266:17–25. [PubMed: 10612656]
26. Zoeteweij JP, Eyes ST, Orenstein JM, Kawamura T, Wu L, Chandran B, Forghani B, Blauvelt A.Identification and rapid quantification of early-and late-lytic human herpesvirus 8 infection insingle cells by flow cytometric analysis: characterization of antiherpesvirus agents. J Virol1999;73:5894–5902. [PubMed: 10364341]
27. Zhu L, Puri V, Chandran B. Characterization of human herpesvirus-8 K8.1A/B glycoproteins bymonoclonal antibodies. Virology 1999;262:237–249. [PubMed: 10489357]
28. Wojcicki JM. Traditional behavioural practices, the exchange of saliva and HHV-8 transmission insub-Saharan African populations. Br J Cancer 2003;89:2016–2017. [PubMed: 14612917]
29. Mbulaiteye SM, Pfeiffer RM, Engels EA, Marshall V, Bakaki PM, Owor AM, Ndugwa CM,Katongole-Mbidde E, Goedert JJ, Biggar RJ, Whitby D. Detection of kaposi sarcoma-associatedherpesvirus DNA in saliva and buffy-coat samples from children with sickle cell disease inUganda. J Infect Dis 2004;190:1382–1386. [PubMed: 15378429]
30. Vieira J, Huang ML, Koelle DM, Corey L. Transmissible Kaposi’s sarcoma-associated herpesvirus(human herpesvirus 8) in saliva of men with a history of Kaposi’s sarcoma. J Virol 1997;71:7083–7087. [PubMed: 9261440]
31. Webster-Cyriaque J. Development of Kaposi’s sarcoma in a surgical wound. N Engl J Med2002;346:1207–1210. [PubMed: 11961149]
Whitby et al. Page 11
Int J Cancer. Author manuscript; available in PMC 2010 April 21.
NIH
-PA Author Manuscript
NIH
-PA Author Manuscript
NIH
-PA Author Manuscript

32. Mizuno F, Osato T, Imai S, Koizumi S, Aya T, Kinoshita T, Hirai N, Hirota M, Ohigashi H,Koshimizu K, et al. Epstein-Barr virus-enhancing plant promoters in east Africa. AIDS Res1986;2:S151–S155. [PubMed: 3030344]
33. Osato T, Mizuno F, Imai S, Aya T, Koizumi S, Kinoshita T, Tokuda H, Ito Y, Hirai N, Hirota M,et al. African Burkitt’s lymphoma and an Epstein-Barr virus-enhancing plant Euphorbia tirucalli.Lancet 1987;1:1257–1258. [PubMed: 2884382]
34. van den Bosch C, Griffin BE, Kazembe P, Dziweni C, Kadzamira L. Are plant factors a missinglink in the evolution of endemic Burkitt’s lymphoma? Br J Cancer 1993;68:1232–1235. [PubMed:8260378]
35. MacNeil A, Sumba OP, Lutzke ML, Moormann A, Rochford R. Activation of the Epstein-Barrvirus lytic cycle by the latex of the plant Euphorbia tirucalli. Br J Cancer 2003;88:1566–1569.[PubMed: 12771923]
36. Mizuno F, Koizumi S, Osato T, Kokwaro JO, Ito Y. Chinese and African Euphorbiaceae plantextracts: markedly enhancing effect on Epstein-Barr virus-induced transformation. Cancer Lett1983;19:199–205. [PubMed: 6309363]
37. Imai S, Sugiura M, Mizuno F, Ohigashi H, Koshimizu K, Chiba S, Osato T. African Burkitt’slymphoma: a plant, Euphorbia tirucalli, reduces Epstein-Barr virus-specific cellular immunity.Anticancer Res 1994;14:933–936. [PubMed: 8074496]
38. Ohigashi H, Koshimizu K, Tokuda H, Hiramatsu S, Jato J, Ito Y. Epstein-Barr virus-inducingactivity of Euphorbiaceae plants commonly grown in Cameroon. Cancer Lett 1985;28:135–141.[PubMed: 2996755]
39. Ito Y, Yanase S, Tokuda H, Kishishita M, Ohigashi H, Hirota M, Koshimizu K. Epstein-Barr virusactivation by tung oil, extracts of Aleurites fordii and its diterpene ester 12-O-hexadecanoyl-16-hydroxy-phorbol-13-acetate. Cancer Lett 1983;18:87–95. [PubMed: 6297709]
Whitby et al. Page 12
Int J Cancer. Author manuscript; available in PMC 2010 April 21.
NIH
-PA Author Manuscript
NIH
-PA Author Manuscript
NIH
-PA Author Manuscript

FIGURE 1.Time course experiment with 28 extracts that caused the highest increases in KSHV viralload in the initial screen. The names and country of origin of the extracts are listed in TableIII. The results are shown relative to the viral load observed in sodium butyrate inducedcells. The standard deviation was calculated from the results of day 1 for all samples. Blackdashed lines indicate one and a half standard deviations above and below the normalizedaverage unstimulated control values for each day.
Whitby et al. Page 13
Int J Cancer. Author manuscript; available in PMC 2010 April 21.
NIH
-PA Author Manuscript
NIH
-PA Author Manuscript
NIH
-PA Author Manuscript

FIGURE 2.(a) Raw CT values for three cellular mRNAs, namely actin (blue squares), gapdh (redtriangles) and c-myc (black circles). CT values are depicted on the vertical axis andcorrespond to the level of mRNA on a logarithmic scale. Higher CT values indicate lowermRNA levels. Hence, a CT = 40, for the negative nontemplate control (NTC) lanesindicated no amplification. We used BCP-1 cells as a positive control. As expected, gapdhmRNA is more abundant than actin, which in turn is more abundant than c-myc mRNA, asindicated by their relative CT values. Moreover, a 1:2 dilution of the input cDNA poolresulted in the same, reproducible and significant increase in CT for each mRNA, affirmingthe quantitative nature of our analysis. (b) dCT values for 2 KSHV mRNAs, K14 (red
Whitby et al. Page 14
Int J Cancer. Author manuscript; available in PMC 2010 April 21.
NIH
-PA Author Manuscript
NIH
-PA Author Manuscript
NIH
-PA Author Manuscript

circles) and ORF57 (blue squares) and 2 cellular mRNAs, actin (black open circles) and c-myc (black triangles) at days 0, 1, 2, 3 and 4 after exposure to natural product extracts.Lower CT values correspond to higher mRNA levels on a log 2 scale, and 0 indicatesmRNA levels equivalent to gapdh mRNA.
Whitby et al. Page 15
Int J Cancer. Author manuscript; available in PMC 2010 April 21.
NIH
-PA Author Manuscript
NIH
-PA Author Manuscript
NIH
-PA Author Manuscript
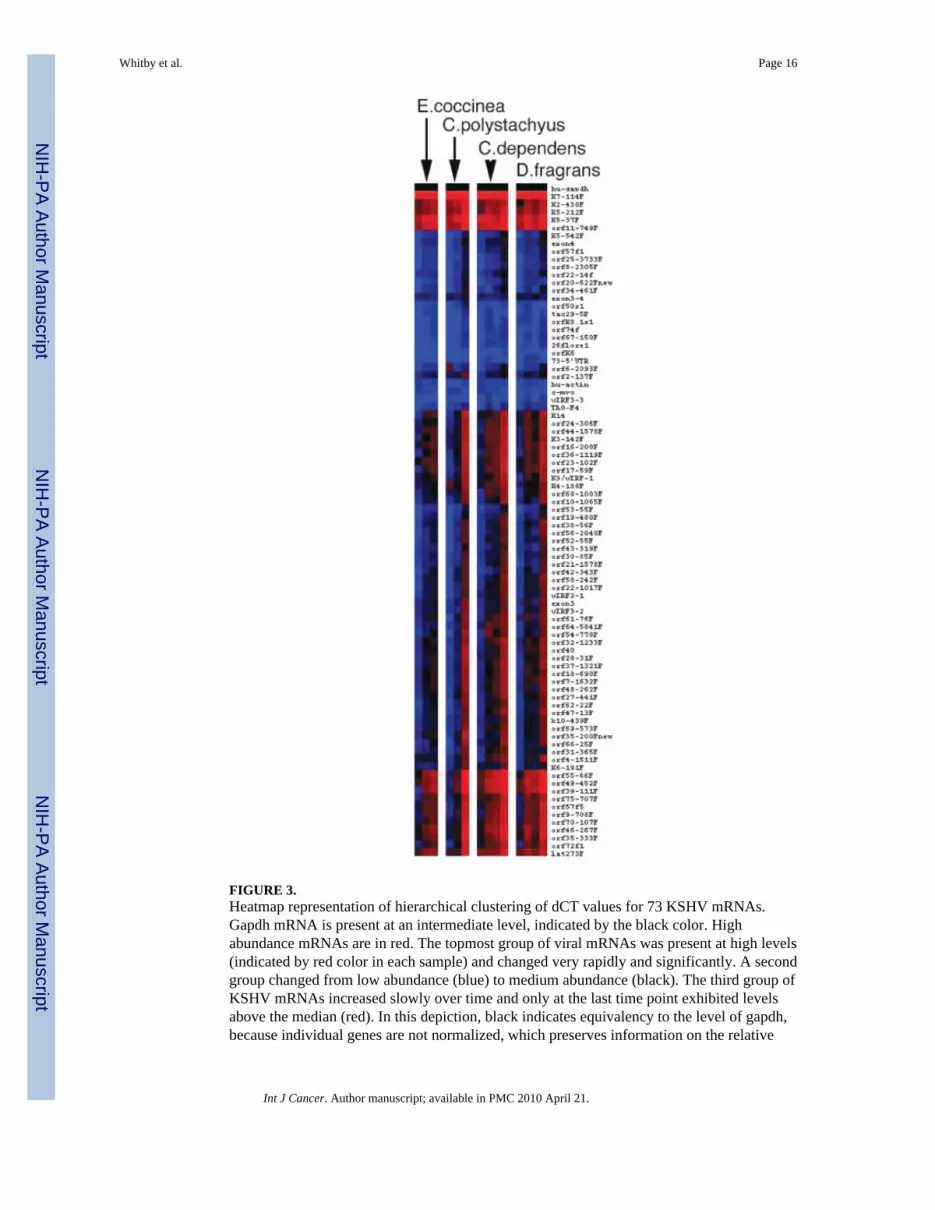
FIGURE 3.Heatmap representation of hierarchical clustering of dCT values for 73 KSHV mRNAs.Gapdh mRNA is present at an intermediate level, indicated by the black color. Highabundance mRNAs are in red. The topmost group of viral mRNAs was present at high levels(indicated by red color in each sample) and changed very rapidly and significantly. A secondgroup changed from low abundance (blue) to medium abundance (black). The third group ofKSHV mRNAs increased slowly over time and only at the last time point exhibited levelsabove the median (red). In this depiction, black indicates equivalency to the level of gapdh,because individual genes are not normalized, which preserves information on the relative
Whitby et al. Page 16
Int J Cancer. Author manuscript; available in PMC 2010 April 21.
NIH
-PA Author Manuscript
NIH
-PA Author Manuscript
NIH
-PA Author Manuscript

levels of each mRNA to one another. Primer pairs that amplified splice site specific mRNAswere excluded because the relative PCR efficiency was not comparable.
Whitby et al. Page 17
Int J Cancer. Author manuscript; available in PMC 2010 April 21.
NIH
-PA Author Manuscript
NIH
-PA Author Manuscript
NIH
-PA Author Manuscript

FIGURE 4.KSHV virion production in supernatant from BCP-1 cells stimulated with extracts from C.dependens, E. coccinea, C. polystachyus and D. fragrans. Concentrated cell supernatantsfrom untreated BCP-1 cells and extract exposed cells were run on a denaturingpolyacrylamide gel and the proteins were transferred to a PVDF membrane. Immunoblottingfor reactivity of the late lytic glycoprotein K8.1A/B demonstrated KSHV virion productionin the cells treated with all 4 extracts but not in the untreated BCP-1 cells.
Whitby et al. Page 18
Int J Cancer. Author manuscript; available in PMC 2010 April 21.
NIH
-PA Author Manuscript
NIH
-PA Author Manuscript
NIH
-PA Author Manuscript

FIGURE 5.Electron microscopy of BCP-1 cells stimulated with extracts from C. dependens, E.coccinea, C. polystachyus and D. fragrans demonstrated the production of typicalherpesvirus virions. Immature and mature particles were observed in cells treated with all 4extracts as well as the positive control (sodium butyrate). Panels A and B show immatureparticles assembled in the nucleus. Panel C shows mature particles in a cytoplasmic vacuole.Panel D shows an extracellular mature particle. The scale bar represents 200 nm.
Whitby et al. Page 19
Int J Cancer. Author manuscript; available in PMC 2010 April 21.
NIH
-PA Author Manuscript
NIH
-PA Author Manuscript
NIH
-PA Author Manuscript

NIH
-PA Author Manuscript
NIH
-PA Author Manuscript
NIH
-PA Author Manuscript
Whitby et al. Page 20
TABLE I
Natural Products Causing KSHV Reactivation by Geographical Region
Region Total productstested Inactive (%) Activators (%) Inhibitors (%)
Africa 2,477 2,010 (81.1) 126 (5.1) 341 (13.8)
Non-Africa and unknown: 1226 948 (77.3) 58 (4.7) 220 (17.9)
Asia and Europe 40 33 (82.5) 0 7 (17.5)
Central America and Caribbean 245 193 (78.7) 14 (5.6) 38 (15.5)
South America 284 210 (73.9) 9 (3.2) 65 (22.9)
Philippines and Indonesia 415 311 (74.9) 30 (7.2) 74 (17.8)
Unknown 242 201 (83.4) 5 (2.1) 36 (14.9)
Int J Cancer. Author manuscript; available in PMC 2010 April 21.

NIH
-PA Author Manuscript
NIH
-PA Author Manuscript
NIH
-PA Author Manuscript
Whitby et al. Page 21
TABLE II
Plant Families from which 5% or More Extracts Produced KSHV Reactivation
Plant family Number of extractsscreened Activators (%)
Acanthaceae 27 4 (14.8)
Apocynaceae 121 6 (5.0)
Asteraceae 79 4 (5.0)
Boraginaceae 24 2 (8.3)
Caesalpiniaceae 163 8 (4.9)
Celastraceae 57 4 (7.0)
Hypericaceae 3 2 (67.0.)
Leguminosae 31 3 (9.7)
Mimosaceae 66 3 (5.0)
Moraceae 109 6 (5.5)
Pittosporaceae 7 3 (43.0)
Rutaceae 42 4 (9.5)
Solanaceae 32 3 (9.4)
Int J Cancer. Author manuscript; available in PMC 2010 April 21.

NIH
-PA Author Manuscript
NIH
-PA Author Manuscript
NIH
-PA Author Manuscript
Whitby et al. Page 22
TABLE III
Name, Family and Country of Origin of Natural Products from which Aqueous Extracts Produced the HighestLevels of KSHV Reactivation in Initial Screen
Name Family Country of origin Log copiesper 105 cells
Chasmanthera dependens Menispermaceae Tanzania 10.36
Lepistemon owariensis Convolvulaceae Tanzania 10.32
Chenopodium fasciculosum Chenopodiaceae Tanzania 10.08
Acacia amythethophylla Mimosaceae Tanzania 10.00
Vepris simplicifolia Rutaceae Tanzania 9.96
Dalbergia ecastaphyllum Fabaceae Ghana 9.94
Not identified1 Leguminoseae Papua New Guinea 9.88
Pittosporum verticillatum Pittosporaceae Madagascar 9.83
Dracaena fragrans Agavaceae Tanzania 9.74
Cleistanthus polystachyus Euphorbiaceae Cameroon 9.71
Astripomoea grantii Convolvulaceae Tanzania 9.70
Not identified2 Not Identified Philippine Islands 9.57
Eugenia soyauxii Myrtaceae Gabon 9.51
Psorospermum febrifugum Hyperiaceae Tanzania 9.51
Maesa lanceolata Myrsinaceae Tanzania 9.45
Emilia coccinea Asteraceae Tanzania 9.30
Erythrina dominguezii Leguminosae Bolivia 9.30
Salacia whytei Celastraceae Gabon 9.28
Salvadora persica Salvadoraceae Tanzania 9.28
Brucea antidysenterica Simaroubaceae Tanzania 9.26
Chlorophytum blepharophyllum Liliaceae Tanzania 9.26
Ekebergia benguelensis Meliaceae Tanzania 9.23
Cnestis ferruginea Connaraceae Cameroon 9.20
Stericulia tragacantha Sterculiaceae Gabon 9.18
Testulea gabonensis Ochnaceae Gabon 9.15
Datura stramonium Solanaceae Tanzania 9.15
Canavalia rosea Fabaceae Ghana 9.04
Aspilia bussei Asteraceae Ghana 9.04
1Unidentified legume.
2Unidentified marine animal.
Int J Cancer. Author manuscript; available in PMC 2010 April 21.

NIH
-PA Author Manuscript
NIH
-PA Author Manuscript
NIH
-PA Author Manuscript
Whitby et al. Page 23
TABLE IV
Maximum Fold Induction by Natural Product Extracts for Selected mRNAS
Gene E. coccinea C. polystachyus C. dependens D. fragrans
ORF 26 214 614 586 658
ORF 29 740 2602 1231 1155
ORF 50 19 127 25 36
ORF 57 103 294 332 363
K8.1 61 63 103 93
c-myc 2 2 2 1.8
Int J Cancer. Author manuscript; available in PMC 2010 April 21.