Embed Size (px)
Citation preview

ARTICLE IN PRESS
0143-8166/$ - se
doi:10.1016/j.op
�CorrespondE-mail addr
Optics and Lasers in Engineering 45 (2007) 960–966
www.elsevier.com/locate/optlaseng
Pulsed Nd:YAG laser welding of AISI 304 to AISI 420 stainless steels
Jose Roberto Berrettaa,�, Wagner de Rossib, Maurıcio David Martins das Nevesc,Ivan Alves de Almeidab, Nilson Dias Vieira Juniorb
aCentro Tecnologico da Marinha, Av. Prof. Lineu Prestes, 2242, Cidade Universitaria, 05508-900, Sao Paulo, BrazilbInstituto de Pesquisas Energeticas e Nucleares, Centro de Lasers e Aplicac- oes, Sao Paulo, SP, Brazil
cInstituto de Pesquisas Energeticas e Nucleares, Centro de Ciencia e Tecnologia dos Materiais, Sao Paulo, SP, Brazil
Received 1 November 2006; received in revised form 1 January 2007; accepted 1 February 2007
Available online 19 April 2007
Abstract
The technique to weld AISI 304 stainless steel to AISI 420 stainless steel with a pulsed Nd:YAG laser has been investigated. The main
objective of this study was to determine the influence of the laser beam position, with respect to the joint, on weld characteristics.
Specimens were welded with the laser beam incident on the joint and moved 0.1 and 0.2mm on either side of the joint. The joints were
examined in an optical microscope for cracks, pores and to determine the weld geometry. The microstructure of the weld and the heat
affected zones were observed in a scanning electron microscope. An energy dispersive spectrometer, coupled to the scanning electron
microscope, was used to determine variations in (weight %) the main chemical elements across the fillet weld. Vickers microhardness
testing and tensile testing were carried out to determine the mechanical properties of the weld. The results of the various tests and
examinations enabled definition of the best position for the incident laser beam with respect to the joint, for welding together the two
stainless steels.
r 2007 Elsevier Ltd. All rights reserved.
Keywords: Laser welding; Stainless steel; Welding of dissimilar materials
1. Introduction
In recent years, the consumer industry has beenincorporating a variety of materials in its products madeon a large scale to improve performance and reduce costs.This has resulted in increased demands for techniques toweld dissimilar materials and for use in large scaleindustrial production [1–3]. Among the available weldingtechniques, laser welding has received increasing attention[4]. One of the reasons for this is rapid development inrecent years in high-energy density beam technology [5–7].
Many of the advantages and limitations of laser welding,compared to other welding processes, depend on focusedbeam properties. The high power density permits weldingbased on the keyhole principle, and the reduced energytransfer to the material produces a very narrow heataffected zone (HAZ) with low residual stress and small
e front matter r 2007 Elsevier Ltd. All rights reserved.
tlaseng.2007.02.001
ing author. Tel.: +5511 38169307; fax: +55 11 38169307.
ess: [email protected] (J.R. Berretta).
distortions [8]. The high cooling rate favors the formationof a fine microstructure, and this normally impartsimproved mechanical properties [9,10]. On the other hand,the high cooling rates could generate the martensitic phasein the microstructure, and this phase could jeopardize someof the mechanical properties of the weld. Base materialselection, component design and weld joint design are alsoinfluenced by laser welding characteristics [9].An additional problem emerges when it involves the
welding together of two materials with different metallur-gical and physical properties, such as absorption at thelaser wavelength, thermal conductivity and melting point.The formation of certain metallurgical phases in thesematerials could result in decrease in mechanical andfunctional properties of the joint. Decrease in solubilityof alloying elements could lead to cracking. To solve theseproblems and to obtain welds with adequate properties it isessential to precisely control the process and the processparameters. Thus two possibilities emerge, as alternatives,to resolve this problem: modification in the temporal shape

ARTICLE IN PRESSJ.R. Berretta et al. / Optics and Lasers in Engineering 45 (2007) 960–966 961
of the pulse laser [11] or variation of the position of thelaser beam with respect to the joint [12]. In the first case, itwas possible to control the heating and cooling rates of theweld pool, which could improve the metallurgical char-acteristics of the weld region. In the second case, supply ofdifferent energies to the two materials could compensatefor the differences in absorption of the laser beam and inthe thermal conductivities.
Autogenously welding is the main advantage in joiningdissimilar materials with a laser beam. Positioning of thefocused beam by CNC facilitates location control andchemical composition of the weld fillet. This procedurerequires close tolerances in the preparation of the joint.Therefore, the welding of dissimilar materials with laserbeams permits high-quality joints with small HAZ to beobtained. This process can be carried out at high speedsand easily automated [13].
The main objective of this investigation was to evaluatechanges in position of the incident laser beam, with respectto the joint, on the characteristics of the weld fillet, such as,its geometry, depth of penetration, formation of cracks andpores. Alloying element distribution along the cross-sectionof the weld and mechanical properties of the weld,determined from microhardness and tensile tests were alsomeasured and correlated to the beam position.
2. Experimental procedure
Welding was carried out with the aid of a pulsed Nd:YAGlaser, homemade, with pulse energy of up to 10 J, repetitionrate of up to 500Hz, average power of 100W, peak power of3 kW and pulse duration from 0.2 up to 10ms.
The laser beam was focused at a position 3mm below thesurface of the material and the following parameters wereused in the experiments: energy (E) ¼ 6.0 J, average power(Pm) ¼ 84W, pulse duration (tp) ¼ 7ms and pulse fre-quency (f) ¼ 14Hz. The weld fillets were prepared at awelding speed (v) ¼ 300mm/min and pulse overlaps ofapproximately 30%. Argon gas was used at a flow rate of10 l/min.
The materials subjected to laser welding were austeniticstainless steel AISI 304 and martensitic stainless steel AISI420. Table 1 presents the chemical compositions of the twosteels, which were obtained by wave dispersive X-rayfluorescence spectroscopy.
The base materials were cut to size of 20mm� 50mmfrom 0.8mm thick sheet. The steels were joined byautogenously welding from the top along of 50mm.
Table 1
Chemical composition of the materials
Ni (%) Cr (%) Fe (%) C (%) Mn (%)
AISI 304 8.9 18.4 71.2 1.06
AISI 420 0.13 13.0 86.2 0.17
The laser beam was positioned at the joint and moved0.1 and 0.2mm on either side. The specimens generated byvarying the laser beam position were identified as follows:LJ—beam along the joint; MO1 and MO2—beam moved0.1 and 0.2mm in the direction of AISI 420 steel,respectively; A01 and A02—beam moved 0.1 and 0.2mmin the direction of AISI 304 steel, respectively.The joints were initially examined in an optical micro-
scope. The cross-sections of the weld fillets were examinedto determine its geometry, the depth of penetration and forcracks in the HAZ as well as the weld zone. The geometryand cross-sectional dimensions of the weld helped define itsaverage area. With this area, and the position of the laserbeam with respect to the joint, the average wt% of themain chemical elements (Cr, Ni, Fe) of the two alloys in theweld zone could be predicted.The cross-sectional microstructures of the joints were
observed in a scanning electron microscope. Energydispersive spectroscopic measurements were carried outalong the cross-section and at a depth of approximately0.3mm and at intervals of 0.06mm to determine thevariation, in wt%, of the main elements.The Schaeffler diagram was used as a tool to make
consistent correlations between the measured data [9]. Withthis diagram, the measured and estimated data were comparedand the microstructure in the weld regions, obtained under thevarying conditions, could be visualized. The diagram, shownlater in Fig. 7, has a small triangular region in the center whereferrite and martensite are the expected microstructures. Thisarea defines the region that renders defect-free welds.To evaluate the mechanical properties, Vickers micro-
hardness tests were carried out along the cross-section witha 40 g load, at a depth of 0.3mm and at 0.07mm intervals.This parameter was measured in the weld fillet and in theHAZ with the aid of an instrumented microhardness tester.The tensile test was carried out to complete the evaluation
and was based on the MB-4 method of ABNT (TechnicalStandards of the Brazilian Association). Three tensile testspecimens were prepared for each type of joint. In all thetensile tests, the maximum load, the load at yield anddeformation were measured. The tensile tests were carried outin a Universal testing machine with cross-head displacementrate of 5mm/min and sampling rate of 10 points per second.
3. Results
Optical micrographs of the different weld cross-sectionsare shown in Figs. 1–5.
Si (%) S (%) P (%) Mo (%) N2 (%) Cu (%)
0.34 0.03 0.05 0.05
0.46 0.04 0.02
ARTICLE IN PRESS
0.4 0.6 0.8 1.0 1.2 1.4 1.6
0
10
20
30
40
50
60
70
80
90
100L
Weld Zone AISI 420AISI 304
J
We
igh
t %
of e
lem
en
ts [%
]
Position along cross section [mm]
CrFeNi
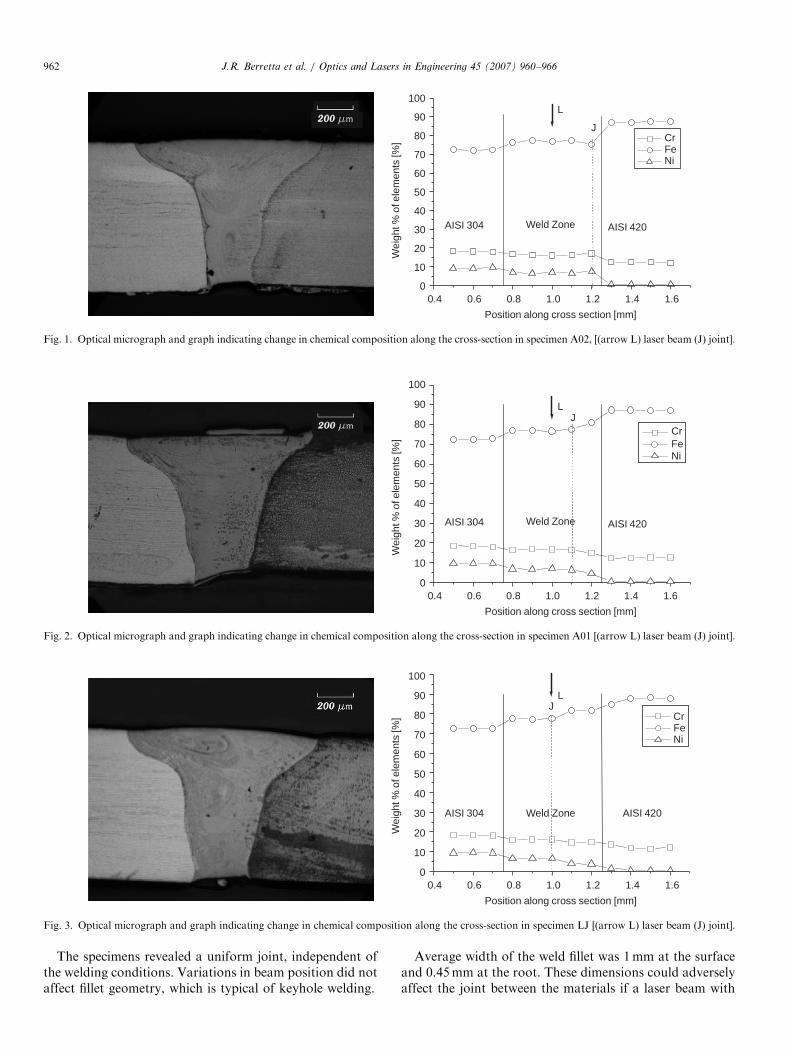
Fig. 1. Optical micrograph and graph indicating change in chemical composition along the cross-section in specimen A02, [(arrow L) laser beam (J) joint].
0.4 0.6 0.8 1.0 1.2 1.4 1.6
0
10
20
30
40
50
60
70
80
90
100
L
Weld Zone AISI 420
Cr
AISI 304
J
We
igh
t %
of e
lem
en
ts [%
]
Position along cross section [mm]
FFNi
Cr
Fe
Ni
Fig. 2. Optical micrograph and graph indicating change in chemical composition along the cross-section in specimen A01 [(arrow L) laser beam (J) joint].
0.4 0.6 0.8 1.0 1.2 1.4 1.6
0
10
20
30
40
50
60
70
80
90
100
L
Weld Zone AISI 420AISI 304
J
We
igh
t %
of e
lem
en
ts [%
]
Position along cross section [mm]
CrFeNi
Fig. 3. Optical micrograph and graph indicating change in chemical composition along the cross-section in specimen LJ [(arrow L) laser beam (J) joint].
J.R. Berretta et al. / Optics and Lasers in Engineering 45 (2007) 960–966962
The specimens revealed a uniform joint, independent ofthe welding conditions. Variations in beam position did notaffect fillet geometry, which is typical of keyhole welding.
Average width of the weld fillet was 1mm at the surfaceand 0.45mm at the root. These dimensions could adverselyaffect the joint between the materials if a laser beam with

ARTICLE IN PRESS
0.4 0.6 0.8 1.0 1.2 1.4 1.6
0
10
20
30
40
50
60
70
80
90
100
L
Weld Zone AISI 420AISI 304
J
We
igh
t %
of e
lem
en
ts [%
]
Position along cross section [mm]
CrFeNi
Fig. 4. Optical micrograph and graph indicating change in chemical composition along the cross-section in specimen M01 [(arrow L) laser beam (J) joint].
0.4 0.6 0.8 1.0 1.2 1.4 1.6
0
10
20
30
40
50
60
70
80
90
100
L
Weld Zone AISI 420AISI 304
JW
eig
ht %
of e
lem
en
ts [%
]
Position along cross section [mm]
CrFeNi
Fig. 5. Optical micrograph and graph indicating change in chemical composition along the cross-section in specimen M02 [(arrow L) laser beam (J) joint].
Fig. 6. Details of a typical weld zone obtained by the laser welding process, molten zone and base material (left) weld zone (right).
J.R. Berretta et al. / Optics and Lasers in Engineering 45 (2007) 960–966 963
shifts of 0.2mm with respect to the joint is used or byvariations in the welding process.
Cracks were not observed in the weld zone and in theHAZ. Pores, formed by keyhole collapse during welding
were also not observed in the cross-sections that wereexamined.The graphs in Figs. 1–5 show the wt% distribution of the
main elements (Cr, Ni, Fe) along the weld cross-section. It

ARTICLE IN PRESSJ.R. Berretta et al. / Optics and Lasers in Engineering 45 (2007) 960–966964
can be observed that the elemental distribution in the weldzone is homogeneous for all laser beam positions.
The scanning electron microscopic observations revealeda fine grained microstructure, and basically dendritic in theweld zone (Fig. 6). This type of microstructure isconsequent to high cooling rates, typical of the laserwelding process [10].
The wt% of the main chemical elements (Cr, Ni, Fe) inthe fillet cross-section were obtained by energy dispersivespectroscopy. These measurements enabled the averagewt% values of the main chemical elements to be estimated.These values, shown in Table 2, suggest that the laser beamposition with respect to the joint influenced the distributionof these elements, in wt%, in the weld zone.
In the Schaeffler diagram (Fig. 7) it can be seen that theestimated points formed a straight segment between thepoints of the base materials, foreseen in applications wherethe materials are dissimilar.
The Cr and Ni equivalent values are located in a regionof the Schaeffler diagram with the least probability ofdefects in the weld fillet. It can also be seen that thewelding, carried out with laser beam shifting in thedirection of AISI 420 steel, facilitates the formation of amicrostructure with the martensitic phase.
Table 2
EDX measured average wt% values of the main chemical elements in the
laser weld fillet as a function of the beam position with respect to the joint
Specimen Ni (wt%) Cr (wt%) Fe (wt%)
A02 6.9570.45 16.1870.44 76.6770.88
AO1 6.0770.29 16.1270.18 77.8070.41
LJ 5.3371.46 15.5370.78 79.1372.22
M01 3.2970.60 14.5170.49 82.2071.07
M02 2.4270.75 13.4770.66 84.1171.40
Fig. 7. Schaeffler diagram showing the average wt% points of the main
chemical elements in the laser weld fillet. (circle) Foreseen and (square)
measured by EDX, as a function of the beam position with respect to the
joint.
Fig. 8 shows the microhardness profiles. The maximumhardness value is located in the HAZ of AISI 420 steel, andthis was observed for all incident laser beam positions.It can be seen, depending on the extent of laser beam
shift from the AISI 420 steel in the direction of AISI 304steel, that there is a gradual reduction in hardness alongthe cross-section of the weld zone. When the beam isshifted in the direction of AISI 420 steel, the weld zonecontains a large amount of martensite, which reduces tovery low values as the beam moves towards AISI 304 steel.The data obtained were in accord with the Schaefflerdiagram.Table 3 shows the tensile test results and welding
efficiency. The latter is defined as the quotient betweenmaximum load withstood by the welded material and themaximum load withstood by the base material. Themaximum load of the base material was taken to be thatof AISI 420 steel, as its tensile strength is lower than that ofAISI 304 steel.The efficiency of the weld can attain a maximum value of
100%. This value indicates correct adjustment of theprocess parameters and no material loss in autogenouslaser welding. From Table 3 it can be seen that specimen LJ(with the beam on the joint) parameters furnish maximum
0.4 0.6 0.8 1.0 1.2 1.4 1.6
0
100
200
300
400
500
600
700
AISI420Weld ZoneAISI 304
Mic
roh
ard
ne
ss H
v4
0 [K
gf/
mm
2]
Position along cross section [mm]
A02
A01
LJ
M01
M02
Fig. 8. Vickers microhardness profile along the cross-section of the fillet as
a function of laser beam incidence with respect to the joint.
Table 3
Tensile test results
Specimen Maximum load
(kgf)
Load at yield
(kgf)
Deformation
(%)
Welding
efficiency (%)
AISI 304 687.971.2 281.078.0 89.671.5
AISI 420 679.672.8 428.7711.3 24.870.8
A02 152.974.4 — 0.5970.07 22.570.6
AO1 414.8717.1 283.472.2 6.370.9 61.072.5
LJ 679.571.9 295.371.6 50.570.3 99.970.1
M01 598.6712.0 291.470.4 24.372.1 88.171.8
M02 326.5712.9 285.470.8 2.270.4 48.071.9

ARTICLE IN PRESSJ.R. Berretta et al. / Optics and Lasers in Engineering 45 (2007) 960–966 965
welding efficiency. Fig. 9 shows specimen LJ having failedbeyond the weld region.
Fig. 10 shows the surface fractured resulting from thetensile tests of the samples (A02, M02, A01 and M01). Allthese samples ruptured in the fillet weld. It is observed, inall of them, imperfect penetration generating areas of nowelded part at the joint bottom. This fact is explained bythe low energy of the pulse and the consequent smalldimension of the fusion zone. Like this, when moving the
Fig. 9. Tensile test specimen LJ.
Fig. 10. Surface fractured resulting from the tensile
laser beam in relation to joint with the overlap ratio of30%, the welding efficiency was committed (Table 3).
4. Conclusions
Joints obtained under all the welding conditions wereuniform. Variations in beam position did not influenceweld fillet geometry, which is typical of keyhole welding.The position of the laser beam with respect to the joint
influenced the wt% of the main chemical elements (Cr, Ni,Fe) in the weld zone but did not interfere with thehomogeneity of the elements in the weld zone.The weld zone revealed a fine microstructure and was
basically dendritic, due to the high cooling rate, and this ischaracteristic of the laser welding process.Positioning of the laser beam on the joint or its shift in
the direction of AISI 304 steel favors the joint. When thelaser beam is shifted in the direction of AISI 420 steel, thestructure contains martensite, as foreseen.The HAZ of AISI 420 steel, for any incident laser beam
position had the highest microhardness value.Depending on the extent of shift of the laser beam
position, from the AISI 420 steel to AISI 304 steel, agradual reduction in hardness along the cross-section of theweld zone was observed.
tests of the samples (A02, M02, A01 and M01).

ARTICLE IN PRESSJ.R. Berretta et al. / Optics and Lasers in Engineering 45 (2007) 960–966966
The specimen LJ attained the maximum weldingefficiency. In the tensile test, fracture occurred outside theweld region.
The laser welding technique for dissimilar materials is apromising technique and could compete in the future withother methods that are well established and commercially used.
Acknowledgments
The authors gratefully acknowledge the financial sup-port of CAPES and CNPq.
References
[1] Karagiannis L, Chryssolouris G. Nd:YAG laser welding—an over-
view. In: Third GR-I international conference on new laser
technologies and applications. Proc SPIE 2003;5131:260–4.
[2] Katayama S. Laser welding of aluminium alloys and dissimilar
metals. Weld Inter 2004;18(8):618–25.
[3] Zhang L, Fontana G. Autogenous laser welding of stainless steel to
free-cutting steel for the manufacture of hydraulic valves. J Mater
Process Technol 1998;74:174–82.
[4] Mackwood AP, Crafer RC. Thermal modeling of laser welding and
related processes: a literature review. Opt Laser Technol 2005;37:99–115.
[5] Kaiser E, Schafer P. Pulse sharping optimizes the quality of seam-
and spotwelds. In: Lasers in manufacturing 2005—proceeding of the
third international WLT—conference on lasers in manufacturing,
2005. p. 695–8.
[6] Zhang L, Gobbi SL, Richter KH. Autogenous welding of Hastelloy
X to Mar-M 247 by laser. J Mater Process Technol 1997;70:
285–92.
[7] Sun Z, Kuo M. Bridging the joint gap with wire feed laser welding. J
Mater Process Technol 1999;87:213–22.
[8] Petretis Br, Balciuniene M. Peculiarities of laser welding of metals.
Lithuaniam J Phys 2005;45(1):59–69.
[9] Metals Handbook, Welding, Brazing and Soldering, ASM, (9a ed.);
vol. 6, 1993. ISBN 0-87170-007.
[10] Kane SF. Welding consumable development for a criogenic applica-
tion. Welding Research Supplement, 1999. p. 292s–300s.
[11] Jokiel M, Durr U, Holtz R, Liebers R. Laser welding of dissimilar
metals: strategies with pulsed Nd:YAG lasers. In: Lasers in
manufacturing 2005—proceedings of the third international WLT-
conference on lasers in manufacturing, Munich, Germany, June 2005.
p. 631–6.
[12] Berretta JR, Rossi W. Laser welding of dissimilar metals with pulsed
Nd:YAG laser. Doctors thesis, Instituro de Pesquisas Energeticas e
Nucleares, Universidade de Sao Paulo, 2005.
[13] Lima MSF, Rossi W, Berretta JR. Joining titanium and steel using
laser beam welding. In: 38th CIRP international seminar on
manufacturing systems, 2005.


![Radiation defects in Nd:YAG single crystals and their influence on the optical properties and optical output of Nd:YAG laser [in Polish]](https://img.dokumen.tips/doc/110x75/635f22ad095e4caf22068fde/radiation-defects-in-ndyag-single-crystals-and-their-influence-on-the-optical-properties.jpg)