Embed Size (px)
Citation preview
HCIR 2010 Proceedings of the Fourth
Workshop on Human-Computer Interaction and Information Retrieval
http://www.hcir2010.org
Rutgers University, New Brunswick, NJ USA
August 22, 2010
Workshop Chairs:
Bill Kules, The Catholic University of America Daniel Tunkelang, Google
Ryen White, Microsoft Research
Program Chair:
Rob Capra, University of North Carolina at Chapel Hill
Local Arrangements Chair:
Catherine L. Smith, Kent State University
Supporters:
Linguistic Data Consortium

ii
Fourth Workshop on Human-Computer Interaction and Information Retrieval
When we held the first HCIR workshop in 2007, the idea of uniting the fields of Human-Computer Interaction (HCI) and Information Retrieval (IR) was a battle cry to move this research area from the fringes of computer science into the mainstream. Three years later, as we organize this fourth HCIR workshop on the heels of a highly successful HCIR 2009 in Washington, DC we see some of the fruits of our labor. Topics like interactive information retrieval and exploratory search are receiving increasing attention, among both academic researchers and industry practitioners.
But we have only begun this journey. Most of the work in these two fields still stays within their silos, and the efforts to realize more sophisticated models, tools, and evaluation metrics for information seeking are still in their early stages.
In this year's one-day workshop, we will continue to explore the advances each domain
can bring to the other.
New this year, we also ran the HCIR Challenge. Six teams participated. The aim of the
challenge was to encourage researchers and practitioners to build and demonstrate
effective information access systems. Challenge participants had no-cost access to a
large collection of almost two million newspaper articles with rich metadata from The
New York Times, generously provided for use in the challenge by the Linguistic Data
Consortium. The focus of participation was on building systems (or using existing ones)
to help people search the collection interactively. Entries were be evaluated by the
workshop organizers based on HCIR criteria (specifically: effectiveness, efficiency,
control, transparency, guidance, fun) and will also be judged by workshop attendees.
iii
Table of Contents
Submissions Selected for Oral Presentation
VISTO: for Web Information Gathering and Organization ……………………….....7
Anwar Alhenshiri, Carolyn Watters, and Michael Shepherd (Dalhousie University)
Time-based Exploration of News Archives …………………………………………. 12
Omar Alonso (Microsoft Corporation), Klaus Berberich (Max-Planck Institute for
Informatics), Srikanta Bedathur (Max-Planck Institute for Informatics),and Gerhard
Weikum (Max-Planck Institute for Informatics)
Combining Computational Analyses and Interactive Visualization to Enhance
Information Retrieval ……………………………………………………………………. 16
Carsten Goerg, Jaeyeon Kihm, Jaegul Choo, Zhicheng Liu, Sivasailam Muthiah,
Haesun Park, and John Stasko (Georgia Institute of Technology)
Impact of Retrieval Precision on Perceived Difficulty and
Other User Measures ……………………………………………………………………. 20
Mark Smucker and Chandra Prakash Jethani (University of Waterloo)
Exploratory Searching As Conceptual Exploration ……………………………….. 24
Pertti Vakkari (University of Tampere)
Casual-leisure Searching: The Exploratory Search Scenarios that Break
our Current Models ……………………………………………………………………… 28
Max L. Wilson (Swansea University) and David Elsweiler (University of Erlangen)
Challenge Reports
Search for Journalists: New York Times Challenge Report ..…………………... 32
Corrado Boscarino, Arjen P. de Vries, and Wouter Alink
(Centrum Wiskunde and Informatica)
Exploring the New York Times Corpus with NewsClub …………………………. 37
Christian Kohlschütter (Leibniz Universität Hannover)
Searching Through Time in the New York Times ………………………….……… 41
Michael Matthews, Pancho Tolchinsky, Roi Blanco, Jordi Atserias, Peter Mika, and
Hugo Zaragoza (Yahoo! Labs)

iv
News Sync: Three Reasons to Visualize News Better …………………………… 45
V.G. Vinod Vydiswaran (University of Illinois),
Jeroen van den Eijkhof (University of Washington),
Raman Chandrasekar (Microsoft Research), Ann Paradiso (Microsoft Research),
and Jim St. George (Microsoft Research)
Custom Dimensions for Text Corpus Navigation ………………………………… 49
Vladimir Zelevinsky (Endeca Technologies)
A Retrieval System Based on Sentiment Analysis ……………………………….. 52
Wei Zheng and Hui Fang (University of Delaware)
Submissions Selected as Posters
Research Papers
Improving Web Search for Information Gathering: Visualization in Effect .…. 55
Anwar Alhenshiri, Carolyn Watters, and Michael Shepherd (Dalhousie University)
User-oriented and Eye-Tracking-based Evaluation of an Interactive
Search System …………………………………………………………………………... 59
Thomas Beckers and Norbert Fuhr (University of Duisberg-Essen)
Exploring Combinations of Sources for Interaction Features for
Document Re-ranking……………………................................................................ 63
Emanuele Di Buccio (University of Padua), Massimo Melucci (University of Padua),
and Dawei Song (The Robert Gordon University)
Extracting Expertise to Facilitate Exploratory Search and Information
Discovery: Combining Information Retrieval Techniques with a
Computational Cognitive Model ……………………………………………………… 67
Wai-Tat Fu and Wei Dong (University of Illinois at Urbana-Champaign)
An Architecture for Real-time Textual Query Term Extraction from Images … 71
Cathal Hoare and Humphrey Sorensen (University College Cork)
Transaction Log Analysis of User Actions in a Faceted Library Catalog
Interface ………………………………………………………………………………….. 75
Bill Kules (The Catholic University of America), Robert Capra (University of North
Carolina at Chapel Hill), and Joseph Ryan (North Carolina State University Libraries)

v
Context in Health Information Retrieval: What and Where ……………………… 79
Carla Lopes and Cristina Ribeiro (University of Porto)
Tactics for Information Search in a Public and an Academic Library
Catalog with Faceted Interfaces ………………………………………………………85
Xi Niu and Bradley M. Hemminger (University of North Carolina at Chapel Hill)
Position Papers
Understanding Information Seeking in the Patent Domain and its
Impact on the Interface Design of IR Systems …………………………………..... 87
Daniela Becks, Matthias Görtz, and Christa Womser-Hacker
(University of Hildesheim)
Better Search Applications Through Domain Specific Context Descriptions . 91
Corrado Boscarino, Arjen P. de Vries, and Jacco van Ossenbruggen
(Centrum Wiskunde and Informatica)
Layered, Adaptive Results: Interaction Concepts for Large, Heterogeneous
Data Sets………………………………………………………………………………….. 95
Duane Degler (Design for Context)
Revisiting Exploratory Search from the HCI Perspective ……………………….. 99
Abdigani Diriye (University College London), Max L. Wilson (Swansea University),
Ann Blandford (University College London), and
Anastasios Tombros (Queen Mary University London)
Supporting Task with Information Appliances: Taxonomy of Needs…………103
Sarah Gilbert, Lori McCay-Peet, and Elaine Toms (Dalhousie University)
A Proposal for Measuring and Implementing Group’s Affective Relevance
in Collaborative Information Seeking………………………………………………. 107
Roberto González-Ibáñez and Chirag Shah (Rutgers University)
Evaluation of Music Information Retrieval: Towards a User-Centered
Approach ………………………………………………………………….................... 111
Xiao Hu (University of Illinois at Urbana Champaign) and
Jingjing Liu (Rutgers University)
vi
Information Derivatives: A New Way to Examine Information Propagation ... 115
Chirag Shah (Rutgers University)
Implicit Factors in Networked Information Feeds ………….............................. 118
Fred Stutzman (University of North Carolina at Chapel Hill)
Improving the Online News Experience …………………………………………... 122
V. G. Vinod Vydiswaran (University of Illinois) and
Raman Chandrasekar (Microsoft Research)
Breaking Down the Assumptions of Faceted Search…………………………… 126
Vladimir Zelevinsky (Endeca Technologies)
A Survey of User Interfaces in Content-based Image Search Engines
on the Web ……………………………………………………………………………… 129
Danyang Zhang (The City University of New York)
VISTO for Web Information Gathering and Organization Anwar Alhenshiri Dalhousie University
6050 University Avenue Halifax, NS, Canada +1 (902) 494-2093
Michael Shepherd Dalhousie University
6050 University Avenue Halifax, NS, Canada +1 (902) 494-1199
Carolyn Watters Dalhousie University
6050 University Avenue Halifax, NS, Canada +1 (902) 494-6723
ABSTRACT
This paper presents a VIsual Search Task Organizer (VISTO).
VISTO is a visual tool with effective information gathering task
capabilities for the Web. In this prototype system, the task of Web
information gathering is taken into consideration with respect to
how user locate information for the task, organize task
information, preserve and re-find task information, and compare
information for effective reasoning and decision making. VISTO
was designed and built based on recommendations from previous
studies in a larger research. The prototype is ready to be evaluated
in the next step of the research.
Categories and Subject Descriptors
H.3.3 [Information Search and Retrieval]: Clustering, Search
Process.
H.1.2 [User/Machine Systems]: Human Factors
H.5.2 [User Interfaces]: User Centered Design.
General Terms
Human Factors, Theory, Measurement.
Keywords
Information retrieval, Web search, user tasks, Web information
gathering, Web information organization and management
1. INTRODUCTION Web information retrieval has been studied in the light of request-
response for a relatively significant period of time. The user
submits a query trying to convey their information need to the
Web and in return, they receive a response from the search engine
in the form of document hits. In many occasions, a search activity
may require that the user continues interacting with the search
engine to achieve a higher-level Web task [15]. Research has
studied user tasks in order to identify a task framework that would
help with understanding user interactions with the Web. Web
tasks have been classified into fact finding, navigation,
performing a transaction, and information gathering [7, 14]. The
latter type accounts for a large portion of the overall tasks on the
Web, representing between 51.7% [7] and 61.5% [19].
A Web information gathering task is a composite of
subtasks/activities users perform while interacting with the Web
for accomplishing a goal described in the task. User activities
during Web information gathering may involve finding sources of
Web information (Web documents), searching for information on
the sources located for the task, finding related information to the
already located sources and information, comparing information
for reasoning and decision making, organizing task information,
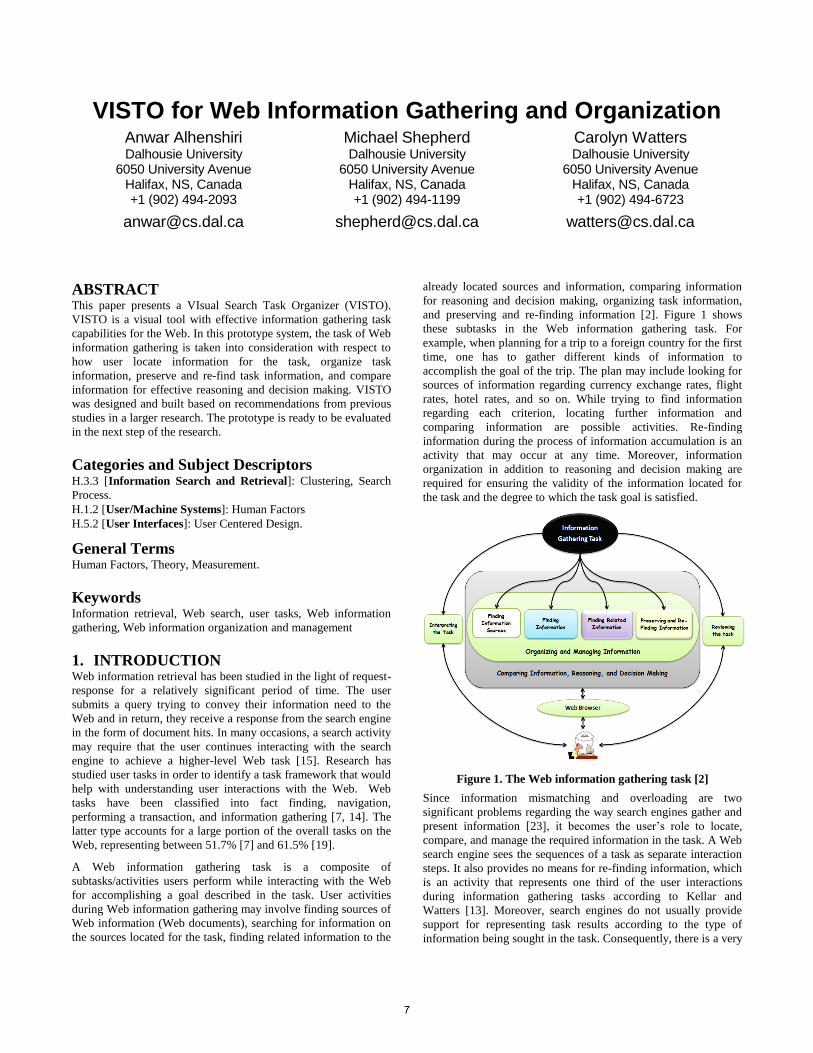
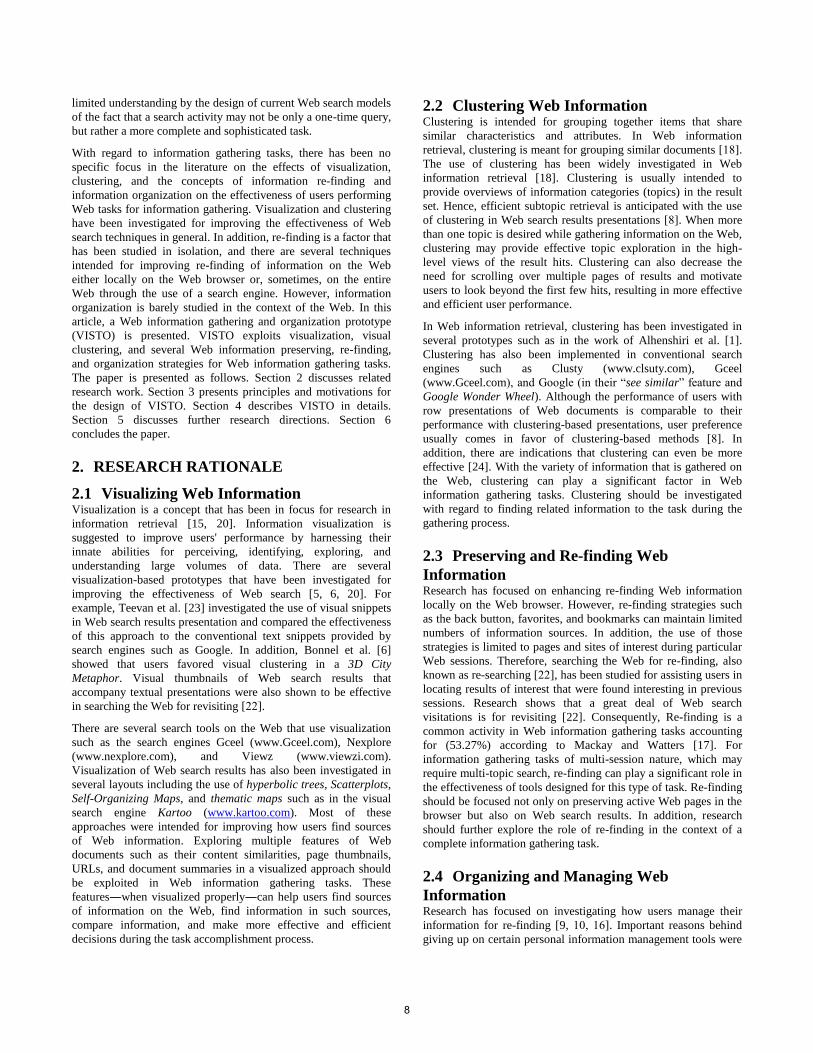
and preserving and re-finding information [2]. Figure 1 shows
these subtasks in the Web information gathering task. For
example, when planning for a trip to a foreign country for the first
time, one has to gather different kinds of information to
accomplish the goal of the trip. The plan may include looking for
sources of information regarding currency exchange rates, flight
rates, hotel rates, and so on. While trying to find information
regarding each criterion, locating further information and
comparing information are possible activities. Re-finding
information during the process of information accumulation is an
activity that may occur at any time. Moreover, information
organization in addition to reasoning and decision making are
required for ensuring the validity of the information located for
the task and the degree to which the task goal is satisfied.
Figure 1. The Web information gathering task [2]
Since information mismatching and overloading are two
significant problems regarding the way search engines gather and
present information [23], it becomes the user’s role to locate,
compare, and manage the required information in the task. A Web
search engine sees the sequences of a task as separate interaction
steps. It also provides no means for re-finding information, which
is an activity that represents one third of the user interactions
during information gathering tasks according to Kellar and
Watters [13]. Moreover, search engines do not usually provide
support for representing task results according to the type of
information being sought in the task. Consequently, there is a very
7
limited understanding by the design of current Web search models
of the fact that a search activity may not be only a one-time query,
but rather a more complete and sophisticated task.
With regard to information gathering tasks, there has been no
specific focus in the literature on the effects of visualization,
clustering, and the concepts of information re-finding and
information organization on the effectiveness of users performing
Web tasks for information gathering. Visualization and clustering
have been investigated for improving the effectiveness of Web
search techniques in general. In addition, re-finding is a factor that
has been studied in isolation, and there are several techniques
intended for improving re-finding of information on the Web
either locally on the Web browser or, sometimes, on the entire
Web through the use of a search engine. However, information
organization is barely studied in the context of the Web. In this
article, a Web information gathering and organization prototype
(VISTO) is presented. VISTO exploits visualization, visual
clustering, and several Web information preserving, re-finding,
and organization strategies for Web information gathering tasks.
The paper is presented as follows. Section 2 discusses related
research work. Section 3 presents principles and motivations for
the design of VISTO. Section 4 describes VISTO in details.
Section 5 discusses further research directions. Section 6
concludes the paper.
2. RESEARCH RATIONALE
2.1 Visualizing Web Information Visualization is a concept that has been in focus for research in
information retrieval [15, 20]. Information visualization is
suggested to improve users' performance by harnessing their
innate abilities for perceiving, identifying, exploring, and
understanding large volumes of data. There are several
visualization-based prototypes that have been investigated for
improving the effectiveness of Web search [5, 6, 20]. For
example, Teevan et al. [23] investigated the use of visual snippets
in Web search results presentation and compared the effectiveness
of this approach to the conventional text snippets provided by
search engines such as Google. In addition, Bonnel et al. [6]
showed that users favored visual clustering in a 3D City
Metaphor. Visual thumbnails of Web search results that
accompany textual presentations were also shown to be effective
in searching the Web for revisiting [22].
There are several search tools on the Web that use visualization
such as the search engines Gceel (www.Gceel.com), Nexplore
(www.nexplore.com), and Viewz (www.viewzi.com).
Visualization of Web search results has also been investigated in
several layouts including the use of hyperbolic trees, Scatterplots,
Self-Organizing Maps, and thematic maps such as in the visual
search engine Kartoo (www.kartoo.com). Most of these
approaches were intended for improving how users find sources
of Web information. Exploring multiple features of Web
documents such as their content similarities, page thumbnails,
URLs, and document summaries in a visualized approach should
be exploited in Web information gathering tasks. These
features―when visualized properly―can help users find sources
of information on the Web, find information in such sources,
compare information, and make more effective and efficient
decisions during the task accomplishment process.
2.2 Clustering Web Information Clustering is intended for grouping together items that share
similar characteristics and attributes. In Web information
retrieval, clustering is meant for grouping similar documents [18].
The use of clustering has been widely investigated in Web
information retrieval [18]. Clustering is usually intended to
provide overviews of information categories (topics) in the result
set. Hence, efficient subtopic retrieval is anticipated with the use
of clustering in Web search results presentations [8]. When more
than one topic is desired while gathering information on the Web,
clustering may provide effective topic exploration in the high-
level views of the result hits. Clustering can also decrease the
need for scrolling over multiple pages of results and motivate
users to look beyond the first few hits, resulting in more effective
and efficient user performance.
In Web information retrieval, clustering has been investigated in
several prototypes such as in the work of Alhenshiri et al. [1].
Clustering has also been implemented in conventional search
engines such as Clusty (www.clsuty.com), Gceel
(www.Gceel.com), and Google (in their “see similar” feature and
Google Wonder Wheel). Although the performance of users with
row presentations of Web documents is comparable to their
performance with clustering-based presentations, user preference
usually comes in favor of clustering-based methods [8]. In
addition, there are indications that clustering can even be more
effective [24]. With the variety of information that is gathered on
the Web, clustering can play a significant factor in Web
information gathering tasks. Clustering should be investigated
with regard to finding related information to the task during the
gathering process.
2.3 Preserving and Re-finding Web
Information Research has focused on enhancing re-finding Web information
locally on the Web browser. However, re-finding strategies such
as the back button, favorites, and bookmarks can maintain limited
numbers of information sources. In addition, the use of those
strategies is limited to pages and sites of interest during particular
Web sessions. Therefore, searching the Web for re-finding, also
known as re-searching [22], has been studied for assisting users in
locating results of interest that were found interesting in previous
sessions. Research shows that a great deal of Web search
visitations is for revisiting [22]. Consequently, Re-finding is a
common activity in Web information gathering tasks accounting
for (53.27%) according to Mackay and Watters [17]. For
information gathering tasks of multi-session nature, which may
require multi-topic search, re-finding can play a significant role in
the effectiveness of tools designed for this type of task. Re-finding
should be focused not only on preserving active Web pages in the
browser but also on Web search results. In addition, research
should further explore the role of re-finding in the context of a
complete information gathering task.
2.4 Organizing and Managing Web
Information Research has focused on investigating how users manage their
information for re-finding [9, 10, 16]. Important reasons behind
giving up on certain personal information management tools were
8
discussed in the work of Jones et al. [11]. Strategies users follow
to manage Web information in order to be able to relocate and
reuse previously found information are discussed in the work of
Jones et al. [10]. Their work shows that users—while gathering
Web information—follow different preserving strategies to re-find
and compare information. Most users gather information over
multiple sessions [17], which indicates the need for management
strategies for preserving and re-finding such information for
reuse. The variety of finding, re-finding, organizing, and
management strategies and approaches users follow while seeking
and gathering Web information can be related to the fact that
current Web tools lack important reminding, integration, and
organization schemes.
Research has had little consideration to factors that would
improve how Web users collect, manage, compare, and organize
information for gathering tasks. On the Web, research has only
considered the case of managing and organizing information for
re-finding [10]. How users organize and manage information
during Web information gathering has had little consideration.
Since Web information gathering tasks may take several sessions,
involve looking at information from different sources, and require
comparing information that may belong to varied topics,
investigating organizational and management strategies users
follow on the Web is necessary.
3. VISTO Principles and Motivations To further exploit the concepts of information visualization, visual
clustering, re-finding, and organization, VISTO was designed.
The prototype offers the following features for supporting
information gathering tasks:
a. Effective visualized search.
b. Intuitive visualized clustering.
c. Effective Web information organization.
d. Effective preserving and re-finding strategies.
VISTO was designed based on the recommendations drawn from
the studies in [1, 2, 3, 10, 23]. Research has studied visualization
and clustering for improving the effectiveness of general Web
search tasks. In addition, re-finding has been investigated for
providing effective techniques that allow users to relocate
previously preserved Web documents. What is lacking in research
regarding Web information gathering tasks is threefold. First,
visualization and clustering should be investigated for improving
the process of accomplishing the whole task. VISTO attempts to
utilize visualization and clustering to allow users to find,
compare, and relate information to the already located sources of
information more effectively.
Second, re-finding has been studied only for permitting users to
effectively and efficiently re-find Web documents that were
preserved in previous sessions. VISTO attempts to create a more
effective storing and re-finding environment. This is done by
allowing users to store individual documents as well as complete
sessions. In addition, re-finding is done not only by searching a
list of documents, but also by using keyword search to re-find
individual documents, sessions, and whole tasks previously
preserved by the user. Third, Information organization has been
studied in the desktop environment for personal information
management. The Web has had little consideration except in the
case of information management for re-finding [10].VISTO takes
a step further and attempts to provide effective organizational
schemes for information during information gathering tasks.
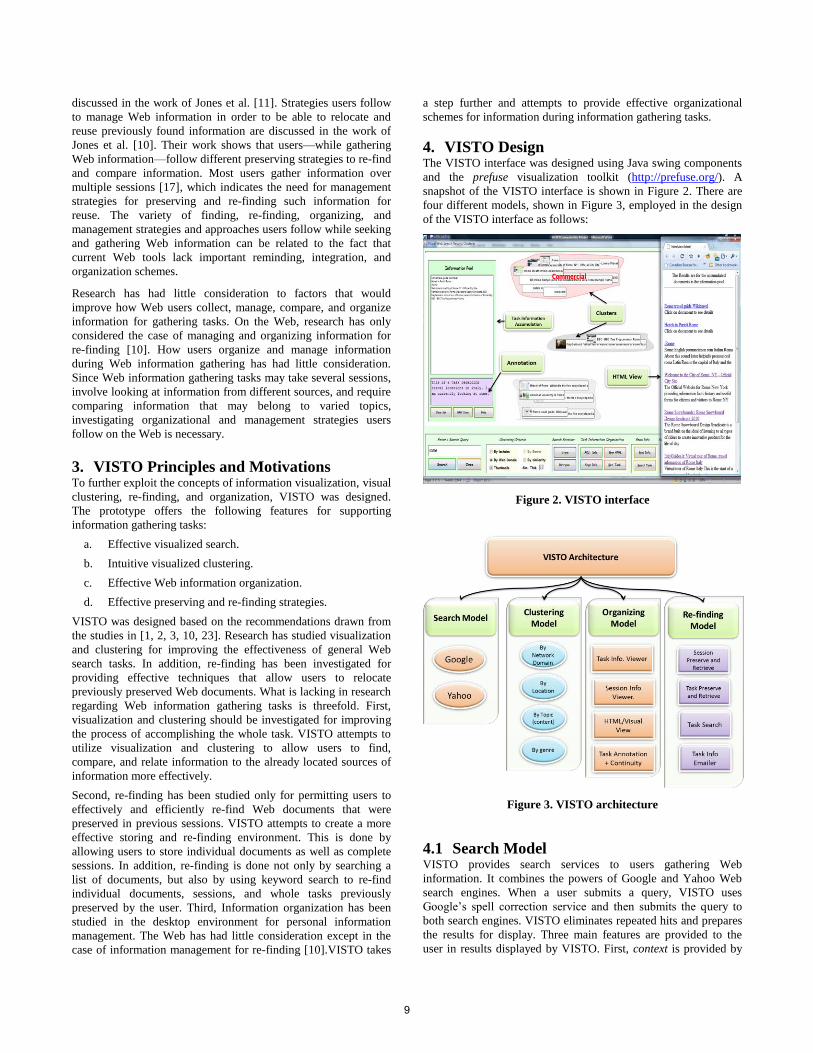
4. VISTO Design The VISTO interface was designed using Java swing components
and the prefuse visualization toolkit (http://prefuse.org/). A
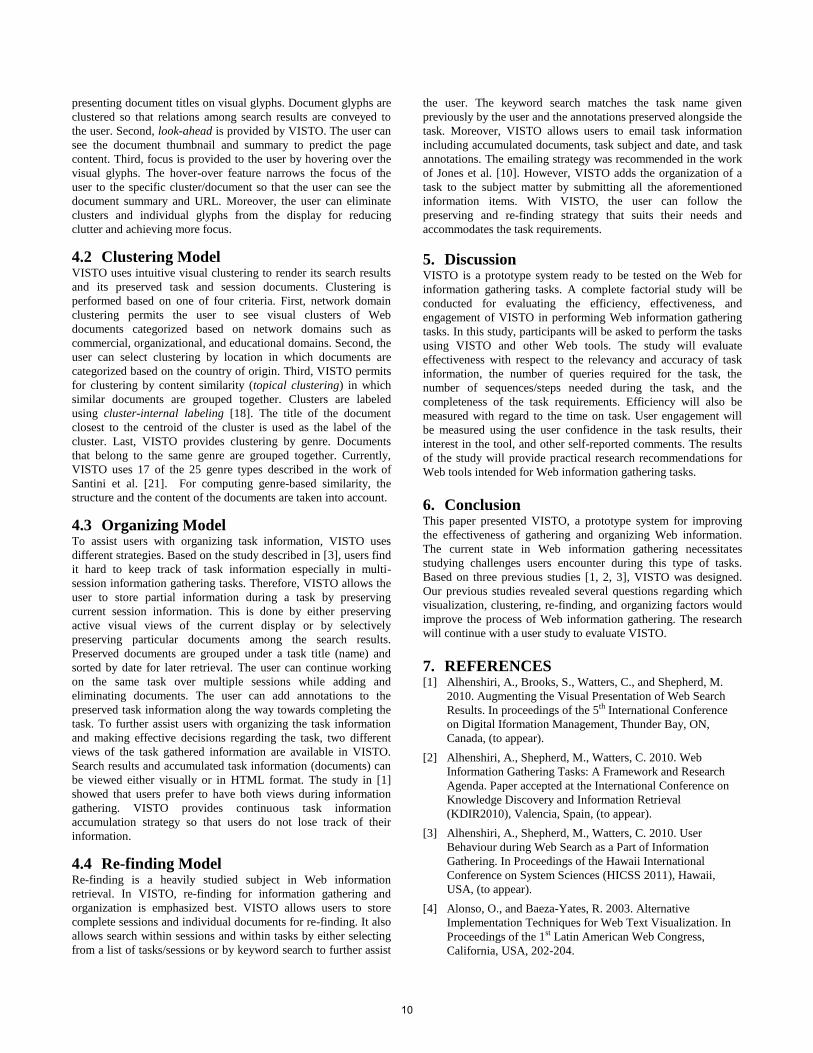
snapshot of the VISTO interface is shown in Figure 2. There are
four different models, shown in Figure 3, employed in the design
of the VISTO interface as follows:
Figure 2. VISTO interface
Figure 3. VISTO architecture
4.1 Search Model VISTO provides search services to users gathering Web
information. It combines the powers of Google and Yahoo Web
search engines. When a user submits a query, VISTO uses
Google’s spell correction service and then submits the query to
both search engines. VISTO eliminates repeated hits and prepares
the results for display. Three main features are provided to the
user in results displayed by VISTO. First, context is provided by
9
presenting document titles on visual glyphs. Document glyphs are
clustered so that relations among search results are conveyed to
the user. Second, look-ahead is provided by VISTO. The user can
see the document thumbnail and summary to predict the page
content. Third, focus is provided to the user by hovering over the
visual glyphs. The hover-over feature narrows the focus of the
user to the specific cluster/document so that the user can see the
document summary and URL. Moreover, the user can eliminate
clusters and individual glyphs from the display for reducing
clutter and achieving more focus.
4.2 Clustering Model VISTO uses intuitive visual clustering to render its search results
and its preserved task and session documents. Clustering is
performed based on one of four criteria. First, network domain
clustering permits the user to see visual clusters of Web
documents categorized based on network domains such as
commercial, organizational, and educational domains. Second, the
user can select clustering by location in which documents are
categorized based on the country of origin. Third, VISTO permits
for clustering by content similarity (topical clustering) in which
similar documents are grouped together. Clusters are labeled
using cluster-internal labeling [18]. The title of the document
closest to the centroid of the cluster is used as the label of the
cluster. Last, VISTO provides clustering by genre. Documents
that belong to the same genre are grouped together. Currently,
VISTO uses 17 of the 25 genre types described in the work of
Santini et al. [21]. For computing genre-based similarity, the
structure and the content of the documents are taken into account.
4.3 Organizing Model To assist users with organizing task information, VISTO uses
different strategies. Based on the study described in [3], users find
it hard to keep track of task information especially in multi-
session information gathering tasks. Therefore, VISTO allows the
user to store partial information during a task by preserving
current session information. This is done by either preserving
active visual views of the current display or by selectively
preserving particular documents among the search results.
Preserved documents are grouped under a task title (name) and
sorted by date for later retrieval. The user can continue working
on the same task over multiple sessions while adding and
eliminating documents. The user can add annotations to the
preserved task information along the way towards completing the
task. To further assist users with organizing the task information
and making effective decisions regarding the task, two different
views of the task gathered information are available in VISTO.
Search results and accumulated task information (documents) can
be viewed either visually or in HTML format. The study in [1]
showed that users prefer to have both views during information
gathering. VISTO provides continuous task information
accumulation strategy so that users do not lose track of their
information.
4.4 Re-finding Model Re-finding is a heavily studied subject in Web information
retrieval. In VISTO, re-finding for information gathering and
organization is emphasized best. VISTO allows users to store
complete sessions and individual documents for re-finding. It also
allows search within sessions and within tasks by either selecting
from a list of tasks/sessions or by keyword search to further assist
the user. The keyword search matches the task name given
previously by the user and the annotations preserved alongside the
task. Moreover, VISTO allows users to email task information
including accumulated documents, task subject and date, and task
annotations. The emailing strategy was recommended in the work
of Jones et al. [10]. However, VISTO adds the organization of a
task to the subject matter by submitting all the aforementioned
information items. With VISTO, the user can follow the
preserving and re-finding strategy that suits their needs and
accommodates the task requirements.
5. Discussion VISTO is a prototype system ready to be tested on the Web for
information gathering tasks. A complete factorial study will be
conducted for evaluating the efficiency, effectiveness, and
engagement of VISTO in performing Web information gathering
tasks. In this study, participants will be asked to perform the tasks
using VISTO and other Web tools. The study will evaluate
effectiveness with respect to the relevancy and accuracy of task
information, the number of queries required for the task, the
number of sequences/steps needed during the task, and the
completeness of the task requirements. Efficiency will also be
measured with regard to the time on task. User engagement will
be measured using the user confidence in the task results, their
interest in the tool, and other self-reported comments. The results
of the study will provide practical research recommendations for
Web tools intended for Web information gathering tasks.
6. Conclusion This paper presented VISTO, a prototype system for improving
the effectiveness of gathering and organizing Web information.
The current state in Web information gathering necessitates
studying challenges users encounter during this type of tasks.
Based on three previous studies [1, 2, 3], VISTO was designed.
Our previous studies revealed several questions regarding which
visualization, clustering, re-finding, and organizing factors would
improve the process of Web information gathering. The research
will continue with a user study to evaluate VISTO.
7. REFERENCES [1] Alhenshiri, A., Brooks, S., Watters, C., and Shepherd, M.
2010. Augmenting the Visual Presentation of Web Search
Results. In proceedings of the 5th International Conference
on Digital Iformation Management, Thunder Bay, ON,
Canada, (to appear).
[2] Alhenshiri, A., Shepherd, M., Watters, C. 2010. Web
Information Gathering Tasks: A Framework and Research
Agenda. Paper accepted at the International Conference on
Knowledge Discovery and Information Retrieval
(KDIR2010), Valencia, Spain, (to appear).
[3] Alhenshiri, A., Shepherd, M., Watters, C. 2010. User
Behaviour during Web Search as a Part of Information
Gathering. In Proceedings of the Hawaii International
Conference on System Sciences (HICSS 2011), Hawaii,
USA, (to appear).
[4] Alonso, O., and Baeza-Yates, R. 2003. Alternative
Implementation Techniques for Web Text Visualization. In
Proceedings of the 1st Latin American Web Congress,
California, USA, 202-204.
10
[5] Bonnel, N., Cotarmanac’h A., and Morin, A. 2005. Meaning
Metaphor for Visualizing Search Results. In Proceedings of
the 9th International Conference on Information
Visualization, London, England, 467-472.
[6] Bonnel, N., Lemaire, V., Cotarmanac’h, A., and Morin, A.
2006. Effective Organization and Visualization of Web
Search Results. In Proceedings of the 24th IASTED
International Multi-Conference on Internet and Multimedia
Systems and Applications, Innsbruck, Austria.209-216.
[7] Broder, A. 2002. A Taxonomy of Web Search. ACM SIGIR
Forum, vol. 36, issue 2, 2-10.
[8] Carpineto, C., Osiński, S., Romano, G., and Weiss, D. 2009.
A Survey of Web Clustering Engines. ACM Computing
Surveys, vol. 41, issue 3, Article No. 17.
[9] Elsweiler, D., and Ruthven, I. 2007. Towards Task-based
Personal Information Management Evaluations. In
proceedings of the 30th Annual International ACM SIGIR
Conference on Research and Development in Information
Retrieval, Amsterdam, The Netherlands, 23-30.
[10] Jones, W., Bruce, H., and Dumais, S. 2003. How do People
Get Back to Information on the Web? How Can They Do It
Better? In Proceedings of the 9th IFIP TC13 International
Conference on Human-Computer Interaction, Zurich,
Switzerland.
[11] Jones, E., Bruce, H., Klasnja, P., and Jones, W. 2008. I Give
Up! Five Factors that Contribute to the Abandonment of
Information Management Strategies. In proceedings of the
68th Annual Meeting of the American Society for
Information Science and Technology, Columbus, OH, USA.
[12] Karim, J., Antonellis, I., Ganapathi, V., and Garcia-Molina,
H. 2009. A Dynamic Navigation Guide for Web Pages. In
CHI 2009.
[13] Kellar, M., and Watters, C. 2006. Using Web Browser
Interactions to Predict Task. In Proceedings of the 15th
International Conference on World Wide Web, Edinburgh,
Scotland, 843-844.
[14] Kellar, M., Watters, K., and Shepherd, M. 2007. A Field
Study Characterizing Web-based Information-Seeking Tasks.
Journal of the American Society for Information Science and
Technology, vol. 58, issue 7, 999-1018.
[15] Kules, W., Wilson, M. L., Schraefel, M. C., and
Shneiderman, B. 2008. From Keyword Search to
Exploration: How Result Visualization Aids Discovery on
the Web. Technical Report, School of Electronics and
Computer Science, University of Southampton.
[16] Mackay, B., Kellar, M., and Watters, C. 2005. An Evaluation
of Landmarks for Re-finding Information on the Web. In
Proceedings of the 2005 ACM Conference on Human
Factors in Computing Systems, Portland, Oregon, USA,
1609 - 1612.
[17] Mackey, B., and Watters, C. 2008. Exploring Multi-session
Web Tasks. In Proceedings of the 2008 ACM Conference on
Human Factors in Computing Systems, Florence, Italy, 4273-
4278.
[18] Manning, C. D., Raghavan, P., and Schütze, H. 2008.
Introduction to Information Retrieval. Cambridge University
Press.
[19] Rose, D., and Levinson, D. 2004. Understanding User Goals
in Web Search. In Proceedings of the 13th International
Conference on World Wide Web, New York, NY, USA, 13-
19.
[20] Suvanaphen, E., and Roberts, J. C. 2004. Textual Difference
Visualization of Multiple Search Results Utilizing Detail in
Context. Theory and Practice of Computer Graphics
Conference, Bournemouth, UK, 2-8.
[21] Santini, M. 2006. Interpreting Genre Evolution on the Web .
EACL 2006 Workshop, Trento, 32-40.
[22] Teevan, J. 2008. How People Recall, Recognize, and Reuse
Search Results. ACM Transactions on Information Systems,
vol. 26, issue 4. Article No. 19.
[23] Teevan, J., Cutrell, E., Fisher, D., Drucker, S. M., Ramos,
G., Andre, P., and Hu, C. 2009. Visual
Snippets: Summarizing Web Pages for Search and
Revisitation. In Proceedings of the 27th International
Conference on Human Factors in Computing Systems,
Boston, MA, USA, 2023-2032.
[24] Turetken, O., & Sharda, R. (2005). Clustering-based Visual
Interfaces for Presentation of Web Search Results: An
Imperical Investigation. Information Systems Frontier, 7(3),
273-297.
11
Time-Based Exploration of News Archives
Omar Alonso Klaus Berberich Srikanta Bedathur Gerhard WeikumMicrosoft Corp. Max-Planck Institute for Informatics
Mountain View, CA Saarbrücken, Germany
[email protected] {kberberi, bedathur, weikum}@mpi-inf.mpg.de
ABSTRACT
In this paper, we present NEAT, a prototype system thatprovides an exploration interface to news archive search.Our prototype visualizes search results making use of twokinds of temporal information, namely, news articles’ publi-cation dates but also their contained temporal expressions.The displayed timelines are annotated with major events,harvested using crowdsourcing, to make it easier for usersto put the shown search results into context. The prototypehas been fully implemented and deployed on the New YorkTimes Annotated Corpus.
Categories and Subject Descriptors
H.3.1 [Content Analysis and Indexing]: Linguistic pro-cessing; D.5.2 [Information Interface]: User Interfaces
General Terms
Design, Experimentation, Human Factors
Keywords
Crowdsourcing, timelines, exploration, news archives
1. INTRODUCTION
News archives keep growing in volume and coverage asfresh content is published and old content is being digitized.The New York Times (NYT), as one example, allows usersto search and access all of its contents published since 1851.The archive of the British newspaper The Times, as a secondexample, even goes back until 1785.
When searching news archives, presenting users with aranked list of few search results is insufficient, as it doesnot reflect how relevant news articles are spread in the timedimension and thus fails to display the course of history.Instead, it forces users to sift through a large number ofrelevant news articles and painstakingly piece together howreal-world events unfolded.
Permission to make digital or hard copies of all or part of this work forpersonal or classroom use is granted without fee provided that copies arenot made or distributed for profit or commercial advantage and that copiesbear this notice and the full citation on the first page. To copy otherwise, torepublish, to post on servers or to redistribute to lists, requires prior specificpermission and/or a fee.HCIR ’10 New Brunswick, New Jersey USACopyright 20XX ACM X-XXXXX-XX-X/XX/XX ...$10.00.
In this paper, we describe our News Exploration AlongTime (NEAT) prototype that provides an exploration inter-face to search news archives. NEAT has been deployed onthe New York Times Annotated Corpus [3], as a real-worldnews archive, and combines several novel features including:
• Use of Richer Temporal Information: News ar-ticles come with different kinds of temporal informa-tion. This includes their publication dates that aretypically readily available. However, within the newsarticles’ contents there is often more temporal infor-mation hidden. For example, a news article on oilspills published on February 3rd 1991 may contain thefollowing sentences: “By contrast, the spill caused bythe Exxon Valdez in 1989 contained almost 11 milliongallons...” and “Nearly three years later, he said,young trees are growing in the mangrove...”. Temporalexpressions (e.g., in 1989 ) are another kind of tem-poral information that can be extracted from the newsarticles’ contents.
• Snippets with Temporal Information: NEAT lever-ages both kinds of temporal information mentionedabove. Relevant news articles are anchored on a time-line based on their publication date. Beyond that,NEAT shows relevant snippets that contain temporalexpressions and anchors them accordingly. In doing so,NEAT facilitates gaining an understanding of when rel-evant news articles were published but also which timesrelevant news content refers to.
• Semantic Temporal Anchors: To aid users in con-textualizing the displayed news articles and snippets,our system shows a set of major events that serve assemantic temporal anchors. Examples of such ma-jor events include “Building of Berlin Wall” (for theyear 1961), “Challenger Disaster” (for January 1986),and “Woodstock” (for the year 1969). We harvest alarge collection of such semantic temporal anchors us-ing the crowdsourcing platform Amazon MechanicalTurk. Note that temporal anchors can easily be per-sonalized - users could thus have local libraries of per-sonal anchors (e.g., including their day of birth or wed-ding day), making it even easier for them to contextu-alize search results.
Organization. Related work is discussed in Section 2.Section 3 gives details on NEAT’s exploration interface. InSection 4, we describe the gathering of timeline annotationsusing crowdsourcing. NEAT’s implementation is subject ofSection 5. Finally, in Section 6, we conclude this work andoutline next steps.
12
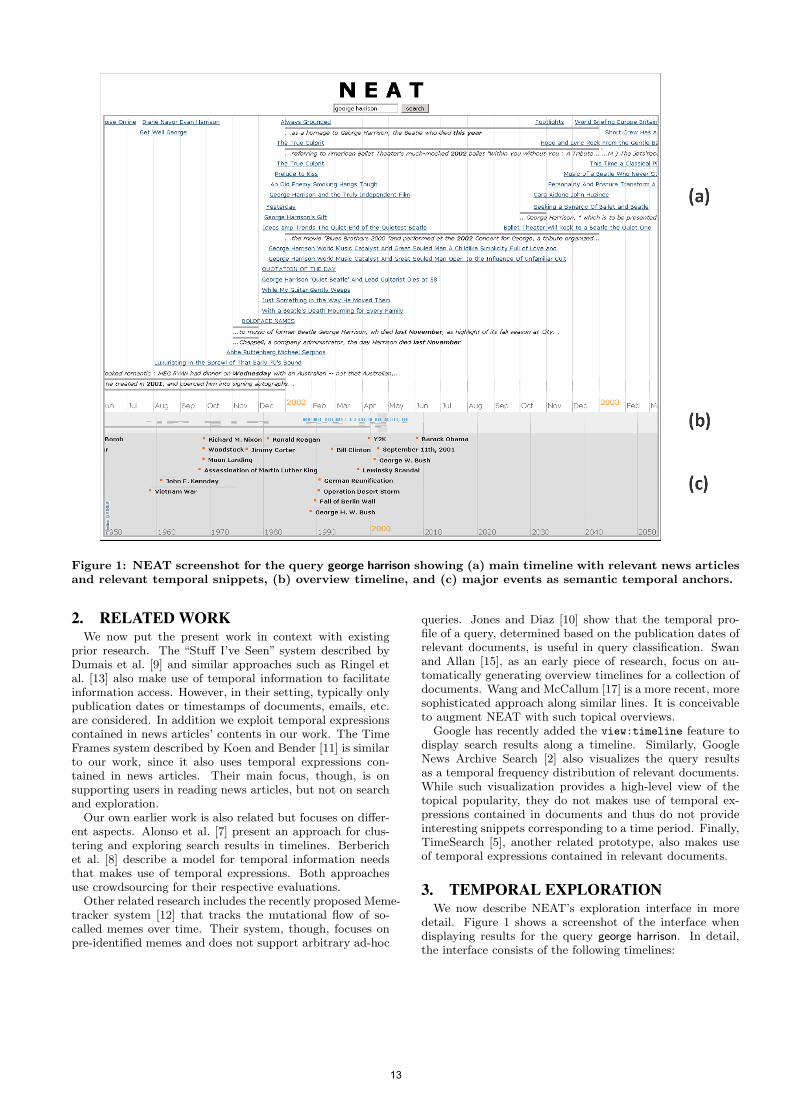
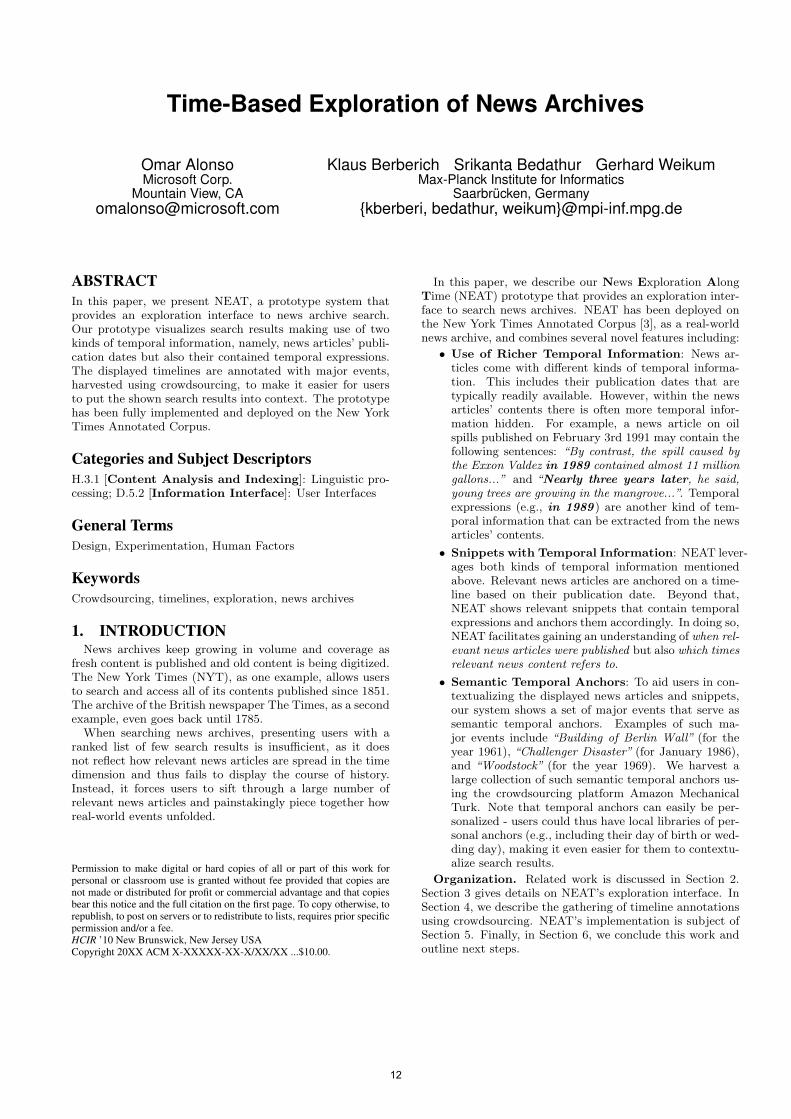
Figure 1: NEAT screenshot for the query george harrison showing (a) main timeline with relevant news articles
and relevant temporal snippets, (b) overview timeline, and (c) major events as semantic temporal anchors.
2. RELATED WORK
We now put the present work in context with existingprior research. The “Stuff I’ve Seen” system described byDumais et al. [9] and similar approaches such as Ringel etal. [13] also make use of temporal information to facilitateinformation access. However, in their setting, typically onlypublication dates or timestamps of documents, emails, etc.are considered. In addition we exploit temporal expressionscontained in news articles’ contents in our work. The TimeFrames system described by Koen and Bender [11] is similarto our work, since it also uses temporal expressions con-tained in news articles. Their main focus, though, is onsupporting users in reading news articles, but not on searchand exploration.
Our own earlier work is also related but focuses on differ-ent aspects. Alonso et al. [7] present an approach for clus-tering and exploring search results in timelines. Berberichet al. [8] describe a model for temporal information needsthat makes use of temporal expressions. Both approachesuse crowdsourcing for their respective evaluations.
Other related research includes the recently proposed Meme-tracker system [12] that tracks the mutational flow of so-called memes over time. Their system, though, focuses onpre-identified memes and does not support arbitrary ad-hoc
queries. Jones and Diaz [10] show that the temporal pro-file of a query, determined based on the publication dates ofrelevant documents, is useful in query classification. Swanand Allan [15], as an early piece of research, focus on au-tomatically generating overview timelines for a collection ofdocuments. Wang and McCallum [17] is a more recent, moresophisticated approach along similar lines. It is conceivableto augment NEAT with such topical overviews.
Google has recently added the view:timeline feature todisplay search results along a timeline. Similarly, GoogleNews Archive Search [2] also visualizes the query resultsas a temporal frequency distribution of relevant documents.While such visualization provides a high-level view of thetopical popularity, they do not makes use of temporal ex-pressions contained in documents and thus do not provideinteresting snippets corresponding to a time period. Finally,TimeSearch [5], another related prototype, also makes useof temporal expressions contained in relevant documents.
3. TEMPORAL EXPLORATION
We now describe NEAT’s exploration interface in moredetail. Figure 1 shows a screenshot of the interface whendisplaying results for the query george harrison. In detail,the interface consists of the following timelines:
13
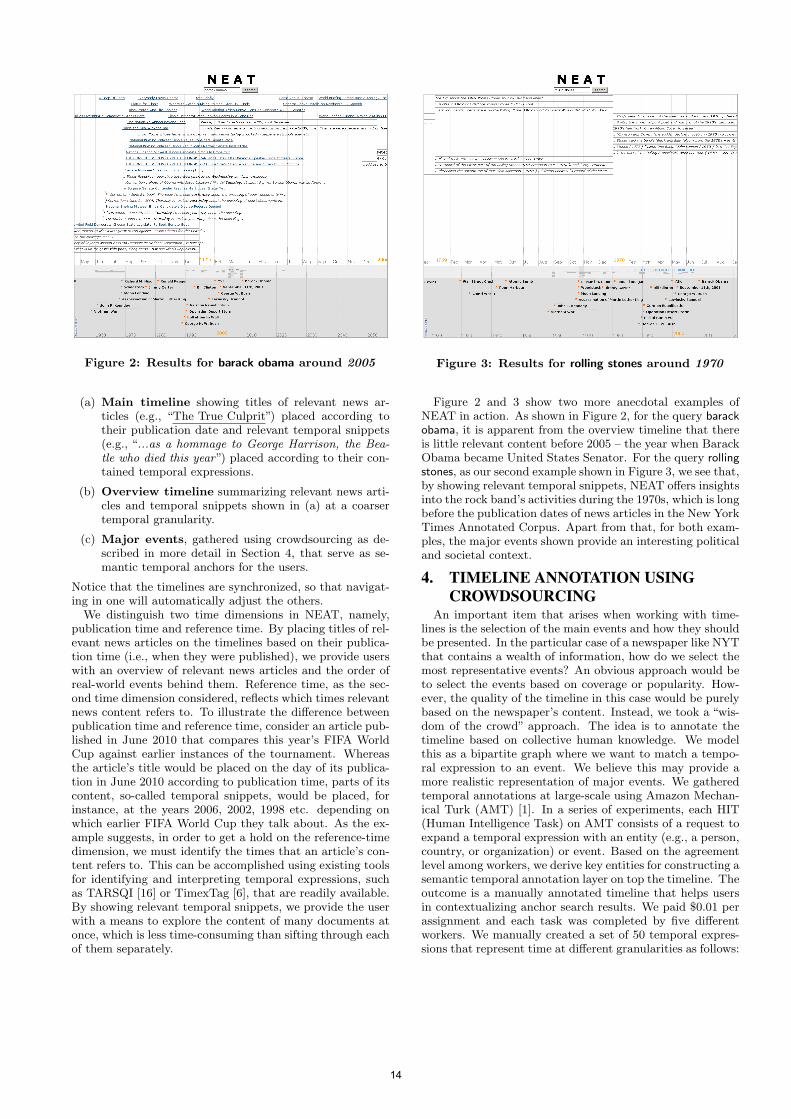
Figure 2: Results for barack obama around 2005
(a) Main timeline showing titles of relevant news ar-ticles (e.g., “The True Culprit”) placed according totheir publication date and relevant temporal snippets(e.g., “...as a hommage to George Harrison, the Bea-tle who died this year”) placed according to their con-tained temporal expressions.
(b) Overview timeline summarizing relevant news arti-cles and temporal snippets shown in (a) at a coarsertemporal granularity.
(c) Major events, gathered using crowdsourcing as de-scribed in more detail in Section 4, that serve as se-mantic temporal anchors for the users.
Notice that the timelines are synchronized, so that navigat-ing in one will automatically adjust the others.
We distinguish two time dimensions in NEAT, namely,publication time and reference time. By placing titles of rel-evant news articles on the timelines based on their publica-tion time (i.e., when they were published), we provide userswith an overview of relevant news articles and the order ofreal-world events behind them. Reference time, as the sec-ond time dimension considered, reflects which times relevantnews content refers to. To illustrate the difference betweenpublication time and reference time, consider an article pub-lished in June 2010 that compares this year’s FIFA WorldCup against earlier instances of the tournament. Whereasthe article’s title would be placed on the day of its publica-tion in June 2010 according to publication time, parts of itscontent, so-called temporal snippets, would be placed, forinstance, at the years 2006, 2002, 1998 etc. depending onwhich earlier FIFA World Cup they talk about. As the ex-ample suggests, in order to get a hold on the reference-timedimension, we must identify the times that an article’s con-tent refers to. This can be accomplished using existing toolsfor identifying and interpreting temporal expressions, suchas TARSQI [16] or TimexTag [6], that are readily available.By showing relevant temporal snippets, we provide the userwith a means to explore the content of many documents atonce, which is less time-consuming than sifting through eachof them separately.
Figure 3: Results for rolling stones around 1970
Figure 2 and 3 show two more anecdotal examples ofNEAT in action. As shown in Figure 2, for the query barackobama, it is apparent from the overview timeline that thereis little relevant content before 2005 – the year when BarackObama became United States Senator. For the query rollingstones, as our second example shown in Figure 3, we see that,by showing relevant temporal snippets, NEAT offers insightsinto the rock band’s activities during the 1970s, which is longbefore the publication dates of news articles in the New YorkTimes Annotated Corpus. Apart from that, for both exam-ples, the major events shown provide an interesting politicaland societal context.
4. TIMELINE ANNOTATION USING
CROWDSOURCING
An important item that arises when working with time-lines is the selection of the main events and how they shouldbe presented. In the particular case of a newspaper like NYTthat contains a wealth of information, how do we select themost representative events? An obvious approach would beto select the events based on coverage or popularity. How-ever, the quality of the timeline in this case would be purelybased on the newspaper’s content. Instead, we took a “wis-dom of the crowd” approach. The idea is to annotate thetimeline based on collective human knowledge. We modelthis as a bipartite graph where we want to match a tempo-ral expression to an event. We believe this may provide amore realistic representation of major events. We gatheredtemporal annotations at large-scale using Amazon Mechan-ical Turk (AMT) [1]. In a series of experiments, each HIT(Human Intelligence Task) on AMT consists of a request toexpand a temporal expression with an entity (e.g., a person,country, or organization) or event. Based on the agreementlevel among workers, we derive key entities for constructing asemantic temporal annotation layer on top the timeline. Theoutcome is a manually annotated timeline that helps usersin contextualizing anchor search results. We paid $0.01 perassignment and each task was completed by five differentworkers. We manually created a set of 50 temporal expres-sions that represent time at different granularities as follows:
14

• Dates (e.g., 9/1/1939 or 4/4/1968 )
• Relative (e.g., last year , next year , or tomorrow)
• Weekdays (e.g., Monday or Tuesday)
• Months (e.g., January or February)
• Years (e.g., 1492 , 1945 , or 1970 )
• Decades (e.g., 60s, 70s, or 80s)
• Centuries (e.g., 19th or 20th)
We ran the experiment for different categories (politics, sports,culture, world affairs, movies, and music) using the same setof temporal expressions. By analyzing the data we can seethat an explicit temporal expression tends to have a clearannotation as we see in the following examples verbatim. Inthe case of “1492”, the workers wrote: America, ChristopherColumbus, Columbus, Columbus discovers America, France.For relative expressions, the annotation tends to be of lessvalue. For the temporal expression “4pm”, we have: After-noon, Bakers, Mauritius, Oprah Winfrey, TED. Going at ahigher level than year, decades also provide interesting infor-mation. For example, for “70s”, we have: disco, oil shocks,Richard Nixon, usa, Watergate. Months provide a mix oftypical calendar events with some other observations. For“March”, workers wrote: Brutus killed Julius Caesar on theides, caesar, Easter, saint patrick, St. Patrick’s Day. Thenext step is to get a consensus among workers and select oneor two significant events for that particular temporal expres-sion. Examples of annotations produced by crowdsourcingare (1969: Woodstock, Moon landing), (1970: Nixon), and(2003-2009: Iraq war) to name a few with different timegranularities. It is not always possible to get consensus onan <event, temporal expression> pair. An interesting exam-ple is the year “1982”, where the crowd annotated: RonaldReagan, Spain World Cup, Charles & Lady Di wedding,and Falklands War. These are all valid events and proba-bly interesting on their own, but we were not able to findconsensus on one or two.
5. IMPLEMENTATION
We now provide some details on the implementation ofour NEAT prototype. Prior to indexing the dataset us-ing our prototype, we annotated temporal expressions us-ing TARSQI [16]. To implement the user interface, shownin Figure 1, we make use of the timeline visualization pro-vided as part of the SIMILE project [4]. When the userissues a query, a request is sent to a Java servlet. ThisJava servlet, running in the backend, then processes the userquery by retrieving a fixed number of relevant documentsand a fixed number of relevant temporal snippets. Noticethat the retrieved temporal snippets are independent fromthe retrieved relevant documents, thus fostering diversityof displayed information. To retrieve relevant documentsand temporal snippets, the servlet accesses two inverted in-dexes, one for documents and one for snippets, that are im-plemented using an Oracle 11g database. To determine therelevance of news articles and temporal snippets, we em-ploy Okapi BM25 [14] as a retrieval model. For temporalsnippets, we slightly modify the retrieval model, using thenumber of temporal expressions contained in a snippet asa multiplicative boosting factor. Finally, before sending aresponse, the servlet looks up metadata for the identified
documents and phrases (e.g., their URLs and publicationdates), and adds markup to highlight query terms and tem-poral expressions.
6. CONCLUSIONS AND FUTURE WORK
We presented NEAT, a working prototype for exploringnews along timelines. We used the New York Times An-notated Corpus to show the features of our system. Theprototype is easy to use and the authors found it interestingto navigate to the past when issuing queries about currentworld affairs.
Future work includes a user study of the user interface toget a better idea (and metrics) about the prototype. Pre-vious research [7] has shown that users like to see informa-tion in time, so we would to explore this in more detail.The annotation of timelines by major events gathered usingcrowdsourcing looks very promising. A limitation is thatthe annotation depends a lot on the quality of the workersand, in our experience, the annotations seemed to have anAmerican flavor instead of being world representative. Weplan to keep working on this aspect.
7. REFERENCES
[1] Amazon Mechanical Turkhttp://www.mturk.com.
[2] Google News Archive Searchhttp://news.google.com/archivesearch.
[3] New York Times Annotated Corpushttp://corpus.nytimes.com.
[4] SIMILE TimeLine Visualization.http://simile.mit.edu/timeline/.
[5] TimeSearch Historyhttp://www.timesearch.info.
[6] D. Ahn et al. A Cascaded Machine Learning Approachto Interpreting Temporal Expressions. HLT-NAACL2007.
[7] O. Alonso et al. Clustering and exploring searchresults using timeline constructions. CIKM 2009.
[8] K. Berberich et al. A Language Modeling Approachfor Temporal Information Needs. ECIR 2010.
[9] S. T. Dumais et al. Stuff I’ve seen: a system forpersonal information retrieval and re-use. SIGIR 2003.
[10] R. Jones and F. Diaz. Temporal profiles of queries.ACM TOIS 2007.
[11] D. B. Koen and W. Bender. Time frames: Temporalaugmentation of the news. IBM Systems Journal 2000.
[12] J. Leskovec et al. Meme-tracking and the dynamics ofthe news cycle. KDD 2009.
[13] M. Ringel et al. Milestones in Time: The Value ofLandmarks in Retrieving Information from PersonalStores. INTERACT 2003.
[14] S. E. Robertson and S. Walker. Okapi/keenbow attrec-8. 1999.
[15] R. Swan and J. Allan. Automatic generation ofoverview timelines. SIGIR 2000.
[16] M. Verhagen et al. A. Rumshisky, J. Phillips, andJ. Pustejovsky. Automating Temporal Annotationwith TARSQI. ACL 2005.
[17] X. Wang and A. McCallum. Topics over time: anon-Markov continuous-time model of topical trends.KDD 2006.
15
Combining Computational Analyses and InteractiveVisualization to Enhance Information Retrieval
Carsten Görg, Jaeyeon Kihm, Jaegul Choo, Zhicheng Liu, Sivasailam Muthiah,Haesun Park, John Stasko
College of Computing, Georgia Institute of Technology, Atlanta, GA USA
ABSTRACTExploratory search and information-seeking support systems at-tempt to go beyond simple information retrieval and assist peoplewith exploration, investigation, learning and understanding activ-ities on document collections. In this work we integrate severalcomputational text analysis techniques, including document sum-marization, document similarity, document clustering, and senti-ment analysis, within the interactive visualization system Jigsawin order to provide a flexible and powerful environment for peopleto examine sets of documents. Our focus is not on cutting edgealgorithms for computational analysis but rather on the process ofintegrating automated analyses with interactive visualizations in asmooth and fluid manner. We illustrate this integration through anexample scenario of a consumer examining a collections of carreviews in order to learn more about the car and understand itsstrengths and weaknesses.
Keywordsexploratory search, information seeking, sense-making, visualiza-tion, visual analytics
1. INTRODUCTIONWe have been developing new interfaces and systems for infor-
mation retrieval, in particular, for retrieval of collections of docu-ments with a goal of understanding the many different dimensionsand contents of those documents. Sometimes called ExploratorySearch [11, 5], Information Seeking Support [6], or Sense-making [4],these processes go beyond the initial retrieval of data by providingenvironments in which a person can browse, explore, investigate,discover, and learn about the topics, themes, and concepts withinthe documents.
More specifically, the following situations provide examples ofthe types of processes we seek to support:
� A police investigator has a collection of case reports, evi-dence reports, and interview transcripts and seeks to “put thepieces together” to identify the culprits behind a crime.
� An academic researcher moves into a new area and seeks tounderstand the key ideas, topics, and trends of the area, aswell as the set of top researchers, their interests, and collab-orations.
Copyright is held by the author/owner(s).HCIR’10, August 22, 2010, New Brunswick, NJ USA.
� A consumer wishes to buy a new digital camera but encoun-ters a large variety of possible models to choose from, eachof which with supporting documentation and consumer re-views.
� A family learns that their child may have a rare disease andthey scour the web for documents and information about thecondition.
Our approach combines two main components: automated com-putational analysis of the documents and interactive visualizationsof the documents themselves and of the results of the analysis. Sucha combination is described as a visual analytics approach [9, 3]and it attempts to leverage the strengths of both the human and thecomputer. Humans excel at the interactive dialog and discourse ofexploration and discovery. They develop new questions and hy-potheses as more and more information is uncovered. The com-puter excels at complicated analyses of large data collections to de-termine metrics, correlations, connections, and statistics about thedocument collection.
Relatively few systems to date, however, have smoothly incor-porated both automated computational analysis and interactive vi-sualization while providing a tight coupling between the two. Itis more common to encounter systems focused on one of the twocapabilities that also add a few elements from the other capabil-ity. For instance, computational analysis tools sometimes providerudimentary user interfaces to access analysis capabilities. Alterna-tively, interactive visualization systems may provide a few simpletechniques such as filtering or statistical analysis of the data.
The system through which we have been exploring this couplingis Jigsaw [8], a tool for helping people explore document collec-tions. Jigsaw is a relatively mature prototype system, and has seeninitial use in the field by clients from law enforcement, investigativereporting, fraud detection, and academic research, among others.An initial user study with the system showed its potential in help-ing investigators and supporting different analysis strategies [2].
Until now, Jigsaw has provided more in the way of interactivevisualization support of document exploration. In particular, Jig-saw visualizes connections between entities across documents tohelp investigators follow trails of information. Recently, we addedenhanced computational analysis to the system. Jigsaw now alsoprovides capabilities such as analysis of document similarity, doc-ument sentiment, document clusters by theme or content, and doc-ument summarization through a few words or sentences.
Our focus has not been about developing innovative new algo-rithms for computational analysis, however. Instead, we have beenexploring methods for smoothly integrating the computational anal-yses into an interactive visual interface in a seamless manner thatwould provide a natural and fluid user experience.
16

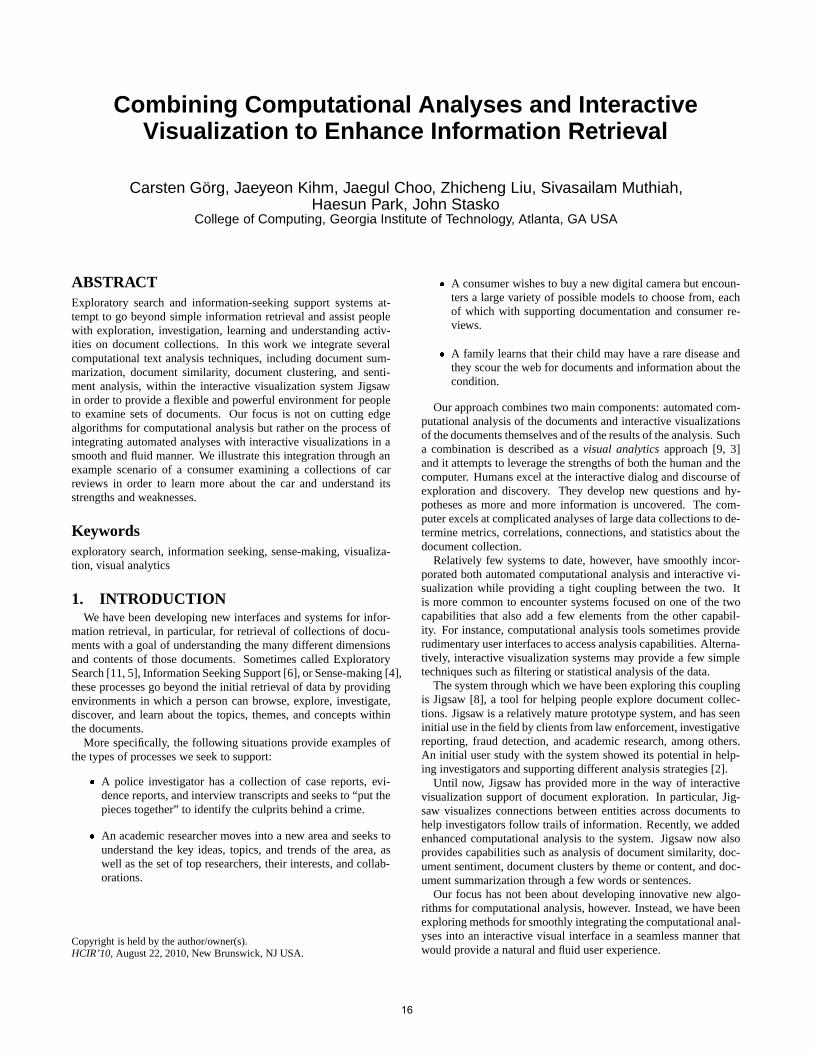
Figure 1: Jigsaw’s Document Grid Views, List View, and Document View showing connections in and statistics of car reviews aboutthe 2009 Hyundai Genesis retrieved from the edmunds.com website.
2. AN EXAMPLE INVESTIGATIVESCENARIO: CAR REVIEWS
Jigsaw is a system for helping analysts with different kinds of in-vestigative and sensemaking scenarios based on textual documents.It is a multi-view system, including a number of different visualiza-tions of the documents in the collection and the entities (e.g., peo-ple, places, organizations, etc.) within those documents. Figure 1shows some of the visualizations. Initially developed for use in in-telligence and law enforcement scenarios, more recently Jigsaw hasseen increased use in other domains and for many different kindsof document collections. More detail about Jigsaw can be foundin [8].
To help illustrate how computational analyses and interactive vi-sualization combine in Jigsaw, we present an example investigativescenario in which an example consumer, Mary, is shopping for anew car. To help her learn about a particular car, the 2009 HyundaiGenesis, that she is considering, Mary examines a document col-lection consisting of 178 reviews of the car from the edmunds.comwebsite. She could, of course, examine these reviews sequentiallyfrom the website in the manner that anyone would do when ex-ploring a topic using a collection of consumer reviews or webpagesretrieved from a search engine. That can, however, be slow and notwell illuminate the key themes and connections across the reviews.
For illustrating Mary’s use of Jigsaw in this scenario, we scrapedthe 178 reviews from the edmunds.com website and imported theminto Jigsaw. Each review is modeled as a document. The maintextual content of the review is the text of the document. The doc-ument’s entities include various rating scores (e.g., exterior design,fuel economy, overall, etc.) that the review author explicitly desig-nated, and other car makes and models mentioned in the review’stext. Additionally, we added an entity type “feature” for which wedefined about 40 general terms about cars such as seat, trunk, andengine, and we look for mention of those terms in the review text.Figure 1 presents several Jigsaw views from the exploration sessionthat will be used throughout our discussion.
To get an overview of the reviews, Mary begins her investigationby invoking the Document Cluster View (Figure 2) and examiningthe different key concepts across the reviews. The Cluster Viewshows each document as a small rectangle and it includes com-mands to cluster the documents based on either the document textor on the entities connected to a document. Here, Mary chose fulldocument text as the basis for the clustering to achieve the broadestinterpretation. Jigsaw then reorganizes the display and positionsthe documents into clusters based on the analysis. Mary noticesclusters around concepts such as the sound system, the ride, fueleconomy, and seating.
17
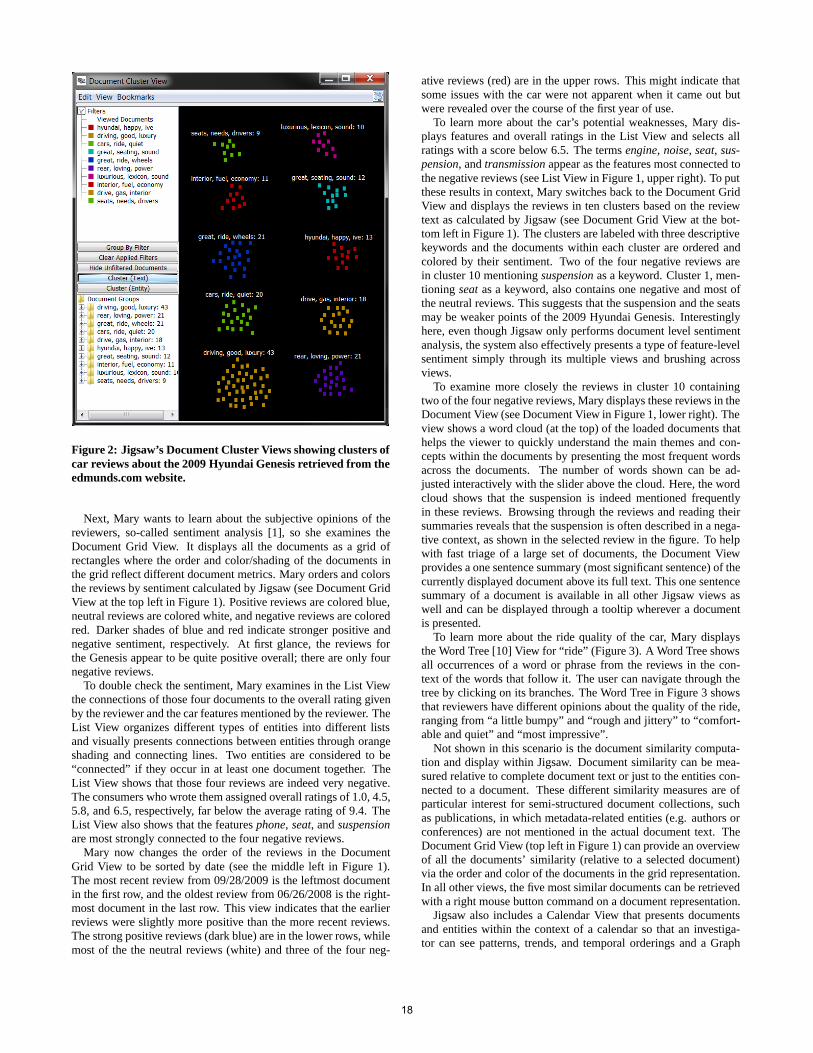
Figure 2: Jigsaw’s Document Cluster Views showing clusters ofcar reviews about the 2009 Hyundai Genesis retrieved from theedmunds.com website.
Next, Mary wants to learn about the subjective opinions of thereviewers, so-called sentiment analysis [1], so she examines theDocument Grid View. It displays all the documents as a grid ofrectangles where the order and color/shading of the documents inthe grid reflect different document metrics. Mary orders and colorsthe reviews by sentiment calculated by Jigsaw (see Document GridView at the top left in Figure 1). Positive reviews are colored blue,neutral reviews are colored white, and negative reviews are coloredred. Darker shades of blue and red indicate stronger positive andnegative sentiment, respectively. At first glance, the reviews forthe Genesis appear to be quite positive overall; there are only fournegative reviews.
To double check the sentiment, Mary examines in the List Viewthe connections of those four documents to the overall rating givenby the reviewer and the car features mentioned by the reviewer. TheList View organizes different types of entities into different listsand visually presents connections between entities through orangeshading and connecting lines. Two entities are considered to be“connected” if they occur in at least one document together. TheList View shows that those four reviews are indeed very negative.The consumers who wrote them assigned overall ratings of 1.0, 4.5,5.8, and 6.5, respectively, far below the average rating of 9.4. TheList View also shows that the features phone, seat, and suspensionare most strongly connected to the four negative reviews.
Mary now changes the order of the reviews in the DocumentGrid View to be sorted by date (see the middle left in Figure 1).The most recent review from 09/28/2009 is the leftmost documentin the first row, and the oldest review from 06/26/2008 is the right-most document in the last row. This view indicates that the earlierreviews were slightly more positive than the more recent reviews.The strong positive reviews (dark blue) are in the lower rows, whilemost of the the neutral reviews (white) and three of the four neg-
ative reviews (red) are in the upper rows. This might indicate thatsome issues with the car were not apparent when it came out butwere revealed over the course of the first year of use.
To learn more about the car’s potential weaknesses, Mary dis-plays features and overall ratings in the List View and selects allratings with a score below 6.5. The terms engine, noise, seat, sus-pension, and transmission appear as the features most connected tothe negative reviews (see List View in Figure 1, upper right). To putthese results in context, Mary switches back to the Document GridView and displays the reviews in ten clusters based on the reviewtext as calculated by Jigsaw (see Document Grid View at the bot-tom left in Figure 1). The clusters are labeled with three descriptivekeywords and the documents within each cluster are ordered andcolored by their sentiment. Two of the four negative reviews arein cluster 10 mentioning suspension as a keyword. Cluster 1, men-tioning seat as a keyword, also contains one negative and most ofthe neutral reviews. This suggests that the suspension and the seatsmay be weaker points of the 2009 Hyundai Genesis. Interestinglyhere, even though Jigsaw only performs document level sentimentanalysis, the system also effectively presents a type of feature-levelsentiment simply through its multiple views and brushing acrossviews.
To examine more closely the reviews in cluster 10 containingtwo of the four negative reviews, Mary displays these reviews in theDocument View (see Document View in Figure 1, lower right). Theview shows a word cloud (at the top) of the loaded documents thathelps the viewer to quickly understand the main themes and con-cepts within the documents by presenting the most frequent wordsacross the documents. The number of words shown can be ad-justed interactively with the slider above the cloud. Here, the wordcloud shows that the suspension is indeed mentioned frequentlyin these reviews. Browsing through the reviews and reading theirsummaries reveals that the suspension is often described in a nega-tive context, as shown in the selected review in the figure. To helpwith fast triage of a large set of documents, the Document Viewprovides a one sentence summary (most significant sentence) of thecurrently displayed document above its full text. This one sentencesummary of a document is available in all other Jigsaw views aswell and can be displayed through a tooltip wherever a documentis presented.
To learn more about the ride quality of the car, Mary displaysthe Word Tree [10] View for “ride” (Figure 3). A Word Tree showsall occurrences of a word or phrase from the reviews in the con-text of the words that follow it. The user can navigate through thetree by clicking on its branches. The Word Tree in Figure 3 showsthat reviewers have different opinions about the quality of the ride,ranging from “a little bumpy” and “rough and jittery” to “comfort-able and quiet” and “most impressive”.
Not shown in this scenario is the document similarity computa-tion and display within Jigsaw. Document similarity can be mea-sured relative to complete document text or just to the entities con-nected to a document. These different similarity measures are ofparticular interest for semi-structured document collections, suchas publications, in which metadata-related entities (e.g. authors orconferences) are not mentioned in the actual document text. TheDocument Grid View (top left in Figure 1) can provide an overviewof all the documents’ similarity (relative to a selected document)via the order and color of the documents in the grid representation.In all other views, the five most similar documents can be retrievedwith a right mouse button command on a document representation.
Jigsaw also includes a Calendar View that presents documentsand entities within the context of a calendar so that an investiga-tor can see patterns, trends, and temporal orderings and a Graph
18
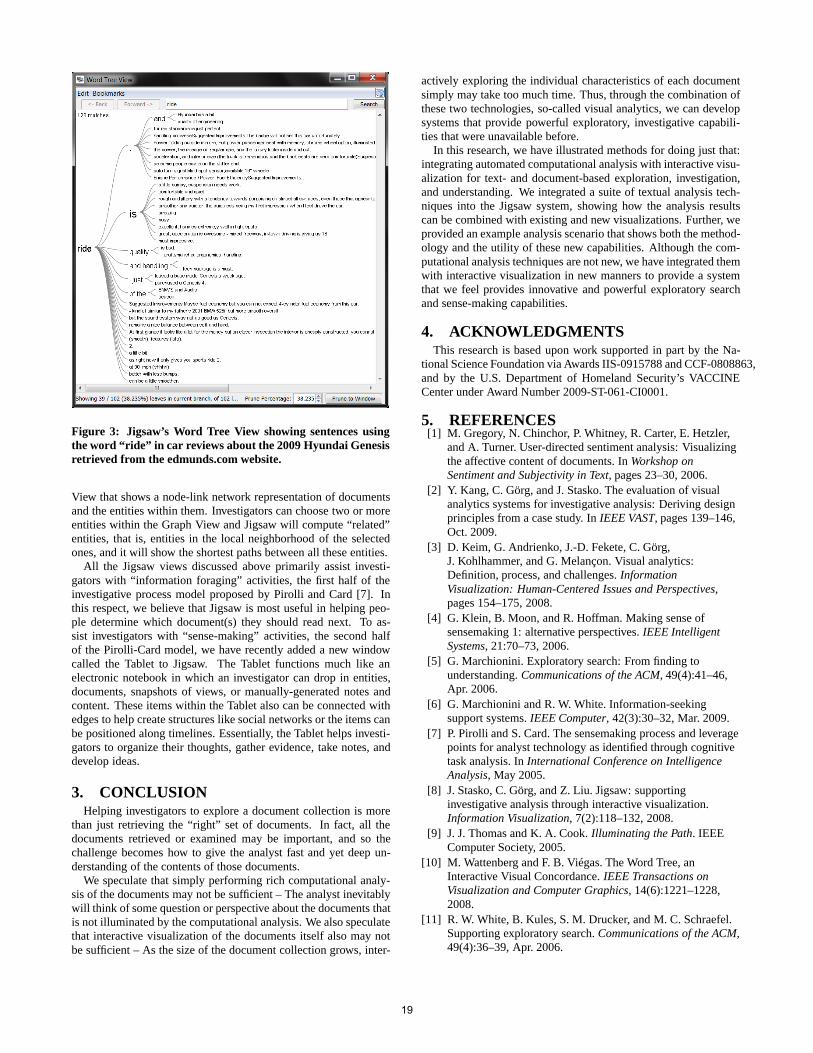
Figure 3: Jigsaw’s Word Tree View showing sentences usingthe word “ride” in car reviews about the 2009 Hyundai Genesisretrieved from the edmunds.com website.
View that shows a node-link network representation of documentsand the entities within them. Investigators can choose two or moreentities within the Graph View and Jigsaw will compute “related”entities, that is, entities in the local neighborhood of the selectedones, and it will show the shortest paths between all these entities.
All the Jigsaw views discussed above primarily assist investi-gators with “information foraging” activities, the first half of theinvestigative process model proposed by Pirolli and Card [7]. Inthis respect, we believe that Jigsaw is most useful in helping peo-ple determine which document(s) they should read next. To as-sist investigators with “sense-making” activities, the second halfof the Pirolli-Card model, we have recently added a new windowcalled the Tablet to Jigsaw. The Tablet functions much like anelectronic notebook in which an investigator can drop in entities,documents, snapshots of views, or manually-generated notes andcontent. These items within the Tablet also can be connected withedges to help create structures like social networks or the items canbe positioned along timelines. Essentially, the Tablet helps investi-gators to organize their thoughts, gather evidence, take notes, anddevelop ideas.
3. CONCLUSIONHelping investigators to explore a document collection is more
than just retrieving the “right” set of documents. In fact, all thedocuments retrieved or examined may be important, and so thechallenge becomes how to give the analyst fast and yet deep un-derstanding of the contents of those documents.
We speculate that simply performing rich computational analy-sis of the documents may not be sufficient – The analyst inevitablywill think of some question or perspective about the documents thatis not illuminated by the computational analysis. We also speculatethat interactive visualization of the documents itself also may notbe sufficient – As the size of the document collection grows, inter-
actively exploring the individual characteristics of each documentsimply may take too much time. Thus, through the combination ofthese two technologies, so-called visual analytics, we can developsystems that provide powerful exploratory, investigative capabili-ties that were unavailable before.
In this research, we have illustrated methods for doing just that:integrating automated computational analysis with interactive visu-alization for text- and document-based exploration, investigation,and understanding. We integrated a suite of textual analysis tech-niques into the Jigsaw system, showing how the analysis resultscan be combined with existing and new visualizations. Further, weprovided an example analysis scenario that shows both the method-ology and the utility of these new capabilities. Although the com-putational analysis techniques are not new, we have integrated themwith interactive visualization in new manners to provide a systemthat we feel provides innovative and powerful exploratory searchand sense-making capabilities.
4. ACKNOWLEDGMENTSThis research is based upon work supported in part by the Na-
tional Science Foundation via Awards IIS-0915788 and CCF-0808863,and by the U.S. Department of Homeland Security’s VACCINECenter under Award Number 2009-ST-061-CI0001.
5. REFERENCES[1] M. Gregory, N. Chinchor, P. Whitney, R. Carter, E. Hetzler,
and A. Turner. User-directed sentiment analysis: Visualizingthe affective content of documents. In Workshop onSentiment and Subjectivity in Text, pages 23–30, 2006.
[2] Y. Kang, C. Görg, and J. Stasko. The evaluation of visualanalytics systems for investigative analysis: Deriving designprinciples from a case study. In IEEE VAST, pages 139–146,Oct. 2009.
[3] D. Keim, G. Andrienko, J.-D. Fekete, C. Görg,J. Kohlhammer, and G. Melançon. Visual analytics:Definition, process, and challenges. InformationVisualization: Human-Centered Issues and Perspectives,pages 154–175, 2008.
[4] G. Klein, B. Moon, and R. Hoffman. Making sense ofsensemaking 1: alternative perspectives. IEEE IntelligentSystems, 21:70–73, 2006.
[5] G. Marchionini. Exploratory search: From finding tounderstanding. Communications of the ACM, 49(4):41–46,Apr. 2006.
[6] G. Marchionini and R. W. White. Information-seekingsupport systems. IEEE Computer, 42(3):30–32, Mar. 2009.
[7] P. Pirolli and S. Card. The sensemaking process and leveragepoints for analyst technology as identified through cognitivetask analysis. In International Conference on IntelligenceAnalysis, May 2005.
[8] J. Stasko, C. Görg, and Z. Liu. Jigsaw: supportinginvestigative analysis through interactive visualization.Information Visualization, 7(2):118–132, 2008.
[9] J. J. Thomas and K. A. Cook. Illuminating the Path. IEEEComputer Society, 2005.
[10] M. Wattenberg and F. B. Viégas. The Word Tree, anInteractive Visual Concordance. IEEE Transactions onVisualization and Computer Graphics, 14(6):1221–1228,2008.
[11] R. W. White, B. Kules, S. M. Drucker, and M. C. Schraefel.Supporting exploratory search. Communications of the ACM,49(4):36–39, Apr. 2006.
19

Impact of Retrieval Precision on Perceived Difficulty andOther User Measures
Mark D. SmuckerDepartment of Management Sciences
University of [email protected]
Chandra Prakash JethaniDavid R. Cheriton School of Computer Science
University of [email protected]
ABSTRACTWhen creating interactive retrieval systems, we want to re-duce the perceived difficulty of finding relevant documents.We conducted a user study that controlled retrieval preci-sion. We found that a higher retrieval precision caused a re-duction in perceived difficulty compared to a lower retrievalprecision. We also found that higher precision increases en-joyment and has some influence on ability to concentrate,but we found no evidence that precision keeps the user en-gaged vs. bored with the search.
1. INTRODUCTIONIn this paper, we examine whether or not the user per-
ceives any differences in the search experience given a changein precision. In other words, does retrieval precision affecthow a user feels about a search for relevant documents? Wecertainly expect the topic to have significant impact on thedegree to which a search seems difficult or enjoyable, butdoes precision?
To answer this question, we utilize data collected as part oflarger user study that we conducted to examine the relation-ship between retrieval precision and human performance [5].In that study, we examined the effect of two levels of pre-cision on the performance of users. We looked at searchresults with a uniform precision at rank N of 0.3 and 0.6.Users were to find as many relevant documents as possiblewithin 10 minutes. We asked the users to work quickly andto balance their speed with accuracy. We found that preci-sion is strongly related to performance for the interfaces andtasks of our study.
While the two levels of precision resulted in different levelsof human performance, did the retrieval precision affect theusers’ perception of search difficulty? We can improve userperformance as measured by some metric of our choosing,but if users do not notice this measured performance im-provement, then we may need to reexamine our conceptionof performance. We found that:
• Retrieval precision has a statistically significant effecton the perceived difficulty of finding relevant docu-ments (p = 0.006) as well on the enjoyability of thesearch experience (p = 0.016).
• The user’s ability to concentrate is somewhat impactedby retrieval precision (p = 0.079).
Copyright is held by the author/owner(s).Fourth Workshop on Human-Computer Interaction and Information Re-trieval (HCIR’10), August 22, 2010, New Brunswick, NJ, USA.
• The mood of the user (bored or engaged) is not affectedby retrieval precision (p = 0.341).
These results add support to results of Bailey, Kelly, andGyllstrom [3] who found that their estimate of topic diffi-culty correlated with perceived difficulty of finding relevantdocuments. Bailey et al. estimated a topic’s difficulty forusers by using a collection of existing user queries for thetopic and measuring the average nDCG of these queries.
There are many ways to describe topic difficulty. For ex-ample, a topic could be hard for users to understand and dis-tinguish relevant from non-relevant documents. Conversely,a topic could be easy to understand, but the topic could re-quire careful inspection of documents for relevance if thereare many requirements attached to what makes a documentrelevant. Users can vary greatly in their familiarity of atopic, and these differences in familiarity could affect theuser’s perception of the topic difficulty. Another notion oftopic difficulty may be to consider easier topics to be thosetopics that allow more relevant documents to be found in agiven amount of time than harder topics.
Rather than attempt to define topic difficulty and deter-mine its affect on various user measures, we control the pre-cision of retrieval results for a set of topics. Many of theways to describe topic difficulty are likely independent ofthe precision of the results the user is examining. Our pri-mary contribution in this paper is that we show evidencethat precision causes changes in perceived difficulty. Whilewe believe that Bailey et al. also found that that users per-ceive it easier to find relevant documents the higher the re-trieval precision, they did not directly control the retrievalprecision nor did they vary precision across a set of topics.
2. METHODS AND MATERIALSIn this section, we briefly describe our user study. Details
can be found in our earlier publication [5].We conducted a two phase user study. 48 users partic-
ipated in the study. The same users participated in bothphases of the study. For each phase, users completed 4search tasks. A task corresponded to searching for docu-ments relevant to a given TREC topic. Each task took 10minutes. In total, we used 8 topics from the 2005 TREC Ro-bust track, which are shown in Table 1. The 2005 Robusttrack used the AQUAINT collection of 1,033,461 newswiredocuments.
Each phase used a different user interface. Figure 1 showsthe user interfaces. In the first phase, users judged the rel-evance of document summaries and full documents. Userssaw one summary or document at a time and had to judge
20
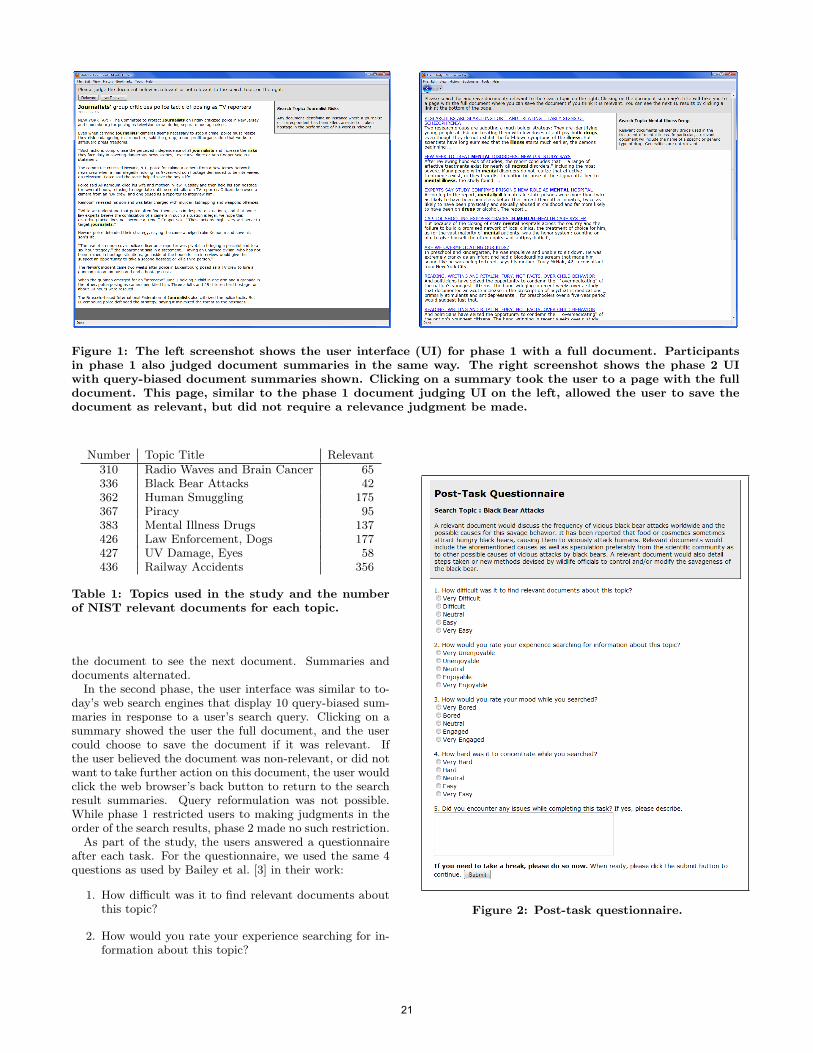
Figure 1: The left screenshot shows the user interface (UI) for phase 1 with a full document. Participantsin phase 1 also judged document summaries in the same way. The right screenshot shows the phase 2 UIwith query-biased document summaries shown. Clicking on a summary took the user to a page with the fulldocument. This page, similar to the phase 1 document judging UI on the left, allowed the user to save thedocument as relevant, but did not require a relevance judgment be made.
Number Topic Title Relevant310 Radio Waves and Brain Cancer 65336 Black Bear Attacks 42362 Human Smuggling 175367 Piracy 95383 Mental Illness Drugs 137426 Law Enforcement, Dogs 177427 UV Damage, Eyes 58436 Railway Accidents 356
Table 1: Topics used in the study and the numberof NIST relevant documents for each topic.
the document to see the next document. Summaries anddocuments alternated.
In the second phase, the user interface was similar to to-day’s web search engines that display 10 query-biased sum-maries in response to a user’s search query. Clicking on asummary showed the user the full document, and the usercould choose to save the document if it was relevant. Ifthe user believed the document was non-relevant, or did notwant to take further action on this document, the user wouldclick the web browser’s back button to return to the searchresult summaries. Query reformulation was not possible.While phase 1 restricted users to making judgments in theorder of the search results, phase 2 made no such restriction.
As part of the study, the users answered a questionnaireafter each task. For the questionnaire, we used the same 4questions as used by Bailey et al. [3] in their work:
1. How difficult was it to find relevant documents aboutthis topic?
2. How would you rate your experience searching for in-formation about this topic?
Figure 2: Post-task questionnaire.
21
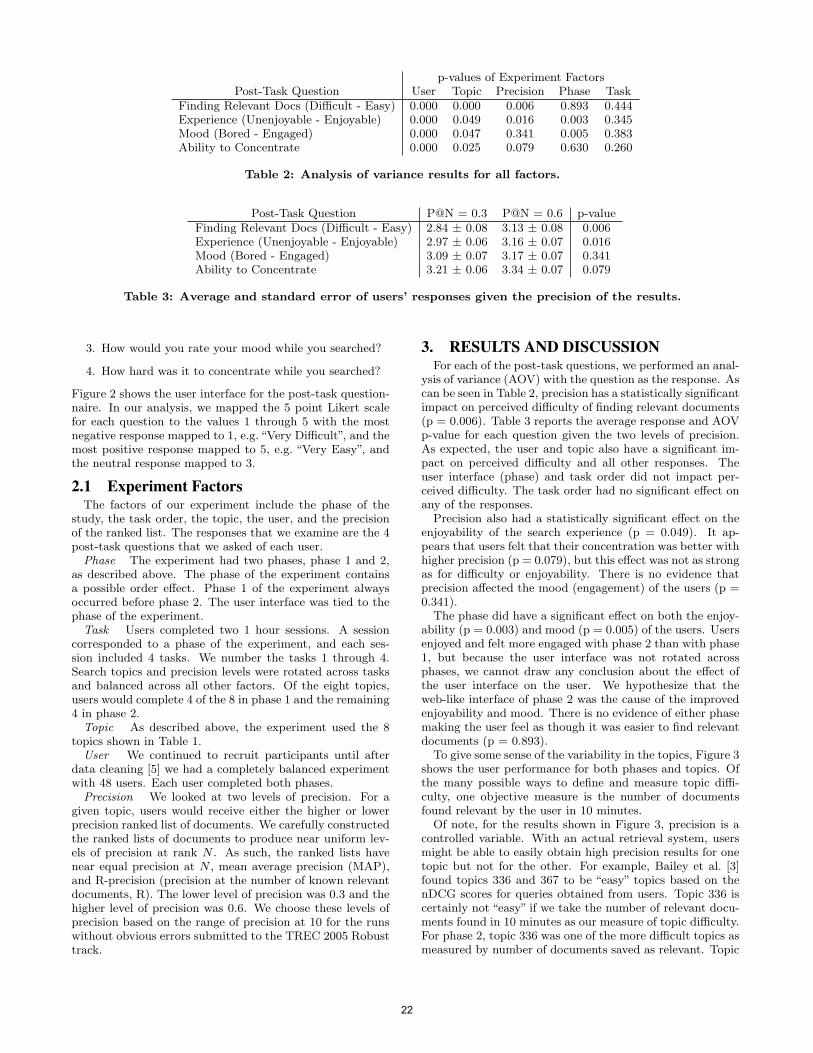
p-values of Experiment FactorsPost-Task Question User Topic Precision Phase Task
Finding Relevant Docs (Difficult - Easy) 0.000 0.000 0.006 0.893 0.444Experience (Unenjoyable - Enjoyable) 0.000 0.049 0.016 0.003 0.345Mood (Bored - Engaged) 0.000 0.047 0.341 0.005 0.383Ability to Concentrate 0.000 0.025 0.079 0.630 0.260
Table 2: Analysis of variance results for all factors.
Post-Task Question P@N = 0.3 P@N = 0.6 p-valueFinding Relevant Docs (Difficult - Easy) 2.84 ± 0.08 3.13 ± 0.08 0.006Experience (Unenjoyable - Enjoyable) 2.97 ± 0.06 3.16 ± 0.07 0.016Mood (Bored - Engaged) 3.09 ± 0.07 3.17 ± 0.07 0.341Ability to Concentrate 3.21 ± 0.06 3.34 ± 0.07 0.079
Table 3: Average and standard error of users’ responses given the precision of the results.
3. How would you rate your mood while you searched?
4. How hard was it to concentrate while you searched?
Figure 2 shows the user interface for the post-task question-naire. In our analysis, we mapped the 5 point Likert scalefor each question to the values 1 through 5 with the mostnegative response mapped to 1, e.g. “Very Difficult”, and themost positive response mapped to 5, e.g. “Very Easy”, andthe neutral response mapped to 3.
2.1 Experiment FactorsThe factors of our experiment include the phase of the
study, the task order, the topic, the user, and the precisionof the ranked list. The responses that we examine are the 4post-task questions that we asked of each user.
Phase The experiment had two phases, phase 1 and 2,as described above. The phase of the experiment containsa possible order effect. Phase 1 of the experiment alwaysoccurred before phase 2. The user interface was tied to thephase of the experiment.
Task Users completed two 1 hour sessions. A sessioncorresponded to a phase of the experiment, and each ses-sion included 4 tasks. We number the tasks 1 through 4.Search topics and precision levels were rotated across tasksand balanced across all other factors. Of the eight topics,users would complete 4 of the 8 in phase 1 and the remaining4 in phase 2.
Topic As described above, the experiment used the 8topics shown in Table 1.
User We continued to recruit participants until afterdata cleaning [5] we had a completely balanced experimentwith 48 users. Each user completed both phases.
Precision We looked at two levels of precision. For agiven topic, users would receive either the higher or lowerprecision ranked list of documents. We carefully constructedthe ranked lists of documents to produce near uniform lev-els of precision at rank N . As such, the ranked lists havenear equal precision at N , mean average precision (MAP),and R-precision (precision at the number of known relevantdocuments, R). The lower level of precision was 0.3 and thehigher level of precision was 0.6. We choose these levels ofprecision based on the range of precision at 10 for the runswithout obvious errors submitted to the TREC 2005 Robusttrack.
3. RESULTS AND DISCUSSIONFor each of the post-task questions, we performed an anal-
ysis of variance (AOV) with the question as the response. Ascan be seen in Table 2, precision has a statistically significantimpact on perceived difficulty of finding relevant documents(p = 0.006). Table 3 reports the average response and AOVp-value for each question given the two levels of precision.As expected, the user and topic also have a significant im-pact on perceived difficulty and all other responses. Theuser interface (phase) and task order did not impact per-ceived difficulty. The task order had no significant effect onany of the responses.
Precision also had a statistically significant effect on theenjoyability of the search experience (p = 0.049). It ap-pears that users felt that their concentration was better withhigher precision (p = 0.079), but this effect was not as strongas for difficulty or enjoyability. There is no evidence thatprecision affected the mood (engagement) of the users (p =0.341).
The phase did have a significant effect on both the enjoy-ability (p = 0.003) and mood (p = 0.005) of the users. Usersenjoyed and felt more engaged with phase 2 than with phase1, but because the user interface was not rotated acrossphases, we cannot draw any conclusion about the effect ofthe user interface on the user. We hypothesize that theweb-like interface of phase 2 was the cause of the improvedenjoyability and mood. There is no evidence of either phasemaking the user feel as though it was easier to find relevantdocuments (p = 0.893).
To give some sense of the variability in the topics, Figure 3shows the user performance for both phases and topics. Ofthe many possible ways to define and measure topic diffi-culty, one objective measure is the number of documentsfound relevant by the user in 10 minutes.
Of note, for the results shown in Figure 3, precision is acontrolled variable. With an actual retrieval system, usersmight be able to easily obtain high precision results for onetopic but not for the other. For example, Bailey et al. [3]found topics 336 and 367 to be “easy” topics based on thenDCG scores for queries obtained from users. Topic 336 iscertainly not “easy” if we take the number of relevant docu-ments found in 10 minutes as our measure of topic difficulty.For phase 2, topic 336 was one of the more difficult topics asmeasured by number of documents saved as relevant. Topic
22
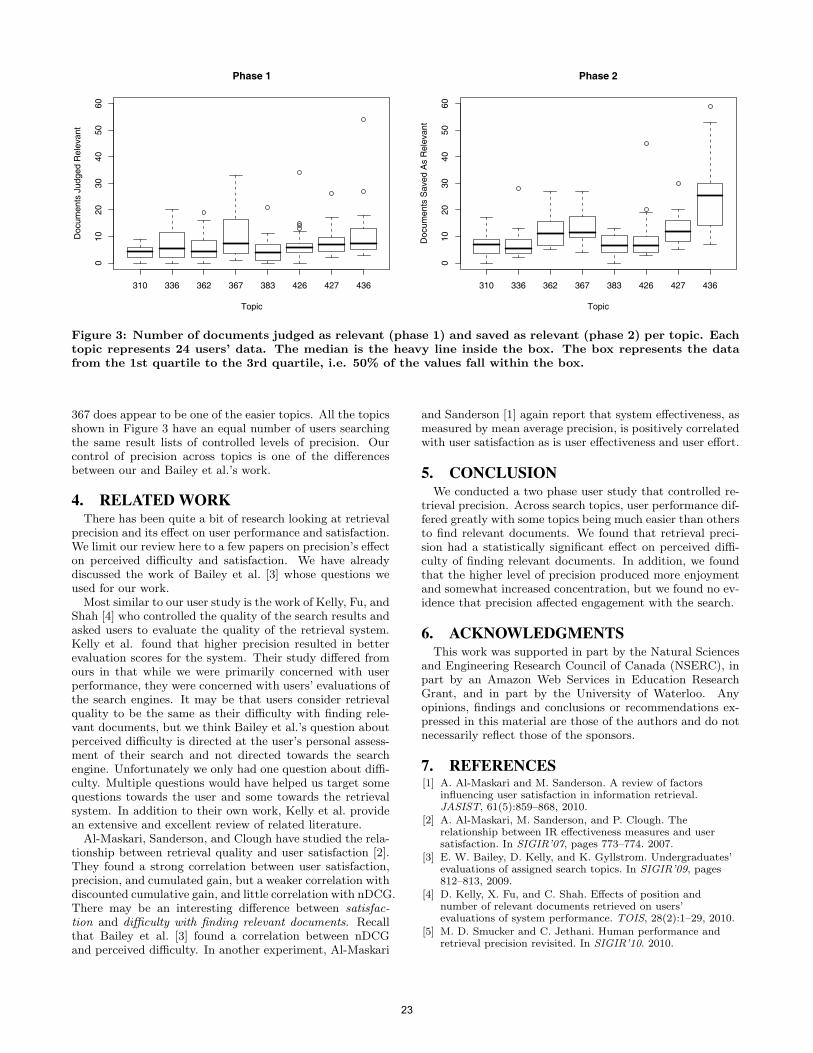
310 336 362 367 383 426 427 436
010
2030
4050
60
Phase 1
Topic
Doc
umen
ts J
udge
d R
elev
ant
310 336 362 367 383 426 427 436
010
2030
4050
60
Phase 2
Topic
Doc
umen
ts S
aved
As
Rel
evan
t
Figure 3: Number of documents judged as relevant (phase 1) and saved as relevant (phase 2) per topic. Eachtopic represents 24 users’ data. The median is the heavy line inside the box. The box represents the datafrom the 1st quartile to the 3rd quartile, i.e. 50% of the values fall within the box.
367 does appear to be one of the easier topics. All the topicsshown in Figure 3 have an equal number of users searchingthe same result lists of controlled levels of precision. Ourcontrol of precision across topics is one of the differencesbetween our and Bailey et al.’s work.
4. RELATED WORKThere has been quite a bit of research looking at retrieval
precision and its effect on user performance and satisfaction.We limit our review here to a few papers on precision’s effecton perceived difficulty and satisfaction. We have alreadydiscussed the work of Bailey et al. [3] whose questions weused for our work.
Most similar to our user study is the work of Kelly, Fu, andShah [4] who controlled the quality of the search results andasked users to evaluate the quality of the retrieval system.Kelly et al. found that higher precision resulted in betterevaluation scores for the system. Their study differed fromours in that while we were primarily concerned with userperformance, they were concerned with users’ evaluations ofthe search engines. It may be that users consider retrievalquality to be the same as their difficulty with finding rele-vant documents, but we think Bailey et al.’s question aboutperceived difficulty is directed at the user’s personal assess-ment of their search and not directed towards the searchengine. Unfortunately we only had one question about diffi-culty. Multiple questions would have helped us target somequestions towards the user and some towards the retrievalsystem. In addition to their own work, Kelly et al. providean extensive and excellent review of related literature.
Al-Maskari, Sanderson, and Clough have studied the rela-tionship between retrieval quality and user satisfaction [2].They found a strong correlation between user satisfaction,precision, and cumulated gain, but a weaker correlation withdiscounted cumulative gain, and little correlation with nDCG.There may be an interesting difference between satisfac-tion and difficulty with finding relevant documents. Recallthat Bailey et al. [3] found a correlation between nDCGand perceived difficulty. In another experiment, Al-Maskari
and Sanderson [1] again report that system effectiveness, asmeasured by mean average precision, is positively correlatedwith user satisfaction as is user effectiveness and user effort.
5. CONCLUSIONWe conducted a two phase user study that controlled re-
trieval precision. Across search topics, user performance dif-fered greatly with some topics being much easier than othersto find relevant documents. We found that retrieval preci-sion had a statistically significant effect on perceived diffi-culty of finding relevant documents. In addition, we foundthat the higher level of precision produced more enjoymentand somewhat increased concentration, but we found no ev-idence that precision affected engagement with the search.
6. ACKNOWLEDGMENTSThis work was supported in part by the Natural Sciences
and Engineering Research Council of Canada (NSERC), inpart by an Amazon Web Services in Education ResearchGrant, and in part by the University of Waterloo. Anyopinions, findings and conclusions or recommendations ex-pressed in this material are those of the authors and do notnecessarily reflect those of the sponsors.
7. REFERENCES[1] A. Al-Maskari and M. Sanderson. A review of factors
influencing user satisfaction in information retrieval.JASIST, 61(5):859–868, 2010.
[2] A. Al-Maskari, M. Sanderson, and P. Clough. Therelationship between IR effectiveness measures and usersatisfaction. In SIGIR’07, pages 773–774. 2007.
[3] E. W. Bailey, D. Kelly, and K. Gyllstrom. Undergraduates’evaluations of assigned search topics. In SIGIR’09, pages812–813, 2009.
[4] D. Kelly, X. Fu, and C. Shah. Effects of position andnumber of relevant documents retrieved on users’evaluations of system performance. TOIS, 28(2):1–29, 2010.
[5] M. D. Smucker and C. Jethani. Human performance andretrieval precision revisited. In SIGIR’10. 2010.
23
Exploratory Searching As Conceptual Exploration Pertti Vakkari
University of Tampere FIN-33014, Finland
ABSTRACT The aim of this paper is to analyze the characteristics of exploratory searching for inferring ideas on how to evaluate exploratory search systems. Exploratory searching is defined as conceptual exploration. Information search process is divided into major stages. Goals, criteria and measures of attaining goals in explicating information need and formulating search are proposed. They can be applied for evaluating search systems aiming at supporting these two stages in searching.
Categories and Subject Descriptors H.3.3 [Information Search and Retrieval]
General Terms Measurement, Performance, Human Factors.
Keywords Exploratory Search Systems, Search Process, Outcomes, Evaluation
1. INTRODUCTION Studies on exploratory searching have gained popularity in recent years, although the same phenomenon has been studied earlier by other names like information search process [6] or task-based searching [13; 14]. Exploratory searching is understood here as searching for learning or investigative activities as defined in [8]. If learning is the ultimate goal of the activity generating searching it is evident that the paradigmatic model of evaluating interactive information retrieval [2; 4; 15] is not sufficient for evaluating exploratory searching. It focuses too much on assessing the output of the search system, not sufficiently observing the outcome of the system. Outputs are the products delivered by a system, whereas outcomes are the benefits the system produces to its users [11]. Typical output in IIR evaluation is the number of relevant items retrieved. The outcome of searching like growing understanding of the topic or to which extent the system supports searchers reaching their goals at various stages of search process is typically left without notice [cf. 14]. There is a need to develop ideas for evaluating exploratory search systems based on a deeper understanding of exploratory searching [cf. 15]. The aim of this paper is to analyze exploratory searching for
creating ideas on how to evaluate exploratory search systems. First, the nature of activities leading to exploratory searching is discussed briefly. Based on that, information search process is conceptualized as representations of concepts and their relations in humans and documents [4]. After that exploratory searching is analyzed and ideas for evaluating search systems are introduced consisting of goals, evaluation criteria and their measures for the beginning stages of searching.
2. EXPLORATORY ACTIONS A common feature of actions leading to exploratory searching is that the actor has insufficient information for solving an ill-structured problem for proceeding in her task [6; 13; 15]. This situation is called e.g. anomalous state of knowledge (ASK) [2] or uncertainty [6]. It is typical that the actor has problems to explicitly express her information need. This kind of ill-structured problems 1) begin with a lack of information necessary to develop a solution or even precisely define the problem, 2) have no single right approach for solution, 3) have problem definitions that change as new information is gathered, and 4) have no identifiable ‘correct’ solution [3]. Creating a solution is a gradual learning process, which implies integrating new information into existing mental models [3; 5]. Understanding learning as conceptual change [10] allows us to conceptualize mental models as consisting of concepts and their relations. This notion matches with the cognitive view of information retrieval, which conceptualizes information as knowledge structures both in humans and documents [4]. Exploratory searching is generated in situations, when actors’ mental models lack concepts and relations between concepts for accurately representing the task. They have insufficient concepts and insufficient relations in their knowledge structure [12]. We claim that exploring concepts and their relations is a major characteristic of exploratory searching. Thus, we may say, that actors search information for obtaining concepts and their relations in order to understand, structure and represent their task more validly for proceeding in its performance. In an ASK when actors have insufficient conceptual understanding, the goal of information searching is to help to understand and structure their task. By implication, the goal of exploratory search systems is to support the search process so that the searchers’ understanding of their task grows and becomes more structured, and therefore produces more useful information items. Consequently, the evaluation of exploratory search systems includes both to which extent they support the search process, and produce useful information items [cf. 2].
3. EVALUATION Evaluation begins typically by analyzing what is the goal of the system, process or service to be evaluated. It is assessed to what extent the object of evaluation attains the goals defined [11]. This requires that we have an understanding of which factors are
Permission to make digital or hard copies of all or part of this work for personal or classroom use is granted without fee provided that copies are not made or distributed for profit or commercial advantage and that copies bear this notice and the full citation on the first page. To copy otherwise, or republish, to post on servers or to redistribute to lists, requires prior specific permission and/or a fee. Conference’10, Month 1–2, 2010, City, State, Country. Copyright 2010 ACM 1-58113-000-0/00/0010…$10.00.
24
associated in reaching the goal, i.e. what means are used to attaining it. In evaluation a distinction is made between outputs and outcomes. Outputs are the products delivered by a system, whereas outcomes are the benefits the system produces to its users [11]. Therefore, in evaluating exploratory search systems, one has to focus on the benefits the system produces to users during the search process, and on benefits the information items retrieved produce to the searchers’ task.
For analyzing the outcomes of the system to users, we divide the search process into three main stages: explicating information need, search formulation, and evaluating search results. Search formulation can be divided into two elements; term selection and query formulation [1]. The former means expressing information need in search terms, and the latter combining terms for formulating a query. In this paper we focus on explicating information need and search formulation.
4. EXPLICATING INFORMATION NEED 4.1 Measuring conceptual constructs The goal of explicating information need is to articulate it so that the actor has a growing understanding of the task for proceeding in its performance. Information need refers to insufficient conceptual construct (mental model) representing the task, which lacks necessary concepts and relations [12]. If the actor does not know much about her task, there may be alternative ways of conceptualizing the task and proceeding in its performance. A predefined, given conceptual structure to be used does not exist. The actor has to construct it incrementally while proceeding in the task. Kuhlthau’s model indicates how the actor’s understanding of a topic changes from vague to clear by formulating a focus [6], i.e. by constructing a necessary conceptual representation. Thus, the conceptual construct representing the task can be reconstructed only afterwards. The actor’s knowledge structure can be measured by observing the number of concepts and their relations that it consists of. Changes in the conceptual construct indicate to which extent the actor has been successful in explicating her information need. If the goal of an exploratory search system is to help the searcher to express information need by explicating the concepts and relations it consists of, then the degree to which the articulation covers these concepts and their interrelations is the criterion of success. This criterion is easy to apply to the given search tasks (topics) in retrieval experiments, because they contain the description of the information needs (topics). They are predefined, known in advance and do not change during the search process [4]. Thus, success can be measured by the proportion of articulated concepts of all concepts the topic consists of. In tasks generated by actors the application of previous criterion is possible only afterwards. In an ASK it is not possible to know in advance the exact conceptual structure of information need [cf. 2]. However, there is some evidence of how conceptual construct changes when actors’ understanding grows. In general, it changes from vague to precise [6; 13]. The extension of concepts decreases, the number of sub-concepts increases, and the number of connections between the concepts increases [5; 10]. This hints, that growth of understanding consists of an increasing number of concepts and their relations, and of the specificity of conceptual construct. Thus, increase in the number of concepts and in the
number of interrelations between these concepts, as well as in the specificity of conceptual construct are the criteria for success of explicating information need for searching. Specificity is reflected in the actors’ ability to differentiate a concept into sub-concepts. This can roughly be measured by the proportion of sub-concepts of all concepts the conceptual construct consists of [cf. 9]. Measures and criteria of success are presented in table 1. Table 1. Measures of success in explicating information need
Measure Criteria of success
Exhaustivity = # of concepts articulated
Increase in the # of concepts articulated in ASK, or Increase in the proportion of concepts articulated in given topics
Specificity = the proportion of sub-concepts of all concepts articulated
Increase in the proportion of sub-concepts of all concepts articulated
Combined measure Increase in the # of concepts added by the increase in the number of specified concepts (greater weight)
Conceptual integration = # number of links expressed between concepts
Increase in the # links between concepts
4.2 Measuring conceptual change Explication of information need for constructing a focus, i.e. when is it fully represented as concepts, may require several iterations within a search session or even several sessions. In the following we focus on changing information needs [cf. 4] for presenting criteria of success in explicating them after the initial search. If the information need is vague after the initial search, the actor continues explicating it. We may distinguish between two types of conceptual changes. The first one is conceptual continuity, which is based on the concepts explicated in the initial search. Conceptual change refers to the situation when the actor replaces at least an existing concept in the conceptual construct by a new concept with differing extension.
In conceptual continuity new explication includes either new concepts or specifications of the concepts explicated in the initial search or both. The specification of a concept means that its extension is smaller than the original one, but it belongs mainly to original extension. It is a class inclusion. An example of this is the specification of the concept “information seeking” as “information retrieval”. Introducing new concepts or specifying old ones is likely to lead to a more specific articulation of information need. As stated earlier the increase in the number of concepts and their interrelations in explicating information need are the criteria of success. Also the proportion of sub-concepts of all concepts explicated can be used as a measure of the specificity of the conceptual construct (table 1). An additional measure of the specificity could be the proportion of concepts in the initial search (previous iteration) specified in the next iteration. It is possible to form a combined measure for the success of explicating information need after the initial search. For each new concept that is introduced in the conceptual construct the weight of e.g. 1 is given, and for each old concept specified e.g. the
25
weight 1.5. The greater weight is assigned to specification, because it adds value to the original concept by limiting its extension. The measure is the sum of the values of the new and specified concepts. This combined measure gives a rough estimate in the increase of the articulation of information need.
In conceptual change at least one old concept in the information need is replaced by a new one with differing extension. Other concepts may be unchanged or specified. It is difficult to infer, how replacing concepts increases the actor’s understanding of information need. In which cases it is justified to claim that the replacing of concepts has increased the understanding of information need? If a concept or concepts are replaced without specifying the remaining ones, it is likely that the actor is surveying the conceptual space of the information need not being able to decide how to specify it. She may be looking for alternative explications among which to choose. We call this activity as conceptual mapping. It resembles Bates’ vary tactics replacing an existing search term by another [1]. In our case, it is likely that the actor’s information need has not become more specific, but it has changed on the same level of specificity. Introducing new concepts in the conceptual construct typically includes creating new relationships between the new and old ones. These relationships contribute to the meaning of the construct [5]. If the actor specifies at least one of the remaining concepts when replacing one or more concepts, this hints that the relations to the new, replacing concepts have helped her to specify the original concept. The meanings of the replacing concepts have contributed in specifying the meaning of the original concept. Thus, at least in part of the specified concept the information need is more specifically articulated. This specification hints also that the replacing concepts are in some way more specific than the replaced concepts, implying that the explication of the whole information need is more specific. We may measure the success of explicating conceptually changing information need as follows. In replacing concepts, the number of concepts does not increase, and thus the understanding has not grown in the sense of a more specific information need. However, replacing may lead to selecting a conceptual alternative among the surveyed concepts, and help the searcher to articulate information need. Therefore, only the concept, which is selected after varying concepts, will receive the weight (e.g. 1). If replacement is associated with the specification of at least one original concept, then each specified concept is assigned the weight 1.5.
5. SEARCH FORMULATION Search formulation is divided into term selection for representing search concepts, and query formulation for combining search terms as a query [1]. We discuss first about term selection, and then query formulation.
5.1 Term selection For evaluating exploratory search system providing support in term selection, we have to define the goal of term selection in order to be able to infer criteria of success. This goal can be understood from the angle of expressing information need or from the angle of information retrieval. Term selection based on information need requires that an actor is able to express the concepts it consists of as search terms. The
goal of term selection is thus to express the concepts of information need. The exhaustivity of query refers to the extent to which the concepts of information need are expressed in the query [7]. Thus, the more exhaustive the query, the more successful term selection is from the angle of expressing the information need. From the angle of information retrieval it has been typical to reduce the success in term selection to the number of relevant items retrieved based on new terms in the query, and inferred measures like precision or recall. Depending on whether the goal of searching is recall or precision, there are known procedures to aim at those goals. Other factors controlled, increasing the exhaustivity and specificity of query increases precision, whereas increasing the extent of the query (# of terms per concept) increases recall [7]. In exploratory searching the actor does not know exactly the concepts her information need consists of, but she tries to articulate them. How would measures like precision or recall reflect to which extent the actor has been successful in articulating the information need and expressing it by search terms? It seems that those measures are not very meaningful in estimating the success of those activities and the help provided by the system.
However, it is suggested that investigative searching is more concerned about recall (maximizing the number of possible relevant objects) than precision (minimizing the number of possibly irrelevant objects) [8]. When actors are exploring possible conceptualizations of their topic in order to formulate a focus, they are typically confused and overwhelmed with information. Information seems inconsistent and incompatible with their prior conceptual constructs [6]. In a situation like this, it is not likely that actors are concerned with recall, but precision. They are not interested in finding most of the documents, which would provide them with ideas in structuring the topic, but a sufficient number for formulating a focus. When the information need is structured containing all the necessary concepts, i.e. when it is stable [4], then it is likely that actors are concerned with recall and aim at comprehensive searches on the topic. Thus, in pre-focus stage, searching is precision oriented, whereas in post-focus stage it is recall oriented.
If searching aims at precision in pre-focus stage, then most productive in term selection is to express all the concepts of information need in search terms. As known, increasing exhaustivity increases precision [7].
5.2 Query formulation Broadening the view from term selection to query formulation may be a more fruitful approach to evaluate search success. In exploratory searching query formulation is open due to the fact that not all concepts in information need are known. The actor aims at finding documents, which would provide her with ideas of how to structure her topic. She tries to find conceptual alternatives within the scope of her information need, and to compare those alternatives [cf. 8; 9]. It is a question about finding connections between concepts, i.e. finding propositions which connect concepts in a meaningful way. A proposition asserts something about two or more concepts and their relations [10].
As stated earlier, growth of understanding is characterized by the increasing number of concepts and their interrelations (i.e. propositions), and by the specificity of concepts. In order to structure information need, the actor should use search tactics that
26
would help her in exploring document space accordingly. A typical way of expanding and mapping conceptual structure is by adding a concept in a query and replacing it by another one leading to vary tactics [1]. Empirical findings confirm, that vary tactics are used for mapping conceptually the search topic [9]. The same study also showed, that searchers quite systematically chunked the search topic into conceptually smaller fields by using successive facets for inspecting the items retrieved [9].
A means of specifying concepts is to provide an actor with the sub-concepts of the concepts in her information need [cf. 1]. E.g. if one is interested in evaluating information searching, it would be beneficial, if the system could provide her with sub-concepts like process evaluation and product evaluation, or efficiency and effectiveness. This is likely to help in specifying her information need. The discussion above hints that structuring searching conceptually both in expressing information need and formulating search would be beneficial in exploratory searching. Consequently, exploratory search systems should provide actors with tools that help them conceptually map and structure the topic of their information need and formulating search tactics accordingly. Distinction between expressing information need and selecting search terms is an analytical one. In searching actors engage in both activities simultaneously. Therefore, it is important that querying facility in exploratory search systems helps searchers to explicitly structure their search formulation conceptually, and that it also provides them with a tool for specifying their search terms e.g. into hierarchically narrower terms.
6. CONCLUSIONS We have explicated the major stages in exploratory searching, and suggested some criteria for evaluating exploratory search systems especially at the early stages in exploration. Our ideas extend the evaluation paradigm from a focus only on the output of the system onto the whole search process. In evaluation of systems and services, the point of departure is to assess to which extent the goal of the system is achieved [11]. It seems that one of the major limitations in interactive evaluation has been to focus on only one goal of information retrieval, optimizing the output in terms of the number of relevant items retrieved. Although this is a necessary condition for a successful information retrieval, the search process is in its turn a necessary condition for a good retrieval result. Therefore, in evaluating search systems, it is important to assess to what extent the search process variables reach their objectives, and through those objectives contribute to retrieval effectiveness [cf. 2]. A major implication of our analysis is that in system evaluation it is critical to define the goals of the tools assessed in improving human performance in information searching. Without reflecting and defining the objectives of the system it is difficult to infer appropriate evaluation criteria. This is of special importance in evaluating tools for supporting exploratory searching. In exploration it is as critical to support the search process and structuring of the topic, as it is to retrieve relevant items [13; 15]. Surveying information space with appropriate tools is likely to contribute to structuring the topic and expressing the information need as search terms leading to growing understanding of the topic and as a consequence, more useful search results. Thus, the exploratory search system should help the user to attain several
search goals from explicating the information need to finding documents conceptually matching that need [8; 15]. It is important to assess to which extent the system attains these various goals. We have excluded from the analysis of search process the evaluation of search results. Our next step is to analyze assessing retrieval results as conceptual exploration. We seek to infer measures of success in this activity understood as conceptual correspondence between searcher’s conceptual construct and author’s conceptual construct in the document retrieved [12]. It is possible to extend this conceptualization also to cover the benefits information retrieval systems produce to task performance, the ultimate goal of these systems. By representing task as a conceptual construct it is possible to relate task performance process to search process as we have described it in this study. This procedure implies that we are able to model and assess how the search process and the use of information in the items retrieved contribute to task performance.
7. REFERENCES [1] Bates, M.J. 1979. Information search tactics. JASIS 30, 205-
214. [2] Belkin, N. J. 1993. Interaction with texts: information
retrieval as information-seeking behavior. In Information Retrieval ´93. Konstanz : Universitetsverlag Konstanz, 55-66.
[3] Gallagher, S., Sher, B., Stepien, W. and Workman, D. 1995. Implementing problem-based learning in science classrooms. School Sci. and Math. 95, 136-140.
[4] Ingwersen, P. and Järvelin, K. 2005. The Turn: Integration of Information Seeking and Retrieval in Context. Springer, Dordrecht.
[5] Kintsch, W. 1998. Comprehension. A paradigm for cognition. Cambridge UP, Cambridge.
[6] Kuhlthau, C. 1993. Seeking Meaning. Ablex, Norwood, N.J. [7] Lancaster, W. and Warner, A. 1993. Information retrieval
today. Information Resources Press, Arlington, VA.
[8] Marchionini, G. 2006. Exploratory search. Comm. ACM 49, 41-46.
[9] Pennanen, M. and Vakkari, P. 2003. Students’ conceptual structure, search process and outcome while preparing a research proposal. JASIST 54,759-770.
[10] Rebich,S. and Gautier, C. 2005. Concept mapping to reveal prior knowledge and conceptual change in a mock summit course on global climate change. J. Sci. Educ. 53, 355-365.
[11] Rossi, P., Lipsey, M. and Freeman, H. 2004. Evaluation. A systematic approach. 7th ed. Sage, Thousand Oaks.
[12] Vakkari, P. 1999. Task complexity, problem structure and information actions. IP&M 35, 819-837.
[13] Vakkari, P. 2001. A Theory of the task-based information retrieval process. J. Doc. 57, 44-60.
[14] Vakkari, P. 2003. Task-based information searching. In ARIST 37 (B. Cronin, Ed.) Information Today, Medford, NJ., 413-464.
[15] White, R.W. and Roth, R. 2009. Exploratory search. Morgan & Claypool.
27
Casual-leisure Searching: the Exploratory Searchscenarios that break our current models
Max L. WilsonFuture Interaction Technologies Lab
Swansea University, [email protected]
David ElsweilerDepartment of Computer Science (8 AI)
University of Erlangen, [email protected]
ABSTRACTIn trying to understand Exploratory Search, the communityhas focused on users who are working towards an informa-tion need, but who are unclear of their goal, technology,or domain of information. Our recent research, however,suggests that this definition misses perhaps the most ex-ploratory search scenario of all - scenarios where the goalis not information-oriented. We present combined evidencefrom two on-going research projects, which demonstratesthat such situations occur regularly within casual-leisure sit-uations. We use our findings to characterise such tasks andsuggest that casual-leisure search scenarios deserve more fo-cus as we work towards supporting exploratory search.
KeywordsExploratory Search, Information Needs, Casual Search
1. INTRODUCTIONIn trying to understand Exploratory Search, the commu-
nity has focused on users who are working towards solv-ing an information need, but who are unclear of their goal,technology, or domain of information. Exploratory searchestypically involve learning or investigating. Similarly, Infor-mation Seeking typically presumes the resolution of an in-formation need. In two separate research projects, however,we have recorded several examples of real-life informationbehaviours that are outside of our definition of ExploratorySearch, and do not fit the model of ‘Work Tasks’ at home.Although neither project was focused on exploratory search,both revealed novel scenarios that we believe need more fo-cus in our community. These novel scenarios include userswith no explicit information need to solve and where theact of searching is often of greater importance than the con-tent found. Such scenarios, which occur regularly in casual-leisure situations [12], are often more exploratory than thenotions of learning and investigation that we currently workwith, and are sometimes performed for much longer periodsof time.
Permission to make digital or hard copies of all or part of this work forpersonal or classroom use is granted without fee provided that copies arenot made or distributed for profit or commercial advantage and that copiesbear this notice and the full citation on the first page. To copy otherwise, torepublish, to post on servers or to redistribute to lists, requires prior specificpermission and/or a fee.Copyright 200X ACM X-XXXXX-XX-X/XX/XX ...$5.00.
In the following sections we first summarise importantinformation seeking and exploratory search research, anddiscuss related work from leisure-studies, which frames ourrecent findings. We then provide an overview of our tworesearch projects, highlighting the findings on casual-leisureinformation behaviours. We conclude by presenting an ini-tial definition of casual-leisure searching and discuss the im-pact that our results may have on how we define and studyexploratory search.
2. RELATED WORKOur models of Information Retrieval (IR), Information
Seeking (IS), Exploratory Search(ES) and Sensemaking areall typically information focused. IR is well established asthe more technical returning of relevant documents or in-formation in relation to a specific given query. IS is morebehaviour-oriented, describing the resolution of an informa-tion need [8]. ES is defined as trying to resolve an informa-tion need when the searcher has limited knowledge of theirgoal, domain, or search system [13], normally involving somekind of learning or investigating behaviour [9]. Sensemakinghas been described as bridging a knowledge gap [2]. Each ofthese definitions underlines the assumption that searchingoccurs to find information (or media, etc).
Investigations have revealed that these situations are oftenmotivated by work tasks [6], where one or more informationseeking episodes help resolve a higher level need. It is typ-ical within the IS community to consider that ExploratorySearch or Sensemaking occurs in order to write a report, andthat as part of IS process, IR is performed to find references.Included in the definition of ‘Work Tasks’ is the notion ofpersonal work tasks, such as buying a car or booking a hol-iday (e.g. [10]).
Despite including “personal tasks”, most of the modelsunderpinning the mentioned research stem from library andinformation science, which has historically focused on workcontexts. However, technological advances and cultural changesmean that information now pervades peoples’ everyday livesand non-work scenarios have become increasingly importantwith respect to information behaviour research [5, 4]. Steb-bins [12] characterises non-work or leisure activities as hedo-nic in nature, the benefits of which include 1) Serendipity;2) Edutainment; 3) Regeneration or re-creation; 4) Main-tenance of interpersonal relationships; and 5) Well-being.Stebbins distinguishes between 3 different leisure situations:Serious leisure, e.g. serious hobbies or volunteer activities;Project-based leisure e.g. planning a holiday or car purchase;and Casual leisure short, pleasurable activities requiring lit-
28
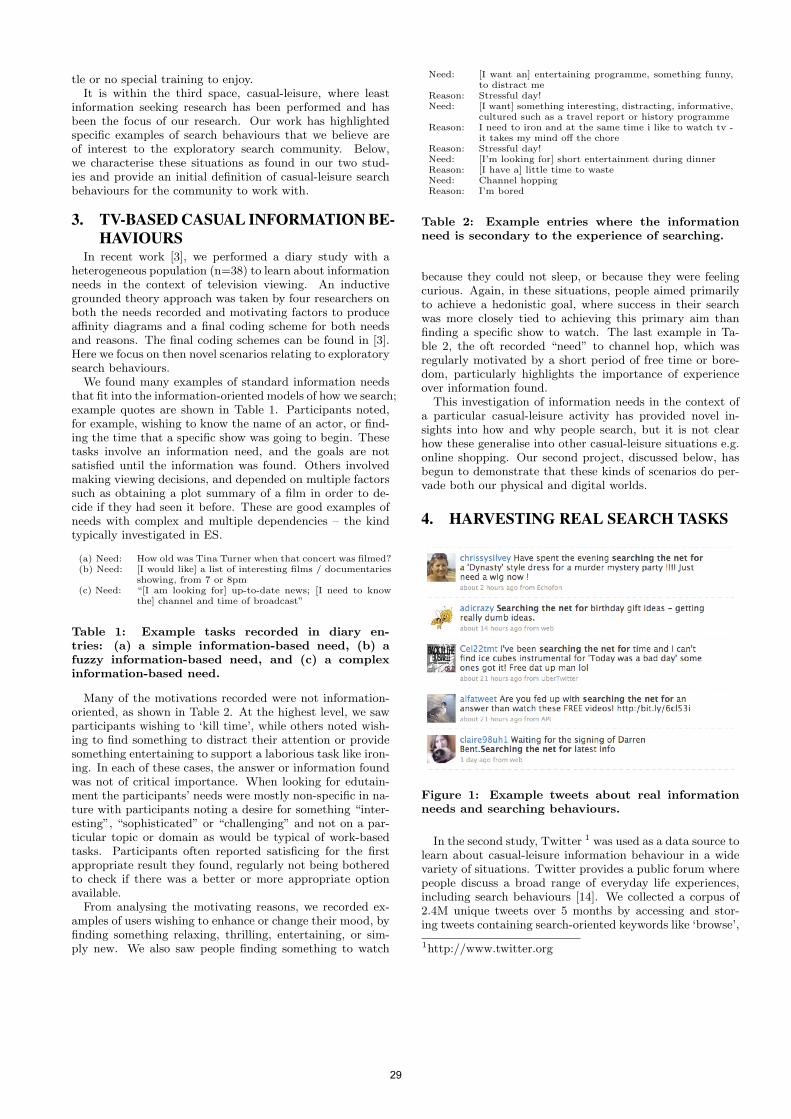
tle or no special training to enjoy.It is within the third space, casual-leisure, where least
information seeking research has been performed and hasbeen the focus of our research. Our work has highlightedspecific examples of search behaviours that we believe areof interest to the exploratory search community. Below,we characterise these situations as found in our two stud-ies and provide an initial definition of casual-leisure searchbehaviours for the community to work with.
3. TV-BASED CASUAL INFORMATION BE-HAVIOURS
In recent work [3], we performed a diary study with aheterogeneous population (n=38) to learn about informationneeds in the context of television viewing. An inductivegrounded theory approach was taken by four researchers onboth the needs recorded and motivating factors to produceaffinity diagrams and a final coding scheme for both needsand reasons. The final coding schemes can be found in [3].Here we focus on then novel scenarios relating to exploratorysearch behaviours.
We found many examples of standard information needsthat fit into the information-oriented models of how we search;example quotes are shown in Table 1. Participants noted,for example, wishing to know the name of an actor, or find-ing the time that a specific show was going to begin. Thesetasks involve an information need, and the goals are notsatisfied until the information was found. Others involvedmaking viewing decisions, and depended on multiple factorssuch as obtaining a plot summary of a film in order to de-cide if they had seen it before. These are good examples ofneeds with complex and multiple dependencies – the kindtypically investigated in ES.
(a) Need: How old was Tina Turner when that concert was filmed?(b) Need: [I would like] a list of interesting films / documentaries
showing, from 7 or 8pm(c) Need: “[I am looking for] up-to-date news; [I need to know
the] channel and time of broadcast”
Table 1: Example tasks recorded in diary en-tries: (a) a simple information-based need, (b) afuzzy information-based need, and (c) a complexinformation-based need.
Many of the motivations recorded were not information-oriented, as shown in Table 2. At the highest level, we sawparticipants wishing to ‘kill time’, while others noted wish-ing to find something to distract their attention or providesomething entertaining to support a laborious task like iron-ing. In each of these cases, the answer or information foundwas not of critical importance. When looking for edutain-ment the participants’ needs were mostly non-specific in na-ture with participants noting a desire for something “inter-esting”, “sophisticated” or “challenging” and not on a par-ticular topic or domain as would be typical of work-basedtasks. Participants often reported satisficing for the firstappropriate result they found, regularly not being botheredto check if there was a better or more appropriate optionavailable.
From analysing the motivating reasons, we recorded ex-amples of users wishing to enhance or change their mood, byfinding something relaxing, thrilling, entertaining, or sim-ply new. We also saw people finding something to watch
Need: [I want an] entertaining programme, something funny,to distract me
Reason: Stressful day!Need: [I want] something interesting, distracting, informative,
cultured such as a travel report or history programmeReason: I need to iron and at the same time i like to watch tv -
it takes my mind off the choreReason: Stressful day!Need: [I’m looking for] short entertainment during dinnerReason: [I have a] little time to wasteNeed: Channel hoppingReason: I’m bored
Table 2: Example entries where the informationneed is secondary to the experience of searching.
because they could not sleep, or because they were feelingcurious. Again, in these situations, people aimed primarilyto achieve a hedonistic goal, where success in their searchwas more closely tied to achieving this primary aim thanfinding a specific show to watch. The last example in Ta-ble 2, the oft recorded “need” to channel hop, which wasregularly motivated by a short period of free time or bore-dom, particularly highlights the importance of experienceover information found.
This investigation of information needs in the context ofa particular casual-leisure activity has provided novel in-sights into how and why people search, but it is not clearhow these generalise into other casual-leisure situations e.g.online shopping. Our second project, discussed below, hasbegun to demonstrate that these kinds of scenarios do per-vade both our physical and digital worlds.
4. HARVESTING REAL SEARCH TASKS
Figure 1: Example tweets about real informationneeds and searching behaviours.
In the second study, Twitter 1 was used as a data source tolearn about casual-leisure information behaviour in a widevariety of situations. Twitter provides a public forum wherepeople discuss a broad range of everyday life experiences,including search behaviours [14]. We collected a corpus of2.4M unique tweets over 5 months by accessing and stor-ing tweets containing search-oriented keywords like ‘browse’,
1http://www.twitter.org
29
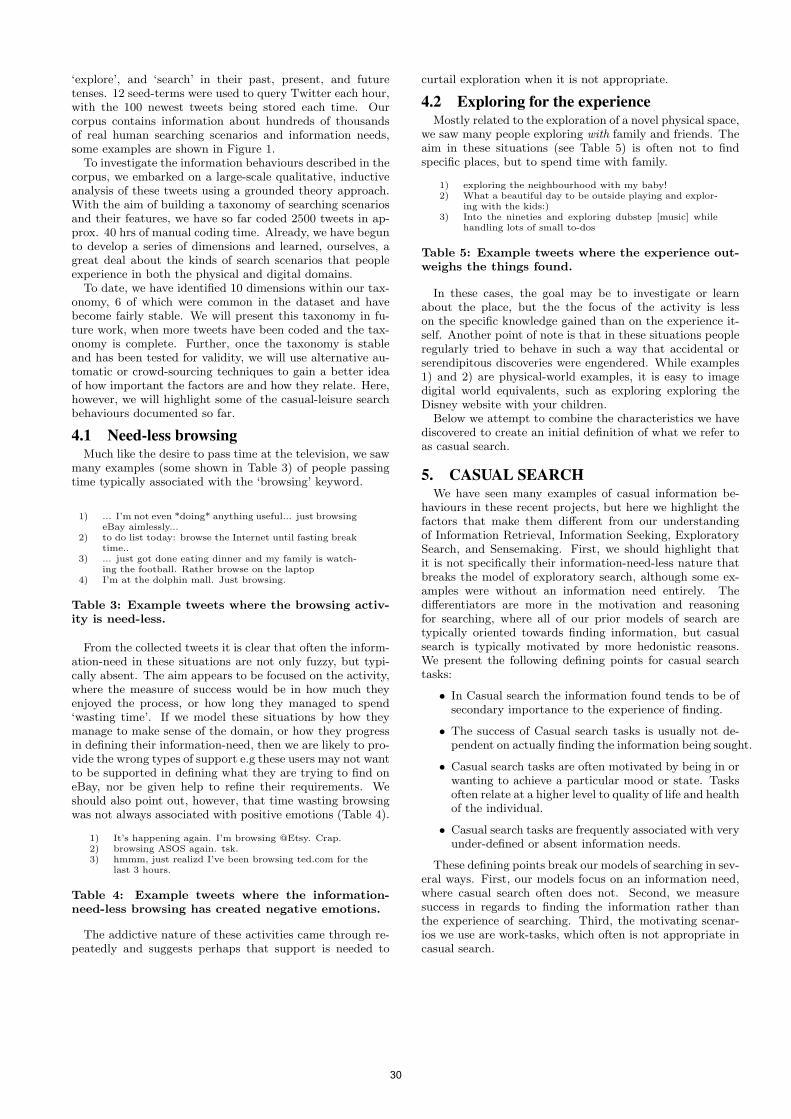
‘explore’, and ‘search’ in their past, present, and futuretenses. 12 seed-terms were used to query Twitter each hour,with the 100 newest tweets being stored each time. Ourcorpus contains information about hundreds of thousandsof real human searching scenarios and information needs,some examples are shown in Figure 1.
To investigate the information behaviours described in thecorpus, we embarked on a large-scale qualitative, inductiveanalysis of these tweets using a grounded theory approach.With the aim of building a taxonomy of searching scenariosand their features, we have so far coded 2500 tweets in ap-prox. 40 hrs of manual coding time. Already, we have begunto develop a series of dimensions and learned, ourselves, agreat deal about the kinds of search scenarios that peopleexperience in both the physical and digital domains.
To date, we have identified 10 dimensions within our tax-onomy, 6 of which were common in the dataset and havebecome fairly stable. We will present this taxonomy in fu-ture work, when more tweets have been coded and the tax-onomy is complete. Further, once the taxonomy is stableand has been tested for validity, we will use alternative au-tomatic or crowd-sourcing techniques to gain a better ideaof how important the factors are and how they relate. Here,however, we will highlight some of the casual-leisure searchbehaviours documented so far.
4.1 Need-less browsingMuch like the desire to pass time at the television, we saw
many examples (some shown in Table 3) of people passingtime typically associated with the ‘browsing’ keyword.
1) ... I’m not even *doing* anything useful... just browsingeBay aimlessly...
2) to do list today: browse the Internet until fasting breaktime..
3) ... just got done eating dinner and my family is watch-ing the football. Rather browse on the laptop
4) I’m at the dolphin mall. Just browsing.
Table 3: Example tweets where the browsing activ-ity is need-less.
From the collected tweets it is clear that often the inform-ation-need in these situations are not only fuzzy, but typi-cally absent. The aim appears to be focused on the activity,where the measure of success would be in how much theyenjoyed the process, or how long they managed to spend‘wasting time’. If we model these situations by how theymanage to make sense of the domain, or how they progressin defining their information-need, then we are likely to pro-vide the wrong types of support e.g these users may not wantto be supported in defining what they are trying to find oneBay, nor be given help to refine their requirements. Weshould also point out, however, that time wasting browsingwas not always associated with positive emotions (Table 4).
1) It’s happening again. I’m browsing @Etsy. Crap.2) browsing ASOS again. tsk.3) hmmm, just realizd I’ve been browsing ted.com for the
last 3 hours.
Table 4: Example tweets where the information-need-less browsing has created negative emotions.
The addictive nature of these activities came through re-peatedly and suggests perhaps that support is needed to
curtail exploration when it is not appropriate.
4.2 Exploring for the experienceMostly related to the exploration of a novel physical space,
we saw many people exploring with family and friends. Theaim in these situations (see Table 5) is often not to findspecific places, but to spend time with family.
1) exploring the neighbourhood with my baby!2) What a beautiful day to be outside playing and explor-
ing with the kids:)3) Into the nineties and exploring dubstep [music] while
handling lots of small to-dos
Table 5: Example tweets where the experience out-weighs the things found.
In these cases, the goal may be to investigate or learnabout the place, but the the focus of the activity is lesson the specific knowledge gained than on the experience it-self. Another point of note is that in these situations peopleregularly tried to behave in such a way that accidental orserendipitous discoveries were engendered. While examples1) and 2) are physical-world examples, it is easy to imagedigital world equivalents, such as exploring exploring theDisney website with your children.
Below we attempt to combine the characteristics we havediscovered to create an initial definition of what we refer toas casual search.
5. CASUAL SEARCHWe have seen many examples of casual information be-
haviours in these recent projects, but here we highlight thefactors that make them different from our understandingof Information Retrieval, Information Seeking, ExploratorySearch, and Sensemaking. First, we should highlight thatit is not specifically their information-need-less nature thatbreaks the model of exploratory search, although some ex-amples were without an information need entirely. Thedifferentiators are more in the motivation and reasoningfor searching, where all of our prior models of search aretypically oriented towards finding information, but casualsearch is typically motivated by more hedonistic reasons.We present the following defining points for casual searchtasks:
• In Casual search the information found tends to be ofsecondary importance to the experience of finding.
• The success of Casual search tasks is usually not de-pendent on actually finding the information being sought.
• Casual search tasks are often motivated by being in orwanting to achieve a particular mood or state. Tasksoften relate at a higher level to quality of life and healthof the individual.
• Casual search tasks are frequently associated with veryunder-defined or absent information needs.
These defining points break our models of searching in sev-eral ways. First, our models focus on an information need,where casual search often does not. Second, we measuresuccess in regards to finding the information rather thanthe experience of searching. Third, the motivating scenar-ios we use are work-tasks, which often is not appropriate incasual search.
30
5.1 DiscussionIn many ways, we are typically aware of these casual in-
formation behaviours in everyday life. Most of us haveourselves wasted time, either intentionally or accidentally,endlessly following links in Wikipedia or watching relatedmovies on youtube. Similarly, services like flickr are for shar-ing and discovering interesting photographs, where trying tofind suitable images for a work task is only one identifiableuse of the system.
Yet our investigations into Exploratory Search, for exam-ple, typically focus on whether people were able to find whatthey wanted. In evaluating the MrTaggy interface [7], forexample, the amount learned was measured by the qualityof subsequent report writing and level of cognitive load. Yetsystems built with social tags are often designed to helppeople discover interesting content. It may be also interest-ing, therefore, to measure how long a user wants to continuean exploratory search task or the affects the task has onhis mood or state. Capra et al [1] chose specifically not touse time as a metric for ES, noting that a good ES sys-tem may encourage people to search for longer. Their tasks,however, had information-oriented learning goals, and so in-creased time would not have been a suitable measure in theircase either. More appropriate measures of casual search arebeginning to arrive. O’Brien et al [11], for example, havedesigned a measure of Engagement, identifying how longpeople remain engaged in an activity, and what factors in-fluence their prolonged engagement. Our work supports theuse of this kind of metric for casual search scenarios.
Beyond challenging the way we measure the success ofexploratory search tasks, we must also consider the way wedefine exploratory search tasks. Currently, we design tasksthat have information-oriented Work Tasks, such as tryingto buy a new piece of technology or writing a report. Wemust consider how we can, with high ecological validity, cre-ate studies where users are provided with hedonistically mo-tivated tasks. Studies could be designed, for example, whereusers are told that there is a unforeseen delay and told theymay use a computer while they wait. Then, when they ap-pear to be bored, or after a reasonable amount of time, thefaux-study continues.
We believe these insights into casual search are particu-larly important for the study of Exploratory Search, whereour working definition of Exploratory Search does not in-clude searchers with non-information oriented goals. Fur-ther, these activities are important to health and wellbe-ing [3]. Some of the casual information behaviours we haveidentified motivate people to explore for websites for hours,but our definition of exploratory search does not cover themall. The community will struggle to design effective sup-port for these lengthy casual search scenarios, or indeed theshort hedonistically motivated searches, if continuing focus-ing on systems that help build knowledge or refine informa-tion needs.
6. SUMMARYIn this paper we have presented initial evidence, from two
recent and on-going research projects, towards a notion ofcasual search. We believe that casual search is not properlycovered by existing definitions of information seeking and ex-ploratory search, but is perhaps one of the more exploratoryscenarios discovered so far. People engaged in casual search
are typically not trying to resolve an information need, andtheir objective is not to learn or investigate. Instead casualsearch involves hedonistically motivated scenarios which in-volves, for example, searching to be entertained and satisfic-ing for any result that, in this case, enjoyable. Consequently,the models and measures we have for exploratory search maynot be sufficiently inclusive, and may need redefining. In-stead, we may wish to focus on measures of maintained en-gagement (e.g. [11]) for how well a search system supportsneed-less exploration.
7. REFERENCES[1] R. Capra, G. Marchionini, J.S. Oh, F. Stutzman, and
Y. Zhang, Effects of structure and interaction style ondistinct search tasks, Proc. JCDL’07, ACM Press,2007, pp. 442–451.
[2] B. Dervin and M. Frenette, Sense-makingmethodology: communicating communicatively withcampaign audience, Sense-Making Methodologyreader: selected writings of Brenda Dervin (BrendaDervin, Lois Foreman-Wernet, and Eric Lauterbach,eds.), Hampton, Cresskil, NJ, 2003, pp. 233–249.
[3] D. Elsweiler, S. Mandl, and B. Kirkegaard-Lunn,Understanding casual-leisure information needs: adiary study in the context of television, Proc. IIiX2010, 3rd Symposium on Information Interaction inContext, 2010.
[4] C. Fulton, Quid pro quo: information sharing inleisure activities, Library Trends 57 (2009), no. 4,753–768.
[5] J. Hartel, The serious leisure frontier in library andinformation science: hobby domains, KnowledgeOrganization 30 (2003), no. 3-4, 228–238.
[6] K. Jarvelin and P. Ingwersen, Information seekingresearch needs extension towards tasks and technology,Information Research 10 (2004), no. 1.
[7] Y. Kammerer, R. Nairn, P. Pirolli, and E. H. Chi,Signpost from the masses: learning effects in anexploratory social tag search browser, Proc. CHI ’09(New York, NY, USA), ACM Press, 2009,pp. 625–634.
[8] G. Marchionini, Information Seeking in ElectronicEnvironments, Cambridge University Press, 1995.
[9] G. Marchionini, Exploratory search: from finding tounderstanding, Commun. ACM 49 (2006), no. 4,41–46.
[10] M. R. Morris, A survey of collaborative web searchpractices, Proc. CHI ’08 (New York, NY, USA), ACM,2008, pp. 1657–1660.
[11] H. L. O’Brien and E. G. Toms, What is userengagement? a conceptual framework for defining userengagement with technology, JASIST 59 (2008), no. 6,1–18.
[12] R. A. Stebbins, Leisure and its relationship to libraryand informations science: bridging the gap, LibraryTrends 57 (2009), no. 4, 618–631.
[13] R. W. White, B. Kules, S. M. Drucker, and m.c.schraefel, Introduction, Commun. ACM 49 (2006),no. 4, 36–39.
[14] M. L. Wilson, Using twitter to assess informationneeds: Early results, Proc. HCIR’09, 2009,pp. 109–112.
31
Search for journalists: New York Times challenge report
Corrado BoscarinoCentrum Wiskunde &
InformaticaScience Park, 123
1098 XG Amsterdam, TheNetherlands
Arjen P. de Vries∗
Centrum Wiskunde &Informatica
Science Park, 1231098 XG Amsterdam, The
Wouter AlinkCentrum Wiskunde &
InformaticaScience Park, 123
1098 XG Amsterdam, TheNetherlands
ABSTRACTWe investigate how a user-centred design to search can im-prove the support of user tasks specific to journalism. Il-lustrated by example information needs, sampled from ourown exploration of the New York Times annotated corpus,we demonstrate how domain specific notions rooted in afield theory of journalism can be transformed into effectivesearch strategies. We present a method for search-contextaware classification of authorities, witnesses, reporters andcolumnists. A first search strategy supports the journalistictask of investigating the trustworthiness of a news source,whereas the second search strategy supports assessments ofthe objectivity of an author. In principle, these strategiescan exploit the semantic annotations in the corpus; however,based on our preliminary work with the corpus, we concludethat straightforward full-text search is still a crucial compo-nent of any effective search strategy, as only recent articlesare annotated, and annotations are far from complete.
Keywordsjournalism, faceted search, interactive IR
1. INTRODUCTION
A rhetoric is a social invention. It arises out ofa time and place, a peculiar social context, es-tablishing for a period the conditions that makea peculiar kind of communication possible andthen is altered or replaced by another scheme.[1]
The particular context where a textual document has beenwritten, the audience an author appeals to, and the goalsshe wants to achieve shape argumentation and the rules awritten text has to comply with in order to be considered
∗Also affiliated to the Delft University of Technology
Permission to make digital or hard copies of all or part of this work forpersonal or classroom use is granted without fee provided that copies arenot made or distributed for profit or commercial advantage and that copiesbear this notice and the full citation on the first page. To copy otherwise, torepublish, to post on servers or to redistribute to lists, requires prior specificpermission and/or a fee.HCIR 2010 New Brunswick USACopyright 20XX ACM X-XXXXX-XX-X/XX/XX ...$10.00.
for publication. Conversely, understanding the features of arhetoric shades some light on the context of a document andon its correct interpretation by a reader.
Journalism is one peculiar discursive practice, which fitswhat, in an attempt to establish a theory of journalism, An-drew R. Cline referred to as an epistemological field [2]. Thismodel for the domain of journalism contains a characterisa-tion of 1) what can and cannot be known, 2) the nature ofthe knower, 3) the nature of the relationships among theknower, the known, and the audience, and 4) the nature oflanguage. Legitimate questions within this domain are “howto correctly represent a fact?”, “why should I trust a certainsource?” or “who’s opinion does a certain text represents?”.We believe that the richness of the semantics provided by theNew York Times (NYT) annotated collection allows to spec-ify search strategies in these domain specific terms, whichare highly abstract from an information system perspective,but nevertheless most familiar to our target end user: a jour-nalist in the process of writing an article. This is the mainintuition behind our contribution to the New York Timeschallenge organised at HCIR2010.
The collection as a whole can be thought of as an implicitdefinition of a dominant journalistic field: through a care-ful process of editing and verification only an article thatcomplies with all the requirements of this domain will ap-pear in the newspaper. Our aim is to support a journalistin accessing the NYT collection by means of domain spe-cific concepts, providing a highly inclusive system, which isintuitive, effective and entertaining to use.
In order to demonstrate our approach, we focus on twoof what perhaps are the most important elements in anytheory of journalism, writers and sources: “it is the curiousrelationship between the reporter as knower and the sourceas knower that creates much of what we understand as jour-nalism. The reporter shifts between the roles of knower andconduit of the known.”[2]. We built a search engine to re-trieve sets of documents which support an end user in chart-ing the entangled relationship between authors of an articleand their sources, showing that abstract concepts can betranslated to possibly very complex search strategies.
In the next section, after briefly discussing how authorsand sources are understood in the domain theory of journal-ism that inspired our design, we introduce four importanttypifications into which, according to this theory, authorsand sources can be classified. An author can aim to producejournalistic knowledge and be a Reporter or to express aprivate opinion and be a Columnist. A source on the otherhand, that is a person who is mentioned in an article as in-
32
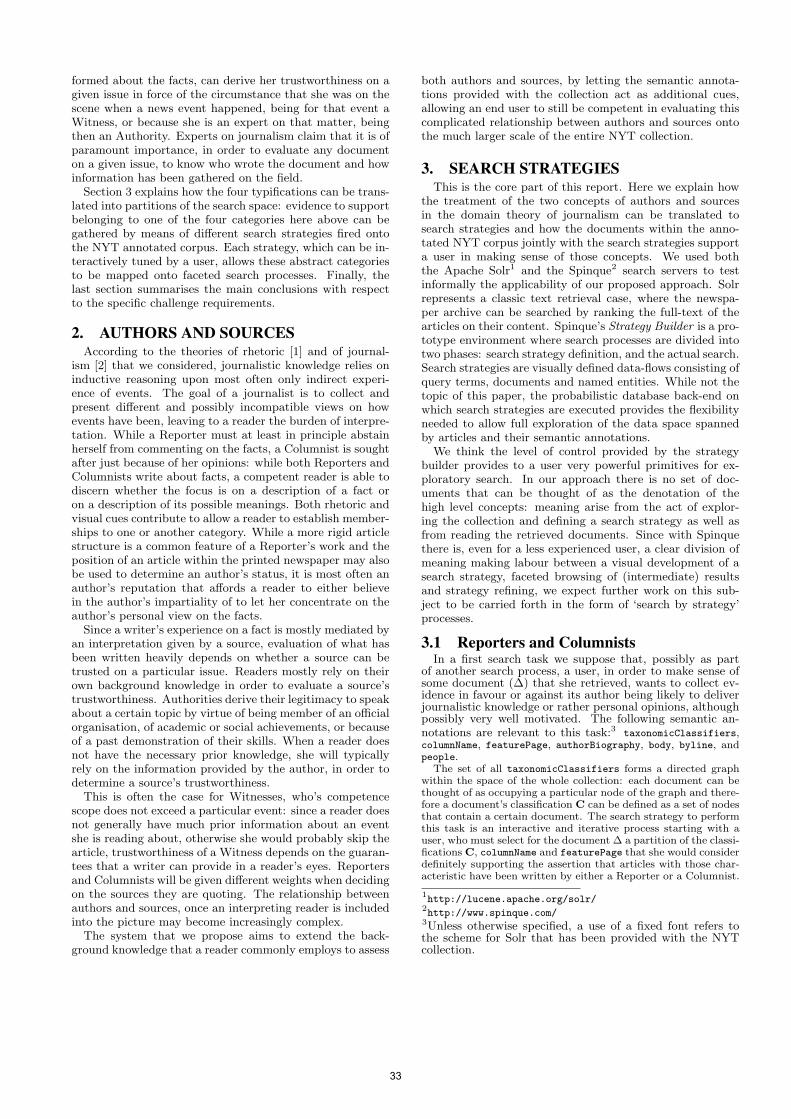
formed about the facts, can derive her trustworthiness on agiven issue in force of the circumstance that she was on thescene when a news event happened, being for that event aWitness, or because she is an expert on that matter, beingthen an Authority. Experts on journalism claim that it is ofparamount importance, in order to evaluate any documenton a given issue, to know who wrote the document and howinformation has been gathered on the field.
Section 3 explains how the four typifications can be trans-lated into partitions of the search space: evidence to supportbelonging to one of the four categories here above can begathered by means of different search strategies fired ontothe NYT annotated corpus. Each strategy, which can be in-teractively tuned by a user, allows these abstract categoriesto be mapped onto faceted search processes. Finally, thelast section summarises the main conclusions with respectto the specific challenge requirements.
2. AUTHORS AND SOURCESAccording to the theories of rhetoric [1] and of journal-
ism [2] that we considered, journalistic knowledge relies oninductive reasoning upon most often only indirect experi-ence of events. The goal of a journalist is to collect andpresent different and possibly incompatible views on howevents have been, leaving to a reader the burden of interpre-tation. While a Reporter must at least in principle abstainherself from commenting on the facts, a Columnist is soughtafter just because of her opinions: while both Reporters andColumnists write about facts, a competent reader is able todiscern whether the focus is on a description of a fact oron a description of its possible meanings. Both rhetoric andvisual cues contribute to allow a reader to establish member-ships to one or another category. While a more rigid articlestructure is a common feature of a Reporter’s work and theposition of an article within the printed newspaper may alsobe used to determine an author’s status, it is most often anauthor’s reputation that affords a reader to either believein the author’s impartiality of to let her concentrate on theauthor’s personal view on the facts.
Since a writer’s experience on a fact is mostly mediated byan interpretation given by a source, evaluation of what hasbeen written heavily depends on whether a source can betrusted on a particular issue. Readers mostly rely on theirown background knowledge in order to evaluate a source’strustworthiness. Authorities derive their legitimacy to speakabout a certain topic by virtue of being member of an officialorganisation, of academic or social achievements, or becauseof a past demonstration of their skills. When a reader doesnot have the necessary prior knowledge, she will typicallyrely on the information provided by the author, in order todetermine a source’s trustworthiness.
This is often the case for Witnesses, who’s competencescope does not exceed a particular event: since a reader doesnot generally have much prior information about an eventshe is reading about, otherwise she would probably skip thearticle, trustworthiness of a Witness depends on the guaran-tees that a writer can provide in a reader’s eyes. Reportersand Columnists will be given different weights when decidingon the sources they are quoting. The relationship betweenauthors and sources, once an interpreting reader is includedinto the picture may become increasingly complex.
The system that we propose aims to extend the back-ground knowledge that a reader commonly employs to assess
both authors and sources, by letting the semantic annota-tions provided with the collection act as additional cues,allowing an end user to still be competent in evaluating thiscomplicated relationship between authors and sources ontothe much larger scale of the entire NYT collection.
3. SEARCH STRATEGIESThis is the core part of this report. Here we explain how
the treatment of the two concepts of authors and sourcesin the domain theory of journalism can be translated tosearch strategies and how the documents within the anno-tated NYT corpus jointly with the search strategies supporta user in making sense of those concepts. We used boththe Apache Solr1 and the Spinque2 search servers to testinformally the applicability of our proposed approach. Solrrepresents a classic text retrieval case, where the newspa-per archive can be searched by ranking the full-text of thearticles on their content. Spinque’s Strategy Builder is a pro-totype environment where search processes are divided intotwo phases: search strategy definition, and the actual search.Search strategies are visually defined data-flows consisting ofquery terms, documents and named entities. While not thetopic of this paper, the probabilistic database back-end onwhich search strategies are executed provides the flexibilityneeded to allow full exploration of the data space spannedby articles and their semantic annotations.
We think the level of control provided by the strategybuilder provides to a user very powerful primitives for ex-ploratory search. In our approach there is no set of doc-uments that can be thought of as the denotation of thehigh level concepts: meaning arise from the act of explor-ing the collection and defining a search strategy as well asfrom reading the retrieved documents. Since with Spinquethere is, even for a less experienced user, a clear division ofmeaning making labour between a visual development of asearch strategy, faceted browsing of (intermediate) resultsand strategy refining, we expect further work on this sub-ject to be carried forth in the form of ‘search by strategy’processes.
3.1 Reporters and ColumnistsIn a first search task we suppose that, possibly as part
of another search process, a user, in order to make sense ofsome document (∆) that she retrieved, wants to collect ev-idence in favour or against its author being likely to deliverjournalistic knowledge or rather personal opinions, althoughpossibly very well motivated. The following semantic an-notations are relevant to this task:3 taxonomicClassifiers,columnName, featurePage, authorBiography, body, byline, andpeople.
The set of all taxonomicClassifiers forms a directed graphwithin the space of the whole collection: each document can bethought of as occupying a particular node of the graph and there-fore a document’s classification C can be defined as a set of nodesthat contain a certain document. The search strategy to performthis task is an interactive and iterative process starting with auser, who must select for the document ∆ a partition of the classi-fications C, columnName and featurePage that she would considerdefinitely supporting the assertion that articles with those char-acteristic have been written by either a Reporter or a Columnist.
1http://lucene.apache.org/solr/
2http://www.spinque.com/
3Unless otherwise specified, a use of a fixed font refers tothe scheme for Solr that has been provided with the NYTcollection.
33
The system should be instructed on how to deal with borderlinecases, whether to exclude them from search or to consider thesefeatures as supporting both cases.
The authorBiography and byline fields are used to query thebody and, respectively, the people fields of documents in the col-lection. The results can again be partitioned by classifications C,columnName and featurePage and, if deemed necessary, the searchprocess can continue, by applying the same strategy to any of thedocuments in the result set. Typically one step only is sufficientto complete the task, which can also be repeated by modifyingthe search strategy in any of its components.
Example.Is the article“CELEBRATION; Chicago”an Opinionist’s work?4
Its classification C is:
<Top, Features; Features, Travel; Travel, Columns;Columns, Celebration; Travel, Sophisticated Trav-eler Magazine; Features, Magazine; Top, Classi-fieds; Classifieds, Job Market; Job Market, JobCategories; Job Categories, Hospitality; Hospi-tality, Restaurant and Travel; Travel, Guides;Guides, Destinations; Destinations, North Amer-ica; North America, United States; United States,Illinois; Illinois, Chicago; Travel, Guides; Guides,Destinations; Destinations, North America; NorthAmerica, United States>
which contain elements from both partitions: the node <Columns,Celebration> is typical of a Columnist’s contribution, while <JobMarket, Job Categories> more of a Reporter and <Illinois,Chicago> is neutral.
Using the annotations byline: By Stephen McCauley and au-thorBiography: Stephen McCauley’s most recent novel is "TrueEnough" (Simon & Schuster). to query the collection, allow toretrieve ‘True Enough’: Just So-So Stories 5, a review of Mc-Cauley’s novel True Enough, which has been published in theSunday Book Review.
By examining this evidence a user can conclude that the orig-inal article ∆ should be regarded as a type Columnist’s work.When necessary this process can continue, by using the <strname="authorBiography">Louis Bayard’s most recent novel is"Endangered Species."</str> as the input of a second iterationstep. It is important to notice that our proposed system doesnot provide a direct answer to the high level question of whetheror not Stephen McCauley should be considered a Columnist inthis case, but only the means for a user to make sense of thissituation. The datum of a certain person being named in an ar-ticle, which is also a book’s review, licenses the statement thatStephen McCauley should be considered a Columnist only uponan autonomous interpretation by a user, who decides that thebook is not written by a journalist, but by a novelist.
3.2 Authorities and WitnessesDesigning search strategies for Authorities and Witnesses is
slightly more complicated as they require to detect events first:an Authority should be trusted because there is a set of pastevents in which the same person served as a source of reliableinformation, while a Witness should be trusted because many ar-ticles published around a certain event count her as a source. Inaddition to what we already used in the previous case, the fol-lowing semantic annotations are also relevant to this task: taxo-nomicClassifiers, publicationDate, locations, dateline, andtext.
The set of all taxonomicClassifiers forms again a directedgraph, which can be used in the same way as in the previous caseto partition the search space. Documents are moreover thoughtof as occupying the spatio-temporal space S defined by the lo-cations, dateline and publicationDate fields.
4www.nytimes.com/2002/03/03/magazine/celebration-
chicago.html5www.nytimes.com/2001/08/05/books/review/05BAYARDTw.html
Figure 1: A Spinque strategy, consisting of con-nected building blocks, depicting a search approachtaken to find the document set for Search A, inwhich the filter on date is a vague predicate. (no.
results 30043)
A user may define an event for which she wants to determinewhich Authorities or Witnesses are potentially reliable source inthe form of a set of documents, that, in order for the system toperform correctly, should occupy a narrow portion of the spatio-temporal space: most likely an event will be defined by onlya fewdocuments, as we tested in these pilot experiments.
Provided that we can find an interval of area δ such that theintersection between a space S and a part of the taxonomy graphcontains δ relevant documents about a given issue, while onlyAδ
relevant documents are outside the interval, for some positiveconstant A, we can define the same issue to denotate an event.Intuitively, many news articles have been published about theevent around the same time and featuring the same places andnames as the event: outside this local regularity the number ofrelevant documents decrease in measure of A.
Evidence for a person being a Witness can be presented to auser by collecting the documents which mention that person intheir text fields and for which there are much less documentsaround other events. Conversely, evidence for Authorities, canbe presented by collecting relevant document in more that oneevent.
Example.Is justice Antonin Scalia an Authority? We first define an event
as a non-empty partition of the search space (Search A):
<keywords: newcomers state welfare policy>,<approx1999-01-14>,<C=Top/News/U.S.>
contains amongst others 3 documents that rank high (using acustom Spinque search strategy) and are about the same event,see Fig.3.2:
34
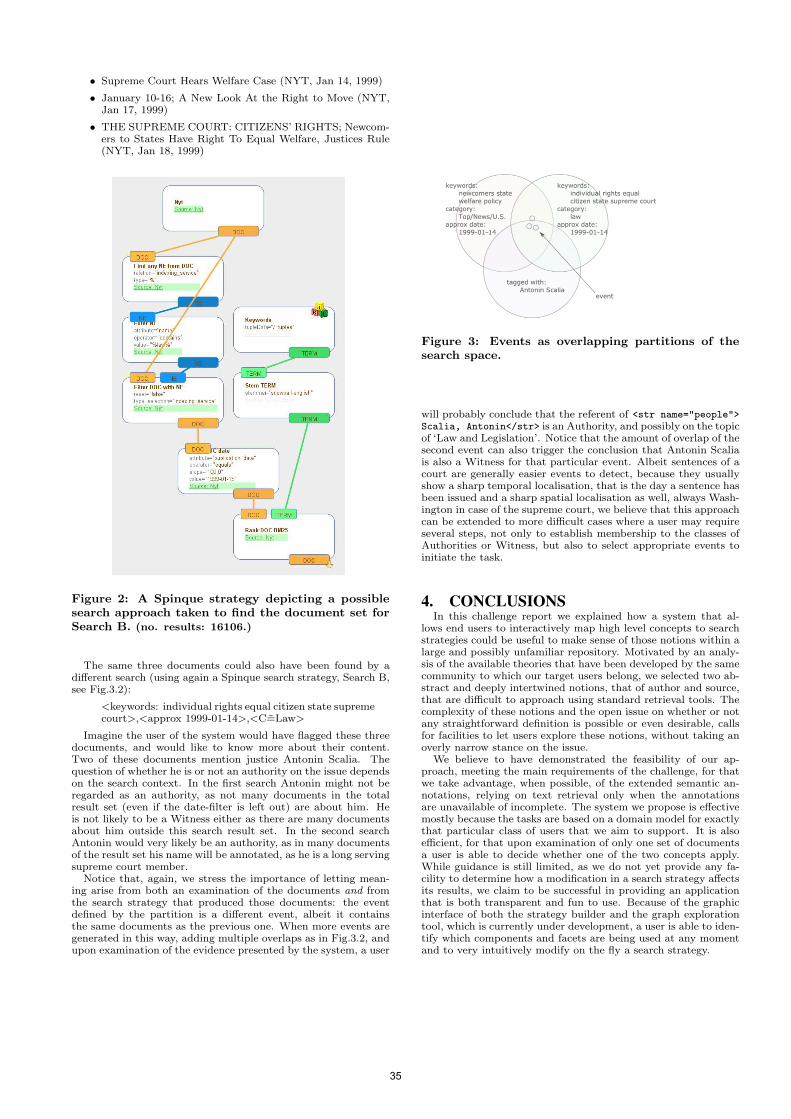
• Supreme Court Hears Welfare Case (NYT, Jan 14, 1999)
• January 10-16; A New Look At the Right to Move (NYT,Jan 17, 1999)
• THE SUPREME COURT: CITIZENS’ RIGHTS; Newcom-ers to States Have Right To Equal Welfare, Justices Rule(NYT, Jan 18, 1999)
Figure 2: A Spinque strategy depicting a possiblesearch approach taken to find the document set forSearch B. (no. results: 16106.)
The same three documents could also have been found by adifferent search (using again a Spinque search strategy, Search B,see Fig.3.2):
<keywords: individual rights equal citizen state supremecourt>,<approx 1999-01-14>,<C=Law>
Imagine the user of the system would have flagged these threedocuments, and would like to know more about their content.Two of these documents mention justice Antonin Scalia. Thequestion of whether he is or not an authority on the issue dependson the search context. In the first search Antonin might not beregarded as an authority, as not many documents in the totalresult set (even if the date-filter is left out) are about him. Heis not likely to be a Witness either as there are many documentsabout him outside this search result set. In the second searchAntonin would very likely be an authority, as in many documentsof the result set his name will be annotated, as he is a long servingsupreme court member.
Notice that, again, we stress the importance of letting mean-ing arise from both an examination of the documents and fromthe search strategy that produced those documents: the eventdefined by the partition is a different event, albeit it containsthe same documents as the previous one. When more events aregenerated in this way, adding multiple overlaps as in Fig.3.2, andupon examination of the evidence presented by the system, a user
Figure 3: Events as overlapping partitions of thesearch space.
will probably conclude that the referent of <str name="people">Scalia, Antonin</str> is an Authority, and possibly on the topicof ‘Law and Legislation’. Notice that the amount of overlap of thesecond event can also trigger the conclusion that Antonin Scaliais also a Witness for that particular event. Albeit sentences of acourt are generally easier events to detect, because they usuallyshow a sharp temporal localisation, that is the day a sentence hasbeen issued and a sharp spatial localisation as well, always Wash-ington in case of the supreme court, we believe that this approachcan be extended to more difficult cases where a user may requireseveral steps, not only to establish membership to the classes ofAuthorities or Witness, but also to select appropriate events toinitiate the task.
4. CONCLUSIONSIn this challenge report we explained how a system that al-
lows end users to interactively map high level concepts to searchstrategies could be useful to make sense of those notions within alarge and possibly unfamiliar repository. Motivated by an analy-sis of the available theories that have been developed by the samecommunity to which our target users belong, we selected two ab-stract and deeply intertwined notions, that of author and source,that are difficult to approach using standard retrieval tools. Thecomplexity of these notions and the open issue on whether or notany straightforward definition is possible or even desirable, callsfor facilities to let users explore these notions, without taking anoverly narrow stance on the issue.
We believe to have demonstrated the feasibility of our ap-proach, meeting the main requirements of the challenge, for thatwe take advantage, when possible, of the extended semantic an-notations, relying on text retrieval only when the annotationsare unavailable of incomplete. The system we propose is effectivemostly because the tasks are based on a domain model for exactlythat particular class of users that we aim to support. It is alsoefficient, for that upon examination of only one set of documentsa user is able to decide whether one of the two concepts apply.While guidance is still limited, as we do not yet provide any fa-cility to determine how a modification in a search strategy affectsits results, we claim to be successful in providing an applicationthat is both transparent and fun to use. Because of the graphicinterface of both the strategy builder and the graph explorationtool, which is currently under development, a user is able to iden-tify which components and facets are being used at any momentand to very intuitively modify on the fly a search strategy.
35

5. REFERENCES[1] J. A. Berlin. Writing instruction in nineteenth-century
American colleges / James A. Berlin ; with a foreword byDonald C. Stewart. Southern Illinois University Press,Carbondale :, 1984.
[2] A. R. Cline. Toward a field theory of journalism, July 2010.
36

Exploring the New York Times Corpus with NewsClub
Christian KohlschütterL3S Research Center / Leibniz Universität Hannover
Appelstr. 9a, 30167 HannoverGermany
ABSTRACTIn this HCIR 2010 challenge paper, I report on the evalu-ation of the NewsClub information retrieval system on theNew York Times corpus.
1. INTRODUCTIONKeyword queries are still the easiest and common way to
start a search in an information retrieval system. However,in many cases these queries can be over- or underspecified,and so the quality of the returned results is strongly de-pendent on the quality of the specified terms. As a com-plementary feature to unstructured text queries (“is there adocument containing the keyword K?”), structured classi-fications (complex taxonomies or orthogonal, faceted cate-gories) can help the user to choose the right document fea-tures to quickly drill-down to a particular aspect within thewhole result set, such that only specifically relevant docu-ments are returned. Additionally, the proposed classifica-tions themselves may satisfy the user’s information need,especially when looking for aggregate information or whenjust checking for the presence of a particular classification(“which authors wrote the most articles concerning X ?”, “isthere a book about Y written by author Z in 2010?”).
However, maintaining a structured classification systemrequires a substantial, continuous effort, deep domain knowl-edge and preferably control over the document creation pro-cess to ensure a somewhat complete and valid classification,as incomplete or wrong classifications may drastically dete-riorate the search experience (especially for the aggregatequeries described above). In any case, especially with grow-ing collections such as in the news domain, it will in anycase be no perfect or concluded labeling.
In this paper, I present my information retrieval systemNewsClub, which provides, in addition to keyword queriesand faceted search, a third way to explore the set of retriev-able documents: relevant terms and phrases. For exam-ple, when querying for “terrorism”, the system determinesAl Qaeda and Osama bin Laden as highly relevant terms.These n-grams are relatively easy to determine from anyunstructured text, do not need any manual processing andyet provide a surprisingly high utility for search. In combi-nation with keyword and faceted search, this allows a veryquick and efficient navigation within the result set.
In addition to just showing the most relevant terms and
Copyright is held by the author/owner(s).ACM X-XXXXX-XX-X/XX/XX.
phrases for a query, NewsClub can also visualize term associ-ations (i.e., determine words that deal with different aspectsof terrorism, for example: Afghanistan/Taliban vs. Palesti-na/Hamas) and find contrasting terms which best match in-dividual sub-queries, i.e.., terrorism w.r.t. Israel/Palestina(Gaza strip, Intifada), Afghanistan (bin Laden, Taliban),Iraq (Saddam, Zarqawi) or the USA (Oklahoma, Littleton).The sub-queries may represent any other typical keyword orclassification feature and thus are easy to specify.
While the NewsClub platform has initially been targetedmainly at analyzing news, it is also being deployed in differ-ent scenarios. A publicly available system is NewsClub imBundestag1, which monitors the plenary sessions in the Ger-man Parliament. It allows to drill-down by speaker, party,role and legislative period and provides the very same text-analytics features described above.
2. USER INTERFACEUI Fundamentals. NewsClub’s Web-based user inter-
face has been designed for the curious searcher who wantsto interact with the system, but it also allows for fast ad-hoc queries. The AJAX application has been built usingthe Google Web Toolkit, designed for low-latency and highextensibility. The fundamental UI structure was inspired bythe Eclipse platform, which allows to have different tabbedpanes in one perspective; NewsClub’s search perspectiveconsists of a keyword query box and a set of tabs, eachcontaining a different view on the query or the results. Thetabs are grouped into the two parts of a horizontally-splitpane, a wide pane on the left, and a tall pane on the right,thus allowing the user to activate two different tabs at once,a large one and a small one. Currently, the user can choosefrom the following tabs. Left : Search results, Associator,Contrastor, Time Window and Detail view. Right : Facets,Term Stack, Sub-queries (see Figure 4).
Search results. In this view, individual search resultsare shown (very much like in traditional search engines).The only notable difference is that NewsClub’s view sup-ports continous scrolling (one can actually scroll throughall retrievable results). Clicking on a result will open theoriginal URL in another window or the locally stored infor-mation in the Detail view. The Facets view contains a treepanel containing all possible facet dimensions, the categoriesand the corresponding number of matching documents forthe current query. By clicking on a category, one can narrowthe search to only those documents that are labeled with the
1http://newsclub.de/bundestag
37
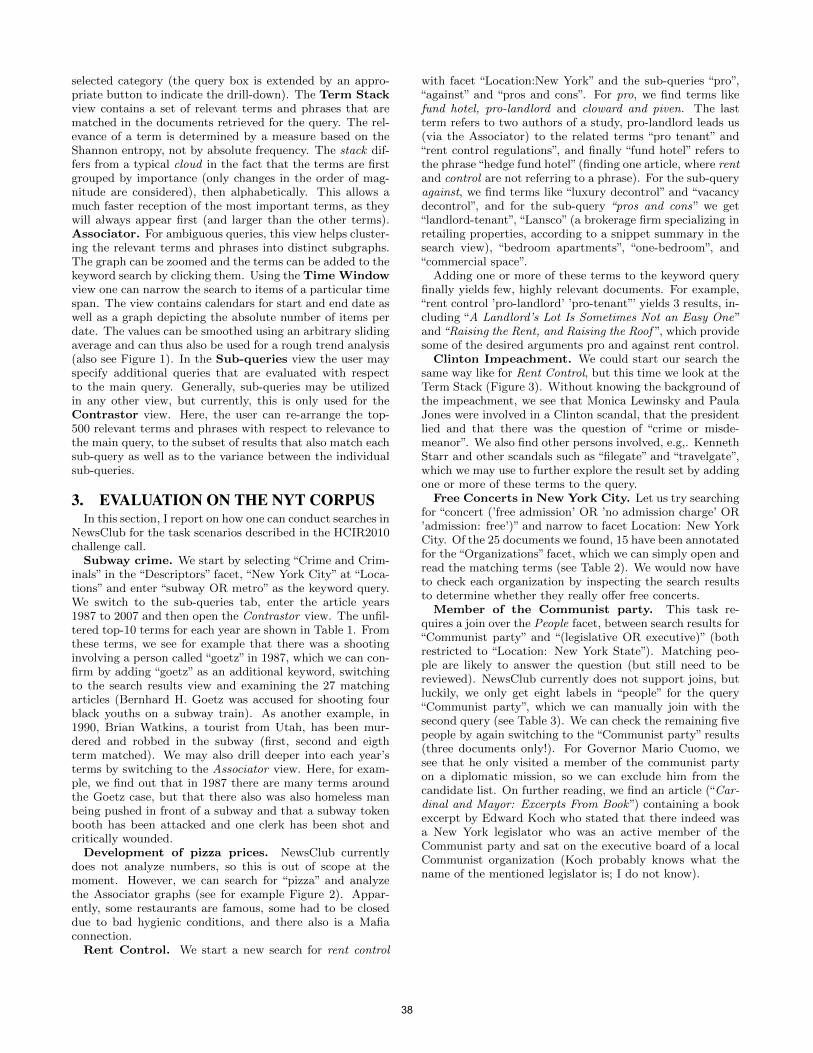
selected category (the query box is extended by an appro-priate button to indicate the drill-down). The Term Stackview contains a set of relevant terms and phrases that arematched in the documents retrieved for the query. The rel-evance of a term is determined by a measure based on theShannon entropy, not by absolute frequency. The stack dif-fers from a typical cloud in the fact that the terms are firstgrouped by importance (only changes in the order of mag-nitude are considered), then alphabetically. This allows amuch faster reception of the most important terms, as theywill always appear first (and larger than the other terms).Associator. For ambiguous queries, this view helps cluster-ing the relevant terms and phrases into distinct subgraphs.The graph can be zoomed and the terms can be added to thekeyword search by clicking them. Using the Time Windowview one can narrow the search to items of a particular timespan. The view contains calendars for start and end date aswell as a graph depicting the absolute number of items perdate. The values can be smoothed using an arbitrary slidingaverage and can thus also be used for a rough trend analysis(also see Figure 1). In the Sub-queries view the user mayspecify additional queries that are evaluated with respectto the main query. Generally, sub-queries may be utilizedin any other view, but currently, this is only used for theContrastor view. Here, the user can re-arrange the top-500 relevant terms and phrases with respect to relevance tothe main query, to the subset of results that also match eachsub-query as well as to the variance between the individualsub-queries.
3. EVALUATION ON THE NYT CORPUSIn this section, I report on how one can conduct searches in
NewsClub for the task scenarios described in the HCIR2010challenge call.
Subway crime. We start by selecting “Crime and Crim-inals” in the “Descriptors” facet, “New York City” at “Loca-tions” and enter “subway OR metro” as the keyword query.We switch to the sub-queries tab, enter the article years1987 to 2007 and then open the Contrastor view. The unfil-tered top-10 terms for each year are shown in Table 1. Fromthese terms, we see for example that there was a shootinginvolving a person called “goetz” in 1987, which we can con-firm by adding “goetz” as an additional keyword, switchingto the search results view and examining the 27 matchingarticles (Bernhard H. Goetz was accused for shooting fourblack youths on a subway train). As another example, in1990, Brian Watkins, a tourist from Utah, has been mur-dered and robbed in the subway (first, second and eigthterm matched). We may also drill deeper into each year’sterms by switching to the Associator view. Here, for exam-ple, we find out that in 1987 there are many terms aroundthe Goetz case, but that there also was also homeless manbeing pushed in front of a subway and that a subway tokenbooth has been attacked and one clerk has been shot andcritically wounded.
Development of pizza prices. NewsClub currentlydoes not analyze numbers, so this is out of scope at themoment. However, we can search for “pizza” and analyzethe Associator graphs (see for example Figure 2). Appar-ently, some restaurants are famous, some had to be closeddue to bad hygienic conditions, and there also is a Mafiaconnection.
Rent Control. We start a new search for rent control
with facet “Location:New York” and the sub-queries “pro”,“against” and “pros and cons”. For pro, we find terms likefund hotel, pro-landlord and cloward and piven. The lastterm refers to two authors of a study, pro-landlord leads us(via the Associator) to the related terms “pro tenant” and“rent control regulations”, and finally “fund hotel” refers tothe phrase“hedge fund hotel”(finding one article, where rentand control are not referring to a phrase). For the sub-queryagainst, we find terms like “luxury decontrol” and “vacancydecontrol”, and for the sub-query “pros and cons” we get“landlord-tenant”, “Lansco” (a brokerage firm specializing inretailing properties, according to a snippet summary in thesearch view), “bedroom apartments”, “one-bedroom”, and“commercial space”.
Adding one or more of these terms to the keyword queryfinally yields few, highly relevant documents. For example,“rent control ’pro-landlord’ ’pro-tenant”’ yields 3 results, in-cluding “A Landlord’s Lot Is Sometimes Not an Easy One”and“Raising the Rent, and Raising the Roof ”, which providesome of the desired arguments pro and against rent control.
Clinton Impeachment. We could start our search thesame way like for Rent Control, but this time we look at theTerm Stack (Figure 3). Without knowing the background ofthe impeachment, we see that Monica Lewinsky and PaulaJones were involved in a Clinton scandal, that the presidentlied and that there was the question of “crime or misde-meanor”. We also find other persons involved, e.g,. KennethStarr and other scandals such as “filegate” and “travelgate”,which we may use to further explore the result set by addingone or more of these terms to the query.
Free Concerts in New York City. Let us try searchingfor “concert (’free admission’ OR ’no admission charge’ OR’admission: free’)” and narrow to facet Location: New YorkCity. Of the 25 documents we found, 15 have been annotatedfor the “Organizations” facet, which we can simply open andread the matching terms (see Table 2). We would now haveto check each organization by inspecting the search resultsto determine whether they really offer free concerts.
Member of the Communist party. This task re-quires a join over the People facet, between search results for“Communist party” and “(legislative OR executive)” (bothrestricted to “Location: New York State”). Matching peo-ple are likely to answer the question (but still need to bereviewed). NewsClub currently does not support joins, butluckily, we only get eight labels in “people” for the query“Communist party”, which we can manually join with thesecond query (see Table 3). We can check the remaining fivepeople by again switching to the “Communist party” results(three documents only!). For Governor Mario Cuomo, wesee that he only visited a member of the communist partyon a diplomatic mission, so we can exclude him from thecandidate list. On further reading, we find an article (“Car-dinal and Mayor: Excerpts From Book”) containing a bookexcerpt by Edward Koch who stated that there indeed wasa New York legislator who was an active member of theCommunist party and sat on the executive board of a localCommunist organization (Koch probably knows what thename of the mentioned legislator is; I do not know).
38
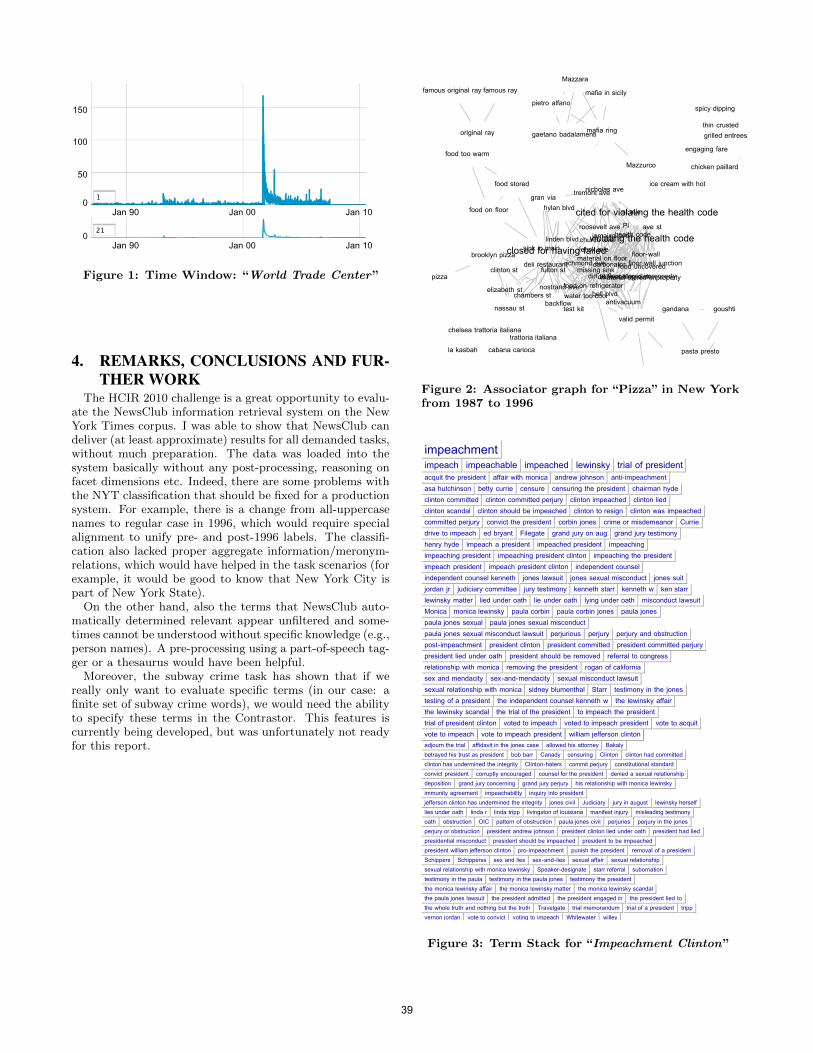
10
50
100
150
Jan 90 Jan 00 Jan 10
210
Jan 90 Jan 00 Jan 10
Figure 1: Time Window: “World Trade Center”
4. REMARKS, CONCLUSIONS AND FUR-THER WORK
The HCIR 2010 challenge is a great opportunity to evalu-ate the NewsClub information retrieval system on the NewYork Times corpus. I was able to show that NewsClub candeliver (at least approximate) results for all demanded tasks,without much preparation. The data was loaded into thesystem basically without any post-processing, reasoning onfacet dimensions etc. Indeed, there are some problems withthe NYT classification that should be fixed for a productionsystem. For example, there is a change from all-uppercasenames to regular case in 1996, which would require specialalignment to unify pre- and post-1996 labels. The classifi-cation also lacked proper aggregate information/meronym-relations, which would have helped in the task scenarios (forexample, it would be good to know that New York City ispart of New York State).
On the other hand, also the terms that NewsClub auto-matically determined relevant appear unfiltered and some-times cannot be understood without specific knowledge (e.g.,person names). A pre-processing using a part-of-speech tag-ger or a thesaurus would have been helpful.
Moreover, the subway crime task has shown that if wereally only want to evaluate specific terms (in our case: afinite set of subway crime words), we would need the abilityto specify these terms in the Contrastor. This features iscurrently being developed, but was unfortunately not readyfor this report.
antivacuum
church ave
dirt at floordishwashing sink
floor wall junctionfloor-wall
food on refrigerator
food uncovered
jamaica ave
lenox ave
bell blvd
material on floor
material stored improperlymissing sink
nostrand ave
Pl
richmond ave
stored improperly
test kit
carbonator
water too cool
ave st
cited for violating the health code
health code
nicholas ave
roosevelt ave
st ave
tremont ave
violating the health code
chambers st
clinton st
closed for having faileddeli restaurant
elizabeth st
fulton st
linden blvd
nassau st
sink in main
chelsea trattoria italianatrattoria italiana
chicken paillard
grilled entrees
hylan blvdgran via
ice cream with hot
backflow
valid permit
engaging fare
spicy dipping
famous original ray famous ray
original ray
food on floor
food stored
food too warm
gaetano badalamenti
mafia in sicily
mafia ring
Mazzara
pietro alfano
gandana goushti
pasta presto
thin crusted
la kasbah
Mazzurco
brooklyn pizza
pizza
cabana carioca
Figure 2: Associator graph for “Pizza” in New Yorkfrom 1987 to 1996
impeachmentimpeach impeachable impeached lewinsky trial of presidentacquit the president affair with monica andrew johnson anti‑impeachmentasa hutchinson betty currie censure censuring the president chairman hydeclinton committed clinton committed perjury clinton impeached clinton liedclinton scandal clinton should be impeached clinton to resign clinton was impeachedcommitted perjury convict the president corbin jones crime or misdemeanor Curriedrive to impeach ed bryant Filegate grand jury on aug grand jury testimonyhenry hyde impeach a president impeached president impeachingimpeaching president impeaching president clinton impeaching the presidentimpeach president impeach president clinton independent counselindependent counsel kenneth jones lawsuit jones sexual misconduct jones suitjordan jr judiciary committee jury testimony kenneth starr kenneth w ken starrlewinsky matter lied under oath lie under oath lying under oath misconduct lawsuitMonica monica lewinsky paula corbin paula corbin jones paula jonespaula jones sexual paula jones sexual misconductpaula jones sexual misconduct lawsuit perjurious perjury perjury and obstructionpost‑impeachment president clinton president committed president committed perjurypresident lied under oath president should be removed referral to congressrelationship with monica removing the president rogan of californiasex and mendacity sex‑and‑mendacity sexual misconduct lawsuitsexual relationship with monica sidney blumenthal Starr testimony in the jonestesting of a president the independent counsel kenneth w the lewinsky affairthe lewinsky scandal the trial of the president to impeach the presidenttrial of president clinton voted to impeach voted to impeach president vote to acquitvote to impeach vote to impeach president william jefferson clintonadjourn the trial affidavit in the jones case allowed his attorney Bakalybetrayed his trust as president bob barr Canady censuring Clinton clinton had committedclinton has undermined the integrity Clinton‑haters commit perjury constitutional standardconvict president corruptly encouraged counsel for the president denied a sexual relationshipdeposition grand jury concerning grand jury perjury his relationship with monica lewinskyimmunity agreement impeachability inquiry into presidentjefferson clinton has undermined the integrity jones civil Judiciary jury in august lewinsky herselflies under oath linda r linda tripp livingston of louisiana manifest injury misleading testimonyoath obstruction OIC pattern of obstruction paula jones civil perjuries perjury in the jonesperjury or obstruction president andrew johnson president clinton lied under oath president had liedpresidential misconduct president should be impeached president to be impeachedpresident william jefferson clinton pro‑impeachment punish the president removal of a presidentSchippers Schipperss sex and lies sex‑and‑lies sexual affair sexual relationshipsexual relationship with monica lewinsky Speaker‑designate starr referral subornationtestimony in the paula testimony in the paula jones testimony the presidentthe monica lewinsky affair the monica lewinsky matter the monica lewinsky scandalthe paula jones lawsuit the president admitted the president engaged in the president lied tothe whole truth and nothing but the truth Travelgate trial memorandum trial of a president trippvernon jordan vote to convict voting to impeach Whitewater willeywilliam jefferson clinton has undermined william jefferson clinton willfully witness in the jones
Figure 3: Term Stack for “Impeachment Clinton”
39
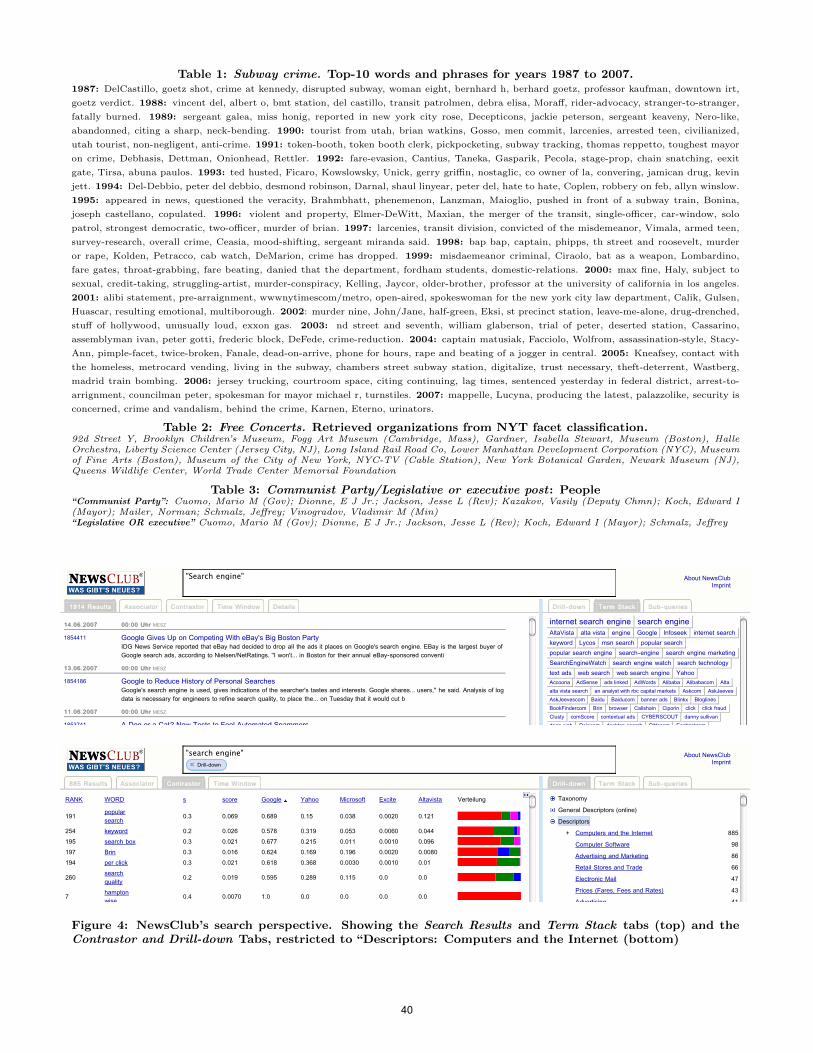
Table 1: Subway crime. Top-10 words and phrases for years 1987 to 2007.1987: DelCastillo, goetz shot, crime at kennedy, disrupted subway, woman eight, bernhard h, berhard goetz, professor kaufman, downtown irt,
goetz verdict. 1988: vincent del, albert o, bmt station, del castillo, transit patrolmen, debra elisa, Moraff, rider-advocacy, stranger-to-stranger,
fatally burned. 1989: sergeant galea, miss honig, reported in new york city rose, Decepticons, jackie peterson, sergeant keaveny, Nero-like,
abandonned, citing a sharp, neck-bending. 1990: tourist from utah, brian watkins, Gosso, men commit, larcenies, arrested teen, civilianized,
utah tourist, non-negligent, anti-crime. 1991: token-booth, token booth clerk, pickpocketing, subway tracking, thomas reppetto, toughest mayor
on crime, Debhasis, Dettman, Onionhead, Rettler. 1992: fare-evasion, Cantius, Taneka, Gasparik, Pecola, stage-prop, chain snatching, eexit
gate, Tirsa, abuna paulos. 1993: ted husted, Ficaro, Kowslowsky, Unick, gerry griffin, nostaglic, co owner of la, convering, jamican drug, kevin
jett. 1994: Del-Debbio, peter del debbio, desmond robinson, Darnal, shaul linyear, peter del, hate to hate, Coplen, robbery on feb, allyn winslow.
1995: appeared in news, questioned the veracity, Brahmbhatt, phenemenon, Lanzman, Maioglio, pushed in front of a subway train, Bonina,
joseph castellano, copulated. 1996: violent and property, Elmer-DeWitt, Maxian, the merger of the transit, single-officer, car-window, solo
patrol, strongest democratic, two-officer, murder of brian. 1997: larcenies, transit division, convicted of the misdemeanor, Vimala, armed teen,
survey-research, overall crime, Ceasia, mood-shifting, sergeant miranda said. 1998: bap bap, captain, phipps, th street and roosevelt, murder
or rape, Kolden, Petracco, cab watch, DeMarion, crime has dropped. 1999: misdaemeanor criminal, Ciraolo, bat as a weapon, Lombardino,
fare gates, throat-grabbing, fare beating, danied that the department, fordham students, domestic-relations. 2000: max fine, Haly, subject to
sexual, credit-taking, struggling-artist, murder-conspiracy, Kelling, Jaycor, older-brother, professor at the university of california in los angeles.
2001: alibi statement, pre-arraignment, wwwnytimescom/metro, open-aired, spokeswoman for the new york city law department, Calik, Gulsen,
Huascar, resulting emotional, multiborough. 2002: murder nine, John/Jane, half-green, Eksi, st precinct station, leave-me-alone, drug-drenched,
stuff of hollywood, unusually loud, exxon gas. 2003: nd street and seventh, william glaberson, trial of peter, deserted station, Cassarino,
assemblyman ivan, peter gotti, frederic block, DeFede, crime-reduction. 2004: captain matusiak, Facciolo, Wolfrom, assassination-style, Stacy-
Ann, pimple-facet, twice-broken, Fanale, dead-on-arrive, phone for hours, rape and beating of a jogger in central. 2005: Kneafsey, contact with
the homeless, metrocard vending, living in the subway, chambers street subway station, digitalize, trust necessary, theft-deterrent, Wastberg,
madrid train bombing. 2006: jersey trucking, courtroom space, citing continuing, lag times, sentenced yesterday in federal district, arrest-to-
arrignment, councilman peter, spokesman for mayor michael r, turnstiles. 2007: mappelle, Lucyna, producing the latest, palazzolike, security is
concerned, crime and vandalism, behind the crime, Karnen, Eterno, urinators.
Table 2: Free Concerts. Retrieved organizations from NYT facet classification.92d Street Y, Brooklyn Children’s Museum, Fogg Art Museum (Cambridge, Mass), Gardner, Isabella Stewart, Museum (Boston), HalleOrchestra, Liberty Science Center (Jersey City, NJ), Long Island Rail Road Co, Lower Manhattan Development Corporation (NYC), Museumof Fine Arts (Boston), Museum of the City of New York, NYC-TV (Cable Station), New York Botanical Garden, Newark Museum (NJ),Queens Wildlife Center, World Trade Center Memorial Foundation
Table 3: Communist Party/Legislative or executive post: People“Communist Party”: Cuomo, Mario M (Gov); Dionne, E J Jr.; Jackson, Jesse L (Rev); Kazakov, Vasily (Deputy Chmn); Koch, Edward I(Mayor); Mailer, Norman; Schmalz, Jeffrey; Vinogradov, Vladimir M (Min)“Legislative OR executive” Cuomo, Mario M (Gov); Dionne, E J Jr.; Jackson, Jesse L (Rev); Koch, Edward I (Mayor); Schmalz, Jeffrey
NewsClub® — Copyright © 1999-2010 Christian Kohlschütter — Die Urheberrechte der Nachrichten liegen bei den Autoren bzw. Agenturen
About NewsClubImprint
1914 Results1914 Results AssociatorAssociator ContrastorContrastor Time WindowTime Window DetailsDetails
MESZ14.06.200714.06.2007 00:00 Uhr00:00 Uhr
1854411 Google Gives Up on Competing With eBay's Big Boston PartyIDG News Service reported that eBay had decided to drop all the ads it places on Google's search engine. EBay is the largest buyer ofGoogle search ads, according to Nielsen/NetRatings. ''I won't... in Boston for their annual eBay-sponsored conventi
MESZ13.06.200713.06.2007 00:00 Uhr00:00 Uhr
1854186 Google to Reduce History of Personal SearchesGoogle's search engine is used, gives indications of the searcher's tastes and interests. Google shares... users,'' he said. Analysis of logdata is necessary for engineers to refine search quality, to place the... on Tuesday that it would cut b
MESZ11.06.200711.06.2007 00:00 Uhr00:00 Uhr
1853741 A Dog or a Cat? New Tests to Fool Automated Spammers
MESZ10.06.200710.06.2007 00:00 Uhr00:00 Uhr
1853684 JOBS: FRESH STARTS: Can Blogs Become A Big Source of Jobs?executive at Indeed.com, a job search engine with postings from more than 5,000 sources. ''It's an...SEARCH ''blog,'' ''blogger'' or''blogging'' on the Indeed.com job board and more than 13,000 jobs come up. But narrow the search to job titles co
MESZ09.06.200709.06.2007 00:00 Uhr00:00 Uhr
1853104 FIVE DAYS: Deal Making Heats Up as Does Food and Drug ScrutinyKeeps Tweaking Its Search EngineSearch Engine 3. For Pornographers, Internet's Virtues Turn to Vices 4. Court
MESZ07.06.200707.06.2007 00:00 Uhr00:00 Uhr
1852789 From Database to Crime Scene: Network Is Potent Police Weaponroom at One Police Plaza, is a search engine, not unlike Google or Yahoo, that can quickly relay... Inspector Kenneth G. Mekeel, thecrime center's commander. Time-consuming searches through paper files
MESZ05.06.200705.06.2007 00:00 Uhr00:00 Uhr
1852317 A Makeover At Ask.com: A New Look And MoreJim Lanzone, the chief executive of Ask.com, the fourth-most-used Internet search engine in the... a radical change to the presentation
Dril l - downDril l - down Term StackTerm Stack Sub -queriesSub -queries
internet search engine search engineAltaVista alta vista engine Google Infoseek internet searchkeyword Lycos msn search popular searchpopular search engine search-engine search engine marketingSearchEngineWatch search engine watch search technologytext ads web search web search engine YahooAccoona AdSense ads linked AdWords Alibaba Alibabacom Altaalta vista search an analyst with rbc capital markets Askcom AskJeevesAskJeevescom Baidu Baiducom banner ads Blinkx BloglinesBookFindercom Brin browser Calishain Ciporin click click fraudClusty comScore contextual ads CYBERSCOUT danny sullivandeep web Dejacom desktop search Dittocom Eachnetcome-commerce engineering english comedian FareChase Feedsterfinding information foreign web Freemerchant Froogle gmailGooglecom Googleplex Googlers Gotocom groupsgooglecomhandful of web Hotbot human search IAC IAC/InterActiveCorpiac interactivecorp icio Inktomi InterActiveCorp Internetinternet censorship Jeeves joe kraus jordan rohan kai fu leeKamangar Kayakcom Kordestani larry page and sergey brinlocal search LookSmart main search Malseed marissa mayermedia metrix Metacrawler metatags Metrix microsoft and yahoominingc Mobissimo MSN natural-language Netease NetscapeNotess online Osako page and sergey brin pay-per-click per clickpersonal home pages personalized search popular internetpopular internet search portal portal site previewtraveprofessor kleinberg query data Rashtchy safa rashtchy searchsearchable search ads search advertising search-based search boxsearch data SearchEngineWatchcom search for the wordsearch function search giant search industry searching the websearch marketing search page search pages search quality
"Search engine"
NewsClub® — Copyright © 1999-2010 Christian Kohlschütter — Die Urheberrechte der Nachrichten liegen bei den Autoren bzw. Agenturen
About NewsClubImprint
885 Results885 Results AssociatorAssociator ContrastorContrastor Time WindowTime Window
RANK WORD s score Google Yahoo Microsoft Excite Altavista Verteilung
191 popularsearch 0.3 0.069 0.689 0.15 0.038 0.0020 0.121
254 keyword 0.2 0.026 0.578 0.319 0.053 0.0060 0.044195 search box 0.3 0.021 0.677 0.215 0.011 0.0010 0.096197 Brin 0.3 0.016 0.624 0.169 0.196 0.0020 0.0080194 per click 0.3 0.021 0.618 0.368 0.0030 0.0010 0.01
260 searchquality 0.2 0.019 0.595 0.289 0.115 0.0 0.0
7 hamptonwise 0.4 0.0070 1.0 0.0 0.0 0.0 0.0
8 kalin casey 0.4 0.0070 1.0 0.0 0.0 0.0 0.0
10 per actionads 0.4 0.0070 1.0 0.0 0.0 0.0 0.0
14 text mining 0.4 0.0070 1.0 0.0 0.0 0.0 0.0
2popularinternetsearch
0.4 0.0090 0.922 0.076 0.0010 0.0010 0.0
202 Groxis 0.3 0.0060 0.742 0.229 0.029 0.0 0.0268 AdSense 0.2 0.0070 0.674 0.184 0.143 0.0 0.0200 Dejacom 0.3 0.011 0.668 0.316 0.0 0.016 0.033 per action 0.4 0.0030 1.0 0.0 0.0 0.0 0.0
27 search forthe word 0.4 0.0030 0.98 0.02 0.0 0.0 0.0
24 cost-per-click 0.4 0.0040 0.979 0.021 0.0 0.0 0.0
25 Randmcnallycom 0.4 0.0030 0.979 0.021 0.0 0.0 0.0
Dril l - downDril l - down Term StackTerm Stack Sub -queriesSub -queries
Taxonomy
General Descriptors (online)
Descriptors
+ Computers and the Internet 885
Computer Software 98
Advertising and Marketing 86
Retail Stores and Trade 66
Electronic Mail 47
Prices (Fares, Fees and Rates) 43
Advertising 41
Books and Literature 41
Music 40
Suits and Litigation 39
Travel and Vacations 38
Research 36
Copyrights 35
Mergers, Acquisitions and Divestitures 35
Privacy 30
Television 27
Biographical Information 26
Labor 26
Children and Youth 23
Colleges and Universities 21
News and News Media 21
"search engine"Drill-down
Figure 4: NewsClub’s search perspective. Showing the Search Results and Term Stack tabs (top) and theContrastor and Drill-down Tabs, restricted to “Descriptors: Computers and the Internet (bottom)
40
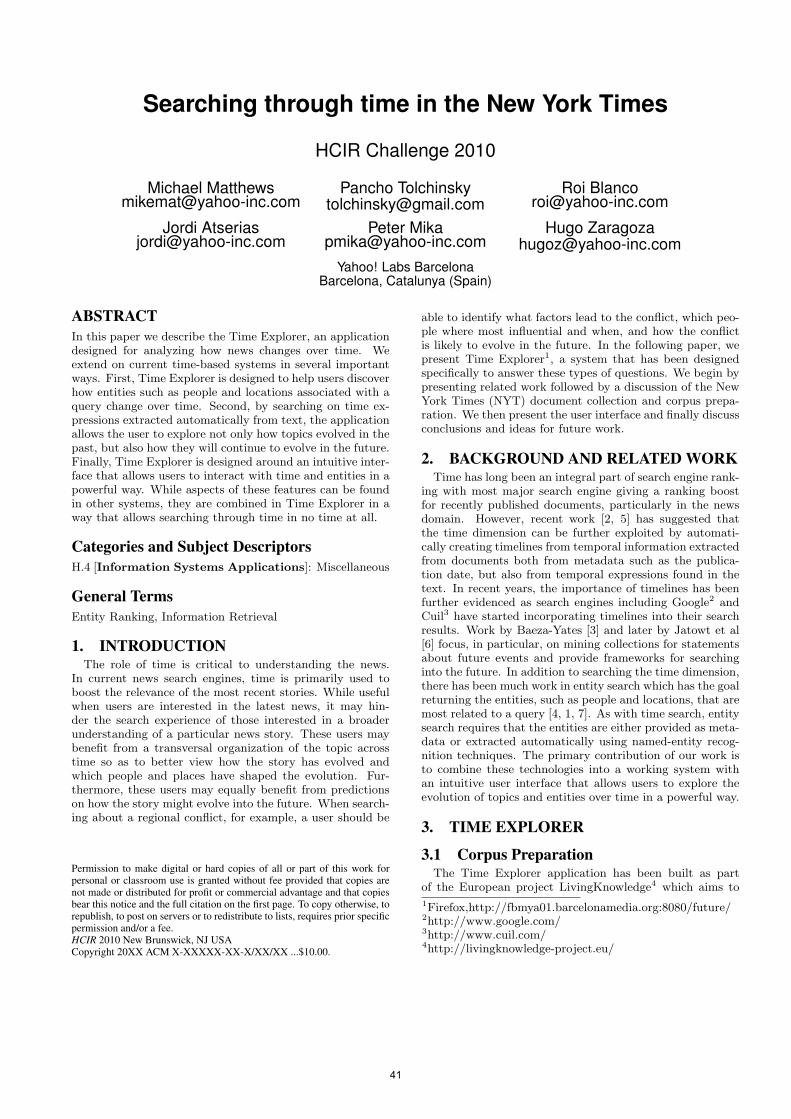
Searching through time in the New York Times
HCIR Challenge 2010
Michael [email protected]
Pancho [email protected]
Jordi [email protected]
Peter [email protected]
Hugo [email protected]
Yahoo! Labs BarcelonaBarcelona, Catalunya (Spain)
ABSTRACTIn this paper we describe the Time Explorer, an applicationdesigned for analyzing how news changes over time. Weextend on current time-based systems in several importantways. First, Time Explorer is designed to help users discoverhow entities such as people and locations associated with aquery change over time. Second, by searching on time ex-pressions extracted automatically from text, the applicationallows the user to explore not only how topics evolved in thepast, but also how they will continue to evolve in the future.Finally, Time Explorer is designed around an intuitive inter-face that allows users to interact with time and entities in apowerful way. While aspects of these features can be foundin other systems, they are combined in Time Explorer in away that allows searching through time in no time at all.
Categories and Subject DescriptorsH.4 [Information Systems Applications]: Miscellaneous
General TermsEntity Ranking, Information Retrieval
1. INTRODUCTIONThe role of time is critical to understanding the news.
In current news search engines, time is primarily used toboost the relevance of the most recent stories. While usefulwhen users are interested in the latest news, it may hin-der the search experience of those interested in a broaderunderstanding of a particular news story. These users maybenefit from a transversal organization of the topic acrosstime so as to better view how the story has evolved andwhich people and places have shaped the evolution. Fur-thermore, these users may equally benefit from predictionson how the story might evolve into the future. When search-ing about a regional conflict, for example, a user should be
Permission to make digital or hard copies of all or part of this work forpersonal or classroom use is granted without fee provided that copies arenot made or distributed for profit or commercial advantage and that copiesbear this notice and the full citation on the first page. To copy otherwise, torepublish, to post on servers or to redistribute to lists, requires prior specificpermission and/or a fee.HCIR 2010 New Brunswick, NJ USACopyright 20XX ACM X-XXXXX-XX-X/XX/XX ...$10.00.
able to identify what factors lead to the conflict, which peo-ple where most influential and when, and how the conflictis likely to evolve in the future. In the following paper, wepresent Time Explorer1, a system that has been designedspecifically to answer these types of questions. We begin bypresenting related work followed by a discussion of the NewYork Times (NYT) document collection and corpus prepa-ration. We then present the user interface and finally discussconclusions and ideas for future work.
2. BACKGROUND AND RELATED WORKTime has long been an integral part of search engine rank-
ing with most major search engine giving a ranking boostfor recently published documents, particularly in the newsdomain. However, recent work [2, 5] has suggested thatthe time dimension can be further exploited by automati-cally creating timelines from temporal information extractedfrom documents both from metadata such as the publica-tion date, but also from temporal expressions found in thetext. In recent years, the importance of timelines has beenfurther evidenced as search engines including Google2 andCuil3 have started incorporating timelines into their searchresults. Work by Baeza-Yates [3] and later by Jatowt et al[6] focus, in particular, on mining collections for statementsabout future events and provide frameworks for searchinginto the future. In addition to searching the time dimension,there has been much work in entity search which has the goalreturning the entities, such as people and locations, that aremost related to a query [4, 1, 7]. As with time search, entitysearch requires that the entities are either provided as meta-data or extracted automatically using named-entity recog-nition techniques. The primary contribution of our work isto combine these technologies into a working system withan intuitive user interface that allows users to explore theevolution of topics and entities over time in a powerful way.
3. TIME EXPLORER
3.1 Corpus PreparationThe Time Explorer application has been built as part
of the European project LivingKnowledge4 which aims to
1Firefox,http://fbmya01.barcelonamedia.org:8080/future/2http://www.google.com/3http://www.cuil.com/4http://livingknowledge-project.eu/
41
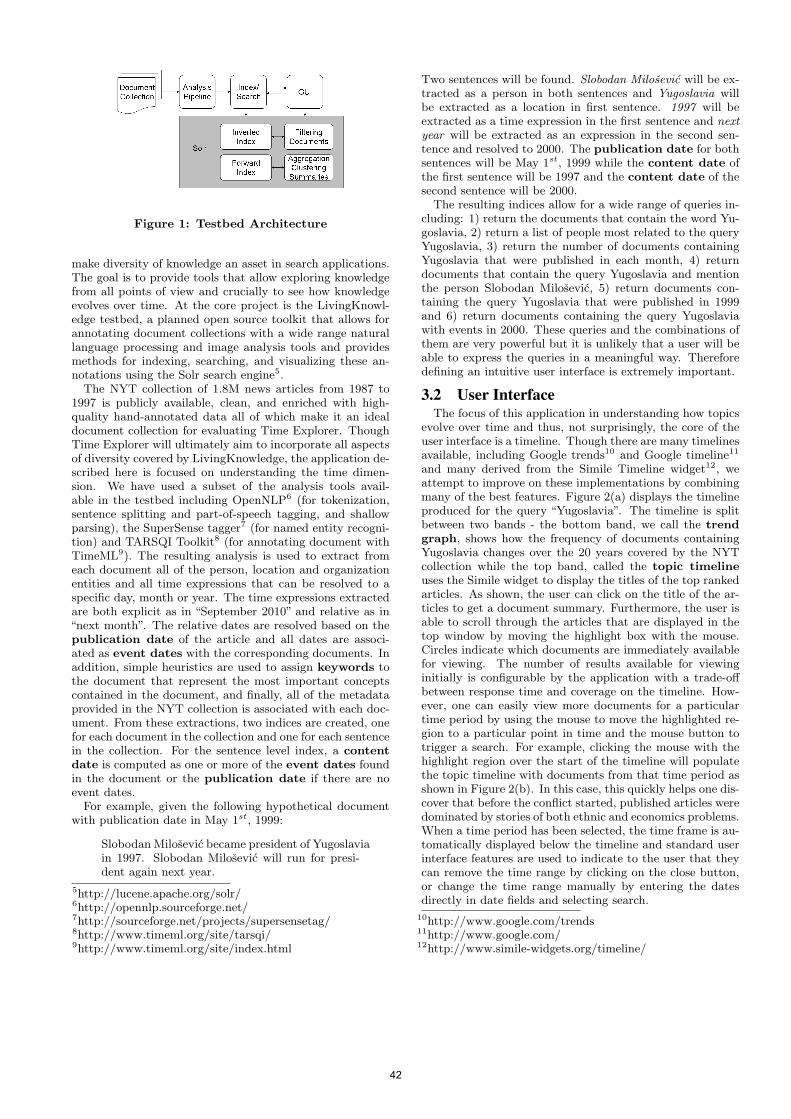
Figure 1: Testbed Architecture
make diversity of knowledge an asset in search applications.The goal is to provide tools that allow exploring knowledgefrom all points of view and crucially to see how knowledgeevolves over time. At the core project is the LivingKnowl-edge testbed, a planned open source toolkit that allows forannotating document collections with a wide range naturallanguage processing and image analysis tools and providesmethods for indexing, searching, and visualizing these an-notations using the Solr search engine5.
The NYT collection of 1.8M news articles from 1987 to1997 is publicly available, clean, and enriched with high-quality hand-annotated data all of which make it an idealdocument collection for evaluating Time Explorer. ThoughTime Explorer will ultimately aim to incorporate all aspectsof diversity covered by LivingKnowledge, the application de-scribed here is focused on understanding the time dimen-sion. We have used a subset of the analysis tools avail-able in the testbed including OpenNLP6 (for tokenization,sentence splitting and part-of-speech tagging, and shallowparsing), the SuperSense tagger7 (for named entity recogni-tion) and TARSQI Toolkit8 (for annotating document withTimeML9). The resulting analysis is used to extract fromeach document all of the person, location and organizationentities and all time expressions that can be resolved to aspecific day, month or year. The time expressions extractedare both explicit as in “September 2010” and relative as in“next month”. The relative dates are resolved based on thepublication date of the article and all dates are associ-ated as event dates with the corresponding documents. Inaddition, simple heuristics are used to assign keywords tothe document that represent the most important conceptscontained in the document, and finally, all of the metadataprovided in the NYT collection is associated with each doc-ument. From these extractions, two indices are created, onefor each document in the collection and one for each sentencein the collection. For the sentence level index, a contentdate is computed as one or more of the event dates foundin the document or the publication date if there are noevent dates.
For example, given the following hypothetical documentwith publication date in May 1st, 1999:
Slobodan Milosevic became president of Yugoslaviain 1997. Slobodan Milosevic will run for presi-dent again next year.
5http://lucene.apache.org/solr/6http://opennlp.sourceforge.net/7http://sourceforge.net/projects/supersensetag/8http://www.timeml.org/site/tarsqi/9http://www.timeml.org/site/index.html
Two sentences will be found. Slobodan Milosevic will be ex-tracted as a person in both sentences and Yugoslavia willbe extracted as a location in first sentence. 1997 will beextracted as a time expression in the first sentence and nextyear will be extracted as an expression in the second sen-tence and resolved to 2000. The publication date for bothsentences will be May 1st, 1999 while the content date ofthe first sentence will be 1997 and the content date of thesecond sentence will be 2000.
The resulting indices allow for a wide range of queries in-cluding: 1) return the documents that contain the word Yu-goslavia, 2) return a list of people most related to the queryYugoslavia, 3) return the number of documents containingYugoslavia that were published in each month, 4) returndocuments that contain the query Yugoslavia and mentionthe person Slobodan Milosevic, 5) return documents con-taining the query Yugoslavia that were published in 1999and 6) return documents containing the query Yugoslaviawith events in 2000. These queries and the combinations ofthem are very powerful but it is unlikely that a user will beable to express the queries in a meaningful way. Thereforedefining an intuitive user interface is extremely important.
3.2 User InterfaceThe focus of this application in understanding how topics
evolve over time and thus, not surprisingly, the core of theuser interface is a timeline. Though there are many timelinesavailable, including Google trends10 and Google timeline11
and many derived from the Simile Timeline widget12, weattempt to improve on these implementations by combiningmany of the best features. Figure 2(a) displays the timelineproduced for the query “Yugoslavia”. The timeline is splitbetween two bands - the bottom band, we call the trendgraph, shows how the frequency of documents containingYugoslavia changes over the 20 years covered by the NYTcollection while the top band, called the topic timelineuses the Simile widget to display the titles of the top rankedarticles. As shown, the user can click on the title of the ar-ticles to get a document summary. Furthermore, the user isable to scroll through the articles that are displayed in thetop window by moving the highlight box with the mouse.Circles indicate which documents are immediately availablefor viewing. The number of results available for viewinginitially is configurable by the application with a trade-offbetween response time and coverage on the timeline. How-ever, one can easily view more documents for a particulartime period by using the mouse to move the highlighted re-gion to a particular point in time and the mouse button totrigger a search. For example, clicking the mouse with thehighlight region over the start of the timeline will populatethe topic timeline with documents from that time period asshown in Figure 2(b). In this case, this quickly helps one dis-cover that before the conflict started, published articles weredominated by stories of both ethnic and economics problems.When a time period has been selected, the time frame is au-tomatically displayed below the timeline and standard userinterface features are used to indicate to the user that theycan remove the time range by clicking on the close button,or change the time range manually by entering the datesdirectly in date fields and selecting search.
10http://www.google.com/trends11http://www.google.com/12http://www.simile-widgets.org/timeline/
42
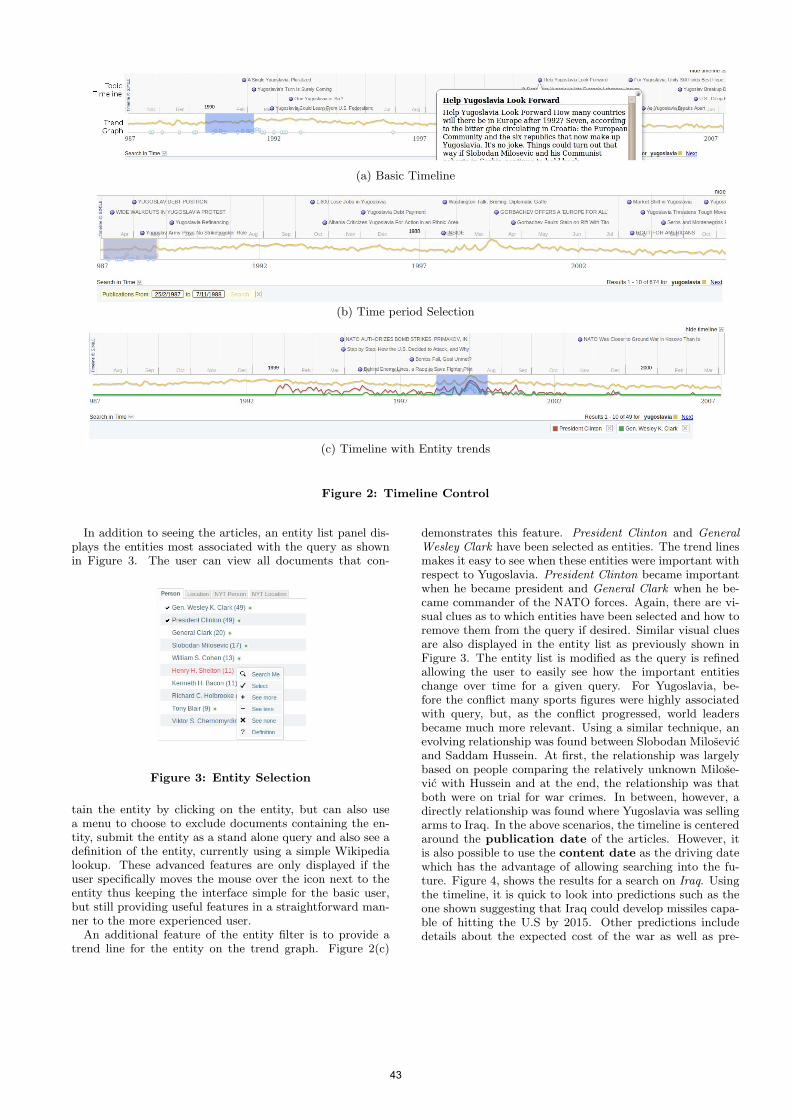
(a) Basic Timeline
(b) Time period Selection
(c) Timeline with Entity trends
Figure 2: Timeline Control
In addition to seeing the articles, an entity list panel dis-plays the entities most associated with the query as shownin Figure 3. The user can view all documents that con-
Figure 3: Entity Selection
tain the entity by clicking on the entity, but can also usea menu to choose to exclude documents containing the en-tity, submit the entity as a stand alone query and also see adefinition of the entity, currently using a simple Wikipedialookup. These advanced features are only displayed if theuser specifically moves the mouse over the icon next to theentity thus keeping the interface simple for the basic user,but still providing useful features in a straightforward man-ner to the more experienced user.
An additional feature of the entity filter is to provide atrend line for the entity on the trend graph. Figure 2(c)
demonstrates this feature. President Clinton and GeneralWesley Clark have been selected as entities. The trend linesmakes it easy to see when these entities were important withrespect to Yugoslavia. President Clinton became importantwhen he became president and General Clark when he be-came commander of the NATO forces. Again, there are vi-sual clues as to which entities have been selected and how toremove them from the query if desired. Similar visual cluesare also displayed in the entity list as previously shown inFigure 3. The entity list is modified as the query is refinedallowing the user to easily see how the important entitieschange over time for a given query. For Yugoslavia, be-fore the conflict many sports figures were highly associatedwith query, but, as the conflict progressed, world leadersbecame much more relevant. Using a similar technique, anevolving relationship was found between Slobodan Milosevicand Saddam Hussein. At first, the relationship was largelybased on people comparing the relatively unknown Milose-vic with Hussein and at the end, the relationship was thatboth were on trial for war crimes. In between, however, adirectly relationship was found where Yugoslavia was sellingarms to Iraq. In the above scenarios, the timeline is centeredaround the publication date of the articles. However, itis also possible to use the content date as the driving datewhich has the advantage of allowing searching into the fu-ture. Figure 4, shows the results for a search on Iraq. Usingthe timeline, it is quick to look into predictions such as theone shown suggesting that Iraq could develop missiles capa-ble of hitting the U.S by 2015. Other predictions includedetails about the expected cost of the war as well as pre-
43
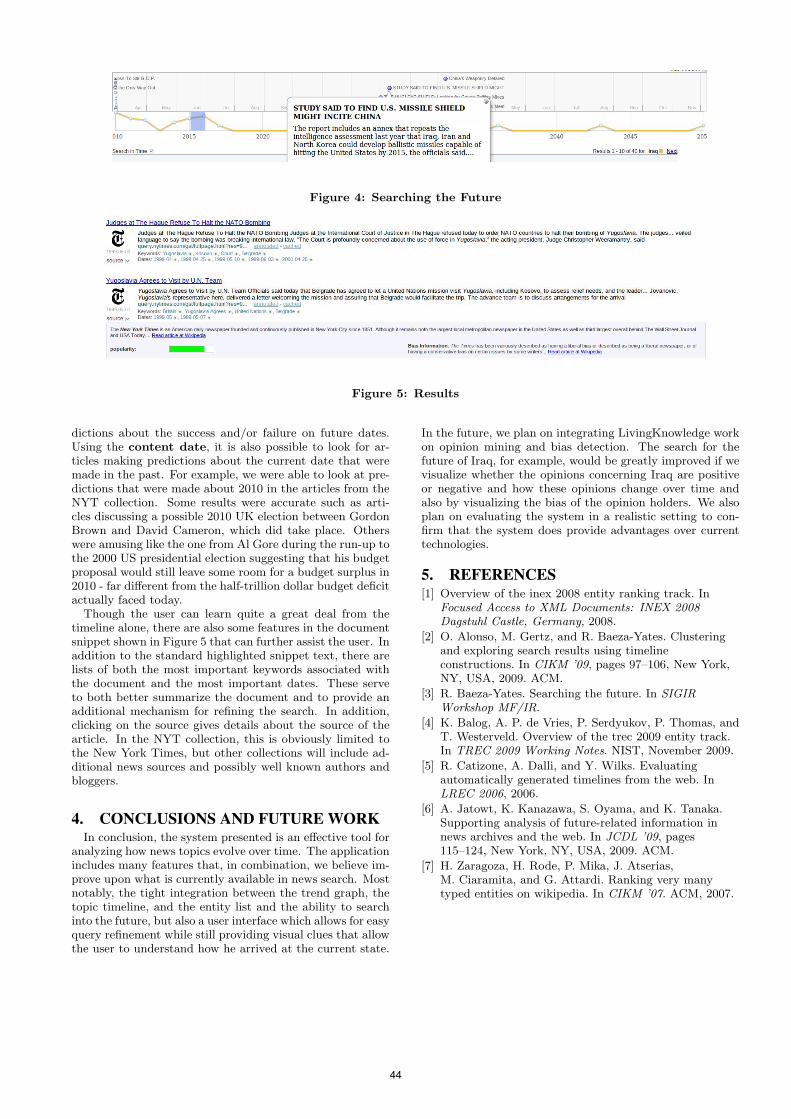
Figure 4: Searching the Future
Figure 5: Results
dictions about the success and/or failure on future dates.Using the content date, it is also possible to look for ar-ticles making predictions about the current date that weremade in the past. For example, we were able to look at pre-dictions that were made about 2010 in the articles from theNYT collection. Some results were accurate such as arti-cles discussing a possible 2010 UK election between GordonBrown and David Cameron, which did take place. Otherswere amusing like the one from Al Gore during the run-up tothe 2000 US presidential election suggesting that his budgetproposal would still leave some room for a budget surplus in2010 - far different from the half-trillion dollar budget deficitactually faced today.
Though the user can learn quite a great deal from thetimeline alone, there are also some features in the documentsnippet shown in Figure 5 that can further assist the user. Inaddition to the standard highlighted snippet text, there arelists of both the most important keywords associated withthe document and the most important dates. These serveto both better summarize the document and to provide anadditional mechanism for refining the search. In addition,clicking on the source gives details about the source of thearticle. In the NYT collection, this is obviously limited tothe New York Times, but other collections will include ad-ditional news sources and possibly well known authors andbloggers.
4. CONCLUSIONS AND FUTURE WORKIn conclusion, the system presented is an effective tool for
analyzing how news topics evolve over time. The applicationincludes many features that, in combination, we believe im-prove upon what is currently available in news search. Mostnotably, the tight integration between the trend graph, thetopic timeline, and the entity list and the ability to searchinto the future, but also a user interface which allows for easyquery refinement while still providing visual clues that allowthe user to understand how he arrived at the current state.
In the future, we plan on integrating LivingKnowledge workon opinion mining and bias detection. The search for thefuture of Iraq, for example, would be greatly improved if wevisualize whether the opinions concerning Iraq are positiveor negative and how these opinions change over time andalso by visualizing the bias of the opinion holders. We alsoplan on evaluating the system in a realistic setting to con-firm that the system does provide advantages over currenttechnologies.
5. REFERENCES[1] Overview of the inex 2008 entity ranking track. In
Focused Access to XML Documents: INEX 2008Dagstuhl Castle, Germany, 2008.
[2] O. Alonso, M. Gertz, and R. Baeza-Yates. Clusteringand exploring search results using timelineconstructions. In CIKM ’09, pages 97–106, New York,NY, USA, 2009. ACM.
[3] R. Baeza-Yates. Searching the future. In SIGIRWorkshop MF/IR.
[4] K. Balog, A. P. de Vries, P. Serdyukov, P. Thomas, andT. Westerveld. Overview of the trec 2009 entity track.In TREC 2009 Working Notes. NIST, November 2009.
[5] R. Catizone, A. Dalli, and Y. Wilks. Evaluatingautomatically generated timelines from the web. InLREC 2006, 2006.
[6] A. Jatowt, K. Kanazawa, S. Oyama, and K. Tanaka.Supporting analysis of future-related information innews archives and the web. In JCDL ’09, pages115–124, New York, NY, USA, 2009. ACM.
[7] H. Zaragoza, H. Rode, P. Mika, J. Atserias,M. Ciaramita, and G. Attardi. Ranking very manytyped entities on wikipedia. In CIKM ’07. ACM, 2007.
44

News Sync: Three Reasons to Visualize News Better V.G.Vinod
Vydiswaran University of Illinois
Urbana, IL
Jeroen van den Eijkhof
University of Washington Seattle, WA
Raman Ann Jim Chandrasekar Paradiso St. George
Microsoft Research, Redmond, WA
{ramanc, annpar, jamessg}@microsoft.com
ABSTRACT News consumption patterns are changing, but the tools to view
news are dominated by portal and search approaches. We suggest
using a mix of search, visualization, natural language processing,
and machine learning to provide a more captivating, sticky news
consumption experience. We present a system that was built for
three scenarios where a user wants to catch up on news from a
particular time period, location, or topic. The results cover key
events from that time period and are prioritized based on the
user’s interests. Further, users can interact with and explore
stories of interest. An initial prototype is currently being piloted.
Categories and Subject Descriptors
H.3.3 [Information Storage and Retrieval]: Information Search
and Retrieval – information filtering, selection process.
General Terms
Algorithms, Human Factors.
Keywords
News summarization, clustering, news adaptation, news
exploration, news interfaces.
1. INTRODUCTION The news landscape has undergone major changes with the advent
of online media. While the readership of traditional newspapers
has declined over the past few years, the consumption of news
over the Internet has increased significantly. In a March 2010
survey of US Internet users [1] on the primary source used to find
news, it was found that the Web/Internet is by far the most
popular source (49%) as compared to Television (32%) and
Newspapers (9%). As with other kinds of online information, the
dominant mode of assessing news online is through search.
According to a Pew Research survey conducted over Apr–Jun
2008 [5], 83% of those going online for news use search engines
to find stories of interest. So, even though there are several
dedicated news portals, consumption of news is triggered
primarily through queries. Search engines today address this user
behavior by integrating relevant news results with Web search
results for news-related queries and provide news verticals and
topic-specific news pages.
However, the presentation of news is not optimal on these sites.
Even as news is shifting online, the presentation of news is still
driven by the print media. There is limited real estate on the
search result pages to display news, and many news articles do not
get surfaced on the site. Finding relevant news is more than just
retrieving news results or restricting the search based on keyword
queries over the news domain. Presentation of news needs to cater
to specific user needs. We propose a use-case or scenario driven
approach to selecting relevant news stories and presenting these
appropriately to the user. Further, users should be able to explore
the news landscape – getting to other related news articles,
visualizing the connections between stories, getting background
information on relevant people and concepts, commenting on and
annotating stories, and sharing interesting items with friends.
In this paper, we present our system, called News Sync, which was
developed to enable such enhanced news experience. The system
is built over the New York Times Corpus released as part of
HCIR Challenge. In Section 2, we present the motivation for this
system with the help of three use-cases, and list key features that
must be present in such a system in Section 3. In Section 4, we
present our solution in detail and show how these use-cases can
be addressed by the system. We conclude in Section 5 with related
work and future steps.
2. NEWS EXPLORATION SCENARIOS In this section, we present three specific scenarios for a user-
driven news digest to illustrate our ideas. We propose techniques
to select and present news according to user needs and
preferences. While the techniques used may not be new, we
suggest that the integration we propose will lead to a better news
experience.
2.1 Scenario 1: Catching up on News Consider the following scenario: Katie is an avid news reader who
tracks news on a daily basis, often following up on specific news
events several times a day. At times, Katie may be cut off from
news, for example, when she goes on a long vacation. When she
is back online, she may want to know what happened while she
was away. She may want to skim through the major news stories
that took place, including updates on the news she was following
regularly before going on vacation.
This caters to a common, specific need of a news consumer
wanting to catch up on news.
2.2 Scenario 2: Diaspora Digest It has become fairly common for people to migrate to another
country or city for work or studies. Though most of these
expatriates try to keep abreast with the news from the country of
origin, they lose touch with traditional sources of news. They visit
news websites from the home country periodically to do so. If
Permission to make digital or hard copies of all or part of this work for
personal or classroom use is granted without fee provided that copies are
not made or distributed for profit or commercial advantage and that
copies bear this notice and the full citation on the first page. To copy
otherwise, or republish, to post on servers or to redistribute to lists,
requires prior specific permission and/or a fee.
HCIR’10, August 22, 2010, New Brunswick, NJ, USA.
Copyright 2010 ACM 1-58113-000-0/00/0010…$10.00.
45
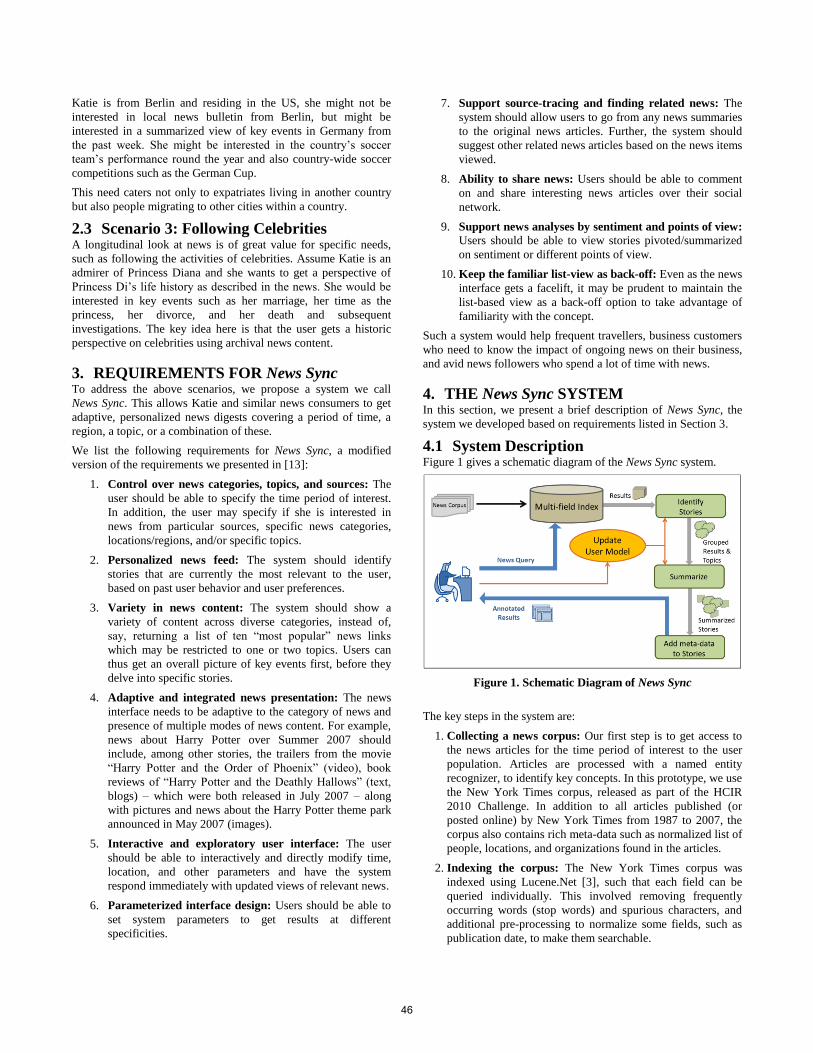
Katie is from Berlin and residing in the US, she might not be
interested in local news bulletin from Berlin, but might be
interested in a summarized view of key events in Germany from
the past week. She might be interested in the country’s soccer
team’s performance round the year and also country-wide soccer
competitions such as the German Cup.
This need caters not only to expatriates living in another country
but also people migrating to other cities within a country.
2.3 Scenario 3: Following Celebrities A longitudinal look at news is of great value for specific needs,
such as following the activities of celebrities. Assume Katie is an
admirer of Princess Diana and she wants to get a perspective of
Princess Di’s life history as described in the news. She would be
interested in key events such as her marriage, her time as the
princess, her divorce, and her death and subsequent
investigations. The key idea here is that the user gets a historic
perspective on celebrities using archival news content.
3. REQUIREMENTS FOR News Sync To address the above scenarios, we propose a system we call
News Sync. This allows Katie and similar news consumers to get
adaptive, personalized news digests covering a period of time, a
region, a topic, or a combination of these.
We list the following requirements for News Sync, a modified
version of the requirements we presented in [13]:
1. Control over news categories, topics, and sources: The
user should be able to specify the time period of interest.
In addition, the user may specify if she is interested in
news from particular sources, specific news categories,
locations/regions, and/or specific topics.
2. Personalized news feed: The system should identify
stories that are currently the most relevant to the user,
based on past user behavior and user preferences.
3. Variety in news content: The system should show a
variety of content across diverse categories, instead of,
say, returning a list of ten “most popular” news links
which may be restricted to one or two topics. Users can
thus get an overall picture of key events first, before they
delve into specific stories.
4. Adaptive and integrated news presentation: The news
interface needs to be adaptive to the category of news and
presence of multiple modes of news content. For example,
news about Harry Potter over Summer 2007 should
include, among other stories, the trailers from the movie
“Harry Potter and the Order of Phoenix” (video), book
reviews of “Harry Potter and the Deathly Hallows” (text,
blogs) – which were both released in July 2007 – along
with pictures and news about the Harry Potter theme park
announced in May 2007 (images).
5. Interactive and exploratory user interface: The user
should be able to interactively and directly modify time,
location, and other parameters and have the system
respond immediately with updated views of relevant news.
6. Parameterized interface design: Users should be able to
set system parameters to get results at different
specificities.
7. Support source-tracing and finding related news: The
system should allow users to go from any news summaries
to the original news articles. Further, the system should
suggest other related news articles based on the news items
viewed.
8. Ability to share news: Users should be able to comment
on and share interesting news articles over their social
network.
9. Support news analyses by sentiment and points of view:
Users should be able to view stories pivoted/summarized
on sentiment or different points of view.
10. Keep the familiar list-view as back-off: Even as the news
interface gets a facelift, it may be prudent to maintain the
list-based view as a back-off option to take advantage of
familiarity with the concept.
Such a system would help frequent travellers, business customers
who need to know the impact of ongoing news on their business,
and avid news followers who spend a lot of time with news.
4. THE News Sync SYSTEM In this section, we present a brief description of News Sync, the
system we developed based on requirements listed in Section 3.
4.1 System Description Figure 1 gives a schematic diagram of the News Sync system.
Figure 1. Schematic Diagram of News Sync
The key steps in the system are:
1. Collecting a news corpus: Our first step is to get access to
the news articles for the time period of interest to the user
population. Articles are processed with a named entity
recognizer, to identify key concepts. In this prototype, we use
the New York Times corpus, released as part of the HCIR
2010 Challenge. In addition to all articles published (or
posted online) by New York Times from 1987 to 2007, the
corpus also contains rich meta-data such as normalized list of
people, locations, and organizations found in the articles.
2. Indexing the corpus: The New York Times corpus was
indexed using Lucene.Net [3], such that each field can be
queried individually. This involved removing frequently
occurring words (stop words) and spurious characters, and
additional pre-processing to normalize some fields, such as
publication date, to make them searchable.
46
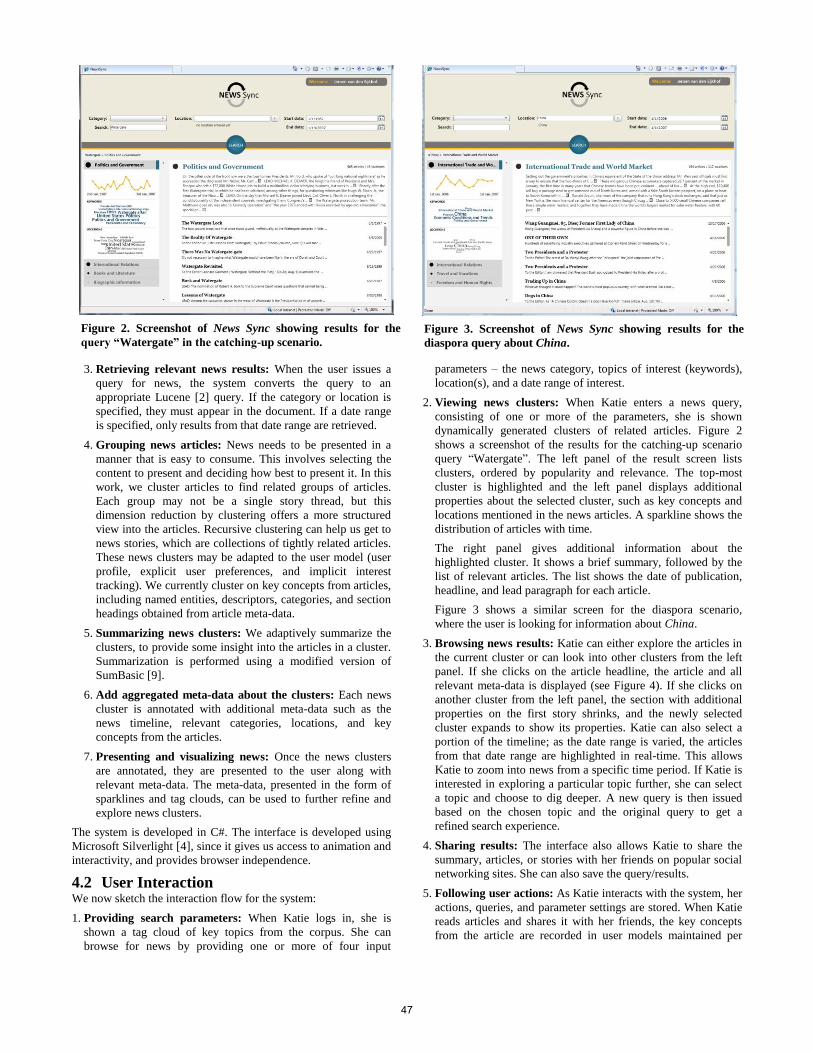
3. Retrieving relevant news results: When the user issues a
query for news, the system converts the query to an
appropriate Lucene [2] query. If the category or location is
specified, they must appear in the document. If a date range
is specified, only results from that date range are retrieved.
4. Grouping news articles: News needs to be presented in a
manner that is easy to consume. This involves selecting the
content to present and deciding how best to present it. In this
work, we cluster articles to find related groups of articles.
Each group may not be a single story thread, but this
dimension reduction by clustering offers a more structured
view into the articles. Recursive clustering can help us get to
news stories, which are collections of tightly related articles.
These news clusters may be adapted to the user model (user
profile, explicit user preferences, and implicit interest
tracking). We currently cluster on key concepts from articles,
including named entities, descriptors, categories, and section
headings obtained from article meta-data.
5. Summarizing news clusters: We adaptively summarize the
clusters, to provide some insight into the articles in a cluster.
Summarization is performed using a modified version of
SumBasic [9].
6. Add aggregated meta-data about the clusters: Each news
cluster is annotated with additional meta-data such as the
news timeline, relevant categories, locations, and key
concepts from the articles.
7. Presenting and visualizing news: Once the news clusters
are annotated, they are presented to the user along with
relevant meta-data. The meta-data, presented in the form of
sparklines and tag clouds, can be used to further refine and
explore news clusters.
The system is developed in C#. The interface is developed using
Microsoft Silverlight [4], since it gives us access to animation and
interactivity, and provides browser independence.
4.2 User Interaction We now sketch the interaction flow for the system:
1. Providing search parameters: When Katie logs in, she is
shown a tag cloud of key topics from the corpus. She can
browse for news by providing one or more of four input
parameters – the news category, topics of interest (keywords),
location(s), and a date range of interest.
2. Viewing news clusters: When Katie enters a news query,
consisting of one or more of the parameters, she is shown
dynamically generated clusters of related articles. Figure 2
shows a screenshot of the results for the catching-up scenario
query “Watergate”. The left panel of the result screen lists
clusters, ordered by popularity and relevance. The top-most
cluster is highlighted and the left panel displays additional
properties about the selected cluster, such as key concepts and
locations mentioned in the news articles. A sparkline shows the
distribution of articles with time.
The right panel gives additional information about the
highlighted cluster. It shows a brief summary, followed by the
list of relevant articles. The list shows the date of publication,
headline, and lead paragraph for each article.
Figure 3 shows a similar screen for the diaspora scenario,
where the user is looking for information about China.
3. Browsing news results: Katie can either explore the articles in
the current cluster or can look into other clusters from the left
panel. If she clicks on the article headline, the article and all
relevant meta-data is displayed (see Figure 4). If she clicks on
another cluster from the left panel, the section with additional
properties on the first story shrinks, and the newly selected
cluster expands to show its properties. Katie can also select a
portion of the timeline; as the date range is varied, the articles
from that date range are highlighted in real-time. This allows
Katie to zoom into news from a specific time period. If Katie is
interested in exploring a particular topic further, she can select
a topic and choose to dig deeper. A new query is then issued
based on the chosen topic and the original query to get a
refined search experience.
4. Sharing results: The interface also allows Katie to share the
summary, articles, or stories with her friends on popular social
networking sites. She can also save the query/results.
5. Following user actions: As Katie interacts with the system, her
actions, queries, and parameter settings are stored. When Katie
reads articles and shares it with her friends, the key concepts
from the article are recorded in user models maintained per
Figure 2. Screenshot of News Sync showing results for the
query “Watergate” in the catching-up scenario.
Figure 3. Screenshot of News Sync showing results for the
diaspora query about China.
47
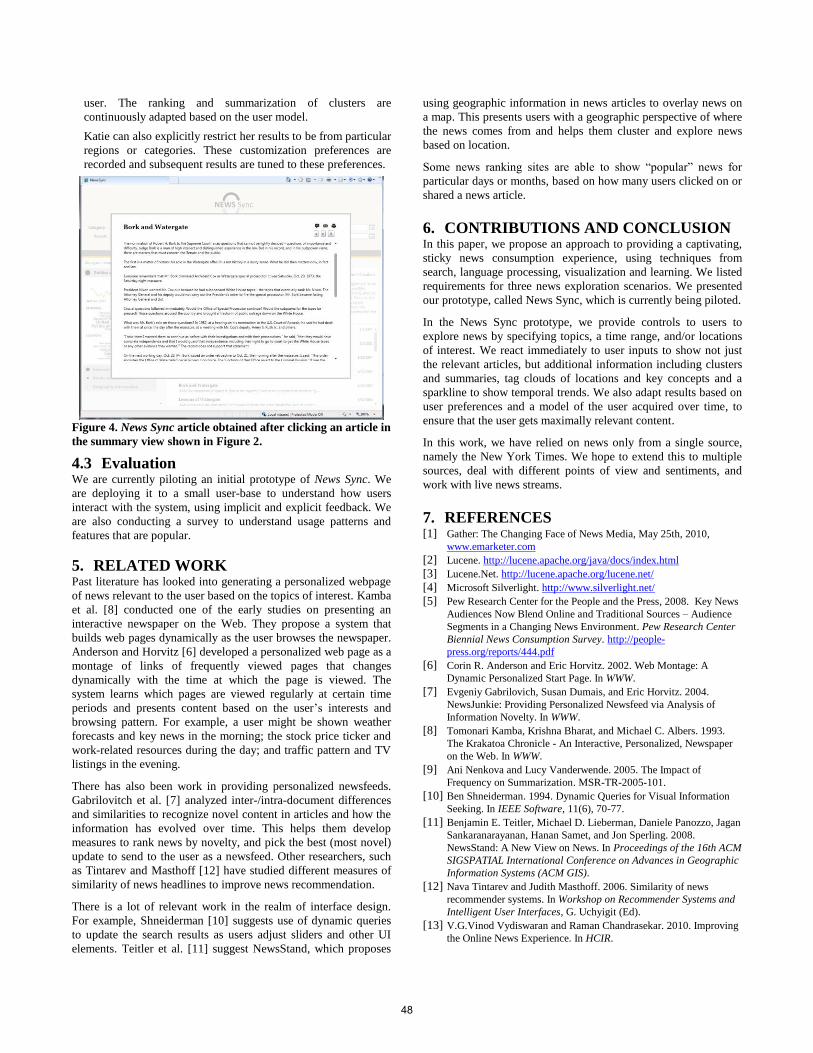
user. The ranking and summarization of clusters are
continuously adapted based on the user model.
Katie can also explicitly restrict her results to be from particular
regions or categories. These customization preferences are
recorded and subsequent results are tuned to these preferences.
Figure 4. News Sync article obtained after clicking an article in
the summary view shown in Figure 2.
4.3 Evaluation We are currently piloting an initial prototype of News Sync. We
are deploying it to a small user-base to understand how users
interact with the system, using implicit and explicit feedback. We
are also conducting a survey to understand usage patterns and
features that are popular.
5. RELATED WORK Past literature has looked into generating a personalized webpage
of news relevant to the user based on the topics of interest. Kamba
et al. [8] conducted one of the early studies on presenting an
interactive newspaper on the Web. They propose a system that
builds web pages dynamically as the user browses the newspaper.
Anderson and Horvitz [6] developed a personalized web page as a
montage of links of frequently viewed pages that changes
dynamically with the time at which the page is viewed. The
system learns which pages are viewed regularly at certain time
periods and presents content based on the user’s interests and
browsing pattern. For example, a user might be shown weather
forecasts and key news in the morning; the stock price ticker and
work-related resources during the day; and traffic pattern and TV
listings in the evening.
There has also been work in providing personalized newsfeeds.
Gabrilovitch et al. [7] analyzed inter-/intra-document differences
and similarities to recognize novel content in articles and how the
information has evolved over time. This helps them develop
measures to rank news by novelty, and pick the best (most novel)
update to send to the user as a newsfeed. Other researchers, such
as Tintarev and Masthoff [12] have studied different measures of
similarity of news headlines to improve news recommendation.
There is a lot of relevant work in the realm of interface design.
For example, Shneiderman [10] suggests use of dynamic queries
to update the search results as users adjust sliders and other UI
elements. Teitler et al. [11] suggest NewsStand, which proposes
using geographic information in news articles to overlay news on
a map. This presents users with a geographic perspective of where
the news comes from and helps them cluster and explore news
based on location.
Some news ranking sites are able to show “popular” news for
particular days or months, based on how many users clicked on or
shared a news article.
6. CONTRIBUTIONS AND CONCLUSION In this paper, we propose an approach to providing a captivating,
sticky news consumption experience, using techniques from
search, language processing, visualization and learning. We listed
requirements for three news exploration scenarios. We presented
our prototype, called News Sync, which is currently being piloted.
In the News Sync prototype, we provide controls to users to
explore news by specifying topics, a time range, and/or locations
of interest. We react immediately to user inputs to show not just
the relevant articles, but additional information including clusters
and summaries, tag clouds of locations and key concepts and a
sparkline to show temporal trends. We also adapt results based on
user preferences and a model of the user acquired over time, to
ensure that the user gets maximally relevant content.
In this work, we have relied on news only from a single source,
namely the New York Times. We hope to extend this to multiple
sources, deal with different points of view and sentiments, and
work with live news streams.
7. REFERENCES [1] Gather: The Changing Face of News Media, May 25th, 2010,
www.emarketer.com
[2] Lucene. http://lucene.apache.org/java/docs/index.html
[3] Lucene.Net. http://lucene.apache.org/lucene.net/
[4] Microsoft Silverlight. http://www.silverlight.net/
[5] Pew Research Center for the People and the Press, 2008. Key News
Audiences Now Blend Online and Traditional Sources – Audience
Segments in a Changing News Environment. Pew Research Center
Biennial News Consumption Survey. http://people-
press.org/reports/444.pdf
[6] Corin R. Anderson and Eric Horvitz. 2002. Web Montage: A
Dynamic Personalized Start Page. In WWW.
[7] Evgeniy Gabrilovich, Susan Dumais, and Eric Horvitz. 2004.
NewsJunkie: Providing Personalized Newsfeed via Analysis of
Information Novelty. In WWW.
[8] Tomonari Kamba, Krishna Bharat, and Michael C. Albers. 1993.
The Krakatoa Chronicle - An Interactive, Personalized, Newspaper
on the Web. In WWW.
[9] Ani Nenkova and Lucy Vanderwende. 2005. The Impact of
Frequency on Summarization. MSR-TR-2005-101.
[10] Ben Shneiderman. 1994. Dynamic Queries for Visual Information
Seeking. In IEEE Software, 11(6), 70-77.
[11] Benjamin E. Teitler, Michael D. Lieberman, Daniele Panozzo, Jagan
Sankaranarayanan, Hanan Samet, and Jon Sperling. 2008.
NewsStand: A New View on News. In Proceedings of the 16th ACM
SIGSPATIAL International Conference on Advances in Geographic
Information Systems (ACM GIS).
[12] Nava Tintarev and Judith Masthoff. 2006. Similarity of news
recommender systems. In Workshop on Recommender Systems and
Intelligent User Interfaces, G. Uchyigit (Ed).
[13] V.G.Vinod Vydiswaran and Raman Chandrasekar. 2010. Improving
the Online News Experience. In HCIR.
48
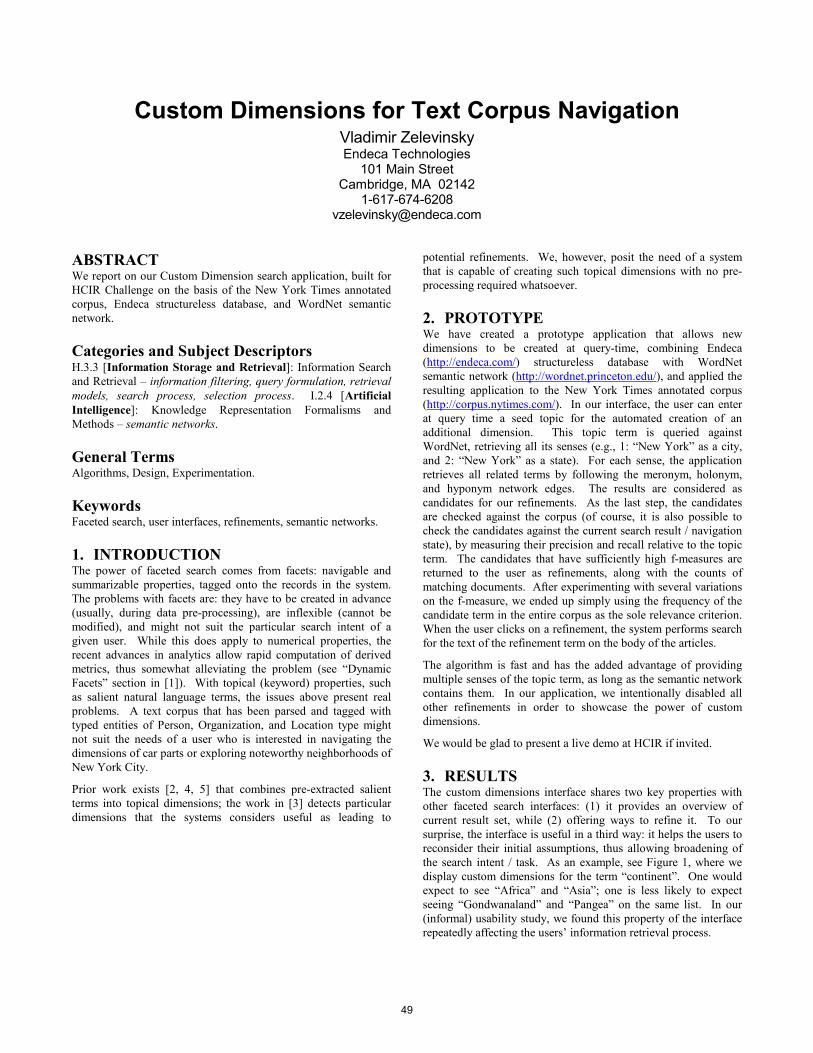
Custom Dimensions for Text Corpus Navigation Vladimir Zelevinsky Endeca Technologies
101 Main Street Cambridge, MA 02142
1-617-674-6208 [email protected]
ABSTRACT We report on our Custom Dimension search application, built for
HCIR Challenge on the basis of the New York Times annotated
corpus, Endeca structureless database, and WordNet semantic
network.
Categories and Subject Descriptors H.3.3 [Information Storage and Retrieval]: Information Search
and Retrieval – information filtering, query formulation, retrieval
models, search process, selection process. I.2.4 [Artificial
Intelligence]: Knowledge Representation Formalisms and
Methods – semantic networks.
General Terms Algorithms, Design, Experimentation.
Keywords Faceted search, user interfaces, refinements, semantic networks.
1. INTRODUCTION The power of faceted search comes from facets: navigable and
summarizable properties, tagged onto the records in the system.
The problems with facets are: they have to be created in advance
(usually, during data pre-processing), are inflexible (cannot be
modified), and might not suit the particular search intent of a
given user. While this does apply to numerical properties, the
recent advances in analytics allow rapid computation of derived
metrics, thus somewhat alleviating the problem (see “Dynamic
Facets” section in [1]). With topical (keyword) properties, such
as salient natural language terms, the issues above present real
problems. A text corpus that has been parsed and tagged with
typed entities of Person, Organization, and Location type might
not suit the needs of a user who is interested in navigating the
dimensions of car parts or exploring noteworthy neighborhoods of
New York City.
Prior work exists [2, 4, 5] that combines pre-extracted salient
terms into topical dimensions; the work in [3] detects particular
dimensions that the systems considers useful as leading to
potential refinements. We, however, posit the need of a system
that is capable of creating such topical dimensions with no pre-
processing required whatsoever.
2. PROTOTYPE We have created a prototype application that allows new
dimensions to be created at query-time, combining Endeca
(http://endeca.com/) structureless database with WordNet
semantic network (http://wordnet.princeton.edu/), and applied the
resulting application to the New York Times annotated corpus
(http://corpus.nytimes.com/). In our interface, the user can enter
at query time a seed topic for the automated creation of an
additional dimension. This topic term is queried against
WordNet, retrieving all its senses (e.g., 1: “New York” as a city,
and 2: “New York” as a state). For each sense, the application
retrieves all related terms by following the meronym, holonym,
and hyponym network edges. The results are considered as
candidates for our refinements. As the last step, the candidates
are checked against the corpus (of course, it is also possible to
check the candidates against the current search result / navigation
state), by measuring their precision and recall relative to the topic
term. The candidates that have sufficiently high f-measures are
returned to the user as refinements, along with the counts of
matching documents. After experimenting with several variations
on the f-measure, we ended up simply using the frequency of the
candidate term in the entire corpus as the sole relevance criterion.
When the user clicks on a refinement, the system performs search
for the text of the refinement term on the body of the articles.
The algorithm is fast and has the added advantage of providing
multiple senses of the topic term, as long as the semantic network
contains them. In our application, we intentionally disabled all
other refinements in order to showcase the power of custom
dimensions.
We would be glad to present a live demo at HCIR if invited.
3. RESULTS The custom dimensions interface shares two key properties with
other faceted search interfaces: (1) it provides an overview of
current result set, while (2) offering ways to refine it. To our
surprise, the interface is useful in a third way: it helps the users to
reconsider their initial assumptions, thus allowing broadening of
the search intent / task. As an example, see Figure 1, where we
display custom dimensions for the term “continent”. One would
expect to see “Africa” and “Asia”; one is less likely to expect
seeing “Gondwanaland” and “Pangea” on the same list. In our
(informal) usability study, we found this property of the interface
repeatedly affecting the users’ information retrieval process.
49
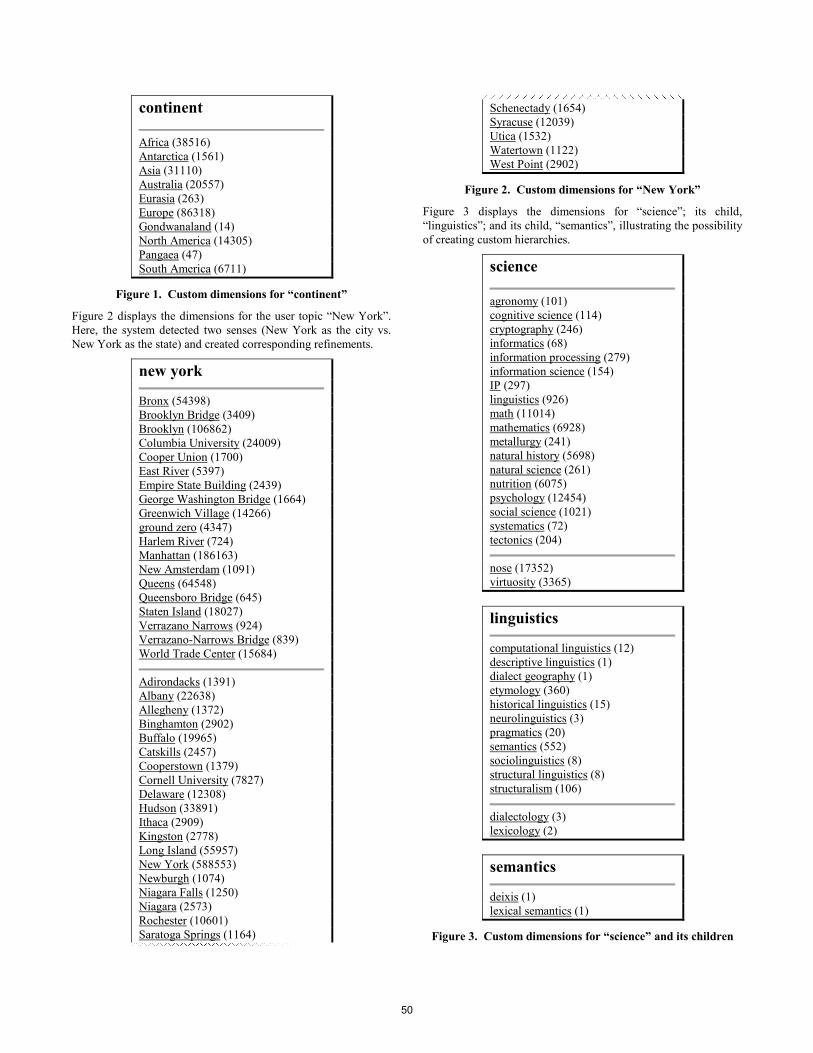
continent
Africa (38516)
Antarctica (1561)
Asia (31110)
Australia (20557)
Eurasia (263)
Europe (86318)
Gondwanaland (14)
North America (14305)
Pangaea (47)
South America (6711)
Figure 1. Custom dimensions for “continent”
Figure 2 displays the dimensions for the user topic “New York”.
Here, the system detected two senses (New York as the city vs.
New York as the state) and created corresponding refinements.
new york
Bronx (54398)
Brooklyn Bridge (3409)
Brooklyn (106862)
Columbia University (24009)
Cooper Union (1700)
East River (5397)
Empire State Building (2439)
George Washington Bridge (1664)
Greenwich Village (14266)
ground zero (4347)
Harlem River (724)
Manhattan (186163)
New Amsterdam (1091)
Queens (64548)
Queensboro Bridge (645)
Staten Island (18027)
Verrazano Narrows (924)
Verrazano-Narrows Bridge (839)
World Trade Center (15684)
Adirondacks (1391)
Albany (22638)
Allegheny (1372)
Binghamton (2902)
Buffalo (19965)
Catskills (2457)
Cooperstown (1379)
Cornell University (7827)
Delaware (12308)
Hudson (33891)
Ithaca (2909)
Kingston (2778)
Long Island (55957)
New York (588553)
Newburgh (1074)
Niagara Falls (1250)
Niagara (2573)
Rochester (10601)
Saratoga Springs (1164)
Schenectady (1654)
Syracuse (12039)
Utica (1532)
Watertown (1122)
West Point (2902)
Figure 2. Custom dimensions for “New York”
Figure 3 displays the dimensions for “science”; its child,
“linguistics”; and its child, “semantics”, illustrating the possibility
of creating custom hierarchies.
science
agronomy (101)
cognitive science (114)
cryptography (246)
informatics (68)
information processing (279)
information science (154)
IP (297)
linguistics (926)
math (11014)
mathematics (6928)
metallurgy (241)
natural history (5698)
natural science (261)
nutrition (6075)
psychology (12454)
social science (1021)
systematics (72)
tectonics (204)
nose (17352)
virtuosity (3365)
linguistics
computational linguistics (12)
descriptive linguistics (1)
dialect geography (1)
etymology (360)
historical linguistics (15)
neurolinguistics (3)
pragmatics (20)
semantics (552)
sociolinguistics (8)
structural linguistics (8)
structuralism (106)
dialectology (3)
lexicology (2)
semantics
deixis (1)
lexical semantics (1)
Figure 3. Custom dimensions for “science” and its children
50

4. CONCLUSIONS The main issue with using the custom dimensions application is
the polysemic nature of language: when performing text search for
a term, it is not guaranteed the system will return only the
documents where this term is used in the sense that corresponds to
the given dimension topic; for example, selecting “Queens” from
the “New York” dimension (Figure 2) will also return documents
that refer to monarchy. Restricting matches to proper nouns
(possibly even pre-extracted with a Location entity extractor) will
solve this particular issue, but will not help with the case of
“Syracuse” being not only a city in the state of New York, but
also a town in Sicily. A possible solution is a reduced-recall,
increased-precision replacement: instead of searching for the
refinement term, the application can perform the search for the
term as well as the text of the topic seed.
The possibility of limiting refinement to pre-extracted salient
terms likewise remains a promising venue of investigation.
The author would like to thank The New York Times for
providing the corpus, and Adam Ferrari for his assistance with
data wrangling.
5. REFERENCES [1] O. Ben-Yitzhak et al. Beyond Basic Faceted Search.
WSDM 2008. DOI:
http://doi.acm.org/10.1145/1341531.1341539
[2] W. Dakka, R. Dayal, P. Ipeirotis. Automatic Discovery of
Useful Facet Terms. Proceedings of the ACM SIGIR ‘06
Workshop on Faceted Search, 2006.
[3] C. Li, N. Yan, S. B. Roy, L. Lisham, G. Das. Facetedpedia: Dynamic Generation of Query Dependent Faceted Interfaces
for Wikipedia. International World Wide Web Conference,
Raleigh, North Carolina, USA, 2010. DOI:
http://doi.acm.org/10.1145/1772690.1772757
[4] E. Stoica, M. Hearst. Demonstration: Using WordNet to
Build Hierarchical Facet Categories. ACM SIGIR Workshop
on Faceted Search, August, 2006.
[5] K. Yang, E. Jacob, A. Loehrlein, S. Lee, N. Yu. Organizing the Web: semi-automatic construction of a faceted scheme.
IADIS International Conference WWW/Internet, Madrid,
Spain, 2004.
51
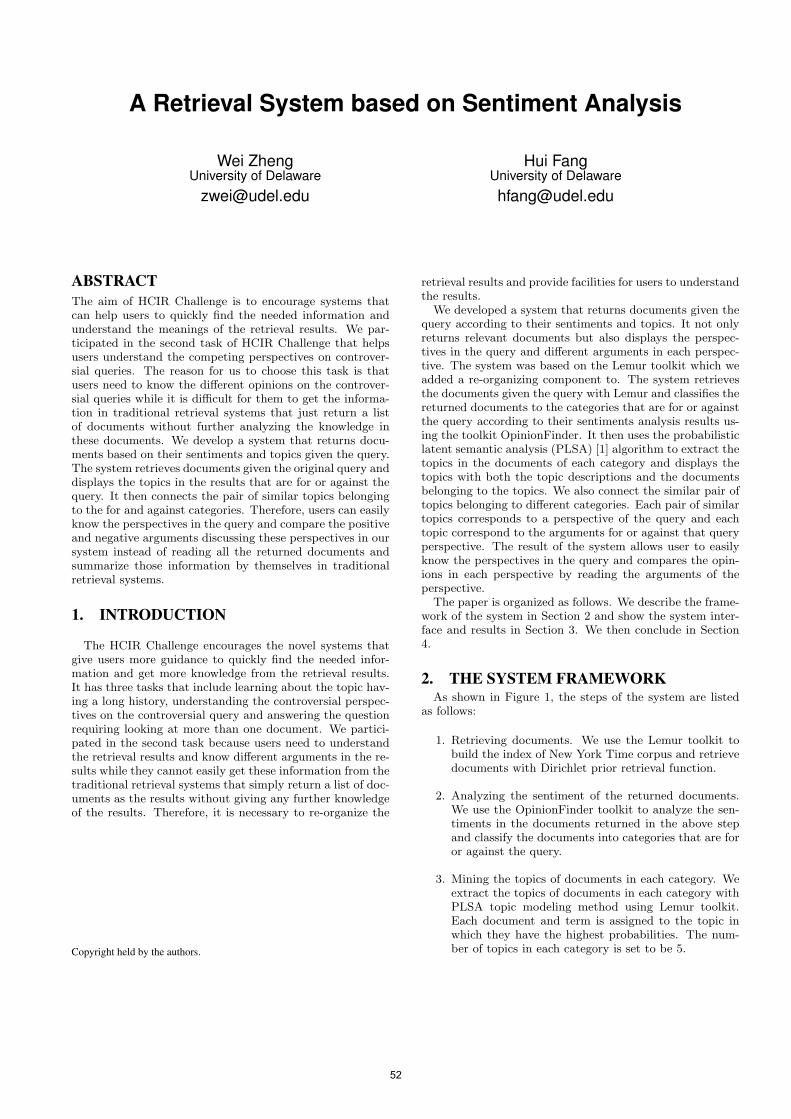
A Retrieval System based on Sentiment Analysis
Wei ZhengUniversity of Delaware
Hui FangUniversity of Delaware
ABSTRACTThe aim of HCIR Challenge is to encourage systems thatcan help users to quickly find the needed information andunderstand the meanings of the retrieval results. We par-ticipated in the second task of HCIR Challenge that helpsusers understand the competing perspectives on controver-sial queries. The reason for us to choose this task is thatusers need to know the different opinions on the controver-sial queries while it is difficult for them to get the informa-tion in traditional retrieval systems that just return a listof documents without further analyzing the knowledge inthese documents. We develop a system that returns docu-ments based on their sentiments and topics given the query.The system retrieves documents given the original query anddisplays the topics in the results that are for or against thequery. It then connects the pair of similar topics belongingto the for and against categories. Therefore, users can easilyknow the perspectives in the query and compare the positiveand negative arguments discussing these perspectives in oursystem instead of reading all the returned documents andsummarize those information by themselves in traditionalretrieval systems.
1. INTRODUCTION
The HCIR Challenge encourages the novel systems thatgive users more guidance to quickly find the needed infor-mation and get more knowledge from the retrieval results.It has three tasks that include learning about the topic hav-ing a long history, understanding the controversial perspec-tives on the controversial query and answering the questionrequiring looking at more than one document. We partici-pated in the second task because users need to understandthe retrieval results and know different arguments in the re-sults while they cannot easily get these information from thetraditional retrieval systems that simply return a list of doc-uments as the results without giving any further knowledgeof the results. Therefore, it is necessary to re-organize the
Copyright held by the authors.
retrieval results and provide facilities for users to understandthe results.
We developed a system that returns documents given thequery according to their sentiments and topics. It not onlyreturns relevant documents but also displays the perspec-tives in the query and different arguments in each perspec-tive. The system was based on the Lemur toolkit which weadded a re-organizing component to. The system retrievesthe documents given the query with Lemur and classifies thereturned documents to the categories that are for or againstthe query according to their sentiments analysis results us-ing the toolkit OpinionFinder. It then uses the probabilisticlatent semantic analysis (PLSA) [1] algorithm to extract thetopics in the documents of each category and displays thetopics with both the topic descriptions and the documentsbelonging to the topics. We also connect the similar pair oftopics belonging to different categories. Each pair of similartopics corresponds to a perspective of the query and eachtopic correspond to the arguments for or against that queryperspective. The result of the system allows user to easilyknow the perspectives in the query and compares the opin-ions in each perspective by reading the arguments of theperspective.
The paper is organized as follows. We describe the frame-work of the system in Section 2 and show the system inter-face and results in Section 3. We then conclude in Section4.
2. THE SYSTEM FRAMEWORKAs shown in Figure 1, the steps of the system are listed
as follows:
1. Retrieving documents. We use the Lemur toolkit tobuild the index of New York Time corpus and retrievedocuments with Dirichlet prior retrieval function.
2. Analyzing the sentiment of the returned documents.We use the OpinionFinder toolkit to analyze the sen-timents in the documents returned in the above stepand classify the documents into categories that are foror against the query.
3. Mining the topics of documents in each category. Weextract the topics of documents in each category withPLSA topic modeling method using Lemur toolkit.Each document and term is assigned to the topic inwhich they have the highest probabilities. The num-ber of topics in each category is set to be 5.
52
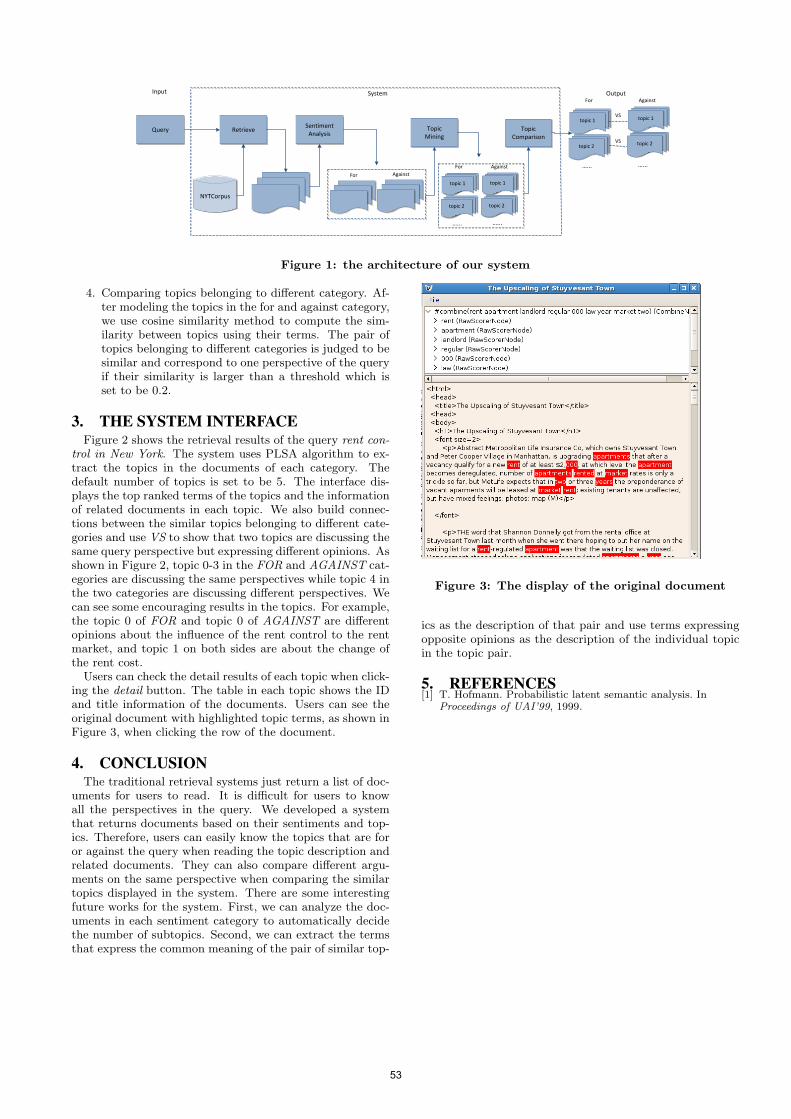
NYTCorpus
Query RetrieveSentiment
AnalysisTopic
Mining
For Against
Topic Comparison
AgainstFor
topic 1
topic 2
…...
topic 1
topic 2
…...
AgainstFor
topic 1
topic 2
…... …...
topic 1
topic 2VS
VS
System OutputInput
Figure 1: the architecture of our system
4. Comparing topics belonging to different category. Af-ter modeling the topics in the for and against category,we use cosine similarity method to compute the sim-ilarity between topics using their terms. The pair oftopics belonging to different categories is judged to besimilar and correspond to one perspective of the queryif their similarity is larger than a threshold which isset to be 0.2.
3. THE SYSTEM INTERFACEFigure 2 shows the retrieval results of the query rent con-
trol in New York. The system uses PLSA algorithm to ex-tract the topics in the documents of each category. Thedefault number of topics is set to be 5. The interface dis-plays the top ranked terms of the topics and the informationof related documents in each topic. We also build connec-tions between the similar topics belonging to different cate-gories and use VS to show that two topics are discussing thesame query perspective but expressing different opinions. Asshown in Figure 2, topic 0-3 in the FOR and AGAINST cat-egories are discussing the same perspectives while topic 4 inthe two categories are discussing different perspectives. Wecan see some encouraging results in the topics. For example,the topic 0 of FOR and topic 0 of AGAINST are differentopinions about the influence of the rent control to the rentmarket, and topic 1 on both sides are about the change ofthe rent cost.
Users can check the detail results of each topic when click-ing the detail button. The table in each topic shows the IDand title information of the documents. Users can see theoriginal document with highlighted topic terms, as shown inFigure 3, when clicking the row of the document.
4. CONCLUSIONThe traditional retrieval systems just return a list of doc-
uments for users to read. It is difficult for users to knowall the perspectives in the query. We developed a systemthat returns documents based on their sentiments and top-ics. Therefore, users can easily know the topics that are foror against the query when reading the topic description andrelated documents. They can also compare different argu-ments on the same perspective when comparing the similartopics displayed in the system. There are some interestingfuture works for the system. First, we can analyze the doc-uments in each sentiment category to automatically decidethe number of subtopics. Second, we can extract the termsthat express the common meaning of the pair of similar top-
Figure 3: The display of the original document
ics as the description of that pair and use terms expressingopposite opinions as the description of the individual topicin the topic pair.
5. REFERENCES[1] T. Hofmann. Probabilistic latent semantic analysis. In
Proceedings of UAI’99, 1999.
53
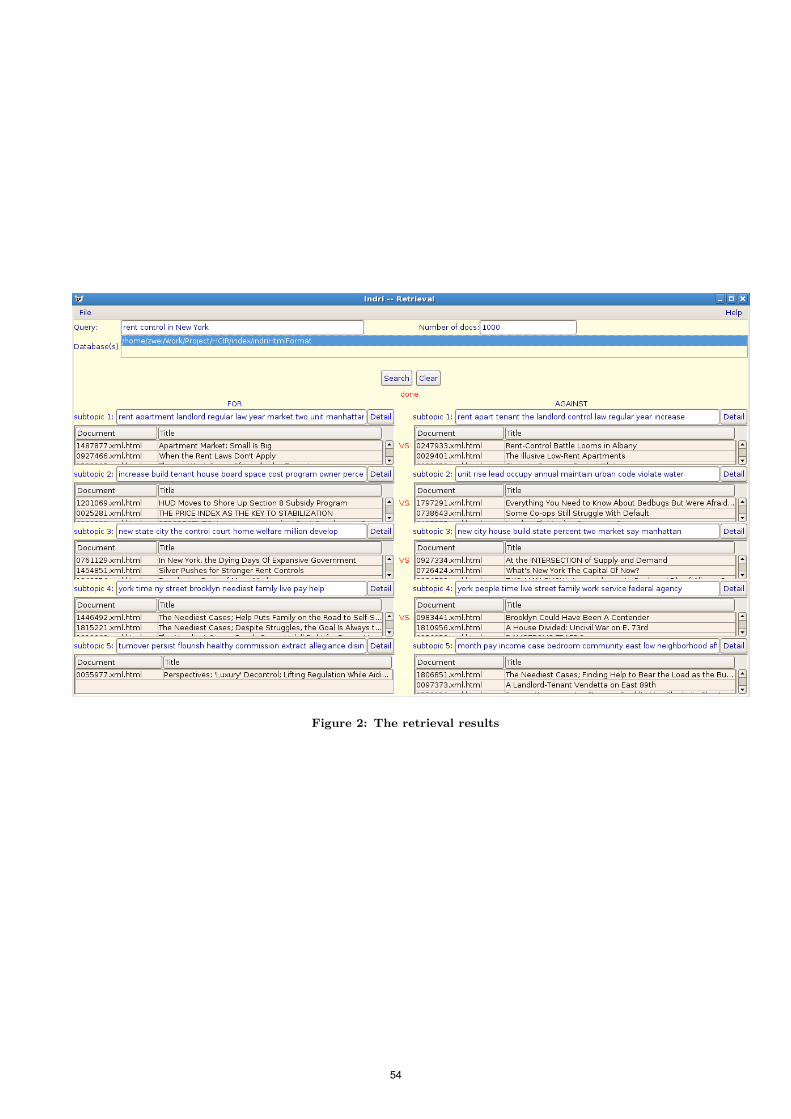
Figure 2: The retrieval results
54

Improving Web Search for Information Gathering:
Visualization in Effect Anwar Alhenshiri Dalhousie University
6050 University Avenue Halifax, NS, Canada +1 (902) 494-2093
Michael Shepherd Dalhousie University
6050 University Avenue Halifax, NS, Canada +1 (902) 494-1199
Carolyn Watters Dalhousie University
6050 University Avenue Halifax, NS, Canada +1 (902) 494-6723
ABSTRACT
The nature of the Web implies heterogeneity, large
volumes, and varied structures. Hence, finding results that
best suit the needs of every individual in every type of Web
task is a very challenging problem. This research presents
an interactive Visual Search Engine (VSE) in which both
query reformulation and results presentation are visualized.
The paper presents the results of a user study in which the
effectiveness of the VSE compare to Google is evaluated.
The VSE was shown to be effective with respect to Web
information gathering tasks.
Categories and Subject Descriptors
H.3.3. [Information Search and Retrieval]: Search process,
query formulation, clustering
General Terms
Measurement, Performance, Design, Experimentation, Human
Factors
Keywords
Web information retrieval, relevancy, information gathering,
search tasks, query reformulation, visual search, visual rendering.
1. INTRODUCTION The process of results presentation in most conventional
search engines presents few links per display with textual
content attached to each link. The user may have to perform
scrolling over multiple pages to find relevant results [11].
However, it has been shown that the majority of Web
search users do not look beyond the first three results [5,
11]. At which point, users either modify the search query
or switch to a different search tool [1].
Information visualization is suggested to improve users'
performance by harnessing their innate abilities for
perceiving, identifying, exploring, and understanding large
volumes of data [3, 4]. Consequently, visualization has
become of interest to researchers in Web information
retrieval due to the large numbers of documents the Web
contains in addition to the often overwhelming resultant
matches of Web search results. Visualization may permit
the display of more results with connectivity features.
Integrating visualization in Web search aims to combine
computation and high bandwidth human perception [13,
14].
In previous works [5, 6], several visualization aspects were
investigated in Web information search and retrieval. Some
of the visualization research either achieved certain levels
of success while being evaluated using search queries or
usability case studies, or suffered from issues of delay and
scalability concerns due to the user of sophisticated 3D
visualizations. Evaluating visualization and clustering-
based search interfaces may reveal different finding in the
case of using the context of a complete task. The presented
VSE aims to utilize the user’s visual abilities to improve
query reconstruction and search results exploration. The
improvement is intended for the case of information
gathering tasks in which uses locate, compare, and further
locate Web documents for satisfying criteria described in
the task [7].
2. DESIGN AND IMPLEMENTATION The VSE uses Google as its underlying search service
provider. Hence, the VSE is a visualized layer built on top
of Google as a search interface with which the user interacts
to submit and reformulate queries and also to explore
search results. The VSE presents results as glyphs on an
interactive interface. Each glyph contains the document title
and a snapshot of the Web page as recommended in the
work of Teevan et al. [12]. Edges between visualized
glyphs represent content similarity between connected
documents. The interactive interface of the VSE permits the
user to see document statistics such as document size,
Google’s PageRank value, and documents’ last updates.
Along with the user original query, the VSE uses alternate
queries provided by the semantic network WordNet [8, 9]
for single term user queries and by randomly reordering
query terms for multiple-term queries.
The VSE permits its users to reconstruct subsequent queries
from a query reconstruction area on the display. The query
55
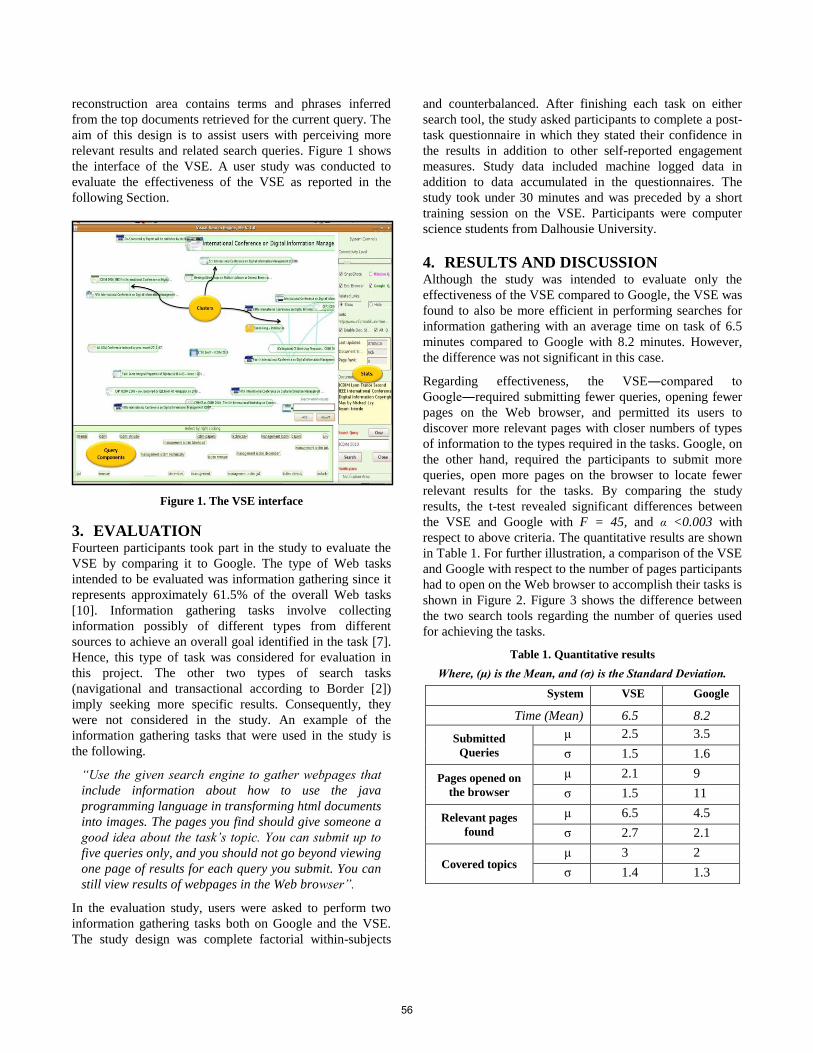
reconstruction area contains terms and phrases inferred
from the top documents retrieved for the current query. The
aim of this design is to assist users with perceiving more
relevant results and related search queries. Figure 1 shows
the interface of the VSE. A user study was conducted to
evaluate the effectiveness of the VSE as reported in the
following Section.
Figure 1. The VSE interface
3. EVALUATION Fourteen participants took part in the study to evaluate the
VSE by comparing it to Google. The type of Web tasks
intended to be evaluated was information gathering since it
represents approximately 61.5% of the overall Web tasks
[10]. Information gathering tasks involve collecting
information possibly of different types from different
sources to achieve an overall goal identified in the task [7].
Hence, this type of task was considered for evaluation in
this project. The other two types of search tasks
(navigational and transactional according to Border [2])
imply seeking more specific results. Consequently, they
were not considered in the study. An example of the
information gathering tasks that were used in the study is
the following.
“Use the given search engine to gather webpages that
include information about how to use the java
programming language in transforming html documents
into images. The pages you find should give someone a
good idea about the task’s topic. You can submit up to
five queries only, and you should not go beyond viewing
one page of results for each query you submit. You can
still view results of webpages in the Web browser”.
In the evaluation study, users were asked to perform two
information gathering tasks both on Google and the VSE.
The study design was complete factorial within-subjects
and counterbalanced. After finishing each task on either
search tool, the study asked participants to complete a post-
task questionnaire in which they stated their confidence in
the results in addition to other self-reported engagement
measures. Study data included machine logged data in
addition to data accumulated in the questionnaires. The
study took under 30 minutes and was preceded by a short
training session on the VSE. Participants were computer
science students from Dalhousie University.
4. RESULTS AND DISCUSSION Although the study was intended to evaluate only the
effectiveness of the VSE compared to Google, the VSE was
found to also be more efficient in performing searches for
information gathering with an average time on task of 6.5
minutes compared to Google with 8.2 minutes. However,
the difference was not significant in this case.
Regarding effectiveness, the VSE―compared to
Google―required submitting fewer queries, opening fewer
pages on the Web browser, and permitted its users to
discover more relevant pages with closer numbers of types
of information to the types required in the tasks. Google, on
the other hand, required the participants to submit more
queries, open more pages on the browser to locate fewer
relevant results for the tasks. By comparing the study
results, the t-test revealed significant differences between
the VSE and Google with F = 45, and α <0.003 with
respect to above criteria. The quantitative results are shown
in Table 1. For further illustration, a comparison of the VSE
and Google with respect to the number of pages participants
had to open on the Web browser to accomplish their tasks is
shown in Figure 2. Figure 3 shows the difference between
the two search tools regarding the number of queries used
for achieving the tasks.
Table 1. Quantitative results
Where, (μ) is the Mean, and (σ) is the Standard Deviation.
System VSE Google
Time (Mean) 6.5 8.2
Submitted
Queries
μ 2.5 3.5
σ 1.5 1.6
Pages opened on
the browser
μ 2.1 9
σ 1.5 11
Relevant pages
found
μ 6.5 4.5
σ 2.7 2.1
Covered topics μ 3 2
σ 1.4 1.3
56
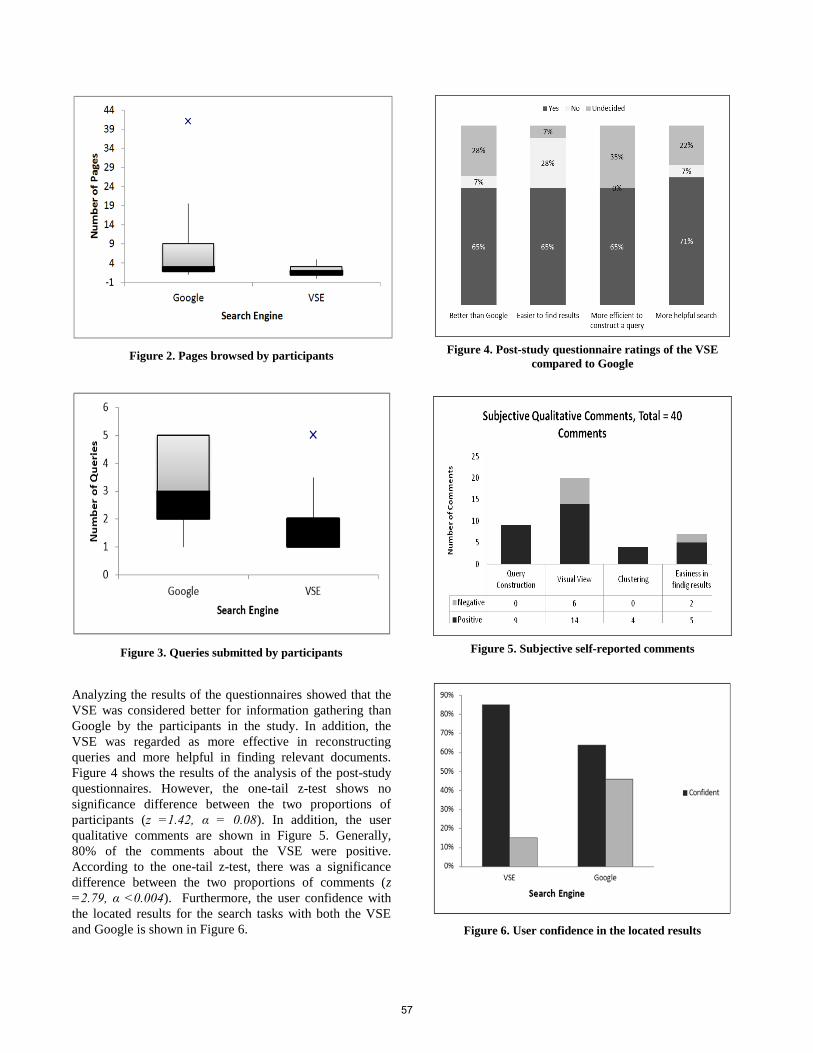
Figure 2. Pages browsed by participants
Figure 3. Queries submitted by participants
Analyzing the results of the questionnaires showed that the
VSE was considered better for information gathering than
Google by the participants in the study. In addition, the
VSE was regarded as more effective in reconstructing
queries and more helpful in finding relevant documents.
Figure 4 shows the results of the analysis of the post-study
questionnaires. However, the one-tail z-test shows no
significance difference between the two proportions of
participants (z =1.42, α = 0.08). In addition, the user
qualitative comments are shown in Figure 5. Generally,
80% of the comments about the VSE were positive.
According to the one-tail z-test, there was a significance
difference between the two proportions of comments (z
=2.79, α <0.004). Furthermore, the user confidence with
the located results for the search tasks with both the VSE
and Google is shown in Figure 6.
Figure 4. Post-study questionnaire ratings of the VSE
compared to Google
Figure 5. Subjective self-reported comments
Figure 6. User confidence in the located results
57

Minor concerns were raised about the slow movement of
the glyphs on the display. However, the study showed that
the current Web search model suffers from ineffectiveness
with regard to how search queries are reformulated and how
search results are presented to the user. In the case of Web
information gathering tasks, the limited document attributes
shown by the search engine, the current approach for
submitting and reformulating search queries, and the way
search results are presented for comparing Web information
and making decisions regarding the task requirements need
further investigations.
5. FUTURE WORK For information gathering tasks, users usually need to
explore more results per session and to effectively perceive
more features of the presented documents to be able to
make effective decisions regarding the information gathered
for the task requirements. In further research, different
layouts will be evaluated for search results presentation. In
addition, different clustering criteria will be investigated in
information gathering with the use of visualization. The
concepts of re-finding and Web information organization
for information gathering will also be investigated.
6. CONCLUSION The VSE demonstrated that exclusive textual presentations
of Web search results would benefit from our
visualizations. The VSE may help Web search users with
finding relevant documents in the case of information
gathering tasks. Future work will focus on this type of task
by emphasizing its underlying subtasks for investigation.
7. REFERENCES [1] Alhenshiri, A. and Solis-Oba, R. 2007. Improving Results
for Short Web Queries Using Preserved Query Knowledge.
In proceedings of the 1st international Conference on Digital
Communications and Computer Applications, Amman,
Jordan, 634-649.
[2] Border, A. 2002. A Taxonomy of Web Search. ACM SIGIR
Forum. Vol. 36, Issue 2, 2-10.
[3] Card, S., K., Mackinlay J. D., and Shneiderman B., Readings
in Information Visualization. 1999. Using Vision to Think.
Morgan Kaufman Publishers, San Francisco, CA, USA.
[4] Friendly, M. 2008. Milestones in the History of Thematic
Cartography, Statistical, Graphics, and Data Visualization.
York University Archives, Canada.
http://www.math.yorku.ca/SCS/Gallery/milestone/
[5] Hoeber, O., and Yang, X. D. 2007. Visual Support for
Exploration within Web Search Results Lists. In Conference
Compendium of the IEEE Information Visualization
Conference (October 28- November 01, Sacramento,
California, USA), 157-167.
[6] Jacso P.: SAVVY SEARCHING.2007. Clustering Search
Results. Part I: Web-wide Search Engines, Online
Information Review, 31(1), 85-91.
[7] Kellar, M., Watters, K., and Shepherd, M. 2007. A Field
Study Characterizing Web-based Information-Seeking Tasks.
Journal of the American Society for Information Science and
Technology, 58(7), 999-1018.
[8] Miller G., A. 1990. WordNet: An On-line Lexical Database.
International Journal of Lexicography, 3(4), 285-303.
[9] Moldovan, D., and Mihalcea, R.2000. Using WordNet and
Lexical Operators to Improve Internet Searches. IEEE
Internet Computing, 4(1), 34-43.
[10] Rose, D., E., and Levinson, D. 2004. Understanding User
Goals in Web Search. In Proceedings of the 13th
International Conference on World Wide Web (May 19-21,
New York, NY, USA), 133-142.
[11] Spink, A., Wolfram, D., Jansen, M., and Saracevic, T. 2001.
Searching the Web: The Public and Their Queries. Journal of
the American Society for Information Science and
Technology, 52(3), 226-234.
[12] Teevan, J., Cutrell, E., Fisher, D., Drucker, S. M., Ramos,
G., André, P. and Hu, C. 2009. Visual Snippets:
Summarizing Web Pages for Search and Revisitation. In
Proceedings of the 27th International Conference on Human
Factors in Computing Systems (April 04-09, Boston, MA,
USA).
[13] Vincente, K., J., Rasmussen, J.1990. The Ecology of Human
Machine Systems: Ii. Mediating “Direct Perception” in
Complex Domain, Journal of Ecological Psychology, 2(3),
207-207.
[14] Youssefi, A., Duke, D., Zaki, M. 2004. Visual Web Mining.
In Proceedings of 13th International World Wide Web
Conference on Alternate Track Papers and Posters (May 19-
21, New York, NY, USA), 394-395.
58
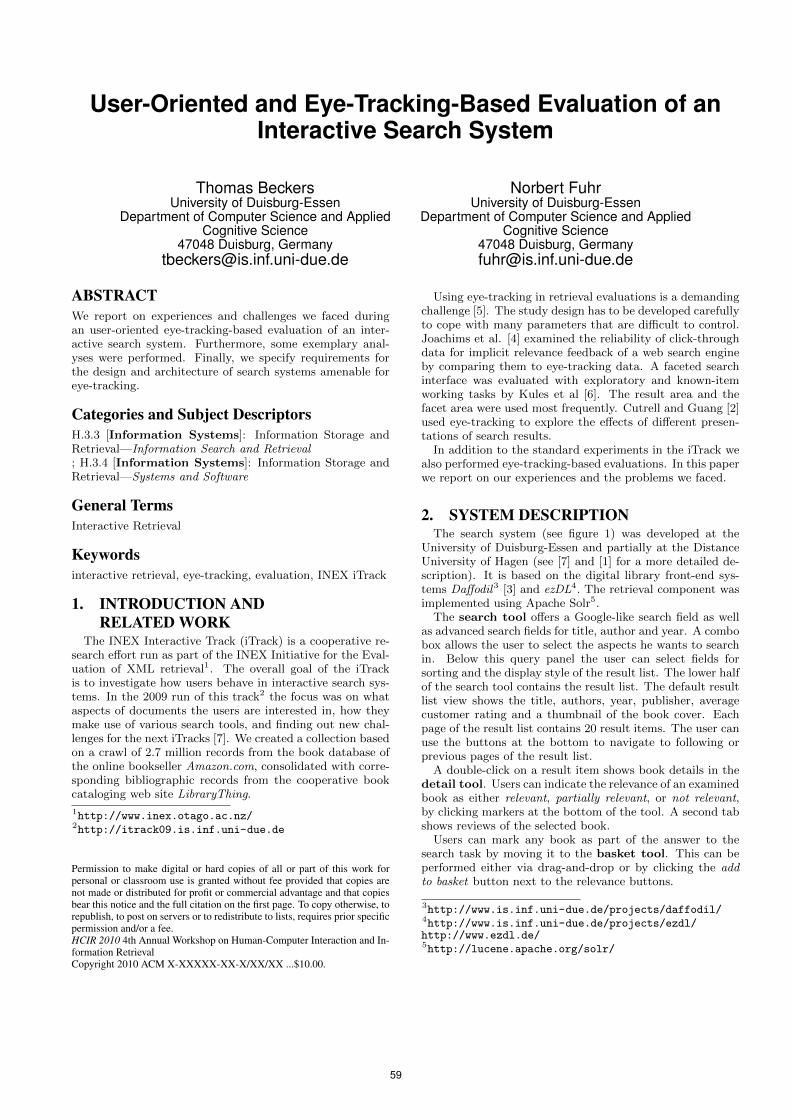
User-Oriented and Eye-Tracking-Based Evaluation of anInteractive Search System
Thomas BeckersUniversity of Duisburg-Essen
Department of Computer Science and AppliedCognitive Science
47048 Duisburg, [email protected]
Norbert FuhrUniversity of Duisburg-Essen
Department of Computer Science and AppliedCognitive Science
47048 Duisburg, [email protected]
ABSTRACTWe report on experiences and challenges we faced duringan user-oriented eye-tracking-based evaluation of an inter-active search system. Furthermore, some exemplary anal-yses were performed. Finally, we specify requirements forthe design and architecture of search systems amenable foreye-tracking.
Categories and Subject DescriptorsH.3.3 [Information Systems]: Information Storage andRetrieval—Information Search and Retrieval; H.3.4 [Information Systems]: Information Storage andRetrieval—Systems and Software
General TermsInteractive Retrieval
Keywordsinteractive retrieval, eye-tracking, evaluation, INEX iTrack
1. INTRODUCTION ANDRELATED WORK
The INEX Interactive Track (iTrack) is a cooperative re-search effort run as part of the INEX Initiative for the Eval-uation of XML retrieval1. The overall goal of the iTrackis to investigate how users behave in interactive search sys-tems. In the 2009 run of this track2 the focus was on whataspects of documents the users are interested in, how theymake use of various search tools, and finding out new chal-lenges for the next iTracks [7]. We created a collection basedon a crawl of 2.7 million records from the book database ofthe online bookseller Amazon.com, consolidated with corre-sponding bibliographic records from the cooperative bookcataloging web site LibraryThing.
1http://www.inex.otago.ac.nz/2http://itrack09.is.inf.uni-due.de
Permission to make digital or hard copies of all or part of this work forpersonal or classroom use is granted without fee provided that copies arenot made or distributed for profit or commercial advantage and that copiesbear this notice and the full citation on the first page. To copy otherwise, torepublish, to post on servers or to redistribute to lists, requires prior specificpermission and/or a fee.HCIR 2010 4th Annual Workshop on Human-Computer Interaction and In-formation RetrievalCopyright 2010 ACM X-XXXXX-XX-X/XX/XX ...$10.00.
Using eye-tracking in retrieval evaluations is a demandingchallenge [5]. The study design has to be developed carefullyto cope with many parameters that are difficult to control.Joachims et al. [4] examined the reliability of click-throughdata for implicit relevance feedback of a web search engineby comparing them to eye-tracking data. A faceted searchinterface was evaluated with exploratory and known-itemworking tasks by Kules et al [6]. The result area and thefacet area were used most frequently. Cutrell and Guang [2]used eye-tracking to explore the effects of different presen-tations of search results.
In addition to the standard experiments in the iTrack wealso performed eye-tracking-based evaluations. In this paperwe report on our experiences and the problems we faced.
2. SYSTEM DESCRIPTIONThe search system (see figure 1) was developed at the
University of Duisburg-Essen and partially at the DistanceUniversity of Hagen (see [7] and [1] for a more detailed de-scription). It is based on the digital library front-end sys-tems Daffodil3 [3] and ezDL4. The retrieval component wasimplemented using Apache Solr5.
The search tool offers a Google-like search field as wellas advanced search fields for title, author and year. A combobox allows the user to select the aspects he wants to searchin. Below this query panel the user can select fields forsorting and the display style of the result list. The lower halfof the search tool contains the result list. The default resultlist view shows the title, authors, year, publisher, averagecustomer rating and a thumbnail of the book cover. Eachpage of the result list contains 20 result items. The user canuse the buttons at the bottom to navigate to following orprevious pages of the result list.
A double-click on a result item shows book details in thedetail tool. Users can indicate the relevance of an examinedbook as either relevant, partially relevant, or not relevant,by clicking markers at the bottom of the tool. A second tabshows reviews of the selected book.
Users can mark any book as part of the answer to thesearch task by moving it to the basket tool. This can beperformed either via drag-and-drop or by clicking the addto basket button next to the relevance buttons.
3http://www.is.inf.uni-due.de/projects/daffodil/4http://www.is.inf.uni-due.de/projects/ezdl/http://www.ezdl.de/5http://lucene.apache.org/solr/
59
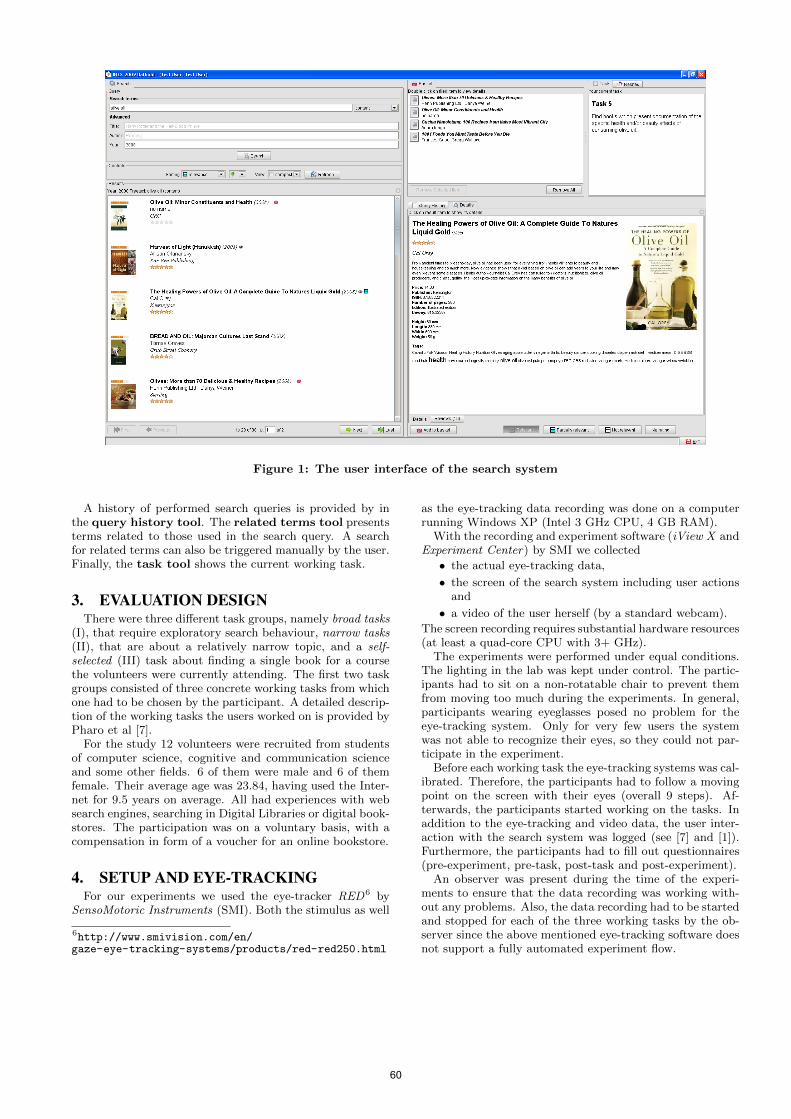
Figure 1: The user interface of the search system
A history of performed search queries is provided by inthe query history tool. The related terms tool presentsterms related to those used in the search query. A searchfor related terms can also be triggered manually by the user.Finally, the task tool shows the current working task.
3. EVALUATION DESIGNThere were three different task groups, namely broad tasks
(I), that require exploratory search behaviour, narrow tasks(II), that are about a relatively narrow topic, and a self-selected (III) task about finding a single book for a coursethe volunteers were currently attending. The first two taskgroups consisted of three concrete working tasks from whichone had to be chosen by the participant. A detailed descrip-tion of the working tasks the users worked on is provided byPharo et al [7].
For the study 12 volunteers were recruited from studentsof computer science, cognitive and communication scienceand some other fields. 6 of them were male and 6 of themfemale. Their average age was 23.84, having used the Inter-net for 9.5 years on average. All had experiences with websearch engines, searching in Digital Libraries or digital book-stores. The participation was on a voluntary basis, with acompensation in form of a voucher for an online bookstore.
4. SETUP AND EYE-TRACKINGFor our experiments we used the eye-tracker RED6 by
SensoMotoric Instruments (SMI). Both the stimulus as well
6http://www.smivision.com/en/gaze-eye-tracking-systems/products/red-red250.html
as the eye-tracking data recording was done on a computerrunning Windows XP (Intel 3 GHz CPU, 4 GB RAM).
With the recording and experiment software (iView X andExperiment Center) by SMI we collected
• the actual eye-tracking data,
• the screen of the search system including user actionsand
• a video of the user herself (by a standard webcam).
The screen recording requires substantial hardware resources(at least a quad-core CPU with 3+ GHz).
The experiments were performed under equal conditions.The lighting in the lab was kept under control. The partic-ipants had to sit on a non-rotatable chair to prevent themfrom moving too much during the experiments. In general,participants wearing eyeglasses posed no problem for theeye-tracking system. Only for very few users the systemwas not able to recognize their eyes, so they could not par-ticipate in the experiment.
Before each working task the eye-tracking systems was cal-ibrated. Therefore, the participants had to follow a movingpoint on the screen with their eyes (overall 9 steps). Af-terwards, the participants started working on the tasks. Inaddition to the eye-tracking and video data, the user inter-action with the search system was logged (see [7] and [1]).Furthermore, the participants had to fill out questionnaires(pre-experiment, pre-task, post-task and post-experiment).
An observer was present during the time of the experi-ments to ensure that the data recording was working with-out any problems. Also, the data recording had to be startedand stopped for each of the three working tasks by the ob-server since the above mentioned eye-tracking software doesnot support a fully automated experiment flow.
60
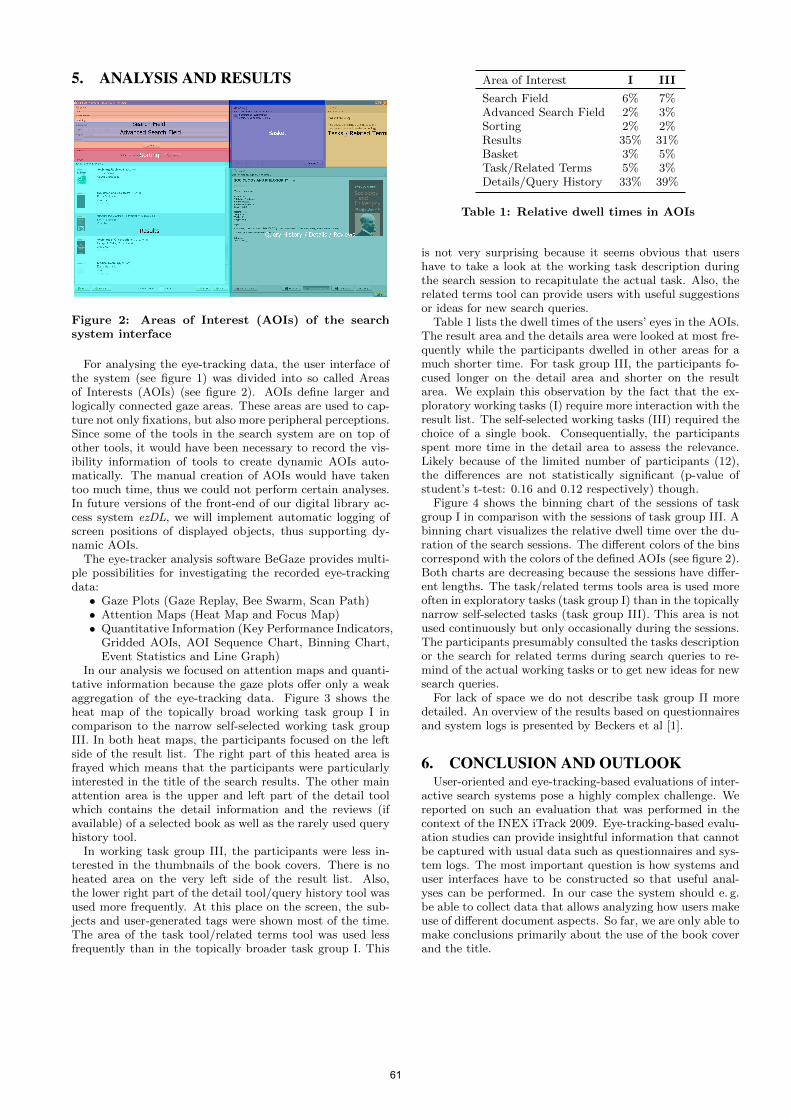
5. ANALYSIS AND RESULTS
Figure 2: Areas of Interest (AOIs) of the searchsystem interface
For analysing the eye-tracking data, the user interface ofthe system (see figure 1) was divided into so called Areasof Interests (AOIs) (see figure 2). AOIs define larger andlogically connected gaze areas. These areas are used to cap-ture not only fixations, but also more peripheral perceptions.Since some of the tools in the search system are on top ofother tools, it would have been necessary to record the vis-ibility information of tools to create dynamic AOIs auto-matically. The manual creation of AOIs would have takentoo much time, thus we could not perform certain analyses.In future versions of the front-end of our digital library ac-cess system ezDL, we will implement automatic logging ofscreen positions of displayed objects, thus supporting dy-namic AOIs.
The eye-tracker analysis software BeGaze provides multi-ple possibilities for investigating the recorded eye-trackingdata:
• Gaze Plots (Gaze Replay, Bee Swarm, Scan Path)• Attention Maps (Heat Map and Focus Map)• Quantitative Information (Key Performance Indicators,
Gridded AOIs, AOI Sequence Chart, Binning Chart,Event Statistics and Line Graph)
In our analysis we focused on attention maps and quanti-tative information because the gaze plots offer only a weakaggregation of the eye-tracking data. Figure 3 shows theheat map of the topically broad working task group I incomparison to the narrow self-selected working task groupIII. In both heat maps, the participants focused on the leftside of the result list. The right part of this heated area isfrayed which means that the participants were particularlyinterested in the title of the search results. The other mainattention area is the upper and left part of the detail toolwhich contains the detail information and the reviews (ifavailable) of a selected book as well as the rarely used queryhistory tool.
In working task group III, the participants were less in-terested in the thumbnails of the book covers. There is noheated area on the very left side of the result list. Also,the lower right part of the detail tool/query history tool wasused more frequently. At this place on the screen, the sub-jects and user-generated tags were shown most of the time.The area of the task tool/related terms tool was used lessfrequently than in the topically broader task group I. This
Area of Interest I III
Search Field 6% 7%Advanced Search Field 2% 3%Sorting 2% 2%Results 35% 31%Basket 3% 5%Task/Related Terms 5% 3%Details/Query History 33% 39%
Table 1: Relative dwell times in AOIs
is not very surprising because it seems obvious that usershave to take a look at the working task description duringthe search session to recapitulate the actual task. Also, therelated terms tool can provide users with useful suggestionsor ideas for new search queries.
Table 1 lists the dwell times of the users’ eyes in the AOIs.The result area and the details area were looked at most fre-quently while the participants dwelled in other areas for amuch shorter time. For task group III, the participants fo-cused longer on the detail area and shorter on the resultarea. We explain this observation by the fact that the ex-ploratory working tasks (I) require more interaction with theresult list. The self-selected working tasks (III) required thechoice of a single book. Consequentially, the participantsspent more time in the detail area to assess the relevance.Likely because of the limited number of participants (12),the differences are not statistically significant (p-value ofstudent’s t-test: 0.16 and 0.12 respectively) though.
Figure 4 shows the binning chart of the sessions of taskgroup I in comparison with the sessions of task group III. Abinning chart visualizes the relative dwell time over the du-ration of the search sessions. The different colors of the binscorrespond with the colors of the defined AOIs (see figure 2).Both charts are decreasing because the sessions have differ-ent lengths. The task/related terms tools area is used moreoften in exploratory tasks (task group I) than in the topicallynarrow self-selected tasks (task group III). This area is notused continuously but only occasionally during the sessions.The participants presumably consulted the tasks descriptionor the search for related terms during search queries to re-mind of the actual working tasks or to get new ideas for newsearch queries.
For lack of space we do not describe task group II moredetailed. An overview of the results based on questionnairesand system logs is presented by Beckers et al [1].
6. CONCLUSION AND OUTLOOKUser-oriented and eye-tracking-based evaluations of inter-
active search systems pose a highly complex challenge. Wereported on such an evaluation that was performed in thecontext of the INEX iTrack 2009. Eye-tracking-based evalu-ation studies can provide insightful information that cannotbe captured with usual data such as questionnaires and sys-tem logs. The most important question is how systems anduser interfaces have to be constructed so that useful anal-yses can be performed. In our case the system should e. g.be able to collect data that allows analyzing how users makeuse of different document aspects. So far, we are only able tomake conclusions primarily about the use of the book coverand the title.
61
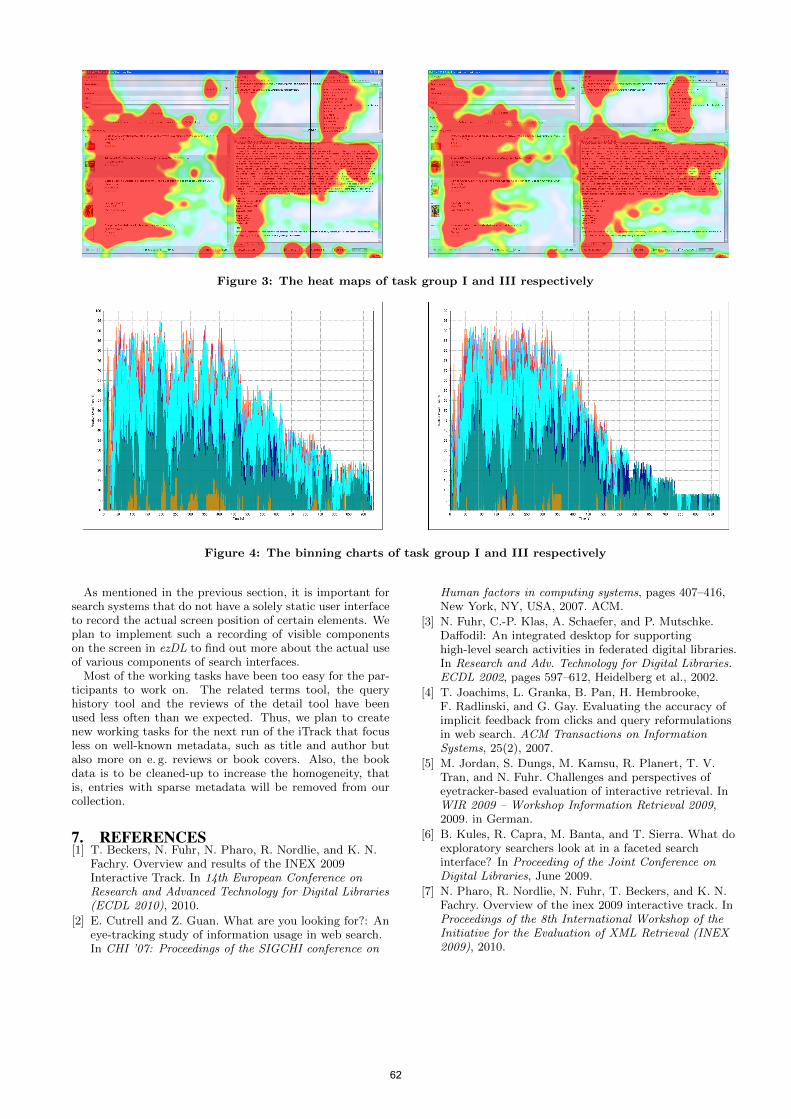
Figure 3: The heat maps of task group I and III respectively
Figure 4: The binning charts of task group I and III respectively
As mentioned in the previous section, it is important forsearch systems that do not have a solely static user interfaceto record the actual screen position of certain elements. Weplan to implement such a recording of visible componentson the screen in ezDL to find out more about the actual useof various components of search interfaces.
Most of the working tasks have been too easy for the par-ticipants to work on. The related terms tool, the queryhistory tool and the reviews of the detail tool have beenused less often than we expected. Thus, we plan to createnew working tasks for the next run of the iTrack that focusless on well-known metadata, such as title and author butalso more on e. g. reviews or book covers. Also, the bookdata is to be cleaned-up to increase the homogeneity, thatis, entries with sparse metadata will be removed from ourcollection.
7. REFERENCES[1] T. Beckers, N. Fuhr, N. Pharo, R. Nordlie, and K. N.
Fachry. Overview and results of the INEX 2009Interactive Track. In 14th European Conference onResearch and Advanced Technology for Digital Libraries(ECDL 2010), 2010.
[2] E. Cutrell and Z. Guan. What are you looking for?: Aneye-tracking study of information usage in web search.In CHI ’07: Proceedings of the SIGCHI conference on
Human factors in computing systems, pages 407–416,New York, NY, USA, 2007. ACM.
[3] N. Fuhr, C.-P. Klas, A. Schaefer, and P. Mutschke.Daffodil: An integrated desktop for supportinghigh-level search activities in federated digital libraries.In Research and Adv. Technology for Digital Libraries.ECDL 2002, pages 597–612, Heidelberg et al., 2002.
[4] T. Joachims, L. Granka, B. Pan, H. Hembrooke,F. Radlinski, and G. Gay. Evaluating the accuracy ofimplicit feedback from clicks and query reformulationsin web search. ACM Transactions on InformationSystems, 25(2), 2007.
[5] M. Jordan, S. Dungs, M. Kamsu, R. Planert, T. V.Tran, and N. Fuhr. Challenges and perspectives ofeyetracker-based evaluation of interactive retrieval. InWIR 2009 – Workshop Information Retrieval 2009,2009. in German.
[6] B. Kules, R. Capra, M. Banta, and T. Sierra. What doexploratory searchers look at in a faceted searchinterface? In Proceeding of the Joint Conference onDigital Libraries, June 2009.
[7] N. Pharo, R. Nordlie, N. Fuhr, T. Beckers, and K. N.Fachry. Overview of the inex 2009 interactive track. InProceedings of the 8th International Workshop of theInitiative for the Evaluation of XML Retrieval (INEX2009), 2010.
62

Exploring Combinations of Sources for InteractionFeatures for Document Re-ranking
Emanuele Di BuccioDepartment of Information
EngineeringUniversity of Padua, [email protected]
Massimo MelucciDepartment of Information
EngineeringUniversity of Padua, Italy
Dawei SongSchool of Computing
The Robert Gordon University,UK
ABSTRACTThe behavior of the user when interacting with a result pageor the corresponding landing documents is a possible sourceof evidence that Information Retrieval (IR) systems can ex-ploit to assist the user when searching for information. In-teraction features can be adopted as evidence to model theuser behavior, thus making it usable to assist relevance pre-diction. One issue when dealing with interaction featuresis the selection of the sources from which these features aredistilled. Individual users and group of users which performa similar task or look for information matching the samequery are possible sources. This paper will focus on thesetwo sources, particularly investigating group of users search-ing for the same topic as source for interaction features tobe used as an alternative to, or in combination with, indi-vidual users. The objective of this work is to investigatethe impact of diverse combinations of these sources on theretrieval effectiveness, specifically when interaction featuresare used as evidence to support document re-ranking.
Categories and Subject DescriptorsH.3.3 [Information Storage and Retrieval]: Relevancefeedback, Search Process.
General TermsExperimentation, Human Factors.
KeywordsInteraction Features, Implicit Relevance Feedback.
1. INTRODUCTIONA potential source of evidence to support IR systems when
predicting relevance is the behavior of the user when inter-acting with result pages or the documents which results referto. Implicit Feedback techniques [1] exploit features that canbe gathered by monitoring the user behavior, e.g. interac-tion features, as indicators of the user interests or intents.
HCIR 2010, August 22, 2010, New Brunswick, NJ USACopyright is held by the author/owner(s).
Interaction feature values can be distilled from diversesources, and the selection of the source for features can af-fect the effectiveness of implicit feedback techniques. In-dividual users and group of interrelated users are possiblesources from which interaction feature values can be ob-served. These sources have been investigated as alternativechoices or used in combination because of their impact onthe reliability and the availability of implicit features. Forinstance, in [2] the authors investigated display-time thresh-olds as implicit indicator of relevance. The obtained resultsshowed that display-time, when considered in isolation andwith regard to an individual user, may be hardly usable tosupport prediction; differently, it was a more consistent indi-cator when the threshold was learned from multiple subjectssharing a common task. In [3] user behavior models to sup-port web search were learned by exploiting simultaneouslyfeature values derived from the individual’s behavior andthose aggregated across all the users and search session foreach query-URL pair, thus reducing the impact of individ-ual variation in behavior. In [4] the authors investigated theimpact of aggregating personalized scores per group formedaccording to diverse criteria on personalization algorithmswhen a small amount of personal data is available.
This work considers the scenario where a user interactswith some of the results obtained by a first search. Thefeatures gathered from this interaction can be exploited toobtain a representation of the information need which refinesand complement the initial one, e.g. a textual query, as anew dimension of the user need representation. This dimen-sion can be then adopted for document re-ranking. Besidethe representation for the dimension, also documents needto be described in terms of the features observed from theuser behavior. Two sources of evidence have been consideredin the research work reported in this paper: individual usersand groups of users. Since two source for features are con-sidered, and a representation both for the dimension and thedocuments is required, that leads to different possible sourcecombinations. For instance, the dimension can be modeledby the features gathered from the individuals, thus obtain-ing a personal user behavior model, and documents can berepresented in terms of group data; this combination makespossible a representation in terms of interaction features fordocuments unseen by the individual users from which theevidence cannot be observed. Since other combinations arepossible, this paper investigates the following research ques-tion: Which is the best combination of source of featuresfor modeling and exploiting the user behavior dimension fordocument re-ranking in terms of retrieval effectiveness?
63

2. METHODOLOGY
2.1 Methodology DescriptionThe methodology adopted in this paper to exploit user
interaction features for document re-ranking represents theuser behavior dimension and the documents as vector sub-spaces according to the formalism proposed in [5]. The basicrationale is to map the collected data, prepared in a matrix,in a new vector space basis. The vector subspace spannedby this basis is the model of the dimension. The mappingis a matrix transformation technique which extracts infor-mation about our dimension from the collected data. Forinstance, if our hypothesis is that a dimension of the user in-formation need can be represented by the correlation amonginteraction features, a technique like Principal ComponentAnalysis (PCA) can be adopted. This is actually the ap-proach proposed in [6] and adopted in this paper.
Also the documents to be re-ranked need to be describedas subspaces; in this work they are represented as one dimen-sional subspaces, namely vectors, of the interaction featurevalues distilled from the users or the user groups behavior.
Once a representation in terms of subspaces has been builtboth for the dimension and the documents, the distanceamong the subspaces provides a measure of the degree towhich the documents, represented with regard to the source,e.g. the user behavior, satisfy the dimension of the informa-tion need representation corresponding to that source.
Differently from [6] where user behavior models were usedto support query expansion, we will focus on the impact ofthe diverse source combinations on document re-ranking.
2.2 Combinations of Sources for FeaturesThe adopted methodology requires a representation both
for the dimension of the information need and for the docu-ments to re-rank with regard to the considered source. Sincewe are considering two distinct sources for features and tworepresentations are required, this leads to four possible com-binations of sources X/Y, where X denotes the source for thedimension and Y that for document representation – X orY is either P (personal) or G (group). The P/P combinationrefers to the case where the features gathered from the in-dividual user – i.e. its personal data – when searching fora specific topic are adopted both for modeling the dimen-sion and for representing documents. The P/G combinationrefers to the case where personal data are adopted for mod-eling the dimension, while the data gathered from a groupof users searching for the considered topic are adopted fordocuments representation. The remaining two combinationshave analogous meaning.
The experiments reported in the next section aim at inves-tigating the impact of the above source combinations on theretrieval effectiveness, specifically when they are adopted tosupport user behavior-based document re-ranking.
3. EXPERIMENTS
3.1 Evaluation MethodologyThe basic rationale underlying the methodology to inves-
tigate the above research question was to observe the behav-ior of the user when visiting the first n results, and then usethis evidence to model it, specifically as a vector subspace;this subspace representation was then used for re-rankingthe top m documents provided by the baseline.
In particular, the evaluation methodology consisted of thefollowing steps, that were performed for each topic-user pair:
1. Selection of the combination of the source for features,that is P/P, P/G, G/P, or G/G.
2. Collection of the features from the first n = 3 visiteddocuments1. The collected features are prepared in amatrix F ∈ Rn×k, where k is the number of featurescollected from the n visited documents.
3. Modeling the dimension of the information need repre-sentation by extracting possible behavioral patterns byapplying PCA on F . The result of the application ofthis technique is an orthonormal basis – one basis vec-tor b for each pattern. Patterns, namely eigenvectors,associated to non-null eigenvalues are tested one at atime as possible models for the dimension – the modelof the dimension is the subspace L({b}) spanned by{b}, namely a one-dimensional subspace.
4. Representation of the documents in terms of featuresgathered from the source selected at step 1. Each doc-ument is represented as a vector y of k features.
5. Re-ranking of the top m = 10 results of the baselinelist according to the measure mb(y) = yT ·PL({b}) ·y,
where PL({b}) = b · bT is the projector onto L({b}).mb(y) provides a measure of the degree to which thedocument representation satisfies the dimension model.
6. Computation of the NDCG@10 for the new result listobtained after document re-ranking using the gainsprovided by the user for the considered topic2.
When the group was adopted as source for features formodeling the dimension, namely in the G/· or ·/G combi-nations, the value fG
i,u′,d,t of a feature i for a specific user-
topic-document (u′, t, d) triple was computed as
fGi,u′,d,t =
1
|G| − 1
∑u∈G and u6=u′
fIi,u,d,t
where G denotes the group constituted by all the users whichvisited the document d with regard to the topic t and fI
i,u,d,t
the feature value observed for a specific individual u withregard to (d, t). In other words the group value of a featurefor a specific user u′ was obtained as the average value ofthe feature values observed for the other users in G. Thereason for this choice was to test if the evidence gatheredfrom users in G other than u′ can “substitute” the featurevalues for the document unseen by the user.
3.2 DatasetAddressing the considered research question requires a
dataset constituted by a set of topics, the properties of theresults and the documents to re-rank for each topic, the fea-tures when interacting with them, and finally explicit judg-ments of the users for each topic-document pair.
1The order in which the users visited the documents in thestudy described in Section 3.2 was not necessarily the dis-played order, so the visited order is adopted.2DCG is computed according to the alternative formulationreported in [7], namely
∑i(2
r(i) − 1)/ log(i+ 1), where r(i)is the relevance of the document at position i. The normal-ization factor is the DCG of the perfect ranking.
64
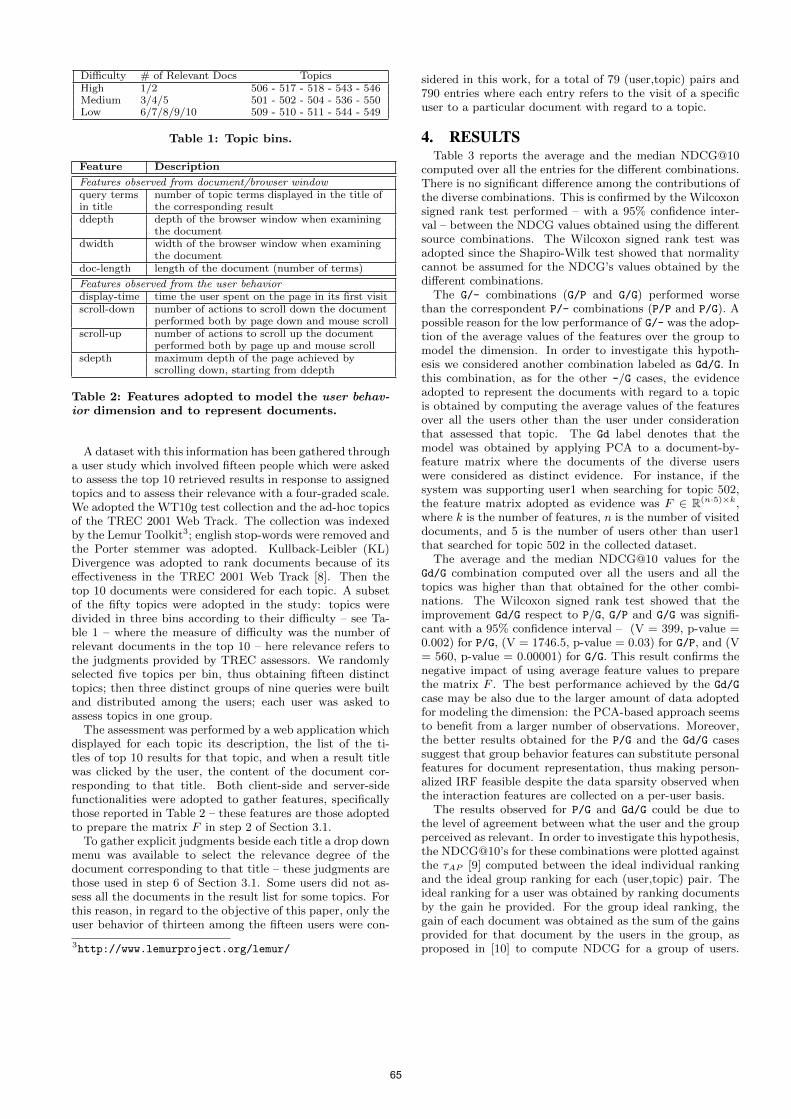
Difficulty # of Relevant Docs TopicsHigh 1/2 506 - 517 - 518 - 543 - 546Medium 3/4/5 501 - 502 - 504 - 536 - 550Low 6/7/8/9/10 509 - 510 - 511 - 544 - 549
Table 1: Topic bins.
Feature Description
Features observed from document/browser windowquery terms number of topic terms displayed in the title ofin title the corresponding resultddepth depth of the browser window when examining
the documentdwidth width of the browser window when examining
the documentdoc-length length of the document (number of terms)
Features observed from the user behaviordisplay-time time the user spent on the page in its first visitscroll-down number of actions to scroll down the document
performed both by page down and mouse scrollscroll-up number of actions to scroll up the document
performed both by page up and mouse scrollsdepth maximum depth of the page achieved by
scrolling down, starting from ddepth
Table 2: Features adopted to model the user behav-ior dimension and to represent documents.
A dataset with this information has been gathered througha user study which involved fifteen people which were askedto assess the top 10 retrieved results in response to assignedtopics and to assess their relevance with a four-graded scale.We adopted the WT10g test collection and the ad-hoc topicsof the TREC 2001 Web Track. The collection was indexedby the Lemur Toolkit3; english stop-words were removed andthe Porter stemmer was adopted. Kullback-Leibler (KL)Divergence was adopted to rank documents because of itseffectiveness in the TREC 2001 Web Track [8]. Then thetop 10 documents were considered for each topic. A subsetof the fifty topics were adopted in the study: topics weredivided in three bins according to their difficulty – see Ta-ble 1 – where the measure of difficulty was the number ofrelevant documents in the top 10 – here relevance refers tothe judgments provided by TREC assessors. We randomlyselected five topics per bin, thus obtaining fifteen distincttopics; then three distinct groups of nine queries were builtand distributed among the users; each user was asked toassess topics in one group.
The assessment was performed by a web application whichdisplayed for each topic its description, the list of the ti-tles of top 10 results for that topic, and when a result titlewas clicked by the user, the content of the document cor-responding to that title. Both client-side and server-sidefunctionalities were adopted to gather features, specificallythose reported in Table 2 – these features are those adoptedto prepare the matrix F in step 2 of Section 3.1.
To gather explicit judgments beside each title a drop downmenu was available to select the relevance degree of thedocument corresponding to that title – these judgments arethose used in step 6 of Section 3.1. Some users did not as-sess all the documents in the result list for some topics. Forthis reason, in regard to the objective of this paper, only theuser behavior of thirteen among the fifteen users were con-
3http://www.lemurproject.org/lemur/
sidered in this work, for a total of 79 (user,topic) pairs and790 entries where each entry refers to the visit of a specificuser to a particular document with regard to a topic.
4. RESULTSTable 3 reports the average and the median NDCG@10
computed over all the entries for the different combinations.There is no significant difference among the contributions ofthe diverse combinations. This is confirmed by the Wilcoxonsigned rank test performed – with a 95% confidence inter-val – between the NDCG values obtained using the differentsource combinations. The Wilcoxon signed rank test wasadopted since the Shapiro-Wilk test showed that normalitycannot be assumed for the NDCG’s values obtained by thedifferent combinations.
The G/- combinations (G/P and G/G) performed worsethan the correspondent P/- combinations (P/P and P/G). Apossible reason for the low performance of G/- was the adop-tion of the average values of the features over the group tomodel the dimension. In order to investigate this hypoth-esis we considered another combination labeled as Gd/G. Inthis combination, as for the other -/G cases, the evidenceadopted to represent the documents with regard to a topicis obtained by computing the average values of the featuresover all the users other than the user under considerationthat assessed that topic. The Gd label denotes that themodel was obtained by applying PCA to a document-by-feature matrix where the documents of the diverse userswere considered as distinct evidence. For instance, if thesystem was supporting user1 when searching for topic 502,the feature matrix adopted as evidence was F ∈ R(n·5)×k,where k is the number of features, n is the number of visiteddocuments, and 5 is the number of users other than user1that searched for topic 502 in the collected dataset.
The average and the median NDCG@10 values for theGd/G combination computed over all the users and all thetopics was higher than that obtained for the other combi-nations. The Wilcoxon signed rank test showed that theimprovement Gd/G respect to P/G, G/P and G/G was signifi-cant with a 95% confidence interval – (V = 399, p-value =0.002) for P/G, (V = 1746.5, p-value = 0.03) for G/P, and (V= 560, p-value = 0.00001) for G/G. This result confirms thenegative impact of using average feature values to preparethe matrix F . The best performance achieved by the Gd/G
case may be also due to the larger amount of data adoptedfor modeling the dimension: the PCA-based approach seemsto benefit from a larger number of observations. Moreover,the better results obtained for the P/G and the Gd/G casessuggest that group behavior features can substitute personalfeatures for document representation, thus making person-alized IRF feasible despite the data sparsity observed whenthe interaction features are collected on a per-user basis.
The results observed for P/G and Gd/G could be due tothe level of agreement between what the user and the groupperceived as relevant. In order to investigate this hypothesis,the NDCG@10’s for these combinations were plotted againstthe τAP [9] computed between the ideal individual rankingand the ideal group ranking for each (user,topic) pair. Theideal ranking for a user was obtained by ranking documentsby the gain he provided. For the group ideal ranking, thegain of each document was obtained as the sum of the gainsprovided for that document by the users in the group, asproposed in [10] to compute NDCG for a group of users.
65
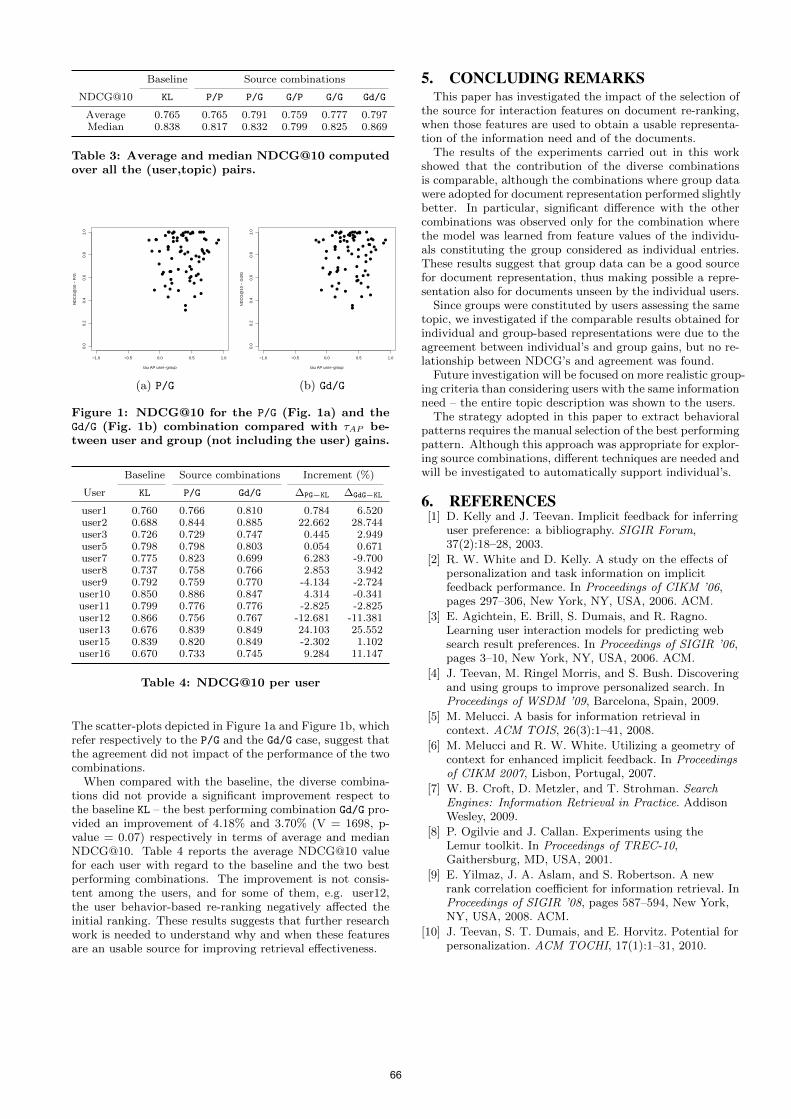
Baseline Source combinations
NDCG@10 KL P/P P/G G/P G/G Gd/G
Average 0.765 0.765 0.791 0.759 0.777 0.797Median 0.838 0.817 0.832 0.799 0.825 0.869
Table 3: Average and median NDCG@10 computedover all the (user,topic) pairs.
●
●
●
●
●
●
●
●
●
●
●
●●●
●●
●
●
●
●
●
●
●●
●
●
●
●●
●
●
●●
●
●
●
●
●
●
●
●
●●
●●
●
●
●
●
●
●
●
●
●
● ●●
●
●
●
●
●●
●
●
●●
●
●
●
●
●
●
●
●
●
●
●
●
−1.0 −0.5 0.0 0.5 1.0
0.0
0.2
0.4
0.6
0.8
1.0
tau AP user−group
ND
CG
@10
− P
/G
(a) P/G
●
●
●
●
●
●
●
●●
●
●
●
●●●
●
●
●
●
●
●
●
●●
●
●
●
●●
●
●
●●
●
●
●
●
●
●
●
●
●
●
●●
●
●
●
●
●
●
●
●
●
● ●●
●
●
●
●
●●
●
●
●●
●
●
●
●
●
●
●
●
●
●
●
●
−1.0 −0.5 0.0 0.5 1.0
0.0
0.2
0.4
0.6
0.8
1.0
tau AP user−group
ND
CG
@10
− G
d/G
(b) Gd/G
Figure 1: NDCG@10 for the P/G (Fig. 1a) and theGd/G (Fig. 1b) combination compared with τAP be-tween user and group (not including the user) gains.
Baseline Source combinations Increment (%)
User KL P/G Gd/G ∆PG−KL ∆GdG−KL
user1 0.760 0.766 0.810 0.784 6.520user2 0.688 0.844 0.885 22.662 28.744user3 0.726 0.729 0.747 0.445 2.949user5 0.798 0.798 0.803 0.054 0.671user7 0.775 0.823 0.699 6.283 -9.700user8 0.737 0.758 0.766 2.853 3.942user9 0.792 0.759 0.770 -4.134 -2.724user10 0.850 0.886 0.847 4.314 -0.341user11 0.799 0.776 0.776 -2.825 -2.825user12 0.866 0.756 0.767 -12.681 -11.381user13 0.676 0.839 0.849 24.103 25.552user15 0.839 0.820 0.849 -2.302 1.102user16 0.670 0.733 0.745 9.284 11.147
Table 4: NDCG@10 per user
The scatter-plots depicted in Figure 1a and Figure 1b, whichrefer respectively to the P/G and the Gd/G case, suggest thatthe agreement did not impact of the performance of the twocombinations.
When compared with the baseline, the diverse combina-tions did not provide a significant improvement respect tothe baseline KL – the best performing combination Gd/G pro-vided an improvement of 4.18% and 3.70% (V = 1698, p-value = 0.07) respectively in terms of average and medianNDCG@10. Table 4 reports the average NDCG@10 valuefor each user with regard to the baseline and the two bestperforming combinations. The improvement is not consis-tent among the users, and for some of them, e.g. user12,the user behavior-based re-ranking negatively affected theinitial ranking. These results suggests that further researchwork is needed to understand why and when these featuresare an usable source for improving retrieval effectiveness.
5. CONCLUDING REMARKSThis paper has investigated the impact of the selection of
the source for interaction features on document re-ranking,when those features are used to obtain a usable representa-tion of the information need and of the documents.
The results of the experiments carried out in this workshowed that the contribution of the diverse combinationsis comparable, although the combinations where group datawere adopted for document representation performed slightlybetter. In particular, significant difference with the othercombinations was observed only for the combination wherethe model was learned from feature values of the individu-als constituting the group considered as individual entries.These results suggest that group data can be a good sourcefor document representation, thus making possible a repre-sentation also for documents unseen by the individual users.
Since groups were constituted by users assessing the sametopic, we investigated if the comparable results obtained forindividual and group-based representations were due to theagreement between individual’s and group gains, but no re-lationship between NDCG’s and agreement was found.
Future investigation will be focused on more realistic group-ing criteria than considering users with the same informationneed – the entire topic description was shown to the users.
The strategy adopted in this paper to extract behavioralpatterns requires the manual selection of the best performingpattern. Although this approach was appropriate for explor-ing source combinations, different techniques are needed andwill be investigated to automatically support individual’s.
6. REFERENCES[1] D. Kelly and J. Teevan. Implicit feedback for inferring
user preference: a bibliography. SIGIR Forum,37(2):18–28, 2003.
[2] R. W. White and D. Kelly. A study on the effects ofpersonalization and task information on implicitfeedback performance. In Proceedings of CIKM ’06,pages 297–306, New York, NY, USA, 2006. ACM.
[3] E. Agichtein, E. Brill, S. Dumais, and R. Ragno.Learning user interaction models for predicting websearch result preferences. In Proceedings of SIGIR ’06,pages 3–10, New York, NY, USA, 2006. ACM.
[4] J. Teevan, M. Ringel Morris, and S. Bush. Discoveringand using groups to improve personalized search. InProceedings of WSDM ’09, Barcelona, Spain, 2009.
[5] M. Melucci. A basis for information retrieval incontext. ACM TOIS, 26(3):1–41, 2008.
[6] M. Melucci and R. W. White. Utilizing a geometry ofcontext for enhanced implicit feedback. In Proceedingsof CIKM 2007, Lisbon, Portugal, 2007.
[7] W. B. Croft, D. Metzler, and T. Strohman. SearchEngines: Information Retrieval in Practice. AddisonWesley, 2009.
[8] P. Ogilvie and J. Callan. Experiments using theLemur toolkit. In Proceedings of TREC-10,Gaithersburg, MD, USA, 2001.
[9] E. Yilmaz, J. A. Aslam, and S. Robertson. A newrank correlation coefficient for information retrieval. InProceedings of SIGIR ’08, pages 587–594, New York,NY, USA, 2008. ACM.
[10] J. Teevan, S. T. Dumais, and E. Horvitz. Potential forpersonalization. ACM TOCHI, 17(1):1–31, 2010.
66
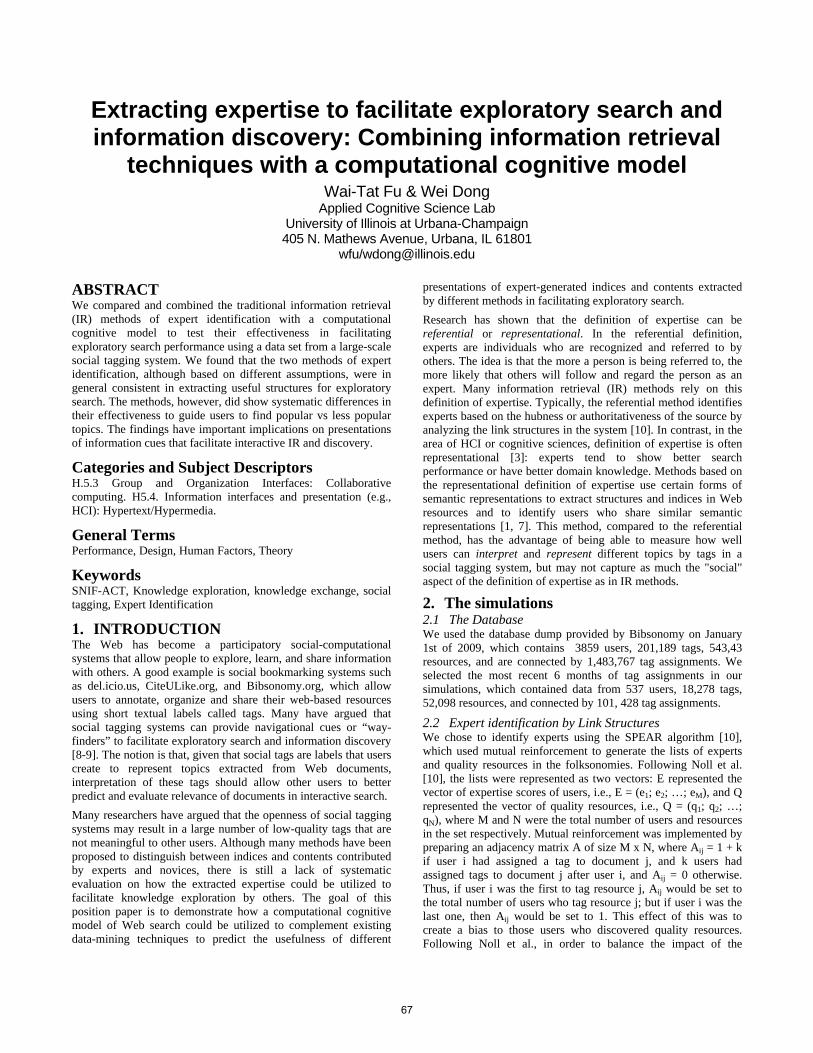
Extracting expertise to facilitate exploratory search and information discovery: Combining information retrieval
techniques with a computational cognitive model Wai-Tat Fu & Wei Dong
Applied Cognitive Science Lab University of Illinois at Urbana-Champaign 405 N. Mathews Avenue, Urbana, IL 61801
ABSTRACT We compared and combined the traditional information retrieval (IR) methods of expert identification with a computational cognitive model to test their effectiveness in facilitating exploratory search performance using a data set from a large-scale social tagging system. We found that the two methods of expert identification, although based on different assumptions, were in general consistent in extracting useful structures for exploratory search. The methods, however, did show systematic differences in their effectiveness to guide users to find popular vs less popular topics. The findings have important implications on presentations of information cues that facilitate interactive IR and discovery.
Categories and Subject Descriptors H.5.3 Group and Organization Interfaces: Collaborative computing. H5.4. Information interfaces and presentation (e.g., HCI): Hypertext/Hypermedia.
General Terms Performance, Design, Human Factors, Theory
Keywords SNIF-ACT, Knowledge exploration, knowledge exchange, social tagging, Expert Identification
1. INTRODUCTION The Web has become a participatory social-computational systems that allow people to explore, learn, and share information with others. A good example is social bookmarking systems such as del.icio.us, CiteULike.org, and Bibsonomy.org, which allow users to annotate, organize and share their web-based resources using short textual labels called tags. Many have argued that social tagging systems can provide navigational cues or “way-finders” to facilitate exploratory search and information discovery [8-9]. The notion is that, given that social tags are labels that users create to represent topics extracted from Web documents, interpretation of these tags should allow other users to better predict and evaluate relevance of documents in interactive search.
Many researchers have argued that the openness of social tagging systems may result in a large number of low-quality tags that are not meaningful to other users. Although many methods have been proposed to distinguish between indices and contents contributed by experts and novices, there is still a lack of systematic evaluation on how the extracted expertise could be utilized to facilitate knowledge exploration by others. The goal of this position paper is to demonstrate how a computational cognitive model of Web search could be utilized to complement existing data-mining techniques to predict the usefulness of different
presentations of expert-generated indices and contents extracted by different methods in facilitating exploratory search.
Research has shown that the definition of expertise can be referential or representational. In the referential definition, experts are individuals who are recognized and referred to by others. The idea is that the more a person is being referred to, the more likely that others will follow and regard the person as an expert. Many information retrieval (IR) methods rely on this definition of expertise. Typically, the referential method identifies experts based on the hubness or authoritativeness of the source by analyzing the link structures in the system [10]. In contrast, in the area of HCI or cognitive sciences, definition of expertise is often representational [3]: experts tend to show better search performance or have better domain knowledge. Methods based on the representational definition of expertise use certain forms of semantic representations to extract structures and indices in Web resources and to identify users who share similar semantic representations [1, 7]. This method, compared to the referential method, has the advantage of being able to measure how well users can interpret and represent different topics by tags in a social tagging system, but may not capture as much the "social" aspect of the definition of expertise as in IR methods.
2. The simulations 2.1 The Database We used the database dump provided by Bibsonomy on January 1st of 2009, which contains 3859 users, 201,189 tags, 543,43 resources, and are connected by 1,483,767 tag assignments. We selected the most recent 6 months of tag assignments in our simulations, which contained data from 537 users, 18,278 tags, 52,098 resources, and connected by 101, 428 tag assignments.
2.2 Expert identification by Link Structures We chose to identify experts using the SPEAR algorithm [10], which used mutual reinforcement to generate the lists of experts and quality resources in the folksonomies. Following Noll et al. [10], the lists were represented as two vectors: E represented the vector of expertise scores of users, i.e., E = (e1; e2; …; eM), and Q represented the vector of quality resources, i.e., Q = (q1; q2; …; qN), where M and N were the total number of users and resources in the set respectively. Mutual reinforcement was implemented by preparing an adjacency matrix A of size M x N, where Aij = 1 + k if user i had assigned a tag to document j, and k users had assigned tags to document j after user i, and Aij = 0 otherwise. Thus, if user i was the first to tag resource j, Aij would be set to the total number of users who tag resource j; but if user i was the last one, then Aij would be set to 1. This effect of this was to create a bias to those users who discovered quality resources. Following Noll et al., in order to balance the impact of the
67
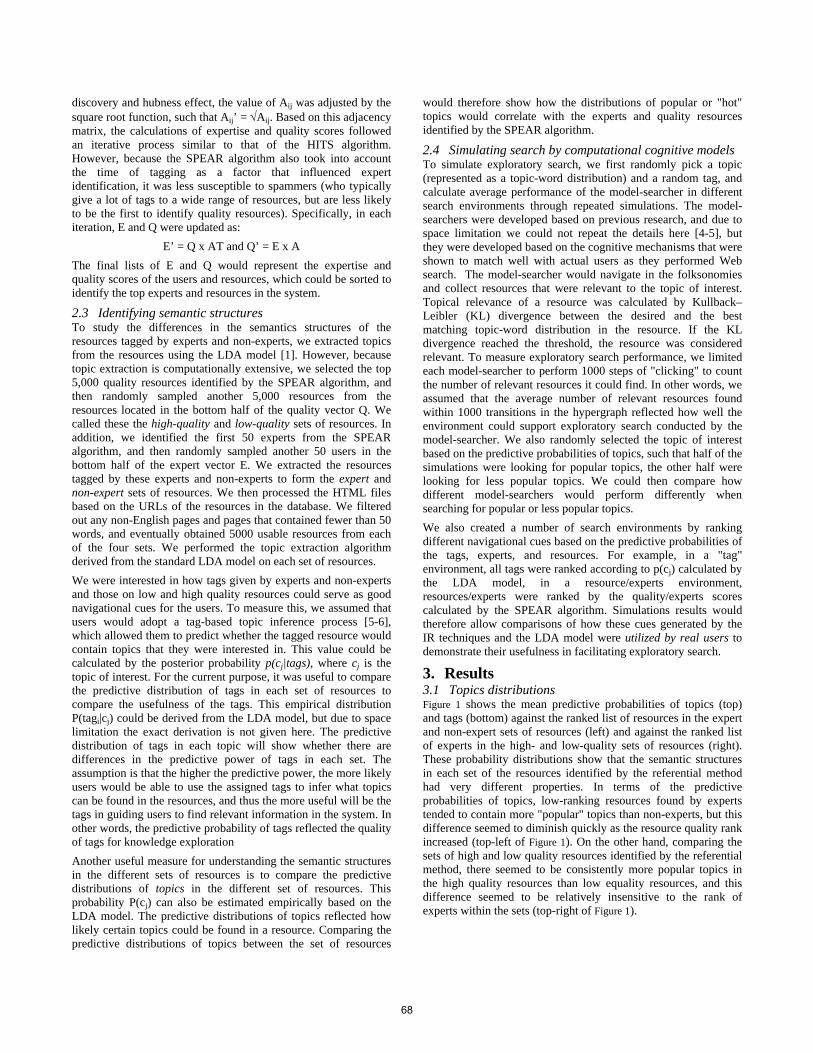
discovery and hubness effect, the value of Aij was adjusted by the square root function, such that Aij’ = Aij. Based on this adjacency matrix, the calculations of expertise and quality scores followed an iterative process similar to that of the HITS algorithm. However, because the SPEAR algorithm also took into account the time of tagging as a factor that influenced expert identification, it was less susceptible to spammers (who typically give a lot of tags to a wide range of resources, but are less likely to be the first to identify quality resources). Specifically, in each iteration, E and Q were updated as:
E’ = Q x AT and Q’ = E x A
The final lists of E and Q would represent the expertise and quality scores of the users and resources, which could be sorted to identify the top experts and resources in the system.
2.3 Identifying semantic structures To study the differences in the semantics structures of the resources tagged by experts and non-experts, we extracted topics from the resources using the LDA model [1]. However, because topic extraction is computationally extensive, we selected the top 5,000 quality resources identified by the SPEAR algorithm, and then randomly sampled another 5,000 resources from the resources located in the bottom half of the quality vector Q. We called these the high-quality and low-quality sets of resources. In addition, we identified the first 50 experts from the SPEAR algorithm, and then randomly sampled another 50 users in the bottom half of the expert vector E. We extracted the resources tagged by these experts and non-experts to form the expert and non-expert sets of resources. We then processed the HTML files based on the URLs of the resources in the database. We filtered out any non-English pages and pages that contained fewer than 50 words, and eventually obtained 5000 usable resources from each of the four sets. We performed the topic extraction algorithm derived from the standard LDA model on each set of resources.
We were interested in how tags given by experts and non-experts and those on low and high quality resources could serve as good navigational cues for the users. To measure this, we assumed that users would adopt a tag-based topic inference process [5-6], which allowed them to predict whether the tagged resource would contain topics that they were interested in. This value could be calculated by the posterior probability p(cj|tags), where cj is the topic of interest. For the current purpose, it was useful to compare the predictive distribution of tags in each set of resources to compare the usefulness of the tags. This empirical distribution P(tagi|cj) could be derived from the LDA model, but due to space limitation the exact derivation is not given here. The predictive distribution of tags in each topic will show whether there are differences in the predictive power of tags in each set. The assumption is that the higher the predictive power, the more likely users would be able to use the assigned tags to infer what topics can be found in the resources, and thus the more useful will be the tags in guiding users to find relevant information in the system. In other words, the predictive probability of tags reflected the quality of tags for knowledge exploration
Another useful measure for understanding the semantic structures in the different sets of resources is to compare the predictive distributions of topics in the different set of resources. This probability P(cj) can also be estimated empirically based on the LDA model. The predictive distributions of topics reflected how likely certain topics could be found in a resource. Comparing the predictive distributions of topics between the set of resources
would therefore show how the distributions of popular or "hot" topics would correlate with the experts and quality resources identified by the SPEAR algorithm.
2.4 Simulating search by computational cognitive models To simulate exploratory search, we first randomly pick a topic (represented as a topic-word distribution) and a random tag, and calculate average performance of the model-searcher in different search environments through repeated simulations. The model-searchers were developed based on previous research, and due to space limitation we could not repeat the details here [4-5], but they were developed based on the cognitive mechanisms that were shown to match well with actual users as they performed Web search. The model-searcher would navigate in the folksonomies and collect resources that were relevant to the topic of interest. Topical relevance of a resource was calculated by Kullback–Leibler (KL) divergence between the desired and the best matching topic-word distribution in the resource. If the KL divergence reached the threshold, the resource was considered relevant. To measure exploratory search performance, we limited each model-searcher to perform 1000 steps of "clicking" to count the number of relevant resources it could find. In other words, we assumed that the average number of relevant resources found within 1000 transitions in the hypergraph reflected how well the environment could support exploratory search conducted by the model-searcher. We also randomly selected the topic of interest based on the predictive probabilities of topics, such that half of the simulations were looking for popular topics, the other half were looking for less popular topics. We could then compare how different model-searchers would perform differently when searching for popular or less popular topics.
We also created a number of search environments by ranking different navigational cues based on the predictive probabilities of the tags, experts, and resources. For example, in a "tag" environment, all tags were ranked according to p(cj) calculated by the LDA model, in a resource/experts environment, resources/experts were ranked by the quality/experts scores calculated by the SPEAR algorithm. Simulations results would therefore allow comparisons of how these cues generated by the IR techniques and the LDA model were utilized by real users to demonstrate their usefulness in facilitating exploratory search.
3. Results 3.1 Topics distributions Figure 1 shows the mean predictive probabilities of topics (top) and tags (bottom) against the ranked list of resources in the expert and non-expert sets of resources (left) and against the ranked list of experts in the high- and low-quality sets of resources (right). These probability distributions show that the semantic structures in each set of the resources identified by the referential method had very different properties. In terms of the predictive probabilities of topics, low-ranking resources found by experts tended to contain more "popular" topics than non-experts, but this difference seemed to diminish quickly as the resource quality rank increased (top-left of Figure 1). On the other hand, comparing the sets of high and low quality resources identified by the referential method, there seemed to be consistently more popular topics in the high quality resources than low equality resources, and this difference seemed to be relatively insensitive to the rank of experts within the sets (top-right of Figure 1).
68

The predictive probabilities of tags also showed interesting difference between the sets of resources. In general, resources tagged by experts contained more predictive tags compared to those by non-experts, and this difference was relatively stable across the set of resources (bottom-left of Figure 1). Similarly, the predictive probabilities of tags between the high and low quality sets of resources also showed differences, but this difference diminished quickly as the expert rank increased.
To summarize, results implied that while following the list of high quality resources would allow users to discover mostly "hot" topics, following the list of experts would allow users to sometimes discover "cold" topics (but could be useful for a subgroup of users) in the folksonomies
3.2 Tag Distributions Figure 1 (bottom) also shows that while tags created by experts were in general predictive, not all tags in the high quality resources were predictive. To confirm these differences, we compared the empirical probability distribution functions (PDF) of the predictive probabilities of topics and tags in each sets of resources (see Figure 2). One could see that the topic distributions between experts and non-experts were indeed less distinguishable than those between low and high quality resources (top-left of Figure 2), but the reverse was true for the tag distributions (bottom-left of Figure 2). This suggested that quality of resources were in general better at predicting "hot" topics; but high quality resources did not necessarily contain fewer "hot" topics. Rather, expert-generated tags tended to be more predictive of "cold" topics than resource quality.
It was quite possible that, because the SPEAR algorithm (and the referential method in general) primarily determined the quality of a resource based on the number of times the resource was identified by experts, resources that contained popular topics were more likely reckoned high quality. As popularity of topics in a folksonomy tended to correlate with frequencies of occurrence of corresponding real-world events, ranking of resources based on the referential method would therefore likely benefit users who were interested in following "hot" topics. On the other hand, although experts identified by the referential method were users who frequently tag the high quality resources, they were also users who tend to tag many resources, and many of these resources were not tagged by other experts. We therefore see that rankings by resources tended to be generally better at distinguishing "hot" from "cold" topics than by the distinction between experts and non-experts.
3.3 Exploratory search performance Figure 3 shows the number of relevant resources found by three model-searchers in the exploratory search simulations. The position-searcher always followed the ranking of cues during evaluation, the topic-satisficer combined ranking and topical relevance of the cues during evaluation (see [4] for details), and the perfect-searcher always picked the cue that had the highest topical relevance (with respect to the topic that it was searching). Comparisons of the three model-searcher would therefore reveal the effects of position and topical relevance of cues on search performance.
As shown in Figure 3, the general uptrend from all four figures suggested that the addition of more rankings of tags, experts, and resources had led to better exploratory performance. Interestingly, for popular topics, rankings of users and resources seemed to lead to slightly better results than the ranking of tags. Consistent with
previous results, this could be attributed to the fact that the rankings of users and resources were based on the referential method that were in general better at predicting hot topics. In contrast, ranking of tags was based on their predictability of topics, which depended, to a large extent, on the likelihood that the tags were uniquely associated with the different topics. Given that hot (popular) topics tended to be associated with semantically general tags that appeared in multiple topics [2], the general predictability of tags for popular topics were therefore lower than the rankings derived from link structures.
Compared to the position-searcher, the topic-satisficer in general found more relevant resources, suggesting that the process of sequential topic evaluation improved exploratory search performance. Similar to the position-searcher, however, tag ranking was slightly less useful for exploring for hot topics compared to expert and resource rankings. On the other hand, the combination of tag and expert or tag and resource rankings did significantly improve performance. Performance of the topic-satisficer in the all-ranking environment was almost the same as
Figure 1. Predictive distributions of topics (top) and tags (bottom) plotted against ranks of resources and experts (lower rank is better) in the sets of resources tagged by experts and non-experts (left) as identified by the algorithm, and the sets of resources identified as high and low quality by the algorithm (right).
Figure 2. The empirical PDF for the predictive probabilities of topics and tags in each of the four sets of resources.
69
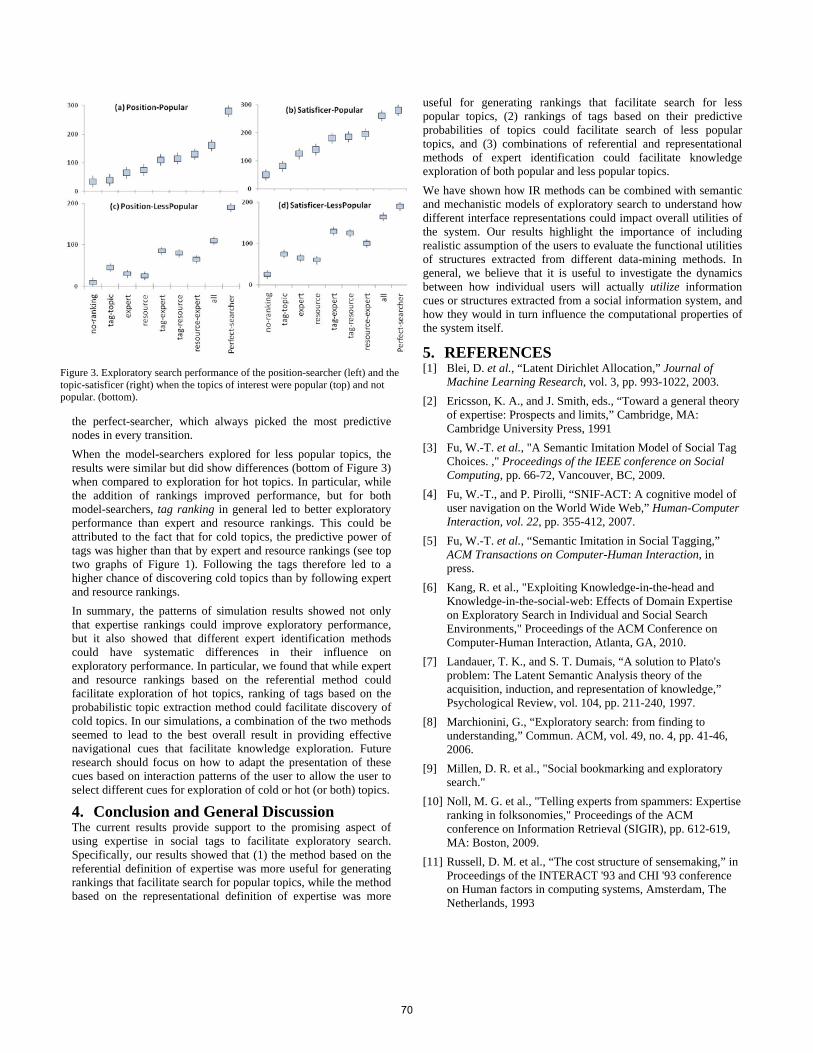
the perfect-searcher, which always picked the most predictive nodes in every transition.
When the model-searchers explored for less popular topics, the results were similar but did show differences (bottom of Figure 3) when compared to exploration for hot topics. In particular, while the addition of rankings improved performance, but for both model-searchers, tag ranking in general led to better exploratory performance than expert and resource rankings. This could be attributed to the fact that for cold topics, the predictive power of tags was higher than that by expert and resource rankings (see top two graphs of Figure 1). Following the tags therefore led to a higher chance of discovering cold topics than by following expert and resource rankings.
In summary, the patterns of simulation results showed not only that expertise rankings could improve exploratory performance, but it also showed that different expert identification methods could have systematic differences in their influence on exploratory performance. In particular, we found that while expert and resource rankings based on the referential method could facilitate exploration of hot topics, ranking of tags based on the probabilistic topic extraction method could facilitate discovery of cold topics. In our simulations, a combination of the two methods seemed to lead to the best overall result in providing effective navigational cues that facilitate knowledge exploration. Future research should focus on how to adapt the presentation of these cues based on interaction patterns of the user to allow the user to select different cues for exploration of cold or hot (or both) topics.
4. Conclusion and General Discussion The current results provide support to the promising aspect of using expertise in social tags to facilitate exploratory search. Specifically, our results showed that (1) the method based on the referential definition of expertise was more useful for generating rankings that facilitate search for popular topics, while the method based on the representational definition of expertise was more
useful for generating rankings that facilitate search for less popular topics, (2) rankings of tags based on their predictive probabilities of topics could facilitate search of less popular topics, and (3) combinations of referential and representational methods of expert identification could facilitate knowledge exploration of both popular and less popular topics.
We have shown how IR methods can be combined with semantic and mechanistic models of exploratory search to understand how different interface representations could impact overall utilities of the system. Our results highlight the importance of including realistic assumption of the users to evaluate the functional utilities of structures extracted from different data-mining methods. In general, we believe that it is useful to investigate the dynamics between how individual users will actually utilize information cues or structures extracted from a social information system, and how they would in turn influence the computational properties of the system itself.
5. REFERENCES [1] Blei, D. et al., “Latent Dirichlet Allocation,” Journal of
Machine Learning Research, vol. 3, pp. 993-1022, 2003.
[2] Ericsson, K. A., and J. Smith, eds., “Toward a general theory of expertise: Prospects and limits,” Cambridge, MA: Cambridge University Press, 1991
[3] Fu, W.-T. et al., "A Semantic Imitation Model of Social Tag Choices. ," Proceedings of the IEEE conference on Social Computing, pp. 66-72, Vancouver, BC, 2009.
[4] Fu, W.-T., and P. Pirolli, “SNIF-ACT: A cognitive model of user navigation on the World Wide Web,” Human-Computer Interaction, vol. 22, pp. 355-412, 2007.
[5] Fu, W.-T. et al., “Semantic Imitation in Social Tagging,” ACM Transactions on Computer-Human Interaction, in press.
[6] Kang, R. et al., "Exploiting Knowledge-in-the-head and Knowledge-in-the-social-web: Effects of Domain Expertise on Exploratory Search in Individual and Social Search Environments," Proceedings of the ACM Conference on Computer-Human Interaction, Atlanta, GA, 2010.
[7] Landauer, T. K., and S. T. Dumais, “A solution to Plato's problem: The Latent Semantic Analysis theory of the acquisition, induction, and representation of knowledge,” Psychological Review, vol. 104, pp. 211-240, 1997.
[8] Marchionini, G., “Exploratory search: from finding to understanding,” Commun. ACM, vol. 49, no. 4, pp. 41-46, 2006.
[9] Millen, D. R. et al., "Social bookmarking and exploratory search."
[10] Noll, M. G. et al., "Telling experts from spammers: Expertise ranking in folksonomies," Proceedings of the ACM conference on Information Retrieval (SIGIR), pp. 612-619, MA: Boston, 2009.
[11] Russell, D. M. et al., “The cost structure of sensemaking,” in Proceedings of the INTERACT '93 and CHI '93 conference on Human factors in computing systems, Amsterdam, The Netherlands, 1993
Figure 3. Exploratory search performance of the position-searcher (left) and the topic-satisficer (right) when the topics of interest were popular (top) and not popular. (bottom).
70
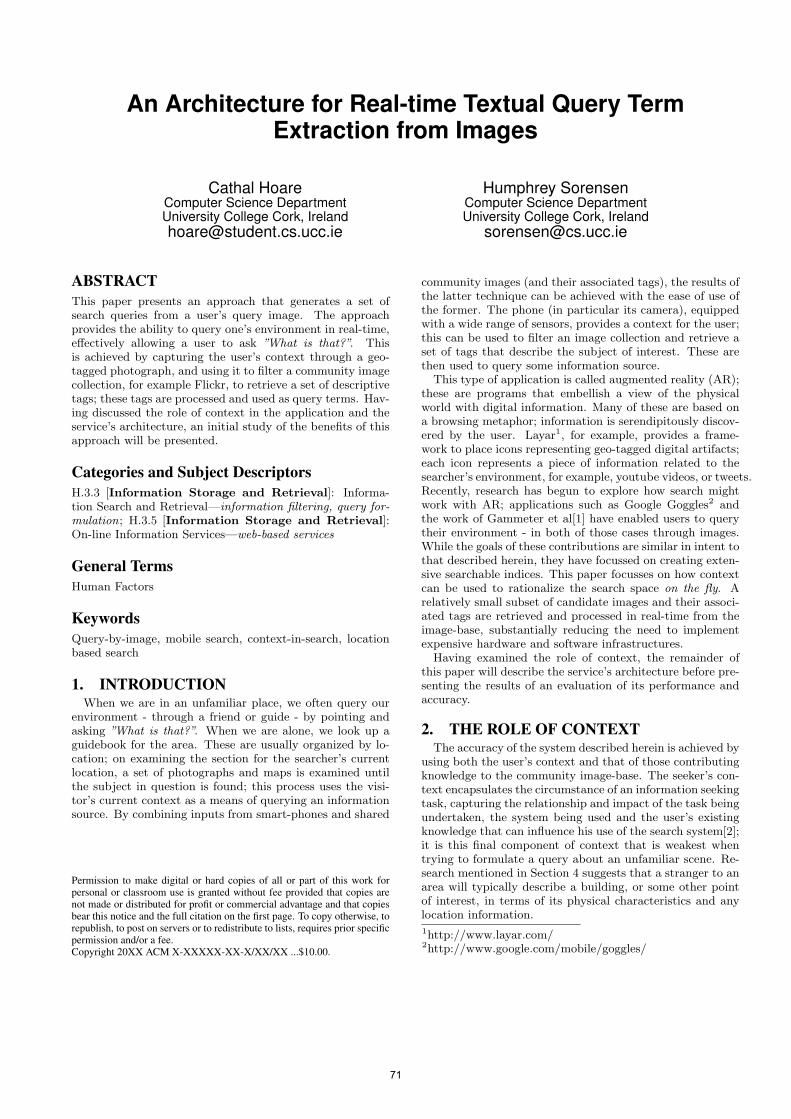
An Architecture for Real-time Textual Query TermExtraction from Images
Cathal HoareComputer Science DepartmentUniversity College Cork, [email protected]
Humphrey SorensenComputer Science DepartmentUniversity College Cork, Ireland
ABSTRACTThis paper presents an approach that generates a set ofsearch queries from a user’s query image. The approachprovides the ability to query one’s environment in real-time,effectively allowing a user to ask ”What is that?”. Thisis achieved by capturing the user’s context through a geo-tagged photograph, and using it to filter a community imagecollection, for example Flickr, to retrieve a set of descriptivetags; these tags are processed and used as query terms. Hav-ing discussed the role of context in the application and theservice’s architecture, an initial study of the benefits of thisapproach will be presented.
Categories and Subject DescriptorsH.3.3 [Information Storage and Retrieval]: Informa-tion Search and Retrieval—information filtering, query for-mulation; H.3.5 [Information Storage and Retrieval]:On-line Information Services—web-based services
General TermsHuman Factors
KeywordsQuery-by-image, mobile search, context-in-search, locationbased search
1. INTRODUCTIONWhen we are in an unfamiliar place, we often query our
environment - through a friend or guide - by pointing andasking ”What is that?”. When we are alone, we look up aguidebook for the area. These are usually organized by lo-cation; on examining the section for the searcher’s currentlocation, a set of photographs and maps is examined untilthe subject in question is found; this process uses the visi-tor’s current context as a means of querying an informationsource. By combining inputs from smart-phones and shared
Permission to make digital or hard copies of all or part of this work forpersonal or classroom use is granted without fee provided that copies arenot made or distributed for profit or commercial advantage and that copiesbear this notice and the full citation on the first page. To copy otherwise, torepublish, to post on servers or to redistribute to lists, requires prior specificpermission and/or a fee.Copyright 20XX ACM X-XXXXX-XX-X/XX/XX ...$10.00.
community images (and their associated tags), the results ofthe latter technique can be achieved with the ease of use ofthe former. The phone (in particular its camera), equippedwith a wide range of sensors, provides a context for the user;this can be used to filter an image collection and retrieve aset of tags that describe the subject of interest. These arethen used to query some information source.
This type of application is called augmented reality (AR);these are programs that embellish a view of the physicalworld with digital information. Many of these are based ona browsing metaphor; information is serendipitously discov-ered by the user. Layar1, for example, provides a frame-work to place icons representing geo-tagged digital artifacts;each icon represents a piece of information related to thesearcher’s environment, for example, youtube videos, or tweets.Recently, research has begun to explore how search mightwork with AR; applications such as Google Goggles2 andthe work of Gammeter et al[1] have enabled users to querytheir environment - in both of those cases through images.While the goals of these contributions are similar in intent tothat described herein, they have focussed on creating exten-sive searchable indices. This paper focusses on how contextcan be used to rationalize the search space on the fly. Arelatively small subset of candidate images and their associ-ated tags are retrieved and processed in real-time from theimage-base, substantially reducing the need to implementexpensive hardware and software infrastructures.
Having examined the role of context, the remainder ofthis paper will describe the service’s architecture before pre-senting the results of an evaluation of its performance andaccuracy.
2. THE ROLE OF CONTEXTThe accuracy of the system described herein is achieved by
using both the user’s context and that of those contributingknowledge to the community image-base. The seeker’s con-text encapsulates the circumstance of an information seekingtask, capturing the relationship and impact of the task beingundertaken, the system being used and the user’s existingknowledge that can influence his use of the search system[2];it is this final component of context that is weakest whentrying to formulate a query about an unfamiliar scene. Re-search mentioned in Section 4 suggests that a stranger to anarea will typically describe a building, or some other pointof interest, in terms of its physical characteristics and anylocation information.
1http://www.layar.com/2http://www.google.com/mobile/goggles/
71
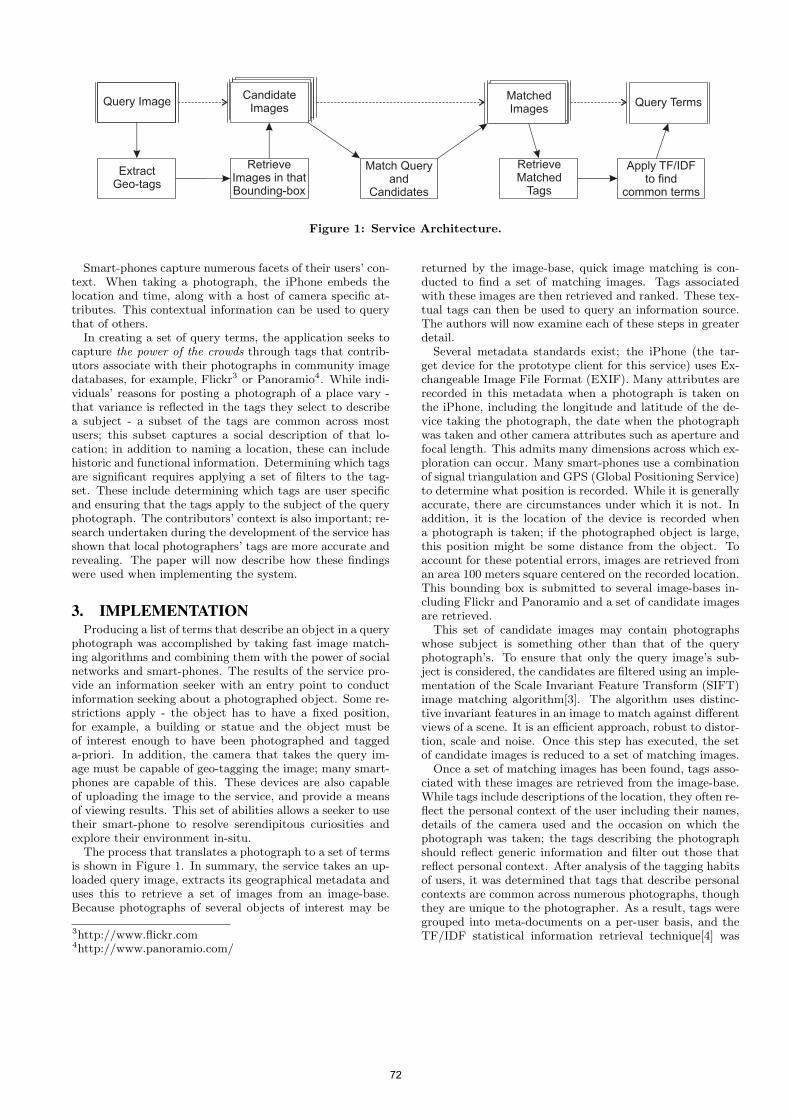
Query ImageCandidate
ImagesMatchedImages
Query Terms
ExtractGeo-tags
Retrieve Images in that Bounding-box
Match Queryand
Candidates
Retrieve Matched
Tags
Apply TF/IDFto find
common terms
Figure 1: Service Architecture.
Smart-phones capture numerous facets of their users’ con-text. When taking a photograph, the iPhone embeds thelocation and time, along with a host of camera specific at-tributes. This contextual information can be used to querythat of others.
In creating a set of query terms, the application seeks tocapture the power of the crowds through tags that contrib-utors associate with their photographs in community imagedatabases, for example, Flickr3 or Panoramio4. While indi-viduals’ reasons for posting a photograph of a place vary -that variance is reflected in the tags they select to describea subject - a subset of the tags are common across mostusers; this subset captures a social description of that lo-cation; in addition to naming a location, these can includehistoric and functional information. Determining which tagsare significant requires applying a set of filters to the tag-set. These include determining which tags are user specificand ensuring that the tags apply to the subject of the queryphotograph. The contributors’ context is also important; re-search undertaken during the development of the service hasshown that local photographers’ tags are more accurate andrevealing. The paper will now describe how these findingswere used when implementing the system.
3. IMPLEMENTATIONProducing a list of terms that describe an object in a query
photograph was accomplished by taking fast image match-ing algorithms and combining them with the power of socialnetworks and smart-phones. The results of the service pro-vide an information seeker with an entry point to conductinformation seeking about a photographed object. Some re-strictions apply - the object has to have a fixed position,for example, a building or statue and the object must beof interest enough to have been photographed and taggeda-priori. In addition, the camera that takes the query im-age must be capable of geo-tagging the image; many smart-phones are capable of this. These devices are also capableof uploading the image to the service, and provide a meansof viewing results. This set of abilities allows a seeker to usetheir smart-phone to resolve serendipitous curiosities andexplore their environment in-situ.
The process that translates a photograph to a set of termsis shown in Figure 1. In summary, the service takes an up-loaded query image, extracts its geographical metadata anduses this to retrieve a set of images from an image-base.Because photographs of several objects of interest may be
3http://www.flickr.com4http://www.panoramio.com/
returned by the image-base, quick image matching is con-ducted to find a set of matching images. Tags associatedwith these images are then retrieved and ranked. These tex-tual tags can then be used to query an information source.The authors will now examine each of these steps in greaterdetail.
Several metadata standards exist; the iPhone (the tar-get device for the prototype client for this service) uses Ex-changeable Image File Format (EXIF). Many attributes arerecorded in this metadata when a photograph is taken onthe iPhone, including the longitude and latitude of the de-vice taking the photograph, the date when the photographwas taken and other camera attributes such as aperture andfocal length. This admits many dimensions across which ex-ploration can occur. Many smart-phones use a combinationof signal triangulation and GPS (Global Positioning Service)to determine what position is recorded. While it is generallyaccurate, there are circumstances under which it is not. Inaddition, it is the location of the device is recorded whena photograph is taken; if the photographed object is large,this position might be some distance from the object. Toaccount for these potential errors, images are retrieved froman area 100 meters square centered on the recorded location.This bounding box is submitted to several image-bases in-cluding Flickr and Panoramio and a set of candidate imagesare retrieved.
This set of candidate images may contain photographswhose subject is something other than that of the queryphotograph’s. To ensure that only the query image’s sub-ject is considered, the candidates are filtered using an imple-mentation of the Scale Invariant Feature Transform (SIFT)image matching algorithm[3]. The algorithm uses distinc-tive invariant features in an image to match against differentviews of a scene. It is an efficient approach, robust to distor-tion, scale and noise. Once this step has executed, the setof candidate images is reduced to a set of matching images.
Once a set of matching images has been found, tags asso-ciated with these images are retrieved from the image-base.While tags include descriptions of the location, they often re-flect the personal context of the user including their names,details of the camera used and the occasion on which thephotograph was taken; the tags describing the photographshould reflect generic information and filter out those thatreflect personal context. After analysis of the tagging habitsof users, it was determined that tags that describe personalcontexts are common across numerous photographs, thoughthey are unique to the photographer. As a result, tags weregrouped into meta-documents on a per-user basis, and theTF/IDF statistical information retrieval technique[4] was
72

Figure 2: The Quad, University College Cork. Theservice returned ’University College Cork’, ’Cork’,’Ireland’, ’UCC’, ’Cork City’ as descriptive tags.
applied to these. This resulted in terms that were commonacross the collection of documents (and thus users) emerg-ing; these are ranked by popularity. While some relevantterms’ significance was easily determined, there were oth-ers that were ranked lower, but were considered very de-scriptive. A second pass of relevance measurement is com-pleted to capture these terms. For each of these terms, aYahoo! Boss5 query is formed by AND-ing each term withthe significant terms, and measuring the number of docu-ments that are returned. While tags that describe personalcontext are rarely associated with the significant descriptivetags, minor descriptive terms appear in many documentswith the significant terms. A list of the top ten descriptiveterms is returned by the service. This list can be used toform queries to an information source; this can be a gen-eral source, Google or Wikipedia, or a custom informationsource.
The implementation of the service instance used duringthe evaluation was architected thus; a service mediator mar-shaled each request; it was responsible for accepting re-quests, making the initial request to the image-base (Flickr),sending requests for work to distributed agents and process-ing their responses into a query. The distributed agents,reserved lab machines, were responsible for processing eachcandidate image and its tags. Both the mediator and tenagents were Apple iMac 2.66 GHz Intel Core Duo machinesrunning 2GB of RAM. The distributed network was enabledusing XServe.
4. RESULTSDuring development of the service, a simple iPhone client
5http://developer.yahoo.com/search/boss/
Figure 3: St. Donat’s Church, Zadar, Croatia. Theservice returned ’Zadar’, ’Croatia’, ’Zadarska’, ’Do-nat’, ’Church’ as descriptive tags.
was developed and deployed to several devices. This appli-cation allowed a user to take a query image, upload it tothe service server and displayed the set of query tags thatwere returned for the query. Two examples are shown, oneinstance from Ireland (Figure 2), and one instance that wassubmitted when visiting Croatia (Figure 3). When the re-turned terms are AND-ed and submitted to Google, the firstpage of results contains Wikipedia articles about each loca-tion. The service was formally evaluated based on its abilityto efficiently produce an accurate query. The quality of theservice’s queries were also evaluated by comparing their pre-cision to those created by human ’visitors’ to a location.
PerformanceQueries executed with an average time of 9.1 seconds.
This time is reduced as more distributed agents are attachedto the service. The greatest limiter to performance wasthe XML handling that resulted from interactions with theimage-bases. This code is currently not fully optimized soperformance gains are expected.
QualityDuring the development of this service, the authors sought
to understand how users would formulate a query whentasked with identifying a building. Using the crowd-sourcingtool, Amazon mTurk6, a series of ten images of local land-marks were presented along with their general location (CorkCity, Ireland). Two hundred participants we asked to pro-vide the initial query they would use to identify the building.
When these queries were submitted to Google’s searchengine, 40% of queries returned a site on the first page of re-
6https://www.mturk.com/mturk/welcome
73
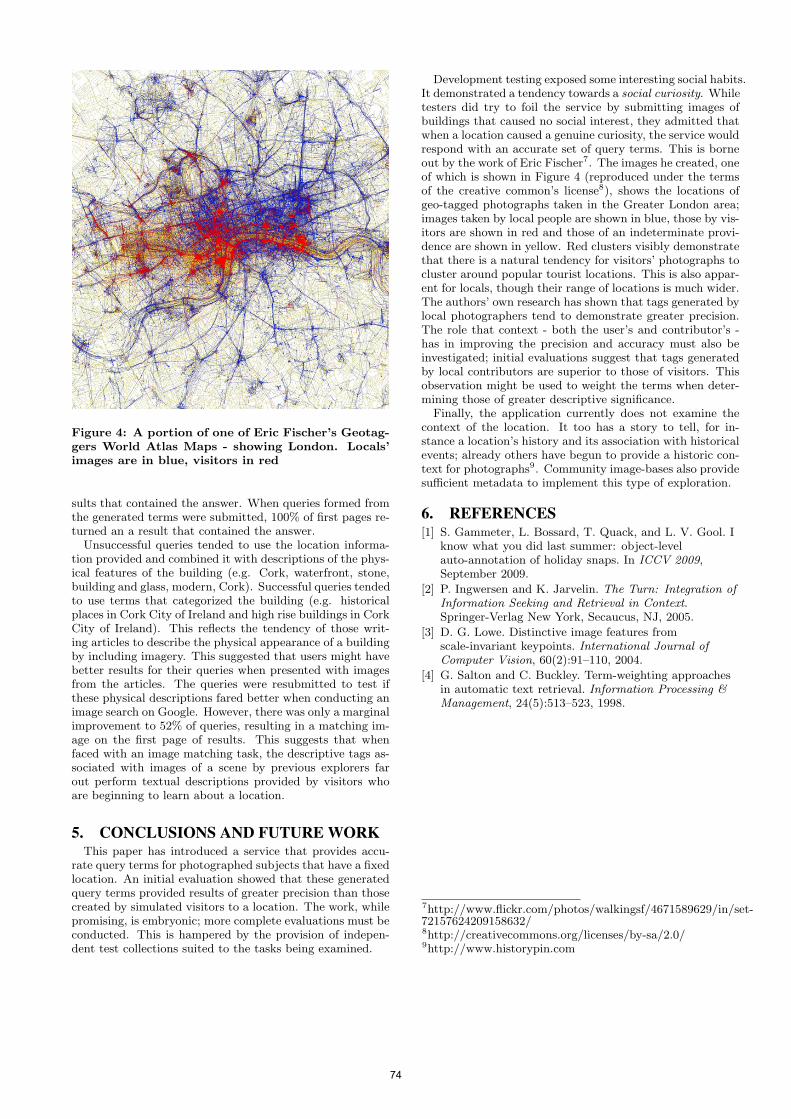
Figure 4: A portion of one of Eric Fischer’s Geotag-gers World Atlas Maps - showing London. Locals’images are in blue, visitors in red
sults that contained the answer. When queries formed fromthe generated terms were submitted, 100% of first pages re-turned an a result that contained the answer.
Unsuccessful queries tended to use the location informa-tion provided and combined it with descriptions of the phys-ical features of the building (e.g. Cork, waterfront, stone,building and glass, modern, Cork). Successful queries tendedto use terms that categorized the building (e.g. historicalplaces in Cork City of Ireland and high rise buildings in CorkCity of Ireland). This reflects the tendency of those writ-ing articles to describe the physical appearance of a buildingby including imagery. This suggested that users might havebetter results for their queries when presented with imagesfrom the articles. The queries were resubmitted to test ifthese physical descriptions fared better when conducting animage search on Google. However, there was only a marginalimprovement to 52% of queries, resulting in a matching im-age on the first page of results. This suggests that whenfaced with an image matching task, the descriptive tags as-sociated with images of a scene by previous explorers farout perform textual descriptions provided by visitors whoare beginning to learn about a location.
5. CONCLUSIONS AND FUTURE WORKThis paper has introduced a service that provides accu-
rate query terms for photographed subjects that have a fixedlocation. An initial evaluation showed that these generatedquery terms provided results of greater precision than thosecreated by simulated visitors to a location. The work, whilepromising, is embryonic; more complete evaluations must beconducted. This is hampered by the provision of indepen-dent test collections suited to the tasks being examined.
Development testing exposed some interesting social habits.It demonstrated a tendency towards a social curiosity. Whiletesters did try to foil the service by submitting images ofbuildings that caused no social interest, they admitted thatwhen a location caused a genuine curiosity, the service wouldrespond with an accurate set of query terms. This is borneout by the work of Eric Fischer7. The images he created, oneof which is shown in Figure 4 (reproduced under the termsof the creative common’s license8), shows the locations ofgeo-tagged photographs taken in the Greater London area;images taken by local people are shown in blue, those by vis-itors are shown in red and those of an indeterminate provi-dence are shown in yellow. Red clusters visibly demonstratethat there is a natural tendency for visitors’ photographs tocluster around popular tourist locations. This is also appar-ent for locals, though their range of locations is much wider.The authors’ own research has shown that tags generated bylocal photographers tend to demonstrate greater precision.The role that context - both the user’s and contributor’s -has in improving the precision and accuracy must also beinvestigated; initial evaluations suggest that tags generatedby local contributors are superior to those of visitors. Thisobservation might be used to weight the terms when deter-mining those of greater descriptive significance.
Finally, the application currently does not examine thecontext of the location. It too has a story to tell, for in-stance a location’s history and its association with historicalevents; already others have begun to provide a historic con-text for photographs9. Community image-bases also providesufficient metadata to implement this type of exploration.
6. REFERENCES[1] S. Gammeter, L. Bossard, T. Quack, and L. V. Gool. I
know what you did last summer: object-levelauto-annotation of holiday snaps. In ICCV 2009,September 2009.
[2] P. Ingwersen and K. Jarvelin. The Turn: Integration ofInformation Seeking and Retrieval in Context.Springer-Verlag New York, Secaucus, NJ, 2005.
[3] D. G. Lowe. Distinctive image features fromscale-invariant keypoints. International Journal ofComputer Vision, 60(2):91–110, 2004.
[4] G. Salton and C. Buckley. Term-weighting approachesin automatic text retrieval. Information Processing &Management, 24(5):513–523, 1998.
7http://www.flickr.com/photos/walkingsf/4671589629/in/set-72157624209158632/8http://creativecommons.org/licenses/by-sa/2.0/9http://www.historypin.com
74
Transaction Log Analysis of User Actions in a Faceted Library Catalog Interface
Bill Kules The Catholic University of America
School of Library and Information Science
Washington, DC
Robert Capra University of North Carolina
School of Information and Library Science
Chapel Hill, NC
Joseph Ryan North Carolina State University Libraries
Raleigh, NC
ABSTRACT In this paper, we report preliminary findings from an
analysis of searcher actions in a faceted library catalog. In
this comparative laboratory study (N=18) searchers were
asked to conduct exploratory searches. For the control
group facet use accounted for approximately 14% of logged
actions. For participants who were shown a 60 second video
about how to use facets, facet use accounted for
approximately 21% of actions. We also observed
differences in sequences of actions that participants
undertook during their searches that suggest that searchers
who watched the facet training video used facets at key
points in their search process such as just after issuing a
search and just before adding an item to their “book bag”.
INTRODUCTION Faceted search interfaces (Tunkelang, 2009; Yee et al.,
2003) are commonly used to support users‟ needs to
conduct iterative, exploratory searches (White et al. 2006).
Search interfaces with hierarchical facets are often found on
shopping and entertainment websites where users are likely
to be familiar with the metadata used for the facet values,
such as clothing styles or movie genres. Recently, libraries
have started incorporating faceted search features into their
on-line public access catalogs (OPACs) using facets such as
Library of Congress subject headings and other metadata.
Previous research on facet use in OPACs indicates their
usefulness. Lown and Hemminger (2009) examined log
data from a four month period of real-world use of North
Carolina State University‟s OPAC and found that facets
were used to refine the results of searches in 34% of the
sessions. They also found that facet refinement of a search
made up 18% of the overall log requests. In our work using
eye-tracking to investigate faceted OPAC use, we have
found that users do spend considerable time looking at the
facets (Kules et al., 2009; Kules and Capra, 2010)
suggesting that they play an important role in the search
process.
The research presented here focuses on how users interact
with faceted OPAC interfaces to conduct exploratory
searches. Specifically, we are interested in improving our
understanding of how faceted interfaces affect searcher
actions and tactics.
The research questions investigated in this study address
aspects of these objectives:
1. How often do searchers use facets for exploratory
search in a library catalog?
2. Do searcher actions differ when training is provided?
3. What sequences of actions are used, and do they differ
when training is provided?
METHOD To examine the research questions, we conducted a
laboratory study in which participants were given
representative search tasks and asked to conduct searches
using a custom-built, Web-based, faceted OPAC interface.
Participants The study was conducted at Catholic University using an
IRB approved protocol. Eighteen (18) undergraduate
students were recruited as participants (8 male, 10 female).
Participants represented 11 different major areas of study.
Eleven participants were 20 or under; seven were 21-30.
Most participants (15) conducted a web search at least
every day and fourteen (14) conducted a library catalog
search at least once per month. Participants were provided
a small honorarium for participation.
Study Design The data presented here was collected as part of a broader
study designed to investigate aspects of how facets are used
in exploratory search and the effects of different training
conditions on the use of the interface. Two methods of data
collection were used while participants completed the
search tasks: 1) user actions with the interface were logged,
and 2) users‟ eye movements were tracked using a Tobii
eye-tracking system. In this paper, we describe the overall
study design, but only present preliminary results from
analysis of the log of user actions.
Participants were assigned to one of three training
conditions: a control group with no training, a group that
was shown a short training video about facet use, and a
group who did not see the video, but was given an interface
that included help links labeled “What‟s This”. There were
six participants in each group. All participants conducted
the same six searches based on representative task
scenarios. Search task orders were counterbalanced within
each training condition. Searches were conducted in a quiet
75
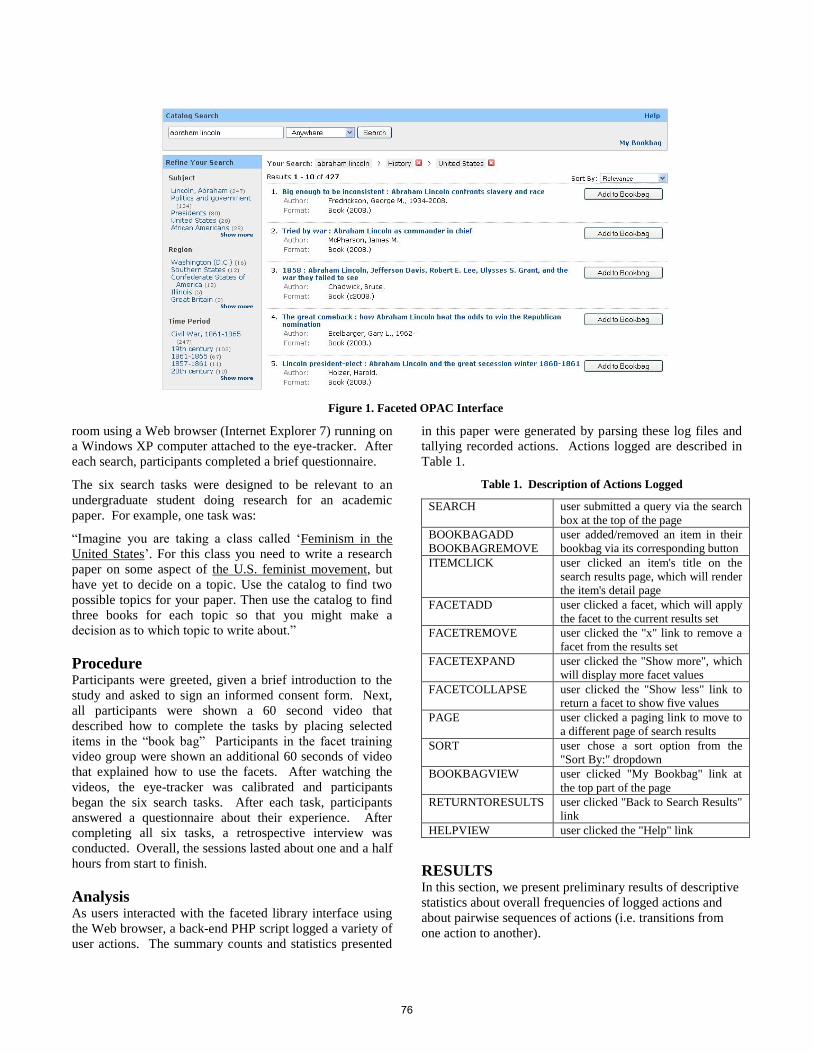
room using a Web browser (Internet Explorer 7) running on
a Windows XP computer attached to the eye-tracker. After
each search, participants completed a brief questionnaire.
The six search tasks were designed to be relevant to an
undergraduate student doing research for an academic
paper. For example, one task was:
“Imagine you are taking a class called „Feminism in the
United States‟. For this class you need to write a research
paper on some aspect of the U.S. feminist movement, but
have yet to decide on a topic. Use the catalog to find two
possible topics for your paper. Then use the catalog to find
three books for each topic so that you might make a
decision as to which topic to write about.”
Procedure Participants were greeted, given a brief introduction to the
study and asked to sign an informed consent form. Next,
all participants were shown a 60 second video that
described how to complete the tasks by placing selected
items in the “book bag” Participants in the facet training
video group were shown an additional 60 seconds of video
that explained how to use the facets. After watching the
videos, the eye-tracker was calibrated and participants
began the six search tasks. After each task, participants
answered a questionnaire about their experience. After
completing all six tasks, a retrospective interview was
conducted. Overall, the sessions lasted about one and a half
hours from start to finish.
Analysis As users interacted with the faceted library interface using
the Web browser, a back-end PHP script logged a variety of
user actions. The summary counts and statistics presented
in this paper were generated by parsing these log files and
tallying recorded actions. Actions logged are described in
Table 1.
Table 1. Description of Actions Logged
SEARCH user submitted a query via the search
box at the top of the page
BOOKBAGADD
BOOKBAGREMOVE
user added/removed an item in their
bookbag via its corresponding button
ITEMCLICK user clicked an item's title on the
search results page, which will render
the item's detail page
FACETADD user clicked a facet, which will apply
the facet to the current results set
FACETREMOVE user clicked the "x" link to remove a
facet from the results set
FACETEXPAND user clicked the "Show more", which
will display more facet values
FACETCOLLAPSE user clicked the "Show less" link to
return a facet to show five values
PAGE user clicked a paging link to move to
a different page of search results
SORT user chose a sort option from the
"Sort By:" dropdown
BOOKBAGVIEW user clicked "My Bookbag" link at
the top part of the page
RETURNTORESULTS user clicked "Back to Search Results"
link
HELPVIEW user clicked the "Help" link
RESULTS In this section, we present preliminary results of descriptive
statistics about overall frequencies of logged actions and
about pairwise sequences of actions (i.e. transitions from
one action to another).
Figure 1. Faceted OPAC Interface
76
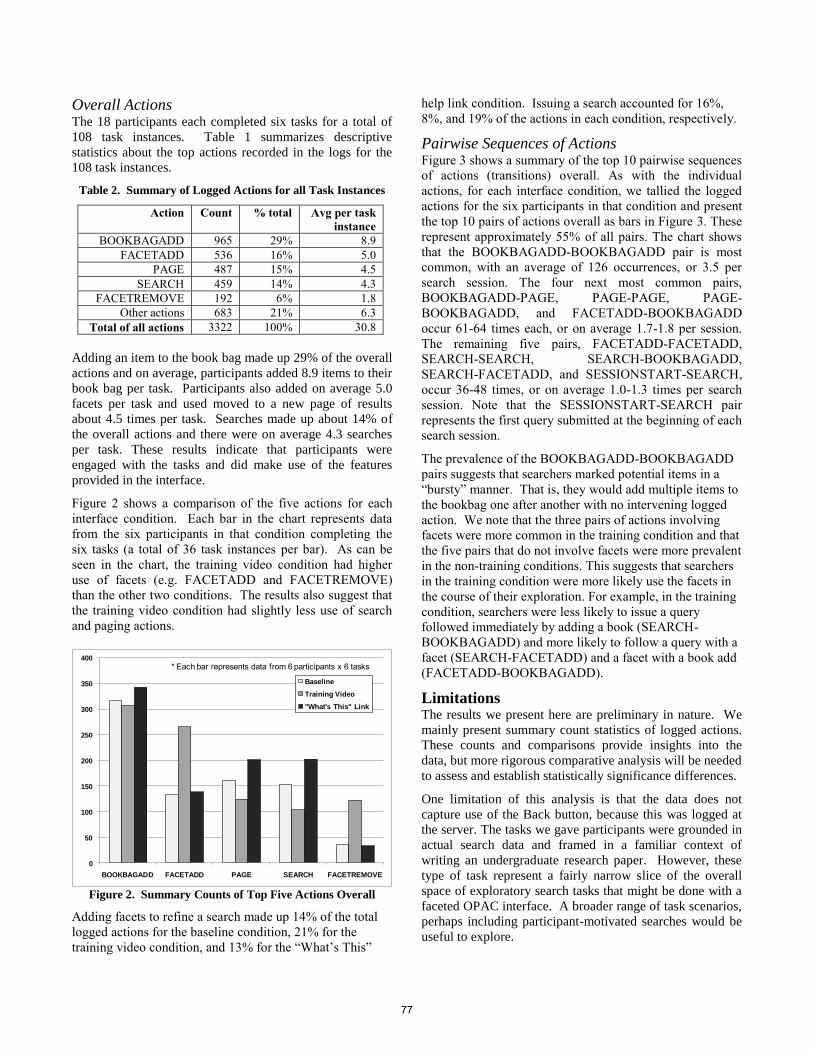
Overall Actions The 18 participants each completed six tasks for a total of
108 task instances. Table 1 summarizes descriptive
statistics about the top actions recorded in the logs for the
108 task instances.
Table 2. Summary of Logged Actions for all Task Instances
Action Count % total Avg per task
instance
BOOKBAGADD 965 29% 8.9
FACETADD 536 16% 5.0
PAGE 487 15% 4.5
SEARCH 459 14% 4.3
FACETREMOVE 192 6% 1.8
Other actions 683 21% 6.3
Total of all actions 3322 100% 30.8
Adding an item to the book bag made up 29% of the overall
actions and on average, participants added 8.9 items to their
book bag per task. Participants also added on average 5.0
facets per task and used moved to a new page of results
about 4.5 times per task. Searches made up about 14% of
the overall actions and there were on average 4.3 searches
per task. These results indicate that participants were
engaged with the tasks and did make use of the features
provided in the interface.
Figure 2 shows a comparison of the five actions for each
interface condition. Each bar in the chart represents data
from the six participants in that condition completing the
six tasks (a total of 36 task instances per bar). As can be
seen in the chart, the training video condition had higher
use of facets (e.g. FACETADD and FACETREMOVE)
than the other two conditions. The results also suggest that
the training video condition had slightly less use of search
and paging actions.
0
50
100
150
200
250
300
350
400
BOOKBAGADD FACETADD PAGE SEARCH FACETREMOVE
Baseline
Training Video
"What's This" Link
* Each bar represents data from 6 participants x 6 tasks
Figure 2. Summary Counts of Top Five Actions Overall
Adding facets to refine a search made up 14% of the total
logged actions for the baseline condition, 21% for the
training video condition, and 13% for the “What’s This”
help link condition. Issuing a search accounted for 16%,
8%, and 19% of the actions in each condition, respectively.
Pairwise Sequences of Actions Figure 3 shows a summary of the top 10 pairwise sequences
of actions (transitions) overall. As with the individual
actions, for each interface condition, we tallied the logged
actions for the six participants in that condition and present
the top 10 pairs of actions overall as bars in Figure 3. These
represent approximately 55% of all pairs. The chart shows
that the BOOKBAGADD-BOOKBAGADD pair is most
common, with an average of 126 occurrences, or 3.5 per
search session. The four next most common pairs,
BOOKBAGADD-PAGE, PAGE-PAGE, PAGE-
BOOKBAGADD, and FACETADD-BOOKBAGADD
occur 61-64 times each, or on average 1.7-1.8 per session.
The remaining five pairs, FACETADD-FACETADD,
SEARCH-SEARCH, SEARCH-BOOKBAGADD,
SEARCH-FACETADD, and SESSIONSTART-SEARCH,
occur 36-48 times, or on average 1.0-1.3 times per search
session. Note that the SESSIONSTART-SEARCH pair
represents the first query submitted at the beginning of each
search session.
The prevalence of the BOOKBAGADD-BOOKBAGADD
pairs suggests that searchers marked potential items in a
“bursty” manner. That is, they would add multiple items to
the bookbag one after another with no intervening logged
action. We note that the three pairs of actions involving
facets were more common in the training condition and that
the five pairs that do not involve facets were more prevalent
in the non-training conditions. This suggests that searchers
in the training condition were more likely use the facets in
the course of their exploration. For example, in the training
condition, searchers were less likely to issue a query
followed immediately by adding a book (SEARCH-
BOOKBAGADD) and more likely to follow a query with a
facet (SEARCH-FACETADD) and a facet with a book add
(FACETADD-BOOKBAGADD).
Limitations The results we present here are preliminary in nature. We
mainly present summary count statistics of logged actions.
These counts and comparisons provide insights into the
data, but more rigorous comparative analysis will be needed
to assess and establish statistically significance differences.
One limitation of this analysis is that the data does not
capture use of the Back button, because this was logged at
the server. The tasks we gave participants were grounded in
actual search data and framed in a familiar context of
writing an undergraduate research paper. However, these
type of task represent a fairly narrow slice of the overall
space of exploratory search tasks that might be done with a
faceted OPAC interface. A broader range of task scenarios,
perhaps including participant-motivated searches would be
useful to explore.
77
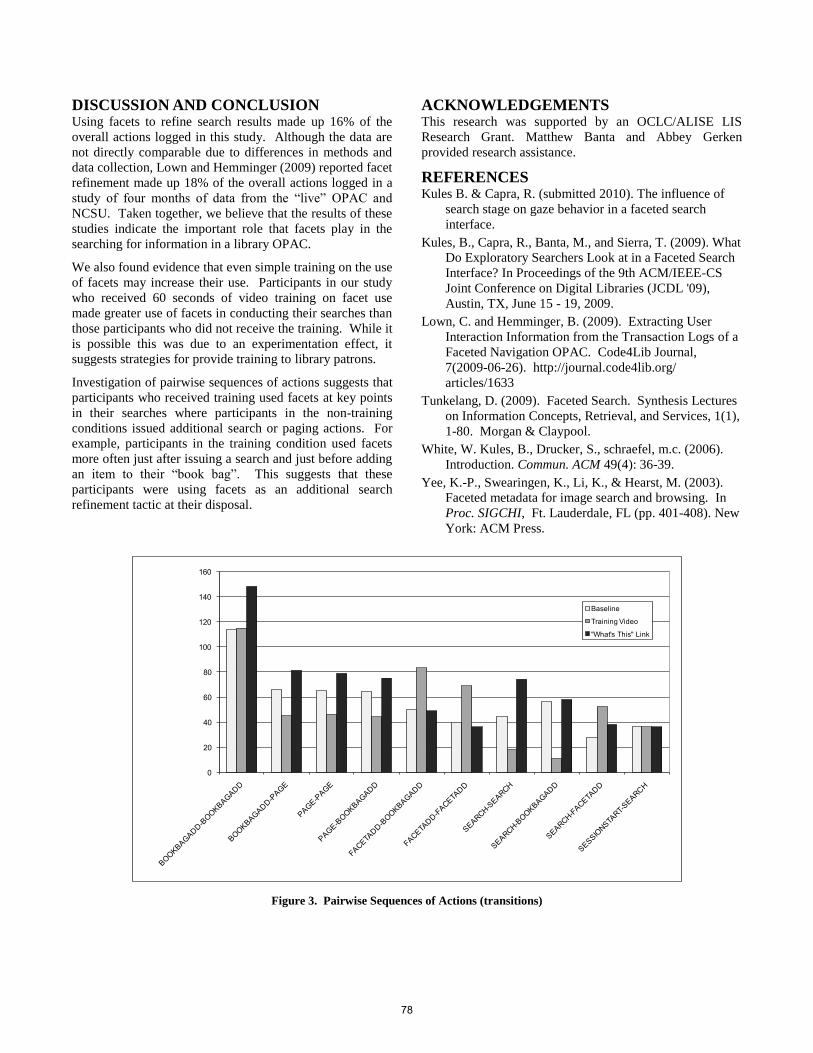
DISCUSSION AND CONCLUSION Using facets to refine search results made up 16% of the
overall actions logged in this study. Although the data are
not directly comparable due to differences in methods and
data collection, Lown and Hemminger (2009) reported facet
refinement made up 18% of the overall actions logged in a
study of four months of data from the “live” OPAC and
NCSU. Taken together, we believe that the results of these
studies indicate the important role that facets play in the
searching for information in a library OPAC.
We also found evidence that even simple training on the use
of facets may increase their use. Participants in our study
who received 60 seconds of video training on facet use
made greater use of facets in conducting their searches than
those participants who did not receive the training. While it
is possible this was due to an experimentation effect, it
suggests strategies for provide training to library patrons.
Investigation of pairwise sequences of actions suggests that
participants who received training used facets at key points
in their searches where participants in the non-training
conditions issued additional search or paging actions. For
example, participants in the training condition used facets
more often just after issuing a search and just before adding
an item to their “book bag”. This suggests that these
participants were using facets as an additional search
refinement tactic at their disposal.
ACKNOWLEDGEMENTS This research was supported by an OCLC/ALISE LIS
Research Grant. Matthew Banta and Abbey Gerken
provided research assistance.
REFERENCES Kules B. & Capra, R. (submitted 2010). The influence of
search stage on gaze behavior in a faceted search
interface.
Kules, B., Capra, R., Banta, M., and Sierra, T. (2009). What
Do Exploratory Searchers Look at in a Faceted Search
Interface? In Proceedings of the 9th ACM/IEEE-CS
Joint Conference on Digital Libraries (JCDL '09),
Austin, TX, June 15 - 19, 2009.
Lown, C. and Hemminger, B. (2009). Extracting User
Interaction Information from the Transaction Logs of a
Faceted Navigation OPAC. Code4Lib Journal,
7(2009-06-26). http://journal.code4lib.org/
articles/1633
Tunkelang, D. (2009). Faceted Search. Synthesis Lectures
on Information Concepts, Retrieval, and Services, 1(1),
1-80. Morgan & Claypool.
White, W. Kules, B., Drucker, S., schraefel, m.c. (2006).
Introduction. Commun. ACM 49(4): 36-39.
Yee, K.-P., Swearingen, K., Li, K., & Hearst, M. (2003).
Faceted metadata for image search and browsing. In
Proc. SIGCHI, Ft. Lauderdale, FL (pp. 401-408). New
York: ACM Press.
0
20
40
60
80
100
120
140
160
Baseline
Training Video
"What's This" Link
Figure 3. Pairwise Sequences of Actions (transitions)
78
Context in Health Information Retrieval: What and Where
Carla Teixeira LopesDepartamento de Engenharia Informática
Faculdade de Engenharia da Universidade doPorto
Rua Dr. Roberto Frias s/n4200-465 Porto, Portugal
Cristina RibeiroDepartamento de Engenharia Informática
Faculdade de Engenharia da Universidade doPorto/INESC-Porto
Rua Dr. Roberto Frias s/n4200-465 Porto, Portugal
ABSTRACTResearchers are aware that context affects information re-trieval in general. The health area is no exception and isparticularly rich in terms of context. To understand howcontext is used in health information research, we collecteda sample of health information research papers that use con-text features. Papers were analyzed and classified accordingto the type of context features and to the stage of the re-trieval process into which they were incorporated. Further,we also identified the specific context features used in eachcategory of features and each stage of the process. Resultsshow a weaker use of interaction context features than we ex-pected and, as supposed, a large use of collective features. Aconsiderable number of papers use context to query relatedactivities. We also found that research is mainly aimed athealth professionals, suggesting a gap in health consumersresearch that should be explored.
Categories and Subject DescriptorsH.3.3 [[Information Storage and Retrieval]]: Informa-tion Search and Retrieval
General TermsHuman Factors
KeywordsContext, Information Retrieval, Survey, Health
1. INTRODUCTIONHealth Information Retrieval (HIR) focus on the applica-
tion of IR concepts and techniques to the domain of health-care. This field has largely evolved in the last few years.Habits of health professionals and consumers (patients, theirfamily and friends) have been changing as a result of sev-eral factors like the increasing production of information ina digital format [27], the greater availability and the easieraccess to health information.
Permission to make digital or hard copies of all or part of this work forpersonal or classroom use is granted without fee provided that copies arenot made or distributed for profit or commercial advantage and that copiesbear this notice and the full citation on the first page. To copy otherwise, torepublish, to post on servers or to redistribute to lists, requires prior specificpermission and/or a fee.HCIR 2010 22 August 2010, New Brunswick NJ, USACopyright 200X ACM X-XXXXX-XX-X/XX/XX ...$10.00.
Several authors agree that context, often ignored, mightbe used to improve the retrieval process [21, 2]. A contextu-alised Information Retrieval (IR) could allow IR systems tolearn and predict what information a searcher needs, learnhow and when information should be displayed, present howinformation relates to other information that has been seenand how it relates to other tasks the user was engaged in anddecide who else should be informed about new information.
According to Lin and Fushman, “the domain of clinicalmedicine is very well-suited for experiments in building richermodels of the information seeking process” [23]. In fact, it’snot difficult to foresee context features in this domain thatcould enrich HIR models. Similarly to any visit to the doc-tor, where the patient doesn’t just say “itch”, but explainsthe context of the “itch” to the doctor, context is relevant toHIR. Other examples of context features that can be usedare the search scenario [24] and its specificities (e.g.: treat-ment of a disease), the searcher’s personal health record,the clinical case in hands and the searcher’s knowledge inthe health domain.
We have done a review on the definition of context ina previous work [25]. To this work, context is consideredan interactional problem, as defined by Dourish [8]. It notonly includes the environmental features surrounding theuser and his activities, but also the interaction in whichhe is involved. We believe context is dynamic and mightchange each time a new search is made, a new set of resultsis reviewed or a new document is viewed [14].
To understand how context is being used in health infor-mation research, we gathered a set of HIR research papersthat use any kind of context features. These papers wereanalyzed and classified according to the type of used con-text features and to the stage of the retrieval process intowhich they were incorporated. Further, we also identifiedthe specific features used in each context category and eachstage of the process.
The following section presents the adopted methodology,specifying how the papers were selected and describing thetaxonomies used in the classification. Section 3 presentsthe classification of the research papers and enumerates thespecific context features used in each category and stage.Finally, in Section 4 we report the main conclusions of thisanalysis.
2. METHODOLOGYTo define the sample of papers, we considered all the doc-
uments classified with the tags context and health in CiteU-
79
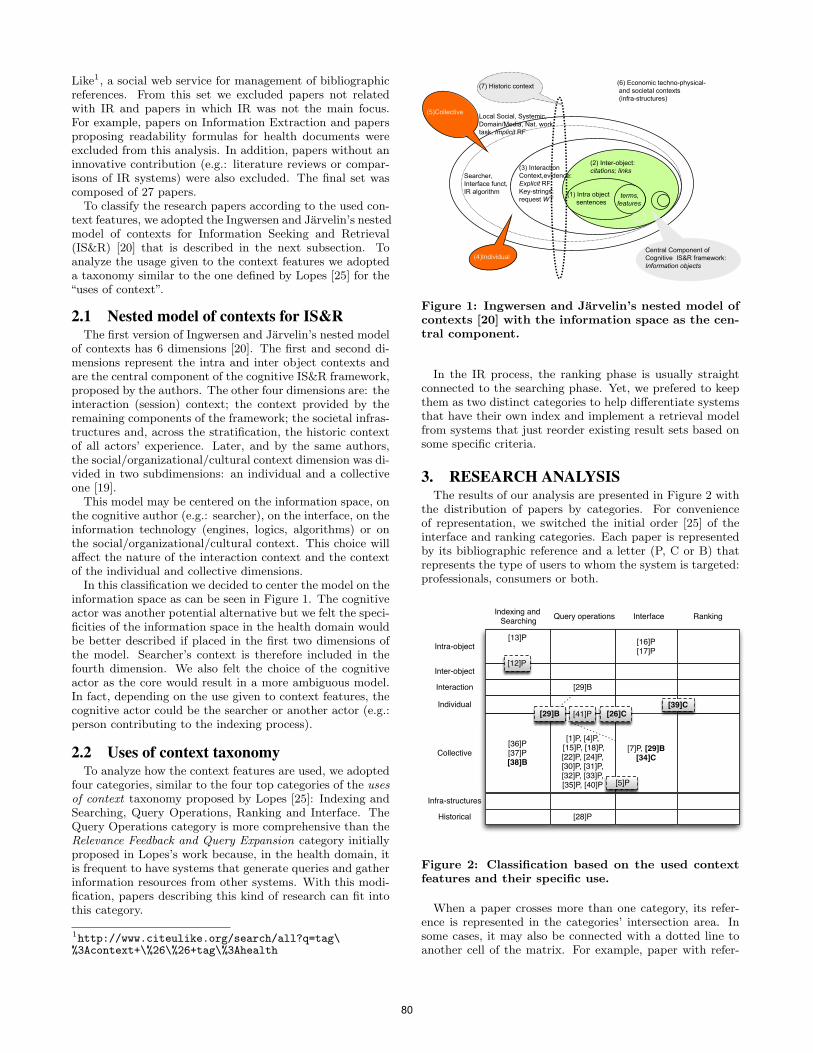
Like1, a social web service for management of bibliographicreferences. From this set we excluded papers not relatedwith IR and papers in which IR was not the main focus.For example, papers on Information Extraction and papersproposing readability formulas for health documents wereexcluded from this analysis. In addition, papers without aninnovative contribution (e.g.: literature reviews or compar-isons of IR systems) were also excluded. The final set wascomposed of 27 papers.
To classify the research papers according to the used con-text features, we adopted the Ingwersen and Jarvelin’s nestedmodel of contexts for Information Seeking and Retrieval(IS&R) [20] that is described in the next subsection. Toanalyze the usage given to the context features we adopteda taxonomy similar to the one defined by Lopes [25] for the“uses of context”.
2.1 Nested model of contexts for IS&RThe first version of Ingwersen and Jarvelin’s nested model
of contexts has 6 dimensions [20]. The first and second di-mensions represent the intra and inter object contexts andare the central component of the cognitive IS&R framework,proposed by the authors. The other four dimensions are: theinteraction (session) context; the context provided by theremaining components of the framework; the societal infras-tructures and, across the stratification, the historic contextof all actors’ experience. Later, and by the same authors,the social/organizational/cultural context dimension was di-vided in two subdimensions: an individual and a collectiveone [19].
This model may be centered on the information space, onthe cognitive author (e.g.: searcher), on the interface, on theinformation technology (engines, logics, algorithms) or onthe social/organizational/cultural context. This choice willaffect the nature of the interaction context and the contextof the individual and collective dimensions.
In this classification we decided to center the model on theinformation space as can be seen in Figure 1. The cognitiveactor was another potential alternative but we felt the speci-ficities of the information space in the health domain wouldbe better described if placed in the first two dimensions ofthe model. Searcher’s context is therefore included in thefourth dimension. We also felt the choice of the cognitiveactor as the core would result in a more ambiguous model.In fact, depending on the use given to context features, thecognitive actor could be the searcher or another actor (e.g.:person contributing to the indexing process).
2.2 Uses of context taxonomyTo analyze how the context features are used, we adopted
four categories, similar to the four top categories of the usesof context taxonomy proposed by Lopes [25]: Indexing andSearching, Query Operations, Ranking and Interface. TheQuery Operations category is more comprehensive than theRelevance Feedback and Query Expansion category initiallyproposed in Lopes’s work because, in the health domain, itis frequent to have systems that generate queries and gatherinformation resources from other systems. With this modi-fication, papers describing this kind of research can fit intothis category.
1http://www.citeulike.org/search/all?q=tag\%3Acontext+\%26\%26+tag\%3Ahealth
Local Social, Systemic, Domain/Media, Nat. work task, Implicit RF
terms, features
(1) Intra object sentences
(2) Inter-object: citations; links (3) Interaction
Context,evidence: Explicit RF Key-strings: request WT
(6) Economic techno-physical- and societal contexts (infra-structures)
(7) Historic context
Central Component of Cognitive IS&R framework: Information objects
(4)Individual
(5)Collective
Searcher, Interface funct, IR algorithm
Figure 1: Ingwersen and Jarvelin’s nested model ofcontexts [20] with the information space as the cen-tral component.
In the IR process, the ranking phase is usually straightconnected to the searching phase. Yet, we prefered to keepthem as two distinct categories to help differentiate systemsthat have their own index and implement a retrieval modelfrom systems that just reorder existing result sets based onsome specific criteria.
3. RESEARCH ANALYSISThe results of our analysis are presented in Figure 2 with
the distribution of papers by categories. For convenienceof representation, we switched the initial order [25] of theinterface and ranking categories. Each paper is representedby its bibliographic reference and a letter (P, C or B) thatrepresents the type of users to whom the system is targeted:professionals, consumers or both.
[13]P [16]P[17]P
Indexing and Searching Query operations Interface Ranking
[29]B
[36]P[37]P[38]B
[1]P, [4]P, [15]P, [18]P, [22]P, [24]P, [30]P, [31]P, [32]P, [33]P, [35]P, [40]P
[7]P, [29]B[34]C
[28]P
Intra-object
Inter-object
Interaction
Individual
Collective
Infra-structures
Historical
[29]B [26]C[39]C
[41]P
[12]P
[5]P
Figure 2: Classification based on the used contextfeatures and their specific use.
When a paper crosses more than one category, its refer-ence is represented in the categories’ intersection area. Insome cases, it may also be connected with a dotted line toanother cell of the matrix. For example, paper with refer-
80
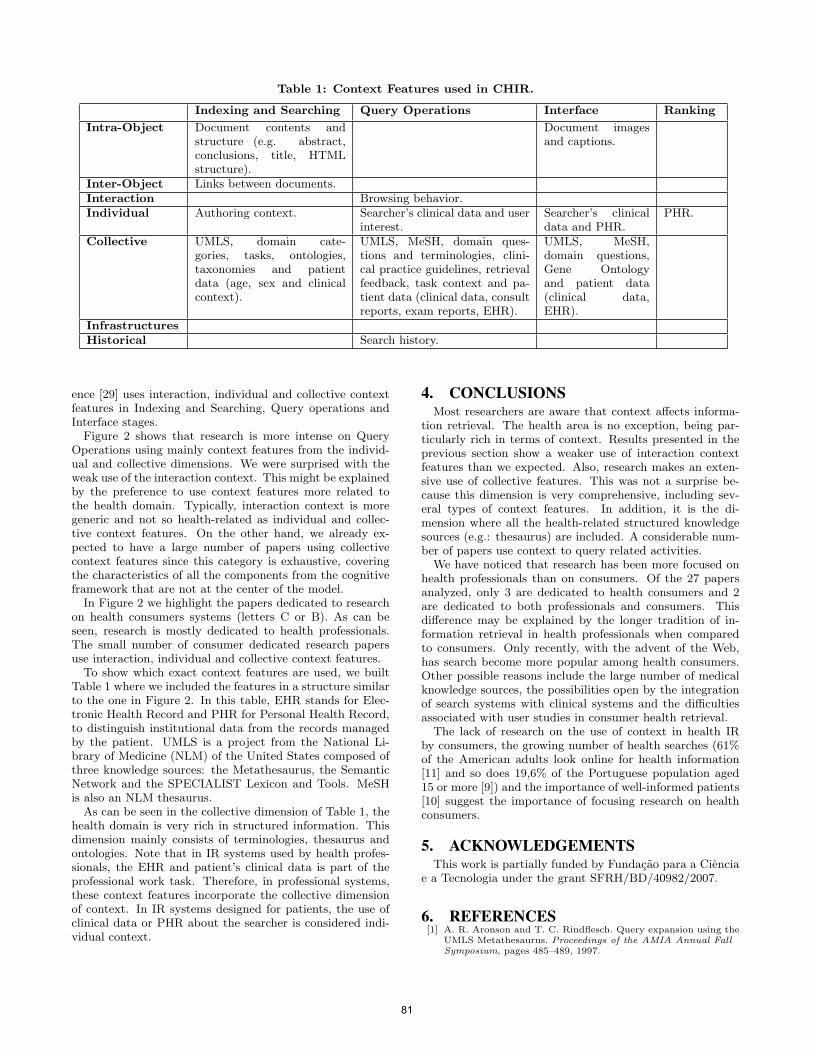
Table 1: Context Features used in CHIR.
Indexing and Searching Query Operations Interface Ranking
Intra-Object Document contents andstructure (e.g. abstract,conclusions, title, HTMLstructure).
Document imagesand captions.
Inter-Object Links between documents.Interaction Browsing behavior.Individual Authoring context. Searcher’s clinical data and user
interest.Searcher’s clinicaldata and PHR.
PHR.
Collective UMLS, domain cate-gories, tasks, ontologies,taxonomies and patientdata (age, sex and clinicalcontext).
UMLS, MeSH, domain ques-tions and terminologies, clini-cal practice guidelines, retrievalfeedback, task context and pa-tient data (clinical data, consultreports, exam reports, EHR).
UMLS, MeSH,domain questions,Gene Ontologyand patient data(clinical data,EHR).
InfrastructuresHistorical Search history.
ence [29] uses interaction, individual and collective contextfeatures in Indexing and Searching, Query operations andInterface stages.
Figure 2 shows that research is more intense on QueryOperations using mainly context features from the individ-ual and collective dimensions. We were surprised with theweak use of the interaction context. This might be explainedby the preference to use context features more related tothe health domain. Typically, interaction context is moregeneric and not so health-related as individual and collec-tive context features. On the other hand, we already ex-pected to have a large number of papers using collectivecontext features since this category is exhaustive, coveringthe characteristics of all the components from the cognitiveframework that are not at the center of the model.
In Figure 2 we highlight the papers dedicated to researchon health consumers systems (letters C or B). As can beseen, research is mostly dedicated to health professionals.The small number of consumer dedicated research papersuse interaction, individual and collective context features.
To show which exact context features are used, we builtTable 1 where we included the features in a structure similarto the one in Figure 2. In this table, EHR stands for Elec-tronic Health Record and PHR for Personal Health Record,to distinguish institutional data from the records managedby the patient. UMLS is a project from the National Li-brary of Medicine (NLM) of the United States composed ofthree knowledge sources: the Metathesaurus, the SemanticNetwork and the SPECIALIST Lexicon and Tools. MeSHis also an NLM thesaurus.
As can be seen in the collective dimension of Table 1, thehealth domain is very rich in structured information. Thisdimension mainly consists of terminologies, thesaurus andontologies. Note that in IR systems used by health profes-sionals, the EHR and patient’s clinical data is part of theprofessional work task. Therefore, in professional systems,these context features incorporate the collective dimensionof context. In IR systems designed for patients, the use ofclinical data or PHR about the searcher is considered indi-vidual context.
4. CONCLUSIONSMost researchers are aware that context affects informa-
tion retrieval. The health area is no exception, being par-ticularly rich in terms of context. Results presented in theprevious section show a weaker use of interaction contextfeatures than we expected. Also, research makes an exten-sive use of collective features. This was not a surprise be-cause this dimension is very comprehensive, including sev-eral types of context features. In addition, it is the di-mension where all the health-related structured knowledgesources (e.g.: thesaurus) are included. A considerable num-ber of papers use context to query related activities.
We have noticed that research has been more focused onhealth professionals than on consumers. Of the 27 papersanalyzed, only 3 are dedicated to health consumers and 2are dedicated to both professionals and consumers. Thisdifference may be explained by the longer tradition of in-formation retrieval in health professionals when comparedto consumers. Only recently, with the advent of the Web,has search become more popular among health consumers.Other possible reasons include the large number of medicalknowledge sources, the possibilities open by the integrationof search systems with clinical systems and the difficultiesassociated with user studies in consumer health retrieval.
The lack of research on the use of context in health IRby consumers, the growing number of health searches (61%of the American adults look online for health information[11] and so does 19,6% of the Portuguese population aged15 or more [9]) and the importance of well-informed patients[10] suggest the importance of focusing research on healthconsumers.
5. ACKNOWLEDGEMENTSThis work is partially funded by Fundacao para a Ciencia
e a Tecnologia under the grant SFRH/BD/40982/2007.
6. REFERENCES[1] A. R. Aronson and T. C. Rindflesch. Query expansion using the
UMLS Metathesaurus. Proceedings of the AMIA Annual FallSymposium, pages 485–489, 1997.
81
[2] R. Bierig and A. Goker. Time, location and interest: anempirical and user-centred study. In IIiX: Proceedings of the1st international conference on Information interaction incontext, pages 79–87, New York, NY, USA, 2006. ACM.
[3] J. J. Cimino. Linking patient information systems tobibliographic resources. Methods of information in medicine,35(2):122–126, June 1996.
[4] J. J. Cimino, A. Aguirre, S. B. Johnson, and P. Peng. Genericqueries for meeting clinical information needs. Bulletin of theMedical Library Association, 81(2):195–206, April 1993.
[5] J. J. Cimino, S. B. Johnson, A. Aguirre, N. Roderer, and P. D.Clayton. The MEDLINE button. In Proc Annu Symp ComputAppl Med Care, pages 81–85, 1992.
[6] J. J. Cimino and J. Li. Sharing infobuttons to resolve clinicians’information needs. In AMIA Annu Symp Proc., page 815, 2003.
[7] A. Doms and M. Schroeder. GoPubMed: exploring PubMedwith the Gene Ontology. Nucl. Acids Res.,33(suppl 2):W783–786, July 2005.
[8] P. Dourish. What we talk about when we talk about context.Personal Ubiquitous Comput., 8(1):19–30, February 2004.
[9] R. Espanha and F. Lupianez Villanueva. Health and theInternet: Autonomy of the User. Technical report, LINI -Lisbon Internet and Networks, 2008.
[10] T. Ferguson. e-patients - how they can help us save health care.Technical report, e-patients scholars working group, 2007.
[11] S. Fox and S. Jones. The social life of health information.Technical report, Pew Internet & American Life Project, June2009.
[12] M. E. Frisse. Searching for information in a hypertext medicalhandbook. In HYPERTEXT ’87: Proceedings of the ACMconference on Hypertext, pages 57–66, New York, NY, USA,1987. ACM.
[13] C. W. Gay, M. Kayaalp, and A. R. Aronson. Semi-automaticindexing of full text biomedical articles. AMIA AnnualSymposium Proceedings, pages 271–275, 2005.
[14] D. J. Harper and D. Kelly. Contextual relevance feedback. InIIiX: Proceedings of the 1st international conference onInformation interaction in context, pages 129–137, New York,NY, USA, 2006. ACM Press.
[15] Z. Hashmi, T. Zrimec, and A. Hopkins. CQGF: Context specificquery generation framework from computerized clinical practiceguidelines. In Second International Conference on theApplications of Digital Information and Web Technologies -ICADIWT ’09, pages 288–293, October 2009.
[16] M. A. Hearst, A. Divoli, H. Guturu, A. Ksikes, P. Nakov, M. A.Wooldridge, and J. Ye. Biotext search engine: beyond abstractsearch. Bioinformatics, 23(16):2196–2197, August 2007.
[17] M. A. Hearst, A. Divoli, J. Ye, and M. A. Wooldridge.Exploring the efficacy of caption search for bioscience journalsearch interfaces. In BioNLP ’07: Proceedings of theWorkshop on BioNLP 2007, pages 73–80, Morristown, NJ,USA, 2007. Association for Computational Linguistics.
[18] W. Hersh, S. Price, and L. Donohoe. Assessing thesaurus-basedquery expansion using the UMLS metathesaurus. AMIAAnnual Symposium Proceedings, pages 344–348, 2000.
[19] P. Ingwersen. Context in information interaction revisited 2006.Presentation at Prolissa 2006: Proceedings of the FourthBiennial DISSAnet Conference, 2006.
[20] P. Ingwersen and K. Jarvelin. The Turn: Integration ofInformation Seeking and Retrieval in Context (TheInformation Retrieval Series). Springer, 1 edition, September2005.
[21] P. Ingwersen, K. Jelin, and N. Belkin, editors. Proceedings ofthe ACM SIGIR 2005 Workshop on Information Retrieval inContext (IRiX), Royal School of Library and InformationScience. Denmark., August 2005.
[22] L. C. Kingsland, A. M. Harbourt, E. J. Syed, and P. L.Schuyler. Coach: applying UMLS knowledge sources in anexpert searcher environment. Bull Med Libr Assoc.,81(2):178–183, April 1993.
[23] J. Lin and D. D. Fushman. Representation of information needsand the elements of context: A case study in the domain ofclinical medicine. In ACM SIGIR 2005 Workshop onInformation Retrieval in Context (IRiX), 2005.
[24] Liu, Zhenyu, Chu, and Wesley. Knowledge-based queryexpansion to support scenario-specific retrieval of medical freetext. Information Retrieval, 10(2):173–202, April 2007.
[25] C. T. Lopes. Context features and their use in informationretrieval. In Third BCS-IRSG Symposium on FutureDirections in Information Access, September 2009.
[26] G. Luo and C. Tang. On iterative intelligent medical search. InSIGIR ’08: Proceedings of the 31st annual internationalACM SIGIR conference on Research and development ininformation retrieval, pages 3–10, New York, NY, USA, 2008.ACM.
[27] P. Lyman and H. R. Varian. How much information. Availablefrom: http://www.sims.berkeley.edu/how-much-info-2003 [cited2008-07-10], 2003.
[28] R. S. Marcus. An experimental comparison of the effectivenessof computers and humans as search intermediaries. Journal ofthe American Society for Information Science. AmericanSociety for Information Science, 34(6):381–404, November1983.
[29] D. S. Martins, L. H. Z. Santana, M. Biajiz, Antonio, and W. L.de Souza. Context-aware information retrieval on a ubiquitousmedical learning environment. In SAC ’08: Proceedings of the2008 ACM symposium on Applied computing, pages2348–2349, New York, NY, USA, 2008. ACM.
[30] S. M. Maviglia, C. S. Yoon, D. W. Bates, and G. Kuperman.Knowledgelink: Impact of context-sensitive informationretrieval on clinicians’ information needs. J Am Med InformAssoc, 13(1):67–73, Jan 2006.
[31] E. A. Mendonca, J. J. Cimino, S. B. Johnson, and Y. H. Seol.Accessing heterogeneous sources of evidence to answer clinicalquestions. Journal of biomedical informatics, 34(2):85–98,April 2001.
[32] R. A. Miller, F. M. Gieszczykiewicz, J. K. Vries, and G. F.Cooper. CHARTLINE: providing bibliographic referencesrelevant to patient charts using the UMLS MetathesaurusKnowledge Sources. Proceedings of the Annual Symposium onComputer Application in Medical Care., pages 86–90, 1992.
[33] S. M. Powsner and P. L. Miller. Linking bibliographic retrievalto clinical reports: Psychtopix. In Proc Annu Symp ComputAppl Med Care, November 1989.
[34] W. Pratt, M. A. Hearst, and L. M. Fagan. A knowledge-basedapproach to organizing retrieved documents. In AAAI’99/IAAI ’99: Proceedings of the sixteenth nationalconference on Artificial intelligence and the eleventhInnovative applications of artificial intelligence conferenceinnovative applications of artificial intelligence, pages 80–85,Menlo Park, CA, USA, 1999. American Association forArtificial Intelligence.
[35] S. L. Price, W. R. Hersh, D. D. Olson, and P. J. Embi.Smartquery: context-sensitive links to medical knowledgesources from the electronic patient record. Proc AMIA Symp,pages 627–631, 2002.
[36] G. P. Purcell, G. D. Rennels, and E. H. Shortliffe. Developmentand evaluation of a context-based document representation forsearching the medical literature. International Journal onDigital Libraries, 1(3):288–296, December 1997.
[37] G. Quellec, M. Lamard, L. Bekri, G. Cazuguel, B. Cochener,and C. Roux. Multimedia medical case retrieval using decisiontrees. In IEEE Engineering in Medicine and Biology Society,volume 2007, pages 4536–4539, ENST Bretagne, GET-ENST,Brest, F-29200 France. [email protected], 2007.
[38] S. Sakji, A. D. D. Dibad, I. Kergourlay, S. Darmoni, andM. Joubert. Information retrieval in context using varioushealth terminologies. In Research Challenges in InformationScience, 2009. RCIS 2009. Third International Conferenceon, pages 453–458, 2009.
[39] J. M. Silva and J. Favela. Context aware retrieval of healthinformation on the Web. In LA-WEB ’06: Proceedings of theFourth Latin American Web Congress (LA-WEB’06), pages135–146, Washington, DC, USA, 2006. IEEE Computer Society.
[40] P. Srinivasan. Retrieval feedback in MEDLINE. Journal of theAmerican Medical Informatics Association : JAMIA,3(2):157–167, 1996.
[41] Q. Zeng and J. J. Cimino. Linking a clinical system toheterogeneous information resources. In Proc AMIA Annu FallSymp., pages 553–557, 1997.
[42] Q. Zeng-Treitler, S. Goryachev, T. Tse, A. Keselman, andA. Boxwala. Estimating consumer familiarity with healthterminology: A context-based approach. J Am Med InformAssoc, 15(3):349–356, May 2008.
82
Tactics for Information Search in a Public and an Academic Library Catalog with Faceted Interfaces
Xi Niu
University of North Carolina at Chapel Hill CB#3360, 100 Manning Hall Chapel Hill, NC 27599-3360
Bradley M. Hemminger University of North Carolina at Chapel Hill
CB#3360, 100 Manning Hall Chapel Hill, NC 27599-3360
ABSTRACT This study examined a large number of searches conducted when the users are interacting with two Endeca-based faceted library catalogs (University of North Carolina at Chapel Hill [UNC] Library catalog and Phoenix Public Library [PPL] catalog). The goal is to investigate people’s search tactics with the faceted catalogs in an academic library and a public library environment. Two large data sets (with 504,142 logs for 40 days, and 1,010,239 logs for 60 days respectively) are analyzed. State transition analysis and maximal repeating patterns [MRP] analysis are conducted to identify the search tactics and action patterns. The results have both implications for designers in developing faceted library catalogs, and methodological contributions to the empirical research on faceted search systems.
1. INTRODUCTION In recent years, faceted navigation has grown to be a well-accepted approach. It has been applied as a standard technique on commercial Web sites for a number of years (Breeding, 2007). Since the adoption of the faceted search in some university libraries, it has become adopted by to many academic and public libraries. Many librarians and IT professionals take it for granted that the categorized labels will help people find what they want. However, little has been known about how people are searching through these faceted systems. While significant work has examined the usability of facets (for example, Antelman et al., 2006; Lown, 2008), few investigated the sequences of moves, i.e., search tactics, made by searchers in order to understand the cognitive process when they are interacting with a faceted search system.
The current paper tackles this problem by examining the tactics of users searching two faceted library catalogs—University of North Carolina at Chapel Hill (UNC) Library catalog and Phoenix Public Library (PPL) catalog, focusing on the comparison between the academic library and the public library.
The two library catalogs, catering to different audiences, represent faceted OPACs in leading research universities and leading public libraries respectively. UNC library catalog (http://search.lib.unc.edu/), implemented faceted search on top of their original catalog system in 2008 to enhance the search ability. PPL’s catalog (http://www.phoenixpubliclibrary.org/default.jsp), , has excellent facet implementation added on its traditional ILS system. The commonality of the two catalogs is both are using the commercial Endeca search engine to implement faceted navigation. However, for UNC catalog, facets are primarily
serving the purpose of narrowing down a search, rather than browsing the collection. In contrast, for PPL catalog, facets are supporting browsing as well as refining a search.
2. BACKGROUND Bates in her paper (1979) first introduces the concept of the search tactic as moves to further a search in information seeking context, as compared to the search strategy which focuses on the plan of the whole search. Since then, a few studies have examined search tactics adopted by users in various search systems. According to Wildemuth (2004), a search tactic is a set of search moves that are temporally and semantically related in order to accomplish a search goal. In her study, she investigated the effects of domain knowledge on search tactic formulation, and found that the search tactics changed over time as the students’ domain knowledge changed. Qiu (1993) used a regression model to examine the fit of Markov models to search tactics in a hypertext system. It was found that a second-order Markov model best fit the data. Chen and Cooper (2002) studied users’ moves of a library catalog through semi-Markov chains and identified six different usage groups with distinct patterns of system usage. Kiestra, Stokmans, and Kamphuis (1994) derived that the minimum “meaningful unit” of search behavior consisted of three consecutive actions, therefore analyzed these fragments of move sequence, and discovered 65 commonly used patterns. Jansen, Spink, and Saraevic (2000) conducted transaction log analysis for over 50,000 Web search engine queries and found that only 22% queries were modifications of a previous query. They also analyzed search moves of 191 search sessions and concluded that the most common session was “a unique query followed by a request to view the next page of results.”
Although the analyses were similar in each of these studies, it is difficult to draw general conclusions due to different search move definitions, and different search systems. In addition, none of this study investigated the search tactics through a faceted search system—almost a standard feature for today’s commercial search engines.
3. RESEARCH PROBLEM This study addresses two research questions. First, it examines the tactics actually used by users to understand how they formulate and reformulate their cognitive process and search strategies when they are searching the faceted library catalogs. Second, it focuses on differences in these tactics that might be attributable to differences between an academic and a public library setting.
83
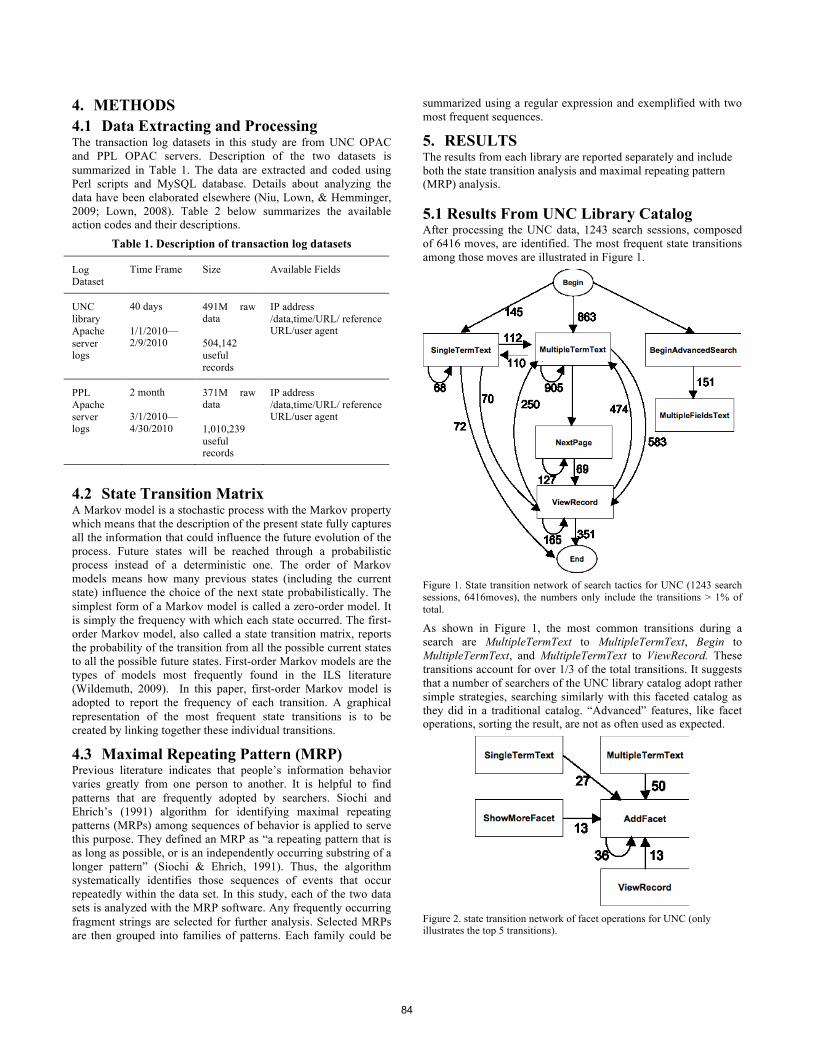
4. METHODS 4.1 Data Extracting and Processing The transaction log datasets in this study are from UNC OPAC and PPL OPAC servers. Description of the two datasets is summarized in Table 1. The data are extracted and coded using Perl scripts and MySQL database. Details about analyzing the data have been elaborated elsewhere (Niu, Lown, & Hemminger, 2009; Lown, 2008). Table 2 below summarizes the available action codes and their descriptions.
Table 1. Description of transaction log datasets
Log Dataset
Time Frame Size Available Fields
UNC library Apache server logs
40 days
1/1/2010—2/9/2010
491M raw data
504,142 useful records
IP address /data,time/URL/ reference URL/user agent
PPL Apache server logs
2 month
3/1/2010—4/30/2010
371M raw data
1,010,239 useful records
IP address /data,time/URL/ reference URL/user agent
4.2 State Transition Matrix A Markov model is a stochastic process with the Markov property which means that the description of the present state fully captures all the information that could influence the future evolution of the process. Future states will be reached through a probabilistic process instead of a deterministic one. The order of Markov models means how many previous states (including the current state) influence the choice of the next state probabilistically. The simplest form of a Markov model is called a zero-order model. It is simply the frequency with which each state occurred. The first-order Markov model, also called a state transition matrix, reports the probability of the transition from all the possible current states to all the possible future states. First-order Markov models are the types of models most frequently found in the ILS literature (Wildemuth, 2009). In this paper, first-order Markov model is adopted to report the frequency of each transition. A graphical representation of the most frequent state transitions is to be created by linking together these individual transitions.
4.3 Maximal Repeating Pattern (MRP) Previous literature indicates that people’s information behavior varies greatly from one person to another. It is helpful to find patterns that are frequently adopted by searchers. Siochi and Ehrich’s (1991) algorithm for identifying maximal repeating patterns (MRPs) among sequences of behavior is applied to serve this purpose. They defined an MRP as “a repeating pattern that is as long as possible, or is an independently occurring substring of a longer pattern” (Siochi & Ehrich, 1991). Thus, the algorithm systematically identifies those sequences of events that occur repeatedly within the data set. In this study, each of the two data sets is analyzed with the MRP software. Any frequently occurring fragment strings are selected for further analysis. Selected MRPs are then grouped into families of patterns. Each family could be
summarized using a regular expression and exemplified with two most frequent sequences.
5. RESULTS The results from each library are reported separately and include both the state transition analysis and maximal repeating pattern (MRP) analysis.
5.1 Results From UNC Library Catalog After processing the UNC data, 1243 search sessions, composed of 6416 moves, are identified. The most frequent state transitions among those moves are illustrated in Figure 1.
Figure 1. State transition network of search tactics for UNC (1243 search sessions, 6416moves), the numbers only include the transitions > 1% of total.
As shown in Figure 1, the most common transitions during a search are MultipleTermText to MultipleTermText, Begin to MultipleTermText, and MultipleTermText to ViewRecord. These transitions account for over 1/3 of the total transitions. It suggests that a number of searchers of the UNC library catalog adopt rather simple strategies, searching similarly with this faceted catalog as they did in a traditional catalog. “Advanced” features, like facet operations, sorting the result, are not as often used as expected.
Figure 2. state transition network of facet operations for UNC (only illustrates the top 5 transitions).
84
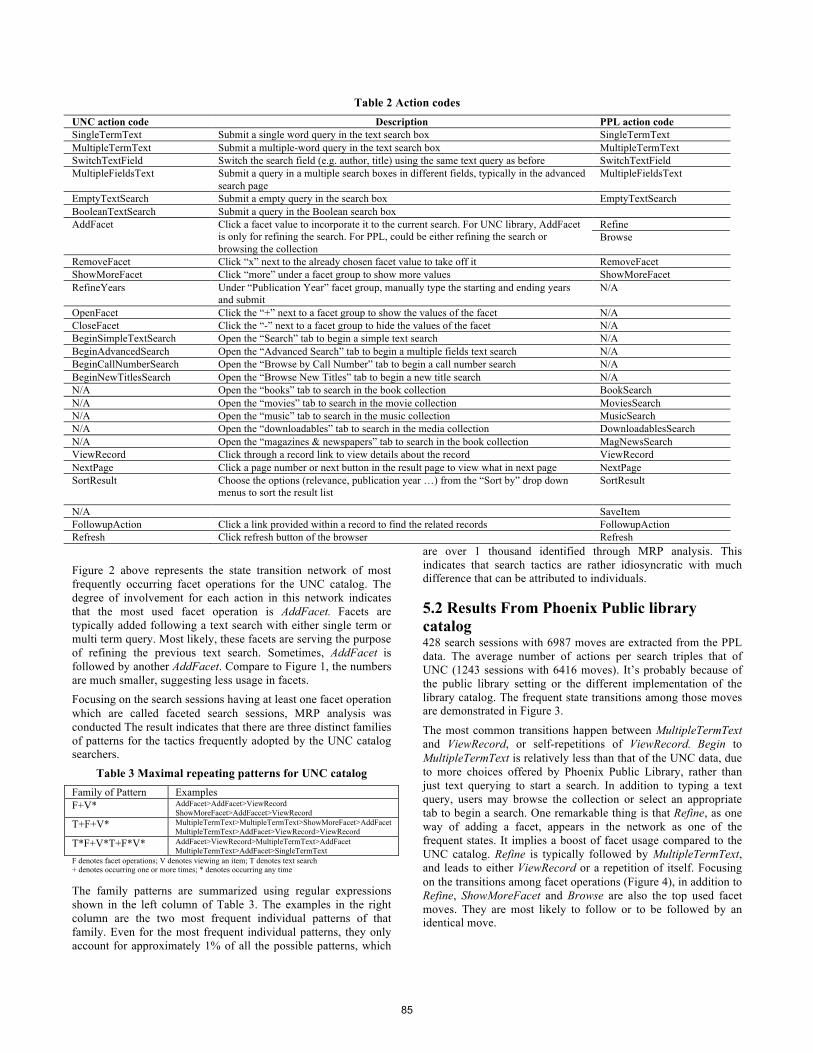
Table 2 Action codes UNC action code Description PPL action code SingleTermText Submit a single word query in the text search box SingleTermText MultipleTermText Submit a multiple-word query in the text search box MultipleTermText SwitchTextField Switch the search field (e.g. author, title) using the same text query as before SwitchTextField MultipleFieldsText Submit a query in a multiple search boxes in different fields, typically in the advanced
search page MultipleFieldsText
EmptyTextSearch Submit a empty query in the search box EmptyTextSearch BooleanTextSearch Submit a query in the Boolean search box
Refine AddFacet Click a facet value to incorporate it to the current search. For UNC library, AddFacet is only for refining the search. For PPL, could be either refining the search or browsing the collection
Browse
RemoveFacet Click “x” next to the already chosen facet value to take off it RemoveFacet ShowMoreFacet Click “more” under a facet group to show more values ShowMoreFacet RefineYears Under “Publication Year” facet group, manually type the starting and ending years
and submit N/A
OpenFacet Click the “+” next to a facet group to show the values of the facet N/A CloseFacet Click the “-” next to a facet group to hide the values of the facet N/A BeginSimpleTextSearch Open the “Search” tab to begin a simple text search N/A BeginAdvancedSearch Open the “Advanced Search” tab to begin a multiple fields text search N/A BeginCallNumberSearch Open the “Browse by Call Number” tab to begin a call number search N/A BeginNewTitlesSearch Open the “Browse New Titles” tab to begin a new title search N/A N/A Open the “books” tab to search in the book collection BookSearch N/A Open the “movies” tab to search in the movie collection MoviesSearch N/A Open the “music” tab to search in the music collection MusicSearch N/A Open the “downloadables” tab to search in the media collection DownloadablesSearch N/A Open the “magazines & newspapers” tab to search in the book collection MagNewsSearch ViewRecord Click through a record link to view details about the record ViewRecord NextPage Click a page number or next button in the result page to view what in next page NextPage SortResult Choose the options (relevance, publication year …) from the “Sort by” drop down
menus to sort the result list SortResult
N/A SaveItem FollowupAction Click a link provided within a record to find the related records FollowupAction Refresh Click refresh button of the browser Refresh
Figure 2 above represents the state transition network of most frequently occurring facet operations for the UNC catalog. The degree of involvement for each action in this network indicates that the most used facet operation is AddFacet. Facets are typically added following a text search with either single term or multi term query. Most likely, these facets are serving the purpose of refining the previous text search. Sometimes, AddFacet is followed by another AddFacet. Compare to Figure 1, the numbers are much smaller, suggesting less usage in facets. Focusing on the search sessions having at least one facet operation which are called faceted search sessions, MRP analysis was conducted The result indicates that there are three distinct families of patterns for the tactics frequently adopted by the UNC catalog searchers.
Table 3 Maximal repeating patterns for UNC catalog Family of Pattern Examples F+V* AddFacet>AddFacet>ViewRecord
ShowMoreFacet>AddFaccet>ViewRecord T+F+V* MultipleTermText>MultipleTermText>ShowMoreFacet>AddFacet
MultipleTermText>AddFacet>ViewRecord>ViewRecord T*F+V*T+F*V* AddFacet>ViewRecord>MultipleTermText>AddFacet
MultipleTermText>AddFacet>SingleTermText F denotes facet operations; V denotes viewing an item; T denotes text search + denotes occurring one or more times; * denotes occurring any time The family patterns are summarized using regular expressions shown in the left column of Table 3. The examples in the right column are the two most frequent individual patterns of that family. Even for the most frequent individual patterns, they only account for approximately 1% of all the possible patterns, which
are over 1 thousand identified through MRP analysis. This indicates that search tactics are rather idiosyncratic with much difference that can be attributed to individuals.
5.2 Results From Phoenix Public library catalog 428 search sessions with 6987 moves are extracted from the PPL data. The average number of actions per search triples that of UNC (1243 sessions with 6416 moves). It’s probably because of the public library setting or the different implementation of the library catalog. The frequent state transitions among those moves are demonstrated in Figure 3.
The most common transitions happen between MultipleTermText and ViewRecord, or self-repetitions of ViewRecord. Begin to MultipleTermText is relatively less than that of the UNC data, due to more choices offered by Phoenix Public Library, rather than just text querying to start a search. In addition to typing a text query, users may browse the collection or select an appropriate tab to begin a search. One remarkable thing is that Refine, as one way of adding a facet, appears in the network as one of the frequent states. It implies a boost of facet usage compared to the UNC catalog. Refine is typically followed by MultipleTermText, and leads to either ViewRecord or a repetition of itself. Focusing on the transitions among facet operations (Figure 4), in addition to Refine, ShowMoreFacet and Browse are also the top used facet moves. They are most likely to follow or to be followed by an identical move.
85
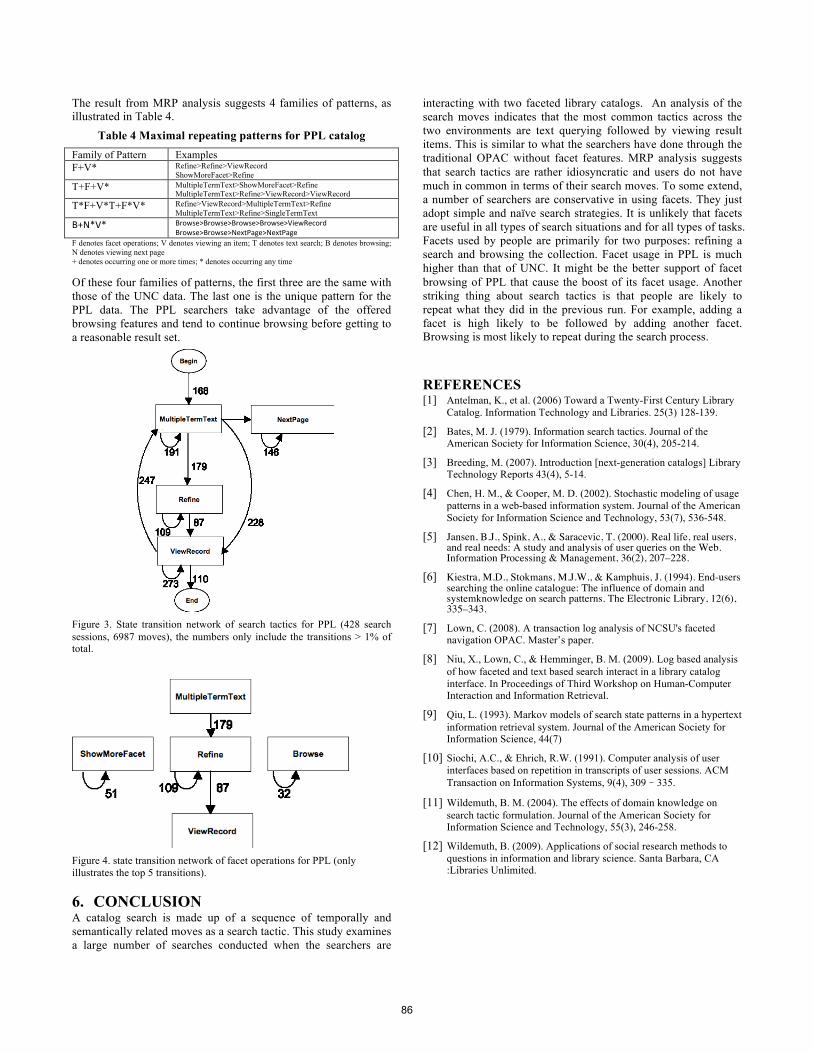
The result from MRP analysis suggests 4 families of patterns, as illustrated in Table 4.
Table 4 Maximal repeating patterns for PPL catalog Family of Pattern Examples F+V* Refine>Refine>ViewRecord
ShowMoreFacet>Refine T+F+V* MultipleTermText>ShowMoreFacet>Refine
MultipleTermText>Refine>ViewRecord>ViewRecord T*F+V*T+F*V* Refine>ViewRecord>MultipleTermText>Refine
MultipleTermText>Refine>SingleTermText B+N*V* Browse>Browse>Browse>Browse>ViewRecord
Browse>Browse>NextPage>NextPage F denotes facet operations; V denotes viewing an item; T denotes text search; B denotes browsing; N denotes viewing next page + denotes occurring one or more times; * denotes occurring any time Of these four families of patterns, the first three are the same with those of the UNC data. The last one is the unique pattern for the PPL data. The PPL searchers take advantage of the offered browsing features and tend to continue browsing before getting to a reasonable result set.
Figure 3. State transition network of search tactics for PPL (428 search sessions, 6987 moves), the numbers only include the transitions > 1% of total.
Figure 4. state transition network of facet operations for PPL (only illustrates the top 5 transitions).
6. CONCLUSION A catalog search is made up of a sequence of temporally and semantically related moves as a search tactic. This study examines a large number of searches conducted when the searchers are
interacting with two faceted library catalogs. An analysis of the search moves indicates that the most common tactics across the two environments are text querying followed by viewing result items. This is similar to what the searchers have done through the traditional OPAC without facet features. MRP analysis suggests that search tactics are rather idiosyncratic and users do not have much in common in terms of their search moves. To some extend, a number of searchers are conservative in using facets. They just adopt simple and naïve search strategies. It is unlikely that facets are useful in all types of search situations and for all types of tasks. Facets used by people are primarily for two purposes: refining a search and browsing the collection. Facet usage in PPL is much higher than that of UNC. It might be the better support of facet browsing of PPL that cause the boost of its facet usage. Another striking thing about search tactics is that people are likely to repeat what they did in the previous run. For example, adding a facet is high likely to be followed by adding another facet. Browsing is most likely to repeat during the search process.
REFERENCES [1] Antelman, K., et al. (2006) Toward a Twenty-First Century Library
Catalog. Information Technology and Libraries. 25(3) 128-139.
[2] Bates, M. J. (1979). Information search tactics. Journal of the American Society for Information Science, 30(4), 205-214.
[3] Breeding, M. (2007). Introduction [next-generation catalogs] Library Technology Reports 43(4), 5-14.
[4] Chen, H. M., & Cooper, M. D. (2002). Stochastic modeling of usage patterns in a web-based information system. Journal of the American Society for Information Science and Technology, 53(7), 536-548.
[5] Jansen, B.J., Spink, A., & Saracevic, T. (2000). Real life, real users, and real needs: A study and analysis of user queries on the Web. Information Processing & Management, 36(2), 207–228.
[6] Kiestra, M.D., Stokmans, M.J.W., & Kamphuis, J. (1994). End-users searching the online catalogue: The influence of domain and systemknowledge on search patterns. The Electronic Library, 12(6), 335–343.
[7] Lown, C. (2008). A transaction log analysis of NCSU's faceted navigation OPAC. Master’s paper.
[8] Niu, X., Lown, C., & Hemminger, B. M. (2009). Log based analysis of how faceted and text based search interact in a library catalog interface. In Proceedings of Third Workshop on Human-Computer Interaction and Information Retrieval.
[9] Qiu, L. (1993). Markov models of search state patterns in a hypertext information retrieval system. Journal of the American Society for Information Science, 44(7)
[10] Siochi, A.C., & Ehrich, R.W. (1991). Computer analysis of user interfaces based on repetition in transcripts of user sessions. ACM Transaction on Information Systems, 9(4), 309–335.
[11] Wildemuth, B. M. (2004). The effects of domain knowledge on search tactic formulation. Journal of the American Society for Information Science and Technology, 55(3), 246-258.
[12] Wildemuth, B. (2009). Applications of social research methods to questions in information and library science. Santa Barbara, CA :Libraries Unlimited.
86
Understanding Information Seeking in the Patent Domain and its Impact on the Interface Design of IR Systems
Daniela Becks University of Hildesheim Marienburger Platz 22 D-31141 Hildesheim +49 5121 883 -811
Matthias Görtz
University of Hildesheim Marienburger Platz 22 D-31141 Hildesheim +49 5121 883 881
Christa Womser-Hacker University of Hildesheim Marienburger Platz 22 D-31141 Hildesheim
+49 5121 883 833
ABSTRACT
In this position paper, we highlight the need for understanding and modeling a user’s context when designing the user interface of an information retrieval system using the example of the patent domain. Based on fundamental concepts of information seeking and retrieval research, we describe the different contextual factors characteristic for this domain and common task scenarios of patent retrieval. Finally, we outline first starting points for coping with these domain-specific conditions in the interface design of IR systems and discuss future research needs.
Categories and Subject Descriptors
H 1.2 [User/Machine Systems]: Human Factors; H.3.3
[Information Search and Retrieval]: Search Process. H.5.2
[Information Interfaces and Presentation]: User Interfaces – Graphical user interfaces (GUI).
General Terms
Design, Human Factors, Theory
Keywords
Information seeking; human-computer interaction; patent retrieval; context modeling
1. INTRODUCTION While in the community of information retrieval (IR) research much effort has been spent on the invention of sophisticated system features and algorithms, the patent or intellectual property domain is still relying on Boolean systems with basic user interfaces. Even though this industry has developed highly sophisticated human strategies to seek for relevant information, one has to wonder why there has been no significant progress in terms of technical support. According to statistics of the World Intellectual Property Organization (WIPO) [14], the total number of patents in force worldwide at the end of 2006 was approximately 6.1 million. This large amount of data indicates
that especially in this domain there should be a certain demand for innovative services to support patent users in their retrieval activities. One approach to enhancing information retrieval activities is the design of the IR system and algorithm itself. This important field of research, however, shall not be the focus of this position paper. Another approach is the design of the user interface to match the respective user need in a given context. In order to be able to develop innovative IR interfaces, it is therefore essential to understand the specificity of the domain and its impact on the interface design of IR systems.
First efforts in the field of information seeking and retrieval (IS&R) research were made. A study in the Swedish Patent and Registration Office (PRV) by Hansen & Järvelin (2005) examined the collaborative character of the patent handling process. They draw the conclusion that “future research should focus on what affects CIR (collaborative IR) processes. Possible research questions could deal with task variation, task complexity or type of task”. [7] Recently, Azzopardi et al. [1] published the results of a survey on patent users. They already started to analyze the relationship between the specialties of this kind of users, their search tasks and the functionalities of patent retrieval systems. [1]
In this position paper we would like to discuss different impact factors on information seeking, highlight the domain-specific aspects of patent retrieval, and give a first outlook on how UI design may be adapted according to these considerations.
2. THE FIELD OF IS&R RESEARCH AND
ITS RELEVANCE FOR IR SYSTEMS In the past thirty years of information science the so-called „cognitive turn“ [8] has widened the scope of traditional information retrieval (IR) research. It includes not only system-orientated perspectives of IR but also cognitive aspects of the entire process of information seeking (IS). The consideration of the actor and his context of a respective work or search task, lead to new fields of research and a variety of conceptual models on information behaviour. “Information behaviour may be defined as the more general field of investigation (as shown in Figure 1), with information-seeking behaviour being a sub-set of the field, particularly concerned with the variety of methods people employ to discover and gain access to information resources. Information searching behaviour is then defined as a sub-set of information-seeking, particularly concerned with the interactions between information user (with or without an intermediary) and computer-based information systems, of which information retrieval systems for textual data may be seen as one type.“ [15]
Permission to make digital or hard copies of all or part of this work for personal or classroom use is granted without fee provided that copies are not made or distributed for profit or commercial advantage and that copies bear this notice and the full citation on the first page. To copy otherwise, or republish, to post on servers or to redistribute to lists, requires prior specific permission and/or a fee. HCIR ’10 Workshop, August 22, 2010, New Brunswick, NJ, USA. Copyright 2010 ACM 1-58113-000-0/00/0010…$10.00.
87
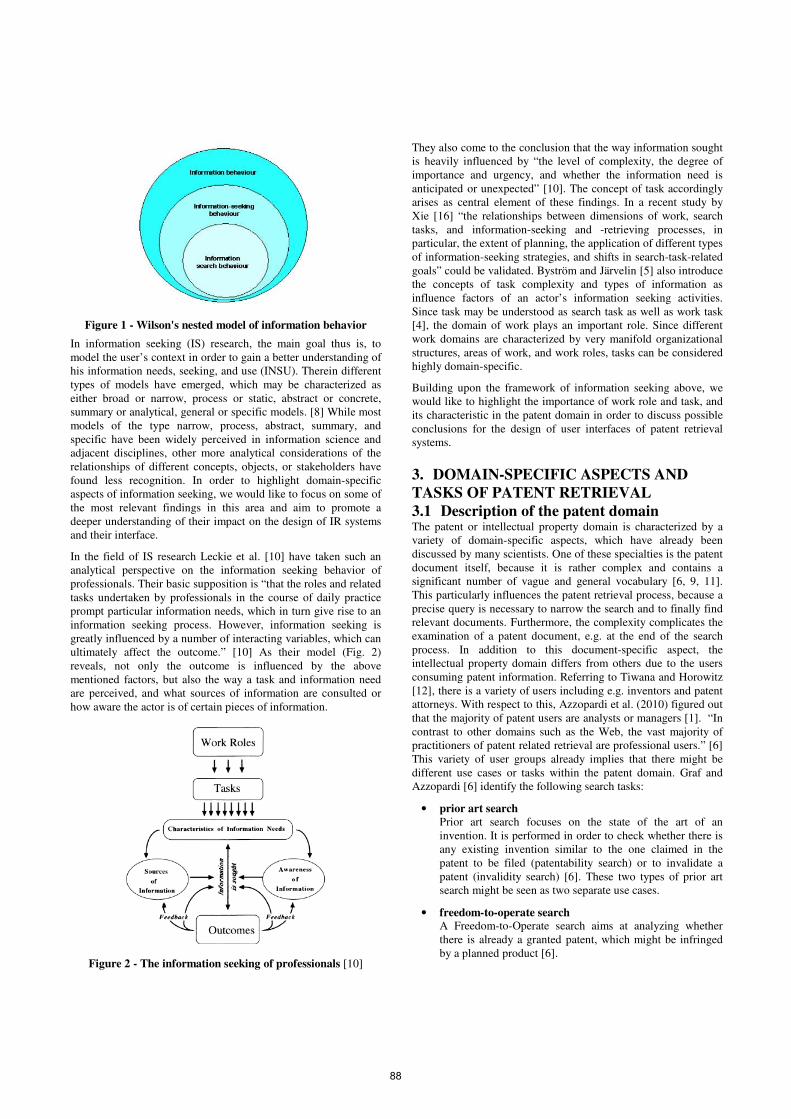
Figure 1 - Wilson's nested model of information behavior
In information seeking (IS) research, the main goal thus is, to model the user’s context in order to gain a better understanding of his information needs, seeking, and use (INSU). Therein different types of models have emerged, which may be characterized as either broad or narrow, process or static, abstract or concrete, summary or analytical, general or specific models. [8] While most models of the type narrow, process, abstract, summary, and specific have been widely perceived in information science and adjacent disciplines, other more analytical considerations of the relationships of different concepts, objects, or stakeholders have found less recognition. In order to highlight domain-specific aspects of information seeking, we would like to focus on some of the most relevant findings in this area and aim to promote a deeper understanding of their impact on the design of IR systems and their interface.
In the field of IS research Leckie et al. [10] have taken such an analytical perspective on the information seeking behavior of professionals. Their basic supposition is “that the roles and related tasks undertaken by professionals in the course of daily practice prompt particular information needs, which in turn give rise to an information seeking process. However, information seeking is greatly influenced by a number of interacting variables, which can ultimately affect the outcome.” [10] As their model (Fig. 2) reveals, not only the outcome is influenced by the above mentioned factors, but also the way a task and information need are perceived, and what sources of information are consulted or how aware the actor is of certain pieces of information.
Figure 2 - The information seeking of professionals [10]
They also come to the conclusion that the way information sought is heavily influenced by “the level of complexity, the degree of importance and urgency, and whether the information need is anticipated or unexpected” [10]. The concept of task accordingly arises as central element of these findings. In a recent study by Xie [16] “the relationships between dimensions of work, search tasks, and information-seeking and -retrieving processes, in particular, the extent of planning, the application of different types of information-seeking strategies, and shifts in search-task-related goals” could be validated. Byström and Järvelin [5] also introduce the concepts of task complexity and types of information as influence factors of an actor’s information seeking activities. Since task may be understood as search task as well as work task [4], the domain of work plays an important role. Since different work domains are characterized by very manifold organizational structures, areas of work, and work roles, tasks can be considered highly domain-specific.
Building upon the framework of information seeking above, we would like to highlight the importance of work role and task, and its characteristic in the patent domain in order to discuss possible conclusions for the design of user interfaces of patent retrieval systems.
3. DOMAIN-SPECIFIC ASPECTS AND
TASKS OF PATENT RETRIEVAL
3.1 Description of the patent domain The patent or intellectual property domain is characterized by a variety of domain-specific aspects, which have already been discussed by many scientists. One of these specialties is the patent document itself, because it is rather complex and contains a significant number of vague and general vocabulary [6, 9, 11]. This particularly influences the patent retrieval process, because a precise query is necessary to narrow the search and to finally find relevant documents. Furthermore, the complexity complicates the examination of a patent document, e.g. at the end of the search process. In addition to this document-specific aspect, the intellectual property domain differs from others due to the users consuming patent information. Referring to Tiwana and Horowitz [12], there is a variety of users including e.g. inventors and patent attorneys. With respect to this, Azzopardi et al. (2010) figured out that the majority of patent users are analysts or managers [1]. “In contrast to other domains such as the Web, the vast majority of practitioners of patent related retrieval are professional users.” [6] This variety of user groups already implies that there might be different use cases or tasks within the patent domain. Graf and Azzopardi [6] identify the following search tasks:
• prior art search
Prior art search focuses on the state of the art of an invention. It is performed in order to check whether there is any existing invention similar to the one claimed in the patent to be filed (patentability search) or to invalidate a patent (invalidity search) [6]. These two types of prior art search might be seen as two separate use cases.
• freedom-to-operate search
A Freedom-to-Operate search aims at analyzing whether there is already a granted patent, which might be infringed by a planned product [6].
88
• competitive analysis
The third common search type is the competitive analysis. In this case, the focus is set on the patents of a competitor and it is performed to find e.g. technical information [6].
With respect to information-seeking behavior, it is recommended to consider the above mentioned use cases, because each of these search types requires a special search strategy. By now, little is known about concrete search strategies, because in the patent domain user observations are nearly impossible. Modeling information-seeking behavior on a theoretical basis can, thus, be advantageous in order to better understand patent searching and human-computer interaction.
3.2 Modeling patent-specific aspects of
information seeking According to the model developed by Leckie et al. [10] (Fig. 2), the information seeking behavior of professionals heavily depends upon the work role of the user, which corresponds to the user types in the patent domain mentioned above. The target group of patent information is already versatile, but can be even more extended. This is done by Tseng and Wu [13], who argue, that the user group can further consist of examiners, researchers and engineers. Comparing the different work roles, we might first summarize, that it can be academic/ scientific (e.g. researcher) on the one hand and purely industrial (e.g. company, experts) on the other hand. Thus, there are two general work roles that need to be considered when modeling information seeking in the patent domain. Referring to the theory of Byström [3], these are characteristic for the domain specificity of work. It should be acknowledged, that the individual role of a patent attorney is a special one, because normally he acts as an intermediary (between inventor and patent office). [11] This fact is confirmed by Azzopardi et al. [1].
Depending on the work context and the individual role of the actor, different search tasks (explained in 3.1) may be performed to fulfill the information need. For example, a competitive analysis might be especially relevant to users being involved in business decision, while an inventor should be most interested in performing a prior art search. In the patent domain, each task is “strongly shaped and driven by judicial and economic requirements” [6]. This fact further implies the influence of external factors on the work task, which in industrial contexts might, in general, be an economic interest. All in all, the patent domain is significantly task-orientated, because each search task is further dominated by the underlying goal to maximize recall and precision [6, 9], which is characteristic for this special domain.
Each search underlies an information need of the user/ actor, which, according to Leckie et al. [10], is conditioned by the defined task. In the intellectual property domain, the difficulty, with respect to the information need, is to translate it into a suitable query. As already mentioned before the language within a patent document is typically vague [6, 9, 11]. This complicates the search, because domain specific knowledge as well as intensive training is necessary to formulate an effective query and to narrow the search results returned by a retrieval system. Most of the queries are significantly complex.
Once the information need is defined, an actor has to decide which information sources to use. Within the patent domain, an
information source can be twofold, because the user has to choose between different databases on the one hand and because he has to decide which part of a patent document is most relevant to the task on the other. In case of a prior art search, for example, the claims would be the most interesting part of a patent [6]. Furthermore, to identify the state of the art of an invention, non-patent as well as patent literature should be considered during the search process [6]. These first examples indicate that the choice of information source is also influenced by the task and the information need of the actor in a given domain.
Summarizing, one can state that the patent domain provides a vivid field of application for existing analytical models in IS research and specifically contains the following influence factors on how information is sought:
• Individual work roles
• Underlying work and search tasks
• Situational and organizational factors
• Type of information need
• Task complexity
• Available information sources
4. SUMMARY AND FUTURE RESEARCH Taking the here described observations of domain specificity in the intellectual property realm into consideration, it may be concluded that the design of the user interface of IR systems needs to account for all of the above mentioned influence factors (s. Fig. 2) in the context of the user. Next to the adaption of retrieval algorithms, the user interface presents a variety of levers to achieve this goal and make patent retrieval more effective, efficient, and more user-friendly.
Regarding the element of available sources of information a context-sensitive IR interface could, for example, provide integrated access to different information sources in order to assist prior art searches. Based on automatic context detection, it could also recommend suitable information sources for the different task types.
Considering the awareness of information interface elements for supporting query formulation or refinement could be implemented as well as the recommendation of suitable query terms. [13] Integrating query expansion methods is also suitable for narrowing the scope of a search task. With respect to this, Azzopardi et al. figured out that especially analysts would welcome such functionalities [1]. This clearly indicates that different work roles long for discriminative interface solutions.
Finally, the user interface may be designed in order to support the
outcomes or what is referred to as “post retrieval interaction” [1] by developing innovative document views or other forms of visualizing complex document structures.
These first ideas demonstrate the relevance a deep understanding of concepts and influence factors of information seeking behavior may have on the design of user interfaces of IR systems in a specific domain of use. The cognitive viewpoint, as presented above, acts as integrating element for a variety of areas in information science [2] and has the ability to bring originally separate fields such as human-computer interaction and information retrieval together. Future research will therefore follow the line of argument of this position paper and further
89
analyze the impact of domain-specific factors on information seeking and the interface as well as system design of information retrieval systems. Therefore, the patent domain as well as other information-intensive domains such as the management consulting as well as academic domain will be subject to future studies of information seeking and human-computer interaction in information retrieval.
REFERENCES [1] Azzopardi, L., Joho, H., & Vanderbauwhede, W. (2010).
Report: A Survey on Patent Users Search Behavior, Search Functionality and System Requirements. Available online: www.ir-facility.org/research/technical-reports/files/irf_tr_2010_00001.pdf
[2] Belkin, N. J. (1990). The cognitive viewpoint in information science. Journal of Information Science, 16(1), 11–15.
[3] Byström, K. (1999). Task complexity, information types and
information sources: Doctoral Dissertation. Tampere: University of Tampere (Acta Universitatis Tamperensis 688).
[4] Byström, K., & Hansen, P. (2005). Conceptual Framework for Tasks in Information Studies. Journal of the American
Society for Information Science and Technology, 56(10), 1050–1061.
[5] Byström, K., & Järvelin, K. (1995). Task complexity affects information seeking and use. Information Processing &
Management, 31(2), 191–213.
[6] Graf, E., & Azzopardi, L. (2008). A methodology for building a patent test collection for prior art search. Proceedings of the 2nd International Workshop on
Evaluating Information Access (EVIA), December 16, 2008, Tokyo, Japan, 60–71.
[7] Hansen, P., & Järvelin, K. (2005). Collaborative information retrieval in an information-intensive domain. Information
Processing and Management, 41(5), 1101‐1119.
[8] Ingwersen, P., & Järvelin, K. (2005). The Turn: Integration
of Information Seeking and Retrieval in Context. Springer-
11645 /Dig. Serial]: Vol. 18. Dordrecht: Springer.
[9] Kando, N. (2000). What Shall We Evaluate? - Preliminary Discussion for the NTCIR Patent IR Challenge (PIC) Based on the Brainstorming with the Specialized Intermediaries in Patent Searching and Patent Attorneys. ACM-SIGIR
Workshop on Patent Retrieval, July 28, 2000, Athens, Greece, 37–42.
[10] Leckie, G. J., Pettigrew, K. E., & Sylvain, C. (1996). Modeling the Information Seeking of Professionals: A General Model Derived from Research on Engineers, Health Care Professionals, and Lawyers. The Library Quarterly,
66(2), 161‐193, from http://www.jstor.org/stable/4309109
[11] Schamlu, M. (1985). Patentschriften - Patentwesen. Eine
argumentationstheoretische Analyse der Textsorte Patent
am Beispiel der Patentschriften zu Lehrmitteln. München: Iudicium.
[12] Tiwana, S., & Horowitz, E. (2009). Extracting Problem Solved Concepts from Patent Documents. Proceedings of the
2nd ACM workshop on Patent Information Retrieval, PaIR
2009, November 6, 2009, Hong Kong, China, 43-48.
[13] Tseng, Y., & Wu, Y. (2008). A Study of Search Tactics for Patentability Search: A Case Study on Patent Engineers. In J. Tait (Ed.). Proceedings of the 1st ACM workshop on
Patent Information Retrieval, PaIR 2008, October 30, 2008, Napa Valley, California, USA, 33-36.
[14] World Intellectual Property Organization (WIPO) (2008): World Patent Report: A statistical review. Geneva: IPstats.
[15] Wilson, T. D. (1999). Models in information behaviour research. Journal of Documentation, 55(3), 249–270.
[16] Xie, I. (2009). Dimensions of tasks: influences on information-seeking and retrieving process. Journal of
Documentation, 65(3), 339–366.
90
Better Search Applications Through Domain SpecificContext Descriptions: a Position Paper
Corrado BoscarinoCentrum Wiskunde &
InformaticaScience Park, 123
1098 XG Amsterdam, TheNetherlands
Arjen P. de Vries∗
Centrum Wiskunde &Informatica
Science Park, 1231098 XG Amsterdam, The
Jacco vanOssenbruggen
†
Centrum Wiskunde &Informatica
Science Park, 1231098 XG Amsterdam, The
ABSTRACTThere is a wide agreement that a user centred approach toIR applications design outperforms system centred ones. Aclassic understanding of this design approach, and specifi-cally of its underlying notion of context, appeared howeverinsufficient to explain the results of a pilot experiment. Werecognise the importance of context, but we define contextdifferently by means of a domain theory: a conceptualisa-tion of the domain at hand, preferably developed within thesame community which users belong to.
1. INTRODUCTIONWe believe that there is a need to escape the narrowness of
existing system centred application development and evalu-ation frameworks, towards designs that are more open andalert to the human user, whose purposes they are supposedto serve. Karen Spark Jones [10] raised the same issue al-ready in the late Eighties, arguing in favour of lines of re-search in Information Retrieval (IR) that go beyond prob-abilistic weighting and of evaluation paradigms that stepoutside the entrenchment of the laboratory. These are stillpresent day challenges for IR research [4]: IR applicationsshould address a more realistic environment comprising realusers with all their expectations, naiveties, affections, clear-cut ideas or just loose or even incoherent judgements.
In IR the most influential and successful attempts to takea user centred stance and to propose an alternative to a clas-sic document space model [14] have been developed from acognitive perspective [3]. We regard an IR system as sup-porting a communicative act between an expert on a certainmatter, who made information available about her knowl-
∗Also affiliated to the Delft University of Technology†Also affiliated to the VU University Amsterdam
Permission to make digital or hard copies of all or part of this work forpersonal or classroom use is granted without fee provided that copies arenot made or distributed for profit or commercial advantage and that copiesbear this notice and the full citation on the first page. To copy otherwise, torepublish, to post on servers or to redistribute to lists, requires prior specificpermission and/or a fee.HCIR 2010 New Brunswick USACopyright 20XX ACM X-XXXXX-XX-X/XX/XX ...$10.00.
edge of the world, and a system’s end-user, who at a certainmoment became aware of an anomaly in her epistemic state.When a user issues a query onto the system in an effort toeliminate that anomaly [2], we may interpret IR in terms oflinguistic interchange. Language is a paradigmatic form ofhuman interaction and several authors describe a cognitiveview, “a forceful theoretical foundation for IR interactionand human-computer interaction (HCI) in general” [8] interms of linguistic notions.
A cognitive view amounts then to recognising that, whilea sentence, an image or more generally a sign may havemany different meanings, interpretation relies on a cognitiveprocess upon receipt of this sign, which is only potentiallyinformative [8]. The goal of search applications upon thisview is“to give access to [these] plausible means or values as,given the situation, may entail transformations of a cognitivestate, thus providing information in a pragmatic sense viacontext” [8].
A cognitive view of IR extends therefore the communica-tion system setup of [2], which is inspired by quantitativemodels of information exchange [16] such as those for trans-missions of electrical signals over noisy channels, into a morecomplex setting where sender and receiver, or speaker andhearer in a classical model of linguistic exchange, are turneddown in favour of agents, who engage in an interactive game.The focus of this ‘linguistic turn’ in IR, a shift from consid-ering documents as labels to regarding them to be part ofa sense making process is an analysis of a linguistic and be-havioural game: a pragmatics of meaning, that is a modelof the way signs are used during information exchange. Acognitive approach explicitly takes an internal perspective[1] by addressing the mental states of agents who play thegame, with its set of mutually agreed upon rules, strate-gies that each agent is determined to employ and criteria ofassessing a positive conclusion of the game.
Many approaches to design often derive a potential togather consensus around their underlying notions from com-mon sense intuitions: obvious properties of reality with whicheveryone is expected to agree. These unquestioned postu-lates may not fully endure a more thorough analysis andcan be challenged by empirical evidence when these gen-eral theoretical frameworks are translated into practice. Atacit assumption in a pragmatics of IR is that understandingthe process through which a world view mediates interpreta-
91
tion amounts to understanding the characteristics of a worldwhere an act of interpretation takes place.
This short position paper reports on how, during the de-velopment of a pilot user study designed to improve ourknowledge on combining information from different sources,we came to evince a lack of coherence at the very bottom ofIR systems design upon a cognitive view. Exchanging a hy-pothetical external observer monitoring communication foran analysis of a subjective mental representation of how agame of exchange is being played leaves a scientist seekingto develop cognitive models of information exchange in anambiguous position: those internal mental models are stillsupposed to be inferred from observed behaviour. A context,which linguistic indexicality refers to, becomes then a com-prehensive set of material, social, cultural and psychologicalcharacteristics, which deterministically settle observed be-haviour.
We believe that this rather implicit assumption of con-sidering mental representations to be observables within acognitive model is the main motivation of most efforts indeveloping a wide range of techniques to improve our knowl-edge of a user’s world. Think aloud protocols, ethnographicstudies or extrapolations of simulated work tasks [9]: theyall aim to carefully charting a user’s environment. Providedthat we take a sufficiently unbiased view, empirical data arethe means to understand user’s behaviour. Conversely, ourinability to make sense of some experimental result or todeduce a correct set of design requirements for a new appli-cation is a consequence of a lack of empirical material or aflaw in our methodological tools. Such ground assumptions,given the weight of these studies in modern IR research,should be investigated.
We are confident that social structures do matter, but weargue that a linguistic interpretation of the cognitive view inIR seems to point against their observability from user per-formance. While the discourse analysis community recentlysuggested that “there is no direct link between situationalor social structures and discourse structures” [5], no compa-rable paradigm shift has yet emerged in accounts of IR asdiscursive practice.
IR is a highly technologically advanced linguistic gameand we must grant the participants to this game more skillsthan current accounts do: apart from intuitively graspingthe material and social background of linguistic interaction,players are proficient in abstracting on a set of rules by fol-lowing which a game can be successfully completed. Wewill suggest to investigate one of these abstract and domainspecific models of a particular discourse that happens to un-derlie our prospective application as the key of a solution tocorrect interpret the results of our user study.
The following section explains how we designed and per-formed our pilot user study and how it challenged our viewson what should be regarded as context of the linguistic IRperformance. Given the limited space that we have, we willnot give much details and we will present the experimentas an empirical trigger for a more abstract claim. Section 3introduces our solution and in the last section we proposesome directions to generalise this conclusion to other IR ap-plications. Our central claim is that we should consider,not only analyses of a user’s environment as it appears to acomputer scientist approaching a new design, but also thedifferent understandings of a domain of interest that weredeveloped in the same community which a user belongs to.
2. STAGING A LINGUISTIC IR GAMEAcknowledging a view that regards HCI and IR as technol-
ogy enabled linguistic exchanges and at the same time onethat considers a cognitive process to provide the main con-tribution to sense making, amounts to stress the functionalrole of language, that is how language is used during interac-tions, rather than its capacity as information carrier: “com-munication should be grounded in the pragmatic practicesby which speakers use language” [12]. Understanding an IRspeech act requires to investigate the situation in which thisact takes place. Whitin this theoretical framework we de-veloped a user study aiming to understand how to supportcombined search for documents which contain informationfrom two repositories: one of textual documents and anotherof images.
Our ground hypothesis was that, because of what Ingw-ersen termed ‘cognitive free fall’ [8], syntactic and semanticcomponents of meaning captured by classic text retrievallanguage models would trigger characteristic pragmatic fea-tures of discourse: “intentionality, meaning, implicit contextand potential informativeness underlying the generated andcommunicated message [that] are immediately lost [...] haveto be rebuilt and recovered” [8]. In order to investigate thisreconstruction process, we designed two different algorithmsto search onto textual documents contained in the Keesings1
archive and pictures available in the Spaarnestad2 collection.The first repository is a Dutch archive of historical chroni-cles and the second one contains for the largest part presspictures annotated with free text and some labelled entitiessuch as persons and publication date in one XML file. Inboth algorithms we used the free text annotations to matchtheir correspondent pictures to one textual document. Ina first algorithm the PF/Tijah3 text retrieval software pro-vided a relevance ranking of the annotations to a textualdocument: the pictures corresponding to the top 5 rankedannotation, provided that they were above a 0.5 threshold,were chosen for the user study. This is a measure of howmuch a set of pictures are about a certain textual document.
A second, two-step algorithm aimed to incorporate in the‘aboutness’ ranking the information available in the textualcollection about a picture. First we generated what can bethought of as a picture’s representation from the point ofview of an external observer, who has complete knowledgeof the textual collection. For every picture we extended itsannotation with a set of paragraphs from the text collectionranked top 10 by the PF/Tijah software, again provided thatthey were above a 0.5 threshold, without regard of whichparticular document they belong to.
A second step is similar to the first algorithm: picturesassociated with the top 5 ranked annotations against thecomplete document collection are considered to match theinformation contained in a textual document. We invited 4people, in different extents familiar with the text collection,to participate in a user study. We asked them to arrangea small number of textual documents and pictures, eachdeemed relevant to the textual document by at least one al-gorithm, in joint excerpts containing one textual documentand at least more than one picture. They have been leftfree to search with a keyword based search engine onto the
1http://www.kha.nl2http://www.spaarnestadphoto.nl3http://dbappl.cs.utwente.nl/pftijah
92
image repository and compare the quality of the images pro-vided by our two algorithms, discussing the process throughwhich the joint documents were being generated. Because ofour assumption on the existence of syntactic and semanticconstraints to interpretation, we expected that the two al-gorithms would trigger different behaviours when employedin a practical search scenario.
As the information in the archive represents a collectiveeffort of many different people, who mediated between issuesas different as aesthetic aspects, scientific rigour, economicfeasibility or maintenance requirements, we expected that,on average over the different topics and despite of users’ dif-ferent personal backgrounds, one journalist, a historian, aphotographer and a member of the Keesings administrativestaff, a clear preference for the second algorithm in all ses-sions would emerge; only this second algorithm was, at leastin principle, designed to grasp some contextual features.
3. THE PROBLEMUsers’ performances were audio-recorded and analysed.
Since methods of investigation depend on prior methodolog-ical stances [17] and results on our framing of the user, theimportance of making methodological choices accountableshould not be underestimated: we selected practitioner’sprofiles [7] as a tool to achieve our goals of putting prac-tical discursive performance centre stage. Interviews withthe participants to the user study concentrate on how anaction is performed rather than on why: instead of asking“why are you doing this or that”, the interviewer focused onasking “how do you achieve this or that result”.
We found that many of these practice narratives exhibitedwhat we termed signposts of experiences: expressions thatdenote familiarity with a certain topic. “Nobody knows whois he”, says one user referring to Brian Epstein when com-menting on using a certain picture to illustrate a text aboutthe Beatles, “I believe you want to show that: I can still re-member to have seen him cycling” says another user abouta very famous Dutch trainer and a not-so-famous profes-sional cyclist himself. Every time we report an occurrenceof a signpost we assign a label to the correspondent user:we call ‘expert’ on a matter a user who speaks out a sign-post in agreement with the information that is present inthe textual collection; a case of disagreement is labelled as‘non-expert’. It is important to remember that, during anal-ysis these labels simply denote a discursive pattern and theprocess of inferring users’ mental models builds upon it, butit is by no means identified with it. We draw from the samemethodological viewpoint, which has already demonstratedits utility in HCI [13], promoting a phenomenological ac-count of social constructions of reality: ‘expert’ and ‘non-expert’ are categories in phenomenological sense [11], botha regular pattern of reality and a mental classification at theresearcher’s side. Actions and discursive evidence were thusmapped to these two categories. We found that ‘experts’were showing a preference for the two-steps algorithm while,against also our expectations, ‘non-experts’ were indifferentto the two algorithms.
Making sense of these tracings of discourse analysis andof the categorisation induced by the two algorithms turnedout to be impossible. Data are available to show that usersshould react differently to the two algorithms, because ofthe way the algorithms are constructed. Data are also avail-able to show that the categorisation of ‘expert’ and ‘non-
expert’ corresponds to measured patterns: one can criticisethe terms, but must agree on the content, even by assigningmore neutral labels such as ‘a’ and ‘b’. We are puzzled by anapparent paradox: we can argue separately in favour of twocategorisations, two divisions of the information interactionspace, but we cannot explain their combined effect.
Our first reaction was to question the scope of this exper-iment. Gathering more data or improving our investigationtools leads, so goes the received view, to a secure determina-tion of all the relevant parameters of the cognitive processunderlying interpretation. In our case either the algorithmswere not grasping any interesting contextual feature, or thecollection did not represent a shared knowledge among allour users, or our panel was too limited, or our methods toosuperficial or some even more dangerous combination of allthese factors flawed our judgement. While we recognise thatall these issues may have conspired against us and we agreethat much more extended experiments may well overturnour results, we suggest that another possibility has been fortoo long, too easily discounted by information interactionresearchers: the possibility that “discourse and actions arenot immediately observable at all” [5], that analysis is medi-ated by a theoretical model and that the validity of a designis only relative to that theoretical model.
4. THE SOLUTIONIn this last section we show a positive example in favour
of the claim that we can make sense of our results by lim-iting the scope of our analysis rather than widening it. Wetake then a step back, recasting this problem in linguisticand cognitive terms in order to find out where we made anunwarranted assumption that generated a paradox.
What we did not justify at any point is why an analysis ofthe setting of a situation allows a complete understandingof the cognitive process, hence of interpretation in IR: “it isa widespread misconception [...] that social situations andtheir properties [...] exercise direct and unmediated influ-ence on language use” [5]. We can paraphrase this critique:even if improve our investigation techniques, for example ex-changing practitioner’s profiles for ethnographic or log-dataanalysis, there is no guarantee that we understand what auser is doing.
Once we recognise this issue, what seemed a puzzle of in-terpretation of empirical data, becomes a more fundamentaland striking impasse. On one side we cannot predict anyparticular matching from a knowledge, how accurate it maybe, of user performance. On the other hand the matchingsthat are relevant for a task are shared at least within a smallcommunity: there is no point in over fitting any algorithmto comply with the requirements of one unique user. Noticethat we do not need a cognitive framework to show this par-ticular point: even in a noisy channel account of IR, or forthat matters any communication channel, even the most ab-stract [15], perfect replication of information at the receiverside, that is in IR perfect replication of the information pos-sessed by a knower at the seeker’s side, is theoretically un-tenable: it implies identifying a knower with an informationseeker and therefore allowing in our model only users witha perfect knowledge of the system.
There is no hope to resolve this impasse within a cognitiveand linguistic model. The subjective construction of inter-pretation in IR that is modelled as a chain of cognitive statechanges during interaction [8] irremediably conflicts with a
93
requirement of any linguistic pragmatics: a totally privateuse of language must be denied. At a certain point the chainof pragmatic explanations must end [18].
Our suggestion to solve this problem is to adapt an insightfrom context theory: there are mental interfaces that medi-ate discursive performance and “what is observably done orsaid is only the tip of a iceberg of a communicative event”[5]. We also suggest that characterisations of these mentalinterfaces or context models should be sought within thesame community, which users belong to; most often outsidecomputer science. The results we may achieve as computerscientists are therefore sound only with respect to that char-acterisation.
In our case remediation theory, an account of the pro-cess “by which new media refashion prior media forms” [6],provides a local solution to the paradox by adding one ad-ditional constraint: remediation depends on the existenceof a prior personal agenda. Those who do not have anybackground knowledge on the matter at hand, cannot havea personal agenda: interpretation is then based on the infor-mation provided by the system at the time the interpretationact is performed. While we witnessed the act of joining dif-ferent media, only one group, that labelled as ‘expert’, wasperforming an act of remediation, because only one groupcomplied with this additional requirement. If we limit thescope of our algorithms to the case of remediation, we thenmay conclude that the second algorithm performed better.We are not caught into the impasse because we have to ac-cept it as inherent to the process that we want to supportas the ‘double logic of remediation’ [6].
5. CONCLUSIONSThe initial aim of our user study was to develop an appli-
cation to allow end-users to retrieve joint documents com-prising information from two different repositories, one ofhistorical documents and one photo archive. While the cog-nitive viewpoint in its linguistic interpretation is confirmedas a very powerful approach to design, the key to solve theissues raised by this task is to modify the received notionof context of interpretation: we derive a sharp distinctionbetween social properties of a situation and cognitive pro-cesses that unfold during interaction. Interpretation is still“mediated by a system of categories or concepts which, forthe information-processing device, are a model of his world”[3, citing De Mey], but a world description, however accu-rate it may be, is not enough to completely understand thisprocess of mediation. A subjective construction determinesthe outcome of this communication act.
Working out the consequences of this paradigm shift re-sults in suggesting an alternative design flow for IR appli-cations. Once we abandon a positivistic belief in the directobservability of discourse and action we need other groundsfor motivating applications. Once the ideal of investigationmethods, which at least in the limit can converge to generalsolutions is recognised as illusory, researchers are left with aweaker, but more reliable notion: that of a world model asconceptualised by a theory specific to the particular domainwhich an end-user belongs to. Design should then start witha first, critical step: a choice to employ a domain theory forthe particular scenario rooted in the research tradition andin the practice of the domain at hand and engaging its do-main specific conceptualisation and even its proper jargon.
6. REFERENCES[1] B. G. Bara and J. Douthwaite. Cognitive Pragmatics:
The Mental Processes of Communication. MIT Press,2010.
[2] N. J. Belkin. Anomalous states of knowledge as a basisfor information retrieval/ Etats anomaux desconnaissances comme base du reperage del’information. The Canadian Journal of InformationScience, 5:133–143, 1980.
[3] N. J. Belkin. The cognitive viewpoint in informationscience. J. Inf. Sci., 16(1):11–15, 1990.
[4] N. J. Belkin. Some(what) grand challenges forinformation retrieval. SIGIR Forum, 42(1):47–54,2008.
[5] T. A. v. Dijk. Society and Discourse: How SocialContexts Influence Text and Talk. University press,Cambridge, 2009.
[6] A. Erll and A. Rigney. Mediation, Remediation, andthe Dynamics of Cultural Memory. Walter de Gruyter,1st edition, 2009.
[7] J. Forester. Exploring urban practice in ademocratising society: opportunities, techniques andchallenges. Development of southern Africa, 23(5), dec2006.
[8] P. Ingwersen. Cognitive perspectives of informationretrieval interaction: elements of a cognitive IR theory.Journal of Documentation, 52:3–50, 1996.
[9] P. Ingwersen and K. Jarvelin. The Turn: Integrationof Information Seeking and Retrieval in Context.Springer-Verlag, Secaucus, NJ, USA, 2005.
[10] K. S. Jones. A look back and a look forward. In SIGIR’88: Proceedings of the 11th annual internationalACM SIGIR conference on Research and developmentin information retrieval, pages 13–29, New York, NY,USA, 1988. ACM.
[11] K. Kwang-ki and T. Berard. Typification in societyand social science: The continuing relevance ofSchutz’s social phenomenology. Human Studies,32(3):263–289, 2009.
[12] K. B. Ng. The applicability of universal pragmatics ininformation retrieval interaction: a pilot study. Inf.Process. Manage., 38(2):237–248, 2002.
[13] K. B. Ng. Toward a theoretical framework forunderstanding the relationship between situated actionand planned action models of behavior in informationretrieval contexts: contributions from phenomenology.Inf. Process. Manage., 38(5):613–626, 2002.
[14] G. Salton. Automatic Text Processing: TheTransformation, Analysis, and Retrieval ofInformation by Computer. Addison-Wesley, 1989.
[15] M. Serres. Le parasite. John Hopkins University,London, 1982.
[16] C. Shannon, N. Petigara, and S. Seshasai. Amathematical theory of communication. Bell SystemTechnical Journal, 27:379–423, 1948.
[17] T. D. Wilson. Alfred Schutz, phenomenology andresearch methodology for information behaviourresearch. In ISIC 2002, pages 193–207, Lisbon,Portugal, 2002.
[18] L. Wittgenstein. Philosophische Untersuchungen - AufGrundlage der Kritisch-genetischen Edition, volume1372. Suhrkamp, Frankfurt a. M., September 1953.
94
Layered, Adaptive Results:
Interaction Concepts for Large, Heterogeneous Data Sets
Duane DeglerDesign for Context
Columbia, MD, USA
ABSTRACTSome data environments are not well served by current styles ofsearch results presentation. One example of this is large-scalearchival, library or museum collections. The range of user goalsand interaction needs can be quite broad, and the informationitself is highly structured yet very heterogeneous – it spans manysubject areas, information types, and presentation/media. Basedon the use of semantic web formats for metadata, we believe it ispossible to leverage the semantic relationships to drive aspects ofresults presentation – to change elements of the UI itself inresponse to the results data. We present these concepts as acatalyst for discussion with the HCIR research community,exploring how semantic structures can support arrangement andcomponents available for refining search results sets, and thusmake the interface more responsive to user’s goals and needs.
1. INTRODUCTIONCurrent commercial search tools are primarily instance-driven –they focus the user on specific content items (results lists) and relyon the quality of relevance algorithms to increase the likelihoodthat information related to a user’s goals will be near the top ofthe results set. While this has successfully addressed some needsin targeted, open world seeking scenarios, limitations have beenidentified both for exploratory search [1] and in more closed-world situations (e.g. intranets and specific domain searching).
Beyond instance-level lists, facets provide a simple, interactiveabstraction of the underlying results set, derived from theattributes of the result instances. However, while they aresuccessful in helping users filter large results sets, they becomeproblematic when the data is very heterogeneous or changesfrequently, and thus the available categories for facets are noteasily representative of the potential results set. Facet categoriescan be difficult to establish, and what can be reliably categorizedmay not map to users’ needs.
There are increasing examples of visualization of search results inorder to get a meta-level profile of the types of results returned [2,ch.10]. There are also good examples of model-driven interactionswith results sets, based on semantic data relationships, where theinteraction with the model extends beyond filtering to broader
exploration. mSpace1 and Parallax2 are two of the best knownexamples. However, in these cases, the models remain primarilysubject-centered, and the UI itself does not adapt to aspects of themodel that are mapped to, or present in, the results metadata andcontent. Fortunately, it’s encouraging to see the concept ofresponsive UIs increasingly discussed in semantic UI and HCIRpapers [e.g. 3, 4, 5].
The work described here represents design thinking and datamodeling, not yet implementation. Future prototypes and userstudies will assess the value of the concepts, identify whatmetadata refinement is needed, and find performance issues fortechnical design. In the meantime, this position paper aims toopen discussion of the concepts with HCIR researchers.
2. DOMAIN & INFORMATION CONTEXTThe domains where this approach is being considered are not“open world” search domains. Within the archival, library andmuseum environments, records and artifacts have particularattributes that provide opportunities and challenges [6]:
Metadata is highly structured, as are hierarchicalrelationships within sets of information. However, muchof this structure is catalog, not subject, related.
Some subject and entity categorization exists, althoughoften at a higher aggregate level, and it may beinconsistently applied.
A wide range of subjects can be present in collections,as they come from a wide range of sources.
Vocabulary changes quite dramatically over time, yetthe vocabulary used to describe items must remainappropriate to its period for historical integrity.Classification schemes that aim to capture thisvocabulary can become huge themselves, with millionsof terms in the most used schemes.
Not all materials are equally indexable for search –collections include handwritten text, scannedphotographs, drawings, encoding-rich databases,statistical data, legalese, and lots of redundant content.
User needs (and familiarity with archival/researchtechniques) vary quite widely, from researching allaspects of detailed subjects that span dozens (orhundreds) of years, to finding single specific documentsrelating to individual personal ancestors.
1 http://mspace.fm2 http://www.freebase.com/labs/parallax/
Permission to make digital or hard copies of all or part of this work forpersonal or classroom use is granted without fee provided that copies arenot made or distributed for profit or commercial advantage and thatcopies bear this notice and the full citation on the first page. To copyotherwise, or republish, to post on servers or to redistribute to lists,requires prior specific permission and/or a fee.HCIR’10, August 22, 2010, New Jersey, USA.Copyright 2010 Duane Degler
95
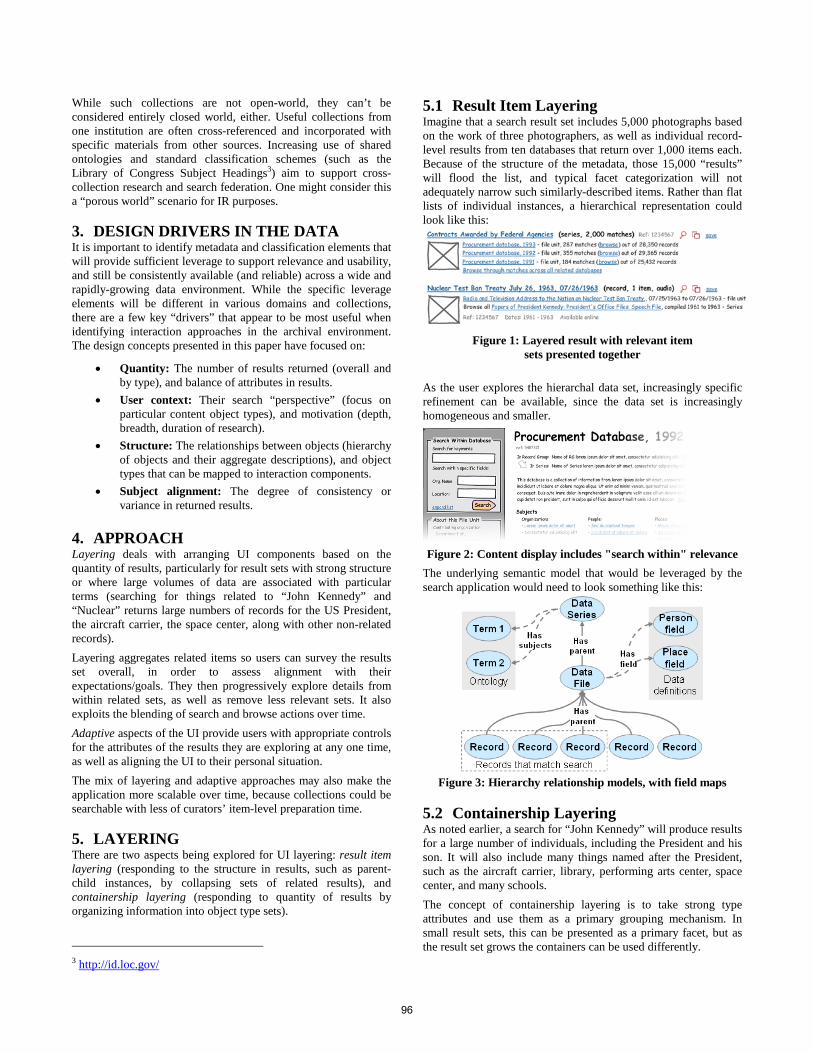
While such collections are not open-world, they can’t beconsidered entirely closed world, either. Useful collections fromone institution are often cross-referenced and incorporated withspecific materials from other sources. Increasing use of sharedontologies and standard classification schemes (such as theLibrary of Congress Subject Headings3) aim to support cross-collection research and search federation. One might consider thisa “porous world” scenario for IR purposes.
3. DESIGN DRIVERS IN THE DATAIt is important to identify metadata and classification elements thatwill provide sufficient leverage to support relevance and usability,and still be consistently available (and reliable) across a wide andrapidly-growing data environment. While the specific leverageelements will be different in various domains and collections,there are a few key “drivers” that appear to be most useful whenidentifying interaction approaches in the archival environment.The design concepts presented in this paper have focused on:
Quantity: The number of results returned (overall andby type), and balance of attributes in results.
User context: Their search “perspective” (focus onparticular content object types), and motivation (depth,breadth, duration of research).
Structure: The relationships between objects (hierarchyof objects and their aggregate descriptions), and objecttypes that can be mapped to interaction components.
Subject alignment: The degree of consistency orvariance in returned results.
4. APPROACHLayering deals with arranging UI components based on thequantity of results, particularly for result sets with strong structureor where large volumes of data are associated with particularterms (searching for things related to “John Kennedy” and“Nuclear” returns large numbers of records for the US President,the aircraft carrier, the space center, along with other non-relatedrecords).
Layering aggregates related items so users can survey the resultsset overall, in order to assess alignment with theirexpectations/goals. They then progressively explore details fromwithin related sets, as well as remove less relevant sets. It alsoexploits the blending of search and browse actions over time.
Adaptive aspects of the UI provide users with appropriate controlsfor the attributes of the results they are exploring at any one time,as well as aligning the UI to their personal situation.
The mix of layering and adaptive approaches may also make theapplication more scalable over time, because collections could besearchable with less of curators’ item-level preparation time.
5. LAYERINGThere are two aspects being explored for UI layering: result itemlayering (responding to the structure in results, such as parent-child instances, by collapsing sets of related results), andcontainership layering (responding to quantity of results byorganizing information into object type sets).
3 http://id.loc.gov/
5.1 Result Item LayeringImagine that a search result set includes 5,000 photographs basedon the work of three photographers, as well as individual record-level results from ten databases that return over 1,000 items each.Because of the structure of the metadata, those 15,000 “results”will flood the list, and typical facet categorization will notadequately narrow such similarly-described items. Rather than flatlists of individual instances, a hierarchical representation couldlook like this:
Figure 1: Layered result with relevant itemsets presented together
As the user explores the hierarchal data set, increasingly specificrefinement can be available, since the data set is increasinglyhomogeneous and smaller.
Figure 2: Content display includes "search within" relevance
The underlying semantic model that would be leveraged by thesearch application would need to look something like this:
Figure 3: Hierarchy relationship models, with field maps
5.2 Containership LayeringAs noted earlier, a search for “John Kennedy” will produce resultsfor a large number of individuals, including the President and hisson. It will also include many things named after the President,such as the aircraft carrier, library, performing arts center, spacecenter, and many schools.
The concept of containership layering is to take strong typeattributes and use them as a primary grouping mechanism. Insmall result sets, this can be presented as a primary facet, but asthe result set grows the containers can be used differently.
96
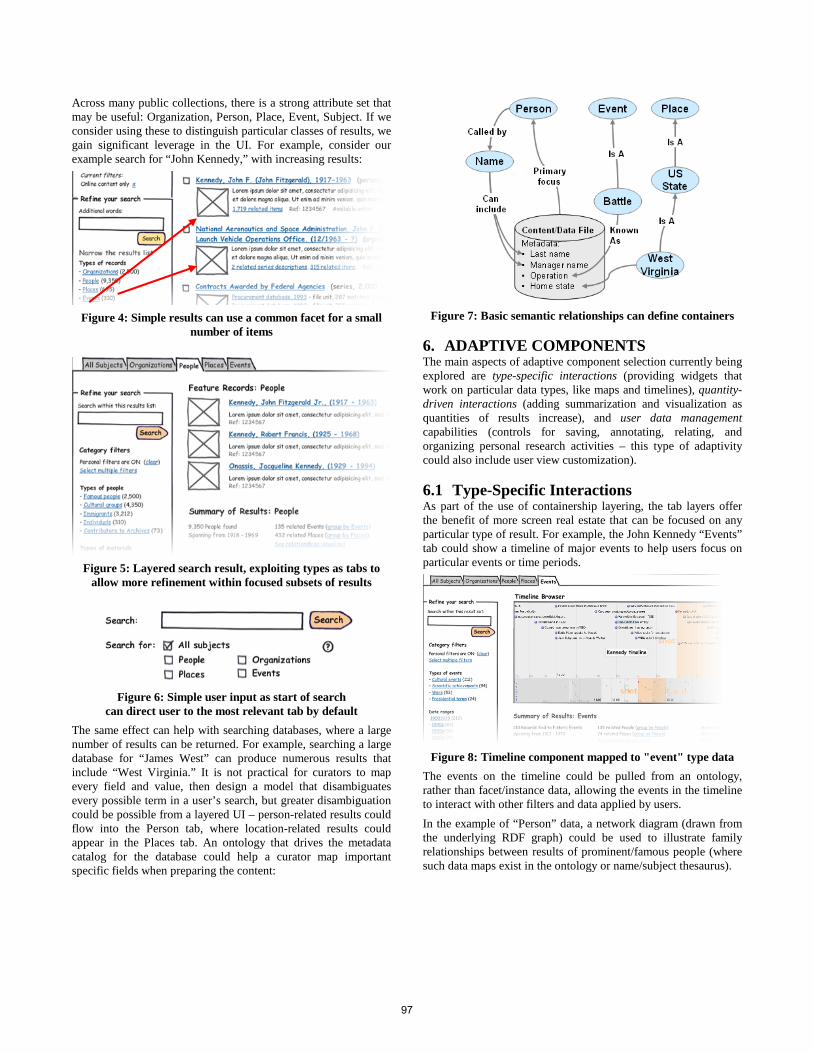
Across many public collections, there is a strong attribute set thatmay be useful: Organization, Person, Place, Event, Subject. If weconsider using these to distinguish particular classes of results, wegain significant leverage in the UI. For example, consider ourexample search for “John Kennedy,” with increasing results:
Figure 4: Simple results can use a common facet for a smallnumber of items
Figure 5: Layered search result, exploiting types as tabs toallow more refinement within focused subsets of results
Figure 6: Simple user input as start of searchcan direct user to the most relevant tab by default
The same effect can help with searching databases, where a largenumber of results can be returned. For example, searching a largedatabase for “James West” can produce numerous results thatinclude “West Virginia.” It is not practical for curators to mapevery field and value, then design a model that disambiguatesevery possible term in a user’s search, but greater disambiguationcould be possible from a layered UI – person-related results couldflow into the Person tab, where location-related results couldappear in the Places tab. An ontology that drives the metadatacatalog for the database could help a curator map importantspecific fields when preparing the content:
Figure 7: Basic semantic relationships can define containers
6. ADAPTIVE COMPONENTSThe main aspects of adaptive component selection currently beingexplored are type-specific interactions (providing widgets thatwork on particular data types, like maps and timelines), quantity-driven interactions (adding summarization and visualization asquantities of results increase), and user data managementcapabilities (controls for saving, annotating, relating, andorganizing personal research activities – this type of adaptivitycould also include user view customization).
6.1 Type-Specific InteractionsAs part of the use of containership layering, the tab layers offerthe benefit of more screen real estate that can be focused on anyparticular type of result. For example, the John Kennedy “Events”tab could show a timeline of major events to help users focus onparticular events or time periods.
Figure 8: Timeline component mapped to "event" type data
The events on the timeline could be pulled from an ontology,rather than facet/instance data, allowing the events in the timelineto interact with other filters and data applied by users.
In the example of “Person” data, a network diagram (drawn fromthe underlying RDF graph) could be used to illustrate familyrelationships between results of prominent/famous people (wheresuch data maps exist in the ontology or name/subject thesaurus).
97
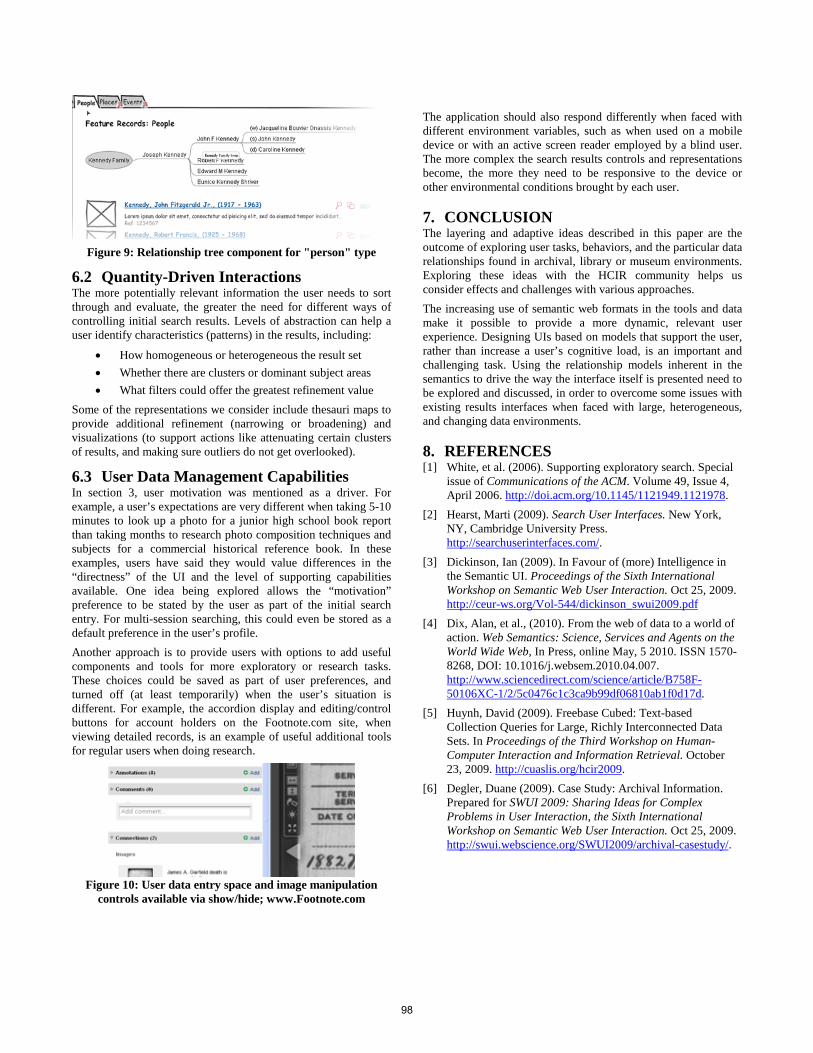
Figure 9: Relationship tree component for "person" type
6.2 Quantity-Driven InteractionsThe more potentially relevant information the user needs to sortthrough and evaluate, the greater the need for different ways ofcontrolling initial search results. Levels of abstraction can help auser identify characteristics (patterns) in the results, including:
How homogeneous or heterogeneous the result set
Whether there are clusters or dominant subject areas
What filters could offer the greatest refinement value
Some of the representations we consider include thesauri maps toprovide additional refinement (narrowing or broadening) andvisualizations (to support actions like attenuating certain clustersof results, and making sure outliers do not get overlooked).
6.3 User Data Management CapabilitiesIn section 3, user motivation was mentioned as a driver. Forexample, a user’s expectations are very different when taking 5-10minutes to look up a photo for a junior high school book reportthan taking months to research photo composition techniques andsubjects for a commercial historical reference book. In theseexamples, users have said they would value differences in the“directness” of the UI and the level of supporting capabilitiesavailable. One idea being explored allows the “motivation”preference to be stated by the user as part of the initial searchentry. For multi-session searching, this could even be stored as adefault preference in the user’s profile.
Another approach is to provide users with options to add usefulcomponents and tools for more exploratory or research tasks.These choices could be saved as part of user preferences, andturned off (at least temporarily) when the user’s situation isdifferent. For example, the accordion display and editing/controlbuttons for account holders on the Footnote.com site, whenviewing detailed records, is an example of useful additional toolsfor regular users when doing research.
Figure 10: User data entry space and image manipulationcontrols available via show/hide; www.Footnote.com
The application should also respond differently when faced withdifferent environment variables, such as when used on a mobiledevice or with an active screen reader employed by a blind user.The more complex the search results controls and representationsbecome, the more they need to be responsive to the device orother environmental conditions brought by each user.
7. CONCLUSIONThe layering and adaptive ideas described in this paper are theoutcome of exploring user tasks, behaviors, and the particular datarelationships found in archival, library or museum environments.Exploring these ideas with the HCIR community helps usconsider effects and challenges with various approaches.
The increasing use of semantic web formats in the tools and datamake it possible to provide a more dynamic, relevant userexperience. Designing UIs based on models that support the user,rather than increase a user’s cognitive load, is an important andchallenging task. Using the relationship models inherent in thesemantics to drive the way the interface itself is presented need tobe explored and discussed, in order to overcome some issues withexisting results interfaces when faced with large, heterogeneous,and changing data environments.
8. REFERENCES[1] White, et al. (2006). Supporting exploratory search. Special
issue of Communications of the ACM. Volume 49, Issue 4,April 2006. http://doi.acm.org/10.1145/1121949.1121978.
[2] Hearst, Marti (2009). Search User Interfaces. New York,NY, Cambridge University Press.http://searchuserinterfaces.com/.
[3] Dickinson, Ian (2009). In Favour of (more) Intelligence inthe Semantic UI. Proceedings of the Sixth InternationalWorkshop on Semantic Web User Interaction. Oct 25, 2009.http://ceur-ws.org/Vol-544/dickinson_swui2009.pdf
[4] Dix, Alan, et al., (2010). From the web of data to a world ofaction. Web Semantics: Science, Services and Agents on theWorld Wide Web, In Press, online May, 5 2010. ISSN 1570-8268, DOI: 10.1016/j.websem.2010.04.007.http://www.sciencedirect.com/science/article/B758F-50106XC-1/2/5c0476c1c3ca9b99df06810ab1f0d17d.
[5] Huynh, David (2009). Freebase Cubed: Text-basedCollection Queries for Large, Richly Interconnected DataSets. In Proceedings of the Third Workshop on Human-Computer Interaction and Information Retrieval. October23, 2009. http://cuaslis.org/hcir2009.
[6] Degler, Duane (2009). Case Study: Archival Information.Prepared for SWUI 2009: Sharing Ideas for ComplexProblems in User Interaction, the Sixth InternationalWorkshop on Semantic Web User Interaction. Oct 25, 2009.http://swui.webscience.org/SWUI2009/archival-casestudy/.
98
Revisiting Exploratory Search from the HCI Perspective Abdigani Diriye†, Max L. Wilson★, Ann Blandford† and Anastasios Tombros‡
†University College London Interaction Centre, University College London, UK ‡Department of Computer Science, Queen Mary University London, UK ★Future Interaction Technologies Lab, Swansea University, UK
{a.diriye, a.blandford}@ucl.ac.uk, [email protected], [email protected]
ABSTRACT In this paper, we revisit the definition of Exploratory Search tasks after 4 years of contributions from the Information Seeking and Retrieval community. We consolidate the factors that influence an exploratory search task: objective, search activities, conceptual complexity, and procedural complexity, and introduce a new factor: domain knowledge. We hypothesize that, in order to support Exploratory Search tasks efficiently, we must consider all the factors from an HCI perspective.
1. INTRODUCTION The concept of a search task is a core component of the Information Science and Retrieval field. Many researchers have distinguished search tasks into two distinct bins: known-item and exploratory search tasks. Despite this binary classification, all search tasks can be seen as being exploratory to some degree [18], and we see that exploratory search tasks can comprise elements of known-item searching. A number of researchers have associated known-item and exploratory search tasks with distinct kinds of search behaviors and activities such as navigation, fact retrieval, learning and investigating [4, 7, 12, 13]. In instances where the searcher is able to adequately specify their information need, we can categorize this type of search as look-up or known-item because of their well-defined information need, and their search task only needing a look-up of a known piece of information. Other researchers have referred to this category as closed tasks [12], information processing tasks [4], simple tasks [5], and specific tasks [15].
The other category of search task, which will be the focus of this paper, is usually motivated by a poor understanding of the search topic, and goes beyond simple fact retrieval. The Information Science and Retrieval community has loosely defined exploratory search tasks as an open-ended, ill-defined and multi-faceted search problem that seeks to foster some knowledge product, or inform some action [13, 14, 18]. Exploratory search tasks are typically detectable from a searcher’s:
• Poor familiarity with the domain of their search goal; • Uncertainty of their search goal; • Uncertainty in the manner to achieve their goal [19].
Exploratory search tasks are not a new phenomenon by any stretch; they have been referred to by different labels in the last 30 years. Prior to Marchionini’s seminal paper on exploratory search [13], this category of search tasks has been referred to as: subject searches [9, 16], general tasks [5, 15], decision tasks [4], and open-ended tasks [12], but they all essentially refer to the same construct.
A number of works has discussed exploratory search tasks from different angles: Byström & Järvelin [4] and Bell and Ruthven [2] discussed it in relation to complexity and uncertainty; Marchionini
[13] described the activities involved distinguishing exploratory search tasks from known-item search tasks; Aula and Russell [1] described it according to the number of actions involved; and Kim and Soergel [10], and White and Roth [18] discussed the inherent sensemaking involved, and Kang et al. [8] have discussed the role of domain knowledge and expertise. In this paper, we revisit the existing definition of exploratory search tasks, and put forward a revised explanation, and finally a few ways taking a HCI perspective can address some of the difficulties experienced by exploratory searchers. In section 2, we discuss some of the attributes of exploratory search tasks; in section 3 present a revised definition; in section 4, we bring to attention an overlooked factor in exploratory search tasks; in section 5, we describe how taking a HCI perspective can support exploratory searching; and finally, in section 6 we summarize our work.
2. DEFINING EXPLORATORY SEARCH Considerable progress has been made in identifying and studying exploratory search tasks by the Information Science and Retrieval community. The body of work describing exploratory search tasks has used factors such as complexity, uncertainty, search objective, motivation, task product, and activities as dimensions to describe them [3, 4, 12, 13, 14]. The factors we discuss below are the most objective and descriptive elements we found in our review, and on occasions we have subsumed factors that greatly overlap.
2.1 Search Objective The objective of any exploratory search task is typically to create a knowledge product or shape an action through searching, browsing, learning and investigation. Exploratory search tasks are usually abstract, open-ended and multifaceted search problems, where the target information can be poorly-defined [13, 18]. The onus of an exploratory search task is more on the journey the searcher takes to find the required information, rather than the information per se.
2.2 Search Activities Exploratory search tasks are associated with higher-level search activities like analysis, comparison, comprehension and evaluation as well as more undirected search behaviors like exploratory browsing1. There is also a strong element of sensemaking and learning inherent in exploratory search tasks, and according to Marchionini’s model of exploratory search tasks [13], these are core activities of exploratory search tasks. White and Roth [18] have discussed how more undirected exploratory search behaviors such as exploratory browsing happen in
1 Though more high-level search activities are associated with exploratory
search tasks, directed search activities like look-up are an important part of exploratory search tasks.
99

conjunction with focused and directed search behaviors like look-up searching.
Exploratory browsing plays an important role in exploratory search tasks: it enables searchers to resolve uncertainty during their search. White and Roth noted this to be a defining characteristic of exploratory search tasks, and ascribe this to the searcher becoming familiar with their search problem and information space [18]. This familiarity with the domain and information space enables the searcher to move further along in their search task, and move from exploratory browsing to more directed and focused searching. But, given the dynamic nature of exploratory search tasks, searchers tend to digress between browsing and searching.
2.3 Conceptual Complexity The concept of complexity has been described at length by Byström and Järvelin [4] and Bell & Ruthven [2]. Byström and Järvelin have categorized tasks based on a priori determinability, or how much of the task’s requirements, process and outcomes can be determined beforehand. This is similar to Kuhlthau’s concept of uncertainty, where in her work on longitudinal searching [11] she showed that uncertainty decreases with understanding. The uncertainty surrounding exploratory search tasks can be a result of the problem context being under-defined, or the difficulty and complexity of the search task. Byström and Järvelin correlated an increase in uncertainty with the search task becoming more complex and difficult. It is widely accepted that well-defined search tasks like known-item searches have a high level of a priori determinability because the searcher is able to determine what information is needed and how they should go about finding it. Whereas for more complex tasks like exploratory search tasks, these factors cannot be a priori determined because of the dynamic and transient nature of the searcher’s perceived information need and understanding of the problem context. Their uncertainty of the domain and search goal makes the process of searching, browsing and learning undirected to a degree. This has not only been shown to affect the complexity of the search task, and the searcher’s information seeking behavior [4], but also increases the uncertainty of the task.
2.4 Procedural Complexity Complexity has also been used by Aula & Russell [1] to describe search tasks. However, there is a semantic difference in their definition, Aula and Russell [1] denote the number of subtasks and steps involved in a search task, whereas Byström and Järvelin’s and Bell and Ruthven’s definition refers to the conceptual complexity related to the search task, such as how complex is it to determine the task requirements. Both these definitions of complexity are valid and important in understanding exploratory search tasks, but for clarification we need to delineate these different constructs, and understand the differences between these two perspectives on complexity. To illustrate this point, a search task requiring a searcher to identify CHI best papers for the last 10 years is clear and conceptually very straightforward, but as this search task has a number of steps, it is procedurally complex.
2.5 Other Attributes Li and Belkin [14] have collated a comprehensive list of attributes and facets to describe everyday tasks from various studies in Information Science and Retrieval. Their classification provides ample description, but for the purposes of this work some of the
facets are redundant, and the search tasks can be better conceptualized by only using a core subset to describe them. For example, attributes relating to the duration, importance and urgency of a task are not considered as core attributes to describe a search task, as we believe these factors do not change the nature of the search task, and whether it is exploratory or not. Our focus has primarily been objective factors such as search motivation and search activities. In the literature, subjective factors such as domain knowledge and search expertise have been overlooked, and excluded in the discussion of exploratory search tasks. These factors play an important role, and affect how information is discovered [8] and how complex a search task is perceived [6, 14, 18].
2.6 Examples of Search Tasks So far, we have discussed the characteristics that distinguish exploratory tasks; we next provide an example and contrast it with a known-item search task to illustrate these differences.
For the known-item task, searchers would need to identify information to complete the task. In this search task, there is very little uncertainty concerning the information the searcher is looking for, and as it is well-defined they would be able to formulate a definitive judgment on whether they have completed their task or not. In comparison, the exploratory search task
requires the user to initially learn about the search topic, and then formulate a decision based on self-defined relevance criteria. This task is not only more difficult and open, but also more engaging, less well-defined, and requires more a priori information to be known. The onus therefore is on the searcher to formulate an understanding, and analyze and investigate the information.
3. A REVISED DEFINITION Based on our survey of the literature, we can define exploratory search tasks involving:
Objective: The purpose of which is to inform a decision or produce some new knowledge;
Search Activities: Which must involve an element of learning, investigation and discovery;
Conceptual Complexity: The search steps and target information can be vague;
Procedural Complexity: The search task must involve a number of search actions;
If we revisit the exploratory search task described above, in light of our criteria for exploratory search tasks, we see that the above example does satisfy these criteria:
Known-item task Identify three Voice over Internet Protocol (VoIP) telephone services.
Exploratory task You are considering purchasing a Voice over Internet Protocol (VoIP) telephone. You want to learn more about VoIP technology and providers that offer the service, and select the provider and telephone that best suits you.
Figure 1: An example of known-item and exploratory search tasks.
100
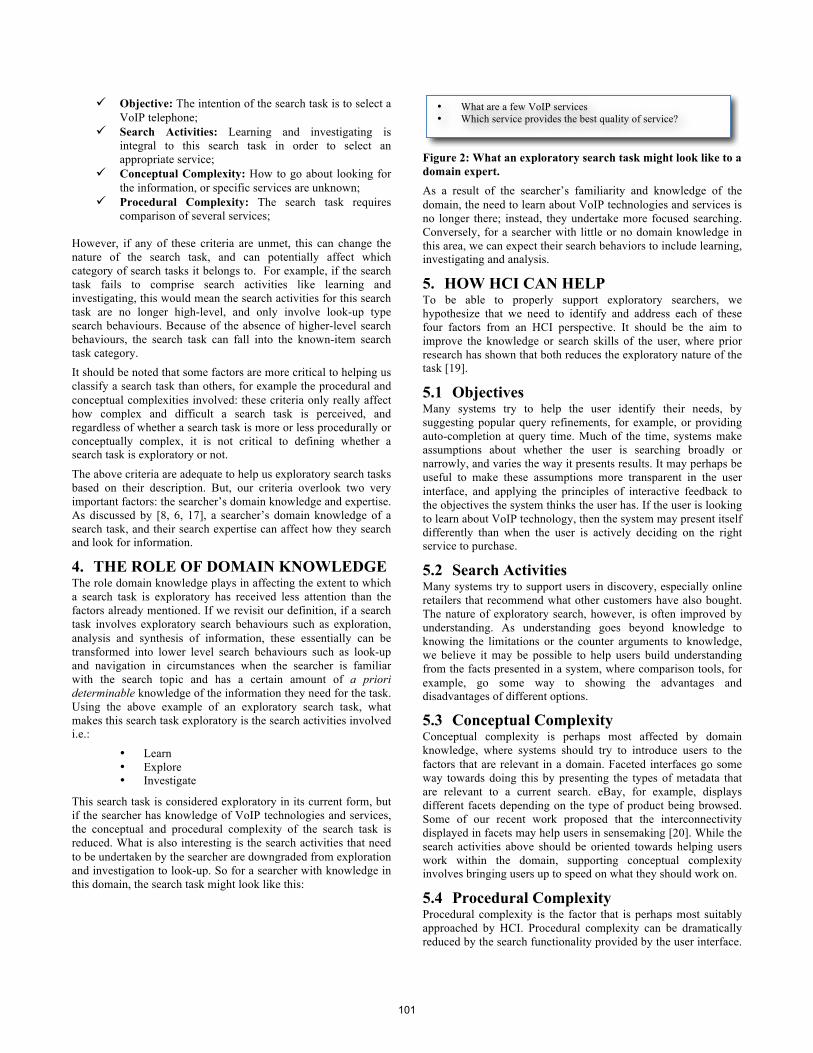
Objective: The intention of the search task is to select a VoIP telephone;
Search Activities: Learning and investigating is integral to this search task in order to select an appropriate service;
Conceptual Complexity: How to go about looking for the information, or specific services are unknown;
Procedural Complexity: The search task requires comparison of several services;
However, if any of these criteria are unmet, this can change the nature of the search task, and can potentially affect which category of search tasks it belongs to. For example, if the search task fails to comprise search activities like learning and investigating, this would mean the search activities for this search task are no longer high-level, and only involve look-up type search behaviours. Because of the absence of higher-level search behaviours, the search task can fall into the known-item search task category. It should be noted that some factors are more critical to helping us classify a search task than others, for example the procedural and conceptual complexities involved: these criteria only really affect how complex and difficult a search task is perceived, and regardless of whether a search task is more or less procedurally or conceptually complex, it is not critical to defining whether a search task is exploratory or not.
The above criteria are adequate to help us exploratory search tasks based on their description. But, our criteria overlook two very important factors: the searcher’s domain knowledge and expertise. As discussed by [8, 6, 17], a searcher’s domain knowledge of a search task, and their search expertise can affect how they search and look for information.
4. THE ROLE OF DOMAIN KNOWLEDGE The role domain knowledge plays in affecting the extent to which a search task is exploratory has received less attention than the factors already mentioned. If we revisit our definition, if a search task involves exploratory search behaviours such as exploration, analysis and synthesis of information, these essentially can be transformed into lower level search behaviours such as look-up and navigation in circumstances when the searcher is familiar with the search topic and has a certain amount of a priori determinable knowledge of the information they need for the task. Using the above example of an exploratory search task, what makes this search task exploratory is the search activities involved i.e.:
• Learn • Explore • Investigate
This search task is considered exploratory in its current form, but if the searcher has knowledge of VoIP technologies and services, the conceptual and procedural complexity of the search task is reduced. What is also interesting is the search activities that need to be undertaken by the searcher are downgraded from exploration and investigation to look-up. So for a searcher with knowledge in this domain, the search task might look like this:
Figure 2: What an exploratory search task might look like to a domain expert. As a result of the searcher’s familiarity and knowledge of the domain, the need to learn about VoIP technologies and services is no longer there; instead, they undertake more focused searching. Conversely, for a searcher with little or no domain knowledge in this area, we can expect their search behaviors to include learning, investigating and analysis.
5. HOW HCI CAN HELP To be able to properly support exploratory searchers, we hypothesize that we need to identify and address each of these four factors from an HCI perspective. It should be the aim to improve the knowledge or search skills of the user, where prior research has shown that both reduces the exploratory nature of the task [19].
5.1 Objectives Many systems try to help the user identify their needs, by suggesting popular query refinements, for example, or providing auto-completion at query time. Much of the time, systems make assumptions about whether the user is searching broadly or narrowly, and varies the way it presents results. It may perhaps be useful to make these assumptions more transparent in the user interface, and applying the principles of interactive feedback to the objectives the system thinks the user has. If the user is looking to learn about VoIP technology, then the system may present itself differently than when the user is actively deciding on the right service to purchase.
5.2 Search Activities Many systems try to support users in discovery, especially online retailers that recommend what other customers have also bought. The nature of exploratory search, however, is often improved by understanding. As understanding goes beyond knowledge to knowing the limitations or the counter arguments to knowledge, we believe it may be possible to help users build understanding from the facts presented in a system, where comparison tools, for example, go some way to showing the advantages and disadvantages of different options.
5.3 Conceptual Complexity Conceptual complexity is perhaps most affected by domain knowledge, where systems should try to introduce users to the factors that are relevant in a domain. Faceted interfaces go some way towards doing this by presenting the types of metadata that are relevant to a current search. eBay, for example, displays different facets depending on the type of product being browsed. Some of our recent work proposed that the interconnectivity displayed in facets may help users in sensemaking [20]. While the search activities above should be oriented towards helping users work within the domain, supporting conceptual complexity involves bringing users up to speed on what they should work on.
5.4 Procedural Complexity Procedural complexity is the factor that is perhaps most suitably approached by HCI. Procedural complexity can be dramatically reduced by the search functionality provided by the user interface.
• What are a few VoIP services • Which service provides the best quality of service?
101
A service that provides an easy comparison service for VoIP technology dramatically reduces the task of comparing options. Performing this service directly with a search engine, however, involves many iterative and repeated result viewing, perhaps within multiple tabs.
6. SUMMARY In this paper, we have put forward a definition of exploratory search tasks that takes into consideration objective and subjective factors. Objective factors like the objective and search activities of a search task determine the category a search task is assigned to. We have discussed how the conceptual and procedural complexity makes a search task more or less difficult, and challenging to undertake. We have also brought to attention subjective factors such as domain knowledge and search expertise which can affect the search activities undertaken by a searcher, and thus how “exploratory” the search task is perceived.
We believe that all four factors identified in our review of exploratory search tasks have to be addressed independently within an exploratory search user interface in order to support searchers effectively. Reduced knowledge of any one of these attributes can turn a normal search task into an exploratory one. We have presented initial ideas for addressing these factors from an HCI perspective and plan to explore these further in the future.
ACKNOWLEDGMENTS We thank Claire Warwick for the initial ideas and discussions. This work is supported by an EPSRC studentship.
7. REFERENCES [1] Aula, A., & Russell, D.M. (2008). Complex and Exploratory
Web Search. ISSS: Information Seeking Support Systems Workshop, 23-24.
[2] Bell, D. J., & Ruthven I. (2004). Searcher's Assessments of Task Complexity for Web Searching. ECIR 2004: 57-71
[3] Byström, K., & Hansen, P. (2002). Work tasks as units for analysis in information seeking and retrieval studies. Proc. of the fourth international conference on conceptions of library and information science.
[4] Byström, K., & Järvelin, K. (1995). Task complexity affects information seeking and use. Info. Processing & Management, 31, 191–213.
[5] Campbell, D. J. (1988). Task complexity: A review and analysis. Academy of Management Review, 13(1), 40–52.
[6] Hsieh-Yee, I. (1993). Effects of search experience and subject knowledge on the search tactics of novice and experienced searchers. Journal of ASIS 44(3), 161–174.
[7] Ingwersen, P., & Järvelin, K. (2005). The turn: Integration of information seeking and retrieval in context. Dortrecht, NL: Springer.
[8] Kang, R., Fu, W.-T., & Kannampallil, T. G., (2010) Exploiting knowledge-in-the-head and knowledge-in-the-social-web: effects of domain expertise on exploratory search in individual and social search environments. CHI 2010: 393-402
[9] Kim, K.-S., & Allen, B. (2000). Cognitive and task influences on web searching behavior. Journal of ASIST, 53(2), 109–119.
[10] Kim, S., & Soergel, D. (2005). Selecting and measuring taskcharacteristics as independent variables. Proc. ASIST, 42, Information Today, Medford, NJ.
[11] Kuhlthau, C.C. (1994). Seeking meaning: a process approach to library and information services. Norwood, NJ: Ablex Publishing, 1994.
[12] Marchionini, G. (1989). Information seeking strategies of novices using a full-text electronic encyclopedia. Journal of ASIS, 40(1), 54–66.
[13] Marchionini, G. Exploratory search: From finding to understanding. CACM, 49(4):41–46, 2006
[14] Li, Y., & Belkin, N. J. (2008). A faceted approach to conceptualizing tasks in information seeking. Inf. Process. Manage., 44(6):1822–1837, 2008.
[15] Qiu, L. (1993). Analytical searching vs. browsing in hypertext information retrieval systems. Canadian Journal of Info. and Library Science, 18(4), 1–13.
[16] Walker, G., & Janes, J. (1999). Online retrieval: A dialogue of theory and practice (2nd ed.). Englewood, CO: Libraries Unlimited.
[17] White, R. W., Dumais, S. T., & Teevan, J. (2009). Characterizing the influence of domain expertise on web search behavior. WSDM 2009: 132-141
[18] White, R. W., & Roth, R. (2009) Exploratory Search: Beyond the Query-Response Paradigm, In Morgan & Claypool Series on Information Concepts, Retrieval, and Services.
[19] Wilson, M. L. (2009) An Analytical Inspection Framework for Evaluating the Search Tactics and User Profiles Supported by Information Seeking Interfaces. PhD Thesis, University of Southampton.
[20] Wilson, M. L. & schraefel, m. c. (2009) The Importance of Conveying Inter-Facet Relationships for Making Sense of Unfamiliar Domains. In: CHI2009 Workshop on Sensemaking, 2009
102
Supporting Task with Information Appliances:
Taxonomy of Needs
Sarah Gilbert, Lori McCay-Peet & Elaine G. Toms iLab, Faculty of Management
Dalhousie University Halifax, Nova Scotia, Canada
+1 (902) 494-8392
sagilber; mccay; etoms{@dal.ca}
ABSTRACT
Integrating search systems with task environments to create task-
specific information appliances will most likely represent the
next wave of technologies. At present, search systems are for the
most part isolated from the actual task environment. In this
paper we have identified one task environment – that of the
student writing a term paper – to propose sets of needs that
should to be supported by tools. In addition, the process of
completing the task illustrates how search needs change in level
of specificity over the life of the task.
Categories and Subject Descriptors
H.3.3 [Information Search and Retrieval]: Search Process
General Terms
Design, Human Factors.
Keywords
Task, Information Appliance.
1. INTRODUCTION As search engine giants such as Yahoo, Google, and Bing fight
for market share, their search interfaces are moving away from
the original simplicity of the search interface popularized by
Google to offer more enhanced search options for users (e.g.,
filtering, visualizations). However, they still strive to meet the
demands of the masses with a “one size fits all” interface and in
doing so fail to address the specific, contextual, task-based
needs of their users. Essentially, what is missing from the
current search engine landscape are task-specific information
appliances that embed search as a core function.
The term “information appliance,” coined by Raskin in 1978,
and popularized by Norman in 1998, is defined as “an appliance
specializing in information…designed to support a specific
activity” [2]. Information appliances are task-specific tools that
support the varied cognitive processes involved in the execution
of complex tasks such as patent writing, thesis topic
development, environmental decision making and project
management. Just as technologies such as the telescope have
enabled us to extend our perceptual capacity to make discoveries
and cutting edge creativity tools hold the promise of extending
our creative abilities [6], information appliances have the
potential to support knowledge work in all its stages from idea
to outcome, supporting the work flow rather than isolated
components of the work task.
Norman suggests that “making a proper information appliance
has two requirements: the tool must fit the task and there must
be universal communication and sharing” [2]. The system needs
to integrate multiple activities to support the task as a whole [5].
Search is linked to task-centric processes; yet search is rarely
fully integrated as exemplified by the way it is currently
included in word processing and email applications. Perhaps the
better implementations are within task-centric applications for
travel and shopping that support highly structured tasks with
very specific goals and known outcomes. However, with student
term paper writing, for example, the topic may not be known
and the outcome may be only known by its format rather than its
content. One of the few to note the close intertwining of search
with task was Vakkari [7,8,9] who additionally observed that
students needed better support during the various stages of
writing a thesis proposal.
Taking but one example from the pool of many task options,
how can we support the student who is writing a term paper? In
this paper we will outline the processes undertaken by students
while writing a paper and illustrate how these processes map to
functions and tools needed in an information appliance to
support the student writing task.
2. Understanding the Problem Kuhlthau’s [1] model of the search process and Vakkari’s
[7,8,9] enrichment of the model form the basis for our
description of the task which interweaves the search for
information with the act of writing a term paper (see column B
of Fig 1). Kuhlthau identified six phases of the information
search process: 1) task initiation, 2) topic selection, 3) prefocus
exploration, 4) focus formulation, 5) information collection and
6) search closure. Each of these phases needs a variety of tools
so that the student gets to the final phase. While Kuhlthau
stopped at search closure, Vakkari extends it to presentation; the
task is not complete and a more iterative process will ensue that
Permission to make digital or hard copies of all or part of this work for
personal or classroom use is granted without fee provided that copies are
not made or distributed for profit or commercial advantage and that
copies bear this notice and the full citation on the first page. To copy
otherwise, or republish, to post on servers or to redistribute to lists,
requires prior specific permission and/or a fee.
HCIR ’10, August 22, 2010, New Brunswick, New Jersey.
Copyright 2010 ACM 1-58113-000-0/00/0010…$10.00.
103
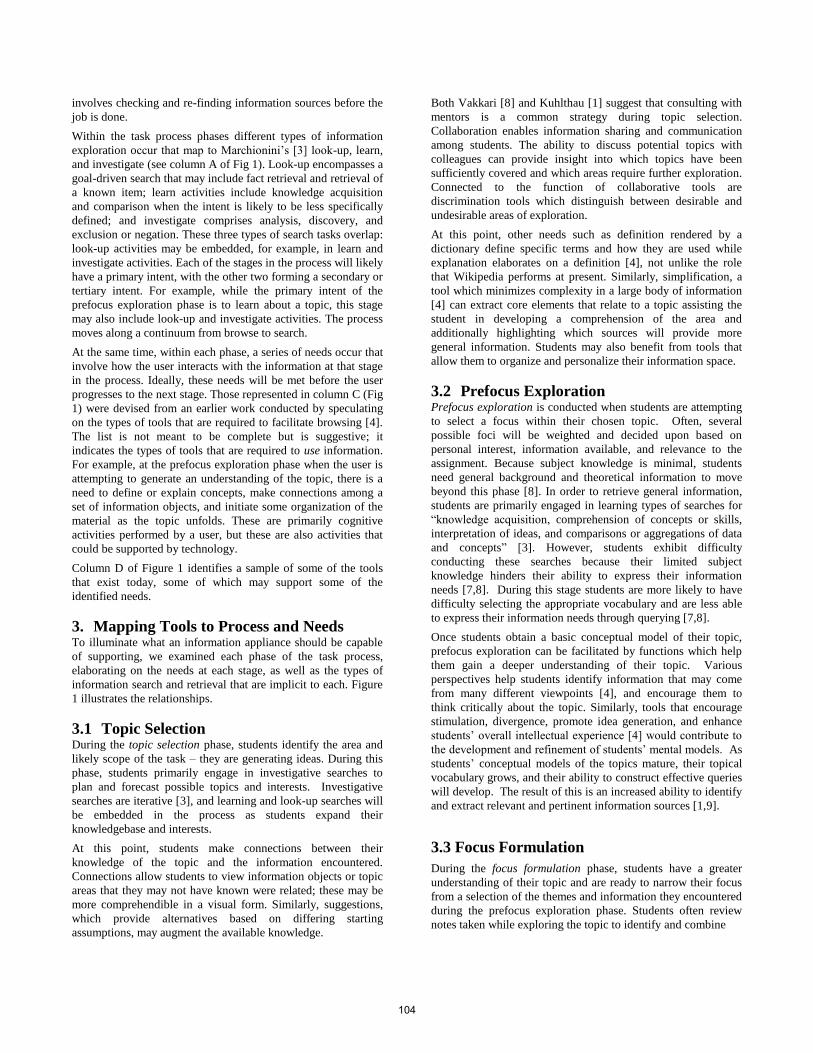
involves checking and re-finding information sources before the
job is done.
Within the task process phases different types of information
exploration occur that map to Marchionini’s [3] look-up, learn,
and investigate (see column A of Fig 1). Look-up encompasses a
goal-driven search that may include fact retrieval and retrieval of
a known item; learn activities include knowledge acquisition
and comparison when the intent is likely to be less specifically
defined; and investigate comprises analysis, discovery, and
exclusion or negation. These three types of search tasks overlap:
look-up activities may be embedded, for example, in learn and
investigate activities. Each of the stages in the process will likely
have a primary intent, with the other two forming a secondary or
tertiary intent. For example, while the primary intent of the
prefocus exploration phase is to learn about a topic, this stage
may also include look-up and investigate activities. The process
moves along a continuum from browse to search.
At the same time, within each phase, a series of needs occur that
involve how the user interacts with the information at that stage
in the process. Ideally, these needs will be met before the user
progresses to the next stage. Those represented in column C (Fig
1) were devised from an earlier work conducted by speculating
on the types of tools that are required to facilitate browsing [4].
The list is not meant to be complete but is suggestive; it
indicates the types of tools that are required to use information.
For example, at the prefocus exploration phase when the user is
attempting to generate an understanding of the topic, there is a
need to define or explain concepts, make connections among a
set of information objects, and initiate some organization of the
material as the topic unfolds. These are primarily cognitive
activities performed by a user, but these are also activities that
could be supported by technology.
Column D of Figure 1 identifies a sample of some of the tools
that exist today, some of which may support some of the
identified needs.
3. Mapping Tools to Process and Needs To illuminate what an information appliance should be capable
of supporting, we examined each phase of the task process,
elaborating on the needs at each stage, as well as the types of
information search and retrieval that are implicit to each. Figure
1 illustrates the relationships.
3.1 Topic Selection During the topic selection phase, students identify the area and
likely scope of the task – they are generating ideas. During this
phase, students primarily engage in investigative searches to
plan and forecast possible topics and interests. Investigative
searches are iterative [3], and learning and look-up searches will
be embedded in the process as students expand their
knowledgebase and interests.
At this point, students make connections between their
knowledge of the topic and the information encountered.
Connections allow students to view information objects or topic
areas that they may not have known were related; these may be
more comprehendible in a visual form. Similarly, suggestions,
which provide alternatives based on differing starting
assumptions, may augment the available knowledge.
Both Vakkari [8] and Kuhlthau [1] suggest that consulting with
mentors is a common strategy during topic selection.
Collaboration enables information sharing and communication
among students. The ability to discuss potential topics with
colleagues can provide insight into which topics have been
sufficiently covered and which areas require further exploration.
Connected to the function of collaborative tools are
discrimination tools which distinguish between desirable and
undesirable areas of exploration.
At this point, other needs such as definition rendered by a
dictionary define specific terms and how they are used while
explanation elaborates on a definition [4], not unlike the role
that Wikipedia performs at present. Similarly, simplification, a
tool which minimizes complexity in a large body of information
[4] can extract core elements that relate to a topic assisting the
student in developing a comprehension of the area and
additionally highlighting which sources will provide more
general information. Students may also benefit from tools that
allow them to organize and personalize their information space.
3.2 Prefocus Exploration Prefocus exploration is conducted when students are attempting
to select a focus within their chosen topic. Often, several
possible foci will be weighted and decided upon based on
personal interest, information available, and relevance to the
assignment. Because subject knowledge is minimal, students
need general background and theoretical information to move
beyond this phase [8]. In order to retrieve general information,
students are primarily engaged in learning types of searches for
“knowledge acquisition, comprehension of concepts or skills,
interpretation of ideas, and comparisons or aggregations of data
and concepts” [3]. However, students exhibit difficulty
conducting these searches because their limited subject
knowledge hinders their ability to express their information
needs [7,8]. During this stage students are more likely to have
difficulty selecting the appropriate vocabulary and are less able
to express their information needs through querying [7,8].
Once students obtain a basic conceptual model of their topic,
prefocus exploration can be facilitated by functions which help
them gain a deeper understanding of their topic. Various
perspectives help students identify information that may come
from many different viewpoints [4], and encourage them to
think critically about the topic. Similarly, tools that encourage
stimulation, divergence, promote idea generation, and enhance
students’ overall intellectual experience [4] would contribute to
the development and refinement of students’ mental models. As
students’ conceptual models of the topics mature, their topical
vocabulary grows, and their ability to construct effective queries
will develop. The result of this is an increased ability to identify
and extract relevant and pertinent information sources [1,9].
3.3 Focus Formulation
During the focus formulation phase, students have a greater
understanding of their topic and are ready to narrow their focus
from a selection of the themes and information they encountered
during the prefocus exploration phase. Students often review
notes taken while exploring the topic to identify and combine
104
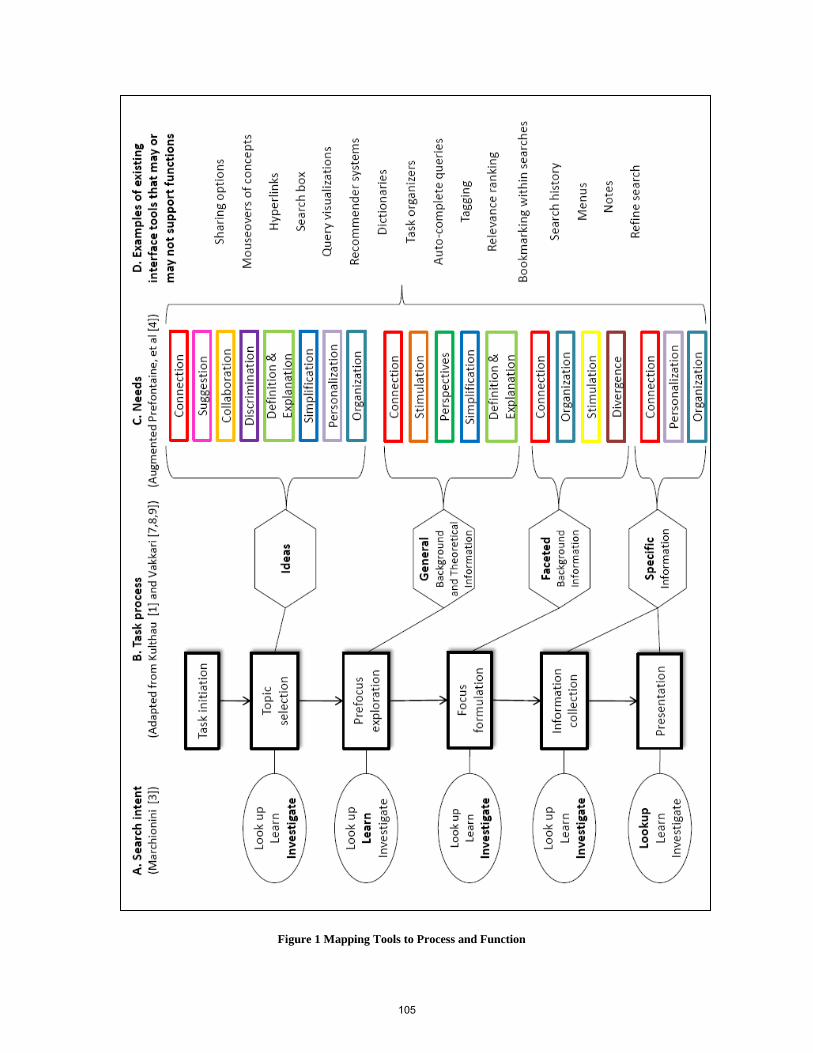
Figure 1 Mapping Tools to Process and Function
105

themes and ideas [1]. During this phase students need to
actualize those “sudden moments of insight” [1] for creativity to
be achieved, accomplished by enabling and promoting
serendipity, and the making of novel connections.
Students conduct investigative searches to identify research gaps
and critically evaluate topical information. During investigative
searches, the intent is to maximize recall and retrieve a high
number of relevant sources [3]. However, the proportion of non-
relevant references increases as the search process matures [8,9]
suggesting that the system should be able to manage and present
the scope of the material involved in that topic. The general
background information reviewed and learned during the
previous phases provides students with a greater understanding
of the vocabulary associated with the topic, enhancing their
ability to use more and more effective querying strategies [7,8].
At the same time their conceptual model is not fully developed,
and they continue to seek faceted background information about
the broad sub-fields of the topic [8]. While the intent is to
retrieve a higher proportion of relevant sources, students have
developed a higher standard of relevance criteria. Precision
searches, which intend to reduce irrelevant sources [3], are
conducted as specificity becomes the dominant requirement.
Note taking and reviewing are core activities during this phase
[1]. Organization re-structures information to make it more
usable [4] and provides students with the option of organizing
their own notes and annotations in a format that they can access
and review. Suggestion and stimulation tools can encourage
connection-making and focus development.
3.4 Information Collection and Presentation When a student has decided on a focus, the information
collecting stage begins. During information collecting, students
actively engage in an investigative search for information that
will support, define, and extend their selected topic [1]. But they
also conduct learning searches to clarify information and expand
their knowledgebase. During this stage, students have a more
fully developed conceptual model of the topic and no longer
need to seek general information; instead, they search for more
specific detailed information that uncovers the central variable
of the task [1,8]. To obtain specific information, students may
once again consult with formal mentors and begin citation
chaining. Functions that enable information collection include
personalization which may help students find information
related to previous search sessions and connection tools can
help them relate this information to their current search.
At this stage, students tend to utilize more effective strategies
with specific queries that use more synonyms, narrower and
related terms, and are more likely to use words that interconnect
the concepts such as Boolean operators [7,8]. Formal mentors
are still consulted but information systems are heavily relied
upon [8]. Students may benefit from organization tools as they
make detailed notes, organize citations, arrange their thoughts
and theories and synthesize ideas and information [1,8] more
formally and likely in writing before and during final
presentation [7].
4. Conclusion and Future Work In his description of information appliances, Norman states that:
“the primary goal is to design the tool to fit the task so well that
the tool becomes part of the task, feeling like a natural extension
of the work, a natural extension of the person” [2]. At present,
search is just another tool among many and not integrated into a
user’s task interface as effectively as the functions and tools of a
driver’s car dashboard. The ultimate goal in most knowledge
work is the acquisition of information to create new information
or knowledge while enhancing the intellectual capabilities of the
individual. This is as true for other types of knowledge workers
as it is for students. Our intent is not to automatically generate a
paper on a topic; it is about providing a useful tool kit that
enables, in the case of our example, a student to learn and
produce a product. The first stage in this process is identifying
and understanding the process and flow involved in completing
the task and determining the needs associated with each phase in
the process. From there, an information appliance can be
designed to incorporate the needs of the user with functions and
tools. The challenge from a development perspective is in
controlling the flow and type of information without controlling
the user. At the same time, it is about introducing a useful set of
tools, pseudo cognitive prostheses, which enhance and augment
human capability.
Acknowledgements
Work supported by NCE GRAND, Canada Foundation for
Innovation, Canada Research Chairs Program, and NSERC.
5. REFERENCES [1] Kuhlthau, C. C. 1993. Seeking Meaning: A Process
Approach to Library and Information Science. Norwood,
NJ: Ablex Publishing.
[2] Norman, D. A. 1998. The Invisible Computer. MIT Press,
Cambridge, MA.
[3] Marchionini, G. 2006. Exploratory search: From finding to
understanding. Commun. ACM, 49(4), 41-46.
[4] Prefontaine, G., Bartlett, J. C. & Toms, E.G. 2001. A
taxonomy of browsing facilitators for digital libraries.
Paper presented at the CAIS/ACSI 2001 (Québec, CA,
May 27-29, 2001).
[5] Puerta Melguizo, M. C., Boves, L., & Ramos, O. M. 2009.
A proactive recommendation system for writing: Helping
without disrupting. Int. J. Ind. Ergonomics, 39(3), 516-
523.
[6] Shneiderman, B. 2007. Creativity support tools:
Accelerating discovery and innovation. Commun. ACM,
50(12), 20-32.
[7] Vakkari, P. 2000. Cognition and changes of search terms
and tactics during task performance: A longitudinal study.
In Proceedings of the RIAO 2000 Conference (Paris,
France, April 12-14, 2000).
[8] Vakkari, P. 2001. A theory of the task-based information
retrieval process: A summary and generalisation of a
longitudinal study. JDoc, 57(1), 44-60.
[9] Vakkari, P. 2000. Relevance and contributing information
types of searched documents in task performance. In
Proceedings of the 23rd Annual International ACM SIGIR
Conference on Research and Development in Information
Retrieval (Athens, Greece, July 24-28, 2000).
106
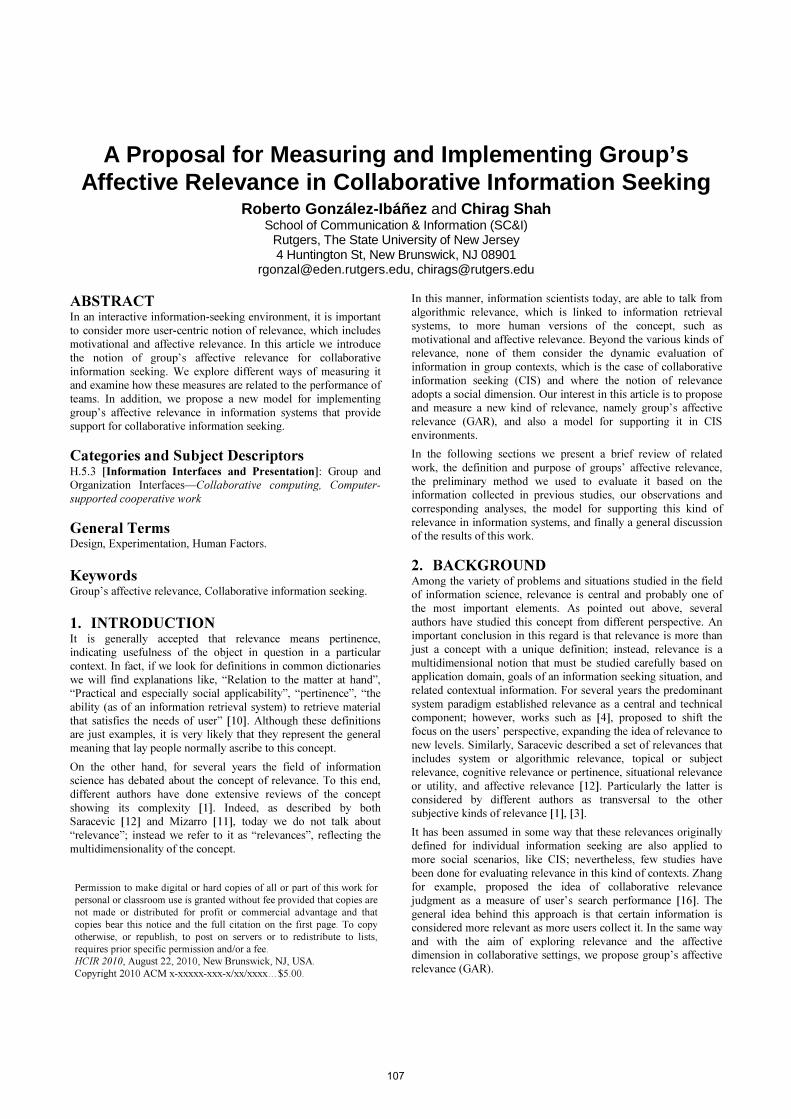
A Proposal for Measuring and Implementing Group’s Affective Relevance in Collaborative Information Seeking
Roberto González-Ibáñez and Chirag Shah School of Communication & Information (SC&I)
Rutgers, The State University of New Jersey 4 Huntington St, New Brunswick, NJ 08901
[email protected], [email protected]
ABSTRACT In an interactive information-seeking environment, it is important
to consider more user-centric notion of relevance, which includes
motivational and affective relevance. In this article we introduce
the notion of group’s affective relevance for collaborative
information seeking. We explore different ways of measuring it
and examine how these measures are related to the performance of
teams. In addition, we propose a new model for implementing
group’s affective relevance in information systems that provide
support for collaborative information seeking.
Categories and Subject Descriptors H.5.3 [Information Interfaces and Presentation]: Group and
Organization Interfaces—Collaborative computing, Computer-
supported cooperative work
General Terms Design, Experimentation, Human Factors.
Keywords Group’s affective relevance, Collaborative information seeking.
1. INTRODUCTION It is generally accepted that relevance means pertinence,
indicating usefulness of the object in question in a particular
context. In fact, if we look for definitions in common dictionaries
we will find explanations like, “Relation to the matter at hand”,
“Practical and especially social applicability”, “pertinence”, “the
ability (as of an information retrieval system) to retrieve material
that satisfies the needs of user” [10]. Although these definitions
are just examples, it is very likely that they represent the general
meaning that lay people normally ascribe to this concept.
On the other hand, for several years the field of information
science has debated about the concept of relevance. To this end,
different authors have done extensive reviews of the concept
showing its complexity [1]. Indeed, as described by both
Saracevic [12] and Mizarro [11], today we do not talk about
“relevance”; instead we refer to it as “relevances”, reflecting the
multidimensionality of the concept.
In this manner, information scientists today, are able to talk from
algorithmic relevance, which is linked to information retrieval
systems, to more human versions of the concept, such as
motivational and affective relevance. Beyond the various kinds of
relevance, none of them consider the dynamic evaluation of
information in group contexts, which is the case of collaborative
information seeking (CIS) and where the notion of relevance
adopts a social dimension. Our interest in this article is to propose
and measure a new kind of relevance, namely group’s affective
relevance (GAR), and also a model for supporting it in CIS
environments.
In the following sections we present a brief review of related
work, the definition and purpose of groups’ affective relevance,
the preliminary method we used to evaluate it based on the
information collected in previous studies, our observations and
corresponding analyses, the model for supporting this kind of
relevance in information systems, and finally a general discussion
of the results of this work.
2. BACKGROUND Among the variety of problems and situations studied in the field
of information science, relevance is central and probably one of
the most important elements. As pointed out above, several
authors have studied this concept from different perspective. An
important conclusion in this regard is that relevance is more than
just a concept with a unique definition; instead, relevance is a
multidimensional notion that must be studied carefully based on
application domain, goals of an information seeking situation, and
related contextual information. For several years the predominant
system paradigm established relevance as a central and technical
component; however, works such as [4], proposed to shift the
focus on the users’ perspective, expanding the idea of relevance to
new levels. Similarly, Saracevic described a set of relevances that
includes system or algorithmic relevance, topical or subject
relevance, cognitive relevance or pertinence, situational relevance
or utility, and affective relevance [12]. Particularly the latter is
considered by different authors as transversal to the other
subjective kinds of relevance [1], [3].
It has been assumed in some way that these relevances originally
defined for individual information seeking are also applied to
more social scenarios, like CIS; nevertheless, few studies have
been done for evaluating relevance in this kind of contexts. Zhang
for example, proposed the idea of collaborative relevance
judgment as a measure of user’s search performance [16]. The
general idea behind this approach is that certain information is
considered more relevant as more users collect it. In the same way
and with the aim of exploring relevance and the affective
dimension in collaborative settings, we propose group’s affective
relevance (GAR).
Permission to make digital or hard copies of all or part of this work for
personal or classroom use is granted without fee provided that copies are
not made or distributed for profit or commercial advantage and that
copies bear this notice and the full citation on the first page. To copy
otherwise, or republish, to post on servers or to redistribute to lists,
requires prior specific permission and/or a fee. HCIR 2010, August 22, 2010, New Brunswick, NJ, USA.
Copyright 2010 ACM x-xxxxx-xxx-x/xx/xxxx…$5.00.
107
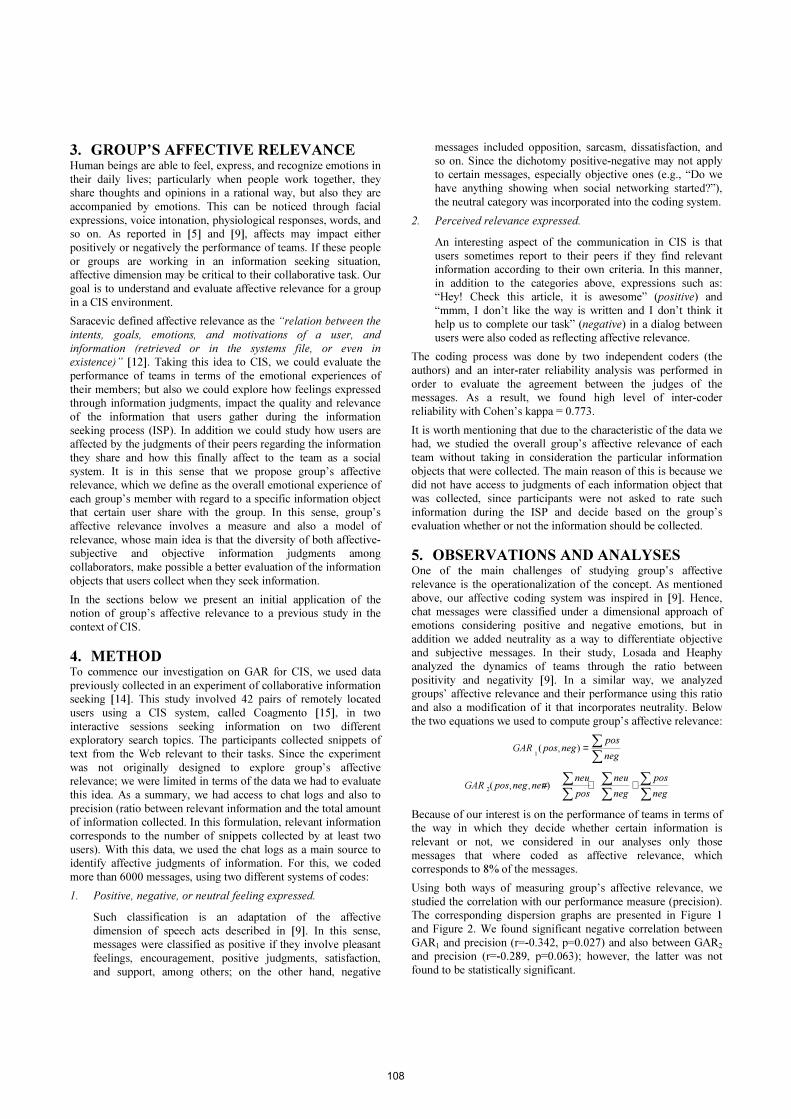
3. GROUP’S AFFECTIVE RELEVANCE Human beings are able to feel, express, and recognize emotions in
their daily lives; particularly when people work together, they
share thoughts and opinions in a rational way, but also they are
accompanied by emotions. This can be noticed through facial
expressions, voice intonation, physiological responses, words, and
so on. As reported in [5] and [9], affects may impact either
positively or negatively the performance of teams. If these people
or groups are working in an information seeking situation,
affective dimension may be critical to their collaborative task. Our
goal is to understand and evaluate affective relevance for a group
in a CIS environment.
Saracevic defined affective relevance as the “relation between the
intents, goals, emotions, and motivations of a user, and
information (retrieved or in the systems file, or even in
existence)” [12]. Taking this idea to CIS, we could evaluate the
performance of teams in terms of the emotional experiences of
their members; but also we could explore how feelings expressed
through information judgments, impact the quality and relevance
of the information that users gather during the information
seeking process (ISP). In addition we could study how users are
affected by the judgments of their peers regarding the information
they share and how this finally affect to the team as a social
system. It is in this sense that we propose group’s affective
relevance, which we define as the overall emotional experience of
each group’s member with regard to a specific information object
that certain user share with the group. In this sense, group’s
affective relevance involves a measure and also a model of
relevance, whose main idea is that the diversity of both affective-
subjective and objective information judgments among
collaborators, make possible a better evaluation of the information
objects that users collect when they seek information.
In the sections below we present an initial application of the
notion of group’s affective relevance to a previous study in the
context of CIS.
4. METHOD To commence our investigation on GAR for CIS, we used data
previously collected in an experiment of collaborative information
seeking [14]. This study involved 42 pairs of remotely located
users using a CIS system, called Coagmento [15], in two
interactive sessions seeking information on two different
exploratory search topics. The participants collected snippets of
text from the Web relevant to their tasks. Since the experiment
was not originally designed to explore group’s affective
relevance; we were limited in terms of the data we had to evaluate
this idea. As a summary, we had access to chat logs and also to
precision (ratio between relevant information and the total amount
of information collected. In this formulation, relevant information
corresponds to the number of snippets collected by at least two
users). With this data, we used the chat logs as a main source to
identify affective judgments of information. For this, we coded
more than 6000 messages, using two different systems of codes:
1. Positive, negative, or neutral feeling expressed.
Such classification is an adaptation of the affective
dimension of speech acts described in [9]. In this sense,
messages were classified as positive if they involve pleasant
feelings, encouragement, positive judgments, satisfaction,
and support, among others; on the other hand, negative
messages included opposition, sarcasm, dissatisfaction, and
so on. Since the dichotomy positive-negative may not apply
to certain messages, especially objective ones (e.g., “Do we
have anything showing when social networking started?”),
the neutral category was incorporated into the coding system.
2. Perceived relevance expressed.
An interesting aspect of the communication in CIS is that
users sometimes report to their peers if they find relevant
information according to their own criteria. In this manner,
in addition to the categories above, expressions such as:
“Hey! Check this article, it is awesome” (positive) and
“mmm, I don’t like the way is written and I don’t think it
help us to complete our task” (negative) in a dialog between
users were also coded as reflecting affective relevance.
The coding process was done by two independent coders (the
authors) and an inter-rater reliability analysis was performed in
order to evaluate the agreement between the judges of the
messages. As a result, we found high level of inter-coder
reliability with Cohen’s kappa = 0.773.
It is worth mentioning that due to the characteristic of the data we
had, we studied the overall group’s affective relevance of each
team without taking in consideration the particular information
objects that were collected. The main reason of this is because we
did not have access to judgments of each information object that
was collected, since participants were not asked to rate such
information during the ISP and decide based on the group’s
evaluation whether or not the information should be collected.
5. OBSERVATIONS AND ANALYSES One of the main challenges of studying group’s affective
relevance is the operationalization of the concept. As mentioned
above, our affective coding system was inspired in [9]. Hence,
chat messages were classified under a dimensional approach of
emotions considering positive and negative emotions, but in
addition we added neutrality as a way to differentiate objective
and subjective messages. In their study, Losada and Heaphy
analyzed the dynamics of teams through the ratio between
positivity and negativity [9]. In a similar way, we analyzed
groups’ affective relevance and their performance using this ratio
and also a modification of it that incorporates neutrality. Below
the two equations we used to compute group’s affective relevance:
∑
∑=neg
posnegposGAR ),(
1
∑∑
∑∑
∑∑ ++=
neg
pos
neg
neu
pos
neuneunegposGAR ),,(
2
Because of our interest is on the performance of teams in terms of
the way in which they decide whether certain information is
relevant or not, we considered in our analyses only those
messages that where coded as affective relevance, which
corresponds to 8% of the messages.
Using both ways of measuring group’s affective relevance, we
studied the correlation with our performance measure (precision).
The corresponding dispersion graphs are presented in Figure 1
and Figure 2. We found significant negative correlation between
GAR1 and precision (r=-0.342, p=0.027) and also between GAR2
and precision (r=-0.289, p=0.063); however, the latter was not
found to be statistically significant.
108
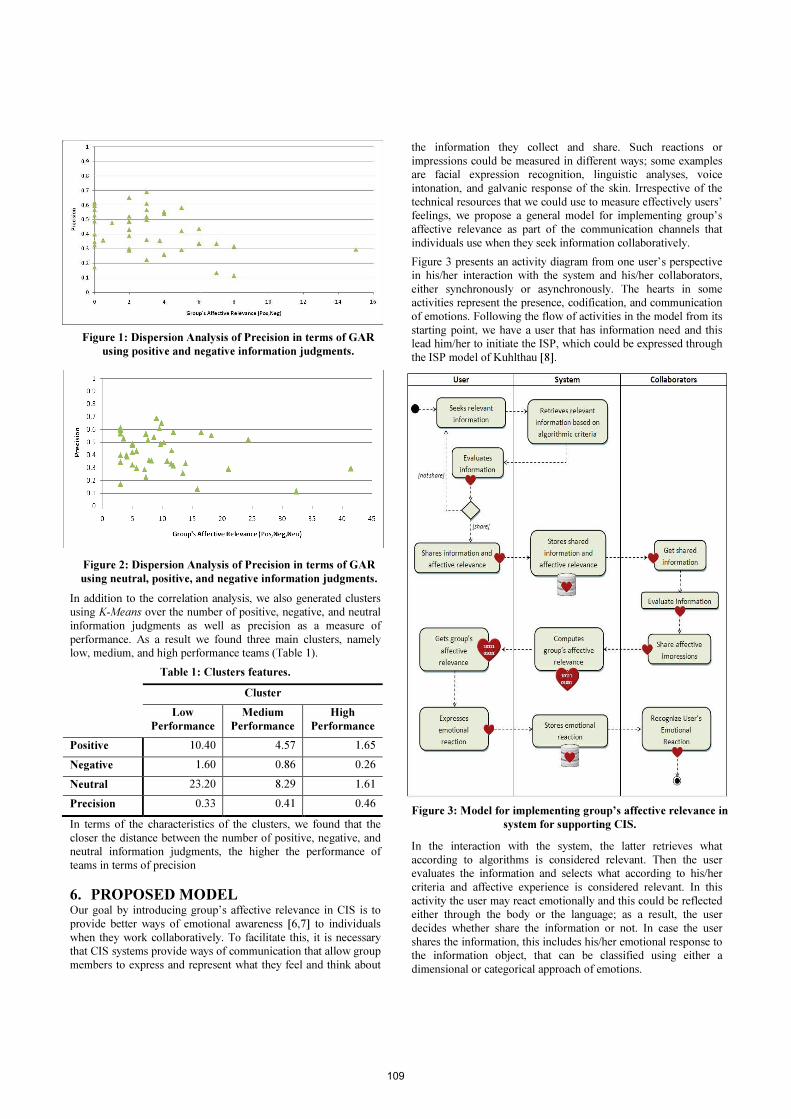
In addition to the correlation analysis, we also generated clusters
using K-Means over the number of positive, negative, and neutral
information judgments as well as precision as a measure of
performance. As a result we found three main clusters, namely
low, medium, and high performance teams (Table 1).
Table 1: Clusters features.
Cluster
Low
Performance
Medium
Performance
High
Performance
Positive 10.40 4.57 1.65
Negative 1.60 0.86 0.26
Neutral 23.20 8.29 1.61
Precision 0.33 0.41 0.46
In terms of the characteristics of the clusters, we found that the
closer the distance between the number of positive, negative, and
neutral information judgments, the higher the performance of
teams in terms of precision
6. PROPOSED MODEL Our goal by introducing group’s affective relevance in CIS is to
provide better ways of emotional awareness [6,7] to individuals
when they work collaboratively. To facilitate this, it is necessary
that CIS systems provide ways of communication that allow group
members to express and represent what they feel and think about
the information they collect and share. Such reactions or
impressions could be measured in different ways; some examples
are facial expression recognition, linguistic analyses, voice
intonation, and galvanic response of the skin. Irrespective of the
technical resources that we could use to measure effectively users’
feelings, we propose a general model for implementing group’s
affective relevance as part of the communication channels that
individuals use when they seek information collaboratively.
Figure 3 presents an activity diagram from one user’s perspective
in his/her interaction with the system and his/her collaborators,
either synchronously or asynchronously. The hearts in some
activities represent the presence, codification, and communication
of emotions. Following the flow of activities in the model from its
starting point, we have a user that has information need and this
lead him/her to initiate the ISP, which could be expressed through
the ISP model of Kuhlthau [8].
In the interaction with the system, the latter retrieves what
according to algorithms is considered relevant. Then the user
evaluates the information and selects what according to his/her
criteria and affective experience is considered relevant. In this
activity the user may react emotionally and this could be reflected
either through the body or the language; as a result, the user
decides whether share the information or not. In case the user
shares the information, this includes his/her emotional response to
the information object, that can be classified using either a
dimensional or categorical approach of emotions.
Figure 3: Model for implementing group’s affective relevance in
system for supporting CIS.
Figure 1: Dispersion Analysis of Precision in terms of GAR
using positive and negative information judgments.
Figure 2: Dispersion Analysis of Precision in terms of GAR
using neutral, positive, and negative information judgments.
109
As an intermediary, the system stores the information and its
associated emotional reaction. Subsequently collaborators get and
evaluate such information either objectively or subjectively.
Hence, new affective judgments are added to the original
information object and this is shared with the rest of the
collaborators through the system. On the other hand, the system
dynamically computes the group’s affective relevance, using
formulations similar to the ones presented in the previous section.
The result of this is reported to the user who shared the
information object, provoking an emotional reaction in him/her
that might later be recognized by his/her peers through the system.
The entire process is incremental and iterative; so the main idea of
implementing this model and use it in experiments is to
understand how users are affected by their peers when the
information that they consider relevant is criticized either
positively or negatively, and how this impacts the information
seeking processes of the team.
7. DISCUSSION Through this paper we proposed a new kind of relevance, namely
group’s affective relevance (GAR) in the context of collaborative
information seeking (CIS). For understanding and evaluating
GAR, we used data from a previous study; in particular, chat
messages that were code as positive, negative, and neutral. In
addition, these messages were classified as exhibiting affective
relevance if they included affective judgments of the information
that the participants shared. We computed each group’s GAR in
two different ways (GAR1 and GAR2) and tried to link them to
groups’ performance in terms of precision. Overall, we found a
weak and negative correlation using GAR1, which is based on
positivity and negativity. On the other hand, we found three main
clusters that characterize teams in terms of the information
judgments they reported during the information seeking process
(ISP) and the performance they achieved also expressed in terms
of precision. A lack of clear correlation could be attributed to the
nature of this study, which was not designed to record or evaluate
affective relevance. We will address this limitation with the future
studies designed specifically for measuring GAR in CIS.
In addition we need to consider additional ways for exploring the
emotional dimension of users in the ISP. As we noticed during the
coding process, the linguistic approach is limited when used in
isolation. To resolve this, in our next study we will examine the
same problem under a multimodal approach, which will include
the study of emotions using a multiple instruments.
Finally, as expressed in the model above, ideally GAR should be
evaluated and studied for each information object that teams
collect. Such study design will enable us to look at the dynamics
of the teams when they decide whether the information being
collected is relevant or not, and how such process affects their
overall performance.
8. ACKNOWLEDGMENTS A part of this work was supported by the National Science
Foundation under grant # IIS 0812363.
9. REFERENCES [1] Borlund, P. (2003). The concept of relevance in IR. Journal
of the American Society for Information Science and
Technology, 54(10), 913–925.
[2] Budd, J.M. (2004) Relevance: Language, semantics,
philosophy. Library Trends, 52(3), 447–462.
[3] Cosijn, E., & Ingwersen, P. (2000). Dimensions of relevance.
Information Processing and Management, 36(4), 533–550.
[4] Dervin, B. & Nilan, M. (1986). Information needs and uses.
In M. E. Williams (Ed.), Annual Review of Information
Science and Technology 21, 3-33. White Plains, NY:
Knowledge Industry Publishers.
[5] Fredrickson, B.L. & Losada, M.F. (2005). The Positive
Affect and the Complex Dynamics of Human Flourishing.
American Psychologist, 60(7), 678-686.
[6] García, O., Favela, J., & Machorro, R. (1999). Emotional
awareness in collaborative systems. In Proceedings of String
Processing and Information Retrieval Symposium, 1999 and
International Workshop on Groupware (pp. 296-303).
[7] González (2006). Evaluación de la Integración del Darse-
Cuenta Emocional en una Aplicación Colaborativa. Master’s
Thesis, Universidad de Santiago de Chile. Santiago, Chile.
[8] Kuhlthau, C.C. (1991). Inside the search process:
Information seeking from the user’s perspective. Journal of
the American Society for Information Science, 42(5), 361–
371.
[9] Losada, M., & Heaphy, E. (2004). The Role of Positivity and
Connectivity in the Performance of Business Teams: A
Nonlinear Dynamics Model. American Behavioral Scientist,
47(6): 740-765.
[10] Merriam-Webster Online. (2009). Retrieved October 1,
2009, from http://www.merriam-webster.com.
[11] Mizzaro, S. (1997). Relevance: The whole history. Journal
of the American Society for Information Science, 48(9), 810–
832.
[12] Saracevic, T. (1996). Relevance reconsidered ‘96. Information science: Integration in perspective. In P.
Ingewersen & N.O. Pors (Eds.), Proceedings of Second
International Conference on Conceptions of Library and
Information Science (CoLIS 1996) (pp. 201–218.).
Copenhagen: The Royal School of Librarianship.
[13] Saracevic, T. (2007) Relevance: A review of the literature and a framework for thinking on the notion in information
science. Part II: Nature and manifestations of relevance.
Journal of the American Society for Information Science and
Technology, 58(13): 1915-1933.
[14] Shah, C. & Marchionini, G. (2009). Query reuse in
exploratory search tasks. Poster at Workshop on Human-
Computer Interaction and Information Retrieval (HCIR)
2009. Washington, DC: October 23, 2009.
[15] Shah, C. (2010). Coagmento - A Collaborative Information
Seeking, Synthesis and Sense-Making Framework. Integrated
demo at CSCW 2010. Savannah, GA: February 6-11, 2010.
[16] Zhang, X. (2002). Collaborative relevance judgment: A
group consensus method for evaluating user search
performance. Journal of the American Society for
Information Science and Technology, 53(3), 220-231.
110

Evaluation of Music Information Retrieval: Towards a User-Centered Approach Xiao Hu
Graduate School of Library and Information Science University of Illinois at Urbana-Champaign
501 E. Daniel St. Champaign, IL, 61801, U.S.A.
Jingjing Liu School of Communication and Information
Rutgers, The State University of New Jersey 4 Huntington St.
New Brunswick, NJ 08901, U.S.A. [email protected]
ABSTRACT With the dramatic increase of online digital music, research on Music Information Retrieval (MIR) is flourishing more than ever. However, evaluation in MIR has been focused on system-centered approaches, where systems are evaluated against a pre-built ground truth dataset using system-focused measurements, and little attention has been spent on user experience. In this paper, we argue that MIR evaluation should take users, in addition to systems, into consideration. We suggest that some measures and models in the established area of Interactive IR in the text domain can be applied to the MIR domain. Novel evaluation measures that are unique to MIR are also proposed. The purpose of this paper is to encourage user-oriented, and thus more comprehensive, approaches to evaluating MIR systems.
Categories and Subject Descriptors H.3.3 [Information Storage and Retrieval]: Information Search and Retrieval – search process, J.5 [Art and Humanities] – Music
General Terms Measurement, Performance, Human Factors.
Keywords evaluation, music information retrieval, user-centered evaluation, usefulness.
1. INTRODUCTION As a crucial aspect of system development, evaluation of Information Retrieval (IR) systems has attracted continuous attention. Much of this effort can be seen from the annual TREC (Text REtrieval Conference) and the frequent appearance of workshops on IR evaluation at the annual conference of SIGIR. In the text IR area, some evaluation criteria and measurements beyond “relevance” have been proposed and used, and these alternative approaches have addressed many aspects of IR
evaluation criteria, including user experiences in the search process, in addition to the well-accepted, system-focused measures such as precision and recall.
In recent years, with the popularity of digital music, research on Music Information Retrieval (MIR) is flourishing more than ever. The International Society of Music Information Retrieval (ISMIR) will have its 11th annual conference this year. In the last decade, a number of new algorithms and systems have been proposed and developed for a variety of MIR-related tasks: genre classification, artist clustering, music recommendation, playlist generation, etc. While these innovations greatly advance the state of the art of MIR, and some of the systems have been turned into real-world applications, the evaluation of MIR algorithms and systems is not as developed: the current evaluation paradigm is dominated by system-oriented approaches, while users, whom MIR systems serve, have rarely been considered in MIR evaluation frameworks.
During IR processes, users accomplish their tasks by interacting with IR systems. Hence, evaluations of IR systems need to take into account users’ interactive processes of information searching and retrieval [2][3][18]. Just as other IR systems, MIR systems do not stand by themselves. The goal of MIR systems is to facilitate users’ music information tasks, and thus the evaluation of MIR should inevitably take users into consideration. In this paper, we suggest that along with the maturity of system-centered MIR evaluation, it is needed to bring users into the picture. User-centered evaluation of MIR is grounded in the nature of music information seeking and as such has broad applicability in the evaluation of MIR.
2. RELATED WORK IN THE MIR DOMAIN 2.1 MIR Evaluation Evaluation of MIR has been dominated by system-centered approaches. Since 2004, the annual event, Music Information Retrieval Evaluation eXchange (MIREX) [13] has become the main venue of system evaluation in the MIR community. MIREX is the counterpart of TREC in the music domain. Just like TREC, there is a variety of MIR tasks included in each year’s MIREX, such as genre classification, mood classification, cover song identification, audio music similarity and retrieval, melody extraction, etc. For each task, systems developed by participatory research groups around the world are run against pre-built test collections and their performances are compared. The measures used in MIREX are all system-centered, including accuracy for classification tasks, average precision for retrieval tasks,
Permission to make digital or hard copies of all or part of this work for personal or classroom use is granted without fee provided that copies are not made or distributed for profit or commercial advantage and that copies bear this notice and the full citation on the first page. To copy otherwise, or republish, to post on servers or to redistribute to lists, requires prior specific permission and/or a fee. HCIR’10, August 22, 2010, New Brunswick, NJ, U.S.A.. Copyright 2010 ACM 1-58113-000-0/00/0004…$5.00.
111
variations of precision/recall for (key, onset) detection tasks, etc. Unlike TREC, as of the year 2010, there has not been a task in MIREX that considers users’ interactions with the systems.
MIR experiments outside MIREX are also primarily evaluated by system-centered approaches, that is, without involving users. Nevertheless, there are a few exceptions. Pauws, S. and Eggen [22] conducted a controlled user experiment to evaluate the quality of playlists generated by the algorithm that the authors proposed. They recruited twenty-two participants, each of whom used the proposed interactive system as well as a control system to generate playlists for two pre-defined situations (“soft music” and “lively music”) over four experimental sessions. The researchers then compared the systems using participants’ ratings on the resultant playlists. A post-experiment interview was conducted to elicit supplementary findings on the perceived usefulness of automatic music compilation. In a similar study, Pauws and van de Wijdeven [23] evaluated their “SatisFly” playlist generation system by conducting a user experiment with twenty-four participants. Each participant rated the playlists generated by the “SatisFly” system and a control system. The measures used in this study included playlist quality as calculated by users’ ratings, time spent on the task, number of button presses in accomplishing the task, as well as perceived usefulness and ease-of-use. On the same line of research, a conclusive user evaluation was conducted in [28] to assess the “similar song” function of the E-Mu jukebox, a music recommendation system. Twenty-two participants used the test system as well as two control systems to perform a playlist generation task where 10 different songs must be chosen for a single imaginary music listening situation. In addition to the measures calculated in [23], this study also measured the order of participants’ preference among the three systems by asking which system they liked most and least.
These three studies conducted user experiments in evaluation and addressed aspects that by no means can be covered in system-centered approaches. The user-dependent measures are essential for understanding users’ experience of MIR systems and for achieving the ultimate goal of MIR systems. Interestingly, these three studies were all on the task of playlist generation, with similar design and scale, were all conducted in the same research lab, Philips Research Laboratories, and were conducted at least five years ago. This indicates that user-oriented evaluation has not been well adopted and has limited influence in MIR.
2.2 User Studies in MIR Despite of the sparseness of user-centered evaluation, MIR researchers have long paid attention to users. User studies in MIR have primarily focused on identifying users’ music information needs and the features users often employed to describe their needs. For example, McPherson and Bainbridge [21] analyzed server logs of the MELDEX digital music library and discovered its usage patterns. Itoh [17] surveyed 21,177 online catalog search logs in an academic music library and identified access points of music scores in online environments. Researchers also analyzed forum postings and requests on Q/A sites (e.g., Google Answers) to identify user needs and information features used in musical queries [1][11][14][19]. Besides these approaches, ethnographic methods (e.g., interviews) and surveys were often used in exploring users’ music information seeking behaviors [12][20]. In a study using multiple user study methods, Vignoli [27]
conducted interviews, user experiments with existing products, as well as online surveys to investigate how music listeners organize and access their digital music collection.
3. USER-CENTERED EVALUATION IN TEXT IR In the area of text IR, for the past over three decades, relevance [24] has been a major criterion of evaluation and has been overwhelmingly used in TREC practice. However, in recent years, researchers have been arguing that relevance is not sufficient in evaluating IR systems because evaluation studies are routinely pursuing information seeking tasks outside of the traditional, so-called Cranfield paradigm and are taking a broader view of tasks, users, and contexts [15][18]. Relevance-based measures such as precision and recall are not good for evaluating Interactive Information Retrieval (IIR) systems, because while users may modify or develop search tasks during search processes, the two measures cannot quantify the “informativeness” of interactions [7]. In addition, neither precision nor recall is a highly significant factor of user satisfaction towards a given retrieval system. Depending on their information seeking tasks, users may not be concerned about retrieving all the documents relevant to their search tasks; for many users, they are happy if they can get a good answer in a short amount of time [16]. Further, the purpose of an IR system is to help users accomplish a task, and therefore IR system evaluation should consider both task success as an outcome and the value of support that IR systems provide over the entire information seeking episode as a process [9]. Relevance-based measurements that only focus on topical matches between the documents and the query terms fail to address these requirements.
There have been alternatives to relevance, such as efficiency, satisfaction [26], and utility [5][9], to name just a few. Kelly [18] pointed out that very complex IIR activities involving both Behavioral Science and Computer Science require pluralistic approaches and methods, and that “a single, prescribed model would be deleterious” (p. 202). The evaluation methods and measures to be used depend, to a large extent, upon the goal of the evaluation. For example, the evaluation may be used for a system that is able to retrieve relevant documents, or for a system that can help its users accomplish specific tasks.
From a phenomenological perspective and based on the nature of information seeking, Belkin and colleagues [4][9] have recently suggested usefulness as a criterion for evaluation of IIR systems. Usefulness, as they argues, can be used to evaluate system support from the aspects of both task outcome and task process in the accomplishment of a task. In terms of the measurements under the usefulness framework, usefulness itself can be a measurement of how much the search results contribute to task accomplishment. In addition, other measures can include but are not limited to: task accomplishment (how well the user finishes the task; how many steps the user goes through; how long it takes) and support of the system to the information seeking goal (to the general task and to each possible sub-task; acceptance or rejection to system suggested search strategies and/or query reformulation; usefulness and the use of retrieved documents; recall and precision of single search; etc.). It should be noted that while usefulness is an alternative to relevance, the authors did not mean to disregard relevance and its measures; instead, relevance measures are part of the usefulness framework. While some of these measures have
112
been used in previous studies, the usefulness framework is not a simple repetition of previous efforts. It suggests that determination of which measures to use in evaluation depends crucially upon the specification of a leading task or goal whose accomplishment itself can be measured. This multiple-measure approach in general echoes Kelly’s notion [18] that there is not a single best method in IIR evaluation.
4. PROPOSED MEASURES IN USER-CENTERED MIR EVALUATION As previously mentioned, while MIR evaluation has been dominated by system-centered approaches which typically measure how well the systems (algorithms) classify music and how relevant their retrieved music was, rare effort has been spent on measuring how well the systems support users’ completion of music information seeking tasks or what users’ search experiences are like. We believe that the concept of usefulness introduced in section 3 could be well applied to MIR system evaluation. We suggest that the measurements of the usefulness framework are applicable to the MIR domain. Further, due to the unique entertaining nature of music that is different from textual information in regular text retrieval, we also suggest additional aspects that are not included in the original usefulness framework proposal, such as entertainability and social life support. In addition, other IIR measurements such as learnability are also important in evaluating MIR systems. Our proposed measures are as follows.
Measure on music information task accomplishment. This measure as Cole et al. [9] proposed in their IIR evaluation framework focuses on search outcome. Since the goal of MIR activities is to support users to fulfill their music information needs represented by their MIR tasks, MIR evaluation can include the measure on task accomplishment in the evaluation as well. This measure can include several points:
• (How) does the user find the desired music?
• How many steps does the user take to find the music?
• How long does the user spend in finding the music?
This is often referred as task completion time or time lag and has long been recognized as one of the most important criteria that could be used to evaluate IR systems [8][18][26].
Measure on system support of the music information seeking process. Information seeking is a process instead of just a search outcome [9]. It is often a continuous process instead of a single query-result activity. This is true in the music domain as well. For example, during a music search process, users may modify and refine their queries after listening to part of a retrieved song. Specific points of this measure can include:
• How does the system support identification of and sequence of sub-tasks (if any) toward the completion of the general music information seeking task?
• How useful is the system in querying support (e.g., query reformulation suggestions)?
• How does the system support displaying and playing search results?
• How does the system support saving search results?
The last two points are very different from text IR. Displaying search results in the music domain is an on-going research question in and of itself. Unlike a text document, a music document (or part of it) has to be played and listened to by the user before he or she can make judgments on its value to the music information needs. Also, due to intellectual property laws, saving a music document is much more complicated than saving a text document, which raises an additional challenge to MIR systems.
Measure on system support of user experience. This aspect includes general rules suggested by experts from Human-Computer Interaction (HCI) and IR areas, as well as our suggested measures that are unique to MIR systems.
• How is the user satisfied with his music finding experience?
• How easy does the user feel the system is to use?
• How much does the system help the user to avoid confusion or “getting lost”?
These points are frequently seen in system interface evaluation, for example in [25].
• How is the system easy to learn?
• How quickly can a user familiarize himself/herself with the system again after not using it for a while?
The above two points are on the learnability of MIR systems. Researchers have realized the influence of learning in the IR process. For example, Borlund [6] argued that IR evaluation should pay attention to the learning process of users and gauge the learnability of an IR system. The issue of learnability is even more important in MIR because MIR systems often include multimedia interfaces that are novel and unfamiliar to most users. For instance, McPherson and Bainbridge [21] studied usage patterns of the MELDEX digital music library and found that although the system supported melodic querying, users still preferred issuing textual queries. The overhead of learning how to issue a melodic query had impeded users from taking full advantage of the system.
• How well does the system support entertainment?
• How well does the system support social life?
The above two points are unique to the MIR domain. Usually, people search music for entertainment purposes, and thus the MIR systems should attempt to support users’ general purpose of entertainment. In addition, music is also an aspect of social life. Users often share their favorite music with friends and carefully select certain kinds of music for specific social events and occasions such as weddings, parties, trips or romantic dates. Therefore, it should be a goal of mature MIR systems to support users’ music-related social life.
The above proposed measures focus on different aspects of users’ interactions with MIR systems. It is desirable to combine multiple measures in evaluation, but the adoption of any of these measures would complement current system-centered approaches.
5. CONCLUSIONS As the ultimate goal of MIR systems is to help users in seeking music information, the evaluation of MIR systems should take users into consideration. This paper advocates a paradigm shift from system-centered evaluation to user-centered evaluation in
113

MIR. Interactive IR in the text domain has been an active research area for decades and has plenty to offer to MIR. By applying IIR and HCI evaluation measures to MIR and proposing measures unique to the music domain, this paper aims to elicit more work and attention on user-centered MIR evaluation.
6. REFERENCES [1] Bainbridge, D., Cunningham, S.J., and Downie, J.S. 2003.
How people describe their music information needs: A grounded theory analysis of music queries. In Proceedings of the 4th International Conference on Music Information Retrieval (ISMIR).
[2] Beaulieu, M., Robertson, S. and Rasmussen, E. 1996. Evaluating interactive systems in TREC. Journal of the American Society for Information Science, 47(1): 85-94.
[3] Belkin, N.J. 2008. Some(what) grand challenges for information retrieval. ACM SIGIR. Forum Archive, 42 (1): 47-54.
[4] Belkin, N., Cole, M., and Liu, J. 2009. A model for evaluation of interactive information retrieval. In Proceedings of the SIGIR 2009 Workshop on the Future of IR Evaluation, pp.7-8.
[5] Belkin, N.J. and Vickery, A. 1985. Interaction in Information Systems: A Review of Research from Document Retrieval to Knowledge-Based Systems. Library and Information Research Report 35: The British Library, University Press, Cambridge.
[6] Borlund, P. 2003. The IIR evaluation model: a framework for evaluation of interactive information retrieval systems. Information Research, 8(3), Paper No.152.
[7] Borlund, P. and Ingwersen, P. 1997. The development of a method for the evaluation of interactive information retrieval systems. Journal of Documentation, 53(3): 225-250.
[8] Cleverdon, C. W. and Keen, E.M. 1966. Factors determining the performance of indexing systems. Vol. 1: Design. Vol 2: Results. Cranfield, U.K: Aslib Cranfield Research Project.
[9] Cole, M., Liu, J., Belkin, N.J., Bierig, R., Gwizdka, J., Liu, C., Zhang, J., and Zhang, X. 2009. Usefulness as the criterion for evaluation of interactive information retrieval. In Proceedings of the 3rd Workshop on Human-Computer Interaction and Information Retrieval (HCIR) (pp. 1-4).
[10] Cooper, W.S. 1973. On selecting a measure of retrieval effectiveness, part 1: The “subjective” philosophy of evaluation,” Journal of the American Society for Information Science, 24, 87–100.
[11] Cunningham, S. J., Bainbridge, D. and Falconer, A. 2006. “More of an art than a science”: supporting the creation of playlists and mixes. In Proceedings of the 7th International Conference on Music Information Retrieval (ISMIR).
[12] Cunningham, S.J., Jones, M., and Jones, S. 2004. Organizing digital music for use: an examination of personal music collections. In Proceedings of the 5th International Conference on Music Information Retrieval (ISMIR), pp. 447-454.
[13] Downie, J. S. 2008. The Music Information Retrieval Evaluation eXchange (2005–2007): A window into music
information retrieval research. Acoustical Science and Technology, 29(4), 247–255.
[14] Downie, J. S. and Cunningham, S. J. 2002.Toward a theory of music information retrieval queries: System design implications. In Proceedings of the 3rd International Conference on Music Information Retrieval (ISMIR).
[15] Geva, S., Kamps, J., Peters, C., Sakai, T., Trotman, A., and Voorhees, E. (Eds.). 2009. Proceedings of the SIGIR 2009 Workshop on the Future of IR Evaluation. Workshop held at SIGIR 2009, Boston, MA, July 23, 2009.
[16] Hearst, M. 2009. Search User Interfaces. Cambridge University Press.
[17] Itoh, M. 2000. Subject search for music: quantitative analysis of access point selection. In Proceedings of the 1st International Conference on Music Information Retrieval (ISMIR).
[18] Kelly, D. 2009. Methods for evaluating interactive information retrieval systems with users. Foundations and Trends in Information Retrieval, 3(1-2): 1-224.
[19] Lee, J. H., 2010. Analysis of user needs and information features in natural language queries seeking music information. Journal of the American Society for Information Science and Technology, 61 (5): 1025-1045.
[20] Lee, J. H. and Downie, J. S. 2004. Survey of music information needs, uses, and seeking behaviours: preliminary findings. In Proceedings of the 5th International Conference on Music Information Retrieval (ISMIR), pp. 441-446.
[21] McPherson, J.R., and Bainbridge, D. 2001. Usage of the MELDEX digital music library. In Proceedings of the 2nd International Conference on Music Information Retrieval (ISMIR).
[22] Pauws, S. and Eggen, B. 2002. PATS: Realization and evaluation of an automatic playlist generator. In Proceedings of the 3th International Conference on Music Information Retrieval (ISMIR).
[23] Pauws, S. and van de Wijdeven, S. 2005. User evaluation of a new interactive playlist generation concept. In Proceedings of the 6th International Conference on Music Information Retrieval (ISMIR).
[24] Saracevic. T. 1975. Relevance: A review of and a framework for the thinking on the notion in information science. Journal of the American Society for Information Science, 26, 321–343.
[25] Sharp, H., Rogers, Y., & Preece, J. 2007. Interaction Design: Beyond Human-computer Interaction. John Wiley & Sons.
[26] Su, L.T. 1992. Evaluation measures for interactive information retrieval. Information Processing and Management, 28, 503–516.
[27] Vignoli, F. 2004. Digital music interaction concepts: a user study. In Proceedings of the 5th International Conference on Music Information Retrieval (ISMIR).
[28] Vignoli, F. and Pauws, S. 2005. A Music Retrieval System Based on User Driven Similarity and Its Evaluation. In Proceedings of the 6th International Conference on Music Information Retrieval (ISMIR).
114
Information Derivatives – A New Way to Examine Information Propagation
Chirag Shah School of Communication & Information (SC&I)
Rutgers, The State University of New Jersey 4 Huntington St, New Brunswick, NJ 08901
[email protected] ABSTRACT An increasing amount of information available online is dynamic in nature. That is, it constantly keeps changing with people consuming and adding their own value to it. We propose to study how such information flows from its original source to other locations through the concept of information derivatives. We treat information as an object and consider the original piece of information as the 0th derivative. Any subsequent use of that information produces 1st derivative, 2nd derivative, and so on. We provide a mathematical formulation of this phenomenon and propose a new framework to study information propagation in online sources, and to understand the dynamic nature of information.
Categories and Subject Descriptors H.1.1 [Models and Principles]: Systems and Information Theory—Information theory
General Terms Measurement, Theory.
Keywords Information propagation, Information derivatives, Information theory, Social media, Network analysis.
1. INTRODUCTION With the changing ways in which information is stored, retrieved, and shared, it is becoming essential to see information as dynamic and constantly changing with its context and usage. Several works have demonstrated how context could be useful in studying dynamic information (e.g., [8, 11]). Easily creating, sharing, and annotating a piece of information has become largely possible due to the ubiquitous nature of social media sites and services. Examples include YouTube for videos, Flickr for photos, delicious for bookmarks, wordpress for blogs, and Twitter for microblogs.
In this paper we look at information as an object [3] and propose a new method for studying its propagation through various channels on the Web. In order to explain this method, we introduce the notion of information derivatives and propose a new framework for studying the dynamic nature of information through its propagation and derivatives.
2. Information propagation and derivatives In the field of library and information science (LIS), information is often viewed as an object [3]. Kaye [7] (p.37) stated: “Library and information professionals, thus have a perception of information as objective matter, defining it instrumentally in terms of data, facts, knowledge and opinion, to be applied to learning, decision making, problem solving and other tasks.” Rowley [10] also reaffirmed that LIS professionals tend to treat information as an object and create a system’s view of information.
There is, however, also other works in the field that treat information as a vehicle for knowledge. For instance, Hill [6] used the term information to mean recordable knowledge, asserting that knowledge is more than information and that information must be recordable and shareable.
2.1 A mathematical view of information derivatives There are many other views of information, but for the work presented here, we will treat information as a thing, acknowledging that such information is recordable, shareable, and modifiable. We follow Brookes’ [2] fundamental equation of information theory: Here, S is the knowledge structure that is modified by the information input ΔI to produce a new knowledge structure (S+ΔS). Instead of knowledge structure, we will focus on changing information itself. In other words, we propose:
Here, I is an original piece of information, ΔV is the value added to that information, and (I+ΔI) is the new information created due to this process. An added value changing the given information is a well-studied concept in information life cycle and related works (e.g., [12]).
Let us consider an example. Using social bookmarking service delicious, one could collect bookmarks. Each of these bookmarks is a piece of information (I) to which one adds tags and notes (ΔV)
Permission to make digital or hard copies of all or part of this work for personal or classroom use is granted without fee provided that copies are not made or distributed for profit or commercial advantage and that copies bear this notice and the full citation on the first page. To copy otherwise, or republish, to post on servers or to redistribute to lists, requires prior specific permission and/or a fee. HCIR 2010, August 22, 2010, New Brunswick, NJ, USA. Copyright 2010 ACM x-xxxxx-xxx-x/xx/xxxx…$5.00.
115
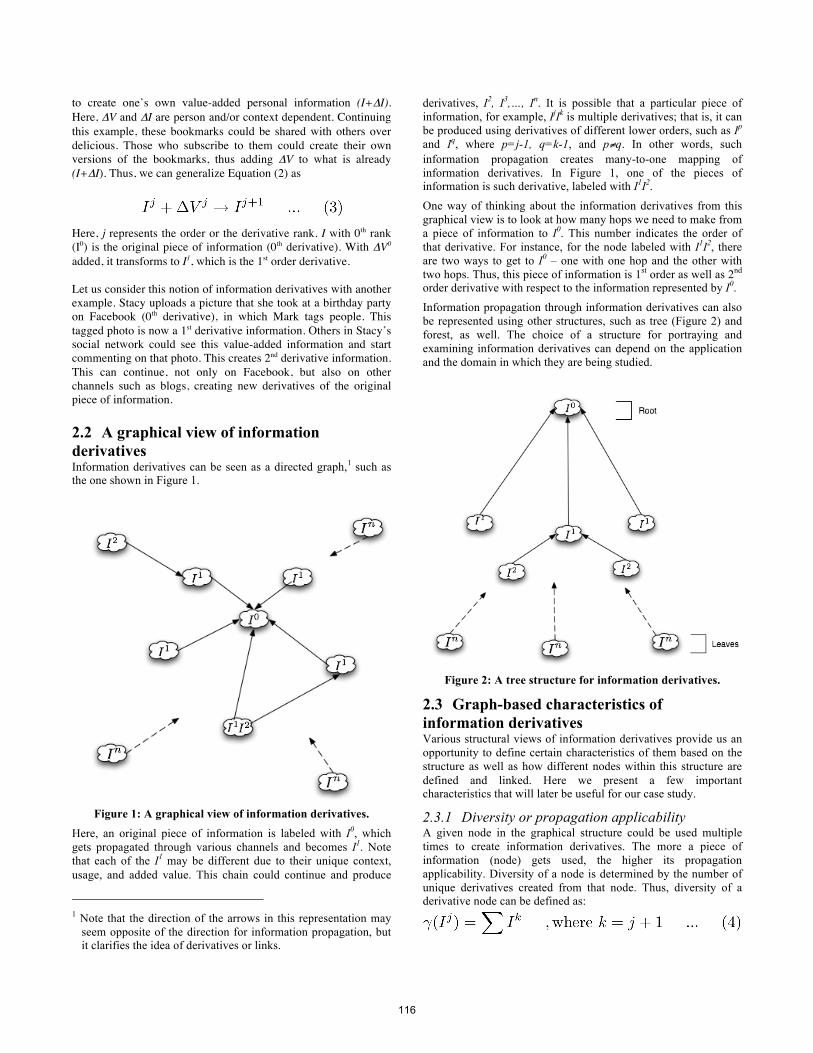
to create one’s own value-added personal information (I+ΔI). Here, ΔV and ΔI are person and/or context dependent. Continuing this example, these bookmarks could be shared with others over delicious. Those who subscribe to them could create their own versions of the bookmarks, thus adding ΔV to what is already (I+ΔI). Thus, we can generalize Equation (2) as
Here, j represents the order or the derivative rank. I with 0th rank (I0) is the original piece of information (0th derivative). With ΔV0 added, it transforms to I1, which is the 1st order derivative. Let us consider this notion of information derivatives with another example. Stacy uploads a picture that she took at a birthday party on Facebook (0th derivative), in which Mark tags people. This tagged photo is now a 1st derivative information. Others in Stacy’s social network could see this value-added information and start commenting on that photo. This creates 2nd derivative information. This can continue, not only on Facebook, but also on other channels such as blogs, creating new derivatives of the original piece of information.
2.2 A graphical view of information derivatives Information derivatives can be seen as a directed graph,1 such as the one shown in Figure 1.
Figure 1: A graphical view of information derivatives.
Here, an original piece of information is labeled with I0, which gets propagated through various channels and becomes I1. Note that each of the I1 may be different due to their unique context, usage, and added value. This chain could continue and produce
1 Note that the direction of the arrows in this representation may
seem opposite of the direction for information propagation, but it clarifies the idea of derivatives or links.
derivatives, I2, I3,…, In. It is possible that a particular piece of information, for example, IjIk is multiple derivatives; that is, it can be produced using derivatives of different lower orders, such as Ip and Iq, where p=j-1, q=k-1, and p≠q. In other words, such information propagation creates many-to-one mapping of information derivatives. In Figure 1, one of the pieces of information is such derivative, labeled with I1I2.
One way of thinking about the information derivatives from this graphical view is to look at how many hops we need to make from a piece of information to I0. This number indicates the order of that derivative. For instance, for the node labeled with I1I2, there are two ways to get to I0 – one with one hop and the other with two hops. Thus, this piece of information is 1st order as well as 2nd order derivative with respect to the information represented by I0.
Information propagation through information derivatives can also be represented using other structures, such as tree (Figure 2) and forest, as well. The choice of a structure for portraying and examining information derivatives can depend on the application and the domain in which they are being studied.
Figure 2: A tree structure for information derivatives.
2.3 Graph-based characteristics of information derivatives Various structural views of information derivatives provide us an opportunity to define certain characteristics of them based on the structure as well as how different nodes within this structure are defined and linked. Here we present a few important characteristics that will later be useful for our case study.
2.3.1 Diversity or propagation applicability A given node in the graphical structure could be used multiple times to create information derivatives. The more a piece of information (node) gets used, the higher its propagation applicability. Diversity of a node is determined by the number of unique derivatives created from that node. Thus, diversity of a derivative node can be defined as:
116

Here, all of Ik are derived from Ij. Note that these Ik come from unique nodes. In case of the Web, these nodes may be different domains.
This characteristic is similar to in-degree of a node in a graph, often used to measure a node’s nature as an authority in network analysis [9].
2.3.2 Deriving index This measures the level of derivation for a piece of information, and is calculated by counting the number of sources it derives. Deriving index is computed as:
Here, Ij is derived from Ik. This characteristic is similar to out-degree of a node in a graph, often used to measure a node’s nature as a hub in network analysis [9].
2.3.3 Density A piece of information may be derived by a single node several times, possibly by different parts of that node. For instance, if a web-domain is considered as a node, its parts are all the webpages in that domain. Density of an information node is computed by dividing the total number of derivations from that node to the number of unique nodes from which those derivations occur. Thus, density:
Here, the denominator is the sum of all the unique nodes (e.g., web-domains) that derive from Ij. Note that γ(Ij) represents total number of derivations (in-degree) from Ij, whereas δ(Ij) indicates how spread out those incoming links are among unique sources that derive from it.
3. DISCUSSION The ways in which people seek, find, and share information have changed considerably in the recent years, and so are the methods for producing and consuming information online. It is not uncommon for one to discover interesting or relevant information from a friend’s blog or a Tweet. In this paper we attempted to formalize such information propagation on the Web. We proposed a notion of information derivatives and presented some of their basic characteristics. Our proposal was inspired by some of the classical works on information as an object, information theory, and network analysis.
The framework presented here using information derivatives can be used for examining almost any case of information flow where information can be treated as an object. One of such domains is blogosphere. Similar to the works of Gruhl et al. [5], and Tremayne et al. [13], we can examine information propagation on certain topics within blogosphere using the notions and properties of information derivatives. Such analysis can help us identify and study connectors (high diversity), and authorities (high deriving index) in a given network. On the theoretical side, the proposed framework can help us classify and explain data, information, and contextual details, similar to Buckland’s [4] discussion about the nature of a
document. With the same example of antelope that Buckland gave, antelope itself can be treated as the 0th derivative, and the scholarly articles about that antelope can be considered as 1st derivatives.2 One could imagine applying similar definitions to various artifacts considered for preservation or archiving.
4. ACKNOWLEDGMENTS The author is sincerely grateful to Gary Marchionini from UNC Chapel Hill, and Geoffrey Baym from UNC Greensboro for their valuable feedback and criticism of this work. The current article is taken from a larger work, co-authored with Geoffrey Baym, which is currently under review.
5. REFERENCES [1] Briet, S. (1951). Qu’est-ce que la documentation. Paris:
EDIT.
[2] Brookes, B. C. (1974). Robert Fairthorne and the scope of information science. Journal of Documentation, 30(2), 139-152.
[3] Buckland, M. K. (1991). Information as Thing. Journal of the American Society for Information Science, 42(5), 351-360.
[4] Buckland, M. K. (1997). What is a “Document”? Journal of the American Society for Information Science, 48(9), 804-809.
[5] Gruhl, D., Guha, R., Liben-Nowell, D., & Tomkins, A. (2004). Information diffusion through blogspace. In Proceedings of World Wide Web (WWW) Conference (p. 491-501). New York, New York, USA: ACM Press.
[6] Hill, M. W. (1982). Information for innovation: a view from the UK. In Proceedings of ICSU-AS Information for Innovation. Amsterdam.
[7] Kaye, D. (1995). The nature of information. Library Review, 44(8), 37-48.
[8] Lee, C. (2007). Taking Context Seriously: A Framework for Contextual Information in Digital Collections. UNC SILS TR-2007-04.
[9] Park, H. W., & Thelwall, M. (2003). Hyperlink Analyses of the World Wide Web: A Review. Journal of Computer-Mediated Communication, 8(4).
[10] Rowley, J. (1998). What is information? Information Services & Use, 18(4), 243-254.
[11] Shah, C. (2009). Mining Contextual Information for Ephemeral Digital Video Preservation. International Journal of Digital Curation (IJDC), 4(1), 175-192.
[12] Taylor, R. S. (1982). Value-added processes in the information life cycle. Journal of the American Society for Information Science, 33(5), 341-346.
[13] Tremayne, M., Zheng, N., Lee, J. K., & Jeong, J. (2006). Issue publics on the web: Applying network theory to the war blogosphere. Journal of Computer-Mediated Communication, 12, 290-310.
2 Briet [1] (p.7-8) recognized a captured antelope as the primary
document, and any article written about it as the secondary documents.
117
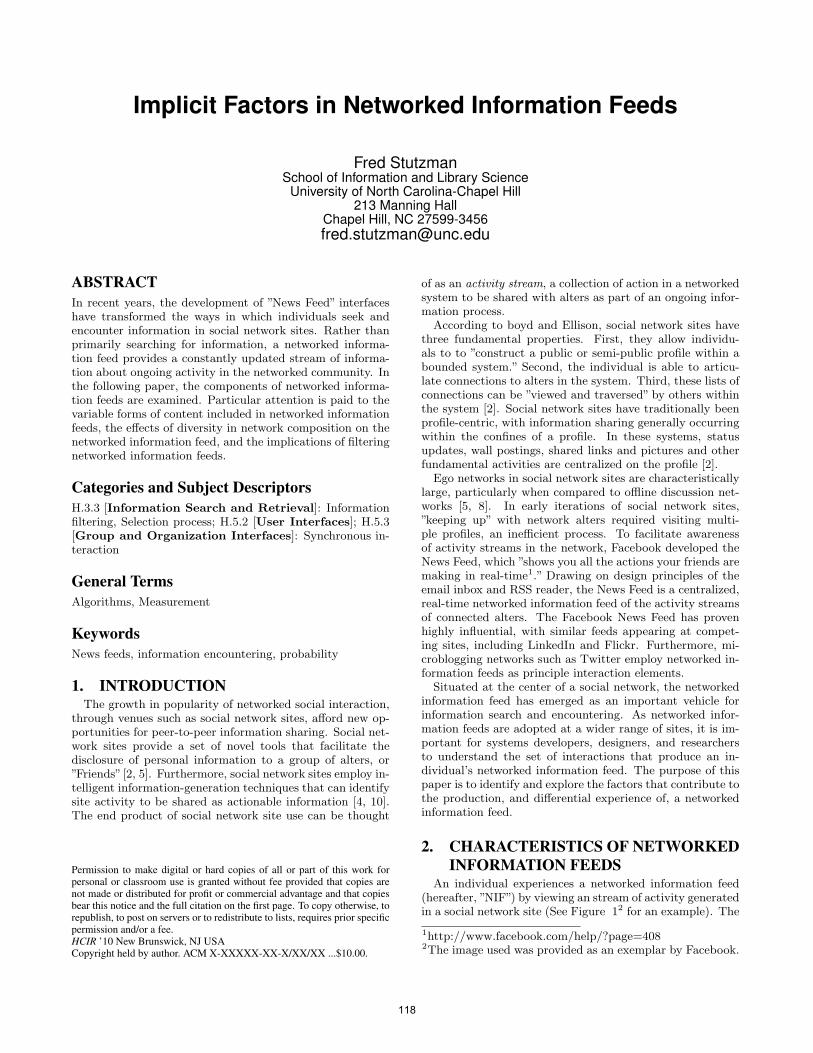
Implicit Factors in Networked Information Feeds
Fred StutzmanSchool of Information and Library Science
University of North Carolina-Chapel Hill213 Manning Hall
Chapel Hill, NC [email protected]
ABSTRACTIn recent years, the development of ”News Feed” interfaceshave transformed the ways in which individuals seek andencounter information in social network sites. Rather thanprimarily searching for information, a networked informa-tion feed provides a constantly updated stream of informa-tion about ongoing activity in the networked community. Inthe following paper, the components of networked informa-tion feeds are examined. Particular attention is paid to thevariable forms of content included in networked informationfeeds, the effects of diversity in network composition on thenetworked information feed, and the implications of filteringnetworked information feeds.
Categories and Subject DescriptorsH.3.3 [Information Search and Retrieval]: Informationfiltering, Selection process; H.5.2 [User Interfaces]; H.5.3[Group and Organization Interfaces]: Synchronous in-teraction
General TermsAlgorithms, Measurement
KeywordsNews feeds, information encountering, probability
1. INTRODUCTIONThe growth in popularity of networked social interaction,
through venues such as social network sites, afford new op-portunities for peer-to-peer information sharing. Social net-work sites provide a set of novel tools that facilitate thedisclosure of personal information to a group of alters, or”Friends”[2, 5]. Furthermore, social network sites employ in-telligent information-generation techniques that can identifysite activity to be shared as actionable information [4, 10].The end product of social network site use can be thought
Permission to make digital or hard copies of all or part of this work forpersonal or classroom use is granted without fee provided that copies arenot made or distributed for profit or commercial advantage and that copiesbear this notice and the full citation on the first page. To copy otherwise, torepublish, to post on servers or to redistribute to lists, requires prior specificpermission and/or a fee.HCIR ’10 New Brunswick, NJ USACopyright held by author. ACM X-XXXXX-XX-X/XX/XX ...$10.00.
of as an activity stream, a collection of action in a networkedsystem to be shared with alters as part of an ongoing infor-mation process.
According to boyd and Ellison, social network sites havethree fundamental properties. First, they allow individu-als to to ”construct a public or semi-public profile within abounded system.” Second, the individual is able to articu-late connections to alters in the system. Third, these lists ofconnections can be ”viewed and traversed” by others withinthe system [2]. Social network sites have traditionally beenprofile-centric, with information sharing generally occurringwithin the confines of a profile. In these systems, statusupdates, wall postings, shared links and pictures and otherfundamental activities are centralized on the profile [2].
Ego networks in social network sites are characteristicallylarge, particularly when compared to offline discussion net-works [5, 8]. In early iterations of social network sites,”keeping up” with network alters required visiting multi-ple profiles, an inefficient process. To facilitate awarenessof activity streams in the network, Facebook developed theNews Feed, which ”shows you all the actions your friends aremaking in real-time1.” Drawing on design principles of theemail inbox and RSS reader, the News Feed is a centralized,real-time networked information feed of the activity streamsof connected alters. The Facebook News Feed has provenhighly influential, with similar feeds appearing at compet-ing sites, including LinkedIn and Flickr. Furthermore, mi-croblogging networks such as Twitter employ networked in-formation feeds as principle interaction elements.
Situated at the center of a social network, the networkedinformation feed has emerged as an important vehicle forinformation search and encountering. As networked infor-mation feeds are adopted at a wider range of sites, it is im-portant for systems developers, designers, and researchersto understand the set of interactions that produce an in-dividual’s networked information feed. The purpose of thispaper is to identify and explore the factors that contribute tothe production, and differential experience of, a networkedinformation feed.
2. CHARACTERISTICS OF NETWORKEDINFORMATION FEEDS
An individual experiences a networked information feed(hereafter, ”NIF”) by viewing an stream of activity generatedin a social network site (See Figure 12 for an example). The
1http://www.facebook.com/help/?page=4082The image used was provided as an exemplar by Facebook.
118
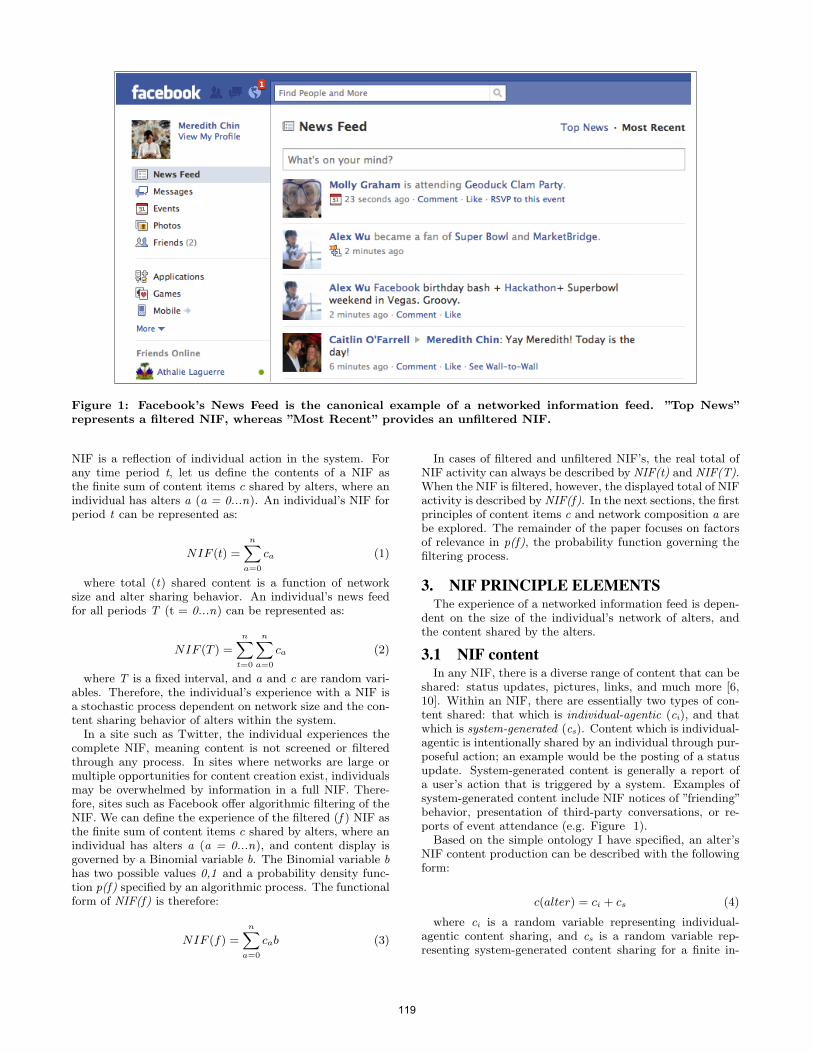
Figure 1: Facebook’s News Feed is the canonical example of a networked information feed. ”Top News”represents a filtered NIF, whereas ”Most Recent” provides an unfiltered NIF.
NIF is a reflection of individual action in the system. Forany time period t, let us define the contents of a NIF asthe finite sum of content items c shared by alters, where anindividual has alters a (a = 0...n). An individual’s NIF forperiod t can be represented as:
NIF (t) =
nXa=0
ca (1)
where total (t) shared content is a function of networksize and alter sharing behavior. An individual’s news feedfor all periods T (t = 0...n) can be represented as:
NIF (T ) =
nXt=0
nXa=0
ca (2)
where T is a fixed interval, and a and c are random vari-ables. Therefore, the individual’s experience with a NIF isa stochastic process dependent on network size and the con-tent sharing behavior of alters within the system.
In a site such as Twitter, the individual experiences thecomplete NIF, meaning content is not screened or filteredthrough any process. In sites where networks are large ormultiple opportunities for content creation exist, individualsmay be overwhelmed by information in a full NIF. There-fore, sites such as Facebook offer algorithmic filtering of theNIF. We can define the experience of the filtered (f ) NIF asthe finite sum of content items c shared by alters, where anindividual has alters a (a = 0...n), and content display isgoverned by a Binomial variable b. The Binomial variable bhas two possible values 0,1 and a probability density func-tion p(f) specified by an algorithmic process. The functionalform of NIF(f) is therefore:
NIF (f) =
nXa=0
cab (3)
In cases of filtered and unfiltered NIF’s, the real total ofNIF activity can always be described by NIF(t) and NIF(T).When the NIF is filtered, however, the displayed total of NIFactivity is described by NIF(f). In the next sections, the firstprinciples of content items c and network composition a arebe explored. The remainder of the paper focuses on factorsof relevance in p(f), the probability function governing thefiltering process.
3. NIF PRINCIPLE ELEMENTSThe experience of a networked information feed is depen-
dent on the size of the individual’s network of alters, andthe content shared by the alters.
3.1 NIF contentIn any NIF, there is a diverse range of content that can be
shared: status updates, pictures, links, and much more [6,10]. Within an NIF, there are essentially two types of con-tent shared: that which is individual-agentic (ci), and thatwhich is system-generated (cs). Content which is individual-agentic is intentionally shared by an individual through pur-poseful action; an example would be the posting of a statusupdate. System-generated content is generally a report ofa user’s action that is triggered by a system. Examples ofsystem-generated content include NIF notices of ”friending”behavior, presentation of third-party conversations, or re-ports of event attendance (e.g. Figure 1).
Based on the simple ontology I have specified, an alter’sNIF content production can be described with the followingform:
c(alter) = ci + cs (4)
where ci is a random variable representing individual-agentic content sharing, and cs is a random variable rep-resenting system-generated content sharing for a finite in-
119

terval. We expect that both of these variables, ci and cs arecontingent on u, a random variable describing site use by thealter. Therefore, the function describing total (T ) expectedalter NIF content production for all periods T (t = 0...n)can be represented as:
c(T ) =
nXt=0
nXa=0
p(cit|uat) + p(cst|uat) (5)
That is, the content production in a NIF depends on analter’s actions in a site, which is conditional on site use.It must be noted that while ci is completely dependent onan alter’s actions, it is possible that cs will contain actionsfrom the alter and the alter’s group of contacts. For exam-ple, if an alter is tagged in a picture, the system generatesactivity on behalf of the alter triggered by the actions of athird party. For simplicity’s sake, we do not create a thirdcategory, instead retaining third-party activity within cs.
Previous work has identified Pareto, Zipf and exponen-tial distributions for content production in large-scale socio-technical environments [1, 3]. Within the context of individ-ual production, the probability of content creation is betterspecified with the Poisson distribution, defined as follows:
P (c) =e−λλc
c!(6)
where c must be a non-negative integer3. Using simula-tion, we can explore potential impact of adding new individ-uals to the NIF at theoretical lambdas 2,4,6, and 8 (Figure2). It should be noted that individual content production inNIF may also be well-specified with the Negative Binomialform (in the case of overdispersion). Furthermore, occa-sional or bursty network use may serve to zero-inflate alterNIF content production over time.
3.2 NIF network propertiesThe amount of content shared in a NIF is functionally
dependent on the size of the alter network. Because we areable to specify an individual probability p(a) of content pro-duction c by alters a (6), we are able to reasonably estimatethe expected impact to an NIF of the addition of alters tothe network with the following form:
E(c) =
nXa=0
paca (7)
In practice, we find that the composition of an NIF net-work has a dual form. Similar to the ontology of content pro-duction, NIF network membership can either be explicit orsystem facilitated. Explicit network membership reflects in-tentional addition of an alter to a NIF network by an individ-ual. Adding a Facebook friend, or ”following”a Twitter userare examples of explicit network additions. System facili-tated inclusion in an NIF refer to the penumbra of system-facilitated activities that allow non-members to participatein an individual’s NIF. For example, by ”Retweeting4,” thealter employs system functionality to bring a potentially ex-ternal individual into a NIF. Similarly, a comment left by
3It is my belief that the exponential features of power law-type distributions are incompatible with individual behav-ior, and therefore poorly specify these probabilities.4i.e., hitting the Retweet button.
0 2 4 6 8 11 14 17 20
Simulated Density at Lamba = 2
Potential content items
Pro
babi
lity
dens
ity o
f con
tent
pro
duct
ion
0.00
0.10
0.20
0 2 4 6 8 11 14 17 20
Simulated Density at Lamba = 4
Potential content items
Pro
babi
lity
dens
ity o
f con
tent
pro
duct
ion
0.00
0.05
0.10
0.15
0 2 4 6 8 11 14 17 20
Simulated Density at Lamba = 6
Potential content items
Pro
babi
lity
dens
ity o
f con
tent
pro
duct
ion
0.00
0.05
0.10
0.15
0 2 4 6 8 11 14 17 20
Simulated Density at Lamba = 8
Potential content items
Pro
babi
lity
dens
ity o
f con
tent
pro
duct
ion
0.00
0.04
0.08
0.12
Figure 2: Simulated probability densities for NIF attheoretical lambdas 2, 4, 6, and 8
an alter on a potentially external individual’s status updatein Facebook may bring the non-member’s content into theNIF.
The impact of adding members to an NIF network ismore experientially complex than a simple addition of vol-ume. We assume that the individual has relationships withcontent-producing alters, and therefore evaluates NIF con-tent in light of these relationships. Furthermore, the partic-ular configuration of relationships within an NIF will affectthe individual’s experience of content. Drawing on theoriesof tie strength, and empirical models of network configu-ration, I briefly explore the experiential impact of networkconfiguration.
3.2.1 Tie strengthAn abundance of literature is devoted to the properties of
social ties [7, 9]. The general principle is that each relation-ship has a certain strength, which is placed on a continuumof weak to strong. Represented mathematically, we can as-sume that each relationship an individual has with an altercan be represented by the random variable s, with possiblevalues 0 → 1.
Although we are able to place a theoretical value on eachrelationship within a NIF, it is unwise to assume that ”tiestrength”always corresponds to a relevance judgment. Earlywork on tie strength identified the unexpected value of weakties [7]; in an NIF, a person may allow weak ties into the net-work to observe ongoing activity, with only a small portionof activity having high relevance. Furthermore, algorithmicidentification of relationship strength has proven to be chal-lenging, though there is good work identifying metrics thatmay be more useful than others for identifying strength [6].
3.2.2 Network configurationWithin the bounded network of a social network site, we
120
are able to identify certain characteristics in relationshippatterns that may influence the NIF experience. In a net-work, each vertex (or node) is connected to alters via anedge. The configuration of edges in the network are de-tectable through graph theoretic techniques, and may beuseful for understanding individual experience of the net-work. Consider a simple measure of graph structure, den-sity:
Density(∆) =2E
v(v − 1)(8)
In which the number of incident edges (E) is a proportionof the total vertices (v) possible in the graph [11]. A highlydense graph would indicate a network with many sharedconnections. A nuclear family, for example, might expectto have a highly dense network when replicated into a NIF.On the other hand, a sparse network indicates a heteroge-nous mix of connections. A traveling salesperson, for exam-ple, may have many connections that do not share networkedges. The density of the network, as well as the relativedegree density between prominent members of the NIF hasimplications for the variety, relevance, and actionable natureof the content shared within the network.
Another important factor is the relationship between net-work configuration and content sharing behavior. Whenwe specifiy the probability of content production (6), weassumed that the lambdas would be (approximately) nor-mally distributed across the population (a safe estimate atlarge population sizes). At the subgraph level, however, itis possible that lambdas covary with network density, i.e.cov(λ, ∆) 6= 0. This is potentially the result of local pro-cesses where some networks are incited share more than oth-ers as a result of influential, vocal few. Therefore, we assumethat certain network configurations have characteristic NIFbehavior and should be modeled with group variance.
4. THE FILTERING PARAMETERFinally, we consider the NIF filtering parameter (3), which
governs the display of content in a filtered NIF. As previ-ously discussed, the filtering parameter is a Binomial vari-able b that has two possible values 0,1 and a probabilitydensity specified by an algorithmic process.
It is beyond the scope of this paper to specify potentialfiltering parameters (see [6] for an extensive list of possibili-ties). In general, we assume that the designers of NIF filterswant to maximize interest in the stream. We can there-fore define maxi as a locally maximized vector of filteringvariables [f1, f2, ..., fn].
In a filtered NIF, we assume that all content items T (2)shared in an individual’s NIF have a probability between 0,1of inclusion in the filtered NIF. Therefore, we define the logodds of inclusion of a content item to be:
log
»pi
(1− pi)
–= α+βtxi1 +βnxi2 +β[maxi]xi3 +βkxik (9)
In this simple form, the log odds of content inclusion area function of individual content production t, network sizen, the local maximization vector maxi and a random termk.
5. CONCLUSIONS
Networked information feeds such as the Facebook NewsFeed are increasingly becoming an important place to bothseek and encounter information. Situated in the midst ofa social context, the NIF has the potential to continuouslydeliver relevant information from a large network of connec-tions. This new form of information retrieval poses chal-lenges to designers and researchers. How can the utility andinterest of content shared in a NIF be maximized? Whatvariables have the greatest potential to affect experiencewith the NIF? What factors are most important when fil-tering NIF’s? This paper is the beginning of a research pro-jected aimed at answering these questions, which are of crit-ical interest to industry, academia, and users of networkedinformation feeds.
6. REFERENCES[1] A. Barabasi, R. Albert, and H. Jeong. Scale-free
characteristics of random networks: The topology ofthe world wide web. Physica A, 281:68–77, 2000.
[2] D. Boyd and N. Ellison. Social network sites:Definition, history, and scholarship. Journal ofComputer-Mediated Communication, 13(1), 2007.
[3] A. Broder, R. Kumar, M. F., P. Raghavan,S. Rajagopalan, R. Stata, A. Tomkins, and J. Wiener.Graph structure in the web. Computer Networks,33(309), 2000.
[4] M. Burke, C. Marlow, and T. Lento. Feed me:motivating newcomer contribution in social networksites. In CHI ’09: Proceedings of the 27th internationalconference on Human factors in computing systems,pages 945–954, New York, NY, USA, 2009. ACM.
[5] N. Ellison, C. Steinfield, and C. Lampe. The benefitsof facebook ”friends:” social capital and collegestudents’ use of online social network sites. Journal ofComputer Mediated Communications, 12(4), 2007.
[6] E. Gilbert and K. Karahalios. Predicting tie strengthwith social media. In CHI ’09: Proceedings of the 27thinternational conference on Human factors incomputing systems, pages 211–220, New York, NY,USA, 2009. ACM.
[7] M. Granovetter. The strength of weak ties. TheAmerican Journal of Sociology, 78(6):1360–1380, 1973.
[8] M. McPherson, L. Smith-Lovin, and M. Brashears.Social isolation in america: Changes in core discussionnetworks over two decades. American SociologicalReview, 71(3):353–375, 2006.
[9] R. Putnam. Bowling Alone : The Collapse andRevival of American Community. Simon & Schuster,New York, NY, 2001.
[10] E. Sun, I. Rosenn, C. Marlow, and T. Lento.Gesundheit! modeling contagion through facebooknews feed. In Proceedings of the Third InternationalConference on Weblogs and Social Media, San Jose,CA, May 2009. AAAI Press, AAAI Press.
[11] S. Wasserman and K. Faust. Social Network Analysis:Methods and Applications. Cambridge UniversityPress, New York, 1994.
121
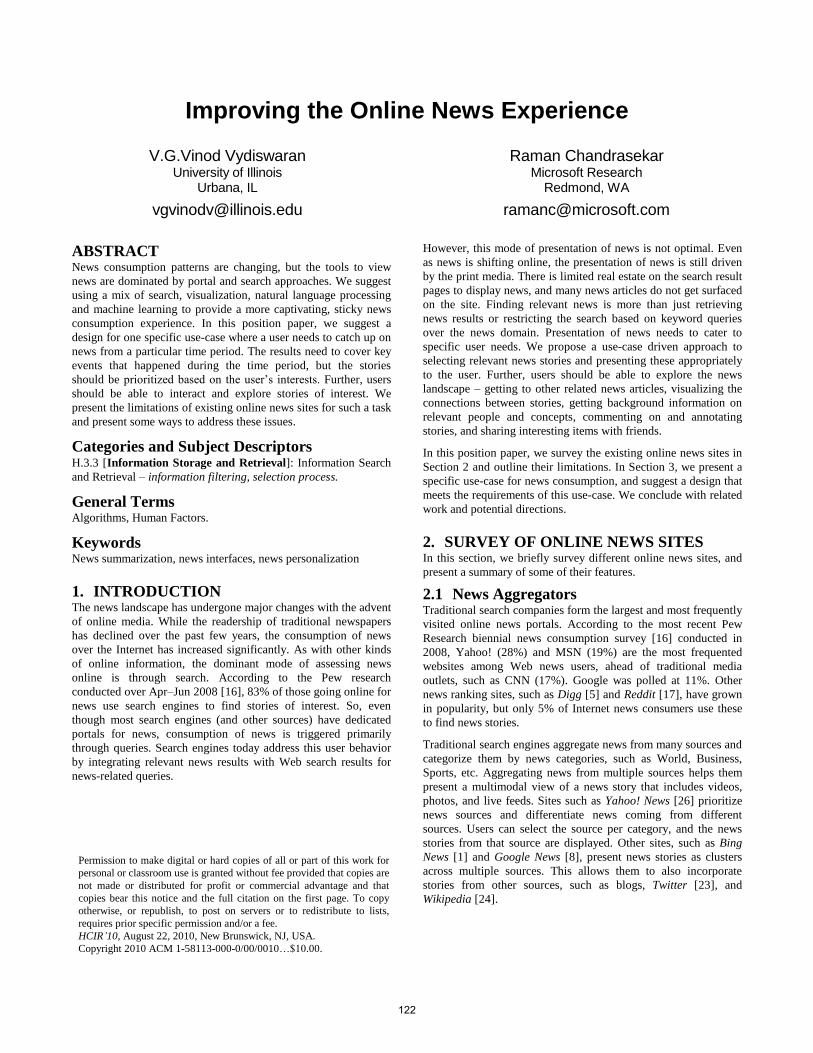
Improving the Online News Experience
V.G.Vinod Vydiswaran University of Illinois
Urbana, IL
Raman Chandrasekar Microsoft Research
Redmond, WA
ABSTRACT News consumption patterns are changing, but the tools to view
news are dominated by portal and search approaches. We suggest
using a mix of search, visualization, natural language processing
and machine learning to provide a more captivating, sticky news
consumption experience. In this position paper, we suggest a
design for one specific use-case where a user needs to catch up on
news from a particular time period. The results need to cover key
events that happened during the time period, but the stories
should be prioritized based on the user’s interests. Further, users
should be able to interact and explore stories of interest. We
present the limitations of existing online news sites for such a task
and present some ways to address these issues.
Categories and Subject Descriptors
H.3.3 [Information Storage and Retrieval]: Information Search
and Retrieval – information filtering, selection process.
General Terms
Algorithms, Human Factors.
Keywords
News summarization, news interfaces, news personalization
1. INTRODUCTION The news landscape has undergone major changes with the advent
of online media. While the readership of traditional newspapers
has declined over the past few years, the consumption of news
over the Internet has increased significantly. As with other kinds
of online information, the dominant mode of assessing news
online is through search. According to the Pew research
conducted over Apr–Jun 2008 [16], 83% of those going online for
news use search engines to find stories of interest. So, even
though most search engines (and other sources) have dedicated
portals for news, consumption of news is triggered primarily
through queries. Search engines today address this user behavior
by integrating relevant news results with Web search results for
news-related queries.
However, this mode of presentation of news is not optimal. Even
as news is shifting online, the presentation of news is still driven
by the print media. There is limited real estate on the search result
pages to display news, and many news articles do not get surfaced
on the site. Finding relevant news is more than just retrieving
news results or restricting the search based on keyword queries
over the news domain. Presentation of news needs to cater to
specific user needs. We propose a use-case driven approach to
selecting relevant news stories and presenting these appropriately
to the user. Further, users should be able to explore the news
landscape – getting to other related news articles, visualizing the
connections between stories, getting background information on
relevant people and concepts, commenting on and annotating
stories, and sharing interesting items with friends.
In this position paper, we survey the existing online news sites in
Section 2 and outline their limitations. In Section 3, we present a
specific use-case for news consumption, and suggest a design that
meets the requirements of this use-case. We conclude with related
work and potential directions.
2. SURVEY OF ONLINE NEWS SITES In this section, we briefly survey different online news sites, and
present a summary of some of their features.
2.1 News Aggregators Traditional search companies form the largest and most frequently
visited online news portals. According to the most recent Pew
Research biennial news consumption survey [16] conducted in
2008, Yahoo! (28%) and MSN (19%) are the most frequented
websites among Web news users, ahead of traditional media
outlets, such as CNN (17%). Google was polled at 11%. Other
news ranking sites, such as Digg [5] and Reddit [17], have grown
in popularity, but only 5% of Internet news consumers use these
to find news stories.
Traditional search engines aggregate news from many sources and
categorize them by news categories, such as World, Business,
Sports, etc. Aggregating news from multiple sources helps them
present a multimodal view of a news story that includes videos,
photos, and live feeds. Sites such as Yahoo! News [26] prioritize
news sources and differentiate news coming from different
sources. Users can select the source per category, and the news
stories from that source are displayed. Other sites, such as Bing
News [1] and Google News [8], present news stories as clusters
across multiple sources. This allows them to also incorporate
stories from other sources, such as blogs, Twitter [23], and
Wikipedia [24].
Permission to make digital or hard copies of all or part of this work for
personal or classroom use is granted without fee provided that copies are
not made or distributed for profit or commercial advantage and that
copies bear this notice and the full citation on the first page. To copy
otherwise, or republish, to post on servers or to redistribute to lists,
requires prior specific permission and/or a fee.
HCIR’10, August 22, 2010, New Brunswick, NJ, USA.
Copyright 2010 ACM 1-58113-000-0/00/0010…$10.00.
122
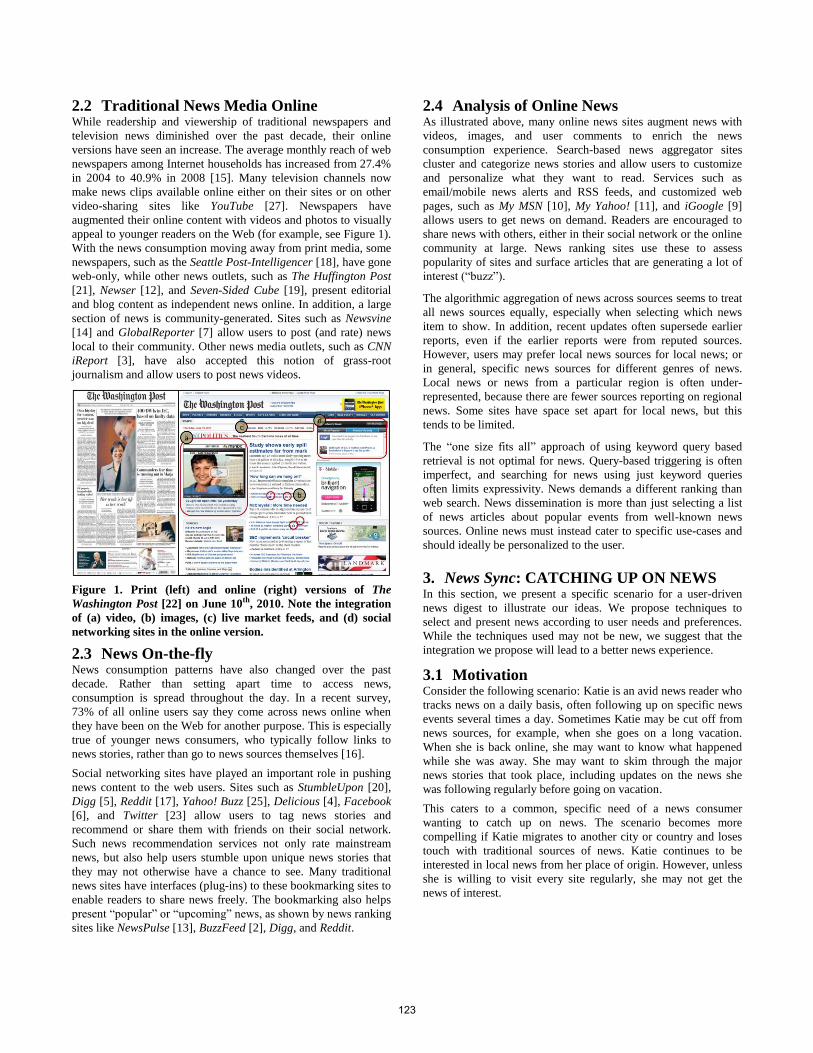
2.2 Traditional News Media Online While readership and viewership of traditional newspapers and
television news diminished over the past decade, their online
versions have seen an increase. The average monthly reach of web
newspapers among Internet households has increased from 27.4%
in 2004 to 40.9% in 2008 [15]. Many television channels now
make news clips available online either on their sites or on other
video-sharing sites like YouTube [27]. Newspapers have
augmented their online content with videos and photos to visually
appeal to younger readers on the Web (for example, see Figure 1).
With the news consumption moving away from print media, some
newspapers, such as the Seattle Post-Intelligencer [18], have gone
web-only, while other news outlets, such as The Huffington Post
[21], Newser [12], and Seven-Sided Cube [19], present editorial
and blog content as independent news online. In addition, a large
section of news is community-generated. Sites such as Newsvine
[14] and GlobalReporter [7] allow users to post (and rate) news
local to their community. Other news media outlets, such as CNN
iReport [3], have also accepted this notion of grass-root
journalism and allow users to post news videos.
Figure 1. Print (left) and online (right) versions of The
Washington Post [22] on June 10th, 2010. Note the integration
of (a) video, (b) images, (c) live market feeds, and (d) social
networking sites in the online version.
2.3 News On-the-fly News consumption patterns have also changed over the past
decade. Rather than setting apart time to access news,
consumption is spread throughout the day. In a recent survey,
73% of all online users say they come across news online when
they have been on the Web for another purpose. This is especially
true of younger news consumers, who typically follow links to
news stories, rather than go to news sources themselves [16].
Social networking sites have played an important role in pushing
news content to the web users. Sites such as StumbleUpon [20],
Digg [5], Reddit [17], Yahoo! Buzz [25], Delicious [4], Facebook
[6], and Twitter [23] allow users to tag news stories and
recommend or share them with friends on their social network.
Such news recommendation services not only rate mainstream
news, but also help users stumble upon unique news stories that
they may not otherwise have a chance to see. Many traditional
news sites have interfaces (plug-ins) to these bookmarking sites to
enable readers to share news freely. The bookmarking also helps
present “popular” or “upcoming” news, as shown by news ranking
sites like NewsPulse [13], BuzzFeed [2], Digg, and Reddit.
2.4 Analysis of Online News As illustrated above, many online news sites augment news with
videos, images, and user comments to enrich the news
consumption experience. Search-based news aggregator sites
cluster and categorize news stories and allow users to customize
and personalize what they want to read. Services such as
email/mobile news alerts and RSS feeds, and customized web
pages, such as My MSN [10], My Yahoo! [11], and iGoogle [9]
allows users to get news on demand. Readers are encouraged to
share news with others, either in their social network or the online
community at large. News ranking sites use these to assess
popularity of sites and surface articles that are generating a lot of
interest (“buzz”).
The algorithmic aggregation of news across sources seems to treat
all news sources equally, especially when selecting which news
item to show. In addition, recent updates often supersede earlier
reports, even if the earlier reports were from reputed sources.
However, users may prefer local news sources for local news; or
in general, specific news sources for different genres of news.
Local news or news from a particular region is often under-
represented, because there are fewer sources reporting on regional
news. Some sites have space set apart for local news, but this
tends to be limited.
The “one size fits all” approach of using keyword query based
retrieval is not optimal for news. Query-based triggering is often
imperfect, and searching for news using just keyword queries
often limits expressivity. News demands a different ranking than
web search. News dissemination is more than just selecting a list
of news articles about popular events from well-known news
sources. Online news must instead cater to specific use-cases and
should ideally be personalized to the user.
3. News Sync: CATCHING UP ON NEWS In this section, we present a specific scenario for a user-driven
news digest to illustrate our ideas. We propose techniques to
select and present news according to user needs and preferences.
While the techniques used may not be new, we suggest that the
integration we propose will lead to a better news experience.
3.1 Motivation Consider the following scenario: Katie is an avid news reader who
tracks news on a daily basis, often following up on specific news
events several times a day. Sometimes Katie may be cut off from
news sources, for example, when she goes on a long vacation.
When she is back online, she may want to know what happened
while she was away. She may want to skim through the major
news stories that took place, including updates on the news she
was following regularly before going on vacation.
This caters to a common, specific need of a news consumer
wanting to catch up on news. The scenario becomes more
compelling if Katie migrates to another city or country and loses
touch with traditional sources of news. Katie continues to be
interested in local news from her place of origin. However, unless
she is willing to visit every site regularly, she may not get the
news of interest.
123
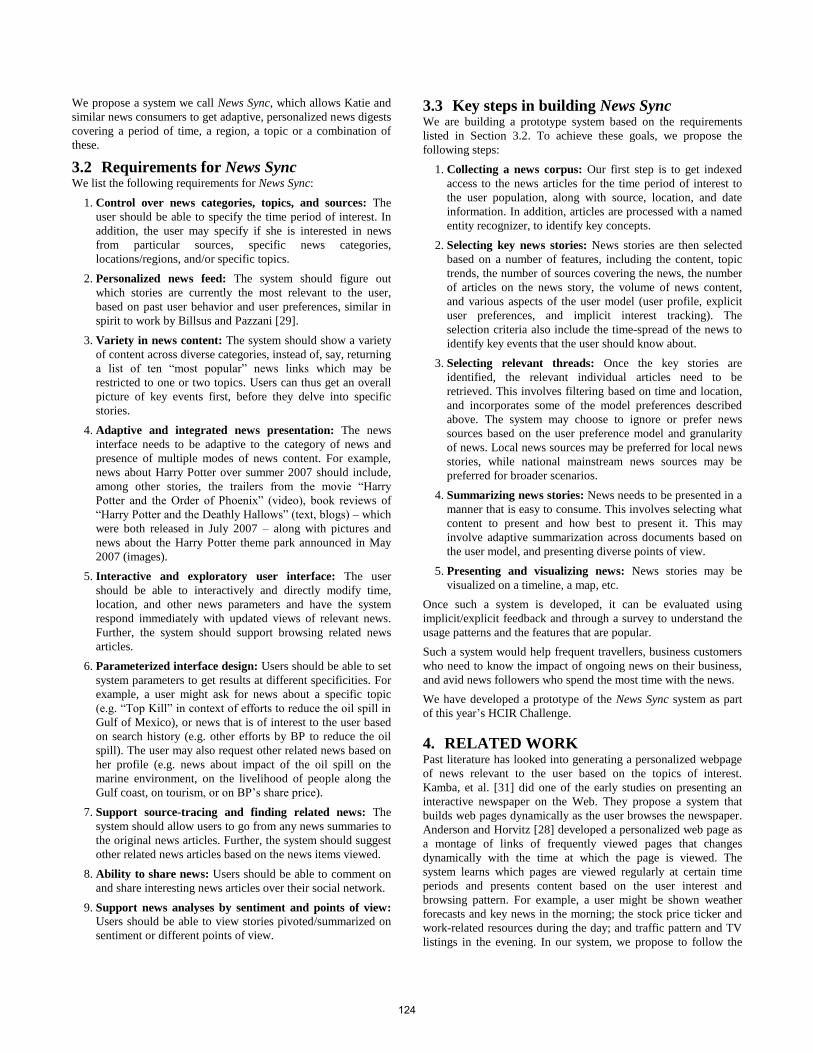
We propose a system we call News Sync, which allows Katie and
similar news consumers to get adaptive, personalized news digests
covering a period of time, a region, a topic or a combination of
these.
3.2 Requirements for News Sync We list the following requirements for News Sync:
1. Control over news categories, topics, and sources: The
user should be able to specify the time period of interest. In
addition, the user may specify if she is interested in news
from particular sources, specific news categories,
locations/regions, and/or specific topics.
2. Personalized news feed: The system should figure out
which stories are currently the most relevant to the user,
based on past user behavior and user preferences, similar in
spirit to work by Billsus and Pazzani [29].
3. Variety in news content: The system should show a variety
of content across diverse categories, instead of, say, returning
a list of ten “most popular” news links which may be
restricted to one or two topics. Users can thus get an overall
picture of key events first, before they delve into specific
stories.
4. Adaptive and integrated news presentation: The news
interface needs to be adaptive to the category of news and
presence of multiple modes of news content. For example,
news about Harry Potter over summer 2007 should include,
among other stories, the trailers from the movie “Harry
Potter and the Order of Phoenix” (video), book reviews of
“Harry Potter and the Deathly Hallows” (text, blogs) – which
were both released in July 2007 – along with pictures and
news about the Harry Potter theme park announced in May
2007 (images).
5. Interactive and exploratory user interface: The user
should be able to interactively and directly modify time,
location, and other news parameters and have the system
respond immediately with updated views of relevant news.
Further, the system should support browsing related news
articles.
6. Parameterized interface design: Users should be able to set
system parameters to get results at different specificities. For
example, a user might ask for news about a specific topic
(e.g. “Top Kill” in context of efforts to reduce the oil spill in
Gulf of Mexico), or news that is of interest to the user based
on search history (e.g. other efforts by BP to reduce the oil
spill). The user may also request other related news based on
her profile (e.g. news about impact of the oil spill on the
marine environment, on the livelihood of people along the
Gulf coast, on tourism, or on BP’s share price).
7. Support source-tracing and finding related news: The
system should allow users to go from any news summaries to
the original news articles. Further, the system should suggest
other related news articles based on the news items viewed.
8. Ability to share news: Users should be able to comment on
and share interesting news articles over their social network.
9. Support news analyses by sentiment and points of view:
Users should be able to view stories pivoted/summarized on
sentiment or different points of view.
3.3 Key steps in building News Sync We are building a prototype system based on the requirements
listed in Section 3.2. To achieve these goals, we propose the
following steps:
1. Collecting a news corpus: Our first step is to get indexed
access to the news articles for the time period of interest to
the user population, along with source, location, and date
information. In addition, articles are processed with a named
entity recognizer, to identify key concepts.
2. Selecting key news stories: News stories are then selected
based on a number of features, including the content, topic
trends, the number of sources covering the news, the number
of articles on the news story, the volume of news content,
and various aspects of the user model (user profile, explicit
user preferences, and implicit interest tracking). The
selection criteria also include the time-spread of the news to
identify key events that the user should know about.
3. Selecting relevant threads: Once the key stories are
identified, the relevant individual articles need to be
retrieved. This involves filtering based on time and location,
and incorporates some of the model preferences described
above. The system may choose to ignore or prefer news
sources based on the user preference model and granularity
of news. Local news sources may be preferred for local news
stories, while national mainstream news sources may be
preferred for broader scenarios.
4. Summarizing news stories: News needs to be presented in a
manner that is easy to consume. This involves selecting what
content to present and how best to present it. This may
involve adaptive summarization across documents based on
the user model, and presenting diverse points of view.
5. Presenting and visualizing news: News stories may be
visualized on a timeline, a map, etc.
Once such a system is developed, it can be evaluated using
implicit/explicit feedback and through a survey to understand the
usage patterns and the features that are popular.
Such a system would help frequent travellers, business customers
who need to know the impact of ongoing news on their business,
and avid news followers who spend the most time with the news.
We have developed a prototype of the News Sync system as part
of this year’s HCIR Challenge.
4. RELATED WORK Past literature has looked into generating a personalized webpage
of news relevant to the user based on the topics of interest.
Kamba, et al. [31] did one of the early studies on presenting an
interactive newspaper on the Web. They propose a system that
builds web pages dynamically as the user browses the newspaper.
Anderson and Horvitz [28] developed a personalized web page as
a montage of links of frequently viewed pages that changes
dynamically with the time at which the page is viewed. The
system learns which pages are viewed regularly at certain time
periods and presents content based on the user interest and
browsing pattern. For example, a user might be shown weather
forecasts and key news in the morning; the stock price ticker and
work-related resources during the day; and traffic pattern and TV
listings in the evening. In our system, we propose to follow the
124
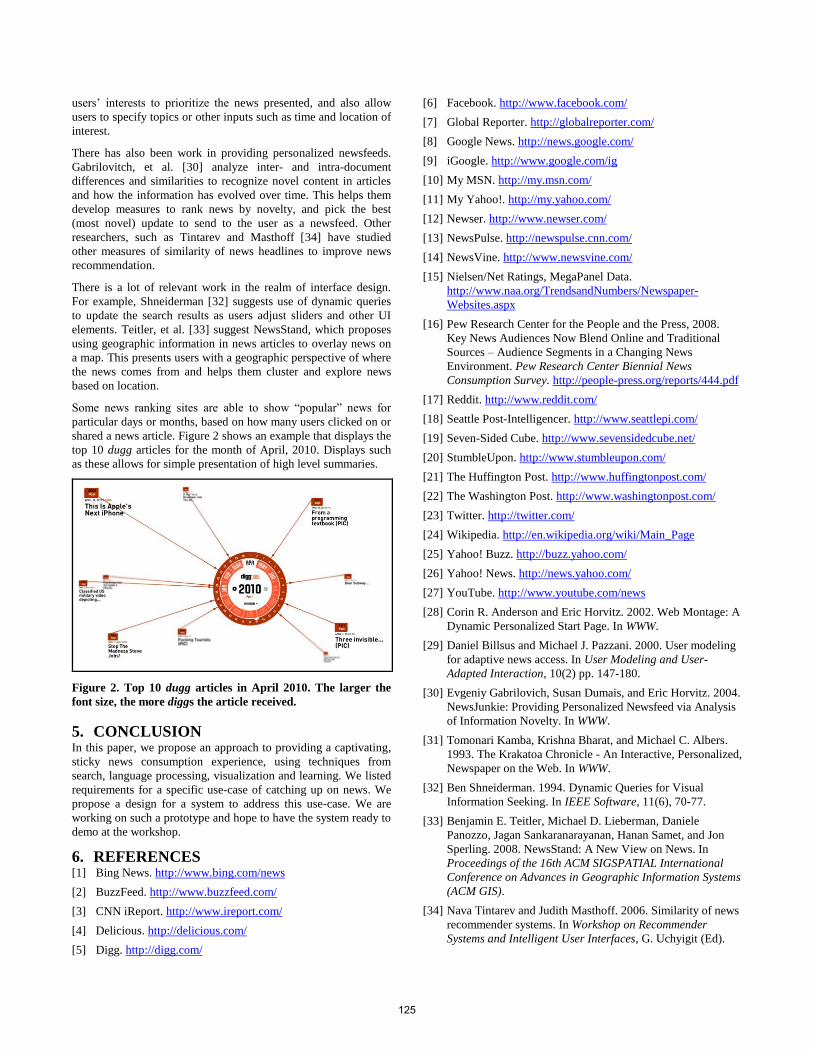
users’ interests to prioritize the news presented, and also allow
users to specify topics or other inputs such as time and location of
interest.
There has also been work in providing personalized newsfeeds.
Gabrilovitch, et al. [30] analyze inter- and intra-document
differences and similarities to recognize novel content in articles
and how the information has evolved over time. This helps them
develop measures to rank news by novelty, and pick the best
(most novel) update to send to the user as a newsfeed. Other
researchers, such as Tintarev and Masthoff [34] have studied
other measures of similarity of news headlines to improve news
recommendation.
There is a lot of relevant work in the realm of interface design.
For example, Shneiderman [32] suggests use of dynamic queries
to update the search results as users adjust sliders and other UI
elements. Teitler, et al. [33] suggest NewsStand, which proposes
using geographic information in news articles to overlay news on
a map. This presents users with a geographic perspective of where
the news comes from and helps them cluster and explore news
based on location.
Some news ranking sites are able to show “popular” news for
particular days or months, based on how many users clicked on or
shared a news article. Figure 2 shows an example that displays the
top 10 dugg articles for the month of April, 2010. Displays such
as these allows for simple presentation of high level summaries.
Figure 2. Top 10 dugg articles in April 2010. The larger the
font size, the more diggs the article received.
5. CONCLUSION In this paper, we propose an approach to providing a captivating,
sticky news consumption experience, using techniques from
search, language processing, visualization and learning. We listed
requirements for a specific use-case of catching up on news. We
propose a design for a system to address this use-case. We are
working on such a prototype and hope to have the system ready to
demo at the workshop.
6. REFERENCES [1] Bing News. http://www.bing.com/news
[2] BuzzFeed. http://www.buzzfeed.com/
[3] CNN iReport. http://www.ireport.com/
[4] Delicious. http://delicious.com/
[5] Digg. http://digg.com/
[6] Facebook. http://www.facebook.com/
[7] Global Reporter. http://globalreporter.com/
[8] Google News. http://news.google.com/
[9] iGoogle. http://www.google.com/ig
[10] My MSN. http://my.msn.com/
[11] My Yahoo!. http://my.yahoo.com/
[12] Newser. http://www.newser.com/
[13] NewsPulse. http://newspulse.cnn.com/
[14] NewsVine. http://www.newsvine.com/
[15] Nielsen/Net Ratings, MegaPanel Data.
http://www.naa.org/TrendsandNumbers/Newspaper-
Websites.aspx
[16] Pew Research Center for the People and the Press, 2008.
Key News Audiences Now Blend Online and Traditional
Sources – Audience Segments in a Changing News
Environment. Pew Research Center Biennial News
Consumption Survey. http://people-press.org/reports/444.pdf
[17] Reddit. http://www.reddit.com/
[18] Seattle Post-Intelligencer. http://www.seattlepi.com/
[19] Seven-Sided Cube. http://www.sevensidedcube.net/
[20] StumbleUpon. http://www.stumbleupon.com/
[21] The Huffington Post. http://www.huffingtonpost.com/
[22] The Washington Post. http://www.washingtonpost.com/
[23] Twitter. http://twitter.com/
[24] Wikipedia. http://en.wikipedia.org/wiki/Main_Page
[25] Yahoo! Buzz. http://buzz.yahoo.com/
[26] Yahoo! News. http://news.yahoo.com/
[27] YouTube. http://www.youtube.com/news
[28] Corin R. Anderson and Eric Horvitz. 2002. Web Montage: A
Dynamic Personalized Start Page. In WWW.
[29] Daniel Billsus and Michael J. Pazzani. 2000. User modeling
for adaptive news access. In User Modeling and User-
Adapted Interaction, 10(2) pp. 147-180.
[30] Evgeniy Gabrilovich, Susan Dumais, and Eric Horvitz. 2004.
NewsJunkie: Providing Personalized Newsfeed via Analysis
of Information Novelty. In WWW.
[31] Tomonari Kamba, Krishna Bharat, and Michael C. Albers.
1993. The Krakatoa Chronicle - An Interactive, Personalized,
Newspaper on the Web. In WWW.
[32] Ben Shneiderman. 1994. Dynamic Queries for Visual
Information Seeking. In IEEE Software, 11(6), 70-77.
[33] Benjamin E. Teitler, Michael D. Lieberman, Daniele
Panozzo, Jagan Sankaranarayanan, Hanan Samet, and Jon
Sperling. 2008. NewsStand: A New View on News. In
Proceedings of the 16th ACM SIGSPATIAL International
Conference on Advances in Geographic Information Systems
(ACM GIS).
[34] Nava Tintarev and Judith Masthoff. 2006. Similarity of news
recommender systems. In Workshop on Recommender
Systems and Intelligent User Interfaces, G. Uchyigit (Ed).
125

Breaking Down the Assumptions of Faceted Search Vladimir Zelevinsky Endeca Technologies
101 Main Street Cambridge, MA 02142
1-617-674-6208 [email protected]
ABSTRACT
In this paper, we list several features of faceted search and
challenge their implicit assumptions.
Categories and Subject Descriptors H.3.3 [Information Storage and Retrieval]: Information Search
and Retrieval – information filtering, query formulation,
relevance feedback, retrieval models, search process, selection
process. H.5.2 [Information Interfaces and Presentation]: User
Interfaces – graphical user interfaces (GUI), theory and methods,
user-centered design. I.2.4 [Artificial Intelligence]: Knowledge
Representation Formalisms and Methods – semantic networks.
General Terms Algorithms, Design, Experimentation, Human Factors.
Keywords Faceted search, user interfaces, refinements, semantic networks,
correlation, fuzzy matching.
1. INTRODUCTION Faceted search has emerged as one of the most effectice processes
for exploratory search and discovery. It allows the user to locate
the records of interest by following, in any order, the process of
iterative refinement; it also permits discovering unknown data by
exposing the sets of data facets that offer both refinement and
data-at-a-glance summarization. When even such a change-
resistant organization as the U.S. Government embraces faceted
search (http://www.whitehouse.gov/search), one can justify
considering this process to be the standard way to resolve
information retrieval needs.
On one hand, the usage patterns and interface details for faceted
search have been ironed out and standardized. Users are starting
to use faceted search applications and transferring such acquired
knowledge to other applications that utilize the same process [4].
Since faceted search user interfaces exhibit similar look and
predictable behavior, the experience of using, for example,
HomeDepot.com can be easily replicated at Lowes.com. On the
other hand, like every successful idea, faceted search is headed
toward the point in its evolution where it is starting to ossify. The
main aim of this paper is, in particular, to list several assumptions
of the faceted search experience that are ripe for reconsideration;
and, more broadly, to suggest that faceted search, however
successful its implementations have been, still contains plenty of
unexplored possibilities and can support a plethora of novel
applications. The first and third ideas below were successfully
prototyped; the second one is currently being investigated.
2. CUSTOM DIMENSIONS The power of faceted search comes, quite (tauto)logically, from
facets: navigable and summarizable properties, tagged onto the
records in the system. The problem with such facets is that they
have to be created in advance (usually, during data pre-
processing), are inflexible (cannot be modified), and might not
suit the particular search intent of a given user. While this does
apply to numerical properties, the recent advances in analytics
allow rapid computation of derived metrics, thus somewhat
alleviating the problem (see “Dynamic Facets” section in [1]).
With topical (keyword) properties, such as salient natural
language terms, however, the issues above fully apply. A text
corpus that have been parsed and tagged with typed entities of
Person, Organization, and Location type might not suit the needs
of the user who is interested in navigating the dimensions of car
parts or exploring noteworthy neighborhoods of New York City.
Prior work exists [3, 7, 8] that combines pre-extracted salient
terms into topical dimensions; the work in [5] detects particular
dimensions that the systems considers useful as leading to
potential refinements. We, however, posit the need of a system
that is capable of creating such topical dimensions with no pre-
processing required whatsoever.
We have created a prototype that allows new dimensions to be
created at query-time, combining Endeca (http://endeca.com/)
structureless database with WordNet semantic network
(http://wordnet.princeton.edu/). See Figure 1 for the diagram of
the user interface and interaction model. In such an interface, the
user can enter at query time a seed topic for the automated
creation of an additional dimension. This topic term is queried
against WordNet, retrieving all its senses. For each sense, we
retrieve all related terms by following the meronym, holonym, and
hyponym network edges. The results are considered as candidates
for our refinements. As the last step, the candidates are checked
against the corpus (of course, it is also possible to check the
candidates against the current search result / navigation state), by
measuring their precision and recall relative to the topic term.
The candidates that have sufficiently high f-measures are returned
to the user as refinements, along with the counts of matching
126
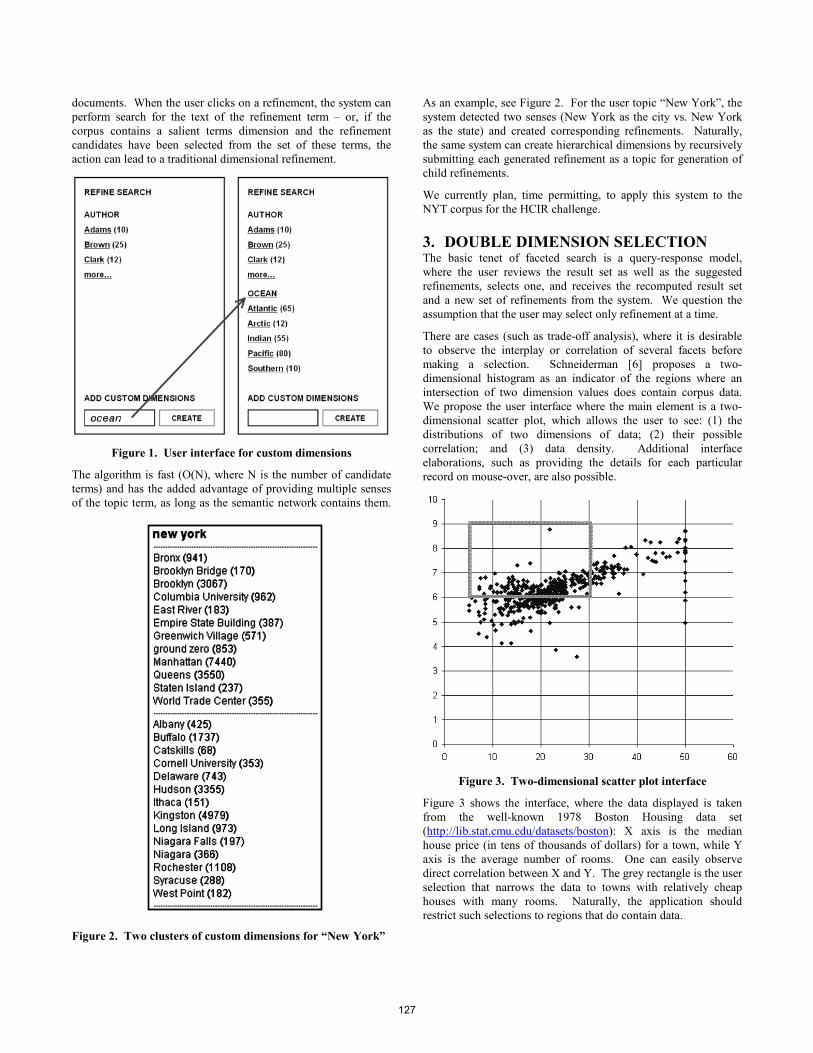
documents. When the user clicks on a refinement, the system can
perform search for the text of the refinement term – or, if the
corpus contains a salient terms dimension and the refinement
candidates have been selected from the set of these terms, the
action can lead to a traditional dimensional refinement.
Figure 1. User interface for custom dimensions
The algorithm is fast (O(N), where N is the number of candidate
terms) and has the added advantage of providing multiple senses
of the topic term, as long as the semantic network contains them.
Figure 2. Two clusters of custom dimensions for “New York”
As an example, see Figure 2. For the user topic “New York”, the
system detected two senses (New York as the city vs. New York
as the state) and created corresponding refinements. Naturally,
the same system can create hierarchical dimensions by recursively
submitting each generated refinement as a topic for generation of
child refinements.
We currently plan, time permitting, to apply this system to the
NYT corpus for the HCIR challenge.
3. DOUBLE DIMENSION SELECTION The basic tenet of faceted search is a query-response model,
where the user reviews the result set as well as the suggested
refinements, selects one, and receives the recomputed result set
and a new set of refinements from the system. We question the
assumption that the user may select only refinement at a time.
There are cases (such as trade-off analysis), where it is desirable
to observe the interplay or correlation of several facets before
making a selection. Schneiderman [6] proposes a two-
dimensional histogram as an indicator of the regions where an
intersection of two dimension values does contain corpus data.
We propose the user interface where the main element is a two-
dimensional scatter plot, which allows the user to see: (1) the
distributions of two dimensions of data; (2) their possible
correlation; and (3) data density. Additional interface
elaborations, such as providing the details for each particular
record on mouse-over, are also possible.
Figure 3. Two-dimensional scatter plot interface
Figure 3 shows the interface, where the data displayed is taken
from the well-known 1978 Boston Housing data set
(http://lib.stat.cmu.edu/datasets/boston): X axis is the median
house price (in tens of thousands of dollars) for a town, while Y
axis is the average number of rooms. One can easily observe
direct correlation between X and Y. The grey rectangle is the user
selection that narrows the data to towns with relatively cheap
houses with many rooms. Naturally, the application should
restrict such selections to regions that do contain data.
127
Note that the question of which X and Y should be used in
construction of the scatter plot interface raises its own set of
challenges. We suggest that a system that calculates either
Pearson correlation coefficients or K-L divergence for all pairs of
dimensions and suggests highly-correlated (or anti-correlated)
pairs would be of interest.
This double dimension selection interface happens to share two
key properties with other faceted search interfaces: (1) it provides
an overview of current result set, while (2) offering ways to refine
it. This duality, by the way, might be yet another assumption of
faceted search interfaces that is ripe for re-consideration.
4. FUZZY SELECTIONS Refinements tend to behave as firm restrictions on the result set:
the records that do not satisfy them are not included in the refined
set. In some cases, this is not the desired behavior. For example,
the user might not be familiar with the data and not sure what
refinements are relevant for the given search intent. We suggest
that in such scenarios it might be helpful to the user to see what
records are not inside the selection but are adjacent to it.
There is considerable amount of research on automatic expansion
of text queries (see, for example, [2]); we, however, are concerned
with the more general case of: (1) automatically expanding the
result set for a broadly defined faceted search, where dimensions
might be textual, numerical, or discrete, and (2) suggesting to the
user those records that are located inside the expanded set but not
in the original one.
We (the author along with user interface expert Blade Kotelly and
software architect Maia Hansen) created a prototype that ran on
top of a restaurant reviews data set. For a given query (which, in
the faceted world, is an intersection of refinements), the
application relaxed, one at a time, every refinement. Numerical
dimensions were relaxed by considering the union of an interval
immediately preceding and immediately succeeding the current
selection; thus, a selection of “price: $10-$20” was substituted
with “price: $5-$10 OR $20-$30”. Discrete dimensions (e.g.,
“cuisine: Chinese”) were replaced with their inverse (“cuisine:
NOT Chinese”). If the relaxed set contained fewer results than
the original, we returned them as “Also consider...” suggestions.
The experience of using such a prototype delivered a two-fold
reaction. On one hand, the system suggesting a highly-rated
Turkish restaurant in the same neighborhood where the user was
trying to find a good Greek eatery was akin to experiencing mind-
reading. On the other hand, some of the suggestions were
perceived as having very little in common with the user query.
The issue of “how one can compare average entrée price with the
walking distance to the nearest bus stop” still remains open. As
the next step, we are considering applying K-L divergence to
detect which properties are the most characteristic of the original
result set (as differing from the complete set of records in the
system). Then the expanded set of “penumbra” records can be
filtered to select those that share such characteristic properties but
might differ on less relevant ones.
5. CONCLUSION The three assumptions listed above are meant to be neither an
exhaustive list – nor even a coherent one, covering as they do pre-
processing, refinement selection, and system's response to selected
refinements. They are, however, intended to indicate several ways
of breaking down standard assumptions and conventions of the
faced search interface. If this paper succeeds in encouraging UX
researchers to “think outside the refinement box” and look for
under-explored possibilities of faceted search, it will have fulfilled
its intended function.
6. REFERENCES [1] O. Ben-Yitzhak et al. Beyond Basic Faceted Search.
WSDM 2008. DOI:
http://doi.acm.org/10.1145/1341531.1341539
[2] C. Carpineto, R. de Mori, G. Romano, B. Bigi. An
information-theoretic approach to automatic query
expansion. ACM Transactions on Information Systems,
volume 19, 1-27, January 2001. DOI:
http://doi.acm.org/10.1145/366836.366860
[3] W. Dakka, R. Dayal, P. Ipeirotis. Automatic Discovery of
Useful Facet Terms. Proceedings of the ACM SIGIR ‘06
Workshop on Faceted Search, 2006.
[4] M. Hearst, A. Elliott, J. English, R. Sinha, K. Swearingen,
K.-P. Yee. Finding the flow in web site search.
Communications of the ACM, 45:42-49, September 2002.
DOI: http://doi.acm.org/10.1145/567498.567525
[5] C. Li, N. Yan, S. B. Roy, L. Lisham, G. Das. Facetedpedia:
Dynamic Generation of Query Dependent Faceted Interfaces
for Wikipedia. International World Wide Web Conference,
Raleigh, North Carolina, USA, 2010. DOI:
http://doi.acm.org/10.1145/1772690.1772757
[6] B. Schneiderman, Dynamic Queries for Visual Information
Seeking. IEEE Software, 11, 70-77, June 1994. DOI:
http://doi.acm.org/10.1109/52.329404
[7] E. Stoica, M. Hearst. Demonstration: Using WordNet to
Build Hierarchical Facet Categories. ACM SIGIR Workshop
on Faceted Search, August, 2006.
[8] K. Yang, E. Jacob, A. Loehrlein, S. Lee, N. Yu. Organizing
the Web: semi-automatic construction of a faceted scheme.
IADIS International Conference WWW/Internet, Madrid,
Spain, 2004.
128
A Survey of User Interfaces in Content-based Image Search Engines on the Web
Danyang Zhang York College, The City University of New York
9420 Guy R. Brewer Blvd. Jamaica, NY 11451
1-718-262-2749
ABSTRACT Content-based image retrieval or CBIR technique has been researched for over a decade, and most researches have been focusing on image matching technologies such as feature extraction and similarity measurement. Recently, there has been an attempt to build content-based image search engines on the web in such a way that they could be as popular as their text-based counterparts. In order to do so, other key issues including user interface should also be explored. This paper presents the user interfaces of current content-based image search engines on the Internet, and analyzes their advantages and disadvantages.
Categories and Subject Descriptors H.5.2 [Information Interfaces and Presentation]: User Interfaces – evaluation/methodology, graphical user interfaces (GUI).
General Terms Design
Keywords User Interface, Usability, CBIR, Content-based Image Search Engine
1. INTRODUCTION Content-based image retrieval or CBIR technique analyzes the actual contents of an image and searches for other images with similar visual features such as colors, shapes, and patterns. CBIR technique has been studied for over a decade [18], and numerous image matching methods and algorithms have been proposed in literature [2, 4, 8, 11, 15]. Content-based image search is useful in many fields including online social networking, E-commerce, E-health, and virtual museums. While the image matching technique is still under improvement, researchers and developers have already started to build content-based image search engines on the web that are expected to be as popular as their text-based counterparts.
The current content-based image search engines on the web can be classified into two broad categories, i.e., domain-specific image search engines and general image search engines. Domain-specific image search engines are designed for a certain purpose within a certain range. For example, Like.com [13] searches for similar looking products from its partner E-commerce websites, and Retrievr [17] allows its users to search and explore in a selection of Flickr [9] (Flickr is an image and video hosting website) images by drawing a rough sketch. Domain-specific
image search engines focus either on a specific category like people search or product retrieval, or within a limited range such as a specified image database; thus they are relatively easier to implement.
General image search engines provide their users with the power of searching the same or similar looking images over the whole Internet. For example, both TinEye [19] and GazoPa [10] aim on looking for similar images on the entire web. They provide various ways for image search including searching by query image, searching by keywords, and searching by sketch. General content-based image search engines need to differentiate images by categories and index gigantic number of images (e.g., TinEye has indexed more than 1,500,000,000 images from the web [19]); thus they are much harder to construct than domain-specific ones.
Although the above-mentioned content-based image search engines are available on the web, the total number of such search engines is far less than that of text-based ones. And they are not as widely used as their text-based counterparts. This is due to many reasons including low precision ratio, low recall ratio, and unfriendly user interface.
Low precision ratio is because CBIR is still a young field, and its techniques still have room for improvement. Low recall ratio is due to the terrifying number (billions) of images on the web and this number increases by thousands everyday; therefore it is very difficult to index and store all these images in the database. The above two issues are currently researched by many scholars and developers. This paper concentrates on another important aspect, i.e., usability, especially user interface.
Usability of a system refers to how much effort a user has to take in order to use the system and get results. The usability of a system can be evaluated by user satisfaction, the likelihood of user return, and the frequency of use [16]. It is a comprehensive concept and contains many aspects like system design, user interface, and visualization (searching results display).
User interface decides how users interact with the system and how they feel about the system in terms of outlook and easiness of use. A friendly and artistic user interface would attract and retain users, while an unfriendly or dry one could drive users away. This paper conducts a survey and analyzes the user interfaces of current content-based image search engines on the web.
The rest of this paper is organized as follows. The next section makes a brief review of the previous and current literatures on usability of web-based CBIR systems. Section 3 explores the user
129
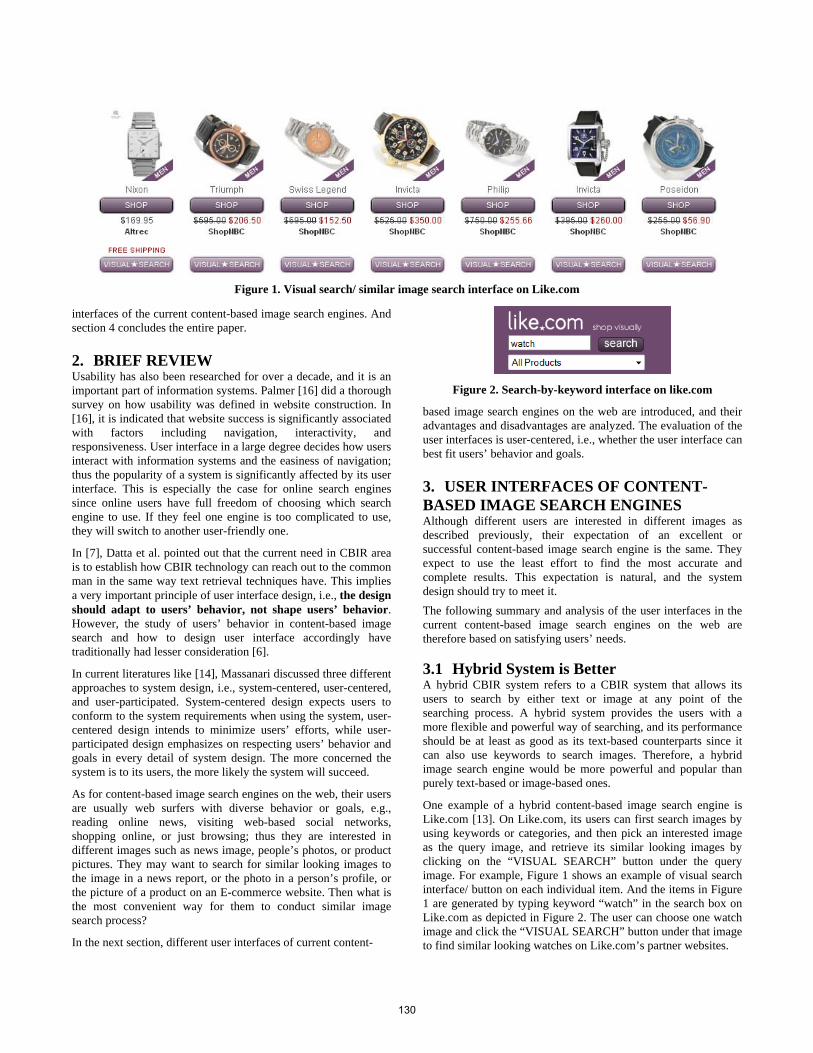
Figure 1. Visual search/ similar image search interface on Like.com
interfaces of the current content-based image search engines. And section 4 concludes the entire paper.
2. BRIEF REVIEW Usability has also been researched for over a decade, and it is an important part of information systems. Palmer [16] did a thorough survey on how usability was defined in website construction. In [16], it is indicated that website success is significantly associated with factors including navigation, interactivity, and responsiveness. User interface in a large degree decides how users interact with information systems and the easiness of navigation; thus the popularity of a system is significantly affected by its user interface. This is especially the case for online search engines since online users have full freedom of choosing which search engine to use. If they feel one engine is too complicated to use, they will switch to another user-friendly one.
In [7], Datta et al. pointed out that the current need in CBIR area is to establish how CBIR technology can reach out to the common man in the same way text retrieval techniques have. This implies a very important principle of user interface design, i.e., the design should adapt to users’ behavior, not shape users’ behavior. However, the study of users’ behavior in content-based image search and how to design user interface accordingly have traditionally had lesser consideration [6].
In current literatures like [14], Massanari discussed three different approaches to system design, i.e., system-centered, user-centered, and user-participated. System-centered design expects users to conform to the system requirements when using the system, user-centered design intends to minimize users’ efforts, while user-participated design emphasizes on respecting users’ behavior and goals in every detail of system design. The more concerned the system is to its users, the more likely the system will succeed.
As for content-based image search engines on the web, their users are usually web surfers with diverse behavior or goals, e.g., reading online news, visiting web-based social networks, shopping online, or just browsing; thus they are interested in different images such as news image, people’s photos, or product pictures. They may want to search for similar looking images to the image in a news report, or the photo in a person’s profile, or the picture of a product on an E-commerce website. Then what is the most convenient way for them to conduct similar image search process?
In the next section, different user interfaces of current content-
Figure 2. Search-by-keyword interface on like.com
based image search engines on the web are introduced, and their advantages and disadvantages are analyzed. The evaluation of the user interfaces is user-centered, i.e., whether the user interface can best fit users’ behavior and goals.
3. USER INTERFACES OF CONTENT-BASED IMAGE SEARCH ENGINES Although different users are interested in different images as described previously, their expectation of an excellent or successful content-based image search engine is the same. They expect to use the least effort to find the most accurate and complete results. This expectation is natural, and the system design should try to meet it.
The following summary and analysis of the user interfaces in the current content-based image search engines on the web are therefore based on satisfying users’ needs.
3.1 Hybrid System is Better A hybrid CBIR system refers to a CBIR system that allows its users to search by either text or image at any point of the searching process. A hybrid system provides the users with a more flexible and powerful way of searching, and its performance should be at least as good as its text-based counterparts since it can also use keywords to search images. Therefore, a hybrid image search engine would be more powerful and popular than purely text-based or image-based ones.
One example of a hybrid content-based image search engine is Like.com [13]. On Like.com, its users can first search images by using keywords or categories, and then pick an interested image as the query image, and retrieve its similar looking images by clicking on the “VISUAL SEARCH” button under the query image. For example, Figure 1 shows an example of visual search interface/ button on each individual item. And the items in Figure 1 are generated by typing keyword “watch” in the search box on Like.com as depicted in Figure 2. The user can choose one watch image and click the “VISUAL SEARCH” button under that image to find similar looking watches on Like.com’s partner websites.
130

3.2 User Interfaces of Search-by-query-image Friendly user interface not only means the interface should be as easy as possible to use, but also indicates it can satisfy user’s various searching needs.
There is always a tradeoff between the easiness of use and the complexity of the background technology. That is, the easier it is to use a system, the harder it is to implement it or the more complicated the background technology is. In CBIR area, many current content-based image search engines on the web adopted the most convenient way for image searching. This actually challenges the present CBIR technology to be more developed.
The easiest way to search similar images is different under different searching scenarios or users’ searching needs; therefore, the corresponding user interfaces should be designed to fit users’ various searching needs.
Figure 3. An image uploading interface on Tineye.com
3.2.1 Uploading interface when query image is local If the query image is local, i.e., on the user’s storage devices including hard drive, memory card, and flash drive, then an uploading interface should be provided for the user to upload the image file to the search engine. This uploading interface is standard and it usually contains a search box and a browse/ upload button as shown in Figure 3, which was extracted from TinEye Reverse Image Search [19] website. Once the user clicks the browse/ upload button, a navigation window will be popped up for the user to choose which file to upload. And the search engine will automatically search for similar images once the image file is uploaded.
Some traditional content-based image search engines like ASSERT [1] require users to circle a certain area in the uploaded image before clicking the search button. This way is expected to increase the precision ratio of the searching results, but sometimes, it is not the case, and it significantly increases the users’ burden and thus should be avoided as much as possible in user interface design.
3.2.2 What is the best interface for web images If the query image is on a web page, a friendly image search engine should not ask the user to download the image and then upload it to the search engine for searching purpose. Instead, a more convenient way should be provided. Currently there are at least three ways for this purpose, i.e., copy and paste URL, make bookmarklet, and use plug-in.
Figure 4. Copy and paste URL interface on Tineye.com
Copy and paste URL interface. Figure 4 shows an example of copy and paste URL interface extracted from Tineye.com. The user needs to copy the URL of the web page containing the query image, paste it into the search box, and click the search button. The search engine will then automatically fetch all the images on the pasted URL and present them to the user. The user can then click the interested image to search for its similar images. The inconvenience of this method is that users have to copy and paste
the URL and wait for the search engine to fetch all the images from that web page. To avoid copying and pasting URL, bookmarklet is introduced.
Figure 5. A bookmarklet interface on Tineye.com
Bookmarklet interface. Bookmarklet does exactly the same as copying and pasting URL does, but without the need of copying and pasting URL. Bookmarklet is a little script that is run from the browser's bookmark menu or toolbar. To add bookmarklet, users just need to right-click the link or linked button on the search engine website like “TinEye Images” button on TinEye.com as depicted in Figure 5, and select “Bookmark This Link” (on Mac) or “Add to Favorites” (on PC). Then the bookmarlet is added to the browser’s bookmark toolbar as shown in Figure 5. The bookmarklet “TinEye Images” looks like a regular bookmark, but when the user clicks it, it will fetch all the images on the current web page, and allow users to click on an interested image to search for similar images. Making bookmarklet saves the step of copying and pasting URL, but users need to add it to their browsers’ bookmark menu or toolbar.
Figure 6. An example of similar image search plug-in
Plug-in interface. Plug-in is a software that users can download and install on their browsers to add more functionalities to the browsers or achieve special presentation effects. Similar image search plug-in is designed for searching similar image purpose. There could be many ways to implement the plug-in user interface. One way is to use right-click menu. That is, once the similar image search plug-in is downloaded and installed, users can right click on any online image, and there will be a new item on the right-click menu like “Search Image on TinEye” in Safari as presented in Figure 6. Then the user can click it to search similar images on the web. Plug-in is direct and easy to use, and saves the time of fetching images compared to the previous two methods. The disadvantage is that some users may not want to install plug-in in their browsers.
Among the above three interfaces, plug-in is the most convenient to users’ behaviour and goals. When users intend to search for the similar images of an interested image they came across on the web, the natural way is to directly click/ right-click on the image itself to launch the searching process. Copying and pasting URL puts a heavy load on the users. Even going to the Bookmark or
131
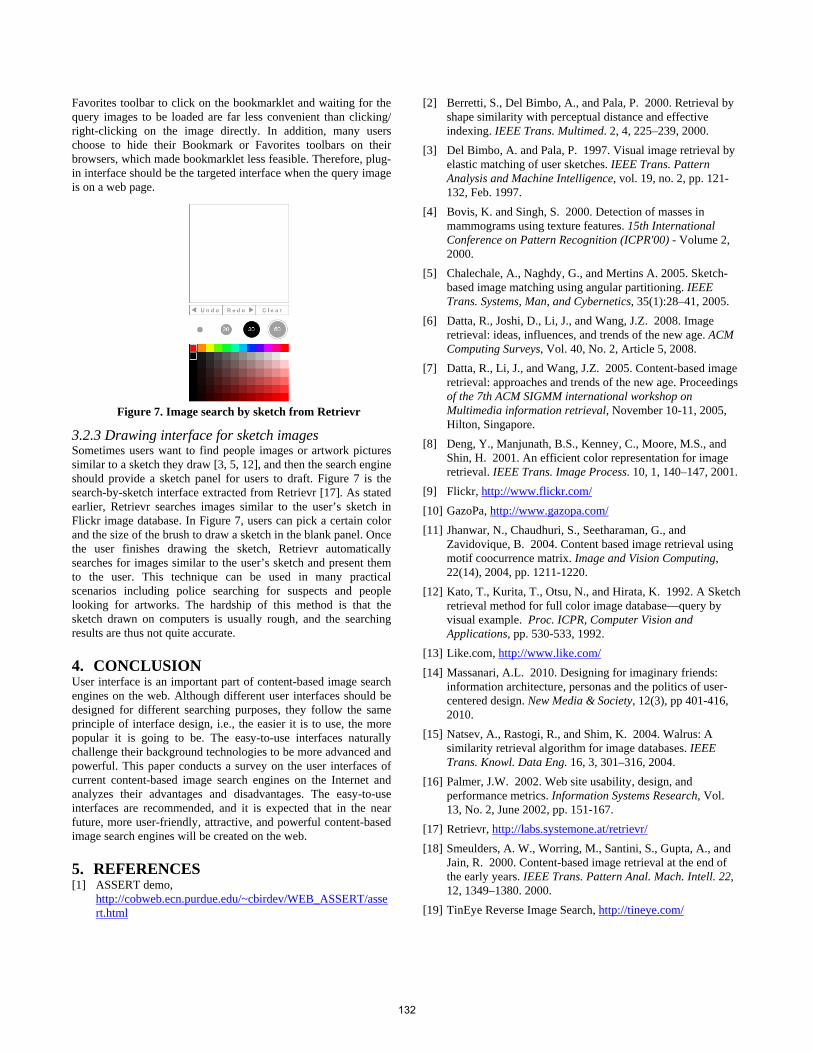
Favorites toolbar to click on the bookmarklet and waiting for the query images to be loaded are far less convenient than clicking/ right-clicking on the image directly. In addition, many users choose to hide their Bookmark or Favorites toolbars on their browsers, which made bookmarklet less feasible. Therefore, plug-in interface should be the targeted interface when the query image is on a web page.
Figure 7. Image search by sketch from Retrievr
3.2.3 Drawing interface for sketch images Sometimes users want to find people images or artwork pictures similar to a sketch they draw [3, 5, 12], and then the search engine should provide a sketch panel for users to draft. Figure 7 is the search-by-sketch interface extracted from Retrievr [17]. As stated earlier, Retrievr searches images similar to the user’s sketch in Flickr image database. In Figure 7, users can pick a certain color and the size of the brush to draw a sketch in the blank panel. Once the user finishes drawing the sketch, Retrievr automatically searches for images similar to the user’s sketch and present them to the user. This technique can be used in many practical scenarios including police searching for suspects and people looking for artworks. The hardship of this method is that the sketch drawn on computers is usually rough, and the searching results are thus not quite accurate.
4. CONCLUSION User interface is an important part of content-based image search engines on the web. Although different user interfaces should be designed for different searching purposes, they follow the same principle of interface design, i.e., the easier it is to use, the more popular it is going to be. The easy-to-use interfaces naturally challenge their background technologies to be more advanced and powerful. This paper conducts a survey on the user interfaces of current content-based image search engines on the Internet and analyzes their advantages and disadvantages. The easy-to-use interfaces are recommended, and it is expected that in the near future, more user-friendly, attractive, and powerful content-based image search engines will be created on the web.
5. REFERENCES [1] ASSERT demo,
http://cobweb.ecn.purdue.edu/~cbirdev/WEB_ASSERT/assert.html
[2] Berretti, S., Del Bimbo, A., and Pala, P. 2000. Retrieval by shape similarity with perceptual distance and effective indexing. IEEE Trans. Multimed. 2, 4, 225–239, 2000.
[3] Del Bimbo, A. and Pala, P. 1997. Visual image retrieval by elastic matching of user sketches. IEEE Trans. Pattern Analysis and Machine Intelligence, vol. 19, no. 2, pp. 121-132, Feb. 1997.
[4] Bovis, K. and Singh, S. 2000. Detection of masses in mammograms using texture features. 15th International Conference on Pattern Recognition (ICPR'00) - Volume 2, 2000.
[5] Chalechale, A., Naghdy, G., and Mertins A. 2005. Sketch-based image matching using angular partitioning. IEEE Trans. Systems, Man, and Cybernetics, 35(1):28–41, 2005.
[6] Datta, R., Joshi, D., Li, J., and Wang, J.Z. 2008. Image retrieval: ideas, influences, and trends of the new age. ACM Computing Surveys, Vol. 40, No. 2, Article 5, 2008.
[7] Datta, R., Li, J., and Wang, J.Z. 2005. Content-based image retrieval: approaches and trends of the new age. Proceedings of the 7th ACM SIGMM international workshop on Multimedia information retrieval, November 10-11, 2005, Hilton, Singapore.
[8] Deng, Y., Manjunath, B.S., Kenney, C., Moore, M.S., and Shin, H. 2001. An efficient color representation for image retrieval. IEEE Trans. Image Process. 10, 1, 140–147, 2001.
[9] Flickr, http://www.flickr.com/
[10] GazoPa, http://www.gazopa.com/
[11] Jhanwar, N., Chaudhuri, S., Seetharaman, G., and Zavidovique, B. 2004. Content based image retrieval using motif coocurrence matrix. Image and Vision Computing, 22(14), 2004, pp. 1211-1220.
[12] Kato, T., Kurita, T., Otsu, N., and Hirata, K. 1992. A Sketch retrieval method for full color image database—query by visual example. Proc. ICPR, Computer Vision and Applications, pp. 530-533, 1992.
[13] Like.com, http://www.like.com/
[14] Massanari, A.L. 2010. Designing for imaginary friends: information architecture, personas and the politics of user-centered design. New Media & Society, 12(3), pp 401-416, 2010.
[15] Natsev, A., Rastogi, R., and Shim, K. 2004. Walrus: A similarity retrieval algorithm for image databases. IEEE Trans. Knowl. Data Eng. 16, 3, 301–316, 2004.
[16] Palmer, J.W. 2002. Web site usability, design, and performance metrics. Information Systems Research, Vol. 13, No. 2, June 2002, pp. 151-167.
[17] Retrievr, http://labs.systemone.at/retrievr/
[18] Smeulders, A. W., Worring, M., Santini, S., Gupta, A., and Jain, R. 2000. Content-based image retrieval at the end of the early years. IEEE Trans. Pattern Anal. Mach. Intell. 22, 12, 1349–1380. 2000.
[19] TinEye Reverse Image Search, http://tineye.com/
132


