Embed Size (px)
Citation preview
Sixth International Joint Conference onNatural Language Processing
Proceedings of the 3rd Workshop onSentiment Analysis where AI meets Psychology
(SAAIP 2013)

ii
We wish to thank our sponsors and supporters!
Platinum Sponsors
www.anlp.jp
Silver Sponsors
www.google.com
Bronze Sponsors
www.rakuten.com
Supporters
Nagoya Convention & Visitors Bureau
iii
We wish to thank our organizers!
Organizers
Asian Federation of Natural Language Processing (AFNLP)
Toyohashi University of Technology
iv
c©2013 Asian Federation of Natural Language Processing
ISBN 978-4-9907348-2-4
v
Preface
In recent times, research activities in the areas of Opinion, Sentiment and/or Emotion in natural languagetexts and other media are gaining ground under the umbrella of affect computing. Huge amount oftext data are available in the Social Web in the form of news, reviews, blogs, chats and even twitter.Sentiment analysis from natural language text is a multifaceted and multidisciplinary problem. Theexisting reported solutions or available systems are still far from perfect or fail to meet the satisfactionlevel of the end users. There are many conceptual rules that govern sentiment and there are even moreclues (possibly unlimited) that can map these concepts from realization to verbalization of a human being.Human psychology that relates to social, cultural, behavioral and environmental aspects of civilizationmay provide the unrevealed clues and govern the sentiment realization. In the present scenario we needconstant research endeavors to reveal and incorporate the human psychological knowledge into machinesin the best possible ways. The important issues that need attention include how various psychologicalphenomena can be explained in computational terms and the various artificial intelligence (AI) conceptsand computer modeling methodologies that are most useful from the psychologist’s point of view.
Regular research papers on sentiment analysis continue to be published in reputed conferences likeACL, EACL, NAACL, EMNLP or COLING. The Sentiment Analysis Symposiums are also drawingthe attention of the research communities from every nook and corner of the world. There have been anincreasing number of efforts in shared tasks such as SemEval 2007 Task 14: Affective Text, SemEval2013 Task 14: Sentiment Analysis on Twitter, TAC 2008 Opinion Summarization task, TREC-BLOGtracks since 2006 and relevant NTCIR tracks since 6th NTCIR that have aimed to focus on differentissues of opinion and emotion analysis. Several communities from sentiment analysis have engagedthemselves to conduct relevant conferences, e.g., Affective Computing and Intelligent Interfaces (ACII)in 2009, 2011 and 2013 and workshops such as Sentiment and Subjectivity in Text in COLING - ACL2006, Sentiment Analysis – Emotion, Metaphor, Ontology and Terminology (EMOT) in LREC 2008,Opinion Mining and Sentiment Analysis (WOMSA) 2009, Topic - Sentiment Analysis for Mass OpinionMeasurement (TSA) in CIKM 2009, Computational Approaches to Analysis and Generation of Emotionin Text in NAACL 2010, Workshop on Computational Approaches to Subjectivity and SentimentAnalysis (WASSA) in ECAI 2010, ACL 2011, ACL 2012 and NAACL-HLT 2013, FLAIRS 2011special track on Affect Computing, Sentiment Elicitation from Natural Text for Information Retrieval andExtraction (SENTIRE 2011 and SENTIRE 2012), EMOTION SENTIMENT and SOCIAL SIGNALS(ES3 2012) in the satellite of LREC 2012, Practice and Theory of Opinion Mining and SentimentAnalysis in conjunction with KONVENS - 2012 (PATHOS 2012, 2013), Workshop on IntelligentApproaches applied to Sentiment Mining and Emotion Analysis (WISMEA 2012), Workshop on Issuesof Sentiment Discovery and Opinion Mining (WISDOM 2012, 2013) and a bunch of special sessions likeSentiment Analysis for Asian Languages (SAAL, 2012), Brain Inspired Natural Language Processing(BINLP 2012), Advances in Cognitive and Emotional Information Processing (ACEIP, 2012) and so on.
Since our previous two workshops in conjunction with the International Joint Conference on NLP(IJCNLP) in Chiang Mai, Thailand during Nov. 7-13, 2011 and with the International Conference onComputational Linguistics (COLING) in Mumbai, India during Dec. 8-15, 2012 were quite successful(with 20 and 14 submissions and more than 30 participants from many countries), we are planning toconduct our next workshop in conjunction with the International Joint Conference on NLP (IJCNLP) inNagoya, Japan during Oct. 14-18, 2013. Inspired by the objectives we aimed at in the first two editions ofthe workshop, the warm responses and feedbacks we received from the participants and attendees and thefinal outcome, the purpose of the proposed 3rd edition of the Workshop on Sentiment Analysis where AImeets Psychology (SAAIP 2013) is to create a framework for presenting and discussing the challengesrelated to sentiment, opinion and emotion analysis in the ground of NLP. This workshop also aims tobring together the researchers in multiple disciplines such as computer science, psychology, cognitivescience, social science and many more who are interested in developing next generation machines that
vi
can recognize and respond to the sentimental states of the human users. This time we received only ninesubmissions and finally four papers have been accepted. Increasing number of workshops in similar fieldday-by-day may be one of the reasons for less number of submissions this time.
The lexical based polarity classification used in sentiment analysis achieved relatively good results inCzech, still classifier shows some error rate. Katerina Veselovská and Jan Hajic, jr. provided a detailedanalysis of such errors caused both by the system and by human reviewers. They have analyzed differenttypes of classifier errors on the real evaluative data and have suggested various improvements. YasuhideMiura, Keigo Hattori, Tomoko Ohkuma and Hiroshi Masuichi proposed a method to extract sentimenttopics from a Japanese text. They utilized sentiment clues and a relaxed labeling schema to extractsentiment topics.
Nataliya Panasenko, Andrej Trnka, Dana Petranová and Slavomír Magál presented the results of GRIDproject which aimed at studying the semantics of 24 emotion terms in 23 languages belonging to 8language families (Indo-European, Indo-Iranian, Afro-Asiatic, Altaic, Uralic, Japonic, Sino-Tibetan,Niger-Congo, and Unclassified). They processed large volume of information from about 5000 activeproject participants who live in 30 countries. The work has been carried out on two Slavic languages –Slovak and Czech and on two emotion terms – love and hatred.
Not only text, music is also a universal language to convey sentiments. Less attention has been paid to theemotion recognition in Indian songs to date. Braja Gopal Patra, Dipankar Das and Sivaji Bandyopadhyayhave built a system for classifying moods of Hindi songs using different audio related features likerhythm, timber and intensity on a small dataset of 230 songs.
We thank all the members of the Program Committee for their excellent and insightful reviews, theauthors who submitted contributions for the workshop and the participants for making the workshop asuccess. We also express our thanks to the IJCNLP 2013 Organizing Committee and Local OrganizingCommittee for their support and cooperation in organizing the workshop.
Organizing Committee3rd Workshop on Sentiment Analysis where AI meets PsychologyIJCNLP 2013October 14, 2013
vii

Organizers:
Sivaji Bandyopadhyay, Jadavpur University, Kolkata (India) (Organizing Chair)Manabu Okumurra, Tokyo Institute of Technology, Tokyo (Japan) (Organizing Chair)Braja Gopal Patra, Jadavpur University (India)
Program Committee:
Khurshid Ahmad, Trinity College Dublin (Ireland)Alexandra Balahur, European Commission Joint Research Centre - Ispra (Italy)Erik Cambria, National University of Singapore(Singapore)Amitava Das, University of North Texas (USA)Dipankar Das, National Institute of Technology (NIT), Meghalaya(India)Diana Inkpen, University of Ottawa (Canada)Noriko Kando, National Institute of Informatics (Japan)Alena Neviarouskaya, University of Tokyo (Japan)Vincent Ng, University of Texas at Dallas, (USA)Fuji Ren, University of Tokushima (Japan)Paolo Rosso, Universitat Politecnica de Valencia (Spain)Patrick Saint-Dizier, IRIT-CNRS (France)Swapna Somasundaran, Siemens Corporate Research (SCR)(USA)Veselin Stoyanov, Cornell University (USA)Carlo Strapparava, Fondazione Bruno Kessler (FBK), (Italy)Stan Szpakowicz, University of Ottawa (Canada)Theresa Wilson, University of Edinburgh (UK)Michael Zock, LIF-CNRS, Marseille (France)Alessandro Valitutti, University of Helsinki (Finland)Veronica Perez-Rosas, University of North Texas (USA)Alexander Gelbukh, Center for Computing Research, CIC (Mexico)Adam Bermingham, Dublin City University (Ireland)
ix

Table of Contents
Why Words Alone Are Not Enough: Error Analysis of Lexicon-based Polarity Classifier for CzechKaterina Veselovská and Jan Hajic, jr. . . . . . . . . . . . . . . . . . . . . . . . . . . . . . . . . . . . . . . . . . . . . . . . . . . . . . . 1
Topic Modeling with Sentiment Clues and Relaxed Labeling SchemaYasuhide Miura, Keigo Hattori, Tomoko Ohkuma and Hiroshi Masuichi . . . . . . . . . . . . . . . . . . . . . . . 6
Bilingual analysis of LOVE and HATRED emotional markers (SPSS-based approach)Nataliya Panasenko, Andrej Trnka, Dana Petranová and Slavomír Magál . . . . . . . . . . . . . . . . . . . . . 15
Automatic Music Mood Classification of Hindi SongsBraja Gopal Patra, Dipankar Das and Sivaji Bandyopadhyay . . . . . . . . . . . . . . . . . . . . . . . . . . . . . . . . 24
xi

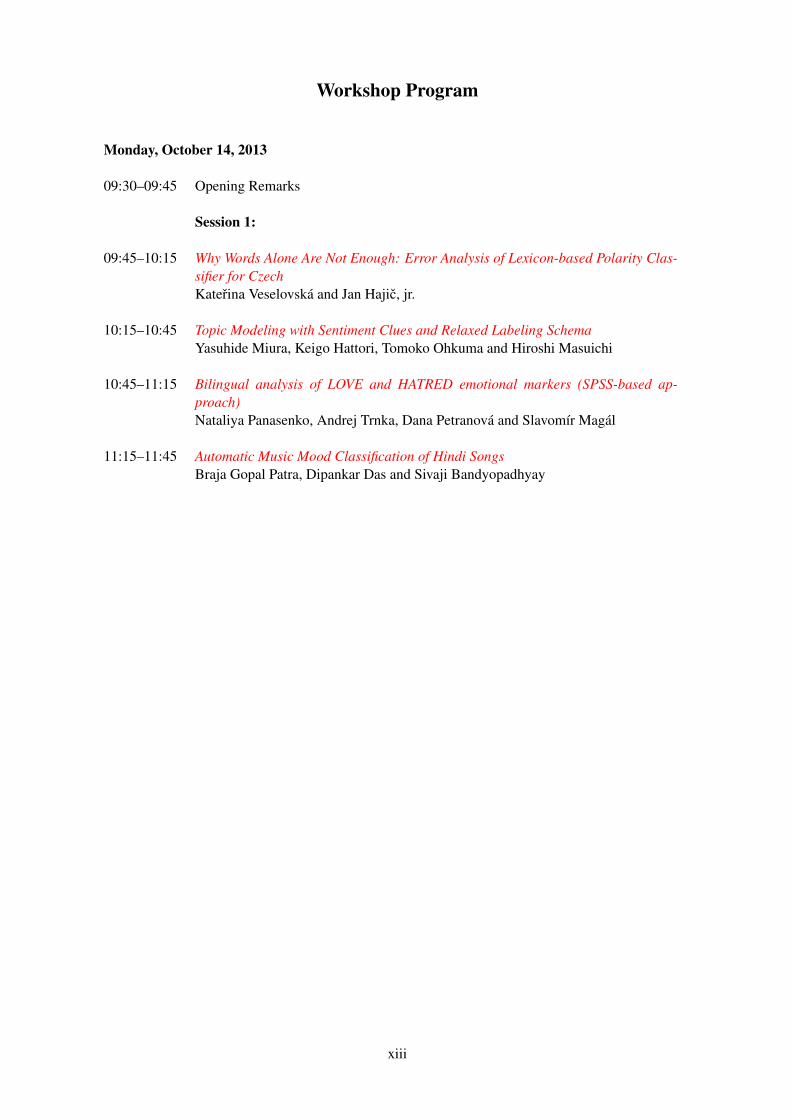
Workshop Program
Monday, October 14, 2013
09:30–09:45 Opening Remarks
Session 1:
09:45–10:15 Why Words Alone Are Not Enough: Error Analysis of Lexicon-based Polarity Clas-sifier for CzechKaterina Veselovská and Jan Hajic, jr.
10:15–10:45 Topic Modeling with Sentiment Clues and Relaxed Labeling SchemaYasuhide Miura, Keigo Hattori, Tomoko Ohkuma and Hiroshi Masuichi
10:45–11:15 Bilingual analysis of LOVE and HATRED emotional markers (SPSS-based ap-proach)Nataliya Panasenko, Andrej Trnka, Dana Petranová and Slavomír Magál
11:15–11:45 Automatic Music Mood Classification of Hindi SongsBraja Gopal Patra, Dipankar Das and Sivaji Bandyopadhyay
xiii

Proceedings of the 3rd Workshop on Sentiment Analysis where AI meets Psychology (SAAIP 2013), IJCNLP 2013, pages 1–5,Nagoya, Japan, October 14, 2013.
Why Words Alone Are Not Enough:
Error Analysis of Lexicon-based Polarity Classifier for Czech
Kateřina Veselovská
Charles University in Prague
Faculty of Mathematics and Physics
Institute of Formal and Applied
Linguistics
Jan Hajič, jr.
Charles University in Prague
Faculty of Mathematics and Physics
Institute of Formal and Applied
Linguistics
Abstract
Lexicon-based classifier is in the long term
one of the main and most effective methods of
polarity classification used in sentiment analy-
sis, i.e. computational study of opinions, sen-
timents and emotions expressed in text (see
Liu, 2010). Although it achieves relatively
good results also for Czech, the classifier still
shows some error rate. This paper provides a
detailed analysis of such errors caused both by
the system and by human reviewers. The iden-
tified errors are representatives of the chal-
lenges faced by the entire area of opinion min-
ing. Therefore, the analysis is essential for fur-
ther research in the field and serves as a basis
for meaningful improvements of the system.
1 Introduction
After finishing the initial phase of our research in
the area of sentiment analysis in Czech during
which the collected data resources were manu-
ally annotated, we attempted to train two classi-
fiers for automatic polarity detection of a given
text: the lexicon-based classifier and the Naive
Bayes classifier. Both systems were trained on
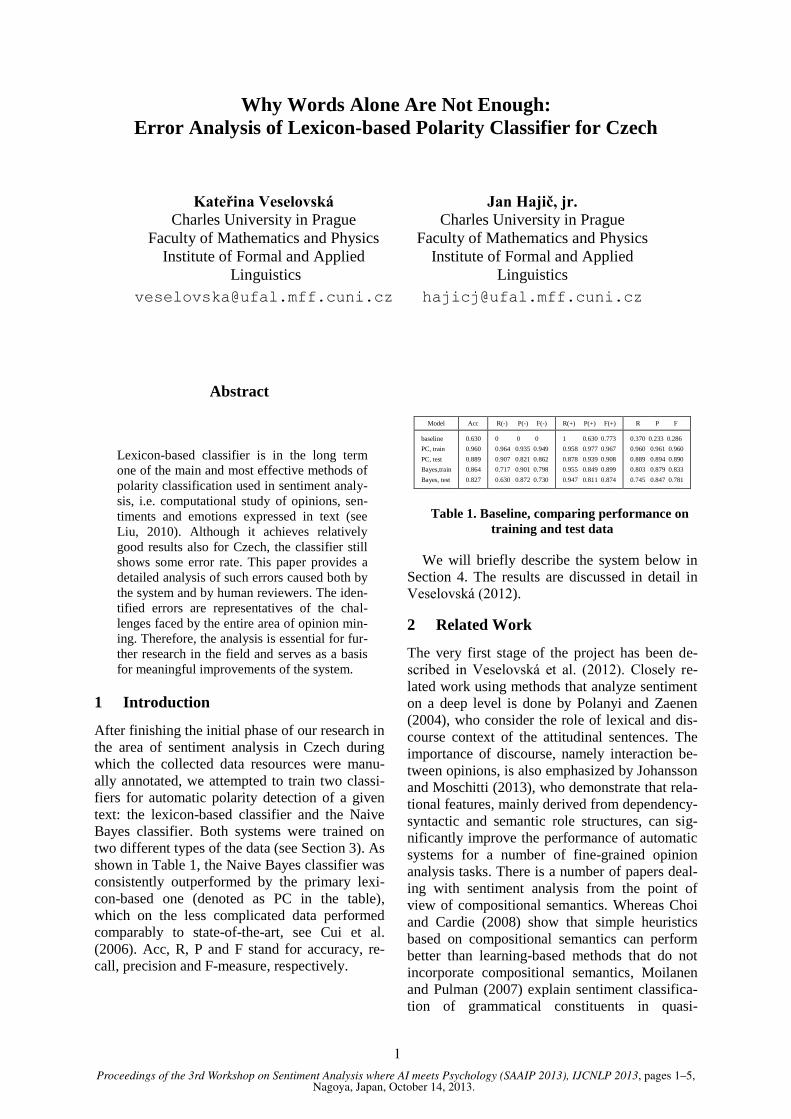
two different types of the data (see Section 3). As
shown in Table 1, the Naive Bayes classifier was
consistently outperformed by the primary lexi-
con-based one (denoted as PC in the table),
which on the less complicated data performed
comparably to state-of-the-art, see Cui et al.
(2006). Acc, R, P and F stand for accuracy, re-
call, precision and F-measure, respectively.
Model Acc R(-) P(-) F(-) R(+) P(+) F(+) R P F
baseline
PC, train
PC, test
Bayes,train
Bayes, test
0.630
0.960
0.889
0.864
0.827
0 0 0
0.964 0.935 0.949
0.907 0.821 0.862
0.717 0.901 0.798
0.630 0.872 0.730
1 0.630 0.773
0.958 0.977 0.967
0.878 0.939 0.908
0.955 0.849 0.899
0.947 0.811 0.874
0.370 0.233 0.286
0.960 0.961 0.960
0.889 0.894 0.890
0.803 0.879 0.833
0.745 0.847 0.781
Table 1. Baseline, comparing performance on
training and test data
We will briefly describe the system below in
Section 4. The results are discussed in detail in
Veselovská (2012).
2 Related Work
The very first stage of the project has been de-
scribed in Veselovská et al. (2012). Closely re-
lated work using methods that analyze sentiment
on a deep level is done by Polanyi and Zaenen
(2004), who consider the role of lexical and dis-
course context of the attitudinal sentences. The
importance of discourse, namely interaction be-
tween opinions, is also emphasized by Johansson
and Moschitti (2013), who demonstrate that rela-
tional features, mainly derived from dependency-
syntactic and semantic role structures, can sig-
nificantly improve the performance of automatic
systems for a number of fine-grained opinion
analysis tasks. There is a number of papers deal-
ing with sentiment analysis from the point of
view of compositional semantics. Whereas Choi
and Cardie (2008) show that simple heuristics
based on compositional semantics can perform
better than learning-based methods that do not
incorporate compositional semantics, Moilanen
and Pulman (2007) explain sentiment classifica-
tion of grammatical constituents in quasi-
1
compositional way. Some work on sentiment
analysis in Czech has been also done by Haber-
nal et al. (2013), but so far no authors provided
error analysis of Czech polarity classifiers.
3 Data
Since our initial motivation was to create a tool
for detecting the way news articles might influ-
ence public opinion, we firstly worked with the
data obtained from the Home section of the
Czech news website Aktualne.cz
(http://aktualne.centrum.cz/) – or more precisely,
with the articles primarily concerned with do-
mestic politics, namely the situation before the
elections in 2010. Unfortunately, it turned out
that the analysis of such texts was a rather diffi-
cult task in terms of automatic processing, be-
cause Czech journalists mostly avoid strongly
evaluative expressions. Moreover, the corpus
was not large enough for a full-scale evaluation,
as it contained merely 410 segments of texts
(6,868 words, 1,935 unique lemmas) which were
manually annotated on polarity. Also, the lan-
guage we were dealing with was not straightfor-
ward. Furthermore, the distribution of polarity
classes over segments was very nonuniform,
with neutral segments occupying 78% of the data
and positive segments making up less than 5%.
Given the small size of the data, it was practi-
cally unachievable to correctly classify positive
segments, and those that were classified correctly
were usually swamped by positively classified
neutral segments. The same problem appeared in
case of negative segments, although less severe.
Consequently, it was not possible to provide the
error analysis based on the results from Aktu-
alne.cz data.
Therefore, we decided to use the auxiliary
data: the domestic appliance reviews from the
Mall.cz (http://www.mall.cz/) retail server ob-
tained from a private company. The Mall.cz cor-
pus is much bigger (158,955 words, 13,473
lemmas). These reviews were divided into posi-
tive (6,365) and negative (3,812) by their au-
thors. We found this data much easier to work
with, because they are primarily evaluative by
their nature and contain no complicated syntactic
or semantic structures. Unlike the data from Ak-
tualne.cz, they also contain explicit polar expres-
sions in a prototypical use. Furthermore, they do
not need to be tagged for the gold-standard anno-
tation. The Mall.cz data, however, do present a
different set of complications: the grammatical
mistakes or typing errors cause noise in the form
of additional lemmas and some of the reviews
are also categorized incorrectly. However, com-
pared to the problems with the news articles,
these are only minor difficulties which can be
easily solved. For this reason, the Mall.cz data
are more suitable for the error analysis task.
4 The Lexicon-based Classifier System
There are several steps leading to the effective
lexicon-based classifier. During the pre-
processing phase, all the data first undergo lem-
matization, using a tagger of Hajič (2004). From
the tagger output, not only do we retain the
lemma but also the part of speech and negation
morphological tags. Then, we automatically gen-
erate a polarity lexicon from the training data and
compute the measurement of how reliable a
given lexicon item works as a polarity indicator.
From our data, we first need to estimate the
probability that, when encountering a given
lemma, it is a part of a polar segment. Assuming
we have that probability for each lemma we en-
counter in a given segment, we can by means of
some aggregation, for instance a simple sum,
easily decide whether to classify the given seg-
ment as polar. Then we can analogously deter-
mine its orientation. The desired properties of an
indicative strength function are satisfied by
lemma precision (see Wiebe et al., 2004). Then
we need to compute a baseline for our lexicon,
i.e. the probability that a randomly chosen word
implicates the given polarity.
The classifier uses a standard unigram bag-of-
words model, simply summing the indicator
strength measurements over all the lemmas in a
given segment. Then it selects the polarity class
with the highest accumulated value in the desired
measure. We have also employed a number of
simple filters and other methods in order to im-
prove the automatic annotation: filtering by fre-
quency, weighed filtering by frequency (where
the threshold for accepting a lemma as a feature
is weighed by the baselines so that smaller polar-
ity classes do not get discriminated), statistical
significance filtering (where we accept a lemma
if we can exclude the hypothesis that it is evenly
distributed across polarity classes at a given level
– 0.999, 0.95 and 0.8) or filtering by part of
speech. Also, we have attempted to deal with
sentence-level negation: first, if a segment con-
tained a negative verb, the values for positive
and negative polarity would be reversed for the
segment, and a less crude method where we
2
would specify which parts of speech to the right
of a negative verb we would like to reverse.
5 Error Analysis
5.1 System Errors
Unfortunately, the first-aid filtering methods
have proven rather useless – even those which
appeared promising when we took a closer look
into the list of incorrectly detected instances. For
example, we found a number of functional words
assigned with a wrong polarity. Nevertheless,
when we removed them from the classification,
the overall results did not improve. Moreover,
when we started to eliminate the content words,
the results got even worse. In order to reveal the
main cause of the mistakes, we had to get back
into the data once again.
We discovered various reasons of the system
errors which can be divided into following cate-
gories. Statistically, the significant source of er-
rors are still the short segments like “Nothing”,
“Price” or “I don’t know” which appear in both
positive and negative reviews. These can by clas-
sified by the simple majority vote. If the vote is
equal, the lemma classification is based on the
baseline.
Also, some of these short segments have
pretty high indicative strength for one polarity,
but they often appear in the reviews expressing
opposite evaluation (so filtering by frequency
does not help):
<dg_postnegativetext>Proti:Kvalita.</dg_post
negativetext>
<dg_postnegativetext>Cons:Quality.</dg_post
negativetext>
In these cases the system always assigns the in-
correct value. The solution to these problems
could be elimination of all one-word answers or
assigning the polarity of these items according to
the polarity they have in subjectivity lexicon for
Czech (see Veselovská, 2013).
One of the most frequented wrongly detected
short phrases was “High price” tagged by the
classifier with a positive instead of negative
value. Besides, the classifier sometimes could
not detect the domain-dependent evaluation, like
“long washing programs”. These cases could be
solved by using n-grams instead of just uni-
grams. Using n-grams could also hold for incor-
rectly detected evaluative idioms (“Je to sázka na
jistotu” – “It is a safe bet” etc.) which are not
listed in the Czech subjectivity lexicon or which
are domain-dependent.
Furthermore, it could be advantageous to ap-
ply a coefficient for the initial and terminal posi-
tion of words in a given segment. According to
the reviews, it seems that the words occurring at
the beginning or in the final parts of the text are
more predictive towards the overall polarity:
<dg_postpositivetext>Pro: Je to výkonný a
kvalitní vysavač, vím to, protože jsem ho měla
víc jak deset let, ale bohužel se častým
používáním porouchal a nechtěla jsem ho nechat
opravovat, tak jsem si koupila nový. Ten starý
vysavač funguje pořád jako vysavač, nejdou s
ním čistit koberce. Půjčovala a půjčuje si ho celá
rodina i příbuzný, je fakt dobrý, mohu ho do-
poručit.</dg_postpositivetext>
<dg_postpositivetext>Pros: It is a high-
performance and quality vacuum cleaner, I am
sure, because I had it for more than ten years,
but unfortunately it got destroyed by the frequent
use and I did not want to have it fixed, so I
bought a new one. I still use the old one, but it is
not possible to clean the carpets with it. The
whole family borrows it constantly, it is really
good and I can only recommend it.
</dg_postpositivetext>
Moreover, the system is at the moment not
able to treat emoticons: it considers every part of
the smiley to be a separate word. To find positive
and negative emoticons could help to detect
given sentiment much better, as outlined in Read
(2005).
There are also errors that can be improved us-
ing some simple linguistic features. We have al-
ready worked with sentential negation, using the
rule roughly saying that all the negated verbs
switch the overall polarity of the given sentence.
But there are still plenty of rules which could be
further implemented. Mostly, this concerns syn-
tactic features. We found many incorrectly de-
tected adversative constructions like:
<dg_postpositivetext>Pro: Není to žádný luxusní
model, ale na chalupu stačí.
</dg_postpositivetext>
<dg_postpositivetext>Pro: It is not a luxurious
model, but for the cottage it will do.
</dg_postpositivetext>
3
The “but” sentences can be as well solved by the
rule, as indicated already in Hatzivassiloglou and
McKeown (1997).
Also, there were many incorrectly evaluated
concessive or conditional sentences in the data:
<dg_postpositivetext> Přestože neplní hlavní
funkci kvůli které jsem ho kupoval (uklidit jednu
místnost po druhé během naší nepřítomnosti), tak
se jedná o jednoho z nejlepších robotů v nabídce
na našem trhu. <dg_postpositivetext>
<dg_postpositivetext> Although it is not suitable
for the function I bought it for (to clean the
rooms one by one when we are not at home), it is
still one of the best available robots.
<dg_postpositivetext>
These problems might be eliminated by creat-
ing a stop-words list of items signalling non-
evaluative part of the sentence.
5.2 Errors Caused by Human Annotators
Quite often, the reviewers were not evaluating
given product, but they were rather commenting
on something completely else:
<dg_postpositivetext>Pro: nemohu hodnotit,
zboží jsem pro poškození vrátil
</dg_postpositivetext>
<dg_postpositivetext>Pro:I cannot review this, I
sent the goods back since it was damaged.
</dg_postpositivetext>
or:
<dg_postpositivetext>Pro: Meteostanici mám
jako dárek pro manžela, vyzkoušela jsem ji jen
krátce při převzetí, tak se ještě nemůžu spoleh-
livě vyjádřit</dg_postpositivetext>
<dg_postpositivetext>Pro: I bought the meteo-
station as a present for my husband and I tried it
out just quickly after I received it, so I cannot
review it yet.</dg_postpositivetext>
On the other hand, we also noticed cases when
the system classified the review correctly any-
way:
<dg_postpositivetext>Pro: Přednosti tato pračka
nemá.</dg_postpositivetext>
<dg_postpositivetext>Pro: This washing ma-
chine has no pluses. </dg_postpositivetext>
This kind of problems is tightly connected to
pragmatics, but it might be partly solved by the
reliable target detection.
The very common instances on which the
classifier failed were the reviews in which people
quoted other reviewers:
<dg_postpositivetext>Pro: Někdo píše SNAD
dobrá značka???? Tato značka je mezi
mraznicemi a ledniceni jednoznačná 1
</dg_postpositivetext>
<dg_postpositivetext>Pro: Anyone said QUITE
good brand???? This brand is number one
among freezers and fridges
</dg_postpositivetext>
This is the matter of reliable finding of different
sources of evaluation.
Some of the reviews contained besides other
things the implicit evaluation:
<dg_postpositivetext>Pro: Nevím, jak jsem
mohla bez sušičky být. Haní ji jen ten kdo ji
nemá, nebo zhrzená manželka, když jí nechce
manžel sušičku koupit. Úspora času, sice něco se
musí žehlit, ale minimálně. Za sobotu jsem stihla
usušit ložní prádlo, včetně obalů z matrací a
lůžkovin (polštáře, deky) a ještě jsem měla
spoustu času.</dg_postpositivetext>
<dg_postpositivetext>Pro:I don’t know how I
could have lived without the dryer. Only those
who don’t have it defame it, or the turned down
wives whose husbands don’t want to buy it for
them. It saves time, some things still need to be
ironed, but very little. I dried the bed linen dur-
ing Saturday, including the mattress and bed
linen cases (pillows, blankets) and I still had
plenty of time.</dg_postpositivetext>
Unfortunately, the implicit evaluation is again
connected to pragmatics and so far it seems to be
one of the most difficult subtasks in sentiment
analysis in general. However, the reviewers (at
least on the Mall.cz retail server) did not tend to
use it more often than prototypical explicit
evaluation.
4
6 Conclusion and Future Work
We have analyzed different types of classifier
errors on the real evaluative data and suggested
various improvements. In the next step of the
research, we would like to use n-grams to find
the domain-dependent evaluative constructions
and evaluative idioms. Also, we would like to
detect the unmarked neutral segments by em-
ploying the simple heuristic model – e.g. when
the system detects expressions like “I don’t
know”. If the segment has less than five words, it
will be classified as neutral.
In addition, we realized that it is necessary to
implement the detection of emoticons and treat
particular parts of adversative constructions
separately. Moreover, it seems unavoidable to
apply the model for the reliable detection of tar-
gets and sources of evaluation, e.g. by employing
methods for detecting thematic concentration of
the text (see Čech et al., 2013).
References
Choi, Yejin & Claire Cardie (2008). Learning with
compositional semantics as structural infer-
ence for subsentential sentiment analysis. In
Proceedings of the Conference on Empirical Meth-
ods in Natural Language Processing (pp 793-801).
Cui, Hang, Mittal, Vibhu, & Datar, Mayur (2006).
Comparative experiments on sentiment classi-
fication for online product reviews. In AAAI
(Vol. 6, pp. 1265-1270).
Čech, Radek, Popescu, Ioan-Iovitz & Gabriel Alt-
mann (2013). Methods of analysis of a thematic
concentration of the text. Czech and Slovak
Linguistic Review. (in press).
Habernal, Ivan, Ptáček, Tomáš & Josef Steinberger
(2013). Sentiment Analysis in Czech Social
Media Using Supervised Machine Learning. In
Proceedings of the 4th Workshop on Computatio-
nal Approaches to Subjectivity, Sentiment and So-
cial Media Analysis (pp 65-74).
Hajič, Jan (2004). Disambiguation of rich inflec-
tion: computational morphology of Czech.
Karolinum.
Hatzivassiloglou, Vasileios & Kathleen McKeown,
(1997). Predicting the semantic orientation of
adjectives. In Proceedings of the 35th Annual
Meeting of the Association for Computational Lin-
guistics and Eighth Conference of the European
Chapter of the Association for Computational Lin-
guistics (pp. 174-181). Association for Computa-
tional Linguistics.
Johansson, Richard & Alessandro Moschitti (2013).
Relational features in fine-grained opinion
analysis. Computational Linguistics 39 (3).
Liu, Bing (2010). Sentiment Analysis and Subjec-
tivity. Invited Chapter for the Handbook of Natural
Language Processing, Second Edition. Marcel
Dekker, Inc: New York.
Moilanen, Karo & Stephen Pulman (2007). Senti-
ment composition. In Proceedings of the Recent
Advances in Natural Language Processing Interna-
tional Conference (pp 378-382).
Polanyi, Livia & Annie Zaenen (2004). Contextual
valence shifters. In Working Notes of the AAAI
Spring Symposium on Exploring Attitude and Af-
fect in Text: Theories and Applications.
Read, Jonathon (2005). Using emoticons to reduce
dependency in machine learning techniques
for sentiment classification. In Proceedings of
the ACL Student Research Workshop (pp. 43-48).
Association for Computational Linguistics.
Veselovská, Kateřina (2012). Sentence-level senti-
ment analysis in Czech. In Proceedings of the
2nd International Conference on Web Intelligence,
Mining and Semantics.
Veselovská, Kateřina, Hajič, Jan Jr. & Jana Šindlero-
vá (2012). Creating annotated resources for
polarity classification in Czech. In Proceedings
of KONVENS (pp. 296-304).
Veselovská, Kateřina (2013). Czech Subjectivity
Lexicon: A Lexical Resource for Czech Polari-
ty Classification. In Proceedings of SLOVKO
2013.
Wiebe, Janyce, Wilson, Theresa, Bruce, Rebecca,
Bell, Matthew, & Martin, Melanie (2004). Lear-
ning subjective language. Computational lin-
guistics, 30 (3) (pp. 277-308).
5
Proceedings of the 3rd Workshop on Sentiment Analysis where AI meets Psychology (SAAIP 2013), IJCNLP 2013, pages 6–14,Nagoya, Japan, October 14, 2013.
Topic Modeling with Sentiment Clues and Relaxed Labeling SchemaYasuhide Miura
Fuji Xerox Co., Ltd., [email protected]
Keigo HattoriFuji Xerox Co., Ltd., Japan
Tomoko OhkumaFuji Xerox Co., Ltd., Japan
Hiroshi MasuichiFuji Xerox Co., Ltd., [email protected]
Abstract
This paper proposes a method to extractsentiment topics from a text collection.The method utilizes sentiment clues anda relaxed labeling schema to extract sen-timent topics. Experiments with a quan-titative and a qualitative evaluations wasdone to confirm the performance of themethod. The quantitative evaluation with apolarity classification marked the accuracyof 0.701 in tweets and 0.691 in newswiretexts. These performances are compara-ble to support vector machine baselines.The qualitative evaluation of polarity topicextraction showed an overall accuracy of0.729, and a higher accuracy of 0.889 forpositive topic extraction. The result indi-cates the efficacy of our method in extract-ing sentiment topics.
1 Introduction
Continuous increase of text data arose an interestto develop a method to automatically analyze alarge collection of texts. Topic modeling methodssuch as Latent Dirichlet Allocation (LDA)(Bleiet al., 2003) are popular methods for such anal-ysis. For example, they have been applied toanalyze newswire topics (Blei et al., 2003; Ra-jagopal et al., 2013), scientific topics (Griffiths andSteyvers, 2004), weblogs (Mei et al., 2007), onlinereviews (Titov and McDonald, 2008b), and mi-croblogs (Ramage et al., 2010; Zhao et al., 2011).Topic modeling methods generally extract prob-ability distributions of word as topics of a giventext collection. Note that this definition is quitedifferent from the definitions in sentiment analy-sis or opinion mining literatures (Yi et al., 2003;Kim and Hovy, 2006; Stoyanov and Cardie, 2008;Das and Bandyopadhyay, 2010a; Das and Bandy-
opadhyay, 2010b) which basically define topic asan object of an opinion. Extracted topics are use-ful as a summary to catch a broad image of a textcollection, but they are not always intuitively inter-pretable by humans. Typical methods for estimat-ing topic modeling parameters aim to maximize alikelihood of training data (Blei et al., 2003; Grif-fiths and Steyvers, 2004). This objective is knownto form topics that are not always most semanti-cally meaningful (Chang et al., 2009).
Approaches to extract more explicit topics us-ing observed labels are being proposed. Super-vised LDA (Blei and McAuliffe, 2007), LabeledLDA (Ramage et al., 2009), and Partially La-beled Dirichlet Allocation (PLDA)(Ramage et al.,2011) are such supervised topic models. Labelsof these supervised topic models are not requiredto be strictly designed. Strictly designed labelshere mean organized and controlled labels likethe categories of Reuters Corpora (Lewis et al.,2004). Ramage et al. (2009) and Ramage et al.(2010) showed the effectiveness of using labelslike del.icio.us tags, Twitter hashtags, and emoti-cons. The use of these non-strict labels can avoidcost-intensive manual annotations of labels. How-ever, available labels completely depend on a com-munity that provides them. This is problematicwhen a text collection to analyze is already speci-fied since we may not find labels that are suitablefor an analysis.
Sentiment labels such as a product rating and aservice rating are widely used labels that are com-munity dependent. For example, a hotel may bepositively rated for food but be negatively rated forroom. These labels have been used successfullyto extract sentiments of various aspects (Blei andMcAuliffe, 2007; Titov and McDonald, 2008a).However, these kind of rating labels can not be ex-pected to exist in communities other than review
6
sites.This paper presents a method to extract sen-
timent topics from a text collection. A notice-able characteristic of our method is that it doesnot require strictly designed sentiment labels. Themethod uses sentiment clues and a relaxed label-ing schema to extract sentiment topics. Sentimentclue here denotes meta data or a lexical charac-teristic that strongly relates to a certain sentiment.Some examples of sentiment clues are: a happyface emoticon that usually expresses a positivesentiment and a social tag1 of a disaster that tendsto bear negative sentiment. Sentiment label here isexpected to be label that expresses a general sen-timent like positive, neutral, or negative. Relaxedlabeling schema is a schema that defines a processof setting labels to a text using the given sentimentclues. The key feature of this schema is that atext with a sentiment clue gets a sentiment-clue-specific label and a sentiment label. This assumesthat words that co-occur with a sentiment cluetend to hold the same sentiment as the sentimentclue. The assumption follows an idea from super-vised sentiment classification methods of Go et al.(2009), Read (2005), and Davidov et al. (2010)which presume strong relationships between cer-tain emoticons and certain sentiments.
Our contributions in this paper are two-fold: (1)we propose a method that does not require strictlydesigned sentiment labels to extract sentiment top-ics from a text collection, (2) we show the effec-tiveness of our method by performing experimentswith a quantitative and a qualitative evaluations.The rest of this paper is organized as follows. Sec-tion 2 describes our method in detail. Section 3explains data that are used in the experiment ofthe method. Section 4 demonstrates the effective-ness of the method with an experiment. Section 5indicates related works of the method. Section 6concludes the paper with some future extensionsto the method.
2 Methods
2.1 Partially Labeled Dirichlet Allocation
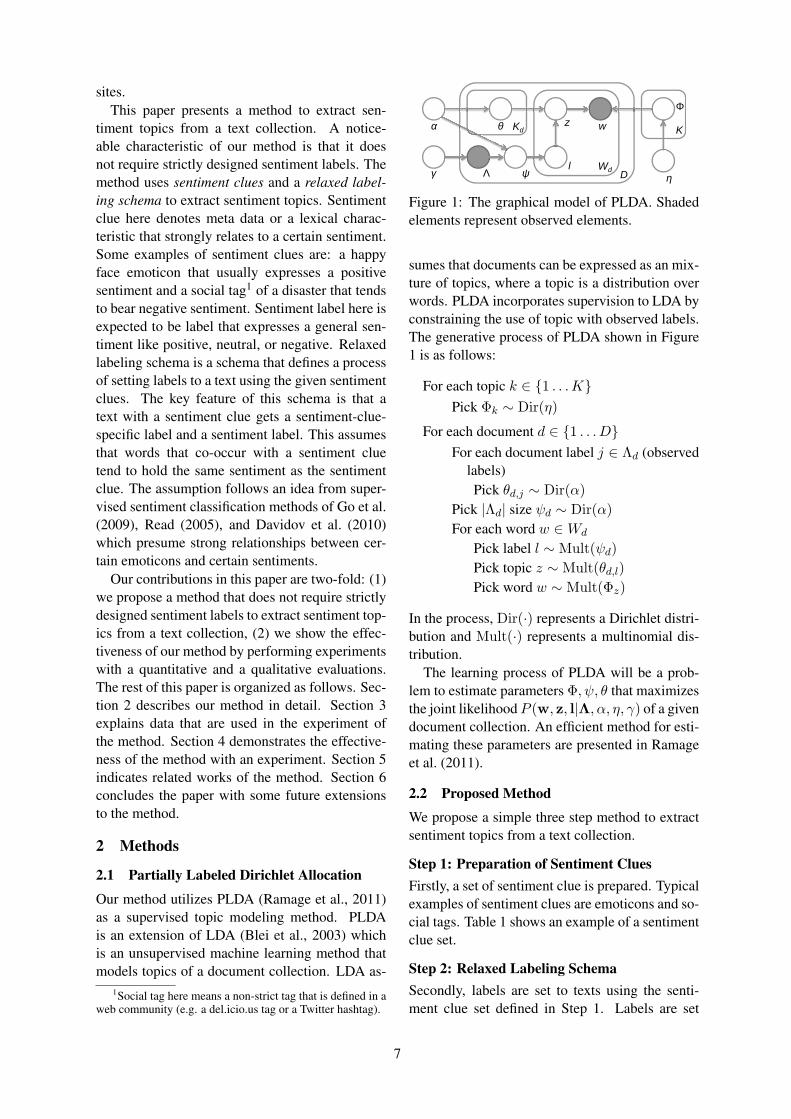
Our method utilizes PLDA (Ramage et al., 2011)as a supervised topic modeling method. PLDAis an extension of LDA (Blei et al., 2003) whichis an unsupervised machine learning method thatmodels topics of a document collection. LDA as-
1Social tag here means a non-strict tag that is defined in aweb community (e.g. a del.icio.us tag or a Twitter hashtag).
Φ
K
DWd
wz
l
Kdθα
γ Λ ψη
Figure 1: The graphical model of PLDA. Shadedelements represent observed elements.
sumes that documents can be expressed as an mix-ture of topics, where a topic is a distribution overwords. PLDA incorporates supervision to LDA byconstraining the use of topic with observed labels.The generative process of PLDA shown in Figure1 is as follows:
For each topic k ∈ {1 . . .K}Pick Φk ∼ Dir(η)
For each document d ∈ {1 . . . D}For each document label j ∈ Λd (observed
labels)Pick θd,j ∼ Dir(α)
Pick |Λd| size ψd ∼ Dir(α)
For each word w ∈Wd
Pick label l ∼ Mult(ψd)
Pick topic z ∼ Mult(θd,l)
Pick word w ∼ Mult(Φz)
In the process, Dir(·) represents a Dirichlet distri-bution and Mult(·) represents a multinomial dis-tribution.
The learning process of PLDA will be a prob-lem to estimate parameters Φ, ψ, θ that maximizesthe joint likelihoodP (w, z, l|Λ, α, η, γ) of a givendocument collection. An efficient method for esti-mating these parameters are presented in Ramageet al. (2011).
2.2 Proposed Method
We propose a simple three step method to extractsentiment topics from a text collection.
Step 1: Preparation of Sentiment CluesFirstly, a set of sentiment clue is prepared. Typicalexamples of sentiment clues are emoticons and so-cial tags. Table 1 shows an example of a sentimentclue set.
Step 2: Relaxed Labeling SchemaSecondly, labels are set to texts using the senti-ment clue set defined in Step 1. Labels are set
7
SentimentClue
Clue Name SentimentLabel
:-) happy face emoticon positive:-( sad face emoticon negative
Table 1: An example of a sentiment clue set.
to text differently in condition of sentiment clueexistence. A text with a sentiment clue gets asentiment-clue-specific label and a sentiment labelthat corresponds to it. For example, with the senti-ment clue set of Table 1, a text including :-) gets ahappy face emoticon label and a positive label. Atext without any sentiment clue gets all sentimentlabels that are defined in Step 1. For example, withthe sentiment clue set of Table 1, a text that doesnot include :-) and :-( gets a positive and a nega-tive labels. Table 2 summarizes how labels are setto texts. The basic policy of this process is to labeltexts with all possible labels. We call this schemarelaxed labeling schema because this all-possiblepolicy is non-strict, thus relaxed.
Step 3: Supervised Topic ModelingThirdly, a supervised topic modeling using PLDAis processed to the labeled texts of Step 2. Senti-ment topics will be extracted as the topics that arelabeled by the sentiment labels of Step 1. Note thatour method is not fully dependent to PLDA. An al-ternate supervised topic modeling method that al-lows multiple labels to a text can be used insteadof PLDA.
3 Data
We performed an experiment to confirm the effec-tiveness of the proposed method. Prior to explain-ing the details of the experiment, we will describedata that we used in it.
3.1 Emoticon Polarity List
We have done a preliminary investigation ofemoticons to define sentiment clues. Firstly, wepicked up six emoticons that are widely used inJapanese. Secondly, 300 tweets, 50 per emoticon,that include one of the six emoticons were anno-tated by three annotators with one of the follow-ing four polarities: positive, negative, positive andnegative, and neutral. Thirdly, the number of posi-tive annotations and negative annotations that twoannotators or more agreed were counted for eachemoticons. Table 3 shows polarity annotations that
Emoticon Polarity(´∇`)ノ positive\ (ˆoˆ)/ positive(ˆ-ˆ) positiveorz negative(´·ω ·`) negative(> <) negative
Table 3: The six emoticons and their largest votepolarities.
Criterion TweetsHAPPY 10,000SAD 10,000NO-EMO 200,000total 220,000
Table 4: The summary of the topic modeling data.
each of the emoticons got the largest vote.
3.2 Topic Modeling Data
Tweets are used as the topic modeling data ofthe proposed method. Public streams tweets inJapanese during the period of May 2011– August2011 are collected using the Twitter streaming API2. From there, we sampled total of 220,000 tweetsthat satisfy one of the following three criteria:
HAPPY 10,000 tweets that contain (´∇`)ノ(a happy emoticon in Japanese, here onEMO-HAPPY).
SAD 10,000 tweets that contain orz (a sad emoti-con in Japanese, here on EMO-SAD).
NO-EMO 200,000 tweets that do not contain anyemoticon3. For this criterion, following twoconditions were also considered: a tweet con-sists of five words or more and a tweet is nota retweet. These conditions are set to reducethe number of uninformative tweets and du-plicate tweets.
In the sampling of NO-EMO, a Japanese morphol-ogy analyzer Kuromoji4 is used for word segmen-tation. Table 4 shows the summary of the sampledtweets.
2https://dev.twitter.com/docs/streaming-apis310,924 Japanese emoticons which we collected from
several web sites are used in this process.4http://www.atilika.org/
8
Text Type HFE label positive label negative label SFE labelTexts with the happy face emoticon
√ √
Texts without any emoticon√ √
Texts with the sad face emoticon√ √
Table 2: The summary of how labels are set to texts with the sentiment clues of Table 1. In the table HFEis “happy face emoticon” and SFE is “sad face emoticon”.
3.3 Polarity Classification Evaluation Data
Two data sets, Tweet and Newswire, are used toevaluate the performance of polarity classifica-tion. Tweet is an evaluation set of general tweetswhose domain is same as the topic modeling data.Newswire is an evaluation set of newswire textswhose domain is quite different from the topicmodeling data. The details of these sets are de-scribed in the following subsections.
3.3.1 Tweet3,000 tweets satisfying the following three con-ditions are sampled from the May 2011–August2011 tweets of Section 3.2:
a. A tweet consists of five words or more (sameas NO-EMO).
b. A tweet includes an adjective, an adverb, anadnominal, or a noun-adverbial. This condi-tion expects to increase the number of tweetsthat include evaluative content.
c. A tweet does not have a POS tag that com-poses more than 80% of its words. This con-dition is set to exclude tweets such as a listof nouns or an interjection that includes a re-peated character.
Note that words and their POS tags are extractedusing Kuromoji like in NO-EMO.
The sampled 3,000 tweets were annotated withone of the following six polarity labels: positive,negative, positive and negative, neutral, advertise-ment, and uninterpretable. Label advertisement isdefined to avoid annotating an advertising tweet topositive. Label uninterpretable is defined to pre-vent annotating a tweet that requires its accompa-nying context to determine a polarity.
Eighteen annotators formed ten pairs5 and eachpair annotated 300 tweets. The annotation agree-ment was 0.417 in Cohen’s Kappa. We extracted
5Two annotators participated in two pairs.
Type Polarity Number
TweetPositive 384Negative 339
NewswirePositive 107Negative 327
Table 5: The compositions of the polarity classifi-cation evaluation data.
723 tweets that two annotators agreed with pos-itive or negative as polarity classification evalua-tion data. Tweet in table 5 shows the compositionof the data.
3.3.2 Newswire434 sentences of the Japanese section of NTCIR-7 Multilingual Opinion Analysis Task (MOAT)(Seki et al., 2008) that satisfies the following con-dition is extracted:
a. A sentence with a positive or a negative po-larity that two or more annotators agreed.
The Japanese section consists of 7,163 sentencesfrom Mainichi Newspaper. Polarities are an-notated to these sentences by three annotators.Note that the sentences are newswire texts, andare mostly non-subjective or neutral polarity.Newswire in table 5 shows the composition of thedata.
4 Experiment
We performed an experiment and two evalua-tions to confirm the effectiveness of the proposedmethod.
4.1 Sentiment Clues
The sentiment clue set of Table 6 was used in theexperiment. Note that the topic modeling data in-clude 10,000 tweets that contain EMO-HAPPYand 10,000 tweets that contain EMO-SAD sincethey are used in the sampling process of them(Section 3.2).
9
Sentiment Clue Sentiment LabelEMO-HAPPY positiveEMO-SAD negative
Table 6: The sentiment clues used in the experi-ment.
4.2 Preprocesses
Number of preprocesses were done to the topicmodeling data to extract words from them.
1. Following normalizations are applied tothe texts: Unicode normalization in formNFKC6, repeated ‘w’s (a character used toexpress laugh in casual Japanese) are re-placed with ‘ww’, a Twitter user name (e.g.@user) is replaced with ‘USER’, a hashtag(e.g. #hashtag) is replaced with ‘HASH-TAG’, and a URL (e.g. http://example.org)is replaced with ‘URL’.
2. Words and their POS tags are extracted fromthe texts using Kuromoji.
3. Words that do not belong to the followingPOS tags are removed (stop POS tag pro-cess): noun7, verb, adjective, adverb, adnom-inal, interjection, filler, symbol-alphabet, andunknown.
4. Six very common stop words such as suru“do” and naru “become” are removed.
5. The words are replaced with their base formsto reduce conjugational variations.
6. Words that appeared twice or less in the dataare removed.
4.3 Supervised Topic Modeling
Stanford Topic Modeling Toolbox8 is used as animplementation of PLDA. For the priors of PLDA,symmetric topic prior α and symmetric word priorη were set to 0.01. Number of topics for eachlabels were set to the numbers listed in Table 7.Background in the table is a special topic thatcan be used to generate words in any documents(tweets) regardless of their sentiment labels. In su-pervised topic modeling, this kind of topic can beused to extract label independent topic (Ramage etal., 2010).
6http://unicode.org/reports/tr15/7There are some exceptions like name suffixes that are
nouns but are removed.8http://www-nlp.stanford.edu/software/tmt/tmt-0.4/
Label Numberpositive 50negative 50EMO-HAPPY 1EMO-SAD 1background 1
Table 7: The number of topics set to each labels.
The parameter estimation of PLDA is done tothe preprocessed data using CVB0 variation ap-proximation (Asuncion et al., 2009) with max it-eration set to 1000. Table 8 shows some examplesof the extracted topics.
4.4 Evaluations
4.4.1 Quantitative Evaluation of TopicsA discriminative polarity classification was per-formed as a quantitative evaluation. Note that thisevaluation dose not directly evaluate the perfor-mance of a sentiment topic extraction. However,following the previous works that jointly modeledsentiment and topic (Lin et al., 2012; Jo and Oh,2011), we perform a sentiment classification eval-uation. A more direct evaluation will be presentedin Section 4.4.2.
Using the parameter estimated topic model,document-topic distribution inferences were con-ducted to the polarity classification evaluation datadescribed in Section 3.3. From there, a positiveand a negative score were calculated for each tweetwith the following equation:
score(d, l) =∑tl
P (tl|d) (1)
In the equation, d is a document (tweet), l is a label(either positive or negative), tl is a topic of l, andP (tl|d) is the posterior probability of tl given d.For each tweet, a label that maximizes Equation 1was set as a classification label.
We also prepared a baseline support vector ma-chine (SVM) based polarity detector similar toGo et al. (2009) for a comparison. HAPPY cri-terion tweets and SAD criterion tweets of Sec-tion 3.2 are used as the positive samples and thenegative samples of SVM respectively. Followingthe best accuracy setting of Go et al. (2009), onlybag-of-word unigrams were used as the featuresof SVM. For preprocesses, same preprocesses asthe proposed method (Section 4.2) with EMO-HAPPY and EMO-SAD emoticons added to the
10
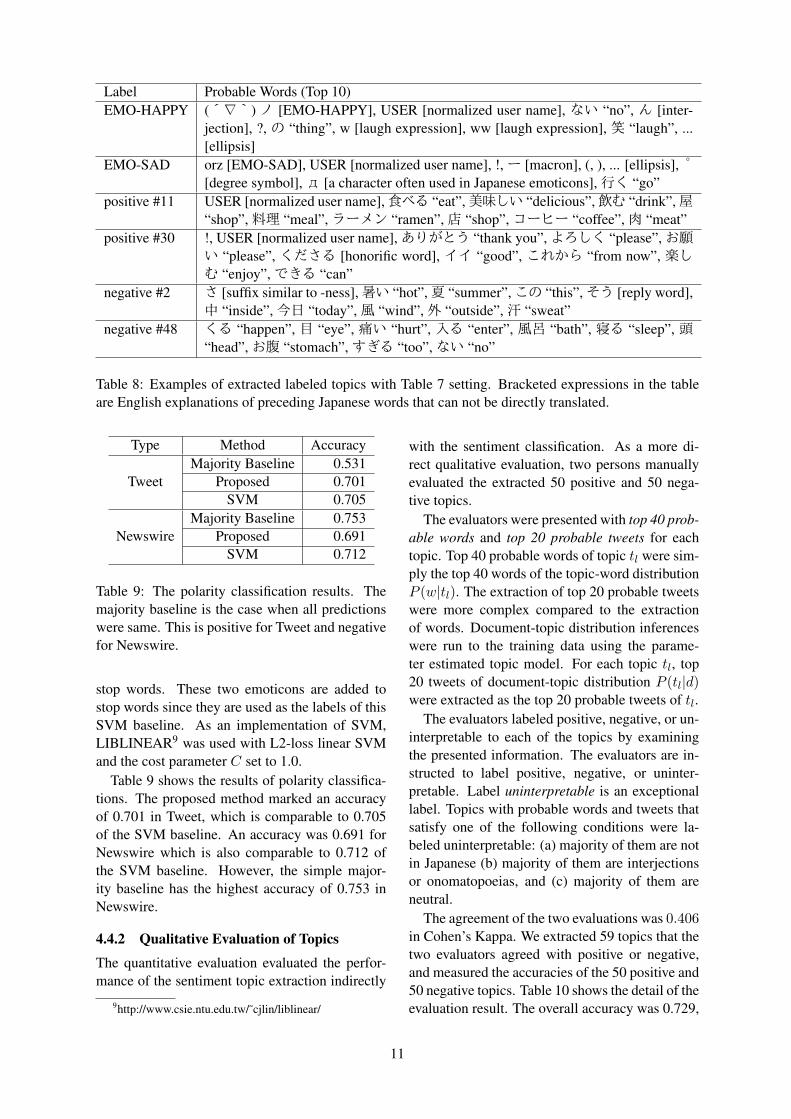
Label Probable Words (Top 10)EMO-HAPPY (´∇`)ノ [EMO-HAPPY], USER [normalized user name], ない “no”, ん [inter-
jection], ?, の “thing”, w [laugh expression], ww [laugh expression], 笑 “laugh”, ...[ellipsis]
EMO-SAD orz [EMO-SAD], USER [normalized user name], !,ー [macron], (, ), ... [ellipsis], °[degree symbol],д [a character often used in Japanese emoticons],行く “go”
positive #11 USER [normalized user name],食べる “eat”,美味しい “delicious”,飲む “drink”,屋“shop”,料理 “meal”,ラーメン “ramen”,店 “shop”,コーヒー “coffee”,肉 “meat”
positive #30 !, USER [normalized user name],ありがとう “thank you”,よろしく “please”,お願い “please”, くださる [honorific word], イイ “good”, これから “from now”, 楽しむ “enjoy”,できる “can”
negative #2 さ [suffix similar to -ness],暑い “hot”,夏 “summer”,この “this”,そう [reply word],中 “inside”,今日 “today”,風 “wind”,外 “outside”,汗 “sweat”
negative #48 くる “happen”, 目 “eye”, 痛い “hurt”, 入る “enter”, 風呂 “bath”, 寝る “sleep”, 頭“head”,お腹 “stomach”,すぎる “too”,ない “no”
Table 8: Examples of extracted labeled topics with Table 7 setting. Bracketed expressions in the tableare English explanations of preceding Japanese words that can not be directly translated.
Type Method AccuracyMajority Baseline 0.531
Tweet Proposed 0.701SVM 0.705
Majority Baseline 0.753Newswire Proposed 0.691
SVM 0.712
Table 9: The polarity classification results. Themajority baseline is the case when all predictionswere same. This is positive for Tweet and negativefor Newswire.
stop words. These two emoticons are added tostop words since they are used as the labels of thisSVM baseline. As an implementation of SVM,LIBLINEAR9 was used with L2-loss linear SVMand the cost parameter C set to 1.0.
Table 9 shows the results of polarity classifica-tions. The proposed method marked an accuracyof 0.701 in Tweet, which is comparable to 0.705of the SVM baseline. An accuracy was 0.691 forNewswire which is also comparable to 0.712 ofthe SVM baseline. However, the simple major-ity baseline has the highest accuracy of 0.753 inNewswire.
4.4.2 Qualitative Evaluation of Topics
The quantitative evaluation evaluated the perfor-mance of the sentiment topic extraction indirectly
9http://www.csie.ntu.edu.tw/˜cjlin/liblinear/
with the sentiment classification. As a more di-rect qualitative evaluation, two persons manuallyevaluated the extracted 50 positive and 50 nega-tive topics.
The evaluators were presented with top 40 prob-able words and top 20 probable tweets for eachtopic. Top 40 probable words of topic tl were sim-ply the top 40 words of the topic-word distributionP (w|tl). The extraction of top 20 probable tweetswere more complex compared to the extractionof words. Document-topic distribution inferenceswere run to the training data using the parame-ter estimated topic model. For each topic tl, top20 tweets of document-topic distribution P (tl|d)were extracted as the top 20 probable tweets of tl.
The evaluators labeled positive, negative, or un-interpretable to each of the topics by examiningthe presented information. The evaluators are in-structed to label positive, negative, or uninter-pretable. Label uninterpretable is an exceptionallabel. Topics with probable words and tweets thatsatisfy one of the following conditions were la-beled uninterpretable: (a) majority of them are notin Japanese (b) majority of them are interjectionsor onomatopoeias, and (c) majority of them areneutral.
The agreement of the two evaluations was 0.406in Cohen’s Kappa. We extracted 59 topics that thetwo evaluators agreed with positive or negative,and measured the accuracies of the 50 positive and50 negative topics. Table 10 shows the detail of theevaluation result. The overall accuracy was 0.729,
11
Label #P #N Accuracypositive 24 3 0.889negative 13 19 0.594overall 0.729
Table 10: The evaluation result of the 50 positivetopics and the 50 negative topics. #P and #N arethe number of topics that the two evaluators agreedas positive and negative respectively.
which indicates the success of the sentiment topicsextraction.
5 Related Works
There are several works that simultaneously mod-eled topic and sentiment. Mei et al. (2007)proposed Topic Sentiment Mixture (TSM) modelwhich is a multinomial mixture model that mixestopic models and a sentiment model. Lin etal. (2012) proposed joint sentiment-topic model(JSTM) that extends LDA to jointly model topicand sentiment. Jo and Oh (2011) proposed As-pect and Sentiment Unification Model (ASUM)that adapts LDA to model aspect and sentimentpairs. Titov and McDonald (2008a) proposedMulti-Aspect Sentiment (MAS) model that mod-els topic with observed aspect ratings and latentoverall sentiment ratings. Blei and McAuliffe(2007) proposed supervised LDA (sLDA) that canhandle sentiments as observed labels. Our methodis different from TSM model, JSTM, and ASUMsince these models handle sentiments as latentvariables. MAS model and sLDA utilize senti-ments explicitly like in our method. However, notlike in the relaxed labeling schema of our method,they have not presented a technique specialized fornon-strict labels.
Sentiment analysis (Pang and Lee, 2008) alsohas a close relationship with our method. We bor-rowed the idea of using sentiment clues from sen-timent analysis methods of Go et al. (2009), Read(2005), and Davidov et al. (2010). Our method isdifferent from these method in the objective thatthe method aims to extract sentiment topics, notsentiments, from a text collection.
6 Conclusion
We proposed a method to extract sentiment top-ics using sentiment clues and the relaxed labelingschema. The quantitative evaluation with the po-larity classification marked the accuracy of 0.701
in tweets and the accuracy of 0.691 in newswiretexts. These performances are comparable to theSVM baselines 0.705 and 0.712 respectively. Thequalitative evaluation of sentiment topics showedthe overall accuracy of 0.729. The result indicatesthe success in the extraction of sentiment topics.However, compared to the high accuracy of 0.889achieved in the extraction of positive topics, theextraction of negative topics showed the moderateaccuracy of 0.594.
One characteristic of our method is that themethod only requires a small set of sentimentclues to extract sentiment topics. Even though themethod has its basis on a supervised topic model-ing method, cost-intensive manual annotations oflabels are not necessary. Despite the weakness ofextracting negative topics shown in the qualitativeevaluation, we think this highly applicable naturemakes our method a convenient method. For fu-ture extensions of the method, we are planning thefollowing two works:
Extraction of Aspect TopicsIn this paper, we proposed a method that extractssentiment topics using sentiment clues. Similarapproach can be taken to extract non-sentimenttopics if there are clues for them. For example,Twitter communities use hashtags to group varietyof topics (Ramage et al., 2010). As a future work,we are planning to perform an aspect topic extrac-tion using social tags as aspect clues.
Introduction of Non-parametric BayesianMethodsIn the experiment of our method, we set the equalnumber of topics to a positive and a negativelabels. How polarities distribute should differamong domains, and this equal number settingmay not work well on some domains. We areplanning to introduce a non-parametric Bayesianmethod (Blei and Jordan, 2005; Ramage et al.,2011) to our method so that the number of topicscan be decided automatically.
ReferencesArthur Asuncion, Max Welling, Padhraic Smyth, and
Yee Whye Teh. 2009. On smoothing and inferencefor topic models. In Proceedings of the Twenty-FifthConference on Uncertainty in Artificial Intelligence,pages 27–34.
David M. Blei and Michael I. Jordan. 2005. Vari-
12
ational inference for Dirichlet process mixtures.Bayesian Analysis, 1:121–144.
David M. Blei and Jon D. McAuliffe. 2007. Super-vised topic models. In Neural Information Process-ing Systems 20, pages 121–128.
David M. Blei, Andrew Y. Ng, and Michael I. Jordan.2003. Latent Dirichlet allocation. Journal of Ma-chine Learning Research, 3:993–1022.
Jonathan Chang, Jordan Boyd-Graber, Sean Gerrish,Chong Wang, and David M. Blei. 2009. Reading tealeaves: how humans interpret topic models. In Neu-ral Information Processing Systems 22, pages 288–296.
Dipankar Das and Sivaji Bandyopadhyay. 2010a. Ex-tracting emotion topics from blog sentences: use ofvoting from multi-engine supervised classifiers. InProceedings of the 2nd international workshop onSearch and mining user-generated contents, pages119–126.
Dipankar Das and Sivaji Bandyopadhyay. 2010b.Identifying emotion topic - an unsupervised hy-brid approach with rhetorical structure and heuris-tic classifier. In Proceedings of The 6th Interna-tional Conference on Natural Language Processingand Knowledge Engineering.
Dmitry Davidov, Oren Tsur, and Ari Rappoport. 2010.Enhanced sentiment learning using twitter hashtagsand smileys. In Proceedings of the 23rd Inter-national Conference on Computational Linguistics:Posters, pages 241–249.
Alec Go, Richa Bhayani, and Lei Huang. 2009. Twit-ter sentiment classification using distant supervision.Technical report, Stanford University.
Thomas L. Griffiths and Mark Steyvers. 2004. Find-ing scientific topics. Proceedings of the NationalAcademy of Sciences, 101(Suppl 1):5228–5235.
Yohan Jo and Alice Oh. 2011. Aspect and sentimentunification model for online review analysis. In Pro-ceedings of the fourth ACM international conferenceon Web search and data mining, pages 815–824.
Soo-Min Kim and Eduard Hovy. 2006. Extractingopinions, opinion holders, and topics expressed inonline news media text. In Proceedings of the Work-shop on Sentiment and Subjectivity in Text, pages 1–8.
David D. Lewis, Yiming Yang, Tony G. Rose, and FanLi. 2004. RCV1: A new benchmark collectionfor text categorization research. Journal of MachineLearning Research, 5:361–397.
Chenghua Lin, Yulan He, Richard Everson, andStefan Ruger. 2012. Weakly supervised jointsentiment-topic detection from text. IEEE Transac-tions on Knowledge and Data Engineering, 24(Issue6):1134–1145.
Qiaozhu Mei, Xu Ling, Matthew Wondra, Hang Su,and ChengXiang Zhai. 2007. Topic sentiment mix-ture: modeling facets and opinions in weblogs. InProceedings of the 16th international conference onWorld Wide Web, pages 171–180.
Bo Pang and Lillian Lee. 2008. Opinion mining andsentiment analysis. Foundations and Trends in In-formation Retrieval, 2(1-2):1–135.
Dheeraj Rajagopal, Daniel Olsher, Erik Cambria, andKenneth Kwok. 2013. Commonsense-based topicmodeling. In Proceedings of the Second Interna-tional Workshop on Issues of Sentiment Discoveryand Opinion Mining, pages 6:1–6:8.
Daniel Ramage, David Hall, Rameshi Nallapati, andChristopher D. Manning. 2009. Labeled LDA:A supervised topic model for credit attribution inmulti-labeled corpora. In Proceedings of the 2009Conference on Empirical Methods in Natural Lan-guage Processing, pages 248–256.
Daniel Ramage, Susan Dumais, and Dan Liebling.2010. Characterizing microblogs with topic models.In Proceedings of the fourth international AAAI con-ference on Weblogs and Social Media, pages 130–137.
Daniel Ramage, Chistopher D. Manning, and SusanDumais. 2011. Partially labeled topic models forinterpretable text mining. In Proceedings of the 17thACM SIGKDD international conference on Knowl-edge discovery and data mining, pages 457–465.
Jonathon Read. 2005. Using emoticons to reduce de-pendency in machine learning techniques for senti-ment classification. In Proceedings of the ACL Stu-dent Research Workshop, pages 43–48.
Yohei Seki, David Kirk Evans, Lun-Wei Ku, Le Sun,Hsin-Hsi Chen, and Noriko Kando. 2008.Overview of multilingual opinion analysis task atNTCIR-7. In Proceedings of the 7th NTCIR Work-shop Meeting on Evaluation of Information Ac-cess Technologies: Information Retrieval, QuestionAnswering, and Cross-Lingual Information Access,pages 185–203.
Veselin Stoyanov and Claire Cardie. 2008. Annotatingtopics of opinions. In Proceedings of the Sixth In-ternational Conference on Language Resources andEvaluation, pages 3213–3217.
Ivan Titov and Ryan McDonald. 2008a. A joint modelof text and aspect ratings for sentiment summariza-tion. In Proceedings of the 46th Annual Meeting ofthe Association for Computational Linguistics: Hu-man Language Technologies, pages 308–316.
Ivan Titov and Ryan McDonald. 2008b. Modelingonline reviews with multi-grain topic models. InProceedings of the 17th international conference onWorld Wide Web, pages 111–120.
13
Jeonghee Yi, Tetsuya Nasukawa, Razvan Bunescu, andWayne Niblack. 2003. Sentiment analyzer: Extract-ing sentiments about a given topic using natural lan-guage processing techniques. In Proceedings of theThird IEEE International Conference on Data Min-ing, pages 427–434.
Wayne Xin Zhao, Jing Jiang, Jianshu Weng, Jing He,Ee-Peng Lim, Hongfei Yan, and Xiaoming Li. 2011.Comparing Twitter and traditional media using topicmodels. In Proceedings of the 33rd European con-ference on Advances in information retrieval, pages338–349.
14
Proceedings of the 3rd Workshop on Sentiment Analysis where AI meets Psychology (SAAIP 2013), IJCNLP 2013, pages 15–23,Nagoya, Japan, October 14, 2013.
Bilingual analysis of LOVE and HATRED emotional markers (SPSS-based approach)
Nataliya Panasenko Faculty of Mass Media
Communication, University of SS Cyril and Methodius (UCM) in
Trnava, Nám. J. Herdu, 2 Trnava Slovakia
Andrej Trnka Faculty of Mass Media
Communication, UCM, Trnava, Nám. J. Herdu, 2 Trnava Slovakia
Dana Petranová Faculty of Mass Media
Communication, UCM, Trnava, Nám. J. Herdu, 2 Trnava Slovakia
Slavomír Magál Faculty of Mass Media
Communication, UCM, Trnava, Nám. J. Herdu, 2 Trnava Slovakia
Abstract
This paper presents the results of GRID pro-ject which aimed at studying the semantics of 24 emotion terms in 23 languages belonging to 8 language families (Indo-European, Indo-Iranian, Afro-Asiatic, Altaic, Uralic, Japonic, Sino-Tibetan, Niger-Congo, and Unclassified). We limit ourselves in this article only to two Slavic languages – Slovak and Czech and to two emotion terms – love and hatred – and try show how greatly information technologies helped the psychologists first of all to obtain, and then to process large volume of informa-tion from a bit less than 5000 people, active project participants, who live in 30 countries.
1 Credits
Though two languages are discussed in the pa-per, it is written by teachers of Faculty of Mass Media Communication, University of SS Cyril and Methodius in Trnava, Slovakia: by prof. Na-taliya Panasenko, assoc. prof. Slavomír Magál, Dr. Dana Petranová and Dr. Andrej Trnka.
2 Introduction
Feelings and emotions are important components of human cognitive activity, behaviour, commu-nication with the world and other people. Human emotional sphere has been thoroughly analyzed by psychologists, philosophers, and linguists.
Outstanding scholars from different countries
(Cornelius, 1996; Ellsworth and Nesse, 2009; Fontaine, Scherer et al. 2007; Frijda, 1986; Лук, 1972 and many others) have made a considerable contribution to creation theoretical and methodo-logical basics of feelings and emotions study. Scholars have described the essence of emotions (Nakonečný, 2000; Scherer, 2005; Stuchlíková, 2007), have made their classification (Ahem and Schwarz, 1979; Додонов, 1975), have described some of them in details (Panasenko, 2012; Сар-баш, 2008), have studied them from cognitive (Byessonova, 2009; Оrtoni, Clore and Collins, 1988) and cultural aspect (Fontaine, 2008; Kita-yama, Markus et al., 1995; Ogarkova, Panasenko et al., 2013; Panasenko, Démuthová et al., 2012; Russel, 1991), specified their attitu-dinal character (Ewert, 1970), role and function of emotions in social life (Slaměník, 2005), means of their expression and perception (Рож-кова, 1974), peculiarities of emotional sphere of people belonging to different professions (teach-ers, musicians, actors, doctors, TV announcers (Ильин, 2001).
In this article we want to show, what ways of
emotion investigation have been recently em-ployed by psychologists and what features de-scribing emotions are important most of all for Slovaks and Czechs. Psychologists take into ac-count different features accompanying emotions, such as features describing the person's evalua-
15
tion or appraisal of the event, features describing the bodily symptoms that tend to occur during the emotional state (felt shivers in the neck or chest, got pale, felt his/her heartbeat slowing down, felt his/her heartbeat getting faster, felt his/her breathing getting faster, perspired, or had moist hands); features describing facial and vocal ex-pressions, that accompany the emotion (blushed, smiled, felt his/her jaw drop, pressed his/her lips together, felt his/her eyebrows go up, frowned, closed his/her eyes, had tears in his/her eyes; changes in the loudness of voice, of speech mel-ody, speech tempo, speech disturbances, etc.). All these symptoms are included into GRID pro-ject, results of which we present in our paper.
3 GRID project
The International GRID Research Consortium was founded in 2005 to organize a world-wide study of the semantics of emotion terms in dif-ferent languages (French, Italian, Portuguese, Romansh, Spanish; Afrikaans, Dutch, English, German; Bulgarian, Czech, Polish, Russian, Slo-vak, Ukrainian; Greek; Hindi; Arabic, Hebrew; Turkish; Estonian, Finnish, Hungarian; Japanese; Chinese, Burmese; Sepedi and Basque) using a componential approach. Project brings together researchers from different countries and disci-plines who have a major interest in language and emotion. GRID project was supported by the Swiss National Center of Competence in Re-search on Affective Sciences (SCAS), University of Geneva (Switzerland) and University of Ghent (Belgium). Here and further on the description of the project was borrowed from the participants' guidelines and from the collective monograph, which reflects results of GRID project (Compo-nents of emotional meaning. A sourcebook, 2013).
In the study native speakers judged the mean-ing of emotion terms in their languages, evaluat-ing them on dimensions reflecting different com-ponents of emotional experience (Fontaine, Scherer, et al. 2007). The GRID consortium was coordinated by Klaus R. Scherer (Switzerland), Johnny R. J. Fontaine (Belgium) and Phoebe C. Ellsworth (USA). 3.1 Data mining Before we present results of the experimental research we want to describe stages of GRID project, which we will name further on as GRID.
First of all, 24 emotion terms (such as sadness, shame, guilt, compassion, love, contentment, happiness, pride, etc.), as well as the tasks to ful-fill which were originally in English, were trans-lated by the coordinators into their native lan-guages, which we have already mentioned.
Participants of the project were asked to re-spond to a web questionnaire hosted on the SCAS website. In the web-based instrument each participant had to evaluate 4 out of 24 emotion words on a profile of 144 componential emotion features. The process of answering lasted from 40 minutes to about an hour. Each language had several data-gathering members (38 people) who followed the instructions provided by the senior coordinators.
The minimum necessary number of people
under test in each language was 120. From the data reflected in the book based on the project results (Components of emotional meaning. A sourcebook, 2013) we see that the number of project participants varies from language to lan-guage. The largest number of people who have completed all the 17 categories of the question-naire is 247 (Chinese, China, Beijing); large number – 220 (Spanish, Peru, Lima), 211 (Chi-nese, Taiwan, Chia-Yi). The smallest number of participants – 66 – was in Burmese (Burma, Myanmar) and in Hebrew – 81 – (Israel, Haifa).
We have 135 Slovak participants in the project
and 125 Czech ones. Though there was no age limit, the average age of Slovak and Czech stu-dents is respectively 22.47 and 19.94. All the questions were grouped into several categories: categ. 1 evaluation (which included such items as features describing the person's evaluation or appraisal of the event – 31 items); categ. 2 bodily symptoms (features describing the bodily symp-toms that tend to occur during the emotional state – 18); categ. 3 expression (features describing facial and vocal expressions and gestures, that accompany the emotion – 26); categ. 4 action tendencies (features describing tendencies to behave in certain ways that accompany the emo-tion – 40); categ. 5 subjective feeling (features describing the subjective experience that charac-terizes the emotion – 22); categ. 6 regulation (features describing ways in which the emotion can be regulated – 4); categ. 7 general (some general features of the emotion experienced – 3). These features are presented below in the tables, where they are abbreviated in such a way: categ2_i7 felt her or his heartbeat getting faster;
16
categ2_i16 blushed; categ3_i7 opened her or his eyes widely; categ5_i6 felt at ease. As we have mentioned above, total number of the features is 144.
Most of the participants (with the exception of people from Tunisia (Arabic, Tunis) and Peru (Spanish, Lima) and partially Ukraine (Russian, Kiev) answered questions on-line; each partici-pant was given four different emotion terms cho-sen at random by the computer. For Slovak stu-dents it was naturally to be involved into the pro-ject on-line; they were called by Vrabec "genera-tion on-line" (2010: 82). The questionnaire was anonymous, but it was necessary to mention age, sex, education, country of residence and spoken languages. It was necessary to answer all the questions of the programme, otherwise the data were not accepted. Later on all the data obtained were thoroughly processed by the latest version of SPSS Statistics ver. 21. This gave us the op-portunity to capture the most important dimen-sions measured by GRID with a limited number of well-differentiating and cross-cultural stable features. 4 Love and hatred as emotive terms As we have already mentioned above, there are many classifications of emotions and feelings and approaches to their study. The question arises how to process the information about them, because ways of processing of the received data are considered to be a prominent aspect of psychological research. For many decades scien-tists offered varied methods of diagnostics of emotional states, verbal and nonverbal ways of feelings and emotions expression. Procedures which with each coil of progress in science be-come more and more complicated and accom-plished result from the theoretical sources of-fered by scholars, as well as technical possibili-ties in a society on the given stage of progress.
The question is how after all the person ex-presses one's feelings and if there are differences in various cultures on adequate perception and interpretation of emotions. As Russell claims (1991), people belonging to different cultures, are capable to perceive and estimate correctly expressions of a human face, to define on it such emotional states, as pleasure, anger, grief, fear, disgust, and surprise. On the other side there are culture specific differences in expressing human emotions and feelings.
The analysis of studies performed by psy-chologists and linguists, gives us an opportunity to assume, that there are universal and specific ways of emotions and feelings expression. We may speak about linguistic and extralinguistic ways (Панасенко, 2009). GRID questionnaire mainly includes extralinguistic ways, such as gesticulation, facial expression, bodily move-ments and some others. Linguistic ways of emo-tions manifestation are presented by intonational ones (categ3"Expression – features describing facial and vocal expressions and gestures that accompany the emotion: spoke louder/ softer/ faster/ slower, had a trembling/ assertive voice, changed the melody of his/her speech, etc.).
Speaking about love and hatred as basic hu-man feelings, we would like to state, that they have been investigated either by linguists or psy-chologists (Ильин, 2001; Fredrickson, 2001; Norman, 2005; Panasenko, 2012; Panasenko et al., 2012; Степанов, 1997; Tissari, 2003; Вор-качев, 1995), but the studies were conducted mainly on a very small number of languages. We would like to mention the Edinburgh Associative Thesaurus (EAT), which is a set of word associa-tion norms showing the counts of word associa-tion as collected from subjects. According to it, love stimulated the following associations. Num-ber of different answers is 49. Total count of all answers is 97. Here is the beginning of the list:
HATE 32 0.33 SEX 9 0.09 GIRL 5 0.05 LIFE 3 0.03 MARRIAGE 3 0.03 WAR 2 0.02 AFFECTION 1 0.01 (Edinburgh Associative Thesaurus).
The list of associations shows, that top one in the list is hatred. It is a very interesting research based on English. GRID is based on a large number of languages. Its results allow us to see different ways of emotions manifestation in dif-ferent cultures. Below we present results of com-parative analysis of emotional markers of LOVE in Slovak and Czech. 4.1 Emotional markers of LOVE (Slovak data) 17 Slovak participants referred to these emotion terms which were described by 144 variables affording nine-point response scale for evalua-tion of each variable. Descriptive analysis of mean values of all variables showed, that Slo-
17
vaks consider the terms "love, attachment" to be perceived by members of their culture mainly through positive characteristics, like something nice and pleasant (see table 1).
number of category description mean categ5_i1 was in an intense emotional state 8,55 categ3_i1 smiled 8,50 categ4_i35 wanted to be tender, sweet, and kind 8,45 categ5_i3 felt good 8,36 categ5_i2 experienced the emotional state for a long time 8,32 categ2_i12 felt warm (whole body) 8,32 categ2_i7 felt his/her heartbeat getting faster 8,27 categ2_i16 blushed 8,27 categ5_i9 felt energetic 8,18 categ4_i39 wanted to sing and dance 8,14
Table 1. List of top ten characteristics which
were stated by Slovak participants as extremely common for love markers
Some characteristic of love markers were
stated more common than the others (see table 2) (after Panasenko, Démuthová et al., 2012: 262).
category number of feature description mean
categ1_i6
that was in itself pleasant for the person (independently of its possible consequences)
7,23 features describing the person’s evalua-tion or appraisal of the event, conscious or not categ1_i18
of which the conse-quences were likely to be positive, desirable for the person him/herself
7,23
categ2_i12 felt warm (whole body) 8,32 features describing the bodily symptoms that tend to occur during the emotional state
categ2_i7 felt his/her heartbeat getting faster
8,27
categ3_i1 smiled 8,50 features describing facial and vocal expressions and gestures, that ac-company the emo-tion.
categ3_i22
changed the melody of his/her speech
7,14
categ4_i35 wanted to be tender, sweet, and kind
8,45 features describing tendencies to behave in certain ways that accompany the emotion
categ4_i39 wanted to sing and dance 8,14
categ5_i1 was in an intense emotional state
8,55 features describing the subjective experience that characterizes the emotion
categ5_i3 felt good
8,36
categ6_i2 showed a stronger degree of emotion than he/she actually felt
7,18 features describing ways in which the emotion can be regulated categ6_i3
showed a weaker degree of emotion than he/she actually felt
5,41
categ7_i2 How frequently is this state generally experi-enced in your society
7,00
some general fea-tures of the emotion experienced
categ7_i3
To what extent is it socially accepted to experience this emo-tional state in your society
7,36
Table 2. Example of the first two the most common features in each category of love
markers in Slovak sample
People under test were of different sex. Though the number of males and females was not equal, it is possible to find out how love is being described and evaluated by men and women. Table 3 presents very interesting results
of gender aspect of love evaluation and display (after Panasenko, Démuthová et al., 2012: 264).
number of category description mean
male mean female
sig.
categ1_i3 that was essentially unpre-dictable
8,00 5,76 0,025
categ1_i21
of which the consequences were likely to be negative, undesirable for somebody else
7,00 3,71 0,025
categ1_i25
with such consequences that the person would be able to live with them and adjust to them
7,20 5,00 0,025
categ2_i13 perspired, or had moist hands
4,60 7,35 0,031
categ3_i12 withdrew from people or things
5,80 2,65 0,025
categ3_i13 moved against people or things
5,80 2,47 0,019
categ3_i20 produced a short utterance 5,80 3,12 0,015
categ4_i16 lacked the motivation to do anything
5,60 3,41 0,048
categ4_i26 wanted to do damage, hit, or say something that hurts
5,20 2,12 0,006
categ4_i27 wanted to break contact with others
5,60 2,65 0,015
categ5_i8 felt negative 5,40 2,82 0,048 categ5_i9 felt energetic 7,00 8,53 0,011 categ5_i12 felt powerful 6,60 8,47 0,048
Table 3. List of characteristics that differ in
Slovak sample according to gender with respect to love markers
Contrary to common stereotypes, men scored
significantly higher in data items connected with life change – they stated that love means that they are more ready to break contact with others (categ4_i27), to withdraw from people or things (categ3_i12), to adjust to the consequences (categ1_i25), etc. more than women are. Not-withstanding gender differences in love evalua-tion, it is very interesting to state 7 common fea-tures which were in Slovak sample perceived identically by males and females. Love is for both genders something important in life what they head for (categ1_i10 and categ1_i11) and what they expect to get by God (or other super-natural power) (categ1_i15). They also have co-incidence with some bodily symptoms (categ2_i10 – felt her or his breathing slowing down, categ3_i22 – changed the melody of her or his speech, categ3_i24 – spoke faster) (after Panasenko, Démuthová et al., 2012: 265).
4.2 Emotional markers of HATRED (Slovak data) 21 Slovak participants referred to this emotion term which was described by 144 variables af-fording nine-point response scale for evaluation of each variable. Description of the tables can be the same as in love markers (see tables 1 and 2).
18
number of category description mean categ4_i37 wanted to destroy whatever was close 7,86 categ5_i1 was in an intense emotional state 7,43 categ3_i13 moved against people or things 7,33 categ2_i2 felt weak limbs 7,29 categ2_i9 felt his/her muscles tensing (whole body) 7,24 categ3_i15 spoke louder 7,19 categ4_i3 felt the urge to stop what he/she was doing 7,19 categ3_i22 changed the melody of his/her speech 7,14 categ3_i5 frowned 7,14 categ4_i26 wanted to do damage, hit, or say something that
hurts 7,10
Table 4. List of top ten characteristics which
were stated by Slovak participants as extremely common for hatred markers
category number of feature description mean
categ1_i20
of which the conse-quences were likely to be negative, undesir-able for the person him/herself
6,95 features describing the person’s evalua-tion or appraisal of the event, conscious or not
categ1_i27 that violated laws or socially accepted norms
6,00
categ2_i2 felt weak limbs 7,29 features describing the bodily symptoms that tend to occur during the emotional state
categ2_i9
felt his/her muscles tensing (whole body) 7,24
categ3_i13 moved against people or things
7,33 features describing facial and vocal expressions and gestures, that ac-company the emo-tion.
categ3_i15
spoke louder
7,19
categ4_i37 wanted to destroy whatredver was close
7,86 features describing tendencies to behave in certain ways that accompany the emotion
categ4_i3 felt the urge to stop what he/she was doing 7,19
categ5_i1 was in an intense emotional state
7,43 features describing the subjective experience that characterizes the emotion
categ5_i2 experienced the emo-tional state for a long time
7,10
categ6_i2 showed a stronger degree of emotion than he/she actually felt
6,43 features describing ways in which the emotion can be regulated categ6_i1
tried to control the intensity of the emo-tional feeling
4,95
categ7_i1
If a speaker of your native language as spoken in your country or region uses the following emotion words to describe an emotional experience, how likely is it that he/she will be changed in a lasting way (due to the emotional experi-ence)
4,95 some general fea-tures of the emotion experienced
categ7_i2 How frequently is this state generally experi-enced in your society
4,29
Table 5. Example of the first two the most com-mon features in each category of hatred markers
in Slovak sample
Table 6 presents very interesting results of gender aspect of hatred evaluation and display.
number of category description mean male
mean female
sig.
categ1_i6 that was in itself pleasant for the person (independently of its possible consequences)
6,00 2,94 0,011
categ1_i7 that was in itself pleasant for somebody else (independently of its possible consequences)
6,00 2,75 0,008
categ1_i12 that was caused by chance 6,60 3,50 0,004
categ1_i15 that was caused by a super-natural power (e.g., God, ancestors, ghosts)
6,60 4,44 0,040
categ1_i27 that violated laws or socially 4,80 7,56 0,015
accepted norms categ3_i6 closed his/her eyes 3,00 5,69 0,032
categ4_i2 wanted the ongoing situation to last or be repeated
4,60 2,19 0,032
categ4_i12 wanted someone to be there to provide help or support
6,00 3,00 0,015
categ4_i31 wanted to tackle the situation 7,00 3,44 0,003
categ4_i33 wanted to take care of another person or cause
4,80 2,19 0,011
categ4_i34 wanted to be near or close to people or things
5,00 2,63 0,019
categ4_i35 wanted to be tender, sweet, and kind
4,80 1,25 0,015
categ5_i3 felt good 4,00 1,81 0,008 categ5_i12 felt powerful 6,20 3,44 0,032 categ5_i16 felt calm 5,20 2,06 0,008
Table 6. List of characteristics that differ in
Slovak sample according to gender with respect to hatred markers
SPSS allows us to present obtained informa-
tion in a different way. Figure 1 shows the an-swer distribution of the first category from Table 6. In the left column there are women's answers and in the right column those of men. We can see that the markers for hatred in male and female understanding are extremely different: men want to tackle the situation, whereas women are sure that men's behaviour violates laws or socially accepted norms.
Figure 1. Answer distribution for
category4_i31" (wanted to tackle the situation) 4.3 Emotional markers of LOVE (Czech data) 17 Czech participants referred to these emotion terms which were described by 144 variables affording nine-point response scale for evalua-tion of each variable.
number of category description mean categ7_i3 to what extent is it socially accepted to
experience this emotional state in your society
8,12
categ2_i7 felt his/her heartbeat getting faster 8,06 categ4_i35 wanted to be tender, sweet, and kind 7,94 categ4_i39 wanted to sing and dance 7,82 categ5_i3 felt good 7,65 categ4_i2 wanted the ongoing situation to last or be
repeated 7,59
categ3_i1 smiled 7,53 categ3_i22 changed the melody of his/her speech 7,47 categ4_i33 wanted to take care of another person or
cause 7,47
categ5_i9 felt energetic 7,41
Table 7. List of top ten characteristics which were stated by Czech participants as extremely
common for love markers
19
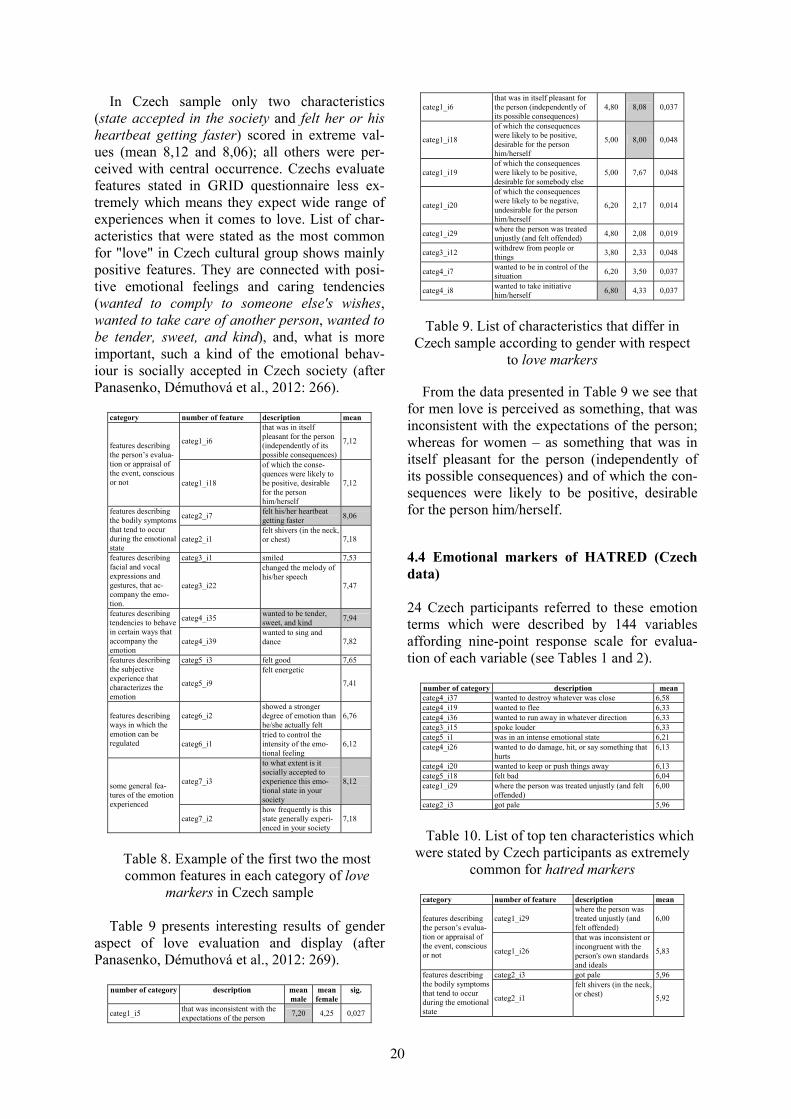
In Czech sample only two characteristics (state accepted in the society and felt her or his heartbeat getting faster) scored in extreme val-ues (mean 8,12 and 8,06); all others were per-ceived with central occurrence. Czechs evaluate features stated in GRID questionnaire less ex-tremely which means they expect wide range of experiences when it comes to love. List of char-acteristics that were stated as the most common for "love" in Czech cultural group shows mainly positive features. They are connected with posi-tive emotional feelings and caring tendencies (wanted to comply to someone else's wishes, wanted to take care of another person, wanted to be tender, sweet, and kind), and, what is more important, such a kind of the emotional behav-iour is socially accepted in Czech society (after Panasenko, Démuthová et al., 2012: 266).
category number of feature description mean
categ1_i6
that was in itself pleasant for the person (independently of its possible consequences)
7,12 features describing the person’s evalua-tion or appraisal of the event, conscious or not categ1_i18
of which the conse-quences were likely to be positive, desirable for the person him/herself
7,12
categ2_i7 felt his/her heartbeat getting faster
8,06 features describing the bodily symptoms that tend to occur during the emotional state
categ2_i1 felt shivers (in the neck, or chest) 7,18
categ3_i1 smiled 7,53 features describing facial and vocal expressions and gestures, that ac-company the emo-tion.
categ3_i22
changed the melody of his/her speech
7,47
categ4_i35 wanted to be tender, sweet, and kind
7,94 features describing tendencies to behave in certain ways that accompany the emotion
categ4_i39 wanted to sing and dance 7,82
categ5_i3 felt good 7,65 features describing the subjective experience that characterizes the emotion
categ5_i9
felt energetic
7,41
categ6_i2 showed a stronger degree of emotion than he/she actually felt
6,76 features describing ways in which the emotion can be regulated categ6_i1
tried to control the intensity of the emo-tional feeling
6,12
categ7_i3
to what extent is it socially accepted to experience this emo-tional state in your society
8,12 some general fea-tures of the emotion experienced
categ7_i2 how frequently is this state generally experi-enced in your society
7,18
Table 8. Example of the first two the most common features in each category of love
markers in Czech sample
Table 9 presents interesting results of gender aspect of love evaluation and display (after Panasenko, Démuthová et al., 2012: 269).
number of category description mean male
mean female
sig.
categ1_i5 that was inconsistent with the expectations of the person
7,20 4,25 0,027
categ1_i6 that was in itself pleasant for the person (independently of its possible consequences)
4,80 8,08 0,037
categ1_i18
of which the consequences were likely to be positive, desirable for the person him/herself
5,00 8,00 0,048
categ1_i19 of which the consequences were likely to be positive, desirable for somebody else
5,00 7,67 0,048
categ1_i20
of which the consequences were likely to be negative, undesirable for the person him/herself
6,20 2,17 0,014
categ1_i29 where the person was treated unjustly (and felt offended)
4,80 2,08 0,019
categ3_i12 withdrew from people or things
3,80 2,33 0,048
categ4_i7 wanted to be in control of the situation
6,20 3,50 0,037
categ4_i8 wanted to take initiative him/herself
6,80 4,33 0,037
Table 9. List of characteristics that differ in
Czech sample according to gender with respect to love markers
From the data presented in Table 9 we see that
for men love is perceived as something, that was inconsistent with the expectations of the person; whereas for women – as something that was in itself pleasant for the person (independently of its possible consequences) and of which the con-sequences were likely to be positive, desirable for the person him/herself. 4.4 Emotional markers of HATRED (Czech data) 24 Czech participants referred to these emotion terms which were described by 144 variables affording nine-point response scale for evalua-tion of each variable (see Tables 1 and 2).
number of category description mean categ4_i37 wanted to destroy whatever was close 6,58 categ4_i19 wanted to flee 6,33 categ4_i36 wanted to run away in whatever direction 6,33 categ3_i15 spoke louder 6,33 categ5_i1 was in an intense emotional state 6,21 categ4_i26 wanted to do damage, hit, or say something that
hurts 6,13
categ4_i20 wanted to keep or push things away 6,13 categ5_i18 felt bad 6,04 categ1_i29 where the person was treated unjustly (and felt
offended) 6,00
categ2_i3 got pale 5,96
Table 10. List of top ten characteristics which
were stated by Czech participants as extremely common for hatred markers
category number of feature description mean
categ1_i29 where the person was treated unjustly (and felt offended)
6,00 features describing the person’s evalua-tion or appraisal of the event, conscious or not categ1_i26
that was inconsistent or incongruent with the person's own standards and ideals
5,83
categ2_i3 got pale 5,96 features describing the bodily symptoms that tend to occur during the emotional state
categ2_i1
felt shivers (in the neck, or chest) 5,92
20
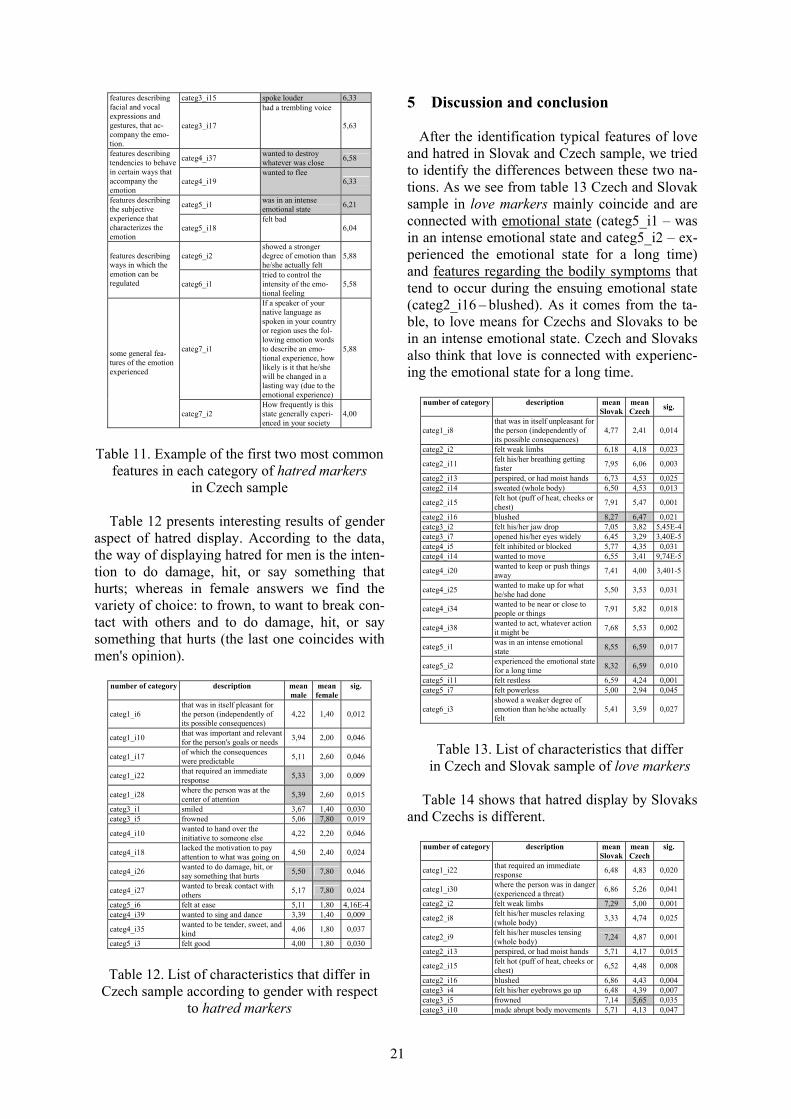
categ3_i15 spoke louder 6,33 features describing facial and vocal expressions and gestures, that ac-company the emo-tion.
categ3_i17
had a trembling voice
5,63
categ4_i37 wanted to destroy whatever was close
6,58 features describing tendencies to behave in certain ways that accompany the emotion
categ4_i19 wanted to flee
6,33
categ5_i1 was in an intense emotional state
6,21 features describing the subjective experience that characterizes the emotion
categ5_i18 felt bad
6,04
categ6_i2 showed a stronger degree of emotion than he/she actually felt
5,88 features describing ways in which the emotion can be regulated categ6_i1
tried to control the intensity of the emo-tional feeling
5,58
categ7_i1
If a speaker of your native language as spoken in your country or region uses the fol-lowing emotion words to describe an emo-tional experience, how likely is it that he/she will be changed in a lasting way (due to the emotional experience)
5,88 some general fea-tures of the emotion experienced
categ7_i2 How frequently is this state generally experi-enced in your society
4,00
Table 11. Example of the first two most common
features in each category of hatred markers in Czech sample
Table 12 presents interesting results of gender
aspect of hatred display. According to the data, the way of displaying hatred for men is the inten-tion to do damage, hit, or say something that hurts; whereas in female answers we find the variety of choice: to frown, to want to break con-tact with others and to do damage, hit, or say something that hurts (the last one coincides with men's opinion).
number of category description mean
male mean female
sig.
categ1_i6 that was in itself pleasant for the person (independently of its possible consequences)
4,22 1,40 0,012
categ1_i10 that was important and relevant for the person's goals or needs
3,94 2,00 0,046
categ1_i17 of which the consequences were predictable
5,11 2,60 0,046
categ1_i22 that required an immediate response
5,33 3,00 0,009
categ1_i28 where the person was at the center of attention
5,39 2,60 0,015
categ3_i1 smiled 3,67 1,40 0,030 categ3_i5 frowned 5,06 7,80 0,019
categ4_i10 wanted to hand over the initiative to someone else
4,22 2,20 0,046
categ4_i18 lacked the motivation to pay attention to what was going on
4,50 2,40 0,024
categ4_i26 wanted to do damage, hit, or say something that hurts
5,50 7,80 0,046
categ4_i27 wanted to break contact with others
5,17 7,80 0,024
categ5_i6 felt at ease 5,11 1,80 4,16E-4categ4_i39 wanted to sing and dance 3,39 1,40 0,009
categ4_i35 wanted to be tender, sweet, and kind
4,06 1,80 0,037
categ5_i3 felt good 4,00 1,80 0,030
Table 12. List of characteristics that differ in
Czech sample according to gender with respect to hatred markers
5 Discussion and conclusion After the identification typical features of love
and hatred in Slovak and Czech sample, we tried to identify the differences between these two na-tions. As we see from table 13 Czech and Slovak sample in love markers mainly coincide and are connected with emotional state (categ5_i1 – was in an intense emotional state and categ5_i2 – ex-perienced the emotional state for a long time) and features regarding the bodily symptoms that tend to occur during the ensuing emotional state (categ2_i16 – blushed). As it comes from the ta-ble, to love means for Czechs and Slovaks to be in an intense emotional state. Czech and Slovaks also think that love is connected with experienc-ing the emotional state for a long time.
number of category description mean Slovak
mean Czech
sig.
categ1_i8 that was in itself unpleasant for the person (independently of its possible consequences)
4,77 2,41 0,014
categ2_i2 felt weak limbs 6,18 4,18 0,023
categ2_i11 felt his/her breathing getting faster
7,95 6,06 0,003
categ2_i13 perspired, or had moist hands 6,73 4,53 0,025 categ2_i14 sweated (whole body) 6,50 4,53 0,013
categ2_i15 felt hot (puff of heat, cheeks or chest)
7,91 5,47 0,001
categ2_i16 blushed 8,27 6,47 0,021 categ3_i2 felt his/her jaw drop 7,05 3,82 5,45E-4categ3_i7 opened his/her eyes widely 6,45 3,29 3,40E-5categ4_i5 felt inhibited or blocked 5,77 4,35 0,031 categ4_i14 wanted to move 6,55 3,41 9,74E-5
categ4_i20 wanted to keep or push things away
7,41 4,00 3,401-5
categ4_i25 wanted to make up for what he/she had done
5,50 3,53 0,031
categ4_i34 wanted to be near or close to people or things
7,91 5,82 0,018
categ4_i38 wanted to act, whatever action it might be
7,68 5,53 0,002
categ5_i1 was in an intense emotional state
8,55 6,59 0,017
categ5_i2 experienced the emotional state for a long time
8,32 6,59 0,010
categ5_i11 felt restless 6,59 4,24 0,001 categ5_i7 felt powerless 5,00 2,94 0,045
categ6_i3 showed a weaker degree of emotion than he/she actually felt
5,41 3,59 0,027
Table 13. List of characteristics that differ
in Czech and Slovak sample of love markers
Table 14 shows that hatred display by Slovaks and Czechs is different.
number of category description mean Slovak
mean Czech
sig.
categ1_i22 that required an immediate response
6,48 4,83 0,020
categ1_i30 where the person was in danger (experienced a threat)
6,86 5,26 0,041
categ2_i2 felt weak limbs 7,29 5,00 0,001
categ2_i8 felt his/her muscles relaxing (whole body)
3,33 4,74 0,025
categ2_i9 felt his/her muscles tensing (whole body)
7,24 4,87 0,001
categ2_i13 perspired, or had moist hands 5,71 4,17 0,015
categ2_i15 felt hot (puff of heat, cheeks or chest)
6,52 4,48 0,008
categ2_i16 blushed 6,86 4,43 0,004 categ3_i4 felt his/her eyebrows go up 6,48 4,39 0,007 categ3_i5 frowned 7,14 5,65 0,035 categ3_i10 made abrupt body movements 5,71 4,13 0,047
21
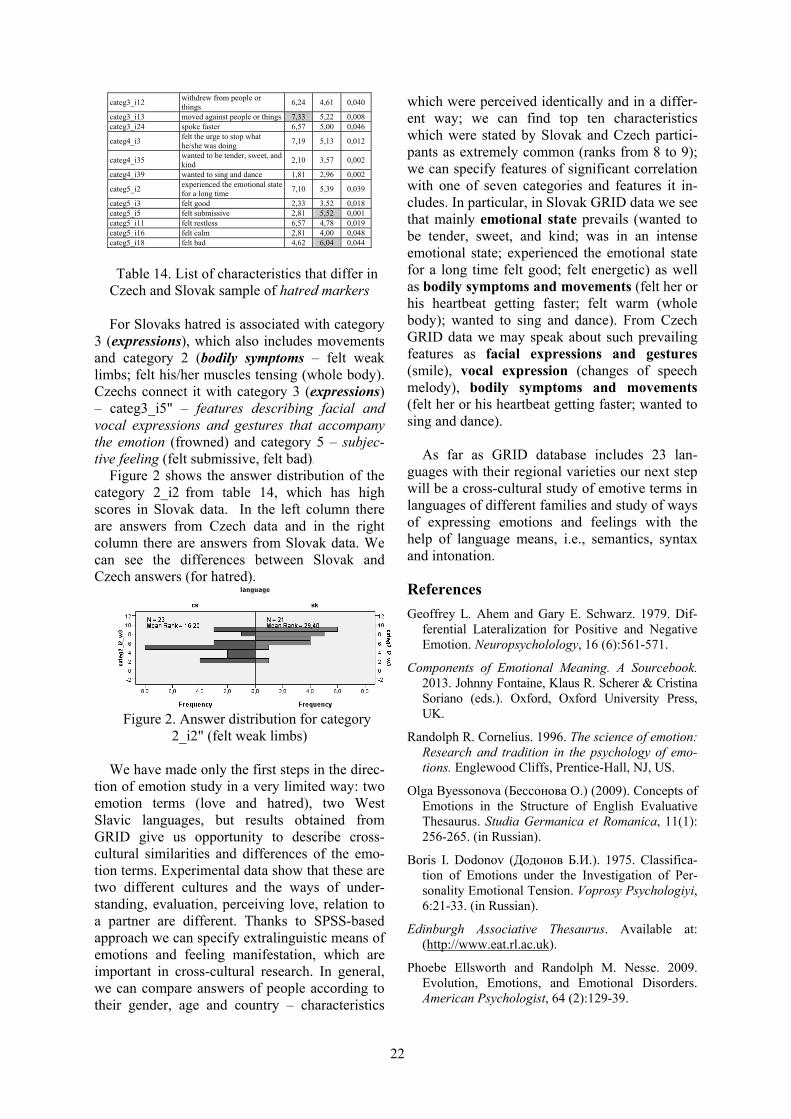
categ3_i12 withdrew from people or things
6,24 4,61 0,040
categ3_i13 moved against people or things 7,33 5,22 0,008 categ3_i24 spoke faster 6,57 5,00 0,046
categ4_i3 felt the urge to stop what he/she was doing
7,19 5,13 0,012
categ4_i35 wanted to be tender, sweet, and kind
2,10 3,57 0,002
categ4_i39 wanted to sing and dance 1,81 2,96 0,002
categ5_i2 experienced the emotional state for a long time
7,10 5,39 0,039
categ5_i3 felt good 2,33 3,52 0,018 categ5_i5 felt submissive 2,81 5,52 0,001 categ5_i11 felt restless 6,57 4,78 0,019 categ5_i16 felt calm 2,81 4,00 0,048 categ5_i18 felt bad 4,62 6,04 0,044
Table 14. List of characteristics that differ in
Czech and Slovak sample of hatred markers
For Slovaks hatred is associated with category 3 (expressions), which also includes movements and category 2 (bodily symptoms – felt weak limbs; felt his/her muscles tensing (whole body). Czechs connect it with category 3 (expressions) – categ3_i5" – features describing facial and vocal expressions and gestures that accompany the emotion (frowned) and category 5 – subjec-tive feeling (felt submissive, felt bad).
Figure 2 shows the answer distribution of the category 2_i2 from table 14, which has high scores in Slovak data. In the left column there are answers from Czech data and in the right column there are answers from Slovak data. We can see the differences between Slovak and Czech answers (for hatred).
Figure 2. Answer distribution for category
2_i2" (felt weak limbs) We have made only the first steps in the direc-
tion of emotion study in a very limited way: two emotion terms (love and hatred), two West Slavic languages, but results obtained from GRID give us opportunity to describe cross-cultural similarities and differences of the emo-tion terms. Experimental data show that these are two different cultures and the ways of under-standing, evaluation, perceiving love, relation to a partner are different. Thanks to SPSS-based approach we can specify extralinguistic means of emotions and feeling manifestation, which are important in cross-cultural research. In general, we can compare answers of people according to their gender, age and country – characteristics
which were perceived identically and in a differ-ent way; we can find top ten characteristics which were stated by Slovak and Czech partici-pants as extremely common (ranks from 8 to 9); we can specify features of significant correlation with one of seven categories and features it in-cludes. In particular, in Slovak GRID data we see that mainly emotional state prevails (wanted to be tender, sweet, and kind; was in an intense emotional state; experienced the emotional state for a long time felt good; felt energetic) as well as bodily symptoms and movements (felt her or his heartbeat getting faster; felt warm (whole body); wanted to sing and dance). From Czech GRID data we may speak about such prevailing features as facial expressions and gestures (smile), vocal expression (changes of speech melody), bodily symptoms and movements (felt her or his heartbeat getting faster; wanted to sing and dance).
As far as GRID database includes 23 lan-guages with their regional varieties our next step will be a cross-cultural study of emotive terms in languages of different families and study of ways of expressing emotions and feelings with the help of language means, i.e., semantics, syntax and intonation.
References
Geoffrey L. Ahem and Gary E. Schwarz. 1979. Dif-ferential Lateralization for Positive and Negative Emotion. Neuropsycholology, 16 (6):561-571.
Components of Emotional Meaning. A Sourcebook. 2013. Johnny Fontaine, Klaus R. Scherer & Cristina Soriano (eds.). Oxford, Oxford University Press, UK.
Randolph R. Cornelius. 1996. The science of emotion: Research and tradition in the psychology of emo-tions. Englewood Cliffs, Prentice-Hall, NJ, US.
Olga Byessonova (Бессонова О.) (2009). Сoncepts of Emotions in the Structure of English Evaluative Thesaurus. Studia Germanica et Romanica, 11(1): 256-265. (in Russian).
Boris I. Dodonov (Додонов Б.И.). 1975. Classifica-tion of Emotions under the Investigation of Per-sonality Emotional Tension. Voprosy Psychologiyi, 6:21-33. (in Russian).
Edinburgh Associative Thesaurus. Available at: (http://www.eat.rl.ac.uk).
Phoebe Ellsworth and Randolph M. Nesse. 2009. Evolution, Emotions, and Emotional Disorders. American Psychologist, 64 (2):129-39.
22
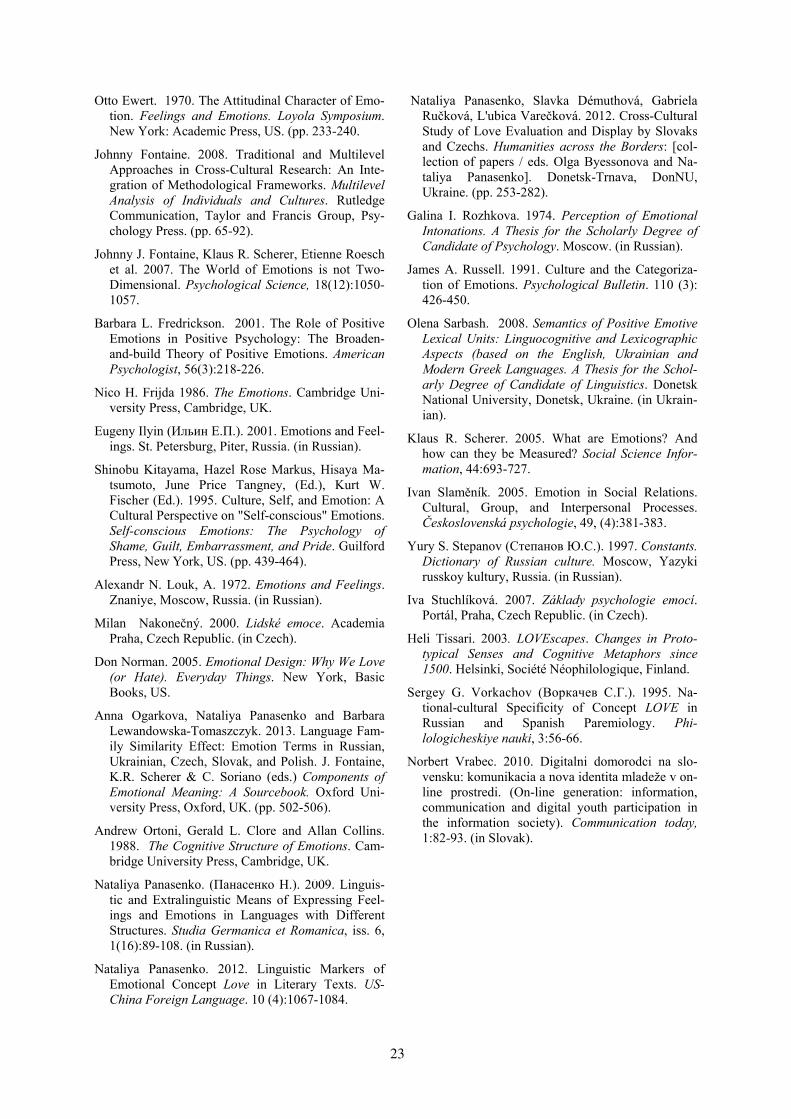
Otto Ewert. 1970. The Attitudinal Character of Emo-tion. Feelings and Emotions. Loyola Symposium. New York: Academic Press, US. (pp. 233-240.
Johnny Fontaine. 2008. Traditional and Multilevel Approaches in Cross-Cultural Research: An Inte-gration of Methodological Frameworks. Multilevel Analysis of Individuals and Cultures. Rutledge Communication, Taylor and Francis Group, Psy-chology Press. (pp. 65-92).
Johnny J. Fontaine, Klaus R. Scherer, Etienne Roesch et al. 2007. The World of Emotions is not Two-Dimensional. Psychological Science, 18(12):1050-1057.
Barbara L. Fredrickson. 2001. The Role of Positive Emotions in Positive Psychology: The Broaden-and-build Theory of Positive Emotions. American Psychologist, 56(3):218-226.
Nico H. Frijda 1986. The Emotions. Cambridge Uni-versity Press, Cambridge, UK.
Eugeny Ilyin (Ильин Е.П.). 2001. Emotions and Feel-ings. St. Petersburg, Piter, Russia. (in Russian).
Shinobu Kitayama, Hazel Rose Markus, Hisaya Ma-tsumoto, June Price Tangney, (Ed.), Kurt W. Fischer (Ed.). 1995. Culture, Self, and Emotion: A Cultural Perspective on "Self-conscious" Emotions. Self-conscious Emotions: The Psychology of Shame, Guilt, Embarrassment, and Pride. Guilford Press, New York, US. (pp. 439-464).
Alexandr N. Louk, А. 1972. Emotions and Feelings. Znaniye, Moscow, Russia. (in Russian).
Milan Nakonečný. 2000. Lidské emoce. Academia Praha, Czech Republic. (in Czech).
Don Norman. 2005. Emotional Design: Why We Love (or Hate). Everyday Things. New York, Basic Books, US.
Anna Ogarkova, Nataliya Panasenko and Barbara Lewandowska-Tomaszczyk. 2013. Language Fam-ily Similarity Effect: Emotion Terms in Russian, Ukrainian, Czech, Slovak, and Polish. J. Fontaine, K.R. Scherer & C. Soriano (eds.) Components of Emotional Meaning: A Sourcebook. Oxford Uni-versity Press, Oxford, UK. (pp. 502-506).
Andrew Оrtoni, Gerald L. Clore and Allan Collins. 1988. The Cognitive Structure of Emotions. Cam-bridge University Press, Cambridge, UK.
Nataliya Panasenko. (Панасенко Н.). 2009. Linguis-tic and Extralinguistic Means of Expressing Feel-ings and Emotions in Languages with Different Structures. Studia Germanica et Romanica, iss. 6, 1(16):89-108. (in Russian).
Nataliya Panasenko. 2012. Linguistic Markers of Emotional Concept Love in Literary Texts. US-China Foreign Language. 10 (4):1067-1084.
Nataliya Panasenko, Slavka Démuthová, Gabriela Ručková, L'ubica Varečková. 2012. Cross-Cultural Study of Love Evaluation and Display by Slovaks and Czechs. Humanities across the Borders: [col-lection of papers / eds. Olga Byessonova and Na-taliya Panasenko]. Donetsk-Trnava, DonNU, Ukraine. (pp. 253-282).
Galina I. Rozhkova. 1974. Perception of Emotional Intonations. A Thesis for the Scholarly Degree of Candidate of Psychology. Moscow. (in Russian).
James A. Russell. 1991. Culture and the Categoriza-tion of Emotions. Psychological Bulletin. 110 (3): 426-450.
Olena Sarbash. 2008. Semantics of Positive Emotive Lexical Units: Linguocognitive and Lexicographic Aspects (based on the English, Ukrainian and Modern Greek Languages. A Thesis for the Schol-arly Degree of Candidate of Linguistics. Donetsk National University, Donetsk, Ukraine. (in Ukrain-ian).
Klaus R. Scherer. 2005. What are Emotions? And how can they be Measured? Social Science Infor-mation, 44:693-727.
Ivan Slaměník. 2005. Emotion in Social Relations. Cultural, Group, and Interpersonal Processes. Československá psychologie, 49, (4):381-383.
Yury S. Stepanov (Степанов Ю.С.). 1997. Constants. Dictionary of Russian culture. Moscow, Yazyki russkoy kultury, Russia. (in Russian).
Iva Stuchlíková. 2007. Základy psychologie emocí. Portál, Praha, Czech Republic. (in Czech).
Heli Tissari. 2003. LOVEscapes. Changes in Proto-typical Senses and Cognitive Metaphors since 1500. Helsinki, Société Néophilologique, Finland.
Sergey G. Vorkachov (Воркачев С.Г.). 1995. Na-tional-cultural Specificity of Concept LOVE in Russian and Spanish Paremiology. Phi-lologicheskiye nauki, 3:56-66.
Norbert Vrabec. 2010. Digitalni domorodci na slo-vensku: komunikacia a nova identita mladeže v on-line prostredi. (On-line generation: information, communication and digital youth participation in the information society). Communication today, 1:82-93. (in Slovak).
23
Proceedings of the 3rd Workshop on Sentiment Analysis where AI meets Psychology (SAAIP 2013), IJCNLP 2013, pages 24–28,Nagoya, Japan, October 14, 2013.
Automatic Music Mood Classification of Hindi Songs
Braja Gopal Patra
Dept. of Computer Science & Engineering,
Jadavpur University, Kolkata, India [email protected]
Dipankar Das
Dept. of Computer Science & Engineering,
NIT Meghalaya, India
Sivaji Bandyopadhyay
Dept. of Computer Science & Engineering,
Jadavpur University, Kolkata, India [email protected]
Abstract
The popularity of internet, downloading and
purchasing music from online music shops are
growing dramatically. As an intimate relation-
ship presents between music and human emo-
tions, we often choose to listen a song that
suits our mood at that instant. Thus, the auto-
matic methods are needed to classify music by
moods even from the uploaded music files in
social networks. However, several studies on
Music Information Retrieval (MIR) have been
carried out in recent decades. In the present
task, we have built a system for classifying
moods of Hindi songs using different audio re-
lated features like rhythm, timber and intensi-
ty. Our dataset is composed of 230 Hindi mu-
sic clips of 30 seconds that consist of five
mood clusters. We have achieved an average
accuracy of 51.56% for music mood classifica-
tion on the above data.
1 Introduction
Music, also referred as the “language of emo-
tion” can be categorized in terms of its emotional
associations (Kim et al., 2010). Music perception
is highly intertwined with both emotion and the
context (Bischoff et al., 2009). Due to explosive
growth of information and multimedia technolo-
gies, digital music has become widely available
in different forms of digital format. Thus, the
management and retrieval of such music is nec-
essary for accessing music according to their
meanings in respective songs. Nowadays, people
are more interested in creating music library
which allows the accessing of songs in accord-
ance with the music moods rather than their title,
artists and or genre. Thus, classifying and re-
trieving music with respect to emotions has be-
come an emerging research area.
The emotional meaning of the music is subjec-
tive and it depends upon many factors including
culture (Lu et al., 2006). Moreover, the mood
category of a song varies depending upon several
psychological conditions of the Human Beings.
Representations of music mood with the psy-
chology remain an active topic for research.
Apart from such challenges, there are several
computational models available for mood classi-
fication. On the other hand, the collection of the
“ground truth” data is still an open challenge. A
variety of efforts have been made towards the
collecting labeled data such as listeners’ survey,
social tags, and data collection games (Kim et
al., 2010).
In our present work, we have developed an au-
tomatic mood classifier for Hindi music. Hindi is
the national language of India. Hindi songs are
one of the popular categories of Indian songs and
are present in Bollywood movies. Hindi songs
make up 72% of the music sales in India1. Main-
ly, we have concentrated on the collection of
Hindi music data annotated with five mood clas-
ses2. Then, a computational model has been de-
veloped to identify the moods of songs using
several high and low level audio features. We
have employed the decision tree classifier (J48)
and achieved 51.56% of reasonable accuracy on
a data set of 230 songs of five mood clusters.
1 http://en.wikipedia.org/wiki/Music_of_India
2 The term class and cluster are used interchangeably
in this paper.
24
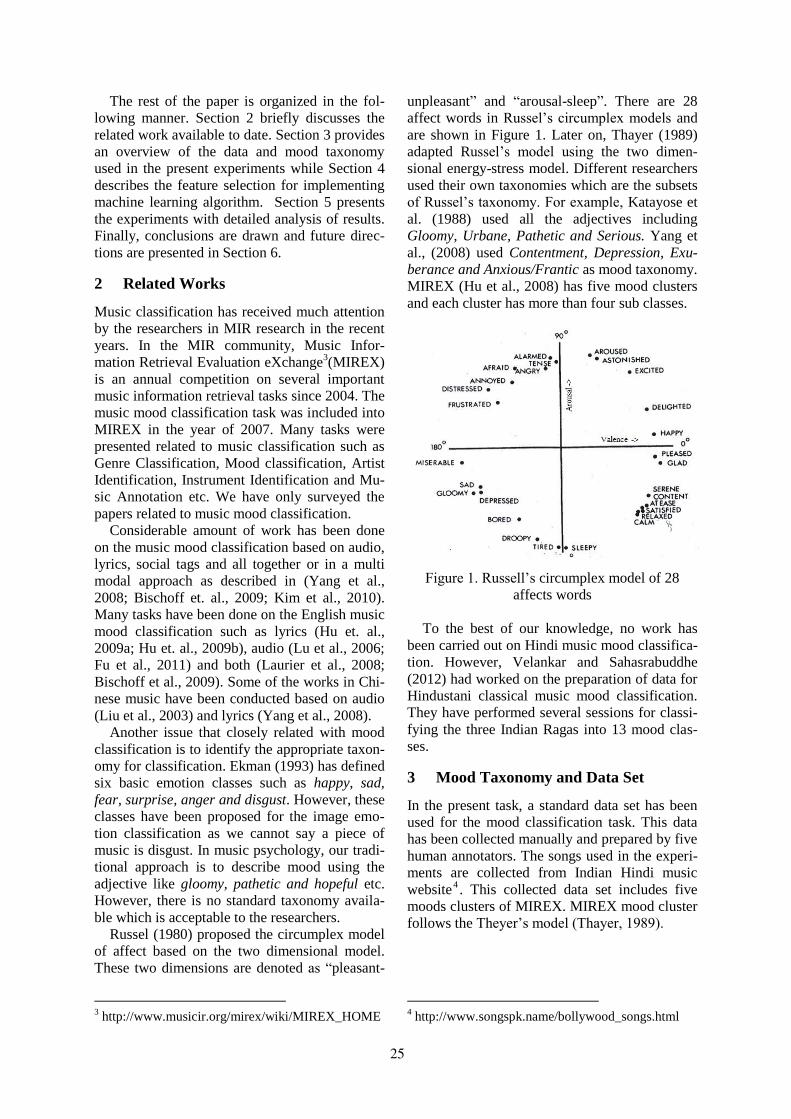
The rest of the paper is organized in the fol-
lowing manner. Section 2 briefly discusses the
related work available to date. Section 3 provides
an overview of the data and mood taxonomy
used in the present experiments while Section 4
describes the feature selection for implementing
machine learning algorithm. Section 5 presents
the experiments with detailed analysis of results.
Finally, conclusions are drawn and future direc-
tions are presented in Section 6.
2 Related Works
Music classification has received much attention
by the researchers in MIR research in the recent
years. In the MIR community, Music Infor-
mation Retrieval Evaluation eXchange3(MIREX)
is an annual competition on several important
music information retrieval tasks since 2004. The
music mood classification task was included into
MIREX in the year of 2007. Many tasks were
presented related to music classification such as
Genre Classification, Mood classification, Artist
Identification, Instrument Identification and Mu-
sic Annotation etc. We have only surveyed the
papers related to music mood classification.
Considerable amount of work has been done
on the music mood classification based on audio,
lyrics, social tags and all together or in a multi
modal approach as described in (Yang et al.,
2008; Bischoff et. al., 2009; Kim et al., 2010).
Many tasks have been done on the English music
mood classification such as lyrics (Hu et. al.,
2009a; Hu et. al., 2009b), audio (Lu et al., 2006;
Fu et al., 2011) and both (Laurier et al., 2008;
Bischoff et al., 2009). Some of the works in Chi-
nese music have been conducted based on audio
(Liu et al., 2003) and lyrics (Yang et al., 2008).
Another issue that closely related with mood
classification is to identify the appropriate taxon-
omy for classification. Ekman (1993) has defined
six basic emotion classes such as happy, sad,
fear, surprise, anger and disgust. However, these
classes have been proposed for the image emo-
tion classification as we cannot say a piece of
music is disgust. In music psychology, our tradi-
tional approach is to describe mood using the
adjective like gloomy, pathetic and hopeful etc.
However, there is no standard taxonomy availa-
ble which is acceptable to the researchers.
Russel (1980) proposed the circumplex model
of affect based on the two dimensional model.
These two dimensions are denoted as “pleasant-
3 http://www.musicir.org/mirex/wiki/MIREX_HOME
unpleasant” and “arousal-sleep”. There are 28
affect words in Russel’s circumplex models and
are shown in Figure 1. Later on, Thayer (1989)
adapted Russel’s model using the two dimen-
sional energy-stress model. Different researchers
used their own taxonomies which are the subsets
of Russel’s taxonomy. For example, Katayose et
al. (1988) used all the adjectives including
Gloomy, Urbane, Pathetic and Serious. Yang et
al., (2008) used Contentment, Depression, Exu-
berance and Anxious/Frantic as mood taxonomy.
MIREX (Hu et al., 2008) has five mood clusters
and each cluster has more than four sub classes.
Figure 1. Russell’s circumplex model of 28
affects words
To the best of our knowledge, no work has
been carried out on Hindi music mood classifica-
tion. However, Velankar and Sahasrabuddhe
(2012) had worked on the preparation of data for
Hindustani classical music mood classification.
They have performed several sessions for classi-
fying the three Indian Ragas into 13 mood clas-
ses.
3 Mood Taxonomy and Data Set
In the present task, a standard data set has been
used for the mood classification task. This data
has been collected manually and prepared by five
human annotators. The songs used in the experi-
ments are collected from Indian Hindi music
website4. This collected data set includes five
moods clusters of MIREX. MIREX mood cluster
follows the Theyer’s model (Thayer, 1989).
4 http://www.songspk.name/bollywood_songs.html
25
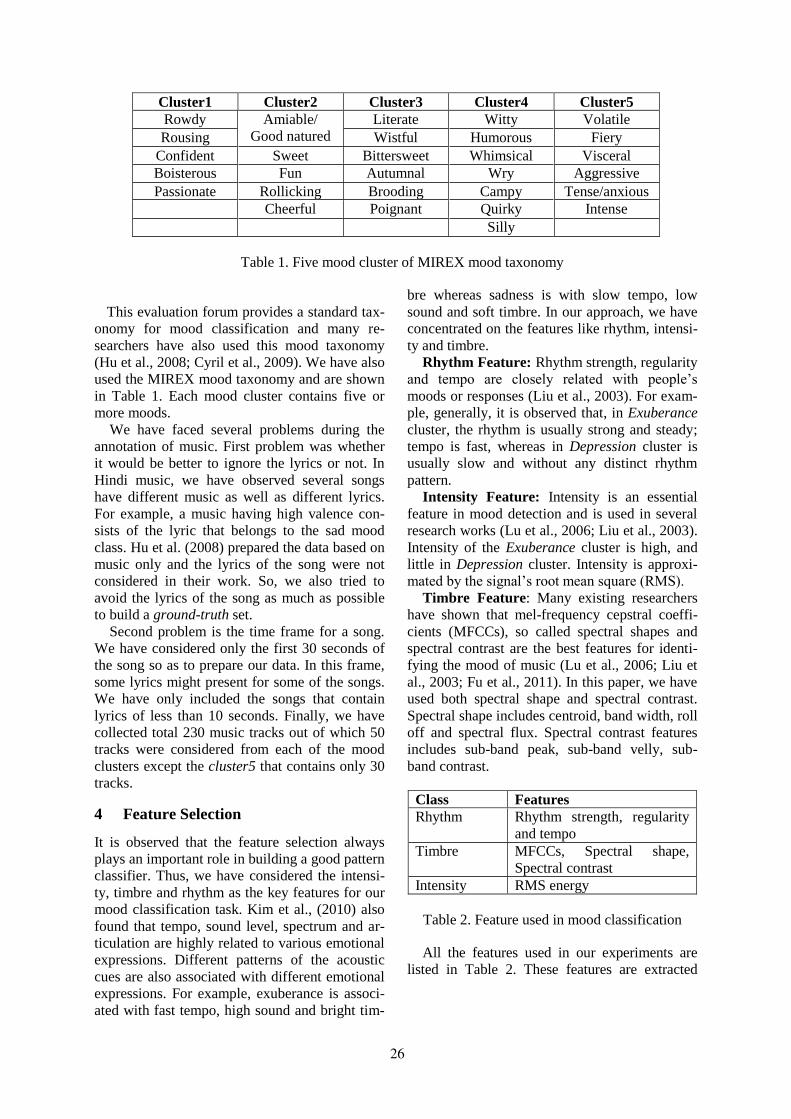
Cluster1 Cluster2 Cluster3 Cluster4 Cluster5
Rowdy Amiable/
Good natured
Literate Witty Volatile
Rousing Wistful Humorous Fiery
Confident Sweet Bittersweet Whimsical Visceral
Boisterous Fun Autumnal Wry Aggressive
Passionate Rollicking Brooding Campy Tense/anxious
Cheerful Poignant Quirky Intense
Silly
Table 1. Five mood cluster of MIREX mood taxonomy
This evaluation forum provides a standard tax-
onomy for mood classification and many re-
searchers have also used this mood taxonomy
(Hu et al., 2008; Cyril et al., 2009). We have also
used the MIREX mood taxonomy and are shown
in Table 1. Each mood cluster contains five or
more moods.
We have faced several problems during the
annotation of music. First problem was whether
it would be better to ignore the lyrics or not. In
Hindi music, we have observed several songs
have different music as well as different lyrics.
For example, a music having high valence con-
sists of the lyric that belongs to the sad mood
class. Hu et al. (2008) prepared the data based on
music only and the lyrics of the song were not
considered in their work. So, we also tried to
avoid the lyrics of the song as much as possible
to build a ground-truth set.
Second problem is the time frame for a song.
We have considered only the first 30 seconds of
the song so as to prepare our data. In this frame,
some lyrics might present for some of the songs.
We have only included the songs that contain
lyrics of less than 10 seconds. Finally, we have
collected total 230 music tracks out of which 50
tracks were considered from each of the mood
clusters except the cluster5 that contains only 30
tracks.
4 Feature Selection
It is observed that the feature selection always
plays an important role in building a good pattern
classifier. Thus, we have considered the intensi-
ty, timbre and rhythm as the key features for our
mood classification task. Kim et al., (2010) also
found that tempo, sound level, spectrum and ar-
ticulation are highly related to various emotional
expressions. Different patterns of the acoustic
cues are also associated with different emotional
expressions. For example, exuberance is associ-
ated with fast tempo, high sound and bright tim-
bre whereas sadness is with slow tempo, low
sound and soft timbre. In our approach, we have
concentrated on the features like rhythm, intensi-
ty and timbre.
Rhythm Feature: Rhythm strength, regularity
and tempo are closely related with people’s
moods or responses (Liu et al., 2003). For exam-
ple, generally, it is observed that, in Exuberance
cluster, the rhythm is usually strong and steady;
tempo is fast, whereas in Depression cluster is
usually slow and without any distinct rhythm
pattern.
Intensity Feature: Intensity is an essential
feature in mood detection and is used in several
research works (Lu et al., 2006; Liu et al., 2003).
Intensity of the Exuberance cluster is high, and
little in Depression cluster. Intensity is approxi-
mated by the signal’s root mean square (RMS).
Timbre Feature: Many existing researchers
have shown that mel-frequency cepstral coeffi-
cients (MFCCs), so called spectral shapes and
spectral contrast are the best features for identi-
fying the mood of music (Lu et al., 2006; Liu et
al., 2003; Fu et al., 2011). In this paper, we have
used both spectral shape and spectral contrast.
Spectral shape includes centroid, band width, roll
off and spectral flux. Spectral contrast features
includes sub-band peak, sub-band velly, sub-
band contrast.
Class Features
Rhythm Rhythm strength, regularity
and tempo
Timbre MFCCs, Spectral shape,
Spectral contrast
Intensity RMS energy
Table 2. Feature used in mood classification
All the features used in our experiments are
listed in Table 2. These features are extracted
26
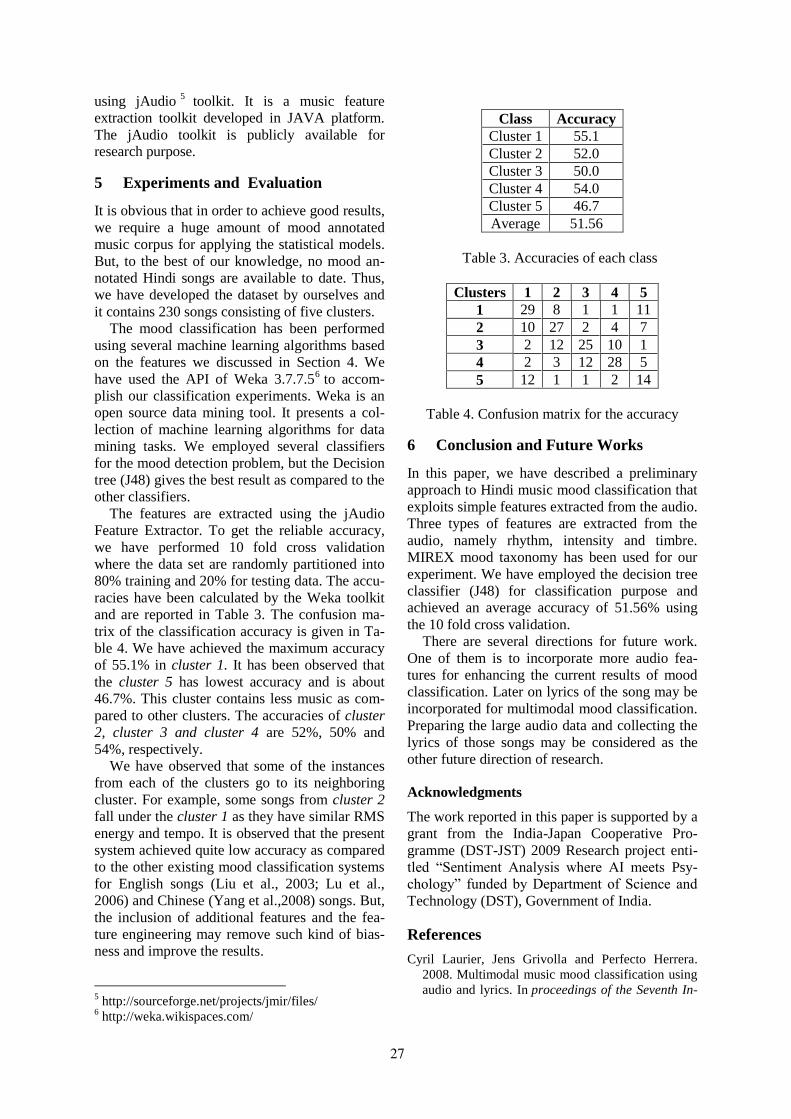
using jAudio5
toolkit. It is a music feature
extraction toolkit developed in JAVA platform.
The jAudio toolkit is publicly available for research purpose.
5 Experiments and Evaluation
It is obvious that in order to achieve good results,
we require a huge amount of mood annotated
music corpus for applying the statistical models.
But, to the best of our knowledge, no mood an-
notated Hindi songs are available to date. Thus,
we have developed the dataset by ourselves and
it contains 230 songs consisting of five clusters.
The mood classification has been performed
using several machine learning algorithms based
on the features we discussed in Section 4. We
have used the API of Weka 3.7.7.56 to accom-
plish our classification experiments. Weka is an
open source data mining tool. It presents a col-
lection of machine learning algorithms for data
mining tasks. We employed several classifiers
for the mood detection problem, but the Decision
tree (J48) gives the best result as compared to the
other classifiers.
The features are extracted using the jAudio
Feature Extractor. To get the reliable accuracy,
we have performed 10 fold cross validation
where the data set are randomly partitioned into
80% training and 20% for testing data. The accu-
racies have been calculated by the Weka toolkit
and are reported in Table 3. The confusion ma-
trix of the classification accuracy is given in Ta-
ble 4. We have achieved the maximum accuracy
of 55.1% in cluster 1. It has been observed that
the cluster 5 has lowest accuracy and is about
46.7%. This cluster contains less music as com-
pared to other clusters. The accuracies of cluster
2, cluster 3 and cluster 4 are 52%, 50% and
54%, respectively.
We have observed that some of the instances
from each of the clusters go to its neighboring
cluster. For example, some songs from cluster 2
fall under the cluster 1 as they have similar RMS
energy and tempo. It is observed that the present
system achieved quite low accuracy as compared
to the other existing mood classification systems
for English songs (Liu et al., 2003; Lu et al.,
2006) and Chinese (Yang et al.,2008) songs. But,
the inclusion of additional features and the fea-
ture engineering may remove such kind of bias-
ness and improve the results.
5 http://sourceforge.net/projects/jmir/files/
6 http://weka.wikispaces.com/
Class Accuracy
Cluster 1 55.1
Cluster 2 52.0
Cluster 3 50.0
Cluster 4 54.0
Cluster 5 46.7
Average 51.56
Table 3. Accuracies of each class
Clusters 1 2 3 4 5
1 29 8 1 1 11
2 10 27 2 4 7
3 2 12 25 10 1
4 2 3 12 28 5
5 12 1 1 2 14
Table 4. Confusion matrix for the accuracy
6 Conclusion and Future Works
In this paper, we have described a preliminary
approach to Hindi music mood classification that
exploits simple features extracted from the audio.
Three types of features are extracted from the
audio, namely rhythm, intensity and timbre.
MIREX mood taxonomy has been used for our
experiment. We have employed the decision tree
classifier (J48) for classification purpose and
achieved an average accuracy of 51.56% using
the 10 fold cross validation.
There are several directions for future work.
One of them is to incorporate more audio fea-
tures for enhancing the current results of mood
classification. Later on lyrics of the song may be
incorporated for multimodal mood classification.
Preparing the large audio data and collecting the
lyrics of those songs may be considered as the
other future direction of research.
Acknowledgments
The work reported in this paper is supported by a
grant from the India-Japan Cooperative Pro-
gramme (DST-JST) 2009 Research project enti-
tled “Sentiment Analysis where AI meets Psy-
chology” funded by Department of Science and
Technology (DST), Government of India.
References
Cyril Laurier, Jens Grivolla and Perfecto Herrera.
2008. Multimodal music mood classification using
audio and lyrics. In proceedings of the Seventh In-
27
ternational Conference on Machine Learning and
Applications (ICMLA'08). pages 688-693. IEEE.
Cyril Laurier, Mohamed Sordo and Perfecto Herrera.
2009. Mood cloud 2.0: Music mood browsing
based on social networks. In Proceedings of the
10th International Society for Music Information
Conference (ISMIR 2009), Kobe, Japan.
Dan Liu, Lie Lu and Hong-Jiang Zhang. 2003. Auto-
matic Mood Detection from Acoustic Music Data.
In proceedings of the International Society for Mu-
sic Information Retrieval Conference (ISMIR
2003).
Haruhiro Katayose, Hasakazu Imai and Seiji Inoku-
chi. 1988. Sentiment extraction in music.
In proceedings of the 9th International Conference
on Pattern Recognition, 1988, pages 1083-1087.
IEEE.
James A. Russell. 1980. A Circumplx Model of Af-
fect. Journal of Personality and Social Psychology,
39(6):1161-1178.
Kerstin Bischoff, Claudiu S. Firan, Raluca Paiu,
Wolfgang Nejdl, Cyril Laurier and Mohamed Sor-
do. 2009. Music Mood and Theme Classification-a
Hybrid Approach. In proceedings of the 10th In-
ternational Society for Music Information Retrieval
Conference (ISMIR 2009), pages 657-662.
Lie Lu, Dan Liu and Hong-Jiang Zhang. 2006. Auto-
matic mood detection and tracking of music audio
signals. IEEE Transactions on Audio, Speech, and
Language Processing, 14(1):5-18.
Makarand R. Velankar and Hari V. Sahasrabuddhe.
2012. A Pilot Study of Hindustani Music Senti-
ments. In Proceedings of 2nd Workshop on Senti-
ment Analysis where AI meets Psychology (COL-
ING-2012). IIT Bombay, Mumbai, India, pages 91-
98.
Paul Ekman. 1993. Facial expression and emotion.
American Psychologist, 48(4):384–392.
Robert E. Thayer. 1989. The Biopsychology of Mood
and Arousal. Oxford University Press, NY.
Soujanya Poria, Alexander Gelbukh, Amir Hussain,
Sivaji Bandyopadhyay and Newton Howard. 2013.
Music Genre Classification: A Semi-supervised
Approach. In Pattern Recognition, Springer Berlin
Heidelberg, pages 254-263.
Xiao Hu, J. Stephen Downie, Cyril Laurier, Mert Bay
and Andreas F. Ehmann. 2008. The 2007 MIREX
Audio Mood Classification Task: Lessons Learned.
In proceedings of the 9th International Society for
Music Information Retrieval Conference (ISMIR
2008), pages 462-467.
Xiao Hu, Stephen J. Downie and Andreas F. Eh-
mann. 2009a. Lyric text mining in music mood
classification. In proceedings of 10th International
Society for Music Information Retrieval Confer-
ence (ISMIR 2009), pages 411-416.
Yajie Hu, Xiaoou Chen and Deshun Yang. 2009b.
Lyric-based Song Emotion Detection with Affec-
tive Lexicon and Fuzzy Clustering Method. In pro-
ceedings of the 10th International Society for Mu-
sic Information Retrieval Conference (ISMIR
2009), pages 123-128.
Yi-Hsuan Yang, Chia-Chu Liu and Homer H. Chen-
Yang. 2006. Music emotion classification: a fuzzy
approach. In Proceedings of the 14th annual ACM
international conference on Multimedia, pages 81-
84. ACM.
Yi-Hsuan Yang, Yu-Ching Lin, Heng-Tze Cheng, I-
Bin Liao, Yeh-Chin Ho and Homer H. Chen. 2008.
Toward multi-modal music emotion classification.
In proceedings of the Advances in Multimedia In-
formation Processing (PCM-2008). Springer, Ber-
lin Heidelberg, pages 70-79.
Youngmoo E. Kim, Erik M. Schmidt, Raymond Mi-
gneco, Brandon G. Morton, Patrick Richardson,
Jeffrey Scott, Jacquelin A. Speck and Douglas
Turnbull. 2010. Music emotion recognition: A state
of the art review. In proceedings of 11th Interna-
tional Society for Music Information Retrieval
Conference (ISMIR 2010), pages 255-266.
Zhouyu Fu, Guojun Lu, Kai Ming Ting and
Dengsheng Zhang. 2011. A survey of audio-based
music classification and annotation. IEEE Transac-
tions on Multimedia, 13(2): 303-319.
28
Author Index
Bandyopadhyay, Sivaji, 24
Das, Dipankar, 24
Hajic, jr., Jan, 1Hattori, Keigo, 6
Magál, Slavomír, 15Masuichi, Hiroshi, 6Miura, Yasuhide, 6
Ohkuma, Tomoko, 6
Panasenko, Nataliya, 15Patra, Braja Gopal, 24Petranová, Dana, 15
Trnka, Andrej, 15
Veselovská, Katerina, 1
29


