Embed Size (px)
Citation preview

Preliminary Analyses of Tympanic-Membrane Motion fromHolographic Measurements
C. Furlong*, J. J. Rosowski†,‡, N. Hulli*, and M. E. Ravicz†*Mechanical Engineering Department, Worcester Polytechnic Institute, Worcester, MA, USA†Eaton-Peabody Laboratory, Department of Otolaryngology, Mass. Eye & Ear Infirmary, Boston,MA, USA‡Harvard-M.I.T. Division of Health Sciences and Technology, Cambridge, MA, USA
AbstractComputer-aided, personal computer (PC) based, optoelectronic holography (OEH) was used toobtain preliminary measurements of the sound-induced displacement of the tympanic membrane(TM) of cadaver cats and chinchillas. Real-time time-averaged holograms, processed at video rates,were used to characterise the frequency dependence of TM displacements as tone frequency wasswept from 400 Hz to 20 kHz. Stroboscopic holography was used at selected frequencies to measure,in full-field-of-view, displacements of the TM surface with nanometer resolution. Thesemeasurements enable the determination and the characterisation of inward and outwarddisplacements of the TM. The time-averaged holographic data suggest standing wave patterns on thecat’s TM surface, which move from simple uni-modal or bi-modal patterns at low frequencies,through complicated multimodal patterns above 3 kHz, to highly ordered arrangements ofdisplacement waves with tone frequencies above 15 kHz. The frequency boundaries of the differentwave patterns are lower in chinchilla (simple patterns below 600 Hz, ordered patterns above 4 kHz)than cat. The stroboscopic holography measurements indicate wave-like motion patterns on the TMsurface, where the number of wavelengths captured along sections of the TM increased with stimulusfrequency with as many as 11 wavelengths visible on the chinchilla TM at 16 kHz. Counts of thevisible number of wavelengths on TM sections with different sound stimulus frequency providedestimates of wave velocity along the TM surface that ranged from 5 m s−1 at frequencies below 8kHz and increased to 25 m s−1 by 20 kHz.
Keywordsholographic measurements; middle-ear mechanics; nondestructive testing; shape and deformationmeasurements; tympanic membrane
IntroductionThe tympanic membrane (TM) is the initial structure involved in the middle-ear’s acousto-mechanical transformation of environmental sounds to sound pressure and velocity within theinner ear. While some basic facts are known about the mechanics of the healthy TM at lowfrequencies, there are still many unresolved issues: e.g. the effect of TM shape and pathologyon function, the effect of large differences in TM mechanical properties across species, thenature of TM function at higher frequencies, and the hypothesised presence of standing ortravelling surface waves on the surface of the TM [1].
Many of these issues can be addressed by measuring the motion of the entire TM surface inresponse to sound. Most of the few extant measurements of TM motion were obtained with
NIH Public AccessAuthor ManuscriptStrain. Author manuscript; available in PMC 2010 June 1.
Published in final edited form as:Strain. 2009 June 1; 45(3): 301–309. doi:10.1111/j.1475-1305.2008.00490.x.
NIH
-PA Author Manuscript
NIH
-PA Author Manuscript
NIH
-PA Author Manuscript
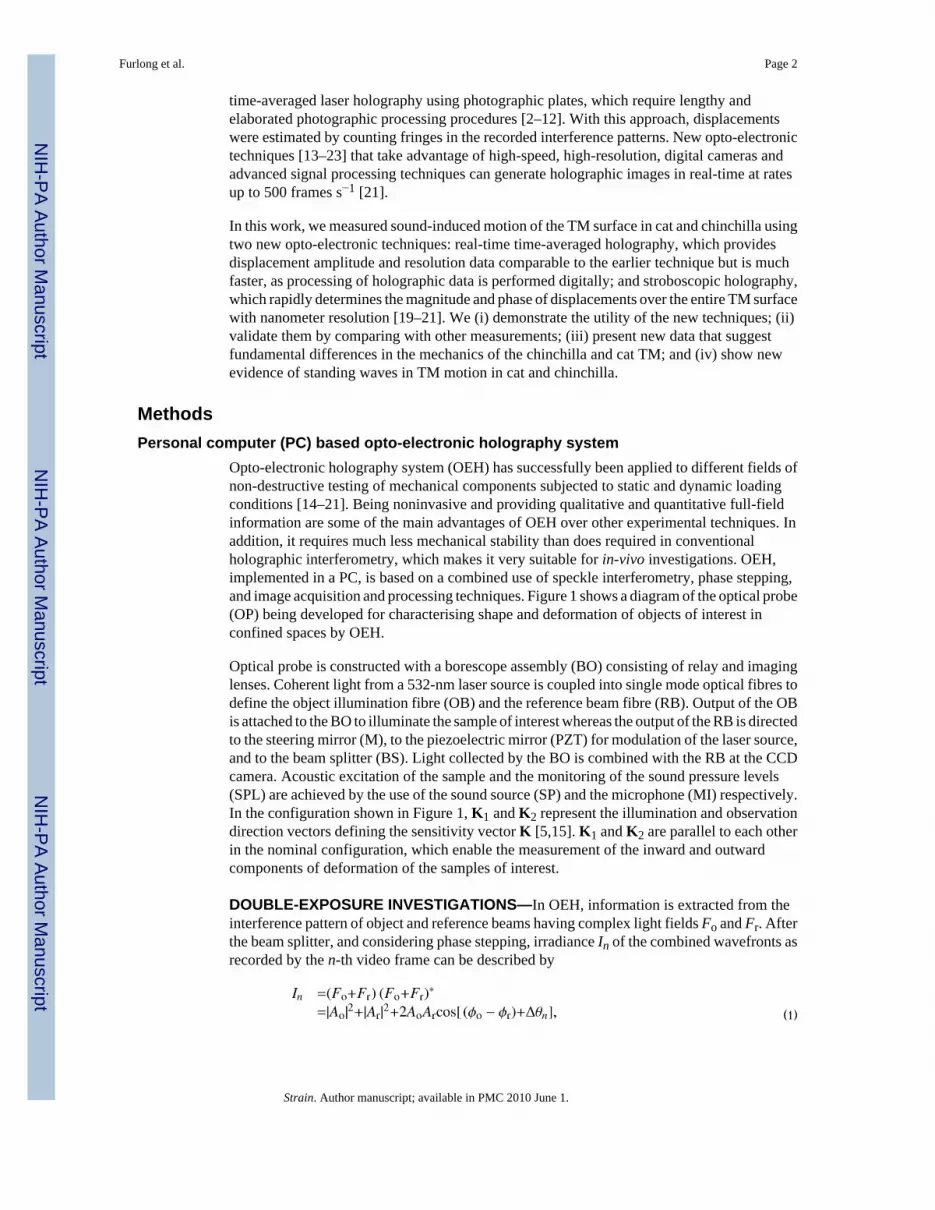
time-averaged laser holography using photographic plates, which require lengthy andelaborated photographic processing procedures [2–12]. With this approach, displacementswere estimated by counting fringes in the recorded interference patterns. New opto-electronictechniques [13–23] that take advantage of high-speed, high-resolution, digital cameras andadvanced signal processing techniques can generate holographic images in real-time at ratesup to 500 frames s−1 [21].
In this work, we measured sound-induced motion of the TM surface in cat and chinchilla usingtwo new opto-electronic techniques: real-time time-averaged holography, which providesdisplacement amplitude and resolution data comparable to the earlier technique but is muchfaster, as processing of holographic data is performed digitally; and stroboscopic holography,which rapidly determines the magnitude and phase of displacements over the entire TM surfacewith nanometer resolution [19–21]. We (i) demonstrate the utility of the new techniques; (ii)validate them by comparing with other measurements; (iii) present new data that suggestfundamental differences in the mechanics of the chinchilla and cat TM; and (iv) show newevidence of standing waves in TM motion in cat and chinchilla.
MethodsPersonal computer (PC) based opto-electronic holography system
Opto-electronic holography system (OEH) has successfully been applied to different fields ofnon-destructive testing of mechanical components subjected to static and dynamic loadingconditions [14–21]. Being noninvasive and providing qualitative and quantitative full-fieldinformation are some of the main advantages of OEH over other experimental techniques. Inaddition, it requires much less mechanical stability than does required in conventionalholographic interferometry, which makes it very suitable for in-vivo investigations. OEH,implemented in a PC, is based on a combined use of speckle interferometry, phase stepping,and image acquisition and processing techniques. Figure 1 shows a diagram of the optical probe(OP) being developed for characterising shape and deformation of objects of interest inconfined spaces by OEH.
Optical probe is constructed with a borescope assembly (BO) consisting of relay and imaginglenses. Coherent light from a 532-nm laser source is coupled into single mode optical fibres todefine the object illumination fibre (OB) and the reference beam fibre (RB). Output of the OBis attached to the BO to illuminate the sample of interest whereas the output of the RB is directedto the steering mirror (M), to the piezoelectric mirror (PZT) for modulation of the laser source,and to the beam splitter (BS). Light collected by the BO is combined with the RB at the CCDcamera. Acoustic excitation of the sample and the monitoring of the sound pressure levels(SPL) are achieved by the use of the sound source (SP) and the microphone (MI) respectively.In the configuration shown in Figure 1, K1 and K2 represent the illumination and observationdirection vectors defining the sensitivity vector K [5,15]. K1 and K2 are parallel to each otherin the nominal configuration, which enable the measurement of the inward and outwardcomponents of deformation of the samples of interest.
DOUBLE-EXPOSURE INVESTIGATIONS—In OEH, information is extracted from theinterference pattern of object and reference beams having complex light fields Fo and Fr. Afterthe beam splitter, and considering phase stepping, irradiance In of the combined wavefronts asrecorded by the n-th video frame can be described by
(1)
Furlong et al. Page 2
Strain. Author manuscript; available in PMC 2010 June 1.
NIH
-PA Author Manuscript
NIH
-PA Author Manuscript
NIH
-PA Author Manuscript

where Ao and Ar are the amplitudes of the object and reference beams, ϕo the randomly varyingphase of the object beam, ϕr the phase of the reference beam and Δθ the known phase stepintroduced between the frames [14–21]. To facilitate double-exposure investigations, theargument of the periodic term of Equation (1) is modified to include the phase change becauseof deformations of the object of interest subjected to specific loading and boundary conditions.This phase change is characterised by the fringe-locus function Ω, whose constant values definefringe loci on the surface of the object as
(2)
where n(x,y) is the interferometric fringe order at the (x,y) location in the image space, K thesensitivity vector, and L the displacement vector [5,15]. Therefore, the irradiance from adeformed object is described by
(3)
where Δϕ = ϕo − ϕr, and Io and Ir represent the intensities of the object and reference beamsrespectively. In Equation (3), Io is assumed to remain constant and the (x,y) arguments wereomitted for clarity. As it is Ω, which carries information pertaining to mechanical displacementsand/or deformations, the OEH’s video processing algorithm eliminates Δϕ from the argumentof the periodic function of the irradiance distributions, given in Equations (1) and (3), yieldingan image which is intensity modulated by a periodic function with Ω as the argument [14–21].
The OEH operates in either display or data mode. In display mode, interference patterns areobserved at video rate speed and are modulated by a cosinusoidal function of the form
(4)
which is obtained by performing specific mathematical operations between frames acquired atthe undeformed and deformed states, described by Equations (1) and (3) respectively [14–21]. This mode is used for adjusting the OEH system and for qualitative investigations. Datamode is used for performing quantitative investigations. In the data mode, two images aregenerated: a cosinusoidal image
(5)
and a sinusoidal image
(6)
which are processed simultaneously to produce quantitative results by computing anddisplaying at video rates [21]
(7)
Furlong et al. Page 3
Strain. Author manuscript; available in PMC 2010 June 1.
NIH
-PA Author Manuscript
NIH
-PA Author Manuscript
NIH
-PA Author Manuscript
Because of the discontinuous nature of Equation (7), recovery of the continuous spatial phasedistributions Ω(x,y) requires the application of phase unwrapping algorithms [17, 18, 21]. Inthe measurements presented in this article, the double-exposure mode of the OEH was usedfor quantitative stroboscopic measurements [20, 21].
TIME-AVERAGED INVESTIGATIONS—For performing time-averaged investigations, ormodal analysis of objects of interest, using the OEH, it is necessary to take into considerationa time varying fringe-locus function Ωt (x,y,t), which is related to periodic motion of the objectunder investigation [5,14–21]. Using Equation (3), it is possible to write
(8)
As the CCD camera registers average intensity at the video rate characterised by the periodΔt, the intensity that is observed is
(9)
and using phase stepping, the resultant intensity distribution for the nth frame is of the form
(10)
where M [Ωt (x, y)] is known as the characteristic function determined by the temporal motionof the object. For the case of sinusoidal vibrations with the period much shorter than the videoframing time
(11)
where Jo [Ωt (x, y)] is the zero order Bessel function of the first kind [5,15]. Equation (10)contains four unknowns: irradiances Io and Ir, phase difference Δϕ, and the fringe-locusfunction Ωt (x,y). The OEH’s video frame processing algorithm eliminates Δϕ from theargument of the irradiance function given by Equation (10), using a set of equations obtainedat a specific step size value of Δθ [14–21].
For time-averaged investigations, the OEH can work in either display or data modes. In thedisplay mode, interference patterns are observed at video rate and are modulated by a functionof the form
(12)
This mode is used for adjusting the OEH system and for qualitative investigations. The datamode [15–17] is used for performing quantitative investigations. In the data mode, additionalimages of the form
Furlong et al. Page 4
Strain. Author manuscript; available in PMC 2010 June 1.
NIH
-PA Author Manuscript
NIH
-PA Author Manuscript
NIH
-PA Author Manuscript

(13)
are generated for quantitative processing and extraction of Ωt [15,20].
Preparation of tympanic membraneThe heads of a cat and two chinchillas used in other physiological experiments were harvestedfrom dead animals. The bilateral bullae were exposed and the bullar walls partially removedto expose the tympanic cavity. The cartilaginous ear canals were resected, and the bony externalauditory canals were drilled away until at least 90% of the TM surface was visible. To enhancediffuse reflection, the TM was painted with a thin layer of white-ink (minimum effects on thedynamics of the TM were observed, as verified with OEH an laser Doppler vibrometry [24,25]). The head was oriented in the object beam of the OEH system with the surface of the TMperpendicular to the beam. The reflected object beam was focused with the optical probe (OP)of the OEH and a glass-backed sound coupler was placed over the TM. Acoustic excitation ofthe TM was provided by the Beyer DT 48 sound source (SP) and the probe-tube microphone(MI) was integrated into the coupler.
Measurement of the Dynamics of TM—To characterise the dynamics and deformationsof the TM, the following procedures were used.
1. Time-averaged holography was applied first in order to identify fundamental naturalfrequencies of vibration and corresponding mode shapes. This was achieved byramping the excitation frequency and amplitude through ranges of interest with theOEH system providing holographic imaging data at video rates >30 Hz.
2. After identification of fundamental frequencies and excitation levels, double-exposure holographic measurements were performed. For a selected fundamentalfrequency and an excitation level of interest, stroboscopic illumination to measureoptical phase between two stimulus phases was applied. Measured optical phase,described by Equation (7), was unwrapped and nanometer scaled deformationsdetermined by the application of Equation (2) while taking into consideration parallelillumination–observation conditions, as obtained by the geometry of the OEH setupand defined by the sensitivity vector K.
Time-averaged holography: iso-displacement contours in cat and chinchilla, 400 Hz to 19kHz
Time-averaged holograms that describe the sound-induced displacements of the TM of cat andchinchilla are shown in Figure 2 at selected frequencies and sound levels. Increasingdisplacements are indicated by the corresponding fringe densities. At low frequencies, the TMdisplacement patterns in cat and chinchilla are simple, as shown in Figure 2A. Thesedisplacements are characterised by one or two regions of maximal displacement.
At intermediate frequencies, the TM displacement patterns are complex, as shown in Figure2B. These displacements are characterised by multiple regions of maximal displacementseparated by areas of small displacement. In cat, the transition from simple to complex occursnear 3000 Hz; in chinchilla, at a much lower frequency, near 600 Hz. The simple and complexdisplacement patterns in cat are similar to those reported previously [2, 8].
At high frequencies, the TM displacement patterns show an ordered arrangement, as shownin Figure 2C. These displacements are characterised by many regions of maximal displacement,which appear arranged in concentric rings surrounding the manubrium. Radial patterns of rays
Furlong et al. Page 5
Strain. Author manuscript; available in PMC 2010 June 1.
NIH
-PA Author Manuscript
NIH
-PA Author Manuscript
NIH
-PA Author Manuscript

can also be seen, especially in chinchilla. In cat, the transition from complex to ordered occursnear 15 000 Hz; in chinchilla, at a much lower frequency, near 4000 Hz. The ordered patternsof rings and rays in these time-averaged holograms are indicative of standing waves on theTM, see Evidence for standing waves on the TM.
Stroboscopic holography: subfringe displacements in cat and chinchilla – complex andordered displacement patterns
Double-exposure holography with stroboscopic illumination was used to measuredisplacements of TM with nanometer resolution. This method enables distinction betweeninward motions and outward motions. Figure 3 and Figure 4 show the difference in TMdisplacement between the condensation and rare-faction phases for selected sound stimuli.
The difference in cat TM displacement between the two stimulus phases at 8776 Hz is shownin Figure 3. Multiple positive and negative maxima are apparent across the TM – a complexdisplacement pattern. Figure 3 demonstrates that regions on the TM undergo motions withdirections that are opposite to the direction of motion of the manubrium (shown around barmarkers). The peak-to-peak surface displacement is on the order of 350 nm. The biphasic spatialvariations shown in Figure 3 are similar to those reported by others [22,23,26]. The significanceof these observations is yet to be understood.
The difference in chinchilla TM displacement between two stimulus phases at 15 700 Hz isshown in Figure 4 – an ordered displacement pattern. The circumferential arrangement ofdisplacement maxima rings is clear in this example, while the rays are less clear. Thecircumferential maxima are arranged such that rings of peak positive displacements alternatewith rings of peak negative displacements. The patterns are somewhat blurred ventral to theumbo, where a significant positive displacement maximum is surrounded by an arc of negativedisplacement maxima. Along the horizontal line (8 mm distance) there are >11 cycles ofdisplacement, as seen in Figure 4. The peak-to-peak surface displacement along this horizontalline is on the order of 50 nm.
Automatic mask generationAn important issue in the quantitative analysis of holographic data is to recognise regions ofa holographic image that correspond to the moving surface of the TM, where that surface islimited by anatomical constraints (e.g. the size of the TM), and by methodological constraints(e.g. the view of the membrane through the OP as well as the degree of removal of surroundingbone).
Algorithms have been developed to quantify: (i) the amount of displacement above backgroundnoise in an image; (ii) regularities in the gradient of measured displacement; and (iii) localcorrelations in the coherence of the reflected signal (i.e. intensity modulation). A weighted sumof these extracted features was tested to automatically generate a mask of the moving surfaceof the chinchilla TM produced by a 2800 Hz, 94 dB SPL stimulus, shown in Figure 5A. Dueto the irregular TM boundary, island-filling and spatial smoothing algorithms were applied toproduce the mask shown in Figure 5B [27].
The effects of variation in the estimate of the masked area on the determination of volumedisplacement were quantified by obtaining the volume displacement of the masked area beforeand after increasing and decreasing the masked area. Small increases or reductions in themasked area produced proportional changes in the estimated volume displacement, such thata change in the masked area of 10% produced a similar percentage change in the estimate ofTM volume displacement.
Furlong et al. Page 6
Strain. Author manuscript; available in PMC 2010 June 1.
NIH
-PA Author Manuscript
NIH
-PA Author Manuscript
NIH
-PA Author Manuscript
DiscussionComparison of TM displacements in cat and chinchilla
Differences in TM motion were observed between cat and chinchilla, perhaps related to thefact that the TM in chinchilla is anatomically larger and rounder than in cat. Chinchilla TMdisplacement patterns change from simple to complex to ordered at lower frequencies than incat, as shown in Figure 2. The chinchilla TM and umbo deform more than cat for a given soundlevel, indicating a greater compliance and a greater response to sound. Umbo displacementscomputed from cat and chinchilla holograms are consistent with previous single-pointmeasurements [22,24,25,28].
Evidence for standing waves on the TMThe circumferential ring pattern of displacement maxima in Figure 2 and Figure 4 is consistentwith the presence of standing waves on the TM surface. (Any travelling wave-like displacementis averaged out of Figure 2.) Standing waves may result from the interaction of surface wavesmoving inward from the tympanic ring toward the umbo and outward toward the tympanicring (possibly reflected at the umbo). The wave speed cw can be computed from the stimulusfrequency f and the spatial separation of the displacement maxima (the distance between + and− magnitude maxima in the stroboscopic measurements) x with
(14)
Figure 6A shows displacement maxima separation in a chinchilla ear determined fromholograms at various frequencies; Figure 6B shows the wave velocity computed from Figure6A. The computed wave speeds are 5–25 m s−1, within the range computed by Fay et al.[26]. The corresponding delay associated with the 4 mm distance between tympanic ring andumbo varies from 800 µs at low frequencies to 160 µs at high frequencies. These delays are4–20 times larger than the 0.040 ms middle-ear transmission delays observed in gerbil [29,30] or predicted for wave motion along the TM of cat [1].
Summary and Future Works—We are developing a PC based OEH system to obtainmeasurements of dynamically induced, nanometer scale deformations in the TM. The OEHsystem, operated in time-averaged and double-exposure modes, has been used to obtainpreliminary measurements of TM behaviour in two species in-vitro. Namely, time-averagedholography has been used to determine modal characteristics of the TM in cat and chinchilla,while double-exposure stroboscopic holography has been applied to obtain quantitative full-field-of-view measurements of deformations with nanometer resolution. The results obtainedare consistent with measurements reported previously [2,8,23] and have been extended, for thefirst time, to cover higher frequencies and amplitudes of excitation.
Preliminary measurements, to be expanded and validated by future investigations, indicate thatTM displacements progress from simple to complex to ordered patterns as excitation frequencyincreases. The difference in TM displacement pattern transition frequencies between cat andchinchilla is consistent with differences in TM mechanical properties. In addition, the time-averaged and double-exposure stroboscopic measurements in both cat and chinchilla suggeststanding waves on the TM at frequencies above 1–4 kHz.
It is stressed that the preliminary measurements presented in this paper were performed tovalidate and demonstrate the applicability of our, currently under development, OEH system.Measurements, as presented, have already shown behaviour of the TM that had not beenobserved and quantified previously, specially at high audible frequencies.
Furlong et al. Page 7
Strain. Author manuscript; available in PMC 2010 June 1.
NIH
-PA Author Manuscript
NIH
-PA Author Manuscript
NIH
-PA Author Manuscript

Our developments will continue with the miniaturisation of the OEH system and its opticalprobe. These developments will follow by the application of this new system to test,characterise, and diagnose human TM. Challenges that are expected range from investigationson the fundamentals of laser-to-tissue interaction (to determine optimal characteristics of thelaser to use in TM), to improve and develop high-speed digital holographic algorithms (toacquire sufficient holographic data with a minimum number of images in order to account forvariations in boundary conditions imposed by physiological changes in live samples), toincorporation of new MEMS and MOEMS systems (to enable the realisation of a miniaturisedoptical probe that is suitable for use in a medical environment.) Furthermore, the OEH systemand its optical probe will be used to attempt answering fundamental questions related to middle-ear mechanics; for instance, the effects of shape and function of the TM across different species,the effects of middle-ear modifications in hearing capabilities, the effects of perforations in theTM, the determination of mechanical properties of the TM and the definition and validationof physical and mechanical models of the TM. Further investigations are in progress and willbe reported in future publications.
AcknowledgmentsThis work was supported by the NIDCD and the Worcester Polytechnic Institute, Mechanical Engineering Department.The authors would like to thank the referees for providing constructive and valuable recommendations and updates.
REFERENCES1. Puria S, Allen JB. Measurements and model of the cat middle ear: evidence of tympanic membrane
acoustic delay. J. Acoust. Soc. Am 1998;104:3463–3481. [PubMed: 9857506]2. Khanna SM, Tonndorf J. Tympanic membrane vibrations in cats studied by time-averaged holography.
J. Acoust. Soc. Am 1972;51:1904–1920. [PubMed: 5045250]3. Fritze W, Kreitlow H, Ringer K. Holographic investigation of the mode of vibration of the human
eardrum. Arch. Otorhinolaryngol 1978;221:255–259. [PubMed: 727985]4. von Bally G. Holographic vibration analysis of the tympanic membrane. Laryngol. Rhinol
1978;57:444–450. (in German).5. Vest, CM. Holographic Interferometry. Wiley, NY: 1979. ?????6. Kawakami S. Vibration analysis in middle ear model with artificial ossicles, total ossicular replacement
prosthesis (TORP) by holographic interferometry. Nippon Jibiinkoka Gakkai Kaiho 1987;90:536–546.(in Japanese). [PubMed: 3625373]
7. Ishihara M. Experimental study of vibration analysis in middle ear models by holographicinterferometry. Effects of the cross-sectioned area of aditus on the vibration of tympanic membrane.Nippon Jibiinkoka Gakkai Kaiho 1989;92:726–735. (in Japanese). [PubMed: 2614565]
8. Decraemer WF, Khanna SM, Funnell WR. Interferometric measurement of the amplitude and phaseof tympanic membrane vibrations in cat. Hear. Res 1989;38:1–17. [PubMed: 2708151]
9. Naito Y. Holographic observation of the tympanic membrane vibration after stapes fixation. NipponJibiinkoka Gakkai Kaiho 1990;93:2021–2027. (in Japanese). [PubMed: 2292753]
10. Okano K. Influence of liquid volume in the middle ear on tympanic membrane vibration (experimentalstudy by holographic interferometry). Nippon Jibiinkoka Gakkai Kaiho 1990;93:1847–1855. (inJapanese). [PubMed: 2280306]
11. Suehiro M. Effects of an increase or decrease in the middle ear pressure on tympanic membranevibrations (experimental study by holographic interferometry). Nippon Jibiinkoka Gakkai Kaiho1990;93:398–406. (in Japanese). [PubMed: 2352048]
12. Maeta M. Effects of the perforation of the tympanic membrane on its vibration – with special referenceto an experimental study by holographic interferometry. Nippon Jibiinkoka Gakkai Kaiho1991;94:231–240. (in Japanese). [PubMed: 2037952]
13. Løkberg OJ, Høgmoen K, Holje OM. Vibration measurement on the human tympanic membrane invivo. Appl. Opt 1979;18:763–765. [PubMed: 20208819]
Furlong et al. Page 8
Strain. Author manuscript; available in PMC 2010 June 1.
NIH
-PA Author Manuscript
NIH
-PA Author Manuscript
NIH
-PA Author Manuscript

14. Stetson KA, Brohinsky WR. Electro optic holography and its application to hologram interferometry.Appl. Opt 1985;24:3631–3637. [PubMed: 18224099]
15. Pryputniewicz, RJ. Quantitative determination of displacements and strains from holograms, Ch. 3.In: Rastogi, PK., editor. Holographic Interferometry. Berlin: Springer-Verlag; 1994. p. 33-72.
16. Furlong C, Pryputniewicz RJ. Optomechanical study and optimization of a cantilever plate dynamics.Proc. SPIE 1995;2545:192–203.
17. Furlong C, Pryputniewicz RJ. Hybrid, experimental and computational, investigation of mechanicalcomponents. Proc. SPIE 1996;2861:13–24.
18. Yokum JS, Furlong C, Franklin KW, Cockrell GD. High resolution shape measurements of objects.J. Pract. Fail. Anal 2001;1:63–70.
19. Pryputniewicz, RJ.; Yokum, JS.; Furlong, C. Optoelectronic holography method for measurementsof absolute inside shapes of objects; Proc. 2002 Int. Conf. On Measurements in Advanced Materialsand Systems, SEM; Milwaukee, WI. 2002.
20. Furlong, C.; Pryputniewicz, RJ. Non-destructive damage evaluation of composite structures byoptoelectronic holography methodologies; Proc. SEM, Dr. C. P. Burger Symposium – Testing andModeling of Structures; Charlotte, NC. 2003.
21. Furlong C, Kolenovic E, Ferguson C. Quantitative optical metrology with CMOS cameras. Proc.SPIE 2004;5532:1–15.
22. Decraemer, WF.; Khanna, SM.; Funnell, WRJ. Vibrations at a fine grid of points on the cat tympanicmembrane measured with a heterodyne interferometer; EOS/SPIE International Symposia onIndustrial Lasers and Inspection, Conference on Biomedical Laser and Metrology and Applications,München; Germany. 1999.
23. Wada H, Ando M, Takeuchi A, Sugawara H, Koike T, Kobayashi T, Hozawa K, Gemma T, Nara M.Vibration measurement of the tympanic membrane of guinea pig temporal bones using time-averagedspeckle pattern interferometry. J. Acoust. Soc. Am 2002;111:2189–2199. 306. [PubMed: 12051438]
24. Buunen TJF, Vlaming MSMG. Laser-Doppler velocity meter applied to tympanic membranevibrations in cat. J. Acoust. Soc. Am 1981;69:744–750. [PubMed: 7240554]
25. Rosowski JJ, Mehta RP, Merchant SN. Diagnostic utility of laser-Doppler vibrometry in conductivehearing loss with normal tympanic membrane. Otol. Neurotol 2003;24:165–175. [PubMed:12621328]
26. Fay J, Puria S, Decraemer WF, Steele C. Three approaches for estimating the elastic modulus of thetympanic membrane. J. Biomech 2005;38:1807–1815. [PubMed: 16023467]
27. Furlong, C. Hybrid, Experimental and Computational, Approach for the Efficient Study andOptimization of Mechanical and Electro-Mechanical Components. Vol. Ph.D. Worcester, MA:Dissertation, Worcester Polytechnic Institute; 1999.
28. Ruggero MA, Rich NC, Robles L, Shivapuja BG. Middle ear response in the chinchilla and itsrelationship to mechanics at the base of the cochlea. J. Acoust. Soc. Am 1990;87:1612–1629.[PubMed: 2341666]
29. Olson ES. Observing middle and inner ear mechanics with novel intracochlear pressure sensors. J.Acoust. Soc. Am 1998;103:3445–3463. [PubMed: 9637031]
30. Overstreet EH III, Ruggero MA. Development of wide-band middle-ear transmission in theMongolian gerbil. J. Acoust. Soc. Am 2002;111:261–270. [PubMed: 11831800]
Furlong et al. Page 9
Strain. Author manuscript; available in PMC 2010 June 1.
NIH
-PA Author Manuscript
NIH
-PA Author Manuscript
NIH
-PA Author Manuscript
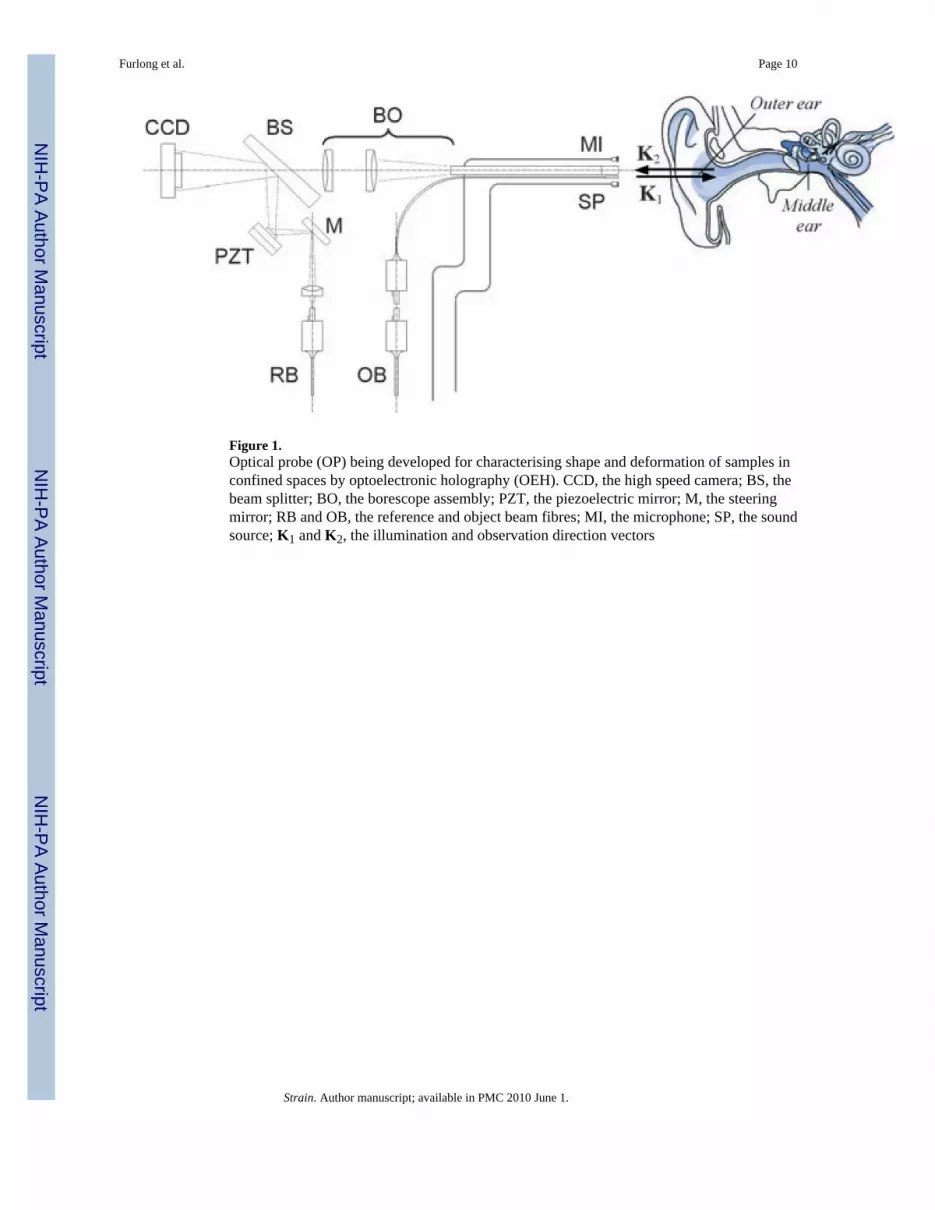
Figure 1.Optical probe (OP) being developed for characterising shape and deformation of samples inconfined spaces by optoelectronic holography (OEH). CCD, the high speed camera; BS, thebeam splitter; BO, the borescope assembly; PZT, the piezoelectric mirror; M, the steeringmirror; RB and OB, the reference and object beam fibres; MI, the microphone; SP, the soundsource; K1 and K2, the illumination and observation direction vectors
Furlong et al. Page 10
Strain. Author manuscript; available in PMC 2010 June 1.
NIH
-PA Author Manuscript
NIH
-PA Author Manuscript
NIH
-PA Author Manuscript
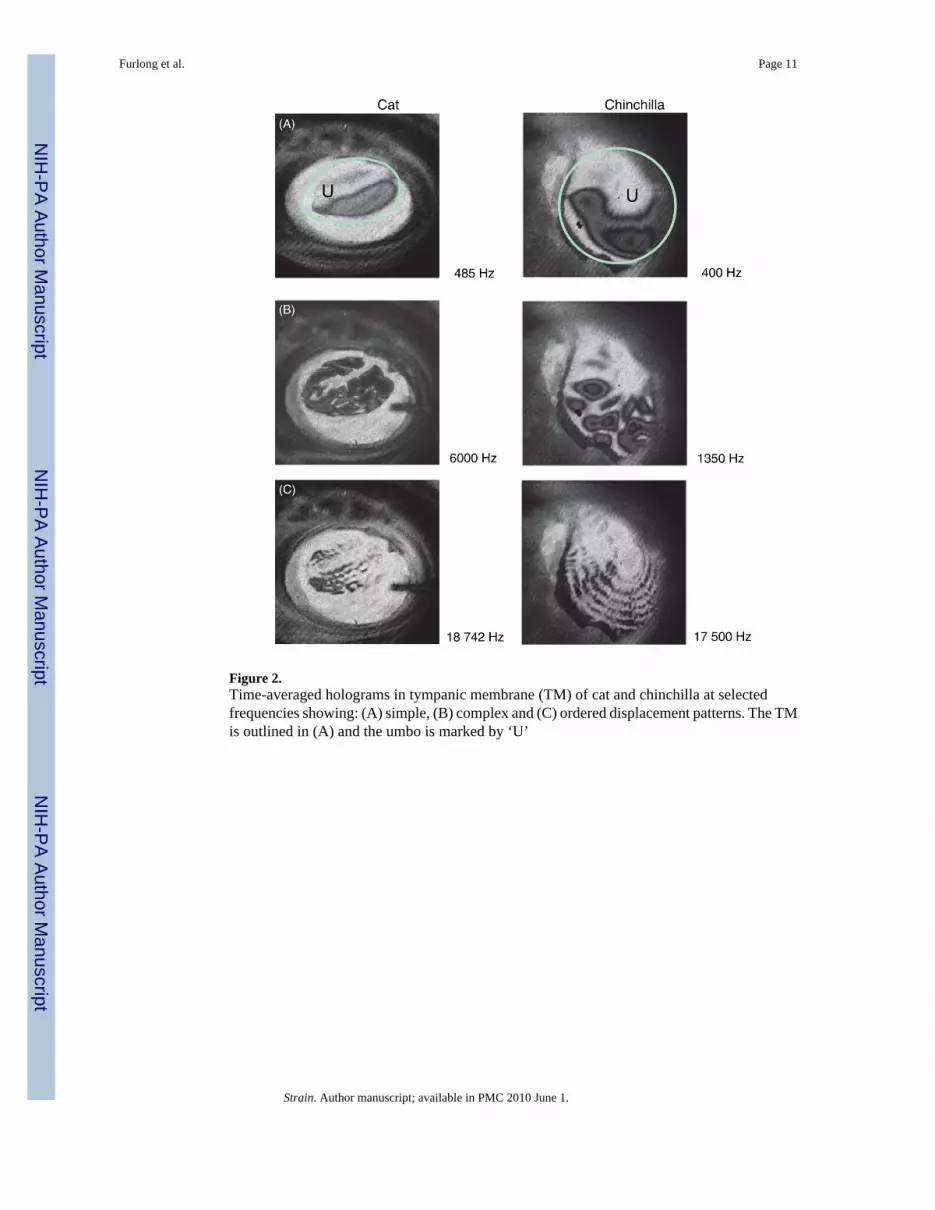
Figure 2.Time-averaged holograms in tympanic membrane (TM) of cat and chinchilla at selectedfrequencies showing: (A) simple, (B) complex and (C) ordered displacement patterns. The TMis outlined in (A) and the umbo is marked by ‘U’
Furlong et al. Page 11
Strain. Author manuscript; available in PMC 2010 June 1.
NIH
-PA Author Manuscript
NIH
-PA Author Manuscript
NIH
-PA Author Manuscript
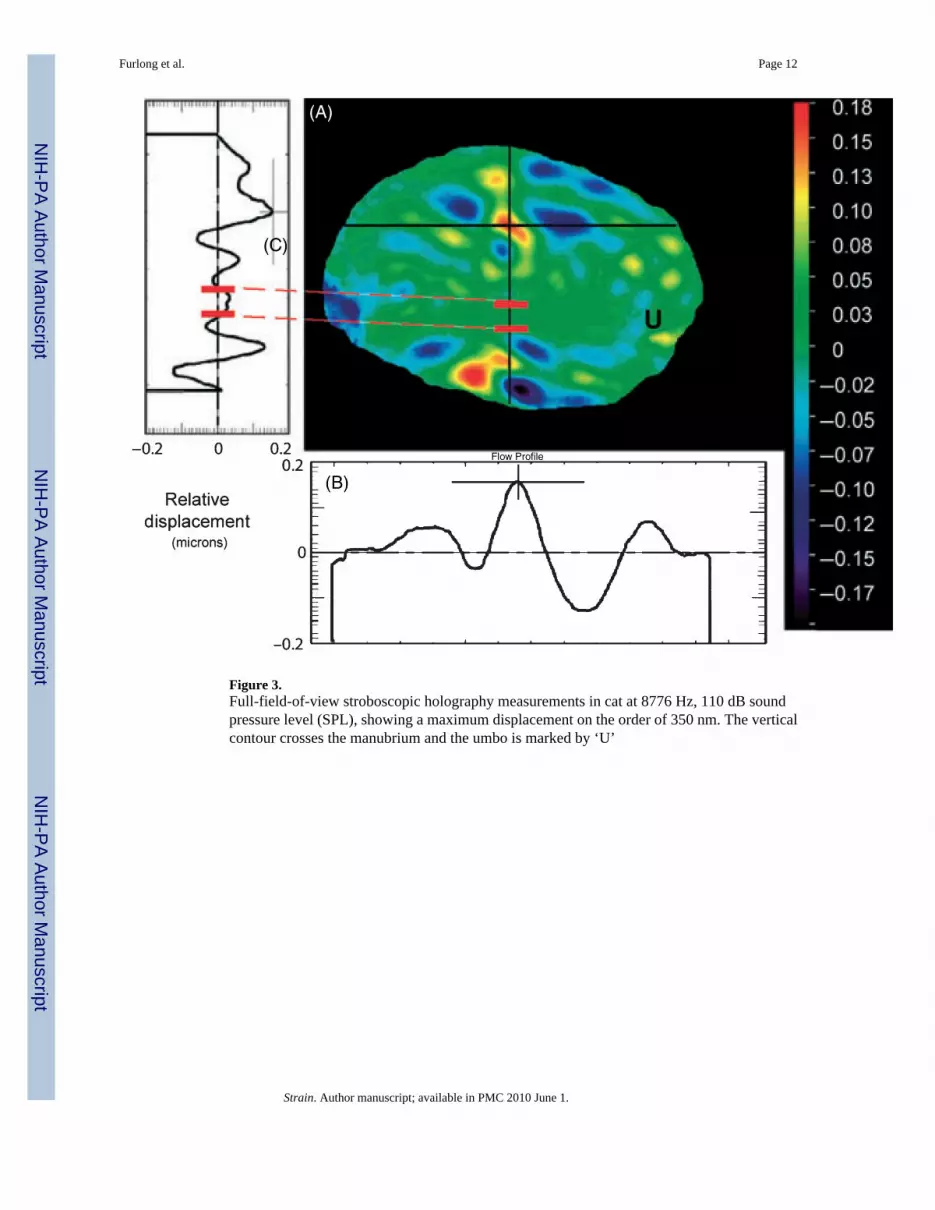
Figure 3.Full-field-of-view stroboscopic holography measurements in cat at 8776 Hz, 110 dB soundpressure level (SPL), showing a maximum displacement on the order of 350 nm. The verticalcontour crosses the manubrium and the umbo is marked by ‘U’
Furlong et al. Page 12
Strain. Author manuscript; available in PMC 2010 June 1.
NIH
-PA Author Manuscript
NIH
-PA Author Manuscript
NIH
-PA Author Manuscript
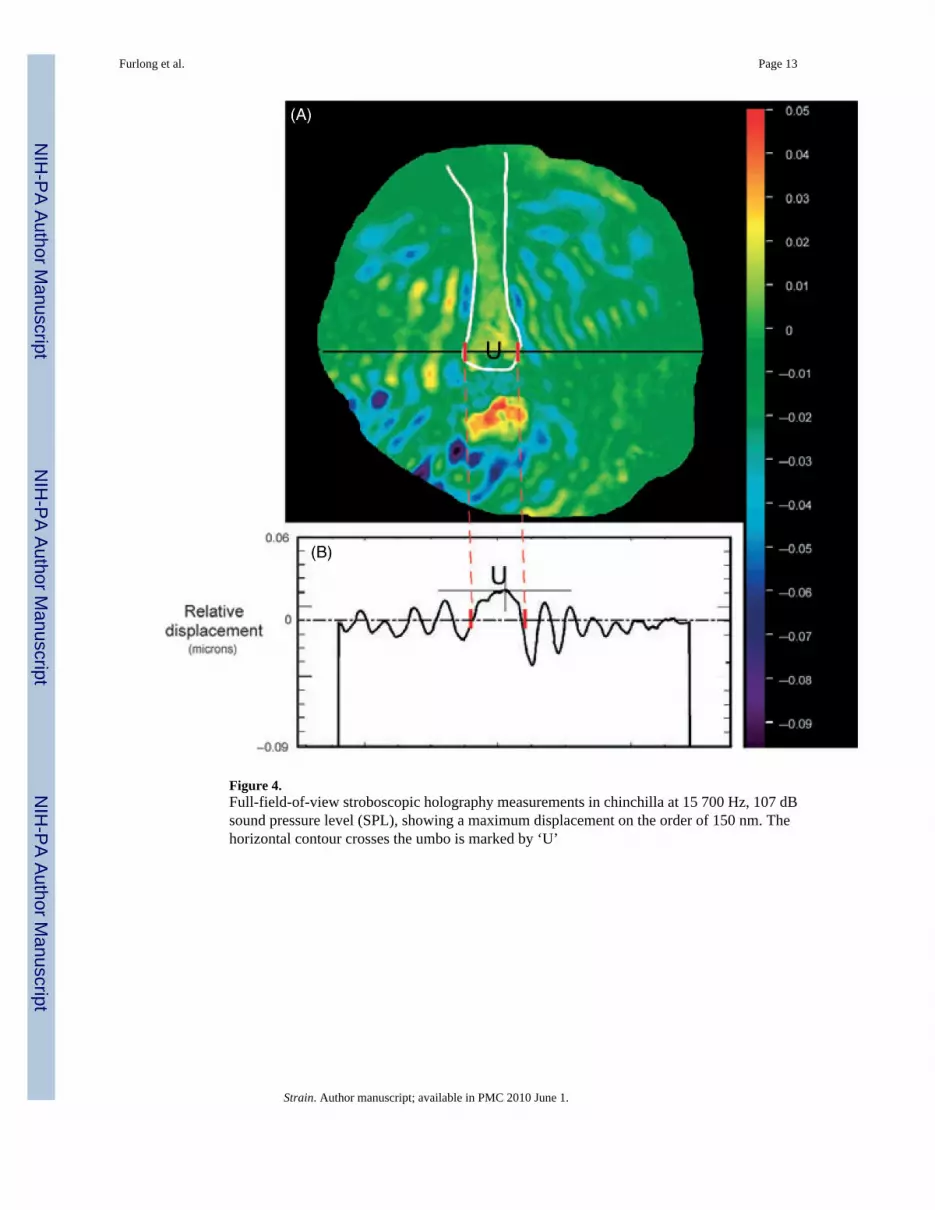
Figure 4.Full-field-of-view stroboscopic holography measurements in chinchilla at 15 700 Hz, 107 dBsound pressure level (SPL), showing a maximum displacement on the order of 150 nm. Thehorizontal contour crosses the umbo is marked by ‘U’
Furlong et al. Page 13
Strain. Author manuscript; available in PMC 2010 June 1.
NIH
-PA Author Manuscript
NIH
-PA Author Manuscript
NIH
-PA Author Manuscript

Figure 5.Automatic mask generation applied to data measured in a chinchilla tympanic membrane (TM)at 2800 Hz, 94 dB sound pressure level (SPL) stimulus: (A) mask without edge smoothing;and (B) mask after application of island-filling and spatial smoothing algorithms
Furlong et al. Page 14
Strain. Author manuscript; available in PMC 2010 June 1.
NIH
-PA Author Manuscript
NIH
-PA Author Manuscript
NIH
-PA Author Manuscript
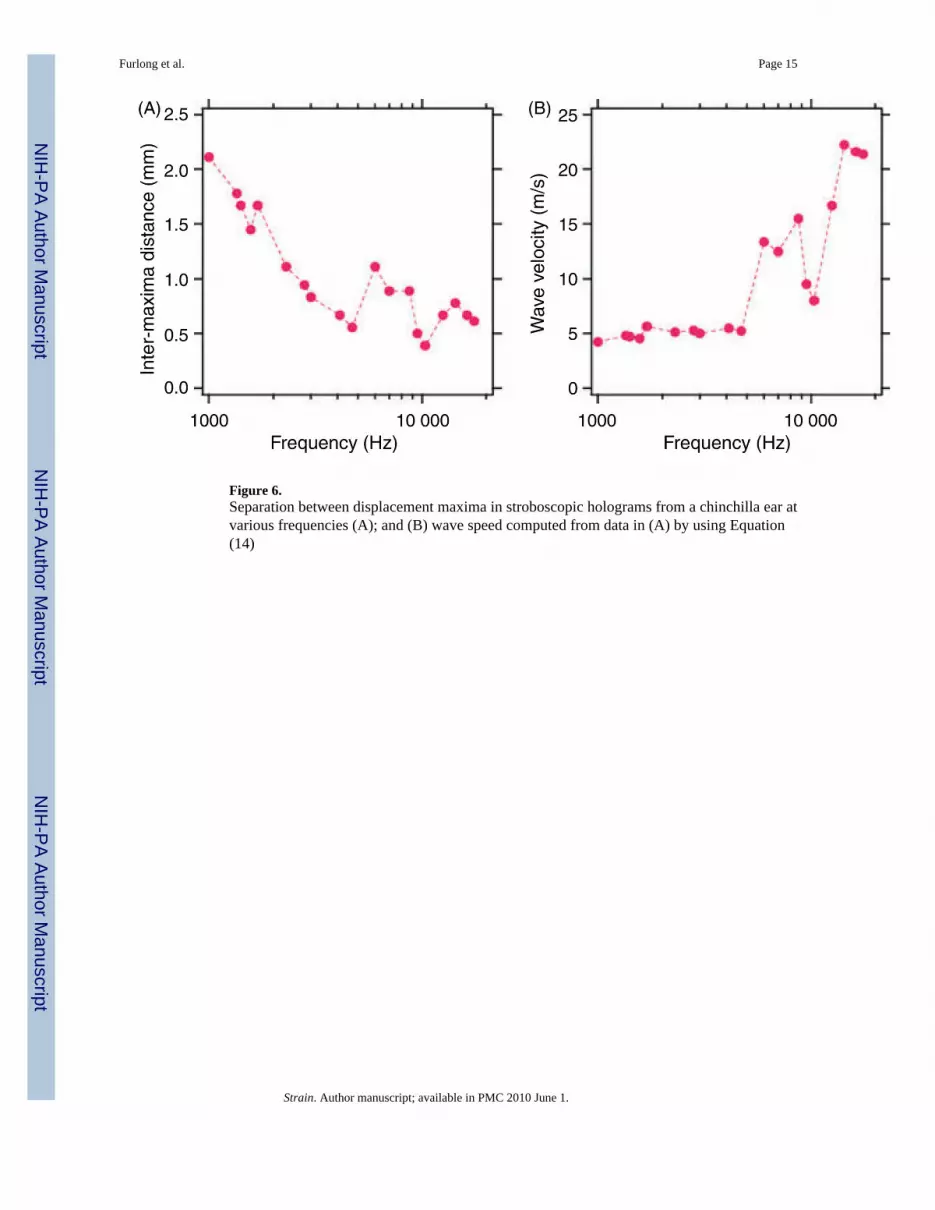
Figure 6.Separation between displacement maxima in stroboscopic holograms from a chinchilla ear atvarious frequencies (A); and (B) wave speed computed from data in (A) by using Equation(14)
Furlong et al. Page 15
Strain. Author manuscript; available in PMC 2010 June 1.
NIH
-PA Author Manuscript
NIH
-PA Author Manuscript
NIH
-PA Author Manuscript


